Exhibit 99.1
Application for Financing Order
Submitted to The Public Utilities Commission of Ohio
on May 3, 2012
BEFORE
THE PUBLIC UTILITIES COMMISSION OF OHIO
| | | | |
In the Matter of the Joint Application | | ) | | |
of Ohio Edison Company, The | | ) | | |
Cleveland Electric Illuminating Company, | | ) | | |
and The Toledo Edison Company for | | ) | | |
Authority to Issue Phase-In-Recovery | | ) | | Case No. 12–1465–EL–ATS |
Bonds and Impose, Charge and Collect | | ) | | |
Phase-In-Recovery Charges and | | ) | | |
For Tariff and Bill Format Approvals | | ) | | |
Change | | ) | | |
Application of Ohio Edison Company, The Cleveland Electric Illuminating Company, and The Toledo Edison Company for Authority to Recover Phase-In Costs and Financing Costs, Issue Phase-In-Recovery Bonds and Impose and Collect Phase-In-Recovery Charges, and for Tariff and Bill Format Approvals and for Commission Action on an Expedited Basis
Applicants, Ohio Edison Company (“OE”), The Cleveland Electric Illuminating Company (“CEI”), and The Toledo Edison Company (“TE” and together with OE and CEI, the “Applicants”) hereby submit this joint application (the “Application”) pursuant to O.R.C. § 4928.231 seeking authority to recover certain specified Phase-In Costs and Financing Costs through the issuance of Bonds payable from the collection of Phase-In-Recovery Charges (herein referred to as “Phase-In-Recovery Bonds”) and to impose and collect such Phase-In-Recovery Charges, all in accordance with O.R.C. §§ 4928.23 through 4928.2318 (referred to herein as the “Act”).
The Commission previously authorized the Applicants to defer and recover as regulatory assets certain costs, with carrying charges, related to fuel costs in 2006 - 2007 (all Applicants), power purchases in 2009 (CEI only), and the transition of all-electric customers toward market
pricing beginning in 2011 (OE and CEI only). The proposed securitization will benefit customers by providing both cost savings and rate mitigation through reducing the overall cost of these regulatory assets and by reducing the rates customers currently are paying toward their recovery. Exhibit A hereto provides the estimated existing deferral balances and citations to the Commission orders associated with the previously-authorized recovery of these regulatory assets or, as they are referred to under the Act, Phase-In Costs. The securitization transaction also is expected to significantly reduce the carrying charges over the recovery period for these Phase-In Costs resulting in customer savings through the issuance of the Phase-In Recovery Bonds (even after including applicable Financing Costs as discussed below), which recovery period will not exceed the overall recovery period under the existing cost recovery methodologies approved by the Commission for such regulatory assets, resulting in estimated nominal costs savings to customers of approximately $104 million in the aggregate as shown on Exhibit B hereto. In addition, the proposed securitization is expected to mitigate rate impacts to customers by flowing the cost savings through to customers annually in a manner that yields lower associated rates compared to the traditional cost recovery mechanisms previously approved by the Commission. This expectation for rate mitigation is based on current interest rates, market conditions and rates currently approved by the Commission. The proceeds from the issuance of the Phase-In-Recovery Bonds will, after the payment of upfront Financing Costs, be primarily applied to the reduction of existing long-term debt of the respective Applicants, which may confer additional long term benefits for both customers and the Applicants through a potential improvement to the Applicants credit metrics resulting from the anticipated use of proceeds from the proposed securitization.
2
| II. | Securitization Transaction |
| | 1. | Each Applicant is an Ohio corporation engaged in the distribution of electricity for sale to retail customers in Ohio under rates and tariffs approved by this Commission and electric distribution utilities pursuant to O.R.C. § 4928.01(A)(6). |
| | 2. | The Act provides for electric distribution utilities to securitize certain previously-approved costs through the issuance of Phase-In-Recovery Bonds pursuant to a Financing Order issued by the Commission. Securitization is authorized if the Commission finds, consistent with market conditions, it measurably enhances cost savings to customers and mitigates rate impacts to customers as compared with the Commission’s previously-approved recovery methods for the Applicants, and is consistent with Ohio policy as set forth in O.R.C. § 4928.02. |
| | 3. | The Applicants request that the Commission issue a Financing Order pursuant to the provisions of O.R.C. § 4928.232(C) and (D)(2) authorizing the issuance of up to an aggregate amount of $555 million of Phase-In-Recovery Bonds, in one or more series and one or more classes/tranches. The proceeds from the issuance of the Phase-In-Recovery Bonds will: (i) allow full collection of the associated Financing Costs described in paragraph 10 below and on Exhibit C] hereto; and (ii) compensate the Applicants for Phase-In Costs described in paragraphs 6, 7 and 8 below and on Exhibit A hereto, at an effective interest rate (after taking into account upfront and ongoing Financing Costs) lower than each Applicant’s Commission-authorized rate of return for such regulatory assets. The benefits to customers of the lower effective interest rate versus the current authorized rate of return are reflected in a reduction in the expected amount payable by customers on both a nominal and a net present value basis as compared with existing recovery mechanisms. |
3
| | 4. | All customers of the Applicants will be responsible for repayment of the Phase-In-Recovery Bonds through the imposition of separate, nonbypassable charges called Phase-In-Recovery Charges. O.R.C. § 4928.239(B)(1). For purposes of this proceeding, “Phase-In Recovery Charges” are those charges to be set forth in a rider to be approved by the Commission in this proceeding, which, together with an adjustment mechanism to be authorized by the Commission pursuant to O.R.C. § 4928.238, will provide for the full and timely recovery of all costs associated with the issuance of or use of proceeds from the proposed Phase-In Recovery Bonds including without limitation all Phase-In Costs and Financing Costs. |
| | 5. | Each Applicant intends to use its portion of the proceeds from the issuance and sale of Phase-In-Recovery Bonds to primarily repay existing long-term debt. Proceeds will also be used to pay Financing Costs, including all required credit enhancement, and may also be used for other corporate purposes. Exhibit D hereto provides current and pro forma capitalization for the Applicants in connection with the proposed issuance of Phase-In-Recovery Bonds. |
| | a) | The repayment of existing long-term debt by the Applicants may result in improved credit metrics for each of the Applicants as the Phase-In Recovery Bonds are not expected to be classified as debt of the Applicants by the rating agencies because they will not be supported by the Applicants’ general revenue streams or collateralized by the assets of any Applicant (assumes the customary securitization transaction such as that proposed is approved). |
4
| | b) | The Phase-In-Recovery Bonds will not be included in the regulatory capital structure of the Applicants going forward. The Phase-In-Recovery Bonds are expected to be recorded in accordance with GAAP primarily as long term debt on the balance sheet of each Applicant’s special purpose entity to which Phase-In-Recovery Property is sold in connection with the securitization (each, an “SPE”) for financial reporting purposes. Such SPE’s Phase-In-Recovery Bonds will also appear on the consolidated balance sheet of the respective Applicant, as the parent company, in its GAAP financial statements. |
| | 6. | CEI requests that the Commission approve the issuance of Phase-In-Recovery Bonds in an amount up to $280 million in the aggregate, the proceeds of which will be used to recover, finance or refinance CEI’s portion of the estimated Financing Costs and the following Phase-In Costs: (i) the remaining uncollected balances of its deferred costs, with carrying charges, associated with the actual fuel costs incurred that exceeded the fuel recovery mechanism revenues collected from January 1, 2006 through December 31, 2007, which currently are being recovered through a separate rider mechanism, namely the Deferred Fuel Cost Recovery Rider (Rider DFC); (ii) the remaining uncollected balances of its |
5
| | deferred costs, with carrying charges, associated with purchase power costs incurred that exceeded the purchase power recovery mechanism revenue from January 1, 2009 through May 31, 2009, which currently are being recovered through a separate rider mechanism, namely the Deferred Generation Cost Recovery Rider (Rider DGC); and (iii) the remaining uncollected balances of its deferred costs, with carrying charges, associated with purchase power costs incurred from March 17, 2010 through June 30, 2011 that exceeded the associated purchase power recovery mechanism revenue due to implementation of the Residential Generation Credit Rider (Rider RGC), which currently are being recovered through a separate rider mechanism, namely the Residential Electric Heating Recovery Rider (Rider RER1). Exhibit A provides the estimated deferral balances as of December 31, 2012. |
| | 7. | OE requests that the Commission approve the issuance of Phase-In-Recovery Bonds in an amount up to $220 million in the aggregate, the proceeds of which will be used to recover, finance or refinance OE’s portion of the estimated Financing Costs and the following Phase-In Costs: (i) the remaining uncollected balances of its deferred costs, with carrying charges, associated with the actual fuel costs incurred that exceeded the fuel recovery mechanism revenues collected from January 1, 2006 through December 31, 2007, which currently are being recovered through a separate rider mechanism, namely Deferred Fuel Cost Recovery Rider (Rider DFC); and (ii) the remaining uncollected balances of its deferred costs, with carrying charges, associated with purchase power costs incurred from March 17, 2010 through June 30, 2011 that exceeded the associated purchase power recovery mechanism revenue due to implementation of the Residential Generation Credit Rider (Rider RGC), which currently are being recovered through a separate rider mechanism, namely Residential Electric Heating Recovery Rider (Rider RER1). Exhibit A provides the estimated deferral balances as of December 31, 2012. |
6
| | 8. | TE requests that the Commission approve the issuance of Phase-In-Recovery Bonds in an amount up to $55 million in the aggregate, the proceeds of which will be used to recover, finance or refinance TE’s portion of the estimated Financing Costs and the following Phase-In Costs: the remaining uncollected balances of its deferred costs, with carrying charges, associated with the actual fuel costs incurred that exceeded the fuel recovery mechanism revenues collected from January 1, 2006 through December 31, 2007, which currently are being recovered through a separate rider mechanism, namely Deferred Fuel Cost Recovery Rider (Rider DFC). Exhibit A provides the estimated deferral balance as of December 31, 2012. |
All of the riders referred to in paragraphs 6, 7 and 8 for which uncollected balances constitute Phase-In Costs to be financed through the proposed securitization are hereinafter referred to as the “Existing Riders.”
| | 9. | Notwithstanding that the Phase-In-Recovery Bonds’ scheduled recovery period (and potential tranching resulting in multiple tranches of Phase-In Recovery Bonds with different maturity dates) will be determined by reference to rating agency considerations and market conditions, Applicants intend that the Phase-In-Recovery Bonds overall scheduled recovery period will not exceed the longest remaining recovery period under the Existing Riders. In an attempt to reduce the average interest cost, and as is customary for transactions of this type, the Phase-In-Recovery Bonds will likely be issued in several classes, referred to in this Application as tranches, each with a different expected maturity date. Each tranche will also have a later final legal maturity date (expected to be up to 2 |
7
| | years after the expected maturity date) by which the Phase-In-Recovery Bonds must be paid in full in the event collections of the Phase-In-Recovery Charges are lower than projected prior to the expected maturity date. Based upon the market conditions as of the date of filing this Application, the recommended tranches with initial principal amounts, first scheduled principal payment dates, expected maturity dates, final legal maturity dates and average lives are shown in Exhibit E hereto. The expected issuance date for the Phase-In-Recovery Bonds, assuming no material changes in market conditions, would be within one hundred twenty (120) days of the Financing Order becoming a Final Financing Order, and for illustrative purposes, we have assumed an issuance date of December 31, 2012. Notwithstanding the foregoing, the final number of tranches, payment and maturity dates and average lives may differ from those set forth on Exhibit E hereto due to market conditions on the date of pricing of the Phase-In-Recovery Bonds. |
| | 10. | An estimate of the upfront and ongoing Financing Costs related to each Applicant’s request as provided in this Application is set forth in Exhibit C hereto. At the time of issuance of the Phase-In-Recovery Bonds, certain of these Financing Costs are likely to vary from such estimate as a result of changes in market conditions and other factors (e.g., the actual costs of redeeming or otherwise retiring existing long-term debt), none of which can be known at this time. The Applicants propose that a statement setting forth final upfront Financing Costs be provided to the Commission promptly upon final determination; provided, however, that the Applicants propose that the Financing |
8
| | Order state that the upfront Financing Costs recoverable through Phase-In-Recovery Charges, exclusive of debt retirement costs, shall not exceed the aggregate limit set forth in the Financing Order. As shown in Exhibit C, the Applicants’ current estimate of such upfront Financing Costs is approximately $8.4 million in the aggregate, exclusive of debt retirement costs. |
| | a) | In the case of debt retirement costs, these costs may vary significantly in response to market conditions and as a result of the terms of the various debt securities to be retired (e.g. whether the Applicants have to tender for such debt securities or repurchase such debt securities on the open market or otherwise have the right to optionally redeem such debt securities). Further, if the Applicants specify the debt securities to be retired or the timing of such retirements then the prices at which such debt securities could be retired, redeemed or repurchased could increase and ultimately result in increased Financing Costs. |
| | b) | The cost of debt retirement may be impacted by changes in market interest rates. The lower prevailing interest rates are at the time of retirement, the higher the cost to effect such retirement may be. All else being equal, the impact of any increase in debt retirement costs caused by lower market interest rates should be somewhat offset by a lower cost of debt on the Phase-In-Recovery Bonds. Therefore, the Applicants request that the Commission authorize each Applicant to retire its debt with the Proceeds from the Phase-In-Recovery Bonds in any manner, consistent with market conditions, that does not impede the securitization transaction from achieving measurably enhanced cost savings and mitigating rate impacts for customers. |
9
| | III. | Retail Rate Impact and Phase-In-Recovery Charges |
| | 11. | As previously stated, the securitization proposed to be implemented pursuant to the Act would provide customers with the benefit of lower cost long-term financing compared to the previously-approved recovery mechanisms (i.e. the Existing Riders). Exhibit B hereto shows the expected debt service associated with the Phase-In-Recovery Bonds based upon market conditions as of the date of this Application and compares those amounts to the current expected costs of recovery for the uncollected Phase-In Costs to be securitized under the Existing Riders, ultimately supporting projected savings to customers on both a nominal and a net present value basis. As demonstrated on Exhibit B hereto, from the point of view of the Applicants’ customers, issuance of Phase-In-Recovery Bonds as proposed in this Application, consistent with the market conditions as of the date of filing this Application, both measurably enhances cost savings to customers and mitigates rate impacts to customers as compared with recovery of such uncollected Phase-In Costs under the Existing Riders. In comparing the estimated Phase-In-Recovery Charges to the rates under the Existing Riders, it is important to acknowledge that such rates are not directly comparable (e.g., current rates do not reflect customer uncollectibles which are recovered separately, while Phase-In-Recovery Charges must reflect uncollectibles as such charges are the sole source of payment for Phase-In-Recovery Bonds). While all amounts shown below: (i) are dependent upon a number of assumptions; and (ii) are based on |
10
| | current estimates and market conditions; and (iii) will periodically change throughout the recovery period in accordance with the approved adjustment mechanisms described in Exhibit F hereto, upon issuance of the proposed Phase-In-Recovery Bonds: |
| | a) | CEI customers would have an estimated initial Phase-In-Recovery Charge of 0.3851 cents/kWh resulting in a monthly cost of $3.85 for the typical residential bill (1,000 kWh). If the Existing Riders continued as approved, a 1,000 kWh residential customer would pay on average for Riders DGC, DFC, and RER1, a total monthly charge of 0.4303 cents/kWh resulting in a monthly cost of $4.30. See Exhibit G hereto for impacts for other customer classes and usage levels. |
| | b) | OE customers would have an estimated initial Phase-In-Recovery Charge of 0.3198 cents/kWh resulting in a monthly cost of $3.20 for the typical residential bill (1,000 kWh). If the Existing Riders continued as approved, a 1,000 kWh residential customer would pay on average for Riders DFC, and RER1, a total monthly charge of 0.3476 cents/kWh resulting in a monthly cost of $3.48. See Exhibit G hereto for impacts for other customer classes and usage levels. |
| | c) | TE customers would have an estimated initial Phase-In-Recovery Charge of 0.0250 cents/kWh resulting in a monthly cost of $0.25 for the typical residential bill (1,000 kWh). If the Existing Riders continued as approved, a 1,000 kWh residential customer would pay on average for Rider DFC, a total monthly charge of 0.0257 cents/kWh resulting in a monthly cost of $0.26. See Exhibit G hereto for impacts for other customer classes and usage levels. |
11
| | 12. | Applicants have attached as Exhibit H hereto proposed tariff sheets reflecting Phase-In-Recovery Charges that are expected to approximate the final tariff charges, based upon currently available information related to the terms of the proposed issuance of Phase-In-Recovery Bonds (the “Proposed Tariff Sheets”). Following issuance of the Financing Order and upon pricing of the Phase-In-Recovery Bonds, the Proposed Tariff Sheets will be updated in accordance with the Commission-approved adjustment mechanism contained in the Financing Order as described in paragraph 16 below to reflect actual costs and any other revised assumptions (e.g., electricity consumption) and filed with the Commission pursuant to O.R.C. § 4928.232(H) (as so updated, the “Final Initial Tariff Sheets”). The Existing Riders will be reduced to zero on the effective date of the Final Initial Tariff Sheets subject to final reconciliation of the remaining deferral balances, if any, which will be maintained on the Applicants books subject to carrying charges until full cost recovery occurs. Any final reconciliation that reduces deferral balances below zero shall similarly produce a customer credit and will not affect the Phase-In-Recovery Charges, which are irrevocable. |
| | 13. | As reflected in the description on the reconciliation mechanism shown in Exhibit F, the determination of the Phase-In-Recovery Charges for each Applicant will take into account (a) the timing and amounts of principal, interest and other ongoing costs of the Phase-in-Recovery Bonds, and (b) the expected monthly electricity consumption by customers of the Applicant. The Phase-In-Recovery |
12
| | Charges shall also take into account factors such as (i) expected delays between the billing and collection of Phase-In-Recovery Charges, and (ii) expected Phase-In-Recovery Charge uncollectibles, which factors will impact the amount and/or timing of collections received in respect of the Phase-In-Recovery Charges, and will therefore impact the rate at which the Phase-In-Recovery Bonds are repaid and interest accrues thereon. The methodology proposed for allocating the amounts to be collected under the Phase-In Recovery Charges among customer classes for each Applicant is generally consistent with the allocations in place under the Existing Riders. Each Applicant will estimate the amount of revenue otherwise collected from each rate schedule under the Existing Riders for the Phase-In Costs. These estimated revenues, by rate schedule, will then be used to determine allocation ratios representing the proportion of the total revenue collected from each rate schedule under the existing recovery methodology on a monthly basis. These allocation ratios will then be applied to the estimated amounts to be recovered under the Phase-In Recovery Charges so that in effect, each rate schedule will be paying approximately the same proportion of the Phase-In Recovery Charges as they otherwise would for Rider DFC, Rider DGC (CEI only) and Rider RER1 (OE and CEI only) under the existing recovery methodology. In the event that any Phase-In Recovery Charges cannot be allocated to a given customer class(es) (e.g., no customers remain in such class(es)), such charges shall be allocated to the remaining customer classes, using the same ratable allocation to the customer classes excluding the class(es) where allocation is infeasible. |
13
| | 14. | Since the Phase-In Recovery Charges are recovered on a nonbypassable basis, the methodology proposed for allocating the Phase-In Recovery Charges for each Applicant to governmental aggregation customers is the same as all other customers. The nonbypassability of the Phase-In Recovery Charges, along with the rate design methodology described in paragraph 13 above, ensure that all customers, including governmental aggregation customers, receive a proportion of the benefits generally consistent with the proportion of the charges they are paying under the existing recovery methodology. Additionally, consistent with 4928.231(B)(5), Exhibit B provides each Applicant’s initial estimate of the amount of Phase-In-Recovery Charges necessary to recover all Phase-In-Costs and Financing Costs. |
| | 15. | The Phase-In-Recovery Bonds would be structured in the manner provided for in the Financing Order consistent with the Act, thus enabling the Phase-In-Recovery Bonds to achieve the highest credit rating and a lower cost than Applicants’ existing, Commission-approved carrying charges, thereby both measurably enhancing cost savings to customers and mitigating rate impacts to customers as compared with the current Commission-approved mechanisms. Thus, issuing Phase-In-Recovery Bonds as proposed, pursuant to the Act, would lower the costs to customers while still permitting Phase-In-Recovery Property to be fully collected over a period that is not expected to exceed the longest remaining recovery period under the Existing Riders. |
| | 16. | The Applicants request that the Financing Order establish the nonbypassable Phase-In-Recovery Charges in accordance with the Proposed Tariff Sheets, |
14
| | described in paragraph 12 above, that will be applied and billed to all customers of each Applicant as a result of the issuance of the proposed Phase-In-Recovery Bonds pursuant to O.R.C. § 4928.239(B)(1), as updated through the Final Initial Tariff Sheets. The final initial Phase-In-Recovery Charges to be included in the Final Initial Tariff Sheets will reflect the terms and conditions of the Final Financing Order including all Phase-In Costs and Financing Costs. As required by O.R.C. § 4928.232(H), after the final terms of the respective tranches of Phase-In-Recovery Bonds have been established and prior to the issuance of those Bonds, the Applicants will determine the resulting final initial Phase-In-Recovery Charges in accordance with the adjustment mechanism approved in the Final Financing Order and make a compliance filing of the Final Initial Tariff Sheets in this docket, which Phase-In-Recovery Charges and Final Initial Tariff Sheets shall be final and effective upon the issuance of the Phase-In-Recovery Bonds without further Commission action. |
| | 17. | The property, rights and interests of each Applicant or its SPE Assignee (further discussed below) under the Financing Order, including the right to impose, charge and collect the Phase-In-Recovery Charges that shall be used to pay and secure the payment of the Phase-In-Recovery Bonds and Financing Costs, and the right to obtain adjustments to those charges, together with the revenues, receipts, collections, rights to payment, payments, moneys, claims or other proceeds arising from the rights and interests created under the Financing Order, shall constitute, until fully collected, Phase-In-Recovery Property as defined under O.R.C. § 4928.23(K). For avoidance of doubt, “Phase-In-Recovery Revenues” |
15
| | constitute “Phase-In-Recovery Property.” The Phase-In-Recovery Charges will be included in customers’ bills of each Applicant, and there will be notation on customers’ bills denoting that the right to impose, charge and collect Phase-In-Recovery Charges is owned by the SPE formed by such Applicant as discussed below. |
| | 18. | As reflected in Exhibit I Proposed Bill Format, the Applicants seek approval of a modified bill format that includes the following language in the notes section of the bill: “Cost Recovery Charges– Recovers previously incurred costs, including PUCO-approved Phase-In Recovery Charges[Applicant Name] collects from all customers on behalf of a subsidiary,[SPE Name], which owns the right to impose and collect such charges.” The Applicants may also include similar language in billing inserts or other communication to customers. Such notation is important to preserve the “bankruptcy remote” nature of the securitization by respecting the legal ownership of the Phase-In Recovery Property. |
| | IV. | Securitization Structure and Documentation. |
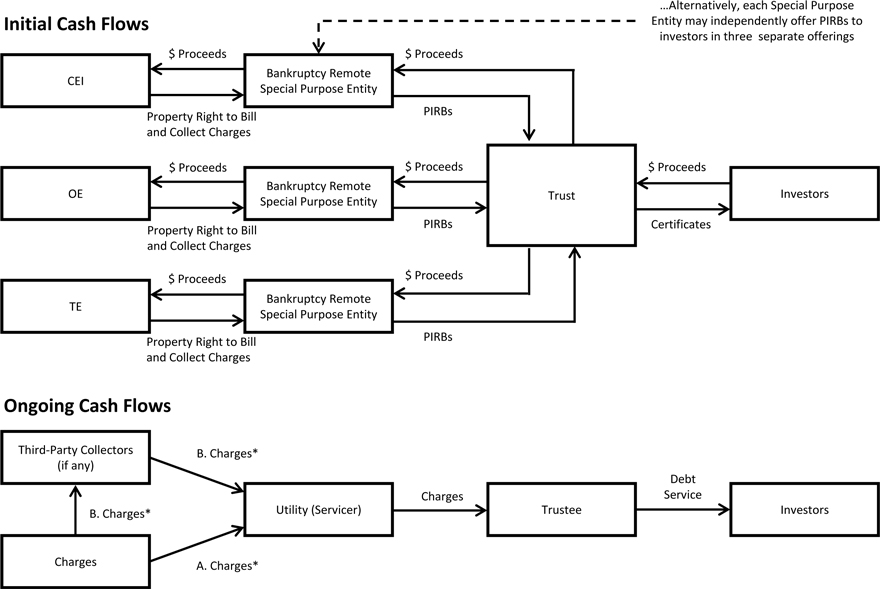
| | 19. | Each Applicant will form a separate, wholly-owned limited liability company, which is expected to be organized in Delaware, as a SPE for purposes of the securitization transaction. Each Applicant will then transfer, sell or assign its Phase-In-Recovery Property to its SPE. See Exhibit J hereto for a structure/transaction flow chart. Applicants request that the Financing Order confirm the formation of each SPE, the sale of Phase-In-Recovery Property to each SPE, and the issuance by each SPE of Phase-In-Recovery Bonds secured by the Phase-In-Recovery Property and other assets and property (subject to possible limited exceptions consistent with paragraph 21(e) below) owned by such SPE. |
16
| | a) | Each SPE will be a bankruptcy-remote, special purpose limited liability company, in that its activities generally will be limited to (i) purchasing, owning, administering and servicing the Phase-In-Recovery Property transferred, sold or assigned to it, (ii) issuing and, if applicable, registering the Phase-in-Recovery Bonds, (iii) making payments on the Phase-In-Recovery Bonds, (iv) managing, selling, assigning, pledging, collecting amounts due on, and otherwise dealing with the Phase-In-Recovery Property and (v) granting a statutory first priority security interest in the Phase-In-Recovery Property to secure such Phase-In-Recovery Bonds. Restrictions will be imposed on each SPE’s ability to commence a bankruptcy case or other insolvency proceeding. Each SPE will have no employees, and it will engage with other parties to undertake the activities necessary to issue the Phase-In-Recovery Bonds and perform other functions in connection with each issuance. |
| | b) | Each of the Applicants will capitalize its respective SPE in an amount anticipated to be approximately 0.50 percent of its initial principal balance of Phase-In-Recovery Bonds, as may be adjusted at the time of issuance based on rating agency requirements. Each Applicant intends to finance its respective SPE’s capitalization amount with cash from working capital, and such amounts will not constitute Financing Costs or be subject to recovery through Phase-In-Recovery Charges. The purpose of this capitalization |
17
| | amount is to cover unexpected ongoing Financing Costs or unexpected short-falls in collections until a true-up adjustment can be effected and the additional revenues can be collected. However, each Applicant will be authorized to recover its average long term debt rate without reduction for accumulated deferred income taxes on its respective SPE’s capitalization amount as an ongoing Financing Cost. Upon the full repayment of the Phase-In-Recovery Bonds, the capitalization amount will be returned to each of the Applicants to the extent of available funds. |
| | c) | Upon the sale of the Phase-In-Recovery Property by each Applicant to its SPE subsidiary as authorized under the Financing Order, there will arise and constitute an existing, present property right and interest in such Phase-In-Recovery Property, which shall continue to exist until the Phase-In-Recovery Bonds and all applicable Financing Costs are paid in full. Consistent with O.R.C. § 4928.232(G), each Applicant requests that the Financing Order confirm the creation of its Phase-In-Recovery Property and that such creation shall be simultaneous with the sale of that property to its SPE, and the grant of a security interest in its Phase-In-Recovery Property, among other SPE assets and property, to secure the repayment of Phase-In-Recovery Bonds and Financing Costs. Additionally, consistent with O.R.C. §4928.234(D), the Financing Order should confirm that all such Phase-In-Recovery Property shall continue to exist regardless of whether Phase-In-Recovery Charges have been billed, have accrued or have been collected and notwithstanding any requirement that value or amount of the property is dependent on the future |
18
| | provision of service to customers by the Applicants, and shall continue to exist until the Phase-In-Recovery Bonds and all Financing Costs are paid in full. |
| | d) | Each SPE will acquire the Phase-In-Recovery Property from the appropriate Applicant with the proceeds of Phase-In-Recovery Bonds, the repayment of which will be secured by a first priority pledge and security interest in all right, title, and interest of the SPE in (i) the Phase-In-Recovery Property, (ii) the transaction documents, (iii) the collection account and all subaccounts established in the Indenture (discussed below) under which the Phase-In-Recovery Bonds will be issued, (iv) the cash used to capitalize the SPE, (v) all other property owned by the SPE (with limited exceptions as may be appropriate) and (vi) all proceeds of each of the foregoing. Each SPE’s Phase-In-Recovery Bonds will be non-recourse to the related Applicant and its assets (i.e., the Applicants will have no obligation to pay any of the principal, interest or other amounts payable on the Phase-In-Recovery Bonds or any Financing Costs); provided, however, that each Applicant could be liable to holders of Phase-In-Recovery Bonds in the event that it breached representations, warranties or covenants made by it in connection with its Sale Agreement (discussed below) or otherwise to such holders in connection with the securitization. |
| | e) | Each SPE will be an “Assignee” of Phase-In-Recovery Property as defined in O.R.C. § 4928.23(B) and as provided for in O.R.C. § 4928.234(A). |
19
| | f) | Each SPE shall, pursuant to its Indenture or organizational documents, have a “priority of payments” that shall establish how collections of Phase-In-Recovery Charges and any other amounts are applied to pay principal, interest on, and other costs related to the Phase-In Recovery Bonds. The right to impose, charge and collect Phase-In-Recovery Charges, although owned by the applicable SPE, will be considered electric distribution utility charges for purposes of priority of customer payments and termination/reconnection of service will be considered charges of the Applicants and will be accorded similar treatment with the Applicants’ own charges under applicable statutes, the Commission’s rules, and Applicants’ tariffs and Electric Service Regulations. |
| | 20. | The Phase-In-Recovery Bonds contemplated by the transactions described in this Application will be “asset-backed securities.” A key feature of any such securities is that the SPE owning the asset or group of assets underlying the asset-backed securities be “bankruptcy remote” from the entity originating such asset or group of assets, which in this case will be an Applicant. More specifically, an asset-backed security must be secured by, and payable from, a cash flow stream associated with an identifiable asset, the collections from which are sufficient to pay debt service and related costs, and the ownership of that asset is normally vested in a limited purpose entity, such as a special-purpose corporation, trust or limited liability company, which is insulated from the credit risks, including the possible bankruptcy, of the originating entity. As a result, the securities issued by such entity shall be secured by, and payable out of, the related cash flow stream. |
20
| | This structure means the Phase-In-Recovery Bonds should have less credit risk than debt securities issued by an Applicant, and investors should therefore be willing to accept a lower rate of return for the asset-backed security than for such other debt securities. If such criteria are satisfied in the proposed securitization, the Phase-In-Recovery Bonds secured by the Phase-In-Recovery Property should receive a triple-A (or equivalent) credit rating from applicable rating agencies. |
| | 21. | In order for the Phase-In-Recovery Bonds to have relatively little credit risk, and therefore, for investors to be willing to accept a relatively lower interest rate for the Phase-In-Recovery Bonds, there are a number of other structural elements and express regulatory authorizations and confirmations customarily required to be included in a Financing Order for ratings and marketing purposes even if already included in the underlying statutory provisions, which are included in this Application including those in paragraphs 21(a) through (j) below. |
| | (a) | Irrevocability: Consistent with O.R.C. § 4928.235(B), the Financing Order should provide that it is irrevocable when final and the Commission may not reduce, impair, postpone, or terminate the Phase-In-Recovery Charges authorized in the Financing Order or impair the Phase-In-Recovery Property or the collection of Phase-In-Recovery Charges or the recovery of Phase-In-Costs and Financing Costs. The Financing Order should further confirm, consistent with the Act, that no adjustment (described in O.R.C. §4928.238) approved by the Commission shall affect the irrevocability of the Financing Order. |
21
| | (b) | State Pledge: Consistent with O.R.C. § 4928.2315, the Financing Order should confirm that the State of Ohio pledges to and agrees with the bondholders, any assignee, and any financing parties under the Financing Order that the State of Ohio will not take or permit any action that impairs the value of Phase-In-Recovery Property under the Financing Order or revises the Phase-In-Costs for which recovery is authorized under the Financing Order or, except as allowed under O.R.C. § 4928.238, relating to the approved adjustment mechanism, reduce, alter or impair Phase-In-Recovery Charges until the Phase-In-Recovery Bonds, all Financing Costs, and all amounts to be paid under any ancillary agreement are paid or performed in full. |
| | (c) | True Sale: Consistent with O.R.C. § 4928.2313, the Financing Order should confirm that any sale, assignment, or transfer of Phase-In-Recovery Property under a Financing Order shall be an absolute transfer and true sale of, and not a pledge of or secured transaction relating to, the seller’s right, title and interest in, to, and under the Phase-In-Recovery Property. |
| | (d) | Successor utility: Consistent with O.R.C. § 4928.2311, the Financing Order should confirm that any successor to an electric distribution utility subject to a Financing Order shall perform and satisfy all obligations of the electric distribution utility under the Financing Order. |
| | (e) | Security interest: Consistent with O.R.C. § 4928.2312, the Financing Order should confirm that a valid and binding security interest in the Phase-In-Recovery Property, among other SPE assets and property, will be created, perfected and enforced to secure the repayment of the principal of and interest |
22
| | on Phase-In-Recovery Bonds, amounts payable under any ancillary agreement, and other Financing Costs; such security interest to be a continuously perfected security interest with priority over any other lien that may subsequently attach to the Phase-In-Recovery Property unless the holder of such lien otherwise agrees in writing. The Financing Order should further confirm that no application of the adjustment mechanism (described in O.R.C. §4928.238) shall effect the validity, perfection, or priority of a security interest in or the transfer of Phase-In-Recovery Property under the Financing Order. |
| | (f) | Bankruptcy of the electric distribution utility: Consistent with O.R.C. § 4928.2310, the Financing Order should confirm that (i) if an electric distribution utility subject to a Financing Order defaults on any required payment of Phase-In-Recovery Revenues to any SPE, a court, upon application by an interested party and without limiting any other remedies available to the applicant, shall order the sequestration and payment of the Phase-In-Recovery Revenues to the applicable SPE for the benefit of bondholders, any assignee and any financing parties, and (ii) customers of an electric distribution utility and each SPE shall be held harmless for the electric distribution utility’s failure to remit any required payment of Phase-In-Recovery Revenues, and such failure shall in no way affect the Phase-In-Recovery Property or the rights to impose, collect and adjust the Phase-In-Recovery Charges. |
23
| | (g) | Nonbypassability: Consistent with O.R.C. § 4928.239, the Financing Order should confirm that the Phase-In-Recovery Charges cannot be avoided by any customer or other person obligated to pay the charges and that, if a customer subsequently receives retail electric distribution service from another electric distribution utility operating in the same service area, the Phase-In-Recovery Charges shall continue to apply to that customer. |
| | (h) | Third Party Billing Agents. Consistent with the nonbypassable nature of the Phase-In-Recovery Charges, the Financing Order should further provide that, while current law requires the electric distribution utility to bill and collect the Phase-In-Recovery Charges directly from customers, if and to the extent that the Commission subsequently allows any third parties to bill and/or collect any Phase-In-Recovery Charges (separately, or as one billing component that may be levied upon the customer), the Commission shall take the necessary steps to ensure nonbypassability, both to preserve the high credit quality of the Phase-In-Recovery Bonds and to minimize the likelihood that any defaults by any such third party result in an increase in charges thereafter billed to all customers. Such steps should generally require that (i) the Commission establish operational standards and minimum credit requirements for any such third party billing intermediary, or require a cash deposit, letter of credit or other credit mitigant in lieu thereof, (ii) the Commission find that regardless of who is responsible for billing, the customers of that electric distribution utility shall continue to be responsible for Phase-In-Recovery Charges, (iii) if a third party meters and bills for the Phase-In-Recovery Charges, that the |
24
| | electric distribution utility (as servicer) must have access to information on billing and usage by customers to provide for proper reporting to the SPE and to perform its obligations as servicer, (iv) in the case of a third party default, billing responsibilities must be promptly transferred to another party to minimize potential losses; and (v) the failure of customers to pay Phase-In-Recovery Charges shall allow service termination by the electric distribution utility on behalf of the SPE of the customers failing to pay Phase-In-Recovery Charges in accordance with Commission-approved service termination rules and orders. |
| | (i) | Validity of the Financing Order: Consistent with O.R.C. § 4928.235, the Financing Order should confirm that it shall remain in effect until the Phase-In-Recovery Bonds issued under the Financing Order are paid in full and all Financing Costs relating to the Phase-In-Recovery Bonds have been paid in full, and the Financing Order shall remain in effect and unabated notwithstanding the bankruptcy, reorganization, or insolvency of the electric distribution utility or any affiliate of the electric distribution utility or the commencement of any judicial or nonjudicial proceeding on the Financing Order. |
| | (j) | Treatment of Phase-In-Recovery Charges: Consistent with O.R.C. § 4928.232(E)(7), to ensure the full and timely collection of Phase-In-Recovery Charges, including to minimize the likelihood that customer defaults in the payment of Phase-In-Recovery Charges result in additional charges being borne by other non-defaulting customers, the Financing Order should provide |
25
| | that the electric distribution utility or other servicer, on behalf of the SPE, shall terminate service of any customer who defaults in the payment of Phase-In-Recovery Charges in accordance with applicable statutes, Commission rules and orders and the Applicants’ rules, tariffs, and practices applicable to other charges owed directly to the electric distribution utility. |
| | 22. | In order to accomplish the securitization, each Applicant will enter into several agreements with its respective SPE subsidiary. Such agreements will be substantially similar among each Applicant and its respective SPE subsidiary. In the case of a registered public offering: (i) material agreements will generally be filed as exhibits to a registration statement filed with the U.S. Securities and Exchange Commission (“SEC”); and (ii) the material terms of each agreement will also be summarized in the related prospectus included in any such registration statement and used in the offer and sale of the Phase-In Recovery Bonds. In the case of an unregistered offering, the material terms of each agreement will typically be summarized in an offering memorandum (or private placement memorandum) used in connection with the marketing of the securities, and are generally made available to current or prospective security holders. |
| | a) | The LLC Agreement for each SPE is the key organizational and governing document for the SPE and contains customary SPE provisions related to its restricted purposes described in paragraph 19(a). The LLC Agreement for each SPE will not permit it to engage in any activity not related to its restricted purposes and will contain provisions regarding separateness, independent managers and restrictions on commencing bankruptcy and |
26
| | insolvency proceedings. It is expected that each SPE will be managed by five managers, at least two of which will be independent managers, in each case appointed by the owner Applicant. Only independent managers are expected to be paid compensation. |
| | b) | Each Administration Agreement will provide for the administrative functions that each Applicant will provide to its SPE subsidiary, including services relating to the preparation of financial statements, required filings with the SEC (if any), any tax returns required to be filed under applicable law, qualifications to do business and minutes of managers’ meetings. Each Applicant (or any successor administrator thereof) will receive a periodic administration fee, expected to be $50,000 annually, for performing these services, which, together with costs and expenses incurred by the administrator, will be recovered through Phase-In-Recovery Charges–as Financing Costs. |
| | c) | Each Sale Agreement will provide for the terms and conditions of the absolute transfer and true sale of the appropriate Applicant’s right, title and interest in, to, and under its Phase-In-Recovery Property to its SPE subsidiary that will issue Phase-In-Recovery Bonds, consistent with the provisions of O.R.C. §4928.2313. Each SPE’s obligation to purchase, and the appropriate Applicant’s obligation to sell, the Phase-In-Recovery Property is subject to numerous conditions in the Sale Agreement, including (among other things): (i) delivery by the appropriate Applicant of a duly executed bill of sale identifying the Phase-In-Recovery Property, (ii) receipt of a Financing Order |
27
| | from the Commission creating the Phase-In-Recovery Property, (iii) certain conditions related to the solvency of the appropriate Applicant, and (iv) delivery by the appropriate Applicant of appropriate opinions of counsel and officers’ certificates. Each Sale Agreement will further provide that the appropriate Applicant has taken all actions required to transfer ownership of the Phase-In-Recovery Property to its SPE, free and clear of all liens, and to perfect such transfer, and that the Phase-In-Recovery Bonds have received a rating or ratings as required by the Financing Order. Customary representations, warranties and covenants by the appropriate Applicant and its SPE will be included in each Sale Agreement. |
| | d) | Each Servicing Agreement details the services that each Applicant, as servicer, will provide to its SPE principally with respect to calculating, billing and collecting the Phase-In-Recovery Charges. Each servicer under the applicable Servicing Agreement will be responsible for (among other things): (i) posting all collections, (ii) responding to inquiries by customers, competitive retail electric suppliers (if any), third party billing agents (if any), the Commission or others regarding Phase-In-Recovery Charges, (iii) calculating historical electricity usage and customer payment information (e.g., uncollectibles, typical lags between billing and collection of charges), (iv) projecting future electricity usage and customer payment information, (v) accounting for collections, (vi) furnishing periodic reports and statements, (vii) making certain filings as necessary to perfect the trustee’s lien on the Phase-In-Recovery Property and (viii) taking all necessary action in |
28
| | connection with true-up adjustments. Each of the Applicants (or any successor servicer thereof) will receive a periodic servicing fee, which will be recovered through Phase-In-Recovery Charges as a Financing Cost. Based upon both the estimated costs of performing the servicing function and market precedent for such fees, the annual servicing fee shall be 0.10% of the initial principal amounts of the Phase-In-Recovery Bonds issued by the SPE of such Applicant, which fee will be paid to the Applicant or a successor electric distribution utility company. Customary for transactions of this type, in the unlikely event that there is no electric distribution utility successor willing or able to assume such servicing duties, a non-utility servicer may need to be engaged, and given the incremental costs for such an entity to perform the servicing function (i.e., an entity not already billing and collecting the same customer base for other charges), the annual servicing fee for such non-utility successor shall not exceed 0.75% of the initial principal amount of the Phase-In-Recovery Bonds issued by the SPE of such electric distribution utility, unless otherwise approved by the Commission. |
| | e) | The Phase-In-Recovery Bonds issued by each SPE will be issued pursuant to an Indenture (and indenture supplement) between such SPE and a third party trustee, which will describe the particular terms of the Phase-In-Recovery Bonds, including the principal amount, interest rate, payment dates, issuance date, collateral, authorized denominations, principal repayment schedule and other material terms of the Phase-In-Recovery Bonds. The Indenture will provide for certain covenants on the part of the applicable SPE, including |
29
| | covenants (among others) restricting each SPE’s ability to (i) merge or consolidate with any other entity, (ii) sell, convey, transfer or otherwise dispose of its assets or property, (iii) terminate its existence or dissolve or liquidate, (iv) permit any lien, charge, security interest or other encumbrance (other than the lien and security interest granted under the Indenture) to be created, (v) engage in any business other than financing, purchasing, owning and managing the Phase-In-Recovery Property, (vi) make any payments, distributions or dividends, and (vii) issue, incur, assume, guarantee or otherwise become liable for any indebtedness except for the Phase-In-Recovery Bonds and any other secured obligations arising under the transaction documents. Each Indenture will further provide for specific events of default, the occurrence and continuation of which may result in the acceleration of the indebtedness evidenced by the Phase-In-Recovery Bonds or the exercise of other remedies by the trustee or bondholders. |
| | 23. | The Applicants seek approval to issue and sell the Phase-In-Recovery Bonds either through (i) a registered public offering under the U.S. Securities Act of 1933, as amended (the “Securities Act”), or (ii) an unregistered offering exempt from registration pursuant to Section 4(2) of the Securities Act (A) with subsequent resales to institutional purchasers and/or purchasers outside the United States pursuant to Rule 144A and Regulation S, respectively, under the Securities Act or (B) as a negotiated private placement. The decision as to which method may be preferable is dependent on factors such as issue size, complexity of issue, current market conditions, and ongoing administrative costs, some of which are |
30
| | not known with certainty at this time. The upfront Financing Cost estimates provided by the Applicants in Exhibit C hereto include an estimate for underwriting and/or placement fees for each approach. The Applicants will determine the appropriate format based upon the expected lowest cost alternative at the time the Phase-In-Recovery Bonds are marketed, considering both the expected interest cost and the estimated upfront and ongoing Financing Costs associated with the Phase-In-Recovery Bonds. |
| | 24. | Each SPE may, as an alternative to directly issuing and marketing the Phase-In-Recovery Bonds to unaffiliated investors through either a registered public offering or unregistered exempt offering as described in paragraph 23 above, issue the Phase-In-Recovery Bonds to a single special purpose trust established jointly by the Applicants (the “PIR Trust”). |
| | a) | Notes or other pass-through certificates or similar instruments (the “PIR Certificates”) would be issued by the PIR Trust to investors representing undivided beneficial interests in the SPEs’ Phase-In-Recovery Bonds held by the PIR Trust. The PIR Trust would engage in no activities other than the holding of the Phase-In-Recovery Bonds, issuing the PIR Certificates and engaging in other related activities. |
| | b) | The PIR Certificates may be sold either through a registered public offering or unregistered exempt offering as described in paragraph 23 above. The decision as to which method may be preferable is dependent on the same factors discussed in paragraph 23 above. |
31
| | c) | The PIR Certificates would be expected to receive a triple-A (or equivalent) credit rating from applicable rating agencies based upon the underlying structure of the PIR Trust-owned Phase-In-Recovery Bonds secured by Phase-In-Recovery Property and supported by the adjustment mechanism. |
| | d) | Combining the issuance of the Phase-In-Recovery Bonds by each of the Applicants in one transaction through the use of the PIR Trust could, as detailed in Exhibit C hereto, result in lower issuance costs and other efficiencies, thereby lowering costs for the Applicant’s customers. None of the SPEs would be obligated, however, with respect to any other SPE’s Phase-In-Recovery Bonds; therefore, the customers of the respective Applicants would not be affected by the actions of any other Applicant or the adequacy of the Phase-In-Recovery Property of such other Applicant. |
| | e) | The PIR Trust would transfer an allocable portion of net proceeds from the sale of the PIR Certificates to each SPE and each such SPE would in turn transfer those proceeds to the applicable Applicant in consideration for the Phase-In-Recovery Property sold to such SPE by such Applicant. |
| | 25. | As is the case with most debt issuances, the cost of the debt, i.e., the effective interest rate, will not be known until the Phase-In-Recovery Bonds are priced at the time they are sold. Based upon current market conditions, typical structural features, and assuming an SEC-registered offering of PIR Certificates rated in the highest category by the rating agencies most actively involved in the rating of securitizations of this type, the weighted average yield of the Phase-In-Recovery Bonds (exclusive of upfront and ongoing costs) is estimated to be less than 3%. |
32
| | In the absence of an extraordinary change in market conditions between the date of this Application and the issuance date of the Phase-In-Recovery Bonds, significant cost savings and mitigation of rate impacts through the proposed Phase-In-Recovery Bond issuance are expected to result (based on the Phase-In-Recovery Bond expected principal repayment schedule reflected in Exhibit E); as such, only a weighted average yield on the various tranches of the Phase-In-Recovery Bonds in excess of 5% would overcome the benefits associated with the Applicants’ proposal. Consistent with O.R.C. § 4928.232(F), the Applicants request that the Commission, in the Financing Order, afford the Applicants the flexibility in establishing the terms and conditions for the Phase-In-Recovery Bonds to accommodate changes in market conditions, including repayment schedules, interest rates, Financing Costs, collateral requirements, required debt service and other reserves, and the ability of each of the Applicants, at its option, to effect a series of issuances of Phase-In-Recovery Bonds and correlated assignments, sales, pledges, or other transfers of Phase-In-Recovery Property. |
| | 26. | It is expected that the Phase-In-Recovery Bonds or if applicable, the PIR Notes, would be sold pursuant to a negotiated sale to investors, coordinated through one or more underwriters, initial purchasers or placement agents. It is customary for securities of this type to be offered pursuant to a negotiated sale. Furthermore, and consistent with most other transactions of this type, the Applicants have engaged an investment banking firm, frequently involved in the underwriting of this type of securities to assist in the process of structuring the transaction. |
33
| | 27. | Certain of the Financing Costs to be recovered from the proceeds of the Phase-In-Recovery Bonds and included in the Phase-In-Recovery Charges will constitute costs of issuing the Phase-In-Recovery Bonds. These Financing Costs, which are referred to as “Estimated Upfront Financing Costs” in Exhibit C, include, without limitation, estimated costs associated with the retiring or refunding of existing long-term debt of the Applicants, counsel fees, structural advisory fees, underwriting fees, rating agency fees, independent auditors fees and filing, printing and marketing expenses. Other Financing Costs will constitute costs necessary to support, repay and service the Phase-In-Recovery Bonds. These Financing Costs, which are referred to as “Estimated Ongoing Financing Costs” in Exhibit C hereto, include servicing fees and other administrative fees. In addition to debt service, these Ongoing Costs include the cost of any overcollateralization or other reserves (if required) for the Phase-In-Recovery Bonds, the periodic costs of servicing the Phase-In-Recovery Bonds and the Phase-In-Recovery Charges, SPE administrative costs and, if the Phase-In-Recovery Bonds are issued in a registered public offering, ongoing SEC compliance costs. While these costs are expected to be relatively stable over time, they may increase or decrease based upon market conditions or factors beyond the Applicants’ control. Debt service, as well as these Ongoing Costs, will be recovered through the imposition and collection and adjustment (or true up), from time to time, of the Phase-In-Recovery Charges. Finally, Financing Costs include the recovery of all tax liabilities associated with the collection of the Phase-In-Recovery Charges or otherwise arising due to the securitization. |
34
| | 28. | The Applicants have also included in Exhibit F hereto a proposed formula-based mechanism for making expeditious periodic adjustments in the Phase-In-Recovery Charges that each Applicant’s customers would be required to pay under the Financing Order. Specifically, the initial update to each Applicant’s Rider PIR will be up to 12 months after the issuance date for the Phase-In-Recovery Bonds. Thereafter, each Applicant’s Rider PIR shall be updated semiannually with the exception of the last year each series of Phase-In-Recovery Bonds is expected to be outstanding in which case updates, as frequently as monthly may be necessary. Otherwise, no later than November 1st and May 1st of each year, the Applicants will file with the Commission a request for approval of these adjusted Phase-In-Recovery Charges which, unless otherwise ordered by the Commission, shall become effective on a service rendered basis on the succeeding January 1st and July 1st, respectively. Consistent with O.R.C. § 4928.238(B), the review of such a request would be limited to determining whether there is any mathematical error in the application of the formula-based mechanism relating to the appropriate amount of any overcollection or undercollection of Phase-In-Recovery Charges and the amount of an adjustment. These adjustments will also cover increases or decreases in trustee and servicing costs, rating agency surveillance fees, legal and accounting fees and other ongoing Financing Costs as well as adjustments for dealing with differences between estimated and actual costs. These adjustments will ensure the recovery of adequate revenues sufficient to provide for the payment of Phase-In Costs, principal, interest, and redemption |
35
| | premiums on the Phase-In-Recovery Bonds, any payments under an ancillary agreement, any amounts required to fund or replenish a reserve account or other account established under any indenture, ancillary agreement or other financing document relating to the Phase-In-Recovery Bonds, any costs of retiring or refunding any existing long-term debt of the Applicants with the proceeds from the Phase-In-Recovery Bonds, and any other Financing Costs and other fees, costs, and charges in respect of Phase-In-Recovery Bonds approved under the proposed Financing Order. The adjustments will also take into account revised projections of electricity consumption and customer payment information (e.g., uncollectibles, lags between customer billing and collection). Finally, the adjustment mechanism will provide for any changes or updates to the Proposed Tariff Sheets compared with the Final Initial Tariff Sheets necessary to reflect the terms of the Financing Order pursuant to O.R.C. § 4928.232(H). |
| | 29. | Issuance of a Financing Order as proposed herein is consistent with O.R.C. § 4928.02. Customers will benefit from the provision of reasonably-priced retail electric service. O.R.C. § 4928.02(A). Because securitization will reduce the overall cost of the nonbypassable riders being replaced by the Phase-In-Recovery Charges and will result in cost savings and rate mitigation, securitization promotes customer choice and the diversity of electric supplies and suppliers. O.R.C. § 4928.02(B) and (C). Securitization also recognizes the continuing emergence of competitive electricity markets through the development and implementation of flexible regulatory treatment and also facilitates the state’s effectiveness in the global economy. O.R.C. § 4928.02(G) and (N). |
36
| | VI. | Timing of Commission Action. |
| | 30. | Applicants request that the Commission consider and approve the securitization and all related matters requested in this Application on an expedited basis by August 1, 2012, in order that Phase-In-Recovery Bonds may be issued in a timely fashion to take advantage of historically low interest rates and the currently-functioning credit markets, and that the savings for customers expected to arise from the implementation of this Application may start being realized as soon as possible, which is within the 135-day timeline set forth in O.R.C. § 4928.232(C)(1). |
WHEREFORE,for the reasons set forth above the Applicants respectfully request that the Commission:
(1) Approve the Applicants’ proposed securitization and, pursuant to the Act, issue a Financing Order granting any and all authorizations that may be required under Ohio law, including, without limitation, approval and authorization in the Financing Order for the consummation of the transactions contemplated by the issuance of Phase-In-Recovery Bonds and related matters (all as described in this Application), including, without limitation, (a) the securitization transaction providing for the recovery of Phase-In-Recovery Costs and Financing Costs, through the issuance of up to an aggregate amount of $555 million of Phase-In-Recovery Bonds payable from collections from Phase-In-Recovery Charges, and the execution, delivery and performance of all documentation necessary to consummate the securitization transaction, (b) the recovery of certain deferred
37
Phase-In-Costs and Financing Costs, (c) the imposition, charging, and collection of Phase-In-Recovery Charges, (d) the creation of the Phase-In-Recovery Property (such creation to be simultaneous with the sale of such Phase-In-Recovery Property to each SPE), the establishment and adjustment from time to time of Phase-In-Recovery Charges from which Phase-In-Recovery Bonds and ongoing Financing Costs will be paid and the adjustment mechanism to be used, (e) the allocation of Phase-In-Recovery Charges among customer classes, (f) the maximum term of the Phase-In-Recovery Bonds, (g) the organization and capitalization of each SPE to which Phase-In-Recovery Property will be sold, (h) the servicing of Phase-In-Recovery Charges by Applicants as initial servicers or any successor servicer under the servicing agreements, (i) implementation of the trust structure contemplated by paragraph 24 of this Application, (j) flexibility in establishing the terms and conditions for the Phase-In-Recovery Bonds to accommodate changes in market conditions, (k) the ability to issue Phase-In-Recovery Bonds in one or more series and to effect correlated assignments, sales, pledges, or other transfers of Phase-in-Recovery Property, (l) approval of the Final Initial Tariff Sheets and associated adjustment mechanism, (m) approval of the change reflected in the proposed Bill Format, and (n) all of the determinations and descriptions required by §4928.232;
(2) Confirm, provide and include in the Financing Order each provision requested in this Application to be confirmed in the Financing Order including, without limitation, each provision set forth in paragraph 21 of this Application;
38
(3) Find that the proposed securitization, consistent with market conditions, measurably enhances cost savings to customers and mitigates rate impacts to customers as compared to the existing cost recovery methods of each of the Applicants;
(4) Make such other findings and issue such other orders as requested by the Applicants in this Application; and
(5) Grant such other and further orders and approvals as it may deem necessary or proper under the circumstances.
[Remainder of Page Intentionally Left Blank]
39
Respectfully submitted,
OHIO EDISON COMPANY,
THE CLEVELAND ELECTRIC ILLUMINATING COMPANY, and
THE TOLEDO EDISON COMPANY
| | | | | | | | |
By: | | /s/ James F. Pearson | | | | By: | | /s/ Steven R. Staub |
| | James F. Pearson | | | | | | Steven R. Staub |
| | Vice President and Treasurer, as to each | | | | | | Assistant Treasurer, as to each |
STATE OF OHIO )
) ss.:
SUMMIT COUNTY )
James F. Pearson and Steven R. Staub, depose and say that they are Vice President and Treasurer and Assistant Treasurer, respectively, of each of Ohio Edison Company, The Cleveland Electric Illuminating Company, and The Toledo Edison Company, Applicants in the above matter, and that they have read and are fully acquainted and familiar with the contents of the foregoing Application and that the statements therein are true as they verily believe.
| | | | |
/s/ James F. Pearson | | | | /s/ Steven R. Staub |
James F. Pearson | | | | Steven R. Staub |
| | |
Subscribed and sworn to before me this 3rd day of May, 2012 | | | | |
| | |
| | | | Attorneys for Applicant |
| | |
/s/ Michele A. Buchtel | | | | /s/ James W. Burk |
| Michele A. Buchtel | | | | James W. Burk, Counsel of Record (0043808) |
Notary Public, State of Ohio Resident of Summit County My Commission Expires August 28, 2016 
| | | | FirstEnergy Service Company 76 South Main Street Akron, Ohio 44308 (330) 384-5861 Fax: (330) 384-3875 Email :burkj@firstenergycorp.com |
| | | | James F, Lang Laura C. McBride CALFEE, HALTER&GRISWOLD LLP 1405 East Sixth Street Cleveland, OH 44114 |
40
Exhibit list for Securitization Application
Exhibit A – Estimated Deferral Balances Subject to Securitization
Exhibit B - Estimated Comparison of Existing Rate Making and Securitization
Exhibit C – Estimated Up-front and Ongoing Financing Costs
Exhibit D – Expected Use of Proceeds and Capitalization
Exhibit E – Indicative Transaction Structure and Expected Principal Repayment Schedule
Exhibit F – Rider PIR Reconciliation Mechanism and Rate Design Process
Exhibit G – Estimated Monthly Typical Bill Impacts
Exhibit H - Proposed Tariffs Sheets for Rider PIR - Phase-In Recovery Rider
Exhibit I – Proposed Bill Format
Exhibit J - Structure/ Transaction Flow Chart
EXHIBIT A
ESTIMATED DEFERRAL BALANCES SUBJECT TO SECURITIZATION
Estimated December 31, 2012 Balances
| | | | | | | | | | | | | | | | | | | | | | |
| | | | | (A) | | | (B) | | | (C) | | | (D) | | | (E) | | (F) |
| | | Category and Current
Recovery Mechanism | | CEI | | | OE | | | TE | | | Total | | | Existing Recovery Period & Interest Rate | | Recovery Authorization |
| | | | | | | |
| 1 | | Deferred Generation Costs - Rider DGC | | | 127,049,987 | | | | 0 | | | | 0 | | | | $127,049,987 | | | June 2011 - May 2021 Annual Interest Rate 6.85% | | PUCO Case No. 08-935-EL-SSO Order dated March 25, 2009 |
| | | | | | | |
| 2 | | 2006-2007 Deferred Fuel Costs - Rider DFC | | | 86,041,909 | | | | 125,727,952 | | | | 36,410,202 | | | | $248,180,063 | | | January 2011 - December 2035 Annual Interest Rate 6.85% | | PUCO Case No. 08-935-EL-SSO Order dated 3/25/09, Case No. 07-1003-EL-ATA Order dated 1/6/10, and continued by 10-388-EL-SSO dated 8/25/10 |
| | | | | | | |
| 3 | | Residential All Electric Credits - Rider RER1 * | | | 21,565,629 | | | | 39,536,661 | | | | 0 | | | | $61,102,290 | | | September 2011 - June 2014 Annual Interest Rate 6.85% | | PUCO Case No. 10-176-EL-ATA Order dated May 25, 2011 |
| | | | | | | | | | | | | | | | | | | | | | |
| 4 | | Total | | | $234,657,526 | | | | $165,264,613 | | | | $36,410,202 | | | | $436,332,340 | | | | | |
| | | | | | | | | | | | | | | | | | | | | | |
| * | The deferred balance collected under Rider RER1 for TE is expected to be fully recovered by the effective date of the securitization. |
Page 1 of 1
EXHIBIT B
CEI
ESTIMATED COMPARISON OF EXISTING RATE MAKING AND SECURITIZATION
| | | | | | | | | | | | | | | | | | | | | | | | | | | | | | | | | | | | | | | | | | | | | | | | | | |
| | | | | Estimated Recovery Under Existing Rate Making | | | Estimated Recovery Under Securitization | | | Savings | |
| | | (A) | | (B) | | | (C) | | | (D) | | | (E) | | | (F) | | | (G) | | | (H) | | | (I) | | | (J) | | | (K) | | | (L) | | | (M) | |
| | | Period | | Ending
Balance | | | Return of
Asset | | | Return on
Asset @
6.85% | | | CAT
Tax (a) | | | Total
Amounts
Billed | | | Ending
Balance | | | Principal
Payments | | | Interest
Payments | | | Other
Ongoing
Financing
Costs (b) | | | Total
Payments | | | Total
Amounts
Billed(c) | | | Nominal
Savings | |
| 1 | | Dec-12 | | | 234,657,526 | | | | | | | | | | | | | | | | | | | | 250,680,890 | | | | | | | | | | | | | | | | | | | | | | | | | |
| 2 | | Jun-13 | | | 222,194,399 | | | | 12,463,127 | | | | 7,787,537 | | | | 52,789 | | | | 20,303,453 | | | | 237,804,995 | | | | 12,875,895 | | | | 2,446,322 | | | | 451,515 | | | | 15,773,732 | | | | 18,171,590 | | | | 2,131,863 | |
| 3 | | Dec-13 | | | 208,639,682 | | | | 13,554,717 | | | | 7,352,046 | | | | 54,499 | | | | 20,961,262 | | | | 222,288,856 | | | | 15,516,139 | | | | 2,406,252 | | | | 457,158 | | | | 18,379,550 | | | | 18,760,329 | | | | 2,200,932 | |
| 4 | | Jun-14 | | | 195,192,852 | | | | 13,446,830 | | | | 6,881,966 | | | | 52,993 | | | | 20,381,789 | | | | 206,760,936 | | | | 15,527,920 | | | | 2,357,966 | | | | 452,187 | | | | 18,338,073 | | | | 18,241,701 | | | | 2,140,088 | |
| 5 | | Dec-14 | | | 187,241,557 | | | | 7,951,295 | | | | 6,512,594 | | | | 37,704 | | | | 14,501,593 | | | | 195,867,010 | | | | 10,893,925 | | | | 2,309,643 | | | | 401,745 | | | | 13,605,314 | | | | 12,978,926 | | | | 1,522,667 | |
| 6 | | Jun-15 | | | 180,315,736 | | | | 6,925,822 | | | | 6,270,732 | | | | 34,400 | | | | 13,230,954 | | | | 186,711,934 | | | | 9,155,076 | | | | 2,275,741 | | | | 390,845 | | | | 11,821,662 | | | | 11,841,704 | | | | 1,389,250 | |
| 7 | | Dec-15 | | | 172,904,508 | | | | 7,411,228 | | | | 6,027,521 | | | | 35,032 | | | | 13,473,781 | | | | 177,446,971 | | | | 9,264,963 | | | | 2,247,250 | | | | 392,928 | | | | 11,905,142 | | | | 12,059,034 | | | | 1,414,747 | |
| 8 | | Jun-16 | | | 165,774,407 | | | | 7,130,101 | | | | 5,777,713 | | | | 33,648 | | | | 12,941,462 | | | | 168,457,507 | | | | 8,989,464 | | | | 2,213,620 | | | | 388,362 | | | | 11,591,447 | | | | 11,582,608 | | | | 1,358,853 | |
| 9 | | Dec-16 | | | 158,158,013 | | | | 7,616,394 | | | | 5,527,546 | | | | 34,263 | | | | 13,178,204 | | | | 159,355,569 | | | | 9,101,938 | | | | 2,150,694 | | | | 390,393 | | | | 11,643,025 | | | | 11,794,492 | | | | 1,383,711 | |
| 10 | | Jun-17 | | | 150,711,317 | | | | 7,446,696 | | | | 5,268,733 | | | | 33,146 | | | | 12,748,575 | | | | 150,420,503 | | | | 8,935,066 | | | | 2,086,980 | | | | 386,707 | | | | 11,408,754 | | | | 11,409,974 | | | | 1,338,600 | |
| 11 | | Dec-17 | | | 142,770,256 | | | | 7,941,061 | | | | 5,007,705 | | | | 33,755 | | | | 12,982,520 | | | | 141,365,331 | | | | 9,055,171 | | | | 2,024,435 | | | | 388,714 | | | | 11,468,320 | | | | 11,619,355 | | | | 1,363,165 | |
| 12 | | Jun-18 | | | 135,028,261 | | | | 7,741,995 | | | | 4,738,236 | | | | 32,533 | | | | 12,512,764 | | | | 132,506,087 | | | | 8,859,244 | | | | 1,961,049 | | | | 384,684 | | | | 11,204,978 | | | | 11,198,924 | | | | 1,313,840 | |
| 13 | | Dec-18 | | | 126,785,862 | | | | 8,242,400 | | | | 4,467,100 | | | | 33,131 | | | | 12,742,630 | | | | 123,537,086 | | | | 8,969,000 | | | | 1,899,034 | | | | 386,656 | | | | 11,254,691 | | | | 11,404,654 | | | | 1,337,976 | |
| 14 | | Jun-19 | | | 118,652,739 | | | | 8,133,123 | | | | 4,185,717 | | | | 32,112 | | | | 12,350,953 | | | | 114,702,980 | | | | 8,834,107 | | | | 1,836,251 | | | | 383,296 | | | | 11,053,654 | | | | 11,054,103 | | | | 1,296,850 | |
| 15 | | Dec-19 | | | 110,008,493 | | | | 8,644,246 | | | | 3,901,088 | | | | 32,703 | | | | 12,578,037 | | | | 105,754,472 | | | | 8,948,507 | | | | 1,774,412 | | | | 385,244 | | | | 11,108,164 | | | | 11,257,343 | | | | 1,320,694 | |
| 16 | | Jun-20 | | | 101,549,363 | | | | 8,459,130 | | | | 3,607,271 | | | | 31,454 | | | | 12,097,855 | | | | 96,999,625 | | | | 8,754,848 | | | | 1,703,336 | | | | 381,125 | | | | 10,839,309 | | | | 10,827,580 | | | | 1,270,275 | |
| 17 | | Dec-20 | | | 92,571,173 | | | | 8,978,190 | | | | 3,311,403 | | | | 32,036 | | | | 12,321,630 | | | | 88,064,524 | | | | 8,935,101 | | | | 1,562,326 | | | | 383,045 | | | | 10,880,471 | | | | 11,027,858 | | | | 1,293,771 | |
| 18 | | Jun-21 | | | 83,760,729 | | | | 8,810,444 | | | | 3,005,869 | | | | 30,803 | | | | 11,847,116 | | | | 79,245,628 | | | | 8,818,896 | | | | 1,418,413 | | | | 378,974 | | | | 10,616,283 | | | | 10,603,169 | | | | 1,243,947 | |
| 19 | | Dec-21 | | | 79,392,337 | | | | 4,368,392 | | | | 2,754,916 | | | | 18,569 | | | | 7,141,877 | | | | 73,712,097 | | | | 5,533,531 | | | | 1,276,371 | | | | 338,611 | | | | 7,148,514 | | | | 6,391,980 | | | | 749,897 | |
| 20 | | Jun-22 | | | 77,707,313 | | | | 1,685,024 | | | | 2,680,806 | | | | 11,381 | | | | 4,377,211 | | | | 71,297,464 | | | | 2,414,633 | | | | 1,187,245 | | | | 314,895 | | | | 3,916,773 | | | | 3,917,604 | | | | 459,607 | |
| 21 | | Dec-22 | | | 75,888,920 | | | | 1,818,393 | | | | 2,621,493 | | | | 11,574 | | | | 4,451,460 | | | | 68,826,957 | | | | 2,470,507 | | | | 1,148,354 | | | | 315,532 | | | | 3,934,393 | | | | 3,984,057 | | | | 467,403 | |
| 22 | | Jun-23 | | | 74,082,179 | | | | 1,806,741 | | | | 2,559,089 | | | | 11,381 | | | | 4,377,211 | | | | 66,342,410 | | | | 2,484,547 | | | | 1,108,563 | | | | 314,895 | | | | 3,908,005 | | | | 3,917,604 | | | | 459,607 | |
| 23 | | Dec-23 | | | 72,137,839 | | | | 1,944,339 | | | | 2,495,547 | | | | 11,574 | | | | 4,451,460 | | | | 63,792,094 | | | | 2,550,316 | | | | 1,068,545 | | | | 315,532 | | | | 3,934,393 | | | | 3,984,057 | | | | 467,403 | |
| 24 | | Jun-24 | | | 70,200,776 | | | | 1,937,063 | | | | 2,428,767 | | | | 11,381 | | | | 4,377,211 | | | | 61,226,453 | | | | 2,565,641 | | | | 1,027,468 | | | | 314,895 | | | | 3,908,005 | | | | 3,917,604 | | | | 459,607 | |
| 25 | | Dec-24 | | | 68,121,587 | | | | 2,079,189 | | | | 2,360,697 | | | | 11,574 | | | | 4,451,460 | | | | 58,593,737 | | | | 2,632,716 | | | | 986,145 | | | | 315,532 | | | | 3,934,393 | | | | 3,984,057 | | | | 467,403 | |
| 26 | | Jun-25 | | | 66,044,990 | | | | 2,076,598 | | | | 2,289,232 | | | | 11,381 | | | | 4,377,211 | | | | 55,944,369 | | | | 2,649,369 | | | | 943,741 | | | | 314,895 | | | | 3,908,005 | | | | 3,917,604 | | | | 459,607 | |
| 27 | | Dec-25 | | | 63,821,418 | | | | 2,223,572 | | | | 2,216,315 | | | | 11,574 | | | | 4,451,460 | | | | 53,226,577 | | | | 2,717,792 | | | | 901,069 | | | | 315,532 | | | | 3,934,393 | | | | 3,984,057 | | | | 467,403 | |
| 28 | | Jun-26 | | | 61,595,422 | | | | 2,225,996 | | | | 2,139,834 | | | | 11,381 | | | | 4,377,211 | | | | 50,490,762 | | | | 2,735,815 | | | | 857,295 | | | | 314,895 | | | | 3,908,005 | | | | 3,917,604 | | | | 459,607 | |
| 29 | | Dec-26 | | | 59,217,261 | | | | 2,378,161 | | | | 2,061,726 | | | | 11,574 | | | | 4,451,460 | | | | 47,685,131 | | | | 2,805,630 | | | | 813,230 | | | | 315,532 | | | | 3,934,393 | | | | 3,984,057 | | | | 467,403 | |
| 30 | | Jun-27 | | | 56,831,305 | | | | 2,385,956 | | | | 1,979,874 | | | | 11,381 | | | | 4,377,211 | | | | 44,860,063 | | | | 2,825,068 | | | | 768,041 | | | | 314,895 | | | | 3,908,005 | | | | 3,917,604 | | | | 459,607 | |
| 31 | | Dec-27 | | | 54,287,626 | | | | 2,543,678 | | | | 1,896,208 | | | | 11,574 | | | | 4,451,460 | | | | 41,963,742 | | | | 2,896,321 | | | | 722,539 | | | | 315,532 | | | | 3,934,393 | | | | 3,984,057 | | | | 467,403 | |
| 32 | | Jun-28 | | | 51,730,402 | | | | 2,557,224 | | | | 1,808,606 | | | | 11,381 | | | | 4,377,211 | | | | 39,046,522 | | | | 2,917,220 | | | | 675,890 | | | | 314,895 | | | | 3,908,005 | | | | 3,917,604 | | | | 459,607 | |
| 33 | | Dec-28 | | | 49,009,506 | | | | 2,720,896 | | | | 1,718,990 | | | | 11,574 | | | | 4,451,460 | | | | 36,056,564 | | | | 2,989,957 | | | | 628,903 | | | | 315,532 | | | | 3,934,393 | | | | 3,984,057 | | | | 467,403 | |
| 34 | | Jun-29 | | | 46,268,907 | | | | 2,740,599 | | | | 1,625,231 | | | | 11,381 | | | | 4,377,211 | | | | 33,044,200 | | | | 3,012,364 | | | | 580,746 | | | | 314,895 | | | | 3,908,005 | | | | 3,917,604 | | | | 459,607 | |
| 35 | | Dec-29 | | | 43,358,264 | | | | 2,910,642 | | | | 1,529,244 | | | | 11,574 | | | | 4,451,460 | | | | 29,957,567 | | | | 3,086,634 | | | | 532,227 | | | | 315,532 | | | | 3,934,393 | | | | 3,984,057 | | | | 467,403 | |
| 36 | | Jun-30 | | | 40,421,326 | | | | 2,936,938 | | | | 1,428,892 | | | | 11,381 | | | | 4,377,211 | | | | 26,846,969 | | | | 3,110,598 | | | | 482,512 | | | | 314,895 | | | | 3,908,005 | | | | 3,917,604 | | | | 459,607 | |
| 37 | | Dec-30 | | | 37,307,524 | | | | 3,113,802 | | | | 1,326,084 | | | | 11,574 | | | | 4,451,460 | | | | 23,660,519 | | | | 3,186,450 | | | | 432,411 | | | | 315,532 | | | | 3,934,393 | | | | 3,984,057 | | | | 467,403 | |
| 38 | | Jun-31 | | | 34,160,369 | | | | 3,147,156 | | | | 1,218,674 | | | | 11,381 | | | | 4,377,211 | | | | 20,448,498 | | | | 3,212,021 | | | | 381,089 | | | | 314,895 | | | | 3,908,005 | | | | 3,917,604 | | | | 459,607 | |
| 39 | | Dec-31 | | | 30,829,045 | | | | 3,331,323 | | | | 1,108,563 | | | | 11,574 | | | | 4,451,460 | | | | 17,158,992 | | | | 3,289,507 | | | | 329,354 | | | | 315,532 | | | | 3,934,393 | | | | 3,984,057 | | | | 467,403 | |
| 40 | | Jun-32 | | | 27,456,811 | | | | 3,372,234 | | | | 993,596 | | | | 11,381 | | | | 4,377,211 | | | | 13,842,253 | | | | 3,316,738 | | | | 276,372 | | | | 314,895 | | | | 3,908,005 | | | | 3,917,604 | | | | 459,607 | |
| 41 | | Dec-32 | | | 23,892,589 | | | | 3,564,222 | | | | 875,665 | | | | 11,574 | | | | 4,451,460 | | | | 10,446,343 | | | | 3,395,910 | | | | 222,950 | | | | 315,532 | | | | 3,934,393 | | | | 3,984,057 | | | | 467,403 | |
| 42 | | Jun-33 | | | 20,279,365 | | | | 3,613,224 | | | | 752,606 | | | | 11,381 | | | | 4,377,211 | | | | 7,021,488 | | | | 3,424,855 | | | | 168,254 | | | | 314,895 | | | | 3,908,005 | | | | 3,917,604 | | | | 459,607 | |
| 43 | | Dec-33 | | | 16,465,781 | | | | 3,813,584 | | | | 626,302 | | | | 11,574 | | | | 4,451,460 | | | | 3,515,719 | | | | 3,505,769 | | | | 113,092 | | | | 315,532 | | | | 3,934,393 | | | | 3,984,057 | | | | 467,403 | |
| 44 | | Jun-34 | | | 12,594,531 | | | | 3,871,250 | | | | 494,580 | | | | 11,381 | | | | 4,377,211 | | | | 0 | | | | 3,515,719 | | | | 56,626 | | | | 0 | | | | 3,572,345 | | | | 3,086,709 | | | | 1,290,502 | |
| 45 | | Dec-34 | | | 8,513,956 | | | | 4,080,575 | | | | 359,312 | | | | 11,574 | | | | 4,451,460 | | | | 0 | | | | 0 | | | | 0 | | | | 0 | | | | 0 | | | | 0 | | | | 4,451,460 | |
| 46 | | Jun-35 | | | 4,366,439 | | | | 4,147,517 | | | | 218,313 | | | | 11,381 | | | | 4,377,211 | | | | 0 | | | | 0 | | | | 0 | | | | 0 | | | | 0 | | | | 0 | | | | 4,377,211 | |
| 47 | | Dec-35 | | | 0 | | | | 4,366,439 | | | | 73,447 | | | | 11,574 | | | | 4,451,460 | | | | 0 | | | | 0 | | | | 0 | | | | 0 | | | | 0 | | | | 0 | | | | 4,451,460 | |
| 48 | | Jun-36 | | | 0 | | | | 0 | | | | 0 | | | | 0 | | | | 0 | | | | 0 | | | | 0 | | | | 0 | | | | 0 | | | | 0 | | | | 0 | | | | 0 | |
| | | | | | | | | | | |
Total | | | | 234,657,525 | | | | 136,273,385 | | | | 966,934 | | | | 371,897,845 | | | | | | | | 250,680,890 | | | | 52,362,756 | | | | 14,687,324 | | | | 317,730,969 | | | | 320,131,959 | | | | 51,765,886 | |
NPV of Total @ 6.85% | | | | 143,124,484 | | | | 88,707,352 | | | | 604,334 | | | | 232,436,170 | | | | | | | | 160,809,586 | | | | 33,935,585 | | | | 8,089,452 | | | | 202,834,624 | | | | 205,222,685 | | | | 27,213,485 | |
Notes:
Line 1, Column B - see Exhibit A, Line 4, Column A
Line 1, Column G - see Exhibit D, Line 1, Column B
Column F = Sum (Columns C-E)
Column K = Sum (Columns H-J)
Column M = Column F -Column L
| (a) | Equal to 0.26% of total billings. |
| (b) | Includes servicing fee, estimated securitization costs and applicable taxes. |
| (c) | Billed amounts exceed payments to allow for lags between billing and collections and to account for uncollectibles. |
Page 1 of 3
EXHIBIT B
OE
ESTIMATED COMPARISON OF EXISTING RATE MAKING AND SECURITIZATION
| | | | | | | | | | | | | | | | | | | | | | | | | | | | | | | | | | | | | | | | | | | | | | | | | | |
| | | | | Estimated Recovery Under Existing Rate Making | | | Estimated Recovery Under Securitization | | | Savings | |
| | | (A) | | (B) | | | (C) | | | (D) | | | (E) | | | (F) | | | (G) | | | (H) | | | (I) | | | (J) | | | (K) | | | (L) | | | (M) | |
| | | Period | | Ending
Balance | | | Return of
Asset | | | Return on
Asset @
6.85% | | | CAT
Tax (a) | | | Total
Amounts
Billed | | | Ending
Balance | | | Principal
Payments | | | Interest
Payments | | | Other
Ongoing
Financing
Costs (b) | | | Total
Payments | | | Total
Amounts
Billed(c) | | | Nominal
Savings | |
| 1 | | Dec-12 | | | 165,264,613 | | | | | | | | | | | | | | | | | | | | 188,353,837 | | | | | | | | | | | | | | | | | | | | | | | | | |
| 2 | | Jun-13 | | | 152,622,997 | | | | 12,641,616 | | | | 5,414,214 | | | | 47,068 | | | | 18,102,897 | | | | 176,614,045 | | | | 11,739,792 | | | | 2,301,988 | | | | 383,363 | | | | 14,425,143 | | | | 16,654,665 | | | | 1,448,232 | |
| 3 | | Dec-13 | | | 139,063,788 | | | | 13,559,209 | | | | 4,979,949 | | | | 48,327 | | | | 18,587,485 | | | | 162,603,438 | | | | 14,010,607 | | | | 2,265,454 | | | | 388,047 | | | | 16,664,108 | | | | 17,100,486 | | | | 1,486,999 | |
| 4 | | Jun-14 | | | 125,391,933 | | | | 13,671,855 | | | | 4,501,874 | | | | 47,375 | | | | 18,221,104 | | | | 148,206,071 | | | | 14,397,367 | | | | 2,221,853 | | | | 384,505 | | | | 17,003,725 | | | | 16,763,416 | | | | 1,457,688 | |
| 5 | | Dec-14 | | | 125,111,128 | | | | 280,805 | | | | 4,276,488 | | | | 11,880 | | | | 4,569,173 | | | | 144,852,453 | | | | 3,353,618 | | | | 2,177,048 | | | | 252,553 | | | | 5,783,219 | | | | 4,203,639 | | | | 365,534 | |
| 6 | | Jun-15 | | | 124,853,554 | | | | 257,575 | | | | 4,267,724 | | | | 11,796 | | | | 4,537,094 | | | | 143,123,398 | | | | 1,729,055 | | | | 2,166,612 | | | | 252,243 | | | | 4,147,909 | | | | 4,174,127 | | | | 362,968 | |
| 7 | | Dec-15 | | | 124,477,353 | | | | 376,201 | | | | 4,256,366 | | | | 12,076 | | | | 4,644,643 | | | | 141,292,425 | | | | 1,830,973 | | | | 2,161,231 | | | | 253,282 | | | | 4,245,486 | | | | 4,273,071 | | | | 371,571 | |
| 8 | | Jun-16 | | | 124,294,384 | | | | 182,969 | | | | 4,247,354 | | | | 11,549 | | | | 4,441,872 | | | | 139,617,471 | | | | 1,674,953 | | | | 2,153,350 | | | | 251,322 | | | | 4,079,626 | | | | 4,086,522 | | | | 355,350 | |
| 9 | | Dec-16 | | | 123,997,869 | | | | 296,515 | | | | 4,238,653 | | | | 11,822 | | | | 4,546,990 | | | | 137,855,393 | | | | 1,762,079 | | | | 2,141,625 | | | | 252,338 | | | | 4,156,042 | | | | 4,183,231 | | | | 363,759 | |
| 10 | | Jun-17 | | | 123,783,200 | | | | 214,668 | | | | 4,230,446 | | | | 11,587 | | | | 4,456,702 | | | | 136,156,206 | | | | 1,699,187 | | | | 2,129,291 | | | | 251,466 | | | | 4,079,944 | | | | 4,100,166 | | | | 356,536 | |
| 11 | | Dec-17 | | | 123,453,593 | | | | 329,607 | | | | 4,220,628 | | | | 11,861 | | | | 4,562,096 | | | | 134,356,028 | | | | 1,800,177 | | | | 2,117,396 | | | | 252,484 | | | | 4,170,058 | | | | 4,197,129 | | | | 364,968 | |
| 12 | | Jun-18 | | | 123,250,568 | | | | 203,026 | | | | 4,212,045 | | | | 11,509 | | | | 4,426,580 | | | | 132,654,335 | | | | 1,701,693 | | | | 2,104,795 | | | | 251,174 | | | | 4,057,662 | | | | 4,072,454 | | | | 354,126 | |
| 13 | | Dec-18 | | | 122,933,938 | | | | 316,630 | | | | 4,202,673 | | | | 11,781 | | | | 4,531,084 | | | | 130,858,092 | | | | 1,796,244 | | | | 2,092,883 | | | | 252,185 | | | | 4,141,311 | | | | 4,168,597 | | | | 362,487 | |
| 14 | | Jun-19 | | | 122,736,550 | | | | 197,388 | | | | 4,194,380 | | | | 11,448 | | | | 4,403,217 | | | | 129,153,469 | | | | 1,704,623 | | | | 2,080,310 | | | | 250,949 | | | | 4,035,881 | | | | 4,050,959 | | | | 352,257 | |
| 15 | | Dec-19 | | | 122,426,475 | | | | 310,076 | | | | 4,185,242 | | | | 11,718 | | | | 4,507,036 | | | | 127,354,914 | | | | 1,798,555 | | | | 2,068,377 | | | | 251,952 | | | | 4,118,884 | | | | 4,146,473 | | | | 360,563 | |
| 16 | | Jun-20 | | | 122,266,166 | | | | 160,309 | | | | 4,177,677 | | | | 11,308 | | | | 4,349,294 | | | | 125,665,926 | | | | 1,688,988 | | | | 2,051,244 | | | | 250,427 | | | | 3,990,659 | | | | 4,001,351 | | | | 347,944 | |
| 17 | | Dec-20 | | | 121,995,740 | | | | 270,425 | | | | 4,169,870 | | | | 11,575 | | | | 4,451,870 | | | | 123,873,226 | | | | 1,792,700 | | | | 2,024,040 | | | | 251,419 | | | | 4,068,160 | | | | 4,095,721 | | | | 356,150 | |
| 18 | | Jun-21 | | | 121,873,936 | | | | 121,804 | | | | 4,163,622 | | | | 11,171 | | | | 4,296,598 | | | | 122,175,770 | | | | 1,697,456 | | | | 1,995,166 | | | | 249,918 | | | | 3,942,540 | | | | 3,952,870 | | | | 343,728 | |
| 19 | | Dec-21 | | | 120,069,993 | | | | 1,803,943 | | | | 4,139,608 | | | | 15,494 | | | | 5,959,045 | | | | 119,252,638 | | | | 2,923,132 | | | | 1,967,826 | | | | 265,986 | | | | 5,156,944 | | | | 5,482,321 | | | | 476,724 | |
| 20 | | Jun-22 | | | 117,543,899 | | | | 2,526,093 | | | | 4,056,595 | | | | 17,160 | | | | 6,599,848 | | | | 115,390,222 | | | | 3,862,416 | | | | 1,920,745 | | | | 272,180 | | | | 6,055,340 | | | | 6,071,860 | | | | 527,988 | |
| 21 | | Dec-22 | | | 114,771,557 | | | | 2,772,343 | | | | 3,965,476 | | | | 17,564 | | | | 6,755,382 | | | | 111,350,033 | | | | 4,040,189 | | | | 1,858,535 | | | | 273,683 | | | | 6,172,407 | | | | 6,214,952 | | | | 540,431 | |
| 22 | | Jun-23 | | | 112,061,382 | | | | 2,710,174 | | | | 3,872,514 | | | | 17,160 | | | | 6,599,848 | | | | 107,368,847 | | | | 3,981,186 | | | | 1,793,461 | | | | 272,180 | | | | 6,046,827 | | | | 6,071,860 | | | | 527,988 | |
| 23 | | Dec-23 | | | 109,098,563 | | | | 2,962,819 | | | | 3,774,999 | | | | 17,564 | | | | 6,755,382 | | | | 103,199,462 | | | | 4,169,385 | | | | 1,729,338 | | | | 273,683 | | | | 6,172,407 | | | | 6,214,952 | | | | 540,431 | |
| 24 | | Jun-24 | | | 106,191,295 | | | | 2,907,268 | | | | 3,675,420 | | | | 17,160 | | | | 6,599,848 | | | | 99,086,999 | | | | 4,112,463 | | | | 1,662,184 | | | | 272,180 | | | | 6,046,827 | | | | 6,071,860 | | | | 527,988 | |
| 25 | | Dec-24 | | | 103,024,534 | | | | 3,166,761 | | | | 3,571,058 | | | | 17,564 | | | | 6,755,382 | | | | 94,784,222 | | | | 4,302,777 | | | | 1,595,946 | | | | 273,683 | | | | 6,172,407 | | | | 6,214,952 | | | | 540,431 | |
| 26 | | Jun-25 | | | 99,906,239 | | | | 3,118,295 | | | | 3,464,393 | | | | 17,160 | | | | 6,599,848 | | | | 90,536,218 | | | | 4,248,003 | | | | 1,526,644 | | | | 272,180 | | | | 6,046,827 | | | | 6,071,860 | | | | 527,988 | |
| 27 | | Dec-25 | | | 96,521,119 | | | | 3,385,119 | | | | 3,352,699 | | | | 17,564 | | | | 6,755,382 | | | | 86,095,718 | | | | 4,440,500 | | | | 1,458,223 | | | | 273,683 | | | | 6,172,407 | | | | 6,214,952 | | | | 540,431 | |
| 28 | | Jun-26 | | | 93,176,879 | | | | 3,344,240 | | | | 3,238,448 | | | | 17,160 | | | | 6,599,848 | | | | 81,707,773 | | | | 4,387,945 | | | | 1,386,702 | | | | 272,180 | | | | 6,046,827 | | | | 6,071,860 | | | | 527,988 | |
| 29 | | Dec-26 | | | 89,557,965 | | | | 3,618,914 | | | | 3,118,904 | | | | 17,564 | | | | 6,755,382 | | | | 77,125,077 | | | | 4,582,696 | | | | 1,316,028 | | | | 273,683 | | | | 6,172,407 | | | | 6,214,952 | | | | 540,431 | |
| 30 | | Jun-27 | | | 85,971,807 | | | | 3,586,158 | | | | 2,996,530 | | | | 17,160 | | | | 6,599,848 | | | | 72,592,647 | | | | 4,532,431 | | | | 1,242,216 | | | | 272,180 | | | | 6,046,827 | | | | 6,071,860 | | | | 527,988 | |
| 31 | | Dec-27 | | | 82,102,570 | | | | 3,869,237 | | | | 2,868,582 | | | | 17,564 | | | | 6,755,382 | | | | 67,863,138 | | | | 4,729,509 | | | | 1,169,215 | | | | 273,683 | | | | 6,172,407 | | | | 6,214,952 | | | | 540,431 | |
| 32 | | Jun-28 | | | 78,257,394 | | | | 3,845,177 | | | | 2,737,511 | | | | 17,160 | | | | 6,599,848 | | | | 63,181,529 | | | | 4,681,608 | | | | 1,093,039 | | | | 272,180 | | | | 6,046,827 | | | | 6,071,860 | | | | 527,988 | |
| 33 | | Dec-28 | | | 74,120,139 | | | | 4,137,255 | | | | 2,600,564 | | | | 17,564 | | | | 6,755,382 | | | | 58,300,440 | | | | 4,881,089 | | | | 1,017,634 | | | | 273,683 | | | | 6,172,407 | | | | 6,214,952 | | | | 540,431 | |
| 34 | | Jun-29 | | | 69,997,632 | | | | 4,122,507 | | | | 2,460,181 | | | | 17,160 | | | | 6,599,848 | | | | 53,464,810 | | | | 4,835,630 | | | | 939,017 | | | | 272,180 | | | | 6,046,827 | | | | 6,071,860 | | | | 527,988 | |
| 35 | | Dec-29 | | | 65,573,413 | | | | 4,424,220 | | | | 2,313,599 | | | | 17,564 | | | | 6,755,382 | | | | 48,427,219 | | | | 5,037,592 | | | | 861,132 | | | | 273,683 | | | | 6,172,407 | | | | 6,214,952 | | | | 540,431 | |
| 36 | | Jun-30 | | | 61,153,971 | | | | 4,419,441 | | | | 2,163,247 | | | | 17,160 | | | | 6,599,848 | | | | 43,432,565 | | | | 4,994,653 | | | | 779,994 | | | | 272,180 | | | | 6,046,827 | | | | 6,071,860 | | | | 527,988 | |
| 37 | | Dec-30 | | | 56,422,501 | | | | 4,731,471 | | | | 2,006,348 | | | | 17,564 | | | | 6,755,382 | | | | 38,233,389 | | | | 5,199,176 | | | | 699,547 | | | | 273,683 | | | | 6,172,407 | | | | 6,214,952 | | | | 540,431 | |
| 38 | | Jun-31 | | | 51,685,134 | | | | 4,737,367 | | | | 1,845,321 | | | | 17,160 | | | | 6,599,848 | | | | 33,074,549 | | | | 5,158,840 | | | | 615,807 | | | | 272,180 | | | | 6,046,827 | | | | 6,071,860 | | | | 527,988 | |
| 39 | | Dec-31 | | | 46,624,692 | | | | 5,060,442 | | | | 1,677,377 | | | | 17,564 | | | | 6,755,382 | | | | 27,708,541 | | | | 5,366,008 | | | | 532,716 | | | | 273,683 | | | | 6,172,407 | | | | 6,214,952 | | | | 540,431 | |
| 40 | | Jun-32 | | | 41,546,925 | | | | 5,077,768 | | | | 1,504,920 | | | | 17,160 | | | | 6,599,848 | | | | 22,380,182 | | | | 5,328,359 | | | | 446,288 | | | | 272,180 | | | | 6,046,827 | | | | 6,071,860 | | | | 527,988 | |
| 41 | | Dec-32 | | | 36,134,256 | | | | 5,412,669 | | | | 1,325,150 | | | | 17,564 | | | | 6,755,382 | | | | 16,841,926 | | | | 5,538,257 | | | | 360,467 | | | | 273,683 | | | | 6,172,407 | | | | 6,214,952 | | | | 540,431 | |
| 42 | | Jun-33 | | | 30,692,024 | | | | 5,442,232 | | | | 1,140,456 | | | | 17,160 | | | | 6,599,848 | | | | 11,338,543 | | | | 5,503,382 | | | | 271,265 | | | | 272,180 | | | | 6,046,827 | | | | 6,071,860 | | | | 527,988 | |
| 43 | | Dec-33 | | | 24,902,229 | | | | 5,789,795 | | | | 948,023 | | | | 17,564 | | | | 6,755,382 | | | | 5,622,444 | | | | 5,716,099 | | | | 182,624 | | | | 273,683 | | | | 6,172,407 | | | | 6,214,952 | | | | 540,431 | |
| 44 | | Jun-34 | | | 19,069,769 | | | | 5,832,460 | | | | 750,227 | | | | 17,160 | | | | 6,599,848 | | | | 0 | | | | 5,622,444 | | | | 90,558 | | | | 0 | | | | 5,713,002 | | | | 4,934,149 | | | | 1,665,698 | |
| 45 | | Dec-34 | | | 12,876,187 | | | | 6,193,581 | | | | 544,237 | | | | 17,564 | | | | 6,755,382 | | | | 0 | | | | 0 | | | | 0 | | | | 0 | | | | 0 | | | | 0 | | | | 6,755,382 | |
| 46 | | Jun-35 | | | 6,625,912 | | | | 6,250,275 | | | | 332,413 | | | | 17,160 | | | | 6,599,848 | | | | 0 | | | | 0 | | | | 0 | | | | 0 | | | | 0 | | | | 0 | | | | 6,599,848 | |
| 47 | | Dec-35 | | | 0 | | | | 6,625,912 | | | | 111,906 | | | | 17,564 | | | | 6,755,382 | | | | 0 | | | | 0 | | | | 0 | | | | 0 | | | | 0 | | | | 0 | | | | 6,755,382 | |
| 48 | | Jun-36 | | | 0 | | | | 0 | | | | 0 | | | | 0 | | | | 0 | | | | 0 | | | | 0 | | | | 0 | | | | 0 | | | | 0 | | | | 0 | | | | 0 | |
| | | | | | | | | | | |
Total | | | | 165,264,613 | | | | 144,495,909 | | | | 807,477 | | | | 310,567,998 | | | | | | | | 188,353,837 | | | | 64,769,814 | | | | 11,495,977 | | | | 264,619,628 | | | | 266,083,085 | | | | 44,484,914 | |
NPV of Total @ 6.85% | | | | 79,458,862 | | | | 84,160,822 | | | | 426,520 | | | | 164,046,204 | | | | | | | | 99,827,398 | | | | 39,186,070 | | | | 6,133,320 | | | | 145,146,788 | | | | 146,588,541 | | | | 17,457,663 | |
Notes:
Line 1, Column B - see Exhibit A, Line 4, Column B
Line 1, Column G - see Exhibit D, Line 1, Column E
Column F = Sum (Columns C-E)
Column K = Sum (Columns H-J)
Column M = Column F - Column L
| (a) | Equal to 0.26% of total billings. |
| (b) | Includes servicing fee, estimated securitization costs and applicable taxes. |
| (c) | Billed amounts exceed payments to allow for lags between billing and collections and to account for uncollectibles. |
Page 2 of 3
EXHIBIT B
TE
ESTIMATED COMPARISON OF EXISTING RATE MAKING AND SECURITIZATION
| | | | | | | | | | | | | | | | | | | | | | | | | | | | | | | | | | | | | | | | | | | | | | | | | | |
| | | | | Estimated Recovery Under Existing Rate Making | | | Estimated Recovery Under Securitization | | | Savings | |
| | | (A) | | (B) | | | (C) | | | (D) | | | (E) | | | (F) | | | (G) | | | (H) | | | (I) | | | (J) | | | (K) | | | (L) | | | (M) | |
| | | Period | | Ending
Balance | | | Return of
Asset | | | Return on
Asset @
6.85% | | | CAT
Tax (a) | | | Total
Amounts
Billed | | | Ending
Balance | | | Principal
Payments | | | Interest
Payments | | | Other
Ongoing
Financing
Costs (b) | | | Total
Payments | | | Total Amounts
Billed(c) | | | Nominal
Savings | |
| 1 | | Dec-12 | | | 36,410,202 | | | | | | | | | | | | | | | | | | | | 45,762,713 | | | | | | | | | | | | | | | | | | | | | | | | | |
| 2 | | Jun-13 | | | 36,269,801 | | | | 140,400 | | | | 1,240,926 | | | | 3,601 | | | | 1,384,927 | | | | 45,300,846 | | | | 461,867 | | | | 633,315 | | | | 64,434 | | | | 1,159,617 | | | | 1,344,764 | | | | 40,163 | |
| 3 | | Dec-13 | | | 36,033,730 | | | | 236,072 | | | | 1,234,080 | | | | 3,832 | | | | 1,473,984 | | | | 44,584,226 | | | | 716,620 | | | | 631,878 | | | | 65,322 | | | | 1,413,820 | | | | 1,431,239 | | | | 42,746 | |
| 4 | | Jun-14 | | | 35,837,685 | | | | 196,045 | | | | 1,227,096 | | | | 3,710 | | | | 1,426,851 | | | | 43,901,687 | | | | 682,538 | | | | 629,648 | | | | 64,852 | | | | 1,377,039 | | | | 1,385,472 | | | | 41,379 | |
| 5 | | Dec-14 | | | 35,555,847 | | | | 281,838 | | | | 1,218,493 | | | | 3,911 | | | | 1,504,242 | | | | 43,150,110 | | | | 751,577 | | | | 627,524 | | | | 65,624 | | | | 1,444,725 | | | | 1,460,619 | | | | 43,623 | |
| 6 | | Jun-15 | | | 35,322,162 | | | | 233,685 | | | | 1,210,115 | | | | 3,764 | | | | 1,447,563 | | | | 42,442,625 | | | | 707,485 | | | | 625,185 | | | | 65,059 | | | | 1,397,729 | | | | 1,405,584 | | | | 41,979 | |
| 7 | | Dec-15 | | | 35,005,880 | | | | 316,282 | | | | 1,200,282 | | | | 3,953 | | | | 1,520,517 | | | | 41,670,415 | | | | 772,210 | | | | 622,983 | | | | 65,786 | | | | 1,460,979 | | | | 1,476,422 | | | | 44,095 | |
| 8 | | Jun-16 | | | 34,777,098 | | | | 228,782 | | | | 1,191,411 | | | | 3,702 | | | | 1,423,896 | | | | 40,973,892 | | | | 696,523 | | | | 618,277 | | | | 64,823 | | | | 1,379,623 | | | | 1,382,603 | | | | 41,293 | |
| 9 | | Dec-16 | | | 34,466,691 | | | | 310,407 | | | | 1,181,778 | | | | 3,890 | | | | 1,496,075 | | | | 40,215,593 | | | | 758,298 | | | | 613,402 | | | | 65,542 | | | | 1,437,242 | | | | 1,452,689 | | | | 43,386 | |
| 10 | | Jun-17 | | | 34,214,994 | | | | 251,697 | | | | 1,172,608 | | | | 3,713 | | | | 1,428,018 | | | | 39,508,322 | | | | 707,271 | | | | 608,094 | | | | 64,864 | | | | 1,380,228 | | | | 1,386,605 | | | | 41,413 | |
| 11 | | Dec-17 | | | 33,880,700 | | | | 334,294 | | | | 1,162,173 | | | | 3,901 | | | | 1,500,368 | | | | 38,735,645 | | | | 772,677 | | | | 603,143 | | | | 65,585 | | | | 1,441,405 | | | | 1,456,858 | | | | 43,511 | |
| 12 | | Jun-18 | | | 33,604,694 | | | | 276,006 | | | | 1,152,184 | | | | 3,723 | | | | 1,431,913 | | | | 38,014,297 | | | | 721,348 | | | | 597,734 | | | | 64,903 | | | | 1,383,985 | | | | 1,390,388 | | | | 41,525 | |
| 13 | | Dec-18 | | | 33,245,206 | | | | 359,487 | | | | 1,140,900 | | | | 3,911 | | | | 1,504,299 | | | | 37,227,342 | | | | 786,956 | | | | 592,684 | | | | 65,624 | | | | 1,445,264 | | | | 1,460,674 | | | | 43,625 | |
| 14 | | Jun-19 | | | 32,940,273 | | | | 304,933 | | | | 1,129,991 | | | | 3,741 | | | | 1,438,664 | | | | 36,489,428 | | | | 737,914 | | | | 587,176 | | | | 64,970 | | | | 1,390,060 | | | | 1,396,943 | | | | 41,721 | |
| 15 | | Dec-19 | | | 32,550,729 | | | | 389,544 | | | | 1,117,694 | | | | 3,929 | | | | 1,511,168 | | | | 35,685,165 | | | | 804,263 | | | | 582,010 | | | | 65,693 | | | | 1,451,966 | | | | 1,467,344 | | | | 43,824 | |
| 16 | | Jun-20 | | | 32,228,318 | | | | 322,411 | | | | 1,105,980 | | | | 3,723 | | | | 1,432,114 | | | | 34,939,500 | | | | 745,665 | | | | 574,764 | | | | 64,905 | | | | 1,385,333 | | | | 1,390,583 | | | | 41,531 | |
| 17 | | Dec-20 | | | 31,821,186 | | | | 407,133 | | | | 1,093,084 | | | | 3,911 | | | | 1,504,127 | | | | 34,122,576 | | | | 816,924 | | | | 562,754 | | | | 65,623 | | | | 1,445,301 | | | | 1,460,507 | | | | 43,620 | |
| 18 | | Jun-21 | | | 31,479,957 | | | | 341,229 | | | | 1,080,749 | | | | 3,707 | | | | 1,425,684 | | | | 33,358,011 | | | | 764,566 | | | | 549,596 | | | | 64,841 | | | | 1,379,002 | | | | 1,384,339 | | | | 41,345 | |
| 19 | | Dec-21 | | | 30,880,859 | | | | 599,098 | | | | 1,065,257 | | | | 4,339 | | | | 1,668,693 | | | | 32,391,501 | | | | 966,509 | | | | 537,281 | | | | 67,263 | | | | 1,571,053 | | | | 1,620,301 | | | | 48,392 | |
| 20 | | Jun-22 | | | 30,253,174 | | | | 627,685 | | | | 1,043,733 | | | | 4,357 | | | | 1,675,775 | | | | 31,359,954 | | | | 1,031,547 | | | | 521,714 | | | | 67,333 | | | | 1,620,595 | | | | 1,627,178 | | | | 48,597 | |
| 21 | | Dec-22 | | | 29,518,152 | | | | 735,022 | | | | 1,019,943 | | | | 4,575 | | | | 1,759,539 | | | | 30,242,232 | | | | 1,117,723 | | | | 505,100 | | | | 68,168 | | | | 1,690,991 | | | | 1,708,513 | | | | 51,027 | |
| 22 | | Jun-23 | | | 28,843,123 | | | | 675,029 | | | | 996,389 | | | | 4,357 | | | | 1,675,775 | | | | 29,176,980 | | | | 1,065,252 | | | | 487,097 | | | | 67,333 | | | | 1,619,682 | | | | 1,627,178 | | | | 48,597 | |
| 23 | | Dec-23 | | | 28,059,112 | | | | 784,011 | | | | 970,954 | | | | 4,575 | | | | 1,759,539 | | | | 28,024,097 | | | | 1,152,883 | | | | 469,939 | | | | 68,168 | | | | 1,690,991 | | | | 1,708,513 | | | | 51,027 | |
| 24 | | Jun-24 | | | 27,333,392 | | | | 725,720 | | | | 945,698 | | | | 4,357 | | | | 1,675,775 | | | | 26,923,119 | | | | 1,100,978 | | | | 451,371 | | | | 67,333 | | | | 1,619,682 | | | | 1,627,178 | | | | 48,597 | |
| 25 | | Dec-24 | | | 26,496,930 | | | | 836,463 | | | | 918,502 | | | | 4,575 | | | | 1,759,539 | | | | 25,733,934 | | | | 1,189,185 | | | | 433,638 | | | | 68,168 | | | | 1,690,991 | | | | 1,708,513 | | | | 51,027 | |
| 26 | | Jun-25 | | | 25,716,936 | | | | 779,994 | | | | 891,424 | | | | 4,357 | | | | 1,675,775 | | | | 24,596,069 | | | | 1,137,865 | | | | 414,484 | | | | 67,333 | | | | 1,619,682 | | | | 1,627,178 | | | | 48,597 | |
| 27 | | Dec-25 | | | 24,824,313 | | | | 892,622 | | | | 862,342 | | | | 4,575 | | | | 1,759,539 | | | | 23,369,404 | | | | 1,226,665 | | | | 396,157 | | | | 68,168 | | | | 1,690,991 | | | | 1,708,513 | | | | 51,027 | |
| 28 | | Jun-26 | | | 23,986,208 | | | | 838,105 | | | | 833,313 | | | | 4,357 | | | | 1,675,775 | | | | 22,193,454 | | | | 1,175,949 | | | | 376,400 | | | | 67,333 | | | | 1,619,682 | | | | 1,627,178 | | | | 48,597 | |
| 29 | | Dec-26 | | | 23,033,456 | | | | 952,752 | | | | 802,213 | | | | 4,575 | | | | 1,759,539 | | | | 20,928,091 | | | | 1,265,363 | | | | 357,459 | | | | 68,168 | | | | 1,690,991 | | | | 1,708,513 | | | | 51,027 | |
| 30 | | Jun-27 | | | 22,133,132 | | | | 900,324 | | | | 771,094 | | | | 4,357 | | | | 1,675,775 | | | | 19,712,821 | | | | 1,215,270 | | | | 337,079 | | | | 67,333 | | | | 1,619,682 | | | | 1,627,178 | | | | 48,597 | |
| 31 | | Dec-27 | | | 21,116,000 | | | | 1,017,133 | | | | 737,832 | | | | 4,575 | | | | 1,759,539 | | | | 18,407,503 | | | | 1,305,318 | | | | 317,505 | | | | 68,168 | | | | 1,690,991 | | | | 1,708,513 | | | | 51,027 | |
| 32 | | Jun-28 | | | 20,149,059 | | | | 966,941 | | | | 704,477 | | | | 4,357 | | | | 1,675,775 | | | | 17,151,635 | | | | 1,255,868 | | | | 296,481 | | | | 67,333 | | | | 1,619,682 | | | | 1,627,178 | | | | 48,597 | |
| 33 | | Dec-28 | | | 19,062,994 | | | | 1,086,064 | | | | 668,900 | | | | 4,575 | | | | 1,759,539 | | | | 15,805,066 | | | | 1,346,569 | | | | 276,253 | | | | 68,168 | | | | 1,690,991 | | | | 1,708,513 | | | | 51,027 | |
| 34 | | Jun-29 | | | 18,024,727 | | | | 1,038,268 | | | | 633,151 | | | | 4,357 | | | | 1,675,775 | | | | 14,507,282 | | | | 1,297,784 | | | | 254,565 | | | | 67,333 | | | | 1,619,682 | | | | 1,627,178 | | | | 48,597 | |
| 35 | | Dec-29 | | | 16,864,858 | | | | 1,159,869 | | | | 595,096 | | | | 4,575 | | | | 1,759,539 | | | | 13,118,121 | | | | 1,389,161 | | | | 233,662 | | | | 68,168 | | | | 1,690,991 | | | | 1,708,513 | | | | 51,027 | |
| 36 | | Jun-30 | | | 15,750,221 | | | | 1,114,636 | | | | 556,782 | | | | 4,357 | | | | 1,675,775 | | | | 11,777,060 | | | | 1,341,062 | | | | 211,287 | | | | 67,333 | | | | 1,619,682 | | | �� | 1,627,178 | | | | 48,597 | |
| 37 | | Dec-30 | | | 14,511,330 | | | | 1,238,891 | | | | 516,074 | | | | 4,575 | | | | 1,759,539 | | | | 10,343,925 | | | | 1,433,135 | | | | 189,687 | | | | 68,168 | | | | 1,690,991 | | | | 1,708,513 | | | | 51,027 | |
| 38 | | Jun-31 | | | 13,314,926 | | | | 1,196,404 | | | | 475,014 | | | | 4,357 | | | | 1,675,775 | | | | 8,958,180 | | | | 1,385,744 | | | | 166,605 | | | | 67,333 | | | | 1,619,682 | | | | 1,627,178 | | | | 48,597 | |
| 39 | | Dec-31 | | | 11,991,427 | | | | 1,323,499 | | | | 431,465 | | | | 4,575 | | | | 1,759,539 | | | | 7,479,643 | | | | 1,478,537 | | | | 144,285 | | | | 68,168 | | | | 1,690,991 | | | | 1,708,513 | | | | 51,027 | |
| 40 | | Jun-32 | | | 10,707,476 | | | | 1,283,952 | | | | 387,467 | | | | 4,357 | | | | 1,675,775 | | | | 6,047,765 | | | | 1,431,878 | | | | 120,471 | | | | 67,333 | | | | 1,619,682 | | | | 1,627,178 | | | | 48,597 | |
| 41 | | Dec-32 | | | 9,293,387 | | | | 1,414,089 | | | | 340,876 | | | | 4,575 | | | | 1,759,539 | | | | 4,522,351 | | | | 1,525,414 | | | | 97,408 | | | | 68,168 | | | | 1,690,991 | | | | 1,708,513 | | | | 51,027 | |
| 42 | | Jun-33 | | | 7,915,698 | | | | 1,377,688 | | | | 293,730 | | | | 4,357 | | | | 1,675,775 | | | | 3,042,842 | | | | 1,479,510 | | | | 72,839 | | | | 67,333 | | | | 1,619,682 | | | | 1,627,178 | | | | 48,597 | |
| 43 | | Dec-33 | | | 6,404,616 | | | | 1,511,082 | | | | 243,883 | | | | 4,575 | | | | 1,759,539 | | | | 1,469,029 | | | | 1,573,813 | | | | 49,010 | | | | 68,168 | | | | 1,690,991 | | | | 1,708,513 | | | | 51,027 | |
| 44 | | Jun-34 | | | 4,926,565 | | | | 1,478,051 | | | | 193,367 | | | | 4,357 | | | | 1,675,775 | | | | 0 | | | | 1,469,029 | | | | 23,661 | | | | 0 | | | | 1,492,690 | | | | 1,286,845 | | | | 388,930 | |
| 45 | | Dec-34 | | | 3,311,633 | | | | 1,614,932 | | | | 140,033 | | | | 4,575 | | | | 1,759,539 | | | | 0 | | | | 0 | | | | 0 | | | | 0 | | | | 0 | | | | 0 | | | | 1,759,539 | |
| 46 | | Jun-35 | | | 1,726,123 | | | | 1,585,510 | | | | 85,909 | | | | 4,357 | | | | 1,675,775 | | | | 0 | | | | 0 | | | | 0 | | | | 0 | | | | 0 | | | | 0 | | | | 1,675,775 | |
| 47 | | Dec-35 | | | 0 | | | | 1,726,123 | | | | 28,841 | | | | 4,575 | | | | 1,759,539 | | | | 0 | | | | 0 | | | | 0 | | | | 0 | | | | 0 | | | | 0 | | | | 1,759,539 | |
| 48 | | Jun-36 | | | 0 | | | | 0 | | | | 0 | | | | 0 | | | | 0 | | | | 0 | | | | 0 | | | | 0 | | | | 0 | | | | 0 | | | | 0 | | | | 0 | |
| | | | | | | | | | | |
Total | | | | 36,410,202 | | | | 38,013,304 | | | | 194,006 | | | | 74,617,511 | | | | | | | | 45,762,713 | | | | 18,001,603 | | | | 2,801,733 | | | | 66,566,049 | | | | 67,069,067 | | | | 7,548,444 | |
NPV of Total @ 6.85% | | | | 13,846,376 | | | | 22,253,965 | | | | 94,106 | | | | 36,194,446 | | | | | | | | 21,136,050 | | | | 10,958,232 | | | | 1,464,398 | | | | 33,558,680 | | | | 33,956,132 | | | | 2,238,315 | |
Notes:
Line 1, Column B - see Exhibit A, Line 4, Column C
Line 1, Column G - see Exhibit D, Line 1, Column H
Column F = Sum (Columns C-E)
Column K = Sum (Columns H-J)
Column M = Column F - Column L
| (a) | Equal to 0.26% of total billings. |
| (b) | Includes servicing fee, estimated securitization costs and applicable taxes. |
| (c) | Billed amounts exceed payments to allow for lags between billing and collections and to account for uncollectibles. |
Page 3 of 3
EXHIBIT C
ESTIMATED UP-FRONT FINANCING COSTS
| | | | | | | | | | | | | | | | | | | | | | | | | | |
| | | | | (A) | | | (B) | | | (C) | | | (D) | | | (E) | | | (F) | |
| | | | | MULTIPLE UTILITY
LEVEL ISSUANCES | | | SINGLE COMBINED ISSUANCE (a) | | | | |
| | | | | Total | | | CEI | | | OE | | | TE | | | Total | | | Savings | |
| 1 | | Accountant’s/Auditor’s Fees | | | 300,000 | | | | 107,559 | | | | 75,752 | | | | 16,689 | | | | 200,000 | | | | 100,000 | |
| 2 | | Fee for Applicant’s Structuring Advisor | | | 900,000 | | | | 161,339 | | | | 113,628 | | | | 25,034 | | | | 300,000 | | | | 600,000 | |
| 3 | | Legal Fees and Expenses for Applicant’s/Issuer’s Counsel | | | 2,500,000 | | | | 1,075,591 | | | | 757,517 | | | | 166,892 | | | | 2,000,000 | | | | 500,000 | |
| 4 | | Legal Fees and Expenses for Trustee’s Counsel | | | 60,000 | | | | 13,445 | | | | 9,469 | | | | 2,086 | | | | 25,000 | | | | 35,000 | |
| 5 | | Legal Fees and Expenses for Underwriter’s Counsel | | | 2,150,000 | | | | 994,921 | | | | 700,703 | | | | 154,375 | | | | 1,850,000 | | | | 300,000 | |
| 6 | | Printing and Filing Costs | | | 300,000 | | | | 53,780 | | | | 37,876 | | | | 8,345 | | | | 100,000 | | | | 200,000 | |
| 7 | | Rating Agency Fees(b) | | | 1,305,000 | | | | 332,152 | | | | 249,569 | | | | 60,636 | | | | 642,357 | | | | 662,643 | |
| 8 | | SEC Registration Fees(c) | | | 19,147 | | | | 9,852 | | | | 7,402 | | | | 1,798 | | | | 19,052 | | | | 95 | |
| 9 | | Servicer Set-up Costs(d) | | | 300,000 | | | | 100,000 | | | | 100,000 | | | | 100,000 | | | | 300,000 | | | | 0 | |
| 10 | | Trustee Payments | | | 30,000 | | | | 13,445 | | | | 9,469 | | | | 2,086 | | | | 25,000 | | | | 5,000 | |
| 11 | | Underwriting Costs(e) | | | 2,436,061 | | | | 1,253,404 | | | | 941,769 | | | | 228,814 | | | | 2,423,987 | | | | 12,074 | |
| 12 | | Miscellaneous(f) | | | 525,000 | | | | 175,000 | | | | 175,000 | | | | 175,000 | | | | 525,000 | | | | 0 | |
| | | | | | | | | | | | | | | | | | | | | | | | | | |
| 13 | | Subtotal Issuance Expenses (Sum Lines 1-12) | | | 10,825,209 | | | | 4,290,488 | | | | 3,178,154 | | | | 941,755 | | | | 8,410,396 | | | | 2,414,812 | |
| 14 | | Debt Retirement Costs(g) | | | 40,054,703 | | | | 11,732,876 | | | | 19,911,070 | | | | 8,410,757 | | | | 40,054,703 | | | | 0 | |
| | | | | | | | | | | | | | | | | | | | | | | | | | |
| 15 | | Total Estimated Upfront Financing Costs (Line 13 + Line 14) | | | 50,879,912 | | | | 16,023,364 | | | | 23,089,224 | | | | 9,352,511 | | | | 48,465,099 | | | | 2,414,812 | |
| (a) | Upfront financing costs expected to be allocated rateably based upon Phase-In Costs amounts assuming an SEC-registered offering, unless otherwise noted. |
| (b) | Based upon current fee schedules applied to issuance amounts which change from time to time. For multiple utility level issuances each applicant will likely be required to pay the minimum Rating Agency fee amount for each issuance. |
| (c) | Based upon current fee level of $0.0000393 applied to issuance amounts. |
| (d) | Assumes $100,000 per utility. |
| (e) | Based upon fee level of 0.50% applied to issuance amounts. |
| (f) | Unforeseen expenses, if any, will be described in the Final Financing Order following the issuance of the Phase-In Recovery Bonds. |
| (g) | Will vary depending upon market conditions and timing / method of debt retirement. |
Page 1 of 2
EXHIBIT C
ESTIMATED ONGOING FINANCING COSTS (ANNUAL AMOUNT)
| | | | | | | | | | | | | | | | | | | | | | | | | | |
| | | | | (A) | | | (B) | | | (C) | | | (D) | | | (E) | | | (F) | |
| | | | | MULTIPLE UTILITY
LEVEL ISSUANCES | | | SINGLE COMBINED ISSUANCE | | | | |
| | | | | Total | | | CEI | | | OE | | | TE | | | Total(a) | | | Savings | |
| 1 | | Servicing Fee (b) | | | 487,212 | | | | 250,681 | | | | 188,354 | | | | 45,763 | | | | 484,797 | | | | 2,415 | |
| 2 | | Administration Fees and Expenses | | | 150,000 | | | | 51,708 | | | | 38,852 | | | | 9,440 | | | | 100,000 | | | | 50,000 | |
| 3 | | Trustee Fees and Expenses | | | 60,000 | | | | 25,854 | | | | 19,426 | | | | 4,720 | | | | 50,000 | | | | 10,000 | |
| 4 | | Legal Fees | | | 60,000 | | | | 25,854 | | | | 19,426 | | | | 4,720 | | | | 50,000 | | | | 10,000 | |
| 5 | | Accounting Fees | | | 150,000 | | | | 51,708 | | | | 38,852 | | | | 9,440 | | | | 100,000 | | | | 50,000 | |
| 6 | | SPE Independent Manager’s Fees | | | 30,000 | | | | 10,342 | | | | 7,770 | | | | 1,888 | | | | 20,000 | | | | 10,000 | |
| 7 | | Rating Agency Fees(c) | | | 225,000 | | | | 38,781 | | | | 29,139 | | | | 7,080 | | | | 75,000 | | | | 150,000 | |
| 8 | | Reporting and SEC Filing Fees | | | 7,500 | | | | 1,293 | | | | 971 | | | | 236 | | | | 2,500 | | | | 5,000 | |
| 9 | | Miscellaneous | | | 6,000 | | | | 2,585 | | | | 1,943 | | | | 472 | | | | 5,000 | | | | 1,000 | |
| 10 | | Return on Capital Account(d) | | | 166,870 | | | | 85,858 | | | | 64,511 | | | | 15,674 | | | | 166,043 | | | | 827 | |
| 11 | | Dealers In Intangible Tax(e) | | | 19,488 | | | | 10,027 | | | | 7,534 | | | | 1,831 | | | | 19,392 | | | | 97 | |
| | | | | | | | | | | | | | | | | | | | | | | | | | |
| 12 | | Total Estimated Ongoing Financing Costs(f)(Sum Lines 1-11) | | | 1,362,071 | | | | 554,693 | | | | 416,779 | | | | 101,261 | | | | 1,072,732 | | | | 289,338 | |
| (a) | Ongoing financing costs expected to be allocated rateably based upon issuance amount assuming a SEC-registered single combined offering. |
| (b) | Assumes each Applicant acts as servicer and earns an annual servicing fee equal to 0.10% of issuance amount. |
| (c) | Based upon current scheduled fee levels. |
| (d) | Assumes each Applicant funds reserve account equal to 0.50% of issuance amount and earns an annual rate of return of 6.85% thereon. |
| (e) | Assumes each securitization SPE required to pay a 0.8% annual tax on amounts funded in capital account. |
| (f) | Estimated, subject to change. |
Page 2 of 2
EXHIBIT D
EXPECTED USE OF PROCEEDS AND CAPITALIZATION
| | | | | | | | | | | | | | | | | | | | | | | | | | | | | | | | | | | | | | | | |
| | | | | (A) | | | (B) | | | (C) | | | (D) | | | (E) | | | (F) | | | (G) | | | (H) | | | (I) | | | (J) |
| | | I. Sources and Uses of Proceeds |
| | | | | The Cleveland Electric Illuminating
Company | | | Ohio Edison Company | | | Toledo Edison Company | | | Notes |
| | | | | | | | | | | |
1 | | PIR Bonds Issued | | | | | | $ | 250,680,890 | | | | | | | | | | | $ | 188,353,837 | | | | | | | | | | | $ | 45,762,713 | | | | | | | Exhibit A, Line 4 + Exhibit C, Page 1, Line 15 |
| | | | | | | | | | | | | | | | | | | | | | | | | | | | | | | | | | | | | | | | |
2 | | Total Sources: | | | | | | $ | 250,680,890 | | | | | | | | | | | $ | 188,353,837 | | | | | | | | | | | $ | 45,762,713 | | | | | | | Line 1 |
| | | | | | | | | | | | | | | | | | | | | | | | | | | | | | | | | | | | | | | | |
| | | | | | | | | | | |
3 | | Issuance Expenses | | | | | | $ | 4,290,488 | | | | | | | | | | | $ | 3,178,154 | | | | | | | | | | | $ | 941,755 | | | | | | | Exhibit C, Page 1, Line 13 |
4 | | Debt Retirement Costs | | | | | | $ | 11,732,876 | | | | | | | | | | | $ | 19,911,070 | | | | | | | | | | | $ | 8,410,757 | | | | | | | Exhibit C, Page 1, Line 14 |
5 | | Debt Retired | | | | | | $ | 234,657,526 | | | | | | | | | | | $ | 165,264,613 | | | | | | | | | | | $ | 25,487,141 | | | | | | | Estimated Debt Retired |
6 | | Corporate Purposes | | | | | | $ | 0 | | | | | | | | | | | $ | 0 | | | | | | | | | | | $ | 10,923,061 | | | | | | | Estimated Other Use of funds |
| | | | | | | | | | | | | | | | | | | | | | | | | | | | | | | | | | | | | | | | |
7 | | Total Uses: | | | | | | $ | 250,680,890 | | | | | | | | | | | $ | 188,353,837 | | | | | | | | | | | $ | 45,762,713 | | | | | | | Sum Lines 3-6 |
| | | | | | | | | | | | | | | | | | | | | | | | | | | | | | | | | | | | | | | | |
| |
| | | II. Current and Pro Forma Capitalization |
| | | | | The Cleveland Electric Illuminating
Company | | | Ohio Edison Company | | | Toledo Edison Company | | | Notes |
| | | At 3/31/2012 | | Current | | | Changes | | | Pro Forma | | | Current | | | Changes | | | Pro Forma | | | Current | | | Changes | | | Pro Forma | | | |
| | | | | | | | | | | |
8 | | Long-term Debt | | $ | 1,811,425,851 | | | ($ | 234,657,526 | ) | | $ | 1,576,768,325 | | | $ | 1,159,025,334 | | | ($ | 165,264,613 | ) | | $ | 993,760,721 | | | $ | 599,084,921 | | | ($ | 25,487,141 | ) | | $ | 573,597,780 | | | Applicant Financial Statements |
| | | | | | | | | | | |
9 | | PIR Bonds | | $ | 0 | | | $ | 250,680,890 | | | $ | 250,680,890 | | | $ | 0 | | | $ | 188,353,837 | | | $ | 188,353,837 | | | $ | 0 | | | $ | 45,762,713 | | | $ | 45,762,713 | | | Line 2 |
| | | | | | | | | | | | | | | | | | | | | | | | | | | | | | | | | | | | | | | | |
10 | | Total Debt | | $ | 1,811,425,851 | | | | | | | $ | 1,827,449,215 | | | $ | 1,159,025,334 | | | | | | | $ | 1,182,114,558 | | | $ | 599,084,921 | | | | | | | $ | 619,360,493 | | | Line 8 + Line 9 |
11 | | Total Equity | | $ | 1,187,753,094 | | | $ | 0 | | | $ | 1,187,753,094 | | | $ | 742,329,238 | | | $ | 0 | | | $ | 742,329,238 | | | $ | 362,900,686 | | | $ | 0 | | | $ | 362,900,686 | | | Applicant Financial Statements |
| | | | | | | | | | | | | | | | | | | | | | | | | | | | | | | | | | | | | | | | |
12 | | Total Capitalization | | $ | 2,999,178,945 | | | | | | | $ | 3,015,202,309 | | | $ | 1,901,354,572 | | | | | | | $ | 1,924,443,796 | | | $ | 961,985,607 | | | | | | | $ | 982,261,179 | | | Line 10 + Line 11 |
| | | | | | | | | | | |
13 | | Capitalization Ratios (including PIR Bonds) | | | | | | | | | | | | | | | | | | | | | | | | | | | | | | | | | | | | | | |
14 | | Debt / Capitalization | | | 60.4 | % | | | | | | | 60.6 | % | | | 61.0 | % | | | | | | | 61.4 | % | | | 62.3 | % | | | | | | | 63.1 | % | | Line 10 / Line 12 |
15 | | Equity / Capitalization | | | 39.6 | % | | | | | | | 39.4 | % | | | 39.0 | % | | | | | | | 38.6 | % | | | 37.7 | % | | | | | | | 36.9 | % | | Line 11 / Line 12 |
| | | | | | | | | | | |
16 | | Capitalization Ratios (excluding PIR Bonds) | | | | | | | | | | | | | | | | | | | | | | | | | | | | | | | | | | | | | | |
17 | | Debt / Capitalization | | | 60.4 | % | | | | | | | 57.0 | % | | | 61.0 | % | | | | | | | 57.2 | % | | | 62.3 | % | | | | | | | 61.2 | % | | Line 8 / (Line 12 - Line 9) |
18 | | Equity / Capitalization | | | 39.6 | % | | | | | | | 43.0 | % | | | 39.0 | % | | | | | | | 42.8 | % | | | 37.7 | % | | | | | | | 38.8 | % | | Line 11 / (Line 12 - Line 9) |
Page 1 of 1
EXHIBIT E
INDICATIVE TRANSACTION STRUCTURE(a)
| | | | | | | | | | | | | | | | | | | | | | | | | | | | |
| (A) | | (B) | | | (C) | | | (D) | | | (E) | | | (F) | |
Tranche | | Initial Principal
Balance(b) | | | Expected
WAL(c) | | | Expected Maturity | | | Legal Final Maturity | | | Interest
Rate | |
A-1 | | $ | 122,000,000 | | | | 1.4 yrs | | | | Dec-2015 | | | | 3.0 yrs | | | | Dec-2017 | | | | 5.0 yrs | | | | 0.62 | % |
A-2 | | $ | 92,400,000 | | | | 5.2 yrs | | | | Dec-2019 | | | | 7.0 yrs | | | | Dec-2021 | | | | 9.0 yrs | | | | 1.40 | % |
A-3 | | $ | 270,397,439 | | | | 14.6 yrs | | | | Jun-2034 | | | | 21.5 yrs | | | | Jun-2036 | | | | 23.5 yrs | | | | 3.22 | % |
| | | | | | | | | | | | | | | | | | | | | | | | | | | | |
| | $ | 484,797,439 | | | | | | | | | | | | | | | | | | | | | | | | | |
| (a) | Estimated, for discussion purposes only. Final structure will depend upon several factors including then-current market conditions. Assumes all three offerings combined into one single pooled offering. |
| (b) | Sum of Columns B, E & H on Exhibit D, Line 2. |
| (c) | Weighted average life represents time-weighted receipt of principal repayment. Principal repayment schedule based upon a percentage of current recoveries on assets securitized. |
Page 1 of 2
EXHIBIT E
EXPECTED PRINCIPAL REPAYMENT SCHEDULE(a)
| | | | | | | | | | | | | | | | |
| | | Tranche A-1 | | | Tranche A-2 | | | Tranche A-3 | | | Total | |
| | | | |
Tranche Size | | $ | 122,000,000 | | | $ | 92,400,000 | | | $ | 270,397,439 | | | $ | 484,797,439 | |
Date | | | | | | | | | | | | | | | | |
Jun-13 | | $ | 25,077,554 | | | $ | 0 | | | $ | 0 | | | $ | 25,077,554 | |
Dec-13 | | $ | 30,243,366 | | | $ | 0 | | | $ | 0 | | | $ | 30,243,366 | |
Jun-14 | | $ | 30,607,825 | | | $ | 0 | | | $ | 0 | | | $ | 30,607,825 | |
Dec-14 | | $ | 14,999,121 | | | $ | 0 | | | $ | 0 | | | $ | 14,999,121 | |
Jun-15 | | $ | 11,591,616 | | | $ | 0 | | | $ | 0 | | | $ | 11,591,616 | |
Dec-15 | | $ | 9,480,518 | | | $ | 2,387,629 | | | $ | 0 | | | $ | 11,868,146 | |
Jun-16 | | $ | 0 | | | $ | 11,360,941 | | | $ | 0 | | | $ | 11,360,941 | |
Dec-16 | | $ | 0 | | | $ | 11,622,315 | | | $ | 0 | | | $ | 11,622,315 | |
Jun-17 | | $ | 0 | | | $ | 11,341,524 | | | $ | 0 | | | $ | 11,341,524 | |
Dec-17 | | $ | 0 | | | $ | 11,628,026 | | | $ | 0 | | | $ | 11,628,026 | |
Jun-18 | | $ | 0 | | | $ | 11,282,285 | | | $ | 0 | | | $ | 11,282,285 | |
Dec-18 | | $ | 0 | | | $ | 11,552,199 | | | $ | 0 | | | $ | 11,552,199 | |
Jun-19 | | $ | 0 | | | $ | 11,276,643 | | | $ | 0 | | | $ | 11,276,643 | |
Dec-19 | | $ | 0 | | | $ | 9,948,437 | | | $ | 1,602,888 | | | $ | 11,551,325 | |
Jun-20 | | $ | 0 | | | $ | 0 | | | $ | 11,189,500 | | | $ | 11,189,500 | |
Dec-20 | | $ | 0 | | | $ | 0 | | | $ | 11,544,725 | | | $ | 11,544,725 | |
Jun-21 | | $ | 0 | | | $ | 0 | | | $ | 11,280,917 | | | $ | 11,280,917 | |
Dec-21 | | $ | 0 | | | $ | 0 | | | $ | 9,423,172 | | | $ | 9,423,172 | |
Jun-22 | | $ | 0 | | | $ | 0 | | | $ | 7,308,595 | | | $ | 7,308,595 | |
Dec-22 | | $ | 0 | | | $ | 0 | | | $ | 7,628,419 | | | $ | 7,628,419 | |
Jun-23 | | $ | 0 | | | $ | 0 | | | $ | 7,530,985 | | | $ | 7,530,985 | |
Dec-23 | | $ | 0 | | | $ | 0 | | | $ | 7,872,584 | | | $ | 7,872,584 | |
Jun-24 | | $ | 0 | | | $ | 0 | | | $ | 7,779,083 | | | $ | 7,779,083 | |
Dec-24 | | $ | 0 | | | $ | 0 | | | $ | 8,124,678 | | | $ | 8,124,678 | |
Jun-25 | | $ | 0 | | | $ | 0 | | | $ | 8,035,237 | | | $ | 8,035,237 | |
Dec-25 | | $ | 0 | | | $ | 0 | | | $ | 8,384,958 | | | $ | 8,384,958 | |
Jun-26 | | $ | 0 | | | $ | 0 | | | $ | 8,299,709 | | | $ | 8,299,709 | |
Dec-26 | | $ | 0 | | | $ | 0 | | | $ | 8,653,690 | | | $ | 8,653,690 | |
Jun-27 | | $ | 0 | | | $ | 0 | | | $ | 8,572,769 | | | $ | 8,572,769 | |
Dec-27 | | $ | 0 | | | $ | 0 | | | $ | 8,931,148 | | | $ | 8,931,148 | |
Jun-28 | | $ | 0 | | | $ | 0 | | | $ | 8,854,696 | | | $ | 8,854,696 | |
Dec-28 | | $ | 0 | | | $ | 0 | | | $ | 9,217,616 | | | $ | 9,217,616 | |
Jun-29 | | $ | 0 | | | $ | 0 | | | $ | 9,145,778 | | | $ | 9,145,778 | |
Dec-29 | | $ | 0 | | | $ | 0 | | | $ | 9,513,386 | | | $ | 9,513,386 | |
Jun-30 | | $ | 0 | | | $ | 0 | | | $ | 9,446,312 | | | $ | 9,446,312 | |
Dec-30 | | $ | 0 | | | $ | 0 | | | $ | 9,818,761 | | | $ | 9,818,761 | |
Jun-31 | | $ | 0 | | | $ | 0 | | | $ | 9,756,606 | | | $ | 9,756,606 | |
Dec-31 | | $ | 0 | | | $ | 0 | | | $ | 10,134,052 | | | $ | 10,134,052 | |
Jun-32 | | $ | 0 | | | $ | 0 | | | $ | 10,076,975 | | | $ | 10,076,975 | |
Dec-32 | | $ | 0 | | | $ | 0 | | | $ | 10,459,581 | | | $ | 10,459,581 | |
Jun-33 | | $ | 0 | | | $ | 0 | | | $ | 10,407,747 | | | $ | 10,407,747 | |
Dec-33 | | $ | 0 | | | $ | 0 | | | $ | 10,795,681 | | | $ | 10,795,681 | |
Jun-34 | | $ | 0 | | | $ | 0 | | | $ | 10,607,192 | | | $ | 10,607,192 | |
Dec-34 | | $ | 0 | | | $ | 0 | | | $ | 0 | | | $ | 0 | |
Jun-35 | | $ | 0 | | | $ | 0 | | | $ | 0 | | | $ | 0 | |
Dec-35 | | $ | 0 | | | $ | 0 | | | $ | 0 | | | $ | 0 | |
| (a) | Estimated, for discussion purposes only. Assumes an issuance date of January 1, 2013. Final structure will depend upon several factors including then-current market conditions. Assumes all three offerings combined into one single combined offering. |
Page 2 of 2
EXHIBIT F -Rider PIR Reconciliation Mechanism and Rate Design Process
Rider PIR Reconciliation Calculation
On or about November 1st and May 1st each year, each Applicant will file an adjustment to the Rider PIR charge to be effective the following January 1st or July 1st, respectively.1 In order to facilitate the semi-annual adjustment, each Applicant will track, on a monthly basis, the amount of phase-in recovery revenue collected under Rider PIR and the associated costs of the Phase-In Recovery Bonds issued by its subsidiary SPE (i.e., debt service and ongoing Financing Costs), so that any difference (whether an over collection or an under collection) can be reflected in the next semi-annual adjustment of the Rider PIR charge.
The Rider PIR charges will be adjusted at least semi-annually to ensure that the expected collections of the Rider PIR charges are adequate to pay principal and interest on the associated Phase-In Recovery Bonds when due pursuant to the expected amortization schedule, pay when due all other ongoing Financing Costs, and to fund the reserve account to the required level. All adjustments will be designed to cause (i) the outstanding principal balance of the Phase-In Recovery Bonds to be equal to the scheduled balance on the expected amortization schedule; (ii) the amount in the reserve subaccount to be equal to the required reserve level; and (iii) any residual subaccount to be zero by the payment date immediately preceding the next adjustment or by the final payment date, if the next payment date is the final payment date.
The methodology for the reconciliation mechanism for a generic month j is provided below.
Let
| | | | |
| COLj | | = | | Phase-In Recovery Charge collections under Rider PIR and interest earned on the associated securitization subaccounts in month j |
| | |
| INTj | | = | | Interest on the associated Phase-In Recovery Bonds paid and / or accrued in month j |
| | |
| PRNj | | = | | Principal of the associated Phase-In Recovery Bonds paid and / or accrued in month j |
| | |
| EXPj | | = | | Ongoing Financing Costs allocated to the associated Phase-In Recovery Bonds paid and / or accrued in month j |
| | |
| RECj | | = | | Reconciliation amount in month j |
| 1 | The initial Rider PIR charge will go into effect as soon as practicable following the issuance of the associated Phase-In Recovery Bonds. The initial update to each Applicant’s Rider PIR will be up to 12 months after the issuance date for the Phase-In Recovery Bonds. |
1
EXHIBIT F -Rider PIR Reconciliation Mechanism and Rate Design Process
Then
| | | | |
| RECj | | = | | (INTj + PRNj + EXPj) - COL, where |
| |
| | RECj > 0g under collection of Rider PIR in month j |
| | RECj < 0g over collection of Rider PIR in month j |
The reconciliation will be tracked monthly and on a cumulative basis, including any interest earned on the securitization subaccounts.
Due to the timing of the semi-annual reconciliations, there will be a three month lag between the time the reconciliation is prepared and the time the resulting proposed Rider PIR charges will go into effect.
Therefore, for purposes of Rider PIR the following terms shall apply (other than for the initial Rider PIR charge):
| | | | |
| PIR Computational Period | | = | | the 6 month period from January 1 through June 30 or July 1 through December 31 of each year over which the new Rider PIR charge will be in effect |
| | |
PIR Reconciliation Period | | = | | the 6 month period from April 1 through September 30 or October 1 through March 31 immediately preceding the PIR Computational Period |
For example, when preparing the reconciliation to be filed on November 1st, only actual results through the end of September will be known, thus leaving a gap of three months – October, November, and December – between the end of the immediately preceding PIR Reconciliation Period and the beginning of the PIR Computational Period. In order to bridge this gap, the Applicants will estimate the monthly reconciliation activity for the three months following the immediately preceding PIR Reconciliation Period. The estimated monthly reconciliation activity will follow the same formula described above, though each of the components in the formula will be estimates as opposed to actual results
The estimated reconciliation amount over these three estimated months will be added to the cumulative actual reconciliation balance through the immediately preceding PIR Reconciliation Period to derive the estimated cumulative reconciliation balance as of the beginning of the upcoming PIR Computational Period. So for a generic PIR Computational Period p,
| | | | |
| | |
| REC BALp | | = | | Cumulative reconciliation balance as of the beginning of PIR Computational Period p (includes estimated activity for the three months following the immediately preceding PIR Reconciliation Period) |
REC BALp will then be included in the revenue requirement calculation for the upcoming PIR Computational Period p.
2
EXHIBIT F -Rider PIR Reconciliation Mechanism and Rate Design Process
Rider PIR Revenue Requirement Calculation
At the time of each semi-annual adjustment, each Applicant will calculate the amount of revenue to be billed under its Rider PIR over the upcoming PIR Computational Period.2 These Rider PIR revenue estimates will take into account any differences between Rider PIR billed revenues and Rider PIR collections, (e.g., applicable taxes, write-offs, and billing lags) such that the estimated Rider PIR billed revenues will be converted to the estimated amount of cash needed to make payments associated with the Phase-In Recovery Bonds over the same six month period. This estimated Rider PIR billed revenue includes the cumulative reconciliation balance (REC BALp) as of the end of the month immediately preceding PIR Computational Period, as described above.
A summary formula for the semi-annual adjustment and associated revenue requirement calculation for a generic PIR Computational Period p is provided below.
Let
| | | | |
| | |
| REV REQp | | = | | Rider PIR revenue requirement for PIR Computational Period p |
| | |
| REC BALp | | = | | Cumulative reconciliation balance as of the beginning of PIR Computational Period p (includes estimated activity for the three months following the immediately preceding PIR Reconciliation Period) |
| | |
| INTp | | = | | Estimated interest on the associated Phase-In Recovery Bonds to be paid and / or accrued in PIR Computational Period p |
| | |
| PRNp | | = | | Estimated principal of the associated Phase-In Recovery Bonds to be paid and / or accrued in PIR Computational Period p |
| | |
| EXPp | | = | | Estimated ongoing Financing Costs allocated to the associated Phase-In Recovery Bonds to be paid and / or accrued in PIR Computational Period p |
| | |
| TAX Ratep | | = | | Composite tax rate applicable to Rider PIR revenues during PIR Computational Period p (includes Commercial Activity Tax and non-Ohio state income taxes) |
| | |
| UNC Ratep | | = | | Estimated uncollectible rate during PIR Computational Period p |
| | |
| LAG Factorp | | = | | Estimated factor to convert from cash to revenue accounting for expected lags between Rider PIR billed revenue and Rider PIR collections during PIR Computational Period p |
| 2 | As noted above, the initial PIR Computational Period may be different than six months. |
3
EXHIBIT F -Rider PIR Reconciliation Mechanism and Rate Design Process
Then
| | | | | | |
| REV REQ | | = | | REC BALp + INTp + PRNp + EXPp | | x LAG Factorp |
| | | (1 – TAX Ratep – UNC Ratep) | |
This revenue requirement calculation will be performed for each PIR Computational Period by each of the Applicants to establish the amount of revenue to be billed by each Applicant over the upcoming six month period effective January 1st or July 1st. Each Applicant’s calculations will only include the principal, interest, and collections associated with and ongoing Financing Costs allocated to the Phase-In Recovery Bonds issued by its subsidiary SPE. The initial charge for Rider PIR will follow this same methodology, though the initial reconciliation balance will have a value of zero.
4
EXHIBIT F -Rider PIR Reconciliation Mechanism and Rate Design Process
Rider PIR Revenue Requirement Allocation and Rate Design
Once the Rider PIR revenue requirement is calculated pursuant to the formula above, it will be allocated to each Applicant’s rate schedules based on allocation ratios designed to mirror the relationships that exist today under the existing recovery mechanisms for the Phase-In Costs (i.e., Riders RER1, DGC, and DFC, where applicable). These allocation factors will be calculated for each PIR Computational Period. A description of the methodology for calculating the allocation ratios is provided below.
The estimated tariff rates that would otherwise be in effect under the existing recovery mechanisms and that are to be used for purposes of calculating the allocation factors for Rider PIR are summarized in the tables below. All prices are shown in terms of ¢/kWh.
Current through June 2014 (¢/kWh)
| | | | | | | | | | | | | | | | | | | | | | | | | | | | | | |
| | | Rider RER1 | | Rider DGC | | Rider DFC | |
Rate Schedule | | CEI | | | OE | | | TE | | CEI | | | OE | | TE | | CEI | | | OE | | | TE | |
RS | | | 0.2787 | | | | 0.3114 | | | | | | 0.1171 | | | | | | | | 0.0345 | | | | 0.0362 | | | | 0.0257 | |
GS | | | | | | | | | | | | | 0.1171 | | | | | | | | 0.0345 | | | | 0.0362 | | | | 0.0257 | |
GP | | | | | | | | | | | | | 0.1130 | | | | | | | | 0.0345 | | | | 0.0362 | | | | 0.0257 | |
GSU | | | | | | | | | | | | | 0.1099 | | | | | | | | 0.0345 | | | | 0.0362 | | | | 0.0257 | |
GT | | | | | | | | | | | | | 0.1097 | | | | | | | | 0.0345 | | | | 0.0362 | | | | 0.0257 | |
STL | | | | | | | | | | | | | 0.1171 | | | | | | | | 0.0345 | | | | 0.0362 | | | | 0.0257 | |
TRF | | | | | | | | | | | | | 0.1171 | | | | | | | | 0.0345 | | | | 0.0362 | | | | 0.0257 | |
POL | | | | | | | | | | | | | 0.1171 | | | | | | | | 0.0345 | | | | 0.0362 | | | | 0.0257 | |
July 2014 through May 2021 (¢/kWh)
| | | | | | | | | | | | | | | | | | | | | | | | | | |
| | | Rider RER1 | | Rider DGC | | Rider DFC | |
Rate Schedule | | CEI | | OE | | TE | | CEI | | | OE | | TE | | CEI | | | OE | | | TE | |
RS | | | | | | | | | 0.1171 | | | | | | | | 0.0345 | | | | 0.0362 | | | | 0.0257 | |
GS | | | | | | | | | 0.1171 | | | | | | | | 0.0345 | | | | 0.0362 | | | | 0.0257 | |
GP | | | | | | | | | 0.1130 | | | | | | | | 0.0345 | | | | 0.0362 | | | | 0.0257 | |
GSU | | | | | | | | | 0.1099 | | | | | | | | 0.0345 | | | | 0.0362 | | | | 0.0257 | |
GT | | | | | | | | | 0.1097 | | | | | | | | 0.0345 | | | | 0.0362 | | | | 0.0257 | |
STL | | | | | | | | | 0.1171 | | | | | | | | 0.0345 | | | | 0.0362 | | | | 0.0257 | |
TRF | | | | | | | | | 0.1171 | | | | | | | | 0.0345 | | | | 0.0362 | | | | 0.0257 | |
POL | | | | | | | | | 0.1171 | | | | | | | | 0.0345 | | | | 0.0362 | | | | 0.0257 | |
June 2021 through December 2035 (¢/kWh)
| | | | | | | | | | | | | | | | | | | | | | | | |
| | | Rider RER1 | | Rider DGC | | Rider DFC | |
Rate Schedule | | CEI | | OE | | TE | | CEI | | OE | | TE | | CEI | | | OE | | | TE | |
RS | | | | | | | | | | | | | | | 0.0345 | | | | 0.0362 | | | | 0.0257 | |
GS | | | | | | | | | | | | | | | 0.0345 | | | | 0.0362 | | | | 0.0257 | |
GP | | | | | | | | | | | | | | | 0.0345 | | | | 0.0362 | | | | 0.0257 | |
GSU | | | | | | | | | | | | | | | 0.0345 | | | | 0.0362 | | | | 0.0257 | |
GT | | | | | | | | | | | | | | | 0.0345 | | | | 0.0362 | | | | 0.0257 | |
STL | | | | | | | | | | | | | | | 0.0345 | | | | 0.0362 | | | | 0.0257 | |
TRF | | | | | | | | | | | | | | | 0.0345 | | | | 0.0362 | | | | 0.0257 | |
POL | | | | | | | | | | | | | | | 0.0345 | | | | 0.0362 | | | | 0.0257 | |
5
EXHIBIT F -Rider PIR Reconciliation Mechanism and Rate Design Process
For each PIR Computational Period, each Applicant will apply the applicable rates from the table above to its most recent sales forecast in order to determine the amount of revenue that otherwise would have been collected from each rate schedule under the existing recovery mechanisms. These estimated revenues will then be used to determine allocation factors by which to allocate its Rider PIR revenue requirement for the upcoming PIR Computational Period.3
For each rate schedule i and each month j, let
| | | | |
| Salesij | | = | | Estimated sales for rate schedule i in month j |
| | |
| RER1 Rateij | | = | | Estimated Rider RER1 rate otherwise applicable to rate schedule i in month j |
| | |
| DGC Rateij | | = | | Estimated Rider DGC rate otherwise applicable to rate schedule i in month j |
| | |
| DFC Rateij | | = | | Estimated Rider DFC rate otherwise applicable to rate schedule i in month j |
Then
| | | | |
 | | = | | Estimated revenue billed to rate schedule i in month j under the otherwise applicable existing recovery mechanisms |
| | |
| | = | | Salesij x [ RER1 Rateij + DGC Rateij + DFC Rateij] |
Let p be a generic PIR Computational Period comprised of months j = k, k+1, …, k+5. Then the estimated revenue to be billed to rate schedule i during PIR Computational Period p under the otherwise applicable existing recovery mechanisms is calculated by

| (1) |
Similarly, the estimated revenue billed to all rate schedules under this same PIR Computational Period p is
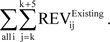
| (2) |
| 3 | In the event that the final legal maturity date of the PIR securitization bonds extends past December 2035, (the month in which recovery of the Phase-In Costs would otherwise be fully recovered under the existing recovery methodology), the estimated tariff prices in effect as of December 2035 from the table will be used for purposes of calculating the allocation factors for Rider PIR. |
6
EXHIBIT F -Rider PIR Reconciliation Mechanism and Rate Design Process
For each Applicant, the resulting ratios of (1) estimated revenue billed to each rate schedule i during PIR Computational Period p under the otherwise applicable existing recovery mechanisms to (2) estimated revenue billed to all rate schedules during PIR Computational Period p under the otherwise applicable recovery mechanisms, will be used to allocate REV REQp to the different rate schedules for PIR Computational Period p.
Let
| | | | |
| REV REQip | | = | | Revenue requirement for PIR Computational Period p allocated to rate schedule i, where 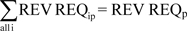
|
| and | | | | |
| | |
| Allocation Factorip | | = | | Allocation factor applied to rate schedule i for purposes of allocating the estimated Rider PIR revenue to be billed during PIR Computational Period p |
| | |
| | = | | 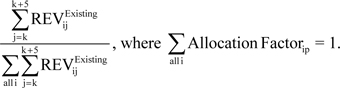 |
Then for each rate schedule i,
| | | | |
| REV REQip | | = | | Allocation Factorip x REV REQp. |
| | |
| | = | | Amount of Rider PIR revenue requirement allocated to rate schedule i in PIR Computational Period p |
Under this methodology, any changes in electric consumption behavior across the rate schedules will be accounted for as part of the calculation of the allocation ratios. For example, if a particular rate schedule experiences a significant change in its electric consumption, this change will be reflected in the sales forecast used to determine the level of revenue otherwise billed under the existing recovery mechanisms, and the resulting allocation ratios will be updated accordingly. In other words, if a particular rate schedule would have otherwise been billed more or less (as a percentage of the total) under the existing recovery mechanisms due to significant changes in its electric consumption, the same relationship among all rate schedules will generally be maintained when allocating the estimated Rider PIR billed revenues under this methodology.
An illustrative example is included as Exhibit F – Attachment 1, which shows, for illustrative purposes, the revenue requirement calculation and associated rate design for the initial Rider PIR charge.
7
| | |
| Rider PIR - Semi-annual Revenue Requirement Calculation | | Exhibit F - Attachment 1 |
| Illustrative Example - Initial Rider PIR Charge | | Page 1 of 3 |
| | | | | | | | | | | | | | | | | | |
Line | | Line Item Description | | CEI | | | OE | | | TE | | | TOTAL | |
| | | | | |
| 1 | | Estimated Debt Service | | | | | | | | | | | | | | | | |
| 2 | | Principal | | | | | | | | | | | | | | | | |
| 3 | | Class A | | $ | 12,875,895 | | | $ | 11,739,792 | | | $ | 461,867 | | | $ | 25,077,554 | |
| 4 | | Class B | | $ | 0 | | | $ | 0 | | | $ | 0 | | | $ | 0 | |
| 5 | | Class C | | $ | 0 | | | $ | 0 | | | $ | 0 | | | $ | 0 | |
| | | | | | | | | | | | | | | | | | |
| 6 | | Total Principal | | $ | 12,875,895 | | | $ | 11,739,792 | | | $ | 461,867 | | | $ | 25,077,554 | |
| 7 | | | | | | | | | | | | | | | | | | |
| 8 | | Interest | | | | | | | | | | | | | | | | |
| 9 | | Class A | | $ | 224,065 | | | $ | 144,708 | | | $ | 10,892 | | | $ | 379,665 | |
| 10 | | Class B | | $ | 504,000 | | | $ | 98,000 | | | $ | 44,800 | | | $ | 646,800 | |
| 11 | | Class C | | $ | 1,718,257 | | | $ | 2,059,280 | | | $ | 577,623 | | | $ | 4,355,161 | |
| | | | | | | | | | | | | | | | | | |
| 12 | | Total Interest | | $ | 2,446,322 | | | $ | 2,301,988 | | | $ | 633,315 | | | $ | 5,381,626 | |
| 13 | | | | | | | | | | | | | | | | | | |
| 14 | | Principal & Interest | | | | | | | | | | | | | | | | |
| 15 | | Class A | | $ | 13,099,960 | | | $ | 11,884,501 | | | $ | 472,759 | | | $ | 25,457,219 | |
| 16 | | Class B | | $ | 504,000 | | | $ | 98,000 | | | $ | 44,800 | | | $ | 646,800 | |
| 17 | | Class C | | $ | 1,718,257 | | | $ | 2,059,280 | | | $ | 577,623 | | | $ | 4,355,161 | |
| | | | | | | | | | | | | | | | | | |
| 18 | | Total Principal & Interest | | $ | 15,322,217 | | | $ | 14,041,780 | | | $ | 1,095,183 | | | $ | 30,459,180 | |
| 19 | | | | | | | | | | | | | | | | | | |
| 20 | | Estimated Ongoing Financing Costs | | | | | | | | | | | | | | | | |
| 21 | | Servicing Fee | | $ | 125,340 | | | $ | 94,177 | | | $ | 22,881 | | | $ | 242,399 | |
| 22 | | Administration Fees and Expenses | | $ | 25,854 | | | $ | 19,426 | | | $ | 4,720 | | | $ | 50,000 | |
| 23 | | Trustee Fees and Expenses | | $ | 12,927 | | | $ | 9,713 | | | $ | 2,360 | | | $ | 25,000 | |
| 24 | | Legal Fees | | $ | 12,927 | | | $ | 9,713 | | | $ | 2,360 | | | $ | 25,000 | |
| 25 | | Accounting Fees | | $ | 25,854 | | | $ | 19,426 | | | $ | 4,720 | | | $ | 50,000 | |
| 26 | | Independent Manager’s Fees | | $ | 5,171 | | | $ | 3,885 | | | $ | 944 | | | $ | 10,000 | |
| 27 | | Rating Agency Fees | | $ | 19,391 | | | $ | 14,570 | | | $ | 3,540 | | | $ | 37,500 | |
| 28 | | Printing and Filing Fees | | $ | 646 | | | $ | 486 | | | $ | 118 | | | $ | 1,250 | |
| 29 | | Miscellaneous | | $ | 1,293 | | | $ | 971 | | | $ | 236 | | | $ | 2,500 | |
| 30 | | Return on Capital Account | | $ | 42,929 | | | $ | 32,256 | | | $ | 7,837 | | | $ | 83,022 | |
| 31 | | Dealers In Intangible Tax | | $ | 5,014 | | | $ | 3,767 | | | $ | 915 | | | $ | 9,696 | |
| | | | | | | | | | | | | | | | | | |
| 32 | | Total Ongoing Financing Costs | | $ | 277,346 | | | $ | 208,389 | | | $ | 50,631 | | | $ | 536,366 | |
| 33 | | | | | | | | | | | | | | | | | | |
| | | | | | | | | | | | | | | | | | |
| 34 | | Estimated Debt Service & Ongoing Financing Costs | | $ | 15,599,563 | | | $ | 14,250,170 | | | $ | 1,145,813 | | | $ | 30,995,547 | |
| | | | | | | | | | | | | | | | | | |
| 35 | | | | | | | | | | | | | | | | | | |
| 36 | | Cumulative Under (Over) Collection | | | | | | | | | | | | | | $ | 0 | |
| 37 | | | | | | | | | | | | | | | | | | |
| | | | | | | | | | | | | | | | | | |
| 38 | | Total to be Recovered Before Gross-ups | | $ | 15,599,563 | | | $ | 14,250,170 | | | $ | 1,145,813 | | | $ | 30,995,547 | |
| | | | | | | | | | | | | | | | | | |
| 39 | | | | | | | | | | | | | | | | | | |
| 40 | | Estimated Uncollectible Ratio | | | 0.75 | % | | | 0.55 | % | | | 0.75 | % | | | | |
| 41 | | CAT Tax & Non-Ohio State Income Tax | | | 0.96 | % | | | 1.05 | % | | | 1.03 | % | | | | |
| | | | | | | | | | | | | | | | | | |
| 42 | | Gross-up Factor - Tax & Uncollectible | | | 1.71 | % | | | 1.60 | % | | | 1.78 | % | | | | |
| 43 | | | | | | | | | | | | | | | | | | |
| | | | | | | | | | | | | | | | | | |
| 44 | | Total Amount to be Collected with Gross-ups | | $ | 15,870,710 | | | $ | 14,481,968 | | | $ | 1,166,537 | | | $ | 31,519,214 | |
| | | | | | | | | | | | | | | | | | |
| 45 | | | | | | | | | | | | | | | | | | |
| 46 | | Billing Lag Conversion Factor | | | 114.5 | % | | | 115.0 | % | | | 115.3 | % | | | | |
| 47 | | | | | | | | | | | | | | | | | | |
| | | | | | | | | | | | | | | | | | |
| 48 | | Total Rider PIR Revenue Requirement | | $ | 18,171,590 | | | $ | 16,654,665 | | | $ | 1,344,764 | | | $ | 36,171,020 | |
| | | | | | | | | | | | | | | | | | |
| | |
| NOTES |
| |
| 1-18 | | Estimated debt service for PIR Bonds to be paid and / or accrued over the upcoming 6 months |
| 20-32 | | Estimated ongoing financing costs to be paid and / or accrued over the upcoming 6 months |
| 34 | | Calculation: Line 18 + Line 32 |
| 36 | | Cumulative under (over) collection of debt service and ongoing expenses as of upcoming 6 month period |
| 38 | | Calculation: Line 34 + Line 36 |
| 40 | | Estimated Uncollectible Expense ratio for upcoming 6 months |
| 41 | | Composite tax rate for taxes aplicable to Rider PIR revenues (includes CAT Tax and non-Ohio state income taxes) |
| 42 | | Gross-up factor applied to amount to be recovered. Calculation: Line 40 + Line 41 |
| 44 | | Calculation: Line 38 / (1 - Line 42) |
| 46 | | Factor to convert from cash to revenue based on estimated lag between billings and cash received |
| 48 | | Calculation: Line 44 x Line 46 |
| | |
| Rider PIR - Allocation Factors | | Exhibit F - Attachment 1 |
| Illustrative Example - Initial Rider PIR Charge * | | Page 2 of 3 |
| | | | | | | | | | | | | | | | | | | | | | | | | | | | | | | | | | | | | | | | | | | | |
| (A) | | (B) | | (C) | | (D) | | | (E) | | | (F) | | | (G) | | | (H) | | | (I) | | | (J) | | | (K) | | | (L) | | | (M) | |
| Line | | Company | | Rate Schedule | | Forecasted kWh
Sales | | | Otherwise Applicable Tariff Rates
(¢/kWh) | | | Otherwise Applicable Tariff Revenue | | | Allocation
Ratio | |
| | | | | RER1 | | | DGC | | | DFC | | | TOTAL | | | RER1 | | | DGC | | | DFC | | | TOTAL | | |
| | | | | | | | | | | | |
| 1 | | CEI | | Rate RS | | | 2,576,378,511 | | | | 0.2787 | | | | 0.1171 | | | | 0.0345 | | | | 0.4303 | | | $ | 7,180,367 | | | $ | 3,016,939 | | | $ | 888,851 | | | $ | 11,086,157 | | | | 54.60 | % |
| 2 | | CEI | | Rate GS | | | 3,529,472,016 | | | | 0.0000 | | | | 0.1171 | | | | 0.0345 | | | | 0.1516 | | | $ | 0 | | | $ | 4,133,012 | | | $ | 1,217,668 | | | $ | 5,350,680 | | | | 26.35 | % |
| 3 | | CEI | | Rate GP 1 | | | 134,859,708 | | | | 0.0000 | | | | 0.1130 | | | | 0.0345 | | | | 0.1475 | | | $ | 0 | | | $ | 152,391 | | | $ | 46,527 | | | $ | 198,918 | | | | 0.98 | % |
| 4 | | CEI | | Rate GP 2 | | | 69,431,894 | | | | 0.0000 | | | | 0.0000 | | | | 0.0345 | | | | 0.0345 | | | $ | 0 | | | $ | 0 | | | $ | 23,954 | | | $ | 23,954 | | | | 0.12 | % |
| 5 | | CEI | | Rate GSU 1 | | | 1,781,056,126 | | | | 0.0000 | | | | 0.1099 | | | | 0.0345 | | | | 0.1444 | | | $ | 0 | | | $ | 1,957,381 | | | $ | 614,464 | | | $ | 2,571,845 | | | | 12.67 | % |
| 6 | | CEI | | Rate GSU 2 | | | 147,722,702 | | | | 0.0000 | | | | 0.0000 | | | | 0.0345 | | | | 0.0345 | | | $ | 0 | | | $ | 0 | | | $ | 50,964 | | | $ | 50,964 | | | | 0.25 | % |
| 7 | | CEI | | Rate GT 1 | | | 469,488,715 | | | | 0.0000 | | | | 0.1097 | | | | 0.0345 | | | | 0.1442 | | | $ | 0 | | | $ | 515,029 | | | $ | 161,974 | | | $ | 677,003 | | | | 3.33 | % |
| 8 | | CEI | | Rate GT 2 | | | 551,005,295 | | | | 0.0000 | | | | 0.0000 | | | | 0.0345 | | | | 0.0345 | | | $ | 0 | | | $ | 0 | | | $ | 190,097 | | | $ | 190,097 | | | | 0.94 | % |
| 9 | | CEI | | Rate STL | | | 63,194,628 | | | | 0.0000 | | | | 0.1171 | | | | 0.0345 | | | | 0.1516 | | | $ | 0 | | | $ | 74,001 | | | $ | 21,802 | | | $ | 95,803 | | | | 0.47 | % |
| 10 | | CEI | | Rate POL | | | 29,283,302 | | | | 0.0000 | | | | 0.1171 | | | | 0.0345 | | | | 0.1516 | | | $ | 0 | | | $ | 34,291 | | | $ | 10,103 | | | $ | 44,393 | | | | 0.22 | % |
| 11 | | CEI | | Rate TRF | | | 8,996,539 | | | | 0.0000 | | | | 0.1171 | | | | 0.0345 | | | | 0.1516 | | | $ | 0 | | | $ | 10,535 | | | $ | 3,104 | | | $ | 13,639 | | | | 0.07 | % |
| 12 | | CEI | | Rate ESIP | | | | | | | 0.0000 | | | | 0.0000 | | | | 0.0000 | | | | 0.0000 | | | $ | 0 | | | $ | 0 | | | $ | 0 | | | $ | 0 | | | | 0.00 | % |
| | | | | | | | | | | | | | | | | | | | | | | | | | | | | | | | | | | | | | | | | | | | |
| 13 | | CEI | | TOTAL | | | 9,360,889,437 | | | | | | | | | | | | | | | | | | | $ | 7,180,367 | | | $ | 9,893,579 | | | $ | 3,229,507 | | | $ | 20,303,453 | | | | 100.00 | % |
| 14 | | | | | | | | | | | | | | | | | | | | | | | | | | | | | | | | | | | | | | | | | | | | |
| 15 | | OE | | Rate RS | | | 4,417,606,731 | | | | 0.3114 | | | | 0.0000 | | | | 0.0362 | | | | 0.3476 | | | $ | 13,756,427 | | | $ | 0 | | | $ | 1,599,174 | | | $ | 15,355,601 | | | | 84.82 | % |
| 16 | | OE | | Rate GS | | | 3,322,756,199 | | | | 0.0000 | | | | 0.0000 | | | | 0.0362 | | | | 0.0362 | | | $ | 0 | | | $ | 0 | | | $ | 1,202,838 | | | $ | 1,202,838 | | | | 6.64 | % |
| 17 | | OE | | Rate GP | | | 1,415,224,337 | | | | 0.0000 | | | | 0.0000 | | | | 0.0362 | | | | 0.0362 | | | $ | 0 | | | $ | 0 | | | $ | 512,311 | | | $ | 512,311 | | | | 2.83 | % |
| 18 | | OE | | Rate GSU | | | 519,654,272 | | | | 0.0000 | | | | 0.0000 | | | | 0.0362 | | | | 0.0362 | | | $ | 0 | | | $ | 0 | | | $ | 188,115 | | | $ | 188,115 | | | | 1.04 | % |
| 19 | | OE | | Rate GT | | | 2,239,971,058 | | | | 0.0000 | | | | 0.0000 | | | | 0.0362 | | | | 0.0362 | | | $ | 0 | | | $ | 0 | | | $ | 810,870 | | | $ | 810,870 | | | | 4.48 | % |
| 20 | | OE | | Rate STL | | | 15,062,508 | | | | 0.0000 | | | | 0.0000 | | | | 0.0362 | | | | 0.0362 | | | $ | 0 | | | $ | 0 | | | $ | 5,453 | | | $ | 5,453 | | | | 0.03 | % |
| 21 | | OE | | Rate POL | | | 17,925,372 | | | | 0.0000 | | | | 0.0000 | | | | 0.0362 | | | | 0.0362 | | | $ | 0 | | | $ | 0 | | | $ | 6,489 | | | $ | 6,489 | | | | 0.04 | % |
| 22 | | OE | | Rate TRF | | | 8,335,177 | | | | 0.0000 | | | | 0.0000 | | | | 0.0362 | | | | 0.0362 | | | $ | 0 | | | $ | 0 | | | $ | 3,017 | | | $ | 3,017 | | | | 0.02 | % |
| 23 | | OE | | Rate ESIP | | | 50,286,811 | | | | 0.0000 | | | | 0.0000 | | | | 0.0362 | | | | 0.0362 | | | $ | 0 | | | $ | 0 | | | $ | 18,204 | | | $ | 18,204 | | | | 0.10 | % |
| | | | | | | | | | | | | | | | | | | | | | | | | | | | | | | | | | | | | | | | | | | | |
| 24 | | OE | | TOTAL | | | 12,006,822,464 | | | | | | | | | | | | | | | | | | | $ | 13,756,427 | | | $ | 0 | | | $ | 4,346,470 | | | $ | 18,102,897 | | | | 100.00 | % |
| 25 | | | | | | | | | | | | | | | | | | | | | | | | | | | | | | | | | | | | | | | | | | | | |
| 26 | | TE | | Rate RS | | | 1,190,363,084 | | | | 0.0000 | | | | 0.0000 | | | | 0.0257 | | | | 0.0257 | | | $ | 0 | | | $ | 0 | | | $ | 305,923 | | | $ | 305,923 | | | | 22.09 | % |
| 27 | | TE | | Rate GS | | | 1,029,986,844 | | | | 0.0000 | | | | 0.0000 | | | | 0.0257 | | | | 0.0257 | | | $ | 0 | | | $ | 0 | | | $ | 264,707 | | | $ | 264,707 | | | | 19.11 | % |
| 28 | | TE | | Rate GP | | | 537,628,374 | | | | 0.0000 | | | | 0.0000 | | | | 0.0257 | | | | 0.0257 | | | $ | 0 | | | $ | 0 | | | $ | 138,170 | | | $ | 138,170 | | | | 9.98 | % |
| 29 | | TE | | Rate GSU | | | 58,074,478 | | | | 0.0000 | | | | 0.0000 | | | | 0.0257 | | | | 0.0257 | | | $ | 0 | | | $ | 0 | | | $ | 14,925 | | | $ | 14,925 | | | | 1.08 | % |
| 30 | | TE | | Rate GT | | | 2,540,943,349 | | | | 0.0000 | | | | 0.0000 | | | | 0.0257 | | | | 0.0257 | | | $ | 0 | | | $ | 0 | | | $ | 653,022 | | | $ | 653,022 | | | | 47.15 | % |
| 31 | | TE | | Rate STL | | | 24,854,471 | | | | 0.0000 | | | | 0.0000 | | | | 0.0257 | | | | 0.0257 | | | $ | 0 | | | $ | 0 | | | $ | 6,388 | | | $ | 6,388 | | | | 0.46 | % |
| 32 | | TE | | Rate POL | | | 5,451,752 | | | | 0.0000 | | | | 0.0000 | | | | 0.0257 | | | | 0.0257 | | | $ | 0 | | | $ | 0 | | | $ | 1,401 | | | $ | 1,401 | | | | 0.10 | % |
| 33 | | TE | | Rate TRF | | | 1,519,955 | | | | 0.0000 | | | | 0.0000 | | | | 0.0257 | | | | 0.0257 | | | $ | 0 | | | $ | 0 | | | $ | 391 | | | $ | 391 | | | | 0.03 | % |
| 34 | | TE | | Rate ESIP | | | | | | | 0.0000 | | | | 0.0000 | | | | 0.0000 | | | | 0.0000 | | | $ | 0 | | | $ | 0 | | | $ | 0 | | | $ | 0 | | | | 0.00 | % |
| | | | | | | | | | | | | | | | | | | | | | | | | | | | | | | | | | | | | | | | | | | | |
| 35 | | TE | | TOTAL | | | 5,388,822,306 | | | | | | | | | | | | | | | | | | | $ | 0 | | | $ | 0 | | | $ | 1,384,927 | | | $ | 1,384,927 | | | | 100.00 | % |
| | |
| NOTES |
| |
| * | | Illustrative calculation of initial Rider PIR charge, estimated to be effective January 1, 2013. As part of the Rider PIR reconciliation process, existing riders that would otherwise go to zero absent the securitization will be reflected as zero in the determination of the allocation factors. For example, under the existing recovery methodology, Rider RER1 is expected to be fully recovered by approximately June 2014 for CEI and OE. Accordingly, the prices in column E will be updated to zero at this time and the allocation factors will be calculated accordingly. |
| (D) | | Estimated kWh sales for the upcoming six-month period based on the most recent sales forecast. |
| (E)-(G) | | Estimated average tariff rates that would otherwise be in effect over the upcoming six-month period |
| (H) | | Calculation: Column E + Column F + Column G |
| (I) | | Calculation: Column D x Column E |
| (J) | | Calculation: Column D x Column F |
| (K) | | Calculation: Column D x Column G |
| (L) | | Calculation: Column I + Column J + Column K |
| (M) | | Calculation: Column L / Company Total Column L |
| | |
| Rider PIR - Rate Design | | Exhibit F - Attachment 1 |
| Illustrative Example - Initial Rider PIR Charge | | Page 3 of 3 |
| | | | | | | | | | | | | | | | | | |
Line | | Line Item Description | | CEI | | | OE | | | TE | | | TOTAL | |
| | | | | |
| 1 | | Rider PIR Revenue Requirement | | $ | 18,171,590 | | | $ | 16,654,665 | | | $ | 1,344,764 | | | $ | 36,171,020 | |
| 2 | | | | | | | | | | | | | | | | | | |
| 3 | | Allocation Ratio | | | | | | | | | | | | | | | | |
| 4 | | Rate RS | | | 54.60 | % | | | 84.82 | % | | | 22.09 | % | | | | |
| 5 | | Rate GS | | | 26.35 | % | | | 6.64 | % | | | 19.11 | % | | | | |
| 6 | | Rate GP 1 | | | 0.98 | % | | | 2.83 | % | | | 9.98 | % | | | | |
| 7 | | Rate GP 2 | | | 0.12 | % | | | | | | | | | | | | |
| 8 | | Rate GSU 1 | | | 12.67 | % | | | 1.04 | % | | | 1.08 | % | | | | |
| 9 | | Rate GSU 2 | | | 0.25 | % | | | | | | | | | | | | |
| 10 | | Rate GT 1 | | | 3.33 | % | | | 4.48 | % | | | 47.15 | % | | | | |
| 11 | | Rate GT 2 | | | 0.94 | % | | | | | | | | | | | | |
| 12 | | Rate STL | | | 0.47 | % | | | 0.03 | % | | | 0.46 | % | | | | |
| 13 | | Rate POL | | | 0.22 | % | | | 0.04 | % | | | 0.10 | % | | | | |
| 14 | | Rate TRF | | | 0.07 | % | | | 0.02 | % | | | 0.03 | % | | | | |
| 15 | | Rate ESIP | | | | | | | 0.10 | % | | | | | | | | |
| | | | | | | | | | | | | | | | | | |
| 16 | | Total Allocation Ratios | | | 100.00 | % | | | 100.00 | % | | | 100.00 | % | | | | |
| 17 | | | | | | | | | | | | | | | | | | |
| 18 | | Allocated Revenue Requirement | | | | | | | | | | | | | | | | |
| 19 | | Rate RS | | $ | 9,922,110 | | | $ | 14,127,153 | | | $ | 297,052 | | | $ | 24,346,315 | |
| 20 | | Rate GS | | $ | 4,788,858 | | | $ | 1,106,611 | | | $ | 257,030 | | | $ | 6,152,499 | |
| 21 | | Rate GP 1 | | $ | 178,032 | | | $ | 471,326 | | | $ | 134,164 | | | $ | 783,522 | |
| 22 | | Rate GP 2 | | $ | 21,439 | | | | | | | | | | | $ | 21,439 | |
| 23 | | Rate GSU 1 | | $ | 2,301,801 | | | $ | 173,066 | | | $ | 14,492 | | | $ | 2,489,359 | |
| 24 | | Rate GSU 2 | | $ | 45,613 | | | | | | | | | | | $ | 45,613 | |
| 25 | | Rate GT 1 | | $ | 605,917 | | | $ | 746,000 | | | $ | 634,085 | | | $ | 1,986,002 | |
| 26 | | Rate GT 2 | | $ | 170,137 | | | | | | | | | | | $ | 170,137 | |
| 27 | | Rate STL | | $ | 85,744 | | | $ | 5,016 | | | $ | 6,202 | | | $ | 96,963 | |
| 28 | | Rate POL | | $ | 39,732 | | | $ | 5,970 | | | $ | 1,360 | | | $ | 47,063 | |
| 29 | | Rate TRF | | $ | 12,207 | | | $ | 2,776 | | | $ | 379 | | | $ | 15,362 | |
| 30 | | Rate ESIP | | | | | | $ | 16,748 | | | | | | | $ | 16,748 | |
| | | | | | | | | | | | | | | | | | |
| 31 | | Total Revenue Requirement | | $ | 18,171,590 | | | $ | 16,654,665 | | | $ | 1,344,764 | | | $ | 36,171,020 | |
| 32 | | | | | | | | | | | | | | | | | | |
| 33 | | Estimated kWh Sales | | | | | | | | | | | | | | | | |
| 34 | | Rate RS | | | 2,576,378,511 | | | | 4,417,606,731 | | | | 1,190,363,084 | | | | 8,184,348,326 | |
| 35 | | Rate GS | | | 3,529,472,016 | | | | 3,322,756,199 | | | | 1,029,986,844 | | | | 7,882,215,059 | |
| 36 | | Rate GP 1 | | | 134,859,708 | | | | 1,415,224,337 | | | | 537,628,374 | | | | 2,087,712,420 | |
| 37 | | Rate GP 2 | | | 69,431,894 | | | | | | | | | | | | 69,431,894 | |
| 38 | | Rate GSU 1 | | | 1,781,056,126 | | | | 519,654,272 | | | | 58,074,478 | | | | 2,358,784,875 | |
| 39 | | Rate GSU 2 | | | 147,722,702 | | | | | | | | | | | | 147,722,702 | |
| 40 | | Rate GT 1 | | | 469,488,715 | | | | 2,239,971,058 | | | | 2,540,943,349 | | | | 5,250,403,122 | |
| 41 | | Rate GT 2 | | | 551,005,295 | | | | | | | | | | | | 551,005,295 | |
| 42 | | Rate STL | | | 63,194,628 | | | | 15,062,508 | | | | 24,854,471 | | | | 103,111,607 | |
| 43 | | Rate POL | | | 29,283,302 | | | | 17,925,372 | | | | 5,451,752 | | | | 52,660,425 | |
| 44 | | Rate TRF | | | 8,996,539 | | | | 8,335,177 | | | | 1,519,955 | | | | 18,851,671 | |
| 45 | | Rate ESIP | | | | | | | 50,286,811 | | | | | | | | 50,286,811 | |
| | | | | | | | | | | | | | | | | | |
| 46 | | Total Estimated kWh Sales | | | 9,360,889,437 | | | | 12,006,822,464 | | | | 5,388,822,306 | | | | 26,756,534,207 | |
| 47 | | | | | | | | | | | | | | | | | | |
| 48 | | Rider PIR Rate (¢/kWh) | | | | | | | | | | | | | | | | |
| 49 | | Rate RS | | | 0.3851 | | | | 0.3198 | | | | 0.0250 | | | | | |
| 50 | | Rate GS | | | 0.1357 | | | | 0.0333 | | | | 0.0250 | | | | | |
| 51 | | Rate GP 1 | | | 0.1320 | | | | 0.0333 | | | | 0.0250 | | | | | |
| 52 | | Rate GP 2 | | | 0.0309 | | | | | | | | | | | | | |
| 53 | | Rate GSU 1 | | | 0.1292 | | | | 0.0333 | | | | 0.0250 | | | | | |
| 54 | | Rate GSU 2 | | | 0.0309 | | | | | | | | | | | | | |
| 55 | | Rate GT 1 | | | 0.1291 | | | | 0.0333 | | | | 0.0250 | | | | | |
| 56 | | Rate GT 2 | | | 0.0309 | | | | | | | | | | | | | |
| 57 | | Rate STL | | | 0.1357 | | | | 0.0333 | | | | 0.0250 | | | | | |
| 58 | | Rate POL | | | 0.1357 | | | | 0.0333 | | | | 0.0250 | | | | | |
| 59 | | Rate TRF | | | 0.1357 | | | | 0.0333 | | | | 0.0250 | | | | | |
| 60 | | Rate ESIP | | | | | | | 0.0333 | | | | | | | | | |
| | |
| NOTES |
| |
| 1 | | Total amount to be billed under Rider PIR for the upcoming 6 months - Page 1, Line 48 |
| 3-16 | | Allocation ratios based on estimated revenue to be billed under existing Riders RER1, DGC, and DFC - Page 2, Column M |
| 18-31 | | Calculation: Rider PIR Revenue Requirement x Allocation Ratio |
| 33-46 | | Estimated kWh sales for the upcoming 6 months |
| 48-60 | | Calculation: Allocated Revenue Requirement x 100 / Estimated kWh Sales |
Exhibit G
CEI - Page 1 of 24
The Cleveland Electric Illuminating Company
Case No. 12-1465-EL-ATS
Estimated Typical Bills - Comparison (Q2 2012 vs. Q2 2012 w/ Securitization)
| | | | | | | | | | | | | | | | | | | | | | | | |
Bill Data | |
Line No. | | Level of
Demand
(kW)
(A) | | | Level of
Usage
(kWH)
(B) | | | Current
Winter Bill
($)
(C) | | | Proposed
Winter Bill
($)
(D) | | | Dollar
Increase
($)
(E) | | | Percent
Increase
(%)
(E) | |
Residential Service - Standard (Rate RS) | | | | | | | | | |
1 | | | 0 | | | | 250 | | | $ | 33.94 | | | $ | 33.82 | | | $ | (0.11 | ) | | | -0.3 | % |
2 | | | 0 | | | | 500 | | | $ | 63.84 | | | $ | 63.61 | | | $ | (0.23 | ) | | | -0.4 | % |
3 | | | 0 | | | | 750 | | | $ | 93.74 | | | $ | 93.41 | | | $ | (0.34 | ) | | | -0.4 | % |
4 | | | 0 | | | | 1,000 | | | $ | 123.65 | | | $ | 123.20 | | | $ | (0.45 | ) | | | -0.4 | % |
5 | | | 0 | | | | 1,250 | | | $ | 153.55 | | | $ | 152.99 | | | $ | (0.56 | ) | | | -0.4 | % |
6 | | | 0 | | | | 1,500 | | | $ | 183.46 | | | $ | 182.78 | | | $ | (0.68 | ) | | | -0.4 | % |
7 | | | 0 | | | | 2,000 | | | $ | 243.27 | | | $ | 242.36 | | | $ | (0.90 | ) | | | -0.4 | % |
8 | | | 0 | | | | 2,500 | | | $ | 302.84 | | | $ | 301.71 | | | $ | (1.13 | ) | | | -0.4 | % |
9 | | | 0 | | | | 3,000 | | | $ | 362.42 | | | $ | 361.07 | | | $ | (1.36 | ) | | | -0.4 | % |
10 | | | 0 | | | | 3,500 | | | $ | 422.00 | | | $ | 420.42 | | | $ | (1.58 | ) | | | -0.4 | % |
11 | | | 0 | | | | 4,000 | | | $ | 481.58 | | | $ | 479.77 | | | $ | (1.81 | ) | | | -0.4 | % |
12 | | | 0 | | | | 4,500 | | | $ | 541.16 | | | $ | 539.12 | | | $ | (2.03 | ) | | | -0.4 | % |
13 | | | 0 | | | | 5,000 | | | $ | 600.74 | | | $ | 598.48 | | | $ | (2.26 | ) | | | -0.4 | % |
14 | | | 0 | | | | 5,500 | | | $ | 660.31 | | | $ | 657.83 | | | $ | (2.49 | ) | | | -0.4 | % |
15 | | | 0 | | | | 6,000 | | | $ | 719.89 | | | $ | 717.18 | | | $ | (2.71 | ) | | | -0.4 | % |
16 | | | 0 | | | | 6,500 | | | $ | 779.47 | | | $ | 776.53 | | | $ | (2.94 | ) | | | -0.4 | % |
17 | | | 0 | | | | 7,000 | | | $ | 839.05 | | | $ | 835.88 | | | $ | (3.16 | ) | | | -0.4 | % |
18 | | | 0 | | | | 7,500 | | | $ | 898.63 | | | $ | 895.24 | | | $ | (3.39 | ) | | | -0.4 | % |
19 | | | 0 | | | | 8,000 | | | $ | 958.20 | | | $ | 954.59 | | | $ | (3.62 | ) | | | -0.4 | % |
20 | | | 0 | | | | 8,500 | | | $ | 1,017.78 | | | $ | 1,013.94 | | | $ | (3.84 | ) | | | -0.4 | % |
21 | | | 0 | | | | 9,000 | | | $ | 1,077.36 | | | $ | 1,073.29 | | | $ | (4.07 | ) | | | -0.4 | % |
22 | | | 0 | | | | 9,500 | | | $ | 1,136.94 | | | $ | 1,132.64 | | | $ | (4.29 | ) | | | -0.4 | % |
23 | | | 0 | | | | 10,000 | | | $ | 1,196.52 | | | $ | 1,192.00 | | | $ | (4.52 | ) | | | -0.4 | % |
24 | | | 0 | | | | 10,500 | | | $ | 1,256.09 | | | $ | 1,251.35 | | | $ | (4.75 | ) | | | -0.4 | % |
25 | | | 0 | | | | 11,000 | | | $ | 1,315.67 | | | $ | 1,310.70 | | | $ | (4.97 | ) | | | -0.4 | % |
26 | | | 0 | | | | 11,500 | | | $ | 1,375.25 | | | $ | 1,370.05 | | | $ | (5.20 | ) | | | -0.4 | % |
27 | | | 0 | | | | 12,000 | | | $ | 1,434.83 | | | $ | 1,429.41 | | | $ | (5.42 | ) | | | -0.4 | % |
28 | | | 0 | | | | 12,500 | | | $ | 1,494.41 | | | $ | 1,488.76 | | | $ | (5.65 | ) | | | -0.4 | % |
29 | | | 0 | | | | 13,000 | | | $ | 1,553.99 | | | $ | 1,548.11 | | | $ | (5.88 | ) | | | -0.4 | % |
30 | | | 0 | | | | 13,500 | | | $ | 1,613.56 | | | $ | 1,607.46 | | | $ | (6.10 | ) | | | -0.4 | % |
31 | | | 0 | | | | 14,000 | | | $ | 1,673.14 | | | $ | 1,666.81 | | | $ | (6.33 | ) | | | -0.4 | % |
32 | | | 0 | | | | 14,500 | | | $ | 1,732.72 | | | $ | 1,726.17 | | | $ | (6.55 | ) | | | -0.4 | % |
33 | | | 0 | | | | 15,000 | | | $ | 1,792.30 | | | $ | 1,785.52 | | | $ | (6.78 | ) | | | -0.4 | % |
34 | | | 0 | | | | 15,500 | | | $ | 1,851.60 | | | $ | 1,844.59 | | | $ | (7.01 | ) | | | -0.4 | % |
35 | | | 0 | | | | 16,000 | | | $ | 1,910.89 | | | $ | 1,903.66 | | | $ | (7.23 | ) | | | -0.4 | % |
36 | | | 0 | | | | 16,500 | | | $ | 1,970.19 | | | $ | 1,962.73 | | | $ | (7.46 | ) | | | -0.4 | % |
37 | | | 0 | | | | 17,000 | | | $ | 2,029.49 | | | $ | 2,021.80 | | | $ | (7.68 | ) | | | -0.4 | % |
38 | | | 0 | | | | 17,500 | | | $ | 2,088.79 | | | $ | 2,080.88 | | | $ | (7.91 | ) | | | -0.4 | % |
Exhibit G
CEI - Page 2 of 24
The Cleveland Electric Illuminating Company
Case No. 12-1465-EL-ATS
Estimated Typical Bills - Comparison (Q2 2012 vs. Q2 2012 w/ Securitization)
| | | | | | | | | | | | | | | | | | | | | | | | |
Bill Data | |
Line No. | | Level of
Demand
(kW)
(A) | | | Level of
Usage
(kWH)
(B) | | | Current
Winter Bill
($)
(C) | | | Proposed
Winter Bill
($)
(D) | | | Dollar
Increase
($)
(E) | | | Percent
Increase
(%)
(E) | |
Residential Service - Electric Heating (Rate RS) | | | | | | | | | | | | | |
1 | | | 0 | | | | 250 | | | $ | 25.29 | | | $ | 25.17 | | | $ | (0.11 | ) | | | -0.4 | % |
2 | | | 0 | | | | 500 | | | $ | 46.54 | | | $ | 46.31 | | | $ | (0.23 | ) | | | -0.5 | % |
3 | | | 0 | | | | 750 | | | $ | 58.79 | | | $ | 58.46 | | | $ | (0.34 | ) | | | -0.6 | % |
4 | | | 0 | | | | 1,000 | | | $ | 71.05 | | | $ | 70.60 | | | $ | (0.45 | ) | | | -0.6 | % |
5 | | | 0 | | | | 1,250 | | | $ | 83.30 | | | $ | 82.74 | | | $ | (0.56 | ) | | | -0.7 | % |
6 | | | 0 | | | | 1,500 | | | $ | 95.56 | | | $ | 94.88 | | | $ | (0.68 | ) | | | -0.7 | % |
7 | | | 0 | | | | 2,000 | | | $ | 120.07 | | | $ | 119.16 | | | $ | (0.90 | ) | | | -0.8 | % |
8 | | | 0 | | | | 2,500 | | | $ | 144.34 | | | $ | 143.21 | | | $ | (1.13 | ) | | | -0.8 | % |
9 | | | 0 | | | | 3,000 | | | $ | 168.62 | | | $ | 167.27 | | | $ | (1.36 | ) | | | -0.8 | % |
10 | | | 0 | | | | 3,500 | | | $ | 192.90 | | | $ | 191.32 | | | $ | (1.58 | ) | | | -0.8 | % |
11 | | | 0 | | | | 4,000 | | | $ | 217.18 | | | $ | 215.37 | | | $ | (1.81 | ) | | | -0.8 | % |
12 | | | 0 | | | | 4,500 | | | $ | 241.46 | | | $ | 239.42 | | | $ | (2.03 | ) | | | -0.8 | % |
13 | | | 0 | | | | 5,000 | | | $ | 265.74 | | | $ | 263.48 | | | $ | (2.26 | ) | | | -0.9 | % |
14 | | | 0 | | | | 5,500 | | | $ | 290.01 | | | $ | 287.53 | | | $ | (2.49 | ) | | | -0.9 | % |
15 | | | 0 | | | | 6,000 | | | $ | 314.29 | | | $ | 311.58 | | | $ | (2.71 | ) | | | -0.9 | % |
16 | | | 0 | | | | 6,500 | | | $ | 338.57 | | | $ | 335.63 | | | $ | (2.94 | ) | | | -0.9 | % |
17 | | | 0 | | | | 7,000 | | | $ | 362.85 | | | $ | 359.68 | | | $ | (3.16 | ) | | | -0.9 | % |
18 | | | 0 | | | | 7,500 | | | $ | 387.13 | | | $ | 383.74 | | | $ | (3.39 | ) | | | -0.9 | % |
19 | | | 0 | | | | 8,000 | | | $ | 411.40 | | | $ | 407.79 | | | $ | (3.62 | ) | | | -0.9 | % |
20 | | | 0 | | | | 8,500 | | | $ | 435.68 | | | $ | 431.84 | | | $ | (3.84 | ) | | | -0.9 | % |
21 | | | 0 | | | | 9,000 | | | $ | 459.96 | | | $ | 455.89 | | | $ | (4.07 | ) | | | -0.9 | % |
22 | | | 0 | | | | 9,500 | | | $ | 484.24 | | | $ | 479.94 | | | $ | (4.29 | ) | | | -0.9 | % |
23 | | | 0 | | | | 10,000 | | | $ | 508.52 | | | $ | 504.00 | | | $ | (4.52 | ) | | | -0.9 | % |
24 | | | 0 | | | | 10,500 | | | $ | 532.79 | | | $ | 528.05 | | | $ | (4.75 | ) | | | -0.9 | % |
25 | | | 0 | | | | 11,000 | | | $ | 557.07 | | | $ | 552.10 | | | $ | (4.97 | ) | | | -0.9 | % |
26 | | | 0 | | | | 11,500 | | | $ | 581.35 | | | $ | 576.15 | | | $ | (5.20 | ) | | | -0.9 | % |
27 | | | 0 | | | | 12,000 | | | $ | 605.63 | | | $ | 600.21 | | | $ | (5.42 | ) | | | -0.9 | % |
28 | | | 0 | | | | 12,500 | | | $ | 629.91 | | | $ | 624.26 | | | $ | (5.65 | ) | | | -0.9 | % |
29 | | | 0 | | | | 13,000 | | | $ | 654.19 | | | $ | 648.31 | | | $ | (5.88 | ) | | | -0.9 | % |
30 | | | 0 | | | | 13,500 | | | $ | 678.46 | | | $ | 672.36 | | | $ | (6.10 | ) | | | -0.9 | % |
31 | | | 0 | | | | 14,000 | | | $ | 702.74 | | | $ | 696.41 | | | $ | (6.33 | ) | | | -0.9 | % |
32 | | | 0 | | | | 14,500 | | | $ | 727.02 | | | $ | 720.47 | | | $ | (6.55 | ) | | | -0.9 | % |
33 | | | 0 | | | | 15,000 | | | $ | 751.30 | | | $ | 744.52 | | | $ | (6.78 | ) | | | -0.9 | % |
34 | | | 0 | | | | 15,500 | | | $ | 775.30 | | | $ | 768.29 | | | $ | (7.01 | ) | | | -0.9 | % |
35 | | | 0 | | | | 16,000 | | | $ | 799.29 | | | $ | 792.06 | | | $ | (7.23 | ) | | | -0.9 | % |
36 | | | 0 | | | | 16,500 | | | $ | 823.29 | | | $ | 815.83 | | | $ | (7.46 | ) | | | -0.9 | % |
37 | | | 0 | | | | 17,000 | | | $ | 847.29 | | | $ | 839.60 | | | $ | (7.68 | ) | | | -0.9 | % |
38 | | | 0 | | | | 17,500 | | | $ | 871.29 | | | $ | 863.38 | | | $ | (7.91 | ) | | | -0.9 | % |
Exhibit G
CEI - Page 3 of 24
The Cleveland Electric Illuminating Company
Case No. 12-1465-EL-ATS
Estimated Typical Bills - Comparison (Q2 2012 vs. Q2 2012 w/ Securitization)
| | | | | | | | | | | | | | | | | | | | | | | | |
Bill Data | |
Line No. | | Level of
Demand
(kW)
(A) | | | Level of
Usage
(kWH)
(B) | | | Current
Winter Bill
($)
(C) | | | Proposed
Winter Bill
($)
(D) | | | Dollar
Increase
($)
(E) | | | Percent
Increase
(%)
(E) | |
Residential Service - Water Heating (Rate RS) | | | | | | | | | | | | | |
1 | | | 0 | | | | 250 | | | $ | 33.94 | | | $ | 33.82 | | | $ | (0.11 | ) | | | -0.3 | % |
2 | | | 0 | | | | 500 | | | $ | 63.84 | | | $ | 63.61 | | | $ | (0.23 | ) | | | -0.4 | % |
3 | | | 0 | | | | 750 | | | $ | 88.24 | | | $ | 87.91 | | | $ | (0.34 | ) | | | -0.4 | % |
4 | | | 0 | | | | 1,000 | | | $ | 112.65 | | | $ | 112.20 | | | $ | (0.45 | ) | | | -0.4 | % |
5 | | | 0 | | | | 1,250 | | | $ | 137.05 | | | $ | 136.49 | | | $ | (0.56 | ) | | | -0.4 | % |
6 | | | 0 | | | | 1,500 | | | $ | 161.46 | | | $ | 160.78 | | | $ | (0.68 | ) | | | -0.4 | % |
7 | | | 0 | | | | 2,000 | | | $ | 210.27 | | | $ | 209.36 | | | $ | (0.90 | ) | | | -0.4 | % |
8 | | | 0 | | | | 2,500 | | | $ | 258.84 | | | $ | 257.71 | | | $ | (1.13 | ) | | | -0.4 | % |
9 | | | 0 | | | | 3,000 | | | $ | 307.42 | | | $ | 306.07 | | | $ | (1.36 | ) | | | -0.4 | % |
10 | | | 0 | | | | 3,500 | | | $ | 356.00 | | | $ | 354.42 | | | $ | (1.58 | ) | | | -0.4 | % |
11 | | | 0 | | | | 4,000 | | | $ | 404.58 | | | $ | 402.77 | | | $ | (1.81 | ) | | | -0.4 | % |
12 | | | 0 | | | | 4,500 | | | $ | 453.16 | | | $ | 451.12 | | | $ | (2.03 | ) | | | -0.4 | % |
13 | | | 0 | | | | 5,000 | | | $ | 501.74 | | | $ | 499.48 | | | $ | (2.26 | ) | | | -0.5 | % |
14 | | | 0 | | | | 5,500 | | | $ | 550.31 | | | $ | 547.83 | | | $ | (2.49 | ) | | | -0.5 | % |
15 | | | 0 | | | | 6,000 | | | $ | 598.89 | | | $ | 596.18 | | | $ | (2.71 | ) | | | -0.5 | % |
16 | | | 0 | | | | 6,500 | | | $ | 647.47 | | | $ | 644.53 | | | $ | (2.94 | ) | | | -0.5 | % |
17 | | | 0 | | | | 7,000 | | | $ | 696.05 | | | $ | 692.88 | | | $ | (3.16 | ) | | | -0.5 | % |
18 | | | 0 | | | | 7,500 | | | $ | 744.63 | | | $ | 741.24 | | | $ | (3.39 | ) | | | -0.5 | % |
19 | | | 0 | | | | 8,000 | | | $ | 793.20 | | | $ | 789.59 | | | $ | (3.62 | ) | | | -0.5 | % |
20 | | | 0 | | | | 8,500 | | | $ | 841.78 | | | $ | 837.94 | | | $ | (3.84 | ) | | | -0.5 | % |
21 | | | 0 | | | | 9,000 | | | $ | 890.36 | | | $ | 886.29 | | | $ | (4.07 | ) | | | -0.5 | % |
22 | | | 0 | | | | 9,500 | | | $ | 938.94 | | | $ | 934.64 | | | $ | (4.29 | ) | | | -0.5 | % |
23 | | | 0 | | | | 10,000 | | | $ | 987.52 | | | $ | 983.00 | | | $ | (4.52 | ) | | | -0.5 | % |
24 | | | 0 | | | | 10,500 | | | $ | 1,036.09 | | | $ | 1,031.35 | | | $ | (4.75 | ) | | | -0.5 | % |
25 | | | 0 | | | | 11,000 | | | $ | 1,084.67 | | | $ | 1,079.70 | | | $ | (4.97 | ) | | | -0.5 | % |
26 | | | 0 | | | | 11,500 | | | $ | 1,133.25 | | | $ | 1,128.05 | | | $ | (5.20 | ) | | | -0.5 | % |
27 | | | 0 | | | | 12,000 | | | $ | 1,181.83 | | | $ | 1,176.41 | | | $ | (5.42 | ) | | | -0.5 | % |
28 | | | 0 | | | | 12,500 | | | $ | 1,230.41 | | | $ | 1,224.76 | | | $ | (5.65 | ) | | | -0.5 | % |
29 | | | 0 | | | | 13,000 | | | $ | 1,278.99 | | | $ | 1,273.11 | | | $ | (5.88 | ) | | | -0.5 | % |
30 | | | 0 | | | | 13,500 | | | $ | 1,327.56 | | | $ | 1,321.46 | | | $ | (6.10 | ) | | | -0.5 | % |
31 | | | 0 | | | | 14,000 | | | $ | 1,376.14 | | | $ | 1,369.81 | | | $ | (6.33 | ) | | | -0.5 | % |
32 | | | 0 | | | | 14,500 | | | $ | 1,424.72 | | | $ | 1,418.17 | | | $ | (6.55 | ) | | | -0.5 | % |
33 | | | 0 | | | | 15,000 | | | $ | 1,473.30 | | | $ | 1,466.52 | | | $ | (6.78 | ) | | | -0.5 | % |
34 | | | 0 | | | | 15,500 | | | $ | 1,521.60 | | | $ | 1,514.59 | | | $ | (7.01 | ) | | | -0.5 | % |
35 | | | 0 | | | | 16,000 | | | $ | 1,569.89 | | | $ | 1,562.66 | | | $ | (7.23 | ) | | | -0.5 | % |
36 | | | 0 | | | | 16,500 | | | $ | 1,618.19 | | | $ | 1,610.73 | | | $ | (7.46 | ) | | | -0.5 | % |
37 | | | 0 | | | | 17,000 | | | $ | 1,666.49 | | | $ | 1,658.80 | | | $ | (7.68 | ) | | | -0.5 | % |
38 | | | 0 | | | | 17,500 | | | $ | 1,714.79 | | | $ | 1,706.88 | | | $ | (7.91 | ) | | | -0.5 | % |
Exhibit G
CEI - Page 4 of 24
The Cleveland Electric Illuminating Company
Case No. 12-1465-EL-ATS
Estimated Typical Bills - Comparison (Q2 2012 vs. Q2 2012 w/ Securitization)
| | | | | | | | | | | | | | | | | | | | | | | | |
Bill Data | |
Line No. | | Level of
Demand
(kW)
(A) | | | Level of
Usage
(kWH)
(B) | | | Current
Summer Bill
($)
(C) | | | Proposed
Summer Bill
($)
(D) | | | Dollar
Increase
($)
(E) | | | Percent
Increase
(%)
(E) | |
Residential Service - Standard (Rate RS) | | | | | | | | | | | | | |
1 | | | 0 | | | | 250 | | | $ | 36.22 | | | $ | 36.11 | | | $ | (0.11 | ) | | | -0.3 | % |
2 | | | 0 | | | | 500 | | | $ | 68.41 | | | $ | 68.19 | | | $ | (0.23 | ) | | | -0.3 | % |
3 | | | 0 | | | | 750 | | | $ | 100.60 | | | $ | 100.27 | | | $ | (0.34 | ) | | | -0.3 | % |
4 | | | 0 | | | | 1,000 | | | $ | 132.80 | | | $ | 132.34 | | | $ | (0.45 | ) | | | -0.3 | % |
5 | | | 0 | | | | 1,250 | | | $ | 164.99 | | | $ | 164.42 | | | $ | (0.56 | ) | | | -0.3 | % |
6 | | | 0 | | | | 1,500 | | | $ | 197.18 | | | $ | 196.50 | | | $ | (0.68 | ) | | | -0.3 | % |
7 | | | 0 | | | | 2,000 | | | $ | 261.56 | | | $ | 260.66 | | | $ | (0.90 | ) | | | -0.3 | % |
8 | | | 0 | | | | 2,500 | | | $ | 325.71 | | | $ | 324.58 | | | $ | (1.13 | ) | | | -0.3 | % |
9 | | | 0 | | | | 3,000 | | | $ | 389.86 | | | $ | 388.51 | | | $ | (1.36 | ) | | | -0.3 | % |
10 | | | 0 | | | | 3,500 | | | $ | 454.02 | | | $ | 452.43 | | | $ | (1.58 | ) | | | -0.3 | % |
11 | | | 0 | | | | 4,000 | | | $ | 518.17 | | | $ | 516.36 | | | $ | (1.81 | ) | | | -0.3 | % |
12 | | | 0 | | | | 4,500 | | | $ | 582.32 | | | $ | 580.28 | | | $ | (2.03 | ) | | | -0.3 | % |
13 | | | 0 | | | | 5,000 | | | $ | 646.47 | | | $ | 644.21 | | | $ | (2.26 | ) | | | -0.3 | % |
14 | | | 0 | | | | 5,500 | | | $ | 710.62 | | | $ | 708.14 | | | $ | (2.49 | ) | | | -0.3 | % |
15 | | | 0 | | | | 6,000 | | | $ | 774.77 | | | $ | 772.06 | | | $ | (2.71 | ) | | | -0.4 | % |
16 | | | 0 | | | | 6,500 | | | $ | 838.93 | | | $ | 835.99 | | | $ | (2.94 | ) | | | -0.4 | % |
17 | | | 0 | | | | 7,000 | | | $ | 903.08 | | | $ | 899.91 | | | $ | (3.16 | ) | | | -0.4 | % |
18 | | | 0 | | | | 7,500 | | | $ | 967.23 | | | $ | 963.84 | | | $ | (3.39 | ) | | | -0.4 | % |
19 | | | 0 | | | | 8,000 | | | $ | 1,031.38 | | | $ | 1,027.76 | | | $ | (3.62 | ) | | | -0.4 | % |
20 | | | 0 | | | | 8,500 | | | $ | 1,095.53 | | | $ | 1,091.69 | | | $ | (3.84 | ) | | | -0.4 | % |
21 | | | 0 | | | | 9,000 | | | $ | 1,159.68 | | | $ | 1,155.62 | | | $ | (4.07 | ) | | | -0.4 | % |
22 | | | 0 | | | | 9,500 | | | $ | 1,223.84 | | | $ | 1,219.54 | | | $ | (4.29 | ) | | | -0.4 | % |
23 | | | 0 | | | | 10,000 | | | $ | 1,287.99 | | | $ | 1,283.47 | | | $ | (4.52 | ) | | | -0.4 | % |
24 | | | 0 | | | | 10,500 | | | $ | 1,352.14 | | | $ | 1,347.39 | | | $ | (4.75 | ) | | | -0.4 | % |
25 | | | 0 | | | | 11,000 | | | $ | 1,416.29 | | | $ | 1,411.32 | | | $ | (4.97 | ) | | | -0.4 | % |
26 | | | 0 | | | | 11,500 | | | $ | 1,480.44 | | | $ | 1,475.24 | | | $ | (5.20 | ) | | | -0.4 | % |
27 | | | 0 | | | | 12,000 | | | $ | 1,544.59 | | | $ | 1,539.17 | | | $ | (5.42 | ) | | | -0.4 | % |
28 | | | 0 | | | | 12,500 | | | $ | 1,608.75 | | | $ | 1,603.10 | | | $ | (5.65 | ) | | | -0.4 | % |
29 | | | 0 | | | | 13,000 | | | $ | 1,672.90 | | | $ | 1,667.02 | | | $ | (5.88 | ) | | | -0.4 | % |
30 | | | 0 | | | | 13,500 | | | $ | 1,737.05 | | | $ | 1,730.95 | | | $ | (6.10 | ) | | | -0.4 | % |
31 | | | 0 | | | | 14,000 | | | $ | 1,801.20 | | | $ | 1,794.87 | | | $ | (6.33 | ) | | | -0.4 | % |
32 | | | 0 | | | | 14,500 | | | $ | 1,865.35 | | | $ | 1,858.80 | | | $ | (6.55 | ) | | | -0.4 | % |
33 | | | 0 | | | | 15,000 | | | $ | 1,929.50 | | | $ | 1,922.72 | | | $ | (6.78 | ) | | | -0.4 | % |
34 | | | 0 | | | | 15,500 | | | $ | 1,993.37 | | | $ | 1,986.37 | | | $ | (7.01 | ) | | | -0.4 | % |
35 | | | 0 | | | | 16,000 | | | $ | 2,057.25 | | | $ | 2,050.01 | | | $ | (7.23 | ) | | | -0.4 | % |
36 | | | 0 | | | | 16,500 | | | $ | 2,121.12 | | | $ | 2,113.66 | | | $ | (7.46 | ) | | | -0.4 | % |
37 | | | 0 | | | | 17,000 | | | $ | 2,184.99 | | | $ | 2,177.30 | | | $ | (7.68 | ) | | | -0.4 | % |
38 | | | 0 | | | | 17,500 | | | $ | 2,248.86 | | | $ | 2,240.95 | | | $ | (7.91 | ) | | | -0.4 | % |
Exhibit G
CEI - Page 5 of 24
The Cleveland Electric Illuminating Company
Case No. 12-1465-EL-ATS
Estimated Typical Bills - Comparison (Q2 2012 vs. Q2 2012 w/ Securitization)
| | | | | | | | | | | | | | | | | | | | | | | | |
Bill Data | |
Line No. | | Level of
Demand
(kW)
(A) | | | Level of
Usage
(kWH)
(B) | | | Current
Summer Bill
($)
(C) | | | Proposed
Summer Bill
($)
(D) | | | Dollar
Increase
($)
(E) | | | Percent
Increase
(%)
(E) | |
Residential Service - Electric Heating (Rate RS) | | | | | | | | | | | | | |
1 | | | 0 | | | | 250 | | | $ | 36.22 | | | $ | 36.11 | | | $ | (0.11 | ) | | | -0.3 | % |
2 | | | 0 | | | | 500 | | | $ | 68.41 | | | $ | 68.19 | | | $ | (0.23 | ) | | | -0.3 | % |
3 | | | 0 | | | | 750 | | | $ | 91.60 | | | $ | 91.27 | | | $ | (0.34 | ) | | | -0.4 | % |
4 | | | 0 | | | | 1,000 | | | $ | 114.80 | | | $ | 114.34 | | | $ | (0.45 | ) | | | -0.4 | % |
5 | | | 0 | | | | 1,250 | | | $ | 137.99 | | | $ | 137.42 | | | $ | (0.56 | ) | | | -0.4 | % |
6 | | | 0 | | | | 1,500 | | | $ | 161.18 | | | $ | 160.50 | | | $ | (0.68 | ) | | | -0.4 | % |
7 | | | 0 | | | | 2,000 | | | $ | 207.56 | | | $ | 206.66 | | | $ | (0.90 | ) | | | -0.4 | % |
8 | | | 0 | | | | 2,500 | | | $ | 253.71 | | | $ | 252.58 | | | $ | (1.13 | ) | | | -0.4 | % |
9 | | | 0 | | | | 3,000 | | | $ | 299.86 | | | $ | 298.51 | | | $ | (1.36 | ) | | | -0.5 | % |
10 | | | 0 | | | | 3,500 | | | $ | 346.02 | | | $ | 344.43 | | | $ | (1.58 | ) | | | -0.5 | % |
11 | | | 0 | | | | 4,000 | | | $ | 392.17 | | | $ | 390.36 | | | $ | (1.81 | ) | | | -0.5 | % |
12 | | | 0 | | | | 4,500 | | | $ | 438.32 | | | $ | 436.28 | | | $ | (2.03 | ) | | | -0.5 | % |
13 | | | 0 | | | | 5,000 | | | $ | 484.47 | | | $ | 482.21 | | | $ | (2.26 | ) | | | -0.5 | % |
14 | | | 0 | | | | 5,500 | | | $ | 530.62 | | | $ | 528.14 | | | $ | (2.49 | ) | | | -0.5 | % |
15 | | | 0 | | | | 6,000 | | | $ | 576.77 | | | $ | 574.06 | | | $ | (2.71 | ) | | | -0.5 | % |
16 | | | 0 | | | | 6,500 | | | $ | 622.93 | | | $ | 619.99 | | | $ | (2.94 | ) | | | -0.5 | % |
17 | | | 0 | | | | 7,000 | | | $ | 669.08 | | | $ | 665.91 | | | $ | (3.16 | ) | | | -0.5 | % |
18 | | | 0 | | | | 7,500 | | | $ | 715.23 | | | $ | 711.84 | | | $ | (3.39 | ) | | | -0.5 | % |
19 | | | 0 | | | | 8,000 | | | $ | 761.38 | | | $ | 757.76 | | | $ | (3.62 | ) | | | -0.5 | % |
20 | | | 0 | | | | 8,500 | | | $ | 807.53 | | | $ | 803.69 | | | $ | (3.84 | ) | | | -0.5 | % |
21 | | | 0 | | | | 9,000 | | | $ | 853.68 | | | $ | 849.62 | | | $ | (4.07 | ) | | | -0.5 | % |
22 | | | 0 | | | | 9,500 | | | $ | 899.84 | | | $ | 895.54 | | | $ | (4.29 | ) | | | -0.5 | % |
23 | | | 0 | | | | 10,000 | | | $ | 945.99 | | | $ | 941.47 | | | $ | (4.52 | ) | | | -0.5 | % |
24 | | | 0 | | | | 10,500 | | | $ | 992.14 | | | $ | 987.39 | | | $ | (4.75 | ) | | | -0.5 | % |
25 | | | 0 | | | | 11,000 | | | $ | 1,038.29 | | | $ | 1,033.32 | | | $ | (4.97 | ) | | | -0.5 | % |
26 | | | 0 | | | | 11,500 | | | $ | 1,084.44 | | | $ | 1,079.24 | | | $ | (5.20 | ) | | | -0.5 | % |
27 | | | 0 | | | | 12,000 | | | $ | 1,130.59 | | | $ | 1,125.17 | | | $ | (5.42 | ) | | | -0.5 | % |
28 | | | 0 | | | | 12,500 | | | $ | 1,176.75 | | | $ | 1,171.10 | | | $ | (5.65 | ) | | | -0.5 | % |
29 | | | 0 | | | | 13,000 | | | $ | 1,222.90 | | | $ | 1,217.02 | | | $ | (5.88 | ) | | | -0.5 | % |
30 | | | 0 | | | | 13,500 | | | $ | 1,269.05 | | | $ | 1,262.95 | | | $ | (6.10 | ) | | | -0.5 | % |
31 | | | 0 | | | | 14,000 | | | $ | 1,315.20 | | | $ | 1,308.87 | | | $ | (6.33 | ) | | | -0.5 | % |
32 | | | 0 | | | | 14,500 | | | $ | 1,361.35 | | | $ | 1,354.80 | | | $ | (6.55 | ) | | | -0.5 | % |
33 | | | 0 | | | | 15,000 | | | $ | 1,407.50 | | | $ | 1,400.72 | | | $ | (6.78 | ) | | | -0.5 | % |
34 | | | 0 | | | | 15,500 | | | $ | 1,453.37 | | | $ | 1,446.37 | | | $ | (7.01 | ) | | | -0.5 | % |
35 | | | 0 | | | | 16,000 | | | $ | 1,499.25 | | | $ | 1,492.01 | | | $ | (7.23 | ) | | | -0.5 | % |
36 | | | 0 | | | | 16,500 | | | $ | 1,545.12 | | | $ | 1,537.66 | | | $ | (7.46 | ) | | | -0.5 | % |
37 | | | 0 | | | | 17,000 | | | $ | 1,590.99 | | | $ | 1,583.30 | | | $ | (7.68 | ) | | | -0.5 | % |
38 | | | 0 | | | | 17,500 | | | $ | 1,636.86 | | | $ | 1,628.95 | | | $ | (7.91 | ) | | | -0.5 | % |
Exhibit G
CEI - Page 6 of 24
The Cleveland Electric Illuminating Company
Case No. 12-1465-EL-ATS
Estimated Typical Bills - Comparison (Q2 2012 vs. Q2 2012 w/ Securitization)
| | | | | | | | | | | | | | | | | | | | | | | | |
Bill Data | |
Line No. | | Level of
Demand
(kW)
(A) | | | Level of
Usage
(kWH)
(B) | | | Current
Summer Bill
($)
(C) | | | Proposed
Summer Bill
($)
(D) | | | Dollar
Increase
($)
(E) | | | Percent
Increase
(%)
(E) | |
Residential Service - Water Heating (Rate RS) | |
1 | | | 0 | | | | 250 | | | $ | 36.22 | | | $ | 36.11 | | | $ | (0.11 | ) | | | -0.3 | % |
2 | | | 0 | | | | 500 | | | $ | 68.41 | | | $ | 68.19 | | | $ | (0.23 | ) | | | -0.3 | % |
3 | | | 0 | | | | 750 | | | $ | 95.10 | | | $ | 94.77 | | | $ | (0.34 | ) | | | -0.4 | % |
4 | | | 0 | | | | 1,000 | | | $ | 121.80 | | | $ | 121.34 | | | $ | (0.45 | ) | | | -0.4 | % |
5 | | | 0 | | | | 1,250 | | | $ | 148.49 | | | $ | 147.92 | | | $ | (0.56 | ) | | | -0.4 | % |
6 | | | 0 | | | | 1,500 | | | $ | 175.18 | | | $ | 174.50 | | | $ | (0.68 | ) | | | -0.4 | % |
7 | | | 0 | | | | 2,000 | | | $ | 228.56 | | | $ | 227.66 | | | $ | (0.90 | ) | | | -0.4 | % |
8 | | | 0 | | | | 2,500 | | | $ | 281.71 | | | $ | 280.58 | | | $ | (1.13 | ) | | | -0.4 | % |
9 | | | 0 | | | | 3,000 | | | $ | 334.86 | | | $ | 333.51 | | | $ | (1.36 | ) | | | -0.4 | % |
10 | | | 0 | | | | 3,500 | | | $ | 388.02 | | | $ | 386.43 | | | $ | (1.58 | ) | | | -0.4 | % |
11 | | | 0 | | | | 4,000 | | | $ | 441.17 | | | $ | 439.36 | | | $ | (1.81 | ) | | | -0.4 | % |
12 | | | 0 | | | | 4,500 | | | $ | 494.32 | | | $ | 492.28 | | | $ | (2.03 | ) | | | -0.4 | % |
13 | | | 0 | | | | 5,000 | | | $ | 547.47 | | | $ | 545.21 | | | $ | (2.26 | ) | | | -0.4 | % |
14 | | | 0 | | | | 5,500 | | | $ | 600.62 | | | $ | 598.14 | | | $ | (2.49 | ) | | | -0.4 | % |
15 | | | 0 | | | | 6,000 | | | $ | 653.77 | | | $ | 651.06 | | | $ | (2.71 | ) | | | -0.4 | % |
16 | | | 0 | | | | 6,500 | | | $ | 706.93 | | | $ | 703.99 | | | $ | (2.94 | ) | | | -0.4 | % |
17 | | | 0 | | | | 7,000 | | | $ | 760.08 | | | $ | 756.91 | | | $ | (3.16 | ) | | | -0.4 | % |
18 | | | 0 | | | | 7,500 | | | $ | 813.23 | | | $ | 809.84 | | | $ | (3.39 | ) | | | -0.4 | % |
19 | | | 0 | | | | 8,000 | | | $ | 866.38 | | | $ | 862.76 | | | $ | (3.62 | ) | | | -0.4 | % |
20 | | | 0 | | | | 8,500 | | | $ | 919.53 | | | $ | 915.69 | | | $ | (3.84 | ) | | | -0.4 | % |
21 | | | 0 | | | | 9,000 | | | $ | 972.68 | | | $ | 968.62 | | | $ | (4.07 | ) | | | -0.4 | % |
22 | | | 0 | | | | 9,500 | | | $ | 1,025.84 | | | $ | 1,021.54 | | | $ | (4.29 | ) | | | -0.4 | % |
23 | | | 0 | | | | 10,000 | | | $ | 1,078.99 | | | $ | 1,074.47 | | | $ | (4.52 | ) | | | -0.4 | % |
24 | | | 0 | | | | 10,500 | | | $ | 1,132.14 | | | $ | 1,127.39 | | | $ | (4.75 | ) | | | -0.4 | % |
25 | | | 0 | | | | 11,000 | | | $ | 1,185.29 | | | $ | 1,180.32 | | | $ | (4.97 | ) | | | -0.4 | % |
26 | | | 0 | | | | 11,500 | | | $ | 1,238.44 | | | $ | 1,233.24 | | | $ | (5.20 | ) | | | -0.4 | % |
27 | | | 0 | | | | 12,000 | | | $ | 1,291.59 | | | $ | 1,286.17 | | | $ | (5.42 | ) | | | -0.4 | % |
28 | | | 0 | | | | 12,500 | | | $ | 1,344.75 | | | $ | 1,339.10 | | | $ | (5.65 | ) | | | -0.4 | % |
29 | | | 0 | | | | 13,000 | | | $ | 1,397.90 | | | $ | 1,392.02 | | | $ | (5.88 | ) | | | -0.4 | % |
30 | | | 0 | | | | 13,500 | | | $ | 1,451.05 | | | $ | 1,444.95 | | | $ | (6.10 | ) | | | -0.4 | % |
31 | | | 0 | | | | 14,000 | | | $ | 1,504.20 | | | $ | 1,497.87 | | | $ | (6.33 | ) | | | -0.4 | % |
32 | | | 0 | | | | 14,500 | | | $ | 1,557.35 | | | $ | 1,550.80 | | | $ | (6.55 | ) | | | -0.4 | % |
33 | | | 0 | | | | 15,000 | | | $ | 1,610.50 | | | $ | 1,603.72 | | | $ | (6.78 | ) | | | -0.4 | % |
34 | | | 0 | | | | 15,500 | | | $ | 1,663.37 | | | $ | 1,656.37 | | | $ | (7.01 | ) | | | -0.4 | % |
35 | | | 0 | | | | 16,000 | | | $ | 1,716.25 | | | $ | 1,709.01 | | | $ | (7.23 | ) | | | -0.4 | % |
36 | | | 0 | | | | 16,500 | | | $ | 1,769.12 | | | $ | 1,761.66 | | | $ | (7.46 | ) | | | -0.4 | % |
37 | | | 0 | | | | 17,000 | | | $ | 1,821.99 | | | $ | 1,814.30 | | | $ | (7.68 | ) | | | -0.4 | % |
38 | | | 0 | | | | 17,500 | | | $ | 1,874.86 | | | $ | 1,866.95 | | | $ | (7.91 | ) | | | -0.4 | % |
Exhibit G
CEI - Page 7 of 24
The Cleveland Electric Illuminating Company
Case No. 12-1465-EL-ATS
Estimated Typical Bills - Comparison (Q2 2012 vs. Q2 2012 w/ Securitization)
| | | | | | | | | | | | | | | | | | | | | | | | |
Bill Data | |
Line No. | | Level of
Demand
(kW)
(A) | | | Level of
Usage
(kWH)
(B) | | | Current
Winter Bill
($)
(C) | | | Proposed
Winter Bill
($)
(D) | | | Dollar
Increase
(D)-(C)
(E) | | | Percent
Increase
(E)/(C)
(F) | |
General Service Secondary (Rate GS) | | | | | |
1 | | | 10 | | | | 1,000 | | | $ | 168.90 | | | $ | 168.75 | | | $ | (0.16 | ) | | | -0.1 | % |
2 | | | 10 | | | | 2,000 | | | $ | 251.37 | | | $ | 251.05 | | | $ | (0.32 | ) | | | -0.1 | % |
3 | | | 10 | | | | 3,000 | | | $ | 333.41 | | | $ | 332.94 | | | $ | (0.48 | ) | | | -0.1 | % |
4 | | | 10 | | | | 4,000 | | | $ | 415.43 | | | $ | 414.79 | | | $ | (0.64 | ) | | | -0.2 | % |
5 | | | 10 | | | | 5,000 | | | $ | 497.47 | | | $ | 496.68 | | | $ | (0.80 | ) | | | -0.2 | % |
6 | | | 10 | | | | 6,000 | | | $ | 579.49 | | | $ | 578.54 | | | $ | (0.95 | ) | | | -0.2 | % |
7 | | | 1,000 | | | | 100,000 | | | $ | 18,434.64 | | | $ | 18,418.74 | | | $ | (15.90 | ) | | | -0.1 | % |
8 | | | 1,000 | | | | 200,000 | | | $ | 26,581.28 | | | $ | 26,549.48 | | | $ | (31.80 | ) | | | -0.1 | % |
9 | | | 1,000 | | | | 300,000 | | | $ | 34,727.93 | | | $ | 34,680.23 | | | $ | (47.70 | ) | | | -0.1 | % |
10 | | | 1,000 | | | | 400,000 | | | $ | 42,874.57 | | | $ | 42,810.97 | | | $ | (63.60 | ) | | | -0.1 | % |
11 | | | 1,000 | | | | 500,000 | | | $ | 51,021.22 | | | $ | 50,941.72 | | | $ | (79.50 | ) | | | -0.2 | % |
12 | | | 1,000 | | | | 600,000 | | | $ | 59,167.87 | | | $ | 59,072.47 | | | $ | (95.40 | ) | | | -0.2 | % |
Exhibit G
CEI - Page 8 of 24
The Cleveland Electric Illuminating Company
Case No. 12-1465-EL-ATS
Estimated Typical Bills - Comparison (Q2 2012 vs. Q2 2012 w/ Securitization)
| | | | | | | | | | | | | | | | | | | | | | | | |
Bill Data | |
Line No. | | Level of
Demand
(kW)
(A) | | | Level of
Usage
(kWH)
(B) | | | Current
Winter Bill
($)
(C) | | | Proposed
Winter Bill
($)
(D) | | | Dollar
Increase
(D)-(C)
(E) | | | Percent
Increase
(E)/(C)
(F) | |
| General Service Primary (Rate GP) | | | | | |
1 | | | 500 | | | | 50,000 | | | $ | 5,571.63 | | | $ | 5,563.88 | | | $ | (7.75 | ) | | | -0.1 | % |
2 | | | 500 | | | | 100,000 | | | $ | 9,120.95 | | | $ | 9,105.45 | | | $ | (15.50 | ) | | | -0.2 | % |
3 | | | 500 | | | | 150,000 | | | $ | 12,670.27 | | | $ | 12,647.02 | | | $ | (23.25 | ) | | | -0.2 | % |
4 | | | 500 | | | | 200,000 | | | $ | 16,219.60 | | | $ | 16,188.60 | | | $ | (31.00 | ) | | | -0.2 | % |
5 | | | 500 | | | | 250,000 | | | $ | 19,768.92 | | | $ | 19,730.17 | | | $ | (38.75 | ) | | | -0.2 | % |
6 | | | 500 | | | | 300,000 | | | $ | 23,318.24 | | | $ | 23,271.74 | | | $ | (46.50 | ) | | | -0.2 | % |
7 | | | 5,000 | | | | 500,000 | | | $ | 54,260.99 | | | $ | 54,183.49 | | | $ | (77.50 | ) | | | -0.1 | % |
8 | | | 5,000 | | | | 1,000,000 | | | $ | 89,285.28 | | | $ | 89,130.28 | | | $ | (155.00 | ) | | | -0.2 | % |
9 | | | 5,000 | | | | 1,500,000 | | | $ | 123,374.51 | | | $ | 123,142.01 | | | $ | (232.50 | ) | | | -0.2 | % |
10 | | | 5,000 | | | | 2,000,000 | | | $ | 157,463.74 | | | $ | 157,153.74 | | | $ | (310.00 | ) | | | -0.2 | % |
11 | | | 5,000 | | | | 2,500,000 | | | $ | 191,552.97 | | | $ | 191,165.47 | | | $ | (387.50 | ) | | | -0.2 | % |
12 | | | 5,000 | | | | 3,000,000 | | | $ | 225,642.21 | | | $ | 225,177.21 | | | $ | (465.00 | ) | | | -0.2 | % |
Exhibit G
CEI - Page 9 of 24
The Cleveland Electric Illuminating Company
Case No. 12-1465-EL-ATS
Estimated Typical Bills - Comparison (Q2 2012 vs. Q2 2012 w/ Securitization)
| | | | | | | | | | | | | | | | | | | | | | | | |
Bill Data | |
Line No. | | Level of
Demand
(kW)
(A) | | | Level of
Usage
(kWH)
(B) | | | Current
Winter Bill
($)
(C) | | | Proposed
Winter Bill
($)
(D) | | | Dollar
Increase
(D)-(C)
(E) | | | Percent
Increase
(E)/(C)
(F) | |
| General Service Subtransmission (Rate GSU) | |
1 | | | 1,000 | | | | 100,000 | | | $ | 9,226.24 | | | $ | 9,211.04 | | | $ | (15.20 | ) | | | -0.2 | % |
2 | | | 1,000 | | | | 200,000 | | | $ | 15,944.59 | | | $ | 15,914.19 | | | $ | (30.40 | ) | | | -0.2 | % |
3 | | | 1,000 | | | | 300,000 | | | $ | 22,662.93 | | | $ | 22,617.33 | | | $ | (45.60 | ) | | | -0.2 | % |
4 | | | 1,000 | | | | 400,000 | | | $ | 29,381.28 | | | $ | 29,320.48 | | | $ | (60.80 | ) | | | -0.2 | % |
5 | | | 1,000 | | | | 500,000 | | | $ | 36,099.63 | | | $ | 36,023.63 | | | $ | (76.00 | ) | | | -0.2 | % |
6 | | | 1,000 | | | | 600,000 | | | $ | 42,817.97 | | | $ | 42,726.77 | | | $ | (91.20 | ) | | | -0.2 | % |
7 | | | 10,000 | | | | 1,000,000 | | | $ | 90,068.19 | | | $ | 89,916.19 | | | $ | (152.00 | ) | | | -0.2 | % |
8 | | | 10,000 | | | | 2,000,000 | | | $ | 154,443.65 | | | $ | 154,139.65 | | | $ | (304.00 | ) | | | -0.2 | % |
9 | | | 10,000 | | | | 3,000,000 | | | $ | 218,819.12 | | | $ | 218,363.12 | | | $ | (456.00 | ) | | | -0.2 | % |
10 | | | 10,000 | | | | 4,000,000 | | | $ | 283,194.58 | | | $ | 282,586.58 | | | $ | (608.00 | ) | | | -0.2 | % |
11 | | | 10,000 | | | | 5,000,000 | | | $ | 347,570.04 | | | $ | 346,810.04 | | | $ | (760.00 | ) | | | -0.2 | % |
12 | | | 10,000 | | | | 6,000,000 | | | $ | 411,945.50 | | | $ | 411,033.50 | | | $ | (912.00 | ) | | | -0.2 | % |
Exhibit G
CEI - Page 10 of 24
The Cleveland Electric Illuminating Company
Case No. 12-1465-EL-ATS
Estimated Typical Bills - Comparison (Q2 2012 vs. Q2 2012 w/ Securitization)
| | | | | | | | | | | | | | | | | | | | | | | | |
Bill Data | |
Line No. | | Level of
Demand
(kW)
(A) | | | Level of
Usage
(kWH)
(B) | | | Current
Winter Bill
($)
(C) | | | Proposed
Winter Bill
($)
(D) | | | Dollar
Increase
(D)-(C)
(E) | | | Percent
Increase
(E)/(C)
(F) | |
| General Service Transmission (Rate GT) | |
1 | | | 2,000 | | | | 200,000 | | | $ | 25,495.84 | | | $ | 25,465.64 | | | $ | (30.20 | ) | | | -0.1 | % |
2 | | | 2,000 | | | | 400,000 | | | $ | 34,015.33 | | | $ | 33,954.93 | | | $ | (60.40 | ) | | | -0.2 | % |
3 | | | 2,000 | | | | 600,000 | | | $ | 42,534.82 | | | $ | 42,444.22 | | | $ | (90.60 | ) | | | -0.2 | % |
4 | | | 2,000 | | | | 800,000 | | | $ | 51,054.31 | | | $ | 50,933.51 | | | $ | (120.80 | ) | | | -0.2 | % |
5 | | | 2,000 | | | | 1,000,000 | | | $ | 59,104.87 | | | $ | 58,953.87 | | | $ | (151.00 | ) | | | -0.3 | % |
6 | | | 2,000 | | | | 1,200,000 | | | $ | 67,062.76 | | | $ | 66,881.56 | | | $ | (181.20 | ) | | | -0.3 | % |
7 | | | 20,000 | | | | 2,000,000 | | | $ | 248,717.33 | | | $ | 248,415.33 | | | $ | (302.00 | ) | | | -0.1 | % |
8 | | | 20,000 | | | | 4,000,000 | | | $ | 328,296.26 | | | $ | 327,692.26 | | | $ | (604.00 | ) | | | -0.2 | % |
9 | | | 20,000 | | | | 6,000,000 | | | $ | 407,875.18 | | | $ | 406,969.18 | | | $ | (906.00 | ) | | | -0.2 | % |
10 | | | 20,000 | | | | 8,000,000 | | | $ | 487,454.11 | | | $ | 486,246.11 | | | $ | (1,208.00 | ) | | | -0.2 | % |
11 | | | 20,000 | | | | 10,000,000 | | | $ | 567,033.03 | | | $ | 565,523.03 | | | $ | (1,510.00 | ) | | | -0.3 | % |
12 | | | 20,000 | | | | 12,000,000 | | | $ | 646,611.96 | | | $ | 644,799.96 | | | $ | (1,812.00 | ) | | | -0.3 | % |
Exhibit G
CEI - Page 11 of 24
The Cleveland Electric Illuminating Company
Case No. 12-1465-EL-ATS
Estimated Typical Bills - Comparison (Q2 2012 vs. Q2 2012 w/ Securitization)
| | | | | | | | | | | | | | | | | | | | | | | | |
Bill Data | |
Line No. | | Bulb Rating
(Lumens or
Watts)
(A) | | | Level of
Usage
(kWH)
(B) | | | Current
Winter Bill
($)
(C) | | | Proposed
Winter Bill
($)
(D) | | | Dollar
Increase
(D)-(C)
(E) | | | Percent
Increase
(E)/(C)
(F) | |
| Street Lighting Service (Rate STL) | |
1 | | | Company Owned - Incandescent Lighting (a) | |
2 | | | Overhead Service | | | | | | | | | | | | | |
3 | | | 1,000 | | | | 24 | | | $ | 12.00 | | | $ | 11.99 | | | $ | (0.00 | ) | | | 0.0 | % |
4 | | | 2,000 | | | | 56 | | | $ | 13.42 | | | $ | 13.41 | | | $ | (0.01 | ) | | | -0.1 | % |
5 | | | 2,500 | | | | 70 | | | $ | 14.07 | | | $ | 14.06 | | | $ | (0.01 | ) | | | -0.1 | % |
6 | | | 4,000 | | | | 126 | | | $ | 16.57 | | | $ | 16.55 | | | $ | (0.02 | ) | | | -0.1 | % |
7 | | | 6,000 | | | | 157 | | | $ | 17.94 | | | $ | 17.91 | | | $ | (0.02 | ) | | | -0.1 | % |
8 | | | 10,000 | | | | 242 | | | $ | 21.75 | | | $ | 21.71 | | | $ | (0.04 | ) | | | -0.2 | % |
9 | | | 15,000 | | | | 282 | | | $ | 23.53 | | | $ | 23.48 | | | $ | (0.04 | ) | | | -0.2 | % |
10 | | | Underground Service | |
11 | | | 1,000 | | | | 24 | | | $ | 7.16 | | | $ | 7.15 | | | $ | (0.00 | ) | | | -0.1 | % |
12 | | | 2,000 | | | | 56 | | | $ | 8.58 | | | $ | 8.57 | | | $ | (0.01 | ) | | | -0.1 | % |
13 | | | 2,500 | | | | 70 | | | $ | 9.23 | | | $ | 9.22 | | | $ | (0.01 | ) | | | -0.1 | % |
14 | | | 4,000 | | | | 126 | | | $ | 11.73 | | | $ | 11.71 | | | $ | (0.02 | ) | | | -0.2 | % |
15 | | | 6,000 | | | | 157 | | | $ | 13.10 | | | $ | 13.07 | | | $ | (0.02 | ) | | | -0.2 | % |
16 | | | 10,000 | | | | 242 | | | $ | 16.91 | | | $ | 16.87 | | | $ | (0.04 | ) | | | -0.2 | % |
17 | | | 15,000 | | | | 282 | | | $ | 18.69 | | | $ | 18.64 | | | $ | (0.04 | ) | | | -0.2 | % |
18 | | | Company Owned - Mercury Street Lighting (b) | |
19 | | | Overhead Service - Wood Pole | |
20 | | | 175 | | | | 69 | | | $ | 10.48 | | | $ | 10.47 | | | $ | (0.01 | ) | | | -0.1 | % |
21 | | | 250 | | | | 104 | | | $ | 13.46 | | | $ | 13.44 | | | $ | (0.02 | ) | | | -0.1 | % |
22 | | | 400 | | | | 158 | | | $ | 18.45 | | | $ | 18.43 | | | $ | (0.03 | ) | | | -0.1 | % |
23 | | | 1,000 | | | | 380 | | | $ | 40.49 | | | $ | 40.42 | | | $ | (0.06 | ) | | | -0.1 | % |
24 | | | Underground Service - Post Type | |
25 | | | 175 | | | | 69 | | | $ | 14.83 | | | $ | 14.82 | | | $ | (0.01 | ) | | | -0.1 | % |
26 | | | Underground Service - Pole Type | |
27 | | | 175 | | | | 69 | | | $ | 21.39 | | | $ | 21.38 | | | $ | (0.01 | ) | | | -0.1 | % |
28 | | | 250 | | | | 104 | | | $ | 25.18 | | | $ | 25.16 | | | $ | (0.02 | ) | | | -0.1 | % |
29 | | | 400 | | | | 158 | | | $ | 30.39 | | | $ | 30.37 | | | $ | (0.03 | ) | | | -0.1 | % |
30 | | | 400 | | | | 158 | | | $ | 30.64 | | | $ | 30.62 | | | $ | (0.03 | ) | | | -0.1 | % |
31 | | | 400 | | | | 316 | | | $ | 46.95 | | | $ | 46.90 | | | $ | (0.05 | ) | �� | | -0.1 | % |
32 | | | 1000 | | | | 380 | | | $ | 54.32 | | | $ | 54.25 | | | $ | (0.06 | ) | | | -0.1 | % |
Exhibit G
CEI - Page 12 of 24
The Cleveland Electric Illuminating Company
Case No. 12-1465-EL-ATS
Estimated Typical Bills - Comparison (Q2 2012 vs. Q2 2012 w/ Securitization)
| | | | | | | | | | | | | | | | | | | | | | | | |
Bill Data | |
Line No. | | Bulb Rating
(Lumens or
Watts)
(A) | | | Level of
Usage
(kWH)
(B) | | | Current
Winter Bill
($)
(C) | | | Proposed
Winter Bill
($)
(D) | | | Dollar
Increase
(D)-(C)
(E) | | | Percent
Increase
(E)/(C)
(F) | |
| Street Lighting Service (Rate STL) | |
33 | | | Company Owned - High Pressure Sodium Lighting (c) | |
34 | | | Overhead Service - Wood Pole | |
35 | | | 100 | | | | 42 | | | $ | 12.19 | | | $ | 12.18 | | | $ | (0.01 | ) | | | -0.1 | % |
36 | | | 150 | | | | 62 | | | $ | 13.71 | | | $ | 13.70 | | | $ | (0.01 | ) | | | -0.1 | % |
37 | | | 250 | | | | 105 | | | $ | 17.90 | | | $ | 17.88 | | | $ | (0.02 | ) | | | -0.1 | % |
38 | | | 400 | | | | 163 | | | $ | 22.46 | | | $ | 22.43 | | | $ | (0.03 | ) | | | -0.1 | % |
39 | | | Underground Service - Post Type | |
40 | | | 100 | | | | 42 | | | $ | 16.71 | | | $ | 16.70 | | | $ | (0.01 | ) | | | 0.0 | % |
41 | | | Underground Service - Pole Type | |
42 | | | 100 | | | | 42 | | | $ | 23.75 | | | $ | 23.74 | | | $ | (0.01 | ) | | | 0.0 | % |
43 | | | 150 | | | | 62 | | | $ | 25.52 | | | $ | 25.51 | | | $ | (0.01 | ) | | | 0.0 | % |
44 | | | 250 | | | | 105 | | | $ | 29.55 | | | $ | 29.53 | | | $ | (0.02 | ) | | | -0.1 | % |
45 | | | 250 | | | | 210 | | | $ | 46.82 | | | $ | 46.79 | | | $ | (0.03 | ) | | | -0.1 | % |
46 | | | 400 | | | | 163 | | | $ | 33.92 | | | $ | 33.89 | | | $ | (0.03 | ) | | | -0.1 | % |
47 | | | Special Architectural Pole Installations | |
48 | | | 100 | | | | 42 | | | $ | 22.18 | | | $ | 22.17 | | | $ | (0.01 | ) | | | 0.0 | % |
49 | | | 100 | | | | 42 | | | $ | 34.21 | | | $ | 34.20 | | | $ | (0.01 | ) | | | 0.0 | % |
50 | | | 150 | | | | 62 | | | $ | 24.25 | | | $ | 24.24 | | | $ | (0.01 | ) | | | 0.0 | % |
51 | | | 150 | | | | 62 | | | $ | 35.92 | | | $ | 35.91 | | | $ | (0.01 | ) | | | 0.0 | % |
52 | | | 250 | | | | 105 | | | $ | 29.13 | | | $ | 29.11 | | | $ | (0.02 | ) | | | -0.1 | % |
53 | | | 250 | | | | 105 | | | $ | 40.96 | | | $ | 40.94 | | | $ | (0.02 | ) | | | 0.0 | % |
54 | | | 400 | | | | 163 | | | $ | 33.69 | | | $ | 33.66 | | | $ | (0.03 | ) | | | -0.1 | % |
55 | | | 400 | | | | 163 | | | $ | 46.33 | | | $ | 46.30 | | | $ | (0.03 | ) | | | -0.1 | % |
56 | | | Customer Owned - All Lamp Types | |
57 | | | N/A | | | | 25 | | | $ | 1.12 | | | $ | 1.12 | | | $ | (0.00 | ) | | | -0.4 | % |
58 | | | N/A | | | | 50 | | | $ | 2.24 | | | $ | 2.23 | | | $ | (0.01 | ) | | | -0.4 | % |
59 | | | N/A | | | | 75 | | | $ | 4.22 | | | $ | 4.21 | | | $ | (0.01 | ) | | | -0.3 | % |
60 | | | N/A | | | | 100 | | | $ | 6.49 | | | $ | 6.47 | | | $ | (0.02 | ) | | | -0.2 | % |
61 | | | N/A | | | | 125 | | | $ | 8.11 | | | $ | 8.09 | | | $ | (0.02 | ) | | | -0.2 | % |
62 | | | N/A | | | | 150 | | | $ | 11.24 | | | $ | 11.21 | | | $ | (0.02 | ) | | | -0.2 | % |
63 | | | N/A | | | | 175 | | | $ | 13.48 | | | $ | 13.45 | | | $ | (0.03 | ) | | | -0.2 | % |
64 | | | N/A | | | | 200 | | | $ | 17.66 | | | $ | 17.63 | | | $ | (0.03 | ) | | | -0.2 | % |
65 | | | N/A | | | | 225 | | | $ | 20.20 | | | $ | 20.16 | | | $ | (0.04 | ) | | | -0.2 | % |
66 | | | N/A | | | | 250 | | | $ | 11.19 | | | $ | 11.15 | | | $ | (0.04 | ) | | | -0.4 | % |
67 | | | N/A | | | | 275 | | | $ | 13.17 | | | $ | 13.12 | | | $ | (0.04 | ) | | | -0.3 | % |
68 | | | N/A | | | | 300 | | | $ | 15.44 | | | $ | 15.39 | | | $ | (0.05 | ) | | | -0.3 | % |
69 | | | N/A | | | | 325 | | | $ | 17.06 | | | $ | 17.01 | | | $ | (0.05 | ) | | | -0.3 | % |
70 | | | N/A | | | | 350 | | | $ | 20.19 | | | $ | 20.13 | | | $ | (0.06 | ) | | | -0.3 | % |
71 | | | N/A | | | | 375 | | | $ | 22.43 | | | $ | 22.37 | | | $ | (0.06 | ) | | | -0.3 | % |
72 | | | N/A | | | | 400 | | | $ | 26.59 | | | $ | 26.52 | | | $ | (0.06 | ) | | | -0.2 | % |
Exhibit G
CEI - Page 13 of 24
The Cleveland Electric Illuminating Company
Case No. 12-1465-EL-ATS
Estimated Typical Bills - Comparison (Q2 2012 vs. Q2 2012 w/ Securitization)
| | | | | | | | | | | | | | | | | | | | | | | | |
Bill Data | |
Line No. | | Bulb Rating
(Lumens or
Watts)
(A) | | | Level of
Usage
(kWH)
(B) | | | Current
Winter Bill
($)
(C) | | | Proposed
Winter Bill
($)
(D) | | | Dollar
Increase
(D)-(C)
(E) | | | Percent
Increase
(E)/(C)
(F) | |
Street Lighting Service (Rate STL) | |
73 | | | Customer Owned, Limited Company Maintenance - All Lamp Types | |
74 | | | N/A | | | | 25 | | | $ | 1.12 | | | $ | 1.12 | | | $ | (0.00 | ) | | | -0.4 | % |
75 | | | N/A | | | | 50 | | | $ | 2.24 | | | $ | 2.23 | | | $ | (0.01 | ) | | | -0.4 | % |
76 | | | N/A | | | | 75 | | | $ | 5.67 | | | $ | 5.66 | | | $ | (0.01 | ) | | | -0.2 | % |
77 | | | N/A | | | | 100 | | | $ | 9.87 | | | $ | 9.85 | | | $ | (0.02 | ) | | | -0.2 | % |
78 | | | N/A | | | | 125 | | | $ | 12.32 | | | $ | 12.30 | | | $ | (0.02 | ) | | | -0.2 | % |
79 | | | N/A | | | | 150 | | | $ | 18.83 | | | $ | 18.80 | | | $ | (0.02 | ) | | | -0.1 | % |
80 | | | N/A | | | | 175 | | | $ | 22.94 | | | $ | 22.91 | | | $ | (0.03 | ) | | | -0.1 | % |
81 | | | N/A | | | | 200 | | | $ | 32.24 | | | $ | 32.21 | | | $ | (0.03 | ) | | | -0.1 | % |
82 | | | N/A | | | | 225 | | | $ | 37.20 | | | $ | 37.16 | | | $ | (0.04 | ) | | | -0.1 | % |
83 | | | N/A | | | | 250 | | | $ | 11.19 | | | $ | 11.15 | | | $ | (0.04 | ) | | | -0.4 | % |
84 | | | N/A | | | | 275 | | | $ | 14.62 | | | $ | 14.57 | | | $ | (0.04 | ) | | | -0.3 | % |
85 | | | N/A | | | | 300 | | | $ | 18.82 | | | $ | 18.77 | | | $ | (0.05 | ) | | | -0.3 | % |
86 | | | N/A | | | | 325 | | | $ | 21.27 | | | $ | 21.22 | | | $ | (0.05 | ) | | | -0.2 | % |
87 | | | N/A | | | | 350 | | | $ | 27.78 | | | $ | 27.72 | | | $ | (0.06 | ) | | | -0.2 | % |
88 | | | N/A | | | | 375 | | | $ | 31.89 | | | $ | 31.83 | | | $ | (0.06 | ) | | | -0.2 | % |
89 | | | N/A | | | | 400 | | | $ | 41.17 | | | $ | 41.10 | | | $ | (0.06 | ) | | | -0.2 | % |
Exhibit G
CEI - Page 14 of 24
The Cleveland Electric Illuminating Company
Case No. 12-1465-EL-ATS
Estimated Typical Bills - Comparison (Q2 2012 vs. Q2 2012 w/ Securitization)
| | | | | | | | | | | | | | | | | | | | | | | | |
Bill Data | |
Line No. | | Bulb Rating
(Lumens or
Watts)
(A) | | | Level of
Usage
(kWH)
(B) | | | Current
Winter Bill
($)
(C) | | | Proposed
Winter Bill
($)
(D) | | | Dollar
Increase
(D)-(C)
(E) | | | Percent
Increase
(E)/(C)
(F) | |
| Private Outdoor Lighting Service (Rate POL) | |
1 | | | Mercury Lighting | |
2 | | | Overhead Service - Wood Pole | |
3 | | | 175 | | | | 69 | | | $ | 15.57 | | | $ | 15.56 | | | $ | (0.01 | ) | | | -0.1 | % |
4 | | | 400 | | | | 158 | | | $ | 31.88 | | | $ | 31.86 | | | $ | (0.03 | ) | | | -0.1 | % |
5 | | | 1,000 | | | | 380 | | | $ | 63.69 | | | $ | 63.62 | | | $ | (0.06 | ) | | | -0.1 | % |
6 | | | All Other Installations | |
7 | | | 175 | | | | 69 | | | $ | 17.91 | | | $ | 17.90 | | | $ | (0.01 | ) | | | -0.1 | % |
8 | | | High Pressure Sodium Lighting | |
9 | | | Overhead Service - Wood Pole | |
10 | | | 100 | | | | 42 | | | $ | 17.14 | | | $ | 17.13 | | | $ | (0.01 | ) | | | 0.0 | % |
11 | | | 150 | | | | 62 | | | $ | 21.44 | | | $ | 21.43 | | | $ | (0.01 | ) | | | 0.0 | % |
12 | | | 250 | | | | 105 | | | $ | 27.34 | | | $ | 27.32 | | | $ | (0.02 | ) | | | -0.1 | % |
13 | | | 400 | | | | 163 | | | $ | 37.29 | | | $ | 37.26 | | | $ | (0.03 | ) | | | -0.1 | % |
14 | | | All Other Installations | |
15 | | | 100 | | | | 42 | | | $ | 20.22 | | | $ | 20.21 | | | $ | (0.01 | ) | | | 0.0 | % |
16 | | | 150 | | | | 62 | | | $ | 26.84 | | | $ | 26.83 | | | $ | (0.01 | ) | | | 0.0 | % |
17 | | | 150 | | | | 88 | | | $ | 41.53 | | | $ | 41.52 | | | $ | (0.01 | ) | | | 0.0 | % |
18 | | | 250 | | | | 105 | | | $ | 34.08 | | | $ | 34.06 | | | $ | (0.02 | ) | | | 0.0 | % |
19 | | | 250 | | | | 105 | | | $ | 45.82 | | | $ | 45.80 | | | $ | (0.02 | ) | | | 0.0 | % |
20 | | | 400 | | | | 163 | | | $ | 41.61 | | | $ | 41.58 | | | $ | (0.03 | ) | | | -0.1 | % |
Exhibit G
CEI - Page 15 of 24
The Cleveland Electric Illuminating Company
Case No. 12-1465-EL-ATS
Estimated Typical Bills - Comparison (Q2 2012 vs. Q2 2012 w/ Securitization)
| | | | | | | | | | | | | | | | | | | | | | | | |
Bill Data | |
Line No. | | Level of
Demand
(kW)
(A) | | | Level of
Usage
(kWH)
(B) | | | Current
Winter Bill
($)
(C) | | | Proposed
Winter Bill
($)
(D) | | | Dollar
Increase
(D)-(C)
(E) | | | Percent
Increase
(E)/(C)
(F) | |
Traffic Lighting Schedule (Rate TRF) | |
1 | | | 0 | | | | 100 | | | $ | 5.94 | | | $ | 5.92 | | | $ | (0.02 | ) | | | -0.3 | % |
2 | | | 0 | | | | 200 | | | $ | 11.89 | | | $ | 11.86 | | | $ | (0.03 | ) | | | -0.3 | % |
3 | | | 0 | | | | 300 | | | $ | 17.81 | | | $ | 17.76 | | | $ | (0.05 | ) | | | -0.3 | % |
4 | | | 0 | | | | 400 | | | $ | 23.75 | | | $ | 23.68 | | | $ | (0.06 | ) | | | -0.3 | % |
5 | | | 0 | | | | 500 | | | $ | 29.70 | | | $ | 29.62 | | | $ | (0.08 | ) | | | -0.3 | % |
6 | | | 0 | | | | 600 | | | $ | 35.64 | | | $ | 35.54 | | | $ | (0.10 | ) | | | -0.3 | % |
Exhibit G
CEI - Page 16 of 24
The Cleveland Electric Illuminating Company
Case No. 12-1465-EL-ATS
Estimated Typical Bills - Comparison (Q2 2012 vs. Q2 2012 w/ Securitization)
| | | | | | | | | | | | | | | | | | | | | | | | |
Bill Data | |
Line No. | | Level of
Demand
(kW)
(A) | | | Level of
Usage
(kWH)
(B) | | | Current
Summer Bill
($)
(C) | | | Proposed
Summer Bill
($)
(D) | | | Dollar
Increase
(D)-(C)
(E) | | | Percent
Increase
(E)/(C)
(F) | |
General Service Secondary (Rate GS) | | | | | | | | | | | | | |
1 | | | 10 | | | | 1,000 | | | $ | 178.05 | | | $ | 177.90 | | | $ | (0.16 | ) | | | -0.1 | % |
2 | | | 10 | | | | 2,000 | | | $ | 269.66 | | | $ | 269.34 | | | $ | (0.32 | ) | | | -0.1 | % |
3 | | | 10 | | | | 3,000 | | | $ | 360.85 | | | $ | 360.38 | | | $ | (0.48 | ) | | | -0.1 | % |
4 | | | 10 | | | | 4,000 | | | $ | 452.02 | | | $ | 451.38 | | | $ | (0.64 | ) | | | -0.1 | % |
5 | | | 10 | | | | 5,000 | | | $ | 543.21 | | | $ | 542.42 | | | $ | (0.79 | ) | | | -0.1 | % |
6 | | | 10 | | | | 6,000 | | | $ | 634.37 | | | $ | 633.42 | | | $ | (0.95 | ) | | | -0.2 | % |
7 | | | 1,000 | | | | 100,000 | | | $ | 19,349.34 | | | $ | 19,333.44 | | | $ | (15.90 | ) | | | -0.1 | % |
8 | | | 1,000 | | | | 200,000 | | | $ | 28,410.68 | | | $ | 28,378.88 | | | $ | (31.80 | ) | | | -0.1 | % |
9 | | | 1,000 | | | | 300,000 | | | $ | 37,472.03 | | | $ | 37,424.33 | | | $ | (47.70 | ) | | | -0.1 | % |
10 | | | 1,000 | | | | 400,000 | | | $ | 46,533.37 | | | $ | 46,469.77 | | | $ | (63.60 | ) | | | -0.1 | % |
11 | | | 1,000 | | | | 500,000 | | | $ | 55,594.72 | | | $ | 55,515.22 | | | $ | (79.50 | ) | | | -0.1 | % |
12 | | | 1,000 | | | | 600,000 | | | $ | 64,656.07 | | | $ | 64,560.67 | | | $ | (95.40 | ) | | | -0.1 | % |
Exhibit G
CEI - Page 17 of 24
The Cleveland Electric Illuminating Company
Case No. 12-1465-EL-ATS
Estimated Typical Bills - Comparison (Q2 2012 vs. Q2 2012 w/ Securitization)
| | | | | | | | | | | | | | | | | | | | | | | | |
Bill Data | |
Line No. | | Level of
Demand
(kW)
(A) | | | Level of
Usage
(kWH)
(B) | | | Current
Summer Bill
($)
(C) | | | Proposed
Summer Bill
($)
(D) | | | Dollar
Increase
(D)-(C)
(E) | | | Percent
Increase
(E)/(C)
(F) | |
General Service Primary (Rate GP) | |
1 | | | 500 | | | | 50,000 | | | $ | 6,013.13 | | | $ | 6,005.38 | | | $ | (7.75 | ) | | | -0.1 | % |
2 | | | 500 | | | | 100,000 | | | $ | 10,003.95 | | | $ | 9,988.45 | | | $ | (15.50 | ) | | | -0.2 | % |
3 | | | 500 | | | | 150,000 | | | $ | 13,994.77 | | | $ | 13,971.52 | | | $ | (23.25 | ) | | | -0.2 | % |
4 | | | 500 | | | | 200,000 | | | $ | 17,985.60 | | | $ | 17,954.60 | | | $ | (31.00 | ) | | | -0.2 | % |
5 | | | 500 | | | | 250,000 | | | $ | 21,976.42 | | | $ | 21,937.67 | | | $ | (38.75 | ) | | | -0.2 | % |
6 | | | 500 | | | | 300,000 | | | $ | 25,967.24 | | | $ | 25,920.74 | | | $ | (46.50 | ) | | | -0.2 | % |
7 | | | 5,000 | | | | 500,000 | | | $ | 58,675.99 | | | $ | 58,598.49 | | | $ | (77.50 | ) | | | -0.1 | % |
8 | | | 5,000 | | | | 1,000,000 | | | $ | 98,115.28 | | | $ | 97,960.28 | | | $ | (155.00 | ) | | | -0.2 | % |
9 | | | 5,000 | | | | 1,500,000 | | | $ | 136,619.51 | | | $ | 136,387.01 | | | $ | (232.50 | ) | | | -0.2 | % |
10 | | | 5,000 | | | | 2,000,000 | | | $ | 175,123.74 | | | $ | 174,813.74 | | | $ | (310.00 | ) | | | -0.2 | % |
11 | | | 5,000 | | | | 2,500,000 | | | $ | 213,627.97 | | | $ | 213,240.47 | | | $ | (387.50 | ) | | | -0.2 | % |
12 | | | 5,000 | | | | 3,000,000 | | | $ | 252,132.21 | | | $ | 251,667.21 | | | $ | (465.00 | ) | | | -0.2 | % |
Exhibit G
CEI - Page 18 of 24
The Cleveland Electric Illuminating Company
Case No. 12-1465-EL-ATS
Estimated Typical Bills - Comparison (Q2 2012 vs. Q2 2012 w/ Securitization)
| | | | | | | | | | | | | | | | | | | | | | | | |
Bill Data | |
Line No. | | Level of
Demand
(kW)
(A) | | | Level of
Usage
(kWH)
(B) | | | Current
Summer Bill
($)
(C) | | | Proposed
Summer Bill
($)
(D) | | | Dollar
Increase
(D)-(C)
(E) | | | Percent
Increase
(E)/(C)
(F) | |
General Service Subtransmission (Rate GSU) | |
1 | | | 1,000 | | | | 100,000 | | | $ | 10,084.44 | | | $ | 10,069.24 | | | $ | (15.20 | ) | | | -0.2 | % |
2 | | | 1,000 | | | | 200,000 | | | $ | 17,660.99 | | | $ | 17,630.59 | | | $ | (30.40 | ) | | | -0.2 | % |
3 | | | 1,000 | | | | 300,000 | | | $ | 25,237.53 | | | $ | 25,191.93 | | | $ | (45.60 | ) | | | -0.2 | % |
4 | | | 1,000 | | | | 400,000 | | | $ | 32,814.08 | | | $ | 32,753.28 | | | $ | (60.80 | ) | | | -0.2 | % |
5 | | | 1,000 | | | | 500,000 | | | $ | 40,390.63 | | | $ | 40,314.63 | | | $ | (76.00 | ) | | | -0.2 | % |
6 | | | 1,000 | | | | 600,000 | | | $ | 47,967.17 | | | $ | 47,875.97 | | | $ | (91.20 | ) | | | -0.2 | % |
7 | | | 10,000 | | | | 1,000,000 | | | $ | 98,650.19 | | | $ | 98,498.19 | | | $ | (152.00 | ) | | | -0.2 | % |
8 | | | 10,000 | | | | 2,000,000 | | | $ | 171,607.65 | | | $ | 171,303.65 | | | $ | (304.00 | ) | | | -0.2 | % |
9 | | | 10,000 | | | | 3,000,000 | | | $ | 244,565.12 | | | $ | 244,109.12 | | | $ | (456.00 | ) | | | -0.2 | % |
10 | | | 10,000 | | | | 4,000,000 | | | $ | 317,522.58 | | | $ | 316,914.58 | | | $ | (608.00 | ) | | | -0.2 | % |
11 | | | 10,000 | | | | 5,000,000 | | | $ | 390,480.04 | | | $ | 389,720.04 | | | $ | (760.00 | ) | | | -0.2 | % |
12 | | | 10,000 | | | | 6,000,000 | | | $ | 463,437.50 | | | $ | 462,525.50 | | | $ | (912.00 | ) | | | -0.2 | % |
Exhibit G
CEI - Page 19 of 24
The Cleveland Electric Illuminating Company
Case No. 12-1465-EL-ATS
Estimated Typical Bills - Comparison (Q2 2012 vs. Q2 2012 w/ Securitization)
| | | | | | | | | | | | | | | | | | | | | | | | |
Bill Data | |
Line No. | | Level of
Demand
(kW)
(A) | | | Level of
Usage
(kWH)
(B) | | | Current
Summer Bill
($)
(C) | | | Proposed
Summer Bill
($)
(D) | | | Dollar
Increase
(D)-(C)
(E) | | | Percent
Increase
(E)/(C)
(F) | |
General Service Transmission (Rate GT) | | | | | | | | | | | | | |
1 | | | 2,000 | | | | 200,000 | | | $ | 27,210.44 | | | $ | 27,180.24 | | | $ | (30.20 | ) | | | -0.1 | % |
2 | | | 2,000 | | | | 400,000 | | | $ | 37,444.53 | | | $ | 37,384.13 | | | $ | (60.40 | ) | | | -0.2 | % |
3 | | | 2,000 | | | | 600,000 | | | $ | 47,678.62 | | | $ | 47,588.02 | | | $ | (90.60 | ) | | | -0.2 | % |
4 | | | 2,000 | | | | 800,000 | | | $ | 57,912.71 | | | $ | 57,791.91 | | | $ | (120.80 | ) | | | -0.2 | % |
5 | | | 2,000 | | | | 1,000,000 | | | $ | 67,677.87 | | | $ | 67,526.87 | | | $ | (151.00 | ) | | | -0.2 | % |
6 | | | 2,000 | | | | 1,200,000 | | | $ | 77,350.36 | | | $ | 77,169.16 | | | $ | (181.20 | ) | | | -0.2 | % |
7 | | | 20,000 | | | | 2,000,000 | | | $ | 265,863.33 | | | $ | 265,561.33 | | | $ | (302.00 | ) | | | -0.1 | % |
8 | | | 20,000 | | | | 4,000,000 | | | $ | 362,588.26 | | | $ | 361,984.26 | | | $ | (604.00 | ) | | | -0.2 | % |
9 | | | 20,000 | | | | 6,000,000 | | | $ | 459,313.18 | | | $ | 458,407.18 | | | $ | (906.00 | ) | | | -0.2 | % |
10 | | | 20,000 | | | | 8,000,000 | | | $ | 556,038.11 | | | $ | 554,830.11 | | | $ | (1,208.00 | ) | | | -0.2 | % |
11 | | | 20,000 | | | | 10,000,000 | | | $ | 652,763.03 | | | $ | 651,253.03 | | | $ | (1,510.00 | ) | | | -0.2 | % |
12 | | | 20,000 | | | | 12,000,000 | | | $ | 749,487.96 | | | $ | 747,675.96 | | | $ | (1,812.00 | ) | | | -0.2 | % |
Exhibit G
CEI - Page 20 of 24
The Cleveland Electric Illuminating Company
Case No. 12-1465-EL-ATS
Estimated Typical Bills - Comparison (Q2 2012 vs. Q2 2012 w/ Securitization)
| | | | | | | | | | | | | | | | | | | | | | | | |
Bill Data | |
Line No. | | Bulb Rating
(Lumens or
Watts)
(A) | | | Level of
Usage
(kWH)
(B) | | | Current
Summer Bill
($)
(C) | | | Proposed
Summer Bill
($)
(D) | | | Dollar
Increase
(D)-(C)
(E) | | | Percent
Increase
(E)/(C)
(F) | |
Street Lighting Service (Rate STL) | | | | | | | | | | | | | |
1 | | | Company Owned - Incandescent Lighting (a) | |
2 | | | Overhead Service | | | | | | | | | |
3 | | | 1,000 | | | | 24 | | | $ | 12.22 | | | $ | 12.21 | | | $ | (0.00 | ) | | | 0.0 | % |
4 | | | 2,000 | | | | 56 | | | $ | 13.93 | | | $ | 13.92 | | | $ | (0.01 | ) | | | -0.1 | % |
5 | | | 2,500 | | | | 70 | | | $ | 14.71 | | | $ | 14.70 | | | $ | (0.01 | ) | | | -0.1 | % |
6 | | | 4,000 | | | | 126 | | | $ | 17.72 | | | $ | 17.70 | | | $ | (0.02 | ) | | | -0.1 | % |
7 | | | 6,000 | | | | 157 | | | $ | 19.38 | | | $ | 19.35 | | | $ | (0.02 | ) | | | -0.1 | % |
8 | | | 10,000 | | | | 242 | | | $ | 23.97 | | | $ | 23.93 | | | $ | (0.04 | ) | | | -0.2 | % |
9 | | | 15,000 | | | | 282 | | | $ | 26.11 | | | $ | 26.06 | | | $ | (0.04 | ) | | | -0.2 | % |
10 | | | Underground Service | | | | | | | | | | | | | |
11 | | | 1,000 | | | | 24 | | | $ | 7.38 | | | $ | 7.37 | | | $ | (0.00 | ) | | | -0.1 | % |
12 | | | 2,000 | | | | 56 | | | $ | 9.09 | | | $ | 9.08 | | | $ | (0.01 | ) | | | -0.1 | % |
13 | | | 2,500 | | | | 70 | | | $ | 9.87 | | | $ | 9.86 | | | $ | (0.01 | ) | | | -0.1 | % |
14 | | | 4,000 | | | | 126 | | | $ | 12.88 | | | $ | 12.86 | | | $ | (0.02 | ) | | | -0.2 | % |
15 | | | 6,000 | | | | 157 | | | $ | 14.54 | | | $ | 14.51 | | | $ | (0.02 | ) | | | -0.2 | % |
16 | | | 10,000 | | | | 242 | | | $ | 19.13 | | | $ | 19.09 | | | $ | (0.04 | ) | | | -0.2 | % |
17 | | | 15,000 | | | | 282 | | | $ | 21.27 | | | $ | 21.22 | | | $ | (0.04 | ) | | | -0.2 | % |
18 | | | Company Owned - Mercury Street Lighting (b) | |
19 | | | Overhead Service - Wood Pole | |
20 | | | 175 | | | | 69 | | | $ | 11.11 | | | $ | 11.10 | | | $ | (0.01 | ) | | | -0.1 | % |
21 | | | 250 | | | | 104 | | | $ | 14.41 | | | $ | 14.39 | | | $ | (0.02 | ) | | | -0.1 | % |
22 | | | 400 | | | | 158 | | | $ | 19.90 | | | $ | 19.88 | | | $ | (0.03 | ) | | | -0.1 | % |
23 | | | 1,000 | | | | 380 | | | $ | 43.96 | | | $ | 43.89 | | | $ | (0.06 | ) | | | -0.1 | % |
24 | | | Underground Service - Post Type | |
25 | | | 175 | | | | 69 | | | $ | 15.46 | | | $ | 15.45 | | | $ | (0.01 | ) | | | -0.1 | % |
26 | | | Underground Service - Pole Type | |
27 | | | 175 | | | | 69 | | | $ | 22.02 | | | $ | 22.01 | | | $ | (0.01 | ) | | | 0.0 | % |
28 | | | 250 | | | | 104 | | | $ | 26.13 | | | $ | 26.11 | | | $ | (0.02 | ) | | | -0.1 | % |
29 | | | 400 | | | | 158 | | | $ | 31.84 | | | $ | 31.82 | | | $ | (0.03 | ) | | | -0.1 | % |
30 | | | 400 | | | | 158 | | | $ | 32.09 | | | $ | 32.07 | | | $ | (0.03 | ) | | | -0.1 | % |
31 | | | 400 | | | | 316 | | | $ | 49.84 | | | $ | 49.79 | | | $ | (0.05 | ) | | | -0.1 | % |
32 | | | 1000 | | | | 380 | | | $ | 57.79 | | | $ | 57.72 | | | $ | (0.06 | ) | | | -0.1 | % |
Exhibit G
CEI - Page 21 of 24
The Cleveland Electric Illuminating Company
Case No. 12-1465-EL-ATS
Estimated Typical Bills - Comparison (Q2 2012 vs. Q2 2012 w/ Securitization)
| | | | | | | | | | | | | | | | | | | | | | | | |
Bill Data | |
Line No. | | Bulb Rating
(Lumens or
Watts)
(A) | | | Level of
Usage
(kWH)
(B) | | | Current
Summer Bill
($)
(C) | | | Proposed
Summer Bill
($)
(D) | | | Dollar
Increase
(D)-(C)
(E) | | | Percent
Increase
(E)/(C)
(F) | |
Street Lighting Service (Rate STL) | | | | | | | | | | | | | |
33 | | | Company Owned - High Pressure Sodium Lighting (c) | |
34 | | | Overhead Service - Wood Pole | |
35 | | | 100 | | | | 42 | | | $ | 12.57 | | | $ | 12.56 | | | $ | (0.01 | ) | | | -0.1 | % |
36 | | | 150 | | | | 62 | | | $ | 14.28 | | | $ | 14.27 | | | $ | (0.01 | ) | | | -0.1 | % |
37 | | | 250 | | | | 105 | | | $ | 18.86 | | | $ | 18.84 | | | $ | (0.02 | ) | | | -0.1 | % |
38 | | | 400 | | | | 163 | | | $ | 23.95 | | | $ | 23.92 | | | $ | (0.03 | ) | | | -0.1 | % |
39 | | | Underground Service - Post Type | |
40 | | | 100 | | | | 42 | | | $ | 17.09 | | | $ | 17.08 | | | $ | (0.01 | ) | | | 0.0 | % |
41 | | | Underground Service - Pole Type | |
42 | | | 100 | | | | 42 | | | $ | 24.13 | | | $ | 24.12 | | | $ | (0.01 | ) | | | 0.0 | % |
43 | | | 150 | | | | 62 | | | $ | 26.09 | | | $ | 26.08 | | | $ | (0.01 | ) | | | 0.0 | % |
44 | | | 250 | | | | 105 | | | $ | 30.51 | | | $ | 30.49 | | | $ | (0.02 | ) | | | -0.1 | % |
45 | | | 250 | | | | 210 | | | $ | 48.74 | | | $ | 48.71 | | | $ | (0.03 | ) | | | -0.1 | % |
46 | | | 400 | | | | 163 | | | $ | 35.41 | | | $ | 35.38 | | | $ | (0.03 | ) | | | -0.1 | % |
47 | | | Special Architectural Pole Installations | |
48 | | | 100 | | | | 42 | | | $ | 22.56 | | | $ | 22.55 | | | $ | (0.01 | ) | | | 0.0 | % |
49 | | | 100 | | | | 42 | | | $ | 34.59 | | | $ | 34.58 | | | $ | (0.01 | ) | | | 0.0 | % |
50 | | | 150 | | | | 62 | | | $ | 24.82 | | | $ | 24.81 | | | $ | (0.01 | ) | | | 0.0 | % |
51 | | | 150 | | | | 62 | | | $ | 36.49 | | | $ | 36.48 | | | $ | (0.01 | ) | | | 0.0 | % |
52 | | | 250 | | | | 105 | | | $ | 30.09 | | | $ | 30.07 | | | $ | (0.02 | ) | | | -0.1 | % |
53 | | | 250 | | | | 105 | | | $ | 41.92 | | | $ | 41.90 | | | $ | (0.02 | ) | | | 0.0 | % |
54 | | | 400 | | | | 163 | | | $ | 35.18 | | | $ | 35.15 | | | $ | (0.03 | ) | | | -0.1 | % |
55 | | | 400 | | | | 163 | | | $ | 47.82 | | | $ | 47.79 | | | $ | (0.03 | ) | | | -0.1 | % |
56 | | | Customer Owned - All Lamp Types | |
57 | | | N/A | | | | 25 | | | $ | 1.34 | | | $ | 1.34 | | | $ | (0.00 | ) | | | -0.3 | % |
58 | | | N/A | | | | 50 | | | $ | 2.70 | | | $ | 2.69 | | | $ | (0.01 | ) | | | -0.3 | % |
59 | | | N/A | | | | 75 | | | $ | 4.90 | | | $ | 4.89 | | | $ | (0.01 | ) | | | -0.2 | % |
60 | | | N/A | | | | 100 | | | $ | 7.41 | | | $ | 7.39 | | | $ | (0.02 | ) | | | -0.2 | % |
61 | | | N/A | | | | 125 | | | $ | 9.25 | | | $ | 9.23 | | | $ | (0.02 | ) | | | -0.2 | % |
62 | | | N/A | | | | 150 | | | $ | 12.62 | | | $ | 12.59 | | | $ | (0.02 | ) | | | -0.2 | % |
63 | | | N/A | | | | 175 | | | $ | 15.08 | | | $ | 15.05 | | | $ | (0.03 | ) | | | -0.2 | % |
64 | | | N/A | | | | 200 | | | $ | 19.49 | | | $ | 19.46 | | | $ | (0.03 | ) | | | -0.2 | % |
65 | | | N/A | | | | 225 | | | $ | 22.26 | | | $ | 22.22 | | | $ | (0.04 | ) | | | -0.2 | % |
66 | | | N/A | | | | 250 | | | $ | 13.47 | | | $ | 13.43 | | | $ | (0.04 | ) | | | -0.3 | % |
67 | | | N/A | | | | 275 | | | $ | 15.69 | | | $ | 15.64 | | | $ | (0.04 | ) | | | -0.3 | % |
68 | | | N/A | | | | 300 | | | $ | 18.18 | | | $ | 18.13 | | | $ | (0.05 | ) | | | -0.3 | % |
69 | | | N/A | | | | 325 | | | $ | 20.04 | | | $ | 19.99 | | | $ | (0.05 | ) | | | -0.3 | % |
70 | | | N/A | | | | 350 | | | $ | 23.39 | | | $ | 23.33 | | | $ | (0.06 | ) | | | -0.2 | % |
71 | | | N/A | | | | 375 | | | $ | 25.86 | | | $ | 25.80 | | | $ | (0.06 | ) | | | -0.2 | % |
72 | | | N/A | | | | 400 | | | $ | 30.25 | | | $ | 30.18 | | | $ | (0.06 | ) | | | -0.2 | % |
Exhibit G
CEI - Page 22 of 24
The Cleveland Electric Illuminating Company
Case No. 12-1465-EL-ATS
Estimated Typical Bills - Comparison (Q2 2012 vs. Q2 2012 w/ Securitization)
| | | | | | | | | | | | | | | | | | | | | | | | |
Bill Data | |
Line No. | | Bulb Rating
(Lumens or
Watts)
(A) | | | Level of
Usage
(kWH)
(B) | | | Current
Summer Bill
($)
(C) | | | Proposed
Summer Bill
($)
(D) | | | Dollar
Increase
(D)-(C)
(E) | | | Percent
Increase
(E)/(C)
(F) | |
Street Lighting Service (Rate STL) | | | | | | | | | | | | | |
73 | | | Customer Owned, Limited Company Maintenance - All Lamp Types | |
74 | | | N/A | | | | 25 | | | $ | 1.34 | | | $ | 1.34 | | | $ | (0.00 | ) | | | -0.3 | % |
75 | | | N/A | | | | 50 | | | $ | 2.70 | | | $ | 2.69 | | | $ | (0.01 | ) | | | -0.3 | % |
76 | | | N/A | | | | 75 | | | $ | 6.35 | | | $ | 6.34 | | | $ | (0.01 | ) | | | -0.2 | % |
77 | | | N/A | | | | 100 | | | $ | 10.79 | | | $ | 10.77 | | | $ | (0.02 | ) | | | -0.1 | % |
78 | | | N/A | | | | 125 | | | $ | 13.46 | | | $ | 13.44 | | | $ | (0.02 | ) | | | -0.1 | % |
79 | | | N/A | | | | 150 | | | $ | 20.21 | | | $ | 20.18 | | | $ | (0.02 | ) | | | -0.1 | % |
80 | | | N/A | | | | 175 | | | $ | 24.54 | | | $ | 24.51 | | | $ | (0.03 | ) | | | -0.1 | % |
81 | | | N/A | | | | 200 | | | $ | 34.07 | | | $ | 34.04 | | | $ | (0.03 | ) | | | -0.1 | % |
82 | | | N/A | | | | 225 | | | $ | 39.26 | | | $ | 39.22 | | | $ | (0.04 | ) | | | -0.1 | % |
83 | | | N/A | | | | 250 | | | $ | 13.47 | | | $ | 13.43 | | | $ | (0.04 | ) | | | -0.3 | % |
84 | | | N/A | | | | 275 | | | $ | 17.14 | | | $ | 17.09 | | | $ | (0.04 | ) | | | -0.3 | % |
85 | | | N/A | | | | 300 | | | $ | 21.56 | | | $ | 21.51 | | | $ | (0.05 | ) | | | -0.2 | % |
86 | | | N/A | | | | 325 | | | $ | 24.25 | | | $ | 24.20 | | | $ | (0.05 | ) | | | -0.2 | % |
87 | | | N/A | | | | 350 | | | $ | 30.98 | | | $ | 30.92 | | | $ | (0.06 | ) | | | -0.2 | % |
88 | | | N/A | | | | 375 | | | $ | 35.32 | | | $ | 35.26 | | | $ | (0.06 | ) | | | -0.2 | % |
89 | | | N/A | | | | 400 | | | $ | 44.83 | | | $ | 44.76 | | | $ | (0.06 | ) | | | -0.1 | % |
Exhibit G
CEI - Page 23 of 24
The Cleveland Electric Illuminating Company
Case No. 12-1465-EL-ATS
Estimated Typical Bills - Comparison (Q2 2012 vs. Q2 2012 w/ Securitization)
| | | | | | | | | | | | | | | | | | | | | | | | |
Bill Data | |
Line No. | | Bulb Rating
(Lumens or
Watts)
(A) | | | Level of
Usage
(kWH)
(B) | | | Current
Summer Bill
($)
(C) | | | Proposed
Summer Bill
($)
(D) | | | Dollar
Increase
(D)-(C)
(E) | | | Percent
Increase
(E)/(C)
(F) | |
Private Outdoor Lighting Service (Rate POL) | | | | | | | | | | | | | |
1 | | | Mercury Lighting | |
2 | | | Overhead Service - Wood Pole | |
3 | | | 175 | | | | 69 | | | $ | 16.20 | | | $ | 16.19 | | | $ | (0.01 | ) | | | -0.1 | % |
4 | | | 400 | | | | 158 | | | $ | 33.33 | | | $ | 33.31 | | | $ | (0.03 | ) | | | -0.1 | % |
5 | | | 1,000 | | | | 380 | | | $ | 67.16 | | | $ | 67.09 | | | $ | (0.06 | ) | | | -0.1 | % |
6 | | | All Other Installations | |
7 | | | 175 | | | | 69 | | | $ | 18.54 | | | $ | 18.53 | | | $ | (0.01 | ) | | | -0.1 | % |
8 | | | High Pressure Sodium Lighting | |
9 | | | Overhead Service - Wood Pole | |
10 | | | 100 | | | | 42 | | | $ | 17.52 | | | $ | 17.51 | | | $ | (0.01 | ) | | | 0.0 | % |
11 | | | 150 | | | | 62 | | | $ | 22.01 | | | $ | 22.00 | | | $ | (0.01 | ) | | | 0.0 | % |
12 | | | 250 | | | | 105 | | | $ | 28.30 | | | $ | 28.28 | | | $ | (0.02 | ) | | | -0.1 | % |
13 | | | 400 | | | | 163 | | | $ | 38.78 | | | $ | 38.75 | | | $ | (0.03 | ) | | | -0.1 | % |
14 | | | All Other Installations | |
15 | | | 100 | | | | 42 | | | $ | 20.60 | | | $ | 20.59 | | | $ | (0.01 | ) | | | 0.0 | % |
16 | | | 150 | | | | 62 | | | $ | 27.41 | | | $ | 27.40 | | | $ | (0.01 | ) | | | 0.0 | % |
17 | | | 150 | | | | 88 | | | $ | 42.34 | | | $ | 42.33 | | | $ | (0.01 | ) | | | 0.0 | % |
18 | | | 250 | | | | 105 | | | $ | 35.04 | | | $ | 35.02 | | | $ | (0.02 | ) | | | 0.0 | % |
19 | | | 250 | | | | 105 | | | $ | 46.78 | | | $ | 46.76 | | | $ | (0.02 | ) | | | 0.0 | % |
20 | | | 400 | | | | 163 | | | $ | 43.10 | | | $ | 43.07 | | | $ | (0.03 | ) | | | -0.1 | % |
Exhibit G
CEI - Page 24 of 24
The Cleveland Electric Illuminating Company
Case No. 12-1465-EL-ATS
Estimated Typical Bills - Comparison (Q2 2012 vs. Q2 2012 w/ Securitization)
| | | | | | | | | | | | | | | | | | | | | | | | |
Bill Data | |
Line No. | | Level of
Demand
(kW)
(A) | | | Level of
Usage
(kWH)
(B) | | | Current
Summer Bill
($)
(C) | | | Proposed
Summer Bill
($)
(D) | | | Dollar
Increase
(D)-(C)
(E) | | | Percent
Increase
(E)/(C)
(F) | |
Traffic Lighting Schedule (Rate TRF) | | | | | | | | | | | | | |
1 | | | 0 | | | | 100 | | | $ | 6.86 | | | $ | 6.84 | | | $ | (0.02 | ) | | | -0.2 | % |
2 | | | 0 | | | | 200 | | | $ | 13.72 | | | $ | 13.69 | | | $ | (0.03 | ) | | | -0.2 | % |
3 | | | 0 | | | | 300 | | | $ | 20.55 | | | $ | 20.50 | | | $ | (0.05 | ) | | | -0.2 | % |
4 | | | 0 | | | | 400 | | | $ | 27.41 | | | $ | 27.34 | | | $ | (0.06 | ) | | | -0.2 | % |
5 | | | 0 | | | | 500 | | | $ | 34.27 | | | $ | 34.19 | | | $ | (0.08 | ) | | | -0.2 | % |
6 | | | 0 | | | | 600 | | | $ | 41.13 | | | $ | 41.03 | | | $ | (0.10 | ) | | | -0.2 | % |
Exhibit G
OE - Page 1 of 26
Ohio Edison Company
Case No. 12-1465-EL-ATS
Estimated Typical Bills - Comparison (Q2 2012 vs. Q2 2012 w/ Securitization)
| | | | | | | | | | | | | | | | | | | | | | | | |
Bill Data | |
Line
No. | | Level of
Demand
(kW) (A) | | | Level of
Usage
(kWH)
(B) | | | Current
Winter Bill
($)
(C) | | | Proposed
Winter Bill
($)
(D) | | | Dollar
Increase
($)
(E) | | | Percent
Increase
(%)
(E) | |
Residential Service - Standard (Rate RS) | | | | | | | | | | | | | |
1 | | | 0 | | | | 250 | | | $ | 34.74 | | | $ | 34.67 | | | $ | (0.07 | ) | | | -0.2 | % |
2 | | | 0 | | | | 500 | | | $ | 65.45 | | | $ | 65.31 | | | $ | (0.14 | ) | | | -0.2 | % |
3 | | | 0 | | | | 750 | | | $ | 96.15 | | | $ | 95.95 | | | $ | (0.21 | ) | | | -0.2 | % |
4 | | | 0 | | | | 1,000 | | | $ | 126.86 | | | $ | 126.58 | | | $ | (0.28 | ) | | | -0.2 | % |
5 | | | 0 | | | | 1,250 | | | $ | 157.57 | | | $ | 157.22 | | | $ | (0.35 | ) | | | -0.2 | % |
6 | | | 0 | | | | 1,500 | | | $ | 188.28 | | | $ | 187.86 | | | $ | (0.42 | ) | | | -0.2 | % |
7 | | | 0 | | | | 2,000 | | | $ | 249.69 | | | $ | 249.14 | | | $ | (0.56 | ) | | | -0.2 | % |
8 | | | 0 | | | | 2,500 | | | $ | 310.88 | | | $ | 310.18 | | | $ | (0.69 | ) | | | -0.2 | % |
9 | | | 0 | | | | 3,000 | | | $ | 372.06 | | | $ | 371.23 | | | $ | (0.83 | ) | | | -0.2 | % |
10 | | | 0 | | | | 3,500 | | | $ | 433.25 | | | $ | 432.27 | | | $ | (0.97 | ) | | | -0.2 | % |
11 | | | 0 | | | | 4,000 | | | $ | 494.43 | | | $ | 493.32 | | | $ | (1.11 | ) | | | -0.2 | % |
12 | | | 0 | | | | 4,500 | | | $ | 555.62 | | | $ | 554.37 | | | $ | (1.25 | ) | | | -0.2 | % |
13 | | | 0 | | | | 5,000 | | | $ | 616.80 | | | $ | 615.41 | | | $ | (1.39 | ) | | | -0.2 | % |
14 | | | 0 | | | | 5,500 | | | $ | 677.99 | | | $ | 676.46 | | | $ | (1.53 | ) | | | -0.2 | % |
15 | | | 0 | | | | 6,000 | | | $ | 739.17 | | | $ | 737.50 | | | $ | (1.67 | ) | | | -0.2 | % |
16 | | | 0 | | | | 6,500 | | | $ | 800.36 | | | $ | 798.55 | | | $ | (1.81 | ) | | | -0.2 | % |
17 | | | 0 | | | | 7,000 | | | $ | 861.54 | | | $ | 859.60 | | | $ | (1.95 | ) | | | -0.2 | % |
18 | | | 0 | | | | 7,500 | | | $ | 922.73 | | | $ | 920.64 | | | $ | (2.09 | ) | | | -0.2 | % |
19 | | | 0 | | | | 8,000 | | | $ | 983.91 | | | $ | 981.69 | | | $ | (2.22 | ) | | | -0.2 | % |
20 | | | 0 | | | | 8,500 | | | $ | 1,045.10 | | | $ | 1,042.73 | | | $ | (2.36 | ) | | | -0.2 | % |
21 | | | 0 | | | | 9,000 | | | $ | 1,106.28 | | | $ | 1,103.78 | | | $ | (2.50 | ) | | | -0.2 | % |
22 | | | 0 | | | | 9,500 | | | $ | 1,167.47 | | | $ | 1,164.82 | | | $ | (2.64 | ) | | | -0.2 | % |
23 | | | 0 | | | | 10,000 | | | $ | 1,228.65 | | | $ | 1,225.87 | | | $ | (2.78 | ) | | | -0.2 | % |
24 | | | 0 | | | | 10,500 | | | $ | 1,289.84 | | | $ | 1,286.92 | | | $ | (2.92 | ) | | | -0.2 | % |
25 | | | 0 | | | | 11,000 | | | $ | 1,351.02 | | | $ | 1,347.96 | | | $ | (3.06 | ) | | | -0.2 | % |
26 | | | 0 | | | | 11,500 | | | $ | 1,412.20 | | | $ | 1,409.01 | | | $ | (3.20 | ) | | | -0.2 | % |
27 | | | 0 | | | | 12,000 | | | $ | 1,473.39 | | | $ | 1,470.05 | | | $ | (3.34 | ) | | | -0.2 | % |
28 | | | 0 | | | | 12,500 | | | $ | 1,534.57 | | | $ | 1,531.10 | | | $ | (3.48 | ) | | | -0.2 | % |
29 | | | 0 | | | | 13,000 | | | $ | 1,595.76 | | | $ | 1,592.15 | | | $ | (3.61 | ) | | | -0.2 | % |
30 | | | 0 | | | | 13,500 | | | $ | 1,656.94 | | | $ | 1,653.19 | | | $ | (3.75 | ) | | | -0.2 | % |
31 | | | 0 | | | | 14,000 | | | $ | 1,718.13 | | | $ | 1,714.24 | | | $ | (3.89 | ) | | | -0.2 | % |
32 | | | 0 | | | | 14,500 | | | $ | 1,779.31 | | | $ | 1,775.28 | | | $ | (4.03 | ) | | | -0.2 | % |
33 | | | 0 | | | | 15,000 | | | $ | 1,840.50 | | | $ | 1,836.33 | | | $ | (4.17 | ) | | | -0.2 | % |
34 | | | 0 | | | | 15,500 | | | $ | 1,901.40 | | | $ | 1,897.09 | | | $ | (4.31 | ) | | | -0.2 | % |
35 | | | 0 | | | | 16,000 | | | $ | 1,962.31 | | | $ | 1,956.90 | | | $ | (5.41 | ) | | | -0.3 | % |
36 | | | 0 | | | | 16,500 | | | $ | 2,023.21 | | | $ | 2,018.62 | | | $ | (4.59 | ) | | | -0.2 | % |
37 | | | 0 | | | | 17,000 | | | $ | 2,084.12 | | | $ | 2,079.39 | | | $ | (4.73 | ) | | | -0.2 | % |
38 | | | 0 | | | | 17,500 | | | $ | 2,145.02 | | | $ | 2,140.15 | | | $ | (4.86 | ) | | | -0.2 | % |
Exhibit G
OE - Page 2 of 26
Ohio Edison Company
Case No. 12-1465-EL-ATS
Estimated Typical Bills - Comparison (Q2 2012 vs. Q2 2012 w/ Securitization)
| | | | | | | | | | | | | | | | | | | | | | | | |
Bill Data | |
Line
No. | | Level of
Demand
(kW) (A) | | | Level of
Usage
(kWH)
(B) | | | Current
Winter Bill
($)
(C) | | | Proposed
Winter Bill
($)
(D) | | | Dollar
Increase
($)
(E) | | | Percent
Increase
(%)
(E) | |
Residential Service - Electric Heating (Rate RS) | | | | | | | | | | | | | |
1 | | | 0 | | | | 250 | | | $ | 34.74 | | | $ | 34.67 | | | $ | (0.07 | ) | | | -0.2 | % |
2 | | | 0 | | | | 500 | | | $ | 65.45 | | | $ | 65.31 | | | $ | (0.14 | ) | | | -0.2 | % |
3 | | | 0 | | | | 750 | | | $ | 86.98 | | | $ | 86.77 | | | $ | (0.21 | ) | | | -0.2 | % |
4 | | | 0 | | | | 1,000 | | | $ | 108.51 | | | $ | 108.23 | | | $ | (0.28 | ) | | | -0.3 | % |
5 | | | 0 | | | | 1,250 | | | $ | 130.04 | | | $ | 129.70 | | | $ | (0.35 | ) | | | -0.3 | % |
6 | | | 0 | | | | 1,500 | | | $ | 142.65 | | | $ | 142.24 | | | $ | (0.42 | ) | | | -0.3 | % |
7 | | | 0 | | | | 2,000 | | | $ | 167.87 | | | $ | 167.31 | | | $ | (0.56 | ) | | | -0.3 | % |
8 | | | 0 | | | | 2,500 | | | $ | 192.85 | | | $ | 192.16 | | | $ | (0.70 | ) | | | -0.4 | % |
9 | | | 0 | | | | 3,000 | | | $ | 217.84 | | | $ | 217.00 | | | $ | (0.83 | ) | | | -0.4 | % |
10 | | | 0 | | | | 3,500 | | | $ | 242.82 | | | $ | 241.85 | | | $ | (0.97 | ) | | | -0.4 | % |
11 | | | 0 | | | | 4,000 | | | $ | 267.81 | | | $ | 266.70 | | | $ | (1.11 | ) | | | -0.4 | % |
12 | | | 0 | | | | 4,500 | | | $ | 292.79 | | | $ | 291.54 | | | $ | (1.25 | ) | | | -0.4 | % |
13 | | | 0 | | | | 5,000 | | | $ | 317.78 | | | $ | 316.39 | | | $ | (1.39 | ) | | | -0.4 | % |
14 | | | 0 | | | | 5,500 | | | $ | 342.76 | | | $ | 341.23 | | | $ | (1.53 | ) | | | -0.4 | % |
15 | | | 0 | | | | 6,000 | | | $ | 367.75 | | | $ | 366.08 | | | $ | (1.67 | ) | | | -0.5 | % |
16 | | | 0 | | | | 6,500 | | | $ | 392.73 | | | $ | 390.92 | | | $ | (1.81 | ) | | | -0.5 | % |
17 | | | 0 | | | | 7,000 | | | $ | 417.72 | | | $ | 415.77 | | | $ | (1.95 | ) | | | -0.5 | % |
18 | | | 0 | | | | 7,500 | | | $ | 442.70 | | | $ | 440.62 | | | $ | (2.09 | ) | | | -0.5 | % |
19 | | | 0 | | | | 8,000 | | | $ | 467.69 | | | $ | 465.46 | | | $ | (2.22 | ) | | | -0.5 | % |
20 | | | 0 | | | | 8,500 | | | $ | 492.67 | | | $ | 490.31 | | | $ | (2.36 | ) | | | -0.5 | % |
21 | | | 0 | | | | 9,000 | | | $ | 517.66 | | | $ | 515.15 | | | $ | (2.50 | ) | | | -0.5 | % |
22 | | | 0 | | | | 9,500 | | | $ | 542.64 | | | $ | 540.00 | | | $ | (2.64 | ) | | | -0.5 | % |
23 | | | 0 | | | | 10,000 | | | $ | 567.63 | | | $ | 564.85 | | | $ | (2.78 | ) | | | -0.5 | % |
24 | | | 0 | | | | 10,500 | | | $ | 592.61 | | | $ | 589.69 | | | $ | (2.92 | ) | | | -0.5 | % |
25 | | | 0 | | | | 11,000 | | | $ | 617.60 | | | $ | 614.54 | | | $ | (3.06 | ) | | | -0.5 | % |
26 | | | 0 | | | | 11,500 | | | $ | 642.58 | | | $ | 639.38 | | | $ | (3.20 | ) | | | -0.5 | % |
27 | | | 0 | | | | 12,000 | | | $ | 667.56 | | | $ | 664.23 | | | $ | (3.34 | ) | | | -0.5 | % |
28 | | | 0 | | | | 12,500 | | | $ | 692.55 | | | $ | 689.07 | | | $ | (3.48 | ) | | | -0.5 | % |
29 | | | 0 | | | | 13,000 | | | $ | 717.53 | | | $ | 713.92 | | | $ | (3.61 | ) | | | -0.5 | % |
30 | | | 0 | | | | 13,500 | | | $ | 742.52 | | | $ | 738.77 | | | $ | (3.75 | ) | | | -0.5 | % |
31 | | | 0 | | | | 14,000 | | | $ | 767.50 | | | $ | 763.61 | | | $ | (3.89 | ) | | | -0.5 | % |
32 | | | 0 | | | | 14,500 | | | $ | 792.49 | | | $ | 788.46 | | | $ | (4.03 | ) | | | -0.5 | % |
33 | | | 0 | | | | 15,000 | | | $ | 817.47 | | | $ | 813.30 | | | $ | (4.17 | ) | | | -0.5 | % |
34 | | | 0 | | | | 15,500 | | | $ | 842.18 | | | $ | 837.87 | | | $ | (4.31 | ) | | | -0.5 | % |
35 | | | 0 | | | | 16,000 | | | $ | 866.88 | | | $ | 861.47 | | | $ | (5.41 | ) | | | -0.6 | % |
36 | | | 0 | | | | 16,500 | | | $ | 891.59 | | | $ | 887.00 | | | $ | (4.59 | ) | | | -0.5 | % |
37 | | | 0 | | | | 17,000 | | | $ | 916.29 | | | $ | 911.56 | | | $ | (4.73 | ) | | | -0.5 | % |
38 | | | 0 | | | | 17,500 | | | $ | 940.99 | | | $ | 936.13 | | | $ | (4.87 | ) | | | -0.5 | % |
Exhibit G
OE - Page 3 of 26
Ohio Edison Company
Case No. 12-1465-EL-ATS
Estimated Typical Bills - Comparison (Q2 2012 vs. Q2 2012 w/ Securitization)
| | | | | | | | | | | | | | | | | | | | | | | | |
Bill Data | |
Line
No. | | Level of
Demand
(kW)
(A) | | | Level of
Usage
(kWH)
(B) | | | Current
Winter Bill
($)
(C) | | | Proposed
Winter Bill
($)
(D) | | | Dollar
Increase
($)
(E) | | | Percent
Increase
(%)
(E) | |
Residential Service - Water Heating (Rate RS) | | | | | | | | | | | | | |
1 | | | 0 | | | | 250 | | | $ | 34.74 | | | $ | 34.67 | | | $ | (0.07 | ) | | | -0.2 | % |
2 | | | 0 | | | | 500 | | | $ | 65.45 | | | $ | 65.31 | | | $ | (0.14 | ) | | | -0.2 | % |
3 | | | 0 | | | | 750 | | | $ | 91.73 | | | $ | 91.52 | | | $ | (0.21 | ) | | | -0.2 | % |
4 | | | 0 | | | | 1,000 | | | $ | 118.01 | | | $ | 117.73 | | | $ | (0.28 | ) | | | -0.2 | % |
5 | | | 0 | | | | 1,250 | | | $ | 144.29 | | | $ | 143.95 | | | $ | (0.35 | ) | | | -0.2 | % |
6 | | | 0 | | | | 1,500 | | | $ | 170.58 | | | $ | 170.16 | | | $ | (0.42 | ) | | | -0.2 | % |
7 | | | 0 | | | | 2,000 | | | $ | 223.14 | | | $ | 222.59 | | | $ | (0.56 | ) | | | -0.2 | % |
8 | | | 0 | | | | 2,500 | | | $ | 275.48 | | | $ | 274.78 | | | $ | (0.70 | ) | | | -0.3 | % |
9 | | | 0 | | | | 3,000 | | | $ | 327.81 | | | $ | 326.98 | | | $ | (0.83 | ) | | | -0.3 | % |
10 | | | 0 | | | | 3,500 | | | $ | 380.15 | | | $ | 379.17 | | | $ | (0.97 | ) | | | -0.3 | % |
11 | | | 0 | | | | 4,000 | | | $ | 432.48 | | | $ | 431.37 | | | $ | (1.11 | ) | | | -0.3 | % |
12 | | | 0 | | | | 4,500 | | | $ | 484.82 | | | $ | 483.57 | | | $ | (1.25 | ) | | | -0.3 | % |
13 | | | 0 | | | | 5,000 | | | $ | 537.15 | | | $ | 535.76 | | | $ | (1.39 | ) | | | -0.3 | % |
14 | | | 0 | | | | 5,500 | | | $ | 589.49 | | | $ | 587.96 | | | $ | (1.53 | ) | | | -0.3 | % |
15 | | | 0 | | | | 6,000 | | | $ | 641.82 | | | $ | 640.15 | | | $ | (1.67 | ) | | | -0.3 | % |
16 | | | 0 | | | | 6,500 | | | $ | 694.16 | | | $ | 692.35 | | | $ | (1.81 | ) | | | -0.3 | % |
17 | | | 0 | | | | 7,000 | | | $ | 746.49 | | | $ | 744.55 | | | $ | (1.95 | ) | | | -0.3 | % |
18 | | | 0 | | | | 7,500 | | | $ | 798.83 | | | $ | 796.74 | | | $ | (2.09 | ) | | | -0.3 | % |
19 | | | 0 | | | | 8,000 | | | $ | 851.16 | | | $ | 848.94 | | | $ | (2.22 | ) | | | -0.3 | % |
20 | | | 0 | | | | 8,500 | | | $ | 903.50 | | | $ | 901.13 | | | $ | (2.36 | ) | | | -0.3 | % |
21 | | | 0 | | | | 9,000 | | | $ | 955.83 | | | $ | 953.33 | | | $ | (2.50 | ) | | | -0.3 | % |
22 | | | 0 | | | | 9,500 | | | $ | 1,008.17 | | | $ | 1,005.52 | | | $ | (2.64 | ) | | | -0.3 | % |
23 | | | 0 | | | | 10,000 | | | $ | 1,060.50 | | | $ | 1,057.72 | | | $ | (2.78 | ) | | | -0.3 | % |
24 | | | 0 | | | | 10,500 | | | $ | 1,112.84 | | | $ | 1,109.92 | | | $ | (2.92 | ) | | | -0.3 | % |
25 | | | 0 | | | | 11,000 | | | $ | 1,165.17 | | | $ | 1,162.11 | | | $ | (3.06 | ) | | | -0.3 | % |
26 | | | 0 | | | | 11,500 | | | $ | 1,217.50 | | | $ | 1,214.31 | | | $ | (3.20 | ) | | | -0.3 | % |
27 | | | 0 | | | | 12,000 | | | $ | 1,269.84 | | | $ | 1,266.50 | | | $ | (3.34 | ) | | | -0.3 | % |
28 | | | 0 | | | | 12,500 | | | $ | 1,322.17 | | | $ | 1,318.70 | | | $ | (3.47 | ) | | | -0.3 | % |
29 | | | 0 | | | | 13,000 | | | $ | 1,374.51 | | | $ | 1,370.90 | | | $ | (3.61 | ) | | | -0.3 | % |
30 | | | 0 | | | | 13,500 | | | $ | 1,426.84 | | | $ | 1,423.09 | | | $ | (3.75 | ) | | | -0.3 | % |
31 | | | 0 | | | | 14,000 | | | $ | 1,479.18 | | | $ | 1,475.29 | | | $ | (3.89 | ) | | | -0.3 | % |
32 | | | 0 | | | | 14,500 | | | $ | 1,531.51 | | | $ | 1,527.48 | | | $ | (4.03 | ) | | | -0.3 | % |
33 | | | 0 | | | | 15,000 | | | $ | 1,583.85 | | | $ | 1,579.68 | | | $ | (4.17 | ) | | | -0.3 | % |
34 | | | 0 | | | | 15,500 | | | $ | 1,635.90 | | | $ | 1,631.59 | | | $ | (4.31 | ) | | | -0.3 | % |
35 | | | 0 | | | | 16,000 | | | $ | 1,687.96 | | | $ | 1,682.55 | | | $ | (5.41 | ) | | | -0.3 | % |
36 | | | 0 | | | | 16,500 | | | $ | 1,740.01 | | | $ | 1,735.42 | | | $ | (4.59 | ) | | | -0.3 | % |
37 | | | 0 | | | | 17,000 | | | $ | 1,792.07 | | | $ | 1,787.34 | | | $ | (4.73 | ) | | | -0.3 | % |
38 | | | 0 | | | | 17,500 | | | $ | 1,844.12 | | | $ | 1,839.25 | | | $ | (4.86 | ) | | | -0.3 | % |
Exhibit G
OE - Page 4 of 26
Ohio Edison Company
Case No. 12-1465-EL-ATS
Estimated Typical Bills - Comparison (Q2 2012 vs. Q2 2012 w/ Securitization)
| | | | | | | | | | | | | | | | | | | | | | | | |
Bill Data | |
Line
No. | | Level of
Demand
(kW)
(A) | | | Level of
Usage
(kWH)
(B) | | | Current
Summer Bill
($)
(C) | | | Proposed
Summer Bill
($)
(D) | | | Dollar
Increase
($)
(E) | | | Percent
Increase
(%)
(E) | |
Residential Service - Standard (Rate RS) | | | | | | | | | | | | | |
1 | | | 0 | | | | 250 | | | $ | 37.03 | | | $ | 36.96 | | | $ | (0.07 | ) | | | -0.2 | % |
2 | | | 0 | | | | 500 | | | $ | 70.02 | | | $ | 69.88 | | | $ | (0.14 | ) | | | -0.2 | % |
3 | | | 0 | | | | 750 | | | $ | 103.01 | | | $ | 102.81 | | | $ | (0.21 | ) | | | -0.2 | % |
4 | | | 0 | | | | 1,000 | | | $ | 136.01 | | | $ | 135.73 | | | $ | (0.28 | ) | | | -0.2 | % |
5 | | | 0 | | | | 1,250 | | | $ | 169.00 | | | $ | 168.66 | | | $ | (0.35 | ) | | | -0.2 | % |
6 | | | 0 | | | | 1,500 | | | $ | 202.00 | | | $ | 201.58 | | | $ | (0.42 | ) | | | -0.2 | % |
7 | | | 0 | | | | 2,000 | | | $ | 267.99 | | | $ | 267.43 | | | $ | (0.56 | ) | | | -0.2 | % |
8 | | | 0 | | | | 2,500 | | | $ | 333.75 | | | $ | 333.05 | | | $ | (0.69 | ) | | | -0.2 | % |
9 | | | 0 | | | | 3,000 | | | $ | 399.50 | | | $ | 398.67 | | | $ | (0.83 | ) | | | -0.2 | % |
10 | | | 0 | | | | 3,500 | | | $ | 465.26 | | | $ | 464.29 | | | $ | (0.97 | ) | | | -0.2 | % |
11 | | | 0 | | | | 4,000 | | | $ | 531.02 | | | $ | 529.91 | | | $ | (1.11 | ) | | | -0.2 | % |
12 | | | 0 | | | | 4,500 | | | $ | 596.78 | | | $ | 595.53 | | | $ | (1.25 | ) | | | -0.2 | % |
13 | | | 0 | | | | 5,000 | | | $ | 662.54 | | | $ | 661.15 | | | $ | (1.39 | ) | | | -0.2 | % |
14 | | | 0 | | | | 5,500 | | | $ | 728.30 | | | $ | 726.77 | | | $ | (1.53 | ) | | | -0.2 | % |
15 | | | 0 | | | | 6,000 | | | $ | 794.05 | | | $ | 792.39 | | | $ | (1.67 | ) | | | -0.2 | % |
16 | | | 0 | | | | 6,500 | | | $ | 859.81 | | | $ | 858.00 | | | $ | (1.81 | ) | | | -0.2 | % |
17 | | | 0 | | | | 7,000 | | | $ | 925.57 | | | $ | 923.62 | | | $ | (1.95 | ) | | | -0.2 | % |
18 | | | 0 | | | | 7,500 | | | $ | 991.33 | | | $ | 989.24 | | | $ | (2.09 | ) | | | -0.2 | % |
19 | | | 0 | | | | 8,000 | | | $ | 1,057.09 | | | $ | 1,054.86 | | | $ | (2.22 | ) | | | -0.2 | % |
20 | | | 0 | | | | 8,500 | | | $ | 1,122.85 | | | $ | 1,120.48 | | | $ | (2.36 | ) | | | -0.2 | % |
21 | | | 0 | | | | 9,000 | | | $ | 1,188.60 | | | $ | 1,186.10 | | | $ | (2.50 | ) | | | -0.2 | % |
22 | | | 0 | | | | 9,500 | | | $ | 1,254.36 | | | $ | 1,251.72 | | | $ | (2.64 | ) | | | -0.2 | % |
23 | | | 0 | | | | 10,000 | | | $ | 1,320.12 | | | $ | 1,317.34 | | | $ | (2.78 | ) | | | -0.2 | % |
24 | | | 0 | | | | 10,500 | | | $ | 1,385.88 | | | $ | 1,382.96 | | | $ | (2.92 | ) | | | -0.2 | % |
25 | | | 0 | | | | 11,000 | | | $ | 1,451.64 | | | $ | 1,448.58 | | | $ | (3.06 | ) | | | -0.2 | % |
26 | | | 0 | | | | 11,500 | | | $ | 1,517.40 | | | $ | 1,514.20 | | | $ | (3.20 | ) | | | -0.2 | % |
27 | | | 0 | | | | 12,000 | | | $ | 1,583.15 | | | $ | 1,579.82 | | | $ | (3.34 | ) | | | -0.2 | % |
28 | | | 0 | | | | 12,500 | | | $ | 1,648.91 | | | $ | 1,645.44 | | | $ | (3.47 | ) | | | -0.2 | % |
29 | | | 0 | | | | 13,000 | | | $ | 1,714.67 | | | $ | 1,711.06 | | | $ | (3.61 | ) | | | -0.2 | % |
30 | | | 0 | | | | 13,500 | | | $ | 1,780.43 | | | $ | 1,776.68 | | | $ | (3.75 | ) | | | -0.2 | % |
31 | | | 0 | | | | 14,000 | | | $ | 1,846.19 | | | $ | 1,842.30 | | | $ | (3.89 | ) | | | -0.2 | % |
32 | | | 0 | | | | 14,500 | | | $ | 1,911.95 | | | $ | 1,907.91 | | | $ | (4.03 | ) | | | -0.2 | % |
33 | | | 0 | | | | 15,000 | | | $ | 1,977.70 | | | $ | 1,973.53 | | | $ | (4.17 | ) | | | -0.2 | % |
34 | | | 0 | | | | 15,500 | | | $ | 2,043.18 | | | $ | 2,038.87 | | | $ | (4.31 | ) | | | -0.2 | % |
35 | | | 0 | | | | 16,000 | | | $ | 2,108.66 | | | $ | 2,103.25 | | | $ | (5.41 | ) | | | -0.3 | % |
36 | | | 0 | | | | 16,500 | | | $ | 2,174.14 | | | $ | 2,169.55 | | | $ | (4.59 | ) | | | -0.2 | % |
37 | | | 0 | | | | 17,000 | | | $ | 2,239.61 | | | $ | 2,234.89 | | | $ | (4.73 | ) | | | -0.2 | % |
38 | | | 0 | | | | 17,500 | | | $ | 2,305.09 | | | $ | 2,300.23 | | | $ | (4.86 | ) | | | -0.2 | % |
Exhibit G
OE - Page 5 of 26
Ohio Edison Company
Case No. 12-1465-EL-ATS
Estimated Typical Bills - Comparison (Q2 2012 vs. Q2 2012 w/ Securitization)
| | | | | | | | | | | | | | | | | | | | | | | | |
Bill Data | |
Line No. | | Level of
Demand
(kW)
(A) | | | Level of
Usage
(kWH)
(B) | | | Current
Summer Bill
($)
(C) | | | Proposed
Summer Bill
($)
(D) | | | Dollar
Increase
($)
(E) | | | Percent
Increase
(%)
(E) | |
Residential Service - Electric Heating (Rate RS) | | | | | | | | | | | | | |
1 | | | 0 | | | | 250 | | | $ | 37.03 | | | $ | 36.96 | | | $ | (0.07 | ) | | | -0.2 | % |
2 | | | 0 | | | | 500 | | | $ | 70.02 | | | $ | 69.88 | | | $ | (0.14 | ) | | | -0.2 | % |
3 | | | 0 | | | | 750 | | | $ | 93.84 | | | $ | 93.63 | | | $ | (0.21 | ) | | | -0.2 | % |
4 | | | 0 | | | | 1,000 | | | $ | 117.66 | | | $ | 117.38 | | | $ | (0.28 | ) | | | -0.2 | % |
5 | | | 0 | | | | 1,250 | | | $ | 141.48 | | | $ | 141.13 | | | $ | (0.35 | ) | | | -0.2 | % |
6 | | | 0 | | | | 1,500 | | | $ | 165.30 | | | $ | 164.88 | | | $ | (0.42 | ) | | | -0.3 | % |
7 | | | 0 | | | | 2,000 | | | $ | 212.94 | | | $ | 212.38 | | | $ | (0.56 | ) | | | -0.3 | % |
8 | | | 0 | | | | 2,500 | | | $ | 260.35 | | | $ | 259.65 | | | $ | (0.69 | ) | | | -0.3 | % |
9 | | | 0 | | | | 3,000 | | | $ | 307.75 | | | $ | 306.92 | | | $ | (0.83 | ) | | | -0.3 | % |
10 | | | 0 | | | | 3,500 | | | $ | 355.16 | | | $ | 354.19 | | | $ | (0.97 | ) | | | -0.3 | % |
11 | | | 0 | | | | 4,000 | | | $ | 402.57 | | | $ | 401.46 | | | $ | (1.11 | ) | | | -0.3 | % |
12 | | | 0 | | | | 4,500 | | | $ | 449.98 | | | $ | 448.73 | | | $ | (1.25 | ) | | | -0.3 | % |
13 | | | 0 | | | | 5,000 | | | $ | 497.39 | | | $ | 496.00 | | | $ | (1.39 | ) | | | -0.3 | % |
14 | | | 0 | | | | 5,500 | | | $ | 544.80 | | | $ | 543.27 | | | $ | (1.53 | ) | | | -0.3 | % |
15 | | | 0 | | | | 6,000 | | | $ | 592.20 | | | $ | 590.54 | | | $ | (1.67 | ) | | | -0.3 | % |
16 | | | 0 | | | | 6,500 | | | $ | 639.61 | | | $ | 637.80 | | | $ | (1.81 | ) | | | -0.3 | % |
17 | | | 0 | | | | 7,000 | | | $ | 687.02 | | | $ | 685.07 | | | $ | (1.95 | ) | | | -0.3 | % |
18 | | | 0 | | | | 7,500 | | | $ | 734.43 | | | $ | 732.34 | | | $ | (2.09 | ) | | | -0.3 | % |
19 | | | 0 | | | | 8,000 | | | $ | 781.84 | | | $ | 779.61 | | | $ | (2.22 | ) | | | -0.3 | % |
20 | | | 0 | | | | 8,500 | | | $ | 829.25 | | | $ | 826.88 | | | $ | (2.36 | ) | | | -0.3 | % |
21 | | | 0 | | | | 9,000 | | | $ | 876.65 | | | $ | 874.15 | | | $ | (2.50 | ) | | | -0.3 | % |
22 | | | 0 | | | | 9,500 | | | $ | 924.06 | | | $ | 921.42 | | | $ | (2.64 | ) | | | -0.3 | % |
23 | | | 0 | | | | 10,000 | | | $ | 971.47 | | | $ | 968.69 | | | $ | (2.78 | ) | | | -0.3 | % |
24 | | | 0 | | | | 10,500 | | | $ | 1,018.88 | | | $ | 1,015.96 | | | $ | (2.92 | ) | | | -0.3 | % |
25 | | | 0 | | | | 11,000 | | | $ | 1,066.29 | | | $ | 1,063.23 | | | $ | (3.06 | ) | | | -0.3 | % |
26 | | | 0 | | | | 11,500 | | | $ | 1,113.70 | | | $ | 1,110.50 | | | $ | (3.20 | ) | | | -0.3 | % |
27 | | | 0 | | | | 12,000 | | | $ | 1,161.10 | | | $ | 1,157.77 | | | $ | (3.34 | ) | | | -0.3 | % |
28 | | | 0 | | | | 12,500 | | | $ | 1,208.51 | | | $ | 1,205.04 | | | $ | (3.47 | ) | | | -0.3 | % |
29 | | | 0 | | | | 13,000 | | | $ | 1,255.92 | | | $ | 1,252.31 | | | $ | (3.61 | ) | | | -0.3 | % |
30 | | | 0 | | | | 13,500 | | | $ | 1,303.33 | | | $ | 1,299.58 | | | $ | (3.75 | ) | | | -0.3 | % |
31 | | | 0 | | | | 14,000 | | | $ | 1,350.74 | | | $ | 1,346.85 | | | $ | (3.89 | ) | | | -0.3 | % |
32 | | | 0 | | | | 14,500 | | | $ | 1,398.15 | | | $ | 1,394.11 | | | $ | (4.03 | ) | | | -0.3 | % |
33 | | | 0 | | | | 15,000 | | | $ | 1,445.55 | | | $ | 1,441.38 | | | $ | (4.17 | ) | | | -0.3 | % |
34 | | | 0 | | | | 15,500 | | | $ | 1,492.68 | | | $ | 1,488.37 | | | $ | (4.31 | ) | | | -0.3 | % |
35 | | | 0 | | | | 16,000 | | | $ | 1,539.81 | | | $ | 1,534.40 | | | $ | (5.41 | ) | | | -0.4 | % |
36 | | | 0 | | | | 16,500 | | | $ | 1,586.94 | | | $ | 1,582.35 | | | $ | (4.59 | ) | | | -0.3 | % |
37 | | | 0 | | | | 17,000 | | | $ | 1,634.06 | | | $ | 1,629.34 | | | $ | (4.73 | ) | | | -0.3 | % |
38 | | | 0 | | | | 17,500 | | | $ | 1,681.19 | | | $ | 1,676.33 | | | $ | (4.86 | ) | | | -0.3 | % |
Exhibit G
OE - Page 6 of 26
Ohio Edison Company
Case No. 12-1465-EL-ATS
Estimated Typical Bills - Comparison (Q2 2012 vs. Q2 2012 w/ Securitization)
| | | | | | | | | | | | | | | | | | | | | | | | |
Bill Data | |
Line No. | | Level of
Demand
(kW)
(A) | | | Level of
Usage
(kWH)
(B) | | | Current
Summer Bill
($)
(C) | | | Proposed
Summer Bill
($)
(D) | | | Dollar
Increase
($)
(E) | | | Percent
Increase
(%)
(E) | |
Residential Service - Water Heating (Rate RS) | | | | | | | | | |
1 | | | 0 | | | | 250 | | | $ | 37.03 | | | $ | 36.96 | | | $ | (0.07 | ) | | | -0.2 | % |
2 | | | 0 | | | | 500 | | | $ | 70.02 | | | $ | 69.88 | | | $ | (0.14 | ) | | | -0.2 | % |
3 | | | 0 | | | | 750 | | | $ | 98.59 | | | $ | 98.38 | | | $ | (0.21 | ) | | | -0.2 | % |
4 | | | 0 | | | | 1,000 | | | $ | 127.16 | | | $ | 126.88 | | | $ | (0.28 | ) | | | -0.2 | % |
5 | | | 0 | | | | 1,250 | | | $ | 155.73 | | | $ | 155.38 | | | $ | (0.35 | ) | | | -0.2 | % |
6 | | | 0 | | | | 1,500 | | | $ | 184.30 | | | $ | 183.88 | | | $ | (0.42 | ) | | | -0.2 | % |
7 | | | 0 | | | | 2,000 | | | $ | 241.44 | | | $ | 240.88 | | | $ | (0.56 | ) | | | -0.2 | % |
8 | | | 0 | | | | 2,500 | | | $ | 298.35 | | | $ | 297.65 | | | $ | (0.69 | ) | | | -0.2 | % |
9 | | | 0 | | | | 3,000 | | | $ | 355.25 | | | $ | 354.42 | | | $ | (0.83 | ) | | | -0.2 | % |
10 | | | 0 | | | | 3,500 | | | $ | 412.16 | | | $ | 411.19 | | | $ | (0.97 | ) | | | -0.2 | % |
11 | | | 0 | | | | 4,000 | | | $ | 469.07 | | | $ | 467.96 | | | $ | (1.11 | ) | | | -0.2 | % |
12 | | | 0 | | | | 4,500 | | | $ | 525.98 | | | $ | 524.73 | | | $ | (1.25 | ) | | | -0.2 | % |
13 | | | 0 | | | | 5,000 | | | $ | 582.89 | | | $ | 581.50 | | | $ | (1.39 | ) | | | -0.2 | % |
14 | | | 0 | | | | 5,500 | | | $ | 639.80 | | | $ | 638.27 | | | $ | (1.53 | ) | | | -0.2 | % |
15 | | | 0 | | | | 6,000 | | | $ | 696.70 | | | $ | 695.04 | | | $ | (1.67 | ) | | | -0.2 | % |
16 | | | 0 | | | | 6,500 | | | $ | 753.61 | | | $ | 751.80 | | | $ | (1.81 | ) | | | -0.2 | % |
17 | | | 0 | | | | 7,000 | | | $ | 810.52 | | | $ | 808.57 | | | $ | (1.95 | ) | | | -0.2 | % |
18 | | | 0 | | | | 7,500 | | | $ | 867.43 | | | $ | 865.34 | | | $ | (2.09 | ) | | | -0.2 | % |
19 | | | 0 | | | | 8,000 | | | $ | 924.34 | | | $ | 922.11 | | | $ | (2.22 | ) | | | -0.2 | % |
20 | | | 0 | | | | 8,500 | | | $ | 981.25 | | | $ | 978.88 | | | $ | (2.36 | ) | | | -0.2 | % |
21 | | | 0 | | | | 9,000 | | | $ | 1,038.15 | | | $ | 1,035.65 | | | $ | (2.50 | ) | | | -0.2 | % |
22 | | | 0 | | | | 9,500 | | | $ | 1,095.06 | | | $ | 1,092.42 | | | $ | (2.64 | ) | | | -0.2 | % |
23 | | | 0 | | | | 10,000 | | | $ | 1,151.97 | | | $ | 1,149.19 | | | $ | (2.78 | ) | | | -0.2 | % |
24 | | | 0 | | | | 10,500 | | | $ | 1,208.88 | | | $ | 1,205.96 | | | $ | (2.92 | ) | | | -0.2 | % |
25 | | | 0 | | | | 11,000 | | | $ | 1,265.79 | | | $ | 1,262.73 | | | $ | (3.06 | ) | | | -0.2 | % |
26 | | | 0 | | | | 11,500 | | | $ | 1,322.70 | | | $ | 1,319.50 | | | $ | (3.20 | ) | | | -0.2 | % |
27 | | | 0 | | | | 12,000 | | | $ | 1,379.60 | | | $ | 1,376.27 | | | $ | (3.34 | ) | | | -0.2 | % |
28 | | | 0 | | | | 12,500 | | | $ | 1,436.51 | | | $ | 1,433.04 | | | $ | (3.47 | ) | | | -0.2 | % |
29 | | | 0 | | | | 13,000 | | | $ | 1,493.42 | | | $ | 1,489.81 | | | $ | (3.61 | ) | | | -0.2 | % |
30 | | | 0 | | | | 13,500 | | | $ | 1,550.33 | | | $ | 1,546.58 | | | $ | (3.75 | ) | | | -0.2 | % |
31 | | | 0 | | | | 14,000 | | | $ | 1,607.24 | | | $ | 1,603.35 | | | $ | (3.89 | ) | | | -0.2 | % |
32 | | | 0 | | | | 14,500 | | | $ | 1,664.15 | | | $ | 1,660.11 | | | $ | (4.03 | ) | | | -0.2 | % |
33 | | | 0 | | | | 15,000 | | | $ | 1,721.05 | | | $ | 1,716.88 | | | $ | (4.17 | ) | | | -0.2 | % |
34 | | | 0 | | | | 15,500 | | | $ | 1,777.68 | | | $ | 1,773.37 | | | $ | (4.31 | ) | | | -0.2 | % |
35 | | | 0 | | | | 16,000 | | | $ | 1,834.31 | | | $ | 1,828.90 | | | $ | (5.41 | ) | | | -0.3 | % |
36 | | | 0 | | | | 16,500 | | | $ | 1,890.94 | | | $ | 1,886.35 | | | $ | (4.59 | ) | | | -0.2 | % |
37 | | | 0 | | | | 17,000 | | | $ | 1,947.56 | | | $ | 1,942.84 | | | $ | (4.73 | ) | | | -0.2 | % |
38 | | | 0 | | | | 17,500 | | | $ | 2,004.19 | | | $ | 1,999.33 | | | $ | (4.86 | ) | | | -0.2 | % |
Exhibit G
OE - Page 7 of 26
Ohio Edison Company
Case No. 12-1465-EL-ATS
Estimated Typical Bills - Comparison (Q2 2012 vs. Q2 2012 w/ Securitization)
| | | | | | | | | | | | | | | | | | | | | | | | |
Bill Data | |
Line
No. | | Level of
Demand
(kW)
(A) | | | Level of
Usage
(kWH)
(B) | | | Current
Winter Bill
($)
(C) | | | Proposed
Winter Bill
($)
(D) | | | Dollar
Increase
(D)-(C)
(E) | | | Percent
Increase
(E)/(C)
(F) | |
General Service Secondary (Rate GS) | | | | | | | | | | | | | |
1 | | | 10 | | | | 1,000 | | | $ | 149.00 | | | $ | 148.97 | | | $ | (0.03 | ) | | | 0.0 | % |
2 | | | 10 | | | | 2,000 | | | $ | 226.58 | | | $ | 226.53 | | | $ | (0.06 | ) | | | 0.0 | % |
3 | | | 10 | | | | 3,000 | | | $ | 303.71 | | | $ | 303.62 | | | $ | (0.09 | ) | | | 0.0 | % |
4 | | | 10 | | | | 4,000 | | | $ | 380.84 | | | $ | 380.73 | | | $ | (0.12 | ) | | | 0.0 | % |
5 | | | 10 | | | | 5,000 | | | $ | 457.98 | | | $ | 457.83 | | | $ | (0.14 | ) | | | 0.0 | % |
6 | | | 10 | | | | 6,000 | | | $ | 535.08 | | | $ | 534.91 | | | $ | (0.17 | ) | | | 0.0 | % |
7 | | | 1,000 | | | | 100,000 | | | $ | 15,534.93 | | | $ | 15,532.03 | | | $ | (2.90 | ) | | | 0.0 | % |
8 | | | 1,000 | | | | 200,000 | | | $ | 23,191.57 | | | $ | 23,185.77 | | | $ | (5.80 | ) | | | 0.0 | % |
9 | | | 1,000 | | | | 300,000 | | | $ | 30,848.21 | | | $ | 30,839.51 | | | $ | (8.70 | ) | | | 0.0 | % |
10 | | | 1,000 | | | | 400,000 | | | $ | 38,504.84 | | | $ | 38,493.24 | | | $ | (11.60 | ) | | | 0.0 | % |
11 | | | 1,000 | | | | 500,000 | | | $ | 46,161.48 | | | $ | 46,146.98 | | | $ | (14.50 | ) | | | 0.0 | % |
12 | | | 1,000 | | | | 600,000 | | | $ | 53,818.11 | | | $ | 53,800.71 | | | $ | (17.40 | ) | | | 0.0 | % |
Exhibit G
OE - Page 8 of 26
Ohio Edison Company
Case No. 12-1465-EL-ATS
Estimated Typical Bills - Comparison (Q2 2012 vs. Q2 2012 w/ Securitization)
| | | | | | | | | | | | | | | | | | | | | | | | |
Bill Data | |
Line
No. | | Level of
Demand
(kW)
(A) | | | Level of
Usage
(kWH)
(B) | | | Current
Winter Bill
($)
(C) | | | Proposed
Winter Bill
($)
(D) | | | Dollar
Increase
(D)-(C)
(E) | | | Percent
Increase
(E)/(C)
(F) | |
General Service Primary (Rate GP) | | | | | | | | | | | | | |
1 | | | 500 | | | | 50,000 | | | $ | 5,978.56 | | | $ | 5,977.11 | | | $ | (1.45 | ) | | | 0.0 | % |
2 | | | 500 | | | | 100,000 | | | $ | 9,459.58 | | | $ | 9,456.68 | | | $ | (2.90 | ) | | | 0.0 | % |
3 | | | 500 | | | | 150,000 | | | $ | 12,940.60 | | | $ | 12,936.25 | | | $ | (4.35 | ) | | | 0.0 | % |
4 | | | 500 | | | | 200,000 | | | $ | 16,421.62 | | | $ | 16,415.82 | | | $ | (5.80 | ) | | | 0.0 | % |
5 | | | 500 | | | | 250,000 | | | $ | 19,902.63 | | | $ | 19,895.38 | | | $ | (7.25 | ) | | | 0.0 | % |
6 | | | 500 | | | | 300,000 | | | $ | 23,383.65 | | | $ | 23,374.95 | | | $ | (8.70 | ) | | | 0.0 | % |
7 | | | 5,000 | | | | 500,000 | | | $ | 58,330.38 | | | $ | 58,315.88 | | | $ | (14.50 | ) | | | 0.0 | % |
8 | | | 5,000 | | | | 1,000,000 | | | $ | 92,617.21 | | | $ | 92,588.21 | | | $ | (29.00 | ) | | | 0.0 | % |
9 | | | 5,000 | | | | 1,500,000 | | | $ | 125,860.49 | | | $ | 125,816.99 | | | $ | (43.50 | ) | | | 0.0 | % |
10 | | | 5,000 | | | | 2,000,000 | | | $ | 159,103.77 | | | $ | 159,045.77 | | | $ | (58.00 | ) | | | 0.0 | % |
11 | | | 5,000 | | | | 2,500,000 | | | $ | 192,347.06 | | | $ | 192,274.56 | | | $ | (72.50 | ) | | | 0.0 | % |
12 | | | 5,000 | | | | 3,000,000 | | | $ | 225,590.34 | | | $ | 225,503.34 | | | $ | (87.00 | ) | | | 0.0 | % |
Exhibit G
OE - Page 9 of 26
Ohio Edison Company
Case No. 12-1465-EL-ATS
Estimated Typical Bills - Comparison (Q2 2012 vs. Q2 2012 w/ Securitization)
| | | | | | | | | | | | | | | | | | | | | | | | |
Bill Data | |
Line
No. | | Level of
Demand
(kW)
(A) | | | Level of
Usage
(kWH)
(B) | | | Current
Winter Bill
($)
(C) | | | Proposed
Winter Bill
($)
(D) | | | Dollar
Increase
(D)-(C)
(E) | | | Percent
Increase
(E)/(C)
(F) | |
General Service Subtransmission (Rate GSU) | | | | | | | | | | | | | |
1 | | | 1,000 | | | | 100,000 | | | $ | 9,257.49 | | | $ | 9,254.59 | | | $ | (2.90 | ) | | | 0.0 | % |
2 | | | 1,000 | | | | 200,000 | | | $ | 15,847.43 | | | $ | 15,841.63 | | | $ | (5.80 | ) | | | 0.0 | % |
3 | | | 1,000 | | | | 300,000 | | | $ | 22,437.36 | | | $ | 22,428.66 | | | $ | (8.70 | ) | | | 0.0 | % |
4 | | | 1,000 | | | | 400,000 | | | $ | 29,027.30 | | | $ | 29,015.70 | | | $ | (11.60 | ) | | | 0.0 | % |
5 | | | 1,000 | | | | 500,000 | | | $ | 35,617.24 | | | $ | 35,602.74 | | | $ | (14.50 | ) | | | 0.0 | % |
6 | | | 1,000 | | | | 600,000 | | | $ | 42,207.17 | | | $ | 42,189.77 | | | $ | (17.40 | ) | | | 0.0 | % |
7 | | | 10,000 | | | | 1,000,000 | | | $ | 90,146.35 | | | $ | 90,117.35 | | | $ | (29.00 | ) | | | 0.0 | % |
8 | | | 10,000 | | | | 2,000,000 | | | $ | 152,911.91 | | | $ | 152,853.91 | | | $ | (58.00 | ) | | | 0.0 | % |
9 | | | 10,000 | | | | 3,000,000 | | | $ | 215,677.48 | | | $ | 215,590.48 | | | $ | (87.00 | ) | | | 0.0 | % |
10 | | | 10,000 | | | | 4,000,000 | | | $ | 278,443.04 | | | $ | 278,327.04 | | | $ | (116.00 | ) | | | 0.0 | % |
11 | | | 10,000 | | | | 5,000,000 | | | $ | 341,208.60 | | | $ | 341,063.60 | | | $ | (145.00 | ) | | | 0.0 | % |
12 | | | 10,000 | | | | 6,000,000 | | | $ | 403,974.17 | | | $ | 403,800.17 | | | $ | (174.00 | ) | | | 0.0 | % |
Exhibit G
OE - Page 10 of 26
Ohio Edison Company
Case No. 12-1465-EL-ATS
Estimated Typical Bills - Comparison (Q2 2012 vs. Q2 2012 w/ Securitization)
| | | | | | | | | | | | | | | | | | | | | | | | |
Bill Data | |
Line
No. | | Level of
Demand
(kW)
(A) | | | Level of
Usage
(kWH)
(B) | | | Current
Winter Bill
($)
(C) | | | Proposed
Winter Bill
($)
(D) | | | Dollar
Increase
(D)-(C)
(E) | | | Percent
Increase
(E)/(C)
(F) | |
General Service Transmission (Rate GT) | | | | | | | | | | | | | |
1 | | | 2,000 | | | | 200,000 | | | $ | 28,326.82 | | | $ | 28,321.02 | | | $ | (5.80 | ) | | | 0.0 | % |
2 | | | 2,000 | | | | 400,000 | | | $ | 37,071.69 | | | $ | 37,060.09 | | | $ | (11.60 | ) | | | 0.0 | % |
3 | | | 2,000 | | | | 600,000 | | | $ | 45,816.56 | | | $ | 45,799.16 | | | $ | (17.40 | ) | | | 0.0 | % |
4 | | | 2,000 | | | | 800,000 | | | $ | 54,561.43 | | | $ | 54,538.23 | | | $ | (23.20 | ) | | | 0.0 | % |
5 | | | 2,000 | | | | 1,000,000 | | | $ | 62,782.96 | | | $ | 62,753.96 | | | $ | (29.00 | ) | | | 0.0 | % |
6 | | | 2,000 | | | | 1,200,000 | | | $ | 70,901.07 | | | $ | 70,866.27 | | | $ | (34.80 | ) | | | 0.0 | % |
7 | | | 20,000 | | | | 2,000,000 | | | $ | 276,646.92 | | | $ | 276,588.92 | | | $ | (58.00 | ) | | | 0.0 | % |
8 | | | 20,000 | | | | 4,000,000 | | | $ | 357,828.05 | | | $ | 357,712.05 | | | $ | (116.00 | ) | | | 0.0 | % |
9 | | | 20,000 | | | | 6,000,000 | | | $ | 439,009.18 | | | $ | 438,835.18 | | | $ | (174.00 | ) | | | 0.0 | % |
10 | | | 20,000 | | | | 8,000,000 | | | $ | 520,190.30 | | | $ | 519,958.30 | | | $ | (232.00 | ) | | | 0.0 | % |
11 | | | 20,000 | | | | 10,000,000 | | | $ | 601,371.43 | | | $ | 601,081.43 | | | $ | (290.00 | ) | | | 0.0 | % |
12 | | | 20,000 | | | | 12,000,000 | | | $ | 682,552.55 | | | $ | 682,204.55 | | | $ | (348.00 | ) | | | -0.1 | % |
Exhibit G
OE - Page 11 of 26
Ohio Edison Company
Case No. 12-1465-EL-ATS
Estimated Typical Bills - Comparison (Q2 2012 vs. Q2 2012 w/ Securitization)
| | | | | | | | | | | | | | | | | | | | | | | | |
Bill Data | |
Line
No. | | Bulb Rating
(Lumens or
Watts)
(A) | | | Level of
Usage
(kWH)
(B) | | | Current
Winter Bill
($)
(C) | | | Proposed
Winter Bill
($)
(D) | | | Dollar
Increase
(D)-(C)
(E) | | | Percent
Increase
(E)/(C)
(F) | |
Street Lighting Service (Rate STL) | |
1 | | | Company Owned - Incandescent Lighting (a) | |
2 | | | 1,000 | | | | 24 | | | $ | 17.82 | | | $ | 17.82 | | | $ | (0.00 | ) | | | 0.0 | % |
3 | | | 2,000 | | | | 56 | | | $ | 19.30 | | | $ | 19.30 | | | $ | (0.00 | ) | | | 0.0 | % |
4 | | | 2,500 | | | | 70 | | | $ | 19.99 | | | $ | 19.99 | | | $ | (0.00 | ) | | | 0.0 | % |
5 | | | 4,000 | | | | 126 | | | $ | 22.60 | | | $ | 22.59 | | | $ | (0.00 | ) | | | 0.0 | % |
6 | | | 6,000 | | | | 157 | | | $ | 24.04 | | | $ | 24.04 | | | $ | (0.00 | ) | | | 0.0 | % |
7 | | | 10,000 | | | | 242 | | | $ | 28.01 | | | $ | 28.00 | | | $ | (0.01 | ) | | | 0.0 | % |
8 | | | 15,000 | | | | 282 | | | $ | 29.90 | | | $ | 29.89 | | | $ | (0.01 | ) | | | 0.0 | % |
9 | | | Company Owned - Mercury Street Lighting (b) | |
10 | | | Overhead Service - Wood Pole | |
11 | | | 100 | | | | 43 | | | $ | 7.82 | | | $ | 7.82 | | | $ | (0.00 | ) | | | 0.0 | % |
12 | | | 175 | | | | 69 | | | $ | 8.30 | | | $ | 8.30 | | | $ | (0.00 | ) | | | 0.0 | % |
13 | | | 250 | | | | 104 | | | $ | 10.13 | | | $ | 10.13 | | | $ | (0.00 | ) | | | 0.0 | % |
14 | | | 400 | | | | 158 | | | $ | 12.65 | | | $ | 12.65 | | | $ | (0.00 | ) | | | 0.0 | % |
15 | | | 700 | | | | 287 | | | $ | 19.16 | | | $ | 19.15 | | | $ | (0.01 | ) | | | 0.0 | % |
16 | | | 1,000 | | | | 380 | | | $ | 23.15 | | | $ | 23.14 | | | $ | (0.01 | ) | | | 0.0 | % |
17 | | | Overhead Service - Metal Pole | |
18 | | | 100 | | | | 43 | | | $ | 15.64 | | | $ | 15.64 | | | $ | (0.00 | ) | | | 0.0 | % |
19 | | | 175 | | | | 69 | | | $ | 16.18 | | | $ | 16.18 | | | $ | (0.00 | ) | | | 0.0 | % |
20 | | | 250 | | | | 104 | | | $ | 18.95 | | | $ | 18.95 | | | $ | (0.00 | ) | | | 0.0 | % |
21 | | | 250 | | | | 208 | | | $ | 26.89 | | | $ | 26.89 | | | $ | (0.01 | ) | | | 0.0 | % |
22 | | | 400 | | | | 158 | | | $ | 20.89 | | | $ | 20.89 | | | $ | (0.00 | ) | | | 0.0 | % |
23 | | | 400 | | | | 316 | | | $ | 31.57 | | | $ | 31.57 | | | $ | (0.01 | ) | | | 0.0 | % |
24 | | | 700 | | | | 287 | | | $ | 28.92 | | | $ | 28.91 | | | $ | (0.01 | ) | | | 0.0 | % |
25 | | | 1000 | | | | 380 | | | $ | 33.03 | | | $ | 33.02 | | | $ | (0.01 | ) | | | 0.0 | % |
26 | | | 1000 | | | | 760 | | | $ | 56.97 | | | $ | 56.94 | | | $ | (0.02 | ) | | | 0.0 | % |
27 | | | Underground Service - Post Type | |
28 | | | 100 | | | | 43 | | | $ | 10.66 | | | $ | 10.66 | | | $ | (0.00 | ) | | | 0.0 | % |
29 | | | 175 | | | | 69 | | | $ | 11.67 | | | $ | 11.67 | | | $ | (0.00 | ) | | | 0.0 | % |
30 | | | 250 | | | | 104 | | | $ | 14.55 | | | $ | 14.55 | | | $ | (0.00 | ) | | | 0.0 | % |
31 | | | Underground Service - Pole Type | |
32 | | | 100 | | | | 43 | | | $ | 18.04 | | | $ | 18.04 | | | $ | (0.00 | ) | | | 0.0 | % |
33 | | | 175 | | | | 69 | | | $ | 18.88 | | | $ | 18.88 | | | $ | (0.00 | ) | | | 0.0 | % |
34 | | | 250 | | | | 104 | | | $ | 23.35 | | | $ | 23.35 | | | $ | (0.00 | ) | | | 0.0 | % |
35 | | | 400 | | | | 158 | | | $ | 26.18 | | | $ | 26.18 | | | $ | (0.00 | ) | | | 0.0 | % |
36 | | | 700 | | | | 287 | | | $ | 50.86 | | | $ | 50.85 | | | $ | (0.01 | ) | | | 0.0 | % |
37 | | | 1000 | | | | 380 | | | $ | 54.68 | | | $ | 54.67 | | | $ | (0.01 | ) | | | 0.0 | % |
38 | | | 1000 | | | | 760 | | | $ | 76.93 | | | $ | 76.90 | | | $ | (0.02 | ) | | | 0.0 | % |
Exhibit G
OE - Page 12 of 26
Ohio Edison Company
Case No. 12-1465-EL-ATS
Estimated Typical Bills - Comparison (Q2 2012 vs. Q2 2012 w/ Securitization)
| | | | | | | | | | | | | | | | | | | | | | | | |
Bill Data | |
Line
No. | | Bulb Rating
(Lumens or
Watts)
(A) | | | Level of
Usage
(kWH)
(B) | | | Current
Winter Bill
($)
(C) | | | Proposed
Winter Bill
($)
(D) | | | Dollar
Increase
(D)-(C)
(E) | | | Percent
Increase
(E)/(C)
(F) | |
Street Lighting Service (Rate STL) | |
39 | | | Bridge or Underpass Wallpack | |
40 | | | 175 | | | | 69 | | | $ | 10.73 | | | $ | 10.73 | | | $ | (0.00 | ) | | | 0.0 | % |
41 | | | 250 | | | | 104 | | | $ | 12.79 | | �� | $ | 12.79 | | | $ | (0.00 | ) | | | 0.0 | % |
42 | | | Company Owned - High Pressure Sodium Lighting (c) | |
43 | | | Overhead Service - Wood Pole | |
44 | | | 70 | | | | 29 | | | $ | 7.72 | | | $ | 7.72 | | | $ | (0.00 | ) | | | 0.0 | % |
45 | | | 100 | | | | 42 | | | $ | 8.01 | | | $ | 8.01 | | | $ | (0.00 | ) | | | 0.0 | % |
46 | | | 150 | | | | 62 | | | $ | 8.58 | | | $ | 8.58 | | | $ | (0.00 | ) | | | 0.0 | % |
47 | | | 215 | | | | 89 | | | $ | 10.04 | | | $ | 10.04 | | | $ | (0.00 | ) | | | 0.0 | % |
48 | | | 250 | | | | 105 | | | $ | 10.43 | | | $ | 10.43 | | | $ | (0.00 | ) | | | 0.0 | % |
49 | | | 400 | | | | 163 | | | $ | 13.10 | | | $ | 13.10 | | | $ | (0.00 | ) | | | 0.0 | % |
50 | | | 1000 | | | | 410 | | | $ | 26.98 | | | $ | 26.97 | | | $ | (0.01 | ) | | | 0.0 | % |
51 | | | Overhead Service - Metal Pole | |
52 | | | 70 | | | | 29 | | | $ | 15.51 | | | $ | 15.51 | | | $ | (0.00 | ) | | | 0.0 | % |
53 | | | 100 | | | | 42 | | | $ | 15.84 | | | $ | 15.84 | | | $ | (0.00 | ) | | | 0.0 | % |
54 | | | 150 | | | | 62 | | | $ | 17.45 | | | $ | 17.45 | | | $ | (0.00 | ) | | | 0.0 | % |
55 | | | 215 | | | | 89 | | | $ | 18.83 | | | $ | 18.83 | | | $ | (0.00 | ) | | | 0.0 | % |
56 | | | 250 | | | | 105 | | | $ | 19.23 | | | $ | 19.23 | | | $ | (0.00 | ) | | | 0.0 | % |
57 | | | 400 | | | | 163 | | | $ | 22.91 | | | $ | 22.91 | | | $ | (0.00 | ) | | | 0.0 | % |
58 | | | 1000 | | | | 410 | | | $ | 35.95 | | | $ | 35.94 | | | $ | (0.01 | ) | | | 0.0 | % |
59 | | | Underground Service - Post Type | |
60 | | | 70 | | | | 29 | | | $ | 10.82 | | | $ | 10.82 | | | $ | (0.00 | ) | | | 0.0 | % |
61 | | | 100 | | | | 42 | | | $ | 11.45 | | | $ | 11.45 | | | $ | (0.00 | ) | | | 0.0 | % |
62 | | | 150 | | | | 62 | | | $ | 12.67 | | | $ | 12.67 | | | $ | (0.00 | ) | | | 0.0 | % |
63 | | | Underground Service - Pole Type | |
64 | | | 70 | | | | 29 | | | $ | 17.81 | | | $ | 17.81 | | | $ | (0.00 | ) | | | 0.0 | % |
65 | | | 100 | | | | 42 | | | $ | 18.43 | | | $ | 18.43 | | | $ | (0.00 | ) | | | 0.0 | % |
66 | | | 150 | | | | 62 | | | $ | 21.87 | | | $ | 21.87 | | | $ | (0.00 | ) | | | 0.0 | % |
67 | | | 200 | | | | 88 | | | $ | 23.78 | | | $ | 23.78 | | | $ | (0.00 | ) | | | 0.0 | % |
68 | | | 215 | | | | 89 | | | $ | 21.43 | | | $ | 21.43 | | | $ | (0.00 | ) | | | 0.0 | % |
69 | | | 250 | | | | 105 | | | $ | 24.37 | | | $ | 24.37 | | | $ | (0.00 | ) | | | 0.0 | % |
70 | | | 310 | | | | 128 | | | $ | 26.41 | | | $ | 26.40 | | | $ | (0.00 | ) | | | 0.0 | % |
71 | | | 400 | | | | 163 | | | $ | 44.78 | | | $ | 44.78 | | | $ | (0.00 | ) | | | 0.0 | % |
72 | | | 400 | | | | 326 | | | $ | 56.70 | | | $ | 56.69 | | | $ | (0.01 | ) | | | 0.0 | % |
73 | | | 1000 | | | | 410 | | | $ | 59.74 | | | $ | 59.73 | | | $ | (0.01 | ) | | | 0.0 | % |
74 | | | Bridge or Underpass Wallpack | |
75 | | | 70 | | | | 29 | | | $ | 11.38 | | | $ | 11.38 | | | $ | (0.00 | ) | | | 0.0 | % |
76 | | | 100 | | | | 42 | | | $ | 12.70 | | | $ | 12.70 | | | $ | (0.00 | ) | | | 0.0 | % |
77 | | | 150 | | | | 62 | | | $ | 13.42 | | | $ | 13.42 | | | $ | (0.00 | ) | | | 0.0 | % |
78 | | | 215 | | | | 89 | | | $ | 13.34 | | | $ | 13.34 | | | $ | (0.00 | ) | | | 0.0 | % |
79 | | | 250 | | | | 105 | | | $ | 15.85 | | | $ | 15.85 | | | $ | (0.00 | ) | | | 0.0 | % |
Exhibit G
OE - Page 13 of 26
Ohio Edison Company
Case No. 12-1465-EL-ATS
Estimated Typical Bills - Comparison (Q2 2012 vs. Q2 2012 w/ Securitization)
| | | | | | | | | | | | | | | | | | | | | | | | |
Bill Data | |
Line
No. | | Bulb Rating
(Lumens or
Watts)
(A) | | | Level of
Usage
(kWH)
(B) | | | Current
Winter Bill
($)
(C) | | | Proposed
Winter Bill
($)
(D) | | | Dollar
Increase
(D)-(C)
(E) | | | Percent
Increase
(E)/(C)
(F) | |
Street Lighting Service (Rate STL) | |
80 | | | Customer Owned - All Lamp Types | |
81 | | | N/A | | | | 25 | | | $ | 1.26 | | | $ | 1.25 | | | $ | (0.00 | ) | | | -0.1 | % |
82 | | | N/A | | | | 50 | | | $ | 2.50 | | | $ | 2.50 | | | $ | (0.00 | ) | | | -0.1 | % |
83 | | | N/A | | | | 75 | | | $ | 3.76 | | | $ | 3.75 | | | $ | (0.00 | ) | | | -0.1 | % |
84 | | | N/A | | | | 100 | | | $ | 5.01 | | | $ | 5.01 | | | $ | (0.00 | ) | | | -0.1 | % |
85 | | | N/A | | | | 125 | | | $ | 6.26 | | | $ | 6.25 | | | $ | (0.00 | ) | | | -0.1 | % |
86 | | | N/A | | | | 150 | | | $ | 7.50 | | | $ | 7.50 | | | $ | (0.00 | ) | | | -0.1 | % |
87 | | | N/A | | | | 175 | | | $ | 8.77 | | | $ | 8.76 | | | $ | (0.01 | ) | | | -0.1 | % |
88 | | | N/A | | | | 200 | | | $ | 10.03 | | | $ | 10.03 | | | $ | (0.01 | ) | | | -0.1 | % |
89 | | | N/A | | | | 225 | | | $ | 11.27 | | | $ | 11.26 | | | $ | (0.01 | ) | | | -0.1 | % |
90 | | | N/A | | | | 250 | | | $ | 12.51 | | | $ | 12.50 | | | $ | (0.01 | ) | | | -0.1 | % |
91 | | | N/A | | | | 275 | | | $ | 13.77 | | | $ | 13.76 | | | $ | (0.01 | ) | | | -0.1 | % |
92 | | | N/A | | | | 300 | | | $ | 15.03 | | | $ | 15.02 | | | $ | (0.01 | ) | | | -0.1 | % |
93 | | | N/A | | | | 325 | | | $ | 16.27 | | | $ | 16.26 | | | $ | (0.01 | ) | | | -0.1 | % |
94 | | | N/A | | | | 350 | | | $ | 17.52 | | | $ | 17.51 | | | $ | (0.01 | ) | | | -0.1 | % |
95 | | | N/A | | | | 375 | | | $ | 18.77 | | | $ | 18.76 | | | $ | (0.01 | ) | | | -0.1 | % |
96 | | | N/A | | | | 400 | | | $ | 20.02 | | | $ | 20.01 | | | $ | (0.01 | ) | | | -0.1 | % |
97 | | | Customer Owned, Limited Company Maintenance - All Lamp Types | |
98 | | | N/A | | | | 25 | | | $ | 1.88 | | | $ | 1.87 | | | $ | (0.00 | ) | | | 0.0 | % |
99 | | | N/A | | | | 50 | | | $ | 3.73 | | | $ | 3.73 | | | $ | (0.00 | ) | | | 0.0 | % |
100 | | | N/A | | | | 75 | | | $ | 5.61 | | | $ | 5.60 | | | $ | (0.00 | ) | | | 0.0 | % |
101 | | | N/A | | | | 100 | | | $ | 7.48 | | | $ | 7.48 | | | $ | (0.00 | ) | | | 0.0 | % |
102 | | | N/A | | | | 125 | | | $ | 9.35 | | | $ | 9.34 | | | $ | (0.00 | ) | | | 0.0 | % |
103 | | | N/A | | | | 150 | | | $ | 11.20 | | | $ | 11.20 | | | $ | (0.00 | ) | | | 0.0 | % |
104 | | | N/A | | | | 175 | | | $ | 13.08 | | | $ | 13.07 | | | $ | (0.01 | ) | | | 0.0 | % |
105 | | | N/A | | | | 200 | | | $ | 14.96 | | | $ | 14.96 | | | $ | (0.01 | ) | | | 0.0 | % |
106 | | | N/A | | | | 225 | | | $ | 16.82 | | | $ | 16.81 | | | $ | (0.01 | ) | | | 0.0 | % |
107 | | | N/A | | | | 250 | | | $ | 18.67 | | | $ | 18.66 | | | $ | (0.01 | ) | | | 0.0 | % |
108 | | | N/A | | | | 275 | | | $ | 20.55 | | | $ | 20.54 | | | $ | (0.01 | ) | | | 0.0 | % |
109 | | | N/A | | | | 300 | | | $ | 22.43 | | | $ | 22.42 | | | $ | (0.01 | ) | | | 0.0 | % |
110 | | | N/A | | | | 325 | | | $ | 24.29 | | | $ | 24.28 | | | $ | (0.01 | ) | | | 0.0 | % |
111 | | | N/A | | | | 350 | | | $ | 26.15 | | | $ | 26.14 | | | $ | (0.01 | ) | | | 0.0 | % |
112 | | | N/A | | | | 375 | | | $ | 28.02 | | | $ | 28.01 | | | $ | (0.01 | ) | | | 0.0 | % |
113 | | | N/A | | | | 400 | | | $ | 29.89 | | | $ | 29.88 | | | $ | (0.01 | ) | | | 0.0 | % |
Exhibit G
OE - Page 14 of 26
Ohio Edison Company
Case No. 12-1465-EL-ATS
Estimated Typical Bills - Comparison (Q2 2012 vs. Q2 2012 w/ Securitization)
| | | | | | | | | | | | | | | | | | | | | | | | |
Bill Data | |
Line
No. | | Bulb Rating
(Lumens or
Watts)
(A) | | | Level of
Usage
(kWH)
(B) | | | Current
Winter Bill
($)
(C) | | | Proposed
Winter Bill
($)
(D) | | | Dollar
Increase
(D)-(C)
(E) | | | Percent
Increase
(E)/(C)
(F) | |
Street Lighting Service (Rate STL) | |
114 | | | Efficiency Safety Incentive Program - All Lamp Types | |
115 | | | N/A | | | | 25 | | | $ | 2.65 | | | $ | 2.64 | | | $ | (0.00 | ) | | | 0.0 | % |
116 | | | N/A | | | | 50 | | | $ | 5.27 | | | $ | 5.27 | | | $ | (0.00 | ) | | | 0.0 | % |
117 | | | N/A | | | | 75 | | | $ | 7.92 | | | $ | 7.91 | | | $ | (0.00 | ) | | | 0.0 | % |
118 | | | N/A | | | | 100 | | | $ | 10.56 | | | $ | 10.56 | | | $ | (0.00 | ) | | | 0.0 | % |
119 | | | N/A | | | | 125 | | | $ | 13.19 | | | $ | 13.18 | | | $ | (0.00 | ) | | | 0.0 | % |
120 | | | N/A | | | | 150 | | | $ | 15.82 | | | $ | 15.82 | | | $ | (0.00 | ) | | | 0.0 | % |
121 | | | N/A | | | | 175 | | | $ | 18.47 | | | $ | 18.46 | | | $ | (0.01 | ) | | | 0.0 | % |
122 | | | N/A | | | | 200 | | | $ | 21.11 | | | $ | 21.11 | | | $ | (0.01 | ) | | | 0.0 | % |
123 | | | N/A | | | | 225 | | | $ | 23.74 | | | $ | 23.73 | | | $ | (0.01 | ) | | | 0.0 | % |
124 | | | N/A | | | | 250 | | | $ | 26.37 | | | $ | 26.36 | | | $ | (0.01 | ) | | | 0.0 | % |
125 | | | N/A | | | | 275 | | | $ | 29.01 | | | $ | 29.00 | | | $ | (0.01 | ) | | | 0.0 | % |
126 | | | N/A | | | | 300 | | | $ | 31.66 | | | $ | 31.65 | | | $ | (0.01 | ) | | | 0.0 | % |
127 | | | N/A | | | | 325 | | | $ | 34.28 | | | $ | 34.27 | | | $ | (0.01 | ) | | | 0.0 | % |
128 | | | N/A | | | | 350 | | | $ | 36.92 | | | $ | 36.91 | | | $ | (0.01 | ) | | | 0.0 | % |
129 | | | N/A | | | | 375 | | | $ | 39.56 | | | $ | 39.55 | | | $ | (0.01 | ) | | | 0.0 | % |
130 | | | N/A | | | | 400 | | | $ | 42.19 | | | $ | 42.18 | | | $ | (0.01 | ) | | | 0.0 | % |
Exhibit G
OE - Page 15 of 26
Ohio Edison Company
Case No. 12-1465-EL-ATS
Estimated Typical Bills - Comparison (Q2 2012 vs. Q2 2012 w/ Securitization)
| | | | | | | | | | | | | | | | | | | | | | | | |
Bill Data | |
Line
No. | | Bulb Rating
(Lumens or
Watts)
(A) | | | Level of
Usage
(kWH)
(B) | | | Current
Winter Bill
($)
(C) | | | Proposed
Winter Bill
($)
(D) | | | Dollar
Increase
(D)-(C)
(E) | | | Percent
Increase
(E)/(C)
(F) | |
Private Outdoor Lighting Service (Rate POL) | |
1 | | | Mercury Lighting | |
2 | | | Overhead Service - Wood Pole | |
3 | | | 175 | | | | 69 | | | $ | 10.50 | | | $ | 10.50 | | | $ | (0.00 | ) | | | 0.0 | % |
4 | | | 400 | | | | 158 | | | $ | 17.43 | | | $ | 17.43 | | | $ | (0.00 | ) | | | 0.0 | % |
5 | | | 1,000 | | | | 380 | | | $ | 31.42 | | | $ | 31.41 | | | $ | (0.01 | ) | | | 0.0 | % |
6 | | | All Other Installations | |
7 | | | 175 | | | | 69 | | | $ | 14.90 | | | $ | 14.90 | | | $ | (0.00 | ) | | | 0.0 | % |
8 | | | High Pressure Sodium Lighting | |
9 | | | Overhead Service - Wood Pole | |
10 | | | 100 | | | | 42 | | | $ | 10.16 | | | $ | 10.16 | | | $ | (0.00 | ) | | | 0.0 | % |
11 | | | 250 | | | | 105 | | | $ | 16.18 | | | $ | 16.18 | | | $ | (0.00 | ) | | | 0.0 | % |
12 | | | 400 | | | | 163 | | | $ | 20.28 | | | $ | 20.28 | | | $ | (0.00 | ) | | | 0.0 | % |
13 | | | All Other Installations | |
14 | | | 100 | | | | 42 | | | $ | 15.19 | | | $ | 15.19 | | | $ | (0.00 | ) | | | 0.0 | % |
15 | | | Metal Halide Lighting | |
16 | | | Overhead Service - Wood Pole | |
17 | | | 15,000 | | | | 73 | | | $ | 15.45 | | | $ | 15.45 | | | $ | (0.00 | ) | | | 0.0 | % |
18 | | | 23,000 | | | | 111 | | | $ | 17.62 | | | $ | 17.62 | | | $ | (0.00 | ) | | | 0.0 | % |
19 | | | 40,000 | | | | 172 | | | $ | 21.15 | | | $ | 21.15 | | | $ | (0.00 | ) | | | 0.0 | % |
20 | | | All Other Installations | |
21 | | | 15,000 | | | | 73 | | | $ | 25.23 | | | $ | 25.23 | | | $ | (0.00 | ) | | | 0.0 | % |
22 | | | 23,000 | | | | 111 | | | $ | 27.40 | | | $ | 27.40 | | | $ | (0.00 | ) | | | 0.0 | % |
23 | | | 40,000 | | | | 172 | | | $ | 30.93 | | | $ | 30.93 | | | $ | (0.00 | ) | | | 0.0 | % |
Exhibit G
OE - Page 16 of 26
Ohio Edison Company
Case No. 12-1465-EL-ATS
Estimated Typical Bills - Comparison (Q2 2012 vs. Q2 2012 w/ Securitization)
| | | | | | | | | | | | | | | | | | | | | | | | |
Bill Data | |
Line
No. | | Level of
Demand
(kWH)
(A) | | | Level of
Usage
(kWH)
(B) | | | Current
Winter Bill
($)
(C) | | | Proposed
Winter Bill
($)
(D) | | | Dollar
Increase
(D)-(C)
(E) | | | Percent
Increase
(E)/(C)
(F) | |
Traffic Lighting Schedule (Rate TRF) | |
1 | | | 0 | | | | 100 | | | $ | 6.52 | | | $ | 6.52 | | | $ | (0.00 | ) | | | 0.0 | % |
2 | | | 0 | | | | 200 | | | $ | 13.00 | | | $ | 13.00 | | | $ | (0.01 | ) | | | 0.0 | % |
3 | | | 0 | | | | 300 | | | $ | 19.47 | | | $ | 19.46 | | | $ | (0.01 | ) | | | 0.0 | % |
4 | | | 0 | | | | 400 | | | $ | 25.94 | | | $ | 25.93 | | | $ | (0.01 | ) | | | 0.0 | % |
5 | | | 0 | | | | 500 | | | $ | 32.42 | | | $ | 32.41 | | | $ | (0.01 | ) | | | 0.0 | % |
6 | | | 0 | | | | 600 | | | $ | 38.90 | | | $ | 38.89 | | | $ | (0.02 | ) | | | 0.0 | % |
Exhibit G
OE - Page 17 of 26
Ohio Edison Company
Case No. 12-1465-EL-ATS
Estimated Typical Bills - Comparison (Q2 2012 vs. Q2 2012 w/ Securitization)
| | | | | | | | | | | | | | | | | | | | | | | | |
Bill Data | |
Line
No. | | Level of
Demand
(kW)
(A) | | | Level of
Usage
(kWH)
(B) | | | Current
Summer Bill
($)
(C) | | | Proposed
Summer Bill
($)
(D) | | | Dollar
Increase
(D)-(C)
(E) | | | Percent
Increase
(E)/(C)
(F) | |
General Service Secondary (Rate GS) | | | | | | | | | | | | | |
1 | | | 10 | | | | 1,000 | | | $ | 158.15 | | | $ | 158.12 | | | $ | (0.03 | ) | | | 0.0 | % |
2 | | | 10 | | | | 2,000 | | | $ | 244.87 | | | $ | 244.82 | | | $ | (0.06 | ) | | | 0.0 | % |
3 | | | 10 | | | | 3,000 | | | $ | 331.15 | | | $ | 331.06 | | | $ | (0.09 | ) | | | 0.0 | % |
4 | | | 10 | | | | 4,000 | | | $ | 417.43 | | | $ | 417.32 | | | $ | (0.12 | ) | | | 0.0 | % |
5 | | | 10 | | | | 5,000 | | | $ | 503.72 | | | $ | 503.57 | | | $ | (0.15 | ) | | | 0.0 | % |
6 | | | 10 | | | | 6,000 | | | $ | 589.96 | | | $ | 589.79 | | | $ | (0.17 | ) | | | 0.0 | % |
7 | | | 1,000 | | | | 100,000 | | | $ | 16,449.63 | | | $ | 16,446.73 | | | $ | (2.90 | ) | | | 0.0 | % |
8 | | | 1,000 | | | | 200,000 | | | $ | 25,020.97 | | | $ | 25,015.17 | | | $ | (5.80 | ) | | | 0.0 | % |
9 | | | 1,000 | | | | 300,000 | | | $ | 33,592.31 | | | $ | 33,583.61 | | | $ | (8.70 | ) | | | 0.0 | % |
10 | | | 1,000 | | | | 400,000 | | | $ | 42,163.64 | | | $ | 42,152.04 | | | $ | (11.60 | ) | | | 0.0 | % |
11 | | | 1,000 | | | | 500,000 | | | $ | 50,734.98 | | | $ | 50,720.48 | | | $ | (14.50 | ) | | | 0.0 | % |
12 | | | 1,000 | | | | 600,000 | | | $ | 59,306.31 | | | $ | 59,288.91 | | | $ | (17.40 | ) | | | 0.0 | % |
Exhibit G
OE - Page 18 of 26
Ohio Edison Company
Case No. 12-1465-EL-ATS
Estimated Typical Bills - Comparison (Q2 2012 vs. Q2 2012 w/ Securitization)
| | | | | | | | | | | | | | | | | | | | | | | | |
Bill Data | |
Line
No. | | Level of
Demand
(kW)
(A) | | | Level of
Usage
(kWH)
(B) | | | Current
Summer Bill
($)
(C) | | | Proposed
Summer Bill
($)
(D) | | | Dollar
Increase
(D)-(C)
(E) | | | Percent
Increase
(E)/(C)
(F) | |
General Service Primary (Rate GP) | | | | | | | | | | | | | |
1 | | | 500 | | | | 50,000 | | | $ | 6,420.06 | | | $ | 6,418.61 | | | $ | (1.45 | ) | | | 0.0 | % |
2 | | | 500 | | | | 100,000 | | | $ | 10,342.58 | | | $ | 10,339.68 | | | $ | (2.90 | ) | | | 0.0 | % |
3 | | | 500 | | | | 150,000 | | | $ | 14,265.10 | | | $ | 14,260.75 | | | $ | (4.35 | ) | | | 0.0 | % |
4 | | | 500 | | | | 200,000 | | | $ | 18,187.62 | | | $ | 18,181.82 | | | $ | (5.80 | ) | | | 0.0 | % |
5 | | | 500 | | | | 250,000 | | | $ | 22,110.13 | | | $ | 22,102.88 | | | $ | (7.25 | ) | | | 0.0 | % |
6 | | | 500 | | | | 300,000 | | | $ | 26,032.65 | | | $ | 26,023.95 | | | $ | (8.70 | ) | | | 0.0 | % |
7 | | | 5,000 | | | | 500,000 | | | $ | 62,745.38 | | | $ | 62,730.88 | | | $ | (14.50 | ) | | | 0.0 | % |
8 | | | 5,000 | | | | 1,000,000 | | | $ | 101,447.21 | | | $ | 101,418.21 | | | $ | (29.00 | ) | | | 0.0 | % |
9 | | | 5,000 | | | | 1,500,000 | | | $ | 139,105.49 | | | $ | 139,061.99 | | | $ | (43.50 | ) | | | 0.0 | % |
10 | | | 5,000 | | | | 2,000,000 | | | $ | 176,763.77 | | | $ | 176,705.77 | | | $ | (58.00 | ) | | | 0.0 | % |
11 | | | 5,000 | | | | 2,500,000 | | | $ | 214,422.06 | | | $ | 214,349.56 | | | $ | (72.50 | ) | | | 0.0 | % |
12 | | | 5,000 | | | | 3,000,000 | | | $ | 252,080.34 | | | $ | 251,993.34 | | | $ | (87.00 | ) | | | 0.0 | % |
Exhibit G
OE - Page 19 of 26
Ohio Edison Company
Case No. 12-1465-EL-ATS
Estimated Typical Bills - Comparison (Q2 2012 vs. Q2 2012 w/ Securitization)
| | | | | | | | | | | | | | | | | | | | | | | | |
Bill Data | |
Line
No. | | Level of
Demand
(kW)
(A) | | | Level of
Usage
(kWH)
(B) | | | Current
Summer Bill
($)
(C) | | | Proposed
Summer Bill
($)
(D) | | | Dollar
Increase
(D)-(C)
(E) | | | Percent
Increase
(E)/(C)
(F) | |
General Service Subtransmission (Rate GSU) | | | | | | | | | | | | | |
1 | | | 1,000 | | | | 100,000 | | | $ | 10,115.69 | | | $ | 10,112.79 | | | $ | (2.90 | ) | | | 0.0 | % |
2 | | | 1,000 | | | | 200,000 | | | $ | 17,563.83 | | | $ | 17,558.03 | | | $ | (5.80 | ) | | | 0.0 | % |
3 | | | 1,000 | | | | 300,000 | | | $ | 25,011.96 | | | $ | 25,003.26 | | | $ | (8.70 | ) | | | 0.0 | % |
4 | | | 1,000 | | | | 400,000 | | | $ | 32,460.10 | | | $ | 32,448.50 | | | $ | (11.60 | ) | | | 0.0 | % |
5 | | | 1,000 | | | | 500,000 | | | $ | 39,908.24 | | | $ | 39,893.74 | | | $ | (14.50 | ) | | | 0.0 | % |
6 | | | 1,000 | | | | 600,000 | | | $ | 47,356.37 | | | $ | 47,338.97 | | | $ | (17.40 | ) | | | 0.0 | % |
7 | | | 10,000 | | | | 1,000,000 | | | $ | 98,728.35 | | | $ | 98,699.35 | | | $ | (29.00 | ) | | | 0.0 | % |
8 | | | 10,000 | | | | 2,000,000 | | | $ | 170,075.91 | | | $ | 170,017.91 | | | $ | (58.00 | ) | | | 0.0 | % |
9 | | | 10,000 | | | | 3,000,000 | | | $ | 241,423.48 | | | $ | 241,336.48 | | | $ | (87.00 | ) | | | 0.0 | % |
10 | | | 10,000 | | | | 4,000,000 | | | $ | 312,771.04 | | | $ | 312,655.04 | | | $ | (116.00 | ) | | | 0.0 | % |
11 | | | 10,000 | | | | 5,000,000 | | | $ | 384,118.60 | | | $ | 383,973.60 | | | $ | (145.00 | ) | | | 0.0 | % |
12 | | | 10,000 | | | | 6,000,000 | | | $ | 455,466.17 | | | $ | 455,292.17 | | | $ | (174.00 | ) | | | 0.0 | % |
Exhibit G
OE - Page 20 of 26
Ohio Edison Company
Case No. 12-1465-EL-ATS
Estimated Typical Bills - Comparison (Q2 2012 vs. Q2 2012 w/ Securitization)
| | | | | | | | | | | | | | | | | | | | | | | | |
Bill Data | |
Line
No. | | Level of
Demand
(kW)
(A) | | | Level of
Usage
(kWH)
(B) | | | Current
Summer Bill
($)
(C) | | | Proposed
Summer Bill
($)
(D) | | | Dollar
Increase
(D)-(C)
(E) | | | Percent
Increase
(E)/(C)
(F) | |
General Service Transmission (Rate GT) | | | | | | | | | | | | | |
1 | | | 2,000 | | | | 200,000 | | | $ | 30,041.42 | | | $ | 30,035.62 | | | $ | (5.80 | ) | | | 0.0 | % |
2 | | | 2,000 | | | | 400,000 | | | $ | 40,500.89 | | | $ | 40,489.29 | | | $ | (11.60 | ) | | | 0.0 | % |
3 | | | 2,000 | | | | 600,000 | | | $ | 50,960.36 | | | $ | 50,942.96 | | | $ | (17.40 | ) | | | 0.0 | % |
4 | | | 2,000 | | | | 800,000 | | | $ | 61,419.83 | | | $ | 61,396.63 | | | $ | (23.20 | ) | | | 0.0 | % |
5 | | | 2,000 | | | | 1,000,000 | | | $ | 71,355.96 | | | $ | 71,326.96 | | | $ | (29.00 | ) | | | 0.0 | % |
6 | | | 2,000 | | | | 1,200,000 | | | $ | 81,188.67 | | | $ | 81,153.87 | | | $ | (34.80 | ) | | | 0.0 | % |
7 | | | 20,000 | | | | 2,000,000 | | | $ | 293,792.92 | | | $ | 293,734.92 | | | $ | (58.00 | ) | | | 0.0 | % |
8 | | | 20,000 | | | | 4,000,000 | | | $ | 392,120.05 | | | $ | 392,004.05 | | | $ | (116.00 | ) | | | 0.0 | % |
9 | | | 20,000 | | | | 6,000,000 | | | $ | 490,447.18 | | | $ | 490,273.18 | | | $ | (174.00 | ) | | | 0.0 | % |
10 | | | 20,000 | | | | 8,000,000 | | | $ | 588,774.30 | | | $ | 588,542.30 | | | $ | (232.00 | ) | | | 0.0 | % |
11 | | | 20,000 | | | | 10,000,000 | | | $ | 687,101.43 | | | $ | 686,811.43 | | | $ | (290.00 | ) | | | 0.0 | % |
12 | | | 20,000 | | | | 12,000,000 | | | $ | 785,428.55 | | | $ | 785,080.55 | | | $ | (348.00 | ) | | | 0.0 | % |
Exhibit G
OE - Page 21 of 26
Ohio Edison Company
Case No. 12-1465-EL-ATS
Estimated Typical Bills - Comparison (Q2 2012 vs. Q2 2012 w/ Securitization)
| | | | | | | | | | | | | | | | | | | | | | | | |
Bill Data | |
Line
No. | | Bulb Rating
(Lumens or
Watts)
(A) | | | Level of
Usage
(kWH)
(B) | | | Current
Summer Bill
($)
(C) | | | Proposed
Summer Bill
($)
(D) | | | Dollar
Increase
(D)-(C)
(E) | | | Percent
Increase
(E)/(C)
(F) | |
Street Lighting Service (Rate STL) | | | | | | | | | | | | | |
1 | | | Company Owned - Incandescent Lighting (a) | |
2 | | | 1,000 | | | | 24 | | | $ | 18.04 | | | $ | 18.04 | | | $ | (0.00 | ) | | | 0.0 | % |
3 | | | 2,000 | | | | 56 | | | $ | 19.81 | | | $ | 19.81 | | | $ | (0.00 | ) | | | 0.0 | % |
4 | | | 2,500 | | | | 70 | | | $ | 20.63 | | | $ | 20.63 | | | $ | (0.00 | ) | | | 0.0 | % |
5 | | | 4,000 | | | | 126 | | | $ | 23.75 | | | $ | 23.74 | | | $ | (0.00 | ) | | | 0.0 | % |
6 | | | 6,000 | | | | 157 | | | $ | 25.48 | | | $ | 25.48 | | | $ | (0.00 | ) | | | 0.0 | % |
7 | | | 10,000 | | | | 242 | | | $ | 30.23 | | | $ | 30.22 | | | $ | (0.01 | ) | | | 0.0 | % |
8 | | | 15,000 | | | | 282 | | | $ | 32.48 | | | $ | 32.47 | | | $ | (0.01 | ) | | | 0.0 | % |
9 | | | Company Owned - Mercury Street Lighting (b) | |
10 | | | Overhead Service - Wood Pole | |
11 | | | 100 | | | | 43 | | | $ | 8.22 | | | $ | 8.22 | | | $ | (0.00 | ) | | | 0.0 | % |
12 | | | 175 | | | | 69 | | | $ | 8.93 | | | $ | 8.93 | | | $ | (0.00 | ) | | | 0.0 | % |
13 | | | 250 | | | | 104 | | | $ | 11.08 | | | $ | 11.08 | | | $ | (0.00 | ) | | | 0.0 | % |
14 | | | 400 | | | | 158 | | | $ | 14.10 | | | $ | 14.10 | | | $ | (0.00 | ) | | | 0.0 | % |
15 | | | 700 | | | | 287 | | | $ | 21.79 | | | $ | 21.78 | | | $ | (0.01 | ) | | | 0.0 | % |
16 | | | 1,000 | | | | 380 | | | $ | 26.62 | | | $ | 26.61 | | | $ | (0.01 | ) | | | 0.0 | % |
17 | | | Overhead Service - Metal Pole | |
18 | | | 100 | | | | 43 | | | $ | 16.04 | | | $ | 16.04 | | | $ | (0.00 | ) | | | 0.0 | % |
19 | | | 175 | | | | 69 | | | $ | 16.81 | | | $ | 16.81 | | | $ | (0.00 | ) | | | 0.0 | % |
20 | | | 250 | | | | 104 | | | $ | 19.90 | | | $ | 19.90 | | | $ | (0.00 | ) | | | 0.0 | % |
21 | | | 250 | | | | 208 | | | $ | 28.79 | | | $ | 28.79 | | | $ | (0.01 | ) | | | 0.0 | % |
22 | | | 400 | | | | 158 | | | $ | 22.34 | | | $ | 22.34 | | | $ | (0.00 | ) | | | 0.0 | % |
23 | | | 400 | | | | 316 | | | $ | 34.46 | | | $ | 34.46 | | | $ | (0.01 | ) | | | 0.0 | % |
24 | | | 700 | | | | 287 | | | $ | 31.55 | | | $ | 31.54 | | | $ | (0.01 | ) | | | 0.0 | % |
25 | | | 1000 | | | | 380 | | | $ | 36.50 | | | $ | 36.49 | | | $ | (0.01 | ) | | | 0.0 | % |
26 | | | 1000 | | | | 760 | | | $ | 63.93 | | | $ | 63.90 | | | $ | (0.02 | ) | | | 0.0 | % |
27 | | | Underground Service - Post Type | |
28 | | | 100 | | | | 43 | | | $ | 11.06 | | | $ | 11.06 | | | $ | (0.00 | ) | | | 0.0 | % |
29 | | | 175 | | | | 69 | | | $ | 12.30 | | | $ | 12.30 | | | $ | (0.00 | ) | | | 0.0 | % |
30 | | | 250 | | | | 104 | | | $ | 15.50 | | | $ | 15.50 | | | $ | (0.00 | ) | | | 0.0 | % |
31 | | | Underground Service - Pole Type | |
32 | | | 100 | | | | 43 | | | $ | 18.44 | | | $ | 18.44 | | | $ | (0.00 | ) | | | 0.0 | % |
33 | | | 175 | | | | 69 | | | $ | 19.51 | | | $ | 19.51 | | | $ | (0.00 | ) | | | 0.0 | % |
34 | | | 250 | | | | 104 | | | $ | 24.30 | | | $ | 24.30 | | | $ | (0.00 | ) | | | 0.0 | % |
35 | | | 400 | | | | 158 | | | $ | 27.63 | | | $ | 27.63 | | | $ | (0.00 | ) | | | 0.0 | % |
36 | | | 700 | | | | 287 | | | $ | 53.49 | | | $ | 53.48 | | | $ | (0.01 | ) | | | 0.0 | % |
37 | | | 1000 | | | | 380 | | | $ | 58.15 | | | $ | 58.14 | | | $ | (0.01 | ) | | | 0.0 | % |
38 | | | 1000 | | | | 760 | | | $ | 83.89 | | | $ | 83.86 | | | $ | (0.02 | ) | | | 0.0 | % |
Exhibit G
OE - Page 22 of 26
Ohio Edison Company
Case No. 12-1465-EL-ATS
Estimated Typical Bills - Comparison (Q2 2012 vs. Q2 2012 w/ Securitization)
| | | | | | | | | | | | | | | | | | | | | | | | |
Bill Data | |
Line
No. | | Bulb Rating
(Lumens or
Watts)
(A) | | | Level of
Usage
(kWH)
(B) | | | Current
Summer Bill
($)
(C) | | | Proposed
Summer Bill
($)
(D) | | | Dollar
Increase
(D)-(C)
(E) | | | Percent
Increase
(E)/(C)
(F) | |
Street Lighting Service (Rate STL) | | | | | | | | | | | | | |
39 | | | Bridge or Underpass Wallpack | |
40 | | | 175 | | | | 69 | | | $ | 11.36 | | | $ | 11.36 | | | $ | (0.00 | ) | | | 0.0 | % |
41 | | | 250 | | | | 104 | | | $ | 13.74 | | | $ | 13.74 | | | $ | (0.00 | ) | | | 0.0 | % |
42 | | | Company Owned - High Pressure Sodium Lighting (c) | |
43 | | | Overhead Service - Wood Pole | |
44 | | | 70 | | | | 29 | | | $ | 7.98 | | | $ | 7.98 | | | $ | (0.00 | ) | | | 0.0 | % |
45 | | | 100 | | | | 42 | | | $ | 8.39 | | | $ | 8.39 | | | $ | (0.00 | ) | | | 0.0 | % |
46 | | | 150 | | | | 62 | | | $ | 9.15 | | | $ | 9.15 | | | $ | (0.00 | ) | | | 0.0 | % |
47 | | | 215 | | | | 89 | | | $ | 10.86 | | | $ | 10.86 | | | $ | (0.00 | ) | | | 0.0 | % |
48 | | | 250 | | | | 105 | | | $ | 11.39 | | | $ | 11.39 | | | $ | (0.00 | ) | | | 0.0 | % |
49 | | | 400 | | | | 163 | | | $ | 14.59 | | | $ | 14.59 | | | $ | (0.00 | ) | | | 0.0 | % |
50 | | | 1000 | | | | 410 | | | $ | 30.73 | | | $ | 30.72 | | | $ | (0.01 | ) | | | 0.0 | % |
51 | | | Overhead Service - Metal Pole | |
52 | | | 70 | | | | 29 | | | $ | 15.77 | | | $ | 15.77 | | | $ | (0.00 | ) | | | 0.0 | % |
53 | | | 100 | | | | 42 | | | $ | 16.22 | | | $ | 16.22 | | | $ | (0.00 | ) | | | 0.0 | % |
54 | | | 150 | | | | 62 | | | $ | 18.02 | | | $ | 18.02 | | | $ | (0.00 | ) | | | 0.0 | % |
55 | | | 215 | | | | 89 | | | $ | 19.65 | | | $ | 19.65 | | | $ | (0.00 | ) | | | 0.0 | % |
56 | | | 250 | | | | 105 | | | $ | 20.19 | | | $ | 20.19 | | | $ | (0.00 | ) | | | 0.0 | % |
57 | | | 400 | | | | 163 | | | $ | 24.40 | | | $ | 24.40 | | | $ | (0.00 | ) | | | 0.0 | % |
58 | | | 1000 | | | | 410 | | | $ | 39.70 | | | $ | 39.69 | | | $ | (0.01 | ) | | | 0.0 | % |
59 | | | Underground Service - Post Type | |
60 | | | 70 | | | | 29 | | | $ | 11.08 | | | $ | 11.08 | | | $ | (0.00 | ) | | | 0.0 | % |
61 | | | 100 | | | | 42 | | | $ | 11.83 | | | $ | 11.83 | | | $ | (0.00 | ) | | | 0.0 | % |
62 | | | 150 | | | | 62 | | | $ | 13.24 | | | $ | 13.24 | | | $ | (0.00 | ) | | | 0.0 | % |
63 | | | Underground Service - Pole Type | |
64 | | | 70 | | | | 29 | | | $ | 18.07 | | | $ | 18.07 | | | $ | (0.00 | ) | | | 0.0 | % |
65 | | | 100 | | | | 42 | | | $ | 18.81 | | | $ | 18.81 | | | $ | (0.00 | ) | | | 0.0 | % |
66 | | | 150 | | | | 62 | | | $ | 22.44 | | | $ | 22.44 | | | $ | (0.00 | ) | | | 0.0 | % |
67 | | | 200 | | | | 88 | | | $ | 24.59 | | | $ | 24.59 | | | $ | (0.00 | ) | | | 0.0 | % |
68 | | | 215 | | | | 89 | | | $ | 22.25 | | | $ | 22.25 | | | $ | (0.00 | ) | | | 0.0 | % |
69 | | | 250 | | | | 105 | | | $ | 25.33 | | | $ | 25.33 | | | $ | (0.00 | ) | | | 0.0 | % |
70 | | | 310 | | | | 128 | | | $ | 27.58 | | | $ | 27.57 | | | $ | (0.00 | ) | | | 0.0 | % |
71 | | | 400 | | | | 163 | | | $ | 46.27 | | | $ | 46.27 | | | $ | (0.00 | ) | | | 0.0 | % |
72 | | | 400 | | | | 326 | | | $ | 59.68 | | | $ | 59.67 | | | $ | (0.01 | ) | | | 0.0 | % |
73 | | | 1000 | | | | 410 | | | $ | 63.49 | | | $ | 63.48 | | | $ | (0.01 | ) | | | 0.0 | % |
74 | | | Bridge or Underpass Wallpack | |
75 | | | 70 | | | | 29 | | | $ | 11.64 | | | $ | 11.64 | | | $ | (0.00 | ) | | | 0.0 | % |
76 | | | 100 | | | | 42 | | | $ | 13.08 | | | $ | 13.08 | | | $ | (0.00 | ) | | | 0.0 | % |
77 | | | 150 | | | | 62 | | | $ | 13.99 | | | $ | 13.99 | | | $ | (0.00 | ) | | | 0.0 | % |
78 | | | 215 | | | | 89 | | | $ | 14.16 | | | $ | 14.16 | | | $ | (0.00 | ) | | | 0.0 | % |
79 | | | 250 | | | | 105 | | | $ | 16.81 | | | $ | 16.81 | | | $ | (0.00 | ) | | | 0.0 | % |
Exhibit G
OE - Page 23 of 26
Ohio Edison Company
Case No. 12-1465-EL-ATS
Estimated Typical Bills - Comparison (Q2 2012 vs. Q2 2012 w/ Securitization)
| | | | | | | | | | | | | | | | | | | | | | | | |
Bill Data | |
Line
No. | | Bulb Rating
(Lumens
or Watts)
(A) | | | Level of
Usage
(kWH)
(B) | | | Current
Summer Bill
($)
(C) | | | Proposed
Summer Bill
($)
(D) | | | Dollar
Increase
(D)-(C)
(E) | | | Percent
Increase
(E)/(C)
(F) | |
| Street Lighting Service (Rate STL) | | | | | | | | | | | | | | | | | |
80 | | | Customer Owned - All Lamp Types | |
81 | | | N/A | | | | 25 | | | $ | 1.48 | | | $ | 1.47 | | | $ | (0.00 | ) | | | 0.0 | % |
82 | | | N/A | | | | 50 | | | $ | 2.96 | | | $ | 2.96 | | | $ | (0.00 | ) | | | 0.0 | % |
83 | | | N/A | | | | 75 | | | $ | 4.44 | | | $ | 4.43 | | | $ | (0.00 | ) | | | 0.0 | % |
84 | | | N/A | | | | 100 | | | $ | 5.93 | | | $ | 5.93 | | | $ | (0.00 | ) | | | 0.0 | % |
85 | | | N/A | | | | 125 | | | $ | 7.40 | | | $ | 7.39 | | | $ | (0.00 | ) | | | 0.0 | % |
86 | | | N/A | | | | 150 | | | $ | 8.88 | | | $ | 8.88 | | | $ | (0.00 | ) | | | 0.0 | % |
87 | | | N/A | | | | 175 | | | $ | 10.37 | | | $ | 10.36 | | | $ | (0.01 | ) | | | 0.0 | % |
88 | | | N/A | | | | 200 | | | $ | 11.86 | | | $ | 11.86 | | | $ | (0.01 | ) | | | 0.0 | % |
89 | | | N/A | | | | 225 | | | $ | 13.33 | | | $ | 13.32 | | | $ | (0.01 | ) | | | 0.0 | % |
90 | | | N/A | | | | 250 | | | $ | 14.79 | | | $ | 14.78 | | | $ | (0.01 | ) | | | 0.0 | % |
91 | | | N/A | | | | 275 | | | $ | 16.29 | | | $ | 16.28 | | | $ | (0.01 | ) | | | 0.0 | % |
92 | | | N/A | | | | 300 | | | $ | 17.77 | | | $ | 17.76 | | | $ | (0.01 | ) | | | 0.0 | % |
93 | | | N/A | | | | 325 | | | $ | 19.25 | | | $ | 19.24 | | | $ | (0.01 | ) | | | 0.0 | % |
94 | | | N/A | | | | 350 | | | $ | 20.72 | | | $ | 20.71 | | | $ | (0.01 | ) | | | 0.0 | % |
95 | | | N/A | | | | 375 | | | $ | 22.20 | | | $ | 22.19 | | | $ | (0.01 | ) | | | 0.0 | % |
96 | | | N/A | | | | 400 | | | $ | 23.68 | | | $ | 23.67 | | | $ | (0.01 | ) | | | 0.0 | % |
97 | | | Customer Owned, Limited Company Maintenance - All Lamp Types | | | | | |
98 | | | N/A | | | | 25 | | | $ | 2.10 | | | $ | 2.09 | | | $ | (0.00 | ) | | | 0.0 | % |
99 | | | N/A | | | | 50 | | | $ | 4.19 | | | $ | 4.19 | | | $ | (0.00 | ) | | | 0.0 | % |
100 | | | N/A | | | | 75 | | | $ | 6.29 | | | $ | 6.28 | | | $ | (0.00 | ) | | | 0.0 | % |
101 | | | N/A | | | | 100 | | | $ | 8.40 | | | $ | 8.40 | | | $ | (0.00 | ) | | | 0.0 | % |
102 | | | N/A | | | | 125 | | | $ | 10.49 | | | $ | 10.48 | | | $ | (0.00 | ) | | | 0.0 | % |
103 | | | N/A | | | | 150 | | | $ | 12.58 | | | $ | 12.58 | | | $ | (0.00 | ) | | | 0.0 | % |
104 | | | N/A | | | | 175 | | | $ | 14.68 | | | $ | 14.67 | | | $ | (0.01 | ) | | | 0.0 | % |
105 | | | N/A | | | | 200 | | | $ | 16.79 | | | $ | 16.79 | | | $ | (0.01 | ) | | | 0.0 | % |
106 | | | N/A | | | | 225 | | | $ | 18.88 | | | $ | 18.87 | | | $ | (0.01 | ) | | | 0.0 | % |
107 | | | N/A | | | | 250 | | | $ | 20.95 | | | $ | 20.94 | | | $ | (0.01 | ) | | | 0.0 | % |
108 | | | N/A | | | | 275 | | | $ | 23.07 | | | $ | 23.06 | | | $ | (0.01 | ) | | | 0.0 | % |
109 | | | N/A | | | | 300 | | | $ | 25.17 | | | $ | 25.16 | | | $ | (0.01 | ) | | | 0.0 | % |
110 | | | N/A | | | | 325 | | | $ | 27.27 | | | $ | 27.26 | | | $ | (0.01 | ) | | | 0.0 | % |
111 | | | N/A | | | | 350 | | | $ | 29.35 | | | $ | 29.34 | | | $ | (0.01 | ) | | | 0.0 | % |
112 | | | N/A | | | | 375 | | | $ | 31.45 | | | $ | 31.44 | | | $ | (0.01 | ) | | | 0.0 | % |
113 | | | N/A | | | | 400 | | | $ | 33.55 | | | $ | 33.54 | | | $ | (0.01 | ) | | | 0.0 | % |
Exhibit G
OE - Page 24 of 26
Ohio Edison Company
Case No. 12-1465-EL-ATS
Estimated Typical Bills - Comparison (Q2 2012 vs. Q2 2012 w/ Securitization)
| | | | | | | | | | | | | | | | | | | | | | | | |
Bill Data | |
Line
No. | | Bulb Rating
(Lumens or
Watts)
(A) | | | Level of
Usage
(kWH)
(B) | | | Current
Summer Bill
($)
(C) | | | Proposed
Summer Bill
($)
(D) | | | Dollar
Increase
(D)-(C)
(E) | | | Percent
Increase
(E)/(C)
(F) | |
Street Lighting Service (Rate STL) | |
114 | | | Efficiency Safety Incentive Program - All Lamp Types | |
115 | | | N/A | | | | 25 | | | $ | 2.87 | | | $ | 2.86 | | | $ | (0.00 | ) | | | 0.0 | % |
116 | | | N/A | | | | 50 | | | $ | 5.73 | | | $ | 5.73 | | | $ | (0.00 | ) | | | 0.0 | % |
117 | | | N/A | | | | 75 | | | $ | 8.60 | | | $ | 8.59 | | | $ | (0.00 | ) | | | 0.0 | % |
118 | | | N/A | | | | 100 | | | $ | 11.48 | | | $ | 11.48 | | | $ | (0.00 | ) | | | 0.0 | % |
119 | | | N/A | | | | 125 | | | $ | 14.33 | | | $ | 14.32 | | | $ | (0.00 | ) | | | 0.0 | % |
120 | | | N/A | | | | 150 | | | $ | 17.20 | | | $ | 17.20 | | | $ | (0.00 | ) | | | 0.0 | % |
121 | | | N/A | | | | 175 | | | $ | 20.07 | | | $ | 20.06 | | | $ | (0.01 | ) | | | 0.0 | % |
122 | | | N/A | | | | 200 | | | $ | 22.94 | | | $ | 22.94 | | | $ | (0.01 | ) | | | 0.0 | % |
123 | | | N/A | | | | 225 | | | $ | 25.80 | | | $ | 25.79 | | | $ | (0.01 | ) | | | 0.0 | % |
124 | | | N/A | | | | 250 | | | $ | 28.65 | | | $ | 28.64 | | | $ | (0.01 | ) | | | 0.0 | % |
125 | | | N/A | | | | 275 | | | $ | 31.53 | | | $ | 31.52 | | | $ | (0.01 | ) | | | 0.0 | % |
126 | | | N/A | | | | 300 | | | $ | 34.40 | | | $ | 34.39 | | | $ | (0.01 | ) | | | 0.0 | % |
127 | | | N/A | | | | 325 | | | $ | 37.26 | | | $ | 37.25 | | | $ | (0.01 | ) | | | 0.0 | % |
128 | | | N/A | | | | 350 | | | $ | 40.12 | | | $ | 40.11 | | | $ | (0.01 | ) | | | 0.0 | % |
129 | | | N/A | | | | 375 | | | $ | 42.99 | | | $ | 42.98 | | | $ | (0.01 | ) | | | 0.0 | % |
130 | | | N/A | | | | 400 | | | $ | 45.85 | | | $ | 45.84 | | | $ | (0.01 | ) | | | 0.0 | % |
Exhibit G
OE - Page 25 of 26
Ohio Edison Company
Case No. 12-1465-EL-ATS
Estimated Typical Bills - Comparison (Q2 2012 vs. Q2 2012 w/ Securitization)
| | | | | | | | | | | | | | | | | | | | | | | | |
Bill Data | |
Line
No. | | Bulb Rating
(Lumens or
Watts)
(A) | | | Level of
Usage
(kWH)
(B) | | | Current
Summer Bill
($)
(C) | | | Proposed
Summer Bill
($)
(D) | | | Dollar
Increase
(D)-(C)
(E) | | | Percent
Increase
(E)/(C)
(F) | |
Private Outdoor Lighting Service (Rate POL) | |
1 | | | Mercury Lighting | |
2 | | | Overhead Service - Wood Pole | |
3 | | | 175 | | | | 69 | | | $ | 11.09 | | | $ | 11.09 | | | $ | (0.00 | ) | | | 0.0 | % |
4 | | | 400 | | | | 158 | | | $ | 18.85 | | | $ | 18.84 | | | $ | (0.00 | ) | | | 0.0 | % |
5 | | | 1,000 | | | | 380 | | | $ | 34.86 | | | $ | 34.85 | | | $ | (0.01 | ) | | | 0.0 | % |
6 | | | All Other Installations | |
7 | | | 175 | | | | 69 | | | $ | 15.49 | | | $ | 15.49 | | | $ | (0.00 | ) | | | 0.0 | % |
8 | | | High Pressure Sodium Lighting | |
9 | | | Overhead Service - Wood Pole | |
10 | | | 100 | | | | 42 | | | $ | 10.51 | | | $ | 10.51 | | | $ | (0.00 | ) | | | 0.0 | % |
11 | | | 250 | | | | 105 | | | $ | 17.11 | | | $ | 17.11 | | | $ | (0.00 | ) | | | 0.0 | % |
12 | | | 400 | | | | 163 | | | $ | 21.74 | | | $ | 21.73 | | | $ | (0.00 | ) | | | 0.0 | % |
13 | | | All Other Installations | |
14 | | | 100 | | | | 42 | | | $ | 15.54 | | | $ | 15.54 | | | $ | (0.00 | ) | | | 0.0 | % |
15 | | | Metal Halide Lighting | |
16 | | | Overhead Service - Wood Pole | |
17 | | | 15,000 | | | | 73 | | | $ | 16.08 | | | $ | 16.08 | | | $ | (0.00 | ) | | | 0.0 | % |
18 | | | 23,000 | | | | 111 | | | $ | 18.61 | | | $ | 18.60 | | | $ | (0.00 | ) | | | 0.0 | % |
19 | | | 40,000 | | | | 172 | | | $ | 22.69 | | | $ | 22.68 | | | $ | (0.00 | ) | | | 0.0 | % |
20 | | | All Other Installations | |
21 | | | 15,000 | | | | 73 | | | $ | 25.86 | | | $ | 25.86 | | | $ | (0.00 | ) | | | 0.0 | % |
22 | | | 23,000 | | | | 111 | | | $ | 28.39 | | | $ | 28.38 | | | $ | (0.00 | ) | | | 0.0 | % |
23 | | | 40,000 | | | | 172 | | | $ | 32.47 | | | $ | 32.46 | | | $ | (0.00 | ) | | | 0.0 | % |
Exhibit G
OE - Page 26 of 26
Ohio Edison Company
Case No. 12-1465-EL-ATS
Estimated Typical Bills - Comparison (Q2 2012 vs. Q2 2012 w/ Securitization)
| | | | | | | | | | | | | | | | | | | | | | | | |
Bill Data | |
Line
No. | | Level of
Demand
(kW) (A) | | | Level of
Usage
(kWH)
(B) | | | Current
Summer Bill
($)
(C) | | | Proposed
Summer Bill
($)
(D) | | | Dollar
Increase
(D)-(C)
(E) | | | Percent
Increase
(E)/(C)
(F) | |
Traffic Lighting Schedule (Rate TRF) | | | | | | | | | | | | | |
1 | | | 0 | | | | 100 | | | $ | 7.44 | | | $ | 7.44 | | | $ | (0.00 | ) | | | 0.0 | % |
2 | | | 0 | | | | 200 | | | $ | 14.83 | | | $ | 14.83 | | | $ | (0.01 | ) | | | 0.0 | % |
3 | | | 0 | | | | 300 | | | $ | 22.21 | | | $ | 22.20 | | | $ | (0.01 | ) | | | 0.0 | % |
4 | | | 0 | | | | 400 | | | $ | 29.60 | | | $ | 29.59 | | | $ | (0.01 | ) | | | 0.0 | % |
5 | �� | | 0 | | | | 500 | | | $ | 36.99 | | | $ | 36.98 | | | $ | (0.01 | ) | | | 0.0 | % |
6 | | | 0 | | | | 600 | | | $ | 44.39 | | | $ | 44.38 | | | $ | (0.02 | ) | | | 0.0 | % |
Exhibit G
TE - Page 1 of 27
The Toledo Edison Company
Case No. 12-1465-EL-ATS
Estimated Typical Bills - Comparison (Q2 2012 vs. Q2 2012 w/ Securitization)
| | | | | | | | | | | | | | | | | | | | | | | | |
| Bill Data | |
Line
No. | | Level of
Demand
(kW)
(A) | | | Level of
Usage
(kWH)
(B) | | | Current
Winter Bill
($)
(C) | | | Proposed
Winter Bill
($)
(D) | | | Dollar
Increase
($)
(E) | | | Percent
Increase
(%)
(E) | |
|
Residential Service - Standard (Rate RS) | |
| 1 | | | 0 | | | | 250 | | | $ | 35.03 | | | $ | 35.03 | | | $ | (0.00 | ) | | | 0.0 | % |
| 2 | | | 0 | | | | 500 | | | $ | 66.02 | | | $ | 66.02 | | | $ | (0.00 | ) | | | 0.0 | % |
| 3 | | | 0 | | | | 750 | | | $ | 97.02 | | | $ | 97.01 | | | $ | (0.01 | ) | | | 0.0 | % |
| 4 | | | 0 | | | | 1,000 | | | $ | 128.01 | | | $ | 128.01 | | | $ | (0.01 | ) | | | 0.0 | % |
| 5 | | | 0 | | | | 1,250 | | | $ | 159.01 | | | $ | 159.00 | | | $ | (0.01 | ) | | | 0.0 | % |
| 6 | | | 0 | | | | 1,500 | | | $ | 190.01 | | | $ | 190.00 | | | $ | (0.01 | ) | | | 0.0 | % |
| 7 | | | 0 | | | | 2,000 | | | $ | 252.00 | | | $ | 251.98 | | | $ | (0.01 | ) | | | 0.0 | % |
| 8 | | | 0 | | | | 2,500 | | | $ | 313.76 | | | $ | 313.74 | | | $ | (0.02 | ) | | | 0.0 | % |
| 9 | | | 0 | | | | 3,000 | | | $ | 375.52 | | | $ | 375.50 | | | $ | (0.02 | ) | | | 0.0 | % |
| 10 | | | 0 | | | | 3,500 | | | $ | 437.28 | | | $ | 437.26 | | | $ | (0.02 | ) | | | 0.0 | % |
| 11 | | | 0 | | | | 4,000 | | | $ | 499.04 | | | $ | 499.02 | | | $ | (0.03 | ) | | | 0.0 | % |
| 12 | | | 0 | | | | 4,500 | | | $ | 560.80 | | | $ | 560.77 | | | $ | (0.03 | ) | | | 0.0 | % |
| 13 | | | 0 | | | | 5,000 | | | $ | 622.57 | | | $ | 622.53 | | | $ | (0.03 | ) | | | 0.0 | % |
| 14 | | | 0 | | | | 5,500 | | | $ | 684.33 | | | $ | 684.29 | | | $ | (0.04 | ) | | | 0.0 | % |
| 15 | | | 0 | | | | 6,000 | | | $ | 746.09 | | | $ | 746.05 | | | $ | (0.04 | ) | | | 0.0 | % |
| 16 | | | 0 | | | | 6,500 | | | $ | 807.85 | | | $ | 807.80 | | | $ | (0.05 | ) | | | 0.0 | % |
| 17 | | | 0 | | | | 7,000 | | | $ | 869.61 | | | $ | 869.56 | | | $ | (0.05 | ) | | | 0.0 | % |
| 18 | | | 0 | | | | 7,500 | | | $ | 931.37 | | | $ | 931.32 | | | $ | (0.05 | ) | | | 0.0 | % |
| 19 | | | 0 | | | | 8,000 | | | $ | 993.13 | | | $ | 993.08 | | | $ | (0.06 | ) | | | 0.0 | % |
| 20 | | | 0 | | | | 8,500 | | | $ | 1,054.89 | | | $ | 1,054.83 | | | $ | (0.06 | ) | | | 0.0 | % |
| 21 | | | 0 | | | | 9,000 | | | $ | 1,116.66 | | | $ | 1,116.59 | | | $ | (0.06 | ) | | | 0.0 | % |
| 22 | | | 0 | | | | 9,500 | | | $ | 1,178.42 | | | $ | 1,178.35 | | | $ | (0.07 | ) | | | 0.0 | % |
| 23 | | | 0 | | | | 10,000 | | | $ | 1,240.18 | | | $ | 1,240.11 | | | $ | (0.07 | ) | | | 0.0 | % |
| 24 | | | 0 | | | | 10,500 | | | $ | 1,301.94 | | | $ | 1,301.87 | | | $ | (0.07 | ) | | | 0.0 | % |
| 25 | | | 0 | | | | 11,000 | | | $ | 1,363.70 | | | $ | 1,363.62 | | | $ | (0.08 | ) | | | 0.0 | % |
| 26 | | | 0 | | | | 11,500 | | | $ | 1,425.46 | | | $ | 1,425.38 | | | $ | (0.08 | ) | | | 0.0 | % |
| 27 | | | 0 | | | | 12,000 | | | $ | 1,487.22 | | | $ | 1,487.14 | | | $ | (0.08 | ) | | | 0.0 | % |
| 28 | | | 0 | | | | 12,500 | | | $ | 1,548.98 | | | $ | 1,548.90 | | | $ | (0.09 | ) | | | 0.0 | % |
| 29 | | | 0 | | | | 13,000 | | | $ | 1,610.74 | | | $ | 1,610.65 | | | $ | (0.09 | ) | | | 0.0 | % |
| 30 | | | 0 | | | | 13,500 | | | $ | 1,672.51 | | | $ | 1,672.41 | | | $ | (0.09 | ) | | | 0.0 | % |
| 31 | | | 0 | | | | 14,000 | | | $ | 1,734.27 | | | $ | 1,734.17 | | | $ | (0.10 | ) | | | 0.0 | % |
| 32 | | | 0 | | | | 14,500 | | | $ | 1,796.03 | | | $ | 1,795.93 | | | $ | (0.10 | ) | | | 0.0 | % |
| 33 | | | 0 | | | | 15,000 | | | $ | 1,857.79 | | | $ | 1,857.68 | | | $ | (0.11 | ) | | | 0.0 | % |
| 34 | | | 0 | | | | 15,500 | | | $ | 1,919.27 | | | $ | 1,919.16 | | | $ | (0.11 | ) | | | 0.0 | % |
| 35 | | | 0 | | | | 16,000 | | | $ | 1,980.75 | | | $ | 1,980.64 | | | $ | (0.11 | ) | | | 0.0 | % |
| 36 | | | 0 | | | | 16,500 | | | $ | 2,042.23 | | | $ | 2,042.12 | | | $ | (0.12 | ) | | | 0.0 | % |
| 37 | | | 0 | | | | 17,000 | | | $ | 2,103.71 | | | $ | 2,103.59 | | | $ | (0.12 | ) | | | 0.0 | % |
| 38 | | | 0 | | | | 17,500 | | | $ | 2,165.19 | | | $ | 2,165.07 | | | $ | (0.12 | ) | | | 0.0 | % |
Exhibit G
TE - Page 2 of 27
The Toledo Edison Company
Case No. 12-1465-EL-ATS
Estimated Typical Bills - Comparison (Q2 2012 vs. Q2 2012 w/ Securitization)
| | | | | | | | | | | | | | | | | | | | | | | | |
| Bill Data | |
Line
No. | | Level of
Demand
(kW)
(A) | | | Level of
Usage
(kWH)
(B) | | | Current
Winter Bill
($)
(C) | | | Proposed
Winter Bill
($)
(D) | | | Dollar
Increase
($)
(E) | | | Percent
Increase
(%)
(E) | |
|
Residential Service - Electric Heating (Rate RS) | |
| 1 | | | 0 | | | | 250 | | | $ | 35.03 | | | $ | 35.03 | | | $ | (0.00 | ) | | | 0.0 | % |
| 2 | | | 0 | | | | 500 | | | $ | 66.02 | | | $ | 66.02 | | | $ | (0.00 | ) | | | 0.0 | % |
| 3 | | | 0 | | | | 750 | | | $ | 87.87 | | | $ | 87.86 | | | $ | (0.01 | ) | | | 0.0 | % |
| 4 | | | 0 | | | | 1,000 | | | $ | 109.71 | | | $ | 109.71 | | | $ | (0.01 | ) | | | 0.0 | % |
| 5 | | | 0 | | | | 1,250 | | | $ | 131.56 | | | $ | 131.55 | | | $ | (0.01 | ) | | | 0.0 | % |
| 6 | | | 0 | | | | 1,500 | | | $ | 153.41 | | | $ | 153.40 | | | $ | (0.01 | ) | | | 0.0 | % |
| 7 | | | 0 | | | | 2,000 | | | $ | 197.10 | | | $ | 197.08 | | | $ | (0.01 | ) | | | 0.0 | % |
| 8 | | | 0 | | | | 2,500 | | | $ | 225.06 | | | $ | 225.04 | | | $ | (0.02 | ) | | | 0.0 | % |
| 9 | | | 0 | | | | 3,000 | | | $ | 253.02 | | | $ | 253.00 | | | $ | (0.02 | ) | | | 0.0 | % |
| 10 | | | 0 | | | | 3,500 | | | $ | 280.98 | | | $ | 280.96 | | | $ | (0.02 | ) | | | 0.0 | % |
| 11 | | | 0 | | | | 4,000 | | | $ | 308.94 | | | $ | 308.92 | | | $ | (0.03 | ) | | | 0.0 | % |
| 12 | | | 0 | | | | 4,500 | | | $ | 336.90 | | | $ | 336.87 | | | $ | (0.03 | ) | | | 0.0 | % |
| 13 | | | 0 | | | | 5,000 | | | $ | 364.87 | | | $ | 364.83 | | | $ | (0.04 | ) | | | 0.0 | % |
| 14 | | | 0 | | | | 5,500 | | | $ | 392.83 | | | $ | 392.79 | | | $ | (0.04 | ) | | | 0.0 | % |
| 15 | | | 0 | | | | 6,000 | | | $ | 420.79 | | | $ | 420.75 | | | $ | (0.04 | ) | | | 0.0 | % |
| 16 | | | 0 | | | | 6,500 | | | $ | 448.75 | | | $ | 448.70 | | | $ | (0.05 | ) | | | 0.0 | % |
| 17 | | | 0 | | | | 7,000 | | | $ | 476.71 | | | $ | 476.66 | | | $ | (0.05 | ) | | | 0.0 | % |
| 18 | | | 0 | | | | 7,500 | | | $ | 504.67 | | | $ | 504.62 | | | $ | (0.05 | ) | | | 0.0 | % |
| 19 | | | 0 | | | | 8,000 | | | $ | 532.63 | | | $ | 532.58 | | | $ | (0.06 | ) | | | 0.0 | % |
| 20 | | | 0 | | | | 8,500 | | | $ | 560.59 | | | $ | 560.53 | | | $ | (0.06 | ) | | | 0.0 | % |
| 21 | | | 0 | | | | 9,000 | | | $ | 588.56 | | | $ | 588.49 | | | $ | (0.06 | ) | | | 0.0 | % |
| 22 | | | 0 | | | | 9,500 | | | $ | 616.52 | | | $ | 616.45 | | | $ | (0.07 | ) | | | 0.0 | % |
| 23 | | | 0 | | | | 10,000 | | | $ | 644.48 | | | $ | 644.41 | | | $ | (0.07 | ) | | | 0.0 | % |
| 24 | | | 0 | | | | 10,500 | | | $ | 672.44 | | | $ | 672.37 | | | $ | (0.07 | ) | | | 0.0 | % |
| 25 | | | 0 | | | | 11,000 | | | $ | 700.40 | | | $ | 700.32 | | | $ | (0.08 | ) | | | 0.0 | % |
| 26 | | | 0 | | | | 11,500 | | | $ | 728.36 | | | $ | 728.28 | | | $ | (0.08 | ) | | | 0.0 | % |
| 27 | | | 0 | | | | 12,000 | | | $ | 756.32 | | | $ | 756.24 | | | $ | (0.08 | ) | | | 0.0 | % |
| 28 | | | 0 | | | | 12,500 | | | $ | 784.28 | | | $ | 784.20 | | | $ | (0.09 | ) | | | 0.0 | % |
| 29 | | | 0 | | | | 13,000 | | | $ | 812.24 | | | $ | 812.15 | | | $ | (0.09 | ) | | | 0.0 | % |
| 30 | | | 0 | | | | 13,500 | | | $ | 840.21 | | | $ | 840.11 | | | $ | (0.09 | ) | | | 0.0 | % |
| 31 | | | 0 | | | | 14,000 | �� | | $ | 868.17 | | | $ | 868.07 | | | $ | (0.10 | ) | | | 0.0 | % |
| 32 | | | 0 | | | | 14,500 | | | $ | 896.13 | | | $ | 896.03 | | | $ | (0.10 | ) | | | 0.0 | % |
| 33 | | | 0 | | | | 15,000 | | | $ | 924.09 | | | $ | 923.98 | | | $ | (0.11 | ) | | | 0.0 | % |
| 34 | | | 0 | | | | 15,500 | | | $ | 951.77 | | | $ | 951.66 | | | $ | (0.11 | ) | | | 0.0 | % |
| 35 | | | 0 | | | | 16,000 | | | $ | 979.45 | | | $ | 979.34 | | | $ | (0.11 | ) | | | 0.0 | % |
| 36 | | | 0 | | | | 16,500 | | | $ | 1,007.13 | | | $ | 1,007.02 | | | $ | (0.12 | ) | | | 0.0 | % |
| 37 | | | 0 | | | | 17,000 | | | $ | 1,034.81 | | | $ | 1,034.69 | | | $ | (0.12 | ) | | | 0.0 | % |
| 38 | | | 0 | | | | 17,500 | | | $ | 1,062.49 | | | $ | 1,062.37 | | | $ | (0.12 | ) | | | 0.0 | % |
Exhibit G
TE - Page 3 of 27
The Toledo Edison Company
Case No. 12-1465-EL-ATS
Estimated Typical Bills - Comparison (Q2 2012 vs. Q2 2012 w/ Securitization)
| | | | | | | | | | | | | | | | | | | | | | | | |
| Bill Data | |
Line
No. | | Level of
Demand
(kW)
(A) | | | Level of
Usage
(kWH)
(B) | | | Current
Winter Bill
($)
(C) | | | Proposed
Winter Bill
($)
(D) | | | Dollar
Increase
($)
(E) | | | Percent
Increase
(%)
(E) | |
|
Residential Service - Electric Heating Apartment (Rate RS) | |
| 1 | | | 0 | | | | 250 | | | $ | 24.83 | | | $ | 24.83 | | | $ | (0.00 | ) | | | 0.0 | % |
| 2 | | | 0 | | | | 500 | | | $ | 45.62 | | | $ | 45.62 | | | $ | (0.00 | ) | | | 0.0 | % |
| 3 | | | 0 | | | | 750 | | | $ | 57.27 | | | $ | 57.26 | | | $ | (0.01 | ) | | | 0.0 | % |
| 4 | | | 0 | | | | 1,000 | | | $ | 68.91 | | | $ | 68.91 | | | $ | (0.01 | ) | | | 0.0 | % |
| 5 | | | 0 | | | | 1,250 | | | $ | 80.56 | | | $ | 80.55 | | | $ | (0.01 | ) | | | 0.0 | % |
| 6 | | | 0 | | | | 1,500 | | | $ | 92.21 | | | $ | 92.20 | | | $ | (0.01 | ) | | | 0.0 | % |
| 7 | | | 0 | | | | 2,000 | | | $ | 115.50 | | | $ | 115.48 | | | $ | (0.01 | ) | | | 0.0 | % |
| 8 | | | 0 | | | | 2,500 | | | $ | 158.96 | | | $ | 158.94 | | | $ | (0.02 | ) | | | 0.0 | % |
| 9 | | | 0 | | | | 3,000 | | | $ | 202.42 | | | $ | 202.40 | | | $ | (0.02 | ) | | | 0.0 | % |
| 10 | | | 0 | | | | 3,500 | | | $ | 245.88 | | | $ | 245.86 | | | $ | (0.02 | ) | | | 0.0 | % |
| 11 | | | 0 | | | | 4,000 | | | $ | 289.34 | | | $ | 289.32 | | | $ | (0.03 | ) | | | 0.0 | % |
| 12 | | | 0 | | | | 4,500 | | | $ | 332.80 | | | $ | 332.77 | | | $ | (0.03 | ) | | | 0.0 | % |
| 13 | | | 0 | | | | 5,000 | | | $ | 376.27 | | | $ | 376.23 | | | $ | (0.04 | ) | | | 0.0 | % |
| 14 | | | 0 | | | | 5,500 | | | $ | 419.73 | | | $ | 419.69 | | | $ | (0.04 | ) | | | 0.0 | % |
| 15 | | | 0 | | | | 6,000 | | | $ | 463.19 | | | $ | 463.15 | | | $ | (0.04 | ) | | | 0.0 | % |
| 16 | | | 0 | | | | 6,500 | | | $ | 506.65 | | | $ | 506.60 | | | $ | (0.05 | ) | | | 0.0 | % |
| 17 | | | 0 | | | | 7,000 | | | $ | 550.11 | | | $ | 550.06 | | | $ | (0.05 | ) | | | 0.0 | % |
| 18 | | | 0 | | | | 7,500 | | | $ | 593.57 | | | $ | 593.52 | | | $ | (0.05 | ) | | | 0.0 | % |
| 19 | | | 0 | | | | 8,000 | | | $ | 637.03 | | | $ | 636.98 | | | $ | (0.06 | ) | | | 0.0 | % |
| 20 | | | 0 | | | | 8,500 | | | $ | 680.49 | | | $ | 680.43 | | | $ | (0.06 | ) | | | 0.0 | % |
| 21 | | | 0 | | | | 9,000 | | | $ | 723.96 | | | $ | 723.89 | | | $ | (0.06 | ) | | | 0.0 | % |
| 22 | | | 0 | | | | 9,500 | | | $ | 767.42 | | | $ | 767.35 | | | $ | (0.07 | ) | | | 0.0 | % |
| 23 | | | 0 | | | | 10,000 | | | $ | 810.88 | | | $ | 810.81 | | | $ | (0.07 | ) | | | 0.0 | % |
| 24 | | | 0 | | | | 10,500 | | | $ | 854.34 | | | $ | 854.27 | | | $ | (0.07 | ) | | | 0.0 | % |
| 25 | | | 0 | | | | 11,000 | | | $ | 897.80 | | | $ | 897.72 | | | $ | (0.08 | ) | | | 0.0 | % |
| 26 | | | 0 | | | | 11,500 | | | $ | 941.26 | | | $ | 941.18 | | | $ | (0.08 | ) | | | 0.0 | % |
| 27 | | | 0 | | | | 12,000 | | | $ | 984.72 | | | $ | 984.64 | | | $ | (0.08 | ) | | | 0.0 | % |
| 28 | | | 0 | | | | 12,500 | | | $ | 1,028.18 | | | $ | 1,028.10 | | | $ | (0.09 | ) | | | 0.0 | % |
| 29 | | | 0 | | | | 13,000 | | | $ | 1,071.64 | | | $ | 1,071.55 | | | $ | (0.09 | ) | | | 0.0 | % |
| 30 | | | 0 | | | | 13,500 | | | $ | 1,115.11 | | | $ | 1,115.01 | | | $ | (0.09 | ) | | | 0.0 | % |
| 31 | | | 0 | | | | 14,000 | | | $ | 1,158.57 | | | $ | 1,158.47 | | | $ | (0.10 | ) | | | 0.0 | % |
| 32 | | | 0 | | | | 14,500 | | | $ | 1,202.03 | | | $ | 1,201.93 | | | $ | (0.10 | ) | | | 0.0 | % |
| 33 | | | 0 | | | | 15,000 | | | $ | 1,245.49 | | | $ | 1,245.38 | | | $ | (0.11 | ) | | | 0.0 | % |
| 34 | | | 0 | | | | 15,500 | | | $ | 1,288.67 | | | $ | 1,288.56 | | | $ | (0.11 | ) | | | 0.0 | % |
| 35 | | | 0 | | | | 16,000 | | | $ | 1,331.85 | | | $ | 1,331.74 | | | $ | (0.11 | ) | | | 0.0 | % |
| 36 | | | 0 | | | | 16,500 | | | $ | 1,375.03 | | | $ | 1,374.92 | | | $ | (0.12 | ) | | | 0.0 | % |
| 37 | | | 0 | | | | 17,000 | | | $ | 1,418.21 | | | $ | 1,418.09 | | | $ | (0.12 | ) | | | 0.0 | % |
| 38 | | | 0 | | | | 17,500 | | | $ | 1,461.39 | | | $ | 1,461.27 | | | $ | (0.12 | ) | | | 0.0 | % |
Exhibit G
TE - Page 4 of 27
The Toledo Edison Company
Case No. 12-1465-EL-ATS
Estimated Typical Bills - Comparison (Q2 2012 vs. Q2 2012 w/ Securitization)
| | | | | | | | | | | | | | | | | | | | | | | | |
| Bill Data | |
Line
No. | | Level of
Demand
(kW)
(A) | | | Level of
Usage
(kWH)
(B) | | | Current
Winter Bill
($)
(C) | | | Proposed
Winter Bill
($)
(D) | | | Dollar
Increase
($)
(E) | | | Percent
Increase
(%)
(E) | |
|
Residential Service - Water Heating (Rate RS) | |
| 1 | | | 0 | | | | 250 | | | $ | 35.03 | | | $ | 35.03 | | | $ | (0.00 | ) | | | 0.0 | % |
| 2 | | | 0 | | | | 500 | | | $ | 66.02 | | | $ | 66.02 | | | $ | (0.00 | ) | | | 0.0 | % |
| 3 | | | 0 | | | | 750 | | | $ | 91.37 | | | $ | 91.36 | | | $ | (0.01 | ) | | | 0.0 | % |
| 4 | | | 0 | | | | 1,000 | | | $ | 116.71 | | | $ | 116.71 | | | $ | (0.01 | ) | | | 0.0 | % |
| 5 | | | 0 | | | | 1,250 | | | $ | 142.06 | | | $ | 142.05 | | | $ | (0.01 | ) | | | 0.0 | % |
| 6 | | | 0 | | | | 1,500 | | | $ | 167.41 | | | $ | 167.40 | | | $ | (0.01 | ) | | | 0.0 | % |
| 7 | | | 0 | | | | 2,000 | | | $ | 218.10 | | | $ | 218.08 | | | $ | (0.01 | ) | | | 0.0 | % |
| 8 | | | 0 | | | | 2,500 | | | $ | 268.56 | | | $ | 268.54 | | | $ | (0.02 | ) | | | 0.0 | % |
| 9 | | | 0 | | | | 3,000 | | | $ | 319.02 | | | $ | 319.00 | | | $ | (0.02 | ) | | | 0.0 | % |
| 10 | | | 0 | | | | 3,500 | | | $ | 369.48 | | | $ | 369.46 | | | $ | (0.02 | ) | | | 0.0 | % |
| 11 | | | 0 | | | | 4,000 | | | $ | 419.94 | | | $ | 419.92 | | | $ | (0.03 | ) | | | 0.0 | % |
| 12 | | | 0 | | | | 4,500 | | | $ | 470.40 | | | $ | 470.37 | | | $ | (0.03 | ) | | | 0.0 | % |
| 13 | | | 0 | | | | 5,000 | | | $ | 520.87 | | | $ | 520.83 | | | $ | (0.03 | ) | | | 0.0 | % |
| 14 | | | 0 | | | | 5,500 | | | $ | 571.33 | | | $ | 571.29 | | | $ | (0.04 | ) | | | 0.0 | % |
| 15 | | | 0 | | | | 6,000 | | | $ | 621.79 | | | $ | 621.75 | | | $ | (0.04 | ) | | | 0.0 | % |
| 16 | | | 0 | | | | 6,500 | | | $ | 672.25 | | | $ | 672.20 | | | $ | (0.05 | ) | | | 0.0 | % |
| 17 | | | 0 | | | | 7,000 | | | $ | 722.71 | | | $ | 722.66 | | | $ | (0.05 | ) | | | 0.0 | % |
| 18 | | | 0 | | | | 7,500 | | | $ | 773.17 | | | $ | 773.12 | | | $ | (0.05 | ) | | | 0.0 | % |
| 19 | | | 0 | | | | 8,000 | | | $ | 823.63 | | | $ | 823.58 | | | $ | (0.06 | ) | | | 0.0 | % |
| 20 | | | 0 | | | | 8,500 | | | $ | 874.09 | | | $ | 874.03 | | | $ | (0.06 | ) | | | 0.0 | % |
| 21 | | | 0 | | | | 9,000 | | | $ | 924.56 | | | $ | 924.49 | | | $ | (0.06 | ) | | | 0.0 | % |
| 22 | | | 0 | | | | 9,500 | | | $ | 975.02 | | | $ | 974.95 | | | $ | (0.07 | ) | | | 0.0 | % |
| 23 | | | 0 | | | | 10,000 | | | $ | 1,025.48 | | | $ | 1,025.41 | | | $ | (0.07 | ) | | | 0.0 | % |
| 24 | | | 0 | | | | 10,500 | | | $ | 1,075.94 | | | $ | 1,075.87 | | | $ | (0.07 | ) | | | 0.0 | % |
| 25 | | | 0 | | | | 11,000 | | | $ | 1,126.40 | | | $ | 1,126.32 | | | $ | (0.08 | ) | | | 0.0 | % |
| 26 | | | 0 | | | | 11,500 | | | $ | 1,176.86 | | | $ | 1,176.78 | | | $ | (0.08 | ) | | | 0.0 | % |
| 27 | | | 0 | | | | 12,000 | | | $ | 1,227.32 | | | $ | 1,227.24 | | | $ | (0.08 | ) | | | 0.0 | % |
| 28 | | | 0 | | | | 12,500 | | | $ | 1,277.78 | | | $ | 1,277.70 | | | $ | (0.09 | ) | | | 0.0 | % |
| 29 | | | 0 | | | | 13,000 | | | $ | 1,328.24 | | | $ | 1,328.15 | | | $ | (0.09 | ) | | | 0.0 | % |
| 30 | | | 0 | | | | 13,500 | | | $ | 1,378.71 | | | $ | 1,378.61 | | | $ | (0.09 | ) | | | 0.0 | % |
| 31 | | | 0 | | | | 14,000 | | | $ | 1,429.17 | | | $ | 1,429.07 | | | $ | (0.10 | ) | | | 0.0 | % |
| 32 | | | 0 | | | | 14,500 | | | $ | 1,479.63 | | | $ | 1,479.53 | | | $ | (0.10 | ) | | | 0.0 | % |
| 33 | | | 0 | | | | 15,000 | | | $ | 1,530.09 | | | $ | 1,529.98 | | | $ | (0.11 | ) | | | 0.0 | % |
| 34 | | | 0 | | | | 15,500 | | | $ | 1,580.27 | | | $ | 1,580.16 | | | $ | (0.11 | ) | | | 0.0 | % |
| 35 | | | 0 | | | | 16,000 | | | $ | 1,630.45 | | | $ | 1,630.34 | | | $ | (0.11 | ) | | | 0.0 | % |
| 36 | | | 0 | | | | 16,500 | | | $ | 1,680.63 | | | $ | 1,680.52 | | | $ | (0.12 | ) | | | 0.0 | % |
| 37 | | | 0 | | | | 17,000 | | | $ | 1,730.81 | | | $ | 1,730.69 | | | $ | (0.12 | ) | | | 0.0 | % |
| 38 | | | 0 | | | | 17,500 | | | $ | 1,780.99 | | | $ | 1,780.87 | | | $ | (0.12 | ) | | | 0.0 | % |
Exhibit G
TE - Page 5 of 27
The Toledo Edison Company
Case No. 12-1465-EL-ATS
Estimated Typical Bills - Comparison (Q2 2012 vs. Q2 2012 w/ Securitization)
| | | | | | | | | | | | | | | | | | | | | | | | |
| Bill Data | |
Line
No. | | Level of
Demand
(kW)
(A) | | | Level of
Usage
(kWH)
(B) | | | Current
Summer Bill
($)
(C) | | | Proposed
Summer Bill
($)
(D) | | | Dollar
Increase
($)
(E) | | | Percent
Increase
(%)
(E) | |
|
Residential Service - Standard (Rate RS) | |
| 1 | | | 0 | | | | 250 | | | $ | 37.31 | | | $ | 37.31 | | | $ | (0.00 | ) | | | 0.0 | % |
| 2 | | | 0 | | | | 500 | | | $ | 70.60 | | | $ | 70.59 | | | $ | (0.00 | ) | | | 0.0 | % |
| 3 | | | 0 | | | | 750 | | | $ | 103.88 | | | $ | 103.87 | | | $ | (0.01 | ) | | | 0.0 | % |
| 4 | | | 0 | | | | 1,000 | | | $ | 137.16 | | | $ | 137.15 | | | $ | (0.01 | ) | | | 0.0 | % |
| 5 | | | 0 | | | | 1,250 | | | $ | 170.44 | | | $ | 170.44 | | | $ | (0.01 | ) | | | 0.0 | % |
| 6 | | | 0 | | | | 1,500 | | | $ | 203.73 | | | $ | 203.72 | | | $ | (0.01 | ) | | | 0.0 | % |
| 7 | | | 0 | | | | 2,000 | | | $ | 270.29 | | | $ | 270.28 | | | $ | (0.01 | ) | | | 0.0 | % |
| 8 | | | 0 | | | | 2,500 | | | $ | 336.63 | | | $ | 336.61 | | | $ | (0.02 | ) | | | 0.0 | % |
| 9 | | | 0 | | | | 3,000 | | | $ | 402.96 | | | $ | 402.94 | | | $ | (0.02 | ) | | | 0.0 | % |
| 10 | | | 0 | | | | 3,500 | | | $ | 469.30 | | | $ | 469.27 | | | $ | (0.02 | ) | | | 0.0 | % |
| 11 | | | 0 | | | | 4,000 | | | $ | 535.63 | | | $ | 535.60 | | | $ | (0.03 | ) | | | 0.0 | % |
| 12 | | | 0 | | | | 4,500 | | | $ | 601.97 | | | $ | 601.93 | | | $ | (0.03 | ) | | | 0.0 | % |
| 13 | | | 0 | | | | 5,000 | | | $ | 668.30 | | | $ | 668.27 | | | $ | (0.03 | ) | | | 0.0 | % |
| 14 | | | 0 | | | | 5,500 | | | $ | 734.64 | | | $ | 734.60 | | | $ | (0.04 | ) | | | 0.0 | % |
| 15 | | | 0 | | | | 6,000 | | | $ | 800.97 | | | $ | 800.93 | | | $ | (0.04 | ) | | | 0.0 | % |
| 16 | | | 0 | | | | 6,500 | | | $ | 867.30 | | | $ | 867.26 | | | $ | (0.05 | ) | | | 0.0 | % |
| 17 | | | 0 | | | | 7,000 | | | $ | 933.64 | | | $ | 933.59 | | | $ | (0.05 | ) | | | 0.0 | % |
| 18 | | | 0 | | | | 7,500 | | | $ | 999.97 | | | $ | 999.92 | | | $ | (0.05 | ) | | | 0.0 | % |
| 19 | | | 0 | | | | 8,000 | | | $ | 1,066.31 | | | $ | 1,066.25 | | | $ | (0.06 | ) | | | 0.0 | % |
| 20 | | | 0 | | | | 8,500 | | | $ | 1,132.64 | | | $ | 1,132.58 | | | $ | (0.06 | ) | | | 0.0 | % |
| 21 | | | 0 | | | | 9,000 | | | $ | 1,198.98 | | | $ | 1,198.92 | | | $ | (0.06 | ) | | | 0.0 | % |
| 22 | | | 0 | | | | 9,500 | | | $ | 1,265.31 | | | $ | 1,265.25 | | | $ | (0.07 | ) | | | 0.0 | % |
| 23 | | | 0 | | | | 10,000 | | | $ | 1,331.65 | | | $ | 1,331.58 | | | $ | (0.07 | ) | | | 0.0 | % |
| 24 | | | 0 | | | | 10,500 | | | $ | 1,397.98 | | | $ | 1,397.91 | | | $ | (0.07 | ) | | | 0.0 | % |
| 25 | | | 0 | | | | 11,000 | | | $ | 1,464.32 | | | $ | 1,464.24 | | | $ | (0.08 | ) | | | 0.0 | % |
| 26 | | | 0 | | | | 11,500 | | | $ | 1,530.65 | | | $ | 1,530.57 | | | $ | (0.08 | ) | | | 0.0 | % |
| 27 | | | 0 | | | | 12,000 | | | $ | 1,596.99 | | | $ | 1,596.90 | | | $ | (0.08 | ) | | | 0.0 | % |
| 28 | | | 0 | | | | 12,500 | | | $ | 1,663.32 | | | $ | 1,663.23 | | | $ | (0.09 | ) | | | 0.0 | % |
| 29 | | | 0 | | | | 13,000 | | | $ | 1,729.66 | | | $ | 1,729.56 | | | $ | (0.09 | ) | | | 0.0 | % |
| 30 | | | 0 | | | | 13,500 | | | $ | 1,795.99 | | | $ | 1,795.90 | | | $ | (0.09 | ) | | | 0.0 | % |
| 31 | | | 0 | | | | 14,000 | | | $ | 1,862.33 | | | $ | 1,862.23 | | | $ | (0.10 | ) | | | 0.0 | % |
| 32 | | | 0 | | | | 14,500 | | | $ | 1,928.66 | | | $ | 1,928.56 | | | $ | (0.10 | ) | | | 0.0 | % |
| 33 | | | 0 | | | | 15,000 | | | $ | 1,994.99 | | | $ | 1,994.89 | | | $ | (0.11 | ) | | | 0.0 | % |
| 34 | | | 0 | | | | 15,500 | | | $ | 2,061.05 | | | $ | 2,060.94 | | | $ | (0.11 | ) | | | 0.0 | % |
| 35 | | | 0 | | | | 16,000 | | | $ | 2,127.10 | | | $ | 2,126.99 | | | $ | (0.11 | ) | | | 0.0 | % |
| 36 | | | 0 | | | | 16,500 | | | $ | 2,193.16 | | | $ | 2,193.04 | | | $ | (0.12 | ) | | | 0.0 | % |
| 37 | | | 0 | | | | 17,000 | | | $ | 2,259.21 | | | $ | 2,259.09 | | | $ | (0.12 | ) | | | 0.0 | % |
| 38 | | | 0 | | | | 17,500 | | | $ | 2,325.26 | | | $ | 2,325.14 | | | $ | (0.12 | ) | | | 0.0 | % |
Exhibit G
TE - Page 6 of 27
The Toledo Edison Company
Case No. 12-1465-EL-ATS
Estimated Typical Bills - Comparison (Q2 2012 vs. Q2 2012 w/ Securitization)
| | | | | | | | | | | | | | | | | | | | | | | | |
| Bill Data | |
Line
No. | | Level of
Demand
(kW)
(A) | | | Level of
Usage
(kWH)
(B) | | | Current
Summer Bill
($)
(C) | | | Proposed
Summer Bill
($)
(D) | | | Dollar
Increase
($)
(E) | | | Percent
Increase
(%)
(E) | |
| | | |
Residential Service - Electric Heating (Rate RS) | | | | | | | | | | | | | |
| 1 | | | 0 | | | | 250 | | | $ | 37.31 | | | $ | 37.31 | | | $ | (0.00 | ) | | | 0.0 | % |
| 2 | | | 0 | | | | 500 | | | $ | 70.60 | | | $ | 70.59 | | | $ | (0.00 | ) | | | 0.0 | % |
| 3 | | | 0 | | | | 750 | | | $ | 94.73 | | | $ | 94.72 | | | $ | (0.01 | ) | | | 0.0 | % |
| 4 | | | 0 | | | | 1,000 | | | $ | 118.86 | | | $ | 118.85 | | | $ | (0.01 | ) | | | 0.0 | % |
| 5 | | | 0 | | | | 1,250 | | | $ | 142.99 | | | $ | 142.99 | | | $ | (0.01 | ) | | | 0.0 | % |
| 6 | | | 0 | | | | 1,500 | | | $ | 167.13 | | | $ | 167.12 | | | $ | (0.01 | ) | | | 0.0 | % |
| 7 | | | 0 | | | | 2,000 | | | $ | 215.39 | | | $ | 215.38 | | | $ | (0.01 | ) | | | 0.0 | % |
| 8 | | | 0 | | | | 2,500 | | | $ | 263.43 | | | $ | 263.41 | | | $ | (0.02 | ) | | | 0.0 | % |
| 9 | | | 0 | | | | 3,000 | | | $ | 311.46 | | | $ | 311.44 | | | $ | (0.02 | ) | | | 0.0 | % |
| 10 | | | 0 | | | | 3,500 | | | $ | 359.50 | | | $ | 359.47 | | | $ | (0.02 | ) | | | 0.0 | % |
| 11 | | | 0 | | | | 4,000 | | | $ | 407.53 | | | $ | 407.50 | | | $ | (0.03 | ) | | | 0.0 | % |
| 12 | | | 0 | | | | 4,500 | | | $ | 455.57 | | | $ | 455.53 | | | $ | (0.03 | ) | | | 0.0 | % |
| 13 | | | 0 | | | | 5,000 | | | $ | 503.60 | | | $ | 503.57 | | | $ | (0.03 | ) | | | 0.0 | % |
| 14 | | | 0 | | | | 5,500 | | | $ | 551.64 | | | $ | 551.60 | | | $ | (0.04 | ) | | | 0.0 | % |
| 15 | | | 0 | | | | 6,000 | | | $ | 599.67 | | | $ | 599.63 | | | $ | (0.04 | ) | | | 0.0 | % |
| 16 | | | 0 | | | | 6,500 | | | $ | 647.70 | | | $ | 647.66 | | | $ | (0.05 | ) | | | 0.0 | % |
| 17 | | | 0 | | | | 7,000 | | | $ | 695.74 | | | $ | 695.69 | | | $ | (0.05 | ) | | | 0.0 | % |
| 18 | | | 0 | | | | 7,500 | | | $ | 743.77 | | | $ | 743.72 | | | $ | (0.05 | ) | | | 0.0 | % |
| 19 | | | 0 | | | | 8,000 | | | $ | 791.81 | | | $ | 791.75 | | | $ | (0.06 | ) | | | 0.0 | % |
| 20 | | | 0 | | | | 8,500 | | | $ | 839.84 | | | $ | 839.78 | | | $ | (0.06 | ) | | | 0.0 | % |
| 21 | | | 0 | | | | 9,000 | | | $ | 887.88 | | | $ | 887.82 | | | $ | (0.06 | ) | | | 0.0 | % |
| 22 | | | 0 | | | | 9,500 | | | $ | 935.91 | | | $ | 935.85 | | | $ | (0.07 | ) | | | 0.0 | % |
| 23 | | | 0 | | | | 10,000 | | | $ | 983.95 | | | $ | 983.88 | | | $ | (0.07 | ) | | | 0.0 | % |
| 24 | | | 0 | | | | 10,500 | | | $ | 1,031.98 | | | $ | 1,031.91 | | | $ | (0.07 | ) | | | 0.0 | % |
| 25 | | | 0 | | | | 11,000 | | | $ | 1,080.02 | | | $ | 1,079.94 | | | $ | (0.08 | ) | | | 0.0 | % |
| 26 | | | 0 | | | | 11,500 | | | $ | 1,128.05 | | | $ | 1,127.97 | | | $ | (0.08 | ) | | | 0.0 | % |
| 27 | | | 0 | | | | 12,000 | | | $ | 1,176.09 | | | $ | 1,176.00 | | | $ | (0.08 | ) | | | 0.0 | % |
| 28 | | | 0 | | | | 12,500 | | | $ | 1,224.12 | | | $ | 1,224.03 | | | $ | (0.09 | ) | | | 0.0 | % |
| 29 | | | 0 | | | | 13,000 | | | $ | 1,272.16 | | | $ | 1,272.06 | | | $ | (0.09 | ) | | | 0.0 | % |
| 30 | | | 0 | | | | 13,500 | | | $ | 1,320.19 | | | $ | 1,320.10 | | | $ | (0.09 | ) | | | 0.0 | % |
| 31 | | | 0 | | | | 14,000 | | | $ | 1,368.23 | | | $ | 1,368.13 | | | $ | (0.10 | ) | | | 0.0 | % |
| 32 | | | 0 | | | | 14,500 | | | $ | 1,416.26 | | | $ | 1,416.16 | | | $ | (0.10 | ) | | | 0.0 | % |
| 33 | | | 0 | | | | 15,000 | | | $ | 1,464.29 | | | $ | 1,464.19 | | | $ | (0.11 | ) | | | 0.0 | % |
| 34 | | | 0 | | | | 15,500 | | | $ | 1,512.05 | | | $ | 1,511.94 | | | $ | (0.11 | ) | | | 0.0 | % |
| 35 | | | 0 | | | | 16,000 | | | $ | 1,559.80 | | | $ | 1,559.69 | | | $ | (0.11 | ) | | | 0.0 | % |
| 36 | | | 0 | | | | 16,500 | | | $ | 1,607.56 | | | $ | 1,607.44 | | | $ | (0.12 | ) | | | 0.0 | % |
| 37 | | | 0 | | | | 17,000 | | | $ | 1,655.31 | | | $ | 1,655.19 | | | $ | (0.12 | ) | | | 0.0 | % |
| 38 | | | 0 | | | | 17,500 | | | $ | 1,703.06 | | | $ | 1,702.94 | | | $ | (0.12 | ) | | | 0.0 | % |
Exhibit G
TE - Page 7 of 27
The Toledo Edison Company
Case No. 12-1465-EL-ATS
Estimated Typical Bills - Comparison (Q2 2012 vs. Q2 2012 w/ Securitization)
| | | | | | | | | | | | | | | | | | | | | | | | |
| Bill Data | |
Line
No. | | Level of
Demand
(kW)
(A) | | | Level of
Usage
(kWH)
(B) | | | Current
Summer Bill
($)
(C) | | | Proposed
Summer Bill
($)
(D) | | | Dollar
Increase
($)
(E) | | | Percent
Increase
(%)
(E) | |
|
Residential Service - Water Heating (Rate RS) | |
| 1 | | | 0 | | | | 250 | | | $ | 37.31 | | | $ | 37.31 | | | $ | (0.00 | ) | | | 0.0 | % |
| 2 | | | 0 | | | | 500 | | | $ | 70.60 | | | $ | 70.59 | | | $ | (0.00 | ) | | | 0.0 | % |
| 3 | | | 0 | | | | 750 | | | $ | 98.23 | | | $ | 98.22 | | | $ | (0.01 | ) | | | 0.0 | % |
| 4 | | | 0 | | | | 1,000 | | | $ | 125.86 | | | $ | 125.85 | | | $ | (0.01 | ) | | | 0.0 | % |
| 5 | | | 0 | | | | 1,250 | | | $ | 153.49 | | | $ | 153.49 | | | $ | (0.01 | ) | | | 0.0 | % |
| 6 | | | 0 | | | | 1,500 | | | $ | 181.13 | | | $ | 181.12 | | | $ | (0.01 | ) | | | 0.0 | % |
| 7 | | | 0 | | | | 2,000 | | | $ | 236.39 | | | $ | 236.38 | | | $ | (0.01 | ) | | | 0.0 | % |
| 8 | | | 0 | | | | 2,500 | | | $ | 291.43 | | | $ | 291.41 | | | $ | (0.02 | ) | | | 0.0 | % |
| 9 | | | 0 | | | | 3,000 | | | $ | 346.46 | | | $ | 346.44 | | | $ | (0.02 | ) | | | 0.0 | % |
| 10 | | | 0 | | | | 3,500 | | | $ | 401.50 | | | $ | 401.47 | | | $ | (0.02 | ) | | | 0.0 | % |
| 11 | | | 0 | | | | 4,000 | | | $ | 456.53 | | | $ | 456.50 | | | $ | (0.03 | ) | | | 0.0 | % |
| 12 | | | 0 | | | | 4,500 | | | $ | 511.57 | | | $ | 511.53 | | | $ | (0.03 | ) | | | 0.0 | % |
| 13 | | | 0 | | | | 5,000 | | | $ | 566.60 | | | $ | 566.57 | | | $ | (0.03 | ) | | | 0.0 | % |
| 14 | | | 0 | | | | 5,500 | | | $ | 621.64 | | | $ | 621.60 | | | $ | (0.04 | ) | | | 0.0 | % |
| 15 | | | 0 | | | | 6,000 | | | $ | 676.67 | | | $ | 676.63 | | | $ | (0.04 | ) | | | 0.0 | % |
| 16 | | | 0 | | | | 6,500 | | | $ | 731.70 | | | $ | 731.66 | | | $ | (0.05 | ) | | | 0.0 | % |
| 17 | | | 0 | | | | 7,000 | | | $ | 786.74 | | | $ | 786.69 | | | $ | (0.05 | ) | | | 0.0 | % |
| 18 | | | 0 | | | | 7,500 | | | $ | 841.77 | | | $ | 841.72 | | | $ | (0.05 | ) | | | 0.0 | % |
| 19 | | | 0 | | | | 8,000 | | | $ | 896.81 | | | $ | 896.75 | | | $ | (0.06 | ) | | | 0.0 | % |
| 20 | | | 0 | | | | 8,500 | | | $ | 951.84 | | | $ | 951.78 | | | $ | (0.06 | ) | | | 0.0 | % |
| 21 | | | 0 | | | | 9,000 | | | $ | 1,006.88 | | | $ | 1,006.82 | | | $ | (0.06 | ) | | | 0.0 | % |
| 22 | | | 0 | | | | 9,500 | | | $ | 1,061.91 | | | $ | 1,061.85 | | | $ | (0.07 | ) | | | 0.0 | % |
| 23 | | | 0 | | | | 10,000 | | | $ | 1,116.95 | | | $ | 1,116.88 | | | $ | (0.07 | ) | | | 0.0 | % |
| 24 | | | 0 | | | | 10,500 | | | $ | 1,171.98 | | | $ | 1,171.91 | | | $ | (0.07 | ) | | | 0.0 | % |
| 25 | | | 0 | | | | 11,000 | | | $ | 1,227.02 | | | $ | 1,226.94 | | | $ | (0.08 | ) | | | 0.0 | % |
| 26 | | | 0 | | | | 11,500 | | | $ | 1,282.05 | | | $ | 1,281.97 | | | $ | (0.08 | ) | | | 0.0 | % |
| 27 | | | 0 | | | | 12,000 | | | $ | 1,337.09 | | | $ | 1,337.00 | | | $ | (0.08 | ) | | | 0.0 | % |
| 28 | | | 0 | | | | 12,500 | | | $ | 1,392.12 | | | $ | 1,392.03 | | | $ | (0.09 | ) | | | 0.0 | % |
| 29 | | | 0 | | | | 13,000 | | | $ | 1,447.16 | | | $ | 1,447.06 | | | $ | (0.09 | ) | | | 0.0 | % |
| 30 | | | 0 | | | | 13,500 | | | $ | 1,502.19 | | | $ | 1,502.10 | | | $ | (0.09 | ) | | | 0.0 | % |
| 31 | | | 0 | | | | 14,000 | | | $ | 1,557.23 | | | $ | 1,557.13 | | | $ | (0.10 | ) | | | 0.0 | % |
| 32 | | | 0 | | | | 14,500 | | | $ | 1,612.26 | | | $ | 1,612.16 | | | $ | (0.10 | ) | | | 0.0 | % |
| 33 | | | 0 | | | | 15,000 | | | $ | 1,667.29 | | | $ | 1,667.19 | | | $ | (0.11 | ) | | | 0.0 | % |
| 34 | | | 0 | | | | 15,500 | | | $ | 1,722.05 | | | $ | 1,721.94 | | | $ | (0.11 | ) | | | 0.0 | % |
| 35 | | | 0 | | | | 16,000 | | | $ | 1,776.80 | | | $ | 1,776.69 | | | $ | (0.11 | ) | | | 0.0 | % |
| 36 | | | 0 | | | | 16,500 | | | $ | 1,831.56 | | | $ | 1,831.44 | | | $ | (0.12 | ) | | | 0.0 | % |
| 37 | | | 0 | | | | 17,000 | | | $ | 1,886.31 | | | $ | 1,886.19 | | | $ | (0.12 | ) | | | 0.0 | % |
| 38 | | | 0 | | | | 17,500 | | | $ | 1,941.06 | | | $ | 1,940.94 | | | $ | (0.12 | ) | | | 0.0 | % |
Exhibit G
TE - Page 8 of 27
The Toledo Edison Company
Case No. 12-1465-EL-ATS
Estimated Typical Bills - Comparison (Q2 2012 vs. Q2 2012 w/ Securitization)
| | | | | | | | | | | | | | | | | | | | | | | | |
| Bill Data | |
Line
No. | | Level of
Demand
(kW)
(A) | | | Level of
Usage
(kWH)
(B) | | | Current
Winter Bill
($)
(C) | | | Proposed
Winter Bill
($)
(D) | | | Dollar
Increase
(D)-(C)
(E) | | | Percent
Increase
(E)/(C)
(F) | |
|
General Service Secondary (Rate GS) | |
| 1 | | | 10 | | | | 1,000 | | | $ | 165.01 | | | $ | 165.00 | | | $ | (0.01 | ) | | | 0.0 | % |
| 2 | | | 10 | | | | 2,000 | | | $ | 245.56 | | | $ | 245.55 | | | $ | (0.01 | ) | | | 0.0 | % |
| 3 | | | 10 | | | | 3,000 | | | $ | 325.64 | | | $ | 325.61 | | | $ | (0.02 | ) | | | 0.0 | % |
| 4 | | | 10 | | | | 4,000 | | | $ | 405.72 | | | $ | 405.69 | | | $ | (0.03 | ) | | | 0.0 | % |
| 5 | | | 10 | | | | 5,000 | | | $ | 485.81 | | | $ | 485.77 | | | $ | (0.04 | ) | | | 0.0 | % |
| 6 | | | 10 | | | | 6,000 | | | $ | 565.87 | | | $ | 565.83 | | | $ | (0.04 | ) | | | 0.0 | % |
| 7 | | | 1,000 | | | | 100,000 | | | $ | 18,590.88 | | | $ | 18,590.18 | | | $ | (0.70 | ) | | | 0.0 | % |
| 8 | | | 1,000 | | | | 200,000 | | | $ | 26,542.97 | | | $ | 26,541.57 | | | $ | (1.40 | ) | | | 0.0 | % |
| 9 | | | 1,000 | | | | 300,000 | | | $ | 34,495.07 | | | $ | 34,492.97 | | | $ | (2.10 | ) | | | 0.0 | % |
| 10 | | | 1,000 | | | | 400,000 | | | $ | 42,447.16 | | | $ | 42,444.36 | | | $ | (2.80 | ) | | | 0.0 | % |
| 11 | | | 1,000 | | | | 500,000 | | | $ | 50,399.26 | | | $ | 50,395.76 | | | $ | (3.50 | ) | | | 0.0 | % |
| 12 | | | 1,000 | | | | 600,000 | | | $ | 58,351.36 | | | $ | 58,347.16 | | | $ | (4.20 | ) | | | 0.0 | % |
Exhibit G
TE - Page 9 of 27
The Toledo Edison Company
Case No. 12-1465-EL-ATS
Estimated Typical Bills - Comparison (Q2 2012 vs. Q2 2012 w/ Securitization)
| | | | | | | | | | | | | | | | | | | | | | | | |
| Bill Data | |
Line
No. | | Level of
Demand
(kW)
(A) | | | Level of
Usage
(kWH)
(B) | | | Current
Winter Bill
($)
(C) | | | Proposed
Winter Bill
($)
(D) | | | Dollar
Increase
(D)-(C)
(E) | | | Percent
Increase
(E)/(C)
(F) | |
|
General Service Primary (Rate GP) | |
| 1 | | | 500 | | | | 50,000 | | | $ | 5,559.79 | | | $ | 5,559.44 | | | $ | (0.35 | ) | | | 0.0 | % |
| 2 | | | 500 | | | | 100,000 | | | $ | 9,200.24 | | | $ | 9,199.54 | | | $ | (0.70 | ) | | | 0.0 | % |
| 3 | | | 500 | | | | 150,000 | | | $ | 12,840.69 | | | $ | 12,839.64 | | | $ | (1.05 | ) | | | 0.0 | % |
| 4 | | | 500 | | | | 200,000 | | | $ | 16,481.14 | | | $ | 16,479.74 | | | $ | (1.40 | ) | | | 0.0 | % |
| 5 | | | 500 | | | | 250,000 | | | $ | 20,121.58 | | | $ | 20,119.83 | | | $ | (1.75 | ) | | | 0.0 | % |
| 6 | | | 500 | | | | 300,000 | | | $ | 23,762.03 | | | $ | 23,759.93 | | | $ | (2.10 | ) | | | 0.0 | % |
| 7 | | | 5,000 | | | | 500,000 | | | $ | 54,142.69 | | | $ | 54,139.19 | | | $ | (3.50 | ) | | | 0.0 | % |
| 8 | | | 5,000 | | | | 1,000,000 | | | $ | 89,636.27 | | | $ | 89,629.27 | | | $ | (7.00 | ) | | | 0.0 | % |
| 9 | | | 5,000 | | | | 1,500,000 | | | $ | 123,313.50 | | | $ | 123,303.00 | | | $ | (10.50 | ) | | | 0.0 | % |
| 10 | | | 5,000 | | | | 2,000,000 | | | $ | 156,990.73 | | | $ | 156,976.73 | | | $ | (14.00 | ) | | | 0.0 | % |
| 11 | | | 5,000 | | | | 2,500,000 | | | $ | 190,667.96 | | | $ | 190,650.46 | | | $ | (17.50 | ) | | | 0.0 | % |
| 12 | | | 5,000 | | | | 3,000,000 | | | $ | 224,345.19 | | | $ | 224,324.19 | | | $ | (21.00 | ) | | | 0.0 | % |
Exhibit G
TE - Page 10 of 27
The Toledo Edison Company
Case No. 12-1465-EL-ATS
Estimated Typical Bills - Comparison (Q2 2012 vs. Q2 2012 w/ Securitization)
| | | | | | | | | | | | | | | | | | | | | | | | |
| Bill Data | |
Line
No. | | Level of
Demand
(kW)
(A) | | | Level of
Usage
(kWH)
(B) | | | Current
Winter Bill
($)
(C) | | | Proposed
Winter Bill
($)
(D) | | | Dollar
Increase
(D)-(C)
(E) | | | Percent
Increase
(E)/(C)
(F) | |
|
General Service Subtransmission (Rate GSU) | |
| 1 | | | 1,000 | | | | 100,000 | | | $ | 9,299.80 | | | $ | 9,299.10 | | | $ | (0.70 | ) | | | 0.0 | % |
| 2 | | | 1,000 | | | | 200,000 | | | $ | 16,035.00 | | | $ | 16,033.60 | | | $ | (1.40 | ) | | | 0.0 | % |
| 3 | | | 1,000 | | | | 300,000 | | | $ | 22,770.19 | | | $ | 22,768.09 | | | $ | (2.10 | ) | | | 0.0 | % |
| 4 | | | 1,000 | | | | 400,000 | | | $ | 29,505.39 | | | $ | 29,502.59 | | | $ | (2.80 | ) | | | 0.0 | % |
| 5 | | | 1,000 | | | | 500,000 | | | $ | 36,240.59 | | | $ | 36,237.09 | | | $ | (3.50 | ) | | | 0.0 | % |
| 6 | | | 1,000 | | | | 600,000 | | | $ | 42,975.78 | | | $ | 42,971.58 | | | $ | (4.20 | ) | | | 0.0 | % |
| 7 | | | 10,000 | | | | 1,000,000 | | | $ | 90,181.83 | | | $ | 90,174.83 | | | $ | (7.00 | ) | | | 0.0 | % |
| 8 | | | 10,000 | | | | 2,000,000 | | | $ | 152,079.29 | | | $ | 152,065.29 | | | $ | (14.00 | ) | | | 0.0 | % |
| 9 | | | 10,000 | | | | 3,000,000 | | | $ | 213,976.75 | | | $ | 213,955.75 | | | $ | (21.00 | ) | | | 0.0 | % |
| 10 | | | 10,000 | | | | 4,000,000 | | | $ | 275,874.21 | | | $ | 275,846.21 | | | $ | (28.00 | ) | | | 0.0 | % |
| 11 | | | 10,000 | | | | 5,000,000 | | | $ | 337,771.68 | | | $ | 337,736.68 | | | $ | (35.00 | ) | | | 0.0 | % |
| 12 | | | 10,000 | | | | 6,000,000 | | | $ | 399,669.14 | | | $ | 399,627.14 | | | $ | (42.00 | ) | | | 0.0 | % |
Exhibit G
TE - Page 11 of 27
The Toledo Edison Company
Case No. 12-1465-EL-ATS
Estimated Typical Bills - Comparison (Q2 2012 vs. Q2 2012 w/ Securitization)
| | | | | | | | | | | | | | | | | | | | | | | | |
| Bill Data | |
Line
No. | | Level of
Demand
(kW)
(A) | | | Level of
Usage
(kWH)
(B) | | | Current
Winter Bill
($)
(C) | | | Proposed
Winter Bill
($)
(D) | | | Dollar
Increase
(D)-(C)
(E) | | | Percent
Increase
(E)/(C)
(F) | |
|
General Service Transmission (Rate GT) | |
| 1 | | | 2,000 | | | | 200,000 | | | $ | 27,145.94 | | | $ | 27,144.54 | | | $ | (1.40 | ) | | | 0.0 | % |
| 2 | | | 2,000 | | | | 400,000 | | | $ | 35,803.53 | | | $ | 35,800.73 | | | $ | (2.80 | ) | | | 0.0 | % |
| 3 | | | 2,000 | | | | 600,000 | | | $ | 44,461.12 | | | $ | 44,456.92 | | | $ | (4.20 | ) | | | 0.0 | % |
| 4 | | | 2,000 | | | | 800,000 | | | $ | 53,118.71 | | | $ | 53,113.11 | | | $ | (5.60 | ) | | | 0.0 | % |
| 5 | | | 2,000 | | | | 1,000,000 | | | $ | 60,865.41 | | | $ | 60,858.41 | | | $ | (7.00 | ) | | | 0.0 | % |
| 6 | | | 2,000 | | | | 1,200,000 | | | $ | 68,432.10 | | | $ | 68,423.70 | | | $ | (8.40 | ) | | | 0.0 | % |
| 7 | | | 20,000 | | | | 2,000,000 | | | $ | 262,129.87 | | | $ | 262,115.87 | | | $ | (14.00 | ) | | | 0.0 | % |
| 8 | | | 20,000 | | | | 4,000,000 | | | $ | 337,796.79 | | | $ | 337,768.79 | | | $ | (28.00 | ) | | | 0.0 | % |
| 9 | | | 20,000 | | | | 6,000,000 | | | $ | 413,463.72 | | | $ | 413,421.72 | | | $ | (42.00 | ) | | | 0.0 | % |
| 10 | | | 20,000 | | | | 8,000,000 | | | $ | 489,130.64 | | | $ | 489,074.64 | | | $ | (56.00 | ) | | | 0.0 | % |
| 11 | | | 20,000 | | | | 10,000,000 | | | $ | 564,797.57 | | | $ | 564,727.57 | | | $ | (70.00 | ) | | | 0.0 | % |
| 12 | | | 20,000 | | | | 12,000,000 | | | $ | 640,464.49 | | | $ | 640,380.49 | | | $ | (84.00 | ) | | | 0.0 | % |
Exhibit G
TE - Page 12 of 27
The Toledo Edison Company
Case No. 12-1465-EL-ATS
Estimated Typical Bills - Comparison (Q2 2012 vs. Q2 2012 w/ Securitization)
| | | | | | | | | | | | | | | | | | | | | | | | |
| Bill Data | |
Line
No. | | Bulb Rating
(Lumens or
Watts)
(A) | | | Level of
Usage
(kWH)
(B) | | | Current
Winter Bill
($)
(C) | | | Proposed
Winter Bill
($)
(D) | | | Dollar
Increase
(D)-(C)
(E) | | | Percent
Increase
(E)/(C)
(F) | |
|
Street Lighting Service (Rate STL) | |
| 1 | | | Company Owned - Incandescent Street Lighting (a) | |
| 2 | | | Overhead Wood Service (Single lamps) | |
| 3 | | | 1,000 | | | | 24 | | | $ | 12.13 | | | $ | 12.13 | | | $ | (0.00 | ) | | | 0.0 | % |
| 4 | | | 2,000 | | | | 56 | | | $ | 13.68 | | | $ | 13.68 | | | $ | (0.00 | ) | | | 0.0 | % |
| 5 | | | 2,500 | | | | 70 | | | $ | 14.38 | | | $ | 14.38 | | | $ | (0.00 | ) | | | 0.0 | % |
| 6 | | | 4,000 | | | | 126 | | | $ | 17.11 | | | $ | 17.11 | | | $ | (0.00 | ) | | | 0.0 | % |
| 7 | | | 6,000 | | | | 157 | | | $ | 18.60 | | | $ | 18.60 | | | $ | (0.00 | ) | | | 0.0 | % |
| 8 | | | 10,000 | | | | 242 | | | $ | 22.76 | | | $ | 22.75 | | | $ | (0.00 | ) | | | 0.0 | % |
| 9 | | | 15,000 | | | | 282 | | | $ | 24.72 | | | $ | 24.72 | | | $ | (0.00 | ) | | | 0.0 | % |
| 10 | | | Overhead Steel Service (Single lamps) | |
| 11 | | | 1,000 | | | | 24 | | | $ | 13.11 | | | $ | 13.11 | | | $ | (0.00 | ) | | | 0.0 | % |
| 12 | | | 2,000 | | | | 56 | | | $ | 14.66 | | | $ | 14.66 | | | $ | (0.00 | ) | | | 0.0 | % |
| 13 | | | 2,500 | | | | 70 | | | $ | 15.36 | | | $ | 15.36 | | | $ | (0.00 | ) | | | 0.0 | % |
| 14 | | | 4,000 | | | | 126 | | | $ | 18.09 | | | $ | 18.09 | | | $ | (0.00 | ) | | | 0.0 | % |
| 15 | | | 6,000 | | | | 157 | | | $ | 19.58 | | | $ | 19.58 | | | $ | (0.00 | ) | | | 0.0 | % |
| 16 | | | 10,000 | | | | 242 | | | $ | 23.74 | | | $ | 23.73 | | | $ | (0.00 | ) | | | 0.0 | % |
| 17 | | | 15,000 | | | | 282 | | | $ | 25.70 | | | $ | 25.70 | | | $ | (0.00 | ) | | | 0.0 | % |
| 18 | | | Underground Service (Single lamps) | |
| 19 | | | 1,000 | | | | 24 | | | $ | 19.31 | | | $ | 19.31 | | | $ | (0.00 | ) | | | 0.0 | % |
| 20 | | | 2,000 | | | | 56 | | | $ | 20.86 | | | $ | 20.86 | | | $ | (0.00 | ) | | | 0.0 | % |
| 21 | | | 2,500 | | | | 70 | | | $ | 21.56 | | | $ | 21.56 | | | $ | (0.00 | ) | | | 0.0 | % |
| 22 | | | 4,000 | | | | 126 | | | $ | 24.29 | | | $ | 24.29 | | | $ | (0.00 | ) | | | 0.0 | % |
| 23 | | | 6,000 | | | | 157 | | | $ | 25.78 | | | $ | 25.78 | | | $ | (0.00 | ) | | | 0.0 | % |
| 24 | | | 10,000 | | | | 242 | | | $ | 29.94 | | | $ | 29.93 | | | $ | (0.00 | ) | | | 0.0 | % |
| 25 | | | 15,000 | | | | 282 | | | $ | 31.90 | | | $ | 31.90 | | | $ | (0.00 | ) | | | 0.0 | % |
| 26 | | | Underground Service (Dual lamps) | |
| 27 | | | 1,000 | | | | 48 | | | $ | 34.62 | | | $ | 34.61 | | | $ | (0.00 | ) | | | 0.0 | % |
| 28 | | | 2,000 | | | | 112 | | | $ | 37.71 | | | $ | 37.71 | | | $ | (0.00 | ) | | | 0.0 | % |
| 29 | | | 2,500 | | | | 140 | | | $ | 39.09 | | | $ | 39.08 | | | $ | (0.00 | ) | | | 0.0 | % |
| 30 | | | 4,000 | | | | 252 | | | $ | 44.55 | | | $ | 44.55 | | | $ | (0.00 | ) | | | 0.0 | % |
| 31 | | | 6,000 | | | | 314 | | | $ | 47.58 | | | $ | 47.58 | | | $ | (0.00 | ) | | | 0.0 | % |
| 32 | | | 10,000 | | | | 484 | | | $ | 55.87 | | | $ | 55.87 | | | $ | (0.00 | ) | | | 0.0 | % |
| 33 | | | 15,000 | | | | 564 | | | $ | 59.75 | | | $ | 59.75 | | | $ | (0.00 | ) | | | 0.0 | % |
Exhibit G
TE - Page 13 of 27
The Toledo Edison Company
Case No. 12-1465-EL-ATS
Estimated Typical Bills - Comparison (Q2 2012 vs. Q2 2012 w/ Securitization)
| | | | | | | | | | | | | | | | | | | | | | | | |
| Bill Data | |
Line
No. | | Bulb Rating
(Lumens or
Watts)
(A) | | | Level of
Usage
(kWH)
(B) | | | Current
Winter Bill
($)
(C) | | | Proposed
Winter Bill
($)
(D) | | | Dollar
Increase
(D)-(C)
(E) | | | Percent
Increase
(E)/(C)
(F) | |
|
Street Lighting Service (Rate STL) | |
| 34 | | | Company Owned - Fluorescent Street Lighting (a) | |
| 35 | | | Overhead Steel Service (Single lamps) | |
| 36 | | | 6,000 | | | | 45 | | | $ | 19.00 | | | $ | 19.00 | | | $ | (0.00 | ) | | | 0.0 | % |
| 37 | | | 13,800 | | | | 94 | | | $ | 21.40 | | | $ | 21.40 | | | $ | (0.00 | ) | | | 0.0 | % |
| 38 | | | 21,800 | | | | 135 | | | $ | 23.39 | | | $ | 23.39 | | | $ | (0.00 | ) | | | 0.0 | % |
| 39 | | | 43,600 | | | | 264 | | | $ | 29.68 | | | $ | 29.68 | | | $ | (0.00 | ) | | | 0.0 | % |
| 40 | | | Underground Service (Single lamps) | |
| 41 | | | 6,000 | | | | 45 | | | $ | 17.26 | | | $ | 17.26 | | | $ | (0.00 | ) | | | 0.0 | % |
| 42 | | | 13,800 | | | | 94 | | | $ | 19.66 | | | $ | 19.66 | | | $ | (0.00 | ) | | | 0.0 | % |
| 43 | | | 21,800 | | | | 135 | | | $ | 21.65 | | | $ | 21.65 | | | $ | (0.00 | ) | | | 0.0 | % |
| 44 | | | 43,600 | | | | 264 | | | $ | 27.94 | | | $ | 27.94 | | | $ | (0.00 | ) | | | 0.0 | % |
| 45 | | | Underground Service (Dual lamps) | |
| 46 | | | 6,000 | | | | 90 | | | $ | 24.98 | | | $ | 24.98 | | | $ | (0.00 | ) | | | 0.0 | % |
| 47 | | | 13,800 | | | | 188 | | | $ | 29.75 | | | $ | 29.75 | | | $ | (0.00 | ) | | | 0.0 | % |
| 48 | | | 21,800 | | | | 270 | | | $ | 33.75 | | | $ | 33.75 | | | $ | (0.00 | ) | | | 0.0 | % |
| 49 | | | 43,600 | | | | 528 | | | $ | 46.36 | | | $ | 46.35 | | | $ | (0.00 | ) | | | 0.0 | % |
| 50 | | | Company Owned - Mercury Street Lighting - Single lamp (c) | |
| 51 | | | Overhead Service - Wood Pole | |
| 52 | | | 175 | | | | 69 | | | $ | 9.35 | | | $ | 9.35 | | | $ | (0.00 | ) | | | 0.0 | % |
| 53 | | | 250 | | | | 104 | | | $ | 11.64 | | | $ | 11.64 | | | $ | (0.00 | ) | | | 0.0 | % |
| 54 | | | 400 | | | | 158 | | | $ | 15.96 | | | $ | 15.96 | | | $ | (0.00 | ) | | | 0.0 | % |
| 55 | | | 700 | | | | 287 | | | $ | 27.43 | | | $ | 27.43 | | | $ | (0.00 | ) | | | 0.0 | % |
| 56 | | | 1000 | | | | 380 | | | $ | 34.41 | | | $ | 34.41 | | | $ | (0.00 | ) | | | 0.0 | % |
| 57 | | | Overhead Service - Metal Pole | |
| 58 | | | 175 | | | | 69 | | | $ | 11.63 | | | $ | 11.63 | | | $ | (0.00 | ) | | | 0.0 | % |
| 59 | | | 250 | | | | 104 | | | $ | 13.76 | | | $ | 13.76 | | | $ | (0.00 | ) | | | 0.0 | % |
| 60 | | | 400 | | | | 158 | | | $ | 18.66 | | | $ | 18.66 | | | $ | (0.00 | ) | | | 0.0 | % |
| 61 | | | 700 | | | | 287 | | | $ | 30.34 | | | $ | 30.34 | | | $ | (0.00 | ) | | | 0.0 | % |
| 62 | | | 1000 | | | | 380 | | | $ | 37.38 | | | $ | 37.38 | | | $ | (0.00 | ) | | | 0.0 | % |
| 63 | | | Underground Service | |
| 64 | | | 175 | | | | 69 | | | $ | 15.35 | | | $ | 15.35 | | | $ | (0.00 | ) | | | 0.0 | % |
| 65 | | | 250 | | | | 104 | | | $ | 17.60 | | | $ | 17.60 | | | $ | (0.00 | ) | | | 0.0 | % |
| 66 | | | 400 | | | | 158 | | | $ | 22.29 | | | $ | 22.29 | | | $ | (0.00 | ) | | | 0.0 | % |
| 67 | | | 700 | | | | 287 | | | $ | 32.20 | | | $ | 32.20 | | | $ | (0.00 | ) | | | 0.0 | % |
| 68 | | | 1000 | | | | 380 | | | $ | 39.02 | | | $ | 39.02 | | | $ | (0.00 | ) | | | 0.0 | % |
Exhibit G
TE - Page 14 of 27
The Toledo Edison Company
Case No. 12-1465-EL-ATS
Estimated Typical Bills - Comparison (Q2 2012 vs. Q2 2012 w/ Securitization)
| | | | | | | | | | | | | | | | | | | | | | | | |
| Bill Data | |
Line
No. | | Bulb Rating
(Lumens or
Watts)
(A) | | | Level of
Usage
(kWH)
(B) | | | Current
Winter Bill
($)
(C) | | | Proposed
Winter Bill
($)
(D) | | | Dollar
Increase
(D)-(C)
(E) | | | Percent
Increase
(E)/(C)
(F) | |
|
Street Lighting Service (Rate STL) | |
| 69 | | | Company Owned - Mercury Street Lighting - Dual lamps (c) | |
| 70 | | | Overhead Service - Wood Pole | |
| 71 | | | 175 | | | | 138 | | | $ | 16.90 | | | $ | 16.89 | | | $ | (0.00 | ) | | | 0.0 | % |
| 72 | | | 400 | | | | 316 | | | $ | 29.95 | | | $ | 29.95 | | | $ | (0.00 | ) | | | 0.0 | % |
| 73 | | | Overhead Service - Metal Pole | |
| 74 | | | 400 | | | | 316 | | | $ | 32.61 | | | $ | 32.61 | | | $ | (0.00 | ) | | | 0.0 | % |
| 75 | | | Underground Service | |
| 76 | | | 250 | | | | 208 | | | $ | 27.69 | | | $ | 27.69 | | | $ | (0.00 | ) | | | 0.0 | % |
| 77 | | | 400 | | | | 316 | | | $ | 35.88 | | | $ | 35.88 | | | $ | (0.00 | ) | | | 0.0 | % |
| 78 | | | Company Owned - High Pressure Sodium Lighting - Single lamps (d) | |
| 79 | | | Overhead Service - Wood Pole | |
| 80 | | | 100 | | | | 42 | | | $ | 11.21 | | | $ | 11.21 | | | $ | (0.00 | ) | | | 0.0 | % |
| 81 | | | 150 | | | | 62 | | | $ | 13.36 | | | $ | 13.36 | | | $ | (0.00 | ) | | | 0.0 | % |
| 82 | | | 200 | | | | 88 | | | $ | 17.51 | | | $ | 17.51 | | | $ | (0.00 | ) | | | 0.0 | % |
| 83 | | | 250 | | | | 105 | | | $ | 15.50 | | | $ | 15.50 | | | $ | (0.00 | ) | | | 0.0 | % |
| 84 | | | 400 | | | | 163 | | | $ | 21.54 | | | $ | 21.54 | | | $ | (0.00 | ) | | | 0.0 | % |
| 85 | | | Overhead Service - Metal Pole | |
| 86 | | | 100 | | | | 42 | | | $ | 13.06 | | | $ | 13.06 | | | $ | (0.00 | ) | | | 0.0 | % |
| 87 | | | 150 | | | | 62 | | | $ | 14.68 | | | $ | 14.68 | | | $ | (0.00 | ) | | | 0.0 | % |
| 88 | | | 200 | | | | 88 | | | $ | 19.63 | | | $ | 19.63 | | | $ | (0.00 | ) | | | 0.0 | % |
| 89 | | | 250 | | | | 105 | | | $ | 19.47 | | | $ | 19.47 | | | $ | (0.00 | ) | | | 0.0 | % |
| 90 | | | 400 | | | | 163 | | | $ | 24.97 | | | $ | 24.97 | | | $ | (0.00 | ) | | | 0.0 | % |
| 91 | | | Underground Service | |
| 92 | | | 100 | | | | 42 | | | $ | 16.81 | | | $ | 16.81 | | | $ | (0.00 | ) | | | 0.0 | % |
| 93 | | | 100 (orn. | ) | | | 42 | | | $ | 28.11 | | | $ | 28.11 | | | $ | (0.00 | ) | | | 0.0 | % |
| 94 | | | 150 | | | | 62 | | | $ | 15.69 | | | $ | 15.69 | | | $ | (0.00 | ) | | | 0.0 | % |
| 95 | | | 200 | | | | 88 | | | $ | 23.58 | | | $ | 23.58 | | | $ | (0.00 | ) | | | 0.0 | % |
| 96 | | | 250 | | | | 105 | | | $ | 21.17 | | | $ | 21.17 | | | $ | (0.00 | ) | | | 0.0 | % |
| 97 | | | 250 (dwntwn | ) | | | 105 | | | $ | 36.19 | | | $ | 36.19 | | | $ | (0.00 | ) | | | 0.0 | % |
| 98 | | | 400 | | | | 163 | | | $ | 25.70 | | | $ | 25.70 | | | $ | (0.00 | ) | | | 0.0 | % |
| 99 | | | 400 (dwntwn | ) | | | 25 | | | $ | 46.77 | | | $ | 46.77 | | | $ | (0.00 | ) | | | 0.0 | % |
Exhibit G
TE - Page 15 of 27
The Toledo Edison Company
Case No. 12-1465-EL-ATS
Estimated Typical Bills - Comparison (Q2 2012 vs. Q2 2012 w/ Securitization)
| | | | | | | | | | | | | | | | | | | | | | | | |
| Bill Data | |
Line
No. | | Bulb Rating
(Lumens or
Watts)
(A) | | | Level of
Usage
(kWH)
(B) | | | Current
Winter Bill
($)
(C) | | | Proposed
Winter Bill
($)
(D) | | | Dollar
Increase
(D)-(C)
(E) | | | Percent
Increase
(E)/(C)
(F) | |
|
Street Lighting Service (Rate STL) | |
| 100 | | | Company Owned - High Pressure Sodium Lighting - Dual lamps (d) | |
| 101 | | | Overhead Service - Wood Pole | |
| 102 | | | 100 | | | | 84 | | | $ | 21.97 | | | $ | 21.97 | | | $ | (0.00 | ) | | | 0.0 | % |
| 103 | | | 150 | | | | 124 | | | $ | 24.94 | | | $ | 24.94 | | | $ | (0.00 | ) | | | 0.0 | % |
| 104 | | | 250 | | | | 210 | | | $ | 31.17 | | | $ | 31.17 | | | $ | (0.00 | ) | | | 0.0 | % |
| 105 | | | Overhead Service - Metal Pole | |
| 106 | | | 100 | | | | 84 | | | $ | 22.86 | | | $ | 22.86 | | | $ | (0.00 | ) | | | 0.0 | % |
| 107 | | | 150 | | | | 124 | | | $ | 25.38 | | | $ | 25.38 | | | $ | (0.00 | ) | | | 0.0 | % |
| 108 | | | 250 | | | | 210 | | | $ | 32.58 | | | $ | 32.58 | | | $ | (0.00 | ) | | | 0.0 | % |
| 109 | | | Underground Service | |
| 110 | | | 100 | | | | 84 | | | $ | 27.10 | | | $ | 27.10 | | | $ | (0.00 | ) | | | 0.0 | % |
| 111 | | | 150 | | | | 124 | | | $ | 32.06 | | | $ | 32.06 | | | $ | (0.00 | ) | | | 0.0 | % |
| 112 | | | 250 | | | | 210 | | | $ | 38.83 | | | $ | 38.83 | | | $ | (0.00 | ) | | | 0.0 | % |
| 113 | | | 400 (davit | ) | | | 326 | | | $ | 38.97 | | | $ | 38.96 | | | $ | (0.00 | ) | | | 0.0 | % |
| 114 | | | Customer Owned - Limited Company Maintenance - All Lamp Types | |
| 115 | | | N/A | | | | 25 | | | $ | 1.23 | | | $ | 1.23 | | | $ | (0.00 | ) | | | 0.0 | % |
| 116 | | | N/A | �� | | | 50 | | | $ | 2.42 | | | $ | 2.42 | | | $ | (0.00 | ) | | | 0.0 | % |
| 117 | | | N/A | | | | 75 | | | $ | 4.77 | | | $ | 4.77 | | | $ | (0.00 | ) | | | 0.0 | % |
| 118 | | | N/A | | | | 100 | | | $ | 7.49 | | | $ | 7.49 | | | $ | (0.00 | ) | | | 0.0 | % |
| 119 | | | N/A | | | | 125 | | | $ | 9.36 | | | $ | 9.36 | | | $ | (0.00 | ) | | | 0.0 | % |
| 120 | | | N/A | | | | 150 | | | $ | 13.16 | | | $ | 13.16 | | | $ | (0.00 | ) | | | 0.0 | % |
| 121 | | | N/A | | | | 175 | | | $ | 15.81 | | | $ | 15.81 | | | $ | (0.00 | ) | | | 0.0 | % |
| 122 | | | N/A | | | | 200 | | | $ | 20.99 | | | $ | 20.99 | | | $ | (0.00 | ) | | | 0.0 | % |
| 123 | | | N/A | | | | 225 | | | $ | 24.05 | | | $ | 24.05 | | | $ | (0.00 | ) | | | 0.0 | % |
| 124 | | | N/A | | | | 250 | | | $ | 12.18 | | | $ | 12.18 | | | $ | (0.00 | ) | | | 0.0 | % |
| 125 | | | N/A | | | | 275 | | | $ | 14.52 | | | $ | 14.52 | | | $ | (0.00 | ) | | | 0.0 | % |
| 126 | | | N/A | | | | 300 | | | $ | 17.23 | | | $ | 17.23 | | | $ | (0.00 | ) | | | 0.0 | % |
| 127 | | | N/A | | | | 325 | | | $ | 19.10 | | | $ | 19.09 | | | $ | (0.00 | ) | | | 0.0 | % |
| 128 | | | N/A | | | | 350 | | | $ | 22.92 | | | $ | 22.92 | | | $ | (0.00 | ) | | | 0.0 | % |
| 129 | | | N/A | | | | 375 | | | $ | 25.58 | | | $ | 25.58 | | | $ | (0.00 | ) | | | 0.0 | % |
| 130 | | | N/A | | | | 400 | | | $ | 30.73 | | | $ | 30.73 | | | $ | (0.00 | ) | | | 0.0 | % |
Exhibit G
TE - Page 16 of 27
The Toledo Edison Company
Case No. 12-1465-EL-ATS
Estimated Typical Bills - Comparison (Q2 2012 vs. Q2 2012 w/ Securitization)
| | | | | | | | | | | | | | | | | | | | | | | | |
| Bill Data | |
Line
No. | | Bulb Rating
(Lumens or
Watts)
(A) | | | Level of
Usage
(kWH)
(B) | | | Current
Winter Bill
($)
(C) | | | Proposed
Winter Bill
($)
(D) | | | Dollar
Increase
(D)-(C)
(E) | | | Percent
Increase
(E)/(C)
(F) | |
|
Private Outdoor Lighting Service (Rate POL) | |
| 1 | | | Mercury Lighting | |
| 2 | | | Overhead Service - Wood Pole | |
| 3 | | | 175 | | | | 69 | | | $ | 11.76 | | | $ | 11.76 | | | $ | (0.00 | ) | | | 0.0 | % |
| 4 | | | 400 | | | | 158 | | | $ | 30.25 | | | $ | 30.25 | | | $ | (0.00 | ) | | | 0.0 | % |
| 5 | | | 1,000 | | | | 380 | | | $ | 54.98 | | | $ | 54.98 | | | $ | (0.00 | ) | | | 0.0 | % |
| 6 | | | All Other Installations | |
| 7 | | | 175 | | | | 69 | | | $ | 18.35 | | | $ | 18.35 | | | $ | (0.00 | ) | | | 0.0 | % |
| 8 | | | High Pressure Sodium Lighting | |
| 9 | | | Overhead Service - Wood Pole | |
| 10 | | | 200 | | | | 88 | | | $ | 15.97 | | | $ | 15.97 | | | $ | (0.00 | ) | | | 0.0 | % |
| 11 | | | 400 | | | | 163 | | | $ | 28.77 | | | $ | 28.77 | | | $ | (0.00 | ) | | | 0.0 | % |
Exhibit G
TE - Page 17 of 27
The Toledo Edison Company
Case No. 12-1465-EL-ATS
Estimated Typical Bills - Comparison (Q2 2012 vs. Q2 2012 w/ Securitization)
| | | | | | | | | | | | | | | | | | | | | | | | |
| Bill Data | |
Line
No. | | Level of
Demand
(kW)
(A) | | | Level of
Usage
(kWH)
(B) | | | Current
Winter Bill
($)
(C) | | | Proposed
Winter Bill
($)
(D) | | | Dollar
Increase
(D)-(C)
(E) | | | Percent
Increase
(E)/(C)
(F) | |
|
Traffic Lighting Schedule (Rate TRF) | |
| 1 | | | 0 | | | | 100 | | | $ | 10.95 | | | $ | 10.95 | | | $ | (0.00 | ) | | | 0.0 | % |
| 2 | | | 0 | | | | 200 | | | $ | 21.89 | | | $ | 21.89 | | | $ | (0.00 | ) | | | 0.0 | % |
| 3 | | | 0 | | | | 300 | | | $ | 32.82 | | | $ | 32.82 | | | $ | (0.00 | ) | | | 0.0 | % |
| 4 | | | 0 | | | | 400 | | | $ | 43.78 | | | $ | 43.78 | | | $ | (0.00 | ) | | | 0.0 | % |
| 5 | | | 0 | | | | 500 | | | $ | 54.74 | | | $ | 54.74 | | | $ | (0.00 | ) | | | 0.0 | % |
| 6 | | | 0 | | | | 600 | | | $ | 65.66 | | | $ | 65.65 | | | $ | (0.00 | ) | | | 0.0 | % |
Exhibit G
TE - Page 18 of 27
The Toledo Edison Company
Case No. 12-1465-EL-ATS
Estimated Typical Bills - Comparison (Q2 2012 vs. Q2 2012 w/ Securitization)
| | | | | | | | | | | | | | | | | | | | | | | | |
| Bill Data | |
Line
No. | | Level of
Demand
(kW)
(A) | | | Level of
Usage
(kWH)
(B) | | | Current
Summer Bill
($)
(C) | | | Proposed
Summer Bill
($)
(D) | | | Dollar
Increase
(D)-(C)
(E) | | | Percent
Increase
(E)/(C)
(F) | |
|
General Service Secondary (Rate GS) | |
| 1 | | | 10 | | | | 1,000 | | | $ | 174.16 | | | $ | 174.15 | | | $ | (0.01 | ) | | | 0.0 | % |
| 2 | | | 10 | | | | 2,000 | | | $ | 263.85 | | | $ | 263.84 | | | $ | (0.01 | ) | | | 0.0 | % |
| 3 | | | 10 | | | | 3,000 | | | $ | 353.08 | | | $ | 353.05 | | | $ | (0.02 | ) | | | 0.0 | % |
| 4 | | | 10 | | | | 4,000 | | | $ | 442.31 | | | $ | 442.28 | | | $ | (0.03 | ) | | | 0.0 | % |
| 5 | | | 10 | | | | 5,000 | | | $ | 531.55 | | | $ | 531.51 | | | $ | (0.03 | ) | | | 0.0 | % |
| 6 | | | 10 | | | | 6,000 | | | $ | 620.75 | | | $ | 620.71 | | | $ | (0.04 | ) | | | 0.0 | % |
| 7 | | | 1,000 | | | | 100,000 | | | $ | 19,505.58 | | | $ | 19,504.88 | | | $ | (0.70 | ) | | | 0.0 | % |
| 8 | | | 1,000 | | | | 200,000 | | | $ | 28,372.37 | | | $ | 28,370.97 | | | $ | (1.40 | ) | | | 0.0 | % |
| 9 | | | 1,000 | | | | 300,000 | | | $ | 37,239.17 | | | $ | 37,237.07 | | | $ | (2.10 | ) | | | 0.0 | % |
| 10 | | | 1,000 | | | | 400,000 | | | $ | 46,105.96 | | | $ | 46,103.16 | | | $ | (2.80 | ) | | | 0.0 | % |
| 11 | | | 1,000 | | | | 500,000 | | | $ | 54,972.76 | | | $ | 54,969.26 | | | $ | (3.50 | ) | | | 0.0 | % |
| 12 | | | 1,000 | | | | 600,000 | | | $ | 63,839.56 | | | $ | 63,835.36 | | | $ | (4.20 | ) | | | 0.0 | % |
Exhibit G
TE - Page 19 of 27
The Toledo Edison Company
Case No. 12-1465-EL-ATS
Estimated Typical Bills - Comparison (Q2 2012 vs. Q2 2012 w/ Securitization)
| | | | | | | | | | | | | | | | | | | | | | | | |
| Bill Data | |
Line
No. | | Level of
Demand
(kW)
(A) | | | Level of
Usage
(kWH)
(B) | | | Current
Summer Bill
($)
(C) | | | Proposed
Summer Bill
($)
(D) | | | Dollar
Increase
(D)-(C)
(E) | | | Percent
Increase
(E)/(C)
(F) | |
|
General Service Primary (Rate GP) | |
| 1 | | | 500 | | | | 50,000 | | | $ | 6,001.29 | | | $ | 6,000.94 | | | $ | (0.35 | ) | | | 0.0 | % |
| 2 | | | 500 | | | | 100,000 | | | $ | 10,083.24 | | | $ | 10,082.54 | | | $ | (0.70 | ) | | | 0.0 | % |
| 3 | | | 500 | | | | 150,000 | | | $ | 14,165.19 | | | $ | 14,164.14 | | | $ | (1.05 | ) | | | 0.0 | % |
| 4 | | | 500 | | | | 200,000 | | | $ | 18,247.14 | | | $ | 18,245.74 | | | $ | (1.40 | ) | | | 0.0 | % |
| 5 | | | 500 | | | | 250,000 | | | $ | 22,329.08 | | | $ | 22,327.33 | | | $ | (1.75 | ) | | | 0.0 | % |
| 6 | | | 500 | | | | 300,000 | | | $ | 26,411.03 | | | $ | 26,408.93 | | | $ | (2.10 | ) | | | 0.0 | % |
| 7 | | | 5,000 | | | | 500,000 | | | $ | 58,557.69 | | | $ | 58,554.19 | | | $ | (3.50 | ) | | | 0.0 | % |
| 8 | | | 5,000 | | | | 1,000,000 | | | $ | 98,466.27 | | | $ | 98,459.27 | | | $ | (7.00 | ) | | | 0.0 | % |
| 9 | | | 5,000 | | | | 1,500,000 | | | $ | 136,558.50 | | | $ | 136,548.00 | | | $ | (10.50 | ) | | | 0.0 | % |
| 10 | | | 5,000 | | | | 2,000,000 | | | $ | 174,650.73 | | | $ | 174,636.73 | | | $ | (14.00 | ) | | | 0.0 | % |
| 11 | | | 5,000 | | | | 2,500,000 | | | $ | 212,742.96 | | | $ | 212,725.46 | | | $ | (17.50 | ) | | | 0.0 | % |
| 12 | | | 5,000 | | | | 3,000,000 | | | $ | 250,835.19 | | | $ | 250,814.19 | | | $ | (21.00 | ) | | | 0.0 | % |
Exhibit G
TE - Page 20 of 27
The Toledo Edison Company
Case No. 12-1465-EL-ATS
Estimated Typical Bills - Comparison (Q2 2012 vs. Q2 2012 w/ Securitization)
| | | | | | | | | | | | | | | | | | | | | | | | |
| Bill Data | |
Line No. | | Level of
Demand
(kW)
(A) | | | Level of
Usage
(kWH)
(B) | | | Current
Summer Bill
($)
(C) | | | Proposed
Summer Bill
($)
(D) | | | Dollar
Increase
(D)-(C)
(E) | | | Percent
Increase
(E)/(C)
(F) | |
|
General Service Subtransmission (Rate GSU) | |
| 1 | | | 1,000 | | | | 100,000 | | | $ | 10,158.00 | | | $ | 10,157.30 | | | $ | (0.70 | ) | | | 0.0 | % |
| 2 | | | 1,000 | | | | 200,000 | | | $ | 17,751.40 | | | $ | 17,750.00 | | | $ | (1.40 | ) | | | 0.0 | % |
| 3 | | | 1,000 | | | | 300,000 | | | $ | 25,344.79 | | | $ | 25,342.69 | | | $ | (2.10 | ) | | | 0.0 | % |
| 4 | | | 1,000 | | | | 400,000 | | | $ | 32,938.19 | | | $ | 32,935.39 | | | $ | (2.80 | ) | | | 0.0 | % |
| 5 | | | 1,000 | | | | 500,000 | | | $ | 40,531.59 | | | $ | 40,528.09 | | | $ | (3.50 | ) | | | 0.0 | % |
| 6 | | | 1,000 | | | | 600,000 | | | $ | 48,124.98 | | | $ | 48,120.78 | | | $ | (4.20 | ) | | | 0.0 | % |
| 7 | | | 10,000 | | | | 1,000,000 | | | $ | 98,763.83 | | | $ | 98,756.83 | | | $ | (7.00 | ) | | | 0.0 | % |
| 8 | | | 10,000 | | | | 2,000,000 | | | $ | 169,243.29 | | | $ | 169,229.29 | | | $ | (14.00 | ) | | | 0.0 | % |
| 9 | | | 10,000 | | | | 3,000,000 | | | $ | 239,722.75 | | | $ | 239,701.75 | | | $ | (21.00 | ) | | | 0.0 | % |
| 10 | | | 10,000 | | | | 4,000,000 | | | $ | 310,202.21 | | | $ | 310,174.21 | | | $ | (28.00 | ) | | | 0.0 | % |
| 11 | | | 10,000 | | | | 5,000,000 | | | $ | 380,681.68 | | | $ | 380,646.68 | | | $ | (35.00 | ) | | | 0.0 | % |
| 12 | | | 10,000 | | | | 6,000,000 | | | $ | 451,161.14 | | | $ | 451,119.14 | | | $ | (42.00 | ) | | | 0.0 | % |
Exhibit G
TE - Page 21 of 27
The Toledo Edison Company
Case No. 12-1465-EL-ATS
Estimated Typical Bills - Comparison (Q2 2012 vs. Q2 2012 w/ Securitization)
| | | | | | | | | | | | | | | | | | | | | | | | |
| Bill Data | |
Line No. | | Level of
Demand
(kW)
(A) | | | Level of
Usage
(kWH)
(B) | | | Current
Summer Bill
($)
(C) | | | Proposed
Summer Bill
($)
(D) | | | Dollar
Increase
(D)-(C)
(E) | | | Percent
Increase
(E)/(C)
(F) | |
| | | |
General Service Transmission (Rate GT) | | | | | | | | | | | | | |
| 1 | | | 2,000 | | | | 200,000 | | | $ | 28,860.54 | | | $ | 28,859.14 | | | $ | (1.40 | ) | | | 0.0 | % |
| 2 | | | 2,000 | | | | 400,000 | | | $ | 39,232.73 | | | $ | 39,229.93 | | | $ | (2.80 | ) | | | 0.0 | % |
| 3 | | | 2,000 | | | | 600,000 | | | $ | 49,604.92 | | | $ | 49,600.72 | | | $ | (4.20 | ) | | | 0.0 | % |
| 4 | | | 2,000 | | | | 800,000 | | | $ | 59,977.11 | | | $ | 59,971.51 | | | $ | (5.60 | ) | | | 0.0 | % |
| 5 | | | 2,000 | | | | 1,000,000 | | | $ | 69,438.41 | | | $ | 69,431.41 | | | $ | (7.00 | ) | | | 0.0 | % |
| 6 | | | 2,000 | | | | 1,200,000 | | | $ | 78,719.70 | | | $ | 78,711.30 | | | $ | (8.40 | ) | | | 0.0 | % |
| 7 | | | 20,000 | | | | 2,000,000 | | | $ | 279,275.87 | | | $ | 279,261.87 | | | $ | (14.00 | ) | | | 0.0 | % |
| 8 | | | 20,000 | | | | 4,000,000 | | | $ | 372,088.79 | | | $ | 372,060.79 | | | $ | (28.00 | ) | | | 0.0 | % |
| 9 | | | 20,000 | | | | 6,000,000 | | | $ | 464,901.72 | | | $ | 464,859.72 | | | $ | (42.00 | ) | | | 0.0 | % |
| 10 | | | 20,000 | | | | 8,000,000 | | | $ | 557,714.64 | | | $ | 557,658.64 | | | $ | (56.00 | ) | | | 0.0 | % |
| 11 | | | 20,000 | | | | 10,000,000 | | | $ | 650,527.57 | | | $ | 650,457.57 | | | $ | (70.00 | ) | | | 0.0 | % |
| 12 | | | 20,000 | | | | 12,000,000 | | | $ | 743,340.49 | | | $ | 743,256.49 | | | $ | (84.00 | ) | | | 0.0 | % |
Exhibit G
TE - Page 22 of 27
The Toledo Edison Company
Case No. 12-1465-EL-ATS
Estimated Typical Bills - Comparison (Q2 2012 vs. Q2 2012 w/ Securitization)
| | | | | | | | | | | | | | | | | | | | | | | | |
| Bill Data | |
Line No. | | Bulb Rating
(Lumens or
Watts)
(A) | | | Level of
Usage
(kWH)
(B) | | | Current
Summer Bill
($)
(C) | | | Proposed
Summer Bill
($)
(D) | | | Dollar
Increase
(D)-(C)
(E) | | | Percent
Increase
(E)/(C)
(F) | |
| | | |
Street Lighting Service (Rate STL) | | | | | | | | | | | | | |
| 1 | | | Company Owned - Incandescent Street Lighting (a) | |
| 2 | | | Overhead Wood Service (Single lamps) | |
| 3 | | | 1,000 | | | | 24 | | | $ | 12.35 | | | $ | 12.35 | | | $ | (0.00 | ) | | | 0.0 | % |
| 4 | | | 2,000 | | | | 56 | | | $ | 14.19 | | | $ | 14.19 | | | $ | (0.00 | ) | | | 0.0 | % |
| 5 | | | 2,500 | | | | 70 | | | $ | 15.02 | | | $ | 15.02 | | | $ | (0.00 | ) | | | 0.0 | % |
| 6 | | | 4,000 | | | | 126 | | | $ | 18.26 | | | $ | 18.26 | | | $ | (0.00 | ) | | | 0.0 | % |
| 7 | | | 6,000 | | | | 157 | | | $ | 20.04 | | | $ | 20.04 | | | $ | (0.00 | ) | | | 0.0 | % |
| 8 | | | 10,000 | | | | 242 | | | $ | 24.98 | | | $ | 24.97 | | | $ | (0.00 | ) | | | 0.0 | % |
| 9 | | | 15,000 | | | | 282 | | | $ | 27.30 | | | $ | 27.30 | | | $ | (0.00 | ) | | | 0.0 | % |
| 10 | | | Overhead Steel Service (Single lamps) | |
| 11 | | | 1,000 | | | | 24 | | | $ | 13.33 | | | $ | 13.33 | | | $ | (0.00 | ) | | | 0.0 | % |
| 12 | | | 2,000 | | | | 56 | | | $ | 15.17 | | | $ | 15.17 | | | $ | (0.00 | ) | | | 0.0 | % |
| 13 | | | 2,500 | | | | 70 | | | $ | 16.00 | | | $ | 16.00 | | | $ | (0.00 | ) | | | 0.0 | % |
| 14 | | | 4,000 | | | | 126 | | | $ | 19.24 | | | $ | 19.24 | | | $ | (0.00 | ) | | | 0.0 | % |
| 15 | | | 6,000 | | | | 157 | | | $ | 21.02 | | | $ | 21.02 | | | $ | (0.00 | ) | | | 0.0 | % |
| 16 | | | 10,000 | | | | 242 | | | $ | 25.96 | | | $ | 25.95 | | | $ | (0.00 | ) | | | 0.0 | % |
| 17 | | | 15,000 | | | | 282 | | | $ | 28.28 | | | $ | 28.28 | | | $ | (0.00 | ) | | | 0.0 | % |
| 18 | | | Underground Service (Single lamps) | |
| 19 | | | 1,000 | | | | 24 | | | $ | 19.53 | | | $ | 19.53 | | | $ | (0.00 | ) | | | 0.0 | % |
| 20 | | | 2,000 | | | | 56 | | | $ | 21.37 | | | $ | 21.37 | | | $ | (0.00 | ) | | | 0.0 | % |
| 21 | | | 2,500 | | | | 70 | | | $ | 22.20 | | | $ | 22.20 | | | $ | (0.00 | ) | | | 0.0 | % |
| 22 | | | 4,000 | | | | 126 | | | $ | 25.44 | | | $ | 25.44 | | | $ | (0.00 | ) | | | 0.0 | % |
| 23 | | | 6,000 | | | | 157 | | | $ | 27.22 | | | $ | 27.22 | | | $ | (0.00 | ) | | | 0.0 | % |
| 24 | | | 10,000 | | | | 242 | | | $ | 32.16 | | | $ | 32.15 | | | $ | (0.00 | ) | | | 0.0 | % |
| 25 | | | 15,000 | | | | 282 | | | $ | 34.48 | | | $ | 34.48 | | | $ | (0.00 | ) | | | 0.0 | % |
| 26 | | | Underground Service (Dual lamps) | |
| 27 | | | 1,000 | | | | 48 | | | $ | 35.05 | | | $ | 35.04 | | | $ | (0.00 | ) | | | 0.0 | % |
| 28 | | | 2,000 | | | | 112 | | | $ | 38.74 | | | $ | 38.74 | | | $ | (0.00 | ) | | | 0.0 | % |
| 29 | | | 2,500 | | | | 140 | | | $ | 40.37 | | | $ | 40.36 | | | $ | (0.00 | ) | | | 0.0 | % |
| 30 | | | 4,000 | | | | 252 | | | $ | 46.86 | | | $ | 46.86 | | | $ | (0.00 | ) | | | 0.0 | % |
| 31 | | | 6,000 | | | | 314 | | | $ | 50.46 | | | $ | 50.46 | | | $ | (0.00 | ) | | | 0.0 | % |
| 32 | | | 10,000 | | | | 484 | | | $ | 60.30 | | | $ | 60.30 | | | $ | (0.00 | ) | | | 0.0 | % |
| 33 | | | 15,000 | | | | 564 | | | $ | 64.91 | | | $ | 64.91 | | | $ | (0.00 | ) | | | 0.0 | % |
Exhibit G
TE - Page 23 of 27
The Toledo Edison Company
Case No. 12-1465-EL-ATS
Estimated Typical Bills - Comparison (Q2 2012 vs. Q2 2012 w/ Securitization)
| | | | | | | | | | | | | | | | | | | | | | | | |
| Bill Data | |
Line No. | | Bulb Rating
(Lumens or
Watts)
(A) | | | Level of
Usage
(kWH)
(B) | | | Current
Summer Bill
($)
(C) | | | Proposed
Summer Bill
($)
(D) | | | Dollar
Increase
(D)-(C)
(E) | | | Percent
Increase
(E)/(C)
(F) | |
| | | |
Street Lighting Service (Rate STL) | | | | | | | | | | | | | |
| 34 | | | Company Owned - Fluorescent Street Lighting (a) | |
| 35 | | | Overhead Steel Service (Single lamps) | |
| 36 | | | 6,000 | | | | 45 | | | $ | 19.41 | | | $ | 19.41 | | | $ | (0.00 | ) | | | 0.0 | % |
| 37 | | | 13,800 | | | | 94 | | | $ | 22.26 | | | $ | 22.26 | | | $ | (0.00 | ) | | | 0.0 | % |
| 38 | | | 21,800 | | | | 135 | | | $ | 24.63 | | | $ | 24.63 | | | $ | (0.00 | ) | | | 0.0 | % |
| 39 | | | 43,600 | | | | 264 | | | $ | 32.10 | | | $ | 32.10 | | | $ | (0.00 | ) | | | 0.0 | % |
| 40 | | | Underground Service (Single lamps) | |
| 41 | | | 6,000 | | | | 45 | | | $ | 17.67 | | | $ | 17.67 | | | $ | (0.00 | ) | | | 0.0 | % |
| 42 | | | 13,800 | | | | 94 | | | $ | 20.52 | | | $ | 20.52 | | | $ | (0.00 | ) | | | 0.0 | % |
| 43 | | | 21,800 | | | | 135 | | | $ | 22.89 | | | $ | 22.89 | | | $ | (0.00 | ) | | | 0.0 | % |
| 44 | | | 43,600 | | | | 264 | | | $ | 30.36 | | | $ | 30.36 | | | $ | (0.00 | ) | | | 0.0 | % |
| 45 | | | Underground Service (Dual lamps) | |
| 46 | | | 6,000 | | | | 90 | | | $ | 25.80 | | | $ | 25.80 | | | $ | (0.00 | ) | | | 0.0 | % |
| 47 | | | 13,800 | | | | 188 | | | $ | 31.47 | | | $ | 31.47 | | | $ | (0.00 | ) | | | 0.0 | % |
| 48 | | | 21,800 | | | | 270 | | | $ | 36.22 | | | $ | 36.22 | | | $ | (0.00 | ) | | | 0.0 | % |
| 49 | | | 43,600 | | | | 528 | | | $ | 51.19 | | | $ | 51.18 | | | $ | (0.00 | ) | | | 0.0 | % |
| 50 | | | Company Owned - Mercury Street Lighting - Single lamp (c) | |
| 51 | | | Overhead Service - Wood Pole | |
| 52 | | | 175 | | | | 69 | | | $ | 9.98 | | | $ | 9.98 | | | $ | (0.00 | ) | | | 0.0 | % |
| 53 | | | 250 | | | | 104 | | | $ | 12.59 | | | $ | 12.59 | | | $ | (0.00 | ) | | | 0.0 | % |
| 54 | | | 400 | | | | 158 | | | $ | 17.41 | | | $ | 17.41 | | | $ | (0.00 | ) | | | 0.0 | % |
| 55 | | | 700 | | | | 287 | | | $ | 30.06 | | | $ | 30.06 | | | $ | (0.00 | ) | | | 0.0 | % |
| 56 | | | 1000 | | | | 380 | | | $ | 37.88 | | | $ | 37.88 | | | $ | (0.00 | ) | | | 0.0 | % |
| 57 | | | Overhead Service - Metal Pole | |
| 58 | | | 175 | | | | 69 | | | $ | 12.26 | | | $ | 12.26 | | | $ | (0.00 | ) | | | 0.0 | % |
| 59 | | | 250 | | | | 104 | | | $ | 14.71 | | | $ | 14.71 | | | $ | (0.00 | ) | | | 0.0 | % |
| 60 | | | 400 | | | | 158 | | | $ | 20.11 | | | $ | 20.11 | | | $ | (0.00 | ) | | | 0.0 | % |
| 61 | | | 700 | | | | 287 | | | $ | 32.97 | | | $ | 32.97 | | | $ | (0.00 | ) | | | 0.0 | % |
| 62 | | | 1000 | | | | 380 | | | $ | 40.85 | | | $ | 40.85 | | | $ | (0.00 | ) | | | 0.0 | % |
| 63 | | | Underground Service | |
| 64 | | | 175 | | | | 69 | | | $ | 15.98 | | | $ | 15.98 | | | $ | (0.00 | ) | | | 0.0 | % |
| 65 | | | 250 | | | | 104 | | | $ | 18.55 | | | $ | 18.55 | | | $ | (0.00 | ) | | | 0.0 | % |
| 66 | | | 400 | | | | 158 | | | $ | 23.74 | | | $ | 23.74 | | | $ | (0.00 | ) | | | 0.0 | % |
| 67 | | | 700 | | | | 287 | | | $ | 34.83 | | | $ | 34.83 | | | $ | (0.00 | ) | | | 0.0 | % |
| 68 | | | 1000 | | | | 380 | | | $ | 42.49 | | | $ | 42.49 | | | $ | (0.00 | ) | | | 0.0 | % |
Exhibit G
TE - Page 24 of 27
The Toledo Edison Company
Case No. 12-1465-EL-ATS
Estimated Typical Bills - Comparison (Q2 2012 vs. Q2 2012 w/ Securitization)
| | | | | | | | | | | | | | | | | | | | | | | | |
| Bill Data | |
Line No. | | Bulb Rating
(Lumens or
Watts)
(A) | | | Level of
Usage
(kWH)
(B) | | | Current
Summer Bill
($)
(C) | | | Proposed
Summer Bill
($)
(D) | | | Dollar
Increase
(D)-(C)
(E) | | | Percent
Increase
(E)/(C)
(F) | |
| | | |
Street Lighting Service (Rate STL) | | | | | | | | | | | | | |
| 69 | | | Company Owned - Mercury Street Lighting - Dual lamps (c) | |
| 70 | | | Overhead Service - Wood Pole | |
| 71 | | | 175 | | | | 138 | | | $ | 18.16 | | | $ | 18.15 | | | $ | (0.00 | ) | | | 0.0 | % |
| 72 | | | 400 | | | | 316 | | | $ | 32.84 | | | $ | 32.84 | | | $ | (0.00 | ) | | | 0.0 | % |
| 73 | | | Overhead Service - Metal Pole | |
| 74 | | | 400 | | | | 316 | | | $ | 35.50 | | | $ | 35.50 | | | $ | (0.00 | ) | | | 0.0 | % |
| 75 | | | Underground Service | |
| 76 | | | 250 | | | | 208 | | | $ | 29.59 | | | $ | 29.59 | | | $ | (0.00 | ) | | | 0.0 | % |
| 77 | | | 400 | | | | 316 | | | $ | 38.77 | | | $ | 38.77 | | | $ | (0.00 | ) | | | 0.0 | % |
| 78 | | | Company Owned - High Pressure Sodium Lighting - Single lamps (d) | |
| 79 | | | Overhead Service - Wood Pole | |
| 80 | | | 100 | | | | 42 | | | $ | 11.59 | | | $ | 11.59 | | | $ | (0.00 | ) | | | 0.0 | % |
| 81 | | | 150 | | | | 62 | | | $ | 13.93 | | | $ | 13.93 | | | $ | (0.00 | ) | | | 0.0 | % |
| 82 | | | 200 | | | | 88 | | | $ | 18.32 | | | $ | 18.32 | | | $ | (0.00 | ) | | | 0.0 | % |
| 83 | | | 250 | | | | 105 | | | $ | 16.46 | | | $ | 16.46 | | | $ | (0.00 | ) | | | 0.0 | % |
| 84 | | | 400 | | | | 163 | | | $ | 23.03 | | | $ | 23.03 | | | $ | (0.00 | ) | | | 0.0 | % |
| 85 | | | Overhead Service - Metal Pole | |
| 86 | | | 100 | | | | 42 | | | $ | 13.44 | | | $ | 13.44 | | | $ | (0.00 | ) | | | 0.0 | % |
| 87 | | | 150 | | | | 62 | | | $ | 15.25 | | | $ | 15.25 | | | $ | (0.00 | ) | | | 0.0 | % |
| 88 | | | 200 | | | | 88 | | | $ | 20.44 | | | $ | 20.44 | | | $ | (0.00 | ) | | | 0.0 | % |
| 89 | | | 250 | | | | 105 | | | $ | 20.43 | | | $ | 20.43 | | | $ | (0.00 | ) | | | 0.0 | % |
| 90 | | | 400 | | | | 163 | | | $ | 26.46 | | | $ | 26.46 | | | $ | (0.00 | ) | | | 0.0 | % |
| 91 | | | Underground Service | |
| 92 | | | 100 | | | | 42 | | | $ | 17.19 | | | $ | 17.19 | | | $ | (0.00 | ) | | | 0.0 | % |
| 93 | | | 100 (orn. | ) | | | 42 | | | $ | 28.49 | | | $ | 28.49 | | | $ | (0.00 | ) | | | 0.0 | % |
| 94 | | | 150 | | | | 62 | | | $ | 16.26 | | | $ | 16.26 | | | $ | (0.00 | ) | | | 0.0 | % |
| 95 | | | 200 | | | | 88 | | | $ | 24.39 | | | $ | 24.39 | | | $ | (0.00 | ) | | | 0.0 | % |
| 96 | | | 250 | | | | 105 | | | $ | 22.13 | | | $ | 22.13 | | | $ | (0.00 | ) | | | 0.0 | % |
| 97 | | | 250 (dwntwn | ) | | | 105 | | | $ | 37.15 | | | $ | 37.15 | | | $ | (0.00 | ) | | | 0.0 | % |
| 98 | | | 400 | | | | 163 | | | $ | 27.19 | | | $ | 27.19 | | | $ | (0.00 | ) | | | 0.0 | % |
| 99 | | | 400 (dwntwn | ) | | | 25 | | | $ | 46.99 | | | $ | 46.99 | | | $ | (0.00 | ) | | | 0.0 | % |
Exhibit G
TE - Page 25 of 27
The Toledo Edison Company
Case No. 12-1465-EL-ATS
Estimated Typical Bills - Comparison (Q2 2012 vs. Q2 2012 w/ Securitization)
| | | | | | | | | | | | | | | | | | | | | | | | |
| Bill Data | |
Line
No. | | Bulb Rating
(Lumens or
Watts)
(A) | | | Level of
Usage
(kWH)
(B) | | | Current
Summer Bill
($)
(C) | | | Proposed
Summer Bill
($)
(D) | | | Dollar
Increase
(D)-(C)
(E) | | | Percent
Increase
(E)/(C)
(F) | |
| | | |
Street Lighting Service (Rate STL) | | | | | | | | | | | | | |
| 100 | | | Company Owned - High Pressure Sodium Lighting - Dual lamps (d) | |
| 101 | | | Overhead Service - Wood Pole | | | | | | | | | | | | | |
| 102 | | | 100 | | | | 84 | | | $ | 22.74 | | | $ | 22.74 | | | $ | (0.00 | ) | | | 0.0 | % |
| 103 | | | 150 | | | | 124 | | | $ | 26.07 | | | $ | 26.07 | | | $ | (0.00 | ) | | | 0.0 | % |
| 104 | | | 250 | | | | 210 | | | $ | 33.09 | | | $ | 33.09 | | | $ | (0.00 | ) | | | 0.0 | % |
| 105 | | | Overhead Service - Metal Pole | | | | | | | | | | | | | |
| 106 | | | 100 | | | | 84 | | | $ | 23.63 | | | $ | 23.63 | | | $ | (0.00 | ) | | | 0.0 | % |
| 107 | | | 150 | | | | 124 | | | $ | 26.51 | | | $ | 26.51 | | | $ | (0.00 | ) | | | 0.0 | % |
| 108 | | | 250 | | | | 210 | | | $ | 34.50 | | | $ | 34.50 | | | $ | (0.00 | ) | | | 0.0 | % |
| 109 | | | Underground Service | | | | | | | | | | | | | |
| 110 | | | 100 | | | | 84 | | | $ | 27.87 | | | $ | 27.87 | | | $ | (0.00 | ) | | | 0.0 | % |
| 111 | | | 150 | | | | 124 | | | $ | 33.19 | | | $ | 33.19 | | | $ | (0.00 | ) | | | 0.0 | % |
| 112 | | | 250 | | | | 210 | | | $ | 40.75 | | | $ | 40.75 | | | $ | (0.00 | ) | | | 0.0 | % |
| 113 | | | 400 (davit | ) | | | 326 | | | $ | 41.95 | | | $ | 41.94 | | | $ | (0.00 | ) | | | 0.0 | % |
| 114 | | | Customer Owned - Limited Company Maintenance - All Lamp Types | |
| 115 | | | N/A | | | | 25 | | | $ | 1.45 | | | $ | 1.45 | | | $ | (0.00 | ) | | | 0.0 | % |
| 116 | | | N/A | | | | 50 | | | $ | 2.88 | | | $ | 2.88 | | | $ | (0.00 | ) | | | 0.0 | % |
| 117 | | | N/A | | | | 75 | | | $ | 5.45 | | | $ | 5.45 | | | $ | (0.00 | ) | | | 0.0 | % |
| 118 | | | N/A | | | | 100 | | | $ | 8.41 | | | $ | 8.41 | | | $ | (0.00 | ) | | | 0.0 | % |
| 119 | | | N/A | | | | 125 | | | $ | 10.50 | | | $ | 10.50 | | | $ | (0.00 | ) | | | 0.0 | % |
| 120 | | | N/A | | | | 150 | | | $ | 14.54 | | | $ | 14.54 | | | $ | (0.00 | ) | | | 0.0 | % |
| 121 | | | N/A | | | | 175 | | | $ | 17.41 | | | $ | 17.41 | | | $ | (0.00 | ) | | | 0.0 | % |
| 122 | | | N/A | | | | 200 | | | $ | 22.82 | | | $ | 22.82 | | | $ | (0.00 | ) | | | 0.0 | % |
| 123 | | | N/A | | | | 225 | | | $ | 26.11 | | | $ | 26.11 | | | $ | (0.00 | ) | | | 0.0 | % |
| 124 | | | N/A | | | | 250 | | | $ | 14.46 | | | $ | 14.46 | | | $ | (0.00 | ) | | | 0.0 | % |
| 125 | | | N/A | | | | 275 | | | $ | 17.04 | | | $ | 17.04 | | | $ | (0.00 | ) | | | 0.0 | % |
| 126 | | | N/A | | | | 300 | | | $ | 19.97 | | | $ | 19.97 | | | $ | (0.00 | ) | | | 0.0 | % |
| 127 | | | N/A | | | | 325 | | | $ | 22.08 | | | $ | 22.07 | | | $ | (0.00 | ) | | | 0.0 | % |
| 128 | | | N/A | | | | 350 | | | $ | 26.12 | | | $ | 26.12 | | | $ | (0.00 | ) | | | 0.0 | % |
| 129 | | | N/A | | | | 375 | | | $ | 29.01 | | | $ | 29.01 | | | $ | (0.00 | ) | | | 0.0 | % |
| 130 | | | N/A | | | | 400 | | | $ | 34.39 | | | $ | 34.39 | | | $ | (0.00 | ) | | | 0.0 | % |
Exhibit G
TE - Page 26 of 27
The Toledo Edison Company
Case No. 12-1465-EL-ATS
Estimated Typical Bills - Comparison (Q2 2012 vs. Q2 2012 w/ Securitization)
| | | | | | | | | | | | | | | | | | | | | | | | |
| Bill Data | |
Line No. | | Bulb Rating
(Lumens or
Watts)
(A) | | | Level of
Usage
(kWH)
(B) | | | Current
Summer Bill
($)
(C) | | | Proposed
Summer Bill
($)
(D) | | | Dollar
Increase
(D)-(C)
(E) | | | Percent
Increase
(E)/(C)
(F) | |
|
Private Outdoor Lighting Service (Rate POL) | |
| 1 | | | Mercury Lighting | |
| 2 | | | Overhead Service - Wood Pole | |
| 3 | | | 175 | | | | 69 | | | $ | 13.22 | | | $ | 13.22 | | | $ | (0.00 | ) | | | 0.0 | % |
| 4 | | | 400 | | | | 158 | | | $ | 33.60 | | | $ | 33.60 | | | $ | (0.00 | ) | | | 0.0 | % |
| 5 | | | 1,000 | | | | 380 | | | $ | 63.01 | | | $ | 63.01 | | | $ | (0.00 | ) | | | 0.0 | % |
| 6 | | | All Other Installations | |
| 7 | | | 175 | | | | 69 | | | $ | 19.81 | | | $ | 19.81 | | | $ | (0.00 | ) | | | 0.0 | % |
| 8 | | | High Pressure Sodium Lighting | |
| 9 | | | Overhead Service - Wood Pole | |
| 10 | | | 200 | | | | 88 | | | $ | 17.84 | | | $ | 17.84 | | | $ | (0.00 | ) | | | 0.0 | % |
| 11 | | | 400 | | | | 163 | | | $ | 32.21 | | | $ | 32.21 | | | $ | (0.00 | ) | | | 0.0 | % |
Exhibit G
TE - Page 27 of 27
The Toledo Edison Company
Case No. 12-1465-EL-ATS
Estimated Typical Bills - Comparison (Q2 2012 vs. Q2 2012 w/ Securitization)
| | | | | | | | | | | | | | | | | | | | | | | | |
| Bill Data | |
Line No. | | Level of
Demand
(kW)
(A) | | | Level of
Usage
(kWH)
(B) | | | Current
Summer Bill
($)
(C) | | | Proposed
Summer Bill
($)
(D) | | | Dollar
Increase
(D)-(C)
(E) | | | Percent
Increase
(E)/(C)
(F) | |
|
Traffic Lighting Schedule (Rate TRF) | |
| 1 | | | 0 | | | | 100 | | | $ | 11.87 | | | $ | 11.87 | | | $ | (0.00 | ) | | | 0.0 | % |
| 2 | | | 0 | | | | 200 | | | $ | 23.72 | | | $ | 23.72 | | | $ | (0.00 | ) | | | 0.0 | % |
| 3 | | | 0 | | | | 300 | | | $ | 35.56 | | | $ | 35.56 | | | $ | (0.00 | ) | | | 0.0 | % |
| 4 | | | 0 | | | | 400 | | | $ | 47.44 | | | $ | 47.44 | | | $ | (0.00 | ) | | | 0.0 | % |
| 5 | | | 0 | | | | 500 | | | $ | 59.31 | | | $ | 59.31 | | | $ | (0.00 | ) | | | 0.0 | % |
| 6 | | | 0 | | | | 600 | | | $ | 71.15 | | | $ | 71.14 | | | $ | (0.00 | ) | | | 0.0 | % |
EXHIBIT H - PROPOSED TARIFFS SHEETS FOR RIDER PIR
| | | | |
| The Cleveland Electric Illuminating Company | | | | Original Sheet X |
| Cleveland, Ohio | | P.U.C.O. No. 13 | | Page 1 of 1 |
RIDER PIR
Phase-In Recovery Rider
APPLICABILITY:
Applicable to any customer who receives electric service under the Company’s rate schedules set forth below. The Phase-In Recovery Rider (PIR) charges will apply, by rate schedule, for all kWhs per kWh. This Rider is nonbypassable within the meaning of O.R.C. § 4928.231 and is not avoidable for customers who take electric generation service from a certified supplier.
RATE:
| | | | |
RS | | | x.xxxx | ¢ |
GS | | | x.xxxx | ¢ |
GP1 | | | x.xxxx | ¢ |
GP2 | | | x.xxxx | ¢ |
GSU1 | | | x.xxxx | ¢ |
GSU2 | | | x.xxxx | ¢ |
GT1 | | | x.xxxx | ¢ |
GT2 | | | x.xxxx | ¢ |
STL | | | x.xxxx | ¢ |
TRF | | | x.xxxx | ¢ |
POL | | | x.xxxx | ¢ |
PROVISIONS:
| 1. | The charges set forth in this Rider recover costs associated with phase-in recovery bonds issued to securitize costs for which the Company was previously authorized recovery, in accordance with O.R.C. §§ 4928.23 through 4928.2318. |
| 2. | The GP2, GSU2, and GT2 PIR charges are applicable to those customers served under a special contract that included a fixed price for service where such fixed price was different than the rate under the otherwise applicable tariff and where the contract term included the period January 1, 2009 through May 31, 2009. The GP1, GSU1, and GT1 PIR charges are applicable to all other customers taking service under these rate schedules. |
RIDER UPDATES:
The charges contained in this Rider shall be updated on a semi-annual basis. No later than November 1st and May 1st of each year, the Company will file with the PUCO a request for approval of the Rider charges which, unless otherwise ordered by the PUCO, shall become effective on a service rendered basis on January 1st and July 1st of each year.
Filed pursuant to Order dated , in Case No. , before
The Public Utilities Commission of Ohio
| | |
| Issued by: , President | | Effective: [DATE] |
EXHIBIT H - PROPOSED TARIFFS SHEETS FOR RIDER PIR
| | | | |
| Ohio Edison Company | | | | Original Sheet X |
| Akron, Ohio | | P.U.C.O. No. 13 | | Page 1 of 1 |
RIDER PIR
Phase-In Recovery Rider
APPLICABILITY:
Applicable to any customer who receives electric service under the Company’s rate schedules set forth below. The Phase-In Recovery Rider (PIR) charges will apply, by rate schedule, for all kWhs per kWh. This Rider is nonbypassable within the meaning of O.R.C. § 4928.231 and is not avoidable for customers who take electric generation service from a certified supplier.
RATE:
| | | | |
RS | | | x.xxxx | ¢ |
GS | | | x.xxxx | ¢ |
GP | | | x.xxxx | ¢ |
GSU | | | x.xxxx | ¢ |
GT | | | x.xxxx | ¢ |
STL | | | x.xxxx | ¢ |
TRF | | | x.xxxx | ¢ |
POL | | | x.xxxx | ¢ |
PROVISIONS:
The charges set forth in this Rider recover costs associated with phase-in recovery bonds issued to securitize costs for which the Company was previously authorized recovery, in accordance with O.R.C. §§ 4928.23 through 4928.2318.
RIDER UPDATES:
The charges contained in this Rider shall be updated on a semi-annual basis. No later than November 1st and May 1st of each year, the Company will file with the PUCO a request for approval of the Rider charges which, unless otherwise ordered by the PUCO, shall become effective on a service rendered basis on January 1st and July 1st of each year.
Filed pursuant to Order dated , in Case No. , before
The Public Utilities Commission of Ohio
| | |
| Issued by: , President | | Effective: [DATE] |
EXHIBIT H - PROPOSED TARIFFS SHEETS FOR RIDER PIR
| | | | |
| The Toledo Edison Company | | | | Original Sheet X |
| Toledo, Ohio | | P.U.C.O. No. 13 | | Page 1 of 1 |
RIDER PIR
Phase-In Recovery Rider
APPLICABILITY:
Applicable to any customer who receives electric service under the Company’s rate schedules set forth below. The Phase-In Recovery Rider (PIR) charges will apply, by rate schedule, for all kWhs per kWh. This Rider is nonbypassable within the meaning of O.R.C. § 4928.231 and is not avoidable for customers who take electric generation service from a certified supplier.
RATE:
| | | | |
RS | | | x.xxxx | ¢ |
GS | | | x.xxxx | ¢ |
GP | | | x.xxxx | ¢ |
GSU | | | x.xxxx | ¢ |
GT | | | x.xxxx | ¢ |
STL | | | x.xxxx | ¢ |
TRF | | | x.xxxx | ¢ |
POL | | | x.xxxx | ¢ |
PROVISIONS:
The charges set forth in this Rider recover costs associated with phase-in recovery bonds issued to securitize costs for which the Company was previously authorized recovery, in accordance with O.R.C. §§ 4928.23 through 4928.2318.
RIDER UPDATES:
The charges contained in this Rider shall be updated on a semi-annual basis. No later than November 1st and May 1st of each year, the Company will file with the PUCO a request for approval of the Rider charges which, unless otherwise ordered by the PUCO, shall become effective on a service rendered basis on January 1st and July 1st of each year.
Filed pursuant to Order dated , in Case No. , before
The Public Utilities Commission of Ohio
| | |
| Issued by: , President | | Effective: [DATE] |
| | | | |
| | EXHIBIT I – PROPOSED BILL FORMAT | | Page 1 of 2 |
| | | | | | |

| | Bill Based On: Actual Meter Reading | | February 18, 2012 | | I20 |
| | | | | | |
| Billing Period: | | Jan 20 to Feb 17, 2012 | | | | Account Number: 999 999 999 999 |
| Name | | JOHN DOE | | | | Amount Due:$190.67 |
| Service | | 123 MAIN ST | | | | Due Date: March 05, 2012 |
| Address | | ANYTOWN OH 11111 | | | | |
To report an emergency or an outage, call 24 hours a day 1-888-544-4877. For Customer Service, call 1-800-589-3101. For Payment Options, call 1-800-686-9901.
Pay your bill online at www.firstenergycorp.com.
Bill issued by: The Illuminating Company, PO Box 3638, Akron OH 44309-3638
Messages
To avoid a 1.5% Late Payment Charge being added to your bill, please pay theAMOUNT DUEby the Due Date.
Your currentPRICE TO COMPAREfor bypassable generation and transmission from Ohio Edison is 6.84 cents per kWh. For you to save, a supplier’s price must be lower. To obtain an Apples to Apples comparison of available competitive electric supplier offers, visit the PUCO web site at www.PUCO.ohio.gov.
Your next meter reading is scheduled for Mar 19, 2012.
Earned Income Tax Credit (EITC) is a tax credit for certain lower-income Individuals. For information and to determine if you qualify, call 1-800-829-1040.
If termination of service would be especially dangerous to your health or the health of someone in your household, please contact our office regarding certification of the related medical condition by a licensed physician, physician’s assistant, clinical nurse specialist, certified nurse practitioner, certified nurse-midwife or local board of health physician so that service can be maintained.
For a brochure describing your customer rights and obligations, please call our Customer Service phone number.
Usage History
| | | | | | | | | | |
| Month | | KWH | | | Month | | KWH | |
| Feb 11 | | | 4,033 | | | Aug 11 | | | 722 | |
| Mar 11 | | | 2,947 | | | Sep 11 | | | 724 | |
| Apr 11 | | | 1,674 | | | Oct 11 | | | 1,286 | |
| May 11 | | | 1,293 | | | Nov 11 | | | 1,696 | |
| Jun 11 | | | 1,071 | | | Dec 11 | | | 2,422 | |
| Jul 11 | | | 686 | | | Jan 12 | | | 4,378 | |
| | | | | | Feb 12 | | | 3,830 | |
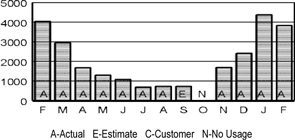
| | | | | | | | |
| | | Feb 11 | | | Feb 12 | |
Average Daily Use (KWH) | | | 144 | | | | 137 | |
Average Daily Temperature | | | 26 | | | | 22 | |
Days in Billing Period | | | 28 | | | | 28 | |
Last 12 Months Use (KWH) | | | | | | | 23,857 | |
Average Monthly Use (KWH) | | | | | | | 1,988 | |
| | | | | | | | |
Account Summary | | | Amount Due | |
| | |
Previous Balance | | | 232.18 | | | | | |
Payments/Adjustments | | | -232.18 | | | | | |
Balance at Billing on Feb 18, 2012 | | | 0.00 | | | | 0.00 | |
The Illuminating Company - Consumption | | | 190.67 | | | | 190.67 | |
| | | | | | | | |
Amount Due by Mar 05, 2012 | | | | | | $ | 190.67 | |
| | | | | | | | |
Usage Information for Meter Number 301027
| | | | |
Feb 17, 2012 KWH Reading (Actual) | | | 92,931 | |
Jan 20, 2012 KWH Reading (Estimate) | | | 89,101 | |
KWH used for 29 day billing period | | | 3,830 | |
Charges from The Illuminating Company
| | | | |
Customer Number 0000000000 0000000000 | | | | |
Rate: Residential Service CE-RSF | | | | |
Customer Charge | | | 4.00 | |
Distribution Related Component | | | 208.56 | |
Cost Recovery Charges | | | -3.23 | |
Bypassable Generation and Transmission Related Component | | | 262.08 | |
Residential Distribution Credit | | | -56.61 | |
Residential Generation Credit | | | -160.86 | |
Residential Non-Standard Credit | | | -63.27 | |
Current Consumption Bill Charges | | $ | 190.67 | |
Detail Payment and Adjustment Information
JOHN DOE
123 MAIN ST
ANYTOWN OH 11111-9999
Return this part with a check or money order payable to The Illuminating Company
Account Number: 999 999 999 999
| | | | |
Amount Paid | | | | |
Amount Due | | $ | 190.67 | |
Due Date | | | Mar 05, 2012 | |
| | |
|
THE ILLUMINATING COMPANY |
PO BOX 3638 |
AKRON OH 44309-3638 |
04999999999999000000000000000000000000190670000190671
Explanation of Terms
Bypassable Generation and Transmission Related Component – Charges for purchasing power and delivering it through the transmission system. These charges are avoided when switching to a Certified Retail Electric Service provider.
Cost Recovery Charges – Recovers previously incurred costs, including PUCO-approved Phase-In Recovery Charges CEI collects from all customers on behalf of a subsidiary, CEI Funding LLC, which owns the right to impose and collect such charges.
Customer Charge – Monthly charge that offsets costs for billing, meter reading, equipment, and service line maintenance.
Distribution Related Component – Charge for moving electricity over distribution lines to a service location.
Economic Development Component – Charges related to economic development support.
Estimated Reading – On the months we do not read a meter, we calculate the bill based on past electrical usage.
KWH (Kilowatt Hour)– A unit of measure for electricity usage equal to 1,000 watts used for one hour.
Late Payment Charge– A charge added to the bill on balances owed after the Due Date.
Price to Compare (PTC)– The utility’s price per KWH for bypassable generation and transmission; can be compared with the price offered by another supplier.
Residential Distribution Credit– A distribution credit for a qualifying rate applied to all usage over 500 KWH during the winter billing period.
Residential Generation Credit– A credit for a qualifying rate and usage applied to all usage during the billing periods beginning October 31 and ending March 31.
Residential Non-Standard Credit– A generation credit for a qualifying rate applied to all usage over 500 KWH during the winter billing period.
Important Information
If you have billing questions or complaints about your Illuminating Company account or for a written explanation of the Price to Compare:
Call Customer Serviceat 1-800-589-3101 from Monday–Friday, 8:00 a.m.–6:00 p.m.
Call Payment Optionsat 1-800-686-9901 from Monday–Friday, 8:00 a.m.–6:00 p.m.
Visit our web siteat www.firstenergycorp.com
Write to usat The Illuminating Company, 76 S. Main St., A-RPC. Akron, OH 44308-1890.
For customers who have a hearing or speech impairmentand use a text telephone, call the TTY (Teletype) at 1-800-750-0750.
We welcome the opportunityto work with you and will try to answer your questions. If your complaint is not resolved after you have called your electric utility, or for general utility information, residential and business customers may contact the Public Utilities Commission of Ohio for assistance at 1-800-686-7826 (toll free), or for TTY at 1-800-686-1570 (toll free), from 8:00 a.m. to 5:00 p.m. weekdays, or at www.PUCO.ohio.gov.
Residential customers may alsocontact the Ohio Consumers’ Counsel for assistance with complaints and utility issues at 1-877-742-5622 (toll free) from 8:00 a.m. to 5:00 p.m. weekdays or at www.pickocc.org.
For Energy Assistance: Contact the Home Energy Assistance Program (HEAP) at 1-800-282-0880 (TDD/TTY 1-800-686-1577) Monday – Friday between 8:00 a.m. and 5:00 p.m.
For your protection, all of our employees wear Photo I.D. badges.
Electronic Check Conversion – Your check authorizes us either to make a one-time electronic funds transfer (EFT) from your account or process as a check. If you have questions about this program, or do not wish to participate, call 1-866-283-8081.
To provide a customer meter reading, use the dials provided and enter the reading online at www.firstenergycorp.com/meterreading or by calling 1-800-589-3101. Have the date you took the reading available.
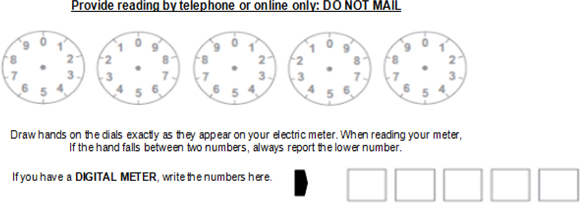
Page 1 of 1
Exhibit J
Structure / Transaction Flow Chart
| * | Charges may be collected directly (A) and / or indirectly (B) |
This foregoing document was electronically filed with the Public Utilities
Commission of Ohio Docketing Information System on
5/3/2012 5:04:55 PM
in
Case No(s). 12-1465-EL-ATS
Summary: Application for Authority to Recover Phase-In Costs and Financing Costs, Issue Phase-In Recovery Bonds and Impose and Collect Phase-In Charges and for Tariff and Bill Format Approvals and for Commission Action on an Expedited Basis
Amendment to Application for Financing Order
Submitted to The Public Utilities Commission of Ohio
on August 16, 2012

August 16, 2012
Mrs. Barcy McNeal
Commission Secretary
The Public Utilities Commission of Ohio
180 East Broad Street
Columbus, OH 43215
SUBJECT: Case No. 12-1465-EL-ATS
Dear Mrs. McNeal:
Please file the following errata in Case No. 12-1465-EL-ATS, the Application of Ohio Edison Company, The Cleveland Electric Illuminating Company, and The Toledo Edison Company for Authority to Recover Phase-in Costs and Financing Costs, Issue Phase-in Recovery Bonds and Impose and Collect Phase-in Recovery Charges, and for Tariff and Bill Format Approvals and for Commission Action on an Expedited Basis.
In the Application, Exhibit A, page 1 of 1, at Line 2 column F contains an incorrect date. The date “1/6/10” that currently appears should be deleted and it should be replaced with the date “3/24/10”. Thank You.
|
| Sincerely, |
|
 |
| Eileen M. Mikkelsen |
| Director, Rates & Regulatory Affairs |
This foregoing document was electronically filed with the Public Utilities
Commission of Ohio Docketing Information System on
8/16/2012 4:50:59 PM
in
Case No(s). 12-1465-EL-ATS
Summary: Application Errata in the Application of Ohio Edison Company, The Cleveland Electric Illuminating Company, and The Toledo Edison Company for Authority to Recover Phase-in Costs and Financing Costs, Issue Phase-in Recovery Bonds and Impose and Collect Phase-in Recovery Charges, and for Tariff and Bill Format Approvals and for Commission Action on an Expedited Basis electronically filed by Karen A Sweeney on behalf of Ohio Edison Company and The Cleveland Electric Illuminating Company and The Toledo Edison Company and Mrs. Eileen M Mikkelsen