Exhibit 99.1
Management’s Discussion and Analysis of Financial Condition and Results of Operations,
Consolidated Financial Statements, Management’s Report on Internal Control over Financial Reporting
and Reports of Independent Registered Public Accounting Firm
MANAGEMENT’S DISCUSSION AND ANALYSIS OF FINANCIAL CONDITION AND
RESULTS OF OPERATIONS
The Clorox Company
(Dollars in millions, except per share amounts)
Management’s Discussion and Analysis of Financial Condition and Results of Operations (MD&A) is designed to provide a reader of the Company’s financial statements with a narrative from the perspective of management on the Company’s financial condition, results of operations, liquidity and certain other factors that may affect future results. The MD&A should be read in conjunction with the Consolidated Financial Statements and related Notes included in Item 8, Financial Statements and Supplementary Data, of this Annual Report on Form 10-K. This MD&A includes the following sections:
| • | | Financial Position and Liquidity |
| • | | Quantitative and Qualitative Disclosure about Market Risk |
| • | | New Accounting Pronouncements |
| • | | Critical Accounting Policies and Estimates |
EXECUTIVE OVERVIEW
The Clorox Company (the Company or Clorox) is a leading manufacturer and marketer of consumer products with fiscal year 2008 net sales of $5,273. The Company sells it products primarily through mass merchandisers, grocery stores and other retail outlets. Clorox markets some of consumers’ most trusted and recognized brand names, including its namesake bleach and cleaning products, Green Works™ natural cleaners, Poett® and Mistolín® cleaning products, Armor All® and STP® auto-care products, Fresh Step® and Scoop Away® cat litter, Kingsford® charcoal, Hidden Valley® and KC Masterpiece® dressings and sauces, Brita® water-filtration systems, Glad® bags, wraps and containers, and Burt’s Bees® natural personal care products. With approximately 8,300 employees worldwide, the Company manufactures products in more than 15 countries and markets them in more than 100 countries.
The Company operates through two operating segments: North America and International. The North America operating segment includes all products marketed in the United States and Canada. The International operating segment includes all products marketed outside the United States and Canada. Historical segment financial information presented herein has been revised to reflect these two operating segments, which were adopted in the first quarter of fiscal year 2008. The Company’s Corporate segment includes certain nonallocated administrative costs, amortization of trademarks and other intangible assets, interest income, interest expense, foreign exchange gains and losses, and other nonoperating income and expense.
The Company primarily markets its leading brands in midsized categories with attractive economic and competitive sets. Most of the Company’s products compete with other nationally-advertised brands within each category and with “private label” brands.
Strategic Initiatives
The Company has developed a strategy to guide it through its 100-year anniversary in 2013. As part of its Centennial Strategy, the Company has established two main objectives: 1) to maximize economic profit across its categories, customers and countries; and 2) be the best at building big-share brands in economically-attractive midsized categories.
The Company has established financial goals to measure its progress against the Centennial Strategy. These goals include 3%-5% annual sales growth, before acquisitions, and 50-75 basis points of improvement in earnings before interest and taxes (EBIT) margin. Additionally, the Company has plans to carefully manage the growth of its asset base. If these financial goals are achieved, the Company believes it can realize double-digit percentage economic profit growth (See “Economic profit” section below) and free cash flow (See “Free cash flow” section below) of 10% of net sales or more.
The Company plans to achieve these financial goals through its leading product portfolio and by leveraging its capabilities in the areas of the consumer, the customer and cost management. From a portfolio perspective, the Company plans to achieve accelerated growth both in and beyond its core categories. The Company is focused on creating value by investing in new and existing categories with profitable growth potential, particularly those categories aligned with global consumer trends in the areas of health and wellness, sustainability, convenience and a more multicultural marketplace. To accomplish this, the Company is focusing on growing existing brands, expanding into adjacent product categories, entering new sales channels, increasing distribution within existing countries and pursuing new businesses in growing markets where the Company can establish and sustain a competitive advantage.
The Company will continue to leverage and grow its capabilities in demand creation and strengthen consumer loyalty to its brands through its three strategic capabilities: Desire, Decide and Delight.
Desire is about integrated pre-purchase communications that increase consumers’ awareness about how the Company’s brands meet their needs;
Decide is about winning at the store shelf, through superior packaging and execution of product assortment, merchandising, pricing and shelving; and
Delight is about continuing to offer high-quality, consumer-preferred products that exceed their expectations, so the consumers will continue to purchase the Company’s products.
The Company will also continue to aggressively focus on pricing and cost management to offset the impact of rising commodity costs and enhance its margins.
Fiscal Year 2008 Summary
Financial Highlights
The Company reported net earnings for the year ended June 30, 2008, of $461 and diluted net earnings per share of $3.24 based on weighted average diluted shares outstanding of approximately 142 million. This compares to net earnings for the year ended June 30, 2007, of $501 and diluted net earnings per share of $3.26 based on weighted average diluted shares outstanding of approximately 154 million. Restructuring-related charges were $0.26 per diluted share for the year ended June 30, 2008, (See “Restructuring and asset impairment costs” section below) as compared with $0.10 per diluted share for the year ended June 30, 2007. Also included in the Company’s results for the year ended June 30, 2008, were costs of $0.09 per diluted share related to the Company’s acquisition of Burt’s Bee, Inc (See “Investing Activities” section below).
Page 2
The Company continues to face a challenging cost environment, largely driven by cost pressures across a large spectrum, including commodity costs, primarily resin and agricultural commodities, and increased energy-related manufacturing and logistics costs. The Company is addressing these challenges through price increases, on-going cost savings programs, focus on product mix and assortment, innovative product improvements and new products, and advertising and trade promotional spending to support and grow its brands.
Certain key fiscal year 2008 developments are summarized as follows:
• | | The Company delivered 9% sales growth. Three percentage points of sales growth came from acquisitions with the balance of sales growth from established brands and new products, including the launch of Green Works™, an innovative line of natural cleaners. |
| • | | The Company responded to cost pressures by executing price increases and aggressively managing costs through initiatives that generated $93 of cost savings, of which $81 was included in gross profit and the remaining $12 was included in other lines of the Consolidated Statement of Earnings. |
| • | | In August 2007, the Company entered into an accelerated share repurchase (ASR) agreement under which the Company repurchased $750 of its shares of common stock from two investment banks. Under the agreement, the banks delivered an initial amount of 10.9 million shares in August 2007 and, upon final settlement, an additional 1.1 million shares in January 2008 (See “Share Repurchases and Dividend Payments” section below). |
| • | | In November 2007, the Company acquired Burt’s Bees Inc. (BBI), a leading manufacturer and marketer of natural personal care products for an aggregate price of $913, excluding $25 for tax benefits associated with the acquisition (See “Investing Activities” section below). |
| • | | The Company issued $750 of debt in notes in October 2007 and $500 of debt in notes in March 2008. These debt issuances were used to partially finance the ASR agreement, the acquisition of BBI and to retire commercial paper (See “Financing Activities” section below). |
| • | | The Company began initiatives to simplify its supply chain and write-down certain non-strategic investments. During fiscal year 2008, the Company recognized $59 of restructuring-related charges and anticipates recognizing between $30 and $35 of additional charges related to these initiatives through fiscal year 2012 (See “Restructuring and asset impairments costs” section below). The Company may, from time to time, decide to pursue additional restructuring related initiatives and therefore may incur restructuring, asset impairment, severance and related charges in the future. |
RESULTS OF OPERATIONS
Management’s discussion and analysis of the Company’s results of operations, unless otherwise noted, compares fiscal year 2008 to fiscal year 2007, and fiscal year 2007 to fiscal year 2006, using percent changes calculated on a rounded basis, except as noted. In certain instances, parenthetical references are made to relevant sections of the Notes to Consolidated Financial Statements to direct the reader to a further detailed discussion. In addition, the discussion of results of worldwide operations includes certain measures not defined by accounting principles generally accepted in the United States of America (non-GAAP measures), including gross profit as a percentage of net sales excluding certain changes, economic profit and free cash flow as a percentage of net sales. Management believes these measures provide investors with additional information about the underlying results and trends of the Company. Information about these non-GAAP measures is set forth in the paragraphs where they are discussed.
Page 3
CONSOLIDATED RESULTS
FINANCIAL PERFORMANCE MEASURES
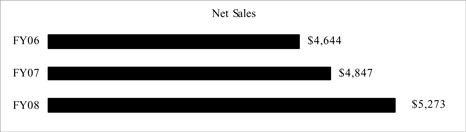
Net salesin fiscal year 2008 increased 9% compared to the prior period. Volume grew 6%, primarily due to the acquisition of BBI, higher shipments of bleach and dilutable cleaners in Latin America, record shipments of Fresh Step® scoopable cat litter, the launch of Green Works™ natural cleaners, strong results in Brita®, and higher shipments of Clorox® disinfecting wipes and Hidden Valley® salad dressings. Partially offsetting these increases were reduced shipments in the North America segment, of Glad® and Clorox® liquid bleach. Sales growth outpaced volume growth primarily due to the benefit of favorable foreign exchange rates and price increases.
Net sales in fiscal year 2007 increased 4% compared to the prior period. Volume grew 2%, primarily due to increased shipments of home-care products, cat litter and the acquisition of bleach businesses in Canada and Latin America in December 2006 and February 2007, respectively. Contributing to the volume growth in fiscal year 2007 were increased shipments of Fresh Step® scoopable cat litter with odor eliminating carbon, Clorox® disinfecting wipes, the launch of Clorox® disinfecting cleaner and increased shipments of Clorox® toilet-bowl cleaner, due to a product improvement. These were partially offset by lower shipments of Clorox 2® color-safe bleach primarily due to the impact of aggressive competitive activity, and Glad® products, which were impacted by higher pricing, and aggressive competitive activity in the trash bags category. Sales growth outpaced volume growth, primarily due to the impact of price increases, partially offset by increased trade-promotion spending.
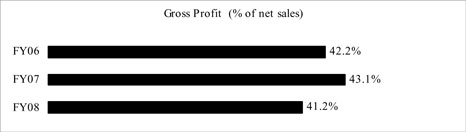
Gross profitincreased 4% in fiscal year 2008, and decreased as a percentage of net sales to 41.2% in fiscal year 2008 from 43.1% in fiscal year 2007. Gross profit as a percentage of net sales was 42.1%, excluding the impact of $19 resulting from the step-up in inventory values associated with the purchase accounting for BBI and incremental charges of $23 related to the Company’s Supply Chain and Other restructuring initiatives. The decline as a percentage of net sales was largely due to increased commodity costs, primarily resin and agricultural commodities, and higher energy-related manufacturing and logistics costs, including the cost of diesel fuel. Also contributing to the decrease was increased trade promotion spending to address competitive activities. These increases were partially offset by cost savings and price increases.
Gross profit increased 7% in fiscal year 2007, and increased as a percentage of net sales to 43.1% in fiscal year 2007 from 42.2% in fiscal year 2006. The increase was primarily due to the benefit of cost savings and price increases. These factors were partially offset by increased commodity, higher manufacturing and logistics costs and increased trade-promotion spending.
Page 4

Diluted net earnings per share from continuing operationsincreased by $0.01 in fiscal year 2008. This slight increase was primarily driven by a decrease in shares outstanding during fiscal year 2008 due to the Company’s repurchase of 14 million of its shares (See “Share Repurchases and Dividend Payments” section below), partially offset by lower net earnings. The decrease in net earnings was primarily attributable to increased commodity costs, manufacturing and logistics costs, increased interest expense due to an increase in borrowings used to finance the BBI acquisition and ASR, and increased restructuring and asset impairment charges (See “Restructuring and asset impairment costs” section below). These increases were partially offset by volume growth, cost savings, and the benefit of favorable foreign exchange rates.
Diluted net earnings per share from continuing operations increased by $0.34 or 12% in fiscal year 2007. The increase was due to higher earnings from continuing operations driven by higher sales and cost savings.
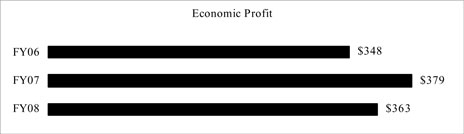
Economic Profit (EP) is a non-GAAP measure used by the Company’s management to evaluate business performance and is considered in determining management’s incentive compensation and the Company’s contribution to employee profit sharing plans (for a detailed reconciliation of EP to earnings from continuing operations before income taxes of $693, the most comparable GAAP financial measure, refer to Exhibit 99.3). EP is defined by the Company as earnings from continuing operations before income taxes, non-cash restructuring and asset impairment costs and interest expense; tax effected, and less a capital charge. The capital charge represents average capital employed by the Company, as defined, multiplied by the weighted-average cost of capital. Weighted-average cost of capital is the blended average of the cost of the Company’s debt and equity capital. Average capital employed represents a two-point average of adjusted capital employed for the current year and total capital employed for the prior year, based on year-end balances. Adjusted capital employed represents total capital employed adjusted to add back the current fiscal year’s non-cash restructuring and asset impairment costs. Total capital employed represents total assets less non-interest bearing liabilities. EP decreased by 4.2% during fiscal year 2008 primarily due to the dilutive near-term effect of the acquisition of BBI. EP increased by 8.9% during fiscal year 2007 primarily due to higher earnings from continuing operations before income taxes, largely due to volume growth and cost savings; and relatively flat average capital employed.
Free cash flow is a non-GAAP measure used by the Company’s management to help assess funds available for investing activities, such as acquisitions, investing in the business to drive growth, and financing activities, including debt payments, dividend payments and share repurchases. Free cash flow is calculated as cash provided by operations less capital expenditures. Free cash flow does not represent cash available only for discretionary expenditures, since the Company has mandatory debt service requirements and other contractual and non-discretionary expenditures.
Page 5
| | | | | | | | | | | | |
| | | 2008 | | | 2007 | | | 2006 | |
Cash provided by operations | | $ | 730 | | | $ | 709 | | | $ | 522 | |
Less: capital expenditures | | | (170 | ) | | | (147 | ) | | | (180 | ) |
| | | | | | | | | | | | |
Free cash flow | | $ | 560 | | | $ | 562 | | | $ | 342 | |
| | | | | | | | | | | | |
Free cash flow as a percentage of net sales | | | 10.6 | % | | | 11.6 | % | | | 7.4 | % |
Free cash flow as a percentage of net salesdecreased to 10.6% in fiscal year 2008 from 11.6% in fiscal year 2007, primarily due to the timing of tax payments and higher capital expenditures partially offset by improvements in working capital. Free cash flow as a percentage of net sales increased to 11.6% in fiscal year 2007 from 7.4% in fiscal year 2006, primarily due to a $151 income tax settlement payment in fiscal year 2006, and lower capital expenditures in 2007.
Expenses
| | | | | | | | | | | | | | | | | | | | | | | | |
| | | | | | | | | Change | | | % of Net Sales | |
| | | | | | | | | 2008
to
2007 | | | 2007
to
2006 | | |
| | | | | | | | | | |
| | | 2008 | | 2007 | | 2006 | | | | 2008 | | | 2007 | | | 2006 | |
Selling and administrative expenses | | $ | 690 | | $ | 642 | | $ | 631 | | 7 | % | | 2 | % | | 13.1 | % | | 13.2 | % | | 13.6 | % |
Advertising costs | | | 486 | | | 474 | | | 450 | | 3 | | | 5 | | | 9.2 | | | 9.8 | | | 9.7 | |
Research and development costs | | | 111 | | | 108 | | | 99 | | 3 | | | 9 | | | 2.1 | | | 2.2 | | | 2.1 | |
Selling and administrative expensesincreased 7% in fiscal year 2008 primarily driven by the BBI and bleach business acquisitions, increased selling costs to drive growth in the grocery channel, the impact of inflationary pressure in Latin America, and increased sales commissions.
Selling and administrative expenses increased 2% in fiscal year 2007 primarily due to transition fees related to the Company’s Information Technology Services (ITS) Agreement (See “Restructuring and asset impairment costs” section below), higher sales commissions, the second year impact of adopting Statement of Financial Accounting Standards No. 123-R,Share Based Payment, and incremental costs to support the Company’s new Centennial strategy. These increases were partially offset by the fiscal year 2006 pretax charges of $25 associated with non-cash historical stock option compensation expense related to prior periods and $11 related to the retirement of the former chairman and CEO from his positions.
Advertising costsincreased 3% in fiscal year 2008 as the Company continued to support its established brands and new products, including Green Works™ natural cleaners and BBI.
Advertising costs increased 5% in fiscal year 2007 as a result of higher spending due to advertising for Fresh Step® scoopable cat litter with odor eliminating carbon, which was launched in the third quarter of fiscal year 2006, new home-care product launches and growth initiatives in Canada and Latin America.
Research and development costsincreased 3% in fiscal year 2008 as the Company continued to support product innovations.
Research and development costs increased 9% in fiscal year 2007 as a result of increased headcount and investment in innovation.
Page 6
Restructuring and asset impairment costs, interest expense, other income, net and effective tax rate on continuing operations
| | | | | | | | | | | | |
| | | 2008 | | | 2007 | | | 2006 | |
Restructuring and asset impairment costs | | $ | 36 | | | $ | 13 | | | $ | 1 | |
Interest expense | | | 168 | | | | 113 | | | | 127 | |
Other income, net | | | (9 | ) | | | (2 | ) | | | (2 | ) |
Income taxes on continuing operations | | | 232 | | | | 247 | | | | 210 | |
Restructuring and asset impairment costsof $36 in fiscal year 2008 related to the Company’s Supply Chain and Other restructuring initiatives. Total restructuring and asset impairment charges, including cost of products sold, were $59 in fiscal year 2008, of which approximately $48 was non-cash. The Supply Chain restructuring involves closing certain domestic and international manufacturing facilities. The Company anticipates redistributing production from these facilities between the remaining facilities and third-party producers to optimize available capacity and reduce operating costs. As a result of this initiative, a number of positions are being eliminated. The Company anticipates the Supply Chain restructuring will be completed in fiscal year 2012. The projected annual cost savings at the completion of this restructuring is expected to be approximately $22 to $24. The Other restructuring charges relate primarily to the write-down of certain new venture investments, intangible assets and equipment and the cost of exiting the Company’s private label food bags business.
The following table summarizes, by segment, the costs associated with the Company’s Supply Chain and Other restructuring initiatives for fiscal year 2008:
| | | | | | | | | | | | |
| | | North
America | | International | | Corporate | | Total |
Cost of products sold | | $ | 19 | | $ | 3 | | $ | 1 | | $ | 23 |
| | | | | | | | | | | | |
Restructuring and asset impairment: | | | | | | | | | | | | |
Severance | | | 3 | | | 2 | | | 2 | | | 7 |
Asset impairment | | | 25 | | | 4 | | | — | | | 29 |
| | | | | | | | | | | | |
Total restructuring and asset impairment costs | | | 28 | | | 6 | | | 2 | | | 36 |
| | | | | | | | | | | | |
Total costs | | $ | 47 | | $ | 9 | | $ | 3 | | $ | 59 |
| | | | | | | | | | | | |
The Company anticipates approximately $20 to $25 of Supply Chain and Other restructuring-related charges, of which approximately $7 are non-cash, to be incurred in fiscal year 2009. The Company anticipates approximately $19 to $22 of the fiscal year 2009 charges to be in the North America segment, of which approximately $16 to $18 are estimated to be recognized as cost of products sold charges (primarily accelerated depreciation for manufacturing equipment and other costs associated with the Supply Chain initiative) and the remainder to be severance charges. The remaining estimated charges will be spread across the International segment and the Corporate segment, and are expected to be classified as cost of products sold and severance. The total anticipated charges for the Supply Chain and Other restructuring initiatives, for the fiscal years 2010 through 2012 are estimated to be approximately $10. The Company may, from time to time, decide to pursue additional restructuring related initiatives and therefore may incur restructuring, asset impairment, severance and related charges in the future. Total restructuring payments through June 30, 2008, were $2 and the total accrued restructuring liability as of June 30, 2008, was $5 (See Note 4).
Restructuring and asset impairment costs of $13 in fiscal year 2007 included $9 of restructuring costs associated with the ITS agreement, described below, which are included as part of the Company’s Corporate segment, and $4 of asset impairment costs, which are included as part of the North America segment.
During fiscal year 2007, the Company entered into the ITS agreement and restructured certain Information Services (IS) activities. The Company incurred administrative expenses and restructuring costs of approximately $23 during its fiscal year ending June 30, 2007, primarily associated with transition and severance costs,
Page 7
which are included as part of the Company’s Corporate segment. In fiscal year 2007, transition costs of $14 were recorded in administrative expense and severance and other related costs of $9 were recorded as restructuring costs. Total restructuring payments through June 30, 2007, were $9 and the total accrued restructuring liability as of June 30, 2007, was zero.
Interest expenseincreased $55 in fiscal year 2008, primarily due to an increase in borrowings used to finance the BBI acquisition and ASR (See “Financing Activities” section below), partially offset by lower interest rates. Interest expense decreased $14 in fiscal year 2007, driven primarily by lower debt levels as a result of a decrease in average borrowings and a $150 debt repayment in the third quarter of fiscal year 2007. These were partially offset by higher interest rates.
Other income, net of $9 in fiscal year 2008 included interest income of $12 and equity earnings in unconsolidated affiliates of $8. Partially offsetting this income were operating expenses from the Company’s investment in low-income housing partnerships and other investment losses of $7, amortization of intangible assets of $7 and net foreign exchange transaction losses of $2.
Other income, net of $2 in fiscal year 2007 included interest income of $8 and equity earnings of $8. Partially offsetting this income were amortization of intangible assets of $5, foreign exchange losses of $4 and operating expenses from the Company’s investment in low-income housing partnerships of $4.
Other income, net of $2 in fiscal year 2006 included interest income of $10 and equity earnings of $7. Partially offsetting this income were operating expenses of $15 from the Company’s investment in low-income housing partnerships.
The effective tax rate on continuing operations was 33.6%, 33.2% and 32.1% in fiscal years 2008, 2007 and 2006, respectively. The fiscal year 2008 tax rate was slightly higher than in fiscal year 2007 due to higher uncertain tax position accruals in fiscal year 2008, partially offset by a decrease in net valuation allowances and the statutory phase-in of increased rates for the domestic manufacturing deduction.
The fiscal year 2007 tax rate was higher than in fiscal year 2006 primarily due to tax benefits recognized on foreign earnings repatriated in fiscal year 2006, offset partially by lower net tax contingency accruals in fiscal year 2007, primarily as a result of the settlement of federal tax issues for the fiscal years 1997 to 2000.
Earnings from discontinued operations
| | | | | | |
| | | 2007 | | 2006 |
Earnings from discontinued operations | | $ | 5 | | $ | 1 |
| | | | | | |
Diluted earnings per share from discontinued operations | | $ | 0.03 | | $ | 0.01 |
| | | | | | |
Diluted earnings per share from discontinued operations in fiscal year 2007 represents an income tax benefit of $5 related to the sale of certain assets remaining from the Company’s discontinued operations in Brazil (See Note 3). Diluted earnings per share from discontinued operations in fiscal year 2006 represents the final receipt of revenues from the interim production of insecticides and Soft Scrub® following the Henkel share exchange (See Note 3).
Page 8
Segment Results
NORTH AMERICA
| | | | | | | | | | | | | | | |
| | | | | | | | | Change | |
| | | 2008 | | 2007 | | 2006 | | 2008
to
2007 | | | 2007
to
2006 | |
Net sales | | $ | 4,440 | | $ | 4,130 | | $ | 4,005 | | 8 | % | | 3 | % |
Earnings from continuing operations before income taxes | | | 1,211 | | | 1,205 | | | 1,131 | | — | | | 7 | |
Fiscal year 2008 versus fiscal year 2007: Volume, net sales and earnings from continuing operations before income taxes increased during fiscal year 2008. Volume growth of 5% was primarily driven by the acquisition of BBI, increased shipments of home-care products primarily due to the launch of the Green Works™ line of natural cleaners and increased shipments of Clorox® disinfecting wipes. Also contributing to the increase was continued growth in cat litter, primarily related to Fresh Step® scoopable cat litter, and higher category consumption of Brita® driven by the overall sustainability trend in the marketplace. These were partially offset by lower shipments of Glad® products primarily driven by category decline, the Company’s exit from a private-label food bag business and lower shipments of laundry products, primarily Clorox® liquid bleach. Net sales growth outpaced volume growth primarily due to the favorable impact of Canadian exchange rates and price increases. Growth in earnings from continuing operations before income taxes was primarily driven by higher sales and cost savings offset by restructuring and asset impairment costs of $47, a $19 step-up in inventory values associated with purchase accounting for BBI, and substantial unfavorable commodity costs.
Fiscal year 2007 versus fiscal year 2006: Volume, net sales and earnings from continuing operations before income taxes increased during fiscal year 2007. Volume growth of 1% was driven primarily by increased shipments of Fresh Step® scoopable cat litter, due to a significant product improvement, the bleach business acquisition in Canada in the second quarter of fiscal year 2007 and increased shipments of home-care products primarily due to strong shipments of Clorox® disinfecting wipes, the launch of Clorox® disinfecting cleaner and increased shipments of Clorox® toilet-bowl cleaner. These increases were partially offset by lower shipments of Clorox 2® color-safe bleach primarily due to the impact of competitive activity. Net sales growth outpaced volume growth primarily due to the impact of price increases, partially offset by increased trade-promotion spending in response to competitive activity. Growth in earnings from continuing operations before income taxes was primarily driven by increased net sales and the benefits of cost savings, partially offset by increased commodity, logistics and advertising costs.
INTERNATIONAL
| | | | | | | | | | | | | | | |
| | | | | | | | | Change | |
| | | 2008 | | 2007 | | 2006 | | 2008
to
2007 | | | 2007
to
2006 | |
Net sales | | $ | 833 | | $ | 717 | | $ | 639 | | 16 | % | | 12 | % |
Earnings from continuing operations before income taxes | | | 146 | | | 141 | | | 129 | | 4 | | | 9 | |
Fiscal year 2008 versus fiscal year 2007: Volume, net sales and earnings from operations before income taxes increased during fiscal year 2008. Volume growth of 7% was driven by increased shipments of bleach and dilutable cleaners in Latin America, primarily due to category growth and the bleach acquisition in the third quarter of fiscal year 2007. The variance between net sales and volume growth was primarily driven by pricing and favorable foreign exchange rates. Growth in earnings from continuing operations before income taxes reflects the benefit of price increases, the impact of foreign exchange rates and increases in net sales, partially offset by increased commodity costs, manufacturing and logistic costs, and charges related to restructuring and asset impairment, primarily in Latin America.
Fiscal year 2007 versus fiscal year 2006: Volume, net sales and earnings from continuing operations before income taxes increased during fiscal year 2007. Volume growth of 9% was driven by increased shipments of home-care products in Latin America, primarily due to category growth and the acquired bleach businesses in
Page 9
certain Latin American countries in the third quarter of fiscal year 2007. The variance between net sales and volume growth was primarily driven by pricing and favorable foreign exchange rates. Growth in earnings from continuing operations before income taxes reflects the benefit of higher net sales and costs savings, partially offset by the impact of increased selling and administrative costs and higher raw material costs.
CORPORATE
| | | | | | | | | | | | | | | | | | |
| | | | | | | | | | | | Change | |
| | | 2008 | | | 2007 | | | 2006 | | | 2008
to
2007 | | | 2007
to
2006 | |
Losses from continuing operations before income taxes | | $ | (664 | ) | | $ | (603 | ) | | $ | (607 | ) | | 10 | % | | (1 | )% |
Fiscal year 2008 versus fiscal year 2007: The losses from continuing operations before income taxes attributable to Corporate increased by $61, or 10%, in fiscal year 2008, primarily due to increased interest expense as a result of higher average borrowings to finance the Company’s ASR agreement and the BBI acquisition.
Fiscal year 2007 versus fiscal year 2006: The losses from continuing operations before income taxes attributable to Corporate decreased by $4, or 1%, primarily due to pretax charges in the prior year of $25 associated with non-cash historical stock option compensation expense related to prior periods and $11 related to the retirement of the former chairman and CEO from his positions. Also contributing to the decrease were lower interest costs, due to a $150 debt repayment in the third quarter of fiscal year 2007, lower commercial paper borrowings due to strong operating cash flows, and lower operating expenses from low-income housing investments. These decreases were partially offset by costs related to the Company’s ITS Agreement, incremental costs to support the Company’s Centennial strategy, increased foreign exchange losses and other smaller items.
FINANCIAL POSITION AND LIQUIDITY
Management’s discussion and analysis of the financial position and liquidity describes the Company’s consolidated operating, investing and financing activities, contractual obligations and off balance sheet arrangements. In certain instances, parenthetical references are made to relevant sections of the Notes to Consolidated Financial Statements to direct the reader to a further detailed discussion.
The Company’s financial position and liquidity remained strong during fiscal year 2008, due to the continued strength of operating cash flows. During fiscal year 2008, the Company remained disciplined in its capital spending and used its strong cash flows and access to the credit markets to purchase BBI, increase dividend payments and repurchase shares.
The following table summarizes cash activities:
| | | | | | | | | | | | |
| | | 2008 | | | 2007 | | | 2006 | |
Cash provided by continuing operations | | $ | 730 | | | $ | 709 | | | $ | 514 | |
Cash used for investing activities | | | (1,082 | ) | | | (268 | ) | | | (161 | ) |
Cash provided by (used for) financing activities | | | 380 | | | | (456 | ) | | | (462 | ) |
Page 10
The Company’s cash position includes amounts held by foreign subsidiaries, and the repatriation of those cash balances from some of the Company’s subsidiaries could result in additional tax costs. However, these cash balances are generally available without legal restriction to fund local business operations. The Company’s cash holdings for fiscal years 2008 and 2007 were as follows:
| | | | | | |
| | | 2008 | | 2007 |
Cash held in foreign accounts in foreign currencies | | $ | 100 | | $ | 73 |
Cash held in foreign accounts in U.S. Dollars | | | 69 | | | 96 |
Cash held in domestic accounts in U.S. Dollars | | | 45 | | | 13 |
| | | | | | |
Total | | $ | 214 | | $ | 182 |
| | | | | | |
During fiscal years 2008, 2007 and 2006, the Company repatriated approximately $164, $30 and $265, respectively, of cash previously held in foreign entities. Of the fiscal year 2006 repatriated cash, $111 represented dividends paid under the terms of the American Jobs Creation Act that the Company used for reinvestment in certain qualified activities.
Operating Activities
Net cash provided by continuing operations increased to $730 in fiscal year 2008 from $709 in fiscal year 2007. The year over year increase was primarily due to the cash impact of changes in working capital, partially offset by the timing of tax payments in the fourth quarter of fiscal year 2008.
In June 2008, the Company reached agreement with the IRS resolving tax issues originally arising in the periods 2001 and 2002. As a result of the settlement agreement, the Company paid $72 in federal taxes and interest for the years 2001 and 2002 in the fourth quarter of fiscal year 2008. The Company had previously provided for these uncertain tax positions. The Company paid $11 in federal taxes and interest for the years 1997 through 2000 in the fourth quarter of fiscal year 2007.
Net cash provided by continuing operations increased to $709 in fiscal year 2007 from $514 in fiscal year 2006. The year-over-year increase was primarily due to a $151 income tax settlement payment, as described below, in the first quarter of fiscal year 2006.
In April 2005, the Company reached a settlement agreement with the IRS which resulted in federal and state tax and interest payments of $151 in the first quarter of fiscal year 2006. The Company had previously accrued for these contingencies.
Investing Activities
Capital expenditures were $170, $147 and $180, respectively, in fiscal years 2008, 2007 and 2006. Capital spending as a percentage of net sales was 3.2%, 3.0% and 3.9% for fiscal years 2008, 2007 and 2006, respectively. Capital expenditures are in line with the Company’s long-term target of 4% or less of net sales. Higher capital spending during fiscal year 2008 was driven primarily by the Company’s manufacturing network consolidation efforts. Lower capital spending during fiscal year 2007 was driven primarily by lower spending on information technology projects compared to fiscal year 2006.
During fiscal year 2008, the Company acquired BBI, a leading manufacturer and marketer of natural personal care products, for an aggregate price of $913, excluding $25 that the Company paid for tax benefits associated with the acquisition. The Company also incurred $8 of costs in connection with the acquisition of BBI. Assets, acquired at fair value, included cash of $33, inventory of $45, other current assets of $24, property, plant and equipment of $16, goodwill of $613, trademarks of $322, other intangibles of $52 and other assets of $1. Liabilities assumed, at fair value, included accounts payable and accrued liabilities of $52, deferred taxes of $138 and other liabilities of $3. The other intangibles will be amortized over a weighted-average estimated useful life of 16 years. Changes to the fair values of the assets acquired and liabilities assumed may be recorded in future periods as the Company finalizes its estimates of fair value.
Page 11
The Company purchased bleach businesses in Canada, effective December 29, 2006, and in certain Latin American countries, effective February 28, 2007, for an aggregate price of $123, with the objective of expanding its global bleach business. The transactions were structured as all cash acquisitions and operating results of the acquired businesses are included in the consolidated net earnings of the North America and International operating segments from their respective dates of acquisition.
Financing Activities
Capital Resources and Liquidity
In March 2008, the Company issued $500 of debt in fixed rate notes at 5.00% due in March 2013 with an effective rate of 5.18%. Interest is payable semi-annually in March and September. Proceeds from the notes were used to partially retire commercial paper used to finance the acquisition of BBI.
In December 2007, the Company repaid $500 of debt which became due. The payment was financed through commercial paper issuances.
In October 2007, the Company issued $750 of debt in fixed rate notes, including $350 of notes at 5.45%, which are due in October 2012 with an effective rate of 5.66%, and $400 of notes at 5.95%, that are due in October 2017 with an effective rate of 6.09%. Interest is payable semi-annually in April and October. Proceeds from the notes were used to partially retire commercial paper used to finance the ASR.
In March 2007, the Company paid off $150 of term debt that became due. The payment was financed through operating cash flows.
The Company was in compliance with all restrictive covenants and limitations as of June 30, 2008 and 2007, and had the following credit ratings at June 30:
| | | | | | | | |
| | | 2008 | | 2007 |
| | | Short-Term | | Long-Term | | Short-Term | | Long-Term |
Standard and Poor’s | | A-2 | | BBB+ | | A-2 | | A- |
Moody’s | | P-2 | | Baa2 | | P-2 | | A3 |
In August 2007 Standard & Poor’s revised the Company’s long-term credit rating to BBB+ after the Company announced its intent to repurchase shares in an aggregate amount of up to $750. Moody’s revised the Company’s long-term credit rating to Baa1 in September 2007 as a result of the share repurchase announcement. In January 2008, after the Company’s acquisition of BBI (See “Investing Activities” section above), Moody’s revised the Company’s long-term credit rating to Baa2. The short-term credit rating remained unchanged.
The Company’s credit facilities as of June 30 were as follows:
| | | | | | |
| | | 2008 | | 2007 |
Revolving credit line | | $ | 1,200 | | $ | 1,300 |
Foreign and other credit lines | | | 48 | | | 95 |
| | | | | | |
Total | | $ | 1,248 | | $ | 1,395 |
| | | | | | |
During fiscal year 2008, the $1,300 in revolving credit agreements were cancelled and replaced by a $1,200 revolving credit agreement, which expires in April 2013, and is available for general corporate purposes and to support commercial paper issuances. As of June 30, 2008, there were no borrowings under the $1,200 revolving credit agreement. The $1,200 revolving credit agreement includes certain restrictive covenants. The Company was in compliance with all restrictive covenants and limitations at June 30, 2008. In addition, at June 30, 2008, the Company had $48 in foreign working capital credit lines and other facilities, of which $25 was available for borrowing.
Page 12
Based on the Company’s working capital requirements, the current borrowing availability under its credit agreements, its credit ratings, and its anticipated ability to generate positive cash flows from operations in the future, the Company believes it will have the funds necessary to meet all of its financing requirements and other fixed obligations as they become due. Should the Company undertake transactions requiring funds in excess of its current cash levels and available credit lines, it might consider the issuance of debt or other securities to finance acquisitions, to repurchase shares, to refinance debt or to fund other activities for general business purposes.
Share Repurchases and Dividend Payments
The Company has two share repurchase programs: an open-market purchase program, which had, as of June 30, 2008, a total authorization of $750, and a program to offset the impact of share dilution related to share-based awards (evergreen program), which has no authorization limit as to amount or timing of repurchases.
The open-market purchase program was approved by the Company’s Board of Directors in May 2008 after the share repurchase open-market program approved in May 2007 was fully utilized by the ASR described below. The open-market purchase program approved in May 2007 replaced the July 2002 and July 2003 share repurchase open-market programs.
On August 10, 2007, the Company entered into an ASR agreement with two investment banks. Under the ASR agreement, the Company repurchased $750 of its shares of common stock from the investment banks for an initial per share amount of $59.59, subject to adjustment. The banks delivered an initial amount of 10.9 million shares to the Company on August 15, 2007. Under the terms of the ASR agreement, the final number of shares the Company repurchased and the timing of the final settlement depended on prevailing market conditions, the final discounted volume weighted average share price over the term of the ASR agreement and other customary adjustments. The final purchase price adjustment was settled on January 17 and 23, 2008, resulting in the receipt of an additional 1.1 million shares by the Company. The final settlement under the ASR agreement did not require the Company to make any additional cash or share payments. Upon final settlement, the average per share amount paid for all shares purchased under the ASR agreement was $62.08. The total number of shares received under the ASR agreement reduced the weighted number of common shares outstanding during the fiscal year 2008 by 10 million shares.
No shares were repurchased under the open-market programs in fiscal year 2007. Share repurchases under the evergreen program were $118 (2 million shares) in fiscal year 2008 and $155 (2.4 million shares) in fiscal year 2007. As of June 30, 2008, the Company is not planning to repurchase any shares in fiscal year 2009 to offset the impact of share dilution related to share-based awards.
On May 13, 2008, the Company announced an increase in the quarterly dividend rate from $0.40 per share to $0.46 per share. Dividends paid in fiscal year 2008 were $228 or $1.60 per share.
Page 13
Contractual Obligations
The Company had contractual obligations payable or maturing in the following fiscal years:
| | | | | | | | | | | | | | | | | | | | | |
| | | 2009 | | 2010 | | 2011 | | 2012 | | 2013 | | Thereafter | | Total |
At June 30, 2008 | | | | | | | | | | | | | | | | | | | | | |
Notes and loans payable(3) | | $ | 755 | | $ | — | | $ | — | | $ | — | | $ | — | | $ | — | | $ | 755 |
Purchase obligations (See Note 18) | | | 222 | | | 73 | | | 40 | | | 22 | | | 15 | | | 16 | | | 388 |
Long-term debt maturities including interest payments | | | 140 | | | 705 | | | 413 | | | 104 | | | 925 | | | 1,121 | | | 3,408 |
ITS Agreement (service agreement only)(1) | | | 40 | | | 37 | | | 33 | | | 31 | | | 29 | | | 8 | | | 178 |
Operating leases | | | 31 | | | 30 | | | 25 | | | 21 | | | 18 | | | 30 | | | 155 |
Contributions to non-qualified supplemental post retirement plans(2) | | | 13 | | | 13 | | | 13 | | | 14 | | | 16 | | | 75 | | | 144 |
Terminal obligation pursuant to Venture Agreement (See Note 13) | | | — | | | — | | | — | | | — | | | — | | | 301 | | | 301 |
Other | | | 1 | | | — | | | — | | | — | | | — | | | — | | | 1 |
| | | | | | | | | | | | | | | | | | | | | |
Total contractual obligations | | $ | 1,202 | | $ | 858 | | $ | 524 | | $ | 192 | | $ | 1,003 | | $ | 1,551 | | $ | 5,330 |
| | | | | | | | | | | | | | | | | | | | | |
| (1) | In October 2006, the Company entered into an ITS Agreement with HP, a third-party service provider. Upon the terms and subject to the conditions set forth in the ITS Agreement, HP is providing certain information technology and related services. The services began in March 2007 and will continue through October 2013. The total minimum contractual obligations at June 30, 2008, are $192, of which $14 are included in operating leases. The minimum contractual obligations are based on an annual service fee that will be adjusted periodically based upon updates to services and equipment provided. Included in the ITS Agreement are certain acceleration payment clauses if the Company terminates the contract without cause. |
| (2) | Represents expected payments through 2018. Based on the accounting rules for retirement and postretirement benefit plans, the liabilities reflected in the Company’s Consolidated Balance Sheets differ from these expected future payments (See Note 21). |
| (3) | The weighted-average interest rate on notes and loans payable was 2.95% at June 30, 2008. |
At June 30, 2008, the liability recorded for uncertain tax positions, excluding associated interest and penalties, was approximately $103 pursuant to FASB Interpretation No. (FIN) 48, Accounting for Uncertainty in Income Taxes—an Interpretation of Financial Accounting Standards Board Statement No. 109. In the twelve months succeeding June 30, 2008, audit resolutions could potentially reduce total unrecognized tax benefits by up to $28, primarily as a result of cash payments. Since the ultimate amount and timing of further cash settlements cannot be predicted with reasonable certainty, liabilities for uncertain tax positions are excluded from the contractual obligation table (See Note 20).
Purchase obligations are defined as purchase agreements that are enforceable and legally binding and that specify all significant terms, including quantity, price and the approximate timing of the transaction. These obligations are related primarily to advertising and inventory purchases. For purchase obligations subject to variable price and/or quantity provisions, an estimate of the price and/or quantity has been made. Examples of the Company’s purchase obligations include commitments for information technology and related services, advertising, raw materials, and contract packing materials, utility agreements, capital expenditure agreements, software acquisition and license commitments and service contracts.
Off Balance Sheet Arrangements
In conjunction with divestitures and other transactions, the Company may provide indemnifications relating to the enforceability of trademarks; pre-existing legal, tax, environmental and employee liabilities; as well as provisions for product returns and other items. The Company has indemnification agreements in effect that specify a maximum possible indemnification exposure. As of June 30, 2008, the Company’s aggregate maximum exposure from these agreements is $291, which consists primarily of an indemnity of up to $250 made to Henkel in connection with the Share Exchange Agreement, subject to a minimum threshold of $12 before any payments would be made. As of June 30, 2008, the Company had not made, nor does it anticipate making, any payments relating to the
Page 14
indemnities contained in the Share Exchange Agreement. The general representations and warranties made by the Company in connection with the Henkel Share Exchange Agreement were made to guarantee statements of fact at the time of the transaction closing and pertain to environmental, legal and other matters.
In addition to the indemnifications related to the general representations and warranties, the Company entered into an agreement with Henkel regarding certain tax matters. The Company and Henkel agreed to be responsible for each other’s taxes on the transaction if their respective actions result in a breach of certain tax representations and warranties in a manner that causes the share-exchange to fail to qualify for tax-free treatment. The Company is unable to estimate the amount of maximum potential liability relating to the tax indemnification but notes that the tax exposure, if any, could be very significant. Any exposure under the agreement would be limited to taxes assessed prior to the expiration of the statute of limitations period for assessing taxes on the share exchange transaction.
During the first quarter of fiscal year 2008, the Company entered into an agreement with the IRS, agreeing to the tax-free treatment of the share exchange transaction. Henkel has advised the Company that the IRS has completed its audit of Henkel’s U.S. group’s federal income tax return for the year in which the share exchange transaction took place and did not propose any adjustments to Henkel’s tax-free treatment of the share exchange transaction. Thus, while the statutes of limitations permitting IRS assessment of tax against the Company and Henkel with respect to the share exchange transaction remain open, it appears likely that the tax-free treatment of the exchange transaction will be sustained.
The Company is a party to letters of credit of $21, primarily related to one of its insurance carriers.
The Company has not recorded any liabilities on any of the aforementioned guarantees at June 30, 2008.
CONTINGENCIES
The Company is involved in certain environmental matters, including Superfund and other response actions at various locations. The Company has a recorded liability of $20 and $23 at June 30, 2008 and 2007, respectively, for its share of the related aggregate future remediation cost. One matter in Dickinson County, Michigan, for which the Company is jointly and severally liable, accounts for a substantial majority of the recorded liability at both June 30, 2008 and 2007. The Company is subject to a cost-sharing arrangement with another party for this matter, under which the Company has agreed to be liable for 24.3% of the aggregate remediation and associated costs, other than legal fees, as the Company and the other party are each responsible for their own such fees. The other party in this matter reported substantial net losses for the full calendar year 2007 and the first half of calendar year 2008 and indicated that it expects substantial net losses for the remainder of calendar year 2008. If the other party with whom the Company shares joint and several liability is unable to pay its share of the response and remediation obligations, the Company would likely be responsible for such obligations. In October 2004, the Company and the other party agreed to a consent judgment with the Michigan Department of Environmental Quality, which sets forth certain remediation goals and monitoring activities. Based on the current status of this matter, and with the assistance of environmental consultants, the Company maintains an undiscounted liability representing its best estimate of its share of costs associated with the capital expenditures, maintenance and other costs to be incurred over an estimated 30-year remediation period. The most significant components of the liability relate to the estimated costs associated with the remediation of groundwater contamination and excess levels of subterranean methane deposits. The Company made payments of less than $1 in fiscal years 2008 and 2007, respectively, towards remediation efforts. Currently, the Company cannot accurately predict the timing of the payments that will likely be made under this estimated obligation. In addition, the Company’s estimated loss exposure is sensitive to a variety of uncertain factors, including the efficacy of remediation efforts, changes in remediation requirements and the timing, varying costs and alternative clean-up technologies that may become available in the future. Although it is possible that the Company’s exposure may exceed the amount recorded, any amount of such additional exposures, or range of exposures, is not estimable at this time.
Page 15
The Company is subject to various other lawsuits and claims relating to issues such as contract disputes, product liability, patents and trademarks, advertising, employee and other matters. Although the results of claims and litigation cannot be predicted with certainty, it is the opinion of management that the ultimate disposition of these matters, to the extent not previously provided for, will not have a material adverse effect, individually or in the aggregate, on the Company’s consolidated financial statements taken as a whole.
QUANTITATIVE AND QUALITATIVE DISCLOSURE ABOUT MARKET RISK
As a multinational company, the Company is exposed to the impact of foreign currency fluctuations, changes in commodity prices, interest-rate risk and other types of market risk. In the normal course of business, the Company manages its exposure to market risk using contractual agreements and a variety of derivative instruments. The Company’s objective in managing its exposure to market risk is to limit the impact of fluctuations on earnings and cash flow through the use of swaps, forward purchases, options and futures contracts. Derivative contracts are entered into for nontrading purposes with major credit-worthy institutions, thereby decreasing the risk of credit loss.
Sensitivity Analysis
For fiscal year 2008, the Company’s exposure to market risk was estimated using sensitivity analyses, which illustrate the change in the fair value of a derivative financial instrument assuming hypothetical changes in foreign exchange rates, market rates or prices. The results of the sensitivity analyses for foreign-currency derivative contracts, commodity derivative contracts and interest rates are summarized below. Actual changes in foreign-exchange rates or market prices may differ from the hypothetical changes, and any changes in the fair value of the contracts, real or hypothetical, would be partly to fully offset by an inverse change in the value of the underlying hedged items.
The Company periodically assesses and takes action to mitigate its exposure to interest-rate risk. As of June 30, 2008, the Company had no outstanding interest-rate derivative contracts.
Foreign Currency Derivative Contracts
The Company seeks to minimize the impact of certain foreign-currency fluctuations by hedging transactional exposures with foreign-currency forward and option contracts. The Company’s foreign-currency transactional exposures pertaining to derivative contracts exist primarily with the Canadian Dollar and certain other currencies. Based on a hypothetical decrease (or increase) of 10% in the value of the U.S. Dollar against the currency for which the Company has derivative instruments at June 30, 2008, the estimated fair value of the Company’s foreign currency derivative contracts would decrease by $4 or increase by $3, resulting in a decrease of $4 or an increase of $3 to accumulated other comprehensive income or pre-tax earnings or losses for fiscal year 2008.
Commodity Derivative Contracts
The Company is exposed to changes in the price of commodities used as raw materials in the manufacturing of its products. These commodities include, among others, resin, diesel, solvent, jet fuel, soybean oil, corrugate and chlor-alkalai. The Company uses various strategies to manage cost exposures on certain raw material purchases with the objective of obtaining more predictable costs for these commodities, including long-term commodity purchase contracts and commodity derivative contracts. Based on a hypothetical decrease (or increase) of 10% in commodity prices at June 30, 2008, the estimated fair value of the Company’s existing derivative contracts would decrease or increase by $16, resulting in decreases or increases to accumulated other comprehensive income or pre-tax earnings or losses based on its hedge accounting designation.
The Company uses different methodologies, when necessary, to estimate the fair value of its derivative contracts. The estimated fair values of the majority of the Company’s contracts are based on quoted market prices, traded exchange market prices, or broker price quotations, and represent the estimated amounts that the Company would pay or receive to terminate the contracts.
Interest Rate
The Company is exposed to interest rate volatility with regard to existing and future issuances of variable rate debt. Primary exposures include movements in London Interbank Offered Rates (LIBOR) and commercial paper rates. The Company periodically uses interest rate swaps and forward interest rate contracts to reduce interest rate volatility. As of June 30, 2008, the Company did not have any interest rate swaps or forward interest rate contracts outstanding. Assuming average variable rate debt levels during the year, a 100 basis point change in interest rates would have increased or decreased interest expense by approximately $11 in fiscal year 2008.
Page 16
NEW ACCOUNTING PRONOUNCEMENTS
On July 1, 2007, the Company adopted FIN 48. This Interpretation prescribes a consistent recognition threshold and measurement standard, as well as criteria for subsequently recognizing, derecognizing, classifying and measuring tax positions for financial statement purposes.
The cumulative effect of adopting FIN 48 was recorded as a $10 reduction to beginning retained earnings. FIN 48 requires uncertain tax positions to be classified as non-current income tax liabilities unless expected to be paid within one year. Upon adoption of FIN 48, income tax liabilities of $53 were reclassified from current to non-current on the Company’s balance sheet (See Note 20).
In September 2006, the FASB issued SFAS No. 157,Fair Value Measurements. This statement defines fair value, establishes a framework for measuring fair value in accordance with U.S. GAAP and expands disclosures about fair value measurements. In February 2008, the FASB issued FASB Staff Position (FSP) No. FAS 157-2, delaying the effective date of SFAS No. 157 for nonfinancial assets and nonfinancial liabilities, except for items that are recognized or disclosed at fair value on a recurring basis. The delayed portions of SFAS No. 157 will be adopted by the Company beginning in its fiscal year ending June 30, 2010, while all other portions of the standard will be adopted by the Company beginning in its fiscal year ending June 30, 2009, as required. The Company does not expect that SFAS No. 157 will have a material impact on its consolidated financial statements when it becomes effective.
In February 2007, the FASB issued SFAS No. 159, The Fair Value Option for Financial Assets and Financial Liabilities, Including an Amendment of FASB Statement No. 115. SFAS No. 159 provides the option to measure, at fair value, eligible financial instrument items using fair value, which are not otherwise required to be measured at fair value. The irrevocable decision to measure items at fair value is made at specified election dates on an instrument-by-instrument basis. Changes in that instrument’s fair value must be recognized in current earnings in subsequent reporting periods. If elected, the first measurement to fair value is reported as a cumulative-effect adjustment to the opening balance of retained earning in the year of adoption. The Company is currently evaluating the impact of the adoption of SFAS No. 159 on its consolidated financial statements if it elects to measure eligible financial instruments at fair value. The standard is effective for the Company beginning in its fiscal year ending June 30, 2009.
In December 2007, the FASB issued SFAS No. 141 (Revised 2007), Business Combinations (SFAS No. 141-R). SFAS No.141-R will significantly change the accounting for future business combinations after adoption. SFAS No. 141-R establishes principles and requirements for how the acquirer of a business recognizes and measures in its financial statements the identifiable assets acquired, the liabilities assumed, including contingent liabilities, and any non controlling interest in the acquired business. SFAS No. 141-R also provides guidance for recognizing and measuring the goodwill acquired in the business combination and determines what information to disclose to enable users of the financial statements to evaluate the nature and financial effects of the business combination. SFAS No. 141-R is effective for fiscal years, and interim periods within those fiscal years, beginning on or after December 15, 2008. Earlier adoption is prohibited. This Statement will be adopted by the Company beginning in its fiscal year ending June 30, 2010, as required. The Company is currently evaluating the impact SFAS No. 141-R will have on its consolidated financial statements when it becomes effective.
In December 2007, the FASB issued SFAS No. 160, Noncontrolling Interests in Consolidated Financial Statements—An Amendment of ARB No. 51. This statement establishes new accounting and reporting standards for the noncontrolling interest in a subsidiary (commonly referred to as minority interest) and for the deconsolidation of a subsidiary. SFAS No. 160 establishes accounting and reporting standards that require the noncontrolling interest to be reported as a component of equity. Changes in a parent’s ownership interest while the parent retains its controlling interest will be accounted for as equity transactions and any retained noncontrolling equity investment upon the deconsolidation of a subsidiary will be initially measured at fair value. SFAS No. 160 is effective for fiscal years, and interim periods within those fiscal years, beginning on or after December 15, 2008. Earlier adoption is prohibited. This Statement will be adopted by the Company beginning in its fiscal year ending June 30, 2010, as required. The Company is currently evaluating the impact SFAS No. 160 will have on its consolidated financial statements when it becomes effective.
Page 17
In March 2008, the FASB issued SFAS No. 161,Disclosures about Derivative Instruments and Hedging Activities - an amendment of SFAS No. 133.This Statement requires disclosures of how and why an entity uses derivative instruments, how derivative instruments and related hedged items are accounted for and how derivative instruments and related hedged items affect an entity’s financial position, financial performance, and cash flows. SFAS No. 161 is effective for fiscal years and interim periods beginning after November 15, 2008, with early application encouraged. This Statement will be adopted by the Company no later than the beginning of the third quarter of its fiscal year ending June 30, 2009, as required. The Company is currently evaluating the impact SFAS No. 161 will have on its consolidated financial statements, when it becomes effective.
In June 2008 the FASB issued FSP EITF 03-6-1,Determining Whether Instruments Granted in Share-Based Payment Transactions Are Participating Securities. This FSP states that unvested share-based payment awards that contain nonforfeitable rights to dividends or dividend equivalents (whether paid or unpaid) are participating securities and shall be included in the computation of earnings per share pursuant to the two-class method. The FSP is effective for financial statements issued for fiscal years beginning after December 15, 2008, and interim periods within those years. Upon adoption, a company is required to retrospectively adjust its earnings per share data (including any amounts related to interim periods, summaries of earnings and selected financial data) to conform with the provisions in this FSP. Earlier adoption is prohibited. This FSP will be adopted by the Company beginning in its fiscal year ending June 30, 2010, as required. The Company is currently evaluating the impact FSP EITF 03-6-1 will have on its consolidated financial statements when it becomes effective.
CRITICAL ACCOUNTING POLICIES AND ESTIMATES
The methods, estimates, and judgments the Company uses in applying its most critical accounting policies have a significant impact on the results the Company reports in its consolidated financial statements. Specific areas, among others, requiring the application of management’s estimates and judgment include assumptions pertaining to accruals for consumer and trade-promotion programs, share-based compensation costs, pension and post-employment benefit costs, future cash flows associated with impairment testing of goodwill and other long-lived assets, credit worthiness of customers, uncertain tax positions, tax valuation allowances and legal, environmental and insurance matters. Accordingly, a different financial presentation could result depending on the judgments, estimates, or assumptions that are used. The most critical accounting policies are those that are most important to the portrayal of the Company’s financial condition and results, and require the Company to make its most difficult and subjective judgments, often estimating the outcome of future events that are inherently uncertain. The Company’s most critical accounting policies are: revenue recognition; valuation of intangible assets and property, plant and equipment; employee benefits, including estimates related to share-based compensation; and income taxes. The Company’s critical accounting policies have been reviewed with the Audit Committee of the Board of Directors. A summary of the Company’s significant accounting policies is contained in Note 1 of the Notes to Consolidated Financial Statements.
Revenue Recognition
Sales are recognized as revenue when the risk of loss and title pass to the customer and when all of the following have occurred: a firm sales arrangement exists, pricing is fixed or determinable, and collection is reasonably assured. Sales are recorded net of allowances for trade-promotions and other discounts.
The Company routinely commits to one-time or on-going trade-promotion programs with customers. Programs include cooperative marketing programs, shelf-price reductions, advantageous end-of-aisle or in-store displays of the Company’s products, graphics and other trade-promotion activities conducted by the customer. Costs related to these programs are recorded as a reduction of sales. The Company’s estimated costs of trade-promotions incorporate historical sales and spending trends by customer and category. The determination of these estimated costs requires judgment and may change in the future as a result of changes in customer promotion participation, particularly for new programs and for programs related to the introduction of new products. Final determination of the total cost of promotion is dependent upon customers providing information about proof of performance and other information related to the promotional event. This process of analyzing and settling trade-promotion programs with customers could impact the Company’s results of operations and trade spending accruals depending on how actual results of the programs compare to original estimates. If the Company’s June 30, 2008, trade spending accrual estimates were to differ by 10%, the impact on net sales would be approximately $4.
Page 18
Valuation of Intangible Assets and Property, Plant and Equipment
The carrying values of goodwill, trademarks with indefinite lives and other indefinite-lived intangible assets are reviewed for possible impairment in accordance with SFAS No. 142,Goodwill and Other Intangible Assets. With respect to goodwill, impairment occurs when the carrying amount of a reporting unit’s goodwill exceeds its implied fair value. An impairment charge is recorded for the difference between the carrying amount and the implied fair value of the reporting unit’s goodwill. For trademarks and other intangible assets with indefinite lives, impairment occurs when the carrying amount of an asset is greater than its fair value. A charge is recorded for the difference between the carrying amount and the fair value. The Company’s estimates of fair value are primarily based on a discounted cash flow approach that requires significant management judgment with respect to future volumes, revenue and expense growth rates, changes in working capital use, foreign-exchange rates, devaluation, inflation and the selection of an appropriate discount rate. The Company tests its goodwill, trademarks with indefinite lives and other indefinite-lived intangible assets annually in the third fiscal quarter unless there are indications during an interim period that these assets may have become impaired.
The Company performed its annual review of goodwill and indefinite-lived intangible assets in the third quarter of fiscal year 2008 and recorded $2 of asset impairment costs related to indefinite-lived intangible assets which were included as part of the International segment. No instances of goodwill impairment were identified. A 10% decline in the fair values of the indefinite-lived intangible assets would have increased the asset impairment costs related to indefinite-lived intangible assets by $2. A 10% decline in the fair values of the reporting units would not have changed the results of the goodwill impairment review.
Property, plant and equipment and finite-lived intangible assets are reviewed for possible impairment in accordance with SFAS No. 144, Accounting for the Impairment or Disposal of Long-Lived Assets. The Company’s impairment review requires significant management judgment including estimating the future success of product lines, future sales volumes, revenue and expense growth rates, alternative uses for the assets and estimated proceeds from the disposal of the assets. The Company conducts quarterly reviews for idle and underutilized equipment, and reviews business plans for possible impairment indicators. Impairment occurs when the carrying amount of the asset exceeds its estimated future undiscounted cash flows and the impairment is viewed as other than temporary. When an impairment is indicated, an impairment charge is recorded for the difference between the asset’s book value and its estimated fair market value. Depending on the asset, estimated fair market value may be determined either by use of a discounted cash flow model or by reference to estimated selling values of assets in similar condition. The use of different assumptions would increase or decrease the estimated fair value of assets and would increase or decrease any impairment measurement.
Employee Benefits
The Company has various individual and group compensation and retirement income programs, including an incentive compensation program, a profit sharing element of The Clorox Company 401(k) plan and share-based compensation programs.
Incentive Compensation and Profit Sharing Programs
Company contributions to the 401(k) plan and payments to managerial staff for the annual incentive compensation program are subject to the Company achieving certain fiscal year performance targets. The 401(k) plan has two components: a 401(k) component and a profit sharing component. Employee contributions made to the 401(k) component are partially matched with Company contributions. The Company’s contributions to the profit sharing component above 3% of eligible employee earnings are discretionary and are based on achieving certain financial targets. The Company’s payouts under the annual incentive compensation program are also based on achieving certain financial targets. The Company accrues for the profit sharing cash contribution and annual incentive compensation program costs quarterly based on estimated annual results. At June 30, 2008, the Company accrued $26 for such costs and anticipates making a profit sharing cash contribution to the 401(k) plan in the first quarter of fiscal year 2009. At June 30, 2008, the Company accrued $40 related to the annual incentive compensation program.
Page 19
Share-Based Compensation
The Company grants various nonqualified stock-based compensation awards, including stock options, performance units and restricted stock. The share-based compensation expense and related income tax benefit recognized in the income statement in fiscal year 2008 was $47 and $18, respectively. As of June 30, 2008, there was $59 of total unrecognized compensation cost related to nonvested stock options, restricted stock, and performance unit awards, which is expected to be recognized over a weighted average remaining vesting period of 2 years.
The Company estimates the fair value of each stock option award on the date of grant using the Black-Scholes valuation model, which requires management to make estimates regarding expected option life, stock price volatility and other assumptions. Groups of employees that have similar historical exercise behavior are considered separately for valuation purposes. The Company estimates stock option forfeitures based on historical data for each employee grouping, and adjusts the rate to expected forfeitures periodically. The adjustment of the forfeiture rate will result in a cumulative catch-up adjustment in the period the forfeiture estimate is changed. During fiscal year 2008, adjustments totaled $1.
The use of different assumptions in the Black-Scholes valuation model could lead to a different estimate of the fair value of each stock option. The expected volatility is based on implied volatility from publicly traded options on the Company’s stock at the date of grant, historical implied volatility of the Company’s publicly traded options and other factors. If the Company’s assumption for the volatility rate increased by one percentage point, the fair value of options granted in fiscal year 2008 would have increased by less than $1. The expected life of the stock options is based on observed historical exercise patterns. If the Company’s assumption for the expected life increased by one year, the fair value of options granted in fiscal year 2008 would have increased by $1.
The Company’s performance unit grants provide for the issuance of common stock to certain managerial staff and executive management if the Company achieves specified performance targets. The performance unit grants generally vest after three years. The fair value of each grant issued is estimated on the date of grant based on the current market price of the stock. The total amount of compensation expense recognized reflects estimated forfeiture rates, and the initial assumption that performance goals will be achieved. Compensation expense is adjusted quarterly based on management’s assessment of the probability that performance goals will be achieved. If such goals are not met or it is determined that achievement of performance goals is not probable, any previously recognized compensation expense is reversed. If it is determined that the performance goals will be exceeded, additional compensation expense is recognized.
Retirement Income Plans
The determination of net periodic pension cost is based on actuarial assumptions including a discount rate to reflect the time value of money, employee compensation rates, demographic assumptions to determine the probability and timing of benefit payments, and the long-term rate of return on plan assets. The selection of assumptions is based on historical trends and known economic and market conditions at the time of valuation. Actual results could differ from expected results because actuarial assumptions and estimates are used. In the calculation of pension expense related to domestic plans for 2008, the Company used a long-term rate of return on plan assets assumption of 8.25% and a beginning of year discount rate assumption of 6.25%. The use of a different discount rate or long-term rate of return on domestic plan assets can significantly impact pension expense. For example, at June 30, 2008, a decrease of 100 basis points in the discount rate would increase pension liability by approximately $48, and potentially increase fiscal year 2009 pension expense by $4. A 100 basis point decrease in the long-term rate of return on plan assets would increase future pension expense in fiscal year 2009 by $3. The Company also has defined benefit pension plans for eligible international employees, including Canadian and Australian employees, and different assumptions are used in the determination of pension expense for those plans, as appropriate. Refer to Note 21 of the Notes to Consolidated Financial Statements for further discussion of pension and other retirement plan obligations.
Page 20
Income Taxes
The Company’s effective tax rate is based on income by tax jurisdiction, statutory tax rates and tax planning opportunities available to the Company in the various jurisdictions in which the Company operates. Significant judgment is required in determining the Company’s effective tax rate and in evaluating its tax positions.
The Company maintains valuation allowances where it is likely that all or a portion of a deferred tax asset will not be realized. Changes in valuation allowances from period to period are included in the Company’s income tax provision in the period of change. In determining whether a valuation allowance is warranted, the Company takes into account such factors as prior earnings history, expected future earnings, unsettled circumstances that, if unfavorably resolved, would adversely affect utilization of a deferred tax asset, carry-back and carry-forward periods, and tax strategies that could potentially enhance the likelihood of realization of a deferred tax asset. Valuation allowances maintained by the Company relate mostly to deferred tax assets arising from the Company’s inability to use net operating losses in certain foreign countries.
In addition to valuation allowances, the Company provides for uncertain tax positions when such tax positions do not meet the recognition thresholds or measurement standards prescribed by FIN 48. Amounts for uncertain tax positions are adjusted in quarters when new information becomes available or when positions are effectively settled.
United States income taxes and foreign withholding taxes are not provided when foreign earnings are indefinitely reinvested in accordance with Accounting Principles Board Opinion No. 23, Accounting for Income Taxes, Special Areas. The Company determines whether its foreign subsidiaries will invest their undistributed earnings indefinitely and reassesses this determination on a periodic basis. Change to the Company’s determination may be warranted based on the Company’s experience as well as plans regarding future international operations and expected remittances.
Page 21
CAUTIONARY STATEMENT
This Annual Report on Form 10-K (this Report), including the exhibits hereto and the information incorporated by reference herein, contains “forward-looking statements” within the meaning of Section 27A of the Securities Act of 1933, as amended (the Securities Act), and Section 21E of the Securities Exchange Act of 1934, as amended (the Exchange Act), and such forward-looking statements involve risks and uncertainties. Except for historical information, matters discussed above, including statements about future volume, sales, costs, cost savings, earnings, cash outflows, plans, objectives, expectations, growth, or profitability, are forward-looking statements based on management’s estimates, assumptions and projections. Words such as “expects,” “anticipates,” “targets,” “goals,” “projects,” “intends,” “plans,” “believes,” “seeks,” “estimates,” and variations on such words, and similar expressions, are intended to identify such forward looking statements. These forward-looking statements are only predictions, subject to risks and uncertainties, and actual results could differ materially from those discussed above. Important factors that could affect performance and cause results to differ materially from management’s expectations are described in the sections entitled “Risk Factors” and “Management’s Discussion and Analysis of Financial Condition and Results of Operations” in this Report, as updated from time to time in the Company’s SEC filings. These factors include, but are not limited to, the Company’s cost levels, including volatility and increases in commodity costs such as resin, diesel, chlor-alkali, and agricultural commodities; increases in energy and transportation costs, including the cost of diesel; general economic and marketplace conditions and events, including consumer spending levels, the rate of economic growth, and the rate of inflation; consumer and customer reaction to price increases; risks related to acquisitions, mergers and divestitures, including the Company’s ability to achieve the projected strategic and financial benefits from the Burt’s Bees acquisition; the ability of the Company to implement and generate expected savings from its programs to reduce costs, including its supply chain restructuring; the success of the Company’s previously announced Centennial Strategy; the need for any additional restructuring or asset-impairment charges; customer-specific ordering patterns and trends; changes in the Company’s tax rates; any difficulty of the Company or its suppliers in obtaining key raw materials or product components used in the production of the Company’s products; risks inherent in sole-supplier relationships; risks related to customer concentration; risks arising out of natural disasters; risks related to the handling and/or transportation of hazardous substances, including but not limited to chlorine; risks inherent in litigation; risks related to international operations, including the risk associated with foreign currencies; the impact of the volatility of the debt markets on the Company’s access to funds and cost of borrowing; risks inherent in maintaining an effective system of internal controls, including the potential impact of acquisitions or the use of third-party service providers; the ability to manage and realize the benefit of joint ventures and other cooperative relationships, including the Company’s joint venture regarding the Company’s Glad® plastic bags, wraps and containers business, and the agreement relating to the provision of information technology and related services by a third party; the success of new products; risks related to changes in the Company’s capital structure; risks related to the Company’s November 2004 share exchange transaction with Henkel KGaA and the Company’s accompanying tax indemnification obligations; risks arising from any declines in cash flow, whether resulting from tax payments, debt payments, share repurchases, interest cost increases greater than expected, increases in debt, changes in credit ratings or otherwise; and the ability of the Company to successfully manage tax, regulatory, product liability, intellectual property, environmental and other legal matters, including the risk resulting from joint and several liability for environmental contingencies.
The Company’s forward looking statements in this Report are based on management’s current views and assumptions regarding future events and speak only as of their dates. The Company undertakes no obligation to publicly update or revise any forward looking statements, whether as a result of new information, future events or otherwise, except as required by the federal securities laws.
In this Report, unless the context requires otherwise, the terms “the Company” and “Clorox” refer to The Clorox Company and its subsidiaries.
Page 22
CONSOLIDATED STATEMENTS OF EARNINGS
The Clorox Company
| | | | | | | | | | | | |
Years ended June 30 Dollars in millions, except per share amounts | | 2008 | | | 2007 | | | 2006 | |
Net sales | | $ | 5,273 | | | $ | 4,847 | | | $ | 4,644 | |
Cost of products sold | | | 3,098 | | | | 2,756 | | | | 2,685 | |
| | | | | | | | | | | | |
| | | |
Gross profit | | | 2,175 | | | | 2,091 | | | | 1,959 | |
| | | |
Selling and administrative expenses | | | 690 | | | | 642 | | | | 631 | |
Advertising costs | | | 486 | | | | 474 | | | | 450 | |
Research and development costs | | | 111 | | | | 108 | | | | 99 | |
Restructuring and asset impairment costs | | | 36 | | | | 13 | | | | 1 | |
Interest expense | | | 168 | | | | 113 | | | | 127 | |
Other income, net | | | (9 | ) | | | (2 | ) | | | (2 | ) |
| | | | | | | | | | | | |
| | | |
Earnings from continuing operations before income taxes | | | 693 | | | | 743 | | | | 653 | |
Income taxes on continuing operations | | | 232 | | | | 247 | | | | 210 | |
| | | | | | | | | | | | |
| | | |
Earnings from continuing operations | | | 461 | | | | 496 | | | | 443 | |
| | | | | | | | | | | | |
| | | |
Earnings from discontinued operations | | | — | | | | 5 | | | | 1 | |
| | | | | | | | | | | | |
| | | |
Net earnings | | $ | 461 | | | $ | 501 | | | $ | 444 | |
| | | | | | | | | | | | |
| | | |
Earnings per share | | | | | | | | | | | | |
Basic | | | | | | | | | | | | |
Continuing operations | | $ | 3.30 | | | $ | 3.28 | | | $ | 2.94 | |
Discontinued operations | | | — | | | | 0.03 | | | | 0.01 | |
| | | | | | | | | | | | |
Basic net earnings per share | | $ | 3.30 | | | $ | 3.31 | | | $ | 2.95 | |
| | | | | | | | | | | | |
| | | |
Diluted | | | | | | | | | | | | |
Continuing operations | | $ | 3.24 | | | $ | 3.23 | | | $ | 2.89 | |
Discontinued operations | | | — | | | | 0.03 | | | | 0.01 | |
| | | | | | | | | | | | |
Diluted net earnings per share | | $ | 3.24 | | | $ | 3.26 | | | $ | 2.90 | |
| | | | | | | | | | | | |
| | | |
Weighted average shares outstanding (in thousands) | | | | | | | | | | | | |
Basic | | | 139,633 | | | | 151,445 | | | | 150,545 | |
Diluted | | | 142,004 | | | | 153,935 | | | | 153,001 | |
See Notes to Consolidated Financial Statements
Page 23
CONSOLIDATED BALANCE SHEETS
The Clorox Company
| | | | | | | | |
As of June 30 Dollars in millions, except share amounts | | 2008 | | | 2007 | |
ASSETS | | | | | | | | |
Current assets | | | | | | | | |
Cash and cash equivalents | | $ | 214 | | | $ | 182 | |
Receivables, net | | | 505 | | | | 460 | |
Inventories, net | | | 384 | | | | 309 | |
Other current assets | | | 146 | | | | 81 | |
| | | | | | | | |
Total current assets | | | 1,249 | | | | 1,032 | |
Property, plant and equipment, net | | | 960 | | | | 976 | |
Goodwill | | | 1,658 | | | | 1,025 | |
Trademarks, net | | | 560 | | | | 254 | |
Other intangible assets, net | | | 123 | | | | 94 | |
Other assets | | | 158 | | | | 200 | |
| | | | | | | | |
| | |
Total assets | | $ | 4,708 | | | $ | 3,581 | |
| | | | | | | | |
| | |
LIABILITIES AND STOCKHOLDERS’ (DEFICIT) EQUITY | | | | | | | | |
Current liabilities | | | | | | | | |
Notes and loans payable | | $ | 755 | | | $ | 74 | |
Current maturities of long-term debt | | | — | | | | 500 | |
Accounts payable | | | 418 | | | | 329 | |
Accrued liabilities | | | 440 | | | | 507 | |
Income taxes payable | | | 48 | | | | 17 | |
| | | | | | | | |
Total current liabilities | | | 1,661 | | | | 1,427 | |
Long-term debt | | | 2,720 | | | | 1,462 | |
Other liabilities | | | 600 | | | | 516 | |
Deferred income taxes | | | 97 | | | | 5 | |
| | | | | | | | |
Total liabilities | | | 5,078 | | | | 3,410 | |
| | | | | | | | |
| | |
Commitments and contingencies | | | | | | | | |
| | |
Stockholders’ (deficit) equity | | | | | | | | |
Common stock: $1.00 par value; 750,000,000 shares authorized; 158,741,461 shares issued at June 30, 2008 and 2007; and 138,038,052 and 151,256,460 shares outstanding at June 30, 2008 and 2007, respectively | | | 159 | | | | 159 | |
Additional paid-in capital | | | 534 | | | | 481 | |
Retained earnings | | | 386 | | | | 185 | |
Treasury shares, at cost: 20,703,409 and 7,485,001 shares at June 30, 2008 and 2007, respectively | | | (1,270 | ) | | | (445 | ) |
Accumulated other comprehensive net losses | | | (179 | ) | | | (209 | ) |
| | | | | | | | |
Stockholders’ (deficit) equity | | | (370 | ) | | | 171 | |
| | | | | | | | |
| | |
Total liabilities and stockholders’ (deficit) equity | | $ | 4,708 | | | $ | 3,581 | |
| | | | | | | | |
See Notes to Consolidated Financial Statements
Page 24
CONSOLIDATED STATEMENTS OF STOCKHOLDERS’ (DEFICIT) EQUITY
The Clorox Company
| | | | | | | | | | | | | | | | | | | | | | | | | | | | | | | | | | | | | | |
| | | Common Stock | | | Additional
Paid-in
Capital | | | Retained
Earnings | | | Treasury
Shares | | | Accumulated
Other
Comprehensive
Net (Losses)
Gains | | | Unearned
Compensation | | | Total | | | Total
Comprehensive
Income | |
Dollars in millions, except share
amounts | | Shares
(000) | | | Amount | | | | | Shares
(000) | | | Amount | | | | | |
Balance at June 30, 2005 | | 249,827 | | | $ | 250 | | | $ | 328 | | | $ | 3,684 | | | (98,144 | ) | | $ | (4,463 | ) | | $ | (336 | ) | | $ | (16 | ) | | $ | (553 | ) | | | | |
Comprehensive income | | | | | | | | | | | | | | | | | | | | | | | | | | | | | | | | | — | | | | | |
Net earnings | | | | | | | | | | | | | | 444 | | | | | | | | | | | | | | | | | | | 444 | | | $ | 444 | |
Translation adjustments, net of tax of $(0) | | | | | | | | | | | | | | | | | | | | | | | | | 2 | | | | | | | | 2 | | | | 2 | |
Change in valuation of derivatives, net of tax of $(1) | | | | | | | | | | | | | | | | | | | | | | | | | 1 | | | | | | | | 1 | | | | 1 | |
Minimum pension liability adjustments, net of tax of $71 | | | | | | | | | | | | | | | | | | | | | | | | | 118 | | | | | | | | 118 | | | | 118 | |
| | | | | | | | | | | | | | | | | | | | | | | | | | | | | | | | | | | | | | |
Total comprehensive income | | | | | | | | | | | | | | | | | | | | | | | | | | | | | | | | | | | | $ | 565 | |
| | | | | | | | | | | | | | | | | | | | | | | | | | | | | | | | | | | | | | |
Dividends | | | | | | | | | | | | | | (174 | ) | | | | | | | | | | | | | | | | | | (174 | ) | | | | |
Employee stock plans | | | | | | | | | | 85 | | | | (15 | ) | | 2,015 | | | | 71 | | | | | | | | | | | | 141 | | | | | |
Reclassification upon adoption of Statement of Financial Accounting Standards (SFAS) No.
123-R | | | | | | | | | | (16 | ) | | | | | | | | | | | | | | | | | | 16 | | | | — | | | | | |
Treasury stock purchased | | | | | | | | | | | | | | | | | (2,400 | ) | | | (135 | ) | | | | | | | | | | | (135 | ) | | | | |
| | | | | | | | | | | | | | | | | | | | | | | | | | | | | | | | | | | | | | |
Balance at June 30, 2006 | | 249,827 | | | | 250 | | | | 397 | | | | 3,939 | | | (98,529 | ) | | | (4,527 | ) | | | (215 | ) | | | — | | | | (156 | ) | | | | |
Comprehensive income | | | | | | | | | | | | | | | | | | | | | | | | | | | | | | | | | | | | | | |
Net earnings | | | | | | | | | | | | | | 501 | | | | | | | | | | | | | | | | | | | 501 | | | $ | 501 | |
Translation adjustments, net of tax of $3 | | | | | | | | | | | | | | | | | | | | | | | | | 47 | | | | | | | | 47 | | | | 47 | |
Change in valuation of derivatives, net of tax of $1 | | | | | | | | | | | | | | | | | | | | | | | | | (3 | ) | | | | | | | (3 | ) | | | (3 | ) |
Minimum pension liability adjustments, net of tax of $0 | | | | | | | | | | | | | | | | | | | | | | | | | 1 | | | | | | | | 1 | | | | 1 | |
| | | | | | | | | | | | | | | | | | | | | | | | | | | | | | | | | | | | | | |
Total comprehensive income | | | | | | | | | | | | | | | | | | | | | | | | | | | | | | | | | | | | $ | 546 | |
| | | | | | | | | | | | | | | | | | | | | | | | | | | | | | | | | | | | | | |
Adjustment to initially apply SFAS No. 158, net of tax of $(23) | | | | | | | | | | | | | | | | | | | | | | | | | (39 | ) | | | | | | | (39 | ) | | | | |
Dividends | | | | | | | | | | | | | | (200 | ) | | | | | | | | | | | | | | | | | | (200 | ) | | | | |
Employee stock plans | | | | | | | | | | 84 | | | | (9 | ) | | 2,358 | | | | 100 | | | | | | | | | | | | 175 | | | | | |
Treasury stock purchased | | | | | | | | | | | | | | | | | (2,400 | ) | | | (155 | ) | | | | | | | | | | | (155 | ) | | | | |
Treasury stock retirement | | (91,086 | ) | | | (91 | ) | | | | | | | (4,046 | ) | | 91,086 | | | | 4,137 | | | | | | | | | | | | — | | | | | |
| | | | | | | | | | | | | | | | | | | | | | | | | | | | | | | | | | | | | | |
Balance at June 30, 2007 | | 158,741 | | | | 159 | | | | 481 | | | | 185 | | | (7,485 | ) | | | (445 | ) | | | (209 | ) | | | — | | | | 171 | | | | | |
Comprehensive income | | | | | | | | | | | | | | | | | | | | | | | | | | | | | | | | | | | | | | |
Net earnings | | | | | | | | | | | | | | 461 | | | | | | | | | | | | | | | | | | | 461 | | | $ | 461 | |
Translation adjustments, net of tax of $(2) | | | | | | | | | | | | | | | | | | | | | | | | | 26 | | | | | | | | 26 | | | | 26 | |
Change in valuation of derivatives, net of tax of $17 | | | | | | | | | | | | | | | | | | | | | | | | | 27 | | | | | | | | 27 | | | | 27 | |
Unrecognized actuarial losses and prior service benefit, net of tax of $(15) | | | | | | | | | | | | | | | | | | | | | | | | | (23 | ) | | | | | | | (23 | ) | | | (23 | ) |
| | | | | | | | | | | | | | | | | | | | | | | | | | | | | | | | | | | | | | |
Total comprehensive income | | | | | | | | | | | | | | | | | | | | | | | | | | | | | | | | | | | | $ | 491 | |
| | | | | | | | | | | | | | | | | | | | | | | | | | | | | | | | | | | | | | |
Cumulative effect of adopting Interpretation No. 48 | | | | | | | | | | | | | | (10 | ) | | | | | | | | | | | | | | | | | | (10 | ) | | | | |
Dividends | | | | | | | | | | | | | | (231 | ) | | | | | | | | | | | | | | | | | | (231 | ) | | | | |
Employee stock plans | | | | | | | | | | 53 | | | | (19 | ) | | 862 | | | | 48 | | | | | | | | | | | | 82 | | | | | |
Treasury stock purchased | | | | | | | | | | | | | | | | | (14,080 | ) | | | (868 | ) | | | | | | | | | | | (868 | ) | | | | |
Other | | | | | | | | | | | | | | | | | | | | | (5 | ) | | | | | | | | | | | (5 | ) | | | | |
| | | | | | | | | | | | | | | | | | | | | | | | | | | | | | | | | | | | | | |
Balance at June 30, 2008 | | 158,741 | | | $ | 159 | | | $ | 534 | | | $ | 386 | | | (20,703 | ) | | $ | (1,270 | ) | | $ | (179 | ) | | $ | — | | | $ | (370 | ) | | | | |
| | | | | | | | | | | | | | | | | | | | | | | | | | | | | | | | | | | | | | |
See Notes to Consolidated Financial Statements
Page 25
CONSOLIDATED STATEMENTS OF CASH FLOWS
The Clorox Company
| | | | | | | | | | | | |
Years ended June 30 Dollars in millions | | 2008 | | | 2007 | | | 2006 | |
Operating activities: | | | | | | | | | | | | |
Net earnings | | $ | 461 | | | $ | 501 | | | $ | 444 | |
Deduct: Earnings from discontinued operations | | | — | | | | 5 | | | | 1 | |
| | | | | | | | | | | | |
Earnings from continuing operations | | | 461 | | | | 496 | | | | 443 | |
Adjustments to reconcile earnings from continuing operations to net cash provided by continuing operations: | | | | | | | | | | | | |
Depreciation and amortization | | | 205 | | | | 192 | | | | 188 | |
Share-based compensation | | | 47 | | | | 49 | | | | 77 | |
Deferred income taxes | | | (42 | ) | | | (15 | ) | | | (28 | ) |
Restructuring and asset impairment activities | | | 29 | | | | 4 | | | | — | |
Other | | | 23 | | | | 26 | | | | 44 | |
Cash effects of changes in: | | | | | | | | | | | | |
Receivables, net | | | (8 | ) | | | (15 | ) | | | (29 | ) |
Inventories, net | | | (26 | ) | | | (8 | ) | | | 26 | |
Other current assets | | | 11 | | | | 13 | | | | (11 | ) |
Accounts payable and accrued liabilities | | | 63 | | | | (30 | ) | | | (50 | ) |
Income taxes payable | | | (33 | ) | | | 7 | | | | (136 | ) |
Pension contributions to qualified plans | | | — | | | | (10 | ) | | | (10 | ) |
| | | | | | | | | | | | |
Net cash provided by continuing operations | | | 730 | | | | 709 | | | | 514 | |
Net cash provided by discontinued operations | | | — | | | | — | | | | 8 | |
| | | | | | | | | | | | |
Net cash provided by operations | | | 730 | | | | 709 | | | | 522 | |
| | | | | | | | | | | | |
| | | |
Investing activities: | | | | | | | | | | | | |
Capital expenditures | | | (170 | ) | | | (147 | ) | | | (180 | ) |
Businesses acquired | | | (913 | ) | | | (123 | ) | | | (16 | ) |
Other | | | 1 | | | | 2 | | | | 35 | |
| | | | | | | | | | | | |
Net cash used for investing activities | | | (1,082 | ) | | | (268 | ) | | | (161 | ) |
| | | | | | | | | | | | |
| | | |
Financing activities: | | | | | | | | | | | | |
Notes and loans payable, net | | | 681 | | | | (87 | ) | | | (204 | ) |
Long-term debt borrowings | | | 1,256 | | | | — | | | | — | |
Long-term debt repayments | | | (500 | ) | | | (150 | ) | | | (29 | ) |
Treasury stock purchased | | | (868 | ) | | | (155 | ) | | | (135 | ) |
Cash dividends paid | | | (228 | ) | | | (183 | ) | | | (173 | ) |
Proceeds from exercise of stock options and other | | | 39 | | | | 119 | | | | 79 | |
| | | | | | | | | | | | |
Net cash provided by (used for) financing activities | | | 380 | | | | (456 | ) | | | (462 | ) |
| | | | | | | | | | | | |
Effect of exchange rate changes on cash and cash equivalents | | | 4 | | | | 5 | | | | — | |
| | | | | | | | | | | | |
Net increase (decrease) in cash and cash equivalents | | | 32 | | | | (10 | ) | | | (101 | ) |
Cash and cash equivalents: | | | | | | | | | | | | |
Beginning of year | | | 182 | | | | 192 | | | | 293 | |
| | | | | | | | | | | | |
End of year | | $ | 214 | | | $ | 182 | | | $ | 192 | |
| | | | | | | | | | | | |
| | | |
Supplemental cash flow information: | | | | | | | | | | | | |
Cash paid for: | | | | | | | | | | | | |
Interest | | $ | 153 | | | $ | 117 | | | $ | 132 | |
Income taxes, net of refunds | | | 299 | | | | 272 | | | | 373 | |
Non-cash financing activities: | | | | | | | | | | | | |
Dividends declared and accrued but not paid | | | 64 | | | | 61 | | | | 43 | |
See Notes to Consolidated Financial Statements
Page 26
NOTES TO CONSOLIDATED FINANCIAL STATEMENTS
The Clorox Company
(Dollars in millions, except per share amounts)
NOTE 1. SUMMARY OF SIGNIFICANT ACCOUNTING POLICIES
Nature of Operations and Basis of Presentation
The Company is principally engaged in the production, marketing and sales of consumer products through mass merchandisers, grocery stores and other retail outlets. The consolidated financial statements include the statements of the Company and its majority-owned and controlled subsidiaries. All significant intercompany transactions and accounts were eliminated in consolidation. Certain prior year reclassifications were made in the consolidated financial statements and related notes to consolidated financial statements to conform to the current year presentation.
Use of Estimates
The preparation of these consolidated financial statements in conformity with accounting principles generally accepted in the United States of America (U.S. GAAP) requires management to make estimates and assumptions that affect reported amounts and related disclosures. Specific areas, among others, requiring the application of management’s estimates and judgment include assumptions pertaining to accruals for consumer and trade-promotion programs, share-based compensation costs, pension and post-employment benefit costs, future cash flows associated with impairment testing of goodwill and other long-lived assets, credit worthiness of customers, uncertain tax positions, tax valuation allowances and legal, environmental and insurance matters. Actual results could materially differ from estimates and assumptions made.
New Accounting Pronouncements
In September 2006, the FASB issued Statements of Financial Accounting Standards (SFAS) No. 157,Fair Value Measurements. This statement defines fair value, establishes a framework for measuring fair value in accordance with U.S. GAAP and expands disclosures about fair value measurements. In February 2008, the FASB issued FASB Staff Position (FSP) No. FAS 157-2, delaying the effective date of SFAS No. 157 for nonfinancial assets and nonfinancial liabilities, except for items that are recognized or disclosed at fair value on a recurring basis. The delayed portions of SFAS No. 157 will be adopted by the Company beginning in its fiscal year ending June 30, 2010, while all other portions of the standard will be adopted by the Company beginning in its fiscal year ending June 30, 2009, as required. The Company does not expect that SFAS No. 157 will have a material impact on its consolidated financial statements, when it becomes effective.
In June 2007, the Company adopted SFAS No. 158, Employers’ Accounting for Defined Benefit Pension and Other Postretirement Plans, an amendment of FASB Statements No. 87, 88, 106, and 132(R). Employee benefit plans and the impact of adopting SFAS No. 158 are more fully described in Note 21.
In February 2007, the FASB issued SFAS No. 159, The Fair Value Option for Financial Assets and Financial Liabilities, Including an Amendment of FASB Statement No. 115. SFAS No. 159 provides the option to measure, at fair value, eligible financial instrument items using fair value, which are not otherwise required to be measured at fair value. The irrevocable decision to measure items at fair value is made at specified election dates on an instrument-by-instrument basis. Changes in that instrument’s fair value must be recognized in current earnings in subsequent reporting periods. If elected, the first measurement to fair value is reported as a cumulative-effect adjustment to the opening balance of retained earning in the year of adoption. The Company is currently evaluating the impact of the adoption of SFAS No. 159 on its consolidated financial statements if it elects to measure eligible financial instruments at fair value. The standard is effective for the Company beginning in its fiscal year ending June 30, 2009.
Page 27
NOTE 1. SUMMARY OF SIGNIFICANT ACCOUNTING POLICIES (Continued)
On July 1, 2007, the Company adopted FASB Interpretation No. (FIN) 48, Accounting for Uncertainty in Income Taxes—an Interpretation of Financial Accounting Standards Board Statement No. 109. This Interpretation prescribes a consistent recognition threshold and measurement standard, as well as criteria for subsequently recognizing, derecognizing, classifying and measuring tax positions for financial statement purposes. The impact of adopting FIN 48 is more fully described in Note 20.
In December 2007, the FASB issued SFAS No. 141 (Revised 2007), Business Combinations (SFAS No. 141-R). SFAS No.141-R will significantly change the accounting for future business combinations after adoption. SFAS No. 141-R establishes principles and requirements for how the acquirer of a business recognizes and measures in its financial statements the identifiable assets acquired, the liabilities assumed, including contingent liabilities, and any non controlling interest in the acquired business. SFAS No. 141-R also provides guidance for recognizing and measuring the goodwill acquired in the business combination and determines what information to disclose to enable users of the financial statements to evaluate the nature and financial effects of the business combination. SFAS No. 141-R is effective for fiscal years, and interim periods within those fiscal years, beginning on or after December 15, 2008. Earlier adoption is prohibited. This Statement will be adopted by the Company beginning in its fiscal year ending June 30, 2010, as required. The Company is currently evaluating the impact SFAS No. 141-R will have on its consolidated financial statements when it becomes effective.
In December 2007, the FASB issued SFAS No. 160, Noncontrolling Interests in Consolidated Financial Statements - An Amendment of ARB No. 51. This statement establishes new accounting and reporting standards for the noncontrolling interest in a subsidiary (commonly referred to as minority interest) and for the deconsolidation of a subsidiary. SFAS No. 160 establishes accounting and reporting standards that require the noncontrolling interest to be reported as a component of equity. Changes in a parent’s ownership interest while the parent retains its controlling interest will be accounted for as equity transactions and any retained noncontrolling equity investment upon the deconsolidation of a subsidiary will be initially measured at fair value. SFAS No. 160 is effective for fiscal years, and interim periods within those fiscal years, beginning on or after December 15, 2008. Earlier adoption is prohibited. This Statement will be adopted by the Company beginning in its fiscal year ending June 30, 2010, as required. The Company is currently evaluating the impact SFAS No. 160 will have on its consolidated financial statements when it becomes effective.
In March 2008, the FASB issued SFAS No. 161,Disclosures about Derivative Instruments and Hedging Activities—an amendment of SFAS No. 133.This Statement requires disclosures of how and why an entity uses derivative instruments, how derivative instruments and related hedged items are accounted for and how derivative instruments and related hedged items affect an entity’s financial position, financial performance, and cash flows. SFAS No. 161 is effective for fiscal years and interim periods beginning after November 15, 2008, with early application encouraged. This Statement will be adopted by the Company no later than the beginning of the third quarter of its fiscal year ending June 30, 2009, as required. The Company is currently evaluating the impact SFAS No. 161 will have on its consolidated financial statements when it becomes effective.
In June 2008 the FASB issued FSP Emerging Issues Task Force (EITF) 03-6-1,Determining Whether Instruments Granted in Share-Based Payment Transactions Are Participating Securities. This FSP states that unvested share-based payment awards that contain nonforfeitable rights to dividends or dividend equivalents (whether paid or unpaid) are participating securities and shall be included in the computation of earnings per share pursuant to the two-class method. The FSP is effective for financial statements issued for fiscal years beginning after December 15, 2008, and interim periods within those years. Upon adoption, a company is required to retrospectively adjust its earnings per share data (including any amounts related to interim periods, summaries of earnings and selected financial data) to conform with the provisions in this FSP. Earlier adoption is prohibited. This FSP will be adopted by the Company beginning in its fiscal year ending June 30, 2010, as required. The Company is currently evaluating the impact FSP EITF 03-6-1 will have on its consolidated financial statements when it becomes effective.
Page 28
NOTE 1. SUMMARY OF SIGNIFICANT ACCOUNTING POLICIES (Continued)
Cash and Cash Equivalents
Cash equivalents consist of highly liquid instruments, time deposits and money market funds with an initial maturity of three months or less. The fair value of cash and cash equivalents approximates the carrying amount.
The Company’s cash position includes amounts held by foreign subsidiaries, and the repatriation of those cash balances from some of the Company’s subsidiaries could result in additional tax costs. However, these cash balances are generally available without legal restriction to fund local business operations. The Company’s cash holdings for fiscal years 2008 and 2007 were as follows:
| | | | | | |
| | | 2008 | | 2007 |
Cash held in foreign accounts in foreign currencies | | $ | 100 | | $ | 73 |
Cash held in foreign accounts in U.S. Dollars | | | 69 | | | 96 |
Cash held in domestic accounts in U.S. Dollars | | | 45 | | | 13 |
| | | | | | |
Total | | $ | 214 | | $ | 182 |
| | | | | | |
Inventories
Inventories are stated at the lower of cost or market. When necessary, the Company provides allowances to adjust the carrying value of its inventory to the lower of cost or market, including any costs to sell or dispose. Appropriate consideration is given to obsolescence, excessive inventory levels, product deterioration and other factors in evaluating net realizable value for the purposes of determining the lower of cost or market.
Property, Plant and Equipment and Finite-Lived Intangible Assets
Property, plant and equipment and finite-lived intangible assets are stated at cost. Depreciation and amortization expense are calculated by the straight-line method using the estimated useful lives of the related assets. The table below provides estimated useful lives of property, plant and equipment by asset classification (See Note 8 for estimated useful lives of finite-lived intangible assets).
| | |
Classification | | Expected
Useful Lives |
Land improvements | | 10 - 30 years |
Buildings | | 10 - 40 years |
Machinery and equipment | | 3 - 15 years |
Computer equipment | | 3 years |
Capitalized software costs | | 3 - 7 years |
Property, plant and equipment and finite-lived intangible assets are reviewed for impairment whenever events or changes in circumstances occur that indicate that the carrying amount of an asset (or asset group) may not be recoverable. The Company’s impairment review is based on an estimate of the undiscounted cash flow at the lowest level for which identifiable cash flows exist. Impairment occurs when the book value of the asset exceeds the estimated future undiscounted cash flows generated by the asset and the impairment is viewed as other than temporary. When an impairment is indicated, an impairment charge is recorded for the difference between the book value of the asset and its estimated fair market value. Depending on the asset, estimated fair market value may be determined either by use of a discounted cash flow model, or by reference to estimated selling values of assets in similar condition.
Page 29
NOTE 1. SUMMARY OF SIGNIFICANT ACCOUNTING POLICIES (Continued)
Impairment Review of Goodwill and Indefinite-Lived Intangible Assets
The carrying values of goodwill, trademarks with indefinite lives and other indefinite-lived intangible assets are reviewed for possible impairment in accordance with SFAS No. 142,Goodwill and Other Intangible Assets. With respect to goodwill, impairment occurs when the carrying amount of a reporting unit’s goodwill exceeds its implied fair value. An impairment charge is recorded for the difference between the carrying amount and the implied fair value of the reporting unit’s goodwill. For trademarks and other intangible assets with indefinite lives, impairment occurs when the carrying amount of an asset is greater than its fair value. A charge is recorded for the difference between the carrying amount and the estimated fair value. The Company’s estimates of fair value are based primarily on a discounted cash flow approach that requires significant management judgment with respect to future volumes, revenue and expense growth rates, changes in working capital use, foreign-exchange rates, devaluation, inflation and the selection of an appropriate discount rate. The Company tests its goodwill, trademarks with indefinite lives and other indefinite-lived intangible assets annually in the third fiscal quarter unless there are indications during an interim period that these assets may have become impaired.
Share-Based Compensation
The Company records compensation expense associated with stock options and other forms of equity compensation in accordance with SFAS No. 123-R, Share-Based Payment, as interpreted by Securities and Exchange Commission Staff Accounting Bulletin No. 107. The Company adopted the modified prospective transition method provided for under SFAS No. 123-R and, consequently, did not retroactively adjust results from prior periods. Under this transition method, compensation cost associated with stock options recognized in the fiscal years ended June 30, 2008, 2007 and 2006, includes: 1) amortization related to the remaining unvested portion of all stock option awards granted prior to July 1, 2005, based on the grant date fair value estimated in accordance with the original provisions of SFAS No. 123, Accounting for Stock-Based Compensation; and 2) amortization related to all stock option awards granted on or after to July 1, 2005, based on the grant-date fair value estimated in accordance with the provisions of SFAS No. 123-R. Amortization is recorded on a straight-line basis over the vesting period.
Prior to July 1, 2005, the Company accounted for stock options according to the provisions of Accounting Principles Board Opinion No. 25, Accounting for Stock Issued to Employees, and related interpretations, and therefore no related compensation expense was recorded for awards granted as it was believed that such awards had no intrinsic value. In the fourth quarter of fiscal year 2006, the Company recorded a pretax cumulative charge of $25 ($16 after-tax) in selling and administrative expenses related to certain grants dating back to the third quarter of fiscal year 1996 based upon the Company’s determination that such grants had intrinsic value on the applicable measurement dates of the option grants (See Note 17).
SFAS No. 123-R requires that cash flows resulting from tax deductions in excess of the cumulative compensation cost recognized for the options exercised (excess tax benefit) be classified as financing cash flows. However, cash flows relating to excess tax benefits for employees directly involved in the manufacturing and/or distribution processes are classified as operating cash flows. For the fiscal years ended June 30 2008, 2007 and 2006, $9, $16 and $17, respectively, of excess tax benefits were generated from share-based payment arrangements, and were recognized as financing cash flows.
Employee Benefits
The Company has qualified and nonqualified defined benefit plans that cover substantially all domestic employees and certain international employees and provide health care benefits for domestic employees who meet age, participation and length of service requirements at retirement.
The Company accounts for its defined benefit and retirement health care plans using actuarial methods required by SFAS No. 87, Employers’ Accounting for Pension, ,and SFAS No. 106, Employers’ Accounting for Postretirement Benefits Other Than Pensions, each as amended by SFAS No. 158.These methods use an attribution approach that generally spreads “plan events” over the service lives of plan participants. Examples of plan events are plan amendments and changes in actuarial assumptions such as the expected return on plan assets, discount rate, and rate of
Page 30
NOTE 1. SUMMARY OF SIGNIFICANT ACCOUNTING POLICIES (Continued)
compensation increase. The principle underlying the attribution approach is that employees render service over their service lives on a relatively “smooth” basis, and therefore the statement of earnings effects of defined benefit and retirement heath care plans are recognized in the same pattern.
One of the principal assumptions used in the net periodic benefit cost calculation is the expected return on plan assets. The required use of an expected return on plan assets may result in recognized pension expense or income that differs from the actual returns of those plan assets in any given year. Over time, however, the goal is for the expected long-term returns to approximate the actual returns and, therefore, the expectation is that the pattern of income and expense recognition should closely match the pattern of the services provided by the participants. The differences between actual and expected returns are recognized in the net periodic benefit cost calculation over the average remaining service period of the plan participants. In developing its expected return on plan assets, the Company considers the long-term actual returns relative to the mix of investments that comprise its plan assets and also develops estimates of future investment returns by considering external sources.
The Company recognizes an actuarial-based obligation at the onset of disability for certain benefits provided to individuals after employment, but before retirement that include medical, dental, vision, life and other benefits.
The Company also has various individual and group incentive compensation programs, including a performance unit program, a bonus program, and a profit sharing element of the Company 401(k) plan. The Company’s contributions to the profit sharing element of the 401(k) plan and payments to managerial staff for the annual bonus program are based on Company performance targets. The Company also matches employee 401(k) contributions up to one thousand dollars per year for eligible employees.
Environmental Costs
The Company is involved in certain environmental remediation and on-going compliance activities. Accruals for environmental matters are recorded on a site-by-site basis when it is probable that a liability has been incurred and the amount of the liability can be reasonably estimated. The Company’s accruals reflect the anticipated participation of other potentially responsible parties in those instances where it is probable that such parties are legally responsible and financially capable of paying their respective shares of the relevant costs. These accruals are adjusted periodically as assessment and remediation efforts progress or as additional technical or legal information becomes available. Actual costs to be incurred at identified sites in future periods may vary from the estimates, given the inherent uncertainties in evaluating environmental exposures. The aggregate accrual for environmental matters is included in other liabilities in the Company’s consolidated balance sheets on an undiscounted basis due to the uncertainty and timing of future payments.
Restructuring Liabilities
Liabilities for costs associated with exit or disposal activities are recognized and measured initially at fair value in the period in which the liability is incurred. Employee termination liabilities are recognized at the time the group of employees is notified, unless the group will be retained to render service beyond a minimum retention period, in which case the liability is recognized ratably over the future service period. A liability for costs that will continue to be incurred under a contract for its remaining term without economic benefit to the Company is recognized at fair value when the Company ceases using the right conveyed by the contract.
Revenue Recognition
Sales are recognized as revenue when the risk of loss and title pass to the customer and when all of the following have occurred: a firm sales arrangement exists, pricing is fixed or determinable, and collection is reasonably assured. Sales are recorded net of allowances for returns, trade-promotions, coupons and other discounts. The Company routinely commits to one-time or on-going trade-promotion programs with customers, and consumer coupon programs that require the Company to estimate and accrue the expected costs of such programs. Programs include cooperative marketing programs, shelf price reductions, advantageous end-of-aisle or in-store displays of the Company’s products, graphics and other trade-promotion
Page 31
NOTE 1. SUMMARY OF SIGNIFICANT ACCOUNTING POLICIES (Continued)
activities conducted by the customer. Coupons are recognized as a liability when distributed based upon expected consumer redemptions. The Company maintains liabilities at the end of each period for the estimated expenses incurred, but unpaid for these programs. Trade-promotion and coupon costs are recorded as a reduction of sales. The Company provides an allowance for doubtful accounts based on its historical experience and a periodic review of its accounts receivable. Receivables were presented net of an allowance for doubtful accounts of $7 and $5 at June 30, 2008 and 2007, respectively. The Company’s provision for doubtful accounts was $4, $2, and less than $1 in fiscal years 2008, 2007, and 2006, respectively.
Cost of Products Sold
Cost of products sold represents the costs directly related to the manufacture and distribution of the Company’s products and primarily includes raw materials, packaging, contract packer fees, shipping and handling, warehousing, package design, and direct and indirect labor and operating costs for the Company’s manufacturing facilities including salary, benefit costs and incentive compensation.
Costs associated with developing and designing new packaging are expensed as incurred and include design, artwork, films, and labeling. Expenses for fiscal years ended June 30, 2008, 2007 and 2006 were $9, $9, and $11, respectively, of which $8, $8 and $11 were classified as cost of products sold, and the remainder was classified as selling and administrative expenses.
Selling and Administrative Expenses
Selling and administrative expenses represent costs incurred by the Company in generating revenues and managing the business and include market research, commissions, and certain administrative expenses. Administrative expenses include salary, benefits, incentive compensation, professional fees and services, software and licensing fees, and other operating costs associated with the Company’s non-manufacturing, non-research and development staff, facilities and equipment.
Advertising and Research and Development Costs
The Company expenses advertising and research and development costs in the period incurred.
Income Taxes
The Company uses the asset and liability method to account for income taxes. Deferred tax assets and liabilities are recognized for the anticipated future tax consequences attributable to differences between financial statement amounts and their respective tax bases. Management reviews the Company’s deferred tax assets to determine whether their value can be realized based upon available evidence. A valuation allowance is established when management believes that it is more likely than not that some portion of its deferred tax assets will not be realized. Changes in valuation allowances from period to period are included in the Company’s tax provision in the period of change. In addition to valuation allowances, the Company provides for uncertain tax positions when such tax positions do not meet the recognition thresholds or measurement standards prescribed by FIN 48. Amounts for uncertain tax positions are adjusted in quarters when new information becomes available or when positions are effectively settled.
U.S. income tax expense and foreign withholding taxes are provided on unremitted foreign earnings that are not indefinitely reinvested at the time the earnings are generated. Where foreign earnings are indefinitely reinvested, no provision for U.S. income or foreign withholding taxes is made. When circumstances change and the Company determines that some or all of the undistributed earnings will be remitted in the foreseeable future, the Company accrues an expense in the current period for U.S. income taxes and foreign withholding taxes attributable to the anticipated remittance.
Foreign Currency Translation
Local currencies are the functional currencies for substantially all of the Company’s foreign operations. When the transactional currency is different than the functional currency, transaction gains and losses are included as a component of other (income) expense, net. Assets and liabilities of foreign operations are translated into U.S. Dollars using the exchange
Page 32
NOTE 1. SUMMARY OF SIGNIFICANT ACCOUNTING POLICIES (Continued)
rates in effect at the balance sheet reporting date. Income and expenses are translated at the average monthly exchange rates during the year. Gains and losses on foreign currency translations are reported as a component of other comprehensive income. Deferred taxes are not provided on cumulative translation adjustments where the Company expects earnings of a foreign subsidiary to be indefinitely reinvested. The income tax effect of currency translation adjustments related to foreign subsidiaries from certain subsidiaries and joint ventures that are not considered indefinitely reinvested is recorded as a component of deferred taxes with an offset to other comprehensive income.
Net Earnings Per Share
Basic net earnings per share is computed by dividing net earnings by the weighted average number of shares outstanding each period on an unrounded basis. Diluted net earnings per share is computed by dividing net earnings by the diluted weighted average number of shares outstanding during each period on an unrounded basis. Diluted net earnings per share reflects the earnings dilution that would occur from the issuance of common shares related to in-the-money stock options, restricted stock and performance units.
Derivative Instruments
The Company’s use of derivative instruments, principally swap, futures, forward, and option contracts, is limited to non-trading purposes and is designed to manage exposure to changes in interest rates, foreign currencies and commodity prices. The Company’s contracts are hedges for transactions with notional balances and periods consistent with the related exposures and do not constitute investments independent of these exposures. Exposure to counterparty credit risk is considered low because these agreements have been entered into with creditworthy institutions.
Most interest rate swaps and commodity purchase and foreign-exchange contracts are designated as fair value or cash flow hedges of long-term debt or raw material purchase obligations, based on certain hedge criteria. The criteria used to determine if hedge accounting treatment is appropriate are: (a) the designation of the hedge to an underlying exposure, (b) whether overall risk is being reduced and (c) whether there is sufficient correlation between the value of the derivative instrument and the underlying obligation. The changes in the fair value of derivatives are recorded as either assets or liabilities in the balance sheet with an offset to net earnings or other comprehensive income, depending on whether, for accounting purposes, the derivative is designated and qualified as a hedge. For fair-value hedge transactions, changes in the fair value of the derivative and changes in the fair value of the item being hedged are recorded in earnings. For cash flow hedge transactions, changes in the fair value of derivatives are reported as a component of other comprehensive income and are recognized in earnings when realized. The Company also has contracts not designated as hedges for accounting purposes and recognizes changes in the fair value of these contracts in other (income) expense, net.
The Company uses different methodologies, when necessary, to estimate the fair value of its derivative contracts. The estimated fair values of the majority of the Company’s contracts are based on quoted market prices, traded exchange market prices, or broker price quotations, and represent the estimated amounts that the Company would pay or receive to terminate the contracts.
NOTE 2. BUSINESSES ACQUIRED
Burt’s Bees Inc.
On November 30, 2007, the Company completed its acquisition of Burt’s Bees Inc. (BBI), a leading manufacturer and marketer of natural personal care products, for an aggregate price of $913, excluding $25 for tax benefits associated with the acquisition. The Company funded the all-cash transaction through a combination of cash and short-term borrowings. Under the terms of the agreement, the Company acquired 100 percent of BBI from its stockholders in a transaction that was structured as a merger. The Company also incurred $8 of transaction costs in connection with the acquisition of BBI. During fiscal year 2008, the Company received tax benefits associated with the acquisition of $17, through a combination of income tax refunds and reduced quarterly estimated tax payments. The Company expects to receive the remaining $8 of tax benefits as income tax refunds during the fiscal year 2009.
Page 33
NOTE 2. BUSINESSES ACQUIRED (Continued)
The operating results of BBI are reported in the Company’s financial statements beginning December 1, 2007, in the North America operating segment. Included in the Company’s results for the fiscal year 2008 was $100 of BBI’s net sales. BBI’s total net sales for fiscal year 2008 was $170, which include net sales prior to the Company’s acquisition of BBI. BBI’s total net sales for fiscal year 2007 was $136.
The following table provides unaudited pro forma results of operations of the Company for fiscal years 2008 and 2007, as if BBI had been acquired as of the beginning of each of the fiscal periods presented. The unaudited pro forma results include certain recurring purchase accounting adjustments such as depreciation and amortization expense on acquired tangible and intangible assets and assumed interest costs. However, unaudited pro forma results do not include certain transaction-related costs including the effect of a step-up of the value of acquired inventory, cost savings or other effects of the planned integration of BBI. Accordingly, such results of operations are not necessarily indicative of the actual results as if the acquisition had occurred at the beginning of the dates indicated or that may result in the future.
| | | | | | |
Years ended June 30 | | 2008 | | 2007 |
Net sales | | $ | 5,343 | | $ | 4,983 |
Earnings from continuing operations | | | 472 | | | 489 |
Diluted net earnings per share from continuing operations | | $ | 3.32 | | $ | 3.18 |
The assets and liabilities of BBI were recorded at their respective estimated fair values as of the date of the acquisition using generally accepted accounting principles for business combinations. The excess of the purchase price over the fair value of the net identifiable assets acquired has been allocated to goodwill. Goodwill represents a substantial portion of the acquisition proceeds because the Burt’s Bees® brand provides the Company with entry into the fast growing, higher margin personal care category. Management believes that there is further growth potential by extending BBI’s product lines into new channels in which the Company has well established customer relationships.
The following table summarizes the estimated fair values of BBI’s assets acquired and liabilities assumed and related deferred income taxes as of the acquisition date. Changes to the fair values of the assets acquired and liabilities assumed may be recorded in future periods as the Company finalizes its estimates of the fair value. The weighted-average estimated useful life of intangible assets subject to amortization is 16 years.
| | | |
Assets acquired | | | |
Cash | | $ | 33 |
Inventory | | | 45 |
Other current assets | | | 24 |
Property, plant and equipment | | | 16 |
Goodwill | | | 613 |
Intangible assets not subject to amortization - trademarks | | | 322 |
Intangible assets subject to amortization: | | | |
Customer list | | | 44 |
Product formulae | | | 8 |
Other assets | | | 1 |
| | | |
Total assets acquired | | | 1,106 |
| | | |
Liabilities assumed | | | |
Current liabilities - primarily accounts payable and accrued liabilities | | | 52 |
Other liabilities | | | 3 |
Current and noncurrent deferred income taxes | | | 138 |
| | | |
Total liabilities assumed | | | 193 |
| | | |
Net assets acquired | | $ | 913 |
| | | |
Page 34
NOTE 2. BUSINESSES ACQUIRED (Continued)
A step-up in the value of inventory of $19 was recorded in the allocation of the purchase price based on valuation estimates. During fiscal year 2008, this step-up amount was charged to cost of products sold as the inventory was sold.
Bleach Business Acquisition
The Company purchased bleach businesses in Canada, effective December 29, 2006, and in certain Latin American countries, effective February 28, 2007, for an aggregate price of $123, with the objective of expanding its global bleach business.
In connection with the purchases, the Company acquired brand trademarks in Canada, trademarks and license agreements in Latin America, and manufacturing facilities in Canada and Venezuela. Employees at the manufacturing facilities transferred to the Company. The Company closed the manufacturing facility in Canada in March 2008. Net assets, acquired at estimated fair value, included inventory of $3, other assets of $9, property, plant and equipment of $7, trademarks of $7 and licenses of $1. The excess of the purchase price over the estimated fair value of the net assets acquired of approximately $53 and $43 was recorded as goodwill in the North America and International segments, respectively. The goodwill resulting from the purchase was primarily attributable to expected growth rates and profitability of the acquired businesses, expected synergies with the Company’s existing operations and access to new markets. The trademarks in Canada are being amortized over a period of 5 years and the licenses in Latin America are being amortized over a period of 3 years.
The transactions were structured as all cash acquisitions and operating results of the acquired businesses are included in the consolidated net earnings of the North America and International segments for the fiscal year ended June 30, 2007, from their respective dates of acquisition. Pro forma results of the Company, assuming the acquisition had occurred at the beginning of each period presented, would not be materially different from the results reported.
NOTE 3. DISCONTINUED OPERATIONS
Brazil Business
In fiscal year 2003, the Company announced its intent to exit its business in Brazil, a reporting unit included in the International segment. At that time, the Company closed its offices in Brazil and sold nearly all of the remaining assets of this business, which were classified as a discontinued operation. On December 22, 2006, the Company sold certain assets remaining from its discontinued operation in Brazil. This transaction resulted in an income tax benefit of $5, which was recorded in discontinued operations during the fiscal year ended June 30, 2007. There were no sales or other significant financial results during fiscal years 2008, 2007 and 2006 from the Brazil business.
Share Exchange Agreement
On November 22, 2004, the Company completed the exchange of its ownership interest in a subsidiary for Henkel KGaA’s (Henkel) interest in Clorox common stock. During fiscal year 2006, the Company recorded net sales and earnings associated with transition services provided to the exchanged subsidiary amounting to $16 and $1, respectively, which were classified as a discontinued operation.
Page 35
NOTE 4. RESTRUCTURING AND ASSET IMPAIRMENT
Restructuring and asset impairment charges were $36, $13, and $1 in fiscal years 2008, 2007 and 2006, respectively.
Supply Chain and Other restructuring
During fiscal year 2008, the Company recognized charges related to its Supply Chain and Other restructuring initiatives. Total restructuring and asset impairment charges, including cost of products sold, were $59 in fiscal year 2008, of which approximately $48 were non-cash. The Supply Chain restructuring involves closing certain domestic and international manufacturing facilities. The Company anticipates redistributing production from the these facilities between the remaining facilities and third-party producers to optimize available capacity and reduce operating costs. As a result of this initiative, a number of positions are being eliminated. The Company anticipates the Supply Chain restructuring will be completed in fiscal year 2012. The Other restructuring charges relate primarily to the write-down of certain new venture investments, intangible assets and equipment and the cost of exiting the Company’s private label food bags business, which the Company decided not to pursue.
The following table summarizes, by segment, the costs associated with the Company’s Supply Chain and Other restructuring initiatives for fiscal year 2008:
| | | | | | | | | | | | |
| | | North
America | | International | | Corporate | | Total |
Cost of products sold | | $ | 19 | | $ | 3 | | $ | 1 | | $ | 23 |
| | | | | | | | | | | | |
Restructuring and asset impairment: | | | | | | | | | | | | |
Severance | | | 3 | | | 2 | | | 2 | | | 7 |
Asset impairment | | | 25 | | | 4 | | | — | | | 29 |
| | | | | | | | | | | | |
Total restructuring and asset impairment costs | | | 28 | | | 6 | | | 2 | | | 36 |
| | | | | | | | | | | | |
Total costs | | $ | 47 | | $ | 9 | | $ | 3 | | $ | 59 |
| | | | | | | | | | | | |
The Company anticipates approximately $20 to $25 of Supply Chain and Other restructuring-related charges, of which approximately $7 are non-cash, to be incurred in fiscal year 2009. The Company anticipates approximately $19 to $22 of the fiscal year 2009 charges to be in the North America segment, of which approximately $16 to $18 are estimated to be recognized as cost of products sold charges (primarily accelerated depreciation for manufacturing equipment and other costs associated with the Supply Chain initiative), and the remainder to be severance charges. The remaining estimated charges will be spread across the International segment and the Corporate segment, and are expected to be classified as cost of products sold and severance. The total anticipated charges for the Supply Chain and Other restructuring initiatives for the fiscal years 2010 through 2012 are estimated to be approximately $10. The Company may, from time to time, decide to pursue additional restructuring related initiatives and therefore may incur restructuring, asset impairment, severance and related charges in the future. Total restructuring payments through June 30, 2008, were $2 and the total accrued restructuring liability as of June 30, 2008, was $5.
Information Technology Services Restructuring
During fiscal year 2007, the Company entered into an Information Technology Services (ITS) Agreement with Hewlett-Packard (HP), a third party service provider, and completed a restructure of certain Information Services (IS) activities. Under the agreement, HP is providing certain information technology and related services as well as information technology equipment through an operating lease through October 2013. The Company incurred administrative expenses and restructuring costs of approximately $23 during its fiscal year ended June 30, 2007, primarily associated with transition and severance costs, which are included as part of the Corporate segment. In fiscal year 2007, costs of $14 were recorded in administrative expense, and severance and other related costs of $9 were recorded as restructuring costs. Total restructuring payments through June 30, 2007, were $9, and the total accrued restructuring liability as of June 30, 2007, was zero.
Page 36
NOTE 4. RESTRUCTURING AND ASSET IMPAIRMENT (Continued)
Other
During fiscal year 2007, the Company recorded $4 of asset impairment costs, which are included in the North America segment.
NOTE 5. INVENTORIES, NET
Inventories, net at June 30 were comprised of the following:
| | | | | | | | |
| | | 2008 | | | 2007 | |
Finished goods | | $ | 320 | | | $ | 251 | |
Raw materials and packaging | | | 94 | | | | 81 | |
Work in process | | | 4 | | | | 4 | |
LIFO allowances | | | (21 | ) | | | (18 | ) |
Allowances for obsolescence | | | (13 | ) | | | (9 | ) |
| | | | | | | | |
Total | | $ | 384 | | | $ | 309 | |
| | | | | | | | |
The last-in, first-out (LIFO) method was used to value approximately 33% and 37% of inventories at June 30, 2008 and 2007, respectively. The carrying values for all other inventories, including inventories of all international businesses, are determined on the first-in, first-out (FIFO) method. The effect on earnings of the liquidation of any LIFO layers was not material for the fiscal years ended June 30, 2008, 2007 and 2006.
Changes in the allowance for inventory obsolescence were as follows:
| | | | | | | | | | | | |
| | | 2008 | | | 2007 | | | 2006 | |
Beginning of year | | $ | (9 | ) | | $ | (4 | ) | | $ | (6 | ) |
Obsolescence provision | | | (12 | ) | | | (10 | ) | | | (6 | ) |
Inventory write-offs | | | 8 | | | | 5 | | | | 8 | |
| | | | | | | | | | | | |
End of year | | $ | (13 | ) | | $ | (9 | ) | | $ | (4 | ) |
| | | | | | | | | | | | |
NOTE 6. OTHER CURRENT ASSETS
Other current assets at June 30 were comprised of the following:
| | | | | | |
| | | 2008 | | 2007 |
Current deferred tax assets | | $ | 57 | | $ | 31 |
Prepaid expenses | | | 45 | | | 44 |
Fair value of derivative instruments | | | 44 | | | 6 |
| | | | | | |
Total | | $ | 146 | | $ | 81 |
| | | | | | |
Page 37
NOTE 7. PROPERTY, PLANT AND EQUIPMENT, NET
The components of property, plant and equipment, net at June 30 were as follows:
| | | | | | | | |
| | | 2008 | | | 2007 | |
Land and improvements | | $ | 123 | | | $ | 118 | |
Buildings | | | 553 | | | | 536 | |
Machinery and equipment | | | 1,436 | | | | 1,357 | |
Computer equipment | | | 91 | | | | 91 | |
Capitalized software costs | | | 282 | | | | 273 | |
Construction in progress | | | 109 | | | | 68 | |
| | | | | | | | |
| | | 2,594 | | | | 2,443 | |
Less: Accumulated depreciation and amortization | | | (1,634 | ) | | | (1,467 | ) |
| | | | | | | | |
Total | | $ | 960 | | | $ | 976 | |
| | | | | | | | |
Depreciation and amortization expense related to property, plant and equipment was $186, $175 and $170 in fiscal years 2008, 2007 and 2006, respectively.
Page 38
NOTE 8. GOODWILL, TRADEMARKS AND OTHER INTANGIBLE ASSETS
Changes in the carrying amount of Goodwill, Trademarks and Other intangibles for the fiscal years ended June 30, 2008 and 2007, are as follows:
| | | | | | | | | | | | | | | | | | | | | | | | | | | | | | | | | | | | | |
| | | Goodwill | | Trademarks | | | Other intangible assets
subject to amortization | |
| | | North
America | | International | | Corporate | | | Total | | Subject to
amortization | | | Not subject to
amortization | | | Total | | | Technology
and Product
formulae | | | Other | | | Total | |
Balance 6/30/2006(1) | | $ | 675 | | $ | 193 | | $ | 46 | | | $ | 914 | | $ | — | | | $ | 232 | | | $ | 232 | | | $ | 89 | | | $ | 18 | | | $ | 107 | |
Segment transfers | | | 30 | | | 16 | | | (46 | ) | | | — | | | — | | | | — | | | | — | | | | — | | | | — | | | | — | |
Acquisitions | | | 53 | | | 35 | | | — | | | | 88 | | | 2 | | | | 11 | | | | 13 | | | | — | | | | 1 | | | | 1 | |
Amortization | | | — | | | — | | | — | | | | — | | | — | | | | — | | | | — | | | | (11 | ) | | | (2 | ) | | | (13 | ) |
Translation Adjustments and Other | | | 7 | | | 16 | | | — | | | | 23 | | | — | | | | 9 | | | | 9 | | | | (2 | ) | | | 1 | | | | (1 | ) |
| | | | | | | | | | | | | | | | | | | | | | | | | | | | | | | | | | | | | |
Balance 6/30/2007 | | | 765 | | | 260 | | | — | | | | 1,025 | | | 2 | | | | 252 | | | | 254 | | | | 76 | | | | 18 | | | | 94 | |
Acquisitions | | | 613 | | | — | | | — | | | | 613 | | | — | | | | 322 | | | | 322 | | | | 8 | | | | 44 | | | | 52 | |
Amortization | | | — | | | — | | | — | | | | — | | | (1 | ) | | | — | | | | (1 | ) | | | (11 | ) | | | (3 | ) | | | (14 | ) |
Impairment charges | | | — | | | — | | | — | | | | — | | | — | | | | (11 | ) | | | (11 | ) | | | (9 | ) | | | — | | | | (9 | ) |
Translation adjustments and other | | | 7 | | | 13 | | | — | | | | 20 | | | — | | | | (4 | ) | | | (4 | ) | | | (1 | ) | | | 1 | | | | — | |
| | | | | | | | | | | | | | | | | | | | | | | | | | | | | | | | | | | | | |
Balance 6/30/2008 | | $ | 1,385 | | $ | 273 | | $ | — | | | $ | 1,658 | | $ | 1 | | | $ | 559 | | | $ | 560 | | | $ | 63 | | | $ | 60 | | | $ | 123 | |
| | | | | | | | | | | | | | | | | | | | | | | | | | | | | | | | | | | | | |
(1) | The June 30, 2006, balances reflect a change in classification of certain indefinite-lived intangible assets to goodwill to properly reflect the classification of the assets in accordance with SFAS No. 141,Business Combinations. The change in the classification resulted in a decrease in indefinite-lived trademarks of $265, an increase in goodwill of $170 and a decrease in non-current deferred tax liabilities of $95. The change in classification has no impact on the results of operations or working capital and is not material to any of the prior periods. |
Trademarks and Other intangible assets subject to amortization are net of accumulated amortization of $204 and $190 at June 30, 2008 and 2007, respectively. Estimated amortization expense for these intangible assets is $14 for fiscal years 2009 and 2010, $13 for fiscal year 2011 and $12 for fiscal years 2012 and 2013. The weighted-average amortization period for trademarks and other intangible assets subject to amortization is 5 years and 14 years, respectively.
During its third fiscal quarter ended March 31, 2008, the Company performed its annual impairment assessment of goodwill and indefinite-lived intangible assets, as required by SFAS No. 142 and recorded impairment charges on indefinite-lived intangible assets of $2 in the International segment.
During the fiscal year ended June 30, 2008, the Company recorded Trademarks and Other intangible asset impairment charges of $11 and $9, respectively, of which $17 was recorded in the North America segment and $3 was recorded in the International segment.
Page 39
NOTE 9. OTHER ASSETS
Other assets were comprised of the following at June 30:
| | | | | | |
| | | 2008 | | 2007 |
Equity investments | | $ | 49 | | $ | 48 |
Investment in insurance contracts | | | 37 | | | 38 |
Deferred tax assets | | | 24 | | | 24 |
Investment in low-income housing partnerships | | | 15 | | | 20 |
Deferred financing costs | | | 13 | | | 6 |
Nonqualified retirement plan assets | | | 7 | | | 13 |
Pension benefit assets | | | 3 | | | 39 |
Other | | | 10 | | | 12 |
| | | | | | |
Total | | $ | 158 | | $ | 200 |
| | | | | | |
Equity Investments
The Company holds various equity investments in a number of consumer products businesses, most of which operate outside the United States. The Company has no ongoing capital commitments, loan requirements, guarantees or any other types of arrangements under the terms of its agreements that would require any future cash contributions or disbursements arising out of an equity investment, except for the investment in low-income housing partnerships described in the following paragraph.
Investment in Insurance Contracts
The Company invests in life insurance policies and records the cash surrender value of the contracts, net of any policy loans, at fair value. Any change in the cash surrender value is reflected in other (income), net.
Investment in Low-Income Housing Partnerships
The Company owns, directly or indirectly, limited partnership interests of up to 99% in 46 low-income housing partnerships, which are accounted for on the equity basis. The purpose of the partnerships is to develop and operate low-income housing rental properties. The general partners, who typically hold 1% of the partnership interests, are third parties unrelated to the Company and its affiliates, and are responsible for controlling and managing the business and financial operations of the partnerships. The partnerships provide the Company with low-income housing tax credits, which are accounted for in accordance with EITF 94-1,Accounting for Tax Benefits Resulting from Investments in Affordable Housing Projects. Tax benefits (detriments), net of equity in the losses of the low-income housing partnerships, were $(3), $3, and $1 in fiscal years 2008, 2007 and 2006, respectively. The Company’s estimated future capital requirement for the partnerships is approximately $1 in fiscal year 2009 and zero thereafter. As a limited partner, the Company is not responsible for any of the liabilities and obligations of the partnerships nor do the partnerships or their creditors have any recourse to the Company other than for the capital requirements. Recovery of the Company’s investments in the partnerships is accomplished through the utilization of low-income housing tax credits, the tax benefits of partnership losses and proceeds from the disposition of rental properties. The risk of these tax credits being unavailable to the Company is considered very low. For the combined group of low-income housing partnerships in which the Company invests, the aggregate underlying assets and liabilities were approximately $342 and $439, respectively, at June 30, 2008. The Company does not consolidate the investment in low-income housing partnerships.
Nonqualified Retirement Plan Assets
The majority of the nonqualified retirement plan assets at June 30, 2008, are held in a trust-owned life insurance policy, whose investment assets are a separately-managed equity and debt portfolio administered by an insurance company. The assets held under this insurance policy are recorded at estimated fair value with changes in estimated value recorded in other (income), net.
Page 40
NOTE 10. ACCRUED LIABILITIES
Accrued liabilities at June 30 consisted of the following:
| | | | | | |
| | | 2008 | | 2007 |
Compensation and employee benefit costs | | $ | 136 | | $ | 120 |
Trade and sales promotion | | | 92 | | | 100 |
Dividends | | | 64 | | | 61 |
Interest | | | 49 | | | 33 |
Taxes | | | 14 | | | 116 |
Venture agreement royalty (Note 13) | | | 9 | | | 9 |
Other | | | 76 | | | 68 |
| | | | | | |
Total | | $ | 440 | | $ | 507 |
| | | | | | |
NOTE 11. DEBT
Notes and loans payable, which mature in less than one year, included the following at June 30:
| | | | | | |
| | | 2008 | | 2007 |
Commercial paper | | $ | 748 | | $ | 58 |
Foreign borrowings | | | 7 | | | 16 |
| | | | | | |
Total | | $ | 755 | | $ | 74 |
| | | | | | |
The weighted average interest rate on notes and loans payable was 2.95% and 5.70% at June 30, 2008 and 2007, respectively. During the fiscal years ended June 30, 2008, 2007 and 2006, the weighted average interest rates on notes and loans payable was 4.45%, 5.72%, and 4.31%, respectively. The carrying value of notes and loans payable at June 30, 2008 and 2007, approximated the fair value of such debt.
Long-term debt at June 30 included the following:
| | | | | | | |
| | | 2008 | | 2007 | |
Senior unsecured notes and debentures: | | | | | | | |
4.20%, $575 due January 2010 | | $ | 576 | | $ | 576 | |
5.00%, $575 due January 2015 | | | 575 | | | 575 | |
5.00%, $500 due March 2013 | | | 499 | | | — | |
5.95%, $400 due October 2017 | | | 398 | | | — | |
5.45%, $350 due October 2012 | | | 349 | | | — | |
6.125%, $300 due February 2011 | | | 307 | | | 311 | |
Floating rate, $500 due December 2007 | | | — | | | 500 | |
Other | | | 16 | | | — | |
| | | | | | | |
Total | | | 2,720 | | | 1,962 | |
Less: Current maturities | | | — | | | (500 | ) |
| | | | | | | |
Long-term debt | | $ | 2,720 | | $ | 1,462 | |
| | | | | | | |
The weighted average interest rate on long-term debt, including the effect of interest rate swaps, was 5.15% and 4.98% at June 30, 2008 and 2007, respectively. During the fiscal years ended June 30, 2008, 2007 and 2006, the weighted average interest rates on long-term debt, including the effect of interest rate swaps, was 5.15%, 5.11%, and 4.88%, respectively. The estimated fair value of long-term debt, including current maturities, was $2,714 and $1,910 at June 30, 2008 and 2007, respectively.
Page 41
NOTE 11. DEBT (Continued)
Credit facilities at June 30 were as follows:
| | | | | | |
| | | 2008 | | 2007 |
Revolving credit line | | $ | 1,200 | | $ | 1,300 |
Foreign and other credit lines | | | 48 | | | 95 |
| | | | | | |
Total | | $ | 1,248 | | $ | 1,395 |
| | | | | | |
During fiscal year 2008, the $1,300 in revolving credit agreements were cancelled and replaced by a $1,200 revolving credit agreement, which expires in April 2013, and is available for general corporate purposes and to support commercial paper issuances. As of June 30, 2008, there were no borrowings under the $1,200 revolving credit agreement. The $1,200 revolving credit agreement includes certain restrictive covenants. The Company was in compliance with all restrictive covenants and limitations at June 30, 2008. In addition, at June 30, 2008, the Company had $48 foreign working capital credit lines and other facilities, of which $25 was available for borrowing.
Debt maturities at June 30, 2008, are zero, $578, $306, $7, $850 and $975 in fiscal years 2009, 2010, 2011, 2012, 2013 and thereafter, respectively.
NOTE 12. FAIR VALUE OF FINANCIAL INSTRUMENTS
The Company’s derivative financial instruments were recorded at fair value in the consolidated balance sheets as assets and liabilities at June 30 as follows:
| | | | | | |
| | | 2008 | | 2007 |
Commodity purchase contracts included in current assets | | $ | 46 | | $ | 6 |
Commodity purchase contracts included in other assets | | | 3 | | | — |
Commodity purchase contracts included in current liabilities | | | — | | | 1 |
Foreign exchange contracts included in current liabilities | | | — | | | 2 |
The Company uses commodity futures, swaps, and option contracts to fix the price of a portion of its raw material requirements. Contract maturities, which extend to fiscal year 2010, are matched to the length of the raw material purchase contracts. Realized contract gains and losses are reflected as adjustments to the cost of the raw materials. The estimated amount of existing pretax net gains for commodity contracts in accumulated other comprehensive net income that is expected to be reclassified into net earnings during the year ending June 30, 2009, is $46.
The Company also enters into certain foreign-currency related derivative contracts to manage a portion of the Company’s foreign exchange risk. The Company has foreign exchange contracts mature in fiscal year 2009. In the years ended June 30, 2007 and 2006, the foreign exchange contracts were accounted for by adjusting the carrying amount of the contracts to market value and recognizing any gain or loss in other (income), net. During the year ended June 30, 2008, the Company’s foreign exchange contracts began qualifying for hedge accounting and are accounted for by recognizing any gain or loss in accumulated other comprehensive net income. The estimated amount of existing pretax net gains for foreign exchange contracts in accumulated other comprehensive income that is expected to be reclassified into net earnings during the year ending June 30, 2009, is less than $1.
As of June 30, 2008, all of the Company’s financial instruments are accorded hedge accounting treatment and are considered effective.
The notional and estimated fair values of the Company’s derivative instruments are summarized below at June 30:
| | | | | | | | | | | | | |
| | | 2008 | | 2007 | |
| | | Notional | | Fair Value | | Notional | | Fair Value | |
Commodity purchase contracts | | $ | 132 | | $ | 49 | | $ | 85 | | $ | 5 | |
Foreign exchange contracts | | | 35 | | | — | | | 38 | | | (2 | ) |
Page 42
NOTE 12. FAIR VALUE OF FINANCIAL INSTRUMENTS (Continued)
The carrying values of cash and cash equivalents, accounts receivable and accounts payable approximate their fair values at June 30, 2008 and 2007, due to the short maturity and nature of those balances. See Note 11 for fair values of notes and loans payable and long-term debt.
NOTE 13. OTHER LIABILITIES
Other liabilities consisted of the following at June 30:
| | | | | | |
| | | 2008 | | 2007 |
Venture agreement net terminal obligation | | $ | 266 | | $ | 263 |
Employee benefit obligations | | | 205 | | | 191 |
Taxes | | | 70 | | | — |
Other | | | 59 | | | 62 |
| | | | | | |
Total | | $ | 600 | | $ | 516 |
| | | | | | |
The taxes included in Other liabilities resulted from the adoption of FIN 48 effective July 1, 2007 (Note 20).
Venture Agreement
In January 2003, the Company entered into an agreement with The Procter & Gamble Company (P&G) by which a venture was formed related to the Company’s Glad® plastic bags, wraps and containers business. The Company maintains a net terminal obligation liability, which reflects the contractual requirement to repurchase P&G’s interest at the termination of the agreement. As of June 30, 2008 and 2007, P&G has a 20% interest in the venture, which is the maximum investment P&G is allowed under the venture agreement. The Company pays a royalty to P&G for its interest in the profits, losses and cash flows, as contractually defined, of the Glad® business.
The agreement has a 20-year term, with a 10-year renewal option and can be terminated under certain circumstances, including at P&G’s option upon a change in control of the Company, or, at either party’s option, upon the sale of the Glad® business by the Company. Upon termination of the agreement, the Company will purchase P&G’s interest for cash at fair value as established by pre-determined valuation procedures. Following termination, the Glad® business will retain the exclusive intellectual property licenses contributed by P&G for the licensed products marketed.
NOTE 14. OTHER CONTINGENCIES
The Company is involved in certain environmental matters, including Superfund and other response actions at various locations. The Company has a recorded liability of $20 and $23 at June 30, 2008 and 2007, respectively, for its share of the related aggregate future remediation cost. One matter in Dickinson County, Michigan, for which the Company is jointly and severally liable, accounts for a substantial majority of the recorded liability at both June 30, 2008 and 2007. The Company is subject to a cost-sharing arrangement with another party for this matter, under which the Company has agreed to be liable for 24.3% of the aggregate remediation and associated costs, other than legal fees, as the Company and the other party are each responsible for their own such fees. The other party in this matter reported substantial net losses for the full calendar year 2007 and the first half of calendar year 2008 and indicated that it expects substantial net losses for the remainder of calendar year 2008. If the other party with whom the Company shares joint and several liability is unable to pay its share of the response and remediation obligations, the Company would likely be responsible for such obligations. In October 2004, the Company and the other party agreed to a consent judgment with the Michigan Department of Environmental Quality, which sets forth certain remediation goals and monitoring activities. Based on the current status of this matter, and with the assistance of environmental consultants, the Company maintains an undiscounted liability representing its best estimate of its share of costs associated with the capital expenditures, maintenance and other costs to be incurred over an estimated 30-year remediation period. The most significant components of the liability relate to the estimated costs associated with the remediation of groundwater contamination and excess levels of subterranean methane
Page 43
NOTE 14. OTHER CONTINGENCIES (Continued)
deposits. The Company made payments of less than $1 in fiscal years 2008 and 2007, respectively, towards remediation efforts. Currently, the Company cannot accurately predict the timing of the payments that will likely be made under this estimated obligation. In addition, the Company’s estimated loss exposure is sensitive to a variety of uncertain factors, including the efficacy of remediation efforts, changes in remediation requirements and the timing, varying costs and alternative clean-up technologies that may become available in the future. Although it is possible that the Company’s exposure may exceed the amount recorded, any amount of such additional exposures, or range of exposures, is not estimable at this time.
The Company is subject to various other lawsuits and claims relating to issues such as contract disputes, product liability, patents and trademarks, advertising, employee and other matters. Although the results of claims and litigation cannot be predicted with certainty, it is the opinion of management that the ultimate disposition of these matters, to the extent not previously provided for, will not have a material adverse effect, individually or in the aggregate, on the Company’s consolidated financial statements taken as a whole.
NOTE 15. STOCKHOLDERS’ (DEFICIT) EQUITY
The Company has two share repurchase programs: an open-market program, which had a total authorization of $750, as of June 30, 2008, and a program to offset the impact of share dilution related to share-based awards (evergreen program), which has no authorization limit.
The open-market program was approved by the Company’s Board of Directors in May 2008 after the share repurchase open-market program approved in May 2007 was fully utilized by the accelerated share repurchase described below. The open-market program approved in May 2007 replaced the July 2002 and July 2003 share repurchase open-market programs.
On August 10, 2007, the Company entered into an accelerated share repurchase (ASR) agreement with two investment banks. Under the ASR agreement, the Company repurchased $750 of its shares of common stock from the investment banks for an initial per share amount of $59.59, subject to adjustment. The banks delivered an initial amount of 10.9 million shares to the Company on August 15, 2007. Under the terms of the ASR agreement, the final number of shares the Company repurchased and the timing of the final settlement depended on prevailing market conditions, the final discounted volume weighted average share price over the term of the ASR agreement and other customary adjustments. The final purchase price adjustment was settled on January 17 and 23, 2008, resulting in the receipt of an additional 1.1 million shares by the Company. The final settlement under the ASR agreement did not require the Company to make any additional cash or share payments. Upon final settlement, the average per share amount paid for all shares purchased under the ASR agreement was $62.08. The total number of shares received under the ASR agreement reduced the weighted number of common shares outstanding during the fiscal year 2008 by 10 million shares.
No shares were repurchased under the open-market programs in fiscal year 2007. Share repurchases under the evergreen program were $118 (2 million shares) in fiscal year 2008 and $155 (2.4 million shares) in fiscal year 2007.
During fiscal years 2008, 2007 and 2006, the Company declared dividends per share of $1.66, $1.31 and $1.15, respectively. During fiscal years 2008, 2007, and 2006, the Company paid dividends per share of $1.60, $1.20 and $1.14, respectively.
Page 44
NOTE 15. STOCKHOLDERS’ (DEFICIT) EQUITY (Continued)
Accumulated other comprehensive net losses at June 30, 2008, 2007 and 2006, included the following net-of-tax (losses) gains:
| | | | | | | | | | | | |
| | | 2008 | | | 2007 | | | 2006 | |
Currency translation | | $ | (142 | ) | | $ | (168 | ) | | $ | (215 | ) |
Derivatives | | | 30 | | | | 3 | | | | 6 | |
Unrecognized actuarial losses and prior service benefit, net | | | (67 | ) | | | (44 | ) | | | — | |
Minimum pension liabilities | | | — | | | | — | | | | (6 | ) |
| | | | | | | | | | | | |
Total | | $ | (179 | ) | | $ | (209 | ) | | $ | (215 | ) |
| | | | | | | | | | | | |
On November 14, 2006, the Company retired 91 million shares of its treasury stock. These shares are now authorized but unissued. In accordance with Accounting Principles Board Opinion No. 6, Status of Accounting Research Bulletin, the treasury stock retirement resulted in a reduction of the following on the Company’s Consolidated Balance Sheet: treasury stock by $4,137, common stock by $91 and retained earnings by $4,046. There was no effect on the Company’s overall equity position as a result of the retirement.
NOTE 16. EARNINGS PER SHARE
A reconciliation of the weighted average number of common shares outstanding (in thousands) used to calculate basic and diluted earnings per common share is as follows for the fiscal years ended June 30:
| | | | | | |
| | | 2008 | | 2007 | | 2006 |
Basic | | 139,633 | | 151,445 | | 150,545 |
Stock options and other | | 2,371 | | 2,490 | | 2,456 |
| | | | | | |
Diluted | | 142,004 | | 153,935 | | 153,001 |
| | | | | | |
|
| Stock options (in thousands) not included in the computation of diluted net earnings per common share because the exercise price of the stock options was greater than the average market price of the common shares and therefore the effect would be antidilutive is as follows for the fiscal years ended June 30: |
| | | |
| | | 2008 | | 2007 | | 2006 |
Stock options | | 2,719 | | 57 | | 439 |
NOTE 17. SHARE-BASED COMPENSATION PLANS
In November 2005, the Company’s stockholders approved the 2005 Stock Incentive Plan (2005 Plan). The 2005 Plan permits the Company to grant various nonqualified, share-based compensation awards, including stock options, restricted stock, performance units, deferred stock units, restricted stock units, stock appreciation rights, performance shares and other stock-based awards. As a result of the adoption of the 2005 Plan, no further awards have been or will be granted from any prior plans, including the 1996 Stock Incentive Plan and the 1993 Directors’ Stock Option Plan. The Company is authorized to grant up to seven million common shares under the 2005 Plan, of which five million common shares were previously available under prior plans. At June 30, 2008, four million common shares are available for grant under the 2005 Plan.
Page 45
NOTE 17. SHARE-BASED COMPENSATION PLANS (Continued)
Compensation cost and related income tax benefit recognized in the Company’s fiscal years 2008, 2007 and 2006 consolidated financial statements for share-based compensation plans were classified as indicated in the table below. These amounts exclude a $25 pre-tax cumulative historical stock option charge ($16 after tax) in fiscal year 2006, as discussed below.
| | | | | | | | | |
| | | 2008 | | 2007 | | 2006 |
Cost of products sold | | $ | 7 | | $ | 7 | | $ | 5 |
Selling and administrative expenses | | | 36 | | | 38 | | | 45 |
Research and development costs | | | 4 | | | 4 | | | 2 |
| | | | | | | | | |
Total compensation cost | | $ | 47 | | $ | 49 | | $ | 52 |
| | | | | | | | | |
Related income tax benefit | | $ | 18 | | $ | 19 | | $ | 20 |
| | | | | | | | | |
Cash received during fiscal year 2008, 2007 and 2006 from stock options exercised under all share-based payment arrangements was $31, $103 and $62, respectively. The Company issues shares for share-based compensation plans from treasury stock. The Company repurchases shares under its program to offset the estimated impact of share dilution related to share-based awards (See Note 15). As of June 30, 2008, the Company is not planning to repurchase any shares in fiscal year 2009 to offset the impact of share dilution related to share-based awards.
Details regarding the valuation and accounting for stock options, restricted stock awards, performance units and deferred stock units for non-employee directors follow.
Stock Options
The fair value of each stock option award granted during fiscal years 2008, 2007 and 2006 is estimated on the date of grant using the Black-Scholes valuation model and assumptions noted in the following table:
| | | | | | |
| | | 2008 | | 2007 | | 2006 |
Expected life | | 5 years | | 5 years | | 5 years |
Expected volatility | | 21.0% to 22.2% | | 22.1% to 24.1% | | 24.2% to 28.0% |
Weighted-average volatility | | 21.6% | | 23.8% | | 27.9% |
Risk-free interest rate | | 2.8% to 4.2% | | 4.6% to 4.7% | | 3.7% to 4.9% |
Dividend yield | | 2.7% to 3.0% | | 1.9% to 2.0% | | 1.8% to 2.1% |
Weighted-average dividend yield | | 2.7% | | 1.9% | | 2.0% |
The expected life of the stock options is based on observed historical exercise patterns. Groups of employees having similar historical exercise behavior are considered separately for valuation purposes. The Company estimates stock option forfeitures based on historical data for each separate employee grouping, and adjusts the rate to expected forfeitures periodically. The adjustment of the forfeiture rate will result in a cumulative catch-up adjustment in the period the forfeiture estimate is changed. The expected volatility is based on implied volatility from publicly traded options on the Company’s stock at the date of grant, historical implied volatility of the Company’s publicly traded options and other factors. The risk-free interest rate is based on the implied yield on a U.S. Treasury zero-coupon issue with a remaining term equal to the expected term of the option. The dividend yield is based on the projected annual dividend payment per share, divided by the stock price at the date of grant.
Page 46
NOTE 17. SHARE-BASED COMPENSATION PLANS (Continued)
Details of the Company’s stock option plan at June 30 are summarized below:
| | | | | | | | | | | |
| | | Number of
Shares | | | Weighted-
Average
Exercise
Price | | Average
Remaining
Contractual
Life | | Aggregate
Intrinsic
Value |
| | | (In thousands) | | | | | | | |
Outstanding at June 30, 2007 | | 8,959 | | | $ | 47 | | | | | |
Granted | | 1,573 | | | | 61 | | | | | |
Exercised | | (769 | ) | | | 40 | | | | | |
Cancelled | | (242 | ) | | | 59 | | | | | |
| | | | | | | | | | | |
Outstanding at June 30, 2008 | | 9,521 | | | | 50 | | 6 years | | $ | 23 |
| | | | | | | | | | | |
Options vested and exercisable at June 30, 2008 | | 6,374 | | | | 45 | | 4 years | | | 47 |
The weighted-average fair value per share of each option granted during fiscal years 2008, 2007, and 2006, estimated at the grant date using the Black-Scholes option pricing model, was $11.86, $14.96 and $14.75, respectively. The total intrinsic value of options exercised in fiscal years 2008, 2007 and 2006 was $16, $49 and $53, respectively.
Results for the fourth quarter and fiscal year 2006 include a pretax cumulative charge of $25 ($16 after-tax or $0.11 per diluted share), resulting from non-cash charges associated with historical stock option compensation expense relating to prior periods dating back to the third quarter of fiscal 1996. The Company identified the additional stock option compensation expense in a voluntary comprehensive review of its stock-option practices that was overseen by the Audit Committee of Clorox’s Board of Directors with the assistance of outside counsel. The Company’s voluntary review identified no evidence of fraud or intentional deviation from U.S. GAAP.
The pretax charge for non-cash compensation expense includes $15 in equity compensation expense related to the determination of the appropriate measurement date for certain stock option grants, of which $2 relates to certain stock options granted to officers prior to December 2001 and $13 relates to certain stock options granted to non-officer employees prior to February 2005. With respect to substantially all of these stock option grants, the Company identified the measurement date as the date that resulted in the lowest market price over a two-week period rather than the end of the two-week period, as required. Consequently, compensation expense was recorded for certain grants identified as having intrinsic value as of the appropriate measurement date.
The remaining $10 in pretax charges results primarily from the requirement to use variable accounting with respect to certain options granted to officers due to existence of documented approval of the options within six months of the repurchase in 2001 of stock options from the same officers. Although the intent was for the options to have been granted more than six months before the repurchase, there is insufficient documentation to demonstrate that final approval of the option grants was made at least six months prior to the repurchase.
Stock option awards outstanding as of June 30, 2008, have generally been granted at prices that are either equal to or above the market value of the stock on the date of grant. As noted above, certain historical stock options were granted prior to fiscal year 2006 at prices below market value. Stock options outstanding as of June 30, 2008, generally vest over four years and expire no later than ten years after the grant date. The Company generally recognizes compensation expense ratably over the vesting period. At June 30, 2008, there was $23 of total unrecognized compensation cost related to nonvested options, which is expected to be recognized over a remaining weighted-average vesting period of two years, subject to forfeitures.
Page 47
NOTE 17. SHARE-BASED COMPENSATION PLANS (Continued)
Restricted Stock Awards
In accordance with SFAS No. 123-R, the fair value of restricted stock awards is estimated on the date of grant based on the market price of the stock and is amortized to compensation expense on a straight-line basis over the related vesting periods, which are generally three to four years. The total number of restricted stock awards expected to vest is adjusted by estimated forfeiture rates.
At June 30, 2008, there was $8 of total unrecognized compensation cost related to nonvested restricted stock awards, which is expected to be recognized over a remaining weighted-average vesting period of three years. The total fair value of the shares that vested in fiscal years 2008, 2007 and 2006 was $10, $11 and $5, respectively. The weighted-average grant-date fair value of awards granted was $60.69, $61.89 and $57.23 per share for fiscal years 2008, 2007 and 2006, respectively.
A summary of the status of the Company’s restricted stock awards at June 30 is presented below:
| | | | | |
| | | Number of
Shares | | | Weighted-Average
Grant-Date
Fair Value
per Share |
| | | (In thousands) | | | |
Restricted stock awards at June 30, 2007 | | 461 | | | $53 |
Granted | | 68 | | | 61 |
Vested | | (206 | ) | | 47 |
Forfeited | | (24 | ) | | 55 |
| | | | | |
Restricted stock awards at June 30, 2008 | | 299 | | | 59 |
| | | | | |
Performance Units
The Company’s performance unit grants provide for the issuance of common stock to certain managerial staff and executive management if the Company achieves certain performance targets. The performance unit grants vest after three years. All performance unit grants receive dividend distributions during their vesting periods. The fair value of each grant issued is estimated on the date of grant based on the current market price of the stock. The total amount of compensation expense recognized reflects estimated forfeiture rates, and the initial assumption that performance goals will be achieved. Compensation expense is adjusted quarterly based on management’s assessment of the probability that performance goals will be achieved. If such goals are not met or it is determined that achievement of performance goals is not probable, any previously recognized compensation expense is reversed. If it is determined that the performance goals will be exceeded, additional compensation expense is recognized.
The number of shares issued will be dependent upon vesting and the achievement of specified performance targets. At June 30, 2008, there was $28 in unrecognized compensation cost related to nonvested performance unit grants which is expected to be recognized over a remaining weighted-average performance period of two years. The weighted-average grant-date fair value of awards granted was $61.16, $61.47 and $57.00 per share for fiscal years 2008, 2007 and 2006, respectively.
Page 48
NOTE 17. SHARE-BASED COMPENSATION PLANS (Continued)
A summary of the status of the Company’s performance unit awards at June 30 is presented below:
| | | | | |
| | | Number of
Shares | | | Weighted-Average
Grant-Date
Fair Value
per Share |
| | | (In thousands) | | | |
Performance unit awards at June 30, 2007 | | 1,253 | | | $55 |
Granted | | 511 | | | 61 |
Vested and distributed | | (83 | ) | | 37 |
Forfeited | | (236 | ) | | 54 |
| | | | | |
Performance unit awards at June 30, 2008 | | 1,445 | | | 58 |
| | | | | |
Performance units vested and deferred at June 30, 2008 | | 138 | | | 46 |
| | | | | |
The nonvested performance units outstanding at June 30, 2008 and 2007, were 1,307,619 and 1,006,851 respectively, and the weighted average grant date fair value was $59.90 and $58.46 per share, respectively. Total shares vested during fiscal year 2008 were 62,160 which had a weighted average grant date fair value per share of $53.45. The total fair value of shares vested was $4, $8, and $6 during fiscal years 2008, 2007 and 2006, respectively. Upon vesting, the recipients of the grants receive the distribution as shares or, if previously elected by those who have the option to, as deferred stock. During fiscal years 2008 and 2007, $3 and $1 of the vested awards were paid by the issuance of shares. At June 30, 2008, $1 of fiscal year 2008 deferred stock and $5 of fiscal year 2007 deferred stock are included in additional paid-in capital.
Deferred Stock Units for Nonemployee Directors
Nonemployee directors receive annual grants of deferred stock units under the Company’s director compensation program and can elect to receive all or a portion of their annual retainers and fees in the form of deferred stock units. The deferred stock units vest immediately, receive dividend distributions, which are reinvested as deferred stock units, and are recognized at their fair value on the date of grant. Each deferred stock unit represents the right to receive one share of the Company’s common stock following the termination of a director’s service.
During fiscal year 2008, the Company granted 23,216 deferred stock units, reinvested dividends of 3,213 units and distributed 12,834 shares, which had a weighted-average fair value on grant date of $62.95, $59.41 and $51.54 per share, respectively. As of June 30, 2008, 127,549 units were outstanding, which had a weighted-average fair value on grant date of $55.28 per share.
Page 49
NOTE 18. LEASES AND OTHER COMMITMENTS
The Company leases transportation equipment, certain information technology equipment and various manufacturing, warehousing, and office facilities. The Company’s leases are classified as operating leases and the Company’s existing contracts will expire by 2019. The Company expects that in the normal course of business, existing contracts will be renewed or replaced by other leases. The following is a schedule of future minimum rental payments required under the Company’s existing non-cancelable lease agreements:
| | |
Fiscal Year | | Future Minimum
Rental Payments |
2009 | | $ 31 |
2010 | | 30 |
2011 | | 25 |
2012 | | 21 |
2013 | | 18 |
Thereafter | | 30 |
| | |
Total | | $155 |
| | |
Rental expense for all operating leases was $59, $53, and $50 in fiscal years 2008, 2007 and 2006, respectively. Space not occupied by the Company in its headquarters building is rented to other tenants under operating leases expiring through 2014. Future minimum rentals to be received under these leases total $5 and do not exceed $2 in any one year.
The Company is also party to certain purchase obligations, which are defined as purchase agreements that are enforceable and legally-binding and that specify all significant terms, including quantity, price and the approximate timing of the transaction. Examples of the Company’s purchase obligations include commitments for information technology and related services, advertising, raw materials and contract packing materials, utility agreements, capital expenditure agreements, software acquisition and license commitments and service contracts. At June 30, 2008, the Company’s purchase obligations, including the services related to the ITS Agreement, totaled $262, $110, $73, $53, $44, and $24 for fiscal years 2009 through 2013, and thereafter, respectively. Estimates for the ITS Agreement are based on an annual service fee that will be adjusted periodically based upon updates to services and equipment provided. Included in the ITS Agreement are certain acceleration payment clauses if the Company terminates the contract without cause.
NOTE 19. OTHER (INCOME), NET
The major components of Other (income), net for the fiscal years ended June 30 were:
| | | | | | | | | | | | |
| | | 2008 | | | 2007 | | | 2006 | |
Interest income | | $ | (12 | ) | | $ | (8 | ) | | $ | (10 | ) |
Equity in earnings of unconsolidated affiliates | | | (8 | ) | | | (8 | ) | | | (7 | ) |
Low-income housing partnership losses (Note 9) | | | 7 | | | | 4 | | | | 15 | |
Amortization of trademarks and other intangible assets | | | 7 | | | | 5 | | | | 5 | |
Foreign exchange transaction losses, net | | | 2 | | | | 4 | | | | — | |
Other | | | (5 | ) | | | 1 | | | | (5 | ) |
| | | | | | | | | | | | |
Total Other (income), net | | $ | (9 | ) | | $ | (2 | ) | | $ | (2 | ) |
| | | | | | | | | | | | |
Page 50
NOTE 20. INCOME TAXES
The provision for income taxes on continuing operations, by tax jurisdiction, consisted of the following for the fiscal years ended June 30:
| | | | | | | | | | | | |
| | | 2008 | | | 2007 | | | 2006 | |
Current | | | | | | | | | | | | |
Federal | | $ | 194 | | | $ | 196 | | | $ | 178 | |
State | | | 28 | | | | 29 | | | | 20 | |
Foreign | | | 52 | | | | 37 | | | | 40 | |
| | | | | | | | | | | | |
Total current | | | 274 | | | | 262 | | | | 238 | |
| | | | | | | | | | | | |
Deferred | | | | | | | | | | | | |
Federal | | | (27 | ) | | | (14 | ) | | | (15 | ) |
Federal — American Jobs Creation Act | | | — | | | | — | | | | (8 | ) |
State | | | (3 | ) | | | — | | | | (1 | ) |
Foreign | | | (12 | ) | | | (1 | ) | | | (4 | ) |
| | | | | | | | | | | | |
Total deferred | | | (42 | ) | | | (15 | ) | | | (28 | ) |
| | | | | | | | | | | | |
Total | | $ | 232 | | | $ | 247 | | | $ | 210 | |
| | | | | | | | | | | | |
The components of earnings from continuing operations before income taxes, by tax jurisdiction, were as follows for the fiscal years ended June 30:
| | | | | | | | | |
| | | 2008 | | 2007 | | 2006 |
United States | | $ | 538 | | $ | 603 | | $ | 516 |
Foreign | | | 155 | | | 140 | | | 137 |
| | | | | | | | | |
Total | | $ | 693 | | $ | 743 | | $ | 653 |
| | | | | | | | | |
A reconciliation of the statutory federal income tax rate to the Company’s effective tax rate on continuing operations follows for the fiscal years ended June 30:
| | | | | | | | | |
| | | 2008 | | | 2007 | | | 2006 | |
Statutory federal tax rate | | 35.0 | % | | 35.0 | % | | 35.0 | % |
State taxes (net of federal tax benefits) | | 2.5 | | | 2.6 | | | 1.4 | |
Tax differential on foreign earnings | | 0.1 | | | (0.7 | ) | | (2.4 | ) |
Net adjustment of prior year federal and state tax accruals | | 1.0 | | | (1.6 | ) | | 1.9 | |
Change in valuation allowance | | (2.3 | ) | | (1.3 | ) | | (0.6 | ) |
Low-income housing tax credits | | (0.4 | ) | | (0.7 | ) | | (1.4 | ) |
Other differences | | (2.3 | ) | | (0.1 | ) | | (1.8 | ) |
| | | | | | | | | |
Effective tax rate | | 33.6 | % | | 33.2 | % | | 32.1 | % |
| | | | | | | | | |
Applicable U.S. income taxes and foreign withholding taxes have not been provided on approximately $125 of undistributed earnings of certain foreign subsidiaries at June 30, 2008, since these earnings are considered indefinitely reinvested. The net federal income tax liability that would arise if these earnings were not indefinitely reinvested is approximately $24. Applicable U.S. income and foreign withholding taxes are provided on these earnings in the periods in which they are no longer considered indefinitely reinvested.
Page 51
NOTE 20. INCOME TAXES (Continued)
During fiscal year 2006, the Company repatriated approximately $265 of cash previously held in foreign entities. Of this amount, $111 represented dividends paid under the terms of the American Jobs Creation Act (AJCA) that the Company reinvested in certain qualified activities. All entities whose earnings had been designated as indefinitely reinvested prior to remitting qualified dividends under the terms of the AJCA have reverted back to indefinite reinvestment status as of June 30, 2006.
With respect to the Company’s stock option plans, realized tax benefits in excess of tax benefits recognized in net earnings are recorded as increases to additional paid-in capital. Excess tax benefits of approximately $9, $16, and $17 were realized and recorded to additional paid-in capital for the fiscal years 2008, 2007 and 2006, respectively. In addition, previously recognized tax benefits of $5, relating to the cumulative charge described at Note 17, were reclassified from additional paid-in capital to income tax expense during the fiscal year 2006.
The components of deferred tax assets and liabilities at June 30 are shown below:
| | | | | | | | |
| | | 2008 | | | 2007 | |
Deferred tax assets | | | | | | | | |
Compensation and benefit programs | | $ | 147 | | | $ | 122 | |
Basis difference related to Venture Agreement | | | 30 | | | | 30 | |
Accruals and reserves | | | 19 | | | | — | |
Net operating loss and tax credit carryforwards | | | 8 | | | | 17 | |
Inventory costs | | | 10 | | | | 13 | |
Other | | | 19 | | | | 23 | |
| | | | | | | | |
Subtotal | | | 233 | | | | 205 | |
Valuation allowance | | | (7 | ) | | | (22 | ) |
| | | | | | | | |
Total deferred tax assets | | | 226 | | | | 183 | |
| | | | | | | | |
Deferred tax liabilities | | | | | | | | |
Fixed and intangible assets | | | (170 | ) | | | (53 | ) |
Low-income housing partnerships | | | (25 | ) | | | (21 | ) |
Mark-to-market adjustments | | | (19 | ) | | | (2 | ) |
Accruals and reserves | | | — | | | | (19 | ) |
Unremitted foreign earnings | | | (9 | ) | | | (15 | ) |
Other | | | (20 | ) | | | (23 | ) |
| | | | | | | | |
Total deferred tax liabilities | | | (243 | ) | | | (133 | ) |
| | | | | | | | |
Net deferred tax assets/(liabilities) | | $ | (17 | ) | | $ | 50 | |
| | | | | | | | |
The net deferred tax assets and liabilities included in the consolidated balance sheet at June 30 were as follows:
| | | | | | | | |
| | | 2008 | | | 2007 | |
Current deferred tax assets | | $ | 57 | | | $ | 31 | |
Noncurrent deferred tax assets | | | 24 | | | | 24 | |
Current deferred tax liabilities | | | (1 | ) | | | — | |
Noncurrent deferred tax liabilities | | | (97 | ) | | | (5 | ) |
| | | | | | | | |
Net deferred tax liabilities | | $ | (17 | ) | | $ | 50 | |
| | | | | | | | |
Net deferred tax liabilities of $138 were recorded during fiscal year 2008 related to the Company’s acquisition of BBI.
Page 52
NOTE 20. INCOME TAXES (Continued)
The Company periodically reviews its deferred tax assets for recoverability. A valuation allowance is established when the Company believes that it is more likely than not that some portion of its deferred tax assets will not be realized. Valuation allowances have been provided to reduce deferred tax assets to amounts considered recoverable. Details of the valuation allowance at June 30 were as follows:
| | | | | | | | |
| | | 2008 | | | 2007 | |
Valuation allowance at beginning of year | | $ | (22 | ) | | $ | (26 | ) |
Net increase in realizability of foreign deferred tax assets | | | 9 | | | | — | |
Decrease in foreign net operating loss carryforward and other | | | 6 | | | | 4 | |
| | | | | | | | |
Valuation allowance at end of year | | $ | (7 | ) | | $ | (22 | ) |
| | | | | | | | |
At June 30, 2008, the Company had no federal foreign tax credit carryforwards. Tax benefits from foreign net operating loss carryforwards of $8 have expiration dates between fiscal years 2009 and 2028. Tax benefits from foreign net operating loss carryforwards of $3 may be carried forward indefinitely.
At June 30, 2007, the Company had federal foreign tax credit carryforwards of $7 with an expiration date in fiscal year 2016. Tax benefits from foreign net operating loss carryforwards of $8 have expiration dates between fiscal years 2009 and 2017. Tax benefits from foreign net operating loss carryforwards of $2 may be carried forward indefinitely.
In June 2008, the Company reached agreement with the IRS resolving tax issues originally arising in the periods 2001 and 2002. As a result of the settlement agreement, the Company paid $72 in federal taxes and interest for the years 2001 and 2002 in the fourth quarter of fiscal year 2008. The Company had previously provided for these uncertain tax positions.
In June 2007, the Company reached agreement with the IRS resolving all remaining tax issues originally arising in the period from 1997 through 2000. As a result of the settlement agreement, the Company paid $11 in federal taxes and interest for the years 1997 through 2000 in the fourth quarter of fiscal year 2007. The Company had previously accrued for these contingencies.
In April 2005, the Company reached an agreement with the IRS resolving certain tax issues originally arising in the period from 1997 through 2000. As a result of the settlement agreement, the Company paid $151 (excluding $13 of tax benefits) in fiscal year 2006. The Company had previously accrued for these contingencies.
On July 1, 2007, the Company adopted FIN 48. The cumulative effect of adopting FIN 48 was recorded as a $10 reduction to beginning retained earnings. FIN 48 requires uncertain tax positions to be classified as non-current income tax liabilities unless expected to be paid within one year. Upon adoption of FIN 48, income tax liabilities of $53 were reclassified from current to non-current on the Company’s balance sheet.
The Company recognizes interest and penalties related to uncertain tax positions as a component of income tax expense. As of July 1, 2007 and June 30, 2008, the total balance of accrued interest and penalties related to uncertain tax positions was $36 and $18, respectively. For fiscal year 2008, income tax expense includes $20 of interest and penalties.
Following is a reconciliation of the beginning and ending amounts of the Company’s gross unrecognized tax benefits:
| | | | |
Unrecognized tax benefits - July 1, 2007 | | $ | 150 | |
Gross increases - tax positions in prior periods | | | 17 | |
Gross decreases - tax positions in prior periods | | | (24 | ) |
Gross increases - current period tax positions | | | 9 | |
Settlements | | | (49 | ) |
| | | | |
Unrecognized tax benefits - June 30, 2008 | | $ | 103 | |
| | | | |
Page 53
NOTE 20. INCOME TAXES (Continued)
As of July 1, 2007 and June 30, 2008, the total amount of unrecognized tax benefits was $150 and $103, respectively, of which $100 and $93, respectively, would affect the effective tax rate, if recognized.
The Company files income tax returns in the U.S. federal and various state, local and foreign jurisdictions. The Internal Revenue Service (IRS) was examining the Company’s 2003 and 2004 income tax returns as of July 1, 2007, and the Company’s 2003 through 2006 income tax returns as of June 30, 2008. Various income tax returns in state and foreign jurisdictions are currently in the process of examination. In the twelve months succeeding June 30, 2008, audit resolutions could potentially reduce total unrecognized tax benefits by up to $28, primarily as a result of cash payments. Audit outcomes and the timing of audit settlements are subject to significant uncertainty.
NOTE 21. EMPLOYEE BENEFIT PLANS
The Company adopted SFAS No. 158 at the end of fiscal year 2007. SFAS No. 158 requires that a liability be recorded when the accumulated benefit obligation exceeds the fair value of plan assets. As a result of the adoption, the Company recorded approximately $39 as an increase to accumulated other comprehensive net losses at June 30, 2007. The applicable June 30, 2008 and 2007, balances included in the Company’s consolidated financial statements and footnotes reflect the adoption of SFAS No. 158.
Retirement Income Plans
The Company has qualified and nonqualified defined benefit plans that cover substantially all domestic employees and certain international employees. Benefits are based on either employee years of service and compensation or a stated dollar amount per years of service. The Company is the sole contributor to the plans in amounts deemed necessary to provide benefits and to the extent deductible for federal income tax purposes. Assets of the plans consist primarily of cash and marketable equity and debt security investments. The Company made contributions of zero, $10, and $10 to its domestic qualified retirement income plans in fiscal years 2008, 2007 and 2006, respectively. The Company has also contributed $1, zero and zero to its foreign retirement income plans for fiscal years 2008, 2007 and 2006, respectively. The Company’s funding policy is to contribute amounts sufficient to meet minimum funding requirements as set forth in employee benefit tax laws plus additional amounts as the Company may determine to be appropriate. At June 30, 2008, the Company does not anticipate that it will be required to make any minimum funding contributions to the qualified retirement income plans.
Retirement Health Care
The Company provides certain health care benefits for employees who meet age, participation and length of service requirements at retirement. The plans pay stated percentages of covered expenses after annual deductibles have been met. Benefits paid take into consideration payments by Medicare. The plans are funded as claims are paid, and the Company has the right to modify or terminate certain of these plans.
Page 54
NOTE 21. EMPLOYEE BENEFIT PLANS (Continued)
The assumed health care cost trend rate used in measuring the accumulated post-retirement benefit obligation (APBO) was 9% for medical and 11% for prescription drugs for fiscal year 2008. These rates have been assumed to gradually decrease by 1% for each year until an assumed ultimate trend of 5% is reached in 2012 for medical and 2014 for prescription drugs. The healthcare cost trend rate assumption has an effect on the amounts reported. The effect of a 100 basis point increase or decrease in the assumed healthcare cost trend rate on the total service and interest cost components, and the postretirement benefit obligation was less than $1, and approximately $1, respectively, for all three years ended at June 30, 2008, 2007 and 2006.
Summarized information for the Company’s retirement income and healthcare plans at and for the fiscal year ended June 30:
| | | | | | | | | | | | | | | | |
| | | Retirement
Income | | | Retirement
Health Care | |
| | | 2008 | | | 2007 | | | 2008 | | | 2007 | |
Change in benefit obligations: | | | | | | | | | | | | | | | | |
Benefit obligation at beginning of year | | $ | 466 | | | $ | 453 | | | $ | 70 | | | $ | 77 | |
Service cost | | | 14 | | | | 11 | | | | 2 | | | | 2 | |
Interest cost | | | 28 | | | | 28 | | | | 5 | | | | 4 | |
Employee contributions to deferred compensation plans | | | 7 | | | | 5 | | | | — | | | | — | |
Actuarial (gain) loss | | | (7 | ) | | | 7 | | | | (2 | ) | | | (9 | ) |
Translation adjustment | | | 2 | | | | 1 | | | | — | | | | — | |
Benefits paid | | | (45 | ) | | | (39 | ) | | | (4 | ) | | | (4 | ) |
| | | | | | | | | | | | | | | | |
Benefit obligation at end of year | | | 465 | | | | 466 | | | | 71 | | | | 70 | |
| | | | | | | | | | | | | | | | |
Change in plan assets: | | | | | | | | | | | | | | | | |
Fair value of assets at beginning of year | | | 392 | | | | 355 | | | | — | | | | — | |
Actual return on plan assets | | | (24 | ) | | | 56 | | | | — | | | | — | |
Employer contributions to qualified and nonqualified plans | | | 14 | | | | 19 | | | | 4 | | | | 4 | |
Translation adjustment | | | 3 | | | | 1 | | | | — | | | | — | |
Benefits paid | | | (45 | ) | | | (39 | ) | | | (4 | ) | | | (4 | ) |
| | | | | | | | | | | | | | | | |
Fair value of plan assets at end of year | | | 340 | | | | 392 | | | | — | | | | — | |
| | | | | | | | | | | | | | | | |
Funded status — plan assets less than benefit obligation | | | (125 | ) | | | (74 | ) | | | (71 | ) | | | (70 | ) |
| | | | | | | | | | | | | | | | |
Accrued benefit cost | | $ | (125 | ) | | $ | (74 | ) | | $ | (71 | ) | | $ | (70 | ) |
| | | | | | | | | | | | | | | | |
Amount recognized in the balance sheets consists of: | | | | | | | | | | | | | | | | |
Pension benefit assets | | $ | 3 | | | $ | 39 | | | $ | — | | | $ | — | |
Current accrued benefit liability | | | (12 | ) | | | (10 | ) | | | (11 | ) | | | (5 | ) |
Non-current accrued benefit liability | | | (116 | ) | | | (103 | ) | | | (60 | ) | | | (65 | ) |
| | | | | | | | | | | | | | | | |
Net amount recognized | | $ | (125 | ) | | $ | (74 | ) | | $ | (71 | ) | | $ | (70 | ) |
| | | | | | | | | | | | | | | | |
Information for plans with accumulated benefit obligation (ABO) in excess of plan assets at June 30:
| | | | | | | | | | | | |
| | | Pension Plans | | Other Retirement Plans |
| | | 2008 | | 2007 | | 2008 | | 2007 |
Projected benefit obligation | | $ | 386 | | $ | 55 | | $ | 62 | | $ | 58 |
Accumulated benefit obligation | | | 374 | | | 48 | | | 62 | | | 58 |
Fair value of plan assets | | | 322 | | | — | | | — | | | — |
Page 55
NOTE 21. EMPLOYEE BENEFIT PLANS (Continued)
The ABO for pension plans was $390 and $395, respectively, at June 30, 2008 and 2007. The ABO for all retirement income plans increased by less than $1 in fiscal year 2008. The Company uses a June 30 measurement date.
Costs of the net retirement income and healthcare plans for the fiscal year ended June 30 include the following components:
| | | | | | | | | | | | | | | | | | | | | | | | |
| | | Retirement Income | | | Retirement Health Care | |
| | | 2008 | | | 2007 | | | 2006 | | | 2008 | | | 2007 | | | 2006 | |
Components of net periodic benefit cost | | | | | | | | | | | | | | | | | | | | | | | | |
Service cost | | $ | 14 | | | $ | 11 | | | $ | 12 | | | $ | 2 | | | $ | 2 | | | $ | 2 | |
Interest cost | | | 28 | | | | 28 | | | | 25 | | | | 5 | | | | 4 | | | | 4 | |
Expected return on plan assets | | | (29 | ) | | | (27 | ) | | | (27 | ) | | | — | | | | — | | | | — | |
Amortization of unrecognized items | | | 7 | | | | 9 | | | | 14 | | | | (1 | ) | | | (2 | ) | | | (1 | ) |
| | | | | | | | | | | | | | | | | | | | | | | | |
Total net periodic benefit cost | | $ | 20 | | | $ | 21 | | | $ | 24 | | | $ | 6 | | | $ | 4 | | | $ | 5 | |
| | | | | | | | | | | | | | | | | | | | | | | | |
Items not yet recognized as a component of post retirement expense as of June 30, 2008, consisted of:
| | | | | | | | |
| | | Retirement
Income | | | Retirement
Health Care | |
Prior service benefit | | $ | — | | | $ | (6 | ) |
Net actuarial loss (gain) | | | 120 | | | | (7 | ) |
Deferred income taxes | | | (45 | ) | | | 5 | |
| | | | | | | | |
Accumulated other comprehensive loss (income) | | $ | 75 | | | $ | (8 | ) |
| | | | | | | | |
Prior service benefit and net actuarial loss (gain) activity recorded in accumulated other comprehensive loss (income) for the fiscal year ended June 30, 2008, include the following:
| | | | | | | | |
| | | Retirement
Income | | | Retirement
Health Care | |
Prior service benefit at beginning of year | | $ | — | | | $ | (7 | ) |
Amortization of cost | | | — | | | | 1 | |
| | | | | | | | |
Prior service benefit at end of year | | $ | — | | | $ | (6 | ) |
| | | | | | | | |
| | |
Net actuarial loss (gain) at beginning of year | | $ | 82 | | | $ | (6 | ) |
Amortization of loss | | | (7 | ) | | | — | |
Loss (gain) during the year | | | 45 | | | | (1 | ) |
| | | | | | | | |
Net actuarial loss (gain) at end of year | | $ | 120 | | | $ | (7 | ) |
| | | | | | | | |
The Company uses the straight line amortization method for unrecognized prior service cost. In fiscal year 2009, the Company expects to recognize, on a pretax basis, approximately $1 of the prior service benefit and $2 of the net actuarial loss as a component of net periodic benefit cost.
The target allocations and weighted average asset allocations of the investment portfolio for the Company’s domestic qualified retirement income plan at June 30 are:
| | | | | | | | | |
| | | % Target
Allocation | | | % of Plan Assets
at June 30 | |
| | | | 2008 | | | 2007 | |
Asset Category | | | | | | | | | |
U.S. equity | | 50 | % | | 50 | % | | 49 | % |
International equity | | 20 | | | 20 | | | 20 | |
Fixed income | | 25 | | | 25 | | | 24 | |
Other | | 5 | | | 5 | | | 7 | |
| | | | | | | | | |
Total | | 100 | % | | 100 | % | | 100 | % |
| | | | | | | | | |
The expected long-term rate of return assumption is based on an analysis of historical experience of the portfolio and the summation of prospective returns for each asset class in proportion to the fund’s current asset allocation. During fiscal year 2008, the Company changed its discount rate assumption from the Moody’s Aa-rated long-term bond yield index to the Citigroup Pension Yield Curve, which more closely approximates the timing and cash outflows of the Company’s defined benefit payments.
Page 56
NOTE 21. EMPLOYEE BENEFIT PLANS (Continued)
The target asset allocation was determined based on the risk tolerance characteristics established for the plan and, at times, may be adjusted to achieve the Company’s overall investment objective and to minimize any concentration of investment risk. The Company’s objective is to invest plan assets in a manner that will generate resources to pay current and projected plan obligations over the life of the domestic qualified retirement income plan.
Weighted-average assumptions used to estimate the actuarial present value of benefit obligations at June 30 are as follows:
| | | | | | | | |
| | | Retirement Income | | Retirement Health Care |
| | | 2008 | | 2007 | | 2008 | | 2007 |
Benefit Obligation | | | | | | | | |
Discount rate | | | | | | | | |
Range | | 6.00% to 9.00% | | 5.50% to 6.25% | | 5.50% to 6.25% | | 5.50% to 6.25% |
Weighted average | | 6.75% | | 6.22% | | 6.69% | | 6.19% |
Rate of compensation increase | | | | | | | | |
Range | | 3.50 to 8.50% | | 3.50% to 5.50% | | n/a | | n/a |
Weighted average | | 4.19% | | 4.18% | | n/a | | n/a |
Weighted-average assumptions used to estimate the net periodic pension and other postretirement benefit costs for the fiscal years ended June 30 are as follows:
| | | | | | |
| | | Retirement Income |
| | | 2008 | | 2007 | | 2006 |
Net periodic costs | | | | | | |
Discount rate | | | | | | |
Range | | 5.50% to 6.25% | | 6.00% to 6.75% | | 5.00% to 5.25% |
Weighted average | | 6.22% | | 6.23% | | 5.01% |
Rate of compensation increase | | | | | | |
Range | | 3.50% to 5.50% | | 3.50% to 5.50% | | 3.50% to 5.50% |
Weighted average | | 4.18% | | 4.17% | | 4.17% |
Expected return on plan assets | | | | | | |
Range | | 6.25% to 8.25% | | 6.50% to 8.25% | | 6.50% to 8.25% |
Weighted average | | 8.15% | | 8.17% | | 8.18% |
| |
| | | Retirement Health Care |
| | | 2008 | | 2007 | | 2006 |
Net periodic costs | | | | | | |
Discount rate | | | | | | |
Range | | 5.50% to 6.25% | | 5.75% to 6.25% | | 5.00% to 5.25% |
Weighted average | | 6.19% | | 6.22% | | 5.01% |
Expected benefit payments for the Company’s pension and other postretirement plans are as follows:
| | | | | | |
| | | Retirement
Income | | Retirement
Health Care |
2009 | | $ | 33 | | $ | 5 |
2010 | | | 34 | | | 6 |
2011 | | | 34 | | | 6 |
2012 | | | 34 | | | 6 |
2013 | | | 38 | | | 6 |
Fiscal years 2014 — 2018 | | | 183 | | | 30 |
Expected benefit payments are based on the same assumptions used to measure the benefit obligations and include estimated future employee service.
Page 57
NOTE 21. EMPLOYEE BENEFIT PLANS (Continued)
Defined Contribution Plans
The Company has defined contribution plans for most of its domestic employees. The cost of those plans is based on the Company’s profitability and the level of participants’ deferrals qualifying for match. The plans include The Clorox Company 401(k) Plan, which has two components, a 401(k) component and a profit sharing component. Employee contributions made to the 401(k) component are partially matched with Company contributions. Company contributions to the profit sharing component above 3% of employee eligible earnings are discretionary and are based on certain Company performance targets for eligible employees. The aggregate cost of the defined contribution plans was $30, $26, and $25 in fiscal years 2008, 2007 and 2006, respectively, including $26, $21 and $21, respectively, of discretionary profit sharing contributions. The Company also has defined contribution plans for certain of its international employees. The aggregate cost of these foreign plans was $3, $3 and $2 in fiscal years 2008, 2007 and 2006, respectively.
NOTE 22. SEGMENT REPORTING
In the first quarter of fiscal year 2008, the Company realigned its operating segments due to changes in its management reporting structure. As a result, the Company operates through two operating segments: North America and International. The North America segment includes all products marketed in the United States and Canada. The International segment includes operations outside the United States and Canada. Each segment is individually managed with separate operating results that are reviewed regularly by the chief operating decision maker. Historical segment financial information presented has been revised to reflect these new operating segments.
Corporate includes certain nonallocated administrative costs, amortization of trademarks and other intangible assets, interest income, interest expense, foreign exchange gains and losses, and other nonoperating income and expense. Corporate assets include cash and cash equivalents, the Company’s headquarters and research and development facilities, information systems hardware and software, pension balances, and other investments.
Page 58
NOTE 22. SEGMENT REPORTING (Continued)
| | | | | | | | | | | | | | | |
| | | Fiscal
Year | | North
America | | International | | Corporate | | | Total
Company |
Net sales | | 2008 | | $ | 4,440 | | $ | 833 | | $ | — | | | $ | 5,273 |
| | 2007 | | | 4,130 | | | 717 | | | — | | | | 4,847 |
| | 2006 | | | 4,005 | | | 639 | | | — | | | | 4,644 |
| | | | | |
Earnings (losses) from continuing operations before income taxes | | 2008 | | | 1,211 | | | 146 | | | (664 | ) | | | 693 |
| | 2007 | | | 1,205 | | | 141 | | | (603 | ) | | | 743 |
| | 2006 | | | 1,131 | | | 129 | | | (607 | ) | | | 653 |
| | | | | |
Equity in earnings of affiliates | | 2008 | | | — | | | 8 | | | — | | | | 8 |
| | 2007 | | | — | | | 8 | | | — | | | | 8 |
| | 2006 | | | — | | | 7 | | | — | | | | 7 |
| | | | | |
Identifiable assets | | 2008 | | | 3,359 | | | 727 | | | 622 | | | | 4,708 |
| | 2007 | | | 2,256 | | | 716 | | | 609 | | | | 3,581 |
| | | | | |
Capital expenditures | | 2008 | | | 117 | | | 13 | | | 40 | | | | 170 |
| | 2007 | | | 106 | | | 10 | | | 31 | | | | 147 |
| | 2006 | | | 115 | | | 14 | | | 51 | | | | 180 |
| | | | | |
Depreciation and amortization | | 2008 | | | 119 | | | 19 | | | 67 | | | | 205 |
| | 2007 | | | 110 | | | 14 | | | 68 | | | | 192 |
| | 2006 | | | 106 | | | 16 | | | 66 | | | | 188 |
| | | | | |
Significant non-cash charges included in earnings from continuing operations before income taxes: | | | | | | | | | | | | | | | |
Asset impairment costs | | 2008 | | | 25 | | | 4 | | | — | | | | 29 |
| | 2007 | | | 4 | | | — | | | — | | | | 4 |
| | 2006 | | | — | | | — | | | — | | | | — |
| | | | | |
Share-based compensation(1) | | 2008 | | | — | | | — | | | 47 | | | | 47 |
| | 2007 | | | — | | | — | | | 49 | | | | 49 |
| | 2006 | | | — | | | — | | | 77 | | | | 77 |
(1) | Included in fiscal year 2006 were pretax charges of $25 related to non-cash historical stock option compensation expense (See Note 17). |
Included in the fiscal year 2006 Corporate segment losses from continuing operations before income taxes was a charge of $11 ($7 after-tax) related to the retirement of the former chairman and CEO from his positions. The after-tax charge includes $4 related to expected accelerated vesting of certain non-cash stock compensation and $3 in connection with expected salary continuation in accordance with the terms of the Company’s stock compensation and long-term disability plans.
Net sales to the Company’s largest customer, Wal-Mart Stores, Inc. and its affiliates, were 26% of consolidated net sales in fiscal years 2008, 2007 and 2006, and occurred primarily within the North America segment. No other customers exceeded 10% of consolidated net sales in any year. During fiscal years 2008, 2007 and 2006, the Company’s five largest customers accounted for 42%, 42% and 41% of its net sales, respectively.
The Company has two product lines that have accounted for 10% or more of total consolidated net sales during each of the past three fiscal years. In fiscal years 2008, 2007 and 2006, respectively, sales of liquid bleach represented approximately 14%, 14% and 13% of the Company’s total consolidated net sales, 11%, 12% and 11% of net sales in its North America segment and 26%, 24% and 23% of net sales in its International segment. In fiscal years 2008, 2007 and 2006, respectively, sales of trash bags represented approximately 13%, 14% and 14% of the Company’s total consolidated net sales. In fiscal years 2008, 2007 and 2006, sales of trash bags represented approximately 15% of net sales in the North America segment and approximately 4% of net sales in the International segment.
Page 59
NOTE 22. SEGMENT REPORTING (Continued)
Net sales and long-lived assets by geographic area at and for the fiscal years ended June 30 were as follows:
| | | | | | | | | | | |
| | | Fiscal
Year | | United
States | | Foreign | | Total
Company |
Net sales | | 2008 | | $ | 4,239 | | $ | 1,034 | | $ | 5,273 |
| | 2007 | | | 3,977 | | | 870 | | | 4,847 |
| | 2006 | | | 3,878 | | | 766 | | | 4,644 |
| | | | |
Long-lived assets | | 2008 | | | 834 | | | 126 | | | 960 |
| | 2007 | | | 847 | | | 129 | | | 976 |
| | 2006 | | | 887 | | | 117 | | | 1,004 |
NOTE 23. GUARANTEES
In conjunction with divestitures and other transactions, the Company may provide indemnifications relating to the enforceability of trademarks; pre-existing legal, tax, environmental and employee liabilities; as well as provisions for product returns and other items. The Company has indemnification agreements in effect that specify a maximum possible indemnification exposure. As of June 30, 2008, the Company’s aggregate maximum exposure from these agreements is $291, which consists primarily of an indemnity of up to $250 made to Henkel in connection with the Share Exchange Agreement, subject to a minimum threshold of $12 before any payments would be made. As of June 30, 2008, the Company had not made, nor does it anticipate making, any payments relating to the indemnities contained in the Share Exchange Agreement. The general representations and warranties made by the Company in connection with the Henkel Share Exchange Agreement were made to guarantee statements of fact at the time of the transaction closing and pertain to environmental, legal and other matters.
In addition to the indemnifications related to the general representations and warranties, the Company entered into an agreement with Henkel regarding certain tax matters. The Company and Henkel agreed to be responsible for each other’s taxes on the transaction if their respective actions result in a breach of certain tax representations and warranties in a manner that causes the share-exchange to fail to qualify for tax-free treatment. The Company is unable to estimate the amount of maximum potential liability relating to the tax indemnification but notes that the tax exposure, if any, could be very significant. Any exposure under the agreement would be limited to taxes assessed prior to the expiration of the statute of limitations period for assessing taxes on the share exchange transaction.
During the first quarter of fiscal year 2008, the Company entered into an agreement with the IRS, agreeing to the tax-free treatment of the share exchange transaction. Henkel has advised the Company that the IRS has completed its audit of Henkel’s U.S. group’s federal income tax return for the year in which the share exchange transaction took place and did not propose any adjustments to Henkel’s tax-free treatment of the share exchange transaction. Thus, while the statutes of limitations permitting IRS assessment of tax against the Company and Henkel with respect to the share exchange transaction remain open, it appears likely that the tax-free treatment of the exchange transaction will be sustained.
The Company is a party to letters of credit of $21, primarily related to one of its insurance carriers.
The Company has not recorded any liabilities on any of the aforementioned guarantees at June 30, 2008.
Page 60
NOTE 24. UNAUDITED QUARTERLY DATA
| | | | | | | | | | | | | | | |
| | | Quarters Ended |
| | | September 30 | | December 31 | | March 31 | | June 30 | | Total Year |
Fiscal year ended June 30, 2008 | | | | | | | | | | | | | | | |
Net sales | | $ | 1,239 | | $ | 1,186 | | $ | 1,353 | | $ | 1,495 | | $ | 5,273 |
| | | | | | | | | | | | | | | |
Cost of products sold | | $ | 711 | | $ | 707 | | $ | 815 | | $ | 865 | | $ | 3,098 |
| | | | | | | | | | | | | | | |
Net earnings | | $ | 111 | | $ | 92 | | $ | 100 | | $ | 158 | | $ | 461 |
| | | | | | | | | | | | | | | |
Per common share: | | | | | | | | | | | | | | | |
Net earnings | | | | | | | | | | | | | | | |
Basic | | $ | 0.77 | | $ | 0.66 | | $ | 0.72 | | $ | 1.15 | | $ | 3.30 |
Diluted | | | 0.76 | | | 0.65 | | | 0.71 | | | 1.13 | | | 3.24 |
Dividends declared per common share | | $ | 0.40 | | $ | 0.40 | | $ | 0.40 | | $ | 0.46 | | $ | 1.66 |
Market price (NYSE) | | | | | | | | | | | | | | | |
High | | $ | 65.68 | | $ | 66.90 | | $ | 65.25 | | $ | 59.80 | | $ | 66.90 |
Low | | | 56.22 | | | 60.46 | | | 55.37 | | | 51.60 | | | 51.60 |
Year-end | | | | | | | | | | | | | | | 55.20 |
| | | | | |
Fiscal year ended June 30, 2007 | | | | | | | | | | | | | | | |
Net sales | | $ | 1,161 | | $ | 1,101 | | $ | 1,241 | | $ | 1,344 | | $ | 4,847 |
| | | | | | | | | | | | | | | |
Cost of products sold | | $ | 663 | | $ | 639 | | $ | 704 | | $ | 750 | | $ | 2,756 |
| | | | | | | | | | | | | | | |
Earnings from continuing operations | | $ | 112 | | $ | 91 | | $ | 129 | | $ | 164 | | $ | 496 |
Earnings from discontinued operations | | | — | | | 5 | | | — | | | — | | | 5 |
| | | | | | | | | | | | | | | |
Net earnings | | $ | 112 | | $ | 96 | | $ | 129 | | $ | 164 | | $ | 501 |
| | | | | | | | | | | | | | | |
Per common share: | | | | | | | | | | | | | | | |
Net earnings | | | | | | | | | | | | | | | |
Basic | | | | | | | | | | | | | | | |
Continuing operations | | $ | 0.74 | | $ | 0.60 | | $ | 0.85 | | $ | 1.08 | | $ | 3.28 |
Discontinued operations | | | — | | | 0.03 | | | — | | | — | | | 0.03 |
| | | | | | | | | | | | | | | |
Net earnings | | $ | 0.74 | | $ | 0.63 | | $ | 0.85 | | $ | 1.08 | | $ | 3.31 |
| | | | | | | | | | | | | | | |
Diluted | | | | | | | | | | | | | | | |
Continuing operations | | $ | 0.73 | | $ | 0.59 | | $ | 0.84 | | $ | 1.07 | | $ | 3.23 |
Discontinued operations | | | — | | | 0.03 | | | — | | | — | | | 0.03 |
| �� | | | | | | | | | | | | | | |
Net earnings | | $ | 0.73 | | $ | 0.62 | | $ | 0.84 | | $ | 1.07 | | $ | 3.26 |
| | | | | | | | | | | | | | | |
Dividends declared per common share | | $ | 0.29 | | $ | 0.31 | | $ | 0.31 | | $ | 0.40 | | $ | 1.31 |
Market price (NYSE) | | | | | | | | | | | | | | | |
High | | $ | 64.16 | | $ | 66.00 | | $ | 67.50 | | $ | 69.36 | | $ | 69.36 |
Low | | | 56.17 | | | 62.83 | | | 60.96 | | | 61.38 | | | 56.17 |
Year-end | | | | | | | | | | | | | | | 62.10 |
Page 61
MANAGEMENT’S REPORT ON INTERNAL CONTROL OVER FINANCIAL REPORTING
The Company’s management is responsible for establishing and maintaining adequate internal control over financial reporting. The Company’s internal control over financial reporting is a process designed under the supervision of its Chief Executive Officer and Chief Financial Officer to provide reasonable assurance regarding the reliability of financial reporting and the preparation of the Company’s financial statements for external reporting in accordance with accounting principles generally accepted in the United States of America. A company’s internal control over financial reporting includes those policies and procedures that pertain to the maintenance of records that, in reasonable detail, accurately and fairly reflect the transactions and dispositions of the assets of the company; provide reasonable assurance that transactions are recorded as necessary to permit preparation of financial statements in accordance with generally accepted accounting principles, and that receipts and expenditures of the company are being made only in accordance with authorizations of management and directors of the company; and provide reasonable assurance regarding prevention or timely detection of unauthorized acquisition, use, or disposition of the company’s assets that could have a material effect on the financial statements.
Because of its inherent limitations, internal control over financial reporting may not prevent or detect misstatements. Also, projections of any evaluation of effectiveness to future periods are subject to the risk that controls may become inadequate because of changes in conditions or that the degree of compliance with the policies or procedures may deteriorate.
Management evaluated the effectiveness of the Company’s internal control over financial reporting using the criteria set forth by the Committee of Sponsoring Organizations of the Treadway Commission (COSO) inInternal Control — Integrated Framework. Management, under the supervision and with the participation of the Company’s Chief Executive Officer and Chief Financial Officer, assessed the effectiveness of the Company’s internal control over financial reporting at June 30, 2008 and concluded that it is effective.
The Company’s independent registered public accounting firm, Ernst & Young LLP has audited the effectiveness of the Company’s internal control over financial reporting as of June 30, 2008.
Page 62
REPORT OF INDEPENDENT REGISTERED PUBLIC ACCOUNTING FIRM
The Board of Directors and Stockholders of The Clorox Company
We have audited the accompanying consolidated balance sheets of The Clorox Company as of June 30, 2008 and 2007, and the related consolidated statements of earnings, stockholders’ equity, and cash flows for each of the three years in the period ended June 30, 2008. Our audits also included the financial statement schedule in Exhibit 99.2. These financial statements and schedule are the responsibility of the Company’s management. Our responsibility is to express an opinion on these financial statements and schedule based on our audits.
We conducted our audits in accordance with the standards of the Public Company Accounting Oversight Board (United States). Those standards require that we plan and perform the audit to obtain reasonable assurance about whether the financial statements are free of material misstatement. An audit includes examining, on a test basis, evidence supporting the amounts and disclosures in the financial statements. An audit also includes assessing the accounting principles used and significant estimates made by management, as well as evaluating the overall financial statement presentation. We believe that our audits provide a reasonable basis for our opinion.
In our opinion, the financial statements referred to above present fairly, in all material respects, the consolidated financial position of The Clorox Company at June 30, 2008 and 2007, and the consolidated results of its operations and its cash flows for each of the three years in the period ended June 30, 2008, in conformity with U.S. generally accepted accounting principles. Also, in our opinion, the related financial statement schedule, when considered in relation to the basic financial statements taken as a whole, presents fairly in all material respects the information set forth therein.
As discussed in the Notes to the consolidated financial statements, on July 1, 2007, the Company changed its method of accounting for uncertain tax positions upon adoption of Financial Accounting Standards Board Interpretation No. 48,Accounting for Uncertainty in Income Taxes. Also, as discussed in the Notes to the consolidated financial statements, on June 30, 2007, the Company adopted the provisions of SFAS No. 158,Employers’ Accounting for Defined Benefit Pension and Other Postretirement Plans, and changed its method of recognizing the funded status of its defined benefit post retirement plans.
We also have audited, in accordance with the standards of the Public Company Accounting Oversight Board (United States), The Clorox Company’s internal control over financial reporting as of June 30, 2008, based on criteria established in Internal Control-Integrated Framework issued by the Committee of Sponsoring Organizations of the Treadway Commission and our report dated August 18, 2008 expressed an unqualified opinion thereon.
/s/ Ernst & Young LLP
San Francisco, California
August 18, 2008
Page 63
REPORT OF INDEPENDENT REGISTERED PUBLIC ACCOUNTING FIRM
The Board of Directors and Stockholders of The Clorox Company
We have audited The Clorox Company’s internal control over financial reporting as of June 30, 2008 based on criteria established in Internal Control—Integrated Framework issued by the Committee of Sponsoring Organizations of the Treadway Commission (the COSO criteria). The Clorox Company’s management is responsible for maintaining effective internal control over financial reporting, and for its assessment of the effectiveness of internal control over financial reporting included in the accompanying Management’s Report on Internal Control Over Financial Reporting. Our responsibility is to express an opinion on the company’s internal control over financial reporting based on our audit.
We conducted our audit in accordance with the standards of the Public Company Accounting Oversight Board (United States). Those standards require that we plan and perform the audit to obtain reasonable assurance about whether effective internal control over financial reporting was maintained in all material respects. Our audit included obtaining an understanding of internal control over financial reporting, assessing the risk that a material weakness exists, testing and evaluating the design and operating effectiveness of internal control based on the assessed risk, and performing such other procedures as we considered necessary in the circumstances. We believe that our audit provides a reasonable basis for our opinion.
A company’s internal control over financial reporting is a process designed to provide reasonable assurance regarding the reliability of financial reporting and the preparation of financial statements for external purposes in accordance with generally accepted accounting principles. A company’s internal control over financial reporting includes those policies and procedures that (1) pertain to the maintenance of records that, in reasonable detail, accurately and fairly reflect the transactions and dispositions of the assets of the company; (2) provide reasonable assurance that transactions are recorded as necessary to permit preparation of financial statements in accordance with generally accepted accounting principles, and that receipts and expenditures of the company are being made only in accordance with authorizations of management and directors of the company; and (3) provide reasonable assurance regarding prevention or timely detection of unauthorized acquisition, use, or disposition of the company’s assets that could have a material effect on the financial statements.
Because of its inherent limitations, internal control over financial reporting may not prevent or detect misstatements. Also, projections of any evaluation of effectiveness to future periods are subject to the risk that controls may become inadequate because of changes in conditions, or that the degree of compliance with the policies or procedures may deteriorate.
In our opinion, The Clorox Company maintained, in all material respects, effective internal control over financial reporting as of June 30, 2008 based on the COSO criteria.
We also have audited, in accordance with the standards of the Public Company Accounting Oversight Board (United States), the consolidated balance sheets of The Clorox Company as of June 30, 2008 and 2007, and the related consolidated statements of earnings, stockholders’ equity, and cash flows for each of the three years in the period ended June 30, 2008 of The Clorox Company and our report dated August 18, 2008 expressed an unqualified opinion thereon.
/s/ Ernst & Young LLP
San Francisco, California
August 18, 2008
Page 64
FIVE-YEAR FINANCIAL SUMMARY
The Clorox Company
| | | | | | | | | | | | | | | |
| | | Years ended June 30 |
Dollars in millions, except share data | | 2008 (1) | | 2007 (3)(4) | | 2006 (2)(4) | | 2005 (3)(4) | | 2004 (4) |
OPERATIONS | | | | | | | | | | | | | | | |
Net sales | | $ | 5,273 | | $ | 4,847 | | $ | 4,644 | | $ | 4,388 | | $ | 4,162 |
Gross profit | | | 2,175 | | | 2,091 | | | 1,959 | | | 1,895 | | | 1,831 |
Earnings from continuing operations | | $ | 461 | | $ | 496 | | $ | 443 | | $ | 517 | | $ | 490 |
Earnings from discontinued operations | | | — | | | 5 | | | 1 | | | 579 | | | 59 |
| | | | | | | | | | | | | | | |
Net earnings | | $ | 461 | | $ | 501 | | $ | 444 | | $ | 1,096 | | $ | 549 |
| | | | | | | | | | | | | | | |
| | | | | |
COMMON STOCK | | | | | | | | | | | | | | | |
Earnings per share | | | | | | | | | | | | | | | |
Continuing operations | | | | | | | | | | | | | | | |
Basic | | $ | 3.30 | | $ | 3.28 | | $ | 2.94 | | $ | 2.92 | | $ | 2.31 |
Diluted | | | 3.24 | | | 3.23 | | | 2.89 | | | 2.88 | | | 2.28 |
Dividends declared per share | | $ | 1.66 | | $ | 1.31 | | $ | 1.15 | | $ | 1.11 | | $ | 1.35 |
| | | | | |
OTHER DATA | | | | | | | | | | | | | | | |
Total assets | | $ | 4,708 | | $ | 3,581 | | $ | 3,521 | | $ | 3,546 | | $ | 3,739 |
Long-term debt | | | 2,720 | | | 1,462 | | | 1,966 | | | 2,122 | | | 475 |
| (1) | In fiscal year 2008, the Company acquired Burt’s Bees Inc. for an aggregate price of $913 excluding $25 for tax benefits associated with the acquisition. In addition, the Company entered into an accelerated share repurchase agreement under which it repurchased 12 million of its shares for an aggregate price of $750. |
| (2) | In fiscal year 2006, the Company began recording compensation expense associated with stock options and other forms of equity compensation in accordance with Statement of Financial Accounting Standards (SFAS) No. 123-R,Share-Based Payment, as interpreted by Securities and Exchange Commission Staff Accounting Bulletin No. 107. |
| (3) | In fiscal year 2005, the Company completed the exchange of its ownership interest in a subsidiary for Henkel KGaA’s interest in Clorox common stock. In fiscal year 2003, the Company announced its intent to sell its business in Brazil, closed its offices in Brazil, and sold nearly all of the remaining assets of this business; in fiscal year 2007, the Company sold certain assets remaining from its discontinued operation in Brazil. |
| (4) | Total assets balances reflect a reclassification of certain indefinite-lived intangible assets to goodwill to properly reflect the classification of the assets in accordance with SFAS No. 141,Business Combinations. The net impact due to deferred tax assets arising from the change in classification was a reduction in total assets by $85, $95, $71 and $95 for fiscal years 2007, 2006, 2005 and 2004, respectively. |
Page 65