UNITED STATES
SECURITIES AND EXCHANGE COMMISSION
Washington, D.C. 20549
FORM N-CSR
CERTIFIED SHAREHOLDER REPORT OF REGISTERED
MANAGEMENT INVESTMENT COMPANIES
Investment Company Act file number | 811-01829 | |||||||
| ||||||||
Columbia Acorn Trust | ||||||||
(Exact name of registrant as specified in charter) | ||||||||
| ||||||||
One Financial Center, Boston, Massachusetts |
| 02111 | ||||||
(Address of principal executive offices) |
| (Zip code) | ||||||
| ||||||||
James R. Bordewick, Jr., Esq. Columbia Management Advisors, LLC One Financial Center Boston, MA 02111 | ||||||||
(Name and address of agent for service) | ||||||||
| ||||||||
Registrant’s telephone number, including area code: | 1-617-426-3750 |
| ||||||
| ||||||||
Date of fiscal year end: | December 31, 2006 |
| ||||||
| ||||||||
Date of reporting period: | December 31, 2006 |
| ||||||
Form N-CSR is to be used by management investment companies to file reports with the Commission not later than 10 days after the transmission to stockholders of any report that is required to be transmitted to stockholders under Rule 30e-1 under the Investment Company Act of 1940 (17 CFR 270.30e-1). The Commission may use the information provided on Form N-CSR in its regulatory, disclosure review, inspection, and policymaking roles.
A registrant is required to disclose the information specified by Form N-CSR, and the Commission will make this information public. A registrant is not required to respond to the collection of information contained in Form N-CSR unless the Form displays a currently valid Office of Management and Budget (“OMB”) control number. Please direct comments concerning the accuracy of the information collection burden estimate and any suggestions for reducing the burden to Secretary, Securities and Exchange Commission, 450 Fifth Street, NW, Washington, DC 20549-0609. The OMB has reviewed this collection of information under the clearance requirements of 44 U.S.C. § 3507.
Item 1. Reports to Stockholders.

4Q
Columbia Acorn
Family of Funds
Class Z Shares
Annual Report
December 31, 2006
n ColumbiaTM
Acorn® Fund
n ColumbiaTM
Acorn International®
n ColumbiaTM
Acorn USA®
n ColumbiaTM
Acorn International SelectSM
n ColumbiaTM
Acorn SelectSM
n ColumbiaTM
Thermostat FundSM
Managed by Columbia Wanger Asset Management, L.P.
NOT FDIC INSURED
May Lose Value
No Bank Guarantee
The views expressed in the "Letter to Shareholders," "Squirrel Chatter II" and "In a Nutshell" commentary reflect the current views of the respective authors. These views are not guarantees of future performance and involve certain risks, uncertainties and assumptions that are difficult to predict so actual outcomes and results may differ significantly from the views expressed. These views are subject to change at any time based upon economic, market or other conditions and the respective parties disclaim any responsibility to update such views. These views may not be relied on as investment advice and, because investment decisions for a Columbia Acorn Fund are based on numerous factors, may not be relied on as an indication of trading intent on behalf of any particular Columbia Acorn Fund. References to specific company securities should not be construed as a recommendation or investment advice.
Letter to Shareholders from the
Columbia Acorn Trust Board of Trustees
The Trustees of the Columbia Acorn Trust are pleased to present this 2006 annual report to shareholders of the Columbia Acorn Family of Funds ("Acorn Funds").
Your Trustees have a fiduciary responsibility to govern the Acorn Funds solely for the purpose intended by their shareholders. That means overseeing the responsiveness of our service providers to the needs and interests of shareholders. Accordingly, our most critical tasks are to evaluate and select service providers and focus on their performance and accountability.
Shareholders of the Acorn Funds have received investment advisory services from Columbia Wanger Asset Management ("CWAM") and its predecessors for many years. Although ownership of CWAM has changed over recent years and CWAM is now owned by the Bank of America ("BOA"), we believe that the critical components required to provide strong investment performance have remained substantially intact at CWAM with the full support of your independent trustees.1 We monitor investment performance throughout the year and annually take a fresh look at the relationships with our service providers with a diligent review and negotiations to assure that our agreements for the next year are responsive to the rights and expectations of shareholders. We are pleased to report that we renewed our in vestment advisory agreement with CWAM for the year ending July 31, 2007.
Expenses paid by the Acorn Funds reduce your total investment returns. Your Trustees are sensitive to the relative importance of fund expenses to shareholders, and we diligently review those expenses on a regular basis. You should note that total expenses of most share classes of each Acorn Fund, expressed as a percentage of the Fund's net assets, declined again in 2006, continuing a trend of recent years. For the Thermostat Fund, total expenses used for this comparison included expenses incurred by the Fund from underlying portfolio funds. The one exception to a decrease in 2006 was the Class Z shares of Columbia Acorn Fund, which had an expense ratio that was unchanged from the prior year.
Your Trustees acted on other matters during the past year. We raised the minimum initial investment for new shareholders in Columbia Acorn International, Columbia Acorn International Select and Columbia Thermostat to $2,500. (The other Funds already had higher minimums.) We negotiated new breakpoints in the investment advisory fee rates above current asset levels for Columbia Acorn USA and Columbia Acorn Select to provide for a greater sharing of economies of scale as future asset growth occurs. We negotiated a new transfer agency and shareholder servicing agreement that has changed the cost of transfer agency services. The fees for those services now cover all sub-transfer agency services provided by financial intermediaries, and Columbia Management Services will no longer waive its right to reimbursement by the Funds for its out-of-pocket expenses. The new agreement will be fully implemented on April 1, 2007 and is estimated t o result in a change of fees paid by shareholders of various share classes in each fund ranging from some decreases to increases up to approximately three basis points. We also reduced the annual rate of Rule 12b-1 fees for Class B shares in all funds from 85 to 75 basis points effective August 1, 2006.
As reported in prior years, we have been waiting for a final determination by an Independent Distribution Consultant ("IDC") on distributions to shareholders of certain Acorn Funds arising from the 2004 settlement of regulatory proceedings involving BOA. Your Board of Trustees has monitored the IDC's process of developing the distribution plan, and we have made recommendations. We recently have been advised that the approval of a definitive plan of distribution is imminent and, based on that information, we expect certain shareholders of Columbia Acorn International Fund and Columbia Acorn International Select Fund to receive distributions. Rust
Consulting (a separate entity not affiliated with BOA) has been engaged to administer the distributions. Rust Consulting will be sending checks and related information to those shareholders who are eligible to receive payments once the plan of distribution is approved.
We are pleased to report that two new independent trustees were elected to the Board during the past year: James A. Star and Patricia H. Werhane. They have impressive backgrounds and experience suited for our Board, and we believe shareholders will benefit from their contributions.
On September 26, 2006 CWAM and the Board held an annual shareholder information meeting in Chicago. The objective of the annual shareholder meeting is to provide information about the investment process and an opportunity to interact with the investment managers of CWAM. The meeting was available on telephone replay for those who could not attend. Next year, in an attempt to increase shareholder attendance, we are considering holding the meeting at a different time of day. We also are exploring other electronic alternatives to make the information available for shareholders who do not reside in Chicago and cannot attend in person. We hope you will take advantage of this opportunity to learn more about the professional managers of CWAM and how your money is managed.
Thank you for your confidence in the Acorn Funds.

Robert E. Nason
Independent Chairman of the Board of Trustees
Columbia Acorn Trust
1 Past performance is no guarantee of future results. The investment return and principal value will fluctuate so that shares may be worth more or less than the original cost. Please consider the investment objectives, risks, charges and expenses of the Acorn Funds carefully before investing.
Columbia Acorn Family of Funds
Table of Contents
| Performance At A Glance | 2 | ||||||
| Squirrel Chatter II Small Caps: The Dilbert Antidote | 3 | ||||||
| Understanding Your Expenses | 6 | ||||||
| Columbia Acorn Fund | |||||||
| In a Nutshell | 8 | ||||||
| At a Glance | 9 | ||||||
| Major Portfolio Changes | 20 | ||||||
| Statement of Investments | 22 | ||||||
| Columbia Acorn International | |||||||
| In a Nutshell | 10 | ||||||
| At a Glance | 11 | ||||||
| Major Portfolio Changes | 33 | ||||||
| Statement of Investments | 35 | ||||||
| Portfolio Diversification | 41 | ||||||
| Columbia Acorn USA | |||||||
| In a Nutshell | 12 | ||||||
| At a Glance | 13 | ||||||
| Major Portfolio Changes | 42 | ||||||
| Statement of Investments | 43 | ||||||
| Columbia Acorn International Select | |||||||
| In a Nutshell | 14 | ||||||
| At a Glance | 15 | ||||||
| Major Portfolio Changes | 49 | ||||||
| Statement of Investments | 50 | ||||||
| Portfolio Diversification | 53 | ||||||
| Columbia Acorn Select | |||||||
| In a Nutshell | 16 | ||||||
| At a Glance | 17 | ||||||
| Major Portfolio Changes | 54 | ||||||
| Statement of Investments | 55 | ||||||
| Columbia Thermostat Fund | |||||||
| In a Nutshell | 18 | ||||||
| At a Glance | 19 | ||||||
| Statement of Investments | 58 | ||||||
| Columbia Acorn Family of Funds | |||||||
| Statements of Assets and Liabilities | 60 | ||||||
| Statements of Operations | 61 | ||||||
| Statements of Changes in Net Assets | 62 | ||||||
| Financial Highlights | 66 | ||||||
| Notes to Financial Statements | 68 | ||||||
| Report of Independent Registered Public Accounting Firm | 76 | ||||||
| Unaudited Information | 77 | ||||||
| Management Fee Evaluation of the Senior Officer | 78 | ||||||
| Board Approval of the Advisory Agreements | 83 | ||||||
| Board of Trustees and Management of Columbia Acorn Funds | 86 | ||||||
| Columbia Acorn Family of Funds Information | 89 | ||||||
2006 Year-End Distributions
The following table details the Funds' year-end distributions. The record date for all Funds except Columbia Thermostat Fund was December 7, 2006. The ex-dividend date was December 8, 2006, and the payable date was December 11, 2006. For Columbia Thermostat Fund, the record date was December 21, 2006. The ex-dividend date was December 22, 2006, and the payable date was December 26, 2006. Columbia Acorn International Select did not have any year-end distributions.
| Short-term Capital Gains | Long-term Capital Gains | Ordinary Income | Reinvestment Price | ||||||||||||||||
| Columbia Acorn Fund | $ | 0.0792 | $ | 1.9924 | $ | 0.1263 | $ | 29.82 | |||||||||||
| Columbia Acorn International | None | $ | 3.3557 | $ | 0.4317 | $ | 38.80 | ||||||||||||
| Columbia Acorn USA | None | $ | 0.5052 | None | $ | 28.96 | |||||||||||||
| Columbia Acorn Select | None | $ | 0.4991 | None | $ | 26.15 | |||||||||||||
| Columbia Thermostat Fund | $ | 0.0558 | $ | 0.4201 | $ | 0.4954 | $ | 12.53 | |||||||||||
1
Columbia Acorn Family of Funds
Performance At A Glance Class Z Average Annual Total Returns through 12/31/06
| NAV on 12/31/06 | 4th quarter* | 1 year | 3 years | 5 years | 10 years | Life of Fund | |||||||||||||||||||||||||
| Columbia (ACRNX) Acorn Fund (6/10/70) | $ | 29.71 | 7.66 | % | 14.45 | % | 16.30 | % | 14.71 | % | 15.16 | % | 16.30 | % | |||||||||||||||||
| Russell 2500 | 8.70 | % | 16.17 | % | 14.10 | % | 12.19 | % | 11.26 | % | NA | ||||||||||||||||||||
| S&P 500 | 6.70 | % | 15.79 | % | 10.44 | % | 6.19 | % | 8.42 | % | 11.98 | % | |||||||||||||||||||
| Lipper Small-Cap Core Funds Index | 8.07 | % | 13.70 | % | 13.12 | % | 10.50 | % | 10.32 | % | NA | ||||||||||||||||||||
| Lipper Mid-Cap Core Funds Index | 7.15 | % | 13.44 | % | 12.75 | % | 10.10 | % | 10.69 | % | NA | ||||||||||||||||||||
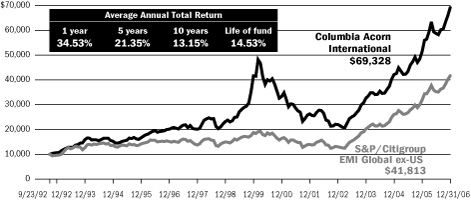
| Columbia (ACINX) Acorn International (9/23/92) | $ | 40.31 | 14.45 | % | 34.53 | % | 28.50 | % | 21.35 | % | 13.15 | % | 14.53 | % | |||||||||||||||||
| S&P/Citigroup EMI Global ex-US | 13.79 | % | 30.83 | % | 27.31 | % | 24.39 | % | 10.65 | % | 10.54 | % | |||||||||||||||||||
| MSCI EAFE | 10.35 | % | 26.34 | % | 19.93 | % | 14.98 | % | 7.71 | % | 8.91 | % | |||||||||||||||||||
| Lipper Int'l Small-Cap Funds Index | 13.68 | % | 28.06 | % | 27.09 | % | 23.99 | % | 13.34 | % | NA | ||||||||||||||||||||
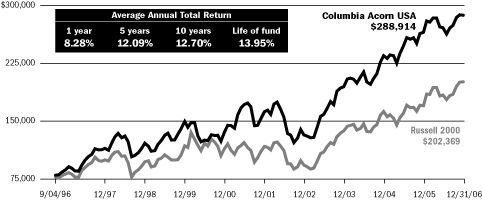
| Columbia (AUSAX) Acorn USA (9/4/96) | $ | 28.66 | 4.78 | % | 8.28 | % | 13.85 | % | 12.09 | % | 12.70 | % | 13.95 | % | |||||||||||||||||
| Russell 2000 | 8.90 | % | 18.37 | % | 13.56 | % | 11.39 | % | 9.44 | % | 10.09 | % | |||||||||||||||||||
| Lipper Small-Cap Core Funds Index | 8.07 | % | 13.70 | % | 13.12 | % | 10.50 | % | 10.32 | % | 10.83 | % | |||||||||||||||||||
| S&P 500 | 6.70 | % | 15.79 | % | 10.44 | % | 6.19 | % | 8.42 | % | 9.50 | % | |||||||||||||||||||
| Columbia (ACFFX) Acorn Int'l Select (11/23/98) | $ | 27.97 | 13.06 | % | 36.27 | % | 25.19 | % | 18.81 | % | NA | 14.07 | % | ||||||||||||||||||
| S&P/Citigroup World ex-US Cap Range $2-10B | 11.32 | % | 27.88 | % | 24.45 | % | 21.24 | % | NA | 12.81 | % | ||||||||||||||||||||
| MSCI EAFE | 10.35 | % | 26.34 | % | 19.93 | % | 14.98 | % | NA | 7.45 | % | ||||||||||||||||||||
| Lipper International Funds Index | 10.55 | % | 25.89 | % | 19.98 | % | 15.14 | % | NA | 8.66 | % | ||||||||||||||||||||
| Columbia (ACTWX) Acorn Select (11/23/98) | $ | 26.59 | 10.51 | % | 19.68 | % | 16.38 | % | 13.67 | % | NA | 15.30 | % | ||||||||||||||||||
| S&P MidCap 400 | 6.99 | % | 10.32 | % | 13.09 | % | 10.89 | % | NA | 11.94 | % | ||||||||||||||||||||
| Lipper Mid-Cap Growth Index | 7.71 | % | 11.02 | % | 11.53 | % | 6.09 | % | NA | 7.23 | % | ||||||||||||||||||||
| S&P 500 | 6.70 | % | 15.79 | % | 10.44 | % | 6.19 | % | NA | 4.10 | % | ||||||||||||||||||||
| Columbia (COTZX) Thermostat Fund (9/25/02)† | $ | 12.57 | 4.11 | % | 10.86 | % | 8.48 | % | NA | NA | 11.51 | % | |||||||||||||||||||
| S&P 500 | 6.70 | % | 15.79 | % | 10.44 | % | NA | NA | 15.81 | % | |||||||||||||||||||||
| Lehman Brothers U.S. Credit Intermediate Bond Index | 1.27 | % | 4.49 | % | 3.32 | % | NA | NA | 4.68 | % | |||||||||||||||||||||
| Lipper Flexible Portfolio Funds Index | 5.99 | % | 12.77 | % | 9.51 | % | NA | NA | 13.38 | % | |||||||||||||||||||||
*Not annualized.
The Funds are listed under "Columbia" in the financial press.
Performance data quoted represents past performance and current performance may be lower or higher. Past performance is no guarantee of future results. The investment return and principal value of an investment in a Fund will fluctuate so that Fund shares, when redeemed, may be worth more or less than their original cost. Please visit columbiafunds.com for daily and most recent month-end updates. Net asset value (NAV) returns do not include sales charges or contingent deferred sales charges (CDSC). Class Z shares are sold only at NAV with no Rule 12b-1 fee. Class Z shares have limited eligibility and the investment minimum requirement may vary. Please see the Funds' prospectuses for details.
Performance may reflect any voluntary waivers or reimbursements of fund expenses by the advisor or its affiliates. Absent these waivers, or reimbursement arrangements, performance results may be lower.
†A "fund of funds" bears its allocable share of the costs and expenses of the underlying funds in which it invests. Such funds are thus subject to two levels of fees and potentially higher expense ratios than would be associated with an investment in an investment fund that invests and trades directly in financial instruments under the direction of a single manager.
Description of indexes: S&P 500 is a broad, market-weighted average of 500 U.S. blue-chip company stock's performance. S&P MidCap 400 is a broad market-weighted index of 400 stocks that are in the next size/tier down from the S&P 500. Russell 2000 is a market-weighted index of 2000 smaller U.S. companies, formed by taking the largest 3,000 companies and eliminating the largest 1,000. Russell 2500 is the smallest 2,500 U.S. companies from this same group. S&P/Citigroup EMI Global ex-US is the bottom 20% of institutionally investable capital of developed and emerging (after 9/30/1994) countries, selected by the index sponsor, outside the U.S. MSCI EAFE is Morgan Stanley's Europe, Australasia and Far East Index, a widely recognized international benchmark that comprises 20 major markets in proportion to world stock market capitalization. S&P/Citigroup World ex-US Cap Range $2–10B is a subset of the broad market selected by the index sponsor rep resenting the mid-cap developed market excluding the U.S. Lipper Indexes include the largest funds tracked by Lipper, Inc. in the named category. Lipper Mid-Cap Growth Index, 30 mid-cap growth funds; Lipper Mid-Cap Core Funds Index, 30 mid-cap core funds; Lipper International Funds Index, 30 largest non-U.S. funds, not including non-U.S. small-cap funds; Lipper International Small-Cap Funds Index, 10 largest non-U.S. funds investing in small-cap companies, including Columbia Acorn International; Lipper Small-Cap Core Funds Index, 30 largest small-cap core funds, including Columbia Acorn Fund. Lipper Flexible Portfolio Funds Index is an equal dollarweighted index of the 30 largest mutual funds within the Flexible Portfolio fund classification, as defined by Lipper. Lehman Brothers U.S. Credit Intermediate Bond Index is the inte rmediate component of the U.S. Credit Index. The U.S. Credit Index includes publicly issued U.S. corporate and foreign debentures and secured notes that meet specified maturity, liquidity, and quality requirements. All indexes are unmanaged and returns include reinvested distributions. It is not possible to invest directly in an index.
2
Squirrel Chatter II
Small Caps: The Dilbert Antidote
 Small Caps vs. Large Caps
Small caps edged out large caps in 2006. The Russell 2500 Index appreciated 16.17%, barely more than the S&P 500's 15.79% return, but enough to keep the domestic small-cap winning streak intact.
Our data indicates that the current small-cap cycle began in March 1999. From the end of March 1999 through year-end 2006, the small-cap Russell 2500 Index returned a total of 144.40%, or 12.22% annually. In contrast, the large-cap S&P 500 Index gained 24.69%, or 2.89% annually.
Why have small caps beaten large caps so much for such a long cycle? By many measures, small caps were at 20-year record low relative valuations at the start of the cycle. In contrast, many large caps then seemed very expensive and of course the "bubble" did deflate starting in the first quarter of 2000.
Small-cap earnings growth also helps explain stock performance. Since the beginning of the March 1999 cycle, Russell 2500 Index earnings per share were up 11.11% annually, while large-cap S&P 500 Index earnings were up 7.10% annually. A combination of cheap stocks and faster earnings growth often provides superior investment results.
In the Funds' 2005 third quarter report to shareholders, I expressed concerns about small-cap valuations. I was perhaps early or maybe just plain wrong. As a firm, we remain cautious, but note that there seems to be no "small-cap mania" or other obvious warning signal for the imminent end of the small-cap cycle. It has become more challenging to find small companies at reasonable prices, but when we see opportunities, we try to take them. For instance, many smaller stocks declined last summer while we believed the business environment was healthy. In September 2006 we took advantage of the slump and added to some of our domestic names at what we thought were good prices.
Small caps have also outperformed over the very long run. The Russell 2500 Index goes back only to 1978, but scholars have linked other time series to derive small- and large-cap performance numbers since 1926.1 From the beginning of 1926 until year-end 2006, small caps returned 12.32% annually while large caps had annual returns of 10.43%. The difference of 1.89% per year may not sound like much, but when compounded over 81 years it makes an enormous difference. A $1,000 investment in small caps would have appreciated to $12,195,329, while the same amount in large caps would have grown to "only" $3,088,420.2
Why have small caps clobbered large caps over the very long term? It seems that many large companies have had problems. We are all aware when a large company such as Enron has a sudden and dramatic collapse. It's big news (kind of like the Hindenburg disaster). But a substantial number of other large companies have more gradually lost market dominance and have provided poor returns to shareholders for years.
At the beginning of the 20th century, United States Steel was the largest stock on the New York Stock Exchange (NYSE). The company fell so far near the end of the century that it was added into the Russell 2500 Index. (As it recovered it was a major upside driver to the benchmark until it graduated out in June 2006.) More recently Kodak, General Motors and Sears spent at least one year between 1966 and 1971 among the top five NYSE capitalization companies. They now do not even rank among the top 300.3 These sorts of declines merit further analysis.
From the Desk of Dilbert
Since we are students of smaller companies, when considering reasons for large company declines, we need to turn to experts on large companies. Scott Adams, in his book, The Dilbert Principle, points out that he worked for a large company for seventeen years. He writes, "Most business books are written by consultants and professors who haven't spent much time in a cubicle."4
3
Adams parodies the experiences of employees and management of large companies. He makes his money writing comic strips on the topic. In Dilbert's world his company is a politicized bureaucracy populated by stupid, arrogant managers who do not value employees or customers. His boss is every employee's worst nightmare. Still, Adams' views from his cubicle do provide some useful and humorous insights.
Adams points out early on that people are idiots, including himself. He offers this true example of idiots on the customer side: "Kodak introduced a single use camera called the Weekender. Customers have called the support line to ask if it's okay to use it during the week."5 While this anecdote does not explain Kodak's decline it certainly supports Adams' point!
Since larger companies have more people, one may infer that they have more idiots. But, more seriously, Adams notes that large companies often systematically divert employees away from serving customers and place them on committees to develop things like Mission Statements. Once a Mission Statement ("a long awkward sentence that demonstrates management's inability to think clearly"6) is painstakingly created, next can come a Vision Statement. Large companies also like to hire consultants who in turn tell management (a) to change processes and structures but not the management, (b) to do what employees have been trying to tell them to do, or (c) to authorize more consulting. Worse yet ... "large companies have legal departments. No project is so risk-free that your company lawyer can't kill it."7
Adams suggests obvious ways for large companies to succeed. They include focusing on improving employees and products rather than pursuing bureaucratic tasks or adopting the latest managerial fad.
The Innovator's Dilemma
For another take on the business world, we turned to Harvard Business School professor Clayton Christensen. His book, The Innovator's Dilemma,8 explains how well-managed companies often miss opportunities and are injured by new competitors offering disruptive innovations.
Well managed companies tend to listen to customers, study and forecast underlying demand, invest heavily in research, and watch for competitors. They develop improved new products or services that address large established markets and often promise higher margins.
Christensen explains that existing customers often do not want disruptive new products or services. Nascent markets are by nature tiny and unpredictable. At first, disruptive innovations often provide lower performance and margins. Success for these innovations seems unlikely and large companies appear rational to not invest in them.
But this seemingly rational path is often a mistake. Christensen's examples include makers of computer disk drives, minicomputers, mechanical excavators and steel. In each case, existing customers had little desire for innovative new products or processes, which admittedly had some inferior attributes like price/performance or quality vs. existing products. The innovators found niche customers who appreciated some aspects of the new product such as size, ruggedness, or cost, and then improved their products at a faster rate than competitors. What had been an inferior product became fully competitive, at a lower cost.
How can a large company compete against a possible disruptive innovation? Imagine a smart manager saying, "Hey guys, I've got this new, lower performance, lower-margin product that existing customers say they don't want, but we should invest in it anyway should a market develop, in which case we will improve it over time. And oh, by the way, we need to divert people from existing high margin products." That is unlikely. Instead, as Christensen points out, the company's management often decides to continue to go up market, producing high gross-margin products for existing customers. More often than not, this decision is a mistake. Companies unwilling to innovate tend to eventually lose market share.
Christensen offers possible ways for large companies to innovate. A favorite is to create a small, preferably remote, autonomous division with agility and
4
a low-cost structure, whose sole focus is to develop an innovation and sell it to new customers. The division must be able to experience short-term failures and change tactics. Though some large companies have succeeded by taking this approach, few come to mind. This solution is anathema to Dilbert-style bureaucracies and managements.
Small Company Advantages
Most startups and small companies focus on hiring and keeping good employees and providing customers fine products or services. Many are created by refugees from large companies who rejected bureaucracies. Small companies with distinct cultures may not need 72-page expense policies. These companies appear to have more streamlined policies, and some seem to abide by a sort of simplified Golden Rule: "Serve the customers, spend company money wisely, and behave like the founder does." If Adams had started work at a small company he might have remained there, reasonably content. But the world would be poorer without Dilbert.
Christensen says, "Large companies often surrender emerging growth markets because smaller, disruptive companies are actually more capable of pursuing them... Their values embrace small markets, and their cost structures can accommodate lower margins. Their market research and resource allocation processes allow managers to proceed intuitively rather than having to be backed up by careful research and analysis, presented in PowerPoint."9 Small companies seem to have DNA that naturally corresponds to both Adams' and Christensen's managerial solutions.
We admit being clearly biased towards small caps but the reality is that more small companies fail than large companies (in part because there are more small companies to begin with). Small company failures are less newsworthy events and rarely warrant major stories (kind of like third-world bus plunges10). We've owned our share of disappointing companies, including a few bankruptcies.
While there are losers in both the large and small cap ranks, a minority of enormously successful small-cap companies with that innovative DNA have driven overall small-cap returns. That is why we believe small-cap investing can be a winner's game. We've had dozens of what we believe to be spectacular winners over the life of the Columbia Acorn Funds. These have far offset our losers and may be worthy of their own Squirrel Chatter II column in the future.

Charles P. McQuaid
President and Chief Investment Officer
Columbia Wanger Asset Management, L.P.
1 U.S. Small Stock Total Return (Morningstar/Ibbottson Encor Application) linked with the Russell 2500 Index on 12/31/1978. Large-cap data based on the S&P 500.
2 Keep in mind that an investment cannot be made directly in an index, and past performance is no guarantee of future results. This is for illustrative purposes only and not indicative of any investment. The data assumes reinvestment of all income and does not account for taxes or transaction costs. Source: U.S. Small Stock Total Return linked with the Russell 2500 on 12/31/1978 and, for large caps, the S&P 500. Both equity categories soundly beat inflation. At year end 2006, $11,384 had the purchasing power of $1,000 in 1926. Inflation data from inflationdata.com, calculated using the CPI Index.
3 As of January 9, 2007.
4 Adams, Scott, The Dilbert Principle (New York: HarperCollins Publishers, 1996), pg. 4.
5 Ibid., pg. 9.
6 Ibid., pg. 36.
7 Ibid., pg. 88.
8 Christensen, Clayton M., The Innovator's Dilemma, (New York: HarperCollins Publishers, 1997)
9 Ibid., pg. 192.
10 In Tim Miller's The Panama Hat Trail (New York: William Morrow and Company, Inc., 1986), the author confesses his fears about Latin American bus rides. These fears have been brought on by years of reading standard, two-sentence bus-plunge pieces used by newspapers in the United States as fillers on the foreign-news page. The date lines change, but the headlines always include the words "bus plunge."
Stocks of small- and mid-cap companies pose special risks, including possible illiquidity and greater price volatility than stocks of larger, more established companies. International investing involves special risks, including foreign taxation, currency risks, risks associated with possible differences in financial standards and other risks associated with future political and economic developments. A fund that maintains a relatively concentrated portfolio may be subject to greater risk than a fund that is more fully diversified.
Past performance is no guarantee of future results.
5
Understanding Your Expenses
As a Fund shareholder, you incur two types of costs. There are transaction costs, which generally include sales charges on purchases and may include redemption or exchange fees. There are also ongoing costs, which generally include investment advisory fees, Rule 12b-1 fees and other Fund expenses. The information on this page is intended to help you understand your ongoing costs of investing in the Columbia Acorn Funds and to compare these costs with the ongoing costs of investing in other mutual funds.
Analyzing your Fund's expenses
To illustrate these ongoing costs, we have provided examples and calculated the expenses paid by investors in the Class Z shares of the Columbia Acorn Funds for the last six months. The information in the following table is based on an initial, hypothetical investment of $1,000, which is invested at the beginning of the reporting period and held for the entire period. Expense information is calculated two ways and each method provides you with different information. The amount listed in the "Actual" column is calculated using each Fund's actual operating expenses and total return for the period. The amount listed in the "Hypothetical" column assumes that the return each year is 5% before expenses and then applies each Fund's actual expense ratio for the period to the hypothetical return. You should not use the hypothetical account values and expenses to estimate either your actual account balance at the end of the period or the expenses you paid during the reporting period. See the "Compare with other funds" information for details on using the hypothetical data.
>July 1, 2006 – December 31, 2006
Account value at the beginning of the period ($) | Account value at the end of the period ($) | Expenses paid during the period ($) | Fund's annualized expense ratio (%)* | ||||||||||||||||||||||||||||
| Class Z Shares | Actual | Hypothetical | Actual | Hypothetical | Actual | Hypothetical | Actual | ||||||||||||||||||||||||
| Columbia Acorn Fund | 1,000.00 | 1,000.00 | 1,081.72 | 1,021.48 | 3.88 | 3.77 | 0.74 | ||||||||||||||||||||||||
| Columbia Acorn International | 1,000.00 | 1,000.00 | 1,177.30 | 1,020.47 | 5.16 | 4.79 | 0.94 | ||||||||||||||||||||||||
| Columbia Acorn USA | 1,000.00 | 1,000.00 | 1,059.59 | 1,020.21 | 5.14 | 5.04 | 0.99 | ||||||||||||||||||||||||
| Columbia Acorn International Select | 1,000.00 | 1,000.00 | 1,207.69 | 1,018.90 | 6.96 | 6.36 | 1.25 | ||||||||||||||||||||||||
| Columbia Acorn Select | 1,000.00 | 1,000.00 | 1,135.20 | 1,020.37 | 5.17 | 4.89 | 0.96 | ||||||||||||||||||||||||
| Columbia Thermostat Fund | 1,000.00 | 1,000.00 | 1,081.01 | 1,023.95 | 1.31 | 1.28 | 0.25 | ||||||||||||||||||||||||
Expenses paid during the period are equal to each Fund's annualized expense ratio, multiplied by the average account value over the period and then multiplied by the number of days in the Fund's most recent fiscal half-year and divided by 365.
Had the investment adviser and/or transfer agent not reimbursed/waived a portion of expenses, total return would have been reduced.
It is important to note that the expense amounts shown in the table are meant to highlight only ongoing costs of investing in the Funds and do not reflect any transaction costs, such as sales charges, redemption or exchange fees. Therefore, the hypothetical examples provided may not help you determine the relative total costs of owning different funds. If these transaction costs were included, your costs would have been higher.
Columbia Thermostat Fund's expenses do not include fees and expenses incurred by the Fund from the underlying portfolio funds.
*For the six months ended December 31, 2006.
Compare with other funds
Since all mutual funds are required to include the same hypothetical calculations about expenses in shareholder reports, you can use this information to compare the ongoing cost of investing in the Funds with other funds. To do so, compare the 5% hypothetical example with the 5% hypothetical examples that appear in the shareholder reports of other funds. As you compare hypothetical examples of other funds, it is important to note that hypothetical
6
examples are meant to highlight the continuing costs of investing in a fund and do not reflect any transaction costs, such as sales charges or redemption or exchange fees.
Estimating your actual expenses
To estimate the expenses that you actually paid over the period, first you will need your account balance at the end of the period:
• For shareholders who receive their account statements from Columbia Management Services, Inc., your account balance is available online at columbiafunds.com or by calling Shareholder Services at (800) 922-6769.
• For shareholders who receive their account statements from their brokerage firm, contact your brokerage firm to obtain your account balance.
1. Divide your ending account balance by $1,000. For example, if an account balance was $8,600 at the end of the period, the result would be 8.6.
2. In the section of the table titled "Expenses paid during the period," locate the amount for your Fund. You will find this number is in the column labeled "Actual." Multiply this number by the result from step 1. Your answer is an estimate of the expenses you paid on your account during the period.
7
Columbia Acorn Fund
In a Nutshell

Charles P. McQuaid
Lead Portfolio Manager

Robert A. Mohn
Co-Portfolio Manager
Performance data quoted represents past performance and current performance may be lower or higher. Past performance is no guarantee of future results. The investment return and principal value of an investment in the Fund will fluctuate so that shares, when redeemed, may be worth more or less than the original cost. Performance may reflect any voluntary waivers or reimbursements of fund expenses by the Adviser or its affiliates. Absent these waivers, or reimbursement arrangements, performance results may be lower. Please visit columbiafunds.com for daily and most recent month-end performance updates.
Fund's Positions
in Mentioned Holdings
As of 12/31/06, the Fund's positions in the holdings mentioned were:
| Coach | 1.7 | % | |||||
| People's Bank of Bridgeport | 1.0 | % | |||||
| Chico's FAS | 0.8 | % | |||||
| SEI Investments | 0.8 | % | |||||
| Time Warner Telecom | 0.5 | % | |||||
| Christopher & Banks | 0.4 | % | |||||
| Hong Kong Exchanges and Clearing | 0.4 | % | |||||
| Chattem | 0.3 | % | |||||
| UrAsia Energy | 0.3 | % | |||||
| Jubilee Mines | 0.2 | % | |||||
| Station Casinos | 0.2 | % | |||||
| USG People | 0.2 | % | |||||
| Vallourec | 0.2 | % | |||||
Portfolio holdings are subject to change periodically and may not be representative of current characteristics and holdings.
Columbia Acorn Fund returned 14.45% in 2006, somewhat less than the 16.17% gain of the Russell 2500 Index, its most comparable benchmark. As shown on Page 2, the Fund slightly beat the Lipper Small- and Mid-Cap Core Indexes for the year. While we are disappointed that the Fund's 10-year outperformance streak ended, we are pleased that it did well vs. its peers.
In 2006, many small- and mid-cap managers had a tough time beating benchmarks, as microcaps, real estate investment trusts ("REITs"), utilities and materials companies outperformed. We had relatively few investments in microcaps, due to what we believed were high valuations. While the Fund's REITs, utilities and materials stocks outperformed, the Fund did not own enough of them. We thought that REITs on average were expensive and we did not find enough utilities and materials companies that we thought were fundamentally attractive.
During the fourth quarter, the Fund rose 7.66%, slightly below the smaller cap indexes but slightly ahead of the larger cap indexes. Microcaps and materials stocks remained outperformers in the fourth quarter.
Foreign stocks continued to boost Columbia Acorn Fund performance, rising 45.37% in the year and 16.44% in the quarter. They include all four of the Fund's 2006 top percentage winners. Hong Kong Exchanges and Clearing traded up 173% on increased trading of Chinese securities, French pipe maker Vallourec surged 157% on rising demand from energy and process industries, Canada's UrAsia Energy popped 147% on rising uranium volumes and prices, and USG People, a Dutch temporary staffing company, jumped 105% due to increased demand from employers in Europe. We cut the Fund's position in Vallourec during the year, as we were concerned about competition and a possible slowdown in U.S. natural gas drilling. We also trimmed the Fund's positions in Hong Kong Exchanges and Clearing and USG People.
Australia's Jubilee Mines joined the foreign winner's circle in the fourth quarter, extracting a 63% gain on higher nickel prices and continued exploration success. In the three years ending 2006, Columbia Acorn Fund's foreign stocks rose 152%. Given such gains, we deemed it prudent to continue trimming. As of year-end 2006, foreign stocks were 12.5% of the Fund, down 0.5% in the quarter and 3.1% in the year.
Columbia Acorn Fund's largest dollar gainer for both periods was Coach, rising 29% in the year and 25% in the quarter on strong sales and margins. Other domestic big-dollar winners for the year included People's Bank of Bridgeport, coining a 48% return as it proceeded to demutualize fully, and SEI Investments, up 62% on solid earnings growth. Time Warner Telecom provided the best domestic percentage gain in the year, doubling on fine sales and cash flow momentum. The Fund's largest domestic percentage gainers in the quarter were Chattem, up 43% thanks to a highly accretive acquisition, and Station Casinos, winning 42% as it received a takeover bid. Some 26 of the Fund's stocks were subject to new takeover bids in 2006.
Retailers Chico's FAS and Christopher & Banks had merchandising problems in 2006. Chico's was the Fund's largest dollar loser and dropped 53% in the year. Christopher & Banks was the largest dollar loser for the quarter, off 36%. During the fourth quarter we bought some additional Chico's. While our opinions are subject to change, we believe both companies should do well going forward.
Small-cap stocks are often more volatile and less liquid than the stocks of larger companies. Small companies may have a shorter history of operations than larger companies and may have a less diversified product line, making them more susceptible to market pressure. Investments in foreign securities have special risks, including political or economic instability, higher costs, different regulations, accounting standards, trading practices and levels of information, and currency exchange rate fluctuations.
8
Columbia Acorn Fund (ACRNX)
At a Glance
Pretax and After-tax Average Annual Total Returns (Class Z)
through December 31, 2006
Performance data quoted represents past performance and current performance may be lower or higher. Past performance is no guarantee of future results. The investment return and principal value of an investment in the Fund will fluctuate so that Fund shares, when redeemed, may be worth more or less than their original cost. Performance may reflect any voluntary waivers or reimbursements of Fund expenses by the Adviser or its affiliates. Absent these waivers or reimbursement arrangements, performance results may be lower. Visit columbiafunds.com for daily and most recent month-end updates.
| Inception 6/10/70 | 1 year | 5 years | 10 years | ||||||||||||
| Returns before taxes | 14.45 | % | 14.71 | % | 15.16 | % | |||||||||
| Returns after taxes on distributions | 12.95 | 14.07 | 13.52 | ||||||||||||
| Returns after taxes on distributions and sale of fund shares | 11.04 | 12.85 | 12.80 | ||||||||||||
| Russell 2500 (pretax) | 16.17 | 12.19 | 11.26 | ||||||||||||
| S&P 500 (pretax) | 15.79 | 6.19 | 8.42 | ||||||||||||
After-tax returns are calculated using the highest historical individual federal marginal income tax rates, and do not reflect the impact of state and local taxes. Returns after taxes on distributions and sale of Fund shares reflect the additional tax impact of long-term gains or losses realized when Fund shares are sold. The returns are taxed at the maximum rate and assume shares were purchased at the beginning of the period. Actual after-tax returns depend on the investor's tax situation and may differ from those shown. After-tax returns are not relevant to investors who hold their Fund shares through tax-deferred arrangements such as 401(k) plans or individual retirement accounts. After-tax returns are shown for Class Z shares only; after-tax returns for other share classes will vary. Indexes do not reflect any deduction for fees, expenses or taxes.
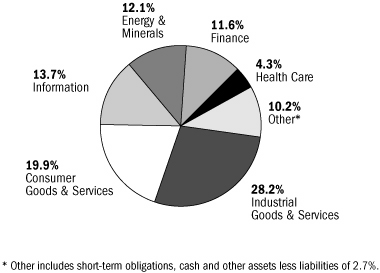
Columbia Acorn Fund Portfolio Diversification
as a % of net assets as of 12/31/06

Columbia Acorn Fund Top 10 Holdings
as a % of net assets as of 12/31/06
| 1. | Coach Designer & Retailer of Branded Leather Accessories | 1.7 | % | ||||||||
| 2. | Expeditors International of Washington International Freight Forwarder | 1.2 | % | ||||||||
| 3. | Abercrombie & Fitch Teen Apparel Retailer | 1.2 | % | ||||||||
| 4. | People's Bank of Bridgeport Connecticut Savings & Loan | 1.0 | % | ||||||||
| 5. | Eaton Vance Specialty Mutual Funds | 1.0 | % | ||||||||
| 6. | FMC Technologies Oil & Gas Well Head Manufacturer | 0.9 | % | ||||||||
| 7. | AmeriCredit Auto Lending | 0.9 | % | ||||||||
| 8. | Genlyte Group Commercial Lighting Fixtures | 0.8 | % | ||||||||
| 9. | Ametek Aerospace/Industrial Instruments | 0.8 | % | ||||||||
| 10. | ITT Educational Services Post-secondary Degree Programs | 0.8 | % | ||||||||
The Fund's top 10 holdings and portfolio diversification vary with changes in portfolio investments. See the Statement of Investments for a complete list of the Fund's holdings.
The Growth of a $75,000 Investment in Columbia Acorn Fund (Class Z)
June 10, 1970 through December 31, 2006
This graph compares the results of $75,000 invested in Columbia Acorn Fund at inception on June 10, 1970 to the S&P 500 Index and to an initial $238,325 investment in the Russell 2500 Index on the index's December 31, 1978 inception date. The indexes are unmanaged and returns for both the indexes and the Fund include reinvested dividends and capital gains. It is not possible to invest directly in an index. The graph does not reflect tax deductions that a shareholder would pay on Fund distributions or the sale of Fund shares.
Total Net Assets of the Fund:
$18,945.1 million
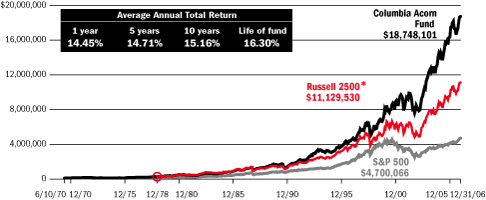
*A $75,000 investment in Columbia Acorn Fund at inception appreciated to $238,325 on December 31, 1978, the inception date of the Russell 2500. For comparison with the Russell 2500, we assigned the index the same value as the Fund at index inception.
9
Columbia Acorn International
In a Nutshell

P. Zachary Egan
Co-Portfolio Manager

Louis J. Mendes III
Co-Portfolio Manager
Performance data quoted represents past performance and current performance may be lower or higher. Past performance is no guarantee of future results. The investment return and principal value of an investment in the Fund will fluctuate so that shares, when redeemed, may be worth more or less than the original cost. Performance may reflect any voluntary waivers or reimbursements of fund expenses by the Adviser or its affiliates. Absent these waivers, or reimbursement arrangements, performance results may be lower. Please visit columbiafunds.com for daily and most recent month-end performance updates.
Columbia Acorn International Fund gained 34.53% in 2006, 3.70% ahead of the benchmark S&P/Citigroup EMI Global ex-US Index ("EMI"), and 8.19% ahead of the large-cap MSCI EAFE Index ("EAFE"). During the fourth quarter, the Fund rose 14.45%, ahead of both indexes. Aside from successful stock selection, the Fund's good results were driven by strong returns in Europe, where the Fund maintained a moderate overweight position, and by emerging markets. These areas more than offset declining markets in Japan, where the Fund maintained a slight underweight position. On a sector basis, energy, basic materials and industrials posted strong absolute and relative returns. The weakening U.S. dollar translated into a net gain of 7.50% for shareholders over the course of the year.
For the seventh consecutive year, international small-cap stocks outperformed relative to international large-cap stocks. At this time last year, we noted that the strong price movement of small-cap stocks globally had eroded the valuation discount to larger-caps. We were surprised that, among the regions we track, only Japanese small caps underperformed their large-cap counterparts in both the fourth quarter and the annual period.
In May through July, global small caps exhibited significant volatility. In a context of relatively high valuations, this seems to have been driven by anxiety about the sustainability of U.S. consumption, and the effects a U.S. slowdown would likely have on the global economy. This short-term correction reinforced our conviction that valuation matters a great deal when considering risk, even though many financial market participants look, rather, at historic volatility. It strikes us that higher valuations simply provide a lower margin of safety when making predictions in circumstances fraught with uncertainty.
Emerging markets as a group, which represent less than 20% of the Fund's exposure, posted another strong year, returning over 45%. It is noteworthy that emerging market bond spreads, a key indicator of perceived risk, have narrowed considerably. Whether risk in these markets is in fact lower, due to structural reforms and other factors, or if the lower risk premium simply reflects excess liquidity, remains a hotly contested issue. It is true that we are seeing an ever increasing number of dynamic, entrepreneurial companies coming to the market in industrializing countries, and fulfilling increasingly stringent listing requirements defined by the local exchanges. In Brazil, for example, the Novo Mercado now allows only one class of stock, which confers to minority investors a greater voice in corporate governance than was the case just five years ago, when non-voting preferred shares were commonplace.
We have remarked in past reports that the Japanese market is looking increasingly attractive in terms of valuation and fundamentals. After a strong second half of 2005, the Japanese market did an about face and ended 2006 as the planet's worst-performing major region. The Japan portion of the EMI declined nearly 11% in local currency, and small-cap stocks were hit particularly hard. In our opinion, this has strengthened the valuation argument for Japan. On a price-to-earnings comparison, Japanese small caps are now trading at a reasonable discount both to their average over the last decade (not surprising, given overvaluation), but also to small caps in other markets. The economy is improving, we are seeing reasonable growth in many small-cap companies, and strong balance sheets limit downside risk. Contingent upon our ability to find good investment ideas, we expect to continue moving money into Japanese companies in the course of 2007.
International investments involve greater potential risks, including less regulation, currency fluctuations, economic instability and political developments. Investments in small- and mid-cap companies may be subject to greater volatility and price fluctuations because they may be thinly traded and less liquid.
10
Columbia Acorn International (ACINX)
At a Glance
Performance data quoted represents past performance and current performance may be lower or higher. Past performance is no guarantee of future results. The investment return and principal value of an investment in the Fund will fluctuate so that Fund shares, when redeemed, may be worth more or less than their original cost. Performance may reflect any voluntary waivers or reimbursements of Fund expenses by the Adviser or its affiliates. Absent these waivers or reimbursement arrangements, performance results may be lower. Visit columbiafunds.com for daily and most recent month-end updates.
Pretax and After-tax Average Annual Total Returns (Class Z)
through December 31, 2006
| Inception 9/23/92 | 1 year | 5 years | 10 years | ||||||||||||
| Returns before taxes | 34.53 | % | 21.35 | % | 13.15 | % | |||||||||
| Returns after taxes on distributions | 32.08 | 20.68 | 12.01 | ||||||||||||
| Returns after taxes on distributions and sale of fund shares | 24.72 | 18.86 | 11.26 | ||||||||||||
| S&P/Citigroup EMI Global ex-US (pretax) | 30.83 | 24.39 | 10.65 | ||||||||||||
After-tax returns are calculated using the highest historical individual federal marginal income tax rates, and do not reflect the impact of state and local taxes. Returns after taxes on distributions and sale of Fund shares reflect the additional tax impact of long-term gains or losses realized when Fund shares are sold. The returns are taxed at the maximum rate and assume shares were purchased at the beginning of the period. Actual after-tax returns depend on the investor's tax situation and may differ from those shown. After-tax returns are not relevant to investors who hold their Fund shares through tax-deferred arrangements such as 401(k) plans or individual retirement accounts. After-tax returns are shown for Class Z shares only; after-tax returns for other share classes will vary. Indexes do not reflect any deduction for fees, expenses or taxes.
Columbia Acorn International Portfolio Diversification
as a % of net assets as of 12/31/06
Columbia Acorn International Top 10 Holdings
as a % of net assets as of 12/31/06
| 1. | Hexagon (Sweden) Measurement Equipment & Polymers | 1.5 | % | ||||||||
| 2. | Fugro (Netherlands) Oilfield Services | 1.4 | % | ||||||||
| 3. | C&C Group (Ireland) Beverage Company | 1.4 | % | ||||||||
| 4. | Hong Kong Exchanges and Clearing (Hong Kong) Hong Kong Equity & Derivatives Market Operator | 1.3 | % | ||||||||
| 5. | SES Global (France) Satellite Broadcasting Services | 1.2 | % | ||||||||
| 6. | Aalberts Industries (Netherlands) Flow Control & Heat Treatment | 1.1 | % | ||||||||
| 7. | Housing Development Finance (India) Indian Mortgage Lender | 1.1 | % | ||||||||
| 8. | Geberit (Switzerland) Plumbing Supplies | 1.1 | % | ||||||||
| 9. | IAWS Group (Ireland) Baked Goods | 1.1 | % | ||||||||
| 10. | Bank of Ireland (Ireland) Irish Commercial Bank | 1.1 | % | ||||||||
The Fund's top 10 holdings and portfolio diversification vary with changes in portfolio investments. See the Statement of Investments for a complete list of the Fund's holdings.
The Growth of a $10,000 Investment in Columbia Acorn International (Class Z)
September 23, 1992 through December 31, 2006
This graph compares the results of $10,000 invested in Columbia Acorn International at inception on September 23, 1992 to the S&P/Citigroup EMI Global ex-US. The index is unmanaged and returns for both the index and Fund include reinvested dividends and capital gains. It is not possible to invest directly in an index. The graph does not reflect tax deductions that a shareholder would pay on Fund distributions or the sale of Fund shares.
Total Net Assets of the Fund:
$4,343.4 million
11
Columbia Acorn USA
In a Nutshell

Robert A. Mohn
Lead Portfolio Manager
Performance data quoted represents past performance and current performance may be lower or higher. Past performance is no guarantee of future results. The investment return and principal value of an investment in the Fund will fluctuate so that shares, when redeemed, may be worth more or less than the original cost. Performance may reflect any voluntary waivers or reimbursements of fund expenses by the Adviser or its affiliates. Absent these waivers, or reimbursement arrangements, performance results may be lower. Please visit columbiafunds.com for daily and most recent month-end performance updates.
Fund's Positions
in Mentioned Holdings
As of 12/31/06, the Fund's positions in the holdings mentioned were:
| Crown Castle International | 2.1 | % | |||||
| Oxford Industries | 2.0 | % | |||||
| Genlyte Group | 1.9 | % | |||||
| Avid Technology | 1.8 | % | |||||
| Time Warner Telecom | 1.8 | % | |||||
| Scotts Miracle-Gro | 1.7 | % | |||||
| World Acceptance | 1.5 | % | |||||
| Pentair | 1.3 | % | |||||
| American Tower | 1.2 | % | |||||
| True Religion Apparel | 0.9 | % | |||||
| Novell | 0.8 | % | |||||
| Chico's FAS | 0.6 | % | |||||
| Christopher & Banks | 0.6 | % | |||||
| CNET Networks | 0.6 | % | |||||
| AnnTaylor Stores | 0.5 | % | |||||
| Neurocrine Biosciences | 0.0 | % | |||||
Portfolio holdings are subject to change periodically and may not be representative of current characteristics and holdings.
Columbia Acorn USA ended the fourth quarter up 4.78%, underperforming the 8.90% gain of the Russell 2000 Index. For the year, the Fund was up 8.28% while the index posted an 18.37% gain. The year ended as it began with a run up in the more speculative companies of the small-cap market. These spikes in lesser quality stocks hurt the Fund's relative performance for the quarter and the year.
The top contributor to Fund gains in the quarter was men's apparel manufacturer Oxford Industries. The stock was up 16% on the strength of its Ben Sherman and Tommy Bahama brands. Lawn and garden products company Scotts Miracle-Gro saw strong revenue growth, and the stock gained 16% in the fourth quarter. Pentair, a maker of pumps and water treatment equipment, rebounded from weak performance earlier in the year. The stock was up 20% in the fourth quarter.
While the quarter produced one retail winner, retailing was more strongly represented on the losers list. Women's retailers Christopher & Banks, True Religion Apparel and AnnTaylor Stores were down between 20% and 37% in the quarter. While True Religion, a maker of premium denim products, has seen nice sales in the U.S. market, distribution snafus hurt sales in Japan. Christopher & Banks and AnnTaylor both produced fall lines that didn't take off with customers, hurting sales.
For the year, telecom stocks were the biggest positive contributors to performance. Time Warner Telecom, an owner of fiber optic networks connected to over 6,000 office buildings, was up 103% on strong sales growth. Cellular tower companies Crown Castle International and American Tower also posted strong annual gains, up 20% and 38%, respectively. As cellular minute usage grows, cellular service providers continue to turn to these companies for antenna space.
Outside the telecom sector, lender World Acceptance was up 65% for the year as credit losses fell and loan growth increased. Genlyte Group, a maker of commercial lighting fixtures, was up 46% as non-residential construction increased, driving demand for its products.
Technology and health care stocks were among the laggards for the year. Neurocrine Biosciences was the worst performer, falling 65% before we sold it. The stock collapsed when the FDA withheld full approval of its high dosage sleep medication Indiplon. CNET Networks, a provider of software product reviews on technology websites, was down 39% in the Fund for the year. CNET's business is driven by new product launches, and two highly anticipated product launches, Microsoft's Vista and Sony's PlayStation 3, were tardy. Avid Technology, a provider of digital editing software and systems, fell more than 30% in part because broadcasters have been slow to upgrade to digital. Software company Novell fell 30% in the year as the company's transition to open source software is taking longer than the market expected. Outside the health care and technology sectors, retailer Chico's FAS missed the mark with its customers this year, sending th e stock down roughly 55%.
It tended to pay to disregard risk in 2006. Risky securities such as micro-caps, commodities, emerging markets and complex investment bank-bred derivatives were the big winners. To the daredevils went the spoils. But we believe risk still matters (remember, Evel Knievel occasionally crashed). Our preferred method of managing your Fund's risk level is to stock it with well-capitalized, small-cap businesses possessing long-term economic advantages and trading in the market at sensible prices.
Risks include stock market fluctuations due to economic and business developments. Investments in small- and mid-cap companies may be subject to greater volatility and price fluctuations because they may be thinly traded and less liquid.
12
Columbia Acorn USA (AUSAX)
At a Glance
Performance data quoted represents past performance and current performance may be lower or higher. Past performance is no guarantee of future results. The investment return and principal value of an investment in the Fund will fluctuate so that Fund shares, when redeemed, may be worth more or less than their original cost. Performance may reflect any voluntary waivers or reimbursements of Fund expenses by the Adviser or its affiliates. Absent these waivers or reimbursement arrangements, performance results may be lower. Visit columbiafunds.com for daily and most recent month-end updates.
Pretax and After-tax Average Annual Total Returns (Class Z)
through December 31, 2006
| Inception 9/4/96 | 1 year | 5 years | 10 years | ||||||||||||
| Returns before taxes | 8.28 | % | 12.09 | % | 12.70 | % | |||||||||
| Returns after taxes on distributions | 7.94 | 11.83 | 12.00 | ||||||||||||
| Returns after taxes on distributions and sale of fund shares | 5.83 | 10.57 | 11.05 | ||||||||||||
| Russell 2000 (pretax) | 18.37 | 11.39 | 9.44 | ||||||||||||
After-tax returns are calculated using the highest historical individual federal marginal income tax rates, and do not reflect the impact of state and local taxes. Returns after taxes on distributions and sale of Fund shares reflect the additional tax impact of long-term gains or losses realized when Fund shares are sold. The returns are taxed at the maximum rate and assume shares were purchased at the beginning of the period. Actual after-tax returns depend on the investor's tax situation and may differ from those shown. After-tax returns are not relevant to investors who hold their Fund shares through tax-deferred arrangements such as 401(k) plans or individual retirement accounts. After-tax returns are shown for Class Z shares only; after-tax returns for other share classes will vary. Indexes do not reflect any deduction for fees, expenses or taxes.
Columbia Acorn USA Portfolio Diversification
as a % of net assets as of 12/31/06

Columbia Acorn USA Top 10 Holdings
as a % of net assets as of 12/31/06
| 1. | Crown Castle International Communication Towers | 2.1 | % | ||||||||
| 2. | Oxford Industries Branded & Private Label Apparel | 2.0 | % | ||||||||
| 3. | Genlyte Group Commercial Lighting Fixtures | 1.9 | % | ||||||||
| 4. | Avid Technology Digital Nonlinear Editing Software & Systems | 1.8 | % | ||||||||
| 5. | AmeriCredit Auto Lending | 1.8 | % | ||||||||
| 6. | Abercrombie & Fitch Teen Apparel Retailer | 1.8 | % | ||||||||
| 7. | Time Warner Telecom Fiber Optic Telephone/Data Services | 1.8 | % | ||||||||
| 8. | ITT Educational Services Post-secondary Degree Programs | 1.8 | % | ||||||||
| 9. | Scotts Miracle-Gro Consumer Lawn & Garden Products | 1.7 | % | ||||||||
| 10. | Edwards Lifesciences Heart Valves | 1.7 | % | ||||||||
The Fund's top 10 holdings and portfolio diversification vary with changes in portfolio investments. See the Statement of Investments for a complete list of the Fund's holdings.
The Growth of a $75,000 Investment in Columbia Acorn USA (Class Z)
September 4, 1996 through December 31, 2006
This graph compares the results of $75,000 invested in Columbia Acorn USA at inception on September 4, 1996 to the Russell 2000 Index. The index is unmanaged and returns for both the index and the Fund include reinvested dividends and capital gains. It is not possible to invest directly in an index. The graph does not reflect tax deductions that a shareholder would pay on Fund distributions or the sale of Fund shares.
Total Net Assets of the Fund:
$1,580.2 million
13
Columbia Acorn International Select
In a Nutshell

Christopher J. Olson
Lead Portfolio Manager
Performance data quoted represents past performance and current performance may be lower or higher. Past performance is no guarantee of future results. The investment return and principal value of an investment in the Fund will fluctuate so that shares, when redeemed, may be worth more or less than the original cost. Performance may reflect any voluntary waivers or reimbursements of fund expenses by the Adviser or its affiliates. Absent these waivers, or reimbursement arrangements, performance results may be lower. Please visit columbiafunds.com for daily and most recent month-end performance updates.
Fund's Positions
in Mentioned Holdings
As of 12/31/06, the Fund's positions in the holdings mentioned were:
| C&C Group | 5.3 | % | |||||
| Hong Kong Exchanges and Clearing | 3.2 | % | |||||
| IAWS Group | 2.3 | % | |||||
| Daito Trust Construction | 1.8 | % | |||||
| Kenedix | 1.8 | % | |||||
| Sparx Asset Management | 0.0 | % | |||||
Portfolio holdings are subject to change periodically and may not be representative of current characteristics and holdings.
Columbia Acorn International Select gained an impressive 13.06% in the fourth quarter and ended 2006 with a 36.27% gain. The Fund outperformed its benchmark, the S&P/Citigroup World ex-US Cap Range $2-10B Index, for both time periods. The index was up 11.32% for the quarter and 27.88% for the year. Outperformance was strong in a number of areas, particularly Ireland and Hong Kong where the Fund was overweight. In a reversal from last year, the weakest market was Japan. The Fund was underweight in this market throughout the year.
The top three contributors to Fund performance in the quarter and the year were the same. Irish beverage company C&C Group gained another 32% in the fourth quarter and ended the year up 159%. Strong sales and a well received launch of its cider product in the United Kingdom resulted in dramatic earnings upgrades. Hong Kong Exchanges and Clearing was ranked second for the quarter and year. The company operates the Hong Kong equity and derivatives market and rose 49% in the quarter and posted an annual gain of 171% in the Fund. Increased trading volume and new stock listings from China drove this stock's stellar performance. Rounding out the top three, Ireland's IAWS Group, a manufacturer and distributor of baked goods, increased 38% in the fourth quarter and ended the year up 80%. The stock benefited from strong performance in its baked goods divisions and from the acquisition of Otis Spunkmeyer, a U.S. cookie dough manufactu rer.
Even in such a strong year, there were some stocks that detracted from performance and, as was the case at mid-year, the common thread was Japan. In a year where the Fund was up over 36%, both the Fund's Japanese portfolio and the Japanese weighting in its benchmark index were essentially flat. Daito Trust Construction, a developer of apartment and condo buildings in Japan, fell 16% in the quarter and was down nearly 11% for the year. The stock fell as new construction orders slowed when it switched to a new order system. In the fourth quarter, fund manager Sparx Asset Management fell 29%. We opted to sell the stock as we became concerned about its higher cost base resulting from a recent acquisition. Kenedix, a Japanese real estate investment manager, fell 22% in the quarter despite earnings upgrades as investors became concerned about possible interest rate increases in Japan.
International mid-cap stocks have had a strong run for the last five years, which likely has some investors questioning how much steam is left in these names. While we can't predict the future, we are still finding attractively valued stocks to include in Columbia Acorn International Select.
International investments involve greater potential risks, including less regulation, currency fluctuations, economic instability and political developments. Investments in small- and mid-cap companies may be subject to greater volatility and price fluctuations because they may be thinly traded and less liquid. By maintaining a relatively concentrated portfolio, the fund may be subject to greater risk than a fund that is more fully diversified.
14
Columbia Acorn International Select (ACFFX)
At a Glance
Performance data quoted represents past performance and current performance may be lower or higher. Past performance is no guarantee of future results. The investment return and principal value of an investment in the Fund will fluctuate so that Fund shares, when redeemed, may be worth more or less than their original cost. Performance may reflect any voluntary waivers or reimbursements of Fund expenses by the Adviser or its affiliates. Absent these waivers or reimbursement arrangements, performance results may be lower. Visit columbiafunds.com for daily and most recent month-end updates.
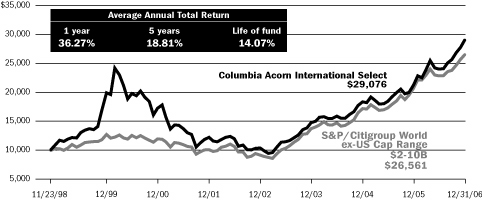
Pretax and After-tax Average Annual Total Returns (Class Z)
through December 31, 2006
| Inception 11/23/98 | 1 year | 5 years | Life of fund | ||||||||||||
| Returns before taxes | 36.27 | % | 18.81 | % | 14.07 | % | |||||||||
| Returns after taxes on distributions | 36.16 | 18.81 | 14.00 | ||||||||||||
| Returns after taxes on distributions and sale of fund shares | 23.56 | 16.73 | 12.60 | ||||||||||||
| S&P/Citigroup World ex-US Cap Range $2-10B (pretax) | 27.88 | 21.24 | 12.81 | ||||||||||||
After-tax returns are calculated using the highest historical individual federal marginal income tax rates, and do not reflect the impact of state and local taxes. Returns after taxes on distributions and sale of Fund shares reflect the additional tax impact of long-term gains or losses realized when Fund shares are sold. The returns are taxed at the maximum rate and assume shares were purchased at the beginning of the period. Actual after-tax returns depend on the investor's tax situation and may differ from those shown. After-tax returns are not relevant to investors who hold their Fund shares through tax-deferred arrangements such as 401(k) plans or individual retirement accounts. After-tax returns are shown for Class Z shares only; after-tax returns for other share classes will vary. Indexes do not reflect any deduction for fees, expenses or taxes.
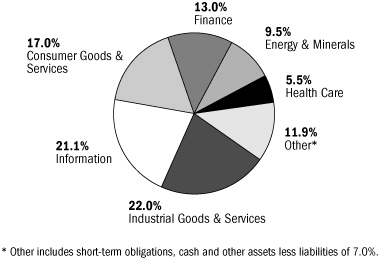
Columbia Acorn International Select Portfolio Diversification
as a % of net assets as of 12/31/06
Columbia Acorn International Select Top 10
Holdings as a % of net assets as of 12/31/06
| 1. | C&C Group (Ireland) Beverage Company | 5.3% | |||||||||
| 2. | Bank of Ireland (Ireland) Irish Commercial Bank | 4.1% | |||||||||
| 3. | Anglo Irish Bank (Ireland) Small Business & Middle Market Banking | 3.7% | |||||||||
| 4. | Synthes (Switzerland) Products for Orthopedic Surgery | 3.3% | |||||||||
| 5. | Hong Kong Exchanges and Clearing (Hong Kong) Hong Kong Equity & Derivatives Market Operator | 3.2% | |||||||||
| 6. | Northern Rock (United Kingdom) Lowest Cost Mortgage Bank in UK | 2.9% | |||||||||
| 7. | Alliance Atlantis Communication (Canada) CATV Channels, TV/Movie Production/Distribution | 2.9% | |||||||||
| 8. | Jupiter Telecommunications (Japan) Largest Cable Service Provider in Japan | 2.9% | |||||||||
| 9. | Red Electrica de Espana (Spain) Spanish Power Grid | 2.7% | |||||||||
| 10. | Aeon Mall (Japan) Suburban Shopping Mall Developer, Owner & Operator | 2.7% | |||||||||
The Fund's top 10 holdings and portfolio diversification vary with changes in portfolio investments. See the Statement of Investments for a complete list of the Fund's holdings.
The Growth of a $10,000 Investment in Columbia Acorn International Select (Class Z)
November 23, 1998 through December 31, 2006
This graph compares the results of $10,000 invested in Columbia Acorn International Select at inception on November 23, 1998 to the S&P/Citigroup World ex-US Cap Range $2-10B Index. The index and Fund returns include reinvested dividends and capital gains. It is not possible to invest directly in an index. The graph does not reflect tax deductions that a shareholder would pay on Fund distributions or the sale of Fund shares.
Total Net Assets of the Fund: $168.9 million
15
Columbia Acorn Select
In a Nutshell

Ben Andrews
Lead Portfolio Manager
Performance data quoted represents past performance and current performance may be lower or higher. Past performance is no guarantee of future results. The investment return and principal value of an investment in the Fund will fluctuate so that shares, when redeemed, may be worth more or less than the original cost. Performance may reflect any voluntary waivers or reimbursements of fund expenses by the Adviser or its affiliates. Absent these waivers, or reimbursement arrangements, performance results may be lower. Please visit columbiafunds.com for daily and most recent month-end performance updates.
Fund's Positions
in Mentioned Holdings
As of 12/31/06, the Fund's positions in the holdings mentioned were:
| UrAsia Energy | 6.2 | % | |||||
| Safeway | 5.5 | % | |||||
| Liberty Global | 4.7 | % | |||||
| American Tower | 3.8 | % | |||||
| Avid Technology | 3.7 | % | |||||
| Potash | 3.1 | % | |||||
| Career Education | 0.0 | % | |||||
| Mine Safety Appliances | 0.0 | % | |||||
Portfolio holdings are subject to change periodically and may not be representative of current characteristics and holdings.
Columbia Acorn Select returned 10.51% during the quarter, ahead of the S&P MidCap 400's 6.99% and the S&P 500's 6.70% gains. For 2006, the Fund was up 19.68%, ahead of the S&P MidCap 400's 10.32% and the S&P 500's 15.79% gains. In the fourth quarter of 2005 we stated that our goal for 2006 was to outperform the Fund's benchmark index as well as provide a positive return for shareholders. We are happy to say that we delivered on both.
UrAsia Energy led the way with a 149% gain in the Fund for the year as uranium prices reached a record of $70 per pound vs. $36 at the end of 2005. The recent flooding of competitor Cameco's Cigar Lake Mine caused part of the price jump. Cameco announced that its initial predicted production of eight million lbs/yr (5% of world demand) would be delayed by at least one year. Production of uranium at Cigar Lake was forecasted to begin in early 2008 and utilities were counting on the new supply to meet the growing demand for fuel to run nuclear reactors. While Cameco expects the mine may eventually produce 18 million lbs/yr, if it faces longer production delays than it anticipates, uranium prices could remain high, benefiting UrAsia.
On the downside, Avid Technology, which lagged all year, fell 32% (or reduced the Fund's return by 1.28%) as the company guided sales and earnings down for 2006 due to delayed products and an acquisition that needed resuscitation. While obviously disappointed, we believe the long-term outlook remains sound and we added to the Fund's position in the stock. Avid is a leader in digital editing software and systems used by the film and news industries. Additionally, we believe that Avid has the potential to become a leader in consumer video and audio editing in the next few years. Over the last decade, consumer competition has dwindled while product demand has increased. We believe that this nascent market should give Avid an opportunity for solid revenue growth.
Most other losses for the year were relatively small in position size or percentages. In fact, all losses combined for the year took away just 3.83% from Fund gains. On the up side, the five top winners (UrAsia Energy, Safeway, Liberty Global, Potash, and American Tower) accounted for 11.59% of the Fund's 19.68% return.
In the quarter we sold two positions, Career Education and Mine Safety Appliances, while we purchased five new stocks. A couple of these new positions are small as we continue to determine if our theories for ownership are correct. If our confidence builds, so might these positions, otherwise we will likely exit.
As we enter 2007, we see plenty of what we consider to be positive signs: falling oil prices, low inflation rates despite a sharp run up in raw materials (perhaps due to the outsourcing of labor), 10-year treasury yields (though off their bottom) near historical lows, and a rebounding dollar. But we believe that there are plenty of troubling signs as well. We get nervous when the most popular investments are emerging market debt, obscure credit derivatives, and private equity, which are leading a buyout frenzy funded with debt. As always, our primary focus is to beat the Fund's benchmark despite all the macroeconomic noise.
Risks of owning the Fund include stock market fluctuations due to economic and business developments and potentially greater price volatility due to the Fund's concentration in a limited number of stocks of mid-size companies.
16
Columbia Acorn Select (ACTWX)
At a Glance
Performance data quoted represents past performance and current performance may be lower or higher. Past performance is no guarantee of future results. The investment return and principal value of an investment in the Fund will fluctuate so that Fund shares, when redeemed, may be worth more or less than their original cost. Performance may reflect any voluntary waivers or reimbursements of Fund expenses by the Adviser or its affiliates. Absent these waivers or reimbursement arrangements, performance results may be lower. Visit columbiafunds.com for daily and most recent month-end updates.
Pretax and After-tax Average Annual Total Returns (Class Z)
through December 31, 2006
| Inception 11/23/98 | 1 year | 5 years | Life of fund | ||||||||||||
| Returns before taxes | 19.68 | % | 13.67 | % | 15.30 | % | |||||||||
| Returns after taxes on distributions | 19.11 | 13.36 | 14.76 | ||||||||||||
| Returns after taxes on distributions and sale of fund shares | 13.21 | 11.93 | 13.46 | ||||||||||||
| S&P MidCap 400 (pretax) | 10.32 | 10.89 | 11.94 | ||||||||||||
After-tax returns are calculated using the highest historical individual federal marginal income tax rates, and do not reflect the impact of state and local taxes. Returns after taxes on distributions and sale of Fund shares reflect the additional tax impact of long-term gains or losses realized when Fund shares are sold. The returns are taxed at the maximum rate and assume shares were purchased at the beginning of the period. Actual after-tax returns depend on the investor's tax situation and may differ from those shown. After-tax returns are not relevant to investors who hold their Fund shares through tax-deferred arrangements such as 401(k) plans or individual retirement accounts. After-tax returns are shown for Class Z shares only; after-tax returns for other share classes will vary. Indexes do not reflect any deduction for fees, expenses or taxes.
Columbia Acorn Select Portfolio Diversification
as a % of net assets as of 12/31/06
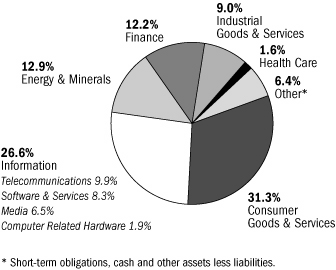
Columbia Acorn Select Top 10 Holdings
as a % of net assets as of 12/31/06
| 1. | UrAsia Energy Uranium Mining in Kazakhstan | 6.2 | % | ||||||||
| 2. | Safeway Supermarkets | 5.5 | % | ||||||||
| 3. | Tellabs Telecommunications Equipment | 5.1 | % | ||||||||
| 4. | Liberty Global CATV Holding Company | 4.7 | % | ||||||||
| 5. | ITT Educational Services Post-secondary Degree Programs | 4.4 | % | ||||||||
| 6. | Abercrombie & Fitch Teen Apparel Retailer | 4.4 | % | ||||||||
| 7. | American Tower Communication Towers in USA & Mexico | 3.8 | % | ||||||||
| 8. | Expedia Online Travel Services Company | 3.7 | % | ||||||||
| 9. | Avid Technology Digital Nonlinear Editing Software & Systems | 3.7 | % | ||||||||
| 10. | Janus Capital Group Manages Mutual Funds | 3.3% | |||||||||
The Fund's top 10 holdings and portfolio diversification vary with changes in portfolio investments. See the Statement of Investments for a complete list of the Fund's holdings.
The Growth of a $50,000 Investment in Columbia Acorn Select (Class Z)
November 23, 1998 through December 31, 2006
This graph compares the results of $50,000 invested in Columbia Acorn Select at inception on November 23, 1998 to the S&P MidCap 400 Index. The index is unmanaged and returns for both the index and the Fund include reinvested dividends and capital gains. It is not possible to invest directly in an index. The graph does not reflect tax deductions that a shareholder would pay on Fund distributions or the sale of Fund shares.
Total Net Assets of the Fund:
$2,237.7 million
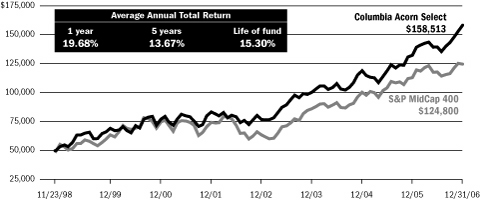
17
Columbia Thermostat Fund
In a Nutshell

Charles P. McQuaid
Lead Portfolio Manager
Performance data quoted represents past performance and current performance may be lower or higher. Past performance is no guarantee of future results. The investment return and principal value of an investment in the Fund will fluctuate so that shares, when redeemed, may be worth more or less than the original cost. Performance may reflect any voluntary waivers or reimbursements of fund expenses by the Adviser or its affiliates. Absent these waivers, or reimbursement arrangements, performance results may be lower. Please visit columbiafunds.com for daily and most recent month-end performance updates.
A "fund of fund" bears its allocable share of the costs and expenses of the underlying funds in which it invests. Such funds are thus subject to two levels of fees and potentially higher expense ratios than would be associated with a fund that invests and trades directly in financial instruments under the direction of a single manager.
Columbia Thermostat Fund ended the fourth quarter up 4.11% and returned 10.86% for the year. Fund performance, as expected, was between the S&P 500 Index and the Lehman Brothers U.S. Credit Intermediate Bond Index for both time periods (see Page 2 for index data). Fund returns fell short of the 5.99% quarterly gain and 12.77% annual gain of the Lipper Flexible Portfolio Funds Index.
We made two changes to the Fund in the fourth quarter. Effective December 22, 2006, we replaced Columbia Large Cap Value Fund with Columbia Marsico Growth Fund. While Columbia Large Cap Value Fund has a good track record, we believe shareholders will be better served by owning more of the large-cap growth sector. The new fund comprises 15% of Columbia Thermostat Fund's allocation of stock funds.
We also updated the Fund's stock/bond allocation table, increasing the scale by 100 S&P 500 points. This resulted in a 10% point hike in ownership of equity funds, and a 10% point reduction of bond funds. We made the change in order to reflect our estimates of S&P 500 earnings growth and possible market valuations.
As the following table illustrates, the equity portion of the portfolio had impressive gains in the quarter and for the full year. For the fourth quarter, the Fund's equity component was up 8.82% and, for the year, it was up 20.34%. Columbia Acorn International, which we added to Columbia Thermostat in 2005, posted top gains for both time periods.
Results of the Funds Owned in Columbia Thermostat Fund
at December 31, 2006
This table shows only the weightings as of the end of the quarter and the results of the funds held by the Fund at that date.
| Equities Fund | Weightings in Category | 4th quarter returns | 1-year returns to 12/31/06 | ||||||||||||
| Columbia Acorn Fund | 15 | % | 7.66 | % | 14.45 | % | |||||||||
| Columbia Acorn Select | 10 | % | 10.51 | % | 19.68 | % | |||||||||
| Columbia Marsico Growth Fund1 | 15 | % | 7.74 | % | 7.18 | % | |||||||||
| Columbia Acorn International | 15 | % | 14.45 | % | 34.53 | % | |||||||||
| Columbia Dividend Income Fund | 20 | % | 6.75 | % | 20.07 | % | |||||||||
| Columbia Large Cap Enhanced Core Fund | 25 | % | 7.27 | % | 16.81 | % | |||||||||
| Weighted Average Equity Return | 100 | % | 8.82 | % | 20.34 | % | |||||||||
| Fixed Income Fund | Weightings in Category | 4th quarter returns | 1-year returns to 12/31/06 | ||||||||||||
| Columbia Federal Securities Fund | 30 | % | 0.99 | % | 3.74 | % | |||||||||
| Columbia Intermediate Bond Fund | 50 | % | 1.52 | % | 4.60 | % | |||||||||
| Columbia Conservative High Yield Fund | 20 | % | 3.01 | % | 6.17 | % | |||||||||
| Weighted Average Income Return | 100 | % | 1.66 | % | 4.66 | % | |||||||||
1Columbia Large Cap Value Fund was replaced by Columbia Marsico Growth Fund on December 22, 2006.
Columbia Thermostat Fund
Rebalancing in the Fourth Quarter
| October 5, 2006: | 35% stock, 65% bond | ||||||
| November 20, 2006: | 30% stock, 70% bond | ||||||
| December 22, 2006: | 40% stock, 60% bond | ||||||
The value of an investment in the Fund is based primarily on the performance of the underlying portfolio funds and the allocation of the Fund's assets among them. An investment in the underlying funds may present certain risks, including stock market fluctuations that occur in response to economic and business developments; and a greater degree of social, political and economic volatility associated with international investing. Investing in small- and mid-cap stocks may present special risks including possible illiquidity and greater price volatility than stocks of larger, more established companies. Investments in foreign securities have special risks including political or economic instability, higher costs, different regulations, accounting standards, trading practices and levels of information, and currency exchange rate fluctuations. Changes in interest rates and changes in the financial strength of issuers of lower-rat ed bonds may also affect underlying fund performance. The Fund is also subject to the risk that the investment adviser's decisions regarding asset classes and portfolio funds will not anticipate market trends successfully, resulting in a failure to preserve capital or lower total return. In addition, the Fund may buy and sell shares of the portfolio funds frequently. This may result in higher transaction costs and additional tax liability. This is not an offer of the shares of any other mutual fund mentioned herein.
18
Columbia Thermostat Fund (COTZX)
At a Glance
Performance data quoted represents past performance and current performance may be lower or higher. Past performance is no guarantee of future results. The investment return and principal value of an investment in the Fund will fluctuate so that Fund shares, when redeemed, may be worth more or less than their original cost. Performance may reflect any voluntary waivers or reimbursements of Fund expenses by the Adviser or its affiliates. Absent these waivers or reimbursement arrangements, performance results may be lower. Visit columbiafunds.com for daily and most recent month-end updates.
Pretax and After-tax Average Annual Total Returns (Class Z)
through December 31, 2006
| Inception 9/25/02 | 1 year | 3 year | Life of fund | ||||||||||||
| Returns before taxes | 10.86 | % | 8.48 | % | 11.51 | % | |||||||||
| Returns after taxes on distributions | 8.30 | 6.56 | 10.02 | ||||||||||||
| Returns after taxes on distributions and sale of fund shares | 8.09 | 6.47 | 9.35 | ||||||||||||
| S&P 500 (pretax) | 15.79 | 10.44 | 15.81 | ||||||||||||
| Lehman Brothers U.S. Credit Intermediate Bond Index (pretax) | 4.49 | 3.32 | 4.68 | ||||||||||||
| Lipper Flexible Portfolio Funds Index (pretax) | 12.77 | 9.51 | 13.38 | ||||||||||||
After-tax returns are calculated using the highest historical individual federal marginal income tax rates, and do not reflect the impact of state and local taxes. Returns after taxes on distributions and sale of Fund shares reflect the additional tax impact of long-term gains or losses realized when Fund shares are sold. The returns are taxed at the maximum rate and assume shares were purchased at the beginning of the period. Actual after-tax returns depend on the investor's tax situation and may differ from those shown. After-tax returns are not relevant to investors who hold their Fund shares through tax-deferred arrangements such as 401(k) plans or individual retirement accounts. After-tax returns are shown for Class Z shares only; after-tax returns for other share classes will vary. Indexes do not reflect any deduction for fees, expenses or taxes.
Columbia Thermostat Fund Asset Allocation
as a % of net assets as of 12/31/06
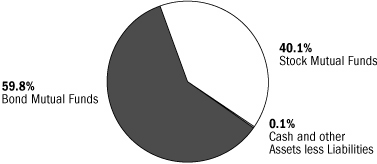
Columbia Thermostat Fund Portfolio Weightings
as a % of assets in each investment category
as of 12/31/06
Stock Mutual Funds
| Columbia Large Cap Enhanced Core Fund | 25 | % | |||||
| Columbia Dividend Income Fund | 20 | % | |||||
| Columbia Acorn Fund | 15 | % | |||||
| Columbia Acorn International | 15 | % | |||||
| Columbia Marsico Growth Fund | 15 | % | |||||
| Columbia Acorn Select | 10 | % | |||||
Bond Mutual Funds
| Columbia Intermediate Bond Fund | 50 | % | |||||
| Columbia Federal Securities Fund | 30 | % | |||||
| Columbia Conservative High Yield Fund | 20 | % | |||||
The Growth of a $10,000 Investment in Columbia Thermostat Fund (Class Z)
September 25, 2002 through December 31, 2006
This graph compares the results of $10,000 invested in Columbia Thermostat Fund at inception on September 25, 2002 to the S&P 500, the Lehman Brothers U.S. Credit Intermediate Bond Index and the Lipper Flexible Portfolio Funds Index. The Indexes are unmanaged and returns for the indexes and the Fund include reinvested dividends and capital gains. It is not possible to invest directly in an index. The graph does not reflect tax deductions that a shareholder would pay on Fund distributions or the sale of Fund shares.
Total Net Assets of the Fund:
$188.5 million
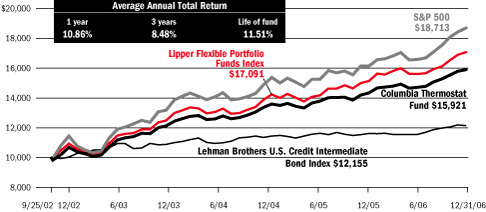
19
Columbia Acorn Fund
Major Portfolio Changes in the Fourth Quarter (Unaudited)
| Number of Shares | |||||||||||
| 09/30/06 | 12/31/06 | ||||||||||
| Additions | |||||||||||
| Information | |||||||||||
| AMIS Holdings | 1,950,000 | 2,425,000 | |||||||||
| Ceridian | 2,800,000 | 3,460,000 | |||||||||
| Cogent Communications | 0 | 1,000,000 | |||||||||
| Globalstar | 0 | 600,000 | |||||||||
| II VI | 1,913,000 | 2,025,000 | |||||||||
| Informatica | 0 | 3,400,000 | |||||||||
| IPG Photonics | 0 | 410,000 | |||||||||
| Kenexa | 775,000 | 828,000 | |||||||||
| Littelfuse | 915,000 | 1,135,000 | |||||||||
| NAVTEQ | 600,000 | 1,100,000 | |||||||||
| Polycom | 0 | 600,000 | |||||||||
| Sanmina-SCI | 7,500,000 | 10,000,000 | |||||||||
| Sohu.com | 554,000 | 650,000 | |||||||||
| Talx | 0 | 443,000 | |||||||||
| Trimble Navigation | 1,250,000 | 1,450,000 | |||||||||
| Varian | 670,000 | 800,000 | |||||||||
| Consumer Goods & Services | |||||||||||
| Abercrombie & Fitch | 2,450,000 | 3,140,000 | |||||||||
| Charming Shoppes | 0 | 1,700,000 | |||||||||
| Chico's FAS | 6,630,000 | 7,080,000 | |||||||||
| Heelys | 0 | 150,000 | |||||||||
| J Crew Group | 1,100,000 | 1,350,000 | |||||||||
| Knoll | 1,703,000 | 1,809,000 | |||||||||
| NutriSystem | 0 | 600,000 | |||||||||
| Pierre & Vacances (France) | 76,500 | 110,000 | |||||||||
| Vail Resorts | 2,110,000 | 2,390,000 | |||||||||
| Industrial Goods & Services | |||||||||||
| Administaff | 1,300,000 | 1,670,000 | |||||||||
| American Reprographics | 0 | 315,000 | |||||||||
| Ametek (includes the effect of a 3 for 2 stock split) | 2,750,000 | 4,700,000 | |||||||||
| Armor Holdings | 0 | 750,000 | |||||||||
| G&K Services | 426,000 | 512,000 | |||||||||
| Ibiden (Japan) | 193,800 | 558,000 | |||||||||
| K&F Industries Holdings | 1,582,000 | 1,712,000 | |||||||||
| USG People (Netherlands) | 650,000 | 925,000 | |||||||||
| Watsco | 2,286,000 | 2,375,000 | |||||||||
| WW Grainger | 1,200,000 | 1,300,000 | |||||||||
| Zumtobel (Austria) | 0 | 373,000 | |||||||||
| Energy & Minerals | |||||||||||
| Atwood Oceanics | 1,096,000 | 1,200,000 | |||||||||
| Enerflex Systems (Canada) | 1,140,000 | 2,280,000 | |||||||||
| Fugro (Netherlands) | 2,728,301 | 2,928,301 | |||||||||
| Rowan | 1,411,000 | 1,611,000 | |||||||||
| Number of Shares | |||||||||||
| 09/30/06 | 12/31/06 | ||||||||||
| Finance | |||||||||||
| Aspen Insurance | 0 | 1,650,000 | |||||||||
| BOK Financial | 2,505,000 | 2,605,000 | |||||||||
| Chittenden | 892,000 | 1,042,000 | |||||||||
| Conseco | 0 | 1,000,000 | |||||||||
| East West Bancorp | 400,000 | 690,000 | |||||||||
| Eaton Vance | 4,200,000 | 5,500,000 | |||||||||
| Endurance Specialty Holdings | 1,559,000 | 1,690,000 | |||||||||
| Glacier Bancorp (includes the effect of a 3 for 2 stock split) | 2,720,000 | 4,080,000 | |||||||||
| HCC Insurance Holdings | 2,330,000 | 3,125,000 | |||||||||
| Marlin Business Services | 510,000 | 685,000 | |||||||||
| McGrath Rentcorp | 1,042,000 | 1,212,000 | |||||||||
| Montpelier Re | 0 | 1,100,000 | |||||||||
| Nuveen Investments | 1,757,000 | 2,157,000 | |||||||||
| Stifel Financial | 0 | 130,000 | |||||||||
| Health Care | |||||||||||
| Barrier Therapeutics | 420,000 | 1,321,000 | |||||||||
| Cephalon | 0 | 765,000 | |||||||||
| Collagenex Pharmaceuticals | 400,000 | 830,000 | |||||||||
| Cooper | 0 | 700,000 | |||||||||
| Dade Behring | 0 | 550,000 | |||||||||
| Endo Pharmaceuticals | 0 | 1,295,000 | |||||||||
| Eresearch Technology | 2,250,000 | 2,300,000 | |||||||||
| Haemonetics | 350,000 | 550,000 | |||||||||
| ICU Medical | 1,000,000 | 1,083,000 | |||||||||
| The Medicines Company | 0 | 600,000 | |||||||||
| Medicis Pharmaceutical | 0 | 400,000 | |||||||||
| MGI Pharma | 0 | 1,510,000 | |||||||||
| Nektar Therapeutics | 1,360,000 | 2,360,000 | |||||||||
| Neurogen | 0 | 655,000 | |||||||||
| Nuvelo | 0 | 1,650,000 | |||||||||
| Omnicare | 0 | 900,000 | |||||||||
| Orthofix International | 732,500 | 942,500 | |||||||||
| Owens & Minor | 650,000 | 1,200,000 | |||||||||
| PDL BioPharma | 1,800,000 | 2,300,000 | |||||||||
| Polymedica | 0 | 700,000 | |||||||||
| QLT | 0 | 2,500,000 | |||||||||
| Viasys Healthcare | 875,000 | 1,050,000 | |||||||||
| Other Industries | |||||||||||
| Parkway Properties | 536,000 | 628,000 | |||||||||
20
| Number of Shares | |||||||||||
| 09/30/06 | 12/31/06 | ||||||||||
| Sales | |||||||||||
| Information | |||||||||||
| Alltel | 1,600,000 | 1,300,000 | |||||||||
| Bally Technologies | 3,900,000 | 3,500,000 | |||||||||
| ClickSoftware Technologies | 917,000 | 0 | |||||||||
| Getty Images | 400,000 | 300,000 | |||||||||
| infoUSA | 2,285,000 | 1,696,000 | |||||||||
| Intermec | 1,240,000 | 500,000 | |||||||||
| Kanbay International | 500,000 | 0 | |||||||||
| Liberty Global Series A | 1,750,000 | 1,500,000 | |||||||||
| M6-Metropole Television (France) | 165,500 | 0 | |||||||||
| Micros Systems | 1,800,000 | 1,400,000 | |||||||||
| Outdoor Channel Holdings | 700,000 | 0 | |||||||||
| Phoenixtec Power (Taiwan) | 11,976,000 | 0 | |||||||||
| PRIMEDIA | 1,739,000 | 0 | |||||||||
| Progress Software | 1,130,000 | 708,000 | |||||||||
| Rogers | 870,000 | 620,000 | |||||||||
| Symbol Technologies | 5,347,000 | 0 | |||||||||
| Tele2 (Sweden) | 2,300,000 | 0 | |||||||||
| Telephone & Data Systems | 980,000 | 700,000 | |||||||||
| Travelzoo | 200,000 | 0 | |||||||||
| Vasco Data Security International | 230,000 | 0 | |||||||||
| VitalStream Holdings | 875,000 | 0 | |||||||||
| Consumer Goods & Services | |||||||||||
| Borders Group | 750,000 | 0 | |||||||||
| Career Education | 374,000 | 0 | |||||||||
| C&C Group (Ireland) | 2,550,000 | 2,500,000 | |||||||||
| Four Seasons Hotels (Canada) | 915,000 | 643,000 | |||||||||
| Intrawest (Canada) | 900,000 | 0 | |||||||||
| Lincoln Technical Institute | 244,000 | 100,000 | |||||||||
| Michaels Stores | 2,760,000 | 0 | |||||||||
| Mohawk Industries | 765,000 | 0 | |||||||||
| Nobia (Sweden) | 1,398,000 | 1,048,000 | |||||||||
| PETCO Animal Supplies | 2,250,000 | 0 | |||||||||
| Station Casinos | 1,400,000 | 540,000 | |||||||||
| Industrial Goods & Services | |||||||||||
| Forward Air | 2,000,000 | 1,900,000 | |||||||||
| Gardner Denver | 1,350,000 | 600,000 | |||||||||
| Grafton Group (Ireland) | 3,500,000 | 3,000,000 | |||||||||
| Hyundai Mobis (South Korea) | 267,000 | 0 | |||||||||
| Novozymes (Denmark) | 730,000 | 590,000 | |||||||||
| NuCo2 | 1,031,000 | 510,000 | |||||||||
| Oshkosh Truck | 212,000 | 0 | |||||||||
| Poyry (Finland) | 740,000 | 0 | |||||||||
| Tenaris (Argentina) | 1,064,000 | 0 | |||||||||
| Number of Shares | |||||||||||
| 09/30/06 | 12/31/06 | ||||||||||
| Finance | |||||||||||
| Anglo Irish Bank (Ireland) | 3,500,000 | 3,000,000 | |||||||||
| Cascade Bancorp | 370,000 | 300,000 | |||||||||
| Cass Information Systems | 46,001 | 8,000 | |||||||||
| City Bank/Lynnwood WA | 413,000 | 0 | |||||||||
| Depfa Bank (Germany) | 2,275,000 | 1,425,000 | |||||||||
| First Financial Bankshares | 406,000 | 286,000 | |||||||||
| Great Southern Bancorp | 796,000 | 663,000 | |||||||||
| Komercni Banka (Czech Republic) | 250,000 | 0 | |||||||||
| SY Bancorp | 304,000 | 219,000 | |||||||||
| Energy & Minerals | |||||||||||
| Chicago Bridge & Iron | 953,000 | 0 | |||||||||
| Helmerich & Payne | 714,000 | 0 | |||||||||
| Maritrans | 600,000 | 0 | |||||||||
| Newpark Resources | 2,860,000 | 2,580,000 | |||||||||
| Pride International | 2,300,000 | 1,520,000 | |||||||||
| Tullow Oil (United Kingdom) | 13,500,000 | 9,315,000 | |||||||||
| Veritas DGC | 225,000 | 0 | |||||||||
| Health Care | |||||||||||
| Arena Pharmaceuticals | 1,429,000 | 1,179,000 | |||||||||
| Coventry Health Care | 707,000 | 500,000 | |||||||||
| Exelixis | 3,230,000 | 388,000 | |||||||||
| Hogy Medical (Japan) | 390,000 | 0 | |||||||||
| Intermagnetics General | 1,770,000 | 0 | |||||||||
| Intermune | 1,116,000 | 0 | |||||||||
| Keryx Biopharmaceuticals | 1,135,000 | 0 | |||||||||
| Lincare Holdings | 2,491,000 | 1,991,000 | |||||||||
| Maxygen | 1,585,000 | 0 | |||||||||
| Rigel Pharmaceuticals | 1,275,000 | 0 | |||||||||
| Synthes (Switzerland) | 350,000 | 315,000 | |||||||||
| Tercica | 1,500,000 | 0 | |||||||||
21
Columbia Acorn Fund
Statement of Investments, December 31, 2006
| Number of Shares | Value (000) | ||||||||||
| Equities: 94.9% | |||||||||||
| Information 23.8% | |||||||||||
| > Business Software 3.8% | |||||||||||
| 2,750,000 | Kronos (b)(c) | $ | 101,035 | ||||||||
| Labor Management Solutions | |||||||||||
| 12,000,000 | Novell (b) | 74,400 | |||||||||
| Directory, Operating System & Identity Management Software | |||||||||||
| 1,400,000 | Micros Systems (b) | 73,780 | |||||||||
| Information Systems for Restaurants & Hotels | |||||||||||
| 1,800,000 | Avid Technology (b) | 67,068 | |||||||||
| Digital Nonlinear Editing Software & Systems | |||||||||||
| 2,500,000 | Witness Systems (b)(c) | 43,825 | |||||||||
| Customer Experience Management Software | |||||||||||
| 2,400,000 | Parametric Technology (b) | 43,248 | |||||||||
| Engineering Software & Services | |||||||||||
| 3,400,000 | Informatica (b) | 41,514 | |||||||||
| Enterprise Data Integration Software | |||||||||||
| 6,000,000 | Actuate (b)(c) | 35,640 | |||||||||
| Information Delivery Software & Solutions | |||||||||||
| 2,131,000 | Concur Technologies (b)(c) | 34,181 | |||||||||
| Web Enabled Cost & Expense Management Software | |||||||||||
| 1,800,000 | Cadence Design Systems (b) | 32,238 | |||||||||
| Electronic Design Automation | |||||||||||
| 828,000 | Kenexa (b) | 27,539 | |||||||||
| Human Capital Management (HCM) Software | |||||||||||
| 2,500,000 | Radiant Systems (b)(c) | 26,100 | |||||||||
| Point of Sale Systems: Convenient Stores & Restaurants | |||||||||||
| 3,000,000 | Lawson Software (b) | 22,170 | |||||||||
| Enterprise Resource Planning (ERP) Software | |||||||||||
| 3,500,000 | Agile Software (b)(c) | 21,525 | |||||||||
| Product Design Software | |||||||||||
| 5,600,000 | Indus International (b)(c) | 21,224 | |||||||||
| Enterprise Asset Management Software | |||||||||||
| 1,490,000 | JDA Software (b)(c) | 20,517 | |||||||||
| Application/Software & Services for Retailers | |||||||||||
| 708,000 | Progress Software (b) | 19,775 | |||||||||
| Application Development Software | |||||||||||
| 1,500,000 | webMethods (b) | 11,040 | |||||||||
| Enterprise Applications Integration Tools | |||||||||||
| 3,500,000 | Tumbleweed Communications (b)(c) | 9,205 | |||||||||
| Email Content Security & File Transfer Management | |||||||||||
| 726,024 | |||||||||||
| > Computer Hardware & Related Equipment 2.9% | |||||||||||
| 1,620,000 | Amphenol | 100,570 | |||||||||
| Electronic Connectors | |||||||||||
| 1,945,000 | Belden CDT | 76,030 | |||||||||
| Specialty Cable | |||||||||||
| 2,025,000 | II VI (b)(c) | 56,579 | |||||||||
| Laser Components | |||||||||||
| 1,634,000 | Nice Systems (Israel) (b) | 50,294 | |||||||||
| Audio & Video Recording Solutions | |||||||||||
| 620,000 | Rogers (b) | 36,673 | |||||||||
| PCB Laminates & High-performance Foams | |||||||||||
| 230,000 | Wincor Nixdorf (Germany) | 35,778 | |||||||||
| Retail POS Systems & ATM Machines | |||||||||||
| Number of Shares | Value (000) | ||||||||||
| 9,956,115 | Advantech (Taiwan) | $ | 35,774 | ||||||||
| Embedded Computers | |||||||||||
| 1,027,000 | Avocent (b) | 34,764 | |||||||||
| Computer Control Switches | |||||||||||
| 900,000 | Netgear (b) | 23,625 | |||||||||
| Networking Products for Small Business & Home | |||||||||||
| 1,310,000 | CTS | 20,567 | |||||||||
| Electronic Components, Sensors & Electronics Manufacturing Solutions | |||||||||||
| 1,875,000 | Seachange International (b)(c) | 19,162 | |||||||||
| Systems for Video on Demand & Ad Insertion | |||||||||||
| 530,000 | Zebra Technologies (b) | 18,439 | |||||||||
| Bar Code Printers | |||||||||||
| 375,000 | Diebold | 17,475 | |||||||||
| Automated Teller Machines | |||||||||||
| 625,000 | Excel Technology (b)(c) | 15,994 | |||||||||
| Laser Systems & Electro-optical Components | |||||||||||
| 500,000 | Intermec (b) | 12,135 | |||||||||
| Bar Code & Wireless LAN Systems | |||||||||||
| 553,859 | |||||||||||
| > Mobile Communications 2.6% | |||||||||||
| 4,500,000 | Crown Castle International (b) | 145,350 | |||||||||
| Communications Towers | |||||||||||
| 3,500,000 | American Tower (b) | 130,480 | |||||||||
| Communications Towers in USA & Mexico | |||||||||||
| 1,300,000 | Alltel | 78,624 | |||||||||
| Cellular Telephone Services | |||||||||||
| 8,000,000 | Dobson Communications (b)(c) | 69,680 | |||||||||
| Rural & Small City Cellular Telephone Services | |||||||||||
| 700,000 | Telephone & Data Systems | 38,031 | |||||||||
| Cellular & Wireline Telephone Services | |||||||||||
| 2,500,000 | Openwave Systems (b) | 23,075 | |||||||||
| Internet Software for Mobile Devices | |||||||||||
| 600,000 | Globalstar (b) | 8,346 | |||||||||
| Satellite Mobile Voice & Data Carrier | |||||||||||
| 493,586 | |||||||||||
| > Instrumentation 1.6% | |||||||||||
| 2,800,000 | Flir Systems (b) | 89,124 | |||||||||
| Infrared Cameras | |||||||||||
| 1,450,000 | Trimble Navigation (b) | 73,558 | |||||||||
| GPS-based Instruments | |||||||||||
| 750,000 | Mettler Toledo (b) | 59,138 | |||||||||
| Laboratory Equipment | |||||||||||
| 711,000 | Dionex (b) | 40,321 | |||||||||
| Ion & Liquid Chromatography | |||||||||||
| 800,000 | Varian (b) | 35,832 | |||||||||
| Analytical Instruments | |||||||||||
| 410,000 | IPG Photonics | 9,840 | |||||||||
| Fiber Lasers | |||||||||||
| 307,813 | |||||||||||
| > CATV 1.5% | |||||||||||
| 4,015,000 | Discovery Holding (b) | 64,601 | |||||||||
| CATV Programming | |||||||||||
| 2,050,000 | Liberty Global Series C (b) | 57,400 | |||||||||
| Cable TV Franchises Outside the USA | |||||||||||
| 70,000 | Jupiter Telecommunications (Japan) (b) | 56,162 | |||||||||
| Largest Cable Service Provider in Japan | |||||||||||
| 1,500,000 | Liberty Global Series A (b) | 43,725 | |||||||||
| Cable TV Franchises Outside the USA | |||||||||||
22
| Number of Shares | Value (000) | ||||||||||
| > CATV—continued | |||||||||||
| 8,000,000 | Gemstar-TV Guide International (b) | $ | 32,080 | ||||||||
| TV Program Guides & CATV Programming | |||||||||||
| 655,000 | Liberty Media Corp - Interactive (b) | 14,128 | |||||||||
| CATV & E-Commerce | |||||||||||
| 130,000 | Liberty Media Corp - Capital (b) | 12,738 | |||||||||
| CATV Holding Company | |||||||||||
| 1,250,000 | Mediacom Communications (b) | 10,050 | |||||||||
| Cable Television Franchises | |||||||||||
| 290,884 | |||||||||||
| > Gaming Equipment & Services 1.4% | |||||||||||
| 2,750,000 | International Game Technology | 127,050 | |||||||||
| Slot Machines & Progressive Slots | |||||||||||
| 3,500,000 | Bally Technologies (b)(c) | 65,380 | |||||||||
| Slot Machines & Software | |||||||||||
| 2,430,000 | Shuffle Master (b)(c) | 63,666 | |||||||||
| Card Shufflers & Casino Games | |||||||||||
| 500,000 | Scientific Games (b) | 15,115 | |||||||||
| Lottery Services Provider | |||||||||||
| 271,211 | |||||||||||
| > Semiconductors & Related Equipment 1.4% | |||||||||||
| 3,865,000 | Integrated Device Technology (b) | 59,830 | |||||||||
| Communications Semiconductors | |||||||||||
| 4,425,000 | Entegris (b) | 47,878 | |||||||||
| Semiconductor Wafer Shipping & Handling Products | |||||||||||
| 1,135,000 | Littelfuse (b)(c) | 36,184 | |||||||||
| Little Fuses | |||||||||||
| 1,425,000 | Microsemi (b) | 28,001 | |||||||||
| Analog/Mixed Signal Semiconductors | |||||||||||
| 690,000 | Supertex (b)(c) | 27,083 | |||||||||
| Mixed-signal Semiconductors | |||||||||||
| 2,425,000 | AMIS Holdings (b) | 25,632 | |||||||||
| Mixed-signal Semiconductors | |||||||||||
| 4,439,544 | Novatek Microelectronics (Taiwan) | 20,114 | |||||||||
| LCD Related Integrated Circuits Designer | |||||||||||
| 1,905,000 | IXYS (b)(c) | 16,955 | |||||||||
| Power Semiconductors | |||||||||||
| 261,677 | |||||||||||
| > Business Information & Marketing Services 1.2% | |||||||||||
| 3,460,000 | Ceridian (b) | 96,811 | |||||||||
| HR Services & Payment Processing | |||||||||||
| 1,900,000 | Navigant Consulting (b) | 37,544 | |||||||||
| Financial Consulting Firm | |||||||||||
| 916,000 | Fair Isaac | 37,236 | |||||||||
| Credit Scoring & Decision Analytic Software | |||||||||||
| 2,000,000 | ProQuest (b)(c) | 20,900 | |||||||||
| Information Services for Education & Automotive Markets | |||||||||||
| 1,696,000 | infoUSA | 20,199 | |||||||||
| Business Data for Sales Leads | |||||||||||
| 300,000 | Getty Images (b) | 12,846 | |||||||||
| Photographs for Publications & Electronic Media | |||||||||||
| 225,536 | |||||||||||
| > Financial Processors 1.1% | |||||||||||
| 2,774,000 | Global Payments | 128,436 | |||||||||
| Credit Card Processor | |||||||||||
| Number of Shares | Value (000) | ||||||||||
| 6,500,000 | Hong Kong Exchanges and Clearing (Hong Kong) | $ | 71,002 | ||||||||
| Hong Kong Equity & Derivatives Market Operator | |||||||||||
| 600,000 | Cubic | 13,020 | |||||||||
| Revenue Collection & Defense Systems | |||||||||||
| 212,458 | |||||||||||
| > Internet Related 1.0% | |||||||||||
| 3,000,000 | ValueClick (b) | 70,890 | |||||||||
| Internet Advertising | |||||||||||
| 9,500,000 | SkillSoft Publishing (b)(c) | 58,995 | |||||||||
| Web-based Learning Solutions (E-Learning) | |||||||||||
| 4,000,000 | CNET Networks (b) | 36,360 | |||||||||
| Internet Advertising on Niche Websites | |||||||||||
| 650,000 | Sohu.com (China ) (b) | 15,600 | |||||||||
| Chinese Internet Portal/Online Advertising | |||||||||||
| 181,845 | |||||||||||
| > Telecommunications Equipment 0.9% | |||||||||||
| 13,600,000 | Tellabs (b) | 139,536 | |||||||||
| Telecommunications Equipment | |||||||||||
| 600,000 | Polycom (b) | 18,546 | |||||||||
| Video Conferencing Equipment | |||||||||||
| 1,510,000 | Symmetricom (b) | 13,469 | |||||||||
| Network Timing & Synchronization Devices | |||||||||||
| 171,551 | |||||||||||
| > Computer Services 0.7% | |||||||||||
| 1,350,000 | SRA International (b) | 36,099 | |||||||||
| Government IT Services | |||||||||||
| 5,000,000 | iGate Capital (b)(c) | 34,400 | |||||||||
| IT & Business Process Outsourcing Services | |||||||||||
| 4,000,000 | BearingPoint (b) | 31,480 | |||||||||
| Business Consulting & Technology Strategy | |||||||||||
| 4,600,000 | AnswerThink Consulting (b)(c) | 14,168 | |||||||||
| IT Integration & Best Practice Research | |||||||||||
| 443,000 | TALX | 12,160 | |||||||||
| Outsourced Human Resource Services | |||||||||||
| 128,307 | |||||||||||
| > Telephone Services 0.7% | |||||||||||
| 4,500,000 | Time Warner Telecom (b) | 89,685 | |||||||||
| Fiber Optic Telephone/Data Services | |||||||||||
| 1,500,000 | Windstream | 21,330 | |||||||||
| Rural Telephone Franchises | |||||||||||
| 1,000,000 | Cogent Communications (b) | 16,220 | |||||||||
| Internet Data Pipelines | |||||||||||
| 127,235 | |||||||||||
| > Contract Manufacturing 0.5% | |||||||||||
| 1,705,000 | Jabil Circuit | 41,858 | |||||||||
| Electronic Manufacturing Services | |||||||||||
| 10,000,000 | Sanmina-SCI (b) | 34,500 | |||||||||
| Electronic Manufacturing Services | |||||||||||
| 1,020,000 | Plexus (b) | 24,357 | |||||||||
| Electronic Manufacturing Services | |||||||||||
| 100,715 | |||||||||||
| > Television Programming 0.5% | |||||||||||
| 1,423,100 | Alliance Atlantis Communication (Canada) (b) | 61,603 | |||||||||
| CATV Channels, TV/Movie Production/Distribution | |||||||||||
23
Columbia Acorn Fund
Statement of Investments, continued
| Number of Shares | Value (000) | ||||||||||
| > Television Programming—continued | |||||||||||
| 3,000,000 | Lions Gate Entertainment (b) | $ | 32,190 | ||||||||
| Film & TV Studio | |||||||||||
| 93,793 | |||||||||||
| > Consumer Software 0.5% | |||||||||||
| 2,300,000 | THQ (b) | 74,796 | |||||||||
| Entertainment Software | |||||||||||
| 1,000,000 | Activision (b) | 17,240 | |||||||||
| Entertainment Software | |||||||||||
| 92,036 | |||||||||||
| > Electronics Distribution 0.5% | |||||||||||
| 3,100,000 | Avnet (b) | 79,143 | |||||||||
| Electronic Components Distribution | |||||||||||
| 710,000 | Agilysys | 11,885 | |||||||||
| IT Distributor | |||||||||||
| 91,028 | |||||||||||
| > Radio 0.3% | |||||||||||
| 1,541,000 | Salem Communications (c) | 18,415 | |||||||||
| Radio Stations for Religious Programming | |||||||||||
| 1,500,000 | Cumulus Media (b) | 15,585 | |||||||||
| Radio Stations in Small Cities | |||||||||||
| 1,400,000 | Saga Communications (b)(c) | 13,454 | |||||||||
| Radio Stations in Small- & Mid-sized Cities | |||||||||||
| 2,400,000 | Spanish Broadcasting System (b)(c) | 9,864 | |||||||||
| Spanish Language Radio Stations | |||||||||||
| 57,318 | |||||||||||
| > Satellite Broadcasting & Services 0.3% | |||||||||||
| 2,755,000 | SES Global (France) | 48,930 | |||||||||
| Satellite Broadcasting Services | |||||||||||
| 48,930 | |||||||||||
| > Publishing 0.2% | |||||||||||
| 1,100,000 | NAVTEQ (b) | 38,467 | |||||||||
| Map Data for Electronic Devices | |||||||||||
| 38,467 | |||||||||||
| > TV Broadcasting 0.2% | |||||||||||
| 2,500,000 | Entravision Communications (b) | 20,550 | |||||||||
| Spanish Language TV, Radio & Outdoor | |||||||||||
| 1,750,000 | Gray Television | 12,828 | |||||||||
| Mid Market Affiliated TV Stations | |||||||||||
| 33,378 | |||||||||||
| Information Total | 4,507,651 | ||||||||||
| Consumer Goods & Services 18.8% | |||||||||||
| > Retail 4.2% | |||||||||||
| 3,140,000 | Abercrombie & Fitch | 218,638 | |||||||||
| Teen Apparel Retailer | |||||||||||
| 7,080,000 | Chico's FAS (b) | 146,485 | |||||||||
| Women's Specialty Retail | |||||||||||
| 4,600,000 | Urban Outfitters (b) | 105,938 | |||||||||
| Apparel & Home Specialty Retailer | |||||||||||
| 3,743,000 | Christopher & Banks (c) | 69,844 | |||||||||
| Women's Apparel Retailer | |||||||||||
| 1,350,000 | J Crew Group (b) | 52,043 | |||||||||
| Multi-channel Branded Retailer | |||||||||||
| 1,400,000 | Williams-Sonoma | 44,016 | |||||||||
| Home Goods & Furnishing Retailer | |||||||||||
| Number of Shares | Value (000) | ||||||||||
| 1,223,000 | AnnTaylor Stores (b) | $ | 40,163 | ||||||||
| Women's Apparel Retailer | |||||||||||
| 1,630,000 | Rona (Canada) (b) | 29,353 | |||||||||
| Leading Canadian Do-it-yourself Retailer | |||||||||||
| 775,000 | Genesco (b) | 28,908 | |||||||||
| Multi-concept Branded Footwear Retailer | |||||||||||
| 1,700,000 | Charming Shoppes (b) | 23,001 | |||||||||
| Women'S Specialty Plus Size Apparel Retailer | |||||||||||
| 3,500,000 | Edgars Consolidated Stores (South Africa) | 19,423 | |||||||||
| Retail Conglomerate | |||||||||||
| 1,200,000 | Gaiam (b)(c) | 16,416 | |||||||||
| Healthy Living Catalogs & E-Commerce | |||||||||||
| 794,228 | |||||||||||
| > Apparel 2.5% | |||||||||||
| 7,330,000 | Coach (b) | 314,897 | |||||||||
| Designer & Retailer of Branded Leather Accessories | |||||||||||
| 2,268,000 | Carter's (b) | 57,834 | |||||||||
| Children's Branded Apparel | |||||||||||
| 919,000 | Oxford Industries (c) | 45,628 | |||||||||
| Branded & Private Label Apparel | |||||||||||
| 3,000,000 | Billabong International (Australia) | 41,230 | |||||||||
| Action Sports Apparel Brand Manager | |||||||||||
| 900,000 | True Religion Apparel (b) | 13,779 | |||||||||
| Premium Denim | |||||||||||
| 150,000 | Heelys | 4,816 | |||||||||
| Wheeled Footwear | |||||||||||
| 478,184 | |||||||||||
| > Other Consumer Services 2.4% | |||||||||||
| 2,250,000 | ITT Educational Services (b)(c) | 149,332 | |||||||||
| Post-secondary Degree Programs | |||||||||||
| 5,400,000 | ServiceMaster | 70,794 | |||||||||
| Lawn Care, Pest Control, Commercial Disaster Responce | |||||||||||
| 1,275,000 | Weight Watchers International | 66,976 | |||||||||
| Weight Loss Programs | |||||||||||
| 600,000 | NutriSystem (b) | 38,034 | |||||||||
| Weight Loss Program | |||||||||||
| 1,500,000 | Universal Technical Institute (b)(c) | 33,315 | |||||||||
| Vocational Training | |||||||||||
| 800,000 | Regis | 31,632 | |||||||||
| Hair Salons | |||||||||||
| 1,530,000 | Central Parking | 27,540 | |||||||||
| Owner, Operator, Manager of Parking Lots & Garages | |||||||||||
| 110,000 | Pierre & Vacances (France) | 13,481 | |||||||||
| Vacation Apartment Lets | |||||||||||
| 2,550,000 | Princeton Review (b)(c) | 13,464 | |||||||||
| College Preparation Courses | |||||||||||
| 100,000 | Lincoln Technical Institute (b) | 1,349 | |||||||||
| Vocational Training | |||||||||||
| 445,917 | |||||||||||
| > Leisure Products 2.2% | |||||||||||
| 1,751,000 | Harley-Davidson | 123,393 | |||||||||
| Motorcycles & Related Merchandise | |||||||||||
| 1,416,000 | Speedway Motorsports | 54,374 | |||||||||
| Motorsport Racetrack Owner & Operator | |||||||||||
| 1,025,000 | International Speedway | 52,316 | |||||||||
| Largest Motorsports Racetrack Owner & Operator | |||||||||||
24
| Number of Shares | Value (000) | ||||||||||
| > Leisure Products—continued | |||||||||||
| 1,032,000 | RC2 (b) | $ | 45,408 | ||||||||
| Toys, Infant Products & Collectibles | |||||||||||
| 900,000 | Polaris Industries | 42,147 | |||||||||
| Leisure Vehicles & Related Products | |||||||||||
| 4,690,000 | Fleetwood Enterprises (b)(c) | 37,098 | |||||||||
| RV & Manufactured Home Maker | |||||||||||
| 690,000 | Winnebago | 22,708 | |||||||||
| Premier Motorhome Maker | |||||||||||
| 441,000 | Thor Industries | 19,400 | |||||||||
| RV & Bus Manufacturer | |||||||||||
| 600,000 | Callaway Golf | 8,646 | |||||||||
| Premium Golf Clubs & Balls | |||||||||||
| 405,490 | |||||||||||
| > Nondurables 1.6% | |||||||||||
| 2,740,000 | Scotts Miracle-Gro | 141,521 | |||||||||
| Consumer Lawn & Garden Products | |||||||||||
| 1,650,000 | Jarden (b) | 57,404 | |||||||||
| Branded Household Products | |||||||||||
| 1,010,000 | Chattem (b)(c) | 50,581 | |||||||||
| Personal Care Products | |||||||||||
| 1,800,000 | Helen of Troy (b)(c) | 43,668 | |||||||||
| Hair Dryers & Curling Irons | |||||||||||
| 1,100,000 | Natura Cosmeticos (Brazil) | 15,262 | |||||||||
| Direct Retailer of Cosmetics | |||||||||||
| 308,436 | |||||||||||
| > Furniture & Textiles 1.4% | |||||||||||
| 2,550,000 | HNI (c) | 113,246 | |||||||||
| Office Furniture & Fireplaces | |||||||||||
| 2,068,000 | Herman Miller | 75,192 | |||||||||
| Office Furniture | |||||||||||
| 1,048,000 | Nobia (Sweden) | 40,326 | |||||||||
| Kitchen Cabinet Manufacturing & Distribution | |||||||||||
| 1,809,000 | Knoll | 39,798 | |||||||||
| Office Furniture | |||||||||||
| 268,562 | |||||||||||
| > Casinos & Gaming 1.3% | |||||||||||
| 3,200,000 | Pinnacle Entertainment (b)(c) | 106,048 | |||||||||
| Regional Casino Operator | |||||||||||
| 1,700,000 | Penn National Gaming (b) | 70,754 | |||||||||
| Regional Casino Operator | |||||||||||
| 540,000 | Station Casinos | 44,102 | |||||||||
| Las Vegas Locals Casinos | |||||||||||
| 690,000 | Intralot (Greece) | 24,133 | |||||||||
| Lottery & Gaming Systems/Services | |||||||||||
| 226,000 | Lakes Entertainment (b) | 2,439 | |||||||||
| Native American Casinos Development | |||||||||||
| 247,476 | |||||||||||
| > Travel 1.3% | |||||||||||
| 2,390,000 | Vail Resorts (b)(c) | 107,120 | |||||||||
| Ski Resort Operator & Developer | |||||||||||
| 4,000,000 | Expedia (b) | 83,920 | |||||||||
| Online Travel Services Company | |||||||||||
| 643,000 | Four Seasons Hotels (Canada) | 52,719 | |||||||||
| Luxury Hotel Operator | |||||||||||
| 243,759 | |||||||||||
| Number of Shares | Value (000) | ||||||||||
| > Restaurants 0.7% | |||||||||||
| 2,145,000 | Sonic (b) | $ | 51,373 | ||||||||
| Quick Service Restaurant | |||||||||||
| 1,000,000 | Red Robin Gourmet Burgers (b)(c) | 35,850 | |||||||||
| Casual Dining Restaurant | |||||||||||
| 1,600,000 | AFC Enterprises (b)(c) | 28,272 | |||||||||
| Popeyes Restaurants | |||||||||||
| 800,000 | Cheesecake Factory (b) | 19,680 | |||||||||
| Casual Dining Restaurants | |||||||||||
| 135,175 | |||||||||||
| > Consumer Goods Distribution 0.5% | |||||||||||
| 2,500,000 | Pool | 97,925 | |||||||||
| Distributor of Swimming Pool Supplies & Equipment | |||||||||||
| 97,925 | |||||||||||
| > Food & Beverage 0.4% | |||||||||||
| 2,500,000 | C&C Group (Ireland) | 44,372 | |||||||||
| Beverage Company | |||||||||||
| 1,000,000 | IAWS Group (Ireland) | 25,607 | |||||||||
| Baked Goods | |||||||||||
| 69,979 | |||||||||||
| > Other Durable Goods 0.2% | |||||||||||
| 14,999,300 | Techtronic Industries (Hong Kong) | 19,415 | |||||||||
| Power Tools & Motorized Appliances | |||||||||||
| 900,000 | Champion Enterprises (b) | 8,424 | |||||||||
| Manufactured Homes | |||||||||||
| 5,700,000 | Ducati Motor (Italy) (b) | 6,914 | |||||||||
| Motorcycles & Related Merchandise | |||||||||||
| 172,000 | Cavco Industries (b) | 6,027 | |||||||||
| Higher End Manufactured Homes | |||||||||||
| 40,780 | |||||||||||
| > Cruise Lines 0.1% | |||||||||||
| 400,000 | Carnival | 19,620 | |||||||||
| Largest Cruise Line | |||||||||||
| 19,620 | |||||||||||
| Consumer Goods & Services: Total | 3,555,531 | ||||||||||
| Industrial Goods & Services 17.2% | |||||||||||
| > Machinery 5.6% | |||||||||||
| 4,700,000 | Ametek | 149,648 | |||||||||
| Aerospace/Industrial Instruments | |||||||||||
| 3,600,000 | Donaldson | 124,956 | |||||||||
| Industrial Air Filtration | |||||||||||
| 3,500,000 | Clarcor (c) | 118,335 | |||||||||
| Mobile & Industrial Filters | |||||||||||
| 2,200,000 | ESCO Technologies (b)(c) | 99,968 | |||||||||
| Automatic Electric Meter Readers | |||||||||||
| 2,850,000 | Pentair | 89,490 | |||||||||
| Pumps, Water Treatment & Tools | |||||||||||
| 2,500,000 | Pall | 86,375 | |||||||||
| Filtration & Fluids Clarification | |||||||||||
| 1,900,000 | Mine Safety Appliances (c) | 69,635 | |||||||||
| Safety Equipment | |||||||||||
| 1,250,000 | Nordson | 62,287 | |||||||||
| Dispensing Systems for Adhesives & Coatings | |||||||||||
| 1,100,000 | Kaydon | 43,714 | |||||||||
| Specialized Friction & Motion Control Products | |||||||||||
| 750,000 | Armor Holdings (b) | 41,137 | |||||||||
| Military Trucks, Armor & Helmets | |||||||||||
25
Columbia Acorn Fund
Statement of Investments, continued
| Number of Shares | Value (000) | ||||||||||
| > Machinery—continued | |||||||||||
| 1,712,000 | K&F Industries Holdings (b) | $ | 38,880 | ||||||||
| Aircraft Wheels, Brakes & Fuel Tank Bladders | |||||||||||
| 833,000 | Toro | 38,843 | |||||||||
| Turf Maintenance Equipment | |||||||||||
| 2,100,000 | Goodman Global (b) | 36,120 | |||||||||
| HVAC Equipment Manufacturer | |||||||||||
| 253,600 | Neopost (France) | 31,847 | |||||||||
| Postage Meter Machines | |||||||||||
| 600,000 | Gardner Denver (b) | 22,386 | |||||||||
| Air Compressors, Blowers & Pumps | |||||||||||
| 1,053,621 | |||||||||||
| > Other Industrial Services 2.6% | |||||||||||
| 5,500,000 | Expeditors International of Washington | 222,750 | |||||||||
| International Freight Forwarder | |||||||||||
| 3,200,000 | UTI Worldwide | 95,680 | |||||||||
| Global Logistics & Freight Forwarding | |||||||||||
| 1,900,000 | Forward Air (c) | 54,967 | |||||||||
| Freight Transportation Between Airports | |||||||||||
| 1,650,000 | Mobile Mini (b) | 44,451 | |||||||||
| Portable Storage Units Leasing | |||||||||||
| 374,000 | Imtech (Netherlands) | 23,770 | |||||||||
| Engineering & Technical Services | |||||||||||
| 512,000 | G&K Services | 19,912 | |||||||||
| Uniform Rental | |||||||||||
| 655,000 | TAL International Group | 17,482 | |||||||||
| Intermodal Freight Containers Leasing | |||||||||||
| 315,000 | American Reprographics (b) | 10,493 | |||||||||
| Document Management & Logistics | |||||||||||
| 489,505 | |||||||||||
| > Industrial Distribution 1.8% | |||||||||||
| 2,375,000 | Watsco (c) | 112,005 | |||||||||
| HVAC Distribution | |||||||||||
| 1,300,000 | WW Grainger | 90,922 | |||||||||
| Industrial Distribution | |||||||||||
| 1,925,000 | Airgas | 78,001 | |||||||||
| Industrial Gas Distributor | |||||||||||
| 3,000,000 | Grafton Group (Ireland) | 50,139 | |||||||||
| Builders Materials Wholesaling & Do-it-yourself Retailing | |||||||||||
| 510,000 | NuCo2 (b) | 12,541 | |||||||||
| Bulk Co2 Gas Distribution to Restaurants | |||||||||||
| 343,608 | |||||||||||
| > Construction 1.6% | |||||||||||
| 1,900,000 | Florida Rock | 81,795 | |||||||||
| Aggregates & Concrete | |||||||||||
| 2,200,000 | Simpson Manufacturing | 69,630 | |||||||||
| Wall Joint Maker | |||||||||||
| 650,000 | Martin Marietta Materials | 67,541 | |||||||||
| Aggregates | |||||||||||
| 30,000 | Geberit (Switzerland) | 46,222 | |||||||||
| Plumbing Supplies | |||||||||||
| 1,000,000 | Kingspan Group (Ireland) | 26,492 | |||||||||
| Building Insulation & Environmental Containers | |||||||||||
| 90,000 | Ciments Francais (France) | 17,283 | |||||||||
| Leading French & Emerging Markets Cement Producer | |||||||||||
| 308,963 | |||||||||||
| Number of Shares | Value (000) | ||||||||||
| > Industrial Materials & Specialty Chemicals 1.4% | |||||||||||
| 2,700,000 | Spartech (c) | $ | 70,794 | ||||||||
| Plastics Distribution & Compounding | |||||||||||
| 590,000 | Novozymes (Denmark) | 50,579 | |||||||||
| Industrial Enzymes | |||||||||||
| 28,000 | Sika (Switzerland) | 43,410 | |||||||||
| Chemicals for Construction & Industrial Applications | |||||||||||
| 1,228,000 | Drew Industries (b)(c) | 31,940 | |||||||||
| RV & Manufactured Home Components | |||||||||||
| 195,000 | Sociedad Quimica y Minera de Chile (Chile) | 26,436 | |||||||||
| Producer of Specialty Fertilizers, Lithium & Iodine | |||||||||||
| 400,000 | Carbone Lorraine (France) | 22,482 | |||||||||
| Advanced Industrial Materials | |||||||||||
| 200,000 | Imerys (France) | 17,746 | |||||||||
| Industrial Minerals Producer | |||||||||||
| 431,000 | Koninklijke TenCate (Netherlands) | 13,187 | |||||||||
| Advanced Textiles & Industrial Fabrics | |||||||||||
| 276,574 | |||||||||||
| > Electrical Components 1.1% | |||||||||||
| 1,963,000 | Genlyte Group (b)(c) | 153,330 | |||||||||
| Commercial Lighting Fixtures | |||||||||||
| 1,125,000 | Ushio (Japan) | 23,157 | |||||||||
| Industrial Light Sources | |||||||||||
| 700,000 | Legrand (France) (b) | 20,514 | |||||||||
| Electrical Components | |||||||||||
| 373,000 | Zumtobel (Austria) (b) | 11,869 | |||||||||
| Lighting Systems | |||||||||||
| 208,870 | |||||||||||
| > Outsourcing Services 1.1% | |||||||||||
| 1,670,000 | Administaff (c) | 71,426 | |||||||||
| Professional Employer Organization | |||||||||||
| 2,500,000 | Quanta Services (b) | 49,175 | |||||||||
| Electrical & Telecom Construction Services | |||||||||||
| 925,000 | USG People (Netherlands) | 40,196 | |||||||||
| Temporary Staffing Services | |||||||||||
| 2,000,000 | Labor Ready (b) | 36,660 | |||||||||
| Temporary Manual Labor | |||||||||||
| 600,000 | GP Strategies (b) | 4,980 | |||||||||
| Training Programs | |||||||||||
| 202,437 | |||||||||||
| > Conglomerates 0.8% | |||||||||||
| 766,000 | Aalberts Industries (Netherlands) | 66,219 | |||||||||
| Flow Control & Heat Treatment | |||||||||||
| 1,350,000 | Hexagon (Sweden) | 57,470 | |||||||||
| Measurement Equipment & Polymers | |||||||||||
| 558,000 | Ibiden (Japan) | 28,185 | |||||||||
| Electronic Parts & Ceramics | |||||||||||
| 151,874 | |||||||||||
| > Steel 0.8% | |||||||||||
| 2,860,000 | Gibraltar Industries (c) | 67,239 | |||||||||
| Steel Processing | |||||||||||
| 2,300,000 | Worthington Industries | 40,756 | |||||||||
| Steel Processing | |||||||||||
| 135,000 | Vallourec (France) | 38,989 | |||||||||
| Oil, Gas & Industrial Seamless Tubes | |||||||||||
| 146,984 | |||||||||||
26
| Number of Shares | Value (000) | ||||||||||
| > Waste Management 0.4% | |||||||||||
| 1,700,000 | Waste Connections (b) | $ | 70,635 | ||||||||
| Solid Waste Management | |||||||||||
| 70,635 | |||||||||||
| Industrial Goods & Services: Total | 3,253,071 | ||||||||||
| Finance 14.3% | |||||||||||
| > Insurance 4.2% | |||||||||||
| 3,125,000 | HCC Insurance Holdings | 100,281 | |||||||||
| Specialty Insurance | |||||||||||
| 2,040,000 | Philadelphia Consolidated Holding (b) | 90,902 | |||||||||
| Specialty Insurance | |||||||||||
| 149,000 | Markel (b) | 71,535 | |||||||||
| Specialty Insurance | |||||||||||
| 1,200,000 | Assurant | 66,300 | |||||||||
| Specialty Insurance | |||||||||||
| 1,690,000 | Endurance Specialty Holdings | 61,820 | |||||||||
| Commercial Lines Insurance/Reinsurance | |||||||||||
| 1,748,000 | Leucadia National | 49,294 | |||||||||
| Insurance Holding Company | |||||||||||
| 995,000 | Protective Life | 47,262 | |||||||||
| Life Insurance | |||||||||||
| 1,650,000 | Aspen Insurance | 43,494 | |||||||||
| Commercial Lines Insurance/Reinsurance | |||||||||||
| 710,000 | Selective Insurance Group | 40,676 | |||||||||
| Commercial & Personal Lines Insurance | |||||||||||
| 1,550,000 | United America Indemnity (b)(c) | 39,262 | |||||||||
| Specialty Insurance | |||||||||||
| 740,000 | Stancorp Financial Group | 33,337 | |||||||||
| Group Life & Disability Insurance | |||||||||||
| 570,000 | RLI | 32,159 | |||||||||
| Specialty Insurance | |||||||||||
| 750,000 | Delphi Financial Group | 30,345 | |||||||||
| Group Employee Benefit Products & Services | |||||||||||
| 600,000 | National Financial Partners | 26,382 | |||||||||
| Distributor of Life Insurance, Group Benefits & Investment Advisory Services | |||||||||||
| 500,000 | April Group (France) | 24,018 | |||||||||
| Insurance Policy Construction | |||||||||||
| 1,100,000 | Montpelier Re | 20,471 | |||||||||
| Commercial Lines Insurance/Reinsurance | |||||||||||
| 1,000,000 | Conseco (b) | 19,980 | |||||||||
| Life, Long-Term Care & Medical Supplement Insurance | |||||||||||
| 797,518 | |||||||||||
| > Banks 4.2% | |||||||||||
| 2,605,000 | BOK Financial | 143,223 | |||||||||
| Tulsa Based S.W. Bank | |||||||||||
| 3,600,000 | Associated Banc-Corp | 125,568 | |||||||||
| Midwest Bank | |||||||||||
| 4,080,000 | Glacier Bancorp (c) | 99,715 | |||||||||
| Mountain States Bank | |||||||||||
| 3,156,000 | TCF Financial | 86,538 | |||||||||
| Great Lakes Bank | |||||||||||
| 2,850,000 | Northern Rock (United Kingdom) | 65,544 | |||||||||
| Lowest Cost Mortgage Bank in UK | |||||||||||
| 3,000,000 | Anglo Irish Bank (Ireland) | 62,202 | |||||||||
| Small Business & Middle Market Banking | |||||||||||
| 1,320,000 | West Coast Bancorp (c) | 45,725 | |||||||||
| Portland Small Business Bank | |||||||||||
| Number of Shares | Value (000) | ||||||||||
| 1,042,000 | Chittenden | $ | 31,979 | ||||||||
| Vermont & Western Massachusetts Banks | |||||||||||
| 1,425,000 | Depfa Bank (Germany) | 25,559 | |||||||||
| Investment Banker to Public Authorities | |||||||||||
| 690,000 | East West Bancorp | 24,440 | |||||||||
| LA Bank with Chinese Focus | |||||||||||
| 663,000 | Great Southern Bancorp | 19,565 | |||||||||
| Missouri Real Estate Lender | |||||||||||
| 949,000 | West Bancorporation (c) | 16,873 | |||||||||
| Des Moines Commercial Bank | |||||||||||
| 286,000 | First Financial Bankshares | 11,972 | |||||||||
| West Texas Bank | |||||||||||
| 300,000 | Cascade Bancorp | 9,309 | |||||||||
| Central Oregon Bank | |||||||||||
| 400,000 | First Mutual Bancshares (c) | 9,272 | |||||||||
| Seattle Community Bank | |||||||||||
| 219,000 | SY Bancorp | 6,132 | |||||||||
| Louisville Bank | |||||||||||
| 150,000 | Greene County Bancshares | 5,960 | |||||||||
| Tennessee Bank | |||||||||||
| 8,000 | Cass Information Systems | 289 | |||||||||
| Payables Outsourcer | |||||||||||
| 789,865 | |||||||||||
| > Brokerage & Money Management 2.4% | |||||||||||
| 5,500,000 | Eaton Vance | 181,555 | |||||||||
| Specialty Mutual Funds | |||||||||||
| 2,464,000 | SEI Investments | 146,756 | |||||||||
| Mutual Fund Administration & Investment Management | |||||||||||
| 2,157,000 | Nuveen Investments | 111,905 | |||||||||
| Money Management | |||||||||||
| 450,000 | Investment Technology Group (b) | 19,296 | |||||||||
| Electronic Trading | |||||||||||
| 130,000 | Stifel Financial (b) | 5,100 | |||||||||
| Traditional Middle-American Broker | |||||||||||
| 464,612 | |||||||||||
| > Finance Companies 1.8% | |||||||||||
| 6,500,000 | AmeriCredit (b)(c) | 163,605 | |||||||||
| Auto Lending | |||||||||||
| 1,500,000 | World Acceptance (b)(c) | 70,425 | |||||||||
| Personal Loans | |||||||||||
| 1,212,000 | McGrath Rentcorp | 37,124 | |||||||||
| Temporary Space & IT Equipment Rentals | |||||||||||
| 1,119,000 | Electro Rent (b) | 18,687 | |||||||||
| Test & Measurement Rentals | |||||||||||
| 685,000 | Marlin Business Services (b)(c) | 16,461 | |||||||||
| National Small Equipment Leasing | |||||||||||
| 250,000 | Banca Italease (Italy) | 14,526 | |||||||||
| Italian Leasing & Factoring Leader | |||||||||||
| 900,000 | Paragon Group (United Kingdom) | 11,775 | |||||||||
| UK Buy-to-let Finance Company | |||||||||||
| 332,603 | |||||||||||
| > Savings & Loans 1.7% | |||||||||||
| 4,326,000 | People's Bank Bridgeport | 193,026 | |||||||||
| Connecticut Savings & Loan | |||||||||||
| 1,700,000 | Housing Development Finance (India) | 62,617 | |||||||||
| Indian Mortgage Lender | |||||||||||
| 1,178,000 | Anchor Bancorp Wisconsin (c) | 33,950 | |||||||||
| Wisconsin Thrift | |||||||||||
27
Columbia Acorn Fund
Statement of Investments, continued
| Number of Shares | Value (000) | ||||||||||
| > Savings & Loans—continued | |||||||||||
| 1,285,000 | Washington Federal | $ | 30,236 | ||||||||
| Traditional Thrift | |||||||||||
| 360,000 | Provident New York Bancorp | 5,393 | |||||||||
| New York State Thrift | |||||||||||
| 325,222 | |||||||||||
| Finance: Total | 2,709,820 | ||||||||||
| Energy & Minerals 8.0% | |||||||||||
| > Oil & Gas Producers 3.7% | |||||||||||
| 2,700,000 | Ultra Petroleum (b) | 128,925 | |||||||||
| Oil & Gas Producer | |||||||||||
| 2,500,000 | XTO Energy | 117,625 | |||||||||
| Oil & Gas Producer | |||||||||||
| 2,400,000 | Equitable Resources | 100,200 | |||||||||
| Natural Gas Producer & Utility | |||||||||||
| 4,900,000 | Talisman Energy (Canada) | 83,197 | |||||||||
| Oil & Gas Producer | |||||||||||
| 9,315,000 | Tullow Oil (United Kingdom) | 72,571 | |||||||||
| Oil & Gas Producer | |||||||||||
| 2,000,000 | Southwestern Energy (b) | 70,100 | |||||||||
| Natural Gas Producer | |||||||||||
| 1,500,000 | Range Resources | 41,190 | |||||||||
| Oil & Gas Producer | |||||||||||
| 850,000 | St. Mary Land & Exploration | 31,314 | |||||||||
| Oil & Gas Producer | |||||||||||
| 3,200,000 | Vaalco Energy (b)(c) | 21,600 | |||||||||
| Oil & Gas Producer | |||||||||||
| 700,000 | Denbury Resources (b) | 19,453 | |||||||||
| Oil Producer Using Co2 Injection | |||||||||||
| 1,200,000 | McMoran Exploration (b) | 17,064 | |||||||||
| Natural Gas Producer & Developer | |||||||||||
| 703,239 | |||||||||||
| > Oil Services 3.2% | |||||||||||
| 2,820,000 | FMC Technologies (b) | 173,797 | |||||||||
| Oil & Gas Well Head Manufacturer | |||||||||||
| 2,928,301 | Fugro (Netherlands) | 139,874 | |||||||||
| Oilfield Services | |||||||||||
| 1,200,000 | Atwood Oceanics (b) | 58,764 | |||||||||
| Offshore Drilling Contractor | |||||||||||
| 1,611,000 | Rowan | 53,485 | |||||||||
| Offshore Drilling Contractor | |||||||||||
| 1,520,000 | Pride International (b) | 45,615 | |||||||||
| Offshore Drilling Contractor | |||||||||||
| 2,400,000 | Key Energy Services (b) | 37,560 | |||||||||
| Well Workover Services | |||||||||||
| 1,190,000 | Tetra Technologies (b) | 30,440 | |||||||||
| U.S.-based Services Company with Life of Field Approach | |||||||||||
| 750,000 | CARBO Ceramics | 28,028 | |||||||||
| Natural Gas Well Stimulants | |||||||||||
| 2,280,000 | Enerflex Systems (Canada) (c) | 21,604 | |||||||||
| Natural Gas Compresser Rental & Fabrication | |||||||||||
| 2,580,000 | Newpark Resources (b) | 18,602 | |||||||||
| Drilling Fluid Services | |||||||||||
| 607,769 | |||||||||||
| > Mining 0.6% | |||||||||||
| 13,100,000 | UrAsia Energy (Canada) (b)(e) | 60,324 | |||||||||
| Uranium Mining in Kazakhstan | |||||||||||
| Number of Shares | Value (000) | ||||||||||
| 2,900,000 | Jubilee Mines (Australia) | $ | 36,126 | ||||||||
| Nickel Mining in Australia | |||||||||||
| 1,000,000 | Ivanhoe Mines (Canada) (b) | 9,862 | |||||||||
| Copper Mine Project in Mongolia | |||||||||||
| 106,312 | |||||||||||
| > Oil Refining, Marketing & Distribution 0.3% | |||||||||||
| 966,000 | Atmos Energy | 30,825 | |||||||||
| Dallas Natural Gas Utility | |||||||||||
| 435,000 | Oneok | 18,757 | |||||||||
| Natural Gas Distribution, Pipeline Processing & Trading | |||||||||||
| 19,000 | Dynegy (b) | 138 | |||||||||
| Energy Trading & Generation | |||||||||||
| 49,720 | |||||||||||
| > Agricultural Commodities 0.2% | |||||||||||
| 550,000 | Aracruz Celulose (Brazil) | 33,682 | |||||||||
| Brazilian Hardwood Pulp Producer | |||||||||||
| 35,000,000 | Global Bio-chem Technology Group (China ) | 11,776 | |||||||||
| Refiner of Corn-based Commodities | |||||||||||
| 45,458 | |||||||||||
| Energy & Minerals: Total | 1,512,498 | ||||||||||
| Health Care 7.8% | |||||||||||
| > Health Care Services 2.4% | |||||||||||
| 1,991,000 | Lincare Holdings (b) | 79,321 | |||||||||
| Home Health Care Services | |||||||||||
| 1,000,000 | Rhoen-Klinikum (Germany) | 48,486 | |||||||||
| Health Care Services | |||||||||||
| 410,000 | OPG Groep (Netherlands) | 48,174 | |||||||||
| Health Care Supplies & Pharmacies | |||||||||||
| 1,085,000 | Charles River Laboratories (b) | 46,926 | |||||||||
| Pharmaceutical Research | |||||||||||
| 2,250,000 | PSS World Medical (b) | 43,943 | |||||||||
| Medical Supplies Distributor | |||||||||||
| 1,125,000 | LCA-Vision (c) | 38,655 | |||||||||
| Lasik Surgery Centers | |||||||||||
| 900,000 | Omnicare | 34,767 | |||||||||
| Pharmacy Services For Nursing Homes | |||||||||||
| 1,150,000 | United Surgical Partners (b) | 32,603 | |||||||||
| Outpatient Surgery Center | |||||||||||
| 500,000 | Coventry Health Care (b) | 25,025 | |||||||||
| HMO | |||||||||||
| 808,000 | PRA International (b) | 20,418 | |||||||||
| Contract Research Organization | |||||||||||
| 2,300,000 | Eresearch Technology (b) | 15,479 | |||||||||
| Clinical Research Services | |||||||||||
| 1,433,000 | Dendrite International (b) | 15,347 | |||||||||
| Software for Pharmaceutical Sales Force Automation | |||||||||||
| 449,144 | |||||||||||
| > Medical Equipment & Devices 1.5% | |||||||||||
| 942,500 | Orthofix International (b)(c) | 47,125 | |||||||||
| Bone Fixation & Stimulation Devices | |||||||||||
| 1,000,000 | Edwards Lifesciences (b) | 47,040 | |||||||||
| Heart Valves | |||||||||||
| 870,000 | Vital Signs (c) | 43,430 | |||||||||
| Anesthesia, Respiratory & Sleep Products | |||||||||||
| 315,000 | Synthes (Switzerland) | 37,549 | |||||||||
| Products for Orthopedic Surgery | |||||||||||
28
| Number of Shares | Value (000) | ||||||||||
| > Medical Equipment & Devices—continued | |||||||||||
| 1,050,000 | Viasys Healthcare (b) | $ | 29,211 | ||||||||
| Respiratory & Neurology Medical Equipment | |||||||||||
| 550,000 | Haemonetics (b) | 24,761 | |||||||||
| Blood & Plasma Collection Equipment | |||||||||||
| 205,000 | Essilor International (France) | 21,988 | |||||||||
| Eyeglass Lenses | |||||||||||
| 550,000 | Dade Behring | 21,896 | |||||||||
| Clinical Diagnostics Supplier | |||||||||||
| 552,000 | Advanced Medical Optics (b) | 19,430 | |||||||||
| Medical Devices for Eye Care | |||||||||||
| 292,430 | |||||||||||
| > Biotechnology & Drug Delivery 1.5% | |||||||||||
| 2,300,000 | PDL BioPharma (b) | 46,322 | |||||||||
| Proprietary Monoclonal Antibodies | |||||||||||
| 2,360,000 | Nektar Therapeutics (b) | 35,895 | |||||||||
| Drug Delivery Technologies | |||||||||||
| 2,880,000 | Ligand Pharmaceuticals (b) | 31,536 | |||||||||
| Drugs for Pain, Cancer, Osteoporosis & Diabetes | |||||||||||
| 2,000,000 | Medarex (b) | 29,580 | |||||||||
| Humanized Antibodies | |||||||||||
| 1,780,000 | Array Biopharma (b) | 22,998 | |||||||||
| Drugs for Cancer & Inflammatory Diseases | |||||||||||
| 1,650,000 | Human Genome Sciences (b) | 20,526 | |||||||||
| Drug Discovery/Development | |||||||||||
| 1,179,000 | Arena Pharmaceuticals (b) | 15,221 | |||||||||
| Novel Drug Targeting Technology | |||||||||||
| 2,000,000 | Cytokinetics (b)(c) | 14,960 | |||||||||
| Drugs for Cancer & Heart Failure | |||||||||||
| 2,300,000 | Seattle Genetics (b) | 12,259 | |||||||||
| Antibody-based Therapies for Cancer | |||||||||||
| 2,520,000 | Decode Genetics (b) | 11,416 | |||||||||
| Drugs for Heart Attack, Asthma & Vascular Disease | |||||||||||
| 3,100,000 | Lexicon Genetics (b) | 11,191 | |||||||||
| Drug Discovery | |||||||||||
| 1,650,000 | Nuvelo (b) | 6,600 | |||||||||
| Development-Stage Biotech Focused On Cardiovascular/Cancer | |||||||||||
| 1,750,000 | Genitope (b) | 6,160 | |||||||||
| Cancer Vaccine | |||||||||||
| 655,000 | Neurogen (b) | 3,897 | |||||||||
| Development-Stage Biotech Focused On Neurology | |||||||||||
| 388,000 | Exelixis (b) | 3,492 | |||||||||
| Treatments for Cancer & Metabolic Disorders | |||||||||||
| 1,249,999 | Perlegen Sciences (e) | 3,375 | |||||||||
| Large Scale Gene Sequencing | |||||||||||
| 1,100,000 | La Jolla Pharmaceutical (b) | 3,333 | |||||||||
| Lupus Treatment | |||||||||||
| 1,875,000 | Locus Discovery, Series D, Pfd. (b)(e) | 512 | |||||||||
| High Throughput Rational Drug Design | |||||||||||
| 359,944 | Microdose (e) | 360 | |||||||||
| Drug Inhaler Development | |||||||||||
| 279,633 | |||||||||||
| > Medical Supplies 1.3% | |||||||||||
| 1,910,000 | Cytyc (b) | 54,053 | |||||||||
| Consumables Related to Women's Health | |||||||||||
| 1,083,000 | ICU Medical (b)(c) | 44,056 | |||||||||
| Intravenous Therapy Products | |||||||||||
| 1,200,000 | Owens & Minor | 37,524 | |||||||||
| Distribution of Medical Supplies | |||||||||||
| Number of Shares | Value (000) | ||||||||||
| 905,000 | Arrow International | $ | 32,019 | ||||||||
| Disposable Catheters | |||||||||||
| 700,000 | Cooper | 31,150 | |||||||||
| Contact Lens Manufacturer | |||||||||||
| 700,000 | Polymedica | 28,287 | |||||||||
| Diabetes Supply Distributor | |||||||||||
| 486,000 | Techne (b) | 26,949 | |||||||||
| Cytokines, Antibodies & Other Reagents for Life Science | |||||||||||
| 254,038 | |||||||||||
| > Pharmaceuticals 1.1% | |||||||||||
| 765,000 | Cephalon (b) | 53,864 | |||||||||
| Specialty Pharmaceuticals for Pain, Central Nervous System & Oncology | |||||||||||
| 1,295,000 | Endo Pharmaceuticals (b) | 35,716 | |||||||||
| Specialty Pharmaceuticals for Pain Management | |||||||||||
| 1,510,000 | MGI Pharma (b) | 27,799 | |||||||||
| Specialty Pharmaceuticals for Oncology & Acute Care | |||||||||||
| 2,500,000 | QLT (b) | 21,150 | |||||||||
| Specialty Pharmaceuticals – Ophthalmology & Dermatology | |||||||||||
| 4,000,000 | United Drug (Ireland) | 20,968 | |||||||||
| Irish Pharmaceutical Wholesaler & Outsourcer | |||||||||||
| 600,000 | The Medicines Company (b) | 19,032 | |||||||||
| Specialty Pharmaceuticals – Cardiovascular | |||||||||||
| 400,000 | Medicis Pharmaceutical | 14,052 | |||||||||
| Specialty Pharmaceuticals – Dermatology | |||||||||||
| 830,000 | Collagenex Pharmaceuticals (b) | 11,595 | |||||||||
| Specialty Pharmaceuticals for Dermatology | |||||||||||
| 1,321,000 | Barrier Therapeutics (b) | 9,960 | |||||||||
| Specialty Pharmaceuticals for Dermatology | |||||||||||
| 214,136 | |||||||||||
| Health Care: Total | 1,489,381 | ||||||||||
| Other Industries 5.0% | |||||||||||
| > Real Estate 4.1% | |||||||||||
| 1,760,000 | Gaylord Entertainment (b) | 89,637 | |||||||||
| Convention Hotels | |||||||||||
| 650,000 | SL Green Realty | 86,307 | |||||||||
| Manhattan Office Buildings | |||||||||||
| 5,850,000 | Highland Hospitality (c) | 83,362 | |||||||||
| Hotel Owner | |||||||||||
| 1,398,000 | Forest City Enterprises, Cl. B (c) | 81,559 | |||||||||
| Commercial & Residential Property Developer | |||||||||||
| 1,320,000 | General Growth Properties | 68,944 | |||||||||
| Regional Shopping Malls | |||||||||||
| 3,700,000 | DiamondRock Hospitality | 66,637 | |||||||||
| Hotel Owner | |||||||||||
| 635,000 | Macerich Company | 54,972 | |||||||||
| Regional Shopping Malls | |||||||||||
| 575,000 | Federal Realty Investment Trust | 48,875 | |||||||||
| Shopping Centers | |||||||||||
| 1,020,000 | Brandywine Realty | 33,915 | |||||||||
| Office Buildings | |||||||||||
| 628,000 | Parkway Properties | 32,034 | |||||||||
| Office Buildings | |||||||||||
| 1,720,000 | Kite Realty Group (c) | 32,026 | |||||||||
| Community Shopping Centers | |||||||||||
| 850,000 | Digital Realty Trust | 29,096 | |||||||||
| Technology-focused Office Buildings | |||||||||||
29
Columbia Acorn Fund
Statement of Investments, continued
| Number of Shares or Principal Amount (000) | Value (000) | ||||||||||
| > Real Estate—continued | |||||||||||
| 1,375,000 | Crescent Real Estate Equities | $ | 27,156 | ||||||||
| Class 'A' Office Buildings | |||||||||||
| 900,000 | American Campus Communities | 25,623 | |||||||||
| Student Housing | |||||||||||
| 4,100 | Kenedix (Japan) | 18,546 | |||||||||
| Real Estate Investment Management | |||||||||||
| 778,689 | |||||||||||
| > Transportation 0.5% | |||||||||||
| 826,200 | Grupo Aeroportuario del Surest (Mexico) | 35,089 | |||||||||
| Cancun & Cozumel Airport Operator | |||||||||||
| 1,556,000 | JB Hunt Transport Services | 32,318 | |||||||||
| Trucking Conglomerate | |||||||||||
| 1,914,000 | Heartland Express | 28,748 | |||||||||
| Regional Trucker | |||||||||||
| 96,155 | |||||||||||
| > Regulated Utilities 0.4% | |||||||||||
| 1,650,000 | Northeast Utilities | 46,464 | |||||||||
| Regulated Electric Utility | |||||||||||
| 589,800 | Red Electrica de Espana (Spain) | 25,253 | |||||||||
| Spanish Power Grid | |||||||||||
| 71,717 | |||||||||||
| Other Industries: Total | 946,561 | ||||||||||
| Total Equities: 94.9% (Cost: $10,836,735) | 17,974,513 | ||||||||||
| Short-Term Obligations: 5.4% | |||||||||||
| $ | 87,000 | Manhattan Asset (f) 5.27% Due 01/18/07-01/19/07 | 86,777 | ||||||||
| 74,000 | Morrigan TRR (f) 5.28% Due 01/16/07-01/17/07 | 73,831 | |||||||||
| 71,000 | American Express 5.22%: 5.23% Due 01/05/07-01/10/07 | 70,931 | |||||||||
| 50,000 | HSBC 5.21% Due 01/03/07 | 49,985 | |||||||||
| 50,000 | Marshall & Ilsley 5.25% Due 01/22/07 | 49,847 | |||||||||
| 50,000 | New Center Asset Trust 5.26% Due 01/25/07 | 49,825 | |||||||||
| 50,000 | PB Financial 5.27% Due 01/26/07 | 49,817 | |||||||||
| 50,000 | Hewlett Packard (f) 5.28% Due 01/29/07 | 49,795 | |||||||||
| 50,000 | Catapult PMX Funding (f) 5.34% Due 02/01/07 | 49,770 | |||||||||
| 45,000 | Citigroup Funding 5.25% Due 01/04/07 | 44,980 | |||||||||
| 45,000 | American General Finance 5.23% Due 01/12/07 | 44,928 | |||||||||
| 45,000 | White Point Funding 5.33% Due 01/30/07 | 44,807 | |||||||||
| 43,000 | Beethoven Funding (f) 5.28% Due 01/23/07 | 42,861 | |||||||||
| 43,000 | Raiffeisen Zentralbank (f) 5.27% Due 01/24/07 | 42,855 | |||||||||
| Principal Amount (000) | Value (000) | ||||||||||
| $ | 40,000 | Toyota Credit de Puerto Rico 5.24% Due 01/11/07 | $ | 39,942 | |||||||
| 40,000 | AIG Funding 5.23% Due 02/07/07 | 39,785 | |||||||||
| 38,000 | Credit Suisse First Boston 5.24% Due 01/09/07 | 37,956 | |||||||||
| 34,000 | LaSalle Bank 5.21% Due 01/02/07 | 33,995 | |||||||||
| 33,000 | Prudential Funding 5.20% Due 01/08/07 | 32,967 | |||||||||
| 30,000 | East Fleet Financial (f) 5.32% Due 02/02/07 | 29,858 | |||||||||
| 30,000 | Ranger Funding (f) 5.29% Due 02/05/07 | 29,846 | |||||||||
| 30,000 | Ebbets Funding (f) 5.28% Due 02/06/07 | 29,842 | |||||||||
| 7,529 | Repurchase Agreement with Fixed Income Clearing Corp., dated 12/29/06, due 01/02/07 at 5.150% collateralized by Frederal Home Loan Bank Bond maturing 10/04/16, market value of $7,681 (repurchase proceeds: $7,533) | 7,529 | |||||||||
| �� | (Amortized Cost: $1,032,729) | 1,032,729 | |||||||||
| Total Investments: 100.3% (Cost: $11,869,464)(a)(d) | 19,007,242 | ||||||||||
| Cash and Other Assets Less Liabilities: (0.3)% | (62,116 | ) | |||||||||
| Total Net Assets: 100.0% | $ | 18,945,126 | |||||||||
30
Columbia Acorn Fund
Statement of Investments, continued
> Notes to Statement of Investments (in thousands)
(a) At December 31, 2006, for federal income tax purposes cost of investments was $11,896,609 and net unrealized appreciation was $7,110,633, consisting of gross unrealized appreciation of $7,490,598 and gross unrealized depreciation of $379,965.
(b) Non-income producing security.
(c) An affiliate may include any company in which the Fund owns five percent or more of its outstanding voting securities. On December 31, 2006, the Fund held five percent or more of the outstanding voting securities of the following companies:
| AnswerThink Consulting | 10.17 | % | |||||
| Actuate | 9.96 | ||||||
| Watsco | 9.84 | ||||||
| Christopher & Banks | 9.84 | ||||||
| Gibraltar Industries | 9.58 | ||||||
| Highland Hospitality | 9.56 | ||||||
| Indus International | 9.45 | ||||||
| iGate Capital | 9.43 | ||||||
| Princeton Review | 9.24 | ||||||
| SkillSoft Publishing | 8.72 | ||||||
| Kronos | 8.66 | ||||||
| World Acceptance | 8.55 | ||||||
| ESCO Technologies | 8.49 | ||||||
| West Coast Bancorp | 8.49 | ||||||
| Salem Communications | 8.42 | ||||||
| Spartech | 8.41 | ||||||
| Radiant Systems | 8.10 | ||||||
| Saga Communications | 7.85 | ||||||
| Glacier Bancorp | 7.81 | ||||||
| ICU Medical | 7.48 | ||||||
| Witness Systems | 7.46 | ||||||
| Fleetwood Enterprises | 7.33 | ||||||
| Tumbleweed Communications | 6.96 | ||||||
| Shuffle Master | 6.95 | ||||||
| Genlyte Group | 9.95 | ||||||
| II VI | 6.90 | ||||||
| Clarcor | 6.85 | ||||||
| ProQuest | 6.69 | ||||||
| Pinnacle Entertainment | 6.65 | ||||||
| Bally Technologies | 6.60 | ||||||
| Vital Signs | 6.58 | ||||||
| Seachange International | 6.41 | ||||||
| United America Indemnity | 6.35 | ||||||
| Forward Air | 6.23 | ||||||
| Vail Resorts | 6.17 | % | |||||
| Agile Software | 6.15 | ||||||
| Red Robin Gourmet Burgers | 6.02 | ||||||
| Administaff | 6.00 | ||||||
| First Mutual Bancshares | 5.99 | ||||||
| Helen of Troy | 5.98 | ||||||
| Kite Realty Group | 5.96 | ||||||
| Spanish Broadcasting System | 5.95 | ||||||
| Concur Technologies | 5.88 | ||||||
| Orthofix International | 5.74 | ||||||
| Marlin Business Services | 5.70 | ||||||
| Drew Industries | 5.68 | ||||||
| IXYS | 5.66 | ||||||
| AmeriCredit | 5.62 | ||||||
| Gaiam | 5.52 | ||||||
| Forest City Enterprises, Cl. B | 5.45 | ||||||
| AFC Enterprises | 5.45 | ||||||
| Vaalco Energy | 5.44 | ||||||
| ITT Educational Services | 5.43 | ||||||
| Chattem | 5.43 | ||||||
| LCA-Vision | 5.41 | ||||||
| West Bancorporation | 5.41 | ||||||
| Anchor Bancorp Wisconsin | 5.40 | ||||||
| Universal Technical Institute | 5.32 | ||||||
| Enerflex Systems | 5.29 | ||||||
| Dobson Communications | 5.29 | ||||||
| Cytokinetics | 5.28 | ||||||
| Mine Safety Appliances | 5.24 | ||||||
| HNI | 5.24 | ||||||
| Oxford Industries | 5.18 | ||||||
| Excel Technology | 5.17 | ||||||
| JDA Software | 5.08 | ||||||
| Littelfuse | 5.06 | ||||||
| Supertex | 5.02 | ||||||
The aggregate cost and value of these investments at December 31, 2006 were $2,146,491 and $3,477,317, respectively. Investments in affiliates represented 18.35% of total net assets at December 31, 2006. Investment activity and income amounts relating to affiliates during the twelve months ended December 31, 2006 were as follows:
| Dividend Income | $ | 21,531 | |||||
| Net realized gain or loss | 25,113 | ||||||
| Change in unrealized gain or loss | (233,206 | ) | |||||
| Purchases | 542,695 | ||||||
| Proceeds from sales | 59,465 | ||||||
In addition, additional purchases of existing portfolio holdings that were not considered affiliates in prior years, resulted in the fund owning more than 5% of the outstanding shares of certain issues at December 31, 2006. Therefore, the cost and market value affiliate disclosure amounts include both acquisitions of new investments in affiliates during the period, as well as prior period investment holdings of companies that became affiliates during the current period.
31
Columbia Acorn Fund
Statement of Investments, continued
> Notes to Statement of Investments:
(d) On December 31, 2006, the market value of foreign securities (in thousands) represented 12.54% of total net assets. The Fund's foreign portfolio was diversified as follows:
| Value | Percent | ||||||||||
| Netherlands | $ | 331,420 | 1.75 | % | |||||||
| Canada | 318,662 | 1.68 | |||||||||
| France | 257,278 | 1.36 | |||||||||
| Ireland | 229,780 | 1.21 | |||||||||
| United Kingdom | 149,890 | 0.79 | |||||||||
| Switzerland | 127,181 | 0.67 | |||||||||
| Japan | 126,050 | 0.67 | |||||||||
| Germany | 109,823 | 0.58 | |||||||||
| Sweden | 97,796 | 0.52 | |||||||||
| Hong Kong | 90,417 | 0.48 | |||||||||
| Australia | 77,356 | 0.41 | |||||||||
| India | 62,617 | 0.33 | |||||||||
| Value | Percent | ||||||||||
| Taiwan | $ | 55,888 | 0.29 | % | |||||||
| Denmark | 50,579 | 0.27 | |||||||||
| Israel | 50,294 | 0.27 | |||||||||
| Brazil | 48,944 | 0.26 | |||||||||
| Mexico | 35,089 | 0.19 | |||||||||
| China | 27,376 | 0.14 | |||||||||
| Chile | 26,436 | 0.14 | |||||||||
| Spain | 25,253 | 0.13 | |||||||||
| Greece | 24,133 | 0.13 | |||||||||
| Italy | 21,440 | 0.11 | |||||||||
| South Africa | 19,423 | 0.10 | |||||||||
| Austria | 11,869 | 0.06 | |||||||||
| Total Foreign Portfolio | 2,374,994 | 12.54 | % | ||||||||
(e) Denotes a restricted security, which is subject to restrictions on resale under federal securities laws. These securities, excluding UrAsia Energy, are valued in good faith by the Board of Trustees. At December 31, 2006, these securities had an aggregate value of $64,571, which represented 0.34% of total net assets.
Additional information on these securities is as follows:
| Security | Acquisition Dates | Shares | Cost | Value | |||||||||||||||
| UrAsia Energy | 10/26/05 | 13,100 | $ | 20,140 | $ | 60,324 | |||||||||||||
| Perlegen Sciences | 3/30/01 | 1,250 | 4,500 | 3,375 | |||||||||||||||
| Locus Discovery, Series D, Pfd. | 09/05/01 | 1,875 | 7,500 | 512 | |||||||||||||||
| Microdose | 11/24/00 | 360 | 2,005 | 360 | |||||||||||||||
| $ | 34,145 | $ | 64,571 | ||||||||||||||||
(f) Security exempt from registration under Section 4(2) of the Securities Act of 1933. These securities may only be resold in exempt transactions to qualified buyers. Private resales of these securities to qualified institutional buyers are also exempt from registration pursuant to Rule 144A under the Securities Act of 1933. At December 31, 2006, these securities had an aggregate value of $435,435, which represented 2.3% of net assets.
32
Columbia Acorn International
Major Portfolio Changes in the Fourth Quarter (Unaudited)
| Number of Shares | |||||||||||
| 09/30/06 | 12/31/06 | ||||||||||
| Additions | |||||||||||
| Europe | |||||||||||
| > France | |||||||||||
| Bacou Dalloz | 171,910 | 190,000 | |||||||||
| Carbone Lorraine | 566,000 | 600,000 | |||||||||
| SES Global | 2,920,000 | 3,000,000 | |||||||||
| > Netherlands | |||||||||||
| Boskalis Westminster | 39,000 | 163,000 | |||||||||
| Smit Internationale | 330,000 | 660,000 | |||||||||
| USG People | 679,000 | 983,000 | |||||||||
| Wavin | 0 | 781,150 | |||||||||
| > United Kingdom | |||||||||||
| Fiberweb Plc | 0 | 887,500 | |||||||||
| Mears Group | 0 | 1,436,000 | |||||||||
| > Germany | |||||||||||
| Elringklinger | 0 | 267,000 | |||||||||
| Gagfah | 0 | 150,000 | |||||||||
| GFK | 415,000 | 460,000 | |||||||||
| > Ireland | |||||||||||
| United Drug | 7,140,000 | 7,925,000 | |||||||||
| > Switzerland | |||||||||||
| Burckhardt Compression | 115,000 | 140,000 | |||||||||
| Schindler | 300,000 | 375,000 | |||||||||
| Synthes | 315,000 | 330,000 | |||||||||
| > Italy | |||||||||||
| Banca Italease | 565,000 | 590,000 | |||||||||
| > Austria | |||||||||||
| Zumtobel | 0 | 373,000 | |||||||||
| > Spain | |||||||||||
| Red Electrica de Espana | 620,000 | 680,000 | |||||||||
| > Norway | |||||||||||
| Kongsberg Automotive | 630,000 | 2,065,000 | |||||||||
| Asia | |||||||||||
| > Japan | |||||||||||
| AIN Pharmaciez | 604,000 | 643,000 | |||||||||
| As One | 0 | 257,000 | |||||||||
| Cosel | 0 | 600,000 | |||||||||
| Ibiden | 143,200 | 420,000 | |||||||||
| JSR | 785,000 | 1,218,000 | |||||||||
| Kintetsu World Express | 460,000 | 640,000 | |||||||||
| Nakanishi | 54,000 | 92,000 | |||||||||
| Park24 | 868,000 | 1,200,000 | |||||||||
| USS | 350,000 | 430,000 | |||||||||
| Yusen Air & Sea Service | 600,000 | 1,030,000 | |||||||||
| Number of Shares | |||||||||||
| 09/30/06 | 12/31/06 | ||||||||||
| > China | |||||||||||
| China Green | 370,000 | 18,000,000 | |||||||||
| China Shipping Development | 13,000,000 | 18,647,000 | |||||||||
| Lenovo Group | 1,731,500 | 48,430,000 | |||||||||
| Sohu.com | 110,000 | 260,000 | |||||||||
| Travelsky Technology | 184,000 | 6,155,000 | |||||||||
| > Hong Kong | |||||||||||
| EganaGoldpfeil | 0 | 4,221,000 | |||||||||
| Melco-PBL Entertainment Macau | 0 | 91,900 | |||||||||
| > Taiwan | |||||||||||
| Formosa International Hotels | 0 | 2,853,000 | |||||||||
| > India | |||||||||||
| Asian Paints | 20,000 | 700,000 | |||||||||
| > Singapore | |||||||||||
| ComfortDelGro | 7,053,000 | 13,000,000 | |||||||||
| Singapore Exchange | 4,630,000 | 7,000,000 | |||||||||
| > South Korea | |||||||||||
| MegaStudy | 0 | 109,787 | |||||||||
| Taewoong | 0 | 112,700 | |||||||||
| Woongjin Thinkbig | 0 | 183,500 | |||||||||
| YBM Sisa.com | 0 | 243,700 | |||||||||
| Other Countries | |||||||||||
| > South Africa | |||||||||||
| Impala Platinum Holdings | 180,000 | 1,440,000 | |||||||||
| Naspers | 0 | 1,295,000 | |||||||||
| > United States | |||||||||||
| Atwood Oceanics | 663,000 | 865,000 | |||||||||
| > New Zealand | |||||||||||
| Sky City Entertainment | 5,500,000 | 5,661,208 | |||||||||
| Latin America | |||||||||||
| > Brazil | |||||||||||
| Brascan Residential Properties | 0 | 604,500 | |||||||||
| Localiza Rent A Car | 170,000 | 500,000 | |||||||||
| > Mexico | |||||||||||
| Grupo Aeroportuario del Centro Norte | 0 | 100,000 | |||||||||
33
Columbia Acorn International
Major Portfolio Changes in the Fourth Quarter (Unaudited) continued
| Number of Shares | |||||||||||
| 09/30/06 | 12/31/06 | ||||||||||
| Sales | |||||||||||
| Europe | |||||||||||
| > France | |||||||||||
| M6-Metropole Television | 333,000 | 0 | |||||||||
| Neopost | 280,000 | 240,000 | |||||||||
| > Netherlands | |||||||||||
| Sligro Food Group | 439,000 | 0 | |||||||||
| > United Kingdom | |||||||||||
| BBA Group | 3,550,000 | 2,982,000 | |||||||||
| Tullow Oil | 5,240,000 | 3,895,691 | |||||||||
| UTV | 2,000,000 | 0 | |||||||||
| Viridian Group | 450,000 | 0 | |||||||||
| > Germany | |||||||||||
| Bilfinger Berger | 200,000 | 0 | |||||||||
| Depfa Bank | 2,250,000 | 1,550,000 | |||||||||
| Grenkeleasing | 305,000 | 0 | |||||||||
| > Ireland | |||||||||||
| Anglo Irish Bank | 2,395,000 | 2,100,000 | |||||||||
| C&C Group | 3,350,000 | 3,300,000 | |||||||||
| IAWS Group | 2,000,000 | 1,800,000 | |||||||||
| Paddy Power | 720,000 | 600,000 | |||||||||
| > Sweden | |||||||||||
| Tele2 | 2,580,000 | 0 | |||||||||
| > Denmark | |||||||||||
| Novozymes | 280,000 | 265,000 | |||||||||
| > Luxembourg | |||||||||||
| Tenaris | 350,000 | 0 | |||||||||
| Number of Shares | |||||||||||
| 09/30/06 | 12/31/06 | ||||||||||
| Asia | |||||||||||
| > Japan | |||||||||||
| Fast Retailing | 220,000 | 110,000 | |||||||||
| Sparx Asset Management | 27,500 | 14,000 | |||||||||
| Toyo Technica | 880,000 | 0 | |||||||||
| > Taiwan | |||||||||||
| Phoenixtec Power | 18,268,000 | 0 | |||||||||
| Other Countries | |||||||||||
| > Canada | |||||||||||
| Kinross Gold | 835,000 | 0 | |||||||||
| RailPower Technologies | 2,825,000 | 2,119,000 | |||||||||
34
Columbia Acorn International
Statement of Investments, December 31, 2006
| Number of Shares | Value (000) | ||||||||||
| Equities: 97.3% | |||||||||||
| Europe 58.3% | |||||||||||
| > France 10.3% | |||||||||||
| 3,000,000 | SES Global | $ | 53,281 | ||||||||
| Satellite Broadcasting Services | |||||||||||
| 800,000 | April Group | 38,428 | |||||||||
| Insurance Policy Construction | |||||||||||
| 375,000 | Norbert Dentressangle | 34,147 | |||||||||
| Transport | |||||||||||
| 600,000 | Carbone Lorraine | 33,722 | |||||||||
| Advanced Industrial Materials | |||||||||||
| 390,000 | Iliad | 33,720 | |||||||||
| Alternative Internet & Telecoms Provider | |||||||||||
| 423,818 | Rubis | 33,118 | |||||||||
| Tank Storage & LPG Supplier | |||||||||||
| 240,000 | Neopost | 30,139 | |||||||||
| Postage Meter Machines | |||||||||||
| 150,000 | Ciments Francais | 28,804 | |||||||||
| Leading French & Emerging Markets Cement Producer | |||||||||||
| 500,000 | Trigano | 25,933 | |||||||||
| Leisure Vehicles & Camping Equipment | |||||||||||
| 360,000 | Eurofins Scientific (b) | 25,707 | |||||||||
| Food Screening & Testing | |||||||||||
| 190,000 | Bacou Dalloz | 25,424 | |||||||||
| Safety Equipment | |||||||||||
| 206,000 | Pierre & Vacances | 25,246 | |||||||||
| Vacation Apartment Lets | |||||||||||
| 240,000 | Imerys | 21,295 | |||||||||
| Industrial Minerals Producer | |||||||||||
| 700,000 | Legrand (b) | 20,514 | |||||||||
| Electrical Components | |||||||||||
| 400,000 | Foncia Groupe | 19,522 | |||||||||
| Real Estate Services | |||||||||||
| 449,000 | |||||||||||
| > Netherlands 7.9% | |||||||||||
| 1,268,490 | Fugro | 60,591 | |||||||||
| Oilfield Services | |||||||||||
| 558,000 | Aalberts Industries | 48,238 | |||||||||
| Flow Control & Heat Treatment | |||||||||||
| 983,000 | USG People | 42,717 | |||||||||
| Temporary Staffing Services | |||||||||||
| 574,000 | Imtech | 36,482 | |||||||||
| Engineering & Technical Services | |||||||||||
| 660,000 | Smit Internationale | 35,507 | |||||||||
| Harbor & Offshore Towage & Marine Services | |||||||||||
| 265,000 | OPG Groep | 31,137 | |||||||||
| Health Care Supplies & Pharmacies | |||||||||||
| 973,000 | Koninklijke TenCate | 29,769 | |||||||||
| Advanced Textiles & Industrial Fabrics | |||||||||||
| 1,150,000 | Unit 4 Agresso (b) | 27,099 | |||||||||
| Business & Security Software | |||||||||||
| 163,000 | Boskalis Westminster | 16,134 | |||||||||
| Dredging and Maritime Contractor | |||||||||||
| 781,150 | Wavin (b) | 15,286 | |||||||||
| Largest European Plastic Pipe Systems Company | |||||||||||
| 342,960 | |||||||||||
| Number of Shares | Value (000) | ||||||||||
| > United Kingdom 7.8% | |||||||||||
| 2,510,714 | Expro International Group | $ | 43,437 | ||||||||
| Offshore Oilfield Services | |||||||||||
| 1,850,000 | Northern Rock | 42,546 | |||||||||
| Lowest Cost Mortgage Bank in UK | |||||||||||
| 7,200,000 | RPS Group | 38,047 | |||||||||
| Environmental Consulting & Planning | |||||||||||
| 2,800,000 | Paragon Group | 36,635 | |||||||||
| UK Buy-to-let Finance Company | |||||||||||
| 3,895,691 | Tullow Oil | 30,351 | |||||||||
| Oil & Gas Producer | |||||||||||
| 1,200,000 | Northgate | 28,231 | |||||||||
| Light Commercial Vehicle Rental Specialist | |||||||||||
| 2,450,000 | Workspace Group | 23,756 | |||||||||
| UK Real Estate | |||||||||||
| 1,300,000 | Keller Group | 22,853 | |||||||||
| International Ground Engineering Specialist | |||||||||||
| 4,200,000 | Taylor Nelson Sofres | 16,447 | |||||||||
| Market Research | |||||||||||
| 2,982,000 | BBA Group | 15,875 | |||||||||
| Aviation Support Services & Non-woven Materials | |||||||||||
| 640,000 | Randgold Resources (b) | 15,014 | |||||||||
| Gold Mining in Western Africa | |||||||||||
| 1,300,000 | Debt Free Direct | 11,443 | |||||||||
| Consumer Debt Reduction & Management Solutions | |||||||||||
| 1,436,000 | Mears Group | 10,188 | |||||||||
| Social housing Mainentance | |||||||||||
| 887,500 | Fiberweb Plc (b) | 3,614 | |||||||||
| Nonwoven Fabrics | |||||||||||
| 70,000 | Detica | 502 | |||||||||
| UK IT Services Company | |||||||||||
| 338,939 | |||||||||||
| > Germany 7.7% | |||||||||||
| 900,000 | Rhoen-Klinikum | 43,637 | |||||||||
| Health Care Services | |||||||||||
| 275,000 | Wincor Nixdorf | 42,778 | |||||||||
| Retail POS Systems & ATM Machines | |||||||||||
| 27,500 | Porsche | 34,976 | |||||||||
| Specialty Automobile Manufacturer | |||||||||||
| 775,000 | CTS Eventim | 29,929 | |||||||||
| Event Ticket Sales | |||||||||||
| 380,000 | Vossloh | 28,722 | |||||||||
| Rail Infrastructure & Diesel Locomotives | |||||||||||
| 1,550,000 | Depfa Bank | 27,801 | |||||||||
| Investment Banker to Public Authorities | |||||||||||
| 450,000 | Hugo Boss Designs | 23,117 | |||||||||
| Fashion Apparel | |||||||||||
| 120,000 | Deutsche Boerse | 22,070 | |||||||||
| Trading, Clearing, Settlement Services for Financial Markets | |||||||||||
| 460,000 | GFK | 19,935 | |||||||||
| Market Research Services | |||||||||||
| 100,000 | Rational | 18,627 | |||||||||
| Commercial Oven Manufacturer | |||||||||||
| 267,000 | Elringklinger | 17,078 | |||||||||
| Automobile Components | |||||||||||
| 870,000 | Takkt | 15,100 | |||||||||
| Mail Order Retailer of Office & Warehouse Durables | |||||||||||
| 283,000 | Deutsche Beteiligungs | 7,499 | |||||||||
| Private Equity Investment Management | |||||||||||
35
Columbia Acorn International
Statement of Investments, continued
| Number of Shares | Value (000) | ||||||||||
| > Germany—continued | |||||||||||
| 150,000 | Gagfah | $ | 4,750 | ||||||||
| German Residential Property | |||||||||||
| 336,019 | |||||||||||
| > Ireland 7.1% | |||||||||||
| 3,300,000 | C&C Group | 58,571 | |||||||||
| Beverage Company | |||||||||||
| 1,800,000 | IAWS Group | 46,093 | |||||||||
| Baked Goods | |||||||||||
| 2,000,000 | Bank of Ireland | 46,073 | |||||||||
| Irish Commercial Bank | |||||||||||
| 2,100,000 | Anglo Irish Bank | 43,541 | |||||||||
| Small Business & Middle Market Banking | |||||||||||
| 7,925,000 | United Drug | 41,543 | |||||||||
| Irish Pharmaceutical Wholesaler & Outsourcer | |||||||||||
| 1,850,000 | Grafton Group | 30,919 | |||||||||
| Builders Materials Wholesaling & Do-it-yourself Retailing | |||||||||||
| 1,150,000 | Kingspan Group | 30,465 | |||||||||
| Building Insulation & Environmental Containers | |||||||||||
| 600,000 | Paddy Power | 11,919 | |||||||||
| Irish Betting Services | |||||||||||
| 309,124 | |||||||||||
| > Switzerland 5.5% | |||||||||||
| 30,000 | Geberit | 46,222 | |||||||||
| Plumbing Supplies | |||||||||||
| 330,000 | Synthes | 39,337 | |||||||||
| Products for Orthopedic Surgery | |||||||||||
| 24,000 | Sika | 37,209 | |||||||||
| Chemicals for Construction & Industrial Applications | |||||||||||
| 475,000 | Kuehne & Nagel | 34,556 | |||||||||
| Freight Forwarding/Logistics | |||||||||||
| 375,000 | Schindler | 23,579 | |||||||||
| Elevator Manufacturer & Service Provider | |||||||||||
| 25,000 | Givaudan | 23,079 | |||||||||
| Fragrances & Flavors | |||||||||||
| 140,000 | Burckhardt Compression (b) | 22,623 | |||||||||
| Gas Compression Pumps | |||||||||||
| 400,000 | Logitech International (b) | 11,482 | |||||||||
| Branded Peripheral Computer Devices | |||||||||||
| 238,087 | |||||||||||
| > Italy 3.0% | |||||||||||
| 590,000 | Banca Italease | 34,280 | |||||||||
| Italian Leasing & Factoring Leader | |||||||||||
| 9,100,000 | CIR | 30,095 | |||||||||
| Italian Holding Company | |||||||||||
| 3,000,000 | Amplifon | 25,282 | |||||||||
| Hearing Aid Retailer | |||||||||||
| 12,800,000 | Ducati Motor (b) | 15,527 | |||||||||
| Motorcycles & Related Merchandise | |||||||||||
| 1,223,000 | GranitiFiandre | 13,217 | |||||||||
| Innovative Stoneware | |||||||||||
| 350,000 | Sabaf | 12,016 | |||||||||
| Supplier to White Goods OEMS | |||||||||||
| 130,417 | |||||||||||
| > Sweden 2.7% | |||||||||||
| 1,550,000 | Hexagon | 65,984 | |||||||||
| Measurement Equipment & Polymers | |||||||||||
| Number of Shares | Value (000) | ||||||||||
| 755,000 | Nobia | $ | 29,052 | ||||||||
| Kitchen Cabinet Manufacturing & Distribution | |||||||||||
| 610,000 | SWECO | 23,519 | |||||||||
| Engineering Consultants | |||||||||||
| 118,555 | |||||||||||
| > Russia 1.2% | |||||||||||
| 575,800 | RosBusinessConsulting (b) | 25,796 | |||||||||
| Financial Information, Media & IT Services in Russia | |||||||||||
| 775,000 | Novolipetsk Steel | 18,019 | |||||||||
| Vertically Integrated Steel Producer | |||||||||||
| 370,000 | Mechel Steel Group | 9,428 | |||||||||
| Coking Coal | |||||||||||
| 53,243 | |||||||||||
| > Poland 0.8% | |||||||||||
| 1,125,500 | Central European Distribution (b) | 33,427 | |||||||||
| Vodka Production & Alcohol Distribution | |||||||||||
| 33,427 | |||||||||||
| > Greece 0.8% | |||||||||||
| 936,000 | Intralot | 32,738 | |||||||||
| Lottery & Gaming Systems/Services | |||||||||||
| 32,738 | |||||||||||
| > Austria 0.7% | |||||||||||
| 300,000 | Wienerberger | 17,819 | |||||||||
| Bricks & Clay Roofing Tiles | |||||||||||
| 373,000 | Zumtobel (b) | 11,868 | |||||||||
| Lighting Systems | |||||||||||
| 29,687 | |||||||||||
| > Spain 0.7% | |||||||||||
| 680,000 | Red Electrica de Espana | 29,115 | |||||||||
| Spanish Power Grid | |||||||||||
| 29,115 | |||||||||||
| > Finland 0.6% | |||||||||||
| 1,756,000 | Poyry | 27,356 | |||||||||
| Engineering Consultants | |||||||||||
| 27,356 | |||||||||||
| > Czech Republic 0.6% | |||||||||||
| 183,000 | Komercni Banka | 27,245 | |||||||||
| Leading Czech Universal Bank | |||||||||||
| 27,245 | |||||||||||
| > Denmark 0.5% | |||||||||||
| 265,000 | Novozymes | 22,718 | |||||||||
| Industrial Enzymes | |||||||||||
| 22,718 | |||||||||||
| > Norway 0.4% | |||||||||||
| 2,065,000 | Kongsberg Automotive | 18,870 | |||||||||
| Automotive Seating & Component Supplier | |||||||||||
| 18,870 | |||||||||||
| Europe: Total | 2,537,500 | ||||||||||
| Asia 22.6% | |||||||||||
| > Japan 13.6% | |||||||||||
| 43,500 | Jupiter Telecommunications (b) | 34,901 | |||||||||
| Largest Cable Service Provider in Japan | |||||||||||
| 600,000 | Aeon Mall | 33,640 | |||||||||
| Suburban Shopping Mall Developer, Owner & Operator | |||||||||||
36
| Number of Shares | Value (000) | ||||||||||
| > Japan—continued | |||||||||||
| 1,218,000 | JSR | $ | 31,566 | ||||||||
| Films & Chemicals for LCD Screens & Electronics | |||||||||||
| 760,000 | Hoya | 29,672 | |||||||||
| Opto-electrical Components & Eyeglass Lenses | |||||||||||
| 3,700,000 | Kansai Paint | 29,316 | |||||||||
| Paint Producer in Japan, India, China & Southeast Asia | |||||||||||
| 6,300 | Kenedix | 28,498 | |||||||||
| Real Estate Investment Management | |||||||||||
| 430,000 | USS | 28,024 | |||||||||
| Used Car Auctioneer | |||||||||||
| 1,272,000 | Ushio | 26,183 | |||||||||
| Industrial Light Sources | |||||||||||
| 546,000 | Daito Trust Construction | 24,981 | |||||||||
| Apartment Builder | |||||||||||
| 1,030,000 | Yusen Air & Sea Service | 22,293 | |||||||||
| Airfreight Logistics | |||||||||||
| 718,000 | Ito En | 21,894 | |||||||||
| Bottled Tea & Other Beverages | |||||||||||
| 420,000 | Ibiden | 21,215 | |||||||||
| Electronic Parts & Ceramics | |||||||||||
| 453,000 | Hogy Medical | 17,529 | |||||||||
| Disposable Surgical Products | |||||||||||
| 714,000 | FCC | 17,267 | |||||||||
| Auto/Motorcycle Clutches | |||||||||||
| 2,000,000 | Chiba Bank | 16,928 | |||||||||
| Regional Bank | |||||||||||
| 640,000 | Kintetsu World Express | 15,557 | |||||||||
| Airfreight Logistics | |||||||||||
| 1,200,000 | Park24 | 15,396 | |||||||||
| Parking Lot Operator | |||||||||||
| 965,000 | T. Hasegawa | 14,990 | |||||||||
| Industrial Flavors & Fragrances | |||||||||||
| 3,000 | Osaka Securities Exchange | 14,975 | |||||||||
| Osaka Securities Exchange | |||||||||||
| 3,500 | Risa Partners | 14,793 | |||||||||
| NPL & Real Estate Related Investment | |||||||||||
| 2,248,000 | Hiroshima Bank | 13,044 | |||||||||
| Regional Bank | |||||||||||
| 92,000 | Nakanishi | 11,298 | |||||||||
| Dental Tools & Machinery | |||||||||||
| 1,500,000 | Bank of Fukuoka | 10,955 | |||||||||
| Regional Bank | |||||||||||
| 370,000 | Shimano | 10,729 | |||||||||
| Bicycle Components & Fishing Tackle | |||||||||||
| 110,000 | Fast Retailing | 10,525 | |||||||||
| Apparel Retailer | |||||||||||
| 14,000 | Sparx Asset Management | 10,361 | |||||||||
| Fund Management | |||||||||||
| 1,230,000 | Kamigumi | 10,080 | |||||||||
| Port Cargo Handling & Logistics | |||||||||||
| 643,000 | AIN Pharmaciez (c) | 9,988 | |||||||||
| Dispensing Pharmacy/Drugstore Operator | |||||||||||
| 600,000 | Cosel | 9,601 | |||||||||
| Industrial Standard Switching Power Supply System | |||||||||||
| 72,000 | Hirose Electric | 8,191 | |||||||||
| Electrical Connectors | |||||||||||
| 375,000 | Nagaileben | 8,072 | |||||||||
| Medical/Health Care Related Clothes | |||||||||||
| Number of Shares | Value (000) | ||||||||||
| 1,650 | Japan Pure Chemical | $ | 7,255 | ||||||||
| Precious Metal Plating Chemicals for Electronics | |||||||||||
| 257,000 | As One | 6,581 | |||||||||
| Scientific Supplies Distributor | |||||||||||
| 3,300 | Message | 5,417 | |||||||||
| Nursing Care Facilities | |||||||||||
| 591,715 | |||||||||||
| > China 2.3% | |||||||||||
| 18,647,000 | China Shipping Development | 28,542 | |||||||||
| China's Dominant Shipper for Oil & Coal | |||||||||||
| 48,430,000 | Lenovo Group | 19,643 | |||||||||
| Third Largest PC Vendor Globally | |||||||||||
| 45,000,000 | Global Bio-Chem Technology Group | 15,141 | |||||||||
| Refiner of Corn-based Commodities | |||||||||||
| 21,750,000 | TPV Technology | 13,737 | |||||||||
| ODM for LCD Monitor & Flat TV | |||||||||||
| 18,000,000 | China Green | 9,815 | |||||||||
| An Agricultural Grower & Processor in China | |||||||||||
| 6,155,000 | Travelsky Technology | 9,400 | |||||||||
| Online Air Travel Bookings in China | |||||||||||
| 260,000 | Sohu.com (b) | 6,240 | |||||||||
| Chinese Internet Portal/Online Advertising | |||||||||||
| 102,518 | |||||||||||
| > Hong Kong 1.8% | |||||||||||
| 5,000,000 | Hong Kong Exchanges and Clearing | 54,617 | |||||||||
| Hong Kong Equity & Derivatives Market Operator | |||||||||||
| 14,000,000 | Techtronic Industries | 18,121 | |||||||||
| Power Tools & Motorized Appliances | |||||||||||
| 4,221,000 | EganaGoldpfeil | 2,376 | |||||||||
| A Leather & Fashion Accessories Brand Manager | |||||||||||
| 91,900 | Melco-PBL Entertainment Macau (b) | 1,954 | |||||||||
| Macau Casino Operator | |||||||||||
| 77,068 | |||||||||||
| > Taiwan 1.5% | |||||||||||
| 6,958,367 | Advantech | 25,003 | |||||||||
| Embedded Computers | |||||||||||
| 3,329,658 | Novatek Microelectronics | 15,086 | |||||||||
| LCD Related Integrated Circuits Designer | |||||||||||
| 7,280,000 | Wah Lee Industrial | 14,846 | |||||||||
| Distributor of Chemicals, Materials & Equipment | |||||||||||
| 2,853,000 | Formosa International Hotels | 8,707 | |||||||||
| Hotel, Food & Beverage Operation & Hospitality Management Services | |||||||||||
| 63,642 | |||||||||||
| > India 1.4% | |||||||||||
| 1,300,000 | Housing Development Finance | 47,884 | |||||||||
| Indian Mortgage Lender | |||||||||||
| 700,000 | Asian Paints | 11,563 | |||||||||
| India's Largest Paint Company | |||||||||||
| 59,447 | |||||||||||
| > Singapore 0.9% | |||||||||||
| 7,000,000 | Singapore Exchange | 25,880 | |||||||||
| Singapore Equity & Derivatives Market Operator | |||||||||||
| 13,000,000 | ComfortDelGro | 13,644 | |||||||||
| Taxi & Mass Transit Service | |||||||||||
| 39,524 | |||||||||||
37
Columbia Acorn International
Statement of Investments, continued
| Number of Shares | Value (000) | ||||||||||
| > South Korea 0.7% | |||||||||||
| 109,787 | MegaStudy (b) | $ | 16,176 | ||||||||
| Online Education Service Provider | |||||||||||
| 243,700 | YBM Sisa.com | 6,131 | |||||||||
| Online Language Educator & Tester | |||||||||||
| 183,500 | Woongjin Thinkbig | 3,892 | |||||||||
| Education Provider for Pre-school/Elementary School | |||||||||||
| 112,700 | Taewoong | 3,868 | |||||||||
| A Player in the Niche Customized Forging Market | |||||||||||
| 30,067 | |||||||||||
| > Indonesia 0.4% | |||||||||||
| 15,000,000 | Perusahaan Gas Negara | 19,347 | |||||||||
| Gas Pipeline Operator | |||||||||||
| 19,347 | |||||||||||
| Asia: Total | 983,328 | ||||||||||
| Other Countries 11.5% | |||||||||||
| > Canada 4.4% | |||||||||||
| 1,060,000 | Alliance Atlantis Communication (b) | 45,885 | |||||||||
| CATV Channels, TV/Movie Production/Distribution | |||||||||||
| 6,775,000 | UrAsia Energy (b)(d) | 31,198 | |||||||||
| Uranium Mining in Kazakhstan | |||||||||||
| 1,190,000 | ShawCor | 25,562 | |||||||||
| Oil & Gas Pipeline Products | |||||||||||
| 1,370,000 | RONA (b) | 24,671 | |||||||||
| Leading Canadian Do-it-yourself Retailer | |||||||||||
| 1,155,000 | Talisman Energy | 19,611 | |||||||||
| Oil & Gas Producer | |||||||||||
| 950,000 | Van Houtte (c) | 14,191 | |||||||||
| Coffee Services & Equipment | |||||||||||
| 530,000 | Major Drilling Group | 11,853 | |||||||||
| Mining Exploration Driller | |||||||||||
| 850,000 | Ivanhoe Mines (b) | 8,382 | |||||||||
| Copper Mine Project in Mongolia | |||||||||||
| 2,000,000 | Northern Orion Resources (b) | 7,272 | |||||||||
| Copper & Gold Mining in Argentina | |||||||||||
| 2,119,000 | RailPower Technologies (b)(d) | 2,744 | |||||||||
| Hybrid Locomotives | |||||||||||
| 191,369 | |||||||||||
| > Australia 3.4% | |||||||||||
| 3,000,000 | Billabong International | 41,229 | |||||||||
| Action Sports Apparel Brand Manager | |||||||||||
| 5,450,000 | Sino Gold (b) | 31,431 | |||||||||
| Gold Mining in The People's Republic of China | |||||||||||
| 4,054,054 | ABC Learning Centres | 26,764 | |||||||||
| Childcare Centers | |||||||||||
| 2,000,000 | Jubilee Mines | 24,915 | |||||||||
| Nickel Mining in Australia | |||||||||||
| 350,000 | Perpetual Trustees | 21,555 | |||||||||
| Mutual Fund Management | |||||||||||
| 145,894 | |||||||||||
| > South Africa 2.2% | |||||||||||
| 1,440,000 | Impala Platinum Holdings | 37,749 | |||||||||
| Platinum Group Metals Mining & Refining | |||||||||||
| 1,295,000 | Naspers | 30,702 | |||||||||
| Media & Education in Africa and other Emerging Markets | |||||||||||
| Number of Shares or Principal Amount (000) | Value (000) | ||||||||||
| 4,500,000 | Edgars Consolidated Stores | $ | 24,972 | ||||||||
| Retail Conglomerate | |||||||||||
| 93,423 | |||||||||||
| > United States 1.0% | |||||||||||
| 865,000 | Atwood Oceanics (b) | 42,359 | |||||||||
| Offshore Drilling Contractor | |||||||||||
| 42,359 | |||||||||||
| > New Zealand 0.5% | |||||||||||
| 5,661,208 | Sky City Entertainment | 20,503 | |||||||||
| Casino/Entertainment Complex | |||||||||||
| 20,503 | |||||||||||
| Other Countries: Total | 493,548 | ||||||||||
| Latin America 4.9% | |||||||||||
| > Brazil 2.8% | |||||||||||
| 4,300,000 | Suzano Papel e Celulose | 42,438 | |||||||||
| Brazilian Pulp & Paper Producer | |||||||||||
| 2,500,000 | Natura Cosmeticos | 34,687 | |||||||||
| Direct Retailer of Cosmetics | |||||||||||
| 720,000 | Porto Seguro (b) | 22,571 | |||||||||
| Auto & Life Insurance | |||||||||||
| 500,000 | Localiza Rent A Car | 14,969 | |||||||||
| Car Rental | |||||||||||
| 604,500 | Brascan Residential properties (b) | 5,074 | |||||||||
| High-End Residential Property Developer | |||||||||||
| 119,739 | |||||||||||
| > Mexico 1.6% | |||||||||||
| 4,500,000 | Consorcio ARA | 30,616 | |||||||||
| Affordable Housing Builder | |||||||||||
| 411,000 | Grupo Aeroportuario del Surest | 17,455 | |||||||||
| Cancun & Cozumel Airport Operator | |||||||||||
| 4,200,000 | Urbi Desarrollos Urbanos (b) | 15,162 | |||||||||
| Affordable Housing Builder | |||||||||||
| 100,000 | Grupo Aeroportuario del Pacifica | 3,919 | |||||||||
| Mexican Aiport Operator | |||||||||||
| 100,000 | Grupo Aeroportuario Centro Norte (b) | 2,226 | |||||||||
| Northern Mexican Aiport Operator | |||||||||||
| 69,378 | |||||||||||
| > Chile 0.5% | |||||||||||
| 160,000 | Sociedad Quimica y Minera de Chile | 21,691 | |||||||||
| Producer of Specialty Fertilizers, Lithium & Iodine | |||||||||||
| 21,691 | |||||||||||
| Latin America: Total | 210,808 | ||||||||||
| Total Equities: 97.3% (Cost: $2,604,653) | 4,225,184 | ||||||||||
| Short-Term Obligations: 2.3% | |||||||||||
| $ | 21,600 | American Express 5.25% Due 01/05/07 | 21,587 | ||||||||
| 21,400 | Ebury Finance (f) 5.35% Due 01/04/07 | 21,391 | |||||||||
| 20,000 | Advantage Asset (f) 5.36% Due 01/02/07 | 19,997 | |||||||||
| 20,000 | Halkin Finance (f) 5.35% Due 01/03/07 | 19,994 | |||||||||
38
| Principal Amount (000) | Value (000) | ||||||||||
| Short-Term Obligations—continued | |||||||||||
| $ | 16,317 | Repurchase Agreement with Fixed Income Clearing Corp., dated 12/29/06, due 1/02/07 at 5.150%, collateralized by Frederal Home Loan Bank Bonds, with various maturities to 10/04/16 market value of $16,644 (repurchase proceeds: $16,326) | $ | 16,317 | |||||||
| (Amortized Cost: $99,286) | 99,286 | ||||||||||
| Total Investments: 99.6% (Cost: $2,703,939)(a)(e) | 4,324,470 | ||||||||||
| Cash and Other Assets Less Liabilities: 0.4% | 18,925 | ||||||||||
| Total Net Assets: 100.0% | $ | 4,343,395 | |||||||||
39
Columbia Acorn International
Statement of Investments, continued
> Notes to Statement of Investments (in thousands)
(a) At December 31, 2006, for federal income tax purposes cost of investments was $2,737,657 and net unrealized appreciation was $1,586,813, consisting of gross unrealized appreciation of $1,655,465 and gross unrealized depreciation of $68,652.
(b) Non-income producing security.
(c) An affiliate may include any company in which the Fund owns five percent or more of its outstanding voting securities. On December 31, 2006, the Fund held five percent or more of the outstanding voting securities of the following companies:
| Van Houtte | 5.91 | % | |||||
| AIN Pharmaciez | 5.68 | ||||||
The aggregate cost and value of these investments at December 31, 2006 were $27,956 and $24,179, respectively. Investments in affiliates represented 0.56% of total net assets at December 31, 2006. Investment activity and income amounts relating to affiliates during the twelve months ended December 31, 2006 were as follows:
| Dividend Income | $ | 418 | |||||
| Net realized gain or loss | — | ||||||
| Change in unrealized gain or loss | (3,777 | ) | |||||
| Purchases | 19,747 | ||||||
| Proceeds from sales | — | ||||||
(d) Denotes a restricted security, which is subject to restrictions on resale under federal securities laws. At December 31, 2006, these securities had an aggregate value of $27,042, which represented 0.62% of total net assets.
Additional information on these securities is as follows:
| Security | Acquisition Dates | Shares | Cost | Value | |||||||||||||||
| Railpower Technologies 144A | 11/10 - 11/18/05 | 2,036 | $ | 9,225 | $ | 2,636 | |||||||||||||
| UrAsia Energy | 10/26/05 | 5,300 | 9,200 | 24,406 | |||||||||||||||
| $ | 18,425 | $ | 27,042 | ||||||||||||||||
(e) On December 31, 2006, the Fund's total investments were denominated in currencies as follows:
| Currency | Value | % of Total Net Assets | |||||||||
| Euro | $ | 1,686,421 | 38.8 | % | |||||||
| Japanese Yen | 591,713 | 13.6 | |||||||||
| British Pounds | 323,924 | 7.5 | |||||||||
| US Dollar | 296,814 | 6.8 | |||||||||
| Swiss Franc | 238,087 | 5.5 | |||||||||
| Other currencies less than 5% of total net assets | 1,187,511 | 27.4 | |||||||||
| $ | 4,324,470 | 99.6 | % | ||||||||
(f) Security exempt from registration under Section 4(2) of the Securities Act of 1933. These securities may only be resold in exempt transactions to qualified buyers. Private resales of these securities to qualified institutional buyers are also exempt from registration pursuant to Rule 144A under the Securities Act of 1933. At December 31, 2006, these securities had an aggregate value of $61,382, which represented 1.4% of net assets.
40
Columbia Acorn International
Portfolio Diversification
At December 31, 2006, the Fund's portfolio investments as a percent of net assets was diversified as follows:
| Value (000) | Percent | ||||||||||
| > Industrial Goods & Services | |||||||||||
| Materials & Speciality Chemicals | $ | 344,854 | 7.9 | % | |||||||
| Other Industrial Services | 253,343 | 5.8 | |||||||||
| Construction | 171,144 | 4.0 | |||||||||
| Conglomerates | 135,437 | 3.1 | |||||||||
| Machinery | 118,021 | 2.7 | |||||||||
| Electrical Components | 76,357 | 1.8 | |||||||||
| Outsourcing & Training Services | 68,780 | 1.6 | |||||||||
| Industrial Distribution | 37,500 | 0.9 | |||||||||
| Steel | 18,019 | 0.4 | |||||||||
| 1,223,455 | 28.2 | ||||||||||
| > Consumer Goods & Services | |||||||||||
| Food | 150,564 | 3.4 | |||||||||
| Retail | 129,078 | 3.0 | |||||||||
| Other Consumer Services | 113,127 | 2.6 | |||||||||
| Durables Goods | 108,636 | 2.5 | |||||||||
| Casinos | 67,114 | 1.5 | |||||||||
| Apparels | 64,346 | 1.5 | |||||||||
| Consumer Goods Distribution | 61,451 | 1.4 | |||||||||
| Nondurables | 40,677 | 0.9 | |||||||||
| Entertainment | 38,636 | 0.9 | |||||||||
| Furniture & Textiles | 29,052 | 0.7 | |||||||||
| Leisure Products | 25,933 | 0.6 | |||||||||
| Travel | 24,369 | 0.6 | |||||||||
| Consumer Electronics | 13,737 | 0.3 | |||||||||
| 866,720 | 19.9 | ||||||||||
| > Information | |||||||||||
| Financial Processors | 102,567 | 2.4 | |||||||||
| Computer Hardware & Related Equipment | 98,906 | 2.3 | |||||||||
| Business Information & Marketing Services | 74,429 | 1.7 | |||||||||
| Satellite Broadcasting | 53,281 | 1.2 | |||||||||
| Television Programming | 45,885 | 1.1 | |||||||||
| Semiconductors & Related Equipment | 44,758 | 1.0 | |||||||||
| Internet Related | 39,960 | 0.9 | |||||||||
| Cable Television | 34,901 | 0.8 | |||||||||
| Television Broadcasting | 30,702 | 0.7 | |||||||||
| Business Software | 27,099 | 0.6 | |||||||||
| Computer Services | 26,298 | 0.6 | |||||||||
| Electronics Distribution | 14,846 | 0.4 | |||||||||
| 593,632 | 13.7 | ||||||||||
| Value (000) | Percent | ||||||||||
| > Energy & Minerals | |||||||||||
| Oil Services | $ | 188,083 | 4.3 | % | |||||||
| Mining | 165,389 | 3.8 | |||||||||
| Agricultural Commodities | 57,579 | 1.3 | |||||||||
| Refining/Marketing/Distribution | 52,465 | 1.2 | |||||||||
| Oil/Gas Producers | 49,962 | 1.2 | |||||||||
| Non-Ferrous Metals | 11,853 | 0.3 | |||||||||
| 525,331 | 12.1 | ||||||||||
| > Finance | |||||||||||
| Banks | 228,133 | 5.3 | |||||||||
| Other Finance Companies | 125,564 | 2.9 | |||||||||
| Insurance | 60,999 | 1.4 | |||||||||
| Savings & Loans | 47,884 | 1.1 | |||||||||
| Money Management | 39,415 | 0.9 | |||||||||
| 501,995 | 11.6 | ||||||||||
| > Other Industries | |||||||||||
| Transportation | 145,520 | 3.3 | |||||||||
| Real Estate | 122,649 | 2.8 | |||||||||
| Regulated Utilities | 59,210 | 1.4 | |||||||||
| 327,379 | 7.5 | ||||||||||
| > Health Care | |||||||||||
| Services | 80,191 | 1.8 | |||||||||
| Pharmaceuticals | 41,543 | 1.0 | |||||||||
| Medical Equipment | 39,337 | 0.9 | |||||||||
| Hospital/ Laboratory Supplies | 25,601 | 0.6 | |||||||||
| 186,672 | 4.3 | ||||||||||
| Total Equities: | 4,225,184 | 97.3 | |||||||||
| Short-Term Obligations: | 99,286 | 2.3 | |||||||||
| Total Investments: | 4,324,470 | 99.6 | |||||||||
| Cash and Other Assets Less Liabilities: | 18,925 | 0.4 | |||||||||
| Net Assets: | $ | 4,343,395 | 100.0 | % | |||||||
41
Columbia Acorn USA
Major Portfolio Changes in the Fourth Quarter (Unaudited)
| Number of Shares | |||||||||||
| 09/30/06 | 12/31/06 | ||||||||||
| Additions | |||||||||||
| Information | |||||||||||
| Globalstar | 0 | 88,000 | |||||||||
| Integrated Device Technology | 783,490 | 1,203,490 | |||||||||
| Polycom | 0 | 130,000 | |||||||||
| Supertex | 0 | 100,000 | |||||||||
| Talx | 0 | 36,900 | |||||||||
| Trimble Navigation | 125,000 | 155,000 | |||||||||
| Consumer Goods & Services | |||||||||||
| Cavco Industries | 75,300 | 225,000 | |||||||||
| Champion Enterprises | 400,000 | 2,078,300 | |||||||||
| Heelys | 0 | 45,000 | |||||||||
| J Crew Group | 125,000 | 175,000 | |||||||||
| Nutrisystem | 0 | 65,000 | |||||||||
| Pool | 0 | 40,000 | |||||||||
| True Religion Apparel | 695,200 | 885,200 | |||||||||
| Health Care | |||||||||||
| Arena Pharmaceuticals | 0 | 225,000 | |||||||||
| Barrier Therapeutics | 0 | 255,100 | |||||||||
| Collagenex Pharmaceuticals | 0 | 150,000 | |||||||||
| Decode Genetics | 235,000 | 636,400 | |||||||||
| The Medicines Company | 0 | 400,000 | |||||||||
| Medicis Pharmaceutical | 0 | 200,000 | |||||||||
| Medicure | 0 | 3,690,300 | |||||||||
| MGI Pharma | 0 | 400,000 | |||||||||
| Nektar Therapeutics | 360,000 | 760,000 | |||||||||
| Neurogen | 0 | 215,000 | |||||||||
| Nuvelo | 0 | 440,000 | |||||||||
| QLT | 0 | 490,000 | |||||||||
| Industrial Goods & Services | |||||||||||
| American Reprographics Company | 0 | 47,200 | |||||||||
| Ametek | 652,500 | 697,500 | |||||||||
| (Includes the effect of a 3 for 2 Stock Split) | |||||||||||
| K&F Industries Holdings | 200,000 | 236,400 | |||||||||
| Labor Ready | 100,000 | 350,000 | |||||||||
| Finance | |||||||||||
| First Busey | 16,227 | 179,996 | |||||||||
| HCC Insurance Holdings | 664,500 | 714,500 | |||||||||
| Lakeland Financial | 11,207 | 125,000 | |||||||||
| Montpelier RE | 0 | 150,000 | |||||||||
| Energy & Minerals | |||||||||||
| Atwood Oceanics | 337,000 | 367,000 | |||||||||
| Other Industries | |||||||||||
| Heartland Express | 424,720 | 524,720 | |||||||||
| Number of Shares | |||||||||||
| 09/30/06 | 12/31/06 | ||||||||||
| Sales | |||||||||||
| Information | |||||||||||
| Alltel | 356,605 | 270,000 | |||||||||
| Intermec | 260,000 | 130,000 | |||||||||
| Micros Systems | 455,200 | 385,000 | |||||||||
| Progress Software | 347,000 | 217,800 | |||||||||
| Symbol Technologies | 584,000 | 0 | |||||||||
| Consumer Goods & Services | |||||||||||
| Michaels Stores | 203,000 | 0 | |||||||||
| Mohawk Industries | 20,000 | 0 | |||||||||
| PETCO Animal Supplies | 608,000 | 0 | |||||||||
| Health Care | |||||||||||
| Exelixis | 235,000 | 28,000 | |||||||||
| Intermagnetics General | 165,000 | 0 | |||||||||
| Intermune | 277,065 | 0 | |||||||||
| Industrial Goods & Services | |||||||||||
| NuCo2 | 113,000 | 56,900 | |||||||||
| Energy & Minerals | |||||||||||
| Chicago Bridge & Iron | 535,000 | 0 | |||||||||
| Pride International | 311,000 | 227,000 | |||||||||
42
Columbia Acorn USA
Statement of Investments, December 31, 2006
| Number of Shares | Value (000) | ||||||||||
| Equities: 94.8% | |||||||||||
| Information 31.7% | |||||||||||
| > Business Software 7.2% | |||||||||||
| 779,900 | Avid Technology (b) | $ | 29,059 | ||||||||
| Digital Nonlinear Editing Software & Systems | |||||||||||
| 660,650 | Kronos (b) | 24,272 | |||||||||
| Labor Management Solutions | |||||||||||
| 385,000 | Micros Systems (b) | 20,289 | |||||||||
| Information Systems for Restaurants & Hotels | |||||||||||
| 2,100,000 | Novell (b) | 13,020 | |||||||||
| Directory, Operating System & Identity Management Software | |||||||||||
| 524,000 | JDA Software (b) | 7,215 | |||||||||
| Application/Software & Services for Retailers | |||||||||||
| 217,800 | Progress Software (b) | 6,083 | |||||||||
| Application Development Software | |||||||||||
| 327,200 | Parametric Technology (b) | 5,896 | |||||||||
| Engineering Software & Services | |||||||||||
| 230,400 | Concur Technologies (b) | 3,696 | |||||||||
| Web Enabled Cost & Expense Management Software | |||||||||||
| 350,000 | webMethods (b) | 2,576 | |||||||||
| Enterprise Applications Integration Tools | |||||||||||
| 250,000 | Agile Software (b) | 1,538 | |||||||||
| Product Design Software | |||||||||||
| 59,300 | Witness Systems (b) | 1,040 | |||||||||
| Customer Experience Management Software | |||||||||||
| 114,684 | |||||||||||
| > Mobile Communications 5.3% | |||||||||||
| 1,005,000 | Crown Castle International (b) | 32,461 | |||||||||
| Communications Towers | |||||||||||
| 506,000 | American Tower (b) | 18,864 | |||||||||
| Communications Towers in USA & Mexico | |||||||||||
| 270,000 | Alltel | 16,330 | |||||||||
| Cellular Telephone Services | |||||||||||
| 1,633,000 | Dobson Communications (b) | 14,223 | |||||||||
| Rural & Small City Cellular Telephone Services | |||||||||||
| 88,000 | Globalstar (b) | 1,224 | |||||||||
| Satellite Mobile Voice & Data Carrier | |||||||||||
| 100,000 | Openwave Systems (b) | 923 | |||||||||
| Internet Software for Mobile Devices | |||||||||||
| 84,025 | |||||||||||
| > Computer Hardware & Related Equipment 3.5% | |||||||||||
| 566,600 | Nice Systems (b) (Israel) | 17,440 | |||||||||
| Audio & Video Recording Solutions | |||||||||||
| 505,000 | II VI (b) | 14,110 | |||||||||
| Laser Components | |||||||||||
| 147,800 | Amphenol | 9,175 | |||||||||
| Electronic Connectors | |||||||||||
| 100,000 | Belden CDT | 3,909 | |||||||||
| Specialty Cable | |||||||||||
| 99,000 | Zebra Technologies (b) | 3,444 | |||||||||
| Bar Code Printers | |||||||||||
| 130,000 | Intermec (b) | 3,155 | |||||||||
| Bar Code & Wireless LAN Systems | |||||||||||
| 40,000 | Rogers (b) | 2,366 | |||||||||
| PCB Laminates & High-performance Foams | |||||||||||
| 90,000 | Netgear (b) | 2,363 | |||||||||
| Networking Products for Small Business & Home | |||||||||||
| 55,962 | |||||||||||
| Number of Shares | Value (000) | ||||||||||
| > Semiconductors & Related Equipment 2.5% | |||||||||||
| 1,203,490 | Integrated Device Technology (b) | $ | 18,630 | ||||||||
| Communications Semiconductors | |||||||||||
| 1,050,000 | Entegris (b) | 11,361 | |||||||||
| Semiconductor Wafer Shipping & Handling Products | |||||||||||
| 210,000 | Microsemi (b) | 4,126 | |||||||||
| Analog/Mixed Signal Semiconductors | |||||||||||
| 100,000 | Supertex (b) | 3,925 | |||||||||
| Mixed-signal Semiconductors | |||||||||||
| 70,000 | Littelfuse (b) | 2,232 | |||||||||
| Little Fuses | |||||||||||
| 40,274 | |||||||||||
| > Instrumentation 2.1% | |||||||||||
| 430,000 | Flir Systems (b) | 13,687 | |||||||||
| Infrared Cameras | |||||||||||
| 140,000 | Mettler Toledo (b) | 11,039 | |||||||||
| Laboratory Equipment | |||||||||||
| 155,000 | Trimble Navigation (b) | 7,863 | |||||||||
| GPS-based Instruments | |||||||||||
| 32,589 | |||||||||||
| > Telephone Services 2.1% | |||||||||||
| 1,386,000 | Time Warner Telecom (b) | 27,623 | |||||||||
| Fiber Optic Telephone/Data Services | |||||||||||
| 340,000 | Windstream | 4,835 | |||||||||
| Rural Telephone Franchises | |||||||||||
| 32,458 | |||||||||||
| > Telecommunications Equipment 1.6% | |||||||||||
| 1,825,000 | Tellabs (b) | 18,724 | |||||||||
| Telecommunications Equipment | |||||||||||
| 130,000 | Polycom (b) | 4,018 | |||||||||
| Vido Conferencing Equipment | |||||||||||
| 323,500 | Symmetricom (b) | 2,886 | |||||||||
| Network Timing & Synchronization Devices | |||||||||||
| 25,628 | |||||||||||
| > Internet Related 1.3% | |||||||||||
| 460,000 | ValueClick (b) | 10,870 | |||||||||
| Internet Advertising | |||||||||||
| 980,000 | CNET Networks (b) | 8,908 | |||||||||
| Internet Advertising on Niche Websites | |||||||||||
| 19,778 | |||||||||||
| > Financial Processors 1.2% | |||||||||||
| 393,280 | Global Payments | 18,209 | |||||||||
| Credit Card Processor | |||||||||||
| 18,209 | |||||||||||
| > Business Information & Marketing Services 1.1% | |||||||||||
| 530,000 | Ceridian (b) | 14,829 | |||||||||
| HR Services & Payment Processing | |||||||||||
| 98,300 | Navigant Consulting (b) | 1,942 | |||||||||
| Financial Consulting Firm | |||||||||||
| 16,771 | |||||||||||
| > Computer Services 0.8% | |||||||||||
| 786,000 | RCM Technologies (b)(c) | 4,708 | |||||||||
| Technology & Engineering Services | |||||||||||
| 1,005,500 | AnswerThink Consulting (b) | 3,097 | |||||||||
| IT Integration & Best Practice Research | |||||||||||
43
Columbia Acorn USA
Statement of Investments, continued
| Number of Shares | Value (000) | ||||||||||
| > Computer Services—continued | |||||||||||
| 95,000 | SRA International (b) | $ | 2,540 | ||||||||
| Government IT Services | |||||||||||
| 235,000 | iGate (b) | 1,617 | |||||||||
| IT & Business Process Outsourcing Services | |||||||||||
| 36,900 | Talx | 1,013 | |||||||||
| Outsourced Human Resource Services | |||||||||||
| 12,975 | |||||||||||
| > CATV 0.8% | |||||||||||
| 2,580,000 | Gemstar-TV Guide International (b) | 10,346 | |||||||||
| TV Program Guides & CATV Programming | |||||||||||
| 140,000 | Discovery Holding (b) | 2,253 | |||||||||
| CATV Programming | |||||||||||
| 12,599 | |||||||||||
| > Radio 0.8% | |||||||||||
| 511,100 | Salem Communications | 6,108 | |||||||||
| Radio Stations for Religious Programming | |||||||||||
| 705,500 | Spanish Broadcasting System (b) | 2,900 | |||||||||
| Spanish Language Radio Stations | |||||||||||
| 300,000 | Saga Communications (b) | 2,883 | |||||||||
| Radio Stations in Small- & Mid-sized Cities | |||||||||||
| 11,891 | |||||||||||
| > TV Broadcasting 0.6% | |||||||||||
| 1,125,000 | Entravision Communications (b) | 9,248 | |||||||||
| Spanish Language TV, Radio & Outdoor | |||||||||||
| 9,248 | |||||||||||
| > Gaming Equipment & Services 0.4% | |||||||||||
| 200,000 | Bally Technologies (b) | 3,736 | |||||||||
| Slot Machines & Software | |||||||||||
| 98,500 | Shuffle Master (b) | 2,581 | |||||||||
| Card Shufflers & Casino Games | |||||||||||
| 6,317 | |||||||||||
| > Television Programming 0.3% | |||||||||||
| 460,000 | Lions Gate Entertainment (b) | 4,936 | |||||||||
| Film & TV Studio | |||||||||||
| 4,936 | |||||||||||
| > Consumer Software 0.1% | |||||||||||
| 60,000 | THQ (b) | 1,951 | |||||||||
| Entertainment Software | |||||||||||
| 1,951 | |||||||||||
| Information: Total | 500,295 | ||||||||||
| Consumer Goods & Services 19.1% | |||||||||||
| > Apparel 4.5% | |||||||||||
| 634,200 | Oxford Industries | 31,488 | |||||||||
| Branded & Private Label Apparel | |||||||||||
| 600,200 | Carter's (b) | 15,305 | |||||||||
| Children's Branded Apparel | |||||||||||
| 885,200 | True Religion Apparel (b) | 13,552 | |||||||||
| Premium Denim | |||||||||||
| 222,200 | Coach (b) | 9,546 | |||||||||
| Designer & Retailer of Branded Leather Accessories | |||||||||||
| 45,000 | Heelys (b) | 1,445 | |||||||||
| Wheeled Footware | |||||||||||
| 71,336 | |||||||||||
| Number of Shares | Value (000) | ||||||||||
| > Retail 4.3% | |||||||||||
| 398,000 | Abercrombie & Fitch | $ | 27,713 | ||||||||
| Teen Apparel Retailer | |||||||||||
| 486,250 | Christopher & Banks | 9,073 | |||||||||
| Women's Apparel Retailer | |||||||||||
| 418,000 | Chico's FAS (b) | 8,648 | |||||||||
| Women's Specialty Retail | |||||||||||
| 224,500 | AnnTaylor Stores (b) | 7,373 | |||||||||
| Women's Apparel Retailer | |||||||||||
| 175,000 | J Crew Group (b) | 6,746 | |||||||||
| Multi-channel Branded Retailer | |||||||||||
| 200,000 | Urban Outfitters (b) | 4,606 | |||||||||
| Apparel & Home Specialty Retailer | |||||||||||
| 95,000 | Genesco (b) | 3,544 | |||||||||
| Multi-concept Branded Footwear Retailer | |||||||||||
| 67,703 | |||||||||||
| > Other Consumer Services 3.1% | |||||||||||
| 416,000 | ITT Educational Services (b) | 27,610 | |||||||||
| Post-secondary Degree Programs | |||||||||||
| 387,700 | Central Parking | 6,979 | |||||||||
| Owner, Operator, Manager of Parking Lots & Garages | |||||||||||
| 310,000 | Universal Technical Institute (b) | 6,885 | |||||||||
| Vocational Training | |||||||||||
| 65,000 | Nutrisystem (b) | 4,120 | |||||||||
| Weight Loss Program | |||||||||||
| 60,000 | Weight Watchers International | 3,152 | |||||||||
| Weight Loss Programs | |||||||||||
| 48,746 | |||||||||||
| > Nondurables 1.9% | |||||||||||
| 531,400 | Scotts Miracle-Gro | 27,447 | |||||||||
| Consumer Lawn & Garden Products | |||||||||||
| 72,000 | Jarden (b) | 2,505 | |||||||||
| Branded Household Products | |||||||||||
| 29,952 | |||||||||||
| > Leisure Products 1.8% | |||||||||||
| 301,300 | International Speedway | 15,378 | |||||||||
| Largest Motorsports Racetrack Owner & Operator | |||||||||||
| 195,500 | Speedway Motorsports | 7,507 | |||||||||
| Motorsport Racetrack Owner & Operator | |||||||||||
| 195,000 | Callaway Golf | 2,810 | |||||||||
| Premium Golf Clubs & Balls | |||||||||||
| 50,000 | Polaris Industries | 2,342 | |||||||||
| Leisure Vehicles & Related Products | |||||||||||
| 28,037 | |||||||||||
| > Other Durable Goods 1.7% | |||||||||||
| 2,078,300 | Champion Enterprises (b) | 19,453 | |||||||||
| Manufactured Homes | |||||||||||
| 225,000 | Cavco Industries (b) | 7,884 | |||||||||
| Higher End Manufactured Homes | |||||||||||
| 27,337 | |||||||||||
| > Restaurants 0.9% | |||||||||||
| 337,500 | Sonic (b) | 8,083 | |||||||||
| Quick Service Restaurant | |||||||||||
| 163,800 | Red Robin Gourmet Burgers (b) | 5,872 | |||||||||
| Casual Dining Restaurant | |||||||||||
| 13,955 | |||||||||||
44
| Number of Shares | Value (000) | ||||||||||
| > Furniture & Textiles 0.4% | |||||||||||
| 106,000 | HNI | $ | 4,707 | ||||||||
| Office Furniture & Fireplaces | |||||||||||
| 55,800 | Knoll | 1,228 | |||||||||
| Office Furniture | |||||||||||
| 5,935 | |||||||||||
| > Casinos & Gaming 0.3% | |||||||||||
| 160,000 | Pinnacle Entertainment (b) | 5,302 | |||||||||
| Regional Casino Operator | |||||||||||
| 5,302 | |||||||||||
| > Travel 0.1% | |||||||||||
| 45,000 | Vail Resorts (b) | 2,017 | |||||||||
| Ski Resort Operator & Developer | |||||||||||
| 2,017 | |||||||||||
| > Consumer Goods Distribution 0.1% | |||||||||||
| 40,000 | Pool | 1,567 | |||||||||
| Distributor of Swimming Pool Supplies & Equipment | |||||||||||
| 1,567 | |||||||||||
| Consumer Goods & Services: Total | 301,887 | ||||||||||
| Health Care 12.7% | |||||||||||
| > Health Care Services 3.3% | |||||||||||
| 550,000 | United Surgical Partners (b) | 15,593 | |||||||||
| Outpatient Surgery Center | |||||||||||
| 291,800 | Lincare Holdings (b) | 11,625 | |||||||||
| Home Health Care Services | |||||||||||
| 380,000 | PSS World Medical (b) | 7,421 | |||||||||
| Medical Supplies Distributor | |||||||||||
| 210,000 | LCA-Vision | 7,216 | |||||||||
| Lasik Surgery Centers | |||||||||||
| 137,000 | Charles River Laboratories (b) | 5,925 | |||||||||
| Pharmaceutical Research | |||||||||||
| 175,000 | PRA International (b) | 4,422 | |||||||||
| Contract Research Organization | |||||||||||
| 52,202 | |||||||||||
| > Biotechnology & Drug Delivery 3.1% | |||||||||||
| 885,000 | PDL BioPharma (b) | 17,824 | |||||||||
| Proprietary Monoclonal Antibodies | |||||||||||
| 760,000 | Nektar Therapeutics (b) | 11,560 | |||||||||
| Drug Delivery Technologies | |||||||||||
| 605,000 | Ligand Pharmaceuticals (b) | 6,625 | |||||||||
| Drugs for Pain, Cancer, Osteoporosis & Diabetes | |||||||||||
| 3,690,300 | Medicure (b)(d) | 4,277 | |||||||||
| Cardiovascular Biotech Company | |||||||||||
| 738,060 | Medicure Warrants (b)(d)(e)(f) | - | |||||||||
| Cardiovascular Biotech Company | |||||||||||
| 225,000 | Arena Pharmaceuticals (b) | 2,905 | |||||||||
| Novel Drug Targeting Technology | |||||||||||
| 636,400 | Decode Genetics (b) | 2,883 | |||||||||
| Drugs For Heart Attack, Asthma & Vascular Disease | |||||||||||
| 440,000 | Nuvelo (b) | 1,760 | |||||||||
| Development-Stage Biotech Focused On Cardiovascular/Cancer | |||||||||||
| 215,000 | Neurogen (b) | 1,279 | |||||||||
| Development-Stage Biotech Focused On Neurology | |||||||||||
| Number of Shares | Value (000) | ||||||||||
| 28,000 | Exelixis (b) | $ | 252 | ||||||||
| Treatments for Cancer & Metabolic Disorders | |||||||||||
| 375,000 | Locus Discovery, Series D, Pfd. (b)(d) | 102 | |||||||||
| High Throughput Rational Drug Design | |||||||||||
| 363,636 | Metabolex, Series F (d) | 84 | |||||||||
| Diabetes Drug Development | |||||||||||
| 49,551 | |||||||||||
| > Medical Equipment & Devices 2.6% | |||||||||||
| 577,400 | Edwards Lifesciences (b) | 27,161 | |||||||||
| Heart Valves | |||||||||||
| 220,000 | Viasys Healthcare (b) | 6,120 | |||||||||
| Respiratory & Neurology Medical Equipment | |||||||||||
| 105,000 | Vital Signs | 5,242 | |||||||||
| Anesthesia, Respiratory & Sleep Products | |||||||||||
| 94,171 | Advanced Medical Optics (b) | 3,315 | |||||||||
| Medical Devices for Eye Care | |||||||||||
| 41,838 | |||||||||||
| > Pharmaceuticals 2.2% | |||||||||||
| 400,000 | The Medicines Company (b) | 12,688 | |||||||||
| Specialty Pharmaceuticals - Cardiovascular | |||||||||||
| 400,000 | MGI Pharma (b) | 7,364 | |||||||||
| Specialty Pharmaceuticals for Oncology & Acute Care | |||||||||||
| 200,000 | Medicis Pharmaceutical | 7,026 | |||||||||
| Specialty Pharmaceuticals - Dermatology | |||||||||||
| 490,000 | QLT (b) | 4,145 | |||||||||
| Specialty Pharmaceuticals - Ophthalmology & Dermatology | |||||||||||
| 150,000 | Collagenex Pharmaceuticals (b) | 2,096 | |||||||||
| Specialty Pharmaceuticals for Dermatology | |||||||||||
| 255,100 | Barrier Therapeutics (b) | 1,923 | |||||||||
| Specialty Pharmaceuticals for Dermatology | |||||||||||
| 35,242 | |||||||||||
| > Medical Supplies 1.5% | |||||||||||
| 270,700 | ICU Medical (b) | 11,012 | |||||||||
| Intravenous Therapy Products | |||||||||||
| 158,300 | Techne (b) | 8,778 | |||||||||
| Cytokines, Antibodies & Other Reagents for Life Science | |||||||||||
| 104,000 | Arrow International | 3,679 | |||||||||
| Disposable Catheters | |||||||||||
| 23,469 | |||||||||||
| Health Care: Total | 202,302 | ||||||||||
| Industrial Goods & Services 12.5% | |||||||||||
| > Machinery 7.1% | |||||||||||
| 580,300 | ESCO Technologies (b) | 26,369 | |||||||||
| Automatic Electric Meter Readers | |||||||||||
| 697,500 | Ametek | 22,209 | |||||||||
| Aerospace/Industrial Instruments | |||||||||||
| 673,600 | Pentair | 21,151 | |||||||||
| Pumps, Water Treatment & Tools | |||||||||||
| 373,600 | Nordson | 18,616 | |||||||||
| Dispensing Systems for Adhesives & Coatings | |||||||||||
| 319,800 | Donaldson | 11,100 | |||||||||
| Industrial Air Filtration | |||||||||||
| 236,400 | K&F Industries Holdings (b) | 5,369 | |||||||||
| Aircraft Wheels, Brakes & Fuel Tank Bladders | |||||||||||
| 71,800 | Toro | 3,348 | |||||||||
| Turf Maintenance Equipment | |||||||||||
45
Columbia Acorn USA
Statement of Investments, continued
| Number of Shares | Value (000) | ||||||||||
| > Machinery—continued | |||||||||||
| 132,000 | Goodman Global (b) | $ | 2,270 | ||||||||
| HVAC Equipment Manufacturer | |||||||||||
| 50,000 | Kaydon | 1,987 | |||||||||
| Specialized Friction & Motion Control Products | |||||||||||
| 112,419 | |||||||||||
| > Electrical Components 1.8% | |||||||||||
| 376,000 | Genlyte Group (b) | 29,369 | |||||||||
| Commercial Lighting Fixtures | |||||||||||
| 29,369 | |||||||||||
| > Outsourcing Services 1.4% | |||||||||||
| 400,000 | Quanta Services (b) | 7,868 | |||||||||
| Electrical & Telecom Construction Services | |||||||||||
| 175,000 | Administaff | 7,485 | |||||||||
| Professional Employer Organization | |||||||||||
| 350,000 | Labor Ready (b) | 6,416 | |||||||||
| Temporary Manual Labor | |||||||||||
| 21,769 | |||||||||||
| > Construction 0.8% | |||||||||||
| 204,050 | Florida Rock | 8,784 | �� | ||||||||
| Aggregates & Concrete | |||||||||||
| 100,000 | Simpson Manufacturing | 3,165 | |||||||||
| Wall Joint Maker | |||||||||||
| 11,949 | |||||||||||
| > Waste Management 0.5% | |||||||||||
| 187,250 | Waste Connections (b) | 7,780 | |||||||||
| Solid Waste Management | |||||||||||
| 7,780 | |||||||||||
| > Other Industrial Services 0.4% | |||||||||||
| 75,900 | G&K Services | 2,952 | |||||||||
| Uniform Rental | |||||||||||
| 63,000 | UTI Worldwide | 1,884 | |||||||||
| Global Logistics & Freight Forwarding | |||||||||||
| 47,200 | American Reprographics Company (b) | 1,572 | |||||||||
| Document Management and Logistics | |||||||||||
| 6,408 | |||||||||||
| > Industrial Distribution 0.3% | |||||||||||
| 70,000 | Watsco | 3,301 | |||||||||
| HVAC Distribution | |||||||||||
| 56,900 | NuCo2 (b) | 1,399 | |||||||||
| Bulk Co2 Gas Distribution to Restaurants | |||||||||||
| 4,700 | |||||||||||
| > Industrial Materials & Specialty Chemicals 0.2% | |||||||||||
| 100,000 | Drew Industries (b) | 2,601 | |||||||||
| RV & Manufactured Home Components | |||||||||||
| 2,601 | |||||||||||
| Industrial Goods & Services: Total | 196,995 | ||||||||||
| Finance 9.2% | |||||||||||
| > Finance Companies 3.5% | |||||||||||
| 1,121,500 | AmeriCredit (b) | 28,228 | |||||||||
| Auto Lending | |||||||||||
| 517,900 | World Acceptance (b) | 24,315 | |||||||||
| Personal Loans | |||||||||||
| 130,000 | McGrath Rentcorp | 3,982 | |||||||||
| Temporary Space & IT Equipment Rentals | |||||||||||
| 56,525 | |||||||||||
| Number of Shares | Value (000) | ||||||||||
| > Insurance 3.0% | |||||||||||
| 714,500 | HCC Insurance Holdings | $ | 22,928 | ||||||||
| Specialty Insurance | |||||||||||
| 14,000 | Markel (b) | 6,721 | |||||||||
| Specialty Insurance | |||||||||||
| 105,000 | Philadelphia Consolidated Holding (b) | 4,679 | |||||||||
| Specialty Insurance | |||||||||||
| 87,000 | Delphi Financial Group | 3,520 | |||||||||
| Group Employee Benefit Products & Services | |||||||||||
| 150,000 | Montpelier Re | 2,791 | |||||||||
| Commercial Lines Insurance/Reinsurance | |||||||||||
| 75,000 | Endurance Specialty Holdings | 2,744 | |||||||||
| Commercial Lines Insurance/Reinsurance | |||||||||||
| 91,000 | United America Indemnity (b) | 2,305 | |||||||||
| Specialty Insurance | |||||||||||
| 120,643 | Eastern Insurance Holdings (b) | 1,757 | |||||||||
| Workers Comp & Specialty Insurance | |||||||||||
| 47,445 | |||||||||||
| > Banks 2.2% | |||||||||||
| 239,500 | TCF Financial | 6,567 | |||||||||
| Great Lakes Bank | |||||||||||
| 212,756 | Chittenden | 6,529 | |||||||||
| Vermont & Western Massachusetts Banks | |||||||||||
| 145,000 | Greene County Bancshares | 5,761 | |||||||||
| Tennessee Bank | |||||||||||
| 179,996 | First Busey | 4,149 | |||||||||
| Illinois Bank | |||||||||||
| 94,000 | Associated Banc-Corp | 3,279 | |||||||||
| Midwest Bank | |||||||||||
| 125,000 | Lakeland Financial | 3,191 | |||||||||
| Indiana Bank | |||||||||||
| 114,777 | Glacier Bancorp | 2,805 | |||||||||
| Mountain States Bank | |||||||||||
| 20,000 | First Financial Bankshares | 837 | |||||||||
| West Texas Bank | |||||||||||
| 31,500 | West Bancorporation | 560 | |||||||||
| Des Moines Commercial Bank | |||||||||||
| 15,696 | Pacific Continental | 303 | |||||||||
| Niche Pacific N.W. Bank | |||||||||||
| 33,981 | |||||||||||
| > Savings & Loans 0.5% | |||||||||||
| 141,400 | Anchor Bancorp Wisconsin | 4,075 | |||||||||
| Wisconsin Thrift | |||||||||||
| 80,000 | People's Bank Bridgeport | 3,570 | |||||||||
| Connecticut Savings & Loan | |||||||||||
| 7,645 | |||||||||||
| Finance: Total | 145,596 | ||||||||||
| Energy & Minerals 7.2% | |||||||||||
| > Oil Services 3.9% | |||||||||||
| 401,700 | FMC Technologies (b) | 24,757 | |||||||||
| Oil & Gas Well Head Manufacturer | |||||||||||
| 367,000 | Atwood Oceanics (b) | 17,972 | |||||||||
| Offshore Drilling Contractor | |||||||||||
| 227,000 | Pride International (b) | 6,812 | |||||||||
| Offshore Drilling Contractor | |||||||||||
| 355,000 | Hanover Compressor (b) | 6,706 | |||||||||
| Natural Gas Compressor Rental & Fabrication | |||||||||||
46
| Number of Shares | Value (000) | ||||||||||
| > Oil Services—continued | |||||||||||
| 76,500 | CARBO Ceramics | $ | 2,859 | ||||||||
| Natural Gas Well Stimulants | |||||||||||
| 155,000 | Key Energy Services (b) | 2,426 | |||||||||
| Well Workover Services | |||||||||||
| 61,532 | |||||||||||
| > Oil & Gas Producers 2.3% | |||||||||||
| 525,000 | Quicksilver Resources (b) | 19,210 | |||||||||
| Natural Gas & Coal Seam Gas Producer | |||||||||||
| 208,400 | Southwestern Energy (b) | 7,304 | |||||||||
| Natural Gas Producer | |||||||||||
| 111,200 | Equitable Resources | 4,643 | |||||||||
| Natural Gas Producer & Utility | |||||||||||
| 450,000 | Vaalco Energy (b) | 3,037 | |||||||||
| Oil & Gas Producer | |||||||||||
| 80,000 | St. Mary Land & Exploration | 2,947 | |||||||||
| Oil & Gas Producer | |||||||||||
| 37,141 | |||||||||||
| > Other Resources 0.5% | |||||||||||
| 242,000 | Layne Christensen (b) | 7,945 | |||||||||
| Oil& Gas Producer/Engineering & Construction/Contract Drilling | |||||||||||
| 7,945 | |||||||||||
| > Oil Refining, Marketing & Distribution 0.5% | |||||||||||
| 155,000 | Atmos Energy | 4,946 | |||||||||
| Dallas Natural Gas Utility | |||||||||||
| 50,250 | Oneok | 2,167 | |||||||||
| Natural Gas Distribution, Pipeline Processing & Trading | |||||||||||
| 7,113 | |||||||||||
| Energy & Minerals: Total | 113,731 | ||||||||||
| Other Industries 2.4% | |||||||||||
| > Real Estate 1.7% | |||||||||||
| 560,000 | DiamondRock Hospitality | 10,086 | |||||||||
| Hotel Owner | |||||||||||
| 350,000 | Highland Hospitality | 4,987 | |||||||||
| Hotel Owner | |||||||||||
| 77,500 | Gaylord Entertainment (b) | 3,947 | |||||||||
| Convention Hotels | |||||||||||
| 100,000 | Digital Realty Trust | 3,423 | |||||||||
| Technology-focused Office Buildings | |||||||||||
| 150,000 | Kite Realty Group | 2,793 | |||||||||
| Community Shopping Centers | |||||||||||
| 90,000 | American Campus Communities | 2,562 | |||||||||
| Student Housing | |||||||||||
| 27,798 | |||||||||||
| > Transportation 0.5% | |||||||||||
| 524,720 | Heartland Express | 7,881 | |||||||||
| Regional Trucker | |||||||||||
| 7,881 | |||||||||||
| Number of Shares or Principal Amount (000) | Value (000) | ||||||||||
| > Regulated Utilities 0.2% | |||||||||||
| 97,500 | Northeast Utilities | $ | 2,746 | ||||||||
| Regulated Electric Utility | |||||||||||
| 2,746 | |||||||||||
| Other Industries: Total | 38,425 | ||||||||||
| Total Equities: 94.8% (Cost: $1,078,675) | 1,499,231 | ||||||||||
| Short-Term Obligations 5.1% | |||||||||||
| $ | 7,900 | Erste Finance (g) 5.28% Due 01/02/07 | 7,899 | ||||||||
| 7,900 | Greyhawk Funding (g) 5.25% Due 01/03/07 | 7,898 | |||||||||
| 7,900 | Compass Securities (g) 5.31% Due 01/04/07 | 7,897 | |||||||||
| 7,900 | Giro Balance (g) 5.33% Due 01/11/07 | 7,888 | |||||||||
| 7,900 | American General Financial 5.26% Due 01/12/07 | 7,887 | |||||||||
| 7,800 | East Fleet Financial 5.32% Due 01/05/07 | 7,795 | |||||||||
| 7,800 | Manhattan Asset (g) 5.31% Due 01/08/07 | 7,792 | |||||||||
| 7,800 | George Street (g) 5.33% Due 01/09/07 | 7,791 | |||||||||
| 7,800 | Advantage Asset (g) 5.33% Due 01/10/07 | 7,790 | |||||||||
| 9,346 | Repurchase Agreement with Fixed Income Clearing Corp., dated 12/29/06, due 1/02/07 at 5.150% collateralized by Federal Home Loan Bank Bond, maturing 1/19/16 market value of $9,537 (repurchase proceeds: $9,351) | 9,346 | |||||||||
| (Amortized Cost: $79,983) | 79,983 | ||||||||||
| Total Investments: 99.9% (Cost: $1,158,658)(a) | 1,579,214 | ||||||||||
| Cash and Other Assets Less Liabilities: 0.1% | 1,014 | ||||||||||
| Total Net Assets: 100.0% | $ | 1,580,228 | |||||||||
47
Columbia Acorn USA
Statement of Investments, continued
> Notes to Statement of Investments (in thousands)
(a) At December 31, 2006, for federal income tax purposes cost of investments was $1,158,903 and net unrealized appreciation was $420,311, consisting of gross unrealized appreciation of $468,917 and gross unrealized depreciation of $48,606.
(b) Non-income producing security.
(c) An affiliate may include any company in which the Fund owns five percent or more of its outstanding voting securities. On December 31, 2006, the Fund held five percent or more of the outstanding voting securities of the following companies:
| RCM Technologies | 6.66 | % | |||||
The aggregate cost and value of this investment at December 31, 2006 were $5,636 and $4,708, respectively. Investments in affiliates represented 0.30% of total net assets at December 31, 2006. Investment activity and income amounts relating to affiliates during the 12 months ended December 31, 2006 were as follows:
| Dividend Income | $ | - | |||||
| Net realized gain or loss | - | ||||||
| Change in unrealized gain or loss | 699 | ||||||
| Purchases | - | ||||||
| Proceeds from sales | - | ||||||
(d) Denotes a restricted security, which is subject to restrictions on resale under federal securities laws. These securities are valued in good faith by the Board of Trustees. At December 31, 2006, these securities had an aggregate value of $4,463, which represented 0.28% of total net assets.
Additional information on these securities is as follows:
| Security | Acquisition Dates | Shares | Cost | Value | |||||||||||||||
| Locus Discovery, Series D, Pfd. | 9/5/01 | 375 | $ | 1,500 | $ | 102 | |||||||||||||
| Metabolex, Series F | 5/11/00 | 364 | 2,000 | 84 | |||||||||||||||
| Medicure | 12/22/06 | 3,690 | 4,797 | 4,277 | |||||||||||||||
| Medicure - Warrants | 12/22/06 | 738 | — | — | |||||||||||||||
| $ | 8,297 | $ | 4,463 | ||||||||||||||||
(e) Security has no value.
(f) Represents fair value as determined in good faith under procedures approved by the Board of Trustees.
(g) Security exempt from registration under Section 4(2) of the Securities Act of 1933. These securities may only be resold in exempt transactions to qualified buyers. Private resales of these securities to qualified institutional buyers are also exempt from registration pursuant to Rule 144A under the Securities Act of 1933. At December 31, 2006, these securities had an aggregate value of $54,955, which represented 3.5% of net assets.
48
Columbia Acorn International Select
Major Portfolio Changes in the Fourth Quarter (Unaudited)
| Number of Shares | |||||||||||
| 09/30/06 | 12/31/06 | ||||||||||
| Additions | |||||||||||
| Europe | |||||||||||
| > Ireland | |||||||||||
| Anglo Irish Bank | 289,000 | 300,000 | |||||||||
| Bank of Ireland | 280,000 | 300,000 | |||||||||
| United Drug | 0 | 700,000 | |||||||||
| > Switzerland | |||||||||||
| Schindler | 23,000 | 26,000 | |||||||||
| Synthes | 38,000 | 47,000 | |||||||||
| > Germany | |||||||||||
| Gagfah | 0 | 24,000 | |||||||||
| Wincor Nixdorf | 0 | 23,000 | |||||||||
| > France | |||||||||||
| SES Global | 196,700 | 250,000 | |||||||||
| > Netherlands | |||||||||||
| Aalberts Industries | 17,000 | 29,000 | |||||||||
| Boskalis Westminster | 2,700 | 7,700 | |||||||||
| Fugro | 30,000 | 55,000 | |||||||||
| > Spain | |||||||||||
| Red Electrica de Espana | 88,000 | 105,000 | |||||||||
| > Sweden | |||||||||||
| Hexagon | 48,000 | 77,000 | |||||||||
| Asia | |||||||||||
| > Japan | |||||||||||
| Ibiden | 15,900 | 33,000 | |||||||||
| JSR | 85,000 | 125,700 | |||||||||
| Park24 | 0 | 110,000 | |||||||||
| > Singapore | |||||||||||
| Singapore Exchange | 0 | 850,000 | |||||||||
| Other Countries | |||||||||||
| > Canada | |||||||||||
| Alliance Atlantis Communication | 102,000 | 114,000 | |||||||||
| RONA | 100,000 | 150,000 | |||||||||
| > South Africa | |||||||||||
| Impala Platinum Holdings | 88,800 | 151,300 | |||||||||
| (Includes the effect of an 8 for 1 spinoff) | |||||||||||
| Naspers | 0 | 145,000 | |||||||||
| > United States | |||||||||||
| Atwood Oceanics | 73,100 | 90,000 | |||||||||
| Number of Shares | |||||||||||
| 09/30/06 | 12/31/06 | ||||||||||
| Sales | |||||||||||
| Europe | |||||||||||
| > Ireland | |||||||||||
| C&C Group | 506,661 | 500,000 | |||||||||
| > Germany | |||||||||||
| Depfa Bank | 225,000 | 90,000 | |||||||||
| > Sweden | |||||||||||
| Tele2 | 255,000 | 0 | |||||||||
| > Denmark | |||||||||||
| Novozymes | 50,000 | 37,500 | |||||||||
| Asia | |||||||||||
| > Japan | |||||||||||
| Daito Trust Construction | 84,000 | 68,000 | |||||||||
| Hiroshima Bank | 199,800 | 0 | |||||||||
| Sparx Asset Management | 2,700 | 0 | |||||||||
| > Hong Kong | |||||||||||
| Hong Kong Exchanges and Clearing | 610,000 | 500,000 | |||||||||
| Other Countries | |||||||||||
| > Canada | |||||||||||
| Kinross Gold | 111,000 | 0 | |||||||||
| Potash | 35,000 | 30,000 | |||||||||
49
Columbia Acorn International Select
Statement of Investments, December 31, 2006
| Number of Shares | Value (000) | ||||||||||
| Equities: 93.0% | |||||||||||
| Europe 54.0% | |||||||||||
| Ireland 18.5% | |||||||||||
| 500,000 | C&C Group | $ | 8,874 | ||||||||
| Beverage Company | |||||||||||
| 300,000 | Bank of Ireland | 6,911 | |||||||||
| Irish Commercial Bank | |||||||||||
| 300,000 | Anglo Irish Bank | 6,220 | |||||||||
| Small Business & Middle Market Banking | |||||||||||
| 150,000 | IAWS Group | 3,841 | |||||||||
| Baked Goods | |||||||||||
| 700,000 | United Drug | 3,669 | |||||||||
| Irish Pharmaceutical Wholesaler & Outsourcer | |||||||||||
| 100,000 | Grafton Group | 1,671 | |||||||||
| Builders Materials Wholesaling & Do-it-yourself Retailing | |||||||||||
| 31,186 | |||||||||||
| Switzerland 9.6% | |||||||||||
| 47,000 | Synthes | 5,603 | |||||||||
| Products for Orthopedic Surgery | |||||||||||
| 2,400 | Geberit | 3,698 | |||||||||
| Plumbing Supplies | |||||||||||
| 42,500 | Kuehne & Nagel | 3,092 | |||||||||
| Freight Forwarding/Logistics | |||||||||||
| 10,250 | Swatch Group | 2,264 | |||||||||
| Watch & Electronics Manufacturer | |||||||||||
| 26,000 | Schindler | 1,635 | |||||||||
| Elevator Manufacturer & Service Provider | |||||||||||
| 16,292 | |||||||||||
| Germany 5.4% | |||||||||||
| 23,000 | Wincor Nixdorf | 3,578 | |||||||||
| Retail POS Systems & ATM Machines | |||||||||||
| 90,000 | Depfa Bank | 1,614 | |||||||||
| Investment Banker to Public Authorities | |||||||||||
| 1,250 | Porsche | 1,590 | |||||||||
| Specialty Automobile Manufacturer | |||||||||||
| 8,500 | Deutsche Boerse | 1,563 | |||||||||
| Trading, Clearing, Settlement Services for Financial Markets | |||||||||||
| 24,000 | Gagfah | 760 | |||||||||
| German Residential Property | |||||||||||
| 9,105 | |||||||||||
| France 5.4% | |||||||||||
| 250,000 | SES Global | 4,440 | |||||||||
| Satellite Broadcasting Services | |||||||||||
| 24,200 | Neopost | 3,039 | |||||||||
| Postage Meter Machines | |||||||||||
| 18,000 | Imerys | 1,597 | |||||||||
| Industrial Minerals Producer | |||||||||||
| 9,076 | |||||||||||
| Netherlands 4.4% | |||||||||||
| 55,000 | Fugro | 2,627 | |||||||||
| Oilfield Services | |||||||||||
| 29,000 | Aalberts Industries | 2,507 | |||||||||
| Flow Control & Heat Treatment | |||||||||||
| 34,000 | USG People | 1,477 | |||||||||
| Temporary Staffing Services | |||||||||||
| Number of Shares | Value (000) | ||||||||||
| 7,700 | Boskalis Westminster | $ | 762 | ||||||||
| Dredging And Maritime Contractor | |||||||||||
| 7,373 | |||||||||||
| United Kingdom 2.9% | |||||||||||
| 215,000 | Northern Rock | 4,945 | |||||||||
| Lowest Cost Mortgage Bank in UK | |||||||||||
| 4,945 | |||||||||||
| Spain 2.7% | |||||||||||
| 105,000 | Red Electrica de Espana | 4,496 | |||||||||
| Spanish Power Grid | |||||||||||
| 4,496 | |||||||||||
| Sweden 1.9% | |||||||||||
| 77,000 | Hexagon | 3,278 | |||||||||
| Measurement Equipment & Polymers | |||||||||||
| 3,278 | |||||||||||
| Denmark 1.9% | |||||||||||
| 37,500 | Novozymes | 3,215 | |||||||||
| Industrial Enzymes | |||||||||||
| 3,215 | |||||||||||
| Czech Republic 1.3% | |||||||||||
| 15,300 | Komercni Banka | 2,278 | |||||||||
| Leading Czech Universal Bank | |||||||||||
| 2,278 | |||||||||||
| Europe: Total | 91,244 | ||||||||||
| Asia 24.9% | |||||||||||
| Japan 19.8% | |||||||||||
| 6,000 | Jupiter Telecommunications (b) | 4,814 | |||||||||
| Largest Cable Service Provider in Japan | |||||||||||
| 80,000 | Aeon Mall | 4,485 | |||||||||
| Suburban Shopping Mall Developer, Owner & Operator | |||||||||||
| 110,000 | Hoya | 4,295 | |||||||||
| Opto-electrical Components & Eyeglass Lenses | |||||||||||
| 125,700 | JSR | 3,258 | |||||||||
| Films & Chemicals for LCD Screens & Electronics | |||||||||||
| 68,000 | Daito Trust Construction | 3,111 | |||||||||
| Apartment Builder | |||||||||||
| 655 | Kenedix | 2,963 | |||||||||
| Real Estate Investment Management | |||||||||||
| 37,000 | USS | 2,411 | |||||||||
| Used Car Auctioneer | |||||||||||
| 280,000 | Kansai Paint | 2,219 | |||||||||
| Paint Producer in Japan, India, China & Southeast Asia | |||||||||||
| 85,000 | Ushio | 1,750 | |||||||||
| Industrial Light Sources | |||||||||||
| 33,000 | Ibiden | 1,667 | |||||||||
| Electronic Parts & Ceramics | |||||||||||
| 110,000 | Park24 | 1,411 | |||||||||
| Parking Lot Operator | |||||||||||
| 36,000 | Ito En | 1,098 | |||||||||
| Bottled Tea & Other Beverages | |||||||||||
| 33,482 | |||||||||||
50
| Number of Shares | Value (000) | ||||||||||
| Hong Kong 3.2% | |||||||||||
| 500,000 | Hong Kong Exchanges and Clearing | $ | 5,462 | ||||||||
| Hong Kong Equity & Derivatives Market Operator | |||||||||||
| 5,462 | |||||||||||
| Singapore 1.9% | |||||||||||
| 850,000 | Singapore Exchange | 3,143 | |||||||||
| Singapore Equity & Derivatives Market Operator | |||||||||||
| 3,143 | |||||||||||
| Asia: Total | 42,087 | ||||||||||
| Other Countries 14.1% | |||||||||||
| Canada 7.1% | |||||||||||
| 114,000 | Alliance Atlantis Communication (b) | 4,935 | |||||||||
| CATV Channels, TV/Movie Production/ Distribution | |||||||||||
| 30,000 | Potash | 4,304 | |||||||||
| World's Largest Producer of Potash | |||||||||||
| 150,000 | RONA (b) | 2,701 | |||||||||
| Leading Canadian Do-it-yourself Retailer | |||||||||||
| 11,940 | |||||||||||
| South Africa 4.4% | |||||||||||
| 151,300 | Impala Platinum Holdings | 3,966 | |||||||||
| Platinum Group Metals Mining & Refining | |||||||||||
| 145,000 | Naspers | 3,437 | |||||||||
| Media & Education In Africa and Other Emerging Markets | |||||||||||
| 7,403 | |||||||||||
| United States 2.6% | |||||||||||
| 90,000 | Atwood Oceanics (b) | 4,407 | |||||||||
| Offshore Drilling Contractor | |||||||||||
| 4,407 | |||||||||||
| Other Countries: Total | 23,750 | ||||||||||
| Total Equities: 93.0% (Cost: $115,011) | 157,081 | ||||||||||
| Principal Amount (000) | Value (000) | ||||||||||
| Short-Term Obligation 6.4% | |||||||||||
| $ | 10,777 | Repurchase Agreement with Fixed Income Clearing Corp., dated 12/29/06, due 1/02/07 at 5.150% collateralized by Federal Home Loan Bank Bond, maturing 1/19/16, market value of $10,995 (repurchase proceeds: $10,783) | $ | 10,777 | |||||||
| (Amortized Cost: $10,777) | 10,777 | ||||||||||
| Total Investments: 99.4% (Cost: $125,788)(a)(c) | 167,858 | ||||||||||
| Cash and Other Assets Less Liabilities: 0.6% | 1,040 | ||||||||||
| Total Net Assets: 100.0% | $ | 168,898 | |||||||||
51
Columbia Acorn International Select
Statement of Investments, continued
> Notes to Statement of Investments (in thousands)
(a) At December 31, 2006, for federal income tax purposes cost of investments was $125,946 and net unrealized appreciation was $41,912, consisting of gross unrealized appreciation of $43,837 and gross unrealized depreciation of $1,925.
(b) Non-income producing security.
(c) On December 31, 2006, the Fund's total investments were denominated in currencies as follows:
| Currency | Value | % of Total Net Assets | |||||||||
| Euro | $ | 61,238 | 36.3 | % | |||||||
| Japanese Yen | 33,481 | 19.8 | |||||||||
| US Dollar | 19,489 | 11.5 | |||||||||
| Swiss Franc | 16,291 | 9.7 | |||||||||
| Other currencies less than 5% of total net assets | 37,359 | 22.1 | |||||||||
| $ | 167,858 | 99.4 | % | ||||||||
52
Columbia Acorn International Select
Portfolio Diversification
At December 31, 2006, the Fund's portfolio investments as a percent of net assets was diversified as follows:
| Value (000) | Percent | ||||||||||
| > Industrial Goods & Services | |||||||||||
| Chemicals | $ | 10,289 | 6.1 | % | |||||||
| Construction | 6,809 | 4.0 | |||||||||
| Other Industrial Services | 4,727 | 2.8 | |||||||||
| Conglomerates | 7,452 | 4.4 | |||||||||
| Machinery | 3,039 | 1.8 | |||||||||
| Electrical Components | 1,750 | 1.0 | |||||||||
| Industrial Distribution | 1,671 | 1.0 | |||||||||
| Outsourcing Services | 1,477 | 0.9 | |||||||||
| 37,214 | 22.0 | ||||||||||
| > Information | |||||||||||
| Financial Processors | 10,168 | 6.0 | |||||||||
| Television Programming | 4,935 | 2.9 | |||||||||
| Cable Television | 4,814 | 2.9 | |||||||||
| Satellite Broadcasting | 4,440 | 2.6 | |||||||||
| Semiconductors & Related Equipment | 4,295 | 2.6 | |||||||||
| Computer Hardware & Related Equipment | 3,578 | 2.1 | |||||||||
| Television Broadcasting | 3,437 | 2.0 | |||||||||
| 35,667 | 21.1 | ||||||||||
| > Consumer Goods & Services | |||||||||||
| Food | 13,813 | 8.2 | |||||||||
| Retail | 7,186 | 4.3 | |||||||||
| Durables Goods | 3,854 | 2.3 | |||||||||
| Consumer Goods Distribution | 2,411 | 1.4 | |||||||||
| Consumer Services | 1,411 | 0.8 | |||||||||
| 28,675 | 17.0 | ||||||||||
| Value (000) | Percent | ||||||||||
| > Finance | |||||||||||
| Banks | $ | 21,968 | 13.0 | ||||||||
| 21,968 | 13.0 | ||||||||||
| > Energy & Minerals | |||||||||||
| Mining | 8,270 | 4.9 | |||||||||
| Oil/Gas Producers | 7,796 | 4.6 | |||||||||
| 16,066 | 9.5 | ||||||||||
| > Health Care | |||||||||||
| Medical Equipment | 5,603 | 3.3 | |||||||||
| Pharmaceuticals | 3,669 | 2.2 | |||||||||
| 9,272 | 5.5 | ||||||||||
| > Other Industries | |||||||||||
| Regulated Utilities | 4,496 | 2.7 | |||||||||
| Real Estate | 3,723 | 2.2 | |||||||||
| 8,219 | 4.9 | ||||||||||
| Total Equities: | 157,081 | 93.0 | % | ||||||||
| Short-Term Obligations: | 10,777 | 6.4 | |||||||||
| Total Investments: | 167,858 | 99.4 | |||||||||
| Cash and Other Assets Less Liabilities: | 1,040 | 0.6 | |||||||||
| Net Assets: | $ | 168,898 | 100.0 | % | |||||||
53
Columbia Acorn Select
Major Portfolio Changes in the Fourth Quarter (Unaudited)
| Number of Shares | |||||||||||
| 09/30/06 | 12/31/06 | ||||||||||
| Additions | |||||||||||
| Consumer Goods & Services | |||||||||||
| Abercrombie & Fitch | 1,370,000 | 1,400,000 | |||||||||
| Coach | 1,506,000 | 1,550,000 | |||||||||
| Costco Wholesale | 845,000 | 850,000 | |||||||||
| Expedia | 3,500,000 | 3,925,000 | |||||||||
| Hertz | 0 | 1,750,000 | |||||||||
| International Speedway | 740,000 | 750,000 | |||||||||
| Safeway | 3,445,000 | 3,550,000 | |||||||||
| Universal Technical Institute | 1,344,400 | 1,350,000 | |||||||||
| Information | |||||||||||
| Avid Technology | 2,075,000 | 2,200,000 | |||||||||
| Canadian Solar | 0 | 550,000 | |||||||||
| Globalstar | 0 | 1,600,000 | |||||||||
| Liberty Global Series C | 2,947,406 | 2,950,000 | |||||||||
| Novell | 5,500,000 | 6,300,000 | |||||||||
| Sanmina - SCI | 7,500,000 | 10,330,000 | |||||||||
| Tellabs | 10,800,000 | 11,100,000 | |||||||||
| Energy & Minerals | |||||||||||
| Atwood Oceanics | 0 | 100,000 | |||||||||
| Finance | |||||||||||
| Conseco | 1,800,000 | 2,000,000 | |||||||||
| Janus Capital Group | 3,400,000 | 3,450,000 | |||||||||
| Montpelier Re | 0 | 500,000 | |||||||||
| SEI Investments | 729,500 | 750,000 | |||||||||
| Industrial Goods & Services | |||||||||||
| Expeditors International of Washington | 1,322,000 | 1,325,000 | |||||||||
| Number of Shares | |||||||||||
| 09/30/06 | 12/31/06 | ||||||||||
| Consumer Goods & Services | |||||||||||
| Career Education | 200,000 | 0 | |||||||||
| Harley-Davidson | 1,100,000 | 750,000 | |||||||||
| ITT Educational Services | 1,625,000 | 1,475,000 | |||||||||
| PETCO Animal Supplies | 1,350,000 | 0 | |||||||||
| Information | |||||||||||
| Liberty Global Series A | 1,045,200 | 800,000 | |||||||||
| Energy & Minerals | |||||||||||
| Pride International | 2,000,000 | 1,300,000 | |||||||||
| UrAsia Energy (Canada) | 31,700,000 | 30,500,000 | |||||||||
| Industrial Goods & Services | |||||||||||
| Mine Safety Appliances | 309,300 | 0 | |||||||||
| Sales | |||||||||||
54
Columbia Acorn Select
Statement of Investments, December 31, 2006
| Number of Shares | Value (000) | ||||||||||
| Equities: 93.6% | |||||||||||
| Consumer Goods & Services 31.3% | |||||||||||
| Retail 11.8% | |||||||||||
| 3,550,000 | Safeway | $ | 122,688 | ||||||||
| Supermarkets | |||||||||||
| 1,400,000 | Abercrombie & Fitch | 97,482 | |||||||||
| Teen Apparel Retailer | |||||||||||
| 850,000 | Costco Wholesale | 44,940 | |||||||||
| Warehouse Superstores | |||||||||||
| 265,110 | |||||||||||
| Other Consumer Services 7.4% | |||||||||||
| 1,475,000 | ITT Educational Services (b) | 97,896 | |||||||||
| Post-secondary Degree Services | |||||||||||
| 728,000 | Weight Watchers International | 38,242 | |||||||||
| Weight Loss Programs | |||||||||||
| 1,350,000 | Universal Technical Institute (b) | 29,983 | |||||||||
| Vocational Training | |||||||||||
| 166,121 | |||||||||||
| Travel 5.0% | |||||||||||
| 3,925,000 | Expedia (b) | 82,346 | |||||||||
| Online Travel Services Company | |||||||||||
| 1,750,000 | Hertz (b) | 30,433 | |||||||||
| Largest U.S. Rental Car Operator | |||||||||||
| 112,779 | |||||||||||
| Leisure Products 4.1% | |||||||||||
| 750,000 | Harley-Davidson | 52,852 | |||||||||
| Motorcycles & Related Merchandise | |||||||||||
| 750,000 | International Speedway | 38,280 | |||||||||
| Largest Motorsports Racetrack Owner & Operator | |||||||||||
| 91,132 | |||||||||||
| Apparel 3.0% | |||||||||||
| 1,550,000 | Coach (b) | 66,588 | |||||||||
| Designer & Retailer of Branded Leather Accessories | |||||||||||
| 66,588 | |||||||||||
| Consumer Goods & Services: Total | 701,730 | ||||||||||
| Information 26.6% | |||||||||||
| CATV 6.5% | |||||||||||
| 2,950,000 | Liberty Global Series C (b) | 82,600 | |||||||||
| Cable TV Franchises Outside the USA | |||||||||||
| 2,500,000 | Discovery Holding (b) | 40,225 | |||||||||
| CATV Programming | |||||||||||
| 800,000 | Liberty Global Series A (b) | 23,320 | |||||||||
| Cable TV Franchises Outside the USA | |||||||||||
| 146,145 | |||||||||||
| Business Software 5.4% | |||||||||||
| 2,200,000 | Avid Technology (b)(c) | 81,972 | |||||||||
| Digital Nonlinear Editing Software & Systems | |||||||||||
| 6,300,000 | Novell (b) | 39,060 | |||||||||
| Directory, Operating System & Identity Management Software | |||||||||||
| 121,032 | |||||||||||
| Number of Shares | Value (000) | ||||||||||
| Telecommunications Equipment 5.1% | |||||||||||
| 11,100,000 | Tellabs (b) | $ | 113,886 | ||||||||
| Telecommunications Equipment | |||||||||||
| 113,886 | |||||||||||
| Mobile Communications 4.8% | |||||||||||
| 2,300,000 | American Tower (b) | 85,744 | |||||||||
| Communications Towers in USA & Mexico | |||||||||||
| 1,600,000 | Globalstar (b) | 22,256 | |||||||||
| Satellite Mobile Voice & Data Carrier | |||||||||||
| 108,000 | |||||||||||
| Internet Related 2.7% | |||||||||||
| 9,600,000 | SkillSoft Publishing (b)(c) | 59,616 | |||||||||
| Web-based Learning Solutions (E-Learning) | |||||||||||
| 59,616 | |||||||||||
| Contract Manufacturing 1.6% | |||||||||||
| 10,330,000 | Sanmina-SCI (b) | 35,639 | |||||||||
| Electronic Manufacturing Services (EMS) | |||||||||||
| 35,639 | |||||||||||
| Semiconductors & Related Equipment 0.3% | |||||||||||
| 550,000 | Canadian Solar (b) | 5,764 | |||||||||
| Solar Cell & Module Manufacturer | |||||||||||
| 5,764 | |||||||||||
| Computer Services 0.2% | |||||||||||
| 1,367,000 | AnswerThink Consulting (b) | 4,210 | |||||||||
| IT Integration & Best Practice Research | |||||||||||
| 4,210 | |||||||||||
| Information: Total | 594,292 | ||||||||||
| Energy & Minerals 12.9% | |||||||||||
| Mining 9.3% | |||||||||||
| 30,050,000 | UrAsia Energy (Canada) (b)(c)(d) | 138,377 | |||||||||
| Uranium Mining in Kazakhstan | |||||||||||
| 480,000 | Potash (Canada) | 68,870 | |||||||||
| World's Largest Producer of Potash | |||||||||||
| 207,247 | |||||||||||
| Oil Services 3.6% | |||||||||||
| 1,300,000 | Pride International (b) | 39,013 | |||||||||
| Offshore Drilling Contractor | |||||||||||
| 600,000 | FMC Technologies (b) | 36,978 | |||||||||
| Oil & Gas Well Head Manufacturer | |||||||||||
| 100,000 | Atwood Oceanics (b) | 4,897 | |||||||||
| Offshore Drilling Contractor | |||||||||||
| 80,888 | |||||||||||
| Energy & Minerals: Total | 288,135 | ||||||||||
| Finance 12.2% | |||||||||||
| Brokerage & Money Management 7.6% | |||||||||||
| 3,450,000 | Janus Capital Group | 74,486 | |||||||||
| Manages Mutual Funds | |||||||||||
| 975,000 | Nuveen Investments | 50,583 | |||||||||
| Money Management | |||||||||||
55
Columbia Acorn Select
Statement of Investments, continued
| Number of Shares | Value (000) | ||||||||||
| Brokerage & Money Management—continued | |||||||||||
| 750,000 | SEI Investments | $ | 44,670 | ||||||||
| Mutual Fund Administration & Investment Management | |||||||||||
| 169,739 | |||||||||||
| Insurance 4.6% | |||||||||||
| 112,000 | Markel (b) | 53,771 | |||||||||
| Specialty Insurance | |||||||||||
| 2,000,000 | Conseco (b) | 39,960 | |||||||||
| Life, Long-Term Care & Medical Supplement Insurance | |||||||||||
| 500,000 | Montpelier Re | 9,305 | |||||||||
| Commercial Lines Insurance/Reinsurance | |||||||||||
| 103,036 | |||||||||||
| Finance: Total | 272,775 | ||||||||||
| Industrial Goods & Services 9.0% | |||||||||||
| Outsourcing Services 2.7% | |||||||||||
| 3,030,000 | Quanta Services (b) | 59,600 | |||||||||
| Electrical & Telecom Construction Services | |||||||||||
| 59,600 | |||||||||||
| Other Industrial Services 2.4% | |||||||||||
| 1,325,000 | Expeditors International of Washington | 53,663 | |||||||||
| International Freight Forwarder | |||||||||||
| 53,663 | |||||||||||
| Waste Management 2.1% | |||||||||||
| 1,300,000 | Waste Management | 47,801 | |||||||||
| U.S. Garbage Collection & Disposal | |||||||||||
| 47,801 | |||||||||||
| Steel 1.8% | |||||||||||
| 2,250,000 | Worthington Industries | 39,870 | |||||||||
| Steel Processing | |||||||||||
| 39,870 | |||||||||||
| Industrial Goods & Services: Total | 200,934 | ||||||||||
| Health Care 1.6% | |||||||||||
| Health Care Services 1.6% | |||||||||||
| 910,000 | Lincare Holdings (b) | 36,254 | |||||||||
| Home Health Care Services | |||||||||||
| 36,254 | |||||||||||
| Health Care: Total | 36,254 | ||||||||||
| Total Equities: 93.6% (Cost: $1,421,211) | 2,094,120 | ||||||||||
| Principal Amount (000) | Value (000) | ||||||||||
| Short-Term Obligations: 6.4% | |||||||||||
| $ | 11,200 | Erste Finance (e) 5.30% Due 01/18/07 | $ | 11,172 | |||||||
| 11,200 | American General Finance 5.25% Due 01/19/07 | 11,171 | |||||||||
| 11,000 | Manhattan Asset (e) 5.33% Due 01/09/07 | 10,987 | |||||||||
| 11,000 | Morrigan TRR (e) 5.35% Due 01/10/07 | 10,985 | |||||||||
| 11,000 | Keel Capital (e) 5.30% Due 01/11/07 | 10,984 | |||||||||
| 11,000 | Advantage Asset (e) 5.33% Due 01/16/07 | 10,976 | |||||||||
| 11,000 | TSL USA (e) 5.33% Due 01/17/07 | 10,974 | |||||||||
| 10,900 | Bavaria TRR (e) 5.30% Due 01/04/07 | 10,895 | |||||||||
| 10,900 | Regency Markets (e) 5.33% Due 01/05/07 | 10,893 | |||||||||
| 10,900 | Deutsche Zentral 5.36% Due 01/08/07 | 10,889 | |||||||||
| 10,800 | Gotham Funding (e) 5.29% Due 01/02/07 | 10,798 | |||||||||
| 10,800 | Greyhawk Funding (e) 5.25% Due 01/03/07 | 10,797 | |||||||||
| 8,000 | MICA Funding (e) 5.33% Due 01/12/07 | 7,987 | |||||||||
| 5,145 | Repurchase Agreement with Fixed Income Clearing Corp., dated 12/29/06, due 1/02/07 at 5.150% collateralized by Federal Home Loan Bank Bond, maturing 1/19/16, market value of $5,251 (repurchase proceeds: $5,148) | 5,145 | |||||||||
| (Amortized Cost: $144,653) | 144,653 | ||||||||||
| Total Investments: 100.0% (Cost: $1,565,864)(a) | 2,238,773 | ||||||||||
| Cash and Other Assets Less Liabilities: 0.0% | (1,062 | ) | |||||||||
| Total Net Assets: 100.0% | $ | 2,237,711 | |||||||||
56
Columbia Acorn Select
Statement of Investments, continued
> Notes to Statement of Investments (in thousands)
(a) At December 31, 2006, for federal income tax purposes cost of investments was $1,575,919 and net unrealized appreciation was $662,854, consisting of gross unrealized appreciation of $690,108 and gross unrealized depreciation of $27,254.
(b) Non-income producing security.
(c) An affiliate may include any company in which the Fund owns five percent or more of its outstanding voting securities. On December 31, 2006, the Fund held five percent or more of the outstanding voting securities of the following companies:
| SkillSoft Publishing | 8.81 | % | |||||
| UrAsia Energy | 6.25 | ||||||
| Avid Technology | 5.36 | ||||||
The aggregate cost and value of these investments at December 31, 2006 were $197,430 and $279,965, respectively. Investments in affiliates represented 12.51% of total net assets at December 31, 2006. Investment activity and income amounts relating to affiliates during the twelve months ended December 31, 2006 were as follows:
| Dividend Income | $ | - | |||||
| Net realized gain or loss | 4,499 | ||||||
| Change in unrealized gain or loss | 66,554 | ||||||
| Purchases | 55,453 | ||||||
| Proceeds from sales | 7,975 | ||||||
(d) Denotes a restricted security, which is subject to restrictions on resale under federal securities laws. At December 31, 2006, this security had a value of $126,663, which represented 5.66% of total net assets.
Additional information on these securities is as follows:
| Security | Acquisition Dates | Shares | Cost | Value | |||||||||||||||
| UrAsia Energy | 10/26/05, 2/01/06 | 27,506 | $ | 42,721 | $ | 126,663 | |||||||||||||
(e) Security exempt from registration under Section 4(2) of the Securities Act of 1933. These securities may only be resold in exempt transactions to qualified buyers. Private resales of these securities to qualified institutional buyers are also exempt from registration pursuant to Rule 144A under the Securities Act of 1933. At December 31, 2006, these securities had an aggregate value of to $117,448, which represented 5.3% of net assets.
57
Columbia Thermostat Fund
Statement of Investments, December 31, 2006
| Number of Shares or Principal Amount (000) | Value (000) | ||||||||||
| > Bond Funds: 59.8% | |||||||||||
| 6,366,247 | Columbia Intermediate Bond Fund, Class Z | $ | 56,278 | ||||||||
| 3,238,571 | Columbia Federal Securities Fund, Class Z | 33,714 | |||||||||
| 2,686,301 | Columbia Conservative High Yield Fund, Class Z | 22,672 | |||||||||
| Total Bond Funds (Cost: $112,552) | 112,664 | ||||||||||
| > Stock Funds: 40.1% | |||||||||||
| 1,280,164 | Columbia Large Cap Enhanced Core Fund, Class Z | 18,831 | |||||||||
| 1,066,505 | Columbia Dividend Income Fund, Class Z | 15,091 | |||||||||
| 284,306 | Columbia Acorn International, Class Z | 11,460 | |||||||||
| 558,135 | Columbia Marsico Growth Fund, Class Z | 11,414 | |||||||||
| 381,117 | Columbia Acorn Fund, Class Z | 11,323 | |||||||||
| 284,501 | Columbia Acorn Select, Class Z | 7,565 | |||||||||
| Total Stock Funds (Cost: $67,936) | 75,684 | ||||||||||
| Short-Term Obligation: 0.4% | |||||||||||
| $ | 721 | Repurchase Agreement with Fixed Income Clearing Corp., dated 12/29/06, due 1/02/07 at 5.150%, collateralized by Federal Home Loan Bank Bond, maturing 1/19/16 market value of $739 (repurchase proceeds: $721) | 721 | ||||||||
| (Cost: $721) | 721 | ||||||||||
| Total Investments: 100.3% (Cost: $181,209)(a) | 189,069 | ||||||||||
| Cash and Other Assets Less Liabilities: (0.3)% | (540 | ) | |||||||||
| Total Net Assets: 100% | $ | 188,529 | |||||||||
> Notes to Statements of Investments (in thousands)
(a) At December 31, 2006, for federal income tax purposes cost of investments was $182,015 and net unrealized appreciation was $7,054, consisting of gross unrealized appreciation of $7,428 and gross unrealized depreciation of $374.
58
Columbia Acorn Family of Funds
> Statements of Assets and Liabilities
> Statements of Operations
> Statements of Changes in Net Assets
> Financial Highlights
> Notes to Financial Statements
59
Columbia Acorn Family of Funds
Statements of Assets and Liabilities
| December 31, 2006 | Columbia Acorn Fund | Columbia Acorn International | Columbia Acorn USA | Columbia Acorn International Select | Columbia Acorn Select | Columbia Thermostat Fund | |||||||||||||||||||||
| (in thousands) | |||||||||||||||||||||||||||
| Assets: | |||||||||||||||||||||||||||
| Unaffiliated investments, at cost | $ | 9,722,973 | $ | 2,675,983 | $ | 1,153,022 | $ | 125,788 | $ | 1,368,434 | $ | 721 | |||||||||||||||
| Affiliated investments, at cost (See Note 4) | 2,146,491 | 27,956 | 5,636 | — | 197,430 | 180,488 | |||||||||||||||||||||
| Unaffiliated investments, at value | $ | 15,529,925 | $ | 4,300,291 | $ | 1,574,506 | $ | 167,858 | $ | 1,958,808 | $ | 721 | |||||||||||||||
| Affiliated investments, at value (See Note 4) | 3,477,317 | 24,179 | 4,708 | — | 279,965 | 188,348 | |||||||||||||||||||||
| Cash | — | 1 | 1 | — | * | — | * | 1 | |||||||||||||||||||
| Foreign currency (cost: Columbia Acorn Fund $2,120; Columbia Acorn International $14,138; Columbia Acorn International Select $24; Columbia Acorn Select $*) | 2,126 | 14,156 | — | 24 | — | * | — | ||||||||||||||||||||
| Receivable for: | |||||||||||||||||||||||||||
| Investments sold | 12,384 | 2,542 | 496 | 499 | 4,446 | — | |||||||||||||||||||||
| Fund shares sold | 29,985 | 8,340 | 4,756 | 616 | 2,885 | 72 | |||||||||||||||||||||
| Dividends and interest | 9,187 | 2,822 | 612 | 193 | 462 | — | * | ||||||||||||||||||||
| Foreign tax reclaims | 503 | 532 | 2 | 36 | — | — | |||||||||||||||||||||
| Deferred Trustees' Compensation Investments | 2,081 | 574 | 148 | — | — | — | |||||||||||||||||||||
| Expense Reimbursement due from Investment Adviser | — | — | — | — | * | — | 38 | ||||||||||||||||||||
| Other assets | — | 2 | — | — | — | — | |||||||||||||||||||||
| Total Assets | 19,063,508 | 4,353,439 | 1,585,229 | 169,226 | 2,246,566 | 189,180 | |||||||||||||||||||||
| Liabilities: | |||||||||||||||||||||||||||
| Payable for: | |||||||||||||||||||||||||||
| Investments purchased | 50,830 | 2,952 | 2,636 | — | 3,690 | — | |||||||||||||||||||||
| Fund shares redeemed | 48,489 | 2,665 | 585 | 82 | 2,448 | 420 | |||||||||||||||||||||
| Management fee | 10,276 | 2,742 | 1,159 | 129 | 1,509 | 16 | |||||||||||||||||||||
| Administration fee | 657 | 146 | 55 | 7 | 76 | 7 | |||||||||||||||||||||
| 12b-1 Service & Distribution fees | 2,896 | 201 | 141 | 16 | 476 | 82 | |||||||||||||||||||||
| Reports to shareholders | 1,403 | 363 | 128 | 49 | 320 | 74 | |||||||||||||||||||||
| Deferred Trustees' fees | 2,081 | 574 | 148 | 12 | 47 | 6 | |||||||||||||||||||||
| Transfer agent fees | 1,431 | 202 | 112 | 9 | 247 | 37 | |||||||||||||||||||||
| Trustees' fees | 18 | 4 | 1 | — | * | 2 | — | * | |||||||||||||||||||
| Audit fee | 38 | 37 | 17 | 17 | 17 | 6 | |||||||||||||||||||||
| Custody fees | 101 | 122 | 3 | 3 | 4 | — | |||||||||||||||||||||
| Other liabilities | 162 | 36 | 16 | 4 | 19 | 3 | |||||||||||||||||||||
| Total Liabilities | 118,382 | 10,044 | 5,001 | 328 | 8,855 | 651 | |||||||||||||||||||||
| Net Assets | $ | 18,945,126 | $ | 4,343,395 | $ | 1,580,228 | $ | 168,898 | $ | 2,237,711 | $ | 188,529 | |||||||||||||||
| Composition of Net Assets: | |||||||||||||||||||||||||||
| Paid in capital | $ | 11,584,527 | $ | 2,715,853 | $ | 1,146,476 | $ | 134,764 | $ | 1,555,934 | $ | 177,137 | |||||||||||||||
| Undistributed (overdistributed) net investment income (Accumulated net investment loss) | (27,265 | ) | (20,256 | ) | (174 | ) | 676 | (9,971 | ) | 249 | |||||||||||||||||
| Accumulated net realized gain (loss) | 250,064 | 27,216 | 13,370 | (8,615 | ) | 18,908 | 3,283 | ||||||||||||||||||||
| Net unrealized appreciation (depreciation) on: | |||||||||||||||||||||||||||
| Investments | 7,137,778 | 1,620,531 | 420,556 | 42,070 | 672,909 | 7,860 | |||||||||||||||||||||
| Foreign currency translations | 22 | 51 | — | 3 | (69 | ) | — | ||||||||||||||||||||
| Net Assets | $ | 18,945,126 | $ | 4,343,395 | $ | 1,580,228 | $ | 168,898 | $ | 2,237,711 | $ | 188,529 | |||||||||||||||
| Net asset value per share – Class A (a) | $ | 29.02 | $ | 40.07 | $ | 28.02 | $ | 27.68 | $ | 26.18 | $ | 12.59 | |||||||||||||||
| (Net assets/shares) | ($4,067,868/140,156) | ($313,401/7,822) | ($245,552/8,763) | ($22,599/817) | ($940,857/35,933) | ($58,013/4,609) | |||||||||||||||||||||
| Maximum offering price per share – Class A (b) | $ | 30.79 | $ | 42.51 | $ | 29.73 | $ | 29.37 | $ | 27.78 | $ | 13.36 | |||||||||||||||
| (Net asset value per share/front- end sales charge) | ($29.02/0.9425) | ($40.07/0.9425) | ($28.02/0.9425) | ($27.68/0.9425) | ($26.18/0.9425) | ($12.59/0.9425) | |||||||||||||||||||||
| Net asset value and offering price per share – Class B (a) | $ | 27.78 | $ | 39.39 | $ | 26.87 | $ | 26.73 | $ | 25.13 | $ | 12.62 | |||||||||||||||
| (Net assets/shares) | ($1,404,165/50,544) | ($94,165/2,390) | ($65,040/2,421) | ($9,787/366) | ($214,260/8,528) | ($72,367/5,733) | |||||||||||||||||||||
| Net asset value and offering price per share – Class C (a) | $ | 27.70 | $ | 39.35 | $ | 26.81 | $ | 26.70 | $ | 25.07 | $ | 12.62 | |||||||||||||||
| (Net assets/shares) | ($1,345,520/48,571) | ($99,425/2,527) | ($55,306/2,063) | ($7,060/264) | ($173,152/6,907) | ($27,375/2,169) | |||||||||||||||||||||
| Net asset value and offering price per share – Class Z (c) | $ | 29.71 | $ | 40.31 | $ | 28.66 | $ | 27.97 | $ | 26.59 | $ | 12.57 | |||||||||||||||
| (Net assets/shares) | ($12,127,573/408,153) | ($3,836,404/95,163) | ($1,214,330/42,372) | ($129,452/4,628) | ($909,442/34,206) | ($30,774/2,448) | |||||||||||||||||||||
(a) Redemption price per share is equal to net asset value less any applicable contingent deferred sales charge and redemption fee.
(b) On sales of $50,000 or more the offering price is reduced.
(c) Redemption price per share is equal to net asset value less any applicable redemption fee.
* Rounds to less than $500.
See accompanying notes to financial statements.
60
Columbia Acorn Family of Funds
Statements of Operations
For the Year Ended December 31, 2006
| (in thousands) | Columbia Acorn Fund | Columbia Acorn International | Columbia Acorn USA | Columbia Acorn International Select | Columbia Acorn Select | Columbia Thermostat Fund | |||||||||||||||||||||
| Investment Income: | |||||||||||||||||||||||||||
| Dividend income | $ | 129,894 | $ | 65,418 | $ | 6,312 | $ | 1,927 | $ | 9,793 | $ | — | |||||||||||||||
| Dividend income from affiliates (See Note 4) | 21,531 | 418 | — | — | — | — | |||||||||||||||||||||
| Dividends from affiliated investment company shares (See Note 4) | — | — | — | — | — | 7,846 | |||||||||||||||||||||
| Interest income | 58,437 | 7,480 | 6,696 | 330 | 3,955 | 39 | |||||||||||||||||||||
| 209,862 | 73,316 | 13,008 | 2,257 | 13,748 | 7,885 | ||||||||||||||||||||||
| Foreign taxes withheld | (4,052 | ) | (5,392 | ) | (7 | ) | (133 | ) | (38 | ) | — | ||||||||||||||||
| Total Investment Income | 205,810 | 67,924 | 13,001 | 2,124 | 13,710 | 7,885 | |||||||||||||||||||||
| Expenses: | |||||||||||||||||||||||||||
| Management fee | 115,422 | 28,296 | 12,636 | 1,172 | 16,054 | 195 | |||||||||||||||||||||
| Administration fee | 7,240 | 1,468 | 587 | 51 | 789 | 78 | |||||||||||||||||||||
| 12b-1 Service and Distribution fees: | |||||||||||||||||||||||||||
| Class A | 9,543 | 553 | 540 | 37 | 2,029 | 162 | |||||||||||||||||||||
| Class B | 11,509 | 682 | 561 | 65 | 1,674 | 606 | |||||||||||||||||||||
| Class C | 13,058 | 762 | 503 | 52 | 1,579 | 276 | |||||||||||||||||||||
| Transfer agent fees: | |||||||||||||||||||||||||||
| Class A | 2,437 | 203 | 139 | 19 | 774 | 115 | |||||||||||||||||||||
| Class B | 2,149 | 165 | 121 | 22 | 433 | 157 | |||||||||||||||||||||
| Class C | 1,235 | 87 | 56 | 9 | 231 | 56 | |||||||||||||||||||||
| Class Z | 3,353 | 1,218 | 350 | 59 | 523 | 29 | |||||||||||||||||||||
| Custody fees | 1,582 | 1,769 | 49 | 48 | 73 | — | * | ||||||||||||||||||||
| Trustees' fees | 756 | 152 | 62 | 3 | 36 | 3 | |||||||||||||||||||||
| Registration & blue sky fees | 380 | 311 | 152 | 83 | 153 | 64 | |||||||||||||||||||||
| Reports to shareholders | 3,228 | 791 | 378 | 91 | 721 | 147 | |||||||||||||||||||||
| Chief compliance officer expenses (See Note 4) | 387 | 74 | 29 | 2 | 41 | 4 | |||||||||||||||||||||
| Non-Recurring costs (See Note 9) | 124 | 25 | 10 | 1 | 13 | 1 | |||||||||||||||||||||
| Other expenses | 1,059 | 298 | 137 | 70 | 158 | 41 | |||||||||||||||||||||
| Total expenses | 173,462 | 36,854 | 16,310 | 1,784 | 25,281 | 1,934 | |||||||||||||||||||||
| Less custody fees paid indirectly | (171 | ) | (11 | ) | (20 | ) | (1 | ) | (22 | ) | — | * | |||||||||||||||
| Less reimbursement of expenses by Investment Adviser | — | — | — | (1 | ) | — | (312 | ) | |||||||||||||||||||
| Less reimbursement of expenses by Transfer Agent: | |||||||||||||||||||||||||||
| Class A | (605 | ) | (24 | ) | (27 | ) | (3 | ) | (219 | ) | (32 | ) | |||||||||||||||
| Class B | (262 | ) | (13 | ) | (12 | ) | (2 | ) | (63 | ) | (37 | ) | |||||||||||||||
| Class C | (208 | ) | (10 | ) | (7 | ) | (1 | ) | (44 | ) | (14 | ) | |||||||||||||||
| Class Z | (1,472 | ) | (233 | ) | (123 | ) | (12 | ) | (178 | ) | (11 | ) | |||||||||||||||
| Non-Recurring costs reimbursed (See Note 9) | (124 | ) | (25 | ) | (10 | ) | (1 | ) | (13 | ) | (1 | ) | |||||||||||||||
| Net Expenses | 170,620 | 36,538 | 16,111 | 1,763 | 24,742 | 1,527 | |||||||||||||||||||||
| Net Investment Income (Loss) | 35,190 | 31,386 | (3,110 | ) | 361 | (11,032 | ) | 6,358 | |||||||||||||||||||
| Net Realized and Unrealized Gain (Loss) on Portfolio Positions: | |||||||||||||||||||||||||||
| Net realized gain (loss) on: | |||||||||||||||||||||||||||
| Unaffiliated investments | 1,585,848 | 392,034 | 46,861 | 18,123 | 67,292 | — | |||||||||||||||||||||
| Affiliated investments (See Note 4) | 25,113 | — | — | — | 4,499 | 9,014 | |||||||||||||||||||||
| Foreign currency transactions | 1,005 | 82 | — | (13 | ) | 12 | — | ||||||||||||||||||||
| Distributions from affiliated investment company shares | — | — | — | — | — | 2,655 | |||||||||||||||||||||
| Net realized loss on disposal of investments purchased in error (prorated) (See Note 8) | — | — | — | — | * | — | — | ||||||||||||||||||||
| Net realized gain | 1,611,966 | 392,116 | 46,861 | 18,110 | 71,803 | 11,669 | |||||||||||||||||||||
| Net change in net unrealized appreciation (depreciation) on: | |||||||||||||||||||||||||||
| Unaffiliated investments | 945,432 | 649,567 | 63,661 | 20,766 | 221,390 | — | |||||||||||||||||||||
| Affiliated investments (See Note 4) | (233,206 | ) | (3,777 | ) | 699 | — | 66,554 | 836 | |||||||||||||||||||
| Foreign currency translations | (8 | ) | (92 | ) | — | 4 | (69 | ) | — | ||||||||||||||||||
| Foreign capital gains tax | — | 3 | — | — | — | — | |||||||||||||||||||||
| Net change in unrealized appreciation (depreciation) | 712,218 | 645,701 | 64,360 | 20,770 | 287,875 | 836 | |||||||||||||||||||||
| Net realized and unrealized gain | 2,324,184 | 1,037,817 | 111,221 | 38,880 | 359,678 | 12,505 | |||||||||||||||||||||
| Net Increase in Net Assets resulting from Operations | $ | 2,359,374 | $ | 1,069,203 | $ | 108,111 | $ | 39,241 | $ | 348,646 | $ | 18,863 | |||||||||||||||
* Rounds to less than $500.
See accompanying notes to financial statements.
61
Columbia Acorn Family of Funds
Statements of Changes in Net Assets
| Columbia Acorn Fund | Columbia Acorn International | Columbia Acorn USA | |||||||||||||||||||||||||
| Increase (Decrease) in Net Assets | Year ended December 31, | Year ended December 31, | Year ended December 31, | ||||||||||||||||||||||||
| (in thousands) | 2006 | 2005 | 2006 | 2005 | 2006 | 2005 | |||||||||||||||||||||
| Operations: | |||||||||||||||||||||||||||
| Net investment income (loss) | $ | 35,190 | $ | 49,723 | $ | 31,386 | $ | 24,670 | $ | (3,110 | ) | $ | 1,300 | ||||||||||||||
| Net realized gain on investments and foreign currency transactions | 1,611,966 | 890,559 | 392,116 | 203,167 | 46,861 | 49,825 | |||||||||||||||||||||
| Net realized gain on affiliated investments and distributions from affiliated investment company shares | — | — | — | — | — | — | |||||||||||||||||||||
| Net change in net unrealized appreciation (depreciation) on investments and foreign currency translations | 712,218 | 898,946 | 645,701 | 258,860 | 64,360 | 75,612 | |||||||||||||||||||||
| Net change in net unrealized appreciation (depreciation) on affiliated investments | — | — | — | — | — | — | |||||||||||||||||||||
| Net Increase from Operations | 2,359,374 | 1,839,228 | 1,069,203 | 486,697 | 108,111 | 126,737 | |||||||||||||||||||||
| Distribution to Shareholders From: | |||||||||||||||||||||||||||
| Net investment income – Class A | (5,394 | ) | (8,157 | ) | (2,223 | ) | (1,772 | ) | — | — | |||||||||||||||||
| Net realized gain – Class A | (313,513 | ) | (177,617 | ) | (26,545 | ) | (4,275 | ) | (5,181 | ) | (7,747 | ) | |||||||||||||||
| Net investment income – Class B | — | — | (141 | ) | (280 | ) | — | — | |||||||||||||||||||
| Net realized gain – Class B | (114,707 | ) | (81,483 | ) | (8,646 | ) | (2,334 | ) | (1,487 | ) | (3,824 | ) | |||||||||||||||
| Net investment income – Class C | — | — | (63 | ) | (171 | ) | — | — | |||||||||||||||||||
| Net realized gain – Class C | (109,093 | ) | (68,235 | ) | (8,998 | ) | (1,462 | ) | (1,223 | ) | (2,282 | ) | |||||||||||||||
| Net investment income – Class Z | (48,532 | ) | (52,311 | ) | (44,617 | ) | (51,974 | ) | — | (1,613 | ) | ||||||||||||||||
| Net realized gain – Class Z | (916,129 | ) | (547,733 | ) | (342,510 | ) | (81,064 | ) | (25,202 | ) | (43,227 | ) | |||||||||||||||
| Total Distribution to Shareholders | (1,507,368 | ) | (935,536 | ) | (433,743 | ) | (143,332 | ) | (33,093 | ) | (58,693 | ) | |||||||||||||||
| Share Transactions: | |||||||||||||||||||||||||||
| Subscriptions – Class A | 1,078,213 | 912,797 | 176,101 | 66,630 | 113,090 | 66,241 | |||||||||||||||||||||
| Distributions reinvested – Class A | 288,002 | 167,704 | 25,843 | 4,900 | 4,383 | 6,880 | |||||||||||||||||||||
| Redemptions – Class A | (822,590 | ) | (579,536 | ) | (63,857 | ) | (14,669 | ) | (51,382 | ) | (25,265 | ) | |||||||||||||||
| Net Increase (Decrease) – Class A | 543,625 | 500,965 | 138,087 | 56,861 | 66,091 | 47,856 | |||||||||||||||||||||
| Subscriptions – Class B | 25,556 | 49,025 | 17,920 | 17,173 | 1,247 | 4,001 | |||||||||||||||||||||
| Distributions reinvested – Class B | 104,566 | 74,120 | 8,016 | 2,310 | 1,351 | 3,491 | |||||||||||||||||||||
| Redemptions – Class B | (212,371 | ) | (174,945 | ) | (20,296 | ) | (10,198 | ) | (14,036 | ) | (11,124 | ) | |||||||||||||||
| Net Increase (Decrease) – Class B | (82,249 | ) | (51,800 | ) | 5,640 | 9,285 | (11,438 | ) | (3,632 | ) | |||||||||||||||||
| Subscriptions – Class C | 166,508 | 171,533 | 50,734 | 15,891 | 17,895 | 8,047 | |||||||||||||||||||||
| Distributions reinvested – Class C | 86,726 | 54,677 | 6,707 | 1,302 | 1,038 | 1,878 | |||||||||||||||||||||
| Redemptions – Class C | (178,699 | ) | (149,119 | ) | (16,582 | ) | (6,051 | ) | (8,640 | ) | (9,090 | ) | |||||||||||||||
| Net Increase (Decrease) – Class C | 74,535 | 77,091 | 40,859 | 11,142 | 10,293 | 835 | |||||||||||||||||||||
| Subscriptions – Class Z | 1,754,910 | 1,686,601 | 707,961 | 577,455 | 371,430 | 302,588 | |||||||||||||||||||||
| Distributions reinvested – Class Z | 824,254 | 513,385 | 279,893 | 103,732 | 22,838 | 40,433 | |||||||||||||||||||||
| Redemptions – Class Z | (1,413,279 | ) | (1,080,069 | ) | (357,229 | ) | (284,340 | ) | (175,498 | ) | (105,312 | ) | |||||||||||||||
| Net Increase – Class Z | 1,165,885 | 1,119,917 | 630,625 | 396,847 | 218,770 | 237,709 | |||||||||||||||||||||
| Net Increase (Decrease) from Share Transactions | 1,701,796 | 1,646,173 | 815,211 | 474,135 | 283,716 | 282,768 | |||||||||||||||||||||
| Redemption Fees | — | — | 147 | 65 | — | — | |||||||||||||||||||||
| Total Increase in Net Assets | 2,553,802 | 2,549,865 | 1,450,818 | 817,565 | 358,734 | 350,812 | |||||||||||||||||||||
| Net Assets: | |||||||||||||||||||||||||||
| Beginning of period | 16,391,324 | 13,841,459 | 2,892,577 | 2,075,012 | 1,221,494 | 870,682 | |||||||||||||||||||||
| End of period | $ | 18,945,126 | $ | 16,391,324 | $ | 4,343,395 | $ | 2,892,577 | $ | 1,580,228 | $ | 1,221,494 | |||||||||||||||
| Undistributed (Overdistributed) Net Investment Income or (Accumulated Net Investment Loss) | $ | (27,265 | ) | $ | (34,063 | ) | $ | (20,256 | ) | $ | (14,604 | ) | $ | (174 | ) | $ | (119 | ) | |||||||||
* Rounds to less than $500.
See accompanying notes to financial statements.
62
| Columbia Acorn International Select | Columbia Acorn Select | Columbia Thermostat Fund | |||||||||||||||||||||||||
| Increase (Decrease) in Net Assets | Year ended December 31, | Year ended December 31, | Year ended December 31, | ||||||||||||||||||||||||
| (in thousands) | 2006 | 2005 | 2006 | 2005 | 2006 | 2005 | |||||||||||||||||||||
| Operations: | |||||||||||||||||||||||||||
| Net investment income (loss) | $ | 361 | $ | 431 | $ | (11,032 | ) | $ | (7,333 | ) | $ | 6,358 | $ | 5,484 | |||||||||||||
| Net realized gain on investments and foreign currency transactions | 18,110 | 5,496 | 71,803 | 46,214 | — | — | |||||||||||||||||||||
| Net realized gain on affiliated investments and distributions from affiliated investment company shares | — | — | — | — | 11,669 | 14,700 | |||||||||||||||||||||
| Net change in net unrealized appreciation (depreciation) on investments and foreign currency translations | 20,770 | 5,773 | 287,875 | 140,962 | — | — | |||||||||||||||||||||
| Net change in net unrealized appreciation (depreciation) on affiliated investments | — | — | — | — | 836 | (10,409 | ) | ||||||||||||||||||||
| Net Increase from Operations | 39,241 | 11,700 | 348,646 | 179,843 | 18,863 | 9,775 | |||||||||||||||||||||
| Distribution to Shareholders From: | |||||||||||||||||||||||||||
| Net investment income – Class A | (2 | ) | (79 | ) | (788 | ) | — | (2,086 | ) | (2,069 | ) | ||||||||||||||||
| Net realized gain – Class A | — | — | (20,503 | ) | (19,098 | ) | (3,300 | ) | (4,875 | ) | |||||||||||||||||
| Net investment income – Class B | — | (46 | ) | — | — | (2,114 | ) | (1,831 | ) | ||||||||||||||||||
| Net realized gain – Class B | — | — | (4,991 | ) | (5,029 | ) | (3,980 | ) | (5,382 | ) | |||||||||||||||||
| Net investment income – Class C | — | * | (24 | ) | — | — | (753 | ) | (617 | ) | |||||||||||||||||
| Net realized gain – Class C | — | — | (3,972 | ) | (3,559 | ) | (1,496 | ) | (1,972 | ) | |||||||||||||||||
| Net investment income – Class Z | (196 | ) | (888 | ) | (1,614 | ) | — | (1,223 | ) | (797 | ) | ||||||||||||||||
| Net realized gain – Class Z | — | — | (19,241 | ) | (19,071 | ) | (1,585 | ) | (1,697 | ) | |||||||||||||||||
| Total Distribution to Shareholders | (198 | ) | (1,037 | ) | (51,109 | ) | (46,757 | ) | (16,537 | ) | (19,240 | ) | |||||||||||||||
| Share Transactions: | |||||||||||||||||||||||||||
| Subscriptions – Class A | 10,850 | 5,743 | 210,532 | 296,611 | 6,298 | 15,104 | |||||||||||||||||||||
| Distributions reinvested – Class A | 2 | 71 | 19,667 | 17,770 | 4,887 | 6,273 | |||||||||||||||||||||
| Redemptions – Class A | (3,070 | ) | (1,004 | ) | (158,467 | ) | (143,717 | ) | (25,185 | ) | (24,089 | ) | |||||||||||||||
| Net Increase (Decrease) – Class A | 7,782 | 4,810 | 71,732 | 170,664 | (14,000 | ) | (2,712 | ) | |||||||||||||||||||
| Subscriptions – Class B | 2,223 | 2,123 | 4,782 | 28,258 | 3,578 | 8,919 | |||||||||||||||||||||
| Distributions reinvested – Class B | — | 41 | 4,452 | 4,510 | 5,496 | 6,512 | |||||||||||||||||||||
| Redemptions – Class B | (1,437 | ) | (1,480 | ) | (31,688 | ) | (26,292 | ) | (16,105 | ) | (11,391 | ) | |||||||||||||||
| Net Increase (Decrease) – Class B | 786 | 684 | (22,454 | ) | 6,476 | (7,031 | ) | 4,040 | |||||||||||||||||||
| Subscriptions – Class C | 2,333 | 1,655 | 20,817 | 48,457 | 4,114 | 5,664 | |||||||||||||||||||||
| Distributions reinvested – Class C | — | * | 20 | 3,230 | 2,903 | 1,960 | 2,303 | ||||||||||||||||||||
| Redemptions – Class C | (924 | ) | (599 | ) | (22,947 | ) | (23,251 | ) | (7,323 | ) | (9,480 | ) | |||||||||||||||
| Net Increase (Decrease) – Class C | 1,409 | 1,076 | 1,100 | 28,109 | (1,249 | ) | (1,513 | ) | |||||||||||||||||||
| Subscriptions – Class Z | 34,878 | 25,890 | 258,516 | 333,604 | 5,698 | 5,843 | |||||||||||||||||||||
| Distributions reinvested – Class Z | 99 | 582 | 14,293 | 13,462 | 2,633 | 2,384 | |||||||||||||||||||||
| Redemptions – Class Z | (10,107 | ) | (7,003 | ) | (170,328 | ) | (155,173 | ) | (3,204 | ) | (2,485 | ) | |||||||||||||||
| Net Increase – Class Z | 24,870 | 19,469 | 102,481 | 191,893 | 5,127 | 5,742 | |||||||||||||||||||||
| Net Increase (Decrease) from Share Transactions | 34,847 | 26,039 | 152,859 | 397,142 | (17,153 | ) | 5,557 | ||||||||||||||||||||
| Redemption Fees | 9 | 9 | — | — | — | — | |||||||||||||||||||||
| Total Increase in Net Assets | 73,899 | 36,711 | 450,396 | 530,228 | (14,827 | ) | (3,908 | ) | |||||||||||||||||||
| Net Assets: | |||||||||||||||||||||||||||
| Beginning of period | 94,999 | 58,288 | 1,787,315 | 1,257,087 | 203,356 | 207,264 | |||||||||||||||||||||
| End of period | $ | 168,898 | $ | 94,999 | $ | 2,237,711 | $ | 1,787,315 | $ | 188,529 | $ | 203,356 | |||||||||||||||
| Undistributed (Overdistributed) Net Investment Income or (Accumulated Net Investment Loss) | $ | 676 | $ | (603 | ) | $ | (9,971 | ) | $ | (7,548 | ) | $ | 249 | $ | 142 | ||||||||||||
63
Columbia Acorn Family of Funds
Statements of Changes in Net Assets, continued
| Columbia Acorn Fund | Columbia Acorn International | Columbia Acorn USA | |||||||||||||||||||||||||
| Changes in Shares of Beneficial Interest: | Year ended December 31, | Year ended December 31, | Year ended December 31, | ||||||||||||||||||||||||
| (in thousands) | 2006 | 2005 | 2006 | 2005 | 2006 | 2005 | |||||||||||||||||||||
| Subscriptions – Class A | 37,015 | 34,302 | 4,588 | 2,150 | 4,113 | 2,559 | |||||||||||||||||||||
| Shares issued in reinvestment and capital gains – Class A | 9,911 | 6,137 | 673 | 155 | 156 | 260 | |||||||||||||||||||||
| Less shares redeemed – Class A | (28,264 | ) | (21,923 | ) | (1,723 | ) | (476 | ) | (1,877 | ) | (990 | ) | |||||||||||||||
| Net Increase (Decrease) – Class A | 18,662 | 18,516 | 3,538 | 1,829 | 2,392 | 1,829 | |||||||||||||||||||||
| Subscriptions – Class B | 909 | 1,922 | 482 | 574 | 47 | 161 | |||||||||||||||||||||
| Shares issued in reinvestment and capital gains – Class B | 3,757 | 2,814 | 212 | 73 | 50 | 137 | |||||||||||||||||||||
| Less shares redeemed – Class B | (7,576 | ) | (6,826 | ) | (553 | ) | (341 | ) | (533 | ) | (451 | ) | |||||||||||||||
| Net Increase (Decrease) – Class B | (2,910 | ) | (2,090 | ) | 141 | 306 | (436 | ) | (153 | ) | |||||||||||||||||
| Subscriptions – Class C | 5,931 | 6,667 | 1,356 | 524 | 678 | 321 | |||||||||||||||||||||
| Shares issued in reinvestment and capital gains – Class C | 3,123 | 2,077 | 178 | 41 | 39 | 74 | |||||||||||||||||||||
| Less shares redeemed – Class C | (6,396 | ) | (5,835 | ) | (455 | ) | (201 | ) | (328 | ) | (363 | ) | |||||||||||||||
| Net Increase (Decrease) – Class C | 2,658 | 2,909 | 1,079 | 364 | 389 | 32 | |||||||||||||||||||||
| Subscriptions – Class Z | 58,774 | 62,182 | 18,601 | 18,615 | 13,228 | 11,555 | |||||||||||||||||||||
| Shares issued in reinvestment and capital gains – Class Z | 27,709 | 18,385 | 7,251 | 3,274 | 796 | 1,500 | |||||||||||||||||||||
| Less shares redeemed – Class Z | (47,499 | ) | (39,912 | ) | (9,331 | ) | (9,349 | ) | (6,302 | ) | (4,040 | ) | |||||||||||||||
| Net Increase – Class Z | 38,984 | 40,655 | 16,521 | 12,540 | 7,722 | 9,015 | |||||||||||||||||||||
| Net Increase (Decrease) in Shares of Beneficial Interest | 57,394 | 59,990 | 21,279 | 15,039 | 10,067 | 10,723 | |||||||||||||||||||||
* Rounds to less than 500 shares.
See accompanying notes to financial statements.
64
| Columbia Acorn International Select | Columbia Acorn Select | Columbia Thermostat Fund | |||||||||||||||||||||||||
| Changes in Shares of Beneficial Interest: | Year ended December 31, | Year ended December 31, | Year ended December 31, | ||||||||||||||||||||||||
| (in thousands) | 2006 | 2005 | 2006 | 2005 | 2006 | 2005 | |||||||||||||||||||||
| Subscriptions – Class A | 446 | 307 | 8,645 | 14,487 | 492 | 1,151 | |||||||||||||||||||||
| Shares issued in reinvestment and capital gains – Class A | — | * | 4 | 777 | 802 | 390 | 497 | ||||||||||||||||||||
| Less shares redeemed – Class A | (131 | ) | (53 | ) | (6,607 | ) | (6,938 | ) | (1,960 | ) | (1,840 | ) | |||||||||||||||
| Net Increase (Decrease) – Class A | 315 | 258 | 2,815 | 8,351 | (1,078 | ) | (192 | ) | |||||||||||||||||||
| Subscriptions – Class B | 97 | 118 | 207 | 1,441 | 279 | 684 | |||||||||||||||||||||
| Shares issued in reinvestment and capital gains – Class B | — | * | 2 | 183 | 211 | 437 | 515 | ||||||||||||||||||||
| Less shares redeemed – Class B | (64 | ) | (81 | ) | (1,373 | ) | (1,313 | ) | (1,253 | ) | (870 | ) | |||||||||||||||
| Net Increase (Decrease) – Class B | 33 | 39 | (983 | ) | 339 | (537 | ) | 329 | |||||||||||||||||||
| Subscriptions – Class C | 100 | 92 | 898 | 2,455 | 322 | 434 | |||||||||||||||||||||
| Shares issued in reinvestment and capital gains – Class C | — | * | 1 | 133 | 136 | 156 | 182 | ||||||||||||||||||||
| Less shares redeemed – Class C | (42 | ) | (33 | ) | (1,002 | ) | (1,172 | ) | (572 | ) | (725 | ) | |||||||||||||||
| Net Increase (Decrease) – Class C | 58 | 60 | 29 | 1,419 | (94 | ) | (109 | ) | |||||||||||||||||||
| Subscriptions – Class Z | 1,448 | 1,378 | 10,565 | 15,890 | 442 | 446 | |||||||||||||||||||||
| Shares issued in reinvestment and capital gains – Class Z | 5 | 33 | 559 | 601 | 210 | 189 | |||||||||||||||||||||
| Less shares redeemed – Class Z | (427 | ) | (378 | ) | (7,111 | ) | (7,371 | ) | (248 | ) | (189 | ) | |||||||||||||||
| Net Increase – Class Z | 1,026 | 1,033 | 4,013 | 9,120 | 404 | 446 | |||||||||||||||||||||
| Net Increase (Decrease) in Shares of Beneficial Interest | 1,432 | 1,390 | 5,874 | 19,229 | (1,305 | ) | 474 | ||||||||||||||||||||
65
Columbia Acorn Family of Funds
Financial Highlights
Columbia Acorn Fund
| Class Z | Year Ended December 31, | ||||||||||||||||||||||
| Selected data for a share outstanding throughout each period | 2006 | 2005 | 2004 | 2003 | 2002 | ||||||||||||||||||
| Net Asset Value, Beginning of Period | $ | 28.17 | $ | 26.45 | $ | 22.56 | $ | 15.50 | $ | 17.88 | |||||||||||||
| Income from Investment Operations | |||||||||||||||||||||||
| Net investment income (a) | 0.13 | 0.15 | 0.04 | 0.03 | 0.02 | ||||||||||||||||||
| Net realized and unrealized gain (loss) | 3.92 | 3.28 | 4.78 | 7.05 | (2.40 | ) | |||||||||||||||||
| Total from Investment Operations | 4.05 | 3.43 | 4.82 | 7.08 | (2.38 | ) | |||||||||||||||||
| Less Distributions Declared to Shareholders | |||||||||||||||||||||||
| From net investment income | (0.13 | ) | (0.15 | ) | (0.02 | ) | — | — | |||||||||||||||
| From net realized gains | (2.38 | ) | (1.56 | ) | (0.91 | ) | (0.02 | ) | — | ||||||||||||||
| Total Distributions Declared to Shareholders | (2.51 | ) | (1.71 | ) | (0.93 | ) | (0.02 | ) | — | ||||||||||||||
| Net Asset Value, End of Period | $ | 29.71 | $ | 28.17 | $ | 26.45 | $ | 22.56 | $ | 15.50 | |||||||||||||
| Total Return (b) | 14.45 | %(c) | 13.11 | %(c) | 21.51 | %(c) | 45.68 | % | (13.31 | )% | |||||||||||||
| Ratios to Average Net Assets/Supplemental Data | |||||||||||||||||||||||
| Expenses (d) | 0.74 | % | 0.74 | % | 0.81 | % | 0.80 | % | 0.82 | % | |||||||||||||
| Net investment income (d) | 0.45 | % | 0.57 | % | 0.18 | % | 0.17 | % | 0.15 | % | |||||||||||||
| Waiver/reimbursement | 0.01 | % | 0.02 | % | 0.02 | % | — | — | |||||||||||||||
| Portfolio turnover rate | 22 | % | 16 | % | 20 | % | 10 | % | 13 | % | |||||||||||||
| Net assets at end of period (in millions) | $ | 12,128 | $ | 10,399 | $ | 8,689 | $ | 7,065 | $ | 4,022 | |||||||||||||
(a) Per share data was calculated using average shares outstanding during the period.
(b) Total return at net asset value assuming all distributions reinvested.
(c) Had the Investment Adviser and/or Transfer Agent not waived and/or reimbursed a portion of expenses, total return would have been reduced.
(d) The benefits derived from custody fees paid indirectly had no impact.
Columbia Acorn International
| Class Z | Year Ended December 31, | ||||||||||||||||||||||
| Selected data for a share outstanding throughout each period | 2006 | 2005 | 2004 | 2003 | 2002 | ||||||||||||||||||
| Net Asset Value, Beginning of Period | $ | 33.44 | $ | 29.03 | $ | 22.66 | $ | 15.40 | $ | 18.47 | |||||||||||||
| Income from Investment Operations | |||||||||||||||||||||||
| Net investment income (a) | 0.35 | 0.34 | 0.25 | 0.21 | 0.14 | ||||||||||||||||||
| Net realized and unrealized gain (loss) | 10.94 | 5.87 | 6.37 | 7.13 | (3.10 | ) | |||||||||||||||||
| Total from Investment Operations | 11.29 | 6.21 | 6.62 | 7.34 | (2.96 | ) | |||||||||||||||||
| Less Distributions Declared to Shareholders | |||||||||||||||||||||||
| From net investment income | (0.51 | ) | (0.72 | ) | (0.25 | ) | (0.08 | ) | (0.11 | ) | |||||||||||||
| From net realized gains | (3.91 | ) | (1.08 | ) | — | — | — | ||||||||||||||||
| Total Distributions Declared to Shareholders | (4.42 | ) | (1.80 | ) | (0.25 | ) | (0.08 | ) | (0.11 | ) | |||||||||||||
| Redemption Fees | |||||||||||||||||||||||
| Redemption fees added to paid in capital | 0.00 | (a)(b) | 0.00 | (a)(b) | 0.00 | (a)(b) | — | �� | — | ||||||||||||||
| Net Asset Value, End of Period | $ | 40.31 | $ | 33.44 | $ | 29.03 | $ | 22.66 | $ | 15.40 | |||||||||||||
| Total Return (c) | 34.53 | %(d) | 21.81 | %(d) | 29.47 | %(d) | 47.80 | % | (16.10 | )% | |||||||||||||
| Ratios to Average Net Assets/Supplemental Data | |||||||||||||||||||||||
| Expenses (e) | 0.94 | % | 0.99 | % | 1.08 | % | 1.05 | % | 1.06 | % | |||||||||||||
| Net investment income (e) | 0.92 | % | 1.09 | % | 1.01 | % | 1.19 | % | 0.80 | % | |||||||||||||
| Waiver/reimbursement | 0.01 | % | 0.02 | % | 0.02 | % | — | — | |||||||||||||||
| Portfolio turnover rate | 31 | % | 27 | % | 40 | % | 40 | % | 52 | % | |||||||||||||
| Net assets at end of period (in millions) | $ | 3,836 | $ | 2,629 | $ | 1,919 | $ | 1,563 | $ | 1,241 | |||||||||||||
(a) Per share data was calculated using average shares outstanding during the period.
(b) Rounds to less than $0.01 per share.
(c) Total return at net asset value assuming all distributions reinvested.
(d) Had the Investment Adviser and/or Transfer Agent not waived and/or reimbursed a portion of expenses, total return would have been reduced.
(e) The benefits derived from custody fees paid indirectly had no impact.
Columbia Acorn USA Fund
| Class Z | Year Ended December 31, | ||||||||||||||||||||||
| Selected data for a share outstanding throughout each period | 2006 | 2005 | 2004 | 2003 | 2002 | ||||||||||||||||||
| Net Asset Value, Beginning of Period | $ | 27.03 | $ | 25.20 | $ | 21.01 | $ | 14.28 | $ | 17.52 | |||||||||||||
| Income from Investment Operations | |||||||||||||||||||||||
| Net investment income (loss) (a) | (0.02 | ) | 0.07 | (0.15 | ) | (0.13 | ) | (0.10 | ) | ||||||||||||||
| Net realized and unrealized gain (loss) | 2.26 | 3.18 | 4.48 | 6.86 | (3.14 | ) | |||||||||||||||||
| Total from Investment Operations | 2.24 | 3.25 | 4.33 | 6.73 | (3.24 | ) | |||||||||||||||||
| Less Distributions Declared to Shareholders | |||||||||||||||||||||||
| From net investment income | — | (0.05 | ) | — | — | — | |||||||||||||||||
| From net realized gains | (0.61 | ) | (1.37 | ) | (0.14 | ) | — | — | |||||||||||||||
| Total Distributions Declared to Shareholders | (0.61 | ) | (1.42 | ) | (0.14 | ) | — | — | |||||||||||||||
| Net Asset Value, End of Period | $ | 28.66 | $ | 27.03 | $ | 25.20 | $ | 21.01 | $ | 14.28 | |||||||||||||
| Total Return (b) | 8.28 | %(c) | 12.98 | %(c) | 20.62 | %(c) | 47.13 | % | (18.49 | )% | |||||||||||||
| Ratios to Average Net Assets/Supplemental Data | |||||||||||||||||||||||
| Expenses (d) | 0.98 | % | 1.01 | % | 1.09 | % | 1.11 | % | 1.17 | % | |||||||||||||
| Net investment income (loss) (d) | (0.07 | )% | 0.28 | % | (0.66 | )% | (0.72 | )% | (0.64 | )% | |||||||||||||
| Waiver/reimbursement | 0.01 | % | 0.01 | % | 0.02 | % | — | — | |||||||||||||||
| Portfolio turnover rate | 13 | % | 13 | % | 18 | % | 7 | % | 31 | % | |||||||||||||
| Net assets at end of period (in millions) | $ | 1,214 | $ | 937 | $ | 646 | $ | 502 | $ | 235 | |||||||||||||
(a) Per share data was calculated using average shares outstanding during the period.
(b) Total return at net asset value assuming all distributions reinvested.
(c) Had the Investment Adviser and/or Transfer Agent not waived and/or reimbursed a portion of expenses, total return would have been reduced.
(d) The benefits derived from custody fees paid indirectly had no impact.
See accompanying notes to financial statements.
66
Columbia Acorn International Select Fund
| Class Z | Year Ended December 31, | ||||||||||||||||||||||
| Selected data for a share outstanding throughout each period | 2006 | 2005 | 2004 | 2003 | 2002 | ||||||||||||||||||
| Net Asset Value, Beginning of Period | $ | 20.57 | $ | 18.02 | $ | 14.58 | $ | 10.29 | $ | 12.09 | |||||||||||||
| Income from Investment Operations | |||||||||||||||||||||||
| Net investment income (a) | 0.10 | 0.13 | 0.04 | 0.06 | 0.03 | ||||||||||||||||||
| Net realized and unrealized gain (loss) | 7.35 | 2.70 | 3.47 | 4.24 | (1.83 | ) | |||||||||||||||||
| Total from Investment Operations | 7.45 | 2.83 | 3.51 | 4.30 | (1.80 | ) | |||||||||||||||||
| Less Distributions Declared to Shareholders | |||||||||||||||||||||||
| From net investment income | (0.05 | ) | (0.28 | ) | (0.07 | ) | (0.01 | ) | — | ||||||||||||||
| Redemption Fees | |||||||||||||||||||||||
| Redemption fees added to paid in capital | 0.00 | (a)(b) | 0.00 | (a)(b) | 0.00 | (a)(b) | — | — | |||||||||||||||
| Net Asset Value, End of Period | $ | 27.97 | $ | 20.57 | $ | 18.02 | $ | 14.58 | $ | 10.29 | |||||||||||||
| Total Return (c)(d) | 36.27 | % | 15.98 | % | 24.14 | % | 41.79 | % | (14.89 | )% | |||||||||||||
| Ratios to Average Net Assets/Supplemental Data | |||||||||||||||||||||||
| Expenses (e) | 1.27 | % | 1.45 | % | 1.45 | % | 1.45 | % | 1.45 | % | |||||||||||||
| Net investment income (e) | 0.44 | % | 0.72 | % | 0.27 | % | 0.56 | % | 0.26 | % | |||||||||||||
| Waiver/reimbursement | 0.01 | % | 0.04 | % | 0.29 | % | 0.42 | % | 0.33 | % | |||||||||||||
| Portfolio turnover rate | 47 | % | 39 | % | 73 | % | 69 | % | 102 | % | |||||||||||||
| Net assets at end of period (in millions) | $ | 129 | $ | 74 | $ | 46 | $ | 34 | $ | 26 | |||||||||||||
(a) Per share data was calculated using average shares outstanding during the period.
(b) Rounds to less than $0.01 per share.
(c) Total return at net asset value assuming all distributions reinvested.
(d) Had the Investment Adviser and/or Transfer Agent not waived and/or reimbursed a portion of expenses, total return would have been reduced.
(e) The benefits derived from custody fees paid indirectly had no impact.
Columbia Acorn Select
| Class Z | Year Ended December 31, | ||||||||||||||||||||||
| Selected data for a share outstanding throughout each period | 2006 | 2005 | 2004 | 2003 | 2002 | ||||||||||||||||||
| Net Asset Value, Beginning of Period | $ | 22.77 | $ | 21.13 | $ | 18.20 | $ | 14.04 | $ | 15.23 | |||||||||||||
| Income from Investment Operations | |||||||||||||||||||||||
| Net investment loss (a) | (0.06 | ) | (0.03 | ) | (0.10 | ) | (0.10 | ) | (0.10 | ) | |||||||||||||
| Net realized and unrealized gain (loss) | 4.51 | 2.35 | 3.47 | 4.39 | (1.09 | ) | |||||||||||||||||
| Total from Investment Operations | 4.45 | 2.32 | 3.37 | 4.29 | (1.19 | ) | |||||||||||||||||
| Less Distributions Declared to Shareholders | |||||||||||||||||||||||
| From net investment income | (0.04 | ) | — | — | — | — | |||||||||||||||||
| From net realized gains | (0.59 | ) | (0.68 | ) | (0.44 | ) | (0.13 | ) | — | ||||||||||||||
| Total Distributions Declared to Shareholders | (0.63 | ) | (0.68 | ) | (0.44 | ) | (0.13 | ) | — | ||||||||||||||
| Net Asset Value, End of Period | $ | 26.59 | $ | 22.77 | $ | 21.13 | $ | 18.20 | $ | 14.04 | |||||||||||||
| Total Return (b) | 19.68 | %(c) | 11.08 | %(c) | 18.58 | %(c) | 30.61 | % | (7.81 | )%(c) | |||||||||||||
| Ratios to Average Net Assets/Supplemental Data | |||||||||||||||||||||||
| Expenses (d) | 0.96 | % | 0.99 | % | 1.13 | % | 1.12 | % | 1.26 | % | |||||||||||||
| Net investment loss (d) | (0.26 | )% | (0.16 | )% | (0.52 | )% | (0.63 | )% | (0.67 | )% | |||||||||||||
| Waiver/reimbursement | 0.02 | % | 0.03 | % | 0.02 | % | — | 0.01 | % | ||||||||||||||
| Portfolio turnover rate | 21 | % | 19 | % | 34 | % | 16 | % | 40 | % | |||||||||||||
| Net assets at end of period (in millions) | $ | 909 | $ | 688 | $ | 445 | $ | 294 | $ | 93 | |||||||||||||
(a) Per share data was calculated using average shares outstanding during the period.
(b) Total return at net asset value assuming all distributions reinvested.
(c) Had the Investment Adviser and/or Transfer Agent not waived and/or reimbursed a portion of expenses, total return would have been reduced.
(d) The benefits derived from custody fees paid indirectly had no impact.
| Columbia Thermostat Fund Class Z | Year Ended December 31, | Inception September 25, 2002 through December 31, | |||||||||||||||||||||
| Selected data for a share outstanding throughout each period | 2006 | 2005 | 2004 | 2003 | 2002 | ||||||||||||||||||
| Net Asset Value, Beginning of Period | $ | 12.50 | 13.12 | $ | 12.31 | $ | 10.41 | $ | 10.00 | ||||||||||||||
| Income from Investment Operations | |||||||||||||||||||||||
| Net investment income (a) | 0.49 | 0.43 | 0.31 | 0.19 | 0.04 | ||||||||||||||||||
| Net realized and unrealized gain | 0.84 | 0.28 | 0.82 | 1.87 | 0.37 | ||||||||||||||||||
| Total from Investment Operations | 1.33 | 0.71 | 1.13 | 2.06 | 0.41 | ||||||||||||||||||
| Less Distributions Declared to Shareholders | |||||||||||||||||||||||
| From net investment income | (0.54 | ) | (0.42 | ) | (0.29 | ) | (0.16 | ) | — | ||||||||||||||
| From net realized gains | (0.72 | ) | (0.91 | ) | (0.03 | ) | (0.00 | )(b) | — | ||||||||||||||
| Total Distributions Declared to Shareholders | (1.26 | ) | (1.33 | ) | (0.32 | ) | (0.16 | ) | — | ||||||||||||||
| Net Asset Value, End of Period | $ | 12.57 | $ | 12.50 | $ | 13.12 | $ | 12.31 | $ | 10.41 | |||||||||||||
| Total Return (c)(d) | 10.86 | % | 5.50 | % | 9.17 | % | 19.79 | % | 4.10 | %(e) | |||||||||||||
| Ratios to Average Net Assets/Supplemental Data | |||||||||||||||||||||||
| Expenses (f) | 0.25 | %(g) | 0.25 | %(g) | 0.25 | %(g) | 0.38 | %(g) | 0.62 | %(h)(i) | |||||||||||||
| Net investment income | 3.84 | %(g) | 3.28 | %(g) | 2.48 | %(g) | 1.64 | %(g) | 1.41 | %(h)(i) | |||||||||||||
| Reimbursement/waiver | 0.13 | % | 0.11 | % | 0.21 | % | 0.88 | % | 19.94 | %(h) | |||||||||||||
| Portfolio turnover rate | 66 | % | 96 | % | 67 | % | 61 | % | 11 | %(e) | |||||||||||||
| Net assets at end of period (in millions) | $ | 31 | $ | 26 | $ | 21 | $ | 14 | $ | 4 | |||||||||||||
(a) Per share data was calculated using average shares outstanding during the period. Recognition of net investment income by the Fund is affected by the timing of the declaration of dividends by the underlying investment companies in which the Fund invests.
(b) Rounds to less than $0.01 per share.
(c) Total return at net asset value assuming all distributions reinvested.
(d) Had the Investment Adviser and/or Transfer Agent not reimbursed a portion of expenses, total return would have been reduced.
(e) Not annualized.
(f) Does not include expenses of the investment companies in which the Fund invests.
(g) The benefits derived from custody fees paid indirectly had no impact.
(h) Annualized.
(i) In accordance with a requirement of the Securities and Exchange Commission, the ratios reflect total expenses prior to the reduction of custody fees for cash balances the Fund maintains with the custodian ("custody fees paid indirectly"). The ratios of expenses to average daily net assets and net investment income to average daily net assets net of custody fees paid indirectly would have been 0.60% and 1.43%, respectively for the period ended December 31, 2002.
See accompanying notes to financial statements.
67
Columbia Acorn Family of Funds
Notes to Financial Statements
1. Nature of Operations
Columbia Acorn Fund, Columbia Acorn International, Columbia Acorn USA, Columbia Acorn International Select, Columbia Acorn Select and Columbia Thermostat Fund (the "Funds") are each a series of Columbia Acorn Trust (the "Trust"), an open-end investment management company organized as a Massachusetts business trust. The investment objective of each Fund, excluding Columbia Thermostat Fund, is to seek long-term growth of capital. The investment objective of Columbia Thermostat Fund is to provide long-term total return. The Fund pursues its investment objective by investing in shares of other mutual funds. As a "fund of funds" under normal circumstances, the Fund allocates at least 95% of its net assets among a selected group of stock and bond mutual funds ("portfolio funds") according to the current level of the Standard & Poor's 500 Stock Index in relation to predetermined ranges set by the Fund's investment adviser. The Fund may invest up to 5% of its net assets plus any cash received that day in cash, repurchase agreements, high quality short-term paper and government securities.
The Funds may issue an unlimited number of shares. The Funds currently offer four classes of shares: Class A, Class B, Class C and Class Z.
Class A shares are sold with a front-end sales charge. Class A shares bought without an initial sales charge in accounts aggregating up to $50 million at the time of purchase are subject to a 1.00% contingent deferred sales charge ("CDSC") if the shares are sold within 12 months of the time to purchase.
Class B shares are subject to a CDSC if sold within six years of purchase. Class B shares will convert to Class A shares automatically eight years after purchase.
Class C shares are subject to a CDSC on redemptions made within one year after purchase.
Columbia Acorn International and Columbia Acorn International Select impose a 2% redemption fee on Class A, Class B, Class C and Class Z shares that are redeemed within 60 days or less. See "Fund Policy on Trading of Fund Shares" as disclosed in the Funds' prospectuses for more information.
Class Z shares are offered continuously at net asset value. There are certain restrictions on the purchase of Class Z shares. Generally, Class Z shares of a Fund may be exchanged for shares of another fund distributed by Columbia Management Distributors, Inc. at no additional charge. However, if Class Z shares of Columbia Acorn International or Columbia Acorn International Select are redeemed or exchanged within 60 days after purchase, the Fund charges you a redemption fee of 2% of the redemption proceeds, with certain exceptions.
The financial highlights for Class A, Class B and Class C shares are presented in a separate annual report.
Investment income, realized and unrealized gains and losses, and certain fund-level expenses are borne pro rata on the basis of the relative net assets of all classes, except each class bears certain expenses unique to that class such as distribution services, transfer agent, and certain other class specific expenses. Differences in class expenses may result in payment of different dividend distributions for each class. All the share classes of the Trust have equal rights with respect to voting subject to Fund or class specific matters.
2. Significant Accounting Policies
>Security valuation
Securities of the Funds are valued at marked value or, if a market quotation for a security is not readily available or is deemed not to be reliable because of events or circumstances that have occurred between the market quotation and the time as of which the security is to be valued, the security is valued at a fair value determined in accordance with procedures established by the Board of Trustees. With respect to Columbia Thermostat Fund, investments in portfolio funds are valued at their net asset value as reported by the underlying funds. A security traded on a securities exchange or in an over-the-counter market in which transaction prices are reported is valued at the last sales price at the time of valuation. A security traded principally on the NASDAQ is valued at the NASDAQ official closing price. A security for which there is no reported sale on the valuation date is valued at the latest bid quotation. A short-term d ebt obligation having a maturity of 60 days or less from the valuation date is valued at amortized cost, which approximates fair value. A security for which a market quotation is not readily available and any other assets are valued as determined in good faith by the Board of Trustees. The Trust has retained an independent statistical fair value pricing service to assist in the fair valuation process for securities principally traded in a foreign market in order to adjust for possible changes in value that may occur between the close of the foreign exchange and the time as of which the securities are to be valued. If a security is valued at a "fair value," that value may be different from the last quoted market price for the security.
68
In September 2006, Statement of Financial Accounting Standards No. 157, Fair Value Measurements ("SFAS 157"), was issued. SFAS 157 is effective for fiscal years beginning after November 15, 2007. SFAS 157 defines fair value, establishes a framework for measuring fair value and expands disclosures about fair value measurements. Management has recently begun to evaluate the impact the application of SFAS 157 will have on the Funds' financial statement disclosures.
>Repurchase agreements
The Funds may engage in repurchase agreement transactions. The Funds, through their custodians, receive delivery of underlying securities collateralizing repurchase agreements. The Funds' investment adviser determines that the value of the underlying securities is at all times at least equal to the resale price. In the event of default or bankruptcy by the other party to the agreement, realization and/or retention of the collateral may be subject to legal proceedings.
>Foreign currency translations
Values of investments denominated in foreign currencies are converted into U.S. dollars using the spot market rate of exchange at the time of valuation. Purchases and sales of investments and dividend and interest income are translated into U.S. dollars using the spot market rate of exchange prevailing on the respective dates of such transactions. The gain or loss resulting from changes in foreign exchange rates is included with net realized and unrealized gain or loss from investments, as appropriate.
>Security transactions and investment income
Security transactions, investment income and portfolio fund transactions are accounted for on the trade date (date the order to buy or sell is executed) and dividend income and realized gain distributions from other funds are recorded on the ex-dividend date, except that certain dividends from foreign securities are recorded as soon as the information is available to the Funds. Interest income is recorded on the accrual basis and includes amortization of discounts on debt obligations when required for federal income tax purposes. Realized gains and losses from security transactions are reported on an identified cost basis.
Awards from class action litigation may be recorded as a reduction of cost. If the applicable securities are no longer owned, the proceeds are recorded as realized gains.
The Funds estimate components of distributions from real estate investment trusts ("REITs"). Distributions received in excess of income are recorded as a reduction of the cost of the related investments. If the applicable securities are no longer owned, any distributions received in excess of income are recorded as realized gains.
>Restricted Securities
Restricted securities are securities that may only be resold upon registration under federal securities laws or in transactions exempt from registration. In some cases, the issuer of restricted securities has agreed to register such securities for resale at the issuer's expense either upon demand by the Funds or in connection with another registered offering of the securities. Many restricted securities may be resold in the secondary market in transactions exempt from registration. Such restricted securities may be determined to be liquid under criteria established by the Board of Trustees. The Funds will not incur any registration costs upon such resale.
>Use of estimates
The preparation of financial statements in conformity with accounting principles generally accepted in the United States of America ("GAAP") requires management to make estimates and assumptions that affect the amounts reported in the financial statements and accompanying notes. Actual results may differ from those estimates.
>Financial instruments
Each Fund may purchase or sell exchange-traded financial futures contracts, which are contracts that obligate that Fund to make or take delivery of a financial instrument or the cash value of a securities index at a specified future date at a specified price. A Fund only enters into such contracts to hedge a portion of its portfolio. Gains and losses are reflected as "Net Realized Gain (Loss) on Futures" on the Statements of Operations. Additionally, each Fund, except for Columbia Acorn USA and Columbia Acorn Select, may engage in portfolio hedging with respect to changes in foreign currency exchange rates by entering into forward foreign currency contracts to purchase or sell foreign currencies. The Statements of Operations reflect gains and losses as realized for closed forward foreign currency contracts and unrealized for open contracts. The Funds bear the market risk that arises from changes in the value of financial instrum ents and securities indices (futures contracts) or from changes in foreign currency rates (forward foreign currency contracts) and the credit risk should a counterparty fail to perform under such contracts.
None of the Funds entered into futures contracts or forward foreign currency contracts during the year ended December 31, 2006.
>Fund share valuation
Fund shares are sold and redeemed on a continuing basis at net asset value. Net asset value per share is determined daily
69
Columbia Acorn Family of Funds
Notes to Financial Statements, continued
as of the close of trading on the New York Stock Exchange ("the NYSE") on each day the NYSE is open for trading. All income, expenses (other than the Class A, Class B and Class C shares Rule 12b-1 service and distribution fees and Class A, Class B, Class C and Class Z shares transfer agent fees) and realized and unrealized gains (losses) of a Fund are allocated to each class proportionately on a daily basis for purposes of determining the net asset value of each class. Redemption fees are accounted for as an addition to paid in capital and are allocated to each class proportionately for purposes of determining the net asset value of each class.
>Custody fees/credits
Custody fees are reduced based on each Fund's cash balances maintained with the custodian. The amount is disclosed as a reduction of total expenses on the Statements of Operations.
>Federal income taxes
The Funds have complied with the provisions of the Internal Revenue Code available to regulated investment companies and, in the manner provided therein, distribute all their taxable income, as well as any net realized gain on sales of investments and foreign currency transactions reportable for federal income tax purposes. Columbia Thermostat Fund distributes all of its taxable income, as well as any net realized gain on sales of portfolio fund shares and any distributions of net realized gains received by the Fund from its portfolio funds, reportable for federal income tax purposes. Accordingly, the Funds paid no federal income taxes and no federal income tax provision was required.
>Foreign capital gains taxes
Realized gains in certain countries may be subject to foreign taxes at the fund level, at rates ranging from approximately 10% to 15%. The Funds accrue for such foreign taxes on net realized and unrealized gains at the appropriate rate for each jurisdiction.
>Distributions to Shareholders
Distributions to shareholders are recorded on the ex-date.
>Indemnification
In the normal course of business, each Fund enters into contracts that contain a variety of representations and warranties and which provide general indemnities. A Fund's maximum exposure under these arrangements is unknown, as this would involve future claims against the Fund. Also, under the Trust's organizational documents, the Trustees and Officers of the Trust are indemnified against certain liabilities that may arise out of their duties to the Trust. However, based on experience, the Funds expect the risk of loss due to these warranties and indemnities to be minimal.
3. Federal Tax Information
The timing and character of income and capital gain distributions are determined in accordance with income tax regulations, which may differ from GAAP. Reclassifications are made to a Fund's capital accounts for permanent tax differences to reflect income and gains available for distribution (or available capital loss carryforwards) under income tax regulations.
For the year ended December 31, 2006, permanent book and tax basis differences resulting primarily from differing treatments for distribution reclassifications, tax equalization, foreign currency transactions, passive foreign investment company ("PFIC") adjustments, foreign capital gains tax adjustments and REIT adjustments were identified and reclassified among the components of the Funds' net assets as follows:
| Undistributed/ (Overdistributed) or (Accumulated) Net Investment Income (Loss) | Accumulated Net Realized Gain/Loss | Paid-In Capital | |||||||||||||
| (in thousands) | |||||||||||||||
| Columbia Acorn Fund | $ | 25,534 | $ | (97,484 | ) | $ | 71,950 | ||||||||
| Columbia Acorn International | 10,006 | (29,717 | ) | 19,711 | |||||||||||
| Columbia Acorn USA | 3,055 | (2,993 | ) | (62 | ) | ||||||||||
| Columbia Acorn International Select | 1,116 | (1,116 | ) | — | |||||||||||
| Columbia Acorn Select | 11,011 | (11,011 | ) | — | |||||||||||
| Columbia Thermostat Fund | (75 | ) | (1,146 | ) | 1,221 | ||||||||||
Net investment income and net realized gains (losses), as disclosed on the Statements of Operations, and net assets were not affected by these reclassifications.
The tax character of distributions paid during the years ended December 31, 2006 and December 31, 2005 was as follows:
| December 31, 2006 | Ordinary Income* | Long-Term Capital Gains | |||||||||
| (in thousands) | |||||||||||
| Columbia Acorn Fund | $ | 102,167 | $ | 1,405,201 | |||||||
| Columbia Acorn International | 47,043 | 386,698 | |||||||||
| Columbia Acorn USA | — | 33,093 | |||||||||
| Columbia Acorn International Select | 198 | — | |||||||||
| Columbia Acorn Select | 9,493 | 41,617 | |||||||||
| Columbia Thermostat Fund | 7,031 | 9,506 | |||||||||
| December 31, 2005 | Ordinary Income* | Long-Term Capital Gains | |||||||||
| (in thousands) | |||||||||||
| Columbia Acorn Fund | $ | 89,415 | $ | 846,121 | |||||||
| Columbia Acorn International | 54,197 | 89,135 | |||||||||
| Columbia Acorn USA | 1,825 | 56,868 | |||||||||
| Columbia Acorn International Select | 1,037 | — | |||||||||
| Columbia Acorn Select | 7,041 | 39,716 | |||||||||
| Columbia Thermostat Fund | 8,262 | 10,978 | |||||||||
*For tax purposes short-term capital gains distributions, if any, are considered ordinary income distributions.
70
As of December 31, 2006, the components of distributable earnings on a tax basis were as follows:
| Undistributed Ordinary Income | Undistributed Long-term Capital Gains | Net Unrealized Appreciation* | |||||||||||||
| (in thousands) | |||||||||||||||
| Columbia Acorn Fund | $ | 30,120 | $ | 222,190 | $ | 7,110,633 | |||||||||
| Columbia Acorn International | 12,300 | 29,026 | 1,586,813 | ||||||||||||
| Columbia Acorn USA | — | 15,636 | 420,311 | ||||||||||||
| Columbia Acorn International Select | 856 | — | 41,912 | ||||||||||||
| Columbia Acorn Select | 9,164 | 9,981 | 662,854 | ||||||||||||
| Columbia Thermostat Fund | 550 | 3,807 | 7,054 | ||||||||||||
*The differences between book-basis and tax-basis net unrealized appreciation/depreciation are primarily due to deferral of losses from wash sales and PFIC adjustments.
Unrealized appreciation and depreciation at December 31, 2006, based on cost of investments for federal income tax purposes was:
| Unrealized Appreciation | Unrealized Depreciation | Net Unrealized Appreciation | |||||||||||||
| (in thousands) | |||||||||||||||
| Columbia Acorn Fund | $ | 7,490,598 | $ | (379,965 | ) | $ | 7,110,633 | ||||||||
| Columbia Acorn International | 1,655,465 | (68,652 | ) | 1,586,813 | |||||||||||
| Columbia Acorn USA | 468,917 | (48,606 | ) | 420,311 | |||||||||||
| Columbia Acorn International Select | 43,837 | (1,925 | ) | 41,912 | |||||||||||
| Columbia Acorn Select | 690,108 | (27,254 | ) | 662,854 | |||||||||||
| Columbia Thermostat Fund | 7,428 | (374 | ) | 7,054 | |||||||||||
The following capital loss carryforwards, determined as of December 31, 2006, may be available to reduce taxable income arising from future net realized gains on investments, if any, to the extent permitted by the Internal Revenue Code:
| Year of Expiration | Columbia Acorn USA | Columbia Acorn International Select | |||||||||
| (in thousands) | |||||||||||
| 2009 | $ | 1,517 | * | $ | — | ||||||
| 2010 | 506 | 6,126 | |||||||||
| 2011 | — | 2,488 | |||||||||
| TOTAL | $ | 2,023 | $ | 8,614 | |||||||
*Of these carryforwards, $2,023 (expiring in 2009 and 2010) remains from Columbia Acorn USA's merger with Stein Roe Small Company Growth Fund on 7/26/2002. Utilization of Stein Roe Small Company Growth Fund's losses could be subject to limitations imposed by the Internal Revenue Code.
The following capital loss carryforwards were utilized during the year ended December 31, 2006.
| (In thousands) | |||||||
| Columbia Acorn USA | $ | 506 | |||||
| Columbia Acorn International Select | 16,995 | ||||||
In June 2006, the Financial Accounting Standards Board (FASB) issued FASB Interpretation No. 48, Accounting for Uncertainty in Income Taxes, an Interpretation of FASB Statement 109 (the "Interpretation"). This Interpretation is effective for fiscal years beginning after December 15, 2006 and is to be applied to all tax positions upon initial adoption. This Interpretation prescribes a minimum recognition threshold and measurement method for the financial statement recognition of tax positions taken or expected to be taken in a tax return and also requires certain expanded disclosures. Columbia Wanger Asset Management, L.P. ("Columbia WAM"), a wholly owned subsidiary of Columbia Management Group, Inc., which in turn is an indirect, wholly owned subsidiary of Bank of America Corporat ion ("BOA"), has recently begun to evaluate the application of this Interpretation to the Funds and has not at this time quantified the impact, if any, resulting from the adoption of this Interpretation on the Funds' financial statements. Effective December 26, 2006, the U.S. Securities and Exchange Commission has extended required implementation of FIN 48 until June 29, 2007, for mutual funds.
4. Transactions with Affiliates
Columbia WAM furnishes continuing investment supervision to the Funds and is responsible for the overall management of the Funds' business affairs.
Effective August 1, 2006, under the Funds' investment management agreement, fees are accrued daily and paid monthly to Columbia WAM at the annual rates shown in the table below for Columbia Acorn USA and Columbia Acorn Select:
| Columbia Acorn USA | |||||||
| Assets | Annual Fee Rate | ||||||
| Up to $200 million | 0.940 | % | |||||
| $200 million to $500 million | 0.890 | % | |||||
| $500 million to $2 billion | 0.840 | % | |||||
| $2 billion to $3 billion | 0.800 | % | |||||
| $3 billion and over | 0.700 | % | |||||
| Columbia Acorn Select | |||||||
| Assets | Annual Fee Rate | ||||||
| Up to $700 million | 0.850 | % | |||||
| $700 million to $2 billion | 0.800 | % | |||||
| $2 billion to $3 billion | 0.750 | % | |||||
| $3 billion and over | 0.700 | % | |||||
For all of the Funds, and prior to August 1, 2006, for Columbia Acorn USA and Columbia Acorn Select, for the period covered by this report as provided under the Funds' investment management agreement, fees were accrued daily
71
Columbia Acorn Family of Funds
Notes to Financial Statements, continued
and paid monthly to Columbia WAM at the annual rates shown in the table below for each Fund.
| Columbia Acorn Fund | |||||||
| Assets | Annual Fee Rate | ||||||
| Up to $700 million | 0.740 | % | |||||
| $700 million to $2 billion | 0.690 | % | |||||
| $2 billion to $6 billion | 0.640 | % | |||||
| $6 billion and over | 0.630 | % | |||||
| Columbia Acorn International | |||||||
| Assets | Annual Fee Rate | ||||||
| Up to $100 million | 1.190 | % | |||||
| $100 million to $500 million | 0.940 | % | |||||
| $500 million and over | 0.740 | % | |||||
| Columbia Acorn USA | |||||||
| Assets | Annual Fee Rate | ||||||
| Up to $200 million | 0.940 | % | |||||
| $200 million to $500 million | 0.890 | % | |||||
| $500 million and over | 0.840 | % | |||||
| Columbia Acorn Select | |||||||
| Assets | Annual Fee Rate | ||||||
| Up to $700 million | 0.850 | % | |||||
| $700 million and over | 0.800 | % | |||||
| Columbia Acorn International Select | |||||||
| All Assets | 0.940 | % | |||||
| Columbia Thermostat Fund | |||||||
| All Assets | 0.100 | % | |||||
For the year ended December 31, 2006, the Funds' annualized effective investment advisory fee rates were as follows:
| Columbia Acorn Fund | 0.64 | % | |||||
| Columbia Acorn International | 0.77 | % | |||||
| Columbia Acorn USA | 0.86 | % | |||||
| Columbia Acorn International Select | 0.94 | % | |||||
| Columbia Acorn Select | 0.82 | % | |||||
| Columbia Thermostat Fund | 0.10 | % | |||||
>Expense Limit
Columbia WAM has voluntarily agreed to reimburse the ordinary operating expenses (exclusive of interest, taxes and extraordinary expenses, if any) exceeding 1.45% of the average daily net assets for Columbia Acorn International Select Class Z shares and 1.35% of the average daily net assets for Columbia Acorn Select Class Z shares. This arrangement may be modified or terminated by either the Funds or Columbia WAM on 30 days notice.
Columbia WAM has agreed to contractually reimburse the ordinary operating expenses (exclusive of interest and fees on borrowings and expenses associated with the Fund's investment in other investment companies) exceeding 0.25% of the average daily net assets of Columbia Thermostat Fund's Class Z shares through April 30, 2007.
Expenses reimbursed by Columbia WAM for Columbia Acorn International Select and Columbia Thermostat Fund for the year ended December 31, 2006 was $1,423 and $311,952, respectively.
Columbia WAM provides administrative services and receives an administration fee from the Funds at the following rates:
| Columbia Acorn Trust | |||||||
| Average daily net asset value: | Annual Fee Rate | ||||||
| On the first $8 billion | 0.05 | % | |||||
| Next $8 billion | 0.04 | % | |||||
| Average daily net asset in excess of $16 billion | 0.03 | % | |||||
For the year ended December 31, 2006 each Fund's annualized effective administration fee rate was 0.04%. Columbia WAM has delegated to Columbia Management Advisors, LLC, an indirect, wholly-owned subsidiary of BOA, responsibility to provide certain administrative services to the Funds.
Columbia Management Distributors, Inc. ("CMDI"), a wholly owned subsidiary of BOA, is the Funds' principal underwriter and receives no compensation on the sale of Class Z shares.
Columbia Management Services, Inc. (the "Transfer Agent"), a wholly owned subsidiary of BOA, provides shareholder services to the Funds and has contracted with Boston Financial Data Services ("BFDS") to serve as sub-transfer agent. For such services, the Transfer Agent receives a fee, paid monthly, at the annual rate of $21.00 per open account. The Transfer Agent also receives reimbursement for certain out-of-pocket expenses. The Transfer Agent waived the reimbursement for certain out-of-pocket expenses through September 30, 2006.
Effective October 1, 2006, a new transfer agency and shareholder servicing agreement was negotiated, which changed the cost of transfer agency services. The annual rate was reduced to $17 per open account. Additionally, fees now
72
include sub-transfer agency services and out of pocket expenses. The Transfer Agent no longer waives its right to reimbursement by the Funds for its out of pocket expenses. The new agreement will be fully implemented on April 1, 2007 and is estimated to result in a change of fees paid by shareholders of various share classes in each fund ranging from some decreases to increases up to approximately three basis points.
Each Fund has adopted a Rule 12b-1 plan which requires it to pay CMDI a service and distribution fee on the net assets attributable to Class A, Class B and Class C shares.
Expenses waived by the Transfer Agent for the year ended December 31, 2006 were as follows:
| (in thousands) | |||||||
| Columbia Acorn Fund | $ | 2,547 | |||||
| Columbia Acorn International | 280 | ||||||
| Columbia Acorn USA | 169 | ||||||
| Columbia Acorn International Select | 18 | ||||||
| Columbia Acorn Select | 504 | ||||||
| Columbia Thermostat Fund | 94 | ||||||
Certain officers and trustees of the Trust are also officers of Columbia WAM. The Trust makes no direct payments to its officers and trustees who are affiliated with Columbia WAM. Trustees' fees and expenses paid by the Funds for the year ended December 31, 2006 were as follows:
| (in thousands) | |||||||
| Columbia Acorn Fund | $ | 756 | |||||
| Columbia Acorn International | 152 | ||||||
| Columbia Acorn USA | 62 | ||||||
| Columbia Acorn International Select | 3 | ||||||
| Columbia Acorn Select | 36 | ||||||
| Columbia Thermostat Fund | 3 | ||||||
The Board of Trustees appointed a Chief Compliance Officer to the Trust in accordance with federal securities regulations. The Funds, along with other affiliated funds, will pay their pro-rata share of the expenses associated with the Office of the Chief Compliance Officer. These expenses are disclosed separately as "Chief compliance officer expenses" in the Statements of Operations.
The Trust provides a deferred compensation plan for its trustees. Under that plan, a trustee may elect to defer all or a portion of his or her compensation. Amounts deferred are retained by the Trust and represent an unfunded obligation of the Trust. The value of amounts deferred is determined by reference to the change in value of Class Z shares of one or more series of the Trust or a money market fund as specified by the trustee. Benefits under the deferred compensation plan are payable when a trustee ceases to be a member of the Board of Trustees.
An affiliate may include any company in which a fund owns five percent or more of its outstanding voting securities. On December 31, 2006, Columbia Acorn Fund, Columbia Acorn International, Columbia Acorn USA and Columbia Acorn Select each held five percent or more of the outstanding voting securities of one or more companies. Details of investments in those affiliated companies are presented on pages 31, 40, 48 and 57, respectively.
During the year ended December 31, 2006, the Funds engaged in purchase and sale transactions with funds that have a common investment adviser (or affiliated investment advisers), common directors/trustees, and/or common officers. Those transactions complied with Rule 17a-7 under the Investment Company Act of 1940 and were as follows:
| Purchases | Sales | ||||||||||
| (in thousands) | |||||||||||
| Columbia Acorn Fund | 668 | 9,383 | |||||||||
| Columbia Acorn International | 19,816 | 1,299 | |||||||||
| Columbia Acorn USA | — | 131 | |||||||||
| Columbia Acorn International Select | 44 | — | |||||||||
| Columbia Acorn Select | — | 178 | |||||||||
5. Borrowing Arrangements
The Trust participates in a $150 million credit facility, which was entered into to facilitate portfolio liquidity. Interest is charged to each participating fund based on its borrowings at a rate per annum equal to the Federal Funds rate plus 0.50%. In addition, a commitment fee of 0.10% per annum for 2006 was accrued and apportioned among the participating funds based on their pro-rata portion of the unutilized line of credit. The commitment fee is included in "Other expenses" in the Statements of Operations. No amounts were borrowed by the Funds under this facility during the year ended December 31, 2006.
6. Investment Transactions
The aggregate cost of purchases and proceeds from sales other than short-term obligations for the year ended December 31, 2006 were:
| Columbia Acorn Fund | |||||||
| (in thousands) | |||||||
| Investment securities | |||||||
| Purchases | $ | 4,835,276 | |||||
| Proceeds from sales | 3,638,890 | ||||||
73
Columbia Acorn Family of Funds
Notes to Financial Statements, continued
| Columbia Acorn International | |||||||
| (in thousands) | |||||||
| Investment securities | |||||||
| Purchases | $ | 1,496,643 | |||||
| Proceeds from sales | 1,105,474 | ||||||
| Columbia Acorn USA | |||||||
| (in thousands) | |||||||
| Investment securities | |||||||
| Purchases | $ | 556,445 | |||||
| Proceeds from sales | 175,858 | ||||||
| Columbia Acorn International Select | |||||||
| (in thousands) | |||||||
| Investment securities | |||||||
| Purchases | $ | 83,230 | |||||
| Proceeds from sales | 55,917 | ||||||
| Columbia Acorn Select | |||||||
| (in thousands) | |||||||
| Investment securities | |||||||
| Purchases | $ | 475,657 | |||||
| Proceeds from sales | 397,359 | ||||||
| Columbia Thermostat Fund | |||||||
| (in thousands) | |||||||
| Investment securities | |||||||
| Purchases | $ | 128,549 | |||||
| Proceeds from sales | 152,932 | ||||||
7. Redemption Fees
For the year ended December 31, 2006, the redemption fees imposed by Columbia Acorn International and Columbia Acorn International Select amounted to $147 and $9, respectively, and are accounted for as additions to paid in capital.
8. Other
For the year ended December 31, 2006, and as a result of an error, Columbia Acorn International Select purchased shares of UrAsia Energy that was subsequently cancelled resulting in a loss of $164. The Fund was reimbursed by Columbia WAM for the full amount of the loss.
9. Legal Proceedings
The Trust, Columbia WAM and the Trustees of the Trust (collectively, the "Columbia defendants") are named as defendants in class and derivative complaints that have been consolidated in a Multi-District Action (the "MDL Action") in the federal district court of Maryland. These lawsuits contend that defendants permitted certain investors to market time their trades in certain Columbia Acorn Funds. The MDL Action is ongoing. However, all claims against Columbia Acorn Trust and the independent trustees of the Trust have been dismissed.
The Trust and Columbia WAM are also defendants in a class action lawsuit that alleges, in summary, that the Trust and Columbia WAM exposed shareholders of Columbia Acorn International Fund to trading by market timers by allegedly: (a) failing to properly evaluate daily whether a significant event affecting the value of the Fund's securities had occurred after foreign markets had closed but before the calculation of the Fund's net asset value ("NAV"); (b) failing to implement the Fund's portfolio valuation and share pricing policies and procedures; and (c) failing to know and implement applicable rules and regulations concerning the calculation of NAV (the "Fair Valuation Lawsuit"). The Seventh Circuit ruled that the plaintiffs' state law claims were preempted under federal law resulting in the dismissal of plaintiffs' complaint. Plaintiffs appealed the Seventh Circuit's ruling to the United States Supreme Court. The Supreme Cour t reversed the Seventh Circuit's ruling on jurisdictional grounds, and the case ultimately was remanded to the state court.
On March 21, 2005, a class action complaint was filed against the Columbia Acorn Trust and Columbia WAM seeking to rescind the CDSC assessed upon redemption of Class B shares of Columbia Acorn Funds due to the alleged market timing of the Columbia Acorn Funds. In addition to the rescission of sales charges, plaintiffs seek recovery of actual damages, attorneys' fees and costs. The case had been transferred to the MDL Action in the federal district court of Maryland.
On April 4, 2006, the plaintiffs and the Columbia defendants named in the MDL Action executed an agreement in principle intended to fully resolve all of the lawsuits consolidated in the MDL Action as well as the Fair Valuation Lawsuit. The court entered a stay after the parties executed a settlement agreement. The settlement has not yet been finalized or approved by the court.
Columbia WAM, the Columbia Acorn Funds and the Trustees of the Trust are also defendants in a consolidated lawsuit filed in the federal district court of Massachusetts alleging that Columbia WAM used Fund assets to make undisclosed payments to brokers as an incentive for the brokers to market the Funds over other mutual funds to investors. The complaint alleges Columbia WAM and the Trustees of the Trust breached certain common law duties and federal laws.
On November 30, 2005, the court dismissed all of the claims alleged against all of the parties in the consolidated complaint. Plaintiffs timely filed a notice of appeal of the district court's dismissal order with the First Circuit Court of Appeals. The parties subsequently executed a settlement term
74
sheet to fully resolve all claims in the litigation. The settlement has not yet been finalized or approved by the court.
On or about January 11, 2005, a putative class action lawsuit was filed in federal district court in Massachusetts against the Trust and the Trustees of the Trust, along with the Columbia Advisers, the sub-administrator of the Columbia Acorn Funds and the Wanger Advisors Funds. The plaintiffs allege that the defendants failed to submit Proof of Claims in connection with settlements of securities class action lawsuits filed against companies in which the Columbia Acorn Funds held positions. The complaint seeks compensatory and punitive damages, and the disgorgement of all fees paid to the Columbia Advisers.
Plaintiffs have voluntarily dismissed the Trust and its independent trustees.
The Trust and Columbia WAM intend to defend these suits vigorously.
As a result of these matters, or any adverse publicity or other developments resulting from them, there may be increased redemptions or reduced sales of Fund shares, which could increase transaction cost or operating expenses, or have other adverse consequences for the Funds. However, based on currently available information, the Columbia Acorn Trust believes that the likelihood that these lawsuits will have a material adverse impact on any Fund is remote, and Columbia WAM believes that the lawsuits are not likely to materially affect its ability to provide investment management services to the Funds.
For the year ended December 31, 2006, Columbia Management has assumed consulting services and legal fees
incurred by the Funds in connection with these matters and the amounts are as follows:
| (in thousands) | |||||||
| Columbia Acorn Fund | $ | 124 | |||||
| Columbia Acorn International | 25 | ||||||
| Columbia Acorn USA | 10 | ||||||
| Columbia Acorn International Select | 1 | ||||||
| Columbia Acorn Select | 13 | ||||||
| Columbia Thermostat Fund | 1 | ||||||
75
Report of Independent Registered Public Accounting Firm
To the Board of Trustees and Shareholders of
Columbia Acorn Trust:
In our opinion, the accompanying statements of assets and liabilities, including the statements of investments, and the related statements of operations, changes in net assets and the financial highlights present fairly, in all material respects, the financial position of Columbia Acorn Fund, Columbia Acorn International, Columbia Acorn USA, Columbia Acorn International Select, Columbia Acorn Select and Columbia Thermostat Fund (each a series of Columbia Acorn Trust, hereinafter referred to as the "Funds") at December 31, 2006, the results of each of their operations for the year then ended, the changes in each of their net assets for each of the two years in the period then ended and the financial highlights for each of the three years in the period then ended, in conformity with accounting principles generally accepted in the United States of America. These financial statements and financial highlights (hereafter referred to a s "financial statements") are the responsibility of the Funds' management; our responsibility is to express an opinion on these financial statements based on our audits. We conducted our audits of these financial statements in accordance with the standards of the Public Company Accounting Oversight Board (United States). Those standards require that we plan and perform the audits to obtain reasonable assurance about whether the financial statements are free of material misstatement. An audit includes examining, on a test basis, evidence supporting the amounts and disclosures in the financial statements, assessing the accounting principles used and significant estimates made by management, and evaluating the overall financial statement presentation. We believe that our audits, which included confirmation of securities at December 31, 2006 by correspondence with the custodian and brokers, provide a reasonable basis for our opinion. The financial highlights of the Funds for the periods ended December 31, 2003 a nd prior were audited by other independent auditors whose report dated February 6, 2004 expressed an unqualified opinion on those financial statements.
PricewaterhouseCoopers LLP
Chicago, Illinois
February 13, 2007
76
Columbia Acorn Family of Funds
Unaudited Information — Class A, B, C and Z shares
Federal Income Tax Information (in thousands)
Columbia Acorn Fund
For the fiscal year ended December 31, 2006, the Fund designated long-term capital gains of $1,499,324.
100.00% of the ordinary income distributed by the Fund, for the year ended December 31, 2006, qualified for the corporate dividends received deduction.
For non-corporate shareholders 87.74%, or the maximum amount allowable under the Jobs and Growth Tax Relief Reconciliation Act of 2003, of income earned by the Fund for the period January 1, 2006 to December 31, 2006 may represent qualified dividend income. Final information will be provided in your 2006 1099-Div Form.
Columbia Acorn International
For the fiscal year ended December 31, 2006, the Fund designated long-term capital gains of $377,272. Foreign taxes paid during the fiscal year ended December 31, 2006, amounting to $5,331 ($0.05 per share) are expected to be passed through to shareholders as 100% allowable foreign tax credits on Form 1099-Div for the year ended December 31, 2006.
For non-corporate shareholders 96.78%, or the maximum amount allowable under the Jobs and Growth Tax Relief Reconciliation Act of 2003, of income earned by the Fund for the period January 1, 2006 to December 31, 2006 may represent qualified dividend income. Final information will be provided in your 2006 1099-Div Form.
Gross income derived from sources within foreign countries amounted to $65,837 ($0.61 per share) for the fiscal year ended December 31, 2006.
Columbia Acorn USA
For the fiscal year ended December 31, 2006, the Fund designated long-term capital gains of $43,304.
Columbia Acorn International Select
Foreign taxes paid during the fiscal year ended December 31, 2006, amounting to $129 ($0.02 per share) are expected to be passed through to shareholders as 100% allowable foreign tax credits on Form 1099-Div for the year ended December 31, 2006.
Gross income derived from sources within foreign countries amounted to $1,927 ($0.35 per share) for the fiscal year ended December 31, 2006.
For non-corporate shareholders 100.00%, or the maximum amount allowable under the Jobs and Growth Tax Relief Reconciliation Act of 2003, of income earned by the Fund for the period January 1, 2006 to December 31, 2006 may represent qualified dividend income. Final information will be provided in your 2006 1099-Div Form.
Columbia Acorn Select
For the fiscal year ended December 31, 2006, the Fund designated long-term capital gains of $51,597.
93.93% of the ordinary income distributed by the Fund, for the year ended December 31, 2006, qualified for the corporate dividends received deduction.
For non-corporate shareholders 96.63%, or the maximum amount allowable under the Jobs and Growth Tax Relief Reconciliation Act of 2003, of income earned by the Fund for the period January 1, 2006 to December 31, 2006 may represent qualified dividend income. Final information will be provided in your 2006 1099-Div Form.
Columbia Thermostat Fund
For the fiscal year ended December 31, 2006, the Fund designated long-term capital gains of $10,806.
77
[Excerpts from:]
Columbia Acorn Trust
Management Fee Evaluation of the Senior Officer
Prepared Pursuant to the New York Attorney General's
Assurance of Discontinuance
Robert P. Scales
Senior Vice President,
Chief Legal Officer
and General Counsel
2006
78
Introduction
The New York Attorney General's Assurance of Discontinuance ("Order") entered into by Columbia Management Advisors, Inc. ("CMAI") and Columbia Management Distributors, Inc., ("CMDI" and collectively with "CMAI," "CMG") in February 2005, allows CMAI to manage or advise a mutual fund, including the Acorn Trust's family of funds (the "Acorn Funds" or "Acorn" or "Trust"), only if the trustees of the Acorn Funds appoint a "Senior Officer" to perform specified duties and responsibilities. One of these responsibilities includes "managing the process by which proposed management fees (including but not limited to, advisory fees) to be charged the [Acorn Funds] are negotiated so that they are negotiated in a manner which is at arms' length and reasonable and consistent with this Assurance of Discontinuance."
The Order also provides that the Board of Trustees of the Acorn Funds ("Board") must determine the reasonableness of proposed "management fees" by using either an annual competitive bidding process supervised by the Senior Officer or Independent Fee Consultant, or by obtaining "an annual independent written evaluation prepared by or under the direction of the Senior Officer or the Independent Fee Consultant."
"Management fees" are only part of the costs and expenses paid by mutual fund shareholders. The expenses can vary depending upon the class of shares held but usually include: (1) investment management or advisory fees to compensate analysts and portfolio managers for stock research and portfolio management, as well as the cost of operating a trading desk; (2) administrative expenses incurred to prepare registration statements and tax returns, calculate the Funds' net asset values, maintain effective compliance procedures and perform recordkeeping services; (3) transfer agency costs for establishing accounts, accepting and disbursing funds, as well as overseeing trading in Fund shares; (4) custodial expenses incurred to hold the securities purchased by the Funds; and (5) distribution expenses, including commissions paid to brokers that sell the Fund shares to investors.
Columbia Wanger Asset Management, L.P. ("CWAM"), the adviser to the Acorn Funds, has proposed that the Trust enter into separate agreements governing the first two categories listed above: an advisory agreement governing portfolio management, and an administration agreement governing certain administration and clerical services. Together the fees paid under these two agreements are referred to as "management fees." Other fund expenses are governed by separate agreements, in particular agreements with two CWAM affiliates: CMDI, the broker-dealer that underwrites and distributes the Acorn Funds' shares, and Columbia Management Services, Inc. ("CMSI"), the Funds' transfer agent. In conformity with the terms of the Order, this evaluation, therefore, addresses only the advisory and administrative contracts between CWAM and the Trust, and does not extend to the other agreements.
According to the Order, the Senior Officer's evaluation must consider at least the following:
(1) Management fees (including components thereof) charged to institutional and other clients of CWAM for like services;
(2) Management fees (including any components thereof) charged by other mutual fund companies for like services;
(3) Costs to CWAM and its affiliates of supplying services pursuant to the management fee agreements, excluding any intra-corporate profit;
(4) Profit margins of CWAM and its affiliates from supplying such services;
(5) Possible economies of scale as the Acorn Funds grow larger; and
(6) The nature and quality of CWAM's services, including the performance of each Acorn Fund.
On November 16, 2004, the Board appointed me Senior Officer under the Order. The Board also determined not to pursue a competitive bidding process and instead, charged me with the responsibility of evaluating the Acorn Funds' proposed advisory and administrative fee contracts with CWAM in conformity with the requirements of the Order. This Report is an annual evaluation required under the Order. In discharging their responsibilities, the independent Trustees have also consulted independent, outside counsel.
79
2005 Evaluation
This is the second annual evaluation prepared in connection with the Order. The first annual evaluation ("2005 Evaluation") was issued on July 20, 2005. This evaluation follows the same structure as the 2005 Evaluation. Some areas are given more emphasis here, while others are given less. Still, the fundamental information gathered for this evaluation is the largely the same as last year. I have noted in this Report where methodologies diverged significantly.
This evaluation was performed in cooperation and regular communication with the Contract Review Committee of the Board of Trustees.
Process and Independence
The objectives of the Order are to insure the independent evaluation of the advisory fees paid by the Acorn Funds as well as to insure that all relevant factors are considered. In my view, the contract renewal process has been conducted at arms-length and with independence in gathering, considering and evaluating all relevant data. At the outset of the process, the Trustees sought and obtained from CWAM and CMG a comprehensive compilation of data regarding Fund performance and expense, adviser profitability, and other information. In advance of the contract renewal process, the Board also explored CWAM's potential capacity restraints, an issue posed by the size of the Acorn Fund and by some of the observations from the 2005 Evaluation. Performance and expense data was obtained from both Morningstar and Lipper, the leading consultants in this area. The rankings prepared by Morningstar and Lipper were independent and were not infl uenced by the adviser. CWAM itself identified what it considers its competition in formulating its own peer group, and the Trustees considered that data as well.
In the course of its work, the Contract Committee gave careful consideration to the conclusions and recommendations contained in the 2005 Evaluation. In particular, the Contract Committee considered the possible introduction of a two-tiered fee structure that would set fees on the basis of a combined CWAM complex level and individual fund level. The Committee concluded that such a fee structure might be confusing to shareholders, though it has not foreclosed such a structure in the future. The Committee is continuing to consider whether economies of scale are appropriately reflected in the Funds' fee schedules.
My evaluation of the advisory contract was shaped, as it was last year, by my experience as Acorn's Chief Compliance Officer ("CCO"). As CCO, I report solely to the Board and have no reporting obligation to or employment relationship with CMG or its affiliates, except for administrative purposes. This too contributes to the independence of this evaluation. I have commented on compliance matters in evaluating the quality of service provided by CWAM.
This Report, its supporting materials and the data contained in other materials submitted to the Contract Committee of the Board, in my view, provide a thorough factual basis upon which the Board, in consultation with independent counsel as it deems appropriate, may conduct management fee negotiations that are in the best interests of the Acorn Funds' shareholders.
The Fee Reductions Mandated under the Order
Under the terms of the Order, CMG agreed to secure certain management fee reductions for the mutual funds advised by its affiliate investment advisers. In some instances, breakpoints were also established. Although neither CWAM nor the Trust was a party to the Order, CWAM offered and the Board accepted certain advisory fee reductions last year. By the terms of the Order, these fees may not be increased before November 30, 2009. I have used these advisory fee levels in my evaluation because they are the fees in the current agreements that CWAM proposes should be continued. Hence, these fee levels are the starting point of an evaluation.
80
Conclusions
My review of the data and other material above leads to the following conclusions with respect to the factors identified in the Order.
1. Performance. The domestic Funds generally have achieved outstanding performance. The Acorn Fund, Acorn USA and Acorn Select all rank very favorably against their peers. The international Funds have not, however, performed nearly as well as the domestic funds, and continue to lag their benchmarks and peers. Management is taking steps to improve the performance of these funds.
2. Management Fees relative to Peers. The management fee rankings for most of the Funds are generally more favorable to shareholders than those of their peer group funds. Management fees do vary by Fund. Acorn Fund is the least expensive and the Acorn USA the most expensive. Acorn USA and Acorn Select were ranked by both Lipper and Morningstar below many of their peers, and therefore impose higher fees than do some of their competitors.
3. Administrative Fees. The Acorn Funds' administrative fee, which is uniform across all Funds, is at a level comparable to that of most peers, provides for appropriate services to Funds, and affords breakpoints that lower the fee as assets increase.
4. Management Fees relative to Institutional and Other Mutual Fund Accounts. CWAM's focus is on its mutual funds. It does not actively seek to manage separate or institutional accounts. The few institutional accounts it does manage vary in rate structures. Some pay advisory fees commensurate with or higher than the Acorn Funds. In a few instances, however, institutional accounts pay lower advisory fees than do the Acorn Funds. One particular institutional account is significant in size and has been under CWAM's management for over 25 years. Finally, in two instances, the Acorn Funds pay slightly higher fees than do similar funds sold through insurance companies.
5. Costs to CWAM and its Affiliates. CWAM's direct costs do not appear excessive, and in some areas have declined in the past year. Indirect costs allocated to CWAM by its parent organization, however, have increased substantially. CWAM's affiliates report operating losses and therefore do not appear to profit from CWAM's advisory agreement with the Acorn Funds.
6. Profit Margins. CWAM's firm-wide, pre-marketing expense profit margins are at the top of the industry, though these comparisons are hampered by limited industry data. High profit margins are not unexpected for firms that manage large, successful funds and have provided outstanding investment performance for investors.
7. Economies of Scale. Economies of scale do exist at CWAM and will expand as the assets of the Acorn Funds get larger. They are, however, only partially reflected in the management fee schedule for the Funds. If the Acorn Funds' assets continue to grow, under the Funds' current fee schedules, shareholders might not benefit in a manner generally commensurate with CWAM's increased profits.
8. Nature and Quality of Services. This category includes a variety of considerations that are difficult to quantify, yet can have a significant bearing on the performance of the Acorn Funds. Several areas merit comment.
a. Capacity. The Funds have continued to grow, posing ever greater challenges in deploying assets effectively. While trends here merit continued monitoring, CWAM appears to be managing assets effectively.
81
b. Compliance. CWAM has a reasonably designed compliance program that protects shareholders.
c. Administrative Services. The Acorn Funds benefit from a variety of administrative services that are performed by CWAM and CMAI.
In my opinion, the process of negotiating an advisory contract for the Acorn Funds has been conducted thoroughly and at arms' length. Further, the Trustees have sufficient information to evaluate management's proposal, and negotiate contract terms that are in the best interests of fund shareholders.
Recommendations
I believe the Trustees should:
1. Continue to consider ways to restructure the advisory fee beyond the current breakpoint schedule to reflect more fully economies of scale.
2. Monitor the performance of Acorn International and Acorn International Select.
3. Continue to monitor CWAM's capacity limitations to insure that Acorn Fund's expanding assets do not impair investment performance.
Robert P. Scales
July 18, 2006
82
Board Approval of the Advisory Agreements
Columbia Acorn Trust (the "Trust") has an investment advisory agreement (the "Agreement") with Columbia Wanger Asset Management, L.P. ("CWAM") under which CWAM manages the Columbia Acorn Funds (the "Funds"). The trustees of the Trust, more than eighty percent of whom have never been affiliated with CWAM ("Independent Trustees"), oversee the management of each Fund and, as required by law, determine at least annually whether to continue the Agreement for each Fund.
The Contract Committee of the board of trustees (the "Committee"), which is comprised of five Independent Trustees, makes recommendations to the board regarding any proposed continuation of the Agreement. After the Committee has made its recommendation, the full board determines whether to approve the continuation of the Agreement. In addition, the board considers matters bearing on the Agreement at most of its other meetings throughout the year and meets at least quarterly with the portfolio managers employed by CWAM.
In connection with their most recent consideration of the Agreement for each Fund, the Committee and all trustees received and reviewed a substantial amount of information provided by CWAM in response to requests of the Independent Trustees and their counsel. Throughout their consideration of the agreements, the Independent Trustees were advised by their independent legal counsel. At each of the meetings at which the Committee or the Independent Trustees considered the Agreement, they met with management and also met separately in executive session with their counsel.
The materials reviewed by the Committee and the trustees included, among other items, (i) information on the investment performance of each Fund and the performance of peer groups of funds and of the Fund's performance benchmarks, (ii) information on each Fund's advisory fees and other expenses, including information comparing the Fund's fees and expenses to those of peer groups of funds and information about any applicable expense limitations and fee "breakpoints," (iii) data on sales and redemptions of Fund shares and (iv) information on the profitability to CWAM and its affiliates of their relationships with the Funds and potential "fall-out" or ancillary benefits that CWAM and its affiliates may receive as a result of their relationships with the Funds. They also considered other information such as (i) CWAM's financial results and financial condition, (ii) each Fund's investment objective and strategies; (iii) the size, edu cation and experience of CWAM's investment staff and their use of technology, external research and trading cost measurement tools, (iv) the allocation of the Funds' brokerage, if any, including allocations to brokers affiliated with CWAM, and the use of "soft" commission dollars to pay Fund expenses or to pay for research products and services, (v) the resources devoted to, and the record of compliance with, the Funds' investment policies and restrictions, policies on personal securities transactions and other compliance policies, (vi) the response of CWAM and its affiliates to various legal and regulatory proceedings since 2003 and (vii) the economic outlook generally and for the mutual fund industry in particular. In addition, the trustees conferred with, and reviewed the Management Fee Evaluation (the "Fee Evaluation") prepared by, the Trust's chief compliance officer, who also serves as the Trust's "Senior Officer" as contemplated by the Assurance of Discontinuance dated February 9, 2005 among affiliate s of CWAM and the Office of the New York Attorney General. A summary of the Fee Evaluation is included in this report. Throughout the process, the trustees had the opportunity to ask questions of and request additional materials from CWAM.
On July 18, 2006 the board of trustees approved continuation of the Agreement through July 31, 2007, with certain amendments to the fee schedules described below. The board approval followed Committee meetings held in February, April, May and June 2006.
In considering the continuation of the Agreement, the trustees reviewed and analyzed various factors that they determined were relevant, including the factors described below, none of which by itself was considered dispositive. However, the material factors and conclusions that formed the basis for the trustees' determination to approve the continuation of the Agreement are discussed separately below.
Nature, quality and extent of services. The trustees reviewed the nature, quality and extent of the services of CWAM and its affiliates to the Funds, taking into account the investment objective and strategy of each Fund and the knowledge the trustees gained from their regular meetings with management on at least a quarterly basis and their ongoing review of information related to the Funds. In addition, the trustees reviewed the resources and key personnel of CWAM and its affiliates, especially those who provide investment management services to the Funds. The trustees also considered other services provided to the Funds by
83
Board Approval of the Advisory Agreements, continued
CWAM and its affiliates, such as managing the execution of portfolio transactions and the selection of broker-dealers for those transactions, serving as the Funds' administrator, monitoring adherence to the Funds' investment restrictions, producing shareholder reports, providing support services for the board and board committees, communicating with shareholders and overseeing the activities of other service providers, including monitoring compliance with various policies and procedures of the Funds and with applicable securities laws and regulations.
The trustees concluded that: the nature, quality and extent of the services provided by CWAM and its affiliates to each Fund were appropriate and consistent with the terms of the Agreement; that the quality of those services had been consistent with or superior to quality norms in the industry; and that the Funds were likely to benefit from the continued provision of those services. They also concluded that each of CWAM and its affiliates had sufficient personnel, with the appropriate education and experience, to serve the Funds effectively and had demonstrated their continuing ability to attract and retain well-qualified personnel. However, they also noted that the Funds might benefit from more senior personnel at CWAM, especially if the assets managed by CWAM continue to increase.
The trustees also negotiated an amended separate agreement with Columbia Management Group, LLC, the parent of CWAM (the "Compliance Agreement"), intended to strengthen the compliance infrastructure for the Funds.
Performance of the Funds. At various meetings of the board, of the Committee and of the board's investment performance analysis committee, the trustees considered the short-term and longer-term performance of each Fund. They reviewed information comparing each Fund's performance with the performance of the Fund's benchmark and with the performance of comparable funds and peer groups as identified by Lipper Inc. ("Lipper") and Morningstar Associates, LLC ("Morningstar"). They noted that each of Columbia Acorn Fund, Columbia Acorn USA and Columbia Acorn Select had outperformed its respective benchmark and Lipper and Morningstar peers in recent and longer periods and that Columbia Thermostat Fund had outperformed its benchmark for the same time periods. They also discussed the performance of Columbia Acorn International and Columbia Acorn International S elect, noting that, although those Funds underperformed their benchmarks for the most recent three- and five-year periods, the Funds had strong absolute returns. During the contract renewal process, the trustees concluded that, although past performance is not necessarily indicative of future results, the Funds' strong performance record was an important factor in their evaluation of the quality of services provided by CWAM under the Agreement.
Costs of Services and Profits Realized by CWAM. At various Committee meetings and other informal meetings, the trustees examined detailed information on fees and expenses of each Fund in comparison to information for other comparable funds as provided by Lipper and Morningstar. As noted in the Fee Evaluation, the expense ratio of each Fund was lower than the median expense ratio of the Fund's respective peer group, and the expense ratio of Columbia Acorn Fund was very low relative to its peer group. Moreover, the advisory fees for most of the Funds were in line with or lower than fees for their respective peer groups, although the contractual rates of advisory fees and the actual advisory fees for some of the Funds were higher than the median advisory fees of the respective peer groups of those Funds.
At the July 18, 2006 meeting, at the recommendation of the Committee, the board negotiated with CWAM, and both parties approved, an amendment to the Agreement to reduce the schedule of annual advisory fee rates for Columbia USA and Columbia Acorn Select, as a percentage of average net assets. The trustees approved additional breakpoints for Columbia Acorn USA at 80 basis points for net asset levels of $2 billion to $3 billion and at 70 basis points for assets levels of $3 billion and above, and for Columbia Acorn Select at 75 basis points for asset levels of $2 billion to $3 billion and at 70 basis points for asset levels of $3 billion and above, respectively. The trustees determined not to seek additional breakpoints in the fee schedule of any other Fund at that time but recognized that they would continue periodically to evaluate the fees paid by each Fund.
The trustees reviewed the profitability of CWAM in serving as each Fund's investment adviser and of CWAM and its affiliates in all of their relationships with each Fund, as well as an explanation of the methodology utilized in allocating various expenses among the Funds and other business units. The trustees took into account the methodology used by CWAM in determining compensation payable to portfolio managers and the very competitive environment for investment management talent. The trustees recognized that profitability comparisons among fund managers are difficult
84
because very little comparative information is publicly available and profitability of any manager is affected by numerous factors, including the organizational structure of the particular manager, the types of funds and other accounts it manages, possible other lines of business, the methodology for allocating expenses and the manager's capital structure and cost of capital.
The trustees also reviewed CWAM's advisory fees for other investment companies, sub-advised funds and other institutional separate accounts. CWAM's rates of fees for most of those other accounts utilizing a particular investment strategy were higher than the advisory fees charged to the Funds with a corresponding strategy, although for a few accounts, the fees were lower. The trustees also noted, however, that CWAM performs significant additional services for the Funds that it does not provide to sub-advised funds or non-mutual fund clients, including administrative services, oversight of the Funds' other service providers, trustee support, regulatory compliance and numerous other services, and that, in serving the Funds, CWAM assumes many legal risks that it does not assume in servicing many of its other clients. Finally, the trustees considered the financial condition of CWAM as part of the contract renewal process.
The trustees concluded that the rates of advisory fees (as amended for Columbia Acorn USA and Columbia Acorn Select) and other compensation payable by the Funds to CWAM and its affiliates were reasonable in relation to the nature and quality of the services to be provided, taking into account the fees charged by other advisers for managing comparable mutual funds with similar strategies and the fees CWAM charges to other clients. The trustees also concluded that the overall expense ratio of each Fund was reasonable, taking into account the size of the Fund, the quality of services provided by CWAM and its affiliates and the investment performance of the Fund.
Economies of Scale. The trustees considered information about the potential for CWAM to realize economies of scale as the assets of the Funds increase. They noted that the fee schedule for each Fund, other than Columbia Acorn International Select and Columbia Thermostat Fund, which are relatively modest in asset size, includes reductions in the rate of fees at various asset levels, including the newly established breakpoints for Columbia Acorn USA and Columbia Acorn Select. The trustees also noted that the Funds share directly in economies of scale through lower charges of third-party service providers based on the combined scale of all of the Funds. Based on all of the information they reviewed, the trustees concluded that the current fee structure of each Fund was reasonable and that the current rates of fees do reflect a sharing between CWAM and th e Fund of economies of scale at the current asset level of the Fund. They agreed, however, to continue their periodic consideration of the Funds' fee structures and economies of scale.
Other Benefits to CWAM. The trustees also considered benefits that accrue to CWAM and its affiliates from their relationships with the Funds. They recognized that two affiliates of CWAM separately serve the Funds as transfer agent and distributor, respectively, and that the transfer agent receives compensation from the Funds for services provided. They recognized that, other than the services provided by CWAM and its affiliates pursuant to various agreements and the fees to be paid by each Fund therefor, the Funds and CWAM may potentially benefit from their relationship with each other in other ways. The trustees considered CWAM's use of commissions paid by each Fund on its portfolio brokerage transactions to obtain research products and services benefiting the Fund and/or other clients of CWAM. They concluded that CWAM's use of the Funds' "soft" comm ission dollars to obtain research products and services was consistent with regulatory requirements and guidance then in effect. They also concluded that CWAM benefits from the receipt of proprietary research products and services acquired through commissions paid on portfolio transactions of the Funds and that the Funds benefit from CWAM's receipt of those products and services as well as research products and services acquired through commissions paid by other clients of CWAM. They further concluded that success of any Fund could attract other business to CWAM or other Funds and that the success of CWAM could enhance its ability to serve the Funds.
After full consideration of the above factors, as well as other factors that were instructive in evaluating the Agreement, the trustees, including all of the Independent Trustees, concluded that the continuation of the Agreement, as amended to revise the fee schedules for Columbia Acorn USA and Columbia Acorn Select, was in the best interest of each Fund. On July 18, 2006, the trustees continued the Agreement as so amended through July 31, 2007, contingent upon the execution of the Compliance Agreement, which was subsequently executed on July 31, 2006.
85
Board of Trustees and Management of Columbia Acorn Funds
Each trustee may serve a term of unlimited duration until the end of the calendar year in which the trustee attains the age of 75 years. The trustees appoint their own successors, provided that at least two-thirds of the trustees, after such appointment, have been elected by shareholders. Shareholders may remove a trustee, with or without cause, upon the vote of two-thirds of the Trust's outstanding shares at any meeting called for that purpose. A trustee may be removed, with or without cause, upon the vote of a majority of the trustees. The names of the trustees and officers of Acorn, the date each was first elected or appointed to office, their principal business occupations during at least the last five years, number of portfolios in the fund complex they oversee, and other directorships they hold, are shown below. Each trustee serves in such capacity for each of the six series of Columbia Acorn Trust and for each of the four series of Wanger Advisors Trust.
The address for the trustees and officers of the Trust is Columbia Wanger Asset Management, L.P., 227 West Monroe Street, Suite 3000, Chicago, Illinois 60606. The Funds' Statement of Additional Information includes additional information about the Funds' trustees and officers. You may obtain a free copy of the Statement of Additional Information by writing or calling toll-free:
Columbia Wanger Asset Management, L.P.
Shareholder Services Group
227 W. Monroe, Suite 3000
Chicago IL 60606
888-4-WANGER (888-492-6437)
| Name, Position(s) with Columbia Acorn and Age at December 31, 2006 | Year First Elected or Appointed to Office* | Principal Occupation(s) during Past Five Years | Number of Portfolios in Fund Complex Overseen by Trustee/Officer | Other Directorships | |||||||||||||||
| Trustees who are not interested persons of Columbia Acorn: | |||||||||||||||||||
| Margaret Eisen, 53, Trustee | 2002 | Managing Director, CFA Institute since 2005; Chief Investment Officer, EAM International LLC (corporate finance and asset management) since 2003; prior thereto, managing director, DeGuardiola Advisors (investment bank); formerly managing director, North American Equities at General Motors Asset Management, and director of Worldwide Pension Investments for DuPont Asset Management. | 10 | Antigenics, Inc. (biotechnology and drugs); Wanger Advisors Trust. | |||||||||||||||
| Jerome Kahn, Jr., 72, Trustee | 1987 | Portfolio manager and stock analyst and former president, William Harris Investors, Inc. (investment adviser). | 10 | Wanger Advisors Trust. | |||||||||||||||
| Steven N. Kaplan, 47, Trustee | 1999 | Neubauer Family Professor of Entrepreneurship and Finance, Graduate School of Business, University of Chicago. | 10 | Morningstar, Inc. (provider of independent investment research); Wanger Advisors Trust. | |||||||||||||||
| David C. Kleinman, 71, Trustee | 1972 | Adjunct professor of strategic management, University of Chicago Graduate School of Business; business consultant. | 10 | Sonic Foundry, Inc. (rich media systems and software); Wanger Advisors Trust. | |||||||||||||||
| Allan B. Muchin, 70, Trustee | 1998 | Chairman emeritus, Katten Muchin Zavis Rosenman (law firm). | 10 | Wanger Advisors Trust. | |||||||||||||||
| Robert E. Nason, 70, Chairman of the Board and Trustee | 1998 | Consultant and private investor; formerly executive partner, chief executive officer and member of the executive committee of Grant Thornton, LLP (public accounting firm) and member of the policy board of Grant Thornton International. | 10 | Wanger Advisors Trust. | |||||||||||||||
| James A. Star, 45 Trustee | 2006 | President, Longview Management Group LLC (investment advisor) since 2003, prior thereto portfolio manager; vice president, Henry Crown and Company (investment firm) since 1994; president and chief investment officer, Star Partners (hedge fund) 1998-2003. | 10 | Wanger Advisors Trust. | |||||||||||||||
| Patricia H. Werhane, 71 Trustee | 2006 | Ruffin Professor of Business Ethics, Darden Graduate School of Business Administration, University of Virginia (since 1993); Senior Fellow of the Olsson Center for Applied Ethics, Darden Graduate School of Business Administration, University of Virginia (2001 to present); and Wicklander Chair of Business Ethics and Director of the Institute for Business and Professional Ethics, DePaul University (since September 2003). | 10 | Wanger Advisors Trust. | |||||||||||||||
86
| Name, Position(s) with Columbia Acorn and Age at December 31, 2006 | Year First Elected or Appointed to Office* | Principal Occupation(s) during Past Five Years | Number of Portfolios in Fund Complex Overseen by Trustee/Officer | Other Directorships | |||||||||||||||
| Trustees who are not interested persons of Columbia Acorn: (continued) | |||||||||||||||||||
| John A. Wing, 71, Trustee | 2002 | Partner, Dancing Lion Investment Partners (investment partnership); prior thereto, Frank Wakely Gunsaulus Professor of Law and Finance, and chairman of the Center for the Study of Law and Financial Markets, Illinois Institute of Technology; formerly chairman of the board and chief executive officer of ABN-AMRO Incorporated, (formerly named The Chicago Corporation, a financial services firm) and chief executive officer of Market Liquidity Network, LLC. | 10 | First Chicago Bank and Trust and First Chicago Bancorp; Wanger Advisors Trust. | |||||||||||||||
| Trustees who are interested persons of Columbia Acorn: | |||||||||||||||||||
| Charles P. McQuaid, 53, Trustee and President (1) | 1992 | President and Chief Investment Officer, Columbia WAM since 2003; portfolio manager since 1995 and director of research 1992-2003; Columbia WAM interim director of international research, Columbia WAM 2003-2004; president, Wanger Advisors Trust since 2003. | 10 | Wanger Advisors Trust. | |||||||||||||||
| Ralph Wanger, 72, Trustee (2) | 1970 | Founder, former president, chief investment officer and portfolio manager, Columbia WAM (July 1992 to September 2003); president, Columbia Acorn Trust (1992 to September 2003); president, Wanger Advisors Trust (1994 to September 2003); director, Wanger Investment Company PLC; advisor to Columbia WAM (September 2003 to September 2005). | 10 | Wanger Advisors Trust. | |||||||||||||||
| Officers of Columbia Acorn Trust: | |||||||||||||||||||
| Ben Andrews, 40, Vice President | 2004 | Analyst and portfolio manager, Columbia WAM since 1998; vice president, Wanger Advisors Trust. | 10 | None. | |||||||||||||||
| J. Kevin Connaughton, 42, Assistant Treasurer | 2001 | Treasurer and Chief Financial Officer Columbia Funds and Liberty All-Star Funds; assistant treasurer Wanger Advisors Trust; treasurer Galaxy Funds (September 2002 to November 2005); treasurer, Columbia Management Multi-Strategy Hedge Fund, LLC (December 2002 to December 2004). | 155 | Banc of America Capital Management (Ireland), Limited. | |||||||||||||||
| Michael G. Clarke, 37, Assistant Treasurer | 2004 | Assistant treasurer, Wanger Advisors Trust; chief accounting officer and assistant treasurer of the Columbia Funds, Liberty Funds, Stein Roe Funds and All-Star Funds since October 2004; Managing Director of Columbia WAM; Controller, Columbia Funds, Liberty Funds, Stein Roe Funds and All-Star Funds (May 2004 to October 2004); Assistant Treasurer (June 2002 to May 2004); Vice President, Product Strategy & Development of the Liberty Funds and Stein Roe Funds (February 2001 to June 2002). | 155 | None. | |||||||||||||||
| Jeffrey R. Coleman, 37, Assistant Treasurer | 2006 | Assistant treasurer, Wanger Advisors Trust since March 2006; Group Operations Manager, Columbia WAM since October 2004; Vice President of CDC IXIS Asset Management Services, Inc. (investment management) (August 2000 to September 2004). | 155 | None. | |||||||||||||||
87
| Name, Position(s) with Columbia Acorn and Age at December 31, 2006 | Year First Elected or Appointed to Office* | Principal Occupation(s) during Past Five Years | Number of Portfolios in Fund Complex Overseen by Trustee/Officer | Other Directorships | |||||||||||||||
| P. Zachary Egan, 38, Vice President | 2003 | Director of international research, Columbia WAM, since December 2004; analyst and portfolio manager, Columbia WAM since 1999; prior thereto, research fellow with the Robert Bosch Foundation. | 6 | None. | |||||||||||||||
| Peter T. Fariel, 49, Assistant Secretary | 2006 | Associate General Counsel, Bank of America since April 2005; prior thereto Partner, Goodwin Procter LLP (law firm). | 155 | None. | |||||||||||||||
| John Kunka, 36, Assistant Treasurer | 2006 | Director of Accounting and Operations, Columbia WAM, since May 2006; assistant treasurer, Wanger Advisors Trust, since 2006; Manager of Mutual Fund Operations, Calamos Advisors, Inc., September 2005 to May 2006; prior thereto, Manager of Mutual Fund Administration, Van Kampen Investments. | 10 | None. | |||||||||||||||
| Bruce H. Lauer, 49, Vice President, Secretary and Treasurer | 1995 | Chief operating officer, Columbia WAM since April 1995; vice president, treasurer and secretary, Wanger Advisors Trust; director, Wanger Investment Company PLC; director, Banc of America Capital Management (Ireland) Ltd. | 10 | None. | |||||||||||||||
| Joseph LaPalm, 36, Vice President | 2006 | Chief compliance officer, Columbia WAM since 2005; vice president, Wanger Advisors Trust since 2006; prior thereto, compliance officer, William Blair & Company (investment firm) | 10 | None. | |||||||||||||||
| Robert A. Mohn, 45, Vice President | 1997 | Analyst and portfolio manager, Columbia WAM since August 1992; director of domestic research, Columbia WAM since March 2004; vice president, Wanger Advisors Trust. | 10 | None. | |||||||||||||||
| Louis J. Mendes, 42, Vice President | 2003 | Analyst and portfolio manager, Columbia WAM since 2001; vice president, Wanger Advisors Trust; prior thereto, analyst and portfolio manager, Merrill Lynch (investment firm). | 10 | None. | |||||||||||||||
| Christopher Olson, 42, Vice President | 2001 | Analyst and portfolio manager, Columbia WAM since January 2001; vice president, Wanger Advisors Trust. | 10 | None. | |||||||||||||||
| Robert Scales, 54, Chief Compliance Officer, Senior Vice President and General Counsel | 2004 | Senior vice president, chief legal officer and general counsel, Wanger Advisors Trust since 2004; Associate General Counsel, Grant Thornton LLP prior thereto. | 10 | None. | |||||||||||||||
| Linda Roth-Wiszowaty, 37, Assistant Secretary | 2006 | Assistant secretary, Wanger Advisors Trust; Executive Administrator, Columbia WAM since April 2004; prior thereto Executive Assistant to the Chief Operating Officer. | 10 | None. | |||||||||||||||
* Dates prior to April 1992 correspond to the date first elected or appointed as a director or officer of The Acorn Fund Inc., the Trust's predecessor.
(1) Trustee who is an "interested person" of the Trust and of Columbia WAM, as defined in the 1940 Act, because he is an officer of the Trust and Columbia WAM.
(2) Trustee who is treated as an "interested person" of the Trust and of Columbia WAM, as defined in the 1940 Act, because he is a former officer of the Trust, former employee of Columbia WAM and former consultant to Columbia WAM.
88
Columbia Acorn Family of Funds
Class Z Share Information
| Minimum Initial Investment in | |||||||
| Columbia Acorn International, | |||||||
| Columbia Acorn International | |||||||
| Select and Columbia Thermostat | |||||||
| Fund | $2,500 $1,000 for an IRA | ||||||
| Minimum Initial Investment in Columbia Acorn Fund and Columbia Acorn USA | $ | 75,000 | |||||
| Minimum Initial Investment in Columbia Acorn Select | $ | 50,000 | |||||
| Minimum Subsequent Investment in all Funds | $ | 50 | |||||
| Exchange Fee | None | ||||||
| Columbia Acorn Fund | ACRNX | ||||||
| Management Fee | 0.64 | % | |||||
| 12b-1 Fee | None | ||||||
| Other Expenses | 0.10 | % | |||||
| Net Expense Ratio | 0.74 | % | |||||
| Columbia Acorn International | ACINX | ||||||
| Management Fee | 0.77 | % | |||||
| 12b-1 Fee | None | ||||||
| Other Expenses | 0.17 | % | |||||
| Net Expense Ratio | 0.94 | % | |||||
| Columbia Acorn USA | AUSAX | ||||||
| Management Fee | 0.86 | % | |||||
| 12b-1 Fee | None | ||||||
| Other Expenses | 0.12 | % | |||||
| Net Expense Ratio | 0.98 | % | |||||
| Columbia Acorn International Select | ACFFX | ||||||
| Management Fee | 0.94 | % | |||||
| 12b-1 Fee | None | ||||||
| Other Expenses | 0.33 | % | |||||
| Net Expense Ratio | 1.27 | % | |||||
| Columbia Acorn Select | ACTWX | ||||||
| Management Fee | 0.82 | % | |||||
| 12b-1 Fee | None | ||||||
| Other Expenses | 0.14 | % | |||||
| Net Expense Ratio | 0.96 | % | |||||
| Columbia Thermostat Fund | COTZX | ||||||
| Management Fee | 0.10 | % | |||||
| 12b-1 Fee | None | ||||||
| Other Expenses | 0.15 | %* | |||||
| Net Expense Ratio | 0.25 | % | |||||
Fees and expenses are for the year ended December 31, 2006 and for Columbia Thermostat Fund include the effect of Columbia Wanger Asset Management's undertaking to reimburse this Fund for any ordinary operating expenses, net of custody fees paid indirectly, in excess of 0.25% of the average net assets. Columbia Thermostat Fund's reimbursement arrangement is contractual through April 30, 2007. From January 1, 2006 through September 30, 2006, the Funds' adviser and/or affiliates had voluntarily agreed to waive a portion of "other expenses" for the Columbia Acorn family of funds. Effective October 1, 2006, the Fund's adviser and/or affiliates have agreed to contractually waive a portion of "other expenses" through March 31, 2007.
* Does not include estimated fees and expenses of 0.69% incurred by the Fund from the underlying portfolio funds.
89
Columbia Acorn Family of Funds
Investment Adviser
Columbia Wanger Asset Management, L.P.
227 West Monroe Street, Suite 3000
Chicago, Illinois 60606
1-800-922-6769
Distributor
Columbia Management Distributors, Inc.
One Financial Center
Boston, Massachusetts 02111-2621
Transfer Agent, Dividend Disbursing Agent
Columbia Management Services, Inc.
P.O. Box 8081
Boston, Massachusetts 02266-8081
1-800-345-6611
Legal Counsel
Bell, Boyd & Lloyd LLP
Chicago, Illinois
Independent Registered Public Accounting Firm
PricewaterhouseCoopers LLP
Chicago, Illinois
This report, including the schedules of investments, is submitted for the general information of the shareholders of Columbia Acorn Trust. This report is not authorized for distribution unless preceded or accompanied by a prospectus. An investor should carefully consider charges and expenses before investing. To obtain a prospectus containing this and other information, please call (800) 922-6769 or visit our website (shown below). Please read the prospectus carefully before you invest or send money.
A description of the policies and procedures that the Funds use to determine how to vote proxies and a copy of the Funds' voting record for the most recent 12-month period ended June 30 are available (i) without charge, upon request, by calling 800-922-6769; (ii) on the Securities and Exchange Commission's website at www.sec.gov; and (iii) on Columbia Management's website at www.columbiafunds.com.
The Funds file a complete schedule of portfolio holdings with the SEC for the first and third quarters of each fiscal year on Form N-Q. The Funds' Form N-Q is available on the SEC's website at www.sec.gov and may be reviewed and copied at the SEC's Public Reference Room in Washington, D.C. Information on the operation of the Public Reference Room may be obtained by calling 1-800-SEC-0330.
Columbia Management Group, LLC ("Columbia Management") is the investment management division of Bank of America Corporation. Columbia Management entities furnish investment management services and products for institutional and individual investors. Columbia Funds are distributed by Columbia Management Distributors, Inc., member NASD and SIPC. Columbia Management Distributors, Inc. is part of Columbia Management and an affiliate of Bank of America Corporation.
Find out what's new at:
www.columbiafunds.com
Our e-mail address is:
ServiceInquiries@ColumbiaManagement.com
Shareholders should not include personal information such as account numbers, Social Security numbers or taxpayer identification numbers in e-mail. We are unable to accept account transactions sent via e-mail.
90
Columbia Acorn Family of Funds
Class Z Shares
Annual Report – December 31, 2006
Columbia Management®
PRESORTED
FIRST-CLASS MAIL
U.S. POSTAGE PAID
HOLLISTON, MA
PERMIT NO. 20
©2007 Columbia Management Distributors, Inc.
One Financial Center, Boston, MA 02111-2621
800-345-6611 www.columbiafunds.com
SHC-42/116427 (02/07) 07/33630

4Q
Columbia Acorn
Family of Funds
Class ABC Shares
Annual Report
December 31, 2006
n ColumbiaTM
Acorn® Fund
n ColumbiaTM
Acorn International®
n ColumbiaTM
Acorn USA®
n ColumbiaTM
Acorn International SelectSM
n ColumbiaTM
Acorn SelectSM
n ColumbiaTM
Thermostat FundSM
Managed by Columbia Wanger Asset Management, L.P.
NOT FDIC INSURED
May Lose Value
No Bank Guarantee
Columbia Acorn Family of Funds
Net Asset Value Per Share as of 12/31/06
| Columbia Acorn Fund | Columbia Acorn International | Columbia Acorn USA | Columbia Acorn International Select | Columbia Acorn Select | Columbia Thermostat Fund | ||||||||||||||||||||||
| Class A | $ | 29.02 | $ | 40.07 | $ | 28.02 | $ | 27.68 | $ | 26.18 | $ | 12.59 | |||||||||||||||
| Class B | $ | 27.78 | $ | 39.39 | $ | 26.87 | $ | 26.73 | $ | 25.13 | $ | 12.62 | |||||||||||||||
| Class C | $ | 27.70 | $ | 39.35 | $ | 26.81 | $ | 26.70 | $ | 25.07 | $ | 12.62 | |||||||||||||||
2006 Year-End Distributions
The following table details the Funds' year-end distributions. The record date for all Funds except Thermostat Fund was December 7, 2006. The ex-dividend date was December 8, 2006, and the payable date was December 11, 2006. For Thermostat Fund, the record date was December 21, 2006. The ex-dividend date was December 22, 2006, and the payable date was December 26, 2006. Acorn International Select did not have any year-end distributions.
| Short-term Capital Gains | Long-term Capital Gains | Ordinary Income | Reinvestment Price | ||||||||||||||||
| Columbia | |||||||||||||||||||
| Acorn Fund Class A | $ | 0.0792 | $ | 1.9924 | $ | 0.0410 | $ | 29.13 — | A | ||||||||||
| Columbia | |||||||||||||||||||
| Acorn Fund Class B and C | $ | 0.0792 | $ | 1.9924 | None | $ | 27.89 — | B | |||||||||||
| $ | 27.82 — | C | |||||||||||||||||
| Columbia | |||||||||||||||||||
| Acorn International Class A | None | $ | 3.3557 | $ | 0.3210 | $ | 38.57 — | A | |||||||||||
| Columbia | |||||||||||||||||||
| Acorn International Class B | None | $ | 3.3557 | $ | 0.0654 | $ | 37.94 — | B | |||||||||||
| Columbia | |||||||||||||||||||
| Acorn International Class C | None | $ | 3.3557 | $ | 0.0272 | $ | 37.90 — | C | |||||||||||
| Columbia | |||||||||||||||||||
| Acorn USA Class A, B and C | None | $ | 0.5052 | None | $ | 28.32 — | A | ||||||||||||
| $27.16 — B | |||||||||||||||||||
| $ | 27.11 — | C | |||||||||||||||||
| Columbia | |||||||||||||||||||
| Acorn Select Class A, B and C | None | $ | 0.4991 | None | $ | 25.76 — | A | ||||||||||||
| $ | 24.72 — | B | |||||||||||||||||
| $ | 24.67 — | C | |||||||||||||||||
| Columbia | |||||||||||||||||||
| Thermostat Fund Class A | $ | 0.0558 | $ | 0.4201 | $ | 0.4633 | $ | 12.55 — | A | ||||||||||
| Columbia | |||||||||||||||||||
| Thermostat Fund Class B | $ | 0.0558 | $ | 0.4201 | $ | 0.3913 | $ | 12.59 — | B | ||||||||||
| Columbia | |||||||||||||||||||
| Thermostat Fund Class C | $ | 0.0558 | $ | 0.4201 | $ | 0.3669 | $ | 12.59 — | C | ||||||||||
The views expressed in the "Letter to Shareholders," "Squirrel Chatter II" and "In a Nutshell" commentary reflect the current views of the respective authors. These views are not guarantees of future performance and involve certain risks, uncertainties and assumptions that are difficult to predict so actual outcomes and results may differ significantly from the views expressed. These views are subject to change at any time based upon economic, market or other conditions and the respective parties disclaim any responsibility to update such views. These views may not be relied on as investment advice and, because investment decisions for a Columbia Acorn Fund are based on numerous factors, may not be relied on as an indication of trading intent on behalf of any particular Columbia Acorn Fund. References to specific company securities should not be construed as a recommendation or investment advice.
Letter to Shareholders from the
Columbia Acorn Trust Board of Trustees
The Trustees of the Columbia Acorn Trust are pleased to present this 2006 annual report to shareholders of the Columbia Acorn Family of Funds ("Acorn Funds").
Your Trustees have a fiduciary responsibility to govern the Acorn Funds solely for the purpose intended by their shareholders. That means overseeing the responsiveness of our service providers to the needs and interests of shareholders. Accordingly, our most critical tasks are to evaluate and select service providers and focus on their performance and accountability.
Shareholders of the Acorn Funds have received investment advisory services from Columbia Wanger Asset Management ("CWAM") and its predecessors for many years. Although ownership of CWAM has changed over recent years and CWAM is now owned by the Bank of America ("BOA"), we believe that the critical components required to provide strong investment performance have remained substantially intact at CWAM with the full support of your independent trustees.1 We monitor investment performance throughout the year and annually take a fresh look at the relationships with our service providers with a diligent review and negotiations to assure that our agreements for the next year are responsive to the rights and expectations of shareholders. We are pleased to report that we renewed our in vestment advisory agreement with CWAM for the year ending July 31, 2007.
Expenses paid by the Acorn Funds reduce your total investment returns. Your Trustees are sensitive to the relative importance of fund expenses to shareholders, and we diligently review those expenses on a regular basis. You should note that total expenses of most share classes of each Acorn Fund, expressed as a percentage of the Fund's net assets, declined again in 2006, continuing a trend of recent years. For the Thermostat Fund, total expenses used for this comparison included expenses incurred by the Fund from underlying portfolio funds. The one exception to a decrease in 2006 was the Class Z shares of Columbia Acorn Fund, which had an expense ratio that was unchanged from the prior year.
Your Trustees acted on other matters during the past year. We raised the minimum initial investment for new shareholders in Columbia Acorn International, Columbia Acorn International Select and Columbia Thermostat to $2,500. (The other Funds already had higher minimums.) We negotiated new breakpoints in the investment advisory fee rates above current asset levels for Columbia Acorn USA and Columbia Acorn Select to provide for a greater sharing of economies of scale as future asset growth occurs. We negotiated a new transfer agency and shareholder servicing agreement that has changed the cost of transfer agency services. The fees for those services now cover all sub-transfer agency services provided by financial intermediaries, and Columbia Management Services will no longer waive its right to reimbursement by the Funds for its out-of-pocket expenses. The new agreement will be fully implemented on April 1, 2007 and is estimated t o result in a change of fees paid by shareholders of various share classes in each fund ranging from some decreases to increases up to approximately three basis points. We also reduced the annual rate of Rule 12b-1 fees for Class B shares in all funds from 85 to 75 basis points effective August 1, 2006.
As reported in prior years, we have been waiting for a final determination by an Independent Distribution Consultant ("IDC") on distributions to shareholders of certain Acorn Funds arising from the 2004 settlement of regulatory proceedings involving BOA. Your Board of Trustees has monitored the IDC's process of developing the distribution plan, and we have made recommendations. We recently have been advised that the approval of a definitive plan of distribution is imminent and, based on that information, we expect certain shareholders of Columbia Acorn International Fund and Columbia Acorn International Select Fund to receive distributions. Rust
Consulting (a separate entity not affiliated with BOA) has been engaged to administer the distributions. Rust Consulting will be sending checks and related information to those shareholders who are eligible to receive payments once the plan of distribution is approved.
We are pleased to report that two new independent trustees were elected to the Board during the past year: James A. Star and Patricia H. Werhane. They have impressive backgrounds and experience suited for our Board, and we believe shareholders will benefit from their contributions.
On September 26, 2006 CWAM and the Board held an annual shareholder information meeting in Chicago. The objective of the annual shareholder meeting is to provide information about the investment process and an opportunity to interact with the investment managers of CWAM. The meeting was available on telephone replay for those who could not attend. Next year, in an attempt to increase shareholder attendance, we are considering holding the meeting at a different time of day. We also are exploring other electronic alternatives to make the information available for shareholders who do not reside in Chicago and cannot attend in person. We hope you will take advantage of this opportunity to learn more about the professional managers of CWAM and how your money is managed.
Thank you for your confidence in the Acorn Funds.

Robert E. Nason
Independent Chairman of the Board of Trustees
Columbia Acorn Trust
1 Past performance is no guarantee of future results. The investment return and principal value will fluctuate so that shares may be worth more or less than the original cost. Please consider the investment objectives, risks, charges and expenses of the Acorn Funds carefully before investing.
Columbia Acorn Family of Funds
Table of Contents
| Share Class Performance | 2 | ||||||
| Fund Performance vs. Benchmarks | 3 | ||||||
| Squirrel Chatter II Small Caps: The Dilbert Antidote | 4 | ||||||
| Understanding Your Expenses | 8 | ||||||
| Columbia Acorn Fund | |||||||
| In a Nutshell | 10 | ||||||
| At a Glance | 11 | ||||||
| Major Portfolio Changes | 22 | ||||||
| Statement of Investments | 24 | ||||||
| Columbia Acorn International | |||||||
| In a Nutshell | 12 | ||||||
| At a Glance | 13 | ||||||
| Major Portfolio Changes | 35 | ||||||
| Statement of Investments | 37 | ||||||
| Portfolio Diversification | 43 | ||||||
| Columbia Acorn USA | |||||||
| In a Nutshell | 14 | ||||||
| At a Glance | 15 | ||||||
| Major Portfolio Changes | 44 | ||||||
| Statement of Investments | 45 | ||||||
| Columbia Acorn International Select | |||||||
| In a Nutshell | 16 | ||||||
| At a Glance | 17 | ||||||
| Major Portfolio Changes | 51 | ||||||
| Statement of Investments | 52 | ||||||
| Portfolio Diversification | 55 | ||||||
| Columbia Acorn Select | |||||||
| In a Nutshell | 18 | ||||||
| At a Glance | 19 | ||||||
| Major Portfolio Changes | 56 | ||||||
| Statement of Investments | 57 | ||||||
| Columbia Thermostat Fund | |||||||
| In a Nutshell | 20 | ||||||
| At a Glance | 21 | ||||||
| Statement of Investments | 60 | ||||||
| Columbia Acorn Family of Funds | |||||||
| Statements of Assets and Liabilities | 62 | ||||||
| Statements of Operations | 63 | ||||||
| Statements of Changes in Net Assets | 64 | ||||||
| Financial Highlights | 68 | ||||||
| Notes to Financial Statements | 75 | ||||||
| Report of Independent Registered Public Accounting Firm | 83 | ||||||
| Unaudited Information | 84 | ||||||
| Management Fee Evaluation of the Senior Officer | 85 | ||||||
| Board Approval of the Advisory Agreements | 90 | ||||||
| Board of Trustees and Management of Columbia Acorn Funds | 93 | ||||||
| Columbia Acorn Family of Funds Information | 96 | ||||||
1
Columbia Acorn Family of Funds
Share Class Performance Average Annual Total Returns through 12/31/06
| Class A | Class B | Class C | |||||||||||||||||||||||||
| Without Sales Charge | With Sales Charge | Without Sales Charge | With Sales Charge | Without Sales Charge | With Sales Charge | ||||||||||||||||||||||
| Columbia Acorn Fund (10/16/00) | |||||||||||||||||||||||||||
| 3 months* | 7.59 | % | 1.40 | % | 7.43 | % | 2.43 | % | 7.37 | % | 6.37 | % | |||||||||||||||
| 1 year | 14.13 | % | 7.57 | % | 13.43 | % | 8.43 | % | 13.25 | % | 12.25 | % | |||||||||||||||
| 3 years | 15.93 | % | 13.66 | % | 15.13 | % | 14.37 | % | 15.03 | % | 15.03 | % | |||||||||||||||
| 5 years | 14.23 | % | 12.88 | % | 13.46 | % | 13.22 | % | 13.41 | % | 13.41 | % | |||||||||||||||
| Life of fund | 13.56 | % | 12.49 | % | 12.82 | % | 12.82 | % | 12.77 | % | 12.77 | % | |||||||||||||||
| Columbia Acorn International (10/16/00) | |||||||||||||||||||||||||||
| 3 months* | 14.36 | % | 7.78 | % | 14.18 | % | 9.18 | % | 14.15 | % | 13.15 | % | |||||||||||||||
| 1 year | 34.16 | % | 26.44 | % | 33.26 | % | 28.26 | % | 33.14 | % | 32.14 | % | |||||||||||||||
| 3 years | 28.06 | % | 25.55 | % | 27.14 | % | 26.52 | % | 27.09 | % | 27.09 | % | |||||||||||||||
| 5 years | 20.85 | % | 19.43 | % | 20.01 | % | 19.82 | % | 19.99 | % | 19.99 | % | |||||||||||||||
| Life of fund | 11.09 | % | 10.04 | % | 10.35 | % | 10.35 | % | 10.32 | % | 10.32 | % | |||||||||||||||
| Columbia Acorn USA (10/16/00) | |||||||||||||||||||||||||||
| 3 months* | 4.70 | % | -1.32 | % | 4.54 | % | -0.46 | % | 4.47 | % | 3.47 | % | |||||||||||||||
| 1 year | 7.95 | % | 1.74 | % | 7.29 | % | 2.29 | % | 7.14 | % | 6.14 | % | |||||||||||||||
| 3 years | 13.47 | % | 11.25 | % | 12.69 | % | 11.90 | % | 12.61 | % | 12.61 | % | |||||||||||||||
| 5 years | 11.61 | % | 10.29 | % | 10.86 | % | 10.60 | % | 10.81 | % | 10.81 | % | |||||||||||||||
| Life of fund | 13.61 | % | 12.53 | % | 12.88 | % | 12.88 | % | 12.84 | % | 12.84 | % | |||||||||||||||
| Columbia | |||||||||||||||||||||||||||
| Acorn International Select (10/16/00) | |||||||||||||||||||||||||||
| 3 months* | 12.98 | % | 6.48 | % | 12.78 | % | 7.78 | % | 12.75 | % | 11.75 | % | |||||||||||||||
| 1 year | 35.97 | % | 28.15 | % | 35.00 | % | 30.00 | % | 34.85 | % | 33.85 | % | |||||||||||||||
| 3 years | 24.83 | % | 22.39 | % | 24.04 | % | 23.38 | % | 23.91 | % | 23.91 | % | |||||||||||||||
| 5 years | 18.42 | % | 17.03 | % | 17.64 | % | 17.43 | % | 17.58 | % | 17.58 | % | |||||||||||||||
| Life of fund | 7.82 | % | 6.80 | % | 7.09 | % | 7.09 | % | 7.06 | % | 7.06 | % | |||||||||||||||
| Columbia Acorn Select (10/16/00) | |||||||||||||||||||||||||||
| 3 months* | 10.37 | % | 4.02 | % | 10.27 | % | 5.27 | % | 10.20 | % | 9.20 | % | |||||||||||||||
| 1 year | 19.32 | % | 12.46 | % | 18.54 | % | 13.54 | % | 18.37 | % | 17.37 | % | |||||||||||||||
| 3 years | 16.03 | % | 13.76 | % | 15.20 | % | 14.44 | % | 15.11 | % | 15.11 | % | |||||||||||||||
| 5 years | 13.26 | % | 11.93 | % | 12.49 | % | 12.24 | % | 12.44 | % | 12.44 | % | |||||||||||||||
| Life of fund | 12.96 | % | 11.89 | % | 12.20 | % | 12.20 | % | 12.16 | % | 12.16 | % | |||||||||||||||
| Columbia Thermostat Fund (3/3/03)† | |||||||||||||||||||||||||||
| 3 months* | 4.01 | % | -1.97 | % | 3.84 | % | -1.01 | % | 3.82 | % | 2.84 | % | |||||||||||||||
| 1 year | 10.56 | % | 4.20 | % | 9.91 | % | 4.91 | % | 9.72 | % | 8.72 | % | |||||||||||||||
| 3 years | 8.22 | % | 6.10 | % | 7.56 | % | 6.69 | % | 7.42 | % | 7.42 | % | |||||||||||||||
| Life of fund | 12.29 | % | 10.57 | % | 11.58 | % | 11.00 | % | 11.47 | % | 11.47 | % | |||||||||||||||
*Not annualized.
Performance data quoted represents past performance and current performance may be lower or higher. Past performance is no guarantee of future results. The investment return and principal value of an investment in a Fund will fluctuate so that Fund shares, when redeemed, may be worth more or less than their original cost. Performance changes over time. Please visit columbiafunds.com for daily and most recent month-end performance updates.
The "with sales charge" returns include the maximum 5.75% sales charge for Class A shares, the appropriate Class B contingent deferred sales charge for the holding period after purchase as follows: through first year—5%, second year—4%, third year—3%, fourth year—3%, fifth year—2%, sixth year—1%, thereafter—0%; and the Class C contingent deferred sales charge of 1% for the first year only. Performance of the different share classes will vary based on differences in sales charges and fees associated with each class.
Performance results reflect any voluntary waivers or reimbursements of Fund expenses by the Adviser or its affiliates. Absent these waivers or reimbursement arrangements, performance results would have been lower.
†A "fund of funds" bears its allocable share of the costs and expenses of the underlying funds in which it invests. Such funds are thus subject to two levels of fees and potentially higher expense ratios than would be associated with an investment in an investment fund that invests and trades directly in financial instruments under the direction of a single manager.
2
Columbia Acorn Family of Funds
Fund Performance vs. Benchmarks Class A Shares, without sales charge,
Average Annual Total Returns through 12/31/06
| 4th quarter* | 1 year | 3 years | 5 years | Life of Fund | |||||||||||||||||||
| Columbia (LACAX) Acorn Fund (10/16/00) | 7.59% | 14.13% | 15.93% | 14.23% | 13.56% | ||||||||||||||||||
| Russell 2500 | 8.70 | % | 16.17 | % | 14.10 | % | 12.19 | % | 10.48 | % | |||||||||||||
| S&P 500 | 6.70 | % | 15.79 | % | 10.44 | % | 6.19 | % | 2.22 | % | |||||||||||||
| Lipper Small-Cap Core Funds Index | 8.07 | % | 13.70 | % | 13.12 | % | 10.50 | % | 9.96 | % | |||||||||||||
| Lipper Mid-Cap Core Funds Index | 7.15 | % | 13.44 | % | 12.75 | % | 10.10 | % | 7.04 | % | |||||||||||||
| Columbia (LAIAX) Acorn International (10/16/00) | 14.36% | 34.16% | 28.06% | 20.85% | 11.09% | ||||||||||||||||||
| S&P/Citigroup EMI Global ex-US | 13.79 | % | 30.83 | % | 27.31 | % | 24.39 | % | 16.05 | % | |||||||||||||
| MSCI EAFE | 10.35 | % | 26.34 | % | 19.93 | % | 14.98 | % | 7.82 | % | |||||||||||||
| Lipper International Small-Cap Funds Index | 13.68 | % | 28.06 | % | 27.09 | % | 23.99 | % | 14.52 | % | |||||||||||||
| Columbia (LAUAX) Acorn USA (10/16/00) | 4.70% | 7.95% | 13.47% | 11.61% | 13.61% | ||||||||||||||||||
| Russell 2000 | 8.90 | % | 18.37 | % | 13.56 | % | 11.39 | % | 9.67 | % | |||||||||||||
| Lipper Small-Cap Core Funds Index | 8.07 | % | 13.70 | % | 13.12 | % | 10.50 | % | 9.96 | % | |||||||||||||
| S&P 500 | 6.70 | % | 15.79 | % | 10.44 | % | 6.19 | % | 2.22 | % | |||||||||||||
| Columbia (LAFAX) Acorn International Select (10/16/00) | 12.98% | 35.97% | 24.83% | 18.42% | 7.82% | ||||||||||||||||||
| S&P/Citigroup World ex-US Cap Range $2-10B | 11.32 | % | 27.88 | % | 24.45 | % | 21.24 | % | 14.23 | % | |||||||||||||
| MSCI EAFE | 10.35 | % | 26.34 | % | 19.93 | % | 14.98 | % | 7.82 | % | |||||||||||||
| Lipper International Funds Index | 10.55 | % | 25.89 | % | 19.98 | % | 15.14 | % | 8.35 | % | |||||||||||||
| Columbia (LTFAX) Acorn Select (10/16/00) | 10.37% | 19.32% | 16.03% | 13.26% | 12.96% | ||||||||||||||||||
| S&P MidCap 400 | 6.99 | % | 10.32 | % | 13.09 | % | 10.89 | % | 9.14 | % | |||||||||||||
| Lipper Mid-Cap Growth Index | 7.71 | % | 11.02 | % | 11.53 | % | 6.09 | % | -1.48 | % | |||||||||||||
| S&P 500 | 6.70 | % | 15.79 | % | 10.44 | % | 6.19 | % | 2.22 | % | |||||||||||||
| Columbia (CTFAX) Thermostat Fund (3/3/03)† | 4.01% | 10.56% | 8.22% | N/A | 12.29% | ||||||||||||||||||
| S&P 500 | 6.70 | % | 15.79 | % | 10.44 | % | N/A | 16.67 | % | ||||||||||||||
| Lehman Brothers U.S. Credit Intermediate Bond Index | 1.27 | % | 4.49 | % | 3.32 | % | N/A | 3.84 | % | ||||||||||||||
| Lipper Flexible Portfolio Funds Index | 5.99 | % | 12.77 | % | 9.51 | % | N/A | 14.12 | % | ||||||||||||||
*Not annualized.
The Funds are listed under "Columbia" in the financial press.
Performance data quoted represents past performance and current performance may be lower or higher. Past performance is no guarantee of future results. The investment return and principal value of an investment in a Fund will fluctuate so that Fund shares, when redeemed, may be worth more or less than their original cost. Performance changes over time. Visit columbiafunds.com for daily and month-end updates.
Performance may reflect any voluntary waivers or reimbursements of fund expenses by the advisor or its affiliates. Absent these waivers, or reimbursement arrangements, performance results may be lower.
†A "fund of funds" bears its allocable share of the costs and expenses of the underlying funds in which it invests. Such funds are thus subject to two levels of fees and potentially higher expense ratios than would be associated with an investment in an investment fund that invests and trades directly in financial instruments under the direction of a single manager.
Description of indexes: S&P 500 is a broad, market-weighted average of 500 U.S. blue-chip companies stock performance. S&P MidCap 400 is a broad market-weighted index of 400 stocks that are in the next size/tier down from the S&P 500. Russell 2000 is a market-weighted index of 2000 smaller U.S. companies, formed by taking the largest 3,000 companies and eliminating the largest 1,000. Russell 2500 is the smallest 2,500 U.S. companies from this same group. S&P/Citigroup EMI Global ex-US is the bottom 20% of institutionally investable capital of developed and emerging (after 9/30/1994) countries, selected by the index sponsor, outside the U.S. MSCI EAFE is Morgan Stanley's Europe, Australasia and Far East Index, a widely recognized international benchmark that comprises 20 major markets in proportion to world stock market capitalization. S&P/Citigroup World ex-US Cap Range $2–10B is a subset of the broad market selected by the index sponsor rep resenting the mid-cap developed market excluding the U.S. Lipper Indexes include the largest funds tracked by Lipper, Inc. in the named category. Lipper Mid-Cap Growth Index, 30 mid-cap growth funds; Lipper Mid-Cap Core Funds Index, 30 mid-cap core funds; Lipper International Funds Index, 30 largest non-U.S. funds, not including non-U.S. small-cap funds; Lipper International Small-Cap Funds Index, 10 largest non-U.S. funds investing in small-cap companies, including Columbia Acorn International; Lipper Small-Cap Core Funds Index, 30 largest small-cap core funds, including Columbia Acorn Fund. Lipper Flexible Portfolio Funds Index is an equal dollarweighted index of the 30 largest mutual funds within the Flexible Portfolio fund classification, as defined by Lipper. Lehman Brothers U.S. Credit Intermediate Bond Index is the inte rmediate component of the U.S. Credit Index. The U.S. Credit Index includes publicly issued U.S. corporate and foreign debentures and secured notes that meet specified maturity, liquidity, and quality requirements. All indexes are unmanaged and returns include reinvested distributions. It is not possible to invest directly in an index.
3
Squirrel Chatter II
Small Caps: The Dilbert Antidote
 Small Caps vs. Large Caps
Small caps edged out large caps in 2006. The Russell 2500 Index appreciated 16.17%, barely more than the S&P 500's 15.79% return, but enough to keep the domestic small-cap winning streak intact.
Our data indicates that the current small-cap cycle began in March 1999. From the end of March 1999 through year-end 2006, the small-cap Russell 2500 Index returned a total of 144.40%, or 12.22% annually. In contrast, the large-cap S&P 500 Index gained 24.69%, or 2.89% annually.
Why have small caps beaten large caps so much for such a long cycle? By many measures, small caps were at 20-year record low relative valuations at the start of the cycle. In contrast, many large caps then seemed very expensive and of course the "bubble" did deflate starting in the first quarter of 2000.
Small-cap earnings growth also helps explain stock performance. Since the beginning of the March 1999 cycle, Russell 2500 Index earnings per share were up 11.11% annually, while large-cap S&P 500 Index earnings were up 7.10% annually. A combination of cheap stocks and faster earnings growth often provides superior investment results.
In the Funds' 2005 third quarter report to shareholders, I expressed concerns about small-cap valuations. I was perhaps early or maybe just plain wrong. As a firm, we remain cautious, but note that there seems to be no "small-cap mania" or other obvious warning signal for the imminent end of the small-cap cycle. It has become more challenging to find small companies at reasonable prices, but when we see opportunities, we try to take them. For instance, many smaller stocks declined last summer while we believed the business environment was healthy. In September 2006 we took advantage of the slump and added to some of our domestic names at what we thought were good prices.
Small caps have also outperformed over the very long run. The Russell 2500 Index goes back only to 1978, but scholars have linked other time series to derive small- and large-cap performance numbers since 1926.1 From the beginning of 1926 until year-end 2006, small caps returned 12.32% annually while large caps had annual returns of 10.43%. The difference of 1.89% per year may not sound like much, but when compounded over 81 years it makes an enormous difference. A $1,000 investment in small caps would have appreciated to $12,195,329, while the same amount in large caps would have grown to "only" $3,088,420.2
Why have small caps clobbered large caps over the very long term? It seems that many large companies have had problems. We are all aware when a large company such as Enron has a sudden and dramatic collapse. It's big news (kind of like the Hindenburg disaster). But a substantial number of other large companies have more gradually lost market dominance and have provided poor returns to shareholders for years.
At the beginning of the 20th century, United States Steel was the largest stock on the New York Stock Exchange (NYSE). The company fell so far near the end of the century that it was added into the Russell 2500 Index. (As it recovered it was a major upside driver to the benchmark until it graduated out in June 2006.) More recently Kodak, General Motors and Sears spent at least one year between 1966 and 1971 among the top five NYSE capitalization companies. They now do not even rank among the top 300.3 These sorts of declines merit further analysis.
From the Desk of Dilbert
Since we are students of smaller companies, when considering reasons for large company declines, we need to turn to experts on large companies. Scott Adams, in his book, The Dilbert Principle, points out that he worked for a large company for seventeen years. He writes, "Most business books are written by consultants and professors who haven't spent much time in a cubicle."4
4
Adams parodies the experiences of employees and management of large companies. He makes his money writing comic strips on the topic. In Dilbert's world his company is a politicized bureaucracy populated by stupid, arrogant managers who do not value employees or customers. His boss is every employee's worst nightmare. Still, Adams' views from his cubicle do provide some useful and humorous insights.
Adams points out early on that people are idiots, including himself. He offers this true example of idiots on the customer side: "Kodak introduced a single use camera called the Weekender. Customers have called the support line to ask if it's okay to use it during the week."5 While this anecdote does not explain Kodak's decline it certainly supports Adams' point!
Since larger companies have more people, one may infer that they have more idiots. But, more seriously, Adams notes that large companies often systematically divert employees away from serving customers and place them on committees to develop things like Mission Statements. Once a Mission Statement ("a long awkward sentence that demonstrates management's inability to think clearly"6) is painstakingly created, next can come a Vision Statement. Large companies also like to hire consultants who in turn tell management (a) to change processes and structures but not the management, (b) to do what employees have been trying to tell them to do, or (c) to authorize more consulting. Worse yet ... "large companies have legal departments. No project is so risk-free that your company lawyer can't kill it."7
Adams suggests obvious ways for large companies to succeed. They include focusing on improving employees and products rather than pursuing bureaucratic tasks or adopting the latest managerial fad.
The Innovator's Dilemma
For another take on the business world, we turned to Harvard Business School professor Clayton Christensen. His book, The Innovator's Dilemma,8 explains how well-managed companies often miss opportunities and are injured by new competitors offering disruptive innovations.
Well managed companies tend to listen to customers, study and forecast underlying demand, invest heavily in research, and watch for competitors. They develop improved new products or services that address large established markets and often promise higher margins.
Christensen explains that existing customers often do not want disruptive new products or services. Nascent markets are by nature tiny and unpredictable. At first, disruptive innovations often provide lower performance and margins. Success for these innovations seems unlikely and large companies appear rational to not invest in them.
But this seemingly rational path is often a mistake. Christensen's examples include makers of computer disk drives, minicomputers, mechanical excavators and steel. In each case, existing customers had little desire for innovative new products or processes, which admittedly had some inferior attributes like price/performance or quality vs. existing products. The innovators found niche customers who appreciated some aspects of the new product such as size, ruggedness, or cost, and then improved their products at a faster rate than competitors. What had been an inferior product became fully competitive, at a lower cost.
How can a large company compete against a possible disruptive innovation? Imagine a smart manager saying, "Hey guys, I've got this new, lower performance, lower-margin product that existing customers say they don't want, but we should invest in it anyway should a market develop, in which case we will improve it over time. And oh, by the way, we need to divert people from existing high margin products." That is unlikely. Instead, as Christensen points out, the company's management often decides to continue to go up market, producing high gross-margin products for existing customers. More often than not, this decision is a mistake. Companies unwilling to innovate tend to eventually lose market share.
Christensen offers possible ways for large companies to innovate. A favorite is to create a small, preferably remote, autonomous division with agility and
5
a low-cost structure, whose sole focus is to develop an innovation and sell it to new customers. The division must be able to experience short-term failures and change tactics. Though some large companies have succeeded by taking this approach, few come to mind. This solution is anathema to Dilbert-style bureaucracies and managements.
Small Company Advantages
Most startups and small companies focus on hiring and keeping good employees and providing customers fine products or services. Many are created by refugees from large companies who rejected bureaucracies. Small companies with distinct cultures may not need 72-page expense policies. These companies appear to have more streamlined policies, and some seem to abide by a sort of simplified Golden Rule: "Serve the customers, spend company money wisely, and behave like the founder does." If Adams had started work at a small company he might have remained there, reasonably content. But the world would be poorer without Dilbert.
Christensen says, "Large companies often surrender emerging growth markets because smaller, disruptive companies are actually more capable of pursuing them... Their values embrace small markets, and their cost structures can accommodate lower margins. Their market research and resource allocation processes allow managers to proceed intuitively rather than having to be backed up by careful research and analysis, presented in PowerPoint."9 Small companies seem to have DNA that naturally corresponds to both Adams' and Christensen's managerial solutions.
We admit being clearly biased towards small caps but the reality is that more small companies fail than large companies (in part because there are more small companies to begin with). Small company failures are less newsworthy events and rarely warrant major stories (kind of like third-world bus plunges10). We've owned our share of disappointing companies, including a few bankruptcies.
While there are losers in both the large and small cap ranks, a minority of enormously successful small-cap companies with that innovative DNA have driven overall small-cap returns. That is why we believe small-cap investing can be a winner's game. We've had dozens of what we believe to be spectacular winners over the life of the Columbia Acorn Funds. These have far offset our losers and may be worthy of their own Squirrel Chatter II column in the future.

Charles P. McQuaid
President and Chief Investment Officer
Columbia Wanger Asset Management, L.P.
1 U.S. Small Stock Total Return (Morningstar/Ibbottson Encor Application) linked with the Russell 2500 Index on 12/31/1978. Large-cap data based on the S&P 500.
2 Keep in mind that an investment cannot be made directly in an index, and past performance is no guarantee of future results. This is for illustrative purposes only and not indicative of any investment. The data assumes reinvestment of all income and does not account for taxes or transaction costs. Source: U.S. Small Stock Total Return linked with the Russell 2500 on 12/31/1978 and, for large caps, the S&P 500. Both equity categories soundly beat inflation. At year end 2006, $11,384 had the purchasing power of $1,000 in 1926. Inflation data from inflationdata.com, calculated using the CPI Index.
3 As of January 9, 2007.
4 Adams, Scott, The Dilbert Principle (New York: HarperCollins Publishers, 1996), pg. 4.
5 Ibid., pg. 9.
6 Ibid., pg. 36.
7 Ibid., pg. 88.
8 Christensen, Clayton M., The Innovator's Dilemma, (New York: HarperCollins Publishers, 1997)
9 Ibid., pg. 192.
10 In Tim Miller's The Panama Hat Trail (New York: William Morrow and Company, Inc., 1986), the author confesses his fears about Latin American bus rides. These fears have been brought on by years of reading standard, two-sentence bus-plunge pieces used by newspapers in the United States as fillers on the foreign-news page. The date lines change, but the headlines always include the words "bus plunge."
Stocks of small- and mid-cap companies pose special risks, including possible illiquidity and greater price volatility than stocks of larger, more established companies. International investing involves special risks, including foreign taxation, currency risks, risks associated with possible differences in financial standards and other risks associated with future political and economic developments. A fund that maintains a relatively concentrated portfolio may be subject to greater risk than a fund that is more fully diversified.
Past performance is no guarantee of future results.
6
This page intentionally left blank.
7
Understanding Your Expenses
As a Fund shareholder, you incur two types of costs. There are transaction costs, which generally include sales charges on purchases and may include redemption or exchange fees. There are also ongoing costs, which generally include investment advisory fees, Rule 12b-1 fees and other Fund expenses. The information on this page is intended to help you understand your ongoing costs of investing in the Columbia Acorn Funds and to compare these costs with the ongoing costs of investing in other mutual funds.
Analyzing your Fund's expenses
To illustrate these ongoing costs, we have provided examples and calculated the expenses paid by investors in the Class A, B, and C shares of the Columbia Acorn Funds for the last six months. The information in the following table is based on an initial hypothetical investment of $1,000, which is invested at the beginning of the reporting period and held for the entire period. Expense information is calculated two ways and each method provides you with different information. The amount listed in the "Actual" column is calculated using each Fund's actual operating expenses and total return for the period. The amount listed in the "Hypothetical" column assumes that the return each year is 5% before expenses and then applies each Fund's actual expense ratio for the period to the hypothetical return. You should not use the hypothetical account values and expenses to estimate either your actual account balance at the end of the perio d or the expenses you paid during the reporting period. See the "Compare with other funds" information for details on using the hypothetical data.
Compare with other funds
Since all mutual funds are required to include the same hypothetical calculations about expenses in shareholder reports, you can use this information to compare the ongoing cost of investing in the Funds with other funds. To do so, compare the 5% hypothetical example with the 5% hypothetical examples that appear in the shareholder reports of other funds. As you compare hypothetical examples of other funds, it is important to note that hypothetical examples are meant to highlight the continuing costs of investing in a fund and do not reflect any transaction costs, such as sales charges or redemption or exchange fees.
Estimating your actual expenses
To estimate the expenses that you actually paid over the period, first you will need your account balance at the end of the period:
• For shareholders who receive their account statements from Columbia Management Services, Inc., your account balance is available online at columbiafunds.com or by calling Shareholder Services at (800) 922-6769.
• For shareholders who receive their account statements from their brokerage firm, contact your brokerage firm to obtain your account balance.
1. Divide your ending account balance by $1,000. For example, if an account balance was $8,600 at the end of the period, the result would be 8.6.
2. In the section of the table titled "Expenses paid during the period," locate the amount for your Fund. You will find this number is in the column labeled "Actual." Multiply this number by the result from step 1. Your answer is an estimate of the expenses you paid on your account during the period.
8
July 1, 2006 – December 31, 2006
| Account value at the beginning of the period ($) | Account value at the end of the period ($) | Expenses paid during the period ($) | Fund's annualized expense ratio (%)* | ||||||||||||||||||||||||||||
| Actual | Hypothetical | Actual | Hypothetical | Actual | Hypothetical | Actual | |||||||||||||||||||||||||
| Columbia Acorn Fund | |||||||||||||||||||||||||||||||
| Class A | 1,000.00 | 1,000.00 | 1,080.30 | 1,020.01 | 5.40 | 5.24 | 1.03 | ||||||||||||||||||||||||
| Class B | 1,000.00 | 1,000.00 | 1,076.98 | 1,017.04 | 8.48 | 8.24 | 1.62 | ||||||||||||||||||||||||
| Class C | 1,000.00 | 1,000.00 | 1,076.02 | 1,016.13 | 9.42 | 9.15 | 1.80 | ||||||||||||||||||||||||
| Columbia Acorn International | |||||||||||||||||||||||||||||||
| Class A | 1,000.00 | 1,000.00 | 1,175.68 | 1,018.90 | 6.85 | 6.36 | 1.25 | ||||||||||||||||||||||||
| Class B | 1,000.00 | 1,000.00 | 1,171.70 | 1,015.83 | 10.18 | 9.45 | 1.86 | ||||||||||||||||||||||||
| Class C | 1,000.00 | 1,000.00 | 1,170.79 | 1,015.02 | 11.05 | 10.26 | 2.02 | ||||||||||||||||||||||||
| Columbia Acorn USA | |||||||||||||||||||||||||||||||
| Class A | 1,000.00 | 1,000.00 | 1,057.92 | 1,018.80 | 6.59 | 6.46 | 1.27 | ||||||||||||||||||||||||
| Class B | 1,000.00 | 1,000.00 | 1,054.70 | 1,015.68 | 9.79 | 9.60 | 1.89 | ||||||||||||||||||||||||
| Class C | 1,000.00 | 1,000.00 | 1,053.59 | 1,014.82 | 10.66 | 10.46 | 2.06 | ||||||||||||||||||||||||
| Columbia Acorn International Select | |||||||||||||||||||||||||||||||
| Class A | 1,000.00 | 1,000.00 | 1,206.08 | 1,017.39 | 8.62 | 7.88 | 1.55 | ||||||||||||||||||||||||
| Class B | 1,000.00 | 1,000.00 | 1,201.90 | 1,013.96 | 12.38 | 11.32 | 2.23 | ||||||||||||||||||||||||
| Class C | 1,000.00 | 1,000.00 | 1,201.09 | 1,013.36 | 13.04 | 11.93 | 2.35 | ||||||||||||||||||||||||
| Columbia Acorn Select | |||||||||||||||||||||||||||||||
| Class A | 1,000.00 | 1,000.00 | 1,133.19 | 1,018.95 | 6.67 | 6.31 | 1.24 | ||||||||||||||||||||||||
| Class B | 1,000.00 | 1,000.00 | 1,129.91 | 1,015.83 | 9.99 | 9.45 | 1.86 | ||||||||||||||||||||||||
| Class C | 1,000.00 | 1,000.00 | 1,128.70 | 1,014.97 | 10.89 | 10.31 | 2.03 | ||||||||||||||||||||||||
| Columbia Thermostat Fund | |||||||||||||||||||||||||||||||
| Class A | 1,000.00 | 1,000.00 | 1,080.00 | 1,022.68 | 2.62 | 2.55 | 0.50 | ||||||||||||||||||||||||
| Class B | 1,000.00 | 1,000.00 | 1,076.62 | 1,020.11 | 5.29 | 5.14 | 1.01 | ||||||||||||||||||||||||
| Class C | 1,000.00 | 1,000.00 | 1,075.52 | 1,018.90 | 6.54 | 6.36 | 1.25 | ||||||||||||||||||||||||
Expenses paid during the period are equal to each Fund's annualized expense ratio, multiplied by the average account value over the period and then multiplied by the number of days in the Fund's most recent fiscal half-year and divided by 365.
Had the investment adviser and/or transfer agent not reimbursed/waived a portion of expenses, total return would have been reduced.
It is important to note that the expense amounts shown in the table are meant to highlight only ongoing costs of investing in the Funds and do not reflect any transaction costs, such as sales charges, redemption or exchange fees. Therefore, the hypothetical examples provided may not help you determine the relative total costs of owning different funds. If these transaction costs were included, your costs would have been higher.
Columbia Thermostat Fund's expenses do not include fees and expenses incurred by the Fund from the underlying portfolio funds.
*For the six months ended December 31, 2006.
9
Columbia Acorn Fund
In a Nutshell

Charles P. McQuaid
Lead Portfolio Manager

Robert A. Mohn
Co-Portfolio Manager
Performance data quoted represents past performance and current performance may be lower or higher. Past performance is no guarantee of future results. The investment return and principal value of an investment in the Fund will fluctuate so that shares, when redeemed, may be worth more or less than the original cost. Performance may reflect any voluntary waivers or reimbursements of fund expenses by the Adviser or its affiliates. Absent these waivers, or reimbursement arrangements, performance results may be lower. Please visit columbiafunds.com for daily and most recent month-end performance updates.
Fund's Positions
in Mentioned Holdings
As of 12/31/06, the Fund's positions in the holdings mentioned were:
| Coach | 1.7 | % | |||||
| People's Bank of Bridgeport | 1.0 | % | |||||
| Chico's FAS | 0.8 | % | |||||
| SEI Investments | 0.8 | % | |||||
| Time Warner Telecom | 0.5 | % | |||||
| Christopher & Banks | 0.4 | % | |||||
| Hong Kong Exchanges and Clearing | 0.4 | % | |||||
| Chattem | 0.3 | % | |||||
| UrAsia Energy | 0.3 | % | |||||
| Jubilee Mines | 0.2 | % | |||||
| Station Casinos | 0.2 | % | |||||
| USG People | 0.2 | % | |||||
| Vallourec | 0.2 | % | |||||
Portfolio characteristics and holdings are subject to change periodically and may not be representative of current characteristics and holdings.
Columbia Acorn Fund returned 14.13% (Class A shares, without sales charge) in 2006, somewhat less than the 16.17% gain of the Russell 2500 Index, its most comparable benchmark. As shown on Page 2, the Fund slightly beat the Lipper Small- and Mid-Cap Core Indexes for the year. While we are disappointed that the Fund's 10-year outperformance streak ended, we are pleased that it did well vs. its peers.
In 2006, many small- and mid-cap managers had a tough time beating benchmarks, as microcaps, real estate investment trusts ("REITs"), utilities and materials companies outperformed. We had relatively few investments in microcaps, due to what we believed were high valuations. While the Fund's REITs, utilities and materials stocks outperformed, the Fund did not own enough of them. We thought that REITs on average were expensive and we did not find enough utilities and materials companies that we thought were fundamentally attractive.
During the fourth quarter, the Fund rose 7.59%, slightly below the smaller cap indexes but slightly ahead of the larger cap indexes. Microcaps and materials stocks remained outperformers in the fourth quarter.
Foreign stocks continued to boost Columbia Acorn Fund performance, rising 45.37% in the year and 16.44% in the quarter. They include all four of the Fund's 2006 top percentage winners. Hong Kong Exchanges and Clearing traded up 173% on increased trading of Chinese securities, French pipe maker Vallourec surged 157% on rising demand from energy and process industries, Canada's UrAsia Energy popped 147% on rising uranium volumes and prices, and USG People, a Dutch temporary staffing company, jumped 105% due to increased demand from employers in Europe. We cut the Fund's position in Vallourec during the year, as we were concerned about competition and a possible slowdown in U.S. natural gas drilling. We also trimmed the Fund's positions in Hong Kong Exchanges and Clearing and USG People.
Australia's Jubilee Mines joined the foreign winner's circle in the fourth quarter, extracting a 63% gain on higher nickel prices and continued exploration success. In the three years ending 2006, Columbia Acorn Fund's foreign stocks rose 152%. Given such gains, we deemed it prudent to continue trimming. As of year-end 2006, foreign stocks were 12.5% of the Fund, down 0.5% in the quarter and 3.1% in the year.
Columbia Acorn Fund's largest dollar gainer for both periods was Coach, rising 29% in the year and 25% in the quarter on strong sales and margins. Other domestic big-dollar winners for the year included People's Bank of Bridgeport, coining a 48% return as it proceeded to demutualize fully, and SEI Investments, up 62% on solid earnings growth. Time Warner Telecom provided the best domestic percentage gain in the year, doubling on fine sales and cash flow momentum. The Fund's largest domestic percentage gainers in the quarter were Chattem, up 43% thanks to a highly accretive acquisition, and Station Casinos, winning 42% as it received a takeover bid. Some 26 of the Fund's stocks were subject to new takeover bids in 2006.
Retailers Chico's FAS and Christopher & Banks had merchandising problems in 2006. Chico's was the Fund's largest dollar loser and dropped 53% in the year. Christopher & Banks was the largest dollar loser for the quarter, off 36%. During the fourth quarter we bought some additional Chico's. While our opinions are subject to change, we believe both companies should do well going forward.
Small-cap stocks are often more volatile and less liquid than the stocks of larger companies. Small companies may have a shorter history of operations than larger companies and may have a less diversified product line, making them more susceptible to market pressure. Investments in foreign securities have special risks, including political or economic instability, higher costs, different regulations, accounting standards, trading practices and levels of information, and currency exchange rate fluctuations.
10
Columbia Acorn Fund (LACAX)
At a Glance
Performance data quoted represents past performance and current performance may be lower or higher. Past performance is no guarantee of future results. The investment return and principal value of an investment in the Fund will fluctuate so that Fund shares, when redeemed, may be worth more or less than their original cost. Performance may reflect any voluntary waivers or reimbursements of Fund expenses by the Adviser or its affiliates. Absent these waivers, or reimbursement arrangements, performance results may be lower. Visit columbiafunds.com for daily and most recent month-end performance updates.
Pretax and After-tax Average Annual Total Returns (Based on Class A Share Returns)
through December 31, 2006
| Inception 10/16/00 | 1 year | 5 years | Life of fund | ||||||||||||||||
| Returns before taxes | NAV POP | 14.13% 7.57 | 14.23% 12.88 | 13.56% 12.49 | |||||||||||||||
| Returns after taxes on distributions | NAV POP | 12.70 6.22 | 13.61 12.27 | 12.58 11.51 | |||||||||||||||
| Returns after taxes on distributions and sale of fund shares | NAV POP | 10.86 6.50 | 12.43 11.22 | 11.63 10.65 | |||||||||||||||
| Russell 2500 (pretax) | 16.17 | 12.19 | 10.48 | ||||||||||||||||
| S&P 500 (pretax) | 15.79 | 6.19 | 2.22 | ||||||||||||||||
After-tax returns are calculated using the highest historical individual federal marginal income tax rates, and do not reflect the impact of state and local taxes. Returns after taxes on distributions and sale of Fund shares reflect the tax impact of gains or losses realized when Fund shares are sold. The returns are taxed at the maximum rate and assume shares were purchased at the beginning of the period. Actual after-tax returns depend on the investor's tax situation and may differ from those shown. After-tax returns are not relevant to investors who hold their Fund shares through tax-deferred arrangements such as 401(k) plans or individual retirement accounts. After-tax returns are shown for Class A shares only; after-tax returns for other share classes will vary. Indexes do not reflect any deduction for fees, expenses or taxes. Investment returns and principal value may fluctuate, resulting in a gain or loss on sale.
Public offering price (POP) returns include the maximum sales charge of 5.75% for Class A shares. Net asset value (NAV) returns do not include sales charges or contingent deferred sales charges (CDSC).
Columbia Acorn Fund Portfolio Diversification
as a % of net assets as of 12/31/06
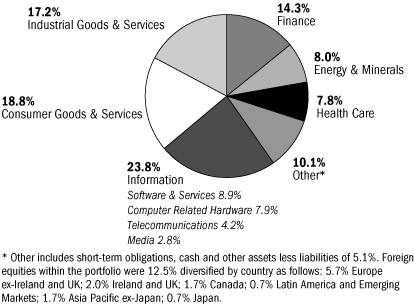
Columbia Acorn Fund Top 10 Holdings
as a % of net assets as of 12/31/06
| 1. | Coach Designer & Retailer of Branded Leather Accessories | 1.7 | % | ||||||||
| 2. | Expeditors International of Washington International Freight Forwarder | 1.2 | % | ||||||||
| 3. | Abercrombie & Fitch Teen Apparel Retailer | 1.2 | % | ||||||||
| 4. | People's Bank of Bridgeport Connecticut Savings & Loan | 1.0 | % | ||||||||
| 5. | Eaton Vance Specialty Mutual Funds | 1.0 | % | ||||||||
| 6. | FMC Technologies Oil & Gas Well Head Manufacturer | 0.9 | % | ||||||||
| 7. | AmeriCredit Auto Lending | 0.9 | % | ||||||||
| 8. | Genlyte Group Commercial Lighting Fixtures | 0.8 | % | ||||||||
| 9. | Ametek Aerospace/Industrial Instruments | 0.8 | % | ||||||||
| 10. | ITT Educational Services Post-secondary Degree Programs | 0.8 | % | ||||||||
The Fund's top 10 holdings and portfolio diversification vary with changes in portfolio investments. See the Statement of Investments for a complete list of the Fund's holdings.
The Growth of a $75,000 Investment in Columbia Acorn Fund (Class A)
October 16, 2000 through December 31, 2006
Illustration is based on a hypothetical $75,000 investment from inception in Class A shares of the Fund, which includes a 4.50% maximum initial sales charge for this level of investment. The index is unmanaged and returns for both the index and the Fund include reinvested dividends and capital gains. It is not possible to invest directly in an index. The graph does not reflect tax deductions that a shareholder would pay on Fund distributions or the sale of Fund shares.
Total Net Assets of the Fund:
$18,945.1 million
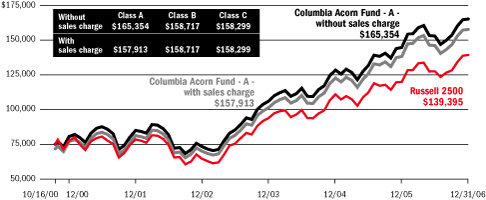
11
Columbia Acorn International
In a Nutshell

P. Zachary Egan
Co-Portfolio Manager

Louis J. Mendes III
Co-Portfolio Manager
Performance data quoted represents past performance and current performance may be lower or higher. Past performance is no guarantee of future results. The investment return and principal value of an investment in the Fund will fluctuate so that shares, when redeemed, may be worth more or less than the original cost. Performance may reflect any voluntary waivers or reimbursements of fund expenses by the Adviser or its affiliates. Absent these waivers, or reimbursement arrangements, performance results may be lower. Please visit columbiafunds.com for daily and most recent month-end performance updates.
Columbia Acorn International Fund gained 34.16% (Class A shares, without sales charge) in 2006, 3.33% ahead of the benchmark S&P/Citigroup EMI Global ex-US Index ("EMI"), and 7.82% ahead of the large-cap MSCI EAFE Index ("EAFE"). During the fourth quarter, the Fund rose 14.36%, ahead of both indexes. Aside from successful stock selection, the Fund's good results were driven by strong returns in Europe, where the Fund maintained a moderate overweight position, and by emerging markets. These areas more than offset declining markets in Japan, where the Fund maintained a slight underweight position. On a sector basis, energy, basic materials and industrials posted strong absolute and relative returns. The weakening U.S. dollar translated into a net gain of 7.50% for shareholders over the course of the year.
For the seventh consecutive year, international small-cap stocks outperformed relative to international large-cap stocks. At this time last year, we noted that the strong price movement of small-cap stocks globally had eroded the valuation discount to larger-caps. We were surprised that, among the regions we track, only Japanese small caps underperformed their large-cap counterparts in both the fourth quarter and the annual period.
In May through July, global small caps exhibited significant volatility. In a context of relatively high valuations, this seems to have been driven by anxiety about the sustainability of U.S. consumption, and the effects a U.S. slowdown would likely have on the global economy. This short-term correction reinforced our conviction that valuation matters a great deal when considering risk, even though many financial market participants look, rather, at historic volatility. It strikes us that higher valuations simply provide a lower margin of safety when making predictions in circumstances fraught with uncertainty.
Emerging markets as a group, which represent less than 20% of the Fund's exposure, posted another strong year, returning over 45%. It is noteworthy that emerging market bond spreads, a key indicator of perceived risk, have narrowed considerably. Whether risk in these markets is in fact lower, due to structural reforms and other factors, or if the lower risk premium simply reflects excess liquidity, remains a hotly contested issue. It is true that we are seeing an ever increasing number of dynamic, entrepreneurial companies coming to the market in industrializing countries, and fulfilling increasingly stringent listing requirements defined by the local exchanges. In Brazil, for example, the Novo Mercado now allows only one class of stock, which confers to minority investors a greater voice in corporate governance than was the case just five years ago, when non-voting preferred shares were commonplace.
We have remarked in past reports that the Japanese market is looking increasingly attractive in terms of valuation and fundamentals. After a strong second half of 2005, the Japanese market did an about face and ended 2006 as the planet's worst-performing major region. The Japan portion of the EMI declined nearly 11% in local currency, and small-cap stocks were hit particularly hard. In our opinion, this has strengthened the valuation argument for Japan. On a price-to-earnings comparison, Japanese small caps are now trading at a reasonable discount both to their average over the last decade (not surprising, given overvaluation), but also to small caps in other markets. The economy is improving, we are seeing reasonable growth in many small-cap companies, and strong balance sheets limit downside risk. Contingent upon our ability to find good investment ideas, we expect to continue moving money into Japanese companies in the course of 2007.
International investments involve greater potential risks, including less regulation, currency fluctuations, economic instability and political developments. Investments in small- and mid-cap companies may be subject to greater volatility and price fluctuations because they may be thinly traded and less liquid.
12
Columbia Acorn International (LAIAX)
At a Glance
Performance data quoted represents past performance and current performance may be lower or higher. Past performance is no guarantee of future results. The investment return and principal value of an investment in the Fund will fluctuate so that Fund shares, when redeemed, may be worth more or less than their original cost. Performance may reflect any voluntary waivers or reimbursements of Fund expenses by the Adviser or its affiliates. Absent these waivers, or reimbursement arrangements, performance results may be lower. Visit columbiafunds.com for daily and most recent month-end performance updates.
Pretax and After-tax Average Annual Total Returns (Based on Class A Share Returns)
through December 31, 2006
| Inception 10/16/00 | 1 year | 5 years | Life of fund | ||||||||||||||||
| Returns before taxes | NAV POP | 34.16% 26.44 | 20.85% 19.43 | 11.09% 10.04 | |||||||||||||||
| Returns after taxes on distributions | NAV POP | 31.91 24.33 | 20.32 18.91 | 10.18 9.14 | |||||||||||||||
| Returns after taxes on distributions and sale of fund shares | NAV POP | 24.51 19.36 | 18.50 17.20 | 9.43 8.48 | |||||||||||||||
| S&P/Citigroup EMI Global ex-US (pretax) | 30.83 | 24.39 | 16.05 | ||||||||||||||||
After-tax returns are calculated using the highest historical individual federal marginal income tax rates, and do not reflect the impact of state and local taxes. Returns after taxes on distributions and sale of Fund shares reflect the tax impact of gains or losses realized when Fund shares are sold. The returns are taxed at the maximum rate and assume shares were purchased at the beginning of the period. Actual after-tax returns depend on the investor's tax situation and may differ from those shown. After-tax returns are not relevant to investors who hold their Fund shares through tax-deferred arrangements such as 401(k) plans or individual retirement accounts. After-tax returns are shown for Class A shares only; after-tax returns for other share classes will vary. Indexes do not reflect any deduction for fees, expenses or taxes. Investment returns and principal value may fluctuate, resulting in a gain or loss on sale.
Public offering price (POP) returns include the maximum sales charge of 5.75% for Class A shares. Net asset value (NAV) returns do not include sales charges or contingent deferred sales charges (CDSC).
Columbia Acorn International Portfolio Diversification
as a % of net assets as of 12/31/06

Columbia Acorn International Top 10 Holdings
as a % of net assets as of 12/31/06
| 1. | Hexagon (Sweden) Measurement Equipment & Polymers | 1.5 | % | ||||||||
| 2. | Fugro (Netherlands) Oilfield Services | 1.4 | % | ||||||||
| 3. | C&C Group (Ireland) Beverage Company | 1.4 | % | ||||||||
| 4. | Hong Kong Exchanges and Clearing (Hong Kong) Hong Kong Equity & Derivatives Market Operator | 1.3 | % | ||||||||
| 5. | SES Global (France) Satellite Broadcasting Services | 1.2 | % | ||||||||
| 6. | Aalberts Industries (Netherlands) Flow Control & Heat Treatment | 1.1 | % | ||||||||
| 7. | Housing Development Finance (India) Indian Mortgage Lender | 1.1 | % | ||||||||
| 8. | Geberit (Switzerland) Plumbing Supplies | 1.1 | % | ||||||||
| 9. | IAWS Group (Ireland) Baked Goods | 1.1 | % | ||||||||
| 10. | Bank of Ireland (Ireland) Irish Commercial Bank | 1.1 | % | ||||||||
The Fund's top 10 holdings and portfolio diversification vary with changes in portfolio investments. See the Statement of Investments for a complete list of the Fund's holdings.
The Growth of a $10,000 Investment in Columbia Acorn International (Class A)
October 16, 2000 through December 31, 2006
Illustration is based on a hypothetical $10,000 investment from inception in Class A shares of the Fund, which includes a 5.75% maximum initial sales charge. The index is unmanaged and returns for both the index and the Fund include reinvested dividends and capital gains. It is not possible to invest directly in an index. The graph does not reflect tax deductions that a shareholder would pay on Fund distributions or the sale of Fund shares.
Total Net Assets of the Fund:
$4,343.4 million
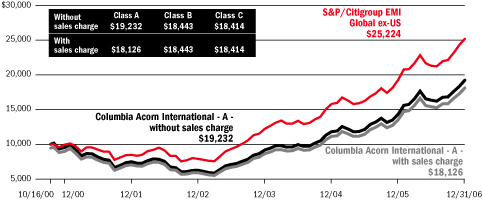
13
Columbia Acorn USA
In a Nutshell

Robert A. Mohn
Lead Portfolio Manager
Performance data quoted represents past performance and current performance may be lower or higher. Past performance is no guarantee of future results. The investment return and principal value of an investment in the Fund will fluctuate so that shares, when redeemed, may be worth more or less than the original cost. Performance may reflect any voluntary waivers or reimbursements of fund expenses by the Adviser or its affiliates. Absent these waivers, or reimbursement arrangements, performance results may be lower. Please visit columbiafunds.com for daily and most recent month-end performance updates.
Fund's Positions
in Mentioned Holdings
As of 12/31/06, the Fund's positions in the holdings mentioned were:
| Crown Castle International | 2.1 | % | |||||
| Oxford Industries | 2.0 | % | |||||
| Genlyte Group | 1.9 | % | |||||
| Avid Technology | 1.8 | % | |||||
| Time Warner Telecom | 1.8 | % | |||||
| Scotts Miracle-Gro | 1.7 | % | |||||
| World Acceptance | 1.5 | % | |||||
| Pentair | 1.3 | % | |||||
| American Tower | 1.2 | % | |||||
| True Religion Apparel | 0.9 | % | |||||
| Novell | 0.8 | % | |||||
| Chico's FAS | 0.6 | % | |||||
| Christopher & Banks | 0.6 | % | |||||
| CNET Networks | 0.6 | % | |||||
| AnnTaylor Stores | 0.5 | % | |||||
| Neurocrine Biosciences | 0.0 | % | |||||
Portfolio characteristics and holdings are subject to change periodically and may not be representative of current characteristics and holdings.
Columbia Acorn USA ended the fourth quarter up 4.70% (Class A shares, without sales charge), underperforming the 8.90% gain of the Russell 2000 Index. For the year, the Fund was up 7.95% while the index posted an 18.37% gain. The year ended as it began with a run up in the more speculative companies of the small-cap market. These spikes in lesser quality stocks hurt the Fund's relative performance for the quarter and the year.
The top contributor to Fund gains in the quarter was men's apparel manufacturer Oxford Industries. The stock was up 16% on the strength of its Ben Sherman and Tommy Bahama brands. Lawn and garden products company Scotts Miracle-Gro saw strong revenue growth, and the stock gained 16% in the fourth quarter. Pentair, a maker of pumps and water treatment equipment, rebounded from weak performance earlier in the year. The stock was up 20% in the fourth quarter.
While the quarter produced one retail winner, retailing was more strongly represented on the losers list. Women's retailers Christopher & Banks, True Religion Apparel and AnnTaylor Stores were down between 20% and 37% in the quarter. While True Religion, a maker of premium denim products, has seen nice sales in the U.S. market, distribution snafus hurt sales in Japan. Christopher & Banks and AnnTaylor both produced fall lines that didn't take off with customers, hurting sales.
For the year, telecom stocks were the biggest positive contributors to performance. Time Warner Telecom, an owner of fiber optic networks connected to over 6,000 office buildings, was up 103% on strong sales growth. Cellular tower companies Crown Castle International and American Tower also posted strong annual gains, up 20% and 38%, respectively. As cellular minute usage grows, cellular service providers continue to turn to these companies for antenna space.
Outside the telecom sector, lender World Acceptance was up 65% for the year as credit losses fell and loan growth increased. Genlyte Group, a maker of commercial lighting fixtures, was up 46% as non-residential construction increased, driving demand for its products.
Technology and health care stocks were among the laggards for the year. Neurocrine Biosciences was the worst performer, falling 65% before we sold it. The stock collapsed when the FDA withheld full approval of its high dosage sleep medication Indiplon. CNET Networks, a provider of software product reviews on technology websites, was down 39% in the Fund for the year. CNET's business is driven by new product launches, and two highly anticipated product launches, Microsoft's Vista and Sony's PlayStation 3, were tardy. Avid Technology, a provider of digital editing software and systems, fell more than 30% in part because broadcasters have been slow to upgrade to digital. Software company Novell fell 30% in the year as the company's transition to open source software is taking longer than the market expected. Outside the health care and technology sectors, retailer Chico's FAS missed the mark with its customers this year, sending th e stock down roughly 55%.
It tended to pay to disregard risk in 2006. Risky securities such as micro-caps, commodities, emerging markets and complex investment bank-bred derivatives were the big winners. To the daredevils went the spoils. But we believe risk still matters (remember, Evel Knievel occasionally crashed). Our preferred method of managing your Fund's risk level is to stock it with well-capitalized, small-cap businesses possessing long-term economic advantages and trading in the market at sensible prices.
Risks include stock market fluctuations due to economic and business developments. Investments in small- and mid-cap companies may be subject to greater volatility and price fluctuations because they may be thinly traded and less liquid.
14
Columbia Acorn USA (LAUAX)
At a Glance
Performance data quoted represents past performance and current performance may be lower or higher. Past performance is no guarantee of future results. The investment return and principal value of an investment in the Fund will fluctuate so that Fund shares, when redeemed, may be worth more or less than their original cost. Performance may reflect any voluntary waivers or reimbursements of Fund expenses by the Adviser or its affiliates. Absent these waivers, or reimbursement arrangements, performance results may be lower. Visit columbiafunds.com for daily and most recent month-end performance updates.
Pretax and After-tax Average Annual Total Returns (Based on Class A Share Returns)
through December 31, 2006
| Inception 10/16/00 | 1 year | 5 years | Life of fund | ||||||||||||||||
| Returns before taxes | NAV POP | 7.95% 1.74 | 11.61% 10.29 | 13.61% 12.53 | |||||||||||||||
| Returns after taxes on distributions | NAV POP | 7.60 1.42 | 11.35 10.04 | 13.36 12.29 | |||||||||||||||
| Returns after taxes on distributions and sale of fund shares | NAV POP | 5.62 1.56 | 10.14 8.96 | 12.02 11.04 | |||||||||||||||
| Russell 2000 (pretax) | 18.37 | 11.39 | 9.67 | ||||||||||||||||
After-tax returns are calculated using the highest historical individual federal marginal income tax rates, and do not reflect the impact of state and local taxes. Returns after taxes on distributions and sale of Fund shares reflect the tax impact of gains or losses realized when Fund shares are sold. The returns are taxed at the maximum rate and assume shares were purchased at the beginning of the period. Actual after-tax returns depend on the investor's tax situation and may differ from those shown. After-tax returns are not relevant to investors who hold their Fund shares through tax-deferred arrangements such as 401(k) plans or individual retirement accounts. After-tax returns are shown for Class A shares only; after-tax returns for other share classes will vary. Indexes do not reflect any deduction for fees, expenses or taxes. Investment returns and principal value may fluctuate, resulting in a gain or loss on sale.
Public offering price (POP) returns include the maximum sales charge of 5.75% for Class A shares. Net asset value (NAV) returns do not include sales charges or contingent deferred sales charges (CDSC).
Columbia Acorn USA Portfolio Diversification
as a % of net assets as of 12/31/06
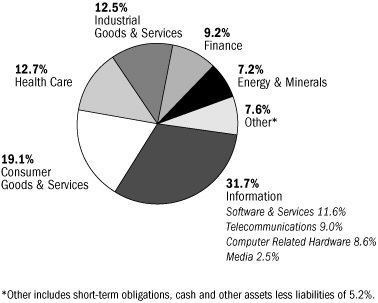
Columbia Acorn USA Top 10 Holdings
as a % of net assets as of 12/31/06
| 1. | Crown Castle International Communication Towers | 2.1 | % | ||||||||
| 2. | Oxford Industries Branded & Private Label Apparel | 2.0 | % | ||||||||
| 3. | Genlyte Group Commercial Lighting Fixtures | 1.9 | % | ||||||||
| 4. | Avid Technology Digital Nonlinear Editing Software & Systems | 1.8 | % | ||||||||
| 5. | AmeriCredit Auto Lending | 1.8 | % | ||||||||
| 6. | Abercrombie & Fitch Teen Apparel Retailer | 1.8 | % | ||||||||
| 7. | Time Warner Telecom Fiber Optic Telephone/Data Services | 1.8 | % | ||||||||
| 8. | ITT Educational Services Post-secondary Degree Programs | 1.8 | % | ||||||||
| 9. | Scotts Miracle-Gro Consumer Lawn & Garden Products | 1.7 | % | ||||||||
| 10. | Edwards Lifesciences Heart Valves | 1.7 | % | ||||||||
The Fund's top 10 holdings and portfolio diversification vary with changes in portfolio investments. See the Statement of Investments for a complete list of the Fund's holdings.
The Growth of a $75,000 Investment in Columbia Acorn USA (Class A)
October 16, 2000 through December 31, 2006
Illustration is based on a hypothetical $75,000 investment from inception in Class A shares of the Fund, which includes a 4.50% maximum initial sales charge for this level of investment. The index is unmanaged and returns for both the index and the Fund include reinvested dividends and capital gains. It is not possible to invest directly in an index. The graph does not reflect tax deductions that a shareholder would pay on Fund distributions or the sale of Fund shares.
Total Net Assets of the Fund:
$1,580.2 million
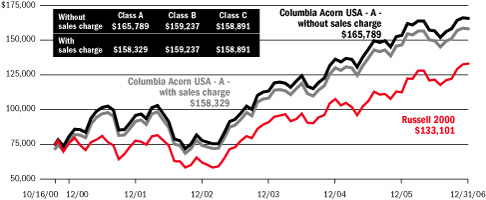
15
Columbia Acorn International Select
In a Nutshell

Christopher J. Olson
Lead Portfolio Manager
Performance data quoted represents past performance and current performance may be lower or higher. Past performance is no guarantee of future results. The investment return and principal value of an investment in the Fund will fluctuate so that shares, when redeemed, may be worth more or less than the original cost. Performance may reflect any voluntary waivers or reimbursements of fund expenses by the Adviser or its affiliates. Absent these waivers, or reimbursement arrangements, performance results may be lower. Please visit columbiafunds.com for daily and most recent month-end performance updates.
Fund's Positions
in Mentioned Holdings
As of 12/31/06, the Fund's positions in the holdings mentioned were:
| C&C Group | 5.3 | % | |||||
| Hong Kong Exchanges and Clearing | 3.2 | % | |||||
| IAWS Group | 2.3 | % | |||||
| Daito Trust Construction | 1.8 | % | |||||
| Kenedix | 1.8 | % | |||||
| Sparx Asset Management | 0.0 | % | |||||
Portfolio characteristics and holdings are subject to change periodically and may not be representative of current characteristics and holdings.
Columbia Acorn International Select gained an impressive 12.98% (Class A shares, without sales charge) in the fourth quarter and ended 2006 with a 35.97% gain. The Fund outperformed its benchmark, the S&P/Citigroup World ex-US Cap Range $2-10B Index, for both time periods. The index was up 11.32% for the quarter and 27.88% for the year. Outperformance was strong in a number of areas, particularly Ireland and Hong Kong where the Fund was overweight. In a reversal from last year, the weakest market was Japan. The Fund was underweight in this market throughout the year.
The top three contributors to Fund performance in the quarter and the year were the same. Irish beverage company C&C Group gained another 32% in the fourth quarter and ended the year up 159%. Strong sales and a well received launch of its cider product in the United Kingdom resulted in dramatic earnings upgrades. Hong Kong Exchanges and Clearing was ranked second for the quarter and year. The company operates the Hong Kong equity and derivatives market and rose 49% in the quarter and posted an annual gain of 171% in the Fund. Increased trading volume and new stock listings from China drove this stock's stellar performance. Rounding out the top three, Ireland's IAWS Group, a manufacturer and distributor of baked goods, increased 38% in the fourth quarter and ended the year up 80%. The stock benefited from strong performance in its baked goods divisions and from the acquisition of Otis Spunkmeyer, a U.S. cookie dough manufactu rer.
Even in such a strong year, there were some stocks that detracted from performance and, as was the case at mid-year, the common thread was Japan. In a year where the Fund was up over 36%, both the Fund's Japanese portfolio and the Japanese weighting in its benchmark index were essentially flat. Daito Trust Construction, a developer of apartment and condo buildings in Japan, fell 16% in the quarter and was down nearly 11% for the year. The stock fell as new construction orders slowed when it switched to a new order system. In the fourth quarter, fund manager Sparx Asset Management fell 29%. We opted to sell the stock as we became concerned about its higher cost base resulting from a recent acquisition. Kenedix, a Japanese real estate investment manager, fell 22% in the quarter despite earnings upgrades as investors became concerned about possible interest rate increases in Japan.
International mid-cap stocks have had a strong run for the last five years, which likely has some investors questioning how much steam is left in these names. While we can't predict the future, we are still finding attractively valued stocks to include in Columbia Acorn International Select.
International investments involve greater potential risks, including less regulation, currency fluctuations, economic instability and political developments. Investments in small- and mid-cap companies may be subject to greater volatility and price fluctuations because they may be thinly traded and less liquid. By maintaining a relatively concentrated portfolio, the fund may be subject to greater risk than a fund that is more fully diversified.
16
Columbia Acorn International Select (LAFAX)
At a Glance
Performance data quoted represents past performance and current performance may be lower or higher. Past performance is no guarantee of future results. The investment return and principal value of an investment in the Fund will fluctuate so that Fund shares, when redeemed, may be worth more or less than their original cost. Performance may reflect any voluntary waivers or reimbursements of Fund expenses by the Adviser or its affiliates. Absent these waivers, or reimbursement arrangements, performance results may be lower. Visit columbiafunds.com for daily and most recent month-end performance updates.
Pretax and After-tax Average Annual Total Returns (Based on Class A Share Returns)
through December 31, 2006
| Inception 10/16/00 | 1 year | 5 years | Life of fund | ||||||||||||||||
| Returns before taxes | NAV POP | 35.97% 28.15 | 18.42% 17.03 | 7.82% 6.80 | |||||||||||||||
| Returns after taxes on distributions | NAV POP | 35.96 28.15 | 18.46 17.06 | 7.83 6.80 | |||||||||||||||
| Returns after taxes on distributions and sale of fund shares | NAV POP | 23.38 18.30 | 16.39 15.12 | 6.86 5.95 | |||||||||||||||
| S&P/Citigroup World ex-US Cap Range $2-10B (pretax) | 27.88 | 21.24 | 14.23 | ||||||||||||||||
After-tax returns are calculated using the highest historical individual federal marginal income tax rates, and do not reflect the impact of state and local taxes. Returns after taxes on distributions and sale of Fund shares reflect the tax impact of gains or losses realized when Fund shares are sold. The returns are taxed at the maximum rate and assume shares were purchased at the beginning of the period. Actual after-tax returns depend on the investor's tax situation and may differ from those shown. After-tax returns are not relevant to investors who hold their Fund shares through tax-deferred arrangements such as 401(k) plans or individual retirement accounts. After-tax returns are shown for Class A shares only; after-tax returns for other share classes will vary. Indexes do not reflect any deduction for fees, expenses or taxes. Investment returns and principal value may fluctuate, resulting in a gain or loss on sale.
Public offering price (POP) returns include the maximum sales charge of 5.75% for Class A shares. Net asset value (NAV) returns do not include sales charges or contingent deferred sales charges (CDSC).
Columbia Acorn International Select Portfolio Diversification
as a % of net assets as of 12/31/06

Columbia Acorn International Select Top 10
Holdings as a % of net assets as of 12/31/06
| 1. | C&C Group (Ireland) Beverage Company | 5.3 | % | ||||||||
| 2. | Bank of Ireland (Ireland) Irish Commercial Bank | 4.1 | % | ||||||||
| 3. | Anglo Irish Bank (Ireland) Small Business & Middle Market Banking | 3.7 | % | ||||||||
| 4. | Synthes (Switzerland) Products for Orthopedic Surgery | 3.3 | % | ||||||||
| 5. | Hong Kong Exchanges and Clearing (Hong Kong) Hong Kong Equity & Derivatives Market Operator | 3.2 | % | ||||||||
| 6. | Northern Rock (United Kingdom) Lowest Cost Mortgage Bank in UK | 2.9 | % | ||||||||
| 7. | Alliance Atlantis Communication (Canada) CATV Channels, TV/Movie Production/Distribution | 2.9 | % | ||||||||
| 8. | Jupiter Telecommunications (Japan) Largest Cable Service Provider in Japan | 2.9 | % | ||||||||
| 9. | Red Electrica de Espana (Spain) Spanish Power Grid | 2.7 | % | ||||||||
| 10. | Aeon Mall (Japan) Suburban Shopping Mall Developer, Owner & Operator | 2.7 | % | ||||||||
The Fund's top 10 holdings and portfolio diversification vary with changes in portfolio investments. See the Statement of Investments for a complete list of the Fund's holdings.
The Growth of a $10,000 Investment in Columbia Acorn International Select (Class A)
October 16, 2000 through December 31, 2006
Illustration is based on a hypothetical $10,000 investment from inception in Class A shares of the Fund, which includes a 5.75% maximum initial sales charge. The index is unmanaged and returns for both the index and the Fund include reinvested dividends and capital gains. It is not possible to invest directly in an index. The graph does not reflect tax deductions that a shareholder would pay on Fund distributions or the sale of Fund shares.
Total Net Assets of the Fund: $168.9 million
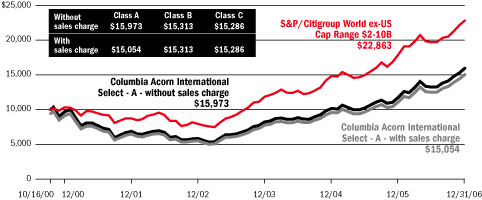
17
Columbia Acorn Select
In a Nutshell

Ben Andrews
Lead Portfolio Manager
Performance data quoted represents past performance and current performance may be lower or higher. Past performance is no guarantee of future results. The investment return and principal value of an investment in the Fund will fluctuate so that shares, when redeemed, may be worth more or less than the original cost. Performance may reflect any voluntary waivers or reimbursements of fund expenses by the Adviser or its affiliates. Absent these waivers, or reimbursement arrangements, performance results may be lower. Please visit columbiafunds.com for daily and most recent month-end performance updates.
Fund's Positions
in Mentioned Holdings
As of 12/31/06, the Fund's positions in the holdings mentioned were:
| UrAsia Energy | 6.2 | % | |||||
| Safeway | 5.5 | % | |||||
| Liberty Global | 4.7 | % | |||||
| American Tower | 3.8 | % | |||||
| Avid Technology | 3.7 | % | |||||
| Potash | 3.1 | % | |||||
| Career Education | 0.0 | % | |||||
| Mine Safety Appliances | 0.0 | % | |||||
Portfolio characteristics and holdings are subject to change periodically and may not be representative of current characteristics and holdings.
Columbia Acorn Select returned 10.37% (Class A shares, without sales charge) during the quarter, ahead of the S&P MidCap 400's 6.99% and the S&P 500's 6.70% gains. For 2006, the Fund was up 19.32%, ahead of the S&P MidCap 400's 10.32% and the S&P 500's 15.79% gains. In the fourth quarter of 2005 we stated that our goal for 2006 was to outperform the Fund's benchmark index as well as provide a positive return for shareholders. We are happy to say that we delivered on both.
UrAsia Energy led the way with a 149% gain in the Fund for the year as uranium prices reached a record of $70 per pound vs. $36 at the end of 2005. The recent flooding of competitor Cameco's Cigar Lake Mine caused part of the price jump. Cameco announced that its initial predicted production of eight million lbs/yr (5% of world demand) would be delayed by at least one year. Production of uranium at Cigar Lake was forecasted to begin in early 2008 and utilities were counting on the new supply to meet the growing demand for fuel to run nuclear reactors. While Cameco expects the mine may eventually produce 18 million lbs/yr, if it faces longer production delays than it anticipates, uranium prices could remain high, benefiting UrAsia.
On the downside, Avid Technology, which lagged all year, fell 32% (or reduced the Fund's return by 1.28%) as the company guided sales and earnings down for 2006 due to delayed products and an acquisition that needed resuscitation. While obviously disappointed, we believe the long-term outlook remains sound and we added to the Fund's position in the stock. Avid is a leader in digital editing software and systems used by the film and news industries. Additionally, we believe that Avid has the potential to become a leader in consumer video and audio editing in the next few years. Over the last decade, consumer competition has dwindled while product demand has increased. We believe that this nascent market should give Avid an opportunity for solid revenue growth.
Most other losses for the year were relatively small in position size or percentages. In fact, all losses combined for the year took away just 3.83% from Fund gains. On the up side, the five top winners (UrAsia Energy, Safeway, Liberty Global, Potash, and American Tower) accounted for 11.59% of the Fund's 19.68% return.
In the quarter we sold two positions, Career Education and Mine Safety Appliances, while we purchased five new stocks. A couple of these new positions are small as we continue to determine if our theories for ownership are correct. If our confidence builds, so might these positions, otherwise we will likely exit.
As we enter 2007, we see plenty of what we consider to be positive signs: falling oil prices, low inflation rates despite a sharp run up in raw materials (perhaps due to the outsourcing of labor), 10-year treasury yields (though off their bottom) near historical lows, and a rebounding dollar. But we believe that there are plenty of troubling signs as well. We get nervous when the most popular investments are emerging market debt, obscure credit derivatives, and private equity, which are leading a buyout frenzy funded with debt. As always, our primary focus is to beat the Fund's benchmark despite all the macroeconomic noise.
Risks of owning the Fund include stock market fluctuations due to economic and business developments and potentially greater price volatility due to the Fund's concentration in a limited number of stocks of mid-size companies.
18
Columbia Acorn Select (LTFAX)
At a Glance
Performance data quoted represents past performance and current performance may be lower or higher. Past performance is no guarantee of future results. The investment return and principal value of an investment in the Fund will fluctuate so that Fund shares, when redeemed, may be worth more or less than their original cost. Performance may reflect any voluntary waivers or reimbursements of Fund expenses by the Adviser or its affiliates. Absent these waivers, or reimbursement arrangements, performance results may be lower. Visit columbiafunds.com for daily and most recent month-end performance updates.
Pretax and After-tax Average Annual Total Returns (Based on Class A Share Returns)
through December 31, 2006
| Inception 10/16/00 | 1 year | 5 years | Life of fund | ||||||||||||||||
| Returns before taxes | NAV POP | 19.32% 12.46 | 13.26% 11.93 | 12.96% 11.89 | |||||||||||||||
| Returns after taxes on distributions | NAV POP | 18.79 11.96 | 12.97 11.64 | 12.67 11.60 | |||||||||||||||
| Returns after taxes on distributions and sale of fund shares | NAV POP | 12.99 8.50 | 11.57 10.37 | 11.37 10.40 | |||||||||||||||
| S&P MidCap 400 (pretax) | 10.32 | 10.89 | 9.14 | ||||||||||||||||
After-tax returns are calculated using the highest historical individual federal marginal income tax rates, and do not reflect the impact of state and local taxes. Returns after taxes on distributions and sale of Fund shares reflect the tax impact of gains or losses realized when Fund shares are sold. The returns are taxed at the maximum rate and assume shares were purchased at the beginning of the period. Actual after-tax returns depend on the investor's tax situation and may differ from those shown. After-tax returns are not relevant to investors who hold their Fund shares through tax-deferred arrangements such as 401(k) plans or individual retirement accounts. After-tax returns are shown for Class A shares only; after-tax returns for other share classes will vary. Indexes do not reflect any deduction for fees, expenses or taxes. Investment returns and principal value may fluctuate, resulting in a gain or loss on sale.
Public offering price (POP) returns include the maximum sales charge of 5.75% for Class A shares. Net asset value (NAV) returns do not include sales charges or contingent deferred sales charges (CDSC).
Columbia Acorn Select Portfolio Diversification
as a % of net assets as of 12/31/06

Columbia Acorn Select Top 10 Holdings
as a % of net assets as of 12/31/06
| 1. | UrAsia Energy Uranium Mining in Kazakhstan | 6.2 | % | ||||||||
| 2. | Safeway Supermarkets | 5.5 | % | ||||||||
| 3. | Tellabs Telecommunications Equipment | 5.1 | % | ||||||||
| 4. | Liberty Global CATV Holding Company | 4.7 | % | ||||||||
| 5. | ITT Educational Services Post-secondary Degree Programs | 4.4 | % | ||||||||
| 6. | Abercrombie & Fitch Teen Apparel Retailer | 4.4 | % | ||||||||
| 7. | American Tower Communication Towers in USA & Mexico | 3.8 | % | ||||||||
| 8. | Expedia Online Travel Services Company | 3.7 | % | ||||||||
| 9. | Avid Technology Digital Nonlinear Editing Software & Systems | 3.7 | % | ||||||||
| 10. | Janus Capital Group Manages Mutual Funds | 3.3 | % | ||||||||
The Fund's top 10 holdings and portfolio diversification vary with changes in portfolio investments. See the Statement of Investments for a complete list of the Fund's holdings.
The Growth of a $50,000 Investment in Columbia Acorn Select (Class A)
October 16, 2000 through December 31, 2006
Illustration is based on a hypothetical $50,000 investment from inception in Class A shares of the Fund, which includes a 4.50% maximum initial sales charge for this level of investment. The index is unmanaged and returns for both the index and the Fund include reinvested dividends and capital gains. It is not possible to invest directly in an index. The graph does not reflect tax deductions that a shareholder would pay on Fund distributions or the sale of Fund shares.
Total Net Assets of the Fund:
$2,237.7 million
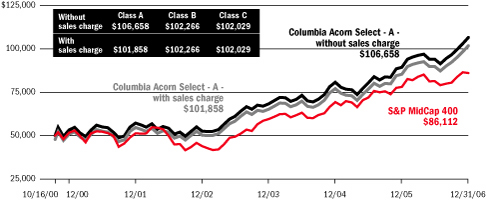
19
Columbia Thermostat Fund
In a Nutshell

Charles P. McQuaid
Lead Portfolio Manager
Performance data quoted represents past performance and current performance may be lower or higher. Past performance is no guarantee of future results. The investment return and principal value of an investment in the Fund will fluctuate so that shares, when redeemed, may be worth more or less than the original cost. Performance may reflect any voluntary waivers or reimbursements of fund expenses by the Adviser or its affiliates. Absent these waivers, or reimbursement arrangements, performance results may be lower. Please visit columbiafunds.com for daily and most recent month-end performance updates.
A "fund of fund" bears its allocable share of the costs and expenses of the underlying funds in which it invests. Such funds are thus subject to two levels of fees and potentially higher expense ratios than would be associated with a fund that invests and trades directly in financial instruments under the direction of a single manager.
Columbia Thermostat Fund ended the fourth quarter up 4.01% (Class A shares, without sales charge) and returned 10.56% for the year. Fund performance, as expected, was between the S&P 500 Index and the Lehman Brothers U.S. Credit Intermediate Bond Index for both time periods (see Page 2 for index data). Fund returns fell short of the 5.99% quarterly gain and 12.77% annual gain of the Lipper Flexible Portfolio Funds Index.
We made two changes to the Fund in the fourth quarter. Effective December 22, 2006, we replaced Columbia Large Cap Value Fund with Columbia Marsico Growth Fund. While Columbia Large Cap Value Fund has a good track record, we believe shareholders will be better served by owning more of the large-cap growth sector. The new fund comprises 15% of Columbia Thermostat Fund's allocation of stock funds.
We also updated the Fund's stock/bond allocation table, increasing the scale by 100 S&P 500 points. This resulted in a 10% point hike in ownership of equity funds, and a 10% point reduction of bond funds. We made the change in order to reflect our estimates of S&P 500 earnings growth and possible market valuations.
As the following table illustrates, the equity portion of the portfolio had impressive gains in the quarter and for the full year. For the fourth quarter, the Fund's equity component was up 8.82% and, for the year, it was up 20.34%. Columbia Acorn International, which we added to Columbia Thermostat in 2005, posted top gains for both time periods.
Results of the Funds Owned in Columbia Thermostat Fund
at December 31, 2006
This table shows only the weightings as of the end of the quarter and the results of the funds held by the Fund at that date.
| Equities Fund | Weightings in Category | 4th quarter returns | 1-year returns to 12/31/06 | ||||||||||||
| Columbia Acorn Fund Z | 15 | % | 7.66 | % | 14.45 | % | |||||||||
| Columbia Acorn Select Z | 10 | % | 10.51 | % | 19.68 | % | |||||||||
| Columbia Marsico Growth Fund1 | 15 | % | 7.74 | % | 7.18 | % | |||||||||
| Columbia Acorn International Z | 15 | % | 14.45 | % | 34.53 | % | |||||||||
| Columbia Dividend Income Fund | 20 | % | 6.75 | % | 20.07 | % | |||||||||
| Columbia Large Cap Enhanced Core Fund | 25 | % | 7.27 | % | 16.81 | % | |||||||||
| Weighted Average Equity Return | 100 | % | 8.82 | % | 20.34 | % | |||||||||
| Fixed Income Fund | Weightings in Category | 4th quarter returns | 1-year returns to 12/31/06 | ||||||||||||
| Columbia Federal Securities Fund | 30 | % | 0.99 | % | 3.74 | % | |||||||||
| Columbia Intermediate Bond Fund | 50 | % | 1.52 | % | 4.60 | % | |||||||||
| Columbia Conservative High Yield Fund | 20 | % | 3.01 | % | 6.17 | % | |||||||||
| Weighted Average Income Return | 100 | % | 1.66 | % | 4.66 | % | |||||||||
1Columbia Large Cap Value Fund was replaced by Columbia Marsico Growth Fund on December 22, 2006.
Columbia Thermostat Fund
Rebalancing in the Fourth Quarter
| October 5, 2006: | 35% stock, 65% bond | ||||||
| November 20, 2006: | 30% stock, 70% bond | ||||||
| December 22, 2006: | 40% stock, 60% bond | ||||||
The value of an investment in the Fund is based primarily on the performance of the underlying portfolio funds and the allocation of the Fund's assets among them. An investment in the underlying funds may present certain risks, including stock market fluctuations that occur in response to economic and business developments; and a greater degree of social, political and economic volatility associated with international investing. Investing in small- and mid-cap stocks may present special risks including possible illiquidity and greater price volatility than stocks of larger, more established companies. Investments in foreign securities have special risks including political or economic instability, higher costs, different regulations, accounting standards, trading practices and levels of information, and currency exchange rate fluctuations. Changes in interest rates and changes in the financial strength of issuers of lower-rat ed bonds may also affect underlying fund performance. The Fund is also subject to the risk that the investment adviser's decisions regarding asset classes and portfolio funds will not anticipate market trends successfully, resulting in a failure to preserve capital or lower total return. In addition, the Fund may buy and sell shares of the portfolio funds frequently. This may result in higher transaction costs and additional tax liability. This is not an offer of the shares of any other mutual fund mentioned herein.
20
Columbia Thermostat Fund (CTFAX)
At a Glance
Performance data quoted represents past performance and current performance may be lower or higher. Past performance is no guarantee of future results. The investment return and principal value of an investment in the Fund will fluctuate so that Fund shares, when redeemed, may be worth more or less than their original cost. Performance may reflect any voluntary waivers or reimbursements of Fund expenses by the Adviser or its affiliates. Absent these waivers, or reimbursement arrangements, performance results may be lower. Visit columbiafunds.com for daily and most recent month-end performance updates.
Pretax and After-tax Average Annual Total Returns (Based on Class A Share Returns)
through December 31, 2006
| Inception 3/3/03 | 1 year | 3 years | Life of fund | ||||||||||||||||
| Returns before taxes | NAV POP | 10.56% 4.20 | 8.22% 6.10 | 12.29% 10.57 | |||||||||||||||
| Returns after taxes on distributions | NAV POP | 8.20 1.98 | 6.41 4.33 | 10.73 9.03 | |||||||||||||||
| Returns after taxes on distributions and sale of fund shares | NAV POP | 7.90 3.71 | 6.31 4.50 | 10.00 8.49 | |||||||||||||||
| S&P 500 (pretax) | 15.79 | 10.44 | 16.67 | ||||||||||||||||
| Lehman Brothers U.S. Credit Intermediate Bond Index (pretax) | 4.49 | 3.32 | 3.84 | ||||||||||||||||
| Lipper Flexible Portfolio Funds Index (pretax) | 12.77 | 9.51 | 14.12 | ||||||||||||||||
After-tax returns are calculated using the highest historical individual federal marginal income tax rates, and do not reflect the impact of state and local taxes. Returns after taxes on distributions and sale of Fund shares reflect the tax impact of gains or losses realized when Fund shares are sold. The returns are taxed at the maximum rate and assume shares were purchased at the beginning of the period. Actual after-tax returns depend on the investor's tax situation and may differ from those shown. After-tax returns are not relevant to investors who hold their Fund shares through tax-deferred arrangements such as 401(k) plans or individual retirement accounts. After-tax returns are shown for Class A shares only; after-tax returns for other share classes will vary. Indexes do not reflect any deduction for fees, expenses or taxes. Investment returns and principal value may fluctuate, resulting in a gain or loss on sale.
Public offering price (POP) returns include the maximum sales charge of 5.75% for Class A shares. Net asset value (NAV) returns do not include sales charges or contingent deferred sales charges (CDSC).
Columbia Thermostat Fund Asset Allocation
as a % of net assets as of 12/31/06

Columbia Thermostat Fund Portfolio Weightings
as a % of assets in each investment category
as of 12/31/06
Stock Mutual Funds
| Columbia Large Cap Enhanced Core Fund | 25 | % | |||||
| Columbia Dividend Income Fund | 20 | % | |||||
| Columbia Acorn Fund | 15 | % | |||||
| Columbia Acorn International | 15 | % | |||||
| Columbia Marsico Growth Fund | 15 | % | |||||
| Columbia Acorn Select | 10 | % | |||||
Bond Mutual Funds
| Columbia Intermediate Bond Fund | 50 | % | |||||
| Columbia Federal Securities Fund | 30 | % | |||||
| Columbia Conservative High Yield Fund | 20 | % | |||||
The Growth of a $10,000 Investment in Columbia Thermostat Fund (Class A)
March 3, 2003 through December 31, 2006
Illustration is based on a hypothetical $10,000 investment from inception in Class A shares of the Fund, which includes a 5.75% maximum initial sales charge. The indexes are unmanaged and returns for both the indexes and the Fund include reinvested dividends and capital gains. It is not possible to invest directly in an index. The graph does not reflect tax deductions that a shareholder would pay on Fund distributions or the sale of Fund shares.
Total Net Assets of the Fund:
$188.5 million
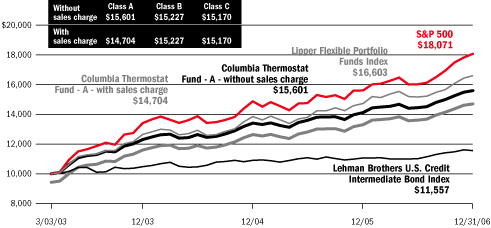
21
Columbia Acorn Fund
Major Portfolio Changes in the Fourth Quarter (Unaudited)
| Number of Shares | |||||||||||
| 09/30/06 | 12/31/06 | ||||||||||
| Additions | |||||||||||
| Information | |||||||||||
| AMIS Holdings | 1,950,000 | 2,425,000 | |||||||||
| Ceridian | 2,800,000 | 3,460,000 | |||||||||
| Cogent Communications | 0 | 1,000,000 | |||||||||
| Globalstar | 0 | 600,000 | |||||||||
| II VI | 1,913,000 | 2,025,000 | |||||||||
| Informatica | 0 | 3,400,000 | |||||||||
| IPG Photonics | 0 | 410,000 | |||||||||
| Kenexa | 775,000 | 828,000 | |||||||||
| Littelfuse | 915,000 | 1,135,000 | |||||||||
| NAVTEQ | 600,000 | 1,100,000 | |||||||||
| Polycom | 0 | 600,000 | |||||||||
| Sanmina-SCI | 7,500,000 | 10,000,000 | |||||||||
| Sohu.com | 554,000 | 650,000 | |||||||||
| Talx | 0 | 443,000 | |||||||||
| Trimble Navigation | 1,250,000 | 1,450,000 | |||||||||
| Varian | 670,000 | 800,000 | |||||||||
| Consumer Goods & Services | |||||||||||
| Abercrombie & Fitch | 2,450,000 | 3,140,000 | |||||||||
| Charming Shoppes | 0 | 1,700,000 | |||||||||
| Chico's FAS | 6,630,000 | 7,080,000 | |||||||||
| Heelys | 0 | 150,000 | |||||||||
| J Crew Group | 1,100,000 | 1,350,000 | |||||||||
| Knoll | 1,703,000 | 1,809,000 | |||||||||
| NutriSystem | 0 | 600,000 | |||||||||
| Pierre & Vacances (France) | 76,500 | 110,000 | |||||||||
| Vail Resorts | 2,110,000 | 2,390,000 | |||||||||
| Industrial Goods & Services | |||||||||||
| Administaff | 1,300,000 | 1,670,000 | |||||||||
| American Reprographics | 0 | 315,000 | |||||||||
| Ametek (includes the effect of a 3 for 2 stock split) | 2,750,000 | 4,700,000 | |||||||||
| Armor Holdings | 0 | 750,000 | |||||||||
| G&K Services | 426,000 | 512,000 | |||||||||
| Ibiden (Japan) | 193,800 | 558,000 | |||||||||
| K&F Industries Holdings | 1,582,000 | 1,712,000 | |||||||||
| USG People (Netherlands) | 650,000 | 925,000 | |||||||||
| Watsco | 2,286,000 | 2,375,000 | |||||||||
| WW Grainger | 1,200,000 | 1,300,000 | |||||||||
| Zumtobel (Austria) | 0 | 373,000 | |||||||||
| Energy & Minerals | |||||||||||
| Atwood Oceanics | 1,096,000 | 1,200,000 | |||||||||
| Enerflex Systems (Canada) | 1,140,000 | 2,280,000 | |||||||||
| Fugro (Netherlands) | 2,728,301 | 2,928,301 | |||||||||
| Rowan | 1,411,000 | 1,611,000 | |||||||||
| Number of Shares | |||||||||||
| 09/30/06 | 12/31/06 | ||||||||||
| Finance | |||||||||||
| Aspen Insurance | 0 | 1,650,000 | |||||||||
| BOK Financial | 2,505,000 | 2,605,000 | |||||||||
| Chittenden | 892,000 | 1,042,000 | |||||||||
| Conseco | 0 | 1,000,000 | |||||||||
| East West Bancorp | 400,000 | 690,000 | |||||||||
| Eaton Vance | 4,200,000 | 5,500,000 | |||||||||
| Endurance Specialty Holdings | 1,559,000 | 1,690,000 | |||||||||
| Glacier Bancorp (includes the effect of a 3 for 2 stock split) | 2,720,000 | 4,080,000 | |||||||||
| HCC Insurance Holdings | 2,330,000 | 3,125,000 | |||||||||
| Marlin Business Services | 510,000 | 685,000 | |||||||||
| McGrath Rentcorp | 1,042,000 | 1,212,000 | |||||||||
| Montpelier Re | 0 | 1,100,000 | |||||||||
| Nuveen Investments | 1,757,000 | 2,157,000 | |||||||||
| Stifel Financial | 0 | 130,000 | |||||||||
| Health Care | |||||||||||
| Barrier Therapeutics | 420,000 | 1,321,000 | |||||||||
| Cephalon | 0 | 765,000 | |||||||||
| Collagenex Pharmaceuticals | 400,000 | 830,000 | |||||||||
| Cooper | 0 | 700,000 | |||||||||
| Dade Behring | 0 | 550,000 | |||||||||
| Endo Pharmaceuticals | 0 | 1,295,000 | |||||||||
| Eresearch Technology | 2,250,000 | 2,300,000 | |||||||||
| Haemonetics | 350,000 | 550,000 | |||||||||
| ICU Medical | 1,000,000 | 1,083,000 | |||||||||
| The Medicines Company | 0 | 600,000 | |||||||||
| Medicis Pharmaceutical | 0 | 400,000 | |||||||||
| MGI Pharma | 0 | 1,510,000 | |||||||||
| Nektar Therapeutics | 1,360,000 | 2,360,000 | |||||||||
| Neurogen | 0 | 655,000 | |||||||||
| Nuvelo | 0 | 1,650,000 | |||||||||
| Omnicare | 0 | 900,000 | |||||||||
| Orthofix International | 732,500 | 942,500 | |||||||||
| Owens & Minor | 650,000 | 1,200,000 | |||||||||
| PDL BioPharma | 1,800,000 | 2,300,000 | |||||||||
| Polymedica | 0 | 700,000 | |||||||||
| QLT | 0 | 2,500,000 | |||||||||
| Viasys Healthcare | 875,000 | 1,050,000 | |||||||||
| Other Industries | |||||||||||
| Parkway Properties | 536,000 | 628,000 | |||||||||
22
| Number of Shares | |||||||||||
| 09/30/06 | 12/31/06 | ||||||||||
| Sales | |||||||||||
| Information | |||||||||||
| Alltel | 1,600,000 | 1,300,000 | |||||||||
| Bally Technologies | 3,900,000 | 3,500,000 | |||||||||
| ClickSoftware Technologies | 917,000 | 0 | |||||||||
| Getty Images | 400,000 | 300,000 | |||||||||
| infoUSA | 2,285,000 | 1,696,000 | |||||||||
| Intermec | 1,240,000 | 500,000 | |||||||||
| Kanbay International | 500,000 | 0 | |||||||||
| Liberty Global Series A | 1,750,000 | 1,500,000 | |||||||||
| M6-Metropole Television (France) | 165,500 | 0 | |||||||||
| Micros Systems | 1,800,000 | 1,400,000 | |||||||||
| Outdoor Channel Holdings | 700,000 | 0 | |||||||||
| Phoenixtec Power (Taiwan) | 11,976,000 | 0 | |||||||||
| PRIMEDIA | 1,739,000 | 0 | |||||||||
| Progress Software | 1,130,000 | 708,000 | |||||||||
| Rogers | 870,000 | 620,000 | |||||||||
| Symbol Technologies | 5,347,000 | 0 | |||||||||
| Tele2 (Sweden) | 2,300,000 | 0 | |||||||||
| Telephone & Data Systems | 980,000 | 700,000 | |||||||||
| Travelzoo | 200,000 | 0 | |||||||||
| Vasco Data Security International | 230,000 | 0 | |||||||||
| VitalStream Holdings | 875,000 | 0 | |||||||||
| Consumer Goods & Services | |||||||||||
| Borders Group | 750,000 | 0 | |||||||||
| Career Education | 374,000 | 0 | |||||||||
| C&C Group (Ireland) | 2,550,000 | 2,500,000 | |||||||||
| Four Seasons Hotels (Canada) | 915,000 | 643,000 | |||||||||
| Intrawest (Canada) | 900,000 | 0 | |||||||||
| Lincoln Technical Institute | 244,000 | 100,000 | |||||||||
| Michaels Stores | 2,760,000 | 0 | |||||||||
| Mohawk Industries | 765,000 | 0 | |||||||||
| Nobia (Sweden) | 1,398,000 | 1,048,000 | |||||||||
| PETCO Animal Supplies | 2,250,000 | 0 | |||||||||
| Station Casinos | 1,400,000 | 540,000 | |||||||||
| Industrial Goods & Services | |||||||||||
| Forward Air | 2,000,000 | 1,900,000 | |||||||||
| Gardner Denver | 1,350,000 | 600,000 | |||||||||
| Grafton Group (Ireland) | 3,500,000 | 3,000,000 | |||||||||
| Hyundai Mobis (South Korea) | 267,000 | 0 | |||||||||
| Novozymes (Denmark) | 730,000 | 590,000 | |||||||||
| NuCo2 | 1,031,000 | 510,000 | |||||||||
| Oshkosh Truck | 212,000 | 0 | |||||||||
| Poyry (Finland) | 740,000 | 0 | |||||||||
| Tenaris (Argentina) | 1,064,000 | 0 | |||||||||
| Number of Shares | |||||||||||
| 09/30/06 | 12/31/06 | ||||||||||
| Finance | |||||||||||
| Anglo Irish Bank (Ireland) | 3,500,000 | 3,000,000 | |||||||||
| Cascade Bancorp | 370,000 | 300,000 | |||||||||
| Cass Information Systems | 46,001 | 8,000 | |||||||||
| City Bank/Lynnwood WA | 413,000 | 0 | |||||||||
| Depfa Bank (Germany) | 2,275,000 | 1,425,000 | |||||||||
| First Financial Bankshares | 406,000 | 286,000 | |||||||||
| Great Southern Bancorp | 796,000 | 663,000 | |||||||||
| Komercni Banka (Czech Republic) | 250,000 | 0 | |||||||||
| SY Bancorp | 304,000 | 219,000 | |||||||||
| Energy & Minerals | |||||||||||
| Chicago Bridge & Iron | 953,000 | 0 | |||||||||
| Helmerich & Payne | 714,000 | 0 | |||||||||
| Maritrans | 600,000 | 0 | |||||||||
| Newpark Resources | 2,860,000 | 2,580,000 | |||||||||
| Pride International | 2,300,000 | 1,520,000 | |||||||||
| Tullow Oil (United Kingdom) | 13,500,000 | 9,315,000 | |||||||||
| Veritas DGC | 225,000 | 0 | |||||||||
| Health Care | |||||||||||
| Arena Pharmaceuticals | 1,429,000 | 1,179,000 | |||||||||
| Coventry Health Care | 707,000 | 500,000 | |||||||||
| Exelixis | 3,230,000 | 388,000 | |||||||||
| Hogy Medical (Japan) | 390,000 | 0 | |||||||||
| Intermagnetics General | 1,770,000 | 0 | |||||||||
| Intermune | 1,116,000 | 0 | |||||||||
| Keryx Biopharmaceuticals | 1,135,000 | 0 | |||||||||
| Lincare Holdings | 2,491,000 | 1,991,000 | |||||||||
| Maxygen | 1,585,000 | 0 | |||||||||
| Rigel Pharmaceuticals | 1,275,000 | 0 | |||||||||
| Synthes (Switzerland) | 350,000 | 315,000 | |||||||||
| Tercica | 1,500,000 | 0 | |||||||||
23
Columbia Acorn Fund
Statement of Investments, December 31, 2006
| Number of Shares | Value (000) | ||||||||||
| Equities: 94.9% | |||||||||||
| Information 23.8% | |||||||||||
| > Business Software 3.8% | |||||||||||
| 2,750,000 | Kronos (b)(c) | $ | 101,035 | ||||||||
| Labor Management Solutions | |||||||||||
| 12,000,000 | Novell (b) | 74,400 | |||||||||
| Directory, Operating System & Identity Management Software | |||||||||||
| 1,400,000 | Micros Systems (b) | 73,780 | |||||||||
| Information Systems for Restaurants & Hotels | |||||||||||
| 1,800,000 | Avid Technology (b) | 67,068 | |||||||||
| Digital Nonlinear Editing Software & Systems | |||||||||||
| 2,500,000 | Witness Systems (b)(c) | 43,825 | |||||||||
| Customer Experience Management Software | |||||||||||
| 2,400,000 | Parametric Technology (b) | 43,248 | |||||||||
| Engineering Software & Services | |||||||||||
| 3,400,000 | Informatica (b) | 41,514 | |||||||||
| Enterprise Data Integration Software | |||||||||||
| 6,000,000 | Actuate (b)(c) | 35,640 | |||||||||
| Information Delivery Software & Solutions | |||||||||||
| 2,131,000 | Concur Technologies (b)(c) | 34,181 | |||||||||
| Web Enabled Cost & Expense Management Software | |||||||||||
| 1,800,000 | Cadence Design Systems (b) | 32,238 | |||||||||
| Electronic Design Automation | |||||||||||
| 828,000 | Kenexa (b) | 27,539 | |||||||||
| Human Capital Management (HCM) Software | |||||||||||
| 2,500,000 | Radiant Systems (b)(c) | 26,100 | |||||||||
| Point of Sale Systems: Convenient Stores & Restaurants | |||||||||||
| 3,000,000 | Lawson Software (b) | 22,170 | |||||||||
| Enterprise Resource Planning (ERP) Software | |||||||||||
| 3,500,000 | Agile Software (b)(c) | 21,525 | |||||||||
| Product Design Software | |||||||||||
| 5,600,000 | Indus International (b)(c) | 21,224 | |||||||||
| Enterprise Asset Management Software | |||||||||||
| 1,490,000 | JDA Software (b)(c) | 20,517 | |||||||||
| Application/Software & Services for Retailers | |||||||||||
| 708,000 | Progress Software (b) | 19,775 | |||||||||
| Application Development Software | |||||||||||
| 1,500,000 | webMethods (b) | 11,040 | |||||||||
| Enterprise Applications Integration Tools | |||||||||||
| 3,500,000 | Tumbleweed Communications (b)(c) | 9,205 | |||||||||
| Email Content Security & File Transfer Management | |||||||||||
| 726,024 | |||||||||||
| > Computer Hardware & Related Equipment 2.9% | |||||||||||
| 1,620,000 | Amphenol | 100,570 | |||||||||
| Electronic Connectors | |||||||||||
| 1,945,000 | Belden CDT | 76,030 | |||||||||
| Specialty Cable | |||||||||||
| 2,025,000 | II VI (b)(c) | 56,579 | |||||||||
| Laser Components | |||||||||||
| 1,634,000 | Nice Systems (Israel) (b) | 50,294 | |||||||||
| Audio & Video Recording Solutions | |||||||||||
| 620,000 | Rogers (b) | 36,673 | |||||||||
| PCB Laminates & High-performance Foams | |||||||||||
| 230,000 | Wincor Nixdorf (Germany) | 35,778 | |||||||||
| Retail POS Systems & ATM Machines | |||||||||||
| Number of Shares | Value (000) | ||||||||||
| 9,956,115 | Advantech (Taiwan) | $ | 35,774 | ||||||||
| Embedded Computers | |||||||||||
| 1,027,000 | Avocent (b) | 34,764 | |||||||||
| Computer Control Switches | |||||||||||
| 900,000 | Netgear (b) | 23,625 | |||||||||
| Networking Products for Small Business & Home | |||||||||||
| 1,310,000 | CTS | 20,567 | |||||||||
| Electronic Components, Sensors & Electronics Manufacturing Solutions | |||||||||||
| 1,875,000 | Seachange International (b)(c) | 19,162 | |||||||||
| Systems for Video on Demand & Ad Insertion | |||||||||||
| 530,000 | Zebra Technologies (b) | 18,439 | |||||||||
| Bar Code Printers | |||||||||||
| 375,000 | Diebold | 17,475 | |||||||||
| Automated Teller Machines | |||||||||||
| 625,000 | Excel Technology (b)(c) | 15,994 | |||||||||
| Laser Systems & Electro-optical Components | |||||||||||
| 500,000 | Intermec (b) | 12,135 | |||||||||
| Bar Code & Wireless LAN Systems | |||||||||||
| 553,859 | |||||||||||
| > Mobile Communications 2.6% | |||||||||||
| 4,500,000 | Crown Castle International (b) | 145,350 | |||||||||
| Communications Towers | |||||||||||
| 3,500,000 | American Tower (b) | 130,480 | |||||||||
| Communications Towers in USA & Mexico | |||||||||||
| 1,300,000 | Alltel | 78,624 | |||||||||
| Cellular Telephone Services | |||||||||||
| 8,000,000 | Dobson Communications (b)(c) | 69,680 | |||||||||
| Rural & Small City Cellular Telephone Services | |||||||||||
| 700,000 | Telephone & Data Systems | 38,031 | |||||||||
| Cellular & Wireline Telephone Services | |||||||||||
| 2,500,000 | Openwave Systems (b) | 23,075 | |||||||||
| Internet Software for Mobile Devices | |||||||||||
| 600,000 | Globalstar (b) | 8,346 | |||||||||
| Satellite Mobile Voice & Data Carrier | |||||||||||
| 493,586 | |||||||||||
| > Instrumentation 1.6% | |||||||||||
| 2,800,000 | Flir Systems (b) | 89,124 | |||||||||
| Infrared Cameras | |||||||||||
| 1,450,000 | Trimble Navigation (b) | 73,558 | |||||||||
| GPS-based Instruments | |||||||||||
| 750,000 | Mettler Toledo (b) | 59,138 | |||||||||
| Laboratory Equipment | |||||||||||
| 711,000 | Dionex (b) | 40,321 | |||||||||
| Ion & Liquid Chromatography | |||||||||||
| 800,000 | Varian (b) | 35,832 | |||||||||
| Analytical Instruments | |||||||||||
| 410,000 | IPG Photonics | 9,840 | |||||||||
| Fiber Lasers | |||||||||||
| 307,813 | |||||||||||
| > CATV 1.5% | |||||||||||
| 4,015,000 | Discovery Holding (b) | 64,601 | |||||||||
| CATV Programming | |||||||||||
| 2,050,000 | Liberty Global Series C (b) | 57,400 | |||||||||
| Cable TV Franchises Outside the USA | |||||||||||
| 70,000 | Jupiter Telecommunications (Japan) (b) | 56,162 | |||||||||
| Largest Cable Service Provider in Japan | |||||||||||
| 1,500,000 | Liberty Global Series A (b) | 43,725 | |||||||||
| Cable TV Franchises Outside the USA | |||||||||||
24
| Number of Shares | Value (000) | ||||||||||
| > CATV—continued | |||||||||||
| 8,000,000 | Gemstar-TV Guide International (b) | $ | 32,080 | ||||||||
| TV Program Guides & CATV Programming | |||||||||||
| 655,000 | Liberty Media Corp - Interactive (b) | 14,128 | |||||||||
| CATV & E-Commerce | |||||||||||
| 130,000 | Liberty Media Corp - Capital (b) | 12,738 | |||||||||
| CATV Holding Company | |||||||||||
| 1,250,000 | Mediacom Communications (b) | 10,050 | |||||||||
| Cable Television Franchises | |||||||||||
| 290,884 | |||||||||||
| > Gaming Equipment & Services 1.4% | |||||||||||
| 2,750,000 | International Game Technology | 127,050 | |||||||||
| Slot Machines & Progressive Slots | |||||||||||
| 3,500,000 | Bally Technologies (b)(c) | 65,380 | |||||||||
| Slot Machines & Software | |||||||||||
| 2,430,000 | Shuffle Master (b)(c) | 63,666 | |||||||||
| Card Shufflers & Casino Games | |||||||||||
| 500,000 | Scientific Games (b) | 15,115 | |||||||||
| Lottery Services Provider | |||||||||||
| 271,211 | |||||||||||
| > Semiconductors & Related Equipment 1.4% | |||||||||||
| 3,865,000 | Integrated Device Technology (b) | 59,830 | |||||||||
| Communications Semiconductors | |||||||||||
| 4,425,000 | Entegris (b) | 47,878 | |||||||||
| Semiconductor Wafer Shipping & Handling Products | |||||||||||
| 1,135,000 | Littelfuse (b)(c) | 36,184 | |||||||||
| Little Fuses | |||||||||||
| 1,425,000 | Microsemi (b) | 28,001 | |||||||||
| Analog/Mixed Signal Semiconductors | |||||||||||
| 690,000 | Supertex (b)(c) | 27,083 | |||||||||
| Mixed-signal Semiconductors | |||||||||||
| 2,425,000 | AMIS Holdings (b) | 25,632 | |||||||||
| Mixed-signal Semiconductors | |||||||||||
| 4,439,544 | Novatek Microelectronics (Taiwan) | 20,114 | |||||||||
| LCD Related Integrated Circuits Designer | |||||||||||
| 1,905,000 | IXYS (b)(c) | 16,955 | |||||||||
| Power Semiconductors | |||||||||||
| 261,677 | |||||||||||
| > Business Information & Marketing Services 1.2% | |||||||||||
| 3,460,000 | Ceridian (b) | 96,811 | |||||||||
| HR Services & Payment Processing | |||||||||||
| 1,900,000 | Navigant Consulting (b) | 37,544 | |||||||||
| Financial Consulting Firm | |||||||||||
| 916,000 | Fair Isaac | 37,236 | |||||||||
| Credit Scoring & Decision Analytic Software | |||||||||||
| 2,000,000 | ProQuest (b)(c) | 20,900 | |||||||||
| Information Services for Education & Automotive Markets | |||||||||||
| 1,696,000 | infoUSA | 20,199 | |||||||||
| Business Data for Sales Leads | |||||||||||
| 300,000 | Getty Images (b) | 12,846 | |||||||||
| Photographs for Publications & Electronic Media | |||||||||||
| 225,536 | |||||||||||
| > Financial Processors 1.1% | |||||||||||
| 2,774,000 | Global Payments | 128,436 | |||||||||
| Credit Card Processor | |||||||||||
| Number of Shares | Value (000) | ||||||||||
| 6,500,000 | Hong Kong Exchanges and Clearing (Hong Kong) | $ | 71,002 | ||||||||
| Hong Kong Equity & Derivatives Market Operator | |||||||||||
| 600,000 | Cubic | 13,020 | |||||||||
| Revenue Collection & Defense Systems | |||||||||||
| 212,458 | |||||||||||
| > Internet Related 1.0% | |||||||||||
| 3,000,000 | ValueClick (b) | 70,890 | |||||||||
| Internet Advertising | |||||||||||
| 9,500,000 | SkillSoft Publishing (b)(c) | 58,995 | |||||||||
| Web-based Learning Solutions (E-Learning) | |||||||||||
| 4,000,000 | CNET Networks (b) | 36,360 | |||||||||
| Internet Advertising on Niche Websites | |||||||||||
| 650,000 | Sohu.com (China ) (b) | 15,600 | |||||||||
| Chinese Internet Portal/Online Advertising | |||||||||||
| 181,845 | |||||||||||
| > Telecommunications Equipment 0.9% | |||||||||||
| 13,600,000 | Tellabs (b) | 139,536 | |||||||||
| Telecommunications Equipment | |||||||||||
| 600,000 | Polycom (b) | 18,546 | |||||||||
| Video Conferencing Equipment | |||||||||||
| 1,510,000 | Symmetricom (b) | 13,469 | |||||||||
| Network Timing & Synchronization Devices | |||||||||||
| 171,551 | |||||||||||
| > Computer Services 0.7% | |||||||||||
| 1,350,000 | SRA International (b) | 36,099 | |||||||||
| Government IT Services | |||||||||||
| 5,000,000 | iGate Capital (b)(c) | 34,400 | |||||||||
| IT & Business Process Outsourcing Services | |||||||||||
| 4,000,000 | BearingPoint (b) | 31,480 | |||||||||
| Business Consulting & Technology Strategy | |||||||||||
| 4,600,000 | AnswerThink Consulting (b)(c) | 14,168 | |||||||||
| IT Integration & Best Practice Research | |||||||||||
| 443,000 | TALX | 12,160 | |||||||||
| Outsourced Human Resource Services | |||||||||||
| 128,307 | |||||||||||
| > Telephone Services 0.7% | |||||||||||
| 4,500,000 | Time Warner Telecom (b) | 89,685 | |||||||||
| Fiber Optic Telephone/Data Services | |||||||||||
| 1,500,000 | Windstream | 21,330 | |||||||||
| Rural Telephone Franchises | |||||||||||
| 1,000,000 | Cogent Communications (b) | 16,220 | |||||||||
| Internet Data Pipelines | |||||||||||
| 127,235 | |||||||||||
| > Contract Manufacturing 0.5% | |||||||||||
| 1,705,000 | Jabil Circuit | 41,858 | |||||||||
| Electronic Manufacturing Services | |||||||||||
| 10,000,000 | Sanmina-SCI (b) | 34,500 | |||||||||
| Electronic Manufacturing Services | |||||||||||
| 1,020,000 | Plexus (b) | 24,357 | |||||||||
| Electronic Manufacturing Services | |||||||||||
| 100,715 | |||||||||||
| > Television Programming 0.5% | |||||||||||
| 1,423,100 | Alliance Atlantis Communication (Canada) (b) | 61,603 | |||||||||
| CATV Channels, TV/Movie Production/Distribution | |||||||||||
25
Columbia Acorn Fund
Statement of Investments, continued
| Number of Shares | Value (000) | ||||||||||
| > Television Programming—continued | |||||||||||
| 3,000,000 | Lions Gate Entertainment (b) | $ | 32,190 | ||||||||
| Film & TV Studio | |||||||||||
| 93,793 | |||||||||||
| > Consumer Software 0.5% | |||||||||||
| 2,300,000 | THQ (b) | 74,796 | |||||||||
| Entertainment Software | |||||||||||
| 1,000,000 | Activision (b) | 17,240 | |||||||||
| Entertainment Software | |||||||||||
| 92,036 | |||||||||||
| > Electronics Distribution 0.5% | |||||||||||
| 3,100,000 | Avnet (b) | 79,143 | |||||||||
| Electronic Components Distribution | |||||||||||
| 710,000 | Agilysys | 11,885 | |||||||||
| IT Distributor | |||||||||||
| 91,028 | |||||||||||
| > Radio 0.3% | |||||||||||
| 1,541,000 | Salem Communications (c) | 18,415 | |||||||||
| Radio Stations for Religious Programming | |||||||||||
| 1,500,000 | Cumulus Media (b) | 15,585 | |||||||||
| Radio Stations in Small Cities | |||||||||||
| 1,400,000 | Saga Communications (b)(c) | 13,454 | |||||||||
| Radio Stations in Small- & Mid-sized Cities | |||||||||||
| 2,400,000 | Spanish Broadcasting System (b)(c) | 9,864 | |||||||||
| Spanish Language Radio Stations | |||||||||||
| 57,318 | |||||||||||
| > Satellite Broadcasting & Services 0.3% | |||||||||||
| 2,755,000 | SES Global (France) | 48,930 | |||||||||
| Satellite Broadcasting Services | |||||||||||
| 48,930 | |||||||||||
| > Publishing 0.2% | |||||||||||
| 1,100,000 | NAVTEQ (b) | 38,467 | |||||||||
| Map Data for Electronic Devices | |||||||||||
| 38,467 | |||||||||||
| > TV Broadcasting 0.2% | |||||||||||
| 2,500,000 | Entravision Communications (b) | 20,550 | |||||||||
| Spanish Language TV, Radio & Outdoor | |||||||||||
| 1,750,000 | Gray Television | 12,828 | |||||||||
| Mid Market Affiliated TV Stations | |||||||||||
| 33,378 | |||||||||||
| Information Total | 4,507,651 | ||||||||||
| Consumer Goods & Services 18.8% | |||||||||||
| > Retail 4.2% | |||||||||||
| 3,140,000 | Abercrombie & Fitch | 218,638 | |||||||||
| Teen Apparel Retailer | |||||||||||
| 7,080,000 | Chico's FAS (b) | 146,485 | |||||||||
| Women's Specialty Retail | |||||||||||
| 4,600,000 | Urban Outfitters (b) | 105,938 | |||||||||
| Apparel & Home Specialty Retailer | |||||||||||
| 3,743,000 | Christopher & Banks (c) | 69,844 | |||||||||
| Women's Apparel Retailer | |||||||||||
| 1,350,000 | J Crew Group (b) | 52,043 | |||||||||
| Multi-channel Branded Retailer | |||||||||||
| 1,400,000 | Williams-Sonoma | 44,016 | |||||||||
| Home Goods & Furnishing Retailer | |||||||||||
| Number of Shares | Value (000) | ||||||||||
| 1,223,000 | AnnTaylor Stores (b) | $ | 40,163 | ||||||||
| Women's Apparel Retailer | |||||||||||
| 1,630,000 | Rona (Canada) (b) | 29,353 | |||||||||
| Leading Canadian Do-it-yourself Retailer | |||||||||||
| 775,000 | Genesco (b) | 28,908 | |||||||||
| Multi-concept Branded Footwear Retailer | |||||||||||
| 1,700,000 | Charming Shoppes (b) | 23,001 | |||||||||
| Women'S Specialty Plus Size Apparel Retailer | |||||||||||
| 3,500,000 | Edgars Consolidated Stores (South Africa) | 19,423 | |||||||||
| Retail Conglomerate | |||||||||||
| 1,200,000 | Gaiam (b)(c) | 16,416 | |||||||||
| Healthy Living Catalogs & E-Commerce | |||||||||||
| 794,228 | |||||||||||
| > Apparel 2.5% | |||||||||||
| 7,330,000 | Coach (b) | 314,897 | |||||||||
| Designer & Retailer of Branded Leather Accessories | |||||||||||
| 2,268,000 | Carter's (b) | 57,834 | |||||||||
| Children's Branded Apparel | |||||||||||
| 919,000 | Oxford Industries (c) | 45,628 | |||||||||
| Branded & Private Label Apparel | |||||||||||
| 3,000,000 | Billabong International (Australia) | 41,230 | |||||||||
| Action Sports Apparel Brand Manager | |||||||||||
| 900,000 | True Religion Apparel (b) | 13,779 | |||||||||
| Premium Denim | |||||||||||
| 150,000 | Heelys | 4,816 | |||||||||
| Wheeled Footwear | |||||||||||
| 478,184 | |||||||||||
| > Other Consumer Services 2.4% | |||||||||||
| 2,250,000 | ITT Educational Services (b)(c) | 149,332 | |||||||||
| Post-secondary Degree Programs | |||||||||||
| 5,400,000 | ServiceMaster | 70,794 | |||||||||
| Lawn Care, Pest Control, Commercial Disaster Responce | |||||||||||
| 1,275,000 | Weight Watchers International | 66,976 | |||||||||
| Weight Loss Programs | |||||||||||
| 600,000 | NutriSystem (b) | 38,034 | |||||||||
| Weight Loss Program | |||||||||||
| 1,500,000 | Universal Technical Institute (b)(c) | 33,315 | |||||||||
| Vocational Training | |||||||||||
| 800,000 | Regis | 31,632 | |||||||||
| Hair Salons | |||||||||||
| 1,530,000 | Central Parking | 27,540 | |||||||||
| Owner, Operator, Manager of Parking Lots & Garages | |||||||||||
| 110,000 | Pierre & Vacances (France) | 13,481 | |||||||||
| Vacation Apartment Lets | |||||||||||
| 2,550,000 | Princeton Review (b)(c) | 13,464 | |||||||||
| College Preparation Courses | |||||||||||
| 100,000 | Lincoln Technical Institute (b) | 1,349 | |||||||||
| Vocational Training | |||||||||||
| 445,917 | |||||||||||
| > Leisure Products 2.2% | |||||||||||
| 1,751,000 | Harley-Davidson | 123,393 | |||||||||
| Motorcycles & Related Merchandise | |||||||||||
| 1,416,000 | Speedway Motorsports | 54,374 | |||||||||
| Motorsport Racetrack Owner & Operator | |||||||||||
| 1,025,000 | International Speedway | 52,316 | |||||||||
| Largest Motorsports Racetrack Owner & Operator | |||||||||||
26
| Number of Shares | Value (000) | ||||||||||
| > Leisure Products—continued | |||||||||||
| 1,032,000 | RC2 (b) | $ | 45,408 | ||||||||
| Toys, Infant Products & Collectibles | |||||||||||
| 900,000 | Polaris Industries | 42,147 | |||||||||
| Leisure Vehicles & Related Products | |||||||||||
| 4,690,000 | Fleetwood Enterprises (b)(c) | 37,098 | |||||||||
| RV & Manufactured Home Maker | |||||||||||
| 690,000 | Winnebago | 22,708 | |||||||||
| Premier Motorhome Maker | |||||||||||
| 441,000 | Thor Industries | 19,400 | |||||||||
| RV & Bus Manufacturer | |||||||||||
| 600,000 | Callaway Golf | 8,646 | |||||||||
| Premium Golf Clubs & Balls | |||||||||||
| 405,490 | |||||||||||
| > Nondurables 1.6% | |||||||||||
| 2,740,000 | Scotts Miracle-Gro | 141,521 | |||||||||
| Consumer Lawn & Garden Products | |||||||||||
| 1,650,000 | Jarden (b) | 57,404 | |||||||||
| Branded Household Products | |||||||||||
| 1,010,000 | Chattem (b)(c) | 50,581 | |||||||||
| Personal Care Products | |||||||||||
| 1,800,000 | Helen of Troy (b)(c) | 43,668 | |||||||||
| Hair Dryers & Curling Irons | |||||||||||
| 1,100,000 | Natura Cosmeticos (Brazil) | 15,262 | |||||||||
| Direct Retailer of Cosmetics | |||||||||||
| 308,436 | |||||||||||
| > Furniture & Textiles 1.4% | |||||||||||
| 2,550,000 | HNI (c) | 113,246 | |||||||||
| Office Furniture & Fireplaces | |||||||||||
| 2,068,000 | Herman Miller | 75,192 | |||||||||
| Office Furniture | |||||||||||
| 1,048,000 | Nobia (Sweden) | 40,326 | |||||||||
| Kitchen Cabinet Manufacturing & Distribution | |||||||||||
| 1,809,000 | Knoll | 39,798 | |||||||||
| Office Furniture | |||||||||||
| 268,562 | |||||||||||
| > Casinos & Gaming 1.3% | |||||||||||
| 3,200,000 | Pinnacle Entertainment (b)(c) | 106,048 | |||||||||
| Regional Casino Operator | |||||||||||
| 1,700,000 | Penn National Gaming (b) | 70,754 | |||||||||
| Regional Casino Operator | |||||||||||
| 540,000 | Station Casinos | 44,102 | |||||||||
| Las Vegas Locals Casinos | |||||||||||
| 690,000 | Intralot (Greece) | 24,133 | |||||||||
| Lottery & Gaming Systems/Services | |||||||||||
| 226,000 | Lakes Entertainment (b) | 2,439 | |||||||||
| Native American Casinos Development | |||||||||||
| 247,476 | |||||||||||
| > Travel 1.3% | |||||||||||
| 2,390,000 | Vail Resorts (b)(c) | 107,120 | |||||||||
| Ski Resort Operator & Developer | |||||||||||
| 4,000,000 | Expedia (b) | 83,920 | |||||||||
| Online Travel Services Company | |||||||||||
| 643,000 | Four Seasons Hotels (Canada) | 52,719 | |||||||||
| Luxury Hotel Operator | |||||||||||
| 243,759 | |||||||||||
| Number of Shares | Value (000) | ||||||||||
| > Restaurants 0.7% | |||||||||||
| 2,145,000 | Sonic (b) | $ | 51,373 | ||||||||
| Quick Service Restaurant | |||||||||||
| 1,000,000 | Red Robin Gourmet Burgers (b)(c) | 35,850 | |||||||||
| Casual Dining Restaurant | |||||||||||
| 1,600,000 | AFC Enterprises (b)(c) | 28,272 | |||||||||
| Popeyes Restaurants | |||||||||||
| 800,000 | Cheesecake Factory (b) | 19,680 | |||||||||
| Casual Dining Restaurants | |||||||||||
| 135,175 | |||||||||||
| > Consumer Goods Distribution 0.5% | |||||||||||
| 2,500,000 | Pool | 97,925 | |||||||||
| Distributor of Swimming Pool Supplies & Equipment | |||||||||||
| 97,925 | |||||||||||
| > Food & Beverage 0.4% | |||||||||||
| 2,500,000 | C&C Group (Ireland) | 44,372 | |||||||||
| Beverage Company | |||||||||||
| 1,000,000 | IAWS Group (Ireland) | 25,607 | |||||||||
| Baked Goods | |||||||||||
| 69,979 | |||||||||||
| > Other Durable Goods 0.2% | |||||||||||
| 14,999,300 | Techtronic Industries (Hong Kong) | 19,415 | |||||||||
| Power Tools & Motorized Appliances | |||||||||||
| 900,000 | Champion Enterprises (b) | 8,424 | |||||||||
| Manufactured Homes | |||||||||||
| 5,700,000 | Ducati Motor (Italy) (b) | 6,914 | |||||||||
| Motorcycles & Related Merchandise | |||||||||||
| 172,000 | Cavco Industries (b) | 6,027 | |||||||||
| Higher End Manufactured Homes | |||||||||||
| 40,780 | |||||||||||
| > Cruise Lines 0.1% | |||||||||||
| 400,000 | Carnival | 19,620 | |||||||||
| Largest Cruise Line | |||||||||||
| 19,620 | |||||||||||
| Consumer Goods & Services: Total | 3,555,531 | ||||||||||
| Industrial Goods & Services 17.2% | |||||||||||
| > Machinery 5.6% | |||||||||||
| 4,700,000 | Ametek | 149,648 | |||||||||
| Aerospace/Industrial Instruments | |||||||||||
| 3,600,000 | Donaldson | 124,956 | |||||||||
| Industrial Air Filtration | |||||||||||
| 3,500,000 | Clarcor (c) | 118,335 | |||||||||
| Mobile & Industrial Filters | |||||||||||
| 2,200,000 | ESCO Technologies (b)(c) | 99,968 | |||||||||
| Automatic Electric Meter Readers | |||||||||||
| 2,850,000 | Pentair | 89,490 | |||||||||
| Pumps, Water Treatment & Tools | |||||||||||
| 2,500,000 | Pall | 86,375 | |||||||||
| Filtration & Fluids Clarification | |||||||||||
| 1,900,000 | Mine Safety Appliances (c) | 69,635 | |||||||||
| Safety Equipment | |||||||||||
| 1,250,000 | Nordson | 62,287 | |||||||||
| Dispensing Systems for Adhesives & Coatings | |||||||||||
| 1,100,000 | Kaydon | 43,714 | |||||||||
| Specialized Friction & Motion Control Products | |||||||||||
| 750,000 | Armor Holdings (b) | 41,137 | |||||||||
| Military Trucks, Armor & Helmets | |||||||||||
27
Columbia Acorn Fund
Statement of Investments, continued
| Number of Shares | Value (000) | ||||||||||
| > Machinery—continued | |||||||||||
| 1,712,000 | K&F Industries Holdings (b) | $ | 38,880 | ||||||||
| Aircraft Wheels, Brakes & Fuel Tank Bladders | |||||||||||
| 833,000 | Toro | 38,843 | |||||||||
| Turf Maintenance Equipment | |||||||||||
| 2,100,000 | Goodman Global (b) | 36,120 | |||||||||
| HVAC Equipment Manufacturer | |||||||||||
| 253,600 | Neopost (France) | 31,847 | |||||||||
| Postage Meter Machines | |||||||||||
| 600,000 | Gardner Denver (b) | 22,386 | |||||||||
| Air Compressors, Blowers & Pumps | |||||||||||
| 1,053,621 | |||||||||||
| > Other Industrial Services 2.6% | |||||||||||
| 5,500,000 | Expeditors International of Washington | 222,750 | |||||||||
| International Freight Forwarder | |||||||||||
| 3,200,000 | UTI Worldwide | 95,680 | |||||||||
| Global Logistics & Freight Forwarding | |||||||||||
| 1,900,000 | Forward Air (c) | 54,967 | |||||||||
| Freight Transportation Between Airports | |||||||||||
| 1,650,000 | Mobile Mini (b) | 44,451 | |||||||||
| Portable Storage Units Leasing | |||||||||||
| 374,000 | Imtech (Netherlands) | 23,770 | |||||||||
| Engineering & Technical Services | |||||||||||
| 512,000 | G&K Services | 19,912 | |||||||||
| Uniform Rental | |||||||||||
| 655,000 | TAL International Group | 17,482 | |||||||||
| Intermodal Freight Containers Leasing | |||||||||||
| 315,000 | American Reprographics (b) | 10,493 | |||||||||
| Document Management & Logistics | |||||||||||
| 489,505 | |||||||||||
| > Industrial Distribution 1.8% | |||||||||||
| 2,375,000 | Watsco (c) | 112,005 | |||||||||
| HVAC Distribution | |||||||||||
| 1,300,000 | WW Grainger | 90,922 | |||||||||
| Industrial Distribution | |||||||||||
| 1,925,000 | Airgas | 78,001 | |||||||||
| Industrial Gas Distributor | |||||||||||
| 3,000,000 | Grafton Group (Ireland) | 50,139 | |||||||||
| Builders Materials Wholesaling & Do-it-yourself Retailing | |||||||||||
| 510,000 | NuCo2 (b) | 12,541 | |||||||||
| Bulk Co2 Gas Distribution to Restaurants | |||||||||||
| 343,608 | |||||||||||
| > Construction 1.6% | |||||||||||
| 1,900,000 | Florida Rock | 81,795 | |||||||||
| Aggregates & Concrete | |||||||||||
| 2,200,000 | Simpson Manufacturing | 69,630 | |||||||||
| Wall Joint Maker | |||||||||||
| 650,000 | Martin Marietta Materials | 67,541 | |||||||||
| Aggregates | |||||||||||
| 30,000 | Geberit (Switzerland) | 46,222 | |||||||||
| Plumbing Supplies | |||||||||||
| 1,000,000 | Kingspan Group (Ireland) | 26,492 | |||||||||
| Building Insulation & Environmental Containers | |||||||||||
| 90,000 | Ciments Francais (France) | 17,283 | |||||||||
| Leading French & Emerging Markets Cement Producer | |||||||||||
| 308,963 | |||||||||||
| Number of Shares | Value (000) | ||||||||||
| > Industrial Materials & Specialty Chemicals 1.4% | |||||||||||
| 2,700,000 | Spartech (c) | $ | 70,794 | ||||||||
| Plastics Distribution & Compounding | |||||||||||
| 590,000 | Novozymes (Denmark) | 50,579 | |||||||||
| Industrial Enzymes | |||||||||||
| 28,000 | Sika (Switzerland) | 43,410 | |||||||||
| Chemicals for Construction & Industrial Applications | |||||||||||
| 1,228,000 | Drew Industries (b)(c) | 31,940 | |||||||||
| RV & Manufactured Home Components | |||||||||||
| 195,000 | Sociedad Quimica y Minera de Chile (Chile) | 26,436 | |||||||||
| Producer of Specialty Fertilizers, Lithium & Iodine | |||||||||||
| 400,000 | Carbone Lorraine (France) | 22,482 | |||||||||
| Advanced Industrial Materials | |||||||||||
| 200,000 | Imerys (France) | 17,746 | |||||||||
| Industrial Minerals Producer | |||||||||||
| 431,000 | Koninklijke TenCate (Netherlands) | 13,187 | |||||||||
| Advanced Textiles & Industrial Fabrics | |||||||||||
| 276,574 | |||||||||||
| > Electrical Components 1.1% | |||||||||||
| 1,963,000 | Genlyte Group (b)(c) | 153,330 | |||||||||
| Commercial Lighting Fixtures | |||||||||||
| 1,125,000 | Ushio (Japan) | 23,157 | |||||||||
| Industrial Light Sources | |||||||||||
| 700,000 | Legrand (France) (b) | 20,514 | |||||||||
| Electrical Components | |||||||||||
| 373,000 | Zumtobel (Austria) (b) | 11,869 | |||||||||
| Lighting Systems | |||||||||||
| 208,870 | |||||||||||
| > Outsourcing Services 1.1% | |||||||||||
| 1,670,000 | Administaff (c) | 71,426 | |||||||||
| Professional Employer Organization | |||||||||||
| 2,500,000 | Quanta Services (b) | 49,175 | |||||||||
| Electrical & Telecom Construction Services | |||||||||||
| 925,000 | USG People (Netherlands) | 40,196 | |||||||||
| Temporary Staffing Services | |||||||||||
| 2,000,000 | Labor Ready (b) | 36,660 | |||||||||
| Temporary Manual Labor | |||||||||||
| 600,000 | GP Strategies (b) | 4,980 | |||||||||
| Training Programs | |||||||||||
| 202,437 | |||||||||||
| > Conglomerates 0.8% | |||||||||||
| 766,000 | Aalberts Industries (Netherlands) | 66,219 | |||||||||
| Flow Control & Heat Treatment | |||||||||||
| 1,350,000 | Hexagon (Sweden) | 57,470 | |||||||||
| Measurement Equipment & Polymers | |||||||||||
| 558,000 | Ibiden (Japan) | 28,185 | |||||||||
| Electronic Parts & Ceramics | |||||||||||
| 151,874 | |||||||||||
| > Steel 0.8% | |||||||||||
| 2,860,000 | Gibraltar Industries (c) | 67,239 | |||||||||
| Steel Processing | |||||||||||
| 2,300,000 | Worthington Industries | 40,756 | |||||||||
| Steel Processing | |||||||||||
| 135,000 | Vallourec (France) | 38,989 | |||||||||
| Oil, Gas & Industrial Seamless Tubes | |||||||||||
| 146,984 | |||||||||||
28
| Number of Shares | Value (000) | ||||||||||
| > Waste Management 0.4% | |||||||||||
| 1,700,000 | Waste Connections (b) | $ | 70,635 | ||||||||
| Solid Waste Management | |||||||||||
| 70,635 | |||||||||||
| Industrial Goods & Services: Total | 3,253,071 | ||||||||||
| Finance 14.3% | |||||||||||
| > Insurance 4.2% | |||||||||||
| 3,125,000 | HCC Insurance Holdings | 100,281 | |||||||||
| Specialty Insurance | |||||||||||
| 2,040,000 | Philadelphia Consolidated Holding (b) | 90,902 | |||||||||
| Specialty Insurance | |||||||||||
| 149,000 | Markel (b) | 71,535 | |||||||||
| Specialty Insurance | |||||||||||
| 1,200,000 | Assurant | 66,300 | |||||||||
| Specialty Insurance | |||||||||||
| 1,690,000 | Endurance Specialty Holdings | 61,820 | |||||||||
| Commercial Lines Insurance/Reinsurance | |||||||||||
| 1,748,000 | Leucadia National | 49,294 | |||||||||
| Insurance Holding Company | |||||||||||
| 995,000 | Protective Life | 47,262 | |||||||||
| Life Insurance | |||||||||||
| 1,650,000 | Aspen Insurance | 43,494 | |||||||||
| Commercial Lines Insurance/Reinsurance | |||||||||||
| 710,000 | Selective Insurance Group | 40,676 | |||||||||
| Commercial & Personal Lines Insurance | |||||||||||
| 1,550,000 | United America Indemnity (b)(c) | 39,262 | |||||||||
| Specialty Insurance | |||||||||||
| 740,000 | Stancorp Financial Group | 33,337 | |||||||||
| Group Life & Disability Insurance | |||||||||||
| 570,000 | RLI | 32,159 | |||||||||
| Specialty Insurance | |||||||||||
| 750,000 | Delphi Financial Group | 30,345 | |||||||||
| Group Employee Benefit Products & Services | |||||||||||
| 600,000 | National Financial Partners | 26,382 | |||||||||
| Distributor of Life Insurance, Group Benefits & Investment Advisory Services | |||||||||||
| 500,000 | April Group (France) | 24,018 | |||||||||
| Insurance Policy Construction | |||||||||||
| 1,100,000 | Montpelier Re | 20,471 | |||||||||
| Commercial Lines Insurance/Reinsurance | |||||||||||
| 1,000,000 | Conseco (b) | 19,980 | |||||||||
| Life, Long-Term Care & Medical Supplement Insurance | |||||||||||
| 797,518 | |||||||||||
| > Banks 4.2% | |||||||||||
| 2,605,000 | BOK Financial | 143,223 | |||||||||
| Tulsa Based S.W. Bank | |||||||||||
| 3,600,000 | Associated Banc-Corp | 125,568 | |||||||||
| Midwest Bank | |||||||||||
| 4,080,000 | Glacier Bancorp (c) | 99,715 | |||||||||
| Mountain States Bank | |||||||||||
| 3,156,000 | TCF Financial | 86,538 | |||||||||
| Great Lakes Bank | |||||||||||
| 2,850,000 | Northern Rock (United Kingdom) | 65,544 | |||||||||
| Lowest Cost Mortgage Bank in UK | |||||||||||
| 3,000,000 | Anglo Irish Bank (Ireland) | 62,202 | |||||||||
| Small Business & Middle Market Banking | |||||||||||
| 1,320,000 | West Coast Bancorp (c) | 45,725 | |||||||||
| Portland Small Business Bank | |||||||||||
| Number of Shares | Value (000) | ||||||||||
| 1,042,000 | Chittenden | $ | 31,979 | ||||||||
| Vermont & Western Massachusetts Banks | |||||||||||
| 1,425,000 | Depfa Bank (Germany) | 25,559 | |||||||||
| Investment Banker to Public Authorities | |||||||||||
| 690,000 | East West Bancorp | 24,440 | |||||||||
| LA Bank with Chinese Focus | |||||||||||
| 663,000 | Great Southern Bancorp | 19,565 | |||||||||
| Missouri Real Estate Lender | |||||||||||
| 949,000 | West Bancorporation (c) | 16,873 | |||||||||
| Des Moines Commercial Bank | |||||||||||
| 286,000 | First Financial Bankshares | 11,972 | |||||||||
| West Texas Bank | |||||||||||
| 300,000 | Cascade Bancorp | 9,309 | |||||||||
| Central Oregon Bank | |||||||||||
| 400,000 | First Mutual Bancshares (c) | 9,272 | |||||||||
| Seattle Community Bank | |||||||||||
| 219,000 | SY Bancorp | 6,132 | |||||||||
| Louisville Bank | |||||||||||
| 150,000 | Greene County Bancshares | 5,960 | |||||||||
| Tennessee Bank | |||||||||||
| 8,000 | Cass Information Systems | 289 | |||||||||
| Payables Outsourcer | |||||||||||
| 789,865 | |||||||||||
| > Brokerage & Money Management 2.4% | |||||||||||
| 5,500,000 | Eaton Vance | 181,555 | |||||||||
| Specialty Mutual Funds | |||||||||||
| 2,464,000 | SEI Investments | 146,756 | |||||||||
| Mutual Fund Administration & Investment Management | |||||||||||
| 2,157,000 | Nuveen Investments | 111,905 | |||||||||
| Money Management | |||||||||||
| 450,000 | Investment Technology Group (b) | 19,296 | |||||||||
| Electronic Trading | |||||||||||
| 130,000 | Stifel Financial (b) | 5,100 | |||||||||
| Traditional Middle-American Broker | |||||||||||
| 464,612 | |||||||||||
| > Finance Companies 1.8% | |||||||||||
| 6,500,000 | AmeriCredit (b)(c) | 163,605 | |||||||||
| Auto Lending | |||||||||||
| 1,500,000 | World Acceptance (b)(c) | 70,425 | |||||||||
| Personal Loans | |||||||||||
| 1,212,000 | McGrath Rentcorp | 37,124 | |||||||||
| Temporary Space & IT Equipment Rentals | |||||||||||
| 1,119,000 | Electro Rent (b) | 18,687 | |||||||||
| Test & Measurement Rentals | |||||||||||
| 685,000 | Marlin Business Services (b)(c) | 16,461 | |||||||||
| National Small Equipment Leasing | |||||||||||
| 250,000 | Banca Italease (Italy) | 14,526 | |||||||||
| Italian Leasing & Factoring Leader | |||||||||||
| 900,000 | Paragon Group (United Kingdom) | 11,775 | |||||||||
| UK Buy-to-let Finance Company | |||||||||||
| 332,603 | |||||||||||
| > Savings & Loans 1.7% | |||||||||||
| 4,326,000 | People's Bank Bridgeport | 193,026 | |||||||||
| Connecticut Savings & Loan | |||||||||||
| 1,700,000 | Housing Development Finance (India) | 62,617 | |||||||||
| Indian Mortgage Lender | |||||||||||
| 1,178,000 | Anchor Bancorp Wisconsin (c) | 33,950 | |||||||||
| Wisconsin Thrift | |||||||||||
29
Columbia Acorn Fund
Statement of Investments, continued
| Number of Shares | Value (000) | ||||||||||
| > Savings & Loans—continued | |||||||||||
| 1,285,000 | Washington Federal | $ | 30,236 | ||||||||
| Traditional Thrift | |||||||||||
| 360,000 | Provident New York Bancorp | 5,393 | |||||||||
| New York State Thrift | |||||||||||
| 325,222 | |||||||||||
| Finance: Total | 2,709,820 | ||||||||||
| Energy & Minerals 8.0% | |||||||||||
| > Oil & Gas Producers 3.7% | |||||||||||
| 2,700,000 | Ultra Petroleum (b) | 128,925 | |||||||||
| Oil & Gas Producer | |||||||||||
| 2,500,000 | XTO Energy | 117,625 | |||||||||
| Oil & Gas Producer | |||||||||||
| 2,400,000 | Equitable Resources | 100,200 | |||||||||
| Natural Gas Producer & Utility | |||||||||||
| 4,900,000 | Talisman Energy (Canada) | 83,197 | |||||||||
| Oil & Gas Producer | |||||||||||
| 9,315,000 | Tullow Oil (United Kingdom) | 72,571 | |||||||||
| Oil & Gas Producer | |||||||||||
| 2,000,000 | Southwestern Energy (b) | 70,100 | |||||||||
| Natural Gas Producer | |||||||||||
| 1,500,000 | Range Resources | 41,190 | |||||||||
| Oil & Gas Producer | |||||||||||
| 850,000 | St. Mary Land & Exploration | 31,314 | |||||||||
| Oil & Gas Producer | |||||||||||
| 3,200,000 | Vaalco Energy (b)(c) | 21,600 | |||||||||
| Oil & Gas Producer | |||||||||||
| 700,000 | Denbury Resources (b) | 19,453 | |||||||||
| Oil Producer Using Co2 Injection | |||||||||||
| 1,200,000 | McMoran Exploration (b) | 17,064 | |||||||||
| Natural Gas Producer & Developer | |||||||||||
| 703,239 | |||||||||||
| > Oil Services 3.2% | |||||||||||
| 2,820,000 | FMC Technologies (b) | 173,797 | |||||||||
| Oil & Gas Well Head Manufacturer | |||||||||||
| 2,928,301 | Fugro (Netherlands) | 139,874 | |||||||||
| Oilfield Services | |||||||||||
| 1,200,000 | Atwood Oceanics (b) | 58,764 | |||||||||
| Offshore Drilling Contractor | |||||||||||
| 1,611,000 | Rowan | 53,485 | |||||||||
| Offshore Drilling Contractor | |||||||||||
| 1,520,000 | Pride International (b) | 45,615 | |||||||||
| Offshore Drilling Contractor | |||||||||||
| 2,400,000 | Key Energy Services (b) | 37,560 | |||||||||
| Well Workover Services | |||||||||||
| 1,190,000 | Tetra Technologies (b) | 30,440 | |||||||||
| U.S.-based Services Company with Life of Field Approach | |||||||||||
| 750,000 | CARBO Ceramics | 28,028 | |||||||||
| Natural Gas Well Stimulants | |||||||||||
| 2,280,000 | Enerflex Systems (Canada) (c) | 21,604 | |||||||||
| Natural Gas Compresser Rental & Fabrication | |||||||||||
| 2,580,000 | Newpark Resources (b) | 18,602 | |||||||||
| Drilling Fluid Services | |||||||||||
| 607,769 | |||||||||||
| > Mining 0.6% | |||||||||||
| 13,100,000 | UrAsia Energy (Canada) (b)(e) | 60,324 | |||||||||
| Uranium Mining in Kazakhstan | |||||||||||
| Number of Shares | Value (000) | ||||||||||
| 2,900,000 | Jubilee Mines (Australia) | $ | 36,126 | ||||||||
| Nickel Mining in Australia | |||||||||||
| 1,000,000 | Ivanhoe Mines (Canada) (b) | 9,862 | |||||||||
| Copper Mine Project in Mongolia | |||||||||||
| 106,312 | |||||||||||
| > Oil Refining, Marketing & Distribution 0.3% | |||||||||||
| 966,000 | Atmos Energy | 30,825 | |||||||||
| Dallas Natural Gas Utility | |||||||||||
| 435,000 | Oneok | 18,757 | |||||||||
| Natural Gas Distribution, Pipeline Processing & Trading | |||||||||||
| 19,000 | Dynegy (b) | 138 | |||||||||
| Energy Trading & Generation | |||||||||||
| 49,720 | |||||||||||
| > Agricultural Commodities 0.2% | |||||||||||
| 550,000 | Aracruz Celulose (Brazil) | 33,682 | |||||||||
| Brazilian Hardwood Pulp Producer | |||||||||||
| 35,000,000 | Global Bio-chem Technology Group (China ) | 11,776 | |||||||||
| Refiner of Corn-based Commodities | |||||||||||
| 45,458 | |||||||||||
| Energy & Minerals: Total | 1,512,498 | ||||||||||
| Health Care 7.8% | |||||||||||
| > Health Care Services 2.4% | |||||||||||
| 1,991,000 | Lincare Holdings (b) | 79,321 | |||||||||
| Home Health Care Services | |||||||||||
| 1,000,000 | Rhoen-Klinikum (Germany) | 48,486 | |||||||||
| Health Care Services | |||||||||||
| 410,000 | OPG Groep (Netherlands) | 48,174 | |||||||||
| Health Care Supplies & Pharmacies | |||||||||||
| 1,085,000 | Charles River Laboratories (b) | 46,926 | |||||||||
| Pharmaceutical Research | |||||||||||
| 2,250,000 | PSS World Medical (b) | 43,943 | |||||||||
| Medical Supplies Distributor | |||||||||||
| 1,125,000 | LCA-Vision (c) | 38,655 | |||||||||
| Lasik Surgery Centers | |||||||||||
| 900,000 | Omnicare | 34,767 | |||||||||
| Pharmacy Services For Nursing Homes | |||||||||||
| 1,150,000 | United Surgical Partners (b) | 32,603 | |||||||||
| Outpatient Surgery Center | |||||||||||
| 500,000 | Coventry Health Care (b) | 25,025 | |||||||||
| HMO | |||||||||||
| 808,000 | PRA International (b) | 20,418 | |||||||||
| Contract Research Organization | |||||||||||
| 2,300,000 | Eresearch Technology (b) | 15,479 | |||||||||
| Clinical Research Services | |||||||||||
| 1,433,000 | Dendrite International (b) | 15,347 | |||||||||
| Software for Pharmaceutical Sales Force Automation | |||||||||||
| 449,144 | |||||||||||
| > Medical Equipment & Devices 1.5% | |||||||||||
| 942,500 | Orthofix International (b)(c) | 47,125 | |||||||||
| Bone Fixation & Stimulation Devices | |||||||||||
| 1,000,000 | Edwards Lifesciences (b) | 47,040 | |||||||||
| Heart Valves | |||||||||||
| 870,000 | Vital Signs (c) | 43,430 | |||||||||
| Anesthesia, Respiratory & Sleep Products | |||||||||||
| 315,000 | Synthes (Switzerland) | 37,549 | |||||||||
| Products for Orthopedic Surgery | |||||||||||
30
| Number of Shares | Value (000) | ||||||||||
| > Medical Equipment & Devices—continued | |||||||||||
| 1,050,000 | Viasys Healthcare (b) | $ | 29,211 | ||||||||
| Respiratory & Neurology Medical Equipment | |||||||||||
| 550,000 | Haemonetics (b) | 24,761 | |||||||||
| Blood & Plasma Collection Equipment | |||||||||||
| 205,000 | Essilor International (France) | 21,988 | |||||||||
| Eyeglass Lenses | |||||||||||
| 550,000 | Dade Behring | 21,896 | |||||||||
| Clinical Diagnostics Supplier | |||||||||||
| 552,000 | Advanced Medical Optics (b) | 19,430 | |||||||||
| Medical Devices for Eye Care | |||||||||||
| 292,430 | |||||||||||
| > Biotechnology & Drug Delivery 1.5% | |||||||||||
| 2,300,000 | PDL BioPharma (b) | 46,322 | |||||||||
| Proprietary Monoclonal Antibodies | |||||||||||
| 2,360,000 | Nektar Therapeutics (b) | 35,895 | |||||||||
| Drug Delivery Technologies | |||||||||||
| 2,880,000 | Ligand Pharmaceuticals (b) | 31,536 | |||||||||
| Drugs for Pain, Cancer, Osteoporosis & Diabetes | |||||||||||
| 2,000,000 | Medarex (b) | 29,580 | |||||||||
| Humanized Antibodies | |||||||||||
| 1,780,000 | Array Biopharma (b) | 22,998 | |||||||||
| Drugs for Cancer & Inflammatory Diseases | |||||||||||
| 1,650,000 | Human Genome Sciences (b) | 20,526 | |||||||||
| Drug Discovery/Development | |||||||||||
| 1,179,000 | Arena Pharmaceuticals (b) | 15,221 | |||||||||
| Novel Drug Targeting Technology | |||||||||||
| 2,000,000 | Cytokinetics (b)(c) | 14,960 | |||||||||
| Drugs for Cancer & Heart Failure | |||||||||||
| 2,300,000 | Seattle Genetics (b) | 12,259 | |||||||||
| Antibody-based Therapies for Cancer | |||||||||||
| 2,520,000 | Decode Genetics (b) | 11,416 | |||||||||
| Drugs for Heart Attack, Asthma & Vascular Disease | |||||||||||
| 3,100,000 | Lexicon Genetics (b) | 11,191 | |||||||||
| Drug Discovery | |||||||||||
| 1,650,000 | Nuvelo (b) | 6,600 | |||||||||
| Development-Stage Biotech Focused On Cardiovascular/Cancer | |||||||||||
| 1,750,000 | Genitope (b) | 6,160 | |||||||||
| Cancer Vaccine | |||||||||||
| 655,000 | Neurogen (b) | 3,897 | |||||||||
| Development-Stage Biotech Focused On Neurology | |||||||||||
| 388,000 | Exelixis (b) | 3,492 | |||||||||
| Treatments for Cancer & Metabolic Disorders | |||||||||||
| 1,249,999 | Perlegen Sciences (e) | 3,375 | |||||||||
| Large Scale Gene Sequencing | |||||||||||
| 1,100,000 | La Jolla Pharmaceutical (b) | 3,333 | |||||||||
| Lupus Treatment | |||||||||||
| 1,875,000 | Locus Discovery, Series D, Pfd. (b)(e) | 512 | |||||||||
| High Throughput Rational Drug Design | |||||||||||
| 359,944 | Microdose (e) | 360 | |||||||||
| Drug Inhaler Development | |||||||||||
| 279,633 | |||||||||||
| > Medical Supplies 1.3% | |||||||||||
| 1,910,000 | Cytyc (b) | 54,053 | |||||||||
| Consumables Related to Women's Health | |||||||||||
| 1,083,000 | ICU Medical (b)(c) | 44,056 | |||||||||
| Intravenous Therapy Products | |||||||||||
| 1,200,000 | Owens & Minor | 37,524 | |||||||||
| Distribution of Medical Supplies | |||||||||||
| Number of Shares | Value (000) | ||||||||||
| 905,000 | Arrow International | $ | 32,019 | ||||||||
| Disposable Catheters | |||||||||||
| 700,000 | Cooper | 31,150 | |||||||||
| Contact Lens Manufacturer | |||||||||||
| 700,000 | Polymedica | 28,287 | |||||||||
| Diabetes Supply Distributor | |||||||||||
| 486,000 | Techne (b) | 26,949 | |||||||||
| Cytokines, Antibodies & Other Reagents for Life Science | |||||||||||
| 254,038 | |||||||||||
| > Pharmaceuticals 1.1% | |||||||||||
| 765,000 | Cephalon (b) | 53,864 | |||||||||
| Specialty Pharmaceuticals for Pain, Central Nervous System & Oncology | |||||||||||
| 1,295,000 | Endo Pharmaceuticals (b) | 35,716 | |||||||||
| Specialty Pharmaceuticals for Pain Management | |||||||||||
| 1,510,000 | MGI Pharma (b) | 27,799 | |||||||||
| Specialty Pharmaceuticals for Oncology & Acute Care | |||||||||||
| 2,500,000 | QLT (b) | 21,150 | |||||||||
| Specialty Pharmaceuticals – Ophthalmology & Dermatology | |||||||||||
| 4,000,000 | United Drug (Ireland) | 20,968 | |||||||||
| Irish Pharmaceutical Wholesaler & Outsourcer | |||||||||||
| 600,000 | The Medicines Company (b) | 19,032 | |||||||||
| Specialty Pharmaceuticals – Cardiovascular | |||||||||||
| 400,000 | Medicis Pharmaceutical | 14,052 | |||||||||
| Specialty Pharmaceuticals – Dermatology | |||||||||||
| 830,000 | Collagenex Pharmaceuticals (b) | 11,595 | |||||||||
| Specialty Pharmaceuticals for Dermatology | |||||||||||
| 1,321,000 | Barrier Therapeutics (b) | 9,960 | |||||||||
| Specialty Pharmaceuticals for Dermatology | |||||||||||
| 214,136 | |||||||||||
| Health Care: Total | 1,489,381 | ||||||||||
| Other Industries 5.0% | |||||||||||
| > Real Estate 4.1% | |||||||||||
| 1,760,000 | Gaylord Entertainment (b) | 89,637 | |||||||||
| Convention Hotels | |||||||||||
| 650,000 | SL Green Realty | 86,307 | |||||||||
| Manhattan Office Buildings | |||||||||||
| 5,850,000 | Highland Hospitality (c) | 83,362 | |||||||||
| Hotel Owner | |||||||||||
| 1,398,000 | Forest City Enterprises, Cl. B (c) | 81,559 | |||||||||
| Commercial & Residential Property Developer | |||||||||||
| 1,320,000 | General Growth Properties | 68,944 | |||||||||
| Regional Shopping Malls | |||||||||||
| 3,700,000 | DiamondRock Hospitality | 66,637 | |||||||||
| Hotel Owner | |||||||||||
| 635,000 | Macerich Company | 54,972 | |||||||||
| Regional Shopping Malls | |||||||||||
| 575,000 | Federal Realty Investment Trust | 48,875 | |||||||||
| Shopping Centers | |||||||||||
| 1,020,000 | Brandywine Realty | 33,915 | |||||||||
| Office Buildings | |||||||||||
| 628,000 | Parkway Properties | 32,034 | |||||||||
| Office Buildings | |||||||||||
| 1,720,000 | Kite Realty Group (c) | 32,026 | |||||||||
| Community Shopping Centers | |||||||||||
| 850,000 | Digital Realty Trust | 29,096 | |||||||||
| Technology-focused Office Buildings | |||||||||||
31
Columbia Acorn Fund
Statement of Investments, continued
| Number of Shares or Principal Amount (000) | Value (000) | ||||||||||
| > Real Estate—continued | |||||||||||
| 1,375,000 | Crescent Real Estate Equities | $ | 27,156 | ||||||||
| Class 'A' Office Buildings | |||||||||||
| 900,000 | American Campus Communities | 25,623 | |||||||||
| Student Housing | |||||||||||
| 4,100 | Kenedix (Japan) | 18,546 | |||||||||
| Real Estate Investment Management | |||||||||||
| 778,689 | |||||||||||
| > Transportation 0.5% | |||||||||||
| 826,200 | Grupo Aeroportuario del Surest (Mexico) | 35,089 | |||||||||
| Cancun & Cozumel Airport Operator | |||||||||||
| 1,556,000 | JB Hunt Transport Services | 32,318 | |||||||||
| Trucking Conglomerate | |||||||||||
| 1,914,000 | Heartland Express | 28,748 | |||||||||
| Regional Trucker | |||||||||||
| 96,155 | |||||||||||
| > Regulated Utilities 0.4% | |||||||||||
| 1,650,000 | Northeast Utilities | 46,464 | |||||||||
| Regulated Electric Utility | |||||||||||
| 589,800 | Red Electrica de Espana (Spain) | 25,253 | |||||||||
| Spanish Power Grid | |||||||||||
| 71,717 | |||||||||||
| Other Industries: Total | 946,561 | ||||||||||
| Total Equities: 94.9% (Cost: $10,836,735) | 17,974,513 | ||||||||||
| Short-Term Obligations: 5.4% | |||||||||||
| $ | 87,000 | Manhattan Asset (f) 5.27% Due 01/18/07-01/19/07 | 86,777 | ||||||||
| 74,000 | Morrigan TRR (f) 5.28% Due 01/16/07-01/17/07 | 73,831 | |||||||||
| 71,000 | American Express 5.22%: 5.23% Due 01/05/07-01/10/07 | 70,931 | |||||||||
| 50,000 | HSBC 5.21% Due 01/03/07 | 49,985 | |||||||||
| 50,000 | Marshall & Ilsley 5.25% Due 01/22/07 | 49,847 | |||||||||
| 50,000 | New Center Asset Trust 5.26% Due 01/25/07 | 49,825 | |||||||||
| 50,000 | PB Financial 5.27% Due 01/26/07 | 49,817 | |||||||||
| 50,000 | Hewlett Packard (f) 5.28% Due 01/29/07 | 49,795 | |||||||||
| 50,000 | Catapult PMX Funding (f) 5.34% Due 02/01/07 | 49,770 | |||||||||
| 45,000 | Citigroup Funding 5.25% Due 01/04/07 | 44,980 | |||||||||
| 45,000 | American General Finance 5.23% Due 01/12/07 | 44,928 | |||||||||
| 45,000 | White Point Funding 5.33% Due 01/30/07 | 44,807 | |||||||||
| 43,000 | Beethoven Funding (f) 5.28% Due 01/23/07 | 42,861 | |||||||||
| 43,000 | Raiffeisen Zentralbank (f) 5.27% Due 01/24/07 | 42,855 | |||||||||
| Principal Amount (000) | Value (000) | ||||||||||
| $ | 40,000 | Toyota Credit de Puerto Rico 5.24% Due 01/11/07 | $ | 39,942 | |||||||
| 40,000 | AIG Funding 5.23% Due 02/07/07 | 39,785 | |||||||||
| 38,000 | Credit Suisse First Boston 5.24% Due 01/09/07 | 37,956 | |||||||||
| 34,000 | LaSalle Bank 5.21% Due 01/02/07 | 33,995 | |||||||||
| 33,000 | Prudential Funding 5.20% Due 01/08/07 | 32,967 | |||||||||
| 30,000 | East Fleet Financial (f) 5.32% Due 02/02/07 | 29,858 | |||||||||
| 30,000 | Ranger Funding (f) 5.29% Due 02/05/07 | 29,846 | |||||||||
| 30,000 | Ebbets Funding (f) 5.28% Due 02/06/07 | 29,842 | |||||||||
| 7,529 | Repurchase Agreement with Fixed Income Clearing Corp., dated 12/29/06, due 01/02/07 at 5.150% collateralized by Frederal Home Loan Bank Bond maturing 10/04/16, market value of $7,681 (repurchase proceeds: $7,533) | 7,529 | |||||||||
| (Amortized Cost: $1,032,729) | 1,032,729 | ||||||||||
| Total Investments: 100.3% (Cost: $11,869,464)(a)(d) | 19,007,242 | ||||||||||
| Cash and Other Assets Less Liabilities: (0.3)% | (62,116 | ) | |||||||||
| Total Net Assets: 100.0% | $ | 18,945,126 | |||||||||
32
Columbia Acorn Fund
Statement of Investments, continued
> Notes to Statement of Investments (in thousands)
(a) At December 31, 2006, for federal income tax purposes cost of investments was $11,896,609 and net unrealized appreciation was $7,110,633, consisting of gross unrealized appreciation of $7,490,598 and gross unrealized depreciation of $379,965.
(b) Non-income producing security.
(c) An affiliate may include any company in which the Fund owns five percent or more of its outstanding voting securities. On December 31, 2006, the Fund held five percent or more of the outstanding voting securities of the following companies:
| AnswerThink Consulting | 10.17 | % | |||||
| Actuate | 9.96 | ||||||
| Watsco | 9.84 | ||||||
| Christopher & Banks | 9.84 | ||||||
| Gibraltar Industries | 9.58 | ||||||
| Highland Hospitality | 9.56 | ||||||
| Indus International | 9.45 | ||||||
| iGate Capital | 9.43 | ||||||
| Princeton Review | 9.24 | ||||||
| SkillSoft Publishing | 8.72 | ||||||
| Kronos | 8.66 | ||||||
| World Acceptance | 8.55 | ||||||
| ESCO Technologies | 8.49 | ||||||
| West Coast Bancorp | 8.49 | ||||||
| Salem Communications | 8.42 | ||||||
| Spartech | 8.41 | ||||||
| Radiant Systems | 8.10 | ||||||
| Saga Communications | 7.85 | ||||||
| Glacier Bancorp | 7.81 | ||||||
| ICU Medical | 7.48 | ||||||
| Witness Systems | 7.46 | ||||||
| Fleetwood Enterprises | 7.33 | ||||||
| Tumbleweed Communications | 6.96 | ||||||
| Shuffle Master | 6.95 | ||||||
| Genlyte Group | 9.95 | ||||||
| II VI | 6.90 | ||||||
| Clarcor | 6.85 | ||||||
| ProQuest | 6.69 | ||||||
| Pinnacle Entertainment | 6.65 | ||||||
| Bally Technologies | 6.60 | ||||||
| Vital Signs | 6.58 | ||||||
| Seachange International | 6.41 | ||||||
| United America Indemnity | 6.35 | ||||||
| Forward Air | 6.23 | ||||||
| Vail Resorts | 6.17 | % | |||||
| Agile Software | 6.15 | ||||||
| Red Robin Gourmet Burgers | 6.02 | ||||||
| Administaff | 6.00 | ||||||
| First Mutual Bancshares | 5.99 | ||||||
| Helen of Troy | 5.98 | ||||||
| Kite Realty Group | 5.96 | ||||||
| Spanish Broadcasting System | 5.95 | ||||||
| Concur Technologies | 5.88 | ||||||
| Orthofix International | 5.74 | ||||||
| Marlin Business Services | 5.70 | ||||||
| Drew Industries | 5.68 | ||||||
| IXYS | 5.66 | ||||||
| AmeriCredit | 5.62 | ||||||
| Gaiam | 5.52 | ||||||
| Forest City Enterprises, Cl. B | 5.45 | ||||||
| AFC Enterprises | 5.45 | ||||||
| Vaalco Energy | 5.44 | ||||||
| ITT Educational Services | 5.43 | ||||||
| Chattem | 5.43 | ||||||
| LCA-Vision | 5.41 | ||||||
| West Bancorporation | 5.41 | ||||||
| Anchor Bancorp Wisconsin | 5.40 | ||||||
| Universal Technical Institute | 5.32 | ||||||
| Enerflex Systems | 5.29 | ||||||
| Dobson Communications | 5.29 | ||||||
| Cytokinetics | 5.28 | ||||||
| Mine Safety Appliances | 5.24 | ||||||
| HNI | 5.24 | ||||||
| Oxford Industries | 5.18 | ||||||
| Excel Technology | 5.17 | ||||||
| JDA Software | 5.08 | ||||||
| Littelfuse | 5.06 | ||||||
| Supertex | 5.02 | ||||||
The aggregate cost and value of these investments at December 31, 2006 were $2,146,491 and $3,477,317, respectively. Investments in affiliates represented 18.35% of total net assets at December 31, 2006. Investment activity and income amounts relating to affiliates during the twelve months ended December 31, 2006 were as follows:
| Dividend Income | $ | 21,531 | |||||
| Net realized gain or loss | 25,113 | ||||||
| Change in unrealized gain or loss | (233,206 | ) | |||||
| Purchases | 542,695 | ||||||
| Proceeds from sales | 59,465 | ||||||
In addition, additional purchases of existing portfolio holdings that were not considered affiliates in prior years, resulted in the fund owning more than 5% of the outstanding shares of certain issues at December 31, 2006. Therefore, the cost and market value affiliate disclosure amounts include both acquisitions of new investments in affiliates during the period, as well as prior period investment holdings of companies that became affiliates during the current period.
33
Columbia Acorn Fund
Statement of Investments, continued
> Notes to Statement of Investments:
(d) On December 31, 2006, the market value of foreign securities (in thousands) represented 12.54% of total net assets. The Fund's foreign portfolio was diversified as follows:
| Value | Percent | ||||||||||
| Netherlands | $ | 331,420 | 1.75 | % | |||||||
| Canada | 318,662 | 1.68 | |||||||||
| France | 257,278 | 1.36 | |||||||||
| Ireland | 229,780 | 1.21 | |||||||||
| United Kingdom | 149,890 | 0.79 | |||||||||
| Switzerland | 127,181 | 0.67 | |||||||||
| Japan | 126,050 | 0.67 | |||||||||
| Germany | 109,823 | 0.58 | |||||||||
| Sweden | 97,796 | 0.52 | |||||||||
| Hong Kong | 90,417 | 0.48 | |||||||||
| Australia | 77,356 | 0.41 | |||||||||
| India | 62,617 | 0.33 | |||||||||
| Value | Percent | ||||||||||
| Taiwan | $ | 55,888 | 0.29 | % | |||||||
| Denmark | 50,579 | 0.27 | |||||||||
| Israel | 50,294 | 0.27 | |||||||||
| Brazil | 48,944 | 0.26 | |||||||||
| Mexico | 35,089 | 0.19 | |||||||||
| China | 27,376 | 0.14 | |||||||||
| Chile | 26,436 | 0.14 | |||||||||
| Spain | 25,253 | 0.13 | |||||||||
| Greece | 24,133 | 0.13 | |||||||||
| Italy | 21,440 | 0.11 | |||||||||
| South Africa | 19,423 | 0.10 | |||||||||
| Austria | 11,869 | 0.06 | |||||||||
| Total Foreign Portfolio | 2,374,994 | 12.54 | % | ||||||||
(e) Denotes a restricted security, which is subject to restrictions on resale under federal securities laws. These securities, excluding UrAsia Energy, are valued in good faith by the Board of Trustees. At December 31, 2006, these securities had an aggregate value of $64,571, which represented 0.34% of total net assets.
Additional information on these securities is as follows:
| Security | Acquisition Dates | Shares | Cost | Value | |||||||||||||||
| UrAsia Energy | 10/26/05 | 13,100 | $ | 20,140 | $ | 60,324 | |||||||||||||
| Perlegen Sciences | 3/30/01 | 1,250 | 4,500 | 3,375 | |||||||||||||||
| Locus Discovery, Series D, Pfd. | 09/05/01 | 1,875 | 7,500 | 512 | |||||||||||||||
| Microdose | 11/24/00 | 360 | 2,005 | 360 | |||||||||||||||
| $ | 34,145 | $ | 64,571 | ||||||||||||||||
(f) Security exempt from registration under Section 4(2) of the Securities Act of 1933. These securities may only be resold in exempt transactions to qualified buyers. Private resales of these securities to qualified institutional buyers are also exempt from registration pursuant to Rule 144A under the Securities Act of 1933. At December 31, 2006, these securities had an aggregate value of $435,435, which represented 2.3% of net assets.
34
Columbia Acorn International
Major Portfolio Changes in the Fourth Quarter (Unaudited)
| Number of Shares | |||||||||||
| 09/30/06 | 12/31/06 | ||||||||||
| Additions | |||||||||||
| Europe | |||||||||||
| > France | |||||||||||
| Bacou Dalloz | 171,910 | 190,000 | |||||||||
| Carbone Lorraine | 566,000 | 600,000 | |||||||||
| SES Global | 2,920,000 | 3,000,000 | |||||||||
| > Netherlands | |||||||||||
| Boskalis Westminster | 39,000 | 163,000 | |||||||||
| Smit Internationale | 330,000 | 660,000 | |||||||||
| USG People | 679,000 | 983,000 | |||||||||
| Wavin | 0 | 781,150 | |||||||||
| > United Kingdom | |||||||||||
| Fiberweb Plc | 0 | 887,500 | |||||||||
| Mears Group | 0 | 1,436,000 | |||||||||
| > Germany | |||||||||||
| Elringklinger | 0 | 267,000 | |||||||||
| Gagfah | 0 | 150,000 | |||||||||
| GFK | 415,000 | 460,000 | |||||||||
| > Ireland | |||||||||||
| United Drug | 7,140,000 | 7,925,000 | |||||||||
| > Switzerland | |||||||||||
| Burckhardt Compression | 115,000 | 140,000 | |||||||||
| Schindler | 300,000 | 375,000 | |||||||||
| Synthes | 315,000 | 330,000 | |||||||||
| > Italy | |||||||||||
| Banca Italease | 565,000 | 590,000 | |||||||||
| > Austria | |||||||||||
| Zumtobel | 0 | 373,000 | |||||||||
| > Spain | |||||||||||
| Red Electrica de Espana | 620,000 | 680,000 | |||||||||
| > Norway | |||||||||||
| Kongsberg Automotive | 630,000 | 2,065,000 | |||||||||
| Asia | |||||||||||
| > Japan | |||||||||||
| AIN Pharmaciez | 604,000 | 643,000 | |||||||||
| As One | 0 | 257,000 | |||||||||
| Cosel | 0 | 600,000 | |||||||||
| Ibiden | 143,200 | 420,000 | |||||||||
| JSR | 785,000 | 1,218,000 | |||||||||
| Kintetsu World Express | 460,000 | 640,000 | |||||||||
| Nakanishi | 54,000 | 92,000 | |||||||||
| Park24 | 868,000 | 1,200,000 | |||||||||
| USS | 350,000 | 430,000 | |||||||||
| Yusen Air & Sea Service | 600,000 | 1,030,000 | |||||||||
| Number of Shares | |||||||||||
| 09/30/06 | 12/31/06 | ||||||||||
| > China | |||||||||||
| China Green | 370,000 | 18,000,000 | |||||||||
| China Shipping Development | 13,000,000 | 18,647,000 | |||||||||
| Lenovo Group | 1,731,500 | 48,430,000 | |||||||||
| Sohu.com | 110,000 | 260,000 | |||||||||
| Travelsky Technology | 184,000 | 6,155,000 | |||||||||
| > Hong Kong | |||||||||||
| EganaGoldpfeil | 0 | 4,221,000 | |||||||||
| Melco-PBL Entertainment Macau | 0 | 91,900 | |||||||||
| > Taiwan | |||||||||||
| Formosa International Hotels | 0 | 2,853,000 | |||||||||
| > India | |||||||||||
| Asian Paints | 20,000 | 700,000 | |||||||||
| > Singapore | |||||||||||
| ComfortDelGro | 7,053,000 | 13,000,000 | |||||||||
| Singapore Exchange | 4,630,000 | 7,000,000 | |||||||||
| > South Korea | |||||||||||
| MegaStudy | 0 | 109,787 | |||||||||
| Taewoong | 0 | 112,700 | |||||||||
| Woongjin Thinkbig | 0 | 183,500 | |||||||||
| YBM Sisa.com | 0 | 243,700 | |||||||||
| Other Countries | |||||||||||
| > South Africa | |||||||||||
| Impala Platinum Holdings | 180,000 | 1,440,000 | |||||||||
| Naspers | 0 | 1,295,000 | |||||||||
| > United States | |||||||||||
| Atwood Oceanics | 663,000 | 865,000 | |||||||||
| > New Zealand | |||||||||||
| Sky City Entertainment | 5,500,000 | 5,661,208 | |||||||||
| Latin America | |||||||||||
| > Brazil | |||||||||||
| Brascan Residential Properties | 0 | 604,500 | |||||||||
| Localiza Rent A Car | 170,000 | 500,000 | |||||||||
| > Mexico | |||||||||||
| Grupo Aeroportuario del Centro Norte | 0 | 100,000 | |||||||||
35
Columbia Acorn International
Major Portfolio Changes in the Fourth Quarter (Unaudited), continued
| Number of Shares | |||||||||||
| 09/30/06 | 12/31/06 | ||||||||||
| Sales | |||||||||||
| Europe | |||||||||||
| > France | |||||||||||
| M6-Metropole Television | 333,000 | 0 | |||||||||
| Neopost | 280,000 | 240,000 | |||||||||
| > Netherlands | |||||||||||
| Sligro Food Group | 439,000 | 0 | |||||||||
| > United Kingdom | |||||||||||
| BBA Group | 3,550,000 | 2,982,000 | |||||||||
| Tullow Oil | 5,240,000 | 3,895,691 | |||||||||
| UTV | 2,000,000 | 0 | |||||||||
| Viridian Group | 450,000 | 0 | |||||||||
| > Germany | |||||||||||
| Bilfinger Berger | 200,000 | 0 | |||||||||
| Depfa Bank | 2,250,000 | 1,550,000 | |||||||||
| Grenkeleasing | 305,000 | 0 | |||||||||
| > Ireland | |||||||||||
| Anglo Irish Bank | 2,395,000 | 2,100,000 | |||||||||
| C&C Group | 3,350,000 | 3,300,000 | |||||||||
| IAWS Group | 2,000,000 | 1,800,000 | |||||||||
| Paddy Power | 720,000 | 600,000 | |||||||||
| > Sweden | |||||||||||
| Tele2 | 2,580,000 | 0 | |||||||||
| > Denmark | |||||||||||
| Novozymes | 280,000 | 265,000 | |||||||||
| > Luxembourg | |||||||||||
| Tenaris | 350,000 | 0 | |||||||||
| Number of Shares | |||||||||||
| 09/30/06 | 12/31/06 | ||||||||||
| Asia | |||||||||||
| > Japan | |||||||||||
| Fast Retailing | 220,000 | 110,000 | |||||||||
| Sparx Asset Management | 27,500 | 14,000 | |||||||||
| Toyo Technica | 880,000 | 0 | |||||||||
| > Taiwan | |||||||||||
| Phoenixtec Power | 18,268,000 | 0 | |||||||||
| Other Countries | |||||||||||
| > Canada | |||||||||||
| Kinross Gold | 835,000 | 0 | |||||||||
| RailPower Technologies | 2,825,000 | 2,119,000 | |||||||||
36
Columbia Acorn International
Statement of Investments, December 31, 2006
| Number of Shares | Value (000) | ||||||||||
| Equities: 97.3% | |||||||||||
| Europe 58.3% | |||||||||||
| > France 10.3% | |||||||||||
| 3,000,000 | SES Global | $ | 53,281 | ||||||||
| Satellite Broadcasting Services | |||||||||||
| 800,000 | April Group | 38,428 | |||||||||
| Insurance Policy Construction | |||||||||||
| 375,000 | Norbert Dentressangle | 34,147 | |||||||||
| Transport | |||||||||||
| 600,000 | Carbone Lorraine | 33,722 | |||||||||
| Advanced Industrial Materials | |||||||||||
| 390,000 | Iliad | 33,720 | |||||||||
| Alternative Internet & Telecoms Provider | |||||||||||
| 423,818 | Rubis | 33,118 | |||||||||
| Tank Storage & LPG Supplier | |||||||||||
| 240,000 | Neopost | 30,139 | |||||||||
| Postage Meter Machines | |||||||||||
| 150,000 | Ciments Francais | 28,804 | |||||||||
| Leading French & Emerging Markets Cement Producer | |||||||||||
| 500,000 | Trigano | 25,933 | |||||||||
| Leisure Vehicles & Camping Equipment | |||||||||||
| 360,000 | Eurofins Scientific (b) | 25,707 | |||||||||
| Food Screening & Testing | |||||||||||
| 190,000 | Bacou Dalloz | 25,424 | |||||||||
| Safety Equipment | |||||||||||
| 206,000 | Pierre & Vacances | 25,246 | |||||||||
| Vacation Apartment Lets | |||||||||||
| 240,000 | Imerys | 21,295 | |||||||||
| Industrial Minerals Producer | |||||||||||
| 700,000 | Legrand (b) | 20,514 | |||||||||
| Electrical Components | |||||||||||
| 400,000 | Foncia Groupe | 19,522 | |||||||||
| Real Estate Services | |||||||||||
| 449,000 | |||||||||||
| > Netherlands 7.9% | |||||||||||
| 1,268,490 | Fugro | 60,591 | |||||||||
| Oilfield Services | |||||||||||
| 558,000 | Aalberts Industries | 48,238 | |||||||||
| Flow Control & Heat Treatment | |||||||||||
| 983,000 | USG People | 42,717 | |||||||||
| Temporary Staffing Services | |||||||||||
| 574,000 | Imtech | 36,482 | |||||||||
| Engineering & Technical Services | |||||||||||
| 660,000 | Smit Internationale | 35,507 | |||||||||
| Harbor & Offshore Towage & Marine Services | |||||||||||
| 265,000 | OPG Groep | 31,137 | |||||||||
| Health Care Supplies & Pharmacies | |||||||||||
| 973,000 | Koninklijke TenCate | 29,769 | |||||||||
| Advanced Textiles & Industrial Fabrics | |||||||||||
| 1,150,000 | Unit 4 Agresso (b) | 27,099 | |||||||||
| Business & Security Software | |||||||||||
| 163,000 | Boskalis Westminster | 16,134 | |||||||||
| Dredging and Maritime Contractor | |||||||||||
| 781,150 | Wavin (b) | 15,286 | |||||||||
| Largest European Plastic Pipe Systems Company | |||||||||||
| 342,960 | |||||||||||
| Number of Shares | Value (000) | ||||||||||
| > United Kingdom 7.8% | |||||||||||
| 2,510,714 | Expro International Group | $ | 43,437 | ||||||||
| Offshore Oilfield Services | |||||||||||
| 1,850,000 | Northern Rock | 42,546 | |||||||||
| Lowest Cost Mortgage Bank in UK | |||||||||||
| 7,200,000 | RPS Group | 38,047 | |||||||||
| Environmental Consulting & Planning | |||||||||||
| 2,800,000 | Paragon Group | 36,635 | |||||||||
| UK Buy-to-let Finance Company | |||||||||||
| 3,895,691 | Tullow Oil | 30,351 | |||||||||
| Oil & Gas Producer | |||||||||||
| 1,200,000 | Northgate | 28,231 | |||||||||
| Light Commercial Vehicle Rental Specialist | |||||||||||
| 2,450,000 | Workspace Group | 23,756 | |||||||||
| UK Real Estate | |||||||||||
| 1,300,000 | Keller Group | 22,853 | |||||||||
| International Ground Engineering Specialist | |||||||||||
| 4,200,000 | Taylor Nelson Sofres | 16,447 | |||||||||
| Market Research | |||||||||||
| 2,982,000 | BBA Group | 15,875 | |||||||||
| Aviation Support Services & Non-woven Materials | |||||||||||
| 640,000 | Randgold Resources (b) | 15,014 | |||||||||
| Gold Mining in Western Africa | |||||||||||
| 1,300,000 | Debt Free Direct | 11,443 | |||||||||
| Consumer Debt Reduction & Management Solutions | |||||||||||
| 1,436,000 | Mears Group | 10,188 | |||||||||
| Social housing Mainentance | |||||||||||
| 887,500 | Fiberweb Plc (b) | 3,614 | |||||||||
| Nonwoven Fabrics | |||||||||||
| 70,000 | Detica | 502 | |||||||||
| UK IT Services Company | |||||||||||
| 338,939 | |||||||||||
| > Germany 7.7% | |||||||||||
| 900,000 | Rhoen-Klinikum | 43,637 | |||||||||
| Health Care Services | |||||||||||
| 275,000 | Wincor Nixdorf | 42,778 | |||||||||
| Retail POS Systems & ATM Machines | |||||||||||
| 27,500 | Porsche | 34,976 | |||||||||
| Specialty Automobile Manufacturer | |||||||||||
| 775,000 | CTS Eventim | 29,929 | |||||||||
| Event Ticket Sales | |||||||||||
| 380,000 | Vossloh | 28,722 | |||||||||
| Rail Infrastructure & Diesel Locomotives | |||||||||||
| 1,550,000 | Depfa Bank | 27,801 | |||||||||
| Investment Banker to Public Authorities | |||||||||||
| 450,000 | Hugo Boss Designs | 23,117 | |||||||||
| Fashion Apparel | |||||||||||
| 120,000 | Deutsche Boerse | 22,070 | |||||||||
| Trading, Clearing, Settlement Services for Financial Markets | |||||||||||
| 460,000 | GFK | 19,935 | |||||||||
| Market Research Services | |||||||||||
| 100,000 | Rational | 18,627 | |||||||||
| Commercial Oven Manufacturer | |||||||||||
| 267,000 | Elringklinger | 17,078 | |||||||||
| Automobile Components | |||||||||||
| 870,000 | Takkt | 15,100 | |||||||||
| Mail Order Retailer of Office & Warehouse Durables | |||||||||||
| 283,000 | Deutsche Beteiligungs | 7,499 | |||||||||
| Private Equity Investment Management | |||||||||||
37
Columbia Acorn International
Statement of Investments, continued
| Number of Shares | Value (000) | ||||||||||
| > Germany—continued | |||||||||||
| 150,000 | Gagfah | $ | 4,750 | ||||||||
| German Residential Property | |||||||||||
| 336,019 | |||||||||||
| > Ireland 7.1% | |||||||||||
| 3,300,000 | C&C Group | 58,571 | |||||||||
| Beverage Company | |||||||||||
| 1,800,000 | IAWS Group | 46,093 | |||||||||
| Baked Goods | |||||||||||
| 2,000,000 | Bank of Ireland | 46,073 | |||||||||
| Irish Commercial Bank | |||||||||||
| 2,100,000 | Anglo Irish Bank | 43,541 | |||||||||
| Small Business & Middle Market Banking | |||||||||||
| 7,925,000 | United Drug | 41,543 | |||||||||
| Irish Pharmaceutical Wholesaler & Outsourcer | |||||||||||
| 1,850,000 | Grafton Group | 30,919 | |||||||||
| Builders Materials Wholesaling & Do-it-yourself Retailing | |||||||||||
| 1,150,000 | Kingspan Group | 30,465 | |||||||||
| Building Insulation & Environmental Containers | |||||||||||
| 600,000 | Paddy Power | 11,919 | |||||||||
| Irish Betting Services | |||||||||||
| 309,124 | |||||||||||
| > Switzerland 5.5% | |||||||||||
| 30,000 | Geberit | 46,222 | |||||||||
| Plumbing Supplies | |||||||||||
| 330,000 | Synthes | 39,337 | |||||||||
| Products for Orthopedic Surgery | |||||||||||
| 24,000 | Sika | 37,209 | |||||||||
| Chemicals for Construction & Industrial Applications | |||||||||||
| 475,000 | Kuehne & Nagel | 34,556 | |||||||||
| Freight Forwarding/Logistics | |||||||||||
| 375,000 | Schindler | 23,579 | |||||||||
| Elevator Manufacturer & Service Provider | |||||||||||
| 25,000 | Givaudan | 23,079 | |||||||||
| Fragrances & Flavors | |||||||||||
| 140,000 | Burckhardt Compression (b) | 22,623 | |||||||||
| Gas Compression Pumps | |||||||||||
| 400,000 | Logitech International (b) | 11,482 | |||||||||
| Branded Peripheral Computer Devices | |||||||||||
| 238,087 | |||||||||||
| > Italy 3.0% | |||||||||||
| 590,000 | Banca Italease | 34,280 | |||||||||
| Italian Leasing & Factoring Leader | |||||||||||
| 9,100,000 | CIR | 30,095 | |||||||||
| Italian Holding Company | |||||||||||
| 3,000,000 | Amplifon | 25,282 | |||||||||
| Hearing Aid Retailer | |||||||||||
| 12,800,000 | Ducati Motor (b) | 15,527 | |||||||||
| Motorcycles & Related Merchandise | |||||||||||
| 1,223,000 | GranitiFiandre | 13,217 | |||||||||
| Innovative Stoneware | |||||||||||
| 350,000 | Sabaf | 12,016 | |||||||||
| Supplier to White Goods OEMS | |||||||||||
| 130,417 | |||||||||||
| > Sweden 2.7% | |||||||||||
| 1,550,000 | Hexagon | 65,984 | |||||||||
| Measurement Equipment & Polymers | |||||||||||
| Number of Shares | Value (000) | ||||||||||
| 755,000 | Nobia | $ | 29,052 | ||||||||
| Kitchen Cabinet Manufacturing & Distribution | |||||||||||
| 610,000 | SWECO | 23,519 | |||||||||
| Engineering Consultants | |||||||||||
| 118,555 | |||||||||||
| > Russia 1.2% | |||||||||||
| 575,800 | RosBusinessConsulting (b) | 25,796 | |||||||||
| Financial Information, Media & IT Services in Russia | |||||||||||
| 775,000 | Novolipetsk Steel | 18,019 | |||||||||
| Vertically Integrated Steel Producer | |||||||||||
| 370,000 | Mechel Steel Group | 9,428 | |||||||||
| Coking Coal | |||||||||||
| 53,243 | |||||||||||
| > Poland 0.8% | |||||||||||
| 1,125,500 | Central European Distribution (b) | 33,427 | |||||||||
| Vodka Production & Alcohol Distribution | |||||||||||
| 33,427 | |||||||||||
| > Greece 0.8% | |||||||||||
| 936,000 | Intralot | 32,738 | |||||||||
| Lottery & Gaming Systems/Services | |||||||||||
| 32,738 | |||||||||||
| > Austria 0.7% | |||||||||||
| 300,000 | Wienerberger | 17,819 | |||||||||
| Bricks & Clay Roofing Tiles | |||||||||||
| 373,000 | Zumtobel (b) | 11,868 | |||||||||
| Lighting Systems | |||||||||||
| 29,687 | |||||||||||
| > Spain 0.7% | |||||||||||
| 680,000 | Red Electrica de Espana | 29,115 | |||||||||
| Spanish Power Grid | |||||||||||
| 29,115 | |||||||||||
| > Finland 0.6% | |||||||||||
| 1,756,000 | Poyry | 27,356 | |||||||||
| Engineering Consultants | |||||||||||
| 27,356 | |||||||||||
| > Czech Republic 0.6% | |||||||||||
| 183,000 | Komercni Banka | 27,245 | |||||||||
| Leading Czech Universal Bank | |||||||||||
| 27,245 | |||||||||||
| > Denmark 0.5% | |||||||||||
| 265,000 | Novozymes | 22,718 | |||||||||
| Industrial Enzymes | |||||||||||
| 22,718 | |||||||||||
| > Norway 0.4% | |||||||||||
| 2,065,000 | Kongsberg Automotive | 18,870 | |||||||||
| Automotive Seating & Component Supplier | |||||||||||
| 18,870 | |||||||||||
| Europe: Total | 2,537,500 | ||||||||||
| Asia 22.6% | |||||||||||
| > Japan 13.6% | |||||||||||
| 43,500 | Jupiter Telecommunications (b) | 34,901 | |||||||||
| Largest Cable Service Provider in Japan | |||||||||||
| 600,000 | Aeon Mall | 33,640 | |||||||||
| Suburban Shopping Mall Developer, Owner & Operator | |||||||||||
38
| Number of Shares | Value (000) | ||||||||||
| > Japan—continued | |||||||||||
| 1,218,000 | JSR | $ | 31,566 | ||||||||
| Films & Chemicals for LCD Screens & Electronics | |||||||||||
| 760,000 | Hoya | 29,672 | |||||||||
| Opto-electrical Components & Eyeglass Lenses | |||||||||||
| 3,700,000 | Kansai Paint | 29,316 | |||||||||
| Paint Producer in Japan, India, China & Southeast Asia | |||||||||||
| 6,300 | Kenedix | 28,498 | |||||||||
| Real Estate Investment Management | |||||||||||
| 430,000 | USS | 28,024 | |||||||||
| Used Car Auctioneer | |||||||||||
| 1,272,000 | Ushio | 26,183 | |||||||||
| Industrial Light Sources | |||||||||||
| 546,000 | Daito Trust Construction | 24,981 | |||||||||
| Apartment Builder | |||||||||||
| 1,030,000 | Yusen Air & Sea Service | 22,293 | |||||||||
| Airfreight Logistics | |||||||||||
| 718,000 | Ito En | 21,894 | |||||||||
| Bottled Tea & Other Beverages | |||||||||||
| 420,000 | Ibiden | 21,215 | |||||||||
| Electronic Parts & Ceramics | |||||||||||
| 453,000 | Hogy Medical | 17,529 | |||||||||
| Disposable Surgical Products | |||||||||||
| 714,000 | FCC | 17,267 | |||||||||
| Auto/Motorcycle Clutches | |||||||||||
| 2,000,000 | Chiba Bank | 16,928 | |||||||||
| Regional Bank | |||||||||||
| 640,000 | Kintetsu World Express | 15,557 | |||||||||
| Airfreight Logistics | |||||||||||
| 1,200,000 | Park24 | 15,396 | |||||||||
| Parking Lot Operator | |||||||||||
| 965,000 | T. Hasegawa | 14,990 | |||||||||
| Industrial Flavors & Fragrances | |||||||||||
| 3,000 | Osaka Securities Exchange | 14,975 | |||||||||
| Osaka Securities Exchange | |||||||||||
| 3,500 | Risa Partners | 14,793 | |||||||||
| NPL & Real Estate Related Investment | |||||||||||
| 2,248,000 | Hiroshima Bank | 13,044 | |||||||||
| Regional Bank | |||||||||||
| 92,000 | Nakanishi | 11,298 | |||||||||
| Dental Tools & Machinery | |||||||||||
| 1,500,000 | Bank of Fukuoka | 10,955 | |||||||||
| Regional Bank | |||||||||||
| 370,000 | Shimano | 10,729 | |||||||||
| Bicycle Components & Fishing Tackle | |||||||||||
| 110,000 | Fast Retailing | 10,525 | |||||||||
| Apparel Retailer | |||||||||||
| 14,000 | Sparx Asset Management | 10,361 | |||||||||
| Fund Management | |||||||||||
| 1,230,000 | Kamigumi | 10,080 | |||||||||
| Port Cargo Handling & Logistics | |||||||||||
| 643,000 | AIN Pharmaciez (c) | 9,988 | |||||||||
| Dispensing Pharmacy/Drugstore Operator | |||||||||||
| 600,000 | Cosel | 9,601 | |||||||||
| Industrial Standard Switching Power Supply System | |||||||||||
| 72,000 | Hirose Electric | 8,191 | |||||||||
| Electrical Connectors | |||||||||||
| 375,000 | Nagaileben | 8,072 | |||||||||
| Medical/Health Care Related Clothes | |||||||||||
| Number of Shares | Value (000) | ||||||||||
| 1,650 | Japan Pure Chemical | $ | 7,255 | ||||||||
| Precious Metal Plating Chemicals for Electronics | |||||||||||
| 257,000 | As One | 6,581 | |||||||||
| Scientific Supplies Distributor | |||||||||||
| 3,300 | Message | 5,417 | |||||||||
| Nursing Care Facilities | |||||||||||
| 591,715 | |||||||||||
| > China 2.3% | |||||||||||
| 18,647,000 | China Shipping Development | 28,542 | |||||||||
| China's Dominant Shipper for Oil & Coal | |||||||||||
| 48,430,000 | Lenovo Group | 19,643 | |||||||||
| Third Largest PC Vendor Globally | |||||||||||
| 45,000,000 | Global Bio-Chem Technology Group | 15,141 | |||||||||
| Refiner of Corn-based Commodities | |||||||||||
| 21,750,000 | TPV Technology | 13,737 | |||||||||
| ODM for LCD Monitor & Flat TV | |||||||||||
| 18,000,000 | China Green | 9,815 | |||||||||
| An Agricultural Grower & Processor in China | |||||||||||
| 6,155,000 | Travelsky Technology | 9,400 | |||||||||
| Online Air Travel Bookings in China | |||||||||||
| 260,000 | Sohu.com (b) | 6,240 | |||||||||
| Chinese Internet Portal/Online Advertising | |||||||||||
| 102,518 | |||||||||||
| > Hong Kong 1.8% | |||||||||||
| 5,000,000 | Hong Kong Exchanges and Clearing | 54,617 | |||||||||
| Hong Kong Equity & Derivatives Market Operator | |||||||||||
| 14,000,000 | Techtronic Industries | 18,121 | |||||||||
| Power Tools & Motorized Appliances | |||||||||||
| 4,221,000 | EganaGoldpfeil | 2,376 | |||||||||
| A Leather & Fashion Accessories Brand Manager | |||||||||||
| 91,900 | Melco-PBL Entertainment Macau (b) | 1,954 | |||||||||
| Macau Casino Operator | |||||||||||
| 77,068 | |||||||||||
| > Taiwan 1.5% | |||||||||||
| 6,958,367 | Advantech | 25,003 | |||||||||
| Embedded Computers | |||||||||||
| 3,329,658 | Novatek Microelectronics | 15,086 | |||||||||
| LCD Related Integrated Circuits Designer | |||||||||||
| 7,280,000 | Wah Lee Industrial | 14,846 | |||||||||
| Distributor of Chemicals, Materials & Equipment | |||||||||||
| 2,853,000 | Formosa International Hotels | 8,707 | |||||||||
| Hotel, Food & Beverage Operation & Hospitality Management Services | |||||||||||
| 63,642 | |||||||||||
| > India 1.4% | |||||||||||
| 1,300,000 | Housing Development Finance | 47,884 | |||||||||
| Indian Mortgage Lender | |||||||||||
| 700,000 | Asian Paints | 11,563 | |||||||||
| India's Largest Paint Company | |||||||||||
| 59,447 | |||||||||||
| > Singapore 0.9% | |||||||||||
| 7,000,000 | Singapore Exchange | 25,880 | |||||||||
| Singapore Equity & Derivatives Market Operator | |||||||||||
| 13,000,000 | ComfortDelGro | 13,644 | |||||||||
| Taxi & Mass Transit Service | |||||||||||
| 39,524 | |||||||||||
39
Columbia Acorn International
Statement of Investments, continued
| Number of Shares | Value (000) | ||||||||||
| > South Korea 0.7% | |||||||||||
| 109,787 | MegaStudy (b) | $ | 16,176 | ||||||||
| Online Education Service Provider | |||||||||||
| 243,700 | YBM Sisa.com | 6,131 | |||||||||
| Online Language Educator & Tester | |||||||||||
| 183,500 | Woongjin Thinkbig | 3,892 | |||||||||
| Education Provider for Pre-school/Elementary School | |||||||||||
| 112,700 | Taewoong | 3,868 | |||||||||
| A Player in the Niche Customized Forging Market | |||||||||||
| 30,067 | |||||||||||
| > Indonesia 0.4% | |||||||||||
| 15,000,000 | Perusahaan Gas Negara | 19,347 | |||||||||
| Gas Pipeline Operator | |||||||||||
| 19,347 | |||||||||||
| Asia: Total | 983,328 | ||||||||||
| Other Countries 11.5% | |||||||||||
| > Canada 4.4% | |||||||||||
| 1,060,000 | Alliance Atlantis Communication (b) | 45,885 | |||||||||
| CATV Channels, TV/Movie Production/Distribution | |||||||||||
| 6,775,000 | UrAsia Energy (b)(d) | 31,198 | |||||||||
| Uranium Mining in Kazakhstan | |||||||||||
| 1,190,000 | ShawCor | 25,562 | |||||||||
| Oil & Gas Pipeline Products | |||||||||||
| 1,370,000 | RONA (b) | 24,671 | |||||||||
| Leading Canadian Do-it-yourself Retailer | |||||||||||
| 1,155,000 | Talisman Energy | 19,611 | |||||||||
| Oil & Gas Producer | |||||||||||
| 950,000 | Van Houtte (c) | 14,191 | |||||||||
| Coffee Services & Equipment | |||||||||||
| 530,000 | Major Drilling Group | 11,853 | |||||||||
| Mining Exploration Driller | |||||||||||
| 850,000 | Ivanhoe Mines (b) | 8,382 | |||||||||
| Copper Mine Project in Mongolia | |||||||||||
| 2,000,000 | Northern Orion Resources (b) | 7,272 | |||||||||
| Copper & Gold Mining in Argentina | |||||||||||
| 2,119,000 | RailPower Technologies (b)(d) | 2,744 | |||||||||
| Hybrid Locomotives | |||||||||||
| 191,369 | |||||||||||
| > Australia 3.4% | |||||||||||
| 3,000,000 | Billabong International | 41,229 | |||||||||
| Action Sports Apparel Brand Manager | |||||||||||
| 5,450,000 | Sino Gold (b) | 31,431 | |||||||||
| Gold Mining in The People's Republic of China | |||||||||||
| 4,054,054 | ABC Learning Centres | 26,764 | |||||||||
| Childcare Centers | |||||||||||
| 2,000,000 | Jubilee Mines | 24,915 | |||||||||
| Nickel Mining in Australia | |||||||||||
| 350,000 | Perpetual Trustees | 21,555 | |||||||||
| Mutual Fund Management | |||||||||||
| 145,894 | |||||||||||
| > South Africa 2.2% | |||||||||||
| 1,440,000 | Impala Platinum Holdings | 37,749 | |||||||||
| Platinum Group Metals Mining & Refining | |||||||||||
| 1,295,000 | Naspers | 30,702 | |||||||||
| Media & Education in Africa and other Emerging Markets | |||||||||||
| Number of Shares or Principal Amount (000) | Value (000) | ||||||||||
| 4,500,000 | Edgars Consolidated Stores | $ | 24,972 | ||||||||
| Retail Conglomerate | |||||||||||
| 93,423 | |||||||||||
| > United States 1.0% | |||||||||||
| 865,000 | Atwood Oceanics (b) | 42,359 | |||||||||
| Offshore Drilling Contractor | |||||||||||
| 42,359 | |||||||||||
| > New Zealand 0.5% | |||||||||||
| 5,661,208 | Sky City Entertainment | 20,503 | |||||||||
| Casino/Entertainment Complex | |||||||||||
| 20,503 | |||||||||||
| Other Countries: Total | 493,548 | ||||||||||
| Latin America 4.9% | |||||||||||
| > Brazil 2.8% | |||||||||||
| 4,300,000 | Suzano Papel e Celulose | 42,438 | |||||||||
| Brazilian Pulp & Paper Producer | |||||||||||
| 2,500,000 | Natura Cosmeticos | 34,687 | |||||||||
| Direct Retailer of Cosmetics | |||||||||||
| 720,000 | Porto Seguro (b) | 22,571 | |||||||||
| Auto & Life Insurance | |||||||||||
| 500,000 | Localiza Rent A Car | 14,969 | |||||||||
| Car Rental | |||||||||||
| 604,500 | Brascan Residential properties (b) | 5,074 | |||||||||
| High-End Residential Property Developer | |||||||||||
| 119,739 | |||||||||||
| > Mexico 1.6% | |||||||||||
| 4,500,000 | Consorcio ARA | 30,616 | |||||||||
| Affordable Housing Builder | |||||||||||
| 411,000 | Grupo Aeroportuario del Surest | 17,455 | |||||||||
| Cancun & Cozumel Airport Operator | |||||||||||
| 4,200,000 | Urbi Desarrollos Urbanos (b) | 15,162 | |||||||||
| Affordable Housing Builder | |||||||||||
| 100,000 | Grupo Aeroportuario del Pacifica | 3,919 | |||||||||
| Mexican Aiport Operator | |||||||||||
| 100,000 | Grupo Aeroportuario Centro Norte (b) | 2,226 | |||||||||
| Northern Mexican Aiport Operator | |||||||||||
| 69,378 | |||||||||||
| > Chile 0.5% | |||||||||||
| 160,000 | Sociedad Quimica y Minera de Chile | 21,691 | |||||||||
| Producer of Specialty Fertilizers, Lithium & Iodine | |||||||||||
| 21,691 | |||||||||||
| Latin America: Total | 210,808 | ||||||||||
| Total Equities: 97.3% (Cost: $2,604,653) | 4,225,184 | ||||||||||
| Short-Term Obligations: 2.3% | |||||||||||
| $ | 21,600 | American Express 5.25% Due 01/05/07 | 21,587 | ||||||||
| 21,400 | Ebury Finance (f) 5.35% Due 01/04/07 | 21,391 | |||||||||
| 20,000 | Advantage Asset (f) 5.36% Due 01/02/07 | 19,997 | |||||||||
| 20,000 | Halkin Finance (f) 5.35% Due 01/03/07 | 19,994 | |||||||||
40
| Principal Amount (000) | Value (000) | ||||||||||
| Short-Term Obligations—continued | |||||||||||
| $ | 16,317 | Repurchase Agreement with Fixed Income Clearing Corp., dated 12/29/06, due 1/02/07 at 5.150%, collateralized by Frederal Home Loan Bank Bonds, with various maturities to 10/04/16 market value of $16,644 (repurchase proceeds: $16,326) | $ | 16,317 | |||||||
| (Amortized Cost: $99,286) | 99,286 | ||||||||||
| Total Investments: 99.6% (Cost: $2,703,939)(a)(e) | 4,324,470 | ||||||||||
| Cash and Other Assets Less Liabilities: 0.4% | 18,925 | ||||||||||
| Total Net Assets: 100.0% | $ | 4,343,395 | |||||||||
41
Columbia Acorn International
Statement of Investments, continued
> Notes to Statement of Investments (in thousands)
(a) At December 31, 2006, for federal income tax purposes cost of investments was $2,737,657 and net unrealized appreciation was $1,586,813, consisting of gross unrealized appreciation of $1,655,465 and gross unrealized depreciation of $68,652.
(b) Non-income producing security.
(c) An affiliate may include any company in which the Fund owns five percent or more of its outstanding voting securities. On December 31, 2006, the Fund held five percent or more of the outstanding voting securities of the following companies:
| Van Houtte | 5.91 | % | |||||
| AIN Pharmaciez | 5.68 | ||||||
The aggregate cost and value of these investments at December 31, 2006 were $27,956 and $24,179, respectively. Investments in affiliates represented 0.56% of total net assets at December 31, 2006. Investment activity and income amounts relating to affiliates during the twelve months ended December 31, 2006 were as follows:
| Dividend Income | $ | 418 | |||||
| Net realized gain or loss | — | ||||||
| Change in unrealized gain or loss | (3,777 | ) | |||||
| Purchases | 19,747 | ||||||
| Proceeds from sales | — | ||||||
(d) Denotes a restricted security, which is subject to restrictions on resale under federal securities laws. At December 31, 2006, these securities had an aggregate value of $27,042, which represented 0.62% of total net assets.
Additional information on these securities is as follows:
| Security | Acquisition Dates | Shares | Cost | Value | |||||||||||||||
| Railpower Technologies 144A | 11/10 - 11/18/05 | 2,036 | $ | 9,225 | $ | 2,636 | |||||||||||||
| UrAsia Energy | 10/26/05 | 5,300 | 9,200 | 24,406 | |||||||||||||||
| $ | 18,425 | $ | 27,042 | ||||||||||||||||
(e) On December 31, 2006, the Fund's total investments were denominated in currencies as follows:
| Currency | Value | % of Total Net Assets | |||||||||
| Euro | $ | 1,686,421 | 38.8 | % | |||||||
| Japanese Yen | 591,713 | 13.6 | |||||||||
| British Pounds | 323,924 | 7.5 | |||||||||
| US Dollar | 296,814 | 6.8 | |||||||||
| Swiss Franc | 238,087 | 5.5 | |||||||||
| Other currencies less than 5% of total net assets | 1,187,511 | 27.4 | |||||||||
| $ | 4,324,470 | 99.6 | % | ||||||||
(f) Security exempt from registration under Section 4(2) of the Securities Act of 1933. These securities may only be resold in exempt transactions to qualified buyers. Private resales of these securities to qualified institutional buyers are also exempt from registration pursuant to Rule 144A under the Securities Act of 1933. At December 31, 2006, these securities had an aggregate value of $61,382, which represented 1.4% of net assets.
42
Columbia Acorn International
Portfolio Diversification
At December 31, 2006, the Fund's portfolio investments as a percent of net assets was diversified as follows:
| Value (000) | Percent | ||||||||||
| > Industrial Goods & Services | |||||||||||
| Materials & Speciality Chemicals | $ | 344,854 | 7.9 | % | |||||||
| Other Industrial Services | 253,343 | 5.8 | |||||||||
| Construction | 171,144 | 4.0 | |||||||||
| Conglomerates | 135,437 | 3.1 | |||||||||
| Machinery | 118,021 | 2.7 | |||||||||
| Electrical Components | 76,357 | 1.8 | |||||||||
| Outsourcing & Training Services | 68,780 | 1.6 | |||||||||
| Industrial Distribution | 37,500 | 0.9 | |||||||||
| Steel | 18,019 | 0.4 | |||||||||
| 1,223,455 | 28.2 | ||||||||||
| > Consumer Goods & Services | |||||||||||
| Food | 150,564 | 3.4 | |||||||||
| Retail | 129,078 | 3.0 | |||||||||
| Other Consumer Services | 113,127 | 2.6 | |||||||||
| Durables Goods | 108,636 | 2.5 | |||||||||
| Casinos | 67,114 | 1.5 | |||||||||
| Apparels | 64,346 | 1.5 | |||||||||
| Consumer Goods Distribution | 61,451 | 1.4 | |||||||||
| Nondurables | 40,677 | 0.9 | |||||||||
| Entertainment | 38,636 | 0.9 | |||||||||
| Furniture & Textiles | 29,052 | 0.7 | |||||||||
| Leisure Products | 25,933 | 0.6 | |||||||||
| Travel | 24,369 | 0.6 | |||||||||
| Consumer Electronics | 13,737 | 0.3 | |||||||||
| 866,720 | 19.9 | ||||||||||
| > Information | |||||||||||
| Financial Processors | 102,567 | 2.4 | |||||||||
| Computer Hardware & Related Equipment | 98,906 | 2.3 | |||||||||
| Business Information & Marketing Services | 74,429 | 1.7 | |||||||||
| Satellite Broadcasting | 53,281 | 1.2 | |||||||||
| Television Programming | 45,885 | 1.1 | |||||||||
| Semiconductors & Related Equipment | 44,758 | 1.0 | |||||||||
| Internet Related | 39,960 | 0.9 | |||||||||
| Cable Television | 34,901 | 0.8 | |||||||||
| Television Broadcasting | 30,702 | 0.7 | |||||||||
| Business Software | 27,099 | 0.6 | |||||||||
| Computer Services | 26,298 | 0.6 | |||||||||
| Electronics Distribution | 14,846 | 0.4 | |||||||||
| 593,632 | 13.7 | ||||||||||
| Value (000) | Percent | ||||||||||
| > Energy & Minerals | |||||||||||
| Oil Services | $ | 188,083 | 4.3 | % | |||||||
| Mining | 165,389 | 3.8 | |||||||||
| Agricultural Commodities | 57,579 | 1.3 | |||||||||
| Refining/Marketing/Distribution | 52,465 | 1.2 | |||||||||
| Oil/Gas Producers | 49,962 | 1.2 | |||||||||
| Non-Ferrous Metals | 11,853 | 0.3 | |||||||||
| 525,331 | 12.1 | ||||||||||
| > Finance | |||||||||||
| Banks | 228,133 | 5.3 | |||||||||
| Other Finance Companies | 125,564 | 2.9 | |||||||||
| Insurance | 60,999 | 1.4 | |||||||||
| Savings & Loans | 47,884 | 1.1 | |||||||||
| Money Management | 39,415 | 0.9 | |||||||||
| 501,995 | 11.6 | ||||||||||
| > Other Industries | |||||||||||
| Transportation | 145,520 | 3.3 | |||||||||
| Real Estate | 122,649 | 2.8 | |||||||||
| Regulated Utilities | 59,210 | 1.4 | |||||||||
| 327,379 | 7.5 | ||||||||||
| > Health Care | |||||||||||
| Services | 80,191 | 1.8 | |||||||||
| Pharmaceuticals | 41,543 | 1.0 | |||||||||
| Medical Equipment | 39,337 | 0.9 | |||||||||
| Hospital/ Laboratory Supplies | 25,601 | 0.6 | |||||||||
| 186,672 | 4.3 | ||||||||||
| Total Equities: | 4,225,184 | 97.3 | |||||||||
| Short-Term Obligations: | 99,286 | 2.3 | |||||||||
| Total Investments: | 4,324,470 | 99.6 | |||||||||
| Cash and Other Assets Less Liabilities: | 18,925 | 0.4 | |||||||||
| Net Assets: | $ | 4,343,395 | 100.0 | % | |||||||
43
Columbia Acorn USA
Major Portfolio Changes in the Fourth Quarter (Unaudited)
| Number of Shares | |||||||||||
| 09/30/06 | 12/31/06 | ||||||||||
| Additions | |||||||||||
| Information | |||||||||||
| Globalstar | 0 | 88,000 | |||||||||
| Integrated Device Technology | 783,490 | 1,203,490 | |||||||||
| Polycom | 0 | 130,000 | |||||||||
| Supertex | 0 | 100,000 | |||||||||
| Talx | 0 | 36,900 | |||||||||
| Trimble Navigation | 125,000 | 155,000 | |||||||||
| Consumer Goods & Services | |||||||||||
| Cavco Industries | 75,300 | 225,000 | |||||||||
| Champion Enterprises | 400,000 | 2,078,300 | |||||||||
| Heelys | 0 | 45,000 | |||||||||
| J Crew Group | 125,000 | 175,000 | |||||||||
| Nutrisystem | 0 | 65,000 | |||||||||
| Pool | 0 | 40,000 | |||||||||
| True Religion Apparel | 695,200 | 885,200 | |||||||||
| Health Care | |||||||||||
| Arena Pharmaceuticals | 0 | 225,000 | |||||||||
| Barrier Therapeutics | 0 | 255,100 | |||||||||
| Collagenex Pharmaceuticals | 0 | 150,000 | |||||||||
| Decode Genetics | 235,000 | 636,400 | |||||||||
| The Medicines Company | 0 | 400,000 | |||||||||
| Medicis Pharmaceutical | 0 | 200,000 | |||||||||
| Medicure | 0 | 3,690,300 | |||||||||
| MGI Pharma | 0 | 400,000 | |||||||||
| Nektar Therapeutics | 360,000 | 760,000 | |||||||||
| Neurogen | 0 | 215,000 | |||||||||
| Nuvelo | 0 | 440,000 | |||||||||
| QLT | 0 | 490,000 | |||||||||
| Industrial Goods & Services | |||||||||||
| American Reprographics Company | 0 | 47,200 | |||||||||
| Ametek | 652,500 | 697,500 | |||||||||
| (Includes the effect of a 3 for 2 Stock Split) | |||||||||||
| K&F Industries Holdings | 200,000 | 236,400 | |||||||||
| Labor Ready | 100,000 | 350,000 | |||||||||
| Finance | |||||||||||
| First Busey | 16,227 | 179,996 | |||||||||
| HCC Insurance Holdings | 664,500 | 714,500 | |||||||||
| Lakeland Financial | 11,207 | 125,000 | |||||||||
| Montpelier RE | 0 | 150,000 | |||||||||
| Energy & Minerals | |||||||||||
| Atwood Oceanics | 337,000 | 367,000 | |||||||||
| Other Industries | |||||||||||
| Heartland Express | 424,720 | 524,720 | |||||||||
| Number of Shares | |||||||||||
| 09/30/06 | 12/31/06 | ||||||||||
| Sales | |||||||||||
| Information | |||||||||||
| Alltel | 356,605 | 270,000 | |||||||||
| Intermec | 260,000 | 130,000 | |||||||||
| Micros Systems | 455,200 | 385,000 | |||||||||
| Progress Software | 347,000 | 217,800 | |||||||||
| Symbol Technologies | 584,000 | 0 | |||||||||
| Consumer Goods & Services | |||||||||||
| Michaels Stores | 203,000 | 0 | |||||||||
| Mohawk Industries | 20,000 | 0 | |||||||||
| PETCO Animal Supplies | 608,000 | 0 | |||||||||
| Health Care | |||||||||||
| Exelixis | 235,000 | 28,000 | |||||||||
| Intermagnetics General | 165,000 | 0 | |||||||||
| Intermune | 277,065 | 0 | |||||||||
| Industrial Goods & Services | |||||||||||
| NuCo2 | 113,000 | 56,900 | |||||||||
| Energy & Minerals | |||||||||||
| Chicago Bridge & Iron | 535,000 | 0 | |||||||||
| Pride International | 311,000 | 227,000 | |||||||||
44
Columbia Acorn USA
Statement of Investments, December 31, 2006
| Number of Shares | Value (000) | ||||||||||
| Equities: 94.8% | |||||||||||
| Information 31.7% | |||||||||||
| > Business Software 7.2% | |||||||||||
| 779,900 | Avid Technology (b) | $ | 29,059 | ||||||||
| Digital Nonlinear Editing Software & Systems | |||||||||||
| 660,650 | Kronos (b) | 24,272 | |||||||||
| Labor Management Solutions | |||||||||||
| 385,000 | Micros Systems (b) | 20,289 | |||||||||
| Information Systems for Restaurants & Hotels | |||||||||||
| 2,100,000 | Novell (b) | 13,020 | |||||||||
| Directory, Operating System & Identity Management Software | |||||||||||
| 524,000 | JDA Software (b) | 7,215 | |||||||||
| Application/Software & Services for Retailers | |||||||||||
| 217,800 | Progress Software (b) | 6,083 | |||||||||
| Application Development Software | |||||||||||
| 327,200 | Parametric Technology (b) | 5,896 | |||||||||
| Engineering Software & Services | |||||||||||
| 230,400 | Concur Technologies (b) | 3,696 | |||||||||
| Web Enabled Cost & Expense Management Software | |||||||||||
| 350,000 | webMethods (b) | 2,576 | |||||||||
| Enterprise Applications Integration Tools | |||||||||||
| 250,000 | Agile Software (b) | 1,538 | |||||||||
| Product Design Software | |||||||||||
| 59,300 | Witness Systems (b) | 1,040 | |||||||||
| Customer Experience Management Software | |||||||||||
| 114,684 | |||||||||||
| > Mobile Communications 5.3% | |||||||||||
| 1,005,000 | Crown Castle International (b) | 32,461 | |||||||||
| Communications Towers | |||||||||||
| 506,000 | American Tower (b) | 18,864 | |||||||||
| Communications Towers in USA & Mexico | |||||||||||
| 270,000 | Alltel | 16,330 | |||||||||
| Cellular Telephone Services | |||||||||||
| 1,633,000 | Dobson Communications (b) | 14,223 | |||||||||
| Rural & Small City Cellular Telephone Services | |||||||||||
| 88,000 | Globalstar (b) | 1,224 | |||||||||
| Satellite Mobile Voice & Data Carrier | |||||||||||
| 100,000 | Openwave Systems (b) | 923 | |||||||||
| Internet Software for Mobile Devices | |||||||||||
| 84,025 | |||||||||||
| > Computer Hardware & Related Equipment 3.5% | |||||||||||
| 566,600 | Nice Systems (b) (Israel) | 17,440 | |||||||||
| Audio & Video Recording Solutions | |||||||||||
| 505,000 | II VI (b) | 14,110 | |||||||||
| Laser Components | |||||||||||
| 147,800 | Amphenol | 9,175 | |||||||||
| Electronic Connectors | |||||||||||
| 100,000 | Belden CDT | 3,909 | |||||||||
| Specialty Cable | |||||||||||
| 99,000 | Zebra Technologies (b) | 3,444 | |||||||||
| Bar Code Printers | |||||||||||
| 130,000 | Intermec (b) | 3,155 | |||||||||
| Bar Code & Wireless LAN Systems | |||||||||||
| 40,000 | Rogers (b) | 2,366 | |||||||||
| PCB Laminates & High-performance Foams | |||||||||||
| 90,000 | Netgear (b) | 2,363 | |||||||||
| Networking Products for Small Business & Home | |||||||||||
| 55,962 | |||||||||||
| Number of Shares | Value (000) | ||||||||||
| > Semiconductors & Related Equipment 2.5% | |||||||||||
| 1,203,490 | Integrated Device Technology (b) | $ | 18,630 | ||||||||
| Communications Semiconductors | |||||||||||
| 1,050,000 | Entegris (b) | 11,361 | |||||||||
| Semiconductor Wafer Shipping & Handling Products | |||||||||||
| 210,000 | Microsemi (b) | 4,126 | |||||||||
| Analog/Mixed Signal Semiconductors | |||||||||||
| 100,000 | Supertex (b) | 3,925 | |||||||||
| Mixed-signal Semiconductors | |||||||||||
| 70,000 | Littelfuse (b) | 2,232 | |||||||||
| Little Fuses | |||||||||||
| 40,274 | |||||||||||
| > Instrumentation 2.1% | |||||||||||
| 430,000 | Flir Systems (b) | 13,687 | |||||||||
| Infrared Cameras | |||||||||||
| 140,000 | Mettler Toledo (b) | 11,039 | |||||||||
| Laboratory Equipment | |||||||||||
| 155,000 | Trimble Navigation (b) | 7,863 | |||||||||
| GPS-based Instruments | |||||||||||
| 32,589 | |||||||||||
| > Telephone Services 2.1% | |||||||||||
| 1,386,000 | Time Warner Telecom (b) | 27,623 | |||||||||
| Fiber Optic Telephone/Data Services | |||||||||||
| 340,000 | Windstream | 4,835 | |||||||||
| Rural Telephone Franchises | |||||||||||
| 32,458 | |||||||||||
| > Telecommunications Equipment 1.6% | |||||||||||
| 1,825,000 | Tellabs (b) | 18,724 | |||||||||
| Telecommunications Equipment | |||||||||||
| 130,000 | Polycom (b) | 4,018 | |||||||||
| Vido Conferencing Equipment | |||||||||||
| 323,500 | Symmetricom (b) | 2,886 | |||||||||
| Network Timing & Synchronization Devices | |||||||||||
| 25,628 | |||||||||||
| > Internet Related 1.3% | |||||||||||
| 460,000 | ValueClick (b) | 10,870 | |||||||||
| Internet Advertising | |||||||||||
| 980,000 | CNET Networks (b) | 8,908 | |||||||||
| Internet Advertising on Niche Websites | |||||||||||
| 19,778 | |||||||||||
| > Financial Processors 1.2% | |||||||||||
| 393,280 | Global Payments | 18,209 | |||||||||
| Credit Card Processor | |||||||||||
| 18,209 | |||||||||||
| > Business Information & Marketing Services 1.1% | |||||||||||
| 530,000 | Ceridian (b) | 14,829 | |||||||||
| HR Services & Payment Processing | |||||||||||
| 98,300 | Navigant Consulting (b) | 1,942 | |||||||||
| Financial Consulting Firm | |||||||||||
| 16,771 | |||||||||||
| > Computer Services 0.8% | |||||||||||
| 786,000 | RCM Technologies (b)(c) | 4,708 | |||||||||
| Technology & Engineering Services | |||||||||||
| 1,005,500 | AnswerThink Consulting (b) | 3,097 | |||||||||
| IT Integration & Best Practice Research | |||||||||||
45
Columbia Acorn USA
Statement of Investments, continued
| Number of Shares | Value (000) | ||||||||||
| > Computer Services—continued | |||||||||||
| 95,000 | SRA International (b) | $ | 2,540 | ||||||||
| Government IT Services | |||||||||||
| 235,000 | iGate (b) | 1,617 | |||||||||
| IT & Business Process Outsourcing Services | |||||||||||
| 36,900 | Talx | 1,013 | |||||||||
| Outsourced Human Resource Services | |||||||||||
| 12,975 | |||||||||||
| > CATV 0.8% | |||||||||||
| 2,580,000 | Gemstar-TV Guide International (b) | 10,346 | |||||||||
| TV Program Guides & CATV Programming | |||||||||||
| 140,000 | Discovery Holding (b) | 2,253 | |||||||||
| CATV Programming | |||||||||||
| 12,599 | |||||||||||
| > Radio 0.8% | |||||||||||
| 511,100 | Salem Communications | 6,108 | |||||||||
| Radio Stations for Religious Programming | |||||||||||
| 705,500 | Spanish Broadcasting System (b) | 2,900 | |||||||||
| Spanish Language Radio Stations | |||||||||||
| 300,000 | Saga Communications (b) | 2,883 | |||||||||
| Radio Stations in Small- & Mid-sized Cities | |||||||||||
| 11,891 | |||||||||||
| > TV Broadcasting 0.6% | |||||||||||
| 1,125,000 | Entravision Communications (b) | 9,248 | |||||||||
| Spanish Language TV, Radio & Outdoor | |||||||||||
| 9,248 | |||||||||||
| > Gaming Equipment & Services 0.4% | |||||||||||
| 200,000 | Bally Technologies (b) | 3,736 | |||||||||
| Slot Machines & Software | |||||||||||
| 98,500 | Shuffle Master (b) | 2,581 | |||||||||
| Card Shufflers & Casino Games | |||||||||||
| 6,317 | |||||||||||
| > Television Programming 0.3% | |||||||||||
| 460,000 | Lions Gate Entertainment (b) | 4,936 | |||||||||
| Film & TV Studio | |||||||||||
| 4,936 | |||||||||||
| > Consumer Software 0.1% | |||||||||||
| 60,000 | THQ (b) | 1,951 | |||||||||
| Entertainment Software | |||||||||||
| 1,951 | |||||||||||
| Information: Total | 500,295 | ||||||||||
| Consumer Goods & Services 19.1% | |||||||||||
| > Apparel 4.5% | |||||||||||
| 634,200 | Oxford Industries | 31,488 | |||||||||
| Branded & Private Label Apparel | |||||||||||
| 600,200 | Carter's (b) | 15,305 | |||||||||
| Children's Branded Apparel | |||||||||||
| 885,200 | True Religion Apparel (b) | 13,552 | |||||||||
| Premium Denim | |||||||||||
| 222,200 | Coach (b) | 9,546 | |||||||||
| Designer & Retailer of Branded Leather Accessories | |||||||||||
| 45,000 | Heelys (b) | 1,445 | |||||||||
| Wheeled Footware | |||||||||||
| 71,336 | |||||||||||
| Number of Shares | Value (000) | ||||||||||
| > Retail 4.3% | |||||||||||
| 398,000 | Abercrombie & Fitch | $ | 27,713 | ||||||||
| Teen Apparel Retailer | |||||||||||
| 486,250 | Christopher & Banks | 9,073 | |||||||||
| Women's Apparel Retailer | |||||||||||
| 418,000 | Chico's FAS (b) | 8,648 | |||||||||
| Women's Specialty Retail | |||||||||||
| 224,500 | AnnTaylor Stores (b) | 7,373 | |||||||||
| Women's Apparel Retailer | |||||||||||
| 175,000 | J Crew Group (b) | 6,746 | |||||||||
| Multi-channel Branded Retailer | |||||||||||
| 200,000 | Urban Outfitters (b) | 4,606 | |||||||||
| Apparel & Home Specialty Retailer | |||||||||||
| 95,000 | Genesco (b) | 3,544 | |||||||||
| Multi-concept Branded Footwear Retailer | |||||||||||
| 67,703 | |||||||||||
| > Other Consumer Services 3.1% | |||||||||||
| 416,000 | ITT Educational Services (b) | 27,610 | |||||||||
| Post-secondary Degree Programs | |||||||||||
| 387,700 | Central Parking | 6,979 | |||||||||
| Owner, Operator, Manager of Parking Lots & Garages | |||||||||||
| 310,000 | Universal Technical Institute (b) | 6,885 | |||||||||
| Vocational Training | |||||||||||
| 65,000 | Nutrisystem (b) | 4,120 | |||||||||
| Weight Loss Program | |||||||||||
| 60,000 | Weight Watchers International | 3,152 | |||||||||
| Weight Loss Programs | |||||||||||
| 48,746 | |||||||||||
| > Nondurables 1.9% | |||||||||||
| 531,400 | Scotts Miracle-Gro | 27,447 | |||||||||
| Consumer Lawn & Garden Products | |||||||||||
| 72,000 | Jarden (b) | 2,505 | |||||||||
| Branded Household Products | |||||||||||
| 29,952 | |||||||||||
| > Leisure Products 1.8% | |||||||||||
| 301,300 | International Speedway | 15,378 | |||||||||
| Largest Motorsports Racetrack Owner & Operator | |||||||||||
| 195,500 | Speedway Motorsports | 7,507 | |||||||||
| Motorsport Racetrack Owner & Operator | |||||||||||
| 195,000 | Callaway Golf | 2,810 | |||||||||
| Premium Golf Clubs & Balls | |||||||||||
| 50,000 | Polaris Industries | 2,342 | |||||||||
| Leisure Vehicles & Related Products | |||||||||||
| 28,037 | |||||||||||
| > Other Durable Goods 1.7% | |||||||||||
| 2,078,300 | Champion Enterprises (b) | 19,453 | |||||||||
| Manufactured Homes | |||||||||||
| 225,000 | Cavco Industries (b) | 7,884 | |||||||||
| Higher End Manufactured Homes | |||||||||||
| 27,337 | |||||||||||
| > Restaurants 0.9% | |||||||||||
| 337,500 | Sonic (b) | 8,083 | |||||||||
| Quick Service Restaurant | |||||||||||
| 163,800 | Red Robin Gourmet Burgers (b) | 5,872 | |||||||||
| Casual Dining Restaurant | |||||||||||
| 13,955 | |||||||||||
46
| Number of Shares | Value (000) | ||||||||||
| > Furniture & Textiles 0.4% | |||||||||||
| 106,000 | HNI | $ | 4,707 | ||||||||
| Office Furniture & Fireplaces | |||||||||||
| 55,800 | Knoll | 1,228 | |||||||||
| Office Furniture | |||||||||||
| 5,935 | |||||||||||
| > Casinos & Gaming 0.3% | |||||||||||
| 160,000 | Pinnacle Entertainment (b) | 5,302 | |||||||||
| Regional Casino Operator | |||||||||||
| 5,302 | |||||||||||
| > Travel 0.1% | |||||||||||
| 45,000 | Vail Resorts (b) | 2,017 | |||||||||
| Ski Resort Operator & Developer | |||||||||||
| 2,017 | |||||||||||
| > Consumer Goods Distribution 0.1% | |||||||||||
| 40,000 | Pool | 1,567 | |||||||||
| Distributor of Swimming Pool Supplies & Equipment | |||||||||||
| 1,567 | |||||||||||
| Consumer Goods & Services: Total | 301,887 | ||||||||||
| Health Care 12.7% | |||||||||||
| > Health Care Services 3.3% | |||||||||||
| 550,000 | United Surgical Partners (b) | 15,593 | |||||||||
| Outpatient Surgery Center | |||||||||||
| 291,800 | Lincare Holdings (b) | 11,625 | |||||||||
| Home Health Care Services | |||||||||||
| 380,000 | PSS World Medical (b) | 7,421 | |||||||||
| Medical Supplies Distributor | |||||||||||
| 210,000 | LCA-Vision | 7,216 | |||||||||
| Lasik Surgery Centers | |||||||||||
| 137,000 | Charles River Laboratories (b) | 5,925 | |||||||||
| Pharmaceutical Research | |||||||||||
| 175,000 | PRA International (b) | 4,422 | |||||||||
| Contract Research Organization | |||||||||||
| 52,202 | |||||||||||
| > Biotechnology & Drug Delivery 3.1% | |||||||||||
| 885,000 | PDL BioPharma (b) | 17,824 | |||||||||
| Proprietary Monoclonal Antibodies | |||||||||||
| 760,000 | Nektar Therapeutics (b) | 11,560 | |||||||||
| Drug Delivery Technologies | |||||||||||
| 605,000 | Ligand Pharmaceuticals (b) | 6,625 | |||||||||
| Drugs for Pain, Cancer, Osteoporosis & Diabetes | |||||||||||
| 3,690,300 | Medicure (b)(d) | 4,277 | |||||||||
| Cardiovascular Biotech Company | |||||||||||
| 738,060 | Medicure Warrants (b)(d)(e)(f) | - | |||||||||
| Cardiovascular Biotech Company | |||||||||||
| 225,000 | Arena Pharmaceuticals (b) | 2,905 | |||||||||
| Novel Drug Targeting Technology | |||||||||||
| 636,400 | Decode Genetics (b) | 2,883 | |||||||||
| Drugs For Heart Attack, Asthma & Vascular Disease | |||||||||||
| 440,000 | Nuvelo (b) | 1,760 | |||||||||
| Development-Stage Biotech Focused On Cardiovascular/Cancer | |||||||||||
| 215,000 | Neurogen (b) | 1,279 | |||||||||
| Development-Stage Biotech Focused On Neurology | |||||||||||
| Number of Shares | Value (000) | ||||||||||
| 28,000 | Exelixis (b) | $ | 252 | ||||||||
| Treatments for Cancer & Metabolic Disorders | |||||||||||
| 375,000 | Locus Discovery, Series D, Pfd. (b)(d) | 102 | |||||||||
| High Throughput Rational Drug Design | |||||||||||
| 363,636 | Metabolex, Series F (d) | 84 | |||||||||
| Diabetes Drug Development | |||||||||||
| 49,551 | |||||||||||
| > Medical Equipment & Devices 2.6% | |||||||||||
| 577,400 | Edwards Lifesciences (b) | 27,161 | |||||||||
| Heart Valves | |||||||||||
| 220,000 | Viasys Healthcare (b) | 6,120 | |||||||||
| Respiratory & Neurology Medical Equipment | |||||||||||
| 105,000 | Vital Signs | 5,242 | |||||||||
| Anesthesia, Respiratory & Sleep Products | |||||||||||
| 94,171 | Advanced Medical Optics (b) | 3,315 | |||||||||
| Medical Devices for Eye Care | |||||||||||
| 41,838 | |||||||||||
| > Pharmaceuticals 2.2% | |||||||||||
| 400,000 | The Medicines Company (b) | 12,688 | |||||||||
| Specialty Pharmaceuticals - Cardiovascular | |||||||||||
| 400,000 | MGI Pharma (b) | 7,364 | |||||||||
| Specialty Pharmaceuticals for Oncology & Acute Care | |||||||||||
| 200,000 | Medicis Pharmaceutical | 7,026 | |||||||||
| Specialty Pharmaceuticals - Dermatology | |||||||||||
| 490,000 | QLT (b) | 4,145 | |||||||||
| Specialty Pharmaceuticals - Ophthalmology & Dermatology | |||||||||||
| 150,000 | Collagenex Pharmaceuticals (b) | 2,096 | |||||||||
| Specialty Pharmaceuticals for Dermatology | |||||||||||
| 255,100 | Barrier Therapeutics (b) | 1,923 | |||||||||
| Specialty Pharmaceuticals for Dermatology | |||||||||||
| 35,242 | |||||||||||
| > Medical Supplies 1.5% | |||||||||||
| 270,700 | ICU Medical (b) | 11,012 | |||||||||
| Intravenous Therapy Products | |||||||||||
| 158,300 | Techne (b) | 8,778 | |||||||||
| Cytokines, Antibodies & Other Reagents for Life Science | |||||||||||
| 104,000 | Arrow International | 3,679 | |||||||||
| Disposable Catheters | |||||||||||
| 23,469 | |||||||||||
| Health Care: Total | 202,302 | ||||||||||
| Industrial Goods & Services 12.5% | |||||||||||
| > Machinery 7.1% | |||||||||||
| 580,300 | ESCO Technologies (b) | 26,369 | |||||||||
| Automatic Electric Meter Readers | |||||||||||
| 697,500 | Ametek | 22,209 | |||||||||
| Aerospace/Industrial Instruments | |||||||||||
| 673,600 | Pentair | 21,151 | |||||||||
| Pumps, Water Treatment & Tools | |||||||||||
| 373,600 | Nordson | 18,616 | |||||||||
| Dispensing Systems for Adhesives & Coatings | |||||||||||
| 319,800 | Donaldson | 11,100 | |||||||||
| Industrial Air Filtration | |||||||||||
| 236,400 | K&F Industries Holdings (b) | 5,369 | |||||||||
| Aircraft Wheels, Brakes & Fuel Tank Bladders | |||||||||||
| 71,800 | Toro | 3,348 | |||||||||
| Turf Maintenance Equipment | |||||||||||
47
Columbia Acorn USA
Statement of Investments, continued
| Number of Shares | Value (000) | ||||||||||
| > Machinery—continued | |||||||||||
| 132,000 | Goodman Global (b) | $ | 2,270 | ||||||||
| HVAC Equipment Manufacturer | |||||||||||
| 50,000 | Kaydon | 1,987 | |||||||||
| Specialized Friction & Motion Control Products | |||||||||||
| 112,419 | |||||||||||
| > Electrical Components 1.8% | |||||||||||
| 376,000 | Genlyte Group (b) | 29,369 | |||||||||
| Commercial Lighting Fixtures | |||||||||||
| 29,369 | |||||||||||
| > Outsourcing Services 1.4% | |||||||||||
| 400,000 | Quanta Services (b) | 7,868 | |||||||||
| Electrical & Telecom Construction Services | |||||||||||
| 175,000 | Administaff | 7,485 | |||||||||
| Professional Employer Organization | |||||||||||
| 350,000 | Labor Ready (b) | 6,416 | |||||||||
| Temporary Manual Labor | |||||||||||
| 21,769 | |||||||||||
| > Construction 0.8% | |||||||||||
| 204,050 | Florida Rock | 8,784 | |||||||||
| Aggregates & Concrete | |||||||||||
| 100,000 | Simpson Manufacturing | 3,165 | |||||||||
| Wall Joint Maker | |||||||||||
| 11,949 | |||||||||||
| > Waste Management 0.5% | |||||||||||
| 187,250 | Waste Connections (b) | 7,780 | |||||||||
| Solid Waste Management | |||||||||||
| 7,780 | |||||||||||
| > Other Industrial Services 0.4% | |||||||||||
| 75,900 | G&K Services | 2,952 | |||||||||
| Uniform Rental | |||||||||||
| 63,000 | UTI Worldwide | 1,884 | |||||||||
| Global Logistics & Freight Forwarding | |||||||||||
| 47,200 | American Reprographics Company (b) | 1,572 | |||||||||
| Document Management and Logistics | |||||||||||
| 6,408 | |||||||||||
| > Industrial Distribution 0.3% | |||||||||||
| 70,000 | Watsco | 3,301 | |||||||||
| HVAC Distribution | |||||||||||
| 56,900 | NuCo2 (b) | 1,399 | |||||||||
| Bulk Co2 Gas Distribution to Restaurants | |||||||||||
| 4,700 | |||||||||||
| > Industrial Materials & Specialty Chemicals 0.2% | |||||||||||
| 100,000 | Drew Industries (b) | 2,601 | |||||||||
| RV & Manufactured Home Components | |||||||||||
| 2,601 | |||||||||||
| Industrial Goods & Services: Total | 196,995 | ||||||||||
| Finance 9.2% | |||||||||||
| > Finance Companies 3.5% | |||||||||||
| 1,121,500 | AmeriCredit (b) | 28,228 | |||||||||
| Auto Lending | |||||||||||
| 517,900 | World Acceptance (b) | 24,315 | |||||||||
| Personal Loans | |||||||||||
| 130,000 | McGrath Rentcorp | 3,982 | |||||||||
| Temporary Space & IT Equipment Rentals | |||||||||||
| 56,525 | |||||||||||
| Number of Shares | Value (000) | ||||||||||
| > Insurance 3.0% | |||||||||||
| 714,500 | HCC Insurance Holdings | $ | 22,928 | ||||||||
| Specialty Insurance | |||||||||||
| 14,000 | Markel (b) | 6,721 | |||||||||
| Specialty Insurance | |||||||||||
| 105,000 | Philadelphia Consolidated Holding (b) | 4,679 | |||||||||
| Specialty Insurance | |||||||||||
| 87,000 | Delphi Financial Group | 3,520 | |||||||||
| Group Employee Benefit Products & Services | |||||||||||
| 150,000 | Montpelier Re | 2,791 | |||||||||
| Commercial Lines Insurance/Reinsurance | |||||||||||
| 75,000 | Endurance Specialty Holdings | 2,744 | |||||||||
| Commercial Lines Insurance/Reinsurance | |||||||||||
| 91,000 | United America Indemnity (b) | 2,305 | |||||||||
| Specialty Insurance | |||||||||||
| 120,643 | Eastern Insurance Holdings (b) | 1,757 | |||||||||
| Workers Comp & Specialty Insurance | |||||||||||
| 47,445 | |||||||||||
| > Banks 2.2% | |||||||||||
| 239,500 | TCF Financial | 6,567 | |||||||||
| Great Lakes Bank | |||||||||||
| 212,756 | Chittenden | 6,529 | |||||||||
| Vermont & Western Massachusetts Banks | |||||||||||
| 145,000 | Greene County Bancshares | 5,761 | |||||||||
| Tennessee Bank | |||||||||||
| 179,996 | First Busey | 4,149 | |||||||||
| Illinois Bank | |||||||||||
| 94,000 | Associated Banc-Corp | 3,279 | |||||||||
| Midwest Bank | |||||||||||
| 125,000 | Lakeland Financial | 3,191 | |||||||||
| Indiana Bank | |||||||||||
| 114,777 | Glacier Bancorp | 2,805 | |||||||||
| Mountain States Bank | |||||||||||
| 20,000 | First Financial Bankshares | 837 | |||||||||
| West Texas Bank | |||||||||||
| 31,500 | West Bancorporation | 560 | |||||||||
| Des Moines Commercial Bank | |||||||||||
| 15,696 | Pacific Continental | 303 | |||||||||
| Niche Pacific N.W. Bank | |||||||||||
| 33,981 | |||||||||||
| > Savings & Loans 0.5% | |||||||||||
| 141,400 | Anchor Bancorp Wisconsin | 4,075 | |||||||||
| Wisconsin Thrift | |||||||||||
| 80,000 | People's Bank Bridgeport | 3,570 | |||||||||
| Connecticut Savings & Loan | |||||||||||
| 7,645 | |||||||||||
| Finance: Total | 145,596 | ||||||||||
| Energy & Minerals 7.2% | |||||||||||
| > Oil Services 3.9% | |||||||||||
| 401,700 | FMC Technologies (b) | 24,757 | |||||||||
| Oil & Gas Well Head Manufacturer | |||||||||||
| 367,000 | Atwood Oceanics (b) | 17,972 | |||||||||
| Offshore Drilling Contractor | |||||||||||
| 227,000 | Pride International (b) | 6,812 | |||||||||
| Offshore Drilling Contractor | |||||||||||
| 355,000 | Hanover Compressor (b) | 6,706 | |||||||||
| Natural Gas Compressor Rental & Fabrication | |||||||||||
48
| Number of Shares | Value (000) | ||||||||||
| > Oil Services—continued | |||||||||||
| 76,500 | CARBO Ceramics | $ | 2,859 | ||||||||
| Natural Gas Well Stimulants | |||||||||||
| 155,000 | Key Energy Services (b) | 2,426 | |||||||||
| Well Workover Services | |||||||||||
| 61,532 | |||||||||||
| > Oil & Gas Producers 2.3% | |||||||||||
| 525,000 | Quicksilver Resources (b) | 19,210 | |||||||||
| Natural Gas & Coal Seam Gas Producer | |||||||||||
| 208,400 | Southwestern Energy (b) | 7,304 | |||||||||
| Natural Gas Producer | |||||||||||
| 111,200 | Equitable Resources | 4,643 | |||||||||
| Natural Gas Producer & Utility | |||||||||||
| 450,000 | Vaalco Energy (b) | 3,037 | |||||||||
| Oil & Gas Producer | |||||||||||
| 80,000 | St. Mary Land & Exploration | 2,947 | |||||||||
| Oil & Gas Producer | |||||||||||
| 37,141 | |||||||||||
| > Other Resources 0.5% | |||||||||||
| 242,000 | Layne Christensen (b) | 7,945 | |||||||||
| Oil& Gas Producer/Engineering & Construction/Contract Drilling | |||||||||||
| 7,945 | |||||||||||
| > Oil Refining, Marketing & Distribution 0.5% | |||||||||||
| 155,000 | Atmos Energy | 4,946 | |||||||||
| Dallas Natural Gas Utility | |||||||||||
| 50,250 | Oneok | 2,167 | |||||||||
| Natural Gas Distribution, Pipeline Processing & Trading | |||||||||||
| 7,113 | |||||||||||
| Energy & Minerals: Total | 113,731 | ||||||||||
| Other Industries 2.4% | |||||||||||
| > Real Estate 1.7% | |||||||||||
| 560,000 | DiamondRock Hospitality | 10,086 | |||||||||
| Hotel Owner | |||||||||||
| 350,000 | Highland Hospitality | 4,987 | |||||||||
| Hotel Owner | |||||||||||
| 77,500 | Gaylord Entertainment (b) | 3,947 | |||||||||
| Convention Hotels | |||||||||||
| 100,000 | Digital Realty Trust | 3,423 | |||||||||
| Technology-focused Office Buildings | |||||||||||
| 150,000 | Kite Realty Group | 2,793 | |||||||||
| Community Shopping Centers | |||||||||||
| 90,000 | American Campus Communities | 2,562 | |||||||||
| Student Housing | |||||||||||
| 27,798 | |||||||||||
| > Transportation 0.5% | |||||||||||
| 524,720 | Heartland Express | 7,881 | |||||||||
| Regional Trucker | |||||||||||
| 7,881 | |||||||||||
| Number of Shares or Principal Amount (000) | Value (000) | ||||||||||
| > Regulated Utilities 0.2% | |||||||||||
| 97,500 | Northeast Utilities | $ | 2,746 | ||||||||
| Regulated Electric Utility | |||||||||||
| 2,746 | |||||||||||
| Other Industries: Total | 38,425 | ||||||||||
| Total Equities: 94.8% (Cost: $1,078,675) | 1,499,231 | ||||||||||
| Short-Term Obligations 5.1% | |||||||||||
| $ | 7,900 | Erste Finance (g) 5.28% Due 01/02/07 | 7,899 | ||||||||
| 7,900 | Greyhawk Funding (g) 5.25% Due 01/03/07 | 7,898 | |||||||||
| 7,900 | Compass Securities (g) 5.31% Due 01/04/07 | 7,897 | |||||||||
| 7,900 | Giro Balance (g) 5.33% Due 01/11/07 | 7,888 | |||||||||
| 7,900 | American General Financial 5.26% Due 01/12/07 | 7,887 | |||||||||
| 7,800 | East Fleet Financial 5.32% Due 01/05/07 | 7,795 | |||||||||
| 7,800 | Manhattan Asset (g) 5.31% Due 01/08/07 | 7,792 | |||||||||
| 7,800 | George Street (g) 5.33% Due 01/09/07 | 7,791 | |||||||||
| 7,800 | Advantage Asset (g) 5.33% Due 01/10/07 | 7,790 | |||||||||
| 9,346 | Repurchase Agreement with Fixed Income Clearing Corp., dated 12/29/06, due 1/02/07 at 5.150% collateralized by Federal Home Loan Bank Bond, maturing 1/19/16 market value of $9,537 (repurchase proceeds: $9,351) | 9,346 | |||||||||
| (Amortized Cost: $79,983) | 79,983 | ||||||||||
| Total Investments: 99.9% (Cost: $1,158,658)(a) | 1,579,214 | ||||||||||
| Cash and Other Assets Less Liabilities: 0.1% | 1,014 | ||||||||||
| Total Net Assets: 100.0% | $ | 1,580,228 | |||||||||
49
Columbia Acorn USA
Statement of Investments, continued
> Notes to Statement of Investments (in thousands)
(a) At December 31, 2006, for federal income tax purposes cost of investments was $1,158,903 and net unrealized appreciation was $420,311, consisting of gross unrealized appreciation of $468,917 and gross unrealized depreciation of $48,606.
(b) Non-income producing security.
(c) An affiliate may include any company in which the Fund owns five percent or more of its outstanding voting securities. On December 31, 2006, the Fund held five percent or more of the outstanding voting securities of the following companies:
| RCM Technologies | 6.66 | % | |||||
The aggregate cost and value of this investment at December 31, 2006 were $5,636 and $4,708, respectively. Investments in affiliates represented 0.30% of total net assets at December 31, 2006. Investment activity and income amounts relating to affiliates during the 12 months ended December 31, 2006 were as follows:
| Dividend Income | $ | - | |||||
| Net realized gain or loss | - | ||||||
| Change in unrealized gain or loss | 699 | ||||||
| Purchases | - | ||||||
| Proceeds from sales | - | ||||||
(d) Denotes a restricted security, which is subject to restrictions on resale under federal securities laws. These securities are valued in good faith by the Board of Trustees. At December 31, 2006, these securities had an aggregate value of $4,463, which represented 0.28% of total net assets.
Additional information on these securities is as follows:
| Security | Acquisition Dates | Shares | Cost | Value | |||||||||||||||
| Locus Discovery, Series D, Pfd. | 9/5/01 | 375 | $ | 1,500 | $ | 102 | |||||||||||||
| Metabolex, Series F | 5/11/00 | 364 | 2,000 | 84 | |||||||||||||||
| Medicure | 12/22/06 | 3,690 | 4,797 | 4,277 | |||||||||||||||
| Medicure - Warrants | 12/22/06 | 738 | — | — | |||||||||||||||
| $ | 8,297 | $ | 4,463 | ||||||||||||||||
(e) Security has no value.
(f) Represents fair value as determined in good faith under procedures approved by the Board of Trustees.
(g) Security exempt from registration under Section 4(2) of the Securities Act of 1933. These securities may only be resold in exempt transactions to qualified buyers. Private resales of these securities to qualified institutional buyers are also exempt from registration pursuant to Rule 144A under the Securities Act of 1933. At December 31, 2006, these securities had an aggregate value of $54,955, which represented 3.5% of net assets.
50
Columbia Acorn International Select
Major Portfolio Changes in the Fourth Quarter (Unaudited)
| Number of Shares | |||||||||||
| 09/30/06 | 12/31/06 | ||||||||||
| Additions | |||||||||||
| Europe | |||||||||||
| > Ireland | |||||||||||
| Anglo Irish Bank | 289,000 | 300,000 | |||||||||
| Bank of Ireland | 280,000 | 300,000 | |||||||||
| United Drug | 0 | 700,000 | |||||||||
| > Switzerland | |||||||||||
| Schindler | 23,000 | 26,000 | |||||||||
| Synthes | 38,000 | 47,000 | |||||||||
| > Germany | |||||||||||
| Gagfah | 0 | 24,000 | |||||||||
| Wincor Nixdorf | 0 | 23,000 | |||||||||
| > France | |||||||||||
| SES Global | 196,700 | 250,000 | |||||||||
| > Netherlands | |||||||||||
| Aalberts Industries | 17,000 | 29,000 | |||||||||
| Boskalis Westminster | 2,700 | 7,700 | |||||||||
| Fugro | 30,000 | 55,000 | |||||||||
| > Spain | |||||||||||
| Red Electrica de Espana | 88,000 | 105,000 | |||||||||
| > Sweden | |||||||||||
| Hexagon | 48,000 | 77,000 | |||||||||
| Asia | |||||||||||
| > Japan | |||||||||||
| Ibiden | 15,900 | 33,000 | |||||||||
| JSR | 85,000 | 125,700 | |||||||||
| Park24 | 0 | 110,000 | |||||||||
| > Singapore | |||||||||||
| Singapore Exchange | 0 | 850,000 | |||||||||
| Other Countries | |||||||||||
| > Canada | |||||||||||
| Alliance Atlantis Communication | 102,000 | 114,000 | |||||||||
| RONA | 100,000 | 150,000 | |||||||||
| > South Africa | |||||||||||
| Impala Platinum Holdings | 88,800 | 151,300 | |||||||||
| (Includes the effect of an 8 for 1 spinoff) | |||||||||||
| Naspers | 0 | 145,000 | |||||||||
| > United States | |||||||||||
| Atwood Oceanics | 73,100 | 90,000 | |||||||||
| Number of Shares | |||||||||||
| 09/30/06 | 12/31/06 | ||||||||||
| Sales | |||||||||||
| Europe | |||||||||||
| > Ireland | |||||||||||
| C&C Group | 506,661 | 500,000 | |||||||||
| > Germany | |||||||||||
| Depfa Bank | 225,000 | 90,000 | |||||||||
| > Sweden | |||||||||||
| Tele2 | 255,000 | 0 | |||||||||
| > Denmark | |||||||||||
| Novozymes | 50,000 | 37,500 | |||||||||
| Asia | |||||||||||
| > Japan | |||||||||||
| Daito Trust Construction | 84,000 | 68,000 | |||||||||
| Hiroshima Bank | 199,800 | 0 | |||||||||
| Sparx Asset Management | 2,700 | 0 | |||||||||
| > Hong Kong | |||||||||||
| Hong Kong Exchanges and Clearing | 610,000 | 500,000 | |||||||||
| Other Countries | |||||||||||
| > Canada | |||||||||||
| Kinross Gold | 111,000 | 0 | |||||||||
| Potash | 35,000 | 30,000 | |||||||||
51
Columbia Acorn International Select
Statement of Investments, December 31, 2006
| Number of Shares | Value (000) | ||||||||||
| Equities: 93.0% | |||||||||||
| Europe 54.0% | |||||||||||
| Ireland 18.5% | |||||||||||
| 500,000 | C&C Group | $ | 8,874 | ||||||||
| Beverage Company | |||||||||||
| 300,000 | Bank of Ireland | 6,911 | |||||||||
| Irish Commercial Bank | |||||||||||
| 300,000 | Anglo Irish Bank | 6,220 | |||||||||
| Small Business & Middle Market Banking | |||||||||||
| 150,000 | IAWS Group | 3,841 | |||||||||
| Baked Goods | |||||||||||
| 700,000 | United Drug | 3,669 | |||||||||
| Irish Pharmaceutical Wholesaler & Outsourcer | |||||||||||
| 100,000 | Grafton Group | 1,671 | |||||||||
| Builders Materials Wholesaling & Do-it-yourself Retailing | |||||||||||
| 31,186 | |||||||||||
| Switzerland 9.6% | |||||||||||
| 47,000 | Synthes | 5,603 | |||||||||
| Products for Orthopedic Surgery | |||||||||||
| 2,400 | Geberit | 3,698 | |||||||||
| Plumbing Supplies | |||||||||||
| 42,500 | Kuehne & Nagel | 3,092 | |||||||||
| Freight Forwarding/Logistics | |||||||||||
| 10,250 | Swatch Group | 2,264 | |||||||||
| Watch & Electronics Manufacturer | |||||||||||
| 26,000 | Schindler | 1,635 | |||||||||
| Elevator Manufacturer & Service Provider | |||||||||||
| 16,292 | |||||||||||
| Germany 5.4% | |||||||||||
| 23,000 | Wincor Nixdorf | 3,578 | |||||||||
| Retail POS Systems & ATM Machines | |||||||||||
| 90,000 | Depfa Bank | 1,614 | |||||||||
| Investment Banker to Public Authorities | |||||||||||
| 1,250 | Porsche | 1,590 | |||||||||
| Specialty Automobile Manufacturer | |||||||||||
| 8,500 | Deutsche Boerse | 1,563 | |||||||||
| Trading, Clearing, Settlement Services for Financial Markets | |||||||||||
| 24,000 | Gagfah | 760 | |||||||||
| German Residential Property | |||||||||||
| 9,105 | |||||||||||
| France 5.4% | |||||||||||
| 250,000 | SES Global | 4,440 | |||||||||
| Satellite Broadcasting Services | |||||||||||
| 24,200 | Neopost | 3,039 | |||||||||
| Postage Meter Machines | |||||||||||
| 18,000 | Imerys | 1,597 | |||||||||
| Industrial Minerals Producer | |||||||||||
| 9,076 | |||||||||||
| Netherlands 4.4% | |||||||||||
| 55,000 | Fugro | 2,627 | |||||||||
| Oilfield Services | |||||||||||
| 29,000 | Aalberts Industries | 2,507 | |||||||||
| Flow Control & Heat Treatment | |||||||||||
| 34,000 | USG People | 1,477 | |||||||||
| Temporary Staffing Services | |||||||||||
| Number of Shares | Value (000) | ||||||||||
| 7,700 | Boskalis Westminster | $ | 762 | ||||||||
| Dredging And Maritime Contractor | |||||||||||
| 7,373 | |||||||||||
| United Kingdom 2.9% | |||||||||||
| 215,000 | Northern Rock | 4,945 | |||||||||
| Lowest Cost Mortgage Bank in UK | |||||||||||
| 4,945 | |||||||||||
| Spain 2.7% | |||||||||||
| 105,000 | Red Electrica de Espana | 4,496 | |||||||||
| Spanish Power Grid | |||||||||||
| 4,496 | |||||||||||
| Sweden 1.9% | |||||||||||
| 77,000 | Hexagon | 3,278 | |||||||||
| Measurement Equipment & Polymers | |||||||||||
| 3,278 | |||||||||||
| Denmark 1.9% | |||||||||||
| 37,500 | Novozymes | 3,215 | |||||||||
| Industrial Enzymes | |||||||||||
| 3,215 | |||||||||||
| Czech Republic 1.3% | |||||||||||
| 15,300 | Komercni Banka | 2,278 | |||||||||
| Leading Czech Universal Bank | |||||||||||
| 2,278 | |||||||||||
| Europe: Total | 91,244 | ||||||||||
| Asia 24.9% | |||||||||||
| Japan 19.8% | |||||||||||
| 6,000 | Jupiter Telecommunications (b) | 4,814 | |||||||||
| Largest Cable Service Provider in Japan | |||||||||||
| 80,000 | Aeon Mall | 4,485 | |||||||||
| Suburban Shopping Mall Developer, Owner & Operator | |||||||||||
| 110,000 | Hoya | 4,295 | |||||||||
| Opto-electrical Components & Eyeglass Lenses | |||||||||||
| 125,700 | JSR | 3,258 | |||||||||
| Films & Chemicals for LCD Screens & Electronics | |||||||||||
| 68,000 | Daito Trust Construction | 3,111 | |||||||||
| Apartment Builder | |||||||||||
| 655 | Kenedix | 2,963 | |||||||||
| Real Estate Investment Management | |||||||||||
| 37,000 | USS | 2,411 | |||||||||
| Used Car Auctioneer | |||||||||||
| 280,000 | Kansai Paint | 2,219 | |||||||||
| Paint Producer in Japan, India, China & Southeast Asia | |||||||||||
| 85,000 | Ushio | 1,750 | |||||||||
| Industrial Light Sources | |||||||||||
| 33,000 | Ibiden | 1,667 | |||||||||
| Electronic Parts & Ceramics | |||||||||||
| 110,000 | Park24 | 1,411 | |||||||||
| Parking Lot Operator | |||||||||||
| 36,000 | Ito En | 1,098 | |||||||||
| Bottled Tea & Other Beverages | |||||||||||
| 33,482 | |||||||||||
52
| Number of Shares | Value (000) | ||||||||||
| Hong Kong 3.2% | |||||||||||
| 500,000 | Hong Kong Exchanges and Clearing | $ | 5,462 | ||||||||
| Hong Kong Equity & Derivatives Market Operator | |||||||||||
| 5,462 | |||||||||||
| Singapore 1.9% | |||||||||||
| 850,000 | Singapore Exchange | 3,143 | |||||||||
| Singapore Equity & Derivatives Market Operator | |||||||||||
| 3,143 | |||||||||||
| Asia: Total | 42,087 | ||||||||||
| Other Countries 14.1% | |||||||||||
| Canada 7.1% | |||||||||||
| 114,000 | Alliance Atlantis Communication (b) | 4,935 | |||||||||
| CATV Channels, TV/Movie Production/ Distribution | |||||||||||
| 30,000 | Potash | 4,304 | |||||||||
| World's Largest Producer of Potash | |||||||||||
| 150,000 | RONA (b) | 2,701 | |||||||||
| Leading Canadian Do-it-yourself Retailer | |||||||||||
| 11,940 | |||||||||||
| South Africa 4.4% | |||||||||||
| 151,300 | Impala Platinum Holdings | 3,966 | |||||||||
| Platinum Group Metals Mining & Refining | |||||||||||
| 145,000 | Naspers | 3,437 | |||||||||
| Media & Education In Africa and Other Emerging Markets | |||||||||||
| 7,403 | |||||||||||
| United States 2.6% | |||||||||||
| 90,000 | Atwood Oceanics (b) | 4,407 | |||||||||
| Offshore Drilling Contractor | |||||||||||
| 4,407 | |||||||||||
| Other Countries: Total | 23,750 | ||||||||||
| Total Equities: 93.0% (Cost: $115,011) | 157,081 | ||||||||||
| Principal Amount (000) | Value (000) | ||||||||||
| Short-Term Obligation 6.4% | |||||||||||
| $ | 10,777 | Repurchase Agreement with Fixed Income Clearing Corp., dated 12/29/06, due 1/02/07 at 5.150% collateralized by Federal Home Loan Bank Bond, maturing 1/19/16, market value of $10,995 (repurchase proceeds: $10,783) | $ | 10,777 | |||||||
| (Amortized Cost: $10,777) | 10,777 | ||||||||||
| Total Investments: 99.4% (Cost: $125,788)(a)(c) | 167,858 | ||||||||||
| Cash and Other Assets Less Liabilities: 0.6% | 1,040 | ||||||||||
| Total Net Assets: 100.0% | $ | 168,898 | |||||||||
53
Columbia Acorn International Select
Statement of Investments, continued
> Notes to Statement of Investments (in thousands)
(a) At December 31, 2006, for federal income tax purposes cost of investments was $125,946 and net unrealized appreciation was $41,912, consisting of gross unrealized appreciation of $43,837 and gross unrealized depreciation of $1,925.
(b) Non-income producing security.
(c) On December 31, 2006, the Fund's total investments were denominated in currencies as follows:
| Currency | Value | % of Total Net Assets | |||||||||
| Euro | $ | 61,238 | 36.3 | % | |||||||
| Japanese Yen | 33,481 | 19.8 | |||||||||
| US Dollar | 19,489 | 11.5 | |||||||||
| Swiss Franc | 16,291 | 9.7 | |||||||||
| Other currencies less than 5% of total net assets | 37,359 | 22.1 | |||||||||
| $ | 167,858 | 99.4 | % | ||||||||
54
Columbia Acorn International Select
Portfolio Diversification
At December 31, 2006, the Fund's portfolio investments as a percent of net assets was diversified as follows:
| Value (000) | Percent | ||||||||||
| > Industrial Goods & Services | |||||||||||
| Chemicals | $ | 10,289 | 6.1 | % | |||||||
| Construction | 6,809 | 4.0 | |||||||||
| Other Industrial Services | 4,727 | 2.8 | |||||||||
| Conglomerates | 7,452 | 4.4 | |||||||||
| Machinery | 3,039 | 1.8 | |||||||||
| Electrical Components | 1,750 | 1.0 | |||||||||
| Industrial Distribution | 1,671 | 1.0 | |||||||||
| Outsourcing Services | 1,477 | 0.9 | |||||||||
| 37,214 | 22.0 | ||||||||||
| > Information | |||||||||||
| Financial Processors | 10,168 | 6.0 | |||||||||
| Television Programming | 4,935 | 2.9 | |||||||||
| Cable Television | 4,814 | 2.9 | |||||||||
| Satellite Broadcasting | 4,440 | 2.6 | |||||||||
| Semiconductors & Related Equipment | 4,295 | 2.6 | |||||||||
| Computer Hardware & Related Equipment | 3,578 | 2.1 | |||||||||
| Television Broadcasting | 3,437 | 2.0 | |||||||||
| 35,667 | 21.1 | ||||||||||
| > Consumer Goods & Services | |||||||||||
| Food | 13,813 | 8.2 | |||||||||
| Retail | 7,186 | 4.3 | |||||||||
| Durables Goods | 3,854 | 2.3 | |||||||||
| Consumer Goods Distribution | 2,411 | 1.4 | |||||||||
| Consumer Services | 1,411 | 0.8 | |||||||||
| 28,675 | 17.0 | ||||||||||
| Value (000) | Percent | ||||||||||
| > Finance | |||||||||||
| Banks | $ | 21,968 | 13.0 | ||||||||
| 21,968 | 13.0 | ||||||||||
| > Energy & Minerals | |||||||||||
| Mining | 8,270 | 4.9 | |||||||||
| Oil/Gas Producers | 7,796 | 4.6 | |||||||||
| 16,066 | 9.5 | ||||||||||
| > Health Care | |||||||||||
| Medical Equipment | 5,603 | 3.3 | |||||||||
| Pharmaceuticals | 3,669 | 2.2 | |||||||||
| 9,272 | 5.5 | ||||||||||
| > Other Industries | |||||||||||
| Regulated Utilities | 4,496 | 2.7 | |||||||||
| Real Estate | 3,723 | 2.2 | |||||||||
| 8,219 | 4.9 | ||||||||||
| Total Equities: | 157,081 | 93.0 | % | ||||||||
| Short-Term Obligations: | 10,777 | 6.4 | |||||||||
| Total Investments: | 167,858 | 99.4 | |||||||||
| Cash and Other Assets Less Liabilities: | 1,040 | 0.6 | |||||||||
| Net Assets: | $ | 168,898 | 100.0 | % | |||||||
55
Columbia Acorn Select
Major Portfolio Changes in the Fourth Quarter (Unaudited)
| Number of Shares | |||||||||||
| 09/30/06 | 12/31/06 | ||||||||||
| Additions | |||||||||||
| Consumer Goods & Services | |||||||||||
| Abercrombie & Fitch | 1,370,000 | 1,400,000 | |||||||||
| Coach | 1,506,000 | 1,550,000 | |||||||||
| Costco Wholesale | 845,000 | 850,000 | |||||||||
| Expedia | 3,500,000 | 3,925,000 | |||||||||
| Hertz | 0 | 1,750,000 | |||||||||
| International Speedway | 740,000 | 750,000 | |||||||||
| Safeway | 3,445,000 | 3,550,000 | |||||||||
| Universal Technical Institute | 1,344,400 | 1,350,000 | |||||||||
| Information | |||||||||||
| Avid Technology | 2,075,000 | 2,200,000 | |||||||||
| Canadian Solar | 0 | 550,000 | |||||||||
| Globalstar | 0 | 1,600,000 | |||||||||
| Liberty Global Series C | 2,947,406 | 2,950,000 | |||||||||
| Novell | 5,500,000 | 6,300,000 | |||||||||
| Sanmina - SCI | 7,500,000 | 10,330,000 | |||||||||
| Tellabs | 10,800,000 | 11,100,000 | |||||||||
| Energy & Minerals | |||||||||||
| Atwood Oceanics | 0 | 100,000 | |||||||||
| Finance | |||||||||||
| Conseco | 1,800,000 | 2,000,000 | |||||||||
| Janus Capital Group | 3,400,000 | 3,450,000 | |||||||||
| Montpelier Re | 0 | 500,000 | |||||||||
| SEI Investments | 729,500 | 750,000 | |||||||||
| Industrial Goods & Services | |||||||||||
| Expeditors International of Washington | 1,322,000 | 1,325,000 | |||||||||
| Number of Shares | |||||||||||
| 09/30/06 | 12/31/06 | ||||||||||
| Sales | |||||||||||
| Consumer Goods & Services | |||||||||||
| Career Education | 200,000 | 0 | |||||||||
| Harley-Davidson | 1,100,000 | 750,000 | |||||||||
| ITT Educational Services | 1,625,000 | 1,475,000 | |||||||||
| PETCO Animal Supplies | 1,350,000 | 0 | |||||||||
| Information | |||||||||||
| Liberty Global Series A | 1,045,200 | 800,000 | |||||||||
| Energy & Minerals | |||||||||||
| Pride International | 2,000,000 | 1,300,000 | |||||||||
| UrAsia Energy (Canada) | 31,700,000 | 30,500,000 | |||||||||
| Industrial Goods & Services | |||||||||||
| Mine Safety Appliances | 309,300 | 0 | |||||||||
56
Columbia Acorn Select
Statement of Investments, December 31, 2006
| Number of Shares | Value (000) | ||||||||||
| Equities: 93.6% | |||||||||||
| Consumer Goods & Services 31.3% | |||||||||||
| Retail 11.8% | |||||||||||
| 3,550,000 | Safeway | $ | 122,688 | ||||||||
| Supermarkets | |||||||||||
| 1,400,000 | Abercrombie & Fitch | 97,482 | |||||||||
| Teen Apparel Retailer | |||||||||||
| 850,000 | Costco Wholesale | 44,940 | |||||||||
| Warehouse Superstores | |||||||||||
| 265,110 | |||||||||||
| Other Consumer Services 7.4% | |||||||||||
| 1,475,000 | ITT Educational Services (b) | 97,896 | |||||||||
| Post-secondary Degree Services | |||||||||||
| 728,000 | Weight Watchers International | 38,242 | |||||||||
| Weight Loss Programs | |||||||||||
| 1,350,000 | Universal Technical Institute (b) | 29,983 | |||||||||
| Vocational Training | |||||||||||
| 166,121 | |||||||||||
| Travel 5.0% | |||||||||||
| 3,925,000 | Expedia (b) | 82,346 | |||||||||
| Online Travel Services Company | |||||||||||
| 1,750,000 | Hertz (b) | 30,433 | |||||||||
| Largest U.S. Rental Car Operator | |||||||||||
| 112,779 | |||||||||||
| Leisure Products 4.1% | |||||||||||
| 750,000 | Harley-Davidson | 52,852 | |||||||||
| Motorcycles & Related Merchandise | |||||||||||
| 750,000 | International Speedway | 38,280 | |||||||||
| Largest Motorsports Racetrack Owner & Operator | |||||||||||
| 91,132 | |||||||||||
| Apparel 3.0% | |||||||||||
| 1,550,000 | Coach (b) | 66,588 | |||||||||
| Designer & Retailer of Branded Leather Accessories | |||||||||||
| 66,588 | |||||||||||
| Consumer Goods & Services: Total | 701,730 | ||||||||||
| Information 26.6% | |||||||||||
| CATV 6.5% | |||||||||||
| 2,950,000 | Liberty Global Series C (b) | 82,600 | |||||||||
| Cable TV Franchises Outside the USA | |||||||||||
| 2,500,000 | Discovery Holding (b) | 40,225 | |||||||||
| CATV Programming | |||||||||||
| 800,000 | Liberty Global Series A (b) | 23,320 | |||||||||
| Cable TV Franchises Outside the USA | |||||||||||
| 146,145 | |||||||||||
| Business Software 5.4% | |||||||||||
| 2,200,000 | Avid Technology (b)(c) | 81,972 | |||||||||
| Digital Nonlinear Editing Software & Systems | |||||||||||
| 6,300,000 | Novell (b) | 39,060 | |||||||||
| Directory, Operating System & Identity Management Software | |||||||||||
| 121,032 | |||||||||||
| Number of Shares | Value (000) | ||||||||||
| Telecommunications Equipment 5.1% | |||||||||||
| 11,100,000 | Tellabs (b) | $ | 113,886 | ||||||||
| Telecommunications Equipment | |||||||||||
| 113,886 | |||||||||||
| Mobile Communications 4.8% | |||||||||||
| 2,300,000 | American Tower (b) | 85,744 | |||||||||
| Communications Towers in USA & Mexico | |||||||||||
| 1,600,000 | Globalstar (b) | 22,256 | |||||||||
| Satellite Mobile Voice & Data Carrier | |||||||||||
| 108,000 | |||||||||||
| Internet Related 2.7% | |||||||||||
| 9,600,000 | SkillSoft Publishing (b)(c) | 59,616 | |||||||||
| Web-based Learning Solutions (E-Learning) | |||||||||||
| 59,616 | |||||||||||
| Contract Manufacturing 1.6% | |||||||||||
| 10,330,000 | Sanmina-SCI (b) | 35,639 | |||||||||
| Electronic Manufacturing Services (EMS) | |||||||||||
| 35,639 | |||||||||||
| Semiconductors & Related Equipment 0.3% | |||||||||||
| 550,000 | Canadian Solar (b) | 5,764 | |||||||||
| Solar Cell & Module Manufacturer | |||||||||||
| 5,764 | |||||||||||
| Computer Services 0.2% | |||||||||||
| 1,367,000 | AnswerThink Consulting (b) | 4,210 | |||||||||
| IT Integration & Best Practice Research | |||||||||||
| 4,210 | |||||||||||
| Information: Total | 594,292 | ||||||||||
| Energy & Minerals 12.9% | |||||||||||
| Mining 9.3% | |||||||||||
| 30,050,000 | UrAsia Energy (Canada) (b)(c)(d) | 138,377 | |||||||||
| Uranium Mining in Kazakhstan | |||||||||||
| 480,000 | Potash (Canada) | 68,870 | |||||||||
| World's Largest Producer of Potash | |||||||||||
| 207,247 | |||||||||||
| Oil Services 3.6% | |||||||||||
| 1,300,000 | Pride International (b) | 39,013 | |||||||||
| Offshore Drilling Contractor | |||||||||||
| 600,000 | FMC Technologies (b) | 36,978 | |||||||||
| Oil & Gas Well Head Manufacturer | |||||||||||
| 100,000 | Atwood Oceanics (b) | 4,897 | |||||||||
| Offshore Drilling Contractor | |||||||||||
| 80,888 | |||||||||||
| Energy & Minerals: Total | 288,135 | ||||||||||
| Finance 12.2% | |||||||||||
| Brokerage & Money Management 7.6% | |||||||||||
| 3,450,000 | Janus Capital Group | 74,486 | |||||||||
| Manages Mutual Funds | |||||||||||
| 975,000 | Nuveen Investments | 50,583 | |||||||||
| Money Management | |||||||||||
57
Columbia Acorn Select
Statement of Investments, continued
| Number of Shares | Value (000) | ||||||||||
| Brokerage & Money Management—continued | |||||||||||
| 750,000 | SEI Investments | $ | 44,670 | ||||||||
| Mutual Fund Administration & Investment Management | |||||||||||
| 169,739 | |||||||||||
| Insurance 4.6% | |||||||||||
| 112,000 | Markel (b) | 53,771 | |||||||||
| Specialty Insurance | |||||||||||
| 2,000,000 | Conseco (b) | 39,960 | |||||||||
| Life, Long-Term Care & Medical Supplement Insurance | |||||||||||
| 500,000 | Montpelier Re | 9,305 | |||||||||
| Commercial Lines Insurance/Reinsurance | |||||||||||
| 103,036 | |||||||||||
| Finance: Total | 272,775 | ||||||||||
| Industrial Goods & Services 9.0% | |||||||||||
| Outsourcing Services 2.7% | |||||||||||
| 3,030,000 | Quanta Services (b) | 59,600 | |||||||||
| Electrical & Telecom Construction Services | |||||||||||
| 59,600 | |||||||||||
| Other Industrial Services 2.4% | |||||||||||
| 1,325,000 | Expeditors International of Washington | 53,663 | |||||||||
| International Freight Forwarder | |||||||||||
| 53,663 | |||||||||||
| Waste Management 2.1% | |||||||||||
| 1,300,000 | Waste Management | 47,801 | |||||||||
| U.S. Garbage Collection & Disposal | |||||||||||
| 47,801 | |||||||||||
| Steel 1.8% | |||||||||||
| 2,250,000 | Worthington Industries | 39,870 | |||||||||
| Steel Processing | |||||||||||
| 39,870 | |||||||||||
| Industrial Goods & Services: Total | 200,934 | ||||||||||
| Health Care 1.6% | |||||||||||
| Health Care Services 1.6% | |||||||||||
| 910,000 | Lincare Holdings (b) | 36,254 | |||||||||
| Home Health Care Services | |||||||||||
| 36,254 | |||||||||||
| Health Care: Total | 36,254 | ||||||||||
| Total Equities: 93.6% (Cost: $1,421,211) | 2,094,120 | ||||||||||
| Principal Amount (000) | Value (000) | ||||||||||
| Short-Term Obligations: 6.4% | |||||||||||
| $ | 11,200 | Erste Finance (e) 5.30% Due 01/18/07 | $ | 11,172 | |||||||
| 11,200 | American General Finance 5.25% Due 01/19/07 | 11,171 | |||||||||
| 11,000 | Manhattan Asset (e) 5.33% Due 01/09/07 | 10,987 | |||||||||
| 11,000 | Morrigan TRR (e) 5.35% Due 01/10/07 | 10,985 | |||||||||
| 11,000 | Keel Capital (e) 5.30% Due 01/11/07 | 10,984 | |||||||||
| 11,000 | Advantage Asset (e) 5.33% Due 01/16/07 | 10,976 | |||||||||
| 11,000 | TSL USA (e) 5.33% Due 01/17/07 | 10,974 | |||||||||
| 10,900 | Bavaria TRR (e) 5.30% Due 01/04/07 | 10,895 | |||||||||
| 10,900 | Regency Markets (e) 5.33% Due 01/05/07 | 10,893 | |||||||||
| 10,900 | Deutsche Zentral 5.36% Due 01/08/07 | 10,889 | |||||||||
| 10,800 | Gotham Funding (e) 5.29% Due 01/02/07 | 10,798 | |||||||||
| 10,800 | Greyhawk Funding (e) 5.25% Due 01/03/07 | 10,797 | |||||||||
| 8,000 | MICA Funding (e) 5.33% Due 01/12/07 | 7,987 | |||||||||
| 5,145 | Repurchase Agreement with Fixed Income Clearing Corp., dated 12/29/06, due 1/02/07 at 5.150% collateralized by Federal Home Loan Bank Bond, maturing 1/19/16, market value of $5,251 (repurchase proceeds: $5,148) | 5,145 | |||||||||
| (Amortized Cost: $144,653) | 144,653 | ||||||||||
| Total Investments: 100.0% (Cost: $1,565,864)(a) | 2,238,773 | ||||||||||
| Cash and Other Assets Less Liabilities: 0.0% | (1,062 | ) | |||||||||
| Total Net Assets: 100.0% | $ | 2,237,711 | |||||||||
58
Columbia Acorn Select
Statement of Investments, continued
> Notes to Statement of Investments (in thousands)
(a) At December 31, 2006, for federal income tax purposes cost of investments was $1,575,919 and net unrealized appreciation was $662,854, consisting of gross unrealized appreciation of $690,108 and gross unrealized depreciation of $27,254.
(b) Non-income producing security.
(c) An affiliate may include any company in which the Fund owns five percent or more of its outstanding voting securities. On December 31, 2006, the Fund held five percent or more of the outstanding voting securities of the following companies:
| SkillSoft Publishing | 8.81 | % | |||||
| UrAsia Energy | 6.25 | ||||||
| Avid Technology | 5.36 | ||||||
The aggregate cost and value of these investments at December 31, 2006 were $197,430 and $279,965, respectively. Investments in affiliates represented 12.51% of total net assets at December 31, 2006. Investment activity and income amounts relating to affiliates during the twelve months ended December 31, 2006 were as follows:
| Dividend Income | $ | - | |||||
| Net realized gain or loss | 4,499 | ||||||
| Change in unrealized gain or loss | 66,554 | ||||||
| Purchases | 55,453 | ||||||
| Proceeds from sales | 7,975 | ||||||
(d) Denotes a restricted security, which is subject to restrictions on resale under federal securities laws. At December 31, 2006, this security had a value of $126,663, which represented 5.66% of total net assets.
Additional information on these securities is as follows:
| Security | Acquisition Dates | Shares | Cost | Value | |||||||||||||||
| UrAsia Energy | 10/26/05, 2/01/06 | 27,506 | $ | 42,721 | $ | 126,663 | |||||||||||||
(e) Security exempt from registration under Section 4(2) of the Securities Act of 1933. These securities may only be resold in exempt transactions to qualified buyers. Private resales of these securities to qualified institutional buyers are also exempt from registration pursuant to Rule 144A under the Securities Act of 1933. At December 31, 2006, these securities had an aggregate value of to $117,448, which represented 5.3% of net assets.
59
Columbia Thermostat Fund
Statement of Investments, December 31, 2006
| Number of Shares or Principal Amount (000) | Value (000) | ||||||||||
| > Bond Funds: 59.8% | |||||||||||
| 6,366,247 | Columbia Intermediate Bond Fund, Class Z | $ | 56,278 | ||||||||
| 3,238,571 | Columbia Federal Securities Fund, Class Z | 33,714 | |||||||||
| 2,686,301 | Columbia Conservative High Yield Fund, Class Z | 22,672 | |||||||||
| Total Bond Funds (Cost: $112,552) | 112,664 | ||||||||||
| > Stock Funds: 40.1% | |||||||||||
| 1,280,164 | Columbia Large Cap Enhanced Core Fund, Class Z | 18,831 | |||||||||
| 1,066,505 | Columbia Dividend Income Fund, Class Z | 15,091 | |||||||||
| 284,306 | Columbia Acorn International, Class Z | 11,460 | |||||||||
| 558,135 | Columbia Marsico Growth Fund, Class Z | 11,414 | |||||||||
| 381,117 | Columbia Acorn Fund, Class Z | 11,323 | |||||||||
| 284,501 | Columbia Acorn Select, Class Z | 7,565 | |||||||||
| Total Stock Funds (Cost: $67,936) | 75,684 | ||||||||||
| Short-Term Obligation: 0.4% | |||||||||||
| $ | 721 | Repurchase Agreement with Fixed Income Clearing Corp., dated 12/29/06, due 1/02/07 at 5.150%, collateralized by Federal Home Loan Bank Bond, maturing 1/19/16 market value of $739 (repurchase proceeds: $721) | 721 | ||||||||
| (Cost: $721) | 721 | ||||||||||
| Total Investments: 100.3% (Cost: $181,209)(a) | 189,069 | ||||||||||
| Cash and Other Assets Less Liabilities: (0.3)% | (540 | ) | |||||||||
| Total Net Assets: 100% | $ | 188,529 | |||||||||
> Notes to Statements of Investments (in thousands)
(a) At December 31, 2006, for federal income tax purposes cost of investments was $182,015 and net unrealized appreciation was $7,054, consisting of gross unrealized appreciation of $7,428 and gross unrealized depreciation of $374.
60
Columbia Acorn Family of Funds
> Statements of Assets and Liabilities
> Statements of Operations
> Statements of Changes in Net Assets
> Financial Highlights
> Notes to Financial Statements
61
Columbia Acorn Family of Funds
Statements of Assets and Liabilities
| December 31, 2006 | Columbia Acorn Fund | Columbia Acorn International | Columbia Acorn USA | Columbia Acorn International Select | Columbia Acorn Select | Columbia Thermostat Fund | |||||||||||||||||||||
| (in thousands) | |||||||||||||||||||||||||||
| Assets: | |||||||||||||||||||||||||||
| Unaffiliated investments, at cost | $ | 9,722,973 | $ | 2,675,983 | $ | 1,153,022 | $ | 125,788 | $ | 1,368,434 | $ | 721 | |||||||||||||||
| Affiliated investments, at cost (See Note 4) | 2,146,491 | 27,956 | 5,636 | — | 197,430 | 180,488 | |||||||||||||||||||||
| Unaffiliated investments, at value | $ | 15,529,925 | $ | 4,300,291 | $ | 1,574,506 | $ | 167,858 | $ | 1,958,808 | $ | 721 | |||||||||||||||
| Affiliated investments, at value (See Note 4) | 3,477,317 | 24,179 | 4,708 | — | 279,965 | 188,348 | |||||||||||||||||||||
| Cash | — | 1 | 1 | — | * | — | * | 1 | |||||||||||||||||||
| Foreign currency (cost: Columbia Acorn Fund $2,120; Columbia Acorn International $14,138; Columbia Acorn International Select $24; Columbia Acorn Select $*) | 2,126 | 14,156 | — | 24 | — | * | — | ||||||||||||||||||||
| Receivable for: | |||||||||||||||||||||||||||
| Investments sold | 12,384 | 2,542 | 496 | 499 | 4,446 | — | |||||||||||||||||||||
| Fund shares sold | 29,985 | 8,340 | 4,756 | 616 | 2,885 | 72 | |||||||||||||||||||||
| Dividends and interest | 9,187 | 2,822 | 612 | 193 | 462 | — | * | ||||||||||||||||||||
| Foreign tax reclaims | 503 | 532 | 2 | 36 | — | — | |||||||||||||||||||||
| Deferred Trustees' Compensation Investments | 2,081 | 574 | 148 | — | — | — | |||||||||||||||||||||
| Expense Reimbursement due from Investment Adviser | — | — | — | — | * | — | 38 | ||||||||||||||||||||
| Other assets | — | 2 | — | — | — | — | |||||||||||||||||||||
| Total Assets | 19,063,508 | 4,353,439 | 1,585,229 | 169,226 | 2,246,566 | 189,180 | |||||||||||||||||||||
| Liabilities: | |||||||||||||||||||||||||||
| Payable for: | |||||||||||||||||||||||||||
| Investments purchased | 50,830 | 2,952 | 2,636 | — | 3,690 | — | |||||||||||||||||||||
| Fund shares redeemed | 48,489 | 2,665 | 585 | 82 | 2,448 | 420 | |||||||||||||||||||||
| Management fee | 10,276 | 2,742 | 1,159 | 129 | 1,509 | 16 | |||||||||||||||||||||
| Administration fee | 657 | 146 | 55 | 7 | 76 | 7 | |||||||||||||||||||||
| 12b-1 Service & Distribution fees | 2,896 | 201 | 141 | 16 | 476 | 82 | |||||||||||||||||||||
| Reports to shareholders | 1,403 | 363 | 128 | 49 | 320 | 74 | |||||||||||||||||||||
| Deferred Trustees' fees | 2,081 | 574 | 148 | 12 | 47 | 6 | |||||||||||||||||||||
| Transfer agent fees | 1,431 | 202 | 112 | 9 | 247 | 37 | |||||||||||||||||||||
| Trustees' fees | 18 | 4 | 1 | — | * | 2 | — | * | |||||||||||||||||||
| Audit fee | 38 | 37 | 17 | 17 | 17 | 6 | |||||||||||||||||||||
| Custody fees | 101 | 122 | 3 | 3 | 4 | — | |||||||||||||||||||||
| Other liabilities | 162 | 36 | 16 | 4 | 19 | 3 | |||||||||||||||||||||
| Total Liabilities | 118,382 | 10,044 | 5,001 | 328 | 8,855 | 651 | |||||||||||||||||||||
| Net Assets | $ | 18,945,126 | $ | 4,343,395 | $ | 1,580,228 | $ | 168,898 | $ | 2,237,711 | $ | 188,529 | |||||||||||||||
| Composition of Net Assets: | |||||||||||||||||||||||||||
| Paid in capital | $ | 11,584,527 | $ | 2,715,853 | $ | 1,146,476 | $ | 134,764 | $ | 1,555,934 | $ | 177,137 | |||||||||||||||
| Undistributed (overdistributed) net investment income (Accumulated net investment loss) | (27,265 | ) | (20,256 | ) | (174 | ) | 676 | (9,971 | ) | 249 | |||||||||||||||||
| Accumulated net realized gain (loss) | 250,064 | 27,216 | 13,370 | (8,615 | ) | 18,908 | 3,283 | ||||||||||||||||||||
| Net unrealized appreciation (depreciation) on: | |||||||||||||||||||||||||||
| Investments | 7,137,778 | 1,620,531 | 420,556 | 42,070 | 672,909 | 7,860 | |||||||||||||||||||||
| Foreign currency translations | 22 | 51 | — | 3 | (69 | ) | — | ||||||||||||||||||||
| Net Assets | $ | 18,945,126 | $ | 4,343,395 | $ | 1,580,228 | $ | 168,898 | $ | 2,237,711 | $ | 188,529 | |||||||||||||||
| Net asset value per share – Class A (a) | $ | 29.02 | $ | 40.07 | $ | 28.02 | $ | 27.68 | $ | 26.18 | $ | 12.59 | |||||||||||||||
| (Net assets/shares) | ($4,067,868/140,156) | ($313,401/7,822) | ($245,552/8,763) | ($22,599/817) | ($940,857/35,933) | ($58,013/4,609) | |||||||||||||||||||||
| Maximum offering price per share – Class A (b) | $ | 30.79 | $ | 42.51 | $ | 29.73 | $ | 29.37 | $ | 27.78 | $ | 13.36 | |||||||||||||||
| (Net asset value per share/front- end sales charge) | ($29.02/0.9425) | ($40.07/0.9425) | ($28.02/0.9425) | ($27.68/0.9425) | ($26.18/0.9425) | ($12.59/0.9425) | |||||||||||||||||||||
| Net asset value and offering price per share – Class B (a) | $ | 27.78 | $ | 39.39 | $ | 26.87 | $ | 26.73 | $ | 25.13 | $ | 12.62 | |||||||||||||||
| (Net assets/shares) | ($1,404,165/50,544) | ($94,165/2,390) | ($65,040/2,421) | ($9,787/366) | ($214,260/8,528) | ($72,367/5,733) | |||||||||||||||||||||
| Net asset value and offering price per share – Class C (a) | $ | 27.70 | $ | 39.35 | $ | 26.81 | $ | 26.70 | $ | 25.07 | $ | 12.62 | |||||||||||||||
| (Net assets/shares) | ($1,345,520/48,571) | ($99,425/2,527) | ($55,306/2,063) | ($7,060/264) | ($173,152/6,907) | ($27,375/2,169) | |||||||||||||||||||||
| Net asset value and offering price per share – Class Z (c) | $ | 29.71 | $ | 40.31 | $ | 28.66 | $ | 27.97 | $ | 26.59 | $ | 12.57 | |||||||||||||||
| (Net assets/shares) | ($12,127,573/408,153) | ($3,836,404/95,163) | ($1,214,330/42,372) | ($129,452/4,628) | ($909,442/34,206) | ($30,774/2,448) | |||||||||||||||||||||
(a) Redemption price per share is equal to net asset value less any applicable contingent deferred sales charge and redemption fee.
(b) On sales of $50,000 or more the offering price is reduced.
(c) Redemption price per share is equal to net asset value less any applicable redemption fee.
* Rounds to less than $500.
See accompanying notes to financial statements.
62
Columbia Acorn Family of Funds
Statements of Operations
For the Year Ended December 31, 2006
| (in thousands) | Columbia Acorn Fund | Columbia Acorn International | Columbia Acorn USA | Columbia Acorn International Select | Columbia Acorn Select | Columbia Thermostat Fund | |||||||||||||||||||||
| Investment Income: | |||||||||||||||||||||||||||
| Dividend income | $ | 129,894 | $ | 65,418 | $ | 6,312 | $ | 1,927 | $ | 9,793 | $ | — | |||||||||||||||
| Dividend income from affiliates (See Note 4) | 21,531 | 418 | — | — | — | — | |||||||||||||||||||||
| Dividends from affiliated investment company shares (See Note 4) | — | — | — | — | — | 7,846 | |||||||||||||||||||||
| Interest income | 58,437 | 7,480 | 6,696 | 330 | 3,955 | 39 | |||||||||||||||||||||
| 209,862 | 73,316 | 13,008 | 2,257 | 13,748 | 7,885 | ||||||||||||||||||||||
| Foreign taxes withheld | (4,052 | ) | (5,392 | ) | (7 | ) | (133 | ) | (38 | ) | — | ||||||||||||||||
| Total Investment Income | 205,810 | 67,924 | 13,001 | 2,124 | 13,710 | 7,885 | |||||||||||||||||||||
| Expenses: | |||||||||||||||||||||||||||
| Management fee | 115,422 | 28,296 | 12,636 | 1,172 | 16,054 | 195 | |||||||||||||||||||||
| Administration fee | 7,240 | 1,468 | 587 | 51 | 789 | 78 | |||||||||||||||||||||
| 12b-1 Service and Distribution fees: | |||||||||||||||||||||||||||
| Class A | 9,543 | 553 | 540 | 37 | 2,029 | 162 | |||||||||||||||||||||
| Class B | 11,509 | 682 | 561 | 65 | 1,674 | 606 | |||||||||||||||||||||
| Class C | 13,058 | 762 | 503 | 52 | 1,579 | 276 | |||||||||||||||||||||
| Transfer agent fees: | |||||||||||||||||||||||||||
| Class A | 2,437 | 203 | 139 | 19 | 774 | 115 | |||||||||||||||||||||
| Class B | 2,149 | 165 | 121 | 22 | 433 | 157 | |||||||||||||||||||||
| Class C | 1,235 | 87 | 56 | 9 | 231 | 56 | |||||||||||||||||||||
| Class Z | 3,353 | 1,218 | 350 | 59 | 523 | 29 | |||||||||||||||||||||
| Custody fees | 1,582 | 1,769 | 49 | 48 | 73 | — | * | ||||||||||||||||||||
| Trustees' fees | 756 | 152 | 62 | 3 | 36 | 3 | |||||||||||||||||||||
| Registration & blue sky fees | 380 | 311 | 152 | 83 | 153 | 64 | |||||||||||||||||||||
| Reports to shareholders | 3,228 | 791 | 378 | 91 | 721 | 147 | |||||||||||||||||||||
| Chief compliance officer expenses (See Note 4) | 387 | 74 | 29 | 2 | 41 | 4 | |||||||||||||||||||||
| Non-recurring costs (See Note 9) | 124 | 25 | 10 | 1 | 13 | 1 | |||||||||||||||||||||
| Other expenses | 1,059 | 298 | 137 | 70 | 158 | 41 | |||||||||||||||||||||
| Total expenses | 173,462 | 36,854 | 16,310 | 1,784 | 25,281 | 1,934 | |||||||||||||||||||||
| Less custody fees paid indirectly | (171 | ) | (11 | ) | (20 | ) | (1 | ) | (22 | ) | — | * | |||||||||||||||
| Less reimbursement of expenses by Investment Adviser | — | — | — | (1 | ) | — | (312 | ) | |||||||||||||||||||
| Less reimbursement of expenses by Transfer Agent: | |||||||||||||||||||||||||||
| Class A | (605 | ) | (24 | ) | (27 | ) | (3 | ) | (219 | ) | (32 | ) | |||||||||||||||
| Class B | (262 | ) | (13 | ) | (12 | ) | (2 | ) | (63 | ) | (37 | ) | |||||||||||||||
| Class C | (208 | ) | (10 | ) | (7 | ) | (1 | ) | (44 | ) | (14 | ) | |||||||||||||||
| Class Z | (1,472 | ) | (233 | ) | (123 | ) | (12 | ) | (178 | ) | (11 | ) | |||||||||||||||
| Non-recurring costs reimbursed (See Note 9) | (124 | ) | (25 | ) | (10 | ) | (1 | ) | (13 | ) | (1 | ) | |||||||||||||||
| Net Expenses | 170,620 | 36,538 | 16,111 | 1,763 | 24,742 | 1,527 | |||||||||||||||||||||
| Net Investment Income (Loss) | 35,190 | 31,386 | (3,110 | ) | 361 | (11,032 | ) | 6,358 | |||||||||||||||||||
| Net Realized and Unrealized Gain (Loss) on Portfolio Positions: | |||||||||||||||||||||||||||
| Net realized gain (loss) on: | |||||||||||||||||||||||||||
| Unaffiliated investments | 1,585,848 | 392,034 | 46,861 | 18,123 | 67,292 | — | |||||||||||||||||||||
| Affiliated investments (See Note 4) | 25,113 | — | — | — | 4,499 | 9,014 | |||||||||||||||||||||
| Foreign currency transactions | 1,005 | 82 | — | (13 | ) | 12 | — | ||||||||||||||||||||
| Distributions from affiliated investment company shares | — | — | — | — | — | 2,655 | |||||||||||||||||||||
| Net realized loss on disposal of investments purchased in error (prorated) (See Note 8) | — | — | — | — | * | — | — | ||||||||||||||||||||
| Net realized gain | 1,611,966 | 392,116 | 46,861 | 18,110 | 71,803 | 11,669 | |||||||||||||||||||||
| Net change in net unrealized appreciation (depreciation) on: | |||||||||||||||||||||||||||
| Unaffiliated investments | 945,432 | 649,567 | 63,661 | 20,766 | 221,390 | — | |||||||||||||||||||||
| Affiliated investments (See Note 4) | (233,206 | ) | (3,777 | ) | 699 | — | 66,554 | 836 | |||||||||||||||||||
| Foreign currency translations | (8 | ) | (92 | ) | — | 4 | (69 | ) | — | ||||||||||||||||||
| Foreign capital gains tax | — | 3 | — | — | — | — | |||||||||||||||||||||
| Net change in unrealized appreciation (depreciation) | 712,218 | 645,701 | 64,360 | 20,770 | 287,875 | 836 | |||||||||||||||||||||
| Net realized and unrealized gain | 2,324,184 | 1,037,817 | 111,221 | 38,880 | 359,678 | 12,505 | |||||||||||||||||||||
| Net Increase in Net Assets resulting from Operations | $ | 2,359,374 | $ | 1,069,203 | $ | 108,111 | $ | 39,241 | $ | 348,646 | $ | 18,863 | |||||||||||||||
* Rounds to less than $500.
See accompanying notes to financial statements.
63
Columbia Acorn Family of Funds
Statements of Changes in Net Assets
| Columbia Acorn Fund | Columbia Acorn International | Columbia Acorn USA | |||||||||||||||||||||||||
| Increase (Decrease) in Net Assets | Year ended December 31, | Year ended December 31, | Year ended December 31, | ||||||||||||||||||||||||
| (in thousands) | 2006 | 2005 | 2006 | 2005 | 2006 | 2005 | |||||||||||||||||||||
| Operations: | |||||||||||||||||||||||||||
| Net investment income (loss) | $ | 35,190 | $ | 49,723 | $ | 31,386 | $ | 24,670 | $ | (3,110 | ) | $ | 1,300 | ||||||||||||||
| Net realized gain on investments and foreign currency transactions | 1,611,966 | 890,559 | 392,116 | 203,167 | 46,861 | 49,825 | |||||||||||||||||||||
| Net realized gain on affiliated investments and distributions from affiliated investment company shares | — | — | — | — | — | — | |||||||||||||||||||||
| Net change in net unrealized appreciation (depreciation) on investments and foreign currency translations | 712,218 | 898,946 | 645,701 | 258,860 | 64,360 | 75,612 | |||||||||||||||||||||
| Net change in net unrealized appreciation (depreciation) on affiliated investments | — | — | — | — | — | — | |||||||||||||||||||||
| Net Increase from Operations | 2,359,374 | 1,839,228 | 1,069,203 | 486,697 | 108,111 | 126,737 | |||||||||||||||||||||
| Distribution to Shareholders From: | |||||||||||||||||||||||||||
| Net investment income – Class A | (5,394 | ) | (8,157 | ) | (2,223 | ) | (1,772 | ) | — | — | |||||||||||||||||
| Net realized gain – Class A | (313,513 | ) | (177,617 | ) | (26,545 | ) | (4,275 | ) | (5,181 | ) | (7,747 | ) | |||||||||||||||
| Net investment income – Class B | — | — | (141 | ) | (280 | ) | — | — | |||||||||||||||||||
| Net realized gain – Class B | (114,707 | ) | (81,483 | ) | (8,646 | ) | (2,334 | ) | (1,487 | ) | (3,824 | ) | |||||||||||||||
| Net investment income – Class C | — | — | (63 | ) | (171 | ) | — | — | |||||||||||||||||||
| Net realized gain – Class C | (109,093 | ) | (68,235 | ) | (8,998 | ) | (1,462 | ) | (1,223 | ) | (2,282 | ) | |||||||||||||||
| Net investment income – Class Z | (48,532 | ) | (52,311 | ) | (44,617 | ) | (51,974 | ) | — | (1,613 | ) | ||||||||||||||||
| Net realized gain – Class Z | (916,129 | ) | (547,733 | ) | (342,510 | ) | (81,064 | ) | (25,202 | ) | (43,227 | ) | |||||||||||||||
| Total Distribution to Shareholders | (1,507,368 | ) | (935,536 | ) | (433,743 | ) | (143,332 | ) | (33,093 | ) | (58,693 | ) | |||||||||||||||
| Share Transactions: | |||||||||||||||||||||||||||
| Subscriptions – Class A | 1,078,213 | 912,797 | 176,101 | 66,630 | 113,090 | 66,241 | |||||||||||||||||||||
| Distributions reinvested – Class A | 288,002 | 167,704 | 25,843 | 4,900 | 4,383 | 6,880 | |||||||||||||||||||||
| Redemptions – Class A | (822,590 | ) | (579,536 | ) | (63,857 | ) | (14,669 | ) | (51,382 | ) | (25,265 | ) | |||||||||||||||
| Net Increase (Decrease) – Class A | 543,625 | 500,965 | 138,087 | 56,861 | 66,091 | 47,856 | |||||||||||||||||||||
| Subscriptions – Class B | 25,556 | 49,025 | 17,920 | 17,173 | 1,247 | 4,001 | |||||||||||||||||||||
| Distributions reinvested – Class B | 104,566 | 74,120 | 8,016 | 2,310 | 1,351 | 3,491 | |||||||||||||||||||||
| Redemptions – Class B | (212,371 | ) | (174,945 | ) | (20,296 | ) | (10,198 | ) | (14,036 | ) | (11,124 | ) | |||||||||||||||
| Net Increase (Decrease) – Class B | (82,249 | ) | (51,800 | ) | 5,640 | 9,285 | (11,438 | ) | (3,632 | ) | |||||||||||||||||
| Subscriptions – Class C | 166,508 | 171,533 | 50,734 | 15,891 | 17,895 | 8,047 | |||||||||||||||||||||
| Distributions reinvested – Class C | 86,726 | 54,677 | 6,707 | 1,302 | 1,038 | 1,878 | |||||||||||||||||||||
| Redemptions – Class C | (178,699 | ) | (149,119 | ) | (16,582 | ) | (6,051 | ) | (8,640 | ) | (9,090 | ) | |||||||||||||||
| Net Increase (Decrease) – Class C | 74,535 | 77,091 | 40,859 | 11,142 | 10,293 | 835 | |||||||||||||||||||||
| Subscriptions – Class Z | 1,754,910 | 1,686,601 | 707,961 | 577,455 | 371,430 | 302,588 | |||||||||||||||||||||
| Distributions reinvested – Class Z | 824,254 | 513,385 | 279,893 | 103,732 | 22,838 | 40,433 | |||||||||||||||||||||
| Redemptions – Class Z | (1,413,279 | ) | (1,080,069 | ) | (357,229 | ) | (284,340 | ) | (175,498 | ) | (105,312 | ) | |||||||||||||||
| Net Increase – Class Z | 1,165,885 | 1,119,917 | 630,625 | 396,847 | 218,770 | 237,709 | |||||||||||||||||||||
| Net Increase (Decrease) from Share Transactions | 1,701,796 | 1,646,173 | 815,211 | 474,135 | 283,716 | 282,768 | |||||||||||||||||||||
| Redemption Fees | — | — | 147 | 65 | — | — | |||||||||||||||||||||
| Total Increase in Net Assets | 2,553,802 | 2,549,865 | 1,450,818 | 817,565 | 358,734 | 350,812 | |||||||||||||||||||||
| Net Assets: | |||||||||||||||||||||||||||
| Beginning of period | 16,391,324 | 13,841,459 | 2,892,577 | 2,075,012 | 1,221,494 | 870,682 | |||||||||||||||||||||
| End of period | $ | 18,945,126 | $ | 16,391,324 | $ | 4,343,395 | $ | 2,892,577 | $ | 1,580,228 | $ | 1,221,494 | |||||||||||||||
| Undistributed (Overdistributed) Net Investment Income or (Accumulated Net Investment Loss) | $ | (27,265 | ) | $ | (34,063 | ) | $ | (20,256 | ) | $ | (14,604 | ) | $ | (174 | ) | $ | (119 | ) | |||||||||
* Rounds to less than $500.
See accompanying notes to financial statements.
64
| Columbia Acorn International Select | Columbia Acorn Select | Columbia Thermostat Fund | |||||||||||||||||||||||||
| Increase (Decrease) in Net Assets | Year ended December 31, | Year ended December 31, | Year ended December 31, | ||||||||||||||||||||||||
| (in thousands) | 2006 | 2005 | 2006 | 2005 | 2006 | 2005 | |||||||||||||||||||||
| Operations: | |||||||||||||||||||||||||||
| Net investment income (loss) | $ | 361 | $ | 431 | $ | (11,032 | ) | $ | (7,333 | ) | $ | 6,358 | $ | 5,484 | |||||||||||||
| Net realized gain on investments and foreign currency transactions | 18,110 | 5,496 | 71,803 | 46,214 | — | — | |||||||||||||||||||||
| Net realized gain on affiliated investments and distributions from affiliated investment company shares | — | — | — | — | 11,669 | 14,700 | |||||||||||||||||||||
| Net change in net unrealized appreciation (depreciation) on investments and foreign currency translations | 20,770 | 5,773 | 287,875 | 140,962 | — | — | |||||||||||||||||||||
| Net change in net unrealized appreciation (depreciation) on affiliated investments | — | — | — | — | 836 | (10,409 | ) | ||||||||||||||||||||
| Net Increase from Operations | 39,241 | 11,700 | 348,646 | 179,843 | 18,863 | 9,775 | |||||||||||||||||||||
| Distribution to Shareholders From: | |||||||||||||||||||||||||||
| Net investment income – Class A | (2 | ) | (79 | ) | (788 | ) | — | (2,086 | ) | (2,069 | ) | ||||||||||||||||
| Net realized gain – Class A | — | — | (20,503 | ) | (19,098 | ) | (3,300 | ) | (4,875 | ) | |||||||||||||||||
| Net investment income – Class B | — | (46 | ) | — | — | (2,114 | ) | (1,831 | ) | ||||||||||||||||||
| Net realized gain – Class B | — | — | (4,991 | ) | (5,029 | ) | (3,980 | ) | (5,382 | ) | |||||||||||||||||
| Net investment income – Class C | — | * | (24 | ) | — | — | (753 | ) | (617 | ) | |||||||||||||||||
| Net realized gain – Class C | — | — | (3,972 | ) | (3,559 | ) | (1,496 | ) | (1,972 | ) | |||||||||||||||||
| Net investment income – Class Z | (196 | ) | (888 | ) | (1,614 | ) | — | (1,223 | ) | (797 | ) | ||||||||||||||||
| Net realized gain – Class Z | — | — | (19,241 | ) | (19,071 | ) | (1,585 | ) | (1,697 | ) | |||||||||||||||||
| Total Distribution to Shareholders | (198 | ) | (1,037 | ) | (51,109 | ) | (46,757 | ) | (16,537 | ) | (19,240 | ) | |||||||||||||||
| Share Transactions: | |||||||||||||||||||||||||||
| Subscriptions – Class A | 10,850 | 5,743 | 210,532 | 296,611 | 6,298 | 15,104 | |||||||||||||||||||||
| Distributions reinvested – Class A | 2 | 71 | 19,667 | 17,770 | 4,887 | 6,273 | |||||||||||||||||||||
| Redemptions – Class A | (3,070 | ) | (1,004 | ) | (158,467 | ) | (143,717 | ) | (25,185 | ) | (24,089 | ) | |||||||||||||||
| Net Increase (Decrease) – Class A | 7,782 | 4,810 | 71,732 | 170,664 | (14,000 | ) | (2,712 | ) | |||||||||||||||||||
| Subscriptions – Class B | 2,223 | 2,123 | 4,782 | 28,258 | 3,578 | 8,919 | |||||||||||||||||||||
| Distributions reinvested – Class B | — | 41 | 4,452 | 4,510 | 5,496 | 6,512 | |||||||||||||||||||||
| Redemptions – Class B | (1,437 | ) | (1,480 | ) | (31,688 | ) | (26,292 | ) | (16,105 | ) | (11,391 | ) | |||||||||||||||
| Net Increase (Decrease) – Class B | 786 | 684 | (22,454 | ) | 6,476 | (7,031 | ) | 4,040 | |||||||||||||||||||
| Subscriptions – Class C | 2,333 | 1,655 | 20,817 | 48,457 | 4,114 | 5,664 | |||||||||||||||||||||
| Distributions reinvested – Class C | — | * | 20 | 3,230 | 2,903 | 1,960 | 2,303 | ||||||||||||||||||||
| Redemptions – Class C | (924 | ) | (599 | ) | (22,947 | ) | (23,251 | ) | (7,323 | ) | (9,480 | ) | |||||||||||||||
| Net Increase (Decrease) – Class C | 1,409 | 1,076 | 1,100 | 28,109 | (1,249 | ) | (1,513 | ) | |||||||||||||||||||
| Subscriptions – Class Z | 34,878 | 25,890 | 258,516 | 333,604 | 5,698 | 5,843 | |||||||||||||||||||||
| Distributions reinvested – Class Z | 99 | 582 | 14,293 | 13,462 | 2,633 | 2,384 | |||||||||||||||||||||
| Redemptions – Class Z | (10,107 | ) | (7,003 | ) | (170,328 | ) | (155,173 | ) | (3,204 | ) | (2,485 | ) | |||||||||||||||
| Net Increase – Class Z | 24,870 | 19,469 | 102,481 | 191,893 | 5,127 | 5,742 | |||||||||||||||||||||
| Net Increase (Decrease) from Share Transactions | 34,847 | 26,039 | 152,859 | 397,142 | (17,153 | ) | 5,557 | ||||||||||||||||||||
| Redemption Fees | 9 | 9 | — | — | — | — | |||||||||||||||||||||
| Total Increase in Net Assets | 73,899 | 36,711 | 450,396 | 530,228 | (14,827 | ) | (3,908 | ) | |||||||||||||||||||
| Net Assets: | |||||||||||||||||||||||||||
| Beginning of period | 94,999 | 58,288 | 1,787,315 | 1,257,087 | 203,356 | 207,264 | |||||||||||||||||||||
| End of period | $ | 168,898 | $ | 94,999 | $ | 2,237,711 | $ | 1,787,315 | $ | 188,529 | $ | 203,356 | |||||||||||||||
| Undistributed (Overdistributed) Net Investment Income or (Accumulated Net Investment Loss) | $ | 676 | $ | (603 | ) | $ | (9,971 | ) | $ | (7,548 | ) | $ | 249 | $ | 142 | ||||||||||||
65
Columbia Acorn Family of Funds
Statements of Changes in Net Assets, continued
| Columbia Acorn Fund | Columbia Acorn International | Columbia Acorn USA | |||||||||||||||||||||||||
| Changes in Shares of Beneficial Interest: | Year ended December 31, | Year ended December 31, | Year ended December 31, | ||||||||||||||||||||||||
| (in thousands) | 2006 | 2005 | 2006 | 2005 | 2006 | 2005 | |||||||||||||||||||||
| Subscriptions – Class A | 37,015 | 34,302 | 4,588 | 2,150 | 4,113 | 2,559 | |||||||||||||||||||||
| Shares issued in reinvestment and capital gains – Class A | 9,911 | 6,137 | 673 | 155 | 156 | 260 | |||||||||||||||||||||
| Less shares redeemed – Class A | (28,264 | ) | (21,923 | ) | (1,723 | ) | (476 | ) | (1,877 | ) | (990 | ) | |||||||||||||||
| Net Increase (Decrease) – Class A | 18,662 | 18,516 | 3,538 | 1,829 | 2,392 | 1,829 | |||||||||||||||||||||
| Subscriptions – Class B | 909 | 1,922 | 482 | 574 | 47 | 161 | |||||||||||||||||||||
| Shares issued in reinvestment and capital gains – Class B | 3,757 | 2,814 | 212 | 73 | 50 | 137 | |||||||||||||||||||||
| Less shares redeemed – Class B | (7,576 | ) | (6,826 | ) | (553 | ) | (341 | ) | (533 | ) | (451 | ) | |||||||||||||||
| Net Increase (Decrease) – Class B | (2,910 | ) | (2,090 | ) | 141 | 306 | (436 | ) | (153 | ) | |||||||||||||||||
| Subscriptions – Class C | 5,931 | 6,667 | 1,356 | 524 | 678 | 321 | |||||||||||||||||||||
| Shares issued in reinvestment and capital gains – Class C | 3,123 | 2,077 | 178 | 41 | 39 | 74 | |||||||||||||||||||||
| Less shares redeemed – Class C | (6,396 | ) | (5,835 | ) | (455 | ) | (201 | ) | (328 | ) | (363 | ) | |||||||||||||||
| Net Increase (Decrease) – Class C | 2,658 | 2,909 | 1,079 | 364 | 389 | 32 | |||||||||||||||||||||
| Subscriptions – Class Z | 58,774 | 62,182 | 18,601 | 18,615 | 13,228 | 11,555 | |||||||||||||||||||||
| Shares issued in reinvestment and capital gains – Class Z | 27,709 | 18,385 | 7,251 | 3,274 | 796 | 1,500 | |||||||||||||||||||||
| Less shares redeemed – Class Z | (47,499 | ) | (39,912 | ) | (9,331 | ) | (9,349 | ) | (6,302 | ) | (4,040 | ) | |||||||||||||||
| Net Increase – Class Z | 38,984 | 40,655 | 16,521 | 12,540 | 7,722 | 9,015 | |||||||||||||||||||||
| Net Increase (Decrease) in Shares of Beneficial Interest | 57,394 | 59,990 | 21,279 | 15,039 | 10,067 | 10,723 | |||||||||||||||||||||
* Rounds to less than 500 shares.
See accompanying notes to financial statements.
66
| Columbia Acorn International Select | Columbia Acorn Select | Columbia Thermostat Fund | |||||||||||||||||||||||||
| Changes in Shares of Beneficial Interest: | Year ended December 31, | Year ended December 31, | Year ended December 31, | ||||||||||||||||||||||||
| (in thousands) | 2006 | 2005 | 2006 | 2005 | 2006 | 2005 | |||||||||||||||||||||
| Subscriptions – Class A | 446 | 307 | 8,645 | 14,487 | 492 | 1,151 | |||||||||||||||||||||
| Shares issued in reinvestment and capital gains – Class A | — | * | 4 | 777 | 802 | 390 | 497 | ||||||||||||||||||||
| Less shares redeemed – Class A | (131 | ) | (53 | ) | (6,607 | ) | (6,938 | ) | (1,960 | ) | (1,840 | ) | |||||||||||||||
| Net Increase (Decrease) – Class A | 315 | 258 | 2,815 | 8,351 | (1,078 | ) | (192 | ) | |||||||||||||||||||
| Subscriptions – Class B | 97 | 118 | 207 | 1,441 | 279 | 684 | |||||||||||||||||||||
| Shares issued in reinvestment and capital gains – Class B | — | * | 2 | 183 | 211 | 437 | 515 | ||||||||||||||||||||
| Less shares redeemed – Class B | (64 | ) | (81 | ) | (1,373 | ) | (1,313 | ) | (1,253 | ) | (870 | ) | |||||||||||||||
| Net Increase (Decrease) – Class B | 33 | 39 | (983 | ) | 339 | (537 | ) | 329 | |||||||||||||||||||
| Subscriptions – Class C | 100 | 92 | 898 | 2,455 | 322 | 434 | |||||||||||||||||||||
| Shares issued in reinvestment and capital gains – Class C | — | * | 1 | 133 | 136 | 156 | 182 | ||||||||||||||||||||
| Less shares redeemed – Class C | (42 | ) | (33 | ) | (1,002 | ) | (1,172 | ) | (572 | ) | (725 | ) | |||||||||||||||
| Net Increase (Decrease) – Class C | 58 | 60 | 29 | 1,419 | (94 | ) | (109 | ) | |||||||||||||||||||
| Subscriptions – Class Z | 1,448 | 1,378 | 10,565 | 15,890 | 442 | 446 | |||||||||||||||||||||
| Shares issued in reinvestment and capital gains – Class Z | 5 | 33 | 559 | 601 | 210 | 189 | |||||||||||||||||||||
| Less shares redeemed – Class Z | (427 | ) | (378 | ) | (7,111 | ) | (7,371 | ) | (248 | ) | (189 | ) | |||||||||||||||
| Net Increase – Class Z | 1,026 | 1,033 | 4,013 | 9,120 | 404 | 446 | |||||||||||||||||||||
| Net Increase (Decrease) in Shares of Beneficial Interest | 1,432 | 1,390 | 5,874 | 19,229 | (1,305 | ) | 474 | ||||||||||||||||||||
67
Columbia Acorn Family of Funds
Financial Highlights
Columbia Acorn Fund
| Class A Shares | Year ended December 31, | ||||||||||||||||||||||
| Selected data for a share outstanding throughout each period | 2006 | 2005 | 2004 | 2003 | 2002 | ||||||||||||||||||
| Net Asset Value, Beginning of Period | $ | 27.57 | $ | 25.93 | $ | 22.20 | $ | 15.34 | $ | 17.80 | |||||||||||||
| Income from Investment Operations | |||||||||||||||||||||||
| Net investment income (loss) (a) | 0.05 | 0.07 | (0.05 | ) | (0.07 | ) | (0.07 | ) | |||||||||||||||
| Net realized and unrealized gain (loss) | 3.82 | 3.20 | 4.69 | 6.95 | (2.39 | ) | |||||||||||||||||
| Total from Investment Operations | 3.87 | 3.27 | 4.64 | 6.88 | (2.46 | ) | |||||||||||||||||
| Less Distributions Declared to Shareholders | |||||||||||||||||||||||
| From net investment income | (0.04 | ) | (0.07 | ) | — | — | — | ||||||||||||||||
| From net realized gains | (2.38 | ) | (1.56 | ) | (0.91 | ) | (0.02 | ) | — | ||||||||||||||
| Total Distributions Declared to Shareholders | (2.42 | ) | (1.63 | ) | (0.91 | ) | (0.02 | ) | — | ||||||||||||||
| Net Asset Value, End of Period | $ | 29.02 | $ | 27.57 | $ | 25.93 | $ | 22.20 | $ | 15.34 | |||||||||||||
| Total Return (b) | 14.13 | %(c) | 12.76 | %(c) | 21.05 | %(c) | 44.85 | % | (13.82 | )% | |||||||||||||
| Ratios to Average Net Assets/Supplemental Data | |||||||||||||||||||||||
| Expenses (d) | 1.02 | % | 1.03 | % | 1.20 | % | 1.33 | % | 1.42 | % | |||||||||||||
| Net investment income (loss) (d) | 0.17 | % | 0.28 | % | (0.21 | )% | (0.36 | )% | (0.45 | )% | |||||||||||||
| Waiver/reimbursement | 0.02 | % | 0.02 | % | 0.02 | % | — | — | |||||||||||||||
| Portfolio turnover rate | 22 | % | 16 | % | 20 | % | 10 | % | 13 | % | |||||||||||||
| Net assets at end of period (000's) | $ | 4,067,868 | $ | 3,349,461 | $ | 2,669,936 | $ | 1,982,260 | $ | 724,121 | |||||||||||||
(a) Per share data was calculated using average shares outstanding during the period.
(b) Total return at net asset value assuming all distributions reinvested and no initial sales charge or contingent deferred sales charge.
(c) Had the Investment Adviser and/or Transfer Agent not waived and/or reimbursed a portion of expenses, total return would have been reduced.
(d) The benefits derived from custody fees paid indirectly had no impact.
| Class B Shares | Year ended December 31, | ||||||||||||||||||||||
| Selected data for a share outstanding throughout each period | 2006 | 2005 | 2004 | 2003 | 2002 | ||||||||||||||||||
| Net Asset Value, Beginning of Period | $ | 26.61 | $ | 25.19 | $ | 21.75 | $ | 15.13 | $ | 17.67 | |||||||||||||
| Income from Investment Operations | |||||||||||||||||||||||
| Net investment loss (a) | (0.13 | ) | (0.11 | ) | (0.22 | ) | (0.18 | ) | (0.17 | ) | |||||||||||||
| Net realized and unrealized gain (loss) | 3.68 | 3.09 | 4.57 | 6.82 | (2.37 | ) | |||||||||||||||||
| Total from Investment Operations | 3.55 | 2.98 | 4.35 | 6.64 | (2.54 | ) | |||||||||||||||||
| Less Distributions Declared to Shareholders | |||||||||||||||||||||||
| From net realized gains | (2.38 | ) | (1.56 | ) | (0.91 | ) | (0.02 | ) | — | ||||||||||||||
| Total Distributions Declared to Shareholders | (2.38 | ) | (1.56 | ) | (0.91 | ) | (0.02 | ) | — | ||||||||||||||
| Net Asset Value, End of Period | $ | 27.78 | $ | 26.61 | $ | 25.19 | $ | 21.75 | $ | 15.13 | |||||||||||||
| Total Return (b) | 13.43 | %(c) | 11.98 | %(c) | 20.15 | %(c) | 43.89 | % | (14.37 | )% | |||||||||||||
| Ratios to Average Net Assets/Supplemental Data | |||||||||||||||||||||||
| Expenses (d) | 1.66 | % | 1.72 | % | 1.95 | % | 1.98 | % | 2.07 | % | |||||||||||||
| Net investment loss (d) | (0.48 | )% | (0.42 | )% | (0.96 | )% | (1.01 | )% | (1.10 | )% | |||||||||||||
| Waiver/reimbursement | 0.02 | % | 0.02 | % | 0.02 | % | — | — | |||||||||||||||
| Portfolio turnover rate | 22 | % | 16 | % | 20 | % | 10 | % | 13 | % | |||||||||||||
| Net assets at end of period (000's) | $ | 1,404,165 | $ | 1,422,580 | $ | 1,399,135 | $ | 1,221,931 | $ | 618,727 | |||||||||||||
(a) Per share data was calculated using average shares outstanding during the period.
(b) Total return at net asset value assuming all distributions reinvested and no initial sales charge or contingent deferred sales charge.
(c) Had the Investment Adviser and/or Transfer Agent not waived and/or reimbursed a portion of expenses, total return would have been reduced.
(d) The benefits derived from custody fees paid indirectly had no impact.
| Class C Shares | Year ended December 31, | ||||||||||||||||||||||
| Selected data for a share outstanding throughout each period | 2006 | 2005 | 2004 | 2003 | 2002 | ||||||||||||||||||
| Net Asset Value, Beginning of Period | $ | 26.58 | $ | 25.18 | $ | 21.75 | $ | 15.12 | $ | 17.66 | |||||||||||||
| Income from Investment Operations | |||||||||||||||||||||||
| Net investment loss (a) | (0.17 | ) | (0.13 | ) | (0.22 | ) | (0.18 | ) | (0.17 | ) | |||||||||||||
| Net realized and unrealized gain (loss) | 3.67 | 3.09 | 4.56 | 6.83 | (2.37 | ) | |||||||||||||||||
| Total from Investment Operations | 3.50 | 2.96 | 4.34 | 6.65 | (2.54 | ) | |||||||||||||||||
| Less Distributions Declared to Shareholders | |||||||||||||||||||||||
| From net realized gains | (2.38 | ) | (1.56 | ) | (0.91 | ) | (0.02 | ) | — | ||||||||||||||
| Total Distributions Declared to Shareholders | (2.38 | ) | (1.56 | ) | (0.91 | ) | (0.02 | ) | — | ||||||||||||||
| Net Asset Value, End of Period | $ | 27.70 | $ | 26.58 | $ | 25.18 | $ | 21.75 | $ | 15.12 | |||||||||||||
| Total Return (b) | 13.25 | %(c) | 11.90 | %(c) | 20.11 | %(c) | 43.99 | % | (14.38 | )% | |||||||||||||
| Ratios to Average Net Assets/Supplemental Data | |||||||||||||||||||||||
| Expenses (d) | 1.80 | % | 1.82 | % | 1.95 | % | 1.98 | % | 2.07 | % | |||||||||||||
| Net investment loss (d) | (0.61 | )% | (0.51 | )% | (0.96 | )% | (1.01 | )% | (1.10 | )% | |||||||||||||
| Waiver/reimbursement | 0.02 | % | 0.02 | % | 0.02 | % | — | — | |||||||||||||||
| Portfolio turnover rate | 22 | % | 16 | % | 20 | % | 10 | % | 13 | % | |||||||||||||
| Net assets at end of period (000's) | $ | 1,345,520 | $ | 1,220,339 | $ | 1,083,006 | $ | 900,016 | $ | 376,024 | |||||||||||||
(a) Per share data was calculated using average shares outstanding during the period.
(b) Total return at net asset value assuming all distributions reinvested and no initial sales charge or contingent deferred sales charge.
(c) Had the Investment Adviser and/or Transfer Agent not waived and/or reimbursed a portion of expenses, total return would have been reduced.
(d) The benefits derived from custody fees paid indirectly had no impact.
See accompanying notes to financial statements.
68
Columbia Acorn International
| Class A Shares | Year ended December 31, | ||||||||||||||||||||||
| Selected data for a share outstanding throughout each period | 2006 | 2005 | 2004 | 2003 | 2002 | ||||||||||||||||||
| Net Asset Value, Beginning of Period | $ | 33.20 | $ | 28.75 | $ | 22.45 | $ | 15.32 | $ | 18.35 | |||||||||||||
| Income from Investment Operations | |||||||||||||||||||||||
| Net investment income (a) | 0.23 | 0.22 | 0.14 | 0.10 | 0.05 | ||||||||||||||||||
| Net realized and unrealized gain (loss) | 10.87 | 5.84 | 6.31 | 7.08 | (3.07 | ) | |||||||||||||||||
| Total from Investment Operations | 11.10 | 6.06 | 6.45 | 7.18 | (3.02 | ) | |||||||||||||||||
| Less Distributions Declared to Shareholders | |||||||||||||||||||||||
| From net investment income | (0.32 | ) | (0.53 | ) | (0.15 | ) | (0.05 | ) | (0.01 | ) | |||||||||||||
| From net realized gains | (3.91 | ) | (1.08 | ) | — | — | — | ||||||||||||||||
| Total Distributions Declared to Shareholders | (4.23 | ) | (1.61 | ) | (0.15 | ) | (0.05 | ) | (0.01 | ) | |||||||||||||
| Net Asset Value, End of Period | $ | 40.07 | $ | 33.20 | $ | 28.75 | $ | 22.45 | $ | 15.32 | |||||||||||||
| Total Return (b) | 34.16 | %(c) | 21.42 | %(c) | 28.91 | %(c) | 46.94 | % | (16.46 | )% | |||||||||||||
| Ratios to Average Net Assets/Supplemental Data | |||||||||||||||||||||||
| Expenses (d) | 1.24 | % | 1.30 | % | 1.48 | % | 1.59 | % | 1.56 | % | |||||||||||||
| Net investment income (d) | 0.61 | % | 0.72 | % | 0.61 | % | 0.57 | % | 0.30 | % | |||||||||||||
| Waiver/reimbursement | 0.01 | % | 0.02 | % | 0.02 | % | — | — | |||||||||||||||
| Portfolio turnover rate | 31 | % | 27 | % | 40 | % | 40 | % | 52 | % | |||||||||||||
| Net assets at end of period (000's) | $ | 313,401 | $ | 142,204 | $ | 70,582 | $ | 52,872 | $ | 33,806 | |||||||||||||
(a) Per share data was calculated using average shares outstanding during the period.
(b) Total return at net asset value assuming all distributions reinvested and no initial sales charge or contingent deferred sales charge.
(c) Had the Investment Adviser and/or Transfer Agent not waived and/or reimbursed a portion of expenses, total return would have been reduced.
(d) The benefits derived from custody fees paid indirectly had no impact.
| Class B Shares | Year ended December 31, | ||||||||||||||||||||||
| Selected data for a share outstanding throughout each period | 2006 | 2005 | 2004 | 2003 | 2002 | ||||||||||||||||||
| Net Asset Value, Beginning of Period | $ | 32.71 | $ | 28.18 | $ | 22.07 | $ | 15.11 | $ | 18.22 | |||||||||||||
| Income from Investment Operations | |||||||||||||||||||||||
| Net investment income (loss) (a) | (0.00 | )(b) | 0.02 | (0.04 | ) | (0.02 | ) | (0.06 | ) | ||||||||||||||
| Net realized and unrealized gain (loss) | 10.66 | 5.73 | 6.19 | 6.98 | (3.05 | ) | |||||||||||||||||
| Total from Investment Operations | 10.66 | 5.75 | 6.15 | 6.96 | (3.11 | ) | |||||||||||||||||
| Less Distributions Declared to Shareholders | |||||||||||||||||||||||
| From net investment income | (0.07 | ) | (0.14 | ) | (0.04 | ) | — | — | |||||||||||||||
| From net realized gains | (3.91 | ) | (1.08 | ) | — | — | — | ||||||||||||||||
| Total Distributions Declared to Shareholders | (3.98 | ) | (1.22 | ) | (0.04 | ) | — | — | |||||||||||||||
| Net Asset Value, End of Period | $ | 39.39 | $ | 32.71 | $ | 28.18 | $ | 22.07 | $ | 15.11 | |||||||||||||
| Total Return (c) | 33.26 | %(d) | 20.57 | %(d) | 27.91 | %(d) | 46.06 | % | (17.07 | )% | |||||||||||||
| Ratios to Average Net Assets/Supplemental Data | |||||||||||||||||||||||
| Expenses (e) | 1.89 | % | 2.01 | % | 2.27 | % | 2.24 | % | 2.21 | % | |||||||||||||
| Net investment income (loss) (e) | (0.01 | )% | 0.08 | % | (0.18 | )% | (0.10 | )% | (0.35 | )% | |||||||||||||
| Waiver/reimbursement | 0.02 | % | 0.02 | % | 0.02 | % | — | — | |||||||||||||||
| Portfolio turnover rate | 31 | % | 27 | % | 40 | % | 40 | % | 52 | % | |||||||||||||
| Net assets at end of period (000's) | $ | 94,165 | $ | 73,572 | $ | 54,752 | $ | 39,800 | $ | 22,560 | |||||||||||||
(a) Per share data was calculated using average shares outstanding during the period.
(b) Rounds to less than $(0.01) per share
(c) Total return at net asset value assuming all distributions reinvested and no initial sales charge or contingent deferred sales charge.
(d) Had the Investment Adviser and/or Transfer Agent not waived and/or reimbursed a portion of expenses, total return would have been reduced.
(e) The benefits derived from custody fees paid indirectly had no impact.
| Class C Shares | Year ended December 31, | ||||||||||||||||||||||
| Selected data for a share outstanding throughout each period | 2006 | 2005 | 2004 | 2003 | 2002 | ||||||||||||||||||
| Net Asset Value, Beginning of Period | $ | 32.68 | $ | 28.19 | $ | 22.06 | $ | 15.11 | $ | 18.21 | |||||||||||||
| Income from Investment Operations | |||||||||||||||||||||||
| Net investment loss (a) | (0.05 | ) | (0.00 | )(b) | (0.03 | ) | (0.01 | ) | (0.06 | ) | |||||||||||||
| Net realized and unrealized gain (loss) | 10.66 | 5.71 | 6.20 | 6.96 | (3.04 | ) | |||||||||||||||||
| Total from Investment Operations | 10.61 | 5.71 | 6.17 | 6.95 | (3.10 | ) | |||||||||||||||||
| Less Distributions Declared to Shareholders | |||||||||||||||||||||||
| From net investment income | (0.03 | ) | (0.14 | ) | (0.04 | ) | — | — | |||||||||||||||
| From net realized gains | (3.91 | ) | (1.08 | ) | — | — | — | ||||||||||||||||
| Total Distributions Declared to Shareholders | (3.94 | ) | (1.22 | ) | (0.04 | ) | — | — | |||||||||||||||
| Net Asset Value, End of Period | $ | 39.35 | $ | 32.68 | $ | 28.19 | $ | 22.06 | $ | 15.11 | |||||||||||||
| Total Return (c) | 33.14 | %(d) | 20.45 | %(d) | 28.01 | %(d) | 46.00 | % | (17.02 | )% | |||||||||||||
| Ratios to Average Net Assets/Supplemental Data | |||||||||||||||||||||||
| Expenses (e) | 2.01 | % | 2.09 | % | 2.24 | % | 2.24 | % | 2.21 | % | |||||||||||||
| Net investment loss (e) | (0.14 | )% | (0.01 | )% | (0.15 | )% | (0.06 | )% | (0.35 | )% | |||||||||||||
| Waiver/reimbursement | 0.01 | % | 0.02 | % | 0.02 | % | — | — | |||||||||||||||
| Portfolio turnover rate | 31 | % | 27 | % | 40 | % | 40 | % | 52 | % | |||||||||||||
| Net assets at end of period (000's) | $ | 99,425 | $ | 47,325 | $ | 30,547 | $ | 22,990 | $ | 14,575 | |||||||||||||
(a) Per share data was calculated using average shares outstanding during the period.
(b) Rounds to less than $(0.01) per share.
(c) Total return at net asset value assuming all distributions reinvested and no initial sales charge or contingent deferred sales charge.
(d) Had the Investment Adviser and/or Transfer Agent not waived and/or reimbursed a portion of expenses, total return would have been reduced.
(e) The benefits derived from custody fees paid indirectly had no impact.
See accompanying notes to financial statements.
69
Columbia Acorn Family of Funds
Financial Highlights, continued
Columbia Acorn USA
| Class A Shares | Year ended December 31, | ||||||||||||||||||||||
| Selected data for a share outstanding throughout each period | 2006 | 2005 | 2004 | 2003 | 2002 | ||||||||||||||||||
| Net Asset Value, Beginning of Period | $ | 26.52 | $ | 24.77 | $ | 20.74 | $ | 14.18 | $ | 17.50 | |||||||||||||
| Income from Investment Operations | |||||||||||||||||||||||
| Net investment loss (a) | (0.10 | ) | (0.01 | ) | (0.24 | ) | (0.22 | ) | (0.19 | ) | |||||||||||||
| Net realized and unrealized gain (loss) | 2.21 | 3.13 | 4.41 | 6.78 | (3.13 | ) | |||||||||||||||||
| Total from Investment Operations | 2.11 | 3.12 | 4.17 | 6.56 | (3.32 | ) | |||||||||||||||||
| Less Distributions Declared to Shareholders | |||||||||||||||||||||||
| From net realized gains | (0.61 | ) | (1.37 | ) | (0.14 | ) | — | — | |||||||||||||||
| Net Asset Value, End of Period | $ | 28.02 | $ | 26.52 | $ | 24.77 | $ | 20.74 | $ | 14.18 | |||||||||||||
| Total Return (b) | 7.95 | %(c) | 12.68 | %(c) | 20.12 | %(c) | 46.26 | % | (18.97 | )% | |||||||||||||
| Ratios to Average Net Assets/Supplemental Data | |||||||||||||||||||||||
| Expenses (d) | 1.26 | % | 1.31 | % | 1.51 | % | 1.65 | % | 1.74 | % | |||||||||||||
| Net investment loss (d) | (0.35 | )% | (0.02 | )% | (1.08 | )% | (1.26 | )% | (1.21 | )% | |||||||||||||
| Waiver/reimbursement | 0.01 | % | 0.01 | % | 0.02 | % | — | — | |||||||||||||||
| Portfolio turnover rate | 13 | % | 13 | % | 18 | % | 7 | % | 31 | % | |||||||||||||
| Net assets at end of period (000's) | $ | 245,552 | $ | 168,922 | $ | 112,509 | $ | 89,650 | $ | 32,422 | |||||||||||||
(a) Per share data was calculated using average shares outstanding during the period.
(b) Total return at net asset value assuming all distributions reinvested and no initial sales charge or contingent deferred sales charge.
(c) Had the Investment Adviser and/or Transfer Agent not waived and/or reimbursed a portion of expenses, total return would have been reduced.
(d) The benefits derived from custody fees paid indirectly had no impact.
| Class B Shares | Year ended December 31, | ||||||||||||||||||||||
| Selected data for a share outstanding throughout each period | 2006 | 2005 | 2004 | 2003 | 2002 | ||||||||||||||||||
| Net Asset Value, Beginning of Period | $ | 25.61 | $ | 24.14 | $ | 20.36 | $ | 14.01 | $ | 17.40 | |||||||||||||
| Income from Investment Operations | |||||||||||||||||||||||
| Net investment loss (a) | (0.27 | ) | (0.18 | ) | (0.39 | ) | (0.32 | ) | (0.29 | ) | |||||||||||||
| Net realized and unrealized gain (loss) | 2.14 | 3.02 | 4.31 | 6.67 | (3.10 | ) | |||||||||||||||||
| Total from Investment Operations | 1.87 | 2.84 | 3.92 | 6.35 | (3.39 | ) | |||||||||||||||||
| Less Distributions Declared to Shareholders | |||||||||||||||||||||||
| From net realized gains | (0.61 | ) | (1.37 | ) | (0.14 | ) | — | — | |||||||||||||||
| Net Asset Value, End of Period | $ | 26.87 | $ | 25.61 | $ | 24.14 | $ | 20.36 | $ | 14.01 | |||||||||||||
| Total Return (b) | 7.29 | %(c) | 11.84 | %(c) | 19.26 | %(c) | 45.32 | % | (19.48 | )% | |||||||||||||
| Ratios to Average Net Assets/Supplemental Data | |||||||||||||||||||||||
| Expenses (d) | 1.93 | % | 2.00 | % | 2.23 | % | 2.30 | % | 2.39 | % | |||||||||||||
| Net investment loss (d) | (1.01 | )% | (0.72 | )% | (1.80 | )% | (1.91 | )% | (1.86 | )% | |||||||||||||
| Waiver/reimbursement | 0.02 | % | 0.01 | % | 0.02 | % | — | — | |||||||||||||||
| Portfolio turnover rate | 13 | % | 13 | % | 18 | % | 7 | % | 31 | % | |||||||||||||
| Net assets at end of period (000's) | $ | 65,040 | $ | 73,168 | $ | 72,643 | $ | 66,175 | $ | 37,478 | |||||||||||||
(a) Per share data was calculated using average shares outstanding during the period.
(b) Total return at net asset value assuming all distributions reinvested and no initial sales charge or contingent deferred sales charge.
(c) Had the Investment Adviser and/or Transfer Agent not waived and/or reimbursed a portion of expenses, total return would have been reduced.
(d) The benefits derived from custody fees paid indirectly had no impact.
| Class C Shares | Year ended December 31, | ||||||||||||||||||||||
| Selected data for a share outstanding throughout each period | 2006 | 2005 | 2004 | 2003 | 2002 | ||||||||||||||||||
| Net Asset Value, Beginning of Period | $ | 25.59 | $ | 24.14 | $ | 20.36 | $ | 14.01 | $ | 17.40 | |||||||||||||
| Income from Investment Operations | |||||||||||||||||||||||
| Net investment loss (a) | (0.30 | ) | (0.20 | ) | (0.39 | ) | (0.32 | ) | (0.29 | ) | |||||||||||||
| Net realized and unrealized gain (loss) | 2.13 | 3.02 | 4.31 | 6.67 | (3.10 | ) | |||||||||||||||||
| Total from Investment Operations | 1.83 | 2.82 | 3.92 | 6.35 | (3.39 | ) | |||||||||||||||||
| Less Distributions Declared to Shareholders | |||||||||||||||||||||||
| From net realized gains | (0.61 | ) | (1.37 | ) | (0.14 | ) | — | — | |||||||||||||||
| Net Asset Value, End of Period | $ | 26.81 | $ | 25.59 | $ | 24.14 | $ | 20.36 | $ | 14.01 | |||||||||||||
| Total Return (b) | 7.14 | %(c) | 11.76 | %(c) | 19.26 | %(c) | 45.32 | % | (19.48 | )% | |||||||||||||
| Ratios to Average Net Assets/Supplemental Data | |||||||||||||||||||||||
| Expenses (d) | 2.05 | % | 2.10 | % | �� | 2.23 | % | 2.30 | % | 2.39 | % | ||||||||||||
| Net investment loss (d) | (1.14 | )% | (0.81 | )% | (1.80 | )% | (1.91 | )% | (1.86 | )% | |||||||||||||
| Waiver/reimbursement | 0.01 | % | 0.01 | % | 0.02 | % | — | — | |||||||||||||||
| Portfolio turnover rate | 13 | % | 13 | % | 18 | % | 7 | % | 31 | % | |||||||||||||
| Net assets at end of period (000's) | $ | 55,306 | $ | 42,844 | $ | 39,643 | $ | 35,662 | $ | 18,313 | |||||||||||||
(a) Per share data was calculated using average shares outstanding during the period.
(b) Total return at net asset value assuming all distributions reinvested and no initial sales charge or contingent deferred sales charge.
(c) Had the Investment Adviser and/or Transfer Agent not waived and/or reimbursed a portion of expenses, total return would have been reduced.
(d) The benefits derived from custody fees paid indirectly had no impact.
See accompanying notes to financial statements.
70
Columbia Acorn International Select
| Class A Shares | Year ended December 31, | ||||||||||||||||||||||
| Selected data for a share outstanding throughout each period | 2006 | 2005 | 2004 | 2003 | 2002 | ||||||||||||||||||
| Net Asset Value, Beginning of Period | $ | 20.36 | $ | 17.85 | $ | 14.45 | $ | 10.24 | $ | 12.07 | |||||||||||||
| Income from Investment Operations | |||||||||||||||||||||||
| Net investment income (loss) (a) | 0.03 | 0.06 | (0.00 | )(b) | 0.03 | (0.01 | ) | ||||||||||||||||
| Net realized and unrealized gain (loss) | 7.29 | 2.69 | 3.43 | 4.18 | (1.82 | ) | |||||||||||||||||
| Total from Investment Operations | 7.32 | 2.75 | 3.43 | 4.21 | (1.83 | ) | |||||||||||||||||
| Less Distributions Declared to Shareholders | |||||||||||||||||||||||
| From net investment income | — | (0.24 | ) | (0.03 | ) | — | — | ||||||||||||||||
| Net Asset Value, End of Period | $ | 27.68 | $ | 20.36 | $ | 17.85 | $ | 14.45 | $ | 10.24 | |||||||||||||
| Total Return (c)(d) | 35.97 | % | 15.60 | % | 23.76 | % | 41.11 | % | (15.16 | )% | |||||||||||||
| Ratios to Average Net Assets/Supplemental Data | |||||||||||||||||||||||
| Expenses (e) | 1.58 | % | 1.70 | % | 1.75 | % | 1.80 | % | 1.80 | % | |||||||||||||
| Net investment income (loss) (e) | 0.11 | % | 0.34 | % | (0.03 | )% | 0.24 | % | (0.09 | )% | |||||||||||||
| Waiver/reimbursement | 0.02 | % | 0.10 | % | 0.37 | % | 0.44 | % | 0.33 | % | |||||||||||||
| Portfolio turnover rate | 47 | % | 39 | % | 73 | % | 69 | % | 102 | % | |||||||||||||
| Net assets at end of period (000's) | $ | 22,599 | $ | 10,219 | $ | 4,357 | $ | 2,557 | $ | 2,612 | |||||||||||||
(a) Per share data was calculated using average shares outstanding during the period.
(b) Rounds to less than $(0.01) per share.
(c) Total return at net asset value assuming all distributions reinvested and no initial sales charge or contingent deferred sales charge.
(d) Had the Investment Adviser and/or Transfer Agent not waived and/or reimbursed a portion of expenses, total return would have been reduced.
(e) The benefits derived from custody fees paid indirectly had no impact.
| Class B Shares | Year ended December 31, | ||||||||||||||||||||||
| Selected data for a share outstanding throughout each period | 2006 | 2005 | 2004 | 2003 | 2002 | ||||||||||||||||||
| Net Asset Value, Beginning of Period | $ | 19.80 | $ | 17.36 | $ | 14.12 | $ | 10.08 | $ | 11.96 | |||||||||||||
| Income from Investment Operations | |||||||||||||||||||||||
| Net investment loss (a) | (0.12 | ) | (0.03 | ) | (0.10 | ) | (0.06 | ) | (0.08 | ) | |||||||||||||
| Net realized and unrealized gain (loss) | 7.05 | 2.61 | 3.34 | 4.10 | (1.80 | ) | |||||||||||||||||
| Total from Investment Operations | 6.93 | 2.58 | 3.24 | 4.04 | (1.88 | ) | |||||||||||||||||
| Less Distributions Declared to Shareholders | |||||||||||||||||||||||
| From net investment income | — | (0.14 | ) | — | — | — | |||||||||||||||||
| Net Asset Value, End of Period | $ | 26.73 | $ | 19.80 | $ | 17.36 | $ | 14.12 | $ | 10.08 | |||||||||||||
| Total Return (b)(c) | 35.00 | % | 14.97 | % | 22.95 | % | 40.08 | % | (15.72 | )% | |||||||||||||
| Ratios to Average Net Assets/Supplemental Data | |||||||||||||||||||||||
| Expenses (d) | 2.25 | % | 2.30 | % | 2.38 | % | 2.45 | % | 2.45 | % | |||||||||||||
| Net investment loss (d) | (0.53 | )% | (0.16 | )% | (0.66 | )% | (0.52 | )% | (0.74 | )% | |||||||||||||
| Waiver/reimbursement | 0.04 | % | 0.28 | % | 0.58 | % | 0.44 | % | 0.33 | % | |||||||||||||
| Portfolio turnover rate | 47 | % | 39 | % | 73 | % | 69 | % | 102 | % | |||||||||||||
| Net assets at end of period (000's) | $ | 9,787 | $ | 6,594 | $ | 5,097 | $ | 3,162 | $ | 1,835 | |||||||||||||
(a) Per share data was calculated using average shares outstanding during the period.
(b) Total return at net asset value assuming all distributions reinvested and no initial sales charge or contingent deferred sales charge.
(c) Had the Investment Adviser and/or Transfer Agent not waived and/or reimbursed a portion of expenses, total return would have been reduced.
(d) The benefits derived from custody fees paid indirectly had no impact.
| Class C Shares | Year ended December 31, | ||||||||||||||||||||||
| Selected data for a share outstanding throughout each period | 2006 | 2005 | 2004 | 2003 | 2002 | ||||||||||||||||||
| Net Asset Value, Beginning of Period | $ | 19.80 | $ | 17.38 | $ | 14.14 | $ | 10.09 | $ | 11.97 | |||||||||||||
| Income from Investment Operations | |||||||||||||||||||||||
| Net investment loss (a) | (0.15 | ) | (0.05 | ) | (0.11 | ) | (0.05 | ) | (0.08 | ) | |||||||||||||
| Net realized and unrealized gain (loss) | 7.05 | 2.60 | 3.35 | 4.10 | (1.80 | ) | |||||||||||||||||
| Total from Investment Operations | 6.90 | 2.55 | 3.24 | 4.05 | (1.88 | ) | |||||||||||||||||
| Less Distributions Declared to Shareholders | |||||||||||||||||||||||
| From net investment income | — | �� | (0.13 | ) | — | — | — | ||||||||||||||||
| Net Asset Value, End of Period | $ | 26.70 | $ | 19.80 | $ | 17.38 | $ | 14.14 | $ | 10.09 | |||||||||||||
| Total Return (b)(c) | 34.85 | % | 14.77 | % | 22.91 | % | 40.14 | % | (15.71 | )% | |||||||||||||
| Ratios to Average Net Assets/Supplemental Data | |||||||||||||||||||||||
| Expenses (d) | 2.38 | % | 2.45 | % | 2.45 | % | 2.45 | % | 2.45 | % | |||||||||||||
| Net investment loss (d) | (0.67 | )% | (0.30 | )% | (0.73 | )% | (0.41 | )% | (0.74 | )% | |||||||||||||
| Waiver/reimbursement | 0.02 | % | 0.17 | % | 0.35 | % | 0.44 | % | 0.33 | % | |||||||||||||
| Portfolio turnover rate | 47 | % | 39 | % | 73 | % | 69 | % | 102 | % | |||||||||||||
| Net assets at end of period (000's) | $ | 7,060 | $ | 4,083 | $ | 2,543 | $ | 3,691 | $ | 2,915 | |||||||||||||
(a) Per share data was calculated using average shares outstanding during the period.
(b) Total return at net asset value assuming all distributions reinvested and no initial sales charge or contingent deferred sales charge.
(c) Had the Investment Adviser and/or Transfer Agent not waived and/or reimbursed a portion of expenses, total return would have been reduced.
(d) The benefits derived from custody fees paid indirectly had no impact.
See accompanying notes to financial statements.
71
Columbia Acorn Family of Funds
Financial Highlights, continued
Columbia Acorn Select
| Class A Shares | Year ended December 31, | ||||||||||||||||||||||
| Selected data for a share outstanding throughout each period | 2006 | 2005 | 2004 | 2003 | 2002 | ||||||||||||||||||
| Net Asset Value, Beginning of Period | $ | 22.47 | $ | 20.83 | $ | 18.01 | $ | 13.93 | $ | 15.17 | |||||||||||||
| Income from Investment Operations | |||||||||||||||||||||||
| Net investment loss (a) | (0.13 | ) | (0.09 | ) | (0.16 | ) | (0.20 | ) | (0.16 | ) | |||||||||||||
| Net realized and unrealized gain (loss) | 4.45 | 2.32 | 3.42 | 4.37 | (1.08 | ) | |||||||||||||||||
| Total from Investment Operations | 4.32 | 2.23 | 3.26 | 4.17 | (1.24 | ) | |||||||||||||||||
| Less Distributions Declared to Shareholders | |||||||||||||||||||||||
| From net investment income | (0.02 | ) | — | — | — | — | |||||||||||||||||
| From net realized gains | (0.59 | ) | (0.59 | ) | (0.44 | ) | (0.09 | ) | — | ||||||||||||||
| Total Distributions Declared to Shareholders | (0.61 | ) | (0.59 | ) | (0.44 | ) | (0.09 | ) | — | ||||||||||||||
| Net Asset Value, End of Period | $ | 26.18 | $ | 22.47 | $ | 20.83 | $ | 18.01 | $ | 13.93 | |||||||||||||
| Total Return (b) | 19.32 | %(c) | 10.78 | %(c) | 18.16 | %(c) | 29.95 | % | (8.17 | )%(c) | |||||||||||||
| Ratios to Average Net Assets/Supplemental Data | |||||||||||||||||||||||
| Expenses (d) | 1.24 | % | 1.26 | % | 1.47 | % | 1.63 | % | 1.70 | % | |||||||||||||
| Net investment loss (d) | (0.54 | )% | (0.42 | )% | (0.86 | )% | (1.15 | )% | (1.11 | )% | |||||||||||||
| Waiver/reimbursement | 0.03 | % | 0.03 | % | 0.02 | % | — | 0.10 | % | ||||||||||||||
| Portfolio turnover rate | 21 | % | 19 | % | 34 | % | 16 | % | 40 | % | |||||||||||||
| Net assets at end of period (000's) | $ | 940,857 | $ | 744,178 | $ | 515,842 | $ | 264,679 | $ | 31,742 | |||||||||||||
(a) Per share data was calculated using average shares outstanding during the period.
(b) Total return at net asset value assuming all distributions reinvested and no initial sales charge or contingent deferred sales charge.
(c) Had the Investment Adviser and/or Transfer Agent not waived and/or reimbursed a portion of expenses, total return would have been reduced.
(d) The benefits derived from custody fees paid indirectly had no impact.
| Class B Shares | Year ended December 31, | ||||||||||||||||||||||
| Selected data for a share outstanding throughout each period | 2006 | 2005 | 2004 | 2003 | 2002 | ||||||||||||||||||
| Net Asset Value, Beginning of Period | $ | 21.71 | $ | 20.23 | $ | 17.64 | $ | 13.73 | $ | 15.05 | |||||||||||||
| Income from Investment Operations | |||||||||||||||||||||||
| Net investment loss (a) | (0.28 | ) | (0.23 | ) | (0.31 | ) | (0.29 | ) | (0.25 | ) | |||||||||||||
| Net realized and unrealized gain (loss) | 4.29 | 2.24 | 3.34 | 4.29 | (1.07 | ) | |||||||||||||||||
| Total from Investment Operations | 4.01 | 2.01 | 3.03 | 4.00 | (1.32 | ) | |||||||||||||||||
| Less Distributions Declared to Shareholders | |||||||||||||||||||||||
| From net realized gains | (0.59 | ) | (0.53 | ) | (0.44 | ) | (0.09 | ) | — | ||||||||||||||
| Net Asset Value, End of Period | $ | 25.13 | $ | 21.71 | $ | 20.23 | $ | 17.64 | $ | 13.73 | |||||||||||||
| Total Return (b) | 18.54 | %(c) | 10.01 | %(c) | 17.24 | %(c) | 29.14 | % | (8.77 | )%(c) | |||||||||||||
| Ratios to Average Net Assets/Supplemental Data | |||||||||||||||||||||||
| Expenses (d) | 1.91 | % | 1.99 | % | 2.26 | % | 2.28 | % | 2.35 | % | |||||||||||||
| Net investment loss (d) | (1.21 | )% | (1.15 | )% | (1.65 | )% | (1.80 | )% | (1.76 | )% | |||||||||||||
| Waiver/reimbursement | 0.03 | % | 0.03 | % | 0.02 | % | — | 0.10 | % | ||||||||||||||
| Portfolio turnover rate | 21 | % | 19 | % | 34 | % | 16 | % | 40 | % | |||||||||||||
| Net assets at end of period (000's) | $ | 214,260 | $ | 206,441 | $ | 185,545 | $ | 118,064 | $ | 33,106 | |||||||||||||
(a) Per share data was calculated using average shares outstanding during the period.
(b) Total return at net asset value assuming all distributions reinvested and no initial sales charge or contingent deferred sales charge.
(c) Had the Investment Adviser and/or Transfer Agent not waived and/or reimbursed a portion of expenses, total return would have been reduced.
(d) The benefits derived from custody fees paid indirectly had no impact.
| Class C Shares | Year ended December 31, | ||||||||||||||||||||||
| Selected data for a share outstanding throughout each period | 2006 | 2005 | 2004 | 2003 | 2002 | ||||||||||||||||||
| Net Asset Value, Beginning of Period | $ | 21.69 | $ | 20.23 | $ | 17.64 | $ | 13.73 | $ | 15.05 | |||||||||||||
| Income from Investment Operations | |||||||||||||||||||||||
| Net investment loss (a) | (0.31 | ) | (0.25 | ) | (0.30 | ) | (0.30 | ) | (0.25 | ) | |||||||||||||
| Net realized and unrealized gain (loss) | 4.28 | 2.24 | 3.33 | 4.30 | (1.07 | ) | |||||||||||||||||
| Total from Investment Operations | 3.97 | 1.99 | 3.03 | 4.00 | (1.32 | ) | |||||||||||||||||
| Less Distributions Declared to Shareholders | |||||||||||||||||||||||
| From net realized gains | (0.59 | ) | (0.53 | ) | (0.44 | ) | (0.09 | ) | — | ||||||||||||||
| Net Asset Value, End of Period | $ | 25.07 | $ | 21.69 | $ | 20.23 | $ | 17.64 | $ | 13.73 | |||||||||||||
| Total Return (b) | 18.37 | %(c) | 9.91 | %(c) | 17.24 | %(c) | 29.14 | % | (8.77 | )%(c) | |||||||||||||
| Ratios to Average Net Assets/Supplemental Data | |||||||||||||||||||||||
| Expenses (d) | 2.04 | % | 2.08 | % | 2.25 | % | 2.28 | % | 2.35 | % | |||||||||||||
| Net investment loss (d) | (1.34 | )% | (1.24 | )% | (1.64 | )% | (1.80 | )% | (1.76 | )% | |||||||||||||
| Waiver/reimbursement | 0.03 | % | 0.03 | % | 0.02 | % | — | 0.10 | % | ||||||||||||||
| Portfolio turnover rate | 21 | % | 19 | % | 34 | % | 16 | % | 40 | % | |||||||||||||
| Net assets at end of period (000's) | $ | 173,152 | $ | 149,160 | $ | 110,435 | $ | 64,212 | $ | 10,919 | |||||||||||||
(a) Per share data was calculated using average shares outstanding during the period.
(b) Total return at net asset value assuming all distributions reinvested and no initial sales charge or contingent deferred sales charge.
(c) Had the Investment Adviser and/or Transfer Agent not waived and/or reimbursed a portion of expenses, total return would have been reduced.
(d) The benefits derived from custody fees paid indirectly had no impact.
See accompanying notes to financial statements.
72
Columbia Acorn Family of Funds
Financial Highlights
| Columbia Thermostat Fund Class A Shares | Year Ended December 31, | Inception March 3, 2003 through December 31, | |||||||||||||||||
| Selected data for a share outstanding throughout each period | 2006 | 2005 | 2004 | 2003 | |||||||||||||||
| Net Asset Value, Beginning of Period | $ | 12.49 | $ | 13.11 | $ | 12.30 | $ | 10.10 | |||||||||||
| Income from Investment Operations | |||||||||||||||||||
| Net investment income (a) | 0.45 | 0.39 | 0.28 | 0.18 | |||||||||||||||
| Net realized and unrealized gain | 0.84 | 0.29 | 0.81 | 2.15 | |||||||||||||||
| Total from Investment Operations | 1.29 | 0.68 | 1.09 | 2.33 | |||||||||||||||
| Less Distributions Declared to Shareholders | |||||||||||||||||||
| From net investment income | (0.47 | ) | �� | (0.39 | ) | (0.25 | ) | (0.13 | ) | ||||||||||
| From net realized gains | (0.72 | ) | (0.91 | ) | (0.03 | ) | (0.00 | )(b) | |||||||||||
| Total Distributions Declared to Shareholders | (1.19 | ) | (1.30 | ) | (0.28 | ) | (0.13 | ) | |||||||||||
| Net Asset Value, End of Period | $ | 12.59 | $ | 12.49 | $ | 13.11 | $ | 12.30 | |||||||||||
| Total Return (c)(d) | 10.56 | % | 5.25 | % | 8.92 | % | 23.10 | %(e) | |||||||||||
| Ratios to Average Net Assets/Supplemental Data | |||||||||||||||||||
| Expenses (f)(g) | 0.50 | % | 0.50 | % | 0.50 | % | 0.57 | %(h) | |||||||||||
| Net investment income (g) | 3.53 | % | 2.97 | % | 2.23 | % | 1.86 | %(h) | |||||||||||
| Reimbursement/waiver | 0.20 | % | 0.15 | % | 0.33 | % | 0.66 | %(h) | |||||||||||
| Portfolio turnover rate | 66 | % | 96 | % | 67 | % | 61 | % | |||||||||||
| Net assets at end of period (000's) | $ | 58,013 | $ | 71,034 | $ | 77,092 | $ | 42,271 | |||||||||||
(a) Per share data was calculated using average shares outstanding during the period. Recognition of net investment income by the Fund is affected by the timing of the declaration of dividends by the underlying investment companies in which the Fund invests.
(b) Rounds to less than $(0.01) per share.
(c) Total return at net asset value assuming all distributions reinvested and no initial sales charge or contingent deferred sales charge.
(d) Had the Investment Adviser and/or Transfer Agent not reimbursed a portion of expenses, total return would have been reduced.
(e) Not annualized.
(f) Does not include expenses of the investment companies in which the Fund invests.
(g) The benefits derived from custody fees paid indirectly had no impact.
(h) Annualized.
| Class B Shares | Year Ended December 31, | Inception March 3, 2003 through December 31, | |||||||||||||||||
| Selected data for a share outstanding throughout each period | 2006 | 2005 | 2004 | 2003 | |||||||||||||||
| Net Asset Value, Beginning of Period | $ | 12.51 | $ | 13.14 | $ | 12.32 | $ | 10.10 | |||||||||||
| Income from Investment Operations | |||||||||||||||||||
| Net investment income (a) | 0.38 | 0.31 | 0.19 | 0.10 | |||||||||||||||
| Net realized and unrealized gain | 0.84 | 0.28 | 0.83 | 2.16 | |||||||||||||||
| Total from Investment Operations | 1.22 | 0.59 | 1.02 | 2.26 | |||||||||||||||
| Less Distributions Declared to Shareholders | |||||||||||||||||||
| From net investment income | (0.39 | ) | (0.31 | ) | (0.17 | ) | (0.04 | ) | |||||||||||
| From net realized gains | (0.72 | ) | (0.91 | ) | (0.03 | ) | (0.00 | )(b) | |||||||||||
| Total Distributions Declared to Shareholders | (1.11 | ) | (1.22 | ) | (0.20 | ) | (0.04 | ) | |||||||||||
| Net Asset Value, End of Period | $ | 12.62 | $ | 12.51 | $ | 13.14 | $ | 12.32 | |||||||||||
| Total Return (c)(d) | 9.91 | % | 4.56 | % | 8.27 | % | 22.38 | %(e) | |||||||||||
| Ratios to Average Net Assets/Supplemental Data | |||||||||||||||||||
| Expenses (f)(g) | 1.06 | % | 1.10 | % | 1.18 | % | 1.32 | %(h) | |||||||||||
| Net investment income (g) | 2.99 | % | 2.39 | % | 1.55 | % | 1.06 | %(h) | |||||||||||
| Reimbursement/waiver | 0.23 | % | 0.19 | % | 0.29 | % | 0.66 | %(h) | |||||||||||
| Portfolio turnover rate | 66 | % | 96 | % | 67 | % | 61 | % | |||||||||||
| Net assets at end of period (000's) | $ | 72,367 | $ | 78,444 | $ | 78,040 | $ | 51,501 | |||||||||||
(a) Per share data was calculated using average shares outstanding during the period. Recognition of net investment income by the Fund is affected by the timing of the declaration of dividends by the underlying investment companies in which the Fund invests.
(b) Rounds to less than $(0.01) per share.
(c) Total return at net asset value assuming all distributions reinvested and no initial sales charge or contingent deferred sales charge.
(d) Had the Investment Adviser and/or Transfer Agent not reimbursed a portion of expenses, total return would have been reduced.
(e) Not annualized.
(f) Does not include expenses of the investment companies in which the Fund invests.
(g) The benefits derived from custody fees paid indirectly had no impact.
(h) Annualized.
See accompanying notes to financial statements.
73
Columbia Acorn Family of Funds
Financial Highlights, continued
| Class C Shares | Year Ended December 31, | Inception March 3, 2003 through December 31, | |||||||||||||||||
| Selected data for a share outstanding throughout each period | 2006 | 2005 | 2004 | 2003 | |||||||||||||||
| Net Asset Value, Beginning of Period | $ | 12.51 | $ | 13.13 | $ | 12.32 | $ | 10.10 | |||||||||||
| Income from Investment Operations | |||||||||||||||||||
| Net investment income (a) | 0.36 | 0.29 | 0.19 | 0.11 | |||||||||||||||
| Net realized and unrealized gain | 0.84 | 0.29 | 0.81 | 2.15 | |||||||||||||||
| Total from Investment Operations | 1.20 | 0.58 | 1.00 | 2.26 | |||||||||||||||
| Less Distributions Declared to Shareholders | |||||||||||||||||||
| From net investment income | (0.37 | ) | (0.29 | ) | (0.16 | ) | (0.04 | ) | |||||||||||
| From net realized gains | (0.72 | ) | (0.91 | ) | (0.03 | ) | (0.00 | )(b) | |||||||||||
| Total Distributions Declared to Shareholders | (1.09 | ) | (1.20 | ) | (0.19 | ) | (0.04 | ) | |||||||||||
| Net Asset Value, End of Period | $ | 12.62 | $ | 12.51 | $ | 13.13 | $ | 12.32 | |||||||||||
| Total Return (c)(d) | 9.72 | % | 4.49 | % | 8.13 | % | 22.38 | %(e) | |||||||||||
| Ratios to Average Net Assets/Supplemental Data | |||||||||||||||||||
| Expenses (f)(g) | 1.25 | % | 1.25 | % | 1.25 | % | 1.32 | %(h) | |||||||||||
| Net investment income (g) | 2.81 | % | 2.21 | % | 1.48 | % | 1.10 | %(h) | |||||||||||
| Reimbursement/waiver | 0.23 | % | 0.19 | % | 0.26 | % | 0.66 | %(h) | |||||||||||
| Portfolio turnover rate | 66 | % | 96 | % | 67 | % | 61 | % | |||||||||||
| Net assets at end of period (000's) | $ | 27,375 | $ | 28,316 | $ | 31,161 | $ | 20,087 | |||||||||||
(a) Per share data was calculated using average shares outstanding during the period. Recognition of net investment income by the Fund is affected by the timing of the declaration of dividends by the underlying investment companies in which the Fund invests.
(b) Rounds to less than $(0.01) per share.
(c) Total return at net asset value assuming all distributions reinvested and no initial sales charge or contingent deferred sales charge.
(d) Had the Investment Adviser and/or Transfer Agent not reimbursed a portion of expenses, total return would have been reduced.
(e) Not annualized.
(f) Does not include expenses of the investment companies in which the Fund invests.
(g) The benefits derived from custody fees paid indirectly had no impact.
(h) Annualized.
See accompanying notes to financial statements.
74
Columbia Acorn Family of Funds
Notes to Financial Statements
1. Nature of Operations
Columbia Acorn Fund, Columbia Acorn International, Columbia Acorn USA, Columbia Acorn International Select, Columbia Acorn Select and Columbia Thermostat Fund (the "Funds") are each a series of Columbia Acorn Trust (the "Trust"), an open-end investment management company organized as a Massachusetts business trust. The investment objective of each Fund, excluding Columbia Thermostat Fund, is to seek long-term growth of capital. The investment objective of Columbia Thermostat Fund is to provide long-term total return. The Fund pursues its investment objective by investing in shares of other mutual funds. As a "fund of funds" under normal circumstances, the Fund allocates at least 95% of its net assets among a selected group of stock and bond mutual funds ("portfolio funds") according to the current level of the Standard & Poor's 500 Stock Index in relation to predetermined ranges set by the Fund's investment adviser. The Fund may invest up to 5% of its net assets plus any cash received that day in cash, repurchase agreements, high quality short-term paper and government securities.
The Funds may issue an unlimited number of shares. The Funds currently offer four classes of shares: Class A, Class B, Class C and Class Z.
Class A shares are sold with a front-end sales charge. Class A shares bought without an initial sales charge in accounts aggregating up to $50 million at the time of purchase are subject to a 1.00% contingent deferred sales charge ("CDSC") if the shares are sold within 12 months of the time to purchase.
Class B shares are subject to a CDSC if sold within six years of purchase. Class B shares will convert to Class A shares automatically eight years after purchase.
Class C shares are subject to a CDSC on redemptions made within one year after purchase.
Columbia Acorn International and Columbia Acorn International Select impose a 2% redemption fee on Class A, Class B, Class C and Class Z shares that are redeemed within 60 days or less. See "Fund Policy on Trading of Fund Shares" as disclosed in the Funds' prospectuses for more information.
Class Z shares are offered continuously at net asset value. There are certain restrictions on the purchase of Class Z shares. Generally, Class Z shares of a Fund may be exchanged for shares of another fund distributed by Columbia Management Distributors, Inc. at no additional charge. However, if Class Z shares of Columbia Acorn International or Columbia Acorn International Select are redeemed or exchanged within 60 days after purchase, the Fund charges you a redemption fee of 2% of the redemption proceeds, with certain exceptions.
The financial highlights for Class Z shares are presented in a separate annual report.
Investment income, realized and unrealized gains and losses, and certain fund-level expenses are borne pro rata on the basis of the relative net assets of all classes, except each class bears certain expenses unique to that class such as distribution services, transfer agent, and certain other class specific expenses. Differences in class expenses may result in payment of different dividend distributions for each class. All the share classes of the Trust have equal rights with respect to voting subject to Fund or class specific matters.
2. Significant Accounting Policies
>Security valuation
Securities of the Funds are valued at marked value or, if a market quotation for a security is not readily available or is deemed not to be reliable because of events or circumstances that have occurred between the market quotation and the time as of which the security is to be valued, the security is valued at a fair value determined in accordance with procedures established by the Board of Trustees. With respect to Columbia Thermostat Fund, investments in portfolio funds are valued at their net asset value as reported by the underlying funds. A security traded on a securities exchange or in an over-the-counter market in which transaction prices are reported is valued at the last sales price at the time of valuation. A security traded principally on the NASDAQ is valued at the NASDAQ official closing price. A security for which there is no reported sale on the valuation date is valued at the latest bid quotation. A short-term d ebt obligation having a maturity of 60 days or less from the valuation date is valued at amortized cost, which approximates fair value. A security for which a market quotation is not readily available and any other assets are valued as determined in good faith by the Board of Trustees. The Trust has retained an independent statistical fair value pricing service to assist in the fair valuation process for securities principally traded in a foreign market in order to adjust for possible changes in value that may occur between the close of the foreign exchange and the time as of which the securities are to be valued. If a security is valued at a "fair value," that value may be different from the last quoted market price for the security.
In September 2006, Statement of Financial Accounting Standards No. 157, Fair Value Measurements ("SFAS 157"), was issued. SFAS 157 is effective for fiscal years beginning after
75
Columbia Acorn Family of Funds
Notes to Financial Statements, continued
November 15, 2007. SFAS 157 defines fair value, establishes a framework for measuring fair value and expands disclosures about fair value measurements. Management has recently begun to evaluate the impact the application of SFAS 157 will have on the Funds' financial statement disclosures.
>Repurchase agreements
The Funds may engage in repurchase agreement transactions. The Funds, through their custodians, receive delivery of underlying securities collateralizing repurchase agreements. The Funds' investment adviser determines that the value of the underlying securities is at all times at least equal to the resale price. In the event of default or bankruptcy by the other party to the agreement, realization and/or retention of the collateral may be subject to legal proceedings.
>Foreign currency translations
Values of investments denominated in foreign currencies are converted into U.S. dollars using the spot market rate of exchange at the time of valuation. Purchases and sales of investments and dividend and interest income are translated into U.S. dollars using the spot market rate of exchange prevailing on the respective dates of such transactions. The gain or loss resulting from changes in foreign exchange rates is included with net realized and unrealized gain or loss from investments, as appropriate.
>Security transactions and investment income
Security transactions, investment income and portfolio fund transactions are accounted for on the trade date (date the order to buy or sell is executed) and dividend income and realized gain distributions from other funds are recorded on the ex-dividend date, except that certain dividends from foreign securities are recorded as soon as the information is available to the Funds. Interest income is recorded on the accrual basis and includes amortization of discounts on debt obligations when required for federal income tax purposes. Realized gains and losses from security transactions are reported on an identified cost basis.
Awards from class action litigation may be recorded as a reduction of cost. If the applicable securities are no longer owned, the proceeds are recorded as realized gains.
The Funds estimate components of distributions from real estate investment trusts ("REITs"). Distributions received in excess of income are recorded as a reduction of the cost of the related investments. If the applicable securities are no longer owned, any distributions received in excess of income are recorded as realized gains.
>Restricted Securities
Restricted securities are securities that may only be resold upon registration under federal securities laws or in transactions exempt from registration. In some cases, the issuer of restricted securities has agreed to register such securities for resale at the issuer's expense either upon demand by the Funds or in connection with another registered offering of the securities. Many restricted securities may be resold in the secondary market in transactions exempt from registration. Such restricted securities may be determined to be liquid under criteria established by the Board of Trustees. The Funds will not incur any registration costs upon such resale.
>Use of estimates
The preparation of financial statements in conformity with accounting principles generally accepted in the United States of America ("GAAP") requires management to make estimates and assumptions that affect the amounts reported in the financial statements and accompanying notes. Actual results may differ from those estimates.
>Financial instruments
Each Fund may purchase or sell exchange-traded financial futures contracts, which are contracts that obligate that Fund to make or take delivery of a financial instrument or the cash value of a securities index at a specified future date at a specified price. A Fund only enters into such contracts to hedge a portion of its portfolio. Gains and losses are reflected as "Net Realized Gain (Loss) on Futures" on the Statements of Operations. Additionally, each Fund, except for Columbia Acorn USA and Columbia Acorn Select, may engage in portfolio hedging with respect to changes in foreign currency exchange rates by entering into forward foreign currency contracts to purchase or sell foreign currencies. The Statements of Operations reflect gains and losses as realized for closed forward foreign currency contracts and unrealized for open contracts. The Funds bear the market risk that arises from changes in the value of financial instrum ents and securities indices (futures contracts) or from changes in foreign currency rates (forward foreign currency contracts) and the credit risk should a counterparty fail to perform under such contracts.
None of the Funds entered into futures contracts or forward foreign currency contracts during the year ended December 31, 2006.
>Fund share valuation
Fund shares are sold and redeemed on a continuing basis at net asset value. Net asset value per share is determined daily
76
as of the close of trading on the New York Stock Exchange ("NYSE") on each day the NYSE is open for trading. All income, expenses (other than the Class A, Class B and Class C shares Rule 12b-1 service and distribution fees and Class A, Class B, Class C and Class Z shares transfer agent fees) and realized and unrealized gains (losses) of a Fund are allocated to each class proportionately on a daily basis for purposes of determining the net asset value of each class. Redemption fees are accounted for as an addition to paid in capital and are allocated to each class proportionately for purposes of determining the net asset value of each class.
>Custody fees/credits
Custody fees are reduced based on each Fund's cash balances maintained with the custodian. The amount is disclosed as a reduction of total expenses on the Statements of Operations.
>Federal income taxes
The Funds have complied with the provisions of the Internal Revenue Code available to regulated investment companies and, in the manner provided therein, distribute all their taxable income, as well as any net realized gain on sales of investments and foreign currency transactions reportable for federal income tax purposes. Columbia Thermostat Fund distributes all of its taxable income, as well as any net realized gain on sales of portfolio fund shares and any distributions of net realized gains received by the Fund from its portfolio funds, reportable for federal income tax purposes. Accordingly, the Funds paid no federal income taxes and no federal income tax provision was required.
>Foreign capital gains taxes
Realized gains in certain countries may be subject to foreign taxes at the fund level, at rates ranging from approximately 10% to 15%. The Funds accrue for such foreign taxes on net realized and unrealized gains at the appropriate rate for each jurisdiction.
>Distributions to Shareholders
Distributions to shareholders are recorded on the ex-date.
>Indemnification
In the normal course of business, each Fund enters into contracts that contain a variety of representations and warranties and which provide general indemnities. A Fund's maximum exposure under these arrangements is unknown, as this would involve future claims against the Fund. Also, under the Trust's organizational documents, the Trustees and Officers of the Trust are indemnified against certain liabilities that may arise out of their duties to the Trust. However, based on experience, the Funds expect the risk of loss due to these warranties and indemnities to be minimal.
3. Federal Tax Information
The timing and character of income and capital gain distributions are determined in accordance with income tax regulations, which may differ from GAAP. Reclassifications are made to a Fund's capital accounts for permanent tax differences to reflect income and gains available for distribution (or available capital loss carryforwards) under income tax regulations.
For the year ended December 31, 2006, permanent book and tax basis differences resulting primarily from differing treatments for distribution reclassifications, tax equalization, foreign currency transactions, passive foreign investment company ("PFIC") adjustments, foreign capital gains tax adjustments and REIT adjustments were identified and reclassified among the components of the Funds' net assets as follows:
| Undistributed/ (Overdistributed) or (Accumulated) Net Investment Income (Loss) | Accumulated Net Realized Gain/Loss | Paid-In Capital | |||||||||||||
| Columbia Acorn Fund | $ | 25,534 | $ | (97,484 | ) | $ | 71,950 | ||||||||
| Columbia Acorn International | 10,006 | (29,717 | ) | 19,711 | |||||||||||
| Columbia Acorn USA | 3,055 | (2,993 | ) | (62 | ) | ||||||||||
| Columbia Acorn International Select | 1,116 | (1,116 | ) | — | |||||||||||
| Columbia Acorn Select | 11,011 | (11,011 | ) | — | |||||||||||
| Columbia Thermostat Fund | (75 | ) | (1,146 | ) | 1,221 | ||||||||||
Net investment income and net realized gains (losses), as disclosed on the Statements of Operations, and net assets were not affected by these reclassifications.
The tax character of distributions paid during the years ended December 31, 2006 and December 31, 2005 was as follows:
| December 31, 2006 | Ordinary Income* | Long-Term Capital Gains | |||||||||
| (in thousands) | |||||||||||
| Columbia Acorn Fund | $ | 102,167 | $ | 1,405,201 | |||||||
| Columbia Acorn International | 47,043 | 386,698 | |||||||||
| Columbia Acorn USA | — | 33,093 | |||||||||
| Columbia Acorn International Select | 198 | — | |||||||||
| Columbia Acorn Select | 9,493 | 41,617 | |||||||||
| Columbia Thermostat Fund | 7,031 | 9,506 | |||||||||
| December 31, 2005 | Ordinary Income* | Long-Term Capital Gains | |||||||||
| (in thousands) | |||||||||||
| Columbia Acorn Fund | $ | 89,415 | $ | 846,121 | |||||||
| Columbia Acorn International | 54,197 | 89,135 | |||||||||
| Columbia Acorn USA | 1,825 | 56,868 | |||||||||
| Columbia Acorn International Select | 1,037 | — | |||||||||
| Columbia Acorn Select | 7,041 | 39,716 | |||||||||
| Columbia Thermostat Fund | 8,262 | 10,978 | |||||||||
*For tax purposes short-term capital gains distributions, if any, are considered ordinary income distributions.
77
Columbia Acorn Family of Funds
Notes to Financial Statements, continued
As of December 31, 2006, the components of distributable earnings on a tax basis were as follows:
| Undistributed Ordinary Income | Undistributed Long-term Capital Gains | Net Unrealized Appreciation* | |||||||||||||
| Columbia Acorn Fund | $ | 30,120 | $ | 222,190 | $ | 7,110,633 | |||||||||
| Columbia Acorn International | 12,300 | 29,026 | 1,586,813 | ||||||||||||
| Columbia Acorn USA | — | 15,636 | 420,311 | ||||||||||||
| Columbia Acorn International Select | 856 | — | 41,912 | ||||||||||||
| Columbia Acorn Select | 9,164 | 9,981 | 662,854 | ||||||||||||
| Columbia Thermostat Fund | 550 | 3,807 | 7,054 | ||||||||||||
*The differences between book-basis and tax-basis net unrealized appreciation/depreciation are primarily due to deferral of losses from wash sales and PFIC adjustments.
Unrealized appreciation and depreciation at December 31, 2006, based on cost of investments for federal income tax purposes was:
| Unrealized Appreciation | Unrealized Depreciation | Net Unrealized Appreciation | |||||||||||||
| Columbia Acorn Fund | $ | 7,490,598 | $ | (379,965 | ) | $ | 7,110,633 | ||||||||
| Columbia Acorn International | 1,655,465 | (68,652 | ) | 1,586,813 | |||||||||||
| Columbia Acorn USA | 468,917 | (48,606 | ) | 420,311 | |||||||||||
| Columbia Acorn International Select | 43,837 | (1,925 | ) | 41,912 | |||||||||||
| Columbia Acorn Select | 690,108 | (27,254 | ) | 662,854 | |||||||||||
| Columbia Thermostat Fund | 7,428 | (374 | ) | 7,054 | |||||||||||
The following capital loss carryforwards, determined as of December 31, 2006, may be available to reduce taxable income arising from future net realized gains on investments, if any, to the extent permitted by the Internal Revenue Code:
| Year of Expiration | Columbia Acorn USA | Columbia Acorn International Select | |||||||||
| (in thousands) | |||||||||||
| 2009 | $ | 1,517 | * | $ | — | ||||||
| 2010 | 506 | 6,126 | |||||||||
| 2011 | — | 2,488 | |||||||||
| TOTAL | $ | 2,023 | $ | 8,614 | |||||||
*Of these carryforwards, $2,023 (expiring in 2009 and 2010) remains from Columbia Acorn USA's merger with Stein Roe Small Company Growth Fund on 7/26/2002. Utilization of Stein Roe Small Company Growth Fund's losses could be subject to limitations imposed by the Internal Revenue Code.
The following capital loss carryforwards were utilized during the year ended December 31, 2006.
| (In thousands) | |||||||
| Columbia Acorn USA | $ | 506 | |||||
| Columbia Acorn International Select | 16,995 | ||||||
In June 2006, the Financial Accounting Standards Board (FASB) issued FASB Interpretation No. 48, Accounting for Uncertainty in Income Taxes, an Interpretation of FASB Statement 109 (the "Interpretation"). This Interpretation is effective for fiscal years beginning after December 15, 2006 and is to be applied to all tax positions upon initial adoption. This Interpretation prescribes a minimum recognition threshold and measurement method for the financial statement recognition of tax positions taken or expected to be taken in a tax return and also requires certain expanded disclosures. Columbia Wanger Asset Management, L.P. ("Columbia WAM"), a wholly owned subsidiary of Columbia Management Group, Inc., which in turn is an indirect, wholly owned subsidiary of Bank of America Corporat ion ("BOA"), has recently begun to evaluate the application of this Interpretation to the Funds and has not at this time quantified the impact, if any, resulting from the adoption of this Interpretation on the Funds' financial statements. Effective December 26, 2006, the U.S. Securities and Exchange Commission has extended required implementation of FIN 48 until June 29, 2007, for mutual funds.
4. Transactions with Affiliates
Columbia WAM furnishes continuing investment supervision to the Funds and is responsible for the overall management of the Funds' business affairs.
Effective August 1, 2006, under the Funds' investment management agreement, fees are accrued daily and paid monthly to Columbia WAM at the annual rates shown in the table below for Columbia Acorn USA and Columbia Acorn Select:
| Columbia Acorn USA | |||||||
| Assets | Annual Fee Rate | ||||||
| Up to $200 million | 0.940 | % | |||||
| $200 million to $500 million | 0.890 | % | |||||
| $500 million to $2 billion | 0.840 | % | |||||
| $2 billion to $3 billion | 0.800 | % | |||||
| $3 billion and over | 0.700 | % | |||||
| Columbia Acorn Select | |||||||
| Assets | Annual Fee Rate | ||||||
| Up to $700 million | 0.850 | % | |||||
| $700 million to $2 billion | 0.800 | % | |||||
| $2 billion to $3 billion | 0.750 | % | |||||
| $3 billion and over | 0.700 | % | |||||
For all of the Funds, and prior to August 1, 2006, for Columbia Acorn USA and Columbia Acorn Select, for the period covered by this report as provided under the Funds' investment management agreement, fees were accrued daily
78
and paid monthly to Columbia WAM at the annual rates shown in the table below for each Fund.
| Columbia Acorn Fund | |||||||
| Assets | Annual Fee Rate | ||||||
| Up to $700 million | 0.740 | % | |||||
| $700 million to $2 billion | 0.690 | % | |||||
| $2 billion to $6 billion | 0.640 | % | |||||
| $6 billion and over | 0.630 | % | |||||
| Columbia Acorn International | |||||||
| Assets | Annual Fee Rate | ||||||
| Up to $100 million | 1.190 | % | |||||
| $100 million to $500 million | 0.940 | % | |||||
| $500 million and over | 0.740 | % | |||||
| Columbia Acorn USA | |||||||
| Assets | Annual Fee Rate | ||||||
| Up to $200 million | 0.940 | % | |||||
| $200 million to $500 million | 0.890 | % | |||||
| $500 million and over | 0.840 | % | |||||
| Columbia Acorn Select | |||||||
| Assets | Annual Fee Rate | ||||||
| Up to $700 million | 0.850 | % | |||||
| $700 million and over | 0.800 | % | |||||
| Columbia Acorn International Select | |||||||
| All Assets | 0.940 | % | |||||
| Columbia Thermostat Fund | |||||||
| All Assets | 0.100 | % | |||||
For the year ended December 31, 2006, the Funds' annualized effective investment advisory fee rates were as follows:
| Columbia Acorn Fund | 0.64 | % | |||||
| Columbia Acorn International | 0.77 | % | |||||
| Columbia Acorn USA | 0.86 | % | |||||
| Columbia Acorn International Select | 0.94 | % | |||||
| Columbia Acorn Select | 0.82 | % | |||||
| Columbia Thermostat Fund | 0.10 | % | |||||
>Expense Limit
Columbia WAM has voluntarily agreed to reimburse the ordinary operating expenses (exclusive of Rule 12b-1 service and distribution fees, interest, taxes and extraordinary expenses, if any) exceeding 1.45% of the average daily net assets for Columbia Acorn International Select Class A, Class B and Class C shares and 1.35% of the average daily net assets for Columbia Acorn Select Class A, Class B and Class C shares. This arrangement may be modified or terminated by either the Funds or Columbia WAM on 30 days notice.
Columbia WAM has agreed to contractually reimburse the ordinary operating expenses (exclusive of Rule 12b-1 service and distribution fees, interest and fees on borrowings, and expenses associated with the Fund's investment in other investment companies) exceeding 0.25% of the average daily net assets of Columbia Thermostat Fund's Class A, Class B and Class C shares through April 30, 2007.
Expenses reimbursed by Columbia WAM for Columbia Acorn International Select and Columbia Thermostat Fund for the year ended December 31, 2006 was $1,423 and $311,952, respectively.
Columbia WAM provides administrative services and receives an administration fee from the Funds at the following rates:
| Columbia Acorn Trust | |||||||
| Average daily net asset value: | Annual Fee Rate | ||||||
| On the first $8 billion | 0.05 | % | |||||
| Next $8 billion | 0.04 | % | |||||
| Average daily net asset in excess of $16 billion | 0.03 | % | |||||
For the year ended December 31, 2006 each Fund's annualized effective administration fee rate was 0.04%. Columbia WAM has delegated to Columbia Management Advisors, LLC, an indirect, wholly owned subsidiary of BOA, responsibility to provide certain administrative services to the Funds.
Columbia Management Distributors, Inc. ("CMDI"), a wholly owned subsidiary of BOA, is the Funds' principal underwriter and receives no compensation on the sale of Class Z shares.
For the year ended December 31, 2006, Columbia Acorn Fund, Columbia Acorn International, Columbia Acorn USA, Columbia Acorn International Select, Columbia Acorn Select and Columbia Thermostat have been advised that CMDI retained $27,806 in underwriting discounts on the sale of Class A shares and received CDSCs of $2,543,079 and $138,559, on Class B and Class C share redemptions, respectively.
Each Fund has adopted a Rule 12b-1 plan which requires it to pay CMDI a monthly service fee equal to 0.25% annually of the average daily net assets attributable to Class A, Class B
79
Columbia Acorn Family of Funds
Notes to Financial Statements, continued
and Class C shares. The Rule 12b-1 plan also requires each fund to pay CMDI a monthly distribution fee equal to 0.60% and 0.75%, annually, of the average daily net assets attributable to Class B and Class C shares, respectively. Effective August 1, 2006 the monthly distribution fee rate for Class B shares was reduced to 0.50% annually, of the average daily net assets. For the period covered by this report the Funds' annualized effective distribution fee rate was 0.56% for Class B shares.
Columbia Management Services, Inc. (the "Transfer Agent"), a wholly owned subsidiary of BOA, provides shareholder services to the Funds and has contracted with Boston Financial Data Services ("BFDS") to serve as sub-transfer agent. For such services, the Transfer Agent receives a fee, paid monthly, at the annual rate of $21.00 per open account. The Transfer Agent also receives reimbursement for certain out-of-pocket expenses. The Transfer Agent waived the reimbursement for certain out-of-pocket expenses through September 30, 2006.
Effective October 1, 2006, a new transfer agency and shareholder servicing agreement was negotiated, which changed the cost of transfer agency services. The annual rate was reduced to $17 per open account. Additionally, fees now include sub-transfer agency services and out of pocket expenses. The Transfer Agent no longer waives its right to reimbursement by the Funds for its out-of-pocket expenses. The new agreement will be fully implemented on April 1, 2007 and is estimated to result in a change of fees paid by shareholders of various share classes in each fund ranging from some decreases to increases up to approximately three basis points.
Expenses waived by the Transfer Agent for the year ended December 31, 2006 were as follows:
| (in thousands) | |||||||
| Columbia Acorn Fund | $ | 2,547 | |||||
| Columbia Acorn International | 280 | ||||||
| Columbia Acorn USA | 169 | ||||||
| Columbia Acorn International Select | 18 | ||||||
| Columbia Acorn Select | 504 | ||||||
| Columbia Thermostat Fund | 94 | ||||||
Certain officers and trustees of the Trust are also officers of Columbia WAM. The Trust makes no direct payments to its officers and trustees who are affiliated with Columbia WAM. Trustees' fees and expenses paid by the Funds for the year ended December 31, 2006 were as follows:
| (in thousands) | |||||||
| Columbia Acorn Fund | $ | 756 | |||||
| Columbia Acorn International | 152 | ||||||
| Columbia Acorn USA | 62 | ||||||
| Columbia Acorn International Select | 3 | ||||||
| Columbia Acorn Select | 36 | ||||||
| Columbia Thermostat Fund | 3 | ||||||
The Board of Trustees appointed a Chief Compliance Officer to the Trust in accordance with federal securities regulations. The Funds, along with other affiliated funds, will pay their pro-rata share of the expenses associated with the Office of the Chief Compliance Officer. These expenses are disclosed separately as "Chief compliance officer expenses" in the Statements of Operations.
The Trust provides a deferred compensation plan for its trustees. Under that plan, a trustee may elect to defer all or a portion of his or her compensation. Amounts deferred are retained by the Trust and represent an unfunded obligation of the Trust. The value of amounts deferred is determined by reference to the change in value of Class Z shares of one or more series of the Trust or a money market fund as specified by the trustee. Benefits under the deferred compensation plan are payable when a trustee ceases to be a member of the Board of Trustees.
An affiliate may include any company in which a fund owns five percent or more of its outstanding voting securities. On December 31, 2006, Columbia Acorn Fund, Columbia Acorn International, Columbia Acorn USA and Columbia Acorn Select each held five percent or more of the outstanding voting securities of one or more companies. Details of investments in those affiliated companies are presented on pages 33, 42, 50 and 59, respectively.
During the year ended December 31, 2006, the Funds engaged in purchase and sale transactions with funds that have a common investment adviser (or affiliated investment advisers), common directors/trustees, and/or common officers.
80
Those transactions complied with Rule 17a-7 under the Investment Company Act of 1940 and were as follows:
| Purchases | Sales | ||||||||||
| (in thousands) | |||||||||||
| Columbia Acorn Fund | 668 | 9,383 | |||||||||
| Columbia Acorn International | 19,816 | 1,299 | |||||||||
| Columbia Acorn USA | — | 131 | |||||||||
| Columbia Acorn International Select | 44 | — | |||||||||
| Columbia Acorn Select | — | 178 | |||||||||
5. Borrowing Arrangements
The Trust participates in a $150 million credit facility, which was entered into to facilitate portfolio liquidity. Interest is charged to each participating fund based on its borrowings at a rate per annum equal to the Federal Funds rate plus 0.50%. In addition, a commitment fee of 0.10% per annum for 2006 was accrued and apportioned among the participating funds based on their pro-rata portion of the unutilized line of credit. The commitment fee is included in "Other expenses" in the Statements of Operations. No amounts were borrowed by the Funds under this facility during the year ended December 31, 2006.
6. Investment Transactions
The aggregate cost of purchases and proceeds from sales other than short-term obligations for the year ended December 31, 2006 were:
| Columbia Acorn Fund | |||||||
| (in thousands) | |||||||
| Investment securities | |||||||
| Purchases | $ | 4,835,276 | |||||
| Proceeds from sales | 3,638,890 | ||||||
| Columbia Acorn International | |||||||
| (in thousands) | |||||||
| Investment securities | |||||||
| Purchases | $ | 1,496,643 | |||||
| Proceeds from sales | 1,105,474 | ||||||
| Columbia Acorn USA | |||||||
| (in thousands) | |||||||
| Investment securities | |||||||
| Purchases | $ | 556,445 | |||||
| Proceeds from sales | 175,858 | ||||||
| Columbia Acorn International Select | |||||||
| (in thousands) | |||||||
| Investment securities | |||||||
| Purchases | $ | 83,230 | |||||
| Proceeds from sales | 55,917 | ||||||
| Columbia Acorn Select | |||||||
| (in thousands) | |||||||
| Investment securities | |||||||
| Purchases | $ | 475,657 | |||||
| Proceeds from sales | 397,359 | ||||||
| Columbia Thermostat Fund | |||||||
| (in thousands) | |||||||
| Investment securities | |||||||
| Purchases | $ | 128,549 | |||||
| Proceeds from sales | 152,932 | ||||||
7. Redemption Fees
For the year ended December 31, 2006, the redemption fees imposed by Columbia Acorn International and Columbia Acorn International Select amounted to $147 and $9, respectively, and are accounted for as additions to paid in capital.
8. Other
For the year ended December 31, 2006, and as a result of an error, Columbia Acorn International Select purchased shares of UrAsia Energy that was subsequently cancelled resulting in a loss of $164. The Fund was reimbursed by Columbia WAM for the full amount of the loss.
9. Legal Proceedings
The Trust, Columbia WAM and the Trustees of the Trust (collectively, the "Columbia defendants") are named as defendants in class and derivative complaints that have been consolidated in a Multi-District Action (the "MDL Action") in the federal district court of Maryland. These lawsuits contend that defendants permitted certain investors to market time their trades in certain Columbia Acorn Funds. The MDL Action is ongoing. However, all claims against Columbia Acorn Trust and the independent trustees of the Trust have been dismissed.
The Trust and Columbia WAM are also defendants in a class action lawsuit that alleges, in summary, that the Trust and Columbia WAM exposed shareholders of Columbia Acorn International Fund to trading by market timers by allegedly: (a) failing to properly evaluate daily whether a significant event affecting the value of the Fund's securities had occurred after foreign markets had closed but before the calculation of the Fund's net asset value ("NAV"); (b) failing to implement the Fund's portfolio valuation and share pricing policies and procedures; and (c) failing to know and implement applicable rules and regulations concerning the calculation of NAV (the "Fair Valuation Lawsuit"). The Seventh Circuit ruled that the plaintiffs' state law claims were preempted under federal law resulting in the dismissal of plaintiffs' complaint. Plaintiffs
81
Columbia Acorn Family of Funds
Notes to Financial Statements, continued
appealed the Seventh Circuit's ruling to the United States Supreme Court. The Supreme Court reversed the Seventh Circuit's ruling on jurisdictional grounds, and the case ultimately was remanded to the state court.
On March 21, 2005, a class action complaint was filed against the Columbia Acorn Trust and Columbia WAM seeking to rescind the CDSC assessed upon redemption of Class B shares of Columbia Acorn Funds due to the alleged market timing of the Columbia Acorn Funds. In addition to the rescission of sales charges, plaintiffs seek recovery of actual damages, attorneys' fees and costs. The case had been transferred to the MDL Action in the federal district court of Maryland.
On April 4, 2006, the plaintiffs and the Columbia defendants named in the MDL Action executed an agreement in principle intended to fully resolve all of the lawsuits consolidated in the MDL Action as well as the Fair Valuation Lawsuit. The court entered a stay after the parties executed a settlement agreement. The settlement has not yet been finalized or approved by the court.
Columbia WAM, the Columbia Acorn Funds and the Trustees of the Trust are also defendants in a consolidated lawsuit filed in the federal district court of Massachusetts alleging that Columbia WAM used Fund assets to make undisclosed payments to brokers as an incentive for the brokers to market the Funds over other mutual funds to investors. The complaint alleges Columbia WAM and the Trustees of the Trust breached certain common law duties and federal laws.
On November 30, 2005, the court dismissed all of the claims alleged against all of the parties in the consolidated complaint. Plaintiffs timely filed a notice of appeal of the district court's dismissal order with the First Circuit Court of Appeals. The parties subsequently executed a settlement term sheet to fully resolve all claims in the litigation. The settlement has not yet been finalized or approved by the court.
On or about January 11, 2005, a putative class action lawsuit was filed in federal district court in Massachusetts against the Trust and the Trustees of the Trust, along with the Columbia Advisers, the sub-administrator of the Columbia Acorn Funds and the Wanger Advisors Funds. The plaintiffs allege that the defendants failed to submit Proof of Claims in connection with settlements of securities class action lawsuits filed against companies in which the Columbia Acorn Funds held positions. The complaint seeks compensatory and punitive damages, and the disgorgement of all fees paid to the Columbia Advisers.
Plaintiffs have voluntarily dismissed the Trust and its independent trustees.
The Trust and Columbia WAM intend to defend these suits vigorously.
As a result of these matters, or any adverse publicity or other developments resulting from them, there may be increased redemptions or reduced sales of Fund shares, which could increase transaction cost or operating expenses, or have other adverse consequences for the Funds. However, based on currently available information, the Columbia Acorn Trust believes that the likelihood that these lawsuits will have a material adverse impact on any Fund is remote, and Columbia WAM believes that the lawsuits are not likely to materially affect its ability to provide investment management services to the Funds.
For the year ended December 31, 2006, Columbia Management has assumed consulting services and legal fees incurred by the Funds in connection with these matters and the amounts are as follows:
| (in thousands) | |||||||
| Columbia Acorn Fund | $ | 124 | |||||
| Columbia Acorn International | 25 | ||||||
| Columbia Acorn USA | 10 | ||||||
| Columbia Acorn International Select | 1 | ||||||
| Columbia Acorn Select | 13 | ||||||
| Columbia Thermostat Fund | 1 | ||||||
82
Report of Independent Registered Public Accounting Firm
To the Board of Trustees and Shareholders of
Columbia Acorn Trust:
In our opinion, the accompanying statements of assets and liabilities, including the statements of investments, and the related statements of operations, changes in net assets and the financial highlights present fairly, in all material respects, the financial position of Columbia Acorn Fund, Columbia Acorn International, Columbia Acorn USA, Columbia Acorn International Select, Columbia Acorn Select and Columbia Thermostat Fund (each a series of Columbia Acorn Trust, hereinafter referred to as the "Funds") at December 31, 2006, the results of each of their operations for the year then ended, the changes in each of their net assets for each of the two years in the period then ended and the financial highlights for each of the three years in the period then ended, in conformity with accounting principles generally accepted in the United States of America. These financial statements and financial highlights (hereafter referred to a s "financial statements") are the responsibility of the Funds' management; our responsibility is to express an opinion on these financial statements based on our audits. We conducted our audits of these financial statements in accordance with the standards of the Public Company Accounting Oversight Board (United States). Those standards require that we plan and perform the audits to obtain reasonable assurance about whether the financial statements are free of material misstatement. An audit includes examining, on a test basis, evidence supporting the amounts and disclosures in the financial statements, assessing the accounting principles used and significant estimates made by management, and evaluating the overall financial statement presentation. We believe that our audits, which included confirmation of securities at December 31, 2006 by correspondence with the custodian and brokers, provide a reasonable basis for our opinion. The financial highlights of the Funds for the periods ended December 31, 2003 a nd prior were audited by other independent auditors whose report dated February 6, 2004 expressed an unqualified opinion on those financial statements.
PricewaterhouseCoopers LLP
Chicago, Illinois
February 13, 2007
83
Columbia Acorn Family of Funds
Unaudited Information — Class A, B, C and Z shares
Federal Income Tax Information (in thousands)
Columbia Acorn Fund
For the fiscal year ended December 31, 2006, the Fund designated long-term capital gains of $1,499,324.
100.00% of the ordinary income distributed by the Fund, for the year ended December 31, 2006, qualified for the corporate dividends received deduction.
For non-corporate shareholders 87.74%, or the maximum amount allowable under the Jobs and Growth Tax Relief Reconciliation Act of 2003, of income earned by the Fund for the period January 1, 2006 to December 31, 2006 may represent qualified dividend income. Final information will be provided in your 2006 1099-Div Form.
Columbia Acorn International
For the fiscal year ended December 31, 2006, the Fund designated long-term capital gains of $377,272. Foreign taxes paid during the fiscal year ended December 31, 2006, amounting to $5,331 ($0.05 per share) are expected to be passed through to shareholders as 100% allowable foreign tax credits on Form 1099-Div for the year ended December 31, 2006.
For non-corporate shareholders 96.78%, or the maximum amount allowable under the Jobs and Growth Tax Relief Reconciliation Act of 2003, of income earned by the Fund for the period January 1, 2006 to December 31, 2006 may represent qualified dividend income. Final information will be provided in your 2006 1099-Div Form.
Gross income derived from sources within foreign countries amounted to $65,837 ($0.61 per share) for the fiscal year ended December 31, 2006.
Columbia Acorn USA
For the fiscal year ended December 31, 2006, the Fund designated long-term capital gains of $43,304.
Columbia Acorn International Select
Foreign taxes paid during the fiscal year ended December 31, 2006, amounting to $129 ($0.02 per share) are expected to be passed through to shareholders as 100% allowable foreign tax credits on Form 1099-Div for the year ended December 31, 2006.
Gross income derived from sources within foreign countries amounted to $1,927 ($0.35 per share) for the fiscal year ended December 31, 2006.
For non-corporate shareholders 100.00%, or the maximum amount allowable under the Jobs and Growth Tax Relief Reconciliation Act of 2003, of income earned by the Fund for the period January 1, 2006 to December 31, 2006 may represent qualified dividend income. Final information will be provided in your 2006 1099-Div Form.
Columbia Acorn Select
For the fiscal year ended December 31, 2006, the Fund designated long-term capital gains of $51,597.
93.93% of the ordinary income distributed by the Fund, for the year ended December 31, 2006, qualified for the corporate dividends received deduction.
For non-corporate shareholders 96.63%, or the maximum amount allowable under the Jobs and Growth Tax Relief Reconciliation Act of 2003, of income earned by the Fund for the period January 1, 2006 to December 31, 2006 may represent qualified dividend income. Final information will be provided in your 2006 1099-Div Form.
Columbia Thermostat Fund
For the fiscal year ended December 31, 2006, the Fund designated long-term capital gains of $10,806.
84
[Excerpts from:]
Columbia Acorn Trust
Management Fee Evaluation of the Senior Officer
Prepared Pursuant to the New York Attorney General's
Assurance of Discontinuance
Robert P. Scales
Senior Vice President,
Chief Legal Officer
and General Counsel
2006
85
Introduction
The New York Attorney General's Assurance of Discontinuance ("Order") entered into by Columbia Management Advisors, Inc. ("CMAI") and Columbia Management Distributors, Inc., ("CMDI" and collectively with "CMAI," "CMG") in February 2005, allows CMAI to manage or advise a mutual fund, including the Acorn Trust's family of funds (the "Acorn Funds" or "Acorn" or "Trust"), only if the trustees of the Acorn Funds appoint a "Senior Officer" to perform specified duties and responsibilities. One of these responsibilities includes "managing the process by which proposed management fees (including but not limited to, advisory fees) to be charged the [Acorn Funds] are negotiated so that they are negotiated in a manner which is at arms' length and reasonable and consistent with this Assurance of Discontinuance."
The Order also provides that the Board of Trustees of the Acorn Funds ("Board") must determine the reasonableness of proposed "management fees" by using either an annual competitive bidding process supervised by the Senior Officer or Independent Fee Consultant, or by obtaining "an annual independent written evaluation prepared by or under the direction of the Senior Officer or the Independent Fee Consultant."
"Management fees" are only part of the costs and expenses paid by mutual fund shareholders. The expenses can vary depending upon the class of shares held but usually include: (1) investment management or advisory fees to compensate analysts and portfolio managers for stock research and portfolio management, as well as the cost of operating a trading desk; (2) administrative expenses incurred to prepare registration statements and tax returns, calculate the Funds' net asset values, maintain effective compliance procedures and perform recordkeeping services; (3) transfer agency costs for establishing accounts, accepting and disbursing funds, as well as overseeing trading in Fund shares; (4) custodial expenses incurred to hold the securities purchased by the Funds; and (5) distribution expenses, including commissions paid to brokers that sell the Fund shares to investors.
Columbia Wanger Asset Management, L.P. ("CWAM"), the adviser to the Acorn Funds, has proposed that the Trust enter into separate agreements governing the first two categories listed above: an advisory agreement governing portfolio management, and an administration agreement governing certain administration and clerical services. Together the fees paid under these two agreements are referred to as "management fees." Other fund expenses are governed by separate agreements, in particular agreements with two CWAM affiliates: CMDI, the broker-dealer that underwrites and distributes the Acorn Funds' shares, and Columbia Management Services, Inc. ("CMSI"), the Funds' transfer agent. In conformity with the terms of the Order, this evaluation, therefore, addresses only the advisory and administrative contracts between CWAM and the Trust, and does not extend to the other agreements.
According to the Order, the Senior Officer's evaluation must consider at least the following:
(1) Management fees (including components thereof) charged to institutional and other clients of CWAM for like services;
(2) Management fees (including any components thereof) charged by other mutual fund companies for like services;
(3) Costs to CWAM and its affiliates of supplying services pursuant to the management fee agreements, excluding any intra-corporate profit;
(4) Profit margins of CWAM and its affiliates from supplying such services;
(5) Possible economies of scale as the Acorn Funds grow larger; and
(6) The nature and quality of CWAM's services, including the performance of each Acorn Fund.
On November 16, 2004, the Board appointed me Senior Officer under the Order. The Board also determined not to pursue a competitive bidding process and instead, charged me with the responsibility of evaluating the Acorn Funds' proposed advisory and administrative fee contracts with CWAM in conformity with the requirements of the Order. This Report is an annual evaluation required under the Order. In discharging their responsibilities, the independent Trustees have also consulted independent, outside counsel.
86
2005 Evaluation
This is the second annual evaluation prepared in connection with the Order. The first annual evaluation ("2005 Evaluation") was issued on July 20, 2005. This evaluation follows the same structure as the 2005 Evaluation. Some areas are given more emphasis here, while others are given less. Still, the fundamental information gathered for this evaluation is the largely the same as last year. I have noted in this Report where methodologies diverged significantly.
This evaluation was performed in cooperation and regular communication with the Contract Review Committee of the Board of Trustees.
Process and Independence
The objectives of the Order are to insure the independent evaluation of the advisory fees paid by the Acorn Funds as well as to insure that all relevant factors are considered. In my view, the contract renewal process has been conducted at arms-length and with independence in gathering, considering and evaluating all relevant data. At the outset of the process, the Trustees sought and obtained from CWAM and CMG a comprehensive compilation of data regarding Fund performance and expense, adviser profitability, and other information. In advance of the contract renewal process, the Board also explored CWAM's potential capacity restraints, an issue posed by the size of the Acorn Fund and by some of the observations from the 2005 Evaluation. Performance and expense data was obtained from both Morningstar and Lipper, the leading consultants in this area. The rankings prepared by Morningstar and Lipper were independent and were not infl uenced by the adviser. CWAM itself identified what it considers its competition in formulating its own peer group, and the Trustees considered that data as well.
In the course of its work, the Contract Committee gave careful consideration to the conclusions and recommendations contained in the 2005 Evaluation. In particular, the Contract Committee considered the possible introduction of a two-tiered fee structure that would set fees on the basis of a combined CWAM complex level and individual fund level. The Committee concluded that such a fee structure might be confusing to shareholders, though it has not foreclosed such a structure in the future. The Committee is continuing to consider whether economies of scale are appropriately reflected in the Funds' fee schedules.
My evaluation of the advisory contract was shaped, as it was last year, by my experience as Acorn's Chief Compliance Officer ("CCO"). As CCO, I report solely to the Board and have no reporting obligation to or employment relationship with CMG or its affiliates, except for administrative purposes. This too contributes to the independence of this evaluation. I have commented on compliance matters in evaluating the quality of service provided by CWAM.
This Report, its supporting materials and the data contained in other materials submitted to the Contract Committee of the Board, in my view, provide a thorough factual basis upon which the Board, in consultation with independent counsel as it deems appropriate, may conduct management fee negotiations that are in the best interests of the Acorn Funds' shareholders.
The Fee Reductions Mandated under the Order
Under the terms of the Order, CMG agreed to secure certain management fee reductions for the mutual funds advised by its affiliate investment advisers. In some instances, breakpoints were also established. Although neither CWAM nor the Trust was a party to the Order, CWAM offered and the Board accepted certain advisory fee reductions last year. By the terms of the Order, these fees may not be increased before November 30, 2009. I have used these advisory fee levels in my evaluation because they are the fees in the current agreements that CWAM proposes should be continued. Hence, these fee levels are the starting point of an evaluation.
87
Conclusions
My review of the data and other material above leads to the following conclusions with respect to the factors identified in the Order.
1. Performance. The domestic Funds generally have achieved outstanding performance. The Acorn Fund, Acorn USA and Acorn Select all rank very favorably against their peers. The international Funds have not, however, performed nearly as well as the domestic funds, and continue to lag their benchmarks and peers. Management is taking steps to improve the performance of these funds.
2. Management Fees relative to Peers. The management fee rankings for most of the Funds are generally more favorable to shareholders than those of their peer group funds. Management fees do vary by Fund. Acorn Fund is the least expensive and the Acorn USA the most expensive. Acorn USA and Acorn Select were ranked by both Lipper and Morningstar below many of their peers, and therefore impose higher fees than do some of their competitors.
3. Administrative Fees. The Acorn Funds' administrative fee, which is uniform across all Funds, is at a level comparable to that of most peers, provides for appropriate services to Funds, and affords breakpoints that lower the fee as assets increase.
4. Management Fees relative to Institutional and Other Mutual Fund Accounts. CWAM's focus is on its mutual funds. It does not actively seek to manage separate or institutional accounts. The few institutional accounts it does manage vary in rate structures. Some pay advisory fees commensurate with or higher than the Acorn Funds. In a few instances, however, institutional accounts pay lower advisory fees than do the Acorn Funds. One particular institutional account is significant in size and has been under CWAM's management for over 25 years. Finally, in two instances, the Acorn Funds pay slightly higher fees than do similar funds sold through insurance companies.
5. Costs to CWAM and its Affiliates. CWAM's direct costs do not appear excessive, and in some areas have declined in the past year. Indirect costs allocated to CWAM by its parent organization, however, have increased substantially. CWAM's affiliates report operating losses and therefore do not appear to profit from CWAM's advisory agreement with the Acorn Funds.
6. Profit Margins. CWAM's firm-wide, pre-marketing expense profit margins are at the top of the industry, though these comparisons are hampered by limited industry data. High profit margins are not unexpected for firms that manage large, successful funds and have provided outstanding investment performance for investors.
7. Economies of Scale. Economies of scale do exist at CWAM and will expand as the assets of the Acorn Funds get larger. They are, however, only partially reflected in the management fee schedule for the Funds. If the Acorn Funds' assets continue to grow, under the Funds' current fee schedules, shareholders might not benefit in a manner generally commensurate with CWAM's increased profits.
8. Nature and Quality of Services. This category includes a variety of considerations that are difficult to quantify, yet can have a significant bearing on the performance of the Acorn Funds. Several areas merit comment.
a. Capacity. The Funds have continued to grow, posing ever greater challenges in deploying assets effectively. While trends here merit continued monitoring, CWAM appears to be managing assets effectively.
88
b. Compliance. CWAM has a reasonably designed compliance program that protects shareholders.
c. Administrative Services. The Acorn Funds benefit from a variety of administrative services that are performed by CWAM and CMAI.
In my opinion, the process of negotiating an advisory contract for the Acorn Funds has been conducted thoroughly and at arms' length. Further, the Trustees have sufficient information to evaluate management's proposal, and negotiate contract terms that are in the best interests of fund shareholders.
Recommendations
I believe the Trustees should:
1. Continue to consider ways to restructure the advisory fee beyond the current breakpoint schedule to reflect more fully economies of scale.
2. Monitor the performance of Acorn International and Acorn International Select.
3. Continue to monitor CWAM's capacity limitations to insure that Acorn Fund's expanding assets do not impair investment performance.
Robert P. Scales
July 18, 2006
89
Board Approval of the Advisory Agreements
Columbia Acorn Trust (the "Trust") has an investment advisory agreement (the "Agreement") with Columbia Wanger Asset Management, L.P. ("CWAM") under which CWAM manages the Columbia Acorn Funds (the "Funds"). The trustees of the Trust, more than eighty percent of whom have never been affiliated with CWAM ("Independent Trustees"), oversee the management of each Fund and, as required by law, determine at least annually whether to continue the Agreement for each Fund.
The Contract Committee of the board of trustees (the "Committee"), which is comprised of five Independent Trustees, makes recommendations to the board regarding any proposed continuation of the Agreement. After the Committee has made its recommendation, the full board determines whether to approve the continuation of the Agreement. In addition, the board considers matters bearing on the Agreement at most of its other meetings throughout the year and meets at least quarterly with the portfolio managers employed by CWAM.
In connection with their most recent consideration of the Agreement for each Fund, the Committee and all trustees received and reviewed a substantial amount of information provided by CWAM in response to requests of the Independent Trustees and their counsel. Throughout their consideration of the agreements, the Independent Trustees were advised by their independent legal counsel. At each of the meetings at which the Committee or the Independent Trustees considered the Agreement, they met with management and also met separately in executive session with their counsel.
The materials reviewed by the Committee and the trustees included, among other items, (i) information on the investment performance of each Fund and the performance of peer groups of funds and of the Fund's performance benchmarks, (ii) information on each Fund's advisory fees and other expenses, including information comparing the Fund's fees and expenses to those of peer groups of funds and information about any applicable expense limitations and fee "breakpoints," (iii) data on sales and redemptions of Fund shares and (iv) information on the profitability to CWAM and its affiliates of their relationships with the Funds and potential "fall-out" or ancillary benefits that CWAM and its affiliates may receive as a result of their relationships with the Funds. They also considered other information such as (i) CWAM's financial results and financial condition, (ii) each Fund's investment objective and strategies; (iii) the size, edu cation and experience of CWAM's investment staff and their use of technology, external research and trading cost measurement tools, (iv) the allocation of the Funds' brokerage, if any, including allocations to brokers affiliated with CWAM, and the use of "soft" commission dollars to pay Fund expenses or to pay for research products and services, (v) the resources devoted to, and the record of compliance with, the Funds' investment policies and restrictions, policies on personal securities transactions and other compliance policies, (vi) the response of CWAM and its affiliates to various legal and regulatory proceedings since 2003 and (vii) the economic outlook generally and for the mutual fund industry in particular. In addition, the trustees conferred with, and reviewed the Management Fee Evaluation (the "Fee Evaluation") prepared by, the Trust's chief compliance officer, who also serves as the Trust's "Senior Officer" as contemplated by the Assurance of Discontinuance dated February 9, 2005 among affiliate s of CWAM and the Office of the New York Attorney General. A summary of the Fee Evaluation is included in this report. Throughout the process, the trustees had the opportunity to ask questions of and request additional materials from CWAM.
On July 18, 2006 the board of trustees approved continuation of the Agreement through July 31, 2007, with certain amendments to the fee schedules described below. The board approval followed Committee meetings held in February, April, May and June 2006.
In considering the continuation of the Agreement, the trustees reviewed and analyzed various factors that they determined were relevant, including the factors described below, none of which by itself was considered dispositive. However, the material factors and conclusions that formed the basis for the trustees' determination to approve the continuation of the Agreement are discussed separately below.
Nature, quality and extent of services. The trustees reviewed the nature, quality and extent of the services of CWAM and its affiliates to the Funds, taking into account the investment objective and strategy of each Fund and the knowledge the trustees gained from their regular meetings with management on at least a quarterly basis and their ongoing review of information related to the Funds. In addition, the trustees reviewed the resources and key personnel of CWAM and its affiliates, especially those who provide investment management services to the Funds. The trustees also considered other services provided to the Funds by
90
Board Approval of the Advisory Agreements, continued
CWAM and its affiliates, such as managing the execution of portfolio transactions and the selection of broker-dealers for those transactions, serving as the Funds' administrator, monitoring adherence to the Funds' investment restrictions, producing shareholder reports, providing support services for the board and board committees, communicating with shareholders and overseeing the activities of other service providers, including monitoring compliance with various policies and procedures of the Funds and with applicable securities laws and regulations.
The trustees concluded that: the nature, quality and extent of the services provided by CWAM and its affiliates to each Fund were appropriate and consistent with the terms of the Agreement; that the quality of those services had been consistent with or superior to quality norms in the industry; and that the Funds were likely to benefit from the continued provision of those services. They also concluded that each of CWAM and its affiliates had sufficient personnel, with the appropriate education and experience, to serve the Funds effectively and had demonstrated their continuing ability to attract and retain well-qualified personnel. However, they also noted that the Funds might benefit from more senior personnel at CWAM, especially if the assets managed by CWAM continue to increase.
The trustees also negotiated an amended separate agreement with Columbia Management Group, LLC, the parent of CWAM (the "Compliance Agreement"), intended to strengthen the compliance infrastructure for the Funds.
Performance of the Funds. At various meetings of the board, of the Committee and of the board's investment performance analysis committee, the trustees considered the short-term and longer-term performance of each Fund. They reviewed information comparing each Fund's performance with the performance of the Fund's benchmark and with the performance of comparable funds and peer groups as identified by Lipper Inc. ("Lipper") and Morningstar Associates, LLC ("Morningstar"). They noted that each of Columbia Acorn Fund, Columbia Acorn USA and Columbia Acorn Select had outperformed its respective benchmark and Lipper and Morningstar peers in recent and longer periods and that Columbia Thermostat Fund had outperformed its benchmark for the same time periods. They also discussed the performance of Columbia Acorn International and Columbia Acorn International S elect, noting that, although those Funds underperformed their benchmarks for the most recent three- and five-year periods, the Funds had strong absolute returns. During the contract renewal process, the trustees concluded that, although past performance is not necessarily indicative of future results, the Funds' strong performance record was an important factor in their evaluation of the quality of services provided by CWAM under the Agreement.
Costs of Services and Profits Realized by CWAM. At various Committee meetings and other informal meetings, the trustees examined detailed information on fees and expenses of each Fund in comparison to information for other comparable funds as provided by Lipper and Morningstar. As noted in the Fee Evaluation, the expense ratio of each Fund was lower than the median expense ratio of the Fund's respective peer group, and the expense ratio of Columbia Acorn Fund was very low relative to its peer group. Moreover, the advisory fees for most of the Funds were in line with or lower than fees for their respective peer groups, although the contractual rates of advisory fees and the actual advisory fees for some of the Funds were higher than the median advisory fees of the respective peer groups of those Funds.
At the July 18, 2006 meeting, at the recommendation of the Committee, the board negotiated with CWAM, and both parties approved, an amendment to the Agreement to reduce the schedule of annual advisory fee rates for Columbia USA and Columbia Acorn Select, as a percentage of average net assets. The trustees approved additional breakpoints for Columbia Acorn USA at 80 basis points for net asset levels of $2 billion to $3 billion and at 70 basis points for assets levels of $3 billion and above, and for Columbia Acorn Select at 75 basis points for asset levels of $2 billion to $3 billion and at 70 basis points for asset levels of $3 billion and above, respectively. The trustees determined not to seek additional breakpoints in the fee schedule of any other Fund at that time but recognized that they would continue periodically to evaluate the fees paid by each Fund.
The trustees reviewed the profitability of CWAM in serving as each Fund's investment adviser and of CWAM and its affiliates in all of their relationships with each Fund, as well as an explanation of the methodology utilized in allocating various expenses among the Funds and other business units. The trustees took into account the methodology used by CWAM in determining compensation payable to portfolio managers and the very competitive environment for investment management talent. The trustees recognized that profitability comparisons among fund managers are difficult
91
Board Approval of the Advisory Agreements, continued
because very little comparative information is publicly available and profitability of any manager is affected by numerous factors, including the organizational structure of the particular manager, the types of funds and other accounts it manages, possible other lines of business, the methodology for allocating expenses and the manager's capital structure and cost of capital.
The trustees also reviewed CWAM's advisory fees for other investment companies, sub-advised funds and other institutional separate accounts. CWAM's rates of fees for most of those other accounts utilizing a particular investment strategy were higher than the advisory fees charged to the Funds with a corresponding strategy, although for a few accounts, the fees were lower. The trustees also noted, however, that CWAM performs significant additional services for the Funds that it does not provide to sub-advised funds or non-mutual fund clients, including administrative services, oversight of the Funds' other service providers, trustee support, regulatory compliance and numerous other services, and that, in serving the Funds, CWAM assumes many legal risks that it does not assume in servicing many of its other clients. Finally, the trustees considered the financial condition of CWAM as part of the contract renewal process.
The trustees concluded that the rates of advisory fees (as amended for Columbia Acorn USA and Columbia Acorn Select) and other compensation payable by the Funds to CWAM and its affiliates were reasonable in relation to the nature and quality of the services to be provided, taking into account the fees charged by other advisers for managing comparable mutual funds with similar strategies and the fees CWAM charges to other clients. The trustees also concluded that the overall expense ratio of each Fund was reasonable, taking into account the size of the Fund, the quality of services provided by CWAM and its affiliates and the investment performance of the Fund.
Economies of Scale. The trustees considered information about the potential for CWAM to realize economies of scale as the assets of the Funds increase. They noted that the fee schedule for each Fund, other than Columbia Acorn International Select and Columbia Thermostat Fund, which are relatively modest in asset size, includes reductions in the rate of fees at various asset levels, including the newly established breakpoints for Columbia Acorn USA and Columbia Acorn Select. The trustees also noted that the Funds share directly in economies of scale through lower charges of third-party service providers based on the combined scale of all of the Funds. Based on all of the information they reviewed, the trustees concluded that the current fee structure of each Fund was reasonable and that the current rates of fees do reflect a sharing between CWAM and th e Fund of economies of scale at the current asset level of the Fund. They agreed, however, to continue their periodic consideration of the Funds' fee structures and economies of scale.
Other Benefits to CWAM. The trustees also considered benefits that accrue to CWAM and its affiliates from their relationships with the Funds. They recognized that two affiliates of CWAM separately serve the Funds as transfer agent and distributor, respectively, and that the transfer agent receives compensation from the Funds for services provided. They recognized that, other than the services provided by CWAM and its affiliates pursuant to various agreements and the fees to be paid by each Fund therefor, the Funds and CWAM may potentially benefit from their relationship with each other in other ways. The trustees considered CWAM's use of commissions paid by each Fund on its portfolio brokerage transactions to obtain research products and services benefiting the Fund and/or other clients of CWAM. They concluded that CWAM's use of the Funds' "soft" comm ission dollars to obtain research products and services was consistent with regulatory requirements and guidance then in effect. They also concluded that CWAM benefits from the receipt of proprietary research products and services acquired through commissions paid on portfolio transactions of the Funds and that the Funds benefit from CWAM's receipt of those products and services as well as research products and services acquired through commissions paid by other clients of CWAM. They further concluded that success of any Fund could attract other business to CWAM or other Funds and that the success of CWAM could enhance its ability to serve the Funds.
After full consideration of the above factors, as well as other factors that were instructive in evaluating the Agreement, the trustees, including all of the Independent Trustees, concluded that the continuation of the Agreement, as amended to revise the fee schedules for Columbia Acorn USA and Columbia Acorn Select, was in the best interest of each Fund. On July 18, 2006, the trustees continued the Agreement as so amended through July 31, 2007, contingent upon the execution of the Compliance Agreement, which was subsequently executed on July 31, 2006.
92
Board of Trustees and Management of Columbia Acorn Funds
Each trustee may serve a term of unlimited duration until the end of the calendar year in which the trustee attains the age of 75 years. The trustees appoint their own successors, provided that at least two-thirds of the trustees, after such appointment, have been elected by shareholders. Shareholders may remove a trustee, with or without cause, upon the vote of two-thirds of the Trust's outstanding shares at any meeting called for that purpose. A trustee may be removed, with or without cause, upon the vote of a majority of the trustees. The names of the trustees and officers of Acorn, the date each was first elected or appointed to office, their principal business occupations during at least the last five years, number of portfolios in the fund complex they oversee, and other directorships they hold, are shown below. Each trustee serves in such capacity for each of the six series of Columbia Acorn Trust and for each of the four series of Wanger Advisors Trust.
The address for the trustees and officers of the Trust is Columbia Wanger Asset Management, L.P., 227 West Monroe Street, Suite 3000, Chicago, Illinois 60606. The Funds' Statement of Additional Information includes additional information about the Funds' trustees and officers. You may obtain a free copy of the Statement of Additional Information by writing or calling toll-free:
Columbia Wanger Asset Management, L.P.
Shareholder Services Group
227 W. Monroe, Suite 3000
Chicago IL 60606
888-4-WANGER (888-492-6437)
| Name, Position(s) with Columbia Acorn and Age at December 31, 2006 | Year First Elected or Appointed to Office* | Principal Occupation(s) during Past Five Years | Number of Portfolios in Fund Complex Overseen by Trustee/Officer | Other Directorships | |||||||||||||||
| Trustees who are not interested persons of Columbia Acorn: | |||||||||||||||||||
| Margaret Eisen, 53, Trustee | 2002 | Managing Director, CFA Institute since 2005; Chief Investment Officer, EAM International LLC (corporate finance and asset management) since 2003; prior thereto, managing director, DeGuardiola Advisors (investment bank); formerly managing director, North American Equities at General Motors Asset Management, and director of Worldwide Pension Investments for DuPont Asset Management. | 10 | Antigenics, Inc. (biotechnology and drugs); Wanger Advisors Trust. | |||||||||||||||
| Jerome Kahn, Jr., 72, Trustee | 1987 | Portfolio manager and stock analyst and former president, William Harris Investors, Inc. (investment adviser). | 10 | Wanger Advisors Trust. | |||||||||||||||
| Steven N. Kaplan, 47, Trustee | 1999 | Neubauer Family Professor of Entrepreneurship and Finance, Graduate School of Business, University of Chicago. | 10 | Morningstar, Inc. (provider of independent investment research); Wanger Advisors Trust. | |||||||||||||||
| David C. Kleinman, 71, Trustee | 1972 | Adjunct professor of strategic management, University of Chicago Graduate School of Business; business consultant. | 10 | Sonic Foundry, Inc. (rich media systems and software); Wanger Advisors Trust. | |||||||||||||||
| Allan B. Muchin, 70, Trustee | 1998 | Chairman emeritus, Katten Muchin Zavis Rosenman (law firm). | 10 | Wanger Advisors Trust. | |||||||||||||||
| Robert E. Nason, 70, Chairman of the Board and Trustee | 1998 | Consultant and private investor; formerly executive partner, chief executive officer and member of the executive committee of Grant Thornton, LLP (public accounting firm) and member of the policy board of Grant Thornton International. | 10 | Wanger Advisors Trust. | |||||||||||||||
| James A. Star, 45 Trustee | 2006 | President, Longview Management Group LLC (investment advisor) since 2003, prior thereto portfolio manager; vice president, Henry Crown and Company (investment firm) since 1994; president and chief investment officer, Star Partners (hedge fund) 1998-2003. | 10 | Wanger Advisors Trust. | |||||||||||||||
| Patricia H. Werhane, 71 Trustee | 2006 | Ruffin Professor of Business Ethics, Darden Graduate School of Business Administration, University of Virginia (since 1993); Senior Fellow of the Olsson Center for Applied Ethics, Darden Graduate School of Business Administration, University of Virginia (2001 to present); and Wicklander Chair of Business Ethics and Director of the Institute for Business and Professional Ethics, DePaul University (since September 2003). | 10 | Wanger Advisors Trust. | |||||||||||||||
93
Board of Trustees and Management of Columbia Acorn Funds, continued
| Name, Position(s) with Columbia Acorn and Age at December 31, 2006 | Year First Elected or Appointed to Office* | Principal Occupation(s) during Past Five Years | Number of Portfolios in Fund Complex Overseen by Trustee/Officer | Other Directorships | |||||||||||||||
| Trustees who are not interested persons of Columbia Acorn: (continued) | |||||||||||||||||||
| John A. Wing, 71, Trustee | 2002 | Partner, Dancing Lion Investment Partners (investment partnership); prior thereto, Frank Wakely Gunsaulus Professor of Law and Finance, and chairman of the Center for the Study of Law and Financial Markets, Illinois Institute of Technology; formerly chairman of the board and chief executive officer of ABN-AMRO Incorporated, (formerly named The Chicago Corporation, a financial services firm) and chief executive officer of Market Liquidity Network, LLC. | 10 | First Chicago Bank and Trust and First Chicago Bancorp; Wanger Advisors Trust. | |||||||||||||||
| Trustees who are interested persons of Columbia Acorn: | |||||||||||||||||||
| Charles P. McQuaid, 53, Trustee and President (1) | 1992 | President and Chief Investment Officer, Columbia WAM since 2003; portfolio manager since 1995 and director of research 1992-2003; Columbia WAM interim director of international research, Columbia WAM 2003-2004; president, Wanger Advisors Trust since 2003. | 10 | Wanger Advisors Trust. | |||||||||||||||
| Ralph Wanger, 72, Trustee (2) | 1970 | Founder, former president, chief investment officer and portfolio manager, Columbia WAM (July 1992 to September 2003); president, Columbia Acorn Trust (1992 to September 2003); president, Wanger Advisors Trust (1994 to September 2003); director, Wanger Investment Company PLC; advisor to Columbia WAM (September 2003 to September 2005). | 10 | Wanger Advisors Trust. | |||||||||||||||
| Officers of Columbia Acorn Trust: | |||||||||||||||||||
| Ben Andrews, 40, Vice President | 2004 | Analyst and portfolio manager, Columbia WAM since 1998; vice president, Wanger Advisors Trust. | 10 | None. | |||||||||||||||
| J. Kevin Connaughton, 42, Assistant Treasurer | 2001 | Treasurer and Chief Financial Officer Columbia Funds and Liberty All-Star Funds; assistant treasurer Wanger Advisors Trust; treasurer Galaxy Funds (September 2002 to November 2005); treasurer, Columbia Management Multi-Strategy Hedge Fund, LLC (December 2002 to December 2004). | 155 | Banc of America Capital Management (Ireland), Limited. | |||||||||||||||
| Michael G. Clarke, 37, Assistant Treasurer | 2004 | Assistant treasurer, Wanger Advisors Trust; chief accounting officer and assistant treasurer of the Columbia Funds, Liberty Funds, Stein Roe Funds and All-Star Funds since October 2004; Managing Director of Columbia WAM; Controller, Columbia Funds, Liberty Funds, Stein Roe Funds and All-Star Funds (May 2004 to October 2004); Assistant Treasurer (June 2002 to May 2004); Vice President, Product Strategy & Development of the Liberty Funds and Stein Roe Funds (February 2001 to June 2002). | 155 | None. | |||||||||||||||
| Jeffrey R. Coleman, 37, Assistant Treasurer | 2006 | Assistant treasurer, Wanger Advisors Trust since March 2006; Group Operations Manager, Columbia WAM since October 2004; Vice President of CDC IXIS Asset Management Services, Inc. (investment management) (August 2000 to September 2004). | 155 | None. | |||||||||||||||
94
Board of Trustees and Management of Columbia Acorn Funds, continued
| Name, Position(s) with Columbia Acorn and Age at December 31, 2006 | Year First Elected or Appointed to Office* | Principal Occupation(s) during Past Five Years | Number of Portfolios in Fund Complex Overseen by Trustee/Officer | Other Directorships | |||||||||||||||
| P. Zachary Egan, 38, Vice President | 2003 | Director of international research, Columbia WAM, since December 2004; analyst and portfolio manager, Columbia WAM since 1999; prior thereto, research fellow with the Robert Bosch Foundation. | 6 | None. | |||||||||||||||
| Peter T. Fariel, 49, Assistant Secretary | 2006 | Associate General Counsel, Bank of America since April 2005; prior thereto Partner, Goodwin Procter LLP (law firm). | 155 | None. | |||||||||||||||
| John Kunka, 36, Assistant Treasurer | 2006 | Director of Accounting and Operations, Columbia WAM, since May 2006; assistant treasurer, Wanger Advisors Trust, since 2006; Manager of Mutual Fund Operations, Calamos Advisors, Inc., September 2005 to May 2006; prior thereto, Manager of Mutual Fund Administration, Van Kampen Investments. | 10 | None. | |||||||||||||||
| Bruce H. Lauer, 49, Vice President, Secretary and Treasurer | 1995 | Chief operating officer, Columbia WAM since April 1995; vice president, treasurer and secretary, Wanger Advisors Trust; director, Wanger Investment Company PLC; director, Banc of America Capital Management (Ireland) Ltd. | 10 | None. | |||||||||||||||
| Joseph LaPalm, 36, Vice President | 2006 | Chief compliance officer, Columbia WAM since 2005; vice president, Wanger Advisors Trust since 2006; prior thereto, compliance officer, William Blair & Company (investment firm) | 10 | None. | |||||||||||||||
| Robert A. Mohn, 45, Vice President | 1997 | Analyst and portfolio manager, Columbia WAM since August 1992; director of domestic research, Columbia WAM since March 2004; vice president, Wanger Advisors Trust. | 10 | None. | |||||||||||||||
| Louis J. Mendes, 42, Vice President | 2003 | Analyst and portfolio manager, Columbia WAM since 2001; vice president, Wanger Advisors Trust; prior thereto, analyst and portfolio manager, Merrill Lynch (investment firm). | 10 | None. | |||||||||||||||
| Christopher Olson, 42, Vice President | 2001 | Analyst and portfolio manager, Columbia WAM since January 2001; vice president, Wanger Advisors Trust. | 10 | None. | |||||||||||||||
| Robert Scales, 54, Chief Compliance Officer, Senior Vice President and General Counsel | 2004 | Senior vice president, chief legal officer and general counsel, Wanger Advisors Trust since 2004; Associate General Counsel, Grant Thornton LLP prior thereto. | 10 | None. | |||||||||||||||
| Linda Roth-Wiszowaty, 37, Assistant Secretary | 2006 | Assistant secretary, Wanger Advisors Trust; Executive Administrator, Columbia WAM since April 2004; prior thereto Executive Assistant to the Chief Operating Officer. | 10 | None. | |||||||||||||||
* Dates prior to April 1992 correspond to the date first elected or appointed as a director or officer of The Acorn Fund Inc., the Trust's predecessor.
(1) Trustee who is an "interested person" of the Trust and of Columbia WAM, as defined in the 1940 Act, because he is an officer of the Trust and Columbia WAM.
(2) Trustee who is treated as an "interested person" of the Trust and of Columbia WAM, as defined in the 1940 Act, because he is a former officer of the Trust, former employee of Columbia WAM and former consultant to Columbia WAM.
95
Columbia Acorn Family of Funds
Class A, B and C Share Information
| Minimum Initial Investment in | |||||||
| Columbia Acorn International, | |||||||
| Columbia Acorn International | |||||||
| Select and Columbia | |||||||
| Thermostat Fund | $2,500 $1,000 for an IRA | ||||||
| Minimum Initial Investment in Columbia Acorn Fund and Columbia Acorn USA | $75,000 | ||||||
| Minimum Initial Investment in Columbia Acorn Select | $50,000 | ||||||
| Minimum Subsequent Investment in all Funds | $50 | ||||||
| Exchange Fee | None | ||||||
| Columbia Acorn Fund | Class A | Class B | Class C | ||||||||||||
| Management Fees | 0.64 | % | 0.64 | % | 0.64 | % | |||||||||
| Distribution and Service (12b-1) Fees | 0.25 | % | 0.81 | % | 1.00 | % | |||||||||
| Other Expenses | 0.13 | % | 0.21 | % | 0.16 | % | |||||||||
| Net Expense Ratio | 1.02 | % | 1.66 | % | 1.80 | % | |||||||||
| Columbia Acorn International | Class A | Class B | Class C | ||||||||||||
| Management Fees | 0.77 | % | 0.77 | % | 0.77 | % | |||||||||
| Distribution and Service (12b-1) Fees | 0.25 | % | 0.81 | % | 1.00 | % | |||||||||
| Other Expenses | 0.22 | % | 0.31 | % | 0.24 | % | |||||||||
| Net Expense Ratio | 1.24 | % | 1.89 | % | 2.01 | % | |||||||||
| Columbia Acorn USA | Class A | Class B | Class C | ||||||||||||
| Management Fees | 0.86 | % | 0.86 | % | 0.86 | % | |||||||||
| Distribution and Service (12b-1) Fees | 0.25 | % | 0.81 | % | 1.00 | % | |||||||||
| Other Expenses | 0.15 | % | 0.26 | % | 0.19 | % | |||||||||
| Net Expense Ratio | 1.26 | % | 1.93 | % | 2.05 | % | |||||||||
| Columbia Acorn International Select | Class A | Class B | Class C | ||||||||||||
| Management Fees | 0.94 | % | 0.94 | % | 0.94 | % | |||||||||
| Distribution and Service (12b-1) Fees | 0.25 | % | 0.81 | % | 1.00 | % | |||||||||
| Other Expenses | 0.39 | % | 0.50 | % | 0.44 | % | |||||||||
| Net Expense Ratio | 1.58 | % | 2.25 | % | 2.38 | % | |||||||||
| Columbia Acorn Select | Class A | Class B | Class C | ||||||||||||
| Management Fees | 0.82 | % | 0.82 | % | 0.82 | % | |||||||||
| Distribution and Service (12b-1) Fees | 0.25 | % | 0.81 | % | 1.00 | % | |||||||||
| Other Expenses | 0.17 | % | 0.28 | % | 0.22 | % | |||||||||
| Net Expense Ratio | 1.24 | % | 1.91 | % | 2.04 | % | |||||||||
| Columbia Thermostat* | Class A | Class B | Class C | ||||||||||||
| Management Fees | 0.10 | % | 0.10 | % | 0.10 | % | |||||||||
| Distribution and Service (12b-1) Fees | 0.25 | % | 0.81 | % | 1.00 | % | |||||||||
| Other Expenses | 0.15 | % | 0.15 | % | 0.15 | % | |||||||||
| Net Expense Ratio | 0.50 | % | 1.06 | % | 1.25 | % | |||||||||
Fees and expenses are for the year ended December 31, 2006 and for Columbia Acorn International Select and Columbia Thermostat Fund include the effect of Columbia Wanger Asset Management's undertaking to reimburse those Funds for any ordinary operating expenses, net of custody fees paid indirectly, in excess of 1.45% and 0.25% of the average net assets, respectively. The expense limitation for Columbia Acorn International Select is voluntary and can be terminated by Columbia Wanger Asset Management, L.P. on 30 days notice. Columbia Thermostat Fund's reimbursement arrangement is contractual through April 30, 2007. From January 1, 2006 through September 30, 2006, the Funds' adviser and/or affiliates had voluntarily agreed to waive a portion of "other expenses" for the Columbia Acorn family of funds. Effective October 1, 2006, the Fund's adviser and/or affiliates have agreed to contractually waive a portion of "other expenses" through March 31, 2007.
* Does not include estimated fees and expenses of 0.69% incurred by the Fund from the underlying portfolio funds.
96
Columbia Acorn Family of Funds
Investment Adviser
Columbia Wanger Asset Management, L.P.
227 West Monroe Street, Suite 3000
Chicago, Illinois 60606
1-800-922-6769
Distributor
Columbia Management Distributors, Inc.
One Financial Center
Boston, Massachusetts 02111-2621
Transfer Agent, Dividend Disbursing Agent
Columbia Management Services, Inc.
P.O. Box 8081
Boston, Massachusetts 02266-8081
1-800-345-6611
Legal Counsel
Bell, Boyd & Lloyd LLP
Chicago, Illinois
Independent Registered Public Accounting Firm
PricewaterhouseCoopers LLP
Chicago, Illinois
This report, including the schedules of investments, is submitted for the general information of the shareholders of Columbia Acorn Trust. This report is not authorized for distribution unless preceded or accompanied by a prospectus. An investor should carefully consider charges and expenses before investing. To obtain a prospectus containing this and other information, please call (800) 922-6769 or visit our website (shown below). Please read the prospectus carefully before you invest or send money.
A description of the policies and procedures that the Funds use to determine how to vote proxies and a copy of the Funds' voting record for the most recent 12-month period ended June 30 are available (i) without charge, upon request, by calling 800-922-6769; (ii) on the Securities and Exchange Commission's website at www.sec.gov; and (iii) on Columbia Management's website at www.columbiafunds.com.
The Funds file a complete schedule of portfolio holdings with the SEC for the first and third quarters of each fiscal year on Form N-Q. The Funds' Form N-Q is available on the SEC's website at www.sec.gov and may be reviewed and copied at the SEC's Public Reference Room in Washington, D.C. Information on the operation of the Public Reference Room may be obtained by calling 1-800-SEC-0330.
Columbia Management Group, LLC ("Columbia Management") is the investment management division of Bank of America Corporation. Columbia Management entities furnish investment management services and products for institutional and individual investors. Columbia Funds are distributed by Columbia Management Distributors, Inc., member NASD and SIPC. Columbia Management Distributors, Inc. is part of Columbia Management and an affiliate of Bank of America Corporation.
Find out what's new at:
www.columbiafunds.com
Our e-mail address is:
ServiceInquiries@ColumbiaManagement.com
Shareholders should not include personal information such as account numbers, Social Security numbers or taxpayer identification numbers in e-mail. We are unable to accept account transactions sent via e-mail.
97
Columbia Acorn Family of Funds
Class A, B, C Shares
Annual Report – December 31, 2006
Columbia Management®
PRESORTED
FIRST-CLASS MAIL
U.S. POSTAGE PAID
HOLLISTON, MA
PERMIT NO. 20
©2007 Columbia Management Distributors, Inc.
One Financial Center, Boston, MA 02111-2621
800-345-6611 www.columbiafunds.com
SHC-43/114526-0906 (11/06) 06/31552
Item 2. Code of Ethics.
(a) The registrant has, as of the end of the period covered by this report, adopted a code of ethics that applies to the registrant’s principal executive officer, principal financial officer, principal accounting officer or controller, or persons performing similar functions, regardless of whether these individuals are employed by the registrant or a third party.
(b) During the period covered by this report, there were not any amendments to a provision of the code of ethics adopted in 2(a) above.
(c) During the period covered by this report, there were no waivers, including any implicit waivers, from a provision of the code of ethics described in 2(a) above that relates to one or more of the items set forth in paragraph (b) of this item’s instructions.
Item 3. Audit Committee Financial Expert.
The registrant’s Board of Trustees has determined that David C. Kleinman, Robert E. Nason and John A. Wing, each of whom are members of the registrant’s Board of Trustees and Audit Committee, each qualify as an audit committee financial expert.
Mr. Kleinman, Mr. Nason and Mr. Wing are each independent trustees, as defined in paragraph (a)(2) of this item’s instructions.
Item 4. Principal Accountant Fees and Services.
(a) Audit Fees. Aggregate Audit Fees billed by the principal accountant for professional services rendered during the fiscal years ended December 31, 2006 and December 31, 2005 are approximately as follows:
2006 |
| 2005 |
| ||
$ | 208,000 |
| $ | 199,200 |
|
Audit Fees include amounts related to the audit of the registrant’s annual financial statements or services that are normally provided by the accountant in connection with statutory and regulatory filings or engagements for those fiscal years.
(b) Audit-Related Fees. Aggregate Audit-Related Fees billed to the registrant by the principal accountant for professional services rendered during the fiscal years ended December 31, 2006 and December 31, 2005 are approximately as follows:
2006 |
| 2005 |
| ||
$ | 26,400 |
| $ | 25,200 |
|
Audit-Related Fees include amounts for assurance and related services by the principal accountant that are reasonably related to the performance of the audit of the registrant’s financial statements and are not reported in Audit Fees above. In both fiscal years 2006 and 2005, Audit-Related Fees consist of certain agreed-upon procedures performed for semi-annual shareholder reports.
During the fiscal years ended December 31, 2006 and December 31, 2005, there were no Audit-Related Fees billed by the registrant’s principal accountant to the registrant’s investment adviser (not including any sub-adviser whose role is primarily portfolio management and is subcontracted with or overseen by another investment adviser) and any entity controlling, controlled by, or under common control with the adviser that provides ongoing services to the registrant for an engagement that related directly to the operations and financial reporting of the registrant.
(c) Tax Fees. Aggregate Tax Fees billed by the principal accountant to the registrant for professional services rendered during the fiscal years ended December 31, 2006 and December 31, 2005 are approximately as follows:
2006 |
| 2005 |
| ||
$ | 37,100 |
| $ | 33,300 |
|
Tax Fees incurred in both fiscal years 2006 and 2005 relate to the review of annual tax returns, the review of required shareholder distribution calculations and typically include amounts for professional services by the principal accountant for tax compliance, tax advice and tax planning.
During the fiscal years ended December 31, 2006 and December 31, 2005, there were no Tax Fees billed by the registrant’s principal accountant to the registrant’s investment adviser (not including any sub-adviser whose role is primarily portfolio management and is subcontracted with or overseen by another investment adviser) and any entity controlling, controlled by, or under common control with the adviser that provides ongoing services to the registrant for an engagement that related directly to the operations and financial reporting of the registrant.
(d) All Other Fees. Aggregate All Other Fees billed by the principal accountant to the registrant for professional services rendered during the fiscal years ended December 31, 2006 and December 31, 2005 are as follows:
2006 |
| 2005 |
| ||
$ | 3,600 |
| $ | 16,800 |
|
All Other Fees include amounts for products and services provided by the principal accountant, other than the services reported in paragraphs (a) through (c) above. In both fiscal years 2006 and 2005, All Other Fees consist of agreed-upon procedures related to the review of the registrant’s anti-money laundering program.
Aggregate All Other Fees billed by the registrant’s principal accountant to the registrant’s investment adviser (not including any sub-adviser whose role is primarily portfolio management and is subcontracted with or overseen by another investment adviser) and any entity controlling, controlled by, or under common control with the adviser that provides ongoing services to the registrant for an engagement that related directly to the operations and financial reporting of the registrant during the fiscal years ended December 31, 2006 and December 31, 2005 are approximately as follows:
2006 |
| 2005 |
| ||
$ | 135,600 |
| $ | 104,200 |
|
In both fiscal years 2006 and 2005, All Other Fees consist of professional services rendered for internal control reviews of the registrant’s transfer agent.
(e)(1) Audit Committee Pre-Approval Policies and Procedures
The policy of the registrant’s Audit Committee is to specifically pre-approve (i) all audit and non-audit (including audit related, tax and all other) services provided by the registrant’s independent auditor to the registrant and individual funds (collectively “Fund Services”) and (ii) all non-audit services provided by the registrant’s independent auditor to the funds’ adviser or a control affiliate of the adviser, that relate directly to the funds’ operations and financial reporting (collectively “Fund-related Adviser Services”). A “control affiliate” is an entity controlling, controlled by, or under common control with the adviser that provides ongoing services to the funds, and the term “adviser” is deemed to exclude any unaffiliated sub-adviser whose role is primarily portfolio management and is sub-contracted or overseen by another investment adviser.
If such Fund Services or Fund-related Adviser Services are required during the period between the Audit Committee’s regularly scheduled meetings, the Chairman of the Audit Committee has the authority to pre-approve the service, with reporting to the full Audit Committee at the next regularly scheduled meeting.
The Audit Committee will waive pre-approval of Fund Services or Fund-related Adviser Services provided that the requirements under paragraph (c)(7)(i)(C) of Rule 2-01 of Regulation S-X are met.
(e)(2) The percentage of services described in paragraphs (b) through (d) of this Item approved pursuant to the “de minimis” exception under paragraph (c)(7)(i)(C) of Rule 2-01 of Regulation S-X during both fiscal years ended December 31, 2006 and December 31, 2005 was zero.
(f) Not applicable.
(g) The aggregate non-audit fees billed by the registrant’s accountant for services rendered to the registrant, and rendered to the registrant’s investment adviser (not including any sub-adviser whose role is primarily portfolio management and is subcontracted with or overseen by another investment adviser), and any entity controlling, controlled by, or under common control with the adviser that provides ongoing services to the registrant for the fiscal years ended December 31, 2006 and December 31, 2005 are approximately as follows:
2006 |
| 2005 |
| ||
$ | 202,700 |
| $ | 179,500 |
|
(h) The registrant’s Audit Committee of the Board of Directors has considered whether the provision of non-audit services that were rendered to the registrant’s adviser (not including any sub-adviser whose role is primarily portfolio management and is subcontracted with or overseen by another investment adviser), and any entity controlling, controlled by, or under common control with the investment adviser that provides ongoing services to the registrant that were not pre-approved pursuant to paragraph (c)(7)(ii) of Rule 2-01 of Regulation S-X, is compatible with maintaining the principal accountant’s independence.
Item 5. Audit Committee of Listed Registrants.
Not applicable.
Item 6. Schedule of Investments
The registrant’s “Schedule I – Investments in securities of unaffiliated issuers” (as set forth in 17 CFR 210.12-12) is included in Item 1 of this Form N-CSR.
Item 7. Disclosure of Proxy Voting Policies and Procedures for Closed-End Management Investment Companies.
Not applicable.
Item 8. Portfolio Managers of Closed-End Management Investment Companies.
Not applicable.
Item 9. Purchases of Equity Securities by Closed-End Management Investment Company and Affiliated Purchasers.
Not applicable.
Item 10. Submission of Matters to a Vote of Security Holders.
There have not been any material changes to the procedures by which shareholders may recommend nominees to the registrant’s board of directors, since those procedures were last disclosed in response to the requirements of Item 7(d)(2)(ii)(G) of Schedule 14A or this Item.
Item 11. Controls and Procedures.
(a) The registrant’s principal executive officer and principal financial officers, based on their evaluation of the registrant’s disclosure controls and procedures as of a date within 90 days of the filing of this report, have concluded that such controls and procedures are adequately designed to ensure that information required to be disclosed by the registrant in Form N-CSR is accumulated and communicated to the registrant’s management, including the principal executive officer and principal financial officer, or persons performing similar functions, as appropriate to allow timely decisions regarding required disclosure.
(b) There was no change in the registrant’s internal control over financial reporting that occurred during the registrant’s second fiscal quarter of the period covered by this report that has materially affected, or is reasonably likely to materially affect, the registrant’s internal control over financial reporting.
Item 12. Exhibits.
(a)(1) Code of ethics required to be disclosed under Item 2 of Form N-CSR attached hereto as Exhibit 99.CODE ETH.
(a)(2) Certifications pursuant to Rule 30a-2(a) under the Investment Company Act of 1940 (17 CFR 270.30a-2(a)) attached hereto as Exhibit 99.CERT.
(a)(3) Not applicable.
(b) Certification pursuant to Rule 30a-2(b) under the Investment Company Act of 1940 (17 CFR 270.30a-2(b)) attached hereto as Exhibit 99.906CERT.
SIGNATURES
Pursuant to the requirements of the Securities Exchange Act of 1934 and the Investment Company Act of 1940, the registrant has duly caused this report to be signed on its behalf by the undersigned, thereunto duly authorized.
(registrant) |
| Columbia Acorn Trust |
|
| ||
|
|
|
| |||
|
|
|
| |||
By (Signature and Title) |
| /s/ Charles P. McQuaid |
|
| ||
| Charles P. McQuaid, President |
|
| |||
|
|
|
| |||
|
|
|
| |||
Date |
| February 22, 2007 |
|
| ||
Pursuant to the requirements of the Securities Exchange Act of 1934 and the Investment Company Act of 1940, this report has been signed below by the following persons on behalf of the registrant and in the capacities and on the dates indicated.
By (Signature and Title) |
| /s/ Charles P. McQuaid |
|
| |
| Charles P. McQuaid, President |
|
| ||
|
|
|
| ||
|
|
|
| ||
Date |
| February 22, 2007 |
|
| |
|
|
|
| ||
|
|
|
| ||
By (Signature and Title) |
| /s/ Bruce H. Lauer |
|
| |
| Bruce H. Lauer, Treasurer |
|
| ||
|
|
|
| ||
|
|
|
| ||
Date |
| February 22, 2007 |
|
| |