UNITED STATES SECURITIES AND EXCHANGE COMMISSION
Washington, D.C. 20549
Form 10-K
| | | | | | | | |
| (Mark One) | | |
| ☒ | ANNUAL REPORT PURSUANT TO SECTION 13 OR 15(d) OF THE SECURITIES EXCHANGE ACT OF 1934 |
| | For the fiscal year ended | December 31, 2024 |
| OR |
| ☐ | TRANSITION REPORT PURSUANT TO SECTION 13 OR 15(d) OF THE SECURITIES EXCHANGE ACT OF 1934 |
| | For the transition period from to |
Commission File Number 1-8641
COEUR MINING, INC.
(Exact name of registrant as specified in its charter)
| | | | | | | | |
| Delaware | 82-0109423 |
(State or other jurisdiction of
incorporation or organization) | (I.R.S. Employer
Identification No.) |
| 200 South Wacker Drive | Suite 2100 | 60606 |
| Chicago | IL | (Zip Code) |
| (Address of principal executive offices) | |
Registrant’s telephone number, including area code: (312) 489-5800
Securities Registered pursuant to Section 12(b) of the Act:
| | | | | | | | |
| Title of each class | Trading Symbol(s) | Name of each exchange on which registered |
| Common Stock (par value $.01 per share) | CDE | New York Stock Exchange |
Securities registered pursuant to Section 12(g) of the Act: None
Indicate by check mark if the registrant is a well-known seasoned issuer as defined in Rule 405 of the Securities Act. Yes x No ¨
Indicate by check mark if the registrant is not required to file reports pursuant to Section 13 or Section 15(d) of the Act. Yes ¨ No x
Indicate by check mark whether the registrant (1) has filed all reports required to be filed by Section 13 or 15(d) of the Securities Exchange Act of 1934 during the preceding 12 months (or for such shorter period that the registrant was required to file such reports), and (2) has been subject to such filing requirements for the past 90 days. Yes x No ¨
Indicate by check mark whether the registrant has submitted electronically every Interactive Data File required to be submitted pursuant to Rule 405 of Regulation S-T (§ 232.405 of this chapter) during the preceding 12 months (or for such shorter period that the registrant was required to submit such files). Yes x No ¨
Indicate by check mark whether the registrant is a large accelerated filer, an accelerated filer, a non-accelerated filer, or a smaller reporting company. See the definitions of “large accelerated filer,” “accelerated filer,” “smaller reporting company,” and “emerging growth company” in Rule 12b-2 of the Exchange Act.
| | | | | | | | | | | | | | | | | |
| Large accelerated filer | | ☑ | Accelerated filer | | ☐ |
| | | |
| Non-accelerated filer | | ☐ | Smaller reporting company | | ☐ |
| | | | | |
| | | Emerging growth company | | ☐ |
If an emerging growth company, indicate by check mark if the registrant has elected not to use the extended transition period for complying with any new or revised financial accounting standards provided pursuant to Section 13(a) of the Exchange Act. ¨
Indicate by check mark whether the registrant has filed a report on and attestation to its management's assessment of the effectiveness of its internal control over financial reporting under Section 404(b) of the Sarbanes-Oxley Act (15 U.S.C 7262(b)) by the registered public accounting firm that prepared or issued its audit report. ☒
If securities are registered pursuant to Section 12(b) of the Act, indicate by check mark whether the financial statements of the registrant included in the filing reflect the correction of an error to previously issued financial statements. ¨
Indicate by check mark whether any of those error corrections are restatements that required a recovery analysis of incentive- based compensation received by any of the registrant’s executive officers during the relevant recovery period pursuant to §240.10D-1(b). ¨
Indicate by check mark whether the registrant is a shell company (as defined in Rule 12b-2 of the Exchange Act). Yes ☐ No x
State the aggregate market value of the voting and non-voting common equity held by non-affiliates computed by reference to the price at which the common equity was last sold, or the average bid and asked price of such common equity, as of the last business day of the registrant’s most recently completed second fiscal quarter.
$2,209,241,490
Indicate the number of shares outstanding of each of the registrant’s classes of common stock, as of the latest practicable date.
As of February 17, 2025, 638,557,875 shares of Common Stock, par value $0.01 per share
DOCUMENTS INCORPORATED BY REFERENCE
Certain information called for by Part III of the Form 10-K is incorporated by reference from the registrant’s definitive proxy statement for the 2025 Annual Meeting of Stockholders which will be filed pursuant to Regulation 14A not later than 120 days after the end of the fiscal year covered by this report.
COEUR MINING, INC.
FORM 10-K
INDEX
| | | | | | | | |
| PART I |
| Item 1. | | |
| Item 1A. | Risk Factors | |
| Item 1B. | Unresolved Staff Comments | |
| Item 1C. | Cybersecurity | |
| Item 2. | Properties | |
| Item 3. | Legal Proceedings | |
| Item 4. | Mine Safety Disclosures | |
| PART II |
| Item 5. | Market for Registrant’s Common Equity, Related Stockholder Matters and Issuer Purchases of Equity Securities | |
| Item 7. | Management’s Discussion and Analysis of Financial Condition and Results of Operations | |
| Item 7A. | Quantitative and Qualitative Disclosures About Market Risk | |
| Item 8. | Financial Statements and Supplementary Data | |
| Item 9. | Changes in and Disagreements With Accountants on Accounting and Financial Disclosure | |
| Item 9A. | Controls and Procedures | |
| Item 9B. | Other Information | |
| PART III |
| Item 10. | Directors, Executive Officers and Corporate Governance | |
| Item 11. | Executive Compensation | |
| Item 12. | Security Ownership of Certain Beneficial Owners and Management and Related Stockholder Matters | |
| Item 13. | Certain Relationships and Related Transactions, and Director Independence | |
| Item 14. | Principal Accounting Fees and Services | |
| PART IV |
| Item 15. | Exhibits, Financial Statement Schedules | |
| Item 16. | Form 10-K Summary | |
| SIGNATURES | |
| | |
PART I
Item 1.Business
GENERAL
Coeur Mining, Inc. (“Coeur”, “the Company”, or “we”), founded in 1928, is a precious metals producer with assets located in the United States, Canada, and Mexico. Our common stock is listed on The New York Stock Exchange under the symbol “CDE”.
Coeur’s strategy is to be a well-diversified, growing precious metals producer with a focus on generating sustainable, high-quality cash flow and returns from a balanced, prospective asset base in mining-friendly jurisdictions along with our commitment to exploration and expansions. Our strategy is guided by our purpose statement, We Pursue a Higher Standard, and three key principles: Protect our People, Places and Planet; Develop Quality Resources, Growth and Plans; and Deliver Impactful Results Through Teamwork. We conduct our business with a proactive focus on responsible practices to positively impact the health, safety and socioeconomic status of our people and the communities in which we operate and be good stewards of the environment.
OUR BUSINESS
Operating Segments
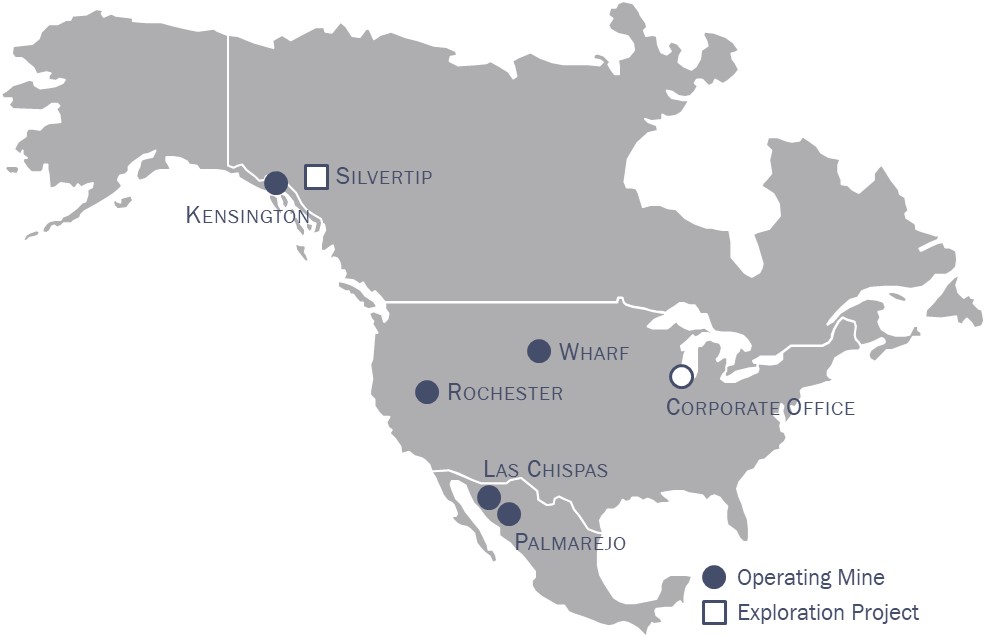
We produce and sell precious metals from the following operating segments:
•The Palmarejo gold-silver complex, located in the State of Chihuahua in northern Mexico, which has been in operation since 2009.
•The Rochester open pit heap leach silver-gold mine, located in northwestern Nevada, which has been in operation since 1986 and completed a significant expansion in 2024.
•The Kensington underground gold mine, located north of Juneau, Alaska, which began operations in 2010.
•The Wharf open pit heap leach gold mine, located near Lead, South Dakota, which was acquired by Coeur in 2015.
•The newly acquired Las Chispas underground silver-gold mine, located in the State of Sonora in northern Mexico, which began operations in 2022.
In addition, the Company operates the Silvertip underground silver-zinc-lead exploration project located in northern British Columbia, Canada, which was acquired by Coeur in 2017.
Metals Prices and Hedging Activities
The financial results of the Company and its operating segments are substantially dependent upon the market prices of gold and silver, which fluctuate widely. The Company has in the past, and may in the future, enter into derivative contracts to protect the selling price for certain anticipated gold and silver production and to manage risks associated with foreign currencies. For additional information, see “Item 1A – Risk Factors”, “Item 7A. Quantitative and Qualitative Disclosures About Market Risk” and “Note 13 – Derivative Financial Instruments in the notes to the Consolidated Financial Statements”.
Metal Processing, Marketing and Sales
We produce gold and silver doré, as well as gold concentrate. The doré produced at the Palmarejo complex, Rochester mine, and newly acquired Las Chispas mine, as well as the electrolytic cathodic sludge produced by the Wharf mine, is refined by a geographically diverse group of third-party refiners into gold and silver bullion according to benchmark standards set by the London Bullion Market Association, which regulates the acceptable requirements for bullion traded in the London precious metals markets. We then sell gold and silver bullion to multi-national banks, bullion trading houses, and refiners across the globe. Our gold concentrate product from the Kensington mine is sold under a long-term offtake agreement and is shipped to geographically diverse third-party smelters.
We believe that the loss of any one smelter, refiner, trader or third-party customer would not materially adversely affect us due to the liquidity of the markets and current availability of alternative trading counterparties.
Commodities
We purchase materials and supplies from third parties to conduct our business, including electricity, fuel, chemical reagents, explosives, steel and concrete. Prices for these commodities are volatile and can fluctuate due to conditions that are difficult to predict, including inflation, currency fluctuations, global competition for resources, consumer or industrial demand
and other factors. For most of these commodities, we have existing alternate sources of supply, or alternate sources of supply are readily available. We continuously monitor supply and cost trends for these items.
GOVERNMENT REGULATION
General
Our business is subject to extensive federal, state, local and foreign laws governing the protection of the environment, prospecting, development, production, mine closure, taxes, labor standards, occupational health, mine safety, toxic substances, protection of endangered, protected or other specified species and other matters. The costs to comply with these regulatory requirements are substantial and possible future legislation and regulations could cause additional expense, capital expenditures, restrictions and delays in the development and continued operation of our properties, the extent of which cannot be predicted. Expenditures for environmental compliance in 2025 are expected to range from $12.3 million to $13.3 million. We have reviewed and considered current federal legislation relating to climate change and do not believe the legislation to have a material effect on our operations. Future changes in U.S., Mexican or Canadian federal, state or provincial laws or regulations could have a material adverse effect upon us and our results of operations. For additional information regarding key regulatory risks, please see “Item 1A - Risk Factors”.
Permitting
The Rochester, Kensington and Wharf mines are subject to extensive U.S. federal and state permitting laws and regulations. Mexico, where the Palmarejo complex and Las Chispas mine are located, and Canada, where the Silvertip exploration property is located, have both adopted laws and guidelines for environmental permitting that are similar to those in effect in the United States. The permitting process in each jurisdiction requires, among other things, a thorough study to determine the baseline condition of the mining site and surrounding area, an environmental impact analysis, and proposed mitigation measures to minimize and offset the environmental impact of mining operations, in addition to consultation requirements with local indigenous groups, in certain instances. We have received all permits required to operate and carry out the current scope of activities at the Palmarejo complex, Las Chispas, Rochester, Kensington and Wharf mines, and the Silvertip exploration property. We are in the process of amending existing permits at our Palmarejo complex, including a significant operating permit that is set to expire in October 2025, to support future planned activities. If we pursue an expansion at Silvertip, it will require new or amended permits.
Maintenance of Mining Claims
All of the jurisdictions where we operate impose federal, state and/or provincial requirements for maintaining mining claims (United States), mining concessions (Mexico) and mineral claims and mining leases (British Columbia), including fees, reporting, and/or evidence of work, among other requirements. Our failure to comply with any of these requirements could result in the loss of our ability to conduct mining activities in a particular location, which could have a material adverse impact on our business.
HUMAN CAPITAL MANAGEMENT
Effective human capital management at Coeur is critical to achieving our strategic goals. We aim to be an employer of choice by promoting safety first and proactively developing our people, while fostering a healthy and inclusive culture. At December 31, 2024, we had approximately 2,116 employees (1,176 in the U.S., 71 in Canada and 869 in Mexico) and over 700 people were working as contractors in support of Coeur’s operations. The newly acquired Las Chispas mine has 314 employees and approximately 775 people working as contractors.
Culture Assessment
We are focused on regular evaluation of our culture. In 2023, we invited all employees to participate in our third culture assessment by completing an anonymous survey. Employee participation in 2023 was 84%, which exceeded industry benchmarks. Feedback was reviewed by the management team and our Board of Directors (our “Board”). The management team also reviewed the results with employees at each of our operations through facilitated discussions to gain additional insight into the feedback. We developed site-specific action plans to address feedback and monitor progress in the future. The results of the assessment confirmed our belief that we have an ethical, safe, engaged, and proud workforce and also highlighted areas for improvement that are now being addressed. We intend to conduct another culture assessment in 2025.
Recruitment
We seek to recruit and retain employees at all levels who embody our purpose statement, We Pursue a Higher Standard, through safe and ethical conduct. Our strong culture of teamwork and our reputation as a responsible company and an engaged community member motivates new employee referrals. We have also created a series of partnership programs in local communities to provide internships, scholarships, and apprenticeships to build a pipeline of potential employees in the next
generation. We have maintained an average employee age of 40 years old since 2018 by focusing on building our bench strength and increasing our under 40 population to 33% of our workforce.
Inclusion
Our Chairman, President & CEO, Mitchell Krebs, was the first precious metals mining CEO to sign the CEO ACTION for Diversity & Inclusion pledge. This pledge highlights Coeur’s continuing commitment to fostering an inclusive workforce, evidenced by programs such as Coeur Heroes, which provided over 80 career opportunities to current and former U.S. Military personnel last year. Four of our Board members have indicated that they are diverse, and 12% of our employees are female, up from 10% in 2020. While we continue to work to increase our overall female population, over 60% of our female employees are supervisor or higher-level positions. In the U.S., approximately 23% of our workforce is non-white, up from 18% in 2020. Partnerships with organizations like the National Society of Black Engineers (NSBE) and Women in Mining (WiM) at their U.S. university chapters are providing further avenues for recruiting. In order to emphasize the importance of inclusion in the workplace, we provided training to our hourly workforce at every operation on topics such as bullying and bystander intervention, as well as education on overall mental wellness to support each employee feeling respected and included at work.
Employee Development
We periodically solicit feedback on each member of our executive team through 360 assessments. We believe this feedback is important to maintaining a strong culture by effectively assessing leadership performance and development, increasing accountability, facilitating succession planning and identifying areas for improvement and change. We provide opportunities for employees to participate in IMPACT training, an intensive one-year training program we created for front-line supervisors throughout our organizational structure to focus on leadership development and mining as a business. Through IMPACT training, we have invested over 22,500 cumulative hours of leadership training and personal development in almost 200 employees. In 2022, after many employees had graduated from IMPACT training over the last 4 years, we introduced our first Advanced IMPACT training for employees at manager and director levels in the organization.
Succession Planning
We conduct robust succession planning throughout the organization annually, by employing specific talent diagnostics and skills development. High potential talent within the organization is identified, and development plans are created starting from our front-line supervisors to our Chief Operating Officer.
Our Board oversees the recruitment, development, and retention of our senior executives. Significant focus is placed on succession planning both for key executive roles and also deeper into the organization. In-depth discussions occur multiple times per year in meetings of the Board, Compensation and Leadership Development Committee and Nominating and Corporate Governance Committee, including in executive sessions to foster candid conversations. Directors have regular and direct exposure to senior leadership and high-potential employees during Board and committee meetings and through other informal meetings and events held during the year.
Local Hire
Investing in local communities extends beyond financial support. Since 2018, we have hired an average of 60% of our new hires from local communities. During 2024, we provided over 40 apprenticeships and internships and worked with organizations such as By the Hand Club in Chicago to educate youth in our communities about career opportunities in mining. Providing career opportunities to local community members and participating in community initiatives creates a closer connection between our operations and local stakeholders and communities.
Rewards & Wellness
As part of our fundamental need to attract and retain talent, we regularly evaluate our compensation, benefits, and employee wellness offerings. We have determined that our average employee earns over 40% more than the average employee in their local markets according to industry benchmarking. Over 93% of U.S. employees are enrolled in our medical benefit plan, and over 90% of U.S. employees contribute to our 401(k) plan. Supplemental healthcare is provided above government requirements in both Canada and Mexico. We were a leader in the mining industry by providing domestic partner benefits in 2017 and participation has increased 250% since introduction. In 2022, we expanded paid parental and primary caregiver leave for U.S. employees.
In addition, we have engaged a third-party mental health care provider for innovative care and counseling resources. This resource leverages technology and clinical best practices to assist our employees and their families gain fast access to highly effective quality care when needed most. We also implemented a Total Worker Health program in 2023, that integrates protection from work-related safety and health hazards with promotion of injury and illness-prevention efforts to advance worker well-being both physically and mentally.
RESPONSIBILITY
At Coeur, we strive for best-in-class environmental performance while meeting the needs of today and respecting the needs of future generations. As a precious metals producer, we have the unique opportunity to supply the raw materials that play a key role in numerous economic priorities, including clean energy and technology. We work to protect our environment through an approach of responsible production and a focus on best practices. On an ongoing basis, we conduct site-specific environmental risk reviews and utilize a set of key performance indicators (“KPIs”) to evaluate performance results by mine. We believe that this systematic approach leads to awareness, risk mitigation and a pursuit of continuous improvement. Comprehensive environmental management plans, in conjunction with topic-specific plans, such as waste management and water resource protection, at each site provide guidance on how to implement our environmental initiatives and meet or exceed regulatory standards.
We recognize changes in stakeholder expectations related to various environmental, social and governance issues, including risks and opportunities related to climate change and greenhouse gas (“GHG”) emissions, biodiversity, water stewardship and tailings management. To that end, We Pursue a Higher Standard through our governance and associated management systems and programs for material topics. For example, we:
•further increased the amount of renewable energy in our purchased electricity through formal agreements with energy providers;
•actively manage GHG emissions and achieved our 35% net intensity reduction target by the end of 2024 compared to base-year;
•enhanced our climate disclosures in-line with recommendations set by the Task Force on Climate-related Financial Disclosures (“TCFD”);
•informed by the knowledge and systems developed as part of our first climate scenario analysis, we continue to incorporate climate-related risks and opportunities into our enterprise risk management and long-term business planning and strategy;
•developed and are implementing a Biodiversity Management Standard;
•drive sound water stewardship whether treating and discharging water at sites where water is abundant or efficiently using water at sites where water is scarce; and
•formalized a Tailings Management Policy and committed to adopting the Global Industry Standard on Tailings Management (“GISTM”).
AVAILABLE INFORMATION
We make available on our website (http://www.coeur.com) our Annual Reports on Form 10-K, Quarterly Reports on Form 10-Q, Current Reports on Form 8-K and Proxy Statements, as well as Forms 3, 4 and 5 with respect to our common stock, including any amendments to any of the foregoing, as soon as reasonably practicable after such reports are electronically filed with the U.S. Securities and Exchange Commission (“SEC”). These filings are also available at http://www.sec.gov.
Copies of our Corporate Governance Guidelines, charters of the key committees of the Board (Audit, Compensation and Leadership Development, Executive, Finance and Technical, Nominating and Corporate Governance, and Environmental, Health, Safety, and Corporate Responsibility Committees) and our Code of Business Conduct and Ethics, applicable to the Chief Executive Officer, Chief Financial Officer and Chief Accounting Officer, among others, are also available on our website. Information contained on our website is not a part of this Report.
CAUTIONARY STATEMENT CONCERNING FORWARD-LOOKING STATEMENTS
This Report contains numerous forward-looking statements within the meaning of Section 21E of the Securities Exchange Act of 1934, as amended (the “Exchange Act”) relating to our mining business, including anticipated mineral reserve and resource estimates, exploration efforts and expenditures, development and expansion initiatives at Kensington and Silvertip, expectations about timing of deliveries against the Kensington, Rochester and Wharf prepayments, permitting, estimated production, costs, capital expenditures, expenses, recoveries, metals prices, integration of acquisitions, sufficiency of assets, ability to discharge liabilities, liquidity management, financing needs, environmental compliance expenditures, environmental, social and governance (“ESG”) and human capital management initiatives, risk management strategies, including hedging, capital resources and use, cash flow maximization, mine life and other strategic initiatives. Such forward-looking statements are identified by the use of words such as “believes,” “intends,” “expects,” “hopes,” “may,” “should,” “plan,” “projected,” “contemplates,” “anticipates” or similar words and involve known and unknown risks, uncertainties and other factors which may cause our actual results, performance, or achievements to be materially different from any future results, performance, or achievements expressed or implied by the forward-looking statements. Factors that could cause actual results to differ materially from those projected in the forward-looking statements include: (i) the risk factors set forth below under Item 1A and in Management’s Discussion and Analysis of Financial Condition and Results of Operations under Item 7; (ii) the risk that anticipated production, cost, expenditure and expense levels at Las Chispas, Palmarejo, Rochester, Wharf and Kensington are not attained; (iii) the risks and hazards inherent in the mining business (including risks inherent in developing and expanding large-scale mining projects, environmental hazards, industrial accidents, weather or geologically-related conditions); (iv) changes in the market prices of gold and silver and a sustained lower price or higher treatment and refining charge environment; (v) the impact of geopolitical conditions, pandemics or epidemics, climate change, extreme weather events and other macro conditions, including disruptions to operations, the need for heightened health and safety protocols, inflation, and disruptions to our vendors, suppliers and the communities where we operate; (vi) the uncertainties inherent in Coeur’s production, exploration and development activities, including risks relating to permitting and regulatory delays (including the impact of government shutdowns), ground conditions, grade and recovery variability; (vii) any future labor disputes or work stoppages (involving us or our subsidiaries or third parties); (viii) the risk of adverse outcomes in litigation; (ix) the uncertainties inherent in the estimation of gold, silver, zinc and lead mineral reserves and resources; (x) impacts from Coeur’s future acquisition of new mining properties or businesses; (xi) the loss of access or insolvency of any third-party refiner or smelter to whom Coeur markets its production; (xii) inflationary pressures; (xiii) continued access to financing sources; (xiv) government orders that may require temporary suspension of operations at one or more of our sites and effects on our suppliers or the refiners and smelters to whom the Company markets its production and on the communities where we operate; (xv) the effects of environmental and other governmental regulations and government shut-downs; (xvi) the risks inherent in the ownership or operation of or investment in mining properties or businesses in foreign countries; and (xvii) our ability to raise additional financing necessary to conduct our business, make payments or refinance our debt. Readers are cautioned not to put undue reliance on forward-looking statements. We disclaim any intent or obligation to update publicly these forward-looking statements, whether as a result of new information, future events or otherwise.
CAUTIONARY NOTE REGARDING DISCLOSURE OF MINERAL PROPERTIES
Mineral Reserves and Resources
We are subject to the reporting requirements of the Exchange Act and applicable Canadian securities laws, and as a result, we report our mineral reserves and mineral resources according to two different standards. U.S. reporting requirements are governed by Item 1300 of Regulation S-K (“S-K 1300”), as issued by the SEC. Canadian reporting requirements for disclosure of mineral properties are governed by National Instrument 43-101 Standards of Disclosure for Mineral Projects (“NI 43-101”), as adopted from the definitions provided by the Canadian Institute of Mining, Metallurgy and Petroleum. Both sets of reporting standards have similar goals in terms of conveying an appropriate level of confidence in the disclosures being reported, but the standards embody slightly different approaches and definitions.
In our public filings in the U.S. and Canada and in certain other announcements not filed with the SEC, we disclose proven and probable reserves and measured, indicated and inferred resources, each as defined in S-K 1300. The estimation of measured resources and indicated resources involves greater uncertainty as to their existence and economic feasibility than the estimation of proven and probable reserves, and therefore, investors are cautioned not to assume that all or any part of measured or indicated resources will ever be converted into S-K 1300-compliant reserves. The estimation of inferred resources involves far greater uncertainty as to their existence and economic viability than the estimation of other categories of resources, and therefore it cannot be assumed that all or any part of inferred resources will ever be upgraded to a higher category. Therefore, investors are cautioned not to assume that all or any part of inferred resources exist, or that they can be mined economically.
Technical Report Summaries and Qualified Persons
The scientific and technical information concerning our mineral projects in this Form 10-K have been reviewed and approved by “qualified persons” under S-K 1300, including our Senior Director, Technical Services, Christopher Pascoe. For a
description of the key assumptions, parameters and methods used to estimate mineral reserves and mineral resources included in this Form 10-K, as well as data verification procedures and a general discussion of the extent to which the estimates may be affected by any known environmental, permitting, legal, title, taxation, sociopolitical, marketing or other relevant factors, please review the Technical Report Summaries for each of the Company’s material properties which are included as exhibits to, and incorporated by reference into, this Report.
Item 1A. Risk Factors
The following discussion, together with the other information set forth in this report, presents what management currently believes could be material risk factors and uncertainties that could adversely affect our business, financial condition or operating results. Other risks and uncertainties, including those not presently known to us or those that we do not believe are material currently may also affect our business and thus the following should not be considered a complete discussion of all risks and uncertainties that the Company may face.
RISKS RELATED TO OUR INDUSTRY
Our results of operations, cash flows and operating costs are highly dependent upon the market prices of gold and silver and of key input commodities used in our business, which are volatile and beyond our control.
Gold and silver are actively traded commodities, and their prices are volatile. The high and low prices for each commodity during the 12 months ended December 31, 2024 are set forth in the following table:
| | | | | | | | | | | | | | |
| Metal | High Price for 2024 | Date | Low Price for 2024 | Date |
| Gold (per ounce) | $2,778 | October 30, 2024 | $1,985 | February 14, 2024 |
| Silver (per ounce) | $34.51 | October 23, 2024 | $22.09 | February 14, 2024 |
Gold and silver prices are affected by many factors beyond the Company’s control, including U.S. dollar strength or weakness, speculation, global currency values, global and regional demand and production, political and economic conditions and other factors. In addition, Exchange Traded Funds (“ETFs”), which have substantially facilitated the ability of large and small investors to buy and sell precious metals, have become significant holders of gold and silver. Gold and silver prices are also affected by prevailing interest rates and returns on other asset classes, expectations of the future rate of inflation and governmental monetary decisions regarding central bank holdings.
Because we derive all of our revenues from sales of these metals, our results of operations and cash flows will fluctuate as the prices of these metals change. A period of significant and sustained lower prices would materially and adversely affect our results of operations and cash flows. In response to environments of lower metal prices and/or higher treatment and refining charges, we may have to revise our operating plans, including reducing operating costs and capital expenditures, terminating or suspending mining operations at one or more of our properties and discontinuing certain exploration and development plans. These types of initiatives may not sufficiently offset reductions in revenues, and we may continue to incur losses associated with sustained lower metals prices and/or higher treatment and refining charges.
Operating costs at our mines are also affected by the price of input commodities, such as fuel, electricity, labor, chemical reagents, explosives, steel and concrete. Prices for these input commodities are volatile and can fluctuate due to conditions that are difficult to predict, including global competition for resources, inflation, currency fluctuations, consumer or industrial demand and other factors. An increase in the cost, or decrease in the availability, of input commodities, labor, or equipment, due to factors beyond the Company’s control may affect the timely conduct and cost of our operations and development projects. Continued volatility in the prices of commodities and other supplies we purchase could lead to higher costs, which would adversely affect results of operations and cash flows.
Volatility in metals prices may also impact the price of our outstanding securities.
Speculation in the market may result in short term volatility in the prices of the metals we produce and result in significant changes in the price of our securities, which may not be reflective of our operating performance or financial results. For example, the price of silver increased 5% between May 23, 2024 and May 29, 2024, and then decreased by 6% on June 7, 2024. This swing in the price of silver was seemingly attributable to a coordinated effort by market participants to drive up the price of silver and did not reflect changes in the underlying fundamentals that typically drive changes in the price of silver, including supply and demand. The price of our common stock increased by 6% and decreased by 6% during the same periods. The trading volume for shares of our common stock also increased significantly during this period. This volatility in the price of our common stock did not, in our view, reflect any significant change in our business or results of operations during the same period.
The estimation of mineral reserves and mineral resources is imprecise and depends upon subjective factors. Estimated mineral reserves and mineral resources may not be realized in actual production. Our results of operations and financial position may be adversely affected by inaccurate estimates.
The mineral reserve and mineral resource figures presented in our public filings are estimates made by our technical personnel and independent mining consultants with whom we contract. Mineral reserve and mineral resource estimates are a function of geological and engineering analyses that require us to make assumptions about production costs, recoveries and the
market prices of gold, silver, zinc and lead. While the Company believes that its mineral reserve and mineral resource estimates are developed using well-established practices and with appropriate controls, mineral reserve and mineral resource estimation is an imprecise and subjective process. The accuracy of these estimates is a function of the quality of available data and of engineering and geological interpretation, judgment and experience. Assumptions about gold, silver, zinc and lead market prices are subject to great uncertainty as those prices fluctuate widely. Declines in the market prices of gold, silver, zinc or lead may render mineral reserves and mineral resources containing relatively lower grades of mineralization uneconomic to exploit, and we may be required to reduce mineral reserve and mineral resource estimates, discontinue development or mining at one or more of our properties or write down assets as impaired. Should we encounter mineralization or geologic formations at any of our mines or projects that are different from those predicted, we may adjust our mineral reserve and mineral resource estimates and alter our mining plans. No assurances can be given that all mineral reserves will be mined, as mineralized material that may qualify as reserves under applicable standards by virtue of being economic to mine may not generate attractive enough returns to be included in our mine plans, due to factors such as the impact of the gold stream at Palmarejo. As a result, we may elect not to mine portions of the mineralized material reported as reserves. In addition, no assurances can be given that any mineral resource estimate will ultimately be reclassified as proven or probable mineral reserves or that inferred resources will be upgraded to measured or indicated resources. Updates to our mining plans or new or updated technical or geological information may also impact anticipated metal recovery rates. Any of these adjustments may adversely affect actual operating performance, production, financial condition, results of operations and cash flows.
A significant delay or disruption in sales of concentrates or doré as a result of the unexpected disruption in services provided by smelters, refiners or other third parties could have a material adverse effect on our results of operations.
We rely on refiners and smelters to refine, process and, in some cases, purchase the gold and silver doré and concentrate produced by our mines. Access to refiners and smelters on economic terms is critical to our ability to sell our products to buyers and generate revenues. We have existing agreements with refiners and smelters, some of whom operate their refining or smelting facilities outside the United States. We believe our current contractual arrangements are sufficient so that the loss of any one refiner or smelter would not significantly or materially impact our operations or our ability to generate revenues. Nevertheless, services provided by a refiner or smelter may be disrupted by new or increased tariffs, duties or other cross-border trade barriers, shipping delays, the bankruptcy or insolvency of one or more refiners or smelters or the inability to agree on acceptable commercial or legal terms with a refiner or smelter. Such an event or events may disrupt an existing relationship with a refiner or smelter or result in the inability to create (or the necessity to terminate) a contractual relationship with a refiner or smelter, which may leave us with limited, uneconomic or no access to refining or smelting services for short or long periods of time. Epidemics, pandemics or natural disasters may also impact refiners, smelters or other third parties with whom we have contractual arrangements or have an indirect effect on our ability to obtain refining, smelting or other third-party services.
Any delay or loss of access to refiners or smelters may significantly impact our ability to generate revenues by selling doré and concentrate products. A default by a refiner or smelter on its contractual obligations to us or an insolvency event or bankruptcy filing by a refiner or smelter may result in the partial or total loss of our doré or concentrate in the possession of the refiner or smelter, and such a loss likely would not be insured by our insurance policies. We cannot ensure that alternative refiners or smelters would be available, that they would offer comparable terms, or that we would not experience delays or disruptions in sales that would materially and adversely affect results of operations.
There are significant hazards associated with mining activities, some of which may not be fully covered by insurance.
The mining business is subject to risks and hazards, including environmental hazards, industrial accidents, the encountering of unusual or unexpected geological formations, geotechnical failures, flooding, earthquakes and periodic interruptions due to inclement or hazardous weather conditions or machine failure. These occurrences could result in damage to, or destruction of, mineral properties or production facilities, personal injury or death, environmental damage, reduced production and delays in mining, asset write-downs, monetary losses and possible legal liability.
We maintain insurance policies that protect against property loss and business interruption in amounts that we believe are reasonable taking into account the nature of, and risks related to, our business and operations as well as the cost of policy premiums. Such insurance is, however, subject to certain exclusions, and potential claims could exceed policy limits. There is no guarantee that we will receive insurance proceeds with respect to a particular event or loss. Insurance fully covering many environmental risks, including potential liability for pollution or other hazards as a result of disposal of waste products occurring from exploration and production, is not generally available. Any liabilities that we incur for these risks and hazards could be significant and could adversely affect results of operations, cash flows and financial condition.
RISKS RELATED TO OUR OPERATIONS
Our future growth will depend upon our ability to expand existing mines and develop and start-up new mines, either through exploration at existing properties or by acquisition of other mining companies or properties.
Because mines have limited lives based on proven and probable mineral reserves, our ability to achieve significant additional growth in revenues and cash flows will depend upon our success in further developing and expanding existing properties and the opportunistic acquisition or development and start-up of exploration projects or new mining properties, such as the acquisition of mining concessions from a subsidiary of Fresnillo plc that are located adjacent to the existing Palmarejo site and the recent acquisition of SilverCrest Metals Inc. (“SilverCrest”), which operates the Las Chispas mine in Sonora, Mexico (the “SilverCrest Transaction”).
While initial development of our operating mines has been substantially completed, development work continues to expand these mines while leveraging existing infrastructure. Palmarejo completed open pit mining several years ago and evolved to be an underground-only operation, developing new underground mining operations. At Rochester, we completed the POA 11 expansion, which is a significant additional expansion that includes a three-stage crushing facility, a new leach pad, and a new Merrill-Crowe processing facility and related infrastructure to support the extension of Rochester’s mine life. At Kensington, we amended our operating permit to allow for an additional 10 years of mine life by providing for expanded tailings and waste rock storage, increased mill throughput, enhanced infrastructure and other benefits (“POA 1”). We are completing a multi-year exploration and underground mine development program to extend the mine life. Our ability to timely complete these and future mine expansion and mine life extension projects is dependent on numerous factors, many of which are outside of our control, including, among others, availability of funding on acceptable terms, timing of receipt of permits and approvals from regulatory authorities, obtaining materials and equipment, as well as construction, engineering and other services, at favorable prices and terms, and disputes with third-party providers of materials, equipment or services. Construction services performed by contractors create a risk of delays or additional costs resulting from, among other factors: inability to negotiate contracts with favorable pricing and terms; delays in performance of the services; failure of a contractor to comply with applicable laws and regulations; termination of a contract by a contractor before completion of the services; failure by a contractor to obtain necessary equipment or materials; mismanagement by a contractor of its workforce; and insolvency or other financial difficulty encountered by a contractor which results in a delay in services or termination of a contract with the contractor. Expected benefits from the Rochester expansion are based on estimates of a variety of key factors, including mineral reserves and resources, grade, recovery rates, the ability of processing infrastructure such as the refinery to meet higher throughput rates, and operating costs among others. However, achieving results in line with those estimates is subject to risks and uncertainties such as variability in grade, recovery rates and cost inputs and any inability of infrastructure to accommodate higher throughput. We cannot provide assurance that we will be able to successfully expand or extend the lives of existing mining operations, and a completed project may not yield the anticipated operational or financial benefits, such as expected availability, throughput, metal recovery rates, concentrate quality, unit costs, operating margin and/or cash flows, any of which may have a material negative impact on returns on invested capital, operating costs or cash flows.
In addition, we have acquired mining properties such as the Silvertip exploration property and the recent acquisition of the Las Chispas mine. We cannot guarantee that we will be able to successfully develop and start-up new mining properties, restart mining and processing activities at the Silvertip exploration property, integrate the operations of the Las Chispas mine or acquire additional mining properties on favorable economic terms or at all.
We regularly evaluate and engage in discussions or negotiations regarding acquisition opportunities. Any transactions that we contemplate or pursue would involve risks and uncertainties and would be subject to competition from other mining companies. There can be no assurance with respect to the timing, likelihood or business effect of any possible transaction.
We may be unable to successfully integrate, may not realize the expected benefits of recent or future acquisitions or may face risks associated with divestitures.
We regularly explore opportunities to selectively acquire other businesses or assets or to divest ourselves of all or part of certain assets in support of our growth plans and strategic objectives. There can be no assurance that the anticipated benefits of past acquisitions, including the SilverCrest Transaction, or any future acquisition, will be realized on the originally anticipated timeline or at all. The success and the ability to realize the anticipated benefits of any acquisition will depend upon our ability to effectively manage the integration, performance and operations of entities or properties we acquire. The process of managing acquired businesses or assets may involve unforeseen challenges and may require a disproportionate amount of our resources, which may divert focus and resources from other strategic opportunities and/or from operational matters during this process. As an example, the ramp up of the Silvertip exploration property, acquired in late 2017, was slower and less profitable
than originally anticipated, due primarily to more significant mill availability and maintenance challenges than were anticipated at the time Silvertip was acquired, as well as deteriorating zinc and lead market conditions.
As a result of the recent SilverCrest Transaction, Coeur’s business has expanded to include the Las Chispas mine in Sonora, Mexico. The commercial viability of the Las Chispas operation is dependent on various elements, including mining and processing costs, deposit characteristics such as size, grade, and infrastructure accessibility, as well as the cyclical nature of metal prices and governmental regulations. Factors such as weather events, permit issues, infrastructure failures, and community-related concerns also pose threats to Las Chispas. While the precise impact of these factors is uncertain, their convergence could render the Las Chispas mine economically unfeasible, potentially leading to closure.
In addition to the above, any acquisition would be accompanied by risks, including:
•a significant change in macroeconomic conditions, including commodity prices, treatment and refining charges or stock prices after we have committed to complete the transaction and established the purchase price or exchange ratio;
•additional debt incurred or issued to fund some or all of acquisition consideration (as was the case with Silvertip and Wharf), resulting in increased interest expense and other borrowing costs;
•issuance of equity securities as acquisition consideration (which occurred in the acquisition of the Lincoln Hill and Silvertip projects and the SilverCrest Transaction), resulting in dilution of our existing stockholders;
•a material ore body may prove to be below our expectations;
•processing facilities may not operate as well as anticipated, and may require significant maintenance, downtime and capital investment, as was the case with the original mill at Silvertip;
•difficulties integrating and assimilating the operations and personnel of any acquired companies and supporting expanded operations, realizing anticipated synergies and maximizing the financial and strategic position of the combined enterprise, and maintaining uniform standards, policies and controls across the organization;
•difficulties or loss of social license to operate resulting from failure of efforts to establish positive relationships and/or agreements with local communities or local indigenous peoples; and
•the acquired business or assets may have significant liabilities, such as environmental liabilities, or significant capital expenditures that we failed to discover or have underestimated.
We cannot predict the impact of future acquisitions on the price of our common stock or assure that we will be able to obtain necessary acquisition or development financing on acceptable terms or at all. Unprofitable acquisitions, or additional liabilities, indebtedness or issuances of securities in connection with such acquisitions or any future mine development, may negatively affect our results of operations.
In connection with dispositions, the Company may provide representations, warranties and indemnities customary for such transactions, as was the case with the Company’s sale of its interest in the Crown, Sterling and La Preciosa projects. There is a risk that the Company may incur liability in the future associated with assets it no longer owns or in which it has a reduced interest.
Significant investment risks and operational costs are associated with exploration and development activities. These risks and costs may result in lower economic returns and may adversely affect our business.
Our ability to sustain or increase current production levels depends in part on successful exploration and development of new ore bodies and expansion of existing mining operations. Substantial expenditures are required to establish mineral reserves, to extract metals from ore and, in the case of new properties, to construct mining and processing facilities.
Our plans include several significant projects to construct or upgrade mining and processing facilities at our existing mining operations or exploration properties, including the planned POA 1 mine life extension at Kensington and future development of the Silvertip exploration project. These projects can take several months or years to complete, are complex and require significant capital expenditures, as demonstrated by the recently completed POA 11 expansion at Rochester. These projects are subject to significant risks described in this Item 1A, any of which may have a material negative impact on returns on invested capital, operating costs or cash flows.
Mineral exploration involves many risks and is frequently unproductive. Even if mineral deposits are found, those deposits may be insufficient in quantity or quality to return a profit from production, or it may take a number of years until production is possible, during which time the economic viability of the project may change. Few properties that are explored are ultimately developed into producing mines. The commercial viability of a mineral deposit, once developed, depends on a number of factors, including: the particular attributes of the deposit, including size, grade and proximity to infrastructure;
government regulations, including taxes, royalties and land tenure; land use; importing and exporting of minerals; environmental protection; mineral prices; and issuance and maintenance of necessary permits. Factors that affect adequacy of infrastructure include reliability of roads, bridges, power sources and water supply; unusual or infrequent weather phenomena; sabotage; and government or other interference in the maintenance or provision of such infrastructure. The exact effect of these factors cannot be accurately predicted, but the combination may result in not receiving an adequate return on invested capital.
In addition, exploration projects such as Silvertip may have little or no relevant operating history upon which to base estimates of future operating costs and capital requirements. Exploration project items such as estimates of mineral resources and mineral reserves, metal recoveries and cash operating costs are to a large extent based upon the interpretation of geologic data obtained from a limited number of drill holes and other sampling techniques and feasibility studies. Estimates of operating costs are then derived based upon anticipated tonnage and grades of ore to be mined and processed, the configuration of the ore body, expected recovery rates of metals from the ore, comparable facility and equipment costs, anticipated climate conditions and other factors. As a result, actual operating costs and economic returns of any and all exploration projects may materially differ from the costs and returns estimated, and accordingly, our financial condition, results of operations and cash flows may be negatively affected.
The Company may be affected by global supply chain disruptions.
The Company may face supply chain disruptions as a result of matters outside of the Company’s control or ability to mitigate, such as natural disasters, transportation disruptions, economic instability, sanctions or tariffs, geopolitical unrest, civil or international hostilities and global pandemics, among others. Recently, the Russian invasion of Ukraine and the Israel-Hamas conflict have resulted in losses of life, displacement of people, and political and economic disruptions on a global scale. Additionally, recent economic tensions involving jurisdictions in which we operate or from which we source goods have resulted in proposals to implement or actual implementation of tariffs and other trade barriers that could result in disruptions to supply chains or lead to increased costs to obtain necessary supplies. There may be unforeseen impacts from these events globally on commodity prices, liquidity and credit or supply chains, and the Company continues to monitor them closely.
We may be required to write down certain long-lived assets, due to metal prices, operational challenges or other factors. Such write-downs may adversely affect our results of operations and financial condition.
We review our long-lived assets for recoverability pursuant to the Financial Accounting Standard Board’s (“FASB”) Accounting Standards Codification Section 360. Under that standard, we review the recoverability of our long-lived assets, such as our mining properties, upon a triggering event. Such review involves estimating the future undiscounted cash flows expected to result from the use and eventual disposition of the asset. Impairment, measured by comparing an asset’s carrying value to its fair value, must be recognized when the carrying value of the asset exceeds these cash flows. We conduct a review of the financial performance of our mines in connection with the preparation of our financial statements for each reporting period and determine whether any triggering events are indicated.
If there are significant and sustained declines in relevant metal prices, or if we fail to control production and operating costs or realize the mineable ore reserves at our mining properties, we may terminate or suspend mining operations at one or more properties. These events could require a further write-down of the carrying value of our assets. Any such actions would adversely affect our results of operations and financial condition.
We may record other types of charges in the future if we sell a property or asset for a price less than its carrying value or have to increase reclamation liabilities in connection with the closure and reclamation of a property. Any additional write-downs of mining properties or other assets could adversely affect our results of operations and financial condition.
Coeur is an international company and is exposed to political and social risks associated with its foreign operations.
A significant portion of our revenues is generated by operations outside the United States, particularly Mexico. Exploration, development, production and closure activities in many countries are potentially subject to heightened political and social risks that are beyond our control and could result in increased costs, capacity constraints and potential disruptions to our business. These risks include the possible unilateral cancellation or forced renegotiation of contracts in which we, directly or indirectly, may have an interest, unfavorable changes in foreign laws and regulations, royalty and tax increases (including taxes associated with the import or export of goods), risks associated with the value-added tax (“VAT”) and income tax refund recovery and collection process, aggressive or punitive tax audits, policy-driven or punitive interference with or moratoriums on processing of permit applications or granting water or mineral concessions, erection of trade barriers, including tariffs and duties, claims by governmental entities or indigenous communities, changes to mining and related laws impacting current and future operations, expropriation or nationalization of property and other risks arising out of foreign sovereignty over areas in which our operations are conducted. As an example, as disclosed in Note 17 -- Commitments and Contingencies to the Consolidated Financial Statements, we are currently engaged in efforts to recover amounts unduly paid to the Mexican government that are owed to Coeur associated with a prior royalty agreement covering gold production at Palmarejo, including
through international arbitration. While the Company believes that it remains legally entitled to be refunded the full amount of the unduly paid VAT receivable and intends to rigorously continue its recovery efforts, based on the continued failure to recover the receivable and unfavorable Mexican court decisions, the Company determined to write down the carrying value of the receivable of $26.0 million at September 2021. In addition, recent amendments to mining, water and environmental laws in Mexico, and recent government actions under the prior Mexican administration intended to slow or halt the normal processing of permits and granting of water or mineral concessions, could impose additional restrictions on our ability to obtain and maintain mining and water rights and operate in Mexico, among other potentially adverse provisions. The main operating permit at Palmarejo expires in October 2025. We filed a routine application to extend the permit in the ordinary course, which the environmental authorities under the prior administration did not act upon, consistent with prior administration policy. Since President Claudia Sheinbaum took office on October 1, 2024, we have seen indications of a return to normal processing of permits, and we are engaging with the government to gain approval for the extension of the permit, but there can be no assurance as to whether or when we will receive it. The right to import and export gold and silver may depend on obtaining certain licenses and quotas, which could be delayed or denied at the discretion of the relevant regulatory authorities, or could become subject to new taxes, tariffs or duties imposed by U.S. or foreign jurisdictions, as well as other actions taken in potential trade disputes, which could have a material adverse effect on our business, financial condition, or future prospects. In addition, our rights under local law may be less secure in countries where judicial systems are susceptible to manipulation and intimidation by government agencies, non-governmental organizations or civic groups.
Any of these developments could require us to curtail or terminate operations at our mines, incur significant costs to renegotiate contracts, meet newly-imposed environmental or other standards, pay greater royalties or higher prices for labor or services and recognize higher taxes, address aggressive or punitive tax audit assessments including through litigation, or experience significant delays or obstacles in the recovery of VAT or income tax refunds owed, which could materially and adversely affect financial condition, results of operations and cash flows.
Our operations outside the United States also expose us to economic and operational risks.
Our operations outside the United States also expose us to economic and operational risks. Local economic conditions, as well as epidemics, pandemics or natural disasters, can cause shortages of skilled workers and supplies, increase costs and adversely affect the security of operations. In addition, higher incidences of criminal activity and violence in the area of some of our foreign operations, including drug cartel-related violence in Mexico, could adversely affect our ability to operate in an optimal fashion and may impose greater risks of extortion and theft, greater risks to our personnel and property, greater risks to the transport of materials to refineries, and greater risks to the supply of services and goods to our operations, including specialized equipment. These conditions, including security concerns in certain communities surrounding the Palmarejo complex impacting third-party deliveries of supplies to Palmarejo, could adversely impact our operations and lead to lower productivity and higher costs, which would adversely affect results of operations and cash flows. Furthermore, with the completion of the SilverCrest Transaction, the Company’s exposure to such risks is expected to increase due to the addition of the Las Chispas operation in Mexico.
In addition, acts of civil disobedience are not uncommon in certain areas of Mexico where our operations or projects are located. In recent years, many mining companies have been the targets of actions to restrict their legally entitled access to mining concessions or property. Such acts of civil disobedience often occur without warning and can result in significant direct and indirect costs. We cannot provide assurance that there will be no disruptions to site access in the future, which could adversely affect our business.
We sell gold doré, gold concentrate, silver doré and silver concentrate in U.S. dollars, but we conduct operations outside the United States in local currency. Currency exchange movements could also adversely affect our results of operations.
Our success depends on developing and maintaining relationships with local communities and other stakeholders.
Our ongoing and future success depends on developing and maintaining productive relationships with the communities surrounding our operations, including indigenous peoples who may have rights or may assert rights to certain of our properties, and other stakeholders in our operating locations. We believe our operations can provide valuable benefits to surrounding communities, including through direct employment, training and skills development and other benefits associated with ongoing payment of taxes. In addition, we seek to maintain our partnerships and relationships with local communities, including indigenous peoples, and stakeholders in a variety of ways, including in-kind contributions, volunteer time, sponsorships and donations. There is an increasing level of public concern relating to the perceived effect of mining activities on indigenous communities. Evolving expectations related to human rights, indigenous interests and environmental protection may result in opposition to the Company’s current or future activities. Notwithstanding our ongoing efforts, local communities and stakeholders could become dissatisfied with our activities or the level of benefits provided, which may result in legal or administrative proceedings, civil unrest, protests, direct action or campaigns against us or our operations. Any such occurrences could materially and adversely affect our financial condition, results of operations and cash flows.
In addition, the growing use of social media to generate, publish and discuss community news and issues and to connect with others has made it significantly easier, among other things, for individuals and groups to share their opinions of our business and our activities, whether true or not. We do not have direct control over how we are perceived by others and any resulting loss of reputation could have a material adverse effect on our business, financial position and results of operations.
Our mining assets are subject to geotechnical and hydrological risks, and a related incident could materially and adversely impact our production, profitability and financial condition, as well as the value of our common stock.
Our mining assets are subject to geotechnical and hydrological risks which could impact the structural integrity of our mines, stockpiles, leach pads and tailings storage facilities. No assurances can be given that unanticipated adverse geotechnical and hydrological conditions, such as landslides, pit wall failures or tailings dam instability will not occur in the future or that such events will be detected in advance. Geotechnical and hydrological instabilities can be difficult to predict and are often affected by risks and hazards outside of our control, such as severe weather and considerable rainfall, which may lead to periodic floods, mudslides, wall instability and seismic activity, which may result in slippage of material. The occurrence of significant leach pad failures at third-party sites in recent years may result in the introduction of additional laws and regulations, which could result in additional operational and compliance costs for our sites. Some of these risks may be heightened further by the remote location of our operations.
Waste rock in the form of tailings generated as a by-product of processed ore is produced at the Kensington and Palmarejo mines. We place tailings into engineered containments, underground as structural backfill, and as thickened tailing into a former open pit. In response to several recent tailings dam failures at third-party operations that have involved loss of life and resulted in severe property and environmental ecosystem damage, we completed a comprehensive review of our tailings dams and operational practices to characterize our risk profile. We concluded that our tailings dams represent a low exposure risk profile for several reasons, including that our tailings dams were constructed using construction methods recognized in the industry as the most stable tailings dam design using high strength and chemically stable rock in construction. Our dams are continuously monitored and inspected by internal resources as well as third-party industry qualified experts. The significant dam failure events at third-party locations that have occurred in recent years may lead to regulatory governance changes stemming from updated laws, regulation or guidance, which could result in increased operational and compliance costs if we need to make changes to existing facilities. The failure of a tailings dam or tailings storage facility at one of our mine sites could result in severe, and in some cases catastrophic, property and environmental damage and loss of life. Geotechnical or hydrological failures could result in limited or restricted access to mine sites, suspension of operations, government investigations, fines and penalties, lawsuits filed by parties who suffer injuries or property damage from such events, increased monitoring costs, remediation costs, loss of mineral reserves and resources and other impacts, which could have a material adverse effect on our results of operations and financial position as well as the value of our common stock.
Our estimates of future production, costs, expenditures and financial results are imprecise, depend upon subjective factors, may not be realized in actual production and such estimates speak only as of their respective dates.
We have in the past, and may in the future, provide estimates and projections of our future production, costs, expenditures and financial results. Any such information is forward-looking. Neither our independent registered public accounting firm nor any other independent expert or outside party compiles or examines these forward-looking statements and, accordingly, do not express any opinion or any other form of assurance on these estimates and projections. Estimates and projections are made by our management and technical personnel and are qualified by, and subject to the assumptions contained or referenced in the filing, release or presentation in which they are made, including assumptions about the availability, accessibility, sufficiency and quality of mineralization, recovery rates, our costs of production, the market prices of gold and silver, our ability to sustain and increase production levels, the ability to produce and sell marketable concentrates and dorés and related treatment and refining charges, the sufficiency of our infrastructure, the performance of our personnel and equipment, our ability to maintain and obtain mining interests and permits, the state of government and community relations, and our compliance with existing and future laws and regulations. We sometimes state possible outcomes as high and low ranges which are intended to provide a sensitivity analysis as variables are changed but are not intended to represent that actual results could not fall outside of the suggested ranges. Actual results and experience may differ materially from these assumptions. Any production, cost, expenditure or financial results estimates speak only as of the date on which they are made, and we disclaim any intent or obligation to update such estimates, whether as a result of new information, future events or otherwise. Accordingly, these forward-looking statements should be considered in the context in which they are made, and undue reliance should not be placed on them.
Our use of derivative contracts to protect against market price volatility exposes us to risk of opportunity loss, mark-to-market fair value adjustments, potential cash collateral calls and exposure to counterparty credit risk.
We have in the past, and may in the future, enter into price risk management contracts to protect against fluctuations in the price of gold and silver, foreign currency rates and changes in the prices of fuel and other input costs. These contracts could include forward sales or purchase contracts, futures contracts, purchased or sold put and call options and other derivative
instruments. We entered into price risk management contracts on certain gold and silver sales in 2021, 2022, 2023 and 2024. We determined to implement these contracts to provide for a minimum level of revenue from the sales of the covered gold and silver ounces in order to mitigate the risk of not being able to fund all or a portion of the costs of several significant projects at our existing operations, such as the Rochester expansion, as well as provide greater certainty in our planning and budgeting process. As of December 31, 2024, no forward contracts remained outstanding but the Company did acquire existing zero cost collar hedges for 1,600 ounces of gold and 200,000 ounces of silver on February 14, 2025 as part of its acquisition of SilverCrest. These hedges settle monthly through March, 2025. See Note 13 — Derivative Financial Instruments & Hedging Activities in the notes to the Consolidated Financial Statements.
The use of derivative instruments can expose us to risk of an opportunity loss and may also result in significant mark-to-market fair value adjustments, which may require us to post cash or other collateral or have a material adverse impact on reported financial results. Our exposure may be particularly acute for our derivative instruments accounted for as cash flow hedges because those contracts are cash net settled on a monthly basis. We are exposed to credit risk with contract counterparties, including, but not limited to, sales contracts and derivative contracts. In the event of nonperformance in connection with a contract, we could be exposed to a loss of value for that contract.
We are dependent upon information technology and operational technology, which are subject to cybersecurity incidents, disruption, damage, failure and other risks associated with implementation and integration.
The information technology and operational technology used in our business and operations are subject to disruption, damage or failure from a variety of sources, including, without limitation, computer viruses, security breaches, cyberattacks, natural disasters and defects in design. Cybersecurity incidents, in particular, are evolving and include, but are not limited to, malicious software, attempts to gain unauthorized access to data or machines and equipment, other electronic security breaches that could lead to disruptions in systems, unauthorized release of confidential or otherwise protected information, and the corruption of data or the disabling, misuse or malfunction of machines and equipment. Various measures have been implemented to manage our risks related to information technology, operational technology and network disruptions. However, given the unpredictability of the timing, nature and scope of information or operational technology disruptions, we could potentially be subject to production downtimes, operational delays, operating accidents, the compromising of confidential or otherwise protected information, destruction or corruption of data, security breaches, other manipulation or improper use of our systems, equipment and networks or financial losses from remedial actions, any of which could have a material adverse effect on cash flows, financial condition or results of operations. We may also incur large expenditures to recover data, to repair or replace networks or information or to protect against similar future events.
We could also be adversely affected by system or network disruptions if new or upgraded information technology systems are defective, not installed properly or not properly integrated into operations. Various measures have been implemented to manage the risks related to the system implementation and modification, but system modification failures could have a material adverse effect on our business, financial position and results of operations. Although the Company has not experienced any material loss to date relating to cybersecurity, there can be no assurance that the Company will not incur such loss in the future. We carry cybersecurity insurance; however, it may not be sufficient to cover losses arising from cybersecurity incidents that may occur.
There has been heightened legislative and regulatory focus on data privacy and cybersecurity in the U.S and elsewhere. We may be required to comply with a fast-evolving set of legal requirements in this area, including substantive data privacy and cybersecurity standards. This regulatory environment may present material obligations and risks to our business, including significantly expanded compliance burdens, costs and enforcement risks.
We may be expected to continue enhancing our ESG practices to meet evolving and inconsistent standards.
ESG factors, including climate-related initiatives such as GHG emissions targets and climate risk management, are a metric used by many institutional investors to review and assess the performance of the Company and a significant factor in their investment decisions. We believe we have established ourselves as a leader among peers in ESG and continued to advance our ESG initiatives, and have adopted specific, objective goals such as continuing to improve our industry-leading safety record, reducing the net intensity of our GHG emissions across the Company, advancing our commitment to an inclusive culture to attract and retain the workforce we need today and in the future, strengthening community relations and protecting critical habitat. However, there are no assurances that our efforts will be sufficient or meet the standards set by ESG analysts or institutional or other investors.
Our operations may be disrupted, and our financial results may be adversely affected by an outbreak of infectious disease or pandemic.
An outbreak of infectious disease, pandemic or a similar public health threat, such as the COVID-19 pandemic, and the response thereto, could adversely impact our business and operations. If a significant portion of our workforce becomes unable
to work or travel to our operations due to illness or government restrictions (including travel restrictions and “shelter-in-place” and similar orders restricting certain activities that may be issued or extended by authorities), we may be forced to reduce or suspend operations at one or more of our mines, which could reduce production, limit exploration activities and development projects and impact liquidity and financial results. While we have implemented several initiatives to protect the health and safety of our employees, contractors and communities to date, some of which have and may result in additional costs to us, there can be no assurance that the Company will remain unaffected by potential future health crises.
Public health threats and related government restrictions, including potential closure of national borders, may disrupt the supply of raw goods, equipment, supplies and services upon which our operations rely.
Third parties with whom we conduct business, including the refiners and smelters that process and, in some cases, purchase the doré and concentrate produced by our mines, are also subject to these risks and may be required to reduce or suspend operations, which could impact our ability to conduct our operations, advance exploration, development and expansion projects, or sell our products and generate revenues.
To the extent any pandemic or other public health threat adversely affects our business and financial results, it may also have the effect of heightening many of the other risks described in this Item 1A, such as those relating to our operations and indebtedness and financing. Because of the highly uncertain and dynamic nature of events pandemics and other public health threats, it is not possible to estimate the full potential impact on our business. However, these effects could have a material impact on our business and results of operations or financial condition.
Our business depends on good relations with, and the retention and hiring of, personnel.
We may experience labor disputes, work stoppages or other disruptions in production that could adversely affect our business and results of operations. Labor disruptions may be used to advocate labor, political or social goals, particularly at non-U.S. mines. For example, labor disruptions may occur in sympathy with strikes or labor unrest in other sectors of local economies. We cannot assure that work stoppages, union organizing activities or other disruptions will not occur in the future. Any such work stoppage or disruption could expose us to significant costs and have a material adverse effect on our business, results of operations or financial condition.
We compete with other mining companies to attract and retain key executives, skilled labor, contractors and other employees. We may be unable to continue to attract and retain skilled and experienced employees and contractors, which could have an adverse effect on our competitive position or adversely impact our results of operations or financial condition.
Continuation of our mining operations is dependent on the availability of sufficient and affordable water supplies.
Our mining operations require significant quantities of water for mining, ore processing and related support facilities. In particular, our properties in Mexico and Nevada are in areas where water is scarce and competition among users for continuing access to water is significant. Continuous production and mine development is dependent on our ability to acquire and maintain water rights and claims and to defeat claims adverse to current water uses in legal proceedings. For example, in January 2024, the Supreme Court of Justice of the Nation issued a ruling that invalidated certain non-material surface water rights previously utilized at Palmarejo. Although each of our operating mines currently has sufficient water rights and claims to cover its operational demands, we cannot predict the potential outcome of pending or future legal proceedings relating to enforcement of water rights, claims and uses, or potential pressure from other users of water, government agencies and officials, and/or non-governmental organizations to limit the amount of water made available to or used for mining activities, regardless of legally valid water rights.
Water shortages may also result from weather or environmental and climate impacts outside of our control. Shortages in water supply could result in interruptions to production and processing activities. In addition, the scarcity of water in certain regions could result in increased costs to obtain sufficient quantities of water to conduct our operations. The loss of some or all water rights, ongoing litigation to enforce existing water rights, ongoing shortages of water to which we have rights and/or significantly higher costs to obtain sufficient quantities of water could result in our inability to maintain production at current or expected levels, require us to curtail or shut down mining operations or could prevent us from pursuing expansion or development opportunities, which could adversely affect our results of operations and financial condition. Laws and regulations may be introduced in the jurisdictions in which we operate which could also limit access to sufficient water resources, adversely affecting our existing operations or our expansion or development plans.
We may not be able to recognize the benefits of deferred tax assets.
We have accrued deferred tax assets in various jurisdictions from past operating losses, but may not be able to utilize part or all of these assets in the future. We recognize the expected future tax benefit from these assets only if it is considered more likely than not that the tax benefit will be realized. Otherwise, a valuation allowance is applied against deferred tax assets that are not more likely than not to be utilized. Assessing the recoverability of deferred tax assets requires management to make
significant estimates related to expectations of future taxable income, including application of existing tax laws in each jurisdiction, assumptions about future metals prices, the macroeconomic environment and results of our operations. To the extent that future cash flows and taxable income differ significantly from estimates, our ability to realize deferred tax assets could be impacted. Additionally, future changes in tax laws or changed interpretations or applications of relevant laws by government agencies – even if contrary to existing legal precedent or punitive in nature – could limit our ability to realize the future benefits represented by our deferred tax assets and annual limitations may impact the timeframe over which the net operating loss carryforwards can be used, potentially impacting cash tax liabilities in a future period.
RISKS RELATED TO INDEBTEDNESS AND FINANCING
Our future operating performance may not generate cash flows sufficient to meet debt payment obligations.
As of December 31, 2024, we had approximately $590.1 million of outstanding indebtedness. Our ability to make scheduled debt payments on outstanding indebtedness will depend on future results of operations and cash flows. Our results of operations and cash flows, in part, are subject to economic factors beyond our control, including the market prices of gold and silver, among other factors described in this Item. Although we have been successful in repaying or refinancing debt historically, there can be no assurance that we can continue to do so. We may not be able to generate enough cash flow to meet obligations and commitments under outstanding debt instruments.
If and to the extent liquidity resources are insufficient to support short- and long-term expenditures, we could face substantial liquidity problems and could be forced to reduce or delay investments and capital expenditures, dispose of material assets or operations, incur additional debt or equity capital or restructure or refinance our indebtedness. We cannot predict whether we would be able to refinance debt, issue equity or debt securities or dispose of assets to raise funds on a timely basis or on satisfactory terms, which could have a material adverse impact on the Company. In a rising interest rate environment, the costs of borrowing additional funds or refinancing outstanding indebtedness would also be expected to increase. The agreements governing our outstanding indebtedness restrict our ability to dispose of certain assets and use the proceeds from those dispositions and may also restrict our ability to raise debt or equity capital to be used to repay other indebtedness when it becomes due. We may not be able to consummate those dispositions or to obtain proceeds in an amount sufficient to meet any debt service obligations then due.
The terms of our debt impose restrictions on our operations.
The agreements governing our outstanding indebtedness include a number of significant negative covenants. These covenants, among other things:
•limit our ability to obtain additional financing, repurchase outstanding equity or issue debt securities;
•require us to meet certain financial covenants including a senior secured leverage ratio, a consolidated net leverage ratio and a consolidated interest coverage ratio;
•require a portion of our cash flows to be dedicated to debt service payments instead of other purposes, which reduces the amount of cash flows available for working capital, capital expenditures, acquisitions and other general corporate purposes;
•limit our ability to sell, transfer or otherwise dispose of assets, enter into transactions with and invest capital in affiliates, enter into agreements restricting our subsidiaries’ ability to pay dividends, consolidate, amalgamate, merge or sell all or substantially all of our assets;
•increase our vulnerability to general adverse economic and industry conditions;
•limit our flexibility in planning for and reacting to changes in the industry in which we compete; and
•place us at a disadvantage compared to other, less leveraged competitors.
A breach of any of these covenants could result in an event of default under the applicable agreement governing our outstanding indebtedness that, if not cured or waived, could cause all amounts outstanding with respect to the debt to be due and payable immediately. Acceleration of any debt could result in cross-defaults under our other debt instruments. Our inability to meet any of these covenants may also result in a lender requiring us to agree to additional restrictive covenants which may, among other things, limit our ability to fund our existing operations or incur additional indebtedness. Our assets and cash flow may be insufficient to repay borrowings fully under all of our outstanding debt instruments if any of our debt instruments are accelerated upon an event of default, which could force the Company into bankruptcy or liquidation.
Any downgrade in the credit ratings assigned to us or our debt securities could increase future borrowing costs, adversely affect the availability of new financing and may result in increased collateral requirements under our existing surety bond portfolio.
There can be no assurance that any rating currently assigned by Standard & Poor’s Rating Services or Moody’s Investors Service to us or our debt securities will remain unchanged for any given period of time or that a rating will not be lowered if, in that rating agency’s judgment, future circumstances relating to the basis of the rating so warrant. For example, rating agencies may reevaluate Coeur’s credit ratings following the consummation of the SilverCrest Transaction. Factors that may impact Coeur's credit ratings following consummation of the SilverCrest Transaction include debt levels, planned asset purchases or sales and near-term and long-term production growth, opportunities, liquidity, asset quality, cost structure, product mix and commodity pricing levels. Likewise, if we are unable to maintain our outstanding debt and financial ratios at levels acceptable to the credit rating agencies, or should our business prospects or financial results deteriorate, including as a result of declines in gold or silver prices or other factors beyond our control, our ratings could be downgraded by the rating agencies. A downgrade by the rating agencies could adversely affect the value of our outstanding debt securities, our existing debt, and our ability to obtain new financing on favorable terms, if at all, may increase borrowing costs, and may result in increased collateral requirements under our existing surety bond portfolio, which in turn may adversely affect our results of operations and financial position.
RISKS RELATED TO APPLICABLE LAWS AND REGULATIONS
We are subject to significant governmental regulations, including the U.S. Mine Safety and Health Act, the Health, Safety and Reclamation Code for Mines under the British Columbia Mines Act and Relevant Sections of the Mexican Official Regulations, and related costs and delays associated with compliance may negatively affect our business.
Mining activities are subject to extensive federal, state, local and foreign laws and regulations governing environmental protection, natural resources, prospecting, development, production, post-closure reclamation, taxes, labor standards and occupational health and safety, including mine safety, toxic substances and other matters. The costs associated with compliance with such laws and regulations are substantial. Changes in existing laws, possible future laws and regulations, or more restrictive interpretations of current laws and regulations by governmental authorities, could cause additional expense, capital expenditures, restrictions on or suspensions of operations and delays in the development of new properties.
U.S. surface and underground mines like the Kensington, Rochester and Wharf mines are regularly inspected by the U.S. Mine Safety and Health Administration (“MSHA”). These inspections may lead to written citations or violation notices, which are reported in Exhibit 95.1 to this Report. Recently, MSHA has been conducting more comprehensive inspections of mining operations in general, focusing on miner health and critical safety hazards. Similar inspections are conducted in British Columbia, Canada, at the Silvertip exploration property by the British Columbia Ministry of Mining and Critical Minerals and in Mexico at the Palmarejo complex and Las Chispas mine by the Mexican Secretaria del Trabajo y Prevision Social (Secretary of Labor and Social Safety).
Recent amendments to mining, water and environmental laws in Mexico, and the subsequent corresponding regulations thereto, could impose additional restrictions on our ability to obtain and maintain mining and water rights and operate in Mexico, among other potentially adverse provisions. Legal actions challenging the validity and implementation of these recent amendments have been filed by various groups and the proceedings remain ongoing.
Failure to comply with applicable laws, regulations and permitting requirements may result in temporary or extended shutdowns, including orders issued by regulatory or judicial authorities causing operations to cease or be curtailed, which may require corrective measures, including the payment of fines or penalties, capital expenditures, installation of additional equipment or remedial actions, any of which could have a material, adverse effect on our business and results of operations.
Compliance with environmental regulations and litigation based on environmental regulations could require significant expenditures.
Environmental regulations mandate, among other things, the maintenance of air and water quality standards, land development and land reclamation, and set forth limitations on the generation, transportation, storage and disposal of solid and hazardous waste. Environmental legislation and environmental justice provisions are evolving in a manner that may require stricter standards and enforcement, increased fines and penalties for non-compliance, more stringent environmental assessments of proposed projects, and a heightened degree of responsibility for mining companies and their officers, directors and employees. We may incur environmental costs that could have a material adverse effect on financial condition and results of operations. Any failure to remedy an environmental problem could require us to suspend operations or enter into interim compliance measures pending completion of the required remedy. The environmental standards that ultimately may be imposed at a mine site affect the cost of remediation and could exceed the financial accruals that we have made for such remediation.
The potential exposure may be significant and could have a material adverse effect on our financial condition and results of operations.
Moreover, governmental authorities and private parties may bring lawsuits based upon damage to property and injury to persons resulting from the environmental, health and safety impacts of prior and current operations, including operations conducted by other mining companies many years ago on properties that we currently or previously owned. These lawsuits could lead to the imposition of substantial fines, remediation costs, penalties and other civil and criminal sanctions. Substantial costs and liabilities, including for restoring the environment after the closure of mines, are inherent in our operations. We cannot assure that any such law, regulation, enforcement or private claim would not have a material adverse effect on our financial condition, results of operations or cash flows.
Some of the mining waste from our U.S. mines currently are exempt to a limited extent from the extensive set of EPA regulations governing hazardous waste under the Resource Conservation and Recovery Act (“RCRA”). If the EPA were to repeal this exemption and designate these mining wastes as hazardous under RCRA, we would be required to make significant expenditures to manage the waste and to construct hazardous waste storage or disposal facilities. Under the Mercury Export Ban Act of 2008 (“MEBA”), incidental elemental mercury generated at our Rochester mine as part of the processing of ore may not be exported outside of the United States and is required to be stored in a facility designated by the U.S. Department of Energy (“DOE”) for long-term mercury management. The DOE is undergoing processes to designate such a facility and to establish storage and handling fees, which is not yet final. The outcome could result in material cost being incurred to ship and store mercury from our Rochester operation. In addition, if any of these wastes causes contamination in or damage to the environment at a U.S. mining facility, that facility could be designated as a “Superfund” site under the Comprehensive Environmental Response, Compensation, and Liability Act (“CERCLA”). Under CERCLA, any present owner or operator of a Superfund site or the owner or operator at the time of contamination may be held jointly and severally liable regardless of fault and may be forced to undertake extensive remedial cleanup action or to pay for the cleanup efforts. The owner or operator also may be liable to federal, state and tribal/indigenous governmental entities for the cost of damages to natural resources, which could be substantial. Additional regulations or requirements also are imposed on our tailings and waste disposal areas in Alaska under the federal Clean Water Act (“CWA”), in Nevada under the Nevada Water Pollution Control Law which implements the CWA, in South Dakota under the South Dakota Water Pollution Control Act and the Administrative Rules of the State of South Dakota, in British Columbia (Canada) under the Health, Safety and Reclamation Code for Mines in British Columbia, the British Columbia Environmental Management Act and the Canadian Metal and Diamond Mining Effluent Regulations, and in Mexico under the General Law of Ecological Balance and Protection of the Environment (the “GLEBPE”) and the regulations under the GLEBPE related to environmental protection in impact assessment matters.
Airborne emissions are subject to controls under air pollution statutes implementing the Clean Air Act in the U.S. and are regulated under the Environmental Management Act in British Columbia (Canada) and the GLEBPE and the regulations under GLEBPE related to prevention and control of the pollution of the atmosphere in Mexico. In addition, there are numerous legislative and regulatory initiatives related to climate change, reductions in greenhouse gas emissions, or energy policy and adoption of these initiatives through legislative actions or administrative policy could have a material adverse effect on results of operations and cash flows. However, we are unable to predict the scope, nature and timing of any new or increased environmental laws and regulations and therefore cannot predict the ultimate impact of such laws and regulations on our business or financial results. We continue to monitor existing and proposed laws and regulations in the jurisdictions in which we operate to consider actions we may take to potentially mitigate any unfavorable impact of such laws or regulations.
In addition, U.S. environmental conservation efforts could result in the withdrawal of certain federal lands from mineral entry under relevant mining law, which could have the effect of restricting our current or future planned activities involving our unpatented mining claims on the affected public lands.
We are required to obtain and renew governmental permits in order to conduct operations, a process which is often costly and time-consuming. Our ability to obtain necessary government permits to expand operations or begin new operations may be materially affected by third-party activists.
In the normal course of our business, we are required to obtain and renew governmental permits for exploration, operations and expansion of existing operations and for the development of new projects, such as the permits recently obtained for the Rochester expansion, POA 1 at Kensington and at Palmarejo to allow the deposit of future tailings into the legacy open pit rather than expanding the current tailings impoundment facility. Obtaining and renewing governmental permits is a complex and time-consuming process. The timeliness and success of permitting efforts are contingent upon many variables not within our control, including the interpretation of permit approval requirements administered by the applicable permitting authority and government and third-party sentiment towards the mining industry generally. We may not be able to obtain or renew permits that are necessary to our operations, or the cost and time required to obtain or renew permits may exceed our expectations. Any unexpected delays or costs associated with the permitting process could impede or delay the development or operation of a mine, which in turn could have a material adverse effect on our revenues and future growth. For example, as noted above, we are working through a prolonged delay in the routine renewal of our main operating permit at Palmarejo,
which expires in October 2025. As has been publicized in media coverage, we understand that other mining projects in Mexico have also experienced extended permitting delays or, in certain circumstances, denials of permits, due to anti-mining policies of the prior Mexican administration which just ended on October 1, 2024. Our early engagements with the new Mexican administration indicate normal processing of permits may be resuming, but there can be no assurance as to when or whether the Palmarejo permit extension will be granted. Any delay in obtaining a permit may require us to revise mine plans or curtail expected production, which could have a material adverse effect on results of operations and cash flow. In addition, key permits and approvals may be revoked or suspended or may be changed in a manner that adversely affects our operations. For example, we recently received a notice of revocation of our permit to operate back-up generators at Palmarejo. We are appealing the revocation and have been granted the right to continue operating the back-up generators during the course of the appeal. We are also applying for a new permit in case our appeal is not successful, but there can be no assurance that the revocation of the prior permit will not have an adverse impact on Palmarejo’s operating and financial results.
Private parties such as environmental activists frequently attempt to intervene in the permitting process and to persuade regulators to deny necessary permits or seek to overturn permits that have been issued. Obtaining the necessary governmental permits is a complex and time-consuming process involving numerous jurisdictions and often involving public hearings and costly undertakings. These third-party actions can materially increase the costs and cause delays in the permitting process and could cause us to not proceed with the development or expansion of a mine. In addition, our ability to successfully obtain key permits and approvals to explore for minerals and to develop, operate and expand mines, as well as to conduct our operations, will likely depend on our ability to develop, operate, expand and close mines in a manner that is consistent with the creation of social and economic benefits in the surrounding communities, which may or may not be required by law. Our ability to obtain permits and approvals and to successfully operate in particular communities may be adversely impacted by real or perceived detrimental events associated with our activities or those of other mining companies affecting the environment, human health and safety of communities in which we operate.
Our business is subject to anti-bribery laws, a breach or violation of which could lead to civil and criminal fines and penalties, loss of licenses or permits and reputational harm.
We operate in certain jurisdictions that have experienced governmental and private sector corruption. The U.S. Foreign Corrupt Practices Act, as well as Canadian and Mexican anti-bribery laws generally prohibit companies and their intermediaries from making improper payments for the purpose of obtaining or retaining business or other commercial advantage. Violations of these laws, or allegations of such violations, could lead to civil and criminal fines and penalties, litigation, and loss of operating licenses or permits, and may damage our reputation, which could have a material adverse effect on our business, financial position and results of operations. Our Code of Business Conduct and Ethics and other corporate policies mandate compliance with these anti-bribery laws, and we provide training and education on these topics to our employees; however, there can be no assurance that our internal control policies and procedures always will protect us from recklessness, fraudulent behavior, dishonesty or other inappropriate acts or violations of laws committed by our affiliates, employees or agents.
We are subject to litigation and may be subject to additional litigation in the future.
We are currently, and may in the future become, subject to other litigation, arbitration (including the current NAFTA arbitration matter involving recovery of amounts unduly paid as VAT in Mexico) or proceedings with other parties. If decided adversely to us, these legal proceedings, or others that could be brought against us in the future, could have a material adverse effect on our financial position or prospects. Responding to disputes, even those that are without merit or ultimately decided in our favor, may require us to incur significant expense, devote significant resources, and may generate adverse publicity, which could materially and adversely affect our business. In the event of a dispute arising at our foreign operations, we may be subject to the exclusive jurisdiction of foreign courts or arbitral panels or may not be successful in subjecting foreign persons to the jurisdiction of courts or arbitral panels in the United States. Our inability to enforce our rights and the enforcement of rights on a prejudicial basis by foreign courts or arbitral panels could have an adverse effect on our results of operations and financial position.
Disputes regarding our mining claims, concessions or surface rights to land in the vicinity of our mining projects could adversely impact operations.
The validity of exploration or mining claims, concessions or rights, which constitute most of our property holdings, is often uncertain and may be contested. We have used commercially reasonable efforts, in accordance with industry standards, to investigate our title or claims to our various properties, however, no assurance can be given that applicable governments will not revoke or significantly alter the conditions of the applicable exploration or mining claims, concessions or rights, or that such exploration or mining claims, concessions or rights will not be challenged by third parties. Although we have attempted to acquire satisfactory title to undeveloped properties, in accordance with mining industry practice, we do not generally obtain title opinions until a decision is made to develop a property. As a result, some titles may be defective, particularly titles to undeveloped properties. Defective title to any of our exploration or mining claims, concessions or rights could result in litigation, insurance claims and potential losses affecting our business as a whole. There may be challenges to the title of any of
the claims, concessions or rights comprising our projects that, if successful, could impair development and operations. A defect could result in us losing all or a portion of our right, title, estate and interest in and to the properties to which the title defect relates.
In Mexico, while mineral rights are administered by the federal government through federally issued mining concessions, federally recognized agrarian communities called ejidos control surface or surface access rights to the land. An ejido may sell or lease lands directly to a private entity. While we have agreements or are in the process of negotiating agreements with the ejidos that impact all of our projects in Mexico, some of these agreements may be subject to renegotiation or legal challenges.
The Company’s effective tax rate could be volatile and materially change as a result of changes in tax laws, mix of earnings and other factors.
We are subject to tax laws in the United States and several foreign jurisdictions. Changes in fiscal and tax policies, including new tax legislation and reform to existing policy, may have a significant negative impact on the Company’s effective tax rate.
Additionally, the jurisdictions in which we operate have and may in the future continue to encounter financial difficulties resulting from one or both of lower tax revenue and new and increased costs. National, state or local governments may seek to raise existing taxes or introduce new taxes, which may adversely affect our business and financial results.
Currently, the Company incurs losses in certain countries where it does not receive a financial statement benefit, and the Company operates in countries which have different statutory rates. Consequently, changes in the mix and source of earnings between countries could have a material impact on the Company’s overall effective tax rate.
In addition, new tax legislation in certain jurisdictions where we operate could negatively affect us. For example, in Nevada, where the Rochester mine is located, in response to a significant loss of tourism and gaming revenue as a result of the COVID-19 pandemic, in June 2021, the Governor signed into law a new excise tax on gross proceeds derived from mining gold and silver. In late 2024, Mexico raised taxes (which are labeled as fees) on EBITDA and revenues from gold and silver. It is difficult to predict whether further changes to tax laws in the jurisdictions where we operate will be passed and, if passed, the impact those changes may have on the Company. Any additional taxes imposed on us would adversely affect our financial condition, perhaps materially.
RISKS RELATED TO OUR COMMON STOCK
We have the ability to issue additional equity securities, including in connection with an acquisition of other companies, including the SilverCrest Transaction, which would lead to dilution of our issued and outstanding common stock and may materially and adversely affect the price of our common stock.
The issuance of additional equity securities or securities convertible into equity securities, whether to acquire new companies or businesses or for other strategic benefits, would result in dilution of our existing stockholders’ equity ownership. For example, in our recent acquisition of SilverCrest we issued 1.6022 shares of Coeur common stock in exchange for each share of issued and outstanding common stock of SilverCrest, resulting in the issuance of 239,331,799 Coeur common shares. The increase to the number of outstanding shares of Coeur’s common stock may impact the marketplace’s view of Coeur’s common stock and may lead to adverse changes in the stock’s trading volume and trading price.
Additionally, former SilverCrest shareholders who received Coeur common stock in the SilverCrest Transaction may choose to sell or otherwise dispose of such shares, or Coeur’s historic stockholders may decide to reduce their investment in Coeur as a result of the SilverCrest Transaction’s impact to Coeur’s overall investment profile. These sales of our common stock (or the perception that these sales may occur) could have the effect of depressing the market price for our common stock. In addition, Coeur’s financial position with the completion of the SilverCrest Transaction may differ from its financial position before the completion of the SilverCrest Transaction, and the results of Coeur’s operations and cash flows following the completion of the SilverCrest Transaction may be affected by factors different from those affecting its financial position or results of operations and cash flows prior to the SilverCrest Transaction, all of which could adversely affect the market price of Coeur common stock. Accordingly, the market price and performance of Coeur common stock subsequent to the acquisition is likely to be different from the performance of Coeur common stock prior to the SilverCrest Transaction.
Other issuances of Coeur common stock may also adversely affect the price of our common stock. In 2024, the Company completed the exchange of $5.9 million principal amount of its 5.125% Senior Notes (the “Senior Notes”) plus accrued interest for 1.8 million shares of its common stock, par value $0.01 per share, pursuant to a privately-negotiated agreement with such issuance of common stock made pursuant to the exemption from the registration requirements afforded by Section 3(a)(9) of the Securities Act of 1933, as amended. In 2024, the Company also entered into subscription agreements with
certain Canadian accredited investors for a private placement offering of an aggregate 7.7 million shares of common stock, par value $0.01 per shares, to be issued as “flow-through shares,” as defined in subsection 66(15) of the Income Tax Act (Canada).
We are authorized to issue, without stockholder approval, 10.0 million shares of preferred stock in one or more series, to establish the number of shares to be included in each series and to fix the designation, powers, preferences and relative participating, optional, conversion and other special rights of the shares of each series as well as the qualification, limitations or restrictions on each series. Any series of preferred stock could contain dividend rights, conversion rights, voting rights, terms of redemption, redemption prices, liquidation preferences or other rights superior to the rights of holders of our common stock. If we issue additional equity securities, the price of our common stock may be materially and adversely affected.
Holders of our common stock may not receive dividends.
We have not historically declared cash dividends on our common stock. Holders of our common stock are entitled to receive only such dividends as our Board of Directors may declare out of funds legally available for such payments. We are incorporated in Delaware and governed by the Delaware General Corporation Law. Delaware law allows a corporation to pay dividends only out of surplus, as determined under Delaware law or, if there is no surplus, out of net profits for the fiscal year in which the dividend was declared and for the preceding fiscal year. Under Delaware law, however, we cannot pay dividends out of net profits if, after we pay the dividend, our capital would be less than the capital represented by the outstanding stock of all classes having a preference upon the distribution of assets. Our ability to pay dividends will be subject to our future earnings, capital requirements and financial condition, as well as our compliance with covenants related to existing or future indebtedness and would only be declared in the discretion of our Board of Directors.
RISKS RELATED TO THE RECENT ACQUISITION OF SILVERCREST METALS INC.
As disclosed in this Form 10-K, including in Part II, Item 7 – Management’s Discussion and Analysis of Financial Condition and Results of Operations, the Company recently completed the SilverCrest Transaction. As described in this Section and below, the SilverCrest Transaction could subject us to significant risks.
Coeur and SilverCrest may be the targets of legal claims, securities class actions, derivative lawsuits and other claims and negative publicity related to the SilverCrest Transaction.
Coeur and SilverCrest may be the target of lawsuits that could result in significant additional costs related to the SilverCrest Transaction. Securities class action lawsuits and derivative lawsuits are often brought against companies that have entered into an agreement to acquire a public company or to be acquired and may seek additional monetary compensation. Even if the lawsuits are unsuccessful or meritless, significant financial resources and attention from management can be required to defend against these claims, and proceedings may result in significant additional costs or challenges. Such proceedings, among other events, could also subject the Company to negative press coverage or public scrutiny that could impact the Company’s existing business performance and operations and its integration of the Las Chispas operation.
Coeur is expected to incur significant transaction costs in connection with the SilverCrest Transaction, which may exceed those anticipated by Coeur.
Coeur has incurred and expects to continue incurring costs related to the SilverCrest Transaction, including integration costs. Such fees and expenses include, but are not limited to, financial advisor fees, legal fees, tax and accounting fees, filing and regulatory fees, soliciting fees, and other advisory services fees. Certain of these fees will be incurred after closing of the SilverCrest Transaction, including for the integration of SilverCrest into Coeur. The timing and amount of fees and expenses incurred for the SilverCrest Transaction and post-closing integration of the companies is difficult to predict and may vary significantly from our initial projections.
The combined company may be unable to integrate the businesses of Coeur and SilverCrest successfully or realize the anticipated benefits of the SilverCrest Transaction.
The Company completed the SilverCrest Transaction with the expectation that it will result in certain benefits for the combined company. These anticipated benefits are dependent, in part, on the successful integration of SilverCrest into Coeur, which is a complex process that includes strategic decisions on, among other factors, business strategy, staffing, and system integration. Coeur did not have the ability to exercise control over SilverCrest before the completion of the SilverCrest Transaction and future operating and financial results for the Las Chispas mine may be adversely impacted by events that were outside of our control prior to the completion of the SilverCrest Transaction. Performance may also be adversely impacted if post-closing integration efforts are not able to be achieved in a timely manner or if the efficiencies and benefits contemplated are not able to be realized. Additionally, management focus on integration matters could result in less attention on the Company’s other operations, which could impact the overall performance of the Company.
Parties with which we and SilverCrest conducted business prior to the closing of the SilverCrest Transaction may be subject to disruption as a result of the SilverCrest Transaction. Customers, suppliers and other persons with whom we and
SilverCrest conducted business before consummation of the SilverCrest Transaction may delay or defer certain business decisions or might decide to seek to terminate, change or renegotiate their relationships with us. In addition, our employees and contractors may experience uncertainty about their respective roles with Coeur, which might adversely affect our ability to attract and retain key personnel. Key management and other employees may also be difficult to retain or may become distracted from day-to-day operations because matters related to integration of the Las Chispas operation may require substantial commitments of their time and resources. These disruptions could have an adverse effect on the results of operations, cash flows and financial position of Coeur, including an adverse effect on our ability to realize the expected benefits of the SilverCrest Transaction.
SilverCrest’s public filings are subject to Canadian disclosure standards, which differ from SEC disclosure requirements.
Coeur and SilverCrest report financial results and mineral reserve and mineral resource estimates under different reporting standards. Coeur prepares its financial statements in accordance with United States Generally Accepted Accounting Principles (“U.S. GAAP”), while SilverCrest prepares its financial statements in accordance with IFRS Accounting Standards issued by the International Accounting Standards Board (“IFRS Accounting Standards”). Coeur’s mineral reserve and mineral resource estimates have been prepared in accordance with Item 1300 of SEC Regulation S-K, while SilverCrest’s mineral reserve and mineral resource estimates have been prepared in accordance with National Instrument 43-101 Standards of Disclosure for Mineral Projects (“NI 43-101”). These varying standards embody different approaches and definitions that could require adjustments, reclassifications, or other different treatment as SilverCrest’s financial statements and mineral reserve and mineral resource estimates are conformed to the standards applicable to the Company, including U.S. GAAP and Item 1300 of SEC Regulation S-K. Furthermore, we have not been involved in the preparation of SilverCrest’s financial statements or its mineral reserve and mineral resource estimates prior to completion of the SilverCrest Transaction. Although Coeur and its advisors conducted due diligence on SilverCrest, there can be no guarantee that Coeur is aware of all relevant information, including all potential liabilities of SilverCrest. Integration of SilverCrest may pose special risks, including one-time write-offs and unanticipated costs. Mineral reserve and resource estimates may be subject to adjustments that differ from the Company’s current expectations and be impacted by a number of factors, including different engineering and geological interpretations and judgements and different pricing assumptions. As a result, it is possible that certain benefits expected from the combination of Coeur and SilverCrest may not be realized.
Item 1B. Unresolved Staff Comments
None.
Item 1C. Cybersecurity
Our cybersecurity program is intended to assess, identify, and manage material risks from cybersecurity threats, including those associated with our use of third-party service providers. We integrate cybersecurity into our top-level enterprise risk management (“ERM”) processes and our site-level operational risk management (“ORM”) processes, including management of operational technology (“OT”) cybersecurity risks. This involves, in part, direct engagement by, and consultation with, our Senior Director of Cybersecurity and IT Infrastructure (“Senior Director”) during ERM and ORM risk assessments, and collaboration between the Senior Director and relevant Operations employees regarding OT cybersecurity.
Our cybersecurity strategy leverages people, processes, and technology to identify and manage cybersecurity risks, including through: security monitoring; vulnerability assessments; patching and security upgrades; deployment of network defenses; regular cybersecurity trainings for users; use of third-party cybersecurity vendors to complement our internal Cybersecurity and IT Infrastructure team, including for monitoring, remediation, and response capabilities; periodic engagement of cybersecurity consultants, including for cybersecurity maturity assessments and recommendations and penetration test exercises; and periodic reviews of aspects of our cybersecurity program by our Internal Audit function.
We also have a Cybersecurity Incident Response Plan (“CSIRP”) to provide a standardized framework for responding to cybersecurity incidents, including escalation to senior management and other key stakeholders, as appropriate. Our CSIRP is reviewed at least annually, and we conduct cybersecurity tabletop exercises to practice our response.
Our Senior Director leads our internal team responsible for assessing and managing cybersecurity risks. The Senior Director has more than 10 years of experience being responsible for cybersecurity at multi-site industrial companies, in addition to IT infrastructure and strategy, and has earned the Global Information Assurance Certification (“GIAC”) Critical Controls, Defensible Security Architecture, Security Leadership, Security Operations, and Strategic Planning, Policy and Leadership certifications, as well as a Cybersecurity Management degree from the SANS Technology Institute. The Senior Director reports directly to the General Counsel and regularly engages with and briefs other members of senior and executive management on cybersecurity issues. A number of IT professionals with experience implementing cybersecurity defenses and responding to cyber attacks report to the Senior Director and, as noted above, the Senior Director also oversees third-party firms specializing in security monitoring and vulnerability assessment.
Our Board, with the assistance of the Audit Committee, to whom the Board has delegated to the primary authority and responsibility to oversee cybersecurity risks, oversees the management of risks arising from cybersecurity incidents, and, as noted above, cybersecurity is one of the material risks tracked through our ERM process. The Audit Committee is briefed quarterly by our Senior Director on cybersecurity emerging risks, strategies, key initiatives, incidents and training and compliance. Executive management and other senior leaders participate in the semi-annual updates to our ERM risk register and heat map, and those updates, which incorporate cybersecurity risk and strategy, also are presented to our Board for discussion and feedback at least annually. We also have protocols by which certain cybersecurity incidents that meet established reporting thresholds are escalated within the Company and, where appropriate, reported promptly to the Audit Committee Chair.
Despite our cybersecurity processes and risk mitigation strategies and practices, the threat landscape has become increasingly sophisticated and aggressive. While we have not experienced any material cybersecurity threats or incidents to date, there can be no assurance that a future cybersecurity incident would not have a material adverse effect on our cash flows, financial condition or results of operations. Additional information on cybersecurity risks we face can be found above under “Item 1A - Risk Factors,” which should be read in conjunction with the foregoing information.
Item 2. Properties
MINING OPERATIONS
The following description of the Company’s mining operations is qualified in its entirety by reference to the Technical Report Summary for each of the operations included as exhibits to this Report and incorporated by reference into this Item 2. Operating statistics for mining operations are presented in the section entitled “Operating Statistics” below.
Mexico — Palmarejo
The Palmarejo complex, operated by our wholly-owned subsidiary, Coeur Mexicana, S.A. de C.V. (“Coeur Mexicana”), consists of: (1) the Palmarejo processing facility; (2) the Guadalupe underground mine; (3) the Independencia underground mine; (4) the La Nación underground mine; and (5) other nearby deposits and exploration targets. The Palmarejo complex is located approximately 260 miles southwest of Chihuahua, in the state of Chihuahua in Northern Mexico. The coordinates for the centroid of the project are 108° 21.8203’ W longitude and 27° 21.5547’ N latitude (760,781 mE, 3,028,984 mN). Specifically, the Guadalupe mine is located at 108º 21.899’ W longitude and 27º 20.996’ N latitude (760,672 mE, 3,027,949 mN); Independencia is located at 108º 21.752’ W longitude and 27 º 22.078’ N latitude (760,873 mE, 3,029,953 m N); and La Nación is located at 108º 21.809’ W longitude and 27º 21.591’ N latitude (760,797 mE, 3,029,051 mN). All coordinates are in the Universal Transverse Mercator (WGS 84), Zone 12. Access to the property is provided by air, rail, and all-weather paved and gravel roads from the state capitol of Chihuahua.
| | | | | |
| Stage: | Production |
| Location: | State of Chihuahua, Northern Mexico |
| Mine Type: | Underground |
| Metals/Mineralization: | Silver and Gold, classified as epithermal deposits and are hosted in multiple veins, breccias, and fractures |
| Product: | Doré |
| Ownership: | 100% |
| Land Position: | 74,119 net acres |
| | | | | |
| Mineral Tenure: | 96 wholly-owned mining concessions |
| Key Permit Conditions: | Authorizations are in place that regulate typical life of mine functions, including production facilities and utilities, mining operations, tailings and waste rock storage, exploration, surface disturbance, land use, vegetation and change in soil use, air emissions, water use, and reclamation. A permit to operate back-up generators during grid power interruptions was recently administratively revoked; however, we are appealing the revocation and also applying for a new permit. We have been granted the right to continue operating the back-up generators during the course of the appeal. Major authorizations were obtained through the completion of several MIAs (Manifestación de Impacto Ambiental), permits associated with forestry vegetation disturbance of change in soil use (Cambio de Uso de Suelo en Terrenos Forestales), and the required authorizations from the National Water Commission (Comisión Nacional del Agua or CONAGUA) for water use, effluent discharge, and to construct facilities in federal watersheds. Operational standards and best management practices (BMPs) have been established to maintain compliance with applicable regulatory standards and permits. |
| Other: | Coeur Mexicana is obligated to sell 50% of Palmarejo gold production (excluding production from certain properties acquired in 2015) to a subsidiary of Franco-Nevada Corporation (“Franco-Nevada”) under a gold stream agreement for the lesser of $800 or spot price per ounce. Coeur Mexicana is subject to other royalty agreements for which there are no mineral resources or mineral reserves associated with them in the current life-of-mine plan. |
USA (Nevada) — Rochester
The Rochester mine and associated heap leach facilities, operated by our wholly-owned subsidiary, Coeur Rochester, Inc. (“Coeur Rochester”), is an open pit silver and gold mine located in Pershing County, Nevada, approximately 13 miles northeast of the city of Lovelock. The mine consists of the main Rochester deposit and the adjacent Nevada Packard deposit, southwest of the Rochester mine. The centroid location for the Rochester site is 400600 E, 4460300 N and the centroid of Rochester pit is located at 4002045 E, 4460050 N and Nevada Packard open pit is located at 400600 E, 4456675 E. All coordinates are in Universal Transverse Mercator (WGS 84), Zone 11T. In November 2018, Coeur Rochester acquired the Lincoln Hill, Gold Ridge and Wilco projects adjacent to Rochester from Alio Gold. The Rochester mine is fully supported with electricity, supplied by a local power company. Ore is mined using conventional open pit methods, with gold and silver recovered by heap leaching of crushed open-pit ore placed on pads located within the Rochester mining area.
Rochester completed the ramp-up and expansion of the operation in 2024. This project included the construction of a new leach pad, a three-stage crushing facility, a Merrill-Crowe process plant, and related infrastructure to support the extension of Rochester’s mine life.
| | | | | |
| Stage: | Production |
| Location: | Near Lovelock, Nevada (West-Central Nevada, USA) |
| Mine Type: | Open Pit Heap Leach |
| Metals/Mineralization: | Silver and Gold; mineralization is hosted in folded and faulted volcanic rocks of the Rochester Formation and overlying Weaver Formation. Silver and gold, consisting of silver sulfosalt minerals, argentite, silver-bearing tetrahedrite and minor native gold, are contained in zones of multiple quartz veins and veinlets (vein, vein swarms and stockworks) with variable amounts of pyrite |
| Product: | Doré |
| Ownership: | 100% |
| Land Position & Mineral Tenure | Coeur Rochester lands, including the Lincoln Hill and related assets, consist of approximately 46,272 net acres •1,465 owned and 358 leased Federal unpatented lode claims and 6 owned federal unpatented placer claims, appropriating approximately 29,982 net acres of public land; •23 patented lode claims, consisting of approximately 392 acres; •Interests owned in approximately 9,327.8 gross acres of additional real property; and •Certain rights in and to approximately 6,182 acres, held either through lease, letter agreement or license. |
| | | | | |
| Key Permit Conditions: | The Rochester Mine has in place and operates subject to all necessary environmental permits and licenses from the appropriate local, state, and federal agencies for typical life of mine functions involving exploration, the open pit mines, heap leach pads, processing infrastructure, and all necessary support facilities. Operational standards and best management practices have been established to maintain compliance with applicable regulatory standards and permits. Major permits or approvals are in place from the U.S. Department of Interior Bureau of Land Management, Nevada Division of Water Resources, the Nevada Division of Environmental Protection, as well through other federal, state, and local entities. The environmental effects of the operation were comprehensively evaluated through the National Environmental Policy Act (“NEPA”) through Environmental Impact Statements. Monitoring programs are in place, and there is an approved reclamation and closure plan that reflects current mining, mitigation, and site facilities. |
| Other: | •A security interest in the Rochester mine has been granted in favor of the lenders under the RCF (as defined below) •Coeur Rochester is obligated to pay a net smelters return of up to 5% to ASARCO, the prior owner, when the average quarterly market price of silver equals or exceeds $30.88 per ounce indexed for inflation, with the condition that the Rochester mine achieves positive cash flow for the applicable year. If cash flow is negative in any calendar year, the maximum royalty payable is $250,000. •Coeur Rochester is party to other royalty agreements for which there are no mineral resources or mineral reserves associated with them in the current life-of-mine plan. |
USA (Alaska) — Kensington
The Kensington underground gold mine and associated milling facilities, operated by our wholly-owned subsidiary, Coeur Alaska, Inc. (“Coeur Alaska”), are located on the east side of the Lynn Canal about 45 miles north-northwest of Juneau, Alaska. The mine consists of the (i) Kensington Main deposit, (ii) Elmira, and (iii) other nearby deposits and exploration targets. The mine is accessed by a horizontal tunnel and utilizes conventional and mechanized underground mining methods. Coordinates for the project centroid are 0494796 E, 652068 N and the Kensington Portal is located at 0494796 E, 6530584 N. All coordinates are in Universal Transverse Mercator (NAD 1983), Zone 8V.
Kensington has completed the planned expansion under POA 1, which increased tailings and waste rock storage capacity to support an expected longer mine life, reflecting positive exploration results, improved metal prices and ongoing operational efficiencies.
| | | | | |
| Stage: | Production |
| Location: | Juneau, Alaska (Southeast Alaska, USA) |
| Mine Type: | Underground |
| Metals/Mineralization: | Gold; gold-bearing mesothermal, quartz, carbonate and pyrite vein swarms and discrete quartz-pyrite veins hosted in Cretaceous-aged Jualin diorite. Most of the gold is contained in calaverite (AuTe2) that occurs in association with native gold as inclusions in and interstitial to pyrite grains and in microfractures in pyrite. |
| Product: | Gold Concentrate |
| Ownership: | 100% |
| | | | | |
| Land Position & Mineral Tenure | •The Kensington Group, totaling approximately 3,972 net acres, consists of 51 patented lode and patented mill site claims comprising approximately 766 net acres, 298 Federal unpatented lode claims covering approximately 3,222 net acres, and 13 State of Alaska mining claims covering approximately 95 net acres. •The Jualin Group, totaling approximately 8,531 net acres, is comprised of 23 patented lode and patented mill site claims covering approximately 388 net acres, 452 Federal unpatented lode claims and 75 Federal unpatented mill site claims appropriating approximately 7,979 net acres, a State of Alaska upland mining lease comprising approximately 682 acres, one State of Alaska mining claim comprising approximately three acres and four State-selected mining claims covering approximately 60 acres. •14 of the 23 patented lode claims cover private surface estate only. The mineral estate to these 14 patented lode claims is owned by the State of Alaska, the mineral rights to which are secured by a State of Alaska upland mining lease. •The Company controls properties comprising the Jualin Group, under a lease agreement with Hyak Mining Company (“Hyak”), which is valid until August 5, 2035 and thereafter, provided mining and production are actively occurring within and from the leased premises. |
| Key Permit Conditions: | The Kensington Mine has in place and operates subject to all necessary environmental permits and licenses from the appropriate local, state, and federal agencies for typical life of mine functions involving mine operations and production/processing facilities and infrastructure, tailings and waste rock storage, exploration, surface disturbance, air emissions, water use, marine transport, and reclamation. Operational standards and best management practices have been established to maintain compliance with applicable regulatory standards and permits. Major permits or approvals are in place from the U.S. Department of Agriculture National Forest Service, U.S. Army Corps of Engineers, U.S. Fish and Wildlife Service, National Oceanic and Atmospheric Administration, State of Alaska, as well through other federal, state, and local entities. The environmental effects of the operation were comprehensively evaluated through the National Environmental Policy Act (NEPA) through Environmental Impact Statements. Monitoring programs are in place, and there is an approved reclamation and closure plan that reflects current mining, mitigation, and site facilities. |
| Other: | •A security interest in the Kensington mine has been granted in favor of the lenders under the RCF. •Coeur Alaska is obligated to pay a subsidiary of Triple Flag Precious Metals Corp. (“Triple Flag”) a net returns royalty on up to two million troy ounces of gold produced from the current boundaries of the Kensington mine at a rate of: (i) 1.25% for production occurring from January 1, 2024 through December 31, 2026 and (ii) 1.5% for production occurring on or after January 1, 2027. •Coeur Alaska is obligated to pay Hyak annually, during the initial term of the mining lease, an advance minimum royalty of $231,000, which amount is adjusted every three years in accordance with changes in the Consumer Price Index as published by the U.S. Department of Commerce for all Urban Consumers, City of Anchorage, Alaska. If production occurs from the leased Hyak premises, a 5% net returns royalty on production as defined by the lease, is due, unless the amount of the net returns royalty is less than the adjusted advance minimum royalty. |
USA (South Dakota) — Wharf
The Wharf mine, operated by our wholly-owned subsidiaries, Wharf Resources (U.S.A.) Inc. (“Wharf”) and Golden Reward Mining Limited Partnership (“Golden Reward”), is located in the northern Black Hills of western South Dakota, approximately four miles southwest of the city of Lead, South Dakota. Coordinates for the project centroid are 44°20’03”N Latitude, 103°50’06”W Longitude and the Wharf Mine coordinates are 44°20’39”N Latitude, 103°51’02”W Longitude. All coordinates are in Universal Transverse Mercator (WGS 84). Access is established by paved road with power supplied by a local power company.
| | | | | |
| Stage: | Production |
| Location: | Lead, South Dakota, USA |
| Mine Type: | Open Pit Heap Leach |
| Metals/Mineralization: | Gold and Silver by-product; a structurally controlled disseminated gold deposit |
| Product: | Electrolytic Cathodic Sludge |
| Ownership: | 100% |
| | | | | |
| Land Position & Mineral Tenure | •The Wharf Group is comprised of 362 patented lode claims, 35 government lots, 123 subdivided lots, and 59 federal unpatented lode claims. These interests cover approximately 3,585 net surface acres, 652 net mineral acres where both the Precambrian and younger formations are owned or controlled, 3,243 net mineral acres of non-Precambrian mineral estate, 1,603 net mineral acres of Precambrian mineral estate and 287 net acres of federal unpatented lode claims. •The Golden Reward Group encompasses 218 patented lode claims, 14 government lots, 19 subdivided lots and 34 federal unpatented lode claims. The Golden Reward Group is comprised of approximately 1,564 net acres of surface estate, 2,988 net mineral acres of mineral estate where both the Precambrian and younger formations are owned or controlled, 357 net mineral acres of Non-Precambrian mineral estate, 153 net mineral acres of Precambrian mineral estate and 25 net acres of federal unpatented lode claims. |
| Key Permit Conditions: | The Wharf Mine has in place and operates subject to all necessary environmental permits and licenses from the appropriate local, state, and federal agencies for typical life of mine functions involving exploration, the open pit mines, heap leach pads, processing infrastructure, and all necessary support facilities. Operational standards and best management practices have been established to maintain compliance with applicable state and federal regulatory standards and permits. Major permits or approvals are in place from the South Dakota Department of Agriculture and Natural Resources, Lawrence County, as well through other federal, state, and local entities. Monitoring programs are in place, and there is an approved reclamation and closure plan that reflects current mining, mitigation, and site facilities. |
| Other: | •A security interest in the Wharf mine has been granted in favor of the lenders under the RCF. •Wharf is obligated to pay a royalty related to a mineral lease on 34 patented lode claims. During the term of the mineral lease, the lessors were also entitled to a royalty on production, if any, of 3% of the net smelter returns of all silver and gold ores, together with other ores and minerals. In addition, there is an advance minimum royalty due the lessors of $5,000 per year unless and until Wharf Resources identifies and publishes a reserve encompassing the leased premises, at which point the advance minimum royalty increases to $25,000 per year. •Wharf is obligated to pay a sliding scale production royalty of 0%-2% on the gross value of all gold in saleable form to Royal Gold, Inc. This royalty encumbers most of the lands comprising the Wharf, together with a small portion of the lands encompassing the Golden Reward, and wholly excludes the Precambrian Mineral Estate. Wharf is obligated to pay a 3% non-participating royalty on gold that is produced from ores mined and delivered to heap leach pads or recovered from tailings. This royalty encumbers the mineral estate, including the Precambrian Mineral Estate, of much of the lands held by Wharf. •Wharf is party to other royalty agreements for which there are no mineral resources or mineral reserves associated with them in the current life-of-mine plan. |
Mexico - Las Chispas
The Las Chispas operation, operated by our wholly-owned subsidiary, Compania Minera La Llamarada S.A. de C.V., consists of: (1) the Las Chispas processing facility; (2) the Las Chispas underground mine; and (3) other nearby deposits and exploration targets. The Las Chispas operation is located on the western edge of the north-trending Sierra Madre Occidental Mountain Range and is geographically adjacent to the Sonora Valley. The Las Chispas operation is located approximately 220 km miles northeast of the city of Hermosillo, in the state of Sonora in Northern Mexico at approximately 30.233902°N latitude and 110.163396°W longitude (580,500E, 3,344,500N), within the Arizpe Mining district. All coordinates are in Universal Transverse Mercator (WGS 84), Zone 12. Access to the property is provided by highway leading from the city of Hermosillo in Sonora, Mexico, and 350 km southwest of Tucson, Arizona.
| | | | | |
| Stage: | Production |
| Location: | State of Sonora, Northern Mexico |
| Mine Type: | Underground |
| Metals/Mineralization: | Silver and Gold, classified as epithermal deposits and are hosted in multiple veins, breccias, and fractures |
| Product: | Doré |
| Ownership: | 100% |
| Land Position: | 3,425 net acres |
| | | | | |
| Mineral Tenure: | 27 wholly-owned mining concessions |
| Key Permit Conditions: | Authorizations are in place that regulate typical life of mine functions, including mineral processing production facilities and utilities, mining operations, tailings and waste rock storage, exploration, surface disturbance, land use, vegetation and change in soil use, air emissions, water use, waste generation, and reclamation. Major authorizations were obtained through the completion of several MIAs (Manifestación de Impacto Ambiental), permits associated with forestry vegetation disturbance of change in soil use (Cambio de Uso de Suelo en Terrenos Forestales), the required authorizations from the National Water Commission (Comisión Nacional del Agua or CONAGUA) for water resource uses, and special handling waste through the Comisión de Ecología y Desarrollo Sustentable del Estado de Sonora (CEDES). Operational standards and best management practices (BMPs) have been established to maintain compliance with applicable regulatory standards and permits. Monitoring programs are established and there is a conceptual reclamation and closure plan prepared in alignment with relevant standards (e.g., Normas Oficiales Mexicanas, NOMs) that reflects current mining, mitigation, and site facilities. |
| Other: | Compania Minera La Llamarada is obligated to pay a 2% royalty on the Nuevo Lupena and Panuco II concessions for material that has processed grades > 0.5 oz/tonnes gold and > 40 oz/tonnes silver, combined. |
EXPLORATION PROJECTS
Canada (British Columbia) — Silvertip
The Silvertip silver-zinc-lead exploration property owned by our wholly-owned subsidiary, Coeur Silvertip Ltd. (“Coeur Silvertip”), is an underground project located in northern British Columbia, Canada just south of the Yukon border. The project centroid coordinates in UTM (NAD 27) are 6,643,900 N and 425,200 E. The project is accessible via a 25-kilometer mine access road off the Alaska Highway.
| | | | | |
| Stage: | Exploration |
| Location: | Northern British Columbia, Canada (10 miles south of the Yukon Territory Border) |
| Mine Type: | Underground |
| Metals/Mineralization: | Silver, Zinc and Lead; carbonate-hosted massive sulfide deposit |
| Product: | Concentrate |
| Ownership: | 100% |
| Land Position & Mineral Tenure: | •Seventy-Three (73) contiguous mineral claims containing approximately 48,998 hectares (121,076 acres), three mining leases containing approximately 1,828 hectares (4,517 acres), and approximately 681 hectares (1,683 acres) under an option agreement entered into November 2024. In total, the Silvertip mine covers an area of approximately 51,507 hectares (127,276 acres) |
| Other: | •Suspended operating activities in February 2020; ongoing exploration and technical work to evaluate and support a potential future operation •Silvertip is obligated to pay a 2.5% net smelter return royalty payable to Triple Flag on all mineral products produced from the Silvertip property, payable quarterly. •Silvertip is party to an agreement with the Kaska Nation which, among other things, provides for annual payments to the Kaska Nation calculated based on the financial performance of the Silvertip property and the average price of silver for the relevant calendar year. |
OTHER PROPERTIES
The Company has leased or owned real property for office space.
OPERATING STATISTICS
| | | | | | | | | | | | | | | | | | | | | | | | | | | | | | | | | | | | | | | |
| Palmarejo | | Rochester |
| 2024 | | 2023 | | 2022 | | | | 2024 | | 2023 | | 2022 | | |
| | | | | | | | | | | | | | | |
| | | | | | | | | | | | | | | |
| | | | | | | | | | | | | | | |
| | | | | | | | | | | | | | | |
| | | | | | | | | | | | | | | |
| Gold produced (oz.) | 108,666 | | | 100,605 | | | 106,782 | | | | | 39,203 | | | 38,775 | | | 34,735 | | | |
| Silver produced (oz.) | 6,779,659 | | | 6,591,590 | | | 6,708,689 | | | | | 4,377,847 | | | 3,391,530 | | | 3,061,924 | | | |
| | | | | | | | | | | | | | | |
| | | | | | | | | | | | | | | |
| | | | | | | | | | | | | | | | | | | | | | | | | | | | | | | | | | | | | | | |
| Kensington | | Wharf |
| 2024 | | 2023 | | 2022 | | | | 2024 | | 2023 | | 2022 | | |
| | | | | | | | | | | | | | | |
| | | | | | | | | | | | | | | |
| | | | | | | | | | | | | | | |
| Gold produced (oz.) | 95,671 | | | 84,789 | | | 109,061 | | | | | 98,042 | | | 93,502 | | | 79,768 | | | |
| | | | | | | | | | | | | | | |
MINERAL RESERVES AND MINERAL RESOURCES
Internal Controls
The Company’s internal controls are designed to provide reasonable assurance that information and processes utilized in assessing its exploration results as well as mineral resource and reserve estimation are reasonable and in line with industry best practices. These internal controls include quality assurance and quality control (“QA/QC”) programs in the collection, analysis, verification, storage, reporting and use of drillhole, assay, metallurgical and other technical and scientific information, including the following:
•Third-party fully certified labs are used for assays used in public disclosure or resource models;
•Drill programs include insertion of blank, duplicate, and certified reference materials;
•QA/QC program with sufficient results for the analytical programs;
•All core and reverse-circulation samples have been cataloged and stored in secure and designated areas on company property;
•Data is subject to validation, which includes checks on downhole surveys, collar coordinates, geological data, and assay data;
•Prior to use in mineral resource or mineral reserve estimation, the selected data to support estimation are downloaded from the database into a project file and reviewed for improbable entries and high values;
•Written procedures and guidelines are used to support estimation methods and approaches;
•Completion of annual technical statements on each mineral resource and mineral reserve estimate by qualified persons. These technical statements include evaluation of modifying and technical factors, incorporate available reconciliation data, and are based on a cashflow analysis; and
•Internal reviews of block models, mineral resources and mineral reserves using a “layered responsibility” approach with Qualified Person involvement at the site and corporate levels.
Internal controls are discussed where required in the relevant chapters of the technical report summary. The following sub-sections summarize the types of procedures, protocols, guidance and controls that Coeur has in place for its exploration and mineral resource and reserve estimation efforts, and the type of risk assessments that are undertaken.
Exploration and Drilling
Coeur has the following internal controls protocols in place for exploration data:
•Written procedures and guidelines to support preferred sampling methods and approaches, with periodic compliance reviews of adherence to such written procedures and guidelines;
•Maintenance of a complete chain-of-custody, ensuring the traceability and integrity of the samples at all handling stages from collection, transportation, sample preparation and analysis to long-term sample storage;
•Geological logs are checked and verified, and there is a physical sign-off to attest to the validation protocol required;
•Quality control checks on collar and downhole survey data for errors or significant deviations;
•Third-party fully certified labs are used for assays used in public disclosure or resource models;
•Appropriate types of quality control samples are inserted into the sample stream at appropriate frequencies to assess analytical data quality;
•Regular inspection of analytical and sample preparation facilities by appropriately experienced Coeur personnel;
•QA/QC data are regularly verified to ensure that outliers, sample mix-ups, contamination, or laboratory biases during the sample preparation and analysis steps are correctly identified, mitigated or remediated. Changes to database entries are required to be documented; and
•Database upload and verification procedures to ensure the accuracy and integrity of the data being entered into the project database(s). These are typically performed using software data-checking routines. Changes to database entries are required to be documented. Data is subject to regular backups.
Mineral Resource and Mineral Reserve Estimates
Coeur has the following internal controls protocols in place for mineral resource and mineral reserve estimation:
•Prior to use in mineral resource or mineral reserve estimation, the selected data to support estimation are downloaded from the database into a project file and reviewed for improbable entries and high values;
•Written procedures and guidelines are used to support estimation methods and approaches;
•Completion of annual technical statements on each mineral resource and mineral reserve estimate by qualified persons. These technical statements include evaluation of modifying and technical factors, incorporate available reconciliation data, and are based on a cashflow analysis; and
•Internal reviews of block models, mineral resources and mineral reserves using a “layered responsibility” approach with qualified person involvement at the site and corporate levels.
Development of our mineral resource and mineral reserve estimates use tools and processes such as mine design, scheduling and geostatistical tools that conform to industry best practices and are regularly reviewed and reconciled by internal and external parties. There are internal and external audit processes for mineral resource and mineral reserve estimation.
Mineral resources and mineral reserves are estimates that contain inherent risk and depend upon geologic interpretation and statistical inferences drawn from drilling and sampling analysis, which may prove to be unreliable. See “Item 1A - Risk Factors” for additional information.
MINERAL RESERVES | | | | | | | | | | | | | | | | | | | | | | | | | | | | | | | | | | | | | | | | | | | | | | | | | | | | | | | | |
| | Summary Gold Mineral Reserves at End of the Fiscal Year Ended December 31, 2024(1)(2)(3)(9) |
| | Proven Mineral Reserves | | Probable Mineral Reserves | | Total Mineral Reserves |
| Coeur
Ownership | Tons (000s) | | Grade (oz./ton) | | Ounces
(000s) | | Tons (000s) | | Grade (oz./ton) | | Ounces
(000s) | | Tons (000s) | | Grade (oz./ton) | | Ounces
(000s) |
| Mexico | | | | | | | | | | | | | | | | | | |
Palmarejo(4) | 100% | 3,473 | | | 0.059 | | | 205 | | | 8,373 | | | 0.057 | | | 475 | | | 11,845 | | | 0.057 | | | 681 | |
Las Chispas(8) | 100% | 787 | | | 0.150 | | | 118 | | | 2,700 | | | 0.088 | | | 239 | | | 3,486 | | | 0.102 | | | 357 | |
| United States | | | | | | | | | | | | | | | | | | |
Rochester(5) | 100% | 468,432 | | | 0.002 | | | 1,116 | | | 59,123 | | | 0.003 | | | 182 | | | 527,555 | | | 0.002 | | | 1,298 | |
Kensington(6) | 100% | 1,340 | | | 0.186 | | | 249 | | | 1,427 | | | 0.177 | | | 252 | | | 2,768 | | | 0.181 | | | 501 | |
Wharf(7) | 100% | 6,563 | | | 0.030 | | | 199 | | | 22,993 | | | 0.024 | | | 558 | | | 29,556 | | | 0.026 | | | 757 | |
| Total Gold | | 480,595 | | | 0.004 | | | 1,887 | | | 94,615 | | | 0.018 | | | 1,706 | | | 575,211 | | | 0.006 | | | 3,593 | |
| | | | | | | | | | | | | | | | | | | | | | | | | | | | | | | | | | | | | | | | | | | | | | | | | | | | | | | | |
| | Summary Silver Mineral Reserves at End of the Fiscal Year Ended December 31, 2024(1)(2)(3)(9) |
| | Proven Mineral Reserves | | Probable Mineral Reserves | | Total Mineral Reserves |
| Coeur
Ownership | Tons (000s) | | Grade (oz./ton) | | Ounces
(000s) | | Tons (000s) | | Grade (oz./ton) | | Ounces
(000s) | | Tons (000s) | | Grade (oz./ton) | | Ounces
(000s) |
| Mexico | | | | | | | | | | | | | | | | | | |
Palmarejo(4) | 100% | 3,473 | | | 3.94 | | | 13,667 | | | 8,373 | | | 3.86 | | | 32,307 | | | 11,845 | | | 3.88 | | | 45,974 | |
Las Chispas(8) | 100% | 787 | | | 16.00 | | | 12,586 | | | 2,700 | | | 7.75 | | | 20,931 | | | 3,486 | | | 9.61 | | | 33,516 | |
| United States | | | | | | | | | | | | | | | | | | |
Rochester(5) | 100% | 468,432 | | | 0.37 | | | 172,408 | | | 59,123 | | | 0.32 | | | 18,632 | | | 527,555 | | | 0.36 | | | 191,040 | |
| | | | | | | | | | | | | | | | | | |
| | | | | | | | | | | | | | | | | | |
| Total Silver | | 472,691 | | | 0.42 | | | 198,660 | | | 70,195 | | | 1.02 | | | 71,870 | | | 542,887 | | | 0.50 | | | 270,530 | |
(1) Certain definitions:
The term “reserve” means that part of a mineral deposit that can be economically and legally extracted or produced at the time of the reserve determination. The term “proven (measured) reserves” means reserves for which (a) quantity is computed from dimensions revealed in outcrops, trenches, workings or drill holes, grade and/or quality are computed from the results of detailed sampling; and (b) the sites for inspection, sampling and measurements are spaced so closely and the geologic character is sufficiently defined that size, shape, depth and mineral content of reserves are well established. The term “probable (indicated) reserves” means reserves for which quantity and grade and/or quality are computed from information similar to that used for proven (measured) reserves, but the sites for inspection, sampling and measurement are farther apart or are otherwise less adequately spaced. The degree of assurance, although lower than that for proven (measured) reserves, is high enough to assume continuity between points of observation. The term “cutoff grade” means the lowest grade of mineralized material considered economic to process. Cutoff grades vary between deposits depending upon prevailing economic conditions, mineability of the deposit, by-products, amenability of the mineralized material to silver or gold extraction and type of milling or leaching facilities available.
(2) Assumed metal prices for 2024 Mineral Reserves were $23.50 per ounce of silver, $1,800 per ounce of gold, $1.15 per pound of zinc, $0.95 per pound of lead, except for Kensington at $2,000 per ounce of gold.
(3) The Mineral Reserve estimates are current as of December 31, 2024, are reported using the definitions in Item 1300 of Regulation S-K and were prepared by the Company’s technical staff.
(4) Mineral Reserve estimates use the following key input parameters: assumption of conventional longhole underground mining; reported above a variable gold equivalent cut-off grade that ranges from 2.13–2.45 g/t AuEq and an incremental development cut-off grade 1.05 g/t AuEq; metallurgical recovery assumption of 92.0% for gold and 83.0% for silver; mining dilution assumes 0.3–1.5 meter of hanging/foot wall waste dilution; mining loss of 15% was applied; variable mining costs that range from US$57.67–US$74.45/tonne, surface haulage costs of US$4.29/tonne, process costs of US$31.06/tonne, general and administrative costs of US$15.95/tonne, and surface/auxiliary support costs of US$4.42/tonne. Excludes the impact of the Franco-Nevada gold stream agreement at Palmarejo in calculation of Mineral Reserves. No assurances can be given that all mineral reserves will be mined, as mineralized material that may qualify as reserves under applicable standards by virtue of having positive economics may not generate attractive enough returns to be included in our mine plans, due to factors such as the impact of the gold stream at Palmarejo. As a result, we may elect not to mine portions of the mineralized material reported as reserves.
(5) Mineral Reserve estimates are tabulated within a confining pit design and use the following input parameters: Rochester oxide variable recovery Au = 77.7–85.9% and Ag = 59.4-61.0%; Rochester sulfide variable recovery Au = 15.2–77.7% and Ag = 0.0–59.4%; with a net smelter return cutoff of $3.76/ton oxide and US$3.86/ton sulfide; Nevada Packard oxide recovery Au = 92.0% and Ag = 61.0%; with a net smelter return cutoff of $4.24/ton for oxide; Lincoln Hill oxide recovery Au = 63.9% and Ag = 39.5%; with a net smelter return cutoff of $4.53/ton for oxide where the NSR is calculated as resource net smelter return (NSR) = silver grade (oz/ton) * silver recovery (%) * (silver price ($/oz) - refining cost ($/oz)) + gold grade (oz/ton) * gold recovery (%) * (gold price ($/oz) - refining cost ($/oz)); variable pit slope angles that approximately average 48º over the life-of-mine
(6) Mineral Reserve estimates use the following key input parameters: assumption of conventional underground mining; gold price of $2,000/oz; reported above a gold cut-off grade of 0.133 oz/ton Au; metallurgical recovery assumption of 94.2%; gold payability of 97.5%; mining dilution of 15-20%; mining loss of 12% was applied; mining costs of US$116.09/ton mined; process costs of US$55.14/ton processed; general and administrative costs of US$53.18/ton processed; sustaining capital US$4.50/ton processed; and concentrate refining and shipping costs of US$97.48/oz sold.
(7) Mineral Reserve estimates use the following key input parameters: assumption of conventional open pit mining; reported above a gold cut-off grade of 0.010 oz/ton Au; average metallurgical recovery assumption of 78.0%; royalty burden of US$140.40/oz Au; pit slope angles that vary from 34–50º; mining costs of US$2.56/ton mined, process costs of US$12.02/ton processed (includes general & administrative and sustaining capital costs).
(8) Mineral Reserve estimates uses the following key input parameters: assumption of conventional underground mining; reported above a silver cut-off grade of 250 g / tonne silver equivalent and an incremental development cut-off grade of 63 g / tonne AgEq; metallurgical recovery assumption of 97.5% for silver and 98.0% for gold; mining dilution assumes 5% for development, 1 meter to 1.5 meters of ELOS (0.5 m – 1.0 m of hanging wall and 0.25 m – 0.5 m of footwall dilution) depending on geotechnical conditions in each stoping location, 0.2 meter ELOS (0.1 m of hanging wall and 0.1 m of footwall dilution) for cut and fill, 0.4 meter ELOS (0.2 m of hanging wall and 0.2 m of footwall dilution), 0.25 m for each exposed backfill floor, and 0.5 m for each exposed backfill wall; mining loss of 2% for development and 5% for stoping was applied, additional losses have been included to account for the required pillars in uphole stopes that cannot be filled; variable production mining costs that range from US$58.06–US$239.51/tonne, development mining costs of US$27.40/tonne, process costs of US$45.72/tonne, site general and administrative costs of US$20.70/tonne, underground general and administrative costs of US$12.81/tonne, and sustaining capital costs of US$7.64/tonne.
(9) Rounding of short tons, grades, and troy ounces, as required by reporting guidelines, may result in apparent differences between tons, grades, and contained metal contents.
MINERAL RESOURCES
| | | | | | | | | | | | | | | | | | | | | | | | | | | | | | | | | | | | | | | | | | | | | | | | | | | | | | | | | | | | | | | | | | | | | | | | | | |
| | Summary Gold Mineral Resources at End of the Fiscal Year Ended December 31, 2024(1)(2)(3)(11) |
| | Measured Mineral Resources | | Indicated Mineral Resources | | Measured + Indicated Mineral Resources | | Inferred Mineral Resources |
| Coeur
Ownership | Tons (000s) | | Grade (oz./ton) | | Ounces
(000s) | | Tons (000s) | | Grade (oz./ton) | | Ounces
(000s) | | Tons (000s) | | Grade (oz./ton) | | Ounces
(000s) | | Tons (000s) | | Grade (oz./ton) | | Ounces
(000s) |
| Mexico | | | | | | | | | | | | | | | | | | | | | | | | |
Palmarejo Mine, Mexico(4) | 100% | 6,996 | | | 0.068 | | | 474 | | | 15,368 | | | 0.062 | | | 949 | | | 22,363 | | | 0.064 | | | 1,423 | | | 6,577 | | | 0.098 | | | 643 |
Las Chispas Mine, Mexico(10) | 100% | 116 | | | 0.305 | | | 35 | | | 1,094 | | | 0.110 | | | 120 | | | 1,211 | | | 0.129 | | | 156 | | | 1,276 | | | 0.113 | | | 144 |
| United States | | | | | | | | | | | | | | | | | | | | | | | | |
Rochester Mine, USA(7) | 100% | 82,371 | | | 0.002 | | | 144 | | | 40,402 | | | 0.003 | | | 116 | | | 122,773 | | | 0.002 | | | 260 | | | 116,521 | | | 0.002 | | | 258 |
Kensington Mine, USA(5) | 100% | 2,150 | | | 0.254 | | | 546 | | | 1,450 | | | 0.235 | | | 340 | | | 3,600 | | | 0.246 | | | 886 | | | 993 | | | 0.229 | | | 228 |
Wharf Mine, USA(6) | 100% | 10,180 | | | 0.017 | | | 175 | | | 49,155 | | | 0.017 | | | 845 | | | 59,335 | | | 0.017 | | | 1,019 | | | 26,735 | | | 0.018 | | | 470 |
Wilco Project, USA(9) | 100% | — | | | — | | | — | | | — | | | — | | | — | | | — | | | — | | | — | | | 25,736 | | | 0.021 | | | 531 |
| Total Gold | | 101,813 | | | 0.013 | | | 1,374 | | | 107,469 | | | 0.022 | | | 2,370 | | | 209,282 | | | 0.018 | | | 3,744 | | | 177,839 | | | 0.013 | | | 2,273 | |
| | | | | | | | | | | | | | | | | | | | | | | | | | | | | | | | | | | | | | | | | | | | | | | | | | | | | | | | | | | | | | | | | | | | | | | | | | |
| | Summary Silver Mineral Resources at End of the Fiscal Year Ended December 31, 2024(1)(2)(3)(11) |
| | Measured Mineral Resources | | Indicated Mineral Resources | | Measured + Indicated Mineral Resources | | Inferred Mineral Resources |
| Coeur
Ownership | Tons (000s) | | Grade (oz./ton) | | Ounces
(000s) | | Tons (000s) | | Grade (oz./ton) | | Ounces
(000s) | | Tons (000s) | | Grade (oz./ton) | | Ounces
(000s) | | Tons (000s) | | Grade (oz./ton) | | Ounces
(000s) |
| Mexico | | | | | | | | | | | | | | | | | | | | | | | | |
Palmarejo Mine, Mexico(4) | 100% | 6,996 | | | 4.59 | | | 32,138 | | | 15,368 | | | 3.76 | | | 57,777 | | | 22,363 | | | 4.02 | | | 89,915 | | | 6,577 | | | 5.28 | | | 34,748 |
Las Chispas Mine, Mexico(10) | 100% | 116 | | | 31.15 | | | 3,623 | | | 1,094 | | | 9.87 | | | 10,798 | | | 1,211 | | | 11.91 | | | 14,421 | | | 1,276 | | | 7.90 | | | 10,088 |
| United States | | | | | | | | | | | | | | | | | | | | | | | | |
Rochester Mine, USA(7) | 100% | 82,371 | | | 0.28 | | | 23,383 | | | 40,402 | | | 0.34 | | | 13,541 | | | 122,773 | | | 0.30 | | | 36,924 | | | 116,521 | | | 0.36 | | | 41,838 | |
Wilco Project, USA(9) | 100% | — | | | — | | | — | | | — | | | — | | | — | | | — | | | — | | | — | | | 25,736 | | | 0.13 | | | 3,346 | |
| Canada | | | | | | | | | | | | | | | | | | | | | | | | |
Silvertip Mine, Canada(8) | 100% | 734 | | | 10.56 | | | 7,749 | | | 6,418 | | | 7.78 | | | 49,919 | | | 7,152 | | | 8.06 | | | 57,668 | | | 2,345 | | | 6.86 | | | 16,084 |
| Total Silver | | 90,217 | | | 0.74 | | | 66,894 | | | 63,282 | | | 2.09 | | | 132,035 | | | 153,499 | | | 1.30 | | | 198,929 | | | 152,456 | | | 0.70 | | | 106,104 | |
| | | | | | | | | | | | | | | | | | | | | | | | | | | | | | | | | | | | | | | | | | | | | | | | | | | | | | | | | | | | | | | | | | | | | | | | | | |
| | Summary Zinc Mineral Resources at End of the Fiscal Year Ended December 31, 2024(1)(2)(3)(11) |
| | Measured Mineral Resources | | Indicated Mineral Resources | | Measured + Indicated Mineral Resources | | Inferred Mineral Resources |
| Coeur
Ownership | Tons (000s) | | Grade (%) | | Pounds
(000s) | | Tons (000s) | | Grade (%) | | Pounds
(000s) | | Tons (000s) | | Grade (%) | | Pounds
(000s) | | Tons (000s) | | Grade (%) | | Pounds
(000s) |
| Canada | | | | | | | | | | | | | | | | | | | | | | | | |
Silvertip Mine, Canada(8) | 100% | 734 | | | 9.9 | % | | 145,703 | | | 6,418 | | | 10.7 | % | | 1,371,074 | | | 7,152 | | | 10.6 | % | | 1,516,777 | | | 2,345 | | | 10.3 | % | | 481,791 | |
| | | | | | | | | | | | | | | | | | | | | | | | | | | | | | | | | | | | | | | | | | | | | | | | | | | | | | | | | | | | | | | | | | | | | | | | | | |
| | Summary Lead Mineral Resources at End of the Fiscal Year Ended December 31, 2024(1)(2)(3)(11) |
| | Measured Mineral Resources | | Indicated Mineral Resources | | Measured + Indicated Mineral Resources | | Inferred Mineral Resources |
| Coeur
Ownership | Tons (000s) | | Grade (%) | | Pounds
(000s) | | Tons (000s) | | Grade (%) | | Pounds
(000s) | | Tons (000s) | | Grade (%) | | Pounds
(000s) | | Tons (000s) | | Grade (%) | | Pounds
(000s) |
| Canada | | | | | | | | | | | | | | | | | | | | | | | | |
Silvertip Mine, Canada(8) | 100% | 734 | | | 7.9 | % | | 115,648 | | | 6,418 | | | 5.1 | % | | 653,008 | | | 7,152 | | | 5.4 | % | | 768,656 | | | 2,345 | | | 4.3 | % | | 199,815 | |
(1) Certain definitions:
The term “resource” means that it is a concentration or occurrence of material of economic interest in or on the Earth’s crust in such form, grade or quantity that there are reasonable prospects for economic extraction. Inferred, Indicated, and Measured resources are in order of increasing confidence based on level of underlying geological evidence. The term ‘inferred resource’ is that part of a mineral resource for which quantity and grade or quality are estimated on the basis of limited geological evidence and sampling. The term “limited geological evidence” means evidence that is only sufficient to establish that geological and grade or quality continuity is more likely than not. The level of geological uncertainty associated an inferred mineral resource is too high to apply relevant technical and economic factors likely to influence the prospects of economic extraction in a manner useful for evaluation of economic viability and must have a reasonable expectation that the majority of inferred mineral resources could be upgraded to indicated or measured mineral resources with continued exploration. In addition, no assurances can be given that any mineral resource estimate will ultimately be reclassified as proven or probable mineral reserves or that inferred resources will be upgraded to measured or indicated resources.
(2) Mineral Resource estimates are reported exclusive of mineral reserves, are current as of December 31, 2024, are reported using definitions in Item 1300 of Regulation S-K and were prepared by the Company’s technical staff.
(3) Assumed metal prices for 2024 estimated Mineral Resources were $27.00 per ounce of silver, $2,100 per ounce of gold, $1.30 per pound of zinc, $1.00 per pound of lead, unless otherwise noted.
(4) Mineral Resource estimates use the following key input parameters: Assumption of conventional longhole underground mining; reported above a variable gold equivalent cut-off grade that ranges from 1.83–2.10 g/t AuEq; metallurgical recovery assumption of 92.0% for gold and 83.0% for silver; variable mining costs that range from US$57.67–US$74.45/tonne, surface haulage costs of US$4.29/tonne, process costs of US$31.06/tonne, general and administrative costs of US$15.95/tonne, and surface/auxiliary support costs of US$4.42/tonne. Excludes the impact of the Franco-Nevada gold stream agreement at Palmarejo in calculation of Mineral Resources.
(5) Mineral Resource estimates use the following key input parameters: metal price of $2,300 per ounce gold, assumption of conventional longhole underground mining; reported above a variable gold cut-off grade of 0.115 oz/ton Au; metallurgical recovery assumption of 94.2%; gold payability of 97.5%, mining costs of US$116.09/ton mined; process costs of US$55.14/ton processed; general and administrative costs of US$53.18/ton processed; Sustaining capital US$4.50/ton processed; and concentrate refining and shipping costs of US$97.48/oz sold.
(6) Mineral Resource estimates use the following key input parameters: assumption of conventional open pit mining; reported above a gold cut-off grade of 0.008 oz/ton Au; average metallurgical recovery assumption of 78.0% across all rock types; royalty burden of US$140.40/oz Au; pit slope angles that vary from 34–50º; mining costs of $2.56/ton mined, process costs of US$12.02/ton processed (includes general & administrative and sustaining capital costs).
(7) Mineral Resource estimates are tabulated within a confining pit shell and use the following input parameters: Rochester oxide variable recovery Au = 77.7–85.9% and Ag = 59.4%; Rochester sulfide variable recovery Au = 15.2–77.7% and Ag = 0.0–59.4%; with a net smelter return cutoff of $3.76/ton
oxide and US$3.86/ton sulfide; Nevada Packard oxide recovery Au = 92.0% and Ag = 61.0%; with a net smelter return cutoff of $4.24/ton for oxide; Lincoln Hill oxide recovery Au = 63.9% and Ag = 39.5%; with a net smelter return cutoff of $4.53/ton for oxide, where the NSR is calculated as resource net smelter return (NSR) = silver grade (oz/ton) * silver recovery (%) * (silver price ($/oz) - refining cost ($/oz)) + gold grade (oz/ton) * gold recovery (%) * (gold price ($/oz) - refining cost ($/oz)); variable pit slope angles that approximately average 48º over the life-of-mine.
(8) Underground Mineral Resource estimates are reported using a net smelter return (“NSR”) cutoff of US$130/tonne. Mineral Resources are reported insitu using the following assumptions: The estimates use the following key input parameters: lead recovery of 89-90%, zinc recovery of 82-83% and silver recovery of 83-84%. Lead concentrate grade of 53-54%; zinc concentrate grade of 56-57%; mining costs of US$68.77/tonne; processing costs of US$58.20/tonne and US$46.49/tonne, where the NSR ($/tonne) = tonnes x grade x metal prices x metallurgical recoveries – royalties – TCRCs – transport costs over the life of the mine. 2023 metal prices were used to determine the mineral resource which were $25.00 per ounce of silver, $1.30 per pound of zinc, $1.00 per pound of lead.
(9) Open Pit Mineral Resource estimates are reported using an equivalent gold cutoff of 0.20 ounces per ton assuming a silver to gold ratio of 60:1. Resources are reported in-situ and contained withed a conceptual measured, indicated and inferred optimized pit shell. Silver price of US$20/oz, gold price of US$1,400/oz. Average oxide and sulfide gold recovery is 70%, average carbonaceous gold recovery is 50%. Average oxide and sulfide gold recovery is 60%. Average carbonaceous silver recovery is 50%. Open pit mining cost is US$1.50/ton, processing and processing and G&A cost is US$5.46/ton; average pit slope angles of 50º. The technical and economic parameters are those that were used in the 2018 Resource Estimation. Based on the QPs review of the estimate, there would be no material change to the mineral resources if a gold price of US$1,700/oz, a silver price of US$22/oz or economic parameters were updated. Therefore the 2018 Mineral Resource report is considered current and is presented unchanged.
(10) Mineral Resource estimates uses the following key input parameters: assumption of conventional underground mining; reported above a silver cut-off grade of 205 g / tonne silver equivalent and an incremental development cut-off grade of 54 g / tonne AgEq; metallurgical recovery assumption of 97.5% for silver and 98.0% for gold; mining loss of 2% for development and 5% for stoping was applied, additional losses have been included to account for the required pillars in uphole stopes that cannot be filled; variable production mining costs that range from US$58.06–US$239.51/t, development mining costs of US$27.40/t, process costs of US$45.72/t, site general and administrative costs of US$20.70/t, underground general and administrative costs of US$12.81/t, and sustaining capital costs of US$7.64/t.
(11) Rounding of short tons, grades, and troy ounces, as required by reporting guidelines, may result in apparent differences between tons, grades, and contained metal contents.
Item 3. Legal Proceedings
See Note 17 -- Commitments and Contingencies in the notes to the Consolidated Financial Statements included herein.
Item 4. Mine Safety Disclosures
Information pertaining to mine safety matters is reported in accordance with Section 1503(a) of the Dodd-Frank Wall Street Reform and Consumer Protection Act in Exhibit 95.1 attached to this Form 10-K.
PART II
Item 5.Market for Registrant’s Common Equity, Related Stockholder Matters and Issuer Purchases of Equity Securities
The Company’s common stock is traded on the New York Stock Exchange under the ticker symbol CDE.
On February 17, 2025, there were 638,557,875 outstanding shares of the Company’s common stock which were held by approximately 1,012 stockholders of record. On February 14, the Company completed the closing of the Transaction to acquire SilverCrest. Coeur acquired all of the issued and outstanding shares of SilverCrest in exchange for 239,331,799 common shares. In connection with the Transaction, Coeur increased the authorized common shares for issuance to 900,000,000 common shares.
Pursuant to a privately negotiated agreement dated March 14, 2024, Coeur exchanged $5.867 million aggregate principal amount of its 5.125% Senior Notes due 2029 for 1,771,651 shares of its common stock, par value $0.01 per share (the “Shares”). The issuance of the Shares was pursuant to the exemption from the registration requirements afforded by Section 3(a)(9) of the Securities Act of 1933, as amended.
STOCK PERFORMANCE CHART
COMPARISON OF CUMULATIVE TOTAL RETURN
AMONG COEUR MINING, S&P 500 INDEX AND PEER GROUP INDEX
The following performance graph compares the performance of the Company’s common stock during the period beginning December 31, 2019 and ending December 31, 2024 to (i) S&P 500, and (ii) the Arca Gold Miners Index (the “TSR Peer Group”), which the Company began using as its peer group index solely for purposes of the relative total stockholder return (“TSR”) calculation under the Company’s equity compensation program beginning in 2023.
The graph assumes a $100 investment in the Company’s common stock and in each of the indexes at the beginning of the period, and a reinvestment of dividends paid on such investments throughout the five-year period.
| | | | | | | | | | | | | | | | | | | | |
| Dec.
2019 | Dec.
2020 | Dec.
2021 | Dec.
2022 | Dec.
2023 | Dec.
2024 |
| Coeur Mining | 100.0 | | 128.09 | | 62.38 | | 41.58 | | 40.35 | | 70.79 | |
| S&P 500 Index | 100.0 | | 118.40 | | 152.39 | | 124.79 | | 157.59 | | 197.02 | |
| TSR Peer Group | 100.0 | | 122.50 | | 109.18 | | 97.97 | | 106.60 | | 116.35 | |
Item 7. Management’s Discussion and Analysis of Financial Condition and Results of Operations
The following Management’s Discussion and Analysis (“MD&A”) provides information that management believes is relevant to an assessment and understanding of the consolidated financial condition and results of operations of Coeur Mining, Inc. and its subsidiaries (collectively the “Company”, “our”, or “we”). We use certain non-GAAP financial performance measures in our MD&A. For a detailed description of these measures, please see “Non-GAAP Financial Performance Measures” at the end of this Item. We provide Costs applicable to sales (“CAS”) allocation, referred to as the co-product method, based on revenue contribution for Palmarejo and Rochester and based on the primary metal, referred to as the by-product method, for Wharf. Revenue from secondary metal, such as silver at Wharf, is treated as a cost credit.
Overview
We are primarily a gold and silver producer with operating assets located in the United States and Mexico and an exploration project in Canada.
2024 Highlights
For the full year 2024, Coeur reported revenue of $1.1 billion and cash provided by operating activities of $174.2 million. We reported GAAP net income of $58.9 million, or $0.15 per diluted share. On a non-GAAP adjusted basis1, the Company reported EBITDA of $339.2 million and net income of $70.1 million, or $0.18 per diluted share.
•Strong full-year 2024 production and cost results – 2024 full-year production of 341,582 ounces of gold and 11.4 million ounces of silver represented year-over-year increases of 8% and 11%, respectively, and fell solidly within the 2024 guidance ranges. Full-year 2024 costs applicable to sales per ounce1 declined year-over-year by 13% for gold and 12% for silver
•Second consecutive quarter of positive free cash flow and further EBITDA growth – Fourth quarter free cash flow of $16 million brought total second half free cash flow to $85 million. Fourth quarter adjusted EBITDA of $116 million resulted in full-year 2024 adjusted EBITDA of $339 million compared to $142 million in 2023
•Strong fourth quarter results from Rochester – Rochester’s silver and gold production increased by 34% and 63%, respectively, quarter-over-quarter to 1.6 million ounces of silver and 15,752 ounces of gold, bringing the full-year totals to 4.4 million silver ounces and 39,203 gold ounces. Tons placed in the fourth quarter totaled 8.2 million tons, exceeding the 7.0 - 8.0 million tons target. Fourth quarter free cash flow of $12 million represented the first positive free cash flow quarter since the fourth quarter of 2019
•Further debt reductions – Coeur repaid an additional $30 million of the revolving credit facility (“RCF”) during the quarter, reducing the outstanding balance by 29%, or $80 million since mid-year to $195 million. The Company’s net debt to adjusted EBITDA ratio declined to 1.6x at year-end compared to 3.4x at year-end 2023
•SilverCrest transaction now closed – Coeur’s $1.58 billion acquisition of SilverCrest Metals Inc. (“SilverCrest”) closed on February 14, 2025, which adds the high-grade, low-cost Las Chispas silver and gold operation in Sonora, Mexico to the Company’s portfolio of North American assets and creates a leading global silver company
•Robust expected 2025 production growth positions Coeur for record results – 2025 production guidance ranges of 380,000 - 440,000 ounces of gold and 16.7 - 20.3 million ounces of silver represent expected year-over-year increases of 20% and 62%, respectively. These ranges reflect the expected benefit of the recently acquired Las Chispas operation and the first full-year of production from the newly expanded Rochester operation totaling 7.0 - 8.3 million silver ounces and 60,000 - 75,000 gold ounces, representing year-over-year expected increases of 75% and 72%, respectively
Selected Financial and Operating Results
| | | | | | | | | | | | | | | | | | | | | | | | | | |
| | | | | | | | | | |
| | | | | Year Ended December 31, |
| | | | | | | | | | 2024 | | 2023 | | 2022 |
| Financial Results: (in thousands, except per share amounts) | | | | | | | | | | | | | | |
| Gold sales | | | | | | | | | | $ | 734,861 | | | $ | 575,677 | | | $ | 572,877 | |
| Silver sales | | | | | | | | | | $ | 319,145 | | | $ | 245,529 | | | $ | 212,759 | |
| | | | | | | | | | | | | | |
| | | | | | | | | | | | | | |
| Consolidated Revenue | | | | | | | | | | $ | 1,054,006 | | | $ | 821,206 | | | $ | 785,636 | |
| Net income (loss) | | | | | | | | | | $ | 58,900 | | | $ | (103,612) | | | $ | (78,107) | |
| Net income (loss) per share, diluted | | | | | | | | | | $ | 0.15 | | | $ | (0.30) | | | $ | (0.28) | |
Adjusted net income (loss)(1) | | | | | | | | | | $ | 70,117 | | | $ | (78,048) | | | $ | (89,059) | |
Adjusted net income (loss) per share, diluted(1) | | | | | | | | | | $ | 0.18 | | | $ | (0.23) | | | $ | (0.32) | |
EBITDA(1) | | | | | | | | | | $ | 302,600 | | | $ | 60,465 | | | $ | 72,038 | |
Adjusted EBITDA(1) | | | | | | | | | | $ | 339,152 | | | $ | 142,302 | | | $ | 138,954 | |
Total debt(2) | | | | | | | | | | $ | 590,058 | | | $ | 545,310 | | | $ | 515,933 | |
| Operating Results: | | | | | | | | | | | | | | |
| Gold ounces produced | | | | | | | | | | 341,582 | | | 317,671 | | | 330,346 | |
| Silver ounces produced | | | | | | | | | | 11,389,519 | | | 10,250,906 | | | 9,816,680 | |
| | | | | | | | | | | | | | |
| | | | | | | | | | | | | | |
| Gold ounces sold | | | | | | | | | | 340,816 | | | 315,511 | | | 329,968 | |
| Silver ounces sold | | | | | | | | | | 11,418,821 | | | 10,140,405 | | | 9,771,724 | |
| | | | | | | | | | | | | | |
| | | | | | | | | | | | | | |
| Average realized price per gold ounce | | | | | | | | | | $ | 2,156 | | | $ | 1,825 | | | $ | 1,736 | |
| Average realized price per silver ounce | | | | | | | | | | $ | 27.95 | | | $ | 24.21 | | | $ | 21.77 | |
| | | | | | | | | | | | | | |
| | | | | | | | | | | | | | |
| | | | | | | | | | | | | | |
| | | | | | | | | | | | | | |
| | | | | | | | | | | | | | |
| | | | | | | | | | | | | | |
| | | | | | | | | | | | | | |
| | | | | | | | | | | | | | |
(1)See “Non-GAAP Financial Performance Measures”.
(2)Includes finance leases. Net of debt issuance costs and premium received.
Consolidated Financial Results
Year Ended December 31, 2024 compared to Year Ended December 31, 2023
Revenue
We sold 340,816 gold ounces and 11.4 million silver ounces, compared to 315,511 gold ounces and 10.1 million silver ounces. Revenue increased by $232.8 million, or 28%, as a result of an 18% and 15% increase in average realized gold and silver prices, respectively, and an 8% and 13% increase in gold and silver ounces sold, respectively. The increase in gold ounces sold was due to higher gold production at all sites, specifically higher grade and recovery rates at Palmarejo, the successful completion of the Rochester expansion, higher mill throughput and grade at Kensington, and higher tons and grade at Wharf. The increase in silver ounces sold was the result of higher grade and recovery rates at Palmarejo, and the successful completion of the Rochester expansion. Gold and silver represented 70% and 30%, respectively, of both 2024 and 2023 sales revenue.
The following table summarizes consolidated metal sales:
| | | | | | | | | | | | | | | | | | | | | | | | | | | | | | | | | |
| | | | | | | Year Ended December 31, | | Increase (Decrease) | | Percentage Change |
| In thousands | | | | | | | | | 2024 | | 2023 | | |
| Gold sales | | | | | | | | | | | $ | 734,861 | | | $ | 575,677 | | | $ | 159,184 | | | 28 | % |
| Silver sales | | | | | | | | | | | 319,145 | | | 245,529 | | | 73,616 | | | 30 | % |
| Metal sales | | | | | | | | | | | $ | 1,054,006 | | | $ | 821,206 | | | $ | 232,800 | | | 28 | % |
Costs Applicable to Sales
Costs applicable to sales decreased $26.7 million, or 4%, primarily due to higher recoverable ounces placed on the leach pad at Wharf, an increase in estimated recoverable ounces on the legacy leach pad in the first quarter of 2024 at Rochester, lower net realizable value (“LCM”) adjustments at Rochester, and the favorable impact of exchange rates at Palmarejo, partially offset by higher gold and silver ounces sold at all sites. For a complete discussion of costs applicable to sales, see Results of Operations below.
Amortization
Amortization increased $25.2 million, or 25%, and resulted primarily from higher gold and silver ounces sold at all sites and, at Rochester, the commencement of production of the new leach pad in mid-September 2023, and the three-stage crushing circuit in March 2024, partially offset by lower LCM adjustments.
Expenses
General and administrative expenses increased $6.1 million, or 15%, primarily due to higher employee compensation, outside service and legal costs.
Exploration expense increased $28.7 million, or 93%, driven by the sustained increased drilling at Palmarejo, Rochester, Wharf and Silvertip in 2024, and the Canadian mining exploration tax credits associated with expenditures at the Silvertip exploration project recognized in 2023.
Pre-development, reclamation, and other expenses decreased $3.4 million, or 6%, stemming from lower losses on the sale of assets and lower ongoing carrying costs at Silvertip, partially offset by the Kensington royalty litigation settlement of $7.2 million and transaction costs of $8.5 million related to the acquisition of SilverCrest.
The following table summarizes pre-development, reclamation, and other expenses:
| | | | | | | | | | | | | | | | | | | | | | | | | | | | | | |
| | | | | | | Year Ended December 31, | Increase (Decrease) | | Percentage Change |
| In thousands | | | | | | | | | 2024 | | 2023 | |
| Silvertip ongoing carrying costs | | | | | | | | | | | 8,513 | | | 15,616 | | (7,103) | | | (45) | % |
| Loss on sale of assets | | | | | | | | | | | 4,250 | | | 12,879 | | (8,629) | | | (67) | % |
| Asset retirement accretion | | | | | | | | | | | 16,778 | | | 16,405 | | 373 | | | 2 | % |
| Kensington royalty litigation settlement | | | | | | | | | | | 7,156 | | | — | | 7,156 | | | 100 | % |
| Transaction costs | | | | | | | | | | | 8,517 | | | — | | 8,517 | | | 100 | % |
| Other | | | | | | | | | | | 6,059 | | | 9,736 | | (3,677) | | | (38) | % |
| Pre-development, reclamation and other expense | | | | | | | | | | | $ | 51,273 | | | $ | 54,636 | | $ | (3,363) | | | (6) | % |
Other Income and Expenses
During the year ended December 31, 2024, the Company incurred a $0.4 million gain in connection with the exchange of $5.9 million in aggregate principal amount plus accrued interest of 2029 Senior Notes for 1.8 million shares of common stock compared to $3.4 million incurred in connection with the exchange of $76.0 million in aggregate principal amount plus accrued interest for 25.2 million shares of common stock during the year ended December 31, 2023.
The Company did not have fair value adjustments, net, during the year ended December 31, 2024 following the sale of the Company’s equity investments in 2023.
Interest expense (net of capitalized interest of $1.1 million) increased to $51.3 million from $29.1 million due to higher interest paid under the RCF attributable to higher average debt levels and higher interest paid under financial leases, partially offset by lower interest payable following the extinguishment of $5.9 million in 2029 Senior Notes.
Other, net increased to a gain of $13.0 million compared to loss $7.5 million as a result of the recognition of the net proceeds received in excess of the Company’s trading price (“FT Premium Liability”) as income of $5.6 million following the renouncement of Silvertip exploration expenditures, favorable foreign exchange rates, particularly in Mexico, and the $12.3 million loss recognized from the sale of the contingent consideration received in connection with the sale of La Preciosa project (the “La Preciosa Deferred Consideration”) in 2023.
Income and Mining Taxes
| | | | | | | | | | | | | |
| | Year Ended December 31, |
| In thousands | 2024 | | 2023 | | |
| Income and mining tax (expense) benefit at statutory rate | $ | (28,465) | | | 14,376 | | | |
| State tax provision from continuing operations | (149) | | | 4,859 | | | |
| Change in valuation allowance | 727 | | | (36,778) | | | |
| | | | | |
| Percentage depletion | 6,974 | | | 5,649 | | | |
| Uncertain tax positions | 2 | | | 6 | | | |
| U.S. and foreign permanent differences | (7,765) | | | (3,056) | | | |
| | | | | |
| Foreign exchange rates | 2,405 | | | 1,179 | | | |
| Foreign inflation and indexing | 2,322 | | | 3,077 | | | |
| Foreign tax rate differences | (8,923) | | | (3,911) | | | |
| Foreign withholding and other taxes | (8,307) | | | (1,381) | | | |
| Mining Taxes | (26,901) | | | (16,884) | | | |
| Sale of non-core assets | — | | | (1,322) | | | |
| Enactment of 1% increase in Mexico special mining duty tax | (1,696) | | | — | | | |
| Other, net | 2,326 | | | (970) | | | |
| Income and mining tax (expense) benefit | $ | (67,450) | | | $ | (35,156) | | | |
Income and mining tax expense of approximately $67.5 million resulted in an effective tax rate of 53.4% for 2024. This compares to income tax expense of $35.2 million for an effective tax rate of (51.4)% for 2023. The comparability of the Company’s income and mining tax (expense) benefit and effective tax rate for the reported periods was impacted by multiple factors, primarily: (i) mining taxes; (ii) variations in our income before income taxes; (iii) geographic distribution of that income; (iv) foreign exchange rates; (v) Mexico mining tax rate increase; (vi) percentage depletion; (vii) the sale of non-core assets; and (viii) the impact of uncertain tax positions. Therefore, the effective tax rate will fluctuate, sometimes significantly, period to period.
The following table summarizes the components of the Company’s income (loss) before tax and income and mining tax (expense) benefit:
| | | | | | | | | | | | | | | | | | | | | | | | | | |
| Year ended December 31, | | | | | | |
| | 2024 | | 2023 | | | | | | |
| In thousands | Income (loss) before tax | Tax (expense) benefit | | Income (loss) before tax | Tax (expense) benefit | | | | | | | | | |
| United States | $ | 50,194 | | $ | (13,063) | | | $ | (107,021) | | $ | (6,956) | | | | | | | | | | |
| Canada | (46,702) | | (1,523) | | | (33,574) | | (848) | | | | | | | | | | |
| Mexico | 125,027 | | (52,864) | | | 72,697 | | (27,352) | | | | | | | | | | |
| Other jurisdictions | (2,169) | | — | | | (558) | | — | | | | | | | | | | |
| $ | 126,350 | | $ | (67,450) | | | $ | (68,456) | | $ | (35,156) | | | | | | | | | | |
A valuation allowance is provided for deferred tax assets for which it is more likely than not that the related tax benefits will not be realized. The Company analyzes its deferred tax assets and, if it is determined that the Company will not realize all or a portion of its deferred tax assets, it will record or increase a valuation allowance. Conversely, if it is determined that the Company will ultimately be more likely than not able to realize all or a portion of the related benefits for which a valuation allowance has been provided, all or a portion of the related valuation allowance will be reduced. There are a number of factors that impact the Company’s ability to realize its deferred tax assets. For additional information, please see “Item 1A - Risk Factors”.
Net Income (Loss)
Net income was $58.9 million, or $0.15 per diluted share, compared to a net loss of $103.6 million, or $0.30 per diluted share. The increase in net income was driven by a 18% and 15% increase in average realized gold and silver prices, respectively, and a 8% and 13% increase in gold and silver ounces sold, respectively, lower ongoing costs at Silvertip, the recognition of the FT Premium Liability income of $5.6 million, lower LCM adjustments at Rochester, and the $12.3 million loss recognized from the sale of the La Preciosa Deferred Consideration in 2023. This was partially offset by the Kensington royalty settlement of $7.2 million, transaction costs of $8.5 million related to the acquisition of SilverCrest, and higher exploration and income and mining taxes expense. Adjusted net income was $70.1 million, or $0.18 per diluted share, compared to adjusted net loss of $78.0 million, or $0.23 per diluted share (see “Non-GAAP Financial Performance Measures”).
Year Ended December 31, 2023 compared to Year Ended December 31, 2022
Revenue
We sold 315,511 gold ounces and 10.1 million silver ounces, compared to 329,968 gold ounces and 9.8 million silver ounces. Revenue increased by $35.6 million, or 5%, as a result of a 4% increase in silver ounces sold and a 5% and 11% increase in average realized gold and silver prices, respectively, partially offset by a 4% decrease in gold ounces sold. The decrease in gold ounces sold was primarily due to lower mill throughput at Palmarejo and Kensington and lower grades at Kensington, partially offset by the timing of production from Rochester’s new leach pad related to startup of the new process plant and timing of recoveries at Wharf. The increase in silver ounces sold was primarily due to the timing of production on Rochester’s new leach pad related to startup of the new process plant, partially offset by lower mill throughput at Palmarejo. Gold and silver represented 70% and 30% of 2023 sales revenue, respectively, compared to 73% and 27% of 2022 sales revenue, respectively.
The following table summarizes consolidated metal sales:
| | | | | | | | | | | | | | | | | | | | | | | | | | | | | | | | | |
| | | Year Ended December 31, | | Increase (Decrease) | | Percentage Change | | | | | | |
| In thousands | | | 2023 | | 2022 | | | | | | | | |
| Gold sales | | | $ | 575,677 | | | $ | 572,877 | | | $ | 2,800 | | | — | % | | | | | | | | |
| Silver sales | | | 245,529 | | | 212,759 | | | 32,770 | | | 15 | % | | | | | | | | |
| Metal sales | | | $ | 821,206 | | | $ | 785,636 | | | $ | 35,570 | | | 5 | % | | | | | | | | |
Costs Applicable to Sales
Costs applicable to sales increased $26.4 million, or 4%, primarily due to the increase in ounces sold at Rochester and Wharf and higher operating costs at Palmarejo partially offset by lower LCM adjustments at Rochester. For a complete discussion of costs applicable to sales, see Results of Operations below.
Amortization
Amortization decreased $11.8 million, or 11%, primarily due to a decrease in gold ounces sold and longer assumed mine life at Kensington, partially offset by the commencement of production of the new leach pad in mid-September 2023 at Rochester.
Expenses
General and administrative expenses increased $2.1 million, or 5%, primarily due to higher employee-related costs.
Exploration expense increased $4.3 million, or 16%, driven by accelerated drilling activity at Palmarejo, Kensington and Silvertip, partially offset by the Canadian mining exploration tax credits associated with expenditures at the Silvertip exploration project recognized in 2023.
Pre-development, reclamation, and other expenses increased $14.0 million, or 34%, stemming from higher asset retirement accretion, a $12.8 million loss on dismantle and disposal of the legacy crusher at Rochester, and non-operating start-up costs associated with the Rochester expansion project, partially offset by lower ongoing carrying costs at Silvertip.
The following table summarizes pre-development, reclamation, and other expenses:
| | | | | | | | | | | | | | | | | | | | | | | | | | | | | | |
| | | | | | | Year Ended December 31, | Increase (Decrease) | | Percentage Change |
| In thousands | | | | | | | | | 2023 | | 2022 |
| | | | | | | | | | | | | | | | |
| Silvertip ongoing carrying costs | | | | | | | | | | | $ | 15,616 | | | $ | 20,963 | | $ | (5,347) | | | (26) | % |
| Loss on sale of assets | | | | | | | | | | | 12,879 | | | (640) | | 13,519 | | | (2,112) | % |
| Asset retirement accretion | | | | | | | | | | | 16,405 | | | 14,232 | | 2,173 | | | 15 | % |
| | | | | | | | | | | | | | | | |
| | | | | | | | | | | | | | | | |
| Other | | | | | | | | | | | 9,736 | | | 6,092 | | 3,644 | | | 60 | % |
| Pre-development, reclamation and other expense | | | | | | | | | | | $ | 54,636 | | | $ | 40,647 | | $ | 13,989 | | | 34 | % |
Other Income and Expenses
During the year ended December 31, 2023, the Company incurred a $3.4 million gain in connection with the exchange of $76.0 million in aggregate principal amount plus accrued interest of 2029 Senior Notes for 25.2 million shares of common stock.
Fair value adjustments, net, increased to a gain of $3.4 million compared to $66.7 million loss as a result of an increase in value of the Company’s equity investments.
Interest expense (net of capitalized interest of $14.6 million) increased to $29.1 million from $23.9 million. Total interest costs for 2023 increased $8.6 million to $43.7 million, due to higher interest paid under the RCF attributable to higher average debt levels, partially offset by lower interest payable following the extinguishment of $76.0 million in 2029 Senior Notes.
Other, net decreased to a loss of $7.5 million compared to a gain of $66.3 million as a result of the $12.3 million loss recognized from the sale of La Preciosa Deferred Consideration 2023 and the $62.2 million gain recognized in connection with the sale of the Sterling/Crown exploration properties in 2022.
Income and Mining Taxes
The Company’s Income and mining tax (expense) benefit consisted of:
| | | | | | | | | | | | | |
| | Year Ended December 31, |
| In thousands | 2023 | | 2022 | | |
| Income and mining tax (expense) benefit at statutory rate | $ | 14,376 | | | $ | 13,249 | | | |
| State tax provision from continuing operations | 4,859 | | | 2,871 | | | |
| Change in valuation allowance | (36,778) | | | (36,670) | | | |
| | | | | |
| Percentage depletion | 5,649 | | | 3,538 | | | |
| Uncertain tax positions | 6 | | | 655 | | | |
| U.S. and foreign permanent differences | (3,056) | | | 365 | | | |
| | | | | |
| Foreign exchange rates | 1,179 | | | (145) | | | |
| Foreign inflation and indexing | 3,077 | | | 2,897 | | | |
| Foreign tax rate differences | (3,911) | | | (4,994) | | | |
| Foreign withholding and other taxes | (1,381) | | | 169 | | | |
| Mining Taxes | (16,884) | | | (11,239) | | | |
| Sale of non-core assets | (1,322) | | | 15,447 | | | |
| Other, net | (970) | | | (801) | | | |
| Income and mining tax (expense) benefit | $ | (35,156) | | | $ | (14,658) | | | |
Income and mining tax expense of approximately $35.2 million resulted in an effective tax rate of 51.4% for 2023. This compares to income tax expense of $14.7 million for an effective tax rate of 23.1% for 2022. The comparability of the Company’s income and mining tax (expense) benefit and effective tax rate for the reported periods was impacted by multiple factors, primarily: (i) the sale of non-core assets; (ii) variations in our income before income taxes; (iii) geographic distribution of that income; (iv) mining taxes; (v) foreign exchange rates; (vi) percentage depletion; and (vii) the impact of uncertain tax positions. Therefore, the effective tax rate will fluctuate, sometimes significantly, period to period.
The following table summarizes the components of the Company’s income (loss) before tax and income and mining tax (expense) benefit:
| | | | | | | | | | | | | | | | | | | | | | | | | | |
| Year ended December 31, | | | | | | |
| | 2023 | | 2022 | | | | | | |
| In thousands | Income (loss) before tax | Tax (expense) benefit | | Income (loss) before tax | Tax (expense) benefit | | | | | | | | | |
| United States | $ | (107,021) | | $ | (6,956) | | | $ | (107,477) | | $ | 2,516 | | | | | | | | | | |
| Canada | (33,574) | | (848) | | | (32,249) | | (51) | | | | | | | | | | |
| Mexico | 72,697 | | (27,352) | | | 77,316 | | (17,123) | | | | | | | | | | |
| Other jurisdictions | (558) | | — | | | (1,039) | | — | | | | | | | | | | |
| $ | (68,456) | | $ | (35,156) | | | $ | (63,449) | | $ | (14,658) | | | | | | | | | | |
A valuation allowance is provided for deferred tax assets for which it is more likely than not that the related tax benefits will not be realized. The Company analyzes its deferred tax assets and, if it is determined that the Company will not realize all or a portion of its deferred tax assets, it will record or increase a valuation allowance. Conversely, if it is determined that the Company will ultimately be more likely than not able to realize all or a portion of the related benefits for which a valuation allowance has been provided, all or a portion of the related valuation allowance will be reduced. There are a number of factors that impact the Company’s ability to realize its deferred tax assets. For additional information, please see “Item 1A - Risk Factors”.
Net Income (Loss)
Net loss was $103.6 million, or $0.30 per diluted share, compared to $78.1 million, or $0.28 per diluted share. The increase in net loss was driven by a 4% decrease in gold ounces sold, higher operating costs at Palmarejo, higher exploration costs, a $12.3 million loss on the sale of the La Preciosa Deferred Consideration, a $12.8 million loss on disposal of the legacy crusher at Rochester, and the $62.2 million gain recognized in connection with the sale of the Sterling/Crown exploration properties in 2022. This was partially offset by a 4% increase in silver ounces sold, a 5% and 11% increase in average realized gold and silver prices, respectively, favorable changes in the fair value of the Company’s equity investments, and a $3.4 million gain in connection with the exchange of 2029 Senior Notes. Adjusted net loss was $78.0 million, or $0.23 per diluted share, compared to $89.1 million, or $0.32 per diluted share (see “Non-GAAP Financial Performance Measures”).
2025 Guidance
Gold and silver production is expected to increase 20% and 62%, respectively, compared to 2024 based on the midpoint of guidance ranges. The increase is primarily driven by the completion and ramp-up of Rochester last year and the addition of Las Chispas in mid-February.
Overall cost guidance has increased slightly at Palmarejo, Kensington and Wharf compared to 2024.
The below exploration expense guidance excludes $17 - $22 million of underground mine development and support costs associated with Silvertip.
Note that Las Chispas guidance reflects results from the February 14 closing of the acquisition. Additionally, Las Chispas cost guidance excludes the effects of the SilverCrest purchase price allocation.
2025 Production Guidance
| | | | | | | | | | | | | | | | | | | | | | | |
| | | | | Gold | | Silver |
| | | | | (oz) | | (K oz) |
| Las Chispas | | | | | 42,500 - 52,500 | | 4,250 - 5,250 |
| Palmarejo | | | | | 95,000 - 105,000 | | 5,400 - 6,500 |
| Rochester | | | | | 60,000 - 75,000 | | 7,000 - 8,300 |
| Kensington | | | | | 92,500 - 107,500 | | — |
| Wharf | | | | | 90,000 - 100,000 | | 50 - 200 |
| | | | | | | |
| Total | | | | | 380,000 - 440,000 | | 16,700 - 20,250 |
2025 Costs Applicable to Sales Guidance
| | | | | | | | | | | | | | | | | | | | |
| | | | | Gold | Silver |
| | | | | ($/oz) | ($/oz) |
| Las Chispas (co-product) | | | | | $850 - $950 | $9.25 - $10.25 |
| Palmarejo (co-product) | | | | | $950 - $1,150 | $17.00 - $18.00 |
| Rochester (co-product) | | | | | $1,250 - $1,450 | $14.50 - $16.50 |
| Kensington | | | | | $1,700 - $1,900 | — |
| Wharf (by-product) | | | | | $1,250 - $1,350 | — |
| | | | | | |
2025 Capital, Exploration and G&A Guidance
| | | | | | | | | | | | | | | | | |
| | | | | ($M) |
| Capital Expenditures, Sustaining | | | | | $132 - $156 |
| Capital Expenditures, Development | | | | | $55 - $69 |
| Exploration, Expensed | | | | | $67 - $77 |
| Exploration, Capitalized | | | | | $10 - $16 |
| General & Administrative Expenses | | | | | $44 - $48 |
Note: The Company’s guidance figures assume estimated prices of $2,700/oz gold and $30.00/oz silver as well as CAD of 1.425 and MXN of 20.50. Guidance figures exclude the impact of any metal sales or foreign exchange hedges.
Results of Operations
Palmarejo
| | | | | | | | | | | | | | | | | | | | | | | | | | |
| | | | Year Ended December 31, |
| | | | | | | | | | 2024 | | 2023 | | 2022 |
| Tons milled | | | | | | | | | | 1,762,779 | | | 2,008,459 | | | 2,197,808 | |
| Average gold grade (oz/t) | | | | | | | | | | 0.07 | | | 0.05 | | | 0.05 | |
| Average silver grade (oz/t) | | | | | | | | | | 4.52 | | | 3.97 | | | 3.63 | |
| Average recovery rate – Au | | | | | | | | | | 93.0 | % | | 91.1 | % | | 92.1 | % |
| Average recovery rate – Ag | | | | | | | | | | 85.0 | % | | 82.7 | % | | 84.2 | % |
| Gold ounces produced | | | | | | | | | | 108,666 | | | 100,605 | | | 106,782 | |
| Silver ounces produced | | | | | | | | | | 6,779,659 | | | 6,591,590 | | | 6,708,689 | |
| Gold ounces sold | | | | | | | | | | 108,783 | | | 99,043 | | | 107,157 | |
| Silver ounces sold | | | | | | | | | | 6,796,715 | | | 6,534,469 | | | 6,695,454 | |
CAS per gold ounce(1) | | | | | | | | | | $ | 898 | | | $ | 961 | | | $ | 886 | |
CAS per silver ounce(1) | | | | | | | | | | $ | 14.38 | | | $ | 15.17 | | | $ | 13.09 | |
(1)See Non-GAAP Financial Performance Measures.
Year Ended December 31, 2024 compared to Year Ended December 31, 2023
Gold and silver production increased 8% and 3%, respectively, as a result of a 40% and 14% increase in gold and silver grades, respectively, and higher gold and silver recovery rates, partially offset by a 12% decrease in mill throughput due to mine sequencing. Metal sales were $379.1 million, or 36% of Coeur’s metal sales, compared with $313.2 million, or 38% of Coeur’s metal sales. Revenue increased by $65.9 million, or 21%, of which $41.5 million was due to higher average realized gold and silver prices and $24.3 million was the result of higher volume of gold and silver production. Costs applicable to sales per gold and silver ounce decreased 7% and 5%, respectively, due to higher production, lower labor and cyanide costs, and the favorable impact of foreign exchange rates on operating costs. Amortization increased by $9.3 million to $45.0 million due to a 10% and 4% increase in gold and silver ounces sold, respectively. Capital expenditures decreased to $30.6 million from $41.8 million due to lower underground development expenditures and the completion of the open pit backfill project in 2023.
Year Ended December 31, 2023 compared to Year Ended December 31, 2022
Gold and silver production decreased 6% and 2%, respectively, as a result of a 9% decrease in mill throughput partially offset by 4% and 9% higher gold and silver grades, respectively. Metal sales were $313.2 million, or 38% of Coeur’s metal sales, compared with $303.4 million, or also 38% of Coeur’s metal sales. Revenue increased by $9.8 million, or 3%, of which $26.4 million was due to higher gold and silver prices, partially offset by a decrease of $16.6 million due to a lower volume of gold and silver production. Costs applicable to sales per gold and silver ounces increased 9% and 16%, respectively, due to the mix of gold and silver sales which impacted co-product cost allocation and unfavorable impact of foreign exchange rates on employee-related and electricity costs. Amortization increased by $0.3 million to $35.7 million. Capital expenditures decreased to $41.8 million from $42.6 million due to lower capitalized exploration expenditures partially offset by higher open pit backfill project and underground development expenditures.
Rochester
| | | | | | | | | | | | | | | | | | | | | | | | | |
| | | Year ended December 31, |
| | | | | | | | | 2024 | | 2023 | | 2022 |
Tons placed(1) | | | | | | | | | 23,529,814 | | | 11,388,657 | | | 14,919,803 | |
| Average gold grade (oz/t) | | | | | | | | | 0.002 | | | 0.003 | | | 0.003 | |
| Average silver grade (oz/t) | | | | | | | | | 0.52 | | | 0.45 | | | 0.41 | |
| Gold ounces produced | | | | | | | | | 39,203 | | | 38,775 | | | 34,735 | |
| Silver ounces produced | | | | | | | | | 4,377,847 | | | 3,391,530 | | | 3,061,924 | |
| Gold ounces sold | | | | | | | | | 38,345 | | | 38,449 | | | 34,370 | |
| Silver ounces sold | | | | | | | | | 4,389,378 | | | 3,339,780 | | | 3,028,986 | |
CAS per gold ounce(2) | | | | | | | | | $ | 1,693 | | | $ | 2,138 | | | $ | 2,403 | |
CAS per silver ounce(2) | | | | | | | | | $ | 20.43 | | | $ | 26.67 | | | $ | 27.26 | |
(1) During the year ended December 31, 2024, 21.5 million and 2.0 million tons of ore were placed on the new leach pad and legacy leach pad, respectively. During the year ended December 31, 2023, 7.3 million and 4.1 million tons of ore were placed on the new leach pad and legacy leach pads, respectively.
(2)See Non-GAAP Financial Performance Measures.
Year Ended December 31, 2024 compared to Year Ended December 31, 2023
Gold and silver production increased 1% and 29%, respectively, driven by the increased production from the new leach pad. Metal sales were $215.8 million, or 20% of Coeur’s metal sales, compared with $156.0 million, or 19% of Coeur’s metal sales. Revenue increased by $59.8 million, or 38%, of which $30.3 million was due to higher average realized gold and silver prices and $29.5 million was attributable to a higher volume of gold and silver production. Costs applicable to sales per gold and silver ounce decreased 21% and 23%, respectively, as a result of the increase in tons placed on the new leach pad, lower maintenance costs and LCM adjustments, and the favorable impact of an increase in estimated recoverable ounces on the legacy leach pad in the first quarter of 2024, partially offset by higher labor, electrical and outside service costs. Amortization increased by $14.9 million to $41.3 million due to higher gold and silver ounces sold, and the commencement of production from the new stage 6 leach pad in mid-September 2023 and the three-stage crushing circuit in March 2024. Capital expenditures decreased to $72.7 million from $263.4 million due to reduced spending related to the expansion project.
Commissioning of Rochester’s new three-stage crushing circuit and truck load-out facility was completed on March 7, 2024 leading to declaration of commercial production and $528 million of construction in process placed into service in the first quarter of 2024. Ore tons placed increased 16% quarter-over-quarter to 8.2 million tons, including approximately 5.1 million tons through the new crushing circuit and placed on the new leach pad.
Year Ended December 31, 2023 compared to Year Ended December 31, 2022
Gold and silver production increased 12% and 11%, respectively, as a result of the Rochester expansion and an improved understanding of gold and silver recoveries based on controlling the size fraction and amount of fines placed on the leach pads. Approximately 64% of the tons placed in 2023 were placed onto the new leach pad. The new leach pad along with the new processing facility commenced production in mid-September 2023. Metal sales were $156.0 million, or 19% of Coeur’s metal sales, compared with $129.7 million, or 17% of Coeur’s metal sales. Revenue increased by $26.4 million, or 20%, of which $15.5 million was due to a higher volume of gold and silver production, and $10.9 million was due to higher average realized gold and silver prices. Costs applicable to sales per gold and silver ounce decreased 11% and 2%, respectively, due to the mix of gold and silver sales and lower LCM adjustments of $39.9 million compared to $46.0 million in the prior year, driven by higher gold and silver prices partially offset by lower tons placed and higher employee-related and maintenance costs. Amortization increased to $26.4 million due to commencement of production of the new leach pad in mid-September 2023. Capital expenditures increased to $263.4 million from $246.4 million due to timing of payments related to the Rochester expansion project.
Kensington
| | | | | | | | | | | | | | | | | | | | | | | | | |
| | | Year ended December 31, |
| | | | | | | | | 2024 | | 2023 | | 2022 |
| Tons milled | | | | | | | | | 699,037 | | | 651,576 | | | 700,346 | |
| Average gold grade (oz/t) | | | | | | | | | 0.15 | | | 0.14 | | | 0.17 | |
| Average recovery rate | | | | | | | | | 91.3 | % | | 91.9 | % | | 92.5 | % |
| Gold ounces produced | | | | | | | | | 95,671 | | | 84,789 | | | 109,061 | |
| Gold ounces sold | | | | | | | | | 95,361 | | | 84,671 | | | 108,972 | |
CAS per gold ounce(1) | | | | | | | | | $ | 1,655 | | | $ | 1,797 | | | $ | 1,423 | |
(1)See Non-GAAP Financial Performance Measures.
Year Ended December 31, 2024 compared to Year Ended December 31, 2023
Gold production increased 13% as a result of a 7% increase in grade and higher mill throughput. Metal sales were $225.1 million, or 21% of Coeur’s metal sales, compared to $162.5 million, or 20% of Coeur’s metal sales. Revenue increased by $62.7 million, or 39%, of which $37.5 million was due to higher average realized gold prices and $25.2 million resulting from a higher volume of gold production. Costs applicable to sales per gold ounce decreased 8% due to higher production, and lower labor and diesel costs, partially offset by higher outside service and royalty costs. Amortization increased by $2.3 million to $28.2 million primarily due to an increase in gold ounces sold. Capital expenditures increased to $68.7 million from $53.3 million reflecting continued investment associated with the multi-year underground development and exploration program designed to extend and enhance the mine life, which began in 2022 and is expected to be completed in 2025, as well as underground development and tailings dam expansion expenditures.
Year Ended December 31, 2023 compared to Year Ended December 31, 2022
Gold production decreased 22% as a result of 18% lower grades and 7% lower mill throughput. Metal sales were $162.5 million, or 20% of Coeur’s metal sales, compared to $202.5 million, or 26% of Coeur’s metal sales. Revenue decreased by $40.0 million, or 20%, of which $46.0 million resulted from a lower volume of gold production, partially offset by a $6.0 million increase due to higher average realized gold prices. Costs applicable to sales per gold ounce increased 26% due to lower production partially offset by lower operating costs. Amortization decreased to $25.9 million primarily due to a decrease in gold ounces sold and the favorable impact of a longer mine life. Capital expenditures increased to $53.3 million from $31.5 million due to the elevated level of investment associated with the multi-year underground development and exploration program aimed at extending and enhancing the mine life, which began in 2022 and is expected to be completed in 2025.
Wharf
| | | | | | | | | | | | | | | | | | | | | | | | | |
| | | Year ended December 31, |
| | | | | | | | | 2024 | | 2023 | | 2022 |
| Tons placed | | | | | | | | | 5,003,935 | | | 4,743,469 | | | 4,506,849 | |
| Average gold grade (oz/t) | | | | | | | | | 0.031 | | | 0.026 | | | 0.021 | |
| Gold ounces produced | | | | | | | | | 98,042 | | | 93,502 | | | 79,768 | |
| Silver ounces produced | | | | | | | | | 232,013 | | | 267,786 | | | 46,067 | |
| Gold ounces sold | | | | | | | | | 98,327 | | | 93,348 | | | 79,469 | |
| Silver ounces sold | | | | | | | | | 232,728 | | | 266,156 | | | 47,284 | |
CAS per gold ounce(1) | | | | | | | | | $ | 935 | | | $ | 1,159 | | | $ | 1,283 | |
(1)See Non-GAAP Financial Performance Measures.
Year Ended December 31, 2024 compared to Year Ended December 31, 2023
Gold production increased 5% driven by higher tons placed and grade placed on the pads, and timing of recoveries. Metal sales were $234.0 million, or 22% of Coeur’s metal sales, compared to $189.5 million, or 23% of Coeur’s metal sales. Revenue increased by $44.5 million, or 23%, of which $33.9 million attributable to higher average realized gold prices and $10.6 million was due to a higher gold production. Costs applicable to sales per gold ounce decreased 19% due to higher tons and grade placed on the pads, and lower diesel costs, partially offset by higher royalties, labor and outside service costs. Amortization remained comparable at $6.5 million. Capital expenditures were $7.2 million.
Year Ended December 31, 2023 compared to Year Ended December 31, 2022
Gold production increased 17% driven by higher grade, higher tons placed and timing of recoveries. Metal sales were $189.5 million, or 23% of Coeur’s metal sales, compared to $150.0 million, or 19% of Coeur’s metal sales. Revenue increased by $39.5 million, or 26%, of which $32.5 million was due to a higher gold production, and an increase of $7.0 million due to higher average realized gold prices. Costs applicable to sales per gold ounce decreased 10% due to lower operating costs and higher grade and tons placed. Amortization decreased to $6.7 million due to higher grade and tons placed and the favorable impact of a longer mine life. Capital expenditures were $2.5 million.
Silvertip
Year Ended December 31, 2024 compared to Year Ended December 31, 2023
Exploration expense totaled $27.3 million in 2024 as the Company continued to focus on expanding the mineral resources at Silvertip, which were supported by 461 meters of underground mine development. Ongoing carrying costs at Silvertip totaled $8.5 million in 2024 compared to $15.6 million in 2023. Capital expenditures in 2024 totaled $3.6 million.
Year Ended December 31, 2023 compared to Year Ended December 31, 2022
Ongoing carrying costs at Silvertip totaled $15.6 million in 2023 and $21.0 million in the prior year. Capital expenditures in 2023 totaled $2.9 million compared to $24.8 million in the prior year due to planned reduction in capital development expenditures.
Liquidity and Capital Resources
At December 31, 2024, the Company had $56.9 million of cash, cash equivalents and restricted cash and $175.7 million available under the RCF. Future borrowing under the RCF may be subject to certain financial covenants. Cash and cash equivalents decreased $6.5 million in the year ended December 31, 2024 due to $183.2 million of capital expenditures primarily related to the completion of the Rochester expansion project, and the $10.0 million initial payment for the acquisition of mining concessions at Palmarejo. This was partially offset by an 8% and 13% increase in gold and silver ounces sold, respectively, a 18% and 15% increase in average realized gold and silver prices, respectively, the net proceeds of $23.7 million from the sale of 7.7 million shares of common stock in the Private Placement Offering (as defined below), and net draws of $20.0 million under the RCF.
On February 21, 2024, the Company entered into an agreement to extend and enhance its RCF (the “February 2024 Amendment”). The February 2024 Amendment, among other things, (1) extends the term of the RCF by approximately two years so that it now matures in February 2027, (2) increases the RCF by $10 million from $390 million to $400 million, (3) adds Fédération Des Caisses Desjardins Du Québec and National Bank of Canada as lenders on the RCF, (4) permits the Company to obtain one or more increases of the RCF in an aggregate amount of up to $100 million in incremental loans and commitments, subject to certain conditions, including obtaining commitments from relevant lenders to provide such increase, (5) allows for unencumbered domestic cash to be included in the calculation of the consolidated net leverage ratio, and (6) allows up to $15 million of non-capitalized underground mine development costs related to Silvertip to be excluded from the calculation of Consolidated EBITDA for purposes of the RCF.
In March 2024, the Company completed the sale of 7,704,725 shares of its common stock (“Private Placement Offering”) issued as “flow-through shares” as defined in subsection 66(15) of the Income Tax Act (Canada) (the “FT Shares”), raising net proceeds of approximately $23.7 million, of which $0.9 million represents net proceeds received in excess of the Company’s average price (“FT Premium Liability”). The proceeds of the issuance of FT Shares are used by the Company for certain qualifying “Canadian Exploration Expenditures” (as such term is defined in the Income Tax Act (Canada)), in conducting an exploration and mineral resource evaluation program on the Silvertip property in British Columbia and Yukon to determine the existence, location, extent, and quality of the silver, lead, and zinc on the Silvertip property.
The Company had no outstanding forward contracts at December 31, 2024 following the final settlement in June 2024. The Company has no current plans to implement new hedges but the Company did acquire existing zero cost collar hedges for 1,600 ounces of gold and 200,000 ounces of silver on February 14, 2025 as part of its acquisition of SilverCrest. These zero cost collar hedges settle monthly through March, 2025. The Company may in the future add new hedges as circumstances warrant.
During the year ended December 31, 2024, the Company exchanged $5.9 million in aggregate principal amount of 2029 Senior Notes plus accrued interest for 1.8 million shares of its common stock.
We currently believe we have sufficient sources of funding to meet our business requirements for the next twelve months and longer-term. We expect to use cash provided by operating activities to fund near term capital requirements, including those described in this Report for our 2025 capital expenditure guidance. The acquisition of SilverCrest will include acquiring a significant amount of cash and gold and silver bullion which will be used along with our cash provided by operating activities to begin a period of debt and prepay reduction. Our longer-term plans contemplates continued exploration to extend mine lives at all of our operating sites, the repayment of the RCF, and additional exploration and studies to determine the viability of the Silvertip business case. Our long-term target leverage of Net Debt to the Last Twelve Months Adjusted EBITDA is 0.0 times Adjusted EBITDA. Our current leverage ratio is 1.6 times Adjusted EBITDA as of December 31, 2024.
We also have additional obligations as part of our ordinary course of business, beyond those committed for capital expenditures and other purchase obligations and commitments for purchases of goods and services.
If and to the extent liquidity resources are insufficient to support short- and long-term expenditures, we may need to incur additional indebtedness or issue additional equity securities, among other financing options, which may not be available on acceptable terms or at all. This could have a material adverse impact on the Company, as discussed in more detail under “Item 1A – Risk Factors”.
Cash Provided by Operating Activities
Net cash provided by operating activities for the year ended December 31, 2024 was $174.2 million, compared to $67.3 million for the year ended December 31, 2023. Adjusted EBITDA for the year ended December 31, 2024 was $339.2 million, compared to $142.3 million for the year ended December 31, 2023 (see “Non-GAAP Financial Performance Measures”). Net cash provided by operating activities was impacted by the following key factors for the applicable periods:
| | | | | | | | | | | | | | | | | | | | | | | |
| | | Year Ended December 31, |
| In thousands | | | | | | | 2024 | | 2023 | | 2022 |
| Cash flow before changes in operating assets and liabilities | | | | | | | $ | 162,359 | | | $ | 58,827 | | | $ | 71,862 | |
| Changes in operating assets and liabilities: | | | | | | | | | | | |
| Receivables | | | | | | | (504) | | | 933 | | | 4,452 | |
| Prepaid expenses and other | | | | | | | 2,777 | | | (461) | | | 240 | |
| Inventories | | | | | | | (69,640) | | | (47,592) | | | (51,448) | |
| Accounts payable and accrued liabilities | | | | | | | 79,242 | | | 55,581 | | | 510 | |
| Cash provided by operating activities | | | | | | | $ | 174,234 | | | $ | 67,288 | | | $ | 25,616 | |
Net cash provided by operating activities increased $106.9 million for the year ended December 31, 2024 compared to the year ended December 31, 2023, primarily due to a 8% and 13% increase in gold and silver ounces sold, respectively, a 18% and 15% increase in average realized gold and silver prices, respectively, partially offset by higher ore placed on leach pads at Rochester and Wharf, lower prepaid revenue at Kensington and increased exploration, general and administrative, interest and income and mining tax expense. Revenue for the year ended December 31, 2024 compared to the year ended December 31, 2023 increased by $232.8 million, of which $142.5 million as the result of higher average gold and silver prices and $90.3 million was due to higher volume of gold sales.
Net cash provided by operating activities increased $41.7 million for the year ended December 31, 2023 compared to the year ended December 31, 2022, primarily due to a 4% increase in silver ounces sold and a 5% and 11% increase in average realized gold and silver prices, the receipt of $55.0 million of prepayments at Kensington, Rochester and Wharf in December 2023, and the receipt of $7.8 million FT Premium Liability, partially offset by a 4% decrease in gold ounces sold, higher operating costs, and timing of VAT collections at Palmarejo. Revenue for the year ended December 31, 2023 compared to the year ended December 31, 2022 increased by $35.6 million, of which $53.0 million was due to higher average realized gold and silver prices, partially offset $17.4 million as a result of lower volume of gold sales.
Cash Used in Investing Activities
Net cash used in investing activities in the year ended December 31, 2024 was $193.5 million compared to $303.7 million in the year ended December 31, 2023. Cash used in investing activities decreased due to lower spending on capital expenditures at Rochester. There were fewer net proceeds on the sale of investments including $39.8 million received from the sale of the Company’s remaining Victoria Gold Common Shares, net proceeds of $7.0 million received from the sale of the La Preciosa Deferred Consideration and $5.0 million received from the sale of the La Preciosa project in 2023 compared to the initial payment of $10.0 million due at closing for the $25.0 million acquisition of mining concessions at Palmarejo in 2024. The Company incurred capital expenditures of $183.2 million in the year ended December 31, 2024 compared with $364.6 million in the year ended December 31, 2023 primarily related to expansion construction and ramp-up activities at Rochester and underground development and exploration at Palmarejo and Kensington in both periods.
Net cash used in investing activities in the year ended December 31, 2023 was $303.7 million compared to $146.2 million in the year ended December 31, 2022. The Company incurred capital expenditures of $364.6 million in the year ended December 31, 2023 compared with $352.4 million in the year ended December 31, 2022 primarily related to construction activities at Rochester and underground development at Palmarejo and Kensington in both periods. Cash used in investing activities increased due to higher capital expenditures, the receipt of net proceeds of $150.2 million and $15.2 million in 2022 from the sale of the Sterling/Crown exploration properties in Nevada and La Preciosa project in Mexico, respectively, partially offset by net proceeds of $7.0 million received from the sale of the La Preciosa Deferred Consideration, $5.0 million received from the collection of amounts due under the promissory note issued in connection with the sale of the La Preciosa project.
Cash Provided by Financing Activities
Net cash provided by financing activities in the year ended December 31, 2024 was $13.9 million compared to $236.1 million in the year ended December 31, 2023. During the year ended December 31, 2024, the Company received net proceeds of $23.7 million from the sale of 7.7 million shares of its common stock in the Private Placement Offering, and drew $20.0 million, net, from the RCF. During the year ended December 31, 2023, the Company drew $95.0 million, net, under the RCF, received aggregate net proceeds of $147.7 million from the sale of 54.6 million shares of its common stock in the March 2023 Equity Offering and September 2023 Equity Offering, and received net proceeds of $20.9 million from the sale of 8.3 million shares of its common stock in the Private Placement Offering.
Net cash provided by financing activities in the year ended December 31, 2023 was $236.1 million compared to $125.0 million in the year ended December 31, 2022. During the year ended December 31, 2023, the Company drew $95.0 million, net, under the RCF, received aggregate net proceeds of $147.7 million from the sale of 54.6 million shares of its
common stock in the March 2023 Equity Offering and September 2023 Equity Offering, and received net proceeds of $20.9 million from the sale of 8.3 million shares of its common stock in the Private Placement Offering. During the year ended December 31, 2022, the Company drew $15.0 million, net, from the RCF and received net proceeds of $147.4 million from the sale of 36.8 million shares of its common stock in the March Equity Offering and the December Equity Offering.
Critical Accounting Policies and Accounting Developments
Listed below are the accounting policies that we believe are critical to our financial statements due to the degree of uncertainty regarding the estimates and assumptions involved and the magnitude of the asset, liability, revenue, and expense being reported. For a discussion of recent accounting pronouncements, see Note 2 -- Summary of Significant Accounting Policies in the notes to the Consolidated Financial Statements.
Revenue Recognition
The Company produces doré and concentrate that is shipped to third-party refiners and smelters, respectively, for processing. The Company enters into contracts to sell its metal to various third-party customers which may include the refiners and smelters that process the doré and concentrate. The Company’s performance obligation in these transactions is generally the transfer of metal to the customer.
In the case of doré shipments, the Company generally sells refined metal at market prices agreed upon by both parties. The Company also has the right, but not the obligation, to sell a portion of the anticipated refined metal in advance of being fully refined. When the Company sells refined metal or advanced metal, the performance obligation is satisfied when the metal is delivered to the customer. Revenue and Costs Applicable to Sales are recorded on a gross basis under these contracts at the time the performance obligation is satisfied.
Under the Company’s concentrate sales contracts with third-party smelters, metal prices are set on a specified future quotational period, typically one to three months after the shipment date, based on market prices. When the Company sells gold concentrate to the third-party smelters, the performance obligation is satisfied when risk of loss is transferred to the customer. The contracts, in general, provide for provisional payment based upon provisional assays and historical metal prices. Final settlement is based on the applicable price for the specified future quotational period and generally occurs three to six months after shipment. The Company’s provisionally priced sales contain an embedded derivative that is required to be separated from the host contract for accounting purposes. The host contract is the receivable from the sale of concentrates measured at the forward price at the time of sale. The embedded derivative does not qualify for hedge accounting and is adjusted to fair value through revenue each period until the date of final metal settlement.
The Company also sells concentrate under off-take agreements to third-party customers that are responsible for arranging the smelting of the concentrate. Prices can either be fixed or based on a quotational period. The quotational period varies by contract, but is generally a one-month period following the shipment of the concentrate. The performance obligation is satisfied when risk of loss is transferred to the customer.
The Company recognizes revenue from concentrate sales, net of treatment and refining charges, when it satisfies the performance obligation of transferring control of the concentrate to the customer.
For doré and off-take sales, the Company may incur a finance charge related to advance sales that is not considered significant and, as such, is not considered a separate performance obligation. In addition, the Company has elected to treat freight costs as a fulfillment cost under ASC 606 and not as a separate performance obligation.
The Company’s gold stream agreement with Franco-Nevada provided for a $22.0 million deposit paid by Franco-Nevada in exchange for the right and obligation, commencing in 2016, to purchase 50% of a portion of Palmarejo gold production at the lesser of $800 or market price per ounce. Because there is no minimum obligation associated with the deposit, it is not considered financing, and each shipment is considered to be a separate performance obligation. The stream agreement represents a contract liability under ASC 606, which requires the Company to ratably recognize a portion of the deposit as revenue for each gold ounce delivered to Franco-Nevada.
Estimates
The preparation of the Company’s consolidated financial statements in conformity with U.S. GAAP requires management to make estimates and assumptions that affect the reported amount of assets and liabilities, disclosure of contingent assets and liabilities at the date of its financial statements, the reported amounts of revenue and expenses during the reporting period, and mined reserves. There can be no assurance that actual results will not differ from those estimates. There are a number of uncertainties inherent in estimating quantities of reserves, including many factors beyond the Company’s control. Mineral reserve estimates are based upon engineering evaluations of samplings of drill holes and other openings. These
estimates involve assumptions regarding future silver and gold prices, mine geology, mining methods and the related costs to develop and mine the reserves. Changes in these assumptions could result in material adjustments to the Company’s reserve estimates. The Company uses reserve estimates in determining the units-of-production amortization and evaluating mine assets for potential impairment. For a discussion of estimates and assumptions used by management that affect the reported amount of assets and liabilities, disclosure of contingent assets and liabilities at the date of its financial statements, the reported amounts of revenue and expenses during the reporting period, and mined reserves, see Note 2 -- Summary of Significant Accounting Policies in the notes to the Consolidated Financial Statements.
Amortization
The Company amortizes its property, plant, and equipment, mining properties, and mine development using the units-of-production method over the estimated life of the ore body generally based on its proven and probable reserves or the straight-line method over the useful life, whichever is shorter. The accounting estimates related to amortization are critical accounting estimates because (1) the determination of reserves involves uncertainties with respect to the ultimate geology of its reserves and the assumptions used in determining the economic feasibility of mining those reserves and (2) changes in estimated proven and probable reserves and asset useful lives can have a material impact on net income.
Impairment of Long-lived Assets
We review and evaluate our long-lived assets for impairment whenever events or changes in circumstances indicate that the related carrying amounts may not be recoverable. Asset impairment is considered to exist if the total estimated undiscounted pretax future cash flows are less than the carrying amount of the asset. In estimating future cash flows, assets are grouped at the lowest level for which there is identifiable cash flows that are largely independent of future cash flows from other asset groups. An impairment loss is measured by discounted estimated future cash flows, and recorded by reducing the asset's carrying amount to fair value. Future cash flows are estimated based on estimated quantities of recoverable minerals, expected gold and silver prices (considering current and historical prices, trends and related factors), production levels, operating costs, capital requirements and reclamation costs, all based on life-of-mine plans.
Existing proven and probable reserves and value beyond proven and probable reserves, including mineralization other than proven and probable reserves, are included when determining the fair value of mine site asset groups at acquisition and, subsequently, in determining whether the assets are impaired. The term “recoverable minerals” refers to the estimated amount of gold and silver that will be obtained after taking into account losses during ore processing and treatment. Estimates of recoverable minerals from exploration stage mineral interests are risk adjusted based on management’s relative confidence in such materials. The ability to achieve the estimated quantities of recoverable minerals from exploration stage mineral interests involves further risks in addition to those risk factors applicable to mineral interests where proven and probable reserves have been identified, due to the lower level of confidence that the identified mineral reserves and resources could ultimately be mined economically. Assets classified as exploration potential have the highest level of risk that the carrying value of the asset can be ultimately realized, due to the still lower level of geological confidence and economic modeling.
Gold and silver prices are volatile and affected by many factors beyond the Company’s control, including prevailing interest rates and returns on other asset classes, expectations regarding inflation, speculation, currency values, governmental decisions regarding precious metals stockpiles, global and regional demand and production, political and economic conditions and other factors that may affect the key assumptions used in the Company’s impairment testing. Various factors could impact our ability to achieve forecasted production levels from proven and probable reserves. Additionally, production, capital and reclamation costs could differ from the assumptions used in the cash flow models used to assess impairment. Actual results may vary from the Company’s estimates and result in additional Impairment of Long-lived Assets.
Ore on Leach Pads
The heap leach process extracts silver and gold by placing ore on an impermeable pad and applying a diluted cyanide solution that dissolves a portion of the contained silver and gold, which are then recovered in metallurgical processes.
The Company uses several integrated steps to scientifically measure the metal content of ore placed on the leach pads. As the ore body is drilled in preparation for the blasting process, samples are taken of the drill residue which are assayed to determine estimated quantities of contained metal. The Company then processes the ore through crushing facilities where the output is again weighed and sampled for assaying. A metallurgical reconciliation with the data collected from the mining operation is completed with appropriate adjustments made to previous estimates. The crushed ore is then transported to the leach pad for application of the leaching solution. As the leach solution is collected from the leach pads, it is continuously sampled for assaying. The quantity of leach solution is measured by flow meters throughout the leaching and precipitation process. After precipitation, the product is converted to doré at the Rochester mine and a form of gold electrolytic cathodic sludge at the Wharf mine, representing the final product produced by each mine. The inventory is stated at lower of cost or net realizable value, with cost being determined using a weighted average cost method.
The historical cost of metal expected to be extracted within 12 months is classified as current and the historical cost of metals contained within the broken ore expected to be extracted beyond 12 months is classified as non-current. Ore on leach pads is valued based on actual production costs incurred to produce and place ore on the leach pad, less costs allocated to minerals recovered through the leach process.
The estimate of both the ultimate recovery expected over time and the quantity of metal that may be extracted relative to the time the leach process occurs requires the use of estimates, which are inherently inaccurate due to the nature of the leaching process. The quantities of metal contained in the ore are based upon actual weights and assay analysis. The rate at which the leach process extracts gold and silver from the crushed ore is based upon laboratory testing and actual experience of more than 20 years of leach pad operations at the Rochester mine and 30 years of leach pad operations at the Wharf mine. The assumptions used by the Company to measure metal content during each stage of the inventory conversion process includes estimated recovery rates based on laboratory testing and assaying. The Company periodically reviews its estimates compared to actual experience and revises its estimates when appropriate. The ultimate recovery will not be known until leaching operations cease. Variations between actual and estimated quantities resulting from changes in assumptions and estimates that do not result in write-downs to net realizable value are accounted for on a prospective basis. In the first quarter of 2024, the Company completed a review of the estimated recoverable ounces of gold and silver on its leach pads and determined that as a result of longer expected leach time and favorable recoveries relative to previous estimates, that the estimated recoverable gold and silver on the Rochester legacy leach pads (Stages 2, 3 and 4) supported an upward revision. An additional 6,000 ounces of gold and 900,000 ounces of silver were added to the legacy leach pads in the first quarter of 2024. There are five reusable heap leach pads (load/offload) used at Wharf. Each pad goes through an approximate 24-month process of loading of ore, leaching and offloading which includes a neutralization and denitrification process. During the leaching cycle of each pad, revised estimated recoverable ounces for each of the pads may result in an upward or downward revision from time to time, which generally have not been significant. The updated recoverable ounce estimate is considered a change in estimate and was accounted for prospectively. As of December 31, 2024, the Company’s combined estimated recoverable ounces of gold and silver on the leach pads were 49,575 and 6.9 million, respectively.
Reclamation
The Company recognizes obligations associated with the retirement of tangible long-lived assets and the associated asset retirement costs. The fair value of a liability for an asset retirement obligation will be recognized in the period in which it is incurred if a reasonable estimate of fair value can be made. The fair value of the liability is added to the carrying amount of the associated asset and this additional carrying amount is depreciated over the life of the asset. An accretion cost, representing the increase over time in the present value of the liability, is recorded each period in Pre-development, Reclamation, and Other. As reclamation work is performed or liabilities are otherwise settled, the recorded amount of the liability is reduced. Future remediation costs for inactive mines are accrued based on management’s best estimate at the end of each period of the discounted costs expected to be incurred at the site. Such cost estimates include, where applicable, ongoing care and maintenance and monitoring costs. Changes in estimates are reflected in earnings in the period an estimate is revised. See Note 9 -- Reclamation in the notes to the Consolidated Financial Statements for additional information.
Derivatives
The Company is exposed to various market risks, including the effect of changes in metal prices and interest rates, and uses derivatives to manage financial exposures that occur in the normal course of business. The Company may elect to designate certain derivatives as hedging instruments under U.S. GAAP.
The Company, from time to time, uses derivative contracts to protect the Company’s exposure to fluctuations in metal prices. The Company has elected to designate these instruments as cash flow hedges of forecasted transactions at their inception. Assuming normal market conditions, the change in the market value of such derivative contracts has historically been, and is expected to continue to be, highly effective at offsetting changes in price movements of the hedged item. The effective portions of cash flow hedges are recorded in Accumulated other comprehensive income (loss) until the hedged item is recognized in earnings. Deferred gains and losses associated with cash flow hedges of revenue from metal sales are recognized as a component of Revenue in the same period as the related sale is recognized. Deferred gains and losses associated with cash flow hedges of foreign currency transactions are recognized as a component of Costs applicable to sales or Predevelopment, reclamation and other in the same period the related expenses are incurred.
For derivatives not designated as hedging instruments, the Company recognizes derivatives as either assets or liabilities on the balance sheet and measures those instruments at fair value. Changes in the value of derivative instruments not designated as hedging instruments are recorded each period in the Consolidated Statement of Comprehensive Income (Loss) in Fair value adjustments, net or Revenue. Management applies judgment in estimating the fair value of instruments that are highly sensitive to assumptions regarding commodity prices, market volatilities, and foreign currency exchange rates. See Note 13 -- Derivative Financial Instruments and Hedging Activities for additional information.
Income and Mining Taxes
The Company accounts for income taxes in accordance with the guidance of ASC 740. The Company’s annual tax rate
is based on income, statutory tax rates in effect and tax planning opportunities available to us in the various jurisdictions in which the Company operates. Significant judgment is required in determining the annual tax expense, current tax assets and liabilities, deferred tax assets and liabilities, and our future taxable income, both as a whole and in various tax jurisdictions, for purposes of assessing our ability to realize future benefit from our deferred tax assets. Actual income taxes could vary from these estimates due to future changes in income tax law, significant changes in the jurisdictions in which we operate or unpredicted results from the final determination of each year’s liability by taxing authorities.
The Company’s deferred income taxes reflect the impact of temporary differences between the reported amounts of assets and liabilities for financial reporting purposes and such amounts measured by tax laws and regulations. In evaluating the realizability of the deferred tax assets, management considers both positive and negative evidence that may exist, such as earnings history, reversal of taxable temporary differences, forecasted operating earnings and available tax planning strategies in each tax jurisdiction. A valuation allowance may be established to reduce our deferred tax assets to the amount that is considered more likely than not to be realized through the generation of future taxable income and other tax planning strategies.
The Company has asserted a partial indefinite reinvestment of earnings from its Mexican operations as determined by management’s judgment about and intentions concerning the future operations of the Company. The Company does not record a U.S. deferred tax liability for foreign earnings that meet the indefinite reversal criteria. Refer to Note 10 -- Income and Mining Taxes for further discussion on our assertion.
The Company’s operations may involve dealing with uncertainties and judgments in the application of complex tax regulations in multiple jurisdictions. The final taxes paid are dependent upon many factors, including negotiations with taxing authorities in various jurisdictions and resolution of disputes arising from federal, state, and international tax audits. The Company recognizes potential liabilities and records tax liabilities for anticipated tax audit issues in the United States and other tax jurisdictions based on its estimate of whether, and the extent to which, additional taxes will be due. The Company adjusts these reserves in light of changing facts and circumstances, such as the progress of a tax audit; however, due to the complexity of some of these uncertainties, the ultimate resolution could result in a payment that is materially different from our current estimate of the tax liabilities. These differences will be reflected as increases or decreases to income tax expense in the period which they are determined. The Company recognizes interest and penalties, if any, related to unrecognized tax benefits in income tax expense.
Other Liquidity Matters
We believe that our liquidity and capital resources in the U.S. are adequate to fund our U.S. operations and corporate activities. The Company has asserted a partial indefinite reinvestment of earnings from its Mexican operations as determined by management’s judgment about, and intentions concerning, the future operations of the Company. The Company does not believe that the amounts reinvested will have a material impact on liquidity.
In order to reduce indebtedness, fund future cash interest payments and/or amounts due at maturity or upon redemption and for general working capital purposes, from time-to-time we may (1) issue equity securities for cash in public or private offerings or (2) repurchase certain of our debt securities for cash or in exchange for other securities, which may include secured or unsecured notes or equity, in each case in open market or privately negotiated transactions. We evaluate any such transactions in light of prevailing market conditions, liquidity requirements, contractual restrictions, and other factors. The amounts involved may be significant and any debt repurchase transactions may occur at a substantial discount to the debt securities’ face amount.
Non-GAAP Financial Performance Measures
Non-GAAP financial measures are intended to provide additional information only and do not have any standard meaning prescribed by generally accepted accounting principles (“GAAP”). Unless otherwise noted, we present the Non-GAAP financial measures in the tables below. These measures should not be considered in isolation or as a substitute for performance measures prepared in accordance with GAAP.
Adjusted Net Income (Loss)
Management uses Adjusted net income (loss) to evaluate the Company’s operating performance, and to plan and forecast its operations. The Company believes the use of Adjusted net income (loss) reflects the underlying operating performance of our core mining business and allows investors and analysts to compare results of the Company to similar results of other mining companies. Management’s determination of the components of Adjusted net income (loss) is evaluated periodically and is based, in part, on a review of non-GAAP financial measures used by mining industry analysts. The tax effect of adjustments are based on statutory tax rates and the Company’s tax attributes, including the impact through the Company’s valuation allowance. The combined effective rate of tax adjustments may not be consistent with the statutory tax rates or the Company’s effective tax rate due to jurisdictional tax attributes and related valuation allowance impacts which may minimize the tax effect of certain adjustments and may not apply to gains and losses equally. Adjusted net income (loss) is reconciled to Net income (loss) in the following table:
| | | | | | | | | | | | | | | | | | | | | | | | | |
| | | | | Year Ended December 31, |
| In thousands except per share amounts | | | | | | | | | 2024 | | 2023 | | 2022 |
| Net income (loss) | | | | | | | | | $ | 58,900 | | | $ | (103,612) | | | $ | (78,107) | |
| Fair value adjustments, net | | | | | | | | | — | | | (3,384) | | | 66,668 | |
| Foreign exchange loss (gain) | | | | | | | | | (4,448) | | | 1,994 | | | 1,648 | |
| (Gain) loss on sale of assets and securities | | | | | | | | | 4,250 | | | 25,197 | | | (64,429) | |
| RMC bankruptcy distribution | | | | | | | | | (1,294) | | | (1,516) | | | (1,651) | |
| | | | | | | | | | | | | |
| (Gain) loss on debt extinguishment | | | | | | | | | (417) | | | (3,437) | | | — | |
| Transaction costs | | | | | | | | | 8,517 | | | — | | | — | |
| Other adjustments | | | | | | | | | 5,429 | | | 4,925 | | | 2,161 | |
Tax effect of adjustments(1) | | | | | | | | | (820) | | | 1,785 | | | (15,349) | |
| Adjusted net income (loss) | | | | | | | | | $ | 70,117 | | | $ | (78,048) | | | $ | (89,059) | |
| | | | | | | | | | | | | |
| Adjusted net income (loss) per share, Basic | | | | | | | | | $ | 0.18 | | | $ | (0.23) | | | $ | (0.32) | |
| Adjusted net income (loss) per share, Diluted | | | | | | | | | $ | 0.18 | | | $ | (0.23) | | | $ | (0.32) | |
(1) For the year ended December 31, 2024, tax effect of adjustments of $(0.8) million (-5%) are primarily related to the RMC bankruptcy distribution,
and nonrecurring expenses at Palmarejo.
For the year ended December 31, 2023, tax effect of adjustments of $1.8 million (8%) is primarily related to the loss on the sale of the La Preciosa Deferred Consideration.
For the year ended December 31, 2022, tax effect of adjustments of $(15.3) million (-558%) is primarily related to the to the fair value adjustments on the
Company’s equity investments and the derecognition of deferred tax liabilities related to the sale of La Preciosa and the Sterling/Crown exploration properties.
EBITDA and Adjusted EBITDA
Management uses EBITDA to evaluate the Company’s operating performance, to plan and forecast its operations, and assess leverage levels and liquidity measures. The Company believes the use of EBITDA reflects the underlying operating performance of our core mining business and allows investors and analysts to compare results of the Company to similar results of other mining companies. Adjusted EBITDA is the basis of a measure used in the indenture governing the 2029 Senior Notes and the RCF to determine our ability to make certain payments and incur additional indebtedness. EBITDA and Adjusted EBITDA do not represent, and should not be considered an alternative to, Net income (Loss) or Cash Flow from Operations as determined under GAAP. Other companies may calculate Adjusted EBITDA differently and those calculations may not be comparable to our presentation. Adjusted EBITDA is reconciled to Net income (loss) in the following table:
| | | | | | | | | | | | | | | | | | | | | | | | | |
| | | | | Year Ended December 31, |
| In thousands | | | | | | | | | 2024 | | 2023 | | 2022 |
| Net income (loss) | | | | | | | | | $ | 58,900 | | | $ | (103,612) | | | $ | (78,107) | |
| | | | | | | | | | | | | |
| Interest expense, net of capitalized interest | | | | | | | | | 51,276 | | | 29,099 | | | 23,861 | |
| Income tax provision (benefit) | | | | | | | | | 67,450 | | | 35,156 | | | 14,658 | |
| Amortization | | | | | | | | | 124,974 | | | 99,822 | | | 111,626 | |
| EBITDA | | | | | | | | | 302,600 | | | 60,465 | | | 72,038 | |
| Fair value adjustments, net | | | | | | | | | — | | | (3,384) | | | 66,668 | |
| Foreign exchange (gain) loss | | | | | | | | | (4,753) | | | 459 | | | 850 | |
| Asset retirement obligation accretion | | | | | | | | | 16,778 | | | 16,405 | | | 14,232 | |
| Inventory adjustments and write-downs | | | | | | | | | 8,042 | | | 43,188 | | | 49,085 | |
| (Gain) loss on sale of assets and securities | | | | | | | | | 4,250 | | | 25,197 | | | (64,429) | |
| RMC bankruptcy distribution | | | | | | | | | (1,294) | | | (1,516) | | | (1,651) | |
| | | | | | | | | | | | | |
| (Gain) loss on debt extinguishment | | | | | | | | | (417) | | | (3,437) | | | — | |
| Transaction costs | | | | | | | | | 8,517 | | | — | | | — | |
| | | | | | | | | | | | | |
| Other adjustments | | | | | | | | | 5,429 | | | 4,925 | | | 2,161 | |
| Adjusted EBITDA | | | | | | | | | $ | 339,152 | | | $ | 142,302 | | | $ | 138,954 | |
Free Cash Flow
Management uses Free Cash Flow as a non-GAAP measure to analyze cash flows generated from operations. Free Cash Flow is Cash Provided By (used in) Operating Activities less Capital expenditures as presented on the Consolidated Statements of Cash Flows. The Company believes Free Cash Flow is also useful as one of the bases for comparing the Company’s performance with its competitors. Although Free Cash Flow and similar measures are frequently used as measures of cash flows generated from operations by other companies, the Company’s calculation of Free Cash Flow is not necessarily comparable to such other similarly titled captions of other companies.
The following table sets forth a reconciliation of Free Cash Flow, a non-GAAP financial measure, to Cash Provided By (used in) Operating Activities, which the Company believes to be the GAAP financial measure most directly comparable to Free Cash Flow.
| | | | | | | | | | | | | | | | | | | | | | | | | | | |
| Consolidated | | | | | Year Ended December 31, |
| (Dollars in thousands) | | | | | | | | | | | 2024 | | 2023 | | 2022 |
| Cash flow from operations | | | | | | | | | | | $ | 174,234 | | | $ | 67,288 | | | $ | 25,616 | |
| Capital expenditures | | | | | | | | | | | 183,188 | | | 364,617 | | | 352,354 | |
| Free cash flow | | | | | | | | | | | $ | (8,954) | | | $ | (297,329) | | | $ | (326,738) | |
Operating Cash Flow Before Changes in Working Capital
Management uses Operating Cash Flow Before Changes in Working Capital as a non-GAAP measure to analyze cash flows generated from operations. Operating Cash Flow Before Changes in Working Capital is Cash Provided By (used in) Operating Activities excluding the change in Receivables, Prepaid expenses and other, Inventories and Accounts payable and accrued liabilities as presented on the Consolidated Statements of Cash Flows. The Company believes Operating Cash Flow Before Changes in Working Capital is also useful as one of the bases for comparing the Company’s performance with its competitors. Although Operating Cash Flow Before Changes in Working Capital and similar measures are frequently used as measures of cash flows generated from operations by other companies, the Company’s calculation of Operating Cash Flow Before Changes in Working Capital is not necessarily comparable to such other similarly titled captions of other companies.
The following table sets forth a reconciliation of Operating Cash Flow Before Changes in Working Capital, a non-GAAP financial measure, to Cash Provided By (used in) Operating Activities, which the Company believes to be the GAAP financial measure most directly comparable to Operating Cash Flow Before Changes in Working Capital.
| | | | | | | | | | | | | | | | | | | | | | | | |
| | | Year Ended December 31, |
| (Dollars in thousands) | | | | | 2024 | | 2023 | | | 2022 | | |
| Cash provided by (used in) operating activities | | | | | $ | 174,234 | | | $ | 67,288 | | | | $ | 25,616 | | | |
| Changes in operating assets and liabilities: | | | | | | | | | | | | |
| Receivables | | | | | 504 | | | (933) | | | | (4,452) | | | |
| Prepaid expenses and other | | | | | (2,777) | | | 461 | | | | (240) | | | |
| Inventories | | | | | 69,640 | | | 47,592 | | | | 51,448 | | | |
| Accounts payable and accrued liabilities | | | | | (79,242) | | | (55,581) | | | | (510) | | | |
| Operating cash flow before changes in working capital | | | | | $ | 162,359 | | | $ | 58,827 | | | | $ | 71,862 | | | |
Net Debt and Leverage Ratio
Management defines Net Debt, a non-GAAP financial measure, as Total Debt, less Cash and Cash Equivalents. We define Leverage Ratio, a non-GAAP financial measure, as the ratio of Net Debt to the Last Twelve Months Adjusted EBITDA. Management believes Net Debt and Leverage Ratio are important measures to monitor our financial flexibility and evaluate the strength of our Consolidated Balance Sheets. Net Debt and Leverage Ratio have limitations as analytical tools and may vary from similarly titled measures used by other companies. Net Debt and Leverage Ratio should not be considered in isolation or as a substitute for an analysis of our results prepared and presented in accordance with GAAP.
The following table presents a reconciliation of Total Debt, the most directly comparable financial measure calculated in accordance with GAAP, to Net Debt for each of the periods presented.
| | | | | | | | | | | | | | | | | | | | | | | | |
| | | Year Ended December 31, |
| (Dollars in thousands) | | | | | 2024 | | 2023 | | | 2022 | | |
| Total debt | | | | | $ | 590,058 | | | $ | 545,310 | | | | $ | 515,933 | | | |
| Cash and cash equivalents | | | | | (55,087) | | | (61,633) | | | | (61,464) | | | |
| Net debt | | | | | $ | 534,971 | | | $ | 483,677 | | | | $ | 454,469 | | | |
| | | | | | | | | | | | |
| Net debt | | | | | $ | 534,971 | | | $ | 483,677 | | | | $ | 454,469 | | | |
| Last Twelve Months Adjusted EBITDA | | | | | $ | 339,152 | | | $ | 142,302 | | | | $ | 138,954 | | | |
| Leverage ratio | | | | | 1.6 | | | 3.4 | | | | 3.3 | | | |
Costs Applicable to Sales
Management uses CAS to evaluate the Company’s current operating performance and life of mine performance from discovery through reclamation. We believe these measures assist analysts, investors and other stakeholders in understanding the costs associated with producing gold and silver, as well as assessing our operating performance and ability to generate free cash flow from operations and sustaining production. These measures may not be indicative of operating profit or cash flow from operations as determined under GAAP. Management believes that allocating CAS to gold and silver based on gold and silver metal sales relative to total metal sales best allows management, analysts, investors and other stakeholders to evaluate the operating performance of the Company. Other companies may calculate CAS differently as a result of reflecting the benefit from selling non-silver metals as a by-product credit, converting to silver equivalent ounces, and differences in underlying accounting principles and accounting frameworks such as in IFRS Accounting Standards.
Year Ended December 31, 2024
| | | | | | | | | | | | | | | | | | | | | | | | | | | | | | | | | | | |
| In thousands (except metal sales and per ounce amounts) | Palmarejo | | Rochester | | Kensington | | Wharf | | Silvertip | | Total |
| Costs applicable to sales, including amortization (U.S. GAAP) | $ | 240,437 | | | $ | 195,904 | | | $ | 185,958 | | | $ | 104,853 | | | $ | 3,235 | | | $ | 730,387 | |
| Amortization | (44,979) | | | (41,293) | | | (28,201) | | | (6,487) | | | (3,235) | | | (124,195) | |
| Costs applicable to sales | $ | 195,458 | | | $ | 154,611 | | | $ | 157,757 | | | $ | 98,366 | | | $ | — | | | $ | 606,192 | |
| | | | | | | | | | | |
| Metal Sales | | | | | | | | | | | |
| Gold ounces | 108,783 | | | 38,345 | | | 95,361 | | | 98,327 | | | | | 340,816 | |
| Silver ounces | 6,796,715 | | | 4,389,378 | | | | | 232,728 | | | — | | | 11,418,821 | |
| | | | | | | | | | | |
| | | | | | | | | | | |
| | | | | | | | | | | |
| | | | | | | | | | | |
| | | | | | | | | | | |
| | | | | | | | | | | |
| | | | | | | | | | | |
| | | | | | | | | | | |
| | | | | | | | | | | |
| Costs applicable to sales | | | | | | | | | | | |
| Gold ($/oz) | $ | 898 | | | $ | 1,693 | | | $ | 1,655 | | | $ | 935 | | | | | $ | 1,210 | |
| Silver ($/oz) | $ | 14.38 | | | $ | 20.43 | | | | | | | $ | — | | | $ | 16.75 | |
| | | | | | | | | | | |
| | | | | | | | | | | |
Year Ended December 31, 2023
| | | | | | | | | | | | | | | | | | | | | | | | | | | | | | | | | | | |
| In thousands (except metal sales and per ounce amounts) | Palmarejo | | Rochester | | Kensington | | Wharf | | Silvertip | | Total |
| Costs applicable to sales, including amortization (U.S. GAAP) | $ | 230,018 | | | $ | 197,663 | | | $ | 178,564 | | | $ | 121,351 | | | $ | 4,018 | | | $ | 731,614 | |
| Amortization | (35,709) | | | (26,392) | | | (25,905) | | | (6,694) | | | (4,018) | | | (98,718) | |
| Costs applicable to sales | $ | 194,309 | | | $ | 171,271 | | | $ | 152,659 | | | $ | 114,657 | | | $ | — | | | $ | 632,896 | |
| | | | | | | | | | | |
| Metal Sales | | | | | | | | | | | |
| Gold ounces | 99,043 | | | 38,449 | | | 84,671 | | | 93,348 | | | | | 315,511 | |
| Silver ounces | 6,534,469 | | | 3,339,780 | | | | | 266,156 | | | — | | | 10,140,405 | |
| | | | | | | | | | | |
| | | | | | | | | | | |
| | | | | | | | | | | |
| | | | | | | | | | | |
| | | | | | | | | | | |
| | | | | | | | | | | |
| | | | | | | | | | | |
| | | | | | | | | | | |
| | | | | | | | | | | |
| Costs applicable to sales | | | | | | | | | | | |
| Gold ($/oz) | $ | 961 | | | $ | 2,138 | | | $ | 1,797 | | | $ | 1,159 | | | | | $ | 1,388 | |
| Silver ($/oz) | $ | 15.17 | | | $ | 26.67 | | | | | | | $ | — | | | $ | 19.06 | |
| | | | | | | | | | | |
| | | | | | | | | | | |
Year Ended December 31, 2022
| | | | | | | | | | | | | | | | | | | | | | | | | | | | | | | | | | | |
| In thousands (except metal sales and per ounce amounts) | Palmarejo | | Rochester | | Kensington | | Wharf | | Silvertip | | Total |
| Costs applicable to sales, including amortization (U.S. GAAP) | $ | 218,008 | | | $ | 187,792 | | | $ | 194,757 | | | $ | 111,310 | | | $ | 4,912 | | | $ | 716,779 | |
| Amortization | (35,432) | | | (22,626) | | | (39,032) | | | (8,247) | | | (4,912) | | | (110,249) | |
| Costs applicable to sales | $ | 182,576 | | | $ | 165,166 | | | $ | 155,725 | | | $ | 103,063 | | | $ | — | | | $ | 606,530 | |
| | | | | | | | | | | |
| Metal Sales | | | | | | | | | | | |
| Gold ounces | 107,157 | | | 34,370 | | | 108,972 | | | 79,469 | | | | | 329,968 | |
| Silver ounces | 6,695,454 | | | 3,028,986 | | | — | | | 47,284 | | | — | | | 9,771,724 | |
| | | | | | | | | | | |
| | | | | | | | | | | |
| | | | | | | | | | | |
| | | | | | | | | | | |
| | | | | | | | | | | |
| | | | | | | | | | | |
| | | | | | | | | | | |
| | | | | | | | | | | |
| | | | | | | | | | | |
| Costs applicable to sales | | | | | | | | | | | |
| Gold ($/oz) | $ | 886 | | | $ | 2,403 | | | $ | 1,423 | | | $ | 1,283 | | | | | $ | 1,317 | |
| Silver ($/oz) | $ | 13.09 | | | $ | 27.26 | | | | | | | $ | — | | | $ | 17.50 | |
| | | | | | | | | | | |
| | | | | | | | | | | |
Reconciliation of Costs Applicable to Sales for 2025 Guidance
| | | | | | | | | | | | | | | | | | | | | | | | | | | | | | | | | |
| In thousands (except metal sales and per ounce amounts) | Las Chispas | | Palmarejo | | Rochester | | Kensington | | Wharf | | | | |
| Costs applicable to sales, including amortization (U.S. GAAP) | $ | 144,729 | | | $ | 245,767 | | | $ | 275,743 | | | $ | 222,569 | | | $ | 130,856 | | | | | |
| Amortization | (45,992) | | | (38,779) | | | (75,033) | | | (43,903) | | | (7,105) | | | | | |
| Costs applicable to sales | $ | 98,737 | | | $ | 206,988 | | | $ | 200,710 | | | $ | 178,666 | | | $ | 123,751 | | | | | |
| By-product credit | — | | | — | | | — | | | — | | | (2,824) | | | | | |
| Adjusted costs applicable to sales | $ | 98,737 | | | $ | 206,988 | | | $ | 200,710 | | | $ | 178,666 | | | $ | 120,927 | | | | | |
| | | | | | | | | | | | | |
| Metal Sales | | | | | | | | | | | | | |
| Gold ounces | 52,000 | | 100,018 | | 68,000 | | 104,271 | | 95,454 | | | | |
| Silver ounces | 5,240,757 | | 6,006,911 | | 7,752,237 | | | | 94,138 | | | | |
| | | | | | | | | | | | | |
| | | | | | | | | | | | | |
| | | | | | | | | | | | | |
| Revenue Split | | | | | | | | | | | | | |
| Gold | 48% | | 50% | | 44% | | 100% | | 100% | | | | |
| Silver | 52% | | 50% | | 56% | | | | | | | | |
| | | | | | | | | | | | | |
| | | | | | | | | | | | | |
| | | | | | | | | | | | | |
| Adjusted costs applicable to sales | | | | | | | | | | | | | |
| Gold ($/oz) | $850 - $950 | | $950 - $1,150 | | $1,250 - $1,450 | | $1,700 - $1,900 | | $1,250 - $1,350 | | | | |
| Silver ($/oz) | $9.25 - $10.25 | | $17.00 - $18.00 | | $14.50 - $16.50 | | | | | | | | |
| | | | | | | | | | | | | |
| | | | | | | | | | | | | |
Reconciliation of Costs Applicable to Sales for 2024 Guidance
| | | | | | | | | | | | | | | | | | | | | | | | | | | |
| In thousands (except metal sales and per ounce amounts) | Palmarejo | | Rochester(1) | | Kensington | | Wharf | | | | |
| Costs applicable to sales, including amortization (U.S. GAAP) | $ | 261,913 | | | $ | 147,456 | | | $ | 195,337 | | | $ | 102,091 | | | | | |
| Amortization | (46,953) | | | (42,237) | | | (28,757) | | | (5,694) | | | | | |
| Costs applicable to sales | $ | 214,960 | | | $ | 105,219 | | | $ | 166,580 | | | $ | 96,397 | | | | | |
| By-product credit | — | | | — | | | 16 | | | (5,328) | | | | | |
| Adjusted costs applicable to sales | $ | 214,960 | | | $ | 105,219 | | | $ | 166,596 | | | $ | 91,069 | | | | | |
| | | | | | | | | | | |
| Metal Sales | | | | | | | | | | | |
| Gold ounces | 104,260 | | 28,170 | | 100,500 | | 91,040 | | | | |
| Silver ounces | 6,652,590 | | 3,197,910 | | | | 205,600 | | | | |
| | | | | | | | | | | |
| | | | | | | | | | | |
| | | | | | | | | | | |
| Revenue Split | | | | | | | | | | | |
| Gold | 51% | | 43% | | 100% | | 100% | | | | |
| Silver | 49% | | 57% | | | | | | | | |
| | | | | | | | | | | |
| | | | | | | | | | | |
| | | | | | | | | | | |
| Adjusted costs applicable to sales | | | | | | | | | | | |
| Gold ($/oz) | $950 - $1,150 | | $1,500 - $1,700 | | $1,525 - $1,725 | | $950 - $1,050 | | | | |
| Silver ($/oz) | $15.50 - $16.50 | | $18.00 - $20.00 | | | | | | | | |
| | | | | | | | | | | |
| | | | | | | | | | | |
(1) Cost guidance for Rochester reflects the second half of 2024.
Item 7A. Quantitative and Qualitative Disclosures About Market Risk
The Company is exposed to various market risks as a part of its operations and engages in risk management strategies to mitigate these risks. The Company continually evaluates the potential benefits of engaging in these strategies based on current market conditions. The Company does not actively engage in the practice of trading derivative instruments for profit. Additional information about the Company’s derivative financial instruments may be found in Note 13 -- Derivative Financial Instruments & Hedging Activities in the notes to the Consolidated Financial Statements. This discussion of the Company’s market risk assessments contains “forward looking statements”. For additional information regarding forward-looking statements and risks and uncertainties that could impact the Company, please refer to Item 2 of this Report - Cautionary Statement Concerning Forward-Looking Statements. Actual results and actions could differ materially from those discussed below.
Gold and Silver Prices
Gold and silver prices may fluctuate widely due to numerous factors, such as U.S. dollar strength or weakness, demand, investor sentiment, inflation or deflation, and global mine production. The Company’s profitability and cash flow may be significantly impacted by changes in the market price of gold and silver.
Decreases in the market price of gold and silver can also significantly affect the value of our metal inventory, stockpiles and leach pads, and it may be necessary to record a write-down to the net realizable value, as well as significantly impact our carrying value of long-lived assets.
Net realizable value represents the estimated future sales price based on short-term and long-term metals prices, less estimated costs to complete production and bring the product to sale. The primary factors that influence the need to record write-downs of our stockpiles, leach pads and product inventory include short-term and long-term metals prices and costs for production inputs such as labor, fuel and energy, materials and supplies as well as realized ore grades and recovery rates. The significant assumptions in determining the stockpile, leach pad and metal inventory adjustments at December 31, 2024 included production cost and capitalized expenditure assumptions unique to each operation, a short-term and long-term gold price of $2,663 and $2,437 per ounce, respectively, and a short-term and long-term silver price of $31.38 and $30.23 per ounce, respectively.
The net realizable value measurement involves the use of estimates and assumptions unique to each mining operation regarding current and future operating and capital costs, metal recoveries, production levels, commodity prices, proven and probable reserve quantities, engineering data and other factors. A high degree of judgment is involved in determining such assumptions and estimates and no assurance can be given that actual results will not differ significantly from those estimates and assumptions.
Hedging
To mitigate the risks associated with metal price fluctuations, the Company may enter into option contracts to hedge future production. The Company had forward contracts for gold and silver that settled monthly through June 2024 in order to protect cash flow during the Rochester expansion ramp-up. The contracts were net cash settled and, if the spot price of gold at the time of expiration was lower than the fixed price or higher than the fixed prices, it resulted in a realized gain or loss, respectively. The forward contracts exposed us to (i) credit risk in the form of non-performance by counterparties for contracts in which the contract price is below the spot price of a commodity, and (ii) price risk to the extent that the spot price exceeds the contract price for quantities of our production covered under contract positions. To reduce counter-party credit exposure, the Company entered into contracts with institutions management deems credit-worthy and limits credit exposure to each institution. For additional information, please see the section titled “Item 1A - Risk Factors” in this Report. For the year ended December 31, 2024, the Company recognized a loss of $12.9 million and $4.3 million related to expired gold and silver contracts, respectively. The Company had no outstanding gold or silver hedging contracts at December 31, 2024 but the Company did acquire existing zero cost collar hedges for 1,600 ounces of gold and 200,000 ounces of silver on February 14, 2025 as part of its acquisition of SilverCrest. These zero cost collar hedges settle monthly through March, 2025.
Provisional Metal Sales
The Company enters into sales contracts with third-party smelters and refiners which, in some cases, provide for a provisional payment based upon preliminary assays and quoted metal prices. The provisionally priced sales contracts contain an embedded derivative that is required to be separated from the host contract. Depending on the difference between the price at the time of sale and the final settlement price, embedded derivatives are recorded as either a derivative asset or liability. The embedded derivatives do not qualify for hedge accounting and, as a result, are marked to the market gold and silver price at the end of each period from the provisional sale date to the date of final settlement. The mark-to-market gains and losses are recorded in earnings. At December 31, 2024, the Company had outstanding provisionally priced sales of 14,173 ounces of gold at an average price of $2,642. Changes in gold prices resulted in provisional pricing mark-to-market loss of $0.2 million during
the twelve months ended December 31, 2024. A 10% change in realized gold prices would cause revenue to vary by $3.7 million.
Foreign Currency
The Company operates, or has mineral interests, in several foreign countries including Canada, Mexico, and New Zealand, which exposes it to foreign currency exchange rate risks. Foreign currency exchange rates are influenced by world market factors beyond the Company’s control, such as supply and demand for U.S. and foreign currencies and related monetary and fiscal policies. Fluctuations in local currency exchange rates in relation to the U.S. dollar may significantly impact profitability and cash flow.
Foreign Exchange Hedging
To manage foreign currency risk, the Company may enter into foreign currency forward exchange contracts. In 2020, the Company entered into foreign currency forward contracts to manage this risk and designated these instruments as cash flow hedges of forecasted foreign denominated transactions. The Company had no outstanding foreign currency forward exchange contracts at December 31, 2024.
Interest Rates
Interest Rate Hedging
The Company may use financial instruments to manage exposures to changes in interest rates on loans, which exposes it to credit risk and market risk. Credit risk is the failure of the counterparty to perform under the terms of the derivative contract. When the fair value of a derivative contract is positive, the counterparty owes the Company, which creates credit risk for the Company. When the fair value of a derivative contract is negative, the Company owes the counterparty and, therefore, it does not pose credit risk. The Company seeks to minimize the credit risk in derivative instruments by entering into transactions with what it believes are high-quality counterparties. Market risk is the adverse effect on the value of a financial instrument that results from a change in interest rates. The Company had no outstanding interest rate swaps at December 31, 2024.
Investment Risk
Equity Price Risk
The Company had no equity securities at December 31, 2024.
Item 8. Financial Statements and Supplementary Data
REPORT OF INDEPENDENT REGISTERED PUBLIC ACCOUNTING FIRM
Board of Directors and Stockholders
Coeur Mining, Inc.
Opinion on the financial statements
We have audited the accompanying consolidated balance sheets of Coeur Mining, Inc. (a Delaware corporation) and subsidiaries (the “Company”) as of December 31, 2024 and 2023, the related consolidated statements of comprehensive income (loss), changes in stockholders’ equity, and cash flows for each of the three years in the period ended December 31, 2024, and the related notes (collectively referred to as the “consolidated financial statements”). In our opinion, the consolidated financial statements present fairly, in all material respects, the financial position of the Company as of December 31, 2024 and 2023, and the results of its operations and its cash flows for each of the three years in the period ended December 31, 2024, in conformity with accounting principles generally accepted in the United States of America.
Change in accounting principle
As discussed in Note 2 to the consolidated financial statements, the Company has adopted new accounting guidance in 2024 related to the disclosure of segment information in accordance with ASU 2023-07, Segment Reporting (Topic 280). The adoption was retrospectively applied to 2023 and 2022.
Basis for opinion
These consolidated financial statements are the responsibility of the Company’s management. Our responsibility is to express an opinion on the Company’s consolidated financial statements based on our audits. We are a public accounting firm registered with the Public Company Accounting Oversight Board (United States) (“PCAOB”) and are required to be independent with respect to the Company in accordance with the U.S. federal securities laws and the applicable rules and regulations of the Securities and Exchange Commission and the PCAOB.
We conducted our audits in accordance with the standards of the PCAOB. Those standards require that we plan and perform the audit to obtain reasonable assurance about whether the financial statements are free of material misstatement, whether due to error or fraud. The Company is not required to have, nor were we engaged to perform, an audit of its internal control over financial reporting. As part of our audits we are required to obtain an understanding of internal control over financial reporting but not for the purpose of expressing an opinion on the effectiveness of the Company’s internal control over financial reporting. Accordingly, we express no such opinion.
Our audits included performing procedures to assess the risks of material misstatement of the financial statements, whether due to error or fraud, and performing procedures that respond to those risks. Such procedures included examining, on a test basis, evidence regarding the amounts and disclosures in the financial statements. Our audits also included evaluating the accounting principles used and significant estimates made by management, as well as evaluating the overall presentation of the financial statements. We believe that our audits provide a reasonable basis for our opinion.
Critical audit matter
The critical audit matter communicated below is a matter arising from the current period audit of the financial statements that was communicated or required to be communicated to the audit committee and that: (1) relates to accounts or disclosures that are material to the financial statements and (2) involved our especially challenging, subjective, or complex judgments. The communication of critical audit matters does not alter in any way our opinion on the financial statements, taken as a whole, and we are not, by communicating the critical audit matter below, providing a separate opinion on the critical audit matter or on the accounts or disclosures to which it relates.
Ore on Leach Pads and Long-Term Stockpile
As described further in Notes 2 and 5 to the consolidated financial statements, the Company’s ore on leach pads balance was $199 million, which includes $168 million at the Company’s Rochester mine, as of December 31, 2024. The balance is comprised of a current balance of $61 million and a non-current balance of $107 million. The Rochester mine long-term stockpile balance is $42 million as of December 31, 2024. The measurement and valuation of the ore on leach pads and long-term stockpile balances involve significant management estimates and assumptions related to the measurement of metal content of ore placed on the leach pads and long-term stockpile, including estimates pertaining to recovery rates and ore grades. The balances are determined based on actual production costs incurred to produce and place ore on the leach pads and long-term
stockpile, less costs allocated to minerals recovered through the leach process. The historical cost of metal expected to be extracted within twelve months is classified as current on the balance sheet. We identified the measurement and valuation for the ore on leach pads and long-term stockpile for the Rochester mine as a critical audit matter.
The principal considerations for our determination that Rochester’s ore on leach pads and long-term stockpile is a critical audit matter are that certain management assumptions are complex and have a higher degree of estimation uncertainty and changes in these assumptions could have a significant impact on the balance. In turn, auditing these amounts required significant auditor judgement.
Our audit procedures related to Rochester’s ore on leach pads and long-term stockpile included the following, among others.
•We obtained and tested Rochester’s 2024 roll forward of the estimated ounces and costs added to, and recovered from the Company’s leach pads and stockpile and reconciled the ending amounts of ounces and costs to the Company’s inventory and production records and tested certain assumptions, such as estimated recovery rates, and ore grades.
•We assessed the Company’s lower of cost or market analysis and related adjustments.
•For the roll forward of estimated ounces, we assessed the completeness and accuracy of mining production information, including tests of daily tonnage processed.
•We evaluated management’s laboratory procedures related to assay testing used to estimate ore grade.
•We evaluated the Company’s use of specialists and their qualifications and experience related to their input on the recovery rates and ore grades estimates used by management in its calculation of ore on leach pads and long-term stockpile balances.
•We assessed the estimated timing of recoveries, which management uses in classifying current and non-current portions of the ore on leach pads balance.
•We tested the effectiveness of management’s controls over mining production information, estimating the recovery rates, ore grades, lower of cost or market calculations, and inventory roll forward related to recording Rochester’s balance of ore on leach pads and long-term stockpile.
/s/ Grant Thornton LLP
We have served as the Company’s auditor since 2016.
Chicago, Illinois
February 19, 2025
REPORT OF INDEPENDENT REGISTERED PUBLIC ACCOUNTING FIRM
Board of Directors and Stockholders
Coeur Mining, Inc.
Opinion on internal control over financial reporting
We have audited the internal control over financial reporting of Coeur Mining, Inc. (a Delaware corporation) and subsidiaries (the “Company”) as of December 31, 2024, based on criteria established in the 2013 Internal Control—Integrated Framework issued by the Committee of Sponsoring Organizations of the Treadway Commission (“COSO”). In our opinion, the Company maintained, in all material respects, effective internal control over financial reporting as of December 31, 2024, based on criteria established in the 2013 Internal Control—Integrated Framework issued by COSO.
We also have audited, in accordance with the standards of the Public Company Accounting Oversight Board (United States) (“PCAOB”), the consolidated financial statements of the Company as of and for the year ended December 31, 2024, and our report dated February 19, 2025 expressed an unqualified opinion on those financial statements.
Basis for opinion
The Company’s management is responsible for maintaining effective internal control over financial reporting and for its assessment of the effectiveness of internal control over financial reporting, included in the accompanying Management’s Report on Internal Control Over Financial Reporting. Our responsibility is to express an opinion on the Company’s internal control over financial reporting based on our audit. We are a public accounting firm registered with the PCAOB and are required to be independent with respect to the Company in accordance with the U.S. federal securities laws and the applicable rules and regulations of the Securities and Exchange Commission and the PCAOB.
We conducted our audit in accordance with the standards of the PCAOB. Those standards require that we plan and perform the audit to obtain reasonable assurance about whether effective internal control over financial reporting was maintained in all material respects. Our audit included obtaining an understanding of internal control over financial reporting, assessing the risk that a material weakness exists, testing and evaluating the design and operating effectiveness of internal control based on the assessed risk, and performing such other procedures as we considered necessary in the circumstances. We believe that our audit provides a reasonable basis for our opinion.
Definition and limitations of internal control over financial reporting
A company’s internal control over financial reporting is a process designed to provide reasonable assurance regarding the reliability of financial reporting and the preparation of financial statements for external purposes in accordance with generally accepted accounting principles. A company’s internal control over financial reporting includes those policies and procedures that (1) pertain to the maintenance of records that, in reasonable detail, accurately and fairly reflect the transactions and dispositions of the assets of the company; (2) provide reasonable assurance that transactions are recorded as necessary to permit preparation of financial statements in accordance with generally accepted accounting principles, and that receipts and expenditures of the company are being made only in accordance with authorizations of management and directors of the company; and (3) provide reasonable assurance regarding prevention or timely detection of unauthorized acquisition, use, or disposition of the company’s assets that could have a material effect on the financial statements.
Because of its inherent limitations, internal control over financial reporting may not prevent or detect misstatements. Also, projections of any evaluation of effectiveness to future periods are subject to the risk that controls may become inadequate because of changes in conditions, or that the degree of compliance with the policies or procedures may deteriorate.
/s/ Grant Thornton LLP
Chicago, Illinois
February 19, 2025
COEUR MINING, INC. AND SUBSIDIARIES
CONSOLIDATED BALANCE SHEETS
| | | | | | | | | | | | | | |
| | December 31, 2024 | | December 31, 2023 |
| ASSETS | Notes | In thousands, except share data |
| CURRENT ASSETS | | | | |
| Cash and cash equivalents | | $ | 55,087 | | | $ | 61,633 | |
| Receivables | 4 | 29,930 | | | 31,035 | |
| Inventory | 5 | 78,617 | | | 76,661 | |
| Ore on leach pads | 5 | 92,724 | | | 79,400 | |
| | | | |
| Prepaid expenses and other | | 16,741 | | | 18,526 | |
| | | | |
| | 273,099 | | | 267,255 | |
| NON-CURRENT ASSETS | | | | |
| Property, plant and equipment and mining properties, net | 6 | 1,817,616 | | | 1,688,288 | |
| | | | |
| Ore on leach pads | 5 | 106,670 | | | 25,987 | |
| Restricted assets | | 8,512 | | | 9,115 | |
| | | | |
| Receivables | 4, 12 | 19,583 | | | 23,140 | |
| Other | | 76,267 | | | 67,063 | |
| TOTAL ASSETS | | $ | 2,301,747 | | | $ | 2,080,848 | |
| LIABILITIES AND STOCKHOLDERS’ EQUITY | | | | |
| CURRENT LIABILITIES | | | | |
| Accounts payable | | $ | 125,877 | | | $ | 115,110 | |
| Accrued liabilities and other | 18 | 156,609 | | | 140,913 | |
| Debt | 8 | 31,380 | | | 22,636 | |
| Reclamation | 9 | 16,954 | | | 10,954 | |
| | | | |
| | 330,820 | | | 289,613 | |
| NON-CURRENT LIABILITIES | | | | |
| Debt | 8 | 558,678 | | | 522,674 | |
| Reclamation | 9 | 243,538 | | | 203,059 | |
| Deferred tax liabilities | | 7,258 | | | 12,360 | |
| Other long-term liabilities | | 38,201 | | | 29,239 | |
| | 847,675 | | | 767,332 | |
| COMMITMENTS AND CONTINGENCIES | 17 | | | |
| STOCKHOLDERS’ EQUITY | | | | |
| Common stock, par value $0.01 per share; authorized 600,000,000 shares, 399,235,632 issued and outstanding at December 31, 2024 and 386,282,957 at December 31, 2023 | | 3,992 | | | 3,863 | |
| Additional paid-in capital | | 4,181,521 | | | 4,139,870 | |
| Accumulated other comprehensive income (loss) | | — | | | 1,331 | |
| Accumulated deficit | | (3,062,261) | | | (3,121,161) | |
| | 1,123,252 | | | 1,023,903 | |
| TOTAL LIABILITIES AND STOCKHOLDERS’ EQUITY | | $ | 2,301,747 | | | $ | 2,080,848 | |
The accompanying notes are an integral part of these Consolidated Financial Statements.
COEUR MINING, INC. AND SUBSIDIARIES
CONSOLIDATED STATEMENTS OF COMPREHENSIVE INCOME (LOSS)
| | | | | | | | | | | | | | | | | | | | | | | | |
| | | | | Year Ended December 31, |
| | | | | | | 2024 | | 2023 | | 2022 |
| | Notes | | | | | In thousands, except share data |
| Revenue | 3 | | | | | $ | 1,054,006 | | | $ | 821,206 | | | $ | 785,636 | |
| COSTS AND EXPENSES | | | | | | | | | | |
Costs applicable to sales(1) | 3 | | | | | 606,192 | | | 632,896 | | | 606,530 | |
| Amortization | | | | | | 124,974 | | | 99,822 | | | 111,626 | |
| General and administrative | | | | | | 47,727 | | | 41,605 | | | 39,460 | |
| Exploration | | | | | | 59,658 | | | 30,962 | | | 26,624 | |
| | | | | | | | | | |
| Pre-development, reclamation, and other | 14 | | | | | 51,273 | | | 54,636 | | | 40,647 | |
| Total costs and expenses | | | | | | 889,824 | | | 859,921 | | | 824,887 | |
| Income (loss) from operations | | | | | | 164,182 | | | (38,715) | | | (39,251) | |
| OTHER INCOME (EXPENSE), NET | | | | | | | | | | |
| Gain (loss) on debt extinguishment | | | | | | 417 | | | 3,437 | | | — | |
| Fair value adjustments, net | 12 | | | | | — | | | 3,384 | | | (66,668) | |
| Interest expense, net of capitalized interest | 8 | | | | | (51,276) | | | (29,099) | | | (23,861) | |
| Other, net | 14 | | | | | 13,027 | | | (7,463) | | | 66,331 | |
| Total other income (expense), net | | | | | | (37,832) | | | (29,741) | | | (24,198) | |
| Income (loss) before income and mining taxes | | | | | | 126,350 | | | (68,456) | | | (63,449) | |
| Income and mining tax (expense) benefit | 10 | | | | | (67,450) | | | (35,156) | | | (14,658) | |
| | | | | | | | | | |
| | | | | | | | | | |
| NET INCOME (LOSS) | | | | | | $ | 58,900 | | | $ | (103,612) | | | $ | (78,107) | |
| OTHER COMPREHENSIVE INCOME (LOSS): | | | | | | | | | | |
| Change in fair value of derivative contracts designated as cash flow hedges | | | | | | (18,507) | | | (318) | | | 37,445 | |
| Reclassification adjustments for realized (gain) loss on cash flow hedges | | | | | | 17,176 | | | (10,694) | | | (23,890) | |
| Other comprehensive income (loss) | | | | | | (1,331) | | | (11,012) | | | 13,555 | |
| COMPREHENSIVE INCOME (LOSS) | | | | | | $ | 57,569 | | | $ | (114,624) | | | $ | (64,552) | |
| | | | | | | | | | |
| NET INCOME (LOSS) PER SHARE | 15 | | | | | | | | | |
| Basic income (loss) per share: | | | | | | | | | | |
| | | | | | | | | | |
| | | | | | | | | | |
| Basic | | | | | | $ | 0.15 | | | $ | (0.30) | | | $ | (0.28) | |
| | | | | | | | | | |
| | | | | | | | | | |
| | | | | | | | | | |
| | | | | | | | | | |
| Diluted | | | | | | $ | 0.15 | | | $ | (0.30) | | | $ | (0.28) | |
(1) Excludes amortization.
The accompanying notes are an integral part of these Consolidated Financial Statements.
COEUR MINING, INC. AND SUBSIDIARIES
CONSOLIDATED STATEMENTS OF CASH FLOWS
| | | | | | | | | | | | | | | | | | | | | | | | |
| | | | | Year Ended December 31, |
| | | | | | | 2024 | | 2023 | | 2022 |
| | Notes | | | | | In thousands |
| CASH FLOWS FROM OPERATING ACTIVITIES: | | | | | | | | | | |
| Net income (loss) | | | | | | $ | 58,900 | | | $ | (103,612) | | | $ | (78,107) | |
| Adjustments: | | | | | | | | | | |
| Amortization | | | | | | 124,974 | | | 99,822 | | | 111,626 | |
| Accretion | | | | | | 18,208 | | | 16,381 | | | 14,850 | |
| Deferred taxes | | | | | | (8,734) | | | (1,495) | | | (18,450) | |
| Gain on debt extinguishment | 8 | | | | | (417) | | | (3,437) | | | — | |
| Fair value adjustments, net | 12 | | | | | — | | | (3,384) | | | 63,529 | |
| Stock-based compensation | 11 | | | | | 12,022 | | | 11,361 | | | 10,030 | |
| | | | | | | | | | |
| Gain on the sale of Sterling/Crown | | | | | | — | | | — | | | (62,249) | |
| Loss on the sale or disposition of assets | 14 | | | | | 4,250 | | | 25,197 | | | — | |
| Write-downs | 5 | | | | | 3,235 | | | 40,247 | | | 45,978 | |
| Deferred revenue recognition | 17 | | | | | (55,562) | | | (25,468) | | | (15,887) | |
| Other | | | | | | 5,483 | | | 3,215 | | | 542 | |
| Changes in operating assets and liabilities: | | | | | | | | | | |
| Receivables | | | | | | (504) | | | 933 | | | 4,452 | |
| Prepaid expenses and other current assets | | | | | | 2,777 | | | (461) | | | 240 | |
| Inventory and ore on leach pads | | | | | | (69,640) | | | (47,592) | | | (51,448) | |
| Accounts payable and accrued liabilities | | | | | | 79,242 | | | 55,581 | | | 510 | |
| CASH PROVIDED BY (USED IN) OPERATING ACTIVITIES | | | | | | 174,234 | | | 67,288 | | | 25,616 | |
| CASH FLOWS FROM INVESTING ACTIVITIES: | | | | | | | | | | |
| Capital expenditures | | | | | | (183,188) | | | (364,617) | | | (352,354) | |
| Acquisitions, net | | | | | | (10,000) | | | — | | | — | |
| Proceeds from the sale of assets | | | | | | 37 | | | 8,546 | | | 165,829 | |
| | | | | | | | | | |
| Sale of investments | | | | | | — | | | 47,611 | | | 40,469 | |
| Proceeds from notes receivable | | | | | | — | | | 5,000 | | | — | |
| Other | | | | | | (362) | | | (239) | | | (107) | |
| CASH USED IN INVESTING ACTIVITIES | | | | | | (193,513) | | | (303,699) | | | (146,163) | |
| CASH FLOWS FROM FINANCING ACTIVITIES: | | | | | | | | | | |
| Issuance of common stock | 15 | | | | | 22,823 | | | 168,964 | | | 147,408 | |
| Issuance of notes and bank borrowings, net of issuance costs | 8 | | | | | 391,500 | | | 598,000 | | | 320,000 | |
| Payments on debt, finance leases, and associated costs | 7,8 | | | | | (398,348) | | | (528,541) | | | (338,721) | |
| | | | | | | | | | |
| Other | | | | | | (2,085) | | | (2,370) | | | (3,661) | |
| CASH PROVIDED BY (USED IN) FINANCING ACTIVITIES | | | | | | 13,890 | | | 236,053 | | | 125,026 | |
| Effect of exchange rate changes on cash and cash equivalents | | | | | | (1,115) | | | 567 | | | 401 | |
| INCREASE (DECREASE) IN CASH, CASH EQUIVALENTS AND RESTRICTED CASH | | | | | | (6,504) | | | 209 | | | 4,880 | |
| Cash, cash equivalents and restricted cash at beginning of period | | | | | | 63,378 | | | 63,169 | | | 58,289 | |
| Cash, cash equivalents and restricted cash at end of period | | | | | | $ | 56,874 | | | $ | 63,378 | | | $ | 63,169 | |
The accompanying notes are an integral part of these Consolidated Financial Statements.
COEUR MINING, INC. AND SUBSIDIARIES
CONSOLIDATED STATEMENT OF CHANGES IN STOCKHOLDERS’ EQUITY
| | | | | | | | | | | | | | | | | | | | | | | | | | | | | | | | | | | |
| In thousands | Common
Stock
Shares | | Common
Stock Par
Value | | Additional
Paid-In Capital | | Accumulated
Deficit | | Accumulated
Other
Comprehensive
Income (Loss) | | Total |
| | | | | | | | | | | |
| | | | | | | | | | | |
| | | | | | | | | | | |
| | | | | | | | | | | |
| | | | | | | | | | | |
| | | | | | | | | | | |
| | | | | | | | | | | |
| | | | | | | | | | | |
| | | | | | | | | | | |
| | | | | | | | | | | |
| Balances at December 31, 2021 | 256,919 | | | $ | 2,569 | | | $ | 3,738,347 | | | $ | (2,939,442) | | | $ | (1,212) | | | $ | 800,262 | |
| Net income (loss) | — | | | — | | | — | | | (78,107) | | | — | | | (78,107) | |
| Other comprehensive income (loss) | — | | | — | | | — | | | — | | | 13,555 | | | 13,555 | |
Common stock issued under "at the market"
stock offering | 36,820 | | | 368 | | | 146,547 | | | — | | | — | | | 146,915 | |
| Common stock issued/canceled under long-term incentive plans and director fees and options, net | 1,959 | | | 20 | | | 6,371 | | | — | | | — | | | 6,391 | |
| Balances at December 31, 2022 | 295,698 | | | $ | 2,957 | | | $ | 3,891,265 | | | $ | (3,017,549) | | | $ | 12,343 | | | $ | 889,016 | |
| Net income (loss) | — | | | — | | | — | | | (103,612) | | | — | | | (103,612) | |
| Other comprehensive income (loss) | — | | | — | | | — | | | — | | | (11,012) | | | (11,012) | |
Common stock issued under "at the market"
stock offering | 54,562 | | | 546 | | | 147,020 | | | — | | | — | | | 147,566 | |
| Common stock issued for the extinguishment of Senior Notes | 25,191 | | | 253 | | | 71,999 | | | — | | | — | | | 72,252 | |
| Common stock issued under Private Placement Offering | 8,276 | | | 83 | | | 20,935 | | | — | | | — | | | 21,018 | |
| Common stock issued/canceled under long-term incentive plans, annual incentive plans, director fees and options, net | 2,556 | | | 24 | | | 8,651 | | | — | | | — | | | 8,675 | |
| Balances at December 31, 2023 | 386,283 | | | $ | 3,863 | | | $ | 4,139,870 | | | $ | (3,121,161) | | | $ | 1,331 | | | $ | 1,023,903 | |
| Net income (loss) | — | | | — | | | — | | | 58,900 | | | — | | | 58,900 | |
| Other comprehensive income (loss) | — | | | — | | | — | | | — | | | (1,331) | | | (1,331) | |
| Debt-for-Equity Exchange | 1,772 | | | 18 | | | 5,350 | | | — | | | — | | | 5,368 | |
| Common stock issued under Private Placement Offering | 7,705 | | | 77 | | | 22,992 | | | — | | | — | | | 23,069 | |
| Kensington royalty settlement | 738 | | | 7 | | | 3,399 | | | — | | | — | | | 3,406 | |
| Common stock issued/canceled under long-term incentive plans, annual incentive plans, director fees and options, net | 2,738 | | | 27 | | | 9,910 | | | — | | | — | | | 9,937 | |
| Balances at December 31, 2024 | 399,236 | | | $ | 3,992 | | | $ | 4,181,521 | | | $ | (3,062,261) | | | $ | — | | | $ | 1,123,252 | |
| | | | | | | | | | | |
| | | | | | | | | | | |
The accompanying notes are an integral part of these Consolidated Financial Statements.
Coeur Mining, Inc. and Subsidiaries
Notes to Consolidated Financial Statements
NOTE 1 - THE COMPANY
Coeur Mining, Inc. (“Coeur” or the “Company”) is primarily a gold and silver producer with assets in the United States, Mexico and Canada. Coeur was incorporated as an Idaho corporation in 1928 under the name Coeur d’Alene Mines Corporation and on May 16, 2013, changed its state of incorporation from the State of Idaho to the State of Delaware and changed its name to Coeur Mining, Inc. Coeur’s corporate headquarters are in Chicago, Illinois.
NOTE 2 - SUMMARY OF SIGNIFICANT ACCOUNTING POLICIES
Risks and uncertainties
As a mining company, the revenue, profitability and future rate of growth of the Company are substantially dependent on the prevailing prices for gold, silver, zinc and lead. The prices of these metals are volatile and affected by many factors beyond the Company’s control, including prevailing interest rates and returns on other asset classes, expectations regarding inflation, speculation, currency values, governmental decisions regarding precious metals stockpiles, global and regional demand and production, political and economic conditions and other factors. A substantial or extended decline in commodity prices could have a material adverse effect on the Company’s financial position, results of operations, cash flows, access to capital and the quantities of reserves that the Company can economically produce. Further, the carrying value of the Company’s property, plant and equipment and mining properties, net, inventories and ore on leach pads are particularly sensitive to the outlook for commodity prices. A decline in the Company’s price outlook from current levels could result in material impairment charges related to these assets.
In addition to changes in commodity prices, other factors such as changes in mine plans, increases in costs, geotechnical failures, changes in social, environmental or regulatory requirements and impacts of global events could result in material impairment charges related to these assets.
Use of Estimates
The Company's Consolidated Financial Statements have been prepared in accordance with United States Generally Accepted Accounting Principles (“U.S. GAAP”). The preparation of the Company's Consolidated Financial Statements requires the Company to make estimates and assumptions that affect the reported amounts of assets and liabilities and the related disclosure of contingent assets and liabilities at the date of the Consolidated Financial Statements and reported amounts of revenues and expenses during the reporting period. The more significant areas requiring the use of management estimates and assumptions relate to metal prices and mineral reserves that are the basis for future cash flow estimates utilized in impairment calculations and units-of production amortization calculations, environmental, reclamation and closure obligations, estimates of recoverable silver and gold in leach pad inventories, estimates of fair value for certain reporting units and asset impairments, valuation allowances for deferred tax assets, and the fair value and accounting treatment of financial instruments, equity securities, asset acquisitions, the allocation of fair value to assets and liabilities assumed in connection with business combinations, and derivative instruments. The Company bases its estimates on historical experience and on various other assumptions that are believed to be reasonable under the circumstances. Accordingly, actual results will differ from the amounts estimated in these financial statements.
Principles of Consolidation
The Consolidated Financial Statements include the wholly-owned subsidiaries of the Company, the most significant of which are Coeur Mexicana S.A. de C.V., Coeur Rochester, Inc., Coeur Alaska, Inc., Wharf Resources (U.S.A.), Inc., and Coeur Silvertip Holdings Ltd. All intercompany balances and transactions have been eliminated.
Cash and Cash Equivalents
Cash and cash equivalents include all highly-liquid investments with an original maturity of three months or less. The Company minimizes its credit risk by investing its cash and cash equivalents with major U.S. and international banks and financial institutions located principally in the United States with a minimum credit rating of A1, as defined by Standard & Poor’s. The Company’s management believes that no concentration of credit risk exists with respect to the investment of its cash and cash equivalents. At certain times, amounts on deposit may exceed federal deposit insurance limits.
Receivables
Trade receivables and other receivable balances are recognized net of an allowance for credit losses. The allowance represents the portion of the amortized cost basis that the Company does not expect to collect due to credit over the contractual life of the receivables, taking into consideration past events, current conditions and reasonable and supportable forecasts of future economic conditions. As of December 31, 2024, the amount of credit loss recognized is not significant.
Coeur Mining, Inc. and Subsidiaries
Notes to Consolidated Financial Statements
Ore on Leach Pads
The heap leach process extracts silver and gold by placing ore on an impermeable pad and applying a diluted cyanide solution that dissolves a portion of the contained silver and gold, which are then recovered in metallurgical processes.
The Company uses several integrated steps to scientifically measure the metal content of ore placed on the leach pads. As the ore body is drilled in preparation for the blasting process, samples are taken of the drill residue and are assayed to determine estimated quantities of contained metal. The Company then processes the ore through crushing facilities where the output is again weighed and sampled for assaying. A metallurgical reconciliation with the data collected from the mining operation is completed with appropriate adjustments made to previous estimates. The crushed ore is then transported to the leach pad for application of the leaching solution. As the leach solution is collected from the leach pads, it is continuously sampled for assaying. The quantity of leach solution is measured by flow meters throughout the leaching and precipitation process. After precipitation, the product is converted to doré at the Rochester mine and a form of gold electrolytic cathodic sludge at the Wharf mine, representing the final product produced by each mine. The inventory is stated at lower of cost or net realizable value, with cost being determined using a weighted average cost method.
The historical cost of metal expected to be extracted within 12 months is classified as current and the historical cost of metals contained within the broken ore expected to be extracted beyond 12 months is classified as non-current. Ore on leach pads is valued based on actual production costs incurred to produce and place ore on the leach pad, less costs allocated to minerals recovered through the leach process.
The estimate of both the ultimate recovery expected over time and the quantity of metal that may be extracted relative to the time the leach process occurs requires the use of estimates, which are inherently inaccurate due to the nature of the leaching process. The quantities of metal contained in the ore are based upon actual weights and assay analysis. The rate at which the leach process extracts gold and silver from the crushed ore is based upon laboratory testing and actual experience of more than 20 years of leach pad operations at the Rochester mine and 30 years of leach pad operations at the Wharf mine. The assumptions used by the Company to measure metal content during each stage of the inventory conversion process includes estimated recovery rates based on laboratory testing and assaying. The Company periodically reviews its estimates compared to actual experience and revises its estimates when appropriate. The ultimate recovery will not be known until leaching operations cease. Variations between actual and estimated quantities resulting from changes in assumptions and estimates that do not result in write-downs to net realizable value are accounted for on a prospective basis. In the first quarter of 2024, the Company completed a review of the estimated recoverable ounces of gold and silver on its leach pads and determined that as a result of longer expected leach time and favorable recoveries relative to previous estimates, that the estimated recoverable gold and silver on the Rochester legacy leach pads (Stages 2, 3 and 4) supported an upward revision. An additional 6,000 ounces of gold and 900,000 ounces of silver were added to the legacy leach pads in the first quarter of 2024. There are five reusable heap leach pads (load/offload) used at Wharf. Each pad goes through an approximate 24-month process of loading of ore, leaching and offloading which includes a neutralization and denitrification process. During the leaching cycle of each pad, revised estimated recoverable ounces for each of the pads may result in an upward or downward revision from time to time, which generally have not been significant. The updated recoverable ounce estimate is considered a change in estimate and was accounted for prospectively. As of December 31, 2024, the Company’s combined estimated recoverable ounces of gold and silver on the leach pads were 49,575 and 6.9 million, respectively.
Metal and Other Inventory
Inventories include concentrate, doré, and operating materials and supplies. The classification of inventory is determined by the stage at which the ore is in the production process. All inventories are stated at the lower of cost or net realizable value, with cost being determined using a weighted average cost method. Concentrate and doré inventory includes product at the mine site and product held by refineries. Metal inventory costs include direct labor, materials, depreciation, depletion and amortization as well as overhead costs relating to mining activities.
Property, Plant, and Equipment and Mining Properties, Net
Expenditures for new facilities, assets acquired pursuant to finance leases, new assets or expenditures that extend the useful lives of existing facilities are capitalized and depreciated using the straight-line method at rates sufficient to depreciate such costs over the shorter of estimated productive lives of such facilities, lease term, or the useful life of the individual assets. Productive lives range from 7 to 30 years for buildings and improvements and 3 to 10 years for machinery and equipment. Certain mining equipment is depreciated using the units-of-production method based upon estimated total proven and probable reserves.
Capitalization of mine development costs begins once all operating permits have been secured, mineralization is classified as proven and probable reserves and a final feasibility study has been completed. Mine development costs include engineering and metallurgical studies, drilling and other related costs to delineate an ore body, the removal of overburden to initially expose an ore body at open pit surface mines and the building of access ways, shafts, lateral access, drifts, ramps and
Coeur Mining, Inc. and Subsidiaries
Notes to Consolidated Financial Statements
other infrastructure at underground mines. Costs incurred before mineralization are classified as proven and probable reserves are capitalized if a project is in pre-production phase or expensed and classified as Exploration or Pre-development if the project is not yet in pre-production. Mine development costs are amortized using the units-of-production method over the estimated life of the ore body generally based on recoverable ounces to be mined from proven and probable reserves. Interest expense allocable to the cost of developing mining properties and to construct new facilities is capitalized until assets are ready for their intended use.
Drilling and related costs incurred at the Company’s operating mines are expensed as incurred in Exploration, unless the Company can conclude with a high degree of confidence, prior to the commencement of a drilling program, that the drilling costs will result in the conversion of a mineral resource into mineral reserve. The Company’s assessment is based on the following factors: results from previous drill programs; results from geological models; results from a mine scoping study confirming economic viability of the resource; and preliminary estimates of mine inventory, ore grade, cash flow and mine life. In addition, the Company must have all permitting and/or contractual requirements necessary to have the right to and/or control of the future benefit from the targeted ore body. The costs of a drilling program that meet these criteria are capitalized as mine development costs. Drilling and related costs of approximately $16.8 million and $10.0 million in the years ended December 31, 2024 and 2023, respectively, were capitalized.
The cost of removing overburden and waste materials to access the ore body at an open pit mine prior to the production phase are referred to as “pre-stripping costs.” Pre-stripping costs are capitalized during the development of an open pit mine. Stripping costs incurred during the production phase of a mine are variable production costs that are included as a component of inventory to be recognized in Costs applicable to sales in the same period as the revenue from the sale of inventory.
Significant payments related to the acquisition of land and mineral rights are capitalized. Prior to acquiring such land or mineral rights, the Company generally makes a preliminary evaluation to determine that the property has significant potential to develop an economic ore body. The time between initial acquisition and full evaluation of a property’s potential is variable and is determined by many factors including location relative to existing infrastructure, the property’s stage of development, geological controls and metal prices. If a mineable ore body is discovered, such costs are amortized when production begins using the units-of-production method based on recoverable ounces to be mined from proven and probable reserves. If no mineable ore body is discovered, such costs are expensed in the period in which it is determined the property has no future economic value.
Impairment of Long-lived Assets
We review and evaluate our long-lived assets for impairment whenever events or changes in circumstances indicate that the related carrying amounts may not be recoverable. Asset impairment is considered to exist if the total estimated undiscounted pretax future cash flows are less than the carrying amount of the asset. In estimating future cash flows, assets are grouped at the lowest level for which there are identifiable cash flows that are largely independent of future cash flows from other asset groups. An impairment loss is measured by discounted estimated future cash flows, and recorded by reducing the asset's carrying amount to fair value. Future cash flows are estimated based on estimated quantities of recoverable minerals, expected gold, silver, lead and zinc prices (considering current and historical prices, trends and related factors), production levels, operating costs, capital requirements and reclamation costs, all based on life-of-mine plans.
Existing proven and probable reserves and value beyond proven and probable reserves, including mineralization other than proven and probable reserves are included when determining the fair value of mine site asset groups at acquisition and, subsequently, in determining whether the assets are impaired. The term “recoverable minerals” refers to the estimated amount of gold, silver, lead and zinc that will be obtained after taking into account losses during ore processing and treatment. Estimates of recoverable minerals from exploration stage mineral interests are risk adjusted based on management’s relative confidence in such materials. The ability to achieve the estimated quantities of recoverable minerals from exploration stage mineral interests involves further risks in addition to those risk factors applicable to mineral interests where proven and probable reserves have been identified, due to the lower level of confidence that the identified mineral resources could ultimately be mined economically. Assets classified as exploration potential have the highest level of risk that the carrying value of the asset can be ultimately realized, due to the still lower level of geological confidence and economic modeling.
Gold, silver, zinc and lead prices are volatile and affected by many factors beyond the Company’s control, including prevailing interest rates and returns on other asset classes, expectations regarding inflation, speculation, currency values, governmental decisions regarding precious metals stockpiles, global and regional demand and production, political and economic conditions and other factors that may affect the key assumptions used in the Company’s impairment testing. Various factors could impact our ability to achieve forecasted production levels from proven and probable reserves. Additionally, production, capital and reclamation costs could differ from the assumptions used in the cash flow models used to assess impairment. Actual results may vary from the Company’s estimates and result in additional Impairment of Long-lived Assets.
Coeur Mining, Inc. and Subsidiaries
Notes to Consolidated Financial Statements
Restricted Assets
The Company, under the terms of its self-insurance and bonding agreements with certain banks, lending institutions and regulatory agencies, is required to collateralize certain portions of its obligations. The Company has collateralized these obligations by assigning certificates of deposit that have maturity dates ranging from three months to a year, to the respective institutions or agencies. At December 31, 2024 and 2023, the Company held certificates of deposit and cash under these agreements of $8.5 million and $9.1 million, respectively. The ultimate timing of the release of the collateralized amounts is dependent on the timing and closure of each mine and repayment of the facility. In order to release the collateral, the Company must seek approval from certain government agencies responsible for monitoring the mine closure status. Collateral could also be released to the extent the Company is able to secure alternative financial assurance satisfactory to the regulatory agencies. The Company believes there is a reasonable probability that the collateral will remain in place beyond a twelve-month period and has therefore classified these investments as long-term.
Leases
We determine if an arrangement is, or contains, a lease at the inception date. Operating leases are included in Other assets, non-current with the related liabilities included in Accrued liabilities and other and Other long-term liabilities. Assets under finance leases, which primarily represent property and equipment, are included in Property, plant and equipment, net, with the related liabilities included in debt, current and debt, non-current on the Consolidated Balance Sheet.
Operating lease assets represent our right to use an underlying asset for the lease term and lease liabilities represent our obligation to make lease payments arising from the lease. Operating lease assets and liabilities are recognized at the lease commencement date based on the estimated present value of lease payments over the lease term. We use our estimated incremental borrowing rate in determining the present value of lease payments. Variable components of the lease payments such as maintenance costs are expensed as incurred and not included in determining the present value. Our lease terms include options to extend or terminate the lease when it is reasonably certain that we will exercise that option. We have elected to not recognize operating lease assets and liabilities for short-term leases that have a lease term of twelve months or less. Lease expense is recognized on a straight-line basis over the lease term. We have lease agreements with lease and non-lease components which are accounted for as a single lease component. See Note 7 -- Leases for additional information related to the Company’s operating and finance leases.
Reclamation
The Company recognizes obligations for the expected future retirement of tangible long-lived assets and other associated asset retirement costs. The fair value of a liability for an asset retirement obligation will be recognized in the period in which it is incurred if a reasonable estimate of fair value can be made. The fair value of the liability is added to the carrying amount of the associated asset and this additional carrying amount is depreciated over the life of the asset. An accretion cost, representing the increase over time in the present value of the liability, is recorded each period in Pre-development, reclamation, and other. As reclamation work is performed or liabilities are otherwise settled, the recorded amount of the liability is reduced. Future remediation costs for inactive mines are accrued based on management’s best estimate at the end of each period of the discounted costs expected to be incurred at the site. Such cost estimates include, where applicable, ongoing care and maintenance and monitoring costs. Changes in estimates are reflected prospectively in the period an estimate is revised. See Note 9 -- Reclamation for additional information.
Foreign Currency
The assets and liabilities of the Company’s foreign subsidiaries are measured using U.S. dollars as their functional currency. Revenues and expenses are remeasured at the average exchange rate for the period. Foreign currency gains and losses are included in the determination of net income or loss.
Derivative Financial Instruments
The Company is exposed to various market risks, including the effect of changes in metal prices, foreign exchange rates and interest rates, and uses derivatives to manage financial exposures that occur in the normal course of business. The Company may elect to designate certain derivatives as hedging instruments under U.S. GAAP.
The Company, from time to time, uses derivative contracts to protect the Company’s exposure to fluctuations in metal prices and foreign exchange rates. The Company has elected to designate these instruments as cash flow hedges of forecasted transactions at their inception. Assuming normal market conditions, the change in the market value of such derivative contracts has historically been, and is expected to continue to be, highly effective at offsetting changes in price movements of the hedged item. The effective portions of cash flow hedges are recorded in Accumulated other comprehensive income (loss) until the hedged item is recognized in earnings. Deferred gains and losses associated with cash flow hedges of metal sales revenue are recognized as a component of Revenue in the same period as the related sale is recognized. Deferred gains and losses associated
Coeur Mining, Inc. and Subsidiaries
Notes to Consolidated Financial Statements
with cash flow hedges of foreign currency transactions are recognized as a component of Costs applicable to sales or Pre-development, reclamation and other in the same period the related expenses are incurred.
For derivatives not designated as hedging instruments, the Company recognizes derivatives as either assets or liabilities on the Consolidated Balance Sheets and measures those instruments at fair value. Changes in the value of derivative instruments not designated as hedging instruments are recorded each period in the Consolidated Statements of Comprehensive Income (Loss) in Fair value adjustments, net or Revenue. Management applies judgment in estimating the fair value of instruments that are highly sensitive to assumptions regarding commodity prices, market volatilities, and foreign currency exchange rates. See Note 13 -- Derivative Financial Instruments and Hedging Activities for additional information.
Stock-based Compensation
The Company estimates the fair value of stock options using the Black-Scholes option pricing model using market comparison. Stock options granted are accounted for as equity-based awards. The Company estimates forfeitures of stock-based awards based on historical data and periodically adjusts the forfeiture rate. The adjustment of the forfeiture rate is recorded as a cumulative adjustment in the period the forfeiture estimate is changed. Compensation costs related to stock-based compensation are included in General and administrative expenses, Costs applicable to sales, and Property, plant, and equipment, net as deemed appropriate.
The fair value of restricted stock is based on the Company’s stock price on the date of grant. The fair value of performance leverage stock units with market conditions is determined using a Monte Carlo simulation model. Stock based compensation expense related to awards with a market or performance condition is generally recognized over the vesting period of the award utilizing the graded vesting method, while all other awards are recognized on a straight-line basis. The Company's estimates may be impacted by certain variables including, but not limited to, stock price volatility, employee stock option exercise behaviors, additional stock option grants, estimates of forfeitures, the Company’s performance, and related tax impacts. See Note 11 -- Stock-Based Compensation for additional information.
Income and Mining Taxes
The Company uses an asset and liability approach which results in the recognition of deferred tax liabilities and assets for the expected future tax consequences or benefits of temporary differences between the financial reporting basis and the tax basis of assets and liabilities, as well as operating loss and tax credit carryforwards, using enacted tax rates in effect in the years in which the differences are expected to reverse.
In assessing the realizability of deferred tax assets, management considers whether it is more likely than not that some portion or all of its deferred tax assets will not be realized. Management considers the scheduled reversal of deferred tax liabilities, projected future taxable income and tax planning strategies in making this assessment. A valuation allowance has been provided for the portion of the Company’s net deferred tax assets for which it is more likely than not that they will not be realized.
Revenue Recognition
The Company produces doré and concentrate that is shipped to third-party refiners and smelters, respectively, for processing. The Company enters into contracts to sell its metal to various third-party customers which may include the refiners and smelters that process the doré and concentrate. The Company’s performance obligation in these transactions is generally the transfer of metal to the customer.
In the case of doré shipments, the Company generally sells refined metal at market prices agreed upon by both parties. The Company also has the right, but not the obligation, to sell a portion of the anticipated refined metal in advance of being fully refined. When the Company sells refined metal or advanced metal, the performance obligation is satisfied when the metal is delivered to the customer. Revenue and Costs applicable to sales are recorded on a gross basis under these contracts at the time the performance obligation is satisfied.
Under the Company’s concentrate sales contracts with third-party smelters, metal prices are set on a specified future quotational period, typically one to three months after the shipment date, based on market prices. When the Company sells gold concentrate to the third-party smelters, the performance obligation is satisfied when risk of loss is transferred to the customer. The contracts, in general, provide for provisional payment based upon provisional assays and historical metal prices. Final settlement is based on the applicable price for the specified future quotational period and generally occurs three to six months after shipment. The Company’s provisionally priced sales contain an embedded derivative that is required to be separated from the host contract for accounting purposes. The host contract is the receivable from the sale of concentrates measured at the forward price at the time of sale. The embedded derivative does not qualify for hedge accounting and is adjusted to fair value through revenue each period until the date of final metal settlement.
Coeur Mining, Inc. and Subsidiaries
Notes to Consolidated Financial Statements
The Company also sells concentrate under off-take agreements to third-party customers that are responsible for arranging the smelting of the concentrate. Prices can either be fixed or based on a quotational period. The quotational period varies by contract, but is generally a one-month period following the shipment of the concentrate. The performance obligation is satisfied when risk of loss is transferred to the customer.
The Company recognizes revenue from concentrate sales, net of treatment and refining charges, when it satisfies the performance obligation of transferring control of the concentrate to the customer.
For doré and off-take sales, the Company may incur a finance charge related to advance sales that is not considered significant and, as such, is not considered a separate performance obligation. In addition, the Company has elected to treat freight costs as a fulfillment cost under ASC 606 and not as a separate performance obligation.
Recently Adopted Accounting Standards
In March 2022, the FASB issued ASU 2022-01, “Derivatives and Hedging (Topic 815): Fair Value Hedging—Portfolio Layer Method” which is intended to make amendments to the fair value hedge accounting previously issued in ASU 2017-12 “Derivatives and Hedging (Topic 815): Targeted Improvements to Accounting for Hedging Activities”. The new standard is effective for reporting periods beginning after December 15, 2022. The standard introduced the portfolio layer method allowing multiple hedged layers of a single closed portfolio when applying fair value hedge accounting. The Company adopted the new derivatives and hedging standards effective January 1, 2023, which did not have a material effect on our financial position, results of operations or cash flows.
In November 2023, the FASB issued ASU 2023-07, “Segment Reporting (Topic 280): Improvements to Reportable Segment Disclosures”, which is intended to improve reportable segment disclosure requirements, primarily through enhanced disclosures about significant segment expenses. The guidance is effective for fiscal years beginning after December 15, 2023, and interim periods within fiscal years beginning after December 15, 2024. Early adoption is permitted. The guidance is to be applied retrospectively to all prior periods presented in the financial statements. Upon transition, the segment expense categories and amounts disclosed in the prior periods should be based on the significant segment expense categories identified and disclosed in the period of adoption. We have adopted the new standard effective December 31, 2024 retrospectively for all periods presented. See Note 3 -- Segment Reporting for all periods presented with the new required disclosures. The new standard did not impact our Consolidated Financial Statements.
Recently Issued Accounting Standards
In December 2023, the FASB issued ASU 2023-09, “Income Taxes (Topic 740): Improvements to Income Tax Disclosures”, which modifies the rules on income tax disclosures to require entities to disclose (1) specific categories in the rate reconciliation, (2) the income or loss from continuing operations before income tax expense or benefit (separated between domestic and foreign) and (3) income tax expense or benefit from continuing operations (separated by federal, state and foreign). ASU 2023-09 also requires entities to disclose their income tax payments to international, federal, state and local jurisdictions, among other changes. The guidance is effective for annual periods beginning after December 15, 2024. Although early adoption is permitted for annual financial statements that have not yet been issued or made available for issuance, the Company believes that there is no material impact to the reader in early adoption. The Company plans to adopt this new guidance on our Consolidated Financial Statements and related disclosures on reporting year ending December 31, 2025.
In November 2024, the FASB issued ASU 2024-03, Income Statement - Reporting Comprehensive Income (Topic 220): Expense Disaggregation Disclosures, which includes amendments to require the disclosure of certain specific costs and expenses that are included in a relevant expense caption on the face of the income statement. Specific costs and expenses that would be required to be disclosed include: purchases of inventory, employee compensation, depreciation and intangible asset amortization. Additionally, a qualitative description of other items is required, equal to the difference between the relevant expense caption and the separately disclosed specific costs. The amendments in ASU 2024-03 are effective for fiscal years beginning after December 15, 2026, and for interim periods beginning after December 15, 2027, and are applied either prospectively or retrospectively at the option of the Company. We are evaluating the impact of the amendments on our Consolidated Financial Statements and related disclosures.
Coeur Mining, Inc. and Subsidiaries
Notes to Consolidated Financial Statements
NOTE 3 – SEGMENT REPORTING
The Company’s operating segments at December 31, 2024 included the Palmarejo, Rochester, Kensington and Wharf mines and Silvertip exploration project. Following consummation of the acquisition of SilverCrest Metals, Inc. on February 14, 2025, the Company will add the Las Chispas operating segment. Except for the Silvertip exploration project, all operating segments are engaged in the discovery, mining, and production of gold and/or silver. The Silvertip exploration project is engaged in the discovery of silver, zinc, lead, and other related metals. “Other” includes certain mineral interests, strategic equity investments, corporate office, elimination of intersegment transactions, and other items necessary to reconcile to consolidated amounts.
The Company’s Chief Operating Decision Maker (“CODM”), comprised of Mitchell J. Krebs, Chairman, President and Chief Executive Officer, Thomas S. Whelan, Chief Financial Officer, and Michael Routledge, Chief Operating Officer, evaluates performance and allocates resources for all of the Company’s reportable segments based on Income (loss) from operations. The CODM uses segment Income (loss) from operations to allocate resources such as corporate employees, and financial or capital resources for each segment during the annual budget and forecasting processes. The CODM considers budget-to-actual variances on a monthly basis using the segment Income (loss) from operations measure when making decisions about allocating capital and personnel to the segments. The accounting policies of the reportable segments are the same as those described in Note 2 -- Summary of Significant Accounting Policies.
Financial information relating to the Company’s segments is as follows (in thousands):
| | | | | | | | | | | | | | | | | | | | | | | | | | | | | | | | | | | | | | | | | |
| Year Ended December 31, 2024 | Palmarejo | | Rochester | | Kensington | | Wharf | | Silvertip | | Other | | Total |
| Revenue | | | | | | | | | | | | | |
| Gold sales | $ | 190,520 | | | $ | 91,541 | | | $ | 225,200 | | | $ | 227,600 | | | $ | — | | | $ | — | | | $ | 734,861 | |
| Silver sales | 188,540 | | | 124,271 | | | (71) | | | 6,405 | | | — | | | — | | | 319,145 | |
| | | | | | | | | | | | | |
| | | | | | | | | | | | | |
| Metal sales | 379,060 | | | 215,812 | | | 225,129 | | | 234,005 | | | — | | | — | | | 1,054,006 | |
| Costs and Expenses | | | | | | | | | | | | | |
Costs applicable to sales(1) | 195,458 | | | 154,611 | | | 157,757 | | | 98,366 | | | — | | | — | | | 606,192 | |
| Amortization | 44,979 | | | 41,293 | | | 28,201 | | | 6,487 | | | 3,235 | | | 779 | | | 124,974 | |
| Exploration | 13,230 | | | 5,070 | | | 5,494 | | | 6,192 | | | 27,332 | | | 2,340 | | | 59,658 | |
| | | | | | | | | | | | | |
Other operating expenses(2) | 8,665 | | | 12,963 | | | 9,753 | | | 4,519 | | | 9,923 | | | 53,177 | | | 99,000 | |
| Costs and expenses | 262,332 | | | 213,937 | | | 201,205 | | | 115,564 | | | 40,490 | | | 56,296 | | | 889,824 | |
| Income (loss) from operations | 116,728 | | | 1,875 | | | 23,924 | | | 118,441 | | | (40,490) | | | (56,296) | | | 164,182 | |
| Other income (expense) | | | | | | | | | | | | | |
| Gain on debt extinguishment | — | | | — | | | — | | | — | | | — | | | 417 | | | 417 | |
| Fair value adjustments, net | — | | | — | | | — | | | — | | | — | | | — | | | — | |
| Interest expense, net | 324 | | | (5,081) | | | (1,681) | | | (544) | | | (11) | | | (44,283) | | | (51,276) | |
Other, net(3) | 7,074 | | | (363) | | | (312) | | | (509) | | | (43) | | | 7,180 | | | 13,027 | |
| Income (loss) before income and mining taxes | 124,126 | | | (3,569) | | | 21,931 | | | 117,388 | | | (40,544) | | | (92,982) | | | 126,350 | |
| Income and mining tax (expense) benefit | (45,765) | | | (1,778) | | | (576) | | | (10,679) | | | — | | | (8,652) | | | (67,450) | |
| Net Income (loss) | $ | 78,361 | | | $ | (5,347) | | | $ | 21,355 | | | $ | 106,709 | | | $ | (40,544) | | | $ | (101,634) | | | $ | 58,900 | |
| | | | | | | | | | | | | |
Segment assets(4) | $ | 316,232 | | | $ | 1,227,745 | | | $ | 223,525 | | | $ | 119,407 | | | $ | 219,613 | | | $ | 55,359 | | | $ | 2,161,881 | |
| Capital expenditures | $ | 30,621 | | | $ | 72,676 | | | $ | 68,656 | | | $ | 7,175 | | | $ | 3,597 | | | $ | 463 | | | $ | 183,188 | |
(1) Excludes amortization.(2) Other operating expenses includes General and administrative and Pre-development, reclamation, and other
(3) See Note 14 -- Additional Comprehensive Income (Loss) Detail for additional detail.
(4) Segment assets include receivables, prepaids, inventories, property, plant and equipment, and mineral interests.
Coeur Mining, Inc. and Subsidiaries
Notes to Consolidated Financial Statements
| | | | | | | | | | | | | | | | | | | | | | | | | | | | | | | | | | | | | | | | | |
| Year Ended December 31, 2023 | Palmarejo | | Rochester | | Kensington | | Wharf | | Silvertip | | Other | | Total |
| Revenue | | | | | | | | | | | | | |
| Gold sales | $ | 155,036 | | | $ | 75,571 | | | $ | 162,010 | | | $ | 183,060 | | | $ | — | | | $ | — | | | $ | 575,677 | |
| Silver sales | 158,171 | | | 80,451 | | | 468 | | | 6,439 | | | — | | | — | | | 245,529 | |
| | | | | | | | | | | | | |
| | | | | | | | | | | | | |
| Metal sales | 313,207 | | | 156,022 | | | 162,478 | | | 189,499 | | | — | | | — | | | 821,206 | |
| Costs and Expenses | | | | | | | | | | | | | |
Costs applicable to sales(1) | 194,309 | | | 171,271 | | | 152,659 | | | 114,657 | | | — | | | — | | | 632,896 | |
| Amortization | 35,709 | | | 26,392 | | | 25,905 | | | 6,694 | | | 4,018 | | | 1,104 | | | 99,822 | |
| Exploration | 7,840 | | | 1,221 | | | 7,900 | | | — | | | 12,251 | | | 1,750 | | | 30,962 | |
| | | | | | | | | | | | | |
Other operating expenses(2) | 8,064 | | | 26,005 | | | 3,440 | | | 4,157 | | | 17,104 | | | 37,471 | | | 96,241 | |
| Costs and expenses | 245,922 | | | 224,889 | | | 189,904 | | | 125,508 | | | 33,373 | | | 40,325 | | | 859,921 | |
| Income (loss) from operations | 67,285 | | | (68,867) | | | (27,426) | | | 63,991 | | | (33,373) | | | (40,325) | | | (38,715) | |
| Other income (expense) | | | | | | | | | | | | | |
| Gain on debt extinguishment | — | | | — | | | — | | | — | | | — | | | 3,437 | | | 3,437 | |
| Fair value adjustments, net | — | | | — | | | — | | | — | | | — | | | 3,384 | | | 3,384 | |
| Interest expense, net | 844 | | | (1,603) | | | (1,744) | | | (329) | | | (63) | | | (26,204) | | | (29,099) | |
Other, net(3) | 4,590 | | | (293) | | | (311) | | | (396) | | | (129) | | | (10,924) | | | (7,463) | |
| Income (loss) before income and mining taxes | 72,719 | | | (70,763) | | | (29,481) | | | 63,266 | | | (33,565) | | | (70,632) | | | (68,456) | |
| Income and mining tax (expense) benefit | (26,016) | | | (816) | | | — | | | (7,047) | | | — | | | (1,277) | | | (35,156) | |
| Net Income (loss) | $ | 46,703 | | | $ | (71,579) | | | $ | (29,481) | | | $ | 56,219 | | | $ | (33,565) | | | $ | (71,909) | | | $ | (103,612) | |
| | | | | | | | | | | | | |
Segment assets(4) | $ | 312,879 | | | $ | 1,081,442 | | | $ | 171,602 | | | $ | 102,245 | | | $ | 215,545 | | | $ | 59,324 | | | $ | 1,943,037 | |
| Capital expenditures | $ | 41,766 | | | $ | 263,401 | | | $ | 53,316 | | | $ | 2,472 | | | $ | 2,867 | | | $ | 795 | | | $ | 364,617 | |
(1) Excludes amortization.(2) Other operating expenses includes General and administrative and Pre-development, reclamation, and other
(3) See Note 14 -- Additional Comprehensive Income (Loss) Detail for additional detail.
(4) Segment assets include receivables, prepaids, inventories, property, plant and equipment, and mineral interests.
| | | | | | | | | | | | | | | | | | | | | | | | | | | | | | | | | | | | | | | | | |
| Year Ended December 31, 2022 | Palmarejo | | Rochester | | Kensington | | Wharf | | Silvertip | | Other | | Total |
| Revenue | | | | | | | | | | | | | |
| Gold sales | $ | 157,595 | | | $ | 64,460 | | | $ | 201,859 | | | $ | 148,963 | | | $ | — | | | $ | — | | | $ | 572,877 | |
| Silver sales | 145,839 | | | 65,203 | | | 634 | | | 1,083 | | | — | | | — | | | 212,759 | |
| | | | | | | | | | | | | |
| | | | | | | | | | | | | |
| Metal sales | 303,434 | | | 129,663 | | | 202,493 | | | 150,046 | | | — | | | — | | | 785,636 | |
| Costs and Expenses | | | | | | | | | | | | | |
Costs applicable to sales(1) | 182,576 | | | 165,166 | | | 155,725 | | | 103,063 | | | — | | | — | | | 606,530 | |
| Amortization | 35,432 | | | 22,626 | | | 39,032 | | | 8,247 | | | 4,912 | | | 1,377 | | | 111,626 | |
| Exploration | 6,605 | | | 4,627 | | | 6,637 | | | — | | | 4,628 | | | 4,127 | | | 26,624 | |
| | | | | | | | | | | | | |
Other operating expenses(2) | 4,372 | | | 7,540 | | | 1,685 | | | 1,379 | | | 22,322 | | | 42,809 | | | 80,107 | |
| Costs and expenses | 228,985 | | | 199,959 | | | 203,079 | | | 112,689 | | | 31,862 | | | 48,313 | | | 824,887 | |
| Income (loss) from operations | 74,449 | | | (70,296) | | | (586) | | | 37,357 | | | (31,862) | | | (48,313) | | | (39,251) | |
| Other income (expense) | | | | | | | | | | | | | |
| | | | | | | | | | | | | |
| Fair value adjustments, net | — | | | — | | | — | | | — | | | — | | | (66,668) | | | (66,668) | |
| Interest expense, net | (12) | | | (810) | | | (1,446) | | | (66) | | | (176) | | | (21,351) | | | (23,861) | |
Other, net(3) | 3,204 | | | (306) | | | (206) | | | (62) | | | (354) | | | 64,055 | | | 66,331 | |
| | | | | | | | | | | | | |
| Income (loss) before income and mining taxes | 77,641 | | | (71,412) | | | (2,238) | | | 37,229 | | | (32,392) | | | (72,277) | | | (63,449) | |
| Income and mining tax (expense) benefit | (28,771) | | | 876 | | | 127 | | | (2,868) | | | — | | | 15,978 | | | (14,658) | |
| Net Income (loss) | $ | 48,870 | | | $ | (70,536) | | | $ | (2,111) | | | $ | 34,361 | | | $ | (32,392) | | | $ | (56,299) | | | $ | (78,107) | |
| | | | | | | | | | | | | |
Segment assets(4) | $ | 295,715 | | | $ | 809,116 | | | $ | 148,516 | | | $ | 105,209 | | | $ | 244,151 | | | $ | 67,275 | | | $ | 1,669,982 | |
| Capital expenditures | $ | 42,648 | | | $ | 246,360 | | | $ | 31,456 | | | $ | 3,138 | | | $ | 24,797 | | | $ | 3,955 | | | $ | 352,354 | |
(1) Excludes amortization.
(2) Other operating expenses includes General and administrative and Pre-development, reclamation, and other
(3) See Note 14 -- Additional Comprehensive Income (Loss) Detail for additional detail.
(4) Segment assets include receivables, prepaids, inventories, property, plant and equipment, and mineral interests.
Coeur Mining, Inc. and Subsidiaries
Notes to Consolidated Financial Statements
| | | | | | | | | | | |
| |
| Assets | December 31, 2024 | | December 31, 2023 |
| Total assets for reportable segments | $ | 2,161,881 | | | $ | 1,943,037 | |
| Cash and cash equivalents | 55,087 | | | 61,633 | |
| Other assets | 84,779 | | | 76,178 | |
| Total consolidated assets | $ | 2,301,747 | | | $ | 2,080,848 | |
Geographic Information
| | | | | | | | | | | |
| Long-Lived Assets | December 31, 2024 | | December 31, 2023 |
| United States | $ | 1,312,976 | | | $ | 1,201,988 | |
| Mexico | 267,144 | | | 256,906 | |
| Canada | 237,263 | | | 229,242 | |
| Other | 233 | | | 152 | |
| Total | $ | 1,817,616 | | | $ | 1,688,288 | |
| | | | | | | | | | | | | | | | | | | | | |
| Revenue | | | Year ended December 31, |
| | | | 2024 | | 2023 | | 2022 |
| United States | | | | | $ | 674,946 | | | $ | 507,999 | | | $ | 482,202 | |
| Mexico | | | | | 379,060 | | | 313,207 | | | 303,434 | |
| | | | | | | | | |
| Total | | | | | $ | 1,054,006 | | | $ | 821,206 | | | $ | 785,636 | |
The Company’s doré, as well as the electrolytic cathodic sludge produced by the Wharf mine, is refined into gold and silver bullion according to benchmark standards set by the London Bullion Market Association, which regulates the acceptable requirements for bullion traded in the London precious metals markets. The Company then sells its gold and silver bullion to multi-national banks, bullion trading houses, and refiners across the globe. The Company had seven trading counterparties at December 31, 2024. The Company's sales of doré and electrolytic cathodic sludge product produced by the Palmarejo, Rochester, and Wharf mines amounted to approximately 79%, 80%, and 74%, of total metal sales for the years ended December 31, 2024, 2023, and 2022, respectively.
The Company’s gold concentrate product from the Kensington mine is sold under a long-term offtake agreement and is shipped to geographically diverse third-party smelters who are responsible for arranging the smelting of the concentrate. The Company’s sales of concentrate produced by the Kensington amounted to approximately 21%, 20%, and 26% of total metal sales for the years ended December 31, 2024, 2023, and 2022, respectively.
The Company believes that the loss of any one smelter, refiner, trader or third-party customer would not have a material adverse effect on the Company due to the liquidity of the markets and current availability of alternative trading counterparties.
The following table indicates customers that represent 10% or more of total sales of metal for at least one of the years ended December 31, 2024, 2023, and 2022 (in millions):
| | | | | | | | | | | | | | | | | | | | |
| Year ended December 31, | |
| Customer | 2024 | | 2023 | 0 | 2022 | Segments reporting revenue |
| Bank of Montreal | $ | 445.6 | | | $ | 367.2 | | | $ | 341.5 | | Palmarejo, Rochester, Wharf |
| Ocean Partners | $ | 484.5 | | | $ | 346.2 | | | $ | 168.9 | | Palmarejo, Rochester, Kensington, Wharf |
| Asahi | $ | 104.9 | | | $ | 63.7 | | | $ | 125.3 | | Palmarejo, Rochester, Kensington, Wharf |
| | | | | | |
| | | | | | |
| | | | | | |
Coeur Mining, Inc. and Subsidiaries
Notes to Consolidated Financial Statements
NOTE 4 – RECEIVABLES
Receivables consist of the following:
| | | | | | | | | | | |
| In thousands | December 31, 2024 | | December 31, 2023 |
| Current receivables: | | | |
| Trade receivables | $ | 7,818 | | | $ | 3,858 | |
| VAT receivable | 12,684 | | | 15,634 | |
| Income tax receivable | 8,509 | | | 10,207 | |
| | | |
Gold and silver forwards realized gains (1) | — | | | 615 | |
| Other | 919 | | | 721 | |
| $ | 29,930 | | | $ | 31,035 | |
| Non-current receivables: | | | |
Other tax receivable (2) | $ | 5,554 | | | $ | 9,111 | |
Deferred cash consideration (3) | 834 | | | 834 | |
Contingent consideration (4) | 13,195 | | | 13,195 | |
| $ | 19,583 | | | $ | 23,140 | |
| Total receivables | $ | 49,513 | | | $ | 54,175 | |
(1) Represents realized gains on gold and silver forward hedges from December 2023 that contractually settled in subsequent months. See Note 13 -- Derivative Financial Instruments & Hedging Activities for additional details on the gold and silver forward hedges.
(2) Consists of exploration credit refunds at Silvertip.
(3) Represents the fair value of the contingent consideration related to the sale of La Preciosa Deferred Consideration, which included the right to an additional payment of $1.0 million on the first anniversary of initial production from any portion of the La Preciosa project. The fair value of the contingent consideration was valued using a discounted cash flow model and is measured at fair value on a non-recurring basis.
(4) Represents the fair value of the contingent consideration associated with the sale of Sterling/Crown exploration properties, which included the right to an additional payment of $50.0 million should the buyer, its affiliates or its successors, report gold resources in the Sterling/Crown exploration properties. The fair value of the contingent consideration was valued using a discounted cash flow model and is measured at fair value on a non-recurring basis.
NOTE 5 – INVENTORY AND ORE ON LEACH PADS
Inventory consists of the following: | | | | | | | | | | | |
| In thousands | December 31, 2024 | | December 31, 2023 |
| Inventory: | | | |
| Concentrate | $ | 5,795 | | | $ | 3,606 | |
| Precious metals | 19,675 | | | 20,395 | |
| Supplies | 53,147 | | | 52,660 | |
| $ | 78,617 | | | $ | 76,661 | |
| Ore on Leach Pads: | | | |
| Current | $ | 92,724 | | | $ | 79,400 | |
| Non-current | 106,670 | | | 25,987 | |
| $ | 199,394 | | | $ | 105,387 | |
| | | |
Long-term Stockpile (included in Other) | $ | 41,718 | | | $ | 46,702 | |
| | | |
| Total Inventory and Ore on Leach Pads | $ | 319,729 | | | $ | 228,750 | |
Coeur reports the carrying value of metal and leach pad inventory at the lower of cost or net realizable value, with cost being determined using a weighted average cost method. In the year ended December 31, 2024, the cost associated with the stockpile at Rochester exceeded its net realizable value, which resulted in non-cash write down of $4.0 million ($3.2 million was recognized in Costs applicable to sales and $0.8 million in Amortization).
Coeur Mining, Inc. and Subsidiaries
Notes to Consolidated Financial Statements
NOTE 6 – PROPERTY, PLANT AND EQUIPMENT AND MINING PROPERTIES, NET
Property, plant and equipment and mining properties, net consist of the following:
| | | | | | | | | | | |
| In thousands | December 31, 2024 | | December 31, 2023 |
| Mine development | $ | 1,502,457 | | | $ | 1,358,189 | |
| Mineral interests | 833,564 | | | 809,912 | |
| Land | 9,000 | | | 8,318 | |
Facilities and equipment(1) | 1,517,170 | | | 947,435 | |
Construction in progress(2) | 145,732 | | | 612,865 | |
| Total | $ | 4,007,923 | | | $ | 3,736,719 | |
Accumulated depreciation, depletion and amortization(3) | (2,190,307) | | | (2,048,431) | |
| Property, plant and equipment and mining properties, net | $ | 1,817,616 | | | $ | 1,688,288 | |
(1) Includes $170.1 million and $127.6 million associated with facilities and equipment assets under finance leases at December 31, 2024 and December 31, 2023, respectively.
(2) Includes $471.7 million of construction costs related to the Rochester expansion project at December 31, 2023.
(3) Includes $63.3 million and $37.6 million of accumulated amortization related to assets under finance leases at December 31, 2024 and December 31, 2023, respectively.
On July 8, 2024, the Company closed on the purchase of mining concessions adjacent to the Palmarejo mine from a subsidiary of Fresnillo plc. Total consideration under the purchase agreement consisted of a cash payment of approximately $25 million, with $10 million paid at closing, an additional $10 million payable twelve months after closing (“Deferred Cash Due 2025”), and an additional $5 million payable 24 months after closing (“Deferred Cash Due 2026”). The concessions are also subject to an inflation-adjusted royalty payment of $25 per ounce for each new gold-equivalent ounce of resource discovered between 450,000 and two million gold equivalent ounces. This resulted in a $23.7 million increase to Mineral interest and the recognition of $9.3 million of Accrued liabilities and other and $4.4 million of Other long-term liabilities for amounts due after closing.
Commissioning of Rochester’s new three-stage crushing circuit and truck load-out facility was completed on March 7, 2024, leading to declaration of commercial production and $528 million of construction in process placed into service in the first quarter of 2024.
NOTE 7 – LEASES
Right of Use Assets and Liabilities
The following table summarizes quantitative information pertaining to the Company’s finance and operating leases.
| | | | | | | | | | | | | | | | | | | | | |
| | | Year ended December 31, |
| In thousands | | | | | 2024 | | 2023 | | 2022 |
| Lease Cost | | | | | | | | | |
| Operating lease cost | | | | | $ | 12,924 | | | $ | 12,536 | | | $ | 11,939 | |
| | | | | | | | | |
| Short-term operating lease cost | | | | | $ | 13,784 | | | $ | 12,223 | | | $ | 10,573 | |
| | | | | | | | | |
| Finance lease cost: | | | | | | | | | |
| Amortization of leased assets | | | | | $ | 34,424 | | | $ | 27,985 | | | $ | 21,571 | |
| Interest on lease liabilities | | | | | 4,844 | | | 3,762 | | | 5,084 | |
| | | | | | | | | |
| | | | | | | | | |
| | | | | | | | | |
| Total finance lease cost | | | | | $ | 39,268 | | | $ | 31,747 | | | $ | 26,655 | |
Coeur Mining, Inc. and Subsidiaries
Notes to Consolidated Financial Statements
Supplemental cash flow information related to leases was as follows:
| | | | | | | | | | | | | | | | | | | | | |
| | | Year ended December 31, |
| In thousands | | | | | 2024 | | 2023 | | 2022 |
| Other Information | | | | | | | | | |
| Cash paid for amounts included in the measurement of lease liabilities: | | | | | | | | | |
| Operating cash flows from operating leases | | | | | $ | 26,709 | | | $ | 24,759 | | | $ | 22,511 | |
| Operating cash flows from finance leases | | | | | $ | 4,844 | | | $ | 3,762 | | | $ | 5,084 | |
| Financing cash flows from finance leases | | | | | $ | 24,524 | | | $ | 24,505 | | | $ | 31,316 | |
Supplemental balance sheet information related to leases was as follows:
| | | | | | | | | | | |
| In thousands | December 31, 2024 | | December 31, 2023 |
| Operating Leases | | | |
| Other assets, non-current | $ | 23,913 | | | $ | 14,064 | |
| | | |
| Accrued liabilities and other | 11,598 | | | 9,975 | |
| Other long-term liabilities | 14,797 | | | 6,340 | |
| Total operating lease liabilities | $ | 26,395 | | | $ | 16,315 | |
| | | |
| Finance Leases | | | |
| Property and equipment, gross | $ | 170,144 | | | $ | 127,591 | |
| Accumulated depreciation | (63,278) | | | (37,612) | |
| Property and equipment, net | $ | 106,866 | | | $ | 89,979 | |
| | | |
| Debt, current | $ | 31,380 | | | $ | 22,636 | |
| Debt, non-current | 73,620 | | | 52,558 | |
| Total finance lease liabilities | $ | 105,000 | | | $ | 75,194 | |
| | | |
| Weighted Average Remaining Lease Term | | | |
| Weighted-average remaining lease term - finance leases | 2.12 | | 2.03 |
| Weighted-average remaining lease term - operating leases | 3.97 | | 5.19 |
| | | |
| Weighted Average Discount Rate | | | |
| Weighted-average discount rate - finance leases | 6.6 | % | | 6.1 | % |
| Weighted-average discount rate - operating leases | 6.2 | % | | 5.3 | % |
Minimum future lease payments under finance and operating leases with terms longer than one year are as follows:
| | | | | | | | | | | |
| As of December 31, 2024 (In thousands) | | | |
| Operating leases | | Finance leases |
| 2025 | $ | 11,841 | | | $ | 37,227 | |
| 2026 | 10,196 | | | 28,132 | |
| 2027 | 1,261 | | | 21,225 | |
| 2028 | 954 | | | 23,040 | |
| 2029 | 952 | | | 10,684 | |
| Thereafter | 4,625 | | | — | |
| Total | $ | 29,829 | | | $ | 120,308 | |
| Less: imputed interest | (3,434) | | | (15,308) | |
| Net lease obligation | $ | 26,395 | | | $ | 105,000 | |
Coeur Mining, Inc. and Subsidiaries
Notes to Consolidated Financial Statements
NOTE 8 – DEBT
| | | | | | | | | | | | | | | | | | | | | | | |
| | December 31, 2024 | | December 31, 2023 |
| In thousands | Current | | Non-Current | | Current | | Non-Current |
2029 Senior Notes, net(1) | $ | — | | | $ | 290,058 | | | $ | — | | | $ | 295,115 | |
Revolving Credit Facility(2) | — | | | 195,000 | | | — | | | 175,000 | |
| Finance lease obligations | 31,380 | | | 73,620 | | | 22,636 | | | 52,559 | |
| $ | 31,380 | | | $ | 558,678 | | | $ | 22,636 | | | $ | 522,674 | |
(1) Net of unamortized debt issuance costs of $3.1 million and $3.9 million at December 31, 2024 and December 31, 2023, respectively.
(2) Unamortized debt issuance costs of $3.4 million and $2.8 million at December 31, 2024 and December 31, 2023, respectively, included in Other Non-Current Assets.
2029 Senior Notes
In March 2021, the Company completed an offering of $375.0 million in aggregate principal amount of senior notes in a private placement conducted pursuant to Rule 144A and Regulation S under the Securities Act of 1933, as amended, for net proceeds of approximately $367.5 million (the “2029 Senior Notes”). The 2029 Senior Notes are governed by an Indenture dated as of March 1, 2021 (the “Indenture”), among the Company, as issuer, certain of the Company's subsidiaries named therein, as guarantors thereto (the “Guarantors”), and The Bank of New York Mellon, as trustee (the “Trustee”). The 2029 Senior Notes bear interest at a rate of 5.125% per year from the date of issuance. Interest on the 2029 Senior Notes is payable semi-annually in arrears on February 15 and August 15 of each year, commencing on August 15, 2021. The 2029 Senior Notes will mature on February 15, 2029 and are fully and unconditionally guaranteed by the Guarantors. As of February 15, 2024, the Company may redeem some or all of the 2029 Senior Notes at redemption prices set forth in the Indenture, together with accrued and unpaid interest.
The Indenture contains covenants that, among other things, limit the Company’s ability under certain circumstances to incur additional indebtedness, pay dividends or make other distributions or repurchase or redeem capital stock, prepay, redeem or repurchase certain debt, make loans and investments, create liens, sell, transfer or otherwise dispose of assets, enter into transactions with affiliates, enter into agreements restricting the Company's subsidiaries' ability to pay dividends and impose conditions on the Company’s ability to engage in mergers, consolidations and sales of all or substantially all of its assets. The Indenture also contains certain “Events of Default” (as defined in the Indenture) customary for indentures of this type. If an Event of Default has occurred and is continuing, the Trustee or the holders of not less than 25% in aggregate principal amount of the 2029 Senior Notes then outstanding may, and the Trustee at the request of the holders of not less than 25% in aggregate principal amount of the 2029 Senior Notes then outstanding shall, declare all unpaid principal of, premium, if any, and accrued interest on all the 2029 Senior Notes to be due and payable.
During the year ended December 31, 2024, the Company exchanged $5.9 million in aggregate principal amount of 2029 Senior Notes plus accrued interest for 1.8 million shares of its common stock. Based on the closing price of the Company’s common stock on the dates of the exchange, the exchanges resulted in a gain of $0.4 million on debt extinguishment.
Revolving Credit Facility
In September 2017, the Company entered into a senior secured revolving credit facility (“RCF”) pursuant to a credit agreement, dated as of September 29, 2017 (as subsequently amended, the “Credit Agreement”), by and among the Company, as borrower, certain subsidiaries of the Company, as guarantors, Bank of America, N.A., as administrative agent and Bank of America, N.A., Royal Bank of Canada, Bank of Montreal, Chicago Branch, the Bank of Nova Scotia and ING Capital LLC, as lenders with an original term of four years. Loans under the RCF bear interest at a rate equal to either a base rate plus a margin ranging from 1.00% to 1.75% or an adjusted LIBOR rate plus a margin ranging from 2.00% to 2.75%, as selected by the Company, in each case, with such margin determined in accordance with a pricing grid based upon the Company’s consolidated net leverage ratio as of the end of the applicable period. The RCF was subsequently amended in 2018, 2019, 2021, 2022, 2023 and 2024, including amendments to extend the term of the RCF, increase its capacity, add and remove lenders, modify restrictive covenants, and address other matters.
Coeur Mining, Inc. and Subsidiaries
Notes to Consolidated Financial Statements
On February 21, 2024, the Company entered into an agreement to extend and enhance the RCF (the “February 2024 Amendment”). The February 2024 Amendment, among other things, (1) extends the term of the RCF by approximately two years so that it now matures in February 2027, (2) increases the RCF to $400 million, (3) adds Fédération Des Caisses Desjardins Du Québec and National Bank of Canada as lenders on the RCF, (4) permits the Company to obtain one or more increases of the RCF in an aggregate amount of up to $100 million in incremental loans and commitments, subject to certain conditions, including obtaining commitments from relevant lenders to provide such increase, (5) allows for unencumbered domestic cash to be included in the calculation of the consolidated net leverage ratio, and (6) allows up to $15 million of non-capitalized underground mine development costs related to Silvertip to be excluded from the calculation of Consolidated EBITDA for purposes of the RCF.
The RCF is secured by substantially all of the assets of the Company and its U.S. subsidiaries, including the land, mineral rights and infrastructure at the Kensington, Rochester and Wharf mines as well as a pledge of the shares and other equity interests of certain of the Company’s subsidiaries. The Credit Agreement contains representations and warranties and affirmative and negative covenants that are usual and customary, including representations, warranties, and covenants that, among other things, restrict the ability of the Company and its subsidiaries to incur additional debt, incur or permit liens on assets, make investments and acquisitions, consolidate or merge with any other company, engage in asset sales and make dividends and distributions. The Credit Agreement requires the Company to meet certain financial covenants, including a senior secured leverage ratio, a consolidated net leverage ratio and a consolidated interest coverage ratio. Obligations under the RCF may be accelerated upon the occurrence of certain customary events of default.
At December 31, 2024, the Company had $195.0 million drawn at a weighted-average interest rate of 6.7%, $29.3 million in outstanding letters of credit and $175.7 million available under the RCF. Future borrowing may be subject to certain financial covenants.
Finance Lease Obligations
From time to time, the Company acquires mining equipment and facilities under finance lease agreements. In the year ended December 31, 2024, the Company entered into multiple new lease financing arrangements for mining equipment, primarily at Rochester for $54.3 million at a weighted average interest rate of 7.0%. Coeur secured a finance lease package for nearly $60.0 million in 2021, all of which has been funded as of December 31, 2024. This package was earmarked for planned equipment for the Rochester expansion project in 2022, 2023 and 2024 and has an interest rate of 5.2%. All finance lease obligations are recorded, upon lease inception, at the present value of future minimum lease payments. For more details, please see Note 7 -- Leases for additional qualitative and quantitative disclosures related to finance leasing arrangements.
Interest Expense
| | | | | | | | | | | | | | | | | | | | | |
| | | | Year Ended December 31, |
| In thousands | | | | | 2024 | | 2023 | | 2022 |
| 2029 Senior Notes | | | | | $ | 15,086 | | | $ | 17,288 | | | 19,219 | |
| Revolving Credit Facility | | | | | 26,749 | | | 17,752 | | | 8,503 | |
| Finance lease obligations | | | | | 4,844 | | | 3,762 | | | 5,084 | |
| Amortization of debt issuance costs | | | | | 2,360 | | | 2,709 | | | 2,052 | |
| Other obligations | | | | | 3,293 | | | 2,149 | | | 166 | |
| Capitalized interest | | | | | (1,056) | | | (14,561) | | | (11,163) | |
| Total interest expense, net of capitalized interest | | | | | $ | 51,276 | | | $ | 29,099 | | | $ | 23,861 | |
Coeur Mining, Inc. and Subsidiaries
Notes to Consolidated Financial Statements
NOTE 9 – RECLAMATION
Reclamation and mine closure costs are based principally on legal and regulatory requirements. Management estimates costs associated with reclamation of mining properties. On an ongoing basis, management evaluates its estimates and assumptions, and future expenditures could differ from current estimates. The estimated reclamation and mine closure costs were discounted using credit-adjusted, risk-free interest rates ranging from 6.7% to 9.6%. The asset retirement obligation increased in 2024 due to increased reclamation and mine closure costs associated with the continued build-out of the new leach pad at Rochester and the extended duration of water treatment as a result of new permitting requirements at Silvertip.
Changes to the Company’s asset retirement obligations for its operating sites are as follows:
| | | | | | | | | | | | | | | |
| | | Year Ended December 31, |
| In thousands | | | | | 2024 | | 2023 |
| Asset retirement obligation - Beginning | | | | | $ | 214,013 | | | $ | 202,431 | |
| Accretion | | | | | 16,778 | | | 16,405 | |
| Additions and changes to estimates | | | | | 35,455 | | | 991 | |
| | | | | | | |
| Settlements | | | | | (5,754) | | | (5,814) | |
| Asset retirement obligation - Ending | | | | | $ | 260,492 | | | $ | 214,013 | |
NOTE 10 – INCOME AND MINING TAXES
The components of Income (loss) before income taxes are below:
| | | | | | | | | | | | | | | | | |
| | Year Ended December 31, |
| In thousands | 2024 | | 2023 | | 2022 |
| United States | $ | 50,194 | | | $ | (107,021) | | | $ | (107,477) | |
| Foreign | 76,156 | | | 38,565 | | | 44,028 | |
| Total | $ | 126,350 | | | $ | (68,456) | | | $ | (63,449) | |
The components of the consolidated Income and mining tax (expense) benefit from continuing operations are below:
| | | | | | | | | | | | | | | | | |
| Year Ended December 31, |
| In thousands | 2024 | | 2023 | | 2022 |
| Current: | | | | | |
| United States | $ | (145) | | | $ | 981 | | | $ | (21) | |
| United States — State mining taxes | (11,256) | | | (7,047) | | | (2,936) | |
| United States — Foreign withholding tax | (33) | | | (119) | | | (300) | |
| Canada | (1,147) | | | (848) | | | (305) | |
| Mexico | (63,604) | | | (30,222) | | | (29,546) | |
| Other | — | | | — | | | — | |
| Deferred: | | | | | |
| United States | 149 | | | 305 | | | 215 | |
| United States — State mining taxes | (1,778) | | | (1,076) | | | 5,558 | |
| Canada | (376) | | | — | | | 254 | |
| Mexico | 10,740 | | | 2,870 | | | 12,423 | |
| Other | — | | | — | | | — | |
| Income tax (expense) benefit | $ | (67,450) | | | $ | (35,156) | | | $ | (14,658) | |
The Company’s Income and mining tax benefit (expense) differed from the amounts computed by applying the United States statutory corporate income tax rate for the following reasons:
Coeur Mining, Inc. and Subsidiaries
Notes to Consolidated Financial Statements
| | | | | | | | | | | | | | | | | |
| | Year Ended December 31, |
| In thousands | 2024 | | 2023 | | 2022 |
| Income and mining tax (expense) benefit at statutory rate | $ | (28,465) | | | $ | 14,376 | | | $ | 13,249 | |
| State tax provision from continuing operations | (149) | | | 4,859 | | | 2,871 | |
| Change in valuation allowance | 727 | | | (36,778) | | | (36,670) | |
| | | | | |
| Percentage depletion | 6,974 | | | 5,649 | | | 3,538 | |
| Uncertain tax positions | 2 | | | 6 | | | 655 | |
| U.S. and foreign permanent differences | (7,765) | | | (3,056) | | | 365 | |
| | | | | |
| Foreign exchange rates | 2,405 | | | 1,179 | | | (145) | |
| Foreign inflation and indexing | 2,322 | | | 3,077 | | | 2,897 | |
| Foreign tax rate differences | (8,923) | | | (3,911) | | | (4,994) | |
| Foreign withholding and other taxes | (8,307) | | | (1,381) | | | 169 | |
| Mining taxes | (26,901) | | | (16,884) | | | (11,239) | |
| Sale of non-core assets | — | | | (1,322) | | | 15,447 | |
| Enactment of 1% increase in Mexico special mining duty tax | (1,696) | | | — | | | — | |
| Other, net | 2,326 | | | (970) | | | (801) | |
| Income and mining tax (expense) benefit | $ | (67,450) | | | $ | (35,156) | | | $ | (14,658) | |
At December 31, 2024 and 2023, the significant components of the Company’s deferred tax assets and liabilities are below:
| | | | | | | | | | | |
| | Year Ended December 31, |
| In thousands | 2024 | | 2023 |
| Deferred tax liabilities: | | | |
| Property, plant, and equipment | $ | 5,529 | | | $ | — | |
| | $ | 5,529 | | | $ | — | |
| Deferred tax assets: | | | |
| Net operating loss carryforwards | $ | 304,244 | | | $ | 302,114 | |
| Mineral properties | 50,824 | | | 44,244 | |
| Property, plant, and equipment | — | | | 12,068 | |
| Mining royalty tax | 8,314 | | | 7,345 | |
| Capital loss carryforwards | 16,910 | | | 5,167 | |
| Asset retirement obligation | 49,306 | | | 45,155 | |
| | | |
| Accrued expenses | 18,117 | | | 25,321 | |
| Tax credit carryforwards | 13,620 | | | 14,506 | |
| Other long-term assets | 30,612 | | | 11,566 | |
| | $ | 491,947 | | | $ | 467,486 | |
| Valuation allowance | (490,044) | | | (479,846) | |
| | $ | 1,903 | | | $ | (12,360) | |
| Net deferred tax liabilities | $ | 3,626 | | | $ | 12,360 | |
A valuation allowance is provided for deferred tax assets for which it is more likely than not that the related tax benefits will not be realized. The Company analyzes its deferred tax assets and, if it is determined that the Company will not realize all or a portion of its deferred tax assets, it will record or increase a valuation allowance. Conversely, if it is determined that the Company will ultimately be more likely than not able to realize all or a portion of the related benefits for which a valuation allowance has been provided, all or a portion of the related valuation allowance will be reduced. There are a number of factors that impact the Company’s ability to realize its deferred tax assets. Based upon this analysis, the Company has recorded valuation allowances as follows:
Coeur Mining, Inc. and Subsidiaries
Notes to Consolidated Financial Statements
| | | | | | | | | | | | | |
| | Year Ended December 31, |
| In thousands | 2024 | | 2023 | | |
| U.S. | $ | 268,119 | | | $ | 262,059 | | | |
| Canada | 200,319 | | | 194,727 | | | |
| Mexico | 408 | | | 723 | | | |
| New Zealand | 21,013 | | | 22,229 | | | |
| Other | 185 | | | 108 | | | |
| | $ | 490,044 | | | $ | 479,846 | | | |
The Company has the following tax attribute carryforwards at December 31, 2024, by jurisdiction:
| | | | | | | | | | | | | | | | | | | | | | | | | | | | | | | | | | | | | | | | | | | |
| In thousands | U.S. | | Canada | | | | Mexico | | New Zealand | | Other | | Total | | | | | | |
| Regular net operating losses | $ | 614,873 | | | $ | 457,894 | | | | | $ | 1,913 | | | $ | 76,041 | | | $ | 814 | | | $ | 1,151,535 | | | | | | | |
| Expiration years | 2025-2037, Indefinite | | 2028-2044 | | | | 2029-2035 | | Indefinite | | 2025-2029 | | | | | | | | |
| Capital losses | 53,483 | | | 26,363 | | | | | — | | | — | | | — | | | 79,846 | | | | | | | |
| Foreign tax credits | 10,864 | | | — | | | | | — | | | — | | | — | | | 10,864 | | | | | | | |
As of December 31, 2024, for U.S. income tax purposes, the Company has federal and state net operating loss carryforwards of $614.9 million and $471.4 million, respectively. U.S. net operating loss carryforwards of $313.8 million arising before December 31, 2017 have a 20-year expiration period, the earliest of which could expire in 2025. U.S. net operating loss carryforwards of $301.1 million arising in 2018 and future periods have an indefinite carryforward period. Foreign tax credits expire if unused beginning in 2026.
The utilization of U.S. net operating loss carryforwards, tax credit carryforwards, and recognized built-in losses may be subject to limitation under the rules regarding a change in stock ownership as determined by the Internal Revenue Code and state tax laws. Section 382 of the Internal Revenue Code of 1986, as amended, imposes annual limitations on the utilization of net operating loss carryforwards, tax credit carryforwards, and certain built-in losses upon an ownership change as defined under that Section. Generally, an ownership change may result from transactions that increase the aggregate ownership of certain shareholders in the Company’s stock by more than 50 percentage points over a three-year testing period. If the Company experiences an ownership change, an annual limitation would be imposed on certain of the Company’s tax attributes, including net operating losses and certain other losses, credits, deductions or tax basis. Management has determined that the Company experienced ownership changes during 2002, 2003, 2007, and 2015 for purposes of Section 382. Based on management’s calculations, the Company does not expect any of its U.S. tax attributes to expire unused as a result of the Section 382 annual limitations. However, the annual limitations may impact the timeframe over which the net operating loss carryforwards can be used, potentially impacting cash tax liabilities in a future period. The U.S. federal tax credits and state net operating losses may potentially be limited as well. We continue to maintain a full valuation allowance on our U.S. net deferred tax assets since it is more likely than not that the related tax benefits will not be realized.
The Company may also experience ownership changes in the future as a result of subsequent shifts in our stock ownership. As a result, if the Company earns U.S. federal taxable income, it may be limited in the ability to (1) recognize current deductions on built-in loss assets and (2) offset this income with our pre-change net operating loss carryforwards and other tax credit carryforwards, which may be subject to limitations, potentially resulting in increased future tax liability to us. Under the Tax Cuts and Jobs Act of 2017 (“TCJA”), federal net operating losses incurred in 2018 and in future years may be carried forward indefinitely, but the deductibility of such federal net operating losses is limited to 80% of future taxable income.
The Company intends to continue repatriating certain earnings from its Mexican operations and has provided deferred income taxes on the planned distributions. Prior to 2023, the Company had asserted that earnings from its Mexican operations were indefinitely reinvested.
Coeur Mining, Inc. and Subsidiaries
Notes to Consolidated Financial Statements
A reconciliation of the beginning and ending amount related to unrecognized tax benefits is below (in thousands):
| | | | | |
| |
| |
| |
| |
| |
| |
| |
| |
| Unrecognized tax benefits at December 31, 2022 | $ | 4 | |
| Gross increase to current period tax positions | $ | — | |
| Gross increase to prior period tax positions | $ | 1 | |
| Reductions in unrecognized tax benefits resulting from a lapse of the applicable statute of limitations | $ | (3) | |
| Unrecognized tax benefits at December 31, 2023 | $ | 2 | |
| Gross increase to current period tax positions | $ | — | |
| Gross increase to prior period tax positions | $ | — | |
| Reductions in unrecognized tax benefits resulting from a lapse of the applicable statute of limitations | $ | (2) | |
| Unrecognized tax benefits at December 31, 2024 | $ | — | |
At December 31, 2024, 2023, and 2022, nil, $2 thousand, and $4 thousand, respectively, of these gross unrecognized benefits would, if recognized, decrease the Company’s effective tax rate.
The Company operates in numerous countries around the world and is subject to, and pays annual income taxes under, the various income tax regimes in the countries in which it operates. The Company has historically filed, and continues to file, all required income tax returns and paid the taxes reasonably determined to be due. The tax rules and regulations in many countries are highly complex and subject to interpretation. From time to time, the Company is subject to a review of its historic income tax filings and, in connection with such reviews, disputes can arise with the taxing authorities over the interpretation or application of certain rules to the Company’s business conducted within the country involved.
The Company files income tax returns in various U.S. federal and state jurisdictions, in all identified foreign jurisdictions, and various others. The statute of limitations remains open from 2021 for the U.S. federal jurisdiction, for 2016 and from 2019 for the Mexico federal jurisdiction, and from 2018 for certain other foreign jurisdictions. Our 2016 federal tax return is currently under audit in Mexico. As a result of statutes of limitations that will begin to expire within the next 12 months in various jurisdictions and possible settlement of audit-related issues with taxing authorities in various jurisdictions with respect to which none of these issues are individually significant, the Company believes that there will be no impact on its unrecognized income tax liability in the next 12 months.
The Company classifies interest and penalties associated with uncertain tax positions as a component of income tax expense and recognized interest and penalties of nil, nil, and nil at December 31, 2024, 2023, and 2022, respectively.
In 2021, the Organization for Economic Co-operation and Development (OECD) published Pillar Two Model Rules defining a global minimum tax, which calls for the taxation of large corporations at a minimum rate of 15%. The OECD has since issued administrative guidance providing transition and safe harbor rules around the implementation of the Pillar Two global minimum tax. Effective January 1, 2024, a number of countries have proposed or enacted legislation to implement core elements of the Pillar Two proposal. The Company’s worldwide revenues did not exceed the thresholds necessary to be subject to the Pillar Two rules during its year ended December 31, 2024.
After considering 2025 business expansions, including the planned Q1 2025 closing of acquisition of SilverCrest Metals Inc., the Company may fall within the scope of the Pillar Two rules as of January 1, 2025. The Company will continue to monitor developments and evaluate the potential impact on future periods. At this time, because the Company primarily does business in jurisdictions with a tax rate greater than 15%, the Company does not anticipate a material future impact to its Consolidated Financial Statements.
NOTE 11 – STOCK-BASED COMPENSATION
The Company has stock incentive plans for executives and eligible employees. Stock awards include restricted stock, performance shares and stock options. Stock-based compensation expense for the years ended December 31, 2024, 2023, and 2022 was $12.0 million, $11.4 million and $10.0 million, respectively. At December 31, 2024, there was $8.9 million of unrecognized stock-based compensation cost which is expected to be recognized over a weighted-average remaining vesting period of 1.6 years.
Coeur Mining, Inc. and Subsidiaries
Notes to Consolidated Financial Statements
Restricted Stock
Restricted stock granted under the Company’s incentive plans is accounted for based on the market value of the underlying shares on the date of grant and generally vests in equal installments annually over three years. Restricted stock awards are accounted for as equity awards. Holders of restricted stock are entitled to vote and to receive any dividends declared on the shares.
The following table summarizes restricted stock activity for the years ended December 31, 2024, 2023, and 2022:
| | | | | | | | | | | | | | | |
| | Restricted Stock | | |
| Number of
Shares | | Weighted
Average
Grant Date
Fair Value | | | | |
| | | | | | | |
| | | | | | | |
| | | | | | | |
| | | | | | | |
| | | | | | | |
| | | | | | | |
| | | | | | | |
| | | | | | | |
| | | | | | | |
| | | | | | | |
| | | | | | | |
| | | | | | | |
| | | | | | | |
| | | | | | | |
| | | | | | | |
| | | | | | | |
| | | | | | | |
| | | | | | | |
| | | | | | | |
| | | | | | | |
| | | | | | | |
| | | | | | | |
| | | | | | | |
| | | | | | | |
| Outstanding at December 31, 2021 | 2,144,804 | | | $ | 6.60 | | | | | |
| Granted | 2,056,121 | | | 4.07 | | | | | |
| Vested | (1,114,513) | | | 6.08 | | | | | |
| Canceled/Forfeited | (301,802) | | | 5.74 | | | | | |
| Outstanding at December 31, 2022 | 2,784,610 | | | $ | 5.05 | | | | | |
| Granted | 3,251,765 | | | 2.94 | | | | | |
| Vested | (1,381,246) | | | 5.09 | | | | | |
| Canceled/Forfeited | (680,710) | | | 3.66 | | | | | |
| Outstanding at December 31, 2023 | 3,974,419 | | | $ | 3.54 | | | | | |
| Granted | 3,129,255 | | | 2.66 | | | | | |
| Vested | (1,576,652) | | | 4.11 | | | | | |
| Canceled/Forfeited | (308,396) | | | 2.82 | | | | | |
| Outstanding at December 31, 2024 | 5,218,626 | | | $ | 2.89 | | | | | |
At December 31, 2024, there was $4.5 million of unrecognized compensation cost related to restricted stock awards to be recognized over a weighted-average period of 1.3 years.
Performance Shares
Performance shares granted under the Company’s incentive plans are accounted for as equity awards at fair value using a Monte Carlo simulation valuation model. Performance shares granted will vest at the end of a three-year service period if internal performance metrics are met, with the number of shares vesting impacted by the inclusion of a modifier based upon a relative stockholder return metric. The relative stockholder return metric is included in the determination of the grant date fair value of the performance shares; however, the recognition of compensation cost for performance share awards is based on the results of the internal performance metrics.
Coeur Mining, Inc. and Subsidiaries
Notes to Consolidated Financial Statements
The following table summarizes performance shares activity for the years ended December 31, 2024, 2023, and 2022:
| | | | | | | | | | | | | | | |
| | Performance Shares | | |
| Number of
Shares | | Weighted
Average
Grant Date
Fair Value | | | | |
| | | | | | | |
| | | | | | | |
| | | | | | | |
| | | | | | | |
| | | | | | | |
| | | | | | | |
| | | | | | | |
| | | | | | | |
| | | | | | | |
| | | | | | | |
| | | | | | | |
| | | | | | | |
| | | | | | | |
| | | | | | | |
| | | | | | | |
| | | | | | | |
| | | | | | | |
| | | | | | | |
| | | | | | | |
| | | | | | | |
| | | | | | | |
| | | | | | | |
| | | | | | | |
| Outstanding at December 31, 2021 | 2,390,013 | | | $ | 5.80 | | | | | |
Granted (1) | 1,325,418 | | | 4.53 | | | | | |
| Vested | (824,064) | | | 5.54 | | | | | |
Canceled/Forfeited (1) | (316,830) | | | 6.11 | | | | | |
| Outstanding at December 31, 2022 | 2,574,537 | | | $ | 5.26 | | | | | |
Granted (2) | 1,816,429 | | | 3.16 | | | | | |
| Vested | (566,891) | | | 4.00 | | | | | |
Canceled/Forfeited (2) | (664,165) | | | 4.32 | | | | | |
| Outstanding at December 31, 2023 | 3,159,910 | | | $ | 4.52 | | | | | |
Granted (3) | 2,076,818 | | | 2.85 | | | | | |
| Vested | (379,402) | | | 8.30 | | | | | |
Canceled/Forfeited (3) | (215,814) | | | 8.55 | | | | | |
| Outstanding at December 31, 2024 | 4,641,512 | | | $ | 3.24 | | | | | |
(1) Includes 175,828 additional shares granted in connection with the vesting of the 2019 award in 2022 due to above-target in accordance with the terms of the award.
(2) Includes 26,200 additional shares granted and 468,393 shares cancelled in connection with the vesting of the 2020 award in 2023 due to above-target and below target performance, respectively, in accordance with the terms of the award.
(3) Includes 22,351 additional shares granted and 187,809 shares cancelled in connection with the vesting of the 2021 award in 2024 due to above-target and below target performance, respectively, in accordance with the terms of the award.
At December 31, 2024, there was $4.4 million of unrecognized compensation cost related to performance shares to be recognized over a weighted average period of 1.8 years.
Stock Options
Stock options granted under the Company’s incentive plans generally vest over three years and are exercisable over a period not to exceed ten years from the grant date. The exercise price of stock options is equal to the fair market value of the shares on the date of the grant. The value of each stock option award is estimated using the Black-Scholes option pricing model. Stock options are accounted for as equity awards.
The following table summarizes stock option activity for the years ended December 31, 2024, 2023, and 2022:
| | | | | | | | | | | | | | | |
| | Stock Options | | |
| Shares | | Weighted
Average
Exercise
Price | | | | |
| | | | | | | |
| | | | | | | |
| | | | | | | |
| | | | | | | |
| | | | | | | |
| | | | | | | |
| | | | | | | |
| | | | | | | |
| | | | | | | |
| | | | | | | |
| | | | | | | |
| | | | | | | |
| | | | | | | |
| | | | | | | |
| | | | | | | |
| | | | | | | |
| | | | | | | |
| | | | | | | |
| | | | | | | |
| | | | | | | |
| | | | | | | |
| | | | | | | |
| | | | | | | |
| | | | | | | |
| Outstanding at December 31, 2021 | 131,253 | | | $ | 16.91 | | | | | |
| | | | | | | |
| Canceled/forfeited | (5,598) | | | 11.88 | | | | | |
| Expired | (31,667) | | | 25.19 | | | | | |
| Outstanding at December 31, 2022 | 93,988 | | | $ | 14.41 | | | | | |
| Canceled/forfeited | — | | | — | | | | | |
| Expired | (39,658) | | | 23.90 | | | | | |
| Outstanding at December 31, 2023 | 54,330 | | | $ | 7.49 | | | | | |
| Canceled/forfeited | (10,908) | | | 9.31 | | | | | |
| Exercised | (14,292) | | | 5.57 | | | | | |
| Outstanding at December 31, 2024 | 29,130 | | | $ | 7.75 | | | | | |
Coeur Mining, Inc. and Subsidiaries
Notes to Consolidated Financial Statements
The following table summarizes outstanding stock options as of December 31, 2024:
| | | | | | | | | | | | | | | | | | | | | | | | | | | | |
| | | | |
Range of
Exercise Price | Number
Outstanding | | Weighted Average
Exercise
Price | | Weighted
Average
Remaining
Contractual
Life (Years) | | Aggregate Intrinsic Value (in thousands) | | | | | |
| $ 0.00-$10.00 | 29,130 | | | $ | 7.75 | | | 2.8 | | — | | | | | | |
| Outstanding | 29,130 | | | $ | 7.75 | | | 2.8 | | $ | — | | | | | | |
| Vested and expected to vest | 29,130 | | | $ | 7.75 | | | 2.8 | | $ | — | | | | | | |
| Exercisable | 29,130 | | | $ | 7.75 | | | 2.8 | | $ | — | | | | | | |
The total intrinsic value of options exercised for the year ended December 31, 2024 was $6 thousand. Cash received from options exercised for the year ended December 31, 2024 was $0.1 million and there was no related tax benefit. The grant date fair value for stock options vested during the years ended December 31, 2024, 2023, and 2022 was nil.
NOTE 12 – FAIR VALUE MEASUREMENTS
| | | | | | | | | | | | | | | | | | | | | |
| | | | Year Ended December 31, |
| In thousands | | | | | 2024 | | 2023 | | 2022 |
Change in the value of equity securities(1) | | | | | $ | — | | | $ | 3,384 | | | $ | (63,529) | |
| | | | | | | | | |
| Termination of gold zero cost collars | | | | | — | | | — | | | (3,139) | |
| Fair value adjustments, net | | | | | $ | — | | | $ | 3,384 | | | $ | (66,668) | |
(1) Includes unrealized losses on held equity securities of nil, nil and $47.9 million for the years ended December 31, 2024, 2023 and 2022, respectively.Accounting standards establish a fair value hierarchy that prioritizes the inputs to valuation techniques used to measure fair value. The hierarchy gives the highest priority to unadjusted quoted prices in active markets for identical assets or liabilities (Level 1), secondary priority to quoted prices in inactive markets or observable inputs (Level 2), and the lowest priority to unobservable inputs (Level 3).
The following table presents the Company’s financial assets and liabilities measured at fair value on a recurring basis (at least annually) by level within the fair value hierarchy. Assets and liabilities are classified in their entirety based on the lowest level of input that is significant to the fair value measurement:
| | | | | | | | | | | | | | | | | | | | | | | |
| | Fair Value at December 31, 2024 |
| In thousands | Total | | Level 1 | | Level 2 | | Level 3 |
| Assets: | | | | | | | |
| | | | | | | |
| Provisional metal sales contracts | $ | 222 | | | $ | — | | | $ | 222 | | | $ | — | |
| | | | | | | |
| | | | | | | |
| | | | | | | |
| Liabilities: | | | | | | | |
| Provisional metal sales contracts | $ | 70 | | | $ | — | | | $ | 70 | | | $ | — | |
| | | | | | | |
| | | | | | | |
| | | | | | | | | | | | | | | | | | | | | | | |
| | Fair Value at December 31, 2023 |
| In thousands | Total | | Level 1 | | Level 2 | | Level 3 |
| Assets: | | | | | | | |
| Provisional metal sales contracts | $ | 318 | | | $ | — | | | $ | 318 | | | $ | — | |
| Silver forwards | 3,312 | | | — | | | 3,312 | | | — | |
| $ | 3,630 | | | $ | — | | | $ | 3,630 | | | $ | — | |
| Liabilities: | | | | | | | |
| Gold forwards | $ | 1,981 | | | $ | — | | | $ | 1,981 | | | $ | — | |
The Company’s provisional metal sales contracts include concentrate and certain doré sales contracts that are valued using pricing models with inputs derived from observable market data, including forward market prices.
The Company’s gold and silver forward contracts are valued using pricing models with inputs derived from observable market data, including forward market prices, yield curves, and credit spreads.
No assets or liabilities were transferred between fair value levels in the year ended December 31, 2024.
Coeur Mining, Inc. and Subsidiaries
Notes to Consolidated Financial Statements
The fair value of financial assets and liabilities carried at book value in the financial statements at December 31, 2024 and December 31, 2023 is presented in the following table:
| | | | | | | | | | | | | | | | | | | | | | | | | | | | | |
| | December 31, 2024 |
| In thousands | Book Value | | Fair Value | | Level 1 | | Level 2 | | Level 3 |
| | | | | | | | | |
| | | | | | | | | |
| Liabilities: | | | | | | | | | |
2029 Senior Notes(1) | $ | 290,058 | | | $ | 278,014 | | | $ | — | | | $ | 278,014 | | | $ | — | |
Revolving Credit Facility(2) | $ | 195,000 | | | $ | 195,000 | | | $ | — | | | $ | 195,000 | | | $ | — | |
| Deferred Cash Due 2025 | $ | 9,644 | | | $ | 9,673 | | | $ | — | | | $ | 9,673 | | | $ | — | |
| Deferred Cash Due 2026 | $ | 4,505 | | | $ | 4,533 | | | $ | — | | | $ | 4,533 | | | $ | — | |
(1) Net of unamortized debt issuance costs of $3.1 million.
(2) Unamortized debt issuance costs of $3.4 million included in Other Non-Current Assets.
| | | | | | | | | | | | | | | | | | | | | | | | | | | | | |
| | December 31, 2023 |
| In thousands | Book Value | | Fair Value | | Level 1 | | Level 2 | | Level 3 |
| Liabilities: | | | | | | | | | |
2029 Senior Notes(1) | $ | 295,115 | | | $ | 271,272 | | | $ | — | | | $ | 271,272 | | | $ | — | |
Revolving Credit Facility(2) | $ | 175,000 | | | $ | 175,000 | | | $ | — | | | $ | 175,000 | | | $ | — | |
(1) Net of unamortized debt issuance costs of $3.9 million.
(2) Unamortized debt issuance costs of $2.8 million included in Other Non-Current Assets.
The fair value of the 2029 Senior Notes was estimated using quoted market prices. The fair value of the RCF approximates book value as the liability is secured, has a variable interest rate, and lacks significant credit concerns.
In July 2024, the Company completed the purchase of the Fresnillo mining concessions. Total consideration includes a cash payment of $10 million paid at closing, the Deferred Cash Due 2025 of $10 million, and the Deferred Cash Due 2026 of $5 million. The fair value of the Deferred Cash Due 2025 and Deferred Cash Due 2026 was estimated using the pricing model with inputs derived from observable and unobservable data, including yield curves and credit spreads. The model inputs can generally be verified and do not involve significant management judgment. Such instruments are classified within Level 2 of the fair value hierarchy.
NOTE 13 – DERIVATIVE FINANCIAL INSTRUMENTS & HEDGING ACTIVITIES
The Company is exposed to various market risks, including the effect of changes in metal prices, foreign currency exchange rates and interest rates, and uses derivatives to manage financial exposures that occur in the normal course of business. Derivative gains and losses are included in operating cash flows in the period in which they contractually settle. The Company does not hold or issue derivatives for trading or speculative purposes.
The Company may elect to designate certain derivatives as hedging instruments under U.S. GAAP. The Company formally documents all relationships between designated hedging instruments and hedged items as well as its risk management objectives and strategies for undertaking hedge transactions. This process includes linking all derivatives designated as hedges to either recognized assets or liabilities or forecasted transactions and assessing, both at inception and on an ongoing basis, the effectiveness of the hedging relationships.
Derivatives Designated as Cash Flow Hedging Strategies
To protect the Company’s exposure to fluctuations in metal prices, particularly during times of elevated capital expenditures, the Company has entered into forward contracts. The contracts were net settled monthly, and if the actual price of gold or silver at the time of expiration is lower than the fixed price or higher than the fixed price, it resulted in a realized gain or loss, respectively. The Company elected to designate these instruments as cash flow hedges of forecasted transactions at their inception. At December 31, 2024, the Company had no outstanding derivative cash flow hedge instruments.
The effective portions of cash flow hedges were recorded in Accumulated other comprehensive income (loss) (“AOCI”) until the hedged item was recognized in earnings. Deferred gains and losses associated with cash flow hedges of metal sales revenue were recognized as a component of Revenue in the same period as the related sale is recognized.
At inception, the Company performed an assessment of the forecasted transactions and the hedging instruments and determined that the hedging relationships are considered perfectly effective. Future assessments are performed to verify that critical terms of the hedging instruments and the forecasted transactions continue to match, and the forecasted transactions
Coeur Mining, Inc. and Subsidiaries
Notes to Consolidated Financial Statements
remain probable, as well as an assessment of any adverse developments regarding the risk of the counterparties defaulting on their commitments. There were no such changes in critical terms or adverse developments.
The following summarizes the classification of the fair value of the derivative instruments designated as cash flow hedges:
| | | | | | | | | | | | | | | | | |
| | December 31, 2024 |
| In thousands | Prepaid expenses and other | | Other assets | | Accrued liabilities and other |
| Gold forwards | $ | — | | | $ | — | | | $ | — | |
| Silver forwards | $ | — | | | $ | — | | | $ | — | |
| | | | | | | | | | | | | | | | | |
| | December 31, 2023 |
| In thousands | Prepaid expenses and other | | Other assets | | Accrued liabilities and other |
| Gold forwards | $ | — | | | $ | — | | | $ | 1,981 | |
| Silver forwards | $ | 3,312 | | | $ | — | | | $ | — | |
The following table sets forth the after-tax gains (losses) on derivatives designated as cash flow hedges that have been included in AOCI and the Consolidated Statement of Comprehensive Income (Loss) for the years ended December 31, 2024 and 2023, respectively (in thousands):
| | | | | | | | | | | | | | | | | | | | | |
| | | Year Ended December 31, |
| | | | | 2024 | | 2023 | | 2022 |
| Amount of Gain (Loss) Recognized in AOCI | | | | | | | | | |
| Gold forwards | | | | | $ | (10,886) | | | $ | (10,627) | | | $ | 42,043 | |
| Silver forwards | | | | | (7,621) | | | 10,309 | | | — | |
| Gold zero cost collars | | | | | — | | | — | | | (4,598) | |
| | | | | | | | | |
| | | | | $ | (18,507) | | | $ | (318) | | | $ | 37,445 | |
| | | | | | | | | |
| Amount of (Gain) Loss Reclassified from AOCI to Earnings | | | | | | | | | |
| Gold forwards | | | | | $ | 12,867 | | | $ | (3,697) | | | $ | (28,488) | |
| Silver forwards | | | | | 4,309 | | | (6,997) | | | — | |
| Gold zero cost collars | | | | | — | | | — | | | 4,598 | |
| | | | | | | | | |
| | | | | $ | 17,176 | | | $ | (10,694) | | | $ | (23,890) | |
Derivatives Not Designated as Hedging Instruments
Provisional Metal Sales
The Company enters into sales contracts with third-party smelters, refiners and off-take customers which, in some cases, provide for a provisional payment based upon preliminary assays and quoted metal prices. The provisionally priced sales contracts contain an embedded derivative that is required to be separated from the host contract for accounting purposes. The host contract is the receivable recorded at the forward price at the time of sale. The embedded derivatives do not qualify for hedge accounting and are marked to market through earnings each period until final settlement.
At December 31, 2024, the Company had the following derivative instruments that settle as follows:
| | | | | | | | | | | |
| In thousands except average prices and notional ounces | 2025 | | 2026 and Thereafter |
| Provisional gold sales contracts | $ | 37,451 | | | $ | — | |
| Average gold price per ounce | $ | 2,642 | | | $ | — | |
| Notional ounces | 14,173 | | | — | |
The following summarizes the classification of the fair value of the derivative instruments:
| | | | | | | | | | | | | | | | | |
| | December 31, 2024 | | | | | | |
| In thousands | Prepaid expenses and other | | Accrued liabilities and other | | | | | | |
| Provisional metal sales contracts | $ | 222 | | | $ | 70 | | | | | | | |
Coeur Mining, Inc. and Subsidiaries
Notes to Consolidated Financial Statements
| | | | | | | | | | | | | | | | | |
| | December 31, 2023 |
| In thousands | Prepaid expenses and other | | Accrued liabilities and other | | | | | | |
| Provisional metal sales contracts | $ | 318 | | | $ | — | | | | | | | |
The following represent mark-to-market gains (losses) on derivative instruments in the years ended December 31, 2024 and 2023, respectively (in thousands):
| | | | | | | | | | | | | | | | | | | | | | | | |
| | | | Year Ended December 31, |
| Financial statement line | Derivative | | | | | 2024 | | 2023 | | 2022 |
| Revenue | Provisional metal sales contracts | | | | | $ | (166) | | | $ | 30 | | | $ | 365 | |
| | | | | | | | | | |
| Fair value adjustments, net | Terminated zero cost collars | | | | | — | | | — | | | (3,139) | |
| | | | | | $ | (166) | | | $ | 30 | | | $ | (2,774) | |
Credit Risk
The credit risk exposure related to any derivative instrument is limited to the unrealized gains, if any, on outstanding contracts based on current market prices. To reduce counter-party credit exposure, the Company enters into contracts with institutions management deems credit-worthy and limits credit exposure to each institution. The Company does not anticipate non-performance by any of its counterparties.
NOTE 14 – ADDITIONAL COMPREHENSIVE INCOME (LOSS) DETAIL
Pre-development, reclamation, and other consists of the following:
| | | | | | | | | | | | | | | | | | | | | |
| | | | Year Ended December 31, |
| In thousands | | | | | 2024 | | 2023 | | 2022 |
| Silvertip ongoing carrying costs | | | | | $ | 8,513 | | | $ | 15,616 | | | 20,963 | |
| Loss on sale of assets | | | | | 4,250 | | | 12,879 | | | (640) | |
| Asset retirement accretion | | | | | 16,778 | | | 16,405 | | | 14,232 | |
Kensington royalty settlement(1) | | | | | 7,156 | | | — | | | — | |
| Transaction costs | | | | | 8,517 | | | — | | | — | |
| Other | | | | | 6,059 | | | 9,736 | | | 6,092 | |
| Pre-development, reclamation and other | | | | | $ | 51,273 | | | $ | 54,636 | | | $ | 40,647 | |
(1) See Note 17 -- Commitments and Contingencies for additional details on the Kensington royalty settlement.
Other, net consists of the following:
| | | | | | | | | | | | | | | | | | | | | |
| | | | Year Ended December 31, |
| In thousands | | | | | 2024 | | 2023 | | 2022 |
| Foreign exchange gain (loss) | | | | | $ | 4,753 | | | $ | (459) | | | $ | (850) | |
| Loss on dispositions | | | | | — | | | (12,318) | | | 63,789 | |
| Flow-through shares | | | | | 5,563 | | | 2,057 | | | — | |
| RMC bankruptcy distribution | | | | | 1,294 | | | 1,516 | | | 1,651 | |
| Other | | | | | 1,417 | | | 1,741 | | | 1,741 | |
| Other, net | | | | | $ | 13,027 | | | $ | (7,463) | | | $ | 66,331 | |
NOTE 15 – NET INCOME (LOSS) PER SHARE
Basic net income (loss) per share is computed by dividing net income (loss) available to common stockholders by the weighted average number of shares of the Company’s common stock outstanding during the period. Diluted net income (loss) per share reflects the potential dilution that would occur if securities or other contracts to issue common stock were exercised or converted into common stock.
For the years ended December 31, 2024, 2023 and 2022, there were 61,467, 1,777,273 and 952,664 common stock equivalents, respectively, related to equity-based awards that were not included in the diluted earnings per share calculation as
Coeur Mining, Inc. and Subsidiaries
Notes to Consolidated Financial Statements
the shares would be antidilutive.
| | | | | | | | | | | | | | | | | | | | | |
| | | Year ended December 31, |
| In thousands except per share amounts | | | | | 2024 | | 2023 | | 2022 |
| | | | | | | | | |
| | | | | | | | | |
| | | | | | | | | |
| | | | | | | | | |
| Net income (loss) available to common stockholders | | | | | $ | 58,900 | | | $ | (103,612) | | | $ | (78,107) | |
| | | | | | | | | |
| Weighted average shares: | | | | | | | | | |
| Basic | | | | | 391,709 | | | 343,059 | | | 275,178 | |
| Effect of stock-based compensation plans | | | | | 5,713 | | | — | | | — | |
| Diluted | | | | | 397,422 | | | 343,059 | | | 275,178 | |
| | | | | | | | | |
| Income (loss) per share: | | | | | | | | | |
| | | | | | | | | |
| | | | | | | | | |
| Basic | | | | | $ | 0.15 | | | $ | (0.30) | | | $ | (0.28) | |
| | | | | | | | | |
| | | | | | | | | |
| | | | | | | | | |
| | | | | | | | | |
| Diluted | | | | | $ | 0.15 | | | $ | (0.30) | | | $ | (0.28) | |
On February 26, 2024, the Company entered into subscription agreements (the “Subscription Agreements”) with certain Canadian accredited investors (the “Investors”) for a private placement offering (the “Private Placement Offering”) of an aggregate of 7,704,725 shares of common stock, par value $0.01 per share, to be issued as “flow-through shares,” as defined in subsection 66(15) of the Income Tax Act (Canada) (the “FT Shares”), which closed on March 8, 2024. The proceeds of the Private Placement Offering are used for certain qualifying “Canadian Exploration Expenditures” (as such term is defined in the Income Tax Act (Canada)) at the Company’s Silvertip exploration project. The initial Private Placement Offering raised net proceeds of $23.7 million, of which $0.9 million represents net proceeds received in excess of the Company’s trading price (“FT Premium Liability”). During the year ended December 31, 2024, the Company recognized the remaining FT Premium Liability associated with the prior year private placement offering of flow-through shares resulting in income of $5.6 million included in Other, net. The FT Premium Liability is included in Accrued liabilities and other on the Consolidated Balance Sheet and will decrease in subsequent periods as certain qualifying “Canadian Exploration Expenditures” are incurred.
The FT Shares were not registered under the Securities Act and were offered and sold outside the United States to accredited investors in reliance on Regulation S and/or Regulation D of the Securities Act.
NOTE 16 - SUPPLEMENTAL GUARANTOR INFORMATION
The following summarized financial information is presented to satisfy disclosure requirements of Rule 13-01 of Regulation S-X resulting from the guarantees by Coeur Alaska, Inc., Coeur Explorations, Inc., Coeur Rochester, Inc., Coeur South America Corp., Wharf Resources (U.S.A.), Inc. and its subsidiaries, Coeur Capital, Inc., Sterling Intermediate Holdco, Inc., and Coeur Sterling Holdings LLC (collectively, the “Subsidiary Guarantors”) of the 2029 Senior Notes. The following schedules present summarized financial information of (a) Coeur, the parent company, and (b) the Subsidiary Guarantors (collectively the “Obligor Group”). The summarized financial information of the Obligor Group is presented on a combined basis with intercompany balances and transactions between entities in the Obligor Group eliminated. The Obligor Group’s amounts due from, amounts due to and transactions with certain wholly-owned domestic and foreign subsidiaries of the Company have been presented in separate line items, if they are material. Each of the Subsidiary Guarantors is 100% owned by Coeur and the guarantees are full and unconditional and joint and several obligations. There are no restrictions on the ability of Coeur to obtain funds from the Subsidiary Guarantors by dividend or loan.
SUMMARIZED BALANCE SHEET
| | | | | | | | | | | | | | | | | | | | | | | |
| Coeur Mining, Inc. | | Subsidiary Guarantors |
| In thousands | December 31, 2024 | | December 31, 2023 | | December 31, 2024 | | December 31, 2023 |
| Current assets | $ | 13,782 | | | $ | 19,850 | | | $ | 164,627 | | | $ | 143,170 | |
Non-current assets(1) | $ | 516,209 | | | $ | 393,773 | | | $ | 1,483,632 | | | $ | 1,286,135 | |
| Non-guarantor intercompany assets | $ | 3,144 | | | $ | — | | | $ | — | | | $ | — | |
| | | | | | | |
| Current liabilities | $ | 31,841 | | | $ | 27,836 | | | $ | 202,329 | | | $ | 198,262 | |
| Non-current liabilities | $ | 496,976 | | | $ | 478,488 | | | $ | 260,210 | | | $ | 203,405 | |
| Non-guarantor intercompany liabilities | $ | 2,642 | | | $ | 6,033 | | | $ | 1,570 | | | $ | 1,591 | |
(1) Coeur Mining, Inc.’s non-current assets includes its investment in Guarantor Subsidiaries.
Coeur Mining, Inc. and Subsidiaries
Notes to Consolidated Financial Statements
SUMMARIZED STATEMENTS OF INCOME
YEAR ENDED DECEMBER 31, 2024
| | | | | | | | | | | | | | | | | |
| In thousands | Coeur Mining, Inc. | | Subsidiary Guarantors | | | | | | |
| Revenue | $ | — | | | $ | 674,946 | | | | | | | |
| | | | | | | | | |
| | | | | | | | | |
| Gross profit (loss) | $ | (780) | | | $ | 188,232 | | | | | | | |
| | | | | | | | | |
| | | | | | | | | |
| | | | | | | | | |
| | | | | | | | | |
| | | | | | | | | |
| | | | | | | | | |
| | | | | | | | | |
| | | | | | | | | |
| | | | | | | | | |
| | | | | | | | | |
| | | | | | | | | |
| | | | | | | | | |
| | | | | | | | | |
| | | | | | | | | |
| | | | | | | | | |
| | | | | | | | | |
| | | | | | | | | |
| | | | | | | | | |
| Net income (loss) | $ | 58,900 | | | $ | 122,655 | | | | | | | |
| | | | | | | | | |
| | | | | | | | | |
| | | | | | | | | |
| | | | | | | | | |
| | | | | | | | | |
| | | | | | | | | |
NOTE 17 – COMMITMENTS AND CONTINGENCIES
Mexico Litigation Matters
As of December 31, 2024, $26.0 million in principal is due from the Mexican government associated with amounts that were paid as VAT under Coeur Mexicana, S.A. de C.V.’s (“Coeur Mexicana’s”) prior royalty agreement with a subsidiary of Franco-Nevada Corporation, which was terminated in 2016. Coeur Mexicana applied for and initially received refunds in the normal course of these amounts paid as VAT associated with the royalty payments; however, in 2011 the Mexican tax authorities began denying refunds of these amounts based on the argument that VAT was not legally due on the royalty payments. Accordingly, Coeur Mexicana began to request refunds of these amounts paid as VAT as undue payments, which the Mexican tax authorities also denied. The Company has since been engaged in ongoing efforts to recover these amounts from the Mexican government (including through refiling refund requests as undue payments rather than refunds of VAT that were due, litigation and international arbitration). Despite a favorable ruling from Mexican tax courts in this matter in 2018, litigation of the matter continued at the Mexican administrative, appeals court and supreme court levels for several years, most of which was determined unfavorably to Coeur based on interpretations of applicable law and prior court decisions which the Company and its counsel believe are contrary to legal precedent, conflicting and erroneous. While the Company believes that it remains legally entitled to be refunded the full amount of the receivable and intends to rigorously continue its recovery efforts, based on the continued failure to recover the receivable and unfavorable Mexican court decisions, the Company determined to write down the carrying value of the receivable at September 30, 2021. Coeur has initiated an arbitration proceeding under Chapter 11 of the North American Free Trade Agreement, or NAFTA, to pursue recovery of the unduly paid VAT plus interest and other damages. Outcomes in NAFTA arbitration and the process for recovering funds even if there is a successful outcome in NAFTA arbitration can be lengthy and unpredictable.
Palmarejo Gold Stream
Coeur Mexicana currently sells 50% of Palmarejo gold production (excluding production from certain properties acquired in 2015 and 2024) to a subsidiary of Franco-Nevada Corporation (“Franco-Nevada”) under a gold stream agreement for the lesser of $800 or spot price per ounce (“Franco-Nevada Gold Stream Agreement”). The Franco-Nevada Gold Stream Agreement supersedes an earlier arrangement made in January 2009 in which Franco-Nevada purchased a royalty covering 50% of the gold produced by Coeur Mexicana from its Palmarejo silver and gold mine in Mexico in exchange for total consideration of $78.0 million, consisting of $75.0 million in cash plus a warrant to acquire Franco-Nevada Common Shares that was then-valued at $3.0 million (the “Prior Gold Stream Agreement”). The Prior Gold Stream Agreement was terminated in 2014 and its minimum ounce delivery requirement satisfied in 2016, after which sales under the Franco-Nevada Gold Stream Agreement commenced. Under the Franco-Nevada Gold Stream Agreement, Coeur Mexicana received a $22.0 million deposit toward future deliveries. In accordance with generally accepted accounting principles, although Coeur Mexicana has satisfied its contractual obligation to repay the deposit to Franco-Nevada, the deposit is accounted for as deferred revenue and is recognized as revenue on a units-of-production basis as ounces are sold to Franco-Nevada. Because there is no minimum obligation associated with the deposit, it is not considered a financing, and each shipment is considered to be a separate performance obligation. The stream agreement represents a contract liability under ASC 606, which requires the Company to ratably recognize a portion of the deposit as revenue for each gold ounce delivered to Franco-Nevada. The remaining unamortized balance is included in Accrued liabilities and other and Other long-term liabilities on the Consolidated Balance Sheet.
The following table presents a roll forward of the Franco-Nevada contract liability balance:
Coeur Mining, Inc. and Subsidiaries
Notes to Consolidated Financial Statements
| | | | | | | | | | | | | | | | | | | | | |
| | | Year Ended December 31, |
| In thousands | | | | | 2024 | | 2023 | | 2022 |
| Opening Balance | | | | | $ | 6,942 | | | $ | 7,411 | | | $ | 8,150 | |
| Revenue Recognized | | | | | (560) | | | (469) | | | (739) | |
| Closing Balance | | | | | $ | 6,382 | | | $ | 6,942 | | | $ | 7,411 | |
Metal Sales Prepayments
In June 2019, Coeur amended its existing sales and purchase contract with a metal sales counterparty for gold concentrate from its Kensington mine (the “Amended Sales Contract”). From time to time thereafter, the Amended Sales Contract has been further amended to allow for additional prepayments. In September 2024, the Company received an additional prepayment of $25.0 million, following the fulfillment of the previous received prepayments.
Additionally, in June 2023, the Company entered into sales and purchase contracts with a metal sales counterparty for gold electrolytic cathodic sludge from its Wharf mine and gold and silver doré from its Rochester mine, both of which were amended in September 2023 to increase the maximum amount available in prepayments to $12.5 million and $17.5 million, respectively. In December 2024, Wharf and Rochester received additional prepayments of $12.5 million and $17.5 million, respectively, following the fulfillment of the previous received prepayments received at Wharf and Rochester.
The metal sales prepayments represent a contract liability under ASC 606, which requires the Company to recognize ratably a portion of the deposit as revenue for each gold and silver ounce delivered to the customer. The remaining contract liability is included in Accrued liabilities and other on the Consolidated Balance Sheet. Under the relevant terms of the Amended Sales Contract, Coeur maintains its exposure to the price of gold and silver and expects to recognize the remaining value of the accrued liability by December 2025.
The following table presents a roll forward of the prepayment contract liability balance:
| | | | | | | | | | | | | | | | | | | | | |
| | | Year Ended December 31, |
| In thousands | | | | | 2024 | | 2023 | | 2022 |
| Opening Balance | | | | | $ | 55,082 | | | $ | 25,016 | | | $ | 15,016 | |
| Additions | | | | | 170,000 | | | 130,066 | | | 36,020 | |
| Revenue Recognized | | | | | (182,918) | | | (100,000) | | | (26,020) | |
| Closing Balance | | | | | $ | 42,164 | | | $ | 55,082 | | | $ | 25,016 | |
Kensington Royalty Matter
On March 28, 2024, the Company and its subsidiary Coeur Alaska, Inc. (“Coeur Alaska”) entered into a settlement agreement to resolve litigation with Maverix Metals Inc. and Maverix Metals (Nevada) Inc. (collectively “Maverix”) regarding the terms of a royalty impacting a portion of the Kensington mine property (the “Maverix Litigation”). While Coeur Alaska continued to believe its claims and counterclaims in the matter were valid, it determined that the settlement was appropriate given the inherent uncertainty presented in litigation matters. In consideration for the dismissal of the Maverix Litigation and pursuant to other customary terms of settlement, Coeur Alaska and Maverix agreed to amend the terms of the royalty to decrease the effective rate of the royalty and to eliminate the concept of cost recoupment provided for in the original royalty. The amended royalty now provides that Coeur Alaska pays a net returns royalty on up to two million troy ounces of gold produced from the current boundaries of the Kensington mine at a rate of: (i) 1.25% for production occurring from January 1, 2024 through December 31, 2026 and (ii) 1.5% for production occurring on or after January 1, 2027. The Company also agreed to issue up to 2,455,000 shares of its common stock to an affiliate of Maverix, including common stock having a then-current fair market value of $3.0 million by April 2, 2024, and common stock having a then-current fair market value of $3.75 million by March 28, 2025 (collectively, the “Settlement Shares”), with a cash-settlement of any shortfall in value if all 2,455,000 shares of common stock are issued. The settlement provides that credit for the value of certain portions of equity issued to be credited against the royalty, as amended, as payment in arrears for production prior to January 1, 2024. In April 2024, the Company issued 737,210 shares to settle the first equity issuance. The issuance of the Settlement Shares is being made pursuant to the exemption from the registration requirements afforded by Section 4(a)(2) of the Securities Act of 1933, as amended.
Other Commitments and Contingencies
As part of its ongoing business and operations, the Company and its affiliates are required to provide surety bonds, bank letters of credit, bank guarantees and, in some cases, cash as financial support for various purposes, including environmental remediation, reclamation, collateral for gold and silver hedges and other general corporate purposes. As of December 31, 2024 and December 31, 2023, the Company had surety bonds totaling $363.7 million and $324.8 million,
Coeur Mining, Inc. and Subsidiaries
Notes to Consolidated Financial Statements
respectively, in place as financial support for future reclamation and closure costs. The obligations associated with these instruments are generally related to performance requirements that the Company addresses through its ongoing operations and, from time-to-time, the Company may be required to post collateral, including cash or letters of credit which reduce availability under its revolving credit facility, to support these instruments. As the specific requirements are met, the beneficiary of the associated instrument cancels and/or returns the instrument to the issuing entity. Certain of these instruments are associated with operating sites with long-lived assets and will remain outstanding until closure. The Company believes it is in compliance with all applicable bonding obligations and will be able to satisfy future bonding requirements through existing or alternative means, as they arise.
NOTE 18 – ADDITIONAL BALANCE SHEET DETAIL AND SUPPLEMENTAL CASH FLOW INFORMATION
Accrued liabilities and other consist of the following:
| | | | | | | | | | | |
| In thousands | December 31, 2024 | | December 31, 2023 |
| Accrued salaries and wages | $ | 31,151 | | | $ | 31,722 | |
| Flow-through share premium received | 853 | | | 5,563 | |
Deferred revenue (1) | 42,863 | | | 55,547 | |
| Income and mining taxes | 36,490 | | | 11,766 | |
Kensington royalty settlement (1) | 3,750 | | | — | |
| Deferred Cash Due 2025 | 9,644 | | | — | |
| Accrued operating costs | 6,577 | | | 11,081 | |
| Unrealized losses on derivatives | 70 | | | 1,981 | |
| Taxes other than income and mining | 5,491 | | | 5,321 | |
| Accrued interest payable | 8,122 | | | 7,957 | |
| Operating lease liabilities | 11,598 | | | 9,975 | |
| Accrued liabilities and other | $ | 156,609 | | | $ | 140,913 | |
(1) See Note 17 -- Commitments and Contingencies for additional details on deferred revenue liabilities.
The following table provides a reconciliation of cash, cash equivalents, and restricted cash reported within the Consolidated Balance Sheets that total the same such amounts shown in the Consolidated Statements of Cash Flows in the years ended December 31, 2024 and 2023:
| | | | | | | | | | | |
| In thousands | December 31, 2024 | | December 31, 2023 |
| Cash and cash equivalents | $ | 55,087 | | | $ | 61,633 | |
Restricted cash equivalents(1) | 1,787 | | | 1,745 | |
| Total cash, cash equivalents and restricted cash shown in the statement of cash flows | $ | 56,874 | | | $ | 63,378 | |
(1) Restricted cash equivalents are included in Prepaid expenses and other and Restricted assets on the Consolidated Balance Sheet.
| | | | | | | | | | | | | | | | | |
| Year ended December 31, |
| 2024 | | 2023 | | 2022 |
| Non-cash lease obligations arising from obtaining operating lease assets | $ | 21,230 | | | $ | 718 | | | $ | 4,120 | |
| Non-cash financing and investing activities: | | | | | |
| Finance lease obligations | $ | 54,330 | | | $ | 32,978 | | | $ | 43,810 | |
| Capital expenditures, not yet paid | $ | 26,515 | | | $ | 44,966 | | | $ | 33,688 | |
| Debt for equity exchange | $ | 5,867 | | | $ | 76,018 | | | $ | — | |
| | | | | |
| Other cash flow information: | | | | | |
| Interest paid | $ | 49,806 | | | $ | 41,249 | | | $ | 32,704 | |
| Income and mining taxes paid | $ | 45,100 | | | $ | 35,000 | | | $ | 41,600 | |
Coeur Mining, Inc. and Subsidiaries
Notes to Consolidated Financial Statements
NOTE 19 – SUBSEQUENT EVENTS
On October 3, 2024, the Company entered into a definitive agreement (the “Agreement”) whereby, a wholly-owned subsidiary of Coeur would acquire all of the issued and outstanding shares of SilverCrest Metals Inc. (“SilverCrest”) pursuant to a court-approved plan of arrangement (the “Transaction”). Under the terms of the Agreement, SilverCrest shareholders were to receive 1.6022 Coeur common shares for each SilverCrest common share (the “Exchange Ratio”).
On February 14, 2025, the Company completed the closing of the Transaction after receiving regulatory approval on February 3, 2025 followed by shareholder approval on February 6, 2025. Coeur acquired all of the issued and outstanding shares of SilverCrest in exchange for 239,331,799 common shares. Based on the closing price of Coeur common shares on the NYSE on February 14, 2025, the implied total equity value was approximately $1.58 billion based on SilverCrest’s common shares outstanding and the Exchange Ratio. Given the timing of the completion of the Transaction, we are currently in the process of valuing the assets acquired and liabilities assumed in the Transaction. As a result, we are unable to provide the amounts recognized as of the acquisition date for the major classes of assets acquired and liabilities assumed and other disclosures. In connection with the Transaction, Coeur increased the authorized common shares for issuance to 900,000,000 common shares.
Coeur Mining, Inc. and Subsidiaries
Notes to Consolidated Financial Statements
Item 9.Changes in and Disagreements with Accountants on Accounting and Financial Disclosure
Not applicable.
Item 9A. Controls and Procedures
(a)Disclosure Controls and Procedures
The Company’s disclosure controls and procedures are designed to provide reasonable assurance that information required to be disclosed by it in its periodic reports filed with the SEC is recorded, processed, summarized and reported, within the time periods specified in the SEC’s rules and forms, and to ensure that such information is accumulated and communicated to the Company’s management, including its Chief Executive Officer and Chief Financial Officer, as appropriate to allow timely decisions regarding required disclosure. Based on an evaluation of the Company’s disclosure controls and procedures conducted by the Company’s Chief Executive Officer and Chief Financial Officer, such officers concluded that the Company’s disclosure controls and procedures were effective and operating at a reasonable assurance level as of December 31, 2024.
(b)Management’s Report on Internal Control Over Financial Reporting
The management of the Company is responsible for establishing and maintaining adequate internal control over financial reporting. The Securities Exchange Act of 1934 defines internal control over financial reporting in Rule 13a-15(f) and 15d-15(f) as a process designed by, or under the supervision of, the Company’s principal executive and principal financial officers and effected by the Company’s board of directors, management and other personnel, to provide reasonable assurance regarding the reliability of financial reporting and the preparation of financial statements for external purposes in accordance with generally accepted accounting principles and includes those policies and procedures that:
a.Pertain to the maintenance of records that in reasonable detail accurately and fairly reflect the transactions and dispositions of the assets of the Company;
b.Provide reasonable assurance that transactions are recorded as necessary to permit preparation of financial statements in accordance with generally accepted accounting principles, and that receipts and expenditures of the Company are being made only in accordance with authorizations of management and directors of the Company; and
c.Provide reasonable assurance regarding prevention or timely detection of unauthorized acquisition, use or disposition of the Company’s assets that could have a material effect on the consolidated financial statements.
Because of its inherent limitations, internal control over financial reporting may not prevent or detect misstatements. Also, projections of any evaluation of effectiveness to future periods are subject to risk that controls may become inadequate because of changes in conditions, or that the degree of compliance with the policies or procedures may deteriorate.
The Company’s management assessed the effectiveness of the Company’s internal control over financial reporting as of December 31, 2024. In making this assessment, the Company’s management used the criteria set forth by the Committee of Sponsoring Organizations of the Treadway Commission (COSO) in Internal Control - Integrated Framework (2013). Based upon its assessment, management concluded that, as of December 31, 2024, the Company’s internal control over financial reporting was effective.
The effectiveness of internal control over financial reporting as of December 31, 2024 has been audited by Grant Thornton LLP, an independent registered public accounting firm, as stated in their report which is included herein.
(c) Changes in Internal Control Over Financial Reporting
There have been no changes in the Company’s internal control over financial reporting during the most recently completed fiscal quarter that have materially affected, or are reasonably likely to materially affect, its internal control over financial reporting.
Item 9B. Other Information
During the year ended December 31, 2024, no director or Section 16 officer adopted, modified or terminated any Rule 10b5-1 trading arrangements or non-Rule 10b5-1 trading arrangements (as defined in Item 408(a) of Regulation S-K).
Item 9C. Disclosure Regarding Foreign Jurisdictions that Prevent Inspections
Not applicable.
PART III
Item 10. Directors, Executive Officers and Corporate Governance
Pursuant to General Instruction G(3) of Form 10-K, the information called for by this Item regarding directors is hereby incorporated by reference from the Company’s definitive proxy statement for the 2025 Annual Meeting of Stockholders filed pursuant to Regulation 14A, or an amendment hereto, to be filed not later than 120 days after the end of the fiscal year covered by this Report under the captions “Proposal No. 1: Election of Directors”, “Information about our Executive Officers”, “Corporate Governance Guidelines and Code of Business Conduct and Ethics” and “Audit Committee Report”.
Item 11.Executive Compensation
Pursuant to General Instruction G(3) of Form 10-K, the information called for by this Item is hereby incorporated by reference from the Company’s definitive proxy statement for the 2025 Annual Meeting of Stockholders filed pursuant to Regulation 14A, or an amendment hereto, to be filed not later than 120 days after the end of the fiscal year covered by this Report under the captions “Compensation Discussion and Analysis,” “2024 Summary Compensation Table,” “2024 Grants of Plan-Based Awards,” “Outstanding Equity Awards at 2024 Year End,” “2024 Stock Vested,” “Nonqualified Deferred Compensation,” “Director Compensation” and “Compensation and Leadership Development Committee Report”.
Item 12.Security Ownership of Certain Beneficial Owners and Management and Related Stockholder Matters
Pursuant to General Instruction G(3) of Form 10-K, certain information called for by this Item is hereby incorporated by reference from the Company’s definitive proxy statement for the 2025 Annual Meeting of Stockholders filed pursuant to Regulation 14A, or an amendment hereto, to be filed not later than 120 days after the end of the fiscal year covered by this report under the caption “Share Ownership”.
Equity Compensation Plan Information
The following table sets forth information as of December 31, 2024 regarding the Company’s equity compensation plans.
| | | | | | | | | | | | | | | | | | | | |
| Plan category | | Number of shares to be
issued upon exercise of
outstanding options, warrants and rights | | Weighted-average exercise
price of outstanding options,
warrants and rights | | Number of shares remaining
available for future issuance
under equity compensation
plans (excluding securities reflected in column (a) (1) |
| | | (a) | | (b) | | (c) |
| Equity compensation plans approved by security holders | | 29,130 | | | $ | 7.75 | | | 4,072,230 | |
| Equity compensation plans not approved by security holders | | — | | | — | | | — | |
| Total | | 29,130 | | | $ | 7.75 | | | 4,072,230 | |
(1)Amounts include 4,641,512 performance shares that cliff vest three years after the date of grant if certain market and performance criteria are met, provided the recipient remains an employee of the Company and subject to approval of the Compensation and Leadership Development Committee of the Board of Directors.
Item 13.Certain Relationships and Related Transactions, and Director Independence
Pursuant to General Instruction G(3) of Form 10-K, the information called for by this Item is hereby incorporated by reference from the Company’s definitive proxy statement for the 2025 Annual Meeting of Stockholders filed pursuant to Regulation 14A, or an amendment hereto, to be filed not later than 120 days after the end of the fiscal year covered by this Report under the captions “Related Person Transactions”, “Meeting Attendance”, “Committees of the Board of Directors”, and “Director Independence”.
Item 14. Principal Accountant Fees and Services
Pursuant to General Instruction G(3) of Form 10-K, the information called for by this Item is hereby incorporated by reference from the Company’s definitive proxy statement for the 2025 Annual Meeting of Stockholders filed pursuant to Regulation 14A, or an amendment hereto, to be filed not later than 120 days after the end of the fiscal year covered by this Report under the captions “Audit and Non-Audit Fees” and “Audit Committee Policies and Procedures for Pre-Approval of Independent Auditor Services.” The Company’s independent registered public accounting firm is Grant Thornton, LLP, Chicago, Illinois, PCAOB ID Number: 248.
PART IV
Item 15. Exhibits
| | | | | |
| 2.1 | Stock Purchase Agreement, dated September 18, 2022, by and among Coeur Mining, Inc., a Delaware corporation, AngloGold Ashanti (U.S.A.) Holdings Inc., a Delaware corporation, AngloGold Ashanti USA Incorporated, a Delaware corporation, Sterling Intermediate Holdco, Inc., a Delaware corporation and Coeur Sterling, Inc., a Nevada corporation. (Incorporated by reference to Exhibit 2.1 to the Registrant’s Current Report on Form 8-K filed on September 19, 2022 (File No. 001-08641)) |
| 2.2 | |
| 3.1 | |
| 3.2 | |
| 3.3 | |
| 3.4 | |
| 3.5 | |
| 3.6 | |
| 4.1 | |
| 4.2 | |
| 4.3 | Indenture, dated March 1, 2021, among Coeur Mining, Inc., as issuer, certain subsidiaries of Coeur Mining, Inc., as guarantors thereto, and The Bank of New York Mellon, as trustee. (Incorporated herein by reference to Exhibit 4.1 to the Registrant’s Current Report on Form 8-K filed on March 1, 2021 (File No. 001-08641)). |
| 10.01 | |
| 10.02 | |
| 10.03 | |
| 10.04 | |
| 10.05 | |
| 10.06 | |
| 10.07 | |
| 10.08 | |
| | | | | |
| 10.09 | |
| 10.10 | |
| 10.11 | Credit Agreement, dated September 29, 2017, by and among Coeur Mining, Inc., certain subsidiaries of Coeur Mining, Inc., as guarantors, the lenders party thereto and Bank of America, N.A., as administrative agent (Incorporated herein by reference to Exhibit 10.1 to the Registrant’s Current Report on Form 8-K filed on October 2, 2017 (File No. 001-08641)). |
| 10.12 | First Amendment to Credit Agreement, dated October 29, 2018, by and among Coeur Mining, Inc., certain subsidiaries of Coeur Mining, Inc., as guarantors, the lenders party thereto and Bank of America, N.A., as administrative agent (Incorporated herein by reference to Exhibit 10.3 to the Registrant’s Quarterly Report on Form 10-Q filed on October 31, 2018 (File No. 001-08641)). |
| 10.13 | |
| 10.14 | |
| 10.15 | |
| 10.16 | |
| 10.17 | |
| 10.18 | |
| 10.19 | |
| 10.20 | |
| 10.21 | Second Amendment to Credit Agreement, dated April 30, 2019, by and among Coeur Mining, Inc., certain subsidiaries of Coeur Mining, Inc., as guarantors, the lenders party thereto and Bank of America, N.A., as administrative agent (Incorporated herein by reference to Exhibit 10.2 to the Registrant’s Quarterly Report filed on Form 10-Q on May 1, 2019 (File No. 001-8641)). |
| 10.22 | Third Amendment to Credit Agreement, dated August 6, 2019, by and among Coeur Mining, Inc., certain subsidiaries of Coeur Mining, Inc., as guarantors, the lenders party thereto and Bank of America, N.A., as administrative agent (Incorporated herein by reference to Exhibit 10.2 to the Registrant’s Quarterly Report on filed Form 10-Q on August 7, 2019 (File No. 001-08641)). |
| 10.23 | |
| 10.24 | |
| 10.25 | First Incremental Facility Amendment, dated December 14, 2020, by and among Coeur Mining, Inc., certain subsidiaries of Coeur Mining, Inc., as guarantors, certain of the lenders party thereto and Bank of America, N.A., as administrative agent (Incorporated herein by reference to Exhibit 10.1 to the Registrant’s Current Report on Form 8-K filed on December 16, 2020 (File. No. 001-08641)). |
| 10.26 | |
| 10.27 | Fifth Amendment to Credit Agreement, dated March 1, 2021, by and among Coeur Mining, Inc., certain subsidiaries of Coeur Mining, Inc., as guarantors, certain of the lenders party thereto and Bank of America, N.A., as administrative agent. (Incorporated herein by reference to Exhibit 10.1 to the Registrant’s Current Report on Form 8-K filed on March 1, 2021 (File No. 001-08641)). |
| | | | | |
| 10.30 | |
| 10.31 | Sixth Amendment to Credit Agreement, dated May 2, 2022, by and among Coeur Mining, Inc., certain subsidiaries of Coeur Mining, Inc., as guarantors, the lenders party thereto and Bank of America, N.A., as administrative agent. (Incorporated by reference to Exhibit 10.1 to the Registrant’s Current Report on Form 8-K filed on May 3, 2022 (File No. 001-08641)). |
| 10.32 | Seventh Amendment to Credit Agreement, dated November 9, 2022, by and among Coeur Mining, Inc., certain subsidiaries of Coeur Mining, Inc., as guarantors, the lenders party thereto and Bank of America, N.A., as administrative agent. (File No. 001-08641)). |
| 10.33 | Eighth Amendment to Credit Agreement, August 9, 2023, by and among Coeur Mining, Inc., certain subsidiaries of Coeur Mining, Inc., as guarantors, the lenders party thereto and Bank of America, N.A., as administrative agent (Incorporated herein by reference to Exhibit 10.1 to the Registrant’s Quarterly Report on Form 10-Q filed on August 9, 2023 (File No. 001-08641). |
| 10.34 | Ninth Amendment to Credit Agreement, February 21, 2024, by and among Coeur Mining, Inc., certain subsidiaries of Coeur Mining, Inc., as guarantors, the lenders party thereto and Bank of America, N.A., as administrative agent (File No. 001-08641). |
| 19 | |
| 21 | |
| 23.1 | |
| 31.1 | |
| 31.2 | |
| 32.1 | |
| 32.2 | |
| 95.1 | |
| 96.1 | |
| 96.2 | |
| 96.3 | |
| 96.4 | |
| 96.5 | |
| 101.INS | XBRL Instance Document* |
| 101.SCH | XBRL Taxonomy Extension Schema* |
| 101.CAL | XBRL Taxonomy Extension Calculation Linkbase* |
| 101.DEF | XBRL Taxonomy Extension Definition Linkbase* |
| 101.LAB | XBRL Taxonomy Extension Label Linkbase* |
| 101.PRE | XBRL Taxonomy Extension Presentation Linkbase* |
| 104 | Cover Page Interactive Data File (formatted as Inline XBRL and included in Exhibit 101). |
* The following financial information from Coeur Mining, Inc.’s Annual Report on Form 10-K for the year ended December 31, 2024, formatted in XBRL (Extensible Business Reporting Language): Consolidated Balance Sheets, Consolidated Statements of Comprehensive Income (Loss), Consolidated Statements of Cash Flows and Consolidated Statement of Changes in Stockholders’ Equity.** Management contract or compensatory plan or arrangement.
Item 16.Form 10-K Summary
None.
SIGNATURES
Pursuant to the requirements of Section 13 or 15(d) of the Securities Exchange Act of 1934, the registrant has duly caused this report to be signed on its behalf by the undersigned, thereunto duly authorized.
COEUR MINING, INC.
(Registrant)
| | | | | | | | | | | |
| Date: | February 19, 2025 | By: | /s/ Mitchell J. Krebs |
| | | Mitchell J. Krebs
(Chairman, President, and Chief Executive Officer) |
Pursuant to the requirements of the Securities Exchange Act of 1934, this report has been signed below by the following persons on behalf of the registrant and in the capacities and on the dates indicated.
| | | | | | | | |
/s/ Mitchell J. Krebs______________________ Mitchell J. Krebs | Chairman, President, and Chief Executive Officer
(Principal Executive Officer) | February 19, 2025 |
| | | |
/s/ Thomas S. Whelan_____________________ Thomas S. Whelan | Senior Vice President and Chief Financial Officer (Principal Financial Officer) | February 19, 2025 |
| | | |
/s/ Ken Watkinson________________________ Ken Watkinson | Vice President, Corporate Controller and Chief Accounting Officer (Principal Accounting Officer) | February 19, 2025 |
| | |
/s/ Linda L. Adamany_____________________ Linda L. Adamany | Director | February 19, 2025 |
| | | |
/s/ Paramita Das__________________________ Paramita Das | Director | February 19, 2025 |
| | |
/s/ N. Eric Fier___________________________ N. Eric Fier | Director | February 19, 2025 |
| | |
/s/ Randolph E. Gress_____________________ Randolph E. Gress | Director | February 19, 2025 |
| | |
/s/ Jeane L. Hull__________________________ Jeane L. Hull | Director | February 19, 2025 |
| | |
/s/ Eduardo Luna_________________________ Eduardo Luna | Director | February 19, 2025 |
| | | |
/s/ Robert E. Mellor_______________________ Robert E. Mellor | Director | February 19, 2025 |
| | | |
/s/ J. Kenneth Thompson___________________
J. Kenneth Thompson | Director | February 19, 2025 |