Coeur d’Alene Mines Corporation
505 Front Avenue, P.O. Box I
Coeur d’Alene, ID 83816-0316
Telephone 208.667.3511
Facsimile 208.667.2213
Press Release
COEUR REPORTS SIGNFICANTLY IMPROVED SECOND
QUARTER AND SIX MONTH RESULTS
—KEY HIGHLIGHTS —
| • | 76% increase in quarterly earnings before interest, taxes, depreciation, and pre-development costs to $7.2 million versus earnings before interest, taxes, depreciation, and pre-development costs of $4.1 million during last year’s 2nd quarter |
| • | 56% increase in earnings before interest, taxes, depreciation, pre-development costs and one-time litigation settlement for the first six months of $15.3 million versus $9.8 million during the first six months of 2004 |
| • | $1.5 million net loss for the quarter (versus a net loss of $5.4 million in the 2ndquarter of 2004) included $3.7 million of pre-development costs for Kensington. The final permits for Kensington were obtained and the project entered the construction phase commencing in the third quarter of 2005. |
| | o | Net loss for the first six months of 2005 of $3.3 million (versus a net loss of $7.1 million in last year’s first six months) included $6.1 million of pre-development costs related to Coeur’s Kensington project |
| • | Quarterly silver production was 3.1 million ounces (compared to 3.3 million silver ounces produced during the 2nd quarter of 2004) |
| | o | 6.0 million ounces of silver was produced during the first six months of 2005 (compared to 6.8 million ounces produced during the first six months of 2004) |
| | o | Shortfall from North American operations on-track to be made up in second half of 2005. Production expected to increase in the second half of 2005. |
| | o | Full year production expected to be approximately 13.5 million ounces of silver and 130,000 ounces of gold during 2005. |
| • | Quarterly gold production increased 8% to 30,300 ounces (versus 28,037 ounces in last year’s 2ndquarter) |
| | o | 19% increase in gold production during the first six months of 2005 to 59,723 ounces (compared to 50,149 gold ounces produced during the first six months of 2004) |
| • | Exploration program delivered substantial reserve increases at South American operations during first six months |
| | o | 3.9 million ounces of silver reserves added |
| • | Endeavor transaction in Australia completed |
| | o | Transaction nominated for the "Dealer Award" at the Australian Diggers and Dealers Conference |
| | o | Expected to contribute nearly 700,000 silver ounces and over US$4.0 million of operating cash flow to Coeur in 2005 |
| | o | Continuing to pursue other external opportunities that will enhance Company cash flow and silver reserves and production |
| • | $280.3 million of cash, cash equivalents and short-term investments at June 30th |
| • | Company signs MOU to explore opportunities in China |
| |
|---|
| Second Quarter 2005 Results (August 9, 2005) | Page 1 of 11 |
COEUR D’ALENE, Idaho –August 9, 2005 – Coeur d’Alene Mines Corporation (NYSE:CDE, TSX:CDM), the world’s largest primary silver producer and a growing gold producer, today reported a net loss of $1.5 million, or $0.01 per share, in the second quarter of 2005, compared to a net loss of $5.4 million, or $0.03 per share, for the year-ago period. Results for the current-year quarter included $3.3 million of exploration expense associated with the successful ore reserve expansion program and $3.7 million resulting from pre-development activities at the Kensington gold project.
Revenue for the second quarter of 2005 was $38.3 million, compared to $27.1 million in the year-ago period.
For the first six months of 2005, the Company reported a net loss of $3.3 million, or $0.01 per share, compared to a net loss of $7.1 million, or $0.03 per share, for the same period of 2004. Revenues were $76.4 million for the first six months of 2005, compared to $56.1 million in the year-ago period.
In commenting on the second-quarter operating results relative to the year-ago period, Dennis E. Wheeler, Chairman, President and Chief Executive Officer, said “The Company reported a 76 percent increase in earnings before interest, taxes, depreciation and pre-development activities. The improvement was the result of increased shipments of silver and gold at prices well above year-ago levels. These favorable results included $3.3 million of exploration expenses.”
Wheeler added, “With our continued robust cash position, we are pleased by the accelerating progress the Company is making on a number of key initiatives. In particular, we have completed the Endeavor silver acquisition in Australia and have begun to see the positive results of that transaction. In addition, as previously reported, we have obtained final permits for the Kensington gold project and have commenced construction activities. We expect that project to start production in early 2007. Although we have made an upward revision to the estimated capital cost and cash operating costs at Kensington, we are more confident than ever in the economic and environmental soundness of the project – and in the prospects for further conversion of existing resources to reserves.”
The Company currently expects full-year silver production to be approximately 13.5 million ounces at a consolidated cash cost of between $4.30 and $4.40 per ounce. The Company currently expects full-year gold production to be approximately 130,000 ounces.
Separately, Coeur has signed a one-year memorandum of understanding with Shanghai Kuntai Non-Ferrous Metals Company, Ltd., to establish a strategic alliance to identify silver market investment, exploration, mining, and acquisition opportunities primarily in China. Under the agreement, Kuntai will identify a minimum of two specific opportunities for consideration and would act as liaison for Coeur within the Chinese business community and with various governmental bodies — and Coeur would agree to provide mining and exploration expertise to evaluate such opportunities. If any commercially viable opportunities are identified, the companies would expect to participate as partners in developments costs, eventual operating costs, and silver production.
Coeur d’Alene Mines Corporation is the world’s largest primary silver producer, as well as a significant, low-cost producer of gold. The Company has mining interests in Nevada, Idaho, Alaska, Argentina, Chile, Bolivia and Australia.
Investor Contact
Scott Lamb
Vice President of Investor Relations
208-665-0777
Conference Call Information
Coeur d’Alene Mines Corporation will hold a conference call to discuss the Company’s second quarter 2005 results at 1 p.m. Eastern time on August 9, 2005. To listen live via telephone, call (877) 209-0397 (US and Canada) or (612) 332-0932 (International). The conference call and presentation will also be web cast on the Company’s web sitewww.coeur.com. A replay of the call will be available through August 16, 2005. The replay dial-in numbers are (800) 475-6701 (US and Canada) and (320) 365-3844 (International) and the access code is 790836.
| |
|---|
| Second Quarter 2005 Results (August 9, 2005) | Page 2 of 11 |
COEUR D’ALENE MINES CORPORATION
PRODUCTION STATISTICS
| Three Months Ended
June 30,
| Six Months Ended
June 30,
|
|---|
| 2005
| 2004
| 2005
| 2004
|
|---|
ROCHESTER MINE | | | | | | | | | | | | | | |
| Silver ozs | | | | 1,208,584 | | | 1,317,006 | | | 2,344,581 | | | 2,627,301 | |
| Gold ozs | | | | 14,412 | | | 16,005 | | | 28,404 | | | 27,480 | |
| Cash costs per oz./silver | | | $ | 7.58 | | $ | 4.54 | | $ | 6.96 | | $ | 5.06 | |
| Full costs per oz./silver | | | $ | 9.93 | | $ | 6.36 | | $ | 9.25 | | $ | 6.79 | |
GALENA MINE | | |
| Silver ozs | | | | 559,700 | | | 954,964 | | | 1,269,996 | | | 1,861,944 | |
| Gold ozs | | | | 54 | | | 88 | | | 145 | | | 189 | |
| Cash costs per oz./silver | | | $ | 8.05 | | $ | 4.95 | | $ | 7.32 | | $ | 4.94 | |
| Full costs per oz./silver | | | $ | 8.95 | | $ | 5.47 | | $ | 8.11 | | $ | 5.45 | |
CERRO BAYO(A) | | |
| Silver ozs | | | | 691,846 | | | 576,150 | | | 1,351,139 | | | 1,372,695 | |
| Gold ozs | | | | 15,100 | | | 11,282 | | | 29,967 | | | 21,240 | |
| Cash costs per oz./silver | | | $ | 0.76 | | $ | 4.11 | | $ | 0.31 | | $ | 2.61 | |
| Full costs per oz./silver | | | $ | 2.28 | | $ | 6.42 | | $ | 2.03 | | $ | 4.78 | |
MARTHA MINE(A) | | |
| Silver ozs | | | | 606,121 | | | 477,126 | | | 985,181 | | | 898,397 | |
| Gold ozs | | | | 735 | | | 662 | | | 1,206 | | | 1,240 | |
| Cash costs per oz./silver | | | $ | 4.43 | | $ | 3.29 | | $ | 4.68 | | $ | 3.22 | |
| Full costs per oz./silver | | | $ | 4.78 | | $ | 4.06 | | $ | 5.07 | | $ | 4.10 | |
ENDEAVOR MINE(B) | | |
| Silver ozs | | | | 58,464 | | | -- | | | 58,464 | | | -- | |
| Cash costs per oz./silver | | | $ | 1.89 | | | -- | | $ | 1.89 | | | -- | |
| Full costs per oz./silver | | | $ | 3.13 | | | -- | | $ | 3.13 | | | -- | |
CONSOLIDATED PRODUCTION TOTALS | | |
| Silver ozs | | | | 3,124,715 | | | 3,325,246 | | | 6,009,361 | | | 6,760,337 | |
| Gold ozs | | | | 30,300 | | | 28,037 | | | 59,723 | | | 50,149 | |
| Cash costs per oz./silver | | | $ | 5.44 | | $ | 4.41 | | $ | 5.12 | | $ | 4.29 | |
| Full costs per oz./silver | | | $ | 6.94 | | $ | 5.79 | | $ | 6.64 | | $ | 5.65 | |
CONSOLIDATED SALES TOTALS | | |
| Silver ozs. sold | | | | 3,492,000 | | | 3,302,000 | | | 6,795,000 | | | 6,628,000 | |
| Gold ozs. sold | | | | 34,000 | | | 27,000 | | | 69,000 | | | 48,000 | |
| Realized price per silver oz | | | $ | 7.22 | | $ | 6.36 | | $ | 7.06 | | $ | 6.72 | |
| Realized price per gold oz | | | $ | 431 | | $ | 398 | | $ | 427 | | $ | 396 | |
| (A) | During the first quarter of 2005, the Company has segregated operating statistics to conform to current year presentation. |
| (B) | On May 23, 2005, the Company acquired all of the silver production and reserves contained at the Endeavor mine in Australia, which is owned and operated by CBH Resources Ltd. (“CBH”), for $38.5 million. Coeur’s share of the silver production from May 23, 2005 to June 30, 2005 was 58,464 ounces at a cash cost of $1.89 per ounce, representing Coeur’s agreed upon operating costs contribution including smelting and refining treatment charges. |
Note: “Cash Costs per Ounce” are calculated by dividing the cash costs computed for each of the Company’s mining properties for a specified period by the amount of gold ounces or silver ounces produced by that property during that same period. Management uses cash costs per ounce produced as a key indicator of the profitability of each of its mining properties. Gold and silver are sold and priced in the world financial markets on a US dollar per ounce basis. By calculating the cash costs from each of the Company’s mines on the same unit basis, management can easily determine the gross margin that each ounce of gold and silver produced is generating.
“Cash Costs” are costs directly related to the physical activities of producing silver and gold and include mining, processing and other plant costs, deferred mining adjustments, third-party refining and smelting costs, marketing expense, on-site general and administrative costs, royalties, in-mine drilling expenditures that are related to production and other direct costs. Sales of by-product metals (primarily gold and copper) are deducted from the above in computing cash costs. Cash costs exclude depreciation, depletion and amortization, corporate general and administrative expense, exploration, interest, and pre-feasibility costs and accruals for mine reclamation. Cash costs are calculated and presented using the “Gold Institute Production Cost Standard” applied consistently for all periods presented.
| |
|---|
| Second Quarter 2005 Results (August 9, 2005) | Page 3 of 11 |
Total cash costs per ounce is a non-GAAP measurement and investors are cautioned not to place undue reliance on it and are urged to read all GAAP accounting disclosures presented in the consolidated financial statements and accompanying footnotes. In addition, see the reconciliation of “cash costs” to production costs under “Costs and Expenses” set forth below:
The following tables present a reconciliation between cash costs per ounce and GAAP production costs reported in the Statement of Operations:
THREE MONTHS ENDED JUNE 30, 2005
| Rochester
| Silver Valley
| Cerro Bayo
| Martha
| Endeavor
| Total
|
|---|
| Production of Silver (ounces) | | | | 1,208,584 | | | 559,700 | | | 691,846 | | | 606,121 | | | 58,464 | | | 3,124,715 | |
| Cash Costs per ounce | | | $ | 7.58 | | $ | 8.05 | | $ | 0.76 | | $ | 4.43 | | $ | 1.89 | | $ | 5.44 | |
|
|
|
|
|
|
|
Total Cash Costs (thousands) | | | $ | 9,166 | | $ | 4,508 | | $ | 527 | | $ | 2,683 | | $ | 111 | | $ | 16,995 | |
Add/(Subtract): | | |
| Third Party Smelting Costs | | | | (196 | ) | | (926 | ) | | (1,017 | ) | | (345 | ) | | (58 | ) | | (2,542 | ) |
| By-Product Credit | | | | 6,168 | | | 690 | | | 6,452 | | | 314 | | | -- | | | 13,624 | |
Deferred Stripping and other
adjustments | | | | (101 | ) | | -- | | | (18 | ) | | (101 | ) | | -- | | | (220 | ) |
| Change in Inventory | | | | (8,240 | ) | | 373 | | | 2,600 | | | 10 | | | (38 | ) | | (5,295 | ) |
|
|
|
|
|
|
|
| Production Costs | | | $ | 6,797 | | $ | 4,645 | | $ | 8,544 | | $ | 2,561 | | $ | 15 | | $ | 22,562 | |
|
|
|
|
|
|
|
THREE MONTHS ENDED JUNE 30, 2004
| Rochester
| Silver Valley
| Cerro Bayo
| Martha
| Total
|
|---|
| | | | | | | | | | | | | | | | | | | | |
| Production of Silver (ounces) | | | | 1,317,006 | | | 954,964 | | | 576,150 | | | 477,126 | | | 3,325,246 | |
| Cash Costs per ounce | | | $ | 4.54 | | $ | 4.95 | | $ | 4.11 | | $ | 3.29 | | $ | 4.41 | |
|
|
|
|
|
|
Total Cash Costs (thousands) | | | $ | 5,981 | | $ | 4,730 | | $ | 2,370 | | $ | 1,571 | | $ | 14,652 | |
Add/(Subtract): | | |
| Third Party Smelting Costs | | | | (190 | ) | | (1,401 | ) | | (1,701 | ) | | (318 | ) | | (3,610 | ) |
| By-Product Credit | | | | 6,274 | | | 920 | | | 4,439 | | | 260 | | | 11,893 | |
| Deferred Stripping Adjustment | | | | (101 | ) | | -- | | | (10 | ) | | (28 | ) | | (139 | ) |
| Change in Inventory | | | | (3,903 | ) | | (361 | ) | | (1,876 | ) | | (290 | ) | | (6,430 | ) |
|
|
|
|
|
|
| Production Costs | | | $ | 8,061 | | $ | 3,888 | | $ | 3,222 | | $ | 1,195 | | $ | 16,366 | |
|
|
|
|
|
|
SIX MONTHS ENDED JUNE 30, 2005
| Rochester
| Silver Valley
| Cerro Bayo
| Martha
| Endeavor
| Total
|
|---|
| Production of Silver (ounces) | | | | 2,344,581 | | | 1,269,996 | | | 1,351,139 | | | 985,181 | | | 58,464 | | | 6,009,361 | |
| Cash Costs per ounce | | | $ | 6.96 | | $ | 7.32 | | $ | 0.31 | | $ | 4.68 | | $ | 1.89 | | $ | 5.12 | |
|
|
|
|
|
|
|
Total Cash Costs (thousands) | | | $ | 16,319 | | $ | 9,290 | | $ | 417 | | $ | 4,615 | | $ | 111 | | $ | 30,753 | |
Add/(Subtract): | | |
| Third Party Smelting Costs | | | | (405 | ) | | (2,132 | ) | | (2,025 | ) | | (567 | ) | | (58 | ) | | (5,189 | ) |
| By-Product Credit | | | | 12,160 | | | 1,628 | | | 12,800 | | | 515 | | | -- | | | 27,102 | |
| Deferred Stripping and other | | |
| adjustments | | | | (201 | ) | | -- | | | (10 | ) | | (174 | ) | | -- | | | (385 | ) |
| Change in Inventory | | | | (11,173 | ) | | (324 | ) | | 3,266 | | | (192 | ) | | (38 | ) | | (8,461 | ) |
|
|
|
|
|
|
|
| Production Costs | | | $ | 16,700 | | $ | 8,462 | | $ | 14,448 | | $ | 4,196 | | $ | 15 | | $ | 43,821 | |
|
|
|
|
|
|
|
| |
|---|
| Second Quarter 2005 Results (August 9, 2005) | Page 4 of 11 |
SIX MONTHS ENDED JUNE 30, 2004
| Rochester
| Silver Valley
| Cerro Bayo
| Martha
| Total
|
|---|
| | | | | | | | | | | | | | | | | | | | |
| Production of Silver (ounces) | | | | 2,627,301 | | | 1,861,944 | | | 1,372,695 | | | 898,397 | | | 6,760,337 | | | | |
| Cash Costs per ounce | | | $ | 5.06 | | $ | 4.94 | | $ | 2.61 | | $ | 3.22 | | $ | 4.29 | | | | |
|
|
|
|
|
| |
| Total Cash Costs (thousands) | | | $ | 13,298 | | $ | 9,199 | | $ | 3,577 | | $ | 2,894 | | $ | 28,968 | | | | |
| Add/(Subtract): | | |
| Third Party Smelting Costs | | | | (421 | ) | | (2,680 | ) | | (2,458 | ) | | (486 | ) | | (6,045 | ) | | | |
| By-Product Credit | | | | 10,962 | | | 1,713 | | | 8,510 | | | 496 | | | 21,681 | | | | |
| Deferred Stripping Adjustment | | | | (200 | ) | | -- | | | (10 | ) | | (55 | ) | | (65 | ) | | | |
| Change in Inventory | | | | (7,800 | ) | | 898 | | | (3,519 | ) | | (602 | ) | | (11,223 | ) | | | |
|
|
|
|
|
| |
| Production Costs | | | $ | 15,839 | | $ | 9,130 | | $ | 6,100 | | $ | 2,247 | | $ | 33,316 | | | | |
|
|
|
|
|
| |
| |
|---|
| Second Quarter 2005 Results (August 9, 2005) | Page 5 of 11 |
COEUR D’ALENE MINES CORPORATION AND SUBSIDIARIES
CONSOLIDATED BALANCE SHEETS
(Unaudited)
| June 30,
2005
| December 31,
2004
|
|---|
| ASSETS | (In Thousands) |
CURRENT ASSETS | | | | | | | | |
| Cash and cash equivalents | | | $ | 233,280 | | $ | 273,079 | |
| Short-term investments | | | | 46,977 | | | 48,993 | |
| Receivables | | | | 22,506 | | | 10,634 | |
| Ore on leach pad | | | | 15,493 | | | 15,046 | |
| Metal and other inventory | | | | 16,654 | | | 17,639 | |
| Deferred tax assets | | | | 1,573 | | | 2,592 | |
| Prepaid expenses and other | | | | 3,669 | | | 3,727 | |
|
| |
| |
| | | | | 340,152 | | | 371,710 | |
PROPERTY, PLANT AND EQUIPMENT | | |
| Property, plant and equipment | | | | 88,842 | | | 85,070 | |
| Less accumulated depreciation | | | | (57,442 | ) | | (54,154 | ) |
|
| |
| |
| | | | | 31,400 | | | 30,916 | |
MINING PROPERTIES | | |
| Operational mining properties | | | | 124,055 | | | 121,344 | |
| Less accumulated depletion | | | | (104,913 | ) | | (100,079 | ) |
|
| |
| |
| | | | | 19,142 | | | 21,265 | |
Mineral interests | | | | 35,152 | | | 20,125 | |
| Non-producing and development properties | | | | 30,618 | | | 26,071 | |
|
| |
| |
| | | | | 84,912 | | | 67,461 | |
OTHER ASSETS | | |
| Non-current ore on leach pad | | | | 38,401 | | | 28,740 | |
| Restricted cash and cash equivalents | | | | 13,119 | | | 10,847 | |
| Debt issuance costs, net | | | | 5,605 | | | 5,757 | |
| Deferred tax assets | | | | 2,858 | | | 1,811 | |
| Other | | | | 9,205 | | | 8,535 | |
|
| |
| |
| | | | | 69,188 | | | 55,690 | |
|
| |
| |
| TOTAL ASSETS | | | $ | 525,652 | | $ | 525,777 | |
|
| |
| |
| | |
| |
|---|
| Second Quarter 2005 Results (August 9, 2005) | Page 6 of 11 |
COEUR D'ALENE MINES CORPORATION AND SUBSIDIARIES
CONSOLIDATED BALANCE SHEETS
(Unaudited)
| June 30,
2005
| December 31,
2004
|
|---|
| LIABILITIES AND SHAREHOLDERS' EQUITY | (In Thousands) |
CURRENT LIABILITIES | | | | | | | | |
| Accounts payable | | | $ | 11,891 | | $ | 8,389 | |
| Accrued liabilities and other | | | | 5,059 | | | 5,306 | |
| Accrued interest payable | | | | 1,031 | | | 1,035 | |
| Accrued salaries and wages | | | | 5,209 | | | 6,379 | |
| Current portion of remediation costs | | | | 484 | | | 1,041 | |
|
| |
| |
| | | | | 23,674 | | | 22,150 | |
LONG-TERM LIABILITIES | | |
| 1 1/4% Convertible Senior Notes due January 2024 | | | | 180,000 | | | 180,000 | |
| Reclamation and mine closure | | | | 24,879 | | | 23,670 | |
| Other long-term liabilities | | | | 6,409 | | | 6,503 | |
|
| |
| |
| | | | | 211,288 | | | 210,173 | |
COMMITMENTS AND CONTINGENCIES | | |
SHAREHOLDERS' EQUITY | | |
| Common Stock, par value $1.00 per share-authorized 500,000,000 | | |
| shares, issued 241,120,982 and 241,028,303 shares in 2005 and | | |
| 2004 (1,059,211 shares held in treasury) | | | | 241,121 | | | 241,028 | |
| Additional paid-in capital | | | | 630,151 | | | 629,809 | |
| Accumulated deficit | | | | (565,227 | ) | | (561,908 | ) |
| Shares held in treasury | | | | (13,190 | ) | | (13,190 | ) |
| Accumulated other comprehensive loss | | | | (2,165 | ) | | (2,285 | ) |
|
| |
| |
| | | | | 290,690 | | | 293,454 | |
|
| |
| |
| TOTAL LIABILITIES AND SHAREHOLDERS' EQUITY | | | $ | 525,652 | | $ | 525,777 | |
|
| |
| |
| |
|---|
| Second Quarter 2005 Results (August 9, 2005) | Page 7 of 11 |
CONSOLIDATED STATEMENTS OF OPERATIONS AND COMPREHENSIVE LOSS
COEUR D’ALENE MINES CORPORATION AND SUBSIDIARIES
(Unaudited)
| Three Months ended June 30,
| Six Months ended June 30,
|
|---|
| 2005
| 2004
| 2005
| 2004
|
|---|
| (In Thousands, except per share data) |
|---|
| REVENUES | | | | | | | | | | | | | | |
| Sales of metal | | | $ | 36,939 | | $ | 26,381 | | $ | 73,146 | | $ | 56,031 | |
| Interest and other | | | | 1,357 | | | 733 | | | 3,298 | | | 86 | |
|
| |
| |
| |
| |
| Total revenues | | | | 38,296 | | | 27,114 | | | 76,444 | | | 56,117 | |
COSTS AND EXPENSES | | |
| Production | | | | 22,562 | | | 16,366 | | | 43,821 | | | 33,316 | |
| Depreciation and depletion | | | | 4,873 | | | 4,773 | | | 9,534 | | | 9,619 | |
| Administrative and general | | | | 4,852 | | | 3,066 | | | 10,378 | | | 6,674 | |
| Exploration | | | | 3,346 | | | 3,041 | | | 6,464 | | | 4,985 | |
| Pre-development | | | | 3,717 | | | 4,037 | | | 6,086 | | | 5,651 | |
| Interest | | | | 562 | | | 657 | | | 1,132 | | | 1,595 | |
| Litigation settlement | | | | -- | | | -- | | | 1,600 | | | -- | |
| Other holding costs | | | | 336 | | | 588 | | | 472 | | | 1,344 | |
|
| |
| |
| |
| |
| Total cost and expenses | | | | 40,248 | | | 32,528 | | | 79,487 | | | 63,184 | |
|
| |
| |
| |
| |
LOSS FROM CONTINUING OPERATIONS BEFORE TAXES | | | | (1,952 | ) | | (5,414 | ) | | (3,043 | ) | | (7,067 | ) |
| Income tax (provision) benefit | | | | 404 | | | -- | | | (275 | ) | | -- | |
|
| |
| |
| |
| |
| NET LOSS | | | | (1,548 | ) | | (5,414 | ) | | (3,318 | ) | | (7,067 | ) |
| Other comprehensive loss | | | | 121 | | | (652 | ) | | 120 | | | (860 | ) |
|
| |
| |
| |
| |
| COMPREHENSIVE LOSS | | | $ | (1,427 | ) | $ | (6,066 | ) | $ | (3,198 | ) | $ | (7,927 | ) |
|
| |
| |
| |
| |
BASIC AND DILUTED LOSS PER SHARE: | | |
| Net loss | | | $ | (0.01 | ) | $ | (0.03 | ) | $ | (0.01 | ) | $ | (0.03 | ) |
|
| |
| |
| |
| |
| Weighted average number of shares of common stock outstanding | | | | 240,028 | | | 213,249 | | | 240,007 | | | 213,195 | |
|
| |
| |
| |
| |
| |
|---|
| Second Quarter 2005 Results (August 9, 2005) | Page 8 of 11 |
COEUR D’ALENE MINES CORPORATION AND SUBSIDIARIES
CONSOLIDATED STATEMENTS OF CASH FLOWS
Three Months Ended June 30, 2005 and 2004
(Unaudited)
| Three Months Ended June 30,
| Six Months Ended June 30,
|
|---|
| 2005
| 2004
| 2005
| 2004
|
|---|
| (In Thousands) |
|---|
| CASH FLOWS FROM OPERATING ACTIVITIES: | | | | | | | | | | | | | | |
| Net loss | | | $ | (1,548 | ) | $ | (5,414 | ) | $ | (3,318 | ) | $ | (7,067 | ) |
| Add (deduct) non-cash items: | | |
| Depreciation and depletion | | | | 4,873 | | | 4,773 | | | 9,534 | | | 9,619 | |
| Deferred taxes | | | | (706 | ) | | | | | (27 | ) |
| Unrealized (gain) loss on embedded derivative | | | | 546 | | | 2,884 | | | (79 | ) | | 1,756 | |
| Amortization of premium/discount | | | | 273 | | | 442 | | | 586 | | | 827 | |
| Amortization of restricted stock compensation | | | | 174 | | | 106 | | | 574 | | | 673 | |
| Amortization of debt issuance costs | | | | 76 | | | 76 | | | 152 | | | 256 | |
| Other charges | | | | 247 | | | (117 | ) | | 268 | | | 113 | |
| Changes in Operating Assets and Liabilities: | | |
| Receivables | | | | (10,308 | ) | | 1,369 | | | (11,872 | ) | | (2,065 | ) |
| Prepaid expenses and other | | | | (1,603 | ) | | 383 | | | (722 | ) | | 819 | |
| Inventories | | | | (5,769 | ) | | (4,898 | ) | | (9,122 | ) | | (9,548 | ) |
| Accounts payable and accrued liabilities | | | | 4,566 | | | 1,359 | | | 2,384 | | | (2,495 | ) |
|
| |
| |
| |
| |
| CASH PROVIDED BY (USED IN) OPERATING ACTIVITIES | | | | (9,179 | ) | | 963 | | | (11,642 | ) | | (7,112 | ) |
CASH FLOWS FROM INVESTING ACTIVITIES: | | |
| Purchases of short-term investments | | | | (12,294 | ) | | (6,735 | ) | | (22,840 | ) | | (58,842 | ) |
| Proceeds from sales of short-term investments | | | | 16,097 | | | 3,120 | | | 22,112 | | | 12,710 | |
| Capital expenditures | | | | (22,657 | ) | | (1,646 | ) | | (26,834 | ) | | (3,126 | ) |
| Other | | | | 96 | | | 22 | | | 113 | | | 237 | |
|
| |
| |
| |
| |
| CASH USED IN INVESTING ACTIVITIES | | | | (18,758 | ) | | (5,239 | ) | | (27,449 | ) | | (49,021 | ) |
CASH FLOWS FROM FINANCING ACTIVITIES: | | |
| Retirement of long-term debt | | | | (76 | ) | | -- | | | (156 | ) | | (9,561 | ) |
| Retirement of building loan | | | | -- | | | -- | | | -- | | | (1,200 | ) |
| Proceeds from issuance of subordinated notes | | | | -- | | | -- | | | -- | | | 180,000 | |
| Debt issuance costs | | | | -- | | | -- | | | -- | | | (6,097 | ) |
| Proceeds from issuance of common stock | | | | 17 | | | -- | | | (552 | ) | | -- | |
| Bank Borrowings on working capital facility | | | | -- | | | -- | | | -- | | | 6,056 | |
| Payments to Bank on working capital facility | | | | -- | | | (2,727 | ) | | -- | | | (8,423 | ) |
| Common stock repurchase | | | | -- | | | -- | | | -- | | | (793 | ) |
| Other | | | | -- | | | (1,452 | ) | | -- | | | (1,407 | ) |
|
| |
| |
| |
| |
| CASH (USED IN) PROVIDED BY FINANCING ACTIVITIES: | | | | (59 | ) | | (4,179 | ) | | (708 | ) | | 158,575 | |
|
| |
| |
| |
| |
INCREASE (DECREASE) IN CASH AND CASH EQUIVALENTS | | | | (27,996 | ) | | (8,455 | ) | | (39,799 | ) | | 102,442 | |
Cash and cash equivalents at beginning of period | | | | 261,276 | | | 173,314 | | | 273,079 | | | 62,417 | |
|
| |
| |
| |
| |
| Cash and cash equivalents at end of period | | | $ | 233,280 | | $ | 164,859 | | $ | 233,280 | | $ | 164,859 | |
|
| |
| |
| |
| |
| |
|---|
| Second Quarter 2005 Results (August 9, 2005) | Page 9 of 11 |
Cautionary Statement
This document contains numerous forward-looking statements within the meaning of securities legislation in the United States and Canada relating to the Company’s silver and gold mining business. Such statements are subject to numerous assumptions and uncertainties, many of which are outside the Company’s control. Operating, exploration and financial data, and other statements in this document are based on information the Company believes reasonable, but involve significant uncertainties as to future gold and silver prices, costs, ore grades, estimation of gold and silver reserves, mining and processing conditions, currency exchange rates, and the completion and/or updating of mining feasibility studies, changes that could result from the Company’s future acquisition of new mining properties or businesses, the risks and hazards inherent in the mining business (including environmental hazards, industrial accidents, weather or geologically related conditions), regulatory and permitting matters, risks inherent in the ownership and operation of, or investment in, mining properties or businesses in foreign countries, as well as other uncertainties and risk factors set out in the Company’s filings from time to time with the SEC and the Ontario Securities Commission, including, without limitation, the Company’s reports on Form 10-K and Form 10-Q. Actual results and timetables could vary significantly from the estimates presented. Readers are cautioned not to put undue reliance on forward-looking statements. The Company disclaims any intent or obligation to update publicly these forward-looking statements, whether as a result of new information, future events or otherwise.
| |
|---|
| Second Quarter 2005 Results (August 9, 2005) | Page 10 of 11 |
Cerro Bayo and Martha Ore Reserve Update
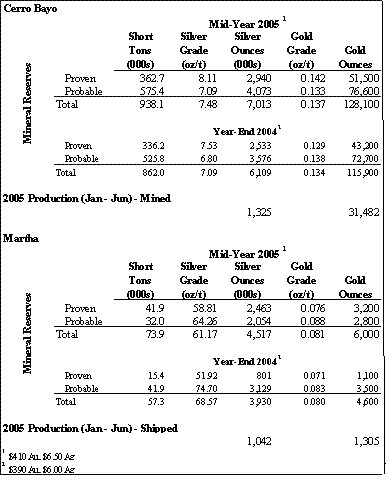
Notes:
| Mid-year 2005 reserves, effective June 30, 2005, reflect first half 2005 mine production, updated pricing assumptions, and changes due to exploration work in the period January through June, 2005. Details of all other key assumptions, parameters and methods used to estimate these mineral reserves are discussed in the Company’s Annual Report on Form 10-K and in the applicable technical reports filed with the respective U.S. and Canadian securities regulatory authorities. |
| There are no known environmental, permitting, legal, title, taxation, sociopolitical, or marketing conditions that would adversely affect the Mid-year 2005 reserves relative to those of year-end 2004. |
| Donald J. Birak, Coeur’s Senior Vice President of Exploration, is the qualified person, per Canadian National Instrument 43-101, responsible for the preparation of the scientific and technical information in this document. Mr. Birak has reviewed the available data and procedures and believes the calculation of reserves was conducted in a professional and competent manner. |
| |
|---|
| Second Quarter 2005 Results (August 9, 2005) | Page 11 of 11 |