Table of Contents
UNITED STATES
SECURITIES AND EXCHANGE COMMISSION
Washington, D.C. 20549
FORM N-CSR
CERTIFIED SHAREHOLDER REPORT OF REGISTERED
MANAGEMENT INVESTMENT COMPANIES
Investment Company Act file number 811-02735
ELFUN TAX-EXEMPT INCOME FUND
(Exact name of registrant as specified in charter)
1600, SUMMER STREET, STAMFORD, CONNECTICUT, 06905
(Address of principal executive offices) (Zip code)
GE ASSET MANAGEMENT, INC.
1600, SUMMER STREET, STAMFORD, CONNECTICUT, 06905
(Name and address of agent for service)
Registrant’s telephone number, including area code: 800-242-0134
Date of fiscal year end: 12/31
Date of reporting period: 12/31/12
Table of Contents
| ITEM 1. | REPORTS TO STOCKHOLDERS |
Table of Contents
Elfun Funds
Annual Report
December 31, 2012

Table of Contents

| 1 | ||||
Manager Reviews and Schedules of Investments | ||||
| 2 | ||||
| 9 | ||||
| 15 | ||||
| 38 | ||||
| 51 | ||||
| 66 | ||||
| 72 | ||||
Financial Statements | ||||
| 74 | ||||
| 78 | ||||
| 80 | ||||
| 82 | ||||
| 84 | ||||
| 97 | ||||
| 98 | ||||
| 99 | ||||
| 102 | ||||
| 106 | ||||
| 109 | ||||
This report has been prepared for shareholders and may be distributed to others only if preceded or accompanied by a current summary prospectus or prospectus.
Table of Contents

Information on the following performance pages relates to the Elfun Funds.
Total returns take into account changes in share price and assume reinvestment of all dividends and capital gains distributions, if any. Total returns shown are net of Fund expenses.
The performance data quoted represent past performance; past performance does not guarantee future results. Investment return and principal value will fluctuate so your shares, when redeemed, may be worth more or less than their original cost. Current performance may be higher or lower than the performance data quoted. Periods less than one year are not annualized. Please call toll-free 800-242-0134 or visit the Funds’ website at http://www.geam.com for the most recent month-end performance data.
A portion of the Elfun Tax-Exempt Income Fund’s income may be subject to state, federal and/or alternative minimum tax. Capital gains, if any, are subject to capital gains tax.
An investment in a Fund is not a deposit of any bank and is not insured or guaranteed by the Federal Deposit Insurance Corporation (FDIC) or any other government agency. An investment in a Fund is subject to risk, including possible loss of principal invested.
The Standard & Poor’s (“S&P”) 500® Composite Price Index of stocks (S&P 500 Index), Morgan Stanley Capital International Europe, Australasia, Far East Index (MSCI EAFE® Index), MSCI® ACWI ex-U.S. Index, Barclays U.S. Aggregate Bond Index, the Barclays U.S. Municipal Bond Index, and the 90 Day U.S. T-Bill are unmanaged indices and do not reflect the actual cost of investing in the instruments that comprise each index. The results shown for the foregoing indices assume the reinvestment of net dividends or interest and do not reflect the fees, expenses or taxes.
S&P 500 Index is an unmanaged, market capitalization-weighted index of stocks of 500 large U.S. companies, which is widely used as a measure of large-cap U.S. stock market performance.
MSCI® EAFE® Index is a market capitalization-weighted index of equity securities of companies domiciled in various countries. The index is designed to represent the performance of developed stock markets outside the U.S. and Canada and excludes certain market segments unavailable to U.S. based investors.
MSCI ACWI Ex-U.S. Index is a market-capitalization weighted index designed to provide a broad measure of stock performance throughout the world, with the exception of U.S. based companies. The MSCI ACWI Ex-U.S. Index includes both developed and emerging markets.
Barclays U.S. Aggregate Bond Index is a market value-weighted index of taxable investment-grade debt issues, including government, corporate, asset-backed and mortgage-backed securities, with maturities of one year or more. This index is designed to represent the performance of the U.S. investment-grade first-rate bond market.
Barclays U.S. Municipal Bond Index is an unmanaged index comprised of investment-grade, fixed rate securities with maturities of at least eight years and less than twelve years.
The 90 Day U.S. T-Bill is an unmanaged measure/index of the performance of the most recently auctioned 90 Day U.S. Treasury bills (i.e. having a total maturity of 90 days) currently available in the marketplace.
The peer universe of underlying funds used for the peer group average annual total return calculation is based on the blend of Morningstar peer categories, as shown. Morningstar is an independent mutual fund rating service. A Fund’s performance may be compared to or ranked within a universe of mutual funds with investment objectives and policies similar but not necessarily identical to the Fund.
©2013 Morningstar, Inc. All Rights Reserved. The Morningstar information contained herein: (1) is proprietary to Morningstar and/or its content providers; (2) may not be copied or distributed; and (3) is not warranted to be accurate, complete or timely. Neither Morningstar nor its content providers are responsible for any damage or losses relating from any use of this information. Past performance is no guarantee of future results.
The views, expressed in this document reflect our judgment as of the publication date and are subject to change at any time without notice.
GE Investment Distributors, Inc., member of FINRA, is the principal underwriter and distributor of the Elfun Funds and a wholly owned subsidiary of GE Asset Management Incorporated, the investment adviser of the Funds.
1
Table of Contents
(Unaudited)

Ralph R. Layman
Executive Vice President and
Chief Investment Officer Emeritus
The Elfun International Equity Fund is managed by a team of portfolio managers that includes Ralph R. Layman (pictured to the left), Jonathan L. Passmore, and Michael J. Solecki. As lead portfolio manager for the Fund, Mr. Layman oversees the entire team and assigns a portion of the Fund to each manager, including himself. Each portfolio manager is limited to the management of his or her portion of the Fund, the size of the portion which Mr. Layman determines on an annual basis. The portfolio managers do not operate independently of each other, rather, the team operates collaboratively, communicating purchases or sales of securities on behalf of the Fund. See portfolio managers’ biographical information beginning on page 106.
| Q. | How did the Elfun International Equity Fund perform compared to its benchmark and Morningstar peer group for the twelve-month period ended December 31, 2012? |
| A. | For the twelve-month period ended December 31, 2012, the Elfun International Equity Fund returned 20.95%. The MSCI EAFE Index, the Fund’s benchmark, returned 17.32% and the Fund’s Morningstar peer group of 804 Foreign Large Blend Funds returned an average of 18.31% over the same period. |
| Q. | What factors affected the Fund’s performance? |
| A. | Despite serious concerns during the year that Spain might be the next country to require assistance, the news from Europe improved throughout 2012. New funding |
| mechanisms designed to support the sovereign debt markets and newly elected administrations backing the Eurozone’s policies served to send markets sharply higher. Relief that China avoided a hard-landing and a new government in Japan dedicated to economic recovery also brought buyers back to international stocks. |
| Q. | What were the primary drivers of Fund performance? |
| A. | Positive contributions came from holdings in information technology (including Samsung Electronics, SAP and Taiwan Semiconductor), healthcare (Essilor—optical products), materials (Syngenta—seeds), consumer discretionary (Volkswagen—autos; WPP—advertising) and staples (Diageo—beverages). Negative contributions came from energy stocks due to fluctuations in oil prices, individual industrial stocks that disappointed the market, and from an underweight in peripheral European banking stocks which, late in the year, rallied strongly on optimism that Europe’s troubles were fading. |
| Q. | Were there any significant changes to the Fund during the period? |
| A. | The largest change came from an addition to holdings in Japan, a region in which the portfolio has consistently been substantially underweight. The election of the Liberal Democratic Party to the Lower House in the fourth quarter of 2012 heralded a period of major |
2
Table of Contents
(Unaudited)

| weakness in the Yen, caused by the incoming government’s determination to introduce inflation and better economic growth to this lagging economy. This has been of significant benefit to the exporting segment of the Japanese market and to interest rate-sensitive stocks, both of which have been added to the portfolio over the last several months. |
3
Table of Contents
(Unaudited)

Understanding Your Fund’s Expenses
4
As a shareholder of the Fund you incur ongoing costs. Ongoing costs include portfolio management fees, professional fees, administrative fees and other Fund expenses. The following example is intended to help you understand your ongoing costs (in dollars) of investing in the Fund and to compare these costs with the ongoing costs of investing in other mutual funds.
To illustrate these ongoing costs, we have provided an example and calculated the expenses paid by investors in units of the Fund during the period. The information in the following table is based on an investment of $1,000, which is invested at the beginning of the period and held for the entire six-month period ended December 31, 2012.
Actual Expenses
The first section of the table provides information about actual account values and actual expenses. You may use the information in this section, together with the amount you invested, to estimate the expenses that you paid over the period. To do so, simply divide your account value by $1,000 (for example, an $8,600 account value divided by $1,000 = 8.6), then multiply the result by the number given for your class under the heading
“Expenses Paid During Period,” to estimate the expenses paid on your account during this period.
Hypothetical Example for Comparison Purposes
The second section of the table provides information about hypothetical account values and hypothetical expenses based on the Fund’s actual expense ratio and an assumed rate of return of 5% per year before expenses, which is not the Fund’s actual return. The hypothetical account values and expenses may not be used to estimate the actual ending account balance or expenses you paid for the period. You may use this information to compare the ongoing costs of investing in the Fund and other funds. To do so, compare this 5% hypothetical example with the 5% hypothetical examples that appear in the shareholders reports of other funds.
Please note that the expenses shown in the table are meant to highlight and help you compare ongoing costs only and do not reflect any transaction costs, such as sales charges or redemption fees, if any. Therefore, the second section of the table is useful in comparing ongoing costs only, and will not help you determine the relative total costs of owning different funds.
July 1, 2012 – December 31, 2012
| Account value at the beginning of the period ($) | Account value at the end of the period ($) | Expenses paid during the period ($)* | ||||||||||
Actual Fund Return | 1,000.00 | 1,142.10 | 2.53 | |||||||||
Hypothetical 5% Return | 1,000.00 | 1,022.77 | 2.39 | |||||||||
| * | Expenses are equal to the Fund’s annualized expense ratio of 0.47% (for the period July 1, 2012 - December 31, 2012), multiplied by the average account value over the period, multiplied by 184/366 (to reflect the one-half year period). |
Table of Contents
(Unaudited)
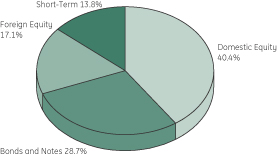
Investment Profile
A mutual fund designed for investors who seek long-term growth of capital and future income by investing principally in foreign securities consistent with prudent investment management and the preservation of capital. The Fund seeks to achieve its investment objective by investing at least 80% of its net assets under normal circumstances in equity securities, such as common stock and preferred stocks and invests primarily (meaning at least 65%) in companies in both developed and emerging market countries outside the United States.
Top Ten Largest Holdings
as of December 31, 2012 as a % of Fair Value(b)(c)
HSBC Holdings PLC | 2.70% | |||
Diageo PLC | 2.65% | |||
Toyota Motor Corp. | 2.53% | |||
SAP AG | 2.50% | |||
Taiwan Semiconductor Manufacturing Company Ltd. | 2.45% | |||
Nestle S.A. | 2.36% | |||
Linde AG | 2.33% | |||
Samsung Electronics Company Ltd. | 2.31% | |||
AIA Group Ltd. | 2.21% | |||
Fresenius SE & Company KGaA | 1.98% |
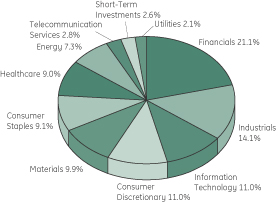
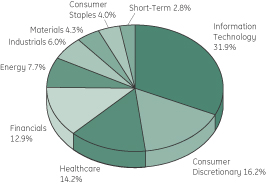
Sector Allocation
as a % of Fair Value of $260,065 (in thousands) as of December 31, 2012(b)(c)
Morningstar Performance Comparison
Based on average annual returns for periods ended December 31, 2012
| One Year | Five Year | Ten Year | ||||||||||
Number of funds in peer group | 804 | 693 | 500 | |||||||||
Peer group average annual total return | 18.31 | % | -3.83 | % | 7.60 | % | ||||||
Morningstar category in peer group: Foreign Large Blend |
| |||||||||||
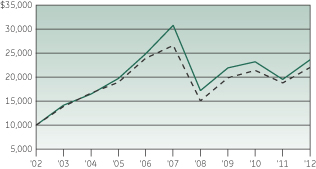
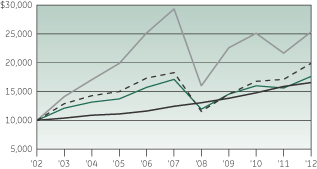
Change in Value of a $10,000 Investment(a)

Average Annual Total Return
for the periods ended December 31, 2012
| (Inception date: 01/01/88) | ||||||||||||||||
| One Year | Five Year | Ten Year | Ending value of a $10,000 investment (a) | |||||||||||||
Elfun International Equity Fund | 20.95% | -5.19% | 8.96% | $23,586 | ||||||||||||
MSCI® EAFE® Index | 17.32% | -3.69% | 8.21% | $22,023 | ||||||||||||
| (a) | Ending value of a $10,000 investment for the ten-year period or since inception, whichever is less. |
| (b) | The securities information regarding holdings, allocations and other characteristics is presented to illustrate examples of securities that the Fund has bought and the diversity of areas in which the Fund may invest as of a particular date. It may not be representative of the Fund’s current or future investments and should not be construed as a recommendation to purchase or sell a particular security. |
| (c) | Fair Value basis is inclusive of short-term investment in GE Institutional Money Market Fund Investment Class. |
See Notes to Performance on page 1 for further information, including an explanation of Morningstar peer categories.
Past performance does not predict future performance. The performance shown on the graph and tables does not reflect the deduction of taxes that a shareholder would pay on Fund distributions or the redemption of Fund shares.
5
Table of Contents
| Elfun International Equity Fund | (in thousands) — December 31, 2012 |

| Number of Shares | Fair Value | |||||||||
Common Stock — 95.3%† |
| |||||||||
| Australia — 2.1% | ||||||||||
Brambles Ltd. | 361,205 | $ | 2,863 | |||||||
CSL Ltd. | 46,204 | 2,608 | ||||||||
| 5,471 | ||||||||||
| Belgium — 0.9% | ||||||||||
Anheuser - Busch InBev N.V. | 27,568 | 2,398 | ||||||||
| Brazil — 0.5% | ||||||||||
Petroleo Brasileiro S.A. ADR | 68,963 | 1,331 | ||||||||
| Canada — 2.7% | ||||||||||
Canadian Natural Resources Ltd. | 26,954 | 775 | ||||||||
Cenovus Energy Inc. | 19,248 | 644 | ||||||||
Potash Corporation of Saskatchewan Inc. | 72,288 | 2,939 | ||||||||
Suncor Energy Inc. | 78,915 | 2,592 | ||||||||
| 6,950 | ||||||||||
| China — 1.1% | ||||||||||
Baidu Inc. ADR | 27,823 | 2,790 | (a) | |||||||
| France — 8.7% | ||||||||||
AXA S.A. | 142,751 | 2,560 | ||||||||
BNP Paribas S.A. | 56,707 | 3,225 | ||||||||
Cap Gemini S.A. | 28,581 | 1,248 | ||||||||
Cie Generale d'Optique Essilor International S.A. | 34,938 | 3,520 | ||||||||
European Aeronautic Defence and Space Company N.V. | 11,089 | 437 | ||||||||
LVMH Moet Hennessy Louis Vuitton S.A. | 17,716 | 3,266 | ||||||||
Safran S.A. | 116,777 | 5,051 | ||||||||
Total S.A. | 19,160 | 996 | ||||||||
Vallourec S.A. | 44,603 | 2,339 | ||||||||
| 22,642 | ||||||||||
| Germany — 10.7% | ||||||||||
Bayer AG | 24,632 | 2,346 | ||||||||
Deutsche Bank AG | 70,406 | 3,094 | ||||||||
| Number of Shares | Fair Value | |||||||||
Fresenius SE & Company KGaA | 44,737 | $ | 5,142 | |||||||
HeidelbergCement AG | 51,057 | 3,121 | ||||||||
Linde AG | 34,698 | 6,063 | ||||||||
SAP AG | 80,814 | 6,491 | ||||||||
Siemens AG | 14,905 | 1,628 | ||||||||
| 27,885 | ||||||||||
| Hong Kong — 2.7% | ||||||||||
AIA Group Ltd. | 1,447,366 | 5,741 | ||||||||
Wharf Holdings Ltd. | 151,550 | 1,209 | ||||||||
| 6,950 | ||||||||||
| India — 0.3% | ||||||||||
Power Grid Corporation of India Ltd. | 333,660 | 704 | ||||||||
| Ireland — 1.2% | ||||||||||
WPP PLC | 222,148 | 3,246 | ||||||||
| Italy — 2.3% | ||||||||||
Eni S.p.A. | 117,504 | 2,875 | ||||||||
Luxottica Group S.p.A. | 78,200 | 3,224 | ||||||||
| 6,099 | ||||||||||
| Japan — 17.1% | ||||||||||
Astellas Pharma Inc. | 54,700 | 2,464 | ||||||||
Bridgestone Corp. | 157,800 | 4,116 | ||||||||
Daito Trust Construction Company Ltd. | 17,200 | 1,629 | ||||||||
FANUC Corp. | 22,000 | 4,101 | ||||||||
JGC Corp. | 94,985 | 2,966 | ||||||||
Kubota Corp. | 177,000 | 2,039 | ||||||||
Mitsubishi Estate Company Ltd. | 59,000 | 1,415 | ||||||||
Mitsubishi Heavy Industries Ltd. | 282,000 | 1,367 | ||||||||
Mitsubishi UFJ Financial Group Inc. | 52,200 | 283 | ||||||||
Mitsui & Company Ltd. | 135,700 | 2,038 | ||||||||
Nikon Corp. | 53,975 | 1,597 | ||||||||
SMC Corp. | 8,500 | 1,547 | ||||||||
Softbank Corp. | 85,199 | 3,128 | ||||||||
Sony Financial Holdings Inc. | 130,300 | 2,347 | ||||||||
Sumitomo Realty & Development Company Ltd. (REIT) | 23,000 | 768 | ||||||||
See Notes to Schedules of Investments and Notes to Financial Statements.
6
Table of Contents
| Elfun International Equity Fund | (in thousands) — December 31, 2012 |
| Number of Shares | Fair Value | |||||||||
The Bank of Yokohama Ltd. | 375,990 | $ | 1,752 | |||||||
Tokio Marine Holdings Inc. | 56,300 | 1,572 | ||||||||
Toyota Motor Corp. | 140,882 | 6,592 | ||||||||
Unicharm Corp. | 56,500 | 2,942 | ||||||||
| 44,663 | ||||||||||
| Netherlands — 2.9% | ||||||||||
ING Groep N.V. | 514,300 | 4,879 | (a) | |||||||
Unilever N.V. | 69,752 | 2,666 | ||||||||
| 7,545 | ||||||||||
| Norway — 0.9% | ||||||||||
Subsea 7 S.A. | 96,213 | 2,309 | ||||||||
| Singapore — 1.3% | ||||||||||
United Overseas Bank Ltd. | 209,518 | 3,437 | ||||||||
| South Korea — 2.3% | ||||||||||
Samsung Electronics Company Ltd. | 4,179 | 6,004 | ||||||||
| Sweden — 3.2% | ||||||||||
Alfa Laval AB | 131,224 | 2,743 | ||||||||
Hexagon AB | 103,976 | 2,628 | ||||||||
Telefonaktiebolaget LM Ericsson | 290,386 | 2,932 | ||||||||
| 8,303 | ||||||||||
| Switzerland — 8.5% | ||||||||||
Nestle S.A. | 94,175 | 6,140 | ||||||||
Novartis AG | 75,887 | 4,790 | ||||||||
Roche Holding AG | 12,861 | 2,598 | ||||||||
Syngenta AG | 10,600 | 4,279 | ||||||||
The Swatch Group AG | 3,300 | 1,672 | ||||||||
Zurich Insurance Group AG | 10,594 | 2,837 | ||||||||
| 22,316 | ||||||||||
| Taiwan — 2.5% | ||||||||||
Taiwan Semiconductor Manufacturing Company Ltd. | 1,905,400 | 6,373 | ||||||||
Taiwan Semiconductor Manufacturing | 9,684 | 166 | ||||||||
| 6,539 | ||||||||||
| Number of Shares | Fair Value | |||||||||
| United Kingdom — 23.4% | ||||||||||
Aggreko PLC | 78,231 | $ | 2,234 | |||||||
BG Group PLC | 163,780 | 2,734 | ||||||||
BHP Billiton PLC | 126,511 | 4,465 | (h) | |||||||
Capita PLC | 207,043 | 2,560 | ||||||||
Diageo PLC | 236,687 | 6,898 | ||||||||
Experian PLC | 96,247 | 1,552 | ||||||||
HSBC Holdings PLC | 661,720 | 7,017 | ||||||||
Intertek Group PLC | 23,428 | 1,191 | ||||||||
Lloyds Banking Group PLC | 2,960,193 | 2,360 | (a) | |||||||
National Grid PLC | 408,783 | 4,691 | ||||||||
Prudential PLC | 288,724 | 4,122 | ||||||||
Reckitt Benckiser Group PLC | 26,512 | 1,684 | ||||||||
Rio Tinto PLC | 84,289 | 4,919 | ||||||||
Royal Dutch Shell PLC | 133,265 | 4,629 | ||||||||
Standard Chartered PLC | 179,428 | 4,647 | ||||||||
Tesco PLC | 187,148 | 1,032 | ||||||||
Vodafone Group PLC | 1,679,134 | 4,230 | ||||||||
| 60,965 | ||||||||||
Total Common Stock | 248,547 | |||||||||
Preferred Stock — 1.8% |
| |||||||||
| Germany — 1.8% | ||||||||||
Volkswagen AG | 21,010 | 4,815 | ||||||||
Total Investments in Securities | 253,362 | |||||||||
Short-Term Investments — 2.6% |
| |||||||||
GE Institutional Money Market Fund — Investment Class 0.06% |
| |||||||||
(Cost $6,703) | 6,703 | (d,k) | ||||||||
Total Investments | 260,065 | |||||||||
Other Assets and Liabilities, | 663 | |||||||||
|
| |||||||||
NET ASSETS — 100.0% | $ | 260,728 | ||||||||
|
| |||||||||
See Notes to Schedules of Investments and Notes to Financial Statements.
7
Table of Contents
| Elfun International Equity Fund | (in thousands) — December 31, 2012 |
Other Information
The Fund had the following long futures contracts open at December 31, 2012 :
| Description | Expiration date | Number of Contracts | Current Notional Value | Unrealized Appreciation/ (Depreciation) | ||||||||||
EURO Stoxx 50 Index Futures | March 2013 | 26 | $ | 896 | $ | (4) | ||||||||
FTSE 100 Index Futures | March 2013 | 22 | 2,091 | (10) | ||||||||||
Topix Index Futures | March 2013 | 18 | 1,793 | 145 | ||||||||||
|
| |||||||||||||
| $ | 131 | |||||||||||||
|
| |||||||||||||
The Fund was invested in the following categories at December 31, 2012 (Unaudited) :
| Industry | | Percentage (based on Fair Value) | | |||
Diversified Financial Services | 9.83% | |||||
Integrated Oil & Gas | 6.08% | |||||
Semiconductors | 4.82% | |||||
Life & Health Insurance | 4.69% | |||||
Pharmaceuticals | 4.69% | |||||
Industrial Machinery | 4.65% | |||||
Automobile Manufacturers | 4.39% | |||||
Diversified Metals & Mining | 3.61% | |||||
Packaged Foods & Meats | 3.39% | |||||
Apparel, Accessories & Luxury Goods | 3.14% | |||||
Wireless Telecommunication Services | 2.83% | |||||
Fertilizers & Agricultural Chemicals | 2.78% | |||||
Distillers & Vintners | 2.65% | |||||
Application Software | 2.50% | |||||
Industrial Gases | 2.33% | |||||
Aerospace & Defense | 2.11% | |||||
Multi-Line Insurance | 2.08% | |||||
Healthcare Services | 1.98% | |||||
Diversified Support Services | 1.96% | |||||
Diversified Real Estate Activities | 1.93% | |||||
Multi-Utilities | 1.80% | |||||
Household Products | 1.78% | |||||
Tires & Rubber | 1.58% | |||||
Healthcare Supplies | 1.35% | |||||
Advertising | 1.26% | |||||
Construction Materials | 1.20% | |||||
Diversified Capital Markets | 1.19% | |||||
Construction & Engineering | 1.14% | |||||
Communications Equipment | 1.13% | |||||
Internet Software & Services | 1.07% | |||||
Research & Consulting Services | 1.05% | |||||
Electronic Equipment & Instruments | 1.01% | |||||
Biotechnology | 1.00% | |||||
Human Resource & Employment Services | 0.98% | |||||
Brewers | 0.92% | |||||
Oil & Gas Equipment & Services | 0.89% | |||||
Construction & Farm Machinery & Heavy Trucks | 0.78% | |||||
Trading Companies & Distributors | 0.78% | |||||
Regional Banks | 0.67% | |||||
Industrial Conglomerates | 0.63% | |||||
Photographic Products | 0.61% | |||||
Property & Casualty Insurance | 0.60% | |||||
IT Consulting & Other Services | 0.48% | |||||
Food Retail | 0.40% | |||||
Oil & Gas Exploration & Production | 0.30% | |||||
Electric Utilities | 0.27% | |||||
Diversified Banks | 0.11% | |||||
|
| |||||
| 97.42% | ||||||
|
| |||||
| Short-Term Investments | | Percentage (based on Fair Value) | | |||
Short-Term Investments | 2.58% | |||||
|
| |||||
| 2.58% | ||||||
|
| |||||
| 100.00% | ||||||
|
| |||||
See Notes to Schedules of Investments and Notes to Financial Statements.
8
Table of Contents
(Unaudited)

David B. Carlson
Chief Investment Officer – U.S. Equities
The Elfun Trusts is managed by David B. Carlson. See portfolio managers’ biographical information beginning on page 106.
| Q. | How did the Elfun Trusts Fund perform compared to its benchmark and Morningstar peer group for the twelve-month period ended December 31, 2012? |
| A. | For the twelve-month period ended December 31, 2012, the Elfun Trusts Fund returned 21.27%. The S&P 500® Index (S&P 500 Index), the Fund’s benchmark, returned 16.00% and the Fund’s Morningstar peer group of 1,741 U.S. Large Cap Growth Funds returned an average of 15.24% over the same period. |
| Q. | What market factors affected the Fund’s performance? |
| A. | It was a good year for the stock market with the S&P 500 Index posting a total return of 16%. Corporate profits grew about 5% and dividends grew faster, about 15%. In 2012 the consensus view on economic growth generally played out; slow growth in the U.S., mild recession in Europe, and a slowdown in China. The big positive for the year came when the European Central Bank said it would do “whatever it takes” to ensure the Euro survives. Interest rates came down around the world. Fears of a major shock to the world’s economy lessened. U.S. economic data, especially housing and autos, was constructive. |
Within the U.S. stock market, the financial sector had the strongest performance with a total return of 29%. The recovery for
banks continued with improving credit quality and a resumption of asset growth. The second best sector was the consumer discretionary sector with a return of 24%, led primarily by the media and retail industries. The worst performing sector was utilities with a return of 1%, but this followed a 20% return the prior year. Energy and materials lagged the market as commodity prices were stable in a slow-growth world.
With lower fears of macro shocks, the price/earnings ratio on the market expanded modestly, but still stood at an attractive level, our opinion, at year-end.
| Q. | What were the primary drivers of Fund performance? |
| A. | When looking at portfolio performance attribution, we look at two components; sector allocation and stock selection. Elfun Trusts did well on both measures last year. The Fund overweighted the healthcare and consumer discretionary sectors which were strong performers; and underweighted utilities and energy which lagged. The technology sector rose in line with the market, but within technology, software and internet stocks did better than hardware stocks, and Elfun Trusts was overweighted in the stronger performing industries. Some of the Fund’s best tech stocks were Ebay, up 68%, Visa, up 50%, and Apple, up 33%. |
The Fund had strong performance among its media holdings; Liberty Global,
9
Table of Contents
(Unaudited)
up 48%, Discovery Communications up 55%, and Comcast, up 56%. The financial sector was a detractor to performance primarily because the Fund did not own enough of the strong performing sector. The financial sector makes up 15% of the S&P 500 Index and 12.9% of Elfun Trusts. The Fund’s financial holdings were up 23% versus a gain of 29% for the benchmark.
Other notable performers were Monsanto, up 37%, aided by higher grain prices, and the retailer Lowes, up 43% on a better outlook for housing in the U.S.
| Q. | Were there any significant changes to the Fund during the period? |
| A. | Once again, changes to the portfolio were relatively modest during the year. Portfolio turnover remained low at 11%. We continue to invest with a long term time horizon. The number of stocks held at year-end was 46, down slightly from a year ago. The characteristics we seek in the Fund’s holdings are above-average growth, financial strength and solid management. The Fund’s holdings are global leaders in their industries. Technology remains a large overweight, but we are tilted towards software and internet services. Consumer discretionary is also an overweight, with emphasis on media and retail. Healthcare made up 14% of the portfolio and remains a modest overweight. In healthcare, we look for strong new product pipelines that can drive growth. |
Growth is a theme across stock selection in all Fund sectors. We believe the developed economies will continue to be burdened with excess debt, fiscal austerity and tax hikes. Growth will likely, in our view, be slow. Finding above-average growth companies at reasonable valuation levels remains our primary investment philosophy.
10
Table of Contents
(Unaudited)

Understanding Your Fund’s Expenses
11
As a shareholder of the Fund you incur ongoing costs. Ongoing costs include portfolio management fees, professional fees, administrative fees and other Fund expenses. The following example is intended to help you understand your ongoing costs (in dollars) of investing in the Fund and to compare these costs with the ongoing costs of investing in other mutual funds.
To illustrate these ongoing costs, we have provided an example and calculated the expenses paid by investors in units of the Fund during the period. The information in the following table is based on an investment of $1,000, which is invested at the beginning of the period and held for the entire six-month period ended December 31, 2012.
Actual Expenses
The first section of the table provides information about actual account values and actual expenses. You may use the information in this section, together with the amount you invested, to estimate the expenses that you paid over the period. To do so, simply divide your account value by $1,000 (for example, an $8,600 account value divided by $1,000 = 8.6), then multiply the result by the number given for your class under the heading “Expenses
Paid During Period,” to estimate the expenses paid on your account during this period.
Hypothetical Example for Comparison Purposes
The second section of the table provides information about hypothetical account values and hypothetical expenses based on the Fund’s actual expense ratio and an assumed rate of return of 5% per year before expenses, which is not the Fund’s actual return. The hypothetical account values and expenses may not be used to estimate the actual ending account balance or expenses you paid for the period. You may use this information to compare the ongoing costs of investing in the Fund and other funds. To do so, compare this 5% hypothetical example with the 5% hypothetical examples that appear in the shareholders reports of other funds.
Please note that the expenses shown in the table are meant to highlight and help you compare ongoing costs only and do not reflect any transaction costs, such as sales charges or redemption fees, if any. Therefore, the second section of the table is useful in comparing ongoing costs only, and will not help you determine the relative total costs of owning different funds.
July 1, 2012 – December 31, 2012
| Account value at the beginning of the period ($) | Account value at the end of the period ($) | Expenses paid during the period ($)* | ||||||||||
Actual Fund Return | 1,000.00 | 1,077.80 | 0.78 | |||||||||
Hypothetical 5% Return | 1,000.00 | 1,024.38 | 0.76 | |||||||||
| * | Expenses are equal to the Fund’s annualized expense ratio of 0.15% (for the period July 1, 2012 - December 31, 2012), multiplied by the average account value over the period, multiplied by 184/366 (to reflect the one-half year period). |
Table of Contents
(Unaudited)

Investment Profile
A mutual fund designed for investors who seek long-term growth of capital and future income rather than current income. The Fund seeks to achieve its investment objective by investing in equity securities of U.S. companies, such as common and preferred stocks.
Top Ten Largest Holdings
as of December 31, 2012 as a % of Fair Value(b)(c)
Qualcomm Inc. | 4.53% | |||
Apple Inc. | 4.28% | |||
Schlumberger Ltd. | 4.26% | |||
eBay Inc. | 4.07% | |||
Express Scripts Holding Co. | 4.04% | |||
PepsiCo Inc. | 3.95% | |||
Visa Inc. | 3.91% | |||
Liberty Global Inc. | 3.75% | |||
Dover Corp. | 3.68% | |||
Monsanto Co. | 3.38% |
Sector Allocation
as a % of Fair Value of $1,819,747 (in thousands) as of December 31, 2012(b)(c)
Morningstar Performance Comparison
Based on average annual returns for periods ended December 31, 2012
| One Year | Five Year | Ten Year | ||||||||||
Number of funds in peer group | 1,741 | 1,573 | 1,300 | |||||||||
Peer group average annual total return | 15.24 | % | 0.70 | % | 6.36 | % | ||||||
Morningstar category in peer group: U.S. Intermediate-Term Bond |
| |||||||||||
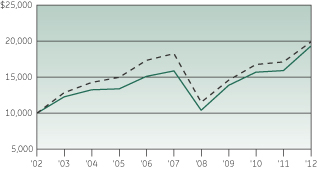
Change in Value of a $10,000 Investment(a)

Average Annual Total Return
for the periods ended December 31, 2012
| (Inception date: 05/27/35) | ||||||||||||||||
| One Year | Five Year | Ten Year | Ending value of a $10,000 investment (a) | |||||||||||||
Elfun Trusts | 21.27% | 3.98% | 6.81% | $19,317 | ||||||||||||
S&P 500® Index | 16.00% | 1.66% | 7.10% | $19,866 | ||||||||||||
| (a) | Ending value of a $10,000 investment for the ten-year period or since inception, whichever is less. |
| (b) | The securities information regarding holdings, allocations and other characteristics is presented to illustrate examples of securities that the Fund has bought and the diversity of areas in which the Fund may invest as of a particular date. It may not be representative of the Fund’s current or future investments and should not be construed as a recommendation to purchase or sell a particular security. |
| (c) | Fair Value basis is inclusive of short-term investment in GE Institutional Money Market Fund Investment Class. |
See Notes to Performance on page 1 for further information, including an explanation of Morningstar peer categories.
Past performance does not predict future performance. The performance shown on the graph and tables does not reflect the deduction of taxes that a shareholder would pay on Fund distributions or the redemption of Fund shares.
12
Table of Contents
| Elfun Trusts | (in thousands) — December 31, 2012 |
| Number of Shares | Fair Value | |||||||||
Common Stock — 97.2%† |
| |||||||||
| Air Freight & Logistics — 1.7% | ||||||||||
United Parcel Service Inc. | 430,000 | $ | 31,704 | |||||||
| Application Software — 1.4% | ||||||||||
Intuit Inc. | 425,000 | 25,288 | ||||||||
| Asset Management & Custody Banks — 2.8% | ||||||||||
State Street Corp. | 1,090,000 | 51,241 | (e) | |||||||
| Automotive Retail — 0.4% | ||||||||||
AutoZone Inc. | 20,000 | 7,089 | (a) | |||||||
| Biotechnology — 5.1% | ||||||||||
Amgen Inc. | 650,000 | 56,108 | ||||||||
Gilead Sciences Inc. | 500,000 | 36,725 | (a) | |||||||
| 92,833 | ||||||||||
| Broadcasting — 1.8% | ||||||||||
Discovery Communications Inc. | 570,000 | 33,345 | (a) | |||||||
| Cable & Satellite — 7.8% | ||||||||||
Comcast Corp. | 1,250,000 | 44,937 | ||||||||
DIRECTV | 400,000 | 20,064 | (a) | |||||||
Liberty Global Inc. | 1,160,000 | 68,150 | (a) | |||||||
Sirius XM Radio Inc. | 3,000,000 | 8,670 | ||||||||
| 141,821 | ||||||||||
| Casinos & Gaming — 0.5% | ||||||||||
Las Vegas Sands Corp. | 200,000 | 9,232 | ||||||||
| Communications Equipment — 5.9% | ||||||||||
Cisco Systems Inc. | 1,250,000 | 24,563 | ||||||||
Qualcomm Inc. | 1,330,000 | 82,487 | ||||||||
| 107,050 | ||||||||||
| Computer Hardware — 4.3% | ||||||||||
Apple Inc. | 146,000 | 77,822 | ||||||||
| Data Processing & Outsourced Services — 9.4% | ||||||||||
Automatic Data Processing Inc. | 225,000 | 12,827 | ||||||||
| Number of Shares | Fair Value | |||||||||
Paychex Inc. | 1,575,000 | $ | 49,045 | |||||||
The Western Union Co. | 2,600,000 | 35,386 | ||||||||
Visa Inc. | 470,000 | 71,243 | ||||||||
| 168,501 | ||||||||||
| Diversified Financial Services — 1.9% | ||||||||||
JPMorgan Chase & Co. | 800,000 | 35,176 | ||||||||
| Electronic Manufacturing Services — 0.6% | ||||||||||
Molex Inc. | 470,000 | 10,491 | ||||||||
| Environmental & Facilities Services — 0.2% | ||||||||||
Stericycle Inc. | 45,000 | 4,197 | (a) | |||||||
| Fertilizers & Agricultural Chemicals — 3.4% | ||||||||||
Monsanto Co. | 650,000 | 61,522 | ||||||||
| Healthcare Equipment — 2.9% | ||||||||||
Covidien PLC | 900,000 | 51,966 | ||||||||
| Healthcare Services — 4.0% | ||||||||||
Express Scripts Holding Co. | 1,360,000 | 73,440 | (a) | |||||||
| Healthcare Supplies — 0.3% | ||||||||||
DENTSPLY International Inc. | 150,000 | 5,942 | ||||||||
| Home Improvement Retail — 3.1% | ||||||||||
Lowe's Companies Inc. | 1,600,000 | 56,832 | ||||||||
| Industrial Gases — 0.9% | ||||||||||
Praxair Inc. | 150,000 | 16,418 | ||||||||
| Industrial Machinery — 3.7% | ||||||||||
Dover Corp. | 1,020,000 | 67,024 | ||||||||
| Integrated Oil & Gas — 2.1% | ||||||||||
Chevron Corp. | 350,000 | 37,849 | ||||||||
| Internet Retail — 1.4% | ||||||||||
Amazon.com Inc. | 100,000 | 25,114 | (a) | |||||||
| Internet Software & Services — 8.3% | ||||||||||
Baidu Inc. ADR | 550,000 | 55,159 | (a) | |||||||
eBay Inc. | 1,450,000 | 73,979 | (a) | |||||||
Google Inc. | 30,000 | 21,281 | (a) | |||||||
| 150,419 | ||||||||||
See Notes to Schedules of Investments and Notes to Financial Statements.
13
Table of Contents
| Elfun Trusts | (in thousands) — December 31, 2012 |
| Number of Shares | Fair Value | |||||||||
| Investment Banking & Brokerage — 2.2% | ||||||||||
The Goldman Sachs Group Inc. | 320,000 | $ | 40,819 | |||||||
| Oil & Gas Equipment & Services — 4.3% | ||||||||||
Schlumberger Ltd. | 1,120,000 | 77,605 | ||||||||
| Oil & Gas Exploration & Production — 1.3% | ||||||||||
Anadarko Petroleum Corp. | 330,000 | 24,522 | ||||||||
| Pharmaceuticals — 1.9% | ||||||||||
Johnson & Johnson | 500,000 | 35,050 | ||||||||
| Reinsurance — 0.6% | ||||||||||
Alleghany Corp. | 30,000 | 10,063 | (a) | |||||||
| Research & Consulting Services — 0.4% | ||||||||||
Nielsen Holdings N.V. | 220,000 | 6,730 | (a) | |||||||
| Soft Drinks — 3.9% | ||||||||||
PepsiCo Inc. | 1,050,000 | 71,851 | ||||||||
| Specialized Finance — 3.3% | ||||||||||
CME Group Inc. | 1,200,000 | 60,852 | ||||||||
| Specialized REITs — 2.0% | ||||||||||
American Tower Corp. | 480,000 | 37,089 | ||||||||
| Specialty Stores — 1.2% | ||||||||||
Dick's Sporting Goods Inc. | 475,000 | 21,608 | ||||||||
| Systems Software — 2.2% | ||||||||||
Microsoft Corp. | 1,250,000 | 33,412 | ||||||||
Oracle Corp. | 200,000 | 6,664 | ||||||||
| 40,076 | ||||||||||
Total Common Stock | 1,768,581 | |||||||||
| Number of Shares | Fair Value | |||||||
Short-Term Investments — 2.8% | ||||||||
GE Institutional Money Market Fund — Investment Class | ||||||||
0.06% | ||||||||
(Cost $51,166) | $ | 51,166 | (d,k) | |||||
Total Investments | 1,819,747 | |||||||
Other Assets and Liabilities, | 515 | |||||||
|
| |||||||
NET ASSETS — 100.0% | $ | 1,820,262 | ||||||
|
| |||||||
See Notes to Schedules of Investments and Notes to Financial Statements.
14
Table of Contents
(Unaudited)

Greg Hartch
Executive Vice President and Strategy and Business Development Leader

David Wiederecht
President and
Chief Investment
Officer – Investment Solutions
The Elfun Diversified Fund is managed by a team of portfolio managers that includes Greg Hartch and David Wiederecht. Mr. Hartch and Mr. Wiederecht are vested with oversight authority for determining asset allocations for the Fund. Each of the U.S. Equity, international equity and fixed income portions of the Fund are managed by separate teams of portfolio managers and analysts. The sub-portfolios underlying the Fund are managed independently of each other, and the portfolio managers have full discretion over their particular sub-portfolio; however, the portfolio management team is collaborative to ensure strict adherence to seek the Fund’s objective. See portfolio managers’ biographical information beginning on page 106.
| Q. | How did the Elfun Diversified Fund perform compared to its benchmark and Morningstar peer group for the twelve-month period ended December 31, 2012? |
| A. | For the twelve-month period ended December 31, 2012, the Elfun Diversified Fund returned 12.77%. The Fund’s broad based benchmarks, the S&P 500® Index (S&P 500 Index), the MSCI All Country World ex-U.S. Index, and the Barclays U.S. Aggregate Bond Index, returned 16.00%, 16.83%, and 4.22%, respectively. The Fund’s Morningstar peer group of 960 U.S. Moderate Allocation funds returned an average of 11.85% over the same period. |
| Q. | What market factors affected the Fund’s performance? |
| A. | The twelve-month period ended December 31, 2012 turned out to be a year of solid returns across asset classes. Equity markets provided double-digit |
| gains, government bond yields were generally lower around the world, and credit spreads moved tighter to boost returns in corporate bonds. This combination of coincident strength of returns across markets appeared unlikely at the start of the year. However, gradual improvement of U.S. growth alongside fading risks from Europe and solid earnings growth helped underpin equity markets, while continued monetary policy support and quantitative easing (QE) has kept interest rates low. |
In the fourth quarter, trends within markets were more divergent than we have seen in recent years. U.S. equities moved lower while non-U.S. equity markets posted robust gains. At the same time, U.S. interest rates were slightly higher, but European yields declined. These moves likely reflect several factors. First, within stock markets, as concerns about the European sovereign debt crisis have abated, valuations in those markets have moved higher. At the same time, growth expectations seem to be bottoming in China, while Japanese markets have benefited from a weaker currency. Second, U.S. markets have enjoyed several years of outperformance. As confidence outside of the U.S. has improved, performance has followed. Finally, the U.S. election in November, followed by the uncertainty around the fiscal cliff and hitting the debt ceiling limit have all contributed to increased uncertainty about growth and policy in the early part of 2013, which seems to have weighed on returns.
15
Table of Contents
(Unaudited)
Signs of economic improvement continued into the end of 2012. On the household side of the economy, growth in employment remained sluggish but positive, resulting in the unemployment rate moving lower. Importantly, the housing market improved as housing starts and sales and housing prices continued to move higher. While levels of activity and price currently remain well below levels witnessed before the financial crisis, we believe the gains appear sustainable and contribute positively to the banking system and real economy. On the manufacturing end, the U.S. ISM index moved back above 50 in December, suggesting a decent level of activity.
International equity markets performed well as an improvement in existing conditions and optimism about the future prevailed despite new clouds on the horizon. In Europe, the European Stability Mechanism going live, Greece passing an acceptable austerity plan, followed by approval from the European Union, and the hope that Spain would accept formal aid, all conspired to push European stocks higher, bond yields lower, and spreads tighter. Stimulus in China early in the fourth quarter of 2012 followed by a calm transfer of power led to a strong recovery in local stocks. Japan held a Lower House election in December with the Liberal Democratic Party winning a decisive mandate for change, leading to an immediate weakening of the Yen and a strong rally in Japanese stocks. Forecasts for the global economy in 2013 remain cautious and therefore, we believe central banks will likely maintain their highly accommodative stance.
The U.S. election maintained the status quo of a divided Congress and a Democratic White House and the prospect of major philosophical battles ahead, starting with the fiscal cliff which only saw a partial solution in the early hours of the New
Year. Corporate earnings were satisfactory although revenue numbers were weak and outlooks were cautious.
Growth concerns have contributed to the downward pressure on fixed income yields. Additional QE from the Federal Reserve along with contained inflation expectations has capped rates in government bonds. Meanwhile, solid corporate balance sheets and cash flows, low default rates, and investor appetite for higher yielding fixed income assets have all contributed to additional tightening of corporate bond spreads. Outside of the U.S., yields have fallen across the board in Europe, reflective of fading systemic risk, which have been coincident with the rally in international equity markets.
| Q. | What were the primary drivers of Fund performance? |
| A. | The Fund’s performance was primarily driven by its asset allocation and underlying security selection. A higher allocation to U.S. equities positively impacted the Fund’s performance as equity markets rallied during the period. A lower allocation to fixed income also contributed to positive performance as fixed income underperformed equities during the period. Both the S&P 500 Index and the MSCI All Country World ex-U.S. Index significantly outperformed the Barclays U.S. Aggregate Bond Index over the twelve-month period. Additionally, security selection, particularly in international equities and fixed income, was a driver of positive absolute and relative performance. |
| Q. | Were there any significant changes to the Fund during the period? |
| A. | The Fund’s exposure to equities, fixed income, and cash remained fairly consistent throughout the |
16
Table of Contents
(Unaudited)
| period. Allocations within the Fund were periodically rebalanced to stay within guidelines. |
As equity markets rallied throughout the first three months of the period, the Fund rebalanced by selling 2% of its U.S. equity exposure and reallocating this to fixed income and cash. Within the Fund’s equity allocation, small-cap exposure was reduced in favor of a larger holding in mid-cap. At the end of May, the Fund rebalanced to new target equity allocations. Within equities, mid-cap, international, and global resources were reduced at the end of May in favor of larger allocations to large-cap U.S. equities, higher dividend equities, and real estate investment trusts (REITs). The Fund’s allocation to mid-cap equity and REITs was also reduced and the cash position in the Fund increased slightly.
The Fund’s overweight to U.S. equities throughout the period reflects our view that on a risk/return basis, U.S. equities continue to be attractive long-term investments. We remain constructive on the
prospects for long-term returns in equity markets based on relatively attractive valuations, expectations for further earnings growth and good prospects for companies to continue to boost dividends and buybacks given strong balance sheets. Non-U.S. equity markets including many emerging markets also appear to have attractive risk/return profiles for long-term disciplined investors.
Throughout the period, the Fund maintained a significant underweight in fixed income, reflecting our view that valuations on both treasuries and corporate bonds are stretched. Returns in bond markets are likely to be more modest as yields are near historical lows and the likelihood for substantial further spread or treasury compression is reduced. Nevertheless, exposure to bonds provides important diversification and downside protection. By allocating between U.S. equities, international equities, and fixed income, we believe the Fund will continue to seek to produce attractive returns while maintaining a prudent level of risk.
17
Table of Contents
(Unaudited)

Understanding Your Fund’s Expenses
18
As a shareholder of the Fund you incur ongoing costs. Ongoing costs include portfolio management fees, professional fees, administrative fees and other Fund expenses. The following example is intended to help you understand your ongoing costs (in dollars) of investing in the Fund and to compare these costs with the ongoing costs of investing in other mutual funds.
To illustrate these ongoing costs, we have provided an example and calculated the expenses paid by investors in units of the Fund during the period. The information in the following table is based on an investment of $1,000, which is invested at the beginning of the period and held for the entire six-month period ended December 31, 2012.
Actual Expenses
The first section of the table provides information about actual account values and actual expenses. You may use the information in this section, together with the amount you invested, to estimate the expenses that you paid over the period. To do so, simply divide your account value by $1,000 (for example, an $8,600 account value divided by $1,000 = 8.6), then multiply the result by the number given for your class under the heading “Expenses
Paid During Period,” to estimate the expenses paid on your account during this period.
Hypothetical Example for Comparison Purposes
The second section of the table provides information about hypothetical account values and hypothetical expenses based on the Fund’s actual expense ratio and an assumed rate of return of 5% per year before expenses, which is not the Fund’s actual return. The hypothetical account values and expenses may not be used to estimate the actual ending account balance or expenses you paid for the period. You may use this information to compare the ongoing costs of investing in the Fund and other funds. To do so, compare this 5% hypothetical example with the 5% hypothetical examples that appear in the shareholders reports of other funds.
Please note that the expenses shown in the table are meant to highlight and help you compare ongoing costs only and do not reflect any transaction costs, such as sales charges or redemption fees, if any. Therefore, the second section of the table is useful in comparing ongoing costs only, and will not help you determine the relative total costs of owning different funds.
July 1, 2012 – December 31, 2012
| Account value at the beginning of the period ($) | Account value at the end of the period ($) | Expenses paid during the period ($)* | ||||||||||
Actual Fund Return | 1,000.00 | 1,060.90 | 2.33 | |||||||||
Hypothetical 5% Return | 1,000.00 | 1,022.82 | 2.29 | |||||||||
| * | Expenses are equal to the Fund’s annualized expense ratio of 0.45% (for the period July 1, 2012 - December 31, 2012), multiplied by the average account value over the period, multiplied by 184/366 (to reflect the one-half year period). |
Table of Contents
(Unaudited)
Investment Profile
A mutual fund designed for investors who seek the highest total return, composed of income and capital appreciation, as is consistent with prudent investment management and the preservation of capital. The Fund seeks to achieve its investment objective by investing primarily in a combination of U.S. and foreign (non-U.S.) equity and debt securities and cash. The Fund’s asset allocation process utilizes information from GE Asset Management’s Asset Allocation Committee to diversify holdings across these asset classes.
Top Ten Largest Holdings
as of December 31, 2012 as a % of Fair Value(b)(c)
Vanguard MSCI Emerging Markets Fund | 3.88% | |||
U.S. Treasury Notes 0.66% 09/30/17 | 2.79% | |||
U.S. Treasury Notes 0.24% 09/30/14 - 10/31/14 | 2.18% | |||
U.S. Treasury Notes 0.56% 02/28/17 | 1.87% | |||
Apple Inc. | 1.44% | |||
Federal National Mortgage Assoc. 4.50% 05/01/18 - 04/01/41 | 1.31% | |||
Qualcomm Inc. | 1.20% | |||
U.S. Treasury Bonds 3.00% 05/15/42 | 1.14% | |||
PepsiCo Inc. | 1.01% | |||
Microsoft Corp. | 0.96% |
Sector Allocation
as a % of Fair Value of $224,507 (in thousands) as of December 31, 2012(b)(c)
Morningstar Performance Comparison
Based on average annual returns for periods ended December 31, 2012
| One Year | Five Year | Ten Year | ||||||||||
Number of funds in peer group | 960 | 811 | 600 | |||||||||
Peer group average annual total return | 11.85 | % | 2.08 | % | 6.04 | % | ||||||
Morningstar category in peer group: Moderate Allocation |
| |||||||||||
Change in Value of a $10,000 Investment(a)

Average Annual Total Return
for the periods ended December 31, 2012
| (Inception date: 01/01/88) | ||||||||||||||||
| One Year | Five Year | Ten Year | Ending value of a $10,000 investment (a) | |||||||||||||
Elfun Diversified Fund | 12.77% | 0.58% | 5.81% | $17,594 | ||||||||||||
S&P 500 Index | 16.00% | 1.66% | 7.10% | $19,866 | ||||||||||||
Barclays U.S. Aggregate Bond Index | 4.22% | 5.94% | 5.18% | $16,575 | ||||||||||||
MSCI All Country World ex U.S. | 16.83% | -2.89% | 9.74% | $25,333 | ||||||||||||
| (a) | Ending value of a $10,000 investment for the ten-year period or since inception, whichever is less. |
| (b) | The securities information regarding holdings, allocations and other characteristics is presented to illustrate examples of securities that the Fund has bought and the diversity of areas in which the Fund may invest as of a particular date. It may not be representative of the Fund’s current or future investments and should not be construed as a recommendation to purchase or sell a particular security. |
| (c) | Fair Value basis is inclusive of short-term investment in GE Institutional Money Market Fund Investment Class. |
See Notes to Performance on page 1 for further information, including an explanation of Morningstar peer categories.
Past performance does not predict future performance. The performance shown on the graph and tables does not reflect the deduction of taxes that a shareholder would pay on Fund distributions or the redemption of Fund shares.
19
Table of Contents
| Elfun Diversified Fund | (in thousands) — December 31, 2012 |
| Number of Shares | Fair Value | |||||||||
Domestic Equity — 37.0%† | ||||||||||
| Advertising — 0.3% | ||||||||||
Omnicom Group Inc. | 10,797 | $ | 539 | |||||||
| Aerospace & Defense — 0.6% | ||||||||||
Honeywell International Inc. | 18,591 | 1,180 | ||||||||
The Boeing Co. | 1,607 | 121 | ||||||||
| 1,301 | ||||||||||
| Agricultural Products — 0.2% | ||||||||||
Archer-Daniels-Midland Co. | 14,930 | 409 | ||||||||
| Air Freight & Logistics — 0.8% | ||||||||||
United Parcel Service Inc. | 22,241 | 1,639 | ||||||||
| Application Software — 0.2% | ||||||||||
Intuit Inc. | 7,374 | 439 | ||||||||
| Asset Management & Custody Banks — 1.3% | ||||||||||
Ameriprise Financial Inc. | 15,329 | 960 | ||||||||
Franklin Resources Inc. | 1,071 | 135 | ||||||||
Invesco Ltd. | 36,086 | 942 | ||||||||
State Street Corp. | 14,280 | 671 | (e) | |||||||
| 2,708 | ||||||||||
| Automobile Manufacturers — 0.2% | ||||||||||
Ford Motor Co. | 26,479 | 343 | ||||||||
| Automotive Retail — 0.1% | ||||||||||
AutoZone Inc. | 400 | 142 | (a) | |||||||
| Biotechnology — 1.0% | ||||||||||
Amgen Inc. | 14,506 | 1,252 | ||||||||
Gilead Sciences Inc. | 11,939 | 877 | (a) | |||||||
| 2,129 | ||||||||||
| Broadcasting — 0.5% | ||||||||||
CBS Corp. | 5,142 | 196 | ||||||||
Discovery Communications Inc. | 14,163 | 829 | (a) | |||||||
| 1,025 | ||||||||||
| Number of Shares | Fair Value | |||||||||
| Cable & Satellite — 1.2% | ||||||||||
Comcast Corp.†† | 17,225 | $ | 644 | |||||||
Comcast Corp.†† | 13,463 | 484 | ||||||||
DIRECTV | 6,088 | 305 | (a) | |||||||
Liberty Global Inc. | 17,206 | 1,011 | (a) | |||||||
| 2,444 | ||||||||||
| Casinos & Gaming — 0.2% | ||||||||||
Las Vegas Sands Corp. | 8,779 | 405 | ||||||||
| Communications Equipment — 2.1% | ||||||||||
Cisco Systems Inc. | 90,354 | 1,774 | ||||||||
Qualcomm Inc. | 43,376 | 2,690 | ||||||||
| 4,464 | ||||||||||
| Computer Hardware — 1.5% | ||||||||||
Apple Inc. | 6,080 | 3,241 | ||||||||
| Construction & Farm Machinery & Heavy Trucks — 0.4% | ||||||||||
Cummins Inc. | 2,057 | 223 | ||||||||
Deere & Co. | 8,297 | 717 | ||||||||
| 940 | ||||||||||
| Consumer Finance — 0.4% | ||||||||||
American Express Co. | 15,086 | 867 | ||||||||
| Data Processing & Outsourced Services — 1.3% | ||||||||||
Paychex Inc. | 33,772 | 1,052 | ||||||||
The Western Union Co. | 46,567 | 634 | ||||||||
Visa Inc. | 7,374 | 1,118 | ||||||||
| 2,804 | ||||||||||
| Department Stores — 0.1% | ||||||||||
Macy's Inc. | 5,656 | 221 | ||||||||
| Distillers & Vintners — 0.1% | ||||||||||
Diageo PLC ADR | 2,417 | 282 | ||||||||
| Distributors — 0.1% | ||||||||||
Genuine Parts Co. | 3,477 | 221 | ||||||||
| Diversified Chemicals — 0.4% | ||||||||||
EI du Pont de Nemours & Co. | 7,316 | 329 | ||||||||
PPG Industries Inc. | 3,252 | 440 | ||||||||
| 769 | ||||||||||
See Notes to Schedules of Investments and Notes to Financial Statements.
20
Table of Contents
| Elfun Diversified Fund | (in thousands) — December 31, 2012 |
| Number of Shares | Fair Value | |||||||||
| Diversified Financial Services — 1.5% | ||||||||||
Citigroup Inc. | 17,737 | $ | 701 | |||||||
JPMorgan Chase & Co. | 18,298 | 804 | ||||||||
Wells Fargo & Co. | 47,624 | 1,628 | ||||||||
| 3,133 | ||||||||||
| Diversified Metals & Mining — 0.0%* | ||||||||||
Freeport-McMoRan Copper & Gold Inc. | 1,543 | 53 | ||||||||
| Drug Retail — 0.1% | ||||||||||
CVS Caremark Corp. | 5,912 | 286 | ||||||||
| Electric Utilities — 0.3% | ||||||||||
NextEra Energy Inc. | 3,856 | 267 | ||||||||
The Southern Co. | 8,461 | 362 | ||||||||
| 629 | ||||||||||
| Electrical Components & Equipment — 0.3% | ||||||||||
Eaton Corp PLC | 11,144 | 604 | ||||||||
| Fertilizers & Agricultural Chemicals — 0.4% | ||||||||||
Monsanto Co. | 9,364 | 886 | ||||||||
| General Merchandise Stores — 0.1% | ||||||||||
Target Corp. | 4,370 | 259 | ||||||||
| Healthcare Distributors — 0.3% | ||||||||||
Cardinal Health Inc. | 13,111 | 540 | ||||||||
| Healthcare Equipment — 1.2% | ||||||||||
Covidien PLC | 34,488 | 1,991 | ||||||||
Medtronic Inc. | 13,882 | 569 | ||||||||
| 2,560 | ||||||||||
| Healthcare Facilities — 0.0%* | ||||||||||
HCA Holdings Inc. | 2,365 | 71 | ||||||||
| Healthcare Services — 0.6% | ||||||||||
Express Scripts Holding Co. | 21,721 | 1,173 | (a) | |||||||
| Healthcare Supplies — 0.1% | ||||||||||
DENTSPLY International Inc. | 6,437 | 255 | ||||||||
| Number of Shares | Fair Value | |||||||||
| Home Building — 0.0%* | ||||||||||
MDC Holdings Inc. | 2,352 | $ | 86 | |||||||
| Home Improvement Retail — 0.9% | ||||||||||
Lowe's Companies Inc. | 42,198 | 1,499 | ||||||||
The Home Depot Inc. | 5,612 | 347 | ||||||||
| 1,846 | ||||||||||
| Household Products — 0.4% | ||||||||||
Kimberly-Clark Corp. | 4,499 | 380 | ||||||||
The Clorox Co. | 6,001 | 439 | ||||||||
| 819 | ||||||||||
| Independent Power Producers & Energy Traders — 0.3% | ||||||||||
AES Corp. | 27,765 | 297 | ||||||||
Calpine Corp. | 16,042 | 291 | (a) | |||||||
| 588 | ||||||||||
| Industrial Gases — 0.1% | ||||||||||
Praxair Inc. | 2,688 | 294 | ||||||||
| Industrial Machinery — 0.6% | ||||||||||
Dover Corp. | 18,373 | 1,207 | ||||||||
| Integrated Oil & Gas — 1.7% | ||||||||||
Chevron Corp. | 14,338 | 1,551 | ||||||||
Exxon Mobil Corp. | 4,422 | 383 | ||||||||
Hess Corp. | 5,347 | 283 | ||||||||
Occidental Petroleum Corp. | 12,352 | 946 | ||||||||
Royal Dutch Shell PLC ADR | 6,044 | 417 | ||||||||
| 3,580 | ||||||||||
| Integrated Telecommunication Services — 0.5% | ||||||||||
AT&T Inc. | 18,643 | 629 | ||||||||
Verizon Communications Inc. | 8,242 | 357 | ||||||||
| 986 | ||||||||||
| Internet Retail — 0.2% | ||||||||||
Amazon.com Inc. | 1,463 | 367 | (a) | |||||||
Internet Software & Services — 1.0% |
| |||||||||
eBay Inc. | 21,771 | 1,111 | (a) | |||||||
Google Inc. | 1,510 | 1,071 | (a) | |||||||
| 2,182 | ||||||||||
See Notes to Schedules of Investments and Notes to Financial Statements.
21
Table of Contents
| Elfun Diversified Fund | (in thousands) — December 31, 2012 |
| Number of Shares | Fair Value | |||||||||
| Investment Banking & Brokerage — 0.3% | ||||||||||
The Goldman Sachs Group Inc. | 4,448 | $ | 567 | |||||||
| IT Consulting & Other Services — 0.5% | ||||||||||
International Business Machines Corp. | 5,943 | 1,138 | (h) | |||||||
| Life & Health Insurance — 0.2% | ||||||||||
Prudential Financial Inc. | 9,151 | 488 | ||||||||
| Life Sciences Tools & Services — 0.3% | ||||||||||
Agilent Technologies Inc. | 8,996 | 368 | ||||||||
PerkinElmer Inc. | 10,283 | 326 | ||||||||
| 694 | ||||||||||
| Movies & Entertainment — 0.5% | ||||||||||
The Walt Disney Co. | 2,572 | 128 | ||||||||
Time Warner Inc. | 20,482 | 980 | ||||||||
| 1,108 | ||||||||||
| Multi-Line Insurance — 0.3% | ||||||||||
American International Group Inc. | 20,220 | 714 | (a) | |||||||
| Multi-Utilities — 0.2% | ||||||||||
Dominion Resources Inc. | 7,027 | 364 | ||||||||
| Oil & Gas Equipment & Services — 1.0% | ||||||||||
Halliburton Co. | 8,226 | 285 | ||||||||
Schlumberger Ltd. | 27,398 | 1,898 | ||||||||
| 2,183 | ||||||||||
| Oil & Gas Exploration & Production — 0.6% | ||||||||||
Anadarko Petroleum Corp. | 11,511 | 855 | ||||||||
Marathon Oil Corp. | 15,424 | 473 | ||||||||
| 1,328 | ||||||||||
| Oil & Gas Storage & Transportation — 0.0%* | ||||||||||
The Williams Companies Inc. | 2,571 | 84 | ||||||||
| Packaged Foods & Meats — 0.4% | ||||||||||
Kraft Foods Group Inc. | 4,642 | 211 | ||||||||
Mondelez International Inc. | 28,321 | 722 | ||||||||
| 933 | ||||||||||
| Number of Shares | Fair Value | |||||||||
| Pharmaceuticals — 2.0% | ||||||||||
Bristol-Myers Squibb Co. | 15,455 | $ | 504 | |||||||
Johnson & Johnson | 23,489 | 1,647 | ||||||||
Merck & Company Inc. | 12,088 | 495 | ||||||||
Pfizer Inc. | 63,989 | 1,605 | ||||||||
| 4,251 | ||||||||||
| Property & Casualty Insurance — 0.5% | ||||||||||
ACE Ltd. | 10,611 | 847 | ||||||||
The Travelers Companies Inc. | 3,842 | 276 | ||||||||
| 1,123 | ||||||||||
| Railroads — 0.4% | ||||||||||
CSX Corp. | 16,967 | 335 | ||||||||
Union Pacific Corp. | 3,374 | 424 | ||||||||
| 759 | ||||||||||
| Regional Banks — 0.2% | ||||||||||
Regions Financial Corp. | 74,554 | 531 | ||||||||
| Research & Consulting Services — 0.1% | ||||||||||
Nielsen Holdings N.V. | 8,329 | 255 | (a) | |||||||
| Restaurants — 0.3% | ||||||||||
Darden Restaurants Inc. | 5,180 | 233 | ||||||||
McDonald's Corp. | 3,963 | 350 | ||||||||
| 583 | ||||||||||
| Retail REITs — 0.1% | ||||||||||
Simon Property Group Inc. | 1,982 | 313 | ||||||||
| Semiconductors — 0.6% | ||||||||||
Altera Corp. | 5,399 | 186 | ||||||||
Analog Devices Inc. | 4,627 | 195 | ||||||||
Intel Corp. | 15,295 | 316 | ||||||||
Microchip Technology Inc. | 3,749 | 122 | ||||||||
Texas Instruments Inc. | 13,303 | 412 | ||||||||
| 1,231 | ||||||||||
| Soft Drinks — 1.3% | ||||||||||
Coca-Cola Enterprises Inc. | 16,967 | 538 | ||||||||
PepsiCo Inc. | 33,067 | 2,263 | ||||||||
| 2,801 | ||||||||||
See Notes to Schedules of Investments and Notes to Financial Statements.
22
Table of Contents
| Elfun Diversified Fund | (in thousands) — December 31, 2012 |
| Number of Shares | Fair Value | |||||||||
| Specialized Finance — 0.6% | ||||||||||
CME Group Inc. | 23,879 | $ | 1,211 | |||||||
| Specialized REITs — 0.6% | ||||||||||
American Tower Corp. | 8,779 | 678 | ||||||||
HCP Inc. | 5,398 | 244 | ||||||||
Public Storage | 1,041 | 151 | ||||||||
Rayonier Inc. | 3,856 | 200 | ||||||||
| 1,273 | ||||||||||
| Specialty Chemicals — 0.1% | ||||||||||
LyondellBasell Industries N.V. | 4,054 | 231 | ||||||||
| Specialty Stores — 0.3% | ||||||||||
Dick's Sporting Goods Inc. | 12,290 | 559 | ||||||||
| Steel — 0.1% | ||||||||||
Allegheny Technologies Inc. | 7,970 | 242 | ||||||||
| Systems Software — 1.5% | ||||||||||
Microsoft Corp. | 80,799 | 2,160 | (h) | |||||||
Oracle Corp. | 32,272 | 1,075 | ||||||||
| 3,235 | ||||||||||
| Tobacco — 0.3% | ||||||||||
Altria Group Inc. | 5,397 | 170 | ||||||||
Philip Morris International Inc. | 5,976 | 500 | ||||||||
| 670 | ||||||||||
| Water Utilities — 0.1% | ||||||||||
American Water Works Company Inc. | 4,713 | 175 | ||||||||
Total Domestic Equity | 78,780 | |||||||||
Foreign Equity — 18.0% | ||||||||||
| Common Stock — 17.7% | ||||||||||
| Advertising — 0.2% | ||||||||||
WPP PLC | 31,970 | 467 | ||||||||
| Number of Shares | Fair Value | |||||||||
| Aerospace & Defense — 0.4% | ||||||||||
European Aeronautic Defence and Space Company N.V. | 1,596 | $ | 63 | |||||||
Safran S.A. | 16,806 | 727 | ||||||||
| 790 | ||||||||||
| Apparel, Accessories & Luxury Goods — 0.6% | ||||||||||
Luxottica Group S.p.A. | 11,254 | 464 | ||||||||
LVMH Moet Hennessy Louis Vuitton S.A. | 2,550 | 470 | ||||||||
The Swatch Group AG | 475 | 241 | ||||||||
| 1,175 | ||||||||||
| Application Software — 0.4% | ||||||||||
SAP AG | 11,631 | 934 | ||||||||
| Automobile Manufacturers — 0.5% | ||||||||||
Toyota Motor Corp. | 20,330 | 951 | ||||||||
| Biotechnology — 0.2% | ||||||||||
CSL Ltd. | 6,649 | 375 | ||||||||
| Brewers — 0.2% | ||||||||||
Anheuser-Busch InBev N.V. | 3,967 | 345 | ||||||||
| Communications Equipment — 0.2% | ||||||||||
Telefonaktiebolaget LM Ericsson | 41,790 | 422 | ||||||||
| Construction & Engineering — 0.2% | ||||||||||
JGC Corp. | 14,998 | 468 | ||||||||
| Construction & Farm Machinery & Heavy Trucks — 0.1% | ||||||||||
Kubota Corp. | 25,000 | 288 | ||||||||
| Construction Materials — 0.2% | ||||||||||
HeidelbergCement AG | 7,348 | 449 | ||||||||
| Distillers & Vintners — 0.5% | ||||||||||
Diageo PLC | 34,062 | 993 | ||||||||
| Diversified Banks — 0.0%* | ||||||||||
Mitsubishi UFJ Financial Group Inc. | 7,500 | 41 | ||||||||
See Notes to Schedules of Investments and Notes to Financial Statements.
23
Table of Contents
| Elfun Diversified Fund | (in thousands) — December 31, 2012 |
| Number of Shares | Fair Value | |||||||||
| Diversified Capital Markets — 0.2% | ||||||||||
Deutsche Bank AG | 10,446 | $ | 459 | |||||||
| Diversified Financial Services — 1.7% | ||||||||||
BNP Paribas S.A. | 8,161 | 464 | ||||||||
HSBC Holdings PLC | 95,229 | 1,010 | ||||||||
ING Groep N.V. | 74,013 | 702 | (a) | |||||||
Lloyds Banking Group PLC | 426,007 | 340 | (a) | |||||||
Standard Chartered PLC | 25,822 | 669 | ||||||||
United Overseas Bank Ltd. | 29,693 | 487 | ||||||||
| 3,672 | ||||||||||
| Diversified Metals & Mining — 0.6% | ||||||||||
BHP Billiton PLC | 18,206 | 643 | ||||||||
Rio Tinto PLC | 12,136 | 708 | ||||||||
| 1,351 | ||||||||||
| Diversified Real Estate Activities — 0.3% | ||||||||||
Daito Trust Construction Company Ltd. | 2,500 | 237 | ||||||||
Mitsubishi Estate Company Ltd. | 9,000 | 216 | ||||||||
Sumitomo Realty & Development Company Ltd. | 2,000 | 67 | ||||||||
Wharf Holdings Ltd. | 21,810 | 174 | ||||||||
| 694 | ||||||||||
| Diversified Support Services — 0.3% | ||||||||||
Aggreko PLC | 11,258 | 321 | ||||||||
Brambles Ltd. | 51,981 | 412 | ||||||||
| 733 | ||||||||||
| Electric Utilities — 0.0%* | ||||||||||
Power Grid Corporation of India Ltd. | 48,018 | 101 | ||||||||
| Electronic Equipment & Instruments — 0.2% | ||||||||||
Hexagon AB | 14,963 | 378 | ||||||||
| Fertilizers & Agricultural Chemicals — 0.6% | ||||||||||
Potash Corporation of Saskatchewan Inc. †† | 6,067 | 247 | ||||||||
Potash Corporation of Saskatchewan Inc. †† | 10,403 | 423 | ||||||||
Syngenta AG | 1,525 | 616 | ||||||||
| 1,286 | ||||||||||
| Number of Shares | Fair Value | |||||||||
| Food Retail — 0.1% | ||||||||||
Tesco PLC | 26,933 | $ | 148 | |||||||
| Healthcare Services — 0.4% | ||||||||||
Fresenius SE & Company KGaA | 6,438 | 740 | ||||||||
| Healthcare Supplies — 0.2% | ||||||||||
Cie Generale d'Optique Essilor International S.A. | 5,028 | 506 | ||||||||
| Heavy Electrical Equipment — 0.1% | ||||||||||
ABB Ltd. ADR | 10,129 | 211 | ||||||||
| Household Products — 0.3% | ||||||||||
Reckitt Benckiser Group PLC | 3,815 | 242 | ||||||||
Unicharm Corp. | 8,100 | 422 | ||||||||
| 664 | ||||||||||
| Human Resource & Employment Services — 0.2% | ||||||||||
Capita PLC | 29,796 | 368 | ||||||||
| Industrial Conglomerates — 0.1% | ||||||||||
Siemens AG | 2,145 | 234 | ||||||||
| Industrial Gases — 0.4% | ||||||||||
Linde AG | 4,993 | 872 | ||||||||
| Industrial Machinery — 0.8% | ||||||||||
Alfa Laval AB | 18,884 | 395 | ||||||||
FANUC Corp. | 3,200 | 596 | ||||||||
Mitsubishi Heavy Industries Ltd. | 41,000 | 199 | ||||||||
SMC Corp. | 1,200 | 218 | ||||||||
Vallourec S.A. | 6,138 | 322 | ||||||||
| 1,730 | ||||||||||
| Integrated Oil & Gas — 1.1% | ||||||||||
BG Group PLC | 23,556 | 393 | ||||||||
Cenovus Energy Inc. | 2,770 | 93 | ||||||||
Eni S.p.A. | 16,910 | 414 | ||||||||
Petroleo Brasileiro S.A. ADR | 9,925 | 192 | ||||||||
Royal Dutch Shell PLC | 19,178 | 666 | ||||||||
Suncor Energy Inc. | 11,357 | 373 | ||||||||
Total S.A. | 2,757 | 143 | ||||||||
| 2,274 | ||||||||||
See Notes to Schedules of Investments and Notes to Financial Statements.
24
Table of Contents
| Elfun Diversified Fund | (in thousands) — December 31, 2012 |
| Number of Shares | Fair Value | |||||||||
| Internet Software & Services — 0.6% | ||||||||||
Baidu Inc. ADR | 12,197 | $ | 1,224 | (a) | ||||||
| IT Consulting & Other Services —0.1% | ||||||||||
Cap Gemini S.A. | 4,114 | 180 | ||||||||
| Life & Health Insurance — 0.8% | ||||||||||
AIA Group Ltd. | 208,293 | 826 | ||||||||
Prudential PLC | 41,550 | 593 | ||||||||
Sony Financial Holdings Inc. | 18,800 | 339 | ||||||||
| 1,758 | ||||||||||
| Multi-Line Insurance — 0.4% | ||||||||||
AXA S.A. | 21,224 | 381 | ||||||||
Zurich Insurance Group AG | 1,525 | 408 | ||||||||
| 789 | ||||||||||
| Multi-Utilities — 0.3% | ||||||||||
National Grid PLC | 58,829 | 675 | ||||||||
| Oil & Gas Equipment & Services — 0.1% | ||||||||||
Subsea 7 S.A. | 13,240 | 318 | ||||||||
| Oil & Gas Exploration & Production — 0.1% | ||||||||||
Canadian Natural Resources Ltd. | 3,879 | 112 | ||||||||
| Packaged Foods & Meats — 0.6% | ||||||||||
Nestle S.A. | 13,553 | 884 | ||||||||
Unilever N.V. | 10,034 | 383 | ||||||||
| 1,267 | ||||||||||
| Pharmaceuticals — 1.2% | ||||||||||
Astellas Pharma Inc. | 7,900 | 356 | ||||||||
Bayer AG | 3,545 | 338 | ||||||||
Novartis AG | 10,921 | 689 | ||||||||
Novartis AG ADR | 11,439 | 724 | ||||||||
Roche Holding AG | 1,851 | 374 | ||||||||
| 2,481 | ||||||||||
| Photographic Products — 0.1% | ||||||||||
Nikon Corp. | 7,797 | 231 | ||||||||
| Property & Casualty Insurance — 0.1% | ||||||||||
Tokio Marine Holdings Inc. | 8,100 | 226 | ||||||||
| Number of Shares | Fair Value | |||||||||
| Regional Banks — 0.1% | ||||||||||
The Bank of Yokohama Ltd. | 53,600 | $ | 250 | |||||||
| Research & Consulting Services —0.2% | ||||||||||
Experian PLC | 13,850 | 223 | ||||||||
Intertek Group PLC | 3,371 | 171 | ||||||||
| 394 | ||||||||||
| Semiconductors — 0.8% | ||||||||||
Samsung Electronics Company Ltd. | 601 | 863 | ||||||||
Taiwan Semiconductor Manufacturing Company Ltd. | 274,484 | 918 | ||||||||
Taiwan Semiconductor Manufacturing Company Ltd. ADR | 1,199 | 21 | ||||||||
| 1,802 | ||||||||||
| Tires & Rubber — 0.3% | ||||||||||
Bridgestone Corp. | 22,600 | 589 | ||||||||
| Trading Companies & Distributors — 0.1% | ||||||||||
Mitsui & Company Ltd. | 19,500 | 293 | ||||||||
| Wireless Telecommunication Services — 0.5% | ||||||||||
Softbank Corp. | 12,200 | 448 | ||||||||
Vodafone Group PLC | 241,647 | 609 | ||||||||
| 1,057 | ||||||||||
Total Common Stock | 37,765 | |||||||||
Preferred Stock — 0.3% | ||||||||||
| Automobile Manufacturers — 0.3% | ||||||||||
Volkswagen AG | 3,024 | 693 | ||||||||
Total Foreign Equity | 38,458 | |||||||||
See Notes to Schedules of Investments and Notes to Financial Statements.
25
Table of Contents
| Elfun Diversified Fund | (in thousands) — December 31, 2012 |
| Principal Amount | Fair Value | |||||||||||
Bonds and Notes — 30.2% |
| |||||||||||
| U.S. Treasuries — 9.9% | ||||||||||||
U.S. Treasury Bonds | ||||||||||||
| 3.00% | 05/15/42 | $ | 2,510 | $ | 2,557 | (h) | ||||||
| 3.13% | 02/15/42 | 796 | 833 | |||||||||
U.S. Treasury Notes |
| |||||||||||
| 0.23% | 07/31/14 | 1,916 | 1,913 | (d,h) | ||||||||
| 0.24% | 09/30/14 - 10/31/14 | 4,896 | 4,897 | (d,h) | ||||||||
| 0.56% | 02/28/17 | 4,146 | 4,201 | (d,h) | ||||||||
| 0.66% | 09/30/17 | 6,270 | 6,258 | (d,h) | ||||||||
| 1.63% | 08/15/22 | 457 | 454 | |||||||||
| 21,113 | ||||||||||||
| Agency Mortgage Backed — 9.5% | ||||||||||||
Federal Home Loan Mortgage Corp. | ||||||||||||
| 2.38% | 01/13/22 | 394 | 412 | |||||||||
| 4.50% | 06/01/33 - 02/01/35 | 11 | 12 | (h) | ||||||||
| 5.00% | 07/01/35 - 06/01/41 | 395 | 443 | (h) | ||||||||
| 5.50% | 05/01/20 - 04/01/39 | 155 | 172 | (h) | ||||||||
| 6.00% | 04/01/17 - 11/01/37 | 359 | 400 | (h) | ||||||||
| 6.50% | 11/01/28 - 07/01/29 | 9 | 12 | (h) | ||||||||
| 7.00% | 10/01/16 - 08/01/36 | 40 | 47 | (h) | ||||||||
| 7.50% | 12/01/30 - 09/01/33 | 9 | 11 | (h) | ||||||||
| 8.00% | 07/01/26 - 11/01/30 | 6 | 7 | (h) | ||||||||
| 8.50% | 04/01/30 - 05/01/30 | 17 | 20 | (h) | ||||||||
Federal National Mortgage Assoc. |
| |||||||||||
| 2.72% | 04/01/37 | 1 | 1 | (i) | ||||||||
| 4.00% | 05/01/19 - 03/01/41 | 733 | 786 | (h) | ||||||||
| 4.50% | 05/01/18 - 04/01/41 | 2,709 | 2,933 | (h) | ||||||||
| 5.00% | 07/01/20 - 06/01/41 | 796 | 892 | (h) | ||||||||
| 5.50% | 04/01/14 - 01/01/39 | 860 | 938 | (h) | ||||||||
| 6.00% | 02/01/14 - 08/01/35 | 417 | 473 | (h) | ||||||||
| 6.50% | 12/01/14 - 08/01/36 | 93 | 101 | (h) | ||||||||
| 7.00% | 01/01/16 - 12/01/33 | 6 | 7 | (h) | ||||||||
| 7.50% | 09/01/13 - 03/01/34 | 26 | 28 | (h) | ||||||||
| 8.00% | 11/01/14 - 11/01/33 | 34 | 39 | (h) | ||||||||
| 8.50% | 05/01/31 | 2 | 3 | (h) | ||||||||
| 9.00% | 12/01/17 - 12/01/22 | 7 | 7 | (h) | ||||||||
| 3.00% | TBA | 1,705 | 1,787 | (c) | ||||||||
| 3.50% | TBA | 1,785 | 1,903 | (c) | ||||||||
| Principal Amount | Fair Value | |||||||||||
| 4.00% | TBA | $ | 835 | $ | 895 | (c) | ||||||
| 4.50% | TBA | 594 | 642 | (c) | ||||||||
| 5.00% | TBA | 485 | 525 | (c) | ||||||||
| 6.00% | TBA | 1,250 | 1,365 | (c) | ||||||||
| 6.50% | TBA | 490 | 546 | (c) | ||||||||
Government National Mortgage Assoc. | ||||||||||||
| 4.50% | 08/15/33 - 03/20/41 | 647 | 712 | (h) | ||||||||
| 5.00% | 08/15/33 | 23 | 25 | (h) | ||||||||
| 6.00% | 04/15/30 - 09/15/36 | 28 | 31 | (h) | ||||||||
| 6.50% | 06/15/24 - 07/15/36 | 52 | 62 | (h) | ||||||||
| 7.00% | 04/15/28 - 10/15/36 | 23 | 26 | (h) | ||||||||
| 7.50% | 07/15/23 - 04/15/28 | 18 | 18 | (h) | ||||||||
| 8.00% | 05/15/30 | 1 | 1 | (h) | ||||||||
| 8.50% | 10/15/17 | 12 | 13 | (h) | ||||||||
| 9.00% | 11/15/16 - 12/15/21 | 14 | 14 | (h) | ||||||||
| 3.00% | TBA | 545 | 579 | (c) | ||||||||
| 3.50% | TBA | 1,540 | 1,673 | (c) | ||||||||
| 4.00% | TBA | 1,035 | 1,131 | (c) | ||||||||
| 5.00% | TBA | 492 | 537 | (c) | ||||||||
| 5.50% | TBA | 50 | 55 | (c) | ||||||||
| 20,284 | ||||||||||||
| Agency Collateralized Mortgage Obligations — 0.2% | ||||||||||||
Collateralized Mortgage Obligation Trust | ||||||||||||
| 0.70% | 11/01/18 | 1 | 1 | (d,f) | ||||||||
Federal Home Loan Mortgage Corp. | ||||||||||||
| 0.08% | 09/25/43 | 295 | 2 | (g,h) | ||||||||
Federal Home Loan Mortgage Corp. REMIC | ||||||||||||
| 3.50% | 11/15/24 - 11/15/30 | 429 | 32 | (g,q) | ||||||||
| 4.50% | 02/15/18 - 03/15/18 | 29 | 1 | (g,h,q) | ||||||||
| 5.00% | 05/15/18 - 10/15/18 | 26 | 1 | (g,h,q) | ||||||||
| 5.50% | 06/15/33 | 26 | 3 | (g,h,q) | ||||||||
| 6.39% | 08/15/25 | 205 | 26 | (g,i) | ||||||||
| 7.50% | 07/15/27 | 16 | 3 | (g,h,q) | ||||||||
Federal Home Loan Mortgage Corp. STRIPS | ||||||||||||
| 4.23% | 08/01/27 | 1 | 1 | (d,f,h) | ||||||||
| 8.00% | 02/01/23 - 07/01/24 | 3 | 0 | (g,h,q) | ||||||||
See Notes to Schedules of Investments and Notes to Financial Statements.
26
Table of Contents
| Elfun Diversified Fund | (in thousands) — December 31, 2012 |
| Principal Amount | Fair Value | |||||||||||
Federal National Mortgage Assoc. REMIC | ||||||||||||
| 1.21% | 12/25/42 | $ | 68 | $ | 2 | (g,h) | ||||||
| 2.71% | 12/25/22 | 1 | 1 | (d,f,h) | ||||||||
| 4.50% | 05/25/18 | 1 | — | ** | (g,h,q) | |||||||
| 5.00% | 10/25/22 - 09/25/40 | 322 | 36 | (g,h,q) | ||||||||
| 5.79% | 07/25/38 | 89 | 10 | (g,i) | ||||||||
| 5.84% | 11/25/40 | 350 | 64 | (g,i) | ||||||||
| 6.29% | 01/25/42 | 233 | 48 | (g,i) | ||||||||
| 7.29% | 05/25/18 | 177 | 19 | (g,h,i) | ||||||||
Federal National Mortgage Assoc. STRIPS | ||||||||||||
| 4.50% | 08/01/35 - 01/01/36 | 81 | 9 | (g,q) | ||||||||
| 5.00% | 03/25/38 - 05/25/38 | 50 | 6 | (g,q) | ||||||||
| 5.50% | 12/01/33 | 13 | 2 | (g,q) | ||||||||
| 6.00% | 01/01/35 | 32 | 5 | (g,q) | ||||||||
| 7.50% | 11/01/23 | 30 | 6 | (g,h,q) | ||||||||
| 8.00% | 08/01/23 - 07/01/24 | 6 | 1 | (g,h,q) | ||||||||
| 8.50% | 03/01/17 - 07/25/22 | 3 | 0 | (g,h,q) | ||||||||
| 9.00% | 05/25/22 | 1 | — | ** | (g,h,q) | |||||||
Government National Mortgage Assoc. | ||||||||||||
| 4.50% | 10/20/37 -08/16/39 | 460 | 50 | (g,q) | ||||||||
| 5.00% | 12/20/35 -09/20/38 | 363 | 31 | (g,q) | ||||||||
| 5.94% | 05/20/40 | 218 | 35 | (g,i) | ||||||||
| 5.96% | 05/20/40 | 389 | 71 | (g,i) | ||||||||
| 6.39% | 12/20/39 | 393 | 64 | (g,i) | ||||||||
| 530 | ||||||||||||
| Asset Backed — 0.0%* | ||||||||||||
Popular ABS Mortgage Pass- Through Trust 2005-5 | ||||||||||||
| 5.30% | 11/25/35 | 50 | 32 | (h) | ||||||||
| Corporate Notes — 9.0% | ||||||||||||
ABB Finance USA Inc. | ||||||||||||
| 1.63% | 05/08/17 | 66 | 67 | |||||||||
AbbVie Inc. | ||||||||||||
| 1.20% | 11/06/15 | 102 | 103 | (b) | ||||||||
| 1.75% | 11/06/17 | 68 | 69 | (b) | ||||||||
| 2.00% | 11/06/18 | 68 | 69 | (b) | ||||||||
| 4.40% | 11/06/42 | 34 | 36 | (b) | ||||||||
AES Corp. | ||||||||||||
| 8.00% | 10/15/17 | 6 | 7 | (h) | ||||||||
| Principal Amount | Fair Value | |||||||||||
AES Panama S.A. | ||||||||||||
| 6.35% | 12/21/16 | $ | 30 | $ | 33 | (b,h) | ||||||
Aetna Inc. | ||||||||||||
| 1.50% | 11/15/17 | 56 | 56 | |||||||||
| 2.75% | 11/15/22 | 68 | 67 | |||||||||
Agilent Technologies Inc. |
| |||||||||||
| 3.20% | 10/01/22 | 33 | 33 | |||||||||
| 5.50% | 09/14/15 | 58 | 65 | (h) | ||||||||
Altria Group Inc. | ||||||||||||
| 4.25% | 08/09/42 | 51 | 49 | |||||||||
Amazon.com Inc. | ||||||||||||
| 1.20% | 11/29/17 | 68 | 68 | |||||||||
| 2.50% | 11/29/22 | 68 | 67 | |||||||||
America Movil SAB de C.V. |
| |||||||||||
| 2.38% | 09/08/16 | 200 | 208 | (h) | ||||||||
American Axle & Manufacturing Inc. | ||||||||||||
| 7.88% | 03/01/17 | 69 | 71 | (h) | ||||||||
American Express Credit Corp. | ||||||||||||
| 1.75% | 06/12/15 | 48 | 49 | (h) | ||||||||
American International Group Inc. | ||||||||||||
| 4.88% | 06/01/22 | 102 | 116 | |||||||||
Amgen Inc. |
| |||||||||||
| 5.38% | 05/15/43 | 64 | 75 | (h) | ||||||||
| 5.65% | 06/15/42 | 30 | 36 | (h) | ||||||||
Amsted Industries Inc. |
| |||||||||||
| 8.13% | 03/15/18 | 38 | 41 | (b,h) | ||||||||
Anadarko Petroleum Corp. |
| |||||||||||
| 6.20% | 03/15/40 | 34 | 42 | |||||||||
Anheuser-Busch InBev Worldwide Inc. | ||||||||||||
| 2.50% | 07/15/22 | 70 | 70 | |||||||||
| 5.38% | 11/15/14 | 43 | 47 | (h) | ||||||||
Archer-Daniels-Midland Co. |
| |||||||||||
| 4.02% | 04/16/43 | 49 | 47 | (b) | ||||||||
Arizona Public Service Co. |
| |||||||||||
| 6.25% | 08/01/16 | 59 | 69 | (h) | ||||||||
AstraZeneca PLC |
| |||||||||||
| 4.00% | 09/18/42 | 41 | 41 | |||||||||
AT&T Inc. |
| |||||||||||
| 0.65% | 02/13/15 | 70 | 70 | (d,h) | ||||||||
| 2.95% | 05/15/16 | 67 | 71 | (h) | ||||||||
| 4.35% | 06/15/45 | 73 | 73 | (b) | ||||||||
| 5.55% | 08/15/41 | 76 | 91 | (h) | ||||||||
See Notes to Schedules of Investments and Notes to Financial Statements.
27
Table of Contents
| Elfun Diversified Fund | (in thousands) — December 31, 2012 |
| Principal Amount | Fair Value | |||||||||||
Autodesk Inc. |
| |||||||||||
| 1.95% | 12/15/17 | $ | 30 | $ | 30 | |||||||
Banco do Nordeste do Brasil S.A. |
| |||||||||||
| 3.63% | 11/09/15 | 100 | 104 | (b,h) | ||||||||
Banco Mercantil del Norte S.A. |
| |||||||||||
| 6.86% | 10/13/21 | 100 | 108 | (b,h) | ||||||||
Bank of America Corp. |
| |||||||||||
| 5.42% | 03/15/17 | 200 | 219 | |||||||||
| 5.70% | 01/24/22 | 103 | 124 | (h) | ||||||||
Berkshire Hathaway Finance Corp. | ||||||||||||
| 1.60% | 05/15/17 | 75 | 76 | (h) | ||||||||
| 3.00% | 05/15/22 | 85 | 89 | (h) | ||||||||
Bombardier Inc. |
| |||||||||||
| 5.75% | 03/15/22 | 8 | 8 | (b) | ||||||||
| 7.75% | 03/15/20 | 354 | 402 | (b,h) | ||||||||
BP Capital Markets PLC |
| |||||||||||
| 1.38% | 11/06/17 | 68 | 68 | |||||||||
| 1.85% | 05/05/17 | 52 | 53 | |||||||||
| 2.25% | 11/01/16 | 115 | 120 | (h) | ||||||||
| 2.50% | 11/06/22 | 68 | 67 | |||||||||
Calpine Corp. |
| |||||||||||
| 7.25% | 10/15/17 | 7 | 7 | (b,h) | ||||||||
Cargill Inc. |
| |||||||||||
| 5.20% | 01/22/13 | 215 | 216 | (b,h) | ||||||||
| 6.00% | 11/27/17 | 1 | 1 | (b,h) | ||||||||
Case New Holland Inc. |
| |||||||||||
| 7.88% | 12/01/17 | 40 | 47 | (h) | ||||||||
Caterpillar Financial Services Corp. | ||||||||||||
| 1.25% | 11/06/17 | 48 | 48 | |||||||||
Caterpillar Inc. |
| |||||||||||
| 1.50% | 06/26/17 | 84 | 85 | |||||||||
Catholic Health Initiatives |
| |||||||||||
| 1.60% | 11/01/17 | 14 | 14 | |||||||||
| 2.95% | 11/01/22 | 54 | 55 | |||||||||
| 4.35% | 11/01/42 | 24 | 24 | |||||||||
CCO Holdings LLC |
| |||||||||||
| 8.13% | 04/30/20 | 61 | 68 | (h) | ||||||||
Central American Bank for Economic Integration | ||||||||||||
| 5.38% | 09/24/14 | 60 | 64 | (b,h) | ||||||||
| Principal Amount | Fair Value | |||||||||||
CenturyLink Inc. |
| |||||||||||
| 5.80% | 03/15/22 | $ | 18 | $ | 19 | |||||||
| 7.65% | 03/15/42 | 26 | 27 | (h) | ||||||||
Cigna Corp. |
| |||||||||||
| 2.75% | 11/15/16 | 69 | 73 | (h) | ||||||||
| 4.00% | 02/15/22 | 28 | 31 | |||||||||
| 5.38% | 02/15/42 | 64 | 75 | (h) | ||||||||
Cincinnati Bell Inc. |
| |||||||||||
| 8.25% | 10/15/17 | 65 | 70 | |||||||||
Citigroup Inc. |
| |||||||||||
| 4.45% | 01/10/17 | 83 | 92 | (h) | ||||||||
| 5.00% | 09/15/14 | 127 | 134 | (h) | ||||||||
| 5.88% | 01/30/42 | 95 | 117 | |||||||||
| 6.13% | 08/25/36 | 100 | 109 | |||||||||
CityCenter Holdings LLC |
| |||||||||||
| 7.63% | 01/15/16 | 41 | 44 | |||||||||
CNA Financial Corp. |
| |||||||||||
| 5.88% | 08/15/20 | 60 | 71 | (h) | ||||||||
Corp Andina de Fomento |
| |||||||||||
| 4.38% | 06/15/22 | 68 | 74 | |||||||||
Corp Nacional del Cobre de Chile | ||||||||||||
| 4.25% | 07/17/42 | 42 | 43 | (b) | ||||||||
| 5.63% | 09/21/35 | 12 | 15 | (b,h) | ||||||||
Covidien International Finance S.A. | ||||||||||||
| 1.35% | 05/29/15 | 56 | 57 | |||||||||
COX Communications Inc. |
| |||||||||||
| 3.25% | 12/15/22 | 25 | 26 | (b) | ||||||||
| 4.70% | 12/15/42 | 17 | 17 | (b) | ||||||||
Crown Castle Towers LLC |
| |||||||||||
| 6.11% | 01/15/40 | 55 | 66 | (b,h) | ||||||||
CSX Corp. |
| |||||||||||
| 4.10% | 03/15/44 | 44 | 43 | |||||||||
| 4.25% | 06/01/21 | 73 | 82 | (h) | ||||||||
CVS Caremark Corp. |
| |||||||||||
| 3.25% | 05/18/15 | 30 | 32 | (h) | ||||||||
DaVita HealthCare Partners Inc. |
| |||||||||||
| 5.75% | 08/15/22 | 26 | 27 | |||||||||
| 6.38% | 11/01/18 | 68 | 73 | (h) | ||||||||
DCP Midstream Operating LP |
| |||||||||||
| 2.50% | 12/01/17 | 68 | 68 | |||||||||
DDR Corp. (REIT) |
| |||||||||||
| 4.63% | 07/15/22 | 49 | 53 | |||||||||
See Notes to Schedules of Investments and Notes to Financial Statements.
28
Table of Contents
| Elfun Diversified Fund | (in thousands) — December 31, 2012 |
| Principal Amount | Fair Value | |||||||||||
Deere & Co. |
| |||||||||||
| 3.90% | 06/09/42 | $ | 37 | $ | 38 | |||||||
Denbury Resources Inc. |
| |||||||||||
| 6.38% | 08/15/21 | 60 | 66 | (h) | ||||||||
| 8.25% | 02/15/20 | 34 | 38 | (h) | ||||||||
DENTSPLY International Inc. |
| |||||||||||
| 2.75% | 08/15/16 | 50 | 52 | (h) | ||||||||
| 4.13% | 08/15/21 | 77 | 82 | (h) | ||||||||
Devon Energy Corp. |
| |||||||||||
| 3.25% | 05/15/22 | 102 | 106 | |||||||||
Diageo Capital PLC |
| |||||||||||
| 1.50% | 05/11/17 | 100 | 101 | (h) | ||||||||
Diageo Investment Corp. |
| |||||||||||
| 2.88% | 05/11/22 | 105 | 108 | (h) | ||||||||
DIRECTV Holdings LLC |
| |||||||||||
| 4.75% | 10/01/14 | 109 | 116 | (h) | ||||||||
| 5.15% | 03/15/42 | 87 | 88 | (h) | ||||||||
Dominion Resources Inc. |
| |||||||||||
| 1.95% | 08/15/16 | 54 | 56 | (h) | ||||||||
DPL Inc. |
| |||||||||||
| 7.25% | 10/15/21 | 188 | 201 | |||||||||
DR Horton Inc. |
| |||||||||||
| 4.38% | 09/15/22 | 52 | 53 | |||||||||
Duke Energy Corp. |
| |||||||||||
| 1.63% | 08/15/17 | 69 | 69 | |||||||||
| 3.05% | 08/15/22 | 205 | 209 | |||||||||
Eastman Chemical Co. |
| |||||||||||
| 2.40% | 06/01/17 | 132 | 136 | (h) | ||||||||
eBay Inc. |
| |||||||||||
| 1.35% | 07/15/17 | 48 | 49 | |||||||||
| 2.60% | 07/15/22 | 35 | 35 | |||||||||
| 4.00% | 07/15/42 | 41 | 40 | |||||||||
Ecopetrol S.A. |
| |||||||||||
| 7.63% | 07/23/19 | 28 | 36 | |||||||||
Empresa de Energia de Bogota S.A. | ||||||||||||
| 6.13% | 11/10/21 | 14 | 16 | (b,h) | ||||||||
Energy Transfer Equity LP |
| |||||||||||
| 7.50% | 10/15/20 | 51 | 59 | (h) | ||||||||
Energy Transfer Partners LP |
| |||||||||||
| 6.50% | 02/01/42 | 62 | 76 | (h) | ||||||||
| 6.70% | 07/01/18 | 56 | 67 | (h) | ||||||||
| Principal Amount | Fair Value | |||||||||||
Enterprise Products Operating LLC | ||||||||||||
| 4.45% | 02/15/43 | $ | 34 | $ | 34 | |||||||
European Investment Bank |
| |||||||||||
| 0.41% | 12/15/14 | 110 | 111 | (d,h) | ||||||||
| 4.88% | 01/17/17 | 150 | 174 | (h) | ||||||||
Exelon Corp. |
| |||||||||||
| 4.90% | 06/15/15 | 111 | 121 | (h) | ||||||||
Express Scripts Holding Co. |
| |||||||||||
| 2.65% | 02/15/17 | 70 | 73 | (b,h) | ||||||||
| 3.13% | 05/15/16 | 113 | 119 | (h) | ||||||||
| 3.90% | 02/15/22 | 34 | 37 | (b,h) | ||||||||
| 4.75% | 11/15/21 | 38 | 43 | (b,h) | ||||||||
Florida Power & Light Co. |
| |||||||||||
| 4.13% | 02/01/42 | 68 | 71 | |||||||||
Ford Motor Credit Company LLC | ||||||||||||
| 3.00% | 06/12/17 | 213 | 219 | |||||||||
Forest Oil Corp. |
| |||||||||||
| 7.25% | 06/15/19 | 68 | 68 | |||||||||
Fresenius Medical Care US Finance Inc. | ||||||||||||
| 5.75% | 02/15/21 | 84 | 90 | (b) | ||||||||
Frontier Communications Corp. | ||||||||||||
| 7.13% | 03/15/19 | 71 | 77 | |||||||||
Georgia Power Co. |
| |||||||||||
| 4.30% | 03/15/42 | 37 | 39 | |||||||||
Goldman Sachs Capital I |
| |||||||||||
| 6.35% | 02/15/34 | 43 | 45 | (h) | ||||||||
Great Plains Energy Inc. |
| |||||||||||
| 4.85% | 06/01/21 | 80 | 88 | |||||||||
Hanesbrands Inc. |
| |||||||||||
| 6.38% | 12/15/20 | 110 | 121 | (h) | ||||||||
HCA Inc. |
| |||||||||||
| 6.50% | 02/15/20 | 119 | 134 | (h) | ||||||||
Heineken N.V. |
| |||||||||||
| 0.73% | 10/01/15 | 48 | 48 | (b,d) | ||||||||
| 1.40% | 10/01/17 | 68 | 68 | (b) | ||||||||
Hewlett-Packard Co. |
| |||||||||||
| 2.60% | 09/15/17 | 74 | 72 | |||||||||
| 6.00% | 09/15/41 | 20 | 20 | |||||||||
Host Hotels & Resorts LP (REIT) | ||||||||||||
| 4.75% | 03/01/23 | 16 | 17 | |||||||||
| 6.00% | 11/01/20 | 34 | 37 | (h) | ||||||||
See Notes to Schedules of Investments and Notes to Financial Statements.
29
Table of Contents
| Elfun Diversified Fund | (in thousands) — December 31, 2012 |
| Principal Amount | Fair Value | |||||||||||
HSBC USA Inc. |
| |||||||||||
| 1.63% | 01/16/18 | $ | 111 | $ | 111 | |||||||
Hughes Satellite Systems Corp. | ||||||||||||
| 6.50% | 06/15/19 | 49 | 54 | (h) | ||||||||
Hyundai Capital America |
| |||||||||||
| 1.63% | 10/02/15 | 68 | 68 | (b) | ||||||||
| 2.13% | 10/02/17 | 35 | 35 | (b) | ||||||||
Intel Corp. |
| |||||||||||
| 1.35% | 12/15/17 | 68 | 68 | |||||||||
| 2.70% | 12/15/22 | 68 | 68 | |||||||||
| 4.25% | 12/15/42 | 34 | 34 | |||||||||
Invesco Finance PLC |
| |||||||||||
| 3.13% | 11/30/22 | 102 | 103 | |||||||||
Jabil Circuit Inc. |
| |||||||||||
| 4.70% | 09/15/22 | 12 | 13 | |||||||||
John Deere Capital Corp. |
| |||||||||||
| 3.15% | 10/15/21 | 54 | 57 | (h) | ||||||||
JPMorgan Chase & Co. |
| |||||||||||
| 3.25% | 09/23/22 | 34 | 35 | |||||||||
| 4.35% | 08/15/21 | 74 | 83 | (h) | ||||||||
| 4.50% | 01/24/22 | 56 | 63 | (h) | ||||||||
KFW |
| |||||||||||
| 2.00% | 10/04/22 | 171 | 171 | |||||||||
| 4.50% | 07/16/18 | 102 | 120 | (h) | ||||||||
Kinder Morgan Energy Partners LP | ||||||||||||
| 5.00% | 08/15/42 | 34 | 36 | |||||||||
Kinross Gold Corp. |
| |||||||||||
| 6.88% | 09/01/41 | 47 | 48 | |||||||||
Korea National Oil Corp. |
| |||||||||||
| 2.88% | 11/09/15 | 100 | 104 | (b,h) | ||||||||
Kraft Foods Group Inc. |
| |||||||||||
| 1.63% | 06/04/15 | 45 | 46 | (b) | ||||||||
| 2.25% | 06/05/17 | 74 | 77 | (b) | ||||||||
| 5.00% | 06/04/42 | 63 | 71 | (b) | ||||||||
Liberty Mutual Group Inc. |
| |||||||||||
| 6.50% | 05/01/42 | 36 | 41 | (b) | ||||||||
Lincoln National Corp. |
| |||||||||||
| 4.20% | 03/15/22 | 25 | 27 | |||||||||
Linn Energy LLC |
| |||||||||||
| 6.25% | 11/01/19 | 8 | 8 | (b) | ||||||||
| 8.63% | 04/15/20 | 56 | 61 | |||||||||
McDonald's Corp. |
| |||||||||||
| 1.88% | 05/29/19 | 75 | 76 | (h) | ||||||||
| Principal Amount | Fair Value | |||||||||||
Memorial Sloan-Kettering Cancer Center | ||||||||||||
| 4.13% | 07/01/52 | $ | 30 | $ | 30 | |||||||
Merck & Company Inc. |
| |||||||||||
| 2.40% | 09/15/22 | 68 | 68 | |||||||||
MidAmerican Energy Holdings Co. | ||||||||||||
| 6.13% | 04/01/36 | 45 | 57 | (h) | ||||||||
Morgan Stanley |
| |||||||||||
| 4.75% | 03/22/17 | 50 | 55 | |||||||||
| 4.88% | 11/01/22 | 102 | 106 | |||||||||
| 5.50% | 07/28/21 | 71 | 81 | (h) | ||||||||
| 5.75% | 01/25/21 | 100 | 114 | (h) | ||||||||
| 6.63% | 04/01/18 | 111 | 131 | |||||||||
Murphy Oil Corp. |
| |||||||||||
| 2.50% | 12/01/17 | 102 | 103 | |||||||||
| 3.70% | 12/01/22 | 68 | 68 | |||||||||
Mylan Inc. |
| |||||||||||
| 7.88% | 07/15/20 | 23 | 27 | (b,h) | ||||||||
Newfield Exploration Co. |
| |||||||||||
| 5.63% | 07/01/24 | 10 | 11 | |||||||||
| 5.75% | 01/30/22 | 68 | 75 | |||||||||
NewMarket Corp. |
| |||||||||||
| 4.10% | 12/15/22 | 37 | 38 | (b) | ||||||||
News America Inc. |
| |||||||||||
| 6.65% | 11/15/37 | 47 | 61 | (h) | ||||||||
Nexen Inc. |
| |||||||||||
| 6.40% | 05/15/37 | 68 | 88 | |||||||||
NextEra Energy Capital Holdings Inc. | ||||||||||||
| 2.60% | 09/01/15 | 129 | 134 | (h) | ||||||||
Nisource Finance Corp. |
| |||||||||||
| 3.85% | 02/15/23 | 85 | 87 | |||||||||
Novartis Capital Corp. |
| |||||||||||
| 2.40% | 09/21/22 | 82 | 82 | |||||||||
NYSE Euronext |
| |||||||||||
| 2.00% | 10/05/17 | 103 | 105 | |||||||||
Oglethorpe Power Corp. |
| |||||||||||
| 5.38% | 11/01/40 | 42 | 49 | (h) | ||||||||
Omnicom Group Inc. |
| |||||||||||
| 3.63% | 05/01/22 | 97 | 101 | (h) | ||||||||
ONEOK Partners LP |
| |||||||||||
| 3.38% | 10/01/22 | 18 | 18 | |||||||||
| 6.13% | 02/01/41 | 45 | 54 | (h) | ||||||||
See Notes to Schedules of Investments and Notes to Financial Statements.
30
Table of Contents
| Elfun Diversified Fund | (in thousands) — December 31, 2012 |
| Principal Amount | Fair Value | |||||||||||
Oracle Corp. |
| |||||||||||
| 1.20% | 10/15/17 | $ | 170 | $ | 171 | |||||||
Pacific Gas & Electric Co. |
| |||||||||||
| 6.05% | 03/01/34 | 52 | 67 | (h) | ||||||||
PacifiCorp |
| |||||||||||
| 6.25% | 10/15/37 | 102 | 137 | (h) | ||||||||
PAETEC Holding Corp. |
| |||||||||||
| 8.88% | 06/30/17 | 11 | 12 | (h) | ||||||||
Peabody Energy Corp. |
| |||||||||||
| 6.25% | 11/15/21 | 40 | 43 | |||||||||
PepsiCo Inc. |
| |||||||||||
| 2.75% | 03/05/22 | 101 | 104 | (h) | ||||||||
Petrobras International Finance Co. | ||||||||||||
| 2.88% | 02/06/15 | 30 | 31 | (h) | ||||||||
| 3.50% | 02/06/17 | 94 | 99 | (h) | ||||||||
| 3.88% | 01/27/16 | 34 | 36 | (h) | ||||||||
Petroleos de Venezuela S.A. |
| |||||||||||
| 4.90% | 10/28/14 | 13 | 12 | |||||||||
Philip Morris International Inc. |
| |||||||||||
| 2.50% | 05/16/16 | 80 | 84 | (h) | ||||||||
| 3.88% | 08/21/42 | 34 | 34 | |||||||||
Plains Exploration & Production Co. | ||||||||||||
| 6.50% | 11/15/20 | 37 | 41 | |||||||||
Power Sector Assets & Liabilities Management Corp. | ||||||||||||
| 7.25% | 05/27/19 | 200 | 257 | |||||||||
| 7.39% | 12/02/24 | 100 | 139 | (b,h) | ||||||||
Pride International Inc. |
| |||||||||||
| 6.88% | 08/15/20 | 77 | 97 | (h) | ||||||||
Prudential Financial Inc. |
| |||||||||||
| 5.63% | 05/12/41 | 38 | 43 | |||||||||
| 5.63% | 06/15/43 | 69 | 72 | (i) | ||||||||
Range Resources Corp. |
| |||||||||||
| 5.75% | 06/01/21 | 68 | 73 | (h) | ||||||||
Reynolds American Inc. |
| |||||||||||
| 3.25% | 11/01/22 | 105 | 105 | |||||||||
Roche Holdings Inc. |
| |||||||||||
| 6.00% | 03/01/19 | 101 | 126 | (b,h) | ||||||||
Rowan Companies Inc. |
| |||||||||||
| 5.40% | 12/01/42 | 45 | 46 | |||||||||
Royal Bank of Canada |
| |||||||||||
| 1.20% | 09/19/17 | 103 | 103 | |||||||||
| Principal Amount | Fair Value | |||||||||||
Royal Bank of Scotland Group PLC | ||||||||||||
| 6.40% | 10/21/19 | $ | 37 | $ | 44 | |||||||
Santander Holdings USA Inc. |
| |||||||||||
| 3.00% | 09/24/15 | 34 | 35 | |||||||||
Schlumberger Investment S.A. |
| |||||||||||
| 2.40% | 08/01/22 | 104 | 103 | (b) | ||||||||
Seagate HDD Cayman |
| |||||||||||
| 7.00% | 11/01/21 | 8 | 9 | |||||||||
Simon Property Group LP (REIT) | ||||||||||||
| 2.75% | 02/01/23 | 20 | 20 | |||||||||
Sinochem Overseas Capital Company Ltd. | ||||||||||||
| 4.50% | 11/12/20 | 100 | 108 | (b,h) | ||||||||
Takeda Pharmaceutical Company Ltd. | ||||||||||||
| 1.63% | 03/17/17 | 200 | 203 | (b,h) | ||||||||
Teva Pharmaceutical Finance Co. BV | ||||||||||||
| 2.95% | 12/18/22 | 111 | 112 | |||||||||
Textron Inc. |
| |||||||||||
| 6.20% | 03/15/15 | 62 | 68 | (h) | ||||||||
The ADT Corp. |
| |||||||||||
| 2.25% | 07/15/17 | 35 | 35 | (b) | ||||||||
| 3.50% | 07/15/22 | 42 | 41 | (b) | ||||||||
| 4.88% | 07/15/42 | 19 | 18 | (b) | ||||||||
The Coca-Cola Co. |
| |||||||||||
| 3.30% | 09/01/21 | 88 | 97 | |||||||||
The Dow Chemical Co. |
| |||||||||||
| 3.00% | 11/15/22 | 34 | 34 | |||||||||
| 4.38% | 11/15/42 | 34 | 34 | |||||||||
The Goldman Sachs Group Inc. | ||||||||||||
| 5.75% | 01/24/22 | 128 | 151 | (h) | ||||||||
| 6.75% | 10/01/37 | 69 | 78 | |||||||||
The Korea Development Bank |
| |||||||||||
| 3.25% | 03/09/16 | 122 | 128 | (h) | ||||||||
The Potomac Edison Co. |
| |||||||||||
| 5.35% | 11/15/14 | 40 | 43 | (h) | ||||||||
The Sherwin-Williams Co. |
| |||||||||||
| 1.35% | 12/15/17 | 34 | 34 | |||||||||
| 4.00% | 12/15/42 | 34 | 34 | |||||||||
The Williams Companies Inc. |
| |||||||||||
| 3.70% | 01/15/23 | 111 | 112 | |||||||||
See Notes to Schedules of Investments and Notes to Financial Statements.
31
Table of Contents
| Elfun Diversified Fund | (in thousands) — December 31, 2012 |
| Principal Amount | Fair Value | |||||||||||
Time Warner Cable Inc. |
| |||||||||||
| 6.75% | 07/01/18 | $ | 72 | $ | 90 | (h) | ||||||
Total Capital International S.A. |
| |||||||||||
| 1.55% | 06/28/17 | 174 | 177 | (h) | ||||||||
| 2.70% | 01/25/23 | 102 | 104 | |||||||||
Toyota Motor Credit Corp. |
| |||||||||||
| 1.25% | 10/05/17 | 68 | 68 | |||||||||
| 1.75% | 05/22/17 | 94 | 96 | (h) | ||||||||
TransAlta Corp. |
| |||||||||||
| 4.50% | 11/15/22 | 68 | 69 | |||||||||
Transocean Inc. |
| |||||||||||
| 3.80% | 10/15/22 | 34 | 35 | |||||||||
Turlock Corp. |
| |||||||||||
| 1.50% | 11/02/17 | 102 | 102 | (b) | ||||||||
| 2.75% | 11/02/22 | 149 | 149 | (b) | ||||||||
U.S. Bancorp |
| |||||||||||
| 3.44% | 02/01/16 | 118 | 124 | |||||||||
United Parcel Service Inc. |
| |||||||||||
| 2.45% | 10/01/22 | 68 | 68 | |||||||||
United Technologies Corp. |
| |||||||||||
| 1.80% | 06/01/17 | 37 | 38 | (h) | ||||||||
| 4.50% | 06/01/42 | 56 | 62 | (h) | ||||||||
UnitedHealth Group Inc. | ||||||||||||
| 0.73% | 10/15/15 | 34 | 34 | (d) | ||||||||
| 1.40% | 10/15/17 | 34 | 34 | |||||||||
Vail Resorts Inc. | ||||||||||||
| 6.50% | 05/01/19 | 107 | 115 | (h) | ||||||||
Verizon Communications Inc. | ||||||||||||
| 2.00% | 11/01/16 | 187 | 194 | (h) | ||||||||
| 2.45% | 11/01/22 | 34 | 34 | |||||||||
| 3.85% | 11/01/42 | 34 | 33 | |||||||||
Viacom Inc. | ||||||||||||
| 2.50% | 12/15/16 | 88 | 92 | (h) | ||||||||
Visteon Corp. | ||||||||||||
| 6.75% | 04/15/19 | 67 | 71 | |||||||||
Vodafone Group PLC | ||||||||||||
| 2.50% | 09/26/22 | 68 | 68 | |||||||||
Watson Pharmaceuticals Inc. | ||||||||||||
| 3.25% | 10/01/22 | 102 | 104 | |||||||||
Weatherford International Inc. | ||||||||||||
| 6.35% | 06/15/17 | 37 | 42 | |||||||||
Weatherford International Ltd. | ||||||||||||
| 4.50% | 04/15/22 | 61 | 65 | (h) | ||||||||
| 5.95% | 04/15/42 | 56 | 61 | (h) | ||||||||
| Principal Amount | Fair Value | |||||||||||
WellPoint Inc. | ||||||||||||
| 1.88% | 01/15/18 | $ | 48 | $ | 49 | |||||||
| 3.30% | 01/15/23 | 104 | 107 | |||||||||
| 3.70% | 08/15/21 | 19 | 20 | |||||||||
Woodside Finance Ltd. | ||||||||||||
| 4.50% | 11/10/14 | 131 | 139 | (b,h) | ||||||||
WPP Finance 2010 | ||||||||||||
| 3.63% | 09/07/22 | 34 | 34 | |||||||||
| 5.13% | 09/07/42 | 34 | 33 | |||||||||
Xstrata Finance Canada Ltd. | ||||||||||||
| 2.45% | 10/25/17 | 136 | 137 | (b) | ||||||||
| 4.00% | 10/25/22 | 61 | 62 | (b) | ||||||||
| 5.80% | 11/15/16 | 64 | 72 | (b,h) | ||||||||
| 19,140 | ||||||||||||
| Non-Agency Collateralized Mortgage Obligations — 0.9% | ||||||||||||
Banc of America Commercial Mortgage Trust 2006-4 | ||||||||||||
| 5.68% | 07/10/46 | 30 | 34 | |||||||||
Banc of America Commercial Mortgage Trust 2007-4 | ||||||||||||
| 5.73% | 02/10/51 | 25 | 30 | (h) | ||||||||
Banc of America Commercial Mortgage Trust 2008-1 | ||||||||||||
| 6.21% | 02/10/51 | 240 | 291 | (h) | ||||||||
Banc of America Merrill Lynch Commercial Mortgage Inc. | ||||||||||||
| 5.19% | 09/10/47 | 80 | 89 | |||||||||
Bear Stearns Commercial Mortgage Securities | ||||||||||||
| 4.93% | 02/13/42 | 80 | 86 | (h) | ||||||||
| 5.40% | 03/11/39 | 19 | 19 | (h) | ||||||||
| 5.57% | 04/12/38 | 80 | 89 | (h) | ||||||||
Citigroup Commercial Mortgage Trust | ||||||||||||
| 5.48% | 10/15/49 | 40 | 38 | |||||||||
COMM 2005-LP5 Mortgage Trust |
| |||||||||||
| 4.98% | 05/10/43 | 40 | 44 | |||||||||
Credit Suisse First Boston Mortgage Securities Corp. | ||||||||||||
| 5.31% | 10/25/35 | 37 | 1 | |||||||||
CSMC Mortgage-Backed Trust Series 2006-1 | ||||||||||||
| 5.51% | 02/25/36 | 8 | — | ** | ||||||||
See Notes to Schedules of Investments and Notes to Financial Statements.
32
Table of Contents
| Elfun Diversified Fund | (in thousands) — December 31, 2012 |
| Principal Amount | Fair Value | |||||||||||
GS Mortgage Securities Corp. II |
| |||||||||||
| 3.00% | 08/10/44 | $ | 80 | $ | 85 | (h) | ||||||
| 5.31% | 08/10/44 | 30 | 35 | (b) | ||||||||
JP Morgan Chase Commercial Mortgage Securities Corp. | ||||||||||||
| 4.27% | 06/15/45 | 70 | 78 | |||||||||
| 4.43% | 12/15/47 | 40 | 39 | (b,i) | ||||||||
| 5.04% | 03/15/46 | 40 | 43 | |||||||||
| 5.34% | 08/12/37 | 60 | 66 | |||||||||
| 5.44% | 06/12/47 | 100 | 115 | |||||||||
| 5.79% | 02/12/51 | 155 | 185 | (h) | ||||||||
LB-UBS Commercial Mortgage Trust | ||||||||||||
| 4.95% | 09/15/30 | 50 | 55 | |||||||||
| 5.16% | 02/15/31 | 80 | 89 | (h) | ||||||||
| 5.87% | 06/15/38 | 30 | 35 | |||||||||
| 20.56% | 12/15/39 | 508 | 6 | (b,d) | ||||||||
MASTR Alternative Loans Trust |
| |||||||||||
| 5.00% | 08/25/18 | 15 | 1 | (g,h,q) | ||||||||
Merrill Lynch | ||||||||||||
| 5.49% | 07/12/46 | 30 | 27 | |||||||||
Morgan Stanley Capital I Trust 2006-IQ11 | ||||||||||||
| 5.70% | 10/15/42 | 40 | 36 | (h) | ||||||||
Morgan Stanley Capital I Trust 2006-TOP21 | ||||||||||||
| 5.16% | 10/12/52 | 100 | 111 | (h) | ||||||||
Morgan Stanley Capital I Trust 2006-TOP23 | ||||||||||||
| 5.82% | 08/12/41 | 30 | 35 | (h) | ||||||||
Morgan Stanley Capital I Trust 2008-TOP29 | ||||||||||||
| 6.27% | 01/11/43 | 50 | 60 | (h) | ||||||||
UBS-Barclays Commercial Mortgage Trust | ||||||||||||
| 4.89% | 05/10/63 | 30 | 27 | (b,i) | ||||||||
Wachovia Bank Commercial Mortgage Trust | ||||||||||||
| 5.47% | 01/15/45 | 80 | 88 | (h) | ||||||||
Wells Fargo Commercial Mortgage Trust | ||||||||||||
| 4.69% | 10/15/45 | 20 | 21 | |||||||||
| 1,958 | ||||||||||||
| Principal Amount | Fair Value | |||||||||||
| Sovereign Bonds — 0.5% | ||||||||||||
Banco Nacional de Desenvolvimento Economico e Social | ||||||||||||
| 5.50% | 07/12/20 | $ | 100 | $ | 118 | (b,h) | ||||||
Gabonese Republic | ||||||||||||
| 8.20% | 12/12/17 | 100 | 121 | |||||||||
Government of Chile | ||||||||||||
| 3.63% | 10/30/42 | 27 | 27 | |||||||||
Government of Dominican Republic | ||||||||||||
| 7.50% | 05/06/21 | 100 | 116 | (b,h) | ||||||||
Government of El Salvador |
| |||||||||||
| 7.65% | 06/15/35 | 20 | 23 | (b,h) | ||||||||
Government of Hungary |
| |||||||||||
| 4.75% | 02/03/15 | 10 | 10 | |||||||||
| 6.25% | 01/29/20 | 39 | 43 | (h) | ||||||||
| 7.63% | 03/29/41 | 10 | 12 | |||||||||
Government of Lebanon |
| |||||||||||
| 4.00% | 12/31/17 | 4 | 4 | |||||||||
| 5.15% | 11/12/18 | 14 | 14 | |||||||||
| 6.10% | 10/04/22 | 14 | 14 | |||||||||
Government of Mexico |
| |||||||||||
| 4.75% | 03/08/44 | 56 | 63 | (h) | ||||||||
| 5.75% | 10/12/49 | 14 | 17 | (h) | ||||||||
Government of Panama |
| |||||||||||
| 6.70% | 01/26/36 | 11 | 16 | (h) | ||||||||
Government of Peru |
| |||||||||||
| 6.55% | 03/14/37 | 39 | 56 | (h) | ||||||||
Government of Philippines |
| |||||||||||
| 6.38% | 01/15/32 | 100 | 137 | (h) | ||||||||
Government of Poland |
| |||||||||||
| 3.00% | 03/17/23 | 11 | 11 | |||||||||
| 5.00% | 03/23/22 | 40 | 47 | |||||||||
| 5.13% | 04/21/21 | 15 | 18 | (h) | ||||||||
| 6.38% | 07/15/19 | 7 | 9 | |||||||||
Government of Romania |
| |||||||||||
| 6.75% | 02/07/22 | 28 | 34 | (b) | ||||||||
Government of Turkey |
| |||||||||||
| 6.88% | 03/17/36 | 14 | 19 | |||||||||
Government of Uruguay |
| |||||||||||
| 6.88% | 09/28/25 | 32 | 44 | |||||||||
Government of Venezuela |
| |||||||||||
| 10.75% | 09/19/13 | 41 | 42 | (h) | ||||||||
See Notes to Schedules of Investments and Notes to Financial Statements.
33
Table of Contents
| Elfun Diversified Fund | (in thousands) — December 31, 2012 |
| Principal Amount | Fair Value | |||||||||||
Government of Vietnam |
| |||||||||||
| 1.50% | 03/12/16 | $ | 5 | $ | 4 | (i) | ||||||
Russian Foreign Bond — Eurobond | ||||||||||||
| 7.50% | 03/31/30 | 10 | 13 | (j) | ||||||||
| 1,032 | ||||||||||||
| Municipal Bonds and Notes — 0.2% | ||||||||||||
American Municipal Power Inc. |
| |||||||||||
| 6.27% | 02/15/50 | 50 | 60 | |||||||||
Municipal Electric Authority of Georgia | ||||||||||||
| 6.64% | 04/01/57 | 39 | 47 | |||||||||
New Jersey Transportation Trust Fund Authority | ||||||||||||
| 6.88% | 12/15/39 | 15 | 17 | (h) | ||||||||
Port Authority of New York & New Jersey | ||||||||||||
| 4.46% | 10/01/62 | 110 | 109 | |||||||||
South Carolina State Public Service Authority | ||||||||||||
| 6.45% | 01/01/50 | 40 | 54 | (h) | ||||||||
State of California |
| |||||||||||
| 5.70% | 11/01/21 | 55 | 66 | |||||||||
| 353 | ||||||||||||
| FNMA — 0.0%* | ||||||||||||
Lehman TBA |
| |||||||||||
| 5.50% | TBA | 60 | — | ** | (c,o,r) | |||||||
Total Bonds and Notes | 64,442 | |||||||||||
| Number of Shares | ||||||||||
Exchange Traded Funds — 5.6% |
| |||||||||
Financial Select Sector | 12,469 | 205 | (p) | |||||||
Industrial Select Sector | 21,842 | 828 | (p) | |||||||
Vanguard MSCI Emerging Markets Fund | 195,451 | 8,703 | ||||||||
Vanguard REIT Fund | 31,916 | 2,100 | ||||||||
Total Exchange Traded Funds | 11,836 | |||||||||
Total Investments in Securities | 193,516 | |||||||||
| Number of Shares | Fair Value | |||||||
Short-Term Investments — 14.5% |
| |||||||
GE Institutional Money Market Fund —Investment Class | ||||||||
0.06% | ||||||||
(Cost $30,991) | $ | 30,991 | (d,k) | |||||
Total Investments | 224,507 | |||||||
Liabilities in Excess of Other | (11,339) | |||||||
|
| |||||||
NET ASSETS — 100.0% | $ | 213,168 | ||||||
|
| |||||||
Other Information
The Fund had the following long futures contracts open at December 31, 2012:
| Description | Expiration Date | Number of Contracts | Current Notional Value | Unrealized Appreciation/ (Depreciation) | ||||||||||
S&P Midcap 400 Index Futures | March 2013 | 73 | $ | 7,432 | $ | 125 | ||||||||
S&P 500 Emini Index Futures | March 2013 | 24 | 1,704 | 9 | ||||||||||
2 Yr. U.S. Treasury Notes Futures | March 2013 | 6 | 1,323 | — | ** | |||||||||
5 Yr. U.S. Treasury Notes Futures | March 2013 | 45 | 5,599 | (8) | ||||||||||
30 Yr. U.S. Treasury Bond Futures | March 2013 | 26 | 3,835 | (43) | ||||||||||
|
| |||||||||||||
| $ | 83 | |||||||||||||
|
| |||||||||||||
See Notes to Schedules of Investments and Notes to Financial Statements.
34
Table of Contents
| Elfun Diversified Fund | (in thousands) — December 31, 2012 |
The Fund had the following short futures contracts open at December 31, 2012:
| Description | Expiration date | Number of Contracts | Current Notional Value | Unrealized Appreciation/ (Depreciation) | ||||||||||
EURO Stoxx 50 Index Futures | March 2013 | 2 | $ | (69) | $ | 1 | ||||||||
FTSE 100 Index Futures | March 2013 | 2 | (190) | 1 | ||||||||||
Topix Index Futures | March 2013 | 1 | (100) | (6) | ||||||||||
Ultra Long-Term U.S. Treasury Bond Futures | March 2013 | 26 | (4,227) | 83 | ||||||||||
10 Yr. U.S. Treasury Notes Futures | March 2013 | 47 | (6,241) | 32 | ||||||||||
|
| |||||||||||||
| $ | 111 | |||||||||||||
|
| |||||||||||||
| $ | 194 | |||||||||||||
|
| |||||||||||||
At December 31, 2012, the Fund had the following foreign currency forward exchange contracts:
| Description | Unrealized (Depreciation) | |
Sold 3,600 EURO; Purchased $4,738 for settlement on 01/22/2013 | $ (10) | |
Sold 1,600 GBP; Purchased $2,597 for settlement on 01/22/2013 | (3) | |
| ||
| $ (13) | ||
| ||
The Fund was invested in the following countries at December 31, 2012 (Unaudited) :
| Country | | Percentage (based on Fair Value) | | |||
United States | 80.06% | |||||
United Kingdom | 4.24% | |||||
Japan | 3.03% | |||||
Germany | 2.27% | |||||
Switzerland | 1.91% | |||||
France | 1.57% | |||||
Canada | 1.00% | |||||
China | 0.59% | |||||
Netherlands | 0.53% | |||||
South Korea | 0.53% | |||||
Sweden | 0.53% | |||||
Hong Kong | 0.45% | |||||
Taiwan | 0.42% | |||||
Australia | 0.41% | |||||
Italy | 0.39% | |||||
Brazil | 0.26% | |||||
Philippines | 0.24% | |||||
Singapore | 0.22% | |||||
Ireland | 0.21% | |||||
Supranational | 0.19% | |||||
Mexico | 0.18% | |||||
Belgium | 0.15% | |||||
Norway | 0.14% | |||||
Gabon | 0.05% | |||||
Dominican Republic | 0.05% | |||||
Curacao | 0.05% | |||||
India | 0.05% | |||||
Poland | 0.04% | |||||
Chile | 0.04% | |||||
Hungary | 0.03% | |||||
Peru | 0.03% | |||||
Venezuela | 0.02% | |||||
Colombia | 0.02% | |||||
Panama | 0.02% | |||||
Uruguay | 0.02% | |||||
Romania | 0.02% | |||||
Lebanon | 0.01% | |||||
El Salvador | 0.01% | |||||
Turkey | 0.01% | |||||
Russian Federation | 0.01% | |||||
|
| |||||
| 100.00% | ||||||
|
| |||||
See Notes to Schedules of Investments and Notes to Financial Statements.
35
Table of Contents
| Elfun Diversified Fund | (in thousands) — December 31, 2012 |
The Fund’s % share of investment in the various categories, based on Fair Value, is as follows at December 31, 2012 (Unaudited):
| Industry | Domestic | Foreign | Total | |||||||||
Exchange Traded Funds | 5.27% | 0.00% | 5.27% | |||||||||
Diversified Financial Services | 1.40% | 1.64% | 3.04% | |||||||||
Pharmaceuticals | 1.89% | 1.11% | 3.00% | |||||||||
Integrated Oil & Gas | 1.59% | 1.01% | 2.60% | |||||||||
Communications Equipment | 1.99% | 0.19% | 2.18% | |||||||||
Internet Software & Services | 0.97% | 0.54% | 1.51% | |||||||||
Computer Hardware | 1.44% | 0.00% | 1.44% | |||||||||
Systems Software | 1.44% | 0.00% | 1.44% | |||||||||
Semiconductors | 0.55% | 0.80% | 1.35% | |||||||||
Industrial Machinery | 0.54% | 0.77% | 1.31% | |||||||||
Data Processing & Outsourced Services | 1.25% | 0.00% | 1.25% | |||||||||
Soft Drinks | 1.25% | 0.00% | 1.25% | |||||||||
Asset Management & Custody Banks | 1.21% | 0.00% | 1.21% | |||||||||
Healthcare Equipment | 1.14% | 0.00% | 1.14% | |||||||||
Biotechnology | 0.95% | 0.17% | 1.12% | |||||||||
Oil & Gas Equipment & Services | 0.97% | 0.14% | 1.11% | |||||||||
Cable & Satellite | 1.09% | 0.00% | 1.09% | |||||||||
Life & Health Insurance | 0.22% | 0.78% | 1.00% | |||||||||
Packaged Foods & Meats | 0.42% | 0.56% | 0.98% | |||||||||
Fertilizers & Agricultural Chemicals | 0.39% | 0.57% | 0.96% | |||||||||
Aerospace & Defense | 0.58% | 0.35% | 0.93% | |||||||||
Automobile Manufacturers | 0.15% | 0.73% | 0.88% | |||||||||
Healthcare Services | 0.52% | 0.33% | 0.85% | |||||||||
Home Improvement Retail | 0.82% | 0.00% | 0.82% | |||||||||
Air Freight & Logistics | 0.73% | 0.00% | 0.73% | |||||||||
Multi-Line Insurance | 0.32% | 0.35% | 0.67% | |||||||||
Household Products | 0.37% | 0.30% | 0.67% | |||||||||
Oil & Gas Exploration & Production | 0.59% | 0.05% | 0.64% | |||||||||
Diversified Metals & Mining | 0.02% | 0.60% | 0.62% | |||||||||
Application Software | 0.20% | 0.42% | 0.62% | |||||||||
Property & Casualty Insurance | 0.50% | 0.10% | 0.60% | |||||||||
IT Consulting & Other Services | 0.51% | 0.08% | 0.59% | |||||||||
Distillers & Vintners | 0.13% | 0.44% | 0.57% | |||||||||
Specialized REITs | 0.57% | 0.00% | 0.57% |
Construction & Farm Machinery & Heavy Trucks | 0.42% | 0.13% | 0.55% | |||||||||
Specialized Finance | 0.54% | 0.00% | 0.54% | |||||||||
Apparel, Accessories & Luxury Goods | 0.00% | 0.52% | 0.52% | |||||||||
Industrial Gases | 0.13% | 0.39% | 0.52% | |||||||||
Movies & Entertainment | 0.49% | 0.00% | 0.49% | |||||||||
Wireless Telecommunication Services | 0.00% | 0.47% | 0.47% | |||||||||
Multi-Utilities | 0.16% | 0.30% | 0.46% | |||||||||
Broadcasting | 0.46% | 0.00% | 0.46% | |||||||||
Advertising | 0.24% | 0.21% | 0.45% | |||||||||
Integrated Telecommunication Services | 0.44% | 0.00% | 0.44% | |||||||||
Consumer Finance | 0.39% | 0.00% | 0.39% | |||||||||
Regional Banks | 0.24% | 0.11% | 0.35% | |||||||||
Diversified Chemicals | 0.34% | 0.00% | 0.34% | |||||||||
Healthcare Supplies | 0.11% | 0.23% | 0.34% | |||||||||
Railroads | 0.34% | 0.00% | 0.34% | |||||||||
Diversified Support Services | 0.00% | 0.33% | 0.33% | |||||||||
Electric Utilities | 0.28% | 0.05% | 0.33% | |||||||||
Life Sciences Tools & Services | 0.31% | 0.00% | 0.31% | |||||||||
Diversified Real Estate Activities | 0.00% | 0.31% | 0.31% | |||||||||
Tobacco | 0.30% | 0.00% | 0.30% | |||||||||
Research & Consulting Services | 0.11% | 0.18% | 0.29% | |||||||||
Electrical Components & Equipment | 0.27% | 0.00% | 0.27% | |||||||||
Tires & Rubber | 0.00% | 0.26% | 0.26% | |||||||||
Independent Power Producers & Energy Traders | 0.26% | 0.00% | 0.26% | |||||||||
Restaurants | 0.26% | 0.00% | 0.26% | |||||||||
Investment Banking & Brokerage | 0.25% | 0.00% | 0.25% | |||||||||
Specialty Stores | 0.25% | 0.00% | 0.25% | |||||||||
Healthcare Distributors | 0.24% | 0.00% | 0.24% | |||||||||
Construction & Engineering | 0.00% | 0.21% | 0.21% | |||||||||
Diversified Capital Markets | 0.00% | 0.20% | 0.20% | |||||||||
Construction Materials | 0.00% | 0.20% | 0.20% | |||||||||
Agricultural Products | 0.18% | 0.00% | 0.18% | |||||||||
Casinos & Gaming | 0.18% | 0.00% | 0.18% | |||||||||
Electronic Equipment & Instruments | 0.00% | 0.17% | 0.17% | |||||||||
Human Resource & Employment Services | 0.00% | 0.16% | 0.16% | |||||||||
Internet Retail | 0.16% | 0.00% | 0.16% |
See Notes to Schedules of Investments and Notes to Financial Statements.
36
Table of Contents
| Elfun Diversified Fund | (in thousands) — December 31, 2012 |
Brewers | 0.00% | 0.15% | 0.15% | |||||||||
Retail REITs | 0.14% | 0.00% | 0.14% | |||||||||
Trading Companies & Distributors | 0.00% | 0.13% | 0.13% | |||||||||
Drug Retail | 0.13% | 0.00% | 0.13% | |||||||||
General Merchandise Stores | 0.12% | 0.00% | 0.12% | |||||||||
Steel | 0.11% | 0.00% | 0.11% | |||||||||
Industrial Conglomerates | 0.00% | 0.10% | 0.10% | |||||||||
Specialty Chemicals | 0.10% | 0.00% | 0.10% | |||||||||
Photographic Products | 0.00% | 0.10% | 0.10% | |||||||||
Distributors | 0.10% | 0.00% | 0.10% | |||||||||
Department Stores | 0.10% | 0.00% | 0.10% | |||||||||
Heavy Electrical Equipment | 0.00% | 0.09% | 0.09% | |||||||||
Water Utilities | 0.08% | 0.00% | 0.08% | |||||||||
Food Retail | 0.00% | 0.07% | 0.07% | |||||||||
Automotive Retail | 0.06% | 0.00% | 0.06% | |||||||||
Home Building | 0.04% | 0.00% | 0.04% | |||||||||
Oil & Gas Storage & Transportation | 0.04% | 0.00% | 0.04% | |||||||||
Healthcare Facilities | 0.03% | 0.00% | 0.03% | |||||||||
Diversified Banks | 0.00% | 0.02% | 0.02% | |||||||||
|
| |||||||||||
| 57.50% | ||||||||||||
|
|
| Sector | | Percentage (based on Fair Value) | | |||
U.S. Treasuries | 9.40% | |||||
Agency Mortgage Backed | 9.04% | |||||
Corporate Notes | 8.52% | |||||
Non-Agency Collateralized Mortgage Obligations | 0.87% | |||||
Sovereign Bonds | 0.46% | |||||
Agency Collateralized Mortgage Obligations | 0.24% | |||||
Municipal Bonds and Notes | 0.16% | |||||
Asset Backed | 0.01% | |||||
|
| |||||
| 28.70% | ||||||
|
| |||||
| Short-Term Investments | ||||||
Short-Term Investments | 13.80% | |||||
|
| |||||
| 100.00% | ||||||
|
| |||||
See Notes to Schedules of Investments and Notes to Financial Statements.
37
Table of Contents
(Unaudited)

Michael J.Caufield
Senior Vice President
The Elfun Tax-Exempt Income Fund is managed by Michael J. Caufield. See portfolio managers’ biographical information beginning on page 106.
| Q. | How did the Elfun Tax-Exempt Income Fund perform compared to its benchmark and Morningstar peer group for the twelve-month period ended December 31, 2012? |
| A. | For the twelve-month period ended December 31, 2012, the Elfun Tax-Exempt Income Fund returned 7.45%. The Barclay’s U.S. Municipal Bond Index, the Fund’s benchmark, returned 6.78%, while the Morningstar peer group of 240 Municipal National Long Bond Funds returned an average of 8.88% over the same period. |
| Q. | What market conditions affected the Fund’s performance? |
| A. | Themes in the municipal market in 2012 included higher new issue supply, strong technicals, interest rates which fell to near fifty year lows, lingering/growing credit concerns and the emergence of a significant threat to municipal tax exemption. The municipal market benefited from the strong flight to quality in the broader fixed income markets and robust tax-exempt bond fund inflows, creating a supply/demand imbalance for much of the year. |
Fund flows aggregated $50 billion for the year per Lipper Analytical Services, a dramatic reversal of the $12 billion of outflows in 2011. As a result net supply
available was a negative $27 billion for the year ultimately driving a flatter yield curve and compressed credit spread leading to significant price appreciation. Longer maturities clearly benefited from consistent downward pressure on rates, as many investors sought additional yield in longer duration assets.
| Q. | What were the primary drivers of Fund performance? |
| A. | Tax-exempt bond yields trended lower this year outperforming most other fixed income markets with “AAA” benchmark yields challenging 50 year lows. With low absolute rates driven by strong technical factors, investors in search of additional yield, gravitated towards longer dated securities and eventually lower rated credits. The result of improved investor sentiment was a flatter yield curve, rewarding for those willing to assume additional interest rate risk and compression of credit quality spreads, which enhanced returns in the high yield sector. Fund performance, given the Fund’s high quality bias was attributable to management of interest rate risk and diversified curve positioning. The Fund maintained a longer duration throughout the year, approximately one half year longer than the Barclay Municipal Bond Index, while overweighting exposure to the twenty to thirty year sector. Curve positioning was clearly a strong contributor to performance as bonds twenty years and longer provided double digit returns. While many peers aggressively benefited from the |
38
Table of Contents
(Unaudited)
| “risk on/ risk off” trade environment, selecting highly volatile securities in exchange for high returns, the Fund had limited exposure to the high yield sector and derived most of its returns from the A- rated sector. Our focus on the maximization of tax-exempt income while limiting volatility continued to shape our investment process, emphasizing consistent returns over a long term horizon. |
| Q. | Were there any significant changes to the Fund during the period? |
| A. | Early in 2012 we restructured the portfolio to take advantage of a relatively steep yield curve, identifying key segments which we believed to possess the best risk reward characteristics, given the Federal Reserve’s accommodative monetary policy. Over the course of the first half of the year we utilized cash carried through year-end, coupon reinvestment and several short duration securities which had limited income potential, to increase exposure in the twenty five- to thirty year segment of the curve. Despite increasing exposure to longer maturities, we managed to maintain duration at modest levels, one half year longer than the Fund’s benchmark, the Barclay Municipal Bond Index by positioning the portfolio diversely across the curve, emphasizing the twenty five year sector. As broad based demand and modest supply encouraged investors to extend their investment horizon the Fund was well positioned to capture the best performing segment of the curve, as yield tightened between 87- to 89 basis points. While 2012 was one of the best performing years’ in the high yield sector, we chose to take advantage of the strong demand for lower rated issues to pare our exposure to the health care sector throughout the year. Given the dramatic and far reaching effects of the Affordable Care Act we chose to |
| reduce our exposure by half during 2012. While the Fund’s hospital holdings returned in excess of 11% and surpassed Barclay Municipal Bond Index returns by 50 basis points, challenges surrounding a new regulatory and reimbursement environment were overriding concerns. The core structure of the Fund remained essentially unchanged as we continue to adhere to our long-term strategy. With income dominated, high quality securities limiting volatility, the Fund continued to provide a favorable balance between income and total return in 2012. |
39
Table of Contents
(Unaudited)

Understanding Your Fund’s Expenses
40
As a shareholder of the Fund you incur ongoing costs. Ongoing costs include portfolio management fees, professional fees, administrative fees and other Fund expenses. The following example is intended to help you understand your ongoing costs (in dollars) of investing in the Fund and to compare these costs with the ongoing costs of investing in other mutual funds.
To illustrate these ongoing costs, we have provided an example and calculated the expenses paid by investors in units of the Fund during the period. The information in the following table is based on an investment of $1,000, which is invested at the beginning of the period and held for the entire six-month period ended December 31, 2012.
Actual Expenses
The first section of the table provides information about actual account values and actual expenses. You may use the information in this section, together with the amount you invested, to estimate the expenses that you paid over the period. To do so, simply divide your account value by $1,000 (for example, an $8,600 account value divided by $1,000 = 8.6), then multiply the result by the number given for your class under the heading “Expenses Paid During Period,” to
estimate the expenses paid on your account during this period.
Hypothetical Example for Comparison Purposes
The second section of the table provides information about hypothetical account values and hypothetical expenses based on the Fund’s actual expense ratio and an assumed rate of return of 5% per year before expenses, which is not the Fund’s actual return. The hypothetical account values and expenses may not be used to estimate the actual ending account balance or expenses you paid for the period. You may use this information to compare the ongoing costs of investing in the Fund and other funds. To do so, compare this 5% hypothetical example with the 5% hypothetical examples that appear in the shareholders reports of other funds.
Please note that the expenses shown in the table are meant to highlight and help you compare ongoing costs only and do not reflect any transaction costs, such as sales charges or redemption fees, if any. Therefore, the second section of the table is useful in comparing ongoing costs only, and will not help you determine the relative total costs of owning different funds.
July 1, 2012 – December 31, 2012
| Account value at the beginning of the period ($) | Account value at the end of the period ($) | Expenses paid during the period ($)* | ||||||||||
Actual Fund Return | 1,000.00 | 1,033.30 | 0.82 | |||||||||
Hypothetical 5% Return | 1,000.00 | 1,024.33 | 0.81 | |||||||||
| * | Expenses are equal to the Fund’s annualized expense ratio of 0.16% (for the period July 1, 2012 - December 31, 2012), multiplied by the average account value over the period, multiplied by 184/366 (to reflect the one-half year period). |
Table of Contents
(Unaudited)
Investment Profile
A mutual fund designed for investors who seek as high a level of current interest income exempt from federal income taxation as is available from a concentration of investments in municipal bonds consistent with prudent investment management and the preservation of capital. The Fund seeks to achieve its investment objective by investing primarily in investment-grade municipal obligations.
Quality Ratings
as of December 31, 2012 as a % of Fair Value(b)
Moody’s / S&P Rating* |
| Percentage of Fair Value |
| |
Aaa / AAA | 9.77% | |||
Aa / AA | 49.36% | |||
A / A | 31.28% | |||
Baa / BBB | 7.86% | |||
Ba / BB and lower | 0.29% | |||
NR / Other | 1.44% | |||
| 100.00% |
| * | Moody’s Investors Services Inc and Standard & Poor’s are nationally recognized statistical rating organizations. |
Sector Allocation
as a % of Fair Value of $1,791,974 (in thousands) as of December 31, 2012.(b)
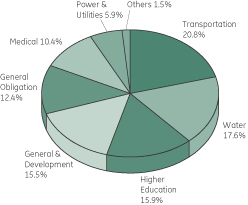
Morningstar Performance Comparison
Based on average annual returns for periods ended 12/31/12
| One Year | Five Year | Ten Year | ||||||||||
Number of funds in peer group | 240 | 229 | 224 | |||||||||
Peer group average annual total return | 8.88 | % | 5.48 | % | 4.48 | % | ||||||
Morningstar category in peer group: Muni National Long |
| |||||||||||
Change in Value of a $10,000 Investment(a)
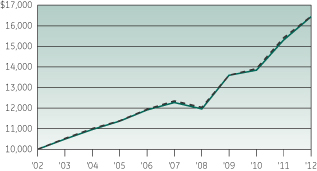
Average Annual Total Return
for the periods ended December 31, 2012
| (Inception date: 01/01/80) | ||||||||||||||||
| One Year | Five Year | Ten Year | Ending value of a $10,000 investment (a) | |||||||||||||
Elfun Tax-Exempt Income Fund | 7.45% | 6.04% | 5.10% | $16,445 | ||||||||||||
Barclays U.S. Municipal Bond Index | 6.78% | 5.91% | 5.10% | $16,449 | ||||||||||||
| (a) | Ending value of a $10,000 investment for the ten-year period or since inception, whichever is less. |
| (b) | The securities information regarding holdings, allocations and other characteristics is presented to illustrate examples of securities that the Fund has bought and the diversity of areas in which the Fund may invest as of a particular date. It may not be representative of the Fund’s current or future investments and should not be construed as a recommendation to purchase or sell a particular security. |
See Notes to Performance on page 1 for further information, including an explanation of Morningstar peer categories.
Past performance does not predict future performance. The performance shown on the graph and tables does not reflect the deduction of taxes that a shareholder would pay on Fund distributions or the redemption of Fund shares.
41
Table of Contents
| Elfun Tax-Exempt Income Fund | (in thousands) — December 31, 2012 |
| Principal Amount | Fair Value | |||||||||||
Municipal Bonds and Notes — 99.3%† |
| |||||||||||
| Alabama — 0.8% | ||||||||||||
East Alabama | ||||||||||||
| 5.00% | 09/01/33 | $ | 5,500 | $ | 5,674 | (m) | ||||||
Montgomery BMC Special Care Facilities Financing Authority (MBIA Insured) | ||||||||||||
| 5.00% | 11/15/20 | 8,375 | 9,085 | (m,n) | ||||||||
| 14,759 | ||||||||||||
| Alaska — 0.2% | ||||||||||||
Alaska Housing Finance Corp. | ||||||||||||
| 5.00% | 12/01/27 | 2,500 | 2,968 | |||||||||
| Arizona — 3.2% | ||||||||||||
Apache County Industrial Development Authority | ||||||||||||
| 4.50% | 03/01/30 | 4,000 | 4,177 | |||||||||
Arizona Health Facilities Authority | ||||||||||||
| 5.00% | 02/01/42 | 2,000 | 2,162 | |||||||||
City of Phoenix AZ | ||||||||||||
| 5.00% | 07/01/19 | 5,000 | 5,847 | |||||||||
Glendale Western Loop 101 Public Facilities Corp. | ||||||||||||
| 6.25% | 07/01/38 | 10,000 | 10,590 | |||||||||
Maricopa County Industrial Development Authority | ||||||||||||
| 5.50% | 07/01/26 | 5,000 | 5,330 | |||||||||
Phoenix Civic | ||||||||||||
| 5.00% | 07/01/40 | 4,750 | 5,229 | |||||||||
Phoenix Civic Improvement Corp. (FGIC Insured) | ||||||||||||
| 5.50% | 07/01/23 - 07/01/24 | 7,260 | 9,606 | (n) | ||||||||
Salt River Project Agricultural Improvement & Power District | ||||||||||||
| 5.00% | 12/01/21 | 10,000 | 12,357 | |||||||||
University Medical Center Corp. | ||||||||||||
| 6.50% | 07/01/39 | 1,000 | 1,166 | |||||||||
| 56,464 | ||||||||||||
| Principal Amount | Fair Value | |||||||||||
| California — 9.0% | ||||||||||||
Bay Area Toll Authority | ||||||||||||
| 4.00% | 04/01/31 | $ | 4,000 | $ | 4,348 | |||||||
| 5.00% | 04/01/31 | 10,000 | 11,397 | (m) | ||||||||
California Educational Facilities Authority | ||||||||||||
| 5.00% | 10/01/32 | 5,255 | 7,312 | |||||||||
| 5.25% | 10/01/39 | 6,000 | 7,053 | |||||||||
| 6.13% | 10/01/36 | 1,500 | 1,809 | |||||||||
California Health Facilities Financing Authority | ||||||||||||
| 5.50% | 08/15/26 | 5,000 | 5,931 | |||||||||
| 6.00% | 07/01/39 | 5,000 | 5,827 | |||||||||
| 6.50% | 10/01/33 | 3,500 | 4,259 | |||||||||
California State Department of Water Resources | ||||||||||||
| 5.00% | 05/01/21 - 12/01/21 | 6,585 | 8,261 | |||||||||
California State Public Works Board | ||||||||||||
| 5.00% | 10/01/28 | 1,500 | 1,700 | |||||||||
| 5.13% | 10/01/31 | 2,000 | 2,254 | |||||||||
| 6.00% | 04/01/26 | 8,475 | 10,299 | |||||||||
Coast Community College District (AGMC Insured) | ||||||||||||
| 3.77% | 08/01/33 | 8,750 | 9,036 | (d,n) | ||||||||
Foothill-De Anza Community College District (AMBAC Insured) | ||||||||||||
| 4.50% | 08/01/31 | 2,600 | 2,849 | (n) | ||||||||
Los Angeles Department of Water & Power | ||||||||||||
| 5.00% | 07/01/43 | 10,000 | 11,516 | |||||||||
Los Angeles Harbor Department | ||||||||||||
| 5.00% | 08/01/26 | 8,000 | 9,520 | |||||||||
Marin Water District Financing Authority | ||||||||||||
| 5.00% | 07/01/44 | 6,000 | 6,889 | |||||||||
Metropolitan Water District of Southern California | ||||||||||||
| 5.00% | 07/01/35 | 5,000 | 5,507 | |||||||||
Newport Mesa Unified School District | ||||||||||||
| 3.29% | 08/01/41 | 10,000 | 1,851 | (d) | ||||||||
See Notes to Schedules of Investments and Notes to Financial Statements.
42
Table of Contents
| Elfun Tax-Exempt Income Fund | (in thousands) — December 31, 2012 |
| Principal Amount | Fair Value | |||||||||||
Sacramento Municipal Utility District | ||||||||||||
| 5.00% | 08/15/28 | $ | 2,500 | $ | 2,960 | |||||||
San Diego Community College District | ||||||||||||
| 5.00% | 08/01/41 | 10,000 | 11,510 | |||||||||
San Diego County Regional Transportation Commission | ||||||||||||
| 5.00% | 04/01/42 | 2,500 | 2,873 | |||||||||
San Diego Unified School District (AGMC Insured) | ||||||||||||
| 5.25% | 07/01/17 - 07/01/19 | 8,795 | 9,087 | (m,n) | ||||||||
State of California | ||||||||||||
| 5.00% | 09/01/41 | 7,500 | 8,393 | |||||||||
| 5.25% | 04/01/35 | �� | 4,500 | 5,245 | ||||||||
University of California (AMBAC Insured) | ||||||||||||
| 5.00% | 05/15/34 | 2,225 | 2,234 | (n) | ||||||||
| 159,920 | ||||||||||||
| Colorado — 0.9% | ||||||||||||
Colorado Health Facilities Authority |
| |||||||||||
| 5.00% | 02/01/41 | 5,000 | 5,549 | |||||||||
Colorado Water Resources & Power Development Authority |
| |||||||||||
| 5.25% | 09/01/17 - 09/01/18 | 2,515 | 2,523 | |||||||||
Metro Wastewater Reclamation District | ||||||||||||
| 5.00% | 04/01/27 | 4,000 | 4,902 | |||||||||
Regional Transportation District | ||||||||||||
| 5.38% | 06/01/31 | 2,500 | 2,835 | |||||||||
| 15,809 | ||||||||||||
| Connecticut — 2.7% | ||||||||||||
Connecticut State Health & Educational Facility Authority | ||||||||||||
| 5.00% | 07/01/40 | 5,500 | 5,994 | |||||||||
South Central Connecticut Regional Water Authority | ||||||||||||
| 5.00% | 08/01/27 - 08/01/41 | 14,900 | 17,064 | |||||||||
State of Connecticut | ||||||||||||
| 5.00% | 01/01/22 - 01/01/24 | 9,705 | 11,959 | |||||||||
| Principal Amount | Fair Value | |||||||||||
State of Connecticut Special Tax Revenue | ||||||||||||
| 5.00% | 11/01/26 | $ | 10,000 | $ | 11,630 | |||||||
Town of Fairfield CT | ||||||||||||
| 5.00% | 08/01/21 | 1,000 | 1,271 | |||||||||
| 47,918 | ||||||||||||
| Delaware — 1.5% | ||||||||||||
County of New Castle DE | ||||||||||||
| 5.00% | 07/15/33 - 07/15/39 | 10,000 | 11,484 | |||||||||
Delaware River & Bay Authority | ||||||||||||
| 5.00% | 01/01/42 | 2,000 | 2,262 | |||||||||
Delaware State Health Facilities Authority | ||||||||||||
| 5.00% | 10/01/40 | 7,800 | 8,733 | |||||||||
State of Delaware | ||||||||||||
| 5.00% | 07/01/28 | 3,000 | 3,623 | |||||||||
| 26,102 | ||||||||||||
| District of Columbia — 1.6% | ||||||||||||
District of Columbia | ||||||||||||
| 5.00% | 04/01/30 | 4,500 | 5,242 | |||||||||
| 5.50% | 04/01/36 | 15,000 | 16,737 | |||||||||
District of Columbia Water & Sewer Authority | ||||||||||||
| 5.25% | 10/01/29 | 5,000 | 5,955 | |||||||||
| 27,934 | ||||||||||||
| Florida — 1.8% | ||||||||||||
Brevard County Health Facilities Authority | ||||||||||||
| 7.00% | 04/01/39 | 1,000 | 1,251 | |||||||||
City of Tampa FL | ||||||||||||
| 5.00% | 10/01/27 | 8,560 | 10,157 | |||||||||
County of Miami-Dade FL Transit System Sales Surtax Revenue | ||||||||||||
| 5.00% | 07/01/42 | 5,000 | 5,640 | |||||||||
Hillsborough County Industrial Development Authority | ||||||||||||
| 5.00% | 10/01/18 | 5,000 | 5,148 | |||||||||
| 5.25% | 10/01/15 - 10/01/24 | 9,590 | 9,861 | |||||||||
| 32,057 | ||||||||||||
See Notes to Schedules of Investments and Notes to Financial Statements.
43
Table of Contents
| Elfun Tax-Exempt Income Fund | (in thousands) — December 31, 2012 |
| Principal Amount | Fair Value | |||||||||||
| Georgia — 5.9% | ||||||||||||
Athens-Clarke County GA Unified Government Water & Sewerage Revenue | ||||||||||||
| 5.50% | 01/01/38 | $ | 7,000 | $ | 8,023 | |||||||
Athens-Clarke County Unified Government Development Authority | ||||||||||||
| 3.61% | 06/15/31 | 6,050 | 6,326 | (d) | ||||||||
Augusta GA Water & Sewerage Revenue (AGMC Insured) | ||||||||||||
| 5.25% | 10/01/34 | 5,400 | 5,775 | (n) | ||||||||
City of Atlanta GA Department of Aviation | ||||||||||||
| 5.00% | 01/01/25 | 10,000 | 11,833 | |||||||||
City of Atlanta GA Department of Aviation (AGMC Insured) | ||||||||||||
| 5.25% | 01/01/33 | 4,000 | 4,192 | (n) | ||||||||
City of Atlanta GA Water & Wastewater Revenue | ||||||||||||
| 6.25% | 11/01/39 | 10,000 | 12,290 | |||||||||
City of Atlanta GA Water & Wastewater Revenue (AGMC Insured) | ||||||||||||
| 5.75% | 11/01/27 - 11/01/30 | 9,500 | 13,172 | (n) | ||||||||
County of Fulton GA Water & Sewerage Revenue (FGIC Insured) | ||||||||||||
| 5.00% | 01/01/30 | 5,000 | 5,194 | (n) | ||||||||
DeKalb Newton & Gwinnett Counties Joint Development Authority | ||||||||||||
| 6.00% | 07/01/34 | 8,500 | 9,869 | |||||||||
Fayette County School District (AGMC Insured) | ||||||||||||
| 4.80% | 03/01/22 | 2,520 | 2,786 | (n) | ||||||||
| 4.85% | 03/01/23 | 2,290 | 2,534 | (n) | ||||||||
Henry County Hospital Authority (MBIA Insured) | ||||||||||||
| 5.00% | 07/01/24 | 1,865 | 1,969 | (n) | ||||||||
Municipal Electric Authority of Georgia | ||||||||||||
| 5.25% | 01/01/19 | 2,490 | 2,987 | |||||||||
| Principal Amount | Fair Value | |||||||||||
Private Colleges & Universities Authority (MBIA Insured) | ||||||||||||
| 6.50% | 11/01/15 | $ | 3,100 | $ | 3,411 | (l,n) | ||||||
State of Georgia |
| |||||||||||
| 4.50% | 01/01/29 | 3,000 | 3,490 | |||||||||
| 5.00% | 08/01/22 - 01/01/26 | 4,790 | 5,652 | |||||||||
| 5.00% | 08/01/22 | 4,460 | 5,306 | (m) | ||||||||
| 104,809 | ||||||||||||
| Hawaii — 2.1% | ||||||||||||
City & County of Honolulu HI |
| |||||||||||
| 5.00% | 04/01/33 | 10,000 | 11,430 | |||||||||
State of Hawaii (AGMC Insured) |
| |||||||||||
| 5.75% | 02/01/14 | 6,500 | 6,876 | (n) | ||||||||
State of Hawaii Airports System Revenue | ||||||||||||
| 5.25% | 07/01/24 | 15,800 | 19,197 | |||||||||
| 37,503 | ||||||||||||
| Idaho — 1.4% | ||||||||||||
Idaho Health Facilities Authority | ||||||||||||
| 6.75% | 11/01/37 | 4,000 | 4,733 | |||||||||
Idaho Housing & Finance Assoc. (MBIA Insured) | ||||||||||||
| 5.00% | 07/15/22 - 07/15/24 | 17,625 | 19,839 | (n) | ||||||||
| 24,572 | ||||||||||||
| Illinois — 2.1% | ||||||||||||
City of Chicago IL O’Hare International Airport Revenue | ||||||||||||
| 5.63% | 01/01/35 | 5,000 | 5,884 | |||||||||
| 5.75% | 01/01/39 | 11,500 | 13,483 | |||||||||
Illinois Finance Authority |
| |||||||||||
| 5.50% | 08/15/43 | 5,000 | 5,412 | (m) | ||||||||
Metropolitan Pier & Exposition Authority (MBIA Insured) | ||||||||||||
| 3.31% | 06/15/22 | 4,305 | 4,118 | (d,n) | ||||||||
| 5.40% | 06/15/19 | 4,000 | 4,603 | (n) | ||||||||
Southwestern Illinois Development Authority (MBIA Insured) | ||||||||||||
| 5.00% | 10/01/21 | 4,000 | 4,922 | (n) | ||||||||
| 38,422 | ||||||||||||
See Notes to Schedules of Investments and Notes to Financial Statements.
44
Table of Contents
| Elfun Tax-Exempt Income Fund | (in thousands) — December 31, 2012 |
| Principal Amount | Fair Value | |||||||||||
| Indiana — 1.1% | ||||||||||||
Indiana Finance Authority |
| |||||||||||
| 5.00% | 06/01/39 | $ | 2,000 | $ | 2,057 | |||||||
Indiana Municipal Power Agency | ||||||||||||
| 5.50% | 01/01/27 | 2,500 | 2,986 | |||||||||
| 5.75% | 01/01/34 | 2,000 | 2,090 | |||||||||
Indianapolis Local Public Improvement Bond Bank | ||||||||||||
| 5.75% | 01/01/38 | 7,000 | 7,970 | |||||||||
Merrillville Multi School Building Corp. | ||||||||||||
| 5.25% | 07/15/28 | 5,000 | 5,539 | |||||||||
| 20,642 | ||||||||||||
| Kentucky — 1.4% | ||||||||||||
Kentucky Economic Development Finance Authority | ||||||||||||
| 6.38% | 06/01/40 | 3,500 | 4,162 | |||||||||
Kentucky State Property & Building Commission (AGC Insured) | ||||||||||||
| 5.25% | 02/01/27 | 10,665 | 12,347 | (n) | ||||||||
Louisville & Jefferson County Metropolitan Sewer District | ||||||||||||
| 5.00% | 05/15/30 | 8,040 | 9,413 | |||||||||
| 25,922 | ||||||||||||
| Louisiana — 1.6% | ||||||||||||
Louisiana Public Facilities Authority | ||||||||||||
| 4.00% | 07/01/42 | 4,000 | 3,945 | |||||||||
| 5.00% | 07/01/42 | 3,500 | 3,820 | |||||||||
Louisiana Public Facilities Authority (MBIA Insured) | ||||||||||||
| 5.38% | 05/15/16 | 7,870 | 8,018 | (m,n) | ||||||||
State of Louisiana |
| |||||||||||
| 5.00% | 09/01/19 | 10,050 | 12,443 | |||||||||
| 28,226 | ||||||||||||
| Maine — 0.3% | ||||||||||||
Maine Health & Higher Educational Facilities Authority | ||||||||||||
| 5.25% | 07/01/21 | 1,790 | 2,077 | |||||||||
| Principal Amount | Fair Value | |||||||||||
Maine Turnpike Authority |
| |||||||||||
| 5.00% | 07/01/42 | $ | 1,000 | $ | 1,143 | |||||||
| 6.00% | 07/01/34 | 1,250 | 1,500 | |||||||||
| 4,720 | ||||||||||||
| Maryland — 4.6% | ||||||||||||
County of Baltimore MD |
| |||||||||||
| 5.00% | 02/01/23 | 7,525 | 9,533 | |||||||||
County of Montgomery MD |
| |||||||||||
| 5.00% | 07/01/21 | 12,905 | 16,553 | |||||||||
County of Prince George’s MD |
| |||||||||||
| 5.00% | 10/01/22 | 6,820 | 7,063 | (m) | ||||||||
County of Baltimore MD |
| |||||||||||
| 5.00% | 09/15/24 - 09/15/25 | 15,080 | 18,905 | |||||||||
Maryland Economic Development Corp. | ||||||||||||
| 5.75% | 06/01/35 | 3,000 | 3,408 | |||||||||
Maryland Health & Higher Educational Facilities Authority | ||||||||||||
| 5.00% | 07/01/32 - 08/15/41 | 4,300 | 4,787 | |||||||||
| 5.13% | 11/15/34 | 7,200 | 7,500 | (m) | ||||||||
State of Maryland |
| |||||||||||
| 5.00% | 11/01/18 | 4,000 | 4,916 | |||||||||
Washington Suburban Sanitary Commission | ||||||||||||
| 4.50% | 06/01/26 | 8,470 | 9,695 | |||||||||
| 82,360 | ||||||||||||
| Massachusetts — 3.7% | ||||||||||||
Massachusetts Department of Transportation | ||||||||||||
| 5.00% | 01/01/37 | 5,000 | 5,527 | |||||||||
Massachusetts Development Finance Agency | ||||||||||||
| 5.00% | 01/01/40 | 4,000 | 4,292 | |||||||||
Massachusetts Health & Educational Facilities Authority | ||||||||||||
| 5.00% | 07/01/34 - 07/15/35 | 20,000 | 22,071 | |||||||||
| 5.50% | 11/15/36 | 4,000 | 4,788 | |||||||||
| 5.75% | 07/01/39 | 7,500 | 8,533 | |||||||||
See Notes to Schedules of Investments and Notes to Financial Statements.
45
Table of Contents
| Elfun Tax-Exempt Income Fund | (in thousands) — December 31, 2012 |
| Principal Amount | Fair Value | |||||||||||
Massachusetts Water Resources Authority | ||||||||||||
| 5.00% | 08/01/41 | $ | 3,000 | $ | 3,436 | |||||||
| 6.50% | 07/15/19 | 14,125 | 16,762 | (l) | ||||||||
| 65,409 | ||||||||||||
| Michigan — 1.5% | ||||||||||||
City of Detroit MI Sewage Disposal System Revenue (AGMC Insured) | ||||||||||||
| 5.25% | 07/01/21 - 07/01/22 | 4,545 | 5,154 | (n) | ||||||||
City of Detroit MI Water Supply System Revenue | ||||||||||||
| 5.75% | 07/01/37 | 5,000 | 5,648 | |||||||||
Lansing Board of Water & Light | ||||||||||||
| 5.00% | 07/01/37 | 3,500 | 3,979 | |||||||||
State of Michigan (AGMC Insured) | ||||||||||||
| 5.25% | 09/15/27 | 5,000 | 5,625 | (n) | ||||||||
State of Michigan Trunk Line Revenue | ||||||||||||
| 5.50% | 11/01/18 | 6,000 | 7,364 | |||||||||
| 27,770 | ||||||||||||
| Mississippi — 0.4% | ||||||||||||
State of Mississippi | ||||||||||||
| 5.50% | 09/01/14 | 7,500 | 8,134 | |||||||||
| Missouri — 1.4% | ||||||||||||
Metropolitan St Louis Sewer District | ||||||||||||
| 5.00% | 05/01/34 - 05/01/42 | 8,000 | 9,425 | |||||||||
Missouri Highway & Transportation Commission | ||||||||||||
| 5.00% | 05/01/21 | 4,610 | 5,657 | |||||||||
Missouri Joint Municipal Electric Utility Commission | ||||||||||||
| 5.75% | 01/01/29 | 4,500 | 4,895 | |||||||||
Missouri State Environmental Improvement & Energy Resources Authority | ||||||||||||
| 5.00% | 01/01/24 | 4,475 | 4,789 | (m) | ||||||||
| Principal Amount | Fair Value | |||||||||||
Missouri State Environmental Improvement & Energy Resources Authority | ||||||||||||
| 5.00% | 01/01/24 | $ | 525 | $ | 558 | |||||||
| 25,324 | ||||||||||||
| Nevada — 0.1% | ||||||||||||
City of Las Vegas N.V. (AGMC Insured) | ||||||||||||
| 5.55% | 06/01/16 | 1,520 | 1,544 | (n) | ||||||||
| New Jersey — 9.5% | ||||||||||||
Cape May County Municipal Utilities Authority (AGMC Insured) | ||||||||||||
| 5.75% | 01/01/15 - 01/01/16 | 8,500 | 9,526 | (n) | ||||||||
Essex County Improvement Authority (AGMC Insured) | ||||||||||||
| 5.25% | 12/15/17 | 235 | 246 | (m,n) | ||||||||
Essex County Improvement Authority (AGMC Insured) | ||||||||||||
| 5.25% | 12/15/17 | 9,765 | 10,173 | (n) | ||||||||
New Jersey Economic Development Authority | ||||||||||||
| 5.00% | 03/01/38 | 4,000 | 4,509 | |||||||||
| 5.50% | 12/15/29 | 5,000 | 5,833 | |||||||||
New Jersey Educational Facilities Authority | ||||||||||||
| 5.25% | 07/01/32 | 2,625 | 2,689 | (m) | ||||||||
| 6.00% | 12/01/17 | 10,000 | 12,016 | |||||||||
New Jersey Healthcare Facilities Financing Authority | ||||||||||||
| 5.63% | 07/01/37 | 2,000 | 2,232 | |||||||||
New Jersey Higher Education Student Assistance Authority | ||||||||||||
| 5.63% | 06/01/30 | 7,500 | 8,371 | |||||||||
New Jersey Institute of Technology | ||||||||||||
| 5.00% | 07/01/42 | 2,000 | 2,273 | |||||||||
New Jersey State Turnpike Authority | ||||||||||||
| 5.00% | 01/01/35 | 2,500 | 2,839 | |||||||||
| 5.25% | 01/01/40 | 10,000 | 11,237 | |||||||||
See Notes to Schedules of Investments and Notes to Financial Statements.
46
Table of Contents
| Elfun Tax-Exempt Income Fund | (in thousands) — December 31, 2012 |
| Principal Amount | Fair Value | |||||||||||
New Jersey State Turnpike Authority (AMBAC Insured) | ||||||||||||
| 6.50% | 01/01/16 | $ | 35,955 | $ | 39,736 | (l,n) | ||||||
| 6.50% | 01/01/16 | 5,135 | 5,905 | (n) | ||||||||
New Jersey Transportation Trust Fund Authority | ||||||||||||
| 5.00% | 06/15/42 | 6,000 | 6,672 | |||||||||
| 5.25% | 06/15/36 | 6,100 | 6,956 | |||||||||
| 5.50% | 06/15/23 - 06/15/24 | 20,280 | 20,761 | (m) | ||||||||
New Jersey Transportation Trust Fund Authority | ||||||||||||
| 5.50% | 06/15/41 | 7,435 | 8,585 | |||||||||
New Jersey Transportation Trust Fund Authority (AGMC Insured) | ||||||||||||
| 5.75% | 12/15/14 | 1,390 | 1,535 | (n) | ||||||||
| 5.75% | 12/15/14 | 4,610 | 5,096 | (l,n) | ||||||||
North Hudson Sewerage Authority | ||||||||||||
| 5.00% | 06/01/42 | 2,000 | 2,240 | |||||||||
| 169,430 | ||||||||||||
| New Mexico — 1.4% | ||||||||||||
New Mexico Finance Authority | ||||||||||||
| 5.00% | 06/15/18 - 12/15/26 | 21,200 | 24,890 | |||||||||
| New York — 7.3% | ||||||||||||
Brooklyn Arena Local Development Corp. |
| |||||||||||
| 6.00% | 07/15/30 | 4,500 | 5,300 | |||||||||
City of New York NY | ||||||||||||
| 5.00% | 08/01/30 | 15,000 | 17,937 | |||||||||
Hempstead Town Industrial Development Agency | ||||||||||||
| 5.00% | 10/01/30 | 1,945 | 2,031 | |||||||||
Long Island Power Authority | ||||||||||||
| 6.00% | 05/01/33 | 7,500 | 9,120 | |||||||||
New York City Transitional Finance Authority Building Aid Revenue | ||||||||||||
| 5.50% | 07/15/31 | 10,000 | 11,529 | |||||||||
New York City Transitional Finance Authority Future Tax Secured Revenue | ||||||||||||
| 5.00% | 11/01/21 | 5,000 | 6,305 | |||||||||
| Principal Amount | Fair Value | |||||||||||
New York Liberty Development Corp. | ||||||||||||
| 5.00% | 11/15/44 | $ | 5,000 | $ | 5,612 | |||||||
| 5.13% | 01/15/44 | 5,000 | 5,555 | |||||||||
New York State Dormitory Authority | ||||||||||||
| 5.00% | 07/01/23 - 07/01/42 | 11,825 | 13,736 | |||||||||
| 5.50% | 07/01/36 - 05/01/37 | 4,000 | 4,582 | |||||||||
| 6.00% | 07/01/40 | 2,000 | 2,404 | |||||||||
| 6.50% | 12/01/21 | 4,500 | 5,228 | |||||||||
New York State Housing Finance Agency | ||||||||||||
| 3.75% | 11/01/37 | 10,030 | 9,886 | |||||||||
New York State Urban Development Corp. | ||||||||||||
| 5.50% | 01/01/19 | 9,000 | 10,986 | |||||||||
Triborough Bridge & Tunnel Authority | ||||||||||||
| 5.00% | 11/15/26 | 10,000 | 11,761 | |||||||||
Westchester County Healthcare Corp. |
| |||||||||||
| 5.00% | 11/01/30 | 4,500 | 5,019 | |||||||||
| 6.13% | 11/01/37 | 2,500 | 2,940 | |||||||||
| 129,931 | ||||||||||||
| North Carolina — 2.5% | ||||||||||||
City of Charlotte NC | ||||||||||||
| 5.00% | 06/01/23 | 4,320 | 5,285 | |||||||||
City of Charlotte NC Water & Sewer System Revenue | ||||||||||||
| 5.00% | 07/01/38 | 5,000 | 5,737 | |||||||||
North Carolina Eastern Municipal Power Agency | ||||||||||||
| 5.00% | 01/01/26 | 5,000 | 5,707 | |||||||||
North Carolina Medical Care Commission | ||||||||||||
| 4.00% | 12/01/45 | 5,000 | 5,004 | |||||||||
| 4.75% | 11/01/43 | 6,000 | 6,349 | |||||||||
| 5.00% | 12/01/45 | 2,500 | 2,814 | |||||||||
North Carolina Turnpike Authority | ||||||||||||
| 5.00% | 07/01/30 | 3,230 | 3,820 | |||||||||
State of North Carolina | ||||||||||||
| 4.75% | 05/01/30 | 4,130 | 4,805 | |||||||||
University of North Carolina at Greensboro | ||||||||||||
| 5.00% | 04/01/36 | 4,000 | 4,583 | |||||||||
| 44,104 | ||||||||||||
See Notes to Schedules of Investments and Notes to Financial Statements.
47
Table of Contents
| Elfun Tax-Exempt Income Fund | (in thousands) — December 31, 2012 |
| Principal Amount | Fair Value | |||||||||||
| Ohio — 3.1% | ||||||||||||
American Municipal Power Inc. | ||||||||||||
| 4.38% | 02/15/44 | $ | 5,000 | $ | 5,153 | |||||||
| 5.00% | 02/15/38 | 5,000 | 5,443 | |||||||||
City of Cincinnati OH Water System Revenue | ||||||||||||
| 5.00% | 12/01/36 | 2,500 | 2,897 | |||||||||
City of Cleveland OH Airport System Revenue | ||||||||||||
| 5.00% | 01/01/29 | 2,000 | 2,288 | |||||||||
City of Columbus OH Sewerage Revenue | ||||||||||||
| 4.50% | 06/01/32 | 700 | 770 | |||||||||
| 4.75% | 06/01/31 | 5,000 | 5,588 | |||||||||
County of Cuyahoga OH | ||||||||||||
| 6.00% | 01/01/32 | 10,000 | 10,282 | (m) | ||||||||
County of Franklin OH | ||||||||||||
| 4.50% | 12/01/37 | 1,750 | 1,850 | |||||||||
County of Hamilton OH Sewer System Revenue (MBIA | ||||||||||||
| 5.00% | 12/01/19 | 4,250 | 4,433 | (m,n) | ||||||||
Cuyahoga Community College District | ||||||||||||
| 5.00% | 08/01/26 - 08/01/27 | 3,000 | 3,455 | |||||||||
Ohio Higher Educational Facility Commission | ||||||||||||
| 5.00% | 01/01/38 | 7,500 | 8,454 | |||||||||
| 6.25% | 05/01/38 | 5,000 | 5,716 | |||||||||
| 56,329 | ||||||||||||
| Oklahoma — 1.1% | ||||||||||||
Claremore Public Works Authority (AGMC Insured) | ||||||||||||
| 5.25% | 06/01/34 | 6,315 | 6,814 | (m,n) | ||||||||
Oklahoma Municipal Power Authority (FGIC Insured) | ||||||||||||
| 4.50% | 01/01/47 | 9,000 | 9,350 | (n) | ||||||||
Oklahoma Turnpike Authority | ||||||||||||
| 5.00% | 01/01/28 | 3,500 | 4,150 | |||||||||
| 20,314 | ||||||||||||
| Principal Amount | Fair Value | |||||||||||
| Pennsylvania — 5.6% | ||||||||||||
Allentown Neighborhood Improvement Zone Development Authority | ||||||||||||
| 5.00% | 05/01/42 | $ | 5,000 | $ | 5,274 | |||||||
City of Philadelphia PA Water & Sewer Revenue | ||||||||||||
| 5.00% | 01/01/36 - 01/01/41 | 18,000 | 20,096 | |||||||||
Commonwealth of Pennsylvania | ||||||||||||
| 5.00% | 11/15/30 | 8,890 | 10,663 | |||||||||
Pennsylvania Higher Educational Facilities Authority | ||||||||||||
| 5.25% | 08/15/25 | 1,750 | 2,109 | |||||||||
Pennsylvania Turnpike Commission | ||||||||||||
| 3.84% | 12/01/34 | 12,000 | 11,790 | (d) | ||||||||
| 5.00% | 06/01/29 - 12/01/42 | 17,500 | 19,327 | |||||||||
Pennsylvania Turnpike Commission (AMBAC Insured) | ||||||||||||
| 5.25% | 12/01/32 | 12,000 | 12,940 | (n) | ||||||||
Pennsylvania Turnpike Commission | ||||||||||||
| 5.25% | 06/01/39 | 9,500 | 10,407 | |||||||||
State Public School Building Authority (AGMC Insured) | ||||||||||||
| 5.25% | 06/01/27 | 8,000 | 8,163 | (m,n) | ||||||||
| 100,769 | ||||||||||||
| Puerto Rico — 2.4% | ||||||||||||
Commonwealth of Puerto Rico | ||||||||||||
| 5.75% | 07/01/38 | 7,000 | 7,075 | |||||||||
| 6.00% | 07/01/39 | 10,000 | 10,237 | |||||||||
Puerto Rico Sales Tax Financing Corp. |
| |||||||||||
| 4.49% | 08/01/32 | 12,000 | 12,086 | (d) | ||||||||
| 5.25% | 08/01/40 | 3,000 | 3,254 | |||||||||
| 5.50% | 08/01/42 | 10,000 | 10,313 | |||||||||
| 42,965 | ||||||||||||
| Rhode Island — 0.1% | ||||||||||||
Rhode Island Health & Educational Building Corp. | ||||||||||||
| 6.25% | 09/15/34 | 1,300 | 1,510 | |||||||||
| 6.50% | 09/15/28 | 1,000 | 1,197 | |||||||||
| 2,707 | ||||||||||||
See Notes to Schedules of Investments and Notes to Financial Statements.
48
Table of Contents
| Elfun Tax-Exempt Income Fund | (in thousands) — December 31, 2012 |
| Principal Amount | Fair Value | |||||||||||
| South Carolina — 5.3% | ||||||||||||
Berkeley County School District | ||||||||||||
| 5.25% | 12/01/24 | $ | 15,000 | $ | 15,579 | |||||||
Charleston Educational Excellence Finance Corp. | ||||||||||||
| 5.25% | 12/01/27 - 12/01/30 | 21,850 | 24,108 | |||||||||
Georgetown County School District | ||||||||||||
| 5.00% | 03/01/18 | 3,640 | 4,388 | |||||||||
Greenville County School District | ||||||||||||
| 5.25% | 12/01/21 | 2,000 | 2,090 | (m) | ||||||||
Lexington County Health Services District Inc. | ||||||||||||
| 5.50% | 11/01/13 | 1,920 | 1,994 | |||||||||
Piedmont Municipal Power Agency | ||||||||||||
| 5.00% | 01/01/25 | 2,315 | 2,711 | |||||||||
Piedmont Municipal Power Agency (AGC Insured) | ||||||||||||
| 5.75% | 01/01/34 | 5,500 | 6,599 | (n) | ||||||||
South Carolina State Public Service Authority | ||||||||||||
| 5.00% | 12/01/30 - 12/01/43 | 17,105 | 19,308 | |||||||||
| 5.50% | 01/01/38 | 14,970 | 17,464 | |||||||||
| 94,241 | ||||||||||||
| Tennessee — 1.4% | ||||||||||||
County of Shelby TN | ||||||||||||
| 5.00% | 03/01/21 | 3,500 | 4,294 | |||||||||
Metropolitan Government of Nashville & Davidson | ||||||||||||
| 5.00% | 05/15/25 | 10,000 | 11,812 | (m) | ||||||||
State of Tennessee | ||||||||||||
| 5.00% | 05/01/19 | 1,000 | 1,217 | (m) | ||||||||
| 5.00% | 10/01/30 | 1,500 | 1,835 | |||||||||
Tennessee State School Bond Authority | ||||||||||||
| 5.00% | 05/01/39 | 5,400 | 6,335 | |||||||||
| 25,493 | ||||||||||||
| Texas — 7.2% | ||||||||||||
City of Austin TX Water & Wastewater System Revenue (AMBAC Insured) | ||||||||||||
| 5.50% | 11/15/16 | 5,450 | 6,418 | (n) | ||||||||
| Principal Amount | Fair Value | |||||||||||
City of Dallas TX Waterworks & Sewer System Revenue | ||||||||||||
| 5.00% | 10/01/37 - 10/01/41 | $ | 14,000 | $ | 16,403 | |||||||
City of Houston TX Utility System Revenue | ||||||||||||
| 5.00% | 11/15/33 | 5,470 | 6,301 | |||||||||
City of Houston TX Utility System Revenue (AGMC Insured) | ||||||||||||
| 5.25% | 05/15/22 | 10,000 | 10,608 | (n) | ||||||||
City of Houston TX Utility System Revenue | ||||||||||||
| 5.25% | 11/15/30 - 11/15/31 | 12,000 | 14,285 | |||||||||
City of San Antonio TX Water System Revenue | ||||||||||||
| 5.00% | 05/15/40 | 10,000 | 11,586 | |||||||||
Dallas Fort Worth International Airport | ||||||||||||
| 5.00% | 11/01/34 | 4,750 | 5,334 | |||||||||
North Texas Tollway Authority | ||||||||||||
| 5.00% | 09/01/31 | 3,500 | 4,115 | |||||||||
| 5.75% | 01/01/38 - 01/01/40 | 21,475 | 23,980 | |||||||||
| 6.00% | 01/01/38 | 5,000 | 5,884 | |||||||||
State of Texas | ||||||||||||
| 5.00% | 04/01/42 | 5,000 | 5,754 | |||||||||
University of Texas System | ||||||||||||
| 5.00% | 08/15/24 - 08/15/30 | 14,210 | 17,187 | |||||||||
| 127,855 | ||||||||||||
| Utah — 1.6% | ||||||||||||
County of Utah UT Transportation Sales Tax Revenue (AGMC Insured) | ||||||||||||
| 4.00% | 12/01/37 - 12/01/39 | 16,730 | 17,698 | (n) | ||||||||
Utah State Board of Regents | ||||||||||||
| 5.00% | 11/01/30 | 4,000 | 4,620 | |||||||||
Utah Transit Authority | ||||||||||||
| 5.00% | 06/15/42 | 5,000 | 5,646 | |||||||||
| 27,964 | ||||||||||||
| Vermont — 0.3% | ||||||||||||
Vermont Educational & Health Buildings Financing Agency | ||||||||||||
| 5.00% | 10/31/46 | 5,700 | 6,298 | |||||||||
See Notes to Schedules of Investments and Notes to Financial Statements.
49
Table of Contents
| Elfun Tax-Exempt Income Fund | (in thousands) — December 31, 2012 |
| Principal Amount | Fair Value | |||||||||||
| Virginia — 0.4% | ||||||||||||
Virginia College Building Authority | ||||||||||||
| 4.38% | 02/01/28 | $ | 845 | $ | 932 | |||||||
Virginia Resources Authority | ||||||||||||
| 5.25% | 11/01/38 | 5,000 | 5,877 | |||||||||
| 6,809 | ||||||||||||
| Washington — 0.8% | ||||||||||||
County of King WA | ||||||||||||
| 5.50% | 12/01/13 | 10,000 | 10,478 | (l) | ||||||||
Port of Seattle WA | ||||||||||||
| 5.00% | 08/01/31 | 3,000 | 3,532 | |||||||||
| 14,010 | ||||||||||||
Total Municipal Bonds and Notes |
| 1,773,397 | ||||||||||
Short-Term Investments — 1.1% |
| |||||||||||
| Time Deposit — 1.1% | ||||||||||||
State Street Corp. | ||||||||||||
| 0.01% | 01/02/13 | 18,577 | 18,577 | (e) | ||||||||
(Cost $18,577) | ||||||||||||
Total Investments |
| 1,791,974 | ||||||||||
Liabilities in Excess of Other Assets, |
| (6,798) | ||||||||||
|
| |||||||||||
NET ASSETS — 100.0% |
| $ | 1,785,176 | |||||||||
|
| |||||||||||
See Notes to Schedules of Investments and Notes to Financial Statements.
50
Table of Contents
(Unaudited)

William M. Healey
Senior Vice President and Chief Investment Officer — Core Fixed Income

Mark H. Johnson
Senior Vice President and Chief Investment Officer — Insurance and Long Duration

Vita Marie Pike
Senior Vice President and Chief Investment Officer — Fixed Income Risk Assets
The Elfun Income Fund is managed by a team of portfolio managers that includes William M. Healey, Mark H. Johnson, and Vita Marie Pike. Mr. Healey, Mr. Johnson, and Ms. Pike are each responsible for a portion of the Fund, the size of which is determined by team consensus and adjusted on a periodic basis, if necessary. Although each portfolio manager manages his or her portion of the fund independent of the other team members, the team is highly collaborative and communicative. See portfolio managers’ biographical information beginning on page 106.
| Q. | How did the Elfun Income Fund perform compared to its benchmark for the twelve-month period ended December 31, 2012? |
| A. | For the twelve-month period ended December 31, 2012, the Elfun Income Fund returned 5.94%. The Barclays Capital U.S. Aggregate Bond Index, the Fund’s benchmark, returned 4.22% and the Fund’s Morningstar peer group of 1,225 U.S. Intermediate-Term Funds returned an average of 6.85% over the same period. |
| Q. | Discuss the factors that materially affected the Fund’s performance during the period. |
| A. | After slowing in the second quarter, the U.S. economy bounced back in the third quarter and continued to show signs of improvement in the fourth quarter. The 10-year treasury traded within a 100 basis point yield range between a high of 2.4% in March to a low in July of 1.4% before ending the year at 1.75%, just 13 basis |
| points lower than where it began the year. The slowly improving U.S. economy combined with accommodative policies from the Federal Reserve and European Central Bank (ECB) supported investor appetite for riskier assets in the low rate environment. This resulted in tighter yield spreads from investment grade corporate bonds, commercial mortgage-backed securities (MBS), high yield and emerging market debt. |
The major driver behind the Fund’s performance versus its benchmark in 2012 was very strong security selection in MBS, high grade corporates and emerging market debt. The emphasis on low coupon agency MBS, which were the focus of Federal Reserve buying, outperformed higher coupon MBS. The Fund’s performance benefited from an underweight in high quality financials and an overweight in BBB-rated energy, non-cyclical and auto issuers combined with an overweight in banks and insurance. Another strong positive contributor was the Fund’s non-index exposure to BB and single B-rated high yield, which outperformed the benchmark by nearly 10% due to spread compression of 170 basis points. Tighter spreads in U.S. dollar denominated emerging market debt and commercial MBS also provided excess return for the Fund.
51
Table of Contents
(Unaudited)
| Q. | Were there any significant changes to the Fund during the period? |
| A. | The Fund’s exposure to high yield and emerging market debt which began the year at 8% and 5%, respectively, was reduced in the first quarter to 4% and 3% and remained there throughout the balance of the year. We also pared the overweight in commercial MBS from 4% to 1% versus a 2% benchmark weight in the first quarter. We initiated a 4% overweight position in agency MBS in May, which was brought back to index neutral in August. The allocation to investment grade credit was reduced to a 4% underweight in August and remained there through year end. While tactically traded throughout the year, the Fund’s duration positioning was biased long versus the benchmark during the first three months then kept relatively neutral to the benchmark before reduced to nearly 0.5 years short of the index in October. |
52
Table of Contents
(Unaudited)

Understanding Your Fund’s Expenses
As a shareholder of the Fund you incur ongoing costs. Ongoing costs include portfolio management fees, professional fees, administrative fees and other Fund expenses. The following example is intended to help you understand your ongoing costs (in dollars) of investing in the Fund and to compare these costs with the ongoing costs of investing in other mutual funds.
To illustrate these ongoing costs, we have provided an example and calculated the expenses paid by investors in units of the Fund during the period. The information in the following table is based on an investment of $1,000, which is invested at the beginning of the period and held for the entire six-month period ended December 31, 2012.
Actual Expenses
The first section of the table provides information about actual account values and actual expenses. You may use the information in this section, together with the amount you invested, to estimate the expenses that you paid over the period. To do so, simply divide your account value by $1,000 (for example, an $8,600 account value divided by $1,000 = 8.6), then multiply the result by the number given for your class under the heading “Expenses
Paid During Period,” to estimate the expenses paid on your account during this period.
Hypothetical Example for Comparison Purposes
The second section of the table provides information about hypothetical account values and hypothetical expenses based on the Fund’s actual expense ratio and an assumed rate of return of 5% per year before expenses, which is not the Fund’s actual return. The hypothetical account values and expenses may not be used to estimate the actual ending account balance or expenses you paid for the period. You may use this information to compare the ongoing costs of investing in the Fund and other funds. To do so, compare this 5% hypothetical example with the 5% hypothetical examples that appear in the shareholders reports of other funds.
Please note that the expenses shown in the table are meant to highlight and help you compare ongoing costs only and do not reflect any transaction costs, such as sales charges or redemption fees, if any. Therefore, the second section of the table is useful in comparing ongoing costs only, and will not help you determine the relative total costs of owning different funds.
July 1, 2012 — December 31, 2012
| Account value at the beginning of the period ($) | Account value at the end of the period ($) | Expenses paid during the period ($)* | ||||||||||
Actual Fund Return | 1,000.00 | 1,022.50 | 1.02 | |||||||||
Hypothetical 5% Return | 1,000.00 | 1,024.13 | 1.02 | |||||||||
| * | Expenses are equal to the Fund’s annualized expense ratio of 0.20% (for the period July 1, 2012 - December 31, 2012), multiplied by the average account value over the period, multiplied by 184/366 (to reflect the one-half year period). |
53
Table of Contents
(Unaudited)
Investment Profile
A mutual fund designed for investors who seek a high level of income consistent with prudent investment management and the preservation of capital. The Fund seeks to achieve its investment objective by investing at least 80% of its net assets under normal circumstances in debt securities. The Fund invests primarily in a variety of investment-grade debt securities, such as mortgage-backed securities, corporate bonds, U.S. Government securities and money market instruments.
Quality Ratings
as of December 31, 2012 as a % of Fair Value(b)(c)
Moody’s / S&P Rating * | | Percentage of Fair Value | | |
Aaa / AAA | 24.50% | |||
Aa / AA | 51.13% | |||
A / A | 6.93% | |||
Baa / BBB | 12.79% | |||
Ba / BB and lower | 4.45% | |||
NR / Other | 0.20% | |||
| 100.00% |
| * | Moody’s Investors Services Inc and Standard & Poor’s are nationally recognized statistical rating organizations. |
Sector Allocation
as a % of Fair Value of $424,854 (in thousands) as of December 31, 2012(b)(c)
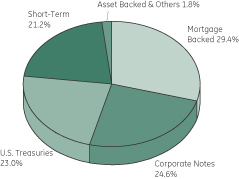
Morningstar Performance Comparison
Based on average annual returns for periods ended 12/31/12
| One Year | Five Year | Ten Year | ||||||||||
Number of funds in peer group | 1,225 | 1,064 | 961 | |||||||||
Peer group average annual total return | 6.85% | 5.57% | 4.73% | |||||||||
Morningstar category in peer group: Intermediate-Term Bond |
| |||||||||||
Change in Value of a $10,000 Investment(a)
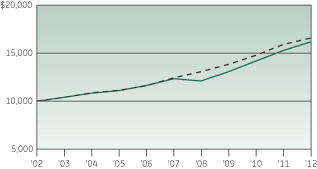

Average Annual Total Return
for the periods ended December 31, 2012
| (Inception date: 12/31/84) | ||||||||||||||||
| One Year | Five Year | Ten Year | Ending value of a $10,000 investment (a) | |||||||||||||
Elfun Income Fund | 5.94% | 5.56% | 4.93% | $ | 16,177 | |||||||||||
Barclays U.S. Aggregate | 4.22% | 5.94% | 5.18% | $ | 16,575 | |||||||||||
| (a) | Ending value of a $10,000 investment for the ten-year period or since inception, whichever is less. |
| (b) | The securities information regarding holdings, allocations and other characteristics is presented to illustrate examples of securities that the Fund has bought and the diversity of areas in which the Fund may invest as of a particular date. It may not be representative of the Fund’s current or future investments and should not be construed as a recommendation to purchase or sell a particular security. |
| (c) | Fair Value basis is inclusive of short-term investment in GE Institutional Money Market Fund Investment Class. |
See Notes to Performance on page 1 for further information, including an explanation of Morningstar peer categories.
Past performance does not predict future performance. The performance shown on the graph and tables does not reflect the deduction of taxes that a shareholder would pay on Fund distributions or the redemption of Fund shares.
54
Table of Contents
| Elfun Income Fund | (in thousands) — December 31, 2012 |
| Principal Amount | Fair Value | |||||||||||
Bonds and Notes — 91.9%† | ||||||||||||
| U.S. Treasuries — 26.8% | ||||||||||||
U.S. Treasury Bonds | ||||||||||||
| 3.00% | 05/15/42 | $ | 11,399 | $ | 11,613 | (h) | ||||||
| 3.13% | 02/15/42 | 3,598 | 3,762 | |||||||||
U.S. Treasury Notes | ||||||||||||
| 0.23% | 07/31/14 | 8,400 | 8,386 | (d,h) | ||||||||
| 0.24% | 09/30/14 - 10/31/14 | 25,284 | 25,289 | (d) | ||||||||
| 0.55% | 01/31/17 - 02/28/17 | 22,825 | 23,124 | (d,h) | ||||||||
| 0.66% | 09/30/17 | 23,464 | 23,422 | (d,h) | ||||||||
| 1.63% | 08/15/22 | 1,984 | 1,971 | |||||||||
| 3.13% | 05/15/19 | 2 | 2 | |||||||||
| 97,569 | ||||||||||||
| Agency Mortgage Backed — 30.5% | ||||||||||||
Federal Home Loan Mortgage Corp. | ||||||||||||
| 2.38% | 01/13/22 | 2,091 | 2,184 | |||||||||
| 4.50% | 06/01/33 - 02/01/35 | 62 | 66 | (h) | ||||||||
| 5.00% | 07/01/35 - 06/01/41 | 2,167 | 2,426 | (h) | ||||||||
| 5.50% | 05/01/20 - 04/01/39 | 988 | 1,095 | (h) | ||||||||
| 6.00% | 04/01/17 - 11/01/37 | 1,817 | 2,009 | (h) | ||||||||
| 6.50% | 07/01/29 | 2 | 3 | (h) | ||||||||
| 7.00% | 10/01/16 - 08/01/36 | 218 | 256 | (h) | ||||||||
| 7.50% | 11/01/29 - 09/01/33 | 20 | 24 | (h) | ||||||||
| 8.00% | 11/01/30 | 11 | 13 | (h) | ||||||||
Federal National Mortgage Assoc. | ||||||||||||
| 2.72% | 04/01/37 | 3 | 3 | (i) | ||||||||
| 4.00% | 05/01/19 - 03/01/41 | 3,935 | 4,223 | (h) | ||||||||
| 4.50% | 05/01/18 - 04/01/41 | 15,421 | 16,695 | (h) | ||||||||
| 5.00% | 07/01/20 - 06/01/41 | 4,038 | 4,526 | (h) | ||||||||
| 5.50% | 03/01/14 - 01/01/39 | 4,917 | 5,391 | (h) | ||||||||
| 6.00% | 02/01/14 - 08/01/35 | 3,123 | 3,506 | (h) | ||||||||
| 6.50% | 06/01/14 - 08/01/36 | 502 | 571 | (h) | ||||||||
| 7.00% | 10/01/16 - 02/01/34 | 56 | 63 | (h) | ||||||||
| 7.50% | 02/01/15 - 03/01/34 | 229 | 274 | (h) | ||||||||
| 8.00% | 11/01/14 - 11/01/33 | 109 | 132 | (h) | ||||||||
| 8.50% | 04/01/30 - 05/01/31 | 16 | 21 | (h) | ||||||||
| 9.00% | 12/01/17 - 12/01/22 | 26 | 29 | (h) | ||||||||
| 3.00% | TBA | 9,295 | 9,739 | (c) | ||||||||
| 3.50% | TBA | 12,420 | 13,236 | (c) | ||||||||
| Principal Amount | Fair Value | |||||||||||
| 4.00% | TBA | $ | 5,365 | $ | 5,751 | (c) | ||||||
| 4.50% | TBA | 805 | 870 | (c) | ||||||||
| 5.00% | TBA | 2,664 | 2,883 | (c) | ||||||||
| 6.00% | TBA | 5,492 | 5,998 | (c) | ||||||||
| 6.50% | TBA | 878 | 977 | (c) | ||||||||
Government National Mortgage Assoc. | ||||||||||||
| 4.50% | 08/15/33 - 03/20/41 | 3,649 | 4,018 | (h) | ||||||||
| 5.00% | 08/15/33 | 143 | 156 | (h) | ||||||||
| 6.00% | 04/15/27 - 09/15/36 | 621 | 704 | (h) | ||||||||
| 6.50% | 04/15/19 - 09/15/36 | 431 | 499 | (h) | ||||||||
| 7.00% | 11/15/27 - 10/15/36 | 175 | 207 | (h) | ||||||||
| 7.50% | 03/15/23 - 10/15/33 | 67 | 74 | (h) | ||||||||
| 8.00% | 09/15/27 | 36 | 39 | (h) | ||||||||
| 8.50% | 10/15/17 | 24 | 25 | (h) | ||||||||
| 9.00% | 11/15/16 - 12/15/21 | 53 | 58 | (h) | ||||||||
| 3.00% | TBA | 2,975 | 3,162 | (c) | ||||||||
| 3.50% | TBA | 8,380 | 9,105 | (c) | ||||||||
| 4.00% | TBA | 5,580 | 6,098 | (c) | ||||||||
| 5.00% | TBA | 3,267 | 3,564 | (c) | ||||||||
| 5.50% | TBA | 435 | 477 | (c) | ||||||||
| 111,150 | ||||||||||||
| Agency Collateralized Mortgage Obligations — 0.8% | ||||||||||||
Collateralized Mortgage Obligation Trust | ||||||||||||
| 0.70% | 11/01/18 | 7 | 6 | (d,f) | ||||||||
Federal Home Loan Mortgage Corp. | ||||||||||||
| 0.08% | 09/25/43 | 2,013 | 16 | (g,h) | ||||||||
Federal Home Loan Mortgage Corp. REMIC | ||||||||||||
| 3.50% | 11/15/24 - 11/15/30 | 2,251 | 164 | (g,q) | ||||||||
| 4.50% | 02/15/18 - 03/15/18 | 160 | 9 | (g,h,q) | ||||||||
| 5.00% | 05/15/17 - 02/15/38 | 274 | 15 | (g,h,q) | ||||||||
| 5.50% | 06/15/33 | 186 | 24 | (g,h,q) | ||||||||
| 6.39% | 08/15/25 | 965 | 124 | (g,i) | ||||||||
| 8.00% | 04/15/20 | 4 | 4 | (h) | ||||||||
Federal Home Loan Mortgage Corp. STRIPS | ||||||||||||
| 4.23% | 08/01/27 | 3 | 2 | (d,f,h) | ||||||||
| 8.00% | 02/01/23 - 07/01/24 | 10 | 2 | (g,h,q) | ||||||||
See Notes to Schedules of Investments and Notes to Financial Statements.
55
Table of Contents
| Elfun Income Fund | (in thousands) — December 31, 2012 |
| Principal Amount | Fair Value | |||||||||||
Federal National Mortgage Assoc. REMIC | ||||||||||||
| 1.21% | 12/25/42 | $ | 473 | $ | 15 | (g,h) | ||||||
| 2.71% | 12/25/22 | 7 | 6 | (d,f,h) | ||||||||
| 4.50% | 05/25/18 | 3 | — | ** | (g,h,q) | |||||||
| 5.00% | 08/25/17 - 09/25/40 | 1,757 | 192 | (g,h,q) | ||||||||
| 5.79% | 07/25/38 | 426 | 46 | (g,i) | ||||||||
| 5.84% | 11/25/40 | 1,920 | 353 | (g,i) | ||||||||
| 6.29% | 01/25/42 | 1,268 | 262 | (g,i) | ||||||||
Federal National Mortgage Assoc. STRIPS | ||||||||||||
| 1.68% | 12/01/34 | 235 | 223 | (d,f,h) | ||||||||
| 4.50% | 08/01/35 - 01/01/36 | 496 | 56 | (g,h,q) | ||||||||
| 5.00% | 03/25/38 - 05/25/38 | 297 | 36 | (g,q) | ||||||||
| 5.50% | 12/01/33 | 62 | 8 | (g,q) | ||||||||
| 6.00% | 01/01/35 | 210 | 34 | (g,h,q) | ||||||||
| 7.50% | 11/01/23 | 31 | 6 | (g,h,q) | ||||||||
| 8.00% | 08/01/23 - 07/01/24 | 20 | 4 | (g,h,q) | ||||||||
| 8.50% | 03/01/17 - 07/25/22 | 18 | 3 | (g,h,q) | ||||||||
| 9.00% | 05/25/22 | 7 | 1 | (g,h,q) | ||||||||
Government National Mortgage Assoc. | ||||||||||||
| 4.50% | 10/20/37 - 08/16/39 | 2,624 | 282 | (g,q) | ||||||||
| 5.00% | 12/20/35 - 09/20/38 | 2,254 | 201 | (g,q) | ||||||||
| 5.94% | 05/20/40 | 1,199 | 193 | (g,i) | ||||||||
| 5.96% | 05/20/40 | 2,121 | 385 | (g,i) | ||||||||
| 6.39% | 12/20/39 | 2,148 | 352 | (g,i) | ||||||||
| 3,024 | ||||||||||||
| Asset Backed — 0.3% | ||||||||||||
Capital One Multi-Asset Execution Trust | ||||||||||||
| 0.83% | 01/15/19 | 500 | 495 | (d,h,i) | ||||||||
Chase Funding Mortgage Loan Asset-Backed Certificates | ||||||||||||
| 3.99% | 11/25/33 | 477 | 461 | (h) | ||||||||
Popular ABS Mortgage Pass- Through Trust 2005-5 | ||||||||||||
| 5.30% | 11/25/35 | 350 | 227 | |||||||||
| 1,183 | ||||||||||||
| Corporate Notes — 28.7% | ||||||||||||
ABB Finance USA Inc. | ||||||||||||
| 1.63% | 05/08/17 | 367 | 372 | |||||||||
| Principal Amount | Fair Value | |||||||||||
AbbVie Inc. | ||||||||||||
| 1.20% | 11/06/15 | $ | 556 | $ | 560 | (b) | ||||||
| 1.75% | 11/06/17 | 372 | 376 | (b) | ||||||||
| 2.00% | 11/06/18 | 369 | 374 | (b) | ||||||||
| 4.40% | 11/06/42 | 186 | 198 | (b) | ||||||||
AES Corp. | ||||||||||||
| 8.00% | 10/15/17 | 401 | 463 | |||||||||
AES Panama S.A. | ||||||||||||
| 6.35% | 12/21/16 | 219 | 240 | (b) | ||||||||
Aetna Inc. | ||||||||||||
| 1.50% | 11/15/17 | 302 | 303 | |||||||||
| 2.75% | 11/15/22 | 371 | 368 | |||||||||
Agilent Technologies Inc. | ||||||||||||
| 3.20% | 10/01/22 | 179 | 181 | |||||||||
| 5.50% | 09/14/15 | 347 | 387 | (h) | ||||||||
ALROSA Finance S.A. | ||||||||||||
| 7.75% | 11/03/20 | 200 | 232 | (b,h) | ||||||||
Altria Group Inc. | ||||||||||||
| 4.25% | 08/09/42 | 279 | 271 | |||||||||
Amazon.com Inc. | ||||||||||||
| 1.20% | 11/29/17 | 370 | 368 | |||||||||
| 2.50% | 11/29/22 | 370 | 365 | |||||||||
America Movil SAB de C.V. | ||||||||||||
| 2.38% | 09/08/16 | 948 | 985 | |||||||||
American Axle & Manufacturing Inc. | ||||||||||||
| 7.88% | 03/01/17 | 367 | 380 | |||||||||
American Express Centurion Bank | ||||||||||||
| 0.90% | 11/13/15 | 372 | 372 | (d) | ||||||||
American Express Credit Corp. | ||||||||||||
| 1.75% | 06/12/15 | 256 | 261 | |||||||||
American International Group Inc. | ||||||||||||
| 4.88% | 06/01/22 | 556 | 635 | |||||||||
Amgen Inc. | ||||||||||||
| 5.38% | 05/15/43 | 343 | 404 | |||||||||
| 5.65% | 06/15/42 | 188 | 226 | (h) | ||||||||
Amsted Industries Inc. | ||||||||||||
| 8.13% | 03/15/18 | 239 | 256 | (b,h) | ||||||||
Anadarko Petroleum Corp. | ||||||||||||
| 6.20% | 03/15/40 | 186 | 229 | |||||||||
Anheuser-Busch InBev Worldwide Inc. | ||||||||||||
| 2.50% | 07/15/22 | 374 | 376 | |||||||||
| 5.38% | 11/15/14 | 228 | 247 | (h) | ||||||||
See Notes to Schedules of Investments and Notes to Financial Statements.
56
Table of Contents
| Elfun Income Fund | (in thousands) — December 31, 2012 |
| Principal Amount | Fair Value | |||||||||||
Archer-Daniels-Midland Co. | ||||||||||||
| 4.02% | 04/16/43 | $ | 234 | $ | 224 | (b) | ||||||
Arizona Public Service Co. | ||||||||||||
| 6.25% | 08/01/16 | 358 | 420 | (h) | ||||||||
AstraZeneca PLC | ||||||||||||
| 4.00% | 09/18/42 | 226 | 229 | |||||||||
AT&T Inc. | ||||||||||||
| 0.65% | 02/13/15 | 377 | 379 | (d) | ||||||||
| 2.95% | 05/15/16 | 319 | 338 | (h) | ||||||||
| 4.35% | 06/15/45 | 669 | 672 | (b) | ||||||||
| 5.55% | 08/15/41 | 400 | 480 | |||||||||
Autodesk Inc. | ||||||||||||
| 1.95% | 12/15/17 | 375 | 373 | |||||||||
Banco del Estado de Chile | ||||||||||||
| 3.88% | 02/08/22 | 150 | 159 | (b) | ||||||||
Banco do Nordeste do Brasil S.A. | ||||||||||||
| 3.63% | 11/09/15 | 200 | 207 | (b) | ||||||||
Banco Mercantil del Norte S.A. | ||||||||||||
| 6.86% | 10/13/21 | 100 | 108 | (b) | ||||||||
Bank of America Corp. | ||||||||||||
| 5.42% | 03/15/17 | 400 | 438 | |||||||||
| 5.70% | 01/24/22 | 558 | 671 | |||||||||
| 5.75% | 12/01/17 | 570 | 664 | |||||||||
Barclays Bank PLC | ||||||||||||
| 2.25% | 05/10/17 | 986 | 1,017 | (b) | ||||||||
| 7.63% | 11/21/22 | 371 | 371 | |||||||||
Berkshire Hathaway Finance Corp. | ||||||||||||
| 1.60% | 05/15/17 | 396 | 404 | (h) | ||||||||
| 3.00% | 05/15/22 | 454 | 473 | (h) | ||||||||
Bombardier Inc. | ||||||||||||
| 5.75% | 03/15/22 | 43 | 44 | (b) | ||||||||
| 7.75% | 03/15/20 | 299 | 339 | (b,h) | ||||||||
BP Capital Markets PLC | ||||||||||||
| 1.38% | 11/06/17 | 371 | 371 | |||||||||
| 1.85% | 05/05/17 | 277 | 283 | |||||||||
| 2.25% | 11/01/16 | 604 | 628 | |||||||||
| 2.50% | 11/06/22 | 371 | 368 | |||||||||
Calpine Corp. | ||||||||||||
| 7.25% | 10/15/17 | 430 | 458 | (b,h) | ||||||||
Cargill Inc. | ||||||||||||
| 5.20% | 01/22/13 | 131 | 131 | (b,h) | ||||||||
| 6.00% | 11/27/17 | 247 | 297 | (b,h) | ||||||||
Case New Holland Inc. | ||||||||||||
| 7.88% | 12/01/17 | 214 | 253 | (h) | ||||||||
| Principal Amount | Fair Value | |||||||||||
Caterpillar Financial Services Corp. | ||||||||||||
| 1.25% | 11/06/17 | $ | 259 | $ | 259 | |||||||
Caterpillar Inc. | ||||||||||||
| 1.50% | 06/26/17 | 450 | 456 | |||||||||
Catholic Health Initiatives | ||||||||||||
| 1.60% | 11/01/17 | 74 | 75 | |||||||||
| 2.95% | 11/01/22 | 296 | 299 | |||||||||
| 4.35% | 11/01/42 | 130 | 133 | |||||||||
CCO Holdings LLC | ||||||||||||
| 8.13% | 04/30/20 | 373 | 418 | |||||||||
Central American Bank for Economic Integration | ||||||||||||
| 5.38% | 09/24/14 | 380 | 405 | (b,h) | ||||||||
CenturyLink Inc. | ||||||||||||
| 5.80% | 03/15/22 | 93 | 98 | |||||||||
| 7.65% | 03/15/42 | 134 | 140 | |||||||||
Cigna Corp. | ||||||||||||
| 2.75% | 11/15/16 | 372 | 391 | |||||||||
| 4.00% | 02/15/22 | 153 | 167 | |||||||||
| 5.38% | 02/15/42 | 350 | 407 | |||||||||
Cincinnati Bell Inc. | ||||||||||||
| 8.25% | 10/15/17 | 398 | 429 | |||||||||
Citigroup Inc. | ||||||||||||
| 4.45% | 01/10/17 | 299 | 331 | (h) | ||||||||
| 5.00% | 09/15/14 | 666 | 701 | (h) | ||||||||
| 5.88% | 01/30/42 | 517 | 638 | (h) | ||||||||
| 6.13% | 08/25/36 | 449 | 489 | (h) | ||||||||
CityCenter Holdings LLC | ||||||||||||
| 7.63% | 01/15/16 | 215 | 230 | |||||||||
CNA Financial Corp. | ||||||||||||
| 5.88% | 08/15/20 | 326 | 385 | |||||||||
CNPC HK Overseas Capital Ltd. | ||||||||||||
| 4.50% | 04/28/21 | 200 | 224 | (b) | ||||||||
Columbus International Inc. | ||||||||||||
| 11.50% | 11/20/14 | 100 | 111 | (b) | ||||||||
Corp Andina de Fomento | ||||||||||||
| 4.38% | 06/15/22 | 372 | 403 | |||||||||
Corp Nacional del Cobre de Chile | ||||||||||||
| 4.25% | 07/17/42 | 222 | 226 | (b) | ||||||||
| 5.63% | 09/21/35 | 76 | 92 | (b) | ||||||||
Covidien International Finance S.A. | ||||||||||||
| 1.35% | 05/29/15 | 296 | 300 | |||||||||
See Notes to Schedules of Investments and Notes to Financial Statements.
57
Table of Contents
| Elfun Income Fund | (in thousands) — December 31, 2012 |
| Principal Amount | Fair Value | |||||||||||
COX Communications Inc. | ||||||||||||
| 3.25% | 12/15/22 | $ | 139 | $ | 143 | (b) | ||||||
| 4.70% | 12/15/42 | 92 | 94 | (b) | ||||||||
Credit Suisse AG | ||||||||||||
| 2.60% | 05/27/16 | 405 | 427 | (b) | ||||||||
Crown Castle Towers LLC | ||||||||||||
| 6.11% | 01/15/40 | 189 | 228 | (b) | ||||||||
CSX Corp. | ||||||||||||
| 4.10% | 03/15/44 | 241 | 238 | |||||||||
| 4.25% | 06/01/21 | 389 | 437 | |||||||||
CVS Caremark Corp. | ||||||||||||
| 3.25% | 05/18/15 | 207 | 219 | |||||||||
DaVita HealthCare Partners Inc. | ||||||||||||
| 5.75% | 08/15/22 | 138 | 145 | |||||||||
| 6.38% | 11/01/18 | 358 | 384 | (h) | ||||||||
DCP Midstream Operating LP | ||||||||||||
| 2.50% | 12/01/17 | 370 | 368 | |||||||||
DDR Corp. (REIT) | ||||||||||||
| 4.63% | 07/15/22 | 262 | 286 | |||||||||
Deere & Co. | ||||||||||||
| 3.90% | 06/09/42 | 197 | 201 | |||||||||
Denbury Resources Inc. | ||||||||||||
| 6.38% | 08/15/21 | 304 | 334 | (h) | ||||||||
| 8.25% | 02/15/20 | 231 | 260 | (h) | ||||||||
DENTSPLY International Inc. | ||||||||||||
| 2.75% | 08/15/16 | 295 | 306 | (h) | ||||||||
| 4.13% | 08/15/21 | 404 | 429 | |||||||||
Devon Energy Corp. | ||||||||||||
| 3.25% | 05/15/22 | 555 | 579 | |||||||||
Diageo Capital PLC | ||||||||||||
| 1.50% | 05/11/17 | 527 | 534 | |||||||||
Diageo Investment Corp. | ||||||||||||
| 2.88% | 05/11/22 | 556 | 574 | |||||||||
DIRECTV Holdings LLC | ||||||||||||
| 4.75% | 10/01/14 | 392 | 419 | |||||||||
| 5.15% | 03/15/42 | 469 | 474 | |||||||||
Dominion Resources Inc. | ||||||||||||
| 1.95% | 08/15/16 | 283 | 291 | |||||||||
DPL Inc. | ||||||||||||
| 7.25% | 10/15/21 | 58 | 62 | |||||||||
DR Horton Inc. | ||||||||||||
| 4.38% | 09/15/22 | 281 | 287 | |||||||||
| Principal Amount | Fair Value | |||||||||||
Duke Energy Corp. | ||||||||||||
| 1.63% | 08/15/17 | $ | 371 | $ | 372 | |||||||
| 3.05% | 08/15/22 | 1,116 | 1,136 | |||||||||
Eastman Chemical Co. | ||||||||||||
| 2.40% | 06/01/17 | 959 | 991 | |||||||||
eBay Inc. | ||||||||||||
| 1.35% | 07/15/17 | 260 | 263 | |||||||||
| 2.60% | 07/15/22 | 185 | 187 | |||||||||
| 4.00% | 07/15/42 | 222 | 216 | |||||||||
Ecopetrol S.A. | ||||||||||||
| 7.63% | 07/23/19 | 145 | 187 | |||||||||
Empresa de Energia de Bogota S.A. | ||||||||||||
| 6.13% | 11/10/21 | 71 | 80 | (b) | ||||||||
Empresa Nacional del Petroleo | ||||||||||||
| 4.75% | 12/06/21 | 100 | 107 | (b) | ||||||||
Energy Transfer Equity LP | ||||||||||||
| 7.50% | 10/15/20 | 269 | 311 | |||||||||
Energy Transfer Partners LP | ||||||||||||
| 6.50% | 02/01/42 | 344 | 421 | |||||||||
| 6.70% | 07/01/18 | 282 | 340 | |||||||||
Enterprise Products Operating LLC | ||||||||||||
| 4.45% | 02/15/43 | 186 | 188 | |||||||||
European Investment Bank | ||||||||||||
| 0.41% | 12/15/14 | 600 | 605 | (d) | ||||||||
| 4.88% | 01/17/17 | 850 | 987 | (h) | ||||||||
Exelon Corp. | ||||||||||||
| 4.90% | 06/15/15 | 505 | 550 | |||||||||
Export Credit Bank of Turkey | ||||||||||||
| 5.38% | 11/04/16 | 225 | 245 | (b) | ||||||||
Express Scripts Holding Co. | ||||||||||||
| 2.65% | 02/15/17 | 904 | 940 | (b,h) | ||||||||
| 3.13% | 05/15/16 | 596 | 628 | |||||||||
| 3.90% | 02/15/22 | 178 | 192 | (b,h) | ||||||||
| 4.75% | 11/15/21 | 199 | 226 | (b,h) | ||||||||
Florida Power & Light Co. | ||||||||||||
| 4.13% | 02/01/42 | 362 | 378 | |||||||||
Ford Motor Credit Company LLC | ||||||||||||
| 3.00% | 06/12/17 | 829 | 852 | |||||||||
Forest Oil Corp. | ||||||||||||
| 7.25% | 06/15/19 | 358 | 360 | |||||||||
Fresenius Medical Care US Finance Inc. | ||||||||||||
| 5.75% | 02/15/21 | 173 | 185 | (b) | ||||||||
See Notes to Schedules of Investments and Notes to Financial Statements.
58
Table of Contents
| Elfun Income Fund | (in thousands) — December 31, 2012 |
| Principal Amount | Fair Value | |||||||||||
Frontier Communications Corp. | ||||||||||||
| 7.13% | 03/15/19 | $ | 354 | $ | 385 | |||||||
Gazprom Neft OAO Via GPN Capital S.A. | ||||||||||||
| 4.38% | 09/19/22 | 200 | 205 | (b) | ||||||||
Georgia Power Co. | ||||||||||||
| 4.30% | 03/15/42 | 198 | 208 | |||||||||
Globo Comunicacao e Participacoes S.A. | ||||||||||||
| 6.25% | 12/31/49 | 100 | 108 | (b,h,j) | ||||||||
Goldman Sachs Capital I | ||||||||||||
| 6.35% | 02/15/34 | 205 | 213 | |||||||||
Great Plains Energy Inc. | ||||||||||||
| 4.85% | 06/01/21 | 403 | 444 | (h) | ||||||||
Hanesbrands Inc. | ||||||||||||
| 6.38% | 12/15/20 | 196 | 216 | (h) | ||||||||
HCA Inc. | ||||||||||||
| 6.50% | 02/15/20 | 309 | 348 | (h) | ||||||||
Heineken N.V. | ||||||||||||
| 0.73% | 10/01/15 | 261 | 261 | (b,d) | ||||||||
| 1.40% | 10/01/17 | 373 | 372 | (b) | ||||||||
Hewlett-Packard Co. | ||||||||||||
| 2.60% | 09/15/17 | 402 | 392 | |||||||||
| 6.00% | 09/15/41 | 111 | 110 | |||||||||
Host Hotels & Resorts LP (REIT) | ||||||||||||
| 4.75% | 03/01/23 | 173 | 183 | |||||||||
| 6.00% | 11/01/20 | 464 | 510 | (h) | ||||||||
HSBC USA Inc. | ||||||||||||
| 1.63% | 01/16/18 | 604 | 605 | |||||||||
Hughes Satellite Systems Corp. | ||||||||||||
| 6.50% | 06/15/19 | 356 | 392 | |||||||||
Hyundai Capital America | ||||||||||||
| 1.63% | 10/02/15 | 371 | 373 | (b) | ||||||||
| 2.13% | 10/02/17 | 189 | 190 | (b) | ||||||||
Ingles Markets Inc. | ||||||||||||
| 8.88% | 05/15/17 | 400 | 426 | (h) | ||||||||
Instituto Costarricense de Electricidad | ||||||||||||
| 6.95% | 11/10/21 | 200 | 227 | (b,h) | ||||||||
Intel Corp. | ||||||||||||
| 1.35% | 12/15/17 | 369 | 369 | |||||||||
| 2.70% | 12/15/22 | 369 | 368 | |||||||||
| 4.25% | 12/15/42 | 185 | 185 | |||||||||
| Principal Amount | Fair Value | |||||||||||
Invesco Finance PLC | ||||||||||||
| 3.13% | 11/30/22 | $ | 558 | $ | 564 | |||||||
Jabil Circuit Inc. | ||||||||||||
| 4.70% | 09/15/22 | 174 | 183 | |||||||||
John Deere Capital Corp. | ||||||||||||
| 3.15% | 10/15/21 | 308 | 325 | |||||||||
JPMorgan Chase & Co. | ||||||||||||
| 3.25% | 09/23/22 | 185 | 191 | |||||||||
| 4.35% | 08/15/21 | 393 | 439 | |||||||||
| 4.50% | 01/24/22 | 294 | 333 | |||||||||
Kazakhstan Temir Zholy Finance BV | ||||||||||||
| 6.38% | 10/06/20 | 200 | 242 | (b) | ||||||||
KazMunayGas National Company JSC | ||||||||||||
| 9.13% | 07/02/18 | 100 | 132 | (b) | ||||||||
| 11.75% | 01/23/15 | 100 | 119 | (b,h) | ||||||||
KFW | ||||||||||||
| 2.00% | 10/04/22 | 929 | 931 | |||||||||
| 4.50% | 07/16/18 | 238 | 281 | (h) | ||||||||
Kinder Morgan Energy Partners LP | ||||||||||||
| 5.00% | 08/15/42 | 186 | 197 | |||||||||
Kinross Gold Corp. | ||||||||||||
| 6.88% | 09/01/41 | 252 | 256 | |||||||||
Korea National Oil Corp. | ||||||||||||
| 2.88% | 11/09/15 | 278 | 290 | (b) | ||||||||
| 3.13% | 04/03/17 | 396 | 415 | (b) | ||||||||
Kraft Foods Group Inc. | ||||||||||||
| 1.63% | 06/04/15 | 248 | 252 | (b) | ||||||||
| 2.25% | 06/05/17 | 394 | 408 | (b) | ||||||||
| 5.00% | 06/04/42 | 335 | 377 | (b) | ||||||||
Levi Strauss & Co. | ||||||||||||
| 7.63% | 05/15/20 | 361 | 393 | (h) | ||||||||
Liberty Mutual Group Inc. | ||||||||||||
| 6.50% | 05/01/42 | 190 | 214 | (b) | ||||||||
Lincoln National Corp. | ||||||||||||
| 4.20% | 03/15/22 | 134 | 144 | |||||||||
Linn Energy LLC | ||||||||||||
| 6.25% | 11/01/19 | 43 | 43 | (b) | ||||||||
| 8.63% | 04/15/20 | 295 | 322 | (h) | ||||||||
LyondellBasell Industries N.V. | ||||||||||||
| 5.00% | 04/15/19 | 200 | 221 | |||||||||
Majapahit Holding BV | ||||||||||||
| 7.75% | 10/17/16 | 100 | 118 | (b) | ||||||||
See Notes to Schedules of Investments and Notes to Financial Statements.
59
Table of Contents
| Elfun Income Fund | (in thousands) — December 31, 2012 |
| Principal Amount | Fair Value | |||||||||||
McDonald's Corp. | ||||||||||||
| 1.88% | 05/29/19 | $ | 395 | $ | 402 | (h) | ||||||
Memorial Sloan-Kettering Cancer Center | ||||||||||||
| 4.13% | 07/01/52 | 165 | 163 | |||||||||
Merck & Company Inc. | ||||||||||||
| 2.40% | 09/15/22 | 372 | 372 | |||||||||
MidAmerican Energy Holdings Co. | ||||||||||||
| 6.13% | 04/01/36 | 330 | 417 | (h) | ||||||||
Morgan Stanley | ||||||||||||
| 4.75% | 03/22/17 | 271 | 296 | |||||||||
| 4.88% | 11/01/22 | 556 | 576 | |||||||||
| 5.50% | 07/28/21 | 377 | 428 | |||||||||
| 5.75% | 01/25/21 | 201 | 230 | |||||||||
| 6.63% | 04/01/18 | 415 | 489 | |||||||||
Murphy Oil Corp. | ||||||||||||
| 2.50% | 12/01/17 | 555 | 558 | |||||||||
| 3.70% | 12/01/22 | 370 | 369 | |||||||||
Mylan Inc. | ||||||||||||
| 7.88% | 07/15/20 | 436 | 515 | (b,h) | ||||||||
National Agricultural Cooperative Federation | ||||||||||||
| 4.25% | 01/28/16 | 231 | 247 | (b,h) | ||||||||
National JSC Naftogaz of Ukraine | ||||||||||||
| 9.50% | 09/30/14 | 200 | 205 | |||||||||
Newfield Exploration Co. | ||||||||||||
| 5.63% | 07/01/24 | 330 | 356 | |||||||||
| 5.75% | 01/30/22 | 358 | 394 | (h) | ||||||||
NewMarket Corp. | ||||||||||||
| 4.10% | 12/15/22 | 201 | 205 | (b) | ||||||||
News America Inc. | ||||||||||||
| 6.65% | 11/15/37 | 206 | 266 | (h) | ||||||||
Nexen Inc. | ||||||||||||
| 6.40% | 05/15/37 | 370 | 478 | |||||||||
NextEra Energy Capital Holdings Inc. | ||||||||||||
| 2.60% | 09/01/15 | 711 | 741 | |||||||||
Nisource Finance Corp. | ||||||||||||
| 3.85% | 02/15/23 | 450 | 462 | |||||||||
Novartis Capital Corp. | ||||||||||||
| 2.40% | 09/21/22 | 446 | 447 | |||||||||
NYSE Euronext | ||||||||||||
| 2.00% | 10/05/17 | 560 | 569 | |||||||||
| Principal Amount | Fair Value | |||||||||||
Odebrecht Drilling Norbe VIII/IX Ltd. | ||||||||||||
| 6.35% | 06/30/21 | $ | 190 | $ | 213 | (b) | ||||||
Oglethorpe Power Corp. | ||||||||||||
| 5.38% | 11/01/40 | 200 | 234 | |||||||||
Omnicom Group Inc. | ||||||||||||
| 3.63% | 05/01/22 | 521 | 543 | (h) | ||||||||
ONEOK Partners LP | ||||||||||||
| 3.38% | 10/01/22 | 99 | 101 | |||||||||
| 6.13% | 02/01/41 | 226 | 271 | |||||||||
Oracle Corp. | ||||||||||||
| 1.20% | 10/15/17 | 927 | 930 | |||||||||
Pacific Gas & Electric Co. | ||||||||||||
| 6.05% | 03/01/34 | 369 | 475 | (h) | ||||||||
PacifiCorp | ||||||||||||
| 6.25% | 10/15/37 | 14 | 19 | |||||||||
PAETEC Holding Corp. | ||||||||||||
| 8.88% | 06/30/17 | 594 | 637 | (h) | ||||||||
Peabody Energy Corp. | ||||||||||||
| 6.25% | 11/15/21 | 213 | 226 | |||||||||
PepsiCo Inc. | ||||||||||||
| 2.75% | 03/05/22 | 532 | 547 | (h) | ||||||||
Petrobras International Finance Co. | ||||||||||||
| 2.88% | 02/06/15 | 159 | 163 | (h) | ||||||||
| 3.50% | 02/06/17 | 495 | 519 | (h) | ||||||||
| 3.88% | 01/27/16 | 159 | 168 | (h) | ||||||||
Petroleos de Venezuela S.A. | ||||||||||||
| 4.90% | 10/28/14 | 68 | 65 | |||||||||
Petroleos Mexicanos | ||||||||||||
| 5.50% | 06/27/44 | 75 | 83 | |||||||||
| 6.00% | 03/05/20 | 150 | 179 | (h) | ||||||||
| 6.50% | 06/02/41 | 71 | 89 | |||||||||
Petroleum Company of Trinidad & Tobago Ltd. | ||||||||||||
| 6.00% | 05/08/22 | 119 | 130 | |||||||||
Philip Morris International Inc. | ||||||||||||
| 2.50% | 05/16/16 | 403 | 424 | (h) | ||||||||
| 3.88% | 08/21/42 | 185 | 186 | |||||||||
Plains Exploration & Production Co. | ||||||||||||
| 6.50% | 11/15/20 | 204 | 226 | |||||||||
Power Sector Assets & Liabilities Management Corp. | ||||||||||||
| 7.39% | 12/02/24 | 100 | 139 | (b,h) | ||||||||
See Notes to Schedules of Investments and Notes to Financial Statements.
60
Table of Contents
| Elfun Income Fund | (in thousands) — December 31, 2012 |
| Principal Amount | Fair Value | |||||||||||
Pride International Inc. | ||||||||||||
| 6.88% | 08/15/20 | $ | 403 | $ | 510 | (h) | ||||||
Prudential Financial Inc. | ||||||||||||
| 5.63% | 05/12/41 | 198 | 226 | (h) | ||||||||
| 5.63% | 06/15/43 | 383 | 397 | (i) | ||||||||
Range Resources Corp. | ||||||||||||
| 5.75% | �� | 06/01/21 | 358 | 383 | (h) | |||||||
Reynolds American Inc. | ||||||||||||
| 3.25% | 11/01/22 | 575 | 578 | |||||||||
Roche Holdings Inc. | ||||||||||||
| 6.00% | 03/01/19 | 405 | 504 | (b,h) | ||||||||
Rowan Companies Inc. | ||||||||||||
| 5.40% | 12/01/42 | 247 | 250 | |||||||||
Royal Bank of Canada | ||||||||||||
| 1.20% | 09/19/17 | 558 | 559 | |||||||||
Royal Bank of Scotland Group PLC | ||||||||||||
| 6.40% | 10/21/19 | 515 | 609 | |||||||||
Russian Agricultural Bank OJSC Via RSHB Capital S.A. | ||||||||||||
| 5.30% | 12/27/17 | 200 | 215 | (b) | ||||||||
Russian Railways via RZD Capital Ltd. | ||||||||||||
| 5.74% | 04/03/17 | 100 | 112 | |||||||||
Santander Holdings USA Inc. | ||||||||||||
| 3.00% | 09/24/15 | 186 | 189 | |||||||||
Schlumberger Investment S.A. | ||||||||||||
| 2.40% | 08/01/22 | 557 | 552 | (b) | ||||||||
Seagate HDD Cayman | ||||||||||||
| 7.00% | 11/01/21 | 43 | 46 | |||||||||
Simon Property Group LP (REIT) | ||||||||||||
| 2.75% | 02/01/23 | 263 | 263 | |||||||||
Sinochem Overseas Capital Company Ltd. | ||||||||||||
| 4.50% | 11/12/20 | 100 | 108 | (b) | ||||||||
Sinopec Group Overseas Development 2012 Ltd. | ||||||||||||
| 2.75% | 05/17/17 | 395 | 410 | (b) | ||||||||
Smurfit Kappa Acquisitions | ||||||||||||
| 4.88% | 09/15/18 | 200 | 204 | (b) | ||||||||
Takeda Pharmaceutical Company Ltd. | ||||||||||||
| 1.63% | 03/17/17 | 741 | 752 | (b) | ||||||||
Teva Pharmaceutical Finance Co. BV | ||||||||||||
| 2.95% | 12/18/22 | 604 | 611 | |||||||||
| Principal Amount | Fair Value | |||||||||||
Textron Inc. | ||||||||||||
| 6.20% | 03/15/15 | $ | 334 | $ | 366 | |||||||
The ADT Corp. | ||||||||||||
| 2.25% | 07/15/17 | 186 | 185 | (b) | ||||||||
| 3.50% | 07/15/22 | 223 | 217 | (b) | ||||||||
| 4.88% | 07/15/42 | 102 | 97 | (b) | ||||||||
The Coca-Cola Co. | ||||||||||||
| 3.30% | 09/01/21 | 442 | 487 | |||||||||
The Dow Chemical Co. | ||||||||||||
| 3.00% | 11/15/22 | 186 | 186 | |||||||||
| 4.38% | 11/15/42 | 186 | 185 | |||||||||
The Goldman Sachs Group Inc. | ||||||||||||
| 5.75% | 01/24/22 | 686 | 811 | (h) | ||||||||
| 6.75% | 10/01/37 | 376 | 426 | |||||||||
The Korea Development Bank | ||||||||||||
| 3.25% | 03/09/16 | 380 | 398 | |||||||||
| 4.00% | 09/09/16 | 220 | 238 | |||||||||
The Potomac Edison Co. | ||||||||||||
| 5.35% | 11/15/14 | 245 | 264 | (h) | ||||||||
The Sherwin-Williams Co. | ||||||||||||
| 1.35% | 12/15/17 | 185 | 185 | |||||||||
| 4.00% | 12/15/42 | 185 | 185 | |||||||||
The Williams Companies Inc. | ||||||||||||
| 3.70% | 01/15/23 | 604 | 609 | |||||||||
Time Warner Cable Inc. | ||||||||||||
| 6.75% | 07/01/18 | 404 | 505 | |||||||||
Total Capital International S.A. | ||||||||||||
| 1.55% | 06/28/17 | 932 | 946 | |||||||||
| 2.70% | 01/25/23 | 558 | 568 | |||||||||
Toyota Motor Credit Corp. | ||||||||||||
| 1.25% | 10/05/17 | 373 | 376 | |||||||||
| 1.75% | 05/22/17 | 500 | 512 | |||||||||
TransAlta Corp. | ||||||||||||
| 4.50% | 11/15/22 | 371 | 376 | |||||||||
Transnet SOC Ltd. | ||||||||||||
| 4.50% | 02/10/16 | 200 | 213 | (b,h) | ||||||||
Transocean Inc. | ||||||||||||
| 3.80% | 10/15/22 | 186 | 191 | |||||||||
Turlock Corp. | ||||||||||||
| 1.50% | 11/02/17 | 556 | 557 | (b) | ||||||||
| 2.75% | 11/02/22 | 811 | 807 | (b) | ||||||||
U.S. Bancorp | ||||||||||||
| 3.44% | 02/01/16 | 645 | 679 | |||||||||
See Notes to Schedules of Investments and Notes to Financial Statements.
61
Table of Contents
| Elfun Income Fund | (in thousands) — December 31, 2012 |
| Principal Amount | Fair Value | |||||||||||
United Parcel Service Inc. | ||||||||||||
| 2.45% | 10/01/22 | $ | 371 | $ | 371 | |||||||
United Technologies Corp. | ||||||||||||
| 1.80% | 06/01/17 | 197 | 203 | (h) | ||||||||
| 4.50% | 06/01/42 | 296 | 329 | (h) | ||||||||
UnitedHealth Group Inc. | ||||||||||||
| 0.73% | 10/15/15 | 186 | 187 | (d) | ||||||||
| 1.40% | 10/15/17 | 186 | 186 | |||||||||
Vail Resorts Inc. | ||||||||||||
| 6.50% | 05/01/19 | 563 | 606 | (h) | ||||||||
Verizon Communications Inc. | ||||||||||||
| 2.00% | 11/01/16 | 989 | 1,024 | (h) | ||||||||
| 2.45% | 11/01/22 | 185 | 185 | |||||||||
| 3.85% | 11/01/42 | 185 | 182 | |||||||||
Viacom Inc. | ||||||||||||
| 2.50% | 12/15/16 | 484 | 505 | (h) | ||||||||
Visteon Corp. | ||||||||||||
| 6.75% | 04/15/19 | 313 | 333 | |||||||||
Vodafone Group PLC | ||||||||||||
| 2.50% | 09/26/22 | 372 | 371 | |||||||||
Watson Pharmaceuticals Inc. | ||||||||||||
| 3.25% | 10/01/22 | 559 | 571 | |||||||||
Weatherford International Inc. | ||||||||||||
| 6.35% | 06/15/17 | 201 | 230 | |||||||||
Weatherford International Ltd. | ||||||||||||
| 4.50% | 04/15/22 | 317 | 336 | |||||||||
| 5.95% | 04/15/42 | 297 | 322 | |||||||||
WellPoint Inc. | ||||||||||||
| 1.88% | 01/15/18 | 255 | 258 | |||||||||
| 3.30% | 01/15/23 | 566 | 581 | |||||||||
| 3.70% | 08/15/21 | 100 | 105 | |||||||||
Woodside Finance Ltd. | ||||||||||||
| 4.50% | 11/10/14 | 699 | 739 | (b,h) | ||||||||
WPP Finance 2010 | ||||||||||||
| 3.63% | 09/07/22 | 186 | 185 | |||||||||
| 5.13% | 09/07/42 | 186 | 182 | |||||||||
Xstrata Finance Canada Ltd. | ||||||||||||
| 2.45% | 10/25/17 | 742 | 749 | (b) | ||||||||
| 4.00% | 10/25/22 | 334 | 338 | (b) | ||||||||
| 5.80% | 11/15/16 | 347 | 392 | (b,h) | ||||||||
| 104,450 | ||||||||||||
| Principal Amount | Fair Value | |||||||||||
| Non-Agency Collateralized Mortgage Obligations — 3.0% | ||||||||||||
Banc of America Commercial Mortgage Trust 2006-4 | ||||||||||||
| 5.68% | 07/10/46 | $ | 190 | $ | 215 | |||||||
Banc of America Commercial Mortgage Trust 2007-4 | ||||||||||||
| 5.73% | 02/10/51 | 40 | 47 | (h) | ||||||||
Banc of America Commercial Mortgage Trust 2008-1 | ||||||||||||
| 6.21% | 02/10/51 | 180 | 218 | (h) | ||||||||
Banc of America Merrill Lynch Commercial Mortgage Inc. | ||||||||||||
| 5.19% | 09/10/47 | 420 | 468 | |||||||||
Bear Stearns Commercial Mortgage Securities | ||||||||||||
| 4.93% | 02/13/42 | 430 | 464 | |||||||||
| 5.40% | 03/11/39 | 109 | 110 | (h) | ||||||||
| 5.57% | 04/12/38 | 370 | 410 | |||||||||
Citigroup Commercial Mortgage Trust | ||||||||||||
| 5.48% | 10/15/49 | 200 | 190 | |||||||||
COMM 2005-LP5 Mortgage Trust | ||||||||||||
| 4.98% | 05/10/43 | 220 | 241 | |||||||||
Credit Suisse First Boston Mortgage Securities Corp. | ||||||||||||
| 5.31% | 10/25/35 | 216 | 4 | |||||||||
CSMC Mortgage-Backed Trust Series 2006-1 | ||||||||||||
| 5.51% | 02/25/36 | 54 | — | ** | ||||||||
GS Mortgage Securities Corp. II | ||||||||||||
| 2.41% | 11/10/45 | 999 | 152 | |||||||||
| 3.00% | 08/10/44 | 410 | 438 | (h) | ||||||||
| 3.55% | 04/10/34 | 210 | 227 | (b) | ||||||||
| 5.31% | 08/10/44 | 190 | 221 | (b) | ||||||||
Impac CMB Trust Series 2004-5 | ||||||||||||
| 2.06% | 10/25/34 | 260 | 248 | (d,h,i) | ||||||||
JP Morgan Chase Commercial Mortgage Securities Corp. | ||||||||||||
| 1.96% | 12/15/47 | 1,290 | 158 | (i) | ||||||||
| 4.27% | 06/15/45 | 380 | 421 | |||||||||
| 4.43% | 12/15/47 | 220 | 213 | (b,i) | ||||||||
| 5.04% | 03/15/46 | 250 | 270 | |||||||||
| 5.34% | 08/12/37 | 1,170 | 1,280 | (h) | ||||||||
See Notes to Schedules of Investments and Notes to Financial Statements.
62
Table of Contents
| Elfun Income Fund | (in thousands) — December 31, 2012 |
| Principal Amount | Fair Value | |||||||||||
| 5.44% | 05/15/45 - 06/12/47 | $ | 980 | $ | 1,120 | |||||||
| 5.79% | 02/12/51 | 390 | 465 | (h) | ||||||||
LB-UBS Commercial Mortgage Trust | ||||||||||||
| 4.95% | 09/15/30 | 310 | 339 | |||||||||
| 5.16% | 02/15/31 | 410 | 458 | |||||||||
| 5.87% | 06/15/38 | 190 | 219 | |||||||||
| 16.25% | 12/15/39 | 3,224 | 36 | (b,d) | ||||||||
MASTR Alternative Loans Trust | ||||||||||||
| 5.00% | 08/25/18 | 105 | 9 | (g,q) | ||||||||
Merrill Lynch | ||||||||||||
| 5.49% | 07/12/46 | 190 | 173 | |||||||||
Morgan Stanley Capital I Trust 2006-IQ11 | ||||||||||||
| 5.70% | 10/15/42 | 250 | 224 | |||||||||
Morgan Stanley Capital I Trust 2006-TOP21 | ||||||||||||
| 5.16% | 10/12/52 | 450 | 500 | (h) | ||||||||
Morgan Stanley Capital I Trust 2006-TOP23 | ||||||||||||
| 5.82% | 08/12/41 | 160 | 185 | |||||||||
Morgan Stanley Capital I Trust 2008-TOP29 | ||||||||||||
| 6.27% | 01/11/43 | 210 | 250 | |||||||||
Morgan Stanley Capital I Trust 2012-C4 | ||||||||||||
| 5.21% | 03/15/45 | 190 | 219 | (b) | ||||||||
UBS-Barclays Commercial Mortgage Trust | ||||||||||||
| 4.89% | 05/10/63 | 180 | 162 | (b,i) | ||||||||
Wachovia Bank Commercial Mortgage Trust | ||||||||||||
| 5.47% | 01/15/45 | 360 | 397 | (h) | ||||||||
Wells Fargo Commercial Mortgage Trust | ||||||||||||
| 4.69% | 10/15/45 | 90 | 96 | |||||||||
Wells Fargo Mortgage Backed Securities Trust | ||||||||||||
| 5.50% | 03/25/36 | 317 | 5 | |||||||||
| 10,852 | ||||||||||||
| Sovereign Bonds — 1.2% | ||||||||||||
Banco Nacional de Desenvolvimento Economico e Social | ||||||||||||
| 5.50% | 07/12/20 | 100 | 118 | (b) | ||||||||
| Principal Amount | Fair Value | |||||||||||
Gabonese Republic | ||||||||||||
| 8.20% | 12/12/17 | $ | 100 | $ | 121 | |||||||
Government of Chile | ||||||||||||
| 3.63% | 10/30/42 | 148 | 146 | |||||||||
Government of Dominican Republic | ||||||||||||
| 7.50% | 05/06/21 | 200 | 232 | (b) | ||||||||
Government of El Salvador | ||||||||||||
| 7.65% | 06/15/35 | 160 | 183 | (b) | ||||||||
Government of Hungary | ||||||||||||
| 4.75% | 02/03/15 | 50 | 52 | |||||||||
| 7.63% | 03/29/41 | 134 | 155 | (h) | ||||||||
Government of Indonesia | ||||||||||||
| 4.88% | 05/05/21 | 200 | 230 | (b,h) | ||||||||
| 11.63% | 03/04/19 | 53 | 80 | (b,h) | ||||||||
Government of Lebanon | ||||||||||||
| 4.00% | 12/31/17 | 21 | 20 | |||||||||
| 5.15% | 11/12/18 | 69 | 69 | |||||||||
| 6.10% | 10/04/22 | 69 | 70 | |||||||||
Government of Lithuania | ||||||||||||
| 6.75% | 01/15/15 | 100 | 110 | (b,h) | ||||||||
Government of Mexico | ||||||||||||
| 4.75% | 03/08/44 | 292 | 330 | |||||||||
| 5.75% | 10/12/49 | 72 | 87 | |||||||||
| 6.05% | 01/11/40 | 84 | 113 | (h) | ||||||||
Government of Panama | ||||||||||||
| 6.70% | 01/26/36 | 59 | 84 | (h) | ||||||||
Government of Peru | ||||||||||||
| 6.55% | 03/14/37 | 225 | 325 | (h) | ||||||||
| 7.35% | 07/21/25 | 100 | 145 | (h) | ||||||||
Government of Philippines | ||||||||||||
| 4.00% | 01/15/21 | 100 | 112 | |||||||||
| 6.38% | 01/15/32 | 100 | 137 | |||||||||
Government of Poland | ||||||||||||
| 3.00% | 03/17/23 | 62 | 62 | |||||||||
| 5.00% | 03/23/22 | 212 | 250 | |||||||||
| 6.38% | 07/15/19 | 37 | 46 | |||||||||
Government of Romania | ||||||||||||
| 6.75% | 02/07/22 | 146 | 177 | (b,h) | ||||||||
Government of South Africa | ||||||||||||
| 6.25% | 03/08/41 | 100 | 133 | |||||||||
Government of Sri Lanka | ||||||||||||
| 7.40% | 01/22/15 | 100 | 107 | (b,h) | ||||||||
See Notes to Schedules of Investments and Notes to Financial Statements.
63
Table of Contents
| Elfun Income Fund | (in thousands) — December 31, 2012 |
| Principal Amount | Fair Value | |||||||||||
Government of Turkey | ||||||||||||
| 5.13% | 03/25/22 | $ | 100 | $ | 115 | |||||||
| 6.88% | 03/17/36 | 71 | 96 | |||||||||
Government of Uruguay | ||||||||||||
| 6.88% | 09/28/25 | 66 | 91 | |||||||||
Government of Venezuela | ||||||||||||
| 10.75% | 09/19/13 | 219 | 225 | (h) | ||||||||
Government of Vietnam | ||||||||||||
| 1.50% | 03/12/16 | 22 | 20 | (i) | ||||||||
Government of Zambia | ||||||||||||
| 5.38% | 09/20/22 | 200 | 199 | (b) | ||||||||
Russian Foreign Bond — Eurobond | ||||||||||||
| 7.50% | 03/31/30 | 55 | 71 | (j) | ||||||||
| 4,511 | ||||||||||||
| Municipal Bonds and Notes — 0.6% | ||||||||||||
American Municipal Power Inc. | ||||||||||||
| 6.27% | 02/15/50 | 275 | 329 | |||||||||
Municipal Electric Authority of Georgia | ||||||||||||
| 6.64% | 04/01/57 | 234 | 280 | (h) | ||||||||
New Jersey Transportation Trust Fund Authority | ||||||||||||
| 6.88% | 12/15/39 | 165 | 190 | (h) | ||||||||
Port Authority of New York & New Jersey | ||||||||||||
| 4.46% | 10/01/62 | 605 | 597 | |||||||||
South Carolina State Public Service Authority | ||||||||||||
| 6.45% | 01/01/50 | 200 | 269 | |||||||||
State of California | ||||||||||||
| 5.70% | 11/01/21 | 280 | 334 | (h) | ||||||||
| 1,999 | ||||||||||||
| FNMA — 0.0%* | ||||||||||||
Lehman TBA | ||||||||||||
| 5.50% | TBA | 239 | —** | (c,o,r) | ||||||||
Total Bonds and Notes | 334,738 | |||||||||||
| Principal Amount | Fair Value | |||||||||||
Short-Term Investments — 24.7% |
| |||||||||||
GE Institutional Money Market Fund — Investment Class | ||||||||||||
0.06% | ||||||||||||
(Cost $64,620) | $ | 64,620 | (d,k) | |||||||||
| Federal Agencies — 7.0% | ||||||||||||
Federal Home Loan Bank Discount Notes | ||||||||||||
| 0.07% | 03/20/13 | 25,500 | 25,496 | (d) | ||||||||
Total Short-Term Investments | 90,116 | |||||||||||
Total Investments | 424,854 | |||||||||||
Liabilities in Excess of Other |
| (60,447) | ||||||||||
|
| |||||||||||
NET ASSETS — 100.0% |
| $ | 364,407 | |||||||||
|
| |||||||||||
Other Information | ||||||||||||
The Fund had the following long futures contracts open at December 31, 2012:
| Description | Expiration Date | Number of Contracts | Current Notional Value | Unrealized Appreciation/ (Depreciation) | ||||||||||
2 Yr. U.S. Treasury Notes Futures | March 2013 | 27 | $ | 5,953 | $ | 2 | ||||||||
5 Yr. U.S. Treasury Notes Futures | March 2013 | 248 | 30,855 | (47) | ||||||||||
30 Yr. U.S. Treasury Bonds Futures | March 2013 | 123 | 18,143 | (233) | ||||||||||
|
| |||||||||||||
| $ | (278) | |||||||||||||
|
| |||||||||||||
See Notes to Schedules of Investments and Notes to Financial Statements.
64
Table of Contents
| Elfun Income Fund | (in thousands) — December 31, 2012 |
The Fund had the following short futures contracts open at December 31, 2012:
| Description | Expiration Date | Number of Contracts | Current Notional Value | Unrealized Appreciation | ||||||||||
Ultra Long-Term U.S. Treasury Bond Futures | March 2013 | 103 | $ | (16,747) | $ | 328 | ||||||||
10 Yr. U.S. Treasury Notes Futures | March 2013 | 188 | (24,963) | 127 | ||||||||||
|
| |||||||||||||
| $ | 455 | |||||||||||||
|
| |||||||||||||
| $ | 177 | |||||||||||||
|
| |||||||||||||
See Notes to Schedules of Investments and Notes to Financial Statements.
65
Table of Contents
(Unaudited)

Michael E. Martini
Vice President
The Elfun Money Market Fund is managed by a team of portfolio managers that includes James C. Gannon, Michael E. Martini (pictured to the left) and Michael Nowakowski. As lead portfolio manager for the Money Market Fund, Mr. Martini has oversight authority over the Fund. See portfolio managers’ biographical information beginning on page 106.
| Q. | How did the Elfun Money Market Fund perform compared to its benchmark for the twelve-month period ended December 31, 2012? |
| A. | For the twelve-month period ended December 31, 2012, the Elfun Money Market Fund returned 0.00%. The 90-day Treasury Bill, the Fund’s benchmark, returned 0.09% and the Fund’s Morningstar peer group of 948 U.S. Money Market Taxable funds returned an average of 0.04% over the same period. |
| Q. | Discuss the factors that materially affected the fund’s performance during the fiscal period. |
| A. | Money market funds in 2012 were impacted by increased global monetary policy actions as well as a continued shrinking supply of investable assets. The Federal Reserve kept its federal funds target at 0 to 0.25% but moved from a “date-based” threshold to numerical thresholds for the path of future policy. The European Central Bank (ECB) engaged in long-term refinancing operations, and announced the Outright Monetary Transaction purchase program. Focusing on the Federal Reserve, they introduced a third round of quantitative ease, purchasing $40 billion of |
| mortgage-backed securities (MBS) per month. While “Operation Twist” expired at year-end, it was replaced with an outright U.S. Treasury purchase program of $45 billion per month. While the extra supply of treasuries from Operation Twist sales caused a dramatic increase in repurchase (repo) rates, a combination of program expirations and asset maturities started pressuring yields lower on all rates products. These factors included (1) over $100 billion U.S.Treasury Bills (UST) and Temporary Liquidity Guarantee Program(FDIC guaranteed) paper maturing, (2) the expectation of excess reserves rising $1 trillion in 2013 from MBS/UST monthly purchases, and (3) the December 31 expiration of the FDIC’s unlimited deposit insurance on non-interest bearing transaction accounts. |
LIBOR rates declined through mid-October, thanks to the aforementioned global policy actions. In the second quarter, Moody’s downgrades of global financial institutions were as expected to better than expected, emboldening some investors to reconsider previously shunned Eurozone banks. French banks were the big beneficiary towards year-end, especially as the “safe-haven” regions of Canada, Australia and Scandinavia either didn’t offer product or posted quite unattractive levels.
Regarding money fund regulation, in August the SEC was unsuccessful in introducing reforms that would have structurally changed money market funds. However, the Financial Stability Oversight Council (FSOC), created under
66
Table of Contents
(Unaudited)
the Dodd-Frank Act, voted in November to release money fund reform proposals for the SEC to either adopt or reject after a comment period (recently extended to mid-February). If any regulations are adopted, the time frame for compliance could be at least a year away.
| Q. | Were there any significant changes to the Fund during the period? |
| A. | After the last Eurozone bank asset matured in early 2012, exposure to the area remained at zero for the remainder of the year. While the ECB dramatically reduced tail risks with the introduction of 3 year Long Term Refinancing Operations and the Outright Monetary Transaction program, the macroeconomic outlook remained challenged, and continues to do so into 2013. The Fund’s weighted average maturity (WAM) and weighted average life (WAL) remained stable throughout the year. The U.S. government/treasury (ex-repo) allocation steadily increased in 2012, from 35% at December 31, 2011 to a high of 52% at June 30, 2012. This sector allocation ranged from 45 to 52% during the year. Concurrently, the allocation to Swiss, UK, and Australian credits, both financial and non-financial, declined. Last, the percent of the Fund invested in assets with 1-day and/or 7-day liquidity remained robust, well above minimum thresholds. |
67
Table of Contents
(Unaudited)

Understanding Your Fund’s Expenses
68
As a shareholder of the Fund you incur ongoing costs. Ongoing costs include portfolio management fees, professional fees, administrative fees and other Fund expenses. The following example is intended to help you understand your ongoing costs (in dollars) of investing in the Fund and to compare these costs with the ongoing costs of investing in other mutual funds.
To illustrate these ongoing costs, we have provided an example and calculated the expenses paid by investors in units of the Fund during the period. The information in the following table is based on an investment of $1,000, which is invested at the beginning of the period and held for the entire six-month period ended December 31, 2012.
Actual Expenses
The first section of the table provides information about actual account values and actual expenses. You may use the information in this section, together with the amount you invested, to estimate the expenses that you paid over the period. To do so, simply divide your account value by $1,000 (for example, an $8,600 account value divided by $1,000 = 8.6), then multiply the result by the number given for your class under the heading “Expenses
Paid During Period,” to estimate the expenses paid on your account during this period.
Hypothetical Example for Comparison Purposes
The second section of the table provides information about hypothetical account values and hypothetical expenses based on the Fund’s actual expense ratio and an assumed rate of return of 5% per year before expenses, which is not the Fund’s actual return. The hypothetical account values and expenses may not be used to estimate the actual ending account balance or expenses you paid for the period. You may use this information to compare the ongoing costs of investing in the Fund and other funds. To do so, compare this 5% hypothetical example with the 5% hypothetical examples that appear in the shareholders reports of other funds.
Please note that the expenses shown in the table are meant to highlight and help you compare ongoing costs only and do not reflect any transaction costs, such as sales charges or redemption fees, if any. Therefore, the second section of the table is useful in comparing ongoing costs only, and will not help you determine the relative total costs of owning different funds.
July 1, 2012 – December 31, 2012
| Account value at the beginning of the period ($) | Account value at the end of the period ($) | Expenses paid during the period ($)* | ||||||||||
Actual Fund Return | 1,000.00 | 1,000.00 | 0.90 | |||||||||
Hypothetical 5% Return | 1,000.00 | 1,024.23 | 0.92 | |||||||||
| * | Expenses are equal to the Fund’s annualized expense ratio of 0.18% (for the period July 1, 2012 - December 31, 2012), multiplied by the average account value over the period, multiplied by 184/366 (to reflect the one-half year period). |
Table of Contents
(Unaudited)
Investment Profile
A mutual fund designed for investors who seek a high level of current income consistent with prudent investment management and the preservation of capital. The Fund seeks its investment objective by investing primarily in short-term, U.S. dollar denominated money market instruments.
Fund yield At December 31, 2012
| Fund | Money Fund Report* | |||||||
7-day current† | 0.00 | % | 0.06 | % | ||||
7-day effective | 0.00 | % | 0.06 | % | ||||
Sector Allocation
as a % of Fair Value of $164,144 (in thousands) as of December 31, 2012(b)
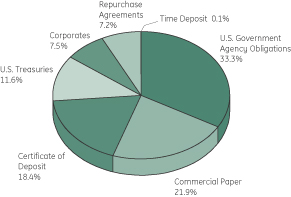
Morningstar Performance Comparison
Based on average annual returns for periods ended 12/31/12
| One Year | Five Year | Ten Year | ||||||||||
Number of funds in peer group | 948 | 829 | 615 | |||||||||
Peer group average annual total return | 0.04 | % | 0.45 | % | 1.51 | % | ||||||
Morningstar Category in peer group: Money Market Taxable |
| |||||||||||
Change in Value of a $10,000 Investment(a)
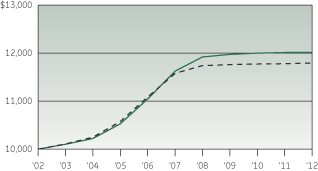

Average Annual Total Return
For the periods ended December 31, 2012
| (Inception date: 06/13/90) | ||||||||||||||||
| One Year | Five | Ten Year | Ending value of a $10,000 investment (a) | |||||||||||||
Elfun Money Market Fund† | 0.00% | 0.64% | 1.84% | $ | 12,009 | |||||||||||
90 Day U.S. T-Bill | 0.09% | 0.36% | 1.66% | $ | 11,790 | |||||||||||
| † | The seven day current yield, rather than the total return, more closely reflects the current earnings of the Money Market Fund at December 31, 2012. |
| * | iMoneyNet’s IBC’s Money Fund report provides average yield for all major money market funds. |
| (a) | Ending value of a $10,000 investment for the ten-year period or since inception, whichever is less. |
| (b) | The securities information regarding holdings, allocations and other characteristics is presented to illustrate examples of securities that the Fund has bought and the diversity of areas in which the Fund may invest as of a particular date. It may not be representative of the Fund’s current or future investments and should not be construed as a recommendation to purchase or sell a particular security. |
See Notes to Performance on page 1 for further information, including an explanation of Morningstar peer categories.
Past performance does not predict future performance. The performance shown on the graph and tables does not reflect the deduction of taxes that a shareholder would pay on Fund distributions or the redemption of Fund shares.
An investment in the Elfun Money Market Fund is not insured or guaranteed by the Federal Deposit Insurance Corporation or by any other Government agency. Although the Fund seeks to preserve the value of your investment at $1.00 per unit, it is possible to lose money by investing in the Fund.
69
Table of Contents
| Elfun Money Market Fund | (in thousands) — December 31, 2012 |
| Principal Amount | Amortized Cost | |||||||||||
Short-Term Investments — 99.8%† |
| |||||||||||
| U.S. Treasuries — 11.6% | ||||||||||||
United States Treasury Bills | ||||||||||||
| 0.14% | 01/03/13 | $ | 130 | $ | 130 | (d) | ||||||
United States Treasury Notes | ||||||||||||
| 0.50% | 05/31/13 | 4,250 | 4,256 | |||||||||
| 0.63% | 04/30/13 | 3,050 | 3,055 | |||||||||
| 1.38% | 01/15/13 - 05/15/13 | 11,550 | 11,575 | |||||||||
| 19,016 | ||||||||||||
| U.S. Government Agency Obligations — 33.2% | ||||||||||||
Fannie Mae Discount Notes | ||||||||||||
| 0.08% | 03/20/13 | 900 | 900 | (d) | ||||||||
| 0.11% | 01/17/13 - 02/06/13 | 6,150 | 6,150 | (d) | ||||||||
| 0.13% | 02/13/13 - 03/06/13 | 8,850 | 8,848 | (d) | ||||||||
| 0.16% | 04/01/13 | 850 | 850 | (d) | ||||||||
Federal Home Loan Bank Discount Notes | ||||||||||||
| 0.11% | 05/17/13 | 1,700 | 1,699 | (d) | ||||||||
| 0.12% | 03/13/13 | 2,300 | 2,299 | (d) | ||||||||
| 0.13% | 01/09/13 - 02/01/13 | 7,500 | 7,500 | (d) | ||||||||
| 0.15% | 01/18/13 | 2,250 | 2,250 | (d) | ||||||||
Federal Home Loan Banks | ||||||||||||
| 0.15% | 02/06/13 | 1,250 | 1,250 | |||||||||
| 0.25% | 04/18/13 | 3,500 | 3,500 | |||||||||
Federal Home Loan Mortgage Corp | ||||||||||||
| 0.16% | 06/17/13 | 1,150 | 1,150 | (i) | ||||||||
| 0.17% | 03/21/13 | 5,550 | 5,550 | (i) | ||||||||
Freddie Mac Discount Notes | ||||||||||||
| 0.07% | 03/18/13 | 2,200 | 2,200 | (d) | ||||||||
| 0.13% | 01/22/13 | 1,650 | 1,650 | (d) | ||||||||
| 0.14% | 01/28/13 | 4,750 | 4,749 | (d) | ||||||||
| 0.15% | 02/04/13 | 1,700 | 1,700 | (d) | ||||||||
| 0.16% | 02/19/13 | 2,350 | 2,349 | (d) | ||||||||
| 54,594 | ||||||||||||
| Commercial Paper — 21.9% | ||||||||||||
Australia & New Zealand Banking Group Ltd | ||||||||||||
| 0.18% | 02/07/13 | 3,550 | 3,549 | (d) | ||||||||
| Principal Amount | Amortized Cost | |||||||||||
BHP Billiton Finance USA Ltd | ||||||||||||
| 0.14% | 01/28/13 | $ | 750 | $ | 750 | (b,d) | ||||||
| 0.17% | 01/14/13 | 2,350 | 2,350 | (d) | ||||||||
Chevron Corp | ||||||||||||
| 0.12% | 01/17/13 | 3,500 | 3,500 | (d) | ||||||||
Commonwealth Bank of Australia | ||||||||||||
| 0.23% | 05/08/13 | 3,300 | 3,300 | (i) | ||||||||
DNB Bank ASA | ||||||||||||
| 0.23% | 03/18/13 | 2,250 | 2,249 | (d) | ||||||||
Glaxosmithkline PLC | ||||||||||||
| 0.15% | 01/04/13 | 3,200 | 3,200 | (d) | ||||||||
HSBC Bank PLC | ||||||||||||
| 0.20% | 03/25/13 | 4,350 | 4,350 | (i) | ||||||||
International Business Machines Corp | ||||||||||||
| 0.07% | 01/03/13 | 1,800 | 1,800 | (d) | ||||||||
JPMorgan Chase & Co | ||||||||||||
| 0.25% | 04/08/13 | 1,900 | 1,899 | (d) | ||||||||
| KFW | ||||||||||||
| 0.20% | 03/07/13 | 2,550 | 2,549 | (b,d) | ||||||||
Procter & Gamble Co/The | ||||||||||||
| 0.15% | 01/10/13 | 1,650 | 1,650 | (d) | ||||||||
Svenska Handelsbanken AB | ||||||||||||
| 0.24% | 02/01/13 | 1,700 | 1,700 | (b,d) | ||||||||
Wal-Mart Stores Inc | ||||||||||||
| 0.10% | 01/24/13 | 3,150 | 3,150 | (d) | ||||||||
| 35,996 | ||||||||||||
| Repurchase Agreement — 7.2% | ||||||||||||
Barclays Capital Inc. U.S. | ||||||||||||
| 0.20% dated 12/31/12, to be repurchased at $3,900 on 01/01/13 collateralized by $ 3,978 U.S.Treasury Bond, 2.63% , maturing on 11/15/20 respectively. 01/02/13 | 3,900 | 3,900 | ||||||||||
Deutsche Bank Securities, Inc. Gov Agcy Repo | ||||||||||||
| 0.20% dated 12/31/12, to be repurchased at $500 on 01/01/13 collateralized by $ 510 U.S. Government Agency Bond, 3.75%, maturing 06/28/13 01/02/13 | 500 | 500 | ||||||||||
See Notes to Schedules of Investments and Notes to Financial Statements.
70
Table of Contents
| Elfun Money Market Fund | (in thousands) — December 31, 2012 |
| Principal Amount | Amortized Cost | |||||||||||
Goldman Sachs & Co. Gov | ||||||||||||
| 0.20% dated 12/31/12, to be repurchased at $3,700 on 01/01/13 collateralized by $ 3,778 U.S. Government Agency Bond, 0.38%, maturing 01/29/14 01/02/13 | $ | 3,700 | $ | 3,700 | ||||||||
HSBC Securities (USA) Inc. Gov Agcy Repo | ||||||||||||
| 0.16% dated 12/31/12, to be repurchased at $1,710 on 01/01/13 collateralized by $ 1,747 U.S. Government Agency Bond, 3.00%, maturing 08/08/19 01/02/13 | 1,710 | 1,710 | ||||||||||
J.P. Morgan Securities LLC 1Wk U.S. Treasury Repo | ||||||||||||
| 0.18% dated 12/31/12, to be repurchased at $1,000 on 01/01/13 collateralized by $ 1,024 U.S.Treasury Bond, 0.25% , maturing on 08/15/15 respectively. 01/02/13 | 1,000 | 1,000 | ||||||||||
J.P. Morgan Securities LLC U.S. Treasury Repo | ||||||||||||
| 0.18% dated 12/31/12, to be repurchased at $1,000 on 01/01/13 collateralized by $ 1,024 U.S.Treasury Bond, 0.25% , maturing on 08/15/15 respectively. 01/02/13 | 1,000 | 1,000 | ||||||||||
| 11,810 | ||||||||||||
| Corporates — 7.5% | ||||||||||||
Inter-American Development Bank Discount Notes | ||||||||||||
| 0.14% | 02/19/13 | 900 | 900 | (d) | ||||||||
| 0.15% | 02/07/13 | 2,850 | 2,850 | (d) | ||||||||
Johnson & Johnson | ||||||||||||
| 0.70% | 05/15/13 | 950 | 952 | |||||||||
| KFW | ||||||||||||
| 0.31% | 02/22/13 | 900 | 900 | (i) | ||||||||
Novartis Capital Corp | ||||||||||||
| 1.90% | 04/24/13 | 1,100 | 1,105 | |||||||||
| Principal Amount | Amortized Cost | |||||||||||
| Sanofi | ||||||||||||
| 0.51% | 03/28/13 | $ | 2,200 | $ | 2,201 | (i) | ||||||
World Bank Discount Notes | ||||||||||||
| 0.10% | 01/07/13 | 3,450 | 3,450 | (d) | ||||||||
| 12,358 | ||||||||||||
| Certificate of Deposit — 18.3% | ||||||||||||
Bank of Montreal | ||||||||||||
| 0.20% | 01/03/13 | 2,450 | 2,450 | |||||||||
Bank of Nova Scotia/Houston | ||||||||||||
| 0.29% | 06/13/13 | 3,500 | 3,500 | (i) | ||||||||
JPMorgan Chase & Co | ||||||||||||
| 0.22% | 03/12/13 | 1,400 | 1,400 | |||||||||
National Australia Bank Ltd/New York | ||||||||||||
| 0.24% | 04/30/13 | 3,300 | 3,300 | (i) | ||||||||
Nordea Bank AB | ||||||||||||
| 0.36% | 02/19/13 | 2,400 | 2,400 | |||||||||
Royal Bank of Canada/New York NY | ||||||||||||
| 0.43% | 04/10/13 | 2,400 | 2,400 | (i) | ||||||||
Skandinaviska Enskilda Banken AB | ||||||||||||
| 0.30% | 04/08/13 | 2,550 | 2,550 | |||||||||
Standard Chartered PLC | ||||||||||||
| 0.48% | 01/10/13 | 3,250 | 3,250 | |||||||||
Svenska Handelsbanken AB | ||||||||||||
| 0.28% | 04/15/13 | 2,050 | 2,050 | |||||||||
Toronto-Dominion Bank | ||||||||||||
| 0.20% | 01/16/13 | 2,800 | 2,800 | |||||||||
Westpac Banking Corp/NY | ||||||||||||
| 0.31% | 02/11/13 | 4,100 | 4,100 | (i) | ||||||||
| 30,200 | ||||||||||||
| Time Deposit — 0.1% | ||||||||||||
State Street Corp | ||||||||||||
| 0.01% | 01/02/13 | 170 | 170 | (e) | ||||||||
Total Short-Term Investments | 164,144 | |||||||||||
Other Assets and Liabilities, | �� | 385 | ||||||||||
|
| |||||||||||
NET ASSETS — 100.0% |
| $ | 164,529 | |||||||||
|
| |||||||||||
See Notes to Schedules of Investments and Notes to Financial Statements.
71
Table of Contents
(In thousands) — December 31, 2012
The views expressed in this document reflect our judgment as of the publication date and are subject to change at any time without notice. The securities cited may not be representative of the Fund’s future investments and should not be construed as a recommendation to purchase or sell a particular security. See the Fund’s summary prospectus and statutory prospectus for complete descriptions of investment objectives, policies, risks and permissible investments.
| (a) | Non-income producing security. |
| (b) | Pursuant to Rule 144A of the Securities Act of 1933, these securities may be resold in transactions exempt from registration, normally to qualified institutional buyers. At December 31, 2012, these securities amounted to $4,270, $25,035 and $8,499 or 2.00%, 6.87% and 5.17% of the net assets of the Elfun Diversified Fund, Elfun Income Fund and Elfun Money Market Fund, respectively. These securities have been determined to be liquid using procedures established by the Fund’s Board of Trustees (Unaudited). |
| (c) | Settlement is on a delayed delivery or when-issued basis with final maturity to be announced (TBA) in the future. |
| (d) | Coupon amount represents effective yield. |
| (e) | State Street Corp. is the parent company of State Street Bank & Trust Co., the Fund’s custodian and accounting agent. |
| (f) | Principal only security. These securities represent the right to receive the monthly principal payments on an underlying pool of mortgages. No payments of interest on the pool are passed through to the “principal only” holder. |
| (g) | Interest only security. These securities represent the right to receive the monthly interest payments on an underlying pool of mortgages. Payments of principal on the pool reduce the value of the “interest only” holding. |
| (h) | At December 31, 2012, all or a portion of this security is reserved and/or pledged to cover collateral requirements for futures, options, forward foreign currency contracts and/or TBA’s. |
| (i) | Variable or floating rate security. The stated rate represents the rate at December 31, 2012. |
| (j) | Step coupon bond. Security becomes interest bearing at a future date. |
| (k) | GE Asset Management, the investment adviser of the Fund, also serves as investment adviser of the GE Institutional Money Market Fund. |
| (l) | Escrowed to maturity bonds are collateralized by U.S. Treasury securities which are held in escrow by a trustee and used to pay principal and interest on such bonds. |
| (m) | Pre-refunded Bonds are collateralized by U.S. Treasury securities, which are held in escrow and are used to pay principal and interest on the tax-exempt issue and to retire the bonds at the earliest refunding date. |
| (n) | The security is insured by AMBAC, AGC, AGMC, MBIA, FSA or FGIC. The Elfun Tax-Exempt Fund had insurance concentrations of 5% or greater as of December 31, 2012 (as a percentage of net assets) as follows: |
| AGMC | 7.60% |
| (o) | Securities in default. |
| (p) | Sponsored by SSGA Funds Management, Inc., an affiliate of State Street Bank & Trust Co., the Fund’s custodian and accounting agent. |
| (q) | Coupon amount represents the coupon of the underlying mortgage securities on which monthly interest payments are based. |
| (r) | Fair Valued Securities |
| † | Percentages are based on net assets as of December 31, 2012. |
72
Table of Contents

(In thousands) — December 31, 2012
| †† | Security traded on different exchanges. |
| * | Less than 0.05% |
| ** | Principal amount or Fair Value is less than $500. |
Abbreviations:
| ADR | — | American Depositary Receipt | ||||
| AGC | — | Assured Guaranty Corporation | ||||
| AGMC | — | Assured Guaranty Municipal Company | ||||
| AMBAC | — | AMBAC Indemnity Corporation | ||||
| FGIC | — | Financial Guaranty Insurance Corporation | ||||
| FSA | — | Financial Security Assurance | ||||
| GDR | — | Global Depositary Receipt | ||||
| MBIA | — | Municipal Bond Investors Assurance Corporation | ||||
| REIT | — | Real Estate Investment Trust | ||||
| REMIC | — | Real Estate Mortgage Investment Conduit | ||||
| SPDR | — | Standard & Poor’s Depository Receipts | ||||
| STRIPS | — | Separate Trading of Registered Interest and Principal of Security | ||||
| TBA | — | To Be Announced |
73
Table of Contents
Selected data based on a unit outstanding during the fiscal years indicated
| Elfun International Equity Fund | 2012 | 2011 | 2010 | 2009 | 2008 | |||||||||||||||
Inception date | — | — | — | — | 1/1/88 | |||||||||||||||
Net asset value, beginning of year | $15.43 | $18.92 | $18.24 | $14.65 | $28.32 | |||||||||||||||
Income (loss) from investment operations: | ||||||||||||||||||||
Net investment income | 0.35 | 0.44 | 0.36 | 0.43 | 0.77 | |||||||||||||||
Net realized and unrealized | 2.88 | (3.48 | ) | 0.69 | 3.63 | (13.26 | ) | |||||||||||||
Total income (loss) from investment operations | 3.23 | (3.04 | ) | 1.05 | 4.06 | (12.49 | ) | |||||||||||||
Less distributions from: | ||||||||||||||||||||
Net investment income | 0.35 | 0.44 | 0.37 | 0.44 | 0.74 | |||||||||||||||
Net realized gains | — | — | — | 0.03 | 0.44 | |||||||||||||||
Return of capital | 0.00 | * | 0.01 | — | — | — | ||||||||||||||
Total distributions | 0.35 | 0.45 | 0.37 | 0.47 | 1.18 | |||||||||||||||
Net asset value, end of year | $18.31 | $15.43 | $18.92 | $18.24 | $14.65 | |||||||||||||||
TOTAL RETURN (a) | 20.95 | % | (16.02 | )% | 5.77 | % | 27.69 | % | (44.15 | )% | ||||||||||
RATIOS/SUPPLEMENTAL DATA: | ||||||||||||||||||||
Net assets, end of year (in thousands) | $260,728 | $240,572 | $309,473 | $301,332 | $248,781 | |||||||||||||||
Ratios to average net assets: | ||||||||||||||||||||
Net investment income | 1.98 | % | 2.34 | % | 2.05 | % | 2.66 | % | 3.10 | % | ||||||||||
Net expenses | 0.45 | %(b) | 0.30 | %(b) | 0.32 | %(b) | 0.27 | %(b) | 0.44 | %(b) | ||||||||||
Gross expenses | 0.45 | % | 0.31 | % | 0.34 | % | 0.28 | % | 0.45 | % | ||||||||||
Portfolio turnover rate | 47 | % | 39 | % | 42 | % | 45 | % | 41 | % | ||||||||||
| Elfun Trusts | 2012 | 2011 | 2010 | 2009 | 2008 | |||||||||||||||
Inception date | — | — | — | — | 5/27/35 | |||||||||||||||
Net asset value, beginning of year | $ 40.35 | $41.38 | $38.50 | $30.23 | $48.73 | |||||||||||||||
Income (loss) from investment operations: | ||||||||||||||||||||
Net investment income | 0.77 | 0.48 | 0.40 | 0.35 | 0.49 | |||||||||||||||
Net realized and unrealized | 7.77 | 0.06 | 4.64 | 9.83 | (17.35 | ) | ||||||||||||||
Total income (loss) from investment operations | 8.54 | 0.54 | 5.04 | 10.18 | (16.86 | ) | ||||||||||||||
Less distributions from: | ||||||||||||||||||||
Net investment income | 0.76 | 0.48 | 0.41 | 0.37 | 0.49 | |||||||||||||||
Return of Capital | — | — | — | 0.03 | 0.02 | |||||||||||||||
Net realized gains | 4.07 | 1.09 | 1.75 | 1.51 | 1.13 | |||||||||||||||
Total distributions | 4.83 | 1.57 | 2.16 | 1.91 | 1.64 | |||||||||||||||
Net asset value, end of year | $ 44.06 | $40.35 | $41.38 | $38.50 | $30.23 | |||||||||||||||
TOTAL RETURN (a) | 21.27 | % | 1.33 | % | 13.07 | % | 33.62 | % | (34.53 | )% | ||||||||||
RATIOS/SUPPLEMENTAL DATA: | ||||||||||||||||||||
Net assets, end of year (in thousands) | $1,820,262 | $1,647,396 | $1,731,716 | $1,639,896 | $1,314,686 | |||||||||||||||
Ratios to average net assets: | ||||||||||||||||||||
Net investment income | 1.60 | % | 1.09 | % | 1.00 | % | 1.05 | % | 1.10 | % | ||||||||||
Net expenses | 0.19 | %(b) | 0.21 | %(b) | 0.21 | %(b) | 0.23 | %(b) | 0.21 | %(b) | ||||||||||
Gross expenses | 0.19 | % | 0.21 | % | 0.22 | % | 0.24 | % | 0.22 | % | ||||||||||
Portfolio turnover rate | 11 | % | 16 | % | 14 | % | 8 | % | 20 | % | ||||||||||
The accompanying Notes are an integral part of these financial statements.
74
Table of Contents

Selected data based on a unit outstanding during the fiscal years indicated
| Elfun Diversified Fund | 2012 | 2011 | 2010 | 2009 | 2008 | |||||||||||||||
Inception date | — | — | — | — | 1/1/88 | |||||||||||||||
Net asset value, beginning of year | $16.53 | $17.41 | $16.08 | $13.41 | $19.80 | |||||||||||||||
Income (loss) from investment operations: | ||||||||||||||||||||
Net investment income | 0.33 | 0.38 | 0.28 | 0.29 | 0.42 | |||||||||||||||
Net realized and unrealized | 1.78 | (0.83) | 1.32 | 2.68 | (6.41) | |||||||||||||||
Total income (loss) from investment operations | 2.11 | (0.45) | 1.60 | 2.97 | (5.99) | |||||||||||||||
Less distributions from: | ||||||||||||||||||||
Net investment income | 0.34 | 0.43 | 0.27 | 0.30 | 0.40 | |||||||||||||||
Net realized gains | — | — | — | 0.00 | * | — | ||||||||||||||
Total distributions | 0.34 | 0.43 | 0.27 | 0.30 | 0.40 | |||||||||||||||
Net asset value, end of year | $18.30 | $16.53 | $17.41 | $16.08 | $13.41 | |||||||||||||||
TOTAL RETURN (a) | 12.77 | % | (2.60) | % | 9.98 | % | 22.13 | % | (30.23) | % | ||||||||||
RATIOS/SUPPLEMENTAL DATA: | ||||||||||||||||||||
Net assets, end of year (in thousands) | $213,168 | $210,095 | $229,881 | $220,654 | $191,347 | |||||||||||||||
Ratios to average net assets: | ||||||||||||||||||||
Net investment income | 1.75 | % | 2.11 | % | 1.76 | % | 1.98 | % | 2.35 | % | ||||||||||
Net expenses | 0.46 | %(b) | 0.40 | %(b) | 0.48 | %(b) | 0.43 | %(b) | 0.31 | %(b) | ||||||||||
Gross expenses | 0.47 | % | 0.41 | % | 0.75 | % | 0.47 | % | 0.33 | % | ||||||||||
Portfolio turnover rate | 173 | % | 197 | % | 148 | % | 142 | % | 180 | % | ||||||||||
| Elfun Tax-Exempt Income Fund | 2012 | 2011 | 2010 | 2009 | 2008 | |||||||||||||||
Inception date | — | — | — | — | 1/1/80 | |||||||||||||||
Net asset value, beginning of year | $11.97 | $11.33 | $11.64 | $10.73 | $11.54 | |||||||||||||||
Income (loss) from investment operations: | ||||||||||||||||||||
Net investment income | 0.51 | 0.53 | 0.53 | 0.53 | 0.53 | |||||||||||||||
Net realized and unrealized | 0.37 | 0.64 | (0.31) | 0.91 | (0.81) | |||||||||||||||
Total income from investment operations | 0.88 | 1.17 | 0.22 | 1.44 | (0.28) | |||||||||||||||
Less distributions from: | ||||||||||||||||||||
Net investment income | 0.51 | 0.53 | 0.53 | 0.53 | 0.53 | |||||||||||||||
Net realized gains | 0.02 | — | — | — | — | |||||||||||||||
Total distributions | 0.53 | 0.53 | 0.53 | 0.53 | 0.53 | |||||||||||||||
Net asset value, end of year | $12.32 | $11.97 | 11.33 | $11.64 | $10.73 | |||||||||||||||
TOTAL RETURN (a) | 7.45 | % | 10.57 | % | 1.86 | % | 13.64 | % | (2.51) | % | ||||||||||
RATIOS/SUPPLEMENTAL DATA: | ||||||||||||||||||||
Net assets, end of year (in thousands) | $1,785,176 | $1,730,904 | $1,677,925 | $1,776,803 | $1,623,597 | |||||||||||||||
Ratios to average net assets: | ||||||||||||||||||||
Net investment income | 4.18 | % | 4.56 | % | 4.54 | % | 4.66 | % | 4.72 | % | ||||||||||
Net expenses | 0.18 | % | 0.19 | % | 0.19 | % | 0.18 | % | 0.12 | % | ||||||||||
Gross expenses | 0.18 | % | 0.19 | % | 0.19 | % | 0.18 | % | 0.12 | % | ||||||||||
Portfolio turnover rate | 28 | % | 31 | % | 26 | % | 33 | % | 37 | % | ||||||||||
The accompanying Notes are an integral part of these financial statements.
75
Table of Contents
Selected data based on a unit outstanding during the fiscal years indicated
| Elfun Income Fund | 2012 | 2011 | 2010 | 2009 | 2008 | |||||||||||||||
Inception date | — | — | — | — | 12/31/84 | |||||||||||||||
Net asset value, beginning of year | $ 11.58 | $11.18 | $10.73 | $10.35 | $11.09 | |||||||||||||||
Income (loss) from investment operations: | ||||||||||||||||||||
Net investment income | 0.26 | 0.39 | 0.36 | 0.43 | 0.52 | |||||||||||||||
Net realized and unrealized gains (losses) on investments | 0.42 | 0.48 | 0.52 | 0.38 | (0.74) | |||||||||||||||
Total income from investment operations | 0.68 | 0.87 | 0.88 | 0.81 | (0.22) | |||||||||||||||
Less distributions from: | ||||||||||||||||||||
Net investment income | 0.26 | 0.38 | 0.43 | 0.43 | 0.52 | |||||||||||||||
Net realized gains | 0.35 | 0.09 | — | — | — | |||||||||||||||
Total distributions | 0.61 | 0.47 | 0.43 | 0.43 | 0.52 | |||||||||||||||
Net asset value, end of year | $ 11.65 | $11.58 | $11.18 | $10.73 | $10.35 | |||||||||||||||
TOTAL RETURN (a) | 5.94 | % | 7.87 | % | 8.31 | % | 8.04 | % | (2.01) | % | ||||||||||
RATIOS/SUPPLEMENTAL DATA: | ||||||||||||||||||||
Net assets, end of year (in thousands) | $364,407 | $363,029 | $350,325 | $338,481 | $328,913 | |||||||||||||||
Ratios to average net assets: | ||||||||||||||||||||
Net investment income | 2.20 | % | 3.39 | % | 3.34 | % | 4.15 | % | 4.88 | % | ||||||||||
Net expenses | 0.23 | %(b) | 0.24 | %(b) | 0.23 | %(b) | 0.24 | %(b) | 0.16 | %(b) | ||||||||||
Gross expenses | 0.25 | % | 0.26 | % | 0.27 | % | 0.27 | % | 0.20 | % | ||||||||||
Portfolio turnover rate | 402 | % | 438 | % | 357 | % | 320 | % | 451 | % | ||||||||||
| Elfun Money Market Fund | 2012 | 2011 | 2010 | 2009 | 2008 | |||||||||||||||
Inception date | — | — | — | — | 6/13/90 | |||||||||||||||
Net asset value, beginning of year | $ 1.00 | $1.00 | $1.00 | $1.00 | $1.00 | |||||||||||||||
Income from investment operations: | ||||||||||||||||||||
Net investment income | — | 0.00 | * | 0.00 | * | 0.00 | * | 0.03 | ||||||||||||
Total income from investment operations | — | 0.00 | * | 0.00 | * | 0.00 | * | 0.03 | ||||||||||||
Less distributions from: | ||||||||||||||||||||
Net investment income | — | 0.00 | * | 0.00 | * | 0.00 | * | 0.03 | ||||||||||||
Total distributions | — | 0.00 | * | 0.00 | * | 0.00 | * | 0.03 | ||||||||||||
Net asset value, end of year | $ 1.00 | $1.00 | $1.00 | $1.00 | $1.00 | |||||||||||||||
TOTAL RETURN (a) | 0.00 | % | 0.07 | % | 0.15 | %(c) | 0.42 | % | 2.57 | % | ||||||||||
RATIOS/SUPPLEMENTAL DATA: | ||||||||||||||||||||
Net assets, end of year (in thousands) | $164,529 | $177,378 | $207,108 | $244,564 | $285,389 | |||||||||||||||
Ratios to average net assets: | ||||||||||||||||||||
Net investment income | — | % | 0.01 | % | 0.06 | % | 0.43 | % | 2.57 | % | ||||||||||
Net expenses | 0.18 | %** | 0.23 | %** | 0.26 | %** | 0.24 | %** | 0.19 | %** | ||||||||||
Gross expenses | 0.32 | % | 0.32 | % | 0.28 | % | 0.24 | % | 0.19 | % | ||||||||||
Notes to Financial Highlights
| (a) | Total returns are historical and assume changes in share price, reinvestment of dividends and capital gains distributions and assume no sales charge. Past performance does not guarantee future results. |
| (b) | Reflects GEAM’s waiver of a portion of the Fund’s management expenses in an amount equal to the management fee earned by GEAM with respect to the Fund’s investment in an affiliated Money Market Fund managed by GEAM. |
| (c) | Total return is revised to correct an error in the total return calculation, which was determined not to be material to previously issued financial statements. |
| * | Less than 0.005 per share. |
| ** | GE Asset Management has voluntarily undertaken to reduce its management fee and/or subsidize certain expenses of the Fund to the extent necessary to maintain a minimum annualized yield of 0.00%. |
The accompanying Notes are an integral part of these financial statements.
76
Table of Contents

[This Page Left Intentionally Blank]
Table of Contents
The accompanying Notes are an integral part of these financial statements.
78
Table of Contents
| ELFUN DIVERSIFIED FUND | ELFUN TAX-EXEMPT INCOME FUND | ELFUN INCOME FUND | ELFUN MONEY MARKET FUND | |||||||||
| $193,516 | $ | 1,773,397 | $ | 334,738 | $ | — | ||||||
| — | 18,577 | 25,496 | 164,144 | |||||||||
| 30,991 | — | 64,620 | — | |||||||||
| 50 | — | — | — | |||||||||
| — | — | — | — | |||||||||
| 472 | 24,126 | 1,687 | 83 | |||||||||
| 33 | 493 | 156 | 905 | |||||||||
| 236 | — | 65 | — | |||||||||
| 454 | 15 | 3 | 9 | |||||||||
| 225,752 | 1,816,608 | 426,765 | 165,141 | |||||||||
| — | 1,903 | 118 | — | |||||||||
| 11,656 | 28,395 | 61,939 | — | |||||||||
| 149 | 842 | 143 | 527 | |||||||||
| 20 | 116 | 17 | 5 | |||||||||
| 296 | 176 | 141 | 80 | |||||||||
| — | — | — | — | |||||||||
| 13 | — | — | — | |||||||||
| 450 | — | — | — | |||||||||
| 12,584 | 31,432 | 62,358 | 612 | |||||||||
| $213,168 | $ | 1,785,176 | $ | 364,407 | $ | 164,529 | ||||||
| 200,892 | 1,627,435 | 356,797 | 164,461 | |||||||||
13 | 70 | 296 | — | |||||||||
| (3,804) | (99 | ) | 72 | 68 | ||||||||
| 15,885 | 157,770 | 7,065 | — | |||||||||
| 194 | — | 177 | — | |||||||||
| (12) | — | — | — | |||||||||
| $213,168 | $ | 1,785,176 | $ | 364,407 | $ | 164,529 | ||||||
| 11,646 | 144,956 | 31,278 | 164,731 | |||||||||
| $ 18.30 | $ | 12.32 | $ | 11.65 | $ | 1.00 | ||||||
79
Table of Contents
The accompanying Notes are an integral part of these financial statements.
80
Table of Contents
| ELFUN DIVERSIFIED FUND | ELFUN TAX-EXEMPT INCOME FUND | ELFUN INCOME FUND | ELFUN MONEY MARKET FUND | |||||||||
| $3,158 | $ | — | $ | 13 | $ | — | ||||||
| 1,677 | 77,737 | 8,903 | 308 | |||||||||
| 17 | 1 | 43 | — | |||||||||
| (96) | — | — | — | |||||||||
| 4,756 | 77,738 | 8,959 | 308 | |||||||||
| 443 | 2,791 | 585 | 303 | |||||||||
| 9 | 17 | 12 | 20 | |||||||||
| 74 | 151 | 88 | 84 | |||||||||
| 391 | 87 | 136 | 75 | |||||||||
| 29 | 40 | 24 | 16 | |||||||||
| 72 | 165 | 76 | 56 | |||||||||
| 1,018 | 3,251 | 921 | 554 | |||||||||
| (33) | — | (80 | ) | (246 | ) | |||||||
| 985 | 3,251 | 841 | 308 | |||||||||
| 3,771 | 74,487 | 8,118 | — | |||||||||
| 7,485 | 9,831 | 14,203 | — | |||||||||
| 692 | — | (2,952 | ) | — | ||||||||
| 106 | — | — | — | |||||||||
| 13,558 | 43,097 | 1,138 | 100 | |||||||||
| 315 | — | 779 | — | |||||||||
| 7 | — | — | — | |||||||||
| 22,163 | 52,928 | 13,168 | 100 | |||||||||
| $25,934 | $ | 127,415 | $ | 21,286 | $ | 100 | ||||||
81
Table of Contents
82
The accompanying Notes are an integral part of these financial statements.
Table of Contents
| ELFUN DIVERSIFIED FUND | ELFUN TAX-EXEMPT INCOME FUND | ELFUN INCOME FUND | ELFUN MONEY MARKET FUND | |||||||||||||||||||||||||||
| 2012 | 2011 | 2012 | 2011 | 2012 | 2011 | 2012 | 2011 | |||||||||||||||||||||||
| $ | 3,771 | $ | 4,708 | $ | 74,487 | $ | 76,130 | $ | 8,118 | $ | 12,138 | $ | — | $ | 11 | |||||||||||||||
| 8,283 | 7,408 | 9,831 | (3,028 | ) | 11,251 | 14,356 | — | 1 | ||||||||||||||||||||||
| 13,880 | (17,941 | ) | 43,097 | 93,947 | 1,917 | 631 | 100 | (100 | ) | |||||||||||||||||||||
| 25,934 | (5,825 | ) | 127,415 | 167,049 | 21,286 | 27,125 | 100 | (88 | ) | |||||||||||||||||||||
| (3,892 | ) | (5,284 | ) | (74,487 | ) | (76,130 | ) | (8,147 | ) | (11,915 | ) | — | (135 | ) | ||||||||||||||||
| — | — | (2,493 | ) | — | (10,695 | ) | (2,650 | ) | — | — | ||||||||||||||||||||
| — | — | — | — | — | — | — | — | |||||||||||||||||||||||
| (3,892 | ) | (5,284 | ) | (76,980 | ) | (76,130 | ) | (18,842 | ) | (14,565 | ) | — | (135 | ) | ||||||||||||||||
| 22,042 | (11,109 | ) | 50,435 | 90,919 | 2,444 | 12,560 | 100 | (223 | ) | |||||||||||||||||||||
| 4,818 | 9,772 | 82,309 | 62,668 | 23,625 | 32,622 | 88,055 | 81,055 | |||||||||||||||||||||||
| 3,393 | 4,588 | 53,624 | 52,299 | 14,078 | 10,532 | — | 121 | |||||||||||||||||||||||
| (27,180 | ) | (23,037 | ) | (132,096 | ) | (152,907 | ) | (38,769 | ) | (43,010 | ) | (101,004 | ) | (110,683 | ) | |||||||||||||||
| (18,969 | ) | (8,677 | ) | 3,837 | (37,940 | ) | (1,066 | ) | 144 | (12,949 | ) | (29,507 | ) | |||||||||||||||||
| 3,073 | (19,786 | ) | 54,272 | 52,979 | 1,378 | 12,704 | (12,849 | ) | (29,730 | ) | ||||||||||||||||||||
| 210,095 | 229,881 | 1,730,904 | 1,677,925 | 363,029 | 350,325 | 177,378 | 207,108 | |||||||||||||||||||||||
| $ | 213,168 | $ | 210,095 | $ | 1,785,176 | $ | 1,730,904 | $ | 364,407 | $ | 363,029 | $ | 164,529 | $ | 177,378 | |||||||||||||||
| $ | 13 | $ | (7 | ) | $ | 70 | $ | — | $ | 295 | $ | 64 | $ | — | $ | — | �� | |||||||||||||
| 269 | 557 | 6,712 | 5,418 | 1,997 | 2,872 | 88,055 | 80,925 | |||||||||||||||||||||||
| 186 | 279 | 4,361 | 4,522 | 1,200 | 919 | — | 121 | |||||||||||||||||||||||
| (1,522 | ) | (1,324 | ) | (10,751 | ) | (13,390 | ) | (3,269 | ) | (3,782 | ) | (101,004 | ) | (110,681 | ) | |||||||||||||||
| (1,067 | ) | (488 | ) | 322 | (3,450 | ) | (72 | ) | 9 | (12,949 | ) | (29,635 | ) | |||||||||||||||||
83
Table of Contents
December 31, 2012
| 1. | Organization of the Funds |
The Elfun Funds (each a “Fund” and collectively the “Funds”) are registered under the Investment Company Act of 1940, as amended (the “1940 Act”), as open-end management investment companies. The Funds operate as Employees’ Securities Companies (as defined in the 1940 Act) and as such are exempt from certain provisions of the 1940 Act.
GE Asset Management Incorporated (“GEAM”), the Funds’ investment adviser, is a wholly owned subsidiary of General Electric Company.
| 2. | Summary of Significant Accounting Policies |
The preparation of financial statements in conformity with U.S. generally accepted accounting principles (GAAP) requires management to make estimates and assumptions that affect the reported amounts of assets and liabilities and disclosure of contingent assets and liabilities at the date of the financial statements and the reported amounts of increases and decreases in net assets from operations during the reporting period. Actual results may differ from those estimates.
Subsequent events after the balance sheet date through the date the financial statements were issued, have been evaluated in the preparation of the financial statements.
There are no items to report.
The following summarizes the significant accounting policies of the Funds:
Securities Valuation and Transactions All investments in securities are recorded at their estimated fair value, as described in Note 3.
Securities transactions are accounted for as of the trade date. Realized gains and losses on investments sold are recorded on the basis of identified cost for both financial statement and federal tax purposes.
Repurchase Agreements Some of the Funds engage in repurchase agreement transactions with respect to instruments that are consistent with the Fund’s invest-
ment objectives or policies. The Funds’ custodian takes possession of the collateral pledged for investments in repurchase agreements on behalf of the Funds. The Funds value the underlying collateral daily on a mark-to-market basis to determine that the value, including accrued interest, is at least equal to 102% for domestic securities and 105% international securities of the repurchase price. In the event the seller defaults and the value of the security declines, or if the seller enters an insolvency proceeding, realization of the collateral by the Funds may be delayed or limited.
Foreign Currency Accounting records of the Funds are maintained in U.S. dollars. Investment securities and other assets and liabilities denominated in a foreign currency are translated to U.S. dollars at the prevailing rates of exchange at period end. Purchases and sales of securities, income receipts and expense payments denominated in foreign currencies are translated into U.S. dollars at the prevailing exchange rate on the respective dates of such transactions.
All assets and liabilities of the Funds initially expressed in foreign currency values will be converted into U.S. dollars at the WM/Reuter exchange rate computed at 11:00 a.m., Eastern time.
The Funds do not isolate the portion of the results of operations resulting from changes in foreign exchange rates from the fluctuations arising from changes in the market prices of securities during the year. Such fluctuations are included in the net realized or unrealized gain or loss from investments. Net realized gains or losses on foreign currency transactions represent net gains or losses on sales and maturities of foreign currency contracts, disposition of foreign currencies, the difference between the amount of net investment income and withholding taxes accrued and the U.S. dollar amount actually received or paid, and gains or losses between the trade and settlement date on purchases and sales of foreign securities. Net unrealized foreign exchange gains and losses arising from changes in the value of other assets and liabilities (including foreign currencies and open foreign currency contracts) as a result of changes in foreign exchange rates are included as increases or decreases in unrealized appreciation/depreciation on foreign currency related transactions.
84
Table of Contents
December 31, 2012

Derivatives The Funds are subject to equity price risk, interest rate risk, credit risk, and foreign currency exchange rate risk in the normal course of pursuing their investment objectives. Certain Funds entered into derivative transactions to gain market exposure for residual and accumulating cash positions, and for managing the duration of fixed-income investments.
Futures Contracts A futures contract represents a commitment for the future purchase or sale of an asset at a specified price on a specified date. Certain Funds invest in interest rate, financial and stock or bond index futures contracts subject to certain limitations. The Elfun International Equity Fund entered into futures contracts for the purpose of gaining market exposure and investing residual cash positions. The Elfun Diversified Fund entered into futures contracts for the purposes of gaining market exposure, investing residual cash positions and managing duration of fixed income investments. The Elfun Income Fund entered into futures contracts for the purpose of managing duration of fixed income investments. Buying futures tends to increase a Fund’s exposure to the underlying instrument while selling futures tends to decrease a Fund’s exposure to the underlying instrument, or hedge other Fund investments. With futures contracts, there is minimal counterparty credit risk to the Funds since futures contracts are exchange traded and the exchange’s clearinghouse, as counterparty to all traded futures, guarantees the futures against default. A Fund’s risks in using these contracts include changes in the value of the underlying instruments, non-performance of the counterparties under the contracts’ terms and changes in the liquidity of the secondary market for the contracts. Futures contracts are valued at the settlement price established each day by the board of trade or exchange on which they principally trade.
Upon entering into a financial futures contract, the Funds are required to pledge to the broker an amount of cash and/or other assets equal to a certain percentage of the contract amount, known as initial margin deposit. Subsequent payments, known as variation margin, are made or received by the Funds each day, depending on the daily fluctuation in the fair value of the underlying security. The Funds record an unrealized gain or loss equal to the daily variation margin. Should market conditions move unexpectedly, the Funds may not achieve the
anticipated benefits of the futures contracts and may incur a loss. The Funds recognize a realized gain or loss on the expiration or closing of a futures contract.
When-Issued Securities and Forward Commitments Certain Funds purchase or sell securities on a when-issued or forward commitment basis. These transactions are arrangements in which the Funds purchase and sell securities with payment and delivery scheduled a month or more after entering into the transaction. The price of the underlying securities and the date when these securities will be delivered and paid for are fixed at the time the transaction is negotiated. Losses may arise due to changes in the market value of the underlying securities or if the counterparty does not perform under the commitments. In connection with such purchases, the Funds maintain cash or liquid assets in an amount equal to the purchase commitments for such underlying securities until settlement date and for sales commitments the Funds maintain equivalent deliverable securities as “cover” for the transaction. Unsettled commitments are valued at the current market value of the underlying security. Daily fluctuations in the value of such commitments are recorded as unrealized gains or losses. The Funds will not enter into such commitments for the purpose of investment leverage.
Forward Foreign Currency Exchange Contracts The Elfun Diversified Fund entered into forward foreign currency exchange contracts to facilitate transactions in foreign denominated securities and to manage the Funds’ currency exposure. Forward foreign currency exchange contracts are valued at the mean between the bid and the offered forward rates as last quoted by a recognized dealer. The aggregate principal amounts of the contracts are not recorded in the Funds’ financial statements. Such amounts appear under the caption Forward Foreign Currency Contracts in the Schedule of Investments. Fluctuations in the value of the contracts are recorded in the Statement of Assets and Liabilities as an asset (or liability) and in the Statement of Operations as unrealized appreciation (depreciation) until the contracts are closed, when they are recorded as realized gains or losses on foreign currency related transactions. The Funds’ risks in using these contracts include changes in the value of foreign currency or the possibility that the counterparties do not perform under the contracts’ terms. When a Fund
85
Table of Contents
December 31, 2012
enters into a forward foreign currency exchange contract, it is required to segregate cash or liquid securities with its custodian in an amount equal to the value of the Fund’s total assets committed to the consummation of the forward contract. If the value of the segregated securities declines, additional cash or securities are segregated so that the value of the account will equal the amount of the Fund’s commitment with respect to the contract.
Investments in Foreign Markets Investments in foreign markets involve special risks and considerations not typically associated with investing in the United States. These risks include revaluation of currencies, high rates of inflation, restrictions on repatriation of income and capital, and adverse political and economic developments. Moreover, securities issued in these markets may be less liquid, subject to government ownership controls, tariffs and taxes, subject to delays in settlements, and their prices may be more volatile.
The Funds may be subject to capital gains and repatriation taxes imposed by certain countries in which they invest. Such taxes are generally based upon income and/or capital gains earned or repatriated. Taxes are accrued based on net investment income, net realized gains and net unrealized appreciation as income and/or capital gains are earned.
Investment Income Corporate actions (including cash dividends) are recorded on ex-dividend date, net of applicable withholding taxes, except for certain foreign corporate actions which are recorded as soon after ex-dividend date as such information becomes available. Withholding taxes in foreign dividends have been provided for in accordance with the Funds’ understanding of the applicable country’s tax rules and rates.
Interest income is recorded on the accrual basis. Accretion of discounts and amortization premiums on taxable bonds are to the call or maturity date, whichever is shorter, using the effective yield method.
Expenses Fund specific expenses are charged to the Fund that incurs such expenses. Such expenses may include custodial fees, legal and accounting fees, printing costs and registration fees. Expenses that are not fund specific are allocated pro rata across the Funds. Expenses of the
fund are generally paid directly by the fund, however, expenses may be paid by GEAM and reimbursed by the fund.
Federal Income Taxes The Funds intend to comply with all sections of the Internal Revenue Code applicable to regulated investment companies, including the distribution of substantially all of their taxable net investment income, tax-exempt income, and net realized capital gains to their shareholders. Therefore, no provision for federal income tax has been made. Each Fund is treated as a separate taxpayer for federal income tax purposes.
| 3. | Securities Valuation |
The Funds utilize various methods to measure the fair value of most of its investments on a recurring basis. GAAP establishes a framework for measuring fair value and providing related disclosures. Broadly, the framework requires fair value to be determined based on the exchange price that would be received for an asset or paid to transfer a liability (an exit price) in the principal or most advantageous market for the asset or liability in an orderly transaction between market participants at the measurement date. In the absence of active markets for the identical assets or liabilities, such measurements involve developing assumptions based on market observable data and, in the absence of such data, internal information that is consistent with what market participants would use in a hypothetical transaction that occurs at the measurement date. It also establishes a three-level valuation hierarchy based upon observable and non-observable inputs.
Observable inputs reflect market data obtained from independent sources, while unobservable inputs reflect our market assumptions. Preference is given to observable inputs. These two types of inputs create the following fair value hierarchy:
Level 1—Quoted prices for identical investments in active markets.
Level 2—Quoted prices for similar investments in active markets; quoted prices for identical or similar investments in markets that are not active; and model-derived valuations whose inputs are observable or whose significant value drivers are observable.
86
Table of Contents
December 31, 2012
Level 3—Significant inputs to the valuation model are unobservable.
Policies and procedures are maintained to value investments using the best and most relevant data available. In addition, pricing vendors are utilized to assist in valuing investments. GEAM performs periodic reviews of the methodologies used by independent pricing services including price validation of individual securities.
Fair Value Measurement The following section describes the valuation methodologies the Funds use to measure different financial investments at fair value.
A Fund’s portfolio securities are valued generally on the basis of market quotations. Equity securities generally are valued at the last reported sale price on the primary market in which they are traded. Portfolio securities listed on NASDAQ are valued using the NASDAQ Official Closing Price, Level 1 securities primarily include publicly-traded equity securities. If no sales occurred on the exchange or NASDAQ that day, the portfolio security generally is valued using the last reported bid price. In those circumstances the Fund classifies the investment securities in Level 2.
Debt securities (other than short-term securities described below) generally are valued at an evaluated bid price as reported by independent pricing services. The pricing services use various pricing models for each asset class. The inputs and assumptions to the model of the pricing services are derived from market observable sources, including: benchmark yields, reported trades, broker/dealer quotes, issuer spreads, benchmark securities, bids, offers, and other market related data. Since many fixed income securities do not trade on a daily basis, the methodology of the pricing service uses other available information as applicable such as benchmark curves, benchmarking of similar securities, sector groupings, and matrix pricing. Thus, certain securities may not be priced using quoted prices, but rather determined from market observable information. These investments are included in Level 2 and are primarily comprised of corporate fixed income, government, mortgage and asset-backed securities. In the absence of a reliable bid price from such a pricing service, debt securities may be valued based on broker or dealer supplied valuations or quotations. In these infrequent circumstances, pricing services
may provide the Fund with valuations that are based on significant unobservable inputs, and in those circumstances the investment securities are classified as Level 3.
A Fund may use non-binding broker or dealer quotes for valuation when there is limited or no relevant market activity for a specific investment or for other investments that share similar characteristics and a price is not provided by a pricing service or is deemed not to be reliable. The Funds have not adjusted the prices obtained. Investment securities priced using non-binding broker or dealer quotes are included in Level 3.
Portfolio Securities and any short-term investments of sufficient credit quality with remaining maturities of sixty days or less at the time of purchase are typically valued on the basis of amortized cost which approximates fair value and these are included in Level 2.
If it is determined that amortized cost does not approximate fair value, securities may be valued based on dealer supplied valuations or quotations. In these infrequent circumstances, pricing services may provide the Fund with valuations that are based on significant unobservable inputs, and in those circumstances the investment securities are classified in Level 3.
If prices are not readily available for a portfolio security, or if it is believed that a price for a portfolio security does not represent its fair value, the security may be valued using procedures approved by the Funds’ Board of Trustees that are designed to establish its “fair” value. These securities are typically classified in Level 3. Those procedures require that the fair value of a security be established by a valuation committee of GEAM. The valuation committee follows different protocols for different types of investments and circumstances. The fair value procedures may be used to value any investment of any Fund in the appropriate circumstances.
Foreign securities may be valued with the assistance of an independent fair value pricing service in circumstances where it is believed that they have been or would be materially affected by events occurring after the close of the portfolio security’s primary market and before the close of regular trading on the NYSE. In these circumstances the Fund classifies the investment securities in Level 2. This independent fair value pricing service uses a
87
Table of Contents
December 31, 2012
proprietary model to identify affected securities, taking into consideration various factors, and the fair value of such securities may be something other than the last available quotation or other market price.
All assets and liabilities of the Funds initially expressed in foreign currency values will be converted into U.S. dollars at the WM/Reuters exchange rate computed at 11:00 a.m. Eastern time.
Fair value determinations generally are used for securities whose value is affected by a significant event that will materially affect the value of a security and which occurs subsequent to the time of the close of the principal market on which such security trades but prior to the calculation of the Fund’s NAV.
The value established for such a portfolio security may be different than what would be produced through the use of market quotations or another methodology. Portfolio securities that are valued using techniques other than market quotations, including “fair valued” securities, may be subject to greater fluctuation in their value from one day to the next than would be the case if market quota-
tions were used. In addition, there is no assurance that a Fund could sell a portfolio security for the value established for it at any time and it is possible that the Fund would incur a loss because a portfolio security is sold at a discount to its established value.
Other financial investments are derivative instruments that are not reflected in total investments, such as futures, forwards, swaps, and written options contracts, which are valued based on fair value as discussed above.
The Funds use closing prices for derivatives included in Level 1, which are traded either on exchanges or liquid over-the counter markets. Derivative assets and liabilities included in Level 2 primarily represent interest rate swaps, cross-currency swaps and foreign currency and commodity forward and option contracts. Derivative assets and liabilities included in Level 3 primarily represent interest rate products that contain embedded optionality or prepayment features.
The inputs or methodology used for valuing securities are not an indication of the risk associated with investing in those securities.
The following tables present the Funds’ investments measured at fair value on a recurring basis at December 31, 2012:
| (Dollars in thousands) | ||||||||||||||||||
| Fund | Investments | Level 1 | Level 2 | Level 3 | Total | |||||||||||||
Elfun International | Investments in Securities † | |||||||||||||||||
| Common Stock | $ | 11,238 | $ | 237,309 | $ | — | $ | 248,547 | ||||||||||
| Preferred Stock | — | 4,815 | — | 4,815 | ||||||||||||||
| Short-Term Investments | 6,703 | — | — | 6,703 | ||||||||||||||
| Total Investments in Securities | $ | 17,941 | $ | 242,124 | $ | — | $ | 260,065 | ||||||||||
| Other Financial Instruments * | ||||||||||||||||||
| Futures Contracts — Unrealized Appreciation | $ | 145 | $ | — | $ | — | $ | 145 | ||||||||||
| Futures Contracts — Unrealized Depreciation | (14 | ) | — | — | (14 | ) | ||||||||||||
| Total Other Financial Instruments | $ | 131 | $ | — | $ | — | $ | 131 | ||||||||||
Elfun Trusts | Investments in Securities † | |||||||||||||||||
| Common Stock | $ | 1,768,581 | $ | — | $ | — | $ | 1,768,581 | ||||||||||
| Short-Term Investments | 51,166 | — | — | 51,166 | ||||||||||||||
| Total Investments in Securities | $ | 1,819,747 | $ | — | $ | — | $ | 1,819,747 | ||||||||||
88
Table of Contents
December 31, 2012
| (Dollars in thousands) | ||||||||||||||||||
| Fund | Investments | Level 1 | Level 2 | Level 3 | Total | |||||||||||||
Elfun Diversified Fund | Investments in Securities † | |||||||||||||||||
| Domestic Equity | $ | 78,780 | $ | — | $ | — | $ | 78,780 | ||||||||||
| Foreign Equity | 3,617 | 34,148 | — | 37,765 | ||||||||||||||
| U.S. Treasuries | — | 21,113 | — | 21,113 | ||||||||||||||
| Agency Mortgage Backed | — | 20,284 | — | 20,284 | ||||||||||||||
| Agency CMOs | — | 530 | — | 530 | ||||||||||||||
| Asset Backed | — | 32 | — | 32 | ||||||||||||||
| Corporate Notes | — | 19,140 | — | 19,140 | ||||||||||||||
| Non-Agency CMOs | — | 1,958 | — | 1,958 | ||||||||||||||
| Sovereign Bonds | — | 1,032 | — | 1,032 | ||||||||||||||
| Municipal Notes and Bonds | — | 353 | — | 353 | ||||||||||||||
| Exchange Traded Funds | 11,836 | — | — | 11,836 | ||||||||||||||
| Preferred Stock | — | 693 | — | 693 | ||||||||||||||
| Short-Term Investments | 30,991 | — | — | 30,991 | ||||||||||||||
| Total Investments in Securities | $ | 125,224 | $ | 99,283 | $ | — | $ | 224,507 | ||||||||||
| Other Financial Instruments * | ||||||||||||||||||
| Futures Contracts — Unrealized Appreciation | $ | 251 | $ | — | $ | — | $ | 251 | ||||||||||
| Futures Contracts — Unrealized Depreciation | (57 | ) | — | — | (57 | ) | ||||||||||||
| Foreign Currency Forward Exchange Contracts — Unrealized Depreciation | (12 | ) | — | — | (12 | ) | ||||||||||||
| Total Other Financial Instruments | $ | 182 | $ | — | $ | — | $ | 182 | ||||||||||
Elfun Tax-Exempt Income Fund | Investments in Securities † | |||||||||||||||||
| Municipal Bonds and Notes | $ | — | $ | 1,773,397 | $ | — | $ | 1,773,397 | ||||||||||
| Short-Term Investments | — | 18,577 | — | 18,577 | ||||||||||||||
| Total Investments in Securities | $ | — | $ | 1,791,974 | $ | — | $ | 1,791,974 | ||||||||||
Elfun Income Fund | Investments in Securities † | |||||||||||||||||
| U.S. Treasuries | $ | — | $ | 97,569 | $ | — | $ | 97,569 | ||||||||||
| Agency Mortgage Backed | — | 111,150 | — | 111,150 | ||||||||||||||
| Agency CMOs | — | 3,024 | 3,024 | |||||||||||||||
| Asset Backed | — | 1,183 | — | 1,183 | ||||||||||||||
| Corporate Notes | — | 104,450 | — | 104,450 | ||||||||||||||
| Non-Agency CMOs | — | 10,852 | — | 10,852 | ||||||||||||||
| Sovereign Bonds | — | 4,511 | — | 4,511 | ||||||||||||||
| Municipal Notes and Bonds | — | 1,999 | — | 1,999 | ||||||||||||||
| Short-Term Investments | 64,620 | 25,496 | — | 90,116 | ||||||||||||||
| Total Investments in Securities | $ | 64,620 | $ | 360,234 | $ | — | $ | 424,854 | ||||||||||
89
Table of Contents
December 31, 2012
| (Dollars in thousands) | ||||||||||||||||||
| Fund | Investments | Level 1 | Level 2 | Level 3 | Total | |||||||||||||
| Other Financial Instruments * | ||||||||||||||||||
| Futures Contracts — Unrealized Appreciation | $ | 457 | $ | — | $ | — | $ | 457 | ||||||||||
| Futures Contracts — Unrealized Depreciation | (280 | ) | — | — | (280 | ) | ||||||||||||
| Total Other Financial Instruments | $ | 177 | $ | — | $ | — | $ | 177 | ||||||||||
Elfun Money Market | Investments in Securities † | |||||||||||||||||
| U.S. Treasuries | $ | — | $ | 19,016 | $ | — | $ | 19,016 | ||||||||||
| U.S. Government Agency Obligations | — | 54,594 | — | 54,594 | ||||||||||||||
| Commercial Paper | — | 35,996 | — | 35,996 | ||||||||||||||
| Repurchase Agreements | — | 11,810 | — | 11,810 | ||||||||||||||
| Corporates | — | 12,358 | — | 12,358 | ||||||||||||||
| Certificates of Deposit | — | 30,200 | — | 30,200 | ||||||||||||||
| Time Deposit | — | 170 | — | 170 | ||||||||||||||
| Total Investments in Securities | $ | — | $ | 164,144 | $ | — | $ | 164,144 | ||||||||||
| † | See Schedule of Investments for Industry Classification |
| * | Other financial instruments include derivative instruments such as futures and forward exchange contracts. Amounts shown represent unrealized appreciation (depreciation), at period end. |
The following tables present the changes in Level 3 investments measured on a recurring basis for the period ended December 31, 2012 (Dollars in thousands):
| Elfun Money Market Fund | Corporates | Total | ||||||
Balance at 12/31/11 | $ | 3,501 | $ | 3,501 | ||||
Accrued discounts/premiums | (1 | ) | (1 | ) | ||||
Realized gain (loss) | — | — | ||||||
Change in unrealized gain (loss) | 100 | 100 | ||||||
Purchases | — | — | ||||||
Sales | (3,600 | ) | (3,600 | ) | ||||
Issuances | — | — | ||||||
Settlements | — | — | ||||||
Transfers into Level 3 | — | — | ||||||
Transfers out of Level 3 | — | — | ||||||
Balance at 12/31/12 | $ | — | $ | — | ||||
Change in unrealized depreciation relating to securities still held at 12/31/12 | $ | — | $ | — | ||||
The Elfun International Equity Fund and the Elfun Diversified Fund utilized the fair value pricing service on December 31, 2012 due to events occurring after the close of foreign local markets and before the close of regular trading on the NYSE. This resulted in certain foreign securities being classified as Level 2 at the end of the period which were classified as Level 1 at December 31, 2011. The value of securities that were transferred to Level 2 from Level 1 as a result was $173,801 and $24,545, respectively (dollars in thousands).
There were no other transfers between Level 1 and Level 2. Transfers between fair value levels are considered to occur at the beginning of the period.
90
Table of Contents
December 31, 2012
| 4. | Derivatives Disclosure |
Shown below are the derivative contracts entered into by the Fund, summarized by primary risk exposure as they appear on the Statement of Assets and Liabilities, all of which are not accounted for as hedging instruments under FASB Accounting Standards Codification (“ASC”) No. 815 Derivatives and Hedging as of December 31, 2012:
(Dollars in thousands): | ||||||||||||
Asset Derivatives December 31, 2012 | Liability Derivatives December 31, 2012 | |||||||||||
| Derivatives not accounted for as hedging instruments under ASC 815 | Location in the Statements of Assets and Liabilities | Fair Value ($) | Location in the Statements of Assets and Liabilities | Fair Value ($) | ||||||||
Elfun International Equity Fund | ||||||||||||
Equity Contracts | Assets, Net Assets — Net Unrealized Appreciation (Depreciation) on Futures | 145 | * | Liabilities, Net Assets — Net Unrealized Appreciation (Depreciation) on Futures | (14 | )* | ||||||
Elfun Diversified Fund | ||||||||||||
Equity Contracts | Assets, Net Assets — Net Unrealized Appreciation (Depreciation) on Futures | 136 | * | Liabilities, Net Assets — Net Unrealized Appreciation (Depreciation) on Futures | (6 | )* | ||||||
Interest Rate Contracts | Assets, Net Assets — Net Unrealized Appreciation (Depreciation) on Futures | 115 | * | Liabilities, Net Assets — Net Unrealized Appreciation (Depreciation) on Futures | (51 | )* | ||||||
Foreign Currency Forward Exchange Contracts | Assets, Net Assets — Net Unrealized Appreciation (Depreciation) on Foreign Currency Forward Exchange Contracts | — | Liabilities, Net Assets — Net Unrealized Appreciation (Depreciation) on Foreign Currency Forward Exchange Contracts | (13 | ) | |||||||
Elfun Income Fund | ||||||||||||
Interest Rate Contracts | Assets, Net Assets — Net Unrealized Appreciation (Depreciation) on Futures | 457 | * | Liabilities, Net Assets — Net Unrealized Appreciation (Depreciation) on Futures | (280 | )* | ||||||
| * | Includes cumulative unrealized appreciation (depreciation) of futures contracts as reported in the Schedule of Investments and within the components of the net assets section of the Statements of Assets and Liabilities. Only the current day’s variation margin is reported within the receivables and/or payables of the Statements of Assets and Liabilities. |
91
Table of Contents
December 31, 2012
Shown below are the effects of derivative instruments on each Fund’s Statement of Operation, summarized by primary risk exposure all of which are not accounted for as hedging instruments under ASC 815.
| Derivatives not accounted for as hedging instruments under ASC 815 | Location in the Statements of Operations | Total Notional Amount of Futures Contracts Purchased/(Sold) ($) | Realized Gain (Loss) on Derivatives Recognized in Income ($) | Change in Unrealized Appreciation (Depreciation) on Derivatives Recognized in Income ($) | ||||||||||
Elfun International Equity Fund | ||||||||||||||
Equity Contracts | Realized gain (loss) on futures, Increase (decrease) in unrealized appreciation (depreciation) on Futures | 46,919/(48,012) | 136 | 49 | ||||||||||
Elfun Diversified Fund | ||||||||||||||
Equity Contracts | Realized gain (loss) on futures, Increase (decrease) in unrealized appreciation (depreciation) on Futures | 58,542/(54,748) | 1,397 | 92 | ||||||||||
Interest Rate Contracts | Realized gain (loss) on futures, Increase (decrease) in unrealized appreciation (depreciation) on Futures | 159,585/(159,515) | (705 | ) | 223 | |||||||||
Foreign Currency Forward Exchange Contracts | Realized gain (loss) on futures, Increase (decrease) in unrealized appreciation (depreciation) on Foreign Currency Forward Exchange Contracts | 0/(7,335) | 106 | 7 | ||||||||||
Elfun Income Fund | ||||||||||||||
Interest Rate Contracts | Realized gain (loss) on futures, Increase (decrease) in unrealized appreciation (depreciation) on Futures | 784,578/(773,980) | (2,952 | ) | 779 | |||||||||
| 5. | Line of Credit |
The Funds share a revolving credit facility of up to $150 million with a number of its affiliates. The credit facility is with its custodian bank, State Street Bank and Trust Company (“State Street”). The revolving credit facility requires the payment of a commitment fee equal to 0.100% per annum on the daily unused portion of the
credit facility, payable quarterly. The portion borne by the Funds generally is borne proportionally based upon net assets. In addition, the Funds have a $100 million uncommitted, unsecured line of credit with State Street. Generally, borrowings under the credit facilities would accrue interest at the Federal Funds Rate plus 50 basis points and would be borne by the borrowing Fund. The maximum amount allowed to be borrowed by any one
92
Table of Contents
December 31, 2012
Fund is the lesser of (i) its prospectus limitation or (ii) 20% of its net assets. The credit facilities were not utilized by the Funds during the period ended December 31, 2012.
| 6. | Compensation and Fees paid to Affiliates |
During 2012, the Funds incurred expenses for the cost of services rendered by GEAM as investment adviser and for services GEAM rendered as unitholder servicing agent.
These expenses are included as administration expenses and unitholder servicing agent expenses in the Statements of Operations. The Trustees received no compensation as Trustees for the Elfun Funds.
GEAM has a contractual arrangement with each Fund (except the Elfun Tax-Exempt Income Fund and the Elfun Money Market Fund) to waive a portion of the Funds’ Management fees in the amount equal to the Management fee earned by GEAM with respect to the Funds’ investment in the GE Institutional Money Market Fund.
| 7. | Investment Transactions |
Purchases and Sales of Securities
The cost of purchases and the proceeds from sales of investments, other than short-term securities and short-term options, for the year ended December 31, 2012, were as follows:
| (Amounts in Thousands): | U.S. Government Securities | Other Securities | ||||||||||||||||
| Fund | Purchases | Sales | Purchases | Sales | ||||||||||||||
Elfun International Equity Fund | $ | — | $ | — | $ | 155,389 | $ | 136,820 | ||||||||||
Elfun Trusts | — | — | 188,125 | 351,429 | ||||||||||||||
Elfun Diversified Fund | 227,214 | 216,744 | 108,233 | 140,265 | ||||||||||||||
Elfun Tax-Exempt Income Fund | — | — | 562,794 | 497,108 | ||||||||||||||
Elfun Income Fund | 1,135,624 | 1,091,971 | 170,459 | 220,478 | ||||||||||||||
| 8. | Income Taxes |
The Funds are subject to ASC 740, Income Taxes. ASC 740 provides guidance for financial accounting and reporting for the effects of income taxes that result from an entity’s activities during the year. ASC 740 also provides guidance regarding how certain tax positions should be recognized, measured, presented and disclosed in the financial statements. ASC 740 requires
evaluation of tax positions taken or expected to be taken in the course of preparing the Funds’ tax returns to determine whether the tax positions are “more likely than not” of being sustained by the applicable tax authority. There are no adjustments to the Funds’ net assets required under ASC 740. The Funds’ 2009, 2010, 2011 and 2012 fiscal years tax returns are still open to examination by the Federal and applicable state tax authorities.
93
Table of Contents
December 31, 2012
At December 31, 2012, information on the tax components of capital was as follows:
| (Amounts in thousands) | ||||||||||||||||||||||||||||||||
| Gross Unrealized Tax | Net Tax Appreciation/ (Depreciation) | Undistributed | ||||||||||||||||||||||||||||||
| Fund | Cost of Investments For Tax Purposes | Appreciation | Depreciation | Investments | Derivatives/ Currency | Income | Accumulated Capital Loss | Late-Year Losses | ||||||||||||||||||||||||
Elfun International Equity Fund | $ | 225,921 | $ | 42,241 | $ | (8,097 | ) | $ | 34,144 | $ | 145 | $ | — | $ | (61,857 | ) | $ | — | ||||||||||||||
Elfun Trusts | 1,310,222 | 541,446 | (31,921 | ) | 509,525 | — | 212 | — | — | |||||||||||||||||||||||
Elfun Diversified Fund | 210,164 | 17,912 | (3,569 | ) | 14,343 | (5 | ) | — | (2,062 | ) | — | |||||||||||||||||||||
Elfun Tax-Exempt Income Fund | 1,634,226 | 158,802 | (1,054 | ) | 157,748 | — | 70 | 12 | (90 | ) | ||||||||||||||||||||||
Elfun Income Fund | 418,448 | 8,608 | (2,202 | ) | 6,406 | — | 1,204 | — | — | |||||||||||||||||||||||
Elfun Money Market Fund | 164,144 | — | — | — | — | 68 | — | — | ||||||||||||||||||||||||
As of December 31, 2012, the following Funds have capital loss carryovers as indicated below. The capital loss carryover is available to offset future realized capital gains to the extent provided in the Internal Revenue Code and regulations thereunder. To the extent that these carryover losses are used to offset future capital gains, it is probable that the gains so offset will not be distributed to shareholders.
| Amounts (In thousands) | ||||||||||||
| Fund | Short-Term | Long-Term | Expires | |||||||||
Elfun International Equity Fund | $ | 33,349 | $ | — | 12/31/17 | |||||||
| 13,483 | — | 12/31/18 | ||||||||||
| 8,869 | 6,156 | N/A | ||||||||||
Elfun Diversified Fund | 2,062 | — | 12/31/17 | |||||||||
These amounts will be available to offset future taxable capital gains. Under the Regulated Investment Company Modernization Act of 2010, the Fund will be permitted to carry forward capital losses incurred in taxable years beginning after December 22, 2010 for an unlimited period. However, any losses incurred during those future years will be required to be utilized prior to the losses incurred in pre-enactment tax years. As a result of this ordering rule, pre-enactment capital loss carryforwards may be more likely to expire unused. Additionally, post-enactment capital losses that are carried forward will retain their character as either short-term or long-term capital losses rather than being considered all short-term as under previous law.
94
Table of Contents
December 31, 2012
During the year ended December 31, 2012, the Funds utilized prior year capital loss carryovers as follows:
| Fund (Amounts in thousands) | Amount | |||
Elfun Diversified Fund | $ | 7,429 | ||
Elfun Tax-Exempt Income Fund | 7,301 | |||
Elfun Money Market Fund | 9 | |||
Any qualified late-year loss is deemed to arise on the first day of the Fund’s next tax year (if the Fund elects to defer such loss). Under this regime, generally, the Fund can elect to defer any post-October capital loss and/or any late-year ordinary loss as defined by the Internal Revenue Code.
The following Fund elected to defer qualified late-year losses for the year ended December 31, 2012 as follows:
| Fund (Amounts in thousands) | Capital | Ordinary | ||||||
Elfun Tax-Exempt Income Fund | $ | 90 | $ | — | ||||
The tax character of distributions paid during the year ended December 31, 2012, were as follows:
| Fund (Amounts in thousands) | Exempt Interest | Ordinary Income | Long-Term Capital Gains | Return of Capital | Total | |||||||||||||||
Elfun International Equity Fund | $ | — | $ | 4,895 | $ | — | $ | 12 | $ | 4,907 | ||||||||||
Elfun Trusts | — | 29,234 | 154,751 | — | 183,985 | |||||||||||||||
Elfun Diversified Fund | — | 3,892 | — | — | 3,892 | |||||||||||||||
Elfun Tax-Exempt Income Fund | 72,267 | 2,220 | 2,493 | — | 76,980 | |||||||||||||||
Elfun Income Fund | — | 18,842 | — | — | 18,842 | |||||||||||||||
The tax composition of distributions paid during the year ended December 31, 2011, were as follows:
| Fund (In thousands) | Exempt Interest | Ordinary Income | Long-Term Capital Gains | Return of Capital | Total | |||||||||||||||
Elfun International Equity Fund | $ | — | $ | 6,736 | $ | — | $ | 199 | $ | 6,935 | ||||||||||
Elfun Trusts | — | 18,959 | 43,352 | — | 62,311 | |||||||||||||||
Elfun Diversified Fund | — | 5,284 | — | — | 5,284 | |||||||||||||||
Elfun Tax-Exempt Income Fund | 74,163 | 1,967 | — | — | 76,130 | |||||||||||||||
Elfun Income Fund | — | 14,565 | — | — | 14,565 | |||||||||||||||
Elfun Money Market Fund | — | 135 | — | — | 135 | |||||||||||||||
Distributions to Shareholders
Elfun Tax-Exempt Income Fund, Elfun Income Fund and Elfun Money Market Fund declare net investment income dividends daily and pay them monthly. All other Funds declare and pay dividends from net investment income annually. All Funds declare and pay net realized capital gains distributions annually. The character of income and gains to be distributed is determined in accordance with income tax regulations which may differ from generally
accepted accounting principles. These differences include (but are not limited to) treatment of realized and unrealized gains and losses on foreign currency contracts, futures, investments organized as partnerships for tax purposes, distributions from Real Estate Investment Trusts (REITs) and other equity investments, losses deferred due to offsetting positions, and losses deferred due to wash sale transactions. Reclassifications are made to the Funds’ capital accounts to reflect income and gains
95
Table of Contents
December 31, 2012
available for distribution (or available capital loss carryovers) under income tax regulations. These reclassifications have no impact on net investment income, realized gains or losses, or net asset value of the
Funds. The calculation of net investment income per share in the Financial Highlights table excludes these adjustments.
The reclassifications for the year ended December 31, 2012 were as follows:
| Fund (Amounts in thousands) | Undistributed Net Investment Income | Accumulated Net Realized Gain (Loss) | Capital paid In | |||||||||
Elfun International Equity Fund | $ | (22 | ) | $ | 29 | $ | (7 | ) | ||||
Elfun Trusts | 95 | (99 | ) | 4 | ||||||||
Elfun Diversified Fund | 141 | (120 | ) | (21 | ) | |||||||
Elfun Tax-Exempt Income Fund | 70 | (70 | ) | — | ||||||||
Elfun Income Fund | 261 | (261 | ) | — | ||||||||
Elfun Money Market Fund | — | 77 | (77 | ) | ||||||||
96
Table of Contents


The Unitholders and Board of Trustees
Elfun Funds
We have audited the accompanying statements of assets and liabilities, including the schedules of investments, of the Elfun International Equity Fund, Elfun Trusts, Elfun Diversified Fund, Elfun Tax-Exempt Income Fund, Elfun Income Fund and Elfun Money Market Fund (collectively, the “Funds”), as of December 31, 2012, and the related statement of operations for the year then ended, statements of changes in net assets for each of the years in the two-year period then ended, and the financial highlights for each of the years in the five-year period then ended. These financial statements and financial highlights are the responsibility of the Funds’ management. Our responsibility is to express an opinion on these financial statements and financial highlights based on our audits.
We conducted our audits in accordance with the standards of the Public Company Accounting Oversight Board (United States). Those standards require that we plan and perform the audit to obtain reasonable assurance about whether the financial statements and financial highlights are free of material misstatement. An audit includes examining, on a test basis, evidence supporting the amounts and disclosures in the financial statements. Our procedures included confirmation of securities owned as of December 31, 2012 by correspondence with the custodian and brokers, or by other appropriate auditing procedures where replies from brokers were not received. An audit also includes assessing the accounting principles used and significant estimates made by management, as well as evaluating the overall financial statement presentation. We believe that our audits provide a reasonable basis for our opinion.
In our opinion, the financial statements and financial highlights referred to above present fairly, in all material respects, the financial position of the Elfun International Equity Fund, Elfun Trusts, Elfun Diversified Fund, Elfun Tax-Exempt Income Fund, Elfun Income Fund and Elfun Money Market Fund as of December 31, 2012, the results of its operations, changes in its net assets and financial highlights for each of the years described above, in conformity with U.S. generally accepted accounting principles.

Boston, Massachusetts
February 27, 2013
97
Table of Contents

For the year ended December 31, 2012
The following funds intend to make an election under Internal Revenue Code Section 853. The election will allow shareholders to treat their attributable share of foreign taxes paid by the Funds to be paid by them directly. For the fiscal year ended December 31, 2012, the total amount of income received by the Funds from sources within foreign countries and possessions of the United States and the total amount of taxes paid by the Funds follows:
| Total Foreign Source Income | Total Foreign Taxes Paid | |||||||
Elfun International Equity Fund | $ | 6,616,138 | $ | 513,702 | ||||
Of the dividends paid from net investment income by the Elfun Tax-Exempt Fund during the calendar year ended December 31, 2011, 97.02% represent exempt interest dividends for Federal income tax purposes.
For the year ended December 31, 2012, the Fund hereby designates as capital gain dividends the amounts set forth, or the amount ultimately treated as capital gain net income.
| Fund | Gross Amount | |||
Elfun Trusts | $ | 154,751,317 | ||
Elfun Tax-Exempt Income Fund | 2,492,732 | |||
For the fiscal year ended December 31, 2012, certain dividends paid by the fund may be subject to a maximum income tax rate of 15%. The following represents the amounts that may be considered qualified dividend income:
| Fund | Qualified Dividend Income | |||
Elfun International Equity Fund | $ | 4,907,346 | ||
Elfun Trusts | 29,445,633 | |||
Elfun Diversified Fund | 3,057,414 | |||
For corporate shareholders the following represent the percentages of respective fund distributions that may be eligible for the dividends received deduction:
| Fund name | Dividends Received Deduction | |||
Elfun Trusts | 100.00 | % | ||
Elfun Diversified Fund | 50.96 | % | ||
The amounts presented herein may differ from amounts presented elsewhere in the financial statements due to differences between tax and financial accounting principles. Please consult a tax advisor if you have any questions about Federal or State income tax laws or on how to prepare your tax returns. If you have specific questions about your Fund account, please consult your investment representative or call 1-800-242-0134.
98
Table of Contents
The Board of Trustees of the Elfun Funds1 (the “Board”) considered and all those that were present unanimously approved the continuance of the investment advisory agreements with GE Asset Management Incorporated (“GEAM”) at a meeting held on December 11, 2012.
In considering whether to approve the Funds’ investment advisory agreements, the Board members considered and discussed a substantial amount of information and analysis provided by GEAM personnel. The Board members also considered detailed information regarding performance and expenses of other investment companies, including those with similar investment strategies and sizes, which was prepared by independent third party provider Morningstar, Inc. (“Morningstar”). The Board members reviewed the fees charged by GEAM for other mutual funds and investment products other than mutual funds that employ the same investment strategies as the Funds. The Board had the opportunity to ask questions and request additional information in connection with its considerations.
Before approving each Fund’s investment advisory agreement, the Board members received and considered memoranda prepared by GEAM personnel that set forth detailed information, including numerous exhibits and other materials related to GEAM’s business and the services it provides to each Fund. The Board members also reviewed materials discussing the legal standards for the consideration of the proposed continuances. The Board members reviewed and discussed the proposed continuance of the agreements with GEAM personnel, including representatives from the legal, compliance and finance departments and senior members of each relevant investment group (e.g., equity, fixed income). The Board members also heard presentations by these representatives, and posed questions and engaged in substantive discussions with them concerning the Funds’ operations and the investment process employed for each Fund. The Board members took into account that many of them possess multi-year experience as Board members and that all of them possess a great deal of
knowledge about GEAM and the Funds in their capacities as senior officers of GEAM. They also took into account their consideration of these types of agreements in recent years. The information was presented in a manner to facilitate comparison to prior periods and to reflect certain enhancements. To focus their review, the Board members asked GEAM personnel, in its oral presentations, to highlight material differences from the information presented in recent years.
In reaching their determinations relating to continuance of the Funds’ investment advisory agreements, the Board members considered all factors that they deemed relevant, including the factors discussed below. In their deliberations, the Board members did not identify any particular information that was all-important or controlling, and each Board member may have attributed different weights to the various factors. The Board members evaluated this information, and all other information available to them, for each Fund separately, and their determinations were made separately in respect of each Fund. In particular, the Board members focused on the following with respect to each Fund:
The Nature, Extent And Quality Of Services Provided
The Board members reviewed the services provided by GEAM and concurred that GEAM provides high quality advisory and administrative services to the Funds. In connection with their consideration of GEAM’s services, the Board members focused on the favorable attributes of GEAM, including (i) an investment philosophy oriented toward long-term performance; (ii) effective processes used for selecting investments and brokers; (iii) effective processes used for providing Fund administration, including controllership and compliance functions and oversight of the performance of other companies that provide services to the Funds; (iv) highly skilled professionals, including analysts, research professionals and portfolio managers with a depth of experience relevant to the Funds; (v) access to significant technological resources from which the Funds may benefit; and (vi) a favorable history and reputation. The Board members noted that each Fund represents only a small amount of the overall assets managed by GEAM, but benefits from a full array of services and resources provided by GEAM. In particular, the Board members discussed that the Funds benefit from a large staff of research analysts employed by GEAM.
1 The Elfun Funds include the Elfun Trusts, Elfun International Equity Fund, Elfun Diversified Fund, Elfun Tax-Exempt Income Fund, Elfun Income Fund, Elfun Money Market Fund (each, a “Fund” and collectively, the “Funds”).
99
Table of Contents

In light of the foregoing, the Board members concluded that the services provided by GEAM continue to be satisfactory.
Investment Performance Of The Funds
The Board members considered the investment performance of the Funds for various periods. The Board members reviewed detailed comparisons of the performance of the Funds with the relevant securities indices and peer groupings of mutual funds prepared by Morningstar with respect to various periods. The Board members also engaged in discussions with GEAM personnel regarding the investment process and performance results for each Fund. These discussions focused on each Fund’s investment objective, the number and experience of portfolio management and supporting research personnel, the investment style and approach employed, the likely market cycles for the investment style and, in some instances, relative underperformance in certain periods. The Board members discussed GEAM’s investment approach with respect to each of the Funds, and the reasons for certain Funds’ relative underperformance.
The Board members concluded that the Funds’ performance was acceptable overall taking into consideration the factors discussed above.
Cost Of The Services Provided To The Funds
The Board members considered the cost of the services provided by GEAM, noting that, pursuant to each investment advisory agreement, GEAM is reimbursed for its reasonable costs incurred in providing the services contemplated by those agreements and is not paid a management fee. The Board also noted that GE Investment Distributors, Inc. (“GEID”), a subsidiary of GEAM, is reimbursed for its reasonable costs incurred in providing services specified in its agreement with the Funds as unitholder servicing agent and is not paid a unitholder servicing fee. The Board members considered that the charges resulting from this arrangement involve all of the expenses incurred by GEAM and GEID with respect to the management and unitholder operations of the Funds, including, without limitation, indirect allocable overhead costs and the direct and indirect costs of GEAM and GEID personnel providing investment management and other services to the Funds. The Board members noted and discussed the additional services provided by GEAM to the Funds compared to other investment products managed by GEAM and the charges that result from
those services, and previously had been provided a study conducted by the Investment Company Institute that discusses and compares advisory fees and services for mutual funds and institutional separate accounts. The Board members also noted that none of the charges resulting from the Funds’ arrangements with GEAM and GEID may include any element of profit.
The Board members also noted that the Board had in prior years reviewed with GEAM personnel the underlying assumptions and methods of cost allocation used by GEAM in allocating its costs and those of the other Fund service providers, including GEID, to the Funds, and that such assumptions and methods used in cost allocation had not changed for this year. The Board members also discussed with GEAM personnel that the basis for their belief that the methods of allocation used by GEAM continue to be reasonable for each area of GEAM’s business.
Based on their review, the Board members concluded that they were satisfied that the assumptions and methods used in cost allocation and the level of expenses incurred by the Funds were not unreasonable or excessive.
The Extent To Which Economies Of Scale Would Be Realized For The Benefit Of Fund Shareholders As The Funds Grow
The Board members considered the extent to which economies of scale would be realized for the benefit of Fund investors as the Funds grow. The Board noted that, although none of the Funds experienced significant growth in assets over the past year, the Funds continue to enjoy fee and expense levels within or below the group of lowest fee and expense funds in their respective peer group comparisons.
The Board members recognized the significant benefits to the Funds resulting from their arrangement with GEAM, which causes them to bear only the reasonable costs incurred by GEAM and GEID, without any element of profit, for the substantial services they provide to the Funds. The Board members also recognized the benefits to the Funds of being able to leverage a favorable cost structure achieved with respect to the Funds’ other operating expenses as a result of GEAM’s large overall base of assets under management and its vendor management practices.
100
Table of Contents
Comparison Of Services To Be Rendered And Costs To Be Incurred
The Board members discussed the services provided to the Funds by GEAM, and the costs incurred by the Funds for those services. The Board members reviewed information concerning the Funds’ expense ratios, and comparative information with respect to peer groupings of mutual funds prepared by Morningstar. They discussed that, in all cases, the Funds enjoy expense levels within or below the group of lowest cost funds in each peer group comparison. In light of this information, the Board members determined that the level of expenses incurred was reasonable in relation to the services provided to the Funds.
Fall-Out Benefits
The Board members considered other actual and potential financial benefits that GEAM may derive from its relationship with the Funds, including, where applicable, soft dollar
commission benefits generated through Fund portfolio transactions. The Board members noted, however, that the Funds benefit from the vast array of resources available through GEAM, and that each Fund represents only a small amount of the overall assets managed by GEAM.
Conclusion
No single factor was determinative to the Board’s decision. Based on their discussion and such other matters as were deemed relevant, the Board members concluded that the proposed level of cost reimbursement to GEAM and projected total expense ratios for the Funds are reasonable in relation to the services provided. In view of these facts, the Board members concluded that the renewal of each investment advisory agreement was in the best interests of the Funds and their shareholders.
101
Table of Contents
Information about Trustees and Executive Officers:
The business and affairs of the Funds are managed under the direction of the Funds’ Board of Trustees. Information pertaining to the Trustees and officers of the Funds is set forth below.
Interested Trustees and Executive Officers
Dmitri Stockton
Address c/o GEAM 1600 Summer St. Stamford, CT 06905
Age 48
Position(s) Held with Fund Chairman of the Board
Term of Office and Length of Time Served Until successor is elected and qualified – 1 year
Principal Occupation(s) During Past 5 Years President and Chief Executive Officer of GEAM since May 2011; President and Chief Executive Officer of GE Capital’s Global Banking unit from January 2009 to April 2011; President and CEO of GE Money’s Central and Eastern European Banking Group from January 2005 to December 2008.
Number of Portfolios in Fund Complex Overseen by Trustee 8
Other Directorships Held by Trustee Director of GEAM since May 2011; Member of the Board of GE Foundation since November 2009; Member of the Executive Advisory Council at North Carolina A&T State University School of Business and Economics since March 2011; Trustee of GE Savings & Security Funds and General Electric Pension Trust since May 2011 and Member of the National Board of Directors of A Better Chance since January 2012.
George A. Bicher
Address c/o GEAM 1600 Summer St. Stamford, CT 06905
Age 54
Position(s) Held with Fund Trustee
Term of Office and Length of Time Served Until successor is elected and qualified – 1 year
Principal Occupation(s) During Past 5 Years Chief Risk Officer of GEAM since March 2011; formerly, Senior Vice President and Portfolio Manager of GEAM from 2009 to 2011; Director of U.S. Equity Research and Portfolio
Manager of GEAM from 2006 to 2009; U.S. equity research analyst of GEAM from 2002 to 2006.
Number of Portfolios in Fund Complex Overseen by Trustee 8
Other Directorships Held by Trustee Trustee of GE Savings & Security Funds and General Electric Pension Trust and Director of GEAM since March 2011.
Joon Won Choe
Address c/o GEAM 1600 Summer St. Stamford, CT 06905
Age 43
Position(s) Held with Fund Vice President & Assistant Secretary
Term of Office and Length of Time Served Until successor is elected and qualified – Vice President and Secretary – 2 years
Principal Occupation(s) During Past 5 Years Senior Vice President and Deputy General Counsel of GEAM since March 2011; Vice President and Secretary of GE Institutional Funds and GE Investments Funds, Inc. since September 2010; Vice President and Assistant Secretary of GE Savings & Security Funds since September 2010; Senior Vice President and Associate General Counsel of GEAM from June 2010 to March 2011; Vice President and Associate General Counsel of GEAM from November 2005 to June 2010; and Vice President and Secretary of GE Funds from September 2010 to February 2011.
Number of Portfolios in Fund Complex Overseen by Officer N/A
Other Directorships Held by Officer N/A
Paul M. Colonna
Address c/o GEAM, 1600 Summer St. Stamford, CT 06905
Age 44
Position Held with Fund Trustee
Term of Office and Length of Time Served Until successor is elected and qualified – 5 years
Principal Occupation(s) During Past 5 Years President and Chief Investment Officer - Public Investments of GEAM since March 2012; President and Chief Investment Officer - Fixed Income from March 2007 to March 2012; Executive Vice President of GEAM from February 2007 to March 2007;
102
Table of Contents

Senior Vice President - Total Return Management of GEAM from March 2005 to March 2007.
Number of Portfolios in Fund Complex Overseen by Trustee 8
Other Directorships Held by Trustee Trustee of GE Savings & Security Funds and General Electric Pension Trust since February 2007; Director of GEAM since March 2007; and Director of GE Asset Management Limited (GEAML) since December 2007.
Michael J. Cosgrove
Address c/o GEAM 1600 Summer St. Stamford, CT 06905
Age 63
Position(s) Held with Fund Trustee
Term of Office and Length of Time Served Until successor is elected and qualified – 25 years
Principal Occupation(s) During Past 5 Years President of Mutual Funds and Global Investment Programs of GEAM since November 2011; President and Chief Executive Officer – Mutual Funds & Intermediary Business of GEAM from March 2007 to November 2011; Executive Vice President of GEAM from February 1997 to March 2007; and Executive Vice President-Mutual Funds of GEAM from March 1993 to March 2007. Also serves as Treasurer of GE Foundation since 1998.
Number of Portfolios in Fund Complex Overseen by Trustee 25
Other Directorships Held by Trustee Chairman of the Board and President of GE Institutional Funds and GE Investments Funds, Inc. since 1997; Trustee of GE Savings & Security Funds, and General Electric Pension Trust since 1988; Director of GEAM since 1988; Trustee of Fordham University from 2002 to June 30, 2010 and since July 2011; Director of GE Investment Distributors, Inc. since June 2011; Director of Skin Cancer Foundation since August 2010; Member of the Board of Governors for the Investment Company Institute since October 2006; Director, GE Asset Management (Ireland) Limited, since February 1999; GE Asset Management Funds Plc since 1998; GE Asset Management Canada Company since 1998 and GE Asset Management Limited since 1998; and Chairman of the Board and President of GE Funds from 1993 to February 2011; and Trustee, GE Volunteers from 1993 to June 2010.
Gregory B. Hartch
Address c/o GEAM 1600 Summer St. Stamford, CT 06905
Age 43
Position(s) Held with Fund Trustee
Term of Office and Length of Time Served Until successor is elected and qualified – 1 year
Principal Occupation(s) During Past 5 Years Executive Vice President and the Strategy and Business Development Leader of GEAM; he became an Executive Vice President in 2013 and has served as the Strategy and Business Development Leader since December 2011; formerly Senior Vice President– Tactical Asset Allocation from 2010 to December 2011; Managing Director – International Real Estate from 2007 to 2010; and Director of Fixed Income Research from 2004 to 2007.
Number of Portfolios in Fund Complex Overseen by Trustee 8
Other Directorships Held by Trustee Trustee of GE Savings & Security Funds and General Electric Pension Trust since January 2012.
Jessica Holscott
Address c/o GEAM 1600 Summer St. Stamford, CT 06905
Age 37
Position(s) Held with Fund Trustee
Term of Office and Length of Time Served Until successor is elected and qualified – less than 1 year
Principal Occupation(s) During Past 5 Years Executive Vice President and Chief Financial Officer of GEAM since August 2012; Staff Executive and Analyst for General Electric’s Chief Financial Officer from April 2011 to August 2012; General Electric Investor Relations from July 2009 to August April 2011; Chief Financial Officer, NBC Local Media from 2007 to July 2009.
Number of Portfolios in Fund Complex Overseen by Trustee 25
Other Directorships Held by Trustee Trustee of GE Savings and Security Funds and General Electric Pension Trust since August 2012; Director of GEAM since August 2012.
103
Table of Contents
Arthur A. Jensen
Address c/o GEAM 1600 Summer St. Stamford, CT 06905
Age 46
Position(s) Held with Fund Treasurer
Term of Office and Length of Time Served Until successor is elected and qualified – 1 year
Principal Occupation(s) During Past 5 Years Treasurer of GE Institutional Funds, GE Investments Funds, Inc. and GE Savings & Security Funds since June 2011; Mutual Funds Controller of GEAM since April 2011; Senior Vice President at Citigroup from 2008 to 2010 and Vice President at JPMorgan from 2005 to 2008.
Number of Portfolios in Fund Complex Overseen by Officer N/A
Other Directorships Held by Officer N/A
Jeanne M. LaPorta
Address c/o GEAM 1600 Summer St. Stamford, CT 06905
Age 47
Position(s) Held with Fund Vice President
Term of Office and Length of Time Served Until successor is elected and qualified – 9 years
Principal Occupation(s) During Past 5 Years Senior Vice President and Commercial Administrative Officer of GEAM since April 2010; Vice President of GE Investments Funds, Inc. and GE Institutional Funds since July 2003; Vice President of GE Savings & Security Funds since October 2003; Secretary of GE Funds from July 2007 to September 2010 and Vice President from July 2007 to February 2011; Senior Vice President and Deputy General Counsel of GEAM from October 2007 to April 2010; Vice President and Assistant Secretary of GE Funds from September 2003 to July 2007 and Assistant Secretary of Elfun Funds and GE Savings & Security Funds from July 2003 to June 2010; and Vice President and Associate General Counsel – Marketing and Client Services (formerly Asset Management Services) of GEAM from May 1997 to October 2007.
Number of Portfolios in Fund Complex Overseen by Officer N/A
Other Directorships Held by Officer N/A
Ralph R. Layman
Address c/o GEAM 1600 Summer St. Stamford, CT 06905
Age 57
Position(s) Held with Fund Trustee
Term of Office and Length of Time Served Until successor is elected and qualified – 21 years
Principal Occupation(s) During Past 5 Years Executive Vice President and Chief Investment Officer – Emeritus of GEAM since March 2012; President and Chief Investment Officer – Public Equities from July 2009 to March 2012; President – International Equities from March 2007 to July 2009; Executive Vice President – International Investments from 1992 to March 2007 and Senior Vice President International Investments from 1991 to 1992.
Number of Portfolios in Fund Complex Overseen by Trustee 8
Other Directorships Held by Trustee Trustee of GE Savings & Security Funds and General Electric Pension Trust since 1993; Director of GE Asset Management Limited (GEAML) since September 1995 and Director of GEAM since July 2009.
Matthew J. Simpson
Address c/o GEAM 1600 Summer St. Stamford, CT 06905
Age 51
Position(s) Held with Fund Trustee
Term of Office and Length of Time Served 5 years
Principal Occupation(s) During Past 5 Years Executive Vice President, General Counsel and Secretary of GEAM since July 2007; Secretary of Elfun Funds and GE Savings & Security Funds since July 2007; Senior Vice President and General Counsel – Marketing and Client Services (formerly Asset Management Services) of GEAM and Senior Vice President and General Counsel of GE Asset Management Services from February 1997 to July 2007; Vice President and Associate General Counsel of GEAM from October 1992 to February 1997; Secretary of GE Institutional Funds and GE Investments Funds, Inc. from 1997 to July 2007 and Vice President from September 2003 to July 2007; Assistant Secretary of Elfun Funds and GE Savings & Security Funds from 1998 to July 2007 and Vice President from October 2003 to July 2007; and Secretary of GE Funds from 1993 to July 2007 and Vice President from September 2003 to July 2007.
104
Table of Contents
Number of Portfolios in Fund Complex Overseen by Trustee 25
Other Directorships Held by Trustee Trustee of GE Savings & Security Funds and General Electric Pension Trust since July 2007; Trustee of GE Institutional Funds since July 2007; Director of GE Investments Funds, Inc. and GEAM since July 2007; and Trustee of GE Funds from July 2007 to February 2011.
Donald W. Torey
Address c/o GEAM 1600 Summer St. Stamford, CT 06905
Age 55
Position(s) Held with Fund Trustee
Term of Office and Length of Time Served Until successor is elected and qualified – 19 years
Principal Occupation(s) During Past 5 years President and Chief Investment Officer – Alternative Investments of GEAM since March 2007; Executive Vice President of GEAM from 1997 to March 2007; Executive Vice President – Alternative Investments from 1997 to March 2007.
Number of Portfolios in Fund Complex Overseen by Trustee 8
Other Directorships Held by Trustee Trustee of GE Savings & Security Funds and General Electric Pension Trust since 1993 and Director of GEAM since 1997.
David Wiederecht
Address c/o GEAM, 1600 Summer St. Stamford, CT 06905
Age 56
Position Held with Fund Trustee
Term of Office and Length of Time Served Until successor is elected and qualified – 4 years
Principal Occupation(s) During Past 5 Years President and Chief Investment Officer – Investment Solutions since February 2008; Portfolio Manager – GE Institutional Funds since September 2010; Managing Director – Alternative Investments from 2004 to 2008; Vice President – Alternative Investments/Private Equity/Hedge Fund from 1998 to 2004.
Number of Portfolios in Fund Complex Overseen by Trustee 8
Other Directorships Held by Trustee Trustee of GE Savings & Security Funds and General Electric Pension Trust since 2008; Director of GEAM since August 2008 and Director of Edmunds Holding Company since 1999.
105
The Statement of Additional Information for the Funds includes additional information about the Trustees and Officers and is available, without charge, upon request by calling 1-800-242-0134.
Table of Contents
Portfolio Manager Biographies
The following sets forth biographical information for those individuals who are primarily responsible for managing the specified Fund’s investments. The portfolio managers may change from time to time.
David B. Carlson is Chief Investment Officer – U.S. Equities at GEAM. He manages the overall U.S. equity investments for GEAM. Mr. Carlson has served as the portfolio manager for Elfun Trusts since 1988. Mr. Carlson joined GEAM in 1982 as a securities analyst for investment operations. He became a Vice President for Mutual Fund Portfolios in 1987, a Senior Vice President in 1989 and an Executive Vice President in 2003.
Michael J. Caufield is a Senior Vice President of GEAM. He is the Chief Investment Officer and portfolio manager of the Elfun Tax-Exempt Income Fund and has served as portfolio manager since October 2000. Mr. Caufield is also the Senior Portfolio Manager for all municipal strategies. Mr. Caufield joined GEAM in 1987 as Vice President, manager of fixed income research & analysis and was promoted to Senior Vice President in 1994.
James C. Gannon is an assistant portfolio manager of GEAM. He has served on the portfolio management team for the Elfun Money Market Fund since December 2000 and has also worked on the Interest Rates desk Since 2007. Since joining GEAM in 1995, Mr. Gannon served in various positions at GEAM including Trade operations specialist in fixed income, and became an assistant portfolio manager in February 2003.
Greg Hartch is an Executive Vice President and the Strategy and Business Development Leader at GEAM. He has served as a portfolio manager for the Elfun Diversified Fund since January 2011. Mr. Hartch joined GEAM in 2002 and has held various positions at GEAM including Senior Vice President – Alternative Assets from 2002 to 2004, Director of Fixed Income Research from 2004 to 2007, Managing Director – International Real Estate from 2007 to 2010 and Senior Vice President - Tactical Asset Allocation from 2010 to 2011. He has served as the Strategy and Business Development Leader since 2011 and became an Executive Vice President in 2013.
Mark H. Johnson is a Senior Vice President and Chief Investment Officer – Insurance and Long Duration of GE Asset Managemen. He has been a member of the portfolio management team for the Elfun Income Fund since September 2007. Mr. Johnson joined GE in 1998 and GEAM as a Vice President and portfolio manager in 2002. He became Senior Vice President in September 2007 and Chief Investment Officer – Insurance and Long Duration in April 2012. Prior to joining GEAM, Mr. Johnson held positions at various insurance companies and public accounting firms.
Ralph R. Layman is an Executive Vice President and Chief Investment Officer Emeritus and a Director of GEAM. Mr. Layman has led the team of portfolio managers for the Elfun International Equity Fund since 1991. Mr. Layman joined GEAM in 1991 as a Senior Vice President for International Investments, became an Executive Vice President in 1992, served as President – International Equities from March 2007 to July 2009, President and Chief Investment Officer – Public Equities from July 2009 to March 2012, and has served as Chief Investment Officer Emeritus since March 2012.
Michael E. Martini is a Vice President and portfolio manager at GEAM. He has served on the portfolio management team for the Elfun Money Market Fund since joining GEAM in March of 2008. Prior to joining GEAM, Mr. Martini was a Vice President at Ceres Capital Partners LLC, where he worked at the firm’s treasury desk from March 2006 to January 2008, and a Senior Vice President at Pacific Investment Management Company (PIMCO) from 1996 to 2004, where he was a portfolio manager at the firm’s money market/short-term desk.
Michael Nowakowski is an Assistant Portfolio Manager at GEAM. He has served on the portfolio management team for the Money Market Fund since July 2011. His responsibilities include cash management, including daily money market trade execution, forecasting and technical projects. Mr. Nowakowski joined GEAM in 2007 as a Data Analyst working on the fixed income Insurance portfolio. Mr. Nowakowski later became the Team Lead of Portfolio Analytics for Total Return and Insurance fixed income.
106
Table of Contents

| Portfolio | Manager Biographies (continued) |
Jonathan L. Passmore is a Senior Vice President of GEAM. He has served as a portfolio manager of the Elfun International Equity Fund since January 2002. Prior to joining GEAM in January 2001, he was with Merrill Lynch for six years, most recently as Director, international equities.
Vita Marie Pike is a Senior Vice President and Chief Investment Officer – Fixed Income Risk Assets of GEAM. She has served on the portfolio management team for the Elfun Income Fund since June 2004. Ms. Pike joined GE in 2001 and GEAM in January 2002 as a Vice President and Senior Portfolio Manager and became Senior Vice President in November 2010 and Chief Investment Officer – Fixed Income Risk Assets in April 2012. Prior to joining GEAM she was with Alliance Capital for over nine years serving in a number of different capacities including portfolio manager.
Michael J. Solecki is a Senior Vice President and Chief Investment Officer – International Equities at GEAM. He has served as a portfolio manager of the Elfun International Equity Fund since August 1999. He joined GEAM in 1990 as an international equity analyst. He became a Vice President for international equity portfolios in 1996, Senior Vice President in 2000, Co-Chief Investment Officer – International equities in March 2009 and Chief Investment Officer – International Equities in March 2012.
David Wiederecht is the President and Chief Investment Officer – Investment Solutions and a Director at GEAM. He has served as a portfolio manager to the Elfun Diversified Fund since January 2011. Mr. Wiederecht joined GEAM in 1988 and has held various positions at GEAM including Vice President – Alternative Investments/Private Equity/Hedge Fund from 1998 to 2004, Managing Director – Alternative Investments from 2004 to 2008, and President and Chief Investment Officer – Investment Strategies since 2008.
107
Table of Contents
Portfolio Managers
Elfun International Equity Fund
Team led by Ralph R. Layman
Elfun Trusts
David B. Carlson
Elfun Diversified Fund
Gregory B. Hartch
David Wiederecht
Elfun Tax-Exempt Income Fund
Michael Caufield
Elfun Income Fund
William M. Healey
Mark H. Johnson
Vita Marie Pike
Elfun Money Market Fund
Team led by Michael E. Martini
Investment Adviser
GE Asset Management Incorporated
Independent Registered Public Accounting Firm
KPMG LLP
Custodian
State Street Bank & Trust Company
Unitholder Servicing Agent
Address all inquiries to:
GE Mutual Funds
BNY Mellon Asset Servicing
P.O. Box 9838
Providence, RI 02940
Officers of the Investment Adviser
Dmitri Stockton, Trustee, President and Chief Executive Officer, GE Asset Management Incorporated
Cheryl H. Beacock, Senior Vice President, Human Resources
George A. Bicher, Trustee, Chief Risk Officer
Paul M. Colonna, Trustee, President and Chief Investment Officer – Public Investments
Michael J. Cosgrove, Trustee, President of Mutual Funds and Global Investment Programs
Gregory B. Hartch, Trustee, Executive Vice President – Strategy and Business Development Leader
Jessica Holscott*, Trustee, Executive Vice President, Chief Financial Officer
Ralph R. Layman, Trustee, Executive Vice President, Chief Investment Officer Emeritus
Maureen B. Mitchell, President of Global Sales and Marketing
Steve Rullo, Senior Vice President – Services and Technology
Matthew J. Simpson, Trustee, Executive Vice President, General Counsel and Secretary
Donald W. Torey, Trustee, President and Chief Investment Officer – Alternative Investments and Real Estate
David Wiederecht, Trustee, President and Chief Investment Officer – Investment Solutions
* Effective August 1, 2012, Ms. Holscott replaced Tracie A. Winbigler as Executive Vice President and Chief Financial Officer.
108
Table of Contents

New Online Service
Your Elfun Mutual Fund accounts can now be accessed on the Internet at www.elfun.org.
Here are some of the benefits of our online service:
• View account balance and transaction history | • View and order tax forms | |
• Make exchanges | • View quarterly statements | |
• Redeem shares | • Change address | |
• Purchase shares | • Re-order money market checks |
Many more features will be added to the web site in the future for your convenience.
New Extended Telephone Service
Our Representatives at the Customer Service Center are available Monday to Friday from 8:30 AM to 8:00 PM Eastern Standard Time. Call toll-free, 1-800-242-0134, for assistance.
Automated Voice Response System
You can also access your account anytime during the day, 7 days a week by dialing 1-800-242-0134. Simply follow the menu to obtain information or make certain transactions.
Contact Us By Mail
If you’d like to write to us, address your inquiries regarding your account(s) to:
GE Mutual Funds
BNY Mellon Asset Servicing
P.O. Box 9838
Providence, RI 02940
We are continuing to upgrade a variety of services in order to give you the tools you need to manage your financial objectives. In the meantime, we welcome all your comments and suggestions.
Table of Contents

MORNINGSTAR RATINGS™
Through December 31, 2012
| FUND (CATEGORY) | NUMBER OF FUNDS IN CATEGORY | STAR RATING | ||||||
| Elfun International Equity — (Foreign Large Blend) | ||||||||
Overall | 853 |
| ||||||
3 year | 741 |
| ||||||
5 year | 567 |
| ||||||
10 year | 317 |
| ||||||
| Elfun Trusts — (Large Growth) | ||||||||
Overall | 1748 |
| ||||||
3 year | 1477 |
| ||||||
5 year | 1279 |
| ||||||
10 year | 804 |
| ||||||
| Elfun Diversified — (Moderate Allocation) | ||||||||
Overall | 1019 |
| ||||||
3 year | 843 |
| ||||||
5 year | 736 |
| ||||||
10 year | 393 |
| ||||||
| Elfun Tax-Exempt Income — (Muni National Long) | ||||||||
Overall | 250 |
| ||||||
3 year | 227 |
| ||||||
5 year | 211 |
| ||||||
10 year | 181 |
| ||||||
| Elfun Income — (Intermediate-Term Bond) | ||||||||
Overall | 1238 |
| ||||||
3 year | 1017 |
| ||||||
5 year | 872 |
| ||||||
10 year | 582 |
| ||||||


Morningstar is an independent fund rating company that seeks to provide a non-biased rating system used in making investment decisions. A fund is rated in its broad asset class on a scale of one to five stars through the evaluation of the historical balance of risk and return after 3 years of performance.
Morningstar calculates a Morningstar Rating based on a Morningstar Risk-Adjusted Return measure that accounts for variation in a fund’s monthly performance (including the effects of sales charges, loads and redemption fees), placing more emphasis on downward variations and rewarding consistent performance. The top ten percent of the funds in each category receive five stars, the next 22.5% receive four stars, the next 35% receive three stars, the next 22.5% receive 2 stars and the bottom 10% receive 1 star. The ratings are subject to change every month. The overall Morningstar Rating for a fund is derived from a weighted average of the performance figures associated with its three-, five- and ten year (if applicable) Morningstar Rating metrics.
Investment return and principal value of an investment will fluctuate and you may have a gain or loss when you sell your shares. Returns assume changes in share price and reinvestment of dividends and capital gains.
Past performance is no guarantee of future results.
This does not constitute a part of the Funds’ Shareholder Report
Table of Contents
Elfun Funds
1600 Summer Street
Stamford, CT 06905
Distributor
GE Investment Distributors Inc.
Member FINRA and SIPC
1600 Summer Street
P.O. Box 7900
Stamford, CT 06904-7900
www.gefunds.com/elfun
The Funds file their complete schedules of portfolio holdings with the Securities and Exchange Commission for the first, second and third quarters of each fiscal year on Form N-Q. The Funds’ Forms N-Q, as well as a description of the policies and procedures that the Funds use to determine how to vote proxies (if any) relating to portfolio securities is available without charge (i) upon request, by calling 1-800-242-0134; (ii) on the Funds’ website at http://www.geam.com; and (iii) on the Commission’s website at http://www.sec.gov. The Funds’ Forms N-Q may be reviewed and copied at the Commission’s Public Reference Room in Washington, DC — information on the operation of the Public Reference Room may be obtained by calling 1-800-SEC-0330.
Information (if any) regarding how the Funds voted proxies relating to portfolio securities during the most recently disclosed 12-months period ended June 30 is available without charge (i) through the Funds’ website at http://www.geam.com; and (ii) on the Commission’s website at http://www.sec.gov.
 | ELF 1 (2/13) |
PRSRT STD
U.S. POSTAGE
PAID
Permit No. 1793
Lancaster, PA
Table of Contents
| ITEM 2. | CODE OF ETHICS. |
The registrant has adopted a code of ethics, as defined in Item 2 of Form N-CSR, applicable to its principal executive officer, principal financial officer, principal accounting officer or controller, or persons performing similar functions. A copy of this code of ethics is filed as Exhibit 1 to this Form N-CSR and is included in the following link:
http://files.gecompany.com/gecom/citizenship/pdfs/TheSpirit&TheLetter.pdf
| ITEM 3. | AUDIT COMMITTEE FINANCIAL EXPERT. |
The Board of Trustees of the Registrant has determined that Donald W. Torey and Jessica Holscott are designated as audit committee financial experts for the Funds; and further that it is the finding of the Board of Trustees that Mr. Torey and Ms. Holscott qualify as audit committee financial experts. Each audit committee member is deemed to be an “interested person” of the Funds as defined in Section 2(a)(19) of the Act (15 U.S.C. 80a-2(a)(19)).
| ITEM 4. | PRINCIPAL ACCOUNTANT FEES AND SERVICES. |
(a) AUDIT FEES. The aggregate fees billed for each of the last two fiscal years (the “Reporting Periods”) for professional services rendered by the Registrant’s principal accountant (the “Auditor”) for the audit of the Registrant’s annual financial statements, or services that are normally provided by the Auditor in connection with the statutory and regulatory filings or engagements for the Reporting Periods were $19,800 in 2011 and $19,800 in 2012.
(b) AUDIT RELATED FEES. There were no fees billed by the Auditor for assurance and related services that were related to the performance of the audit for the Registrant during the Reporting Periods.
(c) TAX FEES. There were no fees billed for professional services rendered by the Auditor for tax compliance, tax advice or tax planning for the Registrant during the Reporting Periods.
(d) ALL OTHER FEES. There were no fees billed for products and services provided by the Auditor, other than the services reported in paragraphs (a) through (c) of this Item for the Registrant during the Reporting Periods.
(e) (1) AUDIT COMMITTEE PRE-APPROVAL POLICIES AND PROCEDURES.
The Audit Committee of the Elfun Funds (the “Funds”) Board of Trustees is responsible, among other things, for the appointment, compensation and oversight of the work of the Fund’s independent accountants/auditors (the “Auditor”). As part of this responsibility and to ensure that the Auditor’s independence is not impaired, the Audit Committee (1) pre-approves the audit and non-audit services provided to the Funds by the Auditor, and (2) all non-audit services provided to the Fund’s investment adviser and covered affiliates (as defined in the Audit Committee Charter) that provide ongoing services to the Funds if the services directly impact the Fund’s operations or financial reporting, in accordance with the Audit Committee Charter. Following are excerpts from the Audit Committee Charter that sets forth the pre-approval policies and procedures:
1. Selection and Pre-Approval of Auditor and Approval of Fees.
(i) The Audit Committee shall pre-approve the selection of the Auditor and shall recommend for ratification the selection, retention or termination of the Auditor by the full Board, including the independent Trustees/Directors, and, in connection therewith, shall evaluate the independence of the Auditor, including: (i) an evaluation of whether the Auditor provides any consulting services to the Fund’s investment adviser and the extent to which the Auditor provides non-audit services to the Fund’s investment adviser and certain other affiliated service providers as defined in Section 2(f) below, which services are not subject to the pre-approval requirements set forth in Section 4 below; (ii) an evaluation of the extent to which the Auditor has any relationships with the Fund or its affiliated persons that are brought to the attention of the Audit Committee by the Auditor in accordance with applicable standards of the Independence Standards Board (“ISB”), because, in the Auditor’s professional judgment, such relationships may reasonably be thought to bear on the Auditor’s independence with respect to the Fund; and (iii) monitoring the Auditor’s compliance with respect to the rotation requirements for the lead and coordinating partners having primary responsibility for the Fund’s audits and any partner responsible for the reviewing the Fund’s audits. The Audit Committee shall review the Auditor’s specific representations as to its independence.
Table of Contents
(b) The Audit Committee shall pre-approve and review the fees charged by the Auditor for audit and non-audit services to be provided to the Fund and certain affiliated service providers (as defined in Section 2(f) below) in accordance with the pre-approval requirements set forth in Section 4 below. The Fund shall provide for appropriate funding, as determined by the Audit Committee, to compensate the Auditor for any authorized service provided to the Fund.
2. Meetings with the Auditor. The Audit Committee shall meet with the Auditor, including private meetings, prior to the commencement of substantial work on the audit and following the conclusion of the audit, as well as such other times as the Audit Committee shall deem necessary or appropriate. The Auditor shall report directly to the Audit Committee. The Auditor shall report at least annually, concerning the following and other pertinent matters:
(a) to review the arrangements for and scope of the annual audit and any special audits;
(b) to provide the Auditor the opportunity to report to the Audit Committee, on a timely basis, all critical accounting policies and practices to be used;
(c) to discuss any matters of concern relating to the Fund’s financial statements, including: (i) any adjustments to such statements recommended by the Auditor, or other results of said audit(s), and (ii) any alternative treatments of financial information within GAAP that have been discussed with Fund management, the ramifications of the use of such alternative disclosures and treatments, and the treatment preferred by the Auditor;
(d) to provide the Auditor the opportunity to report to the Audit Committee, on a timely basis, any material written communication between the Auditor and Fund management, such as any management letter or schedule of unadjusted differences;
(e) to discuss the opinion the Auditor has rendered regarding the Fund’s financial statements;
(f) to report all non-audit services that do not require Audit Committee pre-approval and are provided to certain affiliated persons of the Fund, including: (1) the Fund’s investment adviser or sub-advisers (but excluding any investment sub-adviser whose role is primarily portfolio management and is overseen by the investment adviser), (2) the Fund’s principal underwriter, and (3) any entity controlling, controlled by, or under common control with the investment adviser or principal underwriter, that provides “ongoing” services to the Funds in accordance with the pre-approval requirements of paragraph (c)(7)(i) of Rule 2-01 of Regulation S-X (each, a “Covered Affiliate” and collectively, “Covered Affiliates”);
(g) to review, in accordance with current standards of ISB, all relationships between the Auditor and the Fund or its affiliated persons that, in the Auditor’s professional judgment, may reasonably be thought to bear on its independence, and to confirm, in light of such information, whether the Auditor believes, in its professional judgment, that it may properly serve as independent accountants/auditors with respect to the Fund;
(h) to consider the Auditor’s comments with respect to the Fund’s financial policies, procedures and internal accounting controls and responses thereto by the Fund’s officers and Fund management, as well as other personnel;
(i) to investigate any improprieties or suspected improprieties in the operations of the Fund to the extent necessary or appropriate in light of any internal investigations by the Fund’s officers and/or by officers or employees of the Fund management of such improprieties;
Table of Contents
(j) to receive periodic reports concerning regulatory changes and new accounting pronouncements that significantly affect the value of the Fund’s assets and their financial reporting;
(k) to report on the Fund’s qualification under Subchapter M of the Internal Revenue Code, amounts distributed and reported to shareholders for Federal tax purposes and the Fund’s tax returns; and
(l) to provide the Auditor the opportunity to report on any other matter that the Auditor deems necessary or appropriate to discuss with the Audit Committee.
If the Auditor’s report on the above-listed (and other pertinent) matters is not made in person to the Audit Committee within 60 days following the end of the Fund’s fiscal year, the Auditor shall deliver a written report to the Audit Committee concerning these matters within such 60 day period.
3. Change in Accounting Principles. The Audit Committee shall consider the effect upon the Fund of any changes in accounting principles or practices proposed by the Auditor or the Fund’s officers.
4. Pre-Approval of Audit Related Services and Permissible Non-Audit Services. The Audit Committee shall pre-approve both audit (including audit, review, and attest) services and permissible non-audit services provided to the Fund and, if the nature of the engagement relates directly to the operations and financial reporting of the Fund, permissible non-audit services provided to any Covered Affiliate.
The Audit Committee may determine to delegate the authority to grant pre-approvals to one or more Audit Committee members, each acting on behalf of the Audit Committee. In this event, the member of the Audit Committee so delegated shall report each delegated pre-approval to the Audit Committee at its next regularly scheduled meeting. The Audit Committee may also adopt and follow, in lieu of explicit pre-approval described above, written policies and procedures detailed as to the particular service, designed to safeguard the continued independence of the Auditor, consistent with the requirements of the Act and SEC regulations thereunder.
Notwithstanding the foregoing, the pre-approval requirement concerning permissible non-audit services provided to the Fund or any Covered Affiliate is waived if: (1) the aggregate amount of all such non-audit services provided constitutes no more than five percent (5%) of the total amount of revenues paid to the Auditor by the Fund and the Covered Affiliates during the fiscal year in which the services are provided that would have to be pre-approved by the Audit Committee, (2) the non-audit services were not recognized as non-audit services at the time of the engagement, and (3) such non-audit services are promptly brought to the attention of the Audit Committee and approved by the Audit Committee or one or more designated members of the Audit Committee prior to the completion of the audit.
5. Prohibited Activities of the Auditor. The Audit Committee shall confirm with the Auditor that it is not performing contemporaneously (during the audit and professional engagement period) non-audit services for the Fund that the Audit Committee believes may taint the independence of the Auditor. The Auditor will be responsible for informing the Audit Committee of whether it believes that a particular non-audit service is permissible or prohibited pursuant to applicable regulations and standards.
(2) PERCENTAGE OF SERVICES IN PARAGRAPHS (b) THROUGH (d) APPROVED BY AUDIT COMMITTEE. No fees were charged during 2011 or 2012 for audit related, tax or other services as indicated in sections (b) through (d) of this Item.
(f) Not applicable.
(g) NON-AUDIT FEES. The aggregate non-audit fees billed by the Auditor for services rendered to the Registrant, and rendered to Service Affiliates, for the Reporting Periods were $0 in 2011 and $0 in 2012.
Table of Contents
(h) AUDITOR INDEPENDENCE. There were no non-audit services rendered to Service Affiliates that were not pre-approved.
| ITEM 5. | Audit Committee of Listed Registrants |
The Registrant has a separately-designated standing audit committee established in accordance with Section 3(a)(58)(A) of the Exchange Act (15 U.S.C. 78c(a)(58)(A)). The Registrant’s audit committee members are: Donald W. Torey and Jessica Holscott.
| ITEM 6. | Schedule of Investments. |
Attached as part of ITEM 1.
| ITEM 7. | DISCLOSURE OF PROXY VOTING POLICIES AND PROCEDURES FOR CLOSED-END MANAGEMENT INVESTMENT COMPANIES. |
Applicable only to Closed-End Management Investment Companies.
| ITEM 8. | PORTFOLIO MANAGERS OF CLOSED-END MANAGEMENT INVESTMENT COMPANIES. |
Applicable only to Closed-End Management Investment Companies.
| ITEM 9. | Purchases of Equity Securities by Closed-End Management Investment Company and Affiliated Purchasers. |
Applicable only to Closed-End Management Investment Companies.
| ITEM 10. | Submission of Matters to a Vote of Security Holders. |
No material changes.
| ITEM 11. | CONTROLS AND PROCEDURES. |
The officers providing the certifications in this report in accordance with Rule 30a-3 under the Investment Company Act of 1940 have concluded, based on their evaluation of the registrant’s disclosure controls and procedures (as such term is defined in such rule), that such controls and procedures are adequate and reasonably designed to achieve the purpose described in paragraph (c) of such rule.
There were no significant changes in the registrant’s internal controls or in other factors that could significantly affect these controls subsequent to the date of their last evaluation, including any corrective actions with regard to significant deficiencies and material weaknesses.
| ITEM 12. | EXHIBITS. |
(a) Attached hereto as exhibit 1 is the company’s Code of Ethics.
(b) Attached hereto as Exhibit 2 and Exhibit 3 are the Certifications of Dmitri L. Stockton and Arthur A. Jensen as principal executive officer and principal financial officer, respectively of the Registrant as required by Rule 30a-2(a) under the Act (17 CFR 270.30a-2(a)).
Table of Contents
SIGNATURES
Pursuant to the requirements of the Securities Exchange Act of 1934 and the Investment Company Act of 1940, the Registrant has duly caused this Report to be signed on its behalf by the undersigned, thereunto duly authorized.
Elfun Tax-Exempt Income Fund
| By: | /S/ DMITRI L. STOCKTON | |
| Dmitri L. Stockton | ||
Trustee, President and Chief Executive Officer, GE Asset Management Incorporated | ||
| Date: | February 27, 2013 | |
Pursuant to the requirements of the Securities Exchange Act of 1934 and the Investment Company Act of 1940, this Report has been signed below by the following persons on behalf of the Registrant and in the capacities and on the dates indicated.
| By: | /S/ DMITRI L. STOCKTON | |
Dmitri L. Stockton | ||
Trustee, President and Chief Executive Officer, GE Asset Management Incorporated | ||
| Date: | February 27, 2013 | |
| By: | /S/ ARTHUR A. JENSEN | |
| Arthur A. Jensen | ||
| Treasurer, Elfun Funds | ||
| Date: | February 27, 2013 | |
Table of Contents
EXHIBIT INDEX
(a) Attached hereto as exhibit 1 is the company’s Code of Ethics.
(b)(1) Certifications of principal executive officer and principal financial officer as required by Rule 30a-2 under the Investment Company Act of 1940.
(b)(2) Certification of principal executive officer and principal financial officer as required by Section 906 of the Sarbanes-Oxley Act of 2002.