UNITED STATES
SECURITIES AND EXCHANGE COMMISSION
Washington, D.C. 20549
FORM N-CSR
CERTIFIED SHAREHOLDER REPORT OF REGISTERED
MANAGEMENT INVESTMENT COMPANIES
Investment Company Act file number: 811-02735
ELFUN TAX-EXEMPT INCOME FUND
(Exact name of registrant as specified in charter)
One Lincoln Street
Boston, Massachusetts 02111
(Address of principal executive offices) (Zip code)
Copy to:
| Joshua A. Weinberg, Esq. Managing Director and Managing Counsel SSGA Funds Management, Inc. One Lincoln Street Boston, Massachusetts 02111 (Name and Address of Agent for Service) | Timothy W. Diggins, Esq. Ropes & Gray 800 Boylston Street Boston, Massachusetts 02110-2624 | |
Registrant’s telephone number, including area code: (617) 664-7037
Date of fiscal year end: December 31
Date of reporting period: December 31, 2016
Item 1. Reports to Stockholders
Annual Report
December 31, 2016
Elfun Funds
Elfun International Equity Fund
Elfun Trusts
Elfun Diversified Fund
Elfun Tax-Exempt Income Fund
Elfun Income Fund
Elfun Government Money Market Fund

Elfun Funds
Annual Report
December 31, 2016
Table of Contents
| Page | ||||
| Notes to Performance | 1 | |||
| Manager Reviews and Schedule of Investments | ||||
| 2 | ||||
| 10 | ||||
| 16 | ||||
| 39 | ||||
| 50 | ||||
| 68 | ||||
| Notes to Schedules of Investments | 74 | |||
| Financial Statements | ||||
| 75 | ||||
| 82 | ||||
| 84 | ||||
| 86 | ||||
| 89 | ||||
| Report of Independent Registered Public Accounting Firm | 102 | |||
| Tax Information | 103 | |||
| Advisory Agreement Renewal | 104 | |||
| Special Meeting of Unitholders — Voting Results | 107 | |||
| Additional Information | ||||
| Trustees | 113 | |||
This report has been prepared for shareholders and may be distributed to others only if accompanied with a current prospectus and/or summary prospectus.
Elfun Funds
Notes to Performance — December 31, 2016 (Unaudited)
Information on the following performance pages relates to the Elfun Funds.
Total returns take into account changes in share price and assume reinvestment of all dividends and capital gains distributions, if any. Total returns shown are net of Fund expenses.
The performance data quoted represents past performance; past performance does not guarantee future results. Investment return and principal value will fluctuate so your shares, when redeemed, may be worth more or less than their original cost. Current performance may be higher or lower than the performance data quoted. Periods less than one year are not annualized. Please call toll-free (800) 242-0134 or visit the Funds’ website at http://www.ssgafunds.com/geam for the most recent month-end performance data.
A portion of the Elfun Tax-Exempt Income Fund’s income may be subject to state, federal and/or alternative minimum tax. Capital gains, if any, are subject to capital gains tax.
An investment in a Fund is not a deposit of any bank and is not insured or guaranteed by the Federal Deposit Insurance Corporation (“FDIC”) or any other government agency. An investment in a Fund is subject to risk, including possible loss of principal invested.
The S&P 500® Index, Morgan Stanley Capital International Europe, Australasia, Far East Index (MSCI EAFE® Index), MSCI® ACWI ex-U.S. Index, Bloomberg Barclays U.S. Aggregate Bond Index, the Bloomberg Barclays U.S. Municipal Bond Index, and the 90 Day U.S. T-Bill are unmanaged indices and do not reflect the actual cost of investing in the instruments that comprise each index. The results shown for the foregoing indices assume the reinvestment of net dividends or interest and do not reflect the fees, expenses or taxes.
The S&P 500® Index is an unmanaged, market capitalization-weighted index of stocks of 500 large U.S. companies, which is widely used as a measure of large-cap U.S. stock market performance.
The MSCI® EAFE® Index is a market capitalization-weighted index of equity securities of companies domiciled in various countries. The index is designed to represent the performance of developed stock markets outside the U.S. and Canada and excludes certain market segments unavailable to U.S. based investors.
The MSCI ACWI ex-U.S. Index is a market-capitalization weighted index designed to provide a broad measure of stock performance throughout the world, with the exception of U.S. based companies. The MSCI® ACWI ex-U.S. Index includes both developed and emerging markets.
The Bloomberg Barclays U.S. Aggregate Bond Index is a market value-weighted index of taxable investment-grade debt issues, including government, corporate, asset-backed and mortgage-backed securities, with maturities of one year or more. This index is designed to represent the performance of the U.S. investment-grade first-rate bond market.
The Bloomberg Barclays U.S. Municipal Bond Index is an unmanaged index comprised of investment-grade, fixed rate securities with maturities of at least eight years and less than twelve years.
The 90 Day U.S. T-Bill is an unmanaged measure/index of the performance of the most recently auctioned 90 Day U.S. Treasury bills (i.e. having a total maturity of 90 days) currently available in the marketplace.
The peer universe of underlying funds used for the peer group average annual total return calculation is based on the blend of Morningstar peer categories, as shown. Morningstar is an independent mutual fund rating service. A Fund’s performance may be compared to or ranked within a universe of mutual funds with investment objectives and policies similar but not necessarily identical to the Fund.
©2017 Morningstar, Inc. All Rights Reserved. The Morningstar information contained herein: (1) is proprietary to Morningstar and/or its content providers; (2) may not be copied or distributed; and (3) is not warranted to be accurate, complete or timely. Neither Morningstar nor its content providers are responsible for any damage or losses relating from any use of this information. Past performance is no guarantee of future results.
The views, expressed in this document reflect our judgment as of the publication date and are subject to change at any time without notice.
State Street Global Markets, LLC, member of FINRA & SIPC is the principal underwriter and distributor of the Elfun Funds and a wholly owned subsidiary of State Street Corporation. References to State Street may include State Street Corporation and its affiliates. The Funds pay State Street Bank and Trust Company for its services as custodian and Fund Accounting agent, and pay SSGA Funds Management, Inc. for investment advisory and administrative services.
| Notes to Performance | 1 |
Elfun International Equity Fund
Portfolio Management Discussion and Analysis — December 31, 2016 (Unaudited)
| Q. | How did the Elfun International Equity Fund perform compared to its benchmark and Morningstar peer group for the twelve-month period ended December 31, 2016? |
| A. | For the twelve-month period ended December 31, 2016, the Elfun International Equity Fund returned -0.86%. The MSCI® EAFE Index, the Fund’s benchmark, returned 1.00% and the Fund’s Morningstar peer group of 742 Foreign Large Blend Funds returned an average of 0.67% over the same period. |
| Q. | What factors affected the Fund’s performance? |
| A. | 2016 began with equity markets falling as investors fretted over weakness in the global economy, volatility in China, currency wars, and the continuing fall in oil prices. Given the negativity of investor sentiment, it was remarkable how quickly markets rebounded from February lows, helped by a turnaround in oil and dovish rhetoric from the central banks. But the reality was that the market’s drop was always somewhat disconnected from fundamentals. For example, data out of China had been relatively stable, PMI’s and leading economic indicators were improving, and earnings growth expectations and valuations were reasonable. It was therefore not too surprising that markets mostly rose through the rest of 2016, briefly interrupted in late June when the United Kingdom voted to leave the European Union and early November on initial fears about the impact of Donald Trump’s presidential victory. 2016’s reasonable market return, however, was undermined somewhat for U.S. dollar based investors by foreign currency weakness, especially in the fourth quarter as the dollar’s strength accelerated. |
| For the year, the MSCI EAFE Index generated a 1% total return in U.S. dollars. Earnings growth during the period was not strong causing the market P/E to rise from an already elevated 21.3 at the beginning of the year to 22.9 at the end. At this valuation, the question for investors is whether the market is being overly optimistic or is it correctly pricing in healthier future earnings growth. There are some signs of earnings improvement, with, for example, Europe recently seeing the first upgrades in over a year, but this trend will need to be sustained to justify current valuations. |
| Underlying the market’s headline number was significant variance. Energy and materials, after early weakness, led throughout rest of the year, both finishing up more than 20%. For other cyclical sectors such as financials, it took longer, but starting mid-year they began to outperform, in a pronounced shift toward value stocks. Lagging this year were the defensive sectors: healthcare, utilities, telecom, and consumer staples. |
| Regionally, within the MSCI EAFE regions, the Pacific Basin excluding Japan was the strongest, up 7.9%. This was followed by Japan, which has now outperformed the MSCI® EAFE Index for four years in a row. Europe and the United Kingdom lagged. But outside of the index regions, markets were stronger, with Canada, the U.S., and emerging markets all turning in double-digit returns. |
| Q. | What were the primary drivers of Fund performance? |
| A. | The Fund’s underperformance in 2016 relative to the index came largely from two distinct periods — one at the start of the year and one at the end. In the risk-off environment of the first six weeks of 2016, the Fund, which had a pro-cyclical bias, fell even more than the market. As the market recovered, the Fund mostly outperformed the MSCI® EAFE Index over the next 9 months. This lasted until post-U.S. elections when the Fund again underperformed as the market rotated strongly into value on the potential for higher rates. |
| For the full year, the energy sector, despite accounting for only about 5% of holdings, was the biggest positive contributor to Fund performance this year. As the price of oil recovered, the Fund’s oil and gas holdings and one oil-services company surged, resulting in a nearly 30% average return for the year. The Fund’s technology names, which make up a much bigger percent of holdings, also did well, up over 7% and significantly outpacing the technology sector of the index. Geographically, the Fund’s significant exposure to Continental Europe, which rose modestly, added to performance and its emerging markets holdings, up nearly 9%, also helped. |
| On the negative side, despite doing much better in the latter half of the year as the interest rate outlook improved, banks could not overcome first half weakness and were a drag on the Fund’s performance. Also detracting from performance was the Fund’s exposure to pharmaceutical companies, which were distinctly out of favor this year, although the Fund did avoid many of the worst performers in the index. The Fund’s relatively small exposure to metals & mining stocks hurt performance relative to the broader MSCI® EAFE Index, as this sector jumped more than 50% this year. |
| 2 | Elfun International Equity Fund |
Elfun International Equity Fund
Portfolio Management Discussion and Analysis, continued — December 31, 2016 (Unaudited)
| Derivatives did not have any material impact on Fund performance. |
| Q. | Were there any significant changes to the Fund during the period? |
| A. | There were no changes during the period in the portfolio management team or their approach to investing. Turnover remained relatively low in keeping with our long-term investment horizon, but did result in some changes in positioning. Regionally, the Fund’s weight in companies based in emerging market countries increased as a result of both outperformance and trading. The Fund’s overweight (relative to the MSCI® EAFE Index) in Japan decreased somewhat but remained positive. The Fund’s underweight in the Pacific region outside of Japan became larger over the past year. |
| Among sectors, Information Technology was consistently the largest overweight in 2016 although the size of that overweight fell slightly. The financials sector went from a small overweight to a moderate underweight, due in large part to reductions in Japanese banks. The consumer staples sector has been a consistent underweight, but that underweight was reduced somewhat over the last year. |
| Elfun International Equity Fund | 3 |
Elfun International Equity Fund
Understanding Your Fund’s Expenses — December 31, 2016 (Unaudited)
As a shareholder of the Fund you incur ongoing costs. Ongoing costs include portfolio management fees, professional fees, administrative fees and other Fund expenses. The following example is intended to help you understand your ongoing costs (in dollars) of investing in the Fund and to compare these costs with the ongoing costs of investing in other mutual funds.
To illustrate these ongoing costs, we have provided an example and calculated the expenses paid by investors in units of the Fund during the period. The information in the following table is based on an investment of $1,000, which is invested at the beginning of the period and held for the entire six-month period ended December 31, 2016.
Actual Expenses
The first section of the table provides information about actual account values and actual expenses. You may use the information in this section, together with the amount you invested, to estimate the expenses that you paid over the period. To do so, simply divide your account value by $1,000 (for example, an $8,600 account value divided by $1,000 = 8.6), then multiply the result by the number given under the heading “Expenses paid during the period” to estimate the expenses you paid on your account during the period.
Hypothetical Example for Comparison Purposes
The second section of the table provides information about hypothetical account values and hypothetical expenses based on the Fund’s actual expense ratio and an assumed rate of return of 5% per year before expenses, which is not the Fund’s actual return. The hypothetical account values and expenses may not be used to estimate the actual ending account balance or expenses you paid for the period. You may use this information to compare the ongoing costs of investing in the Fund and other funds. To do so, compare this 5% hypothetical example with the 5% hypothetical examples that appear in the shareholders reports of other funds.
Please note that the expenses shown in the table are meant to highlight and help you compare ongoing costs only and do not reflect transaction costs, such as sales charges or redemption fees, if any. Therefore, the second section of the table is useful in comparing ongoing costs only, and will not help you determine the relative total costs of owning different funds.
| Actual Fund Return | Hypothetical 5% Return (2.5% for the period) | |||||||
Account value at the July 1, 2016 | $ | 1,000.00 | $ | 1,000.00 | ||||
Account value at the end of the period December 31, 2016 | $ | 1,044.40 | $ | 1,023.53 | ||||
Expenses paid during the period* | $ | 1.64 | $ | 1.63 | ||||
| * | Expenses are equal to the Fund’s annualized net expense ratio of 0.32%** (for the period July 1, 2016-December 31, 2016), multiplied by the average account value over the period, multiplied by 184/366 (to reflect the one-half year period). |
| ** | May differ from expense ratio disclosed in the financial highlights, which is calculated based on the entire fiscal year’s data. The ratio above includes the refunded custody expense. Without the refunded custody expense the ratio used in the calculations above would have been 0.39%. |
| 4 | Elfun International Equity Fund |
Elfun International Equity Fund
Performance Summary — December 31, 2016 (Unaudited)
Investment Profile
A mutual fund designed for investors who seek long-term growth of capital and future income by investing principally in foreign securities consistent with prudent investment management and the preservation of capital. The Fund seeks to achieve its investment objectives by investing at least 80% of its net assets under normal circumstances in equity securities, such as common and preferred stocks and invests primarily (meaning at least 65%) in companies in both developed and emerging market countries outside the United States.
Morningstar Performance Comparison
Based on average annual returns for periods ended December 31, 2016
| 1 Year | 5 Year | 10 Year | ||||||||||
Number of funds in peer group | 742 | 624 | 474 | |||||||||
Peer group average annual total return | 0.67 | % | 5.79 | % | 0.38 | % | ||||||
Morningstar Category in peer group: U.S. Foreign Large Blend |
| |||||||||||
Top Ten Largest Holdings
as of December 31, 2016 (as a % of Fair Value) (a)(b)
BNP Paribas S.A. | 3.04 | % | ||
ASML Holding N.V. | 2.32 | % | ||
Roche Holding AG | 2.26 | % | ||
Shire PLC | 2.09 | % | ||
Keyence Corp. | 2.01 | % | ||
Kao Corp. | 1.99 | % | ||
FANUC Corp. | 1.94 | % | ||
Statoil ASA | 1.82 | % | ||
Vodafone Group PLC | 1.79 | % | ||
AIA Group Ltd. | 1.75 | % |
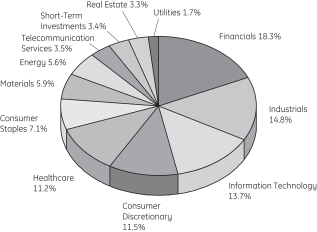
Sector Allocation as of December 31, 2016
Portfolio composition as a % of Fair Value of $207,484 (in thousands) as of December 31, 2016 (a)(b)
Average Annual Total Return for the periods ended December 31, 2016
(Inception date: 01/01/88)
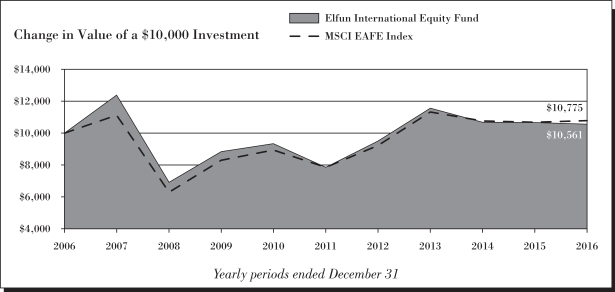
| One Year | Five Year | Ten Year | Ending Value of a $10,000 Investment | |||||||||||||||||
Elfun International Equity Fund | -0.86% | 6.14% | 0.55% | $10,561 | ||||||||||||||||
MSCI EAFE Index | 1.00% | 6.53% | 0.75% | $10,775 | ||||||||||||||||
| Elfun International Equity Fund | 5 |
Elfun International Equity Fund
Performance Summary, continued — December 31, 2016 (Unaudited)
| (a) | Fair Value basis is inclusive of short-term investment in State Street Institutional U.S. Government Money Market Fund Class G Shares. |
| (b) | The securities information regarding holdings, allocations and other characteristics is presented to illustrate examples of securities that the Fund has bought and the diversity of areas in which the Fund may invest as of a particular date. It may not be representative of the Fund’s current or future investments and should not be construed as a recommendation to purchase or sell a particular security. |
See Notes to Performance beginning on page 1 for further information, including an explanation of Morningstar peer categories.
Past performance does not predict future performance. The performance shown in the graphs and tables does not reflect the deduction of taxes that a shareholder would pay on Fund distributions or the redemption of Fund shares.
| 6 | Elfun International Equity Fund |
Elfun International Equity Fund
Schedule of Investments — December 31, 2016
| Number of Shares | Fair $ | |||||||
| Common Stock - 96.4%† | ||||||||
Australia - 1.4% |
| |||||||
Insurance Australia Group Ltd. | 661,199 | 2,867,857 | ||||||
|
| |||||||
Belgium - 1.7% |
| |||||||
Anheuser-Busch InBev S.A. | 33,137 | 3,514,348 | ||||||
|
| |||||||
Canada - 3.4% |
| |||||||
Brookfield Asset Management Inc., Class A | 29,978 | 990,288 | ||||||
Cenovus Energy Inc. | 204,485 | 3,095,370 | ||||||
Seven Generations Energy Ltd., Class A (a) | 130,378 | 3,043,984 | ||||||
|
| |||||||
| 7,129,642 | ||||||||
|
| |||||||
France - 12.3% |
| |||||||
Airbus Group SE | 35,303 | 2,339,900 | ||||||
AXA S.A. | 125,497 | 3,174,845 | ||||||
BNP Paribas S.A. | 98,850 | 6,313,066 | ||||||
Sanofi | 40,794 | 3,308,812 | ||||||
Schneider Electric SE | 45,635 | 3,182,107 | ||||||
Technip S.A. | 23,475 | 1,678,993 | ||||||
Vivendi S.A. | 190,036 | 3,618,953 | ||||||
Zodiac Aerospace | 88,842 | 2,044,199 | ||||||
|
| |||||||
| 25,660,875 | ||||||||
|
| |||||||
Germany - 9.6% | ||||||||
Bayer AG | 29,312 | 3,064,786 | ||||||
Continental AG | 14,370 | 2,784,296 | ||||||
Fresenius SE & Company KGaA | 35,975 | 2,817,768 | ||||||
HeidelbergCement AG | 34,647 | 3,238,888 | ||||||
KION Group AG | 30,440 | 1,697,154 | ||||||
Linde AG | 8,746 | 1,439,998 | ||||||
SAP SE | 37,183 | 3,247,706 | ||||||
Zalando SE (a) | 41,114 | 1,573,716 | ||||||
|
| |||||||
| 19,864,312 | ||||||||
|
| |||||||
Hong Kong - 1.8% | ||||||||
AIA Group Ltd. | 645,167 | 3,640,592 | ||||||
|
| |||||||
India - 2.7% | ||||||||
ICICI Bank Ltd. | 820,607 | 3,083,775 | ||||||
Power Grid Corporation of India Ltd. | 961,182 | 2,598,746 | ||||||
|
| |||||||
| 5,682,521 | ||||||||
|
| |||||||
Ireland - 1.1% | ||||||||
Kerry Group PLC, Class A | 30,953 | 2,216,777 | ||||||
|
| |||||||
Italy - 1.3% | ||||||||
Intesa Sanpaolo S.p.A. | 1,063,529 | 2,721,383 | ||||||
|
| |||||||
| Number of Shares | Fair $ | |||||||
Japan - 25.1% | ||||||||
Astellas Pharma Inc. | 134,200 | 1,867,996 | ||||||
East Japan Railway Co. | 16,800 | 1,454,795 | ||||||
FANUC Corp. | 23,700 | 4,026,369 | ||||||
Fuji Heavy Industries Ltd. | 71,600 | 2,929,440 | ||||||
Kao Corp. | 86,700 | 4,118,872 | ||||||
Keyence Corp. | 6,051 | 4,160,760 | ||||||
Komatsu Ltd. | 152,700 | 3,466,140 | ||||||
Mitsubishi Estate Company Ltd. | 159,459 | 3,182,071 | ||||||
Mitsubishi UFJ Financial Group Inc. | 403,400 | 2,490,922 | ||||||
Mitsui Fudosan Company Ltd. | 153,518 | 3,560,391 | ||||||
Murata Manufacturing Company Ltd. | 17,697 | 2,374,571 | ||||||
Nidec Corp. | 41,800 | 3,614,292 | ||||||
Secom Company Ltd. | 44,800 | 3,283,323 | ||||||
Sekisui House Ltd. | 187,900 | 3,134,217 | ||||||
Shimano Inc. | 17,900 | 2,814,644 | ||||||
SoftBank Group Corp. | 54,201 | 3,608,443 | ||||||
Tokio Marine Holdings Inc. | 19,600 | 805,947 | ||||||
Toyota Motor Corp. | 23,982 | 1,414,225 | ||||||
|
| |||||||
| 52,307,418 | ||||||||
|
| |||||||
Mexico - 0.5% | ||||||||
Grupo Financiero Banorte SAB de C.V., Class O | 190,511 | 944,163 | ||||||
|
| |||||||
Netherlands - 5.2% | ||||||||
ASML Holding N.V. | 42,839 | 4,818,920 | ||||||
ING Groep N.V. | 212,343 | 2,994,462 | ||||||
NXP Semiconductors N.V. (a) | 30,856 | 3,024,197 | ||||||
|
| |||||||
| 10,837,579 | ||||||||
|
| |||||||
Norway - 1.8% | ||||||||
Statoil ASA | 205,451 | 3,780,736 | ||||||
|
| |||||||
South Africa - 1.5% | ||||||||
Naspers Ltd., Class N | 21,218 | 3,125,043 | ||||||
|
| |||||||
South Korea - 1.3% | ||||||||
KEPCO Plant Service & Engineering Company Ltd. | 10,024 | 449,827 | ||||||
Samsung Electronics Company Ltd. | 1,556 | 2,321,503 | ||||||
|
| |||||||
| 2,771,330 | ||||||||
|
| |||||||
Spain - 2.1% | ||||||||
Banco Bilbao Vizcaya Argentaria S.A. | 498,724 | 3,373,951 | ||||||
Iberdrola S.A. | 152,023 | 999,598 | ||||||
|
| |||||||
| 4,373,549 | ||||||||
|
| |||||||
See Notes to Schedules of Investments and Notes to Financial Statements.
| Elfun International Equity Fund | 7 |
Elfun International Equity Fund
Schedule of Investments, continued — December 31, 2016
| Number of Shares | Fair $ | |||||||
Sweden - 4.5% | ||||||||
Assa Abloy AB, Class B | 155,474 | 2,893,980 | ||||||
Hexagon AB, Class B | 65,469 | 2,345,746 | ||||||
Svenska Cellulosa AB SCA, Class B | 47,308 | 1,339,888 | ||||||
Telefonaktiebolaget LM Ericsson, Class B | 471,744 | 2,778,141 | ||||||
|
| |||||||
| 9,357,755 | ||||||||
|
| |||||||
Switzerland - 6.5% | ||||||||
Geberit AG | 5,802 | 2,330,276 | ||||||
Givaudan S.A. | 1,529 | 2,807,216 | ||||||
Nestle S.A. | 50,259 | 3,612,358 | ||||||
Roche Holding AG | 20,442 | 4,678,319 | ||||||
|
| |||||||
| 13,428,169 | ||||||||
|
| |||||||
Taiwan - 1.6% | ||||||||
Taiwan Semiconductor Manufacturing Company Ltd. | 599,900 | 3,378,381 | ||||||
|
| |||||||
United Kingdom - 11.0% | ||||||||
Barclays PLC | 841,350 | 2,323,017 | ||||||
BHP Billiton PLC | 194,570 | 3,141,091 | ||||||
| Number of Shares | Fair $ | |||||||
Johnson Matthey PLC | 42,670 | 1,677,715 | ||||||
Prudential PLC | 108,338 | 2,178,698 | ||||||
Shire PLC | 75,046 | 4,343,499 | ||||||
Smith & Nephew PLC | 203,684 | 3,073,038 | ||||||
Vodafone Group PLC | 1,506,191 | 3,719,457 | ||||||
WPP PLC | 108,869 | 2,442,954 | ||||||
|
| |||||||
| 22,899,469 | ||||||||
|
| |||||||
| Total Common Stock (Cost $194,083,182) | 200,501,899 | |||||||
|
| |||||||
| Short-Term Investments - 3.3% | ||||||||
State Street Institutional U.S. Government Money Market Fund - Class G Shares 0.46% | 6,981,686 | 6,981,686 | ||||||
|
| |||||||
| Total Investments (Cost $201,064,868) | 207,483,585 | |||||||
| Other Assets and Liabilities, net - 0.3% | 560,743 | |||||||
|
| |||||||
| NET ASSETS - 100.0% | 208,044,328 | |||||||
|
| |||||||
Other Information:
The Fund had the following long futures contracts open at December 31, 2016:
| Description | Expiration date | Number of Contracts | Current Notional Value | Unrealized Depreciation | ||||||||||||
MSCI EAFE Mini Index Futures | March 2017 | 64 | $ | 5,361,920 | $ | (14,870 | ) | |||||||||
|
| |||||||||||||||
The Fund was invested in the following sectors at December 31, 2016 (unaudited):
| Sector | Percentage (based on Fair Value) | |||
Diversified Banks | 11.69% | |||
Pharmaceuticals | 6.23% | |||
Wireless Telecommunication Services | 3.53% | |||
Integrated Oil & Gas | 3.31% | |||
Electrical Components & Equipment | 3.28% | |||
Diversified Real Estate Activities | 3.25% | |||
Electronic Equipment & Instruments | 3.14% | |||
Semiconductors | 3.09% | |||
Packaged Foods & Meats | 2.81% | |||
Life & Health Insurance | 2.80% | |||
Building Products | 2.52% | |||
Construction Machinery & Heavy Trucks | 2.49% | |||
Semiconductor Equipment | 2.32% | |||
Specialty Chemicals | 2.16% | |||
| Sector, continued | Percentage (based on Fair Value) | |||
Aerospace & Defense | 2.11% | |||
Automobile Manufacturers | 2.09% | |||
Biotechnology | 2.09% | |||
Personal Products | 1.99% | |||
Industrial Machinery | 1.94% | |||
Property & Casualty Insurance | 1.77% | |||
Movies & Entertainment | 1.74% | |||
Electric Utilities | 1.73% | |||
Brewers | 1.69% | |||
Security & Alarm Services | 1.58% | |||
Application Software | 1.57% | |||
Construction Materials | 1.56% | |||
Multi-Line Insurance | 1.53% | |||
Diversified Metals & Mining | 1.51% | |||
See Notes to Schedules of Investments and Notes to Financial Statements.
| 8 | Elfun International Equity Fund |
Elfun International Equity Fund
Schedule of Investments, continued — December 31, 2016
| Sector, continued | Percentage (based on Fair Value) | |||
Home Building | 1.51% | |||
Cable & Satellite | 1.51% | |||
Healthcare Equipment | 1.48% | |||
Oil & Gas Exploration & Production | 1.47% | |||
Healthcare Services | 1.36% | |||
Leisure Products | 1.36% | |||
Auto Parts & Equipment | 1.34% | |||
Communications Equipment | 1.34% | |||
Advertising | 1.18% | |||
Electronic Components | 1.14% | |||
Technology Hardware, Storage & Peripherals | 1.12% | |||
Oil & Gas Equipment & Services | 0.81% | |||
Internet & Direct Marketing Retail | 0.76% | |||
| Sector, continued | Percentage (based on Fair Value) | |||
Railroads | 0.70% | |||
Industrial Gases | 0.69% | |||
Household Products | 0.65% | |||
Asset Management & Custody Banks | 0.48% | |||
Diversified Support Services | 0.22% | |||
|
| |||
| 96.64% | ||||
|
| |||
Short-Term Investments | ||||
Short-Term Investments | 3.36% | |||
|
| |||
| 3.36% | ||||
|
| |||
| 100.00% | ||||
|
| |||
Affiliate Table
| Number of Shares Held at 12/31/15 | Value at 12/31/15 | Shares Purchased | Shares Sold | Number of Shares Held at 12/31/16 | Value at 12/31/16 | Dividend/ Interest Income | Realized Gain (Loss) | |||||||||||||||||||||||||
State Street Institutional U.S. Government Money Market Fund | 9,904,613 | $ | 9,904,614 | 43,649,050 | 46,571,977 | 6,981,686 | $ | 6,981,686 | $ | 14,486 | $ | — | ||||||||||||||||||||
|
|
|
|
|
| |||||||||||||||||||||||||||
| $ | 6,981,686 | $ | 14,486 | $ | — | |||||||||||||||||||||||||||
|
|
|
|
|
| |||||||||||||||||||||||||||
See Notes to Schedules of Investments and Notes to Financial Statements.
| Elfun International Equity Fund | 9 |
Portfolio Management Discussion and Analysis — December 31, 2016 (Unaudited)
| Q. | How did the Elfun Trusts Fund perform compared to its benchmark and Morningstar peer group for the twelve-month period ended December 31, 2016? |
| A. | For the twelve-month period ended December 31, 2016, the Elfun Trusts Fund returned 6.08%. The S&P 500® Index (the “S&P 500 Index”), the Fund’s benchmark, returned 11.96% and the Fund’s Morningstar peer group of 1,469 U.S. Large Cap Growth Funds returned an average of 3.19% over the same period. |
| Q. | What market factors affected the Fund’s performance? |
| A. | Underlying the 12% return for the S&P 500® Index last year was a wide range of performance at the sector level. The energy sector led the way with a 27% return and the healthcare sector lagged with a decline of 3%. Healthcare was the only sector with a negative return. Post the U.S. presidential election, the financial, industrial and energy sectors rebounded sharply higher. With expectations that the new administration will be more business friendly (lower taxes, stimulus, less regulatory burden, etc.) stocks moved higher across the board. The industrial, energy, and financial sectors were particularly strong post the election. |
| Q. | What were the primary drivers of Fund performance? |
| A. | The Elfun Trusts was not positioned well for the underlying trends in sector performance last year. Healthcare has long been an overweighted sector in the portfolio. It comprises about 21% of the portfolio compared to a weight of 15% in the S&P 500. Pharma and biotech sold off due to fears of a more onerous regulatory environment. We believe these fears are overblown and overly discounted in share prices. We own several pharma, biotech, and medical device companies that we believe will grow at above-average rates due to their pipelines of new products. |
| The portfolio was underweighted in the energy sector, with an energy weight of 5.5% compared with a 7% weight for the S&P 500® Index. Similarly, we are underweighted in industrials with a 4% weight compared to a 9% weight in the S&P 500® Index. With the strong performance of energy and industrials in 2016, these underweights were detractors to relative performance. We entered 2016 with the belief that the economic cycle was long in the tooth and growth would be slow. We underweighted the cyclical sectors and overweighted the growth sectors of healthcare and technology. Frankly, we were surprised by the U.S. presidential election results and were positioned for the status quo. |
| Q. | Were there any significant changes to the Fund during the period? |
| A. | Changes in the portfolio were modest last year. Turnover was 15%, in line with our long term average of 10-20%. We continue to be long term investors. The number of holding declined modestly, from 53 to 45 holdings. Sector exposure is largely the same with the two most overweighted sectors being technology and healthcare. We share the market’s new found enthusiasm for renewed growth post the election results. The portfolio remains underweighted in utilities, telecom, and consumer staples due to the slow growth and dividend yield focus of these sectors. These three sectors lagged the market post the election, and we feel they may continue to lag as interest rates trend higher. We remained focused on high quality, above-average growers trading at valuations we deem attractive. |
| 10 | Elfun Trusts |
Elfun Trusts
Understanding Your Fund’s Expenses — December 31, 2016 (Unaudited)
As a shareholder of the Fund you incur ongoing costs. Ongoing costs include portfolio management fees, professional fees, administrative fees and other Fund expenses. The following example is intended to help you understand your ongoing costs (in dollars) of investing in the Fund and to compare these costs with the ongoing costs of investing in other mutual funds.
To illustrate these ongoing costs, we have provided an example and calculated the expenses paid by investors in units of the Fund during the period. The information in the following table is based on an investment of $1,000, which is invested at the beginning of the period and held for the entire six-month period ended December 31, 2016.
Actual Expenses
The first section of the table provides information about actual account values and actual expenses. You may use the information in this section, together with the amount you invested, to estimate the expenses that you paid over the period. To do so, simply divide your account value by $1,000 (for example, an $8,600 account value divided by $1,000 = 8.6), then multiply the result by the number given under the heading “Expenses paid during the period” to estimate the expenses you paid on your account during the period.
Hypothetical Example for Comparison Purposes
The second section of the table provides information about hypothetical account values and hypothetical expenses based on the Fund’s actual expense ratio and an assumed rate of return of 5% per year before expenses, which is not the Fund’s actual return. The hypothetical account values and expenses may not be used to estimate the actual ending account balance or expenses you paid for the period. You may use this information to compare the ongoing costs of investing in the Fund and other funds. To do so, compare this 5% hypothetical example with the 5% hypothetical examples that appear in the shareholders reports of other funds.
Please note that the expenses shown in the table are meant to highlight and help you compare ongoing costs only and do not reflect transaction costs, such as sales charges or redemption fees, if any. Therefore, the second section of the table is useful in comparing ongoing costs only, and will not help you determine the relative total costs of owning different funds.
| Actual Fund Return | Hypothetical 5% Return (2.5% for the period) | |||||||||
Account value at the beginning of the period July 1, 2016 | $ | 1,000.00 | $ | 1,000.00 | ||||||
Account value at the end of the period December 31, 2016 | $ | 1,069.60 | $ | 1,024.18 | ||||||
Expenses paid during the period* | $ | 0.99 | $ | 0.97 | ||||||
| * | Expenses are equal to the Fund’s annualized net expense ratio of 0.19%** (for the period July 1, 2016-December 31, 2016), multiplied by the average account value over the period, multiplied by 184/366 (to reflect the one-half year period). |
| ** | May differ from expense ratio disclosed in the financial highlights, which is calculated based on the entire fiscal year’s data. |
| Elfun Trusts | 11 |
Elfun Trusts
Performance Summary — December 31, 2016 (Unaudited)
Investment Profile
A mutual fund designed for investors who seek long-term growth of capital and future income rather than current income. The Fund seeks to achieve its investment objectives by investing in equity securities of U.S. companies, such as common and preferred stocks.
Morningstar Performance Comparison
Based on average annual returns for periods ended December 31, 2016
| 1 Year | 5 Year | 10 Year | ||||||||||
Number of funds in peer group | 1,469 | 1,352 | 1,159 | |||||||||
Peer group average annual total return | 3.19 | % | 12.66 | % | 6.32 | % | ||||||
| Morningstar Category in peer group: U.S. Large Growth | ||||||||||||
Top Ten Largest Holdings
as of December 31, 2016 (as a % of Fair Value) (a)(b)
CME Group Inc. | 4.61 | % | ||
Visa Inc., Class A | 4.59 | % | ||
JPMorgan Chase & Co. | 4.45 | % | ||
PepsiCo Inc. | 4.32 | % | ||
Amazon.com Inc. | 4.19 | % | ||
Allergan PLC | 4.06 | % | ||
The Charles Schwab Corp. | 3.90 | % | ||
Schlumberger Ltd. | 3.79 | % | ||
Charter Communications Inc., Class A | 3.59 | % | ||
Apple Inc. | 3.58 | % |
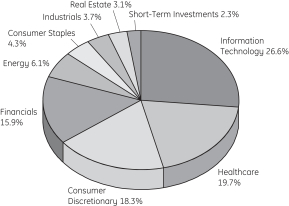
Sector Allocation as of December 31, 2016
Portfolio composition as a % of Fair Value of $2,327,018 (in thousands) as of December 31, 2016 (a)(b)
Average Annual Total Return for the periods ended December 31, 2016
(Inception date: 05/27/35)
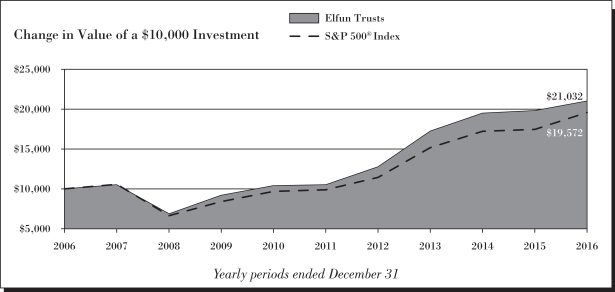
| One Year | Five Year | Ten Year | Ending Value of a $10,000 Investment | |||||||||||||
Elfun Trusts | 6.08 | % | 14.84 | % | 7.72 | % | $ | 21,032 | ||||||||
S&P 500® Index | 11.96 | % | 14.66 | % | 6.95 | % | $ | 19,572 | ||||||||
| 12 | Elfun Trusts |
Elfun Trusts
Performance Summary, continued — December 31, 2016 (Unaudited)
| (a) | Fair Value basis is inclusive of short-term investment in State Street Institutional U.S. Government Money Market Fund Class G Shares. |
| (b) | The securities information regarding holdings, allocations and other characteristics is presented to illustrate examples of securities that the Fund has bought and the diversity of areas in which the Fund may invest as of a particular date. It may not be representative of the Fund’s current or future investments and should not be construed as a recommendation to purchase or sell a particular security. |
See Notes to Performance beginning on page 1 for further information, including an explanation of Morningstar peer categories.
Past performance does not predict future performance. The performance shown in the graphs and tables does not reflect the deduction of taxes that a shareholder would pay on Fund distributions or the redemption of Fund shares.
| Elfun Trusts | 13 |
Elfun Trusts
Schedule of Investments — December 31, 2016
| Number of Shares | Fair Value $ | |||||||
| Common Stock - 97.5%† | ||||||||
Air Freight & Logistics - 0.4% |
| |||||||
United Parcel Service Inc., Class B | 80,000 | 9,171,200 | ||||||
|
| |||||||
Application Software - 3.7% |
| |||||||
Intuit Inc. | 535,000 | 61,316,350 | ||||||
salesforce.com Inc. (a) | 370,000 | 25,330,200 | ||||||
|
| |||||||
| 86,646,550 | ||||||||
|
| |||||||
Biotechnology - 7.1% |
| |||||||
Alexion Pharmaceuticals Inc. (a) | 220,000 | 26,917,000 | ||||||
Amgen Inc. | 460,000 | 67,256,600 | ||||||
Gilead Sciences Inc. | 730,000 | 52,275,300 | ||||||
Vertex Pharmaceuticals Inc. (a) | 270,000 | 19,890,900 | ||||||
|
| |||||||
| 166,339,800 | ||||||||
|
| |||||||
Cable & Satellite - 9.7% |
| |||||||
Charter Communications Inc., Class A (a) | 290,000 | 83,496,800 | ||||||
Comcast Corp., Class A | 680,000 | 46,954,000 | ||||||
Liberty Global PLC, Class C (a) | 2,400,000 | 71,280,000 | ||||||
Sirius XM Holdings Inc. | 5,700,000 | 25,365,000 | ||||||
|
| |||||||
| 227,095,800 | ||||||||
|
| |||||||
Data Processing & Outsourced Services - 7.7% |
| |||||||
Automatic Data Processing Inc. | 170,000 | 17,472,600 | ||||||
Paychex Inc. | 90,000 | 5,479,200 | ||||||
PayPal Holdings Inc. (a) | 1,200,000 | 47,364,000 | ||||||
Square Inc., Class A (a) | 200,000 | 2,726,000 | ||||||
Visa Inc., Class A | 1,370,000 | 106,887,400 | ||||||
|
| |||||||
| 179,929,200 | ||||||||
|
| |||||||
Diversified Banks - 4.5% |
| |||||||
JPMorgan Chase & Co. | 1,200,000 | 103,548,000 | ||||||
|
| |||||||
Financial Exchanges & Data - 7.0% |
| |||||||
CME Group Inc. | 930,000 | 107,275,500 | ||||||
S&P Global Inc. | 520,000 | 55,920,800 | ||||||
|
| |||||||
| 163,196,300 | ||||||||
|
| |||||||
Healthcare Equipment - 3.7% |
| |||||||
Abbott Laboratories | 420,000 | 16,132,200 | ||||||
Medtronic PLC | 970,000 | 69,093,100 | ||||||
|
| |||||||
| 85,225,300 | ||||||||
|
| |||||||
Healthcare Supplies - 1.4% |
| |||||||
The Cooper Companies Inc. | 190,000 | 33,236,700 | ||||||
|
| |||||||
Home Improvement Retail - 2.8% |
| |||||||
Lowe’s Companies Inc. | 930,000 | 66,141,600 | ||||||
|
| |||||||
| Number of Shares | Fair Value $ | |||||||
Industrial Conglomerates - 0.8% |
| |||||||
Honeywell International Inc. | 160,000 | 18,536,000 | ||||||
|
| |||||||
Industrial Machinery - 0.9% |
| |||||||
Dover Corp. | 275,000 | 20,605,750 | ||||||
|
| |||||||
Integrated Oil & Gas - 2.3% |
| |||||||
Chevron Corp. | 460,000 | 54,142,000 | ||||||
|
| |||||||
Internet & Direct Marketing Retail - 4.2% |
| |||||||
Amazon.com Inc. (a) | 130,000 | 97,483,100 | ||||||
|
| |||||||
Internet Software & Services - 6.5% |
| |||||||
Alibaba Group Holding Ltd. ADR (a) | 170,000 | 14,927,700 | ||||||
Alphabet Inc., Class A (a) | 38,000 | 30,113,100 | ||||||
Alphabet Inc., Class C (a) | 83,000 | 64,061,060 | ||||||
Facebook Inc., Class A (a) | 360,000 | 41,418,000 | ||||||
|
| |||||||
| 150,519,860 | ||||||||
|
| |||||||
Investment Banking & Brokerage - 3.9% |
| |||||||
The Charles Schwab Corp. | 2,300,000 | 90,781,000 | ||||||
|
| |||||||
Movies & Entertainment - 1.5% |
| |||||||
The Walt Disney Co. | 340,000 | 35,434,800 | ||||||
|
| |||||||
Oil & Gas Equipment & Services - 3.8% |
| |||||||
Schlumberger Ltd. | 1,050,000 | 88,147,500 | ||||||
|
| |||||||
Pharmaceuticals - 7.4% |
| |||||||
Allergan PLC (a) | 450,000 | 94,504,500 | ||||||
Johnson & Johnson | 460,000 | 52,996,600 | ||||||
Merck & Company Inc. | 275,000 | 16,189,250 | ||||||
Pfizer Inc. | 300,000 | 9,744,000 | ||||||
|
| |||||||
| 173,434,350 | ||||||||
|
| |||||||
Reinsurance - 0.5% |
| |||||||
Alleghany Corp. (a) | 20,000 | 12,162,400 | ||||||
|
| |||||||
Semiconductors - 3.1% |
| |||||||
QUALCOMM Inc. | 1,100,000 | 71,720,000 | ||||||
|
| |||||||
Soft Drinks - 4.3% |
| |||||||
PepsiCo Inc. | 960,000 | 100,444,800 | ||||||
|
| |||||||
Specialized REITs - 3.1% |
| |||||||
American Tower Corp. | 680,000 | 71,862,400 | ||||||
|
| |||||||
Systems Software - 2.0% |
| |||||||
Microsoft Corp. | 750,000 | 46,605,000 | ||||||
|
| |||||||
Technology Hardware, Storage & Peripherals - 3.6% |
| |||||||
Apple Inc. | 720,000 | 83,390,400 | ||||||
|
| |||||||
See Notes to Schedules of Investments and Notes to Financial Statements.
| 14 | Elfun Trusts |
Elfun Trusts
Schedule of Investments, continued — December 31, 2016
| Number of Shares | Fair Value $ | |||||||
Trading Companies & Distributors - 1.6% |
| |||||||
United Rentals Inc. (a) | 360,000 | 38,008,800 | ||||||
|
| |||||||
| Total Common Stock (Cost $1,390,021,446) | 2,273,808,610 | |||||||
|
| |||||||
| Short-Term Investments - 2.3% | ||||||||
State Street Institutional U.S. Government Money Market Fund - Class G Shares 0.46% | 53,209,078 | 53,209,078 | ||||||
|
| |||||||
| Total Investments (Cost $1,443,230,524) | 2,327,017,688 | |||||||
| Other Assets and Liabilities, net - 0.2% | 4,948,073 | |||||||
|
| |||||||
| Net Assets - 100.0% | 2,331,965,761 | |||||||
|
| |||||||
Affiliate Table
| Number of Shares Held at 12/31/15 | Value At 12/31/15 | Shares Purchased | Shares Sold | Number of Shares Held at 12/31/16 | Value at 12/31/16 | Dividend/ Interest Income | Realized Gain (Loss) | |||||||||||||||||||||||||
State Street Corp. | 1,200,000 | $ | 79,632,000 | — | 1,200,000 | — | $ | — | $ | 357,000 | $ | 14,843,346 | ||||||||||||||||||||
State Street Institutional U.S. Government Money Market Fund | 50,527,506 | 50,527,506 | 185,682,546 | 183,000,974 | 53,209,078 | 53,209,078 | 222,766 | — | ||||||||||||||||||||||||
|
|
|
|
|
| |||||||||||||||||||||||||||
| $ | 53,209,078 | $ | 579,766 | $ | 14,843,346 | |||||||||||||||||||||||||||
|
|
|
|
|
| |||||||||||||||||||||||||||
See Notes to Schedules of Investments and Notes to Financial Statements.
| Elfun Trusts | 15 |
Portfolio Management Discussion and Analysis — December 31, 2016 (Unaudited)
| Q. | How did the Elfun Diversified Fund perform compared to its benchmark and Morningstar peer group for the twelve-month period ended December 31, 2016? |
| A. | For the twelve-month period ended December 31, 2016, the Elfun Diversified Fund returned 5.48%. The Fund’s broad based benchmarks, the S&P 500® Index (the “S&P 500 Index”), the MSCI All Country World ex-U.S. Index, and the Bloomberg Barclays U.S. Aggregate Bond Index, returned 11.96%, 4.50% and 2.65%, respectively. The Fund’s Morningstar peer group of 823 U.S. Moderate Allocation funds returned an average of 7.37% over the same period. |
| Q. | What market factors affected the Fund’s performance? |
| A. | 2016 presented a range of challenges and opportunities for investors. After starting the year with considerable weakness in January and February, risk asset markets rebounded sharply. The growth fears that dominated those early weeks gave way to expectations for a more stable, though still subdued macro backdrop. For bond markets this led to continued declines in government bond yields, while equity markets were generally well supported by growth as well as accommodative central bank expectations. |
| As the year progressed, two main events dominated returns and the macro backdrop — the United Kingdom’s June 2016 referendum vote to withdraw from the European Union (the “Brexit vote”) and the U.S. Presidential election. In the end, both produced short-term spikes in market volatility. Following the Brexit vote, equity markets were weak for a short time before recovering. However, the weakness in British Pound and, to a lesser extent, the euro was longer lasting given the political and economic uncertainty that followed. |
| Following the U.S. presidential election, equity market weakness was confined to a few hours before giving way to a strong positive move through the end of the year driven by stronger growth expectations. Forecasts for more favorable fiscal policy courtesy of increased spending and tax cuts plus less regulation played a large role in this move, which also drove substantial outperformance of U.S. equities relative to International markets. Moreover, a sharp appreciation of the dollar through that time contributed to U.S. dollar-based outperformance. Finally, stronger growth and inflation expectations, alongside a related rise in expectations for tighter Federal Reserve policy in 2017 resulted in a sharp rise in U.S. Treasury yields in the fourth quarter. In the end, rates were not much changed for the year, but did experience a big move in the fourth quarter while U.S. equities posted a solid gain for all of 2016. |
| Q. | What were the primary drivers of Fund performance? |
| A. | For the year as a whole, the biggest positive driver of returns came from U.S. equities which rose more than 10%, with solid gains in the fourth quarter. While a smaller allocation in the overall fund, mid-cap equity markets rose more than 20% in 2016, with a gain of nearly 7% in the fourth quarter. Emerging market equities were also a strong positive contributor to overall returns. Fixed income markets produced modest gains of less than 4% in 2016. However, the fourth quarter was much to blame for the full year result, with a decline of nearly 3% in the quarter on the back of rising interest rates. Finally, international equity markets lagged the U.S. considerably for the year, leading to a slight negative return in the aggregate for the asset class. |
| Relative to our strategic benchmark, our underweight allocation to fixed income was a positive to performance given the weak returns in the asset class. Moreover, our overweight allocations to U.S. equities and to Emerging Markets were also positive contributors. Performance within fixed income was a positive contribution while the U.S. and international equity strategies were a drag on overall returns given their respective underperformance. Our overweight allocation to cash acted as a drag on performance, though only modestly given the corresponding underweight position in fixed income. |
| Within tactical overlay positions, a short U.S. equity futures position late in the year to protect against market volatility acted as a modest detractor to overall returns. Meanwhile a tactical position to U.S. high yield bonds yielded a positive contribution for the fourth quarter and for the year as a whole. |
| Q. | Were there any significant changes to the Fund during the period? |
| A. | There were no major changes to the Fund in the year. Allocation shifts within and across asset classes were consistent with historical moves. In the fourth quarter we did modestly add to our fixed income allocation in response to higher interest rates, though we remain substantially underweight. |
| 16 | Elfun Diversified Fund |
Elfun Diversified Fund
Understanding Your Fund’s Expenses — December 31, 2016 (Unaudited)
As a shareholder of the Fund you incur ongoing costs. Ongoing costs include portfolio management fees, professional fees, administrative fees and other Fund expenses. The following example is intended to help you understand your ongoing costs (in dollars) of investing in the Fund and to compare these costs with the ongoing costs of investing in other mutual funds.
To illustrate these ongoing costs, we have provided an example and calculated the expenses paid by investors in units of the Fund during the period. The information in the following table is based on an investment of $1,000, which is invested at the beginning of the period and held for the entire six-month period ended December 31, 2016.
Actual Expenses
The first section of the table provides information about actual account values and actual expenses. You may use the information in this section, together with the amount you invested, to estimate the expenses that you paid over the period. To do so, simply divide your account value by $1,000 (for example, an $8,600 account value divided by $1,000 = 8.6), then multiply the result by the number given under the heading “Expenses paid during the period” to estimate the expenses you paid on your account during the period.
Hypothetical Example for Comparison Purposes
The second section of the table provides information about hypothetical account values and hypothetical expenses based on the Fund’s actual expense ratio and an assumed rate of return of 5% per year before expenses, which is not the Fund’s actual return. The hypothetical account values and expenses may not be used to estimate the actual ending account balance or expenses you paid for the period. You may use this information to compare the ongoing costs of investing in the Fund and other funds. To do so, compare this 5% hypothetical example with the 5% hypothetical examples that appear in the shareholders reports of other funds.
Please note that the expenses shown in the table are meant to highlight and help you compare ongoing costs only and do not reflect transaction costs, such as sales charges or redemption fees, if any. Therefore, the second section of the table is useful in comparing ongoing costs only, and will not help you determine the relative total costs of owning different funds.
| Actual Fund Return | Hypothetical 5% Return (2.5% for the period) | |||||||
Account value at the beginning of the period July 1, 2016 | $ | 1,000.00 | $ | 1,000.00 | ||||
Account value at the end of the period December 31, 2016 | $ | 1,036.50 | $ | 1,023.53 | ||||
Expenses paid during the period* | $ | 1.64 | $ | 1.63 | ||||
| * | Expenses are equal to the Fund’s annualized net expense ratio of 0.32%** (for the period July 1, 2016-December 31, 2016), multiplied by the average account value over the period, multiplied by 184/366 (to reflect the one-half year period). |
| ** | May differ from expense ratio disclosed in the financial highlights, which is calculated based on the entire fiscal year’s data. The ratio above includes the refunded custody expense. Without the refunded custody expense the ratio used in the calculations above would have been 0.44%. |
| Elfun Diversified Fund | 17 |
Elfun Diversified Fund
Performance Summary — December 31, 2016 (Unaudited)
Investment Profile
A mutual fund designed for investors who seek the highest total return, composed of income and capital appreciation, as is consistent with prudent investment management and the preservation of capital. As of December 31, 2016, the Fund seeks to achieve its investment objective by investing primarily in a combination of U.S. and foreign (non-U.S.) equity and debt securities and cash. The Fund’s asset allocation process utilizes information from SSGA FM’s Asset Allocation Committee to diversify holdings across these asset classes and to adjust the asset class weightings based on market and economic conditions.
Morningstar Performance Comparison
Based on average annual returns for periods ended December 31, 2016
| 1 Year | 5 Year | 10 Year | ||||||||||
Number of funds in peer group | 823 | 700 | 557 | |||||||||
Peer group average annual total return | 7.37 | % | 7.66 | % | 4.27 | % | ||||||
Morningstar Category in peer group: U.S. Moderate Allocation |
| |||||||||||
Top Ten Largest Equity Holdings
as of December 31, 2016 (as a % of Fair Value) (a)(b)
Apple Inc. | 0.99 | % | ||
Allergan PLC | 0.99 | % | ||
Wells Fargo & Co. | 0.97 | % | ||
Medtronic PLC | 0.91 | % | ||
QUALCOMM Inc. | 0.83 | % | ||
Citigroup Inc. | 0.82 | % | ||
Johnson & Johnson | 0.73 | % | ||
PepsiCo Inc. | 0.72 | % | ||
Cisco Systems Inc. | 0.69 | % | ||
Bank of America Corp. | 0.69 | % |
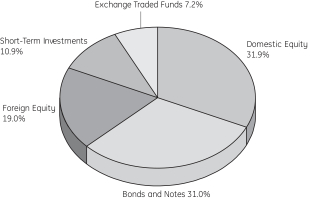
Sector Allocation
Portfolio composition as a % of Fair Value of $207,481 (in thousands) as of December 31, 2016 (a)(b)
Average Annual Total Return for the periods ended December 31, 2016
(Inception date: 01/01/88)
| One Year | Five Year | Ten Year | Ending value of a $10,000 investment | |||||||||||||
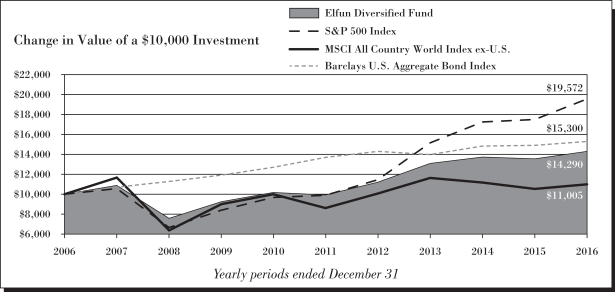
Elfun Diversified Fund | 5.48 | % | 7.56 | % | 3.63 | % | $ | 14,290 | ||||||||
S&P 500 Index | 11.96 | % | 14.66 | % | 6.95 | % | $ | 19,572 | ||||||||
MSCI All Country World Index ex-U.S. | 4.50 | % | 5.00 | % | 0.96 | % | $ | 11,005 | ||||||||
Bloomberg Barclays U.S. Aggregate Bond Index | 2.65 | % | 2.23 | % | 4.34 | % | $ | 15,300 | ||||||||
| 18 | Elfun Diversified Fund |
Elfun Diversified Fund
Performance Summary, continued — December 31, 2016 (Unaudited)
| (a) | Fair Value basis is inclusive of short-term investment in State Street Institutional U.S. Government Money Market Fund Class G Shares. |
| (b) | The securities information regarding holdings, allocations and other characteristics is presented to illustrate examples of securities that the Fund has bought and the diversity of areas in which the Fund may invest as of a particular date. It may not be representative of the Fund’s current or future investments and should not be construed as a recommendation to purchase or sell a particular security. |
See Notes to Performance beginning on page 1 for further information, including an explanation of Morningstar peer categories.
Past performance does not predict future performance. The performance shown in the graphs and tables does not reflect the deduction of taxes that a shareholder would pay on Fund distributions or the redemption of Fund shares.
| Elfun Diversified Fund | 19 |
Elfun Diversified Fund
Schedule of Investments — December 31, 2016
| Principal Amount ($) or Shares | Fair $ | |||||||
| Domestic Equity - 33.2%† | ||||||||
Common Stock - 33.2% |
| |||||||
Aerospace & Defense - 0.8% |
| |||||||
General Dynamics Corp. | 5,525 | 953,947 | ||||||
Hexcel Corp. | 10,723 | 551,591 | ||||||
|
| |||||||
| 1,505,538 | ||||||||
|
| |||||||
Agricultural Products - 0.2% |
| |||||||
Archer-Daniels-Midland Co. | 6,920 | 315,898 | ||||||
|
| |||||||
Airlines - 0.5% |
| |||||||
Delta Air Lines Inc. | 21,468 | 1,056,011 | ||||||
|
| |||||||
Apparel, Accessories & Luxury Goods - 0.3% |
| |||||||
Ralph Lauren Corp. | 2,294 | 207,194 | ||||||
VF Corp. | 5,697 | 303,935 | ||||||
|
| |||||||
| 511,129 | ||||||||
|
| |||||||
Application Software - 0.4% |
| |||||||
Intuit Inc. | 4,756 | 545,085 | ||||||
salesforce.com Inc. (a) | 4,812 | 329,430 | ||||||
|
| |||||||
| 874,515 | ||||||||
|
| |||||||
Asset Management & Custody Banks - 0.5% |
| |||||||
Ameriprise Financial Inc. | 6,572 | 729,098 | ||||||
Invesco Ltd. | 9,178 | 278,460 | ||||||
|
| |||||||
| 1,007,558 | ||||||||
|
| |||||||
Automotive Retail - 0.2% |
| |||||||
Advance Auto Parts Inc. | 2,344 | 396,417 | ||||||
|
| |||||||
Biotechnology - 1.7% |
| |||||||
Alexion Pharmaceuticals Inc. (a) | 4,028 | 492,826 | ||||||
Amgen Inc. | 8,558 | 1,251,265 | ||||||
Gilead Sciences Inc. | 19,390 | 1,388,518 | ||||||
Vertex Pharmaceuticals Inc. (a) | 3,189 | 234,934 | ||||||
|
| |||||||
| 3,367,543 | ||||||||
|
| |||||||
Cable & Satellite - 1.8% |
| |||||||
Charter Communications Inc., Class A (a) | 4,867 | 1,401,307 | ||||||
Comcast Corp., Class A | 15,447 | 1,066,615 | ||||||
Liberty Global PLC, Class C (a) | 23,778 | 706,206 | ||||||
Sirius XM Holdings Inc. | 89,517 | 398,351 | ||||||
|
| |||||||
| 3,572,479 | ||||||||
|
| |||||||
Communications Equipment - 0.7% |
| |||||||
Cisco Systems Inc. | 47,603 | 1,438,563 | ||||||
|
| |||||||
Consumer Finance - 0.7% |
| |||||||
Discover Financial Services | 18,882 | 1,361,203 | ||||||
|
| |||||||
| Principal Amount ($) or Shares | Fair $ | |||||||
Data Processing & Outsourced Services - 0.7% |
| |||||||
PayPal Holdings Inc. (a) | 11,469 | 452,681 | ||||||
Visa Inc., Class A | 12,589 | 982,194 | ||||||
|
| |||||||
| 1,434,875 | ||||||||
|
| |||||||
Diversified Banks - 2.9% |
| |||||||
Bank of America Corp. | 64,758 | 1,431,152 | ||||||
Citigroup Inc. | 28,819 | 1,712,713 | ||||||
JPMorgan Chase & Co. | 7,898 | 681,518 | ||||||
Wells Fargo & Co. | 36,387 | 2,005,288 | ||||||
|
| |||||||
| 5,830,671 | ||||||||
|
| |||||||
Drug Retail - 0.0%* |
| |||||||
CVS Health Corp. | 1,184 | 93,429 | ||||||
|
| |||||||
Electric Utilities - 0.3% |
| |||||||
Exelon Corp. | 4,014 | 142,457 | ||||||
NextEra Energy Inc. | 3,960 | 473,061 | ||||||
|
| |||||||
| 615,518 | ||||||||
|
| |||||||
Financial Exchanges & Data - 0.9% |
| |||||||
CME Group Inc. | 8,224 | 948,638 | ||||||
S&P Global Inc. | 6,994 | 752,135 | ||||||
|
| |||||||
| 1,700,773 | ||||||||
|
| |||||||
General Merchandise Stores - 0.2% |
| |||||||
Dollar General Corp. | 5,739 | 425,088 | ||||||
|
| |||||||
Gold - 0.1% |
| |||||||
Newmont Mining Corp. | 7,642 | 260,363 | ||||||
|
| |||||||
Healthcare Equipment - 0.8% |
| |||||||
Abbott Laboratories | 9,511 | 365,318 | ||||||
Boston Scientific Corp. (a) | 40,591 | 877,983 | ||||||
Stryker Corp. | 2,370 | 283,950 | ||||||
|
| |||||||
| 1,527,251 | ||||||||
|
| |||||||
Healthcare Supplies - 0.2% |
| |||||||
The Cooper Companies Inc. | 2,294 | 401,289 | ||||||
|
| |||||||
Home Improvement Retail - 0.4% |
| |||||||
Lowe’s Companies Inc. | 12,350 | 878,332 | ||||||
|
| |||||||
Housewares & Specialties - 0.4% |
| |||||||
Newell Brands Inc. | 18,601 | 830,535 | ||||||
|
| |||||||
Hypermarkets & Super Centers - 0.2% |
| |||||||
Wal-Mart Stores Inc. | 5,315 | 367,373 | ||||||
|
| |||||||
Independent Power Producers & Energy Traders - 0.1% |
| |||||||
Calpine Corp. (a) | 22,512 | 257,312 | ||||||
|
| |||||||
See Notes to Schedules of Investments and Notes to Financial Statements.
| 20 | Elfun Diversified Fund |
Elfun Diversified Fund
Schedule of Investments, continued — December 31, 2016
| Principal Amount ($) or Shares | Fair $ | |||||||
Industrial Conglomerates - 0.2% |
| |||||||
Honeywell International Inc. | 3,164 | 366,549 | ||||||
|
| |||||||
Industrial Gases - 0.1% |
| |||||||
Air Products & Chemicals Inc. | 1,794 | 258,013 | ||||||
|
| |||||||
Industrial Machinery - 0.6% |
| |||||||
Ingersoll-Rand PLC | 15,153 | 1,137,081 | ||||||
|
| |||||||
Integrated Oil & Gas - 1.6% |
| |||||||
Chevron Corp. | 9,974 | 1,173,940 | ||||||
Exxon Mobil Corp. | 14,036 | 1,266,889 | ||||||
Occidental Petroleum Corp. | 10,991 | 782,889 | ||||||
|
| |||||||
| 3,223,718 | ||||||||
|
| |||||||
Internet & Direct Marketing Retail - 0.5% |
| |||||||
Amazon.com Inc. (a) | 1,287 | 965,083 | ||||||
|
| |||||||
Internet Software & Services - 1.5% |
| |||||||
Alphabet Inc., Class A (a) | 1,264 | 1,001,657 | ||||||
Alphabet Inc., Class C (a) | 1,399 | 1,079,776 | ||||||
Facebook Inc., Class A (a) | 6,994 | 804,660 | ||||||
|
| |||||||
| 2,886,093 | ||||||||
|
| |||||||
Investment Banking & Brokerage - 0.8% |
| |||||||
Morgan Stanley | 15,047 | 635,736 | ||||||
The Charles Schwab Corp. | 25,176 | 993,697 | ||||||
|
| |||||||
| 1,629,433 | ||||||||
|
| |||||||
Life & Health Insurance - 0.2% |
| |||||||
Prudential Financial Inc. | 3,637 | 378,466 | ||||||
|
| |||||||
Movies & Entertainment - 0.3% |
| |||||||
The Walt Disney Co. | 5,707 | 594,784 | ||||||
|
| |||||||
Multi-Line Insurance - 0.4% |
| |||||||
American International Group Inc. | 4,755 | 310,549 | ||||||
The Hartford Financial Services Group Inc. | 9,590 | 456,964 | ||||||
|
| |||||||
| 767,513 | ||||||||
|
| |||||||
Multi-Utilities - 0.5% |
| |||||||
Sempra Energy | 9,697 | 975,906 | ||||||
|
| |||||||
Oil & Gas Equipment & Services - 0.4% |
| |||||||
Schlumberger Ltd. | 8,881 | 745,560 | ||||||
|
| |||||||
Oil & Gas Exploration & Production - 1.3% |
| |||||||
Concho Resources Inc. (a) | 1,193 | 158,192 | ||||||
ConocoPhillips | 16,531 | 828,864 | ||||||
Hess Corp. | 12,764 | 795,069 | ||||||
Noble Energy Inc. | 20,712 | 788,299 | ||||||
|
| |||||||
| 2,570,424 | ||||||||
|
| |||||||
| Principal Amount ($) or Shares | Fair $ | |||||||
Packaged Foods & Meats - 0.5% |
| |||||||
Mondelez International Inc., Class A | 21,201 | 939,840 | ||||||
|
| |||||||
Paper Packaging - 0.1% |
| |||||||
Packaging Corporation of America | 1,510 | 128,078 | ||||||
|
| |||||||
Pharmaceuticals - 2.9% |
| |||||||
Allergan PLC (a) | 9,760 | 2,049,697 | ||||||
Johnson & Johnson | 13,089 | 1,507,984 | ||||||
Merck & Company Inc. | 22,799 | 1,342,177 | ||||||
Pfizer Inc. | 28,041 | 910,772 | ||||||
|
| |||||||
| 5,810,630 | ||||||||
|
| |||||||
Research & Consulting Services - 0.3% |
| |||||||
Nielsen Holdings PLC | 15,566 | 652,994 | ||||||
|
| |||||||
Semiconductor Equipment - 0.6% |
| |||||||
Applied Materials Inc. | 39,505 | 1,274,826 | ||||||
|
| |||||||
Semiconductors - 0.9% |
| |||||||
QUALCOMM Inc. | 26,426 | 1,722,975 | ||||||
|
| |||||||
Soft Drinks - 0.7% |
| |||||||
PepsiCo Inc. | 14,214 | 1,487,211 | ||||||
|
| |||||||
Specialized REITs - 0.6% |
| |||||||
American Tower Corp. | 11,299 | 1,194,078 | ||||||
|
| |||||||
Specialty Chemicals - 0.0%* |
| |||||||
PPG Industries Inc. | 916 | 86,800 | ||||||
|
| |||||||
Systems Software - 0.9% |
| |||||||
Microsoft Corp. | 18,183 | 1,129,892 | ||||||
Oracle Corp. | 14,640 | 562,908 | ||||||
|
| |||||||
| 1,692,800 | ||||||||
|
| |||||||
Technology Hardware, Storage & Peripherals - 1.8% |
| |||||||
Apple Inc. | 17,851 | 2,067,503 | ||||||
Hewlett Packard Enterprise Co. | 15,945 | 368,967 | ||||||
Western Digital Corp. | 17,202 | 1,168,876 | ||||||
|
| |||||||
| 3,605,346 | ||||||||
|
| |||||||
Trading Companies & Distributors - 0.5% |
| |||||||
United Rentals Inc. (a) | 9,794 | 1,034,051 | ||||||
|
| |||||||
| Total Common Stock (Cost $55,166,539) | 66,157,915 | |||||||
|
| |||||||
See Notes to Schedules of Investments and Notes to Financial Statements.
| Elfun Diversified Fund | 21 |
Elfun Diversified Fund
Schedule of Investments, continued — December 31, 2016
| Principal Amount ($) or Shares | Fair $ | |||||||
| Preferred Stock - 0.0%* | ||||||||
Diversified Banks - 0.0%* |
| |||||||
Wells Fargo & Co. 3.09% + 3 month USD LIBOR (i) | 2,735 | 69,031 | ||||||
|
| |||||||
| Total Preferred Stock (Cost $68,375) | 69,031 | |||||||
|
| |||||||
| Total Domestic Equity (Cost $55,230,365) | 66,226,946 | |||||||
|
| |||||||
| Foreign Equity - 19.9% | ||||||||
Common Stock - 19.9% |
| |||||||
Advertising - 0.2% |
| |||||||
WPP PLC | 19,473 | 436,962 | ||||||
|
| |||||||
Aerospace & Defense - 0.4% |
| |||||||
Airbus Group SE | 6,314 | 418,495 | ||||||
Zodiac Aerospace | 15,891 | 365,642 | ||||||
|
| |||||||
| 784,137 | ||||||||
|
| |||||||
Application Software - 0.3% |
| |||||||
SAP SE | 6,651 | 580,924 | ||||||
|
| |||||||
Asset Management & Custody Banks - 0.1% |
| |||||||
Brookfield Asset Management Inc., Class A | 5,362 | 177,127 | ||||||
|
| |||||||
Auto Parts & Equipment - 0.6% |
| |||||||
Continental AG | 2,570 | 497,957 | ||||||
Delphi Automotive PLC | 10,884 | 733,037 | ||||||
|
| |||||||
| 1,230,994 | ||||||||
|
| |||||||
Automobile Manufacturers - 0.4% |
| |||||||
Fuji Heavy Industries Ltd. | 12,800 | 523,699 | ||||||
Toyota Motor Corp. | 4,330 | 255,341 | ||||||
|
| |||||||
| 779,040 | ||||||||
|
| |||||||
Biotechnology - 0.4% |
| |||||||
Shire PLC | 13,423 | 776,894 | ||||||
|
| |||||||
Brewers - 0.3% |
| |||||||
Anheuser-Busch InBev S.A. | 5,927 | 628,589 | ||||||
|
| |||||||
Building Products - 0.5% |
| |||||||
Allegion PLC | 190 | 12,160 | ||||||
Assa Abloy AB, Class B | 27,809 | 517,635 | ||||||
Geberit AG | 1,038 | 416,895 | ||||||
|
| |||||||
| 946,690 | ||||||||
|
| |||||||
Cable & Satellite - 0.3% |
| |||||||
Naspers Ltd., Class N | 3,795 | 558,938 | ||||||
|
| |||||||
| Principal Amount ($) or Shares | Fair $ | |||||||
Communications Equipment - 0.2% |
| |||||||
Telefonaktiebolaget LM Ericsson, Class B | 84,378 | 496,909 | ||||||
|
| |||||||
Construction Machinery & Heavy Trucks - 0.5% |
| |||||||
KION Group AG | 5,445 | 303,581 | ||||||
Komatsu Ltd. | 27,300 | 619,683 | ||||||
|
| |||||||
| 923,264 | ||||||||
|
| |||||||
Construction Materials - 0.3% |
| |||||||
HeidelbergCement AG | 6,197 | 579,311 | ||||||
|
| |||||||
Diversified Banks - 2.2% |
| |||||||
Banco Bilbao Vizcaya Argentaria S.A. | 89,196 | 603,426 | ||||||
Barclays PLC | 150,488 | 415,506 | ||||||
BNP Paribas S.A. | 17,681 | 1,129,199 | ||||||
Grupo Financiero Banorte SAB de C.V., Class O | 34,096 | 168,978 | ||||||
ICICI Bank Ltd. | 146,777 | 551,576 | ||||||
ING Groep N.V. | 37,981 | 535,608 | ||||||
Intesa Sanpaolo S.p.A. | 190,228 | 486,760 | ||||||
Mitsubishi UFJ Financial Group Inc. | 72,200 | 445,822 | ||||||
|
| |||||||
| 4,336,875 | ||||||||
|
| |||||||
Diversified Metals & Mining - 0.3% |
| |||||||
BHP Billiton PLC | 34,802 | 561,835 | ||||||
|
| |||||||
Diversified Real Estate Activities - 0.6% |
| |||||||
Mitsubishi Estate Company Ltd. | 28,918 | 577,071 | ||||||
Mitsui Fudosan Company Ltd. | 26,306 | 610,089 | ||||||
|
| |||||||
| 1,187,160 | ||||||||
|
| |||||||
Diversified Support Services - 0.0%* |
| |||||||
KEPCO Plant Service & Engineering Company Ltd. | 1,793 | 80,461 | ||||||
|
| |||||||
Electric Utilities - 0.3% |
| |||||||
Iberdrola S.A. | 27,192 | 178,796 | ||||||
Power Grid Corporation of India Ltd. | 171,921 | 464,822 | ||||||
|
| |||||||
| 643,618 | ||||||||
|
| |||||||
Electrical Components & Equipment - 0.6% |
| |||||||
Nidec Corp. | 7,500 | 648,498 | ||||||
Schneider Electric SE | 8,163 | 569,202 | ||||||
|
| |||||||
| 1,217,700 | ||||||||
|
| |||||||
Electronic Components - 0.2% |
| |||||||
Murata Manufacturing Company Ltd. | 3,200 | 429,374 | ||||||
|
| |||||||
See Notes to Schedules of Investments and Notes to Financial Statements.
| 22 | Elfun Diversified Fund |
Elfun Diversified Fund
Schedule of Investments, continued — December 31, 2016
| Principal Amount ($) or Shares | Fair $ | |||||||
Electronic Equipment & Instruments - 0.6% |
| |||||||
Hexagon AB, Class B | 11,710 | 419,568 | ||||||
Keyence Corp. | 1,082 | 744,000 | ||||||
|
| |||||||
| 1,163,568 | ||||||||
|
| |||||||
Healthcare Equipment - 1.2% |
| |||||||
Medtronic PLC | 26,438 | 1,883,179 | ||||||
Smith & Nephew PLC | 36,432 | 549,660 | ||||||
|
| |||||||
| 2,432,839 | ||||||||
|
| |||||||
Healthcare Services - 0.3% |
| |||||||
Fresenius SE & Company KGaA | 6,435 | 504,026 | ||||||
|
| |||||||
Home Building - 0.3% |
| |||||||
Sekisui House Ltd. | 33,600 | 560,456 | ||||||
|
| |||||||
Household Products - 0.1% |
| |||||||
Svenska Cellulosa AB SCA, Class B | 8,462 | 239,666 | ||||||
|
| |||||||
Industrial Gases - 0.1% |
| |||||||
Linde AG | 1,564 | 257,507 | ||||||
|
| |||||||
Industrial Machinery - 0.4% |
| |||||||
FANUC Corp. | 4,200 | 713,534 | ||||||
|
| |||||||
Integrated Oil & Gas - 0.6% |
| |||||||
Cenovus Energy Inc. | 36,575 | 553,650 | ||||||
Statoil ASA | 36,747 | 676,223 | ||||||
|
| |||||||
| 1,229,873 | ||||||||
|
| |||||||
Internet & Direct Marketing Retail - 0.1% |
| |||||||
Zalando SE (a)(b) | 7,354 | 281,488 | ||||||
|
| |||||||
Internet Software & Services - 0.1% |
| |||||||
Alibaba Group Holding Ltd. ADR (a) | 2,238 | 196,519 | ||||||
|
| |||||||
Leisure Products - 0.3% |
| |||||||
Shimano Inc. | 3,200 | 503,177 | ||||||
|
| |||||||
Life & Health Insurance - 0.5% |
| |||||||
AIA Group Ltd. | 115,387 | 651,114 | ||||||
Prudential PLC | 19,378 | 389,695 | ||||||
|
| |||||||
| 1,040,809 | ||||||||
|
| |||||||
Movies & Entertainment - 0.3% |
| |||||||
Vivendi S.A. | 33,991 | 647,308 | ||||||
|
| |||||||
Multi-Line Insurance - 0.3% |
| |||||||
AXA S.A. | 22,447 | 567,868 | ||||||
|
| |||||||
| Principal Amount ($) or Shares | Fair $ | |||||||
Oil & Gas Equipment & Services - 0.1% |
| |||||||
Technip S.A. | 4,199 | 300,323 | ||||||
|
| |||||||
Oil & Gas Exploration & Production - 0.3% |
| |||||||
Seven Generations Energy Ltd., Class A (a) | 23,320 | 544,461 | ||||||
|
| |||||||
Packaged Foods & Meats - 0.5% |
| |||||||
Kerry Group PLC, Class A | 5,536 | 396,475 | ||||||
Nestle S.A. | 8,989 | 646,083 | ||||||
|
| |||||||
| 1,042,558 | ||||||||
|
| |||||||
Personal Products - 0.4% |
| |||||||
Kao Corp. | 15,500 | 736,361 | ||||||
|
| |||||||
Pharmaceuticals - 1.2% |
| |||||||
Astellas Pharma Inc. | 24,000 | 334,068 | ||||||
Bayer AG | 5,243 | 548,194 | ||||||
Roche Holding AG | 3,656 | 836,705 | ||||||
Sanofi | 7,297 | 591,862 | ||||||
|
| |||||||
| 2,310,829 | ||||||||
|
| |||||||
Property & Casualty Insurance - 0.6% |
| |||||||
Chubb Ltd. | 3,497 | 462,023 | ||||||
Insurance Australia Group Ltd. | 118,265 | 512,958 | ||||||
Tokio Marine Holdings Inc. | 3,500 | 143,919 | ||||||
|
| |||||||
| 1,118,900 | ||||||||
|
| |||||||
Railroads - 0.1% | ||||||||
East Japan Railway Co. | 3,000 | 259,785 | ||||||
|
| |||||||
Security & Alarm Services - 0.3% |
| |||||||
Secom Company Ltd. | 8,000 | 586,308 | ||||||
|
| |||||||
Semiconductor Equipment - 0.4% |
| |||||||
ASML Holding N.V. | 7,662 | 861,891 | ||||||
|
| |||||||
Semiconductors - 0.8% | ||||||||
NXP Semiconductors N.V. (a) | 9,467 | 927,861 | ||||||
Taiwan Semiconductor Manufacturing Company Ltd. | 107,484 | 605,304 | ||||||
|
| |||||||
| 1,533,165 | ||||||||
|
| |||||||
Specialty Chemicals - 0.4% | ||||||||
Givaudan S.A. | 273 | 501,223 | ||||||
Johnson Matthey PLC | 7,632 | 300,078 | ||||||
|
| |||||||
| 801,301 | ||||||||
|
| |||||||
Technology Hardware, Storage & Peripherals - 0.2% |
| |||||||
Samsung Electronics Company Ltd. | 278 | 414,767 | ||||||
|
| |||||||
See Notes to Schedules of Investments and Notes to Financial Statements.
| Elfun Diversified Fund | 23 |
Elfun Diversified Fund
Schedule of Investments, continued — December 31, 2016
| Principal Amount ($) or Shares | Fair $ | |||||||
Wireless Telecommunication Services - 0.7% |
| |||||||
SoftBank Group Corp. | 9,700 | 645,780 | ||||||
Vodafone Group PLC | 269,404 | 665,278 | ||||||
|
| |||||||
| 1,311,058 | ||||||||
|
| |||||||
| Total Foreign Equity (Cost $38,949,324) | 39,517,147 | |||||||
|
| |||||||
| Bonds and Notes - 32.3% | ||||||||
U.S. Treasuries - 7.1% | ||||||||
U.S. Treasury Bond | 1,273,000 | 1,226,020 | ||||||
U.S. Treasury Notes | ||||||||
0.75% due 09/30/18 (h) | 1,387,600 | 1,377,987 | ||||||
0.88% due | 3,635,000 | 3,603,510 | ||||||
1.00% due 10/15/19 (h) | 46,000 | 45,487 | ||||||
1.25% due 10/31/21 (h) | 3,254,000 | 3,152,225 | ||||||
1.38% due | 2,556,500 | 2,418,931 | ||||||
2.00% due 11/15/26 (h) | 541,000 | 519,679 | ||||||
2.13% due 11/30/23 (h) | 1,852,200 | 1,837,643 | ||||||
|
| |||||||
| 14,181,482 | ||||||||
|
| |||||||
Agency Mortgage Backed - 9.1% |
| |||||||
Federal Home Loan Mortgage Corp. | ||||||||
4.50% due | 2,818 | 3,034 | ||||||
5.00% due | 196,370 | 218,312 | ||||||
5.50% due | 50,399 | 57,479 | ||||||
6.00% due | 126,244 | 145,236 | ||||||
6.50% due | 6,547 | 7,412 | ||||||
7.00% due | 21,545 | 23,853 | ||||||
7.50% due 09/01/33 | 1,201 | 1,264 | ||||||
8.00% due | 2,242 | 2,544 | ||||||
8.50% due 04/01/30 | 7,026 | 8,394 | ||||||
Federal National Mortgage Assoc. | ||||||||
3.00% due | 2,512,981 | 2,508,325 | ||||||
3.50% due | 1,159,839 | 1,194,593 | ||||||
4.00% due | 1,141,390 | 1,205,781 | ||||||
4.50% due | 1,151,315 | 1,239,676 | ||||||
| Principal Amount ($) or Shares | Fair $ | |||||||
5.00% due | 336,316 | 372,790 | ||||||
5.50% due | 210,438 | 233,632 | ||||||
6.00% due | 580,393 | 664,056 | ||||||
6.50% due | 23,164 | 25,842 | ||||||
7.00% due | 1,154 | 1,202 | ||||||
7.50% due | 5,778 | 6,411 | ||||||
8.00% due | 8,798 | 9,159 | ||||||
9.00% due | 1,146 | 1,237 | ||||||
Federal National Mortgage Assoc. 1.60% + 12 month USD LIBOR | ||||||||
2.72% due 04/01/37 (i) | 515 | 527 | ||||||
Federal National Mortgage Assoc. | ||||||||
2.50% due TBA (c) | 713,245 | 714,030 | ||||||
3.00% due TBA (c) | 574,934 | 588,443 | ||||||
3.50% due TBA (c) | 3,632,017 | 3,720,275 | ||||||
Government National Mortgage Assoc. | ||||||||
3.50% due 05/20/43 | 416,358 | 434,498 | ||||||
4.00% due | 480,315 | 513,652 | ||||||
4.50% due | 222,148 | 239,531 | ||||||
5.00% due 08/15/33 | 10,436 | 11,471 | ||||||
6.00% due | 9,894 | 11,637 | ||||||
6.50% due | 13,610 | 15,545 | ||||||
7.00% due | 7,071 | 7,808 | ||||||
7.50% due | 8,405 | 8,583 | ||||||
8.00% due 05/15/30 | 240 | 249 | ||||||
8.50% due 10/15/17 | 189 | 190 | ||||||
9.00% due | 382 | 422 | ||||||
3.00% due TBA (c) | 1,359,307 | 1,375,347 | ||||||
3.50% due TBA (c) | 2,038,961 | 2,118,073 | ||||||
5.00% due TBA (c) | 400,000 | 436,800 | ||||||
5.50% due TBA (c) | 50,000 | 55,700 | ||||||
|
| |||||||
| 18,183,013 | ||||||||
|
| |||||||
Agency Collateralized Mortgage Obligations - 0.4% |
| |||||||
Collateralized Mortgage Obligation Trust | 28 | 27 | ||||||
See Notes to Schedules of Investments and Notes to Financial Statements.
| 24 | Elfun Diversified Fund |
Elfun Diversified Fund
Schedule of Investments, continued — December 31, 2016
| Principal Amount ($) or Shares | Fair $ | |||||||
Federal Home Loan Mortgage Corp. | 183,524 | 388 | ||||||
Federal Home Loan Mortgage Corp. REMIC | ||||||||
3.50% due | 133,160 | 10,876 | ||||||
5.50% due 06/15/33 (g) | 8,329 | 1,680 | ||||||
7.50% due 07/15/27 (g) | 7,538 | 1,245 | ||||||
8.00% due 04/15/20 | 17 | 17 | ||||||
Federal Home Loan Mortgage Corp. REMIC 6.00% - 1 month USD LIBOR | 417,646 | 86,939 | ||||||
Federal Home Loan Mortgage Corp. REMIC 6.10% - 1 month USD LIBOR | 1,027,889 | 157,162 | ||||||
Federal Home Loan Mortgage Corp. REMIC 6.20% - 1 month USD LIBOR | 311,235 | 60,568 | ||||||
Federal Home Loan Mortgage Corp. REMIC 6.60% - 1 month USD LIBOR | 60,220 | 6,167 | ||||||
Federal Home Loan Mortgage Corp. STRIPS | ||||||||
1.47% due 08/01/27 (d)(f) | 322 | 260 | ||||||
8.00% due | 1,259 | 227 | ||||||
Federal Home Loan Mortgage Corp. STRIPS 5.95% - 1 month USD LIBOR | 714,988 | 144,187 | ||||||
Federal National Mortgage Assoc. REMIC | ||||||||
0.51% due 12/25/22 (d)(f) | 381 | 281 | ||||||
1.22% due 12/25/42 (g)(i) | 41,057 | 1,988 | ||||||
5.00% due 09/25/40 (g) | 60,498 | 6,643 | (g) | |||||
1.00% due 05/25/22 | 1 | 23 | ||||||
Federal National Mortgage Assoc. REMIC 6.00% - 1 month USD LIBOR | 1,163,695 | 234,280 | ||||||
Federal National Mortgage Assoc. REMIC 6.60% - 1 month USD LIBOR | 289,665 | 67,264 | ||||||
Federal National Mortgage Assoc. REMIC 7.50% - 1 month USD LIBOR | 13,683 | 409 | ||||||
| Principal Amount ($) or Shares | Fair $ | |||||||
Federal National Mortgage Assoc. STRIPS | ||||||||
4.50% due | 21,853 | 4,080 | ||||||
5.00% due | 12,290 | 2,362 | ||||||
5.50% due 12/25/33 (g) | 4,063 | 805 | ||||||
6.00% due 01/25/35 (g) | 10,684 | 2,165 | ||||||
7.50% due 11/25/23 (g) | 11,536 | 1,976 | ||||||
8.00% due | 2,531 | 511 | ||||||
8.50% due | 16 | — | ||||||
8.50% due 07/25/22 (g) | 251 | 32 | ||||||
9.00% due 05/25/22 (g) | 290 | 36 | ||||||
Government National Mortgage Assoc. | ||||||||
4.50% due | 68,895 | 4,500 | ||||||
5.00% due | 27,706 | 1,069 | ||||||
Government National Mortgage Assoc. 6.25% - 1 month USD LIBOR | 331,319 | 55,985 | ||||||
Government National Mortgage Assoc. 6.80% - 1 month USD LIBOR | 86,822 | 14,918 | ||||||
|
| |||||||
| 869,070 | ||||||||
|
| |||||||
Corporate Notes - 13.3% | ||||||||
21st Century Fox America Inc. | ||||||||
3.38% due 11/15/26 (b) | 50,000 | 48,940 | ||||||
3.70% due 10/15/25 | 23,000 | 23,249 | ||||||
4.75% due 11/15/46 (b) | 12,000 | 12,012 | ||||||
4.95% due 10/15/45 | 9,000 | 9,232 | ||||||
6.65% due 11/15/37 | 55,000 | 67,578 | ||||||
ABB Finance USA Inc. | 76,000 | 76,121 | ||||||
Abbott Laboratories | ||||||||
2.90% due 11/30/21 | 100,000 | 99,763 | ||||||
3.75% due 11/30/26 | 70,000 | 69,478 | ||||||
4.90% due 11/30/46 | 30,000 | 30,730 | ||||||
AbbVie Inc. | ||||||||
2.00% due 11/06/18 | 57,000 | 57,119 | ||||||
3.20% due 05/14/26 | 70,000 | 66,503 | ||||||
4.45% due 05/14/46 | 23,000 | 21,979 | ||||||
4.70% due 05/14/45 | 20,000 | 19,585 | ||||||
ACCO Brands Corp. | ||||||||
5.25% due 12/15/24 (b) | 38,000 | 38,261 | ||||||
6.75% due 04/30/20 | 97,000 | 101,850 | ||||||
See Notes to Schedules of Investments and Notes to Financial Statements.
| Elfun Diversified Fund | 25 |
Elfun Diversified Fund
Schedule of Investments, continued — December 31, 2016
| Principal Amount ($) or Shares | Fair $ | |||||||
Actavis Funding SCS | ||||||||
1.30% due 06/15/17 | 110,000 | 109,938 | ||||||
3.00% due 03/12/20 | 47,000 | 47,628 | ||||||
3.45% due 03/15/22 | 66,000 | 66,925 | ||||||
3.80% due 03/15/25 | 27,000 | 26,997 | ||||||
4.75% due 03/15/45 | 10,000 | 9,799 | ||||||
Aetna Inc. | ||||||||
2.40% due 06/15/21 | 50,000 | 49,729 | ||||||
3.20% due 06/15/26 | 50,000 | 49,391 | ||||||
3.50% due 11/15/24 | 59,000 | 59,786 | ||||||
Aflac Inc. | 33,000 | 31,381 | ||||||
Agrium Inc. | 41,000 | 40,771 | ||||||
Altria Group Inc. | ||||||||
2.63% due 09/16/26 | 30,000 | 28,366 | ||||||
2.95% due 05/02/23 | 39,000 | 38,933 | ||||||
3.88% due 09/16/46 | 30,000 | 27,628 | ||||||
4.50% due 05/02/43 | 17,000 | 17,245 | ||||||
American Axle & Manufacturing Inc. | ||||||||
6.25% due 03/15/21 | 52,000 | 53,690 | ||||||
6.63% due 10/15/22 | 20,000 | 20,624 | ||||||
American Campus Communities Operating Partnership LP | ||||||||
3.35% due 10/01/20 | 38,000 | 38,600 | ||||||
4.13% due 07/01/24 | 28,000 | 28,675 | ||||||
American Electric Power Company Inc. | 75,000 | 75,392 | ||||||
American Express Co. | 46,000 | 46,134 | ||||||
American International Group Inc. | ||||||||
3.75% due 07/10/25 | 82,000 | 82,423 | ||||||
4.50% due 07/16/44 | 19,000 | 18,699 | ||||||
4.80% due 07/10/45 | 30,000 | 31,078 | ||||||
American Tower Corp. (REIT) | ||||||||
3.38% due 10/15/26 | 50,000 | 47,264 | ||||||
3.40% due 02/15/19 | 142,000 | 145,064 | ||||||
AmeriGas Partners LP/AmeriGas Finance Corp. | ||||||||
5.63% due 05/20/24 | 19,000 | 19,428 | ||||||
5.88% due 08/20/26 | 28,000 | 28,420 | ||||||
Amgen Inc. | ||||||||
2.20% due 05/22/19 | 73,000 | 73,545 | ||||||
4.40% due 05/01/45 | 40,000 | 38,312 | ||||||
4.56% due 06/15/48 (b) | 35,000 | 33,785 | ||||||
Amkor Technology Inc. | 98,000 | 100,695 | ||||||
Anadarko Petroleum Corp. | ||||||||
4.85% due 03/15/21 | 5,000 | 5,357 | ||||||
6.60% due 03/15/46 | 5,000 | 6,156 | ||||||
| Principal Amount ($) or Shares | Fair $ | |||||||
Anheuser-Busch InBev Finance Inc. | ||||||||
2.65% due 02/01/21 | 95,000 | 95,436 | ||||||
3.65% due 02/01/26 | 140,000 | 141,908 | ||||||
4.90% due 02/01/46 | 80,000 | 85,899 | ||||||
Anheuser-Busch InBev Worldwide Inc. | 155,000 | 152,385 | ||||||
Anthem Inc. | 50,000 | 49,864 | ||||||
Apache Corp. | 30,000 | 31,331 | ||||||
Apple Inc. | ||||||||
3.25% due 02/23/26 | 46,000 | 45,959 | ||||||
3.45% due 02/09/45 | 46,000 | 40,515 | ||||||
3.85% due 08/04/46 | 40,000 | 38,244 | ||||||
4.65% due 02/23/46 | 25,000 | 26,942 | ||||||
Aramark Services Inc. | ||||||||
5.13% due 01/15/24 (b) | 47,000 | 48,469 | ||||||
5.75% due 03/15/20 | 24,000 | 24,510 | ||||||
Archer-Daniels-Midland Co. | 80,000 | 75,452 | ||||||
Ascension Health | 15,000 | 16,320 | ||||||
AstraZeneca PLC | ||||||||
2.38% due 11/16/20 | 33,000 | 32,862 | ||||||
3.38% due 11/16/25 | 47,000 | 46,611 | ||||||
4.38% due 11/16/45 | 19,000 | 19,033 | ||||||
AT&T Inc. | ||||||||
2.45% due 06/30/20 | 93,000 | 92,286 | ||||||
3.00% due 06/30/22 | 81,000 | 79,425 | ||||||
3.40% due 05/15/25 | 76,000 | 73,154 | ||||||
4.45% due 04/01/24 | 72,000 | 74,973 | ||||||
4.50% due 05/15/35 | 47,000 | 45,341 | ||||||
4.75% due 05/15/46 | 10,000 | 9,456 | ||||||
4.80% due 06/15/44 | 37,000 | 34,898 | ||||||
Bank of America Corp. | ||||||||
1.70% due 08/25/17 | 234,000 | 234,305 | ||||||
2.50% due 10/21/22 | 50,000 | 48,301 | ||||||
2.60% due 01/15/19 | 81,000 | 81,664 | ||||||
2.63% due 04/19/21 | 133,000 | 131,974 | ||||||
3.25% due 10/21/27 | 171,000 | 162,986 | ||||||
3.95% due 04/21/25 | 56,000 | 55,676 | ||||||
4.10% due 07/24/23 | 80,000 | 83,480 | ||||||
4.18% due 11/25/27 | 51,000 | 50,955 | ||||||
4.25% due 10/22/26 | 50,000 | 50,532 | ||||||
Barrick Gold Corp. | 15,000 | 15,372 | ||||||
Barrick North America Finance LLC | 10,000 | 10,189 | ||||||
Baxalta Inc. | 50,000 | 49,958 | ||||||
See Notes to Schedules of Investments and Notes to Financial Statements.
| 26 | Elfun Diversified Fund |
Elfun Diversified Fund
Schedule of Investments, continued — December 31, 2016
| Principal Amount ($) or Shares | Fair $ | |||||||
Berkshire Hathaway Inc. | 14,000 | 14,858 | ||||||
Berry Plastics Corp. | 60,000 | 61,050 | ||||||
BHP Billiton Finance USA Ltd. | 17,000 | 18,952 | ||||||
Biogen Inc. | 20,000 | 20,240 | ||||||
BMW US Capital LLC | ||||||||
2.00% due 04/11/21 (b) | 70,000 | 68,638 | ||||||
2.80% due 04/11/26 (b) | 50,000 | 48,079 | ||||||
BP Capital Markets PLC | ||||||||
1.38% due 05/10/18 | 56,000 | 55,819 | ||||||
3.12% due 05/04/26 | 50,000 | 48,762 | ||||||
3.22% due 11/28/23 | 51,000 | 51,450 | ||||||
Brixmor Operating Partnership LP | 30,000 | 29,867 | ||||||
Buckeye Partners LP | ||||||||
3.95% due 12/01/26 | 30,000 | 29,224 | ||||||
5.60% due 10/15/44 | 14,000 | 14,152 | ||||||
Burlington Northern Santa Fe LLC | 50,000 | 52,271 | ||||||
CalAtlantic Group Inc. | 56,000 | 54,600 | ||||||
Calpine Corp. | ||||||||
5.75% due 01/15/25 | 57,000 | 55,005 | ||||||
5.88% due 01/15/24 (b) | 129,000 | 134,482 | ||||||
Capital One Financial Corp. | 94,000 | 94,187 | ||||||
Caterpillar Inc. | 30,000 | 31,046 | ||||||
Catholic Health Initiatives | ||||||||
2.60% due 08/01/18 | 30,000 | 30,288 | ||||||
4.35% due 11/01/42 | 24,000 | 21,280 | ||||||
CBL & Associates LP | 50,000 | 50,294 | ||||||
CBS Corp. | 50,000 | 46,308 | ||||||
CCO Holdings LLC/CCO Holdings Capital Corp. | 56,000 | 59,780 | ||||||
Celgene Corp. | ||||||||
3.88% due 08/15/25 | 25,000 | 25,325 | ||||||
5.00% due 08/15/45 | 32,000 | 33,208 | ||||||
CenturyLink Inc. | 77,000 | 78,704 | ||||||
Cequel Communications Holdings I LLC/Cequel Capital Corp. | 96,000 | 97,680 | ||||||
Charter Communications Operating LLC/Charter Communications Operating Capital | ||||||||
3.58% due 07/23/20 | 71,000 | 72,386 | ||||||
| Principal Amount ($) or Shares | Fair $ | |||||||
4.91% due 07/23/25 | 101,000 | 106,315 | ||||||
6.38% due 10/23/35 | 9,000 | 10,262 | ||||||
6.48% due 10/23/45 | 19,000 | 21,928 | ||||||
Chevron Corp. | 47,000 | 48,092 | ||||||
Chevron Phillips Chemical Company LLC/Chevron Phillips Chemical Company LP | 71,000 | 70,771 | ||||||
Chubb INA Holdings Inc. | ||||||||
2.30% due 11/03/20 | 51,000 | 50,949 | ||||||
3.35% due 05/03/26 | 41,000 | 41,470 | ||||||
4.35% due 11/03/45 | 20,000 | 21,083 | ||||||
Cigna Corp. | 94,000 | 91,431 | ||||||
Cinemark USA Inc. | 42,000 | 42,525 | ||||||
Cisco Systems Inc. | 50,000 | 47,482 | ||||||
Citigroup Inc. | ||||||||
1.55% due 08/14/17 | 96,000 | 96,064 | ||||||
1.75% due 05/01/18 | 228,000 | 227,482 | ||||||
1.85% due 11/24/17 | 45,000 | 45,082 | ||||||
2.05% due 12/07/18 | 85,000 | 84,973 | ||||||
4.45% due 09/29/27 | 30,000 | 30,500 | ||||||
4.75% due 05/18/46 | 50,000 | 49,960 | ||||||
CMS Energy Corp. | 47,000 | 50,290 | ||||||
CNA Financial Corp. | 60,000 | 66,235 | ||||||
CNH Industrial N.V. | 56,000 | 55,300 | ||||||
Columbia Pipeline Group Inc. | 30,000 | 30,544 | ||||||
Comcast Corp. | ||||||||
3.38% due 08/15/25 | 76,000 | 76,358 | ||||||
4.20% due 08/15/34 | 48,000 | 48,957 | ||||||
4.60% due 08/15/45 | 45,000 | 47,079 | ||||||
ConocoPhillips Co. | ||||||||
3.35% due 11/15/24 | 44,000 | 43,692 | ||||||
5.95% due 03/15/46 | 10,000 | 12,351 | ||||||
Consolidated Edison Company of New York Inc. | 50,000 | 49,059 | ||||||
Corporation Andina de Fomento | 121,000 | 128,364 | ||||||
CSX Corp. | 29,000 | 28,357 | ||||||
CVS Health Corp. | ||||||||
3.88% due 07/20/25 | 45,000 | 46,362 | ||||||
5.13% due 07/20/45 | 44,000 | 48,941 | ||||||
See Notes to Schedules of Investments and Notes to Financial Statements.
| Elfun Diversified Fund | 27 |
Elfun Diversified Fund
Schedule of Investments, continued — December 31, 2016
| Principal Amount ($) or Shares | Fair $ | |||||||
Daimler Finance North America LLC | 150,000 | 151,103 | ||||||
Dana Financing Luxembourg Sarl | 56,000 | 58,520 | ||||||
Danaher Corp. | 26,000 | 27,033 | ||||||
Danone S.A. | ||||||||
2.08% due 11/02/21 (b) | 200,000 | 194,030 | ||||||
2.59% due 11/02/23 (b) | 200,000 | 192,483 | ||||||
2.95% due 11/02/26 (b) | 200,000 | 190,191 | ||||||
Delphi Automotive PLC | 25,000 | 22,924 | ||||||
Deutsche Bank AG | 50,000 | 49,768 | ||||||
Deutsche Telekom International Finance BV | ||||||||
1.95% due 09/19/21 (b) | 150,000 | 144,399 | ||||||
2.49% due 09/19/23 (b) | 150,000 | 143,114 | ||||||
Devon Energy Corp. | ||||||||
5.00% due 06/15/45 | 20,000 | 19,610 | ||||||
5.85% due 12/15/25 | 38,000 | 43,119 | ||||||
Dexia Credit Local S.A. | 250,000 | 250,715 | ||||||
Diageo Investment Corp. | 43,000 | 43,212 | ||||||
Diamond 1 Finance Corp./Diamond 2 Finance Corp. | ||||||||
3.48% due 06/01/19 (b) | 100,000 | 102,055 | ||||||
4.42% due 06/15/21 (b) | 50,000 | 51,694 | ||||||
6.02% due 06/15/26 (b) | 25,000 | 27,047 | ||||||
8.35% due 07/15/46 (b) | 20,000 | 24,588 | ||||||
Dollar General Corp. | ||||||||
1.88% due 04/15/18 | 95,000 | 95,109 | ||||||
3.25% due 04/15/23 | 40,000 | 39,430 | ||||||
4.15% due 11/01/25 | 27,000 | 27,744 | ||||||
Dominion Resources Inc. | 45,000 | 45,227 | ||||||
DTE Energy Co. | 60,000 | 55,655 | ||||||
Duke Energy Corp. | 30,000 | 26,949 | ||||||
Duke Energy Progress LLC | 30,000 | 29,745 | ||||||
Eastman Chemical Co. | 21,000 | 21,511 | ||||||
Ecopetrol S.A. | 24,000 | 20,736 | ||||||
Electricite de France S.A. | 100,000 | 100,188 | ||||||
Eli Lilly & Co. | 10,000 | 9,466 | ||||||
| Principal Amount ($) or Shares | Fair $ | |||||||
Emera US Finance LP | ||||||||
3.55% due 06/15/26 (b) | 35,000 | 34,356 | ||||||
4.75% due 06/15/46 (b) | 10,000 | 10,065 | ||||||
Enbridge Inc. | 31,000 | 31,695 | ||||||
Encana Corp. | 50,000 | 50,359 | ||||||
Energy Transfer Equity LP | 157,000 | 162,102 | ||||||
Energy Transfer Partners LP | 36,000 | 38,832 | ||||||
Entergy Louisiana LLC | 30,000 | 28,345 | ||||||
Enterprise Products Operating LLC | ||||||||
3.70% due 02/15/26 | 51,000 | 51,115 | ||||||
3.95% due 02/15/27 | 130,000 | 132,973 | ||||||
EOG Resources Inc. | 60,000 | 62,705 | ||||||
ERP Operating LP | 19,000 | 19,270 | ||||||
Exelon Corp. | 44,000 | 42,987 | ||||||
Express Scripts Holding Co. | ||||||||
3.40% due 03/01/27 | 35,000 | 32,741 | ||||||
4.80% due 07/15/46 | 15,000 | 14,334 | ||||||
Exxon Mobil Corp. | ||||||||
2.22% due 03/01/21 | 49,000 | 48,988 | ||||||
3.04% due 03/01/26 | 15,000 | 14,958 | ||||||
Five Corners Funding Trust | 200,000 | 211,203 | ||||||
Florida Power & Light Co. | 27,000 | 27,641 | ||||||
Ford Motor Co. | 131,000 | 132,186 | ||||||
Frontier Communications Corp. | ||||||||
7.13% due 03/15/19 | 91,000 | 96,346 | ||||||
11.00% due 09/15/25 | 70,000 | 72,275 | ||||||
General Dynamics Corp. | 50,000 | 46,117 | ||||||
General Motors Co. | 9,000 | 8,660 | ||||||
General Motors Financial Company Inc. | ||||||||
3.15% due 01/15/20 | 66,000 | 66,374 | ||||||
3.20% due 07/13/20 | 113,000 | 113,261 | ||||||
5.25% due 03/01/26 | 80,000 | 84,135 | ||||||
Georgia-Pacific LLC | 12,000 | 12,122 | ||||||
Gilead Sciences Inc. | ||||||||
1.95% due 03/01/22 | 30,000 | 28,996 | ||||||
3.65% due 03/01/26 | 50,000 | 50,627 | ||||||
3.70% due 04/01/24 | 50,000 | 51,264 | ||||||
See Notes to Schedules of Investments and Notes to Financial Statements.
| 28 | Elfun Diversified Fund |
Elfun Diversified Fund
Schedule of Investments, continued — December 31, 2016
| Principal Amount ($) or Shares | Fair $ | |||||||
4.15% due 03/01/47 | 20,000 | 18,957 | ||||||
4.80% due 04/01/44 | 26,000 | 26,947 | ||||||
Halliburton Co. | ||||||||
3.80% due 11/15/25 | 47,000 | 47,684 | ||||||
5.00% due 11/15/45 | 28,000 | 30,308 | ||||||
HCA Inc. | ||||||||
4.75% due 05/01/23 | 122,000 | 124,897 | ||||||
6.50% due 02/15/20 | 98,000 | 107,212 | ||||||
Hess Corp. | ||||||||
4.30% due 04/01/27 | 25,000 | 24,848 | ||||||
5.60% due 02/15/41 | 20,000 | 20,320 | ||||||
5.80% due 04/01/47 | 15,000 | 15,540 | ||||||
Honeywell International Inc. | ||||||||
1.40% due 10/30/19 | 50,000 | 49,513 | ||||||
2.50% due 11/01/26 | 161,000 | 152,474 | ||||||
HSBC Holdings PLC | ||||||||
2.65% due 01/05/22 | 200,000 | 195,507 | ||||||
2.95% due 05/25/21 | 200,000 | 199,749 | ||||||
HSBC USA Inc. | 101,000 | 100,145 | ||||||
Hyundai Capital America | 35,000 | 35,065 | ||||||
Illinois Tool Works Inc. | 49,000 | 50,830 | ||||||
Ingersoll-Rand Luxembourg Finance S.A. | 65,000 | 65,875 | ||||||
Ingles Markets Inc. | 92,000 | 94,530 | ||||||
Intel Corp. | ||||||||
2.45% due 07/29/20 | 47,000 | 47,628 | ||||||
2.60% due 05/19/26 | 84,000 | 81,121 | ||||||
International Paper Co. | 55,000 | 51,871 | ||||||
Interstate Power & Light Co. | 150,000 | 151,277 | ||||||
JB Poindexter & Company Inc. | 23,000 | 24,150 | ||||||
JBS USA LUX S.A./JBS USA Finance Inc. | 59,000 | 59,737 | ||||||
Jefferies Group LLC | ||||||||
5.13% due 01/20/23 | 83,000 | 86,781 | ||||||
6.50% due 01/20/43 | 26,000 | 26,712 | ||||||
JPMorgan Chase & Co. | ||||||||
2.30% due 08/15/21 | 100,000 | 98,056 | ||||||
2.55% due 10/29/20 | 94,000 | 93,858 | ||||||
3.30% due 04/01/26 | 81,000 | 79,472 | ||||||
3.63% due 12/01/27 | 30,000 | 29,058 | ||||||
JPMorgan Chase & Co. 3.32% + 3 month USD LIBOR | 36,000 | 35,910 | ||||||
| Principal Amount ($) or Shares | Fair $ | |||||||
JPMorgan Chase & Co. 3.33% + 3 month USD LIBOR | 110,000 | 111,306 | ||||||
KB Home | 97,000 | 102,335 | ||||||
Kellogg Co. | 7,000 | 6,827 | ||||||
Kinder Morgan Energy Partners LP | ||||||||
3.50% due 09/01/23 | 22,000 | 21,675 | ||||||
6.38% due 03/01/41 | 20,000 | 21,661 | ||||||
Kinder Morgan Inc. | ||||||||
3.05% due 12/01/19 | 19,000 | 19,264 | ||||||
5.05% due 02/15/46 | 20,000 | 19,761 | ||||||
5.55% due 06/01/45 | 28,000 | 29,397 | ||||||
Kraft Heinz Foods Co. | ||||||||
2.80% due 07/02/20 | 53,000 | 53,467 | ||||||
3.00% due 06/01/26 | 12,000 | 11,249 | ||||||
4.38% due 06/01/46 | 53,000 | 49,773 | ||||||
Kreditanstalt fuer Wiederaufbau | ||||||||
2.00% due 10/04/22 | 91,000 | 89,193 | ||||||
4.50% due 07/16/18 | 102,000 | 106,847 | ||||||
L Brands Inc. | 102,000 | 108,885 | ||||||
Lee Enterprises Inc. | 78,000 | 82,680 | ||||||
Lennar Corp. | ||||||||
4.50% due 11/15/19 | 81,000 | 84,139 | ||||||
4.75% due 05/30/25 | 39,000 | 38,025 | ||||||
Levi Strauss & Co. | 59,000 | 59,000 | ||||||
Lincoln National Corp. | 76,000 | 75,709 | ||||||
Lockheed Martin Corp. | ||||||||
3.55% due 01/15/26 | 50,000 | 51,016 | ||||||
3.80% due 03/01/45 | 20,000 | 18,901 | ||||||
4.70% due 05/15/46 | 21,000 | 22,796 | ||||||
Lowe’s Companies Inc. | 76,000 | 70,789 | ||||||
LYB International Finance BV | 15,000 | 15,505 | ||||||
Macy’s Retail Holdings Inc. | 30,000 | 24,680 | ||||||
Marathon Oil Corp. | ||||||||
3.85% due 06/01/25 | 25,000 | 24,212 | ||||||
5.90% due 03/15/18 | 25,000 | 26,101 | ||||||
6.00% due 10/01/17 | 103,000 | 106,072 | ||||||
Marathon Petroleum Corp. | 45,000 | 44,388 | ||||||
Marsh & McLennan Companies Inc. | 49,000 | 49,272 | ||||||
See Notes to Schedules of Investments and Notes to Financial Statements.
| Elfun Diversified Fund | 29 |
Elfun Diversified Fund
Schedule of Investments, continued — December 31, 2016
| Principal Amount ($) or Shares | Fair $ | |||||||
McDonald’s Corp. | ||||||||
3.70% due 01/30/26 | 59,000 | 59,986 | ||||||
4.88% due 12/09/45 | 20,000 | 21,380 | ||||||
Medtronic Inc. | ||||||||
2.50% due 03/15/20 | 28,000 | 28,298 | ||||||
3.50% due 03/15/25 | 100,000 | 102,838 | ||||||
4.63% due 03/15/45 | 43,000 | 46,408 | ||||||
Memorial Sloan-Kettering Cancer Center | 30,000 | 28,904 | ||||||
Merck & Company Inc. | 95,000 | 93,154 | ||||||
MetLife Inc. | 28,000 | 29,737 | ||||||
MGM Resorts International | ||||||||
4.63% due 09/01/26 | 37,000 | 35,613 | ||||||
5.25% due 03/31/20 | 59,000 | 62,392 | ||||||
6.63% due 12/15/21 | 98,000 | 109,515 | ||||||
Microsoft Corp. | ||||||||
1.55% due 08/08/21 | 100,000 | 96,900 | ||||||
2.40% due 08/08/26 | 120,000 | 113,254 | ||||||
3.45% due 08/08/36 | 30,000 | 28,461 | ||||||
3.70% due 08/08/46 | 30,000 | 28,183 | ||||||
4.00% due 02/12/55 | 45,000 | 42,460 | ||||||
Mizuho Financial Group Inc. | 200,000 | 197,738 | ||||||
Molson Coors Brewing Co. | ||||||||
2.10% due 07/15/21 | 71,000 | 69,084 | ||||||
3.00% due 07/15/26 | 68,000 | 64,185 | ||||||
4.20% due 07/15/46 | 21,000 | 19,539 | ||||||
Monsanto Co. | 12,000 | 10,785 | ||||||
Morgan Stanley | ||||||||
2.45% due 02/01/19 | 45,000 | 45,293 | ||||||
2.63% due 11/17/21 | 130,000 | 128,311 | ||||||
2.65% due 01/27/20 | 45,000 | 45,184 | ||||||
3.70% due 10/23/24 | 23,000 | 23,245 | ||||||
3.95% due 04/23/27 | 94,000 | 92,909 | ||||||
4.00% due 07/23/25 | 46,000 | 47,089 | ||||||
4.10% due 05/22/23 | 106,000 | 108,700 | ||||||
Morgan Stanley 1.4% + 3 month USD LIBOR | 101,000 | 102,122 | ||||||
Mylan N.V. | ||||||||
3.15% due 06/15/21 (b) | 24,000 | 23,533 | ||||||
3.95% due 06/15/26 (b) | 25,000 | 23,363 | ||||||
National Retail Properties Inc. | 47,000 | 47,851 | ||||||
NCL Corporation Ltd. |
| |||||||
4.63% due 11/15/20 (b) | 49,000 | 49,858 | ||||||
4.75% due 12/15/21 (b) | 26,000 | 25,984 | ||||||
Newell Brands Inc. |
| |||||||
3.85% due 04/01/23 | 49,000 | 50,775 | ||||||
| Principal Amount ($) or Shares | Fair $ | |||||||
4.20% due 04/01/26 | 39,000 | 40,652 | ||||||
5.50% due 04/01/46 | 30,000 | 34,375 | ||||||
Newmont Mining Corp. | 37,000 | 34,655 | ||||||
Nexen Energy ULC | 12,000 | 14,222 | ||||||
Noble Energy Inc. | 56,000 | 56,359 | ||||||
Northern States Power Co. | 94,000 | 94,077 | ||||||
Northrop Grumman Corp. | 11,000 | 10,413 | ||||||
Novartis Capital Corp. | ||||||||
3.00% due 11/20/25 | 8,000 | 7,933 | ||||||
4.00% due 11/20/45 | 32,000 | 32,226 | ||||||
NRG Energy Inc. | 59,000 | 59,148 | ||||||
Occidental Petroleum Corp. | ||||||||
3.50% due 06/15/25 | 48,000 | 48,615 | ||||||
4.10% due 02/15/47 | 25,000 | 24,300 | ||||||
Omnicom Group Inc. | 31,000 | 31,804 | ||||||
Oracle Corp. | ||||||||
1.90% due 09/15/21 | 50,000 | 48,813 | ||||||
2.40% due 09/15/23 | 34,000 | 32,900 | ||||||
2.65% due 07/15/26 | 70,000 | 66,344 | ||||||
2.95% due 05/15/25 | 50,000 | 48,948 | ||||||
4.00% due 07/15/46 | 30,000 | 28,635 | ||||||
Owens & Minor Inc. | 95,000 | 95,128 | ||||||
Pacific Gas & Electric Co. | 140,000 | 142,887 | ||||||
PacifiCorp | 57,000 | 73,718 | ||||||
Penn National Gaming Inc. | 58,000 | 60,465 | ||||||
PepsiCo Inc. | ||||||||
3.10% due 07/17/22 | 24,000 | 24,630 | ||||||
3.45% due 10/06/46 | 25,000 | 22,724 | ||||||
4.25% due 10/22/44 | 28,000 | 28,858 | ||||||
Perrigo Company PLC | 200,000 | 199,695 | ||||||
Petroleos Mexicanos | ||||||||
3.50% due 01/30/23 | 41,000 | 37,638 | ||||||
4.50% due 01/23/26 | 51,000 | 46,461 | ||||||
5.38% due 03/13/22 (b) | 50,000 | 51,199 | ||||||
5.63% due 01/23/46 | 19,000 | 15,770 | ||||||
6.38% due 02/04/21 (b) | 35,000 | 37,275 | ||||||
6.38% due 01/23/45 | 25,000 | 22,750 | ||||||
6.50% due 03/13/27 (b) | 50,000 | 51,575 | ||||||
6.75% due 09/21/47 (b) | 40,000 | 37,792 | ||||||
PetSmart Inc. | 74,000 | 75,480 | ||||||
See Notes to Schedules of Investments and Notes to Financial Statements.
| 30 | Elfun Diversified Fund |
Elfun Diversified Fund
Schedule of Investments, continued — December 31, 2016
| Principal Amount ($) or Shares | Fair $ | |||||||
Pfizer Inc. | ||||||||
3.00% due 12/15/26 | 71,000 | 70,018 | ||||||
4.13% due 12/15/46 | 25,000 | 25,377 | ||||||
4.40% due 05/15/44 | 29,000 | 30,570 | ||||||
Philip Morris International Inc. | 39,000 | 37,666 | ||||||
Plains All American Pipeline | 20,000 | 17,788 | ||||||
Potash Corporation of Saskatchewan Inc. | 71,000 | 71,345 | ||||||
PPL Capital Funding Inc. | 100,000 | 95,528 | ||||||
Precision Castparts Corp. | 28,000 | 29,390 | ||||||
Prologis LP | 47,000 | 48,095 | ||||||
Prudential Financial Inc. | 47,000 | 48,058 | ||||||
Public Service Electric & Gas Co. | 72,000 | 70,296 | ||||||
PulteGroup Inc. | ||||||||
4.25% due 03/01/21 | 20,000 | 20,450 | ||||||
5.50% due 03/01/26 | 60,000 | 59,550 | ||||||
QUALCOMM Inc. | 14,000 | 14,932 | ||||||
Realty Income Corp. | 70,000 | 65,802 | ||||||
Regency Energy Partners LP/Regency Energy Finance Corp. | 41,000 | 41,561 | ||||||
Reynolds American Inc. | ||||||||
4.45% due 06/12/25 | 79,000 | 83,305 | ||||||
5.85% due 08/15/45 | 13,000 | 15,365 | ||||||
Rio Tinto Finance USA PLC | 23,000 | 22,547 | ||||||
Rogers Communications Inc. | 17,000 | 18,151 | ||||||
Ryder System Inc. | 116,000 | 116,591 | ||||||
Santander UK Group Holdings PLC | 60,000 | 59,860 | ||||||
Schlumberger Holdings Corp. | ||||||||
3.00% due 12/21/20 (b) | 38,000 | 38,774 | ||||||
4.00% due 12/21/25 (b) | 59,000 | 61,748 | ||||||
Shell International Finance BV | ||||||||
2.88% due 05/10/26 | 51,000 | 49,233 | ||||||
3.40% due 08/12/23 | 121,000 | 124,035 | ||||||
| Principal Amount ($) or Shares | Fair $ | |||||||
Shire Acquisitions Investments Ireland DAC | ||||||||
2.40% due 09/23/21 | 100,000 | 96,507 | ||||||
2.88% due 09/23/23 | 100,000 | 94,935 | ||||||
3.20% due 09/23/26 | 50,000 | 46,659 | ||||||
Sinclair Television Group Inc. | 103,000 | 106,090 | ||||||
Southern California Edison Co. | 35,000 | 34,864 | ||||||
Southern Copper Corp. | 20,000 | 19,601 | ||||||
Spectra Energy Partners LP | ||||||||
3.38% due 10/15/26 | 50,000 | 47,752 | ||||||
4.50% due 03/15/45 | 20,000 | 18,980 | ||||||
Sprint Corp. | 114,000 | 119,842 | ||||||
Standard Industries Inc. | 118,000 | 121,245 | ||||||
Statoil ASA | 23,000 | 21,895 | ||||||
Sumitomo Mitsui Financial Group Inc. | 80,000 | 74,228 | ||||||
Sunoco LP/Sunoco Finance Corp. 5.50% due 08/01/20 | 39,000 | 39,780 | ||||||
SUPERVALU Inc. | 97,000 | 97,970 | ||||||
T-Mobile USA Inc. | 98,000 | 103,880 | ||||||
Tampa Electric Co. | 47,000 | 46,924 | ||||||
Target Corp. | 50,000 | 47,631 | ||||||
Teachers Insurance & Annuity Association of America | 45,000 | 48,585 | ||||||
Tenet Healthcare Corp. | ||||||||
4.75% due 06/01/20 | 36,000 | 36,180 | ||||||
6.00% due 10/01/20 | 96,000 | 100,080 | ||||||
Tesoro Corp. | 28,000 | 28,319 | ||||||
Teva Pharmaceutical Finance Netherlands III BV | ||||||||
3.15% due 10/01/26 | 30,000 | 27,616 | ||||||
4.10% due 10/01/46 | 22,000 | 18,814 | ||||||
The Allstate Corp. | ||||||||
3.28% due 12/15/26 | 71,000 | 71,128 | ||||||
4.20% due 12/15/46 | 20,000 | 20,368 | ||||||
The Allstate Corp. 2.94% + 3 month USD LIBOR | 52,000 | 53,763 | ||||||
The Bank of New York Mellon Corp. | 71,000 | 67,388 | ||||||
See Notes to Schedules of Investments and Notes to Financial Statements.
| Elfun Diversified Fund | 31 |
Elfun Diversified Fund
Schedule of Investments, continued — December 31, 2016
| Principal Amount ($) or Shares | Fair $ | |||||||
The Bank of New York Mellon Corp. 3.13% + 3 month USD LIBOR | 100,000 | 91,732 | ||||||
The Coca-Cola Co. | 50,000 | 49,272 | ||||||
The Dow Chemical Co. | 43,000 | 42,314 | ||||||
The Goldman Sachs Group Inc. | ||||||||
2.35% due 11/15/21 | 130,000 | 126,180 | ||||||
2.38% due 01/22/18 | 92,000 | 92,536 | ||||||
2.63% due 01/31/19 - 04/25/21 | 116,000 | 116,039 | ||||||
2.90% due 07/19/18 | 62,000 | 62,846 | ||||||
4.25% due 10/21/25 | 32,000 | 32,464 | ||||||
4.80% due 07/08/44 | 19,000 | 19,909 | ||||||
5.15% due 05/22/45 | 47,000 | 49,335 | ||||||
The Home Depot Inc. | ||||||||
3.35% due 09/15/25 | 66,000 | 67,619 | ||||||
3.50% due 09/15/56 | 26,000 | 22,702 | ||||||
The Kroger Co. | 65,000 | 65,342 | ||||||
The ServiceMaster Company LLC 5.13% due 11/15/24 (b) | 10,000 | 10,150 | ||||||
The Southern Co. |
| |||||||
3.25% due 07/01/26 | 70,000 | 68,026 | ||||||
4.40% due 07/01/46 | 30,000 | 29,613 | ||||||
The Southern Co. 3.63% + 3 month USD LIBOR | 51,000 | 51,513 | ||||||
The Toronto-Dominion Bank | 35,000 | 35,187 | ||||||
The Toronto-Dominion Bank | 30,000 | 29,476 | ||||||
The Travelers Companies Inc. 3.75% due 05/15/46 | 20,000 | 18,832 | ||||||
The Walt Disney Co. | 20,000 | 20,635 | ||||||
Time Inc. | 99,000 | 102,465 | ||||||
Time Warner Cable LLC | ||||||||
4.50% due 09/15/42 | 9,000 | 8,136 | ||||||
6.55% due 05/01/37 | 28,000 | 31,651 | ||||||
Time Warner Inc. | ||||||||
3.80% due 02/15/27 | 66,000 | 65,420 | ||||||
5.35% due 12/15/43 | 85,000 | 89,735 | ||||||
TransCanada PipeLines Ltd. | 24,000 | 26,667 | ||||||
Tyco Electronics Group S.A. | 95,000 | 95,242 | ||||||
Tyson Foods Inc. | 20,000 | 20,182 | ||||||
U.S. Bancorp 3.49% + 3 month USD LIBOR | 94,000 | 95,880 | ||||||
| Principal Amount ($) or Shares | Fair $ | |||||||
United Technologies Corp. |
| |||||||
1.95% due 11/01/21 | 50,000 | 48,965 | ||||||
2.65% due 11/01/26 | 80,000 | 76,699 | ||||||
3.75% due 11/01/46 | 18,000 | 17,093 | ||||||
UnitedHealth Group Inc. | ||||||||
2.70% due 07/15/20 | 60,000 | 60,859 | ||||||
4.75% due 07/15/45 | 74,000 | 81,356 | ||||||
Universal Health Services Inc. 5.00% due 06/01/26 (b) | 37,000 | 36,075 | ||||||
Vale Overseas Ltd. | ||||||||
4.38% due 01/11/22 | 26,000 | 25,545 | ||||||
5.88% due 06/10/21 | 50,000 | 52,375 | ||||||
6.25% due 08/10/26 | 25,000 | 26,000 | ||||||
6.88% due 11/10/39 | 15,000 | 14,588 | ||||||
Ventas Realty LP | 50,000 | 47,368 | ||||||
Verizon Communications Inc. | ||||||||
1.75% due 08/15/21 | 101,000 | 96,798 | ||||||
2.63% due 08/15/26 | 105,000 | 96,511 | ||||||
4.40% due 11/01/34 | 47,000 | 46,318 | ||||||
4.67% due 03/15/55 | 32,000 | 30,083 | ||||||
4.86% due 08/21/46 | 47,000 | 47,532 | ||||||
5.05% due 03/15/34 | 80,000 | 84,123 | ||||||
5.15% due 09/15/23 | 68,000 | 75,112 | ||||||
Viacom Inc. | ||||||||
2.25% due 02/04/22 | 50,000 | 46,940 | ||||||
3.45% due 10/04/26 | 30,000 | 27,685 | ||||||
Virginia Electric & Power Co. | 50,000 | 49,742 | ||||||
Visa Inc. | ||||||||
3.15% due 12/14/25 | 60,000 | 60,180 | ||||||
4.30% due 12/14/45 | 28,000 | 29,493 | ||||||
W.R. Grace & Co. | ||||||||
5.13% due 10/01/21 (b) | 35,000 | 36,488 | ||||||
5.63% due 10/01/24 (b) | 98,000 | 102,900 | ||||||
Wabtec Corp. | 51,000 | 48,951 | ||||||
Wal-Mart Stores Inc. | 38,000 | 40,020 | ||||||
Walgreens Boots Alliance Inc. | 15,000 | 15,192 | ||||||
WEC Energy Group Inc. | 70,000 | 71,247 | ||||||
Wells Fargo & Co. | ||||||||
3.00% due 10/23/26 | 130,000 | 123,601 | ||||||
3.90% due 05/01/45 | 25,000 | 23,664 | ||||||
4.30% due 07/22/27 | 38,000 | 39,026 | ||||||
4.40% due 06/14/46 | 30,000 | 28,654 | ||||||
4.75% due 12/07/46 | 51,000 | 51,477 | ||||||
Wells Fargo & Co. 3.11% + 3 month USD LIBOR | 62,000 | 62,310 | ||||||
See Notes to Schedules of Investments and Notes to Financial Statements.
| 32 | Elfun Diversified Fund |
Elfun Diversified Fund
Schedule of Investments, continued — December 31, 2016
| Principal Amount ($) or Shares | Fair $ | |||||||
Wells Fargo & Co. 3.99% + 3 month USD LIBOR | 66,000 | 69,293 | ||||||
Western Digital Corp. | 10,000 | 11,000 | ||||||
Westlake Chemical Corp. | ||||||||
3.60% due 08/15/26 (b) | 70,000 | 67,230 | ||||||
5.00% due 08/15/46 (b) | 15,000 | 14,788 | ||||||
Williams Partners LP | ||||||||
3.90% due 01/15/25 | 80,000 | 78,363 | ||||||
4.90% due 01/15/45 | 15,000 | 13,838 | ||||||
5.40% due 03/04/44 | 9,000 | 8,707 | ||||||
Windstream Services LLC | 73,000 | 65,152 | ||||||
WPP Finance 2010 | 95,000 | 95,495 | ||||||
XLIT Ltd. | 40,000 | 41,261 | ||||||
XPO Logistics Inc. | 56,000 | 58,800 | ||||||
Zimmer Biomet Holdings Inc. | 47,000 | 45,718 | ||||||
|
| |||||||
| 26,384,739 | ||||||||
|
| |||||||
Non-Agency Collateralized Mortgage Obligations - 1.9% |
| |||||||
American Tower Trust #1 (REIT) | 117,000 | 116,894 | ||||||
Banc of America Commercial Mortgage Trust 2007-1 | 83,000 | 82,885 | ||||||
Banc of America Commercial Mortgage Trust 2007-4 | 15,024 | 15,231 | ||||||
Banc of America Commercial Mortgage Trust 2008-1 | 161,243 | 165,403 | ||||||
Banc of America Merrill Lynch Commercial Mortgage Inc. 2005-1 | 12,493 | 12,481 | ||||||
Bear Stearns Commercial Mortgage Securities Trust 2007-PW18 | 80,000 | 82,567 | ||||||
CFCRE Commercial Mortgage Trust 2016-C7 | 90,322 | 93,158 | ||||||
Citigroup Commercial Mortgage Trust 2014-GC23 | 98,000 | 81,719 | ||||||
Citigroup Commercial Mortgage Trust 2015-GC33 | ||||||||
3.17% due 09/10/58 | 39,319 | 27,439 | ||||||
| Principal Amount ($) or Shares | Fair $ | |||||||
3.78% due 09/10/58 | 100,000 | 104,026 | ||||||
Citigroup Commercial Mortgage Trust 2016-P5 | 90,682 | 87,788 | ||||||
Citigroup Commercial Mortgage Trust 2016-P6 | ||||||||
3.72% due 12/10/49 (i) | 180,583 | 186,295 | ||||||
4.03% due 12/10/49 (i) | 78,331 | 80,226 | ||||||
COMM 2014-CR14 Mortgage Trust | 55,000 | 58,947 | ||||||
COMM 2014-CR19 Mortgage Trust | 100,000 | 79,234 | ||||||
COMM 2015-CR23 Mortgage Trust | 46,009 | 41,873 | ||||||
COMM 2015-CR24 Mortgage Trust | 100,000 | 73,575 | ||||||
COMM 2015-PC1 Mortgage Trust | 46,053 | 45,329 | ||||||
CSAIL 2015-C3 Commercial Mortgage Trust | 47,194 | 34,943 | ||||||
GS Mortgage Securities Trust 2011-GC5 | 1,454 | 1,453 | ||||||
GS Mortgage Securities Trust 2015-GC28 | 984,827 | 59,683 | ||||||
GS Mortgage Securities Trust 2015-GC32 | 43,241 | 32,138 | ||||||
GS Mortgage Securities Trust 2015-GC34 | 103,476 | 73,847 | ||||||
GS Mortgage Securities Trust 2015-GS1 | 69,380 | 53,091 | ||||||
GS Mortgage Securities Trust 2016-GS3 | 93,000 | 89,747 | ||||||
JP Morgan Chase Commercial Mortgage Securities Trust 2007-CB18 | 11,529 | 11,521 | ||||||
JPMBB Commercial Mortgage Securities Trust 2013-C12 | 25,000 | 26,294 | ||||||
JPMBB Commercial Mortgage Securities Trust 2015-C29 | 85,183 | 60,471 | ||||||
See Notes to Schedules of Investments and Notes to Financial Statements.
| Elfun Diversified Fund | 33 |
Elfun Diversified Fund
Schedule of Investments, continued — December 31, 2016
| Principal Amount ($) or Shares | Fair $ | |||||||
JPMBB Commercial Mortgage Securities Trust 2015-C30 | 78,620 | 68,811 | ||||||
LB-UBS Commercial Mortgage Trust 2004-C8 | 22,107 | 62 | ||||||
LB-UBS Commercial Mortgage Trust 2007-C6 | ||||||||
6.11% due 07/15/40 (i) | 52,305 | 53,679 | ||||||
6.11% due 07/15/40 (b) | 120,000 | 121,592 | ||||||
MASTR Alternative Loan Trust 2003-5 | 1,970 | 33 | ||||||
Morgan Stanley Bank of America Merrill Lynch Trust 2014-C18 | 100,000 | 69,833 | ||||||
Morgan Stanley Bank of America Merrill Lynch Trust 2014-C19 | 100,000 | 75,380 | ||||||
Morgan Stanley Bank of America Merrill Lynch Trust 2015-C20 | 721,061 | 54,406 | ||||||
Morgan Stanley Bank of America Merrill Lynch Trust 2015-C21 | 862,549 | 49,752 | ||||||
Morgan Stanley Bank of America Merrill Lynch Trust 2015-C22 | 206,915 | 158,978 | ||||||
Morgan Stanley Bank of America Merrill Lynch Trust 2016-C28 | 32,348 | 21,778 | ||||||
Morgan Stanley Capital I Trust 2006-IQ11 | 40,000 | 39,662 | ||||||
Morgan Stanley Capital I Trust 2006-T21 | 17,615 | 17,605 | ||||||
Morgan Stanley Capital I Trust 2007-IQ16 | 80,000 | 82,062 | ||||||
Morgan Stanley Capital I Trust 2008-T29 | 50,000 | 51,697 | ||||||
Morgan Stanley Capital I Trust 2015-MS1 | 100,000 | 75,311 | ||||||
Morgan Stanley Capital I Trust 2016-UBS9 | ||||||||
1.25% due 03/15/49 (g)(i) | 578,158 | 45,183 | ||||||
3.00% due 03/15/49 (b) | 55,000 | 41,116 | ||||||
Wells Fargo Commercial Mortgage Trust 2015-C26 | 956,413 | 72,958 | ||||||
| Principal Amount ($) or Shares | Fair $ | |||||||
Wells Fargo Commercial Mortgage Trust 2015-C29 | 64,245 | 48,984 | ||||||
Wells Fargo Commercial Mortgage Trust 2015-C30 | 39,326 | 30,737 | ||||||
Wells Fargo Commercial Mortgage Trust 2015-LC22 | 39,338 | 30,650 | ||||||
Wells Fargo Commercial Mortgage Trust 2015-NXS2 | 39,311 | 29,017 | ||||||
Wells Fargo Commercial Mortgage Trust 2016-C33 | 34,338 | 23,848 | ||||||
WFRBS Commercial Mortgage Trust 2013-C17 | 55,000 | 58,364 | ||||||
WFRBS Commercial Mortgage Trust 2014-C19 | 78,742 | 63,527 | ||||||
WFRBS Commercial Mortgage Trust 2014-C22 | 124,695 | 92,972 | ||||||
WFRBS Commercial Mortgage Trust 2014-C24 | 156,648 | 95,632 | ||||||
WFRBS Commercial Mortgage Trust 2014-C25 | 23,000 | 16,056 | ||||||
WFRBS Commercial Mortgage Trust 2014-LC14 | ||||||||
4.35% due 03/15/47 (i) | 123,000 | 130,457 | ||||||
4.59% due 03/15/47 (b)(i) | 130,681 | 103,692 | ||||||
WFRBS Commercial Mortgage Trust 2015-C31 | 19,659 | 14,277 | ||||||
|
| |||||||
| 3,716,369 | ||||||||
|
| |||||||
Sovereign Bonds - 0.3% |
| |||||||
Government of Colombia | 200,000 | 188,500 | ||||||
Government of Mexico |
| |||||||
3.60% due 01/30/25 | 205,000 | 197,620 | ||||||
4.00% due 10/02/23 | 30,000 | 30,069 | ||||||
4.75% due 03/08/44 | 64,000 | 58,176 | ||||||
Government of Peru |
| |||||||
4.13% due 08/25/27 | 27,000 | 28,046 | ||||||
5.63% due 11/18/50 | 15,000 | 16,988 | ||||||
|
| |||||||
| 519,399 | ||||||||
|
| |||||||
Municipal Bonds and Notes - 0.2% |
| |||||||
American Municipal Power Inc. | 50,000 | 60,637 | ||||||
See Notes to Schedules of Investments and Notes to Financial Statements.
| 34 | Elfun Diversified Fund |
Elfun Diversified Fund
Schedule of Investments, continued — December 31, 2016
| Principal Amount ($) or Shares | Fair $ | |||||||
Municipal Electric Authority of Georgia | 54,000 | 66,971 | ||||||
New Jersey Transportation Trust Fund Authority | 15,000 | 16,091 | ||||||
Port Authority of New York & | 95,000 | 96,083 | ||||||
South Carolina State Public Service Authority | 40,000 | 52,756 | ||||||
State of Califtornia | 55,000 | 63,422 | ||||||
State of Illinois | 30,000 | 26,515 | ||||||
|
| |||||||
| 382,475 | ||||||||
|
| |||||||
FNMA (TBA) - 0.0%* |
| |||||||
Lehman | 37,027 | 1,170 | ||||||
|
| |||||||
| Total Bonds and Notes (Cost $64,438,709) | 64,237,717 | |||||||
|
| |||||||
| Principal Amount ($) or Shares | Fair $ | |||||||
| Exchange Traded Funds - 7.5% | ||||||||
SPDR Bloomberg Barclays High Yield Bond ETF (p) | 173,223 | 6,313,978 | ||||||
Vanguard FTSE Emerging Markets ETF | 240,172 | 8,593,354 | ||||||
|
| |||||||
| Total Exchange Traded Funds (Cost $14,845,065) | 14,907,332 | |||||||
|
| |||||||
| Total Investments in Securities (Cost $173,468,012) | 184,889,142 | |||||||
|
| |||||||
| Short-Term Investments - 11.4% | ||||||||
State Street Institutional U.S. Government Money Market Fund - Class G Shares 0.46% | 22,591,439 | 22,591,439 | ||||||
|
| |||||||
| Total Investments (Cost $196,059,451) | 207,480,581 | |||||||
| Liabilities in Excess of Other Assets, net - (4.3)% | (8,542,860 | ) | ||||||
|
| |||||||
| NET ASSETS - 100.0% | 198,937,721 | |||||||
|
| |||||||
Other Information:
The Fund has the following credit default swap contracts open at December 31, 2016:
Centrally Cleared Credit Default Swaps - Buy Protection
| Reference Entity | Counterparty | Notional Amount (000s omitted) | Contract annual Fixed Rate | Termination Date | Market Value | Unamortized Upfront Payments Received | Unrealized Depreciation | |||||||||||||||||||
Markit CDX North America High Yield Index | CME Group Inc. | $ | 2,280 | 5.00% | 12/20/21 | $ | (144,845 | ) | $ | (95,728 | ) | $ | (49,117 | ) | ||||||||||||
Markit CDX North America Investment Grade Index | CME Group Inc. | $ | 1,454 | 1.00% | 12/20/21 | $ | (22,475 | ) | $ | (18,399 | ) | $ | (4,076 | ) | ||||||||||||
|
| |||||||||||||||||||||||||
| $ | (53,193 | ) | ||||||||||||||||||||||||
|
| |||||||||||||||||||||||||
The Fund had the following long futures contracts open at December 31, 2016:
| Description | Expiration date | Number of Contracts | Current Notional Value | Unrealized Depreciation | ||||||||||||
MSCI EAFE Mini Index Futures | March 2017 | 11 | $ | 921,580 | $ | (2,539 | ) | |||||||||
S&P Mid 400 Emini Index Futures | March 2017 | 29 | 4,811,390 | (76,903 | ) | |||||||||||
S&P 500 Emini Index Futures | March 2017 | 9 | 1,006,290 | (14,439 | ) | |||||||||||
Ultra Long-Term U.S. Treasury Bond Futures | March 2017 | 7 | 1,121,750 | (10,211 | ) | |||||||||||
5 Yr. U.S. Treasury Notes Futures | March 2017 | 27 | 3,176,930 | (4,202 | ) | |||||||||||
|
| |||||||||||||||
| $ | (108,294 | ) | ||||||||||||||
|
| |||||||||||||||
See Notes to Schedules of Investments and Notes to Financial Statements.
| Elfun Diversified Fund | 35 |
Elfun Diversified Fund
Schedule of Investments, continued — December 31, 2016
The Fund had the following short futures contracts open at December 31, 2016:
| Description | Expiration date | Number of Contracts | Current Notional Value | Unrealized Appreciation (Depreciation) | ||||||||||||
S&P 500 Emini Index Futures | March 2017 | 40 | $ | (4,472,400 | ) | $ | 31,326 | |||||||||
U.S. Long Bond Futures | March 2017 | 9 | (1,355,906 | ) | 3,436 | |||||||||||
2 Yr. U.S. Treasury Notes Futures | March 2017 | 1 | (216,687 | ) | (455 | ) | ||||||||||
10 Yr. U.S. Treasury Notes Futures | March 2017 | 22 | (2,734,188 | ) | 6,083 | |||||||||||
Ultra 10 Yr. U.S. Treasury Futures | March 2017 | 5 | (670,313 | ) | (834 | ) | ||||||||||
|
| |||||||||||||||
| $ | 39,556 | |||||||||||||||
|
| |||||||||||||||
| $ | (68,738 | ) | ||||||||||||||
|
| |||||||||||||||
The Fund was invested in the following countries/territories at December 31, 2016 (unaudited):
| Country/Territory | Percentage (based on Fair Value) | |||
United States | 78.21% | |||
Japan | 4.63% | |||
United Kingdom | 2.75% | |||
France | 2.66% | |||
Germany | 1.90% | |||
Switzerland | 1.42% | |||
Netherlands | 1.41% | |||
Ireland | 1.31% | |||
Sweden | 0.81% | |||
Canada | 0.77% | |||
India | 0.49% | |||
Spain | 0.38% | |||
Mexico | 0.36% | |||
Norway | 0.34% | |||
Hong Kong | 0.31% | |||
Belgium | 0.30% | |||
| Country/Territory | Percentage (based on Fair Value) | |||
Taiwan | 0.29% | |||
South Africa | 0.27% | |||
Australia | 0.26% | |||
South Korea | 0.26% | |||
Italy | 0.23% | |||
Luxembourg | 0.23% | |||
China | 0.10% | |||
Colombia | 0.10% | |||
Supranational | 0.06% | |||
Cayman Islands | 0.06% | |||
Bermuda | 0.04% | |||
Peru | 0.02% | |||
Brazil | 0.02% | |||
Jersey | 0.01% | |||
|
| |||
| 100.00% | ||||
|
| |||
The Fund’s % share of investment in the various categories, based on Fair Value, is as follows at December 31, 2016 (unaudited):
| Industry | Domestic | Foreign | Total | |||||||||
Exchange Traded Funds | 7.18% | 0.00% | 7.18% | |||||||||
Diversified Banks | 2.85% | 2.08% | 4.93% | |||||||||
Pharmaceuticals | 2.81% | 1.10% | 3.91% | |||||||||
Integrated Oil & Gas | 1.56% | 0.59% | 2.15% | |||||||||
Biotechnology | 1.62% | 0.38% | 2.00% | |||||||||
Cable & Satellite | 1.72% | 0.27% | 1.99% | |||||||||
Technology Hardware, Storage & Peripherals | 1.74% | 0.20% | 1.94% | |||||||||
Healthcare Equipment | 0.74% | 1.17% | 1.91% | |||||||||
Semiconductors | 0.83% | 0.74% | 1.57% | |||||||||
Oil & Gas Exploration & Production | 1.24% | 0.26% | 1.50% | |||||||||
Internet Software & Services | 1.39% | 0.10% | 1.49% | |||||||||
Aerospace & Defense | 0.73% | 0.37% | 1.10% | |||||||||
Semiconductor Equipment | 0.61% | 0.42% | 1.03% | |||||||||
Packaged Foods & Meats | 0.45% | 0.51% | 0.96% | |||||||||
Communications Equipment | 0.69% | 0.24% | 0.93% | |||||||||
Industrial Machinery | 0.55% | 0.34% | 0.89% | |||||||||
Financial Exchanges & Data | 0.82% | 0.00% | 0.82% | |||||||||
Systems Software | 0.82% | 0.00% | 0.82% | |||||||||
See Notes to Schedules of Investments and Notes to Financial Statements.
| 36 | Elfun Diversified Fund |
Elfun Diversified Fund
Schedule of Investments, continued — December 31, 2016
| Industry | Domestic | Foreign | Total | |||||||||
Investment Banking & Brokerage | 0.79% | 0.00% | 0.79% | |||||||||
Soft Drinks | 0.72% | 0.00% | 0.72% | |||||||||
Application Software | 0.42% | 0.28% | 0.70% | |||||||||
Data Processing & Outsourced Services | 0.69% | 0.00% | 0.69% | |||||||||
Life & Health Insurance | 0.18% | 0.50% | 0.68% | |||||||||
Consumer Finance | 0.66% | 0.00% | 0.66% | |||||||||
Multi-Line Insurance | 0.37% | 0.27% | 0.64% | |||||||||
Wireless Telecommunication Services | 0.00% | 0.63% | 0.63% | |||||||||
Electric Utilities | 0.30% | 0.31% | 0.61% | |||||||||
Internet & Direct Marketing Retail | 0.47% | 0.13% | 0.60% | |||||||||
Movies & Entertainment | 0.29% | 0.31% | 0.60% | |||||||||
Auto Parts & Equipment | 0.00% | 0.59% | 0.59% | |||||||||
Electrical Components & Equipment | 0.00% | 0.59% | 0.59% | |||||||||
Specialized REITs | 0.58% | 0.00% | 0.58% | |||||||||
Diversified Real Estate Activities | 0.00% | 0.57% | 0.57% | |||||||||
Asset Management & Custody Banks | 0.48% | 0.09% | 0.57% | |||||||||
Electronic Equipment & Instruments | 0.00% | 0.56% | 0.56% | |||||||||
Property & Casualty Insurance | 0.00% | 0.54% | 0.54% | |||||||||
Airlines | 0.51% | 0.00% | 0.51% | |||||||||
Oil & Gas Equipment & Services | 0.36% | 0.14% | 0.50% | |||||||||
Trading Companies & Distributors | 0.50% | 0.00% | 0.50% | |||||||||
Multi-Utilities | 0.47% | 0.00% | 0.47% | |||||||||
Building Products | 0.00% | 0.46% | 0.46% | |||||||||
Construction Machinery & Heavy Trucks | 0.00% | 0.44% | 0.44% | |||||||||
Specialty Chemicals | 0.04% | 0.39% | 0.43% | |||||||||
Home Improvement Retail | 0.42% | 0.00% | 0.42% | |||||||||
Housewares & Specialties | 0.40% | 0.00% | 0.40% | |||||||||
Automobile Manufacturers | 0.00% | 0.38% | 0.38% | |||||||||
Personal Products | 0.00% | 0.35% | 0.35% | |||||||||
Research & Consulting Services | 0.31% | 0.00% | 0.31% | |||||||||
Brewers | 0.00% | 0.30% | 0.30% | |||||||||
Security & Alarm Services | 0.00% | 0.28% | 0.28% | |||||||||
Construction Materials | 0.00% | 0.28% | 0.28% | |||||||||
Diversified Metals & Mining | 0.00% | 0.27% | 0.27% | |||||||||
Home Building | 0.00% | 0.27% | 0.27% | |||||||||
Industrial Gases | 0.12% | 0.13% | 0.25% | |||||||||
Apparel, Accessories & Luxury Goods | 0.25% | 0.00% | 0.25% | |||||||||
Healthcare Services | 0.00% | 0.24% | 0.24% | |||||||||
Leisure Products | 0.00% | 0.24% | 0.24% | |||||||||
Advertising | 0.00% | 0.21% | 0.21% | |||||||||
Electronic Components | 0.00% | 0.21% | 0.21% | |||||||||
General Merchandise Stores | 0.20% | 0.00% | 0.20% | |||||||||
Healthcare Supplies | 0.19% | 0.00% | 0.19% | |||||||||
Automotive Retail | 0.19% | 0.00% | 0.19% | |||||||||
Hypermarkets & Super Centers | 0.18% | 0.00% | 0.18% | |||||||||
Industrial Conglomerates | 0.18% | 0.00% | 0.18% | |||||||||
Agricultural Products | 0.15% | 0.00% | 0.15% | |||||||||
Gold | 0.13% | 0.00% | 0.13% | |||||||||
Railroads | 0.00% | 0.13% | 0.13% | |||||||||
Independent Power Producers & Energy Traders | 0.12% | 0.00% | 0.12% | |||||||||
Household Products | 0.00% | 0.12% | 0.12% | |||||||||
Paper Packaging | 0.06% | 0.00% | 0.06% | |||||||||
Drug Retail | 0.05% | 0.00% | 0.05% | |||||||||
Diversified Support Services | 0.00% | 0.04% | 0.04% | |||||||||
|
| |||||||||||
| 58.15% | ||||||||||||
|
| |||||||||||
See Notes to Schedules of Investments and Notes to Financial Statements.
| Elfun Diversified Fund | 37 |
Elfun Diversified Fund
Schedule of Investments, continued — December 31, 2016
| Sector | Percentage (based on Fair Value) | |||
Corporate Notes | 12.72% | |||
Agency Mortgage Backed | 8.76% | |||
U.S. Treasuries | 6.84% | |||
Non-Agency Collateralized Mortgage Obligations | 1.79% | |||
Agency Collateralized Mortgage Obligations | 0.42% | |||
Sovereign Bonds | 0.25% | |||
Municipal Bonds and Notes | 0.18% | |||
FNMA (TBA) | 0.00% | ** | ||
|
| |||
| 30.96% | ||||
|
| |||
Short-Term Investments | ||||
Short-Term Investments | 10.89% | |||
|
| |||
| 10.89% | ||||
|
| |||
| 100.00% | ||||
|
| |||
Affiliate Table
| Number of Shares Held at 12/31/15 | Value at 12/31/15 | Shares Purchased | Shares Sold | Number of Shares Held at 12/31/16 | Value at 12/31/16 | Dividend/ Interest Income | Realized Gain (Loss) | |||||||||||||||||||||||||
Industrial Select Sector SPDR Fund | 16,195 | $ | 858,497 | 4,079 | 20,274 | — | $ | — | $ | 10,413 | $ | 204,970 | ||||||||||||||||||||
SPDR Bloomberg Barclays High Yield Bond ETF | — | — | 173,223 | — | 173,223 | 6,313,978 | 235,219 | — | ||||||||||||||||||||||||
State Street Corp. | 15,400 | 1,021,944 | — | 15,400 | — | — | 4,888 | (151,969 | ) | |||||||||||||||||||||||
State Street Institutional U.S. Government Money Market Fund | 28,561,801 | 28,561,801 | 76,584,182 | 82,554,544 | 22,591,439 | 22,591,439 | 65,334 | — | ||||||||||||||||||||||||
|
|
|
|
|
| |||||||||||||||||||||||||||
| $ | 28,905,417 | $ | 315,854 | $ | 53,001 | |||||||||||||||||||||||||||
|
|
|
|
|
| |||||||||||||||||||||||||||
See Notes to Schedules of Investments and Notes to Financial Statements.
| 38 | Elfun Diversified Fund |
Portfolio Management Discussion and Analysis — December 31, 2016 (Unaudited)
| Q. | How did the Elfun Tax-Exempt Income Fund perform compared to its benchmark and Morningstar peer group for the twelve-month period ended December 31, 2016? |
| A. | For the twelve-month period ended December 31, 2016, the Elfun Tax-Exempt Income Fund returned 0.42%. The Bloomberg Barclays U.S. Municipal Bond Index (the “Index”), the Fund’s benchmark, returned 0.25% and the Fund’s Morningstar peer group of 158 U.S. Long-term Municipal Bond funds returned an average of 0.00% over the same period. |
| Q. | What market conditions affected the Fund’s performance? |
| A. | The municipal bond market was challenged throughout 2016 by divergent themes. Favorable technical factors, characterized by strong mutual fund flows and negative net supply dominated the first ten months of the year. Issuers took advantage of historic low yields to refinance outstanding debt further limiting investing opportunities and tightening spreads for willing investors. Tax-exempt interest rates fell to generational lows as municipal bonds out-performed all asset classes. A dramatic shift in post-election investor sentiment, however, led to a retracement of yields during the fourth quarter, once again reinforcing the fact that municipal bonds are fixed income instruments that can be subject to bouts of volatility. The combination of resurgence in equities as well as speculation about the potential for future tax policy change quickly reversed the trend of fund flows into tax-exempt mutual funds, leading the municipal bond market to its worst retuning quarter in over three years. Given our income oriented approach and diverse curve positioning; the Fund’s performance distinguished it from both benchmark and peers. |
| Q. | What were the primary drivers of Fund performance? |
| A. | The Fund’s performance was driven by its diversified curve positioning, emphasis on essential service revenue bonds and active risk management. The Fund benefitted early in the year from a flattening yield curve which rewarded positioning within the fifteen to twenty-five year sector. While many long term funds were rewarded for exposure to thirty year debt, our strategy to concentrate the Fund’s positioning within the intermediate sector of the yield curve allowed the Fund to participate in the massive rally through mid-year, yet limited the impact of rising rates later in the year. The Funds’ lower duration and market underweight in California and New York, the largest issuers within the Index, was a key differentiator during the market sell-off in the fourth quarter. The Fund did not have any material impact from the use of derivatives in 2016. |
| Q. | Were there any significant changes to the Fund during the period? |
| A. | The major change in the Fund impacting returns over the last twelve months was clearly the role active duration management played. The municipal market rally, which began in late 2015 and carried through October of 2016, contributed to a significant flattening of the yield curve. The Fund entered the year with risk levels one third of a year longer than the Bloomberg Barclays Municipal Bond Index and maintained an aggressive profile throughout the first three quarters of the year. In early October our belief that low absolute rates were unsustainable and did not represent a sufficient risk/reward proposition led to a reduction in duration to one third of a year less than the Index. When the market did correct post-election and tax-exempt yields rose by over 90 basis points, the Fund was well positioned to preserve capital, and outperform both its benchmark and peer group in a volatile, rising rate environment. |
| Elfun Tax-Exempt Income Fund | 39 |
Elfun Tax-Exempt Income Fund
Understanding Your Fund’s Expenses — December 31, 2016 (Unaudited)
As a shareholder of the Fund you incur ongoing costs. Ongoing costs include portfolio management fees, professional fees, administrative fees and other Fund expenses. The following example is intended to help you understand your ongoing costs (in dollars) of investing in the Fund and to compare these costs with the ongoing costs of investing in other mutual funds.
To illustrate these ongoing costs, we have provided an example and calculated the expenses paid by investors in units of the Fund during the period. The information in the following table is based on an investment of $1,000, which is invested at the beginning of the period and held for the entire six-month period ended December 31, 2016.
Actual Expenses
The first section of the table provides information about actual account values and actual expenses. You may use the information in this section, together with the amount you invested, to estimate the expenses that you paid over the period. To do so, simply divide your account value by $1,000 (for example, an $8,600 account value divided by $1,000 = 8.6), then multiply the result by the number given under the heading “Expenses paid during the period” to estimate the expenses you paid on your account during the period.
Hypothetical Example for Comparison Purposes
The second section of the table provides information about hypothetical account values and hypothetical expenses based on the Fund’s actual expense ratio and an assumed rate of return of 5% per year before expenses, which is not the Fund’s actual return. The hypothetical account values and expenses may not be used to estimate the actual ending account balance or expenses you paid for the period. You may use this information to compare the ongoing costs of investing in the Fund and other funds. To do so, compare this 5% hypothetical example with the 5% hypothetical examples that appear in the shareholders reports of other funds.
Please note that the expenses shown in the table are meant to highlight and help you compare ongoing costs only and do not reflect transaction costs, such as sales charges or redemption fees, if any. Therefore, the second section of the table is useful in comparing ongoing costs only, and will not help you determine the relative total costs of owning different funds.
| Actual Fund Return | Hypothetical 5% Return (2.5% for the period) | |||||||
Account value at the July 1, 2016 | $ | 1,000.00 | $ | 1,000.00 | ||||
Account value at the December 31, 2016 | $ | 962.40 | $ | 1,024.13 | ||||
Expenses paid during the period* | $ | 0.99 | $ | 1.02 | ||||
| * | Expenses are equal to the Fund’s annualized net expense ratio of 0.20%** (for the period July 1, 2016-December 31, 2016), multiplied by the average account value over the period, multiplied by 184/366 (to reflect the one-half year period). |
| ** | May differ from expense ratio disclosed in the financial highlights, which is calculated based on the entire fiscal year’s data. |
| 40 | Elfun Tax-Exempt Income Fund |
Elfun Tax-Exempt Income Fund
Performance Summary — December 31, 2016 (Unaudited)
Investment Profile
A mutual fund designed for investors who seek as high a level of current interest income exempt from federal income taxation as is available from a concentration of investments in municipal bonds consistent with prudent investment management and the preservation of capital. The Fund seeks to achieve its investment objective by investing primarily in investment-grade municipal obligations.
Morningstar Performance Comparison
Based on average annual returns for periods ended December 31, 2016
| 1 Year | 5 Year | 10 Year | ||||||||||
Number of funds in peer group | 158 | 142 | 133 | |||||||||
Peer group average annual total return | 0.00 | % | 3.42 | % | 3.68 | % | ||||||
Morningstar Category in peer group: Muni National Long |
| |||||||||||
Quality Ratings
as of December 31, 2016 as a % of Fair Value (a)(b)
Moody’s / S&P /Rating* | Percentage of Fair Value | |||
Aaa / AAA | 10.3 | % | ||
Aa / AA | 49.7 | % | ||
A / A | 29.8 | % | ||
Baa / BBB | 3.7 | % | ||
NR / Other | 6.5 | % | ||
|
| |||
| 100.0 | % | |||
Sector Allocation as of December 31, 2016
Portfolio composition as a % of Investments of $1,493,401 (in thousands) as of December 31, 2016 (a)(b)
Average Annual Total Return for the periods ended December 31, 2016
(Inception date: 01/01/80)
| One Year | Five Year | Ten Year | Ending value of a $10,000 investment | |||||||||||||
Elfun Tax-Exempt Income Fund | 0.42 | % | 3.25 | % | 4.19 | % | $ | 15,076 | ||||||||
Bloomberg Barclays U.S. Municipal Bond Index | 0.25 | % | 3.28 | % | 4.25 | % | $ | 15,158 | ||||||||
| Elfun Tax-Exempt Income Fund | 41 |
Elfun Tax-Exempt Income Fund
Performance Summary, continued — December 31, 2016 (Unaudited)
| (a) | Fair Value basis is inclusive of short-term investment in State Street Institutional U.S. Government Money Market Fund Class G Shares. |
| (b) | The securities information regarding holdings, allocations and other characteristics is presented to illustrate examples of securities that the Fund has bought and the diversity of areas in which the Fund may invest as of a particular date. It may not be representative of the Fund’s current or future investments and should not be construed as a recommendation to purchase or sell a particular security. |
See Notes to Performance beginning on page 1 for further information, including an explanation of Morningstar peer categories.
Past performance does not predict future performance. The performance shown in the graphs and tables does not reflect the deduction of taxes that a shareholder would pay on Fund distributions or the redemption of Fund shares.
| 42 | Elfun Tax-Exempt Income Fund |
Elfun Tax-Exempt Income Fund
Schedule of Investments — December 31, 2016
| Principal Amount ($) or Shares | Fair $ | |||||||
| Municipal Bonds and Notes - 96.5%† | ||||||||
Alaska - 0.2% | ||||||||
Alaska Housing Finance Corp. | 2,500,000 | 2,826,275 | ||||||
|
| |||||||
Arizona - 3.0% | ||||||||
Arizona Board of Regents State University System Revenue | 10,930,000 | 12,262,804 | ||||||
City of Phoenix | 5,000,000 | 5,095,826 | ||||||
Phoenix Civic Improvement Corp. | 5,400,000 | 6,427,188 | ||||||
Phoenix Civic Improvement Corp. (NPFG Insured) | 7,260,000 | 8,842,772 | ||||||
Salt River Project Agricultural Improvement & Power District | 10,000,000 | 11,209,500 | ||||||
University Medical Center Corp. | 1,000,000 | 1,121,440 | ||||||
|
| |||||||
| 44,959,530 | ||||||||
|
| |||||||
Arkansas - 0.1% | ||||||||
University of Arkansas | 1,250,000 | 1,414,650 | ||||||
|
| |||||||
California - 10.3% | ||||||||
California Educational Facilities Authority | ||||||||
5.25% due 10/01/39 (l) | 5,000,000 | 5,342,850 | ||||||
6.13% due 10/01/36 | 1,500,000 | 1,749,540 | ||||||
California Health Facilities Financing Authority | ||||||||
4.00% due | 6,500,000 | 6,353,065 | ||||||
5.50% due 08/15/26 | 5,000,000 | 5,655,150 | ||||||
6.00% due 07/01/39 (l) | 5,000,000 | 5,499,900 | ||||||
6.50% due 10/01/33 (l) | 3,500,000 | 3,818,185 | ||||||
California State Department of Water Resources | ||||||||
5.00% due | 14,700,000 | 17,071,808 | ||||||
5.00% due 12/01/21 (k) | 5,000 | 5,723 | ||||||
5.00% due 12/01/29 (l) | 30,000 | 35,968 | ||||||
California State Public Works Board | ||||||||
5.00% due 10/01/28 | 1,500,000 | 1,679,370 | ||||||
5.13% due 10/01/31 | 2,000,000 | 2,235,060 | ||||||
5.25% due 09/01/29 | 10,160,000 | 11,741,607 | ||||||
| Principal Amount ($) or Shares | Fair $ | |||||||
6.00% due 04/01/26 (l) | 8,475,000 | 9,341,060 | ||||||
California State University | 5,900,000 | 5,973,160 | ||||||
Kaweah Delta Health Care District | 2,500,000 | 2,483,125 | ||||||
Los Angeles Department of Water & Power | ||||||||
4.00% due 07/01/46 | 5,710,000 | 5,818,033 | ||||||
5.00% due | 8,750,000 | 9,933,187 | ||||||
Los Angeles Harbor Department | 8,000,000 | 8,674,240 | ||||||
San Diego Community College District | 10,000,000 | 11,422,000 | ||||||
State of California | ||||||||
5.00% due | 18,220,000 | 20,027,639 | ||||||
5.25% due | 12,750,000 | 14,177,868 | ||||||
University of California | 4,000,000 | 4,416,120 | ||||||
|
| |||||||
| 153,454,658 | ||||||||
|
| |||||||
Colorado - 1.7% | ||||||||
Metro Wastewater Reclamation District | 1,730,000 | 1,975,764 | ||||||
Regional Transportation District | ||||||||
4.25% due 11/01/36 | 3,405,000 | 3,767,701 | ||||||
5.00% due | 13,760,000 | 16,341,933 | ||||||
5.38% due 06/01/31 | 2,500,000 | 2,722,950 | ||||||
|
| |||||||
| 24,808,348 | ||||||||
|
| |||||||
Connecticut - 5.8% | ||||||||
Connecticut State Health & Educational Facility Authority | 13,275,000 | 14,352,592 | ||||||
South Central Connecticut Regional Water Authority | 3,695,000 | 4,243,046 | ||||||
State of Connecticut | 15,600,000 | 17,798,054 | ||||||
See Notes to Schedules of Investments and Notes to Financial Statements.
| Elfun Tax-Exempt Income Fund | 43 |
Elfun Tax-Exempt Income Fund
Schedule of Investments, continued — December 31, 2016
| Principal Amount ($) or Shares | Fair $ | |||||||
State of Connecticut Special Tax Revenue | ||||||||
4.00% due 09/01/36 | 10,000,000 | 10,168,100 | ||||||
5.00% due | 35,250,000 | 39,555,922 | ||||||
Town of Fairfield | 1,000,000 | 1,140,310 | ||||||
|
| |||||||
| 87,258,024 | ||||||||
|
| |||||||
Delaware - 1.7% | ||||||||
County of New Castle | 10,000,000 | 10,581,400 | ||||||
Delaware State Health Facilities Authority | 6,300,000 | 6,842,178 | ||||||
Delaware Transportation Authority | 6,680,000 | 7,434,840 | ||||||
State of Delaware |
| |||||||
5.00% due 07/01/28 (l) | 825,000 | 919,512 | ||||||
5.00% due 07/01/28 | 175,000 | 194,231 | ||||||
|
| |||||||
| 25,972,161 | ||||||||
|
| |||||||
District of Columbia - 2.8% |
| |||||||
District of Columbia | ||||||||
5.00% due 06/01/38 | 3,000,000 | 3,402,090 | ||||||
5.50% due 04/01/36 | 15,000,000 | 15,945,450 | ||||||
District of Columbia Water & Sewer Authority | ||||||||
5.00% due 10/01/39 | 15,000,000 | 17,067,000 | ||||||
5.25% due 10/01/29 (l) | 5,000,000 | 5,347,350 | ||||||
|
| |||||||
| 41,761,890 | ||||||||
|
| |||||||
Florida - 1.2% |
| |||||||
Brevard County Health Facilities Authority | 1,000,000 | 1,121,800 | ||||||
City of Tampa Water & Wastewater System Revenue | 8,560,000 | 9,698,737 | ||||||
County of Miami-Dade Special Obligation Revenue | 7,750,000 | 7,768,212 | ||||||
|
| |||||||
| 18,588,749 | ||||||||
|
| |||||||
Georgia - 7.5% |
| |||||||
Athens-Clarke County Unified Government Development Authority | 6,050,000 | 6,375,490 | ||||||
| Principal Amount ($) or Shares | Fair $ | |||||||
Athens-Clarke County Unified Government Water & Sewerage Revenue | 7,000,000 | 7,571,060 | ||||||
Atlanta Development Authority | 8,925,000 | 10,211,449 | ||||||
City of Atlanta Department of Aviation | 18,500,000 | 20,739,540 | ||||||
City of Atlanta Water & Wastewater Revenue | ||||||||
5.25% due 11/01/30 | 5,690,000 | 6,630,728 | ||||||
6.25% due 11/01/39 (l) | 10,000,000 | 11,298,600 | ||||||
City of Atlanta Water & Wastewater Revenue (AGMC Insured) | ||||||||
5.75% due | 9,500,000 | 12,343,035 | ||||||
DeKalb Newton & Gwinnett Counties Joint Development Authority | 8,500,000 | 9,345,410 | ||||||
Municipal Electric Authority of Georgia | ||||||||
5.00% due 01/01/35 | 5,500,000 | 6,160,110 | ||||||
5.25% due 01/01/19 | 2,490,000 | 2,672,791 | ||||||
Richmond County Hospital Authority | 2,855,000 | 2,879,696 | ||||||
State of Georgia |
| |||||||
4.00% due 07/01/32 | 3,350,000 | 3,586,677 | ||||||
4.50% due 01/01/29 (l) | 3,000,000 | 3,140,130 | ||||||
5.00% due 08/01/22 - 01/01/26 (l) | 9,250,000 | 9,576,385 | ||||||
|
| |||||||
| 112,531,101 | ||||||||
|
| |||||||
Hawaii - 2.2% |
| |||||||
City & County Honolulu Wastewater System Revenue | 3,500,000 | 4,024,405 | ||||||
City & County of Honolulu 5.00% due 04/01/33 (l) | 10,000,000 | 10,790,600 | ||||||
State of Hawaii Airports System Revenue | 15,800,000 | 17,598,356 | ||||||
|
| |||||||
| 32,413,361 | ||||||||
|
| |||||||
Idaho - 0.3% |
| |||||||
Idaho Health Facilities Authority | 4,000,000 | 4,340,440 | ||||||
|
| |||||||
See Notes to Schedules of Investments and Notes to Financial Statements.
| 44 | Elfun Tax-Exempt Income Fund |
Elfun Tax-Exempt Income Fund
Schedule of Investments, continued — December 31, 2016
| Principal Amount ($) or Shares | Fair $ | |||||||
Illinois - 3.6% |
| |||||||
City of Chicago O’Hare International Airport Revenue | ||||||||
5.00% due | 3,000,000 | 3,278,750 | ||||||
5.25% due 01/01/42 (c) | 8,000,000 | 9,019,280 | ||||||
5.63% due 01/01/35 | 5,000,000 | 5,601,800 | ||||||
5.75% due 01/01/39 | 11,500,000 | 12,952,450 | ||||||
Illinois State Toll Highway Authority | ||||||||
5.00% due 12/01/32 | 8,050,000 | 9,060,275 | ||||||
Metropolitan Pier & Exposition Authority (NPFG Insured) | ||||||||
5.40% due 06/15/19 (l)(m) | 1,065,000 | 1,096,620 | ||||||
5.40% due 06/15/19 (m) | 2,935,000 | 3,013,042 | ||||||
5.65% due 06/15/22 (k)(m) | 375,000 | 433,402 | ||||||
5.65% due 06/15/22 (m) | 3,930,000 | 4,314,511 | ||||||
Southwestern Illinois Development Authority (NPFG Insured) | 4,000,000 | 4,493,600 | ||||||
|
| |||||||
| 53,263,730 | ||||||||
|
| |||||||
Indiana - 0.7% |
| |||||||
Indiana Municipal Power Agency | 2,500,000 | 2,703,950 | ||||||
Indianapolis Local Public Improvement Bond Bank 5.75% due 01/01/38 | 7,000,000 | 7,512,190 | ||||||
|
| |||||||
| 10,216,140 | ||||||||
|
| |||||||
Kentucky - 2.9% |
| |||||||
Kentucky State Property & Building Commission | 4,180,000 | 4,667,909 | ||||||
Kentucky State Property & Building Commission (AGC Insured) | ||||||||
5.25% due 02/01/27 (l)(m) | 9,450,000 | 10,190,408 | ||||||
5.25% due 02/01/27 (m) | 1,215,000 | 1,298,592 | ||||||
Louisville & Jefferson County Metropolitan Sewer District | 14,340,000 | 16,089,623 | ||||||
University of Louisville | 9,445,000 | 10,906,025 | ||||||
|
| |||||||
| 43,152,557 | ||||||||
|
| |||||||
| Principal Amount ($) or Shares | Fair $ | |||||||
Louisiana - 1.1% |
| |||||||
City of New Orleans Sewerage Service Revenue | 3,900,000 | 4,252,167 | ||||||
Louisiana Public Facilities Authority | 1,000,000 | 1,075,780 | ||||||
State of Louisiana | 10,050,000 | 10,948,470 | ||||||
|
| |||||||
| 16,276,417 | ||||||||
|
| |||||||
Maine - 0.3% |
| |||||||
Maine Health & Higher Educational Facilities Authority | ||||||||
5.25% due 07/01/21 (l) | 315,000 | 352,773 | ||||||
5.25% due 07/01/21 | 1,475,000 | 1,637,869 | ||||||
Maine Turnpike Authority | ||||||||
5.00% due 07/01/42 | 1,000,000 | 1,107,460 | ||||||
6.00% due 07/01/34 (l) | 1,250,000 | 1,388,213 | ||||||
|
| |||||||
| 4,486,315 | ||||||||
|
| |||||||
Maryland - 2.7% |
| |||||||
City of Baltimore | 9,375,000 | 10,499,062 | ||||||
County of Prince George’s | 8,790,000 | 10,015,596 | ||||||
Maryland Economic Development Corp. | 3,000,000 | 3,223,800 | ||||||
Maryland Health & Higher Educational Facilities Authority | 3,300,000 | �� | 3,551,081 | |||||
State of Maryland | 4,000,000 | 4,273,840 | ||||||
Washington Suburban Sanitary Commission | 8,470,000 | 8,866,820 | ||||||
|
| |||||||
| 40,430,199 | ||||||||
|
| |||||||
Massachusetts - 4.3% |
| |||||||
Commonwealth of Massachusetts | 14,000,000 | 16,363,900 | ||||||
Massachusetts Department of Transportation | 10,000,000 | 10,733,600 | ||||||
See Notes to Schedules of Investments and Notes to Financial Statements.
| Elfun Tax-Exempt Income Fund | 45 |
Elfun Tax-Exempt Income Fund
Schedule of Investments, continued — December 31, 2016
| Principal Amount ($) or Shares | Fair $ | |||||||
Massachusetts Development Finance Agency | 4,000,000 | 4,312,118 | ||||||
Massachusetts Health & Educational Facilities Authority | ||||||||
5.00% due 07/01/34 | 7,500,000 | 8,049,300 | ||||||
5.75% due 07/01/39 (l) | 5,000,000 | 5,299,000 | ||||||
Massachusetts School Building Authority | 5,000,000 | 5,678,550 | ||||||
Massachusetts Water Resources Authority | ||||||||
5.00% due 08/01/32 | 4,140,000 | 4,683,209 | ||||||
5.00% due 08/01/41 (l) | 3,000,000 | 3,412,440 | ||||||
6.50% due 07/15/19 (k) | 5,905,000 | 6,260,009 | ||||||
|
| |||||||
| 64,792,126 | ||||||||
|
| |||||||
Michigan - 1.5% |
| |||||||
Lansing Board of Water & Light | 3,500,000 | 3,841,250 | ||||||
State of Michigan | 4,415,000 | 5,240,870 | ||||||
State of Michigan (AGMC Insured) | 5,000,000 | 5,146,950 | ||||||
State of Michigan Trunk Line Revenue | 6,000,000 | 6,451,080 | ||||||
University of Michigan Revenue | 1,000,000 | 1,149,840 | ||||||
|
| |||||||
| 21,829,990 | ||||||||
|
| |||||||
Minnesota - 0.2% |
| |||||||
Minnesota Municipal Power Agency Electric Revenue | 2,250,000 | 2,506,725 | ||||||
Saint Cloud Health Care Revenue | 1,000,000 | 1,099,180 | ||||||
|
| |||||||
| 3,605,905 | ||||||||
|
| |||||||
Missouri - 1.9% |
| |||||||
Bi-State Development Agency of the Missouri-Illinois Metropolitan District | 8,010,000 | 8,946,930 | ||||||
Health & Educational Facilities Authority of the State of Missouri | 6,000,000 | 5,966,440 | ||||||
| Principal Amount ($) or Shares | Fair $ | |||||||
Kansas City Sanitary Sewer System Revenue | 1,725,000 | 1,791,965 | ||||||
Metropolitan St. Louis Sewer District | ||||||||
5.00% due 05/01/45 | 1,500,000 | 1,704,045 | ||||||
5.00% due 05/01/46 | 1,500,000 | 1,710,885 | ||||||
Missouri Highway & Transportation Commission | 4,610,000 | 5,102,440 | ||||||
Missouri Joint Municipal Electric Utility Commission | 1,950,000 | 2,154,106 | ||||||
Missouri State Environmental Improvement & Energy Resources Authority | 525,000 | 526,559 | ||||||
|
| |||||||
| 27,903,370 | ||||||||
|
| |||||||
New Jersey - 6.7% |
| |||||||
New Jersey Economic Development Authority | ||||||||
5.00% due 06/15/41 | 7,250,000 | 7,199,177 | ||||||
5.25% due 06/15/40 | 4,000,000 | 4,081,880 | ||||||
5.50% due 12/15/29 | 5,000,000 | 5,351,000 | ||||||
New Jersey Educational Facilities Authority | ||||||||
4.00% due | 2,000,000 | 2,012,575 | ||||||
5.50% due | 14,700,000 | 15,496,542 | ||||||
6.00% due 12/01/17 (k) | 5,720,000 | 5,972,309 | ||||||
New Jersey Health Care Facilities Financing Authority | 8,200,000 | 7,991,574 | ||||||
New Jersey Health Care Facilities Financing Authority (AGMC Insured) | 6,215,000 | 6,097,599 | ||||||
New Jersey Higher Education Student Assistance Authority | 7,500,000 | 8,096,625 | ||||||
New Jersey State Turnpike Authority | ||||||||
5.00% due | 18,500,000 | 20,472,825 | ||||||
5.25% due 01/01/40 | 10,000,000 | 10,612,400 | ||||||
New Jersey Transportation Trust Fund Authority | ||||||||
5.00% due 06/15/45 | 2,250,000 | 2,239,785 | ||||||
5.25% due 06/15/36 | 5,000,000 | 5,063,000 | ||||||
|
| |||||||
| 100,687,291 | ||||||||
|
| |||||||
See Notes to Schedules of Investments and Notes to Financial Statements.
| 46 | Elfun Tax-Exempt Income Fund |
Elfun Tax-Exempt Income Fund
Schedule of Investments, continued — December 31, 2016
| Principal Amount ($) or Shares | Fair $ | |||||||
New Mexico - 0.7% |
| |||||||
New Mexico Finance Authority | 9,200,000 | 9,927,774 | ||||||
|
| |||||||
| 9,927,774 | ||||||||
|
| |||||||
New York - 8.4% |
| |||||||
Long Island Power Authority | 7,500,000 | 8,287,200 | ||||||
Metropolitan Transportation | 7,750,000 | 8,800,395 | ||||||
New York City Transitional Finance Authority Building Aid Revenue | 10,000,000 | 10,586,200 | ||||||
New York City Transitional Finance Authority Future Tax Secured Revenue | ||||||||
4.00% due 05/01/42 | 5,000,000 | 5,129,050 | ||||||
5.00% due | 25,000,000 | 27,945,750 | ||||||
New York Liberty Development Corp. | ||||||||
5.00% due 11/15/44 | 5,000,000 | 5,411,350 | ||||||
5.13% due 01/15/44 | 10,000,000 | 10,827,700 | ||||||
New York State Dormitory Authority | ||||||||
4.00% due 07/01/40 | 1,000,000 | 1,001,090 | ||||||
5.00% due | 10,000,000 | 12,163,800 | ||||||
5.50% due 05/01/37 (l) | 2,500,000 | 2,733,950 | ||||||
6.00% due 07/01/40 (l) | 2,000,000 | 2,295,240 | ||||||
New York State Thruway Authority | 6,000,000 | 6,464,520 | ||||||
New York State Urban | 9,000,000 | 9,724,950 | ||||||
Triborough Bridge & Tunnel | ||||||||
5.00% due 11/15/26 (l) | 6,170,000 | 6,589,498 | ||||||
5.00% due 11/15/26 | 3,830,000 | 4,082,359 | ||||||
Westchester County Healthcare Corp. | ||||||||
6.13% due 11/01/37 (l) | 2,220,000 | 2,578,397 | ||||||
6.13% due 11/01/37 | 280,000 | 312,435 | ||||||
|
| |||||||
| 124,933,884 | ||||||||
|
| |||||||
North Carolina - 1.7% | ||||||||
Cape Fear Public Utility Authority | 1,800,000 | 1,924,020 | ||||||
| Principal Amount ($) or Shares | Fair $ | |||||||
City of Charlotte | 4,320,000 | 4,788,202 | ||||||
City of Charlotte Water & Sewer System Revenue | 5,000,000 | 5,242,300 | ||||||
North Carolina Capital Facilities Finance Agency | 2,000,000 | 2,051,900 | ||||||
North Carolina Eastern Municipal Power Agency | 5,000,000 | 5,359,000 | ||||||
North Carolina Medical Care Commission | 1,500,000 | 1,515,210 | ||||||
State of North Carolina | 4,130,000 | 4,447,597 | ||||||
|
| |||||||
| 25,328,229 | ||||||||
|
| |||||||
Ohio - 4.5% | ||||||||
American Municipal Power Inc. | ||||||||
5.00% due 02/15/38 (l) | 4,705,000 | 4,904,915 | ||||||
5.00% due 02/15/38 | 295,000 | 304,573 | ||||||
City of Cincinnati Water System Revenue | 2,500,000 | 2,816,325 | ||||||
City of Columbus | ||||||||
5.00% due 07/01/26 (l) | 15,130,000 | 17,849,012 | ||||||
5.00% due | 2,925,000 | 3,427,019 | ||||||
City of Columbus Sewerage Revenue | ||||||||
4.50% due 06/01/32 (l) | 700,000 | 721,770 | ||||||
4.75% due 06/01/31 (l) | 5,000,000 | 5,166,700 | ||||||
Cuyahoga Community College District | 1,800,000 | 1,986,156 | ||||||
Northeast Ohio Regional Sewer District | 12,000,000 | 13,321,320 | ||||||
Ohio Higher Educational Facility Commission | 5,000,000 | 5,447,000 | ||||||
Ohio State Turnpike Commission | 6,000,000 | 6,773,520 | ||||||
University of Cincinnati | 4,000,000 | 4,497,680 | ||||||
|
| |||||||
| 67,215,990 | ||||||||
|
| |||||||
Oklahoma - 0.6% |
| |||||||
Oklahoma Capital Improvement Authority | 5,000,000 | 5,798,520 | ||||||
See Notes to Schedules of Investments and Notes to Financial Statements.
| Elfun Tax-Exempt Income Fund | 47 |
Elfun Tax-Exempt Income Fund
Schedule of Investments, continued — December 31, 2016
| Principal Amount ($) or Shares | Fair $ | |||||||
Oklahoma Turnpike Authority | 3,500,000 | 3,883,600 | ||||||
|
| |||||||
| 9,682,120 | ||||||||
|
| |||||||
Oregon - 0.1% | ||||||||
Eugene Water Revenue | 1,850,000 | 1,910,939 | ||||||
|
| |||||||
Pennsylvania - 3.5% | ||||||||
City of Philadelphia Water & Wastewater Revenue | 8,000,000 | 8,754,800 | ||||||
Delaware River Port Authority | 5,000,000 | 5,690,450 | ||||||
Pennsylvania State University | 1,200,000 | 1,367,448 | ||||||
Pennsylvania Turnpike Commission | ||||||||
5.00% due 06/01/29 (l) | 10,000,000 | 10,851,001 | ||||||
5.00% due 12/01/32 | 1,500,000 | 1,658,940 | ||||||
5.25% due 06/01/39 (l) | 4,595,000 | 5,007,401 | ||||||
5.25% due 06/01/39 | 4,905,000 | 5,232,114 | ||||||
6.00% due 12/01/34 (l) | 3,545,000 | 4,114,220 | ||||||
6.00% due 12/01/34 | 8,455,000 | 9,650,960 | ||||||
Philadelphia Gas Works Co. | 500,000 | 494,415 | ||||||
|
| |||||||
| 52,821,749 | ||||||||
|
| |||||||
Rhode Island - 0.7% | ||||||||
Rhode Island Commerce Corp. | 5,000,000 | 5,719,750 | ||||||
Rhode Island Health & Educational Building Corp. | ||||||||
6.25% due 09/15/34 (l) | 1,300,000 | 1,408,849 | ||||||
6.50% due 09/15/28 (l) | 1,000,000 | 1,087,900 | ||||||
Rhode Island Infrastructure Bank Water Pollution Control Revenue | 2,200,000 | 2,604,624 | ||||||
|
| |||||||
| 10,821,123 | ||||||||
|
| |||||||
South Carolina - 2.6% | ||||||||
Piedmont Municipal Power Agency | 2,315,000 | 2,591,781 | ||||||
Piedmont Municipal Power Agency (AGC Insured) | 5,500,000 | 6,262,080 | ||||||
South Carolina State Public Service Authority | ||||||||
5.00% due | 12,000,000 | 13,289,640 | ||||||
5.50% due 01/01/38 (l) | 14,970,000 | 16,204,221 | ||||||
|
| |||||||
| 38,347,722 | ||||||||
|
| |||||||
| Principal Amount ($) or Shares | Fair $ | |||||||
Tennessee - 1.1% | ||||||||
County of Shelby | 3,500,000 | 3,843,140 | ||||||
State of Tennessee | 1,000,000 | 1,050,900 | ||||||
Tennessee State School Bond Authority | 10,000,000 | 11,340,700 | ||||||
|
| |||||||
| 16,234,740 | ||||||||
|
| |||||||
Texas - 8.0% | ||||||||
City of Austin Water & Wastewater System Revenue | 18,595,000 | 20,635,344 | ||||||
City of Houston Utility System | ||||||||
5.00% due | 10,470,000 | 11,847,035 | ||||||
5.25% due | 12,000,000 | 13,496,660 | ||||||
County of Harris | 3,000,000 | 3,406,440 | ||||||
Dallas Area Rapid Transit | 3,160,000 | 3,566,313 | ||||||
Dallas/Fort Worth International Airport | 5,000,000 | 5,755,750 | ||||||
Harris County-Houston Sports Authority | 2,000,000 | 2,270,700 | ||||||
Judson Independent School District | 2,625,000 | 2,672,985 | ||||||
North Texas Tollway Authority | ||||||||
5.00% due | 4,500,000 | 5,010,035 | ||||||
5.75% due 01/01/38 - 01/01/40 (l) | 20,245,000 | 21,164,123 | ||||||
5.75% due 01/01/40 | 1,230,000 | 1,279,385 | ||||||
6.00% due 01/01/38 | 5,000,000 | 5,678,750 | ||||||
Texas Transportation Commission State Highway Fund | 9,750,000 | 11,401,162 | ||||||
The University of Texas System | 10,000,000 | 12,190,800 | ||||||
|
| |||||||
| 120,375,482 | ||||||||
|
| |||||||
Utah - 0.8% | ||||||||
Utah State Board of Regents | 4,000,000 | 4,389,800 | ||||||
See Notes to Schedules of Investments and Notes to Financial Statements.
| 48 | Elfun Tax-Exempt Income Fund |
Elfun Tax-Exempt Income Fund
Schedule of Investments, continued — December 31, 2016
| Principal Amount ($) or Shares | Fair $ | |||||||
Utah Transit Authority | 7,500,000 | 8,232,375 | ||||||
|
| |||||||
| 12,622,175 | ||||||||
|
| |||||||
Virginia - 1.1% | ||||||||
County of Henrico Water & Sewer Revenue | 2,530,000 | 2,903,251 | ||||||
Virginia Resources Authority | ||||||||
4.00% due 11/01/41 | 5,585,000 | 5,796,336 | ||||||
5.00% due 11/01/46 | 1,720,000 | 1,966,631 | ||||||
5.25% due 11/01/38 (h)(l) | 2,390,000 | 2,558,519 | ||||||
5.25% due 11/01/38 (h) | 2,610,000 | 2,778,397 | ||||||
|
| |||||||
| 16,003,134 | ||||||||
|
| |||||||
| Total Municipal Bonds and Notes (Cost $1,389,923,769) | 1,443,198,288 | |||||||
|
| |||||||
| Principal Amount ($) or Shares | Fair $ | |||||||
| Short-Term Investments - 3.4% | ||||||||
State Street Institutional U.S. Government Money Market | 50,202,639 | 50,202,639 | ||||||
|
| |||||||
| Total Investments (Cost $1,440,126,408) | 1,493,400,927 | |||||||
| Other Assets and Liabilities, net - 0.1% | 1,847,075 | |||||||
|
| |||||||
| NET ASSETS - 100.0% | 1,495,248,002 | |||||||
|
| |||||||
Affiliate Table
| Number of Shares Held at 12/31/15 | Value at 12/31/15 | Shares Purchased | Shares Sold | Number of Shares Held at 12/31/16 | Value at 12/31/16 | Dividend/ Interest Income | Realized Gain (Loss) | |||||||||||||||||||||||||||||||||
State Street Institutional U.S. Government Money Market Fund | 39,963,872 | 39,963,873 | 476,000,147 | 465,761,380 | 50,202,639 | $ | 50,202,639 | $ | 90,074 | $ | — | |||||||||||||||||||||||||||||
|
|
|
|
|
| |||||||||||||||||||||||||||||||||||
| $ | 50,202,639 | $ | 90,074 | $ | — | |||||||||||||||||||||||||||||||||||
|
|
|
|
|
| |||||||||||||||||||||||||||||||||||
See Notes to Schedules of Investments and Notes to Financial Statements.
| Elfun Tax-Exempt Income Fund | 49 |
Portfolio Management Discussion and Analysis — December 31, 2016 (Unaudited)
| Q. | How did the Elfun Income Fund perform compared to its benchmark for the twelve-month period ended December 31, 2016? |
| A. | For the twelve-month period ended December 31, 2016, the Elfun Income Fund returned 3.52%. The Bloomberg Barclays U.S. Aggregate Bond Index, the Fund’s benchmark, returned 2.65% and the Fund’s Morningstar peer group of 993 U.S. Intermediate-Term Funds returned an average of 3.24% over the same period. |
| Q. | What market factors affected the Fund’s performance? |
| A. | The two primary market factors that affected the Fund’s performance were the movement in interest rates and credit spreads over the period. U.S. Treasury yields fell in the first half of 2016 as the timing of a Federal Reserve rate hike was pushed out due to slow growth expectations. The U.S. Treasury 10 year note yield hit a low of 1.35% in July from 2.28% at the start of the year. Rates jumped higher after the November elections. President-elect Trump’s proposal for fiscal stimulus, tax cuts and regulatory reform increased investors’ growth outlook and increased the probability of a rate hike which was met in December when the Federal Open Market Committee raised its Fed Funds target to 0.5-0.75%. The 10-year treasury yield ended the year at 2.45%. Credit spreads spiked early in the year but then steadily tightened from mid-February of 2016 until year-end. The option-adjusted spread (“OAS”) on the Bloomberg Barclays US Credit Index peaked at +200 basis points (bps) in February and finished the year at +118 bps, down -40 bps for the year. Similarly, the OAS on the Bloomberg Barclays US High Yield Index reached +840 bps before dropping to +410 bps by year-end (down -220 bps for the year). |
| Q. | What were the primary drivers of Fund performance? |
| A. | The largest driver of the Fund’s outperformance versus its benchmark came from its relative sector allocation. Exposure to high yield (not in the benchmark) added over +65 bps as the Ba/B rated high yield market returned over +14%. The overweight in investment grade credit added roughly +25 bps due to tightening spreads. The Fund’s duration and curve positioning biased towards lower rates in the first half and a steeper curve in the second half contributed roughly +30 bps. Security selection in investment grade credit and commercial mortgage-backed securities (“CMBS”) added slightly to performance. The use of CDXHY (high yield credit swap) as a hedge against the cash positions detracted roughly -10 bps. |
| Q. | Were there any significant changes to the Fund during the period? |
| A. | The Fund’s duration positioning was biased long relative to the benchmark in the first half of the year then was reduced to neutral in the third quarter and maintained throughout the rest of the year. In general, the credit risk of the Fund was reduced during the year. The spread duration targets (excess above the index) for CMBS, investment grade and high-yield credit were cut nearly in half as credit spreads tightened during the year. |
| 50 | Elfun Income Fund |
Elfun Income Fund
Understanding Your Fund’s Expenses — December 31, 2016 (Unaudited)
As a shareholder of the Fund you incur ongoing costs. Ongoing costs include portfolio management fees, professional fees, administrative fees and other Fund expenses. The following example is intended to help you understand your ongoing costs (in dollars) of investing in the Fund and to compare these costs with the ongoing costs of investing in other mutual funds.
To illustrate these ongoing costs, we have provided an example and calculated the expenses paid by investors in units of the Fund during the period. The information in the following table is based on an investment of $1,000, which is invested at the beginning of the period and held for the entire six-month period ended December 31, 2016.
Actual Expenses
The first section of the table provides information about actual account values and actual expenses. You may use the information in this section, together with the amount you invested, to estimate the expenses that you paid over the period. To do so, simply divide your account value by $1,000 (for example, an $8,600 account value divided by $1,000 = 8.6), then multiply the result by the number given under the heading “Expenses paid during the period” to estimate the expenses you paid on your account during the period.
Hypothetical Example for Comparison Purposes
The second section of the table provides information about hypothetical account values and hypothetical expenses based on the Fund’s actual expense ratio and an assumed rate of return of 5% per year before expenses, which is not the Fund’s actual return. The hypothetical account values and expenses may not be used to estimate the actual ending account balance or expenses you paid for the period. You may use this information to compare the ongoing costs of investing in the Fund and other funds. To do so, compare this 5% hypothetical example with the 5% hypothetical examples that appear in the shareholders reports of other funds.
Please note that the expenses shown in the table are meant to highlight and help you compare ongoing costs only and do not reflect transaction costs, such as sales charges or redemption fees, if any. Therefore, the second section of the table is useful in comparing ongoing costs only, and will not help you determine the relative total costs of owning different funds.
| Actual Fund Return | Hypothetical 5% Return (2.5% for the period) | |||||||
Account value at the July 1, 2016 | $ | 1,000.00 | $ | 1,000.00 | ||||
Account value at the December 31, 2016 | $ | 982.90 | $ | 1,023.53 | ||||
| Expenses paid during the period* | $ | 1.59 | $ | 1.63 | ||||
| * | Expenses are equal to the Fund’s annualized net expense ratio of 0.32%** (for the period July 1, 2016-December 31, 2016), multiplied by the average account value over the period, multiplied by 184/366 (to reflect the one-half year period). |
| ** | May differ from expense ratio disclosed in the financial highlights, which is calculated based on the entire fiscal year’s data. |
| Elfun Income Fund | 51 |
Elfun Income Fund
Performance Summary — December 31, 2016 (Unaudited)
Investment Profile
A mutual fund designed for investors who seek a high level of income consistent with prudent investment management and the preservation of capital. The Fund seeks to achieve its investment objective by investing at least 80% of its net assets under normal circumstances in debt securities. The Fund invests primarily in a variety of investment-grade debt securities, such as mortgage-backed securities, corporate bonds, U.S. Government securities and money market instruments.
Morningstar Performance Comparison
Based on average annual returns for periods ended December 31, 2016
| 1 Year | 5 Year | 10 Year | ||||||||||
Number of funds in peer group | 993 | 899 | 794 | |||||||||
Peer group average annual total return | 3.24 | % | 2.67 | % | 3.89 | % | ||||||
Morningstar Category in peer group: U.S. Intermediate-Term Bond |
| |||||||||||
Quality Ratings
as of December 31, 2016 as a % of Fair Value (a)(b)
Moody’s/S&P/Rating* | Percentage of Fair Value | |||
Aaa / AAA | 15.0 | % | ||
Aa / AA | 47.3 | % | ||
A / A | 9.3 | % | ||
Baa / BBB | 18.0 | % | ||
Ba / BB and lower | 7.8 | % | ||
NR / Other | 2.6 | % | ||
| 100.0 | % | |||
Sector Allocation as of December 31, 2016
Portfolio composition as a % of Fair Value of $313,782 (in thousands) as of December 31, 2016 (a)(b)
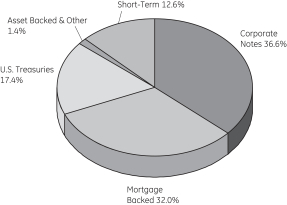
Average Annual Total Return for the periods ended December 31, 2016
(Inception date: 12/31/84)
| One Year | Five Year | Ten Year | Ending Value of a $10,000 Investment | |||||||||||||
Elfun Income Fund | 3.52 | % | 2.86 | % | 4.22 | % | $ | 15,117 | ||||||||
Bloomberg Barclays U.S. Aggregate Bond Index | 2.65 | % | 2.23 | % | 4.34 | % | $ | 15,300 | ||||||||
| 52 | Elfun Income Fund |
Elfun Income Fund
Performance Summary, continued — December 31, 2016 (Unaudited)
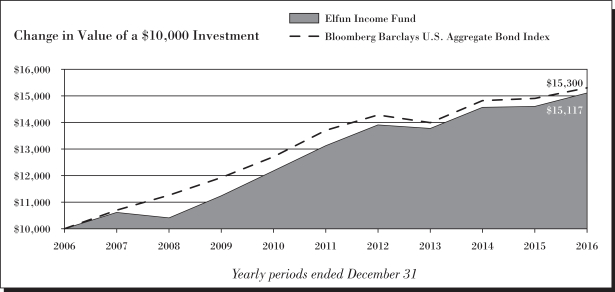
| (a) | Fair Value basis is inclusive of short-term investment in State Street Institutional U.S. Government Money Market Fund Class G Shares. |
| (b) | The securities information regarding holdings, allocations and other characteristics is presented to illustrate examples of securities that the Fund has bought and the diversity of areas in which the Fund may invest as of a particular date. It may not be representative of the Fund’s current or future investments and should not be construed as a recommendation to purchase or sell a particular security. |
See Notes to Performance beginning on page 1 for further information, including an explanation of Morningstar peer categories.
Past performance does not predict future performance. The performance shown in the graphs and tables does not reflect the deduction of taxes that a shareholder would pay on Fund distributions or the redemption of Fund shares.
| Elfun Income Fund | 53 |
Elfun Income Fund
Schedule of Investments — December 31, 2016
Principal Amount ($) | Fair Value $ | |||||||
| Bonds and Notes - 99.2%† | ||||||||
U.S. Treasuries - 19.8% |
| |||||||
U.S. Treasury Bond | 5,364,000 | 5,166,042 | ||||||
U.S. Treasury Notes | ||||||||
0.75% due 09/30/18 (h) | 6,084,400 | 6,042,247 | ||||||
0.88% due 10/15/18 - 06/15/19 (h) | 10,334,400 | 10,241,033 | ||||||
1.00% due 10/15/19 (h) | 200,000 | 197,769 | ||||||
1.25% due 10/31/21 (h) | 18,347,500 | 17,773,645 | ||||||
1.38% due 08/31/23 - 09/30/23 (h) | 7,899,000 | 7,474,392 | ||||||
2.00% due 11/15/26 (h) | 2,250,000 | 2,161,328 | ||||||
2.13% due 11/30/23 (h) | 5,729,200 | 5,684,174 | ||||||
|
| |||||||
| 54,740,630 | ||||||||
|
| |||||||
Agency Mortgage Backed - 28.9% |
| |||||||
Federal Home Loan Mortgage Corp. | ||||||||
4.50% due 06/01/33 - 02/01/35 | 15,020 | 16,176 | ||||||
5.00% due 07/01/35 - 06/01/41 | 1,072,586 | 1,192,300 | ||||||
5.50% due 05/01/20 - 04/01/39 | 322,857 | 367,286 | ||||||
6.00% due 04/01/17 - 11/01/37 | 619,443 | 713,157 | ||||||
6.50% due 07/01/29 | 2,010 | 2,271 | ||||||
7.00% due 01/01/27 - 08/01/36 | 119,853 | 132,772 | ||||||
7.50% due 11/01/29 - 09/01/33 | 8,058 | 8,550 | ||||||
8.00% due 11/01/30 | 4,290 | 4,821 | ||||||
Federal National Mortgage Assoc. | ||||||||
3.00% due 02/01/43 - 10/01/46 (h) | 12,663,647 | 12,641,564 | ||||||
3.50% due 11/01/42 - 08/01/45 (h) | 1,358,445 | 1,399,034 | ||||||
4.00% due 05/01/19 - 03/01/41 | 915,142 | 964,832 | ||||||
4.00% due 01/01/41 - 03/01/44 (h) | 4,415,966 | 4,666,130 | ||||||
4.50% due 05/01/18 - 01/01/41 | 4,387,006 | 4,722,702 | ||||||
5.00% due 07/01/20 - 06/01/41 | 1,755,318 | 1,946,499 | ||||||
5.50% due 06/01/20 - 01/01/39 | 1,252,756 | 1,390,203 | ||||||
6.00% due 05/01/19 - 08/01/35 | 1,112,468 | 1,274,809 | ||||||
6.00% due 05/01/41 (h) | 1,308,391 | 1,495,524 | ||||||
6.50% due 07/01/17 - 08/01/36 | 148,439 | 166,719 | ||||||
Principal Amount ($) | Fair Value $ | |||||||
6.50% due 08/01/28 (h) | 1,745 | 1,974 | ||||||
7.00% due 04/01/17 - 02/01/34 | 15,617 | 16,558 | ||||||
7.50% due 12/01/26 - 12/01/33 | 65,143 | 71,997 | ||||||
8.00% due 06/01/24 - 01/01/33 | 9,584 | 10,083 | ||||||
8.00% due 09/01/25 - 10/01/31 (h) | 11,254 | 12,799 | ||||||
8.50% due 04/01/30 (h) | 3,722 | 4,630 | ||||||
9.00% due 12/01/17 - 12/01/22 | 4,588 | 4,952 | ||||||
Federal National Mortgage Assoc. 1.60% + 12 month USD LIBOR | 2,686 | 2,747 | ||||||
Federal National Mortgage Assoc. TBA | ||||||||
2.50% due 01/01/32 (c) | 3,135,786 | 3,139,235 | ||||||
3.00% due 01/01/32 (c) | 2,351,840 | 2,412,517 | ||||||
3.50% due 01/01/47 (c) | 16,340,620 | 16,737,697 | ||||||
Government National Mortgage Assoc. | ||||||||
3.50% due 05/20/43 | 2,235,125 | 2,332,505 | ||||||
4.00% due | 2,590,373 | 2,770,259 | ||||||
4.50% due | 1,268,897 | 1,368,763 | ||||||
5.00% due 08/15/33 | 65,335 | 71,819 | ||||||
6.00% due | 288,865 | 334,543 | ||||||
6.50% due | 110,805 | 126,133 | ||||||
7.00% due | 66,096 | 71,918 | ||||||
7.50% due | 29,099 | 30,228 | ||||||
8.00% due | 30,333 | 31,541 | ||||||
8.50% due 10/15/17 | 379 | 380 | ||||||
9.00% due | 1,596 | 1,763 | ||||||
3.00% TBA (c) | 5,822,385 | 5,891,089 | ||||||
3.50% TBA (c) | 8,733,578 | 9,072,441 | ||||||
4.00% TBA (c) | 375,000 | 398,025 | ||||||
5.00% TBA (c) | 1,167,000 | 1,274,364 | ||||||
5.50% TBA (c) | 435,000 | 484,590 | ||||||
|
| |||||||
| 79,780,899 | ||||||||
|
| |||||||
Agency Collateralized Mortgage Obligations - 1.5% |
| |||||||
Collateralized Mortgage Obligation Trust | 231 | 230 | ||||||
See Notes to Schedules of Investments and Notes to Financial Statements.
| 54 | Elfun Income Fund |
Elfun Income Fund
Schedule of Investments, continued — December 31, 2016
Principal Amount ($) | Fair Value $ | |||||||
Federal Home Loan Mortgage Corp. | 1,253,611 | 2,651 | ||||||
Federal Home Loan Mortgage Corp. REMIC | ||||||||
3.50% due | 700,073 | 57,347 | ||||||
5.50% due 06/15/33 (g) | 59,230 | 11,950 | ||||||
8.00% due 04/15/20 | 165 | 167 | ||||||
Federal Home Loan Mortgage Corp. REMIC 6.00% - 1 month USD LIBOR | 1,907,581 | 397,089 | ||||||
Federal Home Loan Mortgage Corp. REMIC 6.10% - 1 month USD LIBOR | 4,657,559 | 712,172 | ||||||
Federal Home Loan Mortgage Corp. REMIC 6.20% - 1 month USD LIBOR | 1,420,653 | 276,468 | ||||||
Federal Home Loan Mortgage Corp. REMIC 6.60% - 1 month USD LIBOR | 284,079 | 29,091 | ||||||
Federal Home Loan Mortgage Corp. STRIPS | ||||||||
1.47% due 08/01/27 (d)(f) | 1,164 | 940 | ||||||
8.00% due | 4,173 | 751 | ||||||
Federal Home Loan Mortgage Corp. STRIPS 5.95% - 1 month USD LIBOR | 3,225,986 | 650,426 | ||||||
Federal National Mortgage Assoc. REMIC | ||||||||
0.51% due 12/25/22 (d)(f) | 2,225 | 1,641 | ||||||
1.22% due 12/25/42 (g)(i) | 287,401 | 13,914 | ||||||
5.00% due | 323,729 | 36,763 | ||||||
8.00% due 05/25/22 (g) | 5 | 91 | ||||||
Federal National Mortgage Assoc. REMIC 6.00% - 1 month USD LIBOR | 5,275,790 | 1,062,121 | ||||||
Federal National Mortgage Assoc. REMIC 6.60% - 1 month USD LIBOR | 1,323,337 | 307,298 | ||||||
Principal Amount ($) | Fair Value $ | |||||||
Federal National Mortgage Assoc. STRIPS | ||||||||
1.87% due 12/25/34 (d)(f) | 64,653 | 56,193 | ||||||
4.50% due | 133,539 | 24,874 | ||||||
5.00% due | 72,845 | 14,005 | ||||||
5.50% due 12/25/33 (g) | 19,574 | 3,877 | ||||||
6.00% due 01/25/35 (g) | 71,174 | 14,415 | ||||||
7.50% due 11/25/23 (g) | 11,834 | 2,027 | ||||||
8.00% due | 8,147 | 1,641 | ||||||
8.50% due | 2,066 | 243 | ||||||
9.00% due 05/25/22 (g) | 1,690 | 210 | ||||||
Government National Mortgage Assoc. | ||||||||
4.50% due | 378,453 | 24,172 | ||||||
5.00% due | 188,897 | 7,310 | ||||||
Government National Mortgage Assoc. 6.25% - 1 month USD LIBOR | 1,492,828 | 252,252 | ||||||
Government National Mortgage Assoc. 6.80% - 1 month USD LIBOR | 374,553 | 64,356 | ||||||
|
| |||||||
| 4,026,685 | ||||||||
|
| |||||||
Asset Backed - 0.1% |
| |||||||
Chase Funding Trust 2004-1 | 240,201 | 247,129 | ||||||
|
| |||||||
Corporate Notes - 41.5% |
| |||||||
21st Century Fox America Inc. | ||||||||
3.38% due 11/15/26 (b) | 225,000 | 220,228 | ||||||
3.70% due 10/15/25 | 79,000 | 79,854 | ||||||
4.75% due 11/15/46 (b) | 54,000 | 54,055 | ||||||
4.95% due 10/15/45 | 42,000 | 43,081 | ||||||
6.65% due 11/15/37 | 248,000 | 304,716 | ||||||
ABB Finance USA Inc. | 392,000 | 392,624 | ||||||
Abbott Laboratories | ||||||||
2.90% due 11/30/21 | 450,000 | 448,932 | ||||||
3.75% due 11/30/26 | 315,000 | 312,653 | ||||||
4.90% due 11/30/46 | 135,000 | 138,286 | ||||||
AbbVie Inc. | ||||||||
2.00% due 11/06/18 | 423,000 | 423,886 | ||||||
3.20% due 05/14/26 | 315,000 | 299,263 | ||||||
4.45% due 05/14/46 | 105,000 | 100,341 | ||||||
4.70% due 05/14/45 | 85,000 | 83,236 | ||||||
See Notes to Schedules of Investments and Notes to Financial Statements.
| Elfun Income Fund | 55 |
Elfun Income Fund
Schedule of Investments, continued — December 31, 2016
Principal Amount ($) | Fair Value $ | |||||||
ACCO Brands Corp. | ||||||||
5.25% due 12/15/24 (b) | 167,000 | 168,149 | ||||||
6.75% due 04/30/20 | 426,000 | 447,300 | ||||||
Actavis Funding SCS | ||||||||
1.30% due 06/15/17 | 489,000 | 488,726 | ||||||
3.00% due 03/12/20 | 208,000 | 210,780 | ||||||
3.45% due 03/15/22 | 292,000 | 296,092 | ||||||
3.80% due 03/15/25 | 33,000 | 32,997 | ||||||
4.75% due 03/15/45 | 45,000 | 44,094 | ||||||
Aetna Inc. | ||||||||
2.40% due 06/15/21 | 227,000 | 225,769 | ||||||
3.20% due 06/15/26 | 227,000 | 224,233 | ||||||
3.50% due 11/15/24 | 260,000 | 263,463 | ||||||
Aflac Inc. | 150,000 | 142,642 | ||||||
Agrium Inc. | 189,000 | 187,944 | ||||||
Alibaba Group Holding Ltd. | 205,000 | 202,364 | ||||||
Altria Group Inc. | ||||||||
2.63% due 09/16/26 | 138,000 | 130,482 | ||||||
2.95% due 05/02/23 | 210,000 | 209,642 | ||||||
3.88% due 09/16/46 | 85,000 | 78,281 | ||||||
4.50% due 05/02/43 | 114,000 | 115,645 | ||||||
America Movil SAB de C.V. | ||||||||
3.13% due 07/16/22 | 205,000 | 201,648 | ||||||
5.00% due 03/30/20 | 317,000 | 338,769 | ||||||
American Axle & Manufacturing Inc. | ||||||||
6.25% due 03/15/21 | 279,000 | 288,067 | ||||||
6.63% due 10/15/22 | 84,000 | 86,621 | ||||||
American Campus Communities Operating Partnership LP | ||||||||
3.35% due 10/01/20 | 167,000 | 169,637 | ||||||
4.13% due 07/01/24 | 124,000 | 126,991 | ||||||
American Electric Power Company Inc. | 332,000 | 333,733 | ||||||
American Express Co. | 8,000 | 8,023 | ||||||
American International Group Inc. | ||||||||
3.75% due 07/10/25 | 232,000 | 233,197 | ||||||
4.50% due 07/16/44 | 83,000 | 81,686 | ||||||
4.80% due 07/10/45 | 133,000 | 137,777 | ||||||
American Tower Corp. (REIT) | ||||||||
3.38% due 10/15/26 | 225,000 | 212,687 | ||||||
3.40% due 02/15/19 | 513,000 | 524,070 | ||||||
AmeriGas Partners LP/AmeriGas Finance Corp. | ||||||||
5.63% due 05/20/24 | 83,000 | 84,868 | ||||||
5.88% due 08/20/26 | 125,000 | 126,875 | ||||||
Principal Amount ($) | Fair Value $ | |||||||
Amgen Inc. | ||||||||
2.20% due 05/22/19 | 433,000 | 436,235 | ||||||
4.40% due 05/01/45 | 45,000 | 43,100 | ||||||
4.56% due 06/15/48 (b) | 156,000 | 150,586 | ||||||
Amkor Technology Inc. | 429,000 | 440,797 | ||||||
Anadarko Petroleum Corp. | ||||||||
4.85% due 03/15/21 | 24,000 | 25,713 | ||||||
6.60% due 03/15/46 | 25,000 | 30,779 | ||||||
Anheuser-Busch InBev Finance Inc. | ||||||||
2.65% due 02/01/21 | 415,000 | 416,904 | ||||||
3.65% due 02/01/26 | 334,000 | 338,552 | ||||||
4.90% due 02/01/46 | 215,000 | 230,853 | ||||||
Anheuser-Busch InBev Worldwide Inc. | 515,000 | 506,311 | ||||||
Anthem Inc. | 211,000 | 210,425 | ||||||
Apache Corp. | 132,000 | 137,858 | ||||||
Apple Inc. | ||||||||
3.25% due 02/23/26 | 207,000 | 206,813 | ||||||
3.45% due 02/09/45 | 211,000 | 185,843 | ||||||
3.85% due 08/04/46 | 179,000 | 171,140 | ||||||
4.65% due 02/23/46 | 10,000 | 10,777 | ||||||
Aramark Services Inc. | ||||||||
5.13% due 01/15/24 (b) | 208,000 | 214,500 | ||||||
5.75% due 03/15/20 | 105,000 | 107,231 | ||||||
Archer-Daniels-Midland Co. | 356,000 | 335,761 | ||||||
Ascension Health | 103,000 | 112,062 | ||||||
AstraZeneca PLC | ||||||||
2.38% due 11/16/20 | 147,000 | 146,385 | ||||||
3.38% due 11/16/25 | 209,000 | 207,268 | ||||||
4.38% due 11/16/45 | 83,000 | 83,143 | ||||||
AT&T Inc. | ||||||||
2.45% due 06/30/20 | 418,000 | 414,793 | ||||||
3.00% due 06/30/22 | 224,000 | 219,645 | ||||||
3.40% due 05/15/25 | 214,000 | 205,988 | ||||||
4.45% due 04/01/24 | 319,000 | 332,173 | ||||||
4.50% due 05/15/35 | 208,000 | 200,657 | ||||||
4.75% due 05/15/46 | 45,000 | 42,553 | ||||||
4.80% due 06/15/44 | 163,000 | 153,738 | ||||||
Bank of America Corp. | ||||||||
1.70% due 08/25/17 | 1,050,000 | 1,051,370 | ||||||
2.50% due 10/21/22 | 223,000 | 215,423 | ||||||
2.60% due 01/15/19 | 147,000 | 148,205 | ||||||
2.63% due 04/19/21 | 204,000 | 202,426 | ||||||
3.25% due 10/21/27 | 624,000 | 594,757 | ||||||
3.95% due 04/21/25 | 251,000 | 249,548 | ||||||
4.10% due 07/24/23 | 218,000 | 227,484 | ||||||
See Notes to Schedules of Investments and Notes to Financial Statements.
| 56 | Elfun Income Fund |
Elfun Income Fund
Schedule of Investments, continued — December 31, 2016
Principal Amount ($) | Fair Value $ | |||||||
4.18% due 11/25/27 | 224,000 | 223,800 | ||||||
4.25% due 10/22/26 | 222,000 | 224,361 | ||||||
Barclays Bank PLC | 1,186,000 | 1,188,891 | ||||||
Barclays PLC | 205,000 | 219,491 | ||||||
Barrick Gold Corp. | 66,000 | 67,637 | ||||||
Barrick North America Finance LLC | 45,000 | 45,852 | ||||||
Baxalta Inc. | 221,000 | 220,816 | ||||||
Berkshire Hathaway Energy Co. | 127,000 | 158,368 | ||||||
Berkshire Hathaway Inc. | 3,000 | 3,184 | ||||||
Berry Plastics Corp. | 260,000 | 264,550 | ||||||
BHP Billiton Finance USA Ltd. | 72,000 | 80,268 | ||||||
Biogen Inc. | 83,000 | 83,996 | ||||||
BMW US Capital LLC | ||||||||
2.00% due 04/11/21 (b) | 315,000 | 308,871 | ||||||
2.80% due 04/11/26 (b) | 225,000 | 216,357 | ||||||
BP Capital Markets PLC | ||||||||
1.38% due 05/10/18 | 211,000 | 210,318 | ||||||
3.12% due 05/04/26 | 225,000 | 219,429 | ||||||
3.22% due 11/28/23 | 224,000 | 225,976 | ||||||
Brixmor Operating Partnership LP | 134,000 | 133,406 | ||||||
Buckeye Partners LP |
| |||||||
3.95% due 12/01/26 | 134,000 | 130,534 | ||||||
5.60% due 10/15/44 | 63,000 | 63,686 | ||||||
Burlington Northern Santa Fe LLC | 145,000 | 151,587 | ||||||
CalAtlantic Group Inc. | 250,000 | 243,750 | ||||||
Calpine Corp. |
| |||||||
5.75% due 01/15/25 | 251,000 | 242,215 | ||||||
5.88% due 01/15/24 (b) | 565,000 | 589,012 | ||||||
Capital One Financial Corp. | 416,000 | 416,829 | ||||||
Caterpillar Inc. | 133,000 | 137,637 | ||||||
Catholic Health Initiatives | ||||||||
2.60% due 08/01/18 | 125,000 | 126,201 | ||||||
4.35% due 11/01/42 | 130,000 | 115,266 | ||||||
CBL & Associates LP | 225,000 | 226,323 | ||||||
Principal Amount ($) | Fair Value $ | |||||||
CBS Corp. | 225,000 | 208,385 | ||||||
CCO Holdings LLC/CCO Holdings Capital Corp. | 248,000 | 264,740 | ||||||
Celgene Corp. | 110,000 | 111,430 | ||||||
5.00% due 08/15/45 | 253,000 | 262,554 | ||||||
CenturyLink Inc. | 378,000 | 386,365 | ||||||
Cequel Communications Holdings I LLC/Cequel Capital Corp. | 484,000 | 492,470 | ||||||
Charter Communications Operating LLC/Charter Communications Operating Capital | ||||||||
3.58% due 07/23/20 | 313,000 | 319,112 | ||||||
4.91% due 07/23/25 | 313,000 | 329,470 | ||||||
6.38% due 10/23/35 | 42,000 | 47,890 | ||||||
6.48% due 10/23/45 | 83,000 | 95,789 | ||||||
Chevron Corp. | 207,000 | 211,807 | ||||||
Chevron Phillips Chemical Company LLC/Chevron Phillips Chemical Company LP | 314,000 | 312,989 | ||||||
Chubb INA Holdings Inc. | ||||||||
2.30% due 11/03/20 | 226,000 | 225,772 | ||||||
3.35% due 05/03/26 | 180,000 | 182,065 | ||||||
4.35% due 11/03/45 | 87,000 | 91,710 | ||||||
Cigna Corp. | 417,000 | 405,603 | ||||||
Cinemark USA Inc. | 180,000 | 182,250 | ||||||
Cisco Systems Inc. | 222,000 | 210,818 | ||||||
Citigroup Inc. | ||||||||
1.55% due 08/14/17 | 428,000 | 428,286 | ||||||
1.75% due 05/01/18 | 419,000 | 418,048 | ||||||
1.85% due 11/24/17 | 200,000 | 200,366 | ||||||
2.05% due 12/07/18 | 378,000 | 377,879 | ||||||
4.65% due 07/30/45 | 66,000 | 69,429 | ||||||
4.75% due 05/18/46 | 225,000 | 224,820 | ||||||
CMS Energy Corp. | 209,000 | 223,632 | ||||||
CNA Financial Corp. | 326,000 | 359,877 | ||||||
CNH Industrial N.V. | 250,000 | 246,875 | ||||||
CNOOC Nexen Finance 2014 ULC | 423,000 | 432,770 | ||||||
See Notes to Schedules of Investments and Notes to Financial Statements.
| Elfun Income Fund | 57 |
Elfun Income Fund
Schedule of Investments, continued — December 31, 2016
Principal Amount ($) | Fair Value $ | |||||||
Columbia Pipeline Group Inc. | 134,000 | 136,428 | ||||||
Comcast Corp. | ||||||||
3.38% due 08/15/25 | 244,000 | 245,149 | ||||||
4.20% due 08/15/34 | 206,000 | 210,106 | ||||||
4.60% due 08/15/45 | 210,000 | 219,700 | ||||||
ConocoPhillips Co. | ||||||||
3.35% due 11/15/24 | 116,000 | 115,188 | ||||||
5.95% due 03/15/46 | 45,000 | 55,581 | ||||||
Consolidated Edison Company of New York Inc. | 225,000 | 220,764 | ||||||
Corporation Andina de Fomento | 604,000 | 640,759 | ||||||
Credit Suisse AG | 411,000 | 410,036 | ||||||
Credit Suisse Group Funding Guernsey Ltd. | 470,000 | 468,972 | ||||||
CSX Corp. | 124,000 | 121,252 | ||||||
CVS Health Corp. | ||||||||
3.88% due 07/20/25 | 195,000 | 200,902 | ||||||
5.13% due 07/20/45 | 312,000 | 347,039 | ||||||
Daimler Finance North America LLC | 628,000 | 632,619 | ||||||
Dana Financing Luxembourg Sarl | 250,000 | 261,250 | ||||||
Danaher Corp. | 62,000 | 64,463 | ||||||
Danone S.A. | ||||||||
2.08% due 11/02/21 (b) | 200,000 | 194,030 | ||||||
2.59% due 11/02/23 (b) | 200,000 | 192,483 | ||||||
2.95% due 11/02/26 (b) | 200,000 | 190,191 | ||||||
Delphi Automotive PLC | 113,000 | 103,619 | ||||||
Deutsche Bank AG | 227,000 | 225,945 | ||||||
Deutsche Telekom International Finance BV | ||||||||
1.95% due 09/19/21 (b) | 450,000 | 433,198 | ||||||
2.49% due 09/19/23 (b) | 450,000 | 429,343 | ||||||
Devon Energy Corp. | ||||||||
5.00% due 06/15/45 | 90,000 | 88,246 | ||||||
5.85% due 12/15/25 | 171,000 | 194,034 | ||||||
Dexia Credit Local S.A. | 843,000 | 845,411 | ||||||
Diageo Investment Corp. | 229,000 | 230,130 | ||||||
Diamond 1 Finance Corp./Diamond 2 Finance Corp. | ||||||||
3.48% due 06/01/19 (b) | 450,000 | 459,247 | ||||||
Principal Amount ($) | Fair Value $ | |||||||
4.42% due 06/15/21 (b) | 225,000 | 232,621 | ||||||
6.02% due 06/15/26 (b) | 113,000 | 122,254 | ||||||
8.35% due 07/15/46 (b) | 90,000 | 110,646 | ||||||
Discover Bank | 291,000 | 294,289 | ||||||
Dollar General Corp. | ||||||||
1.88% due 04/15/18 | 410,000 | 410,469 | ||||||
3.25% due 04/15/23 | 179,000 | 176,451 | ||||||
4.15% due 11/01/25 | 119,000 | 122,280 | ||||||
Dominion Resources Inc. | 198,000 | 198,998 | ||||||
DTE Energy Co. | 135,000 | 125,224 | ||||||
Duke Energy Corp. | 135,000 | 121,270 | ||||||
Duke Energy Progress LLC | 125,000 | 123,937 | ||||||
Eastman Chemical Co. | 94,000 | 96,287 | ||||||
Ecopetrol S.A. | 104,000 | 89,856 | ||||||
Electricite de France S.A. | 224,000 | 224,421 | ||||||
Eli Lilly & Co. | 41,000 | 38,811 | ||||||
Emera US Finance LP | ||||||||
3.55% due 06/15/26 (b) | 162,000 | 159,020 | ||||||
4.75% due 06/15/46 (b) | 45,000 | 45,292 | ||||||
Enbridge Inc. | 134,000 | 137,004 | ||||||
Encana Corp. | 223,000 | 224,601 | ||||||
Energy Transfer Equity LP | 677,000 | 699,002 | ||||||
Energy Transfer Partners LP | 228,000 | 245,937 | ||||||
Entergy Louisiana LLC | 134,000 | 126,608 | ||||||
Enterprise Products Operating LLC | ||||||||
3.70% due 02/15/26 | 220,000 | 220,495 | ||||||
3.95% due 02/15/27 | 483,000 | 494,047 | ||||||
EOG Resources Inc. | 280,000 | 292,625 | ||||||
ERP Operating LP | 83,000 | 84,178 | ||||||
Exelon Corp. | 196,000 | 191,486 | ||||||
Express Scripts Holding Co. | ||||||||
3.40% due 03/01/27 | 226,000 | 211,416 | ||||||
4.80% due 07/15/46 | 68,000 | 64,981 | ||||||
Exxon Mobil Corp. | ||||||||
2.22% due 03/01/21 | 126,000 | 125,969 | ||||||
See Notes to Schedules of Investments and Notes to Financial Statements.
| 58 | Elfun Income Fund |
Elfun Income Fund
Schedule of Investments, continued — December 31, 2016
Principal Amount ($) | Fair Value $ | |||||||
3.04% due 03/01/26 | 98,000 | 97,725 | ||||||
FedEx Corp. | 2,000 | 1,869 | ||||||
Five Corners Funding Trust | 457,000 | 482,599 | ||||||
Florida Power & Light Co. | 133,000 | 136,157 | ||||||
Ford Motor Co. | 448,000 | 452,055 | ||||||
Ford Motor Credit Company LLC | 440,000 | 434,644 | ||||||
Frontier Communications Corp. | ||||||||
7.13% due 03/15/19 | 443,000 | 469,026 | ||||||
11.00% due 09/15/25 | 310,000 | 320,075 | ||||||
General Dynamics Corp. | 222,000 | 204,760 | ||||||
General Motors Co. | 42,000 | 40,412 | ||||||
General Motors Financial Company Inc. | ||||||||
3.15% due 01/15/20 | 292,000 | 293,655 | ||||||
3.20% due 07/13/20 | 834,000 | 835,930 | ||||||
5.25% due 03/01/26 | 225,000 | 236,631 | ||||||
Gilead Sciences Inc. | ||||||||
1.95% due 03/01/22 | 134,000 | 129,516 | ||||||
3.65% due 03/01/26 | 235,000 | 237,946 | ||||||
3.70% due 04/01/24 | 223,000 | 228,637 | ||||||
4.15% due 03/01/47 | 85,000 | 80,566 | ||||||
4.80% due 04/01/44 | 94,000 | 97,422 | ||||||
Grupo Televisa SAB | 204,000 | 172,814 | ||||||
Halliburton Co. | ||||||||
3.80% due 11/15/25 | 210,000 | 213,054 | ||||||
5.00% due 11/15/45 | 125,000 | 135,302 | ||||||
HCA Inc. | ||||||||
4.75% due 05/01/23 | 521,000 | 533,374 | ||||||
6.50% due 02/15/20 | 222,000 | 242,868 | ||||||
Hess Corp. | ||||||||
4.30% due 04/01/27 | 114,000 | 113,308 | ||||||
5.60% due 02/15/41 | 90,000 | 91,438 | ||||||
5.80% due 04/01/47 | 68,000 | 70,446 | ||||||
Honeywell International Inc. | ||||||||
1.40% due 10/30/19 | 173,000 | 171,316 | ||||||
2.50% due 11/01/26 | 530,000 | 501,934 | ||||||
HSBC Holdings PLC | ||||||||
2.65% due 01/05/22 | 422,000 | 412,519 | ||||||
4.25% due 03/14/24 | 222,000 | 225,326 | ||||||
4.38% due 11/23/26 | 200,000 | 201,192 | ||||||
HSBC USA Inc. | 248,000 | 245,901 | ||||||
Hyundai Capital America | 189,000 | 189,349 | ||||||
Principal Amount ($) | Fair Value $ | |||||||
Illinois Tool Works Inc. | 216,000 | 224,068 | ||||||
ING Bank N.V. | 200,000 | 200,562 | ||||||
Ingersoll-Rand Luxembourg Finance S.A. | 291,000 | 294,919 | ||||||
Ingles Markets Inc. | 551,000 | 566,152 | ||||||
Intel Corp. | ||||||||
2.45% due 07/29/20 | 208,000 | 210,779 | ||||||
2.60% due 05/19/26 | 131,000 | 126,511 | ||||||
International Business Machines Corp. | 200,000 | 208,032 | ||||||
International Paper Co. | 238,000 | 224,458 | ||||||
Interstate Power & Light Co. | 415,000 | 418,533 | ||||||
JB Poindexter & Company Inc. | 120,000 | 126,000 | ||||||
JBS USA LUX S.A./JBS USA Finance Inc. | 261,000 | 264,262 | ||||||
Jefferies Group LLC | ||||||||
5.13% due 01/20/23 | 168,000 | 175,653 | ||||||
6.50% due 01/20/43 | 140,000 | 143,832 | ||||||
JPMorgan Chase & Co. | ||||||||
2.30% due 08/15/21 | 447,000 | 438,312 | ||||||
2.55% due 10/29/20 | 207,000 | 206,687 | ||||||
3.30% due 04/01/26 | 224,000 | 219,775 | ||||||
3.63% due 12/01/27 | 135,000 | 130,762 | ||||||
JPMorgan Chase & Co. 3.32% + 3 month USD LIBOR | ||||||||
5.00% due 12/29/49 (i) | 158,000 | 157,605 | ||||||
JPMorgan Chase & Co. 3.33% + 3 month USD LIBOR | ||||||||
6.10% due 10/29/49 (i) | 500,000 | 505,937 | ||||||
KB Home | 422,000 | 445,210 | ||||||
Kellogg Co. | 33,000 | 32,184 | ||||||
Kinder Morgan Energy Partners LP | ||||||||
3.50% due 09/01/23 | 137,000 | 134,978 | ||||||
6.38% due 03/01/41 | 89,000 | 96,392 | ||||||
Kinder Morgan Inc. | ||||||||
3.05% due 12/01/19 | 83,000 | 84,151 | ||||||
5.05% due 02/15/46 | 89,000 | 87,937 | ||||||
5.55% due 06/01/45 | 125,000 | 131,236 | ||||||
Kraft Heinz Foods Co. | ||||||||
2.80% due 07/02/20 | 237,000 | 239,087 | ||||||
3.00% due 06/01/26 | 171,000 | 160,305 | ||||||
See Notes to Schedules of Investments and Notes to Financial Statements.
| Elfun Income Fund | 59 |
Elfun Income Fund
Schedule of Investments, continued — December 31, 2016
Principal Amount ($) | Fair Value $ | |||||||
4.38% due 06/01/46 | 239,000 | 224,447 | ||||||
Kreditanstalt fuer Wiederaufbau | 238,000 | 249,311 | ||||||
L Brands Inc. | 443,000 | 472,902 | ||||||
Lee Enterprises Inc. | 347,000 | 367,820 | ||||||
Lennar Corp. | ||||||||
4.50% due 11/15/19 | 349,000 | 362,524 | ||||||
4.75% due 05/30/25 | 174,000 | 169,650 | ||||||
Levi Strauss & Co. | 259,000 | 259,000 | ||||||
Lincoln National Corp. | 204,000 | 203,218 | ||||||
Lockheed Martin Corp. | ||||||||
3.55% due 01/15/26 | 222,000 | 226,509 | ||||||
4.70% due 05/15/46 | 94,000 | 102,040 | ||||||
Lowe’s Companies Inc. | 314,000 | 292,472 | ||||||
LYB International Finance BV | 67,000 | 69,255 | ||||||
Macy’s Retail Holdings Inc. | 134,000 | 110,239 | ||||||
Marathon Oil Corp. | ||||||||
3.85% due 06/01/25 | 112,000 | 108,469 | ||||||
5.90% due 03/15/18 | 112,000 | 116,931 | ||||||
6.00% due 10/01/17 | 455,000 | 468,569 | ||||||
Marathon Petroleum Corp. | 192,000 | 189,389 | ||||||
Marsh & McLennan Companies Inc. | 205,000 | 206,137 | ||||||
McDonald’s Corp. | ||||||||
3.70% due 01/30/26 | 265,000 | 269,427 | ||||||
4.88% due 12/09/45 | 87,000 | 93,001 | ||||||
Medtronic Inc. | ||||||||
2.50% due 03/15/20 | 125,000 | 126,330 | ||||||
3.50% due 03/15/25 | 400,000 | 411,352 | ||||||
4.63% due 03/15/45 | 135,000 | 145,699 | ||||||
Memorial Sloan-Kettering Cancer Center | 165,000 | 158,969 | ||||||
Merck & Company Inc. | 215,000 | 210,823 | ||||||
MetLife Inc. | 128,000 | 135,942 | ||||||
MGM Resorts International | ||||||||
4.63% due 09/01/26 | 167,000 | 160,738 | ||||||
5.25% due 03/31/20 | 258,000 | 272,835 | ||||||
6.63% due 12/15/21 | 431,000 | 481,642 | ||||||
Microsoft Corp. | ||||||||
1.55% due 08/08/21 | 445,000 | 431,205 | ||||||
2.40% due 08/08/26 | 536,000 | 505,870 | ||||||
Principal Amount ($) | Fair Value $ | |||||||
3.45% due 08/08/36 | 135,000 | 128,077 | ||||||
3.70% due 08/08/46 | 135,000 | 126,822 | ||||||
4.00% due 02/12/55 | 217,000 | 204,753 | ||||||
Mizuho Bank Ltd. | 508,000 | 509,953 | ||||||
Mizuho Financial Group Inc. | 205,000 | 202,681 | ||||||
Molson Coors Brewing Co. | ||||||||
2.10% due 07/15/21 | 313,000 | 304,555 | ||||||
3.00% due 07/15/26 | 167,000 | 157,632 | ||||||
4.20% due 07/15/46 | 94,000 | 87,461 | ||||||
Monsanto Co. | 53,000 | 47,632 | ||||||
Morgan Stanley | ||||||||
2.45% due 02/01/19 | 205,000 | 206,334 | ||||||
2.63% due 11/17/21 | 450,000 | 444,152 | ||||||
2.65% due 01/27/20 | 210,000 | 210,857 | ||||||
3.70% due 10/23/24 | 106,000 | 107,131 | ||||||
3.95% due 04/23/27 | 417,000 | 412,161 | ||||||
4.10% due 05/22/23 | 365,000 | 374,298 | ||||||
Morgan Stanley 1.4% + 3 month USD LIBOR | ||||||||
2.28% due 10/24/23 (i) | 446,000 | 450,956 | ||||||
Mylan N.V. | ||||||||
3.15% due 06/15/21 (b) | 106,000 | 103,936 | ||||||
3.95% due 06/15/26 (b) | 110,000 | 102,798 | ||||||
National Retail Properties Inc. | 208,000 | 211,764 | ||||||
NCL Corporation Ltd. |
| |||||||
4.63% due 11/15/20 (b) | 217,000 | 220,798 | ||||||
4.75% due 12/15/21 (b) | 112,000 | 111,931 | ||||||
Newell Brands Inc. |
| |||||||
3.85% due 04/01/23 | 226,000 | 234,188 | ||||||
4.20% due 04/01/26 | 225,000 | 234,530 | ||||||
5.50% due 04/01/46 | 135,000 | 154,689 | ||||||
Newmont Mining Corp. | 158,000 | 147,985 | ||||||
Nexen Energy ULC | 94,000 | 111,408 | ||||||
Noble Energy Inc. | 249,000 | 250,598 | ||||||
Northern States Power Co. | 417,000 | 417,339 | ||||||
Northrop Grumman Corp. | 49,000 | 46,386 | ||||||
Novartis Capital Corp. |
| |||||||
3.00% due 11/20/25 | 34,000 | 33,714 | ||||||
4.00% due 11/20/45 | 142,000 | 143,004 | ||||||
NRG Energy Inc. | 257,000 | 257,642 | ||||||
Occidental Petroleum Corp. |
| |||||||
3.50% due 06/15/25 | 226,000 | 228,896 | ||||||
4.10% due 02/15/47 | 112,000 | 108,862 | ||||||
See Notes to Schedules of Investments and Notes to Financial Statements.
| 60 | Elfun Income Fund |
Elfun Income Fund
Schedule of Investments, continued — December 31, 2016
Principal Amount ($) | Fair Value $ | |||||||
Omnicom Group Inc. |
| 170,000 |
|
| 174,412 |
| ||
Oracle Corp. |
| |||||||
1.90% due 09/15/21 | 222,000 | 216,730 | ||||||
2.40% due 09/15/23 | 151,000 | 146,117 | ||||||
2.65% due 07/15/26 | 315,000 | 298,548 | ||||||
2.95% due 05/15/25 | 80,000 | 78,317 | ||||||
4.00% due 07/15/46 | 135,000 | 128,856 | ||||||
4.13% due 05/15/45 | 85,000 | 82,211 | ||||||
Owens & Minor Inc. | 415,000 | 415,559 | ||||||
Owens-Brockway Glass Container Inc. | 200,000 | 211,000 | ||||||
Pacific Gas & Electric Co. | 617,000 | 629,723 | ||||||
PacifiCorp | 8,000 | 10,346 | ||||||
Penn National Gaming Inc. | 261,000 | 272,092 | ||||||
PepsiCo Inc. | ||||||||
3.10% due 07/17/22 | 105,000 | 107,755 | ||||||
3.45% due 10/06/46 | 112,000 | 101,804 | ||||||
4.25% due 10/22/44 | 123,000 | 126,770 | ||||||
Perrigo Company PLC | 444,000 | 443,323 | ||||||
Perrigo Finance Unlimited Co. | ||||||||
3.50% due 03/15/21 | 225,000 | 227,161 | ||||||
3.90% due 12/15/24 | 223,000 | 218,030 | ||||||
Petroleos Mexicanos | ||||||||
3.50% due 01/30/23 | 197,000 | 180,846 | ||||||
4.50% due 01/23/26 | 224,000 | 204,064 | ||||||
5.38% due 03/13/22 (b) | 225,000 | 230,396 | ||||||
5.63% due 01/23/46 | 83,000 | 68,890 | ||||||
6.38% due 02/04/21 (b) | 165,000 | 175,725 | ||||||
6.38% due 01/23/45 | 112,000 | 101,920 | ||||||
6.50% due 03/13/27 (b) | 225,000 | 232,088 | ||||||
6.75% due 09/21/47 (b) | 180,000 | 170,064 | ||||||
PetSmart Inc. | 331,000 | 337,620 | ||||||
Pfizer Inc. |
| |||||||
3.00% due 12/15/26 | 184,000 | 181,454 | ||||||
4.13% due 12/15/46 | 113,000 | 114,705 | ||||||
4.40% due 05/15/44 | 131,000 | 138,092 | ||||||
Philip Morris International Inc. | 209,000 | 201,852 | ||||||
Plains All American Pipeline LP/PAA Finance Corp. | 90,000 | 80,048 | ||||||
PNC Bank NA | 440,000 | 443,845 | ||||||
Potash Corporation of Saskatchewan Inc. | 314,000 | 315,527 | ||||||
Principal Amount ($) | Fair Value $ | |||||||
PPL Capital Funding Inc. |
| 450,000 |
|
| 429,875 |
| ||
Precision Castparts Corp. |
| 125,000 |
|
| 131,203 |
| ||
Prologis LP | ||||||||
3.75% due 11/01/25 | 208,000 | 212,848 | ||||||
Prudential Financial Inc. | 209,000 | 213,703 | ||||||
Public Service Electric & Gas Co. | 436,000 | 425,681 | ||||||
PulteGroup Inc. |
| |||||||
4.25% due 03/01/21 | 80,000 | 81,800 | ||||||
5.50% due 03/01/26 | 250,000 | 248,125 | ||||||
QUALCOMM Inc. | 67,000 | 71,459 | ||||||
Realty Income Corp. | 310,000 | 291,409 | ||||||
Regency Energy Partners LP/Regency Energy Finance Corp. |
| 180,000 |
|
| 182,462 |
| ||
Reynolds American Inc. |
| |||||||
4.45% due 06/12/25 | 350,000 | 369,071 | ||||||
5.85% due 08/15/45 | 56,000 | 66,189 | ||||||
Rio Tinto Finance USA PLC | 103,000 | 100,970 | ||||||
Rogers Communications Inc. | 75,000 | 80,078 | ||||||
Royal Bank of Canada | 663,000 | 662,110 | ||||||
Royal Bank of Scotland Group PLC |
| 222,000 |
|
| 212,939 |
| ||
Ryder System Inc. |
| 507,000 |
|
| 509,583 |
| ||
Santander Bank NA |
| 258,000 |
|
| 257,864 |
| ||
Santander UK Group Holdings PLC |
| |||||||
3.13% due 01/08/21 | 265,000 | 264,381 | ||||||
4.75% due 09/15/25 (b) | 200,000 | 195,800 | ||||||
Schlumberger Holdings Corp. | ||||||||
3.00% due 12/21/20 (b) | 170,000 | 173,461 | ||||||
4.00% due 12/21/25 (b) | 164,000 | 171,640 | ||||||
Shell International Finance BV |
| |||||||
2.88% due 05/10/26 | 224,000 | 216,241 | ||||||
3.40% due 08/12/23 | 452,000 | 463,336 | ||||||
Shire Acquisitions Investments Ireland DAC | ||||||||
2.40% due 09/23/21 | 245,000 | 236,443 | ||||||
2.88% due 09/23/23 | 245,000 | 232,590 | ||||||
3.20% due 09/23/26 | 221,000 | 206,233 | ||||||
Sinclair Television Group Inc. | 452,000 | 465,560 | ||||||
See Notes to Schedules of Investments and Notes to Financial Statements.
| Elfun Income Fund | 61 |
Elfun Income Fund
Schedule of Investments, continued — December 31, 2016
Principal Amount ($) | Fair Value $ | |||||||
Southern California Edison Co. | 165,000 | 164,360 | ||||||
Southern Copper Corp. |
| 89,000 |
|
| 87,226 |
| ||
Spectra Energy Partners LP |
| |||||||
3.38% due 10/15/26 | 223,000 | 212,974 | ||||||
4.50% due 03/15/45 | 89,000 | 84,463 | ||||||
Sprint Corp. |
| 472,000 |
|
| 496,190 |
| ||
Standard Industries Inc. | 516,000 | 530,190 | ||||||
Statoil ASA | 104,000 | 99,002 | ||||||
Sumitomo Mitsui Banking Corp. |
| |||||||
1.35% due 07/11/17 | 255,000 | 254,746 | ||||||
1.95% due 07/23/18 | 319,000 | 318,720 | ||||||
Sumitomo Mitsui Financial Group Inc. | 360,000 | 334,027 | ||||||
Sunoco LP/Sunoco Finance Corp. | 173,000 | 176,460 | ||||||
SUPERVALU Inc. | 433,000 | 437,330 | ||||||
T-Mobile USA Inc. | 431,000 | 456,860 | ||||||
Tampa Electric Co. | 204,000 | 203,672 | ||||||
Target Corp. | 225,000 | 214,339 | ||||||
Teachers Insurance & Annuity | 290,000 | 313,103 | ||||||
Telecom Italia S.p.A. | 646,000 | 629,850 | ||||||
Tenet Healthcare Corp. |
| |||||||
4.75% due 06/01/20 | 158,000 | 158,790 | ||||||
6.00% due 10/01/20 | 416,000 | 433,680 | ||||||
Tesoro Corp. | 126,000 | 127,436 | ||||||
Teva Pharmaceutical Finance Netherlands III BV | ||||||||
3.15% due 10/01/26 | 134,000 | 123,353 | ||||||
4.10% due 10/01/46 | 102,000 | 87,226 | ||||||
The Allstate Corp. |
| |||||||
3.28% due 12/15/26 | 314,000 | 314,568 | ||||||
4.20% due 12/15/46 | 90,000 | 91,655 | ||||||
The Allstate Corp. 2.94% + 3 month USD LIBOR | 235,000 | 242,966 | ||||||
The Bank of New York Mellon Corp. |
| 312,000 |
|
| 296,129 |
| ||
Principal Amount ($) | Fair Value $ | |||||||
The Bank of New York Mellon Corp. 3.13% + 3 month USD LIBOR | 445,000 | 408,207 | ||||||
The Bank of Tokyo-Mitsubishi UFJ Ltd. | 600,000 | 600,009 | ||||||
The Coca-Cola Co. | 221,000 | 217,780 | ||||||
The Dow Chemical Co. | 213,000 | 209,603 | ||||||
The Goldman Sachs Group Inc. |
| |||||||
2.35% due 11/15/21 | 445,000 | 431,923 | ||||||
2.38% due 01/22/18 | 501,000 | 503,921 | ||||||
2.63% due | 487,000 | 486,878 | ||||||
2.90% due 07/19/18 | 179,000 | 181,442 | ||||||
4.25% due 10/21/25 | 69,000 | 70,000 | ||||||
4.80% due 07/08/44 | 204,000 | 213,757 | ||||||
5.15% due 05/22/45 | 209,000 | 219,384 | ||||||
The Home Depot Inc. |
| |||||||
3.35% due 09/15/25 | 292,000 | 299,161 | ||||||
3.50% due 09/15/56 | 158,000 | 137,961 | ||||||
The Korea Development Bank | 205,000 | 205,359 | ||||||
The Kroger Co. | 291,000 | 292,532 | ||||||
The ServiceMaster Company LLC | 42,000 | 42,630 | ||||||
The Southern Co. | ||||||||
3.25% due 07/01/26 | 315,000 | 306,116 | ||||||
4.40% due 07/01/46 | 135,000 | 133,260 | ||||||
The Southern Co. 3.63% + 3 month USD LIBOR | 224,000 | 226,254 | ||||||
The Toronto-Dominion Bank 2.21% + 5 year USD LIBOR | 134,000 | 131,659 | ||||||
The Travelers Companies Inc. | 90,000 | 84,742 | ||||||
The Walt Disney Co. |
| |||||||
1.85% due 07/30/26 | 149,000 | 134,062 | ||||||
4.13% due 06/01/44 | 65,000 | 67,062 | ||||||
Time Inc. | 433,000 | 448,155 | ||||||
Time Warner Cable LLC |
| |||||||
4.50% due 09/15/42 | 42,000 | 37,969 | ||||||
6.55% due 05/01/37 | 123,000 | 139,040 | ||||||
Time Warner Inc. |
| |||||||
3.80% due 02/15/27 | 291,000 | 288,444 | ||||||
5.35% due 12/15/43 | 259,000 | 273,429 | ||||||
TransCanada PipeLines Ltd. | 12,000 | 13,333 | ||||||
See Notes to Schedules of Investments and Notes to Financial Statements.
| 62 | Elfun Income Fund |
Elfun Income Fund
Schedule of Investments, continued — December 31, 2016
Principal Amount ($) | Fair Value $ | |||||||
Tyco Electronics Group S.A. | 413,000 | 414,051 | ||||||
Tyson Foods Inc. |
| 83,000 |
|
| 83,755 |
| ||
U.S. Bancorp 3.49% + 3 month USD LIBOR |
| 417,000 |
|
| 425,340 |
| ||
UBS Group Funding Jersey Ltd. |
| 200,000 |
|
| 199,938 |
| ||
United Technologies Corp. |
| |||||||
1.95% due 11/01/21 | 223,000 | 218,385 | ||||||
2.65% due 11/01/26 | 173,000 | 165,863 | ||||||
3.75% due 11/01/46 | 78,000 | 74,070 | ||||||
UnitedHealth Group Inc. |
| |||||||
2.70% due 07/15/20 | 275,000 | 278,937 | ||||||
4.75% due 07/15/45 | 182,000 | 200,092 | ||||||
Universal Health Services Inc. | 167,000 | 162,825 | ||||||
Vale Overseas Ltd. |
| |||||||
4.38% due 01/11/22 | 114,000 | 112,005 | ||||||
5.88% due 06/10/21 | 227,000 | 237,783 | ||||||
6.25% due 08/10/26 | 113,000 | 117,520 | ||||||
6.88% due 11/10/39 | 65,000 | 63,213 | ||||||
Ventas Realty LP |
| 225,000 |
|
| 213,155 |
| ||
Verizon Communications Inc. |
| |||||||
1.75% due 08/15/21 | 446,000 | 427,446 | ||||||
2.63% due 08/15/26 | 333,000 | 306,077 | ||||||
4.40% due 11/01/34 | 208,000 | 204,982 | ||||||
4.67% due 03/15/55 | 146,000 | 137,252 | ||||||
4.86% due 08/21/46 | 208,000 | 210,355 | ||||||
5.05% due 03/15/34 | 353,000 | 371,193 | ||||||
5.15% due 09/15/23 | 229,000 | 252,951 | ||||||
Viacom Inc. |
| |||||||
2.25% due 02/04/22 | 225,000 | 211,228 | ||||||
3.45% due 10/04/26 | 135,000 | 124,582 | ||||||
Virgin Media Finance PLC | 435,000 | 436,087 | ||||||
Virginia Electric & Power Co. | 225,000 | 223,838 | ||||||
Visa Inc. |
| |||||||
3.15% due 12/14/25 | 265,000 | 265,795 | ||||||
4.30% due 12/14/45 | 124,000 | 130,613 | ||||||
Volkswagen Group of America Finance LLC 0.44% + 3 month USD LIBOR | 206,000 | 205,469 | ||||||
W.R. Grace & Co. |
| |||||||
5.13% due 10/01/21 (b) | 160,000 | 166,800 | ||||||
5.63% due 10/01/24 (b) | 428,000 | 449,400 | ||||||
Wabtec Corp. | 224,000 | 214,999 | ||||||
Principal Amount ($) | Fair Value $ | |||||||
Wal-Mart Stores Inc. | 179,000 | 188,516 | ||||||
Walgreens Boots Alliance Inc. | 68,000 | 68,868 | ||||||
WEC Energy Group Inc. | 179,000 | 182,189 | ||||||
Wells Fargo & Co. |
| |||||||
3.00% due 10/23/26 | 445,000 | 423,095 | ||||||
3.90% due 05/01/45 | 112,000 | 106,013 | ||||||
4.30% due 07/22/27 | 167,000 | 171,507 | ||||||
4.40% due 06/14/46 | 135,000 | 128,944 | ||||||
4.75% due 12/07/46 | 224,000 | 226,094 | ||||||
Wells Fargo & Co. 3.11% + 3 month USD LIBOR | 273,000 | 274,365 | ||||||
Wells Fargo & Co. 3.99% + 3 month USD LIBOR | 290,000 | 304,471 | ||||||
Western Digital Corp. | 40,000 | 44,000 | ||||||
Westlake Chemical Corp. |
| |||||||
3.60% due 08/15/26 (b) | 215,000 | 206,491 | ||||||
5.00% due 08/15/46 (b) | 64,000 | 63,096 | ||||||
Williams Partners LP | ||||||||
3.90% due 01/15/25 | 358,000 | 350,674 | ||||||
4.90% due 01/15/45 | 68,000 | 62,732 | ||||||
5.40% due 03/04/44 | 42,000 | 40,633 | ||||||
Windstream Services LLC | ||||||||
6.38% due 08/01/23 | 400,000 | 357,000 | ||||||
WPP Finance 2010 | 415,000 | 417,161 | ||||||
XLIT Ltd. | 175,000 | 180,517 | ||||||
XPO Logistics Inc. | 250,000 | 262,500 | ||||||
Zimmer Biomet Holdings Inc. | 208,000 | 202,328 | ||||||
|
| |||||||
| 114,692,822 | ||||||||
|
| |||||||
Non-Agency Collateralized Mortgage Obligations - 6.0% |
| |||||||
American Tower Trust #1 (REIT) | 627,000 | 626,431 | ||||||
Banc of America Commercial Mortgage Trust 2007-1 | 542,000 | 541,249 | ||||||
Banc of America Commercial Mortgage Trust 2007-4 | 24,038 | 24,370 | ||||||
Banc of America Commercial Mortgage Trust 2008-1 | 120,932 | 124,052 | ||||||
See Notes to Schedules of Investments and Notes to Financial Statements.
| Elfun Income Fund | 63 |
Elfun Income Fund
Schedule of Investments, continued — December 31, 2016
Principal Amount ($) | Fair Value $ | |||||||
Banc of America Merrill Lynch Commercial Mortgage Inc. 2005-1 | 69,604 | 69,537 | ||||||
Bear Stearns Commercial Mortgage Securities Trust 2007-PW18 | 430,000 | 443,798 | ||||||
CFCRE Commercial Mortgage Trust 2016-C7 | 387,769 | 399,943 | ||||||
Citigroup Commercial Mortgage Trust 2014-GC23 | 430,000 | 358,563 | ||||||
Citigroup Commercial Mortgage Trust 2015-GC33 | 200,411 | 139,858 | ||||||
Citigroup Commercial Mortgage Trust 2016-P5 | 399,397 | 386,651 | ||||||
Citigroup Commercial Mortgage Trust 2016-P6 | ||||||||
3.72% due 12/10/49 (i) | 778,118 | 802,731 | ||||||
4.03% due 12/10/49 (i) | 336,823 | 344,970 | ||||||
COMM 2013-CR12 Mortgage Trust | 100,000 | 86,863 | ||||||
COMM 2013-LC13 Mortgage Trust | 170,000 | 182,530 | ||||||
COMM 2014-CR14 Mortgage Trust | 240,000 | 257,224 | ||||||
COMM 2014-CR19 Mortgage Trust | 195,777 | 155,121 | ||||||
COMM 2015-CR23 Mortgage Trust | 197,046 | 179,332 | ||||||
COMM 2015-CR24 Mortgage Trust | 401,080 | 295,093 | ||||||
COMM 2015-PC1 Mortgage Trust | 196,196 | 193,112 | ||||||
CSAIL 2015-C2 Commercial Mortgage Trust | 135,000 | 96,075 | ||||||
CSAIL 2015-C3 Commercial Mortgage Trust | 240,335 | 177,948 | ||||||
GS Mortgage Securities Trust 2011-GC5 | 7,450 | 7,446 | ||||||
Principal Amount ($) | Fair Value $ | |||||||
GS Mortgage Securities Trust 2015-GC28 | 2,713,026 | 164,417 | ||||||
GS Mortgage Securities Trust 2015-GC32 | 220,408 | 163,816 | ||||||
GS Mortgage Securities Trust 2015-GC34 | 460,912 | 328,936 | ||||||
GS Mortgage Securities Trust 2015-GS1 | 362,028 | 277,033 | ||||||
GS Mortgage Securities Trust 2016-GS3 | 408,000 | 393,727 | ||||||
GS Mortgage Securities Trust II 2012-GCJ9 | 934,968 | 74,696 | ||||||
Impac CMB Trust 2004-5 0.72% + 1 month USD LIBOR | 111,159 | 106,082 | ||||||
JP Morgan Chase Commercial Mortgage Securities Corp. 2012-LC9 | 1,177,386 | 73,478 | ||||||
JP Morgan Chase Commercial Mortgage Securities Trust 2007-CB18 | 81,855 | 81,798 | ||||||
JPMBB Commercial Mortgage Securities Trust 2013-C12 | 125,000 | 131,470 | ||||||
JPMBB Commercial Mortgage Securities Trust 2013-C17 | 112,726 | 101,268 | ||||||
JPMBB Commercial Mortgage Securities Trust 2014-C18 | 125,901 | 105,527 | ||||||
JPMBB Commercial Mortgage Securities Trust 2014-C19 | 100,000 | 83,523 | ||||||
JPMBB Commercial Mortgage Securities Trust 2015-C29 | 394,870 | 280,315 | ||||||
JPMBB Commercial Mortgage Securities Trust 2015-C30 | 400,742 | 350,744 | ||||||
LB-UBS Commercial Mortgage Trust 2004-C8 | 140,347 | 391 | ||||||
LB-UBS Commercial Mortgage Trust 2007-C6 | ||||||||
6.11% due 07/15/40 (i) | 243,078 | 249,466 | ||||||
See Notes to Schedules of Investments and Notes to Financial Statements.
| 64 | Elfun Income Fund |
Elfun Income Fund
Schedule of Investments, continued — December 31, 2016
Principal Amount ($) | Fair Value $ | |||||||
6.11% due 07/15/40 (b) | 520,000 | 526,900 | ||||||
MASTR Alternative Loan Trust 2003-5 | 13,399 | 224 | ||||||
Morgan Stanley Bank of America Merrill Lynch Trust 2014-C18 | 843,762 | 589,221 | ||||||
Morgan Stanley Bank of America Merrill Lynch Trust 2014-C19 | 242,461 | 182,767 | ||||||
Morgan Stanley Bank of America Merrill Lynch Trust 2015-C20 | 3,106,078 | 234,362 | ||||||
Morgan Stanley Bank of America Merrill Lynch Trust 2015-C21 | 3,713,451 | 214,194 | ||||||
Morgan Stanley Bank of America Merrill Lynch Trust 2015-C22 | 791,221 | 607,915 | ||||||
Morgan Stanley Bank of America Merrill Lynch Trust 2016-C28 | 166,120 | 111,841 | ||||||
Morgan Stanley Capital I Trust 2006-IQ11 | 250,000 | 247,891 | ||||||
Morgan Stanley Capital I Trust 2006-T21 | 102,486 | 102,432 | ||||||
Morgan Stanley Capital I Trust 2007-IQ16 | 430,000 | 441,083 | ||||||
Morgan Stanley Capital I Trust 2008-T29 | 210,000 | 217,128 | ||||||
Morgan Stanley Capital I Trust 2015-MS1 | 270,000 | 203,341 | ||||||
Morgan Stanley Capital I Trust 2016-UBS9 | ||||||||
1.25% due 03/15/49 (g)(i) | 2,967,528 | 231,911 | ||||||
3.00% due 03/15/49 (b) | 239,000 | 178,668 | ||||||
Wells Fargo Commercial Mortgage Trust 2015-C26 | 3,076,585 | 234,692 | ||||||
Wells Fargo Commercial Mortgage Trust 2015-C29 | 327,315 | 249,561 | ||||||
Wells Fargo Commercial Mortgage Trust 2015-C30 | 200,306 | 156,556 | ||||||
Wells Fargo Commercial Mortgage Trust 2015-LC22 | 200,550 | 156,260 | ||||||
Principal Amount ($) | Fair Value $ | |||||||
Wells Fargo Commercial Mortgage Trust 2015-NXS2 | 200,441 | 147,951 | ||||||
Wells Fargo Commercial Mortgage Trust 2016-C33 | 176,460 | 122,550 | ||||||
Wells Fargo Mortgage Backed Securities Trust 2006-3 | 47,452 | — | ||||||
WFRBS Commercial Mortgage Trust 2013-C17 | 235,000 | 249,372 | ||||||
WFRBS Commercial Mortgage Trust 2014-C19 | 400,926 | 323,454 | ||||||
WFRBS Commercial Mortgage Trust 2014-C22 | 535,456 | 399,231 | ||||||
WFRBS Commercial Mortgage Trust 2014-C24 | 769,611 | 469,841 | ||||||
WFRBS Commercial Mortgage Trust 2014-C25 | 96,000 | 67,015 | ||||||
WFRBS Commercial Mortgage Trust 2014-LC14 | ||||||||
4.35% due 03/15/47 (i) | 533,000 | 565,312 | ||||||
4.59% due 03/15/47 (b)(i) | 590,543 | 468,583 | ||||||
WFRBS Commercial Mortgage Trust 2015-C31 | 100,165 | 72,746 | ||||||
|
| |||||||
| 16,632,586 | ||||||||
|
| |||||||
Sovereign Bonds - 0.7% |
| |||||||
Government of Colombia | 323,000 | 304,427 | ||||||
Government of Mexico | ||||||||
3.60% due 01/30/25 | 319,000 | 307,516 | ||||||
4.00% due 10/02/23 | 136,000 | 136,313 | ||||||
4.75% due 03/08/44 | 254,000 | 230,886 | ||||||
Government of Panama | 200,000 | 203,500 | ||||||
Government of Peru | ||||||||
4.13% due 08/25/27 | 123,000 | 127,766 | ||||||
5.63% due 11/18/50 | 67,000 | 75,878 | ||||||
Government of Philippines | ||||||||
3.95% due 01/20/40 | 200,000 | 196,902 | ||||||
4.20% due 01/21/24 | 200,000 | 215,000 | ||||||
|
| |||||||
| 1,798,188 | ||||||||
|
| |||||||
Municipal Bonds and Notes - 0.7% |
| |||||||
American Municipal Power Inc. | 250,000 | 303,187 | ||||||
See Notes to Schedules of Investments and Notes to Financial Statements.
| Elfun Income Fund | 65 |
Elfun Income Fund
Schedule of Investments, continued — December 31, 2016
Principal Amount ($) | Fair Value $ | |||||||
Municipal Electric Authority of Georgia | 267,000 | 331,136 | ||||||
New Jersey Transportation Trust Fund Authority | 165,000 | 177,002 | ||||||
Port Authority of New York & New Jersey | 470,000 | 475,358 | ||||||
South Carolina State Public Service Authority | 175,000 | 230,807 | ||||||
State of California | 280,000 | 322,874 | ||||||
State of Illinois | 125,000 | 110,478 | ||||||
|
| |||||||
| 1,950,842 | ||||||||
|
| |||||||
FNMA (TBA) - 0.0%* |
| |||||||
Lehman | 148,376 | 4,689 | ||||||
|
| |||||||
| Total Bonds and Notes (Cost $274,353,815) | 273,874,470 | |||||||
|
| |||||||
Principal Amount ($) | Fair Value $ | |||||||
| Domestic Equity - 0.1% | ||||||||
Preferred Stock - 0.1% |
| |||||||
Wells Fargo & Co. 3.09% + 3 month USD LIBOR | 12,886 | 325,243 | ||||||
|
| |||||||
| Total Investments in Securities (Cost $274,675,965) | 274,199,713 | |||||||
|
| |||||||
| Short-Term Investments - 14.3% | ||||||||
State Street Institutional U.S. Government Money Market Fund - Class G Shares 0.46% | 39,582,709 | 39,582,709 | ||||||
|
| |||||||
| Total Investments (Cost $314,258,674) | 313,782,422 | |||||||
| Liabilities in Excess of Other Assets, net - (13.6)% | (37,640,226 | ) | ||||||
|
| |||||||
| NET ASSETS - 100.0% | 276,142,196 | |||||||
|
| |||||||
Other Information:
The Fund has the following credit default swap contracts open at December 31, 2016:
Centrally Cleared Credit Default Swaps - Buy Protection
| Reference Entity | Counterparty | Notional Amount (000s omitted) | Contract annual Fixed Rate | Termination Date | Market Value | Unamortized Upfront Payments Received | Unrealized Depreciation | |||||||||||||||||||
Markit CDX North America High Yield Index | CME Group Inc. | $ | 9,800 | 5.00% | 12/20/21 | $ | (622,578 | ) | $ | (412,514 | ) | $ | (210,064 | ) | ||||||||||||
Markit CDX North America Investment Grade Index | CME Group Inc. | 6,437 | 1.00% | 12/20/21 | (99,531 | ) | (81,483 | ) | (18,048 | ) | ||||||||||||||||
|
| |||||||||||||||||||||||||
| $ | (228,112 | ) | ||||||||||||||||||||||||
|
| |||||||||||||||||||||||||
The Fund had the following long futures contracts open at December 31, 2016:
| Description | Expiration date | Number of Contracts | Current Notional Value | Unrealized Depreciation | ||||||||||||
Ultra Long-Term U.S. Treasury Bond Futures | March 2017 | 39 | $ | 6,249,750 | $ | (56,924 | ) | |||||||||
2 Yr. U.S. Treasury Notes Futures | March 2017 | 51 | 11,051,063 | (5,665 | ) | |||||||||||
5 Yr. U.S. Treasury Notes Futures | March 2017 | 7 | 823,648 | (1,488 | ) | |||||||||||
|
| |||||||||||||||
| $ | (64,077 | ) | ||||||||||||||
|
| |||||||||||||||
See Notes to Schedules of Investments and Notes to Financial Statements.
| 66 | Elfun Income Fund |
Elfun Income Fund
Schedule of Investments, continued — December 31, 2016
The Fund had the following short futures contracts open at December 31, 2016:
| Description | Expiration date | Number of Contracts | Current Notional Value | Unrealized Appreciation (Depreciation) | ||||||||||||
U.S. Long Bond Futures | March 2017 | 69 | $ | (10,395,281 | ) | $ | 24,993 | |||||||||
10 Yr. U.S. Treasury Notes Futures | March 2017 | 22 | (2,734,188 | ) | 6,146 | |||||||||||
Ultra 10 Yr. U.S. Treasury Futures | March 2017 | 18 | (2,413,125 | ) | (698 | ) | ||||||||||
|
| |||||||||||||||
| $ | 30,441 | |||||||||||||||
|
| |||||||||||||||
| $ | (33,636 | ) | ||||||||||||||
|
| |||||||||||||||
Affiliate Table
| Number of Shares Held at 12/31/15 | Value at 12/31/15 | Shares Purchased | Shares Sold | Number of Shares Held at 12/31/16 | Value at 12/31/16 | Dividend/ Interest | Realized Gain (Loss) | |||||||||||||||||||||||||
State Street Institutional U.S. Government Money Market Fund | 14,834,394 | 14,834,395 | 150,170,595 | 125,422,280 | 39,582,709 | $ | 39,582,709 | $ | 46,570 | $ | — | |||||||||||||||||||||
|
|
|
|
|
| |||||||||||||||||||||||||||
| $ | 39,582,709 | $ | 46,570 | $ | — | |||||||||||||||||||||||||||
|
|
|
|
|
| |||||||||||||||||||||||||||
See Notes to Schedules of Investments and Notes to Financial Statements.
| Elfun Income Fund | 67 |
Elfun Government Money Market Fund
Portfolio Management Discussion and Analysis — December 31, 2016 (Unaudited)
| Q. | How did the Elfun Government Money Market Fund perform compared to its benchmark for the twelve-month period ended December 31, 2016? |
| For the twelve-month period ended December 31, 2016, the Elfun Government Money Market Fund returned 0.06%. The 90-day Treasury Bill, the Fund’s benchmark, returned 0.32% over the same period. The Fund’s yield was in line with expectations. |
| Q. | What market factors affected the Fund’s performance? |
| 2016 was a historic year for the U.S. Money Market Fund Industry. The Securities and Exchange Commission’s 2a-7 Rule changes announced in 2014 that fundamentally changed the way U.S. taxable prime and tax exempt money market funds operated went into effect in 2016. The most significant rules (variable net asset value calculation of an institutional prime and institutional tax exempt funds and liquidity gates & redemption fees on all prime and tax exempt funds) went into effect on October 14, 2016. This drove $1 trillion of prime money market fund assets into U.S. government money market funds. This new demand for government fund eligible assets (government agency debt and U.S. treasury debt) caused those yield curves to flatten and spreads to tighten vs. overnight funding rates. Even with this change in the market and increased demand for government assets, the Fund performed in line with its objective of principal preservation and liquidity while generating a market rate of return. The Fund benefitted from the increase in U.S. Treasury bill supply in 2016 and indirectly from the increased capacity of the Federal Reserve’s reverse repo facility, which provided a floor for overnight rates. |
| Q. | What were the primary drivers of Fund performance? |
| The performance of this government money market fund is measured by timely access to liquidity in various market conditions. The Fund achieved this objective throughout 2016. |
| Q. | Were there any significant changes to the Fund during the period? |
| There were no significant changes to this Fund during the period. |
| 68 | Elfun Government Money Market Fund |
Elfun Government Money Market Fund
Understanding Your Fund’s Expenses — December 31, 2016 (Unaudited)
As a shareholder of the Fund you incur ongoing costs. Ongoing costs include portfolio management fees, professional fees, administrative fees and other Fund expenses. The following example is intended to help you understand your ongoing costs (in dollars) of investing in the Fund and to compare these costs with the ongoing costs of investing in other mutual funds.
To illustrate these ongoing costs, we have provided an example and calculated the expenses paid by investors in units of the Fund during the period. The information in the following table is based on an investment of $1,000, which is invested at the beginning of the period and held for the entire six-month period ended December 31, 2016.
Actual Expenses
The first section of the table provides information about actual account values and actual expenses. You may use the information in this section, together with the amount you invested, to estimate the expenses that you paid over the period. To do so, simply divide your account value by $1,000 (for example, an $8,600 account value divided by $1,000 = 8.6), then multiply the result by the number given under the heading “Expenses paid during the period” to estimate the expenses you paid on your account during the period.
Hypothetical Example for Comparison Purposes
The second section of the table provides information about hypothetical account values and hypothetical expenses based on the Fund’s actual expense ratio and an assumed rate of return of 5% per year before expenses, which is not the Fund’s actual return. The hypothetical account values and expenses may not be used to estimate the actual ending account balance or expenses you paid for the period. You may use this information to compare the ongoing costs of investing in the Fund and other funds. To do so, compare this 5% hypothetical example with the 5% hypothetical examples that appear in the shareholders reports of other funds.
Please note that the expenses shown in the table are meant to highlight and help you compare ongoing costs only and do not reflect transaction costs, such as sales charges or redemption fees, if any. Therefore, the second section of the table is useful in comparing ongoing costs only, and will not help you determine the relative total costs of owning different funds.
| Actual Fund Return | Hypothetical 5% Return (2.5% for the period) | |||||||
Account value at the July 1, 2016 | $ | 1,000.00 | $ | 1,000.00 | ||||
Account value at the December 31, 2016 | $ | 1,000.60 | $ | 1,021.87 | ||||
| Expenses paid during the period* | $ | 3.27 | $ | 3.30 | ||||
| * | Expenses are equal to the Fund’s annualized net expense ratio of 0.65%** (for the period July 1, 2016-December 31, 2016), multiplied by the average account value over the period, multiplied by 184/366 (to reflect the one-half year period). |
| ** | May differ from expense ratio disclosed in the financial highlights, which is calculated based on the entire fiscal year’s data. The ratio above includes the effect of income tax expense. Without this expense, the expense ratio used in the calculations above would have been 0.31%. |
| Elfun Government Money Market Fund | 69 |
Elfun Government Money Market Fund
Performance Summary — December 31, 2016 (Unaudited)
Investment Profile
A mutual fund designed for investors who seek a high level of current income consistent with prudent investment management and the preservation of capital. The Fund seeks to achieve its investment objective by investing at least 99.5% of its assets under normal circumstances in short-term, U.S. Government securities, cash and/or repurchase agreements that are collateralized by cash or government securities.
Sector Allocation as of December 31, 2016
Portfolio composition as a % of Investments of $111,160 (in thousands) as of December 31, 2016 (a)
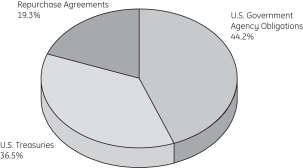
Average Annual Total Return for the periods ended December 31, 2016
(Inception date: 06/13/90)
| One Year | Five Year | Ten Year | Ending Value of a $10,000 Investment | |||||||||||||
Elfun Government Money Market Fund | 0.06 | % | 0.05 | % | 0.86 | % | $ | 10,889 | ||||||||
90 Day U.S. Treasury Bill | 0.34 | % | 0.11 | % | 0.71 | % | $ | 10,748 | ||||||||
| 70 | Elfun Government Money Market Fund |
Elfun Government Money Market Fund
Performance Summary, continued — December 31, 2016 (Unaudited)
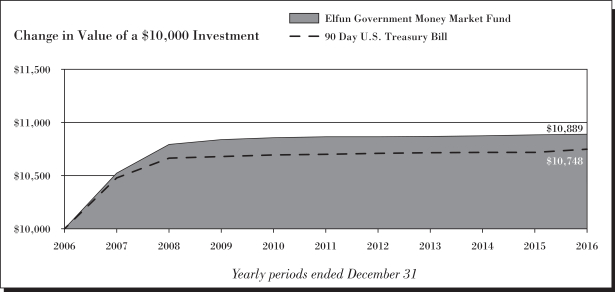
| (a) | The securities information regarding holdings, allocations and other characteristics is presented to illustrate examples of securities that the Fund has bought and the diversity of areas in which the Fund may invest as of a particular date. It may not be representative of the Fund’s current or future investments and should not be construed as a recommendation to purchase or sell a particular security. |
See Notes to Performance beginning on page 1 for further information, including an explanation of Morningstar peer categories.
Past performance does not predict future performance. The performance shown in the graphs and tables does not reflect the deduction of taxes that a shareholder would pay on Fund distributions or the redemption of Fund shares.
An investment in the Elfun Government Money Market Fund is not insured or guaranteed by the Federal Deposit Insurance Corporation or by any other Government agency. Although the Fund seeks to preserve the value of your investment at $1.00 per unit, it is possible to lose money by investing in the Fund.
| Elfun Government Money Market Fund | 71 |
Elfun Government Money Market Fund
Schedule of Investments — December 31, 2016
| Principal Amount ($) | Amortized Cost $ | |||||||
| Short-Term Investments - 99.8%† | ||||||||
U.S. Treasuries - 36.4% |
| |||||||
U.S. Treasury Bills |
| |||||||
0.33% due 01/05/17 (d) | 2,000,000 | 1,999,928 | ||||||
0.34% due | 4,500,000 | 4,499,535 | ||||||
0.35% due 01/26/17 (d) | 1,500,000 | 1,499,646 | ||||||
0.37% due 01/12/17 (d) | 2,000,000 | 1,999,780 | ||||||
0.40% due 02/02/17 (d) | 1,000,000 | 999,649 | ||||||
0.43% due 03/30/17 (d) | 1,000,000 | 998,973 | ||||||
0.49% due 02/23/17 (d) | 2,000,000 | 1,998,587 | ||||||
0.50% due | 5,250,000 | 5,244,840 | ||||||
0.51% due | 3,750,000 | 3,747,436 | ||||||
0.52% due 03/23/17 (d) | 3,250,000 | 3,246,234 | ||||||
0.53% due 03/23/17 (d) | 750,000 | 749,127 | ||||||
0.55% due 03/16/17 (d) | 2,000,000 | 1,997,770 | ||||||
0.56% due 03/30/17 (d) | 1,000,000 | 998,647 | ||||||
0.62% due 06/01/17 (d) | 750,000 | 748,081 | ||||||
0.63% due | 1,250,000 | 1,246,651 | ||||||
0.66% due | 2,000,000 | 1,993,962 | ||||||
U.S. Treasury Notes |
| |||||||
3.00% due 02/28/17 | 600,000 | 602,414 | ||||||
3.13% due 01/31/17 | 2,000,000 | 2,004,328 | ||||||
U.S. Treasury Notes 0.07% + 3 year USD LIBOR | 3,500,000 | 3,500,076 | ||||||
U.S. Treasury Notes 0.08% + 3 year USD LIBOR | 500,000 | 499,998 | ||||||
|
| |||||||
| 40,575,662 | ||||||||
|
| |||||||
U.S. Government Agency Obligations - 44.1% |
| |||||||
Fannie Mae Discount Notes |
| |||||||
0.31% due 01/04/17 (d) | 1,000,000 | 999,974 | ||||||
0.36% due 01/09/17 (d) | 1,200,000 | 1,199,907 | ||||||
0.41% due 01/17/17 (d) | 1,000,000 | 999,822 | ||||||
0.46% due 01/03/17 (d) | 3,000,000 | 2,999,925 | ||||||
0.49% due 02/14/17 (d) | 1,100,000 | 1,099,355 | ||||||
Federal Farm Credit Banks |
| |||||||
0.65% due 10/03/17 (i) | 200,000 | 199,985 | ||||||
0.79% due 01/17/17 (i) | 300,000 | 300,026 | ||||||
Federal Farm Credit Banks | 1,000,000 | 999,985 | ||||||
Federal Farm Credit Banks 0.04% + 1 month USD LIBOR | 800,000 | 799,982 | ||||||
Federal Farm Credit Banks 1 month USD LIBOR - 0.03% | 600,000 | 600,000 | ||||||
| Principal Amount ($) | Amortized Cost $ | |||||||
Federal Farm Credit Banks 1 month USD LIBOR - 0.05% | 500,000 | 499,967 | ||||||
Federal Home Loan Bank Discount Notes | ||||||||
0.33% due 01/05/17 (d) | 500,000 | 499,982 | ||||||
0.38% due | 3,000,000 | 2,999,833 | ||||||
0.44% due | 1,500,000 | 1,499,922 | ||||||
0.45% due 01/18/17 (d) | 2,000,000 | 1,999,577 | ||||||
0.46% due 01/13/17 (d) | 1,000,000 | 999,850 | ||||||
0.49% due 02/10/17 (d) | 2,000,000 | 1,998,933 | ||||||
0.57% due 03/15/17 (d) | 1,000,000 | 998,864 | ||||||
Federal Home Loan Banks |
| |||||||
0.42% due 04/19/17 (i) | 100,000 | 100,000 | ||||||
0.46% due 07/24/17 (i) | 300,000 | 300,000 | ||||||
0.47% due 07/13/17 (i) | 1,000,000 | 1,000,000 | ||||||
0.48% due 07/12/17 (i) | 800,000 | 800,000 | ||||||
0.54% due 07/07/17 (i) | 1,000,000 | 1,000,000 | ||||||
0.56% due 04/19/17 (i) | 100,000 | 99,999 | ||||||
0.57% due 08/11/17 (i) | 200,000 | 200,000 | ||||||
0.60% due 12/13/17 (i) | 1,400,000 | 1,400,000 | ||||||
0.68% due | 1,100,000 | 1,100,000 | ||||||
0.70% due 08/17/17 (i) | 200,000 | 200,000 | ||||||
0.71% due 08/17/17 (i) | 500,000 | 500,000 | ||||||
Federal Home Loan Banks 0.01% + 1 month USD LIBOR | ||||||||
0.74% due 05/18/17 (i) | 900,000 | 900,000 | ||||||
0.77% due 05/23/17 (i) | 500,000 | 500,000 | ||||||
Federal Home Loan Banks 0.02% + 1 month USD LIBOR | 1,300,000 | 1,300,000 | ||||||
Federal Home Loan Banks 1 month USD LIBOR - 0.01% | 1,250,000 | 1,250,000 | ||||||
Federal Home Loan Banks 1 month USD LIBOR - 0.02% | ||||||||
0.64% due 09/07/17 (i) | 800,000 | 800,000 | ||||||
0.74% due 08/28/17 (i) | 1,000,000 | 1,000,000 | ||||||
Federal Home Loan Banks 3 month USD LIBOR - 0.05% | 2,200,000 | 2,200,000 | ||||||
Federal Home Loan Banks 3 month USD LIBOR - 0.06% | ||||||||
0.82% due 02/08/17 (i) | 400,000 | 399,998 | ||||||
0.83% due 02/10/17 (i) | 2,000,000 | 1,999,989 | ||||||
Federal Home Loan Banks 3 month USD LIBOR - 0.10% | ||||||||
0.78% due 04/20/17 (i) | 1,000,000 | 1,000,000 | ||||||
0.90% due 06/29/17 (i) | 1,500,000 | 1,500,000 | ||||||
See Notes to Schedules of Investments and Notes to Financial Statements.
| 72 | Elfun Government Money Market Fund |
Elfun Government Money Market Fund
Schedule of Investments, continued — December 31, 2016
| Principal Amount ($) | Amortized Cost $ | |||||||
Federal Home Loan Banks 3 month USD LIBOR - 0.11% | 2,100,000 | 2,099,997 | ||||||
Federal Home Loan Banks 3 month USD LIBOR - 0.29% | 300,000 | 300,000 | ||||||
Federal Home Loan Banks 3 month USD LIBOR - 0.31% | 1,000,000 | 1,000,000 | ||||||
Federal Home Loan Mortgage Corp. | 800,000 | 800,000 | ||||||
Freddie Mac Discount Notes | ||||||||
0.41% due 01/04/17 (d) | 1,000,000 | 999,967 | ||||||
0.51% due | 1,500,000 | 1,497,430 | ||||||
0.53% due 05/09/17 (d) | 800,000 | 798,521 | ||||||
0.56% due 05/18/17 (d) | 400,000 | 399,163 | ||||||
|
| |||||||
| 49,140,953 | ||||||||
|
| |||||||
| Principal Amount ($) | Amortized Cost $ | |||||||
Repurchase Agreement - 19.3% |
| |||||||
Citigroup Global Markets, Inc. U.S. Treasury Repo 0.51% dated 12/30/16, to be repurchased at $21,443,608 on 01/03/17 collateralized by $21,871,938 U.S. Treasury Notes, 1.38% and 1.63%, maturing on 04/30/20 and 08/15/22, respectively. 01/03/17 | 21,443,000 | 21,443,000 | ||||||
|
| |||||||
| Total Short-Term Investments (Cost $111,159,615) | 111,159,615 | |||||||
| Other Assets and Liabilities, net - 0.2% | 178,917 | |||||||
|
| |||||||
| NET ASSETS - 100.0% | 111,338,532 | |||||||
|
| |||||||
See Notes to Schedules of Investments and Notes to Financial Statements.
| Elfun Government Money Market Fund | 73 |
Elfun Funds
Notes to Schedules of Investments — December 31, 2016
The views expressed in this document reflect our judgment as of the publication date and are subject to change at any time without notice. The securities cited may not be representative of the Funds’ future investments and should not be construed as a recommendation to purchase or sell a particular security. See each Fund’s summary prospectus and the Funds’ statutory prospectus for complete descriptions of investment objectives, policies, risks and permissible investments.
| (a) | Non-income producing security. |
| (b) | Pursuant to Rule 144A of the Securities Act of 1933, as amended, these securities may be resold in transactions exempt from registration, normally to qualified institutional buyers. At December 31, 2016, these securities amounted to $5,671,566 and $24,704,435 or 2.85% and 8.95% of the net assets of the Elfun Diversified Fund and Elfun Income Fund, respectively. These securities have been determined to be liquid using procedures established by each Fund’s Board of Trustees. |
| (c) | Settlement is on a delayed delivery or when-issued basis with final maturity to be announced (“TBA”) in the future. |
| (d) | Coupon amount represents effective yield. |
| (e) | State Street Corp. is the parent company of State Street Bank & Trust Co., the Funds’ sub-administrator, custodian and accounting agent. |
| (f) | Principal only security. These securities represent the right to receive the monthly principal payments on an underlying pool of mortgages. No payments of interest on the pool are passed through to the “principal only” holder. |
| (g) | Interest only security. These securities represent the right to receive the monthly interest payments on an underlying pool of mortgages. Payments of principal on the pool reduce the value of the “interest only” holding. |
| (h) | At December 31, 2016, all or a portion of this security was pledged to cover collateral requirements for futures, swaps and/or TBA’s. |
| (i) | Variable or floating rate security. The stated rate represents the rate at December 31, 2016. |
| (j) | Step coupon bond. |
| (k) | Escrowed to maturity Bonds are collateralized by U.S. Treasury securities which are held in escrow by a trustee and are used to pay principal and interest on such bonds. |
| (l) | Pre-refunded Bonds are collateralized by U.S. Treasury securities, which are held in escrow by a trustee and are used to pay principal and interest on the tax-exempt issue to retire the bonds at the earliest refunding date. |
| (m) | The security is insured by AGC, AGMC, AMBAC, FGIC or NPFG. The Elfun Tax-Exempt Fund had no insurance concentrations of 5% or greater as of December 31, 2016 (as a percentage of net assets). |
| (n) | Represents a payment-in-kind security which may pay all or a portion of interest in additional par. |
| (o) | Security is in default. |
| (p) | Sponsored by SSGA Funds Management, Inc., the Fund’s investment advisor and administrator, effective July 1, 2016, and an affiliate of State Street Bank & Trust Co., the Fund’s sub-administrator, custodian and accounting agent. |
| (q) | Security is fair valued by the Valuation Committee, in accordance with the procedures approved by the Funds’ Board of Trustees. |
| † | Percentages are based on net assets as of December 31, 2016. |
| * | Less than 0.05% |
| ** | Less than 0.005% |
Abbreviations:
ADR - American Depositary Receipt
AGC - Assured Guaranty Corporation
AGMC - Assured Guaranty Municipal Company
AMBAC - AMBAC Indemnity Corporation
FGIC - Financial Guaranty Insurance Corporation
LIBOR - London Interbank Offered Rate
NPFG - National Public Finance Guaranty Corporation
REIT - Real Estate Investment Trust
REMIC - Real Estate Mortgage Investment Conduit
SPDR - Standard and Poor’s Depositary Receipt
STRIPS - Separate Trading of Registered Interest and Principal of Security
TBA - To Be Announced
| 74 | Notes to Schedules of Investments |
Elfun International Equity Fund
Selected data based on a share outstanding throughout the fiscal years indicated
| 12/31/16 | 12/31/15* | 12/31/14* | 12/31/13* | 12/31/12* | ||||||||||||||||
Inception date | 1/1/88 | |||||||||||||||||||
Net asset value, beginning of period | $ | 19.31 | $ | 19.70 | $ | 21.93 | $ | 18.31 | $ | 15.43 | ||||||||||
|
|
|
|
|
|
|
|
|
| |||||||||||
Income/(loss) from investment operations: | ||||||||||||||||||||
Net investment income | 0.41 | 0.34 | 0.58 | 0.37 | 0.35 | |||||||||||||||
Net realized and unrealized gains/(losses) on investments | (0.58 | ) | (0.37 | ) | (2.24 | ) | 3.62 | 2.88 | ||||||||||||
|
|
|
|
|
|
|
|
|
| |||||||||||
Total income/(loss) from investment operations | (0.17 | ) | (0.03 | ) | (1.66 | ) | 3.99 | 3.23 | ||||||||||||
|
|
|
|
|
|
|
|
|
| |||||||||||
Less distributions from: | ||||||||||||||||||||
Net investment income | 0.41 | 0.36 | 0.57 | 0.37 | 0.35 | |||||||||||||||
Return of capital | — | — | — | — | 0.00 | (b) | ||||||||||||||
|
|
|
|
|
|
|
|
|
| |||||||||||
Total distributions | 0.41 | 0.36 | 0.57 | 0.37 | 0.35 | |||||||||||||||
|
|
|
|
|
|
|
|
|
| |||||||||||
Net asset value, end of period | $ | 18.73 | $ | 19.31 | $ | 19.70 | $ | 21.93 | $ | 18.31 | ||||||||||
|
|
|
|
|
|
|
|
|
| |||||||||||
Total return(a) | (0.86 | )% | (0.18 | )% | (7.62 | )% | 21.81 | % | 20.95 | % | ||||||||||
Ratios/Supplemental Data: | ||||||||||||||||||||
Net assets, end of period (in thousands) | $ | 208,044 | $ | 234,448 | $ | 254,310 | $ | 306,922 | $ | 260,728 | ||||||||||
Ratios to average net assets: | ||||||||||||||||||||
Net expenses | 0.37 | %(c,d) | 0.35 | % | 0.33 | %(e) | 0.31 | %(e) | 0.45 | %(e) | ||||||||||
Gross expenses | 0.43 | %(d) | 0.35 | % | 0.33 | % | 0.31 | % | 0.45 | % | ||||||||||
Net investment income | 2.11 | % | 1.59 | % | 2.54 | % | 1.83 | % | 1.98 | % | ||||||||||
Portfolio turnover rate | 33 | % | 24 | % | 36 | % | 49 | % | 47 | % | ||||||||||
| (a) | Total returns are historical and assume changes in share price, reinvestment of dividends and capital gains distributions and assume no sales charge. Past performance does not guarantee future results. |
| (b) | Rounds to less than $0.005. |
| (c) | Reflects a voluntary waiver of management fees by GE Asset Management, Incorporated (“GEAM”) the Fund’s adviser and administrator prior to July 1, 2016. |
| (d) | The net and gross expense ratios include the refunded custody expense (See Note 6). Without the effect of the refunded custody expense, the net and gross ratio would have been 0.40% and 0.47%, respectively. |
| (e) | Includes contractual management fee waiver related to the Fund’s investments in the GE Institutional Money Market Fund (the “Money Market Fund”). The fee waiver agreement was terminated effective June 30, 2014 with the closure of the Money Market Fund. |
| * | Beginning with the year ended December 31, 2016, the Funds were audited by Ernst & Young LLP. The previous years were audited by another independent registered public accounting firm. |
The accompanying Notes are an integral part of these financial statements.
| Financial Highlights | 75 |
Elfun Trusts
Financial Highlights
Selected data based on a share outstanding throughout the fiscal years indicated
| 12/31/16 | 12/31/15* | 12/31/14* | 12/31/13* | 12/31/12* | ||||||||||||||||
Inception date | 5/27/35 | |||||||||||||||||||
Net asset value, beginning of period | $ | 54.59 | $ | 58.02 | $ | 56.07 | $ | 44.06 | $ | 40.35 | ||||||||||
|
|
|
|
|
|
|
|
|
| |||||||||||
Income/(loss) from investment operations: |
| |||||||||||||||||||
Net investment income | 0.81 | 0.80 | 0.75 | 0.71 | 0.77 | |||||||||||||||
Net realized and unrealized gains/(losses) on investments | 2.54 | 0.25 | 6.67 | 14.68 | 7.77 | |||||||||||||||
|
|
|
|
|
|
|
|
|
| |||||||||||
Total income from investment operations | 3.35 | 1.05 | 7.42 | 15.39 | 8.54 | |||||||||||||||
|
|
|
|
|
|
|
|
|
| |||||||||||
Less distributions from: | ||||||||||||||||||||
Net investment income | 0.79 | 0.80 | 0.75 | 0.72 | 0.76 | |||||||||||||||
Net realized gains | 3.92 | 3.68 | 4.72 | 2.66 | 4.07 | |||||||||||||||
|
|
|
|
|
|
|
|
|
| |||||||||||
Total distributions | 4.71 | 4.48 | 5.47 | 3.38 | 4.83 | |||||||||||||||
|
|
|
|
|
|
|
|
|
| |||||||||||
Net asset value, end of period | $ | 53.23 | $ | 54.59 | $ | 58.02 | $ | 56.07 | $ | 44.06 | ||||||||||
|
|
|
|
|
|
|
|
|
| |||||||||||
Total return(a) | 6.08 | % | 1.70 | % | 13.13 | % | 34.98 | % | 21.27 | % | ||||||||||
Ratios/supplemental Data: | ||||||||||||||||||||
Net assets, end of period (in thousands) | $ | 2,331,966 | $ | 2,364,319 | $ | 2,476,637 | $ | 2,326,948 | $ | 1,820,262 | ||||||||||
Ratios to average net assets: | ||||||||||||||||||||
Net expenses | 0.18 | % | 0.16 | % | 0.18 | %(b) | 0.15 | %(b) | 0.19 | %(b) | ||||||||||
Gross expenses | 0.18 | % | 0.16 | % | 0.18 | % | 0.15 | % | 0.19 | % | ||||||||||
Net investment income | 1.43 | % | 1.32 | % | 1.26 | % | 1.36 | % | 1.60 | % | ||||||||||
Portfolio turnover rate | 15 | % | 11 | % | 13 | % | 12 | % | 11 | % | ||||||||||
| (a) | Total returns are historical and assume changes in share price, reinvestment of dividends and capital gains distributions and assume no sales charge. Past performance does not guarantee future results. |
| (b) | Includes contractual management fee waiver related to the Fund’s investments in the GE Institutional Money Market Fund (the “Money Market Fund”). The fee waiver agreement was terminated effective June 30, 2014 with the closure of the Money Market Fund. |
| * | Beginning with the year ended December 31, 2016, the Funds were audited by Ernst & Young LLP. The previous years were audited by another independent registered public accounting firm. |
The accompanying Notes are an integral part of these financial statements.
| 76 | Financial Highlights |
Elfun Diversified Fund
Financial Highlights
Selected data based on a share outstanding throughout the fiscal years indicated
| 12/31/16 | 12/31/15* | 12/31/14* | 12/31/13* | 12/31/12* | ||||||||||||||||
Inception date | 1/1/88 | |||||||||||||||||||
Net asset value, beginning of period | $ | 17.50 | $ | 18.78 | $ | 19.84 | $ | 18.30 | $ | 16.53 | ||||||||||
|
|
|
|
|
|
|
|
|
| |||||||||||
Income/(loss) from investment operations: |
| |||||||||||||||||||
Net investment income | 0.38 | 0.34 | 0.37 | 0.36 | 0.33 | |||||||||||||||
Net realized and unrealized gains/(losses) on investments | 0.58 | (0.57 | ) | 0.62 | 2.70 | 1.78 | ||||||||||||||
|
|
|
|
|
|
|
|
|
| |||||||||||
Total income/(loss) from investment operations | 0.96 | (0.23 | ) | 0.99 | 3.06 | 2.11 | ||||||||||||||
|
|
|
|
|
|
|
|
|
| |||||||||||
Less distributions from: | ||||||||||||||||||||
Net investment income | 0.36 | 0.34 | 0.37 | 0.35 | 0.34 | |||||||||||||||
Net realized gains | 0.19 | 0.71 | 1.65 | 1.17 | — | |||||||||||||||
Return of capital | — | — | 0.03 | — | — | |||||||||||||||
|
|
|
|
|
|
|
|
|
| |||||||||||
Total distributions | 0.55 | 1.05 | 2.05 | 1.52 | 0.34 | |||||||||||||||
|
|
|
|
|
|
|
|
|
| |||||||||||
Net asset value, end of period | $ | 17.91 | $ | 17.50 | $ | 18.78 | $ | 19.84 | $ | 18.30 | ||||||||||
|
|
|
|
|
|
|
|
|
| |||||||||||
Total return(a) | 5.48 | % | (1.25 | )% | 4.95 | % | 16.79 | % | 12.77 | % | ||||||||||
Ratios/supplemental Data: | ||||||||||||||||||||
Net assets, end of period (in thousands) | $ | 198,938 | $ | 209,688 | $ | 230,123 | $ | 235,903 | $ | 213,168 | ||||||||||
Ratios to average net assets: | ||||||||||||||||||||
Net expenses | 0.39 | %(b) | 0.37 | % | 0.39 | %(c) | 0.33 | %(c) | 0.46 | %(c) | ||||||||||
Gross expenses | 0.39 | %(b) | 0.37 | % | 0.39 | % | 0.34 | % | 0.47 | % | ||||||||||
Net investment income | 1.98 | % | 1.69 | % | 1.79 | % | 1.78 | % | 1.75 | % | ||||||||||
Portfolio turnover rate | 116 | % | 123 | % | 176 | % | 144 | % | 173 | % | ||||||||||
| (a) | Total returns are historical and assume changes in share price, reinvestment of dividends and capital gains distributions and assume no sales charge. Past performance does not guarantee future results. |
| (b) | The net and gross expense ratios include the refunded custody expense (See Note 6). Without the effect of the refunded custody expense, the ratios would have been 0.45%. |
| (c) | Includes contractual management fee waiver related to the Fund’s investments in the GE Institutional Money Market Fund (the “Money Market Fund”). The fee waiver agreement was terminated effective June 30, 2014 with the closure of the Money Market Fund. |
| * | Beginning with the year ended December 31, 2016, the Funds were audited by Ernst & Young LLP. The previous years were audited by another independent registered public accounting firm. |
The accompanying Notes are an integral part of these financial statements.
| Financial Highlights | 77 |
Elfun Tax-Exempt Income Fund
Financial Highlights
Selected data based on a share outstanding throughout the fiscal years indicated
| 12/31/16 | 12/31/15* | 12/31/14* | 12/31/13* | 12/31/12* | ||||||||||||||||
Inception date | 1/1/80 | |||||||||||||||||||
Net asset value, beginning of period | $ | 11.88 | $ | 11.97 | $ | 11.34 | $ | 12.32 | $ | 11.97 | ||||||||||
|
|
|
|
|
|
|
|
|
| |||||||||||
Income/(loss) from investment operations: | ||||||||||||||||||||
Net investment income | 0.46 | 0.46 | 0.47 | 0.49 | 0.51 | |||||||||||||||
Net realized and unrealized gains/(losses) on investments | (0.40 | ) | (0.09 | ) | 0.63 | (0.98 | ) | 0.37 | ||||||||||||
|
|
|
|
|
|
|
|
|
| |||||||||||
Total income/(loss) from investment operations | 0.06 | 0.37 | 1.10 | (0.49 | ) | 0.88 | ||||||||||||||
|
|
|
|
|
|
|
|
|
| |||||||||||
Less distributions from: | ||||||||||||||||||||
Net investment income | 0.46 | 0.46 | 0.47 | 0.49 | 0.51 | |||||||||||||||
Net realized gains | — | — | — | 0.00 | (b) | 0.02 | ||||||||||||||
|
|
|
|
|
|
|
|
|
| |||||||||||
Total distributions | 0.46 | 0.46 | 0.47 | 0.49 | 0.53 | |||||||||||||||
|
|
|
|
|
|
|
|
|
| |||||||||||
Net asset value, end of period | $ | 11.48 | $ | 11.88 | $ | 11.97 | $ | 11.34 | $ | 12.32 | ||||||||||
|
|
|
|
|
|
|
|
|
| |||||||||||
Total return(a) | 0.42 | % | 3.21 | % | 9.85 | % | (4.06 | )% | 7.45 | % | ||||||||||
Ratios/Supplemental Data: | ||||||||||||||||||||
Net assets, end of period (in thousands) | $ | 1,495,248 | $ | 1,588,272 | $ | 1,624,266 | $ | 1,568,533 | $ | 1,785,176 | ||||||||||
Ratios to average net assets: | ||||||||||||||||||||
Net expenses | 0.20 | % | 0.18 | % | 0.21 | % | 0.23 | % | 0.18 | % | ||||||||||
Gross expenses | 0.20 | % | 0.18 | % | 0.21 | % | 0.23 | % | 0.18 | % | ||||||||||
Net investment income | 3.84 | % | 3.92 | % | 4.01 | % | 4.14 | % | 4.18 | % | ||||||||||
Portfolio turnover rate | 31 | % | 22 | % | 34 | % | 28 | % | 28 | % | ||||||||||
| (a) | Total returns are historical and assume changes in share price, reinvestment of dividends and capital gains distributions and assume no sales charge. Past performance does not guarantee future results. |
| (b) | Rounds to less than $0.005 |
| * | Beginning with the year ended December 31, 2016, the Funds were audited by Ernst & Young LLP. The previous years were audited by another independent registered public accounting firm. |
The accompanying Notes are an integral part of these financial statements.
| 78 | Financial Highlights |
Elfun Income Fund
Financial Highlights
Selected data based on a share outstanding throughout the fiscal years indicated
| 12/31/16 | 12/31/15* | 12/31/14* | 12/31/13* | 12/31/12* | ||||||||||||||||
Inception date | 12/31/84 | |||||||||||||||||||
Net asset value, beginning of period | $ | 11.26 | $ | 11.57 | $ | 11.22 | $ | 11.65 | $ | 11.58 | ||||||||||
|
|
|
|
|
|
|
|
|
| |||||||||||
Income/(loss) from investment operations: | ||||||||||||||||||||
Net investment income | 0.30 | 0.32 | 0.29 | 0.29 | 0.26 | |||||||||||||||
Net realized and unrealized gains/(losses) on investments | 0.09 | (0.29 | ) | 0.35 | (0.40 | ) | 0.42 | |||||||||||||
|
|
|
|
|
|
|
|
|
| |||||||||||
Total income/(loss) from investment operations | 0.39 | 0.03 | 0.64 | (0.11 | ) | 0.68 | ||||||||||||||
|
|
|
|
|
|
|
|
|
| |||||||||||
Less distributions from: | ||||||||||||||||||||
Net investment income | 0.28 | 0.32 | 0.29 | 0.29 | 0.26 | |||||||||||||||
Net realized gains | 0.09 | 0.02 | 0.00 | (c) | 0.03 | 0.35 | ||||||||||||||
|
|
|
|
|
|
|
|
|
| |||||||||||
Total distributions | 0.37 | 0.34 | 0.29 | 0.32 | 0.61 | |||||||||||||||
|
|
|
|
|
|
|
|
|
| |||||||||||
Net asset value, end of period | $ | 11.28 | $ | 11.26 | $ | 11.57 | $ | 11.22 | $ | 11.65 | ||||||||||
|
|
|
|
|
|
|
|
|
| |||||||||||
Total return(a) | 3.52 | % | 0.22 | % | 5.75 | % | (0.95 | )% | 5.94 | % | ||||||||||
Ratios/Supplemental Data: | ||||||||||||||||||||
Net assets, end of period (in thousands) | $ | 276,142 | $ | 289,872 | $ | 312,756 | $ | 319,994 | $ | 364,407 | ||||||||||
Ratios to average net assets: | ||||||||||||||||||||
Net expenses | 0.31 | % | 0.28 | % | 0.29 | %(b) | 0.28 | %(b) | 0.23 | %(b) | ||||||||||
Gross expenses | 0.31 | % | 0.28 | % | 0.29 | % | 0.29 | % | 0.25 | % | ||||||||||
Net investment income | 2.63 | % | 2.71 | % | 2.50 | % | 2.53 | % | 2.20 | % | ||||||||||
Portfolio turnover rate | 238 | % | 278 | % | 326 | % | 330 | % | 402 | % | ||||||||||
| (a) | Total returns are historical and assume changes in share price, reinvestment of dividends and capital gains distributions and assume no sales charge. Past performance does not guarantee future results. |
| (b) | Includes contractual management fee waiver related to the Fund’s investments in the GE Institutional Money Market Fund (the “Money Market Fund”). The fee waiver agreement was terminated effective June 30, 2014 with the closure of the Money Market Fund. |
| (c) | Rounds to less than $0.005. |
| * | Beginning with the year ended December 31, 2016, the Funds were audited by Ernst & Young LLP. The previous years were audited by another independent registered public accounting firm. |
The accompanying Notes are an integral part of these financial statements.
| Financial Highlights | 79 |
Elfun Government Money Market Fund
Financial Highlights
Selected data based on a share outstanding throughout the fiscal years indicated
| 12/31/16 | 12/31/15* | 12/31/14* | 12/31/13* | 12/31/12* | ||||||||||||||||
Inception date | 6/13/90 | |||||||||||||||||||
Net asset value, beginning of period | $ | 1.00 | $ | 1.00 | $ | 1.00 | $ | 1.00 | $ | 1.00 | ||||||||||
|
|
|
|
|
|
|
|
|
| |||||||||||
Income/(loss) from investment operations: | ||||||||||||||||||||
Net investment income | (0.00 | )(b) | — | — | — | — | ||||||||||||||
Less distributions from: | ||||||||||||||||||||
Net investment income | 0.00 | (b) | 0.00 | (b) | 0.00 | (b) | — | — | ||||||||||||
Net realized gains | — | — | — | 0.00 | * | — | ||||||||||||||
|
|
|
|
|
|
|
|
|
| |||||||||||
Total distributions | 0.00 | (b) | 0.00 | (b) | 0.00 | (b) | — | 0.00 | (b) | |||||||||||
|
|
|
|
|
|
|
|
|
| |||||||||||
Contribution from Advisor | 0.00 | — | — | — | — | |||||||||||||||
|
|
|
|
|
|
|
|
|
| |||||||||||
Net asset value, end of period | $ | 1.00 | $ | 1.00 | $ | 1.00 | $ | 1.00 | $ | 1.00 | ||||||||||
|
|
|
|
|
|
|
|
|
| |||||||||||
Total return(a) | 0.06 | % | 0.08 | % | 0.05 | % | 0.04 | % | 0.00 | % | ||||||||||
Ratios/Supplemental Data: | ||||||||||||||||||||
Net assets, end of period (in thousands) | $ | 111,339 | $ | 129,039 | $ | 139,218 | $ | 166,530 | $ | 164,529 | ||||||||||
Ratios to average net assets: | ||||||||||||||||||||
Net expenses | 0.49 | %(d) | 0.09 | %(c) | 0.05 | %(c) | 0.11 | %(c) | 0.18 | %(c) | ||||||||||
Gross expenses | 0.49 | %(d) | 0.25 | % | 0.36 | % | 0.34 | % | 0.32 | % | ||||||||||
Net investment income (loss) | (0.11 | )%(d) | — | % | — | % | — | % | — | % | ||||||||||
| (a) | Total returns are historical and assume changes in share price, reinvestment of dividends and capital gains distributions and assume no sales charge. Past performance does not guarantee future results. |
| (b) | Rounds to less than $0.005. |
| (c) | Reflects a voluntary waiver of management fees and/or subsidy of certain expenses by GEAM, the adviser and administrator of the Fund prior to July 1, 2016. |
| (d) | Ratio includes income tax expense. Without this expense, the net and gross expense ratios would have been 0.33% and the net investment income ratio would have been 0.05%. |
| * | Beginning with the year ended December 31, 2016, the Funds were audited by Ernst & Young LLP. The previous years were audited by another independent registered public accounting firm. |
The accompanying Notes are an integral part of these financial statements.
| 80 | Financial Highlights |
This page has been intentionally left blank.
Elfun Funds
Statements of Assets and Liabilities — December 31, 2016
| Elfun International Equity Fund | Elfun Trusts | |||||||
Assets | ||||||||
Investments in securities, at Fair Value (cost $194,083,182; $1,390,021,446; $167,302,375; $1,389,923,769; $274,675,965 and $0, respectively) | $ | 200,501,899 | $ | 2,273,808,610 | ||||
Investments in affiliated securities, at fair value (cost $0, $0, $6,165,637, $0, $0 and $0, respectively) | — | — | ||||||
Short-term investments, at fair value | — | — | ||||||
Short-term affiliated investments, at fair value | 6,981,686 | 53,209,078 | ||||||
Repurchase agreements | — | — | ||||||
Cash | — | 47,094 | ||||||
Restricted cash(1) | 385,000 | — | ||||||
Foreign currency (cost $6,445; $0; $1,153; $0; $0 and $0, respectively) | 6,481 | — | ||||||
Receivable for investments sold | — | — | ||||||
Income receivables | 457,933 | 5,759,750 | ||||||
Receivable for fund shares sold | 7,976 | 197,913 | ||||||
Income receivable from affiliated investments | 2,540 | 30,261 | ||||||
Receivable for variation margin on open futures contracts | 16,922 | — | ||||||
Other assets | 5,351 | 19,862 | ||||||
|
|
|
| |||||
Total assets | 208,365,788 | 2,333,072,568 | ||||||
|
|
|
| |||||
Liabilities | ||||||||
Distribution payable to shareholders | — | — | ||||||
Payable for investments purchased | — | — | ||||||
Payable for fund shares redeemed | 103,067 | 549,027 | ||||||
Payable for variation margin on open centrally cleared swap contracts | — | — | ||||||
Payable for variation margin on open futures contracts | — | — | ||||||
Payable to the Adviser (Note 6) | 36,811 | 280,763 | ||||||
Payable for custody and accounting expenses (Note 6) | 31,570 | 37,906 | ||||||
Accrued other expenses | 93,945 | 239,111 | ||||||
Accrued foreign capital gains tax | 56,067 | — | ||||||
|
|
|
| |||||
Total liabilities | 321,460 | 1,106,807 | ||||||
|
|
|
| |||||
Net Assets | $ | 208,044,328 | $ | 2,331,965,761 | ||||
|
|
|
| |||||
Net Assets Consist of: | ||||||||
Capital paid in | 224,722,873 | 1,447,365,970 | ||||||
Undistributed (distributions in excess of) net investment income | — | 53,567 | ||||||
Accumulated net realized gain (loss) | (23,002,671 | ) | 759,060 | |||||
Net unrealized appreciation (depreciation) on: | ||||||||
Investments | 6,362,650 | 883,787,164 | ||||||
Futures | (14,870 | ) | — | |||||
Swap contracts | — | — | ||||||
Foreign currency related transactions | (23,654 | ) | — | |||||
|
|
|
| |||||
Net Assets | $ | 208,044,328 | $ | 2,331,965,761 | ||||
|
|
|
| |||||
Shares outstanding (Par value $10; $10; $10; $10; $10; and $1, respectively; unlimited shares authorized) | 11,108,096 | 43,805,587 | ||||||
Net asset value, offering and redemption price per share | $ | 18.73 | $ | 53.23 | ||||
(1) Deposits at broker for futures contracts. | ||||||||
The accompanying Notes are an integral part of these financial statements.
| 82 | Statements of Assets and Liabilities |
| Elfun Diversified Fund | Elfun Tax-Exempt Income Fund | Elfun Income Fund | Elfun Government Fund | |||||||||||
$ | 178,575,164 |
| $ | 1,443,198,288 | $ | 274,199,713 | $ | — | ||||||
| $ | 6,313,978 | — | — | — | ||||||||||
| — | — | — | 89,716,615 | |||||||||||
| 22,591,439 | 50,202,639 | 39,582,709 | — | |||||||||||
| — | — | — | 21,443,000 | |||||||||||
| 71,367 | — | 287,365 | 779 | |||||||||||
| 300,000 | — | — | — | |||||||||||
| 1,159 | — | — | — | |||||||||||
| 5 | — | 2,074 | — | |||||||||||
| 574,119 | 19,253,821 | 1,617,923 | 53,472 | |||||||||||
| 10,279 | 130,315 | 250,632 | 462,064 | |||||||||||
| 39,355 | 20,220 | 13,100 | — | |||||||||||
| — | — | — | — | |||||||||||
| 5,306 | 14,673 | 5,919 | 4,636 | |||||||||||
|
|
|
|
|
|
|
| |||||||
| 208,482,171 | 1,512,819,956 | 315,959,435 | 111,680,566 | |||||||||||
|
|
|
|
|
|
|
| |||||||
| — | 1,494,097 | 124,208 | 1,530 | |||||||||||
| 8,985,651 | 15,110,870 | 39,342,426 | — | |||||||||||
| 324,875 | 587,405 | 132,279 | 68,675 | |||||||||||
| 2,397 | — | 10,341 | — | |||||||||||
| 9,348 | — | 32,643 | — | |||||||||||
| 28,846 | 202,112 | 39,932 | 9,183 | |||||||||||
| 104,524 | 33,227 | 59,996 | 23,950 | |||||||||||
| 88,809 | 144,243 | 75,414 | 238,696 | |||||||||||
| — | — | — | — | |||||||||||
|
|
|
|
|
|
|
| |||||||
| 9,544,450 | 17,571,954 | 39,817,239 | 342,034 | |||||||||||
|
|
|
|
|
|
|
| |||||||
| $ | 198,937,721 | $ | 1,495,248,002 | $ | 276,142,196 | $ | 111,338,532 | |||||||
|
|
|
|
|
|
|
| |||||||
| 189,586,371 | 1,455,882,914 | 278,894,963 | 111,327,902 | |||||||||||
| — | 62,805 | 295,627 | — | |||||||||||
| (1,942,418 | ) | (13,972,236 | ) | (2,310,394 | ) | 10,630 | ||||||||
| 11,421,130 | 53,274,519 | (476,252 | ) | — | ||||||||||
| (68,738 | ) | — | (33,636 | ) | — | |||||||||
| (53,193 | ) | — | (228,112 | ) | — | |||||||||
| (5,431 | ) | — | — | — | ||||||||||
|
|
|
|
|
|
|
| |||||||
| $ | 198,937,721 | $ | 1,495,248,002 | $ | 276,142,196 | $ | 111,338,532 | |||||||
|
|
|
|
|
|
|
| |||||||
| 11,109,216 | 130,263,595 | 24,478,129 | 111,327,903 | |||||||||||
| $ | 17.91 | $ | 11.48 | $ | 11.28 | $ | 1.00 | |||||||
The accompanying Notes are an integral part of these financial statements.
| Statements of Assets and Liabilities | 83 |
Elfun Funds
Statements of Operations — For the year ended December 31, 2016
Elfun | Elfun Trusts | |||||||
Investment Income | ||||||||
Income | ||||||||
Dividend | $ | 5,869,853 | $ | 36,544,452 | ||||
Interest | 51,411 | 16 | ||||||
Dividend income from affiliated investments | — | 357,000 | ||||||
Interest income from affiliated investments | 14,486 | 222,766 | ||||||
Less: Foreign taxes withheld | (627,191 | ) | — | |||||
|
|
|
| |||||
Total income | 5,308,559 | 37,124,234 | ||||||
|
|
|
| |||||
Expenses | ||||||||
Advisory and administration fees (Note 6) | 651,419 | 3,183,154 | ||||||
Blue Sky fees | 27,031 | 31,287 | ||||||
Transfer agent fees | 144,667 | 552,155 | ||||||
Trustees’ fees (Note 6) | 10,654 | 23,332 | ||||||
Custody and accounting expenses — net (Note 6) | 23,678 | 113,778 | ||||||
Professional fees | 35,930 | 65,566 | ||||||
Other expenses | 35,906 | 190,106 | ||||||
|
|
|
| |||||
Fees waived or amount recouped by the adviser | (146,893 | ) | — | |||||
|
|
|
| |||||
Net expenses | 782,392 | 4,159,378 | ||||||
|
|
|
| |||||
Net investment income (loss), before income tax expense | 4,526,167 | 32,964,856 | ||||||
|
|
|
| |||||
Federal and state income tax expense | — | — | ||||||
|
|
|
| |||||
Net Investment income (loss), net of income tax expense | 4,526,167 | 32,964,856 | ||||||
|
|
|
| |||||
Net Realized and Unrealized Gain (Loss) on Investments | ||||||||
Realized gain (loss) on: | ||||||||
Investments | (7,603,063 | ) | 145,004,444 | |||||
Affiliated investments | — | 14,843,346 | ||||||
Futures | (331,601 | ) | — | |||||
Swap contracts | — | — | ||||||
Foreign currency transactions | (96,330 | ) | — | |||||
Increase (decrease) in unrealized appreciation/depreciation on: | ||||||||
Investments | 865,413 | (55,725,752 | ) | |||||
Futures | (69,937 | ) | — | |||||
Swap contracts | — | — | ||||||
Foreign currency translations | 4,409 | — | ||||||
|
|
|
| |||||
Net realized and unrealized gain (loss) on investments | (7,231,109 | ) | 104,122,038 | |||||
|
|
|
| |||||
Net Increase (Decrease) in Net Assets Resulting from Operations | $ | (2,704,942 | ) | $ | 137,086,894 | |||
|
|
|
| |||||
The accompanying Notes are an integral part of these financial statements.
| 84 | Statements of Operations |
| Elfun Diversified Fund | Elfun Tax-Exempt Income Fund | Elfun Income Fund | Elfun Government | |||||||||||
| $ | 2,668,622 | $ | — | $ | 18,846 | $ | — | |||||||
| 1,972,134 | 63,530,192 | 8,448,100 | 436,161 | |||||||||||
| 250,520 | — | — | — | |||||||||||
| 65,334 | 90,074 | 46,570 | — | |||||||||||
| (128,983 | ) | — | — | — | ||||||||||
|
|
|
|
|
|
|
| |||||||
| 4,827,627 | 63,620,266 | 8,513,516 | 436,161 | |||||||||||
|
|
|
|
|
|
|
| |||||||
| 389,008 | 2,569,214 | 488,795 | 124,377 | |||||||||||
| 27,771 | 31,725 | 31,394 | 26,448 | |||||||||||
| 113,538 | 248,875 | 135,210 | 85,614 | |||||||||||
| 10,590 | 18,970 | 11,086 | 10,075 | |||||||||||
| 173,077 | 98,611 | 168,942 | 62,215 | |||||||||||
| 37,580 | 65,303 | 31,287 | 16,881 | |||||||||||
| 35,856 | 101,160 | 34,371 | 13,733 | |||||||||||
|
|
|
|
|
|
|
| |||||||
| — | — | — | 36,506 | |||||||||||
|
|
|
|
|
|
|
| |||||||
| 787,420 | 3,133,858 | 901,085 | 375,849 | |||||||||||
|
|
|
|
|
|
|
| |||||||
| 4,040,207 | 60,486,408 | 7,612,431 | 60,312 | |||||||||||
|
|
|
|
|
|
|
| |||||||
| — | — | — | 187,966 | |||||||||||
|
|
|
|
|
|
|
| |||||||
| 4,040,207 | 60,486,408 | 7,612,431 | (127,654 | ) | ||||||||||
|
|
|
|
|
|
|
| |||||||
| 539,824 | 7,457,668 | 969,459 | 10,630 | |||||||||||
| 53,001 | — | — | — | |||||||||||
| 986,178 | (761,378 | ) | (132,193 | ) | — | |||||||||
| (221,533 | ) | — | (894,595 | ) | — | |||||||||
| (14,405 | ) | — | — | — | ||||||||||
| 5,641,003 | (58,359,640 | ) | 3,207,601 | — | ||||||||||
| (175,463 | ) | — | (199,437 | ) | — | |||||||||
| (65,921 | ) | — | (288,110 | ) | — | |||||||||
| 238 | — | — | — | |||||||||||
|
|
|
|
|
|
|
| |||||||
| 6,742,922 | (51,663,350 | ) | 2,662,725 | 10,630 | ||||||||||
|
|
|
|
|
|
|
| |||||||
| $ | 10,783,129 | $ | 8,823,058 | $ | 10,275,156 | $ | (117,024 | ) | ||||||
|
|
|
|
|
|
|
| |||||||
The accompanying Notes are an integral part of these financial statements.
| Statements of Operations | 85 |
Elfun Funds
Statements of Changes in Net Assets
| Elfun International Equity Fund | Elfun Trusts | |||||||||||||||
Year Ended December 31, 2016 | Year Ended December 31, 2015* | Year Ended December 31, 2016 | Year Ended December 31, 2015* | |||||||||||||
Increase (Decrease) in Net Assets | ||||||||||||||||
Operations: | ||||||||||||||||
Net investment income | $ | 4,526,167 | $ | 4,060,932 | $ | 32,964,856 | $ | 32,621,203 | ||||||||
Net realized gain (loss) on investments, futures, swap contracts and foreign currency transactions | (8,030,994 | ) | 9,490,815 | 159,847,790 | 145,937,417 | |||||||||||
Net increase (decrease) in unrealized appreciation/depreciation on investments, futures, swap contracts and foreign currency translations | 799,885 | (12,910,334 | ) | (55,725,752 | ) | (134,802,483 | ) | |||||||||
|
|
|
|
|
|
|
| |||||||||
Net increase (decrease) from operations | (2,704,942 | ) | 641,413 | 137,086,894 | 43,756,137 | |||||||||||
|
|
|
|
|
|
|
| |||||||||
Distributions to shareholders from: | ||||||||||||||||
Net investment income | (4,463,973 | ) | (4,270,754 | ) | (32,335,578 | ) | (32,631,167 | ) | ||||||||
Net realized gains | — | — | (160,319,290 | ) | (149,723,012 | ) | ||||||||||
|
|
|
|
|
|
|
| |||||||||
Total distributions | (4,463,973 | ) | (4,270,754 | ) | (192,654,868 | ) | (182,354,179 | ) | ||||||||
|
|
|
|
|
|
|
| |||||||||
Increase (decrease) in assets from operations and distributions | (7,168,915 | ) | (3,629,341 | ) | (55,567,974 | ) | (138,598,042 | ) | ||||||||
|
|
|
|
|
|
|
| |||||||||
Share transactions: | ||||||||||||||||
Proceeds from sale of shares | 2,430,974 | 7,687,967 | 40,411,417 | 52,198,319 | ||||||||||||
Value of distributions reinvested | 3,907,294 | 3,767,932 | 153,709,493 | 145,097,677 | ||||||||||||
Cost of shares redeemed | (25,572,843 | ) | (27,688,653 | ) | (170,906,653 | ) | (171,015,568 | ) | ||||||||
|
|
|
|
|
|
|
| |||||||||
Net increase (decrease) from share transactions | (19,234,575 | ) | (16,232,754 | ) | 23,214,257 | 26,280,428 | ||||||||||
|
|
|
|
|
|
|
| |||||||||
Total increase (decrease) in net assets | (26,403,490 | ) | (19,862,095 | ) | (32,353,717 | ) | (112,317,614 | ) | ||||||||
Net Assets | ||||||||||||||||
Beginning of year | 234,447,818 | 254,309,913 | 2,364,319,478 | 2,476,637,092 | ||||||||||||
|
|
|
|
|
|
|
| |||||||||
End of year | $ | 208,044,328 | $ | 234,447,818 | $ | 2,331,965,761 | $ | 2,364,319,478 | ||||||||
|
|
|
|
|
|
|
| |||||||||
Undistributed (distributions in excess of) net investment income, end of year | $ | — | $ | — | $ | 53,567 | $ | — | ||||||||
Changes in Fund Shares | ||||||||||||||||
Shares sold | 132,254 | 373,067 | 743,822 | 891,191 | ||||||||||||
Issued for distributions reinvested | 211,202 | 193,525 | 2,868,785 | 2,617,674 | ||||||||||||
Shares redeemed | (1,376,432 | ) | (1,332,620 | ) | (3,114,327 | ) | (2,888,958 | ) | ||||||||
|
|
|
|
|
|
|
| |||||||||
Net increase (decrease) in fund shares | (1,032,976 | ) | (766,028 | ) | 498,280 | 619,907 | ||||||||||
|
|
|
|
|
|
|
| |||||||||
| * | Beginning with the year ended December 31, 2016, the Funds were audited by Ernst & Young LLP. The previous years were audited by another independent registered public accounting firm. |
The accompanying Notes are an integral part of these financial statements.
| 86 | Statements of Changes in Net Assets |
| Elfun Diversified Fund | Elfun Tax-Exempt Income Fund | |||||||||||||
Year Ended December 31, 2016 | Year Ended December 31, 2015* | Year Ended December 31, 2016 | Year Ended December 31, 2015* | |||||||||||
| |
|
| ||||||||||||
| $ | 4,040,207 | $ | 3,846,650 | $ | 60,486,408 | $ | 62,688,985 | |||||||
| 1,343,065 | 7,600,987 | 6,696,290 | 4,579,052 | |||||||||||
| 5,399,857 | (14,071,537 | ) | (58,359,640 | ) | (16,826,936 | ) | ||||||||
|
|
|
|
|
|
|
| |||||||
| 10,783,129 | (2,623,900 | ) | 8,823,058 | 50,441,101 | ||||||||||
|
|
|
|
|
|
|
| |||||||
| (3,868,950 | ) | (3,857,222 | ) | (60,486,424 | ) | (62,688,948 | ) | |||||||
| (2,076,599 | ) | (8,123,421 | ) | — | — | |||||||||
|
|
|
|
|
|
|
| |||||||
| (5,945,549 | ) | (11,980,643 | ) | (60,486,424 | ) | (62,688,948 | ) | |||||||
|
|
|
|
|
|
|
| |||||||
| 4,837,580 | (14,604,543 | ) | (51,663,366 | ) | (12,247,847 | ) | ||||||||
|
|
|
|
|
|
|
| |||||||
| 4,779,752 | 7,810,219 | 48,922,399 | 43,503,495 | |||||||||||
| 5,262,614 | 10,589,249 | 41,507,987 | 42,770,187 | |||||||||||
| (25,630,482 | ) | (24,229,945 | ) | (131,791,304 | ) | (110,019,309 | ) | |||||||
|
|
|
|
|
|
|
| |||||||
| (15,588,116 | ) | (5,830,477 | ) | (41,360,918 | ) | (23,745,627 | ) | |||||||
|
|
|
|
|
|
|
| |||||||
| (10,750,536 | ) | (20,435,020 | ) | (93,024,284 | ) | (35,993,474 | ) | |||||||
| 209,688,257 | 230,123,277 | 1,588,272,286 | 1,624,265,760 | |||||||||||
|
|
|
|
|
|
|
| |||||||
| $ | 198,937,721 | $ | 209,688,257 | $ | 1,495,248,002 | $ | 1,588,272,286 | |||||||
|
|
|
|
|
|
|
| |||||||
| $ | — | $ | — | $ | 62,805 | $ | 62,821 | |||||||
| 269,206 | 410,432 | 4,092,545 | 3,667,801 | |||||||||||
| 294,485 | 600,638 | 3,484,183 | 3,606,297 | |||||||||||
| (1,436,390 | ) | (1,284,679 | ) | (11,040,847 | ) | (9,286,454 | ) | |||||||
|
|
|
|
|
|
|
| |||||||
| (872,699 | ) | (273,609 | ) | (3,464,119 | ) | (2,012,356 | ) | |||||||
|
|
|
|
|
|
|
| |||||||
The accompanying Notes are an integral part of these financial statements.
| Statements of Operations | 87 |
Elfun Funds
Statements of Changes in Net Assets
| Elfun Income Fund | Elfun Government Money Market Fund | |||||||||||||||
Year Ended December 31, 2016 | Year Ended December 31, 2015* | Year Ended December 31, 2016 | Year Ended December 31, 2015* | |||||||||||||
Increase (Decrease) in Net Assets |
| |||||||||||||||
Operations: | ||||||||||||||||
Net investment income (loss) | $ | 7,612,431 | $ | 8,245,987 | $ | (127,654 | ) | $ | — | |||||||
Net realized gain (loss) on investments, futures and swap contracts | (57,329 | ) | (184,360 | ) | 10,630 | 533 | ||||||||||
Net increase (decrease) in unrealized appreciation/depreciation on investments, futures and swap contracts | 2,720,054 | (7,179,358 | ) | — | — | |||||||||||
|
|
|
|
|
|
|
| |||||||||
Net increase (decrease) from operations | 10,275,156 | 882,269 | (117,024 | ) | 533 | |||||||||||
|
|
|
|
|
|
|
| |||||||||
Distributions to shareholders from: | ||||||||||||||||
Net investment income | (7,122,727 | ) | (8,344,196 | ) | (60,312 | ) | (104,346 | ) | ||||||||
Net realized gains | (2,276,996 | ) | (558,783 | ) | — | — | ||||||||||
|
|
|
|
|
|
|
| |||||||||
Total distributions | (9,399,723 | ) | (8,902,979 | ) | (60,312 | ) | (104,346 | ) | ||||||||
|
|
|
|
|
|
|
| |||||||||
Increase (decrease) in assets from operations and distributions | 875,433 | (8,020,710 | ) | (177,336 | ) | (103,813 | ) | |||||||||
|
|
|
|
|
|
|
| |||||||||
Share transactions: | ||||||||||||||||
Proceeds from sale of shares | 14,597,102 | 12,735,564 | 49,553,491 | 51,231,809 | ||||||||||||
Value of distributions reinvested | 7,166,423 | 6,651,913 | 54,419 | 94,069 | ||||||||||||
Cost of shares redeemed | (36,369,200 | ) | (34,250,663 | ) | (67,515,314 | ) | (61,401,374 | ) | ||||||||
|
|
|
|
|
|
|
| |||||||||
Net increase (decrease) from share transactions | (14,605,675 | ) | (14,863,186 | ) | (17,907,404 | ) | (10,075,496 | ) | ||||||||
|
|
|
|
|
|
|
| |||||||||
Capital Contribution (Note 7) | — | — | 384,504 | — | ||||||||||||
|
|
|
|
|
|
|
| |||||||||
Total increase (decrease) in net assets | (13,730,242 | ) | (22,883,896 | ) | (17,700,236 | ) | (10,179,309 | ) | ||||||||
Net Assets | ||||||||||||||||
Beginning of year | 289,872,438 | 312,756,334 | 129,038,768 | 139,218,077 | ||||||||||||
|
|
|
|
|
|
|
| |||||||||
End of year | $ | 276,142,196 | $ | 289,872,438 | $ | 111,338,532 | $ | 129,038,768 | ||||||||
|
|
|
|
|
|
|
| |||||||||
Undistributed (distributions in excess of) net investment income, end of year | $ | 295,627 | $ | 359,740 | $ | — | $ | (8,222 | ) | |||||||
Changes in Fund Shares | ||||||||||||||||
Shares sold | 1,268,324 | 1,106,849 | 49,553,491 | 51,126,809 | ||||||||||||
Issued for distributions reinvested | 625,653 | 579,525 | 54,419 | 94,069 | ||||||||||||
Shares redeemed | (3,162,952 | ) | (2,981,124 | ) | (67,515,314 | ) | (61,401,374 | ) | ||||||||
|
|
|
|
|
|
|
| |||||||||
Net decrease in fund shares | (1,268,975 | ) | (1,294,750 | ) | (17,907,404 | ) | (10,180,496 | ) | ||||||||
|
|
|
|
|
|
|
| |||||||||
| * | Beginning with the year ended December 31, 2016, the Funds were audited by Ernst & Young LLP. The previous years were audited by another independent registered public accounting firm. |
The accompanying Notes are an integral part of these financial statements.
| 88 | Statements of Changes in Net Assets |
Elfun Funds
Notes to Financial Statements — December 31, 2016
| 1. | Organization of the Funds |
Elfun International Equity Fund, Elfun Trusts, Elfun Diversified Fund, Elfun Tax-Exempt Income Fund, Elfun Income Fund and Elfun Government Money Market Fund (each a “Fund” and collectively the “Funds”) are each registered under the Investment Company Act of 1940, as amended (the “1940 Act”), as open-end management investment companies. Prior to July 1, 2016, the Funds operated as Employees’ Securities Companies (as defined in the 1940 Act) and, as such, were exempt from certain provisions of the 1940 Act. Each Fund is an investment company and accordingly follows the investment company accounting and reporting guidance of the Financial Accounting Standards Board (“FASB”) Accounting Standard Codification (“ASC”) Topic 946 Financial Services — Investment Companies.
SSGA Funds Management, Inc. (“SSGA FM”) is the investment adviser and administrator of each of the Funds effective July 1, 2016. Prior to July 1, 2016, GE Asset Management Incorporated (“GEAM”) served as the investment adviser and administrator to each Fund.
| 2. | Summary of Significant Accounting Policies |
The preparation of financial statements in conformity with U.S. generally accepted accounting principles (“GAAP”) requires management to make estimates and assumptions that affect the reported amounts of assets and liabilities and disclosure of contingent assets and liabilities at the date of the financial statements and the reported amounts of increases and decreases in net assets from operations during the reporting period. Actual results may differ from those estimates.
Subsequent events after the balance sheet date through the date the financial statements were issued have been evaluated in the preparation of the financial statements. There are no items to report.
The following summarizes the significant accounting policies of the Funds:
Securities Valuation and Transactions All investments in securities are recorded at their estimated fair value, as described in Note 3.
Securities transactions are accounted for as of the trade date. Realized gains and losses on investments sold are recorded on the basis of identified cost for both financial statement and federal tax purposes.
Repurchase Agreements Some of the Funds engage in repurchase agreement transactions with respect to instruments that are consistent with the Fund’s investment objectives or policies. The Funds’ custodian takes possession of the collateral pledged for investments in repurchase agreements on behalf of the Funds. The Funds value the underlying collateral daily on a mark-to-market basis to determine that the value, including accrued interest, is at least equal to 102% for domestic securities and 105% for international securities of the repurchase price. In the event the seller defaults and the value of the security declines, or if the seller enters an insolvency proceeding, realization of the collateral by the Funds may be delayed or limited.
At December 31, 2016, the Elfun Government Money Market Fund had investments in repurchase agreements with a gross value of $21,443,000. The value of the related collateral exceeded the value of the repurchase agreements at December 31, 2016.
Foreign Currency Accounting records of the Funds are maintained in U.S. dollars. Investment securities and other assets and liabilities denominated in a foreign currency are translated to U.S. dollars at the prevailing rates of exchange at period end. Purchases and sales of securities, income receipts and expense payments denominated in foreign currencies are translated into U.S. dollars at the prevailing exchange rate on the respective dates of such transactions.
All assets and liabilities of the Funds initially expressed in foreign currency values will be converted into U.S. dollars at the WM/Reuters exchange rate computed at 11:00 a.m. Eastern time.
The Funds do not isolate the portion of the results of operations resulting from changes in foreign exchange rates from the fluctuations arising from changes in the market prices of securities during the year. Such fluctuations are included in the net realized or unrealized gain or loss from investments. Net realized gains or losses on foreign currency transactions represent net gains or losses on sales and maturities of foreign currency contracts, disposition of foreign currencies, the difference between the amount of net investment income and withholding taxes accrued and the U.S. dollar amount actually received or paid, and gains or losses between the trade and settlement date on purchases and sales of foreign securities. Net unrealized foreign exchange gains and losses arising from changes in the value of other assets and liabilities (including foreign currencies and
| Notes to Financial Statements | 89 |
Elfun Funds
Notes to Financial Statements, continued — December 31, 2016
open foreign currency contracts) as a result of changes in foreign exchange rates are included as increases or decreases in unrealized appreciation/depreciation on foreign currency related transactions.
Derivatives The Funds are subject to equity price risk, interest rate risk, credit risk, and foreign currency exchange rate risk in the normal course of pursuing their investment objectives. Certain Funds entered into derivative transactions (such as options, futures, options on future, interest rate futures, interest rate swaps and credit default swaps) to gain or hedge exposure to certain types of securities as an alternative to investing directly in or selling such securities, or to manage: yield, interest rate exposure (also known as duration), exposure to credit quality, and to gain exposure to certain market segments.
Futures Contracts A futures contract is an agreement to buy or sell a specific amount of a commodity, financial instrument, currency or index at a particular price and future date. Certain Funds may invest in interest rate, financial and stock or bond index futures contracts subject to certain limitations. During the fiscal year ended December 31, 2016, the Elfun International Equity Fund entered into stock index futures contracts for the purpose of gaining market exposure and investing residual cash positions. The Elfun Diversified Fund entered into futures contracts on various stock indices, bonds and notes for the purposes of gaining market exposure, investing residual cash positions and managing duration of fixed income investments. The Elfun Tax-Exempt Income Fund and Elfun Income Fund invested in futures contracts on bonds and notes for to manage duration of fixed income securities. Buying futures tends to increase a Fund’s exposure to the underlying instrument while selling futures tends to decrease a Fund’s exposure to the underlying instrument, or hedge other Fund investments. With futures contracts, there is minimal counterparty credit risk to a Fund since futures contracts are exchange traded and the exchange’s clearinghouse, as counterparty to all traded futures, guarantees the futures against default. A Fund’s risks in using these contracts include changes in the value of the underlying instruments, non-performance of the counterparties under the contracts’ terms and changes in the liquidity of the secondary market for the contracts. Futures contracts are valued at the settlement price established each day by the board of trade or exchange on which they principally trade.
Upon entering into a financial futures contract, a Fund is required to pledge to the broker an amount of cash and/or other assets equal to a certain percentage of the contract amount, known as initial margin deposit. Subsequent payments, known as variation margin, are made or received by a Fund each day, depending on the daily fluctuation in the fair value of the underlying security. A Fund records an unrealized gain or loss equal to the daily variation margin. Should market conditions move unexpectedly, a Fund may not achieve the anticipated benefits of the futures contracts and may incur a loss. A Fund recognizes a realized gain or loss on the expiration or closing of a futures contract.
When-Issued Securities and Forward Commitments The Elfun Income Fund and Elfun Diversified Fund may purchase or sell securities on a when-issued or forward commitment basis. These transactions are arrangements in which a Fund purchases and sells securities with payment and delivery scheduled a month or more after entering into the transaction. The price of the underlying securities and the date when these securities will be delivered and paid for are fixed at the time the transaction is negotiated. Losses may arise due to changes in the market value of the underlying securities or if the counterparty does not perform under the commitments. In connection with such purchases, a Fund maintains cash or liquid assets in an amount equal to the purchase commitments for such underlying securities until settlement date and for sales commitments a Fund maintains equivalent deliverable securities as “cover” for the transaction. Unsettled commitments are valued at the current market value of the underlying security. Daily fluctuations in the value of such commitments are recorded as unrealized gains or losses. The Funds will not enter into such commitments for the purpose of investment leverage.
Credit Default Swaps During the fiscal year ended December 31, 2016, the Elfun Diversified Fund and the Elfun Income Fund engaged in credit default swaps to manage credit risk. When a Fund is the buyer in a credit default swap contract, a Fund is entitled to receive the par (or other agreed upon) value (full notional value) of a referenced debt obligation (or basket of debt obligations) from the counterparty (or central clearing party (“CCP”) in the case of a centrally cleared swap) to the contract if a credit event by a third party, such as a U.S. or foreign corporate issuer or sovereign issuer, on the debt obligation occurs. In return, a Fund pays the counterparty a periodic stream of payments over the term of the contract provided that no credit event has occurred. If no credit event occurs, a Fund loses its investment and recovers nothing. However, if a credit event occurs, a Fund receives full notional value for a referenced debt obligation that may have little or no value. When a Fund is the seller of a credit default swap, it receives a fixed rate of income throughout the term of the contract, provided there is no credit event. If a credit event occurs, a Fund is obligated to pay the notional amount of the swap and in certain instances take delivery of securities of the reference entity upon the occurrence of a credit event, as defined under the terms of that particular swap
| 90 | Notes to Financial Statements |
Elfun Funds
Notes to Financial Statements, continued — December 31, 2016
agreement. Credit events are contract specific but may include bankruptcy, failure to pay, restructuring, obligation acceleration and repudiation/moratorium. If a Fund is a seller of protection and a credit event occurs, the maximum potential amount of future payments that a Fund could be required to make would be an amount equal to the notional amount of the agreement. This potential amount would be partially offset by any recovery value of the respective referenced obligation, or net amount received from the settlement of a buy protection credit default swap agreement entered into by a Fund for the same referenced obligation. As the seller, a Fund may create economic leverage to its portfolio because, in addition to its total net assets, a Fund is subject to investment exposure on the notional amount of the swap. The interest fee paid or received on the swap, which is based on a specified interest rate on a fixed notional amount, is accrued daily as a component of unrealized appreciation (depreciation) and is recorded as realized gain upon receipt or realized loss upon payment. A Fund also records an increase or decrease to unrealized appreciation (depreciation) in an amount equal to the daily valuation. For centrally cleared swaps, the daily change in valuation is recorded as a receivable or payable for variation margin and settled in cash with the CCP daily. All upfront payments, if any, are amortized over the life of the swap as realized gains or losses. Those upfront payments that are paid or received, typically for non-centrally cleared swaps, are recorded as other assets or other liabilities, respectively, net of amortization. For financial reporting purposes, unamortized upfront payments, if any, are netted with unrealized appreciation or depreciation on swaps to determine the market value of swaps. A Fund segregates assets in the form of cash or liquid securities in an amount equal to the notional amount of the credit default swaps of which it is the seller. A Fund segregates assets in the form of cash or liquid securities in an amount equal to any unrealized depreciation of the credit default swaps of which it is the buyer, marked to market on a daily basis. Credit default swaps involve greater risks than if a Fund had invested in the referenced debt obligation directly. If a Fund is a buyer of a credit default swap and no credit event occurs, a Fund will not earn any return on its investment. If a Fund is a seller of a credit default swap, a Fund’s risk of loss may be the entire notional amount of the swap. Swaps may also subject a Fund to the risk that the counterparty to the transaction may not fulfill its obligation. In the case of centrally cleared swaps, counterparty risk is minimal due to protections provided by the CCP.
Forward Foreign Currency Exchange Contracts Certain Funds may enter into forward foreign currency exchange contracts to facilitate transactions in foreign denominated securities and to manage currency exposure. Forward foreign currency exchange contracts are valued at the mean between the bid and the offered forward rates as last quoted by a recognized dealer. The aggregate principal amounts of the contracts are not recorded in a Fund’s financial statements. Such amounts appear under the caption Forward Foreign Currency Contracts in the Schedules of Investments. Fluctuations in the value of the contracts are recorded in the Statements of Assets and Liabilities as an asset (or liability) and in the Statements of Operations as unrealized appreciation (depreciation) until the contracts are closed, when they are recorded as realized gains or losses on foreign currency related transactions. A Fund’s risks in using these contracts include changes in the value of foreign currency or the possibility that the counterparties do not perform under the contracts’ terms. When a Fund enters into a forward foreign currency exchange contract, it is required to segregate cash or liquid securities with its custodian in an amount equal to the value of a Fund’s total assets committed to the consummation of the forward contract. If the value of the segregated securities declines, additional cash or securities are segregated so that the value of the account will equal the amount of a Fund’s commitment with respect to the contract. None of the Funds held any open forward foreign currency exchange contracts at December 31, 2016.
Investments in Foreign Markets Investments in foreign markets involve special risks and considerations not typically associated with investing in the United States. These risks include revaluation of currencies, high rates of inflation, restrictions on repatriation of income and capital, and adverse political and economic developments. Moreover, securities issued in these markets may be less liquid, subject to government ownership controls, tariffs and taxes, subject to delays in settlements, and their prices may be more volatile.
A Fund may be subject to capital gains and repatriation taxes imposed by certain countries in which it invests. Such taxes are generally based upon income and/or capital gains earned or repatriated. Taxes are accrued based on net investment income, net realized gains and net unrealized appreciation as income and/or capital gains are earned. These foreign taxes, if any, are paid by the Funds and are reflected in the Statements of Operations, if applicable. Foreign taxes payable or deferred as of December 31, 2016, if any, are disclosed in the Funds’ Statements of Assets and Liabilities.
Investment Income Corporate actions (including cash dividends) are recorded on the ex-dividend date, net of applicable withholding taxes, except for certain foreign corporate actions which are recorded as soon after the ex-dividend date as such information becomes available. Withholding taxes on foreign dividends, if any, have been provided for in accordance with a Fund’s understanding of the applicable country’s tax rules and rates.
| Notes to Financial Statements | 91 |
Elfun Funds
Notes to Financial Statements, continued — December 31, 2016
Interest income is recorded on the accrual basis. Accretion of discounts and amortization of premiums on bonds are computed, using the effective yield method.
Expenses Fund specific expenses are charged to the Fund that incurs such expenses. Such expenses may include custodial fees, legal and accounting fees, printing costs and registration fees. Expenses that are not fund specific are allocated pro rata across the Funds. Expenses of the Fund are generally paid directly by the Fund; however, expenses may be paid by the investment adviser and reimbursed by the Fund.
Federal Income Taxes The Funds intend to comply with all sections of the Internal Revenue Code of 1986, as amended (the “Internal Revenue Code”), applicable to regulated investment companies including the distribution of substantially all of their taxable net investment income, tax-exempt income and net realized capital gains to their shareholders. Therefore, no provision for federal income tax has been made for the Funds, except for the Elfun Government Money Market Fund, where a provision for income tax related to the capital contribution discussed in Note 7 is reflected in the Statement of Operations. Each Fund is treated as a separate taxpayer for federal income tax purposes.
| 3. | Security Valuation and Transactions |
The Funds utilize various methods to measure the fair value of all of their investments on a recurring basis. GAAP establishes a framework for measuring fair value and providing related disclosures. Broadly, the framework requires fair value to be determined based on the exchange price that would be received for an asset or paid to transfer a liability (an exit price) in the principal or most advantageous market for the asset or liability in an orderly transaction between market participants at the measurement date. In the absence of active markets for the identical assets or liabilities, such measurements involve developing assumptions based on market observable data and, in the absence of such data, internal information that is consistent with what market participants would use in a hypothetical transaction that occurs at the measurement date. It also establishes a three-level valuation hierarchy based upon observable and non-observable inputs.
Observable inputs reflect market data obtained from independent sources, while unobservable inputs reflect our market assumptions. Preference is given to observable inputs. These two types of inputs create the following fair value hierarchy:
| • | Level 1 — Quoted prices for identical investments in active markets. |
| • | Level 2 — Quoted prices for similar investments in active markets; quoted prices for identical or similar investments in markets that are not active; and model-derived valuations whose inputs are observable or whose significant value drivers are observable. |
| • | Level 3 — Significant inputs to the valuation model are unobservable. |
Policies and procedures are maintained to value investments using the best and most relevant data available. In addition, pricing vendors are utilized to assist in valuing investments. SSGA FM performs periodic reviews of the methodologies used by independent pricing services including price validation of individual securities.
Fair Value Measurement The following section describes the valuation methodologies the Funds use to measure different financial investments at fair value.
A Fund’s portfolio securities are valued generally on the basis of market quotations. Equity securities generally are valued at the last reported sale price on the primary market in which they are traded. Portfolio securities listed on NASDAQ are valued using the NASDAQ Official Closing Price, Level 1 securities primarily include publicly-traded equity securities, which may not necessarily represent the last sales price. If no sales occurred on the exchange or NASDAQ that day, the portfolio security generally is valued using the last reported bid price. In those circumstances the Fund typically classifies the investment securities in Level 2.
Debt securities (other than short-term securities described below) generally are valued at an evaluated bid price as reported by independent pricing services. The pricing services use various pricing models for each asset class. The inputs and assumptions to the model of the pricing services are derived from market observable sources, which may include: benchmark yields, reported trades, broker/dealer quotes, issuer spreads, benchmark securities, bids, offers, and other market related data. Since many fixed income securities do not trade on a daily basis, the methodology of the pricing service may use other available
| 92 | Notes to Financial Statements |
Elfun Funds
Notes to Financial Statements, continued — December 31, 2016
information such as benchmark curves, benchmarking of similar securities, sector groupings, and matrix pricing, as applicable. Thus, certain securities may not be priced using market quotations, but rather determined from market observable information. These investments are included in Level 2 and are primarily comprised of corporate fixed income, government, mortgage and asset-backed securities. In the absence of a reliable bid price from such a pricing service, debt securities may be valued based on broker or dealer supplied valuations or quotations. In these infrequent circumstances, pricing services may provide the Funds with valuations that are based on significant unobservable inputs, and in those circumstances the investment securities are classified as Level 3.
A Fund may use non-binding broker or dealer quotes for valuation when there is limited or no relevant market activity for a specific investment or for other investments that share similar characteristics and a price is not provided by a pricing service or is deemed not to be reliable. The Funds have not adjusted the prices obtained. Investment securities priced using non-binding broker or dealer quotes are included in Level 3.
Short-term securities of sufficient credit quality with remaining maturities of sixty days or less at the time of purchase are typically valued on the basis of amortized cost which approximates fair value and these are included in Level 2. If it is determined that amortized cost does not approximate fair value, securities may be valued based on dealer supplied valuations or quotations. In these infrequent circumstances, pricing services may provide the Fund with valuations that are based on significant unobservable inputs, and in those circumstances the investment securities are classified in Level 3.
The Elfun Government Money Market Fund’s securities are recorded on the basis of amortized cost which approximates fair value as permitted by Rule 2a-7 under the 1940 Act. This method values a security at its cost on the date of purchase and, thereafter, assumes a constant amortization to maturity of any premiums or accretion of any discounts.
Investments in registered investment companies are valued at the published daily net asset value (“NAV”) and classified in Level 1.
If prices are not readily available for a portfolio security, or if it is believed that a price for a portfolio security does not represent its fair value, the security may be valued using procedures approved by the Funds’ Board of Trustees that are designed to establish its “fair” value. These securities are typically classified in Level 3. Those procedures require that the fair value of a security be established by a valuation committee of the investment adviser. The valuation committee follows different protocols for different types of investments and circumstances. The fair value procedures may be used to value any investment of any Fund in the appropriate circumstances.
Foreign securities may be valued with the assistance of an independent fair value pricing service in circumstances where it is believed that they have been or would be materially affected by events occurring after the close of the portfolio security’s primary market and before the close of regular trading on the New York Stock Exchange (“NYSE”). In these circumstances, the Funds classify the investment securities in Level 2. This independent fair value pricing service uses a proprietary model to identify affected securities, taking into consideration various factors, and the fair value of such securities may be something other than the last available quotation or other market price.
All assets and liabilities of the Funds initially expressed in foreign currency values will be converted into U.S. dollars at the WM/Reuters exchange rate computed at 11:00 a.m. Eastern time.
Fair value determinations generally are used for securities whose value is affected by a significant event that will materially affect the value of a security and which occurs subsequent to the time of the close of the principal market on which such security trades but prior to the calculation of a Fund’s NAV.
The value established for such a portfolio security valued other than by use of a market quotation (as described above) may be different than what would be produced through the use of market quotations or another methodology. Portfolio securities that are valued using techniques other than market quotations, including “fair valued” securities, may be subject to greater fluctuation in their value from one day to the next than would be the case if market quotations were used. In addition, there is no assurance that a Fund could sell a portfolio security for the value established for it at any time and it is possible that a Fund would incur a loss because a portfolio security is sold at a discount to its established value.
Other financial investments are derivative instruments that are not reflected in total investments, such as futures, forwards, swaps, and written options contracts, which are valued based on fair value as discussed above.
| Notes to Financial Statements | 93 |
Elfun Funds
Notes to Financial Statements, continued — December 31, 2016
The Funds use closing prices for derivatives included in Level 1, which are traded either on exchanges or liquid over-the counter markets. Derivative assets and liabilities included in Level 2 primarily represent interest rate swaps, cross-currency swaps and foreign currency and commodity forward and option contracts. Derivative assets and liabilities included in Level 3 primarily represent interest rate products that contain embedded optionality or prepayment features.
The inputs or methodology used for valuing securities are not an indication of the risk associated with investing in those securities.
The following tables present each Fund’s investments measured at fair value on a recurring basis at December 31, 2016:
| Fund | Investments | Level 1 | Level 2 | Level 3 | Total | |||||||||||||
| Elfun International Equity Fund | Investments in Securities† | |||||||||||||||||
Common Stock | $ | 200,501,899 | $ | — | $ | — | $ | 200,501,899 | ||||||||||
Short-Term Investments | 6,981,686 | — | — | 6,981,686 | ||||||||||||||
|
|
|
|
|
|
|
| |||||||||||
Total Investments in Securities | $ | 207,483,585 | $ | — | $ | — | $ | 207,483,585 | ||||||||||
|
|
|
|
|
|
|
| |||||||||||
Other Financial Instruments* | ||||||||||||||||||
Long Futures Contracts — Unrealized Depreciation | $ | (14,870 | ) | $ | — | $ | — | $ | (14,870 | ) | ||||||||
|
|
|
|
|
|
|
| |||||||||||
| Elfun Trusts | Investments in Securities† | |||||||||||||||||
Common Stock | $ | 2,273,808,610 | $ | — | $ | — | $ | 2,273,808,610 | ||||||||||
Short-Term Investments | 53,209,078 | — | — | 53,209,078 | ||||||||||||||
|
|
|
|
|
|
|
| |||||||||||
Total Investments in Securities | $ | 2,327,017,688 | $ | — | $ | — | $ | 2,327,017,688 | ||||||||||
|
|
|
|
|
|
|
| |||||||||||
| Elfun Diversified Fund | Investments in Securities† | |||||||||||||||||
Domestic Equity | $ | 66,226,946 | $ | — | $ | — | $ | 66,226,946 | ||||||||||
Foreign Equity | 39,517,147 | — | — | 39,517,147 | ||||||||||||||
U.S. Treasuries | — | 14,181,482 | — | 14,181,482 | ||||||||||||||
Agency Mortgage Backed | — | 18,183,013 | — | 18,183,013 | ||||||||||||||
Agency Collateralized Mortgage Obligations | — | 869,070 | — | 869,070 | ||||||||||||||
Corporate Notes | — | 26,384,739 | — | 26,384,739 | ||||||||||||||
Non-Agency Collateralized Mortgage Obligations | — | 3,716,369 | — | 3,716,369 | ||||||||||||||
Sovereign Bonds | — | 519,399 | — | 519,399 | ||||||||||||||
Municipal Bonds and Notes | — | 382,475 | — | 382,475 | ||||||||||||||
FNMA (TBA) | — | — | 1,170 | 1,170 | ||||||||||||||
Exchange Traded Funds | 14,907,332 | — | — | 14,907,332 | ||||||||||||||
Short-Term Investments | 22,591,439 | — | — | 22,591,439 | ||||||||||||||
|
|
|
|
|
|
|
| |||||||||||
Total Investments in Securities | $ | 143,242,864 | $ | 64,236,547 | $ | 1,170 | $ | 207,480,581 | ||||||||||
|
|
|
|
|
|
|
| |||||||||||
Other Financial Instruments* | ||||||||||||||||||
Credit Default Swap Contracts — Unrealized Depreciation | $ | — | $ | (53,193 | ) | $ | — | $ | (53,193 | ) | ||||||||
Long Futures Contracts — Unrealized Depreciation | (108,294 | ) | — | — | (108,294 | ) | ||||||||||||
Short Futures Contracts — Unrealized Appreciation | 40,845 | — | — | 40,845 | ||||||||||||||
Short Futures Contracts — Unrealized Depreciation | (1,289 | ) | — | — | (1,289 | ) | ||||||||||||
|
|
|
|
|
|
|
| |||||||||||
Total Other Financial Instruments | $ | (68,738 | ) | $ | (53,193 | ) | $ | — | $ | (121,931 | ) | |||||||
|
|
|
|
|
|
|
| |||||||||||
| 94 | Notes to Financial Statements |
Elfun Funds
Notes to Financial Statements, continued — December 31, 2016
| Fund | Investments | Level 1 | Level 2 | Level 3 | Total | |||||||||||||
| Elfun Tax-Exempt Income Fund | Investments in Securities† | |||||||||||||||||
Municipal Bonds and Notes | $ | — | $ | 1,443,198,288 | $ | — | $ | 1,443,198,288 | ||||||||||
Short-Term Investments | 50,202,639 | — | — | 50,202,639 | ||||||||||||||
|
|
|
|
|
|
|
| |||||||||||
Total Investments in Securities | $ | 50,202,639 | $ | 1,443,198,288 | $ | — | $ | 1,493,400,927 | ||||||||||
|
|
|
|
|
|
|
| |||||||||||
| Elfun Income Fund | Investments in Securities† | |||||||||||||||||
U.S. Treasuries | $ | — | $ | 54,740,630 | $ | — | $ | 54,740,630 | ||||||||||
Agency Mortgage Backed | — | 79,780,899 | — | 79,780,899 | ||||||||||||||
Agency Collateralized Mortgage Obligations | — | 4,026,685 | — | 4,026,685 | ||||||||||||||
Asset Backed | — | 247,129 | — | 247,129 | ||||||||||||||
Corporate Notes | — | 114,692,822 | — | 114,692,822 | ||||||||||||||
Non-Agency Collateralized Mortgage Obligations | — | 16,632,586 | — | 16,632,586 | ||||||||||||||
Sovereign Bonds | — | 1,798,188 | — | 1,798,188 | ||||||||||||||
Municipal Bonds and Notes | — | 1,950,842 | — | 1,950,842 | ||||||||||||||
FNMA (TBA) | — | — | 4,689 | 4,689 | ||||||||||||||
Preferred Stock | 325,243 | — | — | 325,243 | ||||||||||||||
Short-Term Investments | 39,582,709 | — | — | 39,582,709 | ||||||||||||||
|
|
|
|
|
|
|
| |||||||||||
Total Investments in Securities | $ | 39,907,952 | $ | 273,869,781 | $ | 4,689 | $ | 313,782,422 | ||||||||||
|
|
|
|
|
|
|
| |||||||||||
Other Financial Instruments* | ||||||||||||||||||
Credit Default Swap Contracts — Unrealized Depreciation | $ | — | $ | (228,112 | ) | $ | — | $ | (228,112 | ) | ||||||||
Long Futures Contracts — Unrealized Depreciation | (64,077 | ) | — | — | (64,077 | ) | ||||||||||||
Short Futures Contracts — Unrealized Appreciation | 31,139 | — | — | 31,139 | ||||||||||||||
Short Futures Contracts — Unrealized Depreciation | (698 | ) | — | — | (698 | ) | ||||||||||||
|
|
|
|
|
|
|
| |||||||||||
Total Other Financial Instruments | $ | (33,636 | ) | $ | (228,112 | ) | $ | — | $ | (261,748 | ) | |||||||
|
|
|
|
|
|
|
| |||||||||||
| Elfun Government Money Market Fund | Investments in Securities† | |||||||||||||||||
U.S. Treasuries | $ | — | $ | 40,575,662 | $ | — | $ | 40,575,662 | ||||||||||
U.S. Government Agency Obligations | — | 49,140,953 | — | 49,140,953 | ||||||||||||||
Repurchase Agreements | — | 21,443,000 | — | 21,443,000 | ||||||||||||||
|
|
|
|
|
|
|
| |||||||||||
| Total Investments in Securities | $ | — | $ | 111,159,615 | $ | — | $ | 111,159,615 | ||||||||||
|
|
|
|
|
|
|
| |||||||||||
| † | See Schedules of Investments for Industry Classification. |
| * | Other financial instruments include derivative instruments such as futures contracts and credit default swaps. Amounts shown represent unrealized appreciation (depreciation), at period end. |
There were no transfers between fair value levels during the period. Transfers between fair value levels are recognized at the beginning of the period.
| Notes to Financial Statements | 95 |
Elfun Funds
Notes to Financial Statements, continued — December 31, 2016
| 4. | Derivatives Disclosure |
Shown below are the derivative contracts entered into by each Fund, summarized by primary risk exposure as they appear on the Statements of Assets and Liabilities, none of which are accounted for as hedging instruments under FASB ASC No. 815 Derivatives and Hedging (“ASC 815”) as of December 31, 2016.
Asset Derivatives December 31, 2016 | Liability Derivatives December 31, 2016 | |||||||||||
Derivatives not accounted for as hedging instruments under ASC 815 | Location in the Statements of Assets and Liabilities | Fair Value ($) | Location in the Statements of Assets and Liabilities | Fair Value ($) | ||||||||
| Elfun International Equity Fund | ||||||||||||
| Equity Contracts | Assets, Net Assets — Net Unrealized Appreciation/ (Depreciation) on Futures | — | Liabilities, Net Assets — Net Unrealized Appreciation/ (Depreciation) on Futures | (14,870 | )* | |||||||
| Elfun Diversified Fund | ||||||||||||
| Equity Contracts | Assets, Net Assets — Net Unrealized Appreciation/ (Depreciation) on Futures | 31,326 | * | Liabilities, Net Assets — Net Unrealized Appreciation/ (Depreciation) on Futures | (93,881 | )* | ||||||
| Interest Rate Contracts | Assets, Net Assets — Net Unrealized Appreciation/ (Depreciation) on Futures | 9,519 | * | Liabilities, Net Assets — Net Unrealized Appreciation/ (Depreciation) on Futures | (15,702 | )* | ||||||
| Credit Risk Contracts | Assets, Net Assets — Net Unrealized Appreciation/ (Depreciation) on Swap Contracts | — | Liabilites, Net Assets — Net Unrealized Appreciation/ (Depreciation) on Swap Contracts | (53,193 | )* | |||||||
| Elfun Income Fund | ||||||||||||
| Interest Rate Contracts | Assets, Net Assets — Net Unrealized Appreciation/ (Depreciation) on Futures | 31,139 | * | Liabilities, Net Assets — Net Unrealized Appreciation/ (Depreciation) on Futures | (64,775 | )* | ||||||
| Credit Risk Contracts | Assets, Net Assets — Net Unrealized Appreciation/ (Depreciation) on Swap Contracts | — | Liabilites, Net Assets — Net Unrealized Appreciation/ (Depreciation) on Swap Contracts | (228,112 | )* | |||||||
| * | Includes cumulative unrealized appreciation/(depreciation) of futures and credit default swap contracts as reported in the Schedules of Investments and within the components of the net assets section of the Statement of Assets and Liabilities. Only the current day’s variation margin is reported within the Assets and/or Liabilities section on the Statement of Assets and Liabilities. |
Shown below are the effects of derivative instruments on each Fund’s Statement of Operations, summarized by primary risk exposure, none of which are accounted for as hedging instruments under ASC 815.
| Derivatives not accounted for as hedging instruments under ASC 815 | Location in the Statements of Operations | Realized Gain (Loss) on Derivatives Recognized in Income ($) | Change in Unrealized Appreciation (Depreciation) on Derivatives Recognized in Income ($) | |||||||
| Elfun International Equity Fund | ||||||||||
| Equity Contracts | Realized gain (loss) on Futures, Increase (decrease) in unrealized appreciation/(depreciation) on Futures | (331,601 | ) | (69,937 | ) | |||||
| Elfun Diversified Fund | ||||||||||
| Equity Contracts | Realized gain (loss) on Futures, Increase (decrease) in unrealized appreciation/(depreciation) on Futures | 909,751 | (132,857 | ) | ||||||
| Interest Rate Contracts | Realized gain/(loss) on futures, Increase/(decrease) in unrealized appreciation/(depreciation) on Futures | 76,427 | (42,606 | ) | ||||||
| Credit Risk Contracts | Realized gain/(loss) on credit default swaps Increase/(decrease) in unrealized appreciation/(depreciation) on swap contracts | (221,533 | ) | (65,921 | ) | |||||
| Elfun Tax-Exempt Income Fund | ||||||||||
| Interest Rate Contracts | Realized gain/(loss) on futures, Increase/(decrease) in unrealized appreciation/(depreciation) on Futures | (761,378 | ) | — | ||||||
| 96 | Notes to Financial Statements |
Elfun Funds
Notes to Financial Statements, continued — December 31, 2016
| Derivatives not accounted for as hedging instruments under ASC 815 | Location in the Statements of Operations | Realized Gain (Loss) on Derivatives Recognized in Income ($) | Change in Unrealized Appreciation (Depreciation) on Derivatives Recognized in Income ($) | |||||||
| Elfun Income Fund | ||||||||||
| Interest Rate Contracts | Realized gain/(loss) on futures, Increase/(decrease) in unrealized appreciation/(depreciation) on Futures | (132,193 | ) | (199,437 | ) | |||||
| Credit Risk Contracts | Realized gain/(loss) on credit default swaps Increase/(decrease) in unrealized appreciation/(depreciation) on swap contracts | (894,595 | ) | (288,110 | ) | |||||
During the fiscal year ended December 31, 2016, the Funds had an average notional value of long and short futures contracts as shown below. The Elfun Diversified and Elfun Income Fund had average notional values of $3,386,836 and $14,697,243 on credit default swaps, respectively. Please refer to the table following the Schedule of Investments for open futures contracts and open swap contracts at December 31, 2016.
| Fund | Long Futures Contracts | Short Futures Contracts | ||||||
Elfun International Equity Fund | $ | 2,290,326 | $ | 563,635 | ||||
Elfun Diversified Fund | 14,062,620 | 11,063,218 | ||||||
Elfun Tax-Exempt Income Fund | 4,335,457 | — | ||||||
Elfun Income Fund | 32,422,725 | 29,396,854 | ||||||
| 5. | Line of Credit |
Prior to July 1, 2016, the Funds (excluding Elfun Government Money Market Fund) shared a revolving credit facility of up to $150 million with a number of their affiliates. The credit facility was with the Funds’ custodian bank, State Street Bank and Trust Company (“State Street”). The revolving credit facility required the payment of a commitment fee equal to 0.20% (0.125% prior to October 28, 2015) per annum on the daily unused portion of the credit facility, payable quarterly. The portion borne by each Fund generally was borne proportionally based upon net assets. In addition, the Funds had a $100 million uncommitted, unsecured line of credit with State Street which expired effective October 28, 2015. Generally, borrowings under the credit facilities would accrue interest at the higher of the Overnight LIBOR plus 1.25% and the Overnight Federal Funds Rate plus 1.25% and would be borne by the borrowing Fund. The maximum amount allowed to be borrowed by any one Fund was the lesser of (i) its prospectus limitation or (ii) 20% of its net assets. The revolving credit facility with State Street was terminated effective June 30, 2016.
Currently, the Funds (excluding Elfun Government Money Market Fund) and other affiliated funds (each a “Participant” and, collectively, the “Participants”) participate in a $360 million revolving credit facility provided by a syndication of banks under which the Participants may borrow to fund shareholder redemptions. This agreement expires October 12, 2017, unless extended or renewed.
The Participants are charged an annual commitment fee which is calculated based on the unused portion of the shared credit line. Commitment fees are allocated among each of the Participants based on relative net assets. A Participant incurs and pays the interest expense related to its borrowing. Interest is calculated at a rate per annum equal to the sum of 1% plus the greater of the New York Fed Bank Rate and 1-month LIBOR rate. From July 1, 2016, the date the Funds were added to this credit facility, through October 12, 2016, interest was calculated at a rate per annum equal to the sum of the New York Fed Bank Rate plus 1%.
The Funds did not utilize any of the credit facilities for the fiscal year ended December 31, 2016.
| Notes to Financial Statements | 97 |
Elfun Funds
Notes to Financial Statements, continued — December 31, 2016
| 6. | Compensation and Fees paid to Affiliates |
SSGA FM, a registered investment adviser, was retained by the Board of Trustees of each Fund (the “Board”) effective July 1, 2016 to act as investment adviser and administrator of each Fund. SSGA FM’s compensation for investment advisory and administrative services (“Management Fee”) is paid monthly based on the average daily net assets of each Fund. The Management Fee is stated in the following schedule:
| Fund | Management Fee | |
Elfun International Equity Fund | 0.21% | |
Elfun Trusts | 0.14% | |
Elfun Diversified Fund | 0.17% | |
Elfun Tax-Exempt Income Fund | 0.16% | |
Elfun Income Fund | 0.17% | |
Elfun Government Money Market Fund | 0.10% |
With respect to the Elfun Government Money Market Fund, SSGA FM has voluntarily undertaken to subsidize its management fees and/or certain expenses of the Elfun Government Money Market Fund to the extent necessary to maintain a minimum annualized net yield of 0.00%. This voluntary management fee and/or other expense subsidy may be modified or discontinued by SSGA FM at any time without prior notice. There can be no assurance that these expense subsidies will be sufficient to avoid any loss.
Prior to July 1, 2016, GEAM served as the Funds’ investment adviser and administrator and received compensation from the Funds based on the cost of services rendered by GEAM as investment adviser and administrator. These expenses are included in advisory and administration fees (“Management Fees”) in the Statements of Operations.
GEAM voluntarily subsidized certain expenses of the Elfun Government Money Market Fund (the “Fund”) and, to the extent necessary, reduced its management expense in order to maintain a minimum annualized net yield of 0.00% for the Fund. Pursuant to an agreement between GEAM and the Fund, the Fund agreed to reimburse GEAM for such fee waivers for a period of up to three years from the date of such fee waivers, as long as the Fund’s total operating expense ratio did not exceed 0.60% for the fiscal year in which the reimbursement was made. The amount that the Fund reimbursed GEAM for the period of January 1, 2016 through June 30, 2016 was $36,506 and is included in the Statement of Operations. This agreement terminated effective July 1, 2016.
Prior to July 1, 2016 SSGA FM served as the sub-adviser to the Elfun Government Money Market Fund and for its services, GEAM paid SSGA FM monthly sub-advisory fees which were calculated as a percentage of the average daily net assets of the Elfun Government Money Market Fund.
State Street serves as the sub-administrator and custodian to the Funds. Amounts paid by the Funds to State Street for performing such services are included in advisory and administration and custody and accounting expenses, respectively.
Trustee Compensation The Funds pay no compensation to their Trustees who are officers or employees of SSGA FM or its affiliates. Trustees who are not such officers or employees also serve in a similar capacity for other funds advised by SSGA FM. Compensation paid to independent Trustees is reflected on the Statements of Operations. These fees are allocated pro-rata across funds and share classes served by the Trustees and are based upon the relative net assets of each fund. Prior to July 1, 2016, all of the Trustees were officers or employees of GEAM and received no compensation from the Funds. (For additional information about Trustees’ compensation please refer to the Funds’ Statement of Additional Information).
Other Transactions with Affiliates In December 2015, State Street, announced a review of the manner in which it invoiced certain expenses to certain of its Investment Servicing clients, primarily in the United States, during an 18-year period going back to 1998 and its determination that it had incorrectly invoiced clients for certain expenses. State Street informed its clients that it will pay to them the expenses it concluded were incorrectly invoiced to them, plus interest.
| 98 | Notes to Financial Statements |
Elfun Funds
Notes to Financial Statements, continued — December 31, 2016
Management analyzed the revised invoicing information, by year, to determine which amounts, including interest, should be refunded to the Funds. The amounts in the table below represent the refunded expenses and interest received by the Fund for the periods in question.
| Fund | Refunded Custody Expense* | Interest* | Total | % of Net Assets at 12/31/16 | ||||||||||||
Elfun International Equity Fund | $ | 72,641 | $ | 51,779 | $ | 124,420 | 0.06 | % | ||||||||
Elfun Trusts | 88 | 16 | 104 | 0.00 | % | |||||||||||
Elfun Diversified Fund | 121,135 | 76,942 | 198,077 | 0.10 | % | |||||||||||
Elfun Tax-Exempt Income Fund | 989 | 133 | 1,122 | 0.00 | % | |||||||||||
Elfun Income Fund | 8,225 | 4,847 | 13,072 | 0.00 | % | |||||||||||
Elfun Government Money Market Fund | 11,384 | 6,554 | 18,388 | 0.02 | % | |||||||||||
| * | Refunded Custody Expense and Interest appear on the Statements of Operations in Custodian and Accounting as expenses and Interest income, respectively. |
| 7. | Capital Contribution |
In connection with the sale of its asset management business to State Street Global Advisors, Inc., GE Asset Management Incorporated on October 20, 2016 made a contribution to the Elfun Government Money Market Fund in the amount of $314,868, which contribution has restored the Fund’s mark-to-market net asset value to $1.00 per unit. In addition, GE Asset Management Incorporated agreed to make a voluntary contribution of $69,636 in connection with a prior year distribution matter.
| 8. | Investment Transactions |
Purchases and Sales of Securities The cost of purchases and the proceeds from sales of investments, other than short-term securities, for the fiscal year ended December 31, 2016, were as follows:
| U.S. Government Securities | Other Securities | |||||||||||||||
| Fund | Purchases | Sales | Purchases | Sales | ||||||||||||
Elfun International Equity Fund | $ | — | $ | — | $ | 68,945,829 | $ | 85,812,889 | ||||||||
Elfun Trusts | — | — | 334,665,341 | 473,491,139 | ||||||||||||
Elfun Diversified Fund | 47,026,648 | 44,264,640 | 167,308,904 | 175,169,952 | ||||||||||||
Elfun Tax-Exempt Income Fund | — | — | 472,110,935 | 531,599,234 | ||||||||||||
Elfun Income Fund | 592,004,186 | 570,678,852 | 85,095,857 | 121,315,505 | ||||||||||||
| 9. | Income Taxes |
The Funds are subject to ASC 740, Income Taxes (“ASC 740”). ASC 740 provides guidance for financial accounting and reporting for the effects of income taxes that result from an entity’s activities during the year. ASC 740 also provides guidance regarding how certain tax positions should be recognized, measured, presented and disclosed in the financial statements. ASC 740 requires evaluation of tax positions taken or expected to be taken in the course of preparing each Fund’s tax returns to determine whether the tax positions are “more likely than not” of being sustained by the applicable tax authority. There are no adjustments to any Fund’s net assets required under ASC 740. Each Fund’s 2013, 2014, 2015 and 2016 fiscal year tax returns are still open to examination by the Federal and applicable state tax authorities.
| Notes to Financial Statements | 99 |
Elfun Funds
Notes to Financial Statements, continued — December 31, 2016
At December 31, 2016, information on the tax cost of investments and distributable earnings on a tax basis was as follows:
| Fund | Cost of Investment for Tax Purposes | Gross Tax | Net Tax Appreciation/ (Depreciation) | Undistributed | Late-Year Losses | |||||||||||||||||||||||||||
| Appreciation | Depreciation | Investments | Derivatives/ Currency | Income | Accum. Capital Gain/(Loss) | |||||||||||||||||||||||||||
Elfun International Equity Fund | $ | 203,987,256 | $ | 18,660,950 | $ | (15,220,688 | ) | $ | 3,440,262 | $ | (23,654 | ) | $ | — | $ | (20,095,153 | ) | $ | — | |||||||||||||
Elfun Trusts | 1,442,471,464 | 912,694,897 | (28,148,673 | ) | 884,546,224 | — | 53,567 | — | — | |||||||||||||||||||||||
Elfun Diversified Fund | 198,073,816 | 14,836,536 | (5,429,771 | ) | 9,406,765 | (58,624 | ) | — | — | — | ||||||||||||||||||||||
Elfun Tax-Exempt Income Fund | 1,440,159,428 | 70,002,244 | (16,760,745 | ) | 53,241,499 | — | 62,805 | (13,939,216 | ) | — | ||||||||||||||||||||||
Elfun Income Fund | 314,359,131 | 3,411,990 | (3,988,699 | ) | (576,709 | ) | (228,112 | ) | 295,627 | — | (2,262,052 | ) | ||||||||||||||||||||
Elfun Government Money Market Fund | 111,159,615 | — | — | — | — | 12,160 | — | — | ||||||||||||||||||||||||
During the fiscal year ended December 31, 2016, the Funds utilized prior year capital loss carryovers as follows:
| Fund | Amount | |||
Elfun Tax-Exempt Income Fund | $ | 6,685,633 | ||
Elfun Income Fund | 40,119 | |||
Any qualified late-year loss is deemed to arise on the first day of a Fund’s next tax year (if the Fund elects to defer such loss). Under this regime, generally, a Fund can elect to defer any post-October capital loss and/or any late-year ordinary loss as defined by the Internal Revenue Code.
The following Funds elected to defer qualified late-year losses for the fiscal year ended December 31, 2016 as follows:
| Fund | Capital | Ordinary | ||||||
Elfun Income Fund | $ | 2,262,052 | $ | — | ||||
As of December 31, 2016, the following Funds have capital loss carryovers as indicated below. The capital loss carryover is available to offset future realized capital gains to the extent provided in the Internal Revenue Code and regulations thereunder.
| Amount | ||||||||||||
| Fund | Short-Term | Long-Term | Expires | |||||||||
Elfun International Equity Fund | $ | 13,166,355 | $ | — | 12/31/2018 | |||||||
| $ | 1,395,629 | $ | 5,533,169 | Unlimited | ||||||||
Elfun Tax-Exempt Income Fund | $ | 13,939,216 | $ | — | Unlimited | |||||||
These amounts will be available to offset future taxable capital gains. Under the Regulated Investment Company Modernization Act of 2010, the Fund is permitted to carry forward capital losses incurred in taxable years beginning after December 22, 2010 for an unlimited period. However, any losses incurred during those future years will be required to be utilized prior to the losses incurred in pre-enactment tax years. As a result of this ordering rule, pre-enactment capital loss carryforwards may be more likely to expire unused. Additionally, post-enactment capital losses that are carried forward will retain their character as either short-term or long-term capital losses rather than being considered all short-term as under previous law.
The tax character of distributions paid during the fiscal year ended December 31, 2016, were as follows:
| Fund | Exempt Income | Ordinary Income | Long-Term Capital Gains | Return of Capital | Total | |||||||||||||||
Elfun International Equity Fund | $ | — | $ | 4,463,973 | $ | — | $ | — | $ | 4,463,973 | ||||||||||
Elfun Trusts | — | 38,254,344 | 154,400,524 | — | 192,654,868 | |||||||||||||||
Elfun Diversified Fund | — | 4,396,884 | 1,548,665 | — | 5,945,549 | |||||||||||||||
Elfun Tax-Exempt Income Fund | 59,750,932 | 735,492 | — | — | 60,486,424 | |||||||||||||||
Elfun Income Fund | — | 9,399,723 | — | — | 9,399,723 | |||||||||||||||
Elfun Government Money Market Fund | — | 60,312 | — | — | 60,312 | |||||||||||||||
| 100 | Notes to Financial Statements |
Elfun Funds
Notes to Financial Statements, continued — December 31, 2016
The tax character of distributions paid during the fiscal year ended December 31, 2015, were as follows:
| Fund | Exempt Income | Ordinary Income | Long-Term Capital Gains | Return of Capital | Total | |||||||||||||||
Elfun International Equity Fund | $ | — | $ | 4,270,754 | $ | — | $ | — | $ | 4,270,754 | ||||||||||
Elfun Trusts | — | 32,631,167 | 149,723,012 | — | 182,354,179 | |||||||||||||||
Elfun Diversified Fund | — | 4,151,007 | 7,829,636 | — | 11,980,643 | |||||||||||||||
Elfun Tax-Exempt Income Fund | 61,714,924 | 974,024 | — | — | 62,688,948 | |||||||||||||||
Elfun Income Fund | — | 8,902,979 | — | — | 8,902,979 | |||||||||||||||
Elfun Government Money Market Fund | — | 104,346 | — | — | 104,346 | |||||||||||||||
Distributions to Shareholders The Elfun Tax-Exempt Income Fund, Elfun Income Fund and Elfun Government Money Market Fund declare net investment income dividends daily and pay them monthly. All other Funds declare and pay dividends from net investment income, if any, annually. All Funds declare and pay net realized capital gains distributions, if any, annually. The character of income and gains to be distributed is determined in accordance with income tax regulations which may differ from GAAP. These differences include (but are not limited to) treatment of realized and unrealized gains (losses) on foreign currency contracts, investments in futures, late year loss deferrals, unused capital losses, distributions from real estate investment trusts (“REITs”) and other equity investments, distributions in excess of earnings, litigation proceeds, corporate actions, mixed straddles, return of capital distribution from securities, federal tax expense and losses deferred due to wash sale transactions. Reclassifications are made to a Fund’s capital accounts to reflect income and gains available for distribution (or available capital loss carryovers) under income tax regulations. These reclassifications have no impact on net investment income, realized gains or losses, or NAV of any of the Funds. The calculation of net investment income per share in the Financial Highlights table excludes these adjustments.
The reclassifications for the fiscal year ended December 31, 2016 were as follows:
| Fund | Undistributed Net Investment Income | Accumulated Net Realized Gain (Loss) | Unrealized Loss | Paid In Capital | ||||||||||||
Elfun International Equity Fund | $ | (62,194 | ) | $ | 96,330 | — | $ | (34,136 | ) | |||||||
Elfun Trusts | (575,711 | ) | 1,154,857 | — | (579,146 | ) | ||||||||||
Elfun Diversified Fund | (171,257 | ) | 206,783 | — | (35,526 | ) | ||||||||||
Elfun Income Fund | (553,817 | ) | 553,817 | — | — | |||||||||||
Elfun Government Money Market Fund | 196,188 | — | — | (196,188 | ) | |||||||||||
| 10. | Change in Audit Firm |
KPMG LLP (“KPMG”) served as the independent registered certified public accounting firm of each Fund through its resignation as of June 30, 2016. On November 30, 2016, upon recommendation by the Audit Committee of the Funds, the Funds’ Board selected Ernst & Young LLP (“EY”) to replace KPMG as the independent public accountant for the fiscal year ended December 31, 2016. The reports of KPMG on the financial statements for the fiscal years ended December 31, 2014 and December 31, 2015 contained no adverse opinion or disclaimer of opinion and were not qualified or modified as to uncertainty, audit scope or accounting principles.
During the Funds’ fiscal years ended December 31, 2014 and December 31, 2015 and through the period ended June 30, 2016, there were no disagreements with KPMG on any matter of accounting principles or practices, financial statement disclosure, or auditing scope or procedure, which disagreements if not resolved to the satisfaction of KPMG would have caused them to make reference thereto in their reports on the financial statements for such years or periods.
During the Funds’ fiscal years ended December 31, 2014 and December 31, 2015 and through the period ended June 30, 2016, there were no reportable events (as defined in Item 304(a)(1)(v) of Regulation S-K). The Funds requested and KPMG furnished a letter addressed to the Securities and Exchange Commission stating whether or not it agreed with the above statements. A copy of such letter was filed as Exhibit 77 to each Funds’ Form N-SAR for the period ended December 31, 2016.
During the Funds’ fiscal years ended December 31, 2014 and December 31, 2015 and through November 30, 2016, neither the Funds nor anyone on their behalf has consulted EY on items which: (i) concerned the application of accounting principles to a specified transaction, either completed or proposed, or the type of audit opinion that might be rendered on the Trust’s financial statements or (ii) concerned the subject of a disagreement (as defined in paragraph (a)(1)(iv) of Item 304 of Regulations S-K) or reportable events (as described in paragraph (a)(1)(v) of said Item 304).
| Notes to Financial Statements | 101 |
Elfun Funds
Report of Independent Registered Public Accounting Firm
To the Board of Trustees and Shareholders of Elfun International Equity Fund, Elfun Trusts, Elfun Diversified Fund, Elfun Tax-Exempt Income Fund, Elfun Income Fund, and Elfun Government Money Market Fund:
We have audited the accompanying statements of assets and liabilities of Elfun International Equity Fund, Elfun Trusts, Elfun Diversified Fund, Elfun Tax-Exempt Income Fund, Elfun Income Fund, and Elfun Government Money Market Fund (collectively, the “Funds”), including the schedules of investments, as of December 31, 2016, and the related statements of operations, changes in net assets and the financial highlights for the year then ended. These financial statements and financial highlights are the responsibility of the Funds’ management. Our responsibility is to express an opinion on these financial statements and financial highlights based on our audits. The statements of changes in net assets for the year ended December 31, 2015 and the financial highlights for periods ended prior to January 1, 2016 were audited by another independent registered public accounting firm whose report, dated February 24, 2016, expressed an unqualified opinion on those statements of changes in net assets and financial highlights.
We conducted our audits in accordance with the standards of the Public Company Accounting Oversight Board (United States). Those standards require that we plan and perform the audit to obtain reasonable assurance about whether the financial statements and financial highlights are free of material misstatement. We were not engaged to perform an audit of the Funds’ internal control over financial reporting. Our audits included consideration of internal control over financial reporting as a basis for designing audit procedures that are appropriate in the circumstances, but not for the purpose of expressing an opinion on the effectiveness of the Funds’ internal control over financial reporting. Accordingly, we express no such opinion. An audit also includes examining, on a test basis, evidence supporting the amounts and disclosures in the financial statements and financial highlights, assessing the accounting principles used and significant estimates made by management, and evaluating the overall financial statement presentation. Our procedures included confirmation of securities owned as of December 31, 2016, by correspondence with the custodian, brokers and others or by other appropriate auditing procedures where replies from brokers and others were not received. We believe that our audits provide a reasonable basis for our opinion.
In our opinion, the financial statements and financial highlights referred to above present fairly, in all material respects, the financial position of the Elfun International Equity Fund, Elfun Trusts, Elfun Diversified Fund, Elfun Tax-Exempt Income Fund, Elfun Income Fund, and Elfun Government Money Market Fund at December 31, 2016, and the results of their operations, changes in their net assets, and the financial highlights for the year then ended, in conformity with U.S. generally accepted accounting principles.

Boston, Massachusetts
February 27, 2017
| 102 | Report of Independent Registered Public Accounting Firm |
Elfun Funds
Tax Information — December 31, 2016 (Unaudited)
The following Funds intend to make an election under Internal Revenue Code Section 853. The election will allow shareholders to treat their attributable share of foreign taxes paid by the Funds to be paid by them directly. For the fiscal year ended December 31, 2016, the total amount of income received by the Funds from sources within foreign countries and possessions of the United States and the total amount of taxes paid by the Funds follows:
| Total Foreign Source Income | Total Foreign Taxes Paid | |||||||
Elfun International Equity Fund | $ | 5,865,136 | $ | 586,856 | ||||
For the year ended December 31, 2016, the following Funds hereby designate as capital gain dividends the amounts set forth, or the amount ultimately treated as capital gain net income:
| Fund | Gross Amount | |||
Elfun Trusts | $ | 154,400,524 | ||
Elfun Diversfied Fund | 1,548,665 | |||
For the fiscal year ended December 31, 2016, certain dividends paid by the Funds may be subject to a maximum income tax rate of 20% as provided for by the American Taxpayer Relief Act of 2012. The following represent the amounts that may be considered qualified dividend income:
| Fund | Qualified Dividend Income | |||
Elfun International Equity Fund | $ | 5,656,519 | ||
Elfun Trusts | 35,107,650 | |||
Elfun Diversified Fund | 2,354,243 | |||
For corporate shareholders the following represent the percentages of respective fund distributions that may be eligible for the dividends received deduction:
| Fund | Dividends Received Deduction | |||
Elfun Trusts | 82.42% | |||
Elfun Diversified Fund | 28.02% | |||
For the fiscal year ended December 31, 2016, the following Fund hereby designates as exempt-interest dividends the amounts set forth, or the amount ultimately treated as exempt-interest dividends:
| Fund | Gross Amount | |||
Elfun Tax-Exempt Income Fund | $ | 59,750,932 | ||
The amounts presented herein may differ from amounts presented elsewhere in the financial statements due to differences between tax and financial accounting principles. Please consult a tax advisor if you have any questions about Federal or State income tax laws or on how to prepare your tax returns. If you have specific questions about your Fund account, please consult your investment representative.
| Tax Information | 103 |
Elfun Funds
Advisory Agreement Renewal (Unaudited)
Disclosure for the Boards of Trustees’ Consideration of the Approval of the New Investment Advisory and Administration Agreement with SSGA Funds Management, Inc.
At a meeting of the Boards of Trustees held on April 29, 2016 (the “Board Meeting”), members of the Board of each Fund, including a majority of the Independent Trustees who were present at the Board Meeting, considered and unanimously approved the investment advisory and administration agreement for the Funds (the “New Investment Advisory and Administration Agreement”) with SSGA Funds Management, Inc. (the “Adviser”) on behalf of each Fund. In considering whether to approve the New Investment Advisory and Administration Agreement, the Trustees considered and discussed a substantial amount of information and analysis provided, at the Board’s request, by the Adviser and GE Asset Management Incorporated (“GEAM”).
Before approving the New Investment Advisory and Administration Agreement on behalf of each Fund, the Boards reviewed the information provided with management of the Adviser and GEAM. The Boards also reviewed a memorandum prepared by legal counsel discussing the legal standards for the consideration of the proposed New Investment Advisory and Administration Agreement, as well as other memoranda and information relevant to the legal standards and related considerations for a transaction such as the one between the Adviser and GEAM. Prior to the Board Meeting, the Independent Trustees discussed the New Investment Advisory and Administration Agreement in detail with their independent legal counsel at which no representatives of the Adviser or GEAM were present. The Independent Trustees and their independent legal counsel requested, and received and considered, additional information from the Adviser and GEAM following these sessions.
Prior to and at the Board Meeting, representatives of GEAM and the Adviser explained and discussed with the Boards the specific terms of the asset purchase agreement entered into on March 29, 2016 by General Electric Company with State Street Corporation for the sale of the asset management and advisory services business conducted by GEAM and certain of its subsidiaries (the “Transaction”) and responded to questions raised by the Boards. The Trustees posed questions to these representatives and engaged in significant discussions. In addition, in response to its detailed requests, the Trustees received from the Adviser written responses to their inquiries, which included substantial exhibits and other materials related to the Adviser’s business and the services it proposes to provide to each Fund. The Boards took into account their multi-year experience as Trustees and particularly their consideration of the Existing GEAM Agreements in recent years.
The Boards also received materials relating to the organizational structure and business of the Adviser, including materials describing changes expected as a result of the Transaction. Various information relating to the terms of the Transaction, including the goals, interests and timetable of the Adviser, was discussed as well. The Adviser also advised that no change in investment processes is anticipated as a result of the Transaction, as all of the investment personnel of GEAM responsible for the daily management of the Funds were expected to become employees of the Adviser or its affiliates and continue to serve in the same capacities upon the closing of the Transaction.
In approving the New Investment Advisory and Administration Agreement with the Adviser, the Trustees considered those factors they deemed relevant, including the nature, quality and extent of services expected to be provided by the Adviser. In their deliberations, the Boards did not identify any single factor that was dispositive and each Trustee may have attributed different weights to the various factors. The Trustees evaluated this information and all other information made available to them by the Adviser, as well as the presentations and discussions that occurred at the Board Meeting, for each Fund on a Fund-by-Fund basis, and their determinations were made separately in respect of each Fund.
The material factors and conclusions that formed the basis for the Boards’ determinations to approve the New Investment Advisory and Administration Agreement with the Adviser on behalf of each Fund are as discussed below.
The Nature, Extent and Quality of Services Expected to be Provided.
The Trustees reviewed the services expected to be provided to the Funds by the Adviser. The Boards considered the Adviser’s favorable attributes, including its substantial experience managing mutual funds, investment philosophy and discipline, experienced investment and trading personnel, systems and other resources, and favorable history and reputation. The Boards also reviewed the extensive information provided by the Adviser related to its business, legal and regulatory affairs. This review considered the resources available to the Adviser to provide the services specified under the New Investment Advisory and Administration Agreement. Additionally, the Boards considered that all of the portfolio managers currently managing the Funds will be joining the Adviser as part of the Transaction.
In light of the foregoing, the Boards, including the Independent Trustees, concluded that the services expected to be provided by the Adviser would be satisfactory, particularly given that the same individuals who currently provide portfolio management services to the Funds as employees of GEAM are expected to continue providing such services as employees of the Adviser, benefiting the Funds by providing continuity of service following the Transaction.
| 104 | Advisory Agreement Renewal |
Elfun Funds
Advisory Agreement Renewal (Unaudited), continued
Investment Performance of GEAM and the Adviser.
The Board members considered the investment performance of GEAM and the Adviser for various periods focusing on GEAM’s and the Adviser’s investment performance with respect to registered investment companies and other accounts that have investment objectives and strategies similar to that of the Funds. The Boards also engaged in detailed discussions with GEAM and the Adviser about their investment processes, focusing on the number and experience of portfolio management and supporting research personnel and GEAM’s and the Adviser’s investment style and approach employed. The Boards noted that the Funds’ historical performance under the Existing GEAM Agreements was relevant as the personnel providing portfolio management services would continue to provide those services under the New Investment Advisory and Administration Agreement.
Taking these factors into consideration, the Boards, including the Independent Trustees, concluded that each Fund’s performance was acceptable.
Cost of the Services to be Provided and Profits to be Realized from the Relationship with the Funds.
The Trustees considered the proposed management fees that would be paid to the Adviser by the Funds, and the cost of the services that would be provided by the Adviser to the Funds. Representatives of the Adviser stated that the Adviser was not able to estimate profitability in a meaningful way but expected to discuss any changes in the level of profitability with the Board during the contract renewal process. The Trustees considered the renewal requirements for advisory agreements and their ability to review the management fees annually after the initial term of the New Investment Advisory and Administration Agreement.
Information also was presented regarding the financial condition of the Adviser for various past periods. The Trustees determined that the Adviser should be entitled to earn a reasonable level of profits for the services it proposed to provide to the Funds. The Trustees also recognized the Adviser’s statements concerning its significant investment in supporting registered investment companies.
The Extent to Which Economies of Scale Would Be Realized as the Funds Grow and Whether Fee Levels Would Reflect Such Economies of Scale.
The Trustees considered the extent to which economies of scale would be realized as the Funds grow, and whether the proposed fee levels reflect these economies of scale for the benefit of Fund investors. The Trustees noted also that the Adviser expects its distribution plans and capabilities to provide an opportunity for the Funds to experience additional growth. The Trustees considered that there might be some opportunities for reductions in certain fixed operating expenses that might be enjoyed by the Funds depending on the extent to which their assets increase and determined that, to the extent in the future it were determined that material economies of scale had not been shared with the Funds, the Boards would seek to have those economies of scale shared with the Funds.
Comparison of Services to be Rendered and Fees to be Paid.
The Boards discussed the services expected to be provided to the Funds by the Adviser and the proposed fees to be charged to the Funds for those services. The Trustees reviewed information regarding the proposed advisory fees. The Boards discussed the proposed conversion to a fixed advisory and administration fee for each Fund. The Boards considered that, with respect to each Fund other than the Money Market Fund, the new management fee will be higher than the management expenses incurred by the Fund for the year ended December 31, 2015, but noted that the new management fee for each Fund would be set at or below the five-year historical average of each Fund’s management expenses. The Trustees considered the new fee in relation to the median fees of other mutual funds in each Fund’s peer group and noted that the proposed fee was significantly lower in each case compared to the fees for other peer funds. The Trustees considered that the fees would serve as bona fide compensation of the Adviser for its investment advisory services, in line with the requirements of Section 15(f) of the 1940 Act (discussed below). They also reviewed the fee and expense ratio for each Fund and comparative information with respect to similar products. They discussed that most of the Funds’ fees and expenses should generally remain below or within applicable peer group ranges and, therefore, the Funds would be generally charged a competitive rate in comparison to their peers. The Trustees also considered the Funds’ comparatively lower historical fee structure overall relative to advisers of other comparable industry peer group funds and noted that the Funds have generally benefitted from not having a high management fee rate for most of the Funds since their inception, and that the new management fee rate is based on the historical management expenses incurred by the Funds.
The Boards, including the Independent Trustees, concluded that based on this information, the proposed advisory fees would be reasonable in relation to the services expected to be provided to the Funds.
| Advisory Agreement Renewal | 105 |
Elfun Funds
Advisory Agreement Renewal (Unaudited), continued
Fall-Out Benefits.
The Boards considered actual and potential financial benefits that the Adviser could derive from its relationship with the Funds, including the custody, fund accounting and sub-administration services being proved to the Funds by affiliates of the Adviser. The Boards noted, however, that the affiliates of the Adviser had already been providing such services to the Funds pursuant to various services agreements that had been negotiated at arm’s-length prior to the Transaction, and that the Adviser would not derive any additional benefits from such services following the close of the Transaction.
The Boards did not view this consideration as having a material effect on its overall view of the reasonableness of the proposed fees for the Funds.
Conclusion.
No single factor was determinative to the Boards’ decision. Based on their discussion and such other matters as were deemed relevant, the Trustees, including the Independent Trustees, concluded that the approval of the New Investment Advisory and Administration Agreement with the Adviser was in the best interests of the Funds.
| 106 | Advisory Agreement Renewal |
Elfun Funds
Special Meeting of Unitholders — Voting Results
On June 22, 2016, the Elfun Government Money Market Fund (the “Money Market Fund”), Elfun Tax-Exempt Income Fund (the “Tax-Exempt Fund”), Elfun Income Fund (the “Income Fund”), Elfun Diversified Fund (the “Diversified Fund”), Elfun International Equity Fund (the “International Fund”) and Elfun Trusts (each, a “Fund” and collectively, the “Funds”) held a special meeting of unitholders. Unitholders of record on May 4, 2016 were entitled to vote on the proposals. For each proposal, unitholders voted on a fund-by-fund basis. At the meeting, all proposals were approved by the respective unitholders of each Fund, and the following votes were recorded:
Proposal 1:
Approval of a new investment advisory and administration agreement with SSGA Funds Management, Inc. (“SSGA FM”), pursuant to which SSGA FM will replace GE Asset Management Incorporated (“GEAM”) as investment adviser and administrator to the Funds upon consummation of the sale of the asset management and advisory services business conducted by GEAM and certain of its subsidiaries.
| Money Market Fund | ||||||||||||
| No. of Units | % of Outstanding Units | % of Units Present | ||||||||||
For | 71,687,742.212 | 61.354 | % | 91.433 | % | |||||||
Against | 3,754,246.320 | 3.213 | % | 4.788 | % | |||||||
Abstain | 235,513.330 | 0.202 | % | 0.301 | % | |||||||
Broker Non-Vote | 2,727,078.000 | 2.334 | % | 3.478 | % | |||||||
Total | 78,404,579.862 | 67.103 | % | 100.000 | % | |||||||
| Tax-Exempt Fund | ||||||||||||
| No. of Units | % of Outstanding Units | % of Units Present | ||||||||||
For | 81,969,941.855 | 61.655 | % | 93.514 | % | |||||||
Against | 4,442,590.933 | 3.342 | % | 5.068 | % | |||||||
Abstain | 952,965.077 | 0.717 | % | 1.087 | % | |||||||
Broker Non-Vote | 289,926.000 | 0.218 | % | 0.331 | % | |||||||
Total | 87,655,423.865 | 65.932 | % | 100.000 | % | |||||||
| Income Fund | ||||||||||||
| No. of Units | % of Outstanding Units | % of Units Present | ||||||||||
For | 14,837,943.449 | 58.632 | % | 89.037 | % | |||||||
Against | 603,160.743 | 2.383 | % | 3.619 | % | |||||||
Abstain | 414,170.860 | 1.637 | % | 2.485 | % | |||||||
Broker Non-Vote | 809,736.000 | 3.200 | % | 4.859 | % | |||||||
Total | 16,665,011.052 | 65.852 | % | 100.000 | % | |||||||
| Diversified Fund | ||||||||||||
| No. of Units | % of Outstanding Units | % of Units Present | ||||||||||
For | 6,578,662.211 | 56.349 | % | 91.581 | % | |||||||
Against | 293,974.776 | 2.518 | % | 4.092 | % | |||||||
Abstain | 111,718.856 | 0.957 | % | 1.556 | % | |||||||
Broker Non-Vote | 199,063.000 | 1.705 | % | 2.771 | % | |||||||
Total | 7,183,418.843 | 61.529 | % | 100.000 | % | |||||||
| International Fund | ||||||||||||
| No. of Units | % of Outstanding Units | % of Units Present | ||||||||||
For | 7,142,551.119 | 60.665 | % | 92.813 | % | |||||||
Against | 361,813.358 | 3.073 | % | 4.702 | % | |||||||
Abstain | 142,622.936 | 1.211 | % | 1.853 | % | |||||||
Broker Non-Vote | 48,598.000 | 0.413 | % | 0.632 | % | |||||||
Total | 7,695,585.413 | 65.362 | % | 100.000 | % | |||||||
| Special Meeting of Unitholders — Voting Results | 107 |
Elfun Funds
Special Meeting of Unitholders — Voting Results, continued
| Elfun Trusts | ||||||||||||
| No. of Units | % of Outstanding Units | % of Units Present | ||||||||||
For | 23,683,286.207 | 55.497 | % | 93.009 | % | |||||||
Against | 1,191,119.427 | 2.792 | % | 4.678 | % | |||||||
Abstain | 357,634.068 | 0.838 | % | 1.404 | % | |||||||
Broker Non-Vote | 231,445.000 | 0.542 | % | 0.909 | % | |||||||
Total | 25,463,484.702 | 59.669 | % | 100.000 | % | |||||||
Proposal 2:
Approval of the election of Patrick J. Riley, William L. Boyan, William L. Marshall, Rina K. Spence, Douglas T. Williams and Jeanne M. La Porta to the Board of Trustees of each Fund.
| Money Market Fund | ||||||||||||
| No. of Units | % of Outstanding Units | % of Units Present | ||||||||||
| Mr. Patrick J. Riley | ||||||||||||
Affirmative | 75,899,542.522 | 64.959 | % | 96.805 | % | |||||||
Withhold | 2,505,037.340 | 2.144 | % | 3.195 | % | |||||||
Total | 78,404,579.862 | 67.103 | % | 100.000 | % | |||||||
| Mr. William L. Boyan | ||||||||||||
Affirmative | 75,878,101.632 | 64.940 | % | 96.778 | % | |||||||
Withhold | 2,526,478.230 | 2.163 | % | 3.222 | % | |||||||
Total | 78,404,579.862 | 67.103 | % | 100.000 | % | |||||||
| Mr. William L. Marshall | ||||||||||||
Affirmative | 75,899,347.782 | 64.959 | % | 96.805 | % | |||||||
Withhold | 2,505,232.080 | 2.144 | % | 3.195 | % | |||||||
Total | 78,404,579.862 | 67.103 | % | 100.000 | % | |||||||
| Ms. Rina K. Spence | ||||||||||||
Affirmative | 75,916,028.622 | 64.973 | % | 96.826 | % | |||||||
Withhold | 2,488,551.240 | 2.130 | % | 3.174 | % | |||||||
Total | 78,404,579.862 | 67.103 | % | 100.000 | % | |||||||
| Mr. Douglas T. Williams | ||||||||||||
Affirmative | 75,877,600.982 | 64.940 | % | 96.777 | % | |||||||
Withhold | 2,526,978.880 | 2.163 | % | 3.223 | % | |||||||
Total | 78,404,579.862 | 67.103 | % | 100.000 | % | |||||||
| Ms. Jeanne M. La Porta | ||||||||||||
Affirmative | 75,877,047.252 | 64.939 | % | 96.776 | % | |||||||
Withhold | 2,527,532.610 | 2.164 | % | 3.224 | % | |||||||
Total | 78,404,579.862 | 67.103 | % | 100.000 | % | |||||||
| Tax-Exempt Fund | ||||||||||||
| No. of Units | % of Outstanding Units | % of Units Present | ||||||||||
| Mr. Patrick J. Riley | ||||||||||||
Affirmative | 83,222,710.289 | 62.598 | % | 94.943 | % | |||||||
Withhold | 4,432,713.576 | 3.334 | % | 5.057 | % | |||||||
Total | 87,655,423.865 | 65.932 | % | 100.000 | % | |||||||
| 108 | Special Meeting of Unitholders — Voting Results |
Elfun Funds
Special Meeting of Unitholders — Voting Results, continued
| Tax-Exempt Fund, continued | ||||||||||||
| No. of Units | % of Outstanding Units | % of Units Present | ||||||||||
| Mr. William L. Boyan | ||||||||||||
Affirmative | 83,085,443.978 | 62.494 | % | 94.786 | % | |||||||
Withhold | 4,569,979.887 | 3.438 | % | 5.214 | % | |||||||
Total | 87,655,423.865 | 65.932 | % | 100.000 | % | |||||||
| Mr. William L. Marshall | ||||||||||||
Affirmative | 83,187,469.762 | 62.571 | % | 94.903 | % | |||||||
Withhold | 4,467,954.103 | 3.361 | % | 5.097 | % | |||||||
Total | 87,655,423.865 | 65.932 | % | 100.000 | % | |||||||
| Ms. Rina K. Spence | ||||||||||||
Affirmative | 83,112,769.778 | 62.515 | % | 94.818 | % | |||||||
Withhold | 4,542,654.087 | 3.417 | % | 5.182 | % | |||||||
Total | 87,655,423.865 | 65.932 | % | 100.000 | % | |||||||
| Mr. Douglas T. Williams | ||||||||||||
Affirmative | 83,041,917.707 | 62.462 | % | 94.737 | % | |||||||
Withhold | 4,613,506.158 | 3.470 | % | 5.263 | % | |||||||
Total | 87,655,423.865 | 65.932 | % | 100.000 | % | |||||||
| Ms. Jeanne M. La Porta | ||||||||||||
Affirmative | 83,478,464.050 | 62.790 | % | 95.235 | % | |||||||
Withhold | 4,176,959.815 | 3.142 | % | 4.765 | % | |||||||
Total | 87,655,423.865 | 65.932 | % | 100.000 | % | |||||||
| Income Fund | ||||||||||||
| No. of Units | % of Outstanding Units | % of Units Present | ||||||||||
| Mr. Patrick J. Riley | ||||||||||||
Affirmative | 15,977,635.095 | 63.136 | % | 95.875 | % | |||||||
Withhold | 687,375.957 | 2.716 | % | 4.125 | % | |||||||
Total | 16,665,011.052 | 65.852 | % | 100.000 | % | |||||||
| Mr. William L. Boyan | ||||||||||||
Affirmative | 15,953,185.926 | 63.039 | % | 95.729 | % | |||||||
Withhold | 711,825.126 | 2.813 | % | 4.271 | % | |||||||
Total | 16,665,011.052 | 65.852 | % | 100.000 | % | |||||||
| Mr. William L. Marshall | ||||||||||||
Affirmative | 15,963,868.166 | 63.081 | % | 95.793 | % | |||||||
Withhold | 701,142.886 | 2.771 | % | 4.207 | % | |||||||
Total | 16,665,011.052 | 65.852 | % | 100.000 | % | |||||||
| Ms. Rina K. Spence | ||||||||||||
Affirmative | 15,926,996.647 | 62.936 | % | 95.571 | % | |||||||
Withhold | 738,014.405 | 2.916 | % | 4.429 | % | |||||||
Total | 16,665,011.052 | 65.852 | % | 100.000 | % | |||||||
| Mr. Douglas T. Williams | ||||||||||||
Affirmative | 15,910,253.321 | 62.870 | % | 95.471 | % | |||||||
Withhold | 754,757.731 | 2.982 | % | 4.529 | % | |||||||
Total | 16,665,011.052 | 65.852 | % | 100.000 | % | |||||||
| Ms. Jeanne M. La Porta | ||||||||||||
Affirmative | 15,968,317.529 | 63.099 | % | 95.819 | % | |||||||
Withhold | 696,693.523 | 2.753 | % | 4.181 | % | |||||||
Total | 16,665,011.052 | 65.852 | % | 100.000 | % | |||||||
| Special Meeting of Unitholders — Voting Results | 109 |
Elfun Funds
Special Meeting of Unitholders — Voting Results, continued
| Diversified Fund | ||||||||||||
| No. of Units | % of Outstanding Units | % of Units Present | ||||||||||
| Mr. Patrick J. Riley | ||||||||||||
Affirmative | 6,874,973.595 | 58.887 | % | 95.706 | % | |||||||
Withhold | 308,445.248 | 2.642 | % | 4.294 | % | |||||||
Total | 7,183,418.843 | 61.529 | % | 100.000 | % | |||||||
| Mr. William L. Boyan | ||||||||||||
Affirmative | 6,861,221.735 | 58.769 | % | 95.515 | % | |||||||
Withhold | 322,197.108 | 2.760 | % | 4.485 | % | |||||||
Total | 7,183,418.843 | 61.529 | % | 100.000 | % | |||||||
| Mr. William L. Marshall | ||||||||||||
Affirmative | 6,871,665.264 | 58.859 | % | 95.660 | % | |||||||
Withhold | 311,753.579 | 2.670 | % | 4.340 | % | |||||||
Total | 7,183,418.843 | 61.529 | % | 100.000 | % | |||||||
| Ms. Rina K. Spence | ||||||||||||
Affirmative | 6,868,900.286 | 58.835 | % | 95.622 | % | |||||||
Withhold | 314,518.557 | 2.694 | % | 4.378 | % | |||||||
Total | 7,183,418.843 | 61.529 | % | 100.000 | % | |||||||
| Mr. Douglas T. Williams | ||||||||||||
Affirmative | 6,862,901.606 | 58.784 | % | 95.538 | % | |||||||
Withhold | 320,517.237 | 2.745 | % | 4.462 | % | |||||||
Total | 7,183,418.843 | 61.529 | % | 100.000 | % | |||||||
| Ms. Jeanne M. La Porta | ||||||||||||
Affirmative | 6,868,830.659 | 58.834 | % | 95.621 | % | |||||||
Withhold | 314,588.184 | 2.695 | % | 4.379 | % | |||||||
Total | 7,183,418.843 | 61.529 | % | 100.000 | % | |||||||
| International Fund | ||||||||||||
| No. of Units | % of Outstanding Units | % of Units Present | ||||||||||
| Mr. Patrick J. Riley | ||||||||||||
Affirmative | 7,246,818.051 | 61.550 | % | 94.169 | % | |||||||
Withhold | 448,767.362 | 3.812 | % | 5.831 | % | |||||||
Total | 7,695,585.413 | 65.362 | % | 100.000 | % | |||||||
| Mr. William L. Boyan | ||||||||||||
Affirmative | 7,224,635.055 | 61.362 | % | 93.880 | % | |||||||
Withhold | 470,950.358 | 4.000 | % | 6.120 | % | |||||||
Total | 7,695,585.413 | 65.362 | % | 100.000 | % | |||||||
| Mr. William L. Marshall | ||||||||||||
Affirmative | 7,230,087.881 | 61.408 | % | 93.951 | % | |||||||
Withhold | 465,497.532 | 3.954 | % | 6.049 | % | |||||||
Total | 7,695,585.413 | 65.362 | % | 100.000 | % | |||||||
| Ms. Rina K. Spence | ||||||||||||
Affirmative | 7,235,315.168 | 61.453 | % | 94.019 | % | |||||||
Withhold | 460,270.245 | 3.909 | % | 5.981 | % | |||||||
Total | 7,695,585.413 | 65.362 | % | 100.000 | % | |||||||
| 110 | Special Meeting of Unitholders — Voting Results |
Elfun Funds
Special Meeting of Unitholders — Voting Results, continued
| International Fund, continued | ||||||||||||
| No. of Units | % of Outstanding Units | % of Units Present | ||||||||||
| Mr. Douglas T. Williams | ||||||||||||
Affirmative | 7,228,021.911 | 61.391 | % | 93.924 | % | |||||||
Withhold | 467,563.502 | 3.971 | % | 6.076 | % | |||||||
Total | 7,695,585.413 | 65.362 | % | 100.000 | % | |||||||
| Ms. Jeanne M. La Porta | ||||||||||||
Affirmative | 7,255,021.730 | 61.620 | % | 94.275 | % | |||||||
Withhold | 440,563.683 | 3.742 | % | 5.725 | % | |||||||
Total | 7,695,585.413 | 65.362 | % | 100.000 | % | |||||||
| Elfun Trusts | ||||||||||||
| No. of Units | % of Outstanding Units | % of Units Present | ||||||||||
| Mr. Patrick J. Riley | ||||||||||||
Affirmative | 24,392,547.388 | 57.159 | % | 95.794 | % | |||||||
Withhold | 1,070,937.314 | 2.510 | % | 4.206 | % | |||||||
Total | 25,463,484.702 | 59.669 | % | 100.000 | % | |||||||
| Mr. William L. Boyan | ||||||||||||
Affirmative | 24,314,551.481 | 56.977 | % | 95.488 | % | |||||||
Withhold | 1,148,933.221 | 2.692 | % | 4.512 | % | |||||||
Total | 25,463,484.702 | 59.669 | % | 100.000 | % | |||||||
| Mr. William L. Marshall | ||||||||||||
Affirmative | 24,313,558.351 | 56.974 | % | 95.484 | % | |||||||
Withhold | 1,149,926.351 | 2.695 | % | 4.516 | % | |||||||
Total | 25,463,484.702 | 59.669 | % | 100.000 | % | |||||||
| Ms. Rina K. Spence | ||||||||||||
Affirmative | 24,347,770.790 | 57.054 | % | 95.618 | % | |||||||
Withhold | 1,115,713.912 | 2.615 | % | 4.382 | % | |||||||
Total | 25,463,484.702 | 59.669 | % | 100.000 | % | |||||||
| Mr. Douglas T. Williams | ||||||||||||
Affirmative | 24,278,464.632 | 56.892 | % | 95.346 | % | |||||||
Withhold | 1,185,020.070 | 2.777 | % | 4.654 | % | |||||||
Total | 25,463,484.702 | 59.669 | % | 100.000 | % | |||||||
| Ms. Jeanne M. La Porta | ||||||||||||
Affirmative | 24,414,765.753 | 57.211 | % | 95.881 | % | |||||||
Withhold | 1,048,718.949 | 2.458 | % | 4.119 | % | |||||||
Total | 25,463,484.702 | 59.669 | % | 100.000 | % | |||||||
| Special Meeting of Unitholders — Voting Results | 111 |
Elfun Funds
Special Meeting of Unitholders — Voting Results, continued
Proposal 3:
Approval of manager-of-managers authority for SSGA FM, whereby SSGA FM may, subject to approval of the Board of Trustees of each Fund, enter into and materially amend investment sub-advisory agreements with unaffiliated sub-advisers for a Fund without obtaining unitholder approval in each case.
| Money Market Fund | ||||||||||||
| No. of Units | % of Outstanding Units | % of Units Present | ||||||||||
For | 71,322,436.206 | 61.041 | % | 90.967 | % | |||||||
Against | 3,538,243.246 | 3.028 | % | 4.513 | % | |||||||
Abstain | 816,822.410 | 0.700 | % | 1.042 | % | |||||||
Broker Non-Vote | 2,727,078.000 | 2.334 | % | 3.478 | % | |||||||
Total | 78,404,579.862 | 67.103 | % | 100.000 | % | |||||||
| Tax-Exempt Fund | ||||||||||||
| No. of Units | % of Outstanding Units | % of Units Present | ||||||||||
For | 81,401,973.746 | 61.228 | % | 92.866 | % | |||||||
Against | 4,953,396.073 | 3.726 | % | 5.651 | % | |||||||
Abstain | 1,010,128.046 | 0.760 | % | 1.152 | % | |||||||
Broker Non-Vote | 289,926.000 | 0.218 | % | 0.331 | % | |||||||
Total | 87,655,423.865 | 65.932 | % | 100.000 | % | |||||||
| Income Fund | ||||||||||||
| No. of Units | % of Outstanding Units | % of Units Present | ||||||||||
For | 14,776,746.417 | 58.390 | % | 88.669 | % | |||||||
Against | 646,288.513 | 2.554 | % | 3.878 | % | |||||||
Abstain | 432,240.122 | 1.708 | % | 2.594 | % | |||||||
Broker Non-Vote | 809,736.000 | 3.200 | % | 4.859 | % | |||||||
Total | 16,665,011.052 | 65.852 | % | 100.000 | % | |||||||
| Diversified Fund | ||||||||||||
| No. of Units | % of Outstanding Units | % of Units Present | ||||||||||
For | 6,455,485.810 | 55.294 | % | 89.866 | % | |||||||
Against | 368,253.442 | 3.154 | % | 5.126 | % | |||||||
Abstain | 160,616.591 | 1.376 | % | 2.237 | % | |||||||
Broker Non-Vote | 199,063.000 | 1.705 | % | 2.771 | % | |||||||
Total | 7,183,418.843 | 61.529 | % | 100.000 | % | |||||||
| International Fund | ||||||||||||
| No. of Units | % of Outstanding Units | % of Units Present | ||||||||||
For | 7,102,486.411 | 60.324 | % | 92.292 | % | |||||||
Against | 376,046.027 | 3.194 | % | 4.887 | % | |||||||
Abstain | 168,454.975 | 1.431 | % | 2.189 | % | |||||||
Broker Non-Vote | 48,598.000 | 0.413 | % | 0.632 | % | |||||||
Total | 7,695,585.413 | 65.362 | % | 100.000 | % | |||||||
| Elfun Trusts | ||||||||||||
| No. of Units | % of Outstanding Units | % of Units Present | ||||||||||
For | 23,455,701.718 | 54.964 | % | 92.114 | % | |||||||
Against | 1,330,598.102 | 3.118 | % | 5.226 | % | |||||||
Abstain | 445,739.882 | 1.045 | % | 1.751 | % | |||||||
Broker Non-Vote | 231,445.000 | 0.542 | % | 0.909 | % | |||||||
Total | 25,463,484.702 | 59.669 | % | 100.000 | % | |||||||
| 112 | Special Meeting of Unitholders — Voting Results |
Elfun Funds
Name, Address, and Age | Position(s) Held with Fund | Term of Office and Length of Time Served | Principal Occupation(s) During Past 5 Years | Number of Portfolios in Fund Complex Overseen by Trustee/ Officer | Other Directorships Held by Trustee/Officer | |||||||
| INTERESTED DIRECTORS AND EXECUTIVE OFFICERS | ||||||||||||
Jeanne M. La Porta SSGA Funds State Street One Lincoln | Trustee | Until successor is elected and qualified – 2 years | Senior Managing Director at State Street Global Advisors since July 2016; President of GE Retirement Savings Plan Funds since July 2016; Senior Vice President and Commercial Operations Leader at GEAM from March 2014 to July 2016; President of State Street Institutional Funds and State Street Variable Insurance Series Funds, Inc. since April 2014; President and Trustee of GEAM’s UCITs Funds from March 2014 to November 2014; Senior Vice President and Commercial Administrative Officer at GEAM from April 2010 to March 2014; Vice President of State Street Institutional Funds since July 2003; Vice President of Elfun Funds since October 2003; Vice President of GE Retirement Savings Plan Funds from October 2003 to July 2016; Secretary of GE Funds from July 2007 to September 2010 and Vice President from July 2007 to February 2011; Senior Vice President and Deputy General Counsel of GEAM from October 2007 to April 2010; Vice President and Assistant Secretary of Elfun Funds and GE Retirement Savings Plan Funds from July 2003 to June 2010; and Vice President and Associate General Counsel – Marketing and Client Services (formerly Asset Management Services) at GEAM from May 1997 to October 2007. | 24 | Director of State Street Variable Insurance Series Funds, Inc. since 2014; Trustee of State Street Institutional Funds since 2014; Trustee of Elfun Funds and General Electric Pension Trust since 2014; Director of GE Investment Distributors, Inc. since June 2011. | |||||||
Ellen M.Needham State Street One Lincoln Boston, MA | President | Until successor is elected and qualified – less than 1 year | President and Director, SSGA Funds Management, Inc. (2001 - present)*; Senior Managing Director, State Street Global Advisors (1992 - present).* | N/A | N/A | |||||||
| Trustees | 113 |
Elfun Funds
Trustees, continued
Name, Address, and Age | Position(s) Held with Fund | Term of Office and Length of Time Served | Principal Occupation(s) During Past 5 Years | Number of Portfolios in Fund Complex Overseen by Trustee/ Officer | Other Directorships Held by Trustee/Officer | |||||||
| INTERESTED DIRECTORS AND EXECUTIVE OFFICERS, continued | ||||||||||||
Brian Harris SSGA Funds Management, State Street Boston, MA | Chief Compliance Officer | Until successor is elected and qualified – less than 1 year | Managing Director, State Street Global Advisors and SSGA Funds Management, Inc. (June 2013 - present)*; Senior Vice President and Global Head of Investment Compliance, BofA Global Capital Management (2010-2013); Director of Compliance, AARP Financial Inc. (2008-2010). | N/A | N/A | |||||||
Robert Herlihy Management, State Street One Lincoln | Deputy Chief Compliance Officer | Until successor is elected and qualified – less than 1 year | Chief Compliance Officer of GE Institutional Funds, GE Investments Funds, Inc. and GE Retirement Savings Plan Funds since July 2005; Chief Compliance Officer of GEAM from July 2005 to July 2016; Chief Compliance Officer of GE Funds from July 2005 to February 2011; Manager of Fund Administration at GEAM from March 2002 to 2005. | N/A | N/A | |||||||
Joshua A. Weinberg Management, State Street One Lincoln | Chief Legal Officer | Until successor is elected and qualified – less than 1 year | Vice President and Managing Counsel, State Street Global Advisors (2011 – present); Clerk, SSGA Funds Management, Inc. (2013 – present); Associate, Financial Services Group, Dechert LLP (2006 – 2011). | N/A | N/A | |||||||
Bruce S. Rosenberg Management, State Street One Lincoln | Treasurer | Until successor is elected and qualified – less than 1 year | Managing Director, State Street Global Advisors and SSGA Funds Management, Inc. (July 2015 – present); Director, Credit Suisse (April 2008 – July 2015). | N/A | N/A | |||||||
| 114 | Trustees |
Elfun Funds
Trustees, continued
Name, Address, and Age | Position(s) Held with Fund | Term of Office and Length of Time Served | Principal Occupation(s) During Past 5 Years | Number of Portfolios in Fund Complex Overseen by Trustee/ Officer | Other Directorships Held by Trustee/Officer | |||||||
| INTERESTED DIRECTORS AND EXECUTIVE OFFICERS, continued | ||||||||||||
Ann M. Carpenter Management, State Street One Lincoln | Vice President and Deputy Treasurer | Until successor is elected and qualified – less than 1 year | Chief Operating Officer, SSGA Funds Management, Inc. (April 2014 – present); Managing Director, State Street Global Advisors and SSGA Funds Management, Inc. (2005 –present).* | N/A | N/A | |||||||
Chad C. Hallett Management, State Street One Lincoln | Deputy Treasurer | Until successor is elected and qualified – less than 1 year | Vice President, State Street Global Advisors and SSGA Funds Management, Inc. (November 2014 – present); Vice President, State Street Bank and Trust Company (2001 – November 2014). | N/A | N/A | |||||||
Arthur A. Jensen SSGA Management, State Street One Lincoln YOB: 1967 | Deputy Treasurer | Until successor is elected and qualified – less than 1 year | Treasurer of GE Institutional Funds, GE Investments Funds, Inc. and GE Retirement Savings Plan Funds since June 2011; Mutual Funds Controller of GEAM from April 2011 to July 2016; Senior Vice President at Citigroup from 2008 to 2010; and Vice President at JPMorgan from 2005 to 2008. | N/A | N/A | |||||||
Trevor Swanberg Management, State Street One Lincoln YOB: 1979 | Code of Ethics Compliance Officer | Until successor is elected and qualified – less than 1 year | Vice President, State Street Global Advisors and SSGA Funds Management, Inc. (January 2015 – Present); Senior Manager-Mutual Fund Compliance, ICMA-Retirement Corporation (December 2011 – January 2015); Assistant Vice President, J.P. Morgan (September 2007 – December 2011). | N/A | N/A | |||||||
| Trustees | 115 |
Elfun Funds
Trustees, continued
Name, Address, and Age | Position(s) Held with Fund | Term of Office and Length of Time Served | Principal Occupation(s) During Past 5 Years | Number of Portfolios in Fund Complex Overseen by Trustee/ Officer | Other Directorships Held by Trustee/Officer | |||||||
| NON-INTERESTED DIRECTORS | ||||||||||||
William L. Marshall SSGA Funds Management, Inc. State Street Boston, MA YOB: 1942 | Trustee | Until successor is elected and qualified – less than 1 year | April 2011 to Present, Chairman (until April 2011, Chief Executive Officer and President), Wm. L. Marshall Associates, Inc., Wm. L. Marshall Companies, Inc. and the Marshall Financial Group, Inc. (a registered investment adviser and provider of financial and related consulting services); Certified Financial Planner; Member, Financial Planners Association; 2015 to present, Board Member, The Doylestown Health Foundation Board. | 74 | Trustee and Co- Chairman of the Audit Committee, State Street Institutional Investment Trust; Trustee and Co- Chairman of the Audit Committee, State Street Master Funds; Trustee and Co- Chairman of the Audit Committee, SSGA Funds; Director, Marshall Financial Group, Inc. | |||||||
Patrick J. Riley SSGA Funds Management, Inc. State Street Boston, MA YOB: 1948 | Trustee | Until successor is elected and qualified – less than 1 year | 2002 to May 2010, Associate Justice of the Superior Court, Commonwealth of Massachusetts; 1985 to 2002, Partner, Riley, Burke & Donahue, L.L.P. (law firm); 1998 to Present, Independent Director, State Street Global Advisers Ireland, Ltd. (investment company); 1998 to Present, Independent Director, SSGA Liquidity plc (formerly, SSGA Cash Management Fund plc); January 2009 to Present, Independent Director, SSGA Fixed Income plc; and January 2009 to Present, Independent Director, SSGA Qualified Funds PLC. | 74 | Trustee and Co-Chairman, State Street Institutional Investment Trust; Trustee and Co- Chairman, State Street Master Funds; Trustee and Co- Chairman, SSGA Funds; Board Director and Chairman, SPDR Europe 1PLC Board (2011-Present); Board Director and Chairman, SPDR Europe II, PLC (2013-Present). | |||||||
Rina K. Spence SSGA Funds Management, Inc. State Street Boston, MA 02111- YOB: 1948 | Trustee | Until successor is elected and qualified - less than 1 year | President of SpenceCare International LLC (international healthcare consulting) (1999 – present); Chief Executive Officer, IEmily.com (health internet company) (2000 – 2001); Chief Executive Officer of Consensus Pharmaceutical, Inc. (1998 – 1999); Founder, President and Chief Executive Officer of Spence Center for Women’s Health (1994 – 1998); President and CEO Emerson Hospital (1984 – 1994); Trustee, Eastern Enterprise (utilities) (1988 – 2000); Director, Berkshire Life Insurance Company of America (1993 – 2009); Honorary Consul for Monaco in Boston (2015 – present). | 74 | Trustee and Co-Chairman of the Qualified Legal and Compliance Committee and Co- Chairman of the Governance Committee, State Street Institutional Investment Trust; Trustee and Co- Chairman of the Qualified Legal and Compliance Committee and Co-Chairman of the Governance Committee, State Street Master Funds; Trustee and Co-Chairman of the Qualified Legal and Compliance Committee and Co-Chairman of the Governance Committee, SSGA Funds. | |||||||
| 116 | Trustees |
Elfun Funds
Trustees, continued
Name, Address, and Age | Position(s) Held with Fund | Term of Office and Length of Time Served | Principal Occupation(s) During Past 5 Years | Number of Portfolios in Fund Complex Overseen by Trustee/ Officer | Other Directorships Held by Trustee/Officer | |||||||
| NON-INTERESTED DIRECTORS, continued | ||||||||||||
Douglas T. Williams SSGA Funds Management, Inc. State Street Boston, MA 02111- YOB: 1940 | Trustee | Until successor is elected and qualified – less than 1 year | President, Oakmont Homeowners Association; President, Mariner Sands Chapel; Executive Vice President and member of Executive Committee, Chase Manhattan Bank (1987 -1999); President, Boston Stock Exchange Depository Trust Company, 1981 - 1982; Treasurer, Nantucket Educational Trust, (2002-2007). | 74 | Trustee and Co-Chairman of the Audit Committee, State Street Institutional Investment Trust; Trustee and Co- Chairman of the Audit Committee, State Street Master Funds; Trustee and Co- Chairman of the Audit Committee, SSGA Funds. | |||||||
| * | Served in various capacities and/or with various affiliated entities during noted time period. |
| Trustees | 117 |
Elfun Funds
Shareholder Services
Online Service
Your Elfun Mutual Fund accounts can now be accessed on the Internet at www.ssgafunds.com/geam
Here are some of the online services:
| • | View account balance and transaction history |
| • | Make exchanges |
| • | Redeem shares |
| • | Purchase shares |
| • | View and order tax forms |
| • | View quarterly statements |
| • | Change address |
| • | Re-order money market checks |
Telephone Service
Our Shareholder Service Associates are available Monday to Friday from 9:00 AM to 8:00 PM Eastern Standard Time. Call toll-free, 1-800-242-0134, for assistance.
Automated Voice Response System
You can also access your account anytime during the day, 7 days a week by dialing 1-800-242-0134. Simply follow the menu to obtain information or make certain transactions.
Contact Us By Mail
If you’d like to write to us, address your inquiries regarding your account(s) to:
Elfun Mutual Funds
c/o U.S. Bancorp Fund Services, LLC
P.O. Box 701
Milwaukee, WI 53201-0701
| 118 | Shareholder Services |
Elfun Funds
c/o U.S. Bancorp Fund Services, Ltd.
PO Box 701
Milwaukee, WI 53201-0701
Distributor
State Street Global Markets, LLC
Member FINRA and SIPC
State Street Financial Center
One Lincoln Street
Boston, MA 02111
www.ssga.com/geam
The Funds file their complete schedules of portfolio holdings with the Securities and Exchange Commission for the first, second and third quarters of each fiscal year on Form N-Q. The Funds’ Forms N-Q, as well as a description of the policies and procedures that the Funds use to determine how to vote proxies (if any) relating to portfolio securities is available without charge (i) upon request, by calling 1-800-242-0134; (ii) on the Funds’ website at http://www.ssgafunds.com/geam; and (iii) on the Commission’s website at http://www.sec.gov. The Funds’ Forms N-Q may be reviewed and copied at the Commission’s Public Reference Room in Washington, DC — information on the operation of the Public Reference Room may be obtained by calling 1-800-SEC-0330.
Information (if any) regarding how the Funds voted proxies relating to portfolio securities during the most recently disclosed 12-months period ended June 30 is available without charge (i) through the Funds’ website at http://www.ssgafunds.com/geam; and (ii) on the Commission’s website at http://www.sec.gov.
IBG-22932 |
Item 2. Code of Ethics.
As of the end of the period covered by this report, the Elfun Tax-Exempt Income Fund (the “Fund” or “Registrant”) has adopted a code of ethics, as defined in Item 2(b) of Form N-CSR, that applies to the Registrant’s principal executive officer, principal financial officer, principal accounting officer or controller, or persons performing similar functions, regardless of whether these individuals are employed by the Registrant or a third party (the “Code”). That Code comprises written standards that are reasonably designed to deter wrongdoing and to promote: (1) honest and ethical conduct, including the ethical handling of actual or apparent conflicts of interest between personal and professional relationships; (2) full, fair, accurate, timely and understandable disclosure in reports and documents that the Registrant files with, or submits to, the U.S. Securities Exchange Commission (the “SEC”) and in other public communications made by the Registrant; (3) compliance with applicable laws and governmental rules and regulations; (4) the prompt internal reporting to an appropriate person or persons identified in the Code of violations of the Code; and (5) accountability for adherence to the Code. As of the end of the period and related to the approval of a new investment adviser, the Registrant has adopted a new code of ethics, as defined in Item 2 of Form N-CSR, applicable to its principal executive officer, principal financial officer, principal accounting officer or controller, or persons performing similar functions, which replaces the prior code of ethics. The Registrant has not granted any waivers from any provisions of the Code during the covered period. A copy of the Code is filed as Exhibit 12(a)(1) to this Form N-CSR.
Item 3. Audit Committee Financial Expert.
The Fund’s Board of Trustees (the “Board”) has determined that the Fund has the following “audit committee financial expert “as defined in Item 3(b) of Form N-CSR serving on its Audit Committee: Mr. Richard D. Shirk. The audit committee financial expert is “independent” as that term is defined in Item 3(a)(2) of Form N-CSR.
An “audit committee financial expert” is not an “expert” for any purpose, including for purposes of Section 11 of the Securities Act of 1933, as amended, as a result of being designated as an “audit committee financial expert.” Further, the designation of a person as an “audit committee financial expert” does not mean that the person has any greater duties, obligations, or liability than those imposed on the person without the “audit committee financial expert” designation. Similarly, the designation of a person as an “audit committee financial expert” does not affect the duties, obligations, or liability of any other member of the Audit Committee or Board of Trustees.
Item 4. Principal Accountant Fees and Services.
| (a) | Audit Fees |
For the fiscal year ended December 31, 2016, the aggregate audit fees billed for professional services rendered by Ernst & Young LLP (“E&Y”), the Registrant’s principal accountant, for the audit of the Registrant’s annual financial statements or services normally provided by E&Y in connection with the Registrant’s statutory and regulatory filings and engagements were $27,100. For the fiscal year ended December 31, 2015, the aggregate audit fees billed for professional services rendered by KPMG LLP (“KPMG”), the Registrant’s prior principal accountant, for the audit of the Registrant’s annual financial statements or services normally provided in connection with the Registrant’s statutory and regulatory filings and engagements were $20,800.
| (b) | Audit-Related Fees |
There were no fees billed either by E&Y for the fiscal year ended December 31, 2016 or KPMG for the fiscal year ended December 31, 2015, for assurance and related services that were reasonably related to the performance of the audit of the Registrant’s financial statements that were not reported under paragraph (a) of this Item.
| (c) | Tax Fees |
The aggregate tax fees billed for professional services rendered by E&Y for tax compliance, tax advice, and tax planning in the form of preparation of excise filings and income tax returns for the fiscal year ended December 31, 2016 were $9,866. There were no fees billed for professional services rendered by KPMG for tax compliance, tax advice, or tax planning for the fiscal year ended December 31, 2015.
| (d) | All Other Fees |
For the fiscal year ended December 31, 2016, there were no fees billed for professional services rendered by E&Y for products and services provided by E&Y to the Registrant, other than the services reported in paragraphs (a) through (c).
For the fiscal year ended December 31, 2016, the aggregate fees for professional services rendered by E&Y for products and services provided by E&Y to SSGA Funds Management, Inc. (“SSGA FM” or the “Adviser”) and any entity controlling, controlled by, or under common control with the Adviser that provides ongoing services to the Registrant that (i) relate directly to the operations and financial reporting of the Registrant and (ii) were pre-approved by the Registrant’s audit committee were approximately $7,777,372.
For the fiscal year ended December 31, 2015, there were no fees billed for professional services rendered by KPMG for products and services provided by KPMG to the Registrant, other than the services reported in paragraphs (a) through (c).
| (e)(1) | Audit Committee Pre-Approval Policies and Procedures |
The Fund’s Audit Committee Charter states the following with respect to pre-approval procedures:
The Audit Committee shall have the following duties and powers:
| • | To pre-approve engagements by a Fund’s independent auditor for non-audit services to be rendered to the Fund’s investment adviser (not including any subadviser whose role is primarily portfolio management and is subcontracted with or overseen by another investment adviser), and any entity controlling, controlled by, or under common control with the investment adviser that provides ongoing services to the Fund, if the engagement relates directly to the operations and financial reporting of the Fund; |
| • | To establish, if deemed necessary or appropriate as an alternative to Audit Committee pre-approval of services to be provided by the independent auditor as required by paragraph (b) above, policies and procedures to permit such services to be pre-approved by other means, such as by action of a designated member or members of the Audit Committee, subject to the requirement that the decision of any member to whom authority is delegated to pre-approve an activity shall be presented to the full Audit Committee at its next scheduled meeting; |
Alternate Pre-Approval Procedure:
| • | The Chairperson, or a Co-Chairperson, of the Audit Committee is authorized to pre-approve any engagement involving the Fund’s independent auditors to the same extent as the Audit Committee. Any pre-approval decision by the Chairperson, or a Co-Chairperson, under the foregoing authority shall be presented to the Audit Committee at its next scheduled meeting. |
| (e)(2) | Percentages of Services |
The percentage of services described in each of paragraphs (b) through (d) of this Item rendered by E&Y for the fiscal year ended December 31, 2016 that were approved by the audit committee pursuant to paragraph (c)(7)(i)(C) of Rule 2-01 of Regulation S-X is as follows:
Audit Fees | 100 | % | ||
Audit-Related Fees | 100 | % | ||
Tax Fees | 100 | % | ||
All Other Fees | 100 | % |
There were no fees billed by KPMG for the fiscal year ended December 31, 2015 for audit related, tax or other services as indicated in paragraphs (b) through (d) of this Item.
(f) Not applicable.
| (g) | Total Fees Paid By Adviser and Certain Affiliates |
For the fiscal year ended December 31, 2016, the aggregate non-audit fees billed by E&Y for services rendered to the Registrant and the Adviser and any entity controlling, controlled by, or under common control with the Adviser that provided ongoing services to the Registrant were approximately $25,696,758. For the fiscal year ended December 31, 2015, the aggregate non-audit fees billed by KPMG for services rendered to the Registrant and the Adviser and any entity controlling, controlled by, or under common control with the Adviser that provided ongoing services to the Registrant were $0.
| (h) | Auditor Independence |
On July 1, 2016, State Street Corporation acquired the asset management and advisory services business conducted by GE Asset Management Incorporated (“GEAM”), a wholly owned subsidiary of General Electric Company, and certain of its subsidiaries (the “Transaction”). In connection with the Transaction, Unitholders of the Fund voted to approve SSGA FM as investment adviser of the Fund, replacing GEAM.
In connection with the appointment of E&Y, a member firm of Ernst & Young Global Limited, as the independent auditor of the Fund for their fiscal year ended December 31, 2016, E&Y evaluated its independence and identified the following matters that are inconsistent with the auditor independence rules of the Securities and Exchange Commission (“SEC”). All of the lobbying services and project management services described below occurred prior to the consummation of the Transaction.
Lobbying services
During the audit period, E&Y was a registered lobbyist for the parent company of the former investment adviser to the Fund (the “parent company”) under the Lobbying Disclosure Act of 1995 and provided lobbying services on behalf of the parent company. The services primarily included lobbying efforts, on behalf of the parent company, relating to tax reform and to changes to the tax code or regulations affecting the parent company and its affiliates. The services did not relate to the asset management business of the Fund.
Project management services
During the audit period, E&Y was engaged to provide project management support to the parent company and one of its affiliates in relation to certain information technology programs. The services did not relate to the asset management business of the Fund.
Loan Rule
E&Y has identified one record holder (the “record holder”) of greater than 10% of the shares of State Street Institutional Income Fund (formerly known as GE Institutional Income Fund) and State Street Institutional Premier Growth Equity Fund (formerly known as GE Institutional Premier Growth Equity Fund) (each a series of State Street Institutional Funds (formerly known as (GE Institutional Funds)) (collectively, the “Two Funds”), with which E&Y and covered person professionals maintain lending relationships. These investments in the Two Funds are each held at an omnibus level by the record holder on behalf of its customers, who own the economic interest in the shares. There was one meeting of shareholders of the Two Funds during the audit period. At that meeting, shareholders voted on matters relating to the acquisition by State Street Corporation and its affiliates of substantially all of the asset management and advisory services business conducted by the former investment adviser to the Two Funds, including votes to (i) approve a new investment advisory and administration agreement with SSGA FM, (ii) elect the Trustees to the Board of Trustees, and (iii) approve manager-of-managers authority for SSGA FM with respect to the Two Funds. E&Y and SSGA FM, through discussion with the record holder, have determined that the record holder did not exercise discretionary authority over the shares it held in respect of any of those votes. E&Y believes that, while a lending arrangement with a record owner of greater than 10% of the shares is inconsistent with Rule 2-01(c)(1)(ii)(A) of Regulation S-X, the circumstances fall within the situations described in the relevant No Action Letter issued by the SEC Staff on June 20, 2016.
E&Y has reviewed the independence matters described above and the applicable guidance and has concluded that the services and relationship described above did not impair E&Y’s ability to exercise objective and impartial judgment in connection with the audits of the financial statements of the Fund under the SEC and Public Company Accounting Oversight Board standards for the fiscal year ended December 31, 2016. In light of the representations and determinations by E&Y, SSGA FM has determined that it shares that same belief.
The Audit Committee of the Board of the Fund has considered these independence matters and discussed these matters with E&Y and members of SSGA FM, and based on these discussions and the statements of SSGA FM and E&Y, the Audit Committee believes it was reasonable for it to accept the view of E&Y that E&Y was capable of exercising objective and impartial judgment in connection with the audits of the financial statements of the Fund in the specific circumstances described above.
Item 5. Audit Committee of Listed Registrants.
| Not | applicable to the Registrant. |
Item 6. Schedule of Investments.
| (a) | Schedule of Investments is included as part of the report to shareholders filed under Item 1 of this Form N-CSR. |
| (b) | Not applicable to the Registrant. |
Item 7. Disclosure of Proxy Voting Policies and Procedures for Closed-End Management Investment Companies.
Not applicable to the Registrant.
Item 8. Portfolio Managers of Closed-End Management Investment Companies.
Not applicable to the Registrant.
Item 9. Purchases of Equity Securities by Closed-End Management Investment Company and Affiliated Purchasers.
Not applicable to the Registrant.
Item 10. Submission of Matters to a Vote of Security Holders.
The Board of Trustees approved an Amended and Restated Nominating Committee Charter (the “Charter”) by unanimous written consent on July 18, 2016. The Charter contains procedures related to how shareholders are to submit recommendations for Trustee candidates to the Fund. Those procedures are as follows:
Procedures for Shareholders to Submit Nominee Candidates
(As of February 13, 2014)
A shareholder of the Trust, or of any series thereof, if applicable, must follow the following procedures in order to submit properly a nominee recommendation for the Nominating Committee’s consideration.
| 1. | The shareholder must submit any such recommendation (a “Shareholder Recommendation”) in writing to the Trust, to the attention of the Trust’s Secretary, at the address of the principal executive offices of the Trust. |
| 2. | The Shareholder Recommendation must be delivered to, or mailed and received at, the principal executive offices of the Trust not less than sixty (60) calendar days nor more than ninety (90) calendar days prior to the date of the Board or shareholder meeting at which the nominee candidate would be considered for election. Shareholder Recommendations will be kept on file for two years after receipt of the Shareholder Recommendation. A Shareholder Recommendation considered by the Nominating Committee in connection with the Nominating Committee’s nomination of any candidate(s) for appointment or election as an independent Trustee need not be considered again by the Nominating Committee in connection with any subsequent nomination(s). |
| 3. | The Shareholder Recommendation must include: (i) a statement in writing setting forth (A) the name, age, date of birth, business address, residence address and nationality of the person recommended by the shareholder (the “candidate”), and the names and addresses of at least three professional references; (B) the number of all shares of the Trust (including the series and class, if applicable) owned of record or beneficially by the candidate, the date such shares were acquired and the investment intent of such acquisition(s), as reported to such shareholder by the candidate; (C) any other information regarding the candidate called for with respect to director nominees by paragraphs (a), (d), (e) and (f) of Item 401 of Regulation S-K or paragraph (b) of Item 22 of Rule 14a-101 (Schedule 14A) under the Securities Exchange Act of 1934, as amended (the “Exchange Act”), adopted by the Securities and Exchange Commission (or the corresponding provisions of any applicable regulation or rule subsequently adopted by the Securities and Exchange Commission or any successor agency with jurisdiction related to the Trust); (D) any other information regarding the candidate that would be required to be disclosed if the candidate were a nominee in a proxy statement or other filing required to be made in connection with solicitation of proxies for election of directors pursuant to Section 14 of the Exchange Act and the rules and regulations promulgated thereunder or any other applicable law or regulation; and (E) whether the recommending shareholder believes that the candidate is or will be an “interested person” of the Trust (as defined in the Investment Company Act of 1940, as amended) and, if not an “interested person,” information regarding the candidate that will be sufficient, in the discretion of the Board or the Nominating Committee, for the Trust to make such determination; (ii) the written and signed consent of the candidate to be named as a nominee and to serve as a Trustee if elected; (iii) the recommending shareholder’s name as it appears on the Trust’s books; (iv) the number of all shares of the Trust (including the series and class, if applicable) owned beneficially and of record by the recommending shareholder; (v) a complete description of all arrangements or understandings between the recommending shareholder and the candidate and any other person or persons (including their names) pursuant to which the recommendation is being made by the recommending shareholder including, without limitation, all direct and indirect compensation and other material monetary agreements, arrangements and understandings between the candidate and recommending shareholder during the past three years, and (vi) a brief description of the candidate’s relevant background and experience for membership on the Board, such as qualification as an audit committee financial expert. |
| 4. | The Nominating Committee may require the recommending shareholder to furnish such other information as it may reasonably require or deem necessary to verify any information furnished pursuant to paragraph 3 above or to determine the eligibility of the candidate to serve as a Trustee of the Trust or to satisfy applicable law. If the recommending shareholder fails to provide such other information in writing within seven days of receipt of a written request from the Nominating Committee, the recommendation of such candidate as a nominee will be deemed not properly submitted for consideration, and the Nominating Committee will not be required to consider such candidate. |
Item 11. Controls and Procedures.
(a) The Registrant’s principal executive officer and principal financial officer have concluded that the Registrant’s disclosure controls and procedures (as defined in Rule 30a-3(c) under the Investment Company Act of 1940, as amended (the “1940 Act”)) are effective to provide reasonable assurance that information required to be disclosed by the Registrant on Form N-CSR is recorded, processed, summarized and reported as of a date within 90 days of the filing date of this report, based on their evaluation of these controls and procedures required by Rule 30a-3(b) under the 1940 Act and Rules 13a-15(b) or 15d-15(b) under the Securities Exchange Act of 1934, as amended.
(b) There were no changes in the Registrant’s internal control over financial reporting (as defined in Rule 30a-3(d) under the 1940 Act) that occurred during the Registrant’s second fiscal quarter of the period covered by this Form N-CSR filing that have materially affected, or are reasonably likely to materially affect, the Registrant’s internal control over financial reporting.
Item 12. Exhibits.
| (a)(1) | Code of Ethics pursuant to Item 2 of Form N-CSR is attached hereto. |
| (a)(2) | Certifications of principal executive officer and principal financial and accounting officer of the Registrant as required by Rule 30a-2(a) under the 1940 Act are attached hereto. |
| (a)(3) | Not applicable to the Registrant. |
| (b) | Certifications of principal executive officer and principal financial and accounting officer of the Registrant as required by Rule 30a-2(b) under the 1940 Act and Section 906 of the Sarbanes-Oxley Act of 2002 are attached hereto. |
SIGNATURES
Pursuant to the requirements of the Securities Exchange Act of 1934 and the Investment Company Act of 1940, the Registrant has duly caused this report to be signed on its behalf by the undersigned, thereunto duly authorized.
| Registrant: | ELFUN TAX-EXEMPT INCOME FUND | |
| By: | /s/ Ellen M. Needham | |
| Ellen M. Needham | ||
| President | ||
Date: | March 10, 2017 | |
Pursuant to the requirements of the Securities Exchange Act of 1934 and the Investment Company Act of 1940, this report has been signed below by the following persons on behalf of the Registrant and in the capacities and on the dates indicated.
| By: | /s/ Ellen M. Needham | |
| Ellen M. Needham | ||
| President (Principal Executive Officer) | ||
| Date: | March 10, 2017 | |
| By: | /s/ Bruce S. Rosenberg | |
| Bruce S. Rosenberg | ||
| Treasurer (Principal Financial and Accounting Officer) | ||
| Date: | March 10, 2017 | |