UNITED STATES
SECURITIES AND EXCHANGE COMMISSION
Washington, D.C. 20549
FORM N-CSR
CERTIFIED SHAREHOLDER REPORT OF REGISTERED
MANAGEMENT INVESTMENT COMPANIES
Investment Company Act file number 811-02676
Fidelity School Street Trust
(Exact name of registrant as specified in charter)
245 Summer St., Boston, Massachusetts 02210
(Address of principal executive offices) (Zip code)
Margaret Carey, Secretary
245 Summer St.
Boston, Massachusetts 02210
(Name and address of agent for service)
Registrant's telephone number, including area code:
617-563-7000
| |
Date of fiscal year end: | December 31 |
|
|
Date of reporting period: | December 31, 2023 |
Item 1.
Reports to Stockholders
Fidelity Advisor® Multi-Asset Income Fund
Annual Report
December 31, 2023
Includes Fidelity and Fidelity Advisor share classes
Contents
To view a fund's proxy voting guidelines and proxy voting record for the 12-month period ended June 30, visit http://www.fidelity.com/proxyvotingresults or visit the Securities and Exchange Commission's (SEC) web site at http://www.sec.gov.
You may also call 1-800-544-8544 if you're an individual investing directly with Fidelity, call 1-800-835-5092 if you're a plan sponsor or participant with Fidelity as your recordkeeper or call 1-877-208-0098 on institutional accounts or if you're an advisor or invest through one to request a free copy of the proxy voting guidelines.
Standard & Poor's, S&P and S&P 500 are registered service marks of The McGraw-Hill Companies, Inc. and have been licensed for use by Fidelity Distributors Corporation.
Other third-party marks appearing herein are the property of their respective owners.
All other marks appearing herein are registered or unregistered trademarks or service marks of FMR LLC or an affiliated company. © 2024 FMR LLC. All rights reserved.
This report and the financial statements contained herein are submitted for the general information of the shareholders of the Fund. This report is not authorized for distribution to prospective investors in the Fund unless preceded or accompanied by an effective prospectus.
A fund files its complete schedule of portfolio holdings with the SEC for the first and third quarters of each fiscal year on Form N-PORT. Forms N-PORT are available on the SEC's web site at http://www.sec.gov. A fund's Forms N-PORT may be reviewed and copied at the SEC's Public Reference Room in Washington, DC. Information regarding the operation of the SEC's Public Reference Room may be obtained by calling 1-800-SEC-0330.
For a complete list of a fund's portfolio holdings, view the most recent holdings listing, semiannual report, or annual report on Fidelity's web site at http://www.fidelity.com, http://www.institutional.fidelity.com, or http://www.401k.com, as applicable.
NOT FDIC INSURED •MAY LOSE VALUE •NO BANK GUARANTEE
Neither the Fund nor Fidelity Distributors Corporation is a bank.
Average annual total return reflects the change in the value of an investment, assuming reinvestment of distributions from dividend income and capital gains (the profits earned upon the sale of securities that have grown in value, if any) and assuming a constant rate of performance each year. The hypothetical investment and the average annual total returns do not reflect the deduction of taxes that a shareholder would pay on fund distributions or the redemption of fund shares. During periods of reimbursement by Fidelity, a fund's total return will be greater than it would be had the reimbursement not occurred. How a fund did yesterday is no guarantee of how it will do tomorrow.
| Average Annual Total Returns |
| | | | |
Periods ended December 31, 2023 | Past 1 year | Past 5 years | Life of Fund A |
Class A (incl. 4.00% sales charge) | 6.97% | 9.29% | 7.13% |
Class M (incl. 4.00% sales charge) | 6.98% | 9.33% | 7.15% |
Class C (incl. contingent deferred sales charge) | 9.61% | 9.37% | 6.88% |
| Fidelity® Multi-Asset Income Fund | 11.72% | 10.49% | 7.94% |
| Class I | 11.70% | 10.46% | 7.92% |
| Class Z | 11.81% | 10.57% | 7.99% |
A From September 9, 2015
Class C shares' contingent deferred sales charges included in the past one year, past five years and life of fund total return figures are 1%, 0% and 0%, respectively.
The initial offering of Class Z shares took place on October 2, 2018. Returns prior to October 2, 2018, are those of Class I.
The initial offering of Fidelity® Multi-Asset Income Fund shares took place on March 28, 2018. Returns prior to March 28, 2018 are those of Class I.
| $10,000 Over Life of Fund |
| |
Let's say hypothetically that $10,000 was invested in Fidelity Advisor® Multi-Asset Income Fund - Class A, a class of the fund, on September 9, 2015, and the current 4.00% sales charge was paid. The chart shows how the value of your investment would have changed, and also shows how the Bloomberg U.S. Aggregate Bond Index performed over the same period. |
|
|
Market Recap:
U.S. equities gained 26.29% in 2023, according to the S&P 500® index, as a slowing in the pace of inflation and resilient late-cycle expansion of the U.S. economy provided a favorable backdrop for higher-risk assets for much of the year. After returning -18.11% in 2022, much of the index's sharp reversal was driven by a narrow set of firms in the information technology and communication services sectors. Since March 2022, the U.S. Federal Reserve has raised its benchmark interest rate 11 times in a series of increases aimed at cooling the economy and bringing down inflation, and since July, has held its target rate at a 22-year high. At the Fed's November 1 meeting, the central bank hinted it might be done raising rates, which helped reverse a three-month decline for the S&P 500® that had been driven by soaring yields on longer-term government bonds and mixed earnings from some big and influential firms. Favorable data on inflation, as well as better-than-expected corporate earnings, provided a further boost and the index rose 14% in the final two months of the year. In fixed income, the Bloomberg U.S. Aggregate Bond Index gained 5.53% for the year, as U.S. taxable investment-grade bonds rebounded after returning -13.01% in 2022. For the year, long-term bonds outpaced short-term issues, while lower-quality (higher yielding) bonds topped higher-quality debt. Higher-risk assets, including corporate bonds and asset-backed securities, fared better than U.S. Treasuries.
Comments from Lead Manager Adam Kramer:
For the year, the fund's share classes (excluding sales charges, if applicable) gained roughly 11% to 12%, lagging the 15.58% result of the Composite index, a 50/50 blend of the broad-based S&P 500® index and Bloomberg U.S. Aggregate Bond Index. A sizable underweight and security selection in the equities subportfolio notably detracted from the fund's performance versus the Composite index for the year. Non-Composite exposure to and security selection among convertibles, high-yield floating-rate debt and high-yield bonds also hurt. Conversely, a large underweight in investment-grade bonds more than made up for disappointing security selection within the asset class. Within the equities subportfolio - about 35% of assets, on average, in 2023 - stock picks and an underweight in the information technology sector notably detracted. Security selection in the industrials and consumer discretionary sectors and an overweight in real estate also hurt. Among the biggest individual detractors was a non-Composite position in the stock of Babcock & Wilcox Enterprises (-73%), which we sizably reduced in 2023. Underweights in Nvidia (+234%) and Apple (+50%) also significantly detracted versus the Composite. Conversely, security selection and large underweights in the financials, consumer staples and health care sectors aided relative performance. The top individual contributor was the stock of Uber Technologies (+101%), a new addition to the portfolio. A lack of exposure to Composite index component Pfizer (-41%) also helped.
The views expressed above reflect those of the portfolio manager(s) only through the end of the period as stated on the cover of this report and do not necessarily represent the views of Fidelity or any other person in the Fidelity organization. Any such views are subject to change at any time based upon market or other conditions and Fidelity disclaims any responsibility to update such views. These views may not be relied on as investment advice and, because investment decisions for a Fidelity fund are based on numerous factors, may not be relied on as an indication of trading intent on behalf of any Fidelity fund.
| Top Bond Issuers (% of Fund's net assets) |
(with maturities greater than one year) |
| U.S. Treasury Obligations | 37.6 | |
| Microsoft Corp. | 2.7 | |
| DHT Holdings, Inc. | 2.4 | |
| Uber Technologies, Inc. | 2.0 | |
| JPMorgan Chase & Co. | 1.7 | |
| Amazon.com, Inc. | 1.5 | |
| Energy Transfer LP | 1.4 | |
| Bass Pro Group LLC | 1.2 | |
| Petroleos Mexicanos | 1.2 | |
| Alphabet, Inc. | 1.2 | |
| | 52.9 | |
| |
| Market Sectors (% of Fund's net assets) |
| |
| Energy | 10.6 | |
| Information Technology | 9.2 | |
| Consumer Discretionary | 9.1 | |
| Financials | 6.8 | |
| Industrials | 6.7 | |
| Health Care | 4.8 | |
| Communication Services | 4.2 | |
| Materials | 3.7 | |
| Consumer Staples | 2.7 | |
| Utilities | 2.2 | |
| Real Estate | 1.8 | |
| |
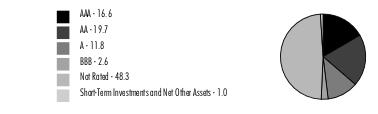
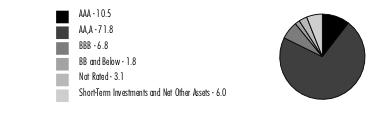
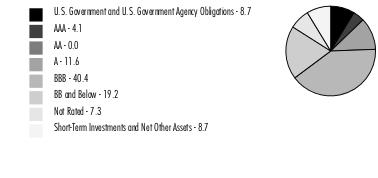
Quality Diversification (% of Fund's net assets) |
|
| |
| We have used ratings from Moody's Investors Service, Inc. Where Moody's® ratings are not available, we have used S&P® ratings. All ratings are as of the date indicated and do not reflect subsequent changes. |
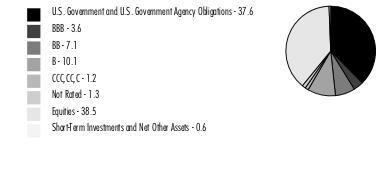
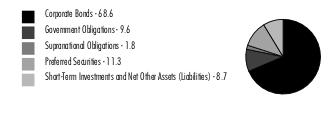
Asset Allocation (% of Fund's net assets) |
|
Written options - (0.1)% |
|
Showing Percentage of Net Assets
| Corporate Bonds - 13.2% |
| | | Principal Amount (a) | Value ($) |
| Convertible Bonds - 0.6% | | | |
| COMMUNICATION SERVICES - 0.2% | | | |
| Media - 0.2% | | | |
| DISH Network Corp. 3.375% 8/15/26 | | 11,380,000 | 6,031,400 |
| | | | |
| REAL ESTATE - 0.2% | | | |
| Real Estate Management & Development - 0.2% | | | |
| Redfin Corp. 0.5% 4/1/27 | | 6,943,000 | 4,456,712 |
| | | | |
| UTILITIES - 0.2% | | | |
| Independent Power and Renewable Electricity Producers - 0.2% | | | |
| NextEra Energy Partners LP 0% 11/15/25 (b) | | 4,396,000 | 3,839,906 |
| | | | |
| TOTAL CONVERTIBLE BONDS | | | 14,328,018 |
| Nonconvertible Bonds - 12.6% | | | |
| COMMUNICATION SERVICES - 1.7% | | | |
| Media - 1.7% | | | |
| Charter Communications Operating LLC/Charter Communications Operating Capital Corp. 3.7% 4/1/51 | | 21,506,000 | 13,988,139 |
| Clear Channel International BV 6.625% 8/1/25 (b) | | 2,575,000 | 2,587,417 |
| Clear Channel Outdoor Holdings, Inc. 9% 9/15/28 (b) | | 4,145,000 | 4,325,162 |
| Gannett Holdings LLC 6% 11/1/26 (b) | | 4,685,000 | 4,134,513 |
| Magallanes, Inc.: | | | |
| 5.141% 3/15/52 | | 6,645,000 | 5,703,774 |
| 5.391% 3/15/62 | | 6,720,000 | 5,754,945 |
| Univision Communications, Inc. 4.5% 5/1/29 (b) | | 4,315,000 | 3,850,070 |
| | | | 40,344,020 |
| CONSUMER DISCRETIONARY - 1.7% | | | |
| Automobile Components - 0.2% | | | |
| Macquarie AirFinance Holdings 8.375% 5/1/28 (b) | | 3,650,000 | 3,822,828 |
| | | | |
| Automobiles - 0.4% | | | |
| Rivian Holdco & Rivian LLC & Rivian Automotive LLC 6 month U.S. LIBOR + 5.620% 11.4932% 10/15/26 (b)(c)(d) | | 9,410,000 | 9,381,820 |
| | | | |
| Hotels, Restaurants & Leisure - 0.8% | | | |
| Affinity Gaming LLC 6.875% 12/15/27 (b) | | 5,125,000 | 4,567,572 |
| Churchill Downs, Inc. 6.75% 5/1/31 (b) | | 3,830,000 | 3,887,203 |
| Dave & Buster's, Inc. 7.625% 11/1/25 (b) | | 4,220,000 | 4,272,750 |
| Ontario Gaming GTA LP 8% 8/1/30 (b) | | 4,440,000 | 4,578,750 |
| Scientific Games Corp. 7.5% 9/1/31 (b) | | 2,580,000 | 2,691,084 |
| | | | 19,997,359 |
| Specialty Retail - 0.3% | | | |
| Bath & Body Works, Inc. 7.6% 7/15/37 | | 2,515,000 | 2,565,300 |
| LCM Investments Holdings 8.25% 8/1/31 (b) | | 3,250,000 | 3,392,039 |
| PetSmart, Inc. / PetSmart Finance Corp. 4.75% 2/15/28 (b) | | 995,000 | 938,070 |
| | | | 6,895,409 |
TOTAL CONSUMER DISCRETIONARY | | | 40,097,416 |
| | | | |
| CONSUMER STAPLES - 0.2% | | | |
| Consumer Staples Distribution & Retail - 0.1% | | | |
| New Albertsons LP 8.7% 5/1/30 | | 2,165,000 | 2,343,613 |
| | | | |
| Personal Care Products - 0.1% | | | |
| HFC Prestige Products, Inc./HFC Prestige International U.S. LLC 6.625% 7/15/30 (b) | | 2,605,000 | 2,676,143 |
| | | | |
TOTAL CONSUMER STAPLES | | | 5,019,756 |
| | | | |
| ENERGY - 2.8% | | | |
| Oil, Gas & Consumable Fuels - 2.8% | | | |
| Calumet Specialty Products Partners LP/Calumet Finance Corp. 11% 4/15/25 (b) | | 5,285,000 | 5,343,323 |
| Enbridge, Inc. 8.5% 1/15/84 (c) | | 2,850,000 | 3,031,391 |
| Northern Oil & Gas, Inc.: | | | |
| 8.125% 3/1/28(b) | | 10,370,000 | 10,499,625 |
| 8.75% 6/15/31(b) | | 6,385,000 | 6,650,600 |
| PBF Holding Co. LLC/PBF Finance Corp. 6% 2/15/28 | | 3,050,000 | 2,969,250 |
| Petroleos Mexicanos 6.95% 1/28/60 | | 43,010,000 | 28,279,075 |
| Sitio Royalties OP / Sitio Finance Corp. 7.875% 11/1/28 (b) | | 8,445,000 | 8,750,878 |
| | | | 65,524,142 |
| FINANCIALS - 0.4% | | | |
| Financial Services - 0.4% | | | |
| GGAM Finance Ltd. 8% 6/15/28 (b) | | 3,400,000 | 3,517,637 |
| Scientific Games Holdings LP/Scientific Games U.S. Finco, Inc. 6.625% 3/1/30 (b) | | 4,630,000 | 4,377,341 |
| | | | 7,894,978 |
| INDUSTRIALS - 1.7% | | | |
| Commercial Services & Supplies - 0.4% | | | |
| Brand Energy & Infrastructure Services, Inc. 10.375% 8/1/30 (b) | | 3,800,000 | 4,018,614 |
| Neptune BidCo U.S., Inc. 9.29% 4/15/29 (b) | | 4,350,000 | 4,045,500 |
| | | | 8,064,114 |
| Ground Transportation - 1.3% | | | |
| Uber Technologies, Inc. 7.5% 9/15/27 (b) | | 29,570,000 | 30,623,579 |
| | | | |
TOTAL INDUSTRIALS | | | 38,687,693 |
| | | | |
| INFORMATION TECHNOLOGY - 1.7% | | | |
| Communications Equipment - 0.1% | | | |
| HTA Group Ltd. 7% 12/18/25 (b) | | 3,300,000 | 3,241,260 |
| | | | |
| Software - 1.6% | | | |
| Cloud Software Group, Inc. 9% 9/30/29 (b) | | 6,635,000 | 6,306,255 |
| McAfee Corp. 7.375% 2/15/30 (b) | | 6,990,000 | 6,383,628 |
| MicroStrategy, Inc. 6.125% 6/15/28 (b) | | 17,495,000 | 16,972,599 |
| Veritas U.S., Inc./Veritas Bermuda Ltd. 7.5% 9/1/25 (b) | | 8,400,000 | 6,934,792 |
| | | | 36,597,274 |
TOTAL INFORMATION TECHNOLOGY | | | 39,838,534 |
| | | | |
| MATERIALS - 1.5% | | | |
| Chemicals - 0.4% | | | |
| LSB Industries, Inc. 6.25% 10/15/28 (b) | | 4,079,000 | 3,868,539 |
| Olympus Water U.S. Holding Corp. 7.125% 10/1/27 (b) | | 2,800,000 | 2,803,136 |
| W.R. Grace Holding LLC 5.625% 8/15/29 (b) | | 4,445,000 | 3,911,409 |
| | | | 10,583,084 |
| Metals & Mining - 1.1% | | | |
| ATI, Inc.: | | | |
| 5.875% 12/1/27 | | 4,343,000 | 4,284,239 |
| 7.25% 8/15/30 | | 3,750,000 | 3,901,468 |
| Carpenter Technology Corp.: | | | |
| 6.375% 7/15/28 | | 2,320,000 | 2,311,295 |
| 7.625% 3/15/30 | | 4,353,000 | 4,488,730 |
| ERO Copper Corp. 6.5% 2/15/30 (b) | | 5,972,000 | 5,268,857 |
| Mineral Resources Ltd. 8% 11/1/27 (b) | | 4,895,000 | 5,018,779 |
| | | | 25,273,368 |
TOTAL MATERIALS | | | 35,856,452 |
| | | | |
| REAL ESTATE - 0.4% | | | |
| Equity Real Estate Investment Trusts (REITs) - 0.4% | | | |
| MPT Operating Partnership LP/MPT Finance Corp. 5% 10/15/27 | | 4,595,000 | 3,753,280 |
| VICI Properties LP 5.125% 5/15/32 | | 4,632,000 | 4,515,290 |
| | | | 8,268,570 |
| UTILITIES - 0.5% | | | |
| Electric Utilities - 0.5% | | | |
| Southern Co. 4% 1/15/51 (c) | | 5,700,000 | 5,419,805 |
| Vistra Operations Co. LLC: | | | |
| 5.625% 2/15/27(b) | | 3,125,000 | 3,082,481 |
| 7.75% 10/15/31(b) | | 3,800,000 | 3,946,638 |
| | | | 12,448,924 |
| TOTAL NONCONVERTIBLE BONDS | | | 293,980,485 |
| TOTAL CORPORATE BONDS (Cost $297,740,681) | | | 308,308,503 |
| | | | |
| U.S. Treasury Obligations - 37.6% |
| | | Principal Amount (a) | Value ($) |
| U.S. Treasury Bonds 3.875% 2/15/43 | | 255,243,000 | 243,358,246 |
| U.S. Treasury Notes: | | | |
| 3.5% 4/30/30 | | 237,451,000 | 232,080,526 |
| 4% 6/30/28 | | 80,608,000 | 80,988,999 |
| 4.125% 7/31/28 | | 189,659,000 | 191,614,858 |
| 4.125% 11/15/32 | | 130,584,000 | 132,736,596 |
| TOTAL U.S. TREASURY OBLIGATIONS (Cost $868,867,502) | | | 880,779,225 |
| | | | |
| Commercial Mortgage Securities - 0.0% |
| | | Principal Amount (a) | Value ($) |
BANK Series 2020-BN30 Class MCDG, 2.9182% 12/15/53 (c)(e) (Cost $177,690) | | 200,000 | 79,781 |
| | | | |
| Common Stocks - 37.1% |
| | | Shares | Value ($) |
| COMMUNICATION SERVICES - 2.3% | | | |
| Diversified Telecommunication Services - 0.0% | | | |
| AT&T, Inc. | | 3,040 | 51,011 |
| Verizon Communications, Inc. | | 1,921 | 72,422 |
| | | | 123,433 |
| Entertainment - 0.6% | | | |
| The Walt Disney Co. | | 87,400 | 7,891,346 |
| Warner Bros Discovery, Inc. (f) | | 455,200 | 5,180,176 |
| | | | 13,071,522 |
| Interactive Media & Services - 1.5% | | | |
| Alphabet, Inc. Class A (f) | | 192,779 | 26,929,299 |
| Meta Platforms, Inc. Class A (f) | | 20,900 | 7,397,764 |
| | | | 34,327,063 |
| Media - 0.2% | | | |
| Comcast Corp. Class A | | 133,030 | 5,833,366 |
| Interpublic Group of Companies, Inc. | | 902 | 29,441 |
| | | | 5,862,807 |
| Wireless Telecommunication Services - 0.0% | | | |
| T-Mobile U.S., Inc. | | 489 | 78,401 |
TOTAL COMMUNICATION SERVICES | | | 53,463,226 |
| CONSUMER DISCRETIONARY - 5.1% | | | |
| Automobiles - 0.5% | | | |
| Stellantis NV (g) | | 198,299 | 4,624,333 |
| Tesla, Inc. (f) | | 21,800 | 5,416,864 |
| | | | 10,041,197 |
| Broadline Retail - 1.5% | | | |
| Amazon.com, Inc. (f) | | 232,100 | 35,265,274 |
| Diversified Consumer Services - 0.0% | | | |
| H&R Block, Inc. | | 755 | 36,519 |
| Hotels, Restaurants & Leisure - 2.4% | | | |
| A&W Revenue Royalties Income Fund (g) | | 277,700 | 6,524,132 |
| Genius Sports Ltd. (f)(g) | | 1,924,565 | 11,893,812 |
| McDonald's Corp. | | 19,626 | 5,819,305 |
| Monarch Casino & Resort, Inc. | | 75,300 | 5,206,995 |
| Penn Entertainment, Inc. (f) | | 358,900 | 9,338,578 |
| Pizza Pizza Royalty Corp. | | 942,900 | 10,474,690 |
| Rush Street Interactive, Inc. (f) | | 1,079,439 | 4,846,681 |
| Super Group SGHC Ltd. (f) | | 866,314 | 2,746,215 |
| | | | 56,850,408 |
| Specialty Retail - 0.3% | | | |
| Academy Sports & Outdoors, Inc. | | 43,425 | 2,866,050 |
| Best Buy Co., Inc. | | 186 | 14,560 |
| Burlington Stores, Inc. (f) | | 263 | 51,148 |
| Dick's Sporting Goods, Inc. | | 28 | 4,115 |
| Lowe's Companies, Inc. | | 20,250 | 4,506,638 |
| TJX Companies, Inc. | | 1,146 | 107,506 |
| | | | 7,550,017 |
| Textiles, Apparel & Luxury Goods - 0.4% | | | |
| Columbia Sportswear Co. | | 72 | 5,727 |
| NIKE, Inc. Class B | | 41,500 | 4,505,655 |
| Tapestry, Inc. | | 671 | 24,700 |
| Under Armour, Inc. Class A (sub. vtg.) (f) | | 493,800 | 4,340,502 |
| | | | 8,876,584 |
TOTAL CONSUMER DISCRETIONARY | | | 118,619,999 |
| CONSUMER STAPLES - 2.5% | | | |
| Beverages - 0.5% | | | |
| Keurig Dr. Pepper, Inc. | | 200,775 | 6,689,823 |
| The Coca-Cola Co. | | 73,541 | 4,333,771 |
| | | | 11,023,594 |
| Consumer Staples Distribution & Retail - 0.2% | | | |
| Albertsons Companies, Inc. | | 203,405 | 4,678,315 |
| Alimentation Couche-Tard, Inc. Class A (multi-vtg.) | | 478 | 28,149 |
| BJ's Wholesale Club Holdings, Inc. (f) | | 540 | 35,996 |
| Costco Wholesale Corp. | | 45 | 29,704 |
| Dollar Tree, Inc. (f) | | 426 | 60,513 |
| Metro, Inc. | | 474 | 24,536 |
| Target Corp. | | 114 | 16,236 |
| Walmart, Inc. | | 814 | 128,327 |
| | | | 5,001,776 |
| Food Products - 1.1% | | | |
| Bunge Global SA | | 347 | 35,030 |
| Flowers Foods, Inc. | | 93,200 | 2,097,932 |
| JBS SA | | 1,190,400 | 6,104,427 |
| Mondelez International, Inc. | | 770 | 55,771 |
| The J.M. Smucker Co. | | 54,100 | 6,837,158 |
| Tyson Foods, Inc. Class A | | 106,400 | 5,719,000 |
| WK Kellogg Co. | | 450,400 | 5,918,256 |
| | | | 26,767,574 |
| Household Products - 0.0% | | | |
| Procter & Gamble Co. | | 878 | 128,662 |
| Personal Care Products - 0.7% | | | |
| Estee Lauder Companies, Inc. Class A | | 121 | 17,696 |
| Kenvue, Inc. | | 445,879 | 9,599,775 |
| Unilever PLC | | 216 | 10,457 |
| Unilever PLC sponsored ADR | | 115,900 | 5,618,832 |
| | | | 15,246,760 |
TOTAL CONSUMER STAPLES | | | 58,168,366 |
| ENERGY - 6.0% | | | |
| Oil, Gas & Consumable Fuels - 6.0% | | | |
| Antero Midstream GP LP (g) | | 359,100 | 4,499,523 |
| Canadian Natural Resources Ltd. | | 936 | 61,322 |
| Canadian Natural Resources Ltd. (g) | | 132,900 | 8,707,608 |
| ConocoPhillips Co. | | 903 | 104,811 |
| DHT Holdings, Inc. | | 5,765,228 | 56,556,887 |
| Energy Transfer LP | | 336,500 | 4,643,700 |
| Enterprise Products Partners LP | | 175,670 | 4,628,905 |
| Exxon Mobil Corp. | | 75,206 | 7,519,096 |
| Freehold Royalties Ltd. (g) | | 404,900 | 4,183,300 |
| Frontline PLC (NY Shares) (g) | | 464,400 | 9,311,220 |
| Hess Corp. | | 409 | 58,961 |
| Hess Midstream LP | | 148,400 | 4,693,892 |
| Imperial Oil Ltd. | | 1,042 | 59,356 |
| MPLX LP | | 127,100 | 4,667,112 |
| Northern Oil & Gas, Inc. | | 169,100 | 6,268,537 |
| Phillips 66 Co. | | 275 | 36,614 |
| Scorpio Tankers, Inc. | | 146,150 | 8,885,920 |
| Sitio Royalties Corp. | | 245,023 | 5,760,491 |
| Southwestern Energy Co. (f) | | 697,600 | 4,569,280 |
| Targa Resources Corp. | | 53,800 | 4,673,606 |
| Valero Energy Corp. | | 211 | 27,430 |
| | | | 139,917,571 |
| FINANCIALS - 1.9% | | | |
| Banks - 1.9% | | | |
| Bank of America Corp. | | 356,417 | 12,000,560 |
| Huntington Bancshares, Inc. | | 4,530 | 57,622 |
| JPMorgan Chase & Co. (h) | | 65,342 | 11,114,674 |
| M&T Bank Corp. | | 471 | 64,565 |
| PNC Financial Services Group, Inc. | | 78,001 | 12,078,455 |
| U.S. Bancorp | | 201,476 | 8,719,881 |
| Wells Fargo & Co. | | 3,247 | 159,817 |
| | | | 44,195,574 |
| Capital Markets - 0.0% | | | |
| BlackRock, Inc. Class A | | 82 | 66,568 |
| Consumer Finance - 0.0% | | | |
| Capital One Financial Corp. | | 405 | 53,104 |
| Financial Services - 0.0% | | | |
| Edenred SA | | 598 | 35,741 |
| Visa, Inc. Class A | | 205 | 53,372 |
| | | | 89,113 |
| Insurance - 0.0% | | | |
| American Financial Group, Inc. | | 389 | 46,248 |
| Chubb Ltd. | | 572 | 129,272 |
| Hartford Financial Services Group, Inc. | | 1,111 | 89,302 |
| Marsh & McLennan Companies, Inc. | | 336 | 63,662 |
| The Travelers Companies, Inc. | | 426 | 81,149 |
| | | | 409,633 |
TOTAL FINANCIALS | | | 44,813,992 |
| HEALTH CARE - 4.6% | | | |
| Biotechnology - 0.8% | | | |
| Gilead Sciences, Inc. | | 82,624 | 6,693,370 |
| Moderna, Inc. (f) | | 104,000 | 10,342,800 |
| | | | 17,036,170 |
| Health Care Providers & Services - 1.1% | | | |
| Centene Corp. (f) | | 75,700 | 5,617,697 |
| Cigna Group | | 314 | 94,027 |
| CVS Health Corp. | | 116,900 | 9,230,424 |
| Laboratory Corp. of America Holdings | | 22,000 | 5,000,380 |
| UnitedHealth Group, Inc. | | 11,448 | 6,027,029 |
| | | | 25,969,557 |
| Life Sciences Tools & Services - 0.6% | | | |
| Danaher Corp. | | 33,652 | 7,785,054 |
| Thermo Fisher Scientific, Inc. | | 12,400 | 6,581,796 |
| | | | 14,366,850 |
| Pharmaceuticals - 2.1% | | | |
| AstraZeneca PLC (United Kingdom) | | 55,492 | 7,485,311 |
| Bristol-Myers Squibb Co. | | 127,443 | 6,539,100 |
| Eli Lilly & Co. | | 23,772 | 13,857,174 |
| Johnson & Johnson | | 33,530 | 5,255,492 |
| Merck & Co., Inc. | | 64,197 | 6,998,757 |
| Roche Holding AG: | | | |
| (participation certificate) | | 328 | 95,347 |
| sponsored ADR | | 240,600 | 8,716,938 |
| Royalty Pharma PLC | | 1,410 | 39,607 |
| Sanofi SA | | 982 | 97,584 |
| | | | 49,085,310 |
TOTAL HEALTH CARE | | | 106,457,887 |
| INDUSTRIALS - 4.1% | | | |
| Aerospace & Defense - 1.1% | | | |
| General Dynamics Corp. | | 22,946 | 5,958,388 |
| Huntington Ingalls Industries, Inc. | | 24,496 | 6,360,141 |
| Lockheed Martin Corp. | | 15,000 | 6,798,600 |
| Northrop Grumman Corp. | | 12,638 | 5,916,353 |
| The Boeing Co. (f) | | 587 | 153,007 |
| | | | 25,186,489 |
| Air Freight & Logistics - 0.2% | | | |
| United Parcel Service, Inc. Class B | | 26,263 | 4,129,331 |
| Building Products - 0.4% | | | |
| Carrier Global Corp. | | 84,300 | 4,843,035 |
| Johnson Controls International PLC | | 86,165 | 4,966,551 |
| | | | 9,809,586 |
| Commercial Services & Supplies - 0.0% | | | |
| GFL Environmental, Inc. | | 522 | 18,007 |
| Veralto Corp. | | 208 | 17,110 |
| | | | 35,117 |
| Construction & Engineering - 0.2% | | | |
| Willscot Mobile Mini Holdings (f) | | 130,300 | 5,798,350 |
| Electrical Equipment - 0.6% | | | |
| AMETEK, Inc. | | 423 | 69,748 |
| Babcock & Wilcox Enterprises, Inc. (f) | | 733,363 | 1,070,710 |
| Eaton Corp. PLC | | 29,100 | 7,007,862 |
| Regal Rexnord Corp. | | 33,629 | 4,977,765 |
| | | | 13,126,085 |
| Ground Transportation - 0.5% | | | |
| CSX Corp. | | 208,200 | 7,218,294 |
| Uber Technologies, Inc. (f)(h) | | 70,000 | 4,309,900 |
| | | | 11,528,194 |
| Industrial Conglomerates - 0.0% | | | |
| General Electric Co. | | 1,137 | 145,115 |
| Hitachi Ltd. | | 376 | 27,046 |
| Siemens AG | | 224 | 42,024 |
| | | | 214,185 |
| Machinery - 0.6% | | | |
| Crane Co. | | 507 | 59,897 |
| Fortive Corp. | | 56,729 | 4,176,956 |
| Hillenbrand, Inc. | | 18,985 | 908,432 |
| ITT, Inc. | | 39,317 | 4,691,304 |
| Stanley Black & Decker, Inc. | | 57,200 | 5,611,320 |
| | | | 15,447,909 |
| Passenger Airlines - 0.3% | | | |
| Alaska Air Group, Inc. (f) | | 181,893 | 7,106,560 |
| Professional Services - 0.2% | | | |
| Clarivate Analytics PLC (f)(g) | | 465,200 | 4,307,752 |
| Experian PLC | | 526 | 21,458 |
| KBR, Inc. | | 605 | 33,523 |
| Paychex, Inc. | | 66 | 7,861 |
| | | | 4,370,594 |
| Trading Companies & Distributors - 0.0% | | | |
| Watsco, Inc. | | 116 | 49,703 |
TOTAL INDUSTRIALS | | | 96,802,103 |
| INFORMATION TECHNOLOGY - 6.7% | | | |
| Communications Equipment - 0.3% | | | |
| Cisco Systems, Inc. | | 118,081 | 5,965,452 |
| Electronic Equipment, Instruments & Components - 0.0% | | | |
| Crane Nxt Co. | | 377 | 21,440 |
| IT Services - 0.0% | | | |
| Accenture PLC Class A | | 204 | 71,586 |
| Amdocs Ltd. | | 860 | 75,585 |
| GTT Communications, Inc. (e) | | 1,508 | 52,976 |
| | | | 200,147 |
| Semiconductors & Semiconductor Equipment - 2.0% | | | |
| Advanced Micro Devices, Inc. (f) | | 66,900 | 9,861,729 |
| Analog Devices, Inc. | | 360 | 71,482 |
| NVIDIA Corp. | | 45,050 | 22,309,661 |
| NXP Semiconductors NV | | 34,060 | 7,822,901 |
| ON Semiconductor Corp. (f) | | 94,300 | 7,876,879 |
| Taiwan Semiconductor Manufacturing Co. Ltd. sponsored ADR | | 975 | 101,400 |
| | | | 48,044,052 |
| Software - 3.3% | | | |
| Gen Digital, Inc. | | 120,145 | 2,741,709 |
| Microsoft Corp. (h) | | 170,595 | 64,150,544 |
| Roper Technologies, Inc. | | 10,594 | 5,775,531 |
| Zoom Video Communications, Inc. Class A (f) | | 70,300 | 5,055,273 |
| | | | 77,723,057 |
| Technology Hardware, Storage & Peripherals - 1.1% | | | |
| Apple, Inc. (h) | | 134,758 | 25,944,958 |
| Samsung Electronics Co. Ltd. | | 1,553 | 94,150 |
| Seagate Technology Holdings PLC | | 140 | 11,952 |
| | | | 26,051,060 |
TOTAL INFORMATION TECHNOLOGY | | | 158,005,208 |
| MATERIALS - 2.2% | | | |
| Chemicals - 0.7% | | | |
| CF Industries Holdings, Inc. | | 74,500 | 5,922,750 |
| Linde PLC | | 458 | 188,105 |
| Nutrien Ltd. | | 104,600 | 5,892,118 |
| The Mosaic Co. | | 156,700 | 5,598,891 |
| | | | 17,601,864 |
| Containers & Packaging - 0.7% | | | |
| Ball Corp. | | 831 | 47,799 |
| Crown Holdings, Inc. | | 94,312 | 8,685,192 |
| International Paper Co. | | 201,800 | 7,295,070 |
| | | | 16,028,061 |
| Metals & Mining - 0.8% | | | |
| Agnico Eagle Mines Ltd. (United States) (g) | | 87,600 | 4,804,860 |
| ATI, Inc. (f) | | 95,300 | 4,333,291 |
| Freeport-McMoRan, Inc. | | 2,921 | 124,347 |
| Newmont Corp. | | 116,300 | 4,813,657 |
| Wheaton Precious Metals Corp. | | 97,226 | 4,796,546 |
| | | | 18,872,701 |
TOTAL MATERIALS | | | 52,502,626 |
| REAL ESTATE - 1.2% | | | |
| Equity Real Estate Investment Trusts (REITs) - 1.2% | | | |
| American Tower Corp. | | 253 | 54,618 |
| Crown Castle International Corp. | | 56,900 | 6,554,311 |
| Digital Realty Trust, Inc. | | 20,000 | 2,691,600 |
| Lamar Advertising Co. Class A | | 757 | 80,454 |
| Postal Realty Trust, Inc. | | 224,094 | 3,262,809 |
| Public Storage | | 154 | 46,970 |
| Simon Property Group, Inc. | | 56,100 | 8,002,104 |
| Ventas, Inc. | | 147,800 | 7,366,352 |
| | | | 28,059,218 |
| UTILITIES - 0.5% | | | |
| Electric Utilities - 0.5% | | | |
| Constellation Energy Corp. | | 47,443 | 5,545,612 |
| Exelon Corp. | | 801 | 28,756 |
| FirstEnergy Corp. | | 653 | 23,939 |
| NextEra Energy, Inc. | | 107,412 | 6,524,205 |
| PG&E Corp. | | 1,726 | 31,120 |
| Southern Co. | | 959 | 67,245 |
| | | | 12,220,877 |
| Independent Power and Renewable Electricity Producers - 0.0% | | | |
| Vistra Corp. | | 545 | 20,993 |
| Multi-Utilities - 0.0% | | | |
| Ameren Corp. | | 364 | 26,332 |
| CenterPoint Energy, Inc. | | 1,001 | 28,599 |
| Dominion Energy, Inc. | | 492 | 23,124 |
| WEC Energy Group, Inc. | | 369 | 31,059 |
| | | | 109,114 |
TOTAL UTILITIES | | | 12,350,984 |
| TOTAL COMMON STOCKS (Cost $746,650,073) | | | 869,161,180 |
| | | | |
| Nonconvertible Preferred Stocks - 0.4% |
| | | Shares | Value ($) |
| ENERGY - 0.3% | | | |
| Oil, Gas & Consumable Fuels - 0.3% | | | |
| Enbridge, Inc. Series L, U.S. TREASURY 5 YEAR INDEX + 3.150% 4.959% (c)(d) | | 110,300 | 2,100,112 |
| Energy Transfer LP 7.60% (c) | | 220,016 | 5,467,398 |
| | | | 7,567,510 |
| INDUSTRIALS - 0.1% | | | |
| Electrical Equipment - 0.1% | | | |
| Babcock & Wilcox Enterprises, Inc. 8.125% | | 149,087 | 2,937,014 |
| TOTAL NONCONVERTIBLE PREFERRED STOCKS (Cost $11,357,158) | | | 10,504,524 |
| | | | |
| Bank Loan Obligations - 4.3% |
| | | Principal Amount (a) | Value ($) |
| CONSUMER DISCRETIONARY - 2.3% | | | |
| Broadline Retail - 1.2% | | | |
| Bass Pro Group LLC Tranche B 1LN, term loan CME Term SOFR 1 Month Index + 3.750% 9.2204% 3/5/28 (c)(d)(i) | | 28,750,085 | 28,721,335 |
| Hotels, Restaurants & Leisure - 1.1% | | | |
| City Football Group Ltd. Tranche B 1LN, term loan CME Term SOFR 1 Month Index + 3.000% 8.4704% 7/21/28 (c)(d)(i) | | 6,097,833 | 6,054,660 |
| Fertitta Entertainment LLC NV Tranche B 1LN, term loan CME Term SOFR 1 Month Index + 4.000% 9.356% 1/27/29 (c)(d)(i) | | 6,328,954 | 6,327,625 |
| Four Seasons Hotels Ltd. Tranche B 1LN, term loan CME Term SOFR 1 Month Index + 2.500% 7.956% 11/30/29 (c)(d)(i) | | 13,677,190 | 13,714,802 |
| | | | 26,097,087 |
TOTAL CONSUMER DISCRETIONARY | | | 54,818,422 |
| FINANCIALS - 0.2% | | | |
| Capital Markets - 0.2% | | | |
| Citadel Securities LP Tranche B 1LN, term loan CME Term SOFR 1 Month Index + 2.500% 7.9704% 7/25/30 (c)(d)(i) | | 3,391,690 | 3,395,929 |
| HEALTH CARE - 0.2% | | | |
| Health Care Technology - 0.2% | | | |
| Athenahealth Group, Inc. Tranche B 1LN, term loan CME Term SOFR 1 Month Index + 3.500% 8.606% 2/15/29 (c)(d)(i) | | 3,945,400 | 3,923,700 |
| INDUSTRIALS - 0.8% | | | |
| Air Freight & Logistics - 0.1% | | | |
| Echo Global Logistics, Inc.: | | | |
| 1LN, term loan CME Term SOFR 3 Month Index + 4.750% 10.1981% 11/23/28 (c)(d)(e)(i) | | 1,876,250 | 1,876,250 |
| 2LN, term loan CME Term SOFR 3 Month Index + 7.000% 12.4832% 11/23/29 (c)(d)(e)(i) | | 655,000 | 652,380 |
| | | | 2,528,630 |
| Construction & Engineering - 0.2% | | | |
| Breakwater Energy Partners, LLC Tranche B 1LN, term loan 11.25% 9/1/26 (c)(d)(e)(i) | | 4,548,091 | 4,406,190 |
| Ground Transportation - 0.5% | | | |
| Uber Technologies, Inc. Tranche B 1LN, term loan CME Term SOFR 1 Month Index + 3.000% 8.1346% 3/3/30 (c)(d)(i) | | 11,763,437 | 11,791,669 |
TOTAL INDUSTRIALS | | | 18,726,489 |
| INFORMATION TECHNOLOGY - 0.8% | | | |
| Software - 0.8% | | | |
| Project Alpha Intermediate Holding, Inc. Tranche B 1LN, term loan CME Term SOFR 1 Month Index + 4.750% 10.0929% 10/26/30 (c)(d)(i) | | 3,700,000 | 3,712,321 |
| Proofpoint, Inc. Tranche B 1LN, term loan CME Term SOFR 1 Month Index + 3.250% 8.7128% 8/31/28 (c)(d)(i) | | 4,454,120 | 4,449,487 |
| RealPage, Inc. Tranche B 1LN, term loan CME Term SOFR 1 Month Index + 3.000% 8.4628% 4/22/28 (c)(d)(i) | | 1,892,107 | 1,874,851 |
| Sophia LP Tranche B 1LN, term loan CME Term SOFR 3 Month Index + 3.500% 8.956% 10/7/27 (c)(d)(i) | | 2,736,005 | 2,738,577 |
| Ukg, Inc. 1LN, term loan: | | | |
| CME Term SOFR 1 Month Index + 4.500% 9.9882% 5/4/26 (c)(d)(i) | | 233,825 | 234,410 |
| CME Term SOFR 3 Month Index + 3.250% 8.7643% 5/4/26 (c)(d)(i) | | 3,952,051 | 3,958,493 |
| VS Buyer LLC Tranche B 1LN, term loan CME Term SOFR 1 Month Index + 3.000% 8.706% 2/28/27 (c)(d)(i) | | 2,592,826 | 2,596,067 |
| | | | 19,564,206 |
| TOTAL BANK LOAN OBLIGATIONS (Cost $99,867,102) | | | 100,428,746 |
| | | | |
| Preferred Securities - 5.8% |
| | | Principal Amount (a) | Value ($) |
| ENERGY - 1.5% | | | |
| Oil, Gas & Consumable Fuels - 1.5% | | | |
| Energy Transfer LP: | | | |
| 3 month U.S. LIBOR + 4.020% 9.6693% (c)(d)(j) | | 13,510,000 | 13,144,397 |
| 6.5% (c)(j) | | 2,450,000 | 2,348,749 |
| 6.625% (c)(j) | | 5,700,000 | 4,902,077 |
| 7.125% (c)(j) | | 3,615,000 | 3,364,403 |
| Plains All American Pipeline LP CME Term SOFR 3 Month Index + 4.110% 9.7513% (c)(d)(j) | | 11,825,000 | 11,576,449 |
| | | | 35,336,075 |
| FINANCIALS - 3.3% | | | |
| Banks - 2.5% | | | |
| Bank of America Corp.: | | | |
| CME Term SOFR 3 Month Index + 3.390% 8.7737% (c)(d)(j) | | 3,900,000 | 3,931,066 |
| 6.25% (c)(j) | | 3,585,000 | 3,624,616 |
| 6.5% (c)(j) | | 6,170,000 | 6,216,801 |
| Citigroup, Inc.: | | | |
| 7.625% (c)(j) | | 3,000,000 | 3,126,790 |
| 9.1073% (c)(d)(j) | | 3,700,000 | 3,753,243 |
| JPMorgan Chase & Co.: | | | |
| CME Term SOFR 3 Month Index + 2.840% 8.2187% (c)(d)(j) | | 13,730,000 | 13,870,082 |
| 4.6% (c)(j) | | 5,910,000 | 5,812,160 |
| 5% (c)(j) | | 5,788,000 | 5,802,781 |
| 6.125% (c)(j) | | 4,620,000 | 4,627,555 |
| Wells Fargo & Co.: | | | |
| 5.9% (c)(j) | | 4,350,000 | 4,316,061 |
| 7.625% (c)(j) | | 4,000,000 | 4,200,425 |
| | | | 59,281,580 |
| Capital Markets - 0.7% | | | |
| Charles Schwab Corp. 5.375% (c)(j) | | 4,805,000 | 4,760,301 |
| Goldman Sachs Group, Inc. CME Term SOFR 3 Month Index + 3.130% 8.5047% (c)(d)(j) | | 3,520,000 | 3,565,002 |
| Morgan Stanley 5.875% (c)(j) | | 3,220,000 | 3,132,671 |
| State Street Corp. CME Term SOFR 3 Month Index + 2.530% 8.1852% (c)(d)(j) | | 5,065,000 | 5,040,259 |
| | | | 16,498,233 |
| Consumer Finance - 0.1% | | | |
| Ally Financial, Inc. 4.7% (c)(j) | | 3,210,000 | 2,197,117 |
TOTAL FINANCIALS | | | 77,976,930 |
| UTILITIES - 1.0% | | | |
| Electric Utilities - 0.2% | | | |
| Duke Energy Corp. 4.875% (c)(j) | | 4,775,000 | 4,768,544 |
| Independent Power and Renewable Electricity Producers - 0.4% | | | |
| Vistra Corp.: | | | |
| 7% (b)(c)(j) | | 5,995,000 | 5,924,570 |
| 8% (b)(c)(j) | | 2,885,000 | 2,920,975 |
| | | | 8,845,545 |
| Multi-Utilities - 0.4% | | | |
| Dominion Energy, Inc. 4.65% (c)(j) | | 5,455,000 | 5,195,820 |
| Sempra 4.875% (c)(j) | | 3,515,000 | 3,474,640 |
| | | | 8,670,460 |
TOTAL UTILITIES | | | 22,284,549 |
| TOTAL PREFERRED SECURITIES (Cost $131,620,828) | | | 135,597,554 |
| | | | |
| Other - 1.0% |
| | | Shares | Value ($) |
| Other - 1.0% | | | |
Fidelity Private Credit Central Fund LLC (k)(l) (Cost $23,787,179) | | 2,393,014 | 24,121,580 |
| | | | |
| Money Market Funds - 1.8% |
| | | Shares | Value ($) |
| Fidelity Cash Central Fund 5.40% (m) | | 15,235,251 | 15,238,298 |
| Fidelity Securities Lending Cash Central Fund 5.40% (m)(n) | | 27,527,185 | 27,529,938 |
| TOTAL MONEY MARKET FUNDS (Cost $42,768,236) | | | 42,768,236 |
| | | | |
| TOTAL INVESTMENT IN SECURITIES - 101.2% (Cost $2,222,836,449) | 2,371,749,329 |
NET OTHER ASSETS (LIABILITIES) - (1.2)% | (28,430,778) |
| NET ASSETS - 100.0% | 2,343,318,551 |
| | |
| Written Options |
| | Counterparty | Number of Contracts | Notional Amount ($) | Exercise Price ($) | Expiration Date | Value ($) |
| Call Options | | | | | | |
| Apple, Inc. | Chicago Board Options Exchange | 495 | 9,530,235 | 195.00 | 02/16/24 | (256,163) |
| JPMorgan Chase & Co. | Chicago Board Options Exchange | 100 | 1,701,000 | 155.00 | 01/19/24 | (153,250) |
| Microsoft Corp. | Chicago Board Options Exchange | 792 | 29,782,368 | 360.00 | 01/19/24 | (1,469,160) |
| Uber Technologies, Inc. | Chicago Board Options Exchange | 200 | 1,231,400 | 50.00 | 01/19/24 | (235,500) |
| Uber Technologies, Inc. | Chicago Board Options Exchange | 500 | 3,078,500 | 52.50 | 01/19/24 | (465,000) |
| | | | | | | |
| TOTAL WRITTEN OPTIONS | | | | | | (2,579,073) |
Legend
| (a) | Amount is stated in United States dollars unless otherwise noted. |
| (b) | Security exempt from registration under Rule 144A of the Securities Act of 1933. These securities may be resold in transactions exempt from registration, normally to qualified institutional buyers. At the end of the period, the value of these securities amounted to $213,356,342 or 9.1% of net assets. |
| (c) | Coupon rates for floating and adjustable rate securities reflect the rates in effect at period end. |
| (d) | Coupon is indexed to a floating interest rate which may be multiplied by a specified factor and/or subject to caps or floors. |
| (g) | Security or a portion of the security is on loan at period end. |
| (h) | Security or a portion of the security is pledged as collateral for options written. At period end, the value of securities pledged amounted to $45,323,503. |
| (i) | Remaining maturities of bank loan obligations may be less than the stated maturities shown as a result of contractual or optional prepayments by the borrower. Such prepayments cannot be predicted with certainty. |
| (j) | Security is perpetual in nature with no stated maturity date. |
| (k) | Affiliated fund that is generally available only to investment companies and other accounts managed by Fidelity Investments. |
| (l) | Restricted securities (including private placements) - Investment in securities not registered under the Securities Act of 1933 (excluding 144A issues). At the end of the period, the value of restricted securities (excluding 144A issues) amounted to $24,121,580 or 1.0% of net assets. |
| (m) | Affiliated fund that is generally available only to investment companies and other accounts managed by Fidelity Investments. The rate quoted is the annualized seven-day yield of the fund at period end. A complete unaudited listing of the fund's holdings as of its most recent quarter end is available upon request. In addition, each Fidelity Central Fund's financial statements, which are not covered by the Fund's Report of Independent Registered Public Accounting Firm, are available on the SEC's website or upon request. |
| (n) | Investment made with cash collateral received from securities on loan. |
| Additional information on each restricted holding is as follows: |
| Security | Acquisition Date | Acquisition Cost ($) |
| Fidelity Private Credit Central Fund LLC | 4/28/22 - 12/12/23 | 23,787,179 |
| | | |
Affiliated Central Funds
Fiscal year to date information regarding the Fund's investments in Fidelity Central Funds, including the ownership percentage, is presented below.
| Affiliate | Value, beginning of period ($) | Purchases ($) | Sales Proceeds ($) | Dividend Income ($) | Realized Gain (loss) ($) | Change in Unrealized appreciation (depreciation) ($) | Value, end of period ($) | % ownership, end of period |
| Fidelity Cash Central Fund 5.40% | 18,295,144 | 1,014,805,276 | 1,017,862,122 | 505,696 | - | - | 15,238,298 | 0.0% |
| Fidelity Private Credit Central Fund LLC | 13,386,113 | 10,354,772 | - | 2,871,428 | 34,577 | 346,118 | 24,121,580 | 3.6% |
| Fidelity Securities Lending Cash Central Fund 5.40% | 30,634,576 | 236,134,585 | 239,239,223 | 158,161 | - | - | 27,529,938 | 0.1% |
| Total | 62,315,833 | 1,261,294,633 | 1,257,101,345 | 3,535,285 | 34,577 | 346,118 | 66,889,816 | |
| | | | | | | | | |
Amounts in the dividend income column in the above table include any capital gain distributions from underlying funds, which are presented in the corresponding line item in the Statement of Operations, if applicable.
Amounts in the dividend income column for Fidelity Securities Lending Cash Central Fund represents the income earned on investing cash collateral, less rebates paid to borrowers and any lending agent fees associated with the loan, plus any premium payments received for lending certain types of securities.
Amounts included in the purchases and sales proceeds columns may include in-kind transactions, if applicable.
Investment Valuation
The following is a summary of the inputs used, as of December 31, 2023, involving the Fund's assets and liabilities carried at fair value. The inputs or methodology used for valuing securities may not be an indication of the risk associated with investing in those securities. For more information on valuation inputs, and their aggregation into the levels used below, please refer to the Investment Valuation section in the accompanying Notes to Financial Statements.
| Valuation Inputs at Reporting Date: |
| Description | Total ($) | Level 1 ($) | Level 2 ($) | Level 3 ($) |
Investments in Securities: | | | | |
|
| Equities: | | | | |
Communication Services | 53,463,226 | 53,463,226 | - | - |
Consumer Discretionary | 118,619,999 | 118,619,999 | - | - |
Consumer Staples | 58,168,366 | 58,157,909 | 10,457 | - |
Energy | 147,485,081 | 147,485,081 | - | - |
Financials | 44,813,992 | 44,813,992 | - | - |
Health Care | 106,457,887 | 98,779,645 | 7,678,242 | - |
Industrials | 99,739,117 | 99,648,589 | 90,528 | - |
Information Technology | 158,005,208 | 157,952,232 | - | 52,976 |
Materials | 52,502,626 | 52,502,626 | - | - |
Real Estate | 28,059,218 | 28,059,218 | - | - |
Utilities | 12,350,984 | 12,350,984 | - | - |
|
| Corporate Bonds | 308,308,503 | - | 308,308,503 | - |
|
| U.S. Government and Government Agency Obligations | 880,779,225 | - | 880,779,225 | - |
|
| Commercial Mortgage Securities | 79,781 | - | - | 79,781 |
|
| Bank Loan Obligations | 100,428,746 | - | 93,493,926 | 6,934,820 |
|
| Preferred Securities | 135,597,554 | - | 135,597,554 | - |
|
| Other | 24,121,580 | - | 24,121,580 | - |
|
| Money Market Funds | 42,768,236 | 42,768,236 | - | - |
| Total Investments in Securities: | 2,371,749,329 | 914,601,737 | 1,450,080,015 | 7,067,577 |
Derivative Instruments: Liabilities | | | | |
Written Options | (2,579,073) | (2,579,073) | - | - |
| Total Liabilities | (2,579,073) | (2,579,073) | - | - |
| Total Derivative Instruments: | (2,579,073) | (2,579,073) | - | - |
Value of Derivative Instruments
The following table is a summary of the Fund's value of derivative instruments by primary risk exposure as of December 31, 2023. For additional information on derivative instruments, please refer to the Derivative Instruments section in the accompanying Notes to Financial Statements.
Primary Risk Exposure / Derivative Type | Value |
| Asset ($) | Liability ($) |
| Equity Risk | | |
Written Options (a) | 0 | (2,579,073) |
| Total Equity Risk | 0 | (2,579,073) |
| Total Value of Derivatives | 0 | (2,579,073) |
(a)Gross value is presented in the Statement of Assets and Liabilities in the written options, at value line-item.
| Statement of Assets and Liabilities |
| | | | December 31, 2023 |
| | | | | |
| Assets | | | | |
| Investment in securities, at value (including securities loaned of $26,632,446) - See accompanying schedule: | | | | |
Unaffiliated issuers (cost $2,156,281,034) | $ | 2,304,859,513 | | |
Fidelity Central Funds (cost $66,555,415) | | 66,889,816 | | |
| | | | | |
| | | | | |
| Total Investment in Securities (cost $2,222,836,449) | | | $ | 2,371,749,329 |
| Cash | | | | 5,699 |
| Foreign currency held at value (cost $24,503) | | | | 24,503 |
| Receivable for investments sold | | | | 250,135 |
| Receivable for fund shares sold | | | | 6,326,845 |
| Dividends receivable | | | | 1,210,694 |
| Interest receivable | | | | 18,688,179 |
| Distributions receivable from Fidelity Central Funds | | | | 381,609 |
| Prepaid expenses | | | | 1,863 |
| Other receivables | | | | 11,332 |
Total assets | | | | 2,398,650,188 |
| Liabilities | | | | |
| Payable for investments purchased | $ | 19,809,106 | | |
| Payable for fund shares redeemed | | 3,059,527 | | |
| Distributions payable | | 716,927 | | |
| Accrued management fee | | 1,027,832 | | |
| Distribution and service plan fees payable | | 128,227 | | |
| Written options, at value (premium received $840,654) | | 2,579,073 | | |
| Other affiliated payables | | 311,291 | | |
| Other payables and accrued expenses | | 169,872 | | |
| Collateral on securities loaned | | 27,529,782 | | |
| Total Liabilities | | | | 55,331,637 |
| Commitments and contingent liabilities (see Commitments note) | | | | |
| Net Assets | | | $ | 2,343,318,551 |
| Net Assets consist of: | | | | |
| Paid in capital | | | $ | 2,414,041,020 |
| Total accumulated earnings (loss) | | | | (70,722,469) |
| Net Assets | | | $ | 2,343,318,551 |
| | | | | |
| Net Asset Value and Maximum Offering Price | | | | |
| Class A : | | | | |
Net Asset Value and redemption price per share ($217,454,061 ÷ 16,286,257 shares)(a) | | | $ | 13.35 |
| Maximum offering price per share (100/96.00 of $13.35) | | | $ | 13.91 |
| Class M : | | | | |
Net Asset Value and redemption price per share ($24,030,827 ÷ 1,797,839 shares)(a) | | | $ | 13.37 |
| Maximum offering price per share (100/96.00 of $13.37) | | | $ | 13.93 |
| Class C : | | | | |
Net Asset Value and offering price per share ($97,311,346 ÷ 7,301,486 shares)(a) | | | $ | 13.33 |
| Fidelity Multi-Asset Income Fund : | | | | |
Net Asset Value, offering price and redemption price per share ($1,050,521,233 ÷ 78,644,001 shares) | | | $ | 13.36 |
| Class I : | | | | |
Net Asset Value, offering price and redemption price per share ($695,649,023 ÷ 52,091,340 shares) | | | $ | 13.35 |
| Class Z : | | | | |
Net Asset Value, offering price and redemption price per share ($258,352,061 ÷ 19,341,472 shares) | | | $ | 13.36 |
(a)Redemption price per share is equal to net asset value less any applicable contingent deferred sales charge. |
| Statement of Operations |
| | | | Year ended December 31, 2023 |
| Investment Income | | | | |
| Dividends | | | $ | 32,476,701 |
| Interest | | | | 68,577,134 |
| Income from Fidelity Central Funds (including $158,161 from security lending) | | | | 3,511,733 |
| Total Income | | | | 104,565,568 |
| Expenses | | | | |
| Management fee | $ | 11,246,917 | | |
| Transfer agent fees | | 2,627,565 | | |
| Distribution and service plan fees | | 1,356,681 | | |
| Accounting fees | | 755,141 | | |
| Custodian fees and expenses | | 61,018 | | |
| Independent trustees' fees and expenses | | 7,188 | | |
| Registration fees | | 233,422 | | |
| Audit | | 82,940 | | |
| Legal | | 6,364 | | |
| Interest | | 13,748 | | |
| Miscellaneous | | 46,623 | | |
| Total expenses before reductions | | 16,437,607 | | |
| Expense reductions | | (155,879) | | |
| Total expenses after reductions | | | | 16,281,728 |
| Net Investment income (loss) | | | | 88,283,840 |
| Realized and Unrealized Gain (Loss) | | | | |
| Net realized gain (loss) on: | | | | |
| Investment Securities: | | | | |
| Unaffiliated issuers | | (14,868,215) | | |
| Affiliated issuers | | 34,577 | | |
| Foreign currency transactions | | (84,777) | | |
| Written options | | (4,774,672) | | |
| Capital gain distributions from Fidelity Central Funds | | 23,552 | | |
| Total net realized gain (loss) | | | | (19,669,535) |
| Change in net unrealized appreciation (depreciation) on: | | | | |
| Investment Securities: | | | | |
| Unaffiliated issuers | | 153,905,842 | | |
| Affiliated issuers | | 346,118 | | |
| Assets and liabilities in foreign currencies | | 6,829 | | |
| Written options | | (1,738,419) | | |
| Total change in net unrealized appreciation (depreciation) | | | | 152,520,370 |
| Net gain (loss) | | | | 132,850,835 |
| Net increase (decrease) in net assets resulting from operations | | | $ | 221,134,675 |
| Statement of Changes in Net Assets |
| |
| | Year ended December 31, 2023 | | Year ended December 31, 2022 |
| Increase (Decrease) in Net Assets | | | | |
| Operations | | | | |
| Net investment income (loss) | $ | 88,283,840 | $ | 64,882,530 |
| Net realized gain (loss) | | (19,669,535) | | (190,308,842) |
| Change in net unrealized appreciation (depreciation) | | 152,520,370 | | (142,207,654) |
| Net increase (decrease) in net assets resulting from operations | | 221,134,675 | | (267,633,966) |
| Distributions to shareholders | | (88,768,777) | | (79,967,145) |
| | | | | |
| Share transactions - net increase (decrease) | | 473,148,435 | | 192,272,417 |
| Total increase (decrease) in net assets | | 605,514,333 | | (155,328,694) |
| | | | | |
| Net Assets | | | | |
| Beginning of period | | 1,737,804,218 | | 1,893,132,912 |
| End of period | $ | 2,343,318,551 | $ | 1,737,804,218 |
| | | | | |
| | | | | |
Financial Highlights
| Fidelity Advisor® Multi-Asset Income Fund Class A |
| |
| Years ended December 31, | | 2023 | | 2022 | | 2021 | | 2020 | | 2019 |
Selected Per-Share Data | | | | | | | | | | |
| Net asset value, beginning of period | $ | 12.48 | $ | 14.97 | $ | 13.15 | $ | 11.72 | $ | 9.81 |
| Income from Investment Operations | | | | | | | | | | |
Net investment income (loss) A,B | | .527 | | .440 | | .339 | | .384 | | .293 |
| Net realized and unrealized gain (loss) | | .874 | | (2.378) | | 1.923 | | 1.464 | | 1.922 |
| Total from investment operations | | 1.401 | | (1.938) | | 2.262 | | 1.848 | | 2.215 |
| Distributions from net investment income | | (.531) | | (.448) | | (.407) | | (.401) | | (.298) |
| Distributions from net realized gain | | - | | (.104) | | (.035) | | (.017) | | (.007) |
| Total distributions | | (.531) | | (.552) | | (.442) | | (.418) | | (.305) |
| Net asset value, end of period | $ | 13.35 | $ | 12.48 | $ | 14.97 | $ | 13.15 | $ | 11.72 |
Total Return C,D | | 11.43% | | (13.08)% | | 17.40% | | 16.26% | | 22.84% |
Ratios to Average Net Assets B,E,F | | | | | | | | | | |
| Expenses before reductions | | 1.00% | | 1.00% | | 1.01% | | 1.13% | | 1.26% |
| Expenses net of fee waivers, if any | | .99% | | 1.00% | | 1.01% | | 1.10% | | 1.10% |
| Expenses net of all reductions | | .99% | | 1.00% | | 1.01% | | 1.08% | | 1.09% |
| Net investment income (loss) | | 4.09% | | 3.34% | | 2.35% | | 3.27% | | 2.69% |
| Supplemental Data | | | | | | | | | | |
| Net assets, end of period (000 omitted) | $ | 217,454 | $ | 151,549 | $ | 132,537 | $ | 30,583 | $ | 23,438 |
Portfolio turnover rate G | | 175% | | 256% | | 150% | | 308% | | 298% |
ACalculated based on average shares outstanding during the period.
BNet investment income (loss) is affected by the timing of the declaration of dividends by any underlying mutual funds or exchange-traded funds (ETFs). Net investment income (loss) of any mutual funds or ETFs is not included in the Fund's net investment income (loss) ratio.
CTotal returns would have been lower if certain expenses had not been reduced during the applicable periods shown.
DTotal returns do not include the effect of the sales charges.
EFees and expenses of any underlying mutual funds or exchange-traded funds (ETFs) are not included in the Fund's expense ratio. The Fund indirectly bears its proportionate share of these expenses. For additional expense information related to investments in Fidelity Central Funds, please refer to the "Investments in Fidelity Central Funds" note found in the Notes to Financial Statements section of the most recent Annual or Semi-Annual report. For additional expense information related to investments in Fidelity Private Credit Central Fund LLC, please refer to the Investment in Fidelity Private Credit Central Fund LLC note found in the Notes to Financial Statements section of the most recent Annual or Semi-Annual report.
FExpense ratios reflect operating expenses of the class. Expenses before reductions do not reflect amounts reimbursed, waived, or reduced through arrangements with the investment adviser, brokerage services, or other offset arrangements, if applicable, and do not represent the amount paid by the class during periods when reimbursements, waivers or reductions occur.
GAmount does not include the portfolio activity of any underlying mutual funds or exchange-traded funds (ETFs).
| Fidelity Advisor® Multi-Asset Income Fund Class M |
| |
| Years ended December 31, | | 2023 | | 2022 | | 2021 | | 2020 | | 2019 |
Selected Per-Share Data | | | | | | | | | | |
| Net asset value, beginning of period | $ | 12.50 | $ | 14.99 | $ | 13.15 | $ | 11.72 | $ | 9.81 |
| Income from Investment Operations | | | | | | | | | | |
Net investment income (loss) A,B | | .531 | | .444 | | .342 | | .383 | | .292 |
| Net realized and unrealized gain (loss) | | .873 | | (2.379) | | 1.943 | | 1.463 | | 1.923 |
| Total from investment operations | | 1.404 | | (1.935) | | 2.285 | | 1.846 | | 2.215 |
| Distributions from net investment income | | (.534) | | (.451) | | (.410) | | (.399) | | (.298) |
| Distributions from net realized gain | | - | | (.104) | | (.035) | | (.017) | | (.007) |
| Total distributions | | (.534) | | (.555) | | (.445) | | (.416) | | (.305) |
| Net asset value, end of period | $ | 13.37 | $ | 12.50 | $ | 14.99 | $ | 13.15 | $ | 11.72 |
Total Return C,D | | 11.44% | | (13.05)% | | 17.58% | | 16.24% | | 22.84% |
Ratios to Average Net Assets B,E,F | | | | | | | | | | |
| Expenses before reductions | | .98% | | .99% | | .99% | | 1.13% | | 1.30% |
| Expenses net of fee waivers, if any | | .97% | | .99% | | .99% | | 1.10% | | 1.10% |
| Expenses net of all reductions | | .97% | | .99% | | .99% | | 1.08% | | 1.09% |
| Net investment income (loss) | | 4.11% | | 3.36% | | 2.37% | | 3.27% | | 2.69% |
| Supplemental Data | | | | | | | | | | |
| Net assets, end of period (000 omitted) | $ | 24,031 | $ | 18,176 | $ | 18,698 | $ | 11,048 | $ | 9,719 |
Portfolio turnover rate G | | 175% | | 256% | | 150% | | 308% | | 298% |
ACalculated based on average shares outstanding during the period.
BNet investment income (loss) is affected by the timing of the declaration of dividends by any underlying mutual funds or exchange-traded funds (ETFs). Net investment income (loss) of any mutual funds or ETFs is not included in the Fund's net investment income (loss) ratio.
CTotal returns would have been lower if certain expenses had not been reduced during the applicable periods shown.
DTotal returns do not include the effect of the sales charges.
EFees and expenses of any underlying mutual funds or exchange-traded funds (ETFs) are not included in the Fund's expense ratio. The Fund indirectly bears its proportionate share of these expenses. For additional expense information related to investments in Fidelity Central Funds, please refer to the "Investments in Fidelity Central Funds" note found in the Notes to Financial Statements section of the most recent Annual or Semi-Annual report. For additional expense information related to investments in Fidelity Private Credit Central Fund LLC, please refer to the Investment in Fidelity Private Credit Central Fund LLC note found in the Notes to Financial Statements section of the most recent Annual or Semi-Annual report.
FExpense ratios reflect operating expenses of the class. Expenses before reductions do not reflect amounts reimbursed, waived, or reduced through arrangements with the investment adviser, brokerage services, or other offset arrangements, if applicable, and do not represent the amount paid by the class during periods when reimbursements, waivers or reductions occur.
GAmount does not include the portfolio activity of any underlying mutual funds or exchange-traded funds (ETFs).
| Fidelity Advisor® Multi-Asset Income Fund Class C |
| |
| Years ended December 31, | | 2023 | | 2022 | | 2021 | | 2020 | | 2019 |
Selected Per-Share Data | | | | | | | | | | |
| Net asset value, beginning of period | $ | 12.46 | $ | 14.94 | $ | 13.13 | $ | 11.70 | $ | 9.80 |
| Income from Investment Operations | | | | | | | | | | |
Net investment income (loss) A,B | | .430 | | .341 | | .231 | | .298 | | .210 |
| Net realized and unrealized gain (loss) | | .873 | | (2.368) | | 1.917 | | 1.463 | | 1.915 |
| Total from investment operations | | 1.303 | | (2.027) | | 2.148 | | 1.761 | | 2.125 |
| Distributions from net investment income | | (.433) | | (.349) | | (.303) | | (.314) | | (.218) |
| Distributions from net realized gain | | - | | (.104) | | (.035) | | (.017) | | (.007) |
| Total distributions | | (.433) | | (.453) | | (.338) | | (.331) | | (.225) |
| Net asset value, end of period | $ | 13.33 | $ | 12.46 | $ | 14.94 | $ | 13.13 | $ | 11.70 |
Total Return C,D | | 10.61% | | (13.69)% | | 16.50% | | 15.44% | | 21.87% |
Ratios to Average Net Assets B,E,F | | | | | | | | | | |
| Expenses before reductions | | 1.75% | | 1.76% | | 1.76% | | 1.84% | | 2.13% |
| Expenses net of fee waivers, if any | | 1.74% | | 1.76% | | 1.76% | | 1.84% | | 1.85% |
| Expenses net of all reductions | | 1.74% | | 1.75% | | 1.76% | | 1.82% | | 1.84% |
| Net investment income (loss) | | 3.34% | | 2.59% | | 1.60% | | 2.53% | | 1.94% |
| Supplemental Data | | | | | | | | | | |
| Net assets, end of period (000 omitted) | $ | 97,311 | $ | 66,028 | $ | 61,356 | $ | 13,015 | $ | 4,634 |
Portfolio turnover rate G | | 175% | | 256% | | 150% | | 308% | | 298% |
ACalculated based on average shares outstanding during the period.
BNet investment income (loss) is affected by the timing of the declaration of dividends by any underlying mutual funds or exchange-traded funds (ETFs). Net investment income (loss) of any mutual funds or ETFs is not included in the Fund's net investment income (loss) ratio.
CTotal returns would have been lower if certain expenses had not been reduced during the applicable periods shown.
DTotal returns do not include the effect of the contingent deferred sales charge.
EFees and expenses of any underlying mutual funds or exchange-traded funds (ETFs) are not included in the Fund's expense ratio. The Fund indirectly bears its proportionate share of these expenses. For additional expense information related to investments in Fidelity Central Funds, please refer to the "Investments in Fidelity Central Funds" note found in the Notes to Financial Statements section of the most recent Annual or Semi-Annual report. For additional expense information related to investments in Fidelity Private Credit Central Fund LLC, please refer to the Investment in Fidelity Private Credit Central Fund LLC note found in the Notes to Financial Statements section of the most recent Annual or Semi-Annual report.
FExpense ratios reflect operating expenses of the class. Expenses before reductions do not reflect amounts reimbursed, waived, or reduced through arrangements with the investment adviser, brokerage services, or other offset arrangements, if applicable, and do not represent the amount paid by the class during periods when reimbursements, waivers or reductions occur.
GAmount does not include the portfolio activity of any underlying mutual funds or exchange-traded funds (ETFs).
| Fidelity® Multi-Asset Income Fund |
| |
| Years ended December 31, | | 2023 | | 2022 | | 2021 | | 2020 | | 2019 |
Selected Per-Share Data | | | | | | | | | | |
| Net asset value, beginning of period | $ | 12.49 | $ | 14.98 | $ | 13.15 | $ | 11.72 | $ | 9.81 |
| Income from Investment Operations | | | | | | | | | | |
Net investment income (loss) A,B | | .563 | | .480 | | .378 | | .417 | | .322 |
| Net realized and unrealized gain (loss) | | .873 | | (2.381) | | 1.934 | | 1.460 | | 1.919 |
| Total from investment operations | | 1.436 | | (1.901) | | 2.312 | | 1.877 | | 2.241 |
| Distributions from net investment income | | (.566) | | (.485) | | (.447) | | (.430) | | (.324) |
| Distributions from net realized gain | | - | | (.104) | | (.035) | | (.017) | | (.007) |
| Total distributions | | (.566) | | (.589) | | (.482) | | (.447) | | (.331) |
| Net asset value, end of period | $ | 13.36 | $ | 12.49 | $ | 14.98 | $ | 13.15 | $ | 11.72 |
Total Return C | | 11.72% | | (12.83)% | | 17.80% | | 16.55% | | 23.14% |
Ratios to Average Net Assets B,D,E | | | | | | | | | | |
| Expenses before reductions | | .73% | | .73% | | .74% | | .85% | | .94% |
| Expenses net of fee waivers, if any | | .72% | | .73% | | .74% | | .85% | | .85% |
| Expenses net of all reductions | | .72% | | .73% | | .74% | | .83% | | .84% |
| Net investment income (loss) | | 4.36% | | 3.62% | | 2.63% | | 3.53% | | 2.94% |
| Supplemental Data | | | | | | | | | | |
| Net assets, end of period (000 omitted) | $ | 1,050,521 | $ | 912,819 | $ | 1,125,873 | $ | 211,236 | $ | 60,534 |
Portfolio turnover rate F | | 175% | | 256% | | 150% | | 308% | | 298% |
ACalculated based on average shares outstanding during the period.
BNet investment income (loss) is affected by the timing of the declaration of dividends by any underlying mutual funds or exchange-traded funds (ETFs). Net investment income (loss) of any mutual funds or ETFs is not included in the Fund's net investment income (loss) ratio.
CTotal returns would have been lower if certain expenses had not been reduced during the applicable periods shown.
DFees and expenses of any underlying mutual funds or exchange-traded funds (ETFs) are not included in the Fund's expense ratio. The Fund indirectly bears its proportionate share of these expenses. For additional expense information related to investments in Fidelity Central Funds, please refer to the "Investments in Fidelity Central Funds" note found in the Notes to Financial Statements section of the most recent Annual or Semi-Annual report. For additional expense information related to investments in Fidelity Private Credit Central Fund LLC, please refer to the Investment in Fidelity Private Credit Central Fund LLC note found in the Notes to Financial Statements section of the most recent Annual or Semi-Annual report.
EExpense ratios reflect operating expenses of the class. Expenses before reductions do not reflect amounts reimbursed, waived, or reduced through arrangements with the investment adviser, brokerage services, or other offset arrangements, if applicable, and do not represent the amount paid by the class during periods when reimbursements, waivers or reductions occur.
FAmount does not include the portfolio activity of any underlying mutual funds or exchange-traded funds (ETFs).
| Fidelity Advisor® Multi-Asset Income Fund Class I |
| |
| Years ended December 31, | | 2023 | | 2022 | | 2021 | | 2020 | | 2019 |
Selected Per-Share Data | | | | | | | | | | |
| Net asset value, beginning of period | $ | 12.48 | $ | 14.97 | $ | 13.15 | $ | 11.72 | $ | 9.81 |
| Income from Investment Operations | | | | | | | | | | |
Net investment income (loss) A,B | | .559 | | .474 | | .375 | | .417 | | .319 |
| Net realized and unrealized gain (loss) | | .874 | | (2.379) | | 1.924 | | 1.461 | | 1.922 |
| Total from investment operations | | 1.433 | | (1.905) | | 2.299 | | 1.878 | | 2.241 |
| Distributions from net investment income | | (.563) | | (.481) | | (.444) | | (.431) | | (.324) |
| Distributions from net realized gain | | - | | (.104) | | (.035) | | (.017) | | (.007) |
| Total distributions | | (.563) | | (.585) | | (.479) | | (.448) | | (.331) |
| Net asset value, end of period | $ | 13.35 | $ | 12.48 | $ | 14.97 | $ | 13.15 | $ | 11.72 |
Total Return C | | 11.70% | | (12.87)% | | 17.70% | | 16.56% | | 23.14% |
Ratios to Average Net Assets B,D,E | | | | | | | | | | |
| Expenses before reductions | | .75% | | .76% | | .76% | | .83% | | 1.00% |
| Expenses net of fee waivers, if any | | .75% | | .76% | | .76% | | .83% | | .85% |
| Expenses net of all reductions | | .75% | | .76% | | .76% | | .81% | | .84% |
| Net investment income (loss) | | 4.33% | | 3.59% | | 2.60% | | 3.54% | | 2.94% |
| Supplemental Data | | | | | | | | | | |
| Net assets, end of period (000 omitted) | $ | 695,649 | $ | 429,436 | $ | 461,353 | $ | 55,206 | $ | 26,507 |
Portfolio turnover rate F | | 175% | | 256% | | 150% | | 308% | | 298% |
ACalculated based on average shares outstanding during the period.
BNet investment income (loss) is affected by the timing of the declaration of dividends by any underlying mutual funds or exchange-traded funds (ETFs). Net investment income (loss) of any mutual funds or ETFs is not included in the Fund's net investment income (loss) ratio.
CTotal returns would have been lower if certain expenses had not been reduced during the applicable periods shown.
DFees and expenses of any underlying mutual funds or exchange-traded funds (ETFs) are not included in the Fund's expense ratio. The Fund indirectly bears its proportionate share of these expenses. For additional expense information related to investments in Fidelity Central Funds, please refer to the "Investments in Fidelity Central Funds" note found in the Notes to Financial Statements section of the most recent Annual or Semi-Annual report. For additional expense information related to investments in Fidelity Private Credit Central Fund LLC, please refer to the Investment in Fidelity Private Credit Central Fund LLC note found in the Notes to Financial Statements section of the most recent Annual or Semi-Annual report.
EExpense ratios reflect operating expenses of the class. Expenses before reductions do not reflect amounts reimbursed, waived, or reduced through arrangements with the investment adviser, brokerage services, or other offset arrangements, if applicable, and do not represent the amount paid by the class during periods when reimbursements, waivers or reductions occur.
FAmount does not include the portfolio activity of any underlying mutual funds or exchange-traded funds (ETFs).
| Fidelity Advisor® Multi-Asset Income Fund Class Z |
| |
| Years ended December 31, | | 2023 | | 2022 | | 2021 | | 2020 | | 2019 |
Selected Per-Share Data | | | | | | | | | | |
| Net asset value, beginning of period | $ | 12.49 | $ | 14.98 | $ | 13.15 | $ | 11.72 | $ | 9.81 |
| Income from Investment Operations | | | | | | | | | | |
Net investment income (loss) A,B | | .572 | | .480 | | .388 | | .431 | | .335 |
| Net realized and unrealized gain (loss) | | .874 | | (2.372) | | 1.933 | | 1.457 | | 1.916 |
| Total from investment operations | | 1.446 | | (1.892) | | 2.321 | | 1.888 | | 2.251 |
| Distributions from net investment income | | (.576) | | (.494) | | (.456) | | (.441) | | (.334) |
| Distributions from net realized gain | | - | | (.104) | | (.035) | | (.017) | | (.007) |
| Total distributions | | (.576) | | (.598) | | (.491) | | (.458) | | (.341) |
| Net asset value, end of period | $ | 13.36 | $ | 12.49 | $ | 14.98 | $ | 13.15 | $ | 11.72 |
Total Return C | | 11.81% | | (12.77)% | | 17.87% | | 16.65% | | 23.25% |
Ratios to Average Net Assets B,D,E | | | | | | | | | | |
| Expenses before reductions | | .65% | | .66% | | .67% | | .77% | | .85% |
| Expenses net of fee waivers, if any | | .65% | | .66% | | .67% | | .76% | | .76% |
| Expenses net of all reductions | | .65% | | .66% | | .67% | | .74% | | .75% |
| Net investment income (loss) | | 4.43% | | 3.69% | | 2.69% | | 3.61% | | 3.03% |
| Supplemental Data | | | | | | | | | | |
| Net assets, end of period (000 omitted) | $ | 258,352 | $ | 159,796 | $ | 93,316 | $ | 20,701 | $ | 5,123 |
Portfolio turnover rate F | | 175% | | 256% | | 150% | | 308% | | 298% |
ACalculated based on average shares outstanding during the period.
BNet investment income (loss) is affected by the timing of the declaration of dividends by any underlying mutual funds or exchange-traded funds (ETFs). Net investment income (loss) of any mutual funds or ETFs is not included in the Fund's net investment income (loss) ratio.
CTotal returns would have been lower if certain expenses had not been reduced during the applicable periods shown.
DFees and expenses of any underlying mutual funds or exchange-traded funds (ETFs) are not included in the Fund's expense ratio. The Fund indirectly bears its proportionate share of these expenses. For additional expense information related to investments in Fidelity Central Funds, please refer to the "Investments in Fidelity Central Funds" note found in the Notes to Financial Statements section of the most recent Annual or Semi-Annual report. For additional expense information related to investments in Fidelity Private Credit Central Fund LLC, please refer to the Investment in Fidelity Private Credit Central Fund LLC note found in the Notes to Financial Statements section of the most recent Annual or Semi-Annual report.
EExpense ratios reflect operating expenses of the class. Expenses before reductions do not reflect amounts reimbursed, waived, or reduced through arrangements with the investment adviser, brokerage services, or other offset arrangements, if applicable, and do not represent the amount paid by the class during periods when reimbursements, waivers or reductions occur.
FAmount does not include the portfolio activity of any underlying mutual funds or exchange-traded funds (ETFs).
For the period ended December 31, 2023
1. Organization.
Fidelity Advisor Multi-Asset Income Fund (the Fund) is a fund of Fidelity School Street Trust (the Trust) and is authorized to issue an unlimited number of shares. The Trust is registered under the Investment Company Act of 1940, as amended (the 1940 Act), as an open-end management investment company organized as a Massachusetts business trust. The Fund offers Class A, Class M, Class C, Fidelity Multi-Asset Income Fund, Class I and Class Z shares, each of which has equal rights as to assets and voting privileges. Class A, Class M, Class C, Class I and Class Z are Fidelity Advisor classes. Each class has exclusive voting rights with respect to matters that affect that class. Class C shares will automatically convert to Class A shares after a holding period of eight years from the initial date of purchase, with certain exceptions.
2. Investments in Fidelity Central Funds.
Funds may invest in Fidelity Central Funds, which are open-end investment companies generally available only to other investment companies and accounts managed by the investment adviser and its affiliates. The Schedule of Investments lists any Fidelity Central Funds held as an investment as of period end, but does not include the underlying holdings of each Fidelity Central Fund. An investing fund indirectly bears its proportionate share of the expenses of the underlying Fidelity Central Funds.
Based on its investment objective, each Fidelity Central Fund may invest or participate in various investment vehicles or strategies that are similar to those of the investing fund. These strategies are consistent with the investment objectives of the investing fund and may involve certain economic risks which may cause a decline in value of each of the Fidelity Central Funds and thus a decline in the value of the investing fund.
| Fidelity Central Fund | Investment Manager | Investment Objective | Investment Practices | Expense RatioA |
| Fidelity Money Market Central Funds | Fidelity Management & Research Company LLC (FMR) | Each fund seeks to obtain a high level of current income consistent with the preservation of capital and liquidity. | Short-term Investments | Less than .005% |
A Expenses expressed as a percentage of average net assets and are as of each underlying Central Fund's most recent annual or semi-annual shareholder report.
A complete unaudited list of holdings for each Fidelity Central Fund is available upon request or at the Securities and Exchange Commission website at www.sec.gov. In addition, the financial statements of the Fidelity Central Funds which contain the significant accounting policies (including investment valuation policies) of those funds, and are not covered by the Report of Independent Registered Public Accounting Firm, are available on the Securities and Exchange Commission website or upon request.
3. Investment in Fidelity Private Credit Central Fund LLC.
The Fund invests in Fidelity Private Credit Central Fund LLC (formerly Fidelity Direct Lending Fund, LP), which is a limited liability company available only to certain investment companies managed by the investment adviser and its affiliates. On June 1, 2023, Fidelity Private Credit Central Fund elected to be regulated as a business development company (BDC). Fidelity Private Credit Central Fund LLC's units are not registered under the Securities Act of 1933 and are subject to substantial restrictions on transfer. The Fund has no redemption rights under Fidelity Private Credit Central Fund LLC's limited liability company agreement. There will be no trading market for the units.
Based on its investment objective, Fidelity Private Credit Central Fund LLC may invest or participate in various investments or strategies that are similar to those in which the Fund may invest or participate. These strategies are consistent with the investment objectives of the Fund and may involve certain economic risks which may cause a decline in value of Fidelity Private Credit Central Fund LLC and thus a decline in the value of the Fund. Fidelity Private Credit Central Fund LLC intends to invest primarily in directly originated loans to private companies but also with liquid credit investments, like broadly syndicated loans, and other select private credit investments.
The Schedule of Investments lists Fidelity Private Credit Central Fund LLC as an investment as of period end, but does not include the underlying holdings of Fidelity Private Credit Central Fund LLC. Fidelity Private Credit Central Fund LLC represented less than 5% of the Fund's net assets at period end. The Fund indirectly bears its proportionate share of the expenses of Fidelity Private Credit Central Fund LLC. The annualized expense ratio for Fidelity Private Credit Central Fund LLC for the nine month period ended September 30, 2023 was 9.63%.
4. Significant Accounting Policies.
The Fund is an investment company and applies the accounting and reporting guidance of the Financial Accounting Standards Board (FASB) Accounting Standards Codification Topic 946 Financial Services - Investment Companies. The financial statements have been prepared in conformity with accounting principles generally accepted in the United States of America (GAAP), which require management to make certain estimates and assumptions at the date of the financial statements. Actual results could differ from those estimates. Subsequent events, if any, through the date that the financial statements were issued have been evaluated in the preparation of the financial statements. The Fund's Schedule of Investments lists any underlying mutual funds or exchange-traded funds (ETFs) but does not include the underlying holdings of these funds. The following summarizes the significant accounting policies of the Fund:
Investment Valuation. Investments are valued as of 4:00 p.m. Eastern time on the last calendar day of the period. The Board of Trustees (the Board) has designated the Fund's investment adviser as the valuation designee responsible for the fair valuation function and performing fair value determinations as needed. The investment adviser has established a Fair Value Committee (the Committee) to carry out the day-to-day fair valuation responsibilities and has adopted policies and procedures to govern the fair valuation process and the activities of the Committee. In accordance with these fair valuation policies and procedures, which have been approved by the Board, the Fund attempts to obtain prices from one or more third party pricing services or brokers to value its investments. When current market prices, quotations or currency exchange rates are not readily available or reliable, investments will be fair valued in good faith by the Committee, in accordance with the policies and procedures. Factors used in determining fair value vary by investment type and may include market or investment specific events, transaction data, estimated cash flows, and market observations of comparable investments. The frequency that the fair valuation procedures are used cannot be predicted and they may be utilized to a significant extent. The Committee manages the Fund's fair valuation practices and maintains the fair valuation policies and procedures. The Fund's investment adviser reports to the Board information regarding the fair valuation process and related material matters.
The Fund categorizes the inputs to valuation techniques used to value its investments into a disclosure hierarchy consisting of three levels as shown below:
Level 1 - unadjusted quoted prices in active markets for identical investments
Level 2 - other significant observable inputs (including quoted prices for similar investments, interest rates, prepayment speeds, etc.)
Level 3 - unobservable inputs (including the Fund's own assumptions based on the best information available)
Valuation techniques used to value the Fund's investments by major category are as follows:
Debt securities, including restricted securities, are valued based on evaluated prices received from third party pricing services or from brokers who make markets in such securities. Corporate bonds, bank loan obligations, preferred securities and U.S. government and government agency obligations are valued by pricing services who utilize matrix pricing which considers yield or price of bonds of comparable quality, coupon, maturity and type or by broker-supplied prices. Commercial mortgage securities are valued by pricing services who utilize matrix pricing which considers prepayment speed assumptions, attributes of the collateral, yield or price of bonds of comparable quality, coupon, maturity and type or by broker-supplied prices. When independent prices are unavailable or unreliable, debt securities may be valued utilizing pricing methodologies which consider similar factors that would be used by third party pricing services. For foreign debt securities, when significant market or security specific events arise, valuations may be determined in good faith in accordance with procedures adopted by the Board. Debt securities are generally categorized as Level 2 in the hierarchy but may be Level 3 depending on the circumstances.
Equity securities, including restricted securities, for which market quotations are readily available, are valued at the last reported sale price or official closing price as reported by a third party pricing service on the primary market or exchange on which they are traded and are categorized as Level 1 in the hierarchy. In the event there were no sales during the day or closing prices are not available, securities are valued at the last quoted bid price or may be valued using the last available price and are generally categorized as Level 2 in the hierarchy. For foreign equity securities, when market or security specific events arise, comparisons to the valuation of American Depositary Receipts (ADRs), futures contracts, ETFs and certain indexes as well as quoted prices for similar securities may be used and would be categorized as Level 2 in the hierarchy. For equity securities, including restricted securities, where observable inputs are limited, assumptions about market activity and risk are used and these securities may be categorized as Level 3 in the hierarchy.
Exchange-traded options are valued using the last sale price or, in the absence of a sale, the last offering price and are categorized as Level 1 in the hierarchy. Investments in open-end mutual funds, including the Fidelity Central Funds, are valued at their closing net asset value (NAV) each business day and are categorized as Level 1 in the hierarchy.
Fidelity Private Credit Central Fund LLC is valued at its net asset value (NAV) each month end and is categorized as Level 2 in the hierarchy.
Changes in valuation techniques may result in transfers in or out of an assigned level within the disclosure hierarchy. The aggregate value of investments by input level as of December 31, 2023 is included at the end of the Fund's Schedule of Investments.
Foreign Currency. Certain Funds may use foreign currency contracts to facilitate transactions in foreign-denominated securities. Gains and losses from these transactions may arise from changes in the value of the foreign currency or if the counterparties do not perform under the contracts' terms.
Foreign-denominated assets, including investment securities, and liabilities are translated into U.S. dollars at the exchange rates at period end. Purchases and sales of investment securities, income and dividends received, and expenses denominated in foreign currencies are translated into U.S. dollars at the exchange rate in effect on the transaction date.
The effects of exchange rate fluctuations on investments are included with the net realized and unrealized gain (loss) on investment securities. Other foreign currency transactions resulting in realized and unrealized gain (loss) are disclosed separately.
Investment Transactions and Income. For financial reporting purposes, the Fund's investment holdings and NAV include trades executed through the end of the last business day of the period. The NAV per share for processing shareholder transactions is calculated as of the close of business of the New York Stock Exchange (NYSE), normally 4:00 p.m. Eastern time and includes trades executed through the end of the prior business day. Gains and losses on securities sold are determined on the basis of identified cost and include proceeds received from litigation. Commissions paid to certain brokers with whom the investment adviser, or its affiliates, places trades on behalf of a fund include an amount in addition to trade execution, which may be rebated back to a fund. Any such rebates are included in net realized gain (loss) on investments in the Statement of Operations. Dividend income is recorded on the ex-dividend date, except for certain dividends from foreign securities where the ex-dividend date may have passed, which are recorded as soon as the Fund is informed of the ex-dividend date. Non-cash dividends included in dividend income, if any, are recorded at the fair market value of the securities received. Income and capital gain distributions from Fidelity Central Funds, if any, are recorded on the ex-dividend date. Certain distributions received by the Fund represent a return of capital or capital gain. The Fund determines the components of these distributions subsequent to the ex-dividend date, based upon receipt of tax filings or other correspondence relating to the underlying investment. These distributions are recorded as a reduction of cost of investments and/or as a realized gain. Interest income is accrued as earned and includes coupon interest and amortization of premium and accretion of discount on debt securities as applicable. Investment income is recorded net of foreign taxes withheld where recovery of such taxes is uncertain. Debt obligations may be placed on non-accrual status and related interest income may be reduced by ceasing current accruals and writing off interest receivables when the collection of all or a portion of interest has become doubtful based on consistently applied procedures. A debt obligation is removed from non-accrual status when the issuer resumes interest payments or when collectability of interest is reasonably assured. Funds may file withholding tax reclaims in certain jurisdictions to recover a portion of amounts previously withheld. Any withholding tax reclaims income is included in the Statement of Operations in dividends. Any receivables for withholding tax reclaims are included in the Statement of Assets and Liabilities in dividend receivable.
Class Allocations and Expenses. Investment income, realized and unrealized capital gains and losses, common expenses of a fund, and certain fund-level expense reductions, if any, are allocated daily on a pro-rata basis to each class based on the relative net assets of each class to the total net assets of a fund. Each class differs with respect to transfer agent and distribution and service plan fees incurred, as applicable. Certain expense reductions may also differ by class, if applicable. For the reporting period, the allocated portion of income and expenses to each class as a percent of its average net assets may vary due to the timing of recording these transactions in relation to fluctuating net assets of the classes. Expenses directly attributable to a fund are charged to that fund. Expenses attributable to more than one fund are allocated among the respective funds on the basis of relative net assets or other appropriate methods. Expenses included in the accompanying financial statements reflect the expenses of that fund and do not include any expenses associated with any underlying mutual funds or exchange-traded funds (ETFs). Although not included in a fund's expenses, a fund indirectly bears its proportionate share of these expenses through the net asset value of each underlying mutual fund or exchange-traded fund (ETF). Expense estimates are accrued in the period to which they relate and adjustments are made when actual amounts are known.
Income Tax Information and Distributions to Shareholders. Each year, the Fund intends to qualify as a regulated investment company under Subchapter M of the Internal Revenue Code, including distributing substantially all of its taxable income and realized gains. As a result, no provision for U.S. Federal income taxes is required. As of December 31, 2023, the Fund did not have any unrecognized tax benefits in the financial statements; nor is the Fund aware of any tax positions for which it is reasonably possible that the total amounts of unrecognized tax benefits will significantly change in the next twelve months. The Fund files a U.S. federal tax return, in addition to state and local tax returns as required. The Fund's federal income tax returns are subject to examination by the Internal Revenue Service (IRS) for a period of three fiscal years after they are filed. State and local tax returns may be subject to examination for an additional fiscal year depending on the jurisdiction. Foreign taxes are provided for based on the Fund's understanding of the tax rules and rates that exist in the foreign markets in which it invests.
Distributions are declared and recorded daily and paid monthly from net investment income. Distributions from realized gains, if any, are declared and recorded on the ex-dividend date. Income and capital gain distributions are declared separately for each class. Income and capital gain distributions are determined in accordance with income tax regulations, which may differ from GAAP.
Capital accounts within the financial statements are adjusted for permanent book-tax differences. These adjustments have no impact on net assets or the results of operations. Capital accounts are not adjusted for temporary book-tax differences which will reverse in a subsequent period.
Book-tax differences are primarily due to the short-term gain distributions from the underlying funds, foreign currency transactions, passive foreign investment companies (PFIC), contingent interest, equity-debt classifications, certain conversion ratio adjustments, partnerships, capital loss carryforwards and losses deferred due to wash sales and options.
As of period end, the cost and unrealized appreciation (depreciation) in securities, and derivatives if applicable, for federal income tax purposes were as follows:
| Gross unrealized appreciation | $165,739,646 |
| Gross unrealized depreciation | (24,206,855) |
| Net unrealized appreciation (depreciation) | $141,532,791 |
| Tax Cost | $2,227,637,465 |
The tax-based components of distributable earnings as of period end were as follows:
| Capital loss carryforward | $(206,745,876) |
| Net unrealized appreciation (depreciation) on securities and other investments | $138,111,062 |
Capital loss carryforwards are only available to offset future capital gains of the Fund to the extent provided by regulations and may be limited. The capital loss carryforward information presented below, including any applicable limitation, is estimated as of fiscal period end and is subject to adjustment.
Short-term | $(183,559,393) |
Long-term | (23,186,483) |
| Total capital loss carryforward | $(206,745,876) |
The tax character of distributions paid was as follows:
| | December 31, 2023 | December 31, 2022 |
| Ordinary Income | $88,768,777 | $65,902,273 |
| Long-term Capital Gains | - | 14,064,872 |
| Total | $88,768,777 | $79,967,145 |
Restricted Securities (including Private Placements). Funds may invest in securities that are subject to legal or contractual restrictions on resale. These securities generally may be resold in transactions exempt from registration or to the public if the securities are registered. Disposal of these securities may involve time-consuming negotiations and expense, and prompt sale at an acceptable price may be difficult. Information regarding restricted securities held at period end is included at the end of the Schedule of Investments, if applicable.
Loans and Other Direct Debt Instruments. Direct debt instruments are interests in amounts owed to lenders by corporate or other borrowers. These instruments may be in the form of loans, trade claims or other receivables and may include standby financing commitments such as revolving credit facilities that obligate a fund to supply additional cash to the borrower on demand. Loans may be acquired through assignment, participation, or may be made directly to a borrower. Such instruments are presented in the Bank Loan Obligations section in the Schedule of Investments. Certain funds may also invest in unfunded loan commitments, which are contractual obligations for future funding. Information regarding unfunded commitments is included at the end of the Schedule of Investments, if applicable.
Commitments. A commitment is an agreement to acquire an investment at a future date (subject to conditions) in connection with a potential public or non-public offering. The amount of commitments outstanding at period end are presented in the table below. These commitments are not included in the net assets of the Fund at period end.
| | Investment to be Acquired | Commitment Amount |
| Fidelity Advisor Multi-Asset Income Fund | Fidelity Private Credit Central Fund LLC | $9,165,981 |
5. Derivative Instruments.
Risk Exposures and the Use of Derivative Instruments. The Fund's investment objectives allow for various types of derivative instruments, including options. Derivatives are investments whose value is primarily derived from underlying assets, indices or reference rates and may be transacted on an exchange or over-the-counter (OTC). Derivatives may involve a future commitment to buy or sell a specified asset based on specified terms, to exchange future cash flows at periodic intervals based on a notional principal amount, or for one party to make one or more payments upon the occurrence of specified events in exchange for periodic payments from the other party.
Derivatives were used to increase returns and to manage exposure to certain risks as defined below. The success of any strategy involving derivatives depends on analysis of numerous economic factors, and if the strategies for investment do not work as intended, the objectives may not be achieved.
Derivatives were used to increase or decrease exposure to the following risk(s):
| | |
| Equity Risk | Equity risk relates to the fluctuations in the value of financial instruments as a result of changes in market prices (other than those arising from interest rate risk or foreign exchange risk), whether caused by factors specific to an individual investment, its issuer, or all factors affecting all instruments traded in a market or market segment. |
Funds are also exposed to additional risks from investing in derivatives, such as liquidity risk and counterparty credit risk. Liquidity risk is the risk that a fund will be unable to close out the derivative in the open market in a timely manner. Counterparty credit risk is the risk that the counterparty will not be able to fulfill its obligation to a fund. Counterparty credit risk related to exchange-traded contracts may be mitigated by the protection provided by the exchange on which they trade.
Investing in derivatives may involve greater risks than investing in the underlying assets directly and, to varying degrees, may involve risk of loss in excess of any initial investment and collateral received and amounts recognized in the Statement of Assets and Liabilities. In addition, there may be the risk that the change in value of the derivative contract does not correspond to the change in value of the underlying instrument.
Net Realized Gain (Loss) and Change in Net Unrealized Appreciation (Depreciation) on Derivatives. The table below, which reflects the impacts of derivatives on the financial performance, summarizes the net realized gain (loss) and change in net unrealized appreciation (depreciation) for derivatives during the period as presented in the Statement of Operations.
| Primary Risk Exposure / Derivative Type | Net Realized Gain (Loss) ($) | Change in Net Unrealized Appreciation (Depreciation) ($) |
| Fidelity Advisor Multi-Asset Income Fund | | |
| Equity Risk | | |
| Written Options | (4,774,672) | (1,738,419) |
| Total Equity Risk | (4,774,672) | (1,738,419) |
| Interest Rate Risk | | |
| Totals | (4,774,672) | (1,738,419) |
If there are any open positions at period end, a summary of the value of derivatives by primary risk exposure is included at the end of the Schedule of Investments.
Options. Options give the purchaser the right, but not the obligation, to buy (call) or sell (put) an underlying security or financial instrument at an agreed exercise or strike price between or on certain dates. Options obligate the seller (writer) to buy (put) or sell (call) an underlying instrument at the exercise or strike price or cash settle an underlying derivative instrument if the holder exercises the option on or before the expiration date.
Exchange-traded written covered call options were used to manage exposure to the market. When a fund writes a covered call option, a fund holds the underlying instrument which must be delivered to the holder upon the exercise of the option.
Upon entering into a written options contract, a fund will receive a premium. Premiums received are reflected as a liability on the Statement of Assets and Liabilities. Options are valued daily and any unrealized appreciation (depreciation) is reflected in total accumulated earnings (loss) in the Statement of Assets and Liabilities. When a written option is exercised, the premium is added to the proceeds from the sale of the underlying instrument in determining the gain or loss realized on that investment. When an option is closed, a gain or loss is realized depending on whether the proceeds or amount paid for the closing sale transaction are greater or less than the premium received. When an option expires, gains and losses are realized to the extent of premiums received. The net realized gain (loss) on closed and expired written options and the change in net unrealized appreciation (depreciation) on written options are presented in the Statement of Operations.
Writing call options tends to decrease exposure to the underlying instrument and risk of loss is the change in value in excess of the premium received.
Any open options at period end are presented in the Schedule of Investments under the caption "Written Options", and are representative of volume of activity during the period unless an average contracts amount is presented.
6. Purchases and Sales of Investments.
Purchases and sales of securities, other than short-term securities, U.S. government securities and in-kind transactions, as applicable, are noted in the table below.
| | Purchases ($) | Sales ($) |
| Fidelity Advisor Multi-Asset Income Fund | 2,680,400,929 | 2,971,145,181 |
7. Fees and Other Transactions with Affiliates.
Management Fee. Fidelity Management & Research Company LLC (the investment adviser) and its affiliates provide the Fund with investment management related services for which the Fund pays a monthly management fee. The management fee is the sum of an individual fund fee rate that is based on an annual rate of .45% of the Fund's average net assets and an annualized group fee rate that averaged .10% during the period. The group fee rate is based upon the monthly average net assets of a group of registered investment companies with which the investment adviser has management contracts. The group fee rate decreases as assets under management increase and increases as assets under management decrease. For the reporting period, the total annual management fee rate was .55% of the Fund's average net assets.
Distribution and Service Plan Fees. In accordance with Rule 12b-1 of the 1940 Act, the Fund has adopted separate Distribution and Service Plans for each class of shares. Certain classes pay Fidelity Distributors Company LLC (FDC), an affiliate of the investment adviser, separate Distribution and Service Fees, each of which is based on an annual percentage of each class' average net assets. In addition, FDC may pay financial intermediaries for selling shares of the Fund and providing shareholder support services. For the period, the Distribution and Service Fee rates, total fees and amounts retained by FDC were as follows:
| | Distribution Fee | Service Fee | Total Fees | Retained by FDC |
| Class A | -% | .25% | $471,122 | $32,770 |
| Class M | -% | .25% | 57,767 | - |
| Class C | .75% | .25% | 827,792 | 245,029 |
| | | | $1,356,681 | $277,799 |
Sales Load. FDC may receive a front-end sales charge of up to 4.00% for selling Class A shares and Class M shares, some of which is paid to financial intermediaries for selling shares of the Fund. Depending on the holding period, FDC may receive contingent deferred sales charges levied on Class A, Class M and Class C redemptions. The deferred sales charges are 1.00% for Class C shares, 1.00% for certain purchases of Class A shares and .25% for certain purchases of Class M shares.
For the period, sales charge amounts retained by FDC were as follows:
| | Retained by FDC |
| Class A | $67,931 |
| Class M | 8,048 |
Class C A | 515 |
| | $76,494 |
A When Class C shares are initially sold, FDC pays commissions from its own resources to financial intermediaries through which the sales are made.
Transfer Agent Fees. Fidelity Investments Institutional Operations Company LLC (FIIOC), an affiliate of the investment adviser, is the transfer, dividend disbursing and shareholder servicing agent for each class of the Fund.
During November 2023, the Board approved a change in the transfer agent fees effective December 1, 2023 to a fixed annual rate of class-level average net assets as follows:
| | % of Class-Level Average Net Assets |
| Class A | 0.1437% |
| Class M | 0.1252% |
| Class C | 0.1461% |
| Fidelity Multi-Asset Income Fund | 0.1263% |
| Class I | 0.1490% |
Prior to December 1, 2023, FIIOC received account fees and asset-based fees that varied according to the account size and type of account of the shareholders of the respective classes of the Fund, except for Class Z. FIIOC received an asset-based fee of Class Z's average net assets. FIIOC pays for typesetting, printing and mailing of shareholder reports, except proxy statements.
For the period, transfer agent fees for each class were as follows:
| | Amount | % of Class-Level Average Net Assets |
| Class A | $271,826 | .14 |
| Class M | 28,731 | .12 |
| Class C | 121,019 | .15 |
| Fidelity Multi-Asset Income Fund | 1,244,884 | .13 |
| Class I | 861,296 | .15 |
| Class Z | 99,809 | .05 |
| | $2,627,565 | |
Accounting Fees. Fidelity Service Company, Inc. (FSC), an affiliate of the investment adviser, maintains the Fund's accounting records.
During November 2023, the Board approved a change in the accounting fees effective December 1, 2023 to a fixed annual rate of average net assets as follows:
| | % of Average Net Assets |
| Fidelity Advisor Multi-Asset Income Fund | 0.0365% |
Prior to December 1, 2023, the accounting fee was based on the level of average net assets for each month. For the period, the fees were equivalent to the following annual rates:
| | % of Average Net Assets |
| Fidelity Advisor Multi-Asset Income Fund | .04 |
Subsequent Event - Management Fee. Effective March 1, 2024, the Fund's management contract will be amended to incorporate administrative services previously covered under separate services agreements (Transfer Agent and Accounting agreements). The amended contract incorporates a management fee rate that may vary by class. The investment adviser or an affiliate will pay certain expenses of managing and operating the Fund out of each class's management fee.
Each class of the Fund will pay a management fee to the investment adviser. The management fee will be calculated and paid to the investment adviser every month.
When determining a class's management fee, a mandate rate will be calculated based on the monthly average net assets of a group of funds advised by FMR within a designated asset class. A discount rate will be subtracted from the mandate rate once the Fund's monthly average net assets reach a certain level. The mandate rate and discount rate may vary by class.
The annual management fee rate for a class of shares of the Fund will be the lesser of (1) the class's mandate rate reduced by the class's discount rate (if applicable) or (2) the amount set forth in the following table.
| | Maximum Management Fee Rate % |
| Class A | 0.71 |
| Class M | 0.69 |
| Class C | 0.71 |
| Fidelity Multi-Asset Income Fund | 0.69 |
| Class I | 0.71 |
| Class Z | 0.61 |
One-twelfth of the management fee rate for a class will be applied to the average net assets of the class for the month, giving a dollar amount which is the management fee for the class for that month.
A different management fee rate may be applicable to each class of the Fund. The difference between classes is the result of separate arrangements for class-level services and/or waivers of certain expenses. It is not the result of any difference in advisory or custodial fees or other expenses related to the management of the Fund's assets, which do not vary by class.
Effective March 1, 2024, the Fund's sub-advisory agreements with FMR Investment Management (UK) Limited, Fidelity Management & Research (Hong Kong) Limited, and Fidelity Management & Research (Japan) Limited will be amended to provide that the investment adviser will pay each sub-adviser monthly fees equal to 110% of the sub-adviser's costs for providing sub-advisory services.
Brokerage Commissions. A portion of portfolio transactions were placed with brokerage firms which are affiliates of the investment adviser. Brokerage commissions are included in net realized gain (loss) and change in net unrealized appreciation (depreciation) in the Statement of Operations. The commissions paid to these affiliated firms were as follows:
| | Amount |
| Fidelity Advisor Multi-Asset Income Fund | $46,044 |
| |
Interfund Lending Program. Pursuant to an Exemptive Order issued by the Securities and Exchange Commission (the SEC), the Fund, along with other registered investment companies having management contracts with Fidelity Management & Research Company LLC (FMR), or other affiliated entities of FMR, may participate in an interfund lending program. This program provides an alternative credit facility allowing the Fund to borrow from, or lend money to, other participating affiliated funds. At period end, there were no interfund loans outstanding. Activity in this program during the period for which loans were outstanding was as follows:
| | Borrower or Lender | Average Loan Balance | Weighted Average Interest Rate | Interest Expense |
Fidelity Advisor Multi-Asset Income Fund | Borrower | $10,432,556 | 5.27% | $13,748 |
Interfund Trades. Funds may purchase from or sell securities to other Fidelity Funds under procedures adopted by the Board. The procedures have been designed to ensure these interfund trades are executed in accordance with Rule 17a-7 of the 1940 Act. Any interfund trades are included within the respective purchases and sales amounts shown in the Purchases and Sales of Investments note. Interfund trades during the period are noted in the table below.
| | Purchases ($) | Sales ($) | Realized Gain (Loss) ($) |
| Fidelity Advisor Multi-Asset Income Fund | 98,177,133 | 44,602,064 | (4,471,908) |
8. Committed Line of Credit.
Certain Funds participate with other funds managed by the investment adviser or an affiliate in a $4.25 billion credit facility (the "line of credit") to be utilized for temporary or emergency purposes to fund shareholder redemptions or for other short-term liquidity purposes. The participating funds have agreed to pay commitment fees on their pro-rata portion of the line of credit, which are reflected in Miscellaneous expenses on the Statement of Operations, and are listed below. During the period, there were no borrowings on this line of credit.
| | Amount |
| Fidelity Advisor Multi-Asset Income Fund | $3,516 |
9. Security Lending.
Funds lend portfolio securities from time to time in order to earn additional income. Lending agents are used, including National Financial Services (NFS), an affiliate of the investment adviser. Pursuant to a securities lending agreement, NFS will receive a fee, which is capped at 9.9% of a fund's daily lending revenue, for its services as lending agent. A fund may lend securities to certain qualified borrowers, including NFS. On the settlement date of the loan, a fund receives collateral (in the form of U.S. Treasury obligations, letters of credit and/or cash) against the loaned securities and maintains collateral in an amount not less than 100% of the market value of the loaned securities during the period of the loan. The market value of the loaned securities is determined at the close of business of a fund and any additional required collateral is delivered to a fund on the next business day. A fund or borrower may terminate the loan at any time, and if the borrower defaults on its obligation to return the securities loaned because of insolvency or other reasons, a fund may apply collateral received from the borrower against the obligation. A fund may experience delays and costs in recovering the securities loaned. Any cash collateral received is invested in the Fidelity Securities Lending Cash Central Fund. Any loaned securities are identified as such in the Schedule of Investments, and the value of loaned securities and cash collateral at period end, as applicable, are presented in the Statement of Assets and Liabilities. Security lending income represents the income earned on investing cash collateral, less rebates paid to borrowers and any lending agent fees associated with the loan, plus any premium payments received for lending certain types of securities. Security lending income is presented in the Statement of Operations as a component of income from Fidelity Central Funds. Affiliated security lending activity, if any, was as follows:
| | Total Security Lending Fees Paid to NFS | Security Lending Income From Securities Loaned to NFS | Value of Securities Loaned to NFS at Period End |
| Fidelity Advisor Multi-Asset Income Fund | $16,954 | $- | $- |
10. Expense Reductions.
The investment adviser has contractually agreed to waive the Fund's management fee with respect to the portion of the Fund's assets invested in Fidelity Private Credit Central Fund LLC until April 30, 2025. During the period, this waiver reduced the Fund's management fee by $68,713.
Through arrangements with the Fund's custodian, credits realized as a result of certain uninvested cash balances were used to reduce the Fund's expenses. During the period, custodian credits reduced the Fund's expenses by $22,634.
In addition, during the period the investment adviser or an affiliate reimbursed and/or waived a portion of fund-level operating expenses in the amount of $64,532.
10. Distributions to Shareholders.
Distributions to shareholders of each class were as follows:
| | Year ended December 31, 2023 | Year ended December 31, 2022 |
| Fidelity Advisor Multi-Asset Income Fund | | |
| Distributions to shareholders | | |
| Class A | $ 7,754,725 | $5,772,546 |
| Class M | 953,328 | 759,383 |
| Class C | 2,783,408 | 2,169,681 |
| Fidelity Multi-Asset Income Fund | 43,103,018 | 44,657,109 |
| Class I | 25,270,299 | 20,536,453 |
| Class Z | 8,903,999 | 6,071,973 |
Total | $88,768,777 | $79,967,145 |
11. Share Transactions.
Share transactions for each class were as follows and may contain in-kind transactions, automatic conversions between classes or exchanges between affiliated funds:
| | Shares | Shares | Dollars | Dollars |
| | Year ended December 31, 2023 | Year ended December 31, 2022 | Year ended December 31, 2023 | Year ended December 31, 2022 |
| Fidelity Advisor Multi-Asset Income Fund | | | | |
| Class A | | | | |
| Shares sold | 7,188,675 | 6,336,833 | $93,140,549 | $85,415,686 |
| Reinvestment of distributions | 594,257 | 434,015 | 7,702,451 | 5,697,737 |
| Shares redeemed | (3,638,476) | (3,481,264) | (46,877,488) | (46,490,265) |
| Net increase (decrease) | 4,144,456 | 3,289,584 | $53,965,512 | $44,623,158 |
| Class M | | | | |
| Shares sold | 1,156,437 | 606,872 | $15,026,676 | $8,184,084 |
| Reinvestment of distributions | 71,484 | 56,339 | 927,719 | 744,403 |
| Shares redeemed | (884,770) | (455,853) | (11,411,762) | (6,077,604) |
| Net increase (decrease) | 343,151 | 207,358 | $4,542,633 | $2,850,883 |
| Class C | | | | |
| Shares sold | 3,223,512 | 2,507,496 | $41,625,256 | $34,008,784 |
| Reinvestment of distributions | 214,459 | 163,306 | 2,774,182 | 2,146,933 |
| Shares redeemed | (1,436,237) | (1,477,001) | (18,519,208) | (19,604,187) |
| Net increase (decrease) | 2,001,734 | 1,193,801 | $25,880,230 | $16,551,530 |
| Fidelity Multi-Asset Income Fund | | | | |
| Shares sold | 31,353,312 | 31,508,307 | $407,148,901 | $430,437,209 |
| Reinvestment of distributions | 2,783,876 | 2,905,716 | 36,124,114 | 38,469,681 |
| Shares redeemed | (28,593,663) | (36,488,320) | (369,480,090) | (485,233,528) |
| Net increase (decrease) | 5,543,525 | (2,074,297) | $73,792,925 | $(16,326,638) |
| Class I | | | | |
| Shares sold | 33,707,412 | 28,061,399 | $436,588,435 | $381,135,730 |
| Reinvestment of distributions | 1,898,815 | 1,499,206 | 24,611,062 | 19,757,925 |
| Shares redeemed | (17,914,182) | (25,971,837) | (230,743,002) | (344,201,843) |
| Net increase (decrease) | 17,692,045 | 3,588,768 | $230,456,495 | $56,691,812 |
| Class Z | | | | |
| Shares sold | 10,309,136 | 12,397,128 | $133,126,083 | $166,221,659 |
| Reinvestment of distributions | 574,699 | 402,239 | 7,450,113 | 5,239,020 |
| Shares redeemed | (4,339,760) | (6,232,578) | (56,065,556) | (83,579,007) |
| Net increase (decrease) | 6,544,075 | 6,566,789 | $84,510,640 | $87,881,672 |
12. Other.
A fund's organizational documents provide former and current trustees and officers with a limited indemnification against liabilities arising in connection with the performance of their duties to the fund. In the normal course of business, a fund may also enter into contracts that provide general indemnifications. A fund's maximum exposure under these arrangements is unknown as this would be dependent on future claims that may be made against a fund. The risk of material loss from such claims is considered remote.
13. Risk and Uncertainties.
Many factors affect a fund's performance. Developments that disrupt global economies and financial markets, such as pandemics, epidemics, outbreaks of infectious diseases, war, terrorism, and environmental disasters, may significantly affect a fund's investment performance. The effects of these developments to a fund will be impacted by the types of securities in which a fund invests, the financial condition, industry, economic sector, and geographic location of an issuer, and a fund's level of investment in the securities of that issuer. Significant concentrations in security types, issuers, industries, sectors, and geographic locations may magnify the factors that affect a fund's performance.
To the Board of Trustees of Fidelity School Street Trust and Shareholders of Fidelity Advisor Multi-Asset Income Fund
Opinion on the Financial Statements
We have audited the accompanying statement of assets and liabilities, including the schedule of investments, of Fidelity Advisor Multi-Asset Income Fund (one of the funds constituting Fidelity School Street Trust, referred to hereafter as the "Fund") as of December 31, 2023, the related statement of operations for the year ended December 31, 2023, the statement of changes in net assets for each of the two years in the period ended December 31, 2023, including the related notes, and the financial highlights for each of the five years in the period ended December 31, 2023 (collectively referred to as the "financial statements"). In our opinion, the financial statements present fairly, in all material respects, the financial position of the Fund as of December 31, 2023, the results of its operations for the year then ended, the changes in its net assets for each of the two years in the period ended December 31, 2023 and the financial highlights for each of the five years in the period ended December 31, 2023 in conformity with accounting principles generally accepted in the United States of America.
Basis for Opinion
These financial statements are the responsibility of the Fund's management. Our responsibility is to express an opinion on the Fund's financial statements based on our audits. We are a public accounting firm registered with the Public Company Accounting Oversight Board (United States) (PCAOB) and are required to be independent with respect to the Fund in accordance with the U.S. federal securities laws and the applicable rules and regulations of the Securities and Exchange Commission and the PCAOB.
We conducted our audits of these financial statements in accordance with the standards of the PCAOB. Those standards require that we plan and perform the audit to obtain reasonable assurance about whether the financial statements are free of material misstatement, whether due to error or fraud.
Our audits included performing procedures to assess the risks of material misstatement of the financial statements, whether due to error or fraud, and performing procedures that respond to those risks. Such procedures included examining, on a test basis, evidence regarding the amounts and disclosures in the financial statements. Our audits also included evaluating the accounting principles used and significant estimates made by management, as well as evaluating the overall presentation of the financial statements. Our procedures included confirmation of securities owned as of December 31, 2023 by correspondence with the custodian, agent banks, and brokers; when replies were not received from brokers, we performed other auditing procedures. We believe that our audits provide a reasonable basis for our opinion.
/s/ PricewaterhouseCoopers LLP
Boston, Massachusetts
February 14, 2024
We have served as the auditor of one or more investment companies in the Fidelity group of funds since 1932.
The Trustees, Members of the Advisory Board (if any), and officers of the trust and fund, as applicable, are listed below. The Board of Trustees governs the fund and is responsible for protecting the interests of shareholders. The Trustees are experienced executives who meet periodically throughout the year to oversee the fund's activities, review contractual arrangements with companies that provide services to the fund, oversee management of the risks associated with such activities and contractual arrangements, and review the fund's performance. Each of the Trustees oversees 314 funds.
The Trustees hold office without limit in time except that (a) any Trustee may resign; (b) any Trustee may be removed by written instrument, signed by at least two-thirds of the number of Trustees prior to such removal; (c) any Trustee who requests to be retired or who has become incapacitated by illness or injury may be retired by written instrument signed by a majority of the other Trustees; and (d) any Trustee may be removed at any special meeting of shareholders by a two-thirds vote of the outstanding voting securities of the trust. Each Trustee who is not an interested person (as defined in the 1940 Act) of the trust and the fund is referred to herein as an Independent Trustee. Each Independent Trustee shall retire not later than the last day of the calendar year in which his or her 75th birthday occurs. The Independent Trustees may waive this mandatory retirement age policy with respect to individual Trustees. Officers and Advisory Board Members hold office without limit in time, except that any officer or Advisory Board Member may resign or may be removed by a vote of a majority of the Trustees at any regular meeting or any special meeting of the Trustees. Except as indicated, each individual has held the office shown or other offices in the same company for the past five years.
The fund's Statement of Additional Information (SAI) includes more information about the Trustees. To request a free copy, call Fidelity at 1-800-544-8544 if you're an individual investing directly with Fidelity, call 1-800-835-5092 if you're a plan sponsor or participant with Fidelity as your recordkeeper or call 1-877-208-0098 on institutional accounts or if you're an advisor or invest through one.
Experience, Skills, Attributes, and Qualifications of the Trustees. The Governance and Nominating Committee has adopted a statement of policy that describes the experience, qualifications, attributes, and skills that are necessary and desirable for potential Independent Trustee candidates (Statement of Policy). The Board believes that each Trustee satisfied at the time he or she was initially elected or appointed a Trustee, and continues to satisfy, the standards contemplated by the Statement of Policy. The Governance and Nominating Committee also engages professional search firms to help identify potential Independent Trustee candidates who have the experience, qualifications, attributes, and skills consistent with the Statement of Policy. From time to time, additional criteria based on the composition and skills of the current Independent Trustees, as well as experience or skills that may be appropriate in light of future changes to board composition, business conditions, and regulatory or other developments, have also been considered by the professional search firms and the Governance and Nominating Committee. In addition, the Board takes into account the Trustees' commitment and participation in Board and committee meetings, as well as their leadership of standing and ad hoc committees throughout their tenure.
In determining that a particular Trustee was and continues to be qualified to serve as a Trustee, the Board has considered a variety of criteria, none of which, in isolation, was controlling. The Board believes that, collectively, the Trustees have balanced and diverse experience, qualifications, attributes, and skills, which allow the Board to operate effectively in governing the fund and protecting the interests of shareholders. Information about the specific experience, skills, attributes, and qualifications of each Trustee, which in each case led to the Board's conclusion that the Trustee should serve (or continue to serve) as a trustee of the fund, is provided below.
Board Structure and Oversight Function. Abigail P. Johnson is an interested person and currently serves as Chairman. The Trustees have determined that an interested Chairman is appropriate and benefits shareholders because an interested Chairman has a personal and professional stake in the quality and continuity of services provided to the fund. Independent Trustees exercise their informed business judgment to appoint an individual of their choosing to serve as Chairman, regardless of whether the Trustee happens to be independent or a member of management. The Independent Trustees have determined that they can act independently and effectively without having an Independent Trustee serve as Chairman and that a key structural component for assuring that they are in a position to do so is for the Independent Trustees to constitute a substantial majority for the Board. The Independent Trustees also regularly meet in executive session. Michael E. Kenneally serves as Chairman of the Independent Trustees and as such (i) acts as a liaison between the Independent Trustees and management with respect to matters important to the Independent Trustees and (ii) with management prepares agendas for Board meetings.
Fidelity® funds are overseen by different Boards of Trustees. The fund's Board oversees Fidelity's investment-grade bond, money market, asset allocation and certain equity funds, and other Boards oversee Fidelity's alternative investment, high income and other equity funds. The asset allocation funds may invest in Fidelity® funds that are overseen by such other Boards. The use of separate Boards, each with its own committee structure, allows the Trustees of each group of Fidelity® funds to focus on the unique issues of the funds they oversee, including common research, investment, and operational issues. On occasion, the separate Boards establish joint committees to address issues of overlapping consequences for the Fidelity® funds overseen by each Board.
The Trustees operate using a system of committees to facilitate the timely and efficient consideration of all matters of importance to the Trustees, the fund, and fund shareholders and to facilitate compliance with legal and regulatory requirements and oversight of the fund's activities and associated risks. The Board, acting through its committees, has charged FMR and its affiliates with (i) identifying events or circumstances the occurrence of which could have demonstrably adverse effects on the fund's business and/or reputation; (ii) implementing processes and controls to lessen the possibility that such events or circumstances occur or to mitigate the effects of such events or circumstances if they do occur; and (iii) creating and maintaining a system designed to evaluate continuously business and market conditions in order to facilitate the identification and implementation processes described in (i) and (ii) above. Because the day-to-day operations and activities of the fund are carried out by or through FMR, its affiliates, and other service providers, the fund's exposure to risks is mitigated but not eliminated by the processes overseen by the Trustees. While each of the Board's committees has responsibility for overseeing different aspects of the fund's activities, oversight is exercised primarily through the Operations and Audit Committees. In addition, an ad hoc Board committee of Independent Trustees has worked with FMR to enhance the Board's oversight of investment and financial risks, legal and regulatory risks, technology risks, and operational risks, including the development of additional risk reporting to the Board. Appropriate personnel, including but not limited to the fund's Chief Compliance Officer (CCO), FMR's internal auditor, the independent accountants, the fund's Treasurer and portfolio management personnel, make periodic reports to the Board's committees, as appropriate, including an annual review of Fidelity's risk management program for the Fidelity® funds. The responsibilities of each standing committee, including their oversight responsibilities, are described further under "Standing Committees of the Trustees."
Interested Trustees*:
Correspondence intended for a Trustee who is an interested person may be sent to Fidelity Investments, 245 Summer Street, Boston, Massachusetts 02210.
Name, Year of Birth; Principal Occupations and Other Relevant Experience+
Abigail P. Johnson (1961)
Year of Election or Appointment: 2009
Trustee
Chairman of the Board of Trustees
Ms. Johnson also serves as Trustee of other Fidelity® funds. Ms. Johnson serves as Chairman (2016-present), Chief Executive Officer (2014-present), and Director (2007-present) of FMR LLC (diversified financial services company), President of Fidelity Financial Services (2012-present) and President of Personal, Workplace and Institutional Services (2005-present). Ms. Johnson is Chairman and Director of Fidelity Management & Research Company LLC (investment adviser firm, 2011-present). Previously, Ms. Johnson served as Chairman and Director of FMR Co., Inc. (investment adviser firm, 2011-2019), Vice Chairman (2007-2016) and President (2013-2016) of FMR LLC, President and a Director of Fidelity Management & Research Company (2001-2005), a Trustee of other investment companies advised by Fidelity Management & Research Company, Fidelity Investments Money Management, Inc. (investment adviser firm), and FMR Co., Inc. (2001-2005), Senior Vice President of the Fidelity® funds (2001-2005), and managed a number of Fidelity® funds. Ms. Abigail P. Johnson and Mr. Arthur E. Johnson are not related.
Jennifer Toolin McAuliffe (1959)
Year of Election or Appointment: 2016
Trustee
Ms. McAuliffe also serves as Trustee of other Fidelity® funds and as Trustee of Fidelity Charitable (2020-present). Previously, Ms. McAuliffe served as Co-Head of Fixed Income of Fidelity Investments Limited (now known as FIL Limited (FIL)) (diversified financial services company), Director of Research for FIL's credit and quantitative teams in London, Hong Kong and Tokyo and Director of Research for taxable and municipal bonds at Fidelity Investments Money Management, Inc. Ms. McAuliffe previously served as a member of the Advisory Board of certain Fidelity® funds (2016). Ms. McAuliffe was previously a lawyer at Ropes & Gray LLP and an international banker at Chemical Bank NA (now JPMorgan Chase & Co.). Ms. McAuliffe also currently serves as director or trustee of several not-for-profit entities.
Christine J. Thompson (1958)
Year of Election or Appointment: 2023
Trustee
Ms. Thompson also serves as a Trustee of other Fidelity® funds. Ms. Thompson serves as Leader of Advanced Technologies for Investment Management at Fidelity Investments (2018-present). Previously, Ms. Thompson served as Chief Investment Officer in the Bond group at Fidelity Management & Research Company (2010-2018) and held various other roles including Director of municipal bond portfolio managers and Portfolio Manager of certain Fidelity® funds.
* Determined to be an "Interested Trustee" by virtue of, among other things, his or her affiliation with the trust or various entities under common control with FMR.
+ The information includes the Trustee's principal occupation during the last five years and other information relating to the experience, attributes, and skills relevant to the Trustee's qualifications to serve as a Trustee, which led to the conclusion that the Trustee should serve as a Trustee for the fund.
Independent Trustees:
Correspondence intended for an Independent Trustee may be sent to Fidelity Investments, P.O. Box 55235, Boston, Massachusetts 02205-5235.
Name, Year of Birth; Principal Occupations and Other Relevant Experience+
Elizabeth S. Acton (1951)
Year of Election or Appointment: 2013
Trustee
Ms. Acton also serves as Trustee of other Fidelity® funds. Prior to her retirement, Ms. Acton served as Executive Vice President, Finance (2011-2012), Executive Vice President, Chief Financial Officer (2002-2011) and Treasurer (2004-2005) of Comerica Incorporated (financial services). Prior to joining Comerica, Ms. Acton held a variety of positions at Ford Motor Company (1983-2002), including Vice President and Treasurer (2000-2002) and Executive Vice President and Chief Financial Officer of Ford Motor Credit Company (1998-2000). Ms. Acton currently serves as a member of the Board and Audit and Finance Committees of Beazer Homes USA, Inc. (homebuilding, 2012-present). Ms. Acton previously served as a member of the Advisory Board of certain Fidelity® funds (2013-2016).
Laura M. Bishop (1961)
Year of Election or Appointment: 2023
Trustee
Ms. Bishop also serves as Trustee or Member of the Advisory Board of other Fidelity® funds. Prior to her retirement, Ms. Bishop held a variety of positions at United Services Automobile Association (2001-2020), including Executive Vice President and Chief Financial Officer (2014-2020) and Senior Vice President and Deputy Chief Financial Officer (2012-2014). Ms. Bishop currently serves as a member of the Audit Committee and Compensation and Personnel Committee (2021-present) of the Board of Directors of Korn Ferry (global organizational consulting). Previously, Ms. Bishop served as a Member of the Advisory Board of certain Fidelity® funds (2022-2023).
Ann E. Dunwoody (1953)
Year of Election or Appointment: 2018
Trustee
General Dunwoody also serves as Trustee of other Fidelity® funds. General Dunwoody (United States Army, Retired) was the first woman in U.S. military history to achieve the rank of four-star general and prior to her retirement in 2012 held a variety of positions within the U.S. Army, including Commanding General, U.S. Army Material Command (2008-2012). General Dunwoody currently serves as a member of the Board, Chair of Nomination Committee and a member of the Corporate Governance Committee of Kforce Inc. (professional staffing services, 2016-present) and a member of the Board of Automattic Inc. (software engineering, 2018-present). Previously, General Dunwoody served as President of First to Four LLC (leadership and mentoring services, 2012-2022), a member of the Advisory Board and Nominating and Corporate Governance Committee of L3 Technologies, Inc. (communication, electronic, sensor and aerospace systems, 2013-2019) and a member of the Board and Audit and Sustainability and Corporate Responsibility Committees of Republic Services, Inc. (waste collection, disposal and recycling, 2013-2016). General Dunwoody also serves on several boards for non-profit organizations, including as a member of the Board, Chair of the Nomination and Governance Committee and a member of the Audit Committee of the Noble Reach Foundation (formerly Logistics Management Institute) (consulting non-profit, 2012-present) and a member of the Board of ThanksUSA (military family education non-profit, 2014-present). Previously, General Dunwoody served as a member of the Board of Florida Institute of Technology (2015-2022) and a member of the Council of Trustees for the Association of the United States Army (advocacy non-profit, 2013-2021). General Dunwoody previously served as a member of the Advisory Board of certain Fidelity® funds (2018).
John Engler (1948)
Year of Election or Appointment: 2014
Trustee
Mr. Engler also serves as Trustee of other Fidelity® funds. Previously, Mr. Engler served as Governor of Michigan (1991-2003), President of the Business Roundtable (2011-2017) and interim President of Michigan State University (2018-2019). Previously, Mr. Engler served as a member of the Board of Stride, Inc. (formerly K12 Inc.) (technology-based education company, 2012-2022), a member of the Board of Universal Forest Products (manufacturer and distributor of wood and wood-alternative products, 2003-2019) and Trustee of The Munder Funds (2003-2014). Mr. Engler previously served as a member of the Advisory Board of certain Fidelity® funds (2014-2016).
Robert F. Gartland (1951)
Year of Election or Appointment: 2010
Trustee
Mr. Gartland also serves as Trustee of other Fidelity® funds. Prior to his retirement, Mr. Gartland held a variety of positions at Morgan Stanley (financial services, 1979-2007), including Managing Director (1987-2007) and Chase Manhattan Bank (1975-1978). Mr. Gartland previously served as Chairman and an investor in Gartland & Mellina Group Corp. (consulting, 2009-2019), as a member of the Board of National Securities Clearing Corporation (1993-1996) and as Chairman of TradeWeb (2003-2004).
Robert W. Helm (1957)
Year of Election or Appointment: 2023
Trustee
Mr. Helm also serves as Trustee or Member of the Advisory Board of other Fidelity® funds. Mr. Helm was formerly Deputy Chairman (2003-2020), partner (1991-2020) and an associate (1984-1991) of Dechert LLP (formerly Dechert Price & Rhoads). Mr. Helm currently serves on boards and committees of several not-for-profit organizations, including as a Trustee and member of the Executive Committee of the Baltimore Council on Foreign Affairs, a member of the Board of Directors of the St. Vincent de Paul Society of Baltimore and a member of the Life Guard Society of Mt. Vernon. Previously, Mr. Helm served as a Member of the Advisory Board of certain Fidelity® funds (2021-2023).
Michael E. Kenneally (1954)
Year of Election or Appointment: 2009
Trustee
Chairman of the Independent Trustees
Mr. Kenneally also serves as Trustee of other Fidelity® funds and was Vice Chairman (2018-2021) of the Independent Trustees of certain Fidelity® funds. Prior to retirement in 2005, he was Chairman and Global Chief Executive Officer of Credit Suisse Asset Management, the worldwide fund management and institutional investment business of Credit Suisse Group. Previously, Mr. Kenneally was an Executive Vice President and the Chief Investment Officer for Bank of America. In this role, he was responsible for the investment management, strategy and products delivered to the bank's institutional, high-net-worth and retail clients. Earlier, Mr. Kenneally directed the organization's equity and quantitative research groups. He began his career as a research analyst and then spent more than a dozen years as a portfolio manager for endowments, pension plans and mutual funds. He earned the Chartered Financial Analyst (CFA) designation in 1991.
Mark A. Murray (1954)
Year of Election or Appointment: 2016
Trustee
Mr. Murray also serves as Trustee of other Fidelity® funds. Previously, Mr. Murray served as Co-Chief Executive Officer (2013-2016), President (2006-2013) and Vice Chairman (2013-2020) of Meijer, Inc. Mr. Murray serves as a member of the Board (2009-present) and Public Policy and Responsibility Committee (2009-present) and Chair of the Nuclear Review Committee (2019-present) of DTE Energy Company (diversified energy company). Mr. Murray previously served as a member of the Board of Spectrum Health (not-for-profit health system, 2015-2019) and as a member of the Board and Audit Committee and Chairman of the Nominating and Corporate Governance Committee of Universal Forest Products, Inc. (manufacturer and distributor of wood and wood-alternative products, 2004-2016). Mr. Murray also serves as a member of the Board of many community and professional organizations. Mr. Murray previously served as a member of the Advisory Board of certain Fidelity® funds (2016).
Carol J. Zierhoffer (1960)
Year of Election or Appointment: 2023
Trustee
Ms. Zierhoffer also serves as Trustee or Member of the Advisory Board of other Fidelity® funds. Prior to her retirement, Ms. Zierhoffer held a variety of positions at Bechtel Corporation (engineering company, 2013-2019), including Principal Vice President and Chief Information Officer (2013-2016) and Senior Vice President and Chief Information Officer (2016-2019). Ms. Zierhoffer currently serves as a member of the Board of Directors, Audit Committee and Compensation Committee of Allscripts Healthcare Solutions, Inc. (healthcare technology, 2020-present) and as a member of the Board of Directors, Audit and Finance Committee and Nominating and Governance Committee of Atlas Air Worldwide Holdings, Inc. (aviation operating services, 2021-present). Previously, Ms. Zierhoffer served as a member of the Board of Directors and Audit Committee and as the founding Chair of the Information Technology Committee of MedAssets, Inc. (healthcare technology, 2013-2016), and as a Member of the Advisory Board of certain Fidelity® funds (2023).
+ The information includes the Trustee's principal occupation during the last five years and other information relating to the experience, attributes, and skills relevant to the Trustee's qualifications to serve as a Trustee, which led to the conclusion that the Trustee should serve as a Trustee for the fund.
Advisory Board Members and Officers:
Correspondence intended for a Member of the Advisory Board (if any) may be sent to Fidelity Investments, P.O. Box 55235, Boston, Massachusetts 02205-5235. Correspondence intended for an officer may be sent to Fidelity Investments, 245 Summer Street, Boston, Massachusetts 02210.
Name, Year of Birth; Principal Occupation
Heather Bonner (1977)
Year of Election or Appointment: 2023
Assistant Treasurer
Ms. Bonner also serves as an officer of other funds. Ms. Bonner is a Senior Vice President (2022-present) and is an employee of Fidelity Investments (2022-present). Ms. Bonner serves as Vice President, Treasurer, or Assistant Treasurer of certain Fidelity entities. Prior to joining Fidelity, Ms. Bonner served as Managing Director at AQR Capital Management (2013-2022) and was the Treasurer and Principal Financial Officer of the AQR Funds (2013-2022).
Craig S. Brown (1977)
Year of Election or Appointment: 2019
Assistant Treasurer
Mr. Brown also serves as an officer of other funds. Mr. Brown is a Vice President (2015-present) and is an employee of Fidelity Investments. Mr. Brown serves as Assistant Treasurer of FIMM, LLC (2021-present). Previously, Mr. Brown served as Assistant Treasurer of certain Fidelity® funds (2019-2022).
John J. Burke III (1964)
Year of Election or Appointment: 2018
Chief Financial Officer
Mr. Burke also serves as Chief Financial Officer of other funds. Mr. Burke is Head of Fidelity Fund and Investment Operations (2018-present) and is an employee of Fidelity Investments. Mr. Burke serves as President, Executive Vice President, or Director of certain Fidelity entities. Previously Mr. Burke served as head of Asset Management Investment Operations (2012-2018).
Margaret Carey (1973)
Year of Election or Appointment: 2023
Secretary and Chief Legal Officer (CLO)
Ms. Carey also serves as an officer of other funds and as CLO of certain Fidelity entities. Ms. Carey is a Senior Vice President, Deputy General Counsel (2019-present) and is an employee of Fidelity Investments.
David J. Carter (1973)
Year of Election or Appointment: 2020
Assistant Secretary
Mr. Carter also serves as Assistant Secretary of other funds. Mr. Carter is a Senior Vice President, Deputy General Counsel (2022-present) and is an employee of Fidelity Investments. Mr. Carter serves as Chief Legal Officer of Fidelity Investments Institutional Operations Company LLC - Shareholder Division (transfer agent, 2020-present).
Jonathan Davis (1968)
Year of Election or Appointment: 2010
Assistant Treasurer
Mr. Davis also serves as an officer of other funds. Mr. Davis is a Vice President (2006-present) and is an employee of Fidelity Investments. Mr. Davis serves as Assistant Treasurer of certain Fidelity entities.
Laura M. Del Prato (1964)
Year of Election or Appointment: 2018
President and Treasurer
Ms. Del Prato also serves as an officer of other funds. Ms. Del Prato is a Senior Vice President (2017-present) and is an employee of Fidelity Investments. Ms. Del Prato serves as Vice President or Assistant Treasurer of certain Fidelity entities. Previously, Ms. Del Prato served as President and Treasurer of The North Carolina Capital Management Trust: Cash Portfolio and Term Portfolio (2018-2020).
Robin Foley (1964)
Year of Election or Appointment: 2023
Vice President
Ms. Foley also serves as Vice President of other funds. Ms. Foley serves as Head of Fidelity's Fixed Income division (2023-present) and is an employee of Fidelity Investments. Previously, Ms. Foley served as Chief Investment Officer of Bonds (2017-2023).
Christopher M. Gouveia (1973)
Year of Election or Appointment: 2023
Chief Compliance Officer
Mr. Gouveia also serves as Chief Compliance Officer of other funds. Mr. Gouveia is a Senior Vice President of Asset Management Compliance (2019-present) and is an employee of Fidelity Investments. Mr. Gouveia serves as Compliance Officer of Fidelity Management Trust Company (2023-present). Previously, Mr. Gouveia served as Chief Compliance Officer of the North Carolina Capital Management Trust (2016-2019).
Colm A. Hogan (1973)
Year of Election or Appointment: 2016
Assistant Treasurer
Mr. Hogan also serves as an officer of other funds. Mr. Hogan is a Vice President (2016-present) and is an employee of Fidelity Investments. Mr. Hogan serves as Assistant Treasurer of certain Fidelity entities. Previously, Mr. Hogan served as Deputy Treasurer of certain Fidelity® funds (2016-2020) and Assistant Treasurer of certain Fidelity® funds (2016-2018).
Chris Maher (1972)
Year of Election or Appointment: 2013
Assistant Treasurer
Mr. Maher also serves as an officer of other funds. Mr. Maher is a Vice President (2008-present) and is an employee of Fidelity Investments. Mr. Maher serves as Assistant Treasurer of certain Fidelity entities. Previously, Mr. Maher served as Assistant Treasurer of certain funds (2013-2020).
Brett Segaloff (1972)
Year of Election or Appointment: 2021
Anti-Money Laundering (AML) Officer
Mr. Segaloff also serves as AML Officer of other funds. Mr. Segaloff is a Vice President (2022-present) and is an employee of Fidelity Investments. Mr. Segaloff serves as Anti Money Laundering Compliance Officer or Anti Money Laundering/Bank Secrecy Act Compliance Officer of certain Fidelity entities.
Stacie M. Smith (1974)
Year of Election or Appointment: 2013
Assistant Treasurer
Ms. Smith also serves as an officer of other funds. Ms. Smith is a Senior Vice President (2016-present) and is an employee of Fidelity Investments. Ms. Smith serves as Assistant Treasurer of certain Fidelity entities and has served in other fund officer roles.
Jim Wegmann (1979)
Year of Election or Appointment: 2021
Deputy Treasurer
Mr. Wegmann also serves as an officer of other funds. Mr. Wegmann is a Vice President (2016-present) and is an employee of Fidelity Investments. Mr. Wegmann serves as Assistant Treasurer of FIMM, LLC (2021-present). Previously, Mr. Wegmann served as Assistant Treasurer of certain Fidelity® funds (2019-2021).
As a shareholder, you incur two types of costs: (1) transaction costs, which may include sales charges (loads) on purchase payments or redemption proceeds, as applicable and (2) ongoing costs, which generally include management fees, distribution and/or service (12b-1) fees and other Fund expenses. This Example is intended to help you understand your ongoing costs (in dollars) of investing in a fund and to compare these costs with the ongoing costs of investing in other mutual funds.
| The Example is based on an investment of $1,000 invested at the beginning of the period and held for the entire period (July 1, 2023 to December 31, 2023). |
Actual Expenses
The first line of the accompanying table provides information about actual account values and actual expenses. You may use the information in this line, together with the amount you invested, to estimate the expenses that you paid over the period. Simply divide your account value by $1,000.00 (for example, an $8,600 account value divided by $1,000.00 = 8.6), then multiply the result by the number in the first line for a class/Fund under the heading entitled "Expenses Paid During Period" to estimate the expenses you paid on your account during this period. If any fund is a shareholder of any underlying mutual funds or exchange-traded funds (ETFs) (the Underlying Funds), such fund indirectly bears its proportional share of the expenses of the Underlying Funds in addition to the direct expenses incurred presented in the table. These fees and expenses are not included in the annualized expense ratio used to calculate the expense estimate in the table below.
Hypothetical Example for Comparison Purposes
The second line of the accompanying table provides information about hypothetical account values and hypothetical expenses based on the actual expense ratio and an assumed rate of return of 5% per year before expenses, which is not the actual return. The hypothetical account values and expenses may not be used to estimate the actual ending account balance or expenses you paid for the period. You may use this information to compare the ongoing costs of investing in the Fund and other funds. To do so, compare this 5% hypothetical example with the 5% hypothetical examples that appear in the shareholder reports of the other funds. If any fund is a shareholder of any Underlying Funds, such fund indirectly bears its proportional share of the expenses of the Underlying Funds in addition to the direct expenses as presented in the table. These fees and expenses are not included in the annualized expense ratio used to calculate the expense estimate in the table below.
Please note that the expenses shown in the table are meant to highlight your ongoing costs only and do not reflect any transaction costs. Therefore, the second line of the table is useful in comparing ongoing costs only, and will not help you determine the relative total costs of owning different funds. In addition, if these transactional costs were included, your costs would have been higher.
| | | | | Annualized Expense Ratio- A | | Beginning Account Value July 1, 2023 | | Ending Account Value December 31, 2023 | | Expenses Paid During Period- C July 1, 2023 to December 31, 2023 |
| Fidelity Advisor® Multi-Asset Income Fund | | | | | | | | | | |
| Class A | | | | .98% | | | | | | |
| Actual | | | | | | $ 1,000 | | $ 1,041.50 | | $ 5.04 |
Hypothetical-B | | | | | | $ 1,000 | | $ 1,020.27 | | $ 4.99 |
| Class M | | | | .96% | | | | | | |
| Actual | | | | | | $ 1,000 | | $ 1,042.30 | | $ 4.94 |
Hypothetical-B | | | | | | $ 1,000 | | $ 1,020.37 | | $ 4.89 |
| Class C | | | | 1.73% | | | | | | |
| Actual | | | | | | $ 1,000 | | $ 1,037.60 | | $ 8.89 |
Hypothetical-B | | | | | | $ 1,000 | | $ 1,016.48 | | $ 8.79 |
| Fidelity® Multi-Asset Income Fund | | | | .72% | | | | | | |
| Actual | | | | | | $ 1,000 | | $ 1,042.90 | | $ 3.71 |
Hypothetical-B | | | | | | $ 1,000 | | $ 1,021.58 | | $ 3.67 |
| Class I | | | | .74% | | | | | | |
| Actual | | | | | | $ 1,000 | | $ 1,042.80 | | $ 3.81 |
Hypothetical-B | | | | | | $ 1,000 | | $ 1,021.48 | | $ 3.77 |
| Class Z | | | | .64% | | | | | | |
| Actual | | | | | | $ 1,000 | | $ 1,043.30 | | $ 3.30 |
Hypothetical-B | | | | | | $ 1,000 | | $ 1,021.98 | | $ 3.26 |
| |
A Annualized expense ratio reflects expenses net of applicable fee waivers.
B 5% return per year before expenses
C Expenses are equal to the annualized expense ratio, multiplied by the average account value over the period, multiplied by 184/ 365 (to reflect the one-half year period). The fees and expenses of any Underlying Funds are not included in each annualized expense ratio.
The dividend and capital gains distributions for the fund(s) are available on Fidelity.com or Institutional.Fidelity.com.
A total of 19.36% of the dividends distributed during the fiscal year was derived from interest on U.S. Government securities which is generally exempt from state income tax.
The fund designates $33,491,507 of distributions paid in the calendar year 2022, as qualifying to be taxed as interest-related dividends for nonresident alien shareholders.
The fund designates $55,166,876 of distributions paid during the fiscal year ended 2023 as qualifying to be taxed as section 163(j) interest dividends.
A percentage of the dividends distributed during the fiscal year qualify for the dividends-received deduction for corporate shareholders:
| | Class A | Class M | Class C | Fidelity Multi-Asset Income Fund | Class I | Class Z | |
| January 2023 | 10% | 10% | 12% | 9% | 9% | 9% | |
| February 2023 | 10% | 10% | 11% | 9% | 9% | 9% | |
| March 2023 | 10% | 11% | 13% | 9% | 9% | 9% | |
| April 2023 | 10% | 10% | 12% | 9% | 9% | 9% | |
| May 2023 | 10% | 10% | 12% | 9% | 9% | 9% | |
| June 2023 | 10% | 9% | 12% | 9% | 9% | 9% | |
| July 2023 | 10% | 10% | 12% | 9% | 9% | 9% | |
| August 2023 | 10% | 10% | 12% | 9% | 9% | 10% | |
| September 2023 | 10% | 10% | 12% | 9% | 9% | 9% | |
| October 2023 | 10% | 10% | 12% | 9% | 9% | 9% | |
| November 2023 | 10% | 10% | 12% | 9% | 9% | 9% | |
| December 2023 | 10% | 10% | 12% | 9% | 9% | 9% | |
A percentage of the dividends distributed during the fiscal year may be taken into account as a dividend for purposes of the maximum rate under section 1(h)(11) of the Internal Revenue Code.
| | Class A | Class M | Class C | Fidelity Multi-Asset Income Fund | Class I | Class Z |
| January 2023 | 17.89% | 17.93% | 22.84% | 16.61% | 16.81% | 16.28% |
| February 2023 | 17.93% | 18.08% | 20.84% | 17.26% | 17.26% | 16.50% |
| March 2023 | 18.20% | 19.39% | 23.30% | 16.64% | 17.06% | 16.67% |
| April 2023 | 18.16% | 18.31% | 23.61% | 17.15% | 17.15% | 16.80% |
| May 2023 | 18.32% | 17.83% | 21.81% | 16.58% | 17.17% | 16.72% |
| June 2023 | 17.90% | 16.48% | 22.42% | 16.66% | 17.31% | 16.22% |
| July 2023 | 18.03% | 17.64% | 22.49% | 16.74% | 17.04% | 16.40% |
| August 2023 | 17.89% | 17.54% | 21.14% | 16.69% | 16.88% | 17.58% |
| September 2023 | 18.03% | 17.89% | 22.62% | 16.76% | 16.89% | 16.67% |
| October 2023 | 17.91% | 17.45% | 21.73% | 16.79% | 16.95% | 16.70% |
| November 2023 | 17.69% | 17.83% | 21.28% | 16.83% | 16.97% | 16.71% |
| December 2023 | 18.08% | 17.81% | 22.68% | 16.77% | 16.94% | 16.48% |
A percentage of the dividends distributed during the fiscal year qualify as a section 199A dividend:
| | Class A | Class M | Class C | Fidelity Multi-Asset Income Fund | Class I | Class Z |
| January 2023 | 2.33% | 2.34% | 2.98% | 2.17% | 2.19% | 2.12% |
| February 2023 | 2.34% | 2.36% | 2.72% | 2.25% | 2.25% | 2.15% |
| March 2023 | 2.37% | 2.53% | 3.04% | 2.17% | 2.22% | 2.17% |
| April 2023 | 2.37% | 2.39% | 3.08% | 2.24% | 2.24% | 2.19% |
| May 2023 | 2.39% | 2.32% | 2.84% | 2.16% | 2.24% | 2.18% |
| June 2023 | 2.33% | 2.15% | 2.92% | 2.17% | 2.26% | 2.12% |
| July 2023 | 2.35% | 2.30% | 2.93% | 2.18% | 2.22% | 2.14% |
| August 2023 | 2.33% | 2.29% | 2.76% | 2.18% | 2.20% | 2.29% |
| September 2023 | 2.35% | 2.33% | 2.95% | 2.19% | 2.20% | 2.17% |
| October 2023 | 2.34% | 2.28% | 2.83% | 2.19% | 2.21% | 2.18% |
| November 2023 | 2.31% | 2.32% | 2.77% | 2.19% | 2.21% | 2.18% |
| December 2023 | 2.36% | 2.32% | 2.96% | 2.19% | 2.21% | 2.15% |
The fund will notify shareholders in January 2024 of amounts for use in preparing 2023 income tax returns.
Board Approval of Investment Advisory Contracts and Management Fees
Fidelity Advisor Multi-Asset Income Fund
Each year, the Board of Trustees, including the Independent Trustees (together, the Board), considers the renewal of the fund's management contract with Fidelity Management & Research Company LLC (FMR) and the sub-advisory agreements (together, the Advisory Contracts) for the fund. FMR and the sub-advisers are referred to herein as the Investment Advisers. The Board, assisted by the advice of fund counsel and Independent Trustees' counsel, requests and considers a broad range of information relevant to the renewal of the Advisory Contracts throughout the year.
The Board meets regularly and, at each of its meetings, covers an extensive agenda of topics and materials and considers factors that are relevant to its annual consideration of the renewal of the fund's Advisory Contracts, including the services and support provided to the fund and its shareholders. The Board's Operations Committee, of which all the Independent Trustees are members, meets regularly throughout the year and requests, receives and considers, among other matters, information related to the annual consideration of the renewal of the fund's Advisory Contracts before making its recommendation to the Board. The Board also meets as needed to review matters specifically related to the Board's annual consideration of the renewal of the Advisory Contracts. Members of the Board may also meet from time to time with trustees of other Fidelity funds through joint ad hoc committees to discuss certain matters relevant to all of the Fidelity funds.
At its September 2023 meeting, the Board unanimously determined to renew the fund's Advisory Contracts. In reaching its determination, the Board considered all factors it believed relevant, including (i) the nature, extent, and quality of the services provided to the fund and its shareholders (including the investment performance of the fund); (ii) the competitiveness relative to peer funds of the fund's management fee and the total expense ratio of a representative class (the retail class, which was selected because it was the largest class without 12b-1 fees in 2022); (iii) the total costs of the services provided by and the profits realized by FMR and its affiliates (Fidelity) from its relationships with the fund; and (iv) the extent to which, if any, economies of scale exist and are realized as the fund grows, and whether any economies of scale are appropriately shared with fund shareholders. The Board also considered the broad range of investment choices available to shareholders from FMR's competitors and that the fund's shareholders have chosen to invest in the fund, which is part of the Fidelity family of funds. The Board's decision to renew the Advisory Contracts was not based on any single factor.
The Board reached a determination, with the assistance of fund counsel and Independent Trustees' counsel and through the exercise of its business judgment, that the renewal of the Advisory Contracts was in the best interests of the fund and its shareholders and that the compensation payable under the Advisory Contracts was fair and reasonable in light of all of the surrounding circumstances.
Nature, Extent, and Quality of Services Provided. The Board considered Fidelity's staffing as it relates to the fund, including the backgrounds and experience of investment personnel, and also considered the Investment Advisers' implementation of the fund's investment program. The Independent Trustees also had discussions with senior management of Fidelity's investment operations and investment groups. The Board considered the structure of the investment personnel compensation program and whether this structure provides appropriate incentives to act in the best interests of the fund. Additionally, the Board considered the portfolio managers' investments, if any, in the funds that they manage.
Resources Dedicated to Investment Management and Support Services. The Board reviewed the general qualifications and capabilities of Fidelity's investment staff, including its size, education, experience, and resources, as well as Fidelity's approach to recruiting, training, managing, and compensating investment personnel. The Board noted the resources devoted to Fidelity's global investment organization, and that Fidelity's analysts have extensive resources, tools and capabilities that allow them to conduct quantitative and fundamental analysis, as well as credit analysis of issuers, counterparties and guarantors. Further, the Board considered that Fidelity's investment professionals have sufficient access to global information and data so as to provide competitive investment results over time, and that those professionals also have access to sophisticated tools that permit them to assess portfolio construction and risk and performance attribution characteristics continuously, as well as to transmit new information and research conclusions rapidly around the world. Additionally, in its deliberations, the Board considered Fidelity's trading, risk management, compliance, cybersecurity, and technology and operations capabilities and resources, which are integral parts of the investment management process.
Shareholder and Administrative Services. The Board considered (i) the nature, extent, quality, and cost of advisory, administrative, and shareholder services performed by Fidelity under the Advisory Contracts and under separate agreements covering transfer agency, pricing and bookkeeping, and securities lending services for the fund; (ii) the nature and extent of Fidelity's supervision of third party service providers, principally custodians, subcustodians, and pricing vendors; and (iii) the resources devoted by Fidelity to, and the record of compliance with, the fund's compliance policies and procedures. The Board also reviewed the allocation of fund brokerage, including allocations to brokers affiliated with the Investment Advisers, the use of brokerage commissions to pay fund expenses, and the use of "soft" commission dollars to pay for research services. The Board also considered the fund's securities lending activities and any payments made to Fidelity relating to securities lending.
The Board noted that the growth of fund assets over time across the complex allows Fidelity to reinvest in the development of services designed to enhance the value and convenience of the Fidelity funds as investment vehicles. These services include 24-hour access to account information and market information over the Internet and through telephone representatives, investor education materials and asset allocation tools. The Board also considered that it reviews customer service metrics such as telephone response times, continuity of services on the website and metrics addressing services at Fidelity Investor Centers.
Investment in a Large Fund Family. The Board considered the benefits to shareholders of investing in a fund that is part of a large family of funds offering a variety of investment disciplines and providing a large variety of fund investor services. The Board noted that Fidelity had taken, or had made recommendations to the Board that resulted in the Fidelity funds taking, a number of actions over the previous year that benefited particular funds and/or the Fidelity funds in general.
Investment Performance. The Board took into account discussions that occur with representatives of the Investment Advisers, and reports that it receives, at Board meetings throughout the year relating to fund investment performance. In this regard the Board noted that as part of regularly scheduled fund reviews and other reports to the Board on fund performance, the Board considered annualized return information for the fund for different time periods, measured against one or more appropriate securities market indices, including a customized blended index that reflects the respective weights of the fund's asset classes (each a benchmark index) and an appropriate peer group of funds with similar objectives (peer group). The Board also considered information about performance attribution. In its evaluation of fund investment performance at meetings throughout the year, the Board gave particular attention to information indicating underperformance of certain Fidelity funds over different time periods and discussed with the Investment Advisers the reasons for such underperformance.
In addition to reviewing absolute and relative fund performance, the Independent Trustees periodically consider the appropriateness of fund performance metrics in evaluating the results achieved. The Independent Trustees generally give greater weight to fund performance over longer time periods than over shorter time periods. Depending on the circumstances, the Independent Trustees may be satisfied with a fund's performance notwithstanding that it lags its benchmark index or peer group for certain periods.
Based on its review, the Board concluded that the nature, extent, and quality of services provided to the fund under the Advisory Contracts should continue to benefit the shareholders of the fund.
Competitiveness of Management Fee and Total Expense Ratio. The Board was provided with information regarding industry trends in management fees and expenses. In its review of the fund's management fee and the total expense ratio of the retail class, the Board considered the fund's management fee rate as well as other fund or class expenses, as applicable, such as transfer agent fees, pricing and bookkeeping fees, fund-paid 12b-1 fees, and custodial, legal, and audit fees. The Board noted that Fidelity may agree to waive fees or reimburse expenses from time to time, and the extent to which, if any, it has done so for the fund.
Comparisons of Management Fees and Total Expense Ratios. Among other things, the Board reviewed data for selected groups of competitive funds and classes (referred to as "mapped groups") that were compiled by Fidelity based on combining similar investment objective categories (as classified by Lipper) that have comparable investment mandates. The data reviewed by the Board included (i) gross management fee comparisons (before taking into account expense reimbursements or caps) relative to the total universe of funds within the mapped group; (ii) gross management fee comparisons relative to a subset of non-Fidelity funds in the mapped group that are similar in size and management fee structure to the fund (referred to as the "asset size peer group"); (iii) total expense comparisons of the retail class of the fund relative to funds and classes in the mapped group that have a similar sales load structure to the retail class of the fund (referred to as the "similar sales load structure group"); and (iv) total expense comparisons of the retail class of the fund relative to funds and classes in the similar sales load structure group that are similar in size and management fee structure to the fund (referred to as the "total expense asset size peer group"). The total expense asset size peer group comparison excludes performance adjustments and fund-paid 12b-1 fees to eliminate variability in fee structures.
The information provided to the Board indicated that the fund's management fee rate ranked below the competitive median of the mapped group for 2022 and below the competitive median of the asset size peer group for 2022. Further, the information provided to the Board indicated that the total expense ratio of the retail class of the fund ranked below the competitive median of the similar sales load structure group for 2022 and below the competitive median of the total expense asset size peer group for 2022.
The Board also considered that, for funds subject to the group fee, FMR agreed to voluntarily waive fees over a specified period of time in amounts designed to account for assets converted from certain funds to certain collective investment trusts.
Other Contractual Arrangements. The Board further considered that FMR has contractually agreed to reimburse Class A, Class M, Class C, Class I, Class Z, and the retail class of the fund to the extent that total operating expenses, with certain exceptions, as a percentage of their respective average net assets, exceed 1.10%, 1.10%, 1.85%, 0.85%, 0.76%, and 0.85% through April 30, 2024.
Fees Charged to Other Fidelity Clients. The Board also considered Fidelity fee structures and other information with respect to clients of Fidelity, such as other funds advised or subadvised by Fidelity, pension plan clients, and other institutional clients with similar mandates. The Board noted that a joint ad hoc committee created by it and the boards of other Fidelity funds periodically reviews and compares Fidelity's institutional investment advisory business with its business of providing services to the Fidelity funds and also noted the most recent findings of the committee. The Board noted that the committee's review included a consideration of the differences in services provided, fees charged, and costs incurred, as well as competition in the markets serving the different categories of clients.
Based on its review, the Board concluded that the fund's management fee is fair and reasonable in light of the services that the fund receives and the other factors considered. Further, based on its review of total expense ratios and fees charged to other Fidelity clients, the Board concluded that the total expense ratio of each class of the fund was reasonable in light of the services that the fund and its shareholders receive and the other factors considered.
Costs of the Services and Profitability. The Board considered the revenues earned and the expenses incurred by Fidelity in conducting the business of developing, marketing, distributing, managing, administering and servicing the fund and servicing the fund's shareholders. The Board also considered the level of Fidelity's profits in respect of all the Fidelity funds.
On an annual basis, Fidelity presents to the Board information about the profitability of its relationships with the fund. Fidelity calculates profitability information for each fund, as well as aggregate profitability information for groups of Fidelity funds and all Fidelity funds, using a series of detailed revenue and cost allocation methodologies which originate with the books and records of Fidelity on which Fidelity's audited financial statements are based. The Audit Committee of the Board reviews any significant changes from the prior year's methodologies and the full Board approves such changes.
A public accounting firm has been engaged annually by the Board as part of the Board's assessment of Fidelity's profitability analysis. The engagement includes the review and assessment of the methodologies used by Fidelity in determining the revenues and expenses attributable to Fidelity's fund business, and completion of agreed-upon procedures in respect of the mathematical accuracy of certain fund profitability information and its conformity to established allocation methodologies. After considering the reports issued under the engagement and information provided by Fidelity, the Board concluded that while other allocation methods may also be reasonable, Fidelity's profitability methodologies are reasonable in all material respects.
The Board also reviewed Fidelity's non-fund businesses and potential indirect benefits such businesses may have received as a result of their association with Fidelity's fund business (i.e., fall-out benefits) as well as cases where Fidelity's affiliates may benefit from the funds' business. The Board considered areas where potential indirect benefits to the Fidelity funds from their relationships with Fidelity may exist. The Board's consideration of these matters was informed by the findings of a joint ad hoc committee created by it and the boards of other Fidelity funds to evaluate potential fall-out benefits.
The Board considered the costs of the services provided by and the profits realized by Fidelity in connection with the operation of the fund and was satisfied that the profitability was not excessive.
Economies of Scale. The Board considered whether there have been economies of scale in respect of the management of the Fidelity funds, whether the Fidelity funds (including the fund) have appropriately benefited from any such economies of scale, and whether there is potential for realization of any further economies of scale. The Board considered the extent to which the fund will benefit from economies of scale as assets grow through increased services to the fund, through waivers or reimbursements, or through fee or expense ratio reductions. The Board also noted that a committee created by it and the boards of other Fidelity funds periodically analyzes whether Fidelity attains economies of scale in respect of the management and servicing of the Fidelity funds, whether the Fidelity funds have appropriately benefited from such economies of scale, and whether there is potential for realization of any further economies of scale.
The Board recognized that the fund's management contract incorporates a "group fee" structure, which provides for lower group fee rates as total "group assets" increase, and for higher group fee rates as total "group assets" decrease ("group assets" as defined in the management contract). FMR calculates the group fee rates based on a tiered asset "breakpoint" schedule that varies based on asset class. The Board considered that the group fee is designed to deliver the benefits of economies of scale to fund shareholders when total Fidelity fund assets increase, even if assets of any particular fund are unchanged or have declined, because some portion of Fidelity's costs are attributable to services provided to all Fidelity funds, and all funds benefit if those costs can be allocated among more assets. The Board also considered that Fidelity agreed to impose a temporary fee waiver in the form of additional breakpoints to the current breakpoint schedule. The Board concluded that, given the group fee structure, fund shareholders will benefit from lower management fees as "group assets" increase at the fund complex level, regardless of whether Fidelity achieves any such economies of scale.
The Board concluded, taking into account the analysis of the committee, that economies of scale, if any, are being appropriately shared between fund shareholders and Fidelity.
Additional Information Requested by the Board. In order to develop fully the factual basis for consideration of the Fidelity funds' advisory contracts, the Board requested and received additional information on certain topics, including: (i) Fidelity's fund profitability methodology, profitability trends for certain funds, the allocation of various costs to different funds, and the impact of certain factors on fund profitability results; (ii) portfolio manager changes that have occurred during the past year and Fidelity's views regarding portfolio manager investment in the Fidelity funds that they manage; (iii) hiring, training, and retaining personnel; (iv) the arrangements with and compensation paid to certain fund sub-advisers and the treatment of such compensation within Fidelity's fund profitability methodology; (v) the terms of the funds' various management fee structures, including the basic group fee and the terms of Fidelity's voluntary expense limitation arrangements; (vi) Fidelity's transfer agent, pricing and bookkeeping fees, expense and service structures for different funds and classes relative to competitive trends and market conditions; (vii) the impact on fund profitability of recent industry trends, such as the growth in passively managed funds and the changes in flows for different types of funds; (viii) the types of management fee and total expense comparisons provided, and the challenges and limitations associated with such information; (ix) explanations regarding the relative total expense ratios and management fees of certain funds and classes, total expense and management fee competitive trends, and methodologies for total expense and management fee competitive comparisons; (x) information concerning expense limitations applicable to certain funds; and (xi) matters related to money market funds, exchange-traded funds, and target date funds.
Conclusion. Based on its evaluation of all of the conclusions noted above, and after considering all factors it believed relevant, the Board, including the Independent Trustees, concluded that the advisory and sub-advisory fee arrangements are fair and reasonable in light of all of the surrounding circumstances and that the fund's Advisory Contracts should be renewed through September 30, 2024.
| A special meeting of shareholders was held on October 18, 2023. The results of votes taken among shareholders on the proposal before them are reported below. Each vote reported represents one dollar of net asset value held on the record date for the meeting. |
| Proposal 1 |
| To elect a Board of Trustees. |
| | # of Votes | % of Votes |
| Abigail P. Johnson |
| Affirmative | 21,333,918,003.710 | 98.990 |
| Withheld | 218,238,294.280 | 1.010 |
| TOTAL | 21,552,156,297.990 | 100.000 |
| Jennifer Toolin McAuliffe |
| Affirmative | 21,341,064,648.470 | 99.020 |
| Withheld | 211,091,649.520 | 0.980 |
| TOTAL | 21,552,156,297.990 | 100.000 |
| Christine J. Thompson |
| Affirmative | 21,338,732,597.390 | 99.010 |
| Withheld | 213,423,700.600 | 0.990 |
| TOTAL | 21,552,156,297.990 | 100.000 |
| Elizabeth S. Acton |
| Affirmative | 21,317,028,547.600 | 98.910 |
| Withheld | 235,127,750.390 | 1.090 |
| TOTAL | 21,552,156,297.990 | 100.000 |
| Laura M. Bishop |
| Affirmative | 21,336,468,393.320 | 99.000 |
| Withheld | 215,687,904.670 | 1.000 |
| TOTAL | 21,552,156,297.990 | 100.000 |
| Ann E. Dunwoody |
| Affirmative | 21,320,223,866.150 | 98.920 |
| Withheld | 231,932,431.840 | 1.080 |
| TOTAL | 21,552,156,297.990 | 100.000 |
| John Engler |
| Affirmative | 21,279,172,233.730 | 98.730 |
| Withheld | 272,984,064.260 | 1.270 |
| TOTAL | 21,552,156,297.990 | 100.000 |
| Robert F. Gartland |
| Affirmative | 21,319,450,613.340 | 98.920 |
| Withheld | 232,705,684.650 | 1.080 |
| TOTAL | 21,552,156,297.990 | 100.000 |
| Robert W. Helm |
| Affirmative | 21,334,642,392.210 | 98.990 |
| Withheld | 217,513,905.780 | 1.010 |
| TOTAL | 21,552,156,297.990 | 100.000 |
| Arthur E. Johnson |
| Affirmative | 21,298,270,597.120 | 98.820 |
| Withheld | 253,885,700.870 | 1.180 |
| TOTAL | 21,552,156,297.990 | 100.000 |
| Michael E. Kenneally |
| Affirmative | 20,916,217,437.980 | 97.050 |
| Withheld | 635,938,860.010 | 2.950 |
| TOTAL | 21,552,156,297.990 | 100.000 |
| Mark A. Murray |
| Affirmative | 21,321,664,592.720 | 98.930 |
| Withheld | 230,491,705.270 | 1.070 |
| TOTAL | 21,552,156,297.990 | 100.000 |
| Carol J. Zierhoffer |
| Affirmative | 21,337,428,755.990 | 99.000 |
| Withheld | 214,727,542.000 | 1.000 |
| TOTAL | 21,552,156,297.990 | 100.000 |
| | | |
| Proposal 1 reflects trust wide proposal and voting results. |
1.9865887.108
AMAI-ANN-0224
Fidelity® Series International Credit Fund
Annual Report
December 31, 2023
Contents
To view a fund's proxy voting guidelines and proxy voting record for the 12-month period ended June 30, visit http://www.fidelity.com/proxyvotingresults or visit the Securities and Exchange Commission's (SEC) web site at http://www.sec.gov.
You may also call 1-800-544-8544 to request a free copy of the proxy voting guidelines.
Standard & Poor's, S&P and S&P 500 are registered service marks of The McGraw-Hill Companies, Inc. and have been licensed for use by Fidelity Distributors Corporation.
Other third-party marks appearing herein are the property of their respective owners.
All other marks appearing herein are registered or unregistered trademarks or service marks of FMR LLC or an affiliated company. © 2024 FMR LLC. All rights reserved.
This report and the financial statements contained herein are submitted for the general information of the shareholders of the Fund. This report is not authorized for distribution to prospective investors in the Fund unless preceded or accompanied by an effective prospectus.
A fund files its complete schedule of portfolio holdings with the SEC for the first and third quarters of each fiscal year on Form N-PORT. Forms N-PORT are available on the SEC's web site at http://www.sec.gov. A fund's Forms N-PORT may be reviewed and copied at the SEC's Public Reference Room in Washington, DC. Information regarding the operation of the SEC's Public Reference Room may be obtained by calling 1-800-SEC-0330.
For a complete list of a fund's portfolio holdings, view the most recent holdings listing, semiannual report, or annual report on Fidelity's web site at http://www.fidelity.com, http://www.institutional.fidelity.com, or http://www.401k.com, as applicable.
NOT FDIC INSURED •MAY LOSE VALUE •NO BANK GUARANTEE
Neither the Fund nor Fidelity Distributors Corporation is a bank.
Average annual total return reflects the change in the value of an investment, assuming reinvestment of distributions from dividend income and capital gains (the profits earned upon the sale of securities that have grown in value, if any) and assuming a constant rate of performance each year. The hypothetical investment and the average annual total returns do not reflect the deduction of taxes that a shareholder would pay on fund distributions or the redemption of fund shares. During periods of reimbursement by Fidelity, a fund's total return will be greater than it would be had the reimbursement not occurred. How a fund did yesterday is no guarantee of how it will do tomorrow.
| Average Annual Total Returns |
| | | | |
Periods ended December 31, 2023 | Past 1 year | Past 5 years | Life of Fund A |
| Fidelity® Series International Credit Fund | 7.77% | 1.86% | 1.58% |
A From July 25, 2017
| $10,000 Over Life of Fund |
| |
Let's say hypothetically that $10,000 was invested in Fidelity® Series International Credit Fund, on July 25, 2017, when the fund started. The chart shows how the value of your investment would have changed, and also shows how the Bloomberg Global Aggregate Credit Ex U.S. Index (Hedged USD) performed over the same period. |
|
|
Market Recap:
Global investment-grade bonds gained 8.68% in 2023, according to the Bloomberg Global Aggregate Credit Index (Hedged USD), as falling commodity prices, cooling inflation and the easing of monetary tightening efforts by the U.S. Federal Reserve and other central banks provided a favorable backdrop for global credit assets. The strong gain followed a difficult 2022, during which the index returned -14.22%. The 2023 advance was driven by a powerful rally in the year's final two months, but the 12-month period was marked by high levels of volatility. The bond market saw sluggish returns for much of the year, including sharp sell-offs in September and October after the U.S. Fed temporarily adopted a "higher for longer" message on interest rates. But after the Fed struck a more optimistic tone at its committee meetings in November and December, a strong relief rally followed, as investors priced in the expectation of rate cuts in 2024. That said, the magnitude of future global easing remains uncertain at year-end. Between March 2022 and July 2023, the Fed hiked its benchmark interest rate 11 times, from a target range of 0% to 0.25% to a range of 5.25% to 5.50%, a 22-year high, before pausing and deciding to hold rates steady through year-end. To varying degrees, other major central banks have followed the Fed's lead: the Bank of England's benchmark rate stood at 5.25% at year-end, while the European Central Bank's was at 4% after policymakers paused increases in October.
Comments from Co-Portfolio Managers Michael Foggin, Lisa Easterbrook and Andrew Lewis:
For the year, the fund returned 7.77%, lagging, net of fees, the 8.70% result of the benchmark the Bloomberg Global Aggregate Credit Ex US Index (Hedged USD). At year-end, about 68% of the portfolio was in corporate bond holdings, while 12% was in non-benchmark exposure to U.S. government bonds and roughly 14% in non-U.S. government securities. The fund also had about a 5% allocation to cash as of December 31. Roughly 45% of the fund was invested in investment-grade securities rates A and above, while about 45% was in bonds rated BBB and lower. Versus the Bloomberg benchmark, the largest individual relative detractor was a sizable sub-investment-grade stake in Credit Suisse. In March, Swiss regulators orchestrated the bank's takeover by its chief Swiss banking rival, UBS Group, resulting in the loss of our sub-investment-grade position. Holdings in the debt of European property company Heimstaden also detracted from the relative result. Conversely, an overweight stake in senior Credit Suisse bonds, which were folded into the new UBS Group, contributed to the fund's relative result. Top fund holdings at the end of the year included European Investment Bank bonds, KfW and Swiss Re.
The views expressed above reflect those of the portfolio manager(s) only through the end of the period as stated on the cover of this report and do not necessarily represent the views of Fidelity or any other person in the Fidelity organization. Any such views are subject to change at any time based upon market or other conditions and Fidelity disclaims any responsibility to update such views. These views may not be relied on as investment advice and, because investment decisions for a Fidelity fund are based on numerous factors, may not be relied on as an indication of trading intent on behalf of any Fidelity fund.
Quality Diversification (% of Fund's net assets) |
|
| |
| We have used ratings from Moody's Investors Service, Inc. Where Moody's® ratings are not available, we have used S&P® ratings. All ratings are as of the date indicated and do not reflect subsequent changes. |
Asset Allocation (% of Fund's net assets) |
|
Futures and Swaps - 22.2% |
Forward foreign currency contracts - (70.0)% |
|
Geographic Diversification (% of Fund's net assets) |
|
* Includes Short-Term investments and Net Other Assets (Liabilities). Percentages are adjusted for the effect of derivatives, if applicable. |
| |
Forward foreign currency contracts and other assets and liabilities are included within United States of America, as applicable.
Showing Percentage of Net Assets
| Nonconvertible Bonds - 61.4% |
| | | Principal Amount (a) | Value ($) |
| Australia - 1.7% | | | |
| AusNet Services Holdings Pty Ltd. 1.625% 3/11/81 (Reg. S) (b) | EUR | 150,000 | 149,180 |
| Leighton Finance U.S.A. Pty Ltd. 1.5% 5/28/29 (Reg. S) | EUR | 600,000 | 571,726 |
| QBE Insurance Group Ltd.: | | | |
| 2.5% 9/13/38 (Reg. S) (b) | GBP | 500,000 | 539,926 |
| 6.75% 12/2/44 (Reg. S) (b) | | 570,000 | 566,438 |
TOTAL AUSTRALIA | | | 1,827,270 |
| Belgium - 0.5% | | | |
| KBC Group NV 6.324% 9/21/34 (b)(c) | | 550,000 | 580,901 |
| Denmark - 1.8% | | | |
| Danske Bank A/S: | | | |
| 2.25% 1/14/28 (Reg. S) (b) | GBP | 705,000 | 819,958 |
| 4.625% 4/13/27 (Reg. S) (b) | GBP | 200,000 | 252,696 |
| 4.75% 6/21/30 (Reg. S) (b) | EUR | 561,000 | 652,610 |
| Jyske Bank A/S 5% 10/26/28 (b) | EUR | 225,000 | 258,075 |
TOTAL DENMARK | | | 1,983,339 |
| Finland - 0.6% | | | |
| Nordea Bank Abp 4.125% 5/5/28 (Reg. S) | EUR | 600,000 | 683,749 |
| France - 4.9% | | | |
| BNP Paribas SA: | | | |
| 2.159% 9/15/29 (b)(c) | | 225,000 | 195,696 |
| 2.5% 3/31/32 (Reg. S) (b) | EUR | 600,000 | 626,400 |
| 4.125% 5/24/33 (Reg. S) | EUR | 600,000 | 697,906 |
| BPCE SA 1.5% 1/13/42 (Reg. S) (b) | EUR | 600,000 | 600,385 |
| Credit Agricole SA 1.25% 10/2/24 (Reg. S) | GBP | 100,000 | 123,678 |
| Electricite de France SA: | | | |
| 5.5% 1/25/35 (Reg. S) | GBP | 600,000 | 771,597 |
| 5.7% 5/23/28 (c) | | 350,000 | 362,126 |
| 6.25% 5/23/33 (c) | | 350,000 | 378,765 |
| Engie SA 4.25% 9/6/34 (Reg. S) | EUR | 300,000 | 350,978 |
| Holding d'Infrastructures et des Metiers de l'Environnement 0.625% 9/16/28 (Reg. S) | EUR | 200,000 | 191,692 |
| Lagardere S.C.A.: | | | |
| 1.625% 6/21/24 (Reg. S) | EUR | 100,000 | 109,841 |
| 1.75% 10/7/27 (Reg. S) | EUR | 200,000 | 219,962 |
| Societe Generale: | | | |
| 4.75% 11/24/25 (c) | | 200,000 | 195,862 |
| 6.691% 1/10/34 (b)(c) | | 200,000 | 211,193 |
| Technip Energies NV 1.125% 5/28/28 | EUR | 300,000 | 298,537 |
TOTAL FRANCE | | | 5,334,618 |
| Germany - 9.8% | | | |
| ACCENTRO Real Estate AG 5.625% 2/13/26 (Reg. S) | EUR | 472,500 | 202,778 |
| AGPS BondCo PLC: | | | |
| 4.625% 1/14/26 (Reg. S) (b) | EUR | 2,000,000 | 762,829 |
| 5% 4/27/27 (Reg. S) (b) | EUR | 200,000 | 72,861 |
| Bayer AG 4.625% 5/26/33 (Reg. S) | EUR | 300,000 | 345,562 |
| Bayer U.S. Finance LLC 6.375% 11/21/30 (c) | | 300,000 | 308,658 |
| Commerzbank AG 8.625% 2/28/33 (Reg. S) (b) | GBP | 100,000 | 135,399 |
| Deutsche Bank AG: | | | |
| 3.25% 5/24/28 (Reg. S) (b) | EUR | 400,000 | 432,016 |
| 4% 6/24/32 (Reg. S) (b) | EUR | 800,000 | 848,275 |
| 6.125% 12/12/30 (Reg. S) (b) | GBP | 800,000 | 1,032,409 |
| EnBW Energie Baden-Wuerttemberg AG 1.375% 8/31/81 (Reg. S) (b) | EUR | 500,000 | 470,517 |
| KfW: | | | |
| 0% 3/31/27 (Reg. S) | EUR | 1,000,000 | 1,021,447 |
| 0% 9/17/30 (Reg. S) | EUR | 2,700,000 | 2,530,322 |
| 2.875% 5/29/26 (Reg. S) | EUR | 935,000 | 1,040,907 |
| Robert Bosch GmbH 4.375% 6/2/43 (Reg. S) | EUR | 200,000 | 236,698 |
| Schaeffler AG 3.375% 10/12/28 (Reg. S) | EUR | 400,000 | 427,229 |
| Sirius Real Estate Ltd. 1.125% 6/22/26 (Reg. S) | EUR | 300,000 | 298,418 |
| ZF Europe Finance BV 2% 2/23/26 (Reg. S) | EUR | 200,000 | 210,302 |
| ZF Finance GmbH 2% 5/6/27 (Reg. S) | EUR | 300,000 | 305,594 |
TOTAL GERMANY | | | 10,682,221 |
| Greece - 0.3% | | | |
| Alpha Bank SA 4.25% 2/13/30 (Reg. S) (b) | EUR | 250,000 | 268,911 |
| Hong Kong - 1.3% | | | |
| AIA Group Ltd. 0.88% 9/9/33 (Reg. S) (b) | EUR | 300,000 | 282,087 |
| Prudential Funding Asia PLC 2.95% 11/3/33 (Reg. S) (b) | | 1,300,000 | 1,139,304 |
TOTAL HONG KONG | | | 1,421,391 |
| Ireland - 2.9% | | | |
| AerCap Ireland Capital Ltd./AerCap Global Aviation Trust 6.5% 7/15/25 | | 150,000 | 151,901 |
| AIB Group PLC 2.25% 4/4/28 (Reg. S) (b) | EUR | 1,200,000 | 1,269,739 |
| Bank of Ireland Group PLC: | | | |
| 1.375% 8/11/31 (Reg. S) (b) | EUR | 800,000 | 823,176 |
| 2.029% 9/30/27 (b)(c) | | 950,000 | 866,213 |
TOTAL IRELAND | | | 3,111,029 |
| Italy - 0.8% | | | |
| Enel SpA 3.375% (Reg. S) (b)(d) | EUR | 300,000 | 315,040 |
| UniCredit SpA 2.731% 1/15/32 (Reg. S) (b) | EUR | 539,000 | 557,780 |
TOTAL ITALY | | | 872,820 |
| Luxembourg - 2.4% | | | |
| Alpha Trains Finance SA 2.064% 6/30/30 | EUR | 802,000 | 841,638 |
| Blackstone Property Partners Europe LP: | | | |
| 1% 5/4/28 (Reg. S) | EUR | 1,050,000 | 969,924 |
| 1.75% 3/12/29 (Reg. S) | EUR | 600,000 | 556,599 |
| 2.625% 10/20/28 (Reg. S) | GBP | 250,000 | 271,532 |
TOTAL LUXEMBOURG | | | 2,639,693 |
| Mexico - 1.7% | | | |
| Petroleos Mexicanos 6.5% 3/13/27 | | 1,980,000 | 1,840,163 |
| Netherlands - 2.3% | | | |
| ING Groep NV: | | | |
| 4.5% 5/23/29 (Reg. S) (b) | EUR | 500,000 | 568,634 |
| 4.75% 5/23/34 (Reg. S) (b) | EUR | 900,000 | 1,056,211 |
| JDE Peet's BV 2.25% 9/24/31 (c) | | 150,000 | 120,135 |
| Rabobank Nederland 4% 1/10/30 (Reg. S) | EUR | 300,000 | 341,886 |
| REWE International Finance 4.875% 9/13/30 (Reg. S) | EUR | 100,000 | 116,929 |
| Universal Music Group NV 4% 6/13/31 (Reg. S) | EUR | 200,000 | 230,736 |
TOTAL NETHERLANDS | | | 2,434,531 |
| Poland - 0.4% | | | |
| GTC Aurora Luxembourg SA 2.25% 6/23/26 (Reg. S) | EUR | 500,000 | 397,698 |
| Portugal - 0.3% | | | |
| Fidelidade-Companhia de Seguros SA 4.25% 9/4/31 (Reg. S) (b) | EUR | 300,000 | 297,521 |
| Spain - 0.4% | | | |
| Iberdrola Finanzas SAU 7.375% 1/29/24 | GBP | 100,000 | 127,582 |
| Werfenlife SA 4.625% 6/6/28 (Reg. S) | EUR | 300,000 | 337,354 |
TOTAL SPAIN | | | 464,936 |
| Sweden - 0.6% | | | |
| Heimstaden AB 4.375% 3/6/27 (Reg. S) | EUR | 500,000 | 227,138 |
| Samhallsbyggnadsbolaget I Norden AB: | | | |
| 1.75% 1/14/25 (Reg. S) | EUR | 200,000 | 189,883 |
| 2.25% 8/12/27 (Reg. S) | EUR | 250,000 | 184,890 |
TOTAL SWEDEN | | | 601,911 |
| Switzerland - 4.8% | | | |
| Cloverie PLC 4.5% 9/11/44 (Reg. S) (b) | | 902,000 | 889,065 |
| Demeter Investments BV: | | | |
| 5.625% 8/15/52 (Reg. S) (b) | | 964,000 | 934,104 |
| 5.75% 8/15/50 (Reg. S) (b) | | 1,300,000 | 1,280,734 |
| UBS Group AG: | | | |
| 2.125% 11/15/29 (Reg. S) (b) | GBP | 500,000 | 564,262 |
| 4.194% 4/1/31 (b)(c) | | 250,000 | 232,761 |
| 4.282% 1/9/28 (c) | | 298,000 | 288,640 |
| 4.75% 3/17/32 (Reg. S) (b) | EUR | 270,000 | 313,792 |
| 4.988% 8/5/33 (Reg. S) (b) | | 200,000 | 193,366 |
| Zurich Finance (Ireland) DAC 3.5% 5/2/52 (Reg. S) (b) | | 600,000 | 488,022 |
TOTAL SWITZERLAND | | | 5,184,746 |
| United Kingdom - 20.1% | | | |
| Admiral Group PLC 8.5% 1/6/34 (Reg. S) | GBP | 100,000 | 139,929 |
| Anglian Water (Osprey) Financing PLC 2% 7/31/28 (Reg. S) | GBP | 175,000 | 181,997 |
| Barclays PLC: | | | |
| 5.262% 1/29/34 (Reg. S) (b) | EUR | 490,000 | 578,667 |
| 7.437% 11/2/33 (b) | | 200,000 | 223,945 |
| 8.407% 11/14/32 (Reg. S) (b) | GBP | 300,000 | 407,523 |
| Heathrow Funding Ltd.: | | | |
| 2.625% 3/16/28 (Reg. S) | GBP | 500,000 | 566,281 |
| 7.125% 2/14/24 | GBP | 750,000 | 956,771 |
| HSBC Holdings PLC: | | | |
| 4.787% 3/10/32 (Reg. S) (b) | EUR | 470,000 | 548,369 |
| 4.856% 5/23/33 (Reg. S) (b) | EUR | 500,000 | 585,490 |
| 6.8% 9/14/31 (b) | GBP | 160,000 | 219,733 |
| 7.39% 11/3/28 (b) | | 350,000 | 375,038 |
| 8.201% 11/16/34 (Reg. S) (b) | GBP | 400,000 | 562,314 |
| Imperial Tobacco Finance PLC 3.5% 7/26/26 (c) | | 2,407,000 | 2,296,115 |
| InterContinental Hotel Group PLC 3.375% 10/8/28 (Reg. S) | GBP | 340,000 | 403,684 |
| John Lewis PLC 6.125% 1/21/25 | GBP | 1,659,000 | 2,106,599 |
| Lloyds Bank Corporate Markets PLC 1.75% 7/11/24 (Reg. S) | GBP | 140,000 | 174,783 |
| Lloyds Banking Group PLC: | | | |
| 1.985% 12/15/31 (b) | GBP | 400,000 | 457,339 |
| 4.5% 1/11/29 (Reg. S) (b) | EUR | 230,000 | 263,561 |
| 4.75% 9/21/31 (Reg. S) (b) | EUR | 670,000 | 781,302 |
| Marks & Spencer PLC: | | | |
| 3.75% 5/19/26 (Reg. S) | GBP | 100,000 | 123,460 |
| 4.5% 7/10/27 (Reg. S) | GBP | 270,000 | 331,607 |
| Mobico Group PLC 4.875% 9/26/31 (Reg. S) | EUR | 500,000 | 559,250 |
| Nationwide Building Society 6.178% 12/7/27 (Reg. S) (b) | GBP | 300,000 | 392,448 |
| NatWest Group PLC: | | | |
| 2.105% 11/28/31 (Reg. S) (b) | GBP | 650,000 | 737,738 |
| 3.622% 8/14/30 (Reg. S) (b) | GBP | 250,000 | 304,711 |
| 4.771% 2/16/29 (Reg. S) (b) | EUR | 600,000 | 688,332 |
| 7.416% 6/6/33 (Reg. S) (b) | GBP | 300,000 | 399,192 |
| NGG Finance PLC 2.125% 9/5/82 (Reg. S) (b) | EUR | 750,000 | 750,225 |
| Reckitt Benckiser Treasury Services PLC 3.875% 9/14/33 (Reg. S) | EUR | 290,000 | 338,978 |
| Rolls-Royce PLC 3.375% 6/18/26 | GBP | 440,000 | 531,996 |
| Severn Trent Utilities Finance PLC: | | | |
| 4.625% 11/30/34 (Reg. S) | GBP | 140,000 | 174,220 |
| 6.125% 2/26/24 | GBP | 65,000 | 82,871 |
| Southern Water Services Finance Ltd. 1.625% 3/30/27 (Reg. S) | GBP | 208,000 | 233,637 |
| SW Finance I PLC 7.375% 12/12/41 (Reg. S) | GBP | 160,000 | 218,016 |
| Tesco Corporate Treasury Services PLC: | | | |
| 2.75% 4/27/30 (Reg. S) | GBP | 500,000 | 562,943 |
| 5.5% 2/27/35 (Reg. S) | GBP | 160,000 | 206,129 |
| Thames Water Utility Finance PLC 1.875% 1/24/24 (Reg. S) | GBP | 130,000 | 164,150 |
| The Berkeley Group PLC 2.5% 8/11/31 (Reg. S) | GBP | 400,000 | 392,619 |
| Travis Perkins PLC 3.75% 2/17/26 (Reg. S) | GBP | 200,000 | 239,889 |
| Tritax EuroBox PLC 0.95% 6/2/26 (Reg. S) | EUR | 210,000 | 210,483 |
| Virgin Money UK PLC 7.625% 8/23/29 (Reg. S) (b) | GBP | 600,000 | 813,030 |
| Vodafone Group PLC 4.875% 10/3/78 (Reg. S) (b) | GBP | 250,000 | 309,538 |
| Whitbread PLC: | | | |
| 2.375% 5/31/27 (Reg. S) | GBP | 250,000 | 290,084 |
| 3.375% 10/16/25 (Reg. S) | GBP | 800,000 | 986,726 |
TOTAL UNITED KINGDOM | | | 21,871,712 |
| United States of America - 3.8% | | | |
| Blackstone Private Credit Fund 4.875% 4/14/26 | GBP | 800,000 | 973,906 |
| Carrier Global Corp. 4.5% 11/29/32 (Reg. S) | EUR | 200,000 | 236,131 |
| Citigroup, Inc. 5.875% 7/1/24 (Reg. S) | GBP | 200,000 | 254,491 |
| Duke Energy Corp. 3.85% 6/15/34 | EUR | 550,000 | 599,961 |
| Ford Motor Credit Co. LLC 6.86% 6/5/26 | GBP | 400,000 | 525,594 |
| General Motors Financial Co., Inc. 5.15% 8/15/26 (Reg. S) | GBP | 100,000 | 128,024 |
| Morgan Stanley 4.656% 3/2/29 (b) | EUR | 300,000 | 343,728 |
| MPT Operating Partnership LP/MPT Finance Corp. 2.5% 3/24/26 | GBP | 250,000 | 258,461 |
| Southern Co. 1.875% 9/15/81 (b) | EUR | 850,000 | 803,609 |
TOTAL UNITED STATES OF AMERICA | | | 4,123,905 |
| TOTAL NONCONVERTIBLE BONDS (Cost $72,187,028) | | | 66,623,065 |
| | | | |
| U.S. Government and Government Agency Obligations - 11.3% |
| | | Principal Amount (a) | Value ($) |
| U.S. Treasury Obligations - 11.3% | | | |
| U.S. Treasury Bonds: | | | |
| 1.125% 8/15/40 | | 700,000 | 446,797 |
| 2.25% 8/15/46 | | 500,000 | 355,488 |
| 3.25% 5/15/42 (e) | | 2,600,000 | 2,281,094 |
| 3.625% 5/15/53 | | 500,000 | 462,266 |
| 4% 11/15/42 | | 710,000 | 690,004 |
| 4.375% 8/15/43 | | 50,000 | 51,039 |
| 6.25% 5/15/30 (f) | | 2,660,000 | 3,006,838 |
| U.S. Treasury Notes: | | | |
| 1.5% 2/29/24 | | 200,000 | 198,786 |
| 2.625% 7/31/29 (e) | | 3,000,000 | 2,809,219 |
| 3.5% 2/15/33 | | 1,000,000 | 969,727 |
| 4.375% 11/30/28 | | 1,000,000 | 1,023,281 |
| | | | |
| TOTAL U.S. GOVERNMENT AND GOVERNMENT AGENCY OBLIGATIONS (Cost $12,206,730) | | | 12,294,539 |
| | | | |
| Foreign Government and Government Agency Obligations - 6.5% |
| | | Principal Amount (a) | Value ($) |
| Germany - 4.0% | | | |
| German Federal Republic: | | | |
| 0% 5/15/35 (Reg. S) | EUR | 950,000 | 825,947 |
| 1% 5/15/38(Reg. S) (f) | EUR | 2,485,000 | 2,332,093 |
| 1.25% 8/15/48 | EUR | 1,345,000 | 1,206,051 |
TOTAL GERMANY | | | 4,364,091 |
| Japan - 2.5% | | | |
| Japan Government, yield at date of purchase -0.1896% to -0.1796% 2/5/24 to 2/26/24 | JPY | 384,900,000 | 2,730,306 |
| TOTAL FOREIGN GOVERNMENT AND GOVERNMENT AGENCY OBLIGATIONS (Cost $7,895,099) | | | 7,094,397 |
| | | | |
| Supranational Obligations - 5.7% |
| | | Principal Amount (a) | Value ($) |
| European Investment Bank: | | | |
| 0% 6/17/27 | EUR | 2,400,000 | 2,442,534 |
| 0% 1/14/31 (Reg. S) | EUR | 1,300,000 | 1,206,728 |
| 0.625% 1/22/29 (Reg. S) | EUR | 1,200,000 | 1,213,377 |
| 3% 11/15/28 (Reg. S) | EUR | 350,000 | 396,629 |
| European Union: | | | |
| 0% 10/4/28 (Reg. S) | EUR | 175,000 | 172,419 |
| 2.75% 10/5/26 (Reg. S) | EUR | 700,000 | 778,581 |
| TOTAL SUPRANATIONAL OBLIGATIONS (Cost $5,940,048) | | | 6,210,268 |
| | | | |
| Preferred Securities - 10.4% |
| | | Principal Amount (a) | Value ($) |
| Australia - 0.8% | | | |
| QBE Insurance Group Ltd. 5.25% (Reg. S) (b)(d) | | 850,000 | 814,982 |
| Canada - 0.5% | | | |
| Bank of Nova Scotia: | | | |
| CME Term SOFR 3 Month Index + 2.900% 8.3354% (b)(d)(g) | | 390,000 | 359,919 |
| 4.9% (b)(d) | | 165,000 | 158,207 |
TOTAL CANADA | | | 518,126 |
| Czech Republic - 0.2% | | | |
| CPI Property Group SA 3.75% (Reg. S) (b)(d) | EUR | 800,000 | 208,631 |
| Finland - 0.2% | | | |
| Citycon Oyj 4.496% (Reg. S) (b)(d) | EUR | 300,000 | 267,450 |
| France - 0.5% | | | |
| BNP Paribas SA 6.625% (Reg. S) (b)(d) | | 550,000 | 557,060 |
| Germany - 3.4% | | | |
| Aroundtown SA 3.375% (Reg. S) (b)(d) | EUR | 1,400,000 | 625,754 |
| AT Securities BV USD SWAP SEMI 30/360 5Y INDX + 3.540% 7.747% (Reg. S) (b)(d)(g) | | 750,000 | 368,425 |
| Grand City Properties SA 1.5% (Reg. S) (b)(d) | EUR | 1,300,000 | 643,695 |
| Volkswagen International Finance NV: | | | |
| 3.375% (Reg. S) (b)(d) | EUR | 100,000 | 110,934 |
| 3.748% (Reg. S) (b)(d) | EUR | 300,000 | 310,278 |
| 3.875% (Reg. S) (b)(d) | EUR | 900,000 | 930,140 |
| 4.625% (Reg. S) (b)(d) | EUR | 637,000 | 722,308 |
TOTAL GERMANY | | | 3,711,534 |
| Ireland - 0.9% | | | |
| AerCap Holdings NV 5.875% 10/10/79 (b) | | 450,000 | 450,325 |
| AIB Group PLC 6.25% (Reg. S) (b)(d) | EUR | 450,000 | 492,436 |
TOTAL IRELAND | | | 942,761 |
| Sweden - 1.0% | | | |
| Heimstaden Bostad AB: | | | |
| 3.248% (Reg. S) (b)(d) | EUR | 1,500,000 | 890,789 |
| 3.625% (Reg. S) (b)(d) | EUR | 150,000 | 68,473 |
| Samhallsbyggnadsbolaget I Norden AB 2.624% (Reg. S) (b)(d) | EUR | 650,000 | 122,593 |
TOTAL SWEDEN | | | 1,081,855 |
| Switzerland - 0.4% | | | |
| Credit Suisse Group AG Claim (h) | | 1,900,000 | 218,500 |
| UBS Group AG 7% (Reg. S) (b)(d) | | 200,000 | 210,511 |
TOTAL SWITZERLAND | | | 429,011 |
| United Kingdom - 2.5% | | | |
| Barclays PLC: | | | |
| 5.875% (Reg. S) (b)(d) | GBP | 350,000 | 430,618 |
| 7.125% (b)(d) | GBP | 200,000 | 248,403 |
| 8.875% (b)(d) | GBP | 200,000 | 255,028 |
| British American Tobacco PLC 3% (Reg. S) (b)(d) | EUR | 1,100,000 | 1,084,302 |
| Mobico Group PLC 4.25% (Reg. S) (b)(d) | GBP | 190,000 | 221,389 |
| SSE PLC 3.74% (Reg. S) (b)(d) | GBP | 400,000 | 492,395 |
TOTAL UNITED KINGDOM | | | 2,732,135 |
| TOTAL PREFERRED SECURITIES (Cost $18,862,022) | | | 11,263,545 |
| | | | |
| Money Market Funds - 3.7% |
| | | Shares | Value ($) |
Fidelity Cash Central Fund 5.40% (i) (Cost $4,058,877) | | 4,058,065 | 4,058,877 |
| | | | |
| TOTAL INVESTMENT IN SECURITIES - 99.0% (Cost $121,149,804) | 107,544,691 |
NET OTHER ASSETS (LIABILITIES) - 1.0% | 1,069,270 |
| NET ASSETS - 100.0% | 108,613,961 |
| | |
| Futures Contracts |
| | Number of contracts | Expiration Date | Notional Amount ($) | Value ($) | Unrealized Appreciation/ (Depreciation) ($) |
| Purchased | | | | | |
| | | | | | |
| Bond Index Contracts | | | | | |
| ASX 10 Year Treasury Bond Index Contracts (Australia) | 9 | Mar 2024 | 715,517 | 20,872 | 20,872 |
| Eurex Euro-Buxl 30 Year Bond Contracts (Germany) | 1 | Mar 2024 | 156,452 | 11,854 | 11,854 |
| Eurex Euro-Schatz Contracts (Germany) | 18 | Mar 2024 | 2,117,166 | 16,271 | 16,271 |
| TME 10 Year Canadian Note Contracts (Canada) | 36 | Mar 2024 | 3,373,820 | 141,924 | 141,924 |
| | | | | | |
| TOTAL BOND INDEX CONTRACTS | | | | | 190,921 |
| | | | | | |
| Treasury Contracts | | | | | |
| CBOT 2-Year U.S. Treasury Note Contracts (United States) | 32 | Mar 2024 | 6,589,250 | 65,939 | 65,939 |
| CBOT 5-Year U.S. Treasury Note Contracts (United States) | 88 | Mar 2024 | 9,572,063 | 212,716 | 212,716 |
| CBOT Long Term U.S. Treasury Bond Contracts (United States) | 37 | Mar 2024 | 4,622,688 | 319,482 | 319,482 |
| | | | | | |
| TOTAL TREASURY CONTRACTS | | | | | 598,137 |
| | | | | | |
| TOTAL PURCHASED | | | | | 789,058 |
| | | | | | |
| Sold | | | | | |
| | | | | | |
| Bond Index Contracts | | | | | |
| ICE Long Gilt Contracts (United Kingdom) | 15 | Mar 2024 | 1,962,642 | (104,273) | (104,273) |
| | | | | | |
| TOTAL FUTURES CONTRACTS | | | | | 684,785 |
| The notional amount of futures purchased as a percentage of Net Assets is 25.0% |
| The notional amount of futures sold as a percentage of Net Assets is 1.8% |
For the period, the average monthly notional amount at value for futures contracts in the aggregate was $34,740,826.
| Forward Foreign Currency Contracts |
Currency Purchased
| Currency Sold | Counterparty | Settlement Date | Unrealized Appreciation/ (Depreciation) ($) |
| | | | | | | |
| EUR | 78,000 | USD | 86,217 | Bank of America, N.A. | 1/03/24 | (108) |
| CAD | 26,000 | USD | 19,130 | BNP Paribas S.A. | 1/12/24 | 494 |
| EUR | 2,252,000 | USD | 2,432,768 | JPMorgan Chase Bank, N.A. | 1/12/24 | 54,291 |
| GBP | 132,000 | USD | 167,071 | BNP Paribas S.A. | 1/12/24 | 1,192 |
| GBP | 67,000 | USD | 83,965 | Brown Brothers Harriman & Co | 1/12/24 | 1,441 |
| GBP | 317,000 | USD | 404,842 | Citibank, N. A. | 1/12/24 | (756) |
| GBP | 38,000 | USD | 48,323 | Goldman Sachs Bank USA | 1/12/24 | 116 |
| USD | 45,967 | AUD | 70,000 | Brown Brothers Harriman & Co | 1/12/24 | (1,750) |
| USD | 101,092 | CAD | 134,000 | BNP Paribas S.A. | 1/12/24 | (50) |
| USD | 41,274 | CAD | 56,000 | Canadian Imperial Bk. of Comm. | 1/12/24 | (994) |
| USD | 511,897 | EUR | 465,000 | BNP Paribas S.A. | 1/12/24 | (1,639) |
| USD | 1,457,313 | EUR | 1,318,000 | Bank of America, N.A. | 1/12/24 | 1,742 |
| USD | 49,070,713 | EUR | 45,259,000 | Bank of America, N.A. | 1/12/24 | (912,335) |
| USD | 32,394 | EUR | 30,000 | Brown Brothers Harriman & Co | 1/12/24 | (738) |
| USD | 388,097 | EUR | 359,000 | Brown Brothers Harriman & Co | 1/12/24 | (8,374) |
| USD | 87,426 | EUR | 80,000 | Brown Brothers Harriman & Co | 1/12/24 | (925) |
| USD | 74,669 | EUR | 68,000 | Citibank, N. A. | 1/12/24 | (429) |
| USD | 319,323 | GBP | 251,000 | BNP Paribas S.A. | 1/12/24 | (632) |
| USD | 22,995,756 | GBP | 18,217,000 | BNP Paribas S.A. | 1/12/24 | (225,789) |
| USD | 201,275 | GBP | 160,000 | Bank of America, N.A. | 1/12/24 | (2,680) |
| USD | 62,017 | GBP | 49,000 | Citibank, N. A. | 1/12/24 | (444) |
| USD | 2,686,401 | JPY | 385,300,000 | BNP Paribas S.A. | 1/12/24 | (50,221) |
| | | | | | | |
| TOTAL FORWARD FOREIGN CURRENCY CONTRACTS | | (1,148,588) |
| Unrealized Appreciation | | | 59,276 |
| Unrealized Depreciation | | | (1,207,864) |
For the period, the average contract value for forward foreign currency contracts was $78,650,654. Contract value represents contract amount in United States dollars plus or minus unrealized appreciation or depreciation, respectively.
| Credit Default Swaps |
| Underlying Reference | | Maturity Date | Clearinghouse / Counterparty | Fixed Payment Received/ (Paid) | Payment Frequency | Notional Amount(1) | Value ($) | Upfront Premium Received/ (Paid) ($) | Unrealized Appreciation/ (Depreciation) ($) |
| Buy Protection | | | | | | | | | | |
| Intesa Sanpaolo SpA | | Jun 2028 | JPMorgan Chase Bank, N.A. | (1%) | Quarterly | EUR | 955,000 | (12,161) | 1,236 | (10,925) |
| | | | | | | | | | | |
(1)Notional amount is stated in U.S. Dollars unless otherwise noted.
Currency Abbreviations
| AUD | - | Australian dollar |
| CAD | - | Canadian dollar |
| EUR | - | European Monetary Unit |
| GBP | - | British pound sterling |
| JPY | - | Japanese yen |
| USD | - | U.S. dollar |
Legend
| (a) | Amount is stated in United States dollars unless otherwise noted. |
| (b) | Coupon rates for floating and adjustable rate securities reflect the rates in effect at period end. |
| (c) | Security exempt from registration under Rule 144A of the Securities Act of 1933. These securities may be resold in transactions exempt from registration, normally to qualified institutional buyers. At the end of the period, the value of these securities amounted to $6,037,065 or 5.6% of net assets. |
| (d) | Security is perpetual in nature with no stated maturity date. |
| (e) | Security or a portion of the security was pledged to cover margin requirements for futures contracts. At period end, the value of securities pledged amounted to $555,877. |
| (f) | Security or a portion of the security has been segregated as collateral for open forward foreign currency contracts. At period end, the value of securities pledged amounted to $1,571,208. |
| (g) | Coupon is indexed to a floating interest rate which may be multiplied by a specified factor and/or subject to caps or floors. |
| (h) | Non-income producing - Security is in default. |
| (i) | Affiliated fund that is generally available only to investment companies and other accounts managed by Fidelity Investments. The rate quoted is the annualized seven-day yield of the fund at period end. A complete unaudited listing of the fund's holdings as of its most recent quarter end is available upon request. In addition, each Fidelity Central Fund's financial statements, which are not covered by the Fund's Report of Independent Registered Public Accounting Firm, are available on the SEC's website or upon request. |
Affiliated Central Funds
Fiscal year to date information regarding the Fund's investments in Fidelity Central Funds, including the ownership percentage, is presented below.
| Affiliate | Value, beginning of period ($) | Purchases ($) | Sales Proceeds ($) | Dividend Income ($) | Realized Gain (loss) ($) | Change in Unrealized appreciation (depreciation) ($) | Value, end of period ($) | % ownership, end of period |
| Fidelity Cash Central Fund 5.40% | 3,368,958 | 62,877,505 | 62,187,586 | 239,076 | - | - | 4,058,877 | 0.0% |
| Fidelity Securities Lending Cash Central Fund 5.40% | - | 45,856 | 45,856 | 7 | - | - | - | 0.0% |
| Total | 3,368,958 | 62,923,361 | 62,233,442 | 239,083 | - | - | 4,058,877 | |
| | | | | | | | | |
Amounts in the dividend income column in the above table include any capital gain distributions from underlying funds, which are presented in the corresponding line item in the Statement of Operations, if applicable.
Amounts in the dividend income column for Fidelity Securities Lending Cash Central Fund represents the income earned on investing cash collateral, less rebates paid to borrowers and any lending agent fees associated with the loan, plus any premium payments received for lending certain types of securities.
Amounts included in the purchases and sales proceeds columns may include in-kind transactions, if applicable.
Investment Valuation
The following is a summary of the inputs used, as of December 31, 2023, involving the Fund's assets and liabilities carried at fair value. The inputs or methodology used for valuing securities may not be an indication of the risk associated with investing in those securities. For more information on valuation inputs, and their aggregation into the levels used below, please refer to the Investment Valuation section in the accompanying Notes to Financial Statements.
| Valuation Inputs at Reporting Date: |
| Description | Total ($) | Level 1 ($) | Level 2 ($) | Level 3 ($) |
Investments in Securities: | | | | |
|
| Corporate Bonds | 66,623,065 | - | 66,623,065 | - |
|
| U.S. Government and Government Agency Obligations | 12,294,539 | - | 12,294,539 | - |
|
| Foreign Government and Government Agency Obligations | 7,094,397 | - | 7,094,397 | - |
|
| Supranational Obligations | 6,210,268 | - | 6,210,268 | - |
|
| Preferred Securities | 11,263,545 | - | 11,263,545 | - |
|
| Money Market Funds | 4,058,877 | 4,058,877 | - | - |
| Total Investments in Securities: | 107,544,691 | 4,058,877 | 103,485,814 | - |
Derivative Instruments: Assets | | | | |
Futures Contracts | 789,058 | 789,058 | - | - |
Forward Foreign Currency Contracts | 59,276 | - | 59,276 | - |
| Total Assets | 848,334 | 789,058 | 59,276 | - |
| Liabilities | | | | |
Futures Contracts | (104,273) | (104,273) | - | - |
Forward Foreign Currency Contracts | (1,207,864) | - | (1,207,864) | - |
Swaps | (12,161) | - | (12,161) | - |
| Total Liabilities | (1,324,298) | (104,273) | (1,220,025) | - |
| Total Derivative Instruments: | (475,964) | 684,785 | (1,160,749) | - |
Value of Derivative Instruments
The following table is a summary of the Fund's value of derivative instruments by primary risk exposure as of December 31, 2023. For additional information on derivative instruments, please refer to the Derivative Instruments section in the accompanying Notes to Financial Statements.
Primary Risk Exposure / Derivative Type | Value |
| Asset ($) | Liability ($) |
| Credit Risk | | |
Swaps (a) | 0 | (12,161) |
| Total Credit Risk | 0 | (12,161) |
| Foreign Exchange Risk | | |
Forward Foreign Currency Contracts (b) | 59,276 | (1,207,864) |
| Total Foreign Exchange Risk | 59,276 | (1,207,864) |
| Interest Rate Risk | | |
Futures Contracts (c) | 789,058 | (104,273) |
| Total Interest Rate Risk | 789,058 | (104,273) |
| Total Value of Derivatives | 848,334 | (1,324,298) |
(a)For bi-lateral over-the-counter (OTC) swaps, reflects gross value which is presented in the Statement of Assets and Liabilities in the bi-lateral OTC swaps, at value line-items.
(b)Gross value is presented in the Statement of Assets and Liabilities in the unrealized appreciation/depreciation on forward foreign currency contracts line-items.
(c)Reflects gross cumulative appreciation (depreciation) on futures contracts as presented in the Schedule of Investments. In the Statement of Assets and Liabilities, the period end daily variation margin is included in receivable or payable for daily variation margin on futures contracts, and the net cumulative appreciation (depreciation) is included in Total accumulated earnings (loss).
The following table is a summary of the Fund's derivatives inclusive of potential netting arrangements.
| | | | | | | | | | | |
| Counterparty | | Value of Derivative Assets ($) | | Value of Derivative Liabilities ($) | | Collateral Received(a) ($) | | Collateral Pledged(a) ($) | | Net(b) ($) |
| Bank of America, N.A. | | 1,742 | | (915,123) | | - | | 913,381 | | - |
| BNP Paribas S.A. | | 1,686 | | (278,331) | | - | | 276,645 | | - |
| Brown Brothers Harriman & Co | | 1,441 | | (11,787) | | - | | - | | (10,346) |
| Canadian Imperial Bk. of Comm. | | - | | (994) | | - | | - | | (994) |
| Citibank, N.A. | | - | | (1,629) | | - | | - | | (1,629) |
| Goldman Sachs Bank USA | | 116 | | - | | - | | - | | 116 |
| JPMorgan Chase Bank, N.A. | | 54,291 | | (12,161) | | - | | - | | 42,130 |
| Total | $ | 59,276 | $ | (1,220,025) | $ | - | $ | 1,190,026 | $ | 29,277 |
| | | | | | | | | | | |
(a) Reflects collateral received from or pledged to an individual counterparty, excluding any excess or initial collateral amounts.
(b) Net represents the receivable / (payable) that would be due from / (to) the counterparty in an event of default. Netting may be allowed across transactions traded under the same legal agreement with the same legal entity. Please refer to Derivative Instruments - Risk Exposures and the Use of Derivative Instruments section in the accompanying Notes to Financial Statements.
| Statement of Assets and Liabilities |
| | | | December 31, 2023 |
| | | | | |
| Assets | | | | |
| Investment in securities, at value - See accompanying schedule: | | | | |
Unaffiliated issuers (cost $117,090,927) | $ | 103,485,814 | | |
Fidelity Central Funds (cost $4,058,877) | | 4,058,877 | | |
| | | | | |
| | | | | |
| Total Investment in Securities (cost $121,149,804) | | | $ | 107,544,691 |
| Foreign currency held at value (cost $922,772) | | | | 929,599 |
| Unrealized appreciation on forward foreign currency contracts | | | | 59,276 |
| Interest receivable | | | | 1,461,880 |
| Distributions receivable from Fidelity Central Funds | | | | 19,866 |
| Receivable for daily variation margin on futures contracts | | | | 23,227 |
| Receivable from investment adviser for expense reductions | | | | 14 |
Total assets | | | | 110,038,553 |
| Liabilities | | | | |
| Payable for investments purchased | $ | 202,462 | | |
| Unrealized depreciation on forward foreign currency contracts | | 1,207,864 | | |
| Bi-lateral OTC swaps, at value | | 12,161 | | |
| Other payables and accrued expenses | | 2,105 | | |
| Total Liabilities | | | | 1,424,592 |
| Net Assets | | | $ | 108,613,961 |
| Net Assets consist of: | | | | |
| Paid in capital | | | $ | 132,275,391 |
| Total accumulated earnings (loss) | | | | (23,661,430) |
| Net Assets | | | $ | 108,613,961 |
Net Asset Value, offering price and redemption price per share ($108,613,961 ÷ 13,603,848 shares) | | | $ | 7.98 |
| Statement of Operations |
| | | | Year ended December 31, 2023 |
| Investment Income | | | | |
| Dividends | | | $ | 919,212 |
| Interest | | | | 3,054,986 |
| Income from Fidelity Central Funds (including $7 from security lending) | | | | 239,083 |
| Total Income | | | | 4,213,281 |
| Expenses | | | | |
| Custodian fees and expenses | $ | 5,483 | | |
| Independent trustees' fees and expenses | | 369 | | |
| Miscellaneous | | 21 | | |
| Total expenses before reductions | | 5,873 | | |
| Expense reductions | | (3,388) | | |
| Total expenses after reductions | | | | 2,485 |
| Net Investment income (loss) | | | | 4,210,796 |
| Realized and Unrealized Gain (Loss) | | | | |
| Net realized gain (loss) on: | | | | |
| Investment Securities: | | | | |
| Unaffiliated issuers | | (4,988,638) | | |
| Forward foreign currency contracts | | (680,102) | | |
| Foreign currency transactions | | 136,167 | | |
| Futures contracts | | (1,297,209) | | |
| Swaps | | (18,563) | | |
| Total net realized gain (loss) | | | | (6,848,345) |
| Change in net unrealized appreciation (depreciation) on: | | | | |
| Investment Securities: | | | | |
| Unaffiliated issuers | | 10,786,320 | | |
| Forward foreign currency contracts | | (1,255,021) | | |
| Assets and liabilities in foreign currencies | | 6,239 | | |
| Futures contracts | | 934,510 | | |
| Swaps | | (9,948) | | |
| Total change in net unrealized appreciation (depreciation) | | | | 10,462,100 |
| Net gain (loss) | | | | 3,613,755 |
| Net increase (decrease) in net assets resulting from operations | | | $ | 7,824,551 |
| Statement of Changes in Net Assets |
| |
| | Year ended December 31, 2023 | | Year ended December 31, 2022 |
| Increase (Decrease) in Net Assets | | | | |
| Operations | | | | |
| Net investment income (loss) | $ | 4,210,796 | $ | 3,449,937 |
| Net realized gain (loss) | | (6,848,345) | | (179,307) |
| Change in net unrealized appreciation (depreciation) | | 10,462,100 | | (24,466,429) |
| Net increase (decrease) in net assets resulting from operations | | 7,824,551 | | (21,195,799) |
| Distributions to shareholders | | (3,893,060) | | (6,502,377) |
| | | | | |
| Share transactions | | | | |
| Proceeds from sales of shares | | 2,069,174 | | 1,114,765 |
| Reinvestment of distributions | | 3,893,060 | | 6,502,377 |
| Cost of shares redeemed | | (2,069,174) | | (1,114,764) |
| | | | | |
Net increase (decrease) in net assets resulting from share transactions | | 3,893,060 | | 6,502,378 |
| Total increase (decrease) in net assets | | 7,824,551 | | (21,195,798) |
| | | | | |
| Net Assets | | | | |
| Beginning of period | | 100,789,410 | | 121,985,208 |
| End of period | $ | 108,613,961 | $ | 100,789,410 |
| | | | | |
| Other Information | | | | |
| Shares | | | | |
| Sold | | 265,952 | | 139,903 |
| Issued in reinvestment of distributions | | 505,276 | | 799,064 |
| Redeemed | | (265,952) | | (139,903) |
| Net increase (decrease) | | 505,276 | | 799,064 |
| | | | | |
Financial Highlights
| Fidelity® Series International Credit Fund |
| |
| Years ended December 31, | | 2023 | | 2022 | | 2021 | | 2020 | | 2019 |
Selected Per-Share Data | | | | | | | | | | |
| Net asset value, beginning of period | $ | 7.69 | $ | 9.92 | $ | 10.23 | $ | 10.08 | $ | 9.50 |
| Income from Investment Operations | | | | | | | | | | |
Net investment income (loss) A,B | | .317 | | .276 | | .255 | | .307 | | .271 |
| Net realized and unrealized gain (loss) | | .266 | | (1.988) | | (.263) | | .516 | | 1.027 |
| Total from investment operations | | .583 | | (1.712) | | (.008) | | .823 | | 1.298 |
| Distributions from net investment income | | (.293) | | (.455) | | (.197) C | | (.423) | | (.299) C |
| Distributions from net realized gain | | - | | (.063) | | (.105) C | | (.250) | | (.378) C |
| Distributions from tax return of capital | | - | | - | | - | | - | | (.041) |
| Total distributions | | (.293) | | (.518) | | (.302) | | (.673) | | (.718) |
| Net asset value, end of period | $ | 7.98 | $ | 7.69 | $ | 9.92 | $ | 10.23 | $ | 10.08 |
Total Return D | | 7.77% | | (17.44)% | | (.07)% | | 8.33% | | 13.85% |
Ratios to Average Net Assets B,E,F | | | | | | | | | | |
| Expenses before reductions | | .01% | | -% G | | .01% | | .01% | | .01% |
| Expenses net of fee waivers, if any | | -% G | | -% G | | -% G | | .01% | | .01% |
| Expenses net of all reductions | | -% G | | -% G | | -% G | | .01% | | .01% |
| Net investment income (loss) | | 4.09% | | 3.20% | | 2.53% | | 3.00% | | 2.69% |
| Supplemental Data | | | | | | | | | | |
| Net assets, end of period (000 omitted) | $ | 108,614 | $ | 100,789 | $ | 121,985 | $ | 122,084 | $ | 112,608 |
Portfolio turnover rate H | | 61% | | 21% | | 65% | | 52% | | 88% |
ACalculated based on average shares outstanding during the period.
BNet investment income (loss) is affected by the timing of the declaration of dividends by any underlying mutual funds or exchange-traded funds (ETFs). Net investment income (loss) of any mutual funds or ETFs is not included in the Fund's net investment income (loss) ratio.
CThe amount shown reflects reclassifications related to book to tax differences that were made in the year shown.
DTotal returns would have been lower if certain expenses had not been reduced during the applicable periods shown.
EFees and expenses of any underlying mutual funds or exchange-traded funds (ETFs) are not included in the Fund's expense ratio. The Fund indirectly bears its proportionate share of these expenses. For additional expense information related to investments in Fidelity Central Funds, please refer to the "Investments in Fidelity Central Funds" note found in the Notes to Financial Statements section of the most recent Annual or Semi-Annual report.
FExpense ratios reflect operating expenses of the class. Expenses before reductions do not reflect amounts reimbursed, waived, or reduced through arrangements with the investment adviser, brokerage services, or other offset arrangements, if applicable, and do not represent the amount paid by the class during periods when reimbursements, waivers or reductions occur.
GAmount represents less than .005%.
HAmount does not include the portfolio activity of any underlying mutual funds or exchange-traded funds (ETFs).
For the period ended December 31, 2023
1. Organization.
Fidelity Series International Credit Fund (the Fund) is a fund of Fidelity School Street Trust (the Trust) and is authorized to issue an unlimited number of shares. Shares are offered only to certain other Fidelity funds, Fidelity managed 529 plans, and Fidelity managed collective investment trusts. The Trust is registered under the Investment Company Act of 1940, as amended (the 1940 Act), as an open-end management investment company organized as a Massachusetts business trust.
2. Investments in Fidelity Central Funds.
Funds may invest in Fidelity Central Funds, which are open-end investment companies generally available only to other investment companies and accounts managed by the investment adviser and its affiliates. The Schedule of Investments lists any Fidelity Central Funds held as an investment as of period end, but does not include the underlying holdings of each Fidelity Central Fund. An investing fund indirectly bears its proportionate share of the expenses of the underlying Fidelity Central Funds.
Based on its investment objective, each Fidelity Central Fund may invest or participate in various investment vehicles or strategies that are similar to those of the investing fund. These strategies are consistent with the investment objectives of the investing fund and may involve certain economic risks which may cause a decline in value of each of the Fidelity Central Funds and thus a decline in the value of the investing fund.
| Fidelity Central Fund | Investment Manager | Investment Objective | Investment Practices | Expense RatioA |
| Fidelity Money Market Central Funds | Fidelity Management & Research Company LLC (FMR) | Each fund seeks to obtain a high level of current income consistent with the preservation of capital and liquidity. | Short-term Investments | Less than .005% |
A Expenses expressed as a percentage of average net assets and are as of each underlying Central Fund's most recent annual or semi-annual shareholder report.
A complete unaudited list of holdings for each Fidelity Central Fund is available upon request or at the Securities and Exchange Commission website at www.sec.gov. In addition, the financial statements of the Fidelity Central Funds which contain the significant accounting policies (including investment valuation policies) of those funds, and are not covered by the Report of Independent Registered Public Accounting Firm, are available on the Securities and Exchange Commission website or upon request.
3. Significant Accounting Policies.
The Fund is an investment company and applies the accounting and reporting guidance of the Financial Accounting Standards Board (FASB) Accounting Standards Codification Topic 946 Financial Services - Investment Companies. The financial statements have been prepared in conformity with accounting principles generally accepted in the United States of America (GAAP), which require management to make certain estimates and assumptions at the date of the financial statements. Actual results could differ from those estimates. Subsequent events, if any, through the date that the financial statements were issued have been evaluated in the preparation of the financial statements. The Fund's Schedule of Investments lists any underlying mutual funds or exchange-traded funds (ETFs) but does not include the underlying holdings of these funds. The following summarizes the significant accounting policies of the Fund:
Investment Valuation. Investments are valued as of 4:00 p.m. Eastern time on the last calendar day of the period. The Board of Trustees (the Board) has designated the Fund's investment adviser as the valuation designee responsible for the fair valuation function and performing fair value determinations as needed. The investment adviser has established a Fair Value Committee (the Committee) to carry out the day-to-day fair valuation responsibilities and has adopted policies and procedures to govern the fair valuation process and the activities of the Committee. In accordance with these fair valuation policies and procedures, which have been approved by the Board, the Fund attempts to obtain prices from one or more third party pricing services or brokers to value its investments. When current market prices, quotations or currency exchange rates are not readily available or reliable, investments will be fair valued in good faith by the Committee, in accordance with the policies and procedures. Factors used in determining fair value vary by investment type and may include market or investment specific events, transaction data, estimated cash flows, and market observations of comparable investments. The frequency that the fair valuation procedures are used cannot be predicted and they may be utilized to a significant extent. The Committee manages the Fund's fair valuation practices and maintains the fair valuation policies and procedures. The Fund's investment adviser reports to the Board information regarding the fair valuation process and related material matters.
The Fund categorizes the inputs to valuation techniques used to value its investments into a disclosure hierarchy consisting of three levels as shown below:
Level 1 - unadjusted quoted prices in active markets for identical investments
Level 2 - other significant observable inputs (including quoted prices for similar investments, interest rates, prepayment speeds, etc.)
Level 3 - unobservable inputs (including the Fund's own assumptions based on the best information available)
Valuation techniques used to value the Fund's investments by major category are as follows:
Debt securities, including restricted securities, are valued based on evaluated prices received from third party pricing services or from brokers who make markets in such securities. Corporate bonds, foreign government and government agency obligations, preferred securities and U.S. government and government agency obligations are valued by pricing services who utilize matrix pricing which considers yield or price of bonds of comparable quality, coupon, maturity and type or by broker-supplied prices. Swaps are marked-to-market daily based on valuations from third party pricing services, registered derivatives clearing organizations (clearinghouses) or broker-supplied valuations. These pricing sources may utilize inputs such as interest rate curves, credit spread curves, default possibilities and recovery rates. When independent prices are unavailable or unreliable, debt securities and swaps may be valued utilizing pricing methodologies which consider similar factors that would be used by third party pricing services. For foreign debt securities, when significant market or security specific events arise, valuations may be determined in good faith in accordance with procedures adopted by the Board. Debt securities and swaps are generally categorized as Level 2 in the hierarchy but may be Level 3 depending on the circumstances.
The U.S. dollar value of forward foreign currency contracts is determined using currency exchange rates supplied by a pricing service and are categorized as Level 2 in the hierarchy. Futures contracts are valued at the settlement price established each day by the board of trade or exchange on which they are traded and are categorized as Level 1 in the hierarchy. Investments in open-end mutual funds, including the Fidelity Central Funds, are valued at their closing net asset value (NAV) each business day and are categorized as Level 1 in the hierarchy.
Changes in valuation techniques may result in transfers in or out of an assigned level within the disclosure hierarchy. The aggregate value of investments by input level as of December 31, 2023 is included at the end of the Fund's Schedule of Investments.
Foreign Currency. Foreign-denominated assets, including investment securities, and liabilities are translated into U.S. dollars at the exchange rates at period end. Purchases and sales of investment securities, income and dividends received, and expenses denominated in foreign currencies are translated into U.S. dollars at the exchange rate in effect on the transaction date.
The effects of exchange rate fluctuations on investments are included with the net realized and unrealized gain (loss) on investment securities. Other foreign currency transactions resulting in realized and unrealized gain (loss) are disclosed separately.
Realized gains and losses on foreign currency transactions arise from the disposition of foreign currency, realized changes in the value of foreign currency between the trade and settlement dates on security transactions, and the difference between the amounts of dividends, interest and foreign withholding taxes recorded on transaction date and the U.S. dollar equivalent of the amounts actually received or paid. Unrealized gains and losses on assets and liabilities in foreign currencies arise from changes in the value of foreign currency, and from assets and liabilities denominated in foreign currencies, other than investments, which are held at period end.
Investment Transactions and Income. For financial reporting purposes, the Fund's investment holdings and NAV include trades executed through the end of the last business day of the period. The NAV per share for processing shareholder transactions is calculated as of the close of business of the New York Stock Exchange (NYSE), normally 4:00 p.m. Eastern time and includes trades executed through the end of the prior business day. Gains and losses on securities sold are determined on the basis of identified cost. Dividend income is recorded on the ex-dividend date. Income and capital gain distributions from Fidelity Central Funds, if any, are recorded on the ex-dividend date. Interest income is accrued as earned and includes coupon interest and amortization of premium and accretion of discount on debt securities as applicable. Investment income is recorded net of foreign taxes withheld where recovery of such taxes is uncertain. Debt obligations may be placed on non-accrual status and related interest income may be reduced by ceasing current accruals and writing off interest receivables when the collection of all or a portion of interest has become doubtful based on consistently applied procedures. A debt obligation is removed from non-accrual status when the issuer resumes interest payments or when collectability of interest is reasonably assured. Funds may file withholding tax reclaims in certain jurisdictions to recover a portion of amounts previously withheld. Any withholding tax reclaims income is included in the Statement of Operations in interest. Any receivables for withholding tax reclaims are included in the Statement of Assets and Liabilities in interest receivable.
Expenses. Expenses directly attributable to a fund are charged to that fund. Expenses attributable to more than one fund are allocated among the respective funds on the basis of relative net assets or other appropriate methods. Expenses included in the accompanying financial statements reflect the expenses of that fund and do not include any expenses associated with any underlying mutual funds or exchange-traded funds. Although not included in a fund's expenses, a fund indirectly bears its proportionate share of these expenses through the net asset value of each underlying mutual fund or exchange-traded fund. Expense estimates are accrued in the period to which they relate and adjustments are made when actual amounts are known.
Income Tax Information and Distributions to Shareholders. Each year, the Fund intends to qualify as a regulated investment company under Subchapter M of the Internal Revenue Code, including distributing substantially all of its taxable income and realized gains. As a result, no provision for U.S. Federal income taxes is required. As of December 31, 2023, the Fund did not have any unrecognized tax benefits in the financial statements; nor is the Fund aware of any tax positions for which it is reasonably possible that the total amounts of unrecognized tax benefits will significantly change in the next twelve months. The Fund files a U.S. federal tax return, in addition to state and local tax returns as required. The Fund's federal income tax returns are subject to examination by the Internal Revenue Service (IRS) for a period of three fiscal years after they are filed. State and local tax returns may be subject to examination for an additional fiscal year depending on the jurisdiction. Foreign taxes are provided for based on the Fund's understanding of the tax rules and rates that exist in the foreign markets in which it invests.
Distributions are declared and recorded on the ex-dividend date. Income and capital gain distributions are determined in accordance with income tax regulations, which may differ from GAAP.
Capital accounts within the financial statements are adjusted for permanent book-tax differences. These adjustments have no impact on net assets or the results of operations. Capital accounts are not adjusted for temporary book-tax differences which will reverse in a subsequent period.
Book-tax differences are primarily due to futures contracts, swaps, foreign currency transactions, market discount, capital loss carryforwards, and losses deferred due to wash sales and excise tax regulations.
As of period end, the cost and unrealized appreciation (depreciation) in securities, and derivatives if applicable, for federal income tax purposes were as follows:
| Gross unrealized appreciation | $2,877,694 |
| Gross unrealized depreciation | (15,473,241) |
| Net unrealized appreciation (depreciation) | $(12,595,547) |
| Tax Cost | $120,916,357 |
The tax-based components of distributable earnings as of period end were as follows:
| Undistributed ordinary income | $487,895 |
| Capital loss carryforward | $(11,586,992) |
| Net unrealized appreciation (depreciation) on securities and other investments | $(12,562,334) |
Capital loss carryforwards are only available to offset future capital gains of the Fund to the extent provided by regulations and may be limited. The capital loss carryforward information presented below, including any applicable limitation, is estimated as of fiscal period end and is subject to adjustment.
Short-term | $(2,667,951) |
Long-term | (8,919,041) |
| Total capital loss carryforward | $(11,586,992) |
The tax character of distributions paid was as follows:
| | December 31, 2023 | December 31, 2022 |
| Ordinary Income | $3,893,060 | $5,727,508 |
| Long-term Capital Gains | - | 774,869 |
| Total | $3,893,060 | $6,502,377 |
Restricted Securities (including Private Placements). Funds may invest in securities that are subject to legal or contractual restrictions on resale. These securities generally may be resold in transactions exempt from registration or to the public if the securities are registered. Disposal of these securities may involve time-consuming negotiations and expense, and prompt sale at an acceptable price may be difficult. Information regarding restricted securities held at period end is included at the end of the Schedule of Investments, if applicable.
4. Derivative Instruments.
Risk Exposures and the Use of Derivative Instruments. The Fund's investment objectives allow for various types of derivative instruments, including futures contracts, forward foreign currency contracts, options and swaps. Derivatives are investments whose value is primarily derived from underlying assets, indices or reference rates and may be transacted on an exchange or over-the-counter (OTC). Derivatives may involve a future commitment to buy or sell a specified asset based on specified terms, to exchange future cash flows at periodic intervals based on a notional principal amount, or for one party to make one or more payments upon the occurrence of specified events in exchange for periodic payments from the other party.
Derivatives were used to increase returns, to gain exposure to certain types of assets, to facilitate transactions in foreign-denominated securities and to manage exposure to certain risks as defined below. The success of any strategy involving derivatives depends on analysis of numerous economic factors, and if the strategies for investment do not work as intended, the objectives may not be achieved.
Derivatives were used to increase or decrease exposure to the following risk(s):
| | |
| Credit Risk | Credit risk relates to the ability of the issuer of a financial instrument to make further principal or interest payments on an obligation or commitment that it has to a fund. |
| Foreign Exchange Risk | Foreign exchange rate risk relates to fluctuations in the value of an asset or liability due to changes in currency exchange rates. |
| Interest Rate Risk | Interest rate risk relates to the fluctuations in the value of interest-bearing securities due to changes in the prevailing levels of market interest rates. |
Funds are also exposed to additional risks from investing in derivatives, such as liquidity risk and counterparty credit risk. Liquidity risk is the risk that a fund will be unable to close out the derivative in the open market in a timely manner. Counterparty credit risk is the risk that the counterparty will not be able to fulfill its obligation to a fund. Derivative counterparty credit risk is managed through formal evaluation of the creditworthiness of all potential counterparties. On certain OTC derivatives such as forward foreign currency contracts, options and bi-lateral swaps, a fund attempts to reduce its exposure to counterparty credit risk by entering into an International Swaps and Derivatives Association, Inc. (ISDA) Master Agreement with each of its counterparties. The ISDA Master Agreement gives a fund the right to terminate all transactions traded under such agreement upon the deterioration in the credit quality of the counterparty beyond specified levels. The ISDA Master Agreement gives each party the right, upon an event of default by the other party or a termination of the agreement, to close out all transactions traded under such agreement and to net amounts owed under each transaction to one net payable by one party to the other. To mitigate counterparty credit risk on bi-lateral OTC derivatives, a fund receives collateral in the form of cash or securities once net unrealized appreciation on outstanding derivative contracts under an ISDA Master Agreement exceeds certain applicable thresholds, subject to certain minimum transfer provisions. The collateral received is held in segregated accounts with the custodian bank in accordance with the collateral agreements entered into between a fund, the counterparty and the custodian bank. A fund could experience delays and costs in gaining access to the collateral even though it is held by the custodian bank. The maximum risk of loss to a fund from counterparty credit risk related to bi-lateral OTC derivatives is generally the aggregate unrealized appreciation and unpaid counterparty payments in excess of any collateral pledged by the counterparty to a fund. A fund may be required to pledge collateral for the benefit of the counterparties on bi-lateral OTC derivatives in an amount not less than each counterparty's unrealized appreciation on outstanding derivative contracts, subject to certain minimum transfer provisions, and any such pledged collateral is identified in the Schedule of Investments. Exchange-traded contracts are not covered by the ISDA Master Agreement; however counterparty credit risk related to these contracts may be mitigated by the protection provided by the exchange on which they trade. A summary of derivatives inclusive of potential netting arrangements is presented at the end of the Schedule of Investments.
Investing in derivatives may involve greater risks than investing in the underlying assets directly and, to varying degrees, may involve risk of loss in excess of any initial investment and collateral received and amounts recognized in the Statement of Assets and Liabilities. In addition, there may be the risk that the change in value of the derivative contract does not correspond to the change in value of the underlying instrument.
Net Realized Gain (Loss) and Change in Net Unrealized Appreciation (Depreciation) on Derivatives. The table below, which reflects the impacts of derivatives on the financial performance, summarizes the net realized gain (loss) and change in net unrealized appreciation (depreciation) for derivatives during the period as presented in the Statement of Operations.
| Primary Risk Exposure / Derivative Type | Net Realized Gain (Loss)($) | Change in Net Unrealized Appreciation (Depreciation)($) |
| Fidelity Series International Credit Fund | | |
| Credit Risk | | |
| Purchased Options | (374,187) | 71,331 |
| Swaps | (18,563) | (9,948) |
| Total Credit Risk | (392,750) | 61,383 |
| Foreign Exchange Risk | | |
| Forward Foreign Currency Contracts | (680,102) | (1,255,021) |
| Total Foreign Exchange Risk | (680,102) | (1,255,021) |
| Interest Rate Risk | | |
| Futures Contracts | (1,297,209) | 934,510 |
| Total Interest Rate Risk | (1,297,209) | 934,510 |
| Totals | (2,370,061) | (259,128) |
If there are any open positions at period end, a summary of the value of derivatives by primary risk exposure is included at the end of the Schedule of Investments.
Forward Foreign Currency Contracts. Forward foreign currency contracts represent obligations to purchase or sell foreign currency on a specified future date at a price fixed at the time the contracts are entered into. Forward foreign currency contracts were used to facilitate transactions in foreign-denominated securities and to manage exposure to certain foreign currencies.
Forward foreign currency contracts are valued daily and fluctuations in exchange rates on open contracts are recorded as unrealized appreciation or (depreciation) and reflected in total accumulated earnings (loss) in the Statement of Assets and Liabilities. When the contract is closed, a gain or loss is realized equal to the difference between the closing value and the value at the time it was opened. Non-deliverable forward foreign currency exchange contracts are settled with the counterparty in cash without the delivery of foreign currency. The net realized gain (loss) and change in net unrealized appreciation (depreciation) on forward foreign currency contracts during the period is presented in the Statement of Operations.
Any open forward foreign currency contracts at period end are presented in the Schedule of Investments under the caption "Forward Foreign Currency Contracts." The contract amount and unrealized appreciation (depreciation) reflects each contract's exposure to the underlying currency at period end, and is representative of volume of activity during the period unless an average contract value is presented.
Futures Contracts. A futures contract is an agreement between two parties to buy or sell a specified underlying instrument for a fixed price at a specified future date. Futures contracts were used to manage exposure to the bond market and fluctuations in interest rates.
Upon entering into a futures contract, a fund is required to deposit either cash or securities (initial margin) with a clearing broker in an amount equal to a certain percentage of the face value of the contract. Futures contracts are marked-to-market daily and subsequent daily payments are made or received by a fund depending on the daily fluctuations in the value of the futures contracts and are recorded as unrealized appreciation or (depreciation). This receivable and/or payable, if any, is included in daily variation margin on futures contracts in the Statement of Assets and Liabilities. Realized gain or (loss) is recorded upon the expiration or closing of a futures contract. The net realized gain (loss) and change in net unrealized appreciation (depreciation) on futures contracts during the period is presented in the Statement of Operations.
Any open futures contracts at period end are presented in the Schedule of Investments under the caption "Futures Contracts". The notional amount at value reflects each contract's exposure to the underlying instrument or index at period end, and is representative of volume of activity during the period unless an average notional amount is presented. Any securities deposited to meet initial margin requirements are identified in the Schedule of Investments. Any cash deposited to meet initial margin requirements is presented as segregated cash with brokers for derivative instruments in the Statement of Assets and Liabilities.
Options. Options give the purchaser the right, but not the obligation, to buy (call) or sell (put) an underlying security or financial instrument at an agreed exercise or strike price between or on certain dates. Options obligate the seller (writer) to buy (put) or sell (call) an underlying instrument at the exercise or strike price or cash settle an underlying derivative instrument if the holder exercises the option on or before the expiration date. OTC options, such as swaptions, which are options where the underlying instrument is a swap, were used to manage exposure to potential credit events.
Upon entering into an options contract, a fund will pay or receive a premium. Premiums paid on purchased options are reflected as cost of investments and premiums received on written options are reflected as a liability on the Statement of Assets and Liabilities. Certain options may be purchased or written with premiums to be paid or received on a future date. Options are valued daily and any unrealized appreciation (depreciation) is reflected in total accumulated earnings (loss) in the Statement of Assets and Liabilities. When an option is exercised, the cost or proceeds of the underlying instrument purchased or sold is adjusted by the amount of the premium. When an option is closed, a gain or loss is realized depending on whether the proceeds or amount paid for the closing sale transaction is greater or less than the premium received or paid. When an option expires, gains and losses are realized to the extent of premiums received and paid, respectively. The net realized and unrealized gains (losses) on purchased options are included in the Statement of Operations in net realized gain (loss) and change in net unrealized appreciation (depreciation) on investment securities. The net realized gain (loss) and change in net unrealized appreciation (depreciation) on written options are presented in the Statement of Operations.
Any open options at period end are presented in the Schedule of Investments under the captions "Purchased Options," "Purchased Swaptions," "Written Options" and "Written Swaptions," as applicable, and are representative of volume of activity during the period unless an average notional amount is presented.
Writing puts and buying calls tend to increase exposure to the underlying instrument while buying puts and writing calls tend to decrease exposure to the underlying instrument. For purchased options, risk of loss is limited to the premium paid, and for written options, risk of loss is the change in value in excess of the premium received.
Swaps. A swap is a contract between two parties to exchange future cash flows at periodic intervals based on a notional principal amount. A bi-lateral OTC swap is a transaction between a fund and a dealer counterparty where cash flows are exchanged between the two parties for the life of the swap.
Bi-lateral OTC swaps are marked-to-market daily and changes in value are reflected in the Statement of Assets and Liabilities in the bi-lateral OTC swaps at value line items. Any upfront premiums paid or received upon entering a bi-lateral OTC swap to compensate for differences between stated terms of the swap and prevailing market conditions (e.g. credit spreads, interest rates or other factors) are recorded in total accumulated earnings (loss) in the Statement of Assets and Liabilities and amortized to realized gain or (loss) ratably over the term of the swap. Any unamortized upfront premiums are presented in the Schedule of Investments.
Payments are exchanged at specified intervals, accrued daily commencing with the effective date of the contract and recorded as realized gain or (loss). Some swaps may be terminated prior to the effective date and realize a gain or loss upon termination. The net realized gain (loss) and change in net unrealized appreciation (depreciation) on swaps during the period is presented in the Statement of Operations.
Any open swaps at period end are included in the Schedule of Investments under the caption "Swaps", and are representative of volume of activity during the period unless an average notional amount is presented.
Credit Default Swaps. Credit default swaps enable a fund to buy or sell protection against specified credit events on a single-name issuer or a traded credit index. Under the terms of a credit default swap the buyer of protection (buyer) receives credit protection in exchange for making periodic payments to the seller of protection (seller) based on a fixed percentage applied to a notional principal amount. In return for these payments, the seller will be required to make a payment upon the occurrence of one or more specified credit events. A fund enters into credit default swaps as a seller to gain credit exposure to an issuer and/or as a buyer to obtain a measure of protection against defaults of an issuer. Periodic payments are made over the life of the contract by the buyer provided that no credit event occurs.
For credit default swaps on most corporate and sovereign issuers, credit events include bankruptcy, failure to pay or repudiation/moratorium. For credit default swaps on corporate or sovereign issuers, the obligation that may be put to the seller is not limited to the specific reference obligation described in the Schedule of Investments. For credit default swaps on asset-backed securities, a credit event may be triggered by events such as failure to pay principal, maturity extension, rating downgrade or write-down. For credit default swaps on asset-backed securities, the reference obligation described represents the security that may be put to the seller. For credit default swaps on a traded credit index, a specified credit event may affect all or individual underlying securities included in the index.
As a seller, if an underlying credit event occurs, a fund will pay a net settlement amount of cash equal to the notional amount of the swap less the recovery value of the reference obligation or underlying securities comprising an index. Only in the event of the industry's inability to value the underlying asset will a fund be required to take delivery of the reference obligation or underlying securities comprising an index and pay an amount equal to the notional amount of the swap.
As a buyer, if an underlying credit event occurs, a fund will receive a net settlement amount of cash equal to the notional amount of the swap less the recovery value of the reference obligation or underlying securities comprising an index. Only in the event of the industry's inability to value the underlying asset will a fund be required to deliver the reference obligation or underlying securities comprising an index in exchange for payment of an amount equal to the notional amount of the swap.
Typically, the value of each credit default swap and credit rating disclosed for each reference obligation in the Schedule of Investments, where a fund is the seller, can be used as measures of the current payment/performance risk of the swap. As the value of the swap changes as a positive or negative percentage of the total notional amount, the payment/performance risk may decrease or increase, respectively. In addition to these measures, the investment adviser monitors a variety of factors including cash flow assumptions, market activity and market sentiment as part of its ongoing process of assessing payment/performance risk.
5. Purchases and Sales of Investments.
Purchases and sales of securities, other than short-term securities, U.S. government securities and in-kind transactions, as applicable, are noted in the table below.
| | Purchases ($) | Sales ($) |
| Fidelity Series International Credit Fund | 44,678,111 | 51,118,325 |
6. Fees and Other Transactions with Affiliates.
Management Fee. Fidelity Management & Research Company LLC (the investment adviser) and its affiliates provide the Fund with investment management related services for which the Fund does not pay a management fee. Under the management contract, the investment adviser or an affiliate pays all ordinary operating expenses of the Fund, except custody fees, fees and expenses of the independent Trustees, and certain miscellaneous expenses such as proxy and shareholder meeting expenses.
Interfund Trades. Funds may purchase from or sell securities to other Fidelity Funds under procedures adopted by the Board. The procedures have been designed to ensure these interfund trades are executed in accordance with Rule 17a-7 of the 1940 Act. Any interfund trades are included within the respective purchases and sales amounts shown in the Purchases and Sales of Investments note. During the period, there were no interfund trades.
Subsequent Event - Sub-Advisory Arrangements. Effective March 1, 2024, the Fund's sub-advisory agreements with FMR Investment Management (UK) Limited, Fidelity Management & Research (Hong Kong) Limited, and Fidelity Management & Research (Japan) Limited will be amended to provide that the investment adviser will pay each sub-adviser monthly fees equal to 110% of the sub-adviser's costs for providing sub-advisory services.
7. Committed Line of Credit.
Certain Funds participate with other funds managed by the investment adviser or an affiliate in a $4.25 billion credit facility (the "line of credit") to be utilized for temporary or emergency purposes to fund shareholder redemptions or for other short-term liquidity purposes. The commitment fees on the pro-rata portion of the line of credit are borne by the investment adviser. During the period, there were no borrowings on this line of credit.
8. Security Lending.
Funds lend portfolio securities from time to time in order to earn additional income. Lending agents are used, including National Financial Services (NFS), an affiliate of the investment adviser. Pursuant to a securities lending agreement, NFS will receive a fee, which is capped at 9.9% of a fund's daily lending revenue, for its services as lending agent. A fund may lend securities to certain qualified borrowers, including NFS. On the settlement date of the loan, a fund receives collateral (in the form of U.S. Treasury obligations, letters of credit and/or cash) against the loaned securities and maintains collateral in an amount not less than 100% of the market value of the loaned securities during the period of the loan. The market value of the loaned securities is determined at the close of business of a fund and any additional required collateral is delivered to a fund on the next business day. A fund or borrower may terminate the loan at any time, and if the borrower defaults on its obligation to return the securities loaned because of insolvency or other reasons, a fund may apply collateral received from the borrower against the obligation. A fund may experience delays and costs in recovering the securities loaned. Any cash collateral received is invested in the Fidelity Securities Lending Cash Central Fund. Any loaned securities are identified as such in the Schedule of Investments, and the value of loaned securities and cash collateral at period end, as applicable, are presented in the Statement of Assets and Liabilities. Security lending income represents the income earned on investing cash collateral, less rebates paid to borrowers and any lending agent fees associated with the loan, plus any premium payments received for lending certain types of securities. Security lending income is presented in the Statement of Operations as a component of income from Fidelity Central Funds. Affiliated security lending activity, if any, was as follows:
| | Total Security Lending Fees Paid to NFS | Security Lending Income From Securities Loaned to NFS | Value of Securities Loaned to NFS at Period End |
| Fidelity Series International Credit Fund | $1 | $ - | $- |
9. Expense Reductions.
The investment adviser contractually agreed to reimburse the Fund to the extent annual operating expenses exceeded .003% of average net assets. This reimbursement will remain in place through April 30, 2027. Some expenses, for example the compensation of the independent Trustees, and certain other expenses such as interest expense, are excluded from this reimbursement. During the period this reimbursement reduced the Fund's expenses by $2,418.
Through arrangements with the Fund's custodian, credits realized as a result of certain uninvested cash balances were used to reduce the Fund's expenses by $970.
10. Other.
A fund's organizational documents provide former and current trustees and officers with a limited indemnification against liabilities arising in connection with the performance of their duties to the fund. In the normal course of business, a fund may also enter into contracts that provide general indemnifications. A fund's maximum exposure under these arrangements is unknown as this would be dependent on future claims that may be made against a fund. The risk of material loss from such claims is considered remote.
11. Risk and Uncertainties.
Many factors affect a fund's performance. Developments that disrupt global economies and financial markets, such as pandemics, epidemics, outbreaks of infectious diseases, war, terrorism, and environmental disasters, may significantly affect a fund's investment performance. The effects of these developments to a fund will be impacted by the types of securities in which a fund invests, the financial condition, industry, economic sector, and geographic location of an issuer, and a fund's level of investment in the securities of that issuer. Significant concentrations in security types, issuers, industries, sectors, and geographic locations may magnify the factors that affect a fund's performance.
To the Board of Trustees of Fidelity School Street Trust and Shareholders of Fidelity Series International Credit Fund
Opinion on the Financial Statements
We have audited the accompanying statement of assets and liabilities, including the schedule of investments, of Fidelity Series International Credit Fund (one of the funds constituting Fidelity School Street Trust, referred to hereafter as the "Fund") as of December 31, 2023, the related statement of operations for the year ended December 31, 2023, the statement of changes in net assets for each of the two years in the period ended December 31, 2023, including the related notes, and the financial highlights for each of the five years in the period ended December 31, 2023 (collectively referred to as the "financial statements"). In our opinion, the financial statements present fairly, in all material respects, the financial position of the Fund as of December 31, 2023, the results of its operations for the year then ended, the changes in its net assets for each of the two years in the period ended December 31, 2023 and the financial highlights for each of the five years in the period ended December 31, 2023 in conformity with accounting principles generally accepted in the United States of America.
Basis for Opinion
These financial statements are the responsibility of the Fund's management. Our responsibility is to express an opinion on the Fund's financial statements based on our audits. We are a public accounting firm registered with the Public Company Accounting Oversight Board (United States) (PCAOB) and are required to be independent with respect to the Fund in accordance with the U.S. federal securities laws and the applicable rules and regulations of the Securities and Exchange Commission and the PCAOB.
We conducted our audits of these financial statements in accordance with the standards of the PCAOB. Those standards require that we plan and perform the audit to obtain reasonable assurance about whether the financial statements are free of material misstatement, whether due to error or fraud.
Our audits included performing procedures to assess the risks of material misstatement of the financial statements, whether due to error or fraud, and performing procedures that respond to those risks. Such procedures included examining, on a test basis, evidence regarding the amounts and disclosures in the financial statements. Our audits also included evaluating the accounting principles used and significant estimates made by management, as well as evaluating the overall presentation of the financial statements. Our procedures included confirmation of securities owned as of December 31, 2023 by correspondence with the custodian and brokers; when replies were not received from brokers, we performed other auditing procedures. We believe that our audits provide a reasonable basis for our opinion.
/s/ PricewaterhouseCoopers LLP
Boston, Massachusetts
February 14, 2024
We have served as the auditor of one or more investment companies in the Fidelity group of funds since 1932.
The Trustees, Members of the Advisory Board (if any), and officers of the trust and fund, as applicable, are listed below. The Board of Trustees governs the fund and is responsible for protecting the interests of shareholders. The Trustees are experienced executives who meet periodically throughout the year to oversee the fund's activities, review contractual arrangements with companies that provide services to the fund, oversee management of the risks associated with such activities and contractual arrangements, and review the fund's performance. Each of the Trustees oversees 314 funds.
The Trustees hold office without limit in time except that (a) any Trustee may resign; (b) any Trustee may be removed by written instrument, signed by at least two-thirds of the number of Trustees prior to such removal; (c) any Trustee who requests to be retired or who has become incapacitated by illness or injury may be retired by written instrument signed by a majority of the other Trustees; and (d) any Trustee may be removed at any special meeting of shareholders by a two-thirds vote of the outstanding voting securities of the trust. Each Trustee who is not an interested person (as defined in the 1940 Act) of the trust and the fund is referred to herein as an Independent Trustee. Each Independent Trustee shall retire not later than the last day of the calendar year in which his or her 75th birthday occurs. The Independent Trustees may waive this mandatory retirement age policy with respect to individual Trustees. Officers and Advisory Board Members hold office without limit in time, except that any officer or Advisory Board Member may resign or may be removed by a vote of a majority of the Trustees at any regular meeting or any special meeting of the Trustees. Except as indicated, each individual has held the office shown or other offices in the same company for the past five years.
The fund's Statement of Additional Information (SAI) includes more information about the Trustees. To request a free copy, call Fidelity at 1-800-544-8544.
Experience, Skills, Attributes, and Qualifications of the Trustees. The Governance and Nominating Committee has adopted a statement of policy that describes the experience, qualifications, attributes, and skills that are necessary and desirable for potential Independent Trustee candidates (Statement of Policy). The Board believes that each Trustee satisfied at the time he or she was initially elected or appointed a Trustee, and continues to satisfy, the standards contemplated by the Statement of Policy. The Governance and Nominating Committee also engages professional search firms to help identify potential Independent Trustee candidates who have the experience, qualifications, attributes, and skills consistent with the Statement of Policy. From time to time, additional criteria based on the composition and skills of the current Independent Trustees, as well as experience or skills that may be appropriate in light of future changes to board composition, business conditions, and regulatory or other developments, have also been considered by the professional search firms and the Governance and Nominating Committee. In addition, the Board takes into account the Trustees' commitment and participation in Board and committee meetings, as well as their leadership of standing and ad hoc committees throughout their tenure.
In determining that a particular Trustee was and continues to be qualified to serve as a Trustee, the Board has considered a variety of criteria, none of which, in isolation, was controlling. The Board believes that, collectively, the Trustees have balanced and diverse experience, qualifications, attributes, and skills, which allow the Board to operate effectively in governing the fund and protecting the interests of shareholders. Information about the specific experience, skills, attributes, and qualifications of each Trustee, which in each case led to the Board's conclusion that the Trustee should serve (or continue to serve) as a trustee of the fund, is provided below.
Board Structure and Oversight Function. Abigail P. Johnson is an interested person and currently serves as Chairman. The Trustees have determined that an interested Chairman is appropriate and benefits shareholders because an interested Chairman has a personal and professional stake in the quality and continuity of services provided to the fund. Independent Trustees exercise their informed business judgment to appoint an individual of their choosing to serve as Chairman, regardless of whether the Trustee happens to be independent or a member of management. The Independent Trustees have determined that they can act independently and effectively without having an Independent Trustee serve as Chairman and that a key structural component for assuring that they are in a position to do so is for the Independent Trustees to constitute a substantial majority for the Board. The Independent Trustees also regularly meet in executive session. Michael E. Kenneally serves as Chairman of the Independent Trustees and as such (i) acts as a liaison between the Independent Trustees and management with respect to matters important to the Independent Trustees and (ii) with management prepares agendas for Board meetings.
Fidelity® funds are overseen by different Boards of Trustees. The fund's Board oversees Fidelity's investment-grade bond, money market, asset allocation and certain equity funds, and other Boards oversee Fidelity's alternative investment, high income and other equity funds. The asset allocation funds may invest in Fidelity® funds that are overseen by such other Boards. The use of separate Boards, each with its own committee structure, allows the Trustees of each group of Fidelity® funds to focus on the unique issues of the funds they oversee, including common research, investment, and operational issues. On occasion, the separate Boards establish joint committees to address issues of overlapping consequences for the Fidelity® funds overseen by each Board.
The Trustees operate using a system of committees to facilitate the timely and efficient consideration of all matters of importance to the Trustees, the fund, and fund shareholders and to facilitate compliance with legal and regulatory requirements and oversight of the fund's activities and associated risks. The Board, acting through its committees, has charged FMR and its affiliates with (i) identifying events or circumstances the occurrence of which could have demonstrably adverse effects on the fund's business and/or reputation; (ii) implementing processes and controls to lessen the possibility that such events or circumstances occur or to mitigate the effects of such events or circumstances if they do occur; and (iii) creating and maintaining a system designed to evaluate continuously business and market conditions in order to facilitate the identification and implementation processes described in (i) and (ii) above. Because the day-to-day operations and activities of the fund are carried out by or through FMR, its affiliates, and other service providers, the fund's exposure to risks is mitigated but not eliminated by the processes overseen by the Trustees. While each of the Board's committees has responsibility for overseeing different aspects of the fund's activities, oversight is exercised primarily through the Operations and Audit Committees. In addition, an ad hoc Board committee of Independent Trustees has worked with FMR to enhance the Board's oversight of investment and financial risks, legal and regulatory risks, technology risks, and operational risks, including the development of additional risk reporting to the Board. Appropriate personnel, including but not limited to the fund's Chief Compliance Officer (CCO), FMR's internal auditor, the independent accountants, the fund's Treasurer and portfolio management personnel, make periodic reports to the Board's committees, as appropriate, including an annual review of Fidelity's risk management program for the Fidelity® funds. The responsibilities of each standing committee, including their oversight responsibilities, are described further under "Standing Committees of the Trustees."
Interested Trustees*:
Correspondence intended for a Trustee who is an interested person may be sent to Fidelity Investments, 245 Summer Street, Boston, Massachusetts 02210.
Name, Year of Birth; Principal Occupations and Other Relevant Experience+
Abigail P. Johnson (1961)
Year of Election or Appointment: 2009
Trustee
Chairman of the Board of Trustees
Ms. Johnson also serves as Trustee of other Fidelity® funds. Ms. Johnson serves as Chairman (2016-present), Chief Executive Officer (2014-present), and Director (2007-present) of FMR LLC (diversified financial services company), President of Fidelity Financial Services (2012-present) and President of Personal, Workplace and Institutional Services (2005-present). Ms. Johnson is Chairman and Director of Fidelity Management & Research Company LLC (investment adviser firm, 2011-present). Previously, Ms. Johnson served as Chairman and Director of FMR Co., Inc. (investment adviser firm, 2011-2019), Vice Chairman (2007-2016) and President (2013-2016) of FMR LLC, President and a Director of Fidelity Management & Research Company (2001-2005), a Trustee of other investment companies advised by Fidelity Management & Research Company, Fidelity Investments Money Management, Inc. (investment adviser firm), and FMR Co., Inc. (2001-2005), Senior Vice President of the Fidelity® funds (2001-2005), and managed a number of Fidelity® funds. Ms. Abigail P. Johnson and Mr. Arthur E. Johnson are not related.
Jennifer Toolin McAuliffe (1959)
Year of Election or Appointment: 2016
Trustee
Ms. McAuliffe also serves as Trustee of other Fidelity® funds and as Trustee of Fidelity Charitable (2020-present). Previously, Ms. McAuliffe served as Co-Head of Fixed Income of Fidelity Investments Limited (now known as FIL Limited (FIL)) (diversified financial services company), Director of Research for FIL's credit and quantitative teams in London, Hong Kong and Tokyo and Director of Research for taxable and municipal bonds at Fidelity Investments Money Management, Inc. Ms. McAuliffe previously served as a member of the Advisory Board of certain Fidelity® funds (2016). Ms. McAuliffe was previously a lawyer at Ropes & Gray LLP and an international banker at Chemical Bank NA (now JPMorgan Chase & Co.). Ms. McAuliffe also currently serves as director or trustee of several not-for-profit entities.
Christine J. Thompson (1958)
Year of Election or Appointment: 2023
Trustee
Ms. Thompson also serves as a Trustee of other Fidelity® funds. Ms. Thompson serves as Leader of Advanced Technologies for Investment Management at Fidelity Investments (2018-present). Previously, Ms. Thompson served as Chief Investment Officer in the Bond group at Fidelity Management & Research Company (2010-2018) and held various other roles including Director of municipal bond portfolio managers and Portfolio Manager of certain Fidelity® funds.
* Determined to be an "Interested Trustee" by virtue of, among other things, his or her affiliation with the trust or various entities under common control with FMR.
+ The information includes the Trustee's principal occupation during the last five years and other information relating to the experience, attributes, and skills relevant to the Trustee's qualifications to serve as a Trustee, which led to the conclusion that the Trustee should serve as a Trustee for the fund.
Independent Trustees:
Correspondence intended for an Independent Trustee may be sent to Fidelity Investments, P.O. Box 55235, Boston, Massachusetts 02205-5235.
Name, Year of Birth; Principal Occupations and Other Relevant Experience+
Elizabeth S. Acton (1951)
Year of Election or Appointment: 2013
Trustee
Ms. Acton also serves as Trustee of other Fidelity® funds. Prior to her retirement, Ms. Acton served as Executive Vice President, Finance (2011-2012), Executive Vice President, Chief Financial Officer (2002-2011) and Treasurer (2004-2005) of Comerica Incorporated (financial services). Prior to joining Comerica, Ms. Acton held a variety of positions at Ford Motor Company (1983-2002), including Vice President and Treasurer (2000-2002) and Executive Vice President and Chief Financial Officer of Ford Motor Credit Company (1998-2000). Ms. Acton currently serves as a member of the Board and Audit and Finance Committees of Beazer Homes USA, Inc. (homebuilding, 2012-present). Ms. Acton previously served as a member of the Advisory Board of certain Fidelity® funds (2013-2016).
Laura M. Bishop (1961)
Year of Election or Appointment: 2023
Trustee
Ms. Bishop also serves as Trustee or Member of the Advisory Board of other Fidelity® funds. Prior to her retirement, Ms. Bishop held a variety of positions at United Services Automobile Association (2001-2020), including Executive Vice President and Chief Financial Officer (2014-2020) and Senior Vice President and Deputy Chief Financial Officer (2012-2014). Ms. Bishop currently serves as a member of the Audit Committee and Compensation and Personnel Committee (2021-present) of the Board of Directors of Korn Ferry (global organizational consulting). Previously, Ms. Bishop served as a Member of the Advisory Board of certain Fidelity® funds (2022-2023).
Ann E. Dunwoody (1953)
Year of Election or Appointment: 2018
Trustee
General Dunwoody also serves as Trustee of other Fidelity® funds. General Dunwoody (United States Army, Retired) was the first woman in U.S. military history to achieve the rank of four-star general and prior to her retirement in 2012 held a variety of positions within the U.S. Army, including Commanding General, U.S. Army Material Command (2008-2012). General Dunwoody currently serves as a member of the Board, Chair of Nomination Committee and a member of the Corporate Governance Committee of Kforce Inc. (professional staffing services, 2016-present) and a member of the Board of Automattic Inc. (software engineering, 2018-present). Previously, General Dunwoody served as President of First to Four LLC (leadership and mentoring services, 2012-2022), a member of the Advisory Board and Nominating and Corporate Governance Committee of L3 Technologies, Inc. (communication, electronic, sensor and aerospace systems, 2013-2019) and a member of the Board and Audit and Sustainability and Corporate Responsibility Committees of Republic Services, Inc. (waste collection, disposal and recycling, 2013-2016). General Dunwoody also serves on several boards for non-profit organizations, including as a member of the Board, Chair of the Nomination and Governance Committee and a member of the Audit Committee of the Noble Reach Foundation (formerly Logistics Management Institute) (consulting non-profit, 2012-present) and a member of the Board of ThanksUSA (military family education non-profit, 2014-present). Previously, General Dunwoody served as a member of the Board of Florida Institute of Technology (2015-2022) and a member of the Council of Trustees for the Association of the United States Army (advocacy non-profit, 2013-2021). General Dunwoody previously served as a member of the Advisory Board of certain Fidelity® funds (2018).
John Engler (1948)
Year of Election or Appointment: 2014
Trustee
Mr. Engler also serves as Trustee of other Fidelity® funds. Previously, Mr. Engler served as Governor of Michigan (1991-2003), President of the Business Roundtable (2011-2017) and interim President of Michigan State University (2018-2019). Previously, Mr. Engler served as a member of the Board of Stride, Inc. (formerly K12 Inc.) (technology-based education company, 2012-2022), a member of the Board of Universal Forest Products (manufacturer and distributor of wood and wood-alternative products, 2003-2019) and Trustee of The Munder Funds (2003-2014). Mr. Engler previously served as a member of the Advisory Board of certain Fidelity® funds (2014-2016).
Robert F. Gartland (1951)
Year of Election or Appointment: 2010
Trustee
Mr. Gartland also serves as Trustee of other Fidelity® funds. Prior to his retirement, Mr. Gartland held a variety of positions at Morgan Stanley (financial services, 1979-2007), including Managing Director (1987-2007) and Chase Manhattan Bank (1975-1978). Mr. Gartland previously served as Chairman and an investor in Gartland & Mellina Group Corp. (consulting, 2009-2019), as a member of the Board of National Securities Clearing Corporation (1993-1996) and as Chairman of TradeWeb (2003-2004).
Robert W. Helm (1957)
Year of Election or Appointment: 2023
Trustee
Mr. Helm also serves as Trustee or Member of the Advisory Board of other Fidelity® funds. Mr. Helm was formerly Deputy Chairman (2003-2020), partner (1991-2020) and an associate (1984-1991) of Dechert LLP (formerly Dechert Price & Rhoads). Mr. Helm currently serves on boards and committees of several not-for-profit organizations, including as a Trustee and member of the Executive Committee of the Baltimore Council on Foreign Affairs, a member of the Board of Directors of the St. Vincent de Paul Society of Baltimore and a member of the Life Guard Society of Mt. Vernon. Previously, Mr. Helm served as a Member of the Advisory Board of certain Fidelity® funds (2021-2023).
Michael E. Kenneally (1954)
Year of Election or Appointment: 2009
Trustee
Chairman of the Independent Trustees
Mr. Kenneally also serves as Trustee of other Fidelity® funds and was Vice Chairman (2018-2021) of the Independent Trustees of certain Fidelity® funds. Prior to retirement in 2005, he was Chairman and Global Chief Executive Officer of Credit Suisse Asset Management, the worldwide fund management and institutional investment business of Credit Suisse Group. Previously, Mr. Kenneally was an Executive Vice President and the Chief Investment Officer for Bank of America. In this role, he was responsible for the investment management, strategy and products delivered to the bank's institutional, high-net-worth and retail clients. Earlier, Mr. Kenneally directed the organization's equity and quantitative research groups. He began his career as a research analyst and then spent more than a dozen years as a portfolio manager for endowments, pension plans and mutual funds. He earned the Chartered Financial Analyst (CFA) designation in 1991.
Mark A. Murray (1954)
Year of Election or Appointment: 2016
Trustee
Mr. Murray also serves as Trustee of other Fidelity® funds. Previously, Mr. Murray served as Co-Chief Executive Officer (2013-2016), President (2006-2013) and Vice Chairman (2013-2020) of Meijer, Inc. Mr. Murray serves as a member of the Board (2009-present) and Public Policy and Responsibility Committee (2009-present) and Chair of the Nuclear Review Committee (2019-present) of DTE Energy Company (diversified energy company). Mr. Murray previously served as a member of the Board of Spectrum Health (not-for-profit health system, 2015-2019) and as a member of the Board and Audit Committee and Chairman of the Nominating and Corporate Governance Committee of Universal Forest Products, Inc. (manufacturer and distributor of wood and wood-alternative products, 2004-2016). Mr. Murray also serves as a member of the Board of many community and professional organizations. Mr. Murray previously served as a member of the Advisory Board of certain Fidelity® funds (2016).
Carol J. Zierhoffer (1960)
Year of Election or Appointment: 2023
Trustee
Ms. Zierhoffer also serves as Trustee or Member of the Advisory Board of other Fidelity® funds. Prior to her retirement, Ms. Zierhoffer held a variety of positions at Bechtel Corporation (engineering company, 2013-2019), including Principal Vice President and Chief Information Officer (2013-2016) and Senior Vice President and Chief Information Officer (2016-2019). Ms. Zierhoffer currently serves as a member of the Board of Directors, Audit Committee and Compensation Committee of Allscripts Healthcare Solutions, Inc. (healthcare technology, 2020-present) and as a member of the Board of Directors, Audit and Finance Committee and Nominating and Governance Committee of Atlas Air Worldwide Holdings, Inc. (aviation operating services, 2021-present). Previously, Ms. Zierhoffer served as a member of the Board of Directors and Audit Committee and as the founding Chair of the Information Technology Committee of MedAssets, Inc. (healthcare technology, 2013-2016), and as a Member of the Advisory Board of certain Fidelity® funds (2023).
+ The information includes the Trustee's principal occupation during the last five years and other information relating to the experience, attributes, and skills relevant to the Trustee's qualifications to serve as a Trustee, which led to the conclusion that the Trustee should serve as a Trustee for the fund.
Advisory Board Members and Officers:
Correspondence intended for a Member of the Advisory Board (if any) may be sent to Fidelity Investments, P.O. Box 55235, Boston, Massachusetts 02205-5235. Correspondence intended for an officer may be sent to Fidelity Investments, 245 Summer Street, Boston, Massachusetts 02210.
Name, Year of Birth; Principal Occupation
Heather Bonner (1977)
Year of Election or Appointment: 2023
Assistant Treasurer
Ms. Bonner also serves as an officer of other funds. Ms. Bonner is a Senior Vice President (2022-present) and is an employee of Fidelity Investments (2022-present). Ms. Bonner serves as Vice President, Treasurer, or Assistant Treasurer of certain Fidelity entities. Prior to joining Fidelity, Ms. Bonner served as Managing Director at AQR Capital Management (2013-2022) and was the Treasurer and Principal Financial Officer of the AQR Funds (2013-2022).
Craig S. Brown (1977)
Year of Election or Appointment: 2019
Assistant Treasurer
Mr. Brown also serves as an officer of other funds. Mr. Brown is a Vice President (2015-present) and is an employee of Fidelity Investments. Mr. Brown serves as Assistant Treasurer of FIMM, LLC (2021-present). Previously, Mr. Brown served as Assistant Treasurer of certain Fidelity® funds (2019-2022).
John J. Burke III (1964)
Year of Election or Appointment: 2018
Chief Financial Officer
Mr. Burke also serves as Chief Financial Officer of other funds. Mr. Burke is Head of Fidelity Fund and Investment Operations (2018-present) and is an employee of Fidelity Investments. Mr. Burke serves as President, Executive Vice President, or Director of certain Fidelity entities. Previously Mr. Burke served as head of Asset Management Investment Operations (2012-2018).
Margaret Carey (1973)
Year of Election or Appointment: 2023
Secretary and Chief Legal Officer (CLO)
Ms. Carey also serves as an officer of other funds and as CLO of certain Fidelity entities. Ms. Carey is a Senior Vice President, Deputy General Counsel (2019-present) and is an employee of Fidelity Investments.
David J. Carter (1973)
Year of Election or Appointment: 2020
Assistant Secretary
Mr. Carter also serves as Assistant Secretary of other funds. Mr. Carter is a Senior Vice President, Deputy General Counsel (2022-present) and is an employee of Fidelity Investments. Mr. Carter serves as Chief Legal Officer of Fidelity Investments Institutional Operations Company LLC - Shareholder Division (transfer agent, 2020-present).
Jonathan Davis (1968)
Year of Election or Appointment: 2010
Assistant Treasurer
Mr. Davis also serves as an officer of other funds. Mr. Davis is a Vice President (2006-present) and is an employee of Fidelity Investments. Mr. Davis serves as Assistant Treasurer of certain Fidelity entities.
Laura M. Del Prato (1964)
Year of Election or Appointment: 2018
President and Treasurer
Ms. Del Prato also serves as an officer of other funds. Ms. Del Prato is a Senior Vice President (2017-present) and is an employee of Fidelity Investments. Ms. Del Prato serves as Vice President or Assistant Treasurer of certain Fidelity entities. Previously, Ms. Del Prato served as President and Treasurer of The North Carolina Capital Management Trust: Cash Portfolio and Term Portfolio (2018-2020).
Robin Foley (1964)
Year of Election or Appointment: 2023
Vice President
Ms. Foley also serves as Vice President of other funds. Ms. Foley serves as Head of Fidelity's Fixed Income division (2023-present) and is an employee of Fidelity Investments. Previously, Ms. Foley served as Chief Investment Officer of Bonds (2017-2023).
Christopher M. Gouveia (1973)
Year of Election or Appointment: 2023
Chief Compliance Officer
Mr. Gouveia also serves as Chief Compliance Officer of other funds. Mr. Gouveia is a Senior Vice President of Asset Management Compliance (2019-present) and is an employee of Fidelity Investments. Mr. Gouveia serves as Compliance Officer of Fidelity Management Trust Company (2023-present). Previously, Mr. Gouveia served as Chief Compliance Officer of the North Carolina Capital Management Trust (2016-2019).
Colm A. Hogan (1973)
Year of Election or Appointment: 2016
Assistant Treasurer
Mr. Hogan also serves as an officer of other funds. Mr. Hogan is a Vice President (2016-present) and is an employee of Fidelity Investments. Mr. Hogan serves as Assistant Treasurer of certain Fidelity entities. Previously, Mr. Hogan served as Deputy Treasurer of certain Fidelity® funds (2016-2020) and Assistant Treasurer of certain Fidelity® funds (2016-2018).
Chris Maher (1972)
Year of Election or Appointment: 2013
Assistant Treasurer
Mr. Maher also serves as an officer of other funds. Mr. Maher is a Vice President (2008-present) and is an employee of Fidelity Investments. Mr. Maher serves as Assistant Treasurer of certain Fidelity entities. Previously, Mr. Maher served as Assistant Treasurer of certain funds (2013-2020).
Brett Segaloff (1972)
Year of Election or Appointment: 2021
Anti-Money Laundering (AML) Officer
Mr. Segaloff also serves as AML Officer of other funds. Mr. Segaloff is a Vice President (2022-present) and is an employee of Fidelity Investments. Mr. Segaloff serves as Anti Money Laundering Compliance Officer or Anti Money Laundering/Bank Secrecy Act Compliance Officer of certain Fidelity entities.
Stacie M. Smith (1974)
Year of Election or Appointment: 2013
Assistant Treasurer
Ms. Smith also serves as an officer of other funds. Ms. Smith is a Senior Vice President (2016-present) and is an employee of Fidelity Investments. Ms. Smith serves as Assistant Treasurer of certain Fidelity entities and has served in other fund officer roles.
Jim Wegmann (1979)
Year of Election or Appointment: 2021
Deputy Treasurer
Mr. Wegmann also serves as an officer of other funds. Mr. Wegmann is a Vice President (2016-present) and is an employee of Fidelity Investments. Mr. Wegmann serves as Assistant Treasurer of FIMM, LLC (2021-present). Previously, Mr. Wegmann served as Assistant Treasurer of certain Fidelity® funds (2019-2021).
As a shareholder, you incur two types of costs: (1) transaction costs, which may include sales charges (loads) on purchase payments or redemption proceeds, as applicable and (2) ongoing costs, which generally include management fees, distribution and/or service (12b-1) fees and other Fund expenses. This Example is intended to help you understand your ongoing costs (in dollars) of investing in a fund and to compare these costs with the ongoing costs of investing in other mutual funds.
| The Example is based on an investment of $1,000 invested at the beginning of the period and held for the entire period (July 1, 2023 to December 31, 2023). |
Actual Expenses
The first line of the accompanying table provides information about actual account values and actual expenses. You may use the information in this line, together with the amount you invested, to estimate the expenses that you paid over the period. Simply divide your account value by $1,000.00 (for example, an $8,600 account value divided by $1,000.00 = 8.6), then multiply the result by the number in the first line for a class/Fund under the heading entitled "Expenses Paid During Period" to estimate the expenses you paid on your account during this period. If any fund is a shareholder of any underlying mutual funds or exchange-traded funds (ETFs) (the Underlying Funds), such fund indirectly bears its proportional share of the expenses of the Underlying Funds in addition to the direct expenses incurred presented in the table. These fees and expenses are not included in the annualized expense ratio used to calculate the expense estimate in the table below.
Hypothetical Example for Comparison Purposes
The second line of the accompanying table provides information about hypothetical account values and hypothetical expenses based on the actual expense ratio and an assumed rate of return of 5% per year before expenses, which is not the actual return. The hypothetical account values and expenses may not be used to estimate the actual ending account balance or expenses you paid for the period. You may use this information to compare the ongoing costs of investing in the Fund and other funds. To do so, compare this 5% hypothetical example with the 5% hypothetical examples that appear in the shareholder reports of the other funds. If any fund is a shareholder of any Underlying Funds, such fund indirectly bears its proportional share of the expenses of the Underlying Funds in addition to the direct expenses as presented in the table. These fees and expenses are not included in the annualized expense ratio used to calculate the expense estimate in the table below.
Please note that the expenses shown in the table are meant to highlight your ongoing costs only and do not reflect any transaction costs. Therefore, the second line of the table is useful in comparing ongoing costs only, and will not help you determine the relative total costs of owning different funds. In addition, if these transactional costs were included, your costs would have been higher.
| | | | | Annualized Expense Ratio- A | | Beginning Account Value July 1, 2023 | | Ending Account Value December 31, 2023 | | Expenses Paid During Period- C July 1, 2023 to December 31, 2023 |
| | | | | | | | | | |
| Fidelity® Series International Credit Fund | | | | -%-D | | | | | | |
| Actual | | | | | | $ 1,000 | | $ 1,066.90 | | $-E |
Hypothetical-B | | | | | | $ 1,000 | | $ 1,025.21 | | $-E |
| |
A Annualized expense ratio reflects expenses net of applicable fee waivers.
B 5% return per year before expenses
C Expenses are equal to the annualized expense ratio, multiplied by the average account value over the period, multiplied by 184/ 365 (to reflect the one-half year period). The fees and expenses of any Underlying Funds are not included in each annualized expense ratio.
D Amount represents less than .005%.
E Amount represents less than $.005.
The dividend and capital gains distributions for the fund(s) are available on Fidelity.com or Institutional.Fidelity.com.
A total of 7.67% of the dividends distributed during the fiscal year was derived from interest on U.S. Government securities which is generally exempt from state income tax.
The fund designates $2,875,899 of distributions paid during the fiscal year ended 2023 as qualifying to be taxed as section 163(j) interest dividends.
The fund will notify shareholders in January 2024 of amounts for use in preparing 2023 income tax returns.
Board Approval of Investment Advisory Contracts and Management Fees
Fidelity Series International Credit Fund
Each year, the Board of Trustees, including the Independent Trustees (together, the Board), considers the renewal of the fund's management contract with Fidelity Management & Research Company LLC (FMR) and the sub-advisory agreements (together, the Advisory Contracts) for the fund. FMR and the sub-advisers are referred to herein as the Investment Advisers. The Board, assisted by the advice of fund counsel and Independent Trustees' counsel, requests and considers a broad range of information relevant to the renewal of the Advisory Contracts throughout the year.
The Board meets regularly and, at each of its meetings, covers an extensive agenda of topics and materials and considers factors that are relevant to its annual consideration of the renewal of the fund's Advisory Contracts, including the services and support provided to the fund and its shareholders. The Board's Operations Committee, of which all the Independent Trustees are members, meets regularly throughout the year and requests, receives and considers, among other matters, information related to the annual consideration of the renewal of the fund's Advisory Contracts before making its recommendation to the Board. The Board also meets as needed to review matters specifically related to the Board's annual consideration of the renewal of the Advisory Contracts. Members of the Board may also meet from time to time with trustees of other Fidelity funds through joint ad hoc committees to discuss certain matters relevant to all of the Fidelity funds.
At its September 2023 meeting, the Board unanimously determined to renew the fund's Advisory Contracts. In considering whether to renew the Advisory Contracts for the fund, the Board considered all factors it believed relevant and reached a determination, with the assistance of fund counsel and Independent Trustees' counsel and through the exercise of its business judgment, that the renewal of the Advisory Contracts was in the best interests of the fund and its shareholders and the fact that no fee is payable under the management contract was fair and reasonable.
Nature, Extent, and Quality of Services Provided. The Board considered staffing as it relates to the fund, including the backgrounds and experience of investment personnel of the Investment Advisers, and also considered the Investment Advisers' implementation of the fund's investment program. The Independent Trustees also had discussions with senior management of Fidelity's investment operations and investment groups. The Board considered the structure of the investment personnel compensation program and whether this structure provides appropriate incentives to act in the best interests of the fund.
Resources Dedicated to Investment Management and Support Services. The Board reviewed the general qualifications and capabilities of Fidelity's investment staff, including its size, education, experience, and resources, as well as Fidelity's approach to recruiting, training, managing, and compensating investment personnel. The Board noted Fidelity's resources devoted to non-U.S. offices and Fidelity's global investment organization. The Board also noted that Fidelity's analysts have extensive resources, tools and capabilities that allow them to conduct quantitative and fundamental analysis, as well as credit analysis of issuers, counterparties and guarantors. Further, the Board considered that Fidelity's investment professionals have sufficient access to global information and data so as to provide competitive investment results over time, and that those professionals also have access to sophisticated tools that permit them to assess portfolio construction and risk and performance attribution characteristics continuously, as well as to transmit new information and research conclusions rapidly around the world. Additionally, in its deliberations, the Board considered Fidelity's trading, risk management, compliance, cybersecurity, and technology and operations capabilities and resources, which are integral parts of the investment management process.
Administrative Services. The Board considered (i) the nature, extent, quality, and cost of advisory and administrative services performed by the Investment Advisers and their affiliates under the Advisory Contracts and under separate agreements covering transfer agency, pricing and bookkeeping, and securities lending services for the fund; (ii) the nature and extent of Fidelity's supervision of third party service providers, principally custodians, subcustodians, and pricing vendors; and (iii) the resources devoted by Fidelity to, and the record of compliance with, the fund's compliance policies and procedures. The Board also considered the fund's securities lending activities and any payments made to Fidelity relating to securities lending.
Investment Performance. The Board reviewed the fund's absolute investment performance, as well as the fund's relative investment performance. In this regard, the Board noted that the fund is designed to offer an investment option for other investment companies, and 529 plans managed by Fidelity and ultimately to enhance the performance of those investment companies, and 529 plans.
Based on its review, the Board concluded that the nature, extent, and quality of services provided to the fund under the Advisory Contracts should continue to benefit the shareholders of the fund.
Competitiveness of Management Fee and Total Expense Ratio. The Board considered that the fund does not pay FMR a management fee for investment advisory services, but that FMR receives fees for providing services to funds that invest in the fund. The Board also noted that FMR or an affiliate undertakes to pay all operating expenses of the fund, except transfer agent fees, 12b-1 fees, Independent Trustee fees and expenses, custodian fees and expenses, proxy and shareholder meeting expenses, interest, taxes, and extraordinary expenses (such as litigation expenses). The Board further noted that the fund pays its non-operating expenses, including brokerage commissions and fees and expenses associated with the fund's securities lending program, if applicable.
The Board further considered that FMR has contractually agreed to reimburse the fund to the extent that total operating expenses, with certain exceptions, as a percentage of its average net assets, exceed 0.003% through April 30, 2026.
Based on its review, the Board considered that the fund does not pay a management fee and concluded that the fund's total expense ratio was reasonable in light of the services that the fund and its shareholders receive and the other factors considered.
Costs of the Services and Profitability. The Board considered the level of Fidelity's profits in respect of all the Fidelity funds.
A public accounting firm has been engaged annually by the Board as part of the Board's assessment of Fidelity's profitability analysis. The engagement includes the review and assessment of the methodologies used by Fidelity in determining the revenues and expenses attributable to Fidelity's fund business, and completion of agreed-upon procedures in respect of the mathematical accuracy of certain fund profitability information and its conformity to established allocation methodologies. After considering the reports issued under the engagement and information provided by Fidelity, the Board concluded that while other allocation methods may also be reasonable, Fidelity's profitability methodologies are reasonable in all material respects.
The Board also reviewed Fidelity's non-fund businesses and potential indirect benefits such businesses may have received as a result of their association with Fidelity's fund business (i.e., fall-out benefits) as well as cases where Fidelity's affiliates may benefit from the funds' business. The Board considered areas where potential indirect benefits to the Fidelity funds from their relationships with Fidelity may exist. The Board's consideration of these matters was informed by the findings of a joint ad hoc committee created by it and the boards of other Fidelity funds to evaluate potential fall-out benefits.
The Board concluded that the costs of the services provided by and the profits realized by Fidelity in connection with the operation of the fund were not relevant to the renewal of the Advisory Contracts because the fund pays no advisory fees and FMR or an affiliate bears all expenses of the fund, with limited exceptions.
Economies of Scale. The Board concluded that because the fund pays no advisory fees and FMR or an affiliate bears all expenses of the fund with certain limited exceptions, the realization of economies of scale was not a material factor in the Board's decision to renew the fund's Advisory Contracts.
Additional Information Requested by the Board. In order to develop fully the factual basis for consideration of the Fidelity funds' advisory contracts, the Board requested and received additional information on certain topics, including: (i) Fidelity's fund profitability methodology, profitability trends for certain funds, the allocation of various costs to different funds, and the impact of certain factors on fund profitability results; (ii) portfolio manager changes that have occurred during the past year and Fidelity's views regarding portfolio manager investment in the Fidelity funds that they manage; (iii) hiring, training, and retaining personnel; (iv) the arrangements with and compensation paid to certain fund sub-advisers on behalf of the Fidelity funds and the treatment of such compensation within Fidelity's fund profitability methodology; (v) the terms of the funds' various management fee structures, including the basic group fee and the terms of Fidelity's voluntary expense limitation arrangements; (vi) Fidelity's transfer agent, pricing and bookkeeping fees, expense and service structures for different funds and classes relative to competitive trends and market conditions; (vii) the impact on fund profitability of recent industry trends, such as the growth in passively managed funds and the changes in flows for different types of funds; (viii) the types of management fee and total expense comparisons provided, and the challenges and limitations associated with such information; (ix) explanations regarding the relative total expense ratios and management fees of certain funds and classes, total expense and management fee competitive trends, and methodologies for total expense and management fee competitive comparisons; and (x) matters related to money market funds, exchange-traded funds, and target date funds. In addition, the Board considered its discussions with Fidelity regarding Fidelity's efforts to maintain the continuous investment and shareholder services necessary for the funds during the current pandemic and economic circumstances.
Conclusion. Based on its evaluation of all of the conclusions noted above, and after considering all factors it believed relevant, the Board, including the Independent Trustees, concluded that the advisory and sub-advisory fee arrangements are fair and reasonable in light of all of the surrounding circumstances and that the fund's Advisory Contracts should be renewed through September 30, 2024.
| A special meeting of shareholders was held on October 18, 2023. The results of votes taken among shareholders on the proposal before them are reported below. Each vote reported represents one dollar of net asset value held on the record date for the meeting. |
| Proposal 1 |
| To elect a Board of Trustees. |
| | # of Votes | % of Votes |
| Abigail P. Johnson |
| Affirmative | 21,333,918,003.710 | 98.990 |
| Withheld | 218,238,294.280 | 1.010 |
| TOTAL | 21,552,156,297.990 | 100.000 |
| Jennifer Toolin McAuliffe |
| Affirmative | 21,341,064,648.470 | 99.020 |
| Withheld | 211,091,649.520 | 0.980 |
| TOTAL | 21,552,156,297.990 | 100.000 |
| Christine J. Thompson |
| Affirmative | 21,338,732,597.390 | 99.010 |
| Withheld | 213,423,700.600 | 0.990 |
| TOTAL | 21,552,156,297.990 | 100.000 |
| Elizabeth S. Acton |
| Affirmative | 21,317,028,547.600 | 98.910 |
| Withheld | 235,127,750.390 | 1.090 |
| TOTAL | 21,552,156,297.990 | 100.000 |
| Laura M. Bishop |
| Affirmative | 21,336,468,393.320 | 99.000 |
| Withheld | 215,687,904.670 | 1.000 |
| TOTAL | 21,552,156,297.990 | 100.000 |
| Ann E. Dunwoody |
| Affirmative | 21,320,223,866.150 | 98.920 |
| Withheld | 231,932,431.840 | 1.080 |
| TOTAL | 21,552,156,297.990 | 100.000 |
| John Engler |
| Affirmative | 21,279,172,233.730 | 98.730 |
| Withheld | 272,984,064.260 | 1.270 |
| TOTAL | 21,552,156,297.990 | 100.000 |
| Robert F. Gartland |
| Affirmative | 21,319,450,613.340 | 98.920 |
| Withheld | 232,705,684.650 | 1.080 |
| TOTAL | 21,552,156,297.990 | 100.000 |
| Robert W. Helm |
| Affirmative | 21,334,642,392.210 | 98.990 |
| Withheld | 217,513,905.780 | 1.010 |
| TOTAL | 21,552,156,297.990 | 100.000 |
| Arthur E. Johnson |
| Affirmative | 21,298,270,597.120 | 98.820 |
| Withheld | 253,885,700.870 | 1.180 |
| TOTAL | 21,552,156,297.990 | 100.000 |
| Michael E. Kenneally |
| Affirmative | 20,916,217,437.980 | 97.050 |
| Withheld | 635,938,860.010 | 2.950 |
| TOTAL | 21,552,156,297.990 | 100.000 |
| Mark A. Murray |
| Affirmative | 21,321,664,592.720 | 98.930 |
| Withheld | 230,491,705.270 | 1.070 |
| TOTAL | 21,552,156,297.990 | 100.000 |
| Carol J. Zierhoffer |
| Affirmative | 21,337,428,755.990 | 99.000 |
| Withheld | 214,727,542.000 | 1.000 |
| TOTAL | 21,552,156,297.990 | 100.000 |
| | | |
| Proposal 1 reflects trust wide proposal and voting results. |
1.9882621.106
SUN-ANN-0224
Fidelity® Series International Developed Markets Bond Index Fund
Annual Report
December 31, 2023
Contents
To view a fund's proxy voting guidelines and proxy voting record for the 12-month period ended June 30, visit http://www.fidelity.com/proxyvotingresults or visit the Securities and Exchange Commission's (SEC) web site at http://www.sec.gov.
You may also call 1-800-544-8544 to request a free copy of the proxy voting guidelines.
BLOOMBERG ® is a trademark and service mark of Bloomberg Finance L.P. and its affiliates (collectively "Bloomberg"). Bloomberg or Bloomberg's licensors own all proprietary rights in the Bloomberg Indices. Neither Bloomberg nor Bloomberg's licensors approves or endorses this material, or guarantees the accuracy or completeness of any information herein, or makes any warranty, express or implied, as to the results to be obtained therefrom and, to the maximum extent allowed by law, neither shall have any liability or responsibility for injury or damages arising in connection therewith.
Standard & Poor's, S&P and S&P 500 are registered service marks of The McGraw-Hill Companies, Inc. and have been licensed for use by Fidelity Distributors Corporation.
Other third-party marks appearing herein are the property of their respective owners.
All other marks appearing herein are registered or unregistered trademarks or service marks of FMR LLC or an affiliated company. © 2024 FMR LLC. All rights reserved.
This report and the financial statements contained herein are submitted for the general information of the shareholders of the Fund. This report is not authorized for distribution to prospective investors in the Fund unless preceded or accompanied by an effective prospectus.
A fund files its complete schedule of portfolio holdings with the SEC for the first and third quarters of each fiscal year on Form N-PORT. Forms N-PORT are available on the SEC's web site at http://www.sec.gov. A fund's Forms N-PORT may be reviewed and copied at the SEC's Public Reference Room in Washington, DC. Information regarding the operation of the SEC's Public Reference Room may be obtained by calling 1-800-SEC-0330.
For a complete list of a fund's portfolio holdings, view the most recent holdings listing, semiannual report, or annual report on Fidelity's web site at http://www.fidelity.com, http://www.institutional.fidelity.com, or http://www.401k.com, as applicable.
NOT FDIC INSURED •MAY LOSE VALUE •NO BANK GUARANTEE
Neither the Fund nor Fidelity Distributors Corporation is a bank.
Average annual total return reflects the change in the value of an investment, assuming reinvestment of distributions from dividend income and capital gains (the profits earned upon the sale of securities that have grown in value, if any) and assuming a constant rate of performance each year. The hypothetical investment and the average annual total returns do not reflect the deduction of taxes that a shareholder would pay on fund distributions or the redemption of fund shares. During periods of reimbursement by Fidelity, a fund's total return will be greater than it would be had the reimbursement not occurred. How a fund did yesterday is no guarantee of how it will do tomorrow.
| Average Annual Total Returns |
| | | | |
Periods ended December 31, 2023 | Past 1 year | Life of Fund A |
| Fidelity® Series International Developed Markets Bond Index Fund | 7.99% | -3.69% |
A From August 31, 2021
| $10,000 Over Life of Fund |
| |
Let's say hypothetically that $10,000 was invested in Fidelity® Series International Developed Markets Bond Index Fund, on August 31, 2021, when the fund started. The chart shows how the value of your investment would have changed, and also shows how the Bloomberg Global Aggregate Treasury ex USD, ex Emerging Markets, RIC Capped, Float Adjusted Index (Hedged USD) performed over the same period. |
|
|
Market Recap:
Global investment-grade bonds gained 8.68% in 2023, according to the Bloomberg Global Aggregate Credit Index (Hedged USD), as falling commodity prices, cooling inflation and the easing of monetary tightening efforts by the U.S. Federal Reserve and other central banks provided a favorable backdrop for global credit assets. The strong gain followed a difficult 2022, during which the index returned -14.22%. The 2023 advance was driven by a powerful rally in the year's final two months, but the 12-month period was marked by high levels of volatility. The bond market saw sluggish returns for much of the year, including sharp sell-offs in September and October after the U.S. Fed temporarily adopted a "higher for longer" message on interest rates. But after the Fed struck a more optimistic tone at its committee meetings in November and December, a strong relief rally followed, as investors priced in the expectation of rate cuts in 2024. That said, the magnitude of future global easing remains uncertain at year-end. Between March 2022 and July 2023, the Fed hiked its benchmark interest rate 11 times, from a target range of 0% to 0.25% to a range of 5.25% to 5.50%, a 22-year high, before pausing and deciding to hold rates steady through year-end. To varying degrees, other major central banks have followed the Fed's lead: the Bank of England's benchmark rate stood at 5.25% at year-end, while the European Central Bank's was at 4% after policymakers paused increases in October.
Comments from Co-Portfolio Managers Brandon Bettencourt and Richard Munclinger:
For the fiscal year, the fund returned 7.99% versus 8.29% for the benchmark, the Bloomberg Global Aggregate Treasury ex USD, ex Emerging Markets, RIC Capped, Float Adjusted Index (Hedged USD), a multicurrency benchmark that includes fixed-rate treasury securities from developed market issuers while excluding U.S. dollar-denominated debt. Given the large number of securities in the index (nearly 1,000) and the significant costs associated with full replication of the index, we construct the portfolio using optimization. This approach minimizes the differences between risk exposures of the fund relative to the index. Exposures include duration, key rate durations, credit quality, sector and issuer allocation, and other factors. Differences in the way fund holdings and index components were priced detracted from relative performance. Fund holdings are priced by a third-party pricing service and validated daily by Fidelity Management and Research's fair-value processes.
The views expressed above reflect those of the portfolio manager(s) only through the end of the period as stated on the cover of this report and do not necessarily represent the views of Fidelity or any other person in the Fidelity organization. Any such views are subject to change at any time based upon market or other conditions and Fidelity disclaims any responsibility to update such views. These views may not be relied on as investment advice and, because investment decisions for a Fidelity fund are based on numerous factors, may not be relied on as an indication of trading intent on behalf of any Fidelity fund.
Quality Diversification (% of Fund's net assets) |
|
| |
| We have used ratings from Moody's Investors Service, Inc. Where Moody's® ratings are not available, we have used S&P® ratings. All ratings are as of the date indicated and do not reflect subsequent changes. |
Asset Allocation (% of Fund's net assets) |
|
Futures - 1.1% |
Forward foreign currency contracts - (101.2)% |
|
Geographic Diversification (% of Fund's net assets) |
|
* Includes Short-Term investments and Net Other Assets (Liabilities). Percentages are adjusted for the effect of derivatives, if applicable. |
| |
Forward foreign currency contracts and other assets and liabilities are included within United States of America, as applicable.
Showing Percentage of Net Assets
| Government Obligations - 99.0% |
| | | Principal Amount (a) | Value ($) |
| Australia - 5.1% | | | |
| Australian Commonwealth: | | | |
| 0.25% 11/21/24 (Reg. S) | AUD | 123,000 | 81,140 |
| 0.25% 11/21/25 (Reg. S) | AUD | 62,192,000 | 39,732,613 |
| 0.5% 9/21/26 (Reg. S) | AUD | 64,476,000 | 40,425,887 |
| 1% 12/21/30 (Reg. S) | AUD | 21,812,000 | 12,328,604 |
| 1% 11/21/31 (Reg. S) | AUD | 34,057,000 | 18,707,829 |
| 1.25% 5/21/32 | AUD | 53,000,000 | 29,308,742 |
| 1.75% 11/21/32 (Reg. S) | AUD | 13,400,000 | 7,644,178 |
| 1.75% 6/21/51 (Reg. S) | AUD | 35,412,000 | 14,239,043 |
| 2.5% 5/21/30 (Reg. S) | AUD | 35,000,000 | 22,153,229 |
| 2.75% 11/21/27 | AUD | 55,551,000 | 36,676,974 |
| 2.75% 11/21/28 | AUD | 28,367,000 | 18,562,397 |
| 2.75% 11/21/29 (Reg. S) | AUD | 52,813,000 | 34,145,631 |
| 2.75% 6/21/35 (Reg. S) | AUD | 16,600,000 | 10,005,041 |
| 2.75% 5/21/41(Reg. S) | AUD | 29,578,000 | 16,453,564 |
| 3% 11/21/33(Reg. S) | AUD | 22,700,000 | 14,257,351 |
| 3.25% 4/21/25 (Reg. S) | AUD | 80,700,000 | 54,563,405 |
| 3.25% 4/21/29(Reg. S) | AUD | 55,800,000 | 37,236,381 |
| 3.75% 4/21/37 (Reg. S) | AUD | 29,572,000 | 19,453,904 |
| 4.25% 4/21/26 | AUD | 12,100,000 | 8,353,464 |
| 4.5% 4/21/33 | AUD | 72,521,000 | 51,511,690 |
| 4.75% 4/21/27(Reg. S) | AUD | 19,600,000 | 13,824,190 |
TOTAL AUSTRALIA | | | 499,665,257 |
| Austria - 4.7% | | | |
| Austrian Republic: | | | |
| 0% 4/20/25 (Reg. S) (b) | EUR | 15,120,000 | 16,103,040 |
| 0% 10/20/28(Reg. S) (b) | EUR | 8,400,000 | 8,296,250 |
| 0% 2/20/30 (Reg. S) (b) | EUR | 26,462,000 | 25,240,378 |
| 0% 2/20/31 (Reg. S) (b) | EUR | 12,003,000 | 11,129,352 |
| 0% 10/20/40 (Reg. S) (b) | EUR | 46,309,000 | 31,928,757 |
| 0.25% 10/20/36(Reg. S) (b) | EUR | 24,709,000 | 19,991,680 |
| 0.5% 4/20/27 (Reg. S) (b) | EUR | 58,716,000 | 61,109,517 |
| 0.5% 2/20/29 (Reg. S) (b) | EUR | 26,300,000 | 26,476,000 |
| 0.75% 10/20/26 (Reg. S) (b) | EUR | 12,510,000 | 13,208,667 |
| 0.75% 2/20/28 (Reg. S) (b) | EUR | 47,597,000 | 49,312,368 |
| 0.75% 3/20/51 (Reg. S) (b) | EUR | 40,577,000 | 27,217,877 |
| 0.85% 6/30/20 (Reg. S) (b) | EUR | 9,316,000 | 4,786,359 |
| 0.9% 2/20/32 (Reg. S) (b) | EUR | 36,230,000 | 35,171,298 |
| 1.2% 10/20/25 (Reg. S) (b) | EUR | 29,419,000 | 31,738,056 |
| 1.5% 2/20/47 (Reg. S) (b) | EUR | 1,482,000 | 1,253,839 |
| 1.5% 11/2/86 (Reg. S) (b) | EUR | 10,300,000 | 7,108,884 |
| 2.1% 9/20/17 (Reg. S) (b) | EUR | 2,620,000 | 2,286,402 |
| 2.9% 2/20/33(Reg. S) (b) | EUR | 32,600,000 | 36,888,489 |
| 3.15% 6/20/44(Reg. S) (b) | EUR | 1,080,000 | 1,241,149 |
| 3.8% 1/26/62 (b) | EUR | 11,365,000 | 14,999,086 |
| 4.15% 3/15/37 (b) | EUR | 16,199,000 | 20,479,770 |
| 4.85% 3/15/26 (b) | EUR | 17,828,000 | 20,655,756 |
TOTAL AUSTRIA | | | 466,622,974 |
| Belgium - 4.9% | | | |
| Belgian Kingdom: | | | |
| 0% 10/22/27 (Reg. S) (b) | EUR | 38,428,000 | 39,010,694 |
| 0% 10/22/31 (b) | EUR | 706,000 | 644,781 |
| 0.1% 6/22/30 (Reg. S) (b) | EUR | 9,500,000 | 9,092,722 |
| 0.35% 6/22/32 (b) | EUR | 41,590,000 | 38,399,186 |
| 0.65% 6/22/71 (Reg. S) (b) | EUR | 1,103,000 | 545,967 |
| 0.8% 6/22/25 (Reg. S) (b) | EUR | 51,678,000 | 55,506,299 |
| 0.8% 6/22/27 (b) | EUR | 6,886,000 | 7,239,513 |
| 0.8% 6/22/28 (Reg. S) (b) | EUR | 29,386,000 | 30,502,798 |
| 0.9% 6/22/29 (b) | EUR | 29,176,000 | 29,952,165 |
| 1% 6/22/26 (Reg. S) (b) | EUR | 10,527,000 | 11,247,262 |
| 1% 6/22/31(Reg. S) (b) | EUR | 19,681,000 | 19,625,637 |
| 1.4% 6/22/53 (Reg. S) (b) | EUR | 31,810,000 | 23,527,944 |
| 1.6% 6/22/47 (b) | EUR | 9,816,000 | 8,147,696 |
| 1.7% 6/22/50 (b) | EUR | 27,649,000 | 22,733,768 |
| 1.9% 6/22/38(Reg. S) (b) | EUR | 7,550,000 | 7,356,648 |
| 2.15% 6/22/66 (b) | EUR | 4,230,000 | 3,689,397 |
| 3% 6/22/33(Reg. S) (b) | EUR | 19,500,000 | 22,240,086 |
| 3.3% 6/22/54 (Reg. S) (b) | EUR | 7,000,000 | 7,885,294 |
| 3.75% 6/22/45(Reg. S) | EUR | 3,138,000 | 3,828,825 |
| 4.25% 3/28/41 (b) | EUR | 44,660,000 | 57,572,393 |
| 4.5% 3/28/26 (b) | EUR | 12,960,000 | 14,949,648 |
| 5% 3/28/35 (b) | EUR | 46,949,000 | 63,069,268 |
TOTAL BELGIUM | | | 476,767,991 |
| Canada - 4.4% | | | |
| Canadian Government: | | | |
| 0.25% 3/1/26 | CAD | 27,528,000 | 19,315,825 |
| 0.5% 9/1/25 | CAD | 24,391,000 | 17,399,677 |
| 0.5% 12/1/30 | CAD | 63,762,000 | 40,400,004 |
| 1% 6/1/27 | CAD | 6,319,000 | 4,419,366 |
| 1.25% 3/1/27 | CAD | 30,500,000 | 21,553,364 |
| 1.25% 6/1/30 | CAD | 12,150,000 | 8,179,255 |
| 1.5% 6/1/26 (c) | CAD | 21,563,000 | 15,501,503 |
| 1.5% 12/1/31 | CAD | 54,493,000 | 36,450,534 |
| 1.75% 12/1/53 | CAD | 38,200,000 | 21,573,825 |
| 2% 6/1/32 | CAD | 23,400,000 | 16,202,631 |
| 2% 12/1/51 | CAD | 64,869,000 | 39,301,787 |
| 2.25% 6/1/29 | CAD | 700,000 | 506,226 |
| 2.5% 12/1/32 | CAD | 24,700,000 | 17,750,590 |
| 2.75% 9/1/27 | CAD | 21,200,000 | 15,687,469 |
| 2.75% 6/1/33 | CAD | 15,500,000 | 11,351,201 |
| 3.25% 12/1/33 | CAD | 20,100,000 | 15,342,340 |
| 3.5% 3/1/28 | CAD | 57,700,000 | 43,947,016 |
| 3.5% 12/1/45 | CAD | 4,519,000 | 3,626,250 |
| 3.75% 2/1/25 | CAD | 57,700,000 | 43,194,114 |
| 4% 6/1/41 | CAD | 22,981,000 | 19,367,136 |
| 5.75% 6/1/29 | CAD | 4,040,000 | 3,447,042 |
| 5.75% 6/1/33 | CAD | 14,800,000 | 13,489,272 |
TOTAL CANADA | | | 428,006,427 |
| Cyprus - 0.3% | | | |
| Republic of Cyprus: | | | |
| 0% 2/9/26 (Reg. S) | EUR | 5,219,000 | 5,424,409 |
| 0.625% 1/21/30 (Reg. S) | EUR | 4,882,000 | 4,724,098 |
| 0.95% 1/20/32 (Reg. S) | EUR | 1,900,000 | 1,796,177 |
| 1.25% 1/21/40 (Reg. S) | EUR | 5,374,000 | 4,283,713 |
| 2.25% 4/16/50 (Reg. S) | EUR | 3,919,000 | 3,202,387 |
| 2.375% 9/25/28 (Reg. S) | EUR | 2,600,000 | 2,814,501 |
| 2.75% 2/26/34 (Reg. S) | EUR | 4,289,000 | 4,498,952 |
TOTAL CYPRUS | | | 26,744,237 |
| Denmark - 1.9% | | | |
| Danish Kingdom: | | | |
| 0% 11/15/24 | DKK | 52,900,000 | 7,621,918 |
| 0% 11/15/31 | DKK | 50,702,000 | 6,357,591 |
| 0% 11/15/31 (Reg. S) | DKK | 146,127,000 | 18,312,048 |
| 0.25% 11/15/52 (Reg. S) | DKK | 143,750,000 | 12,088,650 |
| 0.5% 11/15/27 | DKK | 169,987,000 | 23,705,291 |
| 0.5% 11/15/29(Reg. S) | DKK | 178,726,000 | 24,170,080 |
| 1.75% 11/15/25 | DKK | 124,198,000 | 18,154,011 |
| 2.25% 11/15/33(Reg. S) | DKK | 95,000,000 | 14,059,423 |
| 4.5% 11/15/39 | DKK | 321,664,000 | 60,791,128 |
TOTAL DENMARK | | | 185,260,140 |
| Estonia - 0.1% | | | |
| Estonian Republic: | | | |
| 0.125% 6/10/30 (Reg. S) | EUR | 2,467,000 | 2,256,047 |
| 4% 10/12/32(Reg. S) | EUR | 6,500,000 | 7,715,788 |
TOTAL ESTONIA | | | 9,971,835 |
| Finland - 3.3% | | | |
| Finnish Government: | | | |
| 0% 9/15/26 (Reg. S) (b) | EUR | 17,640,000 | 18,255,794 |
| 0% 9/15/30 (Reg. S) (b) | EUR | 18,105,000 | 17,055,519 |
| 0.125% 9/15/31 (Reg. S) (b) | EUR | 22,467,000 | 20,760,291 |
| 0.125% 4/15/36 (Reg. S) (b) | EUR | 23,991,000 | 19,337,129 |
| 0.125% 4/15/52 (Reg. S) (b) | EUR | 19,800,000 | 10,737,824 |
| 0.25% 9/15/40 (Reg. S) (b) | EUR | 22,189,000 | 16,218,256 |
| 0.5% 4/15/26 (Reg. S) (b) | EUR | 33,649,000 | 35,536,945 |
| 0.5% 9/15/27 (Reg. S) (b) | EUR | 13,808,000 | 14,291,913 |
| 0.5% 9/15/28 (Reg. S) (b) | EUR | 19,079,000 | 19,362,959 |
| 0.5% 9/15/29 (Reg. S) (b) | EUR | 21,445,000 | 21,385,575 |
| 0.5% 4/15/43(Reg. S) (b) | EUR | 27,870,000 | 20,116,474 |
| 0.875% 9/15/25 (Reg. S) (b) | EUR | 22,796,000 | 24,448,323 |
| 1.125% 4/15/34 (Reg. S) (b) | EUR | 2,320,000 | 2,220,798 |
| 1.375% 4/15/47(Reg. S) (b) | EUR | 5,710,000 | 4,779,796 |
| 1.5% 9/15/32(Reg. S) (b) | EUR | 31,260,000 | 31,781,618 |
| 2.75% 7/4/28 (b) | EUR | 20,413,000 | 22,951,828 |
| 3% 9/15/33(Reg. S) (b) | EUR | 18,100,000 | 20,686,842 |
TOTAL FINLAND | | | 319,927,884 |
| France - 7.1% | | | |
| French Government: | | | |
| OAT: | | | |
3.25% 5/25/45 | EUR | 11,653,000 | 13,418,782 |
4.5% 4/25/41 | EUR | 1,710,000 | 2,300,833 |
| 0% 2/25/25(Reg. S) | EUR | 20,610,000 | 22,012,956 |
| 0% 3/25/25(Reg. S) | EUR | 53,272,000 | 56,787,985 |
| 0% 2/25/26 (Reg. S) | EUR | 60,900,000 | 63,922,408 |
| 0% 2/25/27 (Reg. S) | EUR | 26,074,000 | 26,833,904 |
| 0% 11/25/29 (Reg. S) | EUR | 50,654,000 | 49,047,873 |
| 0% 11/25/31 (Reg. S) | EUR | 7,769,000 | 7,124,777 |
| 0% 5/25/32 (Reg. S) | EUR | 22,900,000 | 20,690,536 |
| 0.5% 5/25/29 (Reg. S) | EUR | 32,490,000 | 32,729,804 |
| 0.5% 5/25/40 (Reg. S) (b) | EUR | 24,343,000 | 18,610,136 |
| 0.5% 6/25/44(Reg. S) (b) | EUR | 7,500,000 | 5,185,470 |
| 0.5% 5/25/72 (b) | EUR | 7,170,000 | 3,310,276 |
| 0.75% 2/25/28(Reg. S) | EUR | 14,300,000 | 14,874,310 |
| 0.75% 5/25/28 (Reg. S) | EUR | 12,780,000 | 13,248,230 |
| 0.75% 11/25/28(Reg. S) | EUR | 27,662,000 | 28,474,964 |
| 0.75% 5/25/52 (Reg. S) | EUR | 34,264,000 | 21,677,404 |
| 0.75% 5/25/53 (Reg. S) (b) | EUR | 15,200,000 | 9,425,046 |
| 1.25% 5/25/36(Reg. S) (b) | EUR | 75,986,000 | 70,971,695 |
| 1.5% 5/25/50 (Reg. S) (b) | EUR | 9,827,000 | 7,879,901 |
| 1.75% 6/25/39 (Reg. S) (b) | EUR | 6,190,000 | 5,940,551 |
| 1.75% 5/25/66 (b) | EUR | 4,110,000 | 3,235,820 |
| 2% 11/25/32(Reg. S) | EUR | 32,000,000 | 34,063,976 |
| 2% 5/25/48 (b) | EUR | 70,000 | 63,900 |
| 2.5% 9/24/26(Reg. S) | EUR | 15,600,000 | 17,291,712 |
| 2.5% 5/25/30 | EUR | 50,278,000 | 56,242,162 |
| 2.5% 5/25/43(Reg. S) (b) | EUR | 8,200,000 | 8,420,913 |
| 2.75% 10/25/27 | EUR | 40,810,000 | 45,878,907 |
| 3% 5/25/33 (Reg. S) | EUR | 13,200,000 | 15,158,173 |
| 3% 5/25/54(Reg. S) (b) | EUR | 6,300,000 | 6,830,476 |
| 3.5% 4/25/26 | EUR | 10,516,000 | 11,898,583 |
| 4.75% 4/25/35 | EUR | 36,000 | 47,819 |
TOTAL FRANCE | | | 693,600,282 |
| Germany - 5.0% | | | |
| German Federal Republic: | | | |
| 0% 10/18/24 (Reg. S) | EUR | 1,018,000 | 1,095,510 |
| 0% 4/11/25 (Reg. S) (d) | EUR | 26,010,000 | 27,728,628 |
| 0% 10/10/25 (Reg. S) (d) | EUR | 39,774,000 | 42,090,519 |
| 0% 4/10/26 (Reg. S) (d) | EUR | 11,500,000 | 12,078,351 |
| 0% 10/9/26 (Reg. S) (d) | EUR | 33,949,000 | 35,356,744 |
| 0% 4/16/27 (Reg. S) (d) | EUR | 18,990,000 | 19,629,651 |
| 0% 8/15/29(Reg. S) (d) | EUR | 14,992,000 | 14,907,988 |
| 0% 8/15/30 (Reg. S) (d) | EUR | 31,124,000 | 30,364,860 |
| 0% 8/15/31 | EUR | 940,000 | 898,340 |
| 0% 2/15/32 (Reg. S) | EUR | 15,890,000 | 15,005,016 |
| 0% 5/15/36 (Reg. S) (d) | EUR | 14,965,000 | 12,666,485 |
| 0% 8/15/50 (d) | EUR | 16,203,000 | 9,962,762 |
| 0% 8/15/52 (Reg. S) | EUR | 13,519,000 | 7,951,846 |
| 0.25% 2/15/27 | EUR | 1,710,000 | 1,786,911 |
| 0.25% 2/15/29 (d) | EUR | 20,250,000 | 20,596,544 |
| 1.25% 8/15/48 (c) | EUR | 4,320,000 | 3,873,710 |
| 1.3% 10/15/27(Reg. S) | EUR | 12,400,000 | 13,360,089 |
| 1.7% 8/15/32(Reg. S) (d) | EUR | 20,300,000 | 21,942,995 |
| 1.8% 8/15/53(Reg. S) | EUR | 13,300,000 | 13,241,444 |
| 2.1% 11/15/29(Reg. S) | EUR | 5,600,000 | 6,243,323 |
| 2.2% 4/13/28(Reg. S) | EUR | 19,000,000 | 21,171,167 |
| 2.3% 2/15/33(Reg. S) (d) | EUR | 20,600,000 | 23,321,912 |
| 2.4% 10/19/28(Reg. S) | EUR | 9,900,000 | 11,153,960 |
| 2.5% 7/4/44 | EUR | 52,000 | 59,289 |
| 2.5% 8/15/46 | EUR | 7,381,000 | 8,460,040 |
| 2.6% 8/15/33(Reg. S) | EUR | 11,800,000 | 13,677,263 |
| 2.8% 6/12/25 (Reg. S) | EUR | 9,600,000 | 10,614,000 |
| 3.25% 7/4/42 (d) | EUR | 28,570,000 | 36,018,353 |
| 4% 1/4/37 | EUR | 8,010,000 | 10,639,588 |
| 4.75% 7/4/34 | EUR | 650,000 | 897,587 |
| 4.75% 7/4/40 (d) | EUR | 15,931,000 | 23,526,342 |
| 5.5% 1/4/31 | EUR | 12,481,000 | 16,956,595 |
| 6.5% 7/4/27 | EUR | 4,770,000 | 6,044,723 |
TOTAL GERMANY | | | 493,322,535 |
| Hong Kong - 0.2% | | | |
| Hong Kong Government SAR: | | | |
| 1.25% 6/29/27 | HKD | 66,600,000 | 8,027,992 |
| 1.59% 3/4/36 | HKD | 33,800,000 | 3,562,904 |
| 1.68% 1/21/26 | HKD | 33,050,000 | 4,095,532 |
| 1.89% 3/2/32 | HKD | 9,400,000 | 1,105,304 |
| 1.97% 1/17/29 | HKD | 36,000,000 | 4,397,443 |
| 2.02% 3/7/34 | HKD | 12,000,000 | 1,373,276 |
| 2.13% 7/16/30 | HKD | 4,750,000 | 578,052 |
| 2.22% 8/7/24 | HKD | 3,250,000 | 411,435 |
TOTAL HONG KONG | | | 23,551,938 |
| Ireland - 3.7% | | | |
| Irish Republic: | | | |
| 0% 10/18/31 (Reg. S) | EUR | 31,431,000 | 29,029,252 |
| 0.2% 5/15/27 (Reg. S) | EUR | 7,634,000 | 7,878,550 |
| 0.2% 10/18/30 (Reg. S) | EUR | 21,745,000 | 20,862,799 |
| 0.35% 10/18/32 (Reg. S) | EUR | 43,512,000 | 40,417,997 |
| 0.4% 5/15/35 (Reg. S) | EUR | 24,240,000 | 21,179,163 |
| 0.55% 4/22/41 (Reg. S) | EUR | 13,006,000 | 10,042,369 |
| 0.9% 5/15/28 (Reg. S) | EUR | 19,128,000 | 20,010,255 |
| 1% 5/15/26(Reg. S) | EUR | 50,217,000 | 53,760,862 |
| 1.1% 5/15/29 (Reg. S) | EUR | 53,329,000 | 55,549,488 |
| 1.5% 5/15/50 (Reg. S) | EUR | 25,043,000 | 20,740,083 |
| 1.7% 5/15/37 | EUR | 4,490,000 | 4,416,549 |
| 2% 2/18/45 (Reg.S) | EUR | 23,584,000 | 22,447,701 |
| 2.4% 5/15/30 (Reg. S) | EUR | 20,760,000 | 23,109,306 |
| 3% 10/18/43(Reg. S) | EUR | 13,800,000 | 15,801,843 |
| 5.4% 3/13/25 | EUR | 13,372,000 | 15,153,715 |
TOTAL IRELAND | | | 360,399,932 |
| Italy - 5.9% | | | |
| Italian Republic: | | | |
| 0% 4/1/26 (Reg. S) | EUR | 51,571,000 | 53,453,272 |
| 0% 8/1/26(Reg. S) | EUR | 12,600,000 | 12,956,561 |
| 0.25% 3/15/28 (Reg. S) | EUR | 24,775,000 | 24,514,129 |
| 0.45% 2/15/29(Reg. S) | EUR | 29,560,000 | 28,679,629 |
| 0.6% 8/1/31 (Reg. S) (b) | EUR | 17,143,000 | 15,462,873 |
| 0.95% 8/1/30 (Reg. S) | EUR | 16,920,000 | 16,152,634 |
| 0.95% 6/1/32 (Reg. S) | EUR | 31,140,000 | 28,151,328 |
| 0.95% 3/1/37 (Reg. S) (b) | EUR | 41,747,000 | 32,284,217 |
| 1.1% 4/1/27 (Reg. S) | EUR | 27,790,000 | 29,079,179 |
| 1.45% 5/15/25 | EUR | 12,582,000 | 13,595,433 |
| 1.65% 3/1/32 (b) | EUR | 1,710,000 | 1,650,724 |
| 1.7% 9/1/51 (Reg. S) (b) | EUR | 5,786,000 | 3,924,963 |
| 1.8% 3/1/41 (Reg. S) (b) | EUR | 31,210,000 | 24,841,535 |
| 2.15% 9/1/52 (Reg. S) (b) | EUR | 22,110,000 | 16,220,949 |
| 2.15% 3/1/72 (Reg. S) (b) | EUR | 4,097,000 | 2,756,082 |
| 2.5% 12/1/24 | EUR | 24,400,000 | 26,738,936 |
| 2.5% 12/1/32(Reg. S) | EUR | 18,000,000 | 18,354,665 |
| 2.65% 12/1/27(Reg. S) | EUR | 14,400,000 | 15,772,884 |
| 2.7% 3/1/47 (b) | EUR | 5,850,000 | 5,091,314 |
| 2.8% 6/15/29(Reg. S) | EUR | 16,700,000 | 18,169,307 |
| 3% 8/1/29 | EUR | 18,611,000 | 20,467,951 |
| 3.25% 9/1/46 (b) | EUR | 9,830,000 | 9,421,232 |
| 3.5% 1/15/26(Reg. S) | EUR | 17,100,000 | 19,117,757 |
| 3.7% 6/15/30(Reg. S) | EUR | 5,900,000 | 6,680,611 |
| 3.8% 8/1/28(Reg. S) | EUR | 9,700,000 | 11,078,052 |
| 3.85% 12/15/29(Reg. S) | EUR | 5,900,000 | 6,749,623 |
| 4% 2/1/37 (b) | EUR | 137,000 | 153,058 |
| 4.35% 11/1/33(Reg. S) | EUR | 10,500,000 | 12,274,329 |
| 4.4% 5/1/33(Reg. S) | EUR | 23,400,000 | 27,524,351 |
| 4.45% 9/1/43(Reg. S) (b) | EUR | 4,000,000 | 4,552,425 |
| 4.75% 9/1/44 (b) | EUR | 11,726,000 | 13,930,725 |
| 5% 8/1/34 (b) | EUR | 9,900,000 | 12,167,526 |
| 6% 5/1/31 | EUR | 20,409,000 | 26,500,573 |
| 7.25% 11/1/26 | EUR | 19,492,000 | 24,108,855 |
TOTAL ITALY | | | 582,577,682 |
| Japan - 20.5% | | | |
| Japan Government: | | | |
| 0.005% 12/1/24 | JPY | 2,769,200,000 | 19,649,929 |
| 0.005% 6/1/25 | JPY | 1,408,300,000 | 9,989,541 |
| 0.005% 8/1/25 | JPY | 7,780,900,000 | 55,191,966 |
| 0.005% 9/1/25 | JPY | 2,255,300,000 | 15,993,596 |
| 0.005% 3/20/26 | JPY | 676,550,000 | 4,795,396 |
| 0.005% 6/20/26 | JPY | 4,721,750,000 | 33,461,468 |
| 0.005% 3/20/27 | JPY | 5,770,000,000 | 40,834,822 |
| 0.005% 6/20/27 | JPY | 2,590,000,000 | 18,312,586 |
| 0.1% 3/20/24 | JPY | 260,000,000 | 1,845,023 |
| 0.1% 3/20/27 | JPY | 3,530,000,000 | 25,058,243 |
| 0.1% 6/20/27 | JPY | 5,020,150,000 | 35,612,802 |
| 0.1% 9/20/27 | JPY | 30,000,000 | 212,657 |
| 0.1% 9/20/27 | JPY | 5,328,100,000 | 37,766,026 |
| 0.1% 3/20/28 | JPY | 6,334,600,000 | 44,806,737 |
| 0.1% 9/20/28 | JPY | 1,415,100,000 | 9,981,975 |
| 0.1% 6/20/31 | JPY | 15,092,100,000 | 104,506,906 |
| 0.2% 12/20/27 | JPY | 1,559,000,000 | 11,083,495 |
| 0.2% 3/20/28 | JPY | 2,462,400,000 | 17,490,375 |
| 0.2% 6/20/28 | JPY | 3,820,600,000 | 27,115,963 |
| 0.2% 3/20/32 | JPY | 2,048,200,000 | 14,182,841 |
| 0.2% 9/20/32 | JPY | 1,023,200,000 | 7,049,195 |
| 0.2% 6/20/36 | JPY | 4,474,500,000 | 29,212,773 |
| 0.3% 12/20/25 | JPY | 3,000,000,000 | 21,392,340 |
| 0.3% 9/20/28 | JPY | 2,825,200,000 | 20,111,016 |
| 0.4% 3/20/25 | JPY | 9,610,400,000 | 68,504,431 |
| 0.4% 6/20/25 | JPY | 1,615,650,000 | 11,525,199 |
| 0.4% 9/20/28 | JPY | 2,067,700,000 | 14,788,748 |
| 0.4% 6/20/33 | JPY | 10,242,300,000 | 71,283,502 |
| 0.4% 6/20/41 | JPY | 27,727,900,000 | 169,824,537 |
| 0.4% 3/20/56 | JPY | 140,000,000 | 678,255 |
| 0.5% 12/20/32 | JPY | 6,077,800,000 | 42,892,026 |
| 0.5% 3/20/33 | JPY | 13,766,200,000 | 96,908,190 |
| 0.5% 3/20/60 | JPY | 597,800,000 | 2,865,709 |
| 0.6% 6/20/24 | JPY | 410,400,000 | 2,920,447 |
| 0.6% 12/20/36 | JPY | 8,330,000,000 | 56,823,006 |
| 0.7% 6/20/51 | JPY | 9,617,450,000 | 54,212,406 |
| 0.7% 3/20/61 | JPY | 5,773,100,000 | 29,501,360 |
| 0.8% 9/20/33 | JPY | 5,624,900,000 | 40,557,923 |
| 0.8% 3/20/42 | JPY | 15,485,900,000 | 100,714,363 |
| 0.9% 6/20/42 | JPY | 3,810,000,000 | 25,133,570 |
| 1% 3/20/52 | JPY | 9,999,000,000 | 60,698,894 |
| 1.1% 3/20/43 | JPY | 8,054,000,000 | 54,563,851 |
| 1.1% 6/20/43 | JPY | 6,114,400,000 | 41,312,095 |
| 1.2% 6/20/53 | JPY | 5,376,400,000 | 34,107,348 |
| 1.3% 6/20/52 | JPY | 2,660,000,000 | 17,389,609 |
| 1.4% 12/20/42 | JPY | 8,300,300,000 | 59,325,364 |
| 1.4% 12/20/45 | JPY | 970,400,000 | 6,780,963 |
| 1.4% 9/20/52 | JPY | 2,841,600,000 | 19,008,893 |
| 1.4% 3/20/53 | JPY | 5,827,900,000 | 38,897,719 |
| 1.5% 9/20/43 | JPY | 2,695,500,000 | 19,451,569 |
| 1.6% 3/20/33 | JPY | 4,250,200,000 | 32,900,165 |
| 1.6% 12/20/52 | JPY | 7,051,200,000 | 49,393,406 |
| 1.7% 9/20/32 | JPY | 200,000,000 | 1,558,723 |
| 1.8% 9/20/53 | JPY | 2,224,000,000 | 16,290,406 |
| 2% 12/20/24 | JPY | 1,548,550,000 | 11,197,884 |
| 2% 3/20/25 | JPY | 40,000,000 | 290,610 |
| 2.1% 6/20/27 | JPY | 730,000,000 | 5,536,144 |
| 2.3% 3/20/40 | JPY | 1,641,350,000 | 13,549,402 |
| 2.4% 6/20/28 | JPY | 4,480,650,000 | 34,905,852 |
| 2.4% 3/20/48 | JPY | 4,353,800,000 | 36,160,625 |
| 2.5% 6/20/34 | JPY | 8,518,600,000 | 71,391,305 |
TOTAL JAPAN | | | 2,019,502,170 |
| Latvia - 0.4% | | | |
| Latvian Republic: | | | |
| 0% 3/17/31 (Reg. S) | EUR | 5,378,000 | 4,742,629 |
| 0.25% 1/23/30 (Reg. S) | EUR | 2,400,000 | 2,219,443 |
| 0.375% 10/7/26 (Reg. S) | EUR | 6,887,000 | 7,070,168 |
| 1.125% 5/30/28 (Reg. S) | EUR | 7,800,000 | 7,951,825 |
| 1.375% 9/23/25 (Reg. S) | EUR | 10,220,000 | 10,963,191 |
| 1.375% 5/16/36 (Reg. S) | EUR | 1,833,000 | 1,586,597 |
| 1.875% 2/19/49 (Reg. S) | EUR | 4,878,000 | 3,861,632 |
| 2.25% 2/15/47(Reg. S) | EUR | 1,380,000 | 1,180,918 |
TOTAL LATVIA | | | 39,576,403 |
| Lithuania - 0.5% | | | |
| Lithuanian Republic: | | | |
| 0.5% 7/28/50 (Reg. S) | EUR | 2,285,000 | 1,233,086 |
| 0.75% 5/6/30 (Reg. S) | EUR | 5,762,000 | 5,445,109 |
| 0.75% 7/15/51(Reg. S) | EUR | 2,250,000 | 1,293,012 |
| 0.95% 5/26/27 (Reg. S) | EUR | 1,116,000 | 1,142,429 |
| 1.625% 6/19/49 (Reg. S) | EUR | 1,009,000 | 733,070 |
| 2.1% 5/26/47 (Reg. S) | EUR | 3,903,000 | 3,418,665 |
| 2.125% 10/29/26 (Reg. S) | EUR | 4,140,000 | 4,456,551 |
| 2.125% 10/22/35 (Reg. S) | EUR | 6,210,000 | 6,021,623 |
| 3.875% 6/14/33(Reg. S) | EUR | 5,200,000 | 6,000,185 |
| 4.125% 4/25/28(Reg. S) | EUR | 13,600,000 | 15,478,244 |
TOTAL LITHUANIA | | | 45,221,974 |
| Luxembourg - 0.4% | | | |
| Grand Duchy of Luxembourg: | | | |
| 0% 4/28/25 (Reg. S) | EUR | 174,000 | 184,776 |
| 0% 11/13/26 (Reg. S) | EUR | 10,726,000 | 11,069,884 |
| 0% 4/28/30 (Reg. S) | EUR | 1,879,000 | 1,789,447 |
| 0% 3/24/31 (Reg. S) | EUR | 9,303,000 | 8,655,801 |
| 0% 9/14/32 (Reg. S) | EUR | 2,297,000 | 2,059,225 |
| 0.625% 2/1/27 (Reg. S) | EUR | 5,651,000 | 5,903,493 |
| 1.375% 5/25/29(Reg. S) | EUR | 3,870,000 | 4,068,823 |
| 1.75% 5/25/42(Reg. S) | EUR | 2,630,000 | 2,463,351 |
| 3.25% 3/2/43(Reg. S) | EUR | 5,700,000 | 6,668,463 |
TOTAL LUXEMBOURG | | | 42,863,263 |
| Netherlands - 4.7% | | | |
| Dutch Government: | | | |
| 0% 1/15/26 (b) | EUR | 30,220,000 | 31,772,233 |
| 0% 1/15/27 (Reg. S) (b) | EUR | 2,084,000 | 2,153,851 |
| 0% 1/15/29(Reg. S) (b) | EUR | 4,200,000 | 4,166,468 |
| 0% 7/15/30 (Reg. S) (b) | EUR | 44,713,000 | 42,936,178 |
| 0% 7/15/31 (Reg. S) (b) | EUR | 6,951,000 | 6,513,238 |
| 0% 1/15/38 (Reg. S) (b) | EUR | 28,830,000 | 22,484,862 |
| 0% 1/15/52 (Reg. S) (b) | EUR | 17,727,000 | 10,040,050 |
| 0.25% 7/15/25 (b) | EUR | 35,050,000 | 37,354,050 |
| 0.25% 7/15/29(Reg. S) (b) | EUR | 1,900,000 | 1,893,865 |
| 0.5% 7/15/26(Reg. S) (b) | EUR | 9,511,000 | 10,051,333 |
| 0.5% 7/15/32 (Reg. S) (b) | EUR | 16,600,000 | 15,824,738 |
| 0.5% 1/15/40 (Reg. S) (b) | EUR | 42,689,000 | 34,878,244 |
| 0.75% 7/15/27 (Reg. S) (b) | EUR | 40,302,000 | 42,405,547 |
| 0.75% 7/15/28 (b) | EUR | 78,754,000 | 81,797,949 |
| 2% 1/15/54(Reg. S) (b) | EUR | 18,200,000 | 18,099,377 |
| 2.5% 1/15/33 (b) | EUR | 11,430,000 | 12,843,256 |
| 2.5% 7/15/33(Reg. S) (b) | EUR | 22,500,000 | 25,201,572 |
| 2.75% 1/15/47 (b) | EUR | 18,665,000 | 21,552,531 |
| 3.75% 1/15/42 (b) | EUR | 23,730,000 | 30,866,647 |
| 4% 1/15/37 (b) | EUR | 8,170,000 | 10,521,954 |
TOTAL NETHERLANDS | | | 463,357,943 |
| New Zealand - 1.9% | | | |
| New Zealand Government: | | | |
| 0.25% 5/15/28 | NZD | 39,600,000 | 21,134,729 |
| 0.5% 5/15/24 | NZD | 2,189,000 | 1,359,161 |
| 0.5% 5/15/26 | NZD | 51,379,000 | 29,655,490 |
| 1.5% 5/15/31 | NZD | 63,200,000 | 33,015,035 |
| 1.75% 5/15/41 | NZD | 9,264,000 | 3,854,458 |
| 2% 5/15/32 | NZD | 41,113,000 | 21,824,492 |
| 2.75% 4/15/37 (Reg. S) | NZD | 45,131,000 | 23,462,711 |
| 2.75% 5/15/51 | NZD | 23,500,000 | 10,597,189 |
| 3% 4/20/29 | NZD | 39,494,000 | 23,607,475 |
| 3.5% 4/14/33 (Reg. S) | NZD | 22,900,000 | 13,564,956 |
| 4.5% 4/15/27 | NZD | 12,600,000 | 8,019,651 |
TOTAL NEW ZEALAND | | | 190,095,347 |
| Norway - 1.2% | | | |
| Kingdom of Norway: | | | |
| 1.25% 9/17/31 (Reg. S) (b) | NOK | 12,161,000 | 1,036,089 |
| 1.375% 8/19/30 (Reg. S) (b) | NOK | 325,081,000 | 28,369,765 |
| 1.5% 2/19/26 (Reg. S) (b) | NOK | 76,672,000 | 7,224,445 |
| 1.75% 3/13/25 (Reg. S) (b) | NOK | 199,500,000 | 19,152,071 |
| 1.75% 2/17/27 (Reg. S) (b) | NOK | 263,382,000 | 24,700,083 |
| 1.75% 9/6/29 (Reg. S) (b) | NOK | 75,590,000 | 6,855,024 |
| 2% 4/26/28 (Reg. S) (b) | NOK | 45,900,000 | 4,292,777 |
| 2.125% 5/18/32(Reg. S) (b) | NOK | 142,533,000 | 12,859,269 |
| 3% 8/15/33(Reg. S) (b) | NOK | 97,000,000 | 9,333,783 |
| 3.5% 10/6/42(Reg. S) (b) | NOK | 36,600,000 | 3,788,339 |
TOTAL NORWAY | | | 117,611,645 |
| Portugal - 4.6% | | | |
| Portugal Obrigacoes Do Tesouro: | | | |
| 0.3% 10/17/31 (Reg. S) (b) | EUR | 2,477,000 | 2,301,200 |
| 0.475% 10/18/30 (Reg. S) (b) | EUR | 16,191,000 | 15,683,732 |
| 0.7% 10/15/27 (Reg. S) (b) | EUR | 56,405,000 | 58,769,842 |
| 0.9% 10/12/35 (Reg. S) (b) | EUR | 20,277,000 | 17,901,120 |
| 1% 4/12/52 (Reg. S) (b) | EUR | 14,615,000 | 9,307,191 |
| 1.15% 4/11/42 (Reg. S) (b) | EUR | 27,900,000 | 22,201,804 |
| 1.65% 7/16/32 (Reg. S) (b) | EUR | 71,240,000 | 72,668,347 |
| 1.95% 6/15/29 (Reg. S) (b) | EUR | 46,574,000 | 50,406,083 |
| 2.875% 10/15/25 (Reg. S) (b) | EUR | 73,288,000 | 81,365,511 |
| 2.875% 7/21/26(Reg. S) (b) | EUR | 27,450,000 | 30,811,192 |
| 3.875% 2/15/30(Reg. S) (b) | EUR | 16,065,000 | 19,192,288 |
| 4.1% 2/15/45(Reg. S) (b) | EUR | 7,847,000 | 9,815,874 |
| Republic of Portugal: | | | |
| 2.125% 10/17/28 (b) | EUR | 33,085,000 | 36,264,192 |
| 4.1% 4/15/37 (b) | EUR | 24,573,000 | 30,206,907 |
TOTAL PORTUGAL | | | 456,895,283 |
| Singapore - 2.8% | | | |
| Republic of Singapore: | | | |
| , yield at date of purchase 2.1345% to 3.2056% 10/1/51 | SGD | 41,700,000 | 26,529,068 |
| 1.625% 7/1/31 | SGD | 57,454,000 | 40,290,719 |
| 1.875% 3/1/50 | SGD | 19,850,000 | 12,619,170 |
| 2.125% 6/1/26 | SGD | 65,913,000 | 48,834,803 |
| 2.25% 8/1/36 | SGD | 8,615,000 | 6,188,308 |
| 2.375% 7/1/39 | SGD | 5,400,000 | 3,886,691 |
| 2.625% 5/1/28 | SGD | 3,800,000 | 2,874,150 |
| 2.625% 8/1/32 | SGD | 31,700,000 | 23,839,553 |
| 2.75% 4/1/42 | SGD | 48,017,000 | 36,330,650 |
| 2.875% 9/1/27 | SGD | 41,000,000 | 31,228,036 |
| 2.875% 8/1/28 | SGD | 5,800,000 | 4,431,424 |
| 2.875% 7/1/29 | SGD | 3,553,000 | 2,711,022 |
| 3.375% 9/1/33 | SGD | 23,600,000 | 18,886,616 |
| 3.5% 3/1/27 | SGD | 18,124,000 | 13,984,216 |
TOTAL SINGAPORE | | | 272,634,426 |
| Slovakia - 1.7% | | | |
| Slovakia Republic: | | | |
| 0.125% 6/17/27 (Reg. S) | EUR | 8,670,000 | 8,741,324 |
| 0.25% 5/14/25 (Reg. S) | EUR | 35,344,000 | 37,460,410 |
| 0.375% 4/21/36(Reg. S) | EUR | 5,220,000 | 3,964,221 |
| 1% 6/12/28 (Reg. S) | EUR | 13,930,000 | 14,180,844 |
| 1% 10/9/30 (Reg. S) | EUR | 14,233,000 | 13,757,097 |
| 1% 5/14/32 (Reg. S) | EUR | 18,381,000 | 17,115,038 |
| 1% 10/13/51 (Reg. S) | EUR | 920,000 | 526,119 |
| 1.375% 1/21/27 | EUR | 3,150,000 | 3,331,459 |
| 1.875% 3/9/37 (Reg. S) | EUR | 4,837,000 | 4,408,651 |
| 2% 10/17/47 (Reg. S) | EUR | 18,134,000 | 14,755,826 |
| 2.25% 6/12/68 (Reg. S) | EUR | 1,282,000 | 999,403 |
| 3.625% 1/16/29 (Reg. S) | EUR | 14,171,000 | 16,087,116 |
| 3.625% 6/8/33(Reg. S) | EUR | 24,500,000 | 27,960,415 |
| 3.875% 2/8/33 (Reg. S) | EUR | 3,054,000 | 3,559,996 |
TOTAL SLOVAKIA | | | 166,847,919 |
| Slovenia - 0.9% | | | |
| Republic of Slovenia: | | | |
| 0% 2/12/31 (Reg. S) | EUR | 5,375,000 | 4,856,284 |
| 0.125% 7/1/31(Reg. S) | EUR | 6,660,000 | 6,033,303 |
| 0.4875% 10/20/50 (Reg. S) | EUR | 6,065,000 | 3,451,173 |
| 0.6875% 3/3/81(Reg. S) | EUR | 348,000 | 186,428 |
| 0.875% 7/15/30 (Reg. S) | EUR | 14,118,000 | 13,792,447 |
| 1% 3/6/28(Reg. S) | EUR | 9,000,000 | 9,283,679 |
| 1.1875% 3/14/29 (Reg. S) | EUR | 4,421,000 | 4,511,739 |
| 1.5% 3/25/35 (Reg. S) | EUR | 6,884,000 | 6,381,529 |
| 1.75% 11/3/40 (Reg. S) | EUR | 8,240,000 | 7,376,937 |
| 2.125% 7/28/25 (Reg. S) | EUR | 261,000 | 284,506 |
| 2.25% 3/3/32 (Reg. S) | EUR | 6,950,000 | 7,343,151 |
| 3.125% 8/7/45 (Reg. S) | EUR | 6,338,000 | 6,905,316 |
| 3.625% 3/11/33(Reg. S) | EUR | 4,400,000 | 5,137,651 |
| 5.125% 3/30/26 (Reg. S) | EUR | 12,292,000 | 14,206,175 |
TOTAL SLOVENIA | | | 89,750,318 |
| Spain - 4.7% | | | |
| Spanish Kingdom: | | | |
| 0% 1/31/25 | EUR | 7,857,000 | 8,394,181 |
| 0% 5/31/25 | EUR | 39,010,000 | 41,323,339 |
| 0% 1/31/26 | EUR | 32,671,000 | 34,118,659 |
| 0% 1/31/27 | EUR | 31,580,000 | 32,249,988 |
| 0% 1/31/28 | EUR | 25,308,000 | 25,231,019 |
| 0.5% 10/31/31 (Reg. S) (b) | EUR | 7,736,000 | 7,185,090 |
| 0.6% 10/31/29 (Reg. S) (b) | EUR | 19,277,000 | 18,977,684 |
| 0.7% 4/30/32 (Reg. S) (b) | EUR | 22,230,000 | 20,705,080 |
| 0.8% 7/30/27 (Reg. S) (b) | EUR | 23,656,000 | 24,574,254 |
| 0.8% 7/30/29 | EUR | 24,230,000 | 24,247,169 |
| 0.85% 7/30/37 (Reg. S) (b) | EUR | 23,974,000 | 19,477,651 |
| 1% 7/30/42(Reg. S) (b) | EUR | 13,360,000 | 9,864,569 |
| 1% 10/31/50 (Reg. S) (b) | EUR | 15,809,000 | 9,848,359 |
| 1.2% 10/31/40 (Reg. S) (b) | EUR | 600,000 | 474,086 |
| 1.25% 10/31/30 (Reg. S) (b) | EUR | 8,115,000 | 8,149,848 |
| 1.4% 4/30/28 (Reg. S) (b) | EUR | 14,259,000 | 15,015,732 |
| 1.45% 4/30/29 (Reg. S) (b) | EUR | 8,730,000 | 9,102,603 |
| 1.45% 10/31/71 (Reg. S) (b) | EUR | 8,259,000 | 4,612,227 |
| 1.9% 10/31/52 (Reg. S) (b) | EUR | 11,400,000 | 8,695,752 |
| 1.95% 4/30/26 (Reg. S) (b) | EUR | 11,790,000 | 12,812,371 |
| 2.55% 10/31/32(Reg. S) (b) | EUR | 39,300,000 | 42,321,429 |
| 2.7% 10/31/48 (b) | EUR | 3,843,000 | 3,644,513 |
| 2.9% 10/31/46(Reg. S) (b) | EUR | 720,000 | 717,970 |
| 3.15% 4/30/33 (Reg. S) (b) | EUR | 7,100,000 | 7,967,792 |
| 3.45% 7/30/43(Reg. S) (b) | EUR | 10,500,000 | 11,486,631 |
| 3.55% 10/31/33(Reg. S) (b) | EUR | 12,700,000 | 14,680,795 |
| 4.2% 1/31/37 (b) | EUR | 6,230,000 | 7,602,115 |
| 5.15% 10/31/44 (b) | EUR | 14,225,000 | 19,525,967 |
| 5.75% 7/30/32 | EUR | 6,620,000 | 8,918,222 |
| 6% 1/31/29 | EUR | 6,030,000 | 7,735,889 |
TOTAL SPAIN | | | 459,660,984 |
| Sweden - 1.4% | | | |
| Sweden Kingdom: | | | |
| 0.125% 5/12/31 (Reg. S) | SEK | 176,865,000 | 15,300,820 |
| 0.5% 11/24/45 | SEK | 48,860,000 | 3,417,131 |
| 0.75% 5/12/28 | SEK | 111,760,000 | 10,479,614 |
| 0.75% 11/12/29 | SEK | 246,520,000 | 22,766,691 |
| 1% 11/12/26 (Reg. S) | SEK | 276,075,000 | 26,408,471 |
| 1.375% 6/23/71 | SEK | 45,910,000 | 3,093,880 |
| 1.75% 11/11/33(Reg. S) | SEK | 156,700,000 | 15,140,911 |
| 2.25% 6/1/32 | SEK | 87,865,000 | 8,880,701 |
| 2.5% 5/12/25 | SEK | 223,435,000 | 22,033,160 |
| 3.5% 3/30/39 | SEK | 108,125,000 | 12,525,221 |
TOTAL SWEDEN | | | 140,046,600 |
| Switzerland - 2.6% | | | |
| Switzerland Confederation: | | | |
| 0% 7/24/39 (Reg. S) | CHF | 2,070,000 | 2,213,395 |
| 0.25% 6/23/35(Reg. S) | CHF | 7,110,000 | 8,035,767 |
| 0.5% 6/27/32 | CHF | 27,300,000 | 31,889,828 |
| 0.5% 6/28/45 | CHF | 3,736,000 | 4,316,445 |
| 0.5% 5/24/55(Reg. S) | CHF | 15,200,000 | 17,827,040 |
| 0.5% 5/30/58 (Reg. S) | CHF | 3,907,000 | 4,643,340 |
| 1.25% 5/28/26 | CHF | 5,574,000 | 6,672,974 |
| 1.25% 6/27/37 (Reg. S) | CHF | 6,501,000 | 8,305,403 |
| 1.25% 6/28/43(Reg. S) | CHF | 4,000,000 | 5,283,225 |
| 1.5% 4/30/42 | CHF | 14,124,000 | 19,209,043 |
| 2% 6/25/64 (Reg. S) | CHF | 2,342,000 | 4,364,326 |
| 2.25% 6/22/31(Reg. S) | CHF | 16,319,000 | 21,565,179 |
| 2.5% 3/8/36 (Reg. S) | CHF | 3,128,000 | 4,505,198 |
| 3.5% 4/8/33 | CHF | 26,804,000 | 39,851,386 |
| 4% 4/8/28 | CHF | 25,010,000 | 33,716,769 |
| 4% 1/6/49 (Reg. S) | CHF | 19,826,000 | 41,975,205 |
TOTAL SWITZERLAND | | | 254,374,523 |
| United Kingdom - 4.1% | | | |
| United Kingdom, Great Britain and Northern Ireland: | | | |
| 0.125% 1/31/24 (Reg. S) | GBP | 56,000 | 71,102 |
| 0.125% 1/31/28 (Reg. S) | GBP | 2,396,000 | 2,679,847 |
| 0.375% 10/22/26 (Reg. S) | GBP | 21,340,000 | 24,929,310 |
| 0.375% 10/22/30 (Reg. S) | GBP | 12,977,000 | 13,553,308 |
| 0.5% 1/31/29(Reg. S) | GBP | 24,400,000 | 26,995,134 |
| 0.625% 6/7/25 | GBP | 38,680,000 | 46,954,319 |
| 0.625% 7/31/35 (Reg. S) | GBP | 155,000 | 140,473 |
| 0.875% 1/31/46 (Reg. S) | GBP | 8,692,000 | 5,919,647 |
| 1.25% 7/22/27 | GBP | 18,140,000 | 21,465,957 |
| 1.25% 10/22/41 (Reg. S) | GBP | 54,457,000 | 45,056,377 |
| 1.25% 7/31/51(Reg. S) | GBP | 67,940,000 | 46,088,371 |
| 1.5% 7/22/26(Reg. S) | GBP | 6,200,000 | 7,513,244 |
| 1.625% 10/22/28 | GBP | 3,570,000 | 4,212,671 |
| 1.625% 10/22/71 (Reg. S) | GBP | 19,072,000 | 12,592,645 |
| 3.25% 1/31/33(Reg. S) | GBP | 8,400,000 | 10,472,415 |
| 3.5% 10/22/25(Reg. S) | GBP | 15,700,000 | 19,844,364 |
| 3.5% 7/22/68 | GBP | 1,510,000 | 1,729,797 |
| 3.75% 10/22/53(Reg. S) (d) | GBP | 20,800,000 | 24,753,601 |
| 4.25% 6/7/32 | GBP | 10,600,000 | 14,304,268 |
| 4.25% 3/7/36 (Reg. S) | GBP | 2,199,000 | 2,941,141 |
| 4.25% 12/7/49 (Reg. S) | GBP | 15,124,000 | 19,598,300 |
| 4.5% 6/7/28(Reg. S) | GBP | 8,500,000 | 11,291,741 |
| 4.5% 9/7/34 | GBP | 2,430,000 | 3,328,465 |
| 4.75% 12/7/30 | GBP | 22,792,000 | 31,456,442 |
| United Kingdom, Great Britain and Northern Ireland Treasury GILT 2.5% 7/22/65 (Reg. S) | GBP | 4,840,000 | 4,311,738 |
TOTAL UNITED KINGDOM | | | 402,204,677 |
| TOTAL GOVERNMENT OBLIGATIONS (Cost $10,667,746,900) | | | 9,727,062,589 |
| | | | |
| Money Market Funds - 1.5% |
| | | Shares | Value ($) |
Fidelity Cash Central Fund 5.40% (e) (Cost $149,869,926) | | 149,839,958 | 149,869,926 |
| | | | |
| TOTAL INVESTMENT IN SECURITIES - 100.5% (Cost $10,817,616,826) | 9,876,932,515 |
NET OTHER ASSETS (LIABILITIES) - (0.5)% | (48,392,016) |
| NET ASSETS - 100.0% | 9,828,540,499 |
| | |
| Futures Contracts |
| | Number of contracts | Expiration Date | Notional Amount ($) | Value ($) | Unrealized Appreciation/ (Depreciation) ($) |
| Purchased | | | | | |
| | | | | | |
| Bond Index Contracts | | | | | |
| Eurex Euro-Bobl Contracts (Germany) | 286 | Mar 2024 | 37,660,238 | 654,878 | 654,878 |
| ICE Long Gilt Contracts (United Kingdom) | 538 | Mar 2024 | 70,393,438 | 3,681,321 | 3,681,321 |
| | | | | | |
| TOTAL FUTURES CONTRACTS | | | | | 4,336,199 |
| The notional amount of futures purchased as a percentage of Net Assets is 1.1% |
| Forward Foreign Currency Contracts |
Currency Purchased
| Currency Sold | Counterparty | Settlement Date | Unrealized Appreciation/ (Depreciation) ($) |
| | | | | | | |
| USD | 1,631,622 | CHF | 1,366,077 | JPMorgan Chase Bank, N.A. | 1/03/24 | 7,370 |
| USD | 52,398,482 | EUR | 47,368,000 | BNP Paribas S.A. | 1/03/24 | 106,578 |
| USD | 16,698,244 | GBP | 13,109,000 | BNP Paribas S.A. | 1/03/24 | (11,143) |
| USD | 13,810,617 | SGD | 18,214,409 | BNP Paribas S.A. | 1/03/24 | 9,209 |
| AUD | 718,992,000 | USD | 491,502,931 | Bank of America, N.A. | 1/04/24 | (1,528,504) |
| AUD | 4,097,000 | USD | 2,775,365 | Goldman Sachs Bank USA | 1/04/24 | 16,634 |
| CAD | 554,693,000 | USD | 419,174,035 | Bank of America, N.A. | 1/04/24 | (547,495) |
| CAD | 40,667,000 | USD | 29,647,326 | Brown Brothers Harriman & Co | 1/04/24 | 1,044,039 |
| CAD | 1,754,000 | USD | 1,314,762 | Citibank, N. A. | 1/04/24 | 8,981 |
| CAD | 3,929,000 | USD | 2,897,760 | Goldman Sachs Bank USA | 1/04/24 | 67,455 |
| CHF | 10,073,000 | USD | 11,537,497 | Citibank, N. A. | 1/04/24 | 440,529 |
| CHF | 213,300,000 | USD | 252,874,926 | Citibank, N. A. | 1/04/24 | 764,798 |
| DKK | 1,211,280,307 | USD | 179,848,598 | Bank of America, N.A. | 1/04/24 | (461,480) |
| EUR | 43,578,000 | USD | 47,769,027 | Brown Brothers Harriman & Co | 1/04/24 | 340,979 |
| EUR | 2,687,000 | USD | 2,948,528 | Brown Brothers Harriman & Co | 1/04/24 | 17,913 |
| EUR | 10,906,000 | USD | 11,998,105 | Brown Brothers Harriman & Co | 1/04/24 | 42,092 |
| EUR | 12,918,000 | USD | 14,193,020 | Brown Brothers Harriman & Co | 1/04/24 | 68,421 |
| EUR | 28,541,000 | USD | 31,107,150 | Royal Bank of Canada | 1/04/24 | 402,045 |
| EUR | 4,636,206,000 | USD | 5,131,120,991 | State Street Bank and Trust Co | 1/04/24 | (12,760,865) |
| GBP | 4,519,000 | USD | 5,691,839 | Brown Brothers Harriman & Co | 1/04/24 | 68,339 |
| GBP | 1,957,000 | USD | 2,494,793 | Canadian Imperial Bk. of Comm. | 1/04/24 | (288) |
| GBP | 311,306,000 | USD | 396,136,885 | State Street Bank and Trust Co | 1/04/24 | 671,672 |
| HKD | 176,764,610 | USD | 22,619,497 | BNP Paribas S.A. | 1/04/24 | 18,511 |
| JPY | 6,408,300,000 | USD | 43,494,314 | Brown Brothers Harriman & Co | 1/04/24 | 1,962,014 |
| JPY | 1,547,200,000 | USD | 10,782,039 | Brown Brothers Harriman & Co | 1/04/24 | 192,795 |
| JPY | 283,920,044,303 | USD | 2,007,779,113 | State Street Bank and Trust Co | 1/04/24 | 6,165,702 |
| NOK | 1,170,271,885 | USD | 114,734,787 | State Street Bank and Trust Co | 1/04/24 | 453,689 |
| NZD | 292,347,000 | USD | 185,084,886 | Bank of America, N.A. | 1/04/24 | (276,921) |
| SEK | 1,374,306,000 | USD | 137,508,980 | State Street Bank and Trust Co | 1/04/24 | (1,244,930) |
| SGD | 1,191,000 | USD | 897,270 | BNP Paribas S.A. | 1/04/24 | 5,220 |
| SGD | 373,395,924 | USD | 282,747,179 | State Street Bank and Trust Co | 1/04/24 | 196,528 |
| USD | 16,423,315 | AUD | 24,843,000 | Bank of America, N.A. | 1/04/24 | (506,546) |
| USD | 448,363,486 | AUD | 688,905,000 | State Street Bank and Trust Co | 1/04/24 | (21,107,431) |
| USD | 6,176,484 | AUD | 9,341,000 | State Street Bank and Trust Co | 1/04/24 | (189,166) |
| USD | 406,083,423 | CAD | 556,889,000 | BNP Paribas S.A. | 1/04/24 | (14,200,437) |
| USD | 17,341,221 | CAD | 23,393,000 | BNP Paribas S.A. | 1/04/24 | (313,465) |
| USD | 15,322,178 | CAD | 20,761,000 | State Street Bank and Trust Co | 1/04/24 | (346,138) |
| USD | 253,257,370 | CHF | 223,373,000 | Citibank, N. A. | 1/04/24 | (12,360,380) |
| USD | 174,835,581 | DKK | 1,195,211,000 | Bank of America, N.A. | 1/04/24 | (2,171,719) |
| USD | 2,350,663 | DKK | 16,073,000 | State Street Bank and Trust Co | 1/04/24 | (29,702) |
| USD | 5,012,123,824 | EUR | 4,594,064,000 | Bank of America, N.A. | 1/04/24 | (59,711,636) |
| USD | 155,086,740 | EUR | 141,904,000 | State Street Bank and Trust Co | 1/04/24 | (1,574,930) |
| USD | 15,002,913 | GBP | 11,865,000 | Brown Brothers Harriman & Co | 1/04/24 | (120,900) |
| USD | 381,967,908 | GBP | 307,041,000 | JPMorgan Chase Bank, N.A. | 1/04/24 | (9,404,234) |
| USD | 22,726,591 | HKD | 177,182,000 | Brown Brothers Harriman & Co | 1/04/24 | 35,128 |
| USD | 49,824,598 | JPY | 7,351,900,000 | Bank of America, N.A. | 1/04/24 | (2,325,016) |
| USD | 8,170,396 | JPY | 1,197,200,000 | Bank of America, N.A. | 1/04/24 | (321,765) |
| USD | 12,080,858 | JPY | 1,781,950,000 | Canadian Imperial Bk. of Comm. | 1/04/24 | (559,141) |
| USD | 1,895,591,067 | JPY | 281,548,350,000 | Royal Bank of Canada | 1/04/24 | (101,530,485) |
| USD | 107,851,318 | NOK | 1,170,272,000 | State Street Bank and Trust Co | 1/04/24 | (7,337,170) |
| USD | 7,192,094 | NZD | 11,733,000 | Bank of America, N.A. | 1/04/24 | (224,954) |
| USD | 167,563,354 | NZD | 280,615,000 | State Street Bank and Trust Co | 1/04/24 | (9,828,194) |
| USD | 128,248,920 | SEK | 1,350,910,000 | JPMorgan Chase Bank, N.A. | 1/04/24 | (5,695,390) |
| USD | 2,304,469 | SEK | 23,396,000 | JPMorgan Chase Bank, N.A. | 1/04/24 | (15,272) |
| USD | 6,597,756 | SGD | 8,839,000 | Citibank, N. A. | 1/04/24 | (100,066) |
| USD | 273,176,877 | SGD | 366,490,000 | State Street Bank and Trust Co | 1/04/24 | (4,533,811) |
| SGD | 10,175,000 | USD | 7,725,582 | BNP Paribas S.A. | 2/02/24 | (3,999) |
| USD | 14,666,408 | AUD | 21,460,000 | Bank of America, N.A. | 2/02/24 | 26,975 |
| USD | 493,889,650 | AUD | 721,834,000 | Bank of America, N.A. | 2/02/24 | 1,473,985 |
| USD | 13,797,681 | CAD | 18,189,000 | Bank of America, N.A. | 2/02/24 | 64,641 |
| USD | 420,608,526 | CAD | 556,341,000 | Bank of America, N.A. | 2/02/24 | 560,507 |
| USD | 253,991,451 | CHF | 213,603,000 | Citibank, N. A. | 2/02/24 | (826,583) |
| USD | 5,371,139 | CHF | 4,483,000 | JPMorgan Chase Bank, N.A. | 2/02/24 | 23,138 |
| USD | 179,616,849 | DKK | 1,208,067,000 | Bank of America, N.A. | 2/02/24 | 418,302 |
| USD | 168,479,825 | EUR | 152,129,000 | BNP Paribas S.A. | 2/02/24 | 319,928 |
| USD | 5,150,602,122 | EUR | 4,648,625,000 | State Street Bank and Trust Co | 2/02/24 | 12,119,000 |
| USD | 11,892,790 | GBP | 9,335,000 | BNP Paribas S.A. | 2/02/24 | (8,196) |
| USD | 398,555,247 | GBP | 313,158,000 | State Street Bank and Trust Co | 2/02/24 | (682,998) |
| USD | 23,333,042 | HKD | 182,207,000 | BNP Paribas S.A. | 2/02/24 | (18,334) |
| USD | 2,014,304,022 | JPY | 283,556,800,000 | State Street Bank and Trust Co | 2/02/24 | (6,543,239) |
| USD | 117,457,883 | NOK | 1,197,193,000 | State Street Bank and Trust Co | 2/02/24 | (472,414) |
| USD | 185,563,602 | NZD | 293,080,000 | Bank of America, N.A. | 2/02/24 | 268,755 |
| USD | 138,113,369 | SEK | 1,378,754,000 | State Street Bank and Trust Co | 2/02/24 | 1,235,127 |
| USD | 283,148,627 | SGD | 373,430,000 | State Street Bank and Trust Co | 2/02/24 | (239,156) |
| | | | | | | |
| TOTAL FORWARD FOREIGN CURRENCY CONTRACTS | | (250,517,494) |
| Unrealized Appreciation | | | 29,616,999 |
| Unrealized Depreciation | | | (280,134,493) |
For the period, the average contract value for forward foreign currency contracts was $26,371,867,480. Contract value represents contract amount in United States dollars plus or minus unrealized appreciation or depreciation, respectively.
Currency Abbreviations
| AUD | - | Australian dollar |
| CAD | - | Canadian dollar |
| CHF | - | Swiss franc |
| DKK | - | Danish krone |
| EUR | - | European Monetary Unit |
| GBP | - | British pound sterling |
| HKD | - | Hong Kong dollar |
| JPY | - | Japanese yen |
| NOK | - | Norwegian krone |
| NZD | - | New Zealand dollar |
| SEK | - | Swedish krona |
| SGD | - | Singapore dollar |
| USD | - | U.S. dollar |
Legend
| (a) | Amount is stated in United States dollars unless otherwise noted. |
| (b) | Security exempt from registration under Rule 144A of the Securities Act of 1933. These securities may be resold in transactions exempt from registration, normally to qualified institutional buyers. At the end of the period, the value of these securities amounted to $2,857,129,220 or 29.1% of net assets. |
| (c) | Security or a portion of the security was pledged to cover margin requirements for futures contracts. At period end, the value of securities pledged amounted to $3,355,918. |
| (d) | Security or a portion of the security has been segregated as collateral for open forward foreign currency contracts. At period end, the value of securities pledged amounted to $293,796,194. |
| (e) | Affiliated fund that is generally available only to investment companies and other accounts managed by Fidelity Investments. The rate quoted is the annualized seven-day yield of the fund at period end. A complete unaudited listing of the fund's holdings as of its most recent quarter end is available upon request. In addition, each Fidelity Central Fund's financial statements, which are not covered by the Fund's Report of Independent Registered Public Accounting Firm, are available on the SEC's website or upon request. |
Affiliated Central Funds
Fiscal year to date information regarding the Fund's investments in Fidelity Central Funds, including the ownership percentage, is presented below.
| Affiliate | Value, beginning of period ($) | Purchases ($) | Sales Proceeds ($) | Dividend Income ($) | Realized Gain (loss) ($) | Change in Unrealized appreciation (depreciation) ($) | Value, end of period ($) | % ownership, end of period |
| Fidelity Cash Central Fund 5.40% | 77,361,656 | 2,219,885,646 | 2,147,377,376 | 2,285,578 | - | - | 149,869,926 | 0.3% |
| Total | 77,361,656 | 2,219,885,646 | 2,147,377,376 | 2,285,578 | - | - | 149,869,926 | |
| | | | | | | | | |
Amounts in the dividend income column in the above table include any capital gain distributions from underlying funds, which are presented in the corresponding line item in the Statement of Operations, if applicable.
Amounts included in the purchases and sales proceeds columns may include in-kind transactions, if applicable.
Investment Valuation
The following is a summary of the inputs used, as of December 31, 2023, involving the Fund's assets and liabilities carried at fair value. The inputs or methodology used for valuing securities may not be an indication of the risk associated with investing in those securities. For more information on valuation inputs, and their aggregation into the levels used below, please refer to the Investment Valuation section in the accompanying Notes to Financial Statements.
| Valuation Inputs at Reporting Date: |
| Description | Total ($) | Level 1 ($) | Level 2 ($) | Level 3 ($) |
Investments in Securities: | | | | |
|
| Government Obligations | 9,727,062,589 | - | 9,727,062,589 | - |
|
| Money Market Funds | 149,869,926 | 149,869,926 | - | - |
| Total Investments in Securities: | 9,876,932,515 | 149,869,926 | 9,727,062,589 | - |
Derivative Instruments: Assets | | | | |
Futures Contracts | 4,336,199 | 4,336,199 | - | - |
Forward Foreign Currency Contracts | 29,616,999 | - | 29,616,999 | - |
| Total Assets | 33,953,198 | 4,336,199 | 29,616,999 | - |
| Liabilities | | | | |
Forward Foreign Currency Contracts | (280,134,493) | - | (280,134,493) | - |
| Total Liabilities | (280,134,493) | - | (280,134,493) | - |
| Total Derivative Instruments: | (246,181,295) | 4,336,199 | (250,517,494) | - |
Value of Derivative Instruments
The following table is a summary of the Fund's value of derivative instruments by primary risk exposure as of December 31, 2023. For additional information on derivative instruments, please refer to the Derivative Instruments section in the accompanying Notes to Financial Statements.
Primary Risk Exposure / Derivative Type | Value |
| Asset ($) | Liability ($) |
| Foreign Exchange Risk | | |
Forward Foreign Currency Contracts (a) | 29,616,999 | (280,134,493) |
| Total Foreign Exchange Risk | 29,616,999 | (280,134,493) |
| Interest Rate Risk | | |
Futures Contracts (b) | 4,336,199 | 0 |
| Total Interest Rate Risk | 4,336,199 | 0 |
| Total Value of Derivatives | 33,953,198 | (280,134,493) |
(a)Gross value is presented in the Statement of Assets and Liabilities in the unrealized appreciation/depreciation on forward foreign currency contracts line-items.
(b)Reflects gross cumulative appreciation (depreciation) on futures contracts as presented in the Schedule of Investments. In the Statement of Assets and Liabilities, the period end daily variation margin is included in receivable or payable for daily variation margin on futures contracts, and the net cumulative appreciation (depreciation) is included in Total accumulated earnings (loss).
The following table is a summary of the Fund's derivatives inclusive of potential netting arrangements.
| | | | | | | | | | | |
| Counterparty | | Value of Derivative Assets ($) | | Value of Derivative Liabilities ($) | | Collateral Received(a) ($) | | Collateral Pledged(a) ($) | | Net(b) ($) |
| Bank of America, N.A. | | 2,813,165 | | (68,076,036) | | - | | 65,262,871 | | - |
| BNP Paribas S.A. | | 459,446 | | (14,555,574) | | - | | 14,096,128 | | - |
| Brown Brothers Harriman & Co | | 3,771,720 | | (120,900) | | (3,650,820) | | - | | - |
| Canadian Imperial Bk. of Comm. | | - | | (559,429) | | - | | 366,893 | | (192,536) |
| Citibank, N.A. | | 1,214,308 | | (13,287,029) | | - | | 10,829,674 | | (1,243,047) |
| Goldman Sachs Bank USA | | 84,089 | | - | | - | | - | | 84,089 |
| JPMorgan Chase Bank, N.A. | | 30,508 | | (15,114,896) | | - | | 15,084,388 | | - |
| Royal Bank of Canada | | 402,045 | | (101,530,485) | | - | | 98,190,264 | | (2,938,176) |
| State Street Bank and Trust Co | | 20,841,718 | | (66,890,144) | | - | | 46,048,426 | | - |
| Total | $ | 29,616,999 | $ | (280,134,493) | $ | (3,650,820) | $ | 249,878,644 | $ | (4,289,670) |
| | | | | | | | | | | |
(a) Reflects collateral received from or pledged to an individual counterparty, excluding any excess or initial collateral amounts.
(b) Net represents the receivable / (payable) that would be due from / (to) the counterparty in an event of default. Netting may be allowed across transactions traded under the same legal agreement with the same legal entity. Please refer to Derivative Instruments - Risk Exposures and the Use of Derivative Instruments section in the accompanying Notes to Financial Statements.
| Statement of Assets and Liabilities |
| | | | December 31, 2023 |
| | | | | |
| Assets | | | | |
| Investment in securities, at value - See accompanying schedule: | | | | |
Unaffiliated issuers (cost $10,667,746,900) | $ | 9,727,062,589 | | |
Fidelity Central Funds (cost $149,869,926) | | 149,869,926 | | |
| | | | | |
| | | | | |
| Total Investment in Securities (cost $10,817,616,826) | | | $ | 9,876,932,515 |
| Foreign currency held at value (cost $6,782,757) | | | | 6,851,970 |
| Receivable for investments sold | | | | 83,758,350 |
| Unrealized appreciation on forward foreign currency contracts | | | | 29,616,999 |
| Receivable for fund shares sold | | | | 62,806,652 |
| Interest receivable | | | | 60,908,334 |
| Distributions receivable from Fidelity Central Funds | | | | 729,546 |
| Receivable from investment adviser for expense reductions | | | | 29,777 |
Total assets | | | | 10,121,634,143 |
| Liabilities | | | | |
| Unrealized depreciation on forward foreign currency contracts | $ | 280,134,493 | | |
| Payable for fund shares redeemed | | 11,786,174 | | |
| Payable for daily variation margin on futures contracts | | 916,446 | | |
| Other payables and accrued expenses | | 256,531 | | |
| Total Liabilities | | | | 293,093,644 |
| Net Assets | | | $ | 9,828,540,499 |
| Net Assets consist of: | | | | |
| Paid in capital | | | $ | 10,658,741,069 |
| Total accumulated earnings (loss) | | | | (830,200,570) |
| Net Assets | | | $ | 9,828,540,499 |
Net Asset Value, offering price and redemption price per share ($9,828,540,499 ÷ 1,124,867,828 shares) | | | $ | 8.74 |
| Statement of Operations |
| | | | Year ended December 31, 2023 |
| Investment Income | | | | |
| Interest | | | $ | 125,098,428 |
| Income from Fidelity Central Funds | | | | 2,285,578 |
| Income before foreign taxes withheld | | | $ | 127,384,006 |
| Less foreign taxes withheld | | | | (572,680) |
| Total Income | | | | 126,811,326 |
| Expenses | | | | |
| Custodian fees and expenses | $ | 609,691 | | |
| Independent trustees' fees and expenses | | 32,369 | | |
| Interest | | 1,175 | | |
| Miscellaneous | | 72 | | |
| Total expenses before reductions | | 643,307 | | |
| Expense reductions | | (335,792) | | |
| Total expenses after reductions | | | | 307,515 |
| Net Investment income (loss) | | | | 126,503,811 |
| Realized and Unrealized Gain (Loss) | | | | |
| Net realized gain (loss) on: | | | | |
| Investment Securities: | | | | |
| Unaffiliated issuers | | (224,338,162) | | |
| Forward foreign currency contracts | | 52,981,086 | | |
| Foreign currency transactions | | 7,649,532 | | |
| Futures contracts | | (6,623,023) | | |
| Total net realized gain (loss) | | | | (170,330,567) |
| Change in net unrealized appreciation (depreciation) on: | | | | |
| Investment Securities: | | | | |
| Unaffiliated issuers | | 653,014,678 | | |
| Forward foreign currency contracts | | 79,604,480 | | |
| Assets and liabilities in foreign currencies | | (53,311) | | |
| Futures contracts | | 9,615,100 | | |
| Total change in net unrealized appreciation (depreciation) | | | | 742,180,947 |
| Net gain (loss) | | | | 571,850,380 |
| Net increase (decrease) in net assets resulting from operations | | | $ | 698,354,191 |
| Statement of Changes in Net Assets |
| |
| | Year ended December 31, 2023 | | Year ended December 31, 2022 |
| Increase (Decrease) in Net Assets | | | | |
| Operations | | | | |
| Net investment income (loss) | $ | 126,503,811 | $ | 56,176,815 |
| Net realized gain (loss) | | (170,330,567) | | 698,630,410 |
| Change in net unrealized appreciation (depreciation) | | 742,180,947 | | (1,834,548,641) |
| Net increase (decrease) in net assets resulting from operations | | 698,354,191 | | (1,079,741,416) |
| Distributions to shareholders | | (360,586,125) | | (63,041,158) |
| | | | | |
| Share transactions | | | | |
| Proceeds from sales of shares | | 1,868,490,454 | | 5,973,560,658 |
| Reinvestment of distributions | | 360,586,125 | | 63,041,158 |
| Cost of shares redeemed | | (1,072,708,577) | | (1,260,957,359) |
| | | | | |
Net increase (decrease) in net assets resulting from share transactions | | 1,156,368,002 | | 4,775,644,457 |
| Total increase (decrease) in net assets | | 1,494,136,068 | | 3,632,861,883 |
| | | | | |
| Net Assets | | | | |
| Beginning of period | | 8,334,404,431 | | 4,701,542,548 |
| End of period | $ | 9,828,540,499 | $ | 8,334,404,431 |
| | | | | |
| Other Information | | | | |
| Shares | | | | |
| Sold | | 218,251,463 | | 648,488,407 |
| Issued in reinvestment of distributions | | 41,654,654 | | 7,336,551 |
| Redeemed | | (126,164,722) | | (143,145,897) |
| Net increase (decrease) | | 133,741,395 | | 512,679,061 |
| | | | | |
Financial Highlights
| Fidelity® Series International Developed Markets Bond Index Fund |
| |
| Years ended December 31, | | 2023 | | 2022 | | 2021 A |
Selected Per-Share Data | | | | | | |
| Net asset value, beginning of period | $ | 8.41 | $ | 9.83 | $ | 10.00 |
| Income from Investment Operations | | | | | | |
Net investment income (loss) B,C | | .118 | | .066 | | .007 |
| Net realized and unrealized gain (loss) | | .547 | | (1.420) | | (.169) |
| Total from investment operations | | .665 | | (1.354) | | (.162) |
| Distributions from net investment income | | (.335) | | (.066) | | (.008) |
| Total distributions | | (.335) | | (.066) | | (.008) |
| Net asset value, end of period | $ | 8.74 | $ | 8.41 | $ | 9.83 |
Total Return D,E | | 7.99% | | (13.79)% | | (1.62)% |
Ratios to Average Net Assets C,F,G | | | | | | |
| Expenses before reductions | | .01% | | .01% | | .01% H |
Expenses net of fee waivers, if any I | | -% | | -% | | -% H |
Expenses net of all reductions I | | -% | | -% | | -% H |
| Net investment income (loss) | | 1.38% | | .74% | | .21% H |
| Supplemental Data | | | | | | |
| Net assets, end of period (000 omitted) | $ | 9,828,540 | $ | 8,334,404 | $ | 4,701,543 |
Portfolio turnover rate J | | 18% | | 22% | | 2% K |
AFor the period August 31, 2021 (commencement of operations) through December 31, 2021.
BCalculated based on average shares outstanding during the period.
CNet investment income (loss) is affected by the timing of the declaration of dividends by any underlying mutual funds or exchange-traded funds (ETFs). Net investment income (loss) of any mutual funds or ETFs is not included in the Fund's net investment income (loss) ratio.
DTotal returns for periods of less than one year are not annualized.
ETotal returns would have been lower if certain expenses had not been reduced during the applicable periods shown.
FFees and expenses of any underlying mutual funds or exchange-traded funds (ETFs) are not included in the Fund's expense ratio. The Fund indirectly bears its proportionate share of these expenses. For additional expense information related to investments in Fidelity Central Funds, please refer to the "Investments in Fidelity Central Funds" note found in the Notes to Financial Statements section of the most recent Annual or Semi-Annual report.
GExpense ratios reflect operating expenses of the class. Expenses before reductions do not reflect amounts reimbursed, waived, or reduced through arrangements with the investment adviser, brokerage services, or other offset arrangements, if applicable, and do not represent the amount paid by the class during periods when reimbursements, waivers or reductions occur.
HAnnualized.
IAmount represents less than .005%.
JAmount does not include the portfolio activity of any underlying mutual funds or exchange-traded funds (ETFs).
KAmount not annualized.
For the period ended December 31, 2023
1. Organization.
Fidelity Series International Developed Markets Bond Index Fund (the Fund) is a non-diversified fund of Fidelity School Street Trust (the Trust) and is authorized to issue an unlimited number of shares. Shares are offered only to certain other Fidelity funds, Fidelity managed 529 plans, and Fidelity managed collective investment trusts. The Trust is registered under the Investment Company Act of 1940, as amended (the 1940 Act), as an open-end management investment company organized as a Massachusetts business trust.
2. Investments in Fidelity Central Funds.
Funds may invest in Fidelity Central Funds, which are open-end investment companies generally available only to other investment companies and accounts managed by the investment adviser and its affiliates. The Schedule of Investments lists any Fidelity Central Funds held as an investment as of period end, but does not include the underlying holdings of each Fidelity Central Fund. An investing fund indirectly bears its proportionate share of the expenses of the underlying Fidelity Central Funds.
Based on its investment objective, each Fidelity Central Fund may invest or participate in various investment vehicles or strategies that are similar to those of the investing fund. These strategies are consistent with the investment objectives of the investing fund and may involve certain economic risks which may cause a decline in value of each of the Fidelity Central Funds and thus a decline in the value of the investing fund.
| Fidelity Central Fund | Investment Manager | Investment Objective | Investment Practices | Expense RatioA |
| Fidelity Money Market Central Funds | Fidelity Management & Research Company LLC (FMR) | Each fund seeks to obtain a high level of current income consistent with the preservation of capital and liquidity. | Short-term Investments | Less than .005% |
A Expenses expressed as a percentage of average net assets and are as of each underlying Central Fund's most recent annual or semi-annual shareholder report.
A complete unaudited list of holdings for each Fidelity Central Fund is available upon request or at the Securities and Exchange Commission website at www.sec.gov. In addition, the financial statements of the Fidelity Central Funds which contain the significant accounting policies (including investment valuation policies) of those funds, and are not covered by the Report of Independent Registered Public Accounting Firm, are available on the Securities and Exchange Commission website or upon request.
3. Significant Accounting Policies.
The Fund is an investment company and applies the accounting and reporting guidance of the Financial Accounting Standards Board (FASB) Accounting Standards Codification Topic 946 Financial Services - Investment Companies. The financial statements have been prepared in conformity with accounting principles generally accepted in the United States of America (GAAP), which require management to make certain estimates and assumptions at the date of the financial statements. Actual results could differ from those estimates. Subsequent events, if any, through the date that the financial statements were issued have been evaluated in the preparation of the financial statements. The Fund's Schedule of Investments lists any underlying mutual funds or exchange-traded funds (ETFs) but does not include the underlying holdings of these funds. The following summarizes the significant accounting policies of the Fund:
Investment Valuation. Investments are valued as of 4:00 p.m. Eastern time on the last calendar day of the period. The Board of Trustees (the Board) has designated the Fund's investment adviser as the valuation designee responsible for the fair valuation function and performing fair value determinations as needed. The investment adviser has established a Fair Value Committee (the Committee) to carry out the day-to-day fair valuation responsibilities and has adopted policies and procedures to govern the fair valuation process and the activities of the Committee. In accordance with these fair valuation policies and procedures, which have been approved by the Board, the Fund attempts to obtain prices from one or more third party pricing services or brokers to value its investments. When current market prices, quotations or currency exchange rates are not readily available or reliable, investments will be fair valued in good faith by the Committee, in accordance with the policies and procedures. Factors used in determining fair value vary by investment type and may include market or investment specific events, transaction data, estimated cash flows, and market observations of comparable investments. The frequency that the fair valuation procedures are used cannot be predicted and they may be utilized to a significant extent. The Committee manages the Fund's fair valuation practices and maintains the fair valuation policies and procedures. The Fund's investment adviser reports to the Board information regarding the fair valuation process and related material matters.
The Fund categorizes the inputs to valuation techniques used to value its investments into a disclosure hierarchy consisting of three levels as shown below:
Level 1 - unadjusted quoted prices in active markets for identical investments
Level 2 - other significant observable inputs (including quoted prices for similar investments, interest rates, prepayment speeds, etc.)
Level 3 - unobservable inputs (including the Fund's own assumptions based on the best information available)
Valuation techniques used to value the Fund's investments by major category are as follows:
Debt securities, including restricted securities, are valued based on evaluated prices received from third party pricing services or from brokers who make markets in such securities. Government agency obligations are valued by pricing services who utilize matrix pricing which considers yield or price of bonds of comparable quality, coupon, maturity and type or by broker-supplied prices. When independent prices are unavailable or unreliable, debt securities may be valued utilizing pricing methodologies which consider similar factors that would be used by third party pricing services. For foreign debt securities, when significant market or security specific events arise, valuations may be determined in good faith in accordance with procedures adopted by the Board. Debt securities are generally categorized as Level 2 in the hierarchy but may be Level 3 depending on the circumstances.
The U.S. dollar value of forward foreign currency contracts is determined using currency exchange rates supplied by a pricing service and are categorized as Level 2 in the hierarchy. Futures contracts are valued at the settlement price established each day by the board of trade or exchange on which they are traded and are categorized as Level 1 in the hierarchy. Investments in open-end mutual funds, including the Fidelity Central Funds, are valued at their closing net asset value (NAV) each business day and are categorized as Level 1 in the hierarchy.
Changes in valuation techniques may result in transfers in or out of an assigned level within the disclosure hierarchy. The aggregate value of investments by input level as of December 31, 2023 is included at the end of the Fund's Schedule of Investments.
Foreign Currency. Foreign-denominated assets, including investment securities, and liabilities are translated into U.S. dollars at the exchange rates at period end. Purchases and sales of investment securities, income and dividends received, and expenses denominated in foreign currencies are translated into U.S. dollars at the exchange rate in effect on the transaction date.
The effects of exchange rate fluctuations on investments are included with the net realized and unrealized gain (loss) on investment securities. Other foreign currency transactions resulting in realized and unrealized gain (loss) are disclosed separately.
Realized gains and losses on foreign currency transactions arise from the disposition of foreign currency, realized changes in the value of foreign currency between the trade and settlement dates on security transactions, and the difference between the amounts of dividends, interest and foreign withholding taxes recorded on transaction date and the U.S. dollar equivalent of the amounts actually received or paid. Unrealized gains and losses on assets and liabilities in foreign currencies arise from changes in the value of foreign currency, and from assets and liabilities denominated in foreign currencies, other than investments, which are held at period end.
Investment Transactions and Income. For financial reporting purposes, the Fund's investment holdings and NAV include trades executed through the end of the last business day of the period. The NAV per share for processing shareholder transactions is calculated as of the close of business of the New York Stock Exchange (NYSE), normally 4:00 p.m. Eastern time and includes trades executed through the end of the prior business day. Gains and losses on securities sold are determined on the basis of identified cost. Income and capital gain distributions from Fidelity Central Funds, if any, are recorded on the ex-dividend date. Interest income is accrued as earned and includes coupon interest and amortization of premium and accretion of discount on debt securities as applicable. Investment income is recorded net of foreign taxes withheld where recovery of such taxes is uncertain. Funds may file withholding tax reclaims in certain jurisdictions to recover a portion of amounts previously withheld. Any withholding tax reclaims income is included in the Statement of Operations in interest. Any receivables for withholding tax reclaims are included in the Statement of Assets and Liabilities in interest receivable.
Expenses. Expenses directly attributable to a fund are charged to that fund. Expenses attributable to more than one fund are allocated among the respective funds on the basis of relative net assets or other appropriate methods. Expenses included in the accompanying financial statements reflect the expenses of that fund and do not include any expenses associated with any underlying mutual funds or exchange-traded funds. Although not included in a fund's expenses, a fund indirectly bears its proportionate share of these expenses through the net asset value of each underlying mutual fund or exchange-traded fund. Expense estimates are accrued in the period to which they relate and adjustments are made when actual amounts are known.
Income Tax Information and Distributions to Shareholders. Each year, the Fund intends to qualify as a regulated investment company under Subchapter M of the Internal Revenue Code, including distributing substantially all of its taxable income and realized gains. As a result, no provision for U.S. Federal income taxes is required. As of December 31, 2023, the Fund did not have any unrecognized tax benefits in the financial statements; nor is the Fund aware of any tax positions for which it is reasonably possible that the total amounts of unrecognized tax benefits will significantly change in the next twelve months. The Fund files a U.S. federal tax return, in addition to state and local tax returns as required. The Fund's federal income tax returns are subject to examination by the Internal Revenue Service (IRS) for a period of three fiscal years after they are filed. State and local tax returns may be subject to examination for an additional fiscal year depending on the jurisdiction. Foreign taxes are provided for based on the Fund's understanding of the tax rules and rates that exist in the foreign markets in which it invests.
Distributions are declared and recorded daily and paid monthly from net investment income. Distributions from realized gains, if any, are declared and recorded on the ex-dividend date. Income and capital gain distributions are determined in accordance with income tax regulations, which may differ from GAAP.
Capital accounts within the financial statements are adjusted for permanent book-tax differences. These adjustments have no impact on net assets or the results of operations. Capital accounts are not adjusted for temporary book-tax differences which will reverse in a subsequent period.
Book-tax differences are primarily due to futures contracts, foreign currency transactions, market discount, capital loss carryforwards and losses deferred due to wash sales.
As of period end, the cost and unrealized appreciation (depreciation) in securities, and derivatives if applicable, for federal income tax purposes were as follows:
| Gross unrealized appreciation | $264,143,469 |
| Gross unrealized depreciation | (1,008,064,894) |
| Net unrealized appreciation (depreciation) | $(743,921,425) |
| Tax Cost | $10,794,923,908 |
The tax-based components of distributable earnings as of period end were as follows:
| Undistributed ordinary income | $93,519,414 |
| Capital loss carryforward | $(181,523,600) |
| Net unrealized appreciation (depreciation) on securities and other investments | $(742,196,384) |
Capital loss carryforwards are only available to offset future capital gains of the Fund to the extent provided by regulations and may be limited. The capital loss carryforward information presented below, including any applicable limitation, is estimated as of fiscal period end and is subject to adjustment.
Short-term | $(82,017,951) |
Long-term | (99,505,648) |
| Total capital loss carryforward | $(181,523,600) |
The tax character of distributions paid was as follows:
| | December 31, 2023 | December 31, 2022 |
| Ordinary Income | $360,586,125 | $63,041,158 |
Restricted Securities (including Private Placements). Funds may invest in securities that are subject to legal or contractual restrictions on resale. These securities generally may be resold in transactions exempt from registration or to the public if the securities are registered. Disposal of these securities may involve time-consuming negotiations and expense, and prompt sale at an acceptable price may be difficult. Information regarding restricted securities held at period end is included at the end of the Schedule of Investments, if applicable.
4. Derivative Instruments.
Risk Exposures and the Use of Derivative Instruments. The Fund's investment objectives allow for various types of derivative instruments, including futures contracts and forward foreign currency contracts. Derivatives are investments whose value is primarily derived from underlying assets, indices or reference rates and may be transacted on an exchange or over-the-counter (OTC). Derivatives may involve a future commitment to buy or sell a specified asset based on specified terms, to exchange future cash flows at periodic intervals based on a notional principal amount, or for one party to make one or more payments upon the occurrence of specified events in exchange for periodic payments from the other party.
Derivatives were used to increase returns, to facilitate transactions in foreign-denominated securities and to manage exposure to certain risks as defined below. The success of any strategy involving derivatives depends on analysis of numerous economic factors, and if the strategies for investment do not work as intended, the objectives may not be achieved.
Derivatives were used to increase or decrease exposure to the following risk(s):
| Foreign Exchange Risk | Foreign exchange rate risk relates to fluctuations in the value of an asset or liability due to changes in currency exchange rates. |
| Interest Rate Risk | Interest rate risk relates to the fluctuations in the value of interest-bearing securities due to changes in the prevailing levels of market interest rates. |
Funds are also exposed to additional risks from investing in derivatives, such as liquidity risk and counterparty credit risk. Liquidity risk is the risk that a fund will be unable to close out the derivative in the open market in a timely manner. Counterparty credit risk is the risk that the counterparty will not be able to fulfill its obligation to a fund. Derivative counterparty credit risk is managed through formal evaluation of the creditworthiness of all potential counterparties. On certain OTC derivatives such as forward foreign currency contracts, a fund attempts to reduce its exposure to counterparty credit risk by entering into an International Swaps and Derivatives Association, Inc. (ISDA) Master Agreement with each of its counterparties. The ISDA Master Agreement gives a fund the right to terminate all transactions traded under such agreement upon the deterioration in the credit quality of the counterparty beyond specified levels. The ISDA Master Agreement gives each party the right, upon an event of default by the other party or a termination of the agreement, to close out all transactions traded under such agreement and to net amounts owed under each transaction to one net payable by one party to the other. To mitigate counterparty credit risk on bi-lateral OTC derivatives, a fund receives collateral in the form of cash or securities once net unrealized appreciation on outstanding derivative contracts under an ISDA Master Agreement exceeds certain applicable thresholds, subject to certain minimum transfer provisions. The collateral received is held in segregated accounts with the custodian bank in accordance with the collateral agreements entered into between a fund, the counterparty and the custodian bank. A fund could experience delays and costs in gaining access to the collateral even though it is held by the custodian bank. The maximum risk of loss to a fund from counterparty credit risk related to bi-lateral OTC derivatives is generally the aggregate unrealized appreciation and unpaid counterparty payments in excess of any collateral pledged by the counterparty to a fund. A fund may be required to pledge collateral for the benefit of the counterparties on bi-lateral OTC derivatives in an amount not less than each counterparty's unrealized appreciation on outstanding derivative contracts, subject to certain minimum transfer provisions, and any such pledged collateral is identified in the Schedule of Investments. Exchange-traded contracts are not covered by the ISDA Master Agreement; however counterparty credit risk related to these contracts may be mitigated by the protection provided by the exchange on which they trade. A summary of derivatives inclusive of potential netting arrangements is presented at the end of the Schedule of Investments.
Investing in derivatives may involve greater risks than investing in the underlying assets directly and, to varying degrees, may involve risk of loss in excess of any initial investment and collateral received and amounts recognized in the Statement of Assets and Liabilities. In addition, there may be the risk that the change in value of the derivative contract does not correspond to the change in value of the underlying instrument.
Net Realized Gain (Loss) and Change in Net Unrealized Appreciation (Depreciation) on Derivatives. The table below, which reflects the impacts of derivatives on the financial performance, summarizes the net realized gain (loss) and change in net unrealized appreciation (depreciation) for derivatives during the period as presented in the Statement of Operations.
| Primary Risk Exposure / Derivative Type | Net Realized Gain (Loss)($) | Change in Net Unrealized Appreciation (Depreciation)($) |
| Fidelity Series International Developed Markets Bond Index Fund | | |
| Foreign Exchange Risk | | |
| Forward Foreign Currency Contracts | 52,981,086 | 79,604,480 |
| Total Foreign Exchange Risk | 52,981,086 | 79,604,480 |
| Interest Rate Risk | | |
| Futures Contracts | (6,623,023) | 9,615,100 |
| Total Interest Rate Risk | (6,623,023) | 9,615,100 |
| Totals | 46,358,063 | 89,219,580 |
If there are any open positions at period end, a summary of the value of derivatives by primary risk exposure is included at the end of the Schedule of Investments.
Forward Foreign Currency Contracts. Forward foreign currency contracts represent obligations to purchase or sell foreign currency on a specified future date at a price fixed at the time the contracts are entered into. Forward foreign currency contracts were used to facilitate transactions in foreign-denominated securities and to manage exposure to certain foreign currencies.
Forward foreign currency contracts are valued daily and fluctuations in exchange rates on open contracts are recorded as unrealized appreciation or (depreciation) and reflected in total accumulated earnings (loss) in the Statement of Assets and Liabilities. When the contract is closed, a gain or loss is realized equal to the difference between the closing value and the value at the time it was opened. Non-deliverable forward foreign currency exchange contracts are settled with the counterparty in cash without the delivery of foreign currency. The net realized gain (loss) and change in net unrealized appreciation (depreciation) on forward foreign currency contracts during the period is presented in the Statement of Operations.
Any open forward foreign currency contracts at period end are presented in the Schedule of Investments under the caption "Forward Foreign Currency Contracts." The contract amount and unrealized appreciation (depreciation) reflects each contract's exposure to the underlying currency at period end, and is representative of volume of activity during the period unless an average contract value is presented.
Futures Contracts. A futures contract is an agreement between two parties to buy or sell a specified underlying instrument for a fixed price at a specified future date. Futures contracts were used to manage exposure to the bond market and fluctuations in interest rates.
Upon entering into a futures contract, a fund is required to deposit either cash or securities (initial margin) with a clearing broker in an amount equal to a certain percentage of the face value of the contract. Futures contracts are marked-to-market daily and subsequent daily payments are made or received by a fund depending on the daily fluctuations in the value of the futures contracts and are recorded as unrealized appreciation or (depreciation). This receivable and/or payable, if any, is included in daily variation margin on futures contracts in the Statement of Assets and Liabilities. Realized gain or (loss) is recorded upon the expiration or closing of a futures contract. The net realized gain (loss) and change in net unrealized appreciation (depreciation) on futures contracts during the period is presented in the Statement of Operations.
Any open futures contracts at period end are presented in the Schedule of Investments under the caption "Futures Contracts". The notional amount at value reflects each contract's exposure to the underlying instrument or index at period end, and is representative of volume of activity during the period unless an average notional amount is presented. Any securities deposited to meet initial margin requirements are identified in the Schedule of Investments. Any cash deposited to meet initial margin requirements is presented as segregated cash with brokers for derivative instruments in the Statement of Assets and Liabilities.
5. Purchases and Sales of Investments.
Purchases and sales of securities, other than short-term securities and in-kind transactions, as applicable, are noted in the table below.
| | Purchases ($) | Sales ($) |
| Fidelity Series International Developed Markets Bond Index Fund | 2,636,984,943 | 1,620,345,463 |
6. Fees and Other Transactions with Affiliates.
Management Fee. Fidelity Management & Research Company LLC (the investment adviser) and its affiliates provide the Fund with investment management related services for which the Fund does not pay a management fee. Under the management contract, the investment adviser or an affiliate pays all ordinary operating expenses of the Fund, except custody fees, fees and expenses of the independent Trustees, and certain miscellaneous expenses such as proxy and shareholder meeting expenses.
Interfund Trades. Funds may purchase from or sell securities to other Fidelity Funds under procedures adopted by the Board. The procedures have been designed to ensure these interfund trades are executed in accordance with Rule 17a-7 of the 1940 Act. Any interfund trades are included within the respective purchases and sales amounts shown in the Purchases and Sales of Investments note. During the period, there were no interfund trades.
Subsequent Event - Sub-Advisory Arrangements. Effective March 1, 2024, the Fund's sub-advisory agreements with FMR Investment Management (UK) Limited, Fidelity Management & Research (Hong Kong) Limited, and Fidelity Management & Research (Japan) Limited will be amended to provide that the investment adviser will pay each sub-adviser monthly fees equal to 110% of the sub-adviser's costs for providing sub-advisory services.
7. Committed Line of Credit.
Certain Funds participate with other funds managed by the investment adviser or an affiliate in a $4.25 billion credit facility (the "line of credit") to be utilized for temporary or emergency purposes to fund shareholder redemptions or for other short-term liquidity purposes. The commitment fees on the pro-rata portion of the line of credit are borne by the investment adviser. During the period, there were no borrowings on this line of credit.
8. Bank Borrowings.
The Fund is permitted to have bank borrowings for temporary or emergency purposes to fund shareholder redemptions or for other short-term liquidity requirements. The Fund has established borrowing arrangements with certain banks. The interest rate on the borrowings is the bank's base rate, as revised from time to time. Any open loans, including accrued interest, at period end are presented under the caption "Notes payable" in the Statement of Assets and Liabilities, if applicable. Activity in this program during the period for which loans were outstanding was as follows:
| | Average Loan Balance | Weighted Average Interest Rate | Interest Expense |
| Fidelity Series International Developed Markets Bond Index Fund | $8,329,000 | 5.08% | $1,175 |
9. Expense Reductions.
The investment adviser contractually agreed to reimburse the Fund to the extent annual operating expenses exceeded .003% of average net assets. This reimbursement will remain in place through April 30, 2027. Some expenses, for example the compensation of the independent Trustees, and certain other expenses such as interest expense, are excluded from this reimbursement. During the period this reimbursement reduced the Fund's expenses by $335,792.
10. Other.
A fund's organizational documents provide former and current trustees and officers with a limited indemnification against liabilities arising in connection with the performance of their duties to the fund. In the normal course of business, a fund may also enter into contracts that provide general indemnifications. A fund's maximum exposure under these arrangements is unknown as this would be dependent on future claims that may be made against a fund. The risk of material loss from such claims is considered remote.
At the end of the period, mutual funds and accounts managed by the investment adviser or its affiliates were the owners of record of all of the outstanding shares of the Fund.
11. Risk and Uncertainties.
Many factors affect a fund's performance. Developments that disrupt global economies and financial markets, such as pandemics, epidemics, outbreaks of infectious diseases, war, terrorism, and environmental disasters, may significantly affect a fund's investment performance. The effects of these developments to a fund will be impacted by the types of securities in which a fund invests, the financial condition, industry, economic sector, and geographic location of an issuer, and a fund's level of investment in the securities of that issuer. Significant concentrations in security types, issuers, industries, sectors, and geographic locations may magnify the factors that affect a fund's performance.
To the Board of Trustees of Fidelity School Street Trust and the Shareholders of Fidelity Series International Developed Markets Bond Index Fund:
Opinion on the Financial Statements and Financial Highlights
We have audited the accompanying statement of assets and liabilities of Fidelity Series International Developed Markets Bond Index Fund (the "Fund"), a fund of Fidelity School Street Trust, including the schedule of investments, as of December 31, 2023, the related statement of operations for the year then ended, the statement of changes in net assets for each of the two years in the period then ended, the financial highlights for each of the two years in the period then ended and for the period from August 31, 2021 (commencement of operations) through December 31, 2021, and the related notes. In our opinion, the financial statements and financial highlights present fairly, in all material respects, the financial position of the Fund as of December 31, 2023, and the results of its operations for the year then ended, the changes in its net assets for each of the two years in the period then ended, and the financial highlights for each of the two years in the period then ended and for the period from August 31, 2021 (commencement of operations) through December 31, 2021, in conformity with accounting principles generally accepted in the United States of America.
Basis for Opinion
These financial statements and financial highlights are the responsibility of the Fund's management. Our responsibility is to express an opinion on the Fund's financial statements and financial highlights based on our audits. We are a public accounting firm registered with the Public Company Accounting Oversight Board (United States) (PCAOB) and are required to be independent with respect to the Fund in accordance with the U.S. federal securities laws and the applicable rules and regulations of the Securities and Exchange Commission and the PCAOB.
We conducted our audits in accordance with the standards of the PCAOB. Those standards require that we plan and perform the audit to obtain reasonable assurance about whether the financial statements and financial highlights are free of material misstatement, whether due to error or fraud. The Fund is not required to have, nor were we engaged to perform, an audit of its internal control over financial reporting. As part of our audits, we are required to obtain an understanding of internal control over financial reporting but not for the purpose of expressing an opinion on the effectiveness of the Fund's internal control over financial reporting. Accordingly, we express no such opinion.
Our audits included performing procedures to assess the risks of material misstatement of the financial statements and financial highlights, whether due to error or fraud, and performing procedures that respond to those risks. Such procedures included examining, on a test basis, evidence regarding the amounts and disclosures in the financial statements and financial highlights. Our audits also included evaluating the accounting principles used and significant estimates made by management, as well as evaluating the overall presentation of the financial statements and financial highlights. Our procedures included confirmation of securities owned as of December 31, 2023, by correspondence with the custodian and brokers; when replies were not received from brokers, we performed other auditing procedures. We believe that our audits provide a reasonable basis for our opinion.
/s/ Deloitte & Touche LLP
Boston, Massachusetts
February 14, 2024
We have served as the auditor of one or more of the Fidelity investment companies since 1999.
The Trustees, Members of the Advisory Board (if any), and officers of the trust and fund, as applicable, are listed below. The Board of Trustees governs the fund and is responsible for protecting the interests of shareholders. The Trustees are experienced executives who meet periodically throughout the year to oversee the fund's activities, review contractual arrangements with companies that provide services to the fund, oversee management of the risks associated with such activities and contractual arrangements, and review the fund's performance. Each of the Trustees oversees 314 funds.
The Trustees hold office without limit in time except that (a) any Trustee may resign; (b) any Trustee may be removed by written instrument, signed by at least two-thirds of the number of Trustees prior to such removal; (c) any Trustee who requests to be retired or who has become incapacitated by illness or injury may be retired by written instrument signed by a majority of the other Trustees; and (d) any Trustee may be removed at any special meeting of shareholders by a two-thirds vote of the outstanding voting securities of the trust. Each Trustee who is not an interested person (as defined in the 1940 Act) of the trust and the fund is referred to herein as an Independent Trustee. Each Independent Trustee shall retire not later than the last day of the calendar year in which his or her 75th birthday occurs. The Independent Trustees may waive this mandatory retirement age policy with respect to individual Trustees. Officers and Advisory Board Members hold office without limit in time, except that any officer or Advisory Board Member may resign or may be removed by a vote of a majority of the Trustees at any regular meeting or any special meeting of the Trustees. Except as indicated, each individual has held the office shown or other offices in the same company for the past five years.
The fund's Statement of Additional Information (SAI) includes more information about the Trustees. To request a free copy, call Fidelity at 1-800-544-8544.
Experience, Skills, Attributes, and Qualifications of the Trustees. The Governance and Nominating Committee has adopted a statement of policy that describes the experience, qualifications, attributes, and skills that are necessary and desirable for potential Independent Trustee candidates (Statement of Policy). The Board believes that each Trustee satisfied at the time he or she was initially elected or appointed a Trustee, and continues to satisfy, the standards contemplated by the Statement of Policy. The Governance and Nominating Committee also engages professional search firms to help identify potential Independent Trustee candidates who have the experience, qualifications, attributes, and skills consistent with the Statement of Policy. From time to time, additional criteria based on the composition and skills of the current Independent Trustees, as well as experience or skills that may be appropriate in light of future changes to board composition, business conditions, and regulatory or other developments, have also been considered by the professional search firms and the Governance and Nominating Committee. In addition, the Board takes into account the Trustees' commitment and participation in Board and committee meetings, as well as their leadership of standing and ad hoc committees throughout their tenure.
In determining that a particular Trustee was and continues to be qualified to serve as a Trustee, the Board has considered a variety of criteria, none of which, in isolation, was controlling. The Board believes that, collectively, the Trustees have balanced and diverse experience, qualifications, attributes, and skills, which allow the Board to operate effectively in governing the fund and protecting the interests of shareholders. Information about the specific experience, skills, attributes, and qualifications of each Trustee, which in each case led to the Board's conclusion that the Trustee should serve (or continue to serve) as a trustee of the fund, is provided below.
Board Structure and Oversight Function. Abigail P. Johnson is an interested person and currently serves as Chairman. The Trustees have determined that an interested Chairman is appropriate and benefits shareholders because an interested Chairman has a personal and professional stake in the quality and continuity of services provided to the fund. Independent Trustees exercise their informed business judgment to appoint an individual of their choosing to serve as Chairman, regardless of whether the Trustee happens to be independent or a member of management. The Independent Trustees have determined that they can act independently and effectively without having an Independent Trustee serve as Chairman and that a key structural component for assuring that they are in a position to do so is for the Independent Trustees to constitute a substantial majority for the Board. The Independent Trustees also regularly meet in executive session. Michael E. Kenneally serves as Chairman of the Independent Trustees and as such (i) acts as a liaison between the Independent Trustees and management with respect to matters important to the Independent Trustees and (ii) with management prepares agendas for Board meetings.
Fidelity® funds are overseen by different Boards of Trustees. The fund's Board oversees Fidelity's investment-grade bond, money market, asset allocation and certain equity funds, and other Boards oversee Fidelity's alternative investment, high income and other equity funds. The asset allocation funds may invest in Fidelity® funds that are overseen by such other Boards. The use of separate Boards, each with its own committee structure, allows the Trustees of each group of Fidelity® funds to focus on the unique issues of the funds they oversee, including common research, investment, and operational issues. On occasion, the separate Boards establish joint committees to address issues of overlapping consequences for the Fidelity® funds overseen by each Board.
The Trustees operate using a system of committees to facilitate the timely and efficient consideration of all matters of importance to the Trustees, the fund, and fund shareholders and to facilitate compliance with legal and regulatory requirements and oversight of the fund's activities and associated risks. The Board, acting through its committees, has charged FMR and its affiliates with (i) identifying events or circumstances the occurrence of which could have demonstrably adverse effects on the fund's business and/or reputation; (ii) implementing processes and controls to lessen the possibility that such events or circumstances occur or to mitigate the effects of such events or circumstances if they do occur; and (iii) creating and maintaining a system designed to evaluate continuously business and market conditions in order to facilitate the identification and implementation processes described in (i) and (ii) above. Because the day-to-day operations and activities of the fund are carried out by or through FMR, its affiliates, and other service providers, the fund's exposure to risks is mitigated but not eliminated by the processes overseen by the Trustees. While each of the Board's committees has responsibility for overseeing different aspects of the fund's activities, oversight is exercised primarily through the Operations and Audit Committees. In addition, an ad hoc Board committee of Independent Trustees has worked with FMR to enhance the Board's oversight of investment and financial risks, legal and regulatory risks, technology risks, and operational risks, including the development of additional risk reporting to the Board. Appropriate personnel, including but not limited to the fund's Chief Compliance Officer (CCO), FMR's internal auditor, the independent accountants, the fund's Treasurer and portfolio management personnel, make periodic reports to the Board's committees, as appropriate, including an annual review of Fidelity's risk management program for the Fidelity® funds. The responsibilities of each standing committee, including their oversight responsibilities, are described further under "Standing Committees of the Trustees."
Interested Trustees*:
Correspondence intended for a Trustee who is an interested person may be sent to Fidelity Investments, 245 Summer Street, Boston, Massachusetts 02210.
Name, Year of Birth; Principal Occupations and Other Relevant Experience+
Abigail P. Johnson (1961)
Year of Election or Appointment: 2009
Trustee
Chairman of the Board of Trustees
Ms. Johnson also serves as Trustee of other Fidelity® funds. Ms. Johnson serves as Chairman (2016-present), Chief Executive Officer (2014-present), and Director (2007-present) of FMR LLC (diversified financial services company), President of Fidelity Financial Services (2012-present) and President of Personal, Workplace and Institutional Services (2005-present). Ms. Johnson is Chairman and Director of Fidelity Management & Research Company LLC (investment adviser firm, 2011-present). Previously, Ms. Johnson served as Chairman and Director of FMR Co., Inc. (investment adviser firm, 2011-2019), Vice Chairman (2007-2016) and President (2013-2016) of FMR LLC, President and a Director of Fidelity Management & Research Company (2001-2005), a Trustee of other investment companies advised by Fidelity Management & Research Company, Fidelity Investments Money Management, Inc. (investment adviser firm), and FMR Co., Inc. (2001-2005), Senior Vice President of the Fidelity® funds (2001-2005), and managed a number of Fidelity® funds. Ms. Abigail P. Johnson and Mr. Arthur E. Johnson are not related.
Jennifer Toolin McAuliffe (1959)
Year of Election or Appointment: 2016
Trustee
Ms. McAuliffe also serves as Trustee of other Fidelity® funds and as Trustee of Fidelity Charitable (2020-present). Previously, Ms. McAuliffe served as Co-Head of Fixed Income of Fidelity Investments Limited (now known as FIL Limited (FIL)) (diversified financial services company), Director of Research for FIL's credit and quantitative teams in London, Hong Kong and Tokyo and Director of Research for taxable and municipal bonds at Fidelity Investments Money Management, Inc. Ms. McAuliffe previously served as a member of the Advisory Board of certain Fidelity® funds (2016). Ms. McAuliffe was previously a lawyer at Ropes & Gray LLP and an international banker at Chemical Bank NA (now JPMorgan Chase & Co.). Ms. McAuliffe also currently serves as director or trustee of several not-for-profit entities.
Christine J. Thompson (1958)
Year of Election or Appointment: 2023
Trustee
Ms. Thompson also serves as a Trustee of other Fidelity® funds. Ms. Thompson serves as Leader of Advanced Technologies for Investment Management at Fidelity Investments (2018-present). Previously, Ms. Thompson served as Chief Investment Officer in the Bond group at Fidelity Management & Research Company (2010-2018) and held various other roles including Director of municipal bond portfolio managers and Portfolio Manager of certain Fidelity® funds.
* Determined to be an "Interested Trustee" by virtue of, among other things, his or her affiliation with the trust or various entities under common control with FMR.
+ The information includes the Trustee's principal occupation during the last five years and other information relating to the experience, attributes, and skills relevant to the Trustee's qualifications to serve as a Trustee, which led to the conclusion that the Trustee should serve as a Trustee for the fund.
Independent Trustees:
Correspondence intended for an Independent Trustee may be sent to Fidelity Investments, P.O. Box 55235, Boston, Massachusetts 02205-5235.
Name, Year of Birth; Principal Occupations and Other Relevant Experience+
Elizabeth S. Acton (1951)
Year of Election or Appointment: 2013
Trustee
Ms. Acton also serves as Trustee of other Fidelity® funds. Prior to her retirement, Ms. Acton served as Executive Vice President, Finance (2011-2012), Executive Vice President, Chief Financial Officer (2002-2011) and Treasurer (2004-2005) of Comerica Incorporated (financial services). Prior to joining Comerica, Ms. Acton held a variety of positions at Ford Motor Company (1983-2002), including Vice President and Treasurer (2000-2002) and Executive Vice President and Chief Financial Officer of Ford Motor Credit Company (1998-2000). Ms. Acton currently serves as a member of the Board and Audit and Finance Committees of Beazer Homes USA, Inc. (homebuilding, 2012-present). Ms. Acton previously served as a member of the Advisory Board of certain Fidelity® funds (2013-2016).
Laura M. Bishop (1961)
Year of Election or Appointment: 2023
Trustee
Ms. Bishop also serves as Trustee or Member of the Advisory Board of other Fidelity® funds. Prior to her retirement, Ms. Bishop held a variety of positions at United Services Automobile Association (2001-2020), including Executive Vice President and Chief Financial Officer (2014-2020) and Senior Vice President and Deputy Chief Financial Officer (2012-2014). Ms. Bishop currently serves as a member of the Audit Committee and Compensation and Personnel Committee (2021-present) of the Board of Directors of Korn Ferry (global organizational consulting). Previously, Ms. Bishop served as a Member of the Advisory Board of certain Fidelity® funds (2022-2023).
Ann E. Dunwoody (1953)
Year of Election or Appointment: 2018
Trustee
General Dunwoody also serves as Trustee of other Fidelity® funds. General Dunwoody (United States Army, Retired) was the first woman in U.S. military history to achieve the rank of four-star general and prior to her retirement in 2012 held a variety of positions within the U.S. Army, including Commanding General, U.S. Army Material Command (2008-2012). General Dunwoody currently serves as a member of the Board, Chair of Nomination Committee and a member of the Corporate Governance Committee of Kforce Inc. (professional staffing services, 2016-present) and a member of the Board of Automattic Inc. (software engineering, 2018-present). Previously, General Dunwoody served as President of First to Four LLC (leadership and mentoring services, 2012-2022), a member of the Advisory Board and Nominating and Corporate Governance Committee of L3 Technologies, Inc. (communication, electronic, sensor and aerospace systems, 2013-2019) and a member of the Board and Audit and Sustainability and Corporate Responsibility Committees of Republic Services, Inc. (waste collection, disposal and recycling, 2013-2016). General Dunwoody also serves on several boards for non-profit organizations, including as a member of the Board, Chair of the Nomination and Governance Committee and a member of the Audit Committee of the Noble Reach Foundation (formerly Logistics Management Institute) (consulting non-profit, 2012-present) and a member of the Board of ThanksUSA (military family education non-profit, 2014-present). Previously, General Dunwoody served as a member of the Board of Florida Institute of Technology (2015-2022) and a member of the Council of Trustees for the Association of the United States Army (advocacy non-profit, 2013-2021). General Dunwoody previously served as a member of the Advisory Board of certain Fidelity® funds (2018).
John Engler (1948)
Year of Election or Appointment: 2014
Trustee
Mr. Engler also serves as Trustee of other Fidelity® funds. Previously, Mr. Engler served as Governor of Michigan (1991-2003), President of the Business Roundtable (2011-2017) and interim President of Michigan State University (2018-2019). Previously, Mr. Engler served as a member of the Board of Stride, Inc. (formerly K12 Inc.) (technology-based education company, 2012-2022), a member of the Board of Universal Forest Products (manufacturer and distributor of wood and wood-alternative products, 2003-2019) and Trustee of The Munder Funds (2003-2014). Mr. Engler previously served as a member of the Advisory Board of certain Fidelity® funds (2014-2016).
Robert F. Gartland (1951)
Year of Election or Appointment: 2010
Trustee
Mr. Gartland also serves as Trustee of other Fidelity® funds. Prior to his retirement, Mr. Gartland held a variety of positions at Morgan Stanley (financial services, 1979-2007), including Managing Director (1987-2007) and Chase Manhattan Bank (1975-1978). Mr. Gartland previously served as Chairman and an investor in Gartland & Mellina Group Corp. (consulting, 2009-2019), as a member of the Board of National Securities Clearing Corporation (1993-1996) and as Chairman of TradeWeb (2003-2004).
Robert W. Helm (1957)
Year of Election or Appointment: 2023
Trustee
Mr. Helm also serves as Trustee or Member of the Advisory Board of other Fidelity® funds. Mr. Helm was formerly Deputy Chairman (2003-2020), partner (1991-2020) and an associate (1984-1991) of Dechert LLP (formerly Dechert Price & Rhoads). Mr. Helm currently serves on boards and committees of several not-for-profit organizations, including as a Trustee and member of the Executive Committee of the Baltimore Council on Foreign Affairs, a member of the Board of Directors of the St. Vincent de Paul Society of Baltimore and a member of the Life Guard Society of Mt. Vernon. Previously, Mr. Helm served as a Member of the Advisory Board of certain Fidelity® funds (2021-2023).
Michael E. Kenneally (1954)
Year of Election or Appointment: 2009
Trustee
Chairman of the Independent Trustees
Mr. Kenneally also serves as Trustee of other Fidelity® funds and was Vice Chairman (2018-2021) of the Independent Trustees of certain Fidelity® funds. Prior to retirement in 2005, he was Chairman and Global Chief Executive Officer of Credit Suisse Asset Management, the worldwide fund management and institutional investment business of Credit Suisse Group. Previously, Mr. Kenneally was an Executive Vice President and the Chief Investment Officer for Bank of America. In this role, he was responsible for the investment management, strategy and products delivered to the bank's institutional, high-net-worth and retail clients. Earlier, Mr. Kenneally directed the organization's equity and quantitative research groups. He began his career as a research analyst and then spent more than a dozen years as a portfolio manager for endowments, pension plans and mutual funds. He earned the Chartered Financial Analyst (CFA) designation in 1991.
Mark A. Murray (1954)
Year of Election or Appointment: 2016
Trustee
Mr. Murray also serves as Trustee of other Fidelity® funds. Previously, Mr. Murray served as Co-Chief Executive Officer (2013-2016), President (2006-2013) and Vice Chairman (2013-2020) of Meijer, Inc. Mr. Murray serves as a member of the Board (2009-present) and Public Policy and Responsibility Committee (2009-present) and Chair of the Nuclear Review Committee (2019-present) of DTE Energy Company (diversified energy company). Mr. Murray previously served as a member of the Board of Spectrum Health (not-for-profit health system, 2015-2019) and as a member of the Board and Audit Committee and Chairman of the Nominating and Corporate Governance Committee of Universal Forest Products, Inc. (manufacturer and distributor of wood and wood-alternative products, 2004-2016). Mr. Murray also serves as a member of the Board of many community and professional organizations. Mr. Murray previously served as a member of the Advisory Board of certain Fidelity® funds (2016).
Carol J. Zierhoffer (1960)
Year of Election or Appointment: 2023
Trustee
Ms. Zierhoffer also serves as Trustee or Member of the Advisory Board of other Fidelity® funds. Prior to her retirement, Ms. Zierhoffer held a variety of positions at Bechtel Corporation (engineering company, 2013-2019), including Principal Vice President and Chief Information Officer (2013-2016) and Senior Vice President and Chief Information Officer (2016-2019). Ms. Zierhoffer currently serves as a member of the Board of Directors, Audit Committee and Compensation Committee of Allscripts Healthcare Solutions, Inc. (healthcare technology, 2020-present) and as a member of the Board of Directors, Audit and Finance Committee and Nominating and Governance Committee of Atlas Air Worldwide Holdings, Inc. (aviation operating services, 2021-present). Previously, Ms. Zierhoffer served as a member of the Board of Directors and Audit Committee and as the founding Chair of the Information Technology Committee of MedAssets, Inc. (healthcare technology, 2013-2016), and as a Member of the Advisory Board of certain Fidelity® funds (2023).
+ The information includes the Trustee's principal occupation during the last five years and other information relating to the experience, attributes, and skills relevant to the Trustee's qualifications to serve as a Trustee, which led to the conclusion that the Trustee should serve as a Trustee for the fund.
Advisory Board Members and Officers:
Correspondence intended for a Member of the Advisory Board (if any) may be sent to Fidelity Investments, P.O. Box 55235, Boston, Massachusetts 02205-5235. Correspondence intended for an officer may be sent to Fidelity Investments, 245 Summer Street, Boston, Massachusetts 02210.
Name, Year of Birth; Principal Occupation
Heather Bonner (1977)
Year of Election or Appointment: 2023
Assistant Treasurer
Ms. Bonner also serves as an officer of other funds. Ms. Bonner is a Senior Vice President (2022-present) and is an employee of Fidelity Investments (2022-present). Ms. Bonner serves as Vice President, Treasurer, or Assistant Treasurer of certain Fidelity entities. Prior to joining Fidelity, Ms. Bonner served as Managing Director at AQR Capital Management (2013-2022) and was the Treasurer and Principal Financial Officer of the AQR Funds (2013-2022).
Craig S. Brown (1977)
Year of Election or Appointment: 2019
Assistant Treasurer
Mr. Brown also serves as an officer of other funds. Mr. Brown is a Vice President (2015-present) and is an employee of Fidelity Investments. Mr. Brown serves as Assistant Treasurer of FIMM, LLC (2021-present). Previously, Mr. Brown served as Assistant Treasurer of certain Fidelity® funds (2019-2022).
John J. Burke III (1964)
Year of Election or Appointment: 2018
Chief Financial Officer
Mr. Burke also serves as Chief Financial Officer of other funds. Mr. Burke is Head of Fidelity Fund and Investment Operations (2018-present) and is an employee of Fidelity Investments. Mr. Burke serves as President, Executive Vice President, or Director of certain Fidelity entities. Previously Mr. Burke served as head of Asset Management Investment Operations (2012-2018).
Margaret Carey (1973)
Year of Election or Appointment: 2023
Secretary and Chief Legal Officer (CLO)
Ms. Carey also serves as an officer of other funds and as CLO of certain Fidelity entities. Ms. Carey is a Senior Vice President, Deputy General Counsel (2019-present) and is an employee of Fidelity Investments.
David J. Carter (1973)
Year of Election or Appointment: 2020
Assistant Secretary
Mr. Carter also serves as Assistant Secretary of other funds. Mr. Carter is a Senior Vice President, Deputy General Counsel (2022-present) and is an employee of Fidelity Investments. Mr. Carter serves as Chief Legal Officer of Fidelity Investments Institutional Operations Company LLC - Shareholder Division (transfer agent, 2020-present).
Jonathan Davis (1968)
Year of Election or Appointment: 2010
Assistant Treasurer
Mr. Davis also serves as an officer of other funds. Mr. Davis is a Vice President (2006-present) and is an employee of Fidelity Investments. Mr. Davis serves as Assistant Treasurer of certain Fidelity entities.
Laura M. Del Prato (1964)
Year of Election or Appointment: 2018
President and Treasurer
Ms. Del Prato also serves as an officer of other funds. Ms. Del Prato is a Senior Vice President (2017-present) and is an employee of Fidelity Investments. Ms. Del Prato serves as Vice President or Assistant Treasurer of certain Fidelity entities. Previously, Ms. Del Prato served as President and Treasurer of The North Carolina Capital Management Trust: Cash Portfolio and Term Portfolio (2018-2020).
Robin Foley (1964)
Year of Election or Appointment: 2023
Vice President
Ms. Foley also serves as Vice President of other funds. Ms. Foley serves as Head of Fidelity's Fixed Income division (2023-present) and is an employee of Fidelity Investments. Previously, Ms. Foley served as Chief Investment Officer of Bonds (2017-2023).
Christopher M. Gouveia (1973)
Year of Election or Appointment: 2023
Chief Compliance Officer
Mr. Gouveia also serves as Chief Compliance Officer of other funds. Mr. Gouveia is a Senior Vice President of Asset Management Compliance (2019-present) and is an employee of Fidelity Investments. Mr. Gouveia serves as Compliance Officer of Fidelity Management Trust Company (2023-present). Previously, Mr. Gouveia served as Chief Compliance Officer of the North Carolina Capital Management Trust (2016-2019).
Colm A. Hogan (1973)
Year of Election or Appointment: 2016
Assistant Treasurer
Mr. Hogan also serves as an officer of other funds. Mr. Hogan is a Vice President (2016-present) and is an employee of Fidelity Investments. Mr. Hogan serves as Assistant Treasurer of certain Fidelity entities. Previously, Mr. Hogan served as Deputy Treasurer of certain Fidelity® funds (2016-2020) and Assistant Treasurer of certain Fidelity® funds (2016-2018).
Chris Maher (1972)
Year of Election or Appointment: 2013
Assistant Treasurer
Mr. Maher also serves as an officer of other funds. Mr. Maher is a Vice President (2008-present) and is an employee of Fidelity Investments. Mr. Maher serves as Assistant Treasurer of certain Fidelity entities. Previously, Mr. Maher served as Assistant Treasurer of certain funds (2013-2020).
Brett Segaloff (1972)
Year of Election or Appointment: 2021
Anti-Money Laundering (AML) Officer
Mr. Segaloff also serves as AML Officer of other funds. Mr. Segaloff is a Vice President (2022-present) and is an employee of Fidelity Investments. Mr. Segaloff serves as Anti Money Laundering Compliance Officer or Anti Money Laundering/Bank Secrecy Act Compliance Officer of certain Fidelity entities.
Stacie M. Smith (1974)
Year of Election or Appointment: 2013
Assistant Treasurer
Ms. Smith also serves as an officer of other funds. Ms. Smith is a Senior Vice President (2016-present) and is an employee of Fidelity Investments. Ms. Smith serves as Assistant Treasurer of certain Fidelity entities and has served in other fund officer roles.
Jim Wegmann (1979)
Year of Election or Appointment: 2021
Deputy Treasurer
Mr. Wegmann also serves as an officer of other funds. Mr. Wegmann is a Vice President (2016-present) and is an employee of Fidelity Investments. Mr. Wegmann serves as Assistant Treasurer of FIMM, LLC (2021-present). Previously, Mr. Wegmann served as Assistant Treasurer of certain Fidelity® funds (2019-2021).
As a shareholder, you incur two types of costs: (1) transaction costs, which may include sales charges (loads) on purchase payments or redemption proceeds, as applicable and (2) ongoing costs, which generally include management fees, distribution and/or service (12b-1) fees and other Fund expenses. This Example is intended to help you understand your ongoing costs (in dollars) of investing in a fund and to compare these costs with the ongoing costs of investing in other mutual funds.
| The Example is based on an investment of $1,000 invested at the beginning of the period and held for the entire period (July 1, 2023 to December 31, 2023). |
Actual Expenses
The first line of the accompanying table provides information about actual account values and actual expenses. You may use the information in this line, together with the amount you invested, to estimate the expenses that you paid over the period. Simply divide your account value by $1,000.00 (for example, an $8,600 account value divided by $1,000.00 = 8.6), then multiply the result by the number in the first line for a class/Fund under the heading entitled "Expenses Paid During Period" to estimate the expenses you paid on your account during this period. If any fund is a shareholder of any underlying mutual funds or exchange-traded funds (ETFs) (the Underlying Funds), such fund indirectly bears its proportional share of the expenses of the Underlying Funds in addition to the direct expenses incurred presented in the table. These fees and expenses are not included in the annualized expense ratio used to calculate the expense estimate in the table below.
Hypothetical Example for Comparison Purposes
The second line of the accompanying table provides information about hypothetical account values and hypothetical expenses based on the actual expense ratio and an assumed rate of return of 5% per year before expenses, which is not the actual return. The hypothetical account values and expenses may not be used to estimate the actual ending account balance or expenses you paid for the period. You may use this information to compare the ongoing costs of investing in the Fund and other funds. To do so, compare this 5% hypothetical example with the 5% hypothetical examples that appear in the shareholder reports of the other funds. If any fund is a shareholder of any Underlying Funds, such fund indirectly bears its proportional share of the expenses of the Underlying Funds in addition to the direct expenses as presented in the table. These fees and expenses are not included in the annualized expense ratio used to calculate the expense estimate in the table below.
Please note that the expenses shown in the table are meant to highlight your ongoing costs only and do not reflect any transaction costs. Therefore, the second line of the table is useful in comparing ongoing costs only, and will not help you determine the relative total costs of owning different funds. In addition, if these transactional costs were included, your costs would have been higher.
| | | | | Annualized Expense Ratio- A | | Beginning Account Value July 1, 2023 | | Ending Account Value December 31, 2023 | | Expenses Paid During Period- C July 1, 2023 to December 31, 2023 |
| | | | | | | | | | |
| Fidelity® Series International Developed Markets Bond Index Fund | | | | -%-D | | | | | | |
| Actual | | | | | | $ 1,000 | | $ 1,044.90 | | $-E |
Hypothetical-B | | | | | | $ 1,000 | | $ 1,025.21 | | $-E |
| |
A Annualized expense ratio reflects expenses net of applicable fee waivers.
B 5% return per year before expenses
C Expenses are equal to the annualized expense ratio, multiplied by the average account value over the period, multiplied by 184/ 365 (to reflect the one-half year period). The fees and expenses of any Underlying Funds are not included in each annualized expense ratio.
D Amount represents less than .005%.
E Amount represents less than $.005.
The dividend and capital gains distributions for the fund(s) are available on Fidelity.com or Institutional.Fidelity.com.
A total of 0.17% of the dividends distributed during the fiscal year was derived from interest on U.S. Government securities which is generally exempt from state income tax.
The fund designates $73,838,019 of distributions paid during the fiscal year ended 2023 as qualifying to be taxed as section 163(j) interest dividends.
The amounts per share which represent income derived from sources within, and taxes paid to, foreign countries or possessions of the United States are $0.1202 and $0.0004 for the dividend paid April 6, 2023; $0.0188 and $0.0001 for the dividend paid July 10, 2023; $0.0197 and $0.0001 for the dividend paid October 9, 2023; and $0.1715 and $0.0006 for the dividend paid December 21, 2023.
The fund will notify shareholders in January 2024 of amounts for use in preparing 2023 income tax returns.
Board Approval of Investment Advisory Contracts and Management Fees
Fidelity Series International Developed Markets Bond Index Fund
Each year, the Board of Trustees, including the Independent Trustees (together, the Board), considers the renewal of the fund's management contract with Fidelity Management & Research Company LLC (FMR) and the sub-advisory agreements (together, the Advisory Contracts) for the fund. FMR and the sub-advisers are referred to herein as the Investment Advisers. The Board, assisted by the advice of fund counsel and Independent Trustees' counsel, requests and considers a broad range of information relevant to the renewal of the Advisory Contracts throughout the year.
The Board meets regularly and, at each of its meetings, covers an extensive agenda of topics and materials and considers factors that are relevant to its annual consideration of the renewal of the fund's Advisory Contracts, including the services and support provided to the fund and its shareholders. The Board's Operations Committee, of which all the Independent Trustees are members, meets regularly throughout the year and requests, receives and considers, among other matters, information related to the annual consideration of the renewal of the fund's Advisory Contracts before making its recommendation to the Board. The Board also meets as needed to review matters specifically related to the Board's annual consideration of the renewal of the Advisory Contracts. Members of the Board may also meet from time to time with trustees of other Fidelity funds through joint ad hoc committees to discuss certain matters relevant to all of the Fidelity funds.
At its September 2023 meeting, the Board unanimously determined to renew the fund's Advisory Contracts. The Board considered all factors it believed relevant and reached a determination, with the assistance of fund counsel and Independent Trustees' counsel and through the exercise of its business judgment, that the renewal of the Advisory Contracts was in the best interests of the fund and its shareholders and the fact that no fee is payable under the management contract was fair and reasonable.
Nature, Extent, and Quality of Services Provided. The Board considered staffing as it relates to the fund, including the backgrounds and experience of investment personnel of the Investment Advisers, and also considered the Investment Advisers' implementation of the fund's investment program. The Independent Trustees also had discussions with senior management of Fidelity's investment operations and investment groups. The Board considered the structure of the investment personnel compensation program and whether this structure provides appropriate incentives to act in the best interests of the fund.
Resources Dedicated to Investment Management and Support Services. The Board reviewed the general qualifications and capabilities of Fidelity's investment staff, including its size, education, experience, and resources, as well as Fidelity's approach to recruiting, training, managing, and compensating investment personnel. The Board noted the resources devoted to Fidelity's global investment organization, and that Fidelity's analysts have extensive resources, tools and capabilities that allow them to conduct quantitative and fundamental analysis, as well as credit analysis of issuers, counterparties and guarantors. Further, the Board considered that Fidelity's investment professionals have sufficient access to global information and data so as to provide competitive investment results over time, and that those professionals also have access to sophisticated tools that permit them to assess portfolio construction and risk and performance attribution characteristics continuously, as well as to transmit new information and research conclusions rapidly around the world. Additionally, in its deliberations, the Board considered Fidelity's trading, risk management, compliance, cybersecurity, and technology and operations capabilities and resources, which are integral parts of the investment management process.
Administrative Services. The Board considered (i) the nature, extent, quality, and cost of advisory and administrative services performed by the Investment Advisers and their affiliates under the Advisory Contracts and under separate agreements covering transfer agency, pricing and bookkeeping, and securities lending services for the fund; (ii) the nature and extent of Fidelity's supervision of third party service providers, principally custodians, subcustodians, and pricing vendors; and (iii) the resources devoted by Fidelity to, and the record of compliance with, the fund's compliance policies and procedures. The Board also considered the fund's securities lending activities and any payments made to Fidelity relating to securities lending.
Investment Performance. The Board reviewed the fund's absolute investment performance, as well as the fund's relative investment performance. In this regard, the Board noted that the fund is designed to offer an investment option for other investment companies, collective investment trusts, and 529 plans managed by Fidelity and ultimately to enhance the performance of those investment companies, collective investment trusts, and 529 plans.
Based on its review, the Board concluded that the nature, extent, and quality of services provided to the fund under the Advisory Contracts should continue to benefit the shareholders of the fund.
Competitiveness of Management Fee and Total Expense Ratio. The Board considered that the fund does not pay FMR a management fee for investment advisory services, but that FMR receives fees for providing services to funds, collective investment trusts, and 529 plans that invest in the fund. The Board also noted that FMR or an affiliate undertakes to pay all operating expenses of the fund, except transfer agent fees, 12b-1 fees, Independent Trustee fees and expenses, custodian fees and expenses, proxy and shareholder meeting expenses, interest, taxes, and extraordinary expenses (such as litigation expenses). The Board further noted that the fund pays its non-operating expenses, including brokerage commissions and fees and expenses associated with the fund's securities lending program, if applicable.
The Board further considered that FMR has contractually agreed to reimburse the fund to the extent that total operating expenses, with certain exceptions, as a percentage of its average net assets, exceed 0.003% through April 30, 2026.
Based on its review, the Board considered that the fund does not pay a management fee and concluded that the fund's total expense ratio was reasonable in light of the services that the fund and its shareholders receive and the other factors considered.
Costs of the Services and Profitability. The Board considered the level of Fidelity's profits in respect of all the Fidelity funds.
A public accounting firm has been engaged annually by the Board as part of the Board's assessment of Fidelity's profitability analysis. The engagement includes the review and assessment of the methodologies used by Fidelity in determining the revenues and expenses attributable to Fidelity's fund business, and completion of agreed-upon procedures in respect of the mathematical accuracy of certain fund profitability information and its conformity to established allocation methodologies. After considering the reports issued under the engagement and information provided by Fidelity, the Board concluded that while other allocation methods may also be reasonable, Fidelity's profitability methodologies are reasonable in all material respects.
The Board also reviewed Fidelity's non-fund businesses and potential indirect benefits such businesses may have received as a result of their association with Fidelity's fund business (i.e., fall-out benefits) as well as cases where Fidelity's affiliates may benefit from the funds' business. The Board considered areas where potential indirect benefits to the Fidelity funds from their relationships with Fidelity may exist. The Board's consideration of these matters was informed by the findings of a joint ad hoc committee created by it and the boards of other Fidelity funds to evaluate potential fall-out benefits.
The Board concluded that the costs of the services provided by and the profits realized by Fidelity in connection with the operation of the fund were not relevant to the renewal of the Advisory Contracts because the fund pays no advisory fees and FMR or an affiliate bears all expenses of the fund, with limited exceptions.
Economies of Scale. The Board concluded that because the fund pays no advisory fees and FMR or an affiliate bears all expenses of the fund with certain limited exceptions, the realization of economies of scale was not a material factor in the Board's decision to renew the fund's Advisory Contracts.
Additional Information Requested by the Board. In order to develop fully the factual basis for consideration of the Fidelity funds' advisory contracts, the Board requested and received additional information on certain topics, including: (i) Fidelity's fund profitability methodology, profitability trends for certain funds, the allocation of various costs to different funds, and the impact of certain factors on fund profitability results; (ii) portfolio manager changes that have occurred during the past year and Fidelity's views regarding portfolio manager investment in the Fidelity funds that they manage; (iii) hiring, training, and retaining personnel; (iv) the arrangements with and compensation paid to certain fund sub-advisers on behalf of the Fidelity funds and the treatment of such compensation within Fidelity's fund profitability methodology; (v) the terms of the funds' various management fee structures, including the basic group fee and the terms of Fidelity's voluntary expense limitation arrangements; (vi) Fidelity's transfer agent, pricing and bookkeeping fees, expense and service structures for different funds and classes relative to competitive trends and market conditions; (vii) the impact on fund profitability of recent industry trends, such as the growth in passively managed funds and the changes in flows for different types of funds; (viii) the types of management fee and total expense comparisons provided, and the challenges and limitations associated with such information; (ix) explanations regarding the relative total expense ratios and management fees of certain funds and classes, total expense and management fee competitive trends, and methodologies for total expense and management fee competitive comparisons; and (x) matters related to money market funds, exchange-traded funds, and target date funds. In addition, the Board considered its discussions with Fidelity regarding Fidelity's efforts to maintain the continuous investment and shareholder services necessary for the funds during the current pandemic and economic circumstances.
Conclusion. Based on its evaluation of all of the conclusions noted above, and after considering all factors it believed relevant, the Board, including the Independent Trustees, concluded that the advisory and sub-advisory fee arrangements are fair and reasonable in light of all of the surrounding circumstances and that the fund's Advisory Contracts should be renewed through September 30, 2024.
| A special meeting of shareholders was held on October 18, 2023. The results of votes taken among shareholders on the proposal before them are reported below. Each vote reported represents one dollar of net asset value held on the record date for the meeting. |
| Proposal 1 |
| To elect a Board of Trustees. |
| | # of Votes | % of Votes |
| Abigail P. Johnson |
| Affirmative | 21,333,918,003.710 | 98.990 |
| Withheld | 218,238,294.280 | 1.010 |
| TOTAL | 21,552,156,297.990 | 100.000 |
| Jennifer Toolin McAuliffe |
| Affirmative | 21,341,064,648.470 | 99.020 |
| Withheld | 211,091,649.520 | 0.980 |
| TOTAL | 21,552,156,297.990 | 100.000 |
| Christine J. Thompson |
| Affirmative | 21,338,732,597.390 | 99.010 |
| Withheld | 213,423,700.600 | 0.990 |
| TOTAL | 21,552,156,297.990 | 100.000 |
| Elizabeth S. Acton |
| Affirmative | 21,317,028,547.600 | 98.910 |
| Withheld | 235,127,750.390 | 1.090 |
| TOTAL | 21,552,156,297.990 | 100.000 |
| Laura M. Bishop |
| Affirmative | 21,336,468,393.320 | 99.000 |
| Withheld | 215,687,904.670 | 1.000 |
| TOTAL | 21,552,156,297.990 | 100.000 |
| Ann E. Dunwoody |
| Affirmative | 21,320,223,866.150 | 98.920 |
| Withheld | 231,932,431.840 | 1.080 |
| TOTAL | 21,552,156,297.990 | 100.000 |
| John Engler |
| Affirmative | 21,279,172,233.730 | 98.730 |
| Withheld | 272,984,064.260 | 1.270 |
| TOTAL | 21,552,156,297.990 | 100.000 |
| Robert F. Gartland |
| Affirmative | 21,319,450,613.340 | 98.920 |
| Withheld | 232,705,684.650 | 1.080 |
| TOTAL | 21,552,156,297.990 | 100.000 |
| Robert W. Helm |
| Affirmative | 21,334,642,392.210 | 98.990 |
| Withheld | 217,513,905.780 | 1.010 |
| TOTAL | 21,552,156,297.990 | 100.000 |
| Arthur E. Johnson |
| Affirmative | 21,298,270,597.120 | 98.820 |
| Withheld | 253,885,700.870 | 1.180 |
| TOTAL | 21,552,156,297.990 | 100.000 |
| Michael E. Kenneally |
| Affirmative | 20,916,217,437.980 | 97.050 |
| Withheld | 635,938,860.010 | 2.950 |
| TOTAL | 21,552,156,297.990 | 100.000 |
| Mark A. Murray |
| Affirmative | 21,321,664,592.720 | 98.930 |
| Withheld | 230,491,705.270 | 1.070 |
| TOTAL | 21,552,156,297.990 | 100.000 |
| Carol J. Zierhoffer |
| Affirmative | 21,337,428,755.990 | 99.000 |
| Withheld | 214,727,542.000 | 1.000 |
| TOTAL | 21,552,156,297.990 | 100.000 |
| | | |
| Proposal 1 reflects trust wide proposal and voting results. |
1.9901932.102
IDM-ANN-0224
Fidelity® Intermediate Municipal Income Fund
Annual Report
December 31, 2023
Includes Fidelity and Fidelity Advisor share classes
Contents
To view a fund's proxy voting guidelines and proxy voting record for the 12-month period ended June 30, visit http://www.fidelity.com/proxyvotingresults or visit the Securities and Exchange Commission's (SEC) web site at http://www.sec.gov.
You may also call 1-800-544-8544 if you're an individual investing directly with Fidelity, call 1-800-835-5092 if you're a plan sponsor or participant with Fidelity as your recordkeeper or call 1-877-208-0098 on institutional accounts or if you're an advisor or invest through one to request a free copy of the proxy voting guidelines.
Standard & Poor's, S&P and S&P 500 are registered service marks of The McGraw-Hill Companies, Inc. and have been licensed for use by Fidelity Distributors Corporation.
Other third-party marks appearing herein are the property of their respective owners.
All other marks appearing herein are registered or unregistered trademarks or service marks of FMR LLC or an affiliated company. © 2024 FMR LLC. All rights reserved.
This report and the financial statements contained herein are submitted for the general information of the shareholders of the Fund. This report is not authorized for distribution to prospective investors in the Fund unless preceded or accompanied by an effective prospectus.
A fund files its complete schedule of portfolio holdings with the SEC for the first and third quarters of each fiscal year on Form N-PORT. Forms N-PORT are available on the SEC's web site at http://www.sec.gov. A fund's Forms N-PORT may be reviewed and copied at the SEC's Public Reference Room in Washington, DC. Information regarding the operation of the SEC's Public Reference Room may be obtained by calling 1-800-SEC-0330.
For a complete list of a fund's portfolio holdings, view the most recent holdings listing, semiannual report, or annual report on Fidelity's web site at http://www.fidelity.com, http://www.institutional.fidelity.com, or http://www.401k.com, as applicable.
NOT FDIC INSURED •MAY LOSE VALUE •NO BANK GUARANTEE
Neither the Fund nor Fidelity Distributors Corporation is a bank.
Average annual total return reflects the change in the value of an investment, assuming reinvestment of distributions from dividend income and capital gains (the profits earned upon the sale of securities that have grown in value, if any) and assuming a constant rate of performance each year. The hypothetical investment and the average annual total returns do not reflect the deduction of taxes that a shareholder would pay on fund distributions or the redemption of fund shares. During periods of reimbursement by Fidelity, a fund's total return will be greater than it would be had the reimbursement not occurred. How a fund did yesterday is no guarantee of how it will do tomorrow.
| Average Annual Total Returns |
| | | | |
Periods ended December 31, 2023 | Past 1 year | Past 5 years | Past 10 years |
Class A (incl. 4.00% sales charge) | 1.07% | 1.03% | 1.79% |
Class M (incl. 4.00% sales charge) | 1.01% | 1.07% | 1.83% |
Class C (incl. contingent deferred sales charge) | 3.43% | 1.13% | 1.60% |
| Fidelity® Intermediate Municipal Income Fund | 5.51% | 2.18% | 2.54% |
| Class I | 5.53% | 2.11% | 2.46% |
| Class Z | 5.56% | 2.24% | 2.53% |
Class C shares' contingent deferred sales charges included in the past one year, past five years and past ten years total return figures are 1%, 0% and 0%, respectively.
The initial offering of Class Z shares took place on October 2, 2018. Returns prior to October 2, 2018, are those of Class I.
| $10,000 Over 10 Years |
| |
Let's say hypothetically that $10,000 was invested in Fidelity® Intermediate Municipal Income Fund, a class of the fund, on December 31, 2013. The chart shows how the value of your investment would have changed, and also shows how the Bloomberg Municipal Bond Index performed over the same period. |
|
|
Market Recap:
Tax-exempt municipal bonds gained 6.40% for the 12 months ending December 31, 2023, according to the Bloomberg Municipal Bond Index, buoyed by outsized gains late in the year. Munis posted a notable advance in January, when the bond market reacted positively to a slowdown in the pace of the U.S. Federal Reserve's campaign to bring down inflation by raising interest rates. But munis retreated in several of the following months, when mixed economic data fueled worries that the central bank would continue its hiking cycle for longer than the market expected at the beginning of the year, then declined markedly in August and September when the Fed explicitly adopted a "higher for longer" message on interest rates. In November, however, muni bonds kicked off a powerful two-month rally, posting their biggest monthly gain (+6.35%) since the 1980s, and then rising another 2.32% in December. During both months, the Fed held interest rates steady, while inflation reports came in milder than expected. By year-end, the central bank had indicated they were ready to consider rate cuts for 2024. For the full 12 months, muni tax-backed credit fundamentals remained solid, and the risk of credit-rating downgrades appeared low for most issuers. Lower-quality investment-grade bonds (rated BAA) and longer-term securities (15+ years) delivered the muni market's best returns.
Comments from Co-Portfolio Managers Cormac Cullen, Michael Maka and Elizah McLaughlin:
For the year, the fund's share classes (excluding sales charges, if any), gained roughly 4.5% to 5.5%, versus the 5.26% advance of the Bloomberg 1-17 Year Municipal Bond Index and the 6.40% gain of the benchmark, the Bloomberg Municipal Bond Index. The past 12 months, we focused on long-term objectives and sought to generate attractive tax-exempt income and a competitive risk-adjusted return. Versus the 1-17 Year index, the fund's overweight to lower-quality investment-grade munis contributed to performance, as these securities outpaced higher-quality bonds. Overweights to health care, airport and housing bonds also helped the relative result, thanks to the segments' outperformance of the index amid strong investor demand for higher-yielding securities. The fund's carry advantage, meaning its larger-than-index exposure to high-coupon bonds that were somewhat cushioned from rising interest rates, added further value. Also, the fund had more interest rate sensitivity, as measured by its longer duration, than the index, which boosted the relative result in the final months of the period when muni yields sharply declined. In contrast, differences in the way fund holdings and index components were priced hurt relative performance. Fund holdings are priced by a third-party pricing service and validated daily by Fidelity Management and Research's fair-value processes. Securities within the index, however, are priced by the index provider.
The views expressed above reflect those of the portfolio manager(s) only through the end of the period as stated on the cover of this report and do not necessarily represent the views of Fidelity or any other person in the Fidelity organization. Any such views are subject to change at any time based upon market or other conditions and Fidelity disclaims any responsibility to update such views. These views may not be relied on as investment advice and, because investment decisions for a Fidelity fund are based on numerous factors, may not be relied on as an indication of trading intent on behalf of any Fidelity fund.
| Top Five States (% of Fund's net assets) |
| | |
| Texas | 12.4 |
| Illinois | 9.5 |
| New York | 7.0 |
| Florida | 6.8 |
| California | 4.9 |
| | |
| Revenue Sources (% of Fund's net assets) |
| General Obligations | 31.8 | |
| Transportation | 16.0 | |
| Health Care | 12.1 | |
| Special Tax | 6.5 | |
| State G.O. | 6.2 | |
| Other | 5.1 | |
| Electric Utilities | 5.0 | |
| Others* (Individually Less Than 5%) | 17.3 | |
| | 100.0 | |
| |
| *Includes net other assets | | |
Quality Diversification (% of Fund's net assets) |
|
| |
| We have used ratings from Moody's Investors Service, Inc. Where Moody's® ratings are not available, we have used S&P® ratings. All ratings are as of the date indicated and do not reflect subsequent changes. |
Showing Percentage of Net Assets
| Municipal Bonds - 94.4% |
| | | Principal Amount (a) (000s) | Value ($) (000s) |
| Alabama - 2.6% | | | |
| Black Belt Energy Gas District: | | | |
| Bonds: | | | |
Series 2022 D1, 4%, tender 6/1/27 (b) | | 9,420 | 9,472 |
Series 2022 F, 5.5%, tender 12/1/28 (b) | | 6,460 | 6,897 |
Series 2023 B2, 5.25%, tender 12/1/30 (b) | | 7,120 | 7,747 |
Series 2023 D1, 5.5%, tender 2/1/29 (b) | | 18,160 | 19,434 |
| Series 2022 E: | | | |
5% 6/1/27 | | 4,175 | 4,355 |
5% 6/1/28 | | 5,980 | 6,279 |
| Energy Southeast Ala Coop. District Bonds Series 2023 B1, 5.75%, tender 11/1/31 (b) | | 9,840 | 11,020 |
| Hoover Series 2023: | | | |
| 5% 3/1/39 | | 5,000 | 5,792 |
| 5% 3/1/40 | | 11,480 | 13,180 |
| 5% 3/1/41 | | 3,860 | 4,412 |
| Huntsville Health Care Auth. Bonds Series 2023 A, 5%, tender 6/1/30 (b) | | 32,270 | 35,883 |
| Lower Alabama Gas District Bonds (No. 2 Proj.) Series 2020, 4%, tender 12/1/25 (b) | | 43,790 | 43,952 |
| Mobile County Board of School Commissioners Series 2016 B: | | | |
| 5% 3/1/29 | | 5,875 | 6,163 |
| 5% 3/1/30 | | 6,125 | 6,424 |
| 5% 3/1/31 | | 6,135 | 6,433 |
| 5% 3/1/32 | | 4,930 | 5,163 |
| 5% 3/1/33 | | 7,165 | 7,496 |
| Mobile Indl. Dev. Board Poll. Cont. Rev. Bonds (Alabama Pwr. Co. Barry Plant Proj.) Series 2007 C, 3.78%, tender 6/16/26 (b) | | 6,260 | 6,318 |
| Montgomery Med. Clinic Facilities Series 2015: | | | |
| 5% 3/1/26 | | 1,940 | 1,857 |
| 5% 3/1/27 | | 3,915 | 3,694 |
| 5% 3/1/28 | | 4,225 | 3,933 |
| 5% 3/1/29 | | 3,465 | 3,183 |
| 5% 3/1/30 | | 4,180 | 3,785 |
| Southeast Energy Auth. Coop. Dis Bonds (Proj. No. 6) Series 2023 B, 5%, tender 6/1/30 (b) | | 44,290 | 47,272 |
| Southeast Energy Auth. Rev. Bonds Series 2022 B1, 5%, tender 8/1/28 (b) | | 32,625 | 34,095 |
TOTAL ALABAMA | | | 304,239 |
| Alaska - 0.2% | | | |
| Alaska Gen. Oblig. Series 2016 A, 5% 8/1/33 | | 7,235 | 7,442 |
| Alaska Hsg. Fin. Corp. Mtg. Rev.: | | | |
| Series 2022 A, 3% 6/1/51 | | 3,065 | 2,962 |
| Series 2022 B1, 2% 12/1/32 | | 4,750 | 3,984 |
| Alaska Int'l. Arpts. Revs. Series 2016 B, 5% 10/1/33 | | 7,575 | 7,791 |
TOTAL ALASKA | | | 22,179 |
| Arizona - 2.7% | | | |
| Arizona Indl. Dev. Auth. Hosp. Rev. Series 2021 A: | | | |
| 5% 2/1/33 | | 1,800 | 2,094 |
| 5% 2/1/35 | | 1,580 | 1,825 |
| 5% 2/1/36 | | 1,600 | 1,832 |
| 5% 2/1/37 | | 1,700 | 1,927 |
| Arizona Indl. Dev. Auth. Lease Rev. Series 2020 A, 4% 9/1/46 | | 1,750 | 1,670 |
| Arizona Indl. Dev. Auth. Rev. Series 2019 2, 3.625% 5/20/33 | | 6,832 | 6,468 |
| Chandler Indl. Dev. Auth. Indl. Dev. Rev.: | | | |
| (Intel Corp. Proj.) Series 2022 2, 5%, tender 9/1/27 (b)(c) | | 31,940 | 33,219 |
| Bonds (Intel Corp. Proj.): | | | |
Series 2007, 4.1%, tender 6/15/28 (b)(c) | | 15,385 | 15,653 |
Series 2019, 5%, tender 6/3/24 (b)(c) | | 63,345 | 63,468 |
| Gilbert Wtr. Resources Municpal Property Series 2022: | | | |
| 5% 7/15/32 | | 3,630 | 4,359 |
| 5% 7/15/33 | | 5,080 | 6,082 |
| 5% 7/15/34 | | 4,715 | 5,631 |
| Glendale Gen. Oblig. Series 2017, 5% 7/1/32 | | 2,915 | 3,143 |
| Glendale Sr. Excise Tax Rev. Series 2015 A: | | | |
| 5% 7/1/27 | | 7,770 | 8,018 |
| 5% 7/1/28 | | 7,255 | 7,470 |
| 5% 7/1/29 | | 7,905 | 8,137 |
| Glendale Trans. Excise Tax Rev. Series 2015, 5% 7/1/26 (Assured Guaranty Muni. Corp. Insured) | | 3,565 | 3,680 |
| Indl. Dev. Auth. of The City of Glendale Sr. Living Rev. (Royal Oaks Inspirata Pointe Proj.) Series 2020 A: | | | |
| 4% 5/15/31 | | 560 | 510 |
| 5% 5/15/41 | | 1,000 | 904 |
| 5% 5/15/56 | | 2,625 | 2,153 |
| Maricopa County Indl. Dev. Auth.: | | | |
| (Creighton Univ. Proj.) Series 2020, 5% 7/1/47 | | 3,560 | 3,768 |
| Bonds Series 2019 B, 5%, tender 9/1/24 (b) | | 10,690 | 10,801 |
| Maricopa County Indl. Dev. Auth. Sr. Living Facilities Series 2016: | | | |
| 5.75% 1/1/36 (d) | | 5,170 | 4,174 |
| 6% 1/1/48 (d) | | 7,730 | 5,494 |
| Maricopa County Rev.: | | | |
| Bonds: | | | |
Series 2019 D, 5%, tender 5/15/26 (b) | | 12,610 | 13,182 |
Series C, 5%, tender 10/18/24 (b) | | 9,710 | 9,845 |
| Series 2016 A: | | | |
4% 1/1/24 | | 6,310 | 6,310 |
5% 1/1/24 | | 1,990 | 1,990 |
| Maricopa County Spl. Health Care District Gen. Oblig. Series 2021 D: | | | |
| 4% 7/1/35 | | 2,195 | 2,343 |
| 5% 7/1/33 | | 7,320 | 8,398 |
| 5% 7/1/34 | | 12,000 | 13,703 |
| Mesa Util. Sys. Rev. Series 2021, 4% 7/1/35 | | 2,000 | 2,167 |
| Phoenix Ariz Indl. Dev. Auth. Rev.: | | | |
| (Guam Facilities Foundation, Inc. Projs.) Series 2014, 5.375% 2/1/41 | | 9,525 | 9,052 |
| (Guam Facilities Foundation, Inc. Proj.) Series 2014, 5.125% 2/1/34 | | 6,675 | 6,561 |
| Phoenix Civic Impt. Board Arpt. Rev.: | | | |
| Series 2017 A: | | | |
5% 7/1/27 (c) | | 2,185 | 2,325 |
5% 7/1/28 (c) | | 3,085 | 3,274 |
5% 7/1/36 (c) | | 1,000 | 1,053 |
5% 7/1/42 (c) | | 2,210 | 2,285 |
| Series 2019 B, 5% 7/1/34 (c) | | 2,000 | 2,178 |
| Phoenix Civic Impt. Corp. Series 2019 A: | | | |
| 5% 7/1/29 | | 965 | 1,070 |
| 5% 7/1/30 | | 3,680 | 4,077 |
| 5% 7/1/31 | | 1,255 | 1,386 |
| 5% 7/1/32 | | 3,675 | 4,058 |
| 5% 7/1/36 | | 1,000 | 1,091 |
| 5% 7/1/39 | | 1,090 | 1,167 |
| Salt River Proj. Agricultural Impt. & Pwr. District Elec. Sys. Rev. Series 2017 A, 5% 1/1/33 | | 4,955 | 5,435 |
| Western Maricopa Ed. Ctr. District Series 2019 B: | | | |
| 5% 7/1/24 | | 1,410 | 1,423 |
| 5% 7/1/25 | | 2,285 | 2,352 |
| 5% 7/1/27 | | 3,000 | 3,256 |
TOTAL ARIZONA | | | 312,461 |
| California - 4.9% | | | |
| Bay Area Toll Auth. San Francisco Bay Toll Bridge Rev. Bonds Series B, 2.85%, tender 4/1/25 (b) | | 6,760 | 6,708 |
| California Gen. Oblig.: | | | |
| Series 2004: | | | |
5.25% 12/1/33 | | 110 | 110 |
5.25% 4/1/34 | | 30 | 30 |
5.5% 4/1/30 | | 5 | 5 |
| Series 2016: | | | |
5% 8/1/26 | | 14,065 | 14,944 |
5% 8/1/29 | | 6,970 | 7,389 |
5% 9/1/29 | | 2,755 | 2,926 |
| Series 2017, 5% 8/1/30 | | 14,245 | 15,507 |
| Series 2020: | | | |
4% 3/1/24 | | 6,790 | 6,803 |
4% 3/1/26 | | 3,300 | 3,395 |
4% 11/1/34 | | 5,000 | 5,444 |
4% 11/1/35 | | 1,000 | 1,083 |
4% 3/1/36 | | 2,615 | 2,803 |
4% 11/1/36 | | 9,885 | 10,616 |
5% 11/1/31 | | 21,985 | 25,734 |
5% 11/1/31 | | 3,500 | 4,097 |
5% 11/1/32 | | 6,245 | 7,305 |
5% 11/1/32 | | 10,000 | 11,698 |
| Series 2021, 4% 10/1/26 | | 7,965 | 8,275 |
| Series 2022: | | | |
5% 9/1/34 | | 3,820 | 4,607 |
5% 4/1/35 | | 2,520 | 2,785 |
5% 4/1/35 | | 6,645 | 7,953 |
5% 9/1/35 | | 6,180 | 7,432 |
5% 9/1/35 | | 3,635 | 4,372 |
| Series 2023: | | | |
5% 10/1/34 | | 3,560 | 4,337 |
5% 10/1/39 | | 2,145 | 2,522 |
5% 10/1/42 | | 3,560 | 3,897 |
| California Health Facilities Fing. Auth. Rev.: | | | |
| (St. Joseph Health Sys. Proj.) Series 2013 A, 5% 7/1/25 | | 3,885 | 3,888 |
| Series 2020 A: | | | |
4% 4/1/35 | | 1,170 | 1,213 |
4% 4/1/36 | | 5,000 | 5,157 |
| California Hsg. Fin. Agcy.: | | | |
| Series 2019 A, 4% 3/20/33 | | 3,646 | 3,707 |
| Series 2021 1, 3.5% 11/20/35 | | 20,717 | 20,169 |
| Series 2023 A1, 4.375% 9/20/36 | | 7,910 | 7,939 |
| California Infrastructure and Econ. Dev. Bank Rev. Bonds (Los Angeles County Museum of Art Proj.) Series 2021 A, 1.2%, tender 6/1/28 (b) | | 11,000 | 9,775 |
| California Muni. Fin. Auth. Ctfs. of Prtn. Series 2022 A: | | | |
| 5% 11/1/31 (Assured Guaranty Muni. Corp. Insured) | | 400 | 462 |
| 5% 11/1/32 (Assured Guaranty Muni. Corp. Insured) | | 210 | 246 |
| 5% 11/1/33 (Assured Guaranty Muni. Corp. Insured) | | 435 | 506 |
| 5.25% 11/1/34 (Assured Guaranty Muni. Corp. Insured) | | 1,000 | 1,196 |
| California Muni. Fin. Auth. Solid Waste Disp. Rev. Bonds: | | | |
| (Republic Svcs., Inc. Proj.) Series 2021 B, 4.2%, tender 1/16/24 (b)(c) | | 5,200 | 5,199 |
| Series 2023 A, 4.375%, tender 9/1/33 (b)(c) | | 4,420 | 4,542 |
| California Pub. Works Board Lease Rev. (Various Cap. Projs.) Series 2022 C: | | | |
| 5% 8/1/29 | | 995 | 1,138 |
| 5% 8/1/30 | | 1,265 | 1,476 |
| 5% 8/1/31 | | 555 | 660 |
| 5% 8/1/32 | | 2,095 | 2,489 |
| 5% 8/1/33 | | 2,085 | 2,475 |
| 5% 8/1/34 | | 1,035 | 1,227 |
| California Statewide Cmntys. Dev. Auth. Rev.: | | | |
| Bonds Series 2009 C, 5%, tender 11/1/29 (b) | | 15,715 | 17,721 |
| Series 2015, 5% 2/1/45 | | 4,090 | 2,168 |
| Castaic Lake Wtr. Agcy. Ctfs. of Prtn. Series 1999, 0% 8/1/28 (AMBAC Insured) | | 5,845 | 5,143 |
| Golden State Tobacco Securitization Corp. Tobacco Settlement Rev.: | | | |
| Series 2017 A1, 5% 6/1/26 (Escrowed to Maturity) | | 970 | 1,025 |
| Series 2021 B2, 0% 6/1/66 | | 127,740 | 15,029 |
| Series A, 0% 6/1/24 (Escrowed to Maturity) | | 5,840 | 5,768 |
| Los Angeles Dept. Arpt. Rev.: | | | |
| Series 2016 A: | | | |
5% 5/15/24 (c) | | 2,170 | 2,183 |
5% 5/15/24 (Escrowed to Maturity) (c) | | 295 | 297 |
| Series 2018 A, 5% 5/15/34 (c) | | 1,000 | 1,072 |
| Series 2018 C, 5% 5/15/36 (c) | | 2,960 | 3,128 |
| Series 2019 A, 5% 5/15/35 (c) | | 2,085 | 2,267 |
| Series 2019 D, 5% 5/15/38 (c) | | 3,045 | 3,224 |
| Series 2020 C, 5% 5/15/45 (c) | | 5,820 | 6,141 |
| Series 2021 D: | | | |
4% 5/15/38 (c) | | 4,605 | 4,676 |
4% 5/15/38 (Pre-Refunded to 11/15/31 @ 100) (c) | | 260 | 279 |
5% 5/15/35 (c) | | 1,840 | 2,078 |
5% 5/15/35 (Pre-Refunded to 11/15/31 @ 100) (c) | | 105 | 120 |
5% 5/15/36 (c) | | 6,885 | 7,727 |
5% 5/15/36 (Pre-Refunded to 11/15/31 @ 100) (c) | | 385 | 440 |
| Series 2022 A: | | | |
4% 5/15/37 (c) | | 13,805 | 14,178 |
5% 5/15/36 (c) | | 755 | 852 |
| Series 2023 A: | | | |
5% 5/15/33 (c) | | 12,595 | 14,577 |
5% 5/15/34 (c) | | 13,295 | 15,362 |
5% 5/15/35 (c) | | 5,000 | 5,754 |
5% 5/15/36 (c) | | 1,500 | 1,713 |
5% 5/15/37 (c) | | 1,000 | 1,131 |
5% 5/15/38 (c) | | 1,000 | 1,116 |
5.25% 5/15/39 (c) | | 1,200 | 1,366 |
| Los Angeles Dept. of Wtr. & Pwr. Rev. Series 2015 A, 5% 7/1/29 | | 9,710 | 9,948 |
| Los Angeles Unified School District Series 2020 C: | | | |
| 4% 7/1/36 | | 3,810 | 4,105 |
| 5% 7/1/27 | | 7,615 | 8,326 |
| Los Angeles Unified School District Ctfs. of Prtn. Series 2023 A: | | | |
| 5% 10/1/36 | | 6,000 | 7,240 |
| 5% 10/1/37 | | 3,275 | 3,910 |
| Metropolitan Wtr. District of Southern California Wtr. Rev. Bonds Series 2017 D, SIFMA Municipal Swap Index + 0.140% 4.01%, tender 1/4/24 (b)(e) | | 7,470 | 7,459 |
| Mount Diablo Unified School District Series 2022 B: | | | |
| 4% 8/1/25 | | 3,110 | 3,173 |
| 4% 8/1/26 | | 460 | 479 |
| 4% 8/1/28 | | 3,340 | 3,602 |
| 4% 8/1/30 | | 530 | 584 |
| 4% 8/1/31 | | 340 | 379 |
| 4% 8/1/33 | | 3,490 | 3,885 |
| 4% 8/1/34 | | 2,430 | 2,689 |
| Oakland Unified School District Alameda County Series 2015 A: | | | |
| 5% 8/1/26 (Assured Guaranty Muni. Corp. Insured) | | 3,400 | 3,533 |
| 5% 8/1/28 | | 970 | 1,007 |
| Ontario Int'l. Arpt. Auth. Series 2021 B: | | | |
| 4% 5/15/35 (Assured Guaranty Muni. Corp. Insured) (c) | | 1,100 | 1,138 |
| 4% 5/15/38 (Assured Guaranty Muni. Corp. Insured) (c) | | 1,000 | 1,011 |
| Port of Oakland Rev. Series H, 5% 5/1/26 (c) | | 1,250 | 1,305 |
| Poway Unified School District Pub. Fing. Series 2015 A: | | | |
| 5% 9/1/25 | | 1,115 | 1,142 |
| 5% 9/1/28 | | 1,550 | 1,594 |
| 5% 9/1/32 | | 1,630 | 1,674 |
| Sacramento City Fing. Auth. Rev. Series A, 0% 12/1/26 (Nat'l. Pub. Fin. Guarantee Corp. Insured) | | 3,025 | 2,753 |
| Sacramento City Unified School District: | | | |
| Series 2022 A: | | | |
5% 8/1/33 | | 1,000 | 1,159 |
5% 8/1/34 | | 1,000 | 1,158 |
5% 8/1/37 | | 1,000 | 1,139 |
5% 8/1/38 | | 1,000 | 1,130 |
| Series 2022, 5% 7/1/31 (Build America Mutual Assurance Insured) | | 495 | 585 |
| Sacramento County Arpt. Sys. Rev. Series 2018 C, 5% 7/1/39 (c) | | 3,280 | 3,437 |
| San Diego County Reg'l. Arpt. Auth. Arpt. Rev.: | | | |
| Series 2020 C, 5% 7/1/30 (c) | | 795 | 881 |
| Series 2021 B: | | | |
5% 7/1/37 (c) | | 16,945 | 18,596 |
5% 7/1/38 (c) | | 17,150 | 18,632 |
| Series 2023 B: | | | |
5% 7/1/39 (c) | | 3,515 | 3,876 |
5% 7/1/40 (c) | | 3,290 | 3,622 |
| San Francisco City & County Arpts. Commission Int'l. Arpt. Rev.: | | | |
| Series 2019 A: | | | |
5% 5/1/37 (c) | | 3,290 | 3,530 |
5% 5/1/49 (c) | | 15,380 | 15,919 |
| Series 2022 A: | | | |
5% 5/1/26 (c) | | 13,120 | 13,620 |
5% 5/1/27 (c) | | 13,295 | 14,048 |
| Santa Clara County Fing. Auth. Lease Rev.: | | | |
| (Multiple Facilities Proj.) Series Q, 3% 5/15/37 | | 1,000 | 935 |
| Series 2019 A, 3% 5/1/37 | | 1,670 | 1,619 |
| Univ. of California Revs. Series 2023 BM: | | | |
| 5% 5/15/33 | | 2,850 | 3,554 |
| 5% 5/15/35 | | 2,500 | 3,099 |
| 5% 5/15/36 | | 515 | 634 |
| Washington Township Health Care District Gen. Oblig. Series 2013 A, 5.5% 8/1/40 | | 3,400 | 3,427 |
TOTAL CALIFORNIA | | | 568,312 |
| Colorado - 2.7% | | | |
| Colorado Ctfs. of Prtn. Series 2021 A: | | | |
| 4% 12/15/38 | | 3,000 | 3,130 |
| 5% 12/15/34 | | 6,940 | 8,126 |
| Colorado Health Facilities Auth. Rev. Bonds: | | | |
| (Parkview Med. Ctr., Inc. Proj.) Series 2016, 5% 9/1/46 | | 6,310 | 6,435 |
| Bonds: | | | |
Series 2019 B: | | | |
5%, tender 8/1/26 (b) | | 5,205 | 5,382 |
5%, tender 11/19/26 (b) | | 930 | 991 |
5%, tender 11/19/26 (b) | | 9,160 | 9,683 |
Series 2022 B, 5%, tender 8/17/26 (b) | | 8,705 | 9,165 |
Series 2022 C, 5%, tender 8/15/28 (b) | | 11,655 | 12,775 |
| Series 2019 A1: | | | |
4% 8/1/39 | | 3,940 | 3,964 |
5% 8/1/36 | | 4,000 | 4,313 |
| Series 2019 A2, 5% 8/1/44 | | 16,590 | 17,277 |
| Series 2022 A: | | | |
5% 5/15/31 | | 2,500 | 2,920 |
5% 5/15/32 | | 2,000 | 2,375 |
| Colorado Hsg. & Fin. Auth. Series 2019 H, 4.25% 11/1/49 | | 1,210 | 1,216 |
| Colorado Reg'l. Trans. District (Denver Transit Partners Eagle P3 Proj.) Series 2020: | | | |
| 4% 7/15/33 | | 580 | 604 |
| 4% 7/15/35 | | 1,900 | 1,956 |
| 4% 7/15/38 | | 700 | 705 |
| 4% 7/15/39 | | 1,800 | 1,809 |
| 5% 1/15/30 | | 500 | 543 |
| 5% 7/15/30 | | 350 | 382 |
| 5% 1/15/31 | | 500 | 548 |
| 5% 7/15/31 | | 500 | 548 |
| 5% 1/15/32 | | 700 | 767 |
| Colorado Reg'l. Trans. District Ctfs. of Prtn. Series 2020: | | | |
| 5% 6/1/30 | | 3,000 | 3,360 |
| 5% 6/1/31 | | 1,580 | 1,768 |
| Colorado Springs Utils. Rev. Series 2020: | | | |
| 4% 11/15/36 | | 525 | 553 |
| 4% 11/15/37 | | 670 | 699 |
| 5% 11/15/33 | | 400 | 464 |
| 5% 11/15/33 | | 700 | 813 |
| 5% 11/15/34 | | 685 | 794 |
| 5% 11/15/35 | | 460 | 530 |
| 5% 11/15/36 | | 440 | 503 |
| 5% 11/15/37 | | 635 | 720 |
| 5% 11/15/38 | | 885 | 998 |
| Colorado Univ. Co. Hosp. Auth. Rev. Bonds Series 2019 C, 5%, tender 11/15/24 (b) | | 36,390 | 36,596 |
| Denver City & County Arpt. Rev.: | | | |
| Series 2017 A: | | | |
5% 11/15/24 (c) | | 2,230 | 2,256 |
5% 11/15/27 (c) | | 1,025 | 1,098 |
5% 11/15/28 (c) | | 5,890 | 6,291 |
5% 11/15/29 (c) | | 4,855 | 5,186 |
5% 11/15/30 (c) | | 3,885 | 4,144 |
| Series 2018 A: | | | |
5% 12/1/30 (c) | | 7,475 | 8,321 |
5% 12/1/31 (c) | | 15,915 | 17,088 |
5% 12/1/35 (c) | | 3,350 | 3,572 |
| Series 2022 A: | | | |
5% 11/15/26 (c) | | 15,500 | 16,293 |
5% 11/15/37 (c) | | 7,000 | 7,838 |
| Series 2022 D: | | | |
5.5% 11/15/31 (c) | | 15,970 | 18,714 |
5.5% 11/15/32 (c) | | 4,390 | 5,224 |
5.5% 11/15/33 (c) | | 4,935 | 5,867 |
5.75% 11/15/34 (c) | | 2,540 | 3,073 |
5.75% 11/15/35 (c) | | 2,360 | 2,849 |
| Denver City & County Gen. Oblig.: | | | |
| Series 2020 A: | | | |
2% 8/1/35 | | 16,240 | 13,795 |
2% 8/1/36 | | 13,075 | 10,828 |
| Series 2022 A, 5% 8/1/37 | | 5,285 | 6,205 |
| E-470 Pub. Hwy. Auth. Rev.: | | | |
| Series 2010 A: | | | |
0% 9/1/35 | | 1,940 | 1,330 |
0% 9/1/37 | | 2,915 | 1,807 |
0% 9/1/38 | | 3,650 | 2,132 |
| Series 2020 A: | | | |
5% 9/1/28 | | 2,000 | 2,208 |
5% 9/1/34 | | 1,135 | 1,296 |
| Univ. of Colorado Enterprise Sys. Rev. Bonds Series 2019 C, 2%, tender 10/15/24 (b) | | 23,355 | 23,165 |
TOTAL COLORADO | | | 313,992 |
| Connecticut - 1.6% | | | |
| Connecticut Gen. Oblig.: | | | |
| Series 2016 A, 5% 3/15/26 | | 2,940 | 3,092 |
| Series 2016 E: | | | |
5% 10/15/26 | | 3,445 | 3,678 |
5% 10/15/29 | | 4,975 | 5,293 |
| Series 2018 E: | | | |
5% 9/15/27 | | 4,050 | 4,420 |
5% 9/15/29 | | 4,000 | 4,461 |
5% 9/15/30 | | 4,000 | 4,452 |
5% 9/15/32 | | 1,300 | 1,444 |
| Series 2018 F, 5% 9/15/27 | | 1,000 | 1,091 |
| Series 2019 A: | | | |
5% 4/15/30 | | 2,345 | 2,645 |
5% 4/15/34 | | 2,635 | 2,957 |
5% 4/15/35 | | 915 | 1,025 |
| Series 2020 B, 5% 1/15/26 | | 975 | 1,020 |
| Series 2020 C: | | | |
4% 6/1/35 | | 1,000 | 1,066 |
4% 6/1/37 | | 950 | 997 |
| Series 2021 A, 3% 1/15/39 | | 3,665 | 3,319 |
| Series 2021 B, 4% 1/15/39 | | 6,745 | 7,024 |
| Series 2022 B, 4% 1/15/36 | | 6,860 | 7,367 |
| Series 2022 C: | | | |
5% 6/15/33 | | 300 | 359 |
5% 6/15/36 | | 300 | 353 |
| Series 2022 D, 5% 9/15/31 | | 600 | 710 |
| Series 2024: | | | |
5% 1/15/28 (f) | | 3,000 | 3,297 |
5% 3/1/28 (f) | | 2,000 | 2,204 |
| Series A: | | | |
3% 1/15/24 | | 1,300 | 1,300 |
4% 1/15/24 | | 880 | 880 |
| Series B, 5% 1/15/25 | | 2,000 | 2,044 |
| Connecticut Health & Edl. Facilities Auth. Rev.: | | | |
| Bonds: | | | |
Series 2014 B, 1.8%, tender 7/1/24 (b) | | 7,890 | 7,803 |
Series 2020 B, 5%, tender 1/1/27 (b) | | 2,555 | 2,683 |
| Series 2018 S: | | | |
5% 7/1/26 | | 2,200 | 2,312 |
5% 7/1/29 | | 970 | 1,058 |
| Series 2019 A, 5% 7/1/34 (d) | | 6,000 | 5,918 |
| Series 2019 Q-1: | | | |
5% 11/1/25 | | 1,205 | 1,254 |
5% 11/1/27 | | 3,115 | 3,391 |
5% 11/1/28 | | 1,780 | 1,981 |
| Series 2020 A: | | | |
4% 7/1/36 | | 1,750 | 1,783 |
4% 7/1/38 | | 1,580 | 1,601 |
5% 7/1/29 | | 1,000 | 1,094 |
5% 7/1/30 | | 1,830 | 2,015 |
5% 7/1/31 | | 2,975 | 3,272 |
5% 7/1/33 | | 4,925 | 5,414 |
5% 7/1/34 | | 2,050 | 2,252 |
5% 7/1/35 | | 3,200 | 3,496 |
| Series 2020 K, 4% 7/1/45 | | 350 | 351 |
| Series 2022 L: | | | |
5% 7/1/33 | | 615 | 710 |
5% 7/1/34 | | 830 | 954 |
5% 7/1/35 | | 910 | 1,039 |
5% 7/1/36 | | 935 | 1,058 |
5% 7/1/37 | | 1,010 | 1,132 |
| Series 2022 M: | | | |
5% 7/1/29 | | 820 | 890 |
5% 7/1/32 | | 3,915 | 4,391 |
5% 7/1/33 | | 3,270 | 3,649 |
| Series N: | | | |
4% 7/1/39 | | 4,400 | 3,633 |
4% 7/1/49 | | 3,025 | 2,215 |
| Connecticut Hsg. Fin. Auth. Series 2021 D1, 3% 5/15/51 | | 21,230 | 20,576 |
| Connecticut Spl. Tax Oblig. Trans. Infrastructure Rev.: | | | |
| Series 2021 A, 5% 5/1/35 | | 2,200 | 2,568 |
| Series 2022 A: | | | |
5% 7/1/32 | | 1,500 | 1,797 |
5% 7/1/33 | | 2,065 | 2,515 |
5% 7/1/34 | | 1,500 | 1,808 |
5% 7/1/35 | | 3,205 | 3,847 |
| Series 2022 B: | | | |
5% 7/1/32 | | 2,000 | 2,397 |
5% 7/1/33 | | 1,000 | 1,218 |
| Series A, 5% 5/1/29 | | 3,675 | 4,158 |
| New Britain Gen. Oblig. Series 2009, 5% 4/1/24 (Escrowed to Maturity) | | 509 | 511 |
| Stratford Gen. Oblig. Series 2019, 5% 1/1/29 | | 2,490 | 2,662 |
| Univ. of Connecticut Gen. Oblig. Series 2019 A: | | | |
| 5% 11/1/27 | | 1,720 | 1,879 |
| 5% 11/1/27 | | 2,050 | 2,240 |
| 5% 11/1/28 | | 1,260 | 1,409 |
TOTAL CONNECTICUT | | | 183,432 |
| Delaware - 0.1% | | | |
| Delaware Econ. Dev. Auth. Rev. Bonds (Delmarva Pwr. & Lt. Co. Proj.) Series A, 1.05%, tender 7/1/25 (b) | | 4,110 | 3,948 |
| Delaware River & Bay Auth. Rev. Series 2021: | | | |
| 4% 1/1/39 | | 1,350 | 1,393 |
| 4% 1/1/40 | | 1,200 | 1,230 |
| 4% 1/1/41 | | 700 | 715 |
| 4% 1/1/42 | | 365 | 372 |
| 5% 1/1/27 | | 730 | 781 |
| 5% 1/1/31 | | 150 | 174 |
| 5% 1/1/36 | | 510 | 594 |
| Delaware Trans. Auth. Trans. Sys. Rev. Series 2020, 5% 7/1/32 | | 2,150 | 2,498 |
TOTAL DELAWARE | | | 11,705 |
| Delaware, New Jersey - 0.0% | | | |
| Delaware River & Bay Auth. Rev. Series 2014 C: | | | |
| 5% 1/1/24 | | 1,235 | 1,235 |
| 5% 1/1/25 | | 2,670 | 2,674 |
TOTAL DELAWARE, NEW JERSEY | | | 3,909 |
| District Of Columbia - 1.7% | | | |
| District of Columbia Gen. Oblig.: | | | |
| Series 2021 D: | | | |
4% 2/1/36 | | 2,500 | 2,666 |
4% 2/1/37 | | 2,500 | 2,644 |
| Series 2021 E, 4% 2/1/37 | | 3,240 | 3,427 |
| Series 2023 A: | | | |
5% 1/1/39 | | 3,750 | 4,372 |
5% 1/1/40 | | 1,330 | 1,539 |
| District of Columbia Income Tax Rev.: | | | |
| Series 2020 A, 5% 3/1/24 | | 1,570 | 1,575 |
| Series 2022 A: | | | |
5% 7/1/34 | | 4,000 | 4,808 |
5% 7/1/40 | | 3,555 | 4,091 |
| Series 2022 C, 5% 12/1/34 | | 8,665 | 10,482 |
| District of Columbia Wtr. & Swr. Auth. Pub. Util. Rev. Bonds Series 2022 E, 3%, tender 10/1/27 (b) | | 9,535 | 9,341 |
| Metropolitan Washington Arpts. Auth. Dulles Toll Road Rev. (Dulles Metrorail And Cap. Impt. Proj.) Series 2019 B: | | | |
| 4% 10/1/35 | | 1,185 | 1,206 |
| 4% 10/1/36 | | 1,760 | 1,784 |
| 4% 10/1/37 | | 1,770 | 1,786 |
| 4% 10/1/38 | | 735 | 740 |
| 5% 10/1/33 | | 1,250 | 1,345 |
| Metropolitan Washington DC Arpts. Auth. Sys. Rev.: | | | |
| Series 2017 A: | | | |
5% 10/1/31 (c) | | 2,335 | 2,484 |
5% 10/1/34 (c) | | 1,940 | 2,055 |
5% 10/1/36 (c) | | 1,820 | 1,917 |
| Series 2018 A: | | | |
5% 10/1/28 (c) | | 3,885 | 4,222 |
5% 10/1/29 (c) | | 4,030 | 4,365 |
5% 10/1/30 (c) | | 3,165 | 3,421 |
5% 10/1/31 (c) | | 4,540 | 4,902 |
| Series 2019 A: | | | |
5% 10/1/24 (c) | | 2,395 | 2,420 |
5% 10/1/25 (c) | | 1,530 | 1,572 |
| Series 2021 A: | | | |
4% 10/1/37 (c) | | 1,680 | 1,716 |
4% 10/1/38 (c) | | 1,865 | 1,893 |
4% 10/1/40 (c) | | 3,250 | 3,274 |
5% 10/1/30 (c) | | 7,470 | 8,365 |
5% 10/1/31 (c) | | 12,695 | 14,403 |
5% 10/1/32 (c) | | 18,670 | 21,112 |
5% 10/1/33 (c) | | 19,170 | 21,660 |
5% 10/1/34 (c) | | 4,480 | 5,052 |
5% 10/1/35 (c) | | 3,985 | 4,473 |
5% 10/1/36 (c) | | 3,175 | 3,538 |
| Series 2022 A, 5% 10/1/32 (c) | | 1,250 | 1,436 |
| Series 2022, 5% 10/1/31 (c) | | 2,680 | 3,041 |
| Washington D.C. Metropolitan Transit Auth. Rev. Series 2017 B, 5% 7/1/34 | | 7,990 | 8,560 |
| Washington Metropolitan Area Transit Auth. Series 2023 A: | | | |
| 5% 7/15/33 | | 1,305 | 1,594 |
| 5% 7/15/34 | | 2,450 | 2,980 |
| 5% 7/15/35 | | 2,000 | 2,415 |
| 5% 7/15/37 | | 1,400 | 1,661 |
| 5% 7/15/38 | | 1,100 | 1,286 |
| 5% 7/15/39 | | 1,655 | 1,927 |
TOTAL DISTRICT OF COLUMBIA | | | 189,550 |
| Florida - 6.8% | | | |
| Alachua County School Board Ctfs. Series 2020: | | | |
| 5% 7/1/27 | | 4,285 | 4,606 |
| 5% 7/1/28 | | 7,045 | 7,728 |
| Brevard County Health Facilities Auth. Rev. Series 2023 A: | | | |
| 5% 4/1/30 | | 2,690 | 2,991 |
| 5% 4/1/32 | | 620 | 708 |
| 5% 4/1/37 | | 985 | 1,116 |
| 5% 4/1/39 | | 1,670 | 1,849 |
| Brevard County School Board Ctfs. of Prtn.: | | | |
| Series 2014: | | | |
5% 7/1/27 | | 3,205 | 3,233 |
5% 7/1/30 | | 7,240 | 7,295 |
| Series 2015 C, 5% 7/1/24 | | 2,915 | 2,943 |
| Broward County Arpt. Sys. Rev.: | | | |
| Series 2015 A, 5% 10/1/34 (c) | | 2,000 | 2,042 |
| Series 2017: | | | |
5% 10/1/30 (c) | | 2,050 | 2,172 |
5% 10/1/31 (c) | | 3,100 | 3,287 |
5% 10/1/35 (c) | | 1,000 | 1,050 |
| Series 2019 A, 5% 10/1/39 (c) | | 1,750 | 1,852 |
| Series 2019 B: | | | |
5% 10/1/28 (c) | | 6,000 | 6,488 |
5% 10/1/29 (c) | | 5,000 | 5,482 |
| Series A: | | | |
5% 10/1/29 (c) | | 4,090 | 4,182 |
5% 10/1/31 (c) | | 2,915 | 2,979 |
5% 10/1/32 (c) | | 3,885 | 3,970 |
| Broward County Port Facilities Rev.: | | | |
| Series 2019 A: | | | |
5% 9/1/30 | | 1,230 | 1,391 |
5% 9/1/32 | | 1,055 | 1,178 |
| Series 2019 B: | | | |
4% 9/1/37 (c) | | 1,970 | 2,013 |
5% 9/1/28 (c) | | 710 | 762 |
| Broward County School Board Ctfs. of Prtn.: | | | |
| Series 2015 A: | | | |
5% 7/1/26 | | 11,170 | 11,497 |
5% 7/1/27 | | 8,900 | 9,176 |
5% 7/1/28 | | 3,885 | 3,999 |
| Series 2015 B: | | | |
5% 7/1/25 | | 2,100 | 2,167 |
5% 7/1/26 | | 11,335 | 11,666 |
5% 7/1/27 | | 7,670 | 7,908 |
5% 7/1/28 | | 13,120 | 13,506 |
| Series 2016, 5% 7/1/32 | | 2,430 | 2,530 |
| Series 2020 A, 5% 7/1/31 | | 3,000 | 3,442 |
| Cap. Projs. Fin. Auth. Student Hsg. Rev. (Cap. Projs. Ln. Prog. - Florida Univs.) Series 2020 A: | | | |
| 5% 10/1/31 | | 2,000 | 2,108 |
| 5% 10/1/34 | | 1,250 | 1,304 |
| 5% 10/1/35 | | 500 | 519 |
| Central Florida Expressway Auth. Sr. Lien Rev.: | | | |
| Series 2019 B, 5% 7/1/35 | | 5,000 | 5,555 |
| Series 2021: | | | |
4% 7/1/38 (Assured Guaranty Muni. Corp. Insured) | | 4,000 | 4,174 |
5% 7/1/24 (Assured Guaranty Muni. Corp. Insured) | | 885 | 894 |
5% 7/1/26 (Assured Guaranty Muni. Corp. Insured) | | 4,140 | 4,376 |
| Clay County Sales Surtax Rev. Series 2020: | | | |
| 5% 10/1/24 | | 740 | 751 |
| 5% 10/1/25 | | 1,115 | 1,157 |
| 5% 10/1/31 | | 2,445 | 2,765 |
| 5% 10/1/34 | | 5,390 | 6,082 |
| 5% 10/1/36 | | 3,000 | 3,350 |
| 5% 10/1/37 | | 6,135 | 6,805 |
| County of Broward Tourist Dev. Tax Rev. (Convention Ctr. Expansion Proj.) Series 2021, 4% 9/1/41 | | 2,700 | 2,710 |
| Duval County School Board Ctfs. of Prtn. Series 2015 B: | | | |
| 5% 7/1/27 | | 4,260 | 4,388 |
| 5% 7/1/28 | | 970 | 999 |
| 5% 7/1/30 | | 6,440 | 6,627 |
| Escambia County Health Facilities Auth. Health Facilities Rev. Series 2020 A, 4% 8/15/45 | | 4,570 | 4,197 |
| Florida Dept. of Mgmt. Svcs. Ctfs. of Prtn. Series 2018 A, 5% 11/1/29 | | 6,245 | 7,122 |
| Florida Dept. of Trans. Tpk. Rev. Series 2021 C, 3% 7/1/35 | | 4,020 | 3,943 |
| Florida Higher Edl. Facilities Fing. Auth.: | | | |
| (St. Leo Univ. Proj.) Series 2019: | | | |
5% 3/1/29 | | 1,635 | 1,540 |
5% 3/1/30 | | 1,715 | 1,597 |
5% 3/1/31 | | 1,805 | 1,661 |
5% 3/1/32 | | 1,890 | 1,718 |
| Series 2019: | | | |
5% 10/1/28 | | 1,060 | 1,126 |
5% 10/1/30 | | 1,500 | 1,603 |
5% 10/1/31 | | 1,750 | 1,864 |
5% 10/1/32 | | 1,305 | 1,386 |
| Florida Mid-Bay Bridge Auth. Rev. Series 2015 A: | | | |
| 5% 10/1/27 | | 3,495 | 3,573 |
| 5% 10/1/28 | | 5,000 | 5,116 |
| 5% 10/1/29 | | 2,645 | 2,707 |
| 5% 10/1/30 | | 2,405 | 2,461 |
| Florida Muni. Pwr. Agcy. Rev.: | | | |
| (Requirements Pwr. Supply Proj.) Series 2016 A: | | | |
5% 10/1/30 | | 1,775 | 1,861 |
5% 10/1/31 | | 1,940 | 2,032 |
| Series 2015 B: | | | |
5% 10/1/24 | | 970 | 984 |
5% 10/1/27 | | 1,455 | 1,502 |
| Greater Orlando Aviation Auth. Arpt. Facilities Rev.: | | | |
| Series 2017 A, 5% 10/1/28 (Pre-Refunded to 10/1/27 @ 100) (c) | | 3,380 | 3,615 |
| Series 2019 A: | | | |
5% 10/1/31 (c) | | 4,225 | 4,638 |
5% 10/1/44 (c) | | 14,200 | 14,920 |
| Halifax Hosp. Med. Ctr. Rev. Series 2015: | | | |
| 5% 6/1/28 (Pre-Refunded to 6/1/25 @ 100) | | 1,245 | 1,282 |
| 5% 6/1/35 (Pre-Refunded to 6/1/25 @ 100) | | 2,430 | 2,503 |
| Hillsborough Co. Sldwst and Resource Receivables Series 2016 A: | | | |
| 5% 9/1/24 (c) | | 2,135 | 2,155 |
| 5% 9/1/25 (c) | | 2,150 | 2,206 |
| 5% 9/1/26 (c) | | 2,200 | 2,327 |
| Hillsborough County Port District Series 2018 B, 5% 6/1/38 (c) | | 3,285 | 3,437 |
| Hillsborough County School Board Ctfs. of Prtn. Series 2020 A, 5% 7/1/29 | | 6,955 | 7,732 |
| Indian River County School Board Ctfs. of Prtn. Series 2014: | | | |
| 5% 7/1/24 | | 2,595 | 2,617 |
| 5% 7/1/25 | | 1,940 | 1,995 |
| Jacksonville Elec. Auth. Elec. Sys. Rev.: | | | |
| Series 2017 B, 5% 10/1/26 | | 6,680 | 7,091 |
| Series A: | | | |
4% 10/1/35 | | 5,000 | 5,192 |
5% 10/1/30 | | 5,055 | 5,748 |
5% 10/1/31 | | 2,625 | 2,973 |
5% 10/1/32 | | 4,385 | 4,950 |
| JEA Wtr. & Swr. Sys. Rev. Series 2020 A, 3% 10/1/36 | | 5,000 | 4,745 |
| Lake County School Board Ctfs. of Prtn. Series 2014 A: | | | |
| 5% 6/1/25 (Pre-Refunded to 6/1/24 @ 100) | | 970 | 977 |
| 5% 6/1/26 (Pre-Refunded to 6/1/24 @ 100) | | 1,750 | 1,762 |
| 5% 6/1/28 (Pre-Refunded to 6/1/24 @ 100) | | 485 | 488 |
| Lee Memorial Health Sys. Hosp. Rev.: | | | |
| Bonds Series 2019 A2, 5%, tender 4/1/26 (b) | | 11,585 | 11,876 |
| Series 2019 A1: | | | |
5% 4/1/33 | | 1,650 | 1,802 |
5% 4/1/34 | | 3,250 | 3,535 |
5% 4/1/35 | | 6,325 | 6,865 |
5% 4/1/37 | | 2,190 | 2,351 |
5% 4/1/39 | | 1,500 | 1,591 |
| Manatee County School District Series 2017, 5% 10/1/25 (Assured Guaranty Muni. Corp. Insured) | | 1,940 | 2,012 |
| Miami-Dade County Series 2021 B2, 4% 10/1/38 | | 3,000 | 3,113 |
| Miami-Dade County Aviation Rev.: | | | |
| Series 2012 A: | | | |
5% 10/1/24 (c) | | 9,710 | 9,723 |
5% 10/1/24 | | 2,100 | 2,103 |
| Series 2014 A: | | | |
5% 10/1/27 (c) | | 1,770 | 1,780 |
5% 10/1/29 (c) | | 2,725 | 2,738 |
5% 10/1/33 (c) | | 5,440 | 5,464 |
5% 10/1/37 | | 7,185 | 7,248 |
| Series 2014, 5% 10/1/32 (c) | | 3,135 | 3,149 |
| Series 2015 A: | | | |
5% 10/1/35 (c) | | 2,430 | 2,439 |
5% 10/1/38 (c) | | 1,335 | 1,343 |
| Series 2016 A: | | | |
5% 10/1/30 | | 2,430 | 2,540 |
5% 10/1/31 | | 970 | 1,013 |
| Series 2017 B, 5% 10/1/40 (c) | | 3,190 | 3,289 |
| Series 2020 A: | | | |
4% 10/1/36 | | 2,000 | 2,094 |
4% 10/1/38 | | 2,250 | 2,307 |
5% 10/1/32 | | 2,150 | 2,455 |
5% 10/1/33 | | 3,325 | 3,783 |
| Miami-Dade County Cap. Asset Acquisition: | | | |
| Series 2016: | | | |
5% 10/1/28 | | 5,385 | 5,691 |
5% 10/1/29 | | 3,985 | 4,202 |
5% 10/1/30 | | 7,215 | 7,598 |
| Series 2021 A: | | | |
4% 4/1/44 | | 8,990 | 9,114 |
4% 4/1/46 | | 9,860 | 9,976 |
| Miami-Dade County Expressway Auth.: | | | |
| Series 2010 A, 5% 7/1/40 | | 7,965 | 7,968 |
| Series 2016 A: | | | |
5% 7/1/32 | | 3,865 | 4,022 |
5% 7/1/33 | | 3,205 | 3,334 |
| Series A: | | | |
5% 7/1/31 | | 1,455 | 1,514 |
5% 7/1/34 | | 970 | 1,008 |
| Miami-Dade County Gen. Oblig. Series 2016 A: | | | |
| 5% 7/1/29 | | 10,905 | 12,416 |
| 5% 7/1/31 | | 11,690 | 13,411 |
| Miami-Dade County Indl. Dev. Auth. Solid Waste Disp. Rev. Bonds: | | | |
| (Waste Mgmt., Inc. Proj.) Series 2018 A, 0.000% x SIFMA Municipal Swap Index 4.245%, tender 1/4/24 (b)(c)(e) | | 9,620 | 9,570 |
| Series 2018 B, SIFMA Municipal Swap Index + 0.000% 4.245%, tender 1/4/24 (b)(c)(e) | | 12,500 | 12,435 |
| Miami-Dade County School Board Ctfs. of Prtn.: | | | |
| Series 2014 D: | | | |
5% 11/1/24 | | 11,340 | 11,512 |
5% 11/1/25 | | 11,880 | 12,074 |
5% 11/1/26 | | 7,720 | 7,836 |
| Series 2015 A, 5% 5/1/27 (Assured Guaranty Muni. Corp. Insured) | | 4,100 | 4,206 |
| Series 2015 B, 5% 5/1/28 | | 13,295 | 13,606 |
| Series 2015 D: | | | |
5% 2/1/29 | | 3,935 | 4,105 |
5% 2/1/30 | | 6,310 | 6,579 |
| Series 2016 A: | | | |
5% 8/1/27 | | 7,340 | 7,736 |
5% 5/1/31 | | 19,200 | 20,101 |
| Orange County Health Facilities Auth.: | | | |
| Series 2016 A, 5% 10/1/39 | | 4,180 | 4,306 |
| Series 2023 A: | | | |
5% 10/1/32 | | 1,605 | 1,863 |
5% 10/1/33 | | 750 | 875 |
5% 10/1/34 | | 1,000 | 1,164 |
5% 10/1/35 | | 1,000 | 1,153 |
5% 10/1/36 | | 600 | 686 |
| Orange County School Board Ctfs. of Prtn. Series 2015 C, 5% 8/1/29 (Pre-Refunded to 8/1/25 @ 100) | | 6,800 | 7,036 |
| Orlando Utils. Commission Util. Sys. Rev. Series 2012 A, 5% 10/1/25 | | 875 | 909 |
| Palm Beach County Health Facilities Auth. Hosp. Rev. Series 2014, 5% 12/1/24 (Escrowed to Maturity) | | 660 | 671 |
| Palm Beach County Health Facilities Auth. Rev. Series 2015 C: | | | |
| 5% 5/15/25 | | 1,805 | 1,775 |
| 5% 5/15/30 | | 1,670 | 1,579 |
| Palm Beach County School Board Ctfs. of Prtn.: | | | |
| Series 2014 B, 5% 8/1/25 | | 3,110 | 3,208 |
| Series 2015 B: | | | |
5% 8/1/25 | | 1,580 | 1,630 |
5% 8/1/26 | | 10,160 | 10,486 |
5% 8/1/27 | | 8,045 | 8,297 |
5% 8/1/28 | | 5,325 | 5,478 |
| Series 2015 D: | | | |
5% 8/1/26 | | 23,370 | 24,121 |
5% 8/1/27 | | 10,595 | 10,927 |
5% 8/1/28 | | 3,620 | 3,724 |
| Series 2017 A, 5% 8/1/26 | | 21,905 | 23,235 |
| Series 2018 A: | | | |
5% 8/1/24 | | 1,270 | 1,284 |
5% 8/1/26 | | 1,880 | 1,994 |
| Series 2021 A: | | | |
5% 8/1/38 | | 3,720 | 4,212 |
5% 8/1/39 | | 7,440 | 8,368 |
| Pasco County Gen. Oblig. (Jail Projs.) Series 2021 B: | | | |
| 5% 10/1/32 | | 2,175 | 2,551 |
| 5% 10/1/34 | | 2,400 | 2,804 |
| 5% 10/1/38 | | 2,905 | 3,259 |
| 5% 10/1/39 | | 3,060 | 3,410 |
| 5% 10/1/40 | | 3,215 | 3,561 |
| Pasco County School Board Ctfs. of Prtn. Series 2020 C: | | | |
| 5% 8/1/33 (Assured Guaranty Muni. Corp. Insured) | | 3,000 | 3,461 |
| 5% 8/1/34 (Assured Guaranty Muni. Corp. Insured) | | 2,250 | 2,565 |
| Pinellas County Idr (Drs. Kiran & Pallavi Patel 2017 Foundation for Global Understanding, Inc. Proj.) Series 2019: | | | |
| 5% 7/1/29 | | 400 | 410 |
| 5% 7/1/39 | | 1,000 | 1,004 |
| Seminole County School Board Ctfs. of Prtn. Series 2016 C, 5% 7/1/24 | | 1,700 | 1,716 |
| South Florida Wtr. Mgmt. District Ctfs. of Prtn. Series 2015, 5% 10/1/30 | | 3,885 | 4,070 |
| South Miami Health Facilities Auth. Hosp. Rev. (Baptist Med. Ctr., FL. Proj.) Series 2017: | | | |
| 5% 8/15/24 | | 2,460 | 2,487 |
| 5% 8/15/25 | | 3,980 | 4,097 |
| Tallahassee Health Facilities Rev. Series 2015 A, 5% 12/1/40 | | 1,750 | 1,763 |
| Tampa Bay Wtr. Reg'l. Wtr. Supply Auth. Util. Sys. Rev. Series 2001 A, 6% 10/1/29 | | 2,430 | 2,906 |
| Village Cmnty. Dev. District No. 15 Series 2023: | | | |
| 4.25% 5/1/28 (d) | | 700 | 700 |
| 4.375% 5/1/33 (d) | | 1,000 | 1,002 |
| 4.85% 5/1/38 (d) | | 1,000 | 998 |
| Volusia County Edl. Facilities Auth. Rev. (Embry-Riddle Aeronautical Univ., Inc. Proj.) Series 2020 A: | | | |
| 4% 10/15/35 | | 400 | 415 |
| 4% 10/15/36 | | 375 | 386 |
| 4% 10/15/38 | | 750 | 763 |
| 4% 10/15/39 | | 1,000 | 1,012 |
| 5% 10/15/44 | | 1,365 | 1,448 |
| Volusia County School Board Ctfs. of Prtn.: | | | |
| (Florida Master Lease Prog.) Series 2016 A, 5% 8/1/32 (Build America Mutual Assurance Insured) | | 4,855 | 5,040 |
| Series 2019, 5% 8/1/24 | | 1,800 | 1,820 |
TOTAL FLORIDA | | | 782,374 |
| Georgia - 4.0% | | | |
| Atlanta Arpt. Passenger Facilities Charge Rev. Series 2023 E: | | | |
| 5% 7/1/37 (c) | | 3,750 | 4,243 |
| 5% 7/1/38 (c) | | 2,750 | 3,074 |
| 5% 7/1/40 (c) | | 1,565 | 1,728 |
| Atlanta Arpt. Rev.: | | | |
| Series 2020 A: | | | |
5% 7/1/26 | | 4,290 | 4,541 |
5% 7/1/27 | | 9,365 | 10,161 |
| Series 2021 C: | | | |
4% 7/1/38 (c) | | 745 | 756 |
5% 7/1/25 (c) | | 710 | 727 |
5% 7/1/32 (c) | | 1,750 | 1,973 |
5% 7/1/33 (c) | | 1,050 | 1,183 |
5% 7/1/34 (c) | | 750 | 844 |
5% 7/1/35 (c) | | 1,000 | 1,120 |
5% 7/1/36 (c) | | 1,050 | 1,169 |
5% 7/1/37 (c) | | 1,115 | 1,231 |
| Atlanta Gen. Oblig. Series 2022 A1, 5% 12/1/34 | | 2,250 | 2,710 |
| Atlanta Wtr. & Wastewtr. Rev. Series 2015: | | | |
| 5% 11/1/27 | | 970 | 999 |
| 5% 11/1/29 | | 2,430 | 2,496 |
| Bartow County Dev. Auth. Poll. Cont. Rev. Bonds (Georgia Pwr. Co. Plant Bowen Proj.): | | | |
| Series 2009, 3.95%, tender 3/8/28 (b) | | 19,870 | 20,199 |
| Series 2013, 2.875%, tender 8/19/25 (b) | | 11,435 | 11,231 |
| Brookhaven Dev. Auth. Rev. Series 2019 A: | | | |
| 5% 7/1/24 | | 1,750 | 1,766 |
| 5% 7/1/27 | | 1,500 | 1,624 |
| 5% 7/1/38 | | 2,000 | 2,192 |
| 5% 7/1/39 | | 1,250 | 1,363 |
| Burke County Indl. Dev. Auth. Poll. Cont. Rev. Bonds (Georgia Pwr. Co. Plant Vogtle Proj.): | | | |
| Series 2008, 2.925%, tender 3/12/24 (b) | | 5,000 | 4,984 |
| Series 2012: | | | |
1.7%, tender 8/22/24 (b) | | 9,660 | 9,469 |
2.875%, tender 8/19/25 (b) | | 3,575 | 3,511 |
| Series 2013 1st, 2.925%, tender 3/12/24 (b) | | 7,770 | 7,744 |
| Columbus Med. Ctr. Hosp. Auth. Bonds (Piedmont Healthcare, Inc. Proj.): | | | |
| Series 2019 A, 5%, tender 7/1/26 (b) | | 12,665 | 13,096 |
| Series 2019 B, 5%, tender 7/1/29 (b) | | 10,100 | 11,011 |
| DeKalb Private Hosp. Auth. Rev. Series 2019 B: | | | |
| 5% 7/1/24 | | 1,000 | 1,009 |
| 5% 7/1/26 | | 1,000 | 1,056 |
| 5% 7/1/28 | | 2,000 | 2,215 |
| Fulton County Dev. Auth. Rev.: | | | |
| Series 2019 C: | | | |
5% 7/1/27 | | 3,035 | 3,285 |
5% 7/1/36 | | 1,300 | 1,444 |
5% 7/1/37 | | 1,600 | 1,768 |
5% 7/1/39 | | 1,250 | 1,363 |
| Series 2019, 5% 6/15/44 | | 2,365 | 2,532 |
| Gainesville & Hall County Hosp. Auth. Rev. Series 2020 A, 4% 2/15/37 | | 1,080 | 1,097 |
| Georgia Gen. Oblig. Series 2020 A: | | | |
| 4% 8/1/34 | | 8,545 | 9,294 |
| 4% 8/1/35 | | 15,000 | 16,255 |
| Georgia Muni. Elec. Auth. Pwr. Rev.: | | | |
| Series 2019 A: | | | |
5% 1/1/27 | | 990 | 1,050 |
5% 1/1/28 | | 520 | 560 |
5% 1/1/29 | | 1,140 | 1,247 |
5% 1/1/31 | | 700 | 762 |
5% 1/1/32 | | 515 | 560 |
5% 1/1/33 | | 1,200 | 1,305 |
| Series 2020 A: | | | |
4% 1/1/34 | | 1,870 | 1,959 |
5% 11/1/27 | | 600 | 647 |
5% 11/1/28 | | 820 | 897 |
5% 11/1/29 | | 935 | 1,037 |
5% 1/1/31 | | 1,000 | 1,133 |
5% 1/1/31 | | 1,250 | 1,416 |
5% 1/1/32 | | 1,150 | 1,302 |
5% 1/1/32 | | 1,000 | 1,132 |
5% 1/1/33 | | 1,000 | 1,131 |
5% 1/1/35 | | 1,000 | 1,126 |
| Series 2021 A: | | | |
4% 1/1/46 (Assured Guaranty Muni. Corp. Insured) | | 1,710 | 1,702 |
4% 1/1/46 (Assured Guaranty Muni. Corp. Insured) | | 1,100 | 1,095 |
4% 1/1/51 | | 630 | 596 |
5% 1/1/56 | | 1,635 | 1,675 |
5% 1/1/56 | | 560 | 574 |
5% 1/1/56 | | 820 | 844 |
5% 1/1/62 (Assured Guaranty Muni. Corp. Insured) | | 3,345 | 3,453 |
5% 1/1/63 | | 1,485 | 1,517 |
| Series 2022 A, 5% 7/1/37 (Assured Guaranty Muni. Corp. Insured) | | 2,845 | 3,210 |
| Series 2023 A: | | | |
5% 7/1/33 (Assured Guaranty Muni. Corp. Insured) | | 360 | 420 |
5% 7/1/34 (Assured Guaranty Muni. Corp. Insured) | | 1,000 | 1,163 |
5% 7/1/34 (Assured Guaranty Muni. Corp. Insured) | | 365 | 425 |
5% 7/1/35 (Assured Guaranty Muni. Corp. Insured) | | 845 | 975 |
5% 7/1/35 (Assured Guaranty Muni. Corp. Insured) | | 310 | 358 |
5% 7/1/36 (Assured Guaranty Muni. Corp. Insured) | | 650 | 745 |
5% 7/1/36 (Assured Guaranty Muni. Corp. Insured) | | 450 | 515 |
5% 7/1/37 (Assured Guaranty Muni. Corp. Insured) | | 495 | 562 |
5% 7/1/38 (Assured Guaranty Muni. Corp. Insured) | | 1,230 | 1,379 |
5% 7/1/38 (Assured Guaranty Muni. Corp. Insured) | | 435 | 488 |
5% 7/1/39 (Assured Guaranty Muni. Corp. Insured) | | 500 | 557 |
| Series GG: | | | |
5% 1/1/24 | | 3,520 | 3,520 |
5% 1/1/25 | | 1,215 | 1,216 |
5% 1/1/26 | | 4,855 | 4,859 |
| Georgia Muni. Gas Auth. Rev. (Gas Portfolio III Proj.) Series 2014 U, 5% 10/1/24 | | 1,360 | 1,379 |
| Glynn-Brunswick Memorial Hosp. Auth. Rev. (Southeast Georgia Health Sys. Proj.) Series 2020, 4% 8/1/38 | | 2,000 | 2,000 |
| Main Street Natural Gas, Inc.: | | | |
| Bonds: | | | |
Series 2019 B, 4%, tender 12/2/24 (b) | | 26,260 | 26,318 |
Series 2021 A, 4%, tender 9/1/27 (b) | | 49,740 | 50,032 |
Series 2021 C, 4%, tender 12/1/28 (b) | | 8,420 | 8,477 |
Series 2022 B, 5%, tender 6/1/29 (b) | | 34,655 | 36,577 |
Series 2022 E, 4%, tender 12/1/29 (b) | | 28,790 | 29,007 |
Series 2023 B, 5%, tender 3/1/30 (b) | | 14,245 | 15,188 |
Series 2023 C, 5%, tender 9/1/30 (b) | | 17,055 | 18,246 |
Series 2023 D, 5%, tender 12/1/30 (b) | | 28,360 | 30,163 |
| Series 2022 A, 4% 12/1/29 | | 3,515 | 3,523 |
| Monroe County Dev. Auth. Poll. Cont. Rev. Bonds (Georgia Pwr. Co. Plant Scherer Proj.): | | | |
| Series 2009, 3.875%, tender 3/6/26 (b) | | 2,150 | 2,168 |
| Series 2012, 3.875%, tender 3/6/26 (b) | | 2,785 | 2,808 |
| Series 2023: | | | |
3.875%, tender 3/6/26 (b) | | 3,500 | 3,529 |
3.875%, tender 3/6/26 (b) | | 3,500 | 3,529 |
| Private Colleges & Univs. Auth. Rev.: | | | |
| (The Savannah College of Art & Design Projs.) Series 2021: | | | |
4% 4/1/39 | | 955 | 975 |
4% 4/1/41 | | 1,500 | 1,516 |
5% 4/1/32 | | 800 | 912 |
5% 4/1/34 | | 2,420 | 2,746 |
| Series 2020 B, 5% 9/1/34 | | 3,500 | 4,044 |
TOTAL GEORGIA | | | 460,712 |
| Hawaii - 0.7% | | | |
| Hawaii Arpts. Sys. Rev. Series 2020 A: | | | |
| 4% 7/1/36 (c) | | 925 | 943 |
| 4% 7/1/37 (c) | | 1,385 | 1,402 |
| 4% 7/1/38 (c) | | 1,400 | 1,418 |
| 4% 7/1/39 (c) | | 1,500 | 1,510 |
| 4% 7/1/40 (c) | | 535 | 538 |
| 5% 7/1/33 (c) | | 6,795 | 7,509 |
| Hawaii Gen. Oblig.: | | | |
| Series 2019 FW: | | | |
5% 1/1/31 | | 1,250 | 1,402 |
5% 1/1/35 | | 5,000 | 5,594 |
| Series 2019, 5% 1/1/30 | | 5,140 | 5,770 |
| Series 2020 A: | | | |
4% 7/1/33 (c) | | 1,000 | 1,042 |
4% 7/1/35 (c) | | 280 | 290 |
| Honolulu City & County Gen. Oblig.: | | | |
| Series 2017 D, 5% 9/1/26 | | 3,110 | 3,308 |
| Series 2019 A: | | | |
5% 9/1/27 | | 2,000 | 2,181 |
5% 9/1/30 | | 6,500 | 7,227 |
| Series 2019 D, 5% 8/1/26 | | 4,500 | 4,776 |
| Series 2020 F: | | | |
5% 7/1/33 | | 1,955 | 2,247 |
5% 7/1/34 | | 860 | 988 |
| Series 2022 A: | | | |
5% 11/1/25 | | 2,620 | 2,730 |
5% 11/1/26 | | 700 | 748 |
5% 11/1/27 | | 2,630 | 2,879 |
5% 11/1/28 | | 4,210 | 4,719 |
| Series C: | | | |
4% 7/1/34 | | 850 | 907 |
4% 7/1/37 | | 750 | 785 |
4% 7/1/39 | | 1,200 | 1,238 |
4% 7/1/40 | | 1,250 | 1,282 |
| Univ. Hawaii Rev.: | | | |
| Series 2020 B: | | | |
5% 10/1/29 | | 4,695 | 5,337 |
5% 10/1/30 | | 4,280 | 4,957 |
| Series 2020 D, 5% 10/1/29 | | 1,025 | 1,165 |
TOTAL HAWAII | | | 74,892 |
| Idaho - 0.1% | | | |
| Idaho Hsg. & Fin. Assoc. Single Family Mtg.: | | | |
| (Idaho St Garvee Proj.) Series 2017 A: | | | |
5% 7/15/24 | | 1,260 | 1,273 |
5% 7/15/25 | | 1,260 | 1,301 |
5% 7/15/27 | | 3,140 | 3,400 |
| Series 2019 A, 4% 1/1/50 | | 630 | 629 |
| Series 2021 A: | | | |
4% 7/15/36 | | 2,250 | 2,354 |
4% 7/15/37 | | 750 | 778 |
4% 7/15/38 | | 1,750 | 1,796 |
4% 7/15/39 | | 1,500 | 1,530 |
TOTAL IDAHO | | | 13,061 |
| Illinois - 9.5% | | | |
| Champaign County Cmnty. Unit Series 2020 A: | | | |
| 0% 1/1/26 | | 800 | 747 |
| 0% 1/1/28 | | 575 | 503 |
| Chicago Board of Ed.: | | | |
| Series 2012 A, 5% 12/1/42 | | 1,880 | 1,856 |
| Series 2015 C, 5.25% 12/1/39 | | 1,455 | 1,454 |
| Series 2016 B, 6.5% 12/1/46 | | 700 | 733 |
| Series 2017 A, 7% 12/1/46 (d) | | 2,400 | 2,585 |
| Series 2017 C, 5% 12/1/26 | | 905 | 934 |
| Series 2017 D, 5% 12/1/27 | | 2,500 | 2,608 |
| Series 2017 H: | | | |
5% 12/1/36 | | 5,215 | 5,276 |
5% 12/1/46 | | 3,275 | 3,235 |
| Series 2018 A: | | | |
5% 12/1/24 | | 560 | 564 |
5% 12/1/27 | | 6,280 | 6,551 |
5% 12/1/33 | | 700 | 718 |
5% 12/1/34 | | 1,400 | 1,433 |
| Series 2018 C: | | | |
5% 12/1/24 | | 725 | 730 |
5% 12/1/26 | | 4,625 | 4,773 |
5% 12/1/46 | | 11,410 | 11,348 |
| Series 2019 A: | | | |
5% 12/1/24 | | 2,300 | 2,316 |
5% 12/1/28 | | 6,520 | 6,835 |
5% 12/1/28 | | 510 | 535 |
5% 12/1/29 | | 930 | 982 |
5% 12/1/30 | | 1,335 | 1,396 |
5% 12/1/30 | | 900 | 941 |
5% 12/1/32 | | 1,250 | 1,299 |
| Series 2021 B, 5% 12/1/31 | | 3,250 | 3,439 |
| Series 2022 A, 5% 12/1/47 | | 11,070 | 11,008 |
| Chicago Gen. Oblig.: | | | |
| Series 2019 A, 5.5% 1/1/35 | | 2,000 | 2,179 |
| Series 2020 A, 5% 1/1/31 | | 1,600 | 1,731 |
| Series 2021 A: | | | |
5% 1/1/31 | | 7,690 | 8,440 |
5% 1/1/34 | | 4,995 | 5,453 |
| Series 2023 A: | | | |
4% 1/1/35 | | 8,000 | 7,895 |
5% 1/1/34 | | 7,000 | 7,741 |
5% 1/1/35 | | 2,460 | 2,714 |
5.25% 1/1/36 | | 1,500 | 1,671 |
| Chicago Midway Arpt. Rev.: | | | |
| Series 2014 A: | | | |
5% 1/1/30 (c) | | 2,980 | 2,994 |
5% 1/1/32 (c) | | 6,310 | 6,339 |
5% 1/1/33 (c) | | 7,100 | 7,132 |
| Series 2014 B, 5% 1/1/24 | | 3,235 | 3,235 |
| Series 2016 A: | | | |
5% 1/1/29 (c) | | 2,155 | 2,205 |
5% 1/1/30 (c) | | 3,290 | 3,368 |
5% 1/1/31 (c) | | 3,850 | 3,937 |
| Series 2016 B, 5% 1/1/41 | | 3,390 | 3,455 |
| Series 2023: | | | |
5% 1/1/32 (Build America Mutual Assurance Insured) (c) | | 9,830 | 11,047 |
5% 1/1/33 (Build America Mutual Assurance Insured) (c) | | 3,000 | 3,409 |
| Chicago O'Hare Int'l. Arpt. Rev.: | | | |
| Series 2015 A, 5% 1/1/24 (c) | | 1,045 | 1,045 |
| Series 2015 B, 5% 1/1/32 | | 5,235 | 5,317 |
| Series 2015 C, 5% 1/1/24 (c) | | 1,245 | 1,245 |
| Series 2016 C: | | | |
5% 1/1/24 | | 1,455 | 1,455 |
5% 1/1/25 | | 2,285 | 2,331 |
5% 1/1/26 | | 1,940 | 2,028 |
5% 1/1/33 | | 2,305 | 2,392 |
5% 1/1/34 | | 2,670 | 2,770 |
| Series 2016 D, 5% 1/1/52 | | 6,740 | 6,925 |
| Series 2017 D: | | | |
5% 1/1/27 (c) | | 2,415 | 2,533 |
5% 1/1/28 (c) | | 460 | 484 |
5% 1/1/31 (c) | | 2,850 | 2,990 |
5% 1/1/33 (c) | | 1,455 | 1,521 |
| Series 2018 A: | | | |
5% 1/1/48 (c) | | 3,585 | 3,694 |
5% 1/1/53 (c) | | 6,110 | 6,266 |
| Series 2020 A, 4% 1/1/36 (Assured Guaranty Muni. Corp. Insured) | | 5,000 | 5,238 |
| Series 2023: | | | |
5% 1/1/37 (Build America Mutual Assurance Insured) | | 1,330 | 1,497 |
5.25% 1/1/39 (Build America Mutual Assurance Insured) | | 1,195 | 1,346 |
5.25% 1/1/40 (Build America Mutual Assurance Insured) | | 1,700 | 1,904 |
| Chicago O'Hare Int'l. Arpt. Spl. Facilities Rev. Series 2018, 5% 7/1/38 (c) | | 2,470 | 2,541 |
| Chicago Transit Auth. Cap. Grant Receipts Rev. Series 2021: | | | |
| 5% 6/1/27 | | 2,250 | 2,383 |
| 5% 6/1/28 | | 2,500 | 2,696 |
| Cook County Gen. Oblig.: | | | |
| Series 2021 A: | | | |
5% 11/15/24 | | 1,150 | 1,169 |
5% 11/15/25 | | 1,150 | 1,195 |
5% 11/15/26 | | 2,300 | 2,448 |
| Series 2021 B: | | | |
4% 11/15/26 | | 1,575 | 1,633 |
4% 11/15/27 | | 1,585 | 1,669 |
4% 11/15/28 | | 795 | 833 |
| Series 2022 A: | | | |
5% 11/15/29 | | 4,365 | 4,931 |
5% 11/15/33 | | 1,425 | 1,636 |
| Cook County Ill High School District # Series 2021 A: | | | |
| 2% 12/15/33 | | 1,125 | 975 |
| 2% 12/15/34 | | 1,165 | 998 |
| Cook County Sales Tax Rev.: | | | |
| Series 2022 B, 5% 11/15/32 | | 405 | 466 |
| Series 2022 B, 5% 11/15/34 | | 300 | 343 |
| Series 2022 B: | | | |
5% 11/15/35 | | 850 | 964 |
5% 11/15/36 | | 1,725 | 1,954 |
| Cook, Kane Lake & McHenry Countys Cmnty. College District #512 Series 2017 B, 5% 12/1/24 | | 5,140 | 5,227 |
| Grundy & Will Counties Cmnty. School Gen. Oblig. Series 2018: | | | |
| 5% 2/1/29 | | 935 | 997 |
| 5% 2/1/29 (Pre-Refunded to 2/1/27 @ 100) | | 255 | 273 |
| Illinois Fin. Auth.: | | | |
| Bonds Series 2021 B, 5%, tender 8/15/31 (b) | | 2,940 | 3,298 |
| Series 2020 A: | | | |
5% 8/15/30 | | 2,170 | 2,472 |
5% 8/15/31 | | 1,060 | 1,203 |
5% 8/15/32 | | 1,500 | 1,701 |
5% 8/15/33 | | 1,250 | 1,417 |
| Series 2021 A, 4% 7/15/39 | | 1,500 | 1,533 |
| Series 2022 A: | | | |
5% 8/15/38 | | 2,700 | 3,027 |
5% 8/15/39 | | 3,300 | 3,665 |
5.5% 10/1/47 | | 1,680 | 1,746 |
| Series 2023 A: | | | |
5% 5/15/35 | | 625 | 742 |
5% 5/15/36 | | 400 | 471 |
5% 5/15/38 | | 465 | 535 |
5% 5/15/40 | | 2,500 | 2,843 |
| Illinois Fin. Auth. Rev.: | | | |
| (Bradley Univ. Proj.) Series 2017 C, 5% 8/1/24 | | 1,480 | 1,488 |
| (Centegra Health Sys. Proj.) Series 2014 A, 5% 9/1/34 (Pre-Refunded to 9/1/24 @ 100) | | 585 | 592 |
| (Northwestern Memorial Hosp.,IL. Proj.) Series 2017 A: | | | |
5% 7/15/25 | | 1,385 | 1,428 |
5% 7/15/26 | | 1,940 | 2,047 |
5% 7/15/28 | | 2,040 | 2,226 |
| (OSF Healthcare Sys.) Series 2018 A: | | | |
5% 5/15/29 | | 9,870 | 10,542 |
5% 5/15/30 | | 9,845 | 10,496 |
5% 5/15/31 | | 21,400 | 22,753 |
| (Presence Health Proj.) Series 2016 C: | | | |
5% 2/15/26 | | 2,590 | 2,701 |
5% 2/15/28 | | 6,800 | 7,223 |
5% 2/15/29 | | 10,570 | 11,200 |
5% 2/15/36 | | 2,200 | 2,296 |
| (Rosalind Franklin Univ. Research Bldg. Proj.) Series 2017 C, 5% 8/1/49 | | 845 | 851 |
| (Rush Univ. Med. Ctr. Proj.) Series 2015 A, 5% 11/15/34 | | 1,980 | 2,010 |
| (Silver Cross Health Sys. Proj.) Series 2015 C, 5% 8/15/27 | | 875 | 898 |
| Series 2013: | | | |
5% 11/15/26 | | 2,600 | 2,602 |
5% 11/15/29 | | 780 | 781 |
| Series 2015 A: | | | |
5% 5/15/25 | | 760 | 747 |
5% 11/15/27 | | 1,015 | 1,047 |
5% 11/15/28 | | 1,215 | 1,253 |
5% 11/15/29 | | 1,830 | 1,885 |
5% 11/15/32 | | 3,375 | 3,455 |
5% 11/15/35 | | 1,500 | 1,527 |
| Series 2015 B, 5% 11/15/26 | | 2,940 | 3,008 |
| Series 2015 C, 5% 8/15/44 | | 23,115 | 23,432 |
| Series 2016 A: | | | |
5% 2/15/24 | | 1,455 | 1,458 |
5% 2/15/25 | | 995 | 1,015 |
5% 2/15/26 | | 1,455 | 1,516 |
5% 7/1/30 (Pre-Refunded to 7/1/26 @ 100) | | 2,545 | 2,691 |
5% 8/15/33 (Pre-Refunded to 8/15/26 @ 100) | | 3,205 | 3,377 |
5% 7/1/36 (Pre-Refunded to 7/1/26 @ 100) | | 5,715 | 6,042 |
5% 2/15/45 | | 1,600 | 1,632 |
| Series 2016 C: | | | |
3.75% 2/15/34 | | 2,705 | 2,716 |
4% 2/15/36 | | 5,330 | 5,428 |
4% 2/15/41 | | 4,915 | 4,863 |
5% 2/15/24 | | 565 | 566 |
5% 2/15/31 | | 1,650 | 1,744 |
5% 2/15/32 | | 12,195 | 12,876 |
5% 2/15/33 | | 4,855 | 5,117 |
5% 2/15/41 | | 6,865 | 7,043 |
| Series 2016: | | | |
4% 2/15/41 (Pre-Refunded to 2/15/27 @ 100) | | 35 | 36 |
5% 5/15/28 | | 2,380 | 2,481 |
5% 5/15/29 | | 1,330 | 1,384 |
5% 12/1/29 | | 1,755 | 1,826 |
5% 12/1/33 | | 1,900 | 1,968 |
5% 12/1/40 | | 4,765 | 4,873 |
5% 12/1/46 | | 3,250 | 3,308 |
| Series 2017 A, 5% 8/1/47 | | 750 | 757 |
| Series 2017: | | | |
5% 7/1/29 | | 5,030 | 5,390 |
5% 1/1/30 | | 4,855 | 5,201 |
5% 7/1/31 | | 8,630 | 9,242 |
| Series 2018 A, 5% 5/15/32 | | 9,255 | 9,830 |
| Series 2019: | | | |
4% 9/1/35 | | 1,000 | 882 |
5% 9/1/29 | | 650 | 653 |
5% 9/1/31 | | 500 | 501 |
5% 9/1/32 | | 1,000 | 1,000 |
5% 9/1/34 | | 1,100 | 1,087 |
| Illinois Gen. Oblig.: | | | |
| Series 2006, 5.5% 1/1/28 | | 1,410 | 1,544 |
| Series 2014: | | | |
5% 2/1/26 | | 2,195 | 2,197 |
5% 2/1/27 | | 2,590 | 2,593 |
5% 4/1/28 | | 2,070 | 2,078 |
5% 5/1/28 | | 910 | 914 |
5% 5/1/32 | | 2,430 | 2,441 |
5% 5/1/33 | | 6,410 | 6,437 |
5.25% 2/1/31 | | 10,195 | 10,208 |
| Series 2016: | | | |
4% 2/1/30 (Assured Guaranty Muni. Corp. Insured) | | 12,435 | 12,729 |
5% 6/1/25 | | 7,620 | 7,813 |
5% 6/1/26 | | 1,035 | 1,081 |
5% 2/1/27 | | 8,355 | 8,844 |
5% 2/1/28 | | 5,965 | 6,322 |
5% 2/1/29 | | 5,605 | 5,931 |
5% 1/1/33 | | 1,085 | 1,116 |
5% 1/1/35 | | 3,600 | 3,688 |
5% 1/1/41 | | 2,100 | 2,131 |
5% 11/1/41 | | 3,900 | 3,974 |
| Series 2017 A, 5% 12/1/38 | | 1,250 | 1,306 |
| Series 2017 D, 5% 11/1/25 | | 12,765 | 13,199 |
| Series 2019 B, 5% 9/1/24 | | 5,580 | 5,643 |
| Series 2020 B: | | | |
4% 10/1/32 | | 3,610 | 3,759 |
5% 10/1/30 | | 11,425 | 12,800 |
| Series 2020 C, 4.125% 10/1/36 | | 1,500 | 1,538 |
| Series 2021 A, 5% 3/1/30 | | 2,000 | 2,225 |
| Series 2022 A: | | | |
5% 3/1/30 | | 10,690 | 11,890 |
5% 3/1/35 | | 8,775 | 9,851 |
5.25% 3/1/37 | | 4,590 | 5,179 |
| Series 2022 B: | | | |
5% 3/1/29 | | 3,650 | 4,004 |
5% 3/1/30 | | 15,000 | 16,684 |
5% 3/1/31 | | 23,510 | 26,469 |
5% 3/1/32 | | 6,160 | 7,007 |
5% 3/1/33 | | 14,300 | 16,204 |
5% 3/1/34 | | 30,000 | 33,892 |
5% 3/1/36 | | 18,040 | 20,144 |
| Series 2023 B: | | | |
5% 5/1/29 | | 885 | 973 |
5.25% 5/1/40 | | 2,585 | 2,876 |
5.25% 5/1/42 | | 9,000 | 9,919 |
| Series 2023 C, 5% 5/1/28 | | 5,000 | 5,417 |
| Series 2023 D: | | | |
5% 7/1/29 | | 22,070 | 24,326 |
5% 7/1/35 | | 33,175 | 37,348 |
| Illinois Hsg. Dev. Auth. Series 2022 A, 3.5% 4/1/52 | | 12,920 | 12,711 |
| Illinois Hsg. Dev. Auth. Multi-family Hsg. Rev. Series 2019, 2.9% 7/1/35 | | 8,514 | 7,738 |
| Illinois Hsg. Dev. Auth. Rev.: | | | |
| Series 2016 C, 2.9% 8/1/31 | | 1,825 | 1,731 |
| Series 2019 C, 5% 4/1/28 | | 1,200 | 1,303 |
| Series 2019 D, 2.7% 10/1/34 | | 1,870 | 1,731 |
| Series D, 3.75% 4/1/50 | | 1,400 | 1,392 |
| Illinois Muni. Elec. Agcy. Pwr. Supply Series 2015 A: | | | |
| 5% 2/1/28 | | 9,710 | 9,990 |
| 5% 2/1/31 | | 3,465 | 3,553 |
| Illinois Sales Tax Rev. Series 2021 C: | | | |
| 5% 6/15/24 | | 1,710 | 1,723 |
| 5% 6/15/25 | | 985 | 1,007 |
| 5% 6/15/26 | | 1,500 | 1,560 |
| 5% 6/15/27 | | 3,000 | 3,163 |
| Illinois Toll Hwy. Auth. Toll Hwy. Rev.: | | | |
| Series 2014 D, 5% 1/1/24 | | 5,890 | 5,890 |
| Series 2016 A, 5% 12/1/31 | | 1,735 | 1,808 |
| Series 2019 A, 5% 1/1/44 | | 3,730 | 4,037 |
| Series 2019 C, 5% 1/1/31 | | 4,350 | 4,966 |
| Series 2024 A: | | | |
5% 1/1/28 (f) | | 1,250 | 1,370 |
5% 1/1/29 (f) | | 1,400 | 1,568 |
5% 1/1/30 (f) | | 235 | 268 |
5% 1/1/31 (f) | | 460 | 533 |
| Series A: | | | |
5% 1/1/39 | | 2,100 | 2,357 |
5% 1/1/41 | | 4,580 | 5,072 |
| Series C: | | | |
5% 1/1/25 | | 3,900 | 3,981 |
5% 1/1/26 | | 4,650 | 4,858 |
| Kane, McHenry, Cook & DeKalb Counties Unit School District #300: | | | |
| Series 2015, 5% 1/1/26 | | 8,660 | 8,794 |
| Series 2017, 5% 1/1/29 | | 1,790 | 1,923 |
| Lake County Forest Preservation District Series 2021, 2% 12/15/33 | | 1,000 | 871 |
| McHenry & Kane Counties Cmnty. Consolidated School District #158 Series 2004, 0% 1/1/24 (Assured Guaranty Muni. Corp. Insured) | | 7,810 | 7,810 |
| McHenry County Cmnty. School District #200 Series 2006 B: | | | |
| 0% 1/15/24 | | 3,880 | 3,875 |
| 0% 1/15/24 (Escrowed to Maturity) | | 3,325 | 3,322 |
| 0% 1/15/25 | | 7,510 | 7,249 |
| 0% 1/15/26 | | 5,645 | 5,278 |
| McHenry County Conservation District Gen. Oblig. Series 2014: | | | |
| 5% 2/1/24 | | 2,235 | 2,238 |
| 5% 2/1/27 | | 5,825 | 5,954 |
| Metropolitan Pier & Exposition: | | | |
| (McCormick Place Expansion Proj.) Series 2010 B1: | | | |
0% 6/15/46 (Assured Guaranty Muni. Corp. Insured) | | 2,160 | 813 |
0% 6/15/47 (Assured Guaranty Muni. Corp. Insured) | | 3,985 | 1,413 |
| Series 2002 A, 0% 6/15/31 | | 1,755 | 1,381 |
| Series 2002: | | | |
0% 12/15/29 (Assured Guaranty Muni. Corp. Insured) (Nat'l. Pub. Fin. Guarantee Corp. Insured) | | 9,965 | 8,248 |
0% 12/15/29 (Nat'l. Pub. Fin. Guarantee Corp. Insured) | | 15,070 | 12,415 |
| Series 2020 A, 5% 6/15/50 | | 38,595 | 39,884 |
| Series 2022 A: | | | |
0% 6/15/36 | | 1,350 | 858 |
0% 6/15/37 | | 1,395 | 840 |
0% 12/15/37 | | 1,380 | 808 |
0% 6/15/38 | | 1,500 | 846 |
0% 12/15/38 | | 1,500 | 830 |
0% 6/15/39 | | 1,750 | 932 |
| Railsplitter Tobacco Settlement Auth. Rev. Series 2017, 5% 6/1/24 (Escrowed to Maturity) | | 13,685 | 13,793 |
| Schaumburg Village Gen. Oblig. Series 2023, 4% 12/1/32 | | 11,240 | 12,077 |
| Univ. of Illinois Rev. Series 2023: | | | |
| 5% 10/1/33 | | 1,300 | 1,495 |
| 5% 10/1/34 | | 870 | 991 |
| 5% 10/1/35 | | 885 | 999 |
| 5% 10/1/36 | | 530 | 593 |
| Will County Cmnty. Unit School District #365-U Series 2007 B, 0% 11/1/26 (Pre-Refunded to 11/1/26 @ 100) | | 5,600 | 5,151 |
TOTAL ILLINOIS | | | 1,090,385 |
| Indiana - 1.0% | | | |
| Indiana Dev. Fin. Auth. Envir. Rev. Bonds: | | | |
| Series 2009 A2, 3.75%, tender 6/1/27 (b)(c) | | 3,650 | 3,701 |
| Series 2022 A1, 4.5%, tender 6/1/32 (b)(c) | | 3,200 | 3,271 |
| Indiana Fin. Auth. Envir. Facilities Rev. Bonds (Indianapolis Pwr. & Lt. Co. Proj.): | | | |
| Series 2020 A, 0.75%, tender 4/1/26 (b) | | 1,550 | 1,422 |
| Series 2020 B, 0.95%, tender 4/1/26 (b)(c) | | 2,750 | 2,540 |
| Indiana Fin. Auth. Health Sys. Rev. Bonds Series 2019 B, 2.25%, tender 7/1/25 (b) | | 5,045 | 4,964 |
| Indiana Fin. Auth. Hosp. Rev. Bonds Series 2011 L, 0.7%, tender 1/1/26 (b) | | 24,895 | 23,234 |
| Indiana Fin. Auth. Rev.: | | | |
| (Cmnty. Foundation of Northwest Indiana Obligated Group) Series 2016, 5% 9/1/25 | | 970 | 1,001 |
| Series 2015, 5% 3/1/36 | | 8,060 | 8,198 |
| Series 2016: | | | |
5% 9/1/26 | | 970 | 1,022 |
5% 9/1/29 | | 485 | 513 |
5% 9/1/36 | | 2,090 | 2,186 |
| Indiana Fin. Auth. Wastewtr. Util. Rev. (CWA Auth. Proj.) Series 2015 A, 5% 10/1/26 | | 2,405 | 2,441 |
| Indiana Hsg. & Cmnty. Dev. Auth.: | | | |
| (Glasswater Creek of Whitestown Proj.) Series 2020, 5.375% 10/1/40 (d) | | 3,640 | 2,999 |
| Series 2021 B, 3% 7/1/50 | | 2,320 | 2,260 |
| Series A, 3% 7/1/51 | | 1,600 | 1,560 |
| Indianapolis Local Pub. Impt.: | | | |
| (Indianapolis Arpt. Auth. Proj.) Series 2019 D, 5% 1/1/25 (c) | | 4,710 | 4,777 |
| Series 2021 A, 5% 6/1/24 | | 1,800 | 1,814 |
| Series 2022 G2: | | | |
5% 1/1/32 (c) | | 550 | 616 |
5% 1/1/33 (c) | | 875 | 979 |
5% 1/1/34 (c) | | 750 | 839 |
5% 1/1/35 (c) | | 850 | 948 |
5.25% 1/1/36 (c) | | 1,000 | 1,140 |
5.25% 1/1/37 (c) | | 850 | 962 |
5.25% 1/1/38 (c) | | 1,000 | 1,114 |
5.25% 1/1/39 (c) | | 2,075 | 2,299 |
| Indianapolis Thermal Energy Sys. Series 2016 A: | | | |
| 5% 10/1/24 | | 10,585 | 10,746 |
| 5% 10/1/25 | | 11,400 | 11,823 |
| Saint Joseph County Econ. Dev. Auth. Rev. (St. Mary's College Proj.) Series 2020: | | | |
| 5% 4/1/29 | | 1,185 | 1,297 |
| 5% 4/1/30 | | 2,220 | 2,434 |
| 5% 4/1/33 | | 1,445 | 1,582 |
| Whiting Envir. Facilities Rev. Bonds (BP Products North America, Inc. Proj.): | | | |
| Series 2017, 5%, tender 11/1/24 (b)(c) | | 2,500 | 2,513 |
| Series 2019 A, 5%, tender 6/5/26 (b)(c) | | 12,305 | 12,515 |
TOTAL INDIANA | | | 119,710 |
| Iowa - 0.4% | | | |
| Des Moines Iowa Series 2020 A, 2% 6/1/31 | | 1,295 | 1,169 |
| Iowa Fin. Auth. Rev.: | | | |
| Series 2021 A: | | | |
4% 5/15/28 | | 2,355 | 2,175 |
4% 5/15/53 | | 1,000 | 615 |
| Series 2023 B, 7.25% 5/15/38 | | 4,600 | 4,777 |
| Series A: | | | |
5% 5/15/43 | | 1,410 | 1,135 |
5% 5/15/48 | | 2,910 | 2,220 |
| Iowa Fin. Auth. Solid Waste Facilities Bonds (Gevo NW Iowa RNG, LLC Renewable Natural Gas Proj.) Series 2021, 1.5%, tender 4/1/24, LOC Citibank NA (b)(c) | | 4,130 | 4,101 |
| Iowa Student Ln. Liquidity Corp. Student Ln. Rev.: | | | |
| Series 2019 B, 5% 12/1/28 (c) | | 1,000 | 1,070 |
| Series 2022 B: | | | |
5% 12/1/29 (c) | | 1,575 | 1,701 |
5% 12/1/30 (c) | | 2,000 | 2,174 |
5% 12/1/31 (c) | | 2,000 | 2,194 |
5% 12/1/32 (c) | | 2,000 | 2,206 |
| Series 2023 B: | | | |
5% 12/1/27 (c) | | 1,000 | 1,056 |
5% 12/1/28 (c) | | 1,445 | 1,546 |
5% 12/1/29 (c) | | 3,600 | 3,887 |
5% 12/1/30 (c) | | 2,230 | 2,425 |
5% 12/1/31 (c) | | 4,100 | 4,498 |
5% 12/1/32 (c) | | 3,750 | 4,120 |
5% 12/1/33 (c) | | 4,280 | 4,663 |
TOTAL IOWA | | | 47,732 |
| Kansas - 0.0% | | | |
| Wyandotte County/Kansas City Unified Govt. Util. Sys. Rev. Series 2016 A: | | | |
| 5% 9/1/30 | | 970 | 998 |
| 5% 9/1/32 | | 1,115 | 1,147 |
TOTAL KANSAS | | | 2,145 |
| Kentucky - 2.1% | | | |
| Ashland Med. Ctr. Rev. Series 2019: | | | |
| 4% 2/1/33 | | 1,440 | 1,466 |
| 5% 2/1/28 | | 880 | 934 |
| 5% 2/1/29 | | 530 | 571 |
| 5% 2/1/31 | | 460 | 493 |
| Carroll County Envir. Facilities Rev. Bonds (Kentucky Utils. Co. Proj.) Series 2004 A, 1.75%, tender 9/1/26 (b)(c) | | 7,955 | 7,438 |
| Kenton County Arpt. Board Arpt. Rev. Series 2016: | | | |
| 5% 1/1/25 | | 800 | 816 |
| 5% 1/1/26 | | 585 | 612 |
| 5% 1/1/29 | | 1,555 | 1,618 |
| 5% 1/1/30 | | 1,625 | 1,687 |
| Kentucky Bond Dev. Corp. (Lexington Ctr. Corp. Proj.) Series 2018 A: | | | |
| 5% 9/1/26 | | 1,745 | 1,845 |
| 5% 9/1/28 | | 1,880 | 2,069 |
| 5% 9/1/30 | | 520 | 574 |
| Kentucky Bond Dev. Corp. Edl. Facilities Series 2021: | | | |
| 4% 6/1/32 | | 460 | 482 |
| 4% 6/1/33 | | 375 | 392 |
| 4% 6/1/35 | | 235 | 244 |
| 4% 6/1/38 | | 570 | 589 |
| Kentucky Econ. Dev. Fin. Auth. Series 2019 A1, 5% 8/1/32 | | 1,105 | 1,209 |
| Kentucky Econ. Dev. Fin. Auth. Hosp. Rev. Series 2015 A: | | | |
| 5% 6/1/25 | | 1,725 | 1,740 |
| 5% 6/1/26 | | 1,815 | 1,836 |
| 5% 6/1/27 | | 1,910 | 1,935 |
| 5% 6/1/28 | | 2,005 | 2,033 |
| 5% 6/1/29 | | 2,105 | 2,136 |
| 5% 6/1/30 | | 2,215 | 2,247 |
| Kentucky State Property & Buildings Commission Rev.: | | | |
| (Kentucky St Proj.): | | | |
Series D, 5% 5/1/26 | | 1,180 | 1,241 |
Series D: | | | |
5% 5/1/27 | | 970 | 1,045 |
5% 5/1/28 | | 970 | 1,042 |
| (Proj. No. 112) Series 2016 B, 5% 11/1/27 | | 16,420 | 17,459 |
| (Proj. No. 119) Series 2018: | | | |
5% 5/1/28 | | 4,855 | 5,312 |
5% 5/1/29 | | 565 | 618 |
5% 5/1/31 | | 1,425 | 1,559 |
| Series 2015, 5% 8/1/28 | | 1,035 | 1,067 |
| Series 2016 A: | | | |
5% 2/1/29 | | 5,555 | 5,786 |
5% 2/1/30 | | 5,670 | 5,899 |
5% 2/1/32 | | 2,230 | 2,314 |
5% 2/1/33 | | 2,770 | 2,874 |
| Series 2016 B, 5% 11/1/26 | | 4,825 | 5,136 |
| Series 2017, 5% 4/1/27 | | 4,625 | 4,971 |
| Series A: | | | |
5% 11/1/31 | | 2,000 | 2,201 |
5% 11/1/32 | | 3,000 | 3,296 |
5% 11/1/33 | | 1,500 | 1,646 |
| Kentucky Tpk. Auth. Econ. Dev. Road Rev. Series 2022 B: | | | |
| 5% 7/1/32 | | 400 | 468 |
| 5% 7/1/34 | | 400 | 466 |
| Kentucky, Inc. Pub. Energy Bonds: | | | |
| Series 2024 A1, 5.25%, tender 2/1/32 (b) | | 32,760 | 35,704 |
| Series A, 4%, tender 6/1/26 (b) | | 41,220 | 40,998 |
| Series C1, 4%, tender 6/1/25 (b) | | 28,000 | 28,050 |
| Louisville & Jefferson County: | | | |
| Bonds: | | | |
Series 2020 C, 5%, tender 10/1/26 (b) | | 2,595 | 2,711 |
Series 2020 D, 5%, tender 10/1/29 (b) | | 3,700 | 4,026 |
| Series 2016 A: | | | |
5% 10/1/29 | | 17,585 | 18,324 |
5% 10/1/32 | | 3,230 | 3,358 |
| Series 2020 A, 5% 10/1/37 | | 4,300 | 4,575 |
| Louisville & Jefferson County Metropolitan Govt. Board Wtr. Works Sys. Rev. Series 2022, 5% 11/15/35 | | 2,980 | 3,532 |
TOTAL KENTUCKY | | | 240,644 |
| Louisiana - 0.5% | | | |
| Jefferson Parish Consolidated Sewerage District # 1 Rev. Series 2022: | | | |
| 4% 2/1/35 | | 3,465 | 3,720 |
| 4% 2/1/36 | | 1,960 | 2,088 |
| 4% 2/1/38 | | 1,445 | 1,502 |
| 4% 2/1/39 | | 2,890 | 2,984 |
| Louisiana Hsg. Corp. Single Fami (Home Ownership Prog.) Series 2023 C, 5.75% 12/1/53 | | 3,900 | 4,289 |
| Louisiana Pub. Facilities Auth. Rev. Series 2018 E: | | | |
| 5% 7/1/35 | | 1,655 | 1,796 |
| 5% 7/1/36 | | 1,795 | 1,938 |
| New Orleans Aviation Board Rev.: | | | |
| (North Term. Proj.): | | | |
Series 2015 B: | | | |
5% 1/1/24 (c) | | 2,430 | 2,430 |
5% 1/1/25 (c) | | 2,915 | 2,956 |
5% 1/1/27 (c) | | 2,185 | 2,204 |
Series 2017 B: | | | |
5% 1/1/29 (c) | | 390 | 408 |
5% 1/1/31 (c) | | 730 | 763 |
5% 1/1/36 (c) | | 630 | 655 |
5% 1/1/37 (c) | | 485 | 503 |
| Series 2017 D2: | | | |
5% 1/1/26 (c) | | 730 | 751 |
5% 1/1/29 (c) | | 485 | 507 |
5% 1/1/30 (c) | | 665 | 696 |
5% 1/1/32 (c) | | 1,495 | 1,561 |
5% 1/1/35 (c) | | 1,115 | 1,162 |
5% 1/1/38 (c) | | 570 | 587 |
| St. John Baptist Parish Rev.: | | | |
| (Marathon Oil Corp.) Series 2017, 2.2% 6/1/37 (b) | | 9,665 | 9,139 |
| Bonds (Marathon Oil Corp.) Series 2017: | | | |
2.1%, tender 7/1/24 (b) | | 4,670 | 4,607 |
4.05%, tender 7/1/26 (b) | | 12,590 | 12,449 |
TOTAL LOUISIANA | | | 59,695 |
| Maine - 0.1% | | | |
| Brunswick Series 2020: | | | |
| 2% 11/1/32 | | 1,095 | 975 |
| 2.125% 11/1/34 | | 1,195 | 1,045 |
| 2.375% 11/1/37 | | 605 | 515 |
| Maine Health & Higher Edl. Facilities Auth. Rev. Series 2016 A: | | | |
| 4% 7/1/41 | | 2,030 | 1,869 |
| 4% 7/1/46 | | 2,765 | 2,394 |
| 5% 7/1/41 | | 860 | 862 |
| 5% 7/1/46 | | 865 | 811 |
| Maine Hsg. Auth. Mtg. Series 2015 A3, 3.5% 11/15/34 | | 1,535 | 1,536 |
| Maine Tpk. Auth. Tpk. Rev. Series 2015: | | | |
| 5% 7/1/25 | | 2,230 | 2,307 |
| 5% 7/1/27 | | 1,940 | 2,002 |
TOTAL MAINE | | | 14,316 |
| Maryland - 1.9% | | | |
| Anne Arundel County Gen. Oblig. Series 2021, 3% 10/1/36 | | 2,300 | 2,261 |
| Baltimore County Gen. Oblig.: | | | |
| Series 2020, 4% 3/1/36 | | 7,310 | 7,806 |
| Series 2021: | | | |
3% 3/1/37 | | 3,205 | 3,132 |
5% 3/1/25 | | 1,520 | 1,559 |
| Series 2023: | | | |
5% 3/1/39 | | 5,140 | 6,004 |
5% 3/1/39 | | 1,885 | 2,202 |
5% 3/1/40 | | 2,385 | 2,771 |
5% 3/1/40 | | 1,980 | 2,301 |
| Baltimore Gen. Oblig. Series 2022 A: | | | |
| 5% 10/15/35 | | 1,475 | 1,763 |
| 5% 10/15/37 | | 865 | 1,016 |
| Baltimore Proj. Rev.: | | | |
| Series 2017 C: | | | |
5% 7/1/28 | | 3,465 | 3,691 |
5% 7/1/31 | | 6,580 | 6,998 |
5% 7/1/33 | | 6,635 | 7,044 |
| Series 2017 D, 5% 7/1/33 | | 5,630 | 5,994 |
| Maryland Cmnty. Dev. Admin Dept. Hsg. & Cmnty. Dev.: | | | |
| Series 2019 B, 4% 9/1/49 | | 2,800 | 2,795 |
| Series 2019 C, 3.5% 3/1/50 | | 3,080 | 3,041 |
| Series 2023 E, 6.25% 3/1/54 | | 2,500 | 2,761 |
| Maryland Dept. of Trans.: | | | |
| Series 2019, 4% 10/1/32 | | 3,600 | 3,744 |
| Series 2021 B: | | | |
5% 8/1/32 (c) | | 1,250 | 1,393 |
5% 8/1/33 (c) | | 1,000 | 1,116 |
5% 8/1/35 (c) | | 1,850 | 2,057 |
5% 8/1/36 (c) | | 1,000 | 1,105 |
| Series 2022 A: | | | |
5% 12/1/25 | | 1,400 | 1,463 |
5% 12/1/28 | | 1,265 | 1,426 |
| Series 2022 B, 5% 12/1/25 | | 3,500 | 3,656 |
| Series 2022, 5% 12/1/26 | | 1,205 | 1,293 |
| Maryland Econ. Dev. Auth. Rev. (Ports America Chesapeake LLC. Proj.) Series 2017 A: | | | |
| 5% 6/1/24 | | 1,455 | 1,460 |
| 5% 6/1/25 | | 1,455 | 1,477 |
| 5% 6/1/26 | | 1,940 | 2,007 |
| 5% 6/1/27 | | 1,310 | 1,378 |
| 5% 6/1/31 | | 970 | 1,030 |
| 5% 6/1/32 | | 970 | 1,029 |
| Maryland Econ. Dev. Corp.: | | | |
| (Port Covington Proj.) Series 2020: | | | |
3.25% 9/1/30 | | 500 | 473 |
4% 9/1/40 | | 2,095 | 1,893 |
4% 9/1/50 | | 2,625 | 2,200 |
| (Purple Line Lt. Rail Proj.) Series 2022 B: | | | |
5% 12/31/36 (c) | | 3,185 | 3,414 |
5% 12/31/37 (c) | | 2,500 | 2,657 |
5% 12/31/38 (c) | | 2,200 | 2,328 |
5% 6/30/39 (c) | | 3,700 | 3,899 |
5% 12/31/39 (c) | | 1,700 | 1,792 |
| Maryland Gen. Oblig.: | | | |
| Series 2021 2A, 5% 8/1/29 | | 26,455 | 30,261 |
| Series 2021 A: | | | |
4% 8/1/35 | | 2,575 | 2,814 |
5% 8/1/33 | | 1,810 | 2,147 |
| Series 2022 2C: | | | |
4% 3/1/28 | | 7,595 | 8,110 |
5% 3/1/26 | | 11,000 | 11,571 |
| Series 2022 A: | | | |
5% 6/1/34 | | 1,995 | 2,400 |
5% 6/1/35 | | 3,765 | 4,509 |
| Maryland Health & Higher Edl. Series 2021 A: | | | |
| 4% 6/1/35 | | 500 | 505 |
| 4% 6/1/46 | | 750 | 675 |
| 4% 6/1/51 | | 1,000 | 868 |
| 4% 6/1/55 | | 1,000 | 854 |
| Maryland Health & Higher Edl. Facilities Auth. Rev.: | | | |
| Series 2015: | | | |
5% 7/1/27 | | 1,000 | 1,023 |
5% 7/1/28 | | 1,300 | 1,331 |
5% 7/1/29 | | 2,200 | 2,252 |
5% 7/1/31 | | 1,000 | 1,024 |
| Series 2016 A: | | | |
4% 7/1/42 | | 1,410 | 1,342 |
5% 7/1/33 | | 2,185 | 2,257 |
5% 7/1/34 | | 1,600 | 1,655 |
5% 7/1/35 | | 605 | 625 |
5% 7/1/36 | | 1,700 | 1,753 |
| Maryland Trans. Auth. Trans. Facility Projs. Rev. Series 2020, 5% 7/1/34 | | 5,650 | 6,477 |
| Washington Metropolitan Area Transit Auth. Series 2021 A: | | | |
| 5% 7/15/24 | | 3,400 | 3,438 |
| 5% 7/15/37 | | 6,750 | 7,752 |
| Washington Suburban San. District Series 2023: | | | |
| 5% 6/1/40 | | 6,875 | 8,015 |
| 5% 6/1/41 | | 4,140 | 4,804 |
TOTAL MARYLAND | | | 215,891 |
| Massachusetts - 1.9% | | | |
| Massachusetts Bay Trans. Auth. Sales Tax Rev.: | | | |
| Series 2007 A1, 5.25% 7/1/33 | | 1,905 | 2,388 |
| Series 2015 A, 5% 7/1/45 | | 1,535 | 1,562 |
| Series 2016 A, 0% 7/1/32 | | 12,450 | 9,084 |
| Massachusetts Commonwealth Trans. Fund Rev. (Rail Enhancement Prog.) Series 2021 B: | | | |
| 5% 6/1/38 | | 10,170 | 10,978 |
| 5% 6/1/39 | | 10,765 | 11,580 |
| Massachusetts Dept. of Trans. Metropolitan Hwy. Sys. Rev. Series A, 5% 1/1/31 | | 7,500 | 8,407 |
| Massachusetts Dev. Fin. Agcy. Rev.: | | | |
| (Partners Healthcare Sys., Inc. Proj.) Series 2017 S: | | | |
5% 7/1/24 | | 3,885 | 3,922 |
5% 7/1/30 | | 3,565 | 3,874 |
| Bonds: | | | |
(Partners Healthcare Sys., Inc. Proj.) Series 2017 S-4, 5%, tender 1/25/24 (b) | | 11,290 | 11,302 |
Series A1, 5%, tender 1/31/30 (b) | | 10,135 | 11,503 |
| Series 2015 O1, 4% 7/1/45 | | 3,395 | 3,344 |
| Series 2016 A, 4% 7/15/36 | | 21,300 | 21,890 |
| Series 2016, 5% 10/1/41 | | 3,800 | 3,821 |
| Series 2017 A, 5% 1/1/40 | | 2,980 | 3,052 |
| Series 2019 S1, 5% 10/1/25 | | 2,670 | 2,769 |
| Series 2019: | | | |
5% 7/1/30 | | 1,435 | 1,519 |
5% 7/1/32 | | 1,040 | 1,096 |
| Series 2022: | | | |
5% 10/1/34 | | 1,750 | 2,081 |
5% 10/1/35 | | 1,750 | 2,067 |
5% 10/1/36 | | 1,500 | 1,765 |
| Massachusetts Edl. Fing. Auth. Rev.: | | | |
| Series 2017 B, 4.25% 7/1/46 (c) | | 2,300 | 2,240 |
| Series 2022 B: | | | |
5% 7/1/26 (c) | | 2,600 | 2,688 |
5% 7/1/27 (c) | | 2,350 | 2,453 |
5% 7/1/28 (c) | | 1,775 | 1,885 |
5% 7/1/29 (c) | | 1,925 | 2,069 |
5% 7/1/30 (c) | | 1,000 | 1,088 |
5% 7/1/31 (c) | | 800 | 878 |
| Series 2023 B: | | | |
5% 7/1/31 (c) | | 8,485 | 9,316 |
5% 7/1/33 (c) | | 2,280 | 2,518 |
| Massachusetts Gen. Oblig.: | | | |
| Series 2019 A, 5% 1/1/36 | | 2,560 | 2,843 |
| Series 2019 B, 5% 7/1/36 | | 1,700 | 1,883 |
| Series 2021 A, 5% 9/1/25 | | 13,755 | 14,291 |
| Series 2022 C: | | | |
5% 10/1/33 | | 4,785 | 5,803 |
5% 10/1/34 | | 6,000 | 7,261 |
| Series A, 5% 7/1/28 | | 1,100 | 1,170 |
| Massachusetts Port Auth. Rev.: | | | |
| Series 2019 A, 5% 7/1/31 (c) | | 5,000 | 5,497 |
| Series 2019 C, 5% 7/1/44 (c) | | 3,000 | 3,146 |
| Series 2021 E, 5% 7/1/35 (c) | | 2,400 | 2,698 |
| Series 2022 A: | | | |
5% 7/1/32 (c) | | 1,500 | 1,719 |
5% 7/1/33 (c) | | 1,025 | 1,174 |
5% 7/1/34 (c) | | 1,350 | 1,543 |
| Massachusetts Port Auth. Spl. Facilities Rev. (Bosfuel Proj.) Series 2019 A, 5% 7/1/49 (c) | | 9,190 | 9,481 |
| Massachusetts Wtr. Resources Auth. Wtr. & Swr. Rev. Series 2007 B, 5.25% 8/1/33 | | 5,435 | 6,813 |
| Somerville Gen. Oblig. Series 2020, 2% 10/15/37 | | 3,580 | 2,903 |
| Stoneham Gen. Oblig. Series 2022, 2.125% 1/15/38 | | 3,335 | 2,676 |
| Univ. of Massachusetts Bldg. Auth. Facilities Rev. Series 2022 1, 5% 11/1/39 | | 2,135 | 2,462 |
TOTAL MASSACHUSETTS | | | 216,502 |
| Michigan - 2.9% | | | |
| Detroit Downtown Dev. Auth. Tax: | | | |
| Series 2018 A, 5% 7/1/36 (Assured Guaranty Muni. Corp. Insured) | | 1,000 | 1,005 |
| Series A, 5% 7/1/35 (Assured Guaranty Muni. Corp. Insured) | | 1,200 | 1,207 |
| Detroit Gen. Oblig. Series 2021 A: | | | |
| 4% 4/1/41 | | 1,575 | 1,488 |
| 4% 4/1/42 | | 600 | 560 |
| 5% 4/1/31 | | 900 | 983 |
| 5% 4/1/33 | | 1,075 | 1,166 |
| Detroit School District School Bldg. and Site Impt. Series 2005 A, 5.25% 5/1/30 (Assured Guaranty Muni. Corp. Insured) | | 18,655 | 21,478 |
| Grand Rapids Pub. Schools: | | | |
| Series 2016: | | | |
5% 5/1/30 (Assured Guaranty Muni. Corp. Insured) | | 3,400 | 3,548 |
5% 5/1/31 (Assured Guaranty Muni. Corp. Insured) | | 4,855 | 5,061 |
5% 5/1/32 (Assured Guaranty Muni. Corp. Insured) | | 730 | 760 |
5% 5/1/33 (Assured Guaranty Muni. Corp. Insured) | | 3,030 | 3,157 |
| Series 2017: | | | |
5% 5/1/27 (Assured Guaranty Muni. Corp. Insured) | | 1,310 | 1,403 |
5% 5/1/29 (Assured Guaranty Muni. Corp. Insured) | | 1,890 | 2,024 |
| Great Lakes Wtr. Auth. Sew Disp. Sys. Series 2022 A: | | | |
| 5% 7/1/33 | | 330 | 391 |
| 5% 7/1/35 | | 745 | 878 |
| Great Lakes Wtr. Auth. Wtr. Supply Sys. Rev. Series 2022 A: | | | |
| 5% 7/1/33 | | 270 | 320 |
| 5% 7/1/35 | | 3,000 | 3,535 |
| Kalamazoo Hosp. Fin. Auth. Hosp. Facilities Rev. Series 2016: | | | |
| 5% 5/15/27 | | 3,255 | 3,398 |
| 5% 5/15/27 (Pre-Refunded to 5/15/26 @ 100) | | 20 | 21 |
| 5% 5/15/28 | | 2,460 | 2,564 |
| 5% 5/15/28 (Pre-Refunded to 5/15/26 @ 100) | | 15 | 16 |
| Lake Orion Cmnty. School District Series 2019, 5% 5/1/29 | | 1,685 | 1,904 |
| Lansing Board of Wtr. & Lt. Util. Rev. Bonds Series 2021 B, 2%, tender 7/1/26 (b) | | 5,760 | 5,466 |
| Michigan Bldg. Auth. Rev. (Facilities Prog.) Series 2016 I: | | | |
| 5% 10/15/34 | | 16,710 | 17,591 |
| 5% 4/15/35 | | 2,720 | 2,862 |
| Michigan Fin. Auth. Rev.: | | | |
| (Trinity Health Proj.) Series 2017: | | | |
5% 12/1/24 | | 1,700 | 1,731 |
5% 12/1/25 | | 2,915 | 3,035 |
5% 12/1/26 | | 1,270 | 1,350 |
5% 12/1/27 | | 1,215 | 1,318 |
5% 12/1/28 | | 1,940 | 2,115 |
| Bonds: | | | |
Series 2015 D2, 1.2%, tender 4/13/28 (b) | | 1,775 | 1,595 |
Series 2019 B, 5%, tender 11/16/26 (b) | | 5,450 | 5,703 |
Series 2019 MI2, 5%, tender 2/1/25 (b) | | 10,655 | 10,851 |
| Series 2015 D1: | | | |
5% 7/1/27 | | 415 | 425 |
5% 7/1/29 | | 970 | 996 |
5% 7/1/31 | | 1,165 | 1,194 |
5% 7/1/32 | | 970 | 987 |
5% 7/1/33 | | 825 | 844 |
| Series 2016: | | | |
5% 11/15/30 | | 4,480 | 4,703 |
5% 11/15/32 | | 1,210 | 1,268 |
| Series 2020 A: | | | |
5% 6/1/30 | | 775 | 850 |
5% 6/1/31 | | 1,005 | 1,108 |
5% 6/1/32 | | 970 | 1,069 |
5% 6/1/33 | | 1,745 | 1,921 |
| Series 2020, 5% 6/1/40 | | 2,340 | 2,466 |
| Series 2022: | | | |
5% 4/15/32 | | 8,285 | 9,569 |
5% 4/15/33 | | 5,065 | 5,874 |
5% 4/15/34 | | 2,530 | 2,930 |
5% 4/15/35 | | 1,445 | 1,669 |
| Michigan Gen. Oblig. Series 2016, 5% 3/15/27 | | 3,230 | 3,483 |
| Michigan Hosp. Fin. Auth. Rev.: | | | |
| (Trinity Health Proj.) Series 2008 C: | | | |
5% 12/1/24 | | 1,455 | 1,481 |
5% 12/1/25 | | 1,260 | 1,312 |
5% 12/1/26 | | 1,940 | 2,062 |
5% 12/1/27 | | 1,295 | 1,405 |
5% 12/1/28 | | 2,040 | 2,213 |
| Bonds Series 2010 F3, 4%, tender 7/1/24 (b) | | 23,785 | 23,854 |
| Michigan Hsg. Dev. Auth. Single Family Mtg. Rev.: | | | |
| Series 2021 A, 3% 6/1/52 | | 5,370 | 5,214 |
| Series 2022 D, 5.5% 6/1/53 | | 10,865 | 11,545 |
| Series A, 3.5% 12/1/50 | | 2,620 | 2,586 |
| Michigan Strategic Fund Exempt Facilities Rev. Bonds (Waste Mgmt., Inc. Proj.) Series 2001, 0.58%, tender 8/1/24 (b)(c) | | 3,350 | 3,283 |
| Michigan Strategic Fund Ltd. Oblig. Rev. Bonds: | | | |
| (Consumer Energy Co. Proj.) Series 2019, 1.8%, tender 10/1/24 (b)(c) | | 8,110 | 7,984 |
| (DTE Elec. Co. Exempt Facilities Proj.) Series 2023 DT, 3.875%, tender 6/3/30 (b)(c) | | 3,500 | 3,492 |
| Michigan Technological Univ. Series 2021: | | | |
| 4% 10/1/41 | | 1,450 | 1,451 |
| 5% 10/1/30 | | 1,645 | 1,889 |
| 5% 10/1/31 | | 1,250 | 1,450 |
| 5% 10/1/32 | | 1,250 | 1,444 |
| 5% 10/1/33 | | 1,325 | 1,539 |
| 5% 10/1/34 | | 1,405 | 1,624 |
| Michigan Trunk Line Fund Rev. Series 2020 B, 5% 11/15/36 | | 26,785 | 30,755 |
| Oakland Univ. Rev.: | | | |
| Series 2022 A: | | | |
5% 3/1/26 | | 480 | 502 |
5% 3/1/33 | | 1,000 | 1,144 |
5% 3/1/34 | | 1,905 | 2,164 |
5% 3/1/35 | | 2,000 | 2,265 |
5% 3/1/36 | | 2,095 | 2,355 |
5% 3/1/37 | | 2,200 | 2,453 |
5% 3/1/38 | | 2,310 | 2,544 |
5% 3/1/39 | | 2,425 | 2,653 |
| Series 2022 B: | | | |
5% 3/1/33 | | 1,000 | 1,144 |
5% 3/1/34 | | 1,250 | 1,420 |
5% 3/1/38 | | 1,330 | 1,466 |
5% 3/1/39 | | 1,375 | 1,504 |
| Portage Pub. Schools Series 2016: | | | |
| 5% 11/1/27 | | 1,215 | 1,274 |
| 5% 11/1/29 | | 3,080 | 3,229 |
| Royal Oak Hosp. Fin. Auth. Hosp. Rev. Series 2014 D, 5% 9/1/24 (Pre-Refunded to 3/1/24 @ 100) | | 1,940 | 1,946 |
| Saginaw Hosp. Fin. Auth. Hosp. Rev. Series 2020 J: | | | |
| 5% 7/1/28 | | 565 | 605 |
| 5% 7/1/29 | | 1,000 | 1,087 |
| 5% 7/1/30 | | 425 | 468 |
| 5% 7/1/31 | | 495 | 542 |
| 5% 7/1/32 | | 545 | 597 |
| 5% 7/1/33 | | 595 | 651 |
| 5% 7/1/34 | | 385 | 422 |
| 5% 7/1/35 | | 400 | 437 |
| Univ. of Michigan Rev. Series 2022 D, 5% 4/1/33 | | 1,440 | 1,726 |
| Utica Cmnty. Schools Series 2019: | | | |
| 5% 5/1/30 | | 1,650 | 1,866 |
| 5% 5/1/31 | | 1,400 | 1,581 |
| 5% 5/1/32 | | 2,300 | 2,599 |
| 5% 5/1/33 | | 1,875 | 2,115 |
| 5% 5/1/34 | | 2,450 | 2,762 |
| Warren Consolidated School District Series 2016: | | | |
| 5% 5/1/30 | | 4,415 | 4,626 |
| 5% 5/1/31 | | 4,660 | 4,866 |
| 5% 5/1/32 | | 4,955 | 5,182 |
| Wayne County Arpt. Auth. Rev.: | | | |
| Series 2017 A: | | | |
5% 12/1/29 | | 245 | 264 |
5% 12/1/30 | | 380 | 410 |
5% 12/1/31 | | 390 | 420 |
5% 12/1/36 | | 535 | 572 |
| Series 2017 B: | | | |
5% 12/1/29 (c) | | 685 | 728 |
5% 12/1/30 (c) | | 485 | 515 |
5% 12/1/31 (c) | | 525 | 557 |
5% 12/1/33 (c) | | 375 | 397 |
5% 12/1/36 (c) | | 810 | 848 |
| Series 2017 C: | | | |
5% 12/1/24 | | 2,305 | 2,347 |
5% 12/1/25 | | 2,150 | 2,239 |
5% 12/1/26 | | 1,455 | 1,557 |
5% 12/1/27 | | 1,460 | 1,595 |
TOTAL MICHIGAN | | | 331,067 |
| Minnesota - 0.7% | | | |
| Maple Grove Health Care Sys. Rev. Series 2015, 5% 9/1/26 | | 1,940 | 1,990 |
| Minneapolis & Saint Paul Metropolitan Arpts. Commission Arpt. Rev. Series 2022 B: | | | |
| 5% 1/1/32 (c) | | 780 | 874 |
| 5% 1/1/33 (c) | | 1,165 | 1,308 |
| 5% 1/1/34 (c) | | 1,135 | 1,278 |
| 5% 1/1/35 (c) | | 705 | 792 |
| 5% 1/1/36 (c) | | 565 | 631 |
| Minneapolis Health Care Sys. Rev. Bonds Series 2023 A, 5%, tender 11/15/28 (b) | | 3,945 | 4,282 |
| Minnesota Gen. Oblig.: | | | |
| Series 2021 B, 4% 9/1/32 | | 4,475 | 4,902 |
| Series 2022 B, 4% 8/1/36 | | 11,000 | 11,887 |
| Minnesota Hsg. Fin. Agcy.: | | | |
| Series 2021 D, 3% 1/1/52 | | 7,330 | 7,117 |
| Series 2021, 3% 7/1/51 | | 1,985 | 1,933 |
| Series 2022 A: | | | |
5% 8/1/33 | | 1,875 | 2,199 |
5% 8/1/34 | | 1,500 | 1,777 |
5% 8/1/35 | | 1,210 | 1,429 |
5% 8/1/36 | | 2,320 | 2,726 |
| Series 2022 B, 5% 8/1/32 | | 2,120 | 2,476 |
| Series 2022 C: | | | |
5% 8/1/33 | | 1,780 | 2,087 |
5% 8/1/34 | | 2,685 | 3,181 |
5% 8/1/35 | | 2,820 | 3,331 |
| Series 2023 E, 6.25% 7/1/54 | | 2,250 | 2,491 |
| Minnesota Pub. Facilities Auth. Rev. Series 2016 B, 4% 3/1/26 | | 1,095 | 1,131 |
| Mounds View Independent School District #621 (Minnesota School District Cr. Enhancement Prog.) Series 2018 A: | | | |
| 3.45% 2/1/37 | | 4,795 | 4,797 |
| 3.55% 2/1/38 | | 5,005 | 4,952 |
| Saint Paul Hsg. & Redev. Auth. Hosp. Rev. (HealthEast Care Sys. Proj.) Series 2015 A, 5% 11/15/40 (Pre-Refunded to 11/15/25 @ 100) | | 1,410 | 1,455 |
| Shakopee Sr. Hsg. Rev. Bonds Series 2018, 5.85%, tender 11/1/25 (b)(d) | | 6,850 | 6,646 |
| West Saint Paul Independent School District #197 (Minnesota School District Cr. Enhancement Prog.) Series 2018 A: | | | |
| 3.6% 2/1/37 | | 3,495 | 3,512 |
| 3.65% 2/1/38 | | 3,665 | 3,642 |
| Western Minnesota Muni. Pwr. Agcy. Pwr. Supply Rev. Series 2014 A, 5% 1/1/24 | | 20 | 20 |
TOTAL MINNESOTA | | | 84,846 |
| Mississippi - 0.4% | | | |
| Mississippi Bus. finance Corp. Exempt Facilities Rev. Bonds (Enviva, Inc. Proj.) Series 2022, 7.75%, tender 7/15/32 (b)(c) | | 10,750 | 6,735 |
| Mississippi Dev. Bank Spl. Oblig. (Magnolia Reg'l. Health Ctr. Proj.) Series 2021: | | | |
| 4% 10/1/36 (d) | | 850 | 805 |
| 4% 10/1/41 (d) | | 1,360 | 1,183 |
| 5% 10/1/29 (d) | | 2,000 | 2,103 |
| 5% 10/1/30 (d) | | 2,800 | 2,960 |
| 5% 10/1/32 (d) | | 3,070 | 3,238 |
| Mississippi Gen. Oblig. Series 2017 A, 5% 10/1/30 | | 5,340 | 5,798 |
| Mississippi Hosp. Equip. & Facilities Auth.: | | | |
| (Forrest County Gen. Hosp. Rfdg. Proj.): | | | |
Series 2019 A: | | | |
5% 1/1/30 | | 500 | 545 |
5% 1/1/31 | | 1,500 | 1,636 |
5% 1/1/32 | | 1,750 | 1,905 |
5% 1/1/34 | | 1,065 | 1,161 |
5% 1/1/35 | | 2,000 | 2,178 |
Series 2019 B: | | | |
5% 1/1/25 | | 500 | 508 |
5% 1/1/26 | | 700 | 723 |
5% 1/1/27 | | 1,245 | 1,307 |
5% 1/1/28 | | 500 | 533 |
5% 1/1/29 | | 510 | 551 |
5% 1/1/30 | | 595 | 648 |
| Bonds Series II, 5%, tender 3/1/27 (b) | | 3,025 | 3,181 |
| Series IV: | | | |
5% 10/1/34 | | 1,435 | 1,564 |
5% 10/1/38 | | 1,675 | 1,769 |
5% 10/1/39 | | 1,000 | 1,052 |
TOTAL MISSISSIPPI | | | 42,083 |
| Missouri - 0.6% | | | |
| Cape Girardeau County Indl. Dev. Auth.: | | | |
| (Southeast Hosp. Proj.) Series 2017 A, 5% 3/1/36 | | 2,375 | 2,492 |
| Series 2017 A, 5% 3/1/27 | | 970 | 1,036 |
| Kansas City Indl. Dev. Auth.: | | | |
| (Kansas City Int'l. Arpt. Term. Modernization Proj.) Series 2020 A, 4% 3/1/40 (c) | | 9,950 | 9,905 |
| Series 2020 A, 5% 3/1/33 (c) | | 1,600 | 1,723 |
| Kansas City San. Swr. Sys. Rev. Series 2018 B: | | | |
| 5% 1/1/24 | | 660 | 660 |
| 5% 1/1/29 | | 550 | 606 |
| 5% 1/1/31 | | 415 | 456 |
| 5% 1/1/34 | | 380 | 418 |
| Missouri Health & Edl. Facilities Rev.: | | | |
| Series 2015 B: | | | |
4% 2/1/40 | | 680 | 681 |
5% 2/1/30 | | 2,395 | 2,457 |
5% 2/1/32 | | 2,645 | 2,710 |
5% 2/1/36 | | 2,145 | 2,195 |
5% 2/1/45 | | 3,395 | 3,439 |
| Series 2016: | | | |
5% 5/15/29 | | 970 | 1,012 |
5% 5/15/30 | | 970 | 1,009 |
5% 5/15/31 | | 970 | 1,009 |
5% 5/15/36 | | 2,915 | 3,018 |
| Series 2021: | | | |
4% 2/15/34 | | 400 | 397 |
5% 2/15/30 | | 670 | 710 |
5% 2/15/31 | | 705 | 752 |
| Series 2022 A: | | | |
5% 6/1/32 | | 2,150 | 2,462 |
5% 6/1/33 | | 1,850 | 2,112 |
| Missouri Hsg. Dev. Commission Single Family Mtg. Rev.: | | | |
| (First Place Homeownership Ln. Prog.): | | | |
Series 2021 C, 3.25% 11/1/52 | | 2,535 | 2,475 |
Series 2023 E, 6.5% 5/1/54 | | 5,620 | 6,421 |
| Series 2019, 4% 5/1/50 | | 705 | 705 |
| Saint Louis Arpt. Rev. Series 2019 C, 5% 7/1/30 | | 3,660 | 4,117 |
| Saint Louis County Indl. Dev. Auth. Sr. Living Facilities Rev.: | | | |
| Series 2017, 5% 9/1/48 | | 4,560 | 3,977 |
| Series 2018 A, 5.125% 9/1/48 | | 2,210 | 1,963 |
| St Charles County Francis Howell R-III School District Gen. Oblig. Series 2022: | | | |
| 5% 3/1/34 | | 950 | 1,103 |
| 5% 3/1/35 | | 1,250 | 1,450 |
| 5% 3/1/36 | | 1,250 | 1,441 |
| 5% 3/1/37 | | 1,350 | 1,547 |
| 5% 3/1/38 | | 2,000 | 2,261 |
| 5% 3/1/39 | | 2,740 | 3,084 |
TOTAL MISSOURI | | | 71,803 |
| Montana - 0.2% | | | |
| Gallatin County Indl. Dev. Rev. (Bozeman Fiber Proj.) Series 2021 A: | | | |
| 4% 10/15/32 (d) | | 1,160 | 1,095 |
| 4% 10/15/36 (d) | | 3,065 | 2,792 |
| 4% 10/15/41 (d) | | 4,910 | 4,122 |
| 4% 10/15/46 (d) | | 3,195 | 2,513 |
| 4% 10/15/51 (d) | | 2,625 | 1,975 |
| Montana Board Hsg. Single Family: | | | |
| Series 2017 A, 4% 12/1/47 (c) | | 300 | 299 |
| Series 2019 B, 4% 6/1/50 | | 445 | 446 |
| Montana Facility Fin. Auth. Series 2018 B, 5% 7/1/31 | | 1,170 | 1,236 |
| Montana Facility Fin. Auth. Rev. Series 2016: | | | |
| 5% 2/15/24 | | 2,080 | 2,083 |
| 5% 2/15/25 | | 1,940 | 1,972 |
| 5% 2/15/26 | | 3,105 | 3,207 |
TOTAL MONTANA | | | 21,740 |
| Nebraska - 0.6% | | | |
| Central Plains Energy Proj. Rev. Bonds: | | | |
| (Proj. No. 4) Series 2023 A1, 5%, tender 11/1/29 (b) | | 7,425 | 7,871 |
| Series 2019, 4%, tender 8/1/25 (b) | | 15,350 | 15,434 |
| Lincoln Arpt. Auth. Series 2021, 4% 7/1/36 (c) | | 1,000 | 1,031 |
| Nebraska Invt. Fin. Auth. Single Family Hsg. Rev.: | | | |
| Series 2019 B, 4% 9/1/49 (c) | | 1,955 | 1,944 |
| Series 2019 E, 3.75% 9/1/49 (c) | | 2,145 | 2,124 |
| Series 2020 A, 3.5% 9/1/50 | | 2,190 | 2,165 |
| Series 2022 B: | | | |
5% 3/1/27 (c) | | 1,165 | 1,225 |
5% 9/1/27 (c) | | 1,185 | 1,257 |
5% 3/1/28 (c) | | 1,205 | 1,287 |
5% 9/1/28 (c) | | 650 | 701 |
5% 9/1/29 (c) | | 1,270 | 1,377 |
| Series A, 3% 9/1/45 | | 5,000 | 4,851 |
| Nebraska Pub. Pwr. District Rev.: | | | |
| Series 2016 B: | | | |
5% 1/1/31 | | 3,885 | 4,027 |
5% 1/1/34 | | 4,235 | 4,378 |
5% 1/1/36 | | 5,135 | 5,296 |
| Series 2021 C: | | | |
5% 1/1/24 | | 4,045 | 4,045 |
5% 1/1/26 | | 1,000 | 1,044 |
| Series 2021 D, 5% 1/1/25 | | 600 | 612 |
| Omaha Pub. Pwr. District Elec. Rev.: | | | |
| Series 2022 A: | | | |
5% 2/1/35 | | 575 | 679 |
5% 2/1/36 | | 640 | 754 |
| Series 2022 B: | | | |
5% 2/1/34 | | 1,550 | 1,840 |
5% 2/1/35 | | 450 | 532 |
TOTAL NEBRASKA | | | 64,474 |
| Nevada - 0.7% | | | |
| Carson City Hosp. Rev. (Carson Tahoe Hosp. Proj.) Series 2017: | | | |
| 5% 9/1/24 | | 730 | 737 |
| 5% 9/1/28 | | 445 | 465 |
| 5% 9/1/30 | | 730 | 760 |
| 5% 9/1/32 | | 725 | 753 |
| 5% 9/1/34 | | 740 | 767 |
| Clark County Arpt. Rev.: | | | |
| Series 2014 A2, 5% 7/1/28 | | 1,440 | 1,452 |
| Series 2019 A, 5% 7/1/26 | | 2,965 | 3,138 |
| Series 2019 D, 5% 7/1/24 | | 4,195 | 4,236 |
| Clark County Fuel Tax Series 2017, 3% 11/1/35 | | 3,325 | 3,230 |
| Clark County School District: | | | |
| Series 2017 A: | | | |
5% 6/15/25 | | 5,770 | 5,938 |
5% 6/15/26 | | 5,000 | 5,268 |
| Series 2018 A: | | | |
5% 6/15/33 | | 3,400 | 3,711 |
5% 6/15/34 | | 6,330 | 6,917 |
| Series 2018 B: | | | |
5% 6/15/34 | | 4,195 | 4,629 |
5% 6/15/35 | | 8,000 | 8,762 |
| Series 2020 A, 5% 6/15/33 (Assured Guaranty Muni. Corp. Insured) | | 1,090 | 1,240 |
| Las Vegas Valley Wtr. District Wtr. Impt. Gen. Oblig. Series 2016 A: | | | |
| 5% 6/1/32 | | 2,815 | 2,960 |
| 5% 6/1/33 | | 4,855 | 5,098 |
| 5% 6/1/34 | | 5,145 | 5,392 |
| Nevada Dept. of Bus. & Industry Bonds Series 2023 A, 3.7%, tender 1/31/24 (b)(c)(d) | | 5,300 | 5,294 |
| Nevada Hsg. Division Single Family Mtg. Rev. Series 2019 B, 4% 10/1/49 | | 1,165 | 1,166 |
| Tahoe-Douglas Visitors Auth. Series 2020: | | | |
| 5% 7/1/28 | | 1,500 | 1,571 |
| 5% 7/1/31 | | 2,395 | 2,540 |
| 5% 7/1/35 | | 1,825 | 1,924 |
| 5% 7/1/40 | | 1,000 | 1,027 |
TOTAL NEVADA | | | 78,975 |
| New Hampshire - 0.9% | | | |
| Nat'l. Fin. Auth. Hosp. Rev. (St. Luke's Univ. Health Network Proj.): | | | |
| Series 2012 B, 4% 8/15/37 | | 900 | 905 |
| Series 2021 B: | | | |
4% 8/15/36 | | 730 | 740 |
4% 8/15/38 | | 1,000 | 997 |
4% 8/15/40 | | 1,050 | 1,022 |
4% 8/15/41 | | 1,000 | 967 |
5% 8/15/27 | | 505 | 536 |
5% 8/15/34 | | 905 | 1,021 |
5% 8/15/35 | | 680 | 764 |
| Nat'l. Fin. Auth. Solid Bonds (Waste Mgmt., Inc. Proj.): | | | |
| Series 2019 A1, 2.15%, tender 7/1/24 (b)(c) | | 2,400 | 2,381 |
| Series 2019 A2, 2.15%, tender 7/1/24 (b)(c) | | 2,955 | 2,927 |
| Series 2019 A3, 2.15%, tender 7/1/24 (b)(c) | | 7,545 | 7,474 |
| Nat'l. Finnance Auth.: | | | |
| Series 2020 1, 4.125% 1/20/34 | | 9,319 | 9,214 |
| Series 2022 1, 4.375% 9/20/36 | | 7,112 | 7,183 |
| Series 2023 2A, 3.875% 1/20/38 | | 26,151 | 25,318 |
| New Hampshire Health & Ed. Facilities Auth.: | | | |
| (Dartmouth-Hitchcock Oblgtd Grp Proj.) Series 2018 A, 5% 8/1/30 | | 1,190 | 1,272 |
| (Partners Healthcare Sys., Inc. Proj.) Series 2017: | | | |
5% 7/1/24 | | 1,335 | 1,348 |
5% 7/1/30 | | 2,360 | 2,564 |
| Series 2017: | | | |
5% 7/1/36 | | 2,105 | 2,162 |
5% 7/1/44 | | 1,830 | 1,788 |
| Series 2023 B: | | | |
5.5% 11/1/28 (c) | | 1,000 | 1,094 |
5.5% 11/1/29 (c) | | 1,025 | 1,138 |
5.5% 11/1/31 (c) | | 1,050 | 1,187 |
5.5% 11/1/32 (c) | | 1,000 | 1,139 |
5.5% 11/1/33 (c) | | 1,025 | 1,173 |
| New Hampshire Health & Ed. Facilities Auth. Rev.: | | | |
| Series 2012, 5% 7/1/26 | | 1,245 | 1,246 |
| Series 2016: | | | |
4% 10/1/38 | | 800 | 785 |
5% 10/1/26 | | 4,560 | 4,765 |
5% 10/1/27 | | 4,860 | 5,062 |
5% 10/1/28 | | 1,940 | 2,016 |
5% 10/1/30 | | 7,070 | 7,312 |
| New Hampshire Nat'l. Fin. Auth. Series 2022 2, 4% 10/20/36 | | 10,563 | 10,371 |
TOTAL NEW HAMPSHIRE | | | 107,871 |
| New Jersey - 4.6% | | | |
| Bayonne Gen. Oblig. Series 2016: | | | |
| 5% 7/1/31 (Pre-Refunded to 7/1/26 @ 100) | | 1,430 | 1,512 |
| 5% 7/1/32 (Pre-Refunded to 7/1/26 @ 100) | | 970 | 1,026 |
| 5% 7/1/33 (Pre-Refunded to 7/1/26 @ 100) | | 970 | 1,026 |
| Camden County Impt. Auth. Health Care Redev. Rev. Series 2014 A: | | | |
| 5% 2/15/24 | | 1,940 | 1,942 |
| 5% 2/15/25 (Pre-Refunded to 2/15/24 @ 100) | | 970 | 972 |
| 5% 2/15/29 (Pre-Refunded to 2/15/24 @ 100) | | 1,350 | 1,353 |
| Cherry Hill Township School District Series 2022: | | | |
| 4% 8/1/37 | | 4,500 | 4,689 |
| 4% 8/1/38 | | 3,500 | 3,618 |
| 4% 8/1/39 | | 13,815 | 14,202 |
| 4% 8/1/42 | | 5,500 | 5,602 |
| Clearview Reg'l. High School District Series 2022: | | | |
| 4% 8/1/37 | | 3,200 | 3,314 |
| 4% 8/1/38 | | 3,015 | 3,112 |
| 4% 8/1/39 | | 3,490 | 3,589 |
| Mercer County Gen. Oblig. Series 2021, 2% 2/15/32 | | 2,940 | 2,656 |
| New Jersey Econ. Dev. Auth.: | | | |
| (White Horse HMT Urban Renewal LLC Proj.) Series 2020, 5% 1/1/40 (d) | | 1,535 | 1,074 |
| Series 2022 A: | | | |
5% 11/1/31 | | 2,200 | 2,559 |
5% 11/1/32 | | 1,390 | 1,638 |
5% 11/1/34 | | 2,040 | 2,377 |
5% 11/1/35 | | 2,085 | 2,413 |
| Series 2024 SSS: | | | |
5% 6/15/33 (f) | | 3,225 | 3,738 |
5% 6/15/35 (f) | | 3,000 | 3,499 |
5.25% 6/15/37 (f) | | 1,430 | 1,688 |
| Series A: | | | |
5% 11/1/34 | | 5,150 | 5,721 |
5% 11/1/35 | | 8,205 | 9,062 |
5% 11/1/36 | | 5,010 | 5,501 |
| New Jersey Econ. Dev. Auth. Rev.: | | | |
| (Black Horse EHT Urban Renewal LLC Proj.) Series 2019 A, 5% 10/1/39 (d) | | 1,435 | 946 |
| (Provident Montclair Proj.) Series 2017: | | | |
5% 6/1/25 (Assured Guaranty Muni. Corp. Insured) | | 975 | 1,000 |
5% 6/1/27 (Assured Guaranty Muni. Corp. Insured) | | 1,360 | 1,459 |
5% 6/1/28 (Assured Guaranty Muni. Corp. Insured) | | 1,940 | 2,063 |
5% 6/1/29 (Assured Guaranty Muni. Corp. Insured) | | 1,455 | 1,549 |
| Series 2015 XX, 5% 6/15/26 (Pre-Refunded to 6/15/25 @ 100) | | 19,420 | 20,032 |
| Series 2018 EEE, 5% 6/15/30 | | 2,170 | 2,390 |
| Series 2019: | | | |
5.25% 9/1/25 (d) | | 3,395 | 3,529 |
5.25% 9/1/26 (d) | | 3,200 | 3,405 |
| New Jersey Edl. Facility Series 2016 A, 5% 7/1/29 | | 1,820 | 1,890 |
| New Jersey Envir. Infrastructure Trust: | | | |
| Series 2016 A R1, 5% 9/1/25 | | 2,065 | 2,145 |
| Series 2016 A R2, 5% 9/1/25 | | 3,010 | 3,127 |
| New Jersey Gen. Oblig.: | | | |
| Series 2020 A: | | | |
4% 6/1/30 | | 13,105 | 14,175 |
4% 6/1/31 | | 2,185 | 2,384 |
4% 6/1/32 | | 1,470 | 1,617 |
5% 6/1/25 | | 8,080 | 8,337 |
5% 6/1/26 | | 10,480 | 11,064 |
5% 6/1/29 | | 6,530 | 7,369 |
| Series 2021, 2% 6/1/36 | | 4,395 | 3,610 |
| New Jersey Health Care Facilities Fing. Auth. Rev.: | | | |
| Bonds: | | | |
Series 2019 B1, 5%, tender 7/1/24 (b) | | 8,215 | 8,289 |
Series 2019 B2, 5%, tender 7/1/25 (b) | | 10,070 | 10,355 |
| Series 2016 A: | | | |
5% 7/1/24 (Escrowed to Maturity) | | 790 | 797 |
5% 7/1/28 | | 440 | 465 |
5% 7/1/28 (Pre-Refunded to 7/1/26 @ 100) | | 1,185 | 1,251 |
5% 7/1/33 | | 1,465 | 1,541 |
| Series 2016, 5% 7/1/41 | | 3,665 | 3,708 |
| New Jersey Higher Ed. Student Assistance Auth. Student Ln. Rev.: | | | |
| Series 2017 1A, 5% 12/1/24 (c) | | 3,420 | 3,461 |
| Series 2019 A: | | | |
5% 12/1/24 | | 1,045 | 1,063 |
5% 12/1/25 | | 1,925 | 1,999 |
| Series 2020: | | | |
5% 12/1/24 (c) | | 1,925 | 1,948 |
5% 12/1/24 (c) | | 1,000 | 1,012 |
5% 12/1/25 (c) | | 2,675 | 2,750 |
5% 12/1/25 (c) | | 3,900 | 4,009 |
5% 12/1/26 (c) | | 3,100 | 3,226 |
5% 12/1/28 (c) | | 1,225 | 1,312 |
| Series 2022 A: | | | |
5% 12/1/27 (c) | | 1,275 | 1,346 |
5% 12/1/28 (c) | | 1,400 | 1,499 |
5% 12/1/29 (c) | | 1,400 | 1,515 |
5% 12/1/30 (c) | | 750 | 811 |
| Series 2022 B: | | | |
5% 12/1/27 (c) | | 3,735 | 3,944 |
5% 12/1/28 (c) | | 6,850 | 7,334 |
5% 12/1/29 (c) | | 4,475 | 4,842 |
| Series 2023 A: | | | |
5% 12/1/27 (c) | | 1,350 | 1,426 |
5% 12/1/28 (c) | | 1,325 | 1,419 |
5% 12/1/29 (c) | | 2,000 | 2,164 |
| Series 2023 B: | | | |
5% 12/1/27 (c) | | 5,000 | 5,280 |
5% 12/1/28 (c) | | 5,500 | 5,889 |
5% 12/1/29 (c) | | 5,500 | 5,951 |
| New Jersey Tobacco Settlement Fing. Corp. Series 2018 B, 5% 6/1/46 | | 10,090 | 10,241 |
| New Jersey Tpk. Auth. Tpk. Rev. Series D, 5% 1/1/28 | | 4,740 | 5,000 |
| New Jersey Trans. Trust Fund Auth.: | | | |
| (Trans. Prog.) Series 2019 AA: | | | |
5% 6/15/30 | | 3,500 | 3,873 |
5% 6/15/31 | | 2,250 | 2,487 |
5% 6/15/32 | | 5,660 | 6,246 |
| Series 2006 C: | | | |
0% 12/15/29 (Assured Guaranty Muni. Corp. Insured) | | 5,005 | 4,184 |
0% 12/15/30 (FGIC Insured) | | 10,960 | 8,805 |
0% 12/15/31 (FGIC Insured) | | 5,200 | 4,034 |
0% 12/15/34 | | 13,220 | 9,352 |
| Series 2010 A: | | | |
0% 12/15/27 | | 13,270 | 11,714 |
0% 12/15/28 | | 3,025 | 2,594 |
0% 12/15/30 | | 1,000 | 801 |
| Series 2014 AA: | | | |
5% 6/15/25 | | 12,140 | 12,254 |
5% 6/15/26 | | 7,285 | 7,330 |
| Series 2016 A, 5% 6/15/27 | | 14,620 | 15,352 |
| Series 2018 A: | | | |
5% 12/15/32 | | 1,600 | 1,764 |
5% 12/15/33 | | 6,395 | 7,029 |
5% 12/15/34 | | 8,095 | 8,862 |
| Series 2019 BB, 4% 6/15/36 | | 1,000 | 1,031 |
| Series 2021 A: | | | |
4% 6/15/34 | | 2,510 | 2,654 |
4% 6/15/36 | | 2,500 | 2,611 |
4% 6/15/38 | | 5,000 | 5,156 |
| Series 2022 A, 4% 6/15/39 | | 14,370 | 14,718 |
| Series 2022 AA: | | | |
5% 6/15/30 | | 2,770 | 3,165 |
5% 6/15/31 | | 7,210 | 8,367 |
5% 6/15/32 | | 5,145 | 6,055 |
5% 6/15/33 | | 13,115 | 15,387 |
5% 6/15/35 | | 13,670 | 15,835 |
| Series 2022 CC: | | | |
5% 6/15/33 | | 1,555 | 1,837 |
5% 6/15/35 | | 2,000 | 2,333 |
5% 6/15/37 | | 1,030 | 1,186 |
5.25% 6/15/32 | | 1,450 | 1,734 |
5.25% 6/15/36 | | 1,450 | 1,708 |
| Series A: | | | |
5% 12/15/25 | | 4,380 | 4,567 |
5% 12/15/26 | | 6,900 | 7,357 |
5% 12/15/27 | | 12,250 | 13,359 |
5% 12/15/28 | | 4,270 | 4,754 |
5% 6/15/30 | | 1,125 | 1,182 |
5% 12/15/30 | | 885 | 999 |
5% 12/15/31 | | 4,720 | 5,319 |
5% 12/15/33 | | 1,575 | 1,765 |
| Series AA: | | | |
4% 6/15/36 | | 1,550 | 1,615 |
4% 6/15/37 | | 2,150 | 2,227 |
4% 6/15/39 | | 1,960 | 2,000 |
5% 6/15/35 | | 2,010 | 2,277 |
5% 6/15/36 | | 2,270 | 2,558 |
5% 6/15/38 | | 1,930 | 2,149 |
TOTAL NEW JERSEY | | | 528,407 |
| New Mexico - 0.1% | | | |
| New Mexico Hosp. Equip. Ln. Council Rev. Bonds Series 2019 B, 5%, tender 8/1/25 (b) | | 8,245 | 8,468 |
| New Mexico Mtg. Fin. Auth. Series 2019 D, 3.75% 1/1/50 | | 1,825 | 1,814 |
TOTAL NEW MEXICO | | | 10,282 |
| New York - 7.0% | | | |
| Dorm. Auth. New York Univ. Rev. Series 2016 A, 5% 7/1/25 | | 2,430 | 2,493 |
| East Hampton Union Free School District Series 2017, 2.25% 6/1/28 | | 2,075 | 1,974 |
| Hudson Yards Infrastructure Corp. New York Rev. Series 2017 A: | | | |
| 5% 2/15/32 | | 3,885 | 4,150 |
| 5% 2/15/35 | | 7,285 | 7,749 |
| Long Island Pwr. Auth. Elec. Sys. Rev.: | | | |
| Bonds: | | | |
Series 2019 B, 1.65%, tender 9/1/24 (b) | | 17,685 | 17,462 |
Series 2021 B, 1.5%, tender 9/1/26 (b) | | 9,325 | 8,810 |
| Series 2021, 1% 9/1/25 | | 28,250 | 26,867 |
| Series 2022 A: | | | |
5% 9/1/35 | | 800 | 959 |
5% 9/1/36 | | 1,000 | 1,188 |
| Monroe County Indl. Dev. Corp.: | | | |
| (St. Ann's Cmnty. Proj.) Series 2019, 4% 1/1/30 | | 1,635 | 1,499 |
| (St. Anns Cmnty. Proj.) Series 2019, 5% 1/1/40 | | 2,145 | 1,878 |
| MTA Hudson Rail Yards Trust Oblig. Series 2016 A: | | | |
| 5% 11/15/51 | | 12,380 | 12,380 |
| 5% 11/15/56 | | 11,925 | 11,925 |
| New York City Gen. Oblig.: | | | |
| Series 2015 C, 5% 8/1/27 | | 2,965 | 3,032 |
| Series 2019 B1, 4% 10/1/35 | | 2,395 | 2,546 |
| Series 2021 A1, 5% 8/1/33 | | 2,000 | 2,312 |
| Series 2021 B1, 5% 11/1/32 | | 5,800 | 6,745 |
| Series 2021 F1, 5% 3/1/42 | | 5,410 | 6,020 |
| Series 2021, 4% 8/1/40 | | 8,210 | 8,444 |
| Series 2022 B, 5% 10/1/31 | | 1,500 | 1,777 |
| Series 2022 B1: | | | |
5% 8/1/33 | | 2,350 | 2,818 |
5% 8/1/34 | | 1,750 | 2,093 |
5% 8/1/35 | | 2,250 | 2,678 |
5% 8/1/36 | | 1,570 | 1,855 |
| Series 2022 C, 5% 8/1/33 | | 1,800 | 2,158 |
| Series 2022 D1, 5% 5/1/35 | | 1,540 | 1,828 |
| Series 2023 B1, 5% 10/1/33 | | 1,000 | 1,202 |
| Series C: | | | |
5% 8/1/29 | | 6,945 | 7,909 |
5% 8/1/33 | | 2,500 | 2,890 |
5% 8/1/34 | | 3,310 | 3,819 |
| New York City Health & Hosp. Corp. Rev. Series A, 5% 2/15/25 | | 3,640 | 3,730 |
| New York City Hsg. Dev. Corp. Bonds Series 2023 E2, 3.8%, tender 1/3/28 (b) | | 2,890 | 2,908 |
| New York City Hsg. Dev. Corp. Multifamily Hsg. Bonds: | | | |
| Series 2021 C2, 0.7%, tender 7/1/25 (b) | | 6,175 | 5,857 |
| Series 2021, 0.6%, tender 7/1/25 (b) | | 7,970 | 7,548 |
| Series 2023 A2, 3.73%, tender 12/29/28 (b) | | 18,545 | 18,630 |
| Series 2023 D, 4.3%, tender 11/1/28 (b) | | 9,820 | 10,074 |
| New York City Transitional Fin. Auth. Bldg. Aid Rev.: | | | |
| Series 2018 S3, 5% 7/15/37 | | 2,000 | 2,179 |
| Series 2021 1A, 5% 7/15/32 | | 1,000 | 1,172 |
| Series 2023 A, 5% 7/15/34 | | 2,840 | 3,404 |
| New York City Transitional Fin. Auth. Rev.: | | | |
| Series 2018 C2, 5% 5/1/32 | | 9,175 | 10,081 |
| Series 2019 A, 5% 8/1/35 | | 7,520 | 8,267 |
| Series 2019 B1: | | | |
5% 8/1/34 | | 3,300 | 3,635 |
5% 8/1/35 | | 8,400 | 9,235 |
5% 8/1/36 | | 6,555 | 7,179 |
| Series 2020 C1, 4% 5/1/36 | | 1,075 | 1,149 |
| Series 2021 F1, 5% 11/1/25 | | 16,245 | 16,940 |
| Series 2022 D, 5% 11/1/31 | | 5,450 | 6,478 |
| Series 2022 D1, 5% 11/1/34 | | 5,910 | 7,077 |
| Series 2022 F1, 5% 2/1/36 | | 1,000 | 1,182 |
| Series 2023 E1: | | | |
5% 11/1/37 | | 10,335 | 12,249 |
5% 11/1/39 | | 38,230 | 44,587 |
5% 11/1/40 | | 9,325 | 10,809 |
| Series C: | | | |
4% 5/1/35 | | 3,000 | 3,236 |
4% 5/1/36 | | 8,615 | 9,207 |
| New York Convention Ctr. Dev. Corp. Rev. Series 2015: | | | |
| 5% 11/15/27 | | 1,330 | 1,363 |
| 5% 11/15/40 | | 3,915 | 3,979 |
| New York Dorm. Auth. Rev.: | | | |
| Bonds: | | | |
Series 2019 B2, 5%, tender 5/1/24 (b) | | 3,675 | 3,679 |
Series 2019 B3, 5%, tender 5/1/26 (b) | | 4,055 | 4,179 |
| Series 2022 A, 5% 7/15/37 | | 1,840 | 1,966 |
| Series 2022: | | | |
5% 7/1/32 | | 1,810 | 1,978 |
5% 7/1/33 | | 900 | 981 |
5% 7/1/34 | | 255 | 277 |
| New York Dorm. Auth. Sales Tax Rev. Series 2018 C, 5% 3/15/32 | | 13,810 | 15,182 |
| New York Metropolitan Trans. Auth. Dedicated Tax Fund Rev. Series 2022 A, 5% 11/15/34 | | 735 | 865 |
| New York Metropolitan Trans. Auth. Rev.: | | | |
| Series 2015 C, 5% 11/15/30 | | 1,000 | 1,027 |
| Series 2015 D1, 5% 11/15/33 | | 4,015 | 4,122 |
| Series 2017 A1, 5% 11/15/31 | | 2,000 | 2,120 |
| Series 2017 C-2, 0% 11/15/33 | | 9,795 | 7,091 |
| Series 2017 C1: | | | |
4% 11/15/35 | | 1,770 | 1,797 |
5% 11/15/26 | | 5,975 | 6,325 |
5% 11/15/27 | | 4,435 | 4,782 |
5% 11/15/30 | | 4,315 | 4,679 |
5% 11/15/33 | | 6,955 | 7,521 |
| Series 2017 D: | | | |
5% 11/15/30 | | 1,900 | 2,060 |
5% 11/15/33 | | 6,725 | 7,272 |
| Series 2020 D, 5% 11/15/43 | | 2,500 | 2,660 |
| New York State Dorm. Auth.: | | | |
| Series 2019 D, 4% 2/15/36 | | 10,000 | 10,674 |
| Series 2020 A, 4% 3/15/34 | | 3,055 | 3,315 |
| Series 2021 E, 5% 3/15/36 | | 11,725 | 13,745 |
| Series 2022 A: | | | |
5% 3/15/33 | | 3,825 | 4,576 |
5% 3/15/36 | | 9,140 | 10,715 |
5% 3/15/41 | | 2,640 | 2,973 |
| New York State Hsg. Fin. Agcy. Rev.: | | | |
| Bonds: | | | |
Series 2021 D2, 0.65%, tender 11/1/25 (b) | | 2,750 | 2,578 |
Series 2021 E2, 0.65%, tender 11/1/25 (b) | | 5,000 | 4,674 |
Series 2021 J2, 1.1%, tender 5/1/27 (b) | | 18,855 | 17,208 |
Series 2021 K2, 1%, tender 11/1/26 (b) | | 5,120 | 4,771 |
Series 2022 B2, 2.5%, tender 5/1/27 (b) | | 25,300 | 24,334 |
Series 2023 C2, 3.8%, tender 5/1/29 (b) | | 1,670 | 1,676 |
Series 2023 E2, 3.875%, tender 5/1/28 (b) | | 3,095 | 3,111 |
| Series 2021 A, 0.75% 11/1/25 | | 3,920 | 3,665 |
| Series 2021 B, 0.55% 11/1/24 | | 4,735 | 4,621 |
| New York State Mtg. Agcy. Homeowner Mtg. Series 221, 3.5% 10/1/32 (c) | | 885 | 871 |
| New York State Urban Dev. Corp. Series 2020 C: | | | |
| 4% 3/15/37 | | 5,500 | 5,765 |
| 5% 3/15/36 | | 7,610 | 8,757 |
| New York Thruway Auth. Personal Income Tax Rev. Series 2022 A, 5% 3/15/34 | | 7,250 | 8,728 |
| New York Trans. Dev. Corp.: | | | |
| (Delta Air Lines, Inc. - Laguardia Arpt. Terminals C&D Redev. Proj.) Series 2023, 6% 4/1/35 (c) | | 25,350 | 28,240 |
| (Delta Air Lines, Inc. - LaGuardia Arpt. Termindals C&D Redev. Proj.) Series 2020, 4% 10/1/30 (c) | | 8,000 | 7,854 |
| (Delta Air Lines, Inc. LaGuardia Arpt. Terminals C&D Redev. Proj.): | | | |
Series 2018, 5% 1/1/34 (c) | | 2,500 | 2,545 |
Series 2020, 5% 10/1/35 (c) | | 11,390 | 11,829 |
| (Laguardia Arpt. Term. Redev. Proj.) Series 2016 A, 5% 7/1/41 (c) | | 8,155 | 8,163 |
| (Term. 4 JFK Int'l. Arpt. Proj.): | | | |
Series 2020 A: | | | |
5% 12/1/28 (c) | | 1,220 | 1,313 |
5% 12/1/33 (c) | | 1,800 | 1,970 |
Series 2020 C: | | | |
4% 12/1/39 | | 1,350 | 1,366 |
4% 12/1/40 | | 1,500 | 1,505 |
4% 12/1/41 | | 1,450 | 1,451 |
4% 12/1/42 | | 1,400 | 1,399 |
5% 12/1/28 | | 950 | 1,039 |
5% 12/1/29 | | 950 | 1,049 |
5% 12/1/30 | | 750 | 835 |
5% 12/1/31 | | 950 | 1,053 |
5% 12/1/32 | | 1,125 | 1,243 |
5% 12/1/33 | | 2,640 | 2,906 |
5% 12/1/34 | | 1,600 | 1,758 |
5% 12/1/35 | | 1,500 | 1,640 |
5% 12/1/36 | | 1,700 | 1,846 |
5% 12/1/37 | | 1,755 | 1,891 |
5% 12/1/38 | | 1,500 | 1,611 |
| (Term. 4 John F. Kennedy Int'l. Arpt. Proj.): | | | |
Series 2020 A, 5% 12/1/30 (c) | | 1,900 | 2,084 |
Series 2022: | | | |
5% 12/1/27 (c) | | 8,980 | 9,517 |
5% 12/1/28 (c) | | 2,400 | 2,583 |
5% 12/1/32 (c) | | 8,050 | 9,007 |
5% 12/1/33 (c) | | 9,440 | 10,552 |
5% 12/1/34 (c) | | 10,315 | 11,503 |
5% 12/1/35 (c) | | 5,155 | 5,715 |
5% 12/1/36 (c) | | 3,515 | 3,864 |
5% 12/1/37 (c) | | 9,375 | 10,205 |
| Series 2016 A, 5.25% 1/1/50 (c) | | 13,305 | 13,319 |
| New York Urban Dev. Corp. Rev. Gen. Oblig. (New York State Gen. Oblig. Proj.) Series 2017 A, 5% 3/15/32 | | 2,745 | 2,941 |
| Oneida County Local Dev. Corp. Rev. (Mohawk Valley Health Sys. Proj.) Series 2019 A: | | | |
| 4% 12/1/34 (Assured Guaranty Muni. Corp. Insured) | | 1,000 | 1,025 |
| 4% 12/1/35 (Assured Guaranty Muni. Corp. Insured) | | 1,500 | 1,534 |
| 4% 12/1/36 (Assured Guaranty Muni. Corp. Insured) | | 1,635 | 1,665 |
| Onondaga Civic Dev. Corp. (Syracuse Univ. Proj.) Series 2020 A: | | | |
| 5% 12/1/32 | | 1,250 | 1,446 |
| 5% 12/1/34 | | 2,300 | 2,653 |
| Port Auth. of New York & New Jersey Series 2022 236: | | | |
| 5% 1/15/33 (c) | | 2,000 | 2,285 |
| 5% 1/15/34 (c) | | 3,485 | 4,017 |
| 5% 1/15/35 (c) | | 2,000 | 2,294 |
| 5% 1/15/36 (c) | | 1,000 | 1,138 |
| 5% 1/15/37 (c) | | 1,000 | 1,127 |
| 5% 1/15/39 (c) | | 2,390 | 2,631 |
| 5% 1/15/40 (c) | | 5,000 | 5,480 |
| 5% 1/15/41 (c) | | 6,350 | 6,939 |
| 5% 1/15/42 (c) | | 4,100 | 4,455 |
| Suffolk County Econ. Dev. Corp. Rev. Series 2021: | | | |
| 5.125% 11/1/41 (d) | | 1,360 | 1,123 |
| 5.375% 11/1/54 (d) | | 2,155 | 1,662 |
| Triborough Brdg & Tunl Auth. Series 2023 A, 5% 5/15/40 | | 835 | 963 |
| Triborough Bridge & Tunnel Auth.: | | | |
| Series 2022 E2B, 5% 11/15/32 | | 5,825 | 7,016 |
| Series 2023 A: | | | |
4% 11/15/33 | | 1,430 | 1,598 |
4% 11/15/34 | | 285 | 311 |
5% 11/15/34 | | 1,070 | 1,306 |
TOTAL NEW YORK | | | 807,399 |
| New York And New Jersey - 0.4% | | | |
| Port Auth. of New York & New Jersey: | | | |
| Series 193, 5% 10/15/29 (c) | | 3,650 | 3,742 |
| Series 2019 218, 5% 11/1/36 (c) | | 1,080 | 1,169 |
| Series 2021 226, 5% 10/15/33 (c) | | 1,350 | 1,532 |
| Series 2022 231: | | | |
5% 8/1/33 (c) | | 12,500 | 14,340 |
5% 8/1/34 (c) | | 7,095 | 8,119 |
| Series 2023 238, 5% 7/15/39 (c) | | 3,150 | 3,482 |
| Series 2023 242: | | | |
5% 12/1/36 (c) | | 1,750 | 1,995 |
5% 12/1/37 (c) | | 2,200 | 2,479 |
5% 12/1/38 (c) | | 2,000 | 2,233 |
5% 12/1/39 (c) | | 4,150 | 4,602 |
| Series 223, 4% 7/15/39 (c) | | 2,175 | 2,172 |
TOTAL NEW YORK AND NEW JERSEY | | | 45,865 |
| North Carolina - 0.7% | | | |
| Charlotte Gen. Oblig. Series 2021 A: | | | |
| 2% 6/1/36 | | 2,190 | 1,797 |
| 2% 6/1/37 | | 2,500 | 1,990 |
| Charlotte-Mecklenburg Hosp. Auth. Health Care Sys. Rev. Bonds Series 2021 C, 5%, tender 12/1/28 (b) | | 4,430 | 4,886 |
| New Hanover County Hosp. Rev. Series 2017, 5% 10/1/27 (Escrowed to Maturity) | | 395 | 428 |
| North Carolina Cap. Facilities Fin. Agcy. Edl. Facilities Rev. Series 2021: | | | |
| 4% 5/1/32 | | 1,000 | 1,048 |
| 4% 5/1/33 | | 1,000 | 1,046 |
| 4% 5/1/34 | | 900 | 939 |
| 5% 5/1/26 | | 275 | 286 |
| 5% 5/1/27 | | 400 | 424 |
| 5% 5/1/28 | | 415 | 448 |
| 5% 5/1/29 | | 525 | 575 |
| 5% 5/1/30 | | 560 | 622 |
| North Carolina Hsg. Fin. Agcy. Home Ownership Rev.: | | | |
| Series 2022 48, 3.75% 7/1/52 | | 9,130 | 9,059 |
| Series 2023 52A, 6.25% 1/1/55 | | 5,000 | 5,533 |
| North Carolina Med. Care Commission Health Care Facilities Rev. Bonds Series 2019 C, 2.55%, tender 6/1/26 (b) | | 17,085 | 16,856 |
| North Carolina Med. Care Commission Hosp. Rev.: | | | |
| Bonds Series 2021 B, 5%, tender 2/1/26 (b) | | 3,100 | 3,220 |
| Series 2021 A, 5% 2/1/25 | | 185 | 189 |
| North Carolina State Ed. Assistance Auth. Student Ln. Rev. Series 2023 A: | | | |
| 5% 6/1/43 (c) | | 5,050 | 5,228 |
| 5.5% 6/1/30 (c) | | 1,110 | 1,226 |
| 5.5% 6/1/31 (c) | | 2,450 | 2,730 |
| 5.5% 6/1/32 (c) | | 2,750 | 3,087 |
| 5.5% 6/1/33 (c) | | 2,750 | 3,104 |
| Raleigh Durham Arpt. Auth. Arpt. Rev. Series 2020 A: | | | |
| 5% 5/1/26 (c) | | 3,950 | 4,107 |
| 5% 5/1/27 (c) | | 1,500 | 1,591 |
| 5% 5/1/28 (c) | | 1,875 | 2,023 |
| 5% 5/1/29 (c) | | 1,500 | 1,646 |
| 5% 5/1/30 (c) | | 1,320 | 1,470 |
| 5% 5/1/31 (c) | | 1,350 | 1,502 |
| 5% 5/1/32 (c) | | 1,100 | 1,220 |
TOTAL NORTH CAROLINA | | | 78,280 |
| North Dakota - 0.2% | | | |
| Grand Forks Health Care Sys. Rev. Series 2021: | | | |
| 3% 12/1/39 | | 2,235 | 1,862 |
| 4% 12/1/38 | | 1,250 | 1,185 |
| 4% 12/1/40 | | 5,675 | 5,279 |
| North Dakota Hsg. Fin. Agcy.: | | | |
| Series 2021 A, 3% 1/1/52 | | 4,105 | 3,996 |
| Series 2022 A, 4% 1/1/53 | | 8,100 | 8,114 |
| Series 2023 F, 6.25% 1/1/54 | | 1,790 | 1,982 |
TOTAL NORTH DAKOTA | | | 22,418 |
| Ohio - 1.6% | | | |
| Akron Bath Copley Hosp. District Rev. Series 2020: | | | |
| 4% 11/15/34 | | 970 | 974 |
| 4% 11/15/35 | | 1,000 | 994 |
| 4% 11/15/36 | | 1,000 | 984 |
| 5% 11/15/32 | | 700 | 767 |
| Allen County Hosp. Facilities Rev. Series 2020 A: | | | |
| 5% 12/1/29 | | 2,290 | 2,578 |
| 5% 12/1/30 | | 2,290 | 2,599 |
| American Muni. Pwr., Inc. Rev.: | | | |
| Bonds Series 2021 A2, 1%, tender 8/15/24 (b) | | 6,010 | 5,909 |
| Series 2017 A, 5% 2/15/36 | | 5,000 | 5,402 |
| Series 2021 A: | | | |
4% 2/15/36 | | 4,045 | 4,236 |
4% 2/15/37 | | 3,000 | 3,109 |
4% 2/15/38 | | 215 | 220 |
5% 2/15/33 | | 2,750 | 3,158 |
5% 2/15/34 | | 4,000 | 4,591 |
5% 2/15/35 | | 2,715 | 3,097 |
| Buckeye Tobacco Settlement Fing. Auth. Series 2020 A2, 5% 6/1/36 | | 2,290 | 2,480 |
| Cleveland Arpt. Sys. Rev. Series 2016 A: | | | |
| 5% 1/1/26 (Assured Guaranty Muni. Corp. Insured) | | 970 | 989 |
| 5% 1/1/28 (Assured Guaranty Muni. Corp. Insured) | | 1,480 | 1,506 |
| 5% 1/1/29 (Assured Guaranty Muni. Corp. Insured) | | 2,165 | 2,202 |
| 5% 1/1/30 (Assured Guaranty Muni. Corp. Insured) | | 1,940 | 1,973 |
| Cleveland Income Tax Rev. Series 2021 A1, 3% 10/1/38 | | 1,205 | 1,114 |
| Columbus City School District Series 2016 A: | | | |
| 5% 12/1/32 | | 1,490 | 1,570 |
| 5% 12/1/32 (Pre-Refunded to 6/1/26 @ 100) | | 280 | 295 |
| Fairfield County Hosp. Facilities Rev. (Fairfield Med. Ctr. Proj.) Series 2013: | | | |
| 5% 6/15/25 | | 2,395 | 2,395 |
| 5% 6/15/26 | | 2,515 | 2,516 |
| 5% 6/15/27 | | 2,640 | 2,641 |
| 5% 6/15/28 | | 2,770 | 2,770 |
| Franklin County Convention Facilities Auth. (Greater Columbus Convention Ctr. Hotel Expansion Proj.) Series 2019: | | | |
| 5% 12/1/33 | | 2,000 | 2,236 |
| 5% 12/1/35 | | 1,000 | 1,112 |
| 5% 12/1/36 | | 1,180 | 1,304 |
| 5% 12/1/44 | | 970 | 925 |
| Franklin County Hosp. Facilities Rev. Series 2016 C: | | | |
| 5% 11/1/25 | | 1,940 | 2,015 |
| 5% 11/1/26 | | 2,040 | 2,165 |
| Lake County Hosp. Facilities Rev. Series 2015, 5% 8/15/27 (Pre-Refunded to 8/15/25 @ 100) | | 2,195 | 2,254 |
| Lancaster Port Auth. Gas Rev. Bonds Series 2019, 5%, tender 2/1/25 (b) | | 20,230 | 20,488 |
| Miami County Hosp. Facilities Rev. (Kettering Health Network Obligated Group Proj.) Series 2019: | | | |
| 5% 8/1/31 | | 1,000 | 1,083 |
| 5% 8/1/32 | | 1,000 | 1,083 |
| 5% 8/1/33 | | 1,000 | 1,081 |
| Miami Univ. Series 2020 A: | | | |
| 5% 9/1/30 | | 140 | 161 |
| 5% 9/1/31 | | 950 | 1,092 |
| 5% 9/1/33 | | 1,770 | 2,022 |
| 5% 9/1/34 | | 2,500 | 2,852 |
| Montgomery County Hosp. Rev. (Kettering Health Network Obligated Group Proj.)) Series 2021, 5% 8/1/26 | | 560 | 588 |
| Muskingum County Hosp. Facilities (Genesis Healthcare Sys. Obligated Group Proj.) Series 2013: | | | |
| 5% 2/15/27 | | 5,715 | 5,716 |
| 5% 2/15/44 | | 6,580 | 6,196 |
| 5% 2/15/48 | | 4,500 | 4,114 |
| Northeast Ohio Reg'l. Swr. District Wastewtr. Rev. Series 2019, 3% 11/15/38 | | 1,175 | 1,079 |
| Ohio Air Quality Dev. Auth. Rev. Bonds Series 2022 B, 4.25%, tender 6/1/27 (b)(c) | | 2,350 | 2,396 |
| Ohio Gen. Oblig. Series 2021 A, 5% 6/15/33 | | 2,300 | 2,715 |
| Ohio Hosp. Facilities Rev. Series 2017 A: | | | |
| 5% 1/1/27 | | 2,495 | 2,675 |
| 5% 1/1/29 | | 4,855 | 5,320 |
| Ohio Hosp. Rev.: | | | |
| Bonds Series 2019 C, 2.75%, tender 5/1/28 (b) | | 5,475 | 5,450 |
| Series 2016 A, 5% 1/15/41 | | 5,650 | 5,749 |
| Series 2020 A, 4% 1/15/50 | | 1,580 | 1,492 |
| Ohio Hsg. Fin. Agcy. Residential Mtg. Rev.: | | | |
| (Mtg. Backed Securities Prog.) Series 2019 B, 4.5% 3/1/50 | | 565 | 570 |
| (Mtg.-Backed Securities Prog.) Series 2023 B, 6% 3/1/55 | | 6,340 | 7,053 |
| Ohio State Univ. Gen. Receipts (Multiyear Debt Issuance Prog.) Series 2020 A: | | | |
| 5% 12/1/29 | | 10,000 | 11,441 |
| 5% 12/1/30 | | 1,000 | 1,164 |
| Ohio Tpk. Commission Tpk. Rev. (Infrastructure Projs.) Series 2022 A, 5% 2/15/39 | | 2,860 | 3,293 |
| Ohio Wtr. Dev. Auth. Rev. Series 2022 A, 5% 12/1/40 | | 1,065 | 1,224 |
| Ohio Wtr. Dev. Auth. Wtr. Poll. Cont. Rev. Series 2020 A, 5% 12/1/38 | | 2,505 | 2,816 |
| Scioto County Hosp. Facilities Rev.: | | | |
| Series 2016, 5% 2/15/29 | | 2,250 | 2,321 |
| Series 2019, 5% 2/15/29 | | 4,300 | 4,493 |
TOTAL OHIO | | | 180,807 |
| Oklahoma - 0.2% | | | |
| Canadian Cny Edl. Facilities Auth. (Mustang Pub. Schools Proj.) Series 2017, 5% 9/1/26 | | 2,015 | 2,129 |
| Grand River Dam Auth. Rev. Series 2014 A: | | | |
| 5% 6/1/27 | | 1,165 | 1,173 |
| 5% 6/1/28 | | 1,455 | 1,464 |
| Oklahoma City Pub. Property Auth. Hotel Tax Rev. Series 2015: | | | |
| 5% 10/1/25 | | 1,020 | 1,060 |
| 5% 10/1/26 | | 1,455 | 1,510 |
| 5% 10/1/27 | | 1,155 | 1,198 |
| Oklahoma Dev. Fin. Auth. Rev. (Oklahoma City Univ. Proj.) Series 2019: | | | |
| 4% 8/1/33 | | 2,645 | 2,606 |
| 4% 8/1/34 | | 2,755 | 2,707 |
| 5% 8/1/24 | | 590 | 592 |
| 5% 8/1/25 | | 930 | 942 |
| 5% 8/1/26 | | 540 | 552 |
| 5% 8/1/27 | | 680 | 703 |
| 5% 8/1/28 | | 725 | 756 |
| 5% 8/1/29 | | 755 | 793 |
| 5% 8/1/30 | | 1,370 | 1,436 |
| Oklahoma Hsg. Fin. Agcy. Single Family Mtg. Rev.: | | | |
| (Homeownership Ln. Prog.) Series 2023 C, 6% 3/1/54 | | 1,165 | 1,297 |
| (Homeownership Load Prog.) Series 2023 D, 6.5% 9/1/54 | | 1,300 | 1,483 |
| Oklahoma Pwr. Auth. Pwr. Supply Sys. Rev. Series 2014 B, 5% 1/1/27 | | 2,085 | 2,121 |
TOTAL OKLAHOMA | | | 24,522 |
| Oregon - 1.1% | | | |
| Clackamas County Series 2020, 1.625% 6/1/37 | | 1,195 | 890 |
| Multnomah County School District #1J Portland Series 2020 B, 3% 6/15/33 | | 1,000 | 993 |
| Oregon Facilities Auth. Rev. Series 2022 B, 5% 6/1/30 | | 12,940 | 14,376 |
| Oregon State Hsg. & Cmnty. Svcs. Dept. (Single-Family Mtg. Prog.): | | | |
| Series 2019 A, 2.65% 7/1/39 | | 2,630 | 2,225 |
| Series 2022 A, 4% 7/1/51 | | 6,550 | 6,564 |
| Port of Portland Arpt. Rev.: | | | |
| Series 2020 27A, 4% 7/1/39 (c) | | 2,545 | 2,550 |
| Series 2022 28, 4% 7/1/35 (c) | | 3,000 | 3,087 |
| Series 2023 29: | | | |
5% 7/1/30 (c) | | 12,085 | 13,359 |
5% 7/1/31 (c) | | 12,035 | 13,466 |
5% 7/1/33 (c) | | 9,960 | 11,395 |
5% 7/1/34 (c) | | 2,730 | 3,125 |
5% 7/1/38 (c) | | 2,680 | 2,975 |
5.25% 7/1/40 (c) | | 19,745 | 22,130 |
| Series 23, 5% 7/1/27 | | 1,475 | 1,515 |
| Series 24 B: | | | |
5% 7/1/31 (c) | | 1,000 | 1,049 |
5% 7/1/32 (c) | | 2,795 | 2,931 |
| Series 26 A: | | | |
5% 7/1/29 | | 1,155 | 1,278 |
5% 7/1/33 | | 785 | 903 |
| Series 26 B, 5% 7/1/29 | | 1,000 | 1,112 |
| Series 26 C: | | | |
5% 7/1/25 (c) | | 800 | 819 |
5% 7/1/26 (c) | | 1,300 | 1,353 |
5% 7/1/27 (c) | | 1,090 | 1,153 |
| Series 27 A, 5% 7/1/36 (c) | | 8,655 | 9,465 |
| Salem Hosp. Facility Auth. Rev. Series 2016 A, 4% 5/15/41 | | 3,915 | 3,919 |
| Washington, Multnomah & Yamhill County School District #1J Series 2017, 5% 6/15/30 | | 2,915 | 3,146 |
TOTAL OREGON | | | 125,778 |
| Pennsylvania - 4.3% | | | |
| Allegheny County Arpt. Auth. Rev.: | | | |
| Series 2021 A: | | | |
5% 1/1/33 (c) | | 3,635 | 4,033 |
5% 1/1/51 (c) | | 31,125 | 32,380 |
5% 1/1/56 (c) | | 14,945 | 15,512 |
| Series 2023 A: | | | |
5% 1/1/34 (Assured Guaranty Muni. Corp. Insured) (c) | | 1,730 | 1,971 |
5% 1/1/35 (Assured Guaranty Muni. Corp. Insured) (c) | | 2,000 | 2,273 |
5.25% 1/1/36 (Assured Guaranty Muni. Corp. Insured) (c) | | 1,000 | 1,161 |
5.25% 1/1/37 (Assured Guaranty Muni. Corp. Insured) (c) | | 1,000 | 1,151 |
| Allegheny County Higher Ed. Bldg. Auth. Univ. Rev. Series 2021 A: | | | |
| 4% 3/1/36 | | 825 | 864 |
| 4% 3/1/37 | | 1,000 | 1,039 |
| 4% 3/1/38 | | 1,050 | 1,079 |
| 4% 3/1/39 | | 2,000 | 2,044 |
| 4% 3/1/40 | | 2,115 | 2,148 |
| 4% 3/1/41 | | 385 | 391 |
| Allegheny County Hosp. Dev. Auth. Rev. Series 2019 A: | | | |
| 5% 7/15/24 | | 2,300 | 2,323 |
| 5% 7/15/25 | | 3,030 | 3,123 |
| Allegheny County Indl. Dev. Auth. Rev. Series 2021: | | | |
| 3.5% 12/1/31 | | 2,445 | 1,999 |
| 4% 12/1/41 | | 5,005 | 3,481 |
| 4.25% 12/1/50 | | 5,575 | 3,602 |
| Bucks County Indl. Dev. Auth. Hosp. Rev. Series 2021: | | | |
| 5% 7/1/34 | | 280 | 264 |
| 5% 7/1/35 | | 1,100 | 1,029 |
| 5% 7/1/36 | | 525 | 484 |
| 5% 7/1/37 | | 1,180 | 1,082 |
| Lancaster County Hosp. Auth. Health Ctr. Rev. Series 2021, 5% 11/1/51 | | 7,510 | 7,856 |
| Lehigh County Gen. Purp. Hosp. Rev. Series 2019 A, 4% 7/1/38 | | 1,600 | 1,621 |
| Monroeville Fin. Auth. UPMC Rev. Series 2012, 5% 2/15/26 | | 3,205 | 3,339 |
| Montgomery County Higher Ed. & Health Auth. Rev.: | | | |
| Series 2016 A: | | | |
5% 10/1/28 | | 1,385 | 1,385 |
5% 10/1/29 | | 1,495 | 1,496 |
5% 10/1/32 | | 4,670 | 4,661 |
5% 10/1/36 | | 7,560 | 7,523 |
5% 10/1/40 | | 3,490 | 3,379 |
| Series 2019: | | | |
5% 9/1/30 | | 1,250 | 1,370 |
5% 9/1/31 | | 2,500 | 2,733 |
5% 9/1/33 | | 1,370 | 1,494 |
| Pennsylvania Econ. Dev. Fing. Auth. Series 2023 A1, 5% 5/15/31 | | 17,825 | 20,336 |
| Pennsylvania Econ. Dev. Fing. Auth. Indl. Dev. Rev. (Presbyterian Sr. Living Proj.) Series 2023 B2: | | | |
| 5% 7/1/38 | | 1,045 | 1,085 |
| 5% 7/1/42 | | 3,000 | 3,054 |
| Pennsylvania Econ. Dev. Fing. Auth. Solid Waste Disp. Rev. Bonds: | | | |
| (Republic Svcs., Inc. Proj.) Series 2019 B2, 4.2%, tender 1/16/24 (b)(c) | | 15,500 | 15,497 |
| (Waste Mgmt., Inc. Proj.): | | | |
Series 2017 A, 0.58%, tender 8/1/24 (b)(c) | | 3,200 | 3,135 |
Series 2021 A, SIFMA Municipal Swap Index + 0.400% 4.27%, tender 1/4/24 (b)(c)(e) | | 9,105 | 9,064 |
| Series 2011, 2.15%, tender 7/1/24 (b)(c) | | 12,165 | 12,044 |
| Pennsylvania Gen. Oblig.: | | | |
| Series 2013, 5% 10/15/27 | | 9,710 | 9,749 |
| Series 2016: | | | |
4% 2/1/32 | | 6,490 | 6,633 |
5% 9/15/29 | | 27,190 | 28,768 |
| Series 2017, 5% 1/1/27 | | 8,765 | 9,396 |
| Series 2018: | | | |
3.2% 3/1/29 | | 16,970 | 17,186 |
3.35% 3/1/30 | | 25,255 | 25,616 |
| Series 2022, 5% 10/1/36 | | 8,595 | 10,029 |
| Pennsylvania Higher Ed. Assistance Agcy. Rev. Series 2022 A: | | | |
| 5% 6/1/29 (c) | | 3,800 | 4,084 |
| 5% 6/1/30 (c) | | 8,600 | 9,346 |
| 5% 6/1/31 (c) | | 4,900 | 5,369 |
| Pennsylvania Higher Edl. Facilities Auth. Rev. (Univ. of Penn Health Systems Proj.): | | | |
| Series 2017 A: | | | |
5% 8/15/28 | | 1,215 | 1,306 |
5% 8/15/30 | | 2,090 | 2,242 |
| Series 2017, 5% 8/15/27 | | 1,165 | 1,261 |
| Pennsylvania Pub. School Bldg. Auth. School Rev. (The School District of The City of Harrisburg Proj.) Series 2016 A: | | | |
| 5% 12/1/28 | | 5,265 | 5,586 |
| 5% 12/1/28 (Pre-Refunded to 12/1/26 @ 100) | | 835 | 892 |
| 5% 12/1/33 | | 3,405 | 3,581 |
| 5% 12/1/33 (Pre-Refunded to 12/1/26 @ 100) | | 895 | 956 |
| Pennsylvania State Univ. Series 2023: | | | |
| 5% 9/1/38 | | 750 | 879 |
| 5% 9/1/39 | | 750 | 873 |
| 5% 9/1/40 | | 1,500 | 1,737 |
| Pennsylvania Tpk. Commission Tpk. Rev.: | | | |
| Series 2013 A2: | | | |
5% 12/1/28 | | 1,215 | 1,299 |
5% 12/1/33 | | 1,215 | 1,338 |
| Series 2017 A1: | | | |
5% 12/1/29 | | 1,455 | 1,587 |
5% 12/1/34 | | 970 | 1,051 |
| Series 2021 B: | | | |
5% 12/1/33 | | 2,095 | 2,435 |
5% 12/1/34 | | 1,750 | 2,032 |
5% 12/1/35 | | 1,750 | 2,008 |
| Series 2021 C: | | | |
4% 12/1/38 | | 1,040 | 1,083 |
5% 12/1/37 | | 1,300 | 1,483 |
| Series 2023: | | | |
5% 12/1/32 | | 3,205 | 3,797 |
5% 12/1/33 | | 12,980 | 15,270 |
5% 12/1/34 | | 5,325 | 6,263 |
5% 12/1/35 | | 1,425 | 1,671 |
| Philadelphia Arpt. Rev.: | | | |
| Series 2015 A, 5% 6/15/24 (c) | | 1,590 | 1,600 |
| Series 2017 B: | | | |
5% 7/1/26 (c) | | 2,950 | 3,070 |
5% 7/1/29 (c) | | 1,200 | 1,267 |
5% 7/1/30 (c) | | 1,720 | 1,816 |
5% 7/1/31 (c) | | 2,430 | 2,564 |
5% 7/1/35 (c) | | 800 | 838 |
5% 7/1/47 (c) | | 3,065 | 3,130 |
| Series 2020 A: | | | |
4% 7/1/35 | | 2,000 | 2,101 |
4% 7/1/36 | | 3,500 | 3,631 |
| Series 2021, 5% 7/1/36 (c) | | 2,750 | 3,037 |
| Philadelphia Gas Works Rev. Series 15: | | | |
| 5% 8/1/24 | | 730 | 737 |
| 5% 8/1/25 | | 775 | 799 |
| Philadelphia Gen. Oblig.: | | | |
| Series 2015 B: | | | |
5% 8/1/27 | | 2,915 | 2,996 |
5% 8/1/29 | | 10,165 | 10,408 |
5% 8/1/30 | | 10,705 | 10,939 |
5% 8/1/31 | | 11,280 | 11,506 |
| Series 2019 A: | | | |
5% 8/1/24 | | 3,425 | 3,458 |
5% 8/1/26 | | 3,225 | 3,409 |
| Series 2019 B: | | | |
5% 2/1/24 | | 100 | 100 |
5% 2/1/25 | | 1,135 | 1,156 |
5% 2/1/26 | | 1,180 | 1,233 |
5% 2/1/27 | | 1,500 | 1,605 |
5% 2/1/28 | | 2,250 | 2,459 |
5% 2/1/29 | | 2,425 | 2,701 |
| Philadelphia School District: | | | |
| Series 2019 A, 5% 9/1/34 (Assured Guaranty Muni. Corp. Insured) | | 3,675 | 4,052 |
| Series 2019 B, 5% 9/1/29 | | 3,070 | 3,419 |
| Series 2019 C, 5% 9/1/33 | | 11,245 | 12,497 |
| Philadelphia Wtr. & Wastewtr. Rev. Series 2022 C: | | | |
| 5% 6/1/35 | | 1,110 | 1,302 |
| 5% 6/1/36 | | 1,300 | 1,502 |
| 5% 6/1/37 | | 2,000 | 2,285 |
| 5% 6/1/38 | | 1,500 | 1,686 |
| 5% 6/1/39 | | 1,850 | 2,055 |
| Pittsburgh Wtr. & Swr. Auth. Wtr. & Swr. Sys. Rev.: | | | |
| Series 2019 A, 5% 9/1/38 (Assured Guaranty Muni. Corp. Insured) | | 570 | 627 |
| Series 2019 B: | | | |
5% 9/1/31 (Assured Guaranty Muni. Corp. Insured) | | 1,855 | 2,181 |
5% 9/1/33 (Assured Guaranty Muni. Corp. Insured) | | 1,250 | 1,518 |
| Southcentral Pennsylvania Gen. Auth. Rev. Series 2019 A: | | | |
| 5% 6/1/38 | | 2,890 | 3,104 |
| 5% 6/1/39 | | 4,690 | 5,015 |
| Southeastern Pennsylvania Trans. Auth. Rev. Series 2022: | | | |
| 5% 6/1/33 | | 1,000 | 1,188 |
| 5% 6/1/34 | | 1,000 | 1,185 |
| 5% 6/1/35 | | 1,750 | 2,068 |
| 5% 6/1/36 | | 2,500 | 2,934 |
| State Pub. School Bldg. Auth. Lease Rev. (The School District of Philadelphia Proj.) Series 2015 A, 5% 6/1/26 | | 1,345 | 1,378 |
TOTAL PENNSYLVANIA | | | 497,867 |
| Puerto Rico - 0.7% | | | |
| Puerto Rico Commonwealth Aqueduct & Swr. Auth.: | | | |
| Series 2020 A, 5% 7/1/35 (d) | | 1,500 | 1,514 |
| Series 2021 B, 5% 7/1/37 (d) | | 7,175 | 7,206 |
| Series 2022 A, 5% 7/1/37 (d) | | 3,620 | 3,637 |
| Puerto Rico Commonwealth Pub. Impt. Gen. Oblig.: | | | |
| Series 2021 A1: | | | |
0% 7/1/24 | | 2,040 | 2,000 |
4% 7/1/33 | | 27,122 | 26,555 |
4% 7/1/35 | | 9,725 | 9,403 |
5.625% 7/1/29 | | 4,097 | 4,444 |
| Series 2022 A1, 5.375% 7/1/25 | | 4,735 | 4,840 |
| Puerto Rico Sales Tax Fing. Corp. Sales Tax Rev.: | | | |
| Series 2018 A1, 4.55% 7/1/40 | | 1,450 | 1,457 |
| Series 2019 A2, 4.329% 7/1/40 | | 20,840 | 20,688 |
TOTAL PUERTO RICO | | | 81,744 |
| Rhode Island - 0.6% | | | |
| Rhode Island & Providence Plantations Series 2019 A, 4% 5/1/35 | | 2,160 | 2,271 |
| Rhode Island Gen. Oblig. Series 2022 A, 5% 8/1/35 | | 10,110 | 12,044 |
| Rhode Island Health & Edl. Bldg. Corp. Higher Ed. Facilities Rev.: | | | |
| Series 2016 B: | | | |
5% 9/1/31 | | 10,630 | 10,636 |
5% 9/1/36 | | 320 | 314 |
| Series 2016, 5% 5/15/39 | | 5,475 | 5,535 |
| Rhode Island Health & Edl. Bldg. Corp. Pub. Schools Rev. Series 2015, 5% 5/15/25 (Assured Guaranty Muni. Corp. Insured) | | 7,985 | 8,185 |
| Rhode Island Health and Edl. Bldg. Corp. Higher Ed. Facility Rev. Series 2023: | | | |
| 5% 11/1/33 | | 315 | 373 |
| 5% 11/1/34 | | 375 | 442 |
| 5% 11/1/35 | | 350 | 410 |
| 5% 11/1/37 | | 400 | 459 |
| 5% 11/1/38 | | 350 | 399 |
| 5% 11/1/39 | | 395 | 447 |
| 5% 11/1/40 | | 600 | 676 |
| Rhode Island Hsg. & Mtg. Fin. Corp. Series 2019 70, 4% 10/1/49 | | 1,155 | 1,155 |
| Rhode Island Student Ln. Auth. Student Ln. Rev.: | | | |
| Series 2022 A: | | | |
5% 12/1/26 (c) | | 2,100 | 2,199 |
5% 12/1/27 (c) | | 1,500 | 1,599 |
5% 12/1/28 (c) | | 1,750 | 1,892 |
5% 12/1/29 (c) | | 1,875 | 2,055 |
5% 12/1/30 (c) | | 1,125 | 1,236 |
5% 12/1/31 (c) | | 1,575 | 1,750 |
| Series 2023 A, 5% 12/1/32 (c) | | 5,100 | 5,665 |
| Series A: | | | |
3.5% 12/1/34 (c) | | 1,440 | 1,365 |
4% 12/1/26 (c) | | 520 | 522 |
5% 12/1/29 (c) | | 1,650 | 1,808 |
| Tobacco Settlement Fing. Corp. Series 2015 A: | | | |
| 5% 6/1/24 | | 5,085 | 5,113 |
| 5% 6/1/27 | | 1,770 | 1,806 |
| 5% 6/1/28 | | 2,330 | 2,378 |
TOTAL RHODE ISLAND | | | 72,734 |
| South Carolina - 1.0% | | | |
| Beaufort-Jasper Wtr. & Swr. Sys. Series 2016 B: | | | |
| 5% 3/1/24 | | 970 | 973 |
| 5% 3/1/25 | | 970 | 994 |
| Patriots Energy Group Fing. Agcy. Bonds: | | | |
| Series 2018 A, 4%, tender 2/1/24 (b) | | 23,815 | 23,827 |
| Series 2023 B1, 5.25%, tender 3/1/31 (b) | | 21,845 | 23,789 |
| Scago Edl. Facilities Corp. for Colleton School District (School District of Colleton County Proj.) Series 2015: | | | |
| 5% 12/1/27 | | 3,885 | 3,988 |
| 5% 12/1/29 | | 3,155 | 3,233 |
| South Carolina Hsg. Fin. & Dev. Auth. Mtg. Rev.: | | | |
| Series 2019 A, 4% 1/1/50 | | 2,230 | 2,233 |
| Series 2020 A, 4% 7/1/50 | | 2,265 | 2,266 |
| Series 2023 B, 6% 1/1/54 | | 3,900 | 4,340 |
| South Carolina Jobs-Econ. Dev. Auth.: | | | |
| (Anmed Health Proj.) Series 2016: | | | |
5% 2/1/24 | | 970 | 971 |
5% 2/1/26 | | 1,650 | 1,715 |
| (Anmed Heath Proj.) Series 2016, 5% 2/1/25 | | 1,700 | 1,731 |
| South Carolina Ports Auth. Ports Rev.: | | | |
| Series 2015 (AMT), 5% 7/1/45 (Pre-Refunded to 7/1/25 @ 100) (c) | | 1,000 | 1,025 |
| Series 2018: | | | |
5% 7/1/28 (c) | | 2,235 | 2,400 |
5% 7/1/30 (c) | | 4,790 | 5,132 |
5% 7/1/33 (c) | | 2,150 | 2,294 |
| South Carolina Pub. Svc. Auth. Rev.: | | | |
| Series 2014 C: | | | |
5% 12/1/25 | | 3,885 | 3,931 |
5% 12/1/26 | | 3,885 | 3,917 |
5% 12/1/27 | | 3,010 | 3,035 |
| Series 2016 B: | | | |
5% 12/1/35 | | 6,250 | 6,460 |
5% 12/1/36 | | 9,330 | 9,601 |
| Series 2022 E, 5.25% 12/1/33 (Assured Guaranty Muni. Corp. Insured) | | 1,200 | 1,402 |
| Series A: | | | |
4% 12/1/33 | | 900 | 932 |
4% 12/1/34 | | 4,000 | 4,133 |
4% 12/1/35 | | 500 | 514 |
4% 12/1/37 | | 2,000 | 2,038 |
5% 12/1/31 | | 2,800 | 3,138 |
TOTAL SOUTH CAROLINA | | | 120,012 |
| South Dakota - 0.1% | | | |
| South Dakota Health & Edl. Facilities Auth. Rev.: | | | |
| Series 2014 B: | | | |
5% 11/1/24 | | 1,200 | 1,217 |
5% 11/1/25 | | 1,175 | 1,190 |
5% 11/1/26 | | 195 | 198 |
| Series 2017: | | | |
5% 7/1/24 | | 435 | 439 |
5% 7/1/27 | | 365 | 391 |
5% 7/1/33 | | 1,700 | 1,817 |
5% 7/1/35 | | 1,360 | 1,449 |
| South Dakota Hsg. Dev. Auth.: | | | |
| Series 2023 G, 6.25% 5/1/55 | | 2,550 | 2,825 |
| Series A, 3% 11/1/51 | | 3,020 | 2,941 |
TOTAL SOUTH DAKOTA | | | 12,467 |
| Tennessee - 0.5% | | | |
| Chattanooga Health Ed. & Hsg. Facility Board Rev. Series 2019 A1, 4% 8/1/37 | | 3,040 | 3,083 |
| Greeneville Health & Edl. Facilities Board Series 2018 A: | | | |
| 5% 7/1/29 | | 970 | 1,042 |
| 5% 7/1/30 | | 1,165 | 1,250 |
| Knox County Health Edl. & Hsg. Facilities Board Rev.: | | | |
| Series 2016, 5% 9/1/24 | | 995 | 1,003 |
| Series 2017: | | | |
5% 4/1/24 | | 970 | 973 |
5% 4/1/25 | | 1,315 | 1,335 |
| Memphis-Shelby County Arpt. Auth. Arpt. Rev. Series 2020 B, 5% 7/1/25 (c) | | 1,000 | 1,022 |
| Metropolitan Nashville Arpt. Auth. Rev. Series 2019 B, 5% 7/1/44 (c) | | 1,190 | 1,247 |
| Nashville and Davidson County Metropolitan Govt. Gen. Oblig.: | | | |
| Series 2015 C, 5% 7/1/31 (Pre-Refunded to 7/1/25 @ 100) | | 3,370 | 3,480 |
| Series 2018, 4% 7/1/34 | | 6,000 | 6,258 |
| Series 2021 C, 3% 1/1/35 | | 1,100 | 1,076 |
| Tennergy Corp. Gas Rev. Bonds Series 2019 A, 5%, tender 10/1/24 (b) | | 18,440 | 18,600 |
| Tennessee Energy Acquisition Corp. Bonds Series 2018, 4%, tender 11/1/25 (b) | | 10,670 | 10,711 |
| Tennessee Hsg. Dev. Agcy. Residential: | | | |
| Series 2019 3: | | | |
2.6% 7/1/39 | | 1,040 | 859 |
2.8% 7/1/44 | | 1,265 | 1,006 |
| Series 2019 4, 2.9% 7/1/39 | | 750 | 652 |
| Series 2022 1, 3.75% 7/1/52 | | 6,065 | 6,018 |
| Williamson County Tenn Series 2017, 3.05% 4/1/34 | | 1,680 | 1,664 |
TOTAL TENNESSEE | | | 61,279 |
| Texas - 12.4% | | | |
| Argyle Independent School District Series 2022, 5% 8/15/34 | | 1,005 | 1,191 |
| Austin Arpt. Sys. Rev.: | | | |
| Series 2014: | | | |
5% 11/15/29 (c) | | 2,690 | 2,707 |
5% 11/15/34 (c) | | 1,750 | 1,759 |
| Series 2019 B: | | | |
5% 11/15/27 (c) | | 1,500 | 1,601 |
5% 11/15/28 (c) | | 2,250 | 2,438 |
5% 11/15/29 (c) | | 1,500 | 1,645 |
| Austin Gen. Oblig. Series 2022: | | | |
| 5% 9/1/34 | | 1,600 | 1,921 |
| 5% 9/1/35 | | 2,500 | 2,985 |
| 5% 9/1/36 | | 3,035 | 3,596 |
| Austin Independent School District: | | | |
| Series 2021: | | | |
4% 8/1/32 | | 8,300 | 9,009 |
4% 8/1/33 | | 9,255 | 10,018 |
4% 8/1/34 | | 10,590 | 11,451 |
4% 8/1/35 | | 7,215 | 7,754 |
| Series 2023: | | | |
5% 8/1/35 | | 2,000 | 2,397 |
5% 8/1/36 | | 2,000 | 2,378 |
5% 8/1/39 | | 1,795 | 2,078 |
| Austin Wtr. & Wastewtr. Sys. Rev. Series 2022: | | | |
| 5% 11/15/31 | | 1,000 | 1,175 |
| 5% 11/15/33 | | 650 | 774 |
| 5% 11/15/35 | | 1,000 | 1,177 |
| 5% 11/15/36 | | 1,000 | 1,169 |
| Birdville Independent School District: | | | |
| Series 2020, 2.375% 2/15/35 | | 1,575 | 1,426 |
| Series 2021, 5% 2/15/26 | | 2,225 | 2,329 |
| Board of Regents of The Texas A&M Univ. Sys. Permanent Univ. Fund Series 2023: | | | |
| 5% 7/1/37 | | 8,235 | 9,529 |
| 5% 7/1/38 | | 8,030 | 9,197 |
| Boerne Independent School District Bonds Series 2023, 3.125%, tender 2/1/27 (b) | | 5,625 | 5,639 |
| Brazos County Gen. Oblig. Series 2020, 2.125% 9/1/39 | | 1,515 | 1,108 |
| Brazosport Independent School District Series 2019, 2.125% 2/15/33 | | 3,495 | 3,133 |
| Cedar Park Series 2022, 5% 2/15/36 | | 1,245 | 1,425 |
| Central Reg'l. Mobility Auth.: | | | |
| Series 2015 A: | | | |
5% 1/1/31 (Pre-Refunded to 7/1/25 @ 100) | | 1,165 | 1,201 |
5% 1/1/34 (Pre-Refunded to 7/1/25 @ 100) | | 1,940 | 2,001 |
5% 1/1/40 (Pre-Refunded to 7/1/25 @ 100) | | 5,340 | 5,507 |
| Series 2020 E: | | | |
4% 1/1/34 | | 950 | 1,001 |
4% 1/1/36 | | 750 | 783 |
5% 1/1/30 | | 850 | 953 |
5% 1/1/32 | | 800 | 895 |
5% 1/1/35 | | 915 | 1,020 |
| Series 2020 G: | | | |
4% 1/1/34 | | 1,000 | 1,036 |
4% 1/1/35 | | 1,000 | 1,034 |
4% 1/1/36 | | 1,000 | 1,028 |
5% 1/1/28 | | 500 | 537 |
5% 1/1/29 | | 750 | 828 |
5% 1/1/30 | | 670 | 742 |
5% 1/1/31 | | 725 | 802 |
5% 1/1/32 | | 870 | 959 |
| Series 2021 B, 5% 1/1/35 | | 1,000 | 1,132 |
| City of Denton Series 2020: | | | |
| 2% 2/15/35 | | 1,430 | 1,205 |
| 2% 2/15/36 | | 1,465 | 1,205 |
| 2% 2/15/36 | | 2,670 | 2,197 |
| 2% 2/15/37 | | 510 | 412 |
| 2% 2/15/37 | | 1,495 | 1,194 |
| 2% 2/15/38 | | 1,255 | 969 |
| 2% 2/15/38 | | 1,525 | 1,178 |
| 2% 2/15/39 | | 1,560 | 1,168 |
| 2% 2/15/40 | | 1,585 | 1,153 |
| Clear Creek Independent School District Bonds Series 2013 B, 3.6%, tender 8/15/25 (b) | | 6,655 | 6,716 |
| Cypress-Fairbanks Independent School District: | | | |
| Series 2016: | | | |
5% 2/15/24 | | 24,410 | 24,466 |
5% 2/15/25 | | 20,810 | 21,311 |
5% 2/15/27 | | 3,475 | 3,651 |
| Series 2019 A, 3% 2/15/33 | | 5,000 | 4,976 |
| Series 2020, 4% 2/15/33 | | 1,425 | 1,515 |
| Dallas Area Rapid Transit Sales Tax Rev.: | | | |
| Series 2007, 5.25% 12/1/29 | | 7,135 | 8,261 |
| Series 2020 A: | | | |
5% 12/1/25 | | 750 | 783 |
5% 12/1/26 | | 1,000 | 1,072 |
| Dallas County Util. and Reclamation District Series 2013, 5% 2/15/24 | | 6,130 | 6,143 |
| Dallas Fort Worth Int'l. Arpt. Rev.: | | | |
| Series 2020 A: | | | |
5% 11/1/30 | | 3,090 | 3,580 |
5% 11/1/31 | | 1,300 | 1,505 |
5% 11/1/32 | | 2,000 | 2,314 |
5% 11/1/33 | | 2,000 | 2,312 |
| Series 2020 B, 4% 11/1/35 | | 7,865 | 8,313 |
| Dallas Gen. Oblig. Series 2019 B: | | | |
| 5% 2/15/30 | | 4,080 | 4,590 |
| 5% 2/15/32 | | 7,095 | 7,955 |
| 5% 2/15/33 | | 7,585 | 8,497 |
| Dallas Independent School District: | | | |
| Series 2019: | | | |
5% 2/15/28 | | 1,750 | 1,923 |
5% 2/15/29 | | 2,355 | 2,598 |
5% 2/15/30 | | 5,095 | 5,620 |
| Series 2021, 4% 2/15/26 | | 2,455 | 2,524 |
| Dallas Wtrwks. & Swr. Sys. Rev. Series 2021 C, 3% 10/1/36 | | 2,080 | 1,996 |
| Del Valle Independent School District Series 2021, 2% 6/15/36 | | 3,740 | 3,035 |
| Denton Independent School District: | | | |
| Bonds Series 2014 B: | | | |
2%, tender 8/1/24 (b) | | 7,120 | 7,069 |
2%, tender 8/1/24 (b) | | 1,395 | 1,387 |
2%, tender 8/1/24 (b) | | 670 | 666 |
| Series 2016, 0% 8/15/25 | | 2,770 | 2,645 |
| Eagle Mountain & Saginaw Independent School District Series 2022: | | | |
| 5% 8/15/33 | | 1,190 | 1,404 |
| 5% 8/15/34 | | 1,010 | 1,190 |
| 5% 8/15/35 | | 1,300 | 1,524 |
| 5% 8/15/36 | | 1,895 | 2,203 |
| El Paso Gen. Oblig. Series 2019 A: | | | |
| 5% 8/15/30 | | 5,100 | 5,612 |
| 5% 8/15/31 | | 3,610 | 3,970 |
| 5% 8/15/32 | | 3,620 | 3,974 |
| 5% 8/15/33 | | 5,890 | 6,454 |
| 5% 8/15/34 | | 2,945 | 3,220 |
| El Paso Wtr. & Swr. Rev. Series 2022: | | | |
| 5% 3/1/35 | | 7,140 | 8,176 |
| 5% 3/1/36 | | 5,835 | 6,645 |
| Elgin Independent School District Series 2022, 5% 8/1/30 | | 1,485 | 1,720 |
| Fort Bend Independent School District Bonds Series 2021 B, 0.72%, tender 8/1/26 (b) | | 8,400 | 7,922 |
| Fort Worth Gen. Oblig.: | | | |
| Series 2016, 5% 3/1/27 | | 5,755 | 6,024 |
| Series 2020, 5% 3/1/29 | | 4,200 | 4,725 |
| Series 2021: | | | |
2% 3/1/36 | | 6,480 | 5,325 |
2% 3/1/37 | | 6,480 | 5,307 |
| Fort Worth Independent School District: | | | |
| Series 2016, 5% 2/15/26 | | 3,530 | 3,703 |
| Series 2023: | | | |
5% 2/15/36 | | 440 | 521 |
5% 2/15/37 | | 900 | 1,057 |
5% 2/15/38 | | 1,125 | 1,305 |
5% 2/15/39 | | 1,700 | 1,962 |
| Fort Worth Wtr. & Swr. Rev. Series 2022, 5% 2/15/34 | | 2,135 | 2,483 |
| Frisco Texas Series 2022, 2% 2/15/37 | | 4,640 | 3,849 |
| Galveston Wharves &Term. Series 2023, 5% 8/1/35 (c) | | 1,185 | 1,298 |
| Garland Series 2021, 2% 2/15/39 | | 1,660 | 1,226 |
| Georgetown Util. Sys. Rev. Series 2022: | | | |
| 5% 8/15/31 (Assured Guaranty Muni. Corp. Insured) | | 1,375 | 1,580 |
| 5% 8/15/33 (Assured Guaranty Muni. Corp. Insured) | | 1,500 | 1,726 |
| 5% 8/15/35 (Assured Guaranty Muni. Corp. Insured) | | 1,700 | 1,943 |
| 5% 8/15/36 (Assured Guaranty Muni. Corp. Insured) | | 1,585 | 1,801 |
| Grand Parkway Trans. Corp.: | | | |
| Bonds Series 2023, 5%, tender 4/1/28 (b) | | 42,630 | 45,951 |
| Series 2018 A: | | | |
5% 10/1/31 | | 4,965 | 5,444 |
5% 10/1/32 | | 4,210 | 4,608 |
5% 10/1/33 | | 6,420 | 7,014 |
5% 10/1/34 | | 4,855 | 5,298 |
| Grand Prairie Series 2023: | | | |
| 4% 2/15/38 | | 1,755 | 1,825 |
| 4% 2/15/39 | | 1,465 | 1,515 |
| Harris County Cultural Ed. Facilities Fin. Corp. Rev.: | | | |
| Bonds: | | | |
Series 2019 B, 5%, tender 12/1/24 (b) | | 5,205 | 5,282 |
Series 2020 A, 0.9%, tender 5/15/25 (b) | | 5,000 | 4,798 |
| Series 2019 A: | | | |
4% 10/1/35 | | 1,750 | 1,797 |
4% 10/1/36 | | 3,000 | 3,054 |
| Harris County Flood Cont. District Series 2021 A: | | | |
| 4% 10/1/32 | | 5,130 | 5,522 |
| 4% 10/1/33 | | 6,045 | 6,483 |
| 4% 10/1/34 | | 4,995 | 5,332 |
| 4% 10/1/35 | | 3,400 | 3,601 |
| 4% 10/1/36 | | 3,920 | 4,117 |
| Harris County Gen. Oblig. Series 2022 A: | | | |
| 5% 8/15/31 | | 4,640 | 5,477 |
| 5% 8/15/32 | | 2,500 | 2,995 |
| Hays Consolidated Independent School District Series 2022: | | | |
| 4% 2/15/37 | | 1,000 | 1,062 |
| 5% 2/15/34 | | 1,000 | 1,165 |
| 5% 2/15/35 | | 1,650 | 1,914 |
| 5% 2/15/36 | | 2,250 | 2,593 |
| Houston Arpt. Sys. Rev.: | | | |
| Series 2018 A: | | | |
5% 7/1/26 (c) | | 1,635 | 1,701 |
5% 7/1/27 (c) | | 2,180 | 2,307 |
5% 7/1/28 (c) | | 970 | 1,044 |
| Series 2018 B: | | | |
5% 7/1/28 | | 3,110 | 3,442 |
5% 7/1/29 | | 12,140 | 13,422 |
5% 7/1/30 | | 6,385 | 7,028 |
| Series 2020 A: | | | |
4% 7/1/35 (c) | | 1,500 | 1,538 |
4% 7/1/39 (c) | | 1,895 | 1,907 |
| Series 2021 A: | | | |
4% 7/1/35 (c) | | 1,100 | 1,132 |
4% 7/1/36 (c) | | 2,180 | 2,228 |
4% 7/1/37 (c) | | 1,200 | 1,217 |
4% 7/1/38 (c) | | 1,750 | 1,775 |
4% 7/1/39 (c) | | 4,500 | 4,533 |
| Series 2023 A: | | | |
5% 7/1/36 (Assured Guaranty Muni. Corp. Insured) (c) | | 3,850 | 4,352 |
5% 7/1/37 (Assured Guaranty Muni. Corp. Insured) (c) | | 2,000 | 2,247 |
5.25% 7/1/39 (Assured Guaranty Muni. Corp. Insured) (c) | | 2,700 | 3,051 |
5.25% 7/1/40 (Assured Guaranty Muni. Corp. Insured) (c) | | 5,000 | 5,621 |
| Series 2023, 5% 7/1/38 (Assured Guaranty Muni. Corp. Insured) (c) | | 2,000 | 2,220 |
| Houston Convention and Entertainment Facilities Dept. Hotel Occupancy Tax and Spl. Rev. Series 2019: | | | |
| 5% 9/1/29 | | 1,000 | 1,093 |
| 5% 9/1/30 | | 1,250 | 1,365 |
| 5% 9/1/31 | | 1,650 | 1,800 |
| 5% 9/1/33 | | 1,535 | 1,673 |
| 5% 9/1/34 | | 1,250 | 1,361 |
| 5% 9/1/35 | | 1,700 | 1,845 |
| Houston Gen. Oblig. Series 2017 A: | | | |
| 5% 3/1/24 | | 9,710 | 9,739 |
| 5% 3/1/25 | | 4,080 | 4,176 |
| Houston Util. Sys. Rev.: | | | |
| Series 2014 C, 5% 5/15/28 | | 2,525 | 2,541 |
| Series 2016 B, 5% 11/15/33 | | 2,330 | 2,448 |
| Series 2020 C: | | | |
4% 11/15/35 | | 1,500 | 1,591 |
5% 11/15/30 | | 2,145 | 2,482 |
5% 11/15/31 | | 2,500 | 2,889 |
5% 11/15/32 | | 2,000 | 2,310 |
| Series 2021 A: | | | |
4% 11/15/35 | | 700 | 748 |
4% 11/15/36 | | 700 | 744 |
| Irving Hosp. Auth. Hosp. Rev. Series 2017 A: | | | |
| 5% 10/15/24 | | 485 | 492 |
| 5% 10/15/26 | | 680 | 707 |
| 5% 10/15/27 | | 485 | 505 |
| 5% 10/15/29 | | 630 | 656 |
| 5% 10/15/31 | | 990 | 1,025 |
| 5% 10/15/35 | | 1,425 | 1,470 |
| 5% 10/15/36 | | 3,115 | 3,203 |
| 5% 10/15/39 | | 1,215 | 1,237 |
| 5% 10/15/44 | | 1,440 | 1,459 |
| Lamar Consolidated Independent School District Series 2023: | | | |
| 5% 2/15/37 | | 2,000 | 2,327 |
| 5% 2/15/38 | | 1,750 | 2,002 |
| 5% 2/15/39 | | 5,000 | 5,688 |
| 5% 2/15/40 | | 2,765 | 3,128 |
| Love Field Arpt. Modernization Rev.: | | | |
| Series 2015: | | | |
5% 11/1/30 (c) | | 1,360 | 1,382 |
5% 11/1/31 (c) | | 5,730 | 5,822 |
5% 11/1/35 (c) | | 1,700 | 1,723 |
| Series 2017: | | | |
5% 11/1/26 (c) | | 1,000 | 1,047 |
5% 11/1/33 (c) | | 1,250 | 1,290 |
5% 11/1/34 (c) | | 2,925 | 3,016 |
5% 11/1/35 (c) | | 4,065 | 4,182 |
5% 11/1/36 (c) | | 5,170 | 5,304 |
| Series 2021: | | | |
4% 11/1/34 (Assured Guaranty Muni. Corp. Insured) (c) | | 6,245 | 6,465 |
4% 11/1/38 (Assured Guaranty Muni. Corp. Insured) (c) | | 1,500 | 1,518 |
5% 11/1/33 (Assured Guaranty Muni. Corp. Insured) (c) | | 16,660 | 18,720 |
| Lower Colorado River Auth. Rev.: | | | |
| (LCRA Transmission Svcs. Corp. Proj.): | | | |
Series 2018: | | | |
5% 5/15/32 | | 4,565 | 5,001 |
5% 5/15/34 | | 2,430 | 2,653 |
5% 5/15/36 | | 2,430 | 2,640 |
Series 2019: | | | |
5% 5/15/32 | | 1,500 | 1,674 |
5% 5/15/33 | | 2,250 | 2,507 |
5% 5/15/34 | | 2,250 | 2,500 |
5% 5/15/35 | | 5,575 | 6,176 |
5% 5/15/36 | | 1,075 | 1,188 |
Series 2021, 5% 5/15/25 | | 3,620 | 3,725 |
Series 2022 A: | | | |
5% 5/15/32 | | 395 | 464 |
5.25% 5/15/35 | | 1,500 | 1,766 |
| Series 2015 B: | | | |
5% 5/15/25 | | 6,615 | 6,806 |
5% 5/15/27 | | 2,915 | 2,981 |
5% 5/15/28 | | 2,845 | 2,909 |
5% 5/15/29 | | 8,255 | 8,440 |
| Series 2015 D, 5% 5/15/26 | | 1,360 | 1,390 |
| Series 2020, 5% 5/15/26 | | 3,350 | 3,531 |
| Lubbock County Tex Series 2023 A: | | | |
| 4% 2/15/39 | | 3,250 | 3,311 |
| 5% 2/15/35 | | 1,905 | 2,224 |
| 5% 2/15/37 | | 2,950 | 3,393 |
| 5% 2/15/38 | | 3,105 | 3,518 |
| Magnolia Independent School District Series 2023: | | | |
| 5% 8/15/38 | | 1,135 | 1,304 |
| 5% 8/15/39 | | 3,700 | 4,212 |
| Mansfield Tex Series 2020, 2.5% 2/15/39 | | 1,425 | 1,129 |
| McKinney Independent School District Series 2022, 5% 2/15/35 | | 1,295 | 1,488 |
| Midlothian Independent School District Bonds Series 2013 C, 2%, tender 8/1/24 (b) | | 4,160 | 4,130 |
| Midway Independent School District Series 2020, 4% 8/15/32 | | 1,500 | 1,586 |
| Mission Econ. Dev. Corp. Solid Waste Disp. Rev. Bonds (Waste Mgmt., Inc. Proj.) Series 2018, 0.000% x SIFMA Municipal Swap Index 4.245%, tender 1/4/24 (b)(c)(e) | | 1,145 | 1,139 |
| New Hope Cultural Ed. Facilities Fin. Corp. (Childrens Med. Ctr. of Dallas) Series 2017 A: | | | |
| 5% 8/15/24 | | 1,960 | 1,982 |
| 5% 8/15/25 | | 2,430 | 2,509 |
| 5% 8/15/26 | | 1,505 | 1,589 |
| 5% 8/15/27 | | 1,565 | 1,688 |
| 5% 8/15/30 | | 2,330 | 2,516 |
| Newark Higher Ed. Fin. Corp. (Abilene Christian Univ. Proj.) Series 2016 A: | | | |
| 5% 4/1/27 | | 2,135 | 2,222 |
| 5% 4/1/28 | | 1,395 | 1,454 |
| North East Texas Independent School District Bonds Series 2019, 2.2%, tender 8/1/24 (b) | | 4,310 | 4,265 |
| North Harris County Reg'l. Wtr. Auth. Series 2013, 4% 12/15/24 | | 1,770 | 1,771 |
| North Texas Muni. Wtr. District Upper East Fork Wastewtr. Interceptor Sys. Series 2021, 2% 6/1/39 | | 2,195 | 1,606 |
| North Texas Tollway Auth. Rev.: | | | |
| (Sr. Lien Proj.) Series 2017 A, 5% 1/1/33 | | 1,280 | 1,361 |
| (Sub Lien Proj.) Series 2017 B: | | | |
5% 1/1/30 | | 470 | 488 |
5% 1/1/31 | | 660 | 684 |
5% 1/1/32 | | 2,915 | 3,108 |
| Series 2014, 5% 1/1/24 | | 420 | 420 |
| Series 2015 B: | | | |
5% 1/1/29 | | 9,710 | 9,914 |
5% 1/1/30 | | 4,855 | 4,955 |
| Series 2019 A, 4% 1/1/36 | | 1,725 | 1,794 |
| Series 2019 B, 5% 1/1/25 | | 3,390 | 3,461 |
| Series 2020 A, 4% 1/1/37 | | 3,395 | 3,505 |
| Series 2021 B, 4% 1/1/39 | | 8,025 | 8,221 |
| Northside Independent School District Bonds Series 2019, 1.6%, tender 8/1/24 (b) | | 19,500 | 19,316 |
| Pasadena Independent School District Bonds Series 2015 B, 1.5%, tender 8/15/24 (b) | | 16,765 | 16,586 |
| Pearland Gen. Oblig. Series 2020, 5% 3/1/24 | | 1,975 | 1,981 |
| Pecos Barstow Toyah Independent School District Series 2023: | | | |
| 5% 2/15/31 | | 2,200 | 2,394 |
| 5% 2/15/32 | | 2,750 | 2,992 |
| 5% 2/15/33 | | 2,200 | 2,393 |
| Plano Gen. Oblig. Series 2018, 3.37% 9/1/37 | | 3,485 | 3,475 |
| Plano Independent School District Series 2023: | | | |
| 5% 2/15/34 | | 650 | 782 |
| 5% 2/15/35 | | 2,000 | 2,391 |
| 5% 2/15/36 | | 2,800 | 3,316 |
| 5% 2/15/37 | | 3,125 | 3,664 |
| 5% 2/15/38 | | 3,300 | 3,806 |
| Prosper Independent School District Series 2021 A: | | | |
| 3% 2/15/36 | | 4,780 | 4,669 |
| 3% 2/15/37 | | 1,370 | 1,308 |
| Rockwall Independent School District Series 2015, 0% 2/15/25 | | 1,615 | 1,559 |
| San Antonio Arpt. Sys. Rev. Series 2019 A: | | | |
| 5% 7/1/27 (c) | | 2,380 | 2,513 |
| 5% 7/1/28 (c) | | 1,085 | 1,168 |
| 5% 7/1/29 (c) | | 1,270 | 1,388 |
| 5% 7/1/29 (c) | | 3,200 | 3,486 |
| 5% 7/1/30 (c) | | 1,235 | 1,342 |
| 5% 7/1/30 (c) | | 1,510 | 1,641 |
| 5% 7/1/31 (c) | | 2,310 | 2,509 |
| 5% 7/1/31 (c) | | 1,250 | 1,358 |
| 5% 7/1/32 (c) | | 950 | 1,031 |
| 5% 7/1/32 (c) | | 1,195 | 1,297 |
| San Antonio Elec. & Gas Sys. Rev.: | | | |
| Series 2012, 5.25% 2/1/25 | | 3,110 | 3,188 |
| Series 2017: | | | |
5% 2/1/29 | | 1,455 | 1,572 |
5% 2/1/30 | | 970 | 1,046 |
5% 2/1/31 | | 1,455 | 1,566 |
5% 2/1/33 | | 1,165 | 1,249 |
| Series 2019, 5% 2/1/36 | | 5,980 | 6,709 |
| San Antonio Gen. Oblig. Series 2021, 4% 8/1/33 | | 3,145 | 3,358 |
| San Antonio Wtr. Sys. Rev.: | | | |
| Series 2019 C, 5% 5/15/34 | | 1,550 | 1,754 |
| Series 2022 A: | | | |
5% 5/15/40 | | 2,730 | 3,091 |
5% 5/15/41 | | 2,485 | 2,802 |
| Series 2022 B: | | | |
5% 5/15/32 | | 730 | 869 |
5% 5/15/33 | | 675 | 800 |
5% 5/15/35 | | 1,460 | 1,717 |
5% 5/15/36 | | 1,590 | 1,851 |
| Spring Branch Independent School District Series 2019, 3% 2/1/32 | | 5,315 | 5,330 |
| Tarrant County Cultural Ed. Facilities Fin. Corp. Hosp. Rev. Bonds (Baylor Scott & White Health Proj.) Series 2022 F, 5%, tender 11/15/30 (b) | | 8,030 | 9,013 |
| Tarrant County Cultural Ed. Facilities Fin. Corp. Retirement Facility Rev. (Barton Creek Sr. Living Ctr., Inc. Querencia Proj.) Series 2015, 5% 11/15/30 | | 6,130 | 6,070 |
| Tarrant County Cultural Ed. Facilities Fin. Corp. Rev.: | | | |
| Series 2016 A: | | | |
5% 2/15/25 | | 5,585 | 5,704 |
5% 2/15/34 | | 2,040 | 2,145 |
| Series 2018 B, 5% 7/1/43 | | 3,100 | 3,258 |
| Tarrant County Tex Hosp. District Series 2023: | | | |
| 5% 8/15/33 | | 1,105 | 1,299 |
| 5.25% 8/15/35 | | 1,635 | 1,941 |
| 5.25% 8/15/36 | | 1,000 | 1,179 |
| 5.25% 8/15/37 | | 1,000 | 1,169 |
| 5.25% 8/15/38 | | 1,220 | 1,410 |
| 5.25% 8/15/39 | | 1,750 | 2,008 |
| Texas A&M Univ. Rev.: | | | |
| Series 2021 A, 4% 5/15/34 | | 1,000 | 1,081 |
| Series 2022: | | | |
5% 5/15/32 | | 1,000 | 1,197 |
5% 5/15/33 | | 1,000 | 1,186 |
5% 5/15/34 | | 1,250 | 1,479 |
5% 5/15/35 | | 1,000 | 1,179 |
| Texas Dept. of Hsg. & Cmnty. Affairs Multi-family Hsg. Rev. Series 2019, 2.95% 7/1/36 | | 6,221 | 5,594 |
| Texas Dept. of Hsg. & Cmnty. Affairs Residential Mtg. Rev. Series 2023 B, 6% 1/1/54 | | 16,235 | 18,072 |
| Texas Dept. of Hsg. & Cmnty. Affairs Single Family Mtg. Rev. Series 2019 A, 4% 3/1/50 | | 4,545 | 4,550 |
| Texas Gen. Oblig.: | | | |
| Series 2013 B, 5% 8/1/25 (c) | | 11,725 | 11,740 |
| Series 2014, 5% 8/1/26 (c) | | 5,020 | 5,063 |
| Series 2016, 5.5% 8/1/26 (c) | | 3,750 | 3,973 |
| Series 2017, 3% 8/1/34 (c) | | 2,755 | 2,683 |
| Series 2020 A, 4% 8/1/32 (c) | | 1,700 | 1,788 |
| Series 2020 B: | | | |
4% 8/1/28 (c) | | 4,340 | 4,522 |
4% 8/1/29 (c) | | 5,605 | 5,887 |
4% 8/1/30 (c) | | 5,885 | 6,227 |
4% 8/1/31 (c) | | 6,180 | 6,581 |
| Series 2021 A: | | | |
5% 8/1/30 (c) | | 5,720 | 6,394 |
5% 8/1/31 (c) | | 6,175 | 6,991 |
5% 8/1/32 (c) | | 6,480 | 7,326 |
5% 8/1/33 (c) | | 4,805 | 5,425 |
| Series 2021 B, 5% 8/1/32 (c) | | 4,915 | 5,631 |
| Texas Muni. Gas Acquisition & Su Bonds Series 2023 B, 5.5%, tender 1/1/34 (b) | | 4,835 | 5,373 |
| Texas Muni. Pwr. Agcy. Rev. Series 2021, 3% 9/1/34 (Assured Guaranty Muni. Corp. Insured) | | 1,125 | 1,084 |
| Texas Private Activity Bond Surface Trans. Corp.: | | | |
| (LBJ Infrastructure Group LLC I-635 Managed Lanes Proj.) Series 2020 A: | | | |
4% 6/30/33 | | 2,750 | 2,842 |
4% 12/31/33 | | 1,710 | 1,767 |
4% 6/30/34 | | 4,000 | 4,123 |
4% 12/31/34 | | 4,000 | 4,119 |
4% 6/30/35 | | 4,000 | 4,103 |
4% 6/30/36 | | 1,290 | 1,317 |
4% 12/31/36 | | 2,965 | 3,028 |
| Series 2023: | | | |
5% 6/30/34 (c) | | 2,110 | 2,258 |
5% 12/31/34 (c) | | 2,655 | 2,834 |
5.125% 6/30/35 (c) | | 2,185 | 2,343 |
5.125% 12/31/35 (c) | | 2,095 | 2,242 |
5.25% 6/30/36 (c) | | 2,310 | 2,477 |
5.25% 12/31/36 (c) | | 1,965 | 2,105 |
5.375% 6/30/37 (c) | | 1,275 | 1,368 |
| Texas Pub. Fin. Auth. Lease Rev. Series 2019: | | | |
| 5% 2/1/24 | | 1,130 | 1,132 |
| 5% 2/1/26 | | 2,600 | 2,725 |
| 5% 2/1/27 | | 2,500 | 2,685 |
| 5% 2/1/28 | | 1,315 | 1,445 |
| Texas State Univ. Sys. Fing. Rev. Series 2017 A, 5% 3/15/29 | | 4,530 | 4,877 |
| Texas Trans. Commission Hwy. Impt. Gen. Oblig. Bonds Series 2014 B, 0.65%, tender 4/1/26 (b) | | 44,145 | 41,046 |
| Texas Wtr. Dev. Board Rev.: | | | |
| Series 2017 A: | | | |
5% 4/15/25 | | 6,055 | 6,229 |
5% 4/15/26 | | 4,195 | 4,423 |
5% 4/15/29 | | 6,310 | 6,885 |
5% 4/15/30 | | 16,995 | 18,527 |
| Series 2018 A, 4% 10/15/32 | | 7,000 | 7,311 |
| Series 2018 B: | | | |
4% 10/15/36 | | 9,840 | 10,185 |
5% 4/15/29 | | 2,750 | 3,062 |
5% 10/15/29 | | 2,250 | 2,505 |
5% 10/15/30 | | 3,240 | 3,601 |
5% 4/15/31 | | 5,000 | 5,555 |
| Series 2019 A, 5% 4/15/32 | | 3,805 | 4,322 |
| Series 2019: | | | |
5% 8/1/30 | | 8,650 | 9,817 |
5% 8/1/31 | | 4,500 | 5,096 |
5% 8/1/32 | | 3,000 | 3,394 |
5% 8/1/33 | | 3,450 | 3,900 |
5% 8/1/34 | | 4,500 | 5,079 |
5% 8/1/35 | | 5,500 | 6,191 |
| Series 2020, 5% 8/1/30 | | 3,210 | 3,717 |
| Series 2021, 4% 8/1/35 | | 6,945 | 7,488 |
| Series 2022: | | | |
5% 4/15/32 | | 1,000 | 1,190 |
5% 10/15/32 | | 1,350 | 1,621 |
5% 4/15/33 | | 850 | 1,019 |
5% 10/15/33 | | 1,300 | 1,558 |
| Travis County Gen. Oblig.: | | | |
| Series 2016 A, 5% 3/1/24 | | 2,905 | 2,914 |
| Series 2019 A: | | | |
5% 3/1/34 | | 5,645 | 6,290 |
5% 3/1/35 | | 17,080 | 18,976 |
5% 3/1/36 | | 5,000 | 5,534 |
| Travis County Hsg. Fin. Corp. Bonds Series 2023, 3.75%, tender 8/1/25 (b) | | 2,230 | 2,238 |
| Univ. of Houston Univ. Revs.: | | | |
| Series 2017 A, 5% 2/15/30 | | 6,325 | 6,611 |
| Series 2021 A, 2% 2/15/33 | | 4,105 | 3,650 |
| Univ. of North Texas Univ. Rev. Series 2022 A: | | | |
| 5% 4/15/32 | | 540 | 637 |
| 5% 4/15/33 | | 520 | 610 |
| 5% 4/15/34 | | 720 | 844 |
| 5% 4/15/35 | | 755 | 882 |
| 5% 4/15/36 | | 720 | 835 |
| 5% 4/15/37 | | 950 | 1,093 |
| 5% 4/15/38 | | 1,095 | 1,249 |
| 5% 4/15/39 | | 1,190 | 1,348 |
| Univ. of Texas Board of Regents Sys. Rev. Series 2019 A, 5% 8/15/29 | | 3,060 | 3,487 |
| Univ. of Texas Permanent Univ. Fund Rev.: | | | |
| Series 2016 B, 5% 7/1/29 | | 1,740 | 1,831 |
| Series 2023 A: | | | |
5% 7/1/32 | | 13,135 | 15,784 |
5% 7/1/33 | | 9,375 | 11,454 |
| Waco Gen. Oblig.: | | | |
| Series 2020: | | | |
2% 2/1/33 | | 3,330 | 2,912 |
2.125% 2/1/35 | | 2,240 | 1,933 |
2.375% 2/1/38 | | 1,675 | 1,419 |
2.375% 2/1/39 | | 3,800 | 3,154 |
| Series 2023 A, 4% 2/1/39 | | 3,990 | 4,153 |
| Wichita Falls Independent School District Series 2021, 4% 2/1/24 | | 1,000 | 1,001 |
| Willis Independent School District Series 2021, 2% 2/15/36 | | 1,700 | 1,414 |
TOTAL TEXAS | | | 1,423,757 |
| Utah - 0.3% | | | |
| Intermountain Pwr. Agcy. Pwr. Supply Rev. Series 2022 A, 4% 7/1/36 | | 4,890 | 5,242 |
| Salt Lake City Arpt. Rev.: | | | |
| Series 2017 A: | | | |
5% 7/1/26 (c) | | 1,120 | 1,166 |
5% 7/1/28 (c) | | 3,885 | 4,106 |
5% 7/1/32 (c) | | 1,215 | 1,281 |
| Series 2018 A: | | | |
5% 7/1/29 (c) | | 1,500 | 1,616 |
5% 7/1/30 (c) | | 1,345 | 1,443 |
| Series 2021 A, 4% 7/1/38 (c) | | 5,000 | 5,026 |
| Series 2023 A: | | | |
5.25% 7/1/36 (c) | | 1,500 | 1,731 |
5.25% 7/1/39 (c) | | 1,500 | 1,680 |
5.25% 7/1/40 (c) | | 2,125 | 2,365 |
| Salt Lake Gen. Oblig. Series 2021: | | | |
| 3% 6/15/37 | | 1,055 | 1,022 |
| 3% 6/15/38 | | 1,085 | 1,021 |
| 3% 6/15/39 | | 1,120 | 1,038 |
| Weber School District Utah (Utah School District Bond Guaranty Prog.) Series 2019: | | | |
| 2.375% 6/15/35 | | 1,825 | 1,642 |
| 2.375% 6/15/36 | | 1,150 | 1,016 |
TOTAL UTAH | | | 31,395 |
| Vermont - 0.0% | | | |
| Vermont Student Assistant Corp. Ed. Ln. Rev. Series 2017 A, 5% 6/15/27 (c) | | 1,590 | 1,677 |
| Virginia - 1.9% | | | |
| Arlington County IDA Hosp. Facilities: | | | |
| Bonds Series 2023 A, 5%, tender 7/1/31 (b) | | 13,255 | 14,735 |
| Series 2020: | | | |
5% 7/1/27 | | 120 | 128 |
5% 7/1/28 | | 1,175 | 1,280 |
5% 7/1/30 | | 1,265 | 1,423 |
5% 7/1/32 | | 1,005 | 1,124 |
| Chesapeake Wtr. & Swr. Sys. Series 2021, 2% 7/1/37 | | 1,395 | 1,124 |
| Chesapeake Gen. Oblig. Series 2020 A: | | | |
| 5% 8/1/31 | | 1,500 | 1,748 |
| 5% 8/1/32 | | 1,500 | 1,745 |
| 5% 8/1/33 | | 1,500 | 1,742 |
| Fairfax County Redev. & Hsg. Auth. Rev. Bonds (Dominion Square North Proj.) Series 2023, 5%, tender 1/1/28 (b) | | 4,440 | 4,696 |
| Fredericksburg Econ. Dev. Auth. Rev. Series 2014: | | | |
| 5% 6/15/27 | | 1,260 | 1,268 |
| 5% 6/15/29 | | 1,385 | 1,395 |
| 5% 6/15/33 | | 1,475 | 1,484 |
| Hampton Roads Trans. Accountability Commission: | | | |
| Series 2018 A, 5.5% 7/1/57 (Pre-Refunded to 1/1/28 @ 100) | | 3,725 | 4,173 |
| Series 2021 A, 5% 7/1/26 (Escrowed to Maturity) | | 28,000 | 29,464 |
| Henrico County Series 2020 A, 2% 8/1/32 | | 1,095 | 984 |
| Manassas Series 2021: | | | |
| 1.75% 1/1/35 | | 2,615 | 2,170 |
| 1.75% 1/1/36 | | 2,640 | 2,139 |
| 2% 1/1/34 | | 2,555 | 2,232 |
| Norfolk Econ. Dev. Auth. Hosp. Facilities Rev. Bonds Series 2018 A, 5%, tender 11/1/28 (b) | | 1,455 | 1,602 |
| Stafford County Econ. Dev. Auth. Hosp. Facilities Rev. Series 2016: | | | |
| 4% 6/15/37 | | 615 | 617 |
| 5% 6/15/32 | | 1,750 | 1,811 |
| 5% 6/15/34 | | 2,235 | 2,304 |
| Virginia College Bldg. Auth. Edl. Facilities Rev.: | | | |
| (21st Century College and Equip. Progs.): | | | |
Series 2017 C, 5% 2/1/26 | | 5,540 | 5,825 |
Series 2017 E, 5% 2/1/31 | | 10,295 | 11,338 |
Series 2020 A: | | | |
5% 2/1/34 | | 1,050 | 1,204 |
5% 2/1/35 | | 2,500 | 2,865 |
Series 2021 A, 3% 2/1/39 | | 2,670 | 2,438 |
| (Virginia Gen. Oblig.) Series 2017 E, 5% 2/1/30 | | 8,875 | 9,793 |
| Series 2017 C, 4% 2/1/34 | | 6,890 | 7,136 |
| Series 2019 A, 3% 2/1/36 | | 3,445 | 3,361 |
| Virginia College Bldg. Auth. Edl. Facilities Rev. Rfdg. (Pub. Higher Ed. Fing. Prog.) Series 2023 A, 4% 9/1/41 | | 4,100 | 4,239 |
| Virginia Commonwealth Trans. Board Rev.: | | | |
| (Virginia Gen. Oblig. Proj.) Series 2017 A, 5% 5/15/29 | | 6,160 | 6,740 |
| Series 2022, 4% 5/15/33 | | 6,530 | 7,222 |
| Virginia Small Bus. Fing. Auth.: | | | |
| (95 Express Lanes LLC Proj.) Series 2022: | | | |
4% 1/1/39 (c) | | 1,850 | 1,808 |
4% 7/1/39 (c) | | 2,750 | 2,685 |
4% 1/1/40 (c) | | 3,200 | 3,105 |
5% 7/1/33 (c) | | 5,765 | 6,323 |
5% 7/1/36 (c) | | 2,875 | 3,110 |
5% 1/1/37 (c) | | 6,265 | 6,752 |
| (Elizabeth River Crossings OpCo, LLC Proj.) Series 2022: | | | |
4% 7/1/33 (c) | | 1,590 | 1,620 |
4% 7/1/35 (c) | | 2,540 | 2,571 |
4% 1/1/36 (c) | | 3,000 | 3,032 |
4% 1/1/37 (c) | | 4,500 | 4,512 |
4% 1/1/38 (c) | | 4,750 | 4,690 |
4% 1/1/39 (c) | | 4,000 | 3,930 |
4% 1/1/40 (c) | | 3,500 | 3,424 |
| Series 2020 A: | | | |
5% 1/1/28 | | 1,100 | 1,153 |
5% 1/1/29 | | 1,400 | 1,484 |
5% 1/1/30 | | 1,600 | 1,710 |
| Virginia St Pub. School Auth. Spl. O Series 2023: | | | |
| 5% 8/1/36 | | 1,000 | 1,206 |
| 5% 8/1/37 | | 5,090 | 6,076 |
| 5% 8/1/38 | | 2,370 | 2,796 |
| 5% 8/1/39 | | 2,510 | 2,942 |
| Winchester Econ. Dev. Auth. Series 2015: | | | |
| 5% 1/1/32 | | 1,940 | 2,005 |
| 5% 1/1/33 | | 2,515 | 2,599 |
TOTAL VIRGINIA | | | 213,082 |
| Washington - 2.5% | | | |
| Chelan County Pub. Util. District #1 Columbia River-Rock Island Hydro-Elec. Sys. Rev. Series 1997 A, 0% 6/1/24 (Nat'l. Pub. Fin. Guarantee Corp. Insured) | | 1,990 | 1,965 |
| Energy Northwest Elec. Rev. Series 2022 A, 5% 7/1/33 | | 5,750 | 6,904 |
| King County Gen. Oblig. Series 2021 A: | | | |
| 2% 1/1/36 | | 1,100 | 926 |
| 2% 1/1/37 | | 965 | 790 |
| King County Highline School District # 401 Series 2023: | | | |
| 5% 12/1/38 | | 1,750 | 2,042 |
| 5% 12/1/39 | | 2,750 | 3,189 |
| 5% 12/1/40 | | 3,200 | 3,685 |
| King County Wash Hsg. Auth. Afford (Kirkland Heights Proj.): | | | |
| Series 2023 A1, 5% 1/1/28 | | 3,120 | 3,230 |
| Series 2023 A2, 5% 1/1/28 | | 1,555 | 1,641 |
| Port of Seattle Rev.: | | | |
| Series 2013, 5% 7/1/24 (c) | | 1,075 | 1,076 |
| Series 2016 B: | | | |
5% 10/1/26 (c) | | 3,625 | 3,762 |
5% 10/1/29 (c) | | 4,615 | 4,769 |
| Series 2016: | | | |
5% 2/1/27 | | 1,205 | 1,257 |
5% 2/1/29 | | 2,430 | 2,533 |
| Series 2018 A: | | | |
5% 5/1/29 (c) | | 1,515 | 1,593 |
5% 5/1/37 (c) | | 2,290 | 2,375 |
| Series 2019, 5% 4/1/28 (c) | | 2,250 | 2,411 |
| Seattle Hsg. Auth. Rev. (Northgate Plaza Proj.) Series 2021, 1% 6/1/26 | | 4,345 | 4,069 |
| Seattle Muni. Lt. & Pwr. Rev. Series 2021 A, 4% 7/1/35 | | 8,490 | 9,132 |
| Tacoma Elec. Sys. Rev. Series 2017: | | | |
| 5% 1/1/29 | | 1,050 | 1,121 |
| 5% 1/1/36 | | 1,140 | 1,206 |
| Tobacco Settlement Auth. Rev. Series 2018, 5% 6/1/24 | | 3,430 | 3,432 |
| Washington Convention Ctr. Pub. Facilities: | | | |
| Series 2021 B, 3% 7/1/43 | | 2,150 | 1,752 |
| Series 2021, 4% 7/1/31 | | 40,650 | 40,461 |
| Washington Gen. Oblig.: | | | |
| Series 2018 A, 5% 8/1/32 | | 14,420 | 15,545 |
| Series 2018 C, 5% 8/1/30 | | 6,665 | 7,202 |
| Series 2018 D: | | | |
5% 8/1/32 | | 24,300 | 26,197 |
5% 8/1/33 | | 30,735 | 33,123 |
| Series 2019 B, 5% 6/1/34 | | 3,300 | 3,638 |
| Series 2020 C, 5% 2/1/37 | | 9,530 | 10,750 |
| Series 2021 A, 5% 6/1/38 | | 2,250 | 2,523 |
| Series 2021 B, 5% 6/1/37 | | 1,390 | 1,573 |
| Series 2022 A, 5% 8/1/36 | | 7,250 | 8,560 |
| Series 2022 C, 4% 7/1/35 | | 9,630 | 10,479 |
| Series 2022 D, 4% 7/1/35 | | 4,120 | 4,483 |
| Series 2023 A, 5% 8/1/35 | | 1,435 | 1,707 |
| Series 2023 B, 5% 2/1/39 | | 1,275 | 1,475 |
| Series R-2017 A: | | | |
5% 8/1/28 | | 1,735 | 1,837 |
5% 8/1/30 | | 1,735 | 1,833 |
| Washington Health Care Facilities Auth. Rev.: | | | |
| (Overlake Hosp. Med. Ctr., WA. Proj.) Series 2017 B: | | | |
5% 7/1/25 | | 240 | 243 |
5% 7/1/26 | | 1,935 | 1,981 |
5% 7/1/29 | | 3,100 | 3,233 |
5% 7/1/34 | | 610 | 633 |
5% 7/1/42 | | 5,305 | 5,404 |
| (Providence Health Systems Proj.) Series 2018 B: | | | |
5% 10/1/27 | | 2,430 | 2,587 |
5% 10/1/28 | | 2,045 | 2,215 |
| (Virginia Mason Med. Ctr. Proj.) Series 2017: | | | |
5% 8/15/25 | | 1,300 | 1,325 |
5% 8/15/26 | | 1,175 | 1,211 |
5% 8/15/28 | | 3,825 | 4,001 |
| (Virginia Mason Med. Ctr. Proj.) Series 2017, 5% 8/15/31 | | 5,780 | 6,019 |
| Series 2015, 5% 1/1/29 (Pre-Refunded to 7/1/25 @ 100) | | 1,260 | 1,298 |
| Series 2017, 5% 8/15/32 | | 1,520 | 1,580 |
| Series 2019 A1: | | | |
5% 8/1/31 | | 1,000 | 1,094 |
5% 8/1/35 | | 1,500 | 1,629 |
| Series 2019 A2, 5% 8/1/44 | | 5,995 | 6,243 |
| Washington Higher Ed. Facilities Auth. Rev.: | | | |
| (Whitworth Univ. Proj.): | | | |
Series 2016 A: | | | |
5% 10/1/29 | | 550 | 573 |
5% 10/1/31 | | 2,635 | 2,738 |
5% 10/1/33 | | 560 | 581 |
Series 2019, 4% 10/1/49 | | 5,235 | 4,622 |
| Series 2016 A, 5% 10/1/30 | | 2,510 | 2,612 |
TOTAL WASHINGTON | | | 288,068 |
| West Virginia - 0.0% | | | |
| West Virginia Hosp. Fin. Auth. Hosp. Rev. Series 2018 A, 5% 1/1/36 | | 3,000 | 3,071 |
| Wisconsin - 1.7% | | | |
| Blue Ridge Healthcare Pub. Fin. Auth. Series 2020 A: | | | |
| 5% 1/1/31 | | 1,050 | 1,135 |
| 5% 1/1/34 | | 1,000 | 1,075 |
| 5% 1/1/38 | | 1,050 | 1,103 |
| Howard Suamico Scd Series 2021, 2% 3/1/37 | | 4,410 | 3,570 |
| Kohler Wis School District Series 2021: | | | |
| 2% 3/1/35 | | 1,135 | 967 |
| 2% 3/1/36 | | 1,160 | 965 |
| 2% 3/1/37 | | 1,180 | 954 |
| Madison Gen. Oblig. Series 2020 B: | | | |
| 2% 10/1/31 | | 1,130 | 1,017 |
| 2% 10/1/33 | | 1,130 | 988 |
| Marathon County Wis Series 2021 B, 2.125% 2/1/41 | | 1,600 | 1,136 |
| Pub. Fin. Auth. Edl. Facilities Series 2022 A, 5.25% 3/1/42 | | 5,655 | 5,916 |
| Pub. Fin. Auth. Hosp. Rev.: | | | |
| (Renown Reg'l. Med. Ctr. Proj.) Series 2020 A, 4% 6/1/45 | | 14,900 | 13,899 |
| Series 2019 A, 5% 10/1/44 | | 3,600 | 3,760 |
| Pub. Fin. Auth. Sr. Living Rev. (Mary's Woods At Marylhurst, Inc. Proj.) Series 2017 A: | | | |
| 5% 5/15/30 (d) | | 1,135 | 1,110 |
| 5.25% 5/15/37 (d) | | 535 | 514 |
| 5.25% 5/15/42 (d) | | 420 | 390 |
| 5.25% 5/15/47 (d) | | 420 | 379 |
| 5.25% 5/15/52 (d) | | 790 | 697 |
| Pub. Fin. Auth. Wisconsin Retirement Facility Rev. Series 2018: | | | |
| 5% 10/1/43 (d) | | 1,420 | 1,238 |
| 5% 10/1/48 (d) | | 1,480 | 1,244 |
| 5% 10/1/53 (d) | | 3,010 | 2,469 |
| Roseman Univ. of Health: | | | |
| Series 2018 A, 5.35% 12/1/45 | | 9,015 | 9,158 |
| Series 2020: | | | |
5% 4/1/30 (d) | | 400 | 405 |
5% 4/1/30 (Escrowed to Maturity) (d) | | 100 | 110 |
| Wisconsin Ctr. District Tax Rev.: | | | |
| Series 2020 C: | | | |
0% 12/15/29 (Assured Guaranty Muni. Corp. Insured) | | 1,050 | 870 |
0% 12/15/31 (Assured Guaranty Muni. Corp. Insured) | | 1,350 | 1,039 |
0% 12/15/32 (Assured Guaranty Muni. Corp. Insured) | | 1,400 | 1,037 |
0% 12/15/33 (Assured Guaranty Muni. Corp. Insured) | | 1,350 | 961 |
0% 12/15/34 (Assured Guaranty Muni. Corp. Insured) | | 1,250 | 854 |
| Series 2020 D: | | | |
0% 12/15/28 (Assured Guaranty Muni. Corp. Insured) | | 255 | 219 |
0% 12/15/29 (Assured Guaranty Muni. Corp. Insured) | | 390 | 323 |
0% 12/15/31 (Assured Guaranty Muni. Corp. Insured) | | 1,000 | 770 |
| Wisconsin Gen. Oblig.: | | | |
| Series 2021 2, 5% 5/1/25 | | 5,270 | 5,429 |
| Series 2021 A: | | | |
5% 5/1/32 | | 7,920 | 8,761 |
5% 5/1/34 | | 10,820 | 11,981 |
5% 5/1/35 | | 11,365 | 12,582 |
| Series 2022 4: | | | |
5% 5/1/34 | | 3,000 | 3,592 |
5% 5/1/35 | | 3,000 | 3,569 |
| Series A, 5% 5/1/30 | | 2,915 | 3,064 |
| Wisconsin Health & Edl. Facilities: | | | |
| Bonds Series 2018 C1, 5%, tender 7/29/26 (b) | | 2,515 | 2,628 |
| Series 2014 A: | | | |
5% 11/15/24 | | 8,510 | 8,609 |
5% 11/15/27 | | 6,515 | 6,613 |
| Series 2014: | | | |
5% 5/1/26 | | 810 | 814 |
5% 5/1/28 | | 1,750 | 1,759 |
5% 5/1/29 | | 865 | 870 |
| Series 2015, 5% 12/15/27 | | 1,175 | 1,194 |
| Series 2016, 4% 2/15/38 (Pre-Refunded to 8/15/25 @ 100) | | 1,260 | 1,275 |
| Series 2017 A: | | | |
4% 4/1/39 | | 5,325 | 5,302 |
5% 9/1/34 (Pre-Refunded to 9/1/27 @ 100) | | 1,800 | 1,945 |
5% 9/1/36 (Pre-Refunded to 9/1/27 @ 100) | | 2,100 | 2,269 |
| Series 2019 B1, 2.825% 11/1/28 | | 1,850 | 1,660 |
| Series 2019: | | | |
5% 12/15/31 | | 1,000 | 1,096 |
5% 12/15/32 | | 1,750 | 1,915 |
5% 12/15/34 | | 1,720 | 1,869 |
| Wisconsin Health & Edl. Facilities Auth. Rev.: | | | |
| Series 2012: | | | |
5% 6/1/27 | | 1,750 | 1,752 |
5% 6/1/32 | | 995 | 996 |
5% 6/1/39 | | 2,345 | 2,346 |
| Series 2021, 3% 10/15/37 | | 7,850 | 6,995 |
| Wisconsin Hsg. & Econ. Dev. Auth.: | | | |
| Series 2021 A, 3% 3/1/52 | | 3,790 | 3,661 |
| Series A, 3.5% 9/1/50 | | 6,470 | 6,396 |
| Wisconsin Hsg. & Econ. Dev. Auth. Hsg. Rev. Bonds Series 2021 C: | | | |
| 0.61%, tender 5/1/24 (b) | | 985 | 971 |
| 0.81%, tender 5/1/25 (b) | | 3,800 | 3,632 |
| Wisconsin St Gen. Fund Annual Appropriation Series 2019 A: | | | |
| 5% 5/1/26 (Escrowed to Maturity) | | 8,580 | 9,053 |
| 5% 5/1/27 (Escrowed to Maturity) | | 12,590 | 13,630 |
TOTAL WISCONSIN | | | 198,500 |
| Wyoming - 0.0% | | | |
| Laramie County Hosp. Rev. (Cheyenne Reg'l. Med. Ctr. Proj.) Series 2021, 4% 5/1/24 | | 250 | 251 |
| TOTAL MUNICIPAL BONDS (Cost $10,984,448) | | | 10,880,359 |
| | | | |
| Municipal Notes - 0.7% |
| | | Principal Amount (a) (000s) | Value ($) (000s) |
| Georgia - 0.1% | | | |
| Bartow County Dev. Auth. (Georgia Pwr. Co. Plant Bowen Proj.) Series 2022, 4.3% 1/2/24, VRDN (b)(c) | | 7,100 | 7,100 |
| Kentucky - 0.4% | | | |
| Meade County Indl. Bldg. Rev. (Nucor Steel Brandenburg Proj.): | | | |
| Series 2020 A1, 5.1% 1/2/24, VRDN (b)(c) | | 34,000 | 34,000 |
| Series 2020 B1, 5.1% 1/2/24, VRDN (b)(c) | | 18,600 | 18,600 |
TOTAL KENTUCKY | | | 52,600 |
| North Carolina - 0.2% | | | |
| Hertford County Indl. Facilities Poll. Cont. Fing. Auth. (Nucor Corp. Proj.) Series 2000 A, 4.55% 1/5/24, VRDN (b)(c) | | 19,500 | 19,500 |
| Vermont - 0.0% | | | |
| Vermont Hsg. Fin. Agcy. Multi-family Participating VRDN Series Floater MIZ 91 46, 4.42% 1/2/24 (Liquidity Facility Mizuho Cap. Markets LLC) (b)(g)(h) | | 6,647 | 6,647 |
| TOTAL MUNICIPAL NOTES (Cost $85,847) | | | 85,847 |
| | | | |
| Money Market Funds - 3.9% |
| | | Shares | Value ($) (000s) |
Fidelity Municipal Cash Central Fund 4.24% (i)(j) (Cost $454,138) | | 454,065,143 | 454,142 |
| | | | |
| TOTAL INVESTMENT IN SECURITIES - 99.0% (Cost $11,524,433) | 11,420,348 |
NET OTHER ASSETS (LIABILITIES) - 1.0% | 111,526 |
| NET ASSETS - 100.0% | 11,531,874 |
| | |
Security Type Abbreviations
| VRDN | - | VARIABLE RATE DEMAND NOTE (A debt instrument that is payable upon demand, either daily, weekly or monthly) |
Any values shown as $0 in the Schedule of Investments may reflect amounts less than $500.
Legend
| (a) | Amount is stated in United States dollars unless otherwise noted. |
| (b) | Coupon rates for floating and adjustable rate securities reflect the rates in effect at period end. |
| (c) | Private activity obligations whose interest is subject to the federal alternative minimum tax for individuals. |
| (d) | Security exempt from registration under Rule 144A of the Securities Act of 1933. These securities may be resold in transactions exempt from registration, normally to qualified institutional buyers. At the end of the period, the value of these securities amounted to $91,248,000 or 0.8% of net assets. |
| (e) | Coupon is indexed to a floating interest rate which may be multiplied by a specified factor and/or subject to caps or floors. |
| (f) | Security or a portion of the security purchased on a delayed delivery or when-issued basis. |
| (g) | Provides evidence of ownership in one or more underlying municipal bonds. |
| (h) | Coupon rates are determined by re-marketing agents based on current market conditions. |
| (i) | Information in this report regarding holdings by state and security types does not reflect the holdings of the Fidelity Municipal Cash Central Fund. |
| (j) | Affiliated fund that is generally available only to investment companies and other accounts managed by Fidelity Investments. The rate quoted is the annualized seven-day yield of the fund at period end. A complete unaudited listing of the fund's holdings as of its most recent quarter end is available upon request. In addition, each Fidelity Central Fund's financial statements, which are not covered by the Fund's Report of Independent Registered Public Accounting Firm, are available on the SEC's website or upon request. |
Affiliated Central Funds
Fiscal year to date information regarding the Fund's investments in Fidelity Central Funds, including the ownership percentage, is presented below.
| Affiliate (Amounts in thousands) | Value, beginning of period ($) | Purchases ($) | Sales Proceeds ($) | Dividend Income ($) | Realized Gain (loss) ($) | Change in Unrealized appreciation (depreciation) ($) | Value, end of period ($) | % ownership, end of period |
| Fidelity Municipal Cash Central Fund 4.24% | 382,515 | 1,854,630 | 1,783,015 | 12,360 | - | 12 | 454,142 | 18.4% |
| Total | 382,515 | 1,854,630 | 1,783,015 | 12,360 | - | 12 | 454,142 | |
| | | | | | | | | |
Amounts in the dividend income column in the above table include any capital gain distributions from underlying funds, which are presented in the corresponding line item in the Statement of Operations, if applicable.
Amounts included in the purchases and sales proceeds columns may include in-kind transactions, if applicable.
Investment Valuation
The following is a summary of the inputs used, as of December 31, 2023, involving the Fund's assets and liabilities carried at fair value. The inputs or methodology used for valuing securities may not be an indication of the risk associated with investing in those securities. For more information on valuation inputs, and their aggregation into the levels used below, please refer to the Investment Valuation section in the accompanying Notes to Financial Statements.
| Valuation Inputs at Reporting Date: |
Description (Amounts in thousands) | Total ($) | Level 1 ($) | Level 2 ($) | Level 3 ($) |
Investments in Securities: | | | | |
|
| Municipal Securities | 10,966,206 | - | 10,966,206 | - |
|
| Money Market Funds | 454,142 | 454,142 | - | - |
| Total Investments in Securities: | 11,420,348 | 454,142 | 10,966,206 | - |
| Statement of Assets and Liabilities |
| Amounts in thousands (except per-share amounts) | | | | December 31, 2023 |
| | | | | |
| Assets | | | | |
| Investment in securities, at value - See accompanying schedule: | | | | |
Unaffiliated issuers (cost $11,070,295) | $ | 10,966,206 | | |
Fidelity Central Funds (cost $454,138) | | 454,142 | | |
| | | | | |
| | | | | |
| Total Investment in Securities (cost $11,524,433) | | | $ | 11,420,348 |
| Cash | | | | 110 |
| Receivable for fund shares sold | | | | 13,789 |
| Interest receivable | | | | 136,371 |
| Distributions receivable from Fidelity Central Funds | | | | 1,185 |
| Prepaid expenses | | | | 10 |
| Other receivables | | | | 42 |
Total assets | | | | 11,571,855 |
| Liabilities | | | | |
| Payable for investments purchased on a delayed delivery basis | $ | 17,486 | | |
| Payable for fund shares redeemed | | 10,761 | | |
| Distributions payable | | 8,116 | | |
| Accrued management fee | | 2,342 | | |
| Distribution and service plan fees payable | | 34 | | |
| Other affiliated payables | | 940 | | |
| Other payables and accrued expenses | | 302 | | |
| Total Liabilities | | | | 39,981 |
| Net Assets | | | $ | 11,531,874 |
| Net Assets consist of: | | | | |
| Paid in capital | | | $ | 11,672,727 |
| Total accumulated earnings (loss) | | | | (140,853) |
| Net Assets | | | $ | 11,531,874 |
| | | | | |
| Net Asset Value and Maximum Offering Price | | | | |
| Class A : | | | | |
Net Asset Value and redemption price per share ($113,907 ÷ 11,171 shares)(a) | | | $ | 10.20 |
| Maximum offering price per share (100/96.00 of $10.20) | | | $ | 10.63 |
| Class M : | | | | |
Net Asset Value and redemption price per share ($11,713 ÷ 1,149 shares)(a) | | | $ | 10.19 |
| Maximum offering price per share (100/96.00 of $10.19) | | | $ | 10.61 |
| Class C : | | | | |
Net Asset Value and offering price per share ($9,789 ÷ 960 shares)(a) | | | $ | 10.20 |
| Intermediate Municipal Income : | | | | |
Net Asset Value, offering price and redemption price per share ($4,695,105 ÷ 460,783 shares) | | | $ | 10.19 |
| Class I : | | | | |
Net Asset Value, offering price and redemption price per share ($1,587,677 ÷ 155,574 shares) | | | $ | 10.21 |
| Class Z : | | | | |
Net Asset Value, offering price and redemption price per share ($5,113,683 ÷ 500,908 shares) | | | $ | 10.21 |
(a)Redemption price per share is equal to net asset value less any applicable contingent deferred sales charge. |
| Statement of Operations |
| Amounts in thousands | | | | Year ended December 31, 2023 |
| Investment Income | | | | |
| Interest | | | $ | 303,620 |
| Income from Fidelity Central Funds | | | | 12,360 |
| Total Income | | | | 315,980 |
| Expenses | | | | |
| Management fee | $ | 26,641 | | |
| Transfer agent fees | | 10,077 | | |
| Distribution and service plan fees | | 418 | | |
| Accounting fees and expenses | | 908 | | |
| Custodian fees and expenses | | 96 | | |
| Independent trustees' fees and expenses | | 39 | | |
| Registration fees | | 369 | | |
| Audit | | 63 | | |
| Legal | | 12 | | |
| Miscellaneous | | 117 | | |
| Total expenses before reductions | | 38,740 | | |
| Expense reductions | | (9) | | |
| Total expenses after reductions | | | | 38,731 |
| Net Investment income (loss) | | | | 277,249 |
| Realized and Unrealized Gain (Loss) | | | | |
| Net realized gain (loss) on: | | | | |
| Investment Securities: | | | | |
| Unaffiliated issuers | | (23,082) | | |
| Total net realized gain (loss) | | | | (23,082) |
| Change in net unrealized appreciation (depreciation) on: | | | | |
| Investment Securities: | | | | |
| Unaffiliated issuers | | 337,653 | | |
| Fidelity Central Funds | | 12 | | |
| Total change in net unrealized appreciation (depreciation) | | | | 337,665 |
| Net gain (loss) | | | | 314,583 |
| Net increase (decrease) in net assets resulting from operations | | | $ | 591,832 |
| Statement of Changes in Net Assets |
| |
| Amount in thousands | | Year ended December 31, 2023 | | Year ended December 31, 2022 |
| Increase (Decrease) in Net Assets | | | | |
| Operations | | | | |
| Net investment income (loss) | $ | 277,249 | $ | 207,940 |
| Net realized gain (loss) | | (23,082) | | (16,455) |
| Change in net unrealized appreciation (depreciation) | | 337,665 | | (850,798) |
| Net increase (decrease) in net assets resulting from operations | | 591,832 | | (659,313) |
| Distributions to shareholders | | (275,015) | | (208,771) |
| | | | | |
| Share transactions - net increase (decrease) | | 558,009 | | 929,890 |
| Total increase (decrease) in net assets | | 874,826 | | 61,806 |
| | | | | |
| Net Assets | | | | |
| Beginning of period | | 10,657,048 | | 10,595,242 |
| End of period | $ | 11,531,874 | $ | 10,657,048 |
| | | | | |
| | | | | |
Financial Highlights
| Fidelity Advisor® Intermediate Municipal Income Fund Class A |
| |
| Years ended December 31, | | 2023 | | 2022 | | 2021 | | 2020 | | 2019 |
Selected Per-Share Data | | | | | | | | | | |
| Net asset value, beginning of period | $ | 9.90 | $ | 10.79 | $ | 10.87 | $ | 10.64 | $ | 10.25 |
| Income from Investment Operations | | | | | | | | | | |
Net investment income (loss) A,B | | .217 | | .173 | | .157 | | .191 | | .220 |
| Net realized and unrealized gain (loss) | | .298 | | (.890) | | (.059) | | .241 | | .411 |
| Total from investment operations | | .515 | | (.717) | | .098 | | .432 | | .631 |
| Distributions from net investment income | | (.215) | | (.172) | | (.158) | | (.191) | | (.220) |
| Distributions from net realized gain | | - | | (.001) | | (.020) | | (.011) | | (.021) |
| Total distributions | | (.215) | | (.173) | | (.178) | | (.202) | | (.241) |
| Net asset value, end of period | $ | 10.20 | $ | 9.90 | $ | 10.79 | $ | 10.87 | $ | 10.64 |
Total Return C,D | | 5.28% | | (6.65)% | | .91% | | 4.11% | | 6.20% |
Ratios to Average Net Assets B,E,F | | | | | | | | | | |
| Expenses before reductions | | .68% | | .67% | | .64% | | .66% | | .67% |
| Expenses net of fee waivers, if any | | .68% | | .67% | | .64% | | .66% | | .67% |
| Expenses net of all reductions | | .68% | | .67% | | .64% | | .66% | | .67% |
| Net investment income (loss) | | 2.18% | | 1.71% | | 1.46% | | 1.79% | | 2.09% |
| Supplemental Data | | | | | | | | | | |
| Net assets, end of period (in millions) | $ | 114 | $ | 112 | $ | 166 | $ | 121 | $ | 110 |
Portfolio turnover rate G | | 14% | | 20% | | 11% | | 18% | | 14% |
ACalculated based on average shares outstanding during the period.
BNet investment income (loss) is affected by the timing of the declaration of dividends by any underlying mutual funds or exchange-traded funds (ETFs). Net investment income (loss) of any mutual funds or ETFs is not included in the Fund's net investment income (loss) ratio.
CTotal returns would have been lower if certain expenses had not been reduced during the applicable periods shown.
DTotal returns do not include the effect of the sales charges.
EFees and expenses of any underlying mutual funds or exchange-traded funds (ETFs) are not included in the Fund's expense ratio. The Fund indirectly bears its proportionate share of these expenses. For additional expense information related to investments in Fidelity Central Funds, please refer to the "Investments in Fidelity Central Funds" note found in the Notes to Financial Statements section of the most recent Annual or Semi-Annual report.
FExpense ratios reflect operating expenses of the class. Expenses before reductions do not reflect amounts reimbursed, waived, or reduced through arrangements with the investment adviser, brokerage services, or other offset arrangements, if applicable, and do not represent the amount paid by the class during periods when reimbursements, waivers or reductions occur.
GAmount does not include the portfolio activity of any underlying mutual funds or exchange-traded funds (ETFs).
| Fidelity Advisor® Intermediate Municipal Income Fund Class M |
| |
| Years ended December 31, | | 2023 | | 2022 | | 2021 | | 2020 | | 2019 |
Selected Per-Share Data | | | | | | | | | | |
| Net asset value, beginning of period | $ | 9.90 | $ | 10.78 | $ | 10.87 | $ | 10.63 | $ | 10.24 |
| Income from Investment Operations | | | | | | | | | | |
Net investment income (loss) A,B | | .221 | | .178 | | .162 | | .195 | | .223 |
| Net realized and unrealized gain (loss) | | .288 | | (.880) | | (.070) | | .251 | | .411 |
| Total from investment operations | | .509 | | (.702) | | .092 | | .446 | | .634 |
| Distributions from net investment income | | (.219) | | (.177) | | (.162) | | (.195) | | (.223) |
| Distributions from net realized gain | | - | | (.001) | | (.020) | | (.011) | | (.021) |
| Total distributions | | (.219) | | (.178) | | (.182) | | (.206) | | (.244) |
| Net asset value, end of period | $ | 10.19 | $ | 9.90 | $ | 10.78 | $ | 10.87 | $ | 10.63 |
Total Return C,D | | 5.21% | | (6.51)% | | .85% | | 4.24% | | 6.24% |
Ratios to Average Net Assets B,E,F | | | | | | | | | | |
| Expenses before reductions | | .64% | | .61% | | .60% | | .63% | | .64% |
| Expenses net of fee waivers, if any | | .64% | | .61% | | .60% | | .63% | | .64% |
| Expenses net of all reductions | | .64% | | .61% | | .60% | | .63% | | .64% |
| Net investment income (loss) | | 2.22% | | 1.77% | | 1.49% | | 1.82% | | 2.12% |
| Supplemental Data | | | | | | | | | | |
| Net assets, end of period (in millions) | $ | 12 | $ | 12 | $ | 11 | $ | 15 | $ | 20 |
Portfolio turnover rate G | | 14% | | 20% | | 11% | | 18% | | 14% |
ACalculated based on average shares outstanding during the period.
BNet investment income (loss) is affected by the timing of the declaration of dividends by any underlying mutual funds or exchange-traded funds (ETFs). Net investment income (loss) of any mutual funds or ETFs is not included in the Fund's net investment income (loss) ratio.
CTotal returns would have been lower if certain expenses had not been reduced during the applicable periods shown.
DTotal returns do not include the effect of the sales charges.
EFees and expenses of any underlying mutual funds or exchange-traded funds (ETFs) are not included in the Fund's expense ratio. The Fund indirectly bears its proportionate share of these expenses. For additional expense information related to investments in Fidelity Central Funds, please refer to the "Investments in Fidelity Central Funds" note found in the Notes to Financial Statements section of the most recent Annual or Semi-Annual report.
FExpense ratios reflect operating expenses of the class. Expenses before reductions do not reflect amounts reimbursed, waived, or reduced through arrangements with the investment adviser, brokerage services, or other offset arrangements, if applicable, and do not represent the amount paid by the class during periods when reimbursements, waivers or reductions occur.
GAmount does not include the portfolio activity of any underlying mutual funds or exchange-traded funds (ETFs).
| Fidelity Advisor® Intermediate Municipal Income Fund Class C |
| |
| Years ended December 31, | | 2023 | | 2022 | | 2021 | | 2020 | | 2019 |
Selected Per-Share Data | | | | | | | | | | |
| Net asset value, beginning of period | $ | 9.91 | $ | 10.79 | $ | 10.88 | $ | 10.65 | $ | 10.25 |
| Income from Investment Operations | | | | | | | | | | |
Net investment income (loss) A,B | | .147 | | .102 | | .079 | | .112 | | .142 |
| Net realized and unrealized gain (loss) | | .288 | | (.880) | | (.070) | | .241 | | .420 |
| Total from investment operations | | .435 | | (.778) | | .009 | | .353 | | .562 |
| Distributions from net investment income | | (.145) | | (.101) | | (.079) | | (.112) | | (.141) |
| Distributions from net realized gain | | - | | (.001) | | (.020) | | (.011) | | (.021) |
| Total distributions | | (.145) | | (.102) | | (.099) | | (.123) | | (.162) |
| Net asset value, end of period | $ | 10.20 | $ | 9.91 | $ | 10.79 | $ | 10.88 | $ | 10.65 |
Total Return C,D | | 4.43% | | (7.21)% | | .09% | | 3.34% | | 5.52% |
Ratios to Average Net Assets B,E,F | | | | | | | | | | |
| Expenses before reductions | | 1.38% | | 1.37% | | 1.37% | | 1.40% | | 1.42% |
| Expenses net of fee waivers, if any | | 1.38% | | 1.37% | | 1.37% | | 1.40% | | 1.42% |
| Expenses net of all reductions | | 1.38% | | 1.37% | | 1.37% | | 1.40% | | 1.42% |
| Net investment income (loss) | | 1.47% | | 1.01% | | .72% | | 1.05% | | 1.34% |
| Supplemental Data | | | | | | | | | | |
| Net assets, end of period (in millions) | $ | 10 | $ | 11 | $ | 16 | $ | 27 | $ | 34 |
Portfolio turnover rate G | | 14% | | 20% | | 11% | | 18% | | 14% |
ACalculated based on average shares outstanding during the period.
BNet investment income (loss) is affected by the timing of the declaration of dividends by any underlying mutual funds or exchange-traded funds (ETFs). Net investment income (loss) of any mutual funds or ETFs is not included in the Fund's net investment income (loss) ratio.
CTotal returns would have been lower if certain expenses had not been reduced during the applicable periods shown.
DTotal returns do not include the effect of the contingent deferred sales charge.
EFees and expenses of any underlying mutual funds or exchange-traded funds (ETFs) are not included in the Fund's expense ratio. The Fund indirectly bears its proportionate share of these expenses. For additional expense information related to investments in Fidelity Central Funds, please refer to the "Investments in Fidelity Central Funds" note found in the Notes to Financial Statements section of the most recent Annual or Semi-Annual report.
FExpense ratios reflect operating expenses of the class. Expenses before reductions do not reflect amounts reimbursed, waived, or reduced through arrangements with the investment adviser, brokerage services, or other offset arrangements, if applicable, and do not represent the amount paid by the class during periods when reimbursements, waivers or reductions occur.
GAmount does not include the portfolio activity of any underlying mutual funds or exchange-traded funds (ETFs).
| Fidelity® Intermediate Municipal Income Fund |
| |
| Years ended December 31, | | 2023 | | 2022 | | 2021 | | 2020 | | 2019 |
Selected Per-Share Data | | | | | | | | | | |
| Net asset value, beginning of period | $ | 9.90 | $ | 10.78 | $ | 10.87 | $ | 10.63 | $ | 10.24 |
| Income from Investment Operations | | | | | | | | | | |
Net investment income (loss) A,B | | .248 | | .204 | | .192 | | .225 | | .254 |
| Net realized and unrealized gain (loss) | | .288 | | (.880) | | (.069) | | .251 | | .411 |
| Total from investment operations | | .536 | | (.676) | | .123 | | .476 | | .665 |
| Distributions from net investment income | | (.246) | | (.203) | | (.193) | | (.225) | | (.254) |
| Distributions from net realized gain | | - | | (.001) | | (.020) | | (.011) | | (.021) |
| Total distributions | | (.246) | | (.204) | | (.213) | | (.236) | | (.275) |
| Net asset value, end of period | $ | 10.19 | $ | 9.90 | $ | 10.78 | $ | 10.87 | $ | 10.63 |
Total Return C | | 5.51% | | (6.27)% | | 1.14% | | 4.54% | | 6.55% |
Ratios to Average Net Assets B,D,E | | | | | | | | | | |
| Expenses before reductions | | .36% | | .35% | | .32% | | .34% | | .35% |
| Expenses net of fee waivers, if any | | .36% | | .35% | | .32% | | .34% | | .35% |
| Expenses net of all reductions | | .36% | | .35% | | .32% | | .34% | | .35% |
| Net investment income (loss) | | 2.50% | | 2.03% | | 1.77% | | 2.11% | | 2.41% |
| Supplemental Data | | | | | | | | | | |
| Net assets, end of period (in millions) | $ | 4,695 | $ | 4,758 | $ | 5,501 | $ | 4,666 | $ | 4,621 |
Portfolio turnover rate F | | 14% | | 20% | | 11% | | 18% | | 14% |
ACalculated based on average shares outstanding during the period.
BNet investment income (loss) is affected by the timing of the declaration of dividends by any underlying mutual funds or exchange-traded funds (ETFs). Net investment income (loss) of any mutual funds or ETFs is not included in the Fund's net investment income (loss) ratio.
CTotal returns would have been lower if certain expenses had not been reduced during the applicable periods shown.
DFees and expenses of any underlying mutual funds or exchange-traded funds (ETFs) are not included in the Fund's expense ratio. The Fund indirectly bears its proportionate share of these expenses. For additional expense information related to investments in Fidelity Central Funds, please refer to the "Investments in Fidelity Central Funds" note found in the Notes to Financial Statements section of the most recent Annual or Semi-Annual report.
EExpense ratios reflect operating expenses of the class. Expenses before reductions do not reflect amounts reimbursed, waived, or reduced through arrangements with the investment adviser, brokerage services, or other offset arrangements, if applicable, and do not represent the amount paid by the class during periods when reimbursements, waivers or reductions occur.
FAmount does not include the portfolio activity of any underlying mutual funds or exchange-traded funds (ETFs).
| Fidelity Advisor® Intermediate Municipal Income Fund Class I |
| |
| Years ended December 31, | | 2023 | | 2022 | | 2021 | | 2020 | | 2019 |
Selected Per-Share Data | | | | | | | | | | |
| Net asset value, beginning of period | $ | 9.91 | $ | 10.80 | $ | 10.88 | $ | 10.65 | $ | 10.26 |
| Income from Investment Operations | | | | | | | | | | |
Net investment income (loss) A,B | | .241 | | .197 | | .185 | | .217 | | .246 |
| Net realized and unrealized gain (loss) | | .298 | | (.889) | | (.060) | | .242 | | .411 |
| Total from investment operations | | .539 | | (.692) | | .125 | | .459 | | .657 |
| Distributions from net investment income | | (.239) | | (.197) | | (.185) | | (.218) | | (.246) |
| Distributions from net realized gain | | - | | (.001) | | (.020) | | (.011) | | (.021) |
| Total distributions | | (.239) | | (.198) | | (.205) | | (.229) | | (.267) |
| Net asset value, end of period | $ | 10.21 | $ | 9.91 | $ | 10.80 | $ | 10.88 | $ | 10.65 |
Total Return C | | 5.53% | | (6.41)% | | 1.16% | | 4.36% | | 6.45% |
Ratios to Average Net Assets B,D,E | | | | | | | | | | |
| Expenses before reductions | | .43% | | .42% | | .39% | | .41% | | .43% |
| Expenses net of fee waivers, if any | | .43% | | .42% | | .39% | | .41% | | .43% |
| Expenses net of all reductions | | .43% | | .42% | | .39% | | .41% | | .43% |
| Net investment income (loss) | | 2.42% | | 1.96% | | 1.70% | | 2.03% | | 2.33% |
| Supplemental Data | | | | | | | | | | |
| Net assets, end of period (in millions) | $ | 1,588 | $ | 1,288 | $ | 1,221 | $ | 1,363 | $ | 1,238 |
Portfolio turnover rate F | | 14% | | 20% | | 11% | | 18% | | 14% |
ACalculated based on average shares outstanding during the period.
BNet investment income (loss) is affected by the timing of the declaration of dividends by any underlying mutual funds or exchange-traded funds (ETFs). Net investment income (loss) of any mutual funds or ETFs is not included in the Fund's net investment income (loss) ratio.
CTotal returns would have been lower if certain expenses had not been reduced during the applicable periods shown.
DFees and expenses of any underlying mutual funds or exchange-traded funds (ETFs) are not included in the Fund's expense ratio. The Fund indirectly bears its proportionate share of these expenses. For additional expense information related to investments in Fidelity Central Funds, please refer to the "Investments in Fidelity Central Funds" note found in the Notes to Financial Statements section of the most recent Annual or Semi-Annual report.
EExpense ratios reflect operating expenses of the class. Expenses before reductions do not reflect amounts reimbursed, waived, or reduced through arrangements with the investment adviser, brokerage services, or other offset arrangements, if applicable, and do not represent the amount paid by the class during periods when reimbursements, waivers or reductions occur.
FAmount does not include the portfolio activity of any underlying mutual funds or exchange-traded funds (ETFs).
| Fidelity Advisor® Intermediate Municipal Income Fund Class Z |
| |
| Years ended December 31, | | 2023 | | 2022 | | 2021 | | 2020 | | 2019 |
Selected Per-Share Data | | | | | | | | | | |
| Net asset value, beginning of period | $ | 9.92 | $ | 10.80 | $ | 10.89 | $ | 10.65 | $ | 10.26 |
| Income from Investment Operations | | | | | | | | | | |
Net investment income (loss) A,B | | .254 | | .209 | | .198 | | .230 | | .258 |
| Net realized and unrealized gain (loss) | | .288 | | (.879) | | (.069) | | .252 | | .412 |
| Total from investment operations | | .542 | | (.670) | | .129 | | .482 | | .670 |
| Distributions from net investment income | | (.252) | | (.209) | | (.199) | | (.231) | | (.259) |
| Distributions from net realized gain | | - | | (.001) | | (.020) | | (.011) | | (.021) |
| Total distributions | | (.252) | | (.210) | | (.219) | | (.242) | | (.280) |
| Net asset value, end of period | $ | 10.21 | $ | 9.92 | $ | 10.80 | $ | 10.89 | $ | 10.65 |
Total Return C | | 5.56% | | (6.20)% | | 1.19% | | 4.59% | | 6.59% |
Ratios to Average Net Assets B,D,E | | | | | | | | | | |
| Expenses before reductions | | .31% | | .29% | | .27% | | .29% | | .30% |
| Expenses net of fee waivers, if any | | .31% | | .29% | | .27% | | .29% | | .30% |
| Expenses net of all reductions | | .31% | | .29% | | .27% | | .29% | | .30% |
| Net investment income (loss) | | 2.55% | | 2.09% | | 1.83% | | 2.16% | | 2.46% |
| Supplemental Data | | | | | | | | | | |
| Net assets, end of period (in millions) | $ | 5,114 | $ | 4,476 | $ | 3,680 | $ | 2,923 | $ | 1,756 |
Portfolio turnover rate F | | 14% | | 20% | | 11% | | 18% | | 14% |
ACalculated based on average shares outstanding during the period.
BNet investment income (loss) is affected by the timing of the declaration of dividends by any underlying mutual funds or exchange-traded funds (ETFs). Net investment income (loss) of any mutual funds or ETFs is not included in the Fund's net investment income (loss) ratio.
CTotal returns would have been lower if certain expenses had not been reduced during the applicable periods shown.
DFees and expenses of any underlying mutual funds or exchange-traded funds (ETFs) are not included in the Fund's expense ratio. The Fund indirectly bears its proportionate share of these expenses. For additional expense information related to investments in Fidelity Central Funds, please refer to the "Investments in Fidelity Central Funds" note found in the Notes to Financial Statements section of the most recent Annual or Semi-Annual report.
EExpense ratios reflect operating expenses of the class. Expenses before reductions do not reflect amounts reimbursed, waived, or reduced through arrangements with the investment adviser, brokerage services, or other offset arrangements, if applicable, and do not represent the amount paid by the class during periods when reimbursements, waivers or reductions occur.
FAmount does not include the portfolio activity of any underlying mutual funds or exchange-traded funds (ETFs).
For the period ended December 31, 2023
(Amounts in thousands except percentages)
1. Organization.
Fidelity Intermediate Municipal Income Fund (the Fund) is a fund of Fidelity School Street Trust (the Trust) and is authorized to issue an unlimited number of shares. The Trust is registered under the Investment Company Act of 1940, as amended (the 1940 Act), as an open-end management investment company organized as a Massachusetts business trust. The Fund offers Class A, Class M, Class C, Intermediate Municipal Income, Class I and Class Z shares, each of which has equal rights as to assets and voting privileges. Class A, Class M, Class C, Class I and Class Z are Fidelity Advisor classes. Each class has exclusive voting rights with respect to matters that affect that class. Class C shares will automatically convert to Class A shares after a holding period of eight years from the initial date of purchase, with certain exceptions.
2. Investments in Fidelity Central Funds.
Funds may invest in Fidelity Central Funds, which are open-end investment companies generally available only to other investment companies and accounts managed by the investment adviser and its affiliates. The Schedule of Investments lists any Fidelity Central Funds held as an investment as of period end, but does not include the underlying holdings of each Fidelity Central Fund. An investing fund indirectly bears its proportionate share of the expenses of the underlying Fidelity Central Funds.
Based on its investment objective, each Fidelity Central Fund may invest or participate in various investment vehicles or strategies that are similar to those of the investing fund. These strategies are consistent with the investment objectives of the investing fund and may involve certain economic risks which may cause a decline in value of each of the Fidelity Central Funds and thus a decline in the value of the investing fund.
| Fidelity Central Fund | Investment Manager | Investment Objective | Investment Practices | Expense RatioA |
| Fidelity Money Market Central Funds | Fidelity Management & Research Company LLC (FMR) | Each fund seeks to obtain a high level of current income consistent with the preservation of capital and liquidity. | Short-term Investments | Less than .005% |
A Expenses expressed as a percentage of average net assets and are as of each underlying Central Fund's most recent annual or semi-annual shareholder report.
A complete unaudited list of holdings for each Fidelity Central Fund is available upon request or at the Securities and Exchange Commission website at www.sec.gov. In addition, the financial statements of the Fidelity Central Funds which contain the significant accounting policies (including investment valuation policies) of those funds, and are not covered by the Report of Independent Registered Public Accounting Firm, are available on the Securities and Exchange Commission website or upon request.
3. Significant Accounting Policies.
The Fund is an investment company and applies the accounting and reporting guidance of the Financial Accounting Standards Board (FASB) Accounting Standards Codification Topic 946 Financial Services - Investment Companies. The financial statements have been prepared in conformity with accounting principles generally accepted in the United States of America (GAAP), which require management to make certain estimates and assumptions at the date of the financial statements. Actual results could differ from those estimates. Subsequent events, if any, through the date that the financial statements were issued have been evaluated in the preparation of the financial statements. The Fund's Schedule of Investments lists any underlying mutual funds or exchange-traded funds (ETFs) but does not include the underlying holdings of these funds. The following summarizes the significant accounting policies of the Fund:
Investment Valuation. Investments are valued as of 4:00 p.m. Eastern time on the last calendar day of the period. The Board of Trustees (the Board) has designated the Fund's investment adviser as the valuation designee responsible for the fair valuation function and performing fair value determinations as needed. The investment adviser has established a Fair Value Committee (the Committee) to carry out the day-to-day fair valuation responsibilities and has adopted policies and procedures to govern the fair valuation process and the activities of the Committee. In accordance with these fair valuation policies and procedures, which have been approved by the Board, the Fund attempts to obtain prices from one or more third party pricing services or brokers to value its investments. When current market prices, quotations or currency exchange rates are not readily available or reliable, investments will be fair valued in good faith by the Committee, in accordance with the policies and procedures. Factors used in determining fair value vary by investment type and may include market or investment specific events, transaction data, estimated cash flows, and market observations of comparable investments. The frequency that the fair valuation procedures are used cannot be predicted and they may be utilized to a significant extent. The Committee manages the Fund's fair valuation practices and maintains the fair valuation policies and procedures. The Fund's investment adviser reports to the Board information regarding the fair valuation process and related material matters.
The Fund categorizes the inputs to valuation techniques used to value its investments into a disclosure hierarchy consisting of three levels as shown below:
Level 1 - unadjusted quoted prices in active markets for identical investments
Level 2 - other significant observable inputs (including quoted prices for similar investments, interest rates, prepayment speeds, etc.)
Level 3 - unobservable inputs (including the Fund's own assumptions based on the best information available)
Valuation techniques used to value the Fund's investments by major category are as follows:
Debt securities, including restricted securities, are valued based on evaluated prices received from third party pricing services or from brokers who make markets in such securities. Municipal securities are valued by pricing services who utilize matrix pricing which considers yield or price of bonds of comparable quality, coupon, maturity and type or by broker-supplied prices. When independent prices are unavailable or unreliable, debt securities may be valued utilizing pricing methodologies which consider similar factors that would be used by third party pricing services. Debt securities are generally categorized as Level 2 in the hierarchy but may be Level 3 depending on the circumstances.
Investments in open-end mutual funds, including the Fidelity Central Funds, are valued at their closing net asset value (NAV) each business day and are categorized as Level 1 in the hierarchy.
Changes in valuation techniques may result in transfers in or out of an assigned level within the disclosure hierarchy. The aggregate value of investments by input level as of December 31, 2023 is included at the end of the Fund's Schedule of Investments.
Investment Transactions and Income. For financial reporting purposes, the Fund's investment holdings and NAV include trades executed through the end of the last business day of the period. The NAV per share for processing shareholder transactions is calculated as of the close of business of the New York Stock Exchange (NYSE), normally 4:00 p.m. Eastern time and includes trades executed through the end of the prior business day. Gains and losses on securities sold are determined on the basis of identified cost. Income and capital gain distributions from Fidelity Central Funds, if any, are recorded on the ex-dividend date. Interest income is accrued as earned and includes coupon interest and amortization of premium and accretion of discount on debt securities as applicable. Debt obligations may be placed on non-accrual status and related interest income may be reduced by ceasing current accruals and writing off interest receivables when the collection of all or a portion of interest has become doubtful based on consistently applied procedures. A debt obligation is removed from non-accrual status when the issuer resumes interest payments or when collectability of interest is reasonably assured.
Class Allocations and Expenses. Investment income, realized and unrealized capital gains and losses, common expenses of a fund, and certain fund-level expense reductions, if any, are allocated daily on a pro-rata basis to each class based on the relative net assets of each class to the total net assets of a fund. Each class differs with respect to transfer agent and distribution and service plan fees incurred, as applicable. Certain expense reductions may also differ by class, if applicable. For the reporting period, the allocated portion of income and expenses to each class as a percent of its average net assets may vary due to the timing of recording these transactions in relation to fluctuating net assets of the classes. Expenses directly attributable to a fund are charged to that fund. Expenses attributable to more than one fund are allocated among the respective funds on the basis of relative net assets or other appropriate methods. Expenses included in the accompanying financial statements reflect the expenses of that fund and do not include any expenses associated with any underlying mutual funds or exchange-traded funds (ETFs). Although not included in a fund's expenses, a fund indirectly bears its proportionate share of these expenses through the net asset value of each underlying mutual fund or exchange-traded fund (ETF). Expense estimates are accrued in the period to which they relate and adjustments are made when actual amounts are known.
Deferred Trustee Compensation. Under a Deferred Compensation Plan (the Plan) for certain Funds, certain independent Trustees have elected to defer receipt of a portion of their annual compensation. Deferred amounts are invested in affiliated mutual funds, are marked-to-market and remain in a fund until distributed in accordance with the Plan. The investment of deferred amounts and the offsetting payable to the Trustees presented below are included in the accompanying Statement of Assets and Liabilities in other receivables and other payables and accrued expenses, as applicable.
| Fidelity Intermediate Municipal Income Fund | $39 |
Income Tax Information and Distributions to Shareholders. Each year, the Fund intends to qualify as a regulated investment company under Subchapter M of the Internal Revenue Code, including distributing substantially all of its taxable income and realized gains. As a result, no provision for U.S. Federal income taxes is required. During the period, the Fund incurred a corporate tax liability on undistributed net investment income which is included in Miscellaneous expense on the Statement of Operations. As of December 31, 2023, the Fund did not have any unrecognized tax benefits in the financial statements; nor is the Fund aware of any tax positions for which it is reasonably possible that the total amounts of unrecognized tax benefits will significantly change in the next twelve months. The Fund files a U.S. federal tax return, in addition to state and local tax returns as required. The Fund's federal income tax returns are subject to examination by the Internal Revenue Service (IRS) for a period of three fiscal years after they are filed. State and local tax returns may be subject to examination for an additional fiscal year depending on the jurisdiction.
Distributions are declared and recorded daily and paid monthly from net investment income. Distributions from realized gains, if any, are declared and recorded on the ex-dividend date. Income and capital gain distributions are declared separately for each class. Income and capital gain distributions are determined in accordance with income tax regulations, which may differ from GAAP. In addition, the Fund claimed a portion of the payment made to redeeming shareholders as a distribution for income tax purposes.
Capital accounts within the financial statements are adjusted for permanent book-tax differences. These adjustments have no impact on net assets or the results of operations. Capital accounts are not adjusted for temporary book-tax differences which will reverse in a subsequent period.
Book-tax differences are primarily due to market discount, capital loss carryforwards and losses deferred due to wash sales.
The Fund purchases municipal securities whose interest, in the opinion of the issuer, is free from federal income tax. There is no assurance that the IRS will agree with this opinion. In the event the IRS determines that the issuer does not comply with relevant tax requirements, interest payments from a security could become federally taxable, possibly retroactively to the date the security was issued.
As of period end, the cost and unrealized appreciation (depreciation) in securities, and derivatives if applicable, for federal income tax purposes were as follows:
| Gross unrealized appreciation | $172,521 |
| Gross unrealized depreciation | (273,893) |
| Net unrealized appreciation (depreciation) | $(101,372) |
| Tax Cost | $11,521,720 |
The tax-based components of distributable earnings as of period end were as follows:
| Capital loss carryforward | $(39,399) |
| Net unrealized appreciation (depreciation) on securities and other investments | $(101,372) |
Capital loss carryforwards are only available to offset future capital gains of the Fund to the extent provided by regulations and may be limited. The capital loss carryforward information presented below, including any applicable limitation, is estimated as of fiscal period end and is subject to adjustment.
| Short-term | $(12,369) |
| Long-term | (27,030) |
| Total capital loss carryforward | $(39,399) |
The tax character of distributions paid was as follows:
| | December 31, 2023 | December 31,2022 |
| Tax-exempt Income | $275,015 | $207,804 |
| Ordinary Income | - | 967 |
| Total | $275,015 | $ 208,771 |
Delayed Delivery Transactions and When-Issued Securities. During the period, certain Funds transacted in securities on a delayed delivery or when-issued basis. Payment and delivery may take place after the customary settlement period for that security. The price of the underlying securities and the date when the securities will be delivered and paid for are fixed at the time the transaction is negotiated. Securities purchased on a delayed delivery or when-issued basis are identified as such in the Schedule of Investments. Compensation for interest forgone in the purchase of a delayed delivery or when-issued debt security may be received. With respect to purchase commitments, each applicable Fund identifies securities as segregated in its records with a value at least equal to the amount of the commitment. Payables and receivables associated with the purchases and sales of delayed delivery securities having the same coupon, settlement date and broker are offset. Delayed delivery or when-issued securities that have been purchased from and sold to different brokers are reflected as both payables and receivables in the Statement of Assets and Liabilities under the caption "Delayed delivery", as applicable. Losses may arise due to changes in the value of the underlying securities or if the counterparty does not perform under the contract's terms, or if the issuer does not issue the securities due to political, economic, or other factors.
Restricted Securities (including Private Placements). Funds may invest in securities that are subject to legal or contractual restrictions on resale. These securities generally may be resold in transactions exempt from registration or to the public if the securities are registered. Disposal of these securities may involve time-consuming negotiations and expense, and prompt sale at an acceptable price may be difficult. Information regarding restricted securities held at period end is included at the end of the Schedule of Investments, if applicable.
4. Purchases and Sales of Investments.
Purchases and sales of securities, other than short-term securities and in-kind transactions, as applicable, are noted in the table below.
| | Purchases ($) | Sales ($) |
| Fidelity Intermediate Municipal Income Fund | 2,356,242 | 1,462,064 |
5.Fees and Other Transactions with Affiliates.
Management Fee. Fidelity Management & Research Company LLC (the investment adviser) and its affiliates provide the Fund with investment management related services for which the Fund pays a monthly management fee. The fee is based on an annual asset based fee of .10% of the Fund's average net assets plus an income based fee of 5% of the Fund's gross income throughout the month. For the reporting period, the total annual management fee rate was .24% of average net assets.
Distribution and Service Plan Fees. In accordance with Rule 12b-1 of the 1940 Act, the Fund has adopted separate Distribution and Service Plans for each class of shares. Certain classes pay Fidelity Distributors Company LLC (FDC), an affiliate of the investment adviser, separate Distribution and Service Fees, each of which is based on an annual percentage of each class' average net assets. In addition, FDC may pay financial intermediaries for selling shares of the Fund and providing shareholder support services. For the period, the Distribution and Service Fee rates, total fees and amounts retained by FDC were as follows:
| | Distribution Fee | Service Fee | Total Fees | Retained by FDC | |
| Class A | -% | .25% | $285 | $18 | |
| Class M | -% | .25% | 30 | - | |
| Class C | .75% | .25% | 103 | 21 | |
| | | | $418 | $39 | |
| | | | | | |
| | | | | | | |
Sales Load. FDC may receive a front-end sales charge of up to 4.00% for selling Class A shares and Class M shares, some of which is paid to financial intermediaries for selling shares of the Fund. Depending on the holding period, FDC may receive contingent deferred sales charges levied on Class A, Class M and Class C redemptions. The deferred sales charges are 1.00% for Class C shares, .75% for certain purchases of Class A shares and .25% for certain purchases of Class M shares.
For the period, sales charge amounts retained by FDC were as follows:
| | Retained by FDC |
| Class A | $6 |
| Class M | 2 |
Class C A | - B |
| | $8 |
A When Class C shares are initially sold, FDC pays commissions from its own resources to financial intermediaries through which the sales are made.
B In the amount of less than five hundred dollars
Transfer Agent Fees. Fidelity Investments Institutional Operations Company LLC (FIIOC), an affiliate of the investment adviser, is the transfer, dividend disbursing and shareholder servicing agent for the Fund. FIIOC receives account fees and asset-based fees that vary according to the account size and type of account of the shareholders of the respective classes of the Fund, except for Class Z. FIIOC receives an asset-based fee of Class Z's average net assets. FIIOC pays for typesetting, printing and mailing of shareholder reports, except proxy statements. For the period, transfer agent fees for each class were as follows:
| | Amount | % of Class-Level Average Net Assets |
| Class A | $195 | .17 |
| Class M | 16 | .13 |
| Class C | 13 | .13 |
| Intermediate Municipal Income | 4,897 | .10 |
| Class I | 2,583 | .18 |
| Class Z | 2,373 | .05 |
| | $10,077 | |
Accounting Fees. Fidelity Service Company, Inc. (FSC), an affiliate of the investment adviser, maintains the Fund's accounting records. The accounting fee is based on the level of average net assets for each month. For the period, the fees were equivalent to the following annual rates:
| | % of Average Net Assets |
| Fidelity Intermediate Municipal Income Fund | .01 |
Interfund Trades. Funds may purchase from or sell securities to other Fidelity Funds under procedures adopted by the Board. The procedures have been designed to ensure these interfund trades are executed in accordance with Rule 17a-7 of the 1940 Act. Any interfund trades are included within the respective purchases and sales amounts shown in the Purchases and Sales of Investments note. Interfund trades during the period are noted in the table below.
| | Purchases ($) | Sales ($) | Realized Gain (Loss) ($) |
| Fidelity Intermediate Municipal Income Fund | 100 | 12,400 | - |
| | | | |
Subsequent Event - Sub-Advisory Arrangements. Effective March 1, 2024, the Fund's sub-advisory agreements with FMR Investment Management (UK) Limited, Fidelity Management & Research (Hong Kong) Limited, and Fidelity Management & Research (Japan) Limited will be amended to provide that the investment adviser will pay each sub-adviser monthly fees equal to 110% of the sub-adviser's costs for providing sub-advisory services.
6. Committed Line of Credit.
Certain Funds participate with other funds managed by the investment adviser or an affiliate in a $4.25 billion credit facility (the "line of credit") to be utilized for temporary or emergency purposes to fund shareholder redemptions or for other short-term liquidity purposes. The participating funds have agreed to pay commitment fees on their pro-rata portion of the line of credit, which are reflected in Miscellaneous expenses on the Statement of Operations, and are listed below. During the period, there were no borrowings on this line of credit.
| | Amount |
| Fidelity Intermediate Municipal Income Fund | $20 |
7. Expense Reductions.
Through arrangements with the Fund's custodian, credits realized as a result of certain uninvested cash balances were used to reduce the Fund's expenses. During the period, custodian credits reduced the Fund's expenses by $9.
8. Distributions to Shareholders.
Distributions to shareholders of each class were as follows:
| | Year ended December 31, 2023 | Year ended December 31, 2022 |
| Fidelity Intermediate Municipal Income Fund | | |
| Distributions to shareholders | | |
| Class A | $2,459 | $2,122 |
| Class M | 263 | 199 |
| Class C | 149 | 121 |
| Intermediate Municipal Income | 116,780 | 99,345 |
| Class I | 35,191 | 23,307 |
| Class Z | 120,173 | 83,677 |
Total | $275,015 | $208,771 |
9. Share Transactions.
Share transactions for each class were as follows and may contain in-kind transactions, automatic conversions between classes or exchanges between affiliated funds:
| | Shares | Shares | Dollars | Dollars |
| | Year ended December 31, 2023 | Year ended December 31, 2022 | Year ended December 31, 2023 | Year ended December 31, 2022 |
| Fidelity Intermediate Municipal Income Fund | | | | |
| Class A | | | | |
| Shares sold | 2,518 | 4,281 | $24,920 | $42,635 |
| Reinvestment of distributions | 233 | 197 | 2,321 | 1,978 |
| Shares redeemed | (2,868) | (8,599) | (28,507) | (85,494) |
| Net increase (decrease) | (117) | (4,121) | $(1,266) | $(40,881) |
| Class M | | | | |
| Shares sold | 144 | 488 | $1,455 | $5,040 |
| Reinvestment of distributions | 25 | 18 | 247 | 183 |
| Shares redeemed | (220) | (333) | (2,187) | (3,277) |
| Net increase (decrease) | (51) | 173 | $(485) | $1,946 |
| Class C | | | | |
| Shares sold | 205 | 395 | $2,067 | $3,929 |
| Reinvestment of distributions | 15 | 12 | 146 | 117 |
| Shares redeemed | (420) | (753) | (4,181) | (7,621) |
| Net increase (decrease) | (200) | (346) | $(1,968) | $(3,575) |
| Intermediate Municipal Income | | | | |
| Shares sold | 173,876 | 521,045 | $1,711,975 | $5,206,656 |
| Reinvestment of distributions | 6,910 | 6,296 | 68,726 | 62,970 |
| Shares redeemed | (200,750) | (556,956) | (1,980,739) | (5,583,276) |
| Net increase (decrease) | (19,964) | (29,615) | $(200,038) | $(313,650) |
| Class I | | | | |
| Shares sold | 70,700 | 104,240 | $703,233 | $1,039,398 |
| Reinvestment of distributions | 3,236 | 2,132 | 32,215 | 21,327 |
| Shares redeemed | (48,280) | (89,552) | (478,046) | (892,199) |
| Net increase (decrease) | 25,656 | 16,820 | $257,402 | $168,526 |
| Class Z | | | | |
| Shares sold | 203,049 | 344,261 | $2,026,195 | $3,441,772 |
| Reinvestment of distributions | 7,902 | 5,591 | 78,723 | 55,919 |
| Shares redeemed | (161,444) | (239,165) | (1,600,554) | (2,380,167) |
| Net increase (decrease) | 49,507 | 110,687 | $504,364 | $1,117,524 |
10. Other.
A fund's organizational documents provide former and current trustees and officers with a limited indemnification against liabilities arising in connection with the performance of their duties to the fund. In the normal course of business, a fund may also enter into contracts that provide general indemnifications. A fund's maximum exposure under these arrangements is unknown as this would be dependent on future claims that may be made against a fund. The risk of material loss from such claims is considered remote.
11. Risk and Uncertainties.
Many factors affect a fund's performance. Developments that disrupt global economies and financial markets, such as pandemics, epidemics, outbreaks of infectious diseases, war, terrorism, and environmental disasters, may significantly affect a fund's investment performance. The effects of these developments to a fund will be impacted by the types of securities in which a fund invests, the financial condition, industry, economic sector, and geographic location of an issuer, and a fund's level of investment in the securities of that issuer. Significant concentrations in security types, issuers, industries, sectors, and geographic locations may magnify the factors that affect a fund's performance.
To the Board of Trustees of Fidelity School Street Trust and Shareholders of Fidelity Intermediate Municipal Income Fund
Opinion on the Financial Statements
We have audited the accompanying statement of assets and liabilities, including the schedule of investments, of Fidelity Intermediate Municipal Income Fund (one of the funds constituting Fidelity School Street Trust, referred to hereafter as the "Fund") as of December 31, 2023, the related statement of operations for the year ended December 31, 2023, the statement of changes in net assets for each of the two years in the period ended December 31, 2023, including the related notes, and the financial highlights for each of the five years in the period ended December 31, 2023 (collectively referred to as the "financial statements"). In our opinion, the financial statements present fairly, in all material respects, the financial position of the Fund as of December 31, 2023, the results of its operations for the year then ended, the changes in its net assets for each of the two years in the period ended December 31, 2023 and the financial highlights for each of the five years in the period ended December 31, 2023 in conformity with accounting principles generally accepted in the United States of America.
Basis for Opinion
These financial statements are the responsibility of the Fund's management. Our responsibility is to express an opinion on the Fund's financial statements based on our audits. We are a public accounting firm registered with the Public Company Accounting Oversight Board (United States) (PCAOB) and are required to be independent with respect to the Fund in accordance with the U.S. federal securities laws and the applicable rules and regulations of the Securities and Exchange Commission and the PCAOB.
We conducted our audits of these financial statements in accordance with the standards of the PCAOB. Those standards require that we plan and perform the audit to obtain reasonable assurance about whether the financial statements are free of material misstatement, whether due to error or fraud.
Our audits included performing procedures to assess the risks of material misstatement of the financial statements, whether due to error or fraud, and performing procedures that respond to those risks. Such procedures included examining, on a test basis, evidence regarding the amounts and disclosures in the financial statements. Our audits also included evaluating the accounting principles used and significant estimates made by management, as well as evaluating the overall presentation of the financial statements. Our procedures included confirmation of securities owned as of December 31, 2023 by correspondence with the custodian and brokers; when replies were not received from brokers, we performed other auditing procedures. We believe that our audits provide a reasonable basis for our opinion.
/s/ PricewaterhouseCoopers LLP
Boston, Massachusetts
February 12, 2024
We have served as the auditor of one or more investment companies in the Fidelity group of funds since 1932.
The Trustees, Members of the Advisory Board (if any), and officers of the trust and fund, as applicable, are listed below. The Board of Trustees governs the fund and is responsible for protecting the interests of shareholders. The Trustees are experienced executives who meet periodically throughout the year to oversee the fund's activities, review contractual arrangements with companies that provide services to the fund, oversee management of the risks associated with such activities and contractual arrangements, and review the fund's performance. Each of the Trustees oversees 314 funds.
The Trustees hold office without limit in time except that (a) any Trustee may resign; (b) any Trustee may be removed by written instrument, signed by at least two-thirds of the number of Trustees prior to such removal; (c) any Trustee who requests to be retired or who has become incapacitated by illness or injury may be retired by written instrument signed by a majority of the other Trustees; and (d) any Trustee may be removed at any special meeting of shareholders by a two-thirds vote of the outstanding voting securities of the trust. Each Trustee who is not an interested person (as defined in the 1940 Act) of the trust and the fund is referred to herein as an Independent Trustee. Each Independent Trustee shall retire not later than the last day of the calendar year in which his or her 75th birthday occurs. The Independent Trustees may waive this mandatory retirement age policy with respect to individual Trustees. Officers and Advisory Board Members hold office without limit in time, except that any officer or Advisory Board Member may resign or may be removed by a vote of a majority of the Trustees at any regular meeting or any special meeting of the Trustees. Except as indicated, each individual has held the office shown or other offices in the same company for the past five years.
The fund's Statement of Additional Information (SAI) includes more information about the Trustees. To request a free copy, call Fidelity at 1-800-544-8544 if you're an individual investing directly with Fidelity, call 1-800-835-5092 if you're a plan sponsor or participant with Fidelity as your recordkeeper or call 1-877-208-0098 on institutional accounts or if you're an advisor or invest through one.
Experience, Skills, Attributes, and Qualifications of the Trustees. The Governance and Nominating Committee has adopted a statement of policy that describes the experience, qualifications, attributes, and skills that are necessary and desirable for potential Independent Trustee candidates (Statement of Policy). The Board believes that each Trustee satisfied at the time he or she was initially elected or appointed a Trustee, and continues to satisfy, the standards contemplated by the Statement of Policy. The Governance and Nominating Committee also engages professional search firms to help identify potential Independent Trustee candidates who have the experience, qualifications, attributes, and skills consistent with the Statement of Policy. From time to time, additional criteria based on the composition and skills of the current Independent Trustees, as well as experience or skills that may be appropriate in light of future changes to board composition, business conditions, and regulatory or other developments, have also been considered by the professional search firms and the Governance and Nominating Committee. In addition, the Board takes into account the Trustees' commitment and participation in Board and committee meetings, as well as their leadership of standing and ad hoc committees throughout their tenure.
In determining that a particular Trustee was and continues to be qualified to serve as a Trustee, the Board has considered a variety of criteria, none of which, in isolation, was controlling. The Board believes that, collectively, the Trustees have balanced and diverse experience, qualifications, attributes, and skills, which allow the Board to operate effectively in governing the fund and protecting the interests of shareholders. Information about the specific experience, skills, attributes, and qualifications of each Trustee, which in each case led to the Board's conclusion that the Trustee should serve (or continue to serve) as a trustee of the fund, is provided below.
Board Structure and Oversight Function. Abigail P. Johnson is an interested person and currently serves as Chairman. The Trustees have determined that an interested Chairman is appropriate and benefits shareholders because an interested Chairman has a personal and professional stake in the quality and continuity of services provided to the fund. Independent Trustees exercise their informed business judgment to appoint an individual of their choosing to serve as Chairman, regardless of whether the Trustee happens to be independent or a member of management. The Independent Trustees have determined that they can act independently and effectively without having an Independent Trustee serve as Chairman and that a key structural component for assuring that they are in a position to do so is for the Independent Trustees to constitute a substantial majority for the Board. The Independent Trustees also regularly meet in executive session. Michael E. Kenneally serves as Chairman of the Independent Trustees and as such (i) acts as a liaison between the Independent Trustees and management with respect to matters important to the Independent Trustees and (ii) with management prepares agendas for Board meetings.
Fidelity® funds are overseen by different Boards of Trustees. The fund's Board oversees Fidelity's investment-grade bond, money market, asset allocation and certain equity funds, and other Boards oversee Fidelity's alternative investment, high income and other equity funds. The asset allocation funds may invest in Fidelity® funds that are overseen by such other Boards. The use of separate Boards, each with its own committee structure, allows the Trustees of each group of Fidelity® funds to focus on the unique issues of the funds they oversee, including common research, investment, and operational issues. On occasion, the separate Boards establish joint committees to address issues of overlapping consequences for the Fidelity® funds overseen by each Board.
The Trustees operate using a system of committees to facilitate the timely and efficient consideration of all matters of importance to the Trustees, the fund, and fund shareholders and to facilitate compliance with legal and regulatory requirements and oversight of the fund's activities and associated risks. The Board, acting through its committees, has charged FMR and its affiliates with (i) identifying events or circumstances the occurrence of which could have demonstrably adverse effects on the fund's business and/or reputation; (ii) implementing processes and controls to lessen the possibility that such events or circumstances occur or to mitigate the effects of such events or circumstances if they do occur; and (iii) creating and maintaining a system designed to evaluate continuously business and market conditions in order to facilitate the identification and implementation processes described in (i) and (ii) above. Because the day-to-day operations and activities of the fund are carried out by or through FMR, its affiliates, and other service providers, the fund's exposure to risks is mitigated but not eliminated by the processes overseen by the Trustees. While each of the Board's committees has responsibility for overseeing different aspects of the fund's activities, oversight is exercised primarily through the Operations and Audit Committees. In addition, an ad hoc Board committee of Independent Trustees has worked with FMR to enhance the Board's oversight of investment and financial risks, legal and regulatory risks, technology risks, and operational risks, including the development of additional risk reporting to the Board. Appropriate personnel, including but not limited to the fund's Chief Compliance Officer (CCO), FMR's internal auditor, the independent accountants, the fund's Treasurer and portfolio management personnel, make periodic reports to the Board's committees, as appropriate, including an annual review of Fidelity's risk management program for the Fidelity® funds. The responsibilities of each standing committee, including their oversight responsibilities, are described further under "Standing Committees of the Trustees."
Interested Trustees*:
Correspondence intended for a Trustee who is an interested person may be sent to Fidelity Investments, 245 Summer Street, Boston, Massachusetts 02210.
Name, Year of Birth; Principal Occupations and Other Relevant Experience+
Abigail P. Johnson (1961)
Year of Election or Appointment: 2009
Trustee
Chairman of the Board of Trustees
Ms. Johnson also serves as Trustee of other Fidelity® funds. Ms. Johnson serves as Chairman (2016-present), Chief Executive Officer (2014-present), and Director (2007-present) of FMR LLC (diversified financial services company), President of Fidelity Financial Services (2012-present) and President of Personal, Workplace and Institutional Services (2005-present). Ms. Johnson is Chairman and Director of Fidelity Management & Research Company LLC (investment adviser firm, 2011-present). Previously, Ms. Johnson served as Chairman and Director of FMR Co., Inc. (investment adviser firm, 2011-2019), Vice Chairman (2007-2016) and President (2013-2016) of FMR LLC, President and a Director of Fidelity Management & Research Company (2001-2005), a Trustee of other investment companies advised by Fidelity Management & Research Company, Fidelity Investments Money Management, Inc. (investment adviser firm), and FMR Co., Inc. (2001-2005), Senior Vice President of the Fidelity® funds (2001-2005), and managed a number of Fidelity® funds. Ms. Abigail P. Johnson and Mr. Arthur E. Johnson are not related.
Jennifer Toolin McAuliffe (1959)
Year of Election or Appointment: 2016
Trustee
Ms. McAuliffe also serves as Trustee of other Fidelity® funds and as Trustee of Fidelity Charitable (2020-present). Previously, Ms. McAuliffe served as Co-Head of Fixed Income of Fidelity Investments Limited (now known as FIL Limited (FIL)) (diversified financial services company), Director of Research for FIL's credit and quantitative teams in London, Hong Kong and Tokyo and Director of Research for taxable and municipal bonds at Fidelity Investments Money Management, Inc. Ms. McAuliffe previously served as a member of the Advisory Board of certain Fidelity® funds (2016). Ms. McAuliffe was previously a lawyer at Ropes & Gray LLP and an international banker at Chemical Bank NA (now JPMorgan Chase & Co.). Ms. McAuliffe also currently serves as director or trustee of several not-for-profit entities.
Christine J. Thompson (1958)
Year of Election or Appointment: 2023
Trustee
Ms. Thompson also serves as a Trustee of other Fidelity® funds. Ms. Thompson serves as Leader of Advanced Technologies for Investment Management at Fidelity Investments (2018-present). Previously, Ms. Thompson served as Chief Investment Officer in the Bond group at Fidelity Management & Research Company (2010-2018) and held various other roles including Director of municipal bond portfolio managers and Portfolio Manager of certain Fidelity® funds.
* Determined to be an "Interested Trustee" by virtue of, among other things, his or her affiliation with the trust or various entities under common control with FMR.
+ The information includes the Trustee's principal occupation during the last five years and other information relating to the experience, attributes, and skills relevant to the Trustee's qualifications to serve as a Trustee, which led to the conclusion that the Trustee should serve as a Trustee for the fund.
Independent Trustees:
Correspondence intended for an Independent Trustee may be sent to Fidelity Investments, P.O. Box 55235, Boston, Massachusetts 02205-5235.
Name, Year of Birth; Principal Occupations and Other Relevant Experience+
Elizabeth S. Acton (1951)
Year of Election or Appointment: 2013
Trustee
Ms. Acton also serves as Trustee of other Fidelity® funds. Prior to her retirement, Ms. Acton served as Executive Vice President, Finance (2011-2012), Executive Vice President, Chief Financial Officer (2002-2011) and Treasurer (2004-2005) of Comerica Incorporated (financial services). Prior to joining Comerica, Ms. Acton held a variety of positions at Ford Motor Company (1983-2002), including Vice President and Treasurer (2000-2002) and Executive Vice President and Chief Financial Officer of Ford Motor Credit Company (1998-2000). Ms. Acton currently serves as a member of the Board and Audit and Finance Committees of Beazer Homes USA, Inc. (homebuilding, 2012-present). Ms. Acton previously served as a member of the Advisory Board of certain Fidelity® funds (2013-2016).
Laura M. Bishop (1961)
Year of Election or Appointment: 2023
Trustee
Ms. Bishop also serves as Trustee or Member of the Advisory Board of other Fidelity® funds. Prior to her retirement, Ms. Bishop held a variety of positions at United Services Automobile Association (2001-2020), including Executive Vice President and Chief Financial Officer (2014-2020) and Senior Vice President and Deputy Chief Financial Officer (2012-2014). Ms. Bishop currently serves as a member of the Audit Committee and Compensation and Personnel Committee (2021-present) of the Board of Directors of Korn Ferry (global organizational consulting). Previously, Ms. Bishop served as a Member of the Advisory Board of certain Fidelity® funds (2022-2023).
Ann E. Dunwoody (1953)
Year of Election or Appointment: 2018
Trustee
General Dunwoody also serves as Trustee of other Fidelity® funds. General Dunwoody (United States Army, Retired) was the first woman in U.S. military history to achieve the rank of four-star general and prior to her retirement in 2012 held a variety of positions within the U.S. Army, including Commanding General, U.S. Army Material Command (2008-2012). General Dunwoody currently serves as a member of the Board, Chair of Nomination Committee and a member of the Corporate Governance Committee of Kforce Inc. (professional staffing services, 2016-present) and a member of the Board of Automattic Inc. (software engineering, 2018-present). Previously, General Dunwoody served as President of First to Four LLC (leadership and mentoring services, 2012-2022), a member of the Advisory Board and Nominating and Corporate Governance Committee of L3 Technologies, Inc. (communication, electronic, sensor and aerospace systems, 2013-2019) and a member of the Board and Audit and Sustainability and Corporate Responsibility Committees of Republic Services, Inc. (waste collection, disposal and recycling, 2013-2016). General Dunwoody also serves on several boards for non-profit organizations, including as a member of the Board, Chair of the Nomination and Governance Committee and a member of the Audit Committee of the Noble Reach Foundation (formerly Logistics Management Institute) (consulting non-profit, 2012-present) and a member of the Board of ThanksUSA (military family education non-profit, 2014-present). Previously, General Dunwoody served as a member of the Board of Florida Institute of Technology (2015-2022) and a member of the Council of Trustees for the Association of the United States Army (advocacy non-profit, 2013-2021). General Dunwoody previously served as a member of the Advisory Board of certain Fidelity® funds (2018).
John Engler (1948)
Year of Election or Appointment: 2014
Trustee
Mr. Engler also serves as Trustee of other Fidelity® funds. Previously, Mr. Engler served as Governor of Michigan (1991-2003), President of the Business Roundtable (2011-2017) and interim President of Michigan State University (2018-2019). Previously, Mr. Engler served as a member of the Board of Stride, Inc. (formerly K12 Inc.) (technology-based education company, 2012-2022), a member of the Board of Universal Forest Products (manufacturer and distributor of wood and wood-alternative products, 2003-2019) and Trustee of The Munder Funds (2003-2014). Mr. Engler previously served as a member of the Advisory Board of certain Fidelity® funds (2014-2016).
Robert F. Gartland (1951)
Year of Election or Appointment: 2010
Trustee
Mr. Gartland also serves as Trustee of other Fidelity® funds. Prior to his retirement, Mr. Gartland held a variety of positions at Morgan Stanley (financial services, 1979-2007), including Managing Director (1987-2007) and Chase Manhattan Bank (1975-1978). Mr. Gartland previously served as Chairman and an investor in Gartland & Mellina Group Corp. (consulting, 2009-2019), as a member of the Board of National Securities Clearing Corporation (1993-1996) and as Chairman of TradeWeb (2003-2004).
Robert W. Helm (1957)
Year of Election or Appointment: 2023
Trustee
Mr. Helm also serves as Trustee or Member of the Advisory Board of other Fidelity® funds. Mr. Helm was formerly Deputy Chairman (2003-2020), partner (1991-2020) and an associate (1984-1991) of Dechert LLP (formerly Dechert Price & Rhoads). Mr. Helm currently serves on boards and committees of several not-for-profit organizations, including as a Trustee and member of the Executive Committee of the Baltimore Council on Foreign Affairs, a member of the Board of Directors of the St. Vincent de Paul Society of Baltimore and a member of the Life Guard Society of Mt. Vernon. Previously, Mr. Helm served as a Member of the Advisory Board of certain Fidelity® funds (2021-2023).
Michael E. Kenneally (1954)
Year of Election or Appointment: 2009
Trustee
Chairman of the Independent Trustees
Mr. Kenneally also serves as Trustee of other Fidelity® funds and was Vice Chairman (2018-2021) of the Independent Trustees of certain Fidelity® funds. Prior to retirement in 2005, he was Chairman and Global Chief Executive Officer of Credit Suisse Asset Management, the worldwide fund management and institutional investment business of Credit Suisse Group. Previously, Mr. Kenneally was an Executive Vice President and the Chief Investment Officer for Bank of America. In this role, he was responsible for the investment management, strategy and products delivered to the bank's institutional, high-net-worth and retail clients. Earlier, Mr. Kenneally directed the organization's equity and quantitative research groups. He began his career as a research analyst and then spent more than a dozen years as a portfolio manager for endowments, pension plans and mutual funds. He earned the Chartered Financial Analyst (CFA) designation in 1991.
Mark A. Murray (1954)
Year of Election or Appointment: 2016
Trustee
Mr. Murray also serves as Trustee of other Fidelity® funds. Previously, Mr. Murray served as Co-Chief Executive Officer (2013-2016), President (2006-2013) and Vice Chairman (2013-2020) of Meijer, Inc. Mr. Murray serves as a member of the Board (2009-present) and Public Policy and Responsibility Committee (2009-present) and Chair of the Nuclear Review Committee (2019-present) of DTE Energy Company (diversified energy company). Mr. Murray previously served as a member of the Board of Spectrum Health (not-for-profit health system, 2015-2019) and as a member of the Board and Audit Committee and Chairman of the Nominating and Corporate Governance Committee of Universal Forest Products, Inc. (manufacturer and distributor of wood and wood-alternative products, 2004-2016). Mr. Murray also serves as a member of the Board of many community and professional organizations. Mr. Murray previously served as a member of the Advisory Board of certain Fidelity® funds (2016).
Carol J. Zierhoffer (1960)
Year of Election or Appointment: 2023
Trustee
Ms. Zierhoffer also serves as Trustee or Member of the Advisory Board of other Fidelity® funds. Prior to her retirement, Ms. Zierhoffer held a variety of positions at Bechtel Corporation (engineering company, 2013-2019), including Principal Vice President and Chief Information Officer (2013-2016) and Senior Vice President and Chief Information Officer (2016-2019). Ms. Zierhoffer currently serves as a member of the Board of Directors, Audit Committee and Compensation Committee of Allscripts Healthcare Solutions, Inc. (healthcare technology, 2020-present) and as a member of the Board of Directors, Audit and Finance Committee and Nominating and Governance Committee of Atlas Air Worldwide Holdings, Inc. (aviation operating services, 2021-present). Previously, Ms. Zierhoffer served as a member of the Board of Directors and Audit Committee and as the founding Chair of the Information Technology Committee of MedAssets, Inc. (healthcare technology, 2013-2016), and as a Member of the Advisory Board of certain Fidelity® funds (2023).
+ The information includes the Trustee's principal occupation during the last five years and other information relating to the experience, attributes, and skills relevant to the Trustee's qualifications to serve as a Trustee, which led to the conclusion that the Trustee should serve as a Trustee for the fund.
Advisory Board Members and Officers:
Correspondence intended for a Member of the Advisory Board (if any) may be sent to Fidelity Investments, P.O. Box 55235, Boston, Massachusetts 02205-5235. Correspondence intended for an officer may be sent to Fidelity Investments, 245 Summer Street, Boston, Massachusetts 02210.
Name, Year of Birth; Principal Occupation
Heather Bonner (1977)
Year of Election or Appointment: 2023
Assistant Treasurer
Ms. Bonner also serves as an officer of other funds. Ms. Bonner is a Senior Vice President (2022-present) and is an employee of Fidelity Investments (2022-present). Ms. Bonner serves as Vice President, Treasurer, or Assistant Treasurer of certain Fidelity entities. Prior to joining Fidelity, Ms. Bonner served as Managing Director at AQR Capital Management (2013-2022) and was the Treasurer and Principal Financial Officer of the AQR Funds (2013-2022).
Craig S. Brown (1977)
Year of Election or Appointment: 2019
Assistant Treasurer
Mr. Brown also serves as an officer of other funds. Mr. Brown is a Vice President (2015-present) and is an employee of Fidelity Investments. Mr. Brown serves as Assistant Treasurer of FIMM, LLC (2021-present). Previously, Mr. Brown served as Assistant Treasurer of certain Fidelity® funds (2019-2022).
John J. Burke III (1964)
Year of Election or Appointment: 2018
Chief Financial Officer
Mr. Burke also serves as Chief Financial Officer of other funds. Mr. Burke is Head of Fidelity Fund and Investment Operations (2018-present) and is an employee of Fidelity Investments. Mr. Burke serves as President, Executive Vice President, or Director of certain Fidelity entities. Previously Mr. Burke served as head of Asset Management Investment Operations (2012-2018).
Margaret Carey (1973)
Year of Election or Appointment: 2023
Secretary and Chief Legal Officer (CLO)
Ms. Carey also serves as an officer of other funds and as CLO of certain Fidelity entities. Ms. Carey is a Senior Vice President, Deputy General Counsel (2019-present) and is an employee of Fidelity Investments.
David J. Carter (1973)
Year of Election or Appointment: 2020
Assistant Secretary
Mr. Carter also serves as Assistant Secretary of other funds. Mr. Carter is a Senior Vice President, Deputy General Counsel (2022-present) and is an employee of Fidelity Investments. Mr. Carter serves as Chief Legal Officer of Fidelity Investments Institutional Operations Company LLC - Shareholder Division (transfer agent, 2020-present).
Jonathan Davis (1968)
Year of Election or Appointment: 2010
Assistant Treasurer
Mr. Davis also serves as an officer of other funds. Mr. Davis is a Vice President (2006-present) and is an employee of Fidelity Investments. Mr. Davis serves as Assistant Treasurer of certain Fidelity entities.
Laura M. Del Prato (1964)
Year of Election or Appointment: 2018
President and Treasurer
Ms. Del Prato also serves as an officer of other funds. Ms. Del Prato is a Senior Vice President (2017-present) and is an employee of Fidelity Investments. Ms. Del Prato serves as Vice President or Assistant Treasurer of certain Fidelity entities. Previously, Ms. Del Prato served as President and Treasurer of The North Carolina Capital Management Trust: Cash Portfolio and Term Portfolio (2018-2020).
Robin Foley (1964)
Year of Election or Appointment: 2023
Vice President
Ms. Foley also serves as Vice President of other funds. Ms. Foley serves as Head of Fidelity's Fixed Income division (2023-present) and is an employee of Fidelity Investments. Previously, Ms. Foley served as Chief Investment Officer of Bonds (2017-2023).
Christopher M. Gouveia (1973)
Year of Election or Appointment: 2023
Chief Compliance Officer
Mr. Gouveia also serves as Chief Compliance Officer of other funds. Mr. Gouveia is a Senior Vice President of Asset Management Compliance (2019-present) and is an employee of Fidelity Investments. Mr. Gouveia serves as Compliance Officer of Fidelity Management Trust Company (2023-present). Previously, Mr. Gouveia served as Chief Compliance Officer of the North Carolina Capital Management Trust (2016-2019).
Colm A. Hogan (1973)
Year of Election or Appointment: 2016
Assistant Treasurer
Mr. Hogan also serves as an officer of other funds. Mr. Hogan is a Vice President (2016-present) and is an employee of Fidelity Investments. Mr. Hogan serves as Assistant Treasurer of certain Fidelity entities. Previously, Mr. Hogan served as Deputy Treasurer of certain Fidelity® funds (2016-2020) and Assistant Treasurer of certain Fidelity® funds (2016-2018).
Chris Maher (1972)
Year of Election or Appointment: 2013
Assistant Treasurer
Mr. Maher also serves as an officer of other funds. Mr. Maher is a Vice President (2008-present) and is an employee of Fidelity Investments. Mr. Maher serves as Assistant Treasurer of certain Fidelity entities. Previously, Mr. Maher served as Assistant Treasurer of certain funds (2013-2020).
Brett Segaloff (1972)
Year of Election or Appointment: 2021
Anti-Money Laundering (AML) Officer
Mr. Segaloff also serves as AML Officer of other funds. Mr. Segaloff is a Vice President (2022-present) and is an employee of Fidelity Investments. Mr. Segaloff serves as Anti Money Laundering Compliance Officer or Anti Money Laundering/Bank Secrecy Act Compliance Officer of certain Fidelity entities.
Stacie M. Smith (1974)
Year of Election or Appointment: 2013
Assistant Treasurer
Ms. Smith also serves as an officer of other funds. Ms. Smith is a Senior Vice President (2016-present) and is an employee of Fidelity Investments. Ms. Smith serves as Assistant Treasurer of certain Fidelity entities and has served in other fund officer roles.
Jim Wegmann (1979)
Year of Election or Appointment: 2021
Deputy Treasurer
Mr. Wegmann also serves as an officer of other funds. Mr. Wegmann is a Vice President (2016-present) and is an employee of Fidelity Investments. Mr. Wegmann serves as Assistant Treasurer of FIMM, LLC (2021-present). Previously, Mr. Wegmann served as Assistant Treasurer of certain Fidelity® funds (2019-2021).
As a shareholder, you incur two types of costs: (1) transaction costs, which may include sales charges (loads) on purchase payments or redemption proceeds, as applicable and (2) ongoing costs, which generally include management fees, distribution and/or service (12b-1) fees and other Fund expenses. This Example is intended to help you understand your ongoing costs (in dollars) of investing in a fund and to compare these costs with the ongoing costs of investing in other mutual funds.
| The Example is based on an investment of $1,000 invested at the beginning of the period and held for the entire period (July 1, 2023 to December 31, 2023). |
Actual Expenses
The first line of the accompanying table provides information about actual account values and actual expenses. You may use the information in this line, together with the amount you invested, to estimate the expenses that you paid over the period. Simply divide your account value by $1,000.00 (for example, an $8,600 account value divided by $1,000.00 = 8.6), then multiply the result by the number in the first line for a class/Fund under the heading entitled "Expenses Paid During Period" to estimate the expenses you paid on your account during this period. If any fund is a shareholder of any underlying mutual funds or exchange-traded funds (ETFs) (the Underlying Funds), such fund indirectly bears its proportional share of the expenses of the Underlying Funds in addition to the direct expenses incurred presented in the table. These fees and expenses are not included in the annualized expense ratio used to calculate the expense estimate in the table below.
Hypothetical Example for Comparison Purposes
The second line of the accompanying table provides information about hypothetical account values and hypothetical expenses based on the actual expense ratio and an assumed rate of return of 5% per year before expenses, which is not the actual return. The hypothetical account values and expenses may not be used to estimate the actual ending account balance or expenses you paid for the period. You may use this information to compare the ongoing costs of investing in the Fund and other funds. To do so, compare this 5% hypothetical example with the 5% hypothetical examples that appear in the shareholder reports of the other funds. If any fund is a shareholder of any Underlying Funds, such fund indirectly bears its proportional share of the expenses of the Underlying Funds in addition to the direct expenses as presented in the table. These fees and expenses are not included in the annualized expense ratio used to calculate the expense estimate in the table below.
Please note that the expenses shown in the table are meant to highlight your ongoing costs only and do not reflect any transaction costs. Therefore, the second line of the table is useful in comparing ongoing costs only, and will not help you determine the relative total costs of owning different funds. In addition, if these transactional costs were included, your costs would have been higher.
| | | | | Annualized Expense Ratio- A | | Beginning Account Value July 1, 2023 | | Ending Account Value December 31, 2023 | | Expenses Paid During Period- C July 1, 2023 to December 31, 2023 |
| Fidelity® Intermediate Municipal Income Fund | | | | | | | | | | |
| Class A | | | | .68% | | | | | | |
| Actual | | | | | | $ 1,000 | | $ 1,032.60 | | $ 3.48 |
Hypothetical-B | | | | | | $ 1,000 | | $ 1,021.78 | | $ 3.47 |
| Class M | | | | .64% | | | | | | |
| Actual | | | | | | $ 1,000 | | $ 1,031.80 | | $ 3.28 |
Hypothetical-B | | | | | | $ 1,000 | | $ 1,021.98 | | $ 3.26 |
| Class C | | | | 1.37% | | | | | | |
| Actual | | | | | | $ 1,000 | | $ 1,027.90 | | $ 7.00 |
Hypothetical-B | | | | | | $ 1,000 | | $ 1,018.30 | | $ 6.97 |
| Fidelity® Intermediate Municipal Income Fund | | | | .36% | | | | | | |
| Actual | | | | | | $ 1,000 | | $ 1,034.20 | | $ 1.85 |
Hypothetical-B | | | | | | $ 1,000 | | $ 1,023.39 | | $ 1.84 |
| Class I | | | | .44% | | | | | | |
| Actual | | | | | | $ 1,000 | | $ 1,033.80 | | $ 2.26 |
Hypothetical-B | | | | | | $ 1,000 | | $ 1,022.99 | | $ 2.24 |
| Class Z | | | | .31% | | | | | | |
| Actual | | | | | | $ 1,000 | | $ 1,034.50 | | $ 1.59 |
Hypothetical-B | | | | | | $ 1,000 | | $ 1,023.64 | | $ 1.58 |
| |
A Annualized expense ratio reflects expenses net of applicable fee waivers.
B 5% return per year before expenses
C Expenses are equal to the annualized expense ratio, multiplied by the average account value over the period, multiplied by 184/ 365 (to reflect the one-half year period). The fees and expenses of any Underlying Funds are not included in each annualized expense ratio.
The dividend and capital gains distributions for the fund(s) are available on Fidelity.com or Institutional.Fidelity.com.
During fiscal year ended 2023, 100% of the fund's income dividends was free from federal income tax, and 21.83% of the fund's income dividends was subject to the federal alternative minimum tax.
The fund will notify shareholders in January 2024 of amounts for use in preparing 2023 income tax returns.
Board Approval of Investment Advisory Contracts and Management Fees
Fidelity Intermediate Municipal Income Fund
Each year, the Board of Trustees, including the Independent Trustees (together, the Board), considers the renewal of the fund's management contract with Fidelity Management & Research Company LLC (FMR) and the sub-advisory agreements (together, the Advisory Contracts) for the fund. FMR and the sub-advisers are referred to herein as the Investment Advisers. The Board, assisted by the advice of fund counsel and Independent Trustees' counsel, requests and considers a broad range of information relevant to the renewal of the Advisory Contracts throughout the year.
The Board meets regularly and, at each of its meetings, covers an extensive agenda of topics and materials and considers factors that are relevant to its annual consideration of the renewal of the fund's Advisory Contracts, including the services and support provided to the fund and its shareholders. The Board's Operations Committee, of which all the Independent Trustees are members, meets regularly throughout the year and requests, receives and considers, among other matters, information related to the annual consideration of the renewal of the fund's Advisory Contracts before making its recommendation to the Board. The Board also meets as needed to review matters specifically related to the Board's annual consideration of the renewal of the Advisory Contracts. Members of the Board may also meet from time to time with trustees of other Fidelity funds through joint ad hoc committees to discuss certain matters relevant to all of the Fidelity funds.
At its September 2023 meeting, the Board unanimously determined to renew the fund's Advisory Contracts. In reaching its determination, the Board considered all factors it believed relevant, including (i) the nature, extent, and quality of the services provided to the fund and its shareholders (including the investment performance of the fund); (ii) the competitiveness relative to peer funds of the fund's management fee and the total expense ratio of a representative class (the retail class, which was selected because it was the largest class without 12b-1 fees in 2022); (iii) the total costs of the services provided by and the profits realized by FMR and its affiliates (Fidelity) from its relationships with the fund; and (iv) the extent to which, if any, economies of scale exist and are realized as the fund grows, and whether any economies of scale are appropriately shared with fund shareholders. The Board also considered the broad range of investment choices available to shareholders from FMR's competitors and that the fund's shareholders have chosen to invest in the fund, which is part of the Fidelity family of funds. The Board's decision to renew the Advisory Contracts was not based on any single factor.
The Board reached a determination, with the assistance of fund counsel and Independent Trustees' counsel and through the exercise of its business judgment, that the renewal of the Advisory Contracts was in the best interests of the fund and its shareholders and that the compensation payable under the Advisory Contracts was fair and reasonable in light of all of the surrounding circumstances.
Nature, Extent, and Quality of Services Provided. The Board considered Fidelity's staffing as it relates to the fund, including the backgrounds and experience of investment personnel, and also considered the Investment Advisers' implementation of the fund's investment program. The Independent Trustees also had discussions with senior management of Fidelity's investment operations and investment groups. The Board considered the structure of the investment personnel compensation program and whether this structure provides appropriate incentives to act in the best interests of the fund. Additionally, the Board considered the portfolio managers' investments, if any, in the funds that they manage.
Resources Dedicated to Investment Management and Support Services. The Board reviewed the general qualifications and capabilities of Fidelity's investment staff, including its size, education, experience, and resources, as well as Fidelity's approach to recruiting, training, managing, and compensating investment personnel. The Board noted the resources devoted to Fidelity's global investment organization, and that Fidelity's analysts have extensive resources, tools and capabilities that allow them to conduct quantitative and fundamental analysis, as well as credit analysis of issuers, counterparties and guarantors. Further, the Board considered that Fidelity's investment professionals have sufficient access to global information and data so as to provide competitive investment results over time, and that those professionals also have access to sophisticated tools that permit them to assess portfolio construction and risk and performance attribution characteristics continuously, as well as to transmit new information and research conclusions rapidly around the world. Additionally, in its deliberations, the Board considered Fidelity's trading, risk management, compliance, cybersecurity, and technology and operations capabilities and resources, which are integral parts of the investment management process.
Shareholder and Administrative Services. The Board considered (i) the nature, extent, quality, and cost of advisory, administrative, and shareholder services performed by Fidelity under the Advisory Contracts and under separate agreements covering transfer agency and pricing and bookkeeping services for the fund; (ii) the nature and extent of Fidelity's supervision of third party service providers, principally custodians, subcustodians, and pricing vendors; and (iii) the resources devoted by Fidelity to, and the record of compliance with, the fund's compliance policies and procedures.
The Board noted that the growth of fund assets over time across the complex allows Fidelity to reinvest in the development of services designed to enhance the value and convenience of the Fidelity funds as investment vehicles. These services include 24-hour access to account information and market information over the Internet and through telephone representatives, investor education materials and asset allocation tools. The Board also considered that it reviews customer service metrics such as telephone response times, continuity of services on the website and metrics addressing services at Fidelity Investor Centers.
Investment in a Large Fund Family. The Board considered the benefits to shareholders of investing in a fund that is part of a large family of funds offering a variety of investment disciplines and providing a large variety of fund investor services. The Board noted that Fidelity had taken, or had made recommendations to the Board that resulted in the Fidelity funds taking, a number of actions over the previous year that benefited particular funds and/or the Fidelity funds in general.
Investment Performance. The Board took into account discussions that occur with representatives of the Investment Advisers, and reports that it receives, at Board meetings throughout the year relating to fund investment performance. In this regard the Board noted that as part of regularly scheduled fund reviews and other reports to the Board on fund performance, the Board considered annualized return information for the fund for different time periods, measured against an appropriate securities market index (benchmark index) and an appropriate peer group of funds with similar objectives (peer group). The Board also considered information about performance attribution. In its evaluation of fund investment performance at meetings throughout the year, the Board gave particular attention to information indicating underperformance of certain Fidelity funds over different time periods and discussed with the Investment Advisers the reasons for such underperformance.
In addition to reviewing absolute and relative fund performance, the Independent Trustees periodically consider the appropriateness of fund performance metrics in evaluating the results achieved. The Independent Trustees generally give greater weight to fund performance over longer time periods than over shorter time periods. Depending on the circumstances, the Independent Trustees may be satisfied with a fund's performance notwithstanding that it lags its benchmark index or peer group for certain periods.
Based on its review, the Board concluded that the nature, extent, and quality of services provided to the fund under the Advisory Contracts should continue to benefit the shareholders of the fund.
Competitiveness of Management Fee and Total Expense Ratio. The Board was provided with information regarding industry trends in management fees and expenses. In its review of the fund's management fee and the total expense ratio of the retail class, the Board considered the fund's management fee rate as well as other fund or class expenses, as applicable, such as transfer agent fees, pricing and bookkeeping fees, fund-paid 12b-1 fees, and custodial, legal, and audit fees. The Board also considered the income-based component of the fund's management fee. The Board noted that Fidelity may agree to waive fees or reimburse expenses from time to time, and the extent to which, if any, it has done so for the fund.
Comparisons of Management Fees and Total Expense Ratios. Among other things, the Board reviewed data for selected groups of competitive funds and classes (referred to as "mapped groups") that were compiled by Fidelity based on combining similar investment objective categories (as classified by Lipper) that have comparable investment mandates. The data reviewed by the Board included (i) gross management fee comparisons (before taking into account expense reimbursements or caps) relative to the total universe of funds within the mapped group; (ii) gross management fee comparisons relative to a subset of non-Fidelity funds in the mapped group that are similar in size and management fee structure to the fund (referred to as the "asset size peer group"); (iii) total expense comparisons of the retail class of the fund relative to funds and classes in the mapped group that have a similar sales load structure to the retail class of the fund (referred to as the "similar sales load structure group"); and (iv) total expense comparisons of the retail class of the fund relative to funds and classes in the similar sales load structure group that are similar in size and management fee structure to the fund (referred to as the "total expense asset size peer group"). The total expense asset size peer group comparison excludes performance adjustments and fund-paid 12b-1 fees to eliminate variability in fee structures.
The information provided to the Board indicated that the fund's management fee rate ranked below the competitive median of the mapped group for 2022 and below the competitive median of the asset size peer group for 2022. Further, the information provided to the Board indicated that the total expense ratio of the retail class of the fund ranked below the competitive median of the similar sales load structure group for 2022 and below the competitive median of the total expense asset size peer group for 2022.
The Board also considered that, for funds subject to the group fee, FMR agreed to voluntarily waive fees over a specified period of time in amounts designed to account for assets converted from certain funds to certain collective investment trusts.
Other Contractual Arrangements. The Board further considered that FMR has contractually agreed to reimburse Class A, Class M, Class C, Class I, Class Z, and the retail class of the fund to the extent that total operating expenses, with certain exceptions, as a percentage of their respective average net assets, exceed 0.68%, 0.65%, 1.43%, 0.44%, 0.31%, and 0.37% through April 30, 2024.
Fees Charged to Other Fidelity Clients. The Board also considered Fidelity fee structures and other information with respect to clients of Fidelity, such as other funds advised or subadvised by Fidelity, pension plan clients, and other institutional clients with similar mandates. The Board noted that a joint ad hoc committee created by it and the boards of other Fidelity funds periodically reviews and compares Fidelity's institutional investment advisory business with its business of providing services to the Fidelity funds and also noted the most recent findings of the committee. The Board noted that the committee's review included a consideration of the differences in services provided, fees charged, and costs incurred, as well as competition in the markets serving the different categories of clients.
Based on its review, the Board concluded that the fund's management fee is fair and reasonable in light of the services that the fund receives and the other factors considered. Further, based on its review of total expense ratios and fees charged to other Fidelity clients, the Board concluded that the total expense ratio of each class of the fund was reasonable in light of the services that the fund and its shareholders receive and the other factors considered.
Costs of the Services and Profitability. The Board considered the revenues earned and the expenses incurred by Fidelity in conducting the business of developing, marketing, distributing, managing, administering and servicing the fund and servicing the fund's shareholders. The Board also considered the level of Fidelity's profits in respect of all the Fidelity funds.
On an annual basis, Fidelity presents to the Board information about the profitability of its relationships with the fund. Fidelity calculates profitability information for each fund, as well as aggregate profitability information for groups of Fidelity funds and all Fidelity funds, using a series of detailed revenue and cost allocation methodologies which originate with the books and records of Fidelity on which Fidelity's audited financial statements are based. The Audit Committee of the Board reviews any significant changes from the prior year's methodologies and the full Board approves such changes.
A public accounting firm has been engaged annually by the Board as part of the Board's assessment of Fidelity's profitability analysis. The engagement includes the review and assessment of the methodologies used by Fidelity in determining the revenues and expenses attributable to Fidelity's fund business, and completion of agreed-upon procedures in respect of the mathematical accuracy of certain fund profitability information and its conformity to established allocation methodologies. After considering the reports issued under the engagement and information provided by Fidelity, the Board concluded that while other allocation methods may also be reasonable, Fidelity's profitability methodologies are reasonable in all material respects.
The Board also reviewed Fidelity's non-fund businesses and potential indirect benefits such businesses may have received as a result of their association with Fidelity's fund business (i.e., fall-out benefits) as well as cases where Fidelity's affiliates may benefit from the funds' business. The Board considered areas where potential indirect benefits to the Fidelity funds from their relationships with Fidelity may exist. The Board's consideration of these matters was informed by the findings of a joint ad hoc committee created by it and the boards of other Fidelity funds to evaluate potential fall-out benefits.
The Board considered the costs of the services provided by and the profits realized by Fidelity in connection with the operation of the fund and was satisfied that the profitability was not excessive.
Economies of Scale. The Board considered whether there have been economies of scale in respect of the management of the Fidelity funds, whether the Fidelity funds (including the fund) have appropriately benefited from any such economies of scale, and whether there is potential for realization of any further economies of scale. The Board considered the extent to which the fund will benefit from economies of scale as assets grow through increased services to the fund, through waivers or reimbursements, or through fee or expense ratio reductions. The Board also noted that a committee created by it and the boards of other Fidelity funds periodically analyzes whether Fidelity attains economies of scale in respect of the management and servicing of the Fidelity funds, whether the Fidelity funds have appropriately benefited from such economies of scale, and whether there is potential for realization of any further economies of scale.
The Board concluded, taking into account the analysis of the committee, that economies of scale, if any, are being appropriately shared between fund shareholders and Fidelity.
Additional Information Requested by the Board. In order to develop fully the factual basis for consideration of the Fidelity funds' advisory contracts, the Board requested and received additional information on certain topics, including: (i) Fidelity's fund profitability methodology, profitability trends for certain funds, the allocation of various costs to different funds, and the impact of certain factors on fund profitability results; (ii) portfolio manager changes that have occurred during the past year and Fidelity's views regarding portfolio manager investment in the Fidelity funds that they manage; (iii) hiring, training, and retaining personnel; (iv) the arrangements with and compensation paid to certain fund sub-advisers and the treatment of such compensation within Fidelity's fund profitability methodology; (v) the terms of the funds' various management fee structures, including the basic group fee and the terms of Fidelity's voluntary expense limitation arrangements; (vi) Fidelity's transfer agent, pricing and bookkeeping fees, expense and service structures for different funds and classes relative to competitive trends and market conditions; (vii) the impact on fund profitability of recent industry trends, such as the growth in passively managed funds and the changes in flows for different types of funds; (viii) the types of management fee and total expense comparisons provided, and the challenges and limitations associated with such information; (ix) explanations regarding the relative total expense ratios and management fees of certain funds and classes, total expense and management fee competitive trends, and methodologies for total expense and management fee competitive comparisons; (x) information concerning expense limitations applicable to certain funds; and (xi) matters related to money market funds, exchange-traded funds, and target date funds.
Conclusion. Based on its evaluation of all of the conclusions noted above, and after considering all factors it believed relevant, the Board, including the Independent Trustees, concluded that the advisory and sub-advisory fee arrangements are fair and reasonable in light of all of the surrounding circumstances and that the fund's Advisory Contracts should be renewed through September 30, 2024.
| A special meeting of shareholders was held on October 18, 2023. The results of votes taken among shareholders on the proposal before them are reported below. Each vote reported represents one dollar of net asset value held on the record date for the meeting. |
| Proposal 1 |
| To elect a Board of Trustees. |
| | # of Votes | % of Votes |
| Abigail P. Johnson |
| Affirmative | 21,333,918,003.710 | 98.990 |
| Withheld | 218,238,294.280 | 1.010 |
| TOTAL | 21,552,156,297.990 | 100.000 |
| Jennifer Toolin McAuliffe |
| Affirmative | 21,341,064,648.470 | 99.020 |
| Withheld | 211,091,649.520 | 0.980 |
| TOTAL | 21,552,156,297.990 | 100.000 |
| Christine J. Thompson |
| Affirmative | 21,338,732,597.390 | 99.010 |
| Withheld | 213,423,700.600 | 0.990 |
| TOTAL | 21,552,156,297.990 | 100.000 |
| Elizabeth S. Acton |
| Affirmative | 21,317,028,547.600 | 98.910 |
| Withheld | 235,127,750.390 | 1.090 |
| TOTAL | 21,552,156,297.990 | 100.000 |
| Laura M. Bishop |
| Affirmative | 21,336,468,393.320 | 99.000 |
| Withheld | 215,687,904.670 | 1.000 |
| TOTAL | 21,552,156,297.990 | 100.000 |
| Ann E. Dunwoody |
| Affirmative | 21,320,223,866.150 | 98.920 |
| Withheld | 231,932,431.840 | 1.080 |
| TOTAL | 21,552,156,297.990 | 100.000 |
| John Engler |
| Affirmative | 21,279,172,233.730 | 98.730 |
| Withheld | 272,984,064.260 | 1.270 |
| TOTAL | 21,552,156,297.990 | 100.000 |
| Robert F. Gartland |
| Affirmative | 21,319,450,613.340 | 98.920 |
| Withheld | 232,705,684.650 | 1.080 |
| TOTAL | 21,552,156,297.990 | 100.000 |
| Robert W. Helm |
| Affirmative | 21,334,642,392.210 | 98.990 |
| Withheld | 217,513,905.780 | 1.010 |
| TOTAL | 21,552,156,297.990 | 100.000 |
| Arthur E. Johnson |
| Affirmative | 21,298,270,597.120 | 98.820 |
| Withheld | 253,885,700.870 | 1.180 |
| TOTAL | 21,552,156,297.990 | 100.000 |
| Michael E. Kenneally |
| Affirmative | 20,916,217,437.980 | 97.050 |
| Withheld | 635,938,860.010 | 2.950 |
| TOTAL | 21,552,156,297.990 | 100.000 |
| Mark A. Murray |
| Affirmative | 21,321,664,592.720 | 98.930 |
| Withheld | 230,491,705.270 | 1.070 |
| TOTAL | 21,552,156,297.990 | 100.000 |
| Carol J. Zierhoffer |
| Affirmative | 21,337,428,755.990 | 99.000 |
| Withheld | 214,727,542.000 | 1.000 |
| TOTAL | 21,552,156,297.990 | 100.000 |
| | | |
| Proposal 1 reflects trust wide proposal and voting results. |
1.540000.126
LIM-ANN-0224
Fidelity® Global Credit Fund
Annual Report
December 31, 2023
Includes Fidelity and Fidelity Advisor share classes
Contents
To view a fund's proxy voting guidelines and proxy voting record for the 12-month period ended June 30, visit http://www.fidelity.com/proxyvotingresults or visit the Securities and Exchange Commission's (SEC) web site at http://www.sec.gov.
You may also call 1-800-544-8544 if you're an individual investing directly with Fidelity, call 1-800-835-5092 if you're a plan sponsor or participant with Fidelity as your recordkeeper or call 1-877-208-0098 on institutional accounts or if you're an advisor or invest through one to request a free copy of the proxy voting guidelines.
Standard & Poor's, S&P and S&P 500 are registered service marks of The McGraw-Hill Companies, Inc. and have been licensed for use by Fidelity Distributors Corporation.
Other third-party marks appearing herein are the property of their respective owners.
All other marks appearing herein are registered or unregistered trademarks or service marks of FMR LLC or an affiliated company. © 2024 FMR LLC. All rights reserved.
This report and the financial statements contained herein are submitted for the general information of the shareholders of the Fund. This report is not authorized for distribution to prospective investors in the Fund unless preceded or accompanied by an effective prospectus.
A fund files its complete schedule of portfolio holdings with the SEC for the first and third quarters of each fiscal year on Form N-PORT. Forms N-PORT are available on the SEC's web site at http://www.sec.gov. A fund's Forms N-PORT may be reviewed and copied at the SEC's Public Reference Room in Washington, DC. Information regarding the operation of the SEC's Public Reference Room may be obtained by calling 1-800-SEC-0330.
For a complete list of a fund's portfolio holdings, view the most recent holdings listing, semiannual report, or annual report on Fidelity's web site at http://www.fidelity.com, http://www.institutional.fidelity.com, or http://www.401k.com, as applicable.
NOT FDIC INSURED •MAY LOSE VALUE •NO BANK GUARANTEE
Neither the Fund nor Fidelity Distributors Corporation is a bank.
Average annual total return reflects the change in the value of an investment, assuming reinvestment of distributions from dividend income and capital gains (the profits earned upon the sale of securities that have grown in value, if any) and assuming a constant rate of performance each year. The hypothetical investment and the average annual total returns do not reflect the deduction of taxes that a shareholder would pay on fund distributions or the redemption of fund shares. During periods of reimbursement by Fidelity, a fund's total return will be greater than it would be had the reimbursement not occurred. How a fund did yesterday is no guarantee of how it will do tomorrow.
| Average Annual Total Returns |
| | | | |
Periods ended December 31, 2023 | Past 1 year | Past 5 years | Past 10 years |
Class A (incl. 4.00% sales charge) | 2.47% | 0.11% | 0.28% |
Class M (incl. 4.00% sales charge) | 2.60% | 0.13% | 0.29% |
Class C (incl. contingent deferred sales charge) | 4.92% | 0.19% | 0.09% |
| Fidelity® Global Credit Fund | 7.14% | 1.20% | 0.95% |
| Class I | 7.14% | 1.20% | 0.95% |
| Class Z | 7.21% | 1.29% | 0.99% |
Class C shares' contingent deferred sales charges included in the past one year, past five years and past ten years total return figures are 1%, 0% and 0%, respectively.
The initial offering of Class Z shares took place on October 2, 2018. Returns prior to October 2, 2018, are those of Class I.
Prior to June 1, 2017, the fund was named Fidelity® Global Bond Fund, and the fund operated under certain different investment policies and compared its performance to a different index. The fund's historical performance may not represent its current investment policies.
| $10,000 Over 10 Years |
| |
Let's say hypothetically that $10,000 was invested in Fidelity® Global Credit Fund, a class of the fund, on December 31, 2013. The chart shows how the value of your investment would have changed, and also shows how the Bloomberg Global Aggregate Credit Index (Hedged USD) performed over the same period. |
|
|
Market Recap:
Global investment-grade bonds gained 8.68% in 2023, according to the Bloomberg Global Aggregate Credit Index (Hedged USD), as falling commodity prices, cooling inflation and the easing of monetary tightening efforts by the U.S. Federal Reserve and other central banks provided a favorable backdrop for global credit assets. The strong gain followed a difficult 2022, during which the index returned -14.22%. The 2023 advance was driven by a powerful rally in the year's final two months, but the 12-month period was marked by high levels of volatility. The bond market saw sluggish returns for much of the year, including sharp sell-offs in September and October after the U.S. Fed temporarily adopted a "higher for longer" message on interest rates. But after the Fed struck a more optimistic tone at its committee meetings in November and December, a strong relief rally followed, as investors priced in the expectation of U.S. rate cuts in 2024. That said, the magnitude of future global easing remains uncertain at year-end. Between March 2022 and July 2023, the Fed hiked its benchmark interest rate 11 times, from a target range of 0% to 0.25% to a range of 5.25% to 5.50%, a 22-year high, before pausing and deciding to hold rates steady through year-end. To varying degrees, other major central banks have followed the Fed's lead: the Bank of England's benchmark rate stood at 5.25% at year-end, while the European Central Bank's was at 4% after policymakers paused increases in October.
Comments from Co-Portfolio Managers Michael Foggin, Matthew Bartlett, Lisa Easterbrook and Andrew Lewis:
For the year ending December 31, 2023, the fund (excluding sales charges, if applicable) gained 7.14%, trailing, net of fees, the 8.68% result of the benchmark, the Bloomberg Global Aggregate Credit Index (Hedged USD). At year-end, about 76% of the portfolio was comprised of corporate bond holdings, while 10% was in non-benchmark exposure to U.S. government bonds and roughly 7% in non-U.S. government securities. The fund also had a 6% allocation to cash as of December 31. Roughly 31% of the fund was invested in investment-grade securities rated A and above, while 59% was in bonds rated BBB and lower. Versus the Bloomberg benchmark, the largest individual relative detractor was a sizable sub-investment-grade stake in Credit Suisse. In March, Swiss regulators orchestrated the bank's takeover by its chief Swiss banking rival, UBS Group, resulting in the loss of our sub-investment-grade position. Holdings in the debt of European property company Heimstaden also detracted from the relative result. Conversely, an overweight stake in senior Credit Suisse bonds, which were folded into the new UBS Group, contributed to the fund's relative result. Top fund holdings at the end of the year included UBS Group, KfW and Bank of Ireland Group.
The views expressed above reflect those of the portfolio manager(s) only through the end of the period as stated on the cover of this report and do not necessarily represent the views of Fidelity or any other person in the Fidelity organization. Any such views are subject to change at any time based upon market or other conditions and Fidelity disclaims any responsibility to update such views. These views may not be relied on as investment advice and, because investment decisions for a Fidelity fund are based on numerous factors, may not be relied on as an indication of trading intent on behalf of any Fidelity fund.
Quality Diversification (% of Fund's net assets) |
|
Percentages shown as 0.0% may reflect amounts less than 0.05%. |
| |
| We have used ratings from Moody's Investors Service, Inc. Where Moody's® ratings are not available, we have used S&P® ratings. All ratings are as of the date indicated and do not reflect subsequent changes. |
Asset Allocation (% of Fund's net assets) |
|
Futures and Swaps - 27.3% |
Forward foreign currency contracts - (49.5)% |
|
Geographic Diversification (% of Fund's net assets) |
|
* Includes Short-Term investments and Net Other Assets (Liabilities). Percentages are adjusted for the effect of derivatives, if applicable. |
| |
Forward foreign currency contracts and other assets and liabilities are included within United States of America, as applicable.
Showing Percentage of Net Assets
| Nonconvertible Bonds - 68.6% |
| | | Principal Amount (a) | Value ($) |
| Australia - 2.3% | | | |
| AusNet Services Holdings Pty Ltd. 1.625% 3/11/81 (Reg. S) (b) | EUR | 150,000 | 149,180 |
| Leighton Finance U.S.A. Pty Ltd. 1.5% 5/28/29 (Reg. S) | EUR | 236,000 | 224,879 |
| QBE Insurance Group Ltd.: | | | |
| 2.5% 9/13/38 (Reg. S) (b) | GBP | 150,000 | 161,978 |
| 6.75% 12/2/44 (Reg. S) (b) | | 677,000 | 672,769 |
TOTAL AUSTRALIA | | | 1,208,806 |
| Belgium - 0.4% | | | |
| KBC Group NV 6.324% 9/21/34 (b)(c) | | 200,000 | 211,237 |
| Canada - 0.1% | | | |
| Alimentation Couche-Tard, Inc. 2.95% 1/25/30 (c) | | 54,000 | 48,338 |
| Denmark - 1.3% | | | |
| Danske Bank A/S: | | | |
| 2.25% 1/14/28 (Reg. S) (b) | GBP | 340,000 | 395,441 |
| 4.75% 6/21/30 (Reg. S) (b) | EUR | 140,000 | 162,862 |
| Jyske Bank A/S 5% 10/26/28 (b) | EUR | 125,000 | 143,375 |
TOTAL DENMARK | | | 701,678 |
| Finland - 0.4% | | | |
| Nordea Bank Abp 4.125% 5/5/28 (Reg. S) | EUR | 200,000 | 227,916 |
| France - 4.4% | | | |
| BNP Paribas SA: | | | |
| 2.159% 9/15/29 (b)(c) | | 243,000 | 211,351 |
| 2.5% 3/31/32 (Reg. S) (b) | EUR | 400,000 | 417,600 |
| BPCE SA 1.5% 1/13/42 (Reg. S) (b) | EUR | 200,000 | 200,128 |
| Electricite de France SA: | | | |
| 5.5% 1/25/35 (Reg. S) | GBP | 200,000 | 257,199 |
| 5.7% 5/23/28 (c) | | 200,000 | 206,929 |
| Engie SA 4.25% 9/6/34 (Reg. S) | EUR | 100,000 | 116,993 |
| Holding d'Infrastructures et des Metiers de l'Environnement 0.625% 9/16/28 (Reg. S) | EUR | 200,000 | 191,692 |
| Lagardere S.C.A. 2.125% 10/16/26 (Reg. S) | EUR | 200,000 | 220,116 |
| Societe Generale: | | | |
| 4.75% 11/24/25 (c) | | 200,000 | 195,862 |
| 6.691% 1/10/34 (b)(c) | | 200,000 | 211,193 |
| Technip Energies NV 1.125% 5/28/28 | EUR | 100,000 | 99,512 |
TOTAL FRANCE | | | 2,328,575 |
| Germany - 8.1% | | | |
| ACCENTRO Real Estate AG 5.625% 2/13/26 (Reg. S) | EUR | 495,000 | 212,434 |
| AGPS BondCo PLC: | | | |
| 4.625% 1/14/26 (Reg. S) (b) | EUR | 1,300,000 | 495,839 |
| 5% 4/27/27 (Reg. S) (b) | EUR | 100,000 | 36,430 |
| Bayer AG 4.625% 5/26/33 (Reg. S) | EUR | 150,000 | 172,781 |
| Bayer U.S. Finance LLC 6.375% 11/21/30 (c) | | 200,000 | 205,772 |
| Commerzbank AG 8.625% 2/28/33 (Reg. S) (b) | GBP | 100,000 | 135,399 |
| Deutsche Bank AG: | | | |
| 3.25% 5/24/28 (Reg. S) (b) | EUR | 100,000 | 108,004 |
| 4% 6/24/32 (Reg. S) (b) | EUR | 300,000 | 318,103 |
| 6.125% 12/12/30 (Reg. S) (b) | GBP | 200,000 | 258,102 |
| EnBW Energie Baden-Wuerttemberg AG 1.375% 8/31/81 (Reg. S) (b) | EUR | 300,000 | 282,310 |
| KfW: | | | |
| 0% 3/31/27 (Reg. S) | EUR | 271,000 | 276,812 |
| 0% 12/15/27 (Reg. S) | EUR | 550,000 | 552,760 |
| 2.875% 6/7/33 (Reg. S) | EUR | 400,000 | 452,937 |
| Robert Bosch GmbH 4.375% 6/2/43 (Reg. S) | EUR | 100,000 | 118,349 |
| Schaeffler AG 3.375% 10/12/28 (Reg. S) | EUR | 200,000 | 213,614 |
| Sirius Real Estate Ltd. 1.125% 6/22/26 (Reg. S) | EUR | 200,000 | 198,945 |
| ZF Europe Finance BV 2% 2/23/26 (Reg. S) | EUR | 100,000 | 105,151 |
| ZF Finance GmbH 2% 5/6/27 (Reg. S) | EUR | 200,000 | 203,729 |
TOTAL GERMANY | | | 4,347,471 |
| Greece - 0.4% | | | |
| Alpha Bank SA 4.25% 2/13/30 (Reg. S) (b) | EUR | 200,000 | 215,129 |
| Hong Kong - 1.6% | | | |
| AIA Group Ltd. 0.88% 9/9/33 (Reg. S) (b) | EUR | 200,000 | 188,058 |
| Prudential Funding Asia PLC 2.95% 11/3/33 (Reg. S) (b) | | 742,000 | 650,280 |
TOTAL HONG KONG | | | 838,338 |
| Ireland - 4.2% | | | |
| AerCap Ireland Capital Ltd./AerCap Global Aviation Trust 3.3% 1/30/32 | | 150,000 | 130,549 |
| AIB Group PLC 2.25% 4/4/28 (Reg. S) (b) | EUR | 503,000 | 532,232 |
| Avolon Holdings Funding Ltd.: | | | |
| 4.25% 4/15/26 (c) | | 379,000 | 366,044 |
| 4.375% 5/1/26 (c) | | 26,000 | 25,157 |
| Bank of Ireland Group PLC: | | | |
| 1.375% 8/11/31 (Reg. S) (b) | EUR | 556,000 | 572,107 |
| 2.029% 9/30/27 (b)(c) | | 695,000 | 633,703 |
TOTAL IRELAND | | | 2,259,792 |
| Italy - 0.4% | | | |
| UniCredit SpA 5.861% 6/19/32 (b)(c) | | 200,000 | 195,674 |
| Luxembourg - 1.6% | | | |
| Blackstone Property Partners Europe LP: | | | |
| 1% 5/4/28 (Reg. S) | EUR | 486,000 | 448,936 |
| 1.75% 3/12/29 (Reg. S) | EUR | 278,000 | 257,891 |
| 2.625% 10/20/28 (Reg. S) | GBP | 150,000 | 162,919 |
TOTAL LUXEMBOURG | | | 869,746 |
| Mexico - 1.7% | | | |
| Petroleos Mexicanos 6.5% 3/13/27 | | 996,000 | 925,658 |
| Netherlands - 1.3% | | | |
| ING Groep NV: | | | |
| 4.5% 5/23/29 (Reg. S) (b) | EUR | 100,000 | 113,727 |
| 4.75% 5/23/34 (Reg. S) (b) | EUR | 300,000 | 352,070 |
| Rabobank Nederland 4% 1/10/30 (Reg. S) | EUR | 100,000 | 113,962 |
| Universal Music Group NV 4% 6/13/31 (Reg. S) | EUR | 100,000 | 115,368 |
TOTAL NETHERLANDS | | | 695,127 |
| Poland - 0.6% | | | |
| GTC Aurora Luxembourg SA 2.25% 6/23/26 (Reg. S) | EUR | 382,000 | 303,841 |
| Portugal - 0.5% | | | |
| Banco Espirito Santo SA 4% (Reg. S) (d)(e) | EUR | 200,000 | 57,405 |
| Fidelidade-Companhia de Seguros SA 4.25% 9/4/31 (Reg. S) (b) | EUR | 200,000 | 198,347 |
TOTAL PORTUGAL | | | 255,752 |
| Spain - 0.4% | | | |
| Werfenlife SA 4.625% 6/6/28 (Reg. S) | EUR | 200,000 | 224,903 |
| Sweden - 0.8% | | | |
| Heimstaden AB 4.375% 3/6/27 (Reg. S) | EUR | 300,000 | 136,283 |
| Samhallsbyggnadsbolaget I Norden AB: | | | |
| 1.75% 1/14/25 (Reg. S) | EUR | 200,000 | 189,883 |
| 2.25% 8/12/27 (Reg. S) | EUR | 150,000 | 110,934 |
TOTAL SWEDEN | | | 437,100 |
| Switzerland - 6.5% | | | |
| Cloverie PLC 4.5% 9/11/44 (Reg. S) (b) | | 1,004,000 | 989,603 |
| Demeter Investments BV: | | | |
| 5.625% 8/15/52 (Reg. S) (b) | | 249,000 | 241,278 |
| 5.75% 8/15/50 (Reg. S) (b) | | 868,000 | 855,136 |
| UBS Group AG: | | | |
| 2.125% 11/15/29 (Reg. S) (b) | GBP | 347,000 | 391,598 |
| 4.282% 1/9/28 (c) | | 323,000 | 312,855 |
| 4.988% 8/5/33 (Reg. S) (b) | | 200,000 | 193,366 |
| 6.537% 8/12/33 (b)(c) | | 250,000 | 266,789 |
| Zurich Finance (Ireland) DAC 3.5% 5/2/52 (Reg. S) (b) | | 250,000 | 203,343 |
TOTAL SWITZERLAND | | | 3,453,968 |
| United Kingdom - 11.7% | | | |
| Admiral Group PLC 8.5% 1/6/34 (Reg. S) | GBP | 100,000 | 139,929 |
| Anglian Water (Osprey) Financing PLC 2% 7/31/28 (Reg. S) | GBP | 175,000 | 181,997 |
| Barclays PLC 8.407% 11/14/32 (Reg. S) (b) | GBP | 150,000 | 203,761 |
| Heathrow Funding Ltd. 2.625% 3/16/28 (Reg. S) | GBP | 272,000 | 308,057 |
| HSBC Holdings PLC: | | | |
| 4.787% 3/10/32 (Reg. S) (b) | EUR | 180,000 | 210,014 |
| 4.856% 5/23/33 (Reg. S) (b) | EUR | 200,000 | 234,196 |
| 6.8% 9/14/31 (b) | GBP | 100,000 | 137,333 |
| 8.201% 11/16/34 (Reg. S) (b) | GBP | 100,000 | 140,579 |
| InterContinental Hotel Group PLC 3.375% 10/8/28 (Reg. S) | GBP | 130,000 | 154,350 |
| John Lewis PLC 6.125% 1/21/25 | GBP | 685,000 | 869,813 |
| Lloyds Banking Group PLC: | | | |
| 1.985% 12/15/31 (b) | GBP | 278,000 | 317,850 |
| 4.75% 9/21/31 (Reg. S) (b) | EUR | 270,000 | 314,853 |
| Marks & Spencer PLC 3.75% 5/19/26 (Reg. S) | GBP | 100,000 | 123,460 |
| Mobico Group PLC 4.875% 9/26/31 (Reg. S) | EUR | 150,000 | 167,775 |
| NatWest Group PLC: | | | |
| 2.105% 11/28/31 (Reg. S) (b) | GBP | 486,000 | 551,601 |
| 3.622% 8/14/30 (Reg. S) (b) | GBP | 100,000 | 121,885 |
| 4.771% 2/16/29 (Reg. S) (b) | EUR | 300,000 | 344,166 |
| NGG Finance PLC 2.125% 9/5/82 (Reg. S) (b) | EUR | 329,000 | 329,099 |
| Rolls-Royce PLC 3.375% 6/18/26 | GBP | 110,000 | 132,999 |
| SW Finance I PLC 7.375% 12/12/41 (Reg. S) | GBP | 56,000 | 76,306 |
| Tesco Corporate Treasury Services PLC 2.75% 4/27/30 (Reg. S) | GBP | 100,000 | 112,589 |
| The Berkeley Group PLC 2.5% 8/11/31 (Reg. S) | GBP | 213,000 | 209,069 |
| Travis Perkins PLC 3.75% 2/17/26 (Reg. S) | GBP | 200,000 | 239,889 |
| Tritax EuroBox PLC 0.95% 6/2/26 (Reg. S) | EUR | 110,000 | 110,253 |
| Vodafone Group PLC: | | | |
| 4.875% 10/3/78 (Reg. S) (b) | GBP | 100,000 | 123,815 |
| 6.25% 10/3/78 (Reg. S) (b) | | 250,000 | 248,438 |
| Whitbread PLC 2.375% 5/31/27 (Reg. S) | GBP | 150,000 | 174,050 |
TOTAL UNITED KINGDOM | | | 6,278,126 |
| United States of America - 19.9% | | | |
| Air Lease Corp. 3.125% 12/1/30 | | 191,000 | 167,059 |
| American Airlines, Inc. 3.75% 4/15/27 | | 73,273 | 69,082 |
| Ares Capital Corp.: | | | |
| 2.15% 7/15/26 | | 208,000 | 189,607 |
| 3.25% 7/15/25 | | 260,000 | 249,086 |
| 4.25% 3/1/25 | | 452,000 | 441,855 |
| Blackstone Private Credit Fund 4.875% 4/14/26 | GBP | 396,000 | 482,083 |
| Broadcom, Inc. 2.45% 2/15/31 (c) | | 190,000 | 162,462 |
| Capital One Financial Corp.: | | | |
| 5.468% 2/1/29 (b) | | 44,000 | 43,870 |
| 5.817% 2/1/34 (b) | | 76,000 | 75,630 |
| Carrier Global Corp. 4.5% 11/29/32 (Reg. S) | EUR | 100,000 | 118,066 |
| Centene Corp.: | | | |
| 4.25% 12/15/27 | | 396,000 | 381,567 |
| 4.625% 12/15/29 | | 281,000 | 269,402 |
| Charter Communications Operating LLC/Charter Communications Operating Capital Corp. 4.2% 3/15/28 | | 347,000 | 333,303 |
| Cleco Corporate Holdings LLC 3.375% 9/15/29 | | 695,000 | 608,996 |
| Discover Financial Services 6.7% 11/29/32 | | 15,000 | 15,713 |
| Duke Energy Corp. 3.85% 6/15/34 | EUR | 207,000 | 225,803 |
| Elanco Animal Health, Inc. 6.65% 8/28/28 (b) | | 243,000 | 251,794 |
| Ford Motor Credit Co. LLC 6.86% 6/5/26 | GBP | 130,000 | 170,818 |
| General Motors Financial Co., Inc. 5.15% 8/15/26 (Reg. S) | GBP | 100,000 | 128,024 |
| Hudson Pacific Properties LP 3.95% 11/1/27 | | 486,000 | 406,838 |
| Huntington Bancshares, Inc. 6.208% 8/21/29 (b) | | 150,000 | 154,670 |
| Morgan Stanley 4.656% 3/2/29 (b) | EUR | 100,000 | 114,576 |
| MPT Operating Partnership LP/MPT Finance Corp.: | | | |
| 2.5% 3/24/26 | GBP | 150,000 | 155,076 |
| 3.5% 3/15/31 | | 267,000 | 166,841 |
| NextEra Energy Partners LP 4.25% 9/15/24 (c) | | 35,000 | 33,863 |
| Omega Healthcare Investors, Inc. 4.75% 1/15/28 | | 625,000 | 600,802 |
| Puget Energy, Inc. 4.1% 6/15/30 | | 521,000 | 477,353 |
| Sabra Health Care LP 3.2% 12/1/31 | | 94,000 | 76,891 |
| SITE Centers Corp. 4.7% 6/1/27 | | 382,000 | 375,662 |
| Southern Co. 1.875% 9/15/81 (b) | EUR | 364,000 | 344,134 |
| The AES Corp. 2.45% 1/15/31 | | 497,000 | 417,500 |
| The Boeing Co. 5.15% 5/1/30 | | 313,000 | 318,637 |
| Time Warner Cable LLC 5.875% 11/15/40 | | 278,000 | 251,645 |
| Toll Brothers Finance Corp. 4.875% 3/15/27 | | 452,000 | 449,376 |
| Universal Health Services, Inc. 2.65% 10/15/30 | | 695,000 | 589,310 |
| Vontier Corp. 2.4% 4/1/28 | | 695,000 | 608,792 |
| Vornado Realty LP 3.4% 6/1/31 | | 79,000 | 61,273 |
| Western Gas Partners LP 4.05% 2/1/30 | | 261,000 | 244,072 |
| Zions Bancorp NA 3.25% 10/29/29 | | 500,000 | 408,765 |
TOTAL UNITED STATES OF AMERICA | | | 10,640,296 |
| TOTAL NONCONVERTIBLE BONDS (Cost $41,714,548) | | | 36,667,471 |
| | | | |
| U.S. Government and Government Agency Obligations - 8.7% |
| | | Principal Amount (a) | Value ($) |
| U.S. Treasury Obligations - 8.7% | | | |
| U.S. Treasury Bonds: | | | |
| 1.125% 8/15/40 | | 1,800,000 | 1,148,910 |
| 3.625% 5/15/53 | | 1,100,000 | 1,016,984 |
| 3.875% 5/15/43 (f) | | 1,070,000 | 1,022,119 |
| 6.25% 5/15/30 (g) | | 750,000 | 847,793 |
| U.S. Treasury Notes 1% 7/31/28 | | 700,000 | 615,699 |
| | | | |
| TOTAL U.S. GOVERNMENT AND GOVERNMENT AGENCY OBLIGATIONS (Cost $4,586,814) | | | 4,651,505 |
| | | | |
| Foreign Government and Government Agency Obligations - 0.9% |
| | | Principal Amount (a) | Value ($) |
| Japan - 0.9% | | | |
Japan Government, yield at date of purchase -0.1896% to -0.1796% 2/5/24 to 2/26/24 (Cost $463,135) | JPY | 66,550,000 | 472,078 |
| | | | |
| Supranational Obligations - 1.8% |
| | | Principal Amount (a) | Value ($) |
| European Investment Bank: | | | |
| 0% 1/14/31 (Reg. S) | EUR | 390,000 | 362,018 |
| 0.875% 1/14/28 (Reg. S) | EUR | 550,000 | 572,501 |
| TOTAL SUPRANATIONAL OBLIGATIONS (Cost $880,802) | | | 934,519 |
| | | | |
| Preferred Securities - 11.3% |
| | | Principal Amount (a) | Value ($) |
| Australia - 0.4% | | | |
| QBE Insurance Group Ltd. 5.25% (Reg. S) (b)(h) | | 200,000 | 191,760 |
| Canada - 0.5% | | | |
| Bank of Nova Scotia: | | | |
| CME Term SOFR 3 Month Index + 2.900% 8.3354% (b)(h)(i) | | 205,000 | 189,188 |
| 4.9% (b)(h) | | 82,000 | 78,624 |
TOTAL CANADA | | | 267,812 |
| Czech Republic - 0.3% | | | |
| CPI Property Group SA 3.75% (Reg. S) (b)(h) | EUR | 590,000 | 153,866 |
| Finland - 0.4% | | | |
| Citycon Oyj 4.496% (Reg. S) (b)(h) | EUR | 243,000 | 216,635 |
| France - 0.9% | | | |
| BNP Paribas SA 6.625% (Reg. S) (b)(h) | | 250,000 | 253,209 |
| Electricite de France SA 5.625% (Reg. S) (b)(h) | | 220,000 | 224,863 |
TOTAL FRANCE | | | 478,072 |
| Germany - 3.8% | | | |
| Aroundtown SA 3.375% (Reg. S) (b)(h) | EUR | 1,100,000 | 491,664 |
| AT Securities BV USD SWAP SEMI 30/360 5Y INDX + 3.540% 7.747% (Reg. S) (b)(h)(i) | | 250,000 | 122,808 |
| Grand City Properties SA 1.5% (Reg. S) (b)(h) | EUR | 1,000,000 | 495,150 |
| Volkswagen International Finance NV: | | | |
| 3.375% (Reg. S) (b)(h) | EUR | 100,000 | 110,934 |
| 3.748% (Reg. S) (b)(h) | EUR | 200,000 | 206,852 |
| 3.875% (Reg. S) (b)(h) | EUR | 600,000 | 620,093 |
TOTAL GERMANY | | | 2,047,501 |
| Ireland - 0.9% | | | |
| AerCap Holdings NV 5.875% 10/10/79 (b) | | 202,000 | 202,146 |
| AIB Group PLC 6.25% (Reg. S) (b)(h) | EUR | 250,000 | 273,576 |
TOTAL IRELAND | | | 475,722 |
| Sweden - 0.9% | | | |
| Heimstaden Bostad AB: | | | |
| 3.248% (Reg. S) (b)(h) | EUR | 625,000 | 371,162 |
| 3.625% (Reg. S) (b)(h) | EUR | 150,000 | 68,473 |
| Samhallsbyggnadsbolaget I Norden AB 2.624% (Reg. S) (b)(h) | EUR | 313,000 | 59,033 |
TOTAL SWEDEN | | | 498,668 |
| Switzerland - 0.7% | | | |
| Credit Suisse Group AG Claim (d)(h) | | 1,389,000 | 159,735 |
| UBS Group AG 7% (Reg. S) (b)(h) | | 200,000 | 210,511 |
TOTAL SWITZERLAND | | | 370,246 |
| United Kingdom - 2.5% | | | |
| Barclays PLC: | | | |
| 7.125% (b)(h) | GBP | 200,000 | 248,403 |
| 8.875% (b)(h) | GBP | 200,000 | 255,028 |
| British American Tobacco PLC 3% (Reg. S) (b)(h) | EUR | 388,000 | 382,463 |
| Mobico Group PLC 4.25% (Reg. S) (b)(h) | GBP | 100,000 | 116,520 |
| SSE PLC 3.74% (Reg. S) (b)(h) | GBP | 278,000 | 342,215 |
TOTAL UNITED KINGDOM | | | 1,344,629 |
| TOTAL PREFERRED SECURITIES (Cost $10,984,905) | | | 6,044,911 |
| | | | |
| Money Market Funds - 4.5% |
| | | Shares | Value ($) |
Fidelity Cash Central Fund 5.40% (j) (Cost $2,411,186) | | 2,410,704 | 2,411,186 |
| | | | |
| TOTAL INVESTMENT IN SECURITIES - 95.8% (Cost $61,041,390) | 51,181,670 |
NET OTHER ASSETS (LIABILITIES) - 4.2% | 2,253,150 |
| NET ASSETS - 100.0% | 53,434,820 |
| | |
| Futures Contracts |
| | Number of contracts | Expiration Date | Notional Amount ($) | Value ($) | Unrealized Appreciation/ (Depreciation) ($) |
| Purchased | | | | | |
| | | | | | |
| Bond Index Contracts | | | | | |
| ASX 10 Year Treasury Bond Index Contracts (Australia) | 3 | Mar 2024 | 238,506 | 6,957 | 6,957 |
| Eurex Euro-Bund Contracts (Germany) | 5 | Mar 2024 | 757,420 | 24,045 | 24,045 |
| Eurex Euro-Buxl 30 Year Bond Contracts (Germany) | 4 | Mar 2024 | 625,807 | 47,416 | 47,416 |
| Eurex Euro-Schatz Contracts (Germany) | 6 | Mar 2024 | 705,722 | 5,424 | 5,424 |
| TME 10 Year Canadian Note Contracts (Canada) | 10 | Mar 2024 | 937,172 | 39,423 | 39,423 |
| | | | | | |
| TOTAL BOND INDEX CONTRACTS | | | | | 123,265 |
| | | | | | |
| Treasury Contracts | | | | | |
| CBOT 2-Year U.S. Treasury Note Contracts (United States) | 15 | Mar 2024 | 3,088,711 | 30,909 | 30,909 |
| CBOT 5-Year U.S. Treasury Note Contracts (United States) | 26 | Mar 2024 | 2,828,109 | 62,848 | 62,848 |
| CBOT Long Term U.S. Treasury Bond Contracts (United States) | 54 | Mar 2024 | 6,746,625 | 489,630 | 489,630 |
| CBOT Ultra Long Term U.S. Treasury Bond Contracts (United States) | 1 | Mar 2024 | 133,594 | 12,045 | 12,045 |
| | | | | | |
| TOTAL TREASURY CONTRACTS | | | | | 595,432 |
| | | | | | |
| TOTAL PURCHASED | | | | | 718,697 |
| | | | | | |
| Sold | | | | | |
| | | | | | |
| Bond Index Contracts | | | | | |
| ICE Long Gilt Contracts (United Kingdom) | 7 | Mar 2024 | 915,900 | (49,049) | (49,049) |
| | | | | | |
| TOTAL FUTURES CONTRACTS | | | | | 669,648 |
| The notional amount of futures purchased as a percentage of Net Assets is 30.1% |
| The notional amount of futures sold as a percentage of Net Assets is 1.7% |
For the period, the average monthly notional amount at value for futures contracts in the aggregate was $24,443,063.
| Forward Foreign Currency Contracts |
Currency Purchased
| Currency Sold | Counterparty | Settlement Date | Unrealized Appreciation/ (Depreciation) ($) |
| | | | | | | |
| GBP | 299,000 | USD | 381,854 | Citibank, N. A. | 1/12/24 | (714) |
| USD | 21,670 | AUD | 33,000 | Brown Brothers Harriman & Co | 1/12/24 | (825) |
| USD | 29,422 | CAD | 39,000 | BNP Paribas S.A. | 1/12/24 | (15) |
| USD | 29,481 | CAD | 40,000 | Canadian Imperial Bk. of Comm. | 1/12/24 | (710) |
| USD | 142,010 | EUR | 129,000 | BNP Paribas S.A. | 1/12/24 | (455) |
| USD | 30,717 | EUR | 28,000 | BNP Paribas S.A. | 1/12/24 | (206) |
| USD | 27,487 | EUR | 25,000 | BNP Paribas S.A. | 1/12/24 | (122) |
| USD | 437,857 | EUR | 396,000 | Bank of America, N.A. | 1/12/24 | 523 |
| USD | 16,442,196 | EUR | 15,165,000 | Bank of America, N.A. | 1/12/24 | (305,698) |
| USD | 21,596 | EUR | 20,000 | Brown Brothers Harriman & Co | 1/12/24 | (492) |
| USD | 81,962 | EUR | 75,000 | Brown Brothers Harriman & Co | 1/12/24 | (867) |
| USD | 119,587 | GBP | 94,000 | BNP Paribas S.A. | 1/12/24 | (237) |
| USD | 8,439,898 | GBP | 6,686,000 | BNP Paribas S.A. | 1/12/24 | (82,869) |
| USD | 102,670 | GBP | 82,000 | Bank of America, N.A. | 1/12/24 | (1,857) |
| USD | 29,150 | GBP | 23,000 | Citibank, N. A. | 1/12/24 | (169) |
| USD | 464,699 | JPY | 66,650,000 | BNP Paribas S.A. | 1/12/24 | (8,687) |
| | | | | | | |
| TOTAL FORWARD FOREIGN CURRENCY CONTRACTS | | (403,400) |
| Unrealized Appreciation | | | 523 |
| Unrealized Depreciation | | | (403,923) |
For the period, the average contract value for forward foreign currency contracts was $37,250,712. Contract value represents contract amount in United States dollars plus or minus unrealized appreciation or depreciation, respectively.
| Credit Default Swaps |
| Underlying Reference | | Maturity Date | Clearinghouse / Counterparty | Fixed Payment Received/ (Paid) | Payment Frequency | Notional Amount(1) | Value ($) | Upfront Premium Received/ (Paid) ($) | Unrealized Appreciation/ (Depreciation) ($) |
| Buy Protection | | | | | | | | | | |
| Intesa Sanpaolo SpA | | Jun 2028 | JPMorgan Chase Bank, N.A. | (1%) | Quarterly | EUR | 500,000 | (6,367) | 647 | (5,720) |
| | | | | | | | | | | |
(1)Notional amount is stated in U.S. Dollars unless otherwise noted.
Currency Abbreviations
| AUD | - | Australian dollar |
| CAD | - | Canadian dollar |
| EUR | - | European Monetary Unit |
| GBP | - | British pound sterling |
| JPY | - | Japanese yen |
| USD | - | U.S. dollar |
Legend
| (a) | Amount is stated in United States dollars unless otherwise noted. |
| (b) | Coupon rates for floating and adjustable rate securities reflect the rates in effect at period end. |
| (c) | Security exempt from registration under Rule 144A of the Securities Act of 1933. These securities may be resold in transactions exempt from registration, normally to qualified institutional buyers. At the end of the period, the value of these securities amounted to $3,287,229 or 6.2% of net assets. |
| (d) | Non-income producing - Security is in default. |
| (f) | Security or a portion of the security was pledged to cover margin requirements for futures contracts. At period end, the value of securities pledged amounted to $499,166. |
| (g) | Security or a portion of the security has been segregated as collateral for open forward foreign currency contracts. At period end, the value of securities pledged amounted to $260,817. |
| (h) | Security is perpetual in nature with no stated maturity date. |
| (i) | Coupon is indexed to a floating interest rate which may be multiplied by a specified factor and/or subject to caps or floors. |
| (j) | Affiliated fund that is generally available only to investment companies and other accounts managed by Fidelity Investments. The rate quoted is the annualized seven-day yield of the fund at period end. A complete unaudited listing of the fund's holdings as of its most recent quarter end is available upon request. In addition, each Fidelity Central Fund's financial statements, which are not covered by the Fund's Report of Independent Registered Public Accounting Firm, are available on the SEC's website or upon request. |
Affiliated Central Funds
Fiscal year to date information regarding the Fund's investments in Fidelity Central Funds, including the ownership percentage, is presented below.
| Affiliate | Value, beginning of period ($) | Purchases ($) | Sales Proceeds ($) | Dividend Income ($) | Realized Gain (loss) ($) | Change in Unrealized appreciation (depreciation) ($) | Value, end of period ($) | % ownership, end of period |
| Fidelity Cash Central Fund 5.40% | 1,823,614 | 33,738,104 | 33,150,532 | 142,521 | - | - | 2,411,186 | 0.0% |
| Fidelity Securities Lending Cash Central Fund 5.40% | - | 244,861 | 244,861 | 19 | - | - | - | 0.0% |
| Total | 1,823,614 | 33,982,965 | 33,395,393 | 142,540 | - | - | 2,411,186 | |
| | | | | | | | | |
Amounts in the dividend income column in the above table include any capital gain distributions from underlying funds, which are presented in the corresponding line item in the Statement of Operations, if applicable.
Amounts in the dividend income column for Fidelity Securities Lending Cash Central Fund represents the income earned on investing cash collateral, less rebates paid to borrowers and any lending agent fees associated with the loan, plus any premium payments received for lending certain types of securities.
Amounts included in the purchases and sales proceeds columns may include in-kind transactions, if applicable.
Investment Valuation
The following is a summary of the inputs used, as of December 31, 2023, involving the Fund's assets and liabilities carried at fair value. The inputs or methodology used for valuing securities may not be an indication of the risk associated with investing in those securities. For more information on valuation inputs, and their aggregation into the levels used below, please refer to the Investment Valuation section in the accompanying Notes to Financial Statements.
| Valuation Inputs at Reporting Date: |
| Description | Total ($) | Level 1 ($) | Level 2 ($) | Level 3 ($) |
Investments in Securities: | | | | |
|
| Corporate Bonds | 36,667,471 | - | 36,610,066 | 57,405 |
|
| U.S. Government and Government Agency Obligations | 4,651,505 | - | 4,651,505 | - |
|
| Foreign Government and Government Agency Obligations | 472,078 | - | 472,078 | - |
|
| Supranational Obligations | 934,519 | - | 934,519 | - |
|
| Preferred Securities | 6,044,911 | - | 6,044,911 | - |
|
| Money Market Funds | 2,411,186 | 2,411,186 | - | - |
| Total Investments in Securities: | 51,181,670 | 2,411,186 | 48,713,079 | 57,405 |
Derivative Instruments: Assets | | | | |
Futures Contracts | 718,697 | 718,697 | - | - |
Forward Foreign Currency Contracts | 523 | - | 523 | - |
| Total Assets | 719,220 | 718,697 | 523 | - |
| Liabilities | | | | |
Futures Contracts | (49,049) | (49,049) | - | - |
Forward Foreign Currency Contracts | (403,923) | - | (403,923) | - |
Swaps | (6,367) | - | (6,367) | - |
| Total Liabilities | (459,339) | (49,049) | (410,290) | - |
| Total Derivative Instruments: | 259,881 | 669,648 | (409,767) | - |
Value of Derivative Instruments
The following table is a summary of the Fund's value of derivative instruments by primary risk exposure as of December 31, 2023. For additional information on derivative instruments, please refer to the Derivative Instruments section in the accompanying Notes to Financial Statements.
Primary Risk Exposure / Derivative Type | Value |
| Asset ($) | Liability ($) |
| Credit Risk | | |
Swaps (a) | 0 | (6,367) |
| Total Credit Risk | 0 | (6,367) |
| Foreign Exchange Risk | | |
Forward Foreign Currency Contracts (b) | 523 | (403,923) |
| Total Foreign Exchange Risk | 523 | (403,923) |
| Interest Rate Risk | | |
Futures Contracts (c) | 718,697 | (49,049) |
| Total Interest Rate Risk | 718,697 | (49,049) |
| Total Value of Derivatives | 719,220 | (459,339) |
(a)For bi-lateral over-the-counter (OTC) swaps, reflects gross value which is presented in the Statement of Assets and Liabilities in the bi-lateral OTC swaps, at value line-items.
(b)Gross value is presented in the Statement of Assets and Liabilities in the unrealized appreciation/depreciation on forward foreign currency contracts line-items.
(c)Reflects gross cumulative appreciation (depreciation) on futures contracts as presented in the Schedule of Investments. In the Statement of Assets and Liabilities, the period end daily variation margin is included in receivable or payable for daily variation margin on futures contracts, and the net cumulative appreciation (depreciation) is included in Total accumulated earnings (loss).
| Statement of Assets and Liabilities |
| | | | December 31, 2023 |
| | | | | |
| Assets | | | | |
| Investment in securities, at value - See accompanying schedule: | | | | |
Unaffiliated issuers (cost $58,630,204) | $ | 48,770,484 | | |
Fidelity Central Funds (cost $2,411,186) | | 2,411,186 | | |
| | | | | |
| | | | | |
| Total Investment in Securities (cost $61,041,390) | | | $ | 51,181,670 |
| Cash | | | | 44,852 |
| Foreign currency held at value (cost $653,198) | | | | 659,484 |
| Unrealized appreciation on forward foreign currency contracts | | | | 523 |
| Receivable for fund shares sold | | | | 1,456,354 |
| Interest receivable | | | | 661,923 |
| Distributions receivable from Fidelity Central Funds | | | | 10,561 |
| Receivable from investment adviser for expense reductions | | | | 1,182 |
Total assets | | | | 54,016,549 |
| Liabilities | | | | |
| Unrealized depreciation on forward foreign currency contracts | $ | 403,923 | | |
| Payable for fund shares redeemed | | 123,170 | | |
| Bi-lateral OTC swaps, at value | | 6,367 | | |
| Accrued management fee | | 17,177 | | |
| Distribution and service plan fees payable | | 2,274 | | |
| Payable for daily variation margin on futures contracts | | 20,831 | | |
| Other affiliated payables | | 4,900 | | |
| Other payables and accrued expenses | | 3,087 | | |
| Total Liabilities | | | | 581,729 |
| Net Assets | | | $ | 53,434,820 |
| Net Assets consist of: | | | | |
| Paid in capital | | | $ | 76,465,412 |
| Total accumulated earnings (loss) | | | | (23,030,592) |
| Net Assets | | | $ | 53,434,820 |
| | | | | |
| Net Asset Value and Maximum Offering Price | | | | |
| Class A : | | | | |
Net Asset Value and redemption price per share ($5,534,046 ÷ 731,674 shares)(a) | | | $ | 7.56 |
| Maximum offering price per share (100/96.00 of $7.56) | | | $ | 7.88 |
| Class M : | | | | |
Net Asset Value and redemption price per share ($1,342,790 ÷ 177,490 shares)(a) | | | $ | 7.57 |
| Maximum offering price per share (100/96.00 of $7.57) | | | $ | 7.89 |
| Class C : | | | | |
Net Asset Value and offering price per share ($1,052,372 ÷ 138,969 shares)(a) | | | $ | 7.57 |
| Global Credit : | | | | |
Net Asset Value, offering price and redemption price per share ($32,617,105 ÷ 4,309,489 shares) | | | $ | 7.57 |
| Class I : | | | | |
Net Asset Value, offering price and redemption price per share ($4,949,109 ÷ 654,052 shares) | | | $ | 7.57 |
| Class Z : | | | | |
Net Asset Value, offering price and redemption price per share ($7,939,398 ÷ 1,044,203 shares) | | | $ | 7.60 |
(a)Redemption price per share is equal to net asset value less any applicable contingent deferred sales charge. |
| Statement of Operations |
| | | | Year ended December 31, 2023 |
| Investment Income | | | | |
| Dividends | | | $ | 572,057 |
| Interest | | | | 1,758,624 |
| Income from Fidelity Central Funds (including $19 from security lending) | | | | 142,540 |
| Total Income | | | | 2,473,221 |
| Expenses | | | | |
| Management fee | $ | 236,154 | | |
| Transfer agent fees | | 64,865 | | |
| Distribution and service plan fees | | 27,286 | | |
| Independent trustees' fees and expenses | | 233 | | |
| Miscellaneous | | 2,308 | | |
| Total expenses before reductions | | 330,846 | | |
| Expense reductions | | (19,638) | | |
| Total expenses after reductions | | | | 311,208 |
| Net Investment income (loss) | | | | 2,162,013 |
| Realized and Unrealized Gain (Loss) | | | | |
| Net realized gain (loss) on: | | | | |
| Investment Securities: | | | | |
| Unaffiliated issuers | | (7,325,138) | | |
| Redemptions in-kind | | (4,172,324) | | |
| Forward foreign currency contracts | | (221,450) | | |
| Foreign currency transactions | | 84,754 | | |
| Futures contracts | | (948,914) | | |
| Swaps | | (14,645) | | |
| Total net realized gain (loss) | | | | (12,597,717) |
| Change in net unrealized appreciation (depreciation) on: | | | | |
| Investment Securities: | | | | |
| Unaffiliated issuers | | 14,325,435 | | |
| Forward foreign currency contracts | | (375,701) | | |
| Assets and liabilities in foreign currencies | | (7,036) | | |
| Futures contracts | | 729,792 | | |
| Swaps | | (4,841) | | |
| Total change in net unrealized appreciation (depreciation) | | | | 14,667,649 |
| Net gain (loss) | | | | 2,069,932 |
| Net increase (decrease) in net assets resulting from operations | | | $ | 4,231,945 |
| Statement of Changes in Net Assets |
| |
| | Year ended December 31, 2023 | | Year ended December 31, 2022 |
| Increase (Decrease) in Net Assets | | | | |
| Operations | | | | |
| Net investment income (loss) | $ | 2,162,013 | $ | 2,796,965 |
| Net realized gain (loss) | | (12,597,717) | | (4,020,819) |
| Change in net unrealized appreciation (depreciation) | | 14,667,649 | | (23,854,568) |
| Net increase (decrease) in net assets resulting from operations | | 4,231,945 | | (25,078,422) |
| Distributions to shareholders | | (1,901,556) | | (5,718,208) |
| Distributions to shareholders from tax return of capital | | (92,770) | | - |
| | | | | |
| Total Distributions | | (1,994,326) | | (5,718,208) |
| Share transactions - net increase (decrease) | | (34,416,844) | | (16,078,546) |
| Total increase (decrease) in net assets | | (32,179,225) | | (46,875,176) |
| | | | | |
| Net Assets | | | | |
| Beginning of period | | 85,614,045 | | 132,489,221 |
| End of period | $ | 53,434,820 | $ | 85,614,045 |
| | | | | |
| | | | | |
Financial Highlights
| Fidelity Advisor® Global Credit Fund Class A |
| |
| Years ended December 31, | | 2023 | | 2022 | | 2021 | | 2020 | | 2019 |
Selected Per-Share Data | | | | | | | | | | |
| Net asset value, beginning of period | $ | 7.34 | $ | 9.72 | $ | 10.02 | $ | 9.61 | $ | 8.70 |
| Income from Investment Operations | | | | | | | | | | |
Net investment income (loss) A,B | | .252 | | .197 | | .159 | | .210 | | .214 |
| Net realized and unrealized gain (loss) | | .229 | | (2.118) | | (.236) | | .547 | | 1.031 |
| Total from investment operations | | .481 | | (1.921) | | (.077) | | .757 | | 1.245 |
| Distributions from net investment income | | (.249) | | (.408) | | (.133) C | | (.255) C | | (.224) C |
| Distributions from net realized gain | | - | | (.051) | | (.090) C | | (.092) C | | (.102) C |
| Distributions from tax return of capital | | (.012) | | - | | - | | - | | (.009) |
| Total distributions | | (.261) | | (.459) | | (.223) | | (.347) | | (.335) |
| Net asset value, end of period | $ | 7.56 | $ | 7.34 | $ | 9.72 | $ | 10.02 | $ | 9.61 |
Total Return D,E | | 6.74% | | (19.93)% | | (.76)% | | 8.00% | | 14.37% |
Ratios to Average Net Assets B,F,G | | | | | | | | | | |
| Expenses before reductions | | .88% | | 1.24% | | 1.20% | | 1.27% | | 1.49% |
| Expenses net of fee waivers, if any | | .75% | | .95% | | .99% | | 1.00% | | 1.00% |
| Expenses net of all reductions | | .75% | | .95% | | .99% | | 1.00% | | 1.00% |
| Net investment income (loss) | | 3.44% | | 2.38% | | 1.61% | | 2.14% | | 2.28% |
| Supplemental Data | | | | | | | | | | |
| Net assets, end of period (000 omitted) | $ | 5,534 | $ | 4,778 | $ | 5,643 | $ | 4,643 | $ | 4,739 |
Portfolio turnover rate H | | 37% I | | 19% | | 57% | | 59% | | 85% |
ACalculated based on average shares outstanding during the period.
BNet investment income (loss) is affected by the timing of the declaration of dividends by any underlying mutual funds or exchange-traded funds (ETFs). Net investment income (loss) of any mutual funds or ETFs is not included in the Fund's net investment income (loss) ratio.
CThe amount shown reflects reclassifications related to book to tax differences that were made in the year shown.
DTotal returns would have been lower if certain expenses had not been reduced during the applicable periods shown.
ETotal returns do not include the effect of the sales charges.
FFees and expenses of any underlying mutual funds or exchange-traded funds (ETFs) are not included in the Fund's expense ratio. The Fund indirectly bears its proportionate share of these expenses. For additional expense information related to investments in Fidelity Central Funds, please refer to the "Investments in Fidelity Central Funds" note found in the Notes to Financial Statements section of the most recent Annual or Semi-Annual report.
GExpense ratios reflect operating expenses of the class. Expenses before reductions do not reflect amounts reimbursed, waived, or reduced through arrangements with the investment adviser, brokerage services, or other offset arrangements, if applicable, and do not represent the amount paid by the class during periods when reimbursements, waivers or reductions occur.
HAmount does not include the portfolio activity of any underlying mutual funds or exchange-traded funds (ETFs).
IPortfolio turnover rate excludes securities received or delivered in-kind.
| Fidelity Advisor® Global Credit Fund Class M |
| |
| Years ended December 31, | | 2023 | | 2022 | | 2021 | | 2020 | | 2019 |
Selected Per-Share Data | | | | | | | | | | |
| Net asset value, beginning of period | $ | 7.34 | $ | 9.72 | $ | 10.02 | $ | 9.60 | $ | 8.70 |
| Income from Investment Operations | | | | | | | | | | |
Net investment income (loss) A,B | | .254 | | .199 | | .159 | | .210 | | .214 |
| Net realized and unrealized gain (loss) | | .237 | | (2.121) | | (.237) | | .556 | | 1.021 |
| Total from investment operations | | .491 | | (1.922) | | (.078) | | .766 | | 1.235 |
| Distributions from net investment income | | (.249) | | (.407) | | (.132) C | | (.254) C | | (.224) C |
| Distributions from net realized gain | | - | | (.051) | | (.090) C | | (.092) C | | (.102) C |
| Distributions from tax return of capital | | (.012) | | - | | - | | - | | (.009) |
| Total distributions | | (.261) | | (.458) | | (.222) | | (.346) | | (.335) |
| Net asset value, end of period | $ | 7.57 | $ | 7.34 | $ | 9.72 | $ | 10.02 | $ | 9.60 |
Total Return D,E | | 6.88% | | (19.94)% | | (.77)% | | 8.10% | | 14.25% |
Ratios to Average Net Assets B,F,G | | | | | | | | | | |
| Expenses before reductions | | .90% | | 1.29% | | 1.27% | | 1.35% | | 1.57% |
| Expenses net of fee waivers, if any | | .75% | | .95% | | .99% | | 1.00% | | 1.00% |
| Expenses net of all reductions | | .74% | | .95% | | .99% | | 1.00% | | 1.00% |
| Net investment income (loss) | | 3.45% | | 2.38% | | 1.61% | | 2.14% | | 2.28% |
| Supplemental Data | | | | | | | | | | |
| Net assets, end of period (000 omitted) | $ | 1,343 | $ | 1,366 | $ | 1,983 | $ | 2,062 | $ | 1,939 |
Portfolio turnover rate H | | 37% I | | 19% | | 57% | | 59% | | 85% |
ACalculated based on average shares outstanding during the period.
BNet investment income (loss) is affected by the timing of the declaration of dividends by any underlying mutual funds or exchange-traded funds (ETFs). Net investment income (loss) of any mutual funds or ETFs is not included in the Fund's net investment income (loss) ratio.
CThe amount shown reflects reclassifications related to book to tax differences that were made in the year shown.
DTotal returns would have been lower if certain expenses had not been reduced during the applicable periods shown.
ETotal returns do not include the effect of the sales charges.
FFees and expenses of any underlying mutual funds or exchange-traded funds (ETFs) are not included in the Fund's expense ratio. The Fund indirectly bears its proportionate share of these expenses. For additional expense information related to investments in Fidelity Central Funds, please refer to the "Investments in Fidelity Central Funds" note found in the Notes to Financial Statements section of the most recent Annual or Semi-Annual report.
GExpense ratios reflect operating expenses of the class. Expenses before reductions do not reflect amounts reimbursed, waived, or reduced through arrangements with the investment adviser, brokerage services, or other offset arrangements, if applicable, and do not represent the amount paid by the class during periods when reimbursements, waivers or reductions occur.
HAmount does not include the portfolio activity of any underlying mutual funds or exchange-traded funds (ETFs).
IPortfolio turnover rate excludes securities received or delivered in-kind.
| Fidelity Advisor® Global Credit Fund Class C |
| |
| Years ended December 31, | | 2023 | | 2022 | | 2021 | | 2020 | | 2019 |
Selected Per-Share Data | | | | | | | | | | |
| Net asset value, beginning of period | $ | 7.35 | $ | 9.72 | $ | 10.03 | $ | 9.61 | $ | 8.70 |
| Income from Investment Operations | | | | | | | | | | |
Net investment income (loss) A,B | | .198 | | .137 | | .085 | | .136 | | .143 |
| Net realized and unrealized gain (loss) | | .227 | | (2.112) | | (.246) | | .561 | | 1.027 |
| Total from investment operations | | .425 | | (1.975) | | (.161) | | .697 | | 1.170 |
| Distributions from net investment income | | (.195) | | (.344) | | (.075) C | | (.185) C | | (.150) C |
| Distributions from net realized gain | | - | | (.051) | | (.074) C | | (.092) C | | (.102) C |
| Distributions from tax return of capital | | (.010) | | - | | - | | - | | (.007) |
| Total distributions | | (.205) | | (.395) | | (.149) | | (.277) | | (.260) D |
| Net asset value, end of period | $ | 7.57 | $ | 7.35 | $ | 9.72 | $ | 10.03 | $ | 9.61 |
Total Return E,F | | 5.92% | | (20.47)% | | (1.60)% | | 7.33% | | 13.47% |
Ratios to Average Net Assets A,G,H | | | | | | | | | | |
| Expenses before reductions | | 1.66% | | 2.04% | | 2.02% | | 2.10% | | 2.33% |
| Expenses net of fee waivers, if any | | 1.50% | | 1.70% | | 1.74% | | 1.75% | | 1.75% |
| Expenses net of all reductions | | 1.50% | | 1.70% | | 1.74% | | 1.75% | | 1.75% |
| Net investment income (loss) | | 2.69% | | 1.64% | | .86% | | 1.39% | | 1.53% |
| Supplemental Data | | | | | | | | | | |
| Net assets, end of period (000 omitted) | $ | 1,052 | $ | 1,298 | $ | 2,126 | $ | 2,398 | $ | 2,090 |
Portfolio turnover rate I | | 37% J | | 19% | | 57% | | 59% | | 85% |
ANet investment income (loss) is affected by the timing of the declaration of dividends by any underlying mutual funds or exchange-traded funds (ETFs). Net investment income (loss) of any mutual funds or ETFs is not included in the Fund's net investment income (loss) ratio.
BCalculated based on average shares outstanding during the period.
CThe amount shown reflects reclassifications related to book to tax differences that were made in the year shown.
DTotal distributions per share do not sum due to rounding.
ETotal returns would have been lower if certain expenses had not been reduced during the applicable periods shown.
FTotal returns do not include the effect of the contingent deferred sales charge.
GFees and expenses of any underlying mutual funds or exchange-traded funds (ETFs) are not included in the Fund's expense ratio. The Fund indirectly bears its proportionate share of these expenses. For additional expense information related to investments in Fidelity Central Funds, please refer to the "Investments in Fidelity Central Funds" note found in the Notes to Financial Statements section of the most recent Annual or Semi-Annual report.
HExpense ratios reflect operating expenses of the class. Expenses before reductions do not reflect amounts reimbursed, waived, or reduced through arrangements with the investment adviser, brokerage services, or other offset arrangements, if applicable, and do not represent the amount paid by the class during periods when reimbursements, waivers or reductions occur.
IAmount does not include the portfolio activity of any underlying mutual funds or exchange-traded funds (ETFs).
JPortfolio turnover rate excludes securities received or delivered in-kind.
| Fidelity® Global Credit Fund |
| |
| Years ended December 31, | | 2023 | | 2022 | | 2021 | | 2020 | | 2019 |
Selected Per-Share Data | | | | | | | | | | |
| Net asset value, beginning of period | $ | 7.34 | $ | 9.72 | $ | 10.03 | $ | 9.61 | $ | 8.70 |
| Income from Investment Operations | | | | | | | | | | |
Net investment income (loss) A,B | | .272 | | .221 | | .183 | | .234 | | .238 |
| Net realized and unrealized gain (loss) | | .237 | | (2.122) | | (.247) | | .556 | | 1.030 |
| Total from investment operations | | .509 | | (1.901) | | (.064) | | .790 | | 1.268 |
| Distributions from net investment income | | (.266) | | (.428) | | (.156) C | | (.278) C | | (.246) C |
| Distributions from net realized gain | | - | | (.051) | | (.090) C | | (.092) C | | (.102) C |
| Distributions from tax return of capital | | (.013) | | - | | - | | - | | (.010) |
| Total distributions | | (.279) | | (.479) | | (.246) | | (.370) | | (.358) |
| Net asset value, end of period | $ | 7.57 | $ | 7.34 | $ | 9.72 | $ | 10.03 | $ | 9.61 |
Total Return D | | 7.14% | | (19.73)% | | (.63)% | | 8.36% | | 14.64% |
Ratios to Average Net Assets B,E,F | | | | | | | | | | |
| Expenses before reductions | | .50% | | .94% | | .90% | | .95% | | 1.10% |
| Expenses net of fee waivers, if any | | .50% | | .70% | | .74% | | .75% | | .75% |
| Expenses net of all reductions | | .50% | | .70% | | .74% | | .75% | | .75% |
| Net investment income (loss) | | 3.69% | | 2.64% | | 1.86% | | 2.39% | | 2.53% |
| Supplemental Data | | | | | | | | | | |
| Net assets, end of period (000 omitted) | $ | 32,617 | $ | 40,426 | $ | 65,990 | $ | 96,584 | $ | 61,759 |
Portfolio turnover rate G | | 37% H | | 19% | | 57% | | 59% | | 85% |
ACalculated based on average shares outstanding during the period.
BNet investment income (loss) is affected by the timing of the declaration of dividends by any underlying mutual funds or exchange-traded funds (ETFs). Net investment income (loss) of any mutual funds or ETFs is not included in the Fund's net investment income (loss) ratio.
CThe amount shown reflects reclassifications related to book to tax differences that were made in the year shown.
DTotal returns would have been lower if certain expenses had not been reduced during the applicable periods shown.
EFees and expenses of any underlying mutual funds or exchange-traded funds (ETFs) are not included in the Fund's expense ratio. The Fund indirectly bears its proportionate share of these expenses. For additional expense information related to investments in Fidelity Central Funds, please refer to the "Investments in Fidelity Central Funds" note found in the Notes to Financial Statements section of the most recent Annual or Semi-Annual report.
FExpense ratios reflect operating expenses of the class. Expenses before reductions do not reflect amounts reimbursed, waived, or reduced through arrangements with the investment adviser, brokerage services, or other offset arrangements, if applicable, and do not represent the amount paid by the class during periods when reimbursements, waivers or reductions occur.
GAmount does not include the portfolio activity of any underlying mutual funds or exchange-traded funds (ETFs).
HPortfolio turnover rate excludes securities received or delivered in-kind.
| Fidelity Advisor® Global Credit Fund Class I |
| |
| Years ended December 31, | | 2023 | | 2022 | | 2021 | | 2020 | | 2019 |
Selected Per-Share Data | | | | | | | | | | |
| Net asset value, beginning of period | $ | 7.34 | $ | 9.72 | $ | 10.02 | $ | 9.61 | $ | 8.70 |
| Income from Investment Operations | | | | | | | | | | |
Net investment income (loss) A,B | | .272 | | .220 | | .184 | | .234 | | .239 |
| Net realized and unrealized gain (loss) | | .237 | | (2.121) | | (.238) | | .546 | | 1.029 |
| Total from investment operations | | .509 | | (1.901) | | (.054) | | .780 | | 1.268 |
| Distributions from net investment income | | (.266) | | (.428) | | (.156) C | | (.278) C | | (.246) C |
| Distributions from net realized gain | | - | | (.051) | | (.090) C | | (.092) C | | (.102) C |
| Distributions from tax return of capital | | (.013) | | - | | - | | - | | (.010) |
| Total distributions | | (.279) | | (.479) | | (.246) | | (.370) | | (.358) |
| Net asset value, end of period | $ | 7.57 | $ | 7.34 | $ | 9.72 | $ | 10.02 | $ | 9.61 |
Total Return D | | 7.14% | | (19.73)% | | (.53)% | | 8.25% | | 14.64% |
Ratios to Average Net Assets B,E,F | | | | | | | | | | |
| Expenses before reductions | | .57% | | .93% | | .91% | | .97% | | 1.03% |
| Expenses net of fee waivers, if any | | .50% | | .70% | | .74% | | .75% | | .75% |
| Expenses net of all reductions | | .50% | | .70% | | .74% | | .75% | | .75% |
| Net investment income (loss) | | 3.69% | | 2.64% | | 1.86% | | 2.39% | | 2.53% |
| Supplemental Data | | | | | | | | | | |
| Net assets, end of period (000 omitted) | $ | 4,949 | $ | 4,700 | $ | 8,005 | $ | 9,952 | $ | 4,309 |
Portfolio turnover rate G | | 37% H | | 19% | | 57% | | 59% | | 85% |
ACalculated based on average shares outstanding during the period.
BNet investment income (loss) is affected by the timing of the declaration of dividends by any underlying mutual funds or exchange-traded funds (ETFs). Net investment income (loss) of any mutual funds or ETFs is not included in the Fund's net investment income (loss) ratio.
CThe amount shown reflects reclassifications related to book to tax differences that were made in the year shown.
DTotal returns would have been lower if certain expenses had not been reduced during the applicable periods shown.
EFees and expenses of any underlying mutual funds or exchange-traded funds (ETFs) are not included in the Fund's expense ratio. The Fund indirectly bears its proportionate share of these expenses. For additional expense information related to investments in Fidelity Central Funds, please refer to the "Investments in Fidelity Central Funds" note found in the Notes to Financial Statements section of the most recent Annual or Semi-Annual report.
FExpense ratios reflect operating expenses of the class. Expenses before reductions do not reflect amounts reimbursed, waived, or reduced through arrangements with the investment adviser, brokerage services, or other offset arrangements, if applicable, and do not represent the amount paid by the class during periods when reimbursements, waivers or reductions occur.
GAmount does not include the portfolio activity of any underlying mutual funds or exchange-traded funds (ETFs).
HPortfolio turnover rate excludes securities received or delivered in-kind.
| Fidelity Advisor® Global Credit Fund Class Z |
| |
| Years ended December 31, | | 2023 | | 2022 | | 2021 | | 2020 | | 2019 |
Selected Per-Share Data | | | | | | | | | | |
| Net asset value, beginning of period | $ | 7.37 | $ | 9.75 | $ | 10.04 | $ | 9.61 | $ | 8.70 |
| Income from Investment Operations | | | | | | | | | | |
Net investment income (loss) A,B | | .290 | | .228 | | .191 | | .244 | | .247 |
| Net realized and unrealized gain (loss) | | .226 | | (2.129) | | (.235) | | .556 | | 1.021 |
| Total from investment operations | | .516 | | (1.901) | | (.044) | | .800 | | 1.268 |
| Distributions from net investment income | | (.273) | | (.428) | | (.156) C | | (.278) C | | (.246) C |
| Distributions from net realized gain | | - | | (.051) | | (.090) C | | (.092) C | | (.102) C |
| Distributions from tax return of capital | | (.013) | | - | | - | | - | | (.010) |
| Total distributions | | (.286) | | (.479) | | (.246) | | (.370) | | (.358) |
| Net asset value, end of period | $ | 7.60 | $ | 7.37 | $ | 9.75 | $ | 10.04 | $ | 9.61 |
Total Return D | | 7.21% | | (19.67)% | | (.42)% | | 8.46% | | 14.64% |
Ratios to Average Net Assets B,E,F | | | | | | | | | | |
| Expenses before reductions | | .46% | | .84% | | .78% | | .91% | | 1.05% |
| Expenses net of fee waivers, if any | | .41% | | .61% | | .64% | | .66% | | .66% |
| Expenses net of all reductions | | .41% | | .61% | | .64% | | .66% | | .66% |
| Net investment income (loss) | | 3.79% | | 2.73% | | 1.96% | | 2.48% | | 2.61% |
| Supplemental Data | | | | | | | | | | |
| Net assets, end of period (000 omitted) | $ | 7,939 | $ | 33,046 | $ | 48,742 | $ | 3,017 | $ | 3,004 |
Portfolio turnover rate G | | 37% H | | 19% | | 57% | | 59% | | 85% |
ACalculated based on average shares outstanding during the period.
BNet investment income (loss) is affected by the timing of the declaration of dividends by any underlying mutual funds or exchange-traded funds (ETFs). Net investment income (loss) of any mutual funds or ETFs is not included in the Fund's net investment income (loss) ratio.
CThe amount shown reflects reclassifications related to book to tax differences that were made in the year shown.
DTotal returns would have been lower if certain expenses had not been reduced during the applicable periods shown.
EFees and expenses of any underlying mutual funds or exchange-traded funds (ETFs) are not included in the Fund's expense ratio. The Fund indirectly bears its proportionate share of these expenses. For additional expense information related to investments in Fidelity Central Funds, please refer to the "Investments in Fidelity Central Funds" note found in the Notes to Financial Statements section of the most recent Annual or Semi-Annual report.
FExpense ratios reflect operating expenses of the class. Expenses before reductions do not reflect amounts reimbursed, waived, or reduced through arrangements with the investment adviser, brokerage services, or other offset arrangements, if applicable, and do not represent the amount paid by the class during periods when reimbursements, waivers or reductions occur.
GAmount does not include the portfolio activity of any underlying mutual funds or exchange-traded funds (ETFs).
HPortfolio turnover rate excludes securities received or delivered in-kind.
For the period ended December 31, 2023
1. Organization.
Fidelity Global Credit Fund (the Fund) is a fund of Fidelity School Street Trust (the Trust) and is authorized to issue an unlimited number of shares. The Trust is registered under the Investment Company Act of 1940, as amended (the 1940 Act), as an open-end management investment company organized as a Massachusetts business trust. The Fund offers Class A, Class M, Class C, Global Credit, Class I and Class Z shares, each of which has equal rights as to assets and voting privileges. Class A, Class M, Class C, Class I and Class Z are Fidelity Advisor classes. Each class has exclusive voting rights with respect to matters that affect that class. Class C shares will automatically convert to Class A shares after a holding period of eight years from the initial date of purchase, with certain exceptions.
2. Investments in Fidelity Central Funds.
Funds may invest in Fidelity Central Funds, which are open-end investment companies generally available only to other investment companies and accounts managed by the investment adviser and its affiliates. The Schedule of Investments lists any Fidelity Central Funds held as an investment as of period end, but does not include the underlying holdings of each Fidelity Central Fund. An investing fund indirectly bears its proportionate share of the expenses of the underlying Fidelity Central Funds.
Based on its investment objective, each Fidelity Central Fund may invest or participate in various investment vehicles or strategies that are similar to those of the investing fund. These strategies are consistent with the investment objectives of the investing fund and may involve certain economic risks which may cause a decline in value of each of the Fidelity Central Funds and thus a decline in the value of the investing fund.
| Fidelity Central Fund | Investment Manager | Investment Objective | Investment Practices | Expense RatioA |
| Fidelity Money Market Central Funds | Fidelity Management & Research Company LLC (FMR) | Each fund seeks to obtain a high level of current income consistent with the preservation of capital and liquidity. | Short-term Investments | Less than .005% |
A Expenses expressed as a percentage of average net assets and are as of each underlying Central Fund's most recent annual or semi-annual shareholder report.
A complete unaudited list of holdings for each Fidelity Central Fund is available upon request or at the Securities and Exchange Commission website at www.sec.gov. In addition, the financial statements of the Fidelity Central Funds which contain the significant accounting policies (including investment valuation policies) of those funds, and are not covered by the Report of Independent Registered Public Accounting Firm, are available on the Securities and Exchange Commission website or upon request.
3. Significant Accounting Policies.
The Fund is an investment company and applies the accounting and reporting guidance of the Financial Accounting Standards Board (FASB) Accounting Standards Codification Topic 946 Financial Services - Investment Companies. The financial statements have been prepared in conformity with accounting principles generally accepted in the United States of America (GAAP), which require management to make certain estimates and assumptions at the date of the financial statements. Actual results could differ from those estimates. Subsequent events, if any, through the date that the financial statements were issued have been evaluated in the preparation of the financial statements. The Fund's Schedule of Investments lists any underlying mutual funds or exchange-traded funds (ETFs) but does not include the underlying holdings of these funds. The following summarizes the significant accounting policies of the Fund:
Investment Valuation. Investments are valued as of 4:00 p.m. Eastern time on the last calendar day of the period. The Board of Trustees (the Board) has designated the Fund's investment adviser as the valuation designee responsible for the fair valuation function and performing fair value determinations as needed. The investment adviser has established a Fair Value Committee (the Committee) to carry out the day-to-day fair valuation responsibilities and has adopted policies and procedures to govern the fair valuation process and the activities of the Committee. In accordance with these fair valuation policies and procedures, which have been approved by the Board, the Fund attempts to obtain prices from one or more third party pricing services or brokers to value its investments. When current market prices, quotations or currency exchange rates are not readily available or reliable, investments will be fair valued in good faith by the Committee, in accordance with the policies and procedures. Factors used in determining fair value vary by investment type and may include market or investment specific events, transaction data, estimated cash flows, and market observations of comparable investments. The frequency that the fair valuation procedures are used cannot be predicted and they may be utilized to a significant extent. The Committee manages the Fund's fair valuation practices and maintains the fair valuation policies and procedures. The Fund's investment adviser reports to the Board information regarding the fair valuation process and related material matters.
The Fund categorizes the inputs to valuation techniques used to value its investments into a disclosure hierarchy consisting of three levels as shown below:
Level 1 - unadjusted quoted prices in active markets for identical investments
Level 2 - other significant observable inputs (including quoted prices for similar investments, interest rates, prepayment speeds, etc.)
Level 3 - unobservable inputs (including the Fund's own assumptions based on the best information available)
Valuation techniques used to value the Fund's investments by major category are as follows:
Debt securities, including restricted securities, are valued based on evaluated prices received from third party pricing services or from brokers who make markets in such securities. Corporate bonds, foreign government and government agency obligations, preferred securities and U.S. government and government agency obligations are valued by pricing services who utilize matrix pricing which considers yield or price of bonds of comparable quality, coupon, maturity and type or by broker-supplied prices. Swaps are marked-to-market daily based on valuations from third party pricing services, registered derivatives clearing organizations (clearinghouses) or broker-supplied valuations. These pricing sources may utilize inputs such as interest rate curves, credit spread curves, default possibilities and recovery rates. When independent prices are unavailable or unreliable, debt securities and swaps may be valued utilizing pricing methodologies which consider similar factors that would be used by third party pricing services. For foreign debt securities, when significant market or security specific events arise, valuations may be determined in good faith in accordance with procedures adopted by the Board. Debt securities and swaps are generally categorized as Level 2 in the hierarchy but may be Level 3 depending on the circumstances. The Fund invests a significant portion of its assets in below investment grade securities.
The U.S. dollar value of forward foreign currency contracts is determined using currency exchange rates supplied by a pricing service and are categorized as Level 2 in the hierarchy. Futures contracts are valued at the settlement price established each day by the board of trade or exchange on which they are traded and are categorized as Level 1 in the hierarchy. Investments in open-end mutual funds, including the Fidelity Central Funds, are valued at their closing net asset value (NAV) each business day and are categorized as Level 1 in the hierarchy.
Changes in valuation techniques may result in transfers in or out of an assigned level within the disclosure hierarchy. The aggregate value of investments by input level as of December 31, 2023 is included at the end of the Fund's Schedule of Investments.
Foreign Currency. Foreign-denominated assets, including investment securities, and liabilities are translated into U.S. dollars at the exchange rates at period end. Purchases and sales of investment securities, income and dividends received, and expenses denominated in foreign currencies are translated into U.S. dollars at the exchange rate in effect on the transaction date.
The effects of exchange rate fluctuations on investments are included with the net realized and unrealized gain (loss) on investment securities. Other foreign currency transactions resulting in realized and unrealized gain (loss) are disclosed separately.
Realized gains and losses on foreign currency transactions arise from the disposition of foreign currency, realized changes in the value of foreign currency between the trade and settlement dates on security transactions, and the difference between the amounts of dividends, interest and foreign withholding taxes recorded on transaction date and the U.S. dollar equivalent of the amounts actually received or paid. Unrealized gains and losses on assets and liabilities in foreign currencies arise from changes in the value of foreign currency, and from assets and liabilities denominated in foreign currencies, other than investments, which are held at period end.
Investment Transactions and Income. For financial reporting purposes, the Fund's investment holdings and NAV include trades executed through the end of the last business day of the period. The NAV per share for processing shareholder transactions is calculated as of the close of business of the New York Stock Exchange (NYSE), normally 4:00 p.m. Eastern time and includes trades executed through the end of the prior business day. Gains and losses on securities sold are determined on the basis of identified cost. Dividend income is recorded on the ex-dividend date. Income and capital gain distributions from Fidelity Central Funds, if any, are recorded on the ex-dividend date. Interest income is accrued as earned and includes coupon interest and amortization of premium and accretion of discount on debt securities as applicable. Investment income is recorded net of foreign taxes withheld where recovery of such taxes is uncertain. Debt obligations may be placed on non-accrual status and related interest income may be reduced by ceasing current accruals and writing off interest receivables when the collection of all or a portion of interest has become doubtful based on consistently applied procedures. A debt obligation is removed from non-accrual status when the issuer resumes interest payments or when collectability of interest is reasonably assured. Funds may file withholding tax reclaims in certain jurisdictions to recover a portion of amounts previously withheld. Any withholding tax reclaims income is included in the Statement of Operations in foreign taxes withheld. Any receivables for withholding tax reclaims are included in the Statement of Assets and Liabilities in interest receivable.
Class Allocations and Expenses. Investment income, realized and unrealized capital gains and losses, common expenses of a fund, and certain fund-level expense reductions, if any, are allocated daily on a pro-rata basis to each class based on the relative net assets of each class to the total net assets of a fund. Each class differs with respect to transfer agent and distribution and service plan fees incurred, as applicable. Certain expense reductions may also differ by class, if applicable. For the reporting period, the allocated portion of income and expenses to each class as a percent of its average net assets may vary due to the timing of recording these transactions in relation to fluctuating net assets of the classes. Expenses directly attributable to a fund are charged to that fund. Expenses attributable to more than one fund are allocated among the respective funds on the basis of relative net assets or other appropriate methods. Expenses included in the accompanying financial statements reflect the expenses of that fund and do not include any expenses associated with any underlying mutual funds or exchange-traded funds (ETFs). Although not included in a fund's expenses, a fund indirectly bears its proportionate share of these expenses through the net asset value of each underlying mutual fund or exchange-traded fund (ETF). Expense estimates are accrued in the period to which they relate and adjustments are made when actual amounts are known.
Income Tax Information and Distributions to Shareholders. Each year, the Fund intends to qualify as a regulated investment company under Subchapter M of the Internal Revenue Code, including distributing substantially all of its taxable income and realized gains. As a result, no provision for U.S. Federal income taxes is required. As of December 31, 2023, the Fund did not have any unrecognized tax benefits in the financial statements; nor is the Fund aware of any tax positions for which it is reasonably possible that the total amounts of unrecognized tax benefits will significantly change in the next twelve months. The Fund files a U.S. federal tax return, in addition to state and local tax returns as required. The Fund's federal income tax returns are subject to examination by the Internal Revenue Service (IRS) for a period of three fiscal years after they are filed. State and local tax returns may be subject to examination for an additional fiscal year depending on the jurisdiction. Foreign taxes are provided for based on the Fund's understanding of the tax rules and rates that exist in the foreign markets in which it invests.
Distributions are declared and recorded on the ex-dividend date. Income and capital gain distributions are declared separately for each class. Income and capital gain distributions are determined in accordance with income tax regulations, which may differ from GAAP.
Capital accounts within the financial statements are adjusted for permanent book-tax differences. These adjustments have no impact on net assets or the results of operations. Capital accounts are not adjusted for temporary book-tax differences which will reverse in a subsequent period.
Book-tax differences are primarily due to in-kind transactions, futures contracts, swaps, foreign currency transactions, market discount, tax return of capital distribution, capital loss carryforwards and losses deferred due to wash sales and excise tax regulations.
As of period end, the cost and unrealized appreciation (depreciation) in securities, and derivatives if applicable, for federal income tax purposes were as follows:
| Gross unrealized appreciation | $784,108 |
| Gross unrealized depreciation | (9,877,875) |
| Net unrealized appreciation (depreciation) | $(9,093,767) |
| Tax Cost | $60,950,109 |
The tax-based components of distributable earnings as of period end were as follows:
| Capital loss carryforward | $(13,953,162) |
| Net unrealized appreciation (depreciation) on securities and other investments | $(9,077,431) |
Capital loss carryforwards are only available to offset future capital gains of the Fund to the extent provided by regulations and may be limited. The capital loss carryforward information presented below, including any applicable limitation, is estimated as of fiscal period end and is subject to adjustment.
| Short-term | $(3,928,352) |
| Long-term | (10,024,810) |
| Total capital loss carryforward | $(13,953,162) |
For the period ended December 31, 2023, the Fund's distributions exceeded the aggregate amount of taxable income and net realized gains resulting in a return of capital for tax purposes. This was due to reductions in taxable income available for distribution after certain distributions had been made.
The tax character of distributions paid was as follows:
| | December 31, 2023 | December 31, 2022 |
| Ordinary Income | $1,901,556 | $5,027,639 |
| Long-term Capital Gains | - | 690,569 |
| Tax Return of Capital | 92,770 | - |
| Total | $1,994,326 | $5,718,208 |
Restricted Securities (including Private Placements). Funds may invest in securities that are subject to legal or contractual restrictions on resale. These securities generally may be resold in transactions exempt from registration or to the public if the securities are registered. Disposal of these securities may involve time-consuming negotiations and expense, and prompt sale at an acceptable price may be difficult. Information regarding restricted securities held at period end is included at the end of the Schedule of Investments, if applicable.
4. Derivative Instruments.
Risk Exposures and the Use of Derivative Instruments. The Fund's investment objectives allow for various types of derivative instruments, including futures contracts, forward foreign currency contracts, options and swaps. Derivatives are investments whose value is primarily derived from underlying assets, indices or reference rates and may be transacted on an exchange or over-the-counter (OTC). Derivatives may involve a future commitment to buy or sell a specified asset based on specified terms, to exchange future cash flows at periodic intervals based on a notional principal amount, or for one party to make one or more payments upon the occurrence of specified events in exchange for periodic payments from the other party.
Derivatives were used to increase returns, to gain exposure to certain types of assets, to facilitate transactions in foreign-denominated securities and to manage exposure to certain risks as defined below. The success of any strategy involving derivatives depends on analysis of numerous economic factors, and if the strategies for investment do not work as intended, the objectives may not be achieved.
Derivatives were used to increase or decrease exposure to the following risk(s):
| | |
| Credit Risk | Credit risk relates to the ability of the issuer of a financial instrument to make further principal or interest payments on an obligation or commitment that it has to a fund. |
| Foreign Exchange Risk | Foreign exchange rate risk relates to fluctuations in the value of an asset or liability due to changes in currency exchange rates. |
| Interest Rate Risk | Interest rate risk relates to the fluctuations in the value of interest-bearing securities due to changes in the prevailing levels of market interest rates. |
Funds are also exposed to additional risks from investing in derivatives, such as liquidity risk and counterparty credit risk. Liquidity risk is the risk that a fund will be unable to close out the derivative in the open market in a timely manner. Counterparty credit risk is the risk that the counterparty will not be able to fulfill its obligation to a fund. Derivative counterparty credit risk is managed through formal evaluation of the creditworthiness of all potential counterparties. On certain OTC derivatives such as forward foreign currency contracts, options and bi-lateral swaps, a fund attempts to reduce its exposure to counterparty credit risk by entering into an International Swaps and Derivatives Association, Inc. (ISDA) Master Agreement with each of its counterparties. The ISDA Master Agreement gives a fund the right to terminate all transactions traded under such agreement upon the deterioration in the credit quality of the counterparty beyond specified levels. The ISDA Master Agreement gives each party the right, upon an event of default by the other party or a termination of the agreement, to close out all transactions traded under such agreement and to net amounts owed under each transaction to one net payable by one party to the other. To mitigate counterparty credit risk on bi-lateral OTC derivatives, a fund receives collateral in the form of cash or securities once net unrealized appreciation on outstanding derivative contracts under an ISDA Master Agreement exceeds certain applicable thresholds, subject to certain minimum transfer provisions. The collateral received is held in segregated accounts with the custodian bank in accordance with the collateral agreements entered into between a fund, the counterparty and the custodian bank. A fund could experience delays and costs in gaining access to the collateral even though it is held by the custodian bank. The maximum risk of loss to a fund from counterparty credit risk related to bi-lateral OTC derivatives is generally the aggregate unrealized appreciation and unpaid counterparty payments in excess of any collateral pledged by the counterparty to a fund. A fund may be required to pledge collateral for the benefit of the counterparties on bi-lateral OTC derivatives in an amount not less than each counterparty's unrealized appreciation on outstanding derivative contracts, subject to certain minimum transfer provisions, and any such pledged collateral is identified in the Schedule of Investments. Exchange-traded contracts are not covered by the ISDA Master Agreement; however counterparty credit risk related to these contracts may be mitigated by the protection provided by the exchange on which they trade.
Investing in derivatives may involve greater risks than investing in the underlying assets directly and, to varying degrees, may involve risk of loss in excess of any initial investment and collateral received and amounts recognized in the Statement of Assets and Liabilities. In addition, there may be the risk that the change in value of the derivative contract does not correspond to the change in value of the underlying instrument.
Net Realized Gain (Loss) and Change in Net Unrealized Appreciation (Depreciation) on Derivatives. The table below, which reflects the impacts of derivatives on the financial performance, summarizes the net realized gain (loss) and change in net unrealized appreciation (depreciation) for derivatives during the period as presented in the Statement of Operations.
| Primary Risk Exposure / Derivative Type | Net Realized Gain (Loss)($) | Change in Net Unrealized Appreciation (Depreciation)($) |
| Fidelity Global Credit Fund | | |
| Credit Risk | | |
| Purchased Options | (290,654) | 61,555 |
| Swaps | (14,645) | (4,841) |
| Total Credit Risk | (305,299) | 56,714 |
| Foreign Exchange Risk | | |
| Forward Foreign Currency Contracts | (221,450) | (375,701) |
| Total Foreign Exchange Risk | (221,450) | (375,701) |
| Interest Rate Risk | | |
| Futures Contracts | (948,914) | 729,792 |
| Total Interest Rate Risk | (948,914) | 729,792 |
| Totals | (1,475,663) | 410,805 |
If there are any open positions at period end, a summary of the value of derivatives by primary risk exposure is included at the end of the Schedule of Investments.
Forward Foreign Currency Contracts. Forward foreign currency contracts represent obligations to purchase or sell foreign currency on a specified future date at a price fixed at the time the contracts are entered into. Forward foreign currency contracts were used to facilitate transactions in foreign-denominated securities and to manage exposure to certain foreign currencies.
Forward foreign currency contracts are valued daily and fluctuations in exchange rates on open contracts are recorded as unrealized appreciation or (depreciation) and reflected in total accumulated earnings (loss) in the Statement of Assets and Liabilities. When the contract is closed, a gain or loss is realized equal to the difference between the closing value and the value at the time it was opened. Non-deliverable forward foreign currency exchange contracts are settled with the counterparty in cash without the delivery of foreign currency. The net realized gain (loss) and change in net unrealized appreciation (depreciation) on forward foreign currency contracts during the period is presented in the Statement of Operations.
Any open forward foreign currency contracts at period end are presented in the Schedule of Investments under the caption "Forward Foreign Currency Contracts." The contract amount and unrealized appreciation (depreciation) reflects each contract's exposure to the underlying currency at period end, and is representative of volume of activity during the period unless an average contract value is presented.
Futures Contracts. A futures contract is an agreement between two parties to buy or sell a specified underlying instrument for a fixed price at a specified future date. Futures contracts were used to manage exposure to the bond market and fluctuations in interest rates.
Upon entering into a futures contract, a fund is required to deposit either cash or securities (initial margin) with a clearing broker in an amount equal to a certain percentage of the face value of the contract. Futures contracts are marked-to-market daily and subsequent daily payments are made or received by a fund depending on the daily fluctuations in the value of the futures contracts and are recorded as unrealized appreciation or (depreciation). This receivable and/or payable, if any, is included in daily variation margin on futures contracts in the Statement of Assets and Liabilities. Realized gain or (loss) is recorded upon the expiration or closing of a futures contract. The net realized gain (loss) and change in net unrealized appreciation (depreciation) on futures contracts during the period is presented in the Statement of Operations.
Any open futures contracts at period end are presented in the Schedule of Investments under the caption "Futures Contracts". The notional amount at value reflects each contract's exposure to the underlying instrument or index at period end, and is representative of volume of activity during the period unless an average notional amount is presented. Any securities deposited to meet initial margin requirements are identified in the Schedule of Investments. Any cash deposited to meet initial margin requirements is presented as segregated cash with brokers for derivative instruments in the Statement of Assets and Liabilities.
Options. Options give the purchaser the right, but not the obligation, to buy (call) or sell (put) an underlying security or financial instrument at an agreed exercise or strike price between or on certain dates. Options obligate the seller (writer) to buy (put) or sell (call) an underlying instrument at the exercise or strike price or cash settle an underlying derivative instrument if the holder exercises the option on or before the expiration date. OTC options, such as swaptions, which are options where the underlying instrument is a swap, were used to manage exposure to potential credit events.
Upon entering into an options contract, a fund will pay or receive a premium. Premiums paid on purchased options are reflected as cost of investments and premiums received on written options are reflected as a liability on the Statement of Assets and Liabilities. Certain options may be purchased or written with premiums to be paid or received on a future date. Options are valued daily and any unrealized appreciation (depreciation) is reflected in total accumulated earnings (loss) in the Statement of Assets and Liabilities. When an option is exercised, the cost or proceeds of the underlying instrument purchased or sold is adjusted by the amount of the premium. When an option is closed, a gain or loss is realized depending on whether the proceeds or amount paid for the closing sale transaction is greater or less than the premium received or paid. When an option expires, gains and losses are realized to the extent of premiums received and paid, respectively. The net realized and unrealized gains (losses) on purchased options are included in the Statement of Operations in net realized gain (loss) and change in net unrealized appreciation (depreciation) on investment securities. The net realized gain (loss) and change in net unrealized appreciation (depreciation) on written options are presented in the Statement of Operations.
Any open options at period end are presented in the Schedule of Investments under the captions "Purchased Options," "Purchased Swaptions," "Written Options" and "Written Swaptions," as applicable. For the period, the average monthly notional amount for purchased swaptions was $3,861,264.
Writing puts and buying calls tend to increase exposure to the underlying instrument while buying puts and writing calls tend to decrease exposure to the underlying instrument. For purchased options, risk of loss is limited to the premium paid, and for written options, risk of loss is the change in value in excess of the premium received.
Swaps. A swap is a contract between two parties to exchange future cash flows at periodic intervals based on a notional principal amount. A bi-lateral OTC swap is a transaction between a fund and a dealer counterparty where cash flows are exchanged between the two parties for the life of the swap.
Bi-lateral OTC swaps are marked-to-market daily and changes in value are reflected in the Statement of Assets and Liabilities in the bi-lateral OTC swaps at value line items. Any upfront premiums paid or received upon entering a bi-lateral OTC swap to compensate for differences between stated terms of the swap and prevailing market conditions (e.g. credit spreads, interest rates or other factors) are recorded in total accumulated earnings (loss) in the Statement of Assets and Liabilities and amortized to realized gain or (loss) ratably over the term of the swap. Any unamortized upfront premiums are presented in the Schedule of Investments.
Payments are exchanged at specified intervals, accrued daily commencing with the effective date of the contract and recorded as realized gain or (loss). Some swaps may be terminated prior to the effective date and realize a gain or loss upon termination. The net realized gain (loss) and change in net unrealized appreciation (depreciation) on swaps during the period is presented in the Statement of Operations.
Any open swaps at period end are included in the Schedule of Investments under the caption "Swaps", and are representative of volume of activity during the period unless an average notional amount is presented.
Credit Default Swaps. Credit default swaps enable a fund to buy or sell protection against specified credit events on a single-name issuer or a traded credit index. Under the terms of a credit default swap the buyer of protection (buyer) receives credit protection in exchange for making periodic payments to the seller of protection (seller) based on a fixed percentage applied to a notional principal amount. In return for these payments, the seller will be required to make a payment upon the occurrence of one or more specified credit events. A fund enters into credit default swaps as a seller to gain credit exposure to an issuer and/or as a buyer to obtain a measure of protection against defaults of an issuer. Periodic payments are made over the life of the contract by the buyer provided that no credit event occurs.
For credit default swaps on most corporate and sovereign issuers, credit events include bankruptcy, failure to pay or repudiation/moratorium. For credit default swaps on corporate or sovereign issuers, the obligation that may be put to the seller is not limited to the specific reference obligation described in the Schedule of Investments. For credit default swaps on asset-backed securities, a credit event may be triggered by events such as failure to pay principal, maturity extension, rating downgrade or write-down. For credit default swaps on asset-backed securities, the reference obligation described represents the security that may be put to the seller. For credit default swaps on a traded credit index, a specified credit event may affect all or individual underlying securities included in the index.
As a seller, if an underlying credit event occurs, a fund will pay a net settlement amount of cash equal to the notional amount of the swap less the recovery value of the reference obligation or underlying securities comprising an index. Only in the event of the industry's inability to value the underlying asset will a fund be required to take delivery of the reference obligation or underlying securities comprising an index and pay an amount equal to the notional amount of the swap.
As a buyer, if an underlying credit event occurs, a fund will receive a net settlement amount of cash equal to the notional amount of the swap less the recovery value of the reference obligation or underlying securities comprising an index. Only in the event of the industry's inability to value the underlying asset will a fund be required to deliver the reference obligation or underlying securities comprising an index in exchange for payment of an amount equal to the notional amount of the swap.
Typically, the value of each credit default swap and credit rating disclosed for each reference obligation in the Schedule of Investments, where a fund is the seller, can be used as measures of the current payment/performance risk of the swap. As the value of the swap changes as a positive or negative percentage of the total notional amount, the payment/performance risk may decrease or increase, respectively. In addition to these measures, the investment adviser monitors a variety of factors including cash flow assumptions, market activity and market sentiment as part of its ongoing process of assessing payment/performance risk.
5. Purchases and Sales of Investments.
Purchases and sales of securities, other than short-term securities and in-kind transactions, as applicable, are noted in the table below.
| | Purchases ($) | Sales ($) |
| Fidelity Global Credit Fund | 11,795,466 | 33,476,371 |
6. Fees and Other Transactions with Affiliates.
Management Fee. Fidelity Management & Research Company LLC (the investment adviser) and its affiliates provide the Fund with investment management related services for which the Fund pays a monthly management fee that is based on an annual rate of .40% of the Fund's average net assets. Under the management contract, the investment adviser pays all other operating expenses, except the compensation of the independent Trustees, transfer agent fees, distribution and service plan fees and certain other expenses such as proxy and shareholder meeting expenses.
Distribution and Service Plan Fees. In accordance with Rule 12b-1 of the 1940 Act, the Fund has adopted separate Distribution and Service Plans for each class of shares. Certain classes pay Fidelity Distributors Company LLC (FDC), an affiliate of the investment adviser, separate Distribution and Service Fees, each of which is based on an annual percentage of each class' average net assets. In addition, FDC may pay financial intermediaries for selling shares of the Fund and providing shareholder support services. For the period, the Distribution and Service Fee rates, total fees and amounts retained by FDC were as follows:
| | Distribution Fee | Service Fee | Total Fees | Retained by FDC |
| Class A | - % | .25% | $12,655 | $ - |
| Class M | - % | .25% | 3,308 | 1,356 |
| Class C | .75% | .25% | 11,323 | 4,220 |
| | | | $27,286 | $5,576 |
Sales Load. FDC may receive a front-end sales charge of up to 4.00% for selling Class A shares and Class M shares, some of which is paid to financial intermediaries for selling shares of the Fund. Depending on the holding period, FDC may receive contingent deferred sales charges levied on Class A, Class M and Class C redemptions. The deferred sales charges are 1.00% for Class C shares, .75% for certain purchases of Class A shares and .25% for certain purchases of Class M shares.
For the period, sales charge amounts retained by FDC were as follows:
| | Retained by FDC |
| Class A | $168 |
| Class M | 81 |
Class C A | 13 |
| | $262 |
A When Class C shares are initially sold, FDC pays commissions from its own resources to financial intermediaries through which the sales are made.
Transfer Agent Fees. Fidelity Investments Institutional Operations Company LLC (FIIOC), an affiliate of the investment adviser, is the transfer, dividend disbursing and shareholder servicing agent for each class of the Fund. FIIOC receives account fees and asset-based fees that vary according to the account size and type of account of the shareholders of each respective class of the Fund, with the exception of Global Credit and Class Z. FIIOC receives an asset-based fee of Global Credit's and Class Z's average net assets. FIIOC pays for typesetting, printing and mailing of shareholder reports, except proxy statements. For the period, transfer agent fees for each class were as follows:
| | Amount | % of Class-Level Average Net Assets |
| Class A | $11,219 | .22 |
| Class M | 3,303 | .25 |
| Class C | 2,861 | .25 |
| Global Credit | 35,570 | .10 |
| Class I | 5,651 | .16 |
| Class Z | 6,261 | .05 |
| | $64,865 | |
Interfund Trades. Funds may purchase from or sell securities to other Fidelity Funds under procedures adopted by the Board. The procedures have been designed to ensure these interfund trades are executed in accordance with Rule 17a-7 of the 1940 Act. Any interfund trades are included within the respective purchases and sales amounts shown in the Purchases and Sales of Investments note. During the period, there were no interfund trades.
Affiliated Redemptions In-Kind. Shares that were redeemed in-kind for investments, including accrued interest and cash, if any, are shown in the table below. The net realized gain or loss on investments delivered through in-kind redemptions is included in the "Net realized gain (loss) on: Redemptions in-kind" line in the accompanying Statement of Operations. The amount of the in-kind redemptions is included in share transactions in the accompanying Statement of Changes in Net Assets. There was no gain or loss for federal income tax purposes.
| | Shares | Total net realized gain or loss ($) | Total Proceeds ($) | Participating classes |
| Fidelity Global Credit Fund | 3,394,755 | (4,172,324) | 25,630,401 | Class Z |
Subsequent Event - Sub-Advisory Arrangements. Effective March 1, 2024, the Fund's sub-advisory agreements with FMR Investment Management (UK) Limited, Fidelity Management & Research (Hong Kong) Limited, and Fidelity Management & Research (Japan) Limited will be amended to provide that the investment adviser will pay each sub-adviser monthly fees equal to 110% of the sub-adviser's costs for providing sub-advisory services.
7. Committed Line of Credit.
Certain Funds participate with other funds managed by the investment adviser or an affiliate in a $4.25 billion credit facility (the "line of credit") to be utilized for temporary or emergency purposes to fund shareholder redemptions or for other short-term liquidity purposes. The commitment fees on the pro-rata portion of the line of credit are borne by the investment adviser. During the period, there were no borrowings on this line of credit.
8. Security Lending.
Funds lend portfolio securities from time to time in order to earn additional income. Lending agents are used, including National Financial Services (NFS), an affiliate of the investment adviser. Pursuant to a securities lending agreement, NFS will receive a fee, which is capped at 9.9% of a fund's daily lending revenue, for its services as lending agent. A fund may lend securities to certain qualified borrowers, including NFS. On the settlement date of the loan, a fund receives collateral (in the form of U.S. Treasury obligations, letters of credit and/or cash) against the loaned securities and maintains collateral in an amount not less than 100% of the market value of the loaned securities during the period of the loan. The market value of the loaned securities is determined at the close of business of a fund and any additional required collateral is delivered to a fund on the next business day. A fund or borrower may terminate the loan at any time, and if the borrower defaults on its obligation to return the securities loaned because of insolvency or other reasons, a fund may apply collateral received from the borrower against the obligation. A fund may experience delays and costs in recovering the securities loaned. Any cash collateral received is invested in the Fidelity Securities Lending Cash Central Fund. Any loaned securities are identified as such in the Schedule of Investments, and the value of loaned securities and cash collateral at period end, as applicable, are presented in the Statement of Assets and Liabilities. Security lending income represents the income earned on investing cash collateral, less rebates paid to borrowers and any lending agent fees associated with the loan, plus any premium payments received for lending certain types of securities. Security lending income is presented in the Statement of Operations as a component of income from Fidelity Central Funds. Affiliated security lending activity, if any, was as follows:
| | Total Security Lending Fees Paid to NFS | Security Lending Income From Securities Loaned to NFS | Value of Securities Loaned to NFS at Period End |
| Fidelity Global Credit Fund | $2 | $- | $- |
9. Expense Reductions.
The investment adviser contractually agreed to reimburse expenses of each class to the extent annual operating expenses exceeded certain levels of class-level average net assets as noted in the table below. This reimbursement will remain in place through April 30, 2025. Some expenses, for example the compensation of the independent Trustees, and certain miscellaneous expenses such as proxy and shareholder meeting expenses, are excluded from this reimbursement.
The following classes were in reimbursement during the period:
| | Expense Limitations | Reimbursement |
| Class A | .75% | $6,144 |
| Class M | .75% | 1,979 |
| Class C | 1.50% | 1,736 |
| Global Credit | .50% | - |
| Class I | .50% | 2,251 |
| Class Z | .41% | 6,158 |
| | | $18,268 |
Through arrangements with the Fund's custodian and each class' transfer agent, credits realized as a result of certain uninvested U.S. dollar cash balances were used to reduce the Fund's expenses. During the period, custodian credits reduced the Fund's expenses by $710. During the period, transfer agent credits reduced each class' expenses as noted in the table below.
| | Expense reduction |
| | |
| Class M | $69 |
In addition, during the period the investment adviser or an affiliate reimbursed and/or waived a portion of fund-level operating expenses in the amount of $591.
10. Distributions to Shareholders.
Distributions to shareholders of each class were as follows:
| | Year ended December 31, 2023 | Year ended December 31, 2022 |
| Fidelity Global Credit Fund | | |
| Distributions to shareholders | | |
| Class A | $172,530 | $300,116 |
| Class M | 44,387 | 84,332 |
| Class C | 28,912 | 72,796 |
| Global Credit | 1,245,744 | 2,764,360 |
| Class I | 119,953 | 326,732 |
| Class Z | 290,030 | 2,169,872 |
Total | $1,901,556 | $5,718,208 |
| Tax Return of Capital | | |
| Class A | $8,417 | $- |
| Class M | 2,166 | - |
| Class C | 1,410 | - |
| Global Credit | 60,776 | - |
| Class I | 5,852 | - |
| Class Z | 14,149 | - |
Total | $92,770 | $- |
11. Share Transactions.
Share transactions for each class were as follows and may contain in-kind transactions, automatic conversions between classes or exchanges between affiliated funds:
| | Shares | Shares | Dollars | Dollars |
| | Year ended December 31, 2023 | Year ended December 31, 2022 | Year ended December 31, 2023 | Year ended December 31, 2022 |
| Fidelity Global Credit Fund | | | | |
| Class A | | | | |
| Shares sold | 159,405 | 207,668 | $1,173,700 | $1,808,338 |
| Reinvestment of distributions | 24,596 | 38,368 | 179,282 | 297,448 |
| Shares redeemed | (103,380) | (175,667) | (761,270) | (1,418,729) |
| Net increase (decrease) | 80,621 | 70,369 | $591,712 | $687,057 |
| Class M | | | | |
| Shares sold | 5,462 | 12,702 | $40,149 | $107,139 |
| Reinvestment of distributions | 6,386 | 10,842 | 46,553 | 84,273 |
| Shares redeemed | (20,496) | (41,418) | (151,252) | (354,190) |
| Net increase (decrease) | (8,648) | (17,874) | $(64,550) | $(162,778) |
| Class C | | | | |
| Shares sold | 5,518 | 13,017 | $40,810 | $106,505 |
| Reinvestment of distributions | 4,093 | 9,244 | 29,876 | 71,882 |
| Shares redeemed | (47,331) | (64,213) | (349,506) | (534,214) |
| Net increase (decrease) | (37,720) | (41,952) | $(278,820) | $(355,827) |
| Global Credit | | | | |
| Shares sold | 769,367 | 978,612 | $5,701,262 | $8,605,341 |
| Reinvestment of distributions | 163,367 | 330,283 | 1,191,689 | 2,580,207 |
| Shares redeemed | (2,128,201) | (2,590,700) | (15,706,469) | (21,749,063) |
| Net increase (decrease) | (1,195,467) | (1,281,805) | $(8,813,518) | $(10,563,515) |
| Class I | | | | |
| Shares sold | 301,539 | 503,339 | $2,258,916 | $4,497,585 |
| Reinvestment of distributions | 16,689 | 40,874 | 121,666 | 319,356 |
| Shares redeemed | (304,367) | (727,568) | (2,283,606) | (6,282,582) |
| Net increase (decrease) | 13,861 | (183,355) | $96,976 | $(1,465,641) |
| Class Z | | | | |
| Shares sold | 175,130 | 337,091 | $1,301,331 | $2,832,318 |
| Reinvestment of distributions | 21,246 | 245,267 | 155,640 | 1,916,374 |
| Shares redeemed | (3,636,484) | (1,098,975) | (27,405,615) | (8,966,534) |
| Net increase (decrease) | (3,440,108) | (516,617) | $(25,948,644) | $(4,217,842) |
12. Other.
A fund's organizational documents provide former and current trustees and officers with a limited indemnification against liabilities arising in connection with the performance of their duties to the fund. In the normal course of business, a fund may also enter into contracts that provide general indemnifications. A fund's maximum exposure under these arrangements is unknown as this would be dependent on future claims that may be made against a fund. The risk of material loss from such claims is considered remote.
13. Risk and Uncertainties.
Many factors affect a fund's performance. Developments that disrupt global economies and financial markets, such as pandemics, epidemics, outbreaks of infectious diseases, war, terrorism, and environmental disasters, may significantly affect a fund's investment performance. The effects of these developments to a fund will be impacted by the types of securities in which a fund invests, the financial condition, industry, economic sector, and geographic location of an issuer, and a fund's level of investment in the securities of that issuer. Significant concentrations in security types, issuers, industries, sectors, and geographic locations may magnify the factors that affect a fund's performance.
To the Board of Trustees of Fidelity School Street Trust and Shareholders of Fidelity Global Credit Fund
Opinion on the Financial Statements
We have audited the accompanying statement of assets and liabilities, including the schedule of investments, of Fidelity Global Credit Fund (one of the funds constituting Fidelity School Street Trust, referred to hereafter as the "Fund") as of December 31, 2023, the related statement of operations for the year ended December 31, 2023, the statement of changes in net assets for each of the two years in the period ended December 31, 2023, including the related notes, and the financial highlights for each of the five years in the period ended December 31, 2023 (collectively referred to as the "financial statements"). In our opinion, the financial statements present fairly, in all material respects, the financial position of the Fund as of December 31, 2023, the results of its operations for the year then ended, the changes in its net assets for each of the two years in the period ended December 31, 2023 and the financial highlights for each of the five years in the period ended December 31, 2023 in conformity with accounting principles generally accepted in the United States of America.
Basis for Opinion
These financial statements are the responsibility of the Fund's management. Our responsibility is to express an opinion on the Fund's financial statements based on our audits. We are a public accounting firm registered with the Public Company Accounting Oversight Board (United States) (PCAOB) and are required to be independent with respect to the Fund in accordance with the U.S. federal securities laws and the applicable rules and regulations of the Securities and Exchange Commission and the PCAOB.
We conducted our audits of these financial statements in accordance with the standards of the PCAOB. Those standards require that we plan and perform the audit to obtain reasonable assurance about whether the financial statements are free of material misstatement, whether due to error or fraud.
Our audits included performing procedures to assess the risks of material misstatement of the financial statements, whether due to error or fraud, and performing procedures that respond to those risks. Such procedures included examining, on a test basis, evidence regarding the amounts and disclosures in the financial statements. Our audits also included evaluating the accounting principles used and significant estimates made by management, as well as evaluating the overall presentation of the financial statements. Our procedures included confirmation of securities owned as of December 31, 2023 by correspondence with the custodian and brokers. We believe that our audits provide a reasonable basis for our opinion.
/s/ PricewaterhouseCoopers LLP
Boston, Massachusetts
February 14, 2024
We have served as the auditor of one or more investment companies in the Fidelity group of funds since 1932.
The Trustees, Members of the Advisory Board (if any), and officers of the trust and fund, as applicable, are listed below. The Board of Trustees governs the fund and is responsible for protecting the interests of shareholders. The Trustees are experienced executives who meet periodically throughout the year to oversee the fund's activities, review contractual arrangements with companies that provide services to the fund, oversee management of the risks associated with such activities and contractual arrangements, and review the fund's performance. Each of the Trustees oversees 314 funds.
The Trustees hold office without limit in time except that (a) any Trustee may resign; (b) any Trustee may be removed by written instrument, signed by at least two-thirds of the number of Trustees prior to such removal; (c) any Trustee who requests to be retired or who has become incapacitated by illness or injury may be retired by written instrument signed by a majority of the other Trustees; and (d) any Trustee may be removed at any special meeting of shareholders by a two-thirds vote of the outstanding voting securities of the trust. Each Trustee who is not an interested person (as defined in the 1940 Act) of the trust and the fund is referred to herein as an Independent Trustee. Each Independent Trustee shall retire not later than the last day of the calendar year in which his or her 75th birthday occurs. The Independent Trustees may waive this mandatory retirement age policy with respect to individual Trustees. Officers and Advisory Board Members hold office without limit in time, except that any officer or Advisory Board Member may resign or may be removed by a vote of a majority of the Trustees at any regular meeting or any special meeting of the Trustees. Except as indicated, each individual has held the office shown or other offices in the same company for the past five years.
The fund's Statement of Additional Information (SAI) includes more information about the Trustees. To request a free copy, call Fidelity at 1-800-544-8544 if you're an individual investing directly with Fidelity, call 1-800-835-5092 if you're a plan sponsor or participant with Fidelity as your recordkeeper or call 1-877-208-0098 on institutional accounts or if you're an advisor or invest through one.
Experience, Skills, Attributes, and Qualifications of the Trustees. The Governance and Nominating Committee has adopted a statement of policy that describes the experience, qualifications, attributes, and skills that are necessary and desirable for potential Independent Trustee candidates (Statement of Policy). The Board believes that each Trustee satisfied at the time he or she was initially elected or appointed a Trustee, and continues to satisfy, the standards contemplated by the Statement of Policy. The Governance and Nominating Committee also engages professional search firms to help identify potential Independent Trustee candidates who have the experience, qualifications, attributes, and skills consistent with the Statement of Policy. From time to time, additional criteria based on the composition and skills of the current Independent Trustees, as well as experience or skills that may be appropriate in light of future changes to board composition, business conditions, and regulatory or other developments, have also been considered by the professional search firms and the Governance and Nominating Committee. In addition, the Board takes into account the Trustees' commitment and participation in Board and committee meetings, as well as their leadership of standing and ad hoc committees throughout their tenure.
In determining that a particular Trustee was and continues to be qualified to serve as a Trustee, the Board has considered a variety of criteria, none of which, in isolation, was controlling. The Board believes that, collectively, the Trustees have balanced and diverse experience, qualifications, attributes, and skills, which allow the Board to operate effectively in governing the fund and protecting the interests of shareholders. Information about the specific experience, skills, attributes, and qualifications of each Trustee, which in each case led to the Board's conclusion that the Trustee should serve (or continue to serve) as a trustee of the fund, is provided below.
Board Structure and Oversight Function. Abigail P. Johnson is an interested person and currently serves as Chairman. The Trustees have determined that an interested Chairman is appropriate and benefits shareholders because an interested Chairman has a personal and professional stake in the quality and continuity of services provided to the fund. Independent Trustees exercise their informed business judgment to appoint an individual of their choosing to serve as Chairman, regardless of whether the Trustee happens to be independent or a member of management. The Independent Trustees have determined that they can act independently and effectively without having an Independent Trustee serve as Chairman and that a key structural component for assuring that they are in a position to do so is for the Independent Trustees to constitute a substantial majority for the Board. The Independent Trustees also regularly meet in executive session. Michael E. Kenneally serves as Chairman of the Independent Trustees and as such (i) acts as a liaison between the Independent Trustees and management with respect to matters important to the Independent Trustees and (ii) with management prepares agendas for Board meetings.
Fidelity® funds are overseen by different Boards of Trustees. The fund's Board oversees Fidelity's investment-grade bond, money market, asset allocation and certain equity funds, and other Boards oversee Fidelity's alternative investment, high income and other equity funds. The asset allocation funds may invest in Fidelity® funds that are overseen by such other Boards. The use of separate Boards, each with its own committee structure, allows the Trustees of each group of Fidelity® funds to focus on the unique issues of the funds they oversee, including common research, investment, and operational issues. On occasion, the separate Boards establish joint committees to address issues of overlapping consequences for the Fidelity® funds overseen by each Board.
The Trustees operate using a system of committees to facilitate the timely and efficient consideration of all matters of importance to the Trustees, the fund, and fund shareholders and to facilitate compliance with legal and regulatory requirements and oversight of the fund's activities and associated risks. The Board, acting through its committees, has charged FMR and its affiliates with (i) identifying events or circumstances the occurrence of which could have demonstrably adverse effects on the fund's business and/or reputation; (ii) implementing processes and controls to lessen the possibility that such events or circumstances occur or to mitigate the effects of such events or circumstances if they do occur; and (iii) creating and maintaining a system designed to evaluate continuously business and market conditions in order to facilitate the identification and implementation processes described in (i) and (ii) above. Because the day-to-day operations and activities of the fund are carried out by or through FMR, its affiliates, and other service providers, the fund's exposure to risks is mitigated but not eliminated by the processes overseen by the Trustees. While each of the Board's committees has responsibility for overseeing different aspects of the fund's activities, oversight is exercised primarily through the Operations and Audit Committees. In addition, an ad hoc Board committee of Independent Trustees has worked with FMR to enhance the Board's oversight of investment and financial risks, legal and regulatory risks, technology risks, and operational risks, including the development of additional risk reporting to the Board. Appropriate personnel, including but not limited to the fund's Chief Compliance Officer (CCO), FMR's internal auditor, the independent accountants, the fund's Treasurer and portfolio management personnel, make periodic reports to the Board's committees, as appropriate, including an annual review of Fidelity's risk management program for the Fidelity® funds. The responsibilities of each standing committee, including their oversight responsibilities, are described further under "Standing Committees of the Trustees."
Interested Trustees*:
Correspondence intended for a Trustee who is an interested person may be sent to Fidelity Investments, 245 Summer Street, Boston, Massachusetts 02210.
Name, Year of Birth; Principal Occupations and Other Relevant Experience+
Abigail P. Johnson (1961)
Year of Election or Appointment: 2009
Trustee
Chairman of the Board of Trustees
Ms. Johnson also serves as Trustee of other Fidelity® funds. Ms. Johnson serves as Chairman (2016-present), Chief Executive Officer (2014-present), and Director (2007-present) of FMR LLC (diversified financial services company), President of Fidelity Financial Services (2012-present) and President of Personal, Workplace and Institutional Services (2005-present). Ms. Johnson is Chairman and Director of Fidelity Management & Research Company LLC (investment adviser firm, 2011-present). Previously, Ms. Johnson served as Chairman and Director of FMR Co., Inc. (investment adviser firm, 2011-2019), Vice Chairman (2007-2016) and President (2013-2016) of FMR LLC, President and a Director of Fidelity Management & Research Company (2001-2005), a Trustee of other investment companies advised by Fidelity Management & Research Company, Fidelity Investments Money Management, Inc. (investment adviser firm), and FMR Co., Inc. (2001-2005), Senior Vice President of the Fidelity® funds (2001-2005), and managed a number of Fidelity® funds. Ms. Abigail P. Johnson and Mr. Arthur E. Johnson are not related.
Jennifer Toolin McAuliffe (1959)
Year of Election or Appointment: 2016
Trustee
Ms. McAuliffe also serves as Trustee of other Fidelity® funds and as Trustee of Fidelity Charitable (2020-present). Previously, Ms. McAuliffe served as Co-Head of Fixed Income of Fidelity Investments Limited (now known as FIL Limited (FIL)) (diversified financial services company), Director of Research for FIL's credit and quantitative teams in London, Hong Kong and Tokyo and Director of Research for taxable and municipal bonds at Fidelity Investments Money Management, Inc. Ms. McAuliffe previously served as a member of the Advisory Board of certain Fidelity® funds (2016). Ms. McAuliffe was previously a lawyer at Ropes & Gray LLP and an international banker at Chemical Bank NA (now JPMorgan Chase & Co.). Ms. McAuliffe also currently serves as director or trustee of several not-for-profit entities.
Christine J. Thompson (1958)
Year of Election or Appointment: 2023
Trustee
Ms. Thompson also serves as a Trustee of other Fidelity® funds. Ms. Thompson serves as Leader of Advanced Technologies for Investment Management at Fidelity Investments (2018-present). Previously, Ms. Thompson served as Chief Investment Officer in the Bond group at Fidelity Management & Research Company (2010-2018) and held various other roles including Director of municipal bond portfolio managers and Portfolio Manager of certain Fidelity® funds.
* Determined to be an "Interested Trustee" by virtue of, among other things, his or her affiliation with the trust or various entities under common control with FMR.
+ The information includes the Trustee's principal occupation during the last five years and other information relating to the experience, attributes, and skills relevant to the Trustee's qualifications to serve as a Trustee, which led to the conclusion that the Trustee should serve as a Trustee for the fund.
Independent Trustees:
Correspondence intended for an Independent Trustee may be sent to Fidelity Investments, P.O. Box 55235, Boston, Massachusetts 02205-5235.
Name, Year of Birth; Principal Occupations and Other Relevant Experience+
Elizabeth S. Acton (1951)
Year of Election or Appointment: 2013
Trustee
Ms. Acton also serves as Trustee of other Fidelity® funds. Prior to her retirement, Ms. Acton served as Executive Vice President, Finance (2011-2012), Executive Vice President, Chief Financial Officer (2002-2011) and Treasurer (2004-2005) of Comerica Incorporated (financial services). Prior to joining Comerica, Ms. Acton held a variety of positions at Ford Motor Company (1983-2002), including Vice President and Treasurer (2000-2002) and Executive Vice President and Chief Financial Officer of Ford Motor Credit Company (1998-2000). Ms. Acton currently serves as a member of the Board and Audit and Finance Committees of Beazer Homes USA, Inc. (homebuilding, 2012-present). Ms. Acton previously served as a member of the Advisory Board of certain Fidelity® funds (2013-2016).
Laura M. Bishop (1961)
Year of Election or Appointment: 2023
Trustee
Ms. Bishop also serves as Trustee or Member of the Advisory Board of other Fidelity® funds. Prior to her retirement, Ms. Bishop held a variety of positions at United Services Automobile Association (2001-2020), including Executive Vice President and Chief Financial Officer (2014-2020) and Senior Vice President and Deputy Chief Financial Officer (2012-2014). Ms. Bishop currently serves as a member of the Audit Committee and Compensation and Personnel Committee (2021-present) of the Board of Directors of Korn Ferry (global organizational consulting). Previously, Ms. Bishop served as a Member of the Advisory Board of certain Fidelity® funds (2022-2023).
Ann E. Dunwoody (1953)
Year of Election or Appointment: 2018
Trustee
General Dunwoody also serves as Trustee of other Fidelity® funds. General Dunwoody (United States Army, Retired) was the first woman in U.S. military history to achieve the rank of four-star general and prior to her retirement in 2012 held a variety of positions within the U.S. Army, including Commanding General, U.S. Army Material Command (2008-2012). General Dunwoody currently serves as a member of the Board, Chair of Nomination Committee and a member of the Corporate Governance Committee of Kforce Inc. (professional staffing services, 2016-present) and a member of the Board of Automattic Inc. (software engineering, 2018-present). Previously, General Dunwoody served as President of First to Four LLC (leadership and mentoring services, 2012-2022), a member of the Advisory Board and Nominating and Corporate Governance Committee of L3 Technologies, Inc. (communication, electronic, sensor and aerospace systems, 2013-2019) and a member of the Board and Audit and Sustainability and Corporate Responsibility Committees of Republic Services, Inc. (waste collection, disposal and recycling, 2013-2016). General Dunwoody also serves on several boards for non-profit organizations, including as a member of the Board, Chair of the Nomination and Governance Committee and a member of the Audit Committee of the Noble Reach Foundation (formerly Logistics Management Institute) (consulting non-profit, 2012-present) and a member of the Board of ThanksUSA (military family education non-profit, 2014-present). Previously, General Dunwoody served as a member of the Board of Florida Institute of Technology (2015-2022) and a member of the Council of Trustees for the Association of the United States Army (advocacy non-profit, 2013-2021). General Dunwoody previously served as a member of the Advisory Board of certain Fidelity® funds (2018).
John Engler (1948)
Year of Election or Appointment: 2014
Trustee
Mr. Engler also serves as Trustee of other Fidelity® funds. Previously, Mr. Engler served as Governor of Michigan (1991-2003), President of the Business Roundtable (2011-2017) and interim President of Michigan State University (2018-2019). Previously, Mr. Engler served as a member of the Board of Stride, Inc. (formerly K12 Inc.) (technology-based education company, 2012-2022), a member of the Board of Universal Forest Products (manufacturer and distributor of wood and wood-alternative products, 2003-2019) and Trustee of The Munder Funds (2003-2014). Mr. Engler previously served as a member of the Advisory Board of certain Fidelity® funds (2014-2016).
Robert F. Gartland (1951)
Year of Election or Appointment: 2010
Trustee
Mr. Gartland also serves as Trustee of other Fidelity® funds. Prior to his retirement, Mr. Gartland held a variety of positions at Morgan Stanley (financial services, 1979-2007), including Managing Director (1987-2007) and Chase Manhattan Bank (1975-1978). Mr. Gartland previously served as Chairman and an investor in Gartland & Mellina Group Corp. (consulting, 2009-2019), as a member of the Board of National Securities Clearing Corporation (1993-1996) and as Chairman of TradeWeb (2003-2004).
Robert W. Helm (1957)
Year of Election or Appointment: 2023
Trustee
Mr. Helm also serves as Trustee or Member of the Advisory Board of other Fidelity® funds. Mr. Helm was formerly Deputy Chairman (2003-2020), partner (1991-2020) and an associate (1984-1991) of Dechert LLP (formerly Dechert Price & Rhoads). Mr. Helm currently serves on boards and committees of several not-for-profit organizations, including as a Trustee and member of the Executive Committee of the Baltimore Council on Foreign Affairs, a member of the Board of Directors of the St. Vincent de Paul Society of Baltimore and a member of the Life Guard Society of Mt. Vernon. Previously, Mr. Helm served as a Member of the Advisory Board of certain Fidelity® funds (2021-2023).
Michael E. Kenneally (1954)
Year of Election or Appointment: 2009
Trustee
Chairman of the Independent Trustees
Mr. Kenneally also serves as Trustee of other Fidelity® funds and was Vice Chairman (2018-2021) of the Independent Trustees of certain Fidelity® funds. Prior to retirement in 2005, he was Chairman and Global Chief Executive Officer of Credit Suisse Asset Management, the worldwide fund management and institutional investment business of Credit Suisse Group. Previously, Mr. Kenneally was an Executive Vice President and the Chief Investment Officer for Bank of America. In this role, he was responsible for the investment management, strategy and products delivered to the bank's institutional, high-net-worth and retail clients. Earlier, Mr. Kenneally directed the organization's equity and quantitative research groups. He began his career as a research analyst and then spent more than a dozen years as a portfolio manager for endowments, pension plans and mutual funds. He earned the Chartered Financial Analyst (CFA) designation in 1991.
Mark A. Murray (1954)
Year of Election or Appointment: 2016
Trustee
Mr. Murray also serves as Trustee of other Fidelity® funds. Previously, Mr. Murray served as Co-Chief Executive Officer (2013-2016), President (2006-2013) and Vice Chairman (2013-2020) of Meijer, Inc. Mr. Murray serves as a member of the Board (2009-present) and Public Policy and Responsibility Committee (2009-present) and Chair of the Nuclear Review Committee (2019-present) of DTE Energy Company (diversified energy company). Mr. Murray previously served as a member of the Board of Spectrum Health (not-for-profit health system, 2015-2019) and as a member of the Board and Audit Committee and Chairman of the Nominating and Corporate Governance Committee of Universal Forest Products, Inc. (manufacturer and distributor of wood and wood-alternative products, 2004-2016). Mr. Murray also serves as a member of the Board of many community and professional organizations. Mr. Murray previously served as a member of the Advisory Board of certain Fidelity® funds (2016).
Carol J. Zierhoffer (1960)
Year of Election or Appointment: 2023
Trustee
Ms. Zierhoffer also serves as Trustee or Member of the Advisory Board of other Fidelity® funds. Prior to her retirement, Ms. Zierhoffer held a variety of positions at Bechtel Corporation (engineering company, 2013-2019), including Principal Vice President and Chief Information Officer (2013-2016) and Senior Vice President and Chief Information Officer (2016-2019). Ms. Zierhoffer currently serves as a member of the Board of Directors, Audit Committee and Compensation Committee of Allscripts Healthcare Solutions, Inc. (healthcare technology, 2020-present) and as a member of the Board of Directors, Audit and Finance Committee and Nominating and Governance Committee of Atlas Air Worldwide Holdings, Inc. (aviation operating services, 2021-present). Previously, Ms. Zierhoffer served as a member of the Board of Directors and Audit Committee and as the founding Chair of the Information Technology Committee of MedAssets, Inc. (healthcare technology, 2013-2016), and as a Member of the Advisory Board of certain Fidelity® funds (2023).
+ The information includes the Trustee's principal occupation during the last five years and other information relating to the experience, attributes, and skills relevant to the Trustee's qualifications to serve as a Trustee, which led to the conclusion that the Trustee should serve as a Trustee for the fund.
Advisory Board Members and Officers:
Correspondence intended for a Member of the Advisory Board (if any) may be sent to Fidelity Investments, P.O. Box 55235, Boston, Massachusetts 02205-5235. Correspondence intended for an officer may be sent to Fidelity Investments, 245 Summer Street, Boston, Massachusetts 02210.
Name, Year of Birth; Principal Occupation
Heather Bonner (1977)
Year of Election or Appointment: 2023
Assistant Treasurer
Ms. Bonner also serves as an officer of other funds. Ms. Bonner is a Senior Vice President (2022-present) and is an employee of Fidelity Investments (2022-present). Ms. Bonner serves as Vice President, Treasurer, or Assistant Treasurer of certain Fidelity entities. Prior to joining Fidelity, Ms. Bonner served as Managing Director at AQR Capital Management (2013-2022) and was the Treasurer and Principal Financial Officer of the AQR Funds (2013-2022).
Craig S. Brown (1977)
Year of Election or Appointment: 2019
Assistant Treasurer
Mr. Brown also serves as an officer of other funds. Mr. Brown is a Vice President (2015-present) and is an employee of Fidelity Investments. Mr. Brown serves as Assistant Treasurer of FIMM, LLC (2021-present). Previously, Mr. Brown served as Assistant Treasurer of certain Fidelity® funds (2019-2022).
John J. Burke III (1964)
Year of Election or Appointment: 2018
Chief Financial Officer
Mr. Burke also serves as Chief Financial Officer of other funds. Mr. Burke is Head of Fidelity Fund and Investment Operations (2018-present) and is an employee of Fidelity Investments. Mr. Burke serves as President, Executive Vice President, or Director of certain Fidelity entities. Previously Mr. Burke served as head of Asset Management Investment Operations (2012-2018).
Margaret Carey (1973)
Year of Election or Appointment: 2023
Secretary and Chief Legal Officer (CLO)
Ms. Carey also serves as an officer of other funds and as CLO of certain Fidelity entities. Ms. Carey is a Senior Vice President, Deputy General Counsel (2019-present) and is an employee of Fidelity Investments.
David J. Carter (1973)
Year of Election or Appointment: 2020
Assistant Secretary
Mr. Carter also serves as Assistant Secretary of other funds. Mr. Carter is a Senior Vice President, Deputy General Counsel (2022-present) and is an employee of Fidelity Investments. Mr. Carter serves as Chief Legal Officer of Fidelity Investments Institutional Operations Company LLC - Shareholder Division (transfer agent, 2020-present).
Jonathan Davis (1968)
Year of Election or Appointment: 2010
Assistant Treasurer
Mr. Davis also serves as an officer of other funds. Mr. Davis is a Vice President (2006-present) and is an employee of Fidelity Investments. Mr. Davis serves as Assistant Treasurer of certain Fidelity entities.
Laura M. Del Prato (1964)
Year of Election or Appointment: 2018
President and Treasurer
Ms. Del Prato also serves as an officer of other funds. Ms. Del Prato is a Senior Vice President (2017-present) and is an employee of Fidelity Investments. Ms. Del Prato serves as Vice President or Assistant Treasurer of certain Fidelity entities. Previously, Ms. Del Prato served as President and Treasurer of The North Carolina Capital Management Trust: Cash Portfolio and Term Portfolio (2018-2020).
Robin Foley (1964)
Year of Election or Appointment: 2023
Vice President
Ms. Foley also serves as Vice President of other funds. Ms. Foley serves as Head of Fidelity's Fixed Income division (2023-present) and is an employee of Fidelity Investments. Previously, Ms. Foley served as Chief Investment Officer of Bonds (2017-2023).
Christopher M. Gouveia (1973)
Year of Election or Appointment: 2023
Chief Compliance Officer
Mr. Gouveia also serves as Chief Compliance Officer of other funds. Mr. Gouveia is a Senior Vice President of Asset Management Compliance (2019-present) and is an employee of Fidelity Investments. Mr. Gouveia serves as Compliance Officer of Fidelity Management Trust Company (2023-present). Previously, Mr. Gouveia served as Chief Compliance Officer of the North Carolina Capital Management Trust (2016-2019).
Colm A. Hogan (1973)
Year of Election or Appointment: 2016
Assistant Treasurer
Mr. Hogan also serves as an officer of other funds. Mr. Hogan is a Vice President (2016-present) and is an employee of Fidelity Investments. Mr. Hogan serves as Assistant Treasurer of certain Fidelity entities. Previously, Mr. Hogan served as Deputy Treasurer of certain Fidelity® funds (2016-2020) and Assistant Treasurer of certain Fidelity® funds (2016-2018).
Chris Maher (1972)
Year of Election or Appointment: 2013
Assistant Treasurer
Mr. Maher also serves as an officer of other funds. Mr. Maher is a Vice President (2008-present) and is an employee of Fidelity Investments. Mr. Maher serves as Assistant Treasurer of certain Fidelity entities. Previously, Mr. Maher served as Assistant Treasurer of certain funds (2013-2020).
Brett Segaloff (1972)
Year of Election or Appointment: 2021
Anti-Money Laundering (AML) Officer
Mr. Segaloff also serves as AML Officer of other funds. Mr. Segaloff is a Vice President (2022-present) and is an employee of Fidelity Investments. Mr. Segaloff serves as Anti Money Laundering Compliance Officer or Anti Money Laundering/Bank Secrecy Act Compliance Officer of certain Fidelity entities.
Stacie M. Smith (1974)
Year of Election or Appointment: 2013
Assistant Treasurer
Ms. Smith also serves as an officer of other funds. Ms. Smith is a Senior Vice President (2016-present) and is an employee of Fidelity Investments. Ms. Smith serves as Assistant Treasurer of certain Fidelity entities and has served in other fund officer roles.
Jim Wegmann (1979)
Year of Election or Appointment: 2021
Deputy Treasurer
Mr. Wegmann also serves as an officer of other funds. Mr. Wegmann is a Vice President (2016-present) and is an employee of Fidelity Investments. Mr. Wegmann serves as Assistant Treasurer of FIMM, LLC (2021-present). Previously, Mr. Wegmann served as Assistant Treasurer of certain Fidelity® funds (2019-2021).
As a shareholder, you incur two types of costs: (1) transaction costs, which may include sales charges (loads) on purchase payments or redemption proceeds, as applicable and (2) ongoing costs, which generally include management fees, distribution and/or service (12b-1) fees and other Fund expenses. This Example is intended to help you understand your ongoing costs (in dollars) of investing in a fund and to compare these costs with the ongoing costs of investing in other mutual funds.
| The Example is based on an investment of $1,000 invested at the beginning of the period and held for the entire period (July 1, 2023 to December 31, 2023). |
Actual Expenses
The first line of the accompanying table provides information about actual account values and actual expenses. You may use the information in this line, together with the amount you invested, to estimate the expenses that you paid over the period. Simply divide your account value by $1,000.00 (for example, an $8,600 account value divided by $1,000.00 = 8.6), then multiply the result by the number in the first line for a class/Fund under the heading entitled "Expenses Paid During Period" to estimate the expenses you paid on your account during this period. If any fund is a shareholder of any underlying mutual funds or exchange-traded funds (ETFs) (the Underlying Funds), such fund indirectly bears its proportional share of the expenses of the Underlying Funds in addition to the direct expenses incurred presented in the table. These fees and expenses are not included in the annualized expense ratio used to calculate the expense estimate in the table below.
Hypothetical Example for Comparison Purposes
The second line of the accompanying table provides information about hypothetical account values and hypothetical expenses based on the actual expense ratio and an assumed rate of return of 5% per year before expenses, which is not the actual return. The hypothetical account values and expenses may not be used to estimate the actual ending account balance or expenses you paid for the period. You may use this information to compare the ongoing costs of investing in the Fund and other funds. To do so, compare this 5% hypothetical example with the 5% hypothetical examples that appear in the shareholder reports of the other funds. If any fund is a shareholder of any Underlying Funds, such fund indirectly bears its proportional share of the expenses of the Underlying Funds in addition to the direct expenses as presented in the table. These fees and expenses are not included in the annualized expense ratio used to calculate the expense estimate in the table below.
Please note that the expenses shown in the table are meant to highlight your ongoing costs only and do not reflect any transaction costs. Therefore, the second line of the table is useful in comparing ongoing costs only, and will not help you determine the relative total costs of owning different funds. In addition, if these transactional costs were included, your costs would have been higher.
| | | | | Annualized Expense Ratio- A | | Beginning Account Value July 1, 2023 | | Ending Account Value December 31, 2023 | | Expenses Paid During Period- C July 1, 2023 to December 31, 2023 |
| Fidelity® Global Credit Fund | | | | | | | | | | |
| Class A | | | | .75% | | | | | | |
| Actual | | | | | | $ 1,000 | | $ 1,060.60 | | $ 3.90 |
Hypothetical-B | | | | | | $ 1,000 | | $ 1,021.42 | | $ 3.82 |
| Class M | | | | .75% | | | | | | |
| Actual | | | | | | $ 1,000 | | $ 1,062.00 | | $ 3.90 |
Hypothetical-B | | | | | | $ 1,000 | �� | $ 1,021.42 | | $ 3.82 |
| Class C | | | | 1.50% | | | | | | |
| Actual | | | | | | $ 1,000 | | $ 1,057.60 | | $ 7.78 |
Hypothetical-B | | | | | | $ 1,000 | | $ 1,017.64 | | $ 7.63 |
| Fidelity® Global Credit Fund | | | | .50% | | | | | | |
| Actual | | | | | | $ 1,000 | | $ 1,062.40 | | $ 2.60 |
Hypothetical-B | | | | | | $ 1,000 | | $ 1,022.68 | | $ 2.55 |
| Class I | | | | .50% | | | | | | |
| Actual | | | | | | $ 1,000 | | $ 1,063.90 | | $ 2.60 |
Hypothetical-B | | | | | | $ 1,000 | | $ 1,022.68 | | $ 2.55 |
| Class Z | | | | .41% | | | | | | |
| Actual | | | | | | $ 1,000 | | $ 1,062.80 | | $ 2.13 |
Hypothetical-B | | | | | | $ 1,000 | | $ 1,023.14 | | $ 2.09 |
| |
A Annualized expense ratio reflects expenses net of applicable fee waivers.
B 5% return per year before expenses
C Expenses are equal to the annualized expense ratio, multiplied by the average account value over the period, multiplied by 184/ 365 (to reflect the one-half year period). The fees and expenses of any Underlying Funds are not included in each annualized expense ratio.
The dividend and capital gains distributions for the fund(s) are available on Fidelity.com or Institutional.Fidelity.com.
A total of 4.58% of the dividends distributed during the fiscal year was derived from interest on U.S. Government securities which is generally exempt from state income tax.
The fund designates $661,360 of distributions paid in the calendar year 2022 as qualifying to be taxed as interest-related dividends for nonresident alien shareholders.
The fund designates $760,377 of distributions paid during the fiscal year ended 2023 as qualifying to be taxed as section 163(j) interest dividends.
The fund will notify shareholders in January 2024 of amounts for use in preparing 2023 income tax returns.
Board Approval of Investment Advisory Contracts and Management Fees
Fidelity Global Credit Fund
Each year, the Board of Trustees, including the Independent Trustees (together, the Board), considers the renewal of the fund's management contract with Fidelity Management & Research Company LLC (FMR) and the sub-advisory agreements (together, the Advisory Contracts) for the fund. FMR and the sub-advisers are referred to herein as the Investment Advisers. The Board, assisted by the advice of fund counsel and Independent Trustees' counsel, requests and considers a broad range of information relevant to the renewal of the Advisory Contracts throughout the year.
The Board meets regularly and, at each of its meetings, covers an extensive agenda of topics and materials and considers factors that are relevant to its annual consideration of the renewal of the fund's Advisory Contracts, including the services and support provided to the fund and its shareholders. The Board's Operations Committee, of which all the Independent Trustees are members, meets regularly throughout the year and requests, receives and considers, among other matters, information related to the annual consideration of the renewal of the fund's Advisory Contracts before making its recommendation to the Board. The Board also meets as needed to review matters specifically related to the Board's annual consideration of the renewal of the Advisory Contracts. Members of the Board may also meet from time to time with trustees of other Fidelity funds through joint ad hoc committees to discuss certain matters relevant to all of the Fidelity funds.
At its September 2023 meeting, the Board unanimously determined to renew the fund's Advisory Contracts. In reaching its determination, the Board considered all factors it believed relevant, including (i) the nature, extent, and quality of the services provided to the fund and its shareholders (including the investment performance of the fund); (ii) the competitiveness relative to peer funds of the fund's management fee and the total expense ratio of a representative class (the retail class, which was selected because it was the largest class without 12b-1 fees in 2022); (iii) the total costs of the services provided by and the profits realized by FMR and its affiliates (Fidelity) from its relationships with the fund; and (iv) the extent to which, if any, economies of scale exist and are realized as the fund grows, and whether any economies of scale are appropriately shared with fund shareholders. The Board also considered the broad range of investment choices available to shareholders from FMR's competitors and that the fund's shareholders have chosen to invest in the fund, which is part of the Fidelity family of funds. The Board's decision to renew the Advisory Contracts was not based on any single factor.
The Board reached a determination, with the assistance of fund counsel and Independent Trustees' counsel and through the exercise of its business judgment, that the renewal of the Advisory Contracts was in the best interests of the fund and its shareholders and that the compensation payable under the Advisory Contracts was fair and reasonable in light of all of the surrounding circumstances.
Nature, Extent, and Quality of Services Provided. The Board considered Fidelity's staffing as it relates to the fund, including the backgrounds and experience of investment personnel, and also considered the Investment Advisers' implementation of the fund's investment program. The Independent Trustees also had discussions with senior management of Fidelity's investment operations and investment groups. The Board considered the structure of the investment personnel compensation program and whether this structure provides appropriate incentives to act in the best interests of the fund. Additionally, the Board considered the portfolio managers' investments, if any, in the funds that they manage.
Resources Dedicated to Investment Management and Support Services. The Board reviewed the general qualifications and capabilities of Fidelity's investment staff, including its size, education, experience, and resources, as well as Fidelity's approach to recruiting, managing, training, and compensating investment personnel. The Board noted the resources devoted to Fidelity's global investment organization, and that Fidelity's analysts have extensive resources, tools and capabilities that allow them to conduct quantitative and fundamental analysis, as well as credit analysis of issuers, counterparties and guarantors. Further, the Board considered that Fidelity's investment professionals have sufficient access to global information and data so as to provide competitive investment results over time, and that those professionals also have access to sophisticated tools that permit them to assess portfolio construction and risk and performance attribution characteristics continuously, as well as to transmit new information and research conclusions rapidly around the world. Additionally, in its deliberations, the Board considered Fidelity's trading, risk management, compliance, cybersecurity, and technology and operations capabilities and resources, which are integral parts of the investment management process.
Shareholder and Administrative Services. The Board considered (i) the nature, extent, quality, and cost of advisory, administrative, and shareholder services performed by the Investment Advisers and their affiliates under the Advisory Contracts and under separate agreements covering transfer agency, pricing and bookkeeping, and securities lending services for the fund; (ii) the nature and extent of Fidelity's supervision of third party service providers, principally custodians, subcustodians, and pricing vendors; and (iii) the resources devoted by Fidelity to, and the record of compliance with, the fund's compliance policies and procedures. The Board also considered the fund's securities lending activities and any payments made to Fidelity relating to securities lending.
The Board noted that the growth of fund assets over time across the complex allows Fidelity to reinvest in the development of services designed to enhance the value and convenience of the Fidelity funds as investment vehicles. These services include 24-hour access to account information and market information over the Internet and through telephone representatives, investor education materials and asset allocation tools. The Board also considered that it reviews customer service metrics such as telephone response times, continuity of services on the website and metrics addressing services at Fidelity Investor Centers.
Investment in a Large Fund Family. The Board considered the benefits to shareholders of investing in a fund that is part of a large family of funds offering a variety of investment disciplines and providing a large variety of fund investor services. The Board noted that Fidelity had taken, or had made recommendations to the Board that resulted in the Fidelity funds taking, a number of actions over the previous year that benefited particular funds and/or the Fidelity funds in general.
Investment Performance. The Board took into account discussions that occur with representatives of the Investment Advisers, and reports that it receives, at Board meetings throughout the year relating to fund investment performance. In this regard the Board noted that as part of regularly scheduled fund reviews and other reports to the Board on fund performance, the Board considered annualized return information for the fund for different time periods, measured against an appropriate securities market index (benchmark index) and an appropriate peer group of funds with similar objectives (peer group). The Board also considered information about performance attribution. In its evaluation of fund investment performance at meetings throughout the year, the Board gave particular attention to information indicating underperformance of certain Fidelity funds over different time periods and discussed with the Investment Advisers the reasons for such underperformance.
In addition to reviewing absolute and relative fund performance, the Independent Trustees periodically consider the appropriateness of fund performance metrics in evaluating the results achieved. The Independent Trustees generally give greater weight to fund performance over longer time periods than over shorter time periods. Depending on the circumstances, the Independent Trustees may be satisfied with a fund's performance notwithstanding that it lags its benchmark index or peer group for certain periods.
Based on its review, the Board concluded that the nature, extent, and quality of services provided to the fund under the Advisory Contracts should continue to benefit the shareholders of the fund.
Competitiveness of Management Fee and Total Expense Ratio. The Board was provided with information regarding industry trends in management fees and expenses. In its review of the fund's management fee and total expense ratio of the retail class, the Board considered the fund's management fee rate as well as other "fund-level" expenses, such as pricing and bookkeeping fees and custodial, legal, and audit fees, paid by FMR under the fund's management contract. The Board also considered other "class-level" expenses, such as transfer agent fees and fund-paid 12b-1 fees. The Board also noted that Fidelity may agree to waive fees or reimburse expenses from time to time, and the extent to which, if any, it has done so for the fund.
Comparisons of Management Fees and Total Expense Ratios. Among other things, the Board reviewed data for selected groups of competitive funds and classes (referred to as "mapped groups") that were compiled by Fidelity based on combining similar investment objective categories (as classified by Lipper) that have comparable investment mandates. The data reviewed by the Board included (i) gross management fee comparisons (before taking into account expense reimbursements or caps) relative to the total universe of funds within the mapped group; (ii) gross management fee comparisons relative to a subset of non-Fidelity funds in the mapped group that are similar in size and management fee structure to the fund (referred to as the "asset size peer group"); (iii) total expense comparisons of the retail class of the fund relative to funds and classes in the mapped group that have a similar sales load structure to the retail class of the fund (referred to as the "similar sales load structure group"); and (iv) total expense comparisons of the retail class of the fund relative to funds and classes in the similar sales load structure group that are similar in size and management fee structure to the fund (referred to as the "total expense asset size peer group"). The total expense asset size peer group comparison excludes performance adjustments and fund-paid 12b-1 fees to eliminate variability in fee structures.
The information provided to the Board indicated that the fund's management fee rate ranked below the competitive median of the mapped group for 2022 and below the competitive median of the asset size peer group for 2022. Further, the information provided to the Board indicated that the total expense ratio of the fund's retail class ranked below the competitive median of the similar sales load structure group for 2022 and below the competitive median of the total expense asset size peer group for 2022.
Other Contractual Arrangements. The Board further considered that FMR has contractually agreed to reimburse Class A, Class M, Class C, Class I, Class Z, and the retail class of the fund to the extent that total operating expenses, with certain exceptions, as a percentage of their respective average net assets, exceed 0.75%, 0.75%, 1.50%, 0.50%, 0.41%, and 0.50% through April 30, 2024.
Fees Charged to Other Fidelity Clients. The Board also considered Fidelity fee structures and other information with respect to clients of Fidelity, such as other funds advised or subadvised by Fidelity, pension plan clients, and other institutional clients with similar mandates. The Board noted that a joint ad hoc committee created by it and the boards of other Fidelity funds periodically reviews and compares Fidelity's institutional investment advisory business with its business of providing services to the Fidelity funds and also noted the most recent findings of the committee. The Board noted that the committee's review included a consideration of the differences in services provided, fees charged, and costs incurred, as well as competition in the markets serving the different categories of clients.
Based on its review, the Board concluded that the fund's management fee is fair and reasonable in light of the services that the fund receives and the other factors considered. Further, based on its review of total expense ratios and fees charged to other Fidelity clients, the Board concluded that the total expense ratio of each class of the fund was reasonable in light of the services that the fund and its shareholders receive and the other factors considered.
Costs of the Services and Profitability. The Board considered the revenues earned and the expenses incurred by Fidelity in conducting the business of developing, marketing, distributing, managing, administering and servicing the fund and servicing the fund's shareholders. The Board also considered the level of Fidelity's profits in respect of all the Fidelity funds.
On an annual basis, Fidelity presents to the Board information about the profitability of its relationships with the fund. Fidelity calculates profitability information for each fund, as well as aggregate profitability information for groups of Fidelity funds and all Fidelity funds, using a series of detailed revenue and cost allocation methodologies which originate with the books and records of Fidelity on which Fidelity's audited financial statements are based. The Audit Committee of the Board reviews any significant changes from the prior year's methodologies and the full Board approves such changes.
A public accounting firm has been engaged annually by the Board as part of the Board's assessment of Fidelity's profitability analysis. The engagement includes the review and assessment of the methodologies used by Fidelity in determining the revenues and expenses attributable to Fidelity's fund business, and completion of agreed-upon procedures in respect of the mathematical accuracy of certain fund profitability information and its conformity to established allocation methodologies. After considering the reports issued under the engagement and information provided by Fidelity, the Board concluded that while other allocation methods may also be reasonable, Fidelity's profitability methodologies are reasonable in all material respects.
The Board also reviewed Fidelity's non-fund businesses and potential indirect benefits such businesses may have received as a result of their association with Fidelity's fund business (i.e., fall-out benefits) as well as cases where Fidelity's affiliates may benefit from the funds' business. The Board considered areas where potential indirect benefits to the Fidelity funds from their relationships with Fidelity may exist. The Board's consideration of these matters was informed by the findings of a joint ad hoc committee created by it and the boards of other Fidelity funds to evaluate potential fall-out benefits.
The Board considered the costs of the services provided by and the profits realized by Fidelity in connection with the operation of the fund and was satisfied that the profitability was not excessive.
Economies of Scale. The Board considered whether there have been economies of scale in respect of the management of the Fidelity funds, whether the Fidelity funds (including the fund) have appropriately benefited from any such economies of scale, and whether there is potential for realization of any further economies of scale. The Board considered the extent to which the fund will benefit from economies of scale as assets grow through increased services to the fund, through waivers or reimbursements, or through fee or expense ratio reductions. The Board also noted that a committee created by it and the boards of other Fidelity funds periodically analyzes whether Fidelity attains economies of scale in respect of the management and servicing of the Fidelity funds, whether the Fidelity funds have appropriately benefited from such economies of scale, and whether there is potential for realization of any further economies of scale.
The Board concluded, taking into account the analysis of the committee, that economies of scale, if any, are being appropriately shared between fund shareholders and Fidelity.
Additional Information Requested by the Board. In order to develop fully the factual basis for consideration of the Fidelity funds' advisory contracts, the Board requested and received additional information on certain topics, including: (i) Fidelity's fund profitability methodology, profitability trends for certain funds, the allocation of various costs to different funds, and the impact of certain factors on fund profitability results; (ii) portfolio manager changes that have occurred during the past year and Fidelity's views regarding portfolio manager investment in the Fidelity funds that they manage; (iii) hiring, training, and retaining personnel; (iv) the arrangements with and compensation paid to certain fund sub-advisers and the treatment of such compensation within Fidelity's fund profitability methodology; (v) the terms of the funds' various management fee structures, including the basic group fee and the terms of Fidelity's voluntary expense limitation arrangements; (vi) Fidelity's transfer agent, pricing and bookkeeping fees, expense and service structures for different funds and classes relative to competitive trends and market conditions; (vii) the impact on fund profitability of recent industry trends, such as the growth in passively managed funds and the changes in flows for different types of funds; (viii) the types of management fee and total expense comparisons provided, and the challenges and limitations associated with such information; (ix) explanations regarding the relative total expense ratios and management fees of certain funds and classes, total expense and management fee competitive trends, and methodologies for total expense and management fee competitive comparisons; (x) information concerning expense limitations applicable to certain funds; and (xi) matters related to money market funds, exchange-traded funds, and target date funds.
Conclusion. Based on its evaluation of all of the conclusions noted above, and after considering all factors it believed relevant, the Board, including the Independent Trustees, concluded that the advisory and sub-advisory fee arrangements are fair and reasonable in light of all of the surrounding circumstances and that the fund's Advisory Contracts should be renewed through September 30, 2024.
| A special meeting of shareholders was held on October 18, 2023. The results of votes taken among shareholders on the proposal before them are reported below. Each vote reported represents one dollar of net asset value held on the record date for the meeting. |
| Proposal 1 |
| To elect a Board of Trustees. |
| | # of Votes | % of Votes |
| Abigail P. Johnson |
| Affirmative | 21,333,918,003.710 | 98.990 |
| Withheld | 218,238,294.280 | 1.010 |
| TOTAL | 21,552,156,297.990 | 100.000 |
| Jennifer Toolin McAuliffe |
| Affirmative | 21,341,064,648.470 | 99.020 |
| Withheld | 211,091,649.520 | 0.980 |
| TOTAL | 21,552,156,297.990 | 100.000 |
| Christine J. Thompson |
| Affirmative | 21,338,732,597.390 | 99.010 |
| Withheld | 213,423,700.600 | 0.990 |
| TOTAL | 21,552,156,297.990 | 100.000 |
| Elizabeth S. Acton |
| Affirmative | 21,317,028,547.600 | 98.910 |
| Withheld | 235,127,750.390 | 1.090 |
| TOTAL | 21,552,156,297.990 | 100.000 |
| Laura M. Bishop |
| Affirmative | 21,336,468,393.320 | 99.000 |
| Withheld | 215,687,904.670 | 1.000 |
| TOTAL | 21,552,156,297.990 | 100.000 |
| Ann E. Dunwoody |
| Affirmative | 21,320,223,866.150 | 98.920 |
| Withheld | 231,932,431.840 | 1.080 |
| TOTAL | 21,552,156,297.990 | 100.000 |
| John Engler |
| Affirmative | 21,279,172,233.730 | 98.730 |
| Withheld | 272,984,064.260 | 1.270 |
| TOTAL | 21,552,156,297.990 | 100.000 |
| Robert F. Gartland |
| Affirmative | 21,319,450,613.340 | 98.920 |
| Withheld | 232,705,684.650 | 1.080 |
| TOTAL | 21,552,156,297.990 | 100.000 |
| Robert W. Helm |
| Affirmative | 21,334,642,392.210 | 98.990 |
| Withheld | 217,513,905.780 | 1.010 |
| TOTAL | 21,552,156,297.990 | 100.000 |
| Arthur E. Johnson |
| Affirmative | 21,298,270,597.120 | 98.820 |
| Withheld | 253,885,700.870 | 1.180 |
| TOTAL | 21,552,156,297.990 | 100.000 |
| Michael E. Kenneally |
| Affirmative | 20,916,217,437.980 | 97.050 |
| Withheld | 635,938,860.010 | 2.950 |
| TOTAL | 21,552,156,297.990 | 100.000 |
| Mark A. Murray |
| Affirmative | 21,321,664,592.720 | 98.930 |
| Withheld | 230,491,705.270 | 1.070 |
| TOTAL | 21,552,156,297.990 | 100.000 |
| Carol J. Zierhoffer |
| Affirmative | 21,337,428,755.990 | 99.000 |
| Withheld | 214,727,542.000 | 1.000 |
| TOTAL | 21,552,156,297.990 | 100.000 |
| | | |
| Proposal 1 reflects trust wide proposal and voting results. |
1.939061.111
GLB-ANN-0224
Item 2.
Code of Ethics
As of the end of the period, December 31, 2023, Fidelity School Street Trust (the trust) has adopted a code of ethics, as defined in Item 2 of Form N-CSR, that applies to its President and Treasurer and its Chief Financial Officer. A copy of the code of ethics is filed as an exhibit to this Form N-CSR.
Item 3.
Audit Committee Financial Expert
The Board of Trustees of the trust has determined that Elizabeth S. Acton is an audit committee financial expert, as defined in Item 3 of Form N-CSR. Ms. Acton is independent for purposes of Item 3 of Form N-CSR.
Item 4.
Principal Accountant Fees and Services
Fees and Services
The following table presents fees billed by Deloitte & Touche LLP, the member firms of Deloitte Touche Tohmatsu, and their respective affiliates (collectively, “Deloitte Entities”) in each of the last two fiscal years for services rendered to Fidelity Series International Developed Markets Bond Index Fund (the “Fund”):
Services Billed by Deloitte Entities
December 31, 2023 FeesA
| | | | |
| Audit Fees | Audit-Related Fees | Tax Fees | All Other Fees |
Fidelity Series International Developed Markets Bond Index Fund | $74,200 | $- | $11,600 | $1,700 |
| | | | |
| Audit Fees | Audit-Related Fees | Tax Fees | All Other Fees |
Fidelity Series International Developed Markets Bond Index Fund | $73,200 | $- | $10,100 | $1,700 |
A Amounts may reflect rounding.
The following table presents fees billed by PricewaterhouseCoopers LLP (“PwC”) in each of the last two fiscal years for services rendered to Fidelity Advisor Multi-Asset Income Fund, Fidelity Global Credit Fund, Fidelity Intermediate Municipal Income Fund and Fidelity Series International Credit Fund (the “Funds”):
Services Billed by PwC
December 31, 2023 FeesA
| | | | |
| Audit Fees | Audit-Related Fees | Tax Fees | All Other Fees |
|
|
|
|
|
Fidelity Advisor Multi-Asset Income Fund | $55,100 | $4,500 | $12,200 | $1,900 |
Fidelity Global Credit Fund | $81,700 | $6,500 | $14,000 | $2,700 |
Fidelity Intermediate Municipal Income Fund | $50,200 | $3,800 | $5,600 | $1,600 |
Fidelity Series International Credit Fund | $79,300 | $6,200 | $12,600 | $2,600 |
|
|
|
|
|
| | | | |
| Audit Fees | Audit-Related Fees | Tax Fees | All Other Fees |
|
|
|
|
|
Fidelity Advisor Multi-Asset Income Fund | $52,500 | $4,600 | $13,000 | $2,100 |
Fidelity Global Credit Fund | $81,100 | $6,800 | $13,400 | $3,000 |
Fidelity Intermediate Municipal Income Fund | $47,500 | $3,800 | $5,300 | $1,700 |
Fidelity Series International Credit Fund | $75,000 | $6,300 | $11,500 | $2,800 |
A Amounts may reflect rounding.
The following table(s) present(s) fees billed by Deloitte Entities and PwC that were required to be approved by the Audit Committee for services that relate directly to the operations and financial reporting of the Fund(s) and that are rendered on behalf of Fidelity Management & Research Company LLC ("FMR") and entities controlling, controlled by, or under common control with FMR (not including any sub-adviser whose role is primarily portfolio management and is subcontracted with or overseen by another investment adviser) that provide ongoing services to the Fund(s) (“Fund Service Providers”):
Services Billed by Deloitte Entities
| | |
| December 31, 2023A | December 31, 2022 A |
Audit-Related Fees | $- | $- |
Tax Fees | $- | $- |
All Other Fees | $- | $- |
A Amounts may reflect rounding.
Services Billed by PwC
| | |
| December 31, 2023A | December 31, 2022A |
Audit-Related Fees | $8,284,200 | $7,914,600 |
Tax Fees | $1,000 | $1,000 |
All Other Fees | $- | $- |
A Amounts may reflect rounding.
“Audit-Related Fees” represent fees billed for assurance and related services that are reasonably related to the performance of the fund audit or the review of the fund's financial statements and that are not reported under Audit Fees.
“Tax Fees” represent fees billed for tax compliance, tax advice or tax planning that relate directly to the operations and financial reporting of the fund.
“All Other Fees” represent fees billed for services provided to the fund or Fund Service Provider, a significant portion of which are assurance related, that relate directly to the operations and financial reporting of the fund, excluding those services that are reported under Audit Fees, Audit-Related Fees or Tax Fees.
Assurance services must be performed by an independent public accountant.
* * *
The aggregate non-audit fees billed by Deloitte Entities and PwC for services rendered to the Fund(s), FMR (not including any sub-adviser whose role is primarily portfolio management and is subcontracted with or overseen by another investment adviser), and
any Fund Service Provider for each of the last two fiscal years of the Fund(s) are as follows:
| | |
Billed By | December 31, 2023A | December 31, 2022A |
Deloitte Entities | $255,900 | $469,400 |
PwC | $13,662,000 | $12,957,300 |
|
|
|
A Amounts may reflect rounding.
The trust's Audit Committee has considered non-audit services that were not pre-approved that were provided by Deloitte Entities and PwC to Fund Service Providers to be compatible with maintaining the independence of Deloitte Entities and PwC in its(their) audit of the Fund(s), taking into account representations from Deloitte Entities and PwC, in accordance with Public Company Accounting Oversight Board rules, regarding its independence from the Fund(s) and its(their) related entities and FMR’s review of the appropriateness and permissibility under applicable law of such non-audit services prior to their provision to the Fund(s) Service Providers.
Audit Committee Pre-Approval Policies and Procedures
The trust’s Audit Committee must pre-approve all audit and non-audit services provided by a fund’s independent registered public accounting firm relating to the operations or financial reporting of the fund. Prior to the commencement of any audit or non-audit services to a fund, the Audit Committee reviews the services to determine whether they are appropriate and permissible under applicable law.
The Audit Committee has adopted policies and procedures to, among other purposes, provide a framework for the Committee’s consideration of non-audit services by the audit firms that audit the Fidelity funds. The policies and procedures require that any non-audit service provided by a fund audit firm to a Fidelity fund and any non-audit service provided by a fund auditor to a Fund Service Provider that relates directly to the operations and financial reporting of a Fidelity fund (“Covered Service”) are subject to approval by the Audit Committee before such service is provided.
All Covered Services must be approved in advance of provision of the service either: (i) by formal resolution of the Audit Committee, or (ii) by oral or written approval of the service by the Chair of the Audit Committee (or if the Chair is unavailable, such other member of the Audit Committee as may be designated by the Chair to act in the Chair’s absence). The approval contemplated by (ii) above is permitted where the Treasurer determines that action on such an engagement is necessary before the next meeting of the Audit Committee.
Non-audit services provided by a fund audit firm to a Fund Service Provider that do not relate directly to the operations and financial reporting of a Fidelity fund are reported to the Audit Committee periodically.
Non-Audit Services Approved Pursuant to Rule 2-01(c)(7)(i)(C) and (ii) of Regulation S-X (“De Minimis Exception”)
There were no non-audit services approved or required to be approved by the Audit Committee pursuant to the De Minimis Exception during the Fund’s(s’) last two fiscal years relating to services provided to (i) the Fund(s) or (ii) any Fund Service Provider that relate directly to the operations and financial reporting of the Fund(s).
The Registrant has not retained, for the preparation of the audit report on the financial statements included in the Form N-CSR, a registered public accounting firm that has a branch or office that is located in a foreign jurisdiction and that the Public Company Accounting Oversight Board (the “PCAOB”) has determined that the PCAOB is unable to inspect or investigate completely because of a position taken by an authority in the foreign jurisdiction.
The Registrant is not a “foreign issuer,” as defined in 17 CFR 240.3b-4.
Item 5.
Audit Committee of Listed Registrants
Not applicable.
Item 6.
Investments
(a)
Not applicable.
(b)
Not applicable.
Item 7.
Disclosure of Proxy Voting Policies and Procedures for Closed-End Management Investment Companies
Not applicable.
Item 8.
Portfolio Managers of Closed-End Management Investment Companies
Not applicable.
Item 9.
Purchase of Equity Securities by Closed-End Management Investment Company and Affiliated Purchasers
Not applicable.
Item 10.
Submission of Matters to a Vote of Security Holders
There were no material changes to the procedures by which shareholders may recommend nominees to the trust’s Board of Trustees.
Item 11.
Controls and Procedures
(a)(i) The President and Treasurer and the Chief Financial Officer have concluded that the trust’s disclosure controls and procedures (as defined in Rule 30a-3(c) under the Investment Company Act) provide reasonable assurances that material information relating to the trust is made known to them by the appropriate persons, based on their evaluation of these controls and procedures as of a date within 90 days of the filing date of this report.
(a)(ii) There was no change in the trust’s internal control over financial reporting (as defined in Rule 30a-3(d) under the Investment Company Act) that occurred during the period covered by this report that has materially affected, or is reasonably likely to materially affect, the trust’s internal control over financial reporting.
Item 12.
Disclosure of Securities Lending Activities for Closed-End Management
Investment Companies
Not applicable.
Item 18.
Recovery of Erroneously Awarded Compensation
(a)
Not applicable.
(b)
Not applicable.
Item 19.
Exhibits
SIGNATURES
Pursuant to the requirements of the Securities Exchange Act of 1934 and the Investment Company Act of 1940, the registrant has duly caused this report to be signed on its behalf by the undersigned, thereunto duly authorized.
Fidelity School Street Trust
| |
By: | /s/Laura M. Del Prato |
| Laura M. Del Prato |
| President and Treasurer |
|
|
Date: | February 22, 2024 |
Pursuant to the requirements of the Securities Exchange Act of 1934 and the Investment Company Act of 1940, this report has been signed below by the following persons on behalf of the registrant and in the capacities and on the dates indicated.
| |
By: | /s/Laura M. Del Prato |
| Laura M. Del Prato |
| President and Treasurer |
|
|
Date: | February 22, 2024 |
| |
By: | /s/John J. Burke III |
| John J. Burke III |
| Chief Financial Officer |
|
|
Date: | February 22, 2024 |