| | | |
| | | OMB APPROVAL |
| | |
OMB Number: 3235-0570 |
| | | |
| | | Expires: August 31, 2008 |
| | | |
| | | Estimated average burden |
| | | hours per response: 18.9 |
| | |
|
UNITED STATES
SECURITIES AND EXCHANGE COMMISSION
Washington, D.C. 20549
FORM N-CSR
CERTIFIED SHAREHOLDER REPORT OF REGISTERED MANAGEMENT INVESTMENT COMPANIES
Investment Company Act file number: 811-02773
The Gateway Trust
(Exact name of registrant as specified in charter)
Rookwood Tower, 3805 Edwards Road, Suite 600, Cincinnati, OH 45209
(Address of principal executive offices) (Zip code)
Geoffrey Keenan
The Gateway Trust, Rookwood Tower, 3805 Edwards Road, Suite 600, Cincinnati, OH 45209
(Name and address of agent for service)
Registrant’s telephone number, including area code: (513) 719-1100
Date of fiscal year end: December 31
Date of reporting period: December 31, 2007
Form N-CSR is to be used by management investment companies to file reports with the Commission not later than 10 days after the transmission to stockholders of any report that is required to be transmitted to stockholders under Rule 30e-1 under the Investment Company Act of 1940 (17 CFR 270.30e-1). The Commission may use the information provided on Form N-CSR in its regulatory, disclosure review, inspection, and policymaking roles.
A registrant is required to disclose the information specified by Form N-CSR, and the Commission will make this information public. A registrant is not required to respond to the collection of information contained in Form N-CSR unless the Form displays a currently valid Office of Management and Budget (“OMB”) control number. Please direct comments concerning the accuracy of the information collection burden estimate and any suggestions for reducing the burden to Secretary, Securities and Exchange Commission, 450 Fifth Street, NW, Washington, DC 20549-0609. The OMB has reviewed this collection of information under the clearance requirements of 44 U.S.C. § 3507.
Item 1. Reports to Stockholders
| | GATEWAY FUND ____________ ANNUAL REPORT
December 31, 2007 |
| | |
| | |
| | |
THE GATEWAY TRUST _______ P.O. Box 5211 CINCINNATI, OH 45201-5211 800.354.6339 | |
GATEWAY FUND
LETTER TO SHAREHOLDERS
Dear Shareholder:
Throughout its thirty year history, the Gateway Fund has endeavored to deliver the rewards of effective risk management to its investors. That remains its highest priority. The Fund not only strives for consistent returns, but also returns in excess of those available from other investments comparable in volatility. In the following pages we review the Fund’s risk management strategy, provide an overview of the markets in 2007, discuss the Fund’s performance for the year and offer our perspective for 2008.
STRATEGY REVIEW
The investment objective of the Fund is to capture the majority of the higher returns associated with equity market investments, while exposing investors to significantly less risk than other equity investments. The Fund employs a strategy comprised of three integrated components: sale of cash-settled index call options; purchase of index put options; and ownership of a broadly diversified common stock portfolio designed to support its index option-based risk management strategy.
By selling index call options, the Fund receives cash flow from option premiums in exchange for the uncertain future appreciation of its equity portfolio. The degree of uncertainty in the equity markets determines the magnitude of the cash flow available to the Fund. In highly volatile markets, uncertainty is magnified and cash flow available from index call options rises. Conversely, when markets exhibit reduced volatility, this cash flow decreases. The Fund seeks to optimize the cash flow earned from the sale of index call options, which is an important source of the Fund’s total return.
ASSET ALLOCATION AS A PERCENTAGE OF NET ASSETS DECEMBER 31, 2007 |
| Common Stocks | | | 96.7 | % |
| Put Options | | | 0.6 | % |
| Repurchase Agreement | | | 4.6 | % |
| Call Options Written | | | (2.2 | %) |
| Other Assets and Liabilities, Net | | | 0.3 | % |
| | | | 100.0 | % |
As the cash flow from the sale of index call options varies over time and is somewhat limited in its ability to reduce downside exposure, the Fund also buys index put options that can help protect against a significant market decline over a short period of time. The value of an index put option generally rises as the underlying stock prices decline. The Fund seeks the most cost-effective protection available from index put options, which serve as a key component in reducing the overall volatility of the Fund.
The final component of the Fund’s strategy is the continuous ownership of a diversified common stock portfolio generally representative of the broad U. S. equity market. The common stock portfolio is constructed to provide support for the index option-based risk management strategy by minimizing the difference between the performance of the stock portfolio and that of the equity index underlying the Fund’s option positions while also considering other factors, such as predicted dividend yield of the portfolio.
The interaction of the three components of the Fund’s strategy is designed to provide fairly consistent returns over a wide range of market conditions. Accordingly, the total return of the Fund over a given time period is a combination of the change in market value and the dividend yield associated with the common stock portfolio, the cash flow earned from selling index call options, the cost of purchasing index put options and the operating expenses of the Fund.
GATEWAY FUND
LETTER TO SHAREHOLDERS
2007 MARKET OVERVIEW
Generally speaking, 2007 was a year marked by sound economic fundamentals. Gross domestic product, employment, exports, corporate profits and consumer spending all grew at rates above their historical averages. This growth was accomplished with benign inflation and long-term interest rates which were below average. Nevertheless, as the year progressed, the magnitude of the losses coming from the financial sector, the deteriorating housing market and the widely publicized fear of an impending recession inhibited investors’ enthusiasm for stocks as much as it ignited their desire for high-quality bonds. For its part, the Federal Reserve Board maintained the federal funds rate at 5.25% throughout the first six months of 2007. In the second half of the year, however, three separate interest rate cuts by the Federal Reserve Board lowered the federal funds rate to 4.25% by year-end.
It was a turbulent time for the S&P 500 Index throughout much of 2007, as ongoing anxiety regarding the depth of credit market problems caused equity investors to frequently change market direction. While investors were, at times, able to focus their attention on favorable corporate earnings and export-driven economic growth, fears surrounding the subprime credit crisis, liquidity shortages, high oil prices and declining home sales frequently resurfaced. These fears often prompted investors to unceremoniously exit the equity markets, even when economic fundamentals had not deteriorated to any considerable extent. Fixed income markets also demonstrated increased volatility, showing declines when economic statistics exceeded expectations and advances when deterioration in the housing markets accelerated. The Lehman Brothers U. S. Intermediate Government/Credit Bond Index directly benefited from interest rate cuts in 2007 and the rotation away from stocks and lower-quality bonds.
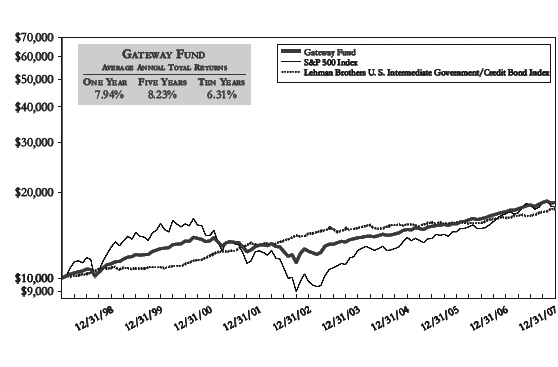
GROWTH OF A $10,000 INVESTMENT
January 1, 1998 - December 31, 2007
Past performance does not guarantee future results. The average annual total return figures assume the reinvestment of distributions, but do not reflect the deduction of taxes paid on distributions or on the redemption of your shares.
GATEWAY FUND
LETTER TO SHAREHOLDERS
Market uncertainties seemed to steadily increase as 2007 progressed and favorable economic data did little to lessen investor anxiety over credit problems. The CBOE Volatility Index (the “VIX”), a key gauge of equity market volatility, nearly doubled over the course of the year as the negative impact of the credit crunch became more significant and pervasive throughout the financial services sector. The VIX peaked in November and reached levels in 2007 not seen since the first quarter of 2003. Volatility thus moved from a dormant fear for investors from 2004-2006 to a factor influencing investor behavior in 2007. Furthermore, since market volatility largely determines the pricing of options, net cash flow available from index option premiums increased as the year progressed.
2007 PERFORMANCE COMMENTARY
The following discussion of the Fund’s comparative performance to the S&P 500 Index and the Lehman Brothers U. S. Intermediate Government/Credit Bond Index focuses on the results of the Fund’s index option-based risk management strategy because its diversified common stock portfolio is designed to support this strategy. For the year ended December 31, 2007, the Fund provided investors with a total return of 7.94%, surpassing both the 5.50% return for the S&P 500 Index and the 7.40% return for the Lehman Brothers U. S. Intermediate Government/Credit Bond Index. Although the Fund’s stock portfolio increasingly came under pressure as the year progressed, the Fund benefited from improved cash flow available from its option activity as volatility, particularly in the second half of the year, increased from the low levels that prevailed for most of the last three years.
PORTFOLIO SECTOR WEIGHTING
AS A PERCENTAGE OF COMMON STOCKS
December 31, 2007
GATEWAY FUND
LETTER TO SHAREHOLDERS
After a positive start to 2007, global financial markets were rattled on February 27, 2007, by a rapid and unexpected plunge in the Shanghai, China, stock market. This plunge, coupled with a fear of global liquidity tightening, unnerved stock investors and drove the year-to-date return of the S&P 500 Index through the end of February into negative territory. The remainder of the quarter saw only a partial reversal of the February sell-off as equity investors rebalanced and reassessed risk in the financial marketplace. For the three months ended March 31, 2007, the S&P 500 Index achieved a modest return of 0.64%. Bonds earned most of their quarterly return in February as the rapidly-deteriorating stock market led hopeful bond investors and fearful equity investors to push bond prices higher. The Lehman Brothers U. S. Intermediate Government/Credit Bond Index ended the quarter up 1.59%. True to its risk management strategy, the Fund’s cash flow from hedging activity helped preserve early first quarter gains when the equity markets declined significantly in late February. Higher option premiums, resulting from increased market volatility, largely propelled the Fund to a first quarter 2007 gain of 2.44%, outperforming both the S&P 500 Index and the Lehman Brothers U. S. Intermediate Government/Credit Bond Index.
The second quarter of 2007 was initially marked by a steady increase in the broad equity markets as favorable trends in corporate profits, employment data and consumer spending overcame the dampening effects of high gasoline prices and a weakening housing sector. The S&P 500 Index reached what was then an all-time high of 1539.18 on June 4, 2007. Shortly thereafter, equity markets were roiled by fears of spreading weakness induced by losses in the subprime mortgage market. However, despite its June sell-off, the S&P 500 Index turned in a stellar quarterly return of 6.28%. The bond market was less fortunate. Already inhibited by fears of increased inflationary pressures, bond investors dramatically felt the impact of the woes in the mortgage markets. As consumer interest rates rose and bond prices fell, the Lehman Brothers U. S. Intermediate Government/Credit Bond Index posted a 0.14% loss for the quarter. The Fund, on the other hand, circumvented much of the market turmoil and achieved positive returns in each of the three months during the second quarter. Benefiting from a modest improvement in available option premiums resulting from a corresponding increase in volatility, the Fund earned a total return of 3.16% for the quarter.
2007 QUARTERLY AND ANNUAL TOTAL RETURNS
| | | | | | | Lehman Bros. U. S. | |
| | | | | | Intermediate | |
| | Gateway | | S&P 500 | | Government/Credit | |
| | Fund | | Index | | Bond Index | |
| First Quarter | | | 2.44 | % | | 0.64 | % | | 1.59 | % |
| Second Quarter | | | 3.16 | % | | 6.28 | % | | (0.14 | %) |
| Third Quarter | | | 2.12 | % | | 2.03 | % | | 2.88 | % |
| Fourth Quarter | | | 0.02 | % | | (3.33 | %) | | 2.91 | % |
| | | | | | | | | | | |
Year | | | 7.94 | % | | 5.50 | % | | 7.40 | % |
Early in the third quarter, investors were unnerved by the prominent failures of some high-profile hedge fund operators and mortgage-lending firms, along with a lack of liquidity in the subprime mortgage markets. However, steep declines in the prices of both equity and high-risk fixed income investments were stalled when central banks worldwide moved aggressively in an attempt to replace liquidity. This intervention by central bank authorities, along with the Federal Reserve Board’s interest rate cut of 0.50% in September, helped to restore calm to the markets by quarter-end. For the third quarter, the S&P 500 Index was able to recover from its sharp July sell-off to advance by 2.03%. The high-quality sectors of the bond market also participated in the recovery as investors expressed their aversion to risk by seeking a safer haven in shorter-term bonds, particularly U. S. Treasury issues. This flight to quality was reflected in the 2.88% quarterly return of the Lehman Brothers U. S. Intermediate Government/Credit Bond Index. Persistent equity market anxiety associated with all the uncertainty in the credit markets caused volatility to increase significantly. This elevated volatility translated into strong cash flow available from option activity, which helped the Fund mitigate equity losses in the first half of the quarter and allow for participation in the recovery that followed. For the three months ended September 30, 2007, the Fund delivered a total return of 2.12%.
GATEWAY FUND
LETTER TO SHAREHOLDERS
The real estate market decline continued in the fourth quarter, forcing many financial institutions with related exposure to record significant write-downs and causing both equity and fixed income investors to become increasingly unsettled. Government policymakers rushed to action, as the Federal Reserve Board cut interest rates by 0.25% on two separate occasions in the fourth quarter. Beyond these cuts, the Federal Reserve Board and its global counterparts acted decisively in an attempt to ease conditions in the credit markets and provide some relief to beleaguered financial service firms. Nevertheless, investors chose to focus on the possibility of future weakness in consumer spending and the publicized fear of an impending recession, furthering the downward momentum of the equity markets during the quarter. The S&P 500 Index dropped by 3.33% in the fourth quarter of 2007. Bond investors were encouraged by signs of economic weakness and the related prospects for further interest rate reductions. The Lehman Brothers U. S. Intermediate Government/Credit Bond Index ended the quarter up 2.91%. Growing uncertainty in the marketplace caused volatility to increase, thereby supporting higher levels of cash flow available from the sale of index call options. This cash flow, net of the cost of protective index put options, was sufficient to offset declining stock values as the Fund was able to preserve capital and return 0.02% for the three months ended December 31, 2007.
COMMON STOCK PORTFOLIO COMPOSITION
DECEMBER 31, 2007
| | | GATEWAY | | S&P 500 | |
| | FUND | | INDEX | |
| Total Holdings | | | 309 | | | 500 | |
| Total S&P Holdings | | | 183 | | | 500 | |
| Total Non-S&P Holdings | | | 126 | | | - | |
Dividend Yield (2) | | | 2.71 | % (1) | | 1.96 | % |
Average Market Cap, $B (2) | | | 37.37 | | | 26.75 | |
Weighted Average Price/Earnings Ratio (2) | | | 17.83 | | | 18.91 | |
Weighted Average Price/Book Ratio (2) | | | 3.92 | | | 4.03 | |
(1) | This percentage represents the dividend yield of the equity securities in the Gateway Fund, not the dividend yield of the Fund itself. |
| (2) | Calculations obtained from Bloomberg, L.P. |
The considerable rise in market volatility, especially during the second half of 2007, was good news for Fund investors. The increase in volatility contributed to improved cash flow available from call option premiums. The use of such cash flow as an important source of total return allowed the Fund to maintain momentum despite intermittent equity market pullbacks during 2007. Unlike the S&P 500 Index and the Lehman Brothers U. S. Intermediate Government/Credit Bond Index, the Fund was able to achieve a positive total return for each of the four quarters in 2007, utilizing volatile market conditions to its advantage. Enhanced net cash flow from option hedging activity helped the Fund to deliver competitive risk-adjusted returns, consistent with its investment objective.
2008 PERSPECTIVE
As we move into 2008, housing markets remain exceptionally weak and the mortgage markets are in disarray. The financial sector is much weaker than the market as a whole, but it is unclear as to whether its negative aspects will affect the broader economy and drag it into recession. While infusions of liquidity and interest rate cuts by central banks have at times calmed investors’ anxiety, the real problems have not gone away. These continuing uncertainties may portend an extension of volatile and perhaps directionless markets in the near-term. The considerable increase in volatility experienced in 2007 serves as a reminder that equity investing, while historically profitable in the long term, may entail significant short-term and sometimes intermediate-term risk. Today, such risk is reflected in concerns regarding the viability of financially engineered investment vehicles created to support credit markets and a slowdown in earnings for several important sectors of the domestic equity market. As a result, there seems to be an ongoing reassessment by investors as to whether financial risk is properly priced across equity and credit markets or whether this risk has been priced too cheaply over the past several years.
GATEWAY FUND
LETTER TO SHAREHOLDERS
With the economy impacted by credit market concerns and growing recessionary fears, the value of the Gateway Fund’s risk management strategy remains apparent. Now, even more than in the past several years, the need to remain vigilant in the face of downside risk is evident. Whether or not equity markets can rebound to deliver returns more in line with historical averages, or fixed income markets can consolidate after significant setbacks in higher-risk segments, heightened uncertainty is spawning greater volatility. In a volatile market environment, hedged portfolios have more cash flow available to help them reduce portfolio fluctuations. As 2008 unfolds, the Fund will continue to utilize its index option-based strategy in an attempt to deliver relatively consistent returns while seeking to maintain a comparatively low-risk profile that helps shareholders persevere in the face of increasing equity market volatility.
ADVISER ACQUISITION AND FUND REORGANIZATION
As previously reported, Gateway Investment Advisers, L.P., the investment adviser for the Fund, agreed to be acquired by Natixis Global Asset Management, L.P. (formerly known as IXIS Asset Management US Group, L.P.), a global financial service organization headquartered in Paris and Boston. One of the strengths of the acquisition is that the Fund’s strategy and management will not change. The transaction was approved at a special meeting of Fund shareholders held on January 18, 2008, and the reorganization is expected to be completed on February 15, 2008.
As always, we appreciate your support and continued confidence.
| Walter G. Sall | Patrick Rogers, CFA | Paul R. Stewart, CFA |
| Chairman | Co-Portfolio Manager | Co-Portfolio Manager |
GATEWAY FUND
PORTFOLIO OF INVESTMENTS - DECEMBER 31, 2007
SHARES | | COMMON STOCKS - 96.7% | VALUE (000’S) |
| | | CONSUMER DISCRETIONARY - 8.0% | | |
| 115,100 | | Abercrombie & Fitch Co. - Class A | $ | 9,205 |
| 136,680 | | Amazon.com, Inc. * | | 12,662 |
| 233,270 | | American Axle & Manufacturing Holdings, Inc. | | 4,343 |
| 232,150 | | American Eagle Outfitters, Inc. | | 4,822 |
| 174,958 | | ArvinMeritor, Inc. | | 2,052 |
| 199,465 | | Best Buy Co., Inc. | | 10,502 |
| 71,069 | | Black & Decker Corporation | | 4,950 |
| 133,819 | | Comcast Corporation - Class A * | | 2,425 |
| 262,890 | | Cooper Tire & Rubber Company | | 4,359 |
| 128,400 | | Eastman Kodak Company | | 2,808 |
| 163,540 | | Entercom Communications Corp. - Class A | | 2,239 |
| 64,800 | | Ethan Allen Interiors Inc. | | 1,847 |
| 1,059,481 | | Ford Motor Company * | | 7,130 |
| 357,365 | | Furniture Brands International, Inc. | | 3,595 |
| 208,510 | | Gap, Inc. | | 4,437 |
| 302,749 | | General Motors Corporation | | 7,535 |
| 108,950 | | Genuine Parts Company | | 5,044 |
| 56,000 | | Harrah’s Entertainment, Inc. | | 4,970 |
| 895,784 | | Home Depot, Inc. | | 24,132 |
| 177,115 | | Idearc Inc. | | 3,110 |
| 97,420 | | International Game Technology | | 4,280 |
| 114,049 | | J. C. Penney Company, Inc. | | 5,017 |
| 224,972 | | Lamar Advertising Company - Class A * | | 10,814 |
| 198,450 | | Leggett & Platt, Incorporated | | 3,461 |
| 24,000 | | Liberty Media Corporation - Class A * | | 2,796 |
| 265,360 | | Limited Brands | | 5,023 |
| 328,050 | | Lowe’s Companies, Inc. | | 7,420 |
| 158,500 | | Macy’s Inc. | | 4,100 |
| 308,840 | | Mattel, Inc. | | 5,880 |
| 525,587 | | McDonald’s Corporation | | 30,962 |
| 382,210 | | Newell Rubbermaid Inc. | | 9,892 |
| 190,000 | | Nordstrom, Inc. | | 6,979 |
| 57,500 | | OfficeMax Inc. | | 1,188 |
| 82,130 | | Omnicom Group Inc. | | 3,904 |
| 67,900 | | Polaris Industries Inc. | | 3,244 |
| 52,000 | | R. H. Donnelley Corp. * | | 1,897 |
| 106,500 | | RadioShack Corporation | | 1,796 |
| 221,228 | | RCN Corporation * | | 3,449 |
| 641,705 | | Regal Entertainment Group - Class A | | 11,596 |
| 153,800 | | Ross Stores, Inc. | | 3,933 |
| 19,909 | | Sears Holding Corporation * | | 2,032 |
| 570,060 | | Sirius Satellite Radio Inc. * | | 1,727 |
| 63,600 | | Snap-on Incorporated | | 3,068 |
See accompanying notes to financial statements.
GATEWAY FUND
PORTFOLIO OF INVESTMENTS - DECEMBER 31, 2007
SHARES | | | VALUE (000’S) |
| | | CONSUMER DISCRETIONARY (CONTINUED) | | |
| 127,100 | | Stanley Works | $ | 6,162 |
| 172,280 | | Staples, Inc. | | 3,975 |
| 121,278 | | Starwood Hotels & Resorts Worldwide, Inc. | | 5,340 |
| 116,490 | | Talbots, Inc. | | 1,377 |
| 56,200 | | Tiffany & Co. | | 2,587 |
| 82,533 | | Tim Hortons, Inc. | | 3,048 |
| 634,970 | | Time Warner Inc. | | 10,483 |
| 122,234 | | TJX Companies, Inc. | | 3,512 |
| 441,750 | | Tupperware Corporation | | 14,591 |
| 87,700 | | Urban Outfitters, Inc. * | | 2,391 |
| 378,070 | | Walt Disney Company | | 12,204 |
| 43,900 | | Wendy’s International, Inc. | | 1,134 |
| 98,474 | | Whirlpool Corporation | | 8,038 |
| 26,475 | | Williams-Sonoma, Inc. | | 686 |
| 668,006 | | XM Satellite Radio Holdings Inc. - Class A * | | 8,176 |
| | | | | 340,329 |
| | | CONSUMER STAPLES - 8.2% | | |
| 785,960 | | Altria Group, Inc. | | 59,403 |
| 102,450 | | Avon Products, Inc. | | 4,050 |
| 708,710 | | Coca-Cola Company | | 43,494 |
| 200,760 | | Colgate-Palmolive Company | | 15,651 |
| 181,610 | | ConAgra Foods, Inc. | | 4,320 |
| 364,832 | | CVS/Caremark Corporation | | 14,502 |
| 162,440 | | Kimberly-Clark Corporation | | 11,264 |
| 850,013 | | Kraft Foods Inc. - Class A | | 27,736 |
| 117,350 | | Loews Corporation - Carolina Group | | 10,010 |
| 33,100 | | Longs Drug Stores Corporation | | 1,556 |
| 359,959 | | PepsiCo, Inc. | | 27,321 |
| 981,064 | | Procter & Gamble Company | | 72,030 |
| 136,336 | | Reynolds American Inc. | | 8,993 |
| 550,450 | | Sara Lee Corporation | | 8,840 |
| 82,790 | | Supervalu, Inc. | | 3,106 |
| 254,797 | | Vector Group Ltd. | | 5,111 |
| 736,130 | | Wal-Mart Stores, Inc. | | 34,988 |
| | | | | 352,375 |
| | | ENERGY - 11.7% | | |
| 56,690 | | Baker Hughes Incorporated | | 4,598 |
| 261,745 | | BJ Services Company | | 6,350 |
| 157,800 | | BP PLC - ADR | | 11,546 |
| 65,500 | | CARBO Ceramics Inc. | | 2,437 |
| 226,287 | | Chesapeake Energy Corporation | | 8,870 |
| 730,974 | | Chevron Corporation | | 68,222 |
| 46,400 | | CNOOC Limited - ADR | | 7,769 |
See accompanying notes to financial statements.
GATEWAY FUND
PORTFOLIO OF INVESTMENTS - DECEMBER 31, 2007
SHARES | | | VALUE (000’S) |
| | | ENERGY (CONTINUED) | | |
| 549,122 | | ConocoPhillips | $ | 48,487 |
| 67,400 | | CONSOL Energy Inc. | | 4,820 |
| 49,731 | | Crosstex Energy, Inc. | | 1,852 |
| 121,700 | | Diamond Offshore Drilling, Inc. | | 17,281 |
| 156,600 | | Eni SPA - ADR | | 11,343 |
| 73,150 | | ENSCO International Incorporated | | 4,361 |
| 1,908,822 | | Exxon Mobil Corporation | | 178,838 |
| 414,730 | | Halliburton Company | | 15,722 |
| 323,700 | | Occidental Petroleum Corporation | | 24,922 |
| 149,349 | | Patterson-UTI Energy, Inc. | | 2,915 |
| 43,803 | | Pioneer Natural Resources Company | | 2,139 |
| 172,300 | | Royal Dutch Shell PLC - Class A - ADR | | 14,508 |
| 394,320 | | Schlumberger Limited | | 38,789 |
| 135,800 | | Smith International, Inc. | | 10,029 |
| 100,350 | | StatoilHydro ASA - ADR | | 3,063 |
| 209,950 | | Tidewater Inc. | | 11,518 |
| | | | | 500,379 |
| | | FINANCIALS - 18.5% | | |
| 110,000 | | Advance America Cash Advance Centers Inc. | | 1,118 |
| 106,400 | | Aegon NV - ADR | | 1,865 |
| 203,760 | | Allstate Corporation | | 10,642 |
| 254,170 | | American Express Company | | 13,222 |
| 628,226 | | American International Group, Inc. | | 36,626 |
| 73,900 | | Aon Corporation | | 3,524 |
| 276,950 | | Arthur J. Gallagher & Co. | | 6,699 |
| 244,100 | | Ashford Hospitality Trust | | 1,755 |
| 30,000 | | Asset Acceptance Capital Corp. * | | 312 |
| 137,500 | | Associated Banc-Corp | | 3,725 |
| 159,300 | | Axa - ADR | | 6,326 |
| 1,782,441 | | Bank of America Corporation | | 73,544 |
| 51,800 | | Barclays PLC - ADR | | 2,091 |
| 383,134 | | Brandywine Realty Trust | | 6,870 |
| 464,941 | | CapitalSource Inc. | | 8,178 |
| 94,250 | | Capitol Federal Financial | | 2,922 |
| 51,212 | | CBL & Associates Properties, Inc. | | 1,224 |
| 412,896 | | Charles Schwab Corporation | | 10,550 |
| 1,794,355 | | Citigroup Inc. | | 52,826 |
| 120,000 | | Citizens Republic Bancorp, Inc. | | 1,741 |
| 40,800 | | CME Group Inc. | | 27,989 |
| 94,100 | | Colonial Properties Trust | | 2,130 |
| 49,030 | | Commerce Bancorp, Inc. | | 1,870 |
| 189,308 | | Countrywide Financial Corporation | | 1,692 |
| 156,675 | | Discover Financial Services | | 2,363 |
See accompanying notes to financial statements.
GATEWAY FUND
PORTFOLIO OF INVESTMENTS - DECEMBER 31, 2007
SHARES | | | VALUE (000’S) |
| | | FINANCIALS (CONTINUED) | | |
| 225,270 | | Duke Realty Corporation | $ | 5,875 |
| 105,900 | | Eaton Vance Corp. | | 4,809 |
| 592,477 | | Fidelity National Financial, Inc. | | 8,656 |
| 226,130 | | First Horizon National Corporation | | 4,104 |
| 77,000 | | First Midwest Bancorp, Inc. | | 2,356 |
| 126,900 | | FirstMerit Corporation | | 2,539 |
| 137,367 | | Goldman Sachs Group, Inc. | | 29,541 |
| 98,012 | | Hartford Financial Services Group, Inc. | | 8,546 |
| 168,700 | | Healthcare Realty Trust, Inc. | | 4,283 |
| 771,266 | | Hospitality Properties Trust | | 24,850 |
| 380,200 | | HSBC Holdings PLC - ADR | | 31,827 |
| 52,500 | | ING Groep NV - ADR | | 2,043 |
| 1,158,067 | | JPMorgan Chase & Co. | | 50,550 |
| 88,541 | | Legg Mason, Inc. | | 6,477 |
| 316,865 | | Lexington Realty Trust | | 4,607 |
| 120,000 | | Liberty Property Trust | | 3,457 |
| 292,423 | | Lincoln National Corporation | | 17,025 |
| 817,800 | | Lloyds TSB Group PLC - ADR | | 30,790 |
| 120,800 | | Mack-Cali Realty Corporation | | 4,107 |
| 205,040 | | Marsh & McLennan Companies, Inc. | | 5,427 |
| 78,650 | | Mercury General Corporation | | 3,918 |
| 202,090 | | Merrill Lynch & Co., Inc. | | 10,848 |
| 318,850 | | Morgan Stanley | | 16,934 |
| 207,200 | | Nationwide Financial Services, Inc. - Class A | | 9,326 |
| 425,450 | | Nationwide Health Properties, Inc. | | 13,346 |
| 836,270 | | New York Community Bancorp, Inc. | | 14,702 |
| 90,966 | | Old National Bancorp | | 1,361 |
| 122,580 | | Old Republic International Corporation | | 1,889 |
| 166,288 | | SCOR Holdings Ltd. - ADR | | 1,375 |
| 261,000 | | Senior Housing Properties Trust | | 5,920 |
| 121,200 | | TCF Financial Corporation | | 2,173 |
| 384,200 | | Travelers Companies, Inc. | | 20,670 |
| 1,150,283 | | U. S. Bancorp | | 36,510 |
| 166,450 | | Unitrin, Inc. | | 7,988 |
| 661,721 | | Wachovia Corporation | | 25,165 |
| 279,700 | | Waddell & Reed Financial, Inc. - Class A | | 10,094 |
| 161,587 | | Washington Mutual, Inc. | | 2,199 |
| 2,203,470 | | Wells Fargo & Company | | 66,523 |
| 48,246 | | XL Capital Ltd. - Class A | | 2,427 |
| 74,941 | | Zenith National Insurance Corp. | | 3,352 |
| | | | | 790,393 |
| | | HEALTH CARE - 11.5% | | |
| 514,510 | | Abbott Laboratories | | 28,890 |
See accompanying notes to financial statements.
GATEWAY FUND
PORTFOLIO OF INVESTMENTS - DECEMBER 31, 2007
SHARES | | | VALUE (000’S) |
| | | HEALTH CARE (CONTINUED) | | |
| 159,200 | | Aetna Inc. | $ | 9,191 |
| 232,407 | | Amgen Inc. * | | 10,793 |
| 157,650 | | Baxter International Inc. | | 9,152 |
| 43,100 | | Biogen Idec Inc. * | | 2,453 |
| 219,012 | | Boston Scientific Corporation * | | 2,547 |
| 1,930,923 | | Bristol-Myers Squibb Company | | 51,208 |
| 22,700 | | Cephalon, Inc. * | | 1,629 |
| 118,825 | | Coventry Health Care, Inc. * | | 7,040 |
| 102,100 | | Covidien Limited | | 4,522 |
| 415,040 | | Eli Lilly and Company | | 22,159 |
| 130,800 | | Genentech, Inc. * | | 8,773 |
| 190,650 | | GlaxoSmithKline PLC - ADR | | 9,607 |
| 1,266,992 | | Johnson & Johnson | | 84,508 |
| 146,700 | | Lincare Holdings Inc. * | | 5,158 |
| 120,613 | | Medco Health Solutions, Inc. * | | 12,230 |
| 276,700 | | Medtronic Inc. | | 13,910 |
| 57,600 | | Mentor Corporation | | 2,252 |
| 1,076,820 | | Merck & Co., Inc. | | 62,574 |
| 2,594,700 | | Pfizer Inc. | | 58,978 |
| 276,780 | | Schering-Plough Corporation | | 7,373 |
| 218,500 | | Teva Pharmaceutical Industries Ltd. - ADR | | 10,156 |
| 421,210 | | UnitedHealth Group Incorporated | | 24,514 |
| 111,200 | | Universal Health Services, Inc. - Class B | | 5,693 |
| 240,200 | | WellPoint, Inc. * | | 21,073 |
| 386,430 | | Wyeth | | 17,076 |
| | | | | 493,459 |
| | | INDUSTRIALS - 11.0% | | |
| 325,400 | | 3M Co. | | 27,438 |
| 50,000 | | Alliant Techsystems Inc. * | | 5,688 |
| 143,200 | | AMR Corporation * | | 2,009 |
| 47,200 | | Avery Dennison Corporation | | 2,508 |
| 268,982 | | Boeing Company | | 23,525 |
| 263,030 | | Caterpillar Inc. | | 19,085 |
| 20,200 | | Corporate Executive Board Company | | 1,214 |
| 319,701 | | CSX Corporation | | 14,060 |
| 36,017 | | Cummins, Inc. | | 4,588 |
| 165,384 | | Deere & Company | | 15,401 |
| 265,400 | | Deluxe Corporation | | 8,729 |
| 90,600 | | Dun & Bradstreet Corporation | | 8,030 |
| 46,617 | | Eaton Corporation | | 4,520 |
| 905,200 | | Emerson Electric Co. | | 51,289 |
| 112,325 | | GATX Corporation | | 4,120 |
| 3,375,046 | | General Electric Company | | 125,113 |
See accompanying notes to financial statements.
GATEWAY FUND
PORTFOLIO OF INVESTMENTS - DECEMBER 31, 2007
SHARES | | | VALUE (000’S) |
| | | INDUSTRIALS (CONTINUED) | | |
| 37,280 | | Goodrich Corporation | $ | 2,632 |
| 347,990 | | Honeywell International Inc. | | 21,426 |
| 163,650 | | Hubbell Incorporated - Class B | | 8,444 |
| 92,400 | | Ingersoll-Rand Company Ltd. - Class A | | 4,294 |
| 61,050 | | Parker-Hannifin Corporation | | 4,598 |
| 90,050 | | Pentair, Inc. | | 3,135 |
| 113,050 | | R. R. Donnelley & Sons Company | | 4,267 |
| 99,530 | | Raytheon Company | | 6,041 |
| 103,500 | | Resources Connection, Inc. * | | 1,880 |
| 211,700 | | SPX Corporation | | 21,773 |
| 96,150 | | Standard Register Company | | 1,121 |
| 95,800 | | Timken Company | | 3,147 |
| 118,700 | | Tyco International Ltd. | | 4,706 |
| 454,630 | | United Parcel Service, Inc. - Class B | | 32,151 |
| 347,340 | | United Technologies Corporation | | 26,585 |
| 239,400 | | Waste Management, Inc. | | 7,821 |
| | | | | 471,338 |
| | | INFORMATION TECHNOLOGY - 15.3% | | |
| 336,900 | | Activision, Inc. * | | 10,006 |
| 165,871 | | Adobe Systems Incorporated * | | 7,088 |
| 66,350 | | ADTRAN, Inc. | | 1,419 |
| 405,350 | | Advanced Micro Devices, Inc. * | | 3,040 |
| 54,500 | | Akamai Technologies, Inc. * | | 1,886 |
| 123,980 | | Altera Corporation | | 2,395 |
| 156,880 | | Analog Devices, Inc. | | 4,973 |
| 273,394 | | Apple Computer, Inc. * | | 54,154 |
| 462,950 | | Applied Materials, Inc. | | 8,222 |
| 58,100 | | Autodesk, Inc. * | | 2,891 |
| 193,650 | | Automatic Data Processing, Inc. | | 8,623 |
| 141,895 | | Broadcom Corporation - Class A * | | 3,709 |
| 47,437 | | Broadridge Financial Solutions Inc. | | 1,064 |
| 1,722,156 | | Cisco Systems, Inc. * | | 46,619 |
| 111,600 | | Cognizant Technology Solutions Corporation - Class A * | | 3,788 |
| 378,275 | | Corning Incorporated | | 9,075 |
| 681,760 | | Dell Inc. * | | 16,710 |
| 78,800 | | DST Systems, Inc. * | | 6,505 |
| 303,909 | | eBay Inc. * | | 10,087 |
| 102,250 | | Electronic Data Systems Corporation | | 2,120 |
| 113,796 | | Fidelity National Information Services, Inc. | | 4,733 |
| 78,200 | | Google Inc. - Class A * | | 54,074 |
| 668,825 | | Hewlett-Packard Company | | 33,762 |
| 2,186,758 | | Intel Corporation | | 58,299 |
| 485,360 | | International Business Machines Corporation | | 52,467 |
See accompanying notes to financial statements.
GATEWAY FUND
PORTFOLIO OF INVESTMENTS - DECEMBER 31, 2007
SHARES | | | VALUE (000’S) |
| | | INFORMATION TECHNOLOGY (CONTINUED) | | |
| 126,000 | | JDS Uniphase Corporation * | $ | 1,676 |
| 66,500 | | KLA-Tencor Corporation | | 3,203 |
| 110,590 | | Linear Technology Corporation | | 3,520 |
| 211,510 | | Microchip Technology Incorporated | | 6,646 |
| 2,690,060 | | Microsoft Corporation | | 95,766 |
| 671,851 | | Motorola, Inc. | | 10,776 |
| 92,680 | | National Semiconductor Corporation | | 2,098 |
| 66,330 | | NAVTEQ Corporation * | | 5,014 |
| 202,872 | | NVIDIA Corporation * | | 6,902 |
| 1,239,367 | | Oracle Corporation * | | 27,985 |
| 144,930 | | Paychex, Inc. | | 5,249 |
| 54,560 | | Plantronics, Inc. | | 1,419 |
| 354,140 | | PMC-Sierra, Inc. * | | 2,316 |
| 489,980 | | QUALCOMM Incorporated | | 19,281 |
| 50,805 | | Quality Systems, Inc. | | 1,549 |
| 68,100 | | Red Hat, Inc. * | | 1,419 |
| 205,884 | | Symantec Corporation * | | 3,323 |
| 677,649 | | Taiwan Semiconductor Manufacturing Company Ltd. - ADR | | 6,749 |
| 401,390 | | Texas Instruments Incorporated | | 13,406 |
| 102,400 | | Tyco Electronics Ltd. | | 3,802 |
| 478,098 | | United Online, Inc. | | 5,651 |
| 62,700 | | VeriSign, Inc. * | | 2,358 |
| 100,795 | | Western Union Company | | 2,447 |
| 174,180 | | Xilinx, Inc. | | 3,809 |
| 448,650 | | Yahoo! Inc. * | | 10,436 |
| | | | | 654,509 |
| | | MATERIALS - 4.5% | | |
| 187,360 | | Alcoa Inc. | | 6,848 |
| 276,136 | | Companhia Siderurgica Nacional SA - ADR | | 24,734 |
| 498,148 | | Dow Chemical Company | | 19,637 |
| 556,010 | | E. I. du Pont de Nemours and Company | | 24,514 |
| 142,200 | | Eastman Chemical Company | | 8,687 |
| 120,900 | | Gerdau SA - ADR | | 3,507 |
| 160,550 | | Lubrizol Corporation | | 8,695 |
| 121,825 | | MeadWestvaco Corporation | | 3,813 |
| 105,100 | | Nucor Corporation | | 6,224 |
| 397,650 | | Olin Corporation | | 7,687 |
| 517,050 | | Packaging Corporation of America | | 14,581 |
| 262,150 | | RPM International, Inc. | | 5,322 |
| 298,600 | | Sonoco Products Company | | 9,758 |
| 426,869 | | Southern Copper Corporation | | 44,877 |
| 251,900 | | Worthington Industries, Inc. | | 4,504 |
| | | | | 193,388 |
See accompanying notes to financial statements.
GATEWAY FUND
PORTFOLIO OF INVESTMENTS - DECEMBER 31, 2007
SHARES | | | VALUE (000’S) |
| | | TELECOMMUNICATION SERVICES - 4.1% | | |
| 2,141,601 | | AT&T Inc. | $ | 89,005 |
| 91,900 | | China Mobile HK Limited - ADR | | 7,983 |
| 1,250,540 | | Citizens Communications Company | | 15,920 |
| 74,300 | | France Telecom SA - ADR | | 2,647 |
| 43,700 | | Iowa Telecommunications Services Incorporated | | 711 |
| 731,684 | | Sprint Nextel Corporation | | 9,607 |
| 1,140,308 | | Verizon Communications Inc. | | 49,820 |
| | | | | 175,693 |
| | | UTILITIES - 3.9% | | |
| 312,190 | | Ameren Corporation | | 16,924 |
| 612,600 | | Atmos Energy Corporation | | 17,177 |
| 339,670 | | Consolidated Edison, Inc. | | 16,593 |
| 764,300 | | Duke Energy Corporation | | 15,416 |
| 127,000 | | Energy East Corporation | | 3,456 |
| 432,230 | | Great Plains Energy Incorporated | | 12,673 |
| 63,300 | | Hawaiian Electric Industries, Inc. | | 1,441 |
| 253,982 | | Integrys Energy Group, Inc. | | 13,128 |
| 180,100 | | National Fuel Gas Company | | 8,407 |
| 341,300 | | NICOR Inc. | | 14,454 |
| 157,950 | | OGE Energy Corp. | | 5,732 |
| 154,800 | | ONEOK, Inc. | | 6,930 |
| 183,650 | | Pepco Holdings, Inc. | | 5,387 |
| 324,453 | | Progress Energy, Inc. | | 15,713 |
| 99,050 | | Public Service Enterprise Group Inc. | | 9,731 |
| 61,786 | | WGL Holdings Inc. | | 2,024 |
| | | | | 165,186 |
| | | | | |
| | | Total common stocks (cost $3,218,386) | | 4,137,049 |
See accompanying notes to financial statements.
GATEWAY FUND
PORTFOLIO OF INVESTMENTS - DECEMBER 31, 2007
CONTRACTS | | | VALUE (000’S) |
| | | PUT OPTIONS - 0.6% | | |
| 4,037 | | On S&P 500 Index expiring January 19, 2008 at 1300 | $ | 363 |
| 3,605 | | On S&P 500 Index expiring January 19, 2008 at 1325 | | 523 |
| 4,068 | | On S&P 500 Index expiring January 19, 2008 at 1350 | | 1,037 |
| 4,059 | | On S&P 500 Index expiring January 19, 2008 at 1375 | | 1,786 |
| 4,049 | | On S&P 500 Index expiring February 16, 2008 at 1350 | | 5,183 |
| 4,193 | | On S&P 500 Index expiring February 16, 2008 at 1375 | | 7,044 |
| 3,817 | | On S&P 500 Index expiring March 22, 2008 at 1350 | | 9,371 |
| 100 | | On S&P 500 Index expiring March 22, 2008 at 1375 | | 297 |
| | | | | |
| | | Total put options (cost $58,432) | | 25,604 |
| | | | | |
| | | REPURCHASE AGREEMENT - 4.6% ** | | |
| | | 3.10% repurchase agreement with U. S. Bank, N. A. | | |
| | | dated December 31, 2007, due January 2, 2008 (repurchase proceeds $197,510) | | 197,476 |
| | | | | |
| | | Total common stocks, put options and repurchase agreement - 101.9% | | 4,360,129 |
| | | | | |
| | | CALL OPTIONS WRITTEN - (2.2%) *** | | |
| (3,355) | | On S&P 500 Index expiring January 19, 2008 at 1450 | | (13,202) |
| (5,427) | | On S&P 500 Index expiring January 19, 2008 at 1475 | | (12,998) |
| (5,445) | | On S&P 500 Index expiring January 19, 2008 at 1500 | | (6,752) |
| (3,421) | | On S&P 500 Index expiring February 16, 2008 at 1450 | | (20,167) |
| (6,935) | | On S&P 500 Index expiring February 16, 2008 at 1475 | | (30,132) |
| (3,345) | | On S&P 500 Index expiring February 16, 2008 at 1500 | | (10,085) |
| | | | | |
| | | Total call options written (premiums received $131,929) | | (93,336) |
| | | | | |
| | | OTHER ASSETS AND LIABILITIES, NET - 0.3% | | 11,906 |
| | | | | |
| | | NET ASSETS - 100.0% | $ | 4,278,699 |
| | | * Non-income producing. |
| | | ** Repurchase agreement fully collateralized by U.S. Government Agency obligations. |
| | | *** The $4,137,049,000 aggregate value of common stocks covers outstanding call options. |
| | | | | |
| | | ADR - American Depository Receipt. | | |
| | | | | |
| | | Common stocks are grouped by sector. | | |
GATEWAY FUND
STATEMENT OF ASSETS AND LIABILITIES - DECEMBER 31, 2007
ASSETS: | | | |
| Common stocks, at value (cost $3,218,386) | | $ | 4,137,049 | |
| Put options, at value (cost $58,432) | | | 25,604 | |
| Repurchase agreement | | | 197,476 | |
| Receivable for Fund shares sold | | | 10,835 | |
| Dividends and interest receivable | | | 7,587 | |
| Other assets | | | 69 | |
| Total assets | | | 4,378,620 | |
| | | | | |
LIABILITIES: | | | | |
| Call options written, at value (premiums received $131,929) | | | 93,336 | |
| Payable for Fund shares redeemed | | | 5,103 | |
| Accrued distribution expenses | | | 1,191 | |
| Accrued investment advisory and management fees | | | 179 | |
| Other accrued expenses and liabilities | | | 112 | |
| Total liabilities | | | 99,921 | |
| | | | | |
NET ASSETS | | $ | 4,278,699 | |
| | | | | |
NET ASSETS CONSIST OF: | | | | |
| Paid-in capital | | $ | 3,599,013 | |
| Accumulated net realized loss on investment transactions | | | (244,742 | ) |
| Net unrealized appreciation on investments | | | 924,428 | |
| Net assets | | $ | 4,278,699 | |
| | | | | |
FUND SHARES OUTSTANDING | | | | |
| (unlimited number of shares authorized) | | | 149,383 | |
| | | | | |
NET ASSET VALUE, OFFERING PRICE AND | | | | |
REDEMPTION PRICE PER SHARE | | $ | 28.64 | |
See accompanying notes to financial statements.
STATEMENT OF OPERATIONS - FOR THE YEAR ENDED DECEMBER 31, 2007
INVESTMENT INCOME: | | | |
| Dividends | | $ | 102,698 | |
| Interest | | | 6,584 | |
| Other income | | | 949 | |
| Total investment income | | | 110,231 | |
| | | | | |
EXPENSES: | | | | |
| Investment advisory and management fees | | | 23,299 | |
| Distribution expenses | | | 12,441 | |
| Trustees’ fees | | | 202 | |
| Custodian fees | | | 113 | |
| Professional fees | | | 101 | |
| Insurance expense | | | 99 | |
| Registration fees | | | 82 | |
| Other expenses | | | 99 | |
| Total expenses | | | 36,436 | |
| | | | | |
NET INVESTMENT INCOME | | | 73,795 | |
| | | | | |
REALIZED AND UNREALIZED GAIN ON INVESTMENTS: | | | | |
Realized gain (loss) on investment transactions: | | | | |
| Common stocks | | | 1,159 | |
| Put options expired and closed | | | (82,752 | ) |
| Call options expired and closed | | | 136,784 | |
| Net realized gain on investment transactions | | | 55,191 | |
| | | | | |
Change in unrealized appreciation/depreciation on investments: | | | | |
| Common stocks | | | 137,910 | |
| Put options | | | (29,109 | ) |
| Call options | | | 48,229 | |
| Net change in unrealized appreciation/depreciation on investments | | | 157,030 | |
| | | | | |
NET REALIZED AND UNREALIZED GAIN ON INVESTMENTS | | | 212,221 | |
| | | | | |
NET INCREASE IN NET ASSETS FROM OPERATIONS | | $ | 286,016 | |
See accompanying notes to financial statements.
STATEMENTS OF CHANGES IN NET ASSETS
(000's)
| | | Year Ended December 31, | |
| | | 2007 | | 2006 | |
FROM OPERATIONS: | | | | | |
| Net investment income | | $ | 73,795 | | $ | 57,532 | |
| Net realized gain (loss) on investment transactions | | | 55,191 | | | (138,037 | ) |
| Net change in unrealized appreciation/depreciation on investments | | | 157,030 | | | 368,810 | |
| Net increase in net assets from operations | | | 286,016 | | | 288,305 | |
| | | | | | | | |
DISTRIBUTIONS TO SHAREHOLDERS: | | | | | | | |
| From net investment income | | | (74,493 | ) | | (57,261 | ) |
| | | | | | | | |
FROM FUND SHARE TRANSACTIONS: | | | | | | | |
| Proceeds from shares sold | | | 1,556,149 | | | 960,602 | |
| Net asset value of shares issued in reinvestment of | | | | | | | |
| distributions to shareholders | | | 65,812 | | | 50,163 | |
| Payments for shares redeemed | | | (884,725 | ) | | (619,512 | ) |
| Net increase in net assets from Fund shares transactions | | | 737,236 | | | 391,253 | |
| | | | | | | | |
NET INCREASE IN NET ASSETS | | | 948,759 | | | 622,297 | |
| | | | | | | | |
NET ASSETS: | | | | | | | |
| Beginning of year | | | 3,329,940 | | | 2,707,643 | |
| End of year | | $ | 4,278,699 | | $ | 3,329,940 | |
| | | | | | | | |
UNDISTRIBUTED NET INVESTMENT INCOME | | $ | — | | $ | 271 | |
| | | | | | | | |
FUND SHARE TRANSACTIONS: | | | | | | | |
| Shares sold | | | 55,273 | | | 36,754 | |
| Shares issued in reinvestment of distributions to shareholders | | | 2,328 | | | 1,888 | |
| Shares redeemed | | | (31,369 | ) | | (23,788 | ) |
| Net increase in Fund shares outstanding | | | 26,232 | | | 14,854 | |
| Shares outstanding, beginning of year | | | 123,151 | | | 108,297 | |
| Shares outstanding, end of year | | | 149,383 | | | 123,151 | |
See accompanying notes to financial statements.
FINANCIAL HIGHLIGHTS - PER SHARE DATA FOR A SHARE OUTSTANDING THROUGHOUT EACH YEAR
| | | Year Ended December 31, | |
| | | 2007 | | 2006 | | 2005 | | 2004 | | 2003 | |
| | | | | | | | | | | | |
BEGINNING NET ASSET VALUE | | $ | 27.04 | | $ | 25.00 | | $ | 24.31 | | $ | 23.00 | | $ | 20.76 | |
| | | | | | | | | | | | | | | | | |
INVESTMENT OPERATIONS: | | | | | | | | | | | | | | | | |
| Net investment income | | | 0.53 | | | 0.48 | | | 0.44 | | | 0.29 | | | 0.17 | |
| Net realized and unrealized gain | | | 1.61 | | | 2.04 | | | 0.70 | | | 1.31 | | | 2.24 | |
| Total from investment operations | | | 2.14 | | | 2.52 | | | 1.14 | | | 1.60 | | | 2.41 | |
| | | | | | | | | | | | | | | | | |
DISTRIBUTIONS: | | | | | | | | | | | | | | | | |
| Dividends from net investment income | | | (0.54 | ) | | (0.48 | ) | | (0.45 | ) | | (0.29 | ) | | (0.17 | ) |
| Distributions from net realized gain | | | — | | | — | | | — | | | — | | | — | |
| Total distributions | | | (0.54 | ) | | (0.48 | ) | | (0.45 | ) | | (0.29 | ) | | (0.17 | ) |
| | | | | | | | | | | | | | | | | |
ENDING NET ASSET VALUE | | $ | 28.64 | | $ | 27.04 | | $ | 25.00 | | $ | 24.31 | | $ | 23.00 | |
| | | | | | | | | | | | | | | | | |
TOTAL RETURN | | | 7.94 | % | | 10.14 | % | | 4.66 | % | | 6.95 | % | | 11.61 | % |
| | | | | | | | | | | | | | | | | |
ENDING NET ASSETS (000’S) | | $ | 4,278,699 | | $ | 3,329,940 | | $ | 2,707,643 | | $ | 2,103,935 | | $ | 1,405,561 | |
| | | | | | | | | | | | | | | | | |
AVERAGE NET ASSETS RATIOS: | | | | | | | | | | | | | | | | |
| Total expenses | | | 0.94 | % | | 0.95 | % | | 0.95 | % | | 0.97 | % | | 0.97 | % |
| Net investment income | | | 1.91 | % | | 1.92 | % | | 1.87 | % | | 1.42 | % | | 0.86 | % |
| | | | | | | | | | | | | | | | | |
PORTFOLIO TURNOVER RATE | | | 5 | % | | 9 | % | | 15 | % | | 71 | % | | 5 | % |
See accompanying notes to financial statements.
NOTES TO FINANCIAL STATEMENTS - DECEMBER 31, 2007
1. ORGANIZATION AND SIGNIFICANT ACCOUNTING POLICIES
The Gateway Trust (the “Trust”) is an Ohio business trust, registered under the Investment Company Act of 1940, which is authorized to establish and operate one or more separate series of mutual funds. The Trust currently operates one diversified mutual fund, the Gateway Fund (the “Fund”). The investment objective of the Fund is to capture the majority of the higher returns associated with equity market investments, while exposing investors to significantly less risk than other equity investments. The Fund attempts to achieve its investment objective primarily by owning a broadly diversified portfolio of common stocks and by selling index call options. The Fund also buys index put options that can protect the Fund from a significant market decline over a short period of time.
The following is a summary of the Fund’s significant accounting policies:
Investments valuation - The Fund values its portfolio securities as of the close of the regular session of trading on the New York Stock Exchange (the “NYSE”), normally 4:00 P.M. Eastern time. Securities, other than option contracts, traded on a national stock exchange are valued at the last reported sales price on the primary exchange on which the security is traded. Securities traded in the over-the-counter market, and which are quoted by NASDAQ, are valued at the NASDAQ Official Closing Price. Option contracts (both purchased and written) are valued at the average of the closing bid and asked quotations. Securities, other than option contracts, for which market quotations are not readily available or in which trading has been suspended during the day, and option contracts for which closing market quotations are not considered to reflect option contract values as of the close of the NYSE, are valued at fair value as determined in good faith under procedures adopted by the Board of Trustees.
Share valuation - The net asset value per share of the Fund is calculated daily by dividing the total value of the Fund’s assets, less liabilities, by the number of shares outstanding. The offering price and redemption price per share are equal to the net asset value per share.
Investment transactions and investment income - Investment transactions are recorded on the trade date. Realized gains and losses are calculated on an identified cost basis. Dividend income is recorded on the ex-dividend date and interest income is accrued daily.
Option transactions - The Fund purchases index put options and writes (sells) index call options. When the Fund writes an index call option, an amount equal to the net premium received (the premium less commission) is recorded as a liability and is subsequently adjusted to the current value until the option expires or the Fund enters into a closing purchase transaction. When an index call option expires on its stipulated expiration date or the Fund enters into a closing purchase transaction, the difference between the net premium received and any amount paid at expiration or on effecting a closing purchase transaction, including commission, is treated as a realized gain or, if the net premium received is less than the amount paid, as a realized loss. The Fund, as writer of an index call option, bears the risk of an unfavorable change in the market value of the index underlying the written option.
Distributions to shareholders - Distributions from net investment income are recorded on the ex-dividend date and are declared and paid to shareholders quarterly. Distributions from net realized capital gains, if any, are recorded on the ex-dividend date and are declared and paid to shareholders annually.
NOTES TO FINANCIAL STATEMENTS - DECEMBER 31, 2007
Federal income taxes - The Fund intends to comply with the provisions of Subchapter M of the Internal Revenue Code applicable to regulated investment companies and distribute substantially all of its taxable income to shareholders. Based on this policy, the Fund makes no provision for income taxes.
At December 31, 2007, the components of distributable earnings on a tax basis were as follows (000’s):
| Cost of common stocks and options | | $ | 3,162,649 | |
| | | | | |
| Gross unrealized appreciation | | $ | 1,034,652 | |
| Gross unrealized depreciation | | | (127,984 | ) |
| Net unrealized appreciation | | | 906,668 | |
| Capital loss carryforwards | | | (226,982 | ) |
| Distributable earnings | | $ | 679,686 | |
The difference between the book basis and tax basis of distributable earnings resulted from the tax deferral of losses on wash sales and the tax recognition of net unrealized appreciation on open option contracts at December 31, 2007. There were no differences between the book basis and tax basis of distributions paid for the years ended December 31, 2007 and 2006. The Fund’s capital loss carryforwards expire December 31, 2011 and December 31, 2014 in the amounts of $48,816,000 and $178,166,000, respectively. For the year ended December 31, 2007, the Fund utilized $73,279,000 of capital loss carryforwards to offset realized gains.
For the year ended December 31, 2007, the Fund reclassified distributions in excess of net investment income of $427,000 against paid-in capital on the Statement of Assets and Liabilities. Such reclassification, the result of permanent differences between book and tax reporting requirements, has no effect on the Fund’s net assets or net asset value per share.
Repurchase agreements - The Fund requires the custodian to hold sufficient collateral to secure repurchase agreements. To reduce the chance of loss in its repurchase transactions, the Fund enters into repurchase agreements only with banks that have more than $1 billion in assets and are creditworthy in the judgment of Gateway Investment Advisers, L.P. (the “Adviser”).
Estimates - The preparation of financial statements in conformity with accounting principles generally accepted in the United States requires management to make estimates and assumptions that affect the reported amounts of assets and liabilities at the date of the financial statements and the reported amounts of income and expenses during the reporting period. Actual results could differ from those estimates.
2. TRANSACTIONS WITH AFFILIATES
The Fund pays the Adviser an investment advisory and management fee under the terms of a Management Agreement at an annual rate of 0.925% of average daily net assets minus all distribution expenses. The Fund has adopted a Distribution Plan pursuant to Rule 12b-1 of the Investment Company Act of 1940 that allows for the payment of distribution expenses by the Fund related to the sale and distribution of its shares. In any year, distribution expenses cannot exceed 0.50% of average daily net assets. The Adviser receives no separate fee for its transfer agency, fund accounting and other services to the Fund, and the Adviser pays the Fund’s expenses of reporting to shareholders under the Management Agreement.
If total annual operating expenses (excluding taxes, interest, brokerage commissions and expenses of an extraordinary nature) exceed 1.50% of the Fund’s average daily net assets, the Adviser has agreed to reduce its fee as necessary to limit the Fund’s expenses to this level.
NOTES TO FINANCIAL STATEMENTS - DECEMBER 31, 2007
3. INVESTMENT TRANSACTIONS
For the year ended December 31, 2007, cost of purchases of investment securities (excluding any short-term investments and U. S. government securities) totaled $906,087,000 and proceeds from sales totaled $197,445,000.
The Fund may write (sell) call options on stock indexes in exchange for cash (that is, the premium received) to enhance earnings on the portfolio securities. However, using these call options limits the opportunity to participate in appreciation of the underlying portfolio beyond certain upper limits set by the contracts. In general, the liability recorded upon receipt of written option premiums increases to offset rises and decreases to offset declines in portfolio value. For the year ended December 31, 2007, transactions in written options were as follows:
| | | Contracts | | Premiums (000’s) | |
| Outstanding at December 31, 2006 | | | 23,038 | | $ | 108,874 | |
| Options written | | | 185,449 | | | 800,694 | |
| Options terminated in closing | | | | | | | |
| purchase transactions | | | (162,766 | ) | | (686,963 | ) |
| Options expired | | | (17,793 | ) | | (90,676 | ) |
| Outstanding at December 31, 2007 | | | 27,928 | | $ | 131,929 | |
4. BANK LINE OF CREDIT
The Fund has an uncommitted $100 million bank line of credit to be used as a temporary liquidity source for meeting redemption requests. Borrowings under this arrangement, expiring October 31, 2008, bear interest at the bank’s prime rate minus 0.50%. There are no fees associated with maintaining this facility. During the year ended December 31, 2007, there were no borrowings on this line of credit.
5. COMMITMENTS AND CONTINGENCIES
The Fund indemnifies the Trustees and officers of the Trust for certain liabilities that might arise from the performance of their duties to the Fund. Additionally, in the normal course of business, the Fund enters into contracts that contain a variety of representations and warranties and which provide general indemnifications. The Fund’s maximum exposure under these arrangements is unknown, as this would involve future claims that may be made against the Fund that have not yet occurred. However, based on experience, the Fund expects the risk of loss to be remote.
6. RECENT ACCOUNTING PRONOUNCEMENTS
In June 2007, the Fund adopted Financial Accounting Standards Board (“FASB”) Interpretation No. 48, “Accounting for Uncertainty in Income Taxes” (“FIN 48”). FIN 48 provides guidance for how uncertain tax positions should be recognized, measured, presented and disclosed in the financial statements. FIN 48 requires the evaluation of tax positions taken or expected to be taken in the course of preparing the Fund’s tax returns to determine whether the tax positions are “more-likely-than-not” of being sustained by the applicable tax authority. Tax positions not deemed to meet the more-likely-than-not threshold would be recorded as a tax benefit or expense in the current year. Based on its evaluation, management believes that the Fund’s tax positions meet the more-likely-than-not threshold and that, accordingly, the adoption of FIN 48 has no material impact on the financial statements of the Fund.
NOTES TO FINANCIAL STATEMENTS - DECEMBER 31, 2007
In September 2006, FASB issued Statement on Financial Accounting Standards No. 157, “Fair Value Measurements” (“SFAS 157”). This standard clarifies the definition of fair value for financial reporting, establishes a framework for measuring fair value and requires additional disclosures about the use of fair value measurements. SFAS 157 is effective for financial statements issued for fiscal years beginning after November 15, 2007 and for interim periods within those fiscal years. Management currently believes that the adoption of SFAS 157 will have no impact on the financial statements of the Fund; however, additional disclosures may be required about the inputs used to develop the measurements of fair value and the effect of certain of the measurements reported in the statement of operations for a fiscal period.
7. TAX INFORMATION (UNAUDITED)
The Fund is required by subchapter M of the Internal Revenue Code of 1986, as amended, to advise shareholders as to the federal income tax status of distributions received during the Fund’s fiscal year.
In 2007, the Fund declared and paid ordinary income dividends totaling $74,493,000, or $0.5350 per share, to shareholders of record. For the year ended December 31, 2007, 100% of the dividends paid from ordinary income are considered “qualified dividends” subject to a federal tax rate of not more than 15% and 100% of the dividends paid qualified for the dividends received deduction for corporations.
8. FUND REORGANIZATION (UNAUDITED)
On June 29, 2007, the Adviser announced that it agreed to sell and transfer substantially all of its assets to Gateway Investment Advisers, LLC, a newly formed, wholly-owned subsidiary of Natixis Global Asset Management, L.P. (formerly known as IXIS Asset Management US Group, L.P.). The closing of the sale is expected to occur on February 15, 2008.
In connection with the sale of the Adviser, the Board of Trustees of the Trust and Fund shareholders approved an Agreement and Plan of Reorganization pursuant to which a newly organized fund (the “New Gateway Fund”), advised by Gateway Investment Advisers, LLC, will acquire all of the assets and assume all of the liabilities of the Fund in exchange for
shares of the New Gateway Fund, which will be immediately distributed to Fund shareholders in complete liquidation of the Fund. The New Gateway Fund will be managed by the same investment personnel using the same investment program as the Fund.
9. SPECIAL MEETING OF SHAREHOLDERS (UNAUDITED)
On January 18, 2008, a special meeting of shareholders of the Fund was held at which an Agreement and Plan of Reorganization providing for the transfer of all Fund assets to, and the assumption of all Fund liabilities by, Gateway Fund (the “New Fund”), a series of Gateway Trust, a Massachusetts business trust, in exchange for shares of the New Fund, and the distribution of such shares to Fund shareholders in complete liquidation of the Fund, was approved. The result of the voting was as follows:
| Approval of Agreement and Plan of Reorganization: | For | 74,346,052.350 |
| | Against | 5,375,620.693 |
| | Abstain | 1,167,355.128 |
REPORT OF INDEPENDENT REGISTERED PUBLIC ACCOUNTING FIRM
To the Board of Trustees and Shareholders of the
Gateway Fund of The Gateway Trust
We have audited the accompanying statements of assets and liabilities, including the portfolio of investments, of the Gateway Fund (the “Fund”) of The Gateway Trust as of December 31, 2007, and the related statement of operations for the year then ended, the statements of changes in net assets for each of the two years in the period then ended, and the financial highlights for each of the five years in the period then ended. These financial statements and financial highlights are the responsibility of the Fund’s management. Our responsibility is to express an opinion on these financial statements and financial highlights based on our audit.
We conducted our audit in accordance with the standards of the Public Company Accounting Oversight Board (United States). Those standards require that we plan and perform the audit to obtain reasonable assurance about whether the financial statements and financial highlights are free of material misstatement. We were not engaged to perform an audit of the Fund’s internal control over financial reporting. Our audit included consideration of internal control over financial reporting as a basis for designing audit procedures that are appropriate in the circumstances, but not for the purpose of expressing an opinion on the effectiveness of the Fund’s internal control over financial reporting. Accordingly, we express no such opinion. An audit also includes examining, on a test basis, evidence supporting the amounts and disclosures in the financial statements and financial highlights, assessing the accounting principles used and significant estimates made by management, and evaluating the overall financial statement presentation. Our procedures included confirmation of securities owned as of December 31, 2007, by correspondence with the custodian. We believe that our audit provides a reasonable basis for our opinion.
In our opinion, the financial statements and financial highlights referred to above present fairly, in all material respects, the financial position of the portfolio constituting the Gateway Fund of The Gateway Trust at December 31, 2007, the results of its operations for the year then ended, the changes in its net assets for each of the two years in the period then ended, and the financial highlights for each of the five years in the period then ended, in conformity with U. S. generally accepted accounting principles.
Cincinnati, Ohio
February 11, 2008
FUND EXPENSES (UNAUDITED)
As a shareholder of the Gateway Fund (the “Fund”), you may incur two types of costs: (1) transaction costs, including any transaction fees that you may be charged if you purchase or redeem the Fund through certain financial institutions; and (2) ongoing costs, including investment advisory and management fees, distribution expenses and other Fund expenses. The example below is intended to help you understand your ongoing costs (in dollars) of investing in the Fund and to compare these costs with the ongoing costs of investing in other mutual funds. The example is based on an investment of $1,000 invested at the beginning of the period (July 1, 2007) and held for the six-month period ended December 31, 2007.
ACTUAL EXPENSES
The first line in the table below provides information about actual account values and actual Fund expenses. You may use the information in this line, together with the amount you invested, to estimate the expenses that you paid over the period. Simply divide your account value by $1,000 (for example, an $8,600 account value divided by $1,000 = 8.6), then multiply the result by the number in the first line under the heading entitled “Expenses Paid During Period” to estimate the expenses you paid on your account during the period.
HYPOTHETICAL EXAMPLE FOR COMPARISON PURPOSES
The second line in the table below provides information about hypothetical account values and hypothetical expenses based on the Fund’s actual expense ratio and an assumed rate of return of 5% per year before expenses, which is not the Fund’s actual return. The hypothetical account values and expenses may not be used to estimate the actual ending account balance or expenses you paid for the period. You may use this information to compare the ongoing costs of investing in the Fund to other mutual funds. To do so, compare this 5% hypothetical example with the 5% hypothetical examples that appear in the shareholder reports of the other funds.
Please note that the expenses shown in the table are meant to highlight ongoing costs only and do not reflect any transaction costs charged by certain financial institutions. Therefore, the second line of the table is useful in comparing ongoing costs only, and will not help you determine the relative total costs of owning different mutual funds. In addition, if you incurred transaction costs, your costs would have been higher. Please refer to the Fund’s prospectus for additional information on applicability of transaction costs for the Fund.
| | | Beginning | | Ending | | Expenses Paid | |
| | | Account Value | | Account Value | | During Period | |
| | | 7/1/07 | | 12/31/07 | | 7/1/07 - 12/31/07* | |
| | | | | | | | |
| Actual | | $ | 1,000.00 | | $ | 1,021.40 | | $ | 4.79 | |
| Hypothetical (5% return before expenses) | | $ | 1,000.00 | | $ | 1,020.47 | | $ | 4.79 | |
| * | Expenses are equal to the Fund’s annualized expense ratio of 0.94%, multiplied by the average account value over the period, multiplied by 184/365 (to reflect the most recent fiscal half-year period). |
MANAGEMENT INFORMATION (UNAUDITED)
THE FOLLOWING PROVIDES INFORMATION REGARDING EACH TRUSTEE WHO IS NOT AN “INTERESTED PERSON” OF THE GATEWAY TRUST, AS DEFINED IN THE INVESTMENT COMPANY ACT OF 1940.
James M. Anderson, Cincinnati Children’s Hospital Medical Center, 3333 Burnet Avenue, Cincinnati, Ohio 45229; Trustee of The Gateway Trust since April 1997; Cincinnati Children’s Hospital Medical Center, President and Chief Executive Officer since November 1996; Trustee of Cincinnati Children’s Hospital Medical Center; Director of Union Central Life; Director of UNIFI Mutual Holding Co.; Director of the National Stock Exchange; Chairman of the Board of the Cincinnati Branch of the Federal Reserve Bank of Cleveland. Age 66.
Stefen F. Brueckner, The Gateway Trust, Rookwood Tower, 3805 Edwards Road, Suite 600, Cincinnati, Ohio 45209; Trustee of The Gateway Trust since October 1992; Humana Inc. (insurance), Vice President - Senior Products since February 2005 and Vice President - Market Operations from July 2001 to February 2005; ProMutual Group (insurance), President and Chief Executive Officer from 1998 to 2000; Anthem Companies, Inc. (insurance), President and Chief Executive Officer from 1995 to 1998. Age 58.
Kenneth A. Drucker, The Gateway Trust, Rookwood Tower, 3805 Edwards Road, Suite 600, Cincinnati, Ohio 45209; Trustee of The Gateway Trust since April 1986; Sequa Corporation (industrial equipment), Vice President and Treasurer from 1987 through 2006; Director of Formica Corporation. Age 62.
Susan J. Hickenlooper, The Gateway Trust, Rookwood Tower, 3805 Edwards Road, Suite 600, Cincinnati, Ohio 45209; Trustee of The Gateway Trust since January 2006; Episcopal Retirement Homes Foundation, President since January 2005; Cincinnati Parks Foundation, Trustee since January 2001 and Treasurer from January 2001 through January 2004; Bartlett & Co. (investment adviser), Senior Portfolio Manager from 1981 to 1998. Age 62.
George A. Turk, The Gateway Trust, Rookwood Tower, 3805 Edwards Road, Suite 600, Cincinnati, Ohio 45209; Trustee of The Gateway Trust since January 2006; National Underground Railroad Freedom Center, Financial Analyst since July 2002; Citizens Financial Corporation (insurance company), Director and Audit Committee Chairman since April 2004; Arthur Andersen LLP, Partner from 1982 to 2000. Age 59.
THE FOLLOWING PROVIDES INFORMATION REGARDING EACH TRUSTEE WHO IS AN “INTERESTED PERSON” OF THE GATEWAY TRUST, AS DEFINED IN THE INVESTMENT COMPANY ACT OF 1940. EACH IS A DIRECTOR, OFFICER AND EMPLOYEE OF THE TRUST’S ADVISER, AND AN OFFICER AND A TRUSTEE OF THE TRUST.
Walter G. Sall, Gateway Investment Advisers, L.P., Rookwood Tower, 3805 Edwards Road, Suite 600, Cincinnati, Ohio 45209; Chairman of The Gateway Trust since December 1977 and Trustee of The Gateway Trust since April 1986; Gateway Investment Advisers, L.P., Chairman since 1995. Age 63.
J. Patrick Rogers, Gateway Investment Advisers, L.P., Rookwood Tower, 3805 Edwards Road, Suite 600, Cincinnati, Ohio 45209; President of The Gateway Trust since January 1997 and Trustee of The Gateway Trust since December 1998; Co-Portfolio Manager of the Gateway Fund from 1994 to 1997; Portfolio Manager of the Gateway Fund from 1997 through December 2006; Co-Portfolio Manager of the Gateway Fund since December 2006; Gateway Investment Advisers, L.P., Chief Executive Officer since 2006 and President since 1995. Age 43.
GATEWAY FUND
MANAGEMENT INFORMATION (UNAUDITED)
THE FOLLOWING PROVIDES INFORMATION REGARDING EACH OFFICER OF THE GATEWAY TRUST AS DEFINED BY THE INVESTMENT COMPANY ACT OF 1940.
Donna M. Brown, Gateway Investment Advisers, L.P., Rookwood Tower, 3805 Edwards Road, Suite 600, Cincinnati, Ohio 45209; Secretary of The Gateway Trust since October 1995; Gateway Investment Advisers, L.P., General Counsel since December 1995 and Chief Compliance Officer since September 2004. Age 48.
Gary H. Goldschmidt, Gateway Investment Advisers, L.P., Rookwood Tower, 3805 Edwards Road, Suite 600, Cincinnati, Ohio 45209; Vice President and Treasurer of The Gateway Trust since April 2000; Gateway Investment Advisers, L.P., Chief Financial Officer since January 2004 and Controller from 1999 to 2004. Age 45.
David D. Jones, 719 Sawdust Road, #113, the Woodlands, TX 77380; Chief Compliance Officer of The Gateway Trust since January 2006; Drake Compliance, LLC (compliance consulting firm), Founder and Managing Member since June 2004; David Jones & Assoc., P.C. (law firm), Founder and Principal since 1998; Citco Mutual Fund Services, Inc. (third-party transfer agent, fund accounting and administration firm), founding Chief Executive Officer from 2001 through 2003.
Age 50.
Geoffrey Keenan, Gateway Investment Advisers, L.P., Rookwood Tower, 3805 Edwards Road, Suite 600, Cincinnati, Ohio 45209; Vice President of The Gateway Trust since April 1996; Gateway Investment Advisers, L.P., Executive Vice President and Chief Operating Officer since December 1995. Age 49.
Paul R. Stewart, Gateway Investment Advisers, L.P., Rookwood Tower, 3805 Edwards Road, Suite 600, Cincinnati, Ohio 45209; Vice President of The Gateway Trust since October 2006; Co-Portfolio Manager of the Gateway Fund since December 2006; Gateway Investment Advisers, L.P., Chief Investment Officer since 2006, Senior Vice President since 2000, Chief Financial Officer from 1996 to 2003 and Controller and Treasurer from 1995 to 1996. Age 42.
The Statement of Additional Information includes additional information regarding the Trustees and is available without charge, upon request, by calling 800.354.6339.
A description of the policies and procedures that the Fund uses to determine how to vote proxies relating to portfolio securities, and information regarding how the Fund voted those proxies during the most recent twelve-month period ended June 30, are available without charge, upon request, by calling the Fund at 800.354.6339, or on the Securities and Exchange Commission’s (the “SEC”) website at www.sec.gov.
The Fund files its complete schedule of portfolio holdings with the SEC for the first and third quarters of each fiscal year (quarters ended March 31 and September 30) on Form N-Q. The filings are available without charge, upon request, by calling the Fund at 800.354.6339. They are also available on the SEC’s website at www.sec.gov and may be reviewed and copied at the SEC’s Public Reference Room in Washington, D.C. Information on the operation of the Public Reference Room may be obtained by calling 800.SEC.0330.
APPROVAL OF INVESTMENT MANAGEMENT AGREEMENT (UNAUDITED)
At a meeting held on October 31, 2007, the Board of Trustees, including the Independent Trustees, unanimously approved the renewal of the Investment Management Agreement (the “Management Agreement”) dated January 1, 2006, between the Gateway Fund (the “Fund”) and Gateway Investment Advisers, L.P. (the “Adviser”). To assist the Trustees in their evaluation of the Management Agreement, the Board was supplied with a written proposal and supporting information from the Adviser in advance of the meeting, as well as presentations from members of the Adviser’s investment management staff. In addition to the foregoing materials, independent legal counsel to the Independent Trustees provided, in advance, a memorandum outlining the duties of the Trustees and factors to be considered by the Board with respect to approval or renewal of investment advisory contracts. After a detailed presentation by the Adviser during which the written materials were reviewed and questions from the Board were answered, the Independent Trustees met in an executive session with counsel to consider the contract approval. The following describes the material factors and conclusions that formed the basis for the Board’s approval of the Management Agreement:
FUND AND ADVISER PERFORMANCE
The Trustees reviewed the performance returns of the Fund as compared with various benchmarks for different time periods. Specifically, they were presented with average annual total returns as of September 30, 2007 for various time periods, as compared to the returns of the S&P 500 Index and Lehman Brothers U. S. Intermediate Government/Credit Bond Index. The Trustees also reviewed the Fund’s risk (as measured by standard deviation of returns) and returns compared to those of the S&P 500 Index and various fixed income benchmarks covering the period from January 1, 1988 to September 30, 2007. The Trustees specifically noted that the Fund’s performance compared favorably to relevant benchmarks on a consistent basis, with a standard deviation of less than half that of the S&P 500 Index for the period. When taking into account the Fund’s investment objective, which is to “capture the majority of the higher returns associated with equity market investments, while exposing investors to significantly less risk than other equity investments,” the Board concluded that the Fund’s performance history made a compelling case that the Adviser had consistently and successfully managed the Fund in accordance with its stated objectives.
NATURE, QUALITY AND EXTENT OF SERVICES PROVIDED
When discussing the nature, quality and extent of services that the Adviser provides the Fund, it was pointed out that, in addition to managing the Fund’s portfolio, essentially all of the business of operating the Fund is conducted by the Adviser. Taking into account that the Adviser has managed the Fund since its inception in 1977 and the longevity and low turnover of the Adviser’s staff, the Board noted the strong and cohesive relationship it has had with the Adviser throughout the Fund’s history. Included in the material presented to the Board was a list of recent articles from independent financial publications that favorably recognized the Fund. The Board also recognized the Adviser’s open and unrestricted communication with the Board and the Trust’s Chief Compliance Officer and the Chief Compliance Officer’s quarterly and annual reports which speak affirmatively of the Adviser’s compliance program. The Board also considered the Adviser’s carefully planned management succession designed to result in no disruption of services to the Fund. Taking into account the personnel involved in servicing the Fund, as well as the initiatives and resources extended by the Adviser as described above, the Board concluded that the services provided to the Fund by the Adviser were superior.
APPROVAL OF INVESTMENT MANAGEMENT AGREEMENT (UNAUDITED)
COMPARISON WITH OTHER CONTRACTS AND OTHER CLIENTS
The Trustees emphasized that the unique fee structure of the Fund operates to the benefit of shareholders. They noted that the Adviser’s compensation is reduced by the Fund’s expenses under its Distribution Plan, such that the Adviser effectively bears the economic burden of all increases in the Fund’s distribution-related expenses. The Trustees were presented with a comparative analysis of advisory fees and expense ratios based on publicly available data and drawn from an extensive range of mutual fund peers. Included in the comparison were all 150 funds which comprise the Morningstar Long-Short category from the September 30, 2007 edition of Morningstar’s Principia. The Board noted that the Fund is a four-star fund within this category and that the Fund’s average annualized returns for the one-, three- and five-year periods ended September 30, 2007 surpassed the Long-Short category average annualized returns for all three periods. Also noted was that the gross expense ratio of the Fund, at 0.95%, was the lowest in the Long-Short category by 14 basis points and about one-third of the average for the category, which was 2.93%. The Trustees also recognized that the Fund had the longest performance history (earliest inception date) in the category and the fourth longest manager tenure at 12.9 years. The Board noted the Fund’s favorable beta, alpha and Sharpe ratio as compared to the Long-Short category averages, which further evidences the Fund’s low risk profile as compared to its peers. The Board also reviewed a presentation of fee rates charged to other clients of the Adviser, and recognized the significant factors accounting for the differences in fee rates. Having considered the comparative data as described above, the Board concluded that the Fund’s shareholders are paying below-market management fees and total expenses.
COST OF SERVICES AND PROFIT TO BE REALIZED BY THE ADVISER
In considering the profits realized by the Adviser, the Board reviewed the Adviser’s most recent audited financial statements and an estimate of its operating margin. After comparing the Adviser’s operating margin with a list of the operating margins of publicly traded money management companies, the Trustees noted that the Adviser’s fiscal year 2006 profit margin and its 2007 year-to-date profit margin were in line with others in the industry. Recognizing the lack of available information on which to base a comparative analysis of the profitability of private investment management firms, and the difficulty of isolating the profitability of the Adviser’s relationship with the Fund from its overall profitability, the Board concluded that the Adviser’s profits from its relationship with the Fund were not unreasonable.
ECONOMIES OF SCALE
When presented with a chart that illustrated the Fund’s expenses at average net asset levels for each of the last nine years (the period since the adoption of the current unitary fee), the Trustees noted that the Fund’s total expense ratio has generally declined as net assets have increased; that the rate of distribution expenses has generally risen as assets have increased; and that the rate of the Adviser’s management fee has correspondingly declined. The Board emphasized that the Fund’s unique fee structure effectively had provided reductions in the rate of the Adviser’s fees as distribution expenses increased in much the same way as they might have been reduced by a fee schedule that incorporates breakpoints. Noting that Fund shareholders have benefited from economies of scale as the Fund’s net assets have grown, they concluded that the Fund’s fee structure is reasonable and that economies of scale have been realized by shareholders despite the absence of asset-level breakpoints in the fee structure.
APPROVAL OF INVESTMENT MANAGEMENT AGREEMENT (UNAUDITED)
OTHER BENEFITS
The Board considered other benefits to the Adviser as a result of its relationship to the Fund. Aside from the management fee, the Board considered the Adviser’s receipt of research services in exchange for soft dollar credit in connection with commissions on the Fund’s equity transactions. When presented with details regarding the commissions charged to the Fund by various broker-dealers and the Adviser’s pursuit of high-quality execution of the Fund’s transactions, it was noted that the Fund pays commissions at or below market level rates and receives quality executions, regardless of whether the commissions are used to pay for research through soft dollar arrangements. It was also indicated that no Adviser client pays lower commissions than the Fund. The Board was presented with a detailed description of the research services received by the Adviser in exchange for soft dollar credits resulting from Fund commissions. The benefits of this research to the Fund were noted as well. After taking into consideration the entire presentation on the Adviser’s use of soft dollars and brokerage allocation, the Board concluded that there was no detrimental effect to the Fund as a result of the Adviser’s soft dollar arrangements and that the Fund benefited from the research received.
The Trustees did not identify any single factor discussed previously as all-important or controlling in their determination to renew the current Investment Management Agreement. The Trustees, including the Independent Trustees, unanimously concluded that the terms of the Investment Management Agreement are fair and reasonable; that the Adviser’s fees are reasonable in light of the services provided to the Fund and the benefits received by the Adviser; and that the Investment Management Agreement should be renewed.
TOTAL RETURNS - DECEMBER 31, 2007
| | | Average Annual Total Return | | | |
| | | One | | Three | | Five | | Ten | | Since Inception | | | |
| | | Year | | Years | | Years | | Years | | on 12/7/77 | | Per Share | |
| | | | | | | | | | | | | | |
GATEWAY FUND | | | 7.94 | % | | 7.56 | % | | 8.23 | % | | 6.31 | % | | 9.03 | % | $ | 28.64 | |
| | | | | | | | | | | | | | | | | | | | |
| Lehman Brothers U. S. Intermediate | | | | | | | | | | | | | | | | | | | |
| Government/Credit Bond Index | | | 7.40 | % | | 4.32 | % | | 4.06 | % | | 5.76 | % | | | | | | |
| | | | | | | | | | | | | | | | | | | | |
| S&P 500 Index | | | 5.50 | % | | 8.61 | % | | 12.83 | % | | 5.91 | % | | | | | | |
| | | Cumulative Total Return | | | |
| | | One | | Three | | Five | | Ten | | Since Inception | |
| | | Year | | Years | | Years | | Years | | on 12/7/77 | |
| | | | | | | | | | | | |
GATEWAY FUND | | | 7.94 | % | | 24.42 | % | | 48.53 | % | | 84.32 | % | | 1,247.06 | % |
| | | | | | | | | | | | | | | | | |
| Lehman Brothers U. S. Intermediate | | | | | | | | | | | | | | | | |
| Government/Credit Bond Index | | | 7.40 | % | | 13.52 | % | | 22.00 | % | | 74.99 | % | | | |
| | | | | | | | | | | | | | | | | |
| S&P 500 Index | | | 5.50 | % | | 28.13 | % | | 82.83 | % | | 77.53 | % | | | |
Data sources throughout this report: Gateway Investment Advisers, L.P. and Thomson Financial Inc.
Performance data throughout this report represents past performance and is no guarantee of future results. The total return figures assume the reinvestment of distributions, but do not reflect the deduction of taxes paid on distributions or on the redemption of your shares. Your investment return and principal value of an investment will fluctuate so that your shares, when redeemed, may be worth more or less than the original cost. Gateway Fund returns throughout this document are net of fees and expenses. An investor may be subject to additional fees and charges if the Fund is sold through intermediaries.
Current performance may be lower or higher than the performance data quoted. Gateway Fund performance data that is current to the most recent month-end is available by calling 800.354.6339 or by accessing our website at www.gatewayfund.com.
This report must be preceded by or accompanied by a prospectus.
Item 2. Code of Ethics.
(a) As of the end of the period covered by this report, the registrant has adopted a code of ethics that applies to the registrant's principal executive officer, principal financial officer, principal accounting officer or controller, or persons performing similar functions, regardless of whether these individuals are employed by the registrant or a third party.
(b) For purposes of this Item, the term “code of ethics” means written standards that are reasonably designed to deter wrongdoing and to promote:
| | (1) | Honest and ethical conduct, including the ethical handling of actual or apparent conflicts of interest between personal and professional relationships; |
| | (2) | Full, fair, accurate, timely, and understandable disclosure in reports and documents that a registrant files with, or submits to, the Commission and in other public communications made by the registrant; |
| (3) | Compliance with applicable governmental laws, rules, and regulations; |
| | (4) | The prompt internal reporting of violations of the code to an appropriate person or persons identified in the code; and |
| (5) | Accountability for adherence to the code. |
(c) Amendments: During the period covered by this report, there were no amendments to the code of ethics.
(d) Waivers: During the period covered by this report, the registrant had not granted a waiver, including an implicit waiver, from a provision of the code of ethics.
(e) Not applicable
(f) The registrant has elected to comply with this item 2(f) by filing a copy of the code of ethics at Item 12(a)(1), where it is incorporated by reference to a previous filing.
Item 3. Audit Committee Financial Expert.
The registrant's Board of Trustees has determined that Kenneth A. Drucker is an audit committee financial expert. He is independent for purposes of this Item 3.
Item 4. Principal Accountant Fees and Services.
(a) Audit Fees
| FY 2007 | | $ | 70,000 | |
| FY 2006 | | $ | 58,300 | |
(b) Audit-Related Fees
| | | Registrant | | Adviser | |
| | | | | | |
| FY 2007 | | $ | 0 | | $ | 31,200 | |
| FY 2006 | | $ | 0 | | $ | 10,600 | |
Nature of Fees. Audit-related services for the Adviser are associated with examination of internal controls related to the Adviser’s transfer agent and registrar functions for SEC Rule 17Ad-13 filing in FY 2007 and FY 2006. In addition, additional fees in FY 2007 are associated with filings and workpaper review related to the upcoming Gateway Fund acquisition.
(c) Tax Fees
| | | Registrant | | Adviser | |
| | | | | | |
| FY 2007 | | $ | 3,500 | | $ | 0 | |
| FY 2006 | | $ | 7,200 | | $ | 0 | |
Nature of Fees. Tax services for registrant included tax compliance and tax return reviews in FY 2007 and FY 2006 as well as FIN 48 review in FY 2006.
(d) All Other Fees
| | | Registrant | | Adviser | |
| | | | | | |
| FY 2007 | | $ | 0 | | $ | 0 | |
| FY 2006 | | $ | 0 | | $ | 0 | |
(e) (1) Audit Committee’s Pre-Approval Policies
Beginning with non-audit service contracts entered into on or after May 6, 2003, the registrant’s Audit Committee is required to pre-approve all audit services and, when appropriate, any non-audit services (including audit-related, tax and all other services) to the registrant. The registrant’s Audit Committee is also required to pre-approve, when appropriate, any non-audit services (including audit-related, tax and all other services) to its adviser, or any entity controlling, controlled by or under common control with the adviser that provides ongoing services to the registrant to the extent that the services are determined to have a direct impact on the operations or financial reporting of the registrant. The registrant’s Audit Committee has established a policy of requiring specific pre-approval of audit and non-audit services on an engagement-by-engagement basis.
(2) Percentages of FY 2007 Non-Audit Services Approved by the Audit Committee
| Audit-Related Fees | | | 100 | % |
| Tax Fees | | | 100 | % |
| All Other Fees | | | N/A | |
(f) During the audit of registrant’s financial statements for the most recent fiscal year, less than 50% of the hours expended on the principal accountant’s engagement were attributed to work performed by persons other than the principal accountant’s full-time, permanent employees.
(g) The aggregate non-audit fees billed by the registrant's accountant for services rendered to the registrant, and rendered to the registrant's investment adviser (not including any sub-adviser whose role is primarily portfolio management and is subcontracted with or overseen by another investment adviser), and any entity controlling, controlled by, or under common control with the adviser that provides ongoing services to the registrant are as follows:
| | | Registrant | | Adviser | |
| | | | | | |
| FY 2007 | | $ | 3,500 | | $ | 31,200 | |
| FY 2006 | | $ | 7,200 | | $ | 10,600 | |
(h) Not applicable. All non-audit services to the registrant’s investment adviser were pre-approved by the Audit Committee for FY 2007 and FY 2006.
Item 5. Audit Committee of Listed Registrants.
Not applicable.
Item 6. Schedule of Investments
Schedule of Investments is included as part of the report to shareholders filed under Item 1 of this Form.
Item 7. Disclosure of Proxy Voting Policies and Procedures for Closed-End Management Investment Companies.
Not applicable.
Item 8. Portfolio Managers of Closed-End Management Investment Companies.
Not applicable.
Item 9. Purchases of Equity Securities by Closed-End Management Investment Company and Affiliated Purchasers.
Not applicable.
Item 10. Submission of Matters to a Vote of Security Holders.
The registrant has not adopted procedures by which shareholders may recommend nominees to the registrant's Board of Trustees.
Item 11. Controls and Procedures.
(a) Based on an evaluation of the registrant’s disclosure controls and procedures as of February 25, 2008, the disclosure controls and procedures are reasonably designed to ensure that the information required in filings of Form N-CSR is recorded, processed, summarized, and reported on a timely basis.
(b) There were no changes in the registrant’s internal control over financial reporting that occurred during the second fiscal quarter of the period covered by this report that have materially affected, or are reasonably likely to materially affect, the registrant’s internal control over financial reporting.
Item 12. Exhibits.
(a)(1) Registrants' Code of Ethics is incorporated by reference to registrant's Form N-CSR for the year ended December 31, 2004 which was filed with the Securities and Exchange Commission on February 23, 2005.
(a)(2) EX-99.CERT. Certifications required by Rule 30a-2(a) of the Investment Company Act of 1940 are filed herewith.
(a)(3) Not Applicable.
(b) EX-99.906.CERT. Certification required by Rule 30a-2(b) of the Investment Company Act of 1940 is filed herewith.
SIGNATURES
Pursuant to the requirements of the Securities Exchange Act of 1934 and the Investment Company Act of 1940, the registrant has duly caused this report to be signed on its behalf by the undersigned, thereunto duly authorized.
The Gateway Trust
| | | | | |
| | | | | |
| By: | | /s/ Walter G. Sall | | |
| | | Walter G. Sall, Chairman | | |
| | | | | |
| Date | | February 25, 2008 | | |
Pursuant to the requirements of the Securities Exchange Act of 1934 and the Investment Company Act of 1940, this report has been signed below by the following persons on behalf of the registrant and in the capacities and on the dates indicated.
| | | | | |
| | | | | |
| By: | | /s/ Walter G. Sall | | |
| | | Walter G. Sall, Chairman | | |
| | | | | |
| Date | | February 25, 2008 | | |
| | | | | |
| | | | | |
| | | | | |
| By: | | /s/ Gary H. Goldschmidt | | |
| | | Gary H. Goldschmidt Vice President and Treasurer | | |
| | | | | |
| Date | | February 25, 2008 | | |