Filed pursuant to Rule 424(b)(3) and Rule 424(c)
Registration Statement No. 333-163550
PROSPECTUS SUPPLEMENT NO. 5
(to Prospectus dated April 6, 2010)
Grubb & Ellis Company
7,575,750 Shares of Common Stock
125,000 Shares of 12% Cumulative Participating Perpetual Convertible Preferred Stock
This Prospectus Supplement No. 5 supplements the prospectus dated April 6, 2010 (as updated, amended and supplemented, the “Prospectus”), which forms a part of our Registration Statement on Form S-1 (Registration Statement No. 333-163550). This prospectus supplement is being filed to update, amend and supplement the information included or incorporated by reference in the Prospectus with the information contained in our current report on Form 8-K, filed with the Securities and Exchange Commission (the “SEC”) on May 11, 2010 (the “Current Report”). Accordingly, we have attached the Current Report to this prospectus supplement.
The Prospectus and this prospectus supplement relate to the disposition of up to 125,000 shares of our outstanding 12% Cumulative Participating Perpetual Convertible Preferred Stock, which we refer to herein as our “12% Preferred Stock”, and up to 7,575,750 shares of our common stock issuable upon conversion of our 12% Preferred Stock that may be sold by the selling stockholders identified in the Prospectus. We have registered the offer and sale of such shares of 12% Preferred Stock and such shares of common stock to satisfy registration rights we have granted. We will not receive any of the proceeds from the sale of the shares of 12% Preferred Stock or shares of common stock by the selling stockholders.
Our common stock is listed on the New York Stock Exchange under the symbol “GBE.” On May 11, 2010, the last reported sales price for our common stock was $1.68.
This prospectus supplement should be read in conjunction with the Prospectus, which is to be delivered with this prospectus supplement. This prospectus supplement updates, amends and supplements the information included or incorporated by reference in the Prospectus. If there is any inconsistency between the information in the Prospectus and this prospectus supplement, you should rely on the information in this prospectus supplement.
Investing in our common stock involves a high degree of risk. You should review carefully the risks and uncertainties described under the heading “Risk Factors” beginning on page 8 of the Prospectus, and under similar headings in any amendments or supplements to the Prospectus.
Neither the Securities and Exchange Commission nor any state securities commission has approved or disapproved of these securities or determined if the Prospectus or this prospectus supplement is truthful or complete. Any representation to the contrary is a criminal offense.
The date of this prospectus supplement is May 12, 2010.
UNITED STATES
SECURITIES AND EXCHANGE COMMISSION
Washington, D.C. 20549
FORM 8-K
CURRENT REPORT
Pursuant to Section 13 or 15(d) of the Securities Exchange Act of 1934
Date of Report (Date of earliest event reported): May 11, 2010
GRUBB & ELLIS COMPANY
(Exact name of registrant as specified in its charter)
| | | | | |
| Delaware | | 1-8122 | | 94-1424307 |
| (State or other Jurisdiction of Incorporation) | | (Commission File Number) | | (IRS Employer Identification No.) |
| | | |
1551 North Tustin Avenue, Suite 300, Santa Ana, California
| | 92705 |
| (Address of Principal Executive Offices) | | (Zip Code) |
Registrant’s telephone number, including area code:(714) 667-8252
| |
Not Applicable
|
| (Former name or former address if changed since last report.) |
Check the appropriate box below if the Form 8-K filing is intended to simultaneously satisfy the filing obligation of the registrant under any of the following provisions:
o Written communications pursuant to Rule 425 under the Securities Act (17 CFR 230.425)
o Soliciting material pursuant to Rule 14a-12 under the Exchange Act (17 CFR 240.14a-12)
o Pre-commencement communications pursuant to Rule 14d-2(b) under the Exchange Act (17 CFR 240.14d-2(b))
o Pre-commencement communications pursuant to Rule 13e-4(c) under the Exchange Act (17 CFR 240.13e-4(c))
1
Item 2.02 Results of Operations and Financial Condition.
On May 11, 2010, Grubb & Ellis Company (the “Company”) issued a press release and later that day held an earnings call reporting its results of operations for the quarter ended March 31, 2010.
A copy of each of the press release issued by the Company regarding the foregoing results and the presentation used in connection with the earnings call are included as Exhibit 99.1 and Exhibit 99.2, respectively, to this Current Report on Form 8-K and each are incorporated herein by reference. A copy of the transcript of the earnings call held by the Company shall be filed as an exhibit pursuant to an amendment to this Current Report on Form 8-K.
Item 9.01 Financial Statements and Exhibits.
| | | |
| | | |
| (d) | | The following is filed as an Exhibit to this Current Report on Form 8-K: |
| | | | |
| | 99.1 | | Press Release issued by Grubb & Ellis Company on May 11, 2010. |
| | 99.2 | | First Quarter 2010 Earnings Conference Call Presentation by Grubb & Ellis Company. |
2
SIGNATURES
Pursuant to the requirements of the Securities Exchange Act of 1934, the Registrant has duly authorized and caused the undersigned to sign this Report on the Registrant’s behalf.
| | | | |
| | | | |
| | GRUBB & ELLIS COMPANY |
| | | | |
| | By: | | /s/ Matthew A. Engel |
| | | | |
| | | | Matthew A. Engel |
| | | | Interim Chief Financial Officer,
Senior Vice President and
Chief Accounting Officer |
Dated: May 11, 2010
3
Exhibit 99.1
| | | |
 | | news release
for immediate release |
| | | |
| Contact: | | Janice McDill |
| Phone: | | 312.698.6707 |
| Email: | | janice.mcdill@grubb-ellis.com |
Grubb & Ellis Company Reports Improved First Quarter 2010 Results
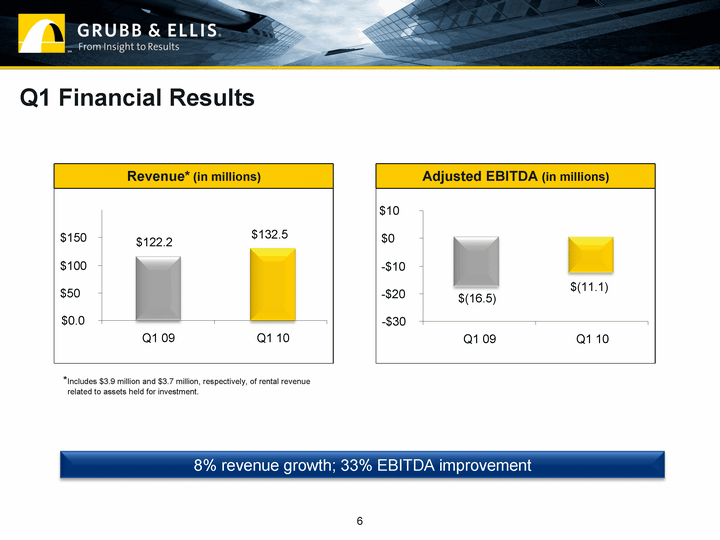
SANTA ANA, Calif. (May 11, 2010) – Grubb & Ellis Company (NYSE: GBE), a leading real estate services and investment firm, today reported first quarter 2010 revenue of $132.5 million, an increase of 8 percent compared with revenue of $122.2 million for the first quarter of 2009.
The company reported a net loss attributable to Grubb & Ellis Company on a GAAP basis of $23.8 million, or $0.41 per common share, for the first quarter of 2010, compared with a net loss of $41.5 million, or $0.65 per common share, for the first quarter of 2009. Adjusted earnings before interest, taxes, depreciation and amortization (adjusted EBITDA) for the first quarter of 2010 was negative $11.1 million, compared with negative adjusted EBITDA of $16.5 million in the same period a year ago, reflecting an improvement of more than 33 percent from the year ago period.
Due to the seasonality of the commercial real estate business, the first quarter is typically the weakest for the company with revenue and profitability building throughout the year.
Company Highlights
| | • | | On May 7, Grubb & Ellis closed a $30 million unsecured convertible senior note offering, the proceeds of which will primarily be used to fund the company’s growth initiatives. |
| | • | | Transaction Services revenue significantly increased in the first quarter of 2010, up 26 percent from the same period a year ago, reflecting the increased productivity of the company’s brokerage professionals and the recovering U.S. commercial real estate market. Management Services revenue grew by 11 percent during the same time period. |
| | • | | The company recruited 19 senior-level brokerage sales professionals during the first quarter, bringing to 118 the number of senior brokerage sales professionals who have joined the company since July 2008. In addition, the company opened owned brokerage offices in San Diego and Phoenix. |
| | • | | Grubb & Ellis Healthcare REIT II, which began raising equity at the end of the third quarter of 2009, has completed its first four acquisitions in 2010. |
| | • | | The company took action to reduce annualized operating expenses by $25 million through a corporate-restructuring that will result in $20 million in cost savings in 2010. |
-more-
| | | |
Grubb & Ellis Company
1551 N. Tustin Avenue, Suite 300 | Santa Ana, CA 92705 | 714.667.8252 |
1
2 – 2 – 2
5/11/10
Grubb & Ellis Company Reports Improved First Quarter 2010 Results
“Our improved first quarter performance reflects the hard work and dedication of our 6,000 professionals along with a clear improvement in the broad fundamentals of the U.S. commercial real estate market,” said Thomas P. D’Arcy, president and chief executive officer of Grubb & Ellis. “We continue to enhance our market position by adding top talent, expanding our service offerings and better aligning our businesses around the needs of our clients and investors. These efforts, when combined with our cost rationalization actions taken during the quarter, create the foundation for growth, especially as the market continues its recovery.”
OPERATING SEGMENTS
Management Services
Management Services revenue includes asset and property management fees as well as reimbursed salaries, wages and benefits from the company’s third-party property management and facilities outsourcing services, along with business services fees. Management Services revenue was $72.4 million for the first quarter of 2010, up 11 percent from $65.5 million for the same period a year ago.
At March 31, 2010, the company managed approximately 243 million square feet of commercial real estate and multi family property.
Transaction Services
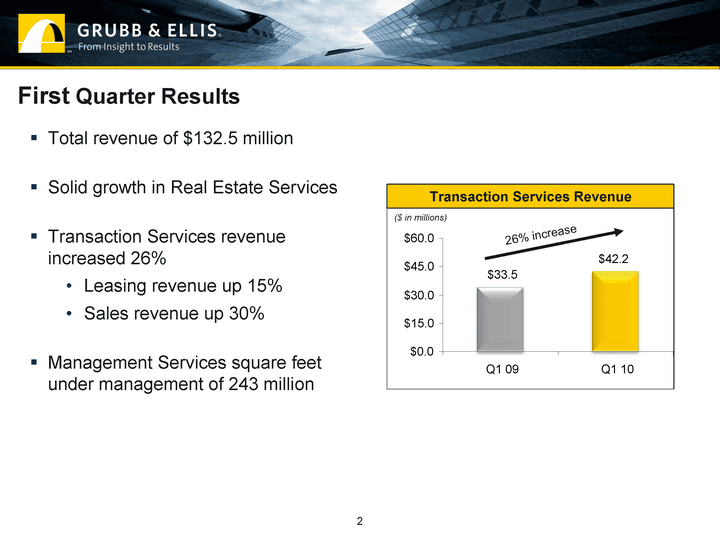
Transaction Services revenue for the first quarter of 2010, including brokerage commission, valuation and consulting revenue, was $42.2 million, compared with $33.5 million for the same period a year ago. The first quarter Transaction Services sales and leasing revenue mix consists of 25 percent sales and 75 percent leasing.
Sales revenue was up 30 percent in the first quarter of 2010, compared with the first quarter of 2009. Leasing revenue increased 15 percent year-over-year. The increase was due to greater transaction velocity as well as the revenue contribution from the company’s recruiting efforts.
Investment Management
Investment Management revenue for the first quarter of 2010, which includes transaction fees, asset management fees and dealer-manager fees, totaled $10.1 million, compared with revenue of $15.7 million in the same period a year ago.
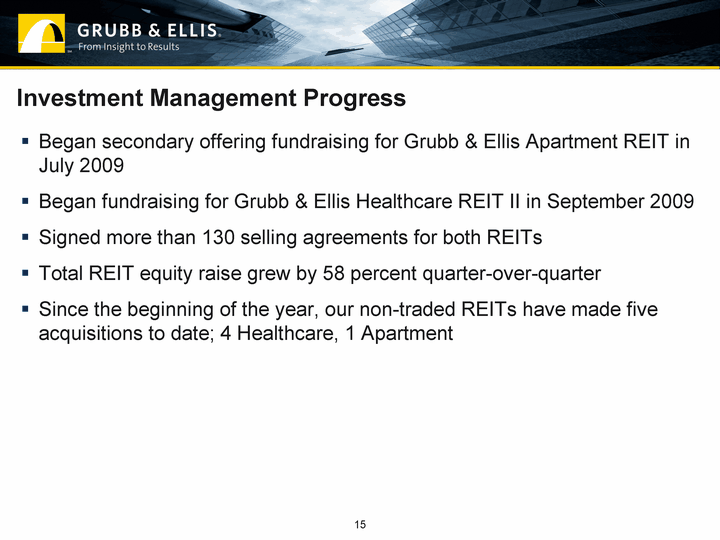
The company’s two non-traded REIT products, which are in the offering stages, raised an aggregate of $30.8 million of equity in the first quarter of 2010, compared with $21.7 million in the fourth quarter of 2009. To date in 2010, Grubb & Ellis Healthcare REIT II has completed four acquisitions and Grubb & Ellis Apartment REIT completed one acquisition.
At March 31, 2010, the company had assets under management of $5.6 billion.
-more-
| | | |
Grubb & Ellis Company
1551 N. Tustin Avenue, Suite 300 | Santa Ana, CA 92705 | 714.667.8252 |
2
3 – 3 – 3
5/11/10
Grubb & Ellis Company Reports Improved First Quarter 2010 Results
Senior Notes Offering
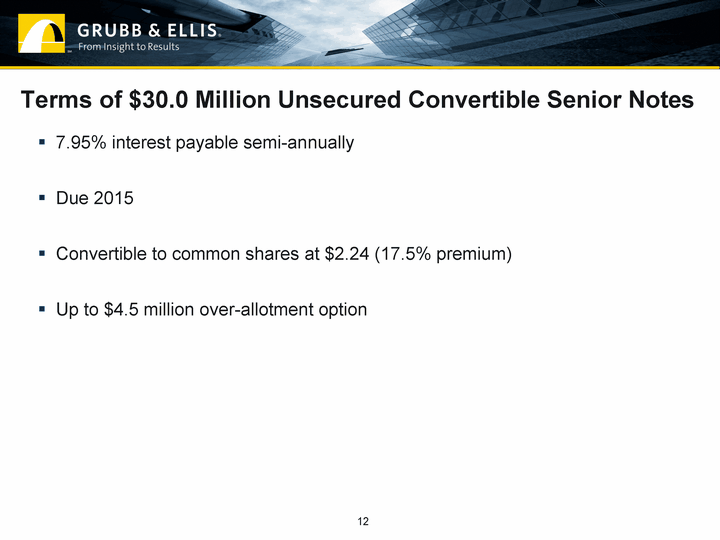
On May 4, 2010, Grubb & Ellis announced that it entered into an agreement to sell $30.0 million aggregate principal of unsecured convertible senior notes due in 2015 in an offering led by JMP Securities. The notes have an interest rate of 7.95% per annum. The company also granted the initial purchaser a 45-day option to purchase up to an additional $4.5 million aggregate principal amount of notes to cover over-allotments, if any. The sale of the notes closed on May 7, 2010.
2010 OUTLOOK
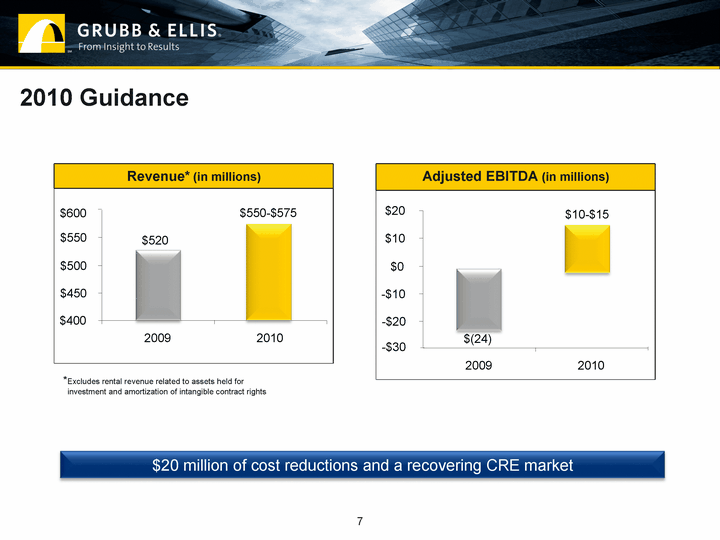
The company reiterated its guidance for 2010 of total revenue of $550 million to $575 million and adjusted EBITDA of $10 million to $15 million.
“With the early signs of recovery evident in the U.S. commercial real estate market, we are intently focused on growth, and the $30 million of new capital we raised earlier this month will be used to support our growth initiatives,” D’Arcy said. “These initiatives include investing in businesses that are extensions of our core platform, the continued recruitment of top industry talent and strategic investments across our businesses. We are fully committed to a growth agenda that will serve to enhance our market position, the benefit of which will accrue to our talented professionals as well as our shareowners.”
Conference Call & Webcast
Management will host a conference call today at 10:30 a.m. Eastern Time to review the results. A live webcast will be accessible through the Investor Relations section of the company’s website at http://www.grubb-ellis.com. The direct dial-in number for the conference call is 1.866.804.6921 for domestic callers and 1.857.350.1667 for international callers. The conference call ID number is 32812921. An audio replay will be available beginning at 1:30 p.m. ET on Tuesday, May 11, until 7 p.m. ET on Tuesday, May 18 and can be accessed by dialing 1.888.286.8010 for domestic callers and 1.617.801.6888 for international callers and entering conference call ID 87144373. In addition, the conference call audio will be archived on the company’s website following the call.
About Grubb & Ellis Company
Grubb & Ellis Company (NYSE: GBE) is one of the largest and most respected commercial real estate services and investment companies in the world. Our 6,000 professionals in more than 100 company-owned and affiliate offices draw from a unique platform of real estate services, practice groups and investment products to deliver comprehensive, integrated solutions to real estate owners, tenants and investors. The firm’s transaction, management, consulting and investment services are supported by highly regarded proprietary market research and extensive local expertise. Through its investment subsidiaries, the company is a leading sponsor of real estate investment programs that provide individuals and institutions the opportunity to invest in a broad range of real estate investment vehicles, including public non-traded real estate investment trusts (REITs), mutual funds and other real estate investment funds. For more information, visitwww.grubb-ellis.com.
-more-
| | | |
Grubb & Ellis Company
1551 N. Tustin Avenue, Suite 300 | Santa Ana, CA 92705 | 714.667.8252 |
3
4 – 4 – 4
5/11/10
Grubb & Ellis Company Reports Improved First Quarter 2010 Results
Forward-Looking Statement
Certain statements included in this press release may constitute forward-looking statements regarding, among other things, the ability of future revenue growth, market trends, new business opportunities and investment programs, results of operations, changes in expense levels and profitability and effects on the company of changes in the real estate markets. These statements involve known and unknown risks, uncertainties and other factors that may cause the company’s actual results and performance in future periods to be materially different from any future results or performance suggested by these statements. Such factors which could adversely affect the company’s ability to obtain these results include, among other things: (i) a continued or further slowdown in the volume and the decline in transaction values of sales and leasing transactions; (ii) the continuing general economic downturn and recessionary pressures on businesses in general; (iii) a prolonged and pronounced recession and continued decline in real estate markets and values; (iv) the unavailability of credit to finance real estate transactions; (v) the ability of the company to return to compliance with the NYSE’s continued listing standards; (vi) the success of current and new investment programs; (vii) the success of new initiatives and investments; (viii) the inability to attain expected levels of revenue, performance, brand equity and expense reductions in the current macroeconomic and credit environment and (ix) other factors described in the company’s annual report on Form 10-K/A for the fiscal year ending December 31, 2009 and in other current reports on Form 8-K filed with the Securities and Exchange Commission (the “SEC”). The company does not undertake any obligation to update forward-looking statements.
Non-GAAP Financial Information
In addition to the results reported in accordance with U.S. generally accepted accounting principles (GAAP) included within this press release, Grubb & Ellis Company has provided certain information, which includes non-GAAP financial measures. Such information is reconciled to its closest GAAP measure in accordance with the Securities and Exchange Commission rules and is included in the attached supplemental data. Management believes that these non-GAAP financial measures are useful to both management and the company’s stockholders in their analysis of the business and operating performance of the company. Management also uses this information for operational planning and decision-making purposes. Non-GAAP financial measures are not and should not be considered a substitute for any GAAP measures. Additionally, non-GAAP financial measures as presented by Grubb & Ellis Company may not be comparable to similarly titled measures reported by other companies.
TABLES FOLLOW
###
| | | |
Grubb & Ellis Company
1551 N. Tustin Avenue, Suite 300 | Santa Ana, CA 92705 | 714.667.8252 |
4
Grubb & Ellis Company
Consolidated Statements of Operations
(in thousands)
(Unaudited)
| | | | | | | | | |
| | | Three Months Ended | |
| | | March 31, | | | March 31, | |
| | | 2010 | | | 2009 | |
| REVENUE | | | | | | | | |
| Management services | | $ | 72,416 | | | $ | 65,531 | |
| Transaction services | | | 42,233 | | | | 33,533 | |
| Investment management | | | 10,102 | | | | 15,657 | |
| Rental related | | | 7,714 | | | | 7,432 | |
| | | | | | | |
| TOTAL REVENUE | | | 132,465 | | | | 122,153 | |
| | | | | | | |
| | | | | | | | | |
| OPERATING EXPENSE | | | | | | | | |
| Compensation costs | | | 35,739 | | | | 38,033 | |
| Transaction commissions and related costs | | | 33,162 | | | | 25,774 | |
| Reimbursable salaries, wages and benefits | | | 52,683 | | | | 49,464 | |
| Restructuring charges | | | 2,730 | | | | — | |
| General and administrative | | | 18,439 | | | | 21,778 | |
| Provision for doubtful accounts | | | 1,667 | | | | 5,418 | |
| Depreciation and amortization | | | 3,258 | | | | 2,441 | |
| Rental related | | | 5,367 | | | | 5,616 | |
| Interest | | | 2,319 | | | | 3,636 | |
| Real estate related impairments | | | 270 | | | | 12,272 | |
| Intangible asset impairment | | | 614 | | | | — | |
| | | | | | | |
| Total operating expense | | | 156,248 | | | | 164,432 | |
| | | | | | | |
| | | | | | | | | |
| OPERATING LOSS | | | (23,783 | ) | | | (42,279 | ) |
| | | | | | | |
| | | | | | | | | |
| OTHER INCOME (EXPENSE) | | | | | | | | |
| Equity in losses of unconsolidated entities | | | (214 | ) | | | (1,231 | ) |
| Interest income | | | 46 | | | | 145 | |
| Other income (expense) | | | 45 | | | | (725 | ) |
| | | | | | | |
| Total other (expense) income | | | (123 | ) | | | (1,811 | ) |
| | | | | | | |
| | | | | | | | | |
| Loss from continuing operations before income tax (provision) benefit | | | (23,906 | ) | | | (44,090 | ) |
| Income tax (provision) benefit | | | (146 | ) | | | 319 | |
| | | | | | | |
| Loss from continuing operations | | | (24,052 | ) | | | (43,771 | ) |
| Income from discontinued operations | | | — | | | | 491 | |
| | | | | | | |
| Net loss | | | (24,052 | ) | | | (43,280 | ) |
| Net loss attributable to noncontrolling interests | | | (271 | ) | | | (1,778 | ) |
| | | | | | | |
| Net loss attributable to Grubb & Ellis Company | | | (23,781 | ) | | | (41,502 | ) |
| Preferred stock dividends | | | (2,897 | ) | | | — | |
| | | | | | | |
| Net loss attributable to Grubb & Ellis Company common shareowners | | $ | (26,678 | ) | | $ | (41,502 | ) |
| | | | | | | |
| | | | | | | | | |
Earnings per share — basic: | | | | | | | | |
| Loss from continuing operations attributable to Grubb & Ellis Company common shareowners | | $ | (0.41 | ) | | $ | (0.66 | ) |
| Income from discontinued operations attributable to Grubb & Ellis Company common shareowners | | | — | | | | 0.01 | |
| | | | | | | |
| Net loss per share attributable to Grubb & Ellis Company common shareowners | | $ | (0.41 | ) | | $ | (0.65 | ) |
| | | | | | | |
| | | | | | | | | |
Earnings per share — diluted: | | | | | | | | |
| Loss from continuing operations attributable to Grubb & Ellis Company common shareowners | | $ | (0.41 | ) | | $ | (0.66 | ) |
| Income from discontinued operations attributable to Grubb & Ellis Company common shareowners | | | — | | | | 0.01 | |
| | | | | | | |
| Net loss per share attributable to Grubb & Ellis Company common shareowners | | $ | (0.41 | ) | | $ | (0.65 | ) |
| | | | | | | |
Grubb & Ellis Company
Consolidated Balance Sheets
(in thousands)
(Unaudited)
| | | | | | | | | |
| | | March 31, | | | December 31, | |
| | | 2010 | | | 2009 | |
| ASSETS |
| Cash and cash equivalents | | $ | 22,542 | | | $ | 39,101 | |
| Restricted cash | | | 15,102 | | | | 13,875 | |
| Investment in marketable securities | | | 2,666 | | | | 690 | |
| Accounts receivable from related parties — net | | | 7,706 | | | | 9,169 | |
| Notes and advances to related parties — net | | | 10,959 | | | | 1,019 | |
| Service fees receivable — net | | | 27,356 | | | | 30,293 | |
| Professional service contracts — net | | | 3,140 | | | | 3,626 | |
| Real estate deposits and pre-acquisition costs | | | 1,072 | | | | 1,321 | |
| Prepaid expenses and other assets | | | 15,367 | | | | 16,497 | |
| Refundable income taxes | | | 5,002 | | | | 4,992 | |
| | | | | | | |
| TOTAL CURRENT ASSETS | | | 110,912 | | | | 120,583 | |
| | | | | | | | | |
| Accounts receivable from related parties — net | | | 16,362 | | | | 15,609 | |
| Notes and advances to related parties — net | | | 13,399 | | | | 14,607 | |
| Professional service contracts — net | | | 6,953 | | | | 7,271 | |
| Investments in unconsolidated entities | | | 4,549 | | | | 3,783 | |
| Properties held for investment — net | | | 81,910 | | | | 82,189 | |
| Property, equipment and leasehold improvements — net | | | 12,445 | | | | 13,190 | |
| Identified intangible assets — net | | | 93,987 | | | | 94,952 | |
| Other assets — net | | | 5,473 | | | | 5,140 | |
| | | | | | | |
| TOTAL ASSETS | | $ | 345,990 | | | $ | 357,324 | |
| | | | | | | |
| | | | | | | | | |
| LIABILITIES AND SHAREOWNERS’ EQUITY |
| Accounts payable and accrued expenses | | $ | 61,868 | | | $ | 62,867 | |
| Due to related parties | | | 2,525 | | | | 2,267 | |
| Notes payable and capital lease obligations | | | 893 | | | | 939 | |
| Other liabilities | | | 36,386 | | | | 38,864 | |
| | | | | | | |
| TOTAL CURRENT LIABILITIES | | | 101,672 | | | | 104,937 | |
| | | | | | | | | |
| Senior notes | | | 16,277 | | | | 16,277 | |
| Notes payable and capital lease obligations | | | 107,536 | | | | 107,755 | |
| Other long-term liabilities | | | 12,443 | | | | 11,622 | |
| Deferred tax liability | | | 25,486 | | | | 25,477 | |
| | | | | | | |
| TOTAL LIABILITIES | | | 263,414 | | | | 266,068 | |
| | | | | | | | | |
| Preferred Stock - 12% cumulative participating perpetual convertible | | | 90,080 | | | | 90,080 | |
| | | | | | | | | |
| Common stock | | | 694 | | | | 654 | |
| Additional paid-in capital | | | 412,767 | | | | 412,774 | |
| Accumulated deficit | | | (435,882 | ) | | | (412,101 | ) |
| Other comprehensive income | | | 126 | | | | — | |
| | | | | | | |
| Total Grubb & Ellis Company shareowners’ equity | | | (22,295 | ) | | | 1,327 | |
| Noncontrolling interests | | | 14,791 | | | | (151 | ) |
| | | | | | | |
| TOTAL EQUITY | | | (7,504 | ) | | | 1,176 | |
| | | | | | | |
| TOTAL LIABILITIES & EQUITY | | $ | 345,990 | | | $ | 357,324 | |
| | | | | | | |
Grubb & Ellis Company
Reconciliation of Net Loss to Adjusted EBITDA
(in thousands)
(Unaudited)
| | | | | | | | | |
| | | Three Months Ended | |
| | | March 31, | | | March 31, | |
| | | 2010 | | | 2009 | |
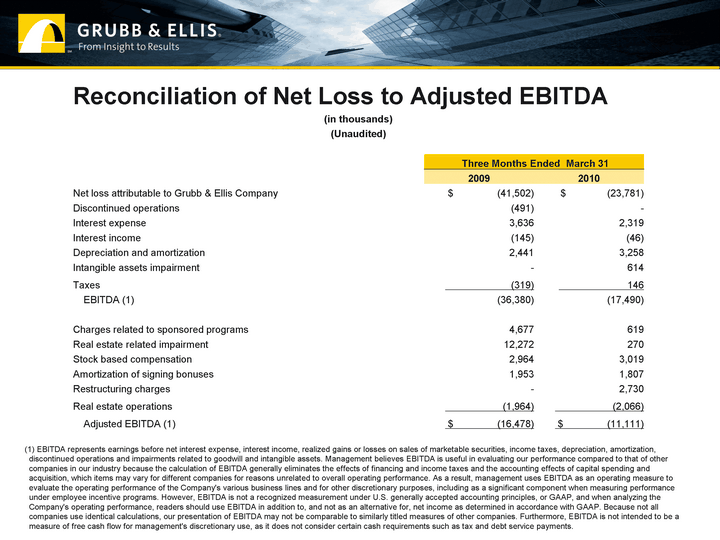
| Net loss attributable to Grubb & Ellis Company | | $ | (23,781 | ) | | $ | (41,502 | ) |
| Discontinued operations | | | — | | | | (491 | ) |
| Interest expense | | | 2,319 | | | | 3,636 | |
| Interest income | | | (46 | ) | | | (145 | ) |
| Depreciation and amortization | | | 3,258 | | | | 2,441 | |
| Intangible asset impairment | | | 614 | | | | — | |
| Taxes | | | 146 | | | | (319 | ) |
| | | | | | | |
| EBITDA (1) | | | (17,490 | ) | | | (36,380 | ) |
| | | | | | | | | |
| Charges related to sponsored programs | | | 619 | | | | 4,677 | |
| Real estate related impairment | | | 270 | | | | 12,272 | |
| Stock based compensation | | | 3,019 | | | | 2,964 | |
| Amortization of signing bonuses | | | 1,807 | | | | 1,953 | |
| Restructuring charges | | | 2,730 | | | | — | |
| Real estate operations | | | (2,066 | ) | | | (1,964 | ) |
| | | | | | | |
| Adjusted EBITDA (1) | | $ | (11,111 | ) | | $ | (16,478 | ) |
| | | | | | | |
| | | |
| (1) | | EBITDA represents earnings before net interest expense, interest income, realized gains or losses on sales of marketable securities, income taxes, depreciation, amortization, discontinued operations and impairments related to goodwill and intangible assets. Management believes EBITDA is useful in evaluating our performance compared to that of other companies in our industry because the calculation of EBITDA generally eliminates the effects of financing and income taxes and the accounting effects of capital spending and acquisition, which items may vary for different companies for reasons unrelated to overall operating performance. As a result, management uses EBITDA as an operating measure to evaluate the operating performance of the Company’s various business lines and for other discretionary purposes, including as a significant component when measuring performance under employee incentive programs. |
| |
| | | However, EBITDA is not a recognized measurement under U.S. generally accepted accounting principles, or GAAP, and when analyzing the Company’s operating performance, readers should use EBITDA in addition to, and not as an alternative for, net income as determined in accordance with GAAP. Because not all companies use identical calculations, our presentation of EBITDA may not be comparable to similarly titled measures of other companies. Furthermore, EBITDA is not intended to be a measure of free cash flow for management’s discretionary use, as it does not consider certain cash requirements such as tax and debt service payments. |
Grubb & Ellis Company
Segment Data
(in thousands)
(Unaudited)
| | | | | | | | | |
| | | Three Months Ended | |
| | | March 31, | | | March 31, | |
| | | 2010 | | | 2009 | |
| MANAGEMENT SERVICES | | | | | | | | |
| Revenue | | $ | 72,416 | | | $ | 65,531 | |
| Compensation costs | | | 9,553 | | | | 9,608 | |
| Transaction commissions and related costs | | | 6,183 | | | | 2,910 | |
| Reimbursable salaries, wages, and benefits | | | 50,358 | | | | 47,293 | |
| General and administrative | | | 2,247 | | | | 2,087 | |
| Provision for doubtful accounts | | | 341 | | | | 775 | |
| | | | | | | |
| Segment operating income | | | 3,734 | | | | 2,858 | |
| | | | | | | | | |
| TRANSACTION SERVICES | | | | | | | | |
| Revenue | | | 42,233 | | | | 33,533 | |
| Compensation costs | | | 10,965 | | | | 11,589 | |
| Transaction commissions and related costs | | | 26,999 | | | | 22,638 | |
| General and administrative | | | 8,848 | | | | 8,817 | |
| Provision for doubtful accounts | | | 804 | | | | 275 | |
| | | | | | | |
| Segment operating loss | | | (5,383 | ) | | | (9,786 | ) |
| | | | | | | | | |
| INVESTMENT MANAGEMENT | | | | | | | | |
| Revenue | | | 10,102 | | | | 15,657 | |
| Compensation costs | | | 6,003 | | | | 7,808 | |
| Transaction commissions and related costs | | | 39 | | | | 7 | |
| Reimbursable salaries, wages, and benefits | | | 2,325 | | | | 2,171 | |
| General and administrative | | | 3,059 | | | | 4,355 | |
| Provision for doubtful accounts | | | 459 | | | | 4,338 | |
| | | | | | | |
| Segment operating loss | | | (1,783 | ) | | | (3,022 | ) |
| | | | | | | | | |
| RECONCILIATION TO NET LOSS ATTRIBUTABLE TO GRUBB & ELLIS COMPANY: | | | | | | | | |
| Total segment operating loss | | | (3,432 | ) | | | (9,950 | ) |
| Rental operations, net of rental related expenses | | | 2,173 | | | | 1,497 | |
| Corporate overhead (compensation, general and administrative costs) | | | (10,314 | ) | | | (12,513 | ) |
| Stock based compensation | | | (3,019 | ) | | | (2,964 | ) |
| Restructuring charges | | | (2,730 | ) | | | — | |
| Depreciation and amortization | | | (3,258 | ) | | | (2,441 | ) |
| Interest | | | (2,319 | ) | | | (3,636 | ) |
| Real estate related impairments | | | (270 | ) | | | (12,272 | ) |
| Intangible asset impairment | | | (614 | ) | | | — | |
| Other expense | | | (123 | ) | | | (1,811 | ) |
| | | | | | | |
| | | | | | | | | |
| Loss from continuing operations before income tax (provision) benefit | | | (23,906 | ) | | | (44,090 | ) |
| Income tax (provision) benefit | | | (146 | ) | | | 319 | |
| | | | | | | |
| Loss from continuing operations | | | (24,052 | ) | | | (43,771 | ) |
| Income from discontinued operations | | | — | | | | 491 | |
| | | | | | | |
| Net loss | | | (24,052 | ) | | | (43,280 | ) |
| | | | | | | |
| Net loss attributable to noncontrolling interests | | | (271 | ) | | | (1,778 | ) |
| | | | | | | |
| Net loss attributable to Grubb & Ellis Company | | $ | (23,781 | ) | | $ | (41,502 | ) |
| | | | | | | |
Grubb & Ellis Company
Calculation of Earnings per Share
(in thousands)
(Unaudited)
| | | | | | | | | |
| | | Three Months Ended | |
| | | March 31, | | | March 31, | |
| | | 2010 | | | 2009 | |
Numerator for (loss) earnings per share — basic: | | | | | | | | |
| | | | | | | | | |
| Loss from continuing operations | | $ | (24,052 | ) | | $ | (43,771 | ) |
| Less: Net loss attributable to the noncontrolling interests | | | 271 | | | | 1,778 | |
| Less: Preferred dividends | | | (2,897 | ) | | | — | |
| | | | | | | |
| Loss from continuing operations attributable to Grubb & Ellis Company common shareowners | | | (26,678 | ) | | | (41,993 | ) |
| | | | | | | |
| | | | | | | | | |
| Income from discontinued operations attributable to Grubb & Ellis Company common shareowners | | | — | | | | 491 | |
| | | | | | | |
| | | | | | | | | |
| Loss attributable to Grubb & Ellis Company | | | (23,781 | ) | | | (41,502 | ) |
| Less: Preferred dividends | | | (2,897 | ) | | | — | |
| | | | | | | |
| Net loss attributable to Grubb & Ellis Company common shareowners | | $ | (26,678 | ) | | $ | (41,502 | ) |
| | | | | | | |
| | | | | | | | | |
(Loss) earnings per share — basic: | | | | | | | | |
| Loss from continuing operations attributable to Grubb & Ellis Company common shareowners | | $ | (0.41 | ) | | $ | (0.66 | ) |
| Income from discontinued operations attributable to Grubb & Ellis Company common shareowners | | | — | | | | 0.01 | |
| | | | | | | |
| Net loss per share attributable to Grubb & Ellis Company common shareowners | | $ | (0.41 | ) | | $ | (0.65 | ) |
| | | | | | | |
| Weighted average shares outstanding — basic | | | 64,350 | | | | 63,525 | |
| | | | | | | |
| | | | | | | | | |
(Loss) earnings per share — diluted (a): | | | | | | | | |
| Loss from continuing operations attributable to Grubb & Ellis Company common shareowners | | $ | (0.41 | ) | | $ | (0.66 | ) |
| Income from discontinued operations attributable to Grubb & Ellis Company common shareowners | | | — | | | | 0.01 | |
| | | | | | | |
| Net loss per share attributable to Grubb & Ellis Company common shareowners | | $ | (0.41 | ) | | $ | (0.65 | ) |
| | | | | | | |
| Weighted average shares outstanding — diluted | | | 64,350 | | | | 63,525 | |
| | | | | | | |
| | | |
| (a) | | For each of the periods presented, fully diluted earnings per share, as computed in accordance with Earnings Per Share Topic 260, produces an anti-dilutive result. Therefore, the results for fully diluted earnings per share are the same as those for basic earnings per share. |
| First Quarter 2010 Earnings Conference Call May 11, 2010 |
| This presentation contains forward-looking statements within the meaning of the Private Securities Litigation Reform Act of 1995. These statements include assumptions regarding expectations or estimates of future financial and operating results or events, industry and market trends and other market opportunities for Grubb & Ellis. The information in this presentation discusses the state of Grubb & Ellis' business as of the date of presentation. Grubb & Ellis does not assume any obligation to update or correct any information covered herein. There are a number of risks and uncertainties that could cause our actual results to differ materially from those described in the forward-looking statements. For additional information concerning risks that could cause such differences, please refer to our annual report on Form 10-K/A, quarterly reports on Form 10-Q and other filings with the Securities and Exchange Commission. We may make certain statements during the course of this presentation which include references to "non-GAAP financial measures," as defined by SEC regulations. As required by these regulations, we have provided reconciliations of these measures to what we believe are the most directly comparable GAAP measures, which are attached hereto within the appendix. Forward Looking Statements 1 |
| First Quarter Results Transaction Services Revenue ($ in millions) 26% increase Total revenue of $132.5 million Solid growth in Real Estate Services Transaction Services revenue increased 26% Leasing revenue up 15% Sales revenue up 30% Management Services square feet under management of 243 million 2 $33.5 $42.2 $0.0 $15.0 $30.0 $45.0 $60.0 Q1 09 Q1 10 |
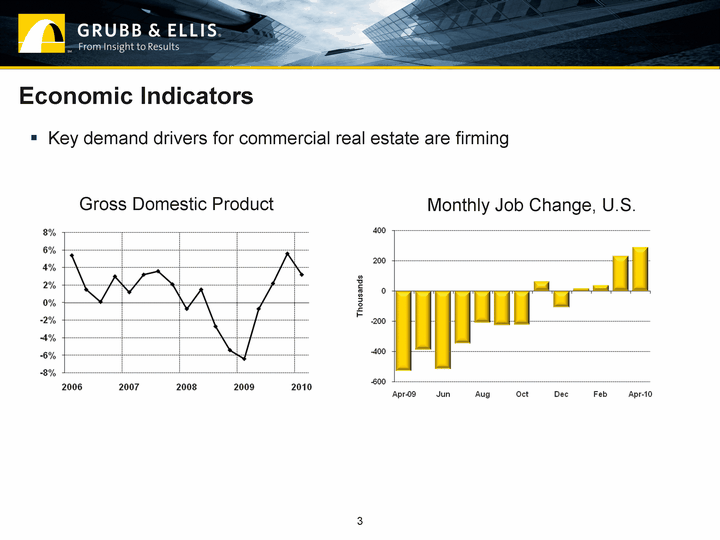
| Economic Indicators 3 Gross Domestic Product Monthly Job Change, U.S. Key demand drivers for commercial real estate are firming |
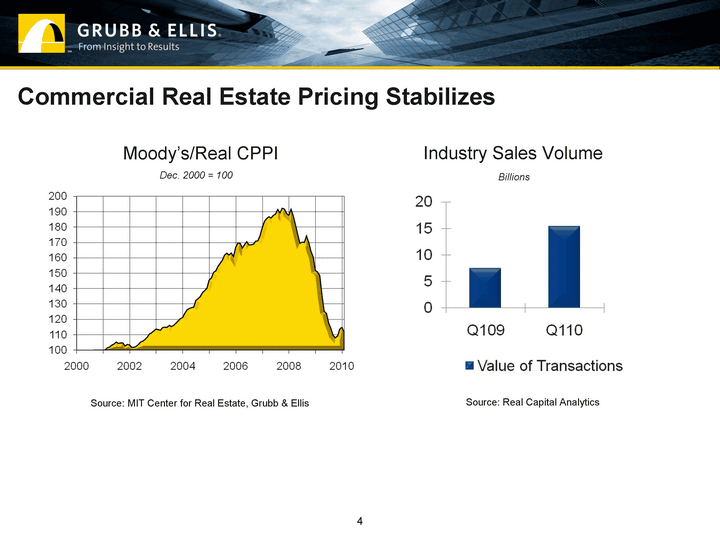
| Commercial Real Estate Pricing Stabilizes 4 Moody's/Real CPPI Dec. 2000 = 100 Source: MIT Center for Real Estate, Grubb & Ellis Industry Sales Volume Source: Real Capital Analytics Billions |
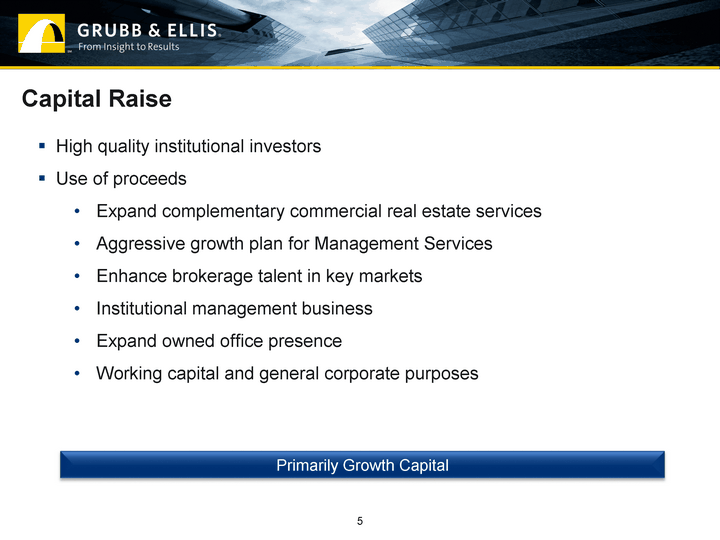
| Capital Raise High quality institutional investors Use of proceeds Expand complementary commercial real estate services Aggressive growth plan for Management Services Enhance brokerage talent in key markets Institutional management business Expand owned office presence Working capital and general corporate purposes 5 Primarily Growth Capital |
| Q1 Financial Results *Includes $3.9 million and $3.7 million, respectively, of rental revenue related to assets held for investment. Revenue* (in millions) 6 $122.2 $132.5 $0.0 $50 $100 $150 Q1 09 Q1 10 8% revenue growth; 33% EBITDA improvement Adjusted EBITDA (in millions) $(11.1) $(16.5) - -$30 - -$20 - -$10 $0 Q1 09 Q1 10 $10 |
| 2010 Guidance *Excludes rental revenue related to assets held for investment and amortization of intangible contract rights Revenue* (in millions) 7 $520 $550-$575 $400 $450 $500 $550 2009 2010 Adjusted EBITDA (in millions) $10-$15 $(24) - -$20 - -$10 $0 $10 2009 2010 $20 - -$30 $20 million of cost reductions and a recovering CRE market $600 |
| Segment Performance ($ in million) Q1 2009 Q1 2010 Management Services $65.5 $72.4 Transaction Services 33.5 42.2 Investment Management 15.7 10.1 Rental Related 7.5 7.8 TOTAL $122.2 $132.5 8 Rental revenue includes $3.9 million and $3.7 million, respectively, of revenue related to assets held for investment. |
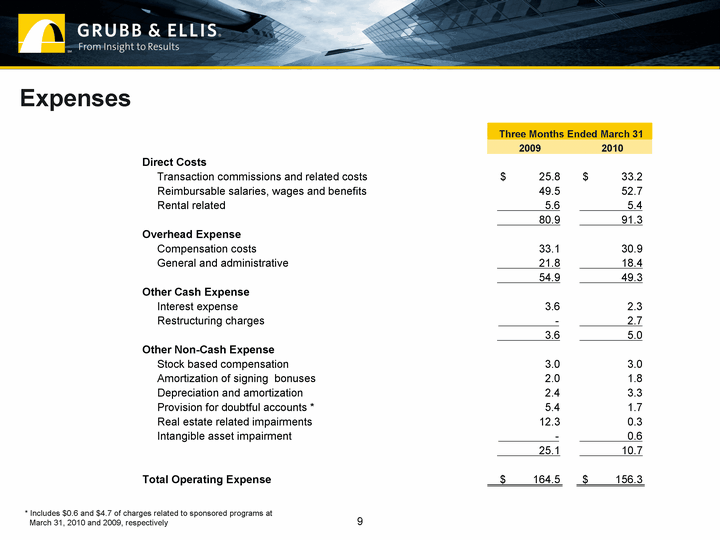
| Expenses 9 Three Months Ended March 31 Three Months Ended March 31 2009 2010 Direct Costs Transaction commissions and related costs $ 25.8 $ 33.2 Reimbursable salaries, wages and benefits 49.5 52.7 Rental related 5.6 5.4 80.9 91.3 Overhead Expense Compensation costs 33.1 30.9 General and administrative 21.8 18.4 54.9 49.3 Other Cash Expense Interest expense 3.6 2.3 Restructuring charges - 2.7 3.6 5.0 Other Non-Cash Expense Stock based compensation 3.0 3.0 Amortization of signing bonuses 2.0 1.8 Depreciation and amortization 2.4 3.3 Provision for doubtful accounts * 5.4 1.7 Real estate related impairments 12.3 0.3 Intangible asset impairment - 0.6 25.1 10.7 Total Operating Expense $ 164.5 $ 156.3 * Includes $0.6 and $4.7 of charges related to sponsored programs at March 31, 2010 and 2009, respectively |
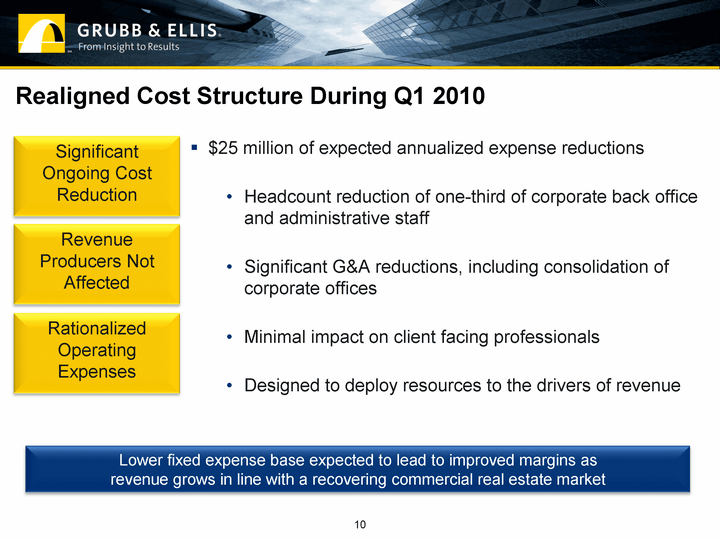
| $25 million of expected annualized expense reductions Headcount reduction of one-third of corporate back office and administrative staff Significant G&A reductions, including consolidation of corporate offices Minimal impact on client facing professionals Designed to deploy resources to the drivers of revenue Realigned Cost Structure During Q1 2010 Lower fixed expense base expected to lead to improved margins as revenue grows in line with a recovering commercial real estate market Significant Ongoing Cost Reduction Revenue Producers Not Affected Rationalized Operating Expenses 10 |
| Balance Sheet Data 11 (1) Excludes $97 million of non-recourse mortgage debt maturing $37 million in 2014 and $60 million in 2017. (2) Assumes exercise by company of two one-year extension options. (3) Notes issuance occurred subsequent to March 31, 2010. Cash $22.5 million at March 31, 2010 $28.0 million net proceeds from convertible note offering(3) Debt(1) No near-term debt maturities $16.3 million senior notes mature 2013(2) $30 million convertible notes mature 2015(3) $10 million recourse mortgage debt matures 2017 2010 2011 2012 2013 2014 2015 2016 2017 |
| Terms of $30.0 Million Unsecured Convertible Senior Notes 12 7.95% interest payable semi-annually Due 2015 Convertible to common shares at $2.24 (17.5% premium) Up to $4.5 million over-allotment option |
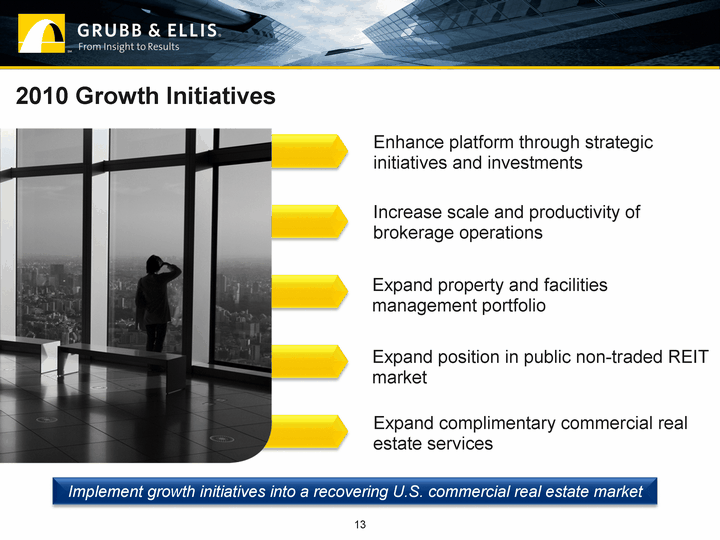
| Expand property and facilities management portfolio Increase scale and productivity of brokerage operations Expand complimentary commercial real estate services 2010 Growth Initiatives Expand position in public non-traded REIT market Enhance platform through strategic initiatives and investments 13 Implement growth initiatives into a recovering U.S. commercial real estate market |
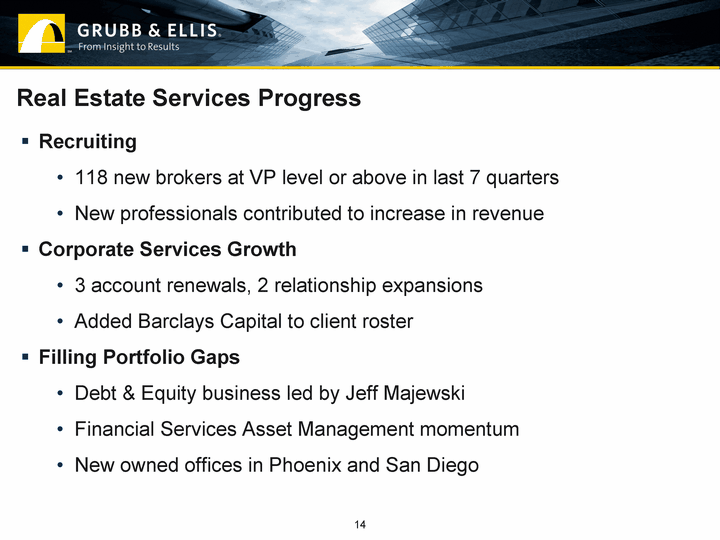
| Real Estate Services Progress 14 Recruiting 118 new brokers at VP level or above in last 7 quarters New professionals contributed to increase in revenue Corporate Services Growth 3 account renewals, 2 relationship expansions Added Barclays Capital to client roster Filling Portfolio Gaps Debt & Equity business led by Jeff Majewski Financial Services Asset Management momentum New owned offices in Phoenix and San Diego |
| Investment Management Progress 15 Began secondary offering fundraising for Grubb & Ellis Apartment REIT in July 2009 Began fundraising for Grubb & Ellis Healthcare REIT II in September 2009 Signed more than 130 selling agreements for both REITs Total REIT equity raise grew by 58 percent quarter-over-quarter Since the beginning of the year, our non-traded REITs have made five acquisitions to date; 4 Healthcare, 1 Apartment |
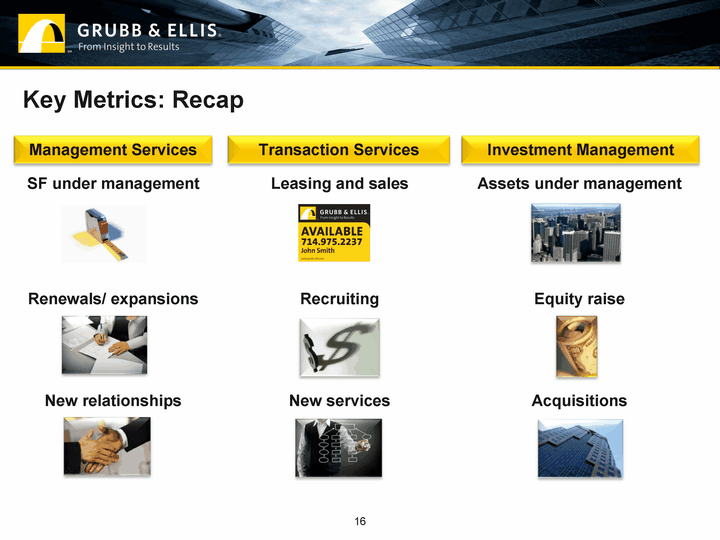
| Assets under management Equity raise Acquisitions Key Metrics: Recap Investment Management SF under management Renewals/ expansions New relationships Leasing and sales Recruiting New services Management Services Transaction Services 16 |
| Reconciliation of Net Loss to Adjusted EBITDA Reconciliation of Net Loss to Adjusted EBITDA Reconciliation of Net Loss to Adjusted EBITDA (in thousands) (in thousands) (in thousands) (Unaudited) (Unaudited) (Unaudited) Three Months Ended March 31 Three Months Ended March 31 2009 2010 Net loss attributable to Grubb & Ellis Company $ (41,502) $ (23,781) Discontinued operations (491) - Interest expense 3,636 2,319 Interest income (145) (46) Depreciation and amortization 2,441 3,258 Intangible assets impairment - 614 Taxes (319) 146 EBITDA (1) (36,380) (17,490) Charges related to sponsored programs 4,677 619 Real estate related impairment 12,272 270 Stock based compensation 2,964 3,019 Amortization of signing bonuses 1,953 1,807 Restructuring charges - 2,730 Real estate operations (1,964) (2,066) Adjusted EBITDA (1) $ (16,478) $ (11,111) (1) EBITDA represents earnings before net interest expense, interest income, realized gains or losses on sales of marketable securities, income taxes, depreciation, amortization, discontinued operations and impairments related to goodwill and intangible assets. Management believes EBITDA is useful in evaluating our performance compared to that of other companies in our industry because the calculation of EBITDA generally eliminates the effects of financing and income taxes and the accounting effects of capital spending and acquisition, which items may vary for different companies for reasons unrelated to overall operating performance. As a result, management uses EBITDA as an operating measure to evaluate the operating performance of the Company's various business lines and for other discretionary purposes, including as a significant component when measuring performance under employee incentive programs. However, EBITDA is not a recognized measurement under U.S. generally accepted accounting principles, or GAAP, and when analyzing the Company's operating performance, readers should use EBITDA in addition to, and not as an alternative for, net income as determined in accordance with GAAP. Because not all companies use identical calculations, our presentation of EBITDA may not be comparable to similarly titled measures of other companies. Furthermore, EBITDA is not intended to be a measure of free cash flow for management's discretionary use, as it does not consider certain cash requirements such as tax and debt service payments. |
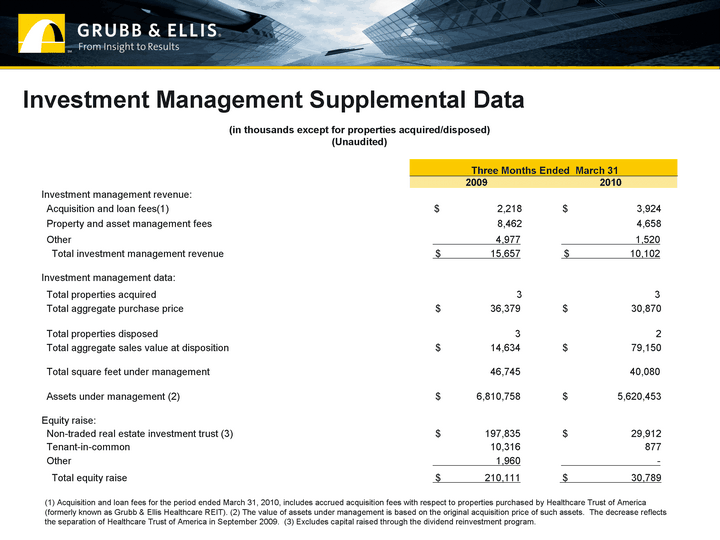
| Investment Management Supplemental Data (in thousands except for properties acquired/disposed) (in thousands except for properties acquired/disposed) (in thousands except for properties acquired/disposed) (Unaudited) (Unaudited) (Unaudited) Three Months Ended March 31 Three Months Ended March 31 2009 2010 Investment management revenue: Acquisition and loan fees(1) $ 2,218 $ 3,924 Property and asset management fees 8,462 4,658 Other 4,977 1,520 Total investment management revenue $ 15,657 $ 10,102 Investment management data: Total properties acquired 3 3 Total aggregate purchase price $ 36,379 $ 30,870 Total properties disposed 3 2 Total aggregate sales value at disposition $ 14,634 $ 79,150 Total square feet under management 46,745 40,080 Assets under management (2) $ 6,810,758 $ 5,620,453 Equity raise: Non-traded real estate investment trust (3) $ 197,835 $ 29,912 Tenant-in-common 10,316 877 Other 1,960 - Total equity raise $ 210,111 $ 30,789 (1) Acquisition and loan fees for the period ended March 31, 2010, includes accrued acquisition fees with respect to properties purchased by Healthcare Trust of America (formerly known as Grubb & Ellis Healthcare REIT). (2) The value of assets under management is based on the original acquisition price of such assets. The decrease reflects the separation of Healthcare Trust of America in September 2009. (3) Excludes capital raised through the dividend reinvestment program. |


