Exhibit 99.e(2)
Contents
Exhibit 99.e(2)
27 May 2004
Budget 2004
Fiscal Strategy Report
The Public Finance (State Sector Management) Bill
This Bill integrates the Fiscal Responsibility Act into the Public Finance Act. This will consolidate the legislation regarding public finances. As well as incorporating additional measures to improve transparency, the Bill proposes changes to distinguish the Budget Policy Statement (BPS) and Fiscal Strategy Report (FSR). Under the existing legislation:
• the BPS requires the Government to set out its long-term fiscal objectives (eg, for the operating balance and debt), and its short-term fiscal intentions with regard to these objectives for the next three years. The BPS must also outline the broad strategic priorities for the coming Budget
• the FSR tabled with the Budget requires the Government to include a comparison of the Budget fiscal forecasts with the short-term fiscal intentions. The FSR also includes longer-term projections for the key fiscal aggregates and an assessment of these projections with the Government’s long-term fiscal objectives.
These requirements mean that the BPS tends to be quite broad in scope, and similar to the FSR in content. Effectively this means that the two documents cover the same material and are published within six months of each other.
The intended change removes the requirement for every BPS to cover high-level fiscal strategy. It will focus more on the priorities for the upcoming Budget. However, if the Government is explicitly changing its high-level fiscal strategy, this would have to be indicated in the BPS. The FSR will become the main document for setting out the Government’s long-term fiscal objectives and short-term fiscal intentions, and how these accord with the principles of responsible fiscal management as stated in the current Fiscal Responsibility Act.
The FSR will also change so as to require the Government to specify the time period to which the long-term fiscal objectives relate. This will be a minimum of 10 years. Under the existing legislation there is only an implicit timeframe associated with the minimum 10-year period for the required fiscal projections. The 2004 FSR incorporates these changes and, by adding to transparency, also remains consistent with the existing reporting requirements of the Fiscal Responsibility Act 1994.
Finally, the Bill will require the Treasury to prepare a statement at least every four years on the long-term fiscal situation. In this statement, the Treasury will assess the risks and outlook over at least a 40-year horizon.
Fiscal Strategy Report
The 2004 Budget Policy Statement (BPS) released in December 2003 set out the overarching fiscal parameters guiding Budget 2004 and outlined the Government’s policy focus. The 2004 Fiscal Strategy Report (FSR) sets out the longer-term fiscal strategy in which the Government’s annual budgets are set.
Over the past five years the New Zealand economy has performed strongly. This, together with careful fiscal management, has resulted in a steady strengthening of the fiscal position. Operating surpluses have increased and gross and net debt levels have been reduced. This has been part of a deliberate fiscal strategy that involves:
• running operating surpluses on average across the economic cycle sufficient to meet New Zealand Superannuation Fund (NZS Fund) contributions
• meeting capital spending pressures and priorities
• maintaining debt at prudent levels.
Progress towards the Government’s fiscal objectives has been more rapid than expected and we are now at the point where additional fiscal policy options have emerged.
The Government’s fiscal policy approach recognises that economic fluctuations will influence the fiscal position and that there is a role for the operation of automatic fiscal stabilisers.(1) This has meant that, to date, we have been cautious not to spend what may have been cyclical increases in operating surpluses. However, the persistence of these surpluses, which would have continued to build under unchanged policy settings and a range of economic scenarios, has made us more confident that structural factors are also at work.
Our decision to change the path of operating surpluses was indicated in the 2003 FSR and confirmed in the 2004 BPS. We signalled that rather than letting the operating surplus continue to rise, we would run OBERAC surpluses, excluding NZS Fund returns, of around 2.5% of GDP and have gross debt-to-GDP tend to drift downward over time.
This FSR demonstrates not only that we are moving forward on key policy objectives, such as Working for Families, but that we remain committed to sound public finances over the long term. We consider it prudent to lower our long-term objective for debt. This is consistent with our aim to put in place arrangements for public finances to cope better with the fiscal impact of demographic change.
Working towards these objectives requires us to continue to focus on increasing economic growth and to maintain good fiscal management.
(1) Automatic fiscal stabilisers are the changes in tax revenue and unemployment spending that occur in response to the economic cycle, without any government decision to alter revenue or expenditure. Automatic fiscal stabilisers make the fiscal position looser in economic downturns and tighter in economic upturns, thus helping to smooth the economic cycle.
The economy is performing strongly…
Over the past year, the economy has performed ahead of expectations. Real GDP growth is estimated to have been at 3.3% in the year to March 2004 against the Budget 2003 forecast of 2.2%, while the unemployment rate has fallen to 4.3% against a forecast of 5.6%. Perhaps even more importantly as far as fiscal outturns are concerned, nominal GDP growth looks like it will grow 7% over the year to June 2004 on the back of stronger-than-expected terms of trade, compared with the 4.4% forecast a year ago.
While slower than the 4.3% recorded in the year to March 2003, the real GDP growth outturn over the past year continues a recent pattern of the economy coming in ahead of expectations. Since the Asian crisis of 1997/98 real economic growth has exceeded the Consensus Forecast for the year ahead in four out of the five calendar years to 2003.
The Treasury expects growth over the next two fiscal years to moderate relative to that seen over 2002/03 and 2003/04, before some rebound later in the forecast period. Over the period as a whole (the four years to March 2008) average per annum growth of around 3% is forecast.
… the underlying fiscal position has improved…
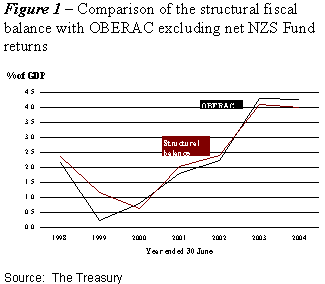
The Government has now achieved its aim of setting Budgets to rebuild the structural fiscal position during the transition to full NZS Fund contributions. Together with careful fiscal management, a strong economic performance has resulted in the Budget Update showing the OBERAC for the year ended 2004 to be over 4% of GDP. Although some of the steady improvement in the OBERAC since 2000 is clearly cyclical, analysis suggests that the majority represents a structural improvement (see Figure 1). Moreover, the fiscal scenarios discussed in the risks and scenarios chapter in this and previous Economic Updates indicate that the fiscal position would remain relatively robust under most plausible scenarios of weaker-than-expected economic conditions.
… and fiscal policy options have emerged
As signalled in the 2004 BPS, the Government has decided to act on the structural improvement in the fiscal position to deliver a social dividend to low- and middle-income families and move forward on other policy objectives, while continuing to meet its long-term fiscal objectives.
Although Budget 2004 is our most significant policy investment yet, with a full operating impact of $3.8 billion, it is a carefully considered adjustment to the structural fiscal position. While spending in the 2004 Budget Update is higher than outlined in the 2004 BPS, reflecting new policy decisions and the assessment of the economic and fiscal outlook, fiscal plans remain consistent with our short-term fiscal intentions. Future Budgets will be smaller. The fiscal forecasts incorporate new operating amounts of $1.8 billion for Budget 2005 and $1.6 billion in Budgets 2006 and 2007. The short-term fiscal intentions set out in this FSR reflect our commitment to Budgets of this smaller scale. Given current economic forecasts, these intentions are to keep core expenses around 32% of GDP by 2007/08. Maintaining this control on spending will ensure we maintain structural operating surpluses of around 3% of GDP.
The Government has undertaken a significant amount of investment in Budget 2004, with new capital spending of $1.3 billion over the next four years. These activities include investment in Auckland infrastructure, a commitment to building new prisons and schools and the purchase of rail infrastructure. The relatively slow decline in gross debt-to-GDP over the next few years reflects these demands, some one-off factors (such as building foreign exchange reserves) and the flow-on effects of the operating impact of Budget 2004.
The net impact of the Government’s spending and tax plans on demand pressures in the economy is likely to be broadly neutral over 2004 and 2005 (ie, neither expansionary nor contractionary). From 2006, the changes generate a relatively modest set of expansionary fiscal impulses, averaging around half a percent of GDP(2).
Nonetheless, the debt objective remains a key element of the Government’s fiscal management approach
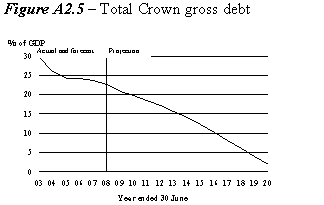
The fiscal forecasts show gross sovereign-issued debt continuing to reduce slowly to 21.8% of GDP by 2008. We are strongly committed to keeping debt-to-GDP below current levels (around 25% of GDP) over the forecast horizon by maintaining significant structural operating balances. However, this commitment does not rule out one-off investment decisions (such as around infrastructure) that could conceivably see the level of debt rise in any one particular year, but that will not threaten our ability to meet our long-term debt objective.
We see it as important that net debt (with NZS Fund assets) continues to fall as a percentage of GDP even in the short term. This shows our ongoing commitment to preparing for the future. Indeed, net debt (with NZS Fund assets) is still falling at rates
(2) The estimated structural fiscal balance adjusts for fluctuations of actual output around trend output. Figure 1 uses a statistical filter to estimate trend output. However, estimates of the structural balance are reasonably robust to other methods of calculating trend output. The Treasury’s analysis of the structural fiscal position and fiscal impulse is set out in the 2003 December Economic and Fiscal Update.
comparable with recent history, even though gross debt-to-GDP is reducing more slowly. Net debt (with NZS Fund assets) is forecast to reach zero in 2008.
The Government is preparing for the future fiscal pressures that will come with an ageing population. We are already more than meeting the long-term debt objective that was specified in the 2002 FSR as:
Manage total debt at prudent levels. In the longer term, gross sovereign-issued debt below 30% of GDP on average over the economic cycle.
With this in mind, we signalled in the 2004 BPS that we would look at lowering the long-term debt objective. We have now decided to change the objective to:
Manage total debt at prudent levels. Gross sovereign-issued debt as a percentage of GDP slowly reducing over the longer term and passing through 20% of GDP before 2015.
This means that the debt objective will play a stronger role as a “fiscal anchor” – a role that has become increasingly important for expenditure control given the move away from setting fiscal provisions, ie, spending caps.
Lower levels of debt-to-GDP also make the fiscal position more robust to economic shocks, reduce debt servicing costs and could make a small positive contribution to the assessment of New Zealand’s credit rating by international agencies.
A lower debt objective will strengthen public finances over the longer term…
Lowering the debt-to-GDP ratio is one approach to strengthening the fiscal position to cope better with future fiscal pressures, including the effects of population ageing on New Zealand Superannuation (NZS) and health spending. Another approach is to smooth costs by making provisions through an accumulation of financial assets, as is the case with the NZS Fund.
If the increases in total age-related spending are long lasting, then under current tax-to-GDP ratios, primary (ie, excluding finance costs) deficits will re-emerge and debt-to-GDP will increase. The timing of this depends on the particular assumptions made about economic growth, interest rates and government spending.
Persistent primary deficits will eventually require lower spending and/or higher taxes. In the interim, a lower debt ratio, and consequently lower financing costs, affords some headroom for age-related spending and will improve the ability to raise debt in the future if necessary. A lower debt ratio also provides time to assess the impact of demographic and other changes and to develop and implement policy responses.
The new debt objective has two aspects:
• The long-term trend decline in the debt-to-GDP ratio.
• The ratio passing through a particular target level.
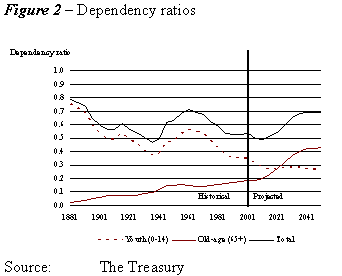
The trend component implies a decline in the debt-to-GDP ratio beyond 2015. This timeframe means that the objective is consistent with the requirements of the Public Finance (State Sector Management) (PF (SSM)) Bill (see box at the start of this Report). It also takes further advantage of the remaining demographic “golden years” – the period over which the increase in dependency ratios is less marked (see Figure 2).
A lower debt objective, together with the NZS Fund, accords with the principles of fiscal management in the Fiscal Responsibility Act by providing a buffer against factors that may adversely impact on debt and net worth in the future. The Government’s other long-term fiscal objectives remain consistent with the change (see Table 1). Our short-term fiscal intentions have been revised to reflect the Government’s plans for the key fiscal aggregates over the next few years. This includes running an OBERAC surplus (excluding net returns on the NZS Fund) of around 3% of GDP. Annex 1 compares the revised intentions with those of the 2004 BPS.
Table 1 – Long-term fiscal objectives
Long-term fiscal objectives | | To achieve the objectives, the Government’s high-level focus is on: |
| | |
Operating balance | | • Operating surpluses (measured by the OBERAC) during the build-up phase of the NZS Fund. The focus is on core Crown revenues and expenses, with tax-to-GDP and core Crown expenses-to-GDP around current levels. • Because the OBERAC surplus includes the net (after-tax) return on the NZS Fund, which the NZS Fund will retain, the Government is |
| |
Operating surplus on average over the economic cycle sufficient to meet the requirements for contributions to the NZS Fund and ensure consistency with the debt objective. | |
Revenue | | effectively targeting OBERAC surpluses excluding the NZS Fund’s retained investment returns. |
Ensure sufficient revenue to meet the | | • A robust, broad-based tax system that raises revenue in a fair and efficient way. |
operating balance objective. | |
| | |
Expenses | | |
| | |
Ensure expenses are consistent with the | | • State-owned enterprises (SOEs) and Crown entities contributing to surpluses, consistent with their legislation and Government policy. |
operating balance objective. | |
| | |
Debt | | • SOEs will have debt structures that reflect best commercial practice. Changes in the level of debt will reflect specific circumstances. • Gross sovereign-issued debt-to-GDP will be reducing during the period ahead of the major demographic changes associated with population ageing. • Net debt, with NZS Fund assets, is expected to fall towards minus 15% of GDP by 2015 (ie, a net financial asset position). |
Manage total debt at prudent levels. Gross sovereign-issued debt as a percentage of GDP slowly reducing over the longer term and passing through 20% of GDP before 2015. | |
| | |
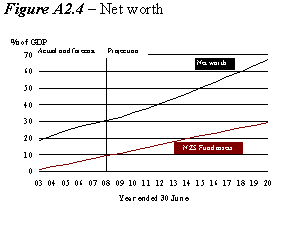
Net worth | | • Increasing net worth consistent with the operating balance objective will see net worth at above 50% of GDP by 2015. • The NZS Fund is expected to be 21% of GDP by 2015. • Consistent with the net worth objective, there will also be a focus on quality investment. |
| |
Increase net worth consistent with the operating balance objective. | |
… and will require the size of Government to remain reasonably stable
The following fiscal projections illustrate likely future progress towards achieving our long-term fiscal objectives. The projections are based on the short-term forecasts in the 2004 Budget Update. Beyond 2008, the projections include an operating allowance consistent with the new operating amount already incorporated in the last years of the forecasts and a capital allowance of $550 million per year. (Other significant assumptions are set out in Annex 2.) The purpose of this operating allowance is to cover new initiatives and cost increases that are not as yet specified. Given the various uncertainties, including policy choices between now and the projection period, actual outcomes are unlikely to match the projections, which are intended to provide a sense of trend in the fiscal aggregates. For example, the actual path of debt-to-GDP will tend to fluctuate with the economic cycle and shocks.
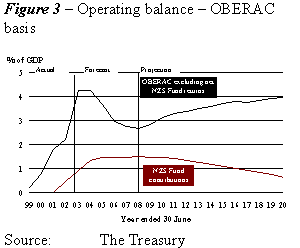
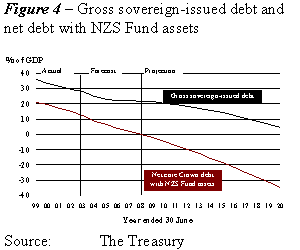
Under the specified economic and fiscal assumptions, the Government is on track to meet its long-term fiscal objectives.(3)
Achieving the new debt objective will require a series of Budgets over the longer term that are more in line with those currently built into the last two years of the fiscal forecasts. This will see the ratio of core expenses-to-GDP remain around 32%.
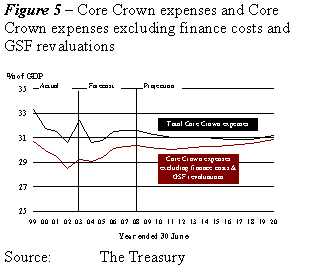
The operating allowance in the projections is not allocated to specific spending areas. Rather, it could be used flexibly to meet a range of factors including new initiatives and bottom-up cost pressures (eg, wage rises). Together, the operating and capital allowances provide a sense of the spending control inherent in the Government’s fiscal strategy, which is needed to meet the new debt objective.
It is likely that the rate of gross debt reduction will increase around 2015 as the student loans scheme matures and contributions to the NZS Fund start to decline. However, sometime in the 2020s, the effects of population ageing and bottom-up cost pressures will put upward pressure on expenses. In the case of NZS, the Government will then start to draw on the accumulated reserves of the NZS Fund.
(3) Projections for the other variables specified as long-term objectives are presented in Annex 2.
Spending pressures are likely to emerge in some sectors
In the health sector, while population ageing will influence future spending, this is only part of the story. Non-demographic cost factors in health are important and have recently been growing at a high rate of almost 4% per capita per year in real terms.
Looking forward, other sectors of government could present future fiscal challenges including, for example, the justice and transport sectors. Changes in the structure of the population may reduce spending pressures in areas such as education that are primarily used by young people. We have acknowledged the importance of keeping an eye on these long-term future fiscal pressures by including in the PF (SSM) Bill a requirement for the Treasury to prepare a statement at least every four years on the long-term fiscal situation. The Treasury will assess the risks and the outlook over at least a 40-year horizon.
Bearing in mind the issues in areas such as health, it is possible that the debt objective will be revisited before the end of the decade in order to reflect new information (eg, developments around demographics and age-related spending) as well as our experience with financial asset management (eg, the NZS Fund). Regardless, the strategy set out in this FSR means we would enter the period of more significant demographic change with a declining debt ratio and a stable ratio of spending to GDP.
We need to continue to make prudent choices now to avoid adding to the fiscal burden on future generations. This means we need to take advantage of the good years immediately ahead of us, so that we are in a better fiscal position to cope with the expected demographic change.
Our commitment to this strategy can be seen in the way we are building up the assets of the NZS Fund, and reducing the debt-to-GDP ratio. We have also included in the PF (SSM) Bill new requirements for the Treasury to produce regular reports on the long-term fiscal position.
It is a testament to our success that we can prepare for tomorrow while fulfilling our policy objectives today.
Hon Dr Michael Cullen
Minister of Finance
20 May 2004
Annex 1
Short-Term Fiscal Intentions
Table A1.1 – Short-term fiscal intentions
2004 Budget Policy Statement | | 2004 Fiscal Strategy Report |
| | |
Operating balance | | |
| | |
Based on new operating amounts for the 2004 Budget, and indicative amounts for the next two Budgets, the operating balance is forecast to be 3.7% of GDP in 2006/07. | | Operating surpluses on an OBERAC basis and excluding net returns on the NZS Fund will be around 3% of GDP, remaining consistent with the long-term objective for the operating balance. |
| | |
If the economic and fiscal outlook evolves as expected, the Government will make changes to its expense and revenue plans. Operating surpluses (on an OBERAC basis) will be lower than current forecasts, at around 3% of GDP, and operating surpluses excluding returns on the NZS Fund (on an OBERAC basis) would be around 2½% of GDP, remaining consistent with the long-term debt objective. | | |
| | |
Debt | | |
| | |
Gross sovereign-issued debt is forecast to be 21.2% of GDP in 2006/07. | | Gross sovereign-issued debt is forecast to be 21.8% of GDP in 2007/08. |
| | |
The Government will set forecast new capital spending amounts that ensure progress is made toward the long-term objective for debt. The Government’s bias is towards lowering rather than raising debt-to-GDP, so there will be a tendency for the ratio to trend downward over time. | | The Government will set forecast new capital spending amounts that ensure progress is made toward the long-term objective for debt. The Government’s bias is towards debt-to-GDP trending down over time. |
| | |
| | Net debt with NZS Fund assets consistently falling as a share of GDP. Net Debt with NZS Fund assets is forecast to be -0.2% of GDP in 2007/08. |
| | |
Expenses | | |
| | |
In 2006/07 total Crown expenses are forecast to be 39.9% of GDP. Within this, core Crown expenses are forecast to be 31.2% of GDP. NZS Fund contributions are forecast to be 1.4% of GDP in 2006/07. | | Total Crown expenses are forecast to be 40.0% of GDP in 2007/08. Core Crown expenses are forecast to be 31.6% of GDP in 2007/08. |
| | |
Based on new operating expense amounts for the 2004 Budget, and indicative amounts for the next two Budgets, total Crown expenses are forecast to be $63.2 billion in 2006/07, and core Crown expenses to be $49.4 billion in 2006/07. | | This is based on new operating expense amounts of $1.8 billion; $1.6 billion; and $1.6 billion for the 2005, 2006 and 2007 Budgets respectively. |
| | |
Revenues | | |
| | |
Total Crown revenues are forecast to be 43.6% of GDP in 2006/07. Within this, core Crown revenues are forecast to be 33.8% of GDP in 2006/07. | | Total Crown revenues are forecast to be 43.1% of GDP in 2007/08. Within this, core Crown revenues are forecast to be 33.8% of GDP in 2007/08. |
| | |
The Government will set revenue plans that ensure progress is made towards the long-term revenue objective | | The Government will set revenue plans that ensure progress is made towards the long-term revenue objective. |
| | |
Net worth Net worth is forecast to be 30.3% of GDP, including NZS Fund assets of 7.4% of GDP, in 2006/07. | | Net worth is forecast to be 30.5% of GDP, including NZS Fund assets of 9.3% of GDP in 2007/08. |
Table A1.2 – Budget Update fiscal forecasts (% of GDP)
Year End June | | 2001 | | 2002 | | 2003 | | 2004 | | 2005 | | 2006 | | 2007 | | 2008 | |
| | Actual | | Forecast | |
Financial Performance | | | | | | | | | | | | | | | | | |
| | | | | | | | | | | | | | | | | |
Total Crown revenue | | 39.1 | | 40.3 | | 44.3 | | 43.7 | | 43.3 | | 43.3 | | 43.2 | | 43.1 | |
Core Crown revenue | | 32.7 | | 32.2 | | 33.9 | | 33.8 | | 33.9 | | 33.8 | | 33.8 | | 33.8 | |
Total Crown expenses | | 38.0 | | 38.5 | | 42.9 | | 39.5 | | 39.5 | | 40.1 | | 40.1 | | 40.0 | |
Core Crown expenses | | 31.5 | | 30.6 | | 32.4 | | 30.6 | | 30.8 | | 31.5 | | 31.6 | | 31.6 | |
OBERAC | | 1.8 | | 2.2 | | 4.3 | | 4.3 | | 3.9 | | 3.3 | | 3.2 | | 3.2 | |
Core Crown operating expenses + contributions to NZS Fund | | 31.5 | | 31.1 | | 33.4 | | 32.0 | | 32.2 | | 33.0 | | 33.0 | | 33.1 | |
OBERAC ex Fund returns | | 1.8 | | 2.2 | | 4.3 | | 4.3 | | 3.7 | | 3.0 | | 2.8 | | 2.7 | |
| | | | | | | | | | | | | | | | | |
Financial Position | | | | | | | | | | | | | | | | | |
| | | | | | | | | | | | | | | | | |
Net worth | | 9.9 | | 15.2 | | 18.5 | | 21.6 | | 24.5 | | 26.8 | | 28.7 | | 30.5 | |
Total Crown gross debt | | 29.8 | | 29.7 | | 29.7 | | 25.9 | | 24.1 | | 24.2 | | 23.7 | | 22.6 | |
Gross sovereign-issued debt | | 31.6 | | 29.2 | | 28.0 | | 24.7 | | 22.6 | | 22.3 | | 22.0 | | 21.8 | |
Core Crown net debt | | 17.2 | | 15.5 | | 13.7 | | 11.5 | | 10.6 | | 10.0 | | 9.4 | | 9.1 | |
Net debt with NZS Fund assets | | 17.2 | | 15.0 | | 12.2 | | 8.7 | | 6.2 | | 4.0 | | 1.8 | | -0.2 | |
| | | | | | | | | | | | | | | | | |
NZS Fund | | | | | | | | | | | | | | | | | |
| | | | | | | | | | | | | | | | | |
Contributions | | 0.0 | | 0.5 | | 0.9 | | 1.4 | | 1.5 | | 1.5 | | 1.5 | | 1.5 | |
NZS Fund returns (after tax) | | 0.0 | | 0.0 | | 0.1 | | 0.1 | | 0.2 | | 0.3 | | 0.4 | | 0.5 | |
Accumulated assets | | 0.0 | | 0.5 | | 1.5 | | 2.8 | | 4.4 | | 6.0 | | 7.6 | | 9.3 | |
The Government’s fiscal intentions indicate its short-term plans are consistent with progress towards its long-term objectives and the principles of responsible fiscal management as specified by the current Fiscal Responsibility Act.
The fiscal forecasts in the Budget Update are consistent with the Government’s short-term fiscal intentions.
Differences between the Budget Update and the short-term fiscal intentions in the 2004 BPS reflect changes in the economic and fiscal forecasts, together with policy changes. These changes are explained in more detail in the fiscal outlook chapter of the Budget Update.
Fiscal Projections
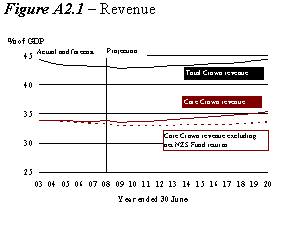
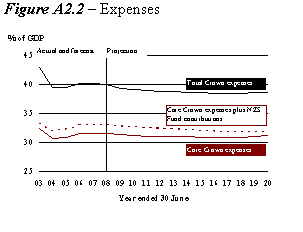
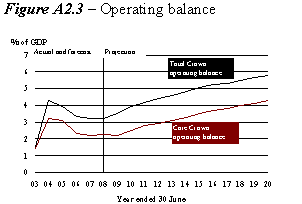
Projections for revenue, expenses, the operating balance, net worth and debt are shown below.
Source: The Treasury
Economic, demographic and fiscal assumptions
From 2004/05 to 2007/08, the fiscal projections incorporate the economic and fiscal forecasts detailed in the Budget Update. Beyond 2007/08, the fiscal projections are based on long-run technical and policy assumptions and are not forecasts. The following assumptions apply beyond 2007/08:
• Nominal GDP grows with labour productivity growth (average annual rate of 1.5%), projected changes in the labour force and inflation (annual rate of 2%).
• Demographic and labour force trends are based on Statistics New Zealand (SNZ) population projections with medium fertility, medium mortality and long-term net migration of 5,000 a year. These projections, which use the 2001 Census as a base, have been updated with SNZ’s 2003-base short-term projections.
• The Treasury has developed its own gender and age-group based model for projecting the labour force, which produces overall labour force numbers that are identical to those in the forecasts. The model’s age profile projections of labour force participation rates are consistent with recent trends in SNZ’s Household Labour Force Survey (HLFS).
As a result, the projections beyond 2007/08 are the result of bottom-up assumptions about the long-run economic drivers of growth. For example, a stronger labour productivity growth assumption will, keeping other factors constant, lead to a higher projection of real GDP growth.
Table A2.1 – Summary of economic assumptions*
June Year(4) | | 2005 | | 2006 | | 2007 | | 2008 | | 2009 | | 2010 | | 2011 | | 2012 | | 2013 | | ….. | | 2020 | |
| | Forecasts | | Projections | |
Labour force growth | | 1.3 | | 1.3 | | 1.5 | | 1.4 | | 1.1 | | 1.0 | | 0.9 | | 0.6 | | 0.5 | | ….. | | 0.2 | |
Unemployment rate | | 4.7 | | 5.0 | | 4.9 | | 4.8 | | 4.8 | | 4.8 | | 4.8 | | 4.8 | | 4.8 | | ….. | | 4.8 | |
Employment growth | | 1.2 | | 1.0 | | 1.6 | | 1.4 | | 1.1 | | 1.0 | | 0.9 | | 0.6 | | 0.5 | | ….. | | 0.2 | |
Labour productivity growth | | 1.4 | | 1.9 | | 1.7 | | 1.6 | | 1.5 | | 1.5 | | 1.5 | | 1.5 | | 1.5 | | ….. | | 1.5 | |
Real GDP | | 2.4 | | 2.8 | | 3.3 | | 3.0 | | 2.6 | | 2.5 | | 2.4 | | 2.1 | | 2.0 | | ….. | | 1.7 | |
Consumer price index (annual % change) | | 2.5 | | 2.3 | | 2.1 | | 2.0 | | 2.0 | | 2.0 | | 2.0 | | 2.0 | | 2.0 | | ….. | | 2.0 | |
Government 10-year bonds (quarterly avg %) | | 6.3 | | 6.0 | | 6.0 | | 6.0 | | 6.0 | | 6.0 | | 6.0 | | 6.0 | | 6.0 | | ….. | | 6.0 | |
Nominal average hourly wage growth | | 4.2 | | 3.8 | | 3.6 | | 3.6 | | 3.5 | | 3.5 | | 3.5 | | 3.5 | | 3.5 | | ….. | | 3.5 | |
* Annual average % change unless otherwise stated.
Sources: The Treasury, Statistics New Zealand
(4) Note that the economic forecasts in the Budget Update are based on a March year.
Table A2.2 – Summary of fiscal assumptions beyond 2007/08
Tax revenue | | GDP linked, with assumptions of constant tax rate boundaries. |
| | |
NZS | | Demographically adjusted and linked to nominal wages after reaching 65% wage floor. |
| | |
Other benefits | | Demographically adjusted and linked to inflation. |
| | |
Health and education | | Demographically adjusted. |
| | |
Finance costs | | A function of debt levels and interest rates. |
| | |
Other | | Not demographically adjusted. |
| | |
Operating allowance | | $1.4 billion (GST inclusive) in 2008/09, increasing at the rate of nominal GDP growth. |
| | |
Capital allowance | | $550 million in 2008/09, growing at the same rate as nominal GDP. |
| | |
NZS Fund | | Contributions to the proposed Fund are assumed to be consistent with the New Zealand Superannuation Fund Act 2001.(5) The expected long run net after-tax annual return assumed is 6.8% per annum. |
Source: The Treasury
Further details of the modelling approach can be found in Treasury Working Paper 00/02 “Manual for the Long-term Fiscal Model”, available at www.treasury.govt.nz.
In addition to the effect of revised short-term fiscal forecasts, the fiscal projections differ from the 2003 FSR for two main reasons:
• The operating allowance has been increased from $1.2 billion to $1.4 billion. This new assumption approximates the $1.6 billion new forecast spending amount in the last year of the fiscal forecasts. (The operating allowance is lower because it does not cover demographic expense increases. These are incorporated in the relevant expense areas.)
• The 2003 FSR included a fiscal drag elasticity assumption of 1.25% (ie, projected tax revenue from individuals was assumed to grow by 1.25% for every percentage point of growth in nominal GDP). All projected tax revenues now grow in line with nominal GDP. This treatment is consistent with that used by other finance ministries and recognises that an aggregate simulation model does not possess the necessary level of detail needed to model fiscal drag accurately. The Treasury incorporates fiscal drag in its individual tax revenue forecasts. Removing the fiscal drag assumption from the projections implicitly suggests that possible changes in tax bases in the projected years will be addressed by changing policy in a revenue-neutral manner.
(5) A more detailed review of the assumptions involved in projecting the NZS Fund contributions and earnings can be found in the 2004 Budget Economic and Fiscal Update. Further details can be found in “Financing New Zealand Superannuation”, a Treasury Working Paper by McCulloch and Frances, available at www.treasury.govt.nz.


