Exhibit 99(e)(2)
Fiscal Strategy Report
The Public Finance Act specifies principles of responsible fiscal management and imposes reporting requirements on the Minister of Finance and the Treasury. The reporting requirements on the Minister include two fiscal responsibility documents: the Fiscal Strategy Report (FSR) and the Budget Policy Statement (BPS). These documents focus on different aspects of the Government’s fiscal policy. The FSR sets out the Government’s long-term fiscal strategy and explains how that strategy accords with the principles of responsible fiscal management. The BPS has a shorter-term focus. The BPS sets out the overarching policy goals that will guide the Government’s Budget decisions and the Government’s priorities for the forthcoming Budget.
In addition, the Treasury is required to publish, at least every four years, a Statement on the Long-Term Fiscal Position looking out at least 40 years. The first Statement must be presented to Parliament by 30 June 2006. The horizon to be covered by the Statement means that it has a different character from the FSR and the BPS, as it will extend across the terms of many more governments, with potentially many different policy regimes.
The table summarises the legislated requirements for each document*.
* For full information see Public Finance Act 1989 Part 2 sections 26F-26N.
Budget Policy Statement | | Fiscal Strategy Report | | Statement on the Long-
term Fiscal Position |
Produced annually before the end of March. | | Produced annually with the Budget. | | Produced at least every four years. |
Requirements: | | Requirements: | | Requirements: |
| | | | |
• state broad strategic priorities for the forthcoming Budget | | • state long-term objectives for fiscal policy | | • prepare a statement on the long-term fiscal position relating to a period of at least 40 years |
| | | | |
• state any changes to long-term objectives | | • explain how the objectives accord with the principles of responsible fiscal management | | • disclose significant assumptions |
| | | | |
• state any changes to short-term intentions | | • provide projections of likely progress against long-term fiscal objectives | | • the Treasury to use its best professional judgments about the risks and the outlook. |
| | | | |
• explain how the changes in objectives and short-term intentions accord with the principles of responsible fiscal management. | | • state short-term intentions (3 or more years) and their consistency with long-term objectives and the Economic and Fiscal Update (EFU). | | |
Fiscal Strategy Report
Introduction
The Government’s fiscal strategy is an integral part of our overall approach to economic management. Continued economic growth and rising employment provide the means for New Zealand’s society to create a higher standard of living and a better quality of life.
The Government’s fiscal position is strong. Probably for the first time in our history, the Crown has moved into a positive net financial asset position. This positive position is the result of the Government’s commitment over the last two terms to building up financial assets and reducing gross debt. We will continue to strengthen our fiscal position to help meet future spending pressures. Given we are now satisfied that a prudent level of debt is in sight, we will implement our strategy primarily by building up financial assets in the New Zealand Superannuation (NZS) Fund and maintaining gross debt at around 20% of GDP.
An ageing population and rising health costs pose particular challenges to the public finances. Greater labour market participation helps to reduce the fiscal costs of providing superannuation now and in the future. The NZS Fund will provide income to help future governments to meet growing New Zealand Superannuation costs. Sustained economic growth and rising participation also help provide the means to fund growing health costs. Ultimately, however, the size of the fiscal pressures New Zealand faces means that there will need to be some policy adjustment by governments over the coming decades.
In order to keep debt stable, we intend to run our cash position so that borrowing tracks in line with GDP over time. In practice, this means that we will continue to run operating surpluses sufficient to enable us to meet the contributions to the NZS Fund and some of our other capital spending needs. This strategy helps deliver macroeconomic stability, limits the public debt burden faced by current and future generations, and ensures that over time, the New Zealand current account reflects private saving and investment decisions.
Over the past six years the economy has grown strongly and we allowed the additional revenue to flow through to the fiscal position in the form of large operating surpluses. Once we were confident that a large share of this revenue growth was structural and would be continued into the future, we decided to reduce the forecast operating and cash position, to bring them more into line with our long-term objectives rather than overachieving on them.
The decisions taken in this and the previous two Budgets resulted in higher operating and capital spending. This increased spending, together with the expected slowdown in revenue growth associated with the slowdown in the economy, sees the operating balance decline over the next few years and the cash position move into deficit.
The Economic and Fiscal Update shows that the Government’s measure of the underlying operating fiscal surplus (the operating balance excluding revaluations and accounting
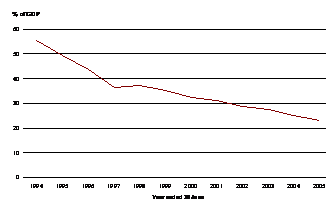
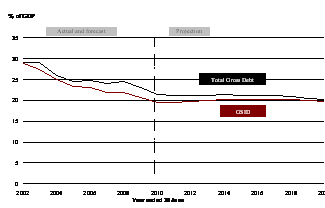
changes, OBERAC) is expected to fall from 4.5% of GDP in the current year to 3.6% in 2006/07 and 2.6% a year later, before recovering to 2.9%. In the current year, gross sovereign-issued debt (GSID) is higher than previously forecast, at around 23%, mainly due to decisions by the Reserve Bank to increase the settlement cash target used in its liquidity management operations. Over the next few years GSID is expected to decline to 19.4% of GDP in 2009/10.
This Fiscal Strategy Report emphasises the Government’s commitment to maintaining gross debt at around 20% of GDP over the medium term. The long-term projections confirm that we are on track to meet our objectives. At the same time, we recognise that there is a significant infrastructure challenge. The Government has made infrastructure spending a priority since it was elected in 1999, with spending on land transport alone of $10.3 billion since then. This emphasis continues in the current term. The Government intends to tackle these challenges and is prepared, if necessary, over the short term to see gross debt rise slightly above its medium-term target.
With the fiscal position in good shape, our approach to fiscal management is to look through the temporary effects of the cycle and maintain our current revenue and expense intentions. The expected economic slowdown is built into the fiscal and economic forecasts. In the event that the slowdown is more pronounced than expected or it has more of an impact on the fiscal position, we intend to continue to let the automatic stabilisers operate and to look through any short-term effects on the operating balance or debt.
Fiscal Strategy and Long-term Objectives
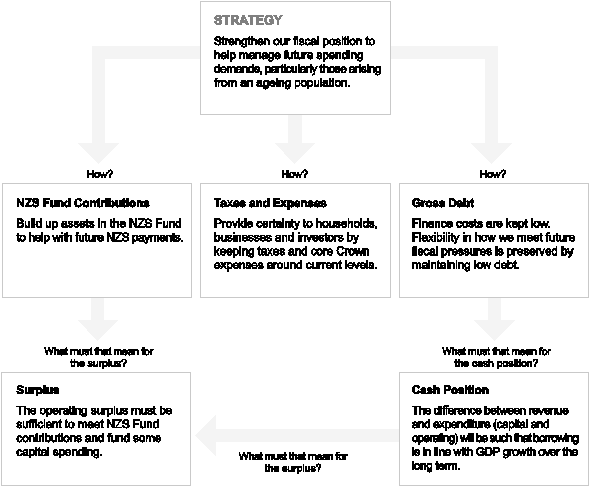
The Government’s fiscal strategy is to strengthen our fiscal position so that it is well placed to respond to future challenges, including those associated with population ageing and the increasing demand for healthcare. The Fiscal Strategy Report sets out how we intend to give effect to this strategy though the long-term objectives (as set out in Annex 1). The strategy is summarised in Figure 1.
Figure 1 — Fiscal strategy at a glance
The Government’s fiscal strategy accords with the principles of responsible fiscal management set out in the Public Finance Act. These principles require the Government to:
• reduce total debt to prudent levels
• maintain debt at prudent levels by ensuring, on average over time, total operating expenses do not exceed total operating revenues
• achieve and maintain levels of net worth that provide a buffer against factors that may adversely impact on net worth in the future
• manage prudently the fiscal risks facing the Government
• pursue policies that are consistent with a reasonable degree of predictability about the level and stability of tax rates in the future.
This Fiscal Strategy Report represents something of a watershed in that for the first time a government is reporting that it is satisfied that a prudent level of debt is in sight. We are now shifting the emphasis to maintaining debt at around 20% of GDP and continuing to strengthen our financial position through the contributions to the NZS Fund, rather than continuing to reduce gross debt.
Building a secure future through maintaining low and stable debt…
Gross debt has fallen markedly since the early 1990s. Based on forecasts in the 2005 Half Year Economic and Fiscal Update (HYEFU) that GSID would fall to around 20% of GDP in 2006/07, the Government decided that it would be appropriate to shift the focus of its debt objective away from reducing debt further towards ensuring that debt remains anchored around 20% of GDP over the long term. Although current forecasts show GSID will fall more slowly than forecast in the HYEFU, we consider that the revised debt objective clarifies the Government’s intentions and its view of the way that fiscal policy should operate over the short to medium term.
Figure 2 – Gross sovereign-issued debt has fallen markedly
Source: The Treasury
Our revised long-term debt objective is to:
Manage debt at prudent levels. Gross sovereign-issued debt broadly stable at around 20% of GDP over the next 10 years.
This objective reflects our view that, with gross debt at low levels, temporary deviations from the target level are of less concern than the forecast trend path of debt. This objective also recognises that there are a range of events, such as cyclical developments in the economy, which may cause the level of debt to depart temporarily from its longer-term trend. In these cases, spending and revenue plans can be maintained with debt moving temporarily higher (lower) as the operating surplus falls (rises) in response to slower (faster) growth. By allowing debt to move in this way, we are allowing fiscal policy to moderate some of the effects of economic cycles. This occurs through the automatic fiscal stabilisers(1). The Government also considers that operating a medium-term fiscal policy will in turn induce more stable private sector investment, by providing certainty about the Government’s policy intentions.
During the upside of the cycle we took care to ensure that the temporary gains were saved so that we would be in the position we are now in, where we do not need to adjust revenue and expense settings. Projections in this FSR show that the operating balance is
(1) Automatic fiscal stabilisers are the changes in tax revenue and spending on unemployment benefits arising from changes in GDP growth over the economic cycle, without any government decision to alter revenue or expense parameters. Automatic fiscal stabilisers lead to reduced revenue and increased expenses in economic downturns and vice versa in upturns, which helps to smooth the swings in the cycle.
expected to remain in surplus and that the debt ratio is stable. But, as the projections of expenses and revenues show, achieving these outcomes requires the maintenance of firm fiscal management. Adjustments to fiscal policy will be made, where necessary, to prevent a sustained departure in the ratio of debt to GDP.
The volatility of reported gross debt is likely to increase following the introduction of the International Financial Reporting Standards (IFRS) for the Crown accounts in 2007/08, to the extent that fair values are increasingly used for measuring financial liabilities. The level of gross debt will also likely record a one-off increase following the introduction of IFRS. This one-off increase will come on top of any increase from proposed changes to the Reserve Bank’s liquidity management operations. Looking forward it will be important to ensure that our fiscal objectives and the indicators we use to assess progress against our objectives remain appropriate and enable us to look through short-term volatility to the medium and long-term path of the fiscal position.
…and building up financial assets…
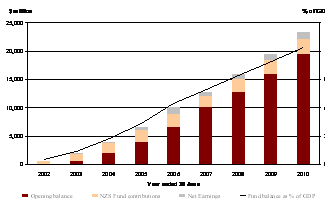
In 2001, the Government established the NZS Fund to meet some of the expected New Zealand Superannuation costs that will be faced by future generations. Our fiscal strategy is to ensure contributions to the NZS Fund are, in most years, able to be met from current revenues. The sum of contributions and investment returns is expected to reach $10 billion by June 2006.
Figure 3 – Assets in the NZS Fund are growing
Source: The Treasury
The NZS Fund will continue to grow over the years ahead, so that by 2010, the NZS Fund will stand at around $23 billion. From about 2028, withdrawals from the NZS Fund will begin. The NZS Fund will continue to pay tax and will grow in nominal terms due to interest earned on accumulated assets.
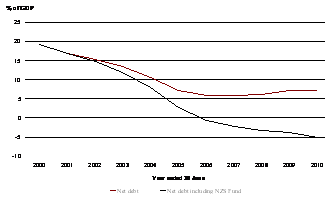
Figure 4 – Net debt including the NZS Fund is now a net asset
Source: The Treasury
The Government’s savings are reflected in net government debt and total Crown net worth. For the first time since records began in 1972 and probably for the first time in our history, net debt including NZS Fund assets is below zero. The Government is now in a positive net financial asset position.
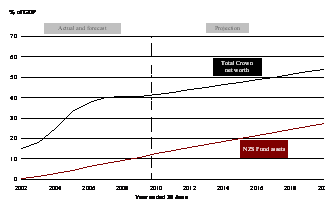
The substantial increase in total Crown net worth, from around 15% of GDP in 2002 to around 37% of GDP now, results from the progress we have made in reducing debt, building assets in the NZS Fund, and investing in infrastructure and other capital.
Figure 5 – Net worth grows as the NZS Fund grows
Source: The Treasury
…requires operating surpluses.
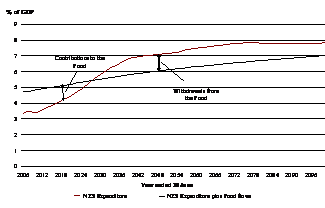
The Government’s fiscal strategy involves running operating surpluses over the long term. By using current income to make contributions to the NZS Fund and meet some of its capital spending priorities, the Government is able to maintain a stable path for debt and taxes over the long term.
We recognise that, as a general rule, keeping revenues and expenses in at least broad balance is consistent with good fiscal performance and with the requirements of the Public Finance Act. However, given the future fiscal costs of population ageing, we have chosen
to help future governments sustain current superannuation entitlements by setting aside some of today’s surplus. That is, part of today’s surplus will be returned to today’s workers when they retire.
Figure 6 – Setting aside income today smoothes net superannuation expenses over time
Source: The Treasury
Note: NZS is presented net of tax
In managing towards our operating balance objective we focus on the core Crown, including departments, the Reserve Bank, Government Superannuation Fund (GSF) and NZS Fund(2).
We aim to achieve our operating balance objective within the context of keeping core Crown revenue (excluding NZS Fund returns) at around current levels of 33% of GDP over the long term. Net returns from the NZS Fund are expected to grow from around 0.7% of GDP today to around 1.5% of GDP in 2020, and are retained by the NZS Fund, which means they are not available for spending until around 2028. Over the period to 2020, contributions to the NZS Fund are expected to decline to less than 1% of GDP from around 1.5% currently.
At the same time, the Government also aims to keep core Crown expenses at around 32% of GDP over the long term(3). This means that, net of NZS Fund returns and contributions, we require core Crown operating surpluses of around 1% of GDP on average over the cycle to maintain our objective of a low and stable gross debt path. Higher operating or capital spending would lead to higher debt.
Together, our revenue and expense intentions mean that we will achieve our objective of budget surpluses over the cycle through a disciplined and prioritised approach to spending and not through recourse to increased taxation.
Cash deficits are expected in the short term
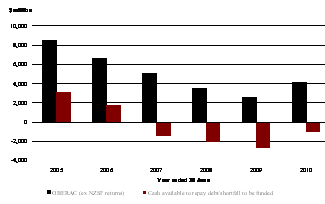
The Budget Economic and Fiscal Update (BEFU) shows that the forecast increase in spending generates cash deficits, which peak at around 1.5% of GDP in 2008/09. Cash
(2) Total Crown revenues and expenses include the activities of State-owned enterprises and Crown entities.
(3) The long term in this instance corresponds with the 15-year horizon in the projections. Over this period, superannuation expenses rise gradually as our population ages.
deficits arise because the operating balance contains a number of retained and non-cash components (such as retained earnings of State-owned enterprises (SOEs) and the NZS Fund, and depreciation expenses) and because the sum of operating and capital spending exceeds the cash available in that particular year. That is, even if the Government’s objective was to achieve balanced budgets in every period, it would still need to borrow to meet its capital investment priorities. By meeting some capital spending from current income the Government is able to invest more than otherwise without increasing the relative debt burden faced by future generations.
Alleviating infrastructure constraints, such as roading, is vital to this Government’s objective of boosting productivity and the rate of sustainable growth. This Government has made infrastructure a priority, with spending of $10.3 billion on land transport alone since 1999, and is prepared, if necessary, to see gross debt rise slightly above its long-term objective of 20% over the short term.
Capital demands are also evident across a range of other expenditure areas including health, education and justice. To help meet capital spending demands and maintain consistency with the debt objective, the Government will balance priorities across operating and capital spending and switch between operating and capital spending where appropriate. The Government is also looking to reallocate expenditure to provide better value for money through a range of expenditure reviews.
Recent Economic and Fiscal Developments
Economic growth is slowing...
New Zealand is coming off a period of very strong economic growth. This strong growth has put considerable pressure on resources. Unemployment has fallen markedly and labour force participation has increased, boosting total gross earnings by over 6% per year in the past six years. Other indicators of capacity utilisation also reached very high levels during the last half of 2005.
There is now clear evidence, however, that the economy has entered a period of slower growth. A cyclical slowing of the economy has been expected for some time, but slower economic growth finally took hold in the second half of 2005, and for domestic demand only in the last quarter.
Figure 7 – Fiscal policy will be expansionary
Source: The Treasury
The Treasury’s forecasts show that year-on-year growth is expected to slow further over 2006, led by an easing in domestic demand growth, before rebounding in 2007 and 2008 to trend or above trend growth rates. The depreciation of the New Zealand dollar and strong global demand is expected to support an export-led recovery in GDP growth. The full benefit of the lower exchange rate will not be realised until well into next year, due to factors such as production lags in the agriculture sector. At the same time, public demand is expected to expand and to help support the economy through the period of slower growth.
During the immediate slowdown, the Government will continue to act prudently and will keep a watch on developments. We will allow the automatic stabilisers to work and do not see a need to reduce expenditure growth or raise taxes to maintain a sound and sustainable fiscal position. The long-term operating balance objective is set over the economic cycle to better allow fiscal policy to support monetary policy, rather than work against it.
The Budget Economic and Fiscal Update forecasts falling revenue growth and stable expenditure growth. This translates into an OBERAC that declines over the forecast period from $7.0 billion (4.5% of GDP) in the current year to $5.4 billion (2.9% of GDP) by 2009/10. Gross debt rises in dollar terms, but declines slowly as a proportion of GDP as the dollar increase in debt is lower than the forecast for nominal GDP growth.
…constraining Budget 2006 and short-term intentions.
As signalled last year, additional operating spending in Budget 2006 is less than what was allocated in each of the last two Budgets. Consistent with the 2006 BPS, Budget 2006 allocates an additional $2.2 billion in operating expenses in 2006/07, rising to $2.5 billion in 2009/10. Budget 2006 also provides an additional $2.7 billion new capital spending over the next four years with $1.3 billion delivered in 2006/07. Operating allowance allocations for Budgets 2007, 2008 and 2009 remain unchanged at around $1.9 billion in 2007, rising by 2% per year, as indicated in the 2006 BPS. Capital spending for Budgets 2007, 2008 and 2009 is $860 million, $570 million and $640 million respectively.
While these expenditure initiatives make an important contribution towards achieving the Government’s goals, the revenue side remains an important part of our fiscal strategy. A priority for the Government over the coming year is to conduct a major review of business taxation, to ensure that the business tax system provides better incentives for productivity gains and improves competitiveness with Australia. Proposals for consultation will be released in the middle of the year, with the intention for changes to take effect from 1 April 2008.
In making decisions for Budget 2006, we have been mindful of economic circumstances. Spending more than currently projected or reducing taxes would lead to an increase in gross debt and put further pressure on monetary policy. Additionally, the structural and cyclical decline in the operating surplus creates a very tight fiscal environment.
Revenue Strategy
The Government will ensure tax policy decisions are consistent with the overall fiscal strategy including the Government’s long-term revenue objective. The Government intends to implement its fiscal strategy with tax to GDP around current levels.
The Government’s wider policy objectives for the next three years include encouraging productivity, growth and savings. The quality and design of tax policy has an important role to play in support of these objectives.
The Government is also committed to a fair distribution of the tax burden and a robust tax system where people pay their intended rates of tax.
The Government will continue to promote sound administration of the tax system and clear and effective tax rules that minimise administration and compliance costs.
The Government will give consideration to the composition of taxation to meet the government’s equity and spending objectives at lowest economic cost.
The Government will consider the use of tax exemptions and concessions only in the context of the full range of policy options and only if the benefits can be shown to outweigh the costs for New Zealand.
The Government, through its confidence and supply agreements with United Future and New Zealand First, is committed to:
• the business tax review (both agreements)
• a new tax rebate regime for charities (United Future)
• a discussion document on income splitting (United Future)
• a new taxation regime for the racing sector (New Zealand First).
Long-term Fiscal Outlook
Maintaining debt around current prudent levels…
The Government’s primary objective for fiscal policy is to ensure sound public finances in the long term. As noted above, we have made significant progress towards meeting our fiscal objectives.
Our assessment is that gross debt has now been reduced to prudent levels and that the benefits from further significant reductions in gross debt are considerably lower than they were previously.
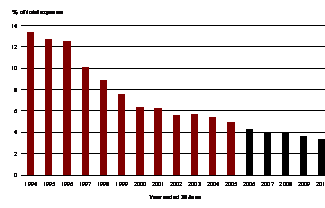
Figure 8 – Debt finance costs are a small proportion of total government spending
Source: The Treasury
We came to this view because we believe that gross debt is no longer a constraint on the capacity of fiscal policy to “look through” temporary economic shocks; financing costs are a relatively small proportion of total government spending; and gross debt is low by international standards. The Government is also building up financial assets, so that net debt has been eliminated. On the other hand, we still need to be conscious of the large net liability position of the economy as a whole.
Further reductions in debt also need to be weighed against the Government’s other economic and social objectives, including its capital spending programme and policies to increase New Zealand’s sustainable growth rate.
In order to meet the objective of keeping GSID broadly stable at around 20% of GDP, the pace of borrowing will need to remain broadly in line with the growth in GDP over the long term. The Government believes that we can afford some borrowing for some expenditure above the growth rate of GDP that provides offsetting growth and revenue benefits, which will ensure that over time debt as a proportion of GDP remains stable. The Government undertakes many activities that, while socially valuable, do not generate direct financial or growth benefits. There are a great many such projects and borrowing for these projects needs to be constrained, and priorities set, if debt is to remain stable as a proportion of GDP.
Figure 9 – Debt is low by international standards
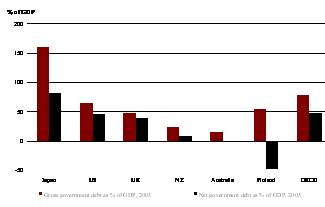
Sources: OECD Economic Outlook 78, Treasury Crown Financial Statements, December 2005. Note: For New Zealand, we use gross sovereign-issued debt for gross debt and net core Crown debt including the NZS Fund for net debt.
By utilising some portion of current revenues, and constraining expenditure growth, we are able to contribute more to infrastructure and other priority policies, such as reducing charges on student loans, than otherwise.
…leads to an increased reliance on building assets in the NZS Fund.
With GSID expected to remain around current levels over time, the NZS Fund becomes the Government’s principal means to continue strengthening net worth.
To achieve this, operating surpluses will need to continue.
The Government remains committed to running operating surpluses, albeit at lower levels than in the recent past. The OBERAC is an important measure of the Government’s fiscal performance, but as noted above, it is the changes and trends within the core Crown accounts that provide a better indicator of the Government’s fiscal stewardship. Our policy decisions are guided by measures of the operating balance that exclude the NZS Fund returns, as these returns are not available for current spending.
Projections
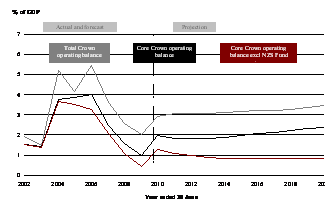
The following fiscal projections illustrate likely future progress towards achieving our long-term fiscal objectives. The projections are based on the forecasts in the BEFU. The fiscal projections carry forward the operating and capital allowances of around $2.1 billion and $750 million respectively, and increase them at the rate of 2% per year. Actual outcomes will likely depart from those projected here, particularly given the uncertainty around the nature of the current slowdown and the time horizon of the projections.
Figure 10 – Operating surpluses are maintained
Source: The Treasury
Operating balance
The operating balance is projected to stabilise at around 3% of GDP, and then to drift upwards, reflecting growing NZS Fund returns. Surpluses that come from State-owned enterprises and Crown entities are retained by these entities. What is left of the surplus is the core Crown operating balance. The core Crown operating balance declines to around 1% of GDP in 2008/09 and then recovers to average around 2% of GDP over the next 10 years. Excluding net NZS Fund returns, the core Crown operating balance averages close to 1% of GDP.
With NZS Fund contributions also expected to average about 1% of GDP over the projection period, the core Crown surplus (excluding net NZS Fund returns) is fully allocated.
Figure 11 – Gross sovereign -issued debt is broadly stable around 20% of GDP
Source: The Treasury
Debt
With GSID currently projected to be close to our long-term objective, there is little scope for increases in spending or reductions in revenue beyond those already included in our plans.
Revenue and expenses
The Government’s long-term revenue and expense objectives are set so as to be consistent with achieving our operating balance objective.
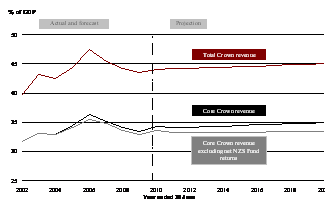
For our revenue projections, we adopt a conservative approach and assume that taxes grow with nominal GDP beyond 2009/10. In practice, taxes will tend to grow somewhat faster than GDP as the growth in personal incomes pushes individuals into higher tax brackets. Our decision to inflation-index personal income tax rates reduces this effect, but real factors, such as productivity growth, higher real wages and increases in participation rates, are still present. As a result, future revenue may actually be higher than projected and provide the Government with some additional flexibility.
Figure 12 – Revenue remains around current levels
Source: The Treasury
Total Crown revenue is projected to rise slightly over the next 15 years, reflecting the growing returns from the NZS Fund. Excluding NZS Fund returns and returns from SOEs and other Crown entities, core Crown revenue remains around current levels of 33% of GDP over the projection period.
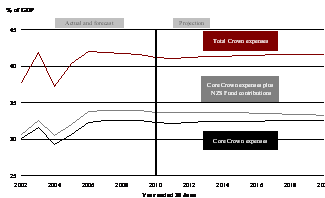
Figure 13 – Expenses are stable
Source: The Treasury
Core Crown expenses are expected to be broadly stable at around 32% of GDP over the forecast and projection periods. Total Crown expenses are also stable.
Looking forward
The Treasury is preparing the first Statement on the Long-Term Fiscal Position, to be published in June. This Statement is required by the Public Finance Act and will help raise awareness and understanding of the fiscal issues arising over coming decades.
Conclusion
The Government has built a reputation for prudent fiscal management. The Government has advanced significant policy programmes in the short and medium term, while at the same time being fiscally responsible over the longer term. The current Government’s fiscal strategy – managing its operating and capital expenditure to continue to build up financial assets through the NZS Fund and maintain debt at prudent levels – has put future governments in a better position to manage the demographic and other cost pressures that New Zealand will face.
It is a testament to our success that we can prepare for tomorrow while fulfilling our policy objectives today.
Hon Dr Michael Cullen
Minister of Finance
10 May 2006
Annex 1
Long-term Fiscal Objectives
The new debt objective is consistent with the principles of responsible fiscal management, laid out in the Public Finance Act, as the Government believes it will have reached prudent debt levels by the end of the forecast period. Thereafter, the Government will maintain debt at prudent levels, consistent with the principles. The Government’s other long-term fiscal objectives remain consistent with this change.
Table A1.1 – Long-term fiscal objectives
Long-term fiscal objectives | | To achieve the objectives, the Government’s high-
level focus is on: | |
| | | |
Operating balance
| | | |
Operating surplus on average over the economic cycle sufficient to meet the requirements for contributions to the NZS Fund and ensure consistency with the debt objective. Revenue Ensure sufficient revenue to meet the operating balance objective. Expenses Ensure expenses are consistent with the operating balance objective. | | • Operating surpluses (measured by the OBERAC) during the build-up phase of the NZS Fund. The focus is on core Crown revenues and expenses, with tax to GDP and core Crown expenses to GDP around current levels. • Because the OBERAC surplus includes the net (after-tax) return on the NZS Fund, which the NZS Fund will retain, the Government is effectively targeting OBERAC surpluses excluding the NZS Fund’s retained investment returns. • Ensure tax policy decisions are consistent with the overall fiscal strategy including the Government’s long-term revenue objective. • SOEs and Crown entities contributing to surpluses, consistent with their legislation and Government policy. | |
| | | |
Debt
| | | |
Manage total debt at prudent levels. Gross sovereign-issued debt broadly stable at around 20% of GDP over the next 10 years. | | • SOEs will have debt structures that reflect best commercial practice. Changes in the level of debt will reflect specific circumstances. • Gross sovereign-issued debt to GDP will be broadly stable over the period ahead of the major demographic changes associated with population ageing. • Net debt, with NZS Fund assets, is expected to fall towards minus 12% of GDP by 2016 (i.e., a net financial asset position). | |
| | | |
Net worth
| | | |
Increase net worth consistent with the operating balance objective. | | • Increasing net worth consistent with the operating balance objective will see net worth a little below 50% of GDP by 2016. • The NZS Fund is expected to be above 21% of GDP by 2016. • Consistent with the net worth objective, there will also be a focus on quality investment. | |
Annex 2
Short-term Fiscal Intentions
Table A2.1 – Short-term fiscal intentions
2006 Fiscal Strategy Report | | 2006 Budget Policy Statement |
| | |
Operating balance Based on operating amounts for the 2006 Budget and indicative amounts for the 2007 and 2008 Budgets, the operating surplus on an OBERAC basis and excluding net returns on the NZS Fund, is forecast to be around 2% of GDP over the next three years, remaining consistent with the long-term objective for the operating balance. | | Operating balance Based on operating amounts for the 2006 Budget, and indicative amounts for the next two Budgets, the operating surplus on an OBERAC basis and excluding net returns on the NZS Fund will be around 2% of GDP across the forecast horizon, remaining consistent with the long-term objective for the operating balance. |
| | |
Debt Total debt is forecast to be 21.4% of GDP in 2009/10. Gross sovereign-issued debt is forecast to be 19.4% of GDP in 2009/10. The Government will set forecast new operating and capital spending amounts over the next three years that are consistent with the long-term objective for debt. | | Debt Gross sovereign-issued debt is forecast to be 19.3% of GDP in 2009/10. The Government will set forecast new capital spending amounts that ensure progress is made toward the long-term objective for debt. The Government’s bias is towards debt to GDP trending down over time. |
| | |
Expenses Total Crown expenses are forecast to be 41.3% of GDP in 2009/10. Core Crown expenses are forecast to average 32.5% over the forecast period and be 32.3% of GDP in 2009/10. This assumes new operating expense amounts of $1.9 billion for the 2007 Budget, rising by 2% per Budget for 2008 and 2009. | | Expenses Total Crown expenses are forecast to be 41.1% of GDP in 2009/10. Core Crown expenses are forecast to average 32.3% over the forecast period and be 32.4% of GDP in 2009/10. This assumes new operating expense amounts of up to $2.4 billion for the 2006 Budget and $1.9 billion rising by 2% for the 2007, 2008 and 2009 Budgets (GST exclusive). |
| | |
Revenues Total Crown revenues are forecast to be 44.1% of GDP in 2009/10. Within this, core Crown revenues are forecast to be 34.2% of GDP in 2009/10. The Government will set revenue plans over the next three years that ensure progress is made towards the long-term revenue objective. | | Revenues Total Crown revenues are forecast to be 43.7% of GDP in 2009/10. Within this, core Crown revenues are forecast to be 34.1% of GDP in 2009/10. The Government will set revenue plans that ensure progress is made towards the long-term revenue objective. |
| | |
Net worth Net worth is forecast to be 37.4% of GDP in 2005/06, 40.2% in 2006/07, 40.6% in 2007/08, 40.5% in 2007/08, and 41.4% of GDP in 2009/10, excluding NZS Fund assets it is forecast to be 29.0% of GDP in 2009/10. | | Net worth Net worth is forecast to be 39.4% of GDP in 2009/10. Excluding NZS Fund assets it is forecast to be 26.9% of GDP. |
The Government’s fiscal intentions are consistent with progress towards meeting its long-term objectives and the principles of responsible fiscal management, as specified by the Public Finance Act. The fiscal forecasts in the BEFU are consistent with the Government’s short-term intentions. Differences between short-term intentions set out in
the 2006 FSR and those in the 2006 BPS reflect changes in the economic and fiscal forecasts, together with policy changes. These changes are discussed in more detail in the BEFU.
Table A2.2 – Budget Economic and Fiscal Update fiscal forecasts (% of GDP)
| | 2003 | | 2004 | | 2005 | | 2006 | | 2007 | | 2008 | | 2009 | | 2010 | |
Year end June | | Actual | | Forecast | |
Financial Performance | | | | | | | | | | | | | | | | | |
Total Crown revenue | | 43.2 | | 42.4 | | 44.4 | | 47.4 | | 45.4 | | 44.3 | | 43.5 | | 44.1 | |
Core Crown revenue | | 33.1 | | 33.0 | | 34.5 | | 36.3 | | 35.1 | | 34.2 | | 33.5 | | 34.2 | |
Total Crown expenses | | 41.9 | | 37.3 | | 40.4 | | 42.1 | | 41.9 | | 41.8 | | 41.6 | | 41.3 | |
Core Crown expenses | | 31.7 | | 29.2 | | 30.6 | | 32.3 | | 32.7 | | 32.6 | | 32.5 | | 32.3 | |
OBERAC | | 4.2 | | 4.7 | | 5.9 | | 4.5 | | 3.6 | | 2.6 | | 2.0 | | 2.9 | |
Core Crown operating expenses + contributions to NZS Fund | | 32.6 | | 30.6 | | 32.0 | | 33.8 | | 33.9 | | 33.9 | | 33.9 | | 33.7 | |
OBERAC ex Fund returns | | 4.2 | | 4.6 | | 5.6 | | 4.2 | | 3.2 | | 2.1 | | 1.4 | | 2.2 | |
Financial Position | | | | | | | | | | | | | | | | | |
Net worth | | 18.0 | | 24.9 | | 33.1 | | 37.4 | | 40.2 | | 40.6 | | 40.5 | | 41.4 | |
Total Crown gross debt | | 29.0 | | 25.6 | | 24.4 | | 24.9 | | 24.0 | | 24.5 | | 23.2 | | 21.4 | |
Gross sovereign-issued debt | | 27.4 | | 25.0 | | 23.2 | | 23.0 | | 21.9 | | 21.9 | | 20.7 | | 19.4 | |
Core Crown net debt | | 13.3 | | 10.7 | | 7.1 | | 5.8 | | 5.8 | | 6.1 | | 7.1 | | 7.2 | |
Net debt with NZS Fund assets | | 11.9 | | 7.9 | | 2.8 | | (0.6 | ) | (2.2 | ) | (3.2 | ) | (3.7 | ) | (5.2 | ) |
Cash | | | | | | | | | | | | | | | | | |
Net cash flows from core Crown operations | | 3.7 | | 3.9 | | 5.7 | | 5.2 | | 2.9 | | 1.9 | | 1.1 | | 2.0 | |
Available to pay debt/(required to be financed) | | 0.9 | | 0.4 | | 2.1 | | 1.1 | | (0.9 | ) | (1.2 | ) | (1.5 | ) | (0.6 | ) |
NZS Fund | | | | | | | | | | | | | | | | | |
Contributions | | 0.9 | | 1.3 | | 1.4 | | 1.5 | | 1.3 | | 1.3 | | 1.4 | | 1.4 | |
NZS Fund returns (after tax) | | 0.1 | | 0.1 | | 0.3 | | 0.7 | | 0.4 | | 0.5 | | 0.6 | | 0.7 | |
Accumulated assets | | 1.4 | | 2.8 | | 4.3 | | 6.4 | | 8.0 | | 9.4 | | 10.8 | | 12.4 | |
Annex 3
Projection Assumptions
From 2005/06 to 2009/10, the fiscal projections incorporate the economic and fiscal forecasts detailed in the Budget Economic and Fiscal Update. Beyond 2009/10, the fiscal projections are based on long-run technical and policy assumptions and are not forecasts. The following assumptions apply beyond 2009/10:
• nominal GDP grows with assumed labour productivity growth (average annual rate of 1.5%), projected changes in the labour force and inflation (average annual rate of 2%), and
• demographic and labour force trends are based on Statistics New Zealand (SNZ) population projections with medium fertility, medium mortality and long-term net migration of 10,000 a year. These projections are based on SNZ 2004 National Population Projections, updated with the Treasury’s short-term migration and population estimates to ensure consistency with the BEFU forecasts.
The projections beyond 2009/10 are the result of assumptions about the long-run economic drivers of growth. For example, a stronger labour productivity growth assumption will, keeping other factors constant, lead to a higher projection of real GDP growth.
Table A3.1 – Summary of economic assumptions*
| | 2006 | | 2007 | | 2008 | | 2009 | | 2010 | | 2011 | | 2012 | | 2013 | | 2014 | | ..... | | 2020 | |
June Year(4) | | Forecasts | | Projections | |
| | | | | | | | | | | | | | | | | | | | | | | |
Labour force | | 1.8 | | 0.6 | | 0.9 | | 1.3 | | 1.6 | | 1.2 | | 0.8 | | 0.9 | | 0.8 | | | | 0.6 | |
Unemployment rate** | | 3.8 | | 4.6 | | 4.7 | | 4.4 | | 4.5 | | 4.5 | | 4.5 | | 4.5 | | 4.5 | | | | 4.5 | |
Employment | | 1.7 | | (0.2 | ) | 0.8 | | 1.6 | | 1.5 | | 1.2 | | 0.8 | | 0.9 | | 0.8 | | | | 0.6 | |
Labour productivity growth*** | | (0.2 | ) | 2.0 | | 2.9 | | 1.7 | | 1.6 | | 1.5 | | 1.5 | | 1.5 | | 1.5 | | | | 1.5 | |
Real GDP | | 1.5 | | 1.5 | | 3.7 | | 3.3 | | 3.1 | | 2.7 | | 2.3 | | 2.4 | | 2.3 | | | | 2.1 | |
Consumer price index (annual % change) | | 3.3 | | 3.2 | | 2.3 | | 2.0 | | 2.0 | | 2.0 | | 2.0 | | 2.0 | | 2.0 | | | | 2.0 | |
Government 10-year bonds (quarterly % rate) | | 5.8 | | 5.9 | | 6.0 | | 6.0 | | 6.0 | | 6.0 | | 6.0 | | 6.0 | | 6.0 | | | | 6.0 | |
Nominal average hourly wage | | 4.7 | | 3.9 | | 3.5 | | 3.5 | | 3.4 | | 3.5 | | 3.5 | | 3.5 | | 3.5 | | | | 3.5 | |
* Annual average % change unless otherwise stated.
** Level of unemployment.
*** Full-time equivalent employed measure.
Sources: The Treasury, Statistics New Zealand
(4) Note that the economic forecasts in the Budget Economic and Fiscal Update are based on a March year.
Table A3.2 – Summary of fiscal assumptions
Tax revenue | GDP linked, with assumptions of constant tax rate boundaries. |
NZS | Demographically adjusted and linked to nominal wages after reaching 65% wage floor. |
Other benefits | Demographically adjusted and linked to inflation. |
Health and education | Demographically adjusted. |
Finance costs | A function of debt levels and interest rates. |
Other | Not demographically adjusted. |
Operating allowance | $1.8 billion (equivalent to $2.1 billion adjusted for demographic growth) in 2010/11, increasing at the rate of 2% per annum. |
Capital allowance | $750 million in 2010/11, increasing at the rate of 2% per annum. |
NZS Fund | Contributions to the Fund are assumed to be consistent with the New Zealand Superannuation Fund Act 2001(5). |
Source: The Treasury
For the FSR projections, expenses are modelled using a “top-down” approach (with the exception of New Zealand Superannuation, which is always modelled so as to capture demographics and wage adjustments). The demographic adjustments in health and education mean that nominal spending will be affected by population changes (both total and composition). In the case of “other benefits”, there is both a demographic and an inflation adjustment (to reflect benefit indexation to the CPI). Other expenses (e.g., core government) are not demographically or inflation adjusted. On an ex post basis, the ”operating allowance” will be allocated across expense areas to reflect choices about non-demographic factors such as wages and new initiatives. This modelling approach provides a sense of the top-down aggregate expenditure control inherent in a particular fiscal strategy.
An alternative approach is to model expenses on a “bottom-up” basis. There is no operating allowance in the bottom-up approach. Rather, expense areas are modelled to capture demographics, inflation and a real growth factor (typically in per capita or per recipient terms). The growth factor can be varied to reflect different views about cost and policy drivers. This modelling approach provides a sense of spending trends, aggregate and by sector, under alternative assumptions. This approach is often used in very long term fiscal modelling and analysis. The Treasury’s forthcoming Statement on the Long-term Fiscal Position will use this approach.
For more information on the LTFM please refer to www.treasury.govt.nz/ltfm/.
The fiscal projections differ from the 2005 FSR because of changes in both the economic outlook and our projection methods, particularly those resulting from changes in the way we project labour force participation.
(5) The Budget Economic and Fiscal Update provides details on contributions over the next four years. Further details can be found in “Financing New Zealand Superannuation”, a Treasury Working Paper 01/20, available at www.treasury.govt.nz/workingpapers/2001/01-20.asp.
LTFM projections of labour-force participation rates have divided the population into five-year age cohorts from 15-19 years through to 60-64 years and 65+. In the past, the LTFM has taken a two-stage approach to projecting labour force participation rates. First, the LTFM allowed rates for each cohort to adjust over the first four years of the projections. Then the LTFM holds the rate arrived at in the final year constant for the remainder of the projection period.
The Treasury has changed the approach to allow participation rates after the initial four-year period to continue to change. The technique takes into account explicitly the evolution of lifetime profiles of participation. It is based on the calculation of the probability of labour market entry and labour market exit for each of the latest cohorts available. These probabilities are kept constant and projected into the future.
Given the historical trend towards rising participation across most cohorts (especially older cohorts and female cohorts), the LTFM now projects slightly higher levels of nominal GDP growth and higher revenue growth over the projection period, which improves both the expected financial performance and financial position of the Crown. Part of this improvement occurs through the interaction with NZS Fund contributions. NZS Fund contributions decline over the projection horizon because future NZS expenses decline as a proportion of GDP, reducing the size of the NZS Fund required to finance future spending.
The Treasury has also made a number of other technical changes to the LTFM to improve its performance and transparency. The LTFM now provides information on the main aggregates on a segmented basis (core Crown, SOE, CE and eliminations).


