Exhibit 99.(d)(2)
Financial Statements of the Government
of New Zealand
for the Year Ended 30 June 2007
10 October 2007
© Crown Copyright Reserved
ISBN 0-478-29370-4
Prepared and furnished to the House of Representatives in accordance with Part III of the Public Finance Act 1989
Contents
Statement of Responsibility
Ministerial Statement
Commentary on the Financial Statements
Introduction
Summary
Comparison with Estimated Actual
The New Zealand Superannuation Fund
Physical Assets
Prior Year Comparison
Indicators of the Government’s Fiscal Performance
Historical Information
Report of the Auditor-General
Financial Statements
Statement of Financial Performance
Analysis of Expenses of the Statement of Financial Performance
Statement of Cash Flows
Reconciliation of Net Cash Flows from Operations to Operating Balance
Statement of Financial Position
Analysis of Key Components of the Statement of Financial Position
Statement of Movements in Equity
Statement of Borrowings
Statement of Commitments
Statement of Quantifiable Contingent Liabilities and Contingent Assets
Statement of Segments
Statement of Accounting Policies
Notes to the Financial Statements
Additional Statements on Core Crown
Core Crown Cash Flow Reconciliation to Government Stock Issues
Statement of Unappropriated Expenditure
Statement of Emergency Expenditure, Expenses or Liabilities
Statement of Trust Money
Supplementary Information
Government Reporting Entity as at 30 June 2007
Information on Property, Plant and Equipment
Information on SOEs and Crown Entities
Statement of Responsibility
These financial statements have been prepared by the Treasury in accordance with the provisions of the Public Finance Act 1989. The financial statements comply with generally accepted accounting practice.
The Treasury is responsible for establishing and maintaining a system of internal control designed to provide reasonable assurance that the transactions recorded are within statutory authority and properly record the use of all public financial resources by the Government. To the best of my knowledge, this system of internal control has operated adequately throughout the reporting period.
John Whitehead
Secretary to the Treasury
28 September 2007
I accept responsibility for the integrity of these financial statements, the information they contain and their compliance with the Public Finance Act 1989.
In my opinion, these financial statements fairly reflect the financial position of the Government as at 30 June 2007 and its operations for the year ended on that date.
Hon Dr Michael Cullen
Minister of Finance
28 September 2007
Ministerial Statement
Continued economic growth and rising employment provide the means for New Zealand’s society to create a higher standard of living and a better quality of life.
The Government’s fiscal position is strong. This is no accident. It reflects many years of sound and prudent economic and fiscal management and a period of strong, sustained economic growth. This positive position is the result of the Government’s commitment over the last three terms to reduce debt and more recently build up financial assets.
The financial statements for the year ended 30 June 2007 will be the last set prepared on a current GAAP basis, with future reporting being on an NZ IFRS basis. They show an Operating Balance excluding Revaluations and Accounting Changes (OBERAC) surplus of $7.9 billion or 4.8 percent of gross domestic product (GDP). This compares with $8.6 billion (5.5 percent) for the previous year. After allowing for capital investment the government recorded a cash surplus of $2.6 billion, down from $3.0 billion in the year ended 30 June 2006. Most of the cash surplus has already been built into spending and tax plans.
The New Zealand Superannuation Fund earned $1.1 billion for the year ended 30 June 2007, once again exceeding expectation and meaning the Fund’s balance has grown faster than expected. At 30 June 2007 the NZS Fund assets stood at $13.0 billion.
Gross sovereign-issued debt (GSID) increased by $0.7 billion in 2006/07 to $36.2 billion, but fell as a percentage of GDP. At 21.7 percent of GDP, GSID is consistent with the Government’s long term debt objective of GSID broadly stable at 20 percent of GDP over the next 10 years, especially if looking through the Settlement Cash levels held by the Reserve Bank. When the Government took office in 1999 GSID was close to 35% of GDP — having met the challenge of reducing debt to prudent levels, the next challenge is to maintain fiscal discipline by keeping debt around current levels.
Net core Crown debt was $3.4 billion (2.1 percent of GDP). Including the assets of the NZS Fund, the Crown was in a net financial asset position of $9.6 billion (5.7 percent of GDP).
The financial results show the Government is implementing fiscal policy in line with its stated fiscal strategy of strengthening the fiscal position so that it is well placed to respond to future challenges such as those associated with population ageing and to have a buffer against external shocks. Along with some unexpected delays in departmental spending, progress against the Government’s fiscal intentions was faster than expected as a result of stronger economic activity and inflation over the latter part of the fiscal year. Allowing revenue to increase is consistent with our policy of letting automatic stabilisers operate and looking through the temporary effects of the economic cycle. The net result of these developments is that the Government was removing significantly more demand from the economy than forecast at Budget time — it would be difficult to argue that the Government is contributing to inflationary pressure.
Looking forward we will continue to strengthen our fiscal position to help meet future spending pressures, but at a much slower pace than experienced over recent years. We continue to expect the OBERAC surplus to fall and net cash flows to move from surplus to deficit over the forecast horizon reflecting a combination of policy intentions and solid but slower economic growth.
Hon Dr Michael Cullen
Minister of Finance
28 September 2007
Commentary on the Financial Statements
Introduction
The Government’s fiscal strategy (outlined in more detail in the 2007 Fiscal Strategy Report) is to strengthen its fiscal position so that it is well placed to respond to future challenges such as those associated with population ageing. The strategy is summarised in Figure 1.
The Government intends to implement this strategy primarily by building up financial assets in the New Zealand Superannuation (NZS) Fund and maintaining gross debt at around 20% of GDP. In order to keep debt stable, the Government has said that it intends to run its core cash position so that core borrowing tracks in line with GDP over time. In practice, this means running operating surpluses sufficient to cover the contributions to the NZS Fund and some other capital spending needs.
The Financial Statements of the Government provide a record of the Government’s financial performance over the 2006/07 financial year and its financial position as at 30 June 2007. They provide a comparison with the fiscal forecasts in the 2007 Budget Economic and Fiscal Update and with the 2005/06 financial statements. These Financial Statements will be the last set prepared on a current GAAP basis, with future reporting being on an NZ IFRS basis. They also provide the public with a snapshot of the progress the Government has made in implementing its fiscal strategy, as set out in the Short Term Fiscal Intentions and Long Term Objectives of the Fiscal Strategy Report.
Figure 1 — Fiscal strategy at a glance
Summary
The Government has recorded an Operating Balance excluding Revaluation and Accounting Changes (OBERAC) of $7.9 billion compared to a Budget forecast of $7.4 billion.
Including revaluation changes the operating balance for the total Crown for 2006/07 was $8.7 billion against a Budget forecast of $6.6 billion.
Taxation revenue was $0.7 billion ahead of forecast, primarily in relation to GST ($0.3 billion) and corporate tax ($0.4 billion).
Core Crown expenses were $0.8 billion below forecast and net surpluses of State-owned enterprises and Crown entities were $0.7 billion ahead of forecast. Decreases in the valuations of the Accident Compensation Corporation (ACC) and Government Superannuation Fund (GSF) liabilities of $0.7 billion and $1.2 billion respectively had a significant impact on these variances.
Core Crown residual cash at $2.6 billion was $0.9 billion ahead of forecast.This was primarily due to higher than expected tax receipts of $0.5 billion, and core Crown operating and capital and underspending of $0.5 billion and $0.3 billion respectively. These variances were offset by lower than expected other operating receipts of $0.4 billion.
Gross sovereign-issued debt at $36.2 billion has increased by $0.7 billion since 2005/06, but fell as a percentage of GDP. At 21.7% of GDP this is consistent with the Government’s long term debt objective of GSID being broadly stable at 20% of GDP over the next 10 years. Looking through the Settlement Cash balances of $7.5 billion held by the Reserve Bank, GSID was $28.7 million or 17.2% of GDP.
Net core Crown debt has fallen to $3.4 billion, or 2.1% of GDP. Including the assets of the New Zealand Superannuation (NZS) Fund, the Government was in a net financial asset position of $9.6 billion or 5.7% of GDP. At 30 June 2007 NZS Fund assets stood at $13.0 billion, following the statutory contribution of $2.0 billion and income after tax of $1.1 billion.
Table 1 — Summary of fiscal indicators
| | 30 June 2007 actual | | Estimated actual | | 30 June 2006 actual | |
| | $million | | % of GDP | | $million | | % of GDP | | $million | | % of GDP | |
Operating Balance | | 8,663 | | 5.2 | | 6,568 | | 4.0 | | 11,473 | | 7.3 | |
OBERAC | | 7,920 | | 4.8 | | 7,380 | | 4.5 | | 8,648 | | 5.5 | |
Residual cash | | 2,648 | | 1.6 | | 1,720 | | 1.0 | | 2,985 | | 1.9 | |
Gross Sovereign Issued Debt | | 36,150 | | 21.7 | | 37,217 | | 22.6 | | 35,461 | | 22.5 | |
Net core Crown Debt | | 3,433 | | 2.1 | | 4,612 | | 2.8 | | 7,745 | | 4.9 | |
Net core Crown debt with NZS Fund assets | | (9,556 | ) | (5.7 | ) | (8,306 | ) | (5.0 | ) | (2,116 | ) | (1.3 | ) |
Net Worth | | 95,836 | | 57.5 | | 88,460 | | 53.7 | | 71,403 | | 45.4 | |
GAAP (old GAAP) and NZ IFRS (new GAAP)
These financial statements have been prepared in accordance with Generally Accepted Accounting Practice (GAAP) which encompasses approved Financial Reporting Standards — so called “old GAAP”. These are the last set of Government Financial Statements to be prepared under old GAAP. From 1 July 2007 the Financial Statements of the Government will be prepared in accordance with New Zealand equivalents to International Financial Reporting Standards (NZ IFRS — “new GAAP”). Information on the impact of NZ IFRS on the financial statement is on page 89.
Comparison with Estimated Actual
This section compares the actual 2006/07 financial results for key fiscal indicators with the 2007 estimated actual forecast released in the 2007 Budget Update.
It follows the fiscal strategy framework, looking first at variances in the operating balance for the whole of Crown ie, including SOEs and Crown entities [see page 6]. It then identifies adjustments to the operating balance necessary to strip out valuation and accounting changes (OBERAC changes), and how these have changed since the estimated actual forecast, and then looks at variances in residual cash compared with forecast.
How operating balance flows translate to OBERAC, which includes SOE and Crown entity activity, and then to the residual cash available to the core Crown is explained in the following table.
Table 2 — Reconciliation to residual core Crown cash
Operating balance to core Crown cash position reconciliation
| | | | 30 June 2007 | | 30 June 2007 | | | | 30 June 2006 | |
| | | | Actual | | Estimated Actual | | Variance | | Actual | |
| | | | $million | | $million | | $million | | $million | |
| | Core Crown revenue | | 60,880 | | 60,241 | | 639 | | 59,508 | |
Less | | Core Cown expenses | | 53,742 | | 54,514 | | 772 | | 50,238 | |
Plus | | Net surpluses/(deficits) of SOEs and Crown entities | | 1,525 | | 841 | | 684 | | 2,203 | |
Equals | | Operating balance | | 8,663 | | 6,568 | | 2,095 | | 11,473 | |
Less | | OBERAC adjustments | | | | | | | | | |
| | Revaluation changes | | 743 | | (812 | ) | 1,555 | | 1,471 | |
| | Accounting changes | | — | | — | | — | | 1,354 | |
Equals | | OBERAC | | 7,920 | | 7,380 | | 540 | | 8,648 | |
Less | | Net return on the NZS Fund (excluding revaluation changes) | | 675 | | 718 | | (43 | ) | 580 | |
Equals | | OBERAC less NZS Fund retained earnings | | 7,245 | | 6,662 | | 583 | | 8,068 | |
Less | | Net retained surpluses of SOEs and Crown entities | | 2,316 | | 1,835 | | (481 | ) | 1,179 | |
| | Non-cash items and working capital movements | | (3,605 | ) | (3,105 | ) | 500 | | (1,970 | ) |
Equals | | Net core Crown cashflow from operations | | 8,534 | | 7,932 | | 602 | | 8,859 | |
Less | | Contribution to NZS Fund | | 2,049 | | 2,049 | | — | | 2,337 | |
Equals | | Net core Crown cashflow from operations after contributions to NZS Fund | | 6,485 | | 5,883 | | 602 | | 6,522 | |
Less | | Purchase of physical assets | | 1,806 | | 2,141 | | (335 | ) | 1,826 | |
| | Advances and Capital injections | | 2,031 | | 2,022 | | 9 | | 1,711 | |
Equals | | Residual Cash | | 2,648 | | 1,720 | | 928 | | 2,985 | |
Revenue and Expenses
The key drivers of revenue and expense variances against forecast are as follows:
| | Variance | | Key drivers |
Total Crown operating balance
(2007 Estimated actual) | | $6.6 billion | | |
| | | | |
Core Crown | | | | |
| | | | |
Taxation revenue | | +$0.7 billion | | GST +$0.3 billion — higher than expected nominal consumption, reflecting growth in prices (inflation) and some increased volumes. Corporate Tax +$0.4 billion — higher than forecast tax assessments across a number of sectors, plus an increase in tax due to a reduction in the provision against tax due in respect of certain structured finance transactions. |
| | | | |
Other revenue | | -$0.1 billion | | |
| | | | |
Expenses | | -$0.8 billion | | GSF -$1.2 billion — The GSF pension liability movement was lower than expected primarily due to an increase in valuation discount rates since the time of the Budget Update. Education -$0.2 billion — Primarily relates to the reversal of previous impairments of the Student Loan portfolio based on updated data received on the collectability of Student Loans at year end. Health -$0.2 billion — Underspends generally in relation to Health Services funding and Primary Care funding. Economic and industrial services -$0.1 billion — Represents underspends in relation to lower operating costs to run the Whirinaki power station and lower spending on funding provided to large budget screen productions due to applicants not meeting milestones. Transport -0.1 billion — Slower than expected implementation on rail projects. Core government services +$0.5 billion — Primarily relates to an increase in the provision for tax doubtful debts. Defence +$0.1 billion — Relates to revaluation losses on military equipment driven by foreign exchange rate movements since the Budget Update. Top- down adjustment +$0.5 billion — The forecast included an adjustment of $0.5 billion to account for timing delays in departmental operating spending. |
| | | | |
Total core Crown | | +$1.4 billion | | |
| | | | |
Net SOE/CE returns | | +$0.7 billion | | ACC +$0.7 billion — ACC unfunded liability movement was lower than expected primarily due to an increase in valuation discount rates since the time of the Budget Update. Land Transport NZ +$0.2 billion — Relates to timing delays in roading providers making funding claims. This is partly due to delays in obtaining resource consents for certain projects. Air New Zealand -$0.2 billion — Primarily due to devaluation of aircraft assets due to changes in foreign exchange rates since the time of the Budget Update. |
| | | | |
Total variance | | +$2.1 billion | | |
| | | | |
Total Crown operating balance
(2007 Actual) | | $8.7 billion | | |
OBERAC
The operating balance of $8.7 billion includes the impact of revaluation and accounting changes. Removing these items gives us an OBERAC of $7.9 billion. The following table outlines the adjustments made to the operating balance to arrive at the OBERAC.
Table 3 — Reconciliation between the operating balance to OBERAC
| | Actual | | Estimated actual | | Variance against estimated actual | |
| | $million | | $million | | $million | |
Operating balance | | 8,663 | | 6,568 | | 2,095 | |
Add back accounting changes and valuation items | | | | | | | |
Net GSF valuation movement | | (1,129 | ) | 108 | | (1,237 | ) |
ACC valuation movement | | 301 | | 1,023 | | (722 | ) |
NPF guarantee | | (49 | ) | — | | (49 | ) |
Kyoto liability movement | | 48 | | — | | 48 | |
Loss on asset revaluations | | 284 | | — | | 284 | |
Other equity investment gains and currency exposure | | (198 | ) | (319 | ) | 121 | |
OBERAC | | 7,920 | | 7,380 | | 540 | |
Residual cash
The operating balance represents the difference between total operating revenue and total operating expenses. Not all of the operating balance reported by the Government is available to assist in the Government’s capital expenditure programme. This is because:
· Some parts of the Government’s operations are restricted and are not available for redistribution. For example, the activity of the NZS Fund is retained by the Fund to help build assets to meet future NZS payments and SOE retain their surpluses for the purpose of achieving their long-term objectives.
· Some transactions do not materialise into cash. For example, depreciation and revaluations movements do not have any cash impact.
Net core Crown cashflows from operations represents the amount available for meeting contributions into the NZS Fund and for funding other capital initiatives.
Residual cash is the balance after taking into account capital payments and therefore it is the flow that contributes to the change in net core Crown debt.
The following table key residual cash variances are as follows.
| | Variance | | Key drivers |
Residual cash estimated actual | | $1.7 billion | | |
| | | | |
Taxation receipts | | +$0.5 billion | | Similar to the revenue variance this has been driven by higher than forecast GST of $0.3 billion and Corporate Tax of 0.2 billion. |
| | | | |
Other operating receipts | | -$0.4 billion | | Health -$0.2 billion — Relates to timing delays in revenue receipts from Crown entities. The cash was subsequently received in July. The rest of the variance was due to lower than forecast investment income namely by Treasury and NZDMO. |
| | | | |
Operating payments | | -$1.0 billion | | There are two main factors driving this variance: · Underspends by departments account for around half the variance. Underspends were spread across a number of departments of particular note Health ($0.2 billion), Economic Development ($0.1 billion) and Treasury ($0.1 billion). · The balance of the variance represents a lag between when expenses are incurred and cash payments are made. These will reverse out in the 2007/08 financial year. |
| | | | |
Operating top-down adjustment | | +$0.5 billion | | The forecast included an adjustment of $0.5 billion to account for timing delays in departmental operating spending. |
| | | | |
Operating cash flow | | +$0.6 billion | | |
| | | | |
Capital payments | | -$0.5 billion | | Defence -$0.1 billion — Underspend relates to payments being withheld when milestones are not reached by suppliers. Education -$0.1 billion — Primarily relate to delays in school property work programmes. Corrections -$0.1 billion — Primarily relate to timing delays of building infrastructure at Rimutaka Prison. Health -$0.1 billion — Delays in capital projects including Wellington Regional Hospital. Additionally deficit support to DHB’s was lower than expected. |
| | | | |
Capital top-down adjustment | | +$0.2 billion | | The forecast included an adjustment of $0.2 billion to account for timing delays in departmental capital spending. |
| | | | |
Investing cash flow | | +$0.3 billion | | |
| | | | |
Total variance | | +$0.9 billion | | |
| | | | |
Residual cash | | $2.6 billion | | |
Application of core Crown Cash Flows

Debt indicators
Table 4 — Comparison of debt indicators
| | Actual | | Estimated actual forecast | | Variance against estimated actual | | 2006 actual | |
| | $ million | | $ million | | $ million | | $ million | |
Gross Sovereign-Issued Debt | | 36,150 | | 37,217 | | 1,067 | | 35,461 | |
% of GDP | | 21.7 | | 22.6 | | 1.0 | | 22.5 | |
GSID (excl Reserve Bank Settlement Cash) | | 28,646 | | 29,694 | | 1,048 | | 33,497 | |
% of GDP | | 17.2 | | 18.0 | | 0.8 | | 21.3 | |
Net Core Crown Debt | | 3,433 | | 4,612 | | 1,179 | | 7,745 | |
% of GDP | | 2.1 | | 2.8 | | 0.7 | | 4.9 | |
Net debt with NZS Fund assets | | (9,556 | ) | (8,306 | ) | 1,250 | | (2,116 | ) |
% of GDP | | (5.7 | ) | (5.0 | ) | 0.7 | | (1.3 | ) |
Gross sovereign-issued debt (GSID) as at 30 June 2007 was $36.2 billion or 21.7 percent of GDP. Compared to forecast GSID was lower by $1.1 billion. Around $0.6 billion is due to a decline in demand for government securities near the end of the financial year, in part due to the Reserve Bank changes to collateral arrangements for banks. The remainder of the variance is a result of lower than expected Reserve Bank borrowing.
The increase in the current year residual cash position has not led to a change in the level of GSID at 30 June 2007, as the borrowing programme is generally set at the time of the Budget Update. However it does have a flow on impact to net core Crown debt, which can be seen in the increase in marketable securities and deposits.
Net core Crown debt was $3.4 billion or 2.1 percent of GDP, and $1.2 billion lower than forecast due primarily to the increase in the residual cash position since the time of the Budget Update.
Net Worth
Table 5 — Comparison of net worth
| | Actual | | Estimated actual forecast | | Variance against estimated actual | | 2006 Actual | |
| | $ million | | $ million | | $million | | $million | |
Financial assets | | 66,384 | | 65,688 | | 696 | | 56,446 | |
Property, plant and equipment | | 96,543 | | 93,258 | | 3,285 | | 79,441 | |
Other assets | | 22,049 | | 20,167 | | 1,882 | | 22,384 | |
Total Assets | | 184,976 | | 179,113 | | 5,863 | | 158,271 | |
Gross debt | | 41,385 | | 42,367 | | 982 | | 39,427 | |
GSF pension liability | | 14,311 | | 15,554 | | 1,243 | | 15,231 | |
ACC claims liability | | 13,735 | | 14,457 | | 722 | | 12,715 | |
Other liabilities | | 19,709 | | 18,275 | | (1,434 | ) | 19,495 | |
Total Liabilities | | 89,140 | | 90,653 | | 1,513 | | 86,868 | |
Net Worth | | 95,836 | | 88,460 | | 7,376 | | 71,403 | |
Net worth was $95.8 billion as at 30 June 2007, which was higher than forecast by $7.4 billion.
An increase against forecast of $5.2 billion was due to the impact of revaluations of property, plant and equipment. These revaluations are not forecast beyond the base month used for deriving the estimated actual. The main factors that have caused the increases in valuation are continuing appreciation of property prices and price increases.
The rest of the increase against forecast has resulted from the higher than expected operating balance.
The New Zealand Superannuation Fund
The assets of NZS Fund are the Government’s means of building up assets to partially pre-fund future New Zealand Superannuation expenses and may only be used for New Zealand Superannuation.
The Government’s contributions to the NZS Fund are calculated over a 40 year rolling horizon to ensure that superannuation entitlements over the next 40 years can be met.
The fund balance as at 30 June 2007 was $13.0 billion. Since the inception of the NZS Fund it has received Government contributions of $10.2 billion and has accumulated retained income of $2.8 billion.
| | 2002 | | 2003 | | 2004 | | 2005 | | 2006 | | 2007 | |
| | $m | | $m | | $m | | $m | | $m | | $m | |
Opening balance | | — | | 615 | | 1,884 | | 3,956 | | 6,555 | | 9,861 | |
Annual contributions | | 600 | | 1,200 | | 1,879 | | 2,107 | | 2,337 | | 2,049 | |
Retained income - (after tax) | | 15 | | 69 | | 193 | | 492 | | 969 | | 1,079 | |
Closing balance | | 615 | | 1,884 | | 3,956 | | 6,555 | | 9,861 | | 12,989 | |
Physical Assets
The Government’s net worth has grown by $24.6 billion over the 2006/07 financial year. Around 70% of this the increase since last year is attributable to growth in physical assets which is mainly due to revaluations and new acquisitions.
| | $billion | |
Opening Balance - at 1 July 2006 | | 79.4 | |
New acquisitions | | 5.8 | |
Disposal of assets | | (0.3 | ) |
Depreciation | | (3.1 | ) |
Revaluations | | 14.7 | |
Closing Balance - at 30 June 2007 | | 96.5 | |
The new acquisition is spread reasonably evenly across the three reporting segments
$billion | | 2007 | | 2006 | |
Core Crown | | 1.9 | | 2.0 | |
Crown entities | | 2.0 | | 2.0 | |
State-owned enterprises | | 1.9 | | 1.9 | |
Total | | 5.8 | | 5.9 | |
The following graphs illustrates the functional areas in which capital spending occurs, focusing on the core Crown and Crown entity segments. A significant portion of the Crown entities purchase of physical assets is funded from core Crown activities (eg, the Ministry of Transport provide funding to maintain and improve state highways).
Prior Year Comparison
This section compares the 2006/07 financial results for the key indicators with the 2005/06 financial results.
Table 6 — Comparison to 2005/06 results
| | 30 June
2007
actual | | 30 June
2006
actual | | Variance | |
| | $million | | $million | | $million | | % | |
Statement of Financial Performance | | | | | | | | | |
Core Crown revenue | | | | | | | | | |
Taxation revenue | | 53,411 | | 52,782 | | 629 | | 1.2 | |
Other revenue | | 7,469 | | 6,726 | | 743 | | 11.0 | |
Total core Crown revenue | | 60,880 | | 59,508 | | 1,372 | | 2.3 | |
Core Crown expenses | | | | | | | | | |
Social security and welfare | | 16,853 | | 15,598 | | (1,255 | ) | (8.0 | ) |
GSF pension expenses | | 302 | | 1,671 | | 1,369 | | 81.9 | |
Health | | 10,327 | | 9,547 | | (780 | ) | (8.2 | ) |
Education | | 9,289 | | 9,914 | | 625 | | 6.3 | |
Other functional classifications | | 14,213 | | 11,447 | | (2,766 | ) | (24.2 | ) |
Forecast for future new spending | | — | | — | | — | | — | |
Finance costs and FX losses/(gains) | | 2,758 | | 2,061 | | (697 | ) | (33.8 | ) |
Total core Crown expenses | | 53,742 | | 50,238 | | (3,504 | ) | (7.0 | ) |
ACC liability expenses | | 1,020 | | 1,321 | | 301 | | 22.8 | |
Net surplus of SOE/Ces | | 2,545 | | 3,524 | | (979 | ) | (27.8 | ) |
Core Crown Operating Balance | | 8,663 | | 11,473 | | (2,810 | ) | (24.5 | ) |
OBERAC | | 7,920 | | 7,380 | | 540 | | 7.3 | |
Residual cash | | 2,648 | | 2,985 | | (337 | ) | (11.3 | ) |
Statement of Financial Position | | | | | | | | | |
Financial assets | | 66,384 | | 56,446 | | 9,938 | | 17.6 | |
Property, plant and equipment | | 96,543 | | 79,441 | | 17,102 | | 21.5 | |
Other assets | | 22,049 | | 22,384 | | (335 | ) | (1.5 | ) |
Total Assets | | 118,592 | | 101,825 | | 16,767 | | 16.5 | |
Gross debt | | 41,385 | | 39,427 | | (1,958 | ) | (5.0 | ) |
Other liabilities | | 47,755 | | 47,441 | | (314 | ) | (0.7 | ) |
Total Liabilities | | 89,140 | | 86,868 | | (2,272 | ) | (2.6 | ) |
Net Worth | | 29,452 | | 14,957 | | 14,495 | | 96.9 | |
Debt indicators | | | | | | | | | |
Gross sovereign-issued debt | | 36,150 | | 35,461 | | (689 | ) | (1.9 | ) |
Net core Crown debt | | 3,433 | | 7,745 | | 4,312 | | 55.7 | |
Net debt with NZS Fund assets | | (9,556 | ) | (2,116 | ) | 7,440 | | 351.6 | |
Revenue and Expenses
The key revenue and expenses changes since the 2005/06 financial year are as follows:
| | Variance | | Key drivers |
Core Crown | | | | |
| | | | |
Tax revenue | | +$0.6 billion | | Source deductions +$1.1 billion — Due to employment and wage growth. GST +0.5 billion — Due to growth in consumption during the year. RWT +$0.4 billion — Primarily due to growth in the deposit base and higher interest rates in 2006/07 compared to 2005/06. The above increases in tax revenue since last year are offset by the fact that the prior year tax revenue numbers included a one-off adjustment relating to changes in provisional tax revenue recognition. |
| | | | |
Other revenue | | +0.7 billion | | Investment income +$0.6 billion — higher returns on the NZS Fund and GSF assets. |
| | | | |
Expenses | | +2.7 billion | | Social security and welfare +$1.3 billion — The main factors resulting in the increase were: · annual indexation of welfare benefits · policy decisions made as part of Budget 2006, in particular the extension to the Working for Families package, and · write off of benefit debts. GSF Pension -$1.4 billion — The main driver was changes in the unfunded liability due to discount rate movements. Health +$0.8 billion — Relates to increase in funding (as part of Budget 2006) allocated to maintain and increase existing services levels and the impact of demographic changes. Education -$0.6 billion — There are two main offsetting factors: · last years accounts included a one-off write of the Student Loan debt to fair value of $1.4 billion, offset by · increases due to roll growth and new policy initiatives. Other functional expenses +2.8 billion — The key drivers were: · core government services expenses were higher by $1.9 billion compared to last year, primarily due to the one-off write-off of tax receivables and an increase in the tax provision for doubtful debts this year · transport expenses were higher by $0.6 billion compared to last year, due to increases in funding to maintain and improve state highways and rail assets · heritage and culture expenses were lower by $0.4 billion. Last years accounts included an one-off expense in relation to the Kyoto Protocol obligation resulting from the government’s decision not to proceed with introducing a carbon tax · the remaining increase is primarily driven by policy decisions made as part of previous year Budget packages. |
| | | | |
Finance cost and FX | | +$0.7 billion | | Foreign exchange losses +0.4 billion — Due to movement in foreign exchange rates since last year. Finance cost +0.3 billion — Combination of higher interest rates and increase in debt holding since last year. |
| | | | |
Total core Crown | | -$2.1 billion | | |
| | | | |
Net SOE/CE returns (excluding valuation changes) | | -$0.7 billion | | · EQC -$0.7 billion — Lower investment income earned this year and also large foreign exchange losses incurred due to an appreciation in the NZ dollar against the US dollar since last year. · Air New Zealand -$0.5 billion — Lower returns this year due to devaluation of aircraft assets (a gain of $0.3 billion was recorded last year). |
| | | | |
Total Crown operating balance | | - $2.8 billion | | |
Other indicators
Gross sovereign issued debt was $0.7 billion higher than last year. The main changes in debt this year were:
· An increase of around $5.5 billion due to the Reserve Bank raising the Settlement Cash Levels.
· A reduction of around $2.8 billion due to a reduction in the issuance of Treasury Bills.
· A reduction in debt due to repayments made during the year.
Net core Crown debt was $4.3 billion lower than last year due primarily to the flow on impact of the residual available from the current year cash flow.
Indicators of the Government’s Fiscal Performance
This section aims to help readers better understand the Government’s fiscal performance.
Each indicator gives valid insights into the government’s historical, current and forecast fiscal performance, but no one indicator gives a complete picture. Individual indicators do, however, come into greater or lesser focus as circumstances change.
When, for example, the New Zealand Government’s net worth was low and net and gross debt levels were high, much of the focus of government and public commentary at that time was on eliminating annual operating deficits and on the need to attain, and later to lock in, annual operating surpluses.
However, as net worth has risen, and gross and net debt levels have fallen, the Government in more recent years has increasingly focused on how to maintain debt levels around current levels and, accordingly, has given more focus to the Government’s annual cash balance.
Most of the indicators in this section may be useful regardless of the particular fiscal strategy being followed. In a few cases (such as the formulation of OBERAC excluding NZS Fund returns), the indicator is used to throw light on the impact of a particular fiscal strategy (in this case the build-up of financial assets in the NZS Fund).
Flow indicators
· Core Crown revenues — core Crown expenses + net surplus of SOEs (ie, after dividends) and Crown entities = Operating balance.
· Core Crown revenues are mainly taxes. Core Crown expenses represent most of the Government’s spending, but not all of it. There are the day-to-day spending (salaries, benefit payments, etc) that does not create Government assets. They also include the amount for new initiatives in forecast years.
· Operating balance — revaluation movements — accounting changes = OBERAC.
· The OBERAC is the residual from revenues and expenses less removal of valuation movements. The OBERAC and operating balance are the same in forecast years.
· OBERAC — retained items (eg, net surplus of SOEs/CEs and net investment returns of the NZS Fund) — non-cash items (eg, depreciation) = Core Crown net cash flow from operations.
· Retained items such as the net surplus of SOEs/Crown entities and the net investment returns of the NZS Fund are retained by these entities. The surpluses generated (unless withdrawn from the entities) cannot be used for other purposes so do not aid in funding other government spending.
· Depreciation expense is also removed as it is non-cash (it is captured in the actual purchase of assets below). Additionally, actual working capital movements such as payment of creditor impacts on the level of net cash flows from operations.
· Core Crown net cash flow from operations — net investing activities (eg, contributions to NZS Fund, purchases of assets, loans to others) = Residual cash.
Cash flows from core Crown operations (excluding the NZS Fund) are the cash equivalent of the operating surplus. They are available to assist funding the capital spending.
Net investment activities include: Contributions to the NZS Fund — the Government’s annual contribution to the NZS Fund to build up assets to contribute to future NZS payments; Purchase of assets — departments buy assets including computer equipment, new buildings (eg, prisons) and defence equipment; Loans to others (advances) — these are mainly student loans (the Government is committed to help students access tertiary education by funding student loans) and refinancing private sector debt of
DHBs and HNZC; Net capital injections — investments in Crown entities such as DHBs and Reserve Bank reserves.Residual cash is the amount that needs to be funded if there is a shortfall. Funding is provided by selling surplus financial assets (because of surplus cash from prior years) or borrowing more.
Stock indicators
· Gross sovereign-issued debt (GSID) = debt issued by the core Crown. (Residual cash available over time is the main factor affecting borrowing requirements and hence gross sovereign-issued debt.)
· Core Crown net debt = gross sovereign-issued debt — core Crown’s financial assets.
· Net worth (NW) = Crown’s total assets — Crown’s total liabilities.
Ratio of core Crown revenue to GDP
The revenue collected is used to meet the Government’s spending needs. It is important to look at this alongside expenses, operating balance and gross debt indicators for insights into the sustainability of current policy settings.
Ratio of core Crown expenses to GDP
This shows the day-to-day spending of the core Crown — ie, it excludes spending by SOEs and Crown entities — and highlights the size of government in the economy and potential scope for crowding out the private sector. This also excludes GSF valuation changes.
By reducing gross debt, the Government has also reduced finance costs.
Operating balance
The operating balance shows whether the government sector has generated enough revenues to cover its expenses in any given year.
This measure can be volatile from year to year due to events outside of the Government’s direct control (such as changes in interest rates and revaluations etc); therefore, it is generally not used as a measure of the Government’s short-term fiscal stewardship.
OBERAC
By excluding revaluations and accounting changes, or things that are outside of the Government’s direct control, the OBERAC gives a more direct indication of the underlying stewardship of the Government.
The current Government wishes to retain the NZS Fund investment returns in the Fund. Therefore, to ensure the Government is meeting its fiscal objectives, the Government has stated that it will be focusing on the OBERAC excluding NZS Fund returns.
Residual cash available and domestic bond programme
The residual cash measure includes capital investment and NZS Fund contributions; therefore, it is the flow contributing to the changes in debt (in the current year net core Crown debt).
The domestic bond programme raises term debt for the Government, the proceeds of which contribute to funding operating and investing activity, and the repayment of maturing debt. The programme tends to be different to the cash residual figure in any given year as financing activity, such as the repayment of debt, needs to be considered.
Gross debt
Total gross debt and GSID are often expressed as a percentage of GDP to put the level of debt into perspective, in terms of a country’s ability to generate growth to repay the debt and/or income to service this debt.
Total gross debt represents the complete picture of whole-of-government obligations to external parties. However, debt issued by SOEs and Crown entities is not explicitly guaranteed by the Crown. The debt that is issued by the sovereign and guaranteed by the sovereign is in GSID. The Government’s long-term debt objective is formulated in terms of GSID.
A high ratio of debt to GDP can have an adverse impact on credit ratings and perceived sustainability of current policy settings. So as a general rule, a relatively low ratio is considered to be prudent. A low ratio of debt to GDP can also provide the Government with more flexibility in their accounts to respond to adverse shocks through increasing debt.
Core Crown financial assets

These are either cash or shares (equity) or a right to receive a financial instrument, which can be converted to cash. The assets of the New Zealand Superannuation (NZS) Fund are becoming the dominant feature of the Crown’s financial assets. The NZS Fund is the Government’s means of building up assets to partially pre-fund future NZS expenses. The Government’s contributions to the NZS Fund are calculated over a 40-year rolling horizon to ensure superannuation entitlements over the next 40 years can be met.
Established under the New Zealand Superannuation and Retirement Income Act 2001, the NZS Fund was created to partially provide for the future cost of NZS, which is expected to almost double in cost due to population ageing.
The Government plans to allocate around $2 billion a year to the NZS Fund over the next 20 years. The NZS Fund’s mandate is to invest money in a way that maximises its returns, without undue risk.
As the cost of providing NZS increases, future governments will draw on the NZS Fund to help smooth the impact of the cost of NZS on their finances.
Core Crown net debt
By including financial assets, net debt can provide additional information about the sustainability of the Government’s accounts. Many international agencies believe the quantity of off-setting financial assets is important when determining the credit-worthiness of a country. That is, if a country has a high ratio of financial assets to GDP, they are better able to justify a high ratio of debt to GDP.
However, as some financial assets are not very liquefiable (or easily converted into cash), it is important to view net debt alongside GSID.
Net worth

Total Crown net worth is one indicator of the degree to which current government activities are sustainable. This indicator should be considered alongside the Crown’s debt position, as relatively high debt to GDP ratios may still be considered sustainable if the Crown has relatively high ratios of saleable or commercial assets to GDP.
Building up net worth is also consistent with preparing for population ageing.
Historical Information
| | 2007 | | 2006 | | 2005 | | 2004 | | 2003 | | 2002 | | 2001 | | 2000 | | 1999 | | 1998 | |
| | $million | | $million | | $million | | $million | | $million | | $million | | $million | | $million | | $million | | $million | |
Statement of Financial Performance | | | | | | | | | | | | | | | | | | | | | |
Tax revenue | | 52,938 | | 52,311 | | 46,624 | | 42,532 | | 39,785 | | 36,215 | | 34,744 | | 32,000 | | 30,227 | | 31,161 | |
% of GDP | | 31.8 | % | 33.3 | % | 30.9 | % | 29.8 | % | 30.0 | % | 28.8 | % | 29.3 | % | 28.8 | % | 28.9 | % | 30.7 | % |
Other revenue | | 24,628 | | 24,608 | | 20,441 | | 17,855 | | 17,242 | | 13,764 | | 10,762 | | 9,557 | | 11,758 | | 9,931 | |
Total Revenue | | 77,566 | | 76,919 | | 67,065 | | 60,387 | | 57,027 | | 49,979 | | 45,506 | | 41,557 | | 41,985 | | 41,092 | |
% of GDP | | 46.5 | % | 48.9 | % | 44.4 | % | 42.3 | % | 43.0 | % | 39.7 | % | 38.4 | % | 37.4 | % | 40.1 | % | 40.5 | % |
Total Expenses | | 69,017 | | 65,422 | | 60,910 | | 53,057 | | 55,224 | | 47,653 | | 44,213 | | 40,128 | | 40,280 | | 39,044 | |
% of GDP | | 41.4 | % | 41.6 | % | 40.3 | % | 37.2 | % | 41.6 | % | 37.9 | % | 37.3 | % | 36.1 | % | 38.5 | % | 38.5 | % |
Net surplus of TEIs | | 120 | | 54 | | 133 | | 139 | | 151 | | 78 | | 65 | | 74 | | 58 | | 79 | |
Minority interest | | (6 | ) | (78 | ) | (41 | ) | (45 | ) | 12 | | (13 | ) | — | | — | | — | | — | |
Operating Balance | | 8,663 | | 11,473 | | 6,247 | | 7,424 | | 1,966 | | 2,391 | | 1,358 | | 1,503 | | 1,763 | | 2,127 | |
% of GDP | | 5.2 | % | 7.3 | % | 4.1 | % | 5.2 | % | 1.5 | % | 1.9 | % | 1.1 | % | 1.4 | % | 1.7 | % | 2.1 | % |
OBERAC | | 7,920 | | 8,648 | | 8,873 | | 6,629 | | 5,580 | | 2,751 | | 2,115 | | 884 | | 246 | | 2,191 | |
% of GDP | | 4.8 | % | 5.5 | % | 5.9 | % | 4.6 | % | 4.2 | % | 2.2 | % | 1.8 | % | 0.8 | % | 0.2 | % | 2.2 | % |
Core Crown Revenue | | 60,880 | | 59,508 | | 52,065 | | 46,932 | | 43,624 | | 39,907 | | 38,005 | | 34,891 | | 34,899 | | 34,222 | |
Core Crown Expenses | | | | | | | | | | | | | | | | | | | | | |
Social security and welfare | | 16,853 | | 15,598 | | 14,682 | | 14,252 | | 13,907 | | 13,485 | | 13,207 | | 12,883 | | 12,889 | | 12,497 | |
GSF pension expenses | | 302 | | 1,671 | | 2,442 | | 660 | | 2,625 | | 1,409 | | 1,112 | | 736 | | 1,372 | | 735 | |
Health | | 10,327 | | 9,547 | | 8,813 | | 8,111 | | 7,501 | | 7,032 | | 6,660 | | 6,146 | | 5,875 | | 5,361 | |
Education | | 9,289 | | 9,914 | | 7,930 | | 7,585 | | 7,016 | | 6,473 | | 6,136 | | 5,712 | | 5,337 | | 5,162 | |
Core government services | | 4,357 | | 2,507 | | 2,217 | | 1,741 | | 1,780 | | 1,540 | | 1,798 | | 1,642 | | 1,634 | | 1,508 | |
Other | | 9,856 | | 8,940 | | 7,911 | | 7,000 | | 6,442 | | 5,838 | | 5,529 | | 5,274 | | 4,940 | | 4,903 | |
Finance costs | | 2,653 | | 2,356 | | 2,274 | | 2,252 | | 2,360 | | 2,118 | | 2,304 | | 2,205 | | 2,367 | | 2,673 | |
Net foreign exchange losses/(gains) | | 105 | | (295 | ) | (35 | ) | 7 | | 118 | | 75 | | (47 | ) | (62 | ) | (47 | ) | 13 | |
Total Core Crown Expenses | | 53,742 | | 50,238 | | 46,234 | | 41,608 | | 41,749 | | 37,970 | | 36,699 | | 34,536 | | 34,367 | | 32,852 | |
Core Crown Cash Flows | | | | | | | | | | | | | | | | | | | | | |
Net cash flow from core operating and investing activity | | 2,648 | | 2,985 | | 3,104 | | 520 | | 1,217 | | (111 | ) | (652 | ) | 1,597 | | 864 | | (554 | ) |
Statement of Financial Position | | | | | | | | | | | | | | | | | | | | | |
Property, plant and equipment | | 96,543 | | 79,441 | | 67,494 | | 57,940 | | 52,667 | | 50,536 | | 45,954 | | 43,609 | | 42,102 | | 40,877 | |
Financial assets | | 66,384 | | 56,446 | | 45,308 | | 35,531 | | 30,338 | | 24,408 | | 21,848 | | 19,921 | | 19,659 | | 17,547 | |
Other assets | | 22,049 | | 22,384 | | 18,029 | | 17,201 | | 16,846 | | 13,116 | | 9,878 | | 9,731 | | 9,588 | | 10,961 | |
Total Assets | | 184,976 | | 158,271 | | 130,831 | | 110,672 | | 99,851 | | 88,060 | | 77,680 | | 73,261 | | 71,349 | | 69,385 | |
Gross debt | | 41,385 | | 39,427 | | 36,864 | | 36,825 | | 38,285 | | 36,564 | | 34,760 | | 34,759 | | 35,833 | | 38,125 | |
% of GDP | | 24.8 | % | 25.1 | % | 24.4 | % | 25.8 | % | 28.8 | % | 29.1 | % | 29.4 | % | 31.3 | % | 34.2 | % | 37.6 | % |
Other liabilities | | 47,755 | | 47,441 | | 43,984 | | 38,384 | | 37,785 | | 32,676 | | 31,457 | | 29,919 | | 29,494 | | 21,339 | |
Total Liabilities | | 89,140 | | 86,868 | | 80,848 | | 75,209 | | 76,070 | | 69,240 | | 66,217 | | 64,678 | | 65,327 | | 59,464 | |
Net Worth | | 95,836 | | 71,403 | | 49,983 | | 35,463 | | 23,781 | | 18,820 | | 11,463 | | 8,583 | | 6,022 | | 9,921 | |
% of GDP | | 57.5 | % | 45.4 | % | 33.1 | % | 24.8 | % | 17.9 | % | 15.0 | % | 9.7 | % | 7.7 | % | 5.8 | % | 9.8 | % |
Net Core Crown Debt | | 3,433 | | 7,745 | | 10,771 | | 15,204 | | 17,577 | | 19,250 | | 19,971 | | 21,396 | | 21,701 | | 24,069 | |
% of GDP | | 2.1 | % | 4.9 | % | 7.1 | % | 10.7 | % | 13.2 | % | 15.3 | % | 16.9 | % | 19.3 | % | 20.7 | % | 23.7 | % |
Gross Sovereign-Issued Debt | | 36,150 | | 35,461 | | 35,045 | | 35,527 | | 36,086 | | 36,202 | | 36,761 | | 36,041 | | 36,712 | | 37,892 | |
% of GDP | | 21.7 | % | 22.5 | % | 23.2 | % | 24.9 | % | 27.2 | % | 28.8 | % | 31.0 | % | 32.4 | % | 35.1 | % | 37.3 | % |
GDP(1) | | 166,714 | | 157,325 | | 150,990 | | 142,746 | | 132,730 | | 125,795 | | 118,407 | | 111,079 | | 104,730 | | 101,524 | |
(1) GDP for 2006/07 is actual data to 30 June 2007. Previous years’ GDP figures have been restated where appropriate with updated data.
Report of the Auditor General
To the Readers of the Financial Statements of the Government of New Zealand for the year ended 30 June 2007
I have audited the financial statements of the Government of New Zealand for the year ended 30 June 2007, using my staff, resources and appointed auditors and their staff.
Unqualified opinion
In our opinion the financial statements of the Government of New Zealand on pages 30 to 100:
· comply with generally accepted accounting practice in New Zealand; and
· fairly reflect:
· the Government of New Zealand’s financial position as at 30 June 2007; and
· the results of its operations and cash flows for the year ended on that date.
The audit was completed on 28 September 2007, and is the date at which our opinion is expressed.
The basis of the opinion is explained below. In addition, we outline the responsibilities of the Government and the Auditor, and explain our independence.
Basis of opinion
We carried out the audit in accordance with the Auditor-General’s Auditing Standards, which incorporate the New Zealand Auditing Standards.
We planned and performed our audit to obtain all the information and explanations we considered necessary in order to obtain reasonable assurance that the financial statements did not have material misstatements, whether caused by fraud or error.
Material misstatements are differences or omissions of amounts and disclosures that would affect a reader’s overall understanding of the financial statements. If we had found material misstatements that were not corrected, we would have referred to them in our opinion.
The audit involved performing procedures to test the information presented in the financial statements. We assessed the results of those procedures in forming our opinion.
Audit procedures generally include:
· determining whether significant financial and management controls are working and can be relied on to produce complete and accurate data;
· verifying samples of transactions and account balances;
· performing analysis to identify anomalies in the reported data;
· reviewing significant estimates and judgements made;
· confirming year-end balances;
· determining whether accounting policies are appropriate and consistently applied; and
· determining whether all financial statement disclosures are adequate.
We did not examine every transaction, nor do we guarantee complete accuracy of the financial statements.
We evaluated the overall adequacy of the presentation of information in the financial statements. We obtained all the information and explanations we required to support our opinion above.
Responsibilities of the Government and the Auditor
The Treasury is responsible for preparing financial statements for the Government in accordance with generally accepted accounting practice in New Zealand. Those financial statements must fairly reflect the financial position of the Government as at 30 June 2007. They must also fairly reflect the results of its operations and cash flows for the year ended on that date. The Minister of Finance is responsible for forming an opinion that those financial statements fairly reflect the financial position and operations of the Government for that year. The responsibilities of the Treasury and the Minister of Finance arise from the Public Finance Act 1989.
We are responsible for expressing an independent opinion on the financial statements and reporting that opinion to you. This responsibility arises from section 15 of the Public Audit Act 2001 and section 30 of the Public Finance Act 1989.
Independence
The Auditor-General, as an Officer of Parliament, is constitutionally and operationally independent of the Government. Other than in exercising functions and powers under the Public Audit Act 2001 as the auditor of public entities, the Auditor-General has no relationship with or interest in the Government.
K B Brady
Controller and Auditor-General
Wellington
New Zealand
Matters relating to the electronic presentation of the audited financial statements
This audit report relates to the financial statements of the Government of New Zealand for the year ended 30 June 2007 included on Treasury web site. The Secretary to the Treasury is responsible for the maintenance and integrity of the Treasury’s web site. We have not been engaged to report on the integrity of the Treasury’s web site. We accept no responsibility for any changes that may have occurred to the financial statements since they were initially presented on the web site.
The audit report refers only to the financial statements named above. It does not provide an opinion on any other information which may have been hyperlinked to/from these financial statements. If readers of this report are concerned with the inherent risks arising from electronic data communication they should refer to the published hard copy of the audited financial statements and related audit report dated 28 September 2007 to confirm the information included in the audited financial statements presented on this web site.
Legislation in New Zealand governing the preparation and dissemination of financial statements may differ from legislation in other jurisdictions.
Financial Statements
Statement of Financial Performance
(for the year ended 30 June 2007)
Forecast | | | | | | Actual | |
Original | | Estimated | | | | | | 30 June | | 30 June | |
Budget(1) | | Actual | | | | | | 2007 | | 2006 | |
$m | | $m | | | | Note | | $m | | $m | |
| | | | Revenue | | | | | | | |
| | | | Levied through the Crown’s Sovereign Power | | | | | | | |
51,408 | | 52,278 | | Taxation revenue(2) | | 1 | | 52,938 | | 52,311 | |
3,179 | | 3,508 | | Levies, fees, fines and penalties | | 1 | | 3,568 | | 3,411 | |
54,587 | | 55,786 | | Total Revenue Levied through the Crown’s Sovereign Power | | 1 | | 56,506 | | 55,722 | |
| | | | Earned through the Crown’s operations | | | | | | | |
12,715 | | 13,111 | | Sales of goods and services | | 2 | | 13,085 | | 13,337 | |
3,687 | | 5,807 | | Investment income | | 3 | | 5,819 | | 5,828 | |
2,361 | | 2,238 | | Other revenue | | 4 | | 2,156 | | 2,032 | |
18,763 | | 21,156 | | Total Revenue Earned through the Crown’s Operations | | | | 21,060 | | 21,197 | |
73,350 | | 76,942 | | Total Crown Revenue | | | | 77,566 | | 76,919 | |
| | | | Expenses | | | | | | | |
| | | | By Input Type | | | | | | | |
18,189 | | 18,430 | | Subsidies and transfer payments | | 5 | | 18,307 | | 16,850 | |
15,136 | | 15,352 | | Personnel expenses | | 6 | | 15,647 | | 15,116 | |
30,559 | | 31,938 | | Operating expenses(2) | | 7 | | 31,778 | | 29,615 | |
320 | | 80 | | Forecast for future new spending | | | | — | | — | |
— | | (500 | ) | Top-down expense adjustment | | | | — | | — | |
2,854 | | 3,023 | | Finance costs | | | | 3,069 | | 2,652 | |
— | | 38 | | Net foreign-exchange losses/(gains) | | | | 116 | | (411 | ) |
(17 | ) | 323 | | Movement in total GSF liability | | 16 | | (920 | ) | 279 | |
674 | | 1,742 | | Movement in total ACC liability | | 17 | | 1,020 | | 1,321 | |
67,715 | | 70,426 | | Total Crown Expenses | | | | 69,017 | | 65,422 | |
5,635 | | 6,516 | | Revenue less Expenses | | | | 8,549 | | 11,497 | |
133 | | 52 | | Net surplus of TEIs | | 13 | | 120 | | 54 | |
5,768 | | 6,568 | | Operating Balance (including minority interest) | | | | 8,669 | | 11,551 | |
— | | — | | Minority interest | | | | (6 | ) | (78 | ) |
5,768 | | 6,568 | | Operating Balance | | | | 8,663 | | 11,473 | |
(1) The original Budget is the forecast for the 2007 financial year, as presented in the 2006 Budget on 18 May 2006.
(2) There has been a change in the disclosure of bad debt write-offs of tax receivables. Tax write-offs are now shown as an expense rather than netted off against revenue. To ensure consistency comparative figures have been adjusted to conform with this change in presentation.
The accompanying notes and accounting policies are an integral part of these statements.
Analysis of Expenses of the Statement of Financial Performance
(for the year ended 30 June 2007)
Below is an analysis of total Crown expenses and core Crown expenses by functional classification.
This information reconciles with the segment information within the Statement of Segments.
Forecast | | | | Actual | |
Original | | Estimated | | | | 30 June | | 30 June | |
Budget | | Actual | | | | 2007 | | 2006 | |
$m | | $m | | | | $m | | $m | |
| | | | Total Crown Expenses | | | | | |
| | | | By Functional Classification | | | | | |
19,706 | | 21,063 | | Social security and welfare | | 20,239 | | 18,969 | |
1,051 | | 1,471 | | GSF pension expenses | | 302 | | 1,671 | |
10,305 | | 10,037 | | Health | | 9,932 | | 9,262 | |
9,892 | | 10,041 | | Education | | 9,836 | | 10,430 | |
2,770 | | 3,550 | | Core government services(1) | | 4,088 | | 2,384 | |
2,604 | | 2,872 | | Law and order | | 2,825 | | 2,420 | |
1,405 | | 1,456 | | Defence | | 1,557 | | 1,339 | |
6,853 | | 7,240 | | Transport and communications | | 7,473 | | 5,986 | |
5,896 | | 5,684 | | Economic and industrial services | | 5,324 | | 6,334 | |
1,198 | | 1,365 | | Primary services | | 1,265 | | 1,219 | |
1,900 | | 1,995 | | Heritage, culture and recreation | | 2,036 | | 2,361 | |
851 | | 913 | | Housing and community development | | 889 | | 758 | |
110 | | 98 | | Other | | 66 | | 48 | |
2,854 | | 3,023 | | Finance costs | | 3,069 | | 2,652 | |
— | | 38 | | Net foreign-exchange losses/(gains) | | 116 | | (411 | ) |
320 | | 80 | | Forecast for future new spending | | — | | — | |
— | | (500 | ) | Top-down expense adjustment | | — | | — | |
67,715 | | 70,426 | | Total Crown Expenses | | 69,017 | | 65,422 | |
| | | | Core Crown Expenses | | | | | |
| | | | By Functional Classification | | | | | |
16,956 | | 16,920 | | Social security and welfare | | 16,853 | | 15,598 | |
1,051 | | 1,471 | | GSF pension expenses | | 302 | | 1,671 | |
10,732 | | 10,492 | | Health | | 10,327 | | 9,547 | |
9,068 | | 9,530 | | Education | | 9,289 | | 9,914 | |
3,040 | | 3,822 | | Core government services(1) | | 4,357 | | 2,507 | |
2,393 | | 2,658 | | Law and order | | 2,653 | | 2,235 | |
1,457 | | 1,508 | | Defence | | 1,602 | | 1,383 | |
2,524 | | 2,549 | | Transport and communications | | 2,461 | | 1,818 | |
1,721 | | 1,605 | | Economic and industrial services | | 1,501 | | 1,592 | |
441 | | 584 | | Primary services | | 477 | | 467 | |
812 | | 778 | | Heritage, culture and recreation | | 838 | | 1,194 | |
278 | | 277 | | Housing and community development | | 257 | | 202 | |
110 | | 97 | | Other | | 67 | | 49 | |
2,090 | | 2,553 | | Finance costs | | 2,653 | | 2,356 | |
— | | 90 | | Net foreign-exchange losses/(gains) | | 105 | | (295 | ) |
320 | | 80 | | Forecast for future new spending | | — | | — | |
— | | (500 | ) | Top-down expense adjustment | | — | | — | |
52,993 | | 54,514 | | Total Core Crown Expenses | | 53,742 | | 50,238 | |
(1) There has been a change in the disclosure of bad debt write-offs of tax receivables. Tax write-offs are now shown as an expense rather than netted off against revenue. To ensure consistency comparative figures have been adjusted to conform with this change in presentation.
The accompanying notes and accounting policies are an integral part of these statements.
Statement of Cash Flows
(for the year ended 30 June 2007)
Forecast | | | | Actual | |
Original | | Estimated | | | | 30 June | | 30 June | |
Budget | | Actual | | | | 2007 | | 2006 | |
$m | | $m | | | | $m | | $m | |
| | | | Cash Flows from Operations | | | | | |
| | | | Cash was provided from | | | | | |
50,738 | | 51,823 | | Total taxation receipts (refer Note 1) | | 52,138 | | 49,706 | |
3,047 | | 3,387 | | Levies, fees, fines and penalties (refer Note 1) | | 3,418 | | 3,246 | |
1,422 | | 2,148 | | Interest | | 2,241 | | 1,622 | |
90 | | 133 | | Dividends | | 435 | | 117 | |
13,089 | | 13,357 | | Sales of goods and services | | 13,515 | | 13,457 | |
2,393 | | 2,091 | | Other operating receipts | | 2,147 | | 1,919 | |
70,779 | | 72,939 | | Total Cash Provided from Operations | | 73,894 | | 70,067 | |
| | | | Cash was disbursed to | | | | | |
18,665 | | 18,592 | | Subsidies and transfer payments | | 18,509 | | 16,944 | |
41,670 | | 41,189 | | Personnel and operating payments | | 40,261 | | 38,964 | |
2,441 | | 2,428 | | Finance costs | | 2,504 | | 2,047 | |
320 | | 80 | | Forecast for future new spending | | — | | — | |
— | | (500 | ) | Top-down operating cash adjustment | | — | | — | |
63,096 | | 61,789 | | Total Cash Disbursed to Operations | | 61,274 | | 57,955 | |
7,683 | | 11,150 | | Net Cash Flows from Operations | | 12,620 | | 12,112 | |
| | | | Cash Flows From Investing Activities | | | | | |
| | | | Cash was provided from | | | | | |
— | | 246 | | Sale of physical assets | | 322 | | 1,865 | |
— | | 246 | | Total Cash Provided from Investing Activities | | 322 | | 1,865 | |
| | | | Cash was disbursed to | | | | | |
6,713 | | 6,782 | | Purchase of physical assets | | 5,853 | | 5,909 | |
1,808 | | 2,409 | | Net increase in advances | | 1,791 | | 1,637 | |
(527 | ) | 9,656 | | Net purchase/(sale) of marketable securities, deposits and equity investments | | 8,273 | | 5,859 | |
256 | | — | | Forecast for future new capital spending | | — | | — | |
— | | (200 | ) | Top-down capital cash adjustment | | — | | — | |
8,250 | | 18,647 | | Total Cash Disbursed to Investing Activities | | 15,917 | | 13,405 | |
(8,250 | ) | (18,401 | ) | Net Cash Flows from Investing Activities | | (15,595 | ) | (11,540 | ) |
(567 | ) | (7,251 | ) | Net Cash Flows from Operating and Investing Activities | | (2,975 | ) | 572 | |
| | | | Cash Flows from Financing Activities | | | | | |
| | | | Cash was provided from | | | | | |
— | | 273 | | Issues of circulating currency | | 81 | | 165 | |
394 | | 6,692 | | Net issue/(repayment) of other New Zealand-dollar borrowing | | 4,009 | | 1,856 | |
394 | | 6,965 | | Total Cash Provided from Financing Activities | | 4,090 | | 2,021 | |
| | | | Cash was disbursed to | | | | | |
(412 | ) | 272 | | Net repayment/(issue) of foreign-currency borrowing | | 219 | | 2,300 | |
656 | | 128 | | Net repayment/(issue) of Government stock(1) | | 334 | | (151 | ) |
244 | | 400 | | Total Cash Disbursed to Financing Activities | | 553 | | 2,149 | |
150 | | 6,565 | | Net Cash Flows from Financing Activities | | 3,537 | | (128 | ) |
(417 | ) | (686 | ) | Net Movement in Cash | | 562 | | 444 | |
3,319 | | 4,168 | | Opening Cash Balance | | 4,168 | | 3,710 | |
— | | (4 | ) | Foreign-exchange gains/(losses) on opening cash | | (101 | ) | 14 | |
2,902 | | 3,478 | | Closing Cash Balance | | 4,629 | | 4,168 | |
(1) Net (repayments)/issues of Government stock is after elimination of Government stock holdings of entities such as NZS Fund, GSF, ACC and EQC. The bonds reconciliation reconciles core Crown activity to New Zealand Debt Management Office (NZDMO) bond issues (refer page 92).
The accompanying notes and accounting policies are an integral part of these statements.
Reconciliation of Net Cash Flows From Operations to Operating Balance
(for the year ended 30 June 2007)
Forecast | | | | Actual | |
Original | | Estimated | | | | 30 June | | 30 June | |
Budget | | Actual | | | | 2007 | | 2006 | |
$m | | $m | | | | $m | | $m | |
| | | | Reconciliation Between the Net Cash Flowsfrom Operations and the Operating Balance | | | | | |
7,683 | | 11,150 | | Net Cash Flows from Operations | | 12,620 | | 12,112 | |
| | | | Items included in the operatingbalance but not in net cash flows from operations | | | | | |
| | | | Valuation Changes | | | | | |
17 | | (323 | ) | Decrease/(increase) in GSF pension liabilities | | 920 | | (279 | ) |
(674 | ) | (1,742 | ) | (Increase)/decrease in ACC liabilities | | (1,020 | ) | (1,321 | ) |
— | | — | | Decrease/(increase)/decrease NPF guarantee | | 49 | | (54 | ) |
— | | — | | Increase/(decrease) in commercial forests | | 27 | | 15 | |
(4 | ) | (281 | ) | Unrealised net foreign-exchange gains/(losses) | | 42 | | 502 | |
548 | | 525 | | Other valuation changes | | 516 | | 1,242 | |
(113 | ) | (1,821 | ) | Total Valuation Changes | | 534 | | 105 | |
| | | | Property, Plant and Equipment Asset Movements | | | | | |
(2,918 | ) | (3,099 | ) | Depreciation | | (3,144 | ) | (2,708 | ) |
— | | — | | (Losses)/gains on sale of physical assets | | (316 | ) | 811 | |
(2,918 | ) | (3,099 | ) | Total Property, Plant and Equipment Movements | | (3,460 | ) | (1,897 | ) |
| | | | Other Non-Cash Items | | | | | |
(167 | ) | (817 | ) | Student loans | | (225 | ) | (1,671 | ) |
(89 | ) | (89 | ) | Amortisation of goodwill | | (99 | ) | (75 | ) |
808 | | 1,060 | | Other | | 1,193 | | 945 | |
552 | | 154 | | Total Other Non-Cash Items | | 869 | | (801 | ) |
| | | | Movements in Working Capital | | | | | |
22 | | (1,402 | ) | (Decrease)/increase in taxes receivable | | (1,145 | ) | 3,225 | |
307 | | (825 | ) | (Decrease)/increase in other receivables | | (136 | ) | 366 | |
161 | | 194 | | Increase/(decrease) in inventories | | 85 | | (39 | ) |
74 | | 2,217 | | (Increase)/decrease in payables | | (704 | ) | (1,598 | ) |
564 | | 184 | | Total Movements in Working Capital | | (1,900 | ) | 1,954 | |
5,768 | | 6,568 | | Operating Balance | | 8,663 | | 11,473 | |
The accompanying notes and accounting policies are an integral part of these statements.
Statement of Financial Position
(as at 30 June 2007)
Forecast | | | | | | Actual | |
Original | | Estimated | | | | | | 30 June | | 30 June | |
Budget | | Actual | | | | | | 2007 | | 2006 | |
$m | | $m | | | | Note | | $m | | $m | |
| | | | Assets | | | | | | | |
2,902 | | 3,478 | | Cash and bank | | 8 | | 4,629 | | 4,168 | |
43,232 | | 52,015 | | Marketable securities, deposits & equity investments | | 8 | | 51,489 | | 43,520 | |
10,021 | | 10,195 | | Advances | | 9 | | 10,266 | | 8,758 | |
10,534 | | 12,247 | | Receivables | | 10 | | 13,193 | | 14,474 | |
1,182 | | 1,101 | | Inventories | | | | 992 | | 907 | |
286 | | 289 | | Other investments | | 11 | | 376 | | 323 | |
73,863 | | 93,258 | | Property, plant and equipment | | 12 | | 96,543 | | 79,441 | |
232 | | 550 | | Commercial forests | | | | 575 | | 575 | |
5,301 | | 5,586 | | Investment in TEIs | | 13 | | 6,305 | | 5,475 | |
398 | | 594 | | Intangible assets (including goodwill) | | 14 | | 608 | | 630 | |
256 | | — | | Forecast for new capital spending | | | | — | | — | |
— | | (200 | ) | Top-down capital adjustment | | | | — | | — | |
148,207 | | 179,113 | | Total Assets | | | | 184,976 | | 158,271 | |
| | | | Liabilities | | | | | | | |
13,559 | | 14,725 | | Payables and provisions | | 15 | | 16,349 | | 16,133 | |
3,408 | | 3,550 | | Currency issued | | | | 3,360 | | 3,362 | |
28,560 | | 30,819 | | Borrowing — sovereign guaranteed | | | | 30,353 | | 29,879 | |
9,828 | | 11,548 | | Borrowing — non-sovereign guaranteed | | | | 11,032 | | 9,548 | |
15,344 | | 15,554 | | GSF Pension liability | | 16 | | 14,311 | | 15,231 | |
13,255 | | 14,457 | | ACC claims liability | | 17 | | 13,735 | | 12,715 | |
83,954 | | 90,653 | | Total Liabilities | | | | 89,140 | | 86,868 | |
64,253 | | 88,460 | | Total Assets less Total Liabilities | | | | 95,836 | | 71,403 | |
| | | | Net Worth | | | | | | | |
36,049 | | 40,022 | | Taxpayer funds | | | | 42,140 | | 33,477 | |
27,989 | | 48,145 | | Revaluation reserve | | 18 | | 53,327 | | 37,633 | |
215 | | 293 | | Minority interest | | | | 369 | | 293 | |
64,253 | | 88,460 | | Net Worth | | | | 95,836 | | 71,403 | |
The accompanying notes and accounting policies are an integral part of these statements.
Analysis of Key Components of the Statement of Financial Position
(as at 30 June 2007)
Following is an analysis of the New Zealand Superannuation (NZS) Fund and Gross and Net Debt information.
The notes to the financial statements provide a breakdown of other key balance sheet items.
New Zealand Superannuation Fund (NZS Fund)
Within marketable securities, deposits and equity investments is the NZS Fund (except for cross holdings of investments with other parts of the Crown, for example the NZS Fund may hold NZ Government Stock). The following information includes all investments and income, including cross-holdings of NZ Government Stock and accrued interest on such stock.
Forecast | | | | Actual | |
Original Budget | | Estimated Actual | | | | 30 June 2007 | | 30 June 2006 | |
$m | | $m | | | | $m | | $m | |
10,015 | | 9,861 | | Opening balance | | 9,861 | | 6,555 | |
2,049 | | 2,049 | | Gross contribution | | 2,049 | | 2,337 | |
675 | | 1,008 | | Income after tax | | 1,079 | | 969 | |
12,739 | | 12,918 | | NZS Fund Balance | | 12,989 | | 9,861 | |
Gross and Net Debt information
Definitions of debt:
Total Crown gross debt is the total borrowings (both sovereign guaranteed and non-sovereign guaranteed) of the total Crown. This equates to the amount in the total Crown balance sheet and represents the complete picture of whole-of-Crown debt obligations to external parties (ie, after eliminations of internal cross-holdings).
The balance sheet splits total Crown debt into sovereign-guaranteed and non-sovereign-guaranteed debt. This split reflects the fact that debt held by SOEs and Crown entities is not explicitly guaranteed by the Crown. Any such debt that may be guaranteed is included in the sovereign-guaranteed total. No debt of SOEs and Crown entities is currently guaranteed by the Crown.
Gross sovereign-issued debt is debt issued by the sovereign (ie, core Crown) and includes Government stock held by the NZS Fund, GSF, ACC or EQC for example. In other words, the gross sovereign-issued debt indicator does not eliminate any internal cross-holdings of entities listed above. The Government’s debt objective uses this measure of debt.
Net core Crown debt is borrowings (financial liabilities) less cash and bank balances, marketable securities and deposits, and advances (financial assets). Net core Crown debt excludes the assets of the NZS Fund and GSF because they are restricted in their use. It is a measure of the core Crown.
Forecast | | | | Actual | |
Original Budget | | Estimated Actual | | | | 30 June 2007 | | 30 June 2006 | |
$m | | $m | | | | $m | | $m | |
38,388 | | 42,367 | | Total Crown Gross Debt | | 41,385 | | 39,427 | |
33,356 | | 35,876 | | Core Crown sovereign guaranteed borrowings | | 35,450 | | 34,477 | |
1,657 | | 1,341 | | Add back cross holdings of NZS Fund and GSF | | 700 | | 984 | |
35,013 | | 37,217 | | Gross Sovereign-Issued Debt | | 36,150 | | 35,461 | |
41,028 | | 48,192 | | Core Crown financial assets | | 49,036 | | 40,599 | |
15,224 | | 15,587 | | Excluding NZS Fund and GSF financial assets | | 16,319 | | 12,883 | |
25,804 | | 32,605 | | Financial assets excluding NZS Fund and GSF | | 32,717 | | 27,716 | |
35,013 | | 37,217 | | Gross Sovereign-Issued Debt | | 36,150 | | 35,461 | |
25,804 | | 32,605 | | Financial assets excluding NZS Fund and GSF | | 32,717 | | 27,716 | |
9,209 | | 4,612 | | Net core Crown Debt | | 3,433 | | 7,745 | |
The accompanying notes and accounting policies are an integral part of these statements.
Statement of Movements in Equity
(for the year ended 30 June 2007)
Forecast | | | | Actual | |
Original Budget | | Estimated Actual | | | | 30 June 2007 | | 30 June 2006 | |
$m | | $m | | | | $m | | $m | |
58,485 | | 71,403 | | Opening Net Worth | | 71,403 | | 49,983 | |
5,768 | | 6,568 | | Operating balance (excl. minority interest) | | 8,663 | | 11,473 | |
— | | — | | Minority interest in operating balance | | 6 | | 78 | |
— | | — | | Increase in minority interest | | 70 | | — | |
— | | 10,489 | | Net revaluations | | 15,694 | | 9,869 | |
5,768 | | 17,057 | | Total Recognised Revenues and Expenses | | 24,433 | | 21,420 | |
64,253 | | 88,460 | | Closing Net Worth | | 95,836 | | 71,403 | |
The accompanying notes and accounting policies are an integral part of these statements.
Statement of Borrowings
(as at 30 June 2007)
Forecast | | | | Actual | |
Original Budget | | Estimated Actual | | | | 30 June 2007 | | 30 June 2006 | |
$m | | $m | | | | $m | | $m | |
| | | | Sovereign Guaranteed Debt | | | | | |
| | | | New Zealand-Dollar Debt | | | | | |
15,982 | | 16,337 | | Government stock(1) | | 16,833 | | 17,002 | |
5,259 | | 2,577 | | Treasury bills | | 2,080 | | 4,860 | |
(10,131 | ) | 8,944 | | Foreign-exchange contracts and loans(2) | | 16,366 | | (11,247 | ) |
482 | | 472 | | Retail stock | | 471 | | 532 | |
11,592 | | 28,330 | | Total New Zealand-Dollar Debt | | 35,750 | | 11,147 | |
| | | | Foreign-Currency Debt(2) | | | | | |
9,309 | | 122 | | United States dollars | | (3,937 | ) | 14,430 | |
508 | | (196 | ) | Japanese yen | | (603 | ) | 404 | |
7,151 | | 2,563 | | European and other currencies | | (857 | ) | 3,898 | |
16,968 | | 2,489 | | Total Foreign-Currency Debt | | (5,397 | ) | 18,732 | |
28,560 | | 30,819 | | Total Sovereign-Guaranteed Debt | | 30,353 | | 29,879 | |
| | | | Non-Sovereign-Guaranteed Debt(3) | | | | | |
7,827 | | 9,391 | | New Zealand dollars | | 8,900 | | 7,198 | |
1,988 | | 2,015 | | United States dollars | | 1,564 | | 1,794 | |
— | | — | | Japanese yen | | 133 | | 279 | |
13 | | 142 | | European and other currencies | | 435 | | 277 | |
9,828 | | 11,548 | | Total Non-Sovereign Guaranteed Debt | | 11,032 | | 9,548 | |
38,388 | | 42,367 | | Total Borrowings | | 41,385 | | 39,427 | |
| | | | Less | | | | | |
| | | | Financial Assets (including restricted assets) | | | | | |
| | | | Marketable Securities, Deposits and Equity Investments | | | | | |
5,213 | | 19,072 | | New Zealand dollars(2) | | 44,554 | | 8,003 | |
11,608 | | 11,221 | | United States dollars(2) | | (10,860 | ) | 11,080 | |
1,173 | | 719 | | Japanese yen(2) | | (286 | ) | 615 | |
7,255 | | 4,288 | | European and other currencies(2) | | (191 | ) | 7,970 | |
275 | | 221 | | Reserve position at International Monetary Fund (IMF) | | 183 | | 458 | |
3,643 | | 2,547 | | New Zealand equity investments | | 3,598 | | 2,721 | |
14,065 | | 13,947 | | Foreign equity investments | | 14,491 | | 12,673 | |
43,232 | | 52,015 | | Total Marketable Securities, Deposits and Equity Investments | | 51,489 | | 43,520 | |
| | | | Advances and Cash and Bank | | | | | |
5,868 | | 5,761 | | Student loans | | 6,011 | | 5,569 | |
4,153 | | 4,434 | | Other advances | | 4,255 | | 3,189 | |
2,902 | | 3,478 | | Cash | | 4,629 | | 4,168 | |
12,923 | | 13,673 | | Total Advances and Cash | | 14,895 | | 12,926 | |
56,155 | | 65,688 | | Total Financial Assets | | 66,384 | | 56,446 | |
(17,767 | ) | (23,321 | ) | Borrowings less Financial Assets | | (24,999 | ) | (17,019 | ) |
(3,562 | ) | 1,256 | | Net New Zealand-dollar (assets)/debt | | (18,829 | ) | (5,569 | ) |
(14,205 | ) | (24,577 | ) | Net foreign-currency (assets)/debt | | (6,170 | ) | (11,450 | ) |
(17,767 | ) | (23,321 | ) | Borrowings less Financial Assets | | (24,999 | ) | (17,019 | ) |
(1) Government stock includes $50 million of infrastructure bonds.
(2) Included within these categories are associated derivative transactions. Each transaction is recorded as an asset or a liability based on its year-end value. Where derivatives (currency swaps and foreign exchange contracts) involve NZ dollar and foreign-currency flows, the flows are separately classified with the result that both positive and negative values are reported within assets and liabilities.
(3) Non-sovereign guaranteed debt is a mixture of secured and non-secured debt. Where debt is secured it is over assets of the particular entity or by way of a negative pledge that while any of the stock issued under the relevant deed remains outstanding the entity will not, subject to certain exceptions, create or permit to exist any charge or lien over any of their respective assets.
The accompanying notes and accounting policies are an integral part of these statements.
Statement of Commitments
(as at 30 June 2007)
| | As at
30 June
2007 | | As at
30 June
2006 | |
| | $m | | $m | |
Capital Commitments | | | | | |
Specialist military equipment | | 823 | | 535 | |
Land and buildings (including electricity assets) | | 605 | | 945 | |
Other property, plant and equipment | | 2,563 | | 2,530 | |
Investments | | 184 | | 818 | |
TEIs | | 90 | | 124 | |
Total Capital Commitments | | 4,265 | | 4,952 | |
Operating Commitments | | | | | |
Non-cancellable accommodation leases | | 2,296 | | 1,940 | |
Other non-cancellable leases | | 2,355 | | 2,466 | |
Non-cancellable contracts for the supply of goods and services | | 1,626 | | 1,908 | |
Other operating commitments | | 7,314 | | 6,462 | |
TEIs | | 303 | | 303 | |
Total Operating Commitments | | 13,894 | | 13,079 | |
Total Commitments | | 18,159 | | 18,031 | |
Total Commitments by Institutional Segment | | | | | |
Core Crown | | 4,857 | | 4,824 | |
Crown entities | | 9,848 | | 9,627 | |
SOEs | | 3,454 | | 3,580 | |
Total Commitments | | 18,159 | | 18,031 | |
| | | | | |
By Term | | | | | |
Capital Commitments | | | | | |
One year or less | | 1,767 | | 3,140 | |
From one year to two years | | 609 | | 651 | |
From two to five years | | 1,352 | | 1,152 | |
Over five years | | 537 | | 9 | |
Capital Commitments | | 4,265 | | 4,952 | |
Operating Commitments | | | | | |
One year or less | | 6,029 | | 5,856 | |
From one year to two years | | 2,709 | | 2,348 | |
From two to five years | | 2,908 | | 2,861 | |
Over five years | | 2,248 | | 2,014 | |
Operating Commitments | | 13,894 | | 13,079 | |
Total Commitments | | 18,159 | | 18,031 | |
The accompanying notes and accounting policies are an integral part of these statements.
Statement of Quantifiable Contingent Liabilities and Contingent Assets
(as at 30 June 2007)
| | As at
30 June
2007 | | As at
30 June
2006 | |
| | $m | | $m | |
Guarantees and indemnities | | 171 | | 405 | |
Uncalled capital | | 2,076 | | 2,592 | |
Legal proceedings and disputes | | 1,170 | | 1,032 | |
Other contingent liabilities | | 1,829 | | 2,073 | |
Total Quantifiable Contingent Liabilities | | 5,246 | | 6,102 | |
Total Quantifiable Contingent Liabilities by | | | | | |
Institutional Segment | | | | | |
Core Crown | | 5,071 | | 5,921 | |
Crown entities | | 45 | | 63 | |
SOEs | | 130 | | 118 | |
Total Quantifiable Contingent Liabilities | | 5,246 | | 6,102 | |
Quantifiable Contingent Assets | | | | | |
Total Crown | | 86 | | 106 | |
Total Quantifiable Contingent Assets | | 86 | | 106 | |
Note 21 contains a breakdown of the material contingent liabilities and a description of non-quantifiable contingent liabilities and contingent assets.
The accompanying notes and accounting policies are an integral part of these statements.
Statement of Segments
Statement of Financial Performance (institutional form)
for the year ended 30 June 2007 (actual to forecast)
| | Current Year Actual vs Forecast | |
| | Core Crown | | Crown entities | |
| | Actual
2007 | | Estimated
Actual | | Actual
2007 | | Estimated
Actual | |
| | $m | | $m | | $m | | $m | |
Revenue | | | | | | | | | |
Taxation revenue | | 53,411 | | 52,853 | | — | | — | |
Levies, fees, fines and penalties | | 633 | | 604 | | 3,012 | | 2,946 | |
Sales of goods and services | | 955 | | 955 | | 1,909 | | 1,845 | |
Investment income | | 5,144 | | 5,104 | | 1,279 | | 1,372 | |
Other revenue | | 737 | | 725 | | 20,513 | | 20,587 | |
Total Revenue | | 60,880 | | 60,241 | | 26,713 | | 26,750 | |
Expenses by Input Type | | | | | | | | | |
Subsidies and transfer payments | | 16,447 | | 16,579 | | 1,967 | | 1,959 | |
Personnel expenses | | 5,508 | | 5,497 | | 8,137 | | 7,897 | |
Operating expenses | | 29,949 | | 29,472 | | 13,925 | | 14,394 | |
Finance costs | | 2,653 | | 2,553 | | 337 | | 307 | |
Net Foreign exchange losses/(gains) | | 105 | | 90 | | 107 | | 44 | |
GSF and ACC liability revaluation movements | | (920 | ) | 323 | | 1,020 | | 1,742 | |
Total Expenses | | 53,742 | | 54,514 | | 25,493 | | 26,343 | |
Expenses by Functional Classification | | | | | | | | | |
Social security and welfare | | 16,853 | | 16,920 | | 3,776 | | 4,525 | |
Health | | 10,327 | | 10,492 | | 8,986 | | 8,812 | |
Education | | 9,289 | | 9,530 | | 6,913 | | 6,890 | |
Other functional classifications | | 14,515 | | 15,349 | | 5,374 | | 5,765 | |
Forecast for future new spending and top-down adjustment | | — | | (420 | ) | — | | — | |
Finance costs and net FX losses/(gains) | | 2,758 | | 2,643 | | 444 | | 351 | |
Total expenses | | 53,742 | | 54,514 | | 25,493 | | 26,343 | |
Net surplus of TEIs | | — | | (10 | ) | 120 | | 62 | |
Minority interest | | — | | — | | — | | — | |
Operating balance | | 7,138 | | 5,717 | | 1,340 | | 469 | |
Statement of Financial Position (institutional form)
as at 30 June 2007 (actual to forecast)
| | Core Crown | | Crown entities | |
| | Actual
2007 | | Estimated
Actual | | Actual
2007 | | Estimated
Actual | |
| | $m | | $m | | $m | | $m | |
Assets | | | | | | | | | |
Financial assets | | 49,036 | | 48,192 | | 18,614 | | 18,847 | |
Physical assets | | 26,432 | | 26,279 | | 41,504 | | 38,970 | |
Investment in SOEs & Crown entities (including TEIs) | | 24,450 | | 24,776 | | 6,305 | | 5,586 | |
Other assets | | 11,076 | | 10,457 | | 2,703 | | 2,308 | |
Total Assets | | 110,994 | | 109,704 | | 69,126 | | 65,711 | |
Liabilities | | | | | | | | | |
Borrowings | | 35,450 | | 35,875 | | 4,285 | | 4,394 | |
Other liabilities | | 27,651 | | 27,955 | | 18,231 | | 18,675 | |
Total Liabilities | | 63,101 | | 63,830 | | 22,516 | | 23,069 | |
Net Worth | | 47,893 | | 45,874 | | 46,610 | | 42,642 | |
Taxpayer funds | | 36,089 | | 34,678 | | 22,704 | | 21,883 | |
Revaluation reserves | | 11,804 | | 11,196 | | 23,906 | | 20,759 | |
Minority interest | | — | | — | | — | | — | |
Net Worth | | 47,893 | | 45,874 | | 46,610 | | 42,642 | |
Analysis of Financial Assets and Borrowings | | | | | | | | | |
Advances and cash | | 10,214 | | 9,187 | | 2,508 | | 2,423 | |
MSDs and equity investments | | 38,822 | | 39,005 | | 16,106 | | 16,424 | |
Total Financial Assets | | 49,036 | | 48,192 | | 18,614 | | 18,847 | |
Borrowings - Sovereign guaranteed | | 35,450 | | 35,875 | | — | | — | |
Borrowings - Non-sovereign guaranteed | | — | | — | | 4,285 | | 4,394 | |
Total Borrowings | | 35,450 | | 35,875 | | 4,285 | | 4,394 | |
Borrowings less Financial Assets | | (13,586 | ) | (12,317 | ) | (14,329 | ) | (14,453 | ) |
Net core Crown Debt | | 3,433 | | 4,612 | | Net core Crown debt and gross sovereign-issued debt differ from the analysis above due to elimination of cross-holdings of Govt stock and adding back the NZS Fund and GSF assets. |
Gross Sovereign-Issued Debt | | 36,150 | | 37,217 |
Statement of Financial Performance (institutional form)
for the year ended 30 June 2007 (actual to forecast)
| | Current Year Actual vs Forecast | |
| | SOE’s | | Inter-segment elimins | | Total Crown | |
| | Actual
2007 | | Estimated
Actual | | Actual
2007 | | Estimated
Actual | | Actual
2007 | | Estimated
Actual | |
| | $m | | $m | | $m | | $m | | $m | | $m | |
Revenue | | | | | | | | | | | | | |
Taxation revenue | | — | | — | | (473 | ) | (575 | ) | 52,938 | | 52,278 | |
Levies, fees, fines and penalties | | — | | — | | (77 | ) | (42 | ) | 3,568 | | 3,508 | |
Sales of goods and services | | 10,908 | | 10,921 | | (687 | ) | (610 | ) | 13,085 | | 13,111 | |
Investment income | | 504 | | 513 | | (1,108 | ) | (1,182 | ) | 5,819 | | 5,807 | |
Other revenue | | 618 | | 770 | | (19,712 | ) | (19,844 | ) | 2,156 | | 2,238 | |
Total Revenue | | 12,030 | | 12,204 | | (22,057 | ) | (22,253 | ) | 77,566 | | 76,942 | |
Expenses by Input Type | | | | | | | | | | | | | |
Subsidies and transfer payments | | — | | — | | (107 | ) | (108 | ) | 18,307 | | 18,430 | |
Personnel expenses | | 2,008 | | 1,964 | | (6 | ) | (6 | ) | 15,647 | | 15,352 | |
Operating expenses | | 8,814 | | 8,638 | | (20,910 | ) | (20,986 | ) | 31,778 | | 31,518 | |
Finance costs | | 552 | | 633 | | (473 | ) | (470 | ) | 3,069 | | 3,023 | |
Net Foreign exchange losses/(gains) | | (96 | ) | (96 | ) | — | | — | | 116 | | 38 | |
GSF and ACC liability revaluation movements | | — | | — | | — | | — | | 100 | | 2,065 | |
Total Expenses | | 11,278 | | 11,139 | | (21,496 | ) | (21,570 | ) | 69,017 | | 70,426 | |
Expenses by Functional Classification | | | | | | | | | | | | | |
Social security and welfare | | — | | — | | (390 | ) | (382 | ) | 20,239 | | 21,063 | |
Health | | — | | — | | (9,381 | ) | (9,267 | ) | 9,932 | | 10,037 | |
Education | | 24 | | 23 | | (6,390 | ) | (6,402 | ) | 9,836 | | 10,041 | |
Other functional classifications | | 10,798 | | 10,579 | | (4,862 | ) | (5,049 | ) | 25,825 | | 26,644 | |
Forecast for future new spending and top-down adjustment | | — | | — | | — | | — | | — | | (420 | ) |
Finance costs and net FX losses/(gains) | | 456 | | 537 | | (473 | ) | (470 | ) | 3,185 | | 3,061 | |
Total expenses | | 11,278 | | 11,139 | | (21,496 | ) | (21,570 | ) | 69,017 | | 70,426 | |
Net surplus of TEIs | | — | | — | | — | | — | | 120 | | 52 | |
Minority interest | | (6 | ) | — | | — | | — | | (6 | ) | — | |
Operating balance | | 746 | | 1,065 | | (561 | ) | (683 | ) | 8,663 | | 6,568 | |
Statement of Financial Position (institutional form)
as at 30 June 2007 (actual to forecast)
| | SOE’s | | Inter-segment elimins | | Total Crown | |
| | Actual
2007 | | Estimated
Actual | | Actual
2007 | | Estimated
Actual | | Actual
2007 | | Estimated
Actual | |
| | $m | | $m | | $m | | $m | | $m | | $m | |
Assets | | | | | | | | | | | | | |
Financial assets | | 6,888 | | 7,028 | | (8,154 | ) | (8,379 | ) | 66,384 | | 65,688 | |
Physical assets | | 28,607 | | 28,009 | | — | | — | | 96,543 | | 93,258 | |
Investment in SOEs & Crown entities (including TEIs) | | — | | — | | (24,450 | ) | (24,776 | ) | 6,305 | | 5,586 | |
Other assets | | 2,713 | | 2,506 | | (748 | ) | (690 | ) | 15,744 | | 14,581 | |
Total Assets | | 38,208 | | 37,543 | | (33,352 | ) | (33,845 | ) | 184,976 | | 179,113 | |
Liabilities | | | | | | | | | | | | | |
Borrowings | | 9,804 | | 10,477 | | (8,154 | ) | (8,379 | ) | 41,385 | | 42,367 | |
Other liabilities | | 3,272 | | 3,037 | | (1,399 | ) | (1,381 | ) | 47,755 | | 48,286 | |
Total Liabilities | | 13,076 | | 13,514 | | (9,553 | ) | (9,760 | ) | 89,140 | | 90,653 | |
Net Worth | | 25,132 | | 24,029 | | (23,799 | ) | (24,085 | ) | 95,836 | | 88,460 | |
Taxpayer funds | | 7,111 | | 7,546 | | (23,764 | ) | (24,085 | ) | 42,140 | | 40,022 | |
Revaluation reserves | | 17,617 | | 16,190 | | — | | — | | 53,327 | | 48,145 | |
Minority interest | | 404 | | 293 | | (35 | ) | — | | 369 | | 293 | |
Net Worth | | 25,132 | | 24,029 | | (23,799 | ) | (24,085 | ) | 95,836 | | 88,460 | |
Analysis of Financial Assets and Borrowings | | | | | | | | | | | | | |
Advances and cash | | 5,340 | | 5,396 | | (3,167 | ) | (3,333 | ) | 14,895 | | 13,673 | |
MSDs and equity investments | | 1,548 | | 1,632 | | (4,987 | ) | (5,046 | ) | 51,489 | | 52,015 | |
Total Financial Assets | | 6,888 | | 7,028 | | (8,154 | ) | (8,379 | ) | 66,384 | | 65,688 | |
Borrowings - sovereign guaranteed | | — | | — | | (5,097 | ) | (5,056 | ) | 30,353 | | 30,819 | |
Borrowings - non-sovereign guaranteed | | 9,804 | | 10,477 | | (3,057 | ) | (3,323 | ) | 11,032 | | 11,548 | |
Total Borrowings | | 9,804 | | 10,477 | | (8,154 | ) | (8,379 | ) | 41,385 | | 42,367 | |
Borrowings less Financial Assets | | 2,916 | | 3,449 | | — | | — | | (24,999 | ) | (23,321 | ) |
Statement of Financial Performance (institutional form)
for the year ended 30 June 2007 (compared with actual 30 June 2006)
| | Current Year Actual vs Prior Year Actual | |
| | Core Crown | | Crown entities | |
| | Actual
2007 | | Actual
2006 | | Actual
2007 | | Actual
2006 | |
| | $m | | $m | | $m | | $m | |
Revenue | | | | | | | | | |
Taxation revenue | | 53,411 | | 52,782 | | — | | — | |
Levies, fees, fines and penalties | | 633 | | 663 | | 3,012 | | 2,811 | |
Sales of goods and services | | 955 | | 884 | | 1,909 | | 1,865 | |
Investment income | | 5,144 | | 4,496 | | 1,279 | | 1,962 | |
Other revenue | | 737 | | 683 | | 20,513 | | 18,677 | |
Total Revenue | | 60,880 | | 59,508 | | 26,713 | | 25,315 | |
Expenses by Input Type | | | | | | | | | |
Subsidies and transfer payments | | 16,447 | | 15,243 | | 1,967 | | 1,708 | |
Personnel expenses | | 5,508 | | 5,656 | | 8,137 | | 7,591 | |
Operating expenses | | 29,949 | | 26,999 | | 13,925 | | 12,967 | |
Finance costs | | 2,653 | | 2,356 | | 337 | | 302 | |
Net foreign exchange losses/(gains) | | 105 | | (295 | ) | 107 | | (113 | ) |
GSF and ACC liability revaluation movements | | (920 | ) | 279 | | 1,020 | | 1,321 | |
Total Expenses | | 53,742 | | 50,238 | | 25,493 | | 23,776 | |
Expenses by Functional Classification | | | | | | | | | |
Social security and welfare | | 16,853 | | 15,598 | | 3,776 | | 3,740 | |
Health | | 10,327 | | 9,547 | | 8,986 | | 8,227 | |
Education | | 9,289 | | 9,914 | | 6,913 | | 6,539 | |
Other functional classifications | | 14,515 | | 13,118 | | 5,374 | | 5,081 | |
Forecast for future new spending | | — | | — | | — | | — | |
Finance costs and net FX losses/(gains) | | 2,758 | | 2,061 | | 444 | | 189 | |
Total expenses | | 53,742 | | 50,238 | | 25,493 | | 23,776 | |
Net surplus of TEIs | | — | | — | | 120 | | 54 | |
Minority interest | | — | | — | | — | | — | |
Operating balance | | 7,138 | | 9,270 | | 1,340 | | 1,593 | |
Statement of Financial Position (institutional form)
as at 30 June 2007 (compared with actual 30 June 2006)
| | Core Crown | | Crown entities | |
| | Actual
2007 | | Actual
2006 | | Actual
2007 | | Actual
2006 | |
| | $m | | $m | | $m | | $m | |
Assets | | | | | | | | | |
Financial assets | | 49,036 | | 40,599 | | 18,614 | | 17,554 | |
Physical assets | | 26,432 | | 25,223 | | 41,504 | | 37,987 | |
Investment in SOEs & Crown entities (including TEIs) | | 24,450 | | 24,169 | | 6,305 | | 5,475 | |
Other assets | | 11,076 | | 12,293 | | 2,703 | | 2,433 | |
Total Assets | | 110,994 | | 102,284 | | 69,126 | | 63,449 | |
Liabilities | | | | | | | | | |
Borrowings | | 35,450 | | 34,477 | | 4,285 | | 4,124 | |
Other liabilities | | 27,651 | | 27,730 | | 18,231 | | 17,503 | |
Total Liabilities | | 63,101 | | 62,207 | | 22,516 | | 21,627 | |
Net Worth | | 47,893 | | 40,077 | | 46,610 | | 41,822 | |
Taxpayer funds | | 36,089 | | 28,929 | | 22,704 | | 21,086 | |
Revaluation reserves | | 11,804 | | 11,148 | | 23,906 | | 20,736 | |
Minority interest | | — | | — | | — | | — | |
Net Worth | | 47,893 | | 40,077 | | 46,610 | | 41,822 | |
Analysis of Financial Assets and Borrowings | | | | | | | | | |
Advances and cash | | 10,214 | | 8,797 | | 2,508 | | 2,308 | |
MSDs and equity investments | | 38,822 | | 31,802 | | 16,106 | | 15,246 | |
Total Financial Assets | | 49,036 | | 40,599 | | 18,614 | | 17,554 | |
Borrowings - Sovereign guaranteed | | 35,450 | | 34,477 | | — | | — | |
Borrowings - Non-sovereign guaranteed | | — | | — | | 4,285 | | 4,124 | |
Total Borrowings | | 35,450 | | 34,477 | | 4,285 | | 4,124 | |
Borrowings less Financial Assets | | (13,586 | ) | (6,122 | ) | (14,329 | ) | (13,430 | ) |
Net core Crown Debt | | 3,433 | | 7,745 | | Net core Crown debt and gross sovereign-issued debt differ from the analysis above due to elimination of cross-holdings of Govt stock and adding back the NZS Fund and GSF assets. |
Gross Sovereign-Issued Debt | | 36,150 | | 35,461 |
Statement of Financial Performance (institutional form)
for the year ended 30 June 2007 (compared with actual 30 June 2006)
| | Current Year Actual vs Prior Year Actual | |
| | State-owned enterprises | | Inter-segment elimins | | Total Crown | |
| | Actual
2007 | | Actual
2006 | | Actual
2007 | | Actual
2006 | | Actual
2007 | | Actual
2006 | |
| | $m | | $m | | $m | | $m | | $m | | $m | |
Revenue | | | | | | | | | | | | | |
Taxation revenue | | — | | — | | (473 | ) | (471 | ) | 52,938 | | 52,311 | |
Levies, fees, fines and penalties | | — | | — | | (77 | ) | (63 | ) | 3,568 | | 3,411 | |
Sales of goods and services | | 10,908 | | 11,206 | | (687 | ) | (618 | ) | 13,085 | | 13,337 | |
Investment income | | 504 | | 1,008 | | (1,108 | ) | (1,638 | ) | 5,819 | | 5,828 | |
Other revenue | | 618 | | 537 | | (19,712 | ) | (17,865 | ) | 2,156 | | 2,032 | |
Total Revenue | | 12,030 | | 12,751 | | (22,057 | ) | (20,655 | ) | 77,566 | | 76,919 | |
Expenses by Input Type | | | | | | | | | | | | | |
Subsidies and transfer payments | | — | | — | | (107 | ) | (101 | ) | 18,307 | | 16,850 | |
Personnel expenses | | 2,008 | | 1,876 | | (6 | ) | (7 | ) | 15,647 | | 15,116 | |
Operating expenses | | 8,814 | | 8,558 | | (20,910 | ) | (18,909 | ) | 31,778 | | 29,615 | |
Finance costs | | 552 | | 443 | | (473 | ) | (449 | ) | 3,069 | | 2,652 | |
Net foreign exchange losses/(gains) | | (96 | ) | (3 | ) | — | | — | | 116 | | (411 | ) |
GSF and ACC liability revaluation movements | | — | | — | | — | | — | | 100 | | 1,600 | |
Total Expenses | | 11,278 | | 10,874 | | (21,496 | ) | (19,466 | ) | 69,017 | | 65,422 | |
Expenses by Functional Classification | | | | | | | | | | | | | |
Social security and welfare | | — | | — | | (390 | ) | (369 | ) | 20,239 | | 18,969 | |
Health | | — | | — | | (9,381 | ) | (8,512 | ) | 9,932 | | 9,262 | |
Education | | 24 | | 22 | | (6,390 | ) | (6,045 | ) | 9,836 | | 10,430 | |
Other functional classifications | | 10,798 | | 10,412 | | (4,862 | ) | (4,091 | ) | 25,825 | | 24,520 | |
Forecast for future new spending | | — | | — | | — | | — | | — | | — | |
Finance costs and net FX losses/(gains) | | 456 | | 440 | | (473 | ) | (449 | ) | 3,185 | | 2,241 | |
Total expenses | | 11,278 | | 10,874 | | (21,496 | ) | (19,466 | ) | 69,017 | | 65,422 | |
Net surplus of TEIs | | — | | — | | — | | — | | 120 | | 54 | |
Minority interest | | (6 | ) | (78 | ) | — | | — | | (6 | ) | (78 | ) |
Operating balance | | 746 | | 1,799 | | (561 | ) | (1,189 | ) | 8,663 | | 11,473 | |
Statement of Financial Position (institutional form)
as at 30 June 2007 (compared with actual 30 June 2006)
| | State-owned enterprises | | Inter-segment elimins | | Total Crown | |
| | Actual
2007 | | Actual
2006 | | Actual
2007 | | Actual
2006 | | Actual
2007 | | Actual
2006 | |
| | $m | | $m | | $m | | $m | | $m | | $m | |
Assets | | | | | | | | | | | | | |
Financial assets | | 6,888 | | 5,368 | | (8,154 | ) | (7,075 | ) | 66,384 | | 56,446 | |
Physical assets | | 28,607 | | 16,231 | | — | | — | | 96,543 | | 79,441 | |
Investment in SOEs & Crown entities (including TEIs) | | — | | — | | (24,450 | ) | (24,169 | ) | 6,305 | | 5,475 | |
Other assets | | 2,713 | | 2,421 | | (748 | ) | (238 | ) | 15,744 | | 16,909 | |
Total Assets | | 38,208 | | 24,020 | | (33,352 | ) | (31,482 | ) | 184,976 | | 158,271 | |
Liabilities | | | | | | | | | | | | | |
Borrowings | | 9,804 | | 7,901 | | (8,154 | ) | (7,075 | ) | 41,385 | | 39,427 | |
Other liabilities | | 3,272 | | 3,004 | | (1,399 | ) | (796 | ) | 47,755 | | 47,441 | |
Total Liabilities | | 13,076 | | 10,905 | | (9,553 | ) | (7,871 | ) | 89,140 | | 86,868 | |
Net Worth | | 25,132 | | 13,115 | | (23,799 | ) | (23,611 | ) | 95,836 | | 71,403 | |
Taxpayer funds | | 7,111 | | 7,073 | | (23,764 | ) | (23,611 | ) | 42,140 | | 33,477 | |
Revaluation reserves | | 17,617 | | 5,749 | | — | | — | | 53,327 | | 37,633 | |
Minority interest | | 404 | | 293 | | (35 | ) | — | | 369 | | 293 | |
Net Worth | | 25,132 | | 13,115 | | (23,799 | ) | (23,611 | ) | 95,836 | | 71,403 | |
Analysis of Financial Assets and Borrowings | | | | | | | | | | | | | |
Advances and cash | | 5,340 | | 4,148 | | (3,167 | ) | (2,327 | ) | 14,895 | | 12,926 | |
MSDs and equity investments | | 1,548 | | 1,220 | | (4,987 | ) | (4,748 | ) | 51,489 | | 43,520 | |
Total Financial Assets | | 6,888 | | 5,368 | | (8,154 | ) | (7,075 | ) | 66,384 | | 56,446 | |
Borrowings - Sovereign guaranteed | | — | | — | | (5,097 | ) | (4,598 | ) | 30,353 | | 29,879 | |
Borrowings - Non-sovereign guaranteed | | 9,804 | | 7,901 | | (3,057 | ) | (2,477 | ) | 11,032 | | 9,548 | |
Total Borrowings | | 9,804 | | 7,901 | | (8,154 | ) | (7,075 | ) | 41,385 | | 39,427 | |
Borrowings less Financial Assets | | 2,916 | | 2,533 | | — | | — | | (24,999 | ) | (17,019 | ) |
Statement of Segments (continued)
Statement of Financial Performance (functional classification)
for the year ended 30 June 2007
| | Actual 2007 | | Actual 2006 | |
| | Total revenue | | Total expenses | | Net segment | | Total revenue | | Total expenses | | Net segment | |
| | $m | | $m | | $m | | $m | | $m | | $m | |
Total Crown by Functional Classification | | | | | | | | | | | | | |
Social security and welfare | | 4,745 | | 20,239 | | (15,494 | ) | 4,655 | | 18,969 | | (14,314 | ) |
GSF pension expenses | | 654 | | 302 | | 352 | | 566 | | 1,671 | | (1,105 | ) |
Health | | 324 | | 9,932 | | (9,608 | ) | 313 | | 9,262 | | (8,949 | ) |
Education | | 697 | | 9,836 | | (9,139 | ) | 670 | | 10,430 | | (9,760 | ) |
Core government services | | 189 | | 4,088 | | (3,899 | ) | 72 | | 2,384 | | (1,974 | ) |
Law and order | | 382 | | 2,825 | | (2,443 | ) | 385 | | 2,420 | | (2,035 | ) |
Defence | | — | | 1,557 | | (1,557 | ) | — | | 1,339 | | (1,339 | ) |
Transport and communications | | 5,898 | | 7,473 | | (1,575 | ) | 5,164 | | 5,986 | | (822 | ) |
Economic and industrial services | | 5,833 | | 5,324 | | 509 | | 7,503 | | 6,334 | | 1,169 | |
Primary services | | 798 | | 1,265 | | (467 | ) | 700 | | 1,219 | | (519 | ) |
Heritage, culture and recreation | | 1,393 | | 2,036 | | (643 | ) | 1,352 | | 2,361 | | (1,009 | ) |
Housing and community development | | 877 | | 889 | | (12 | ) | 806 | | 758 | | 48 | |
Other | | — | | 66 | | (66 | ) | — | | 48 | | (48 | ) |
Finance costs | | 2,257 | | 3,069 | | (812 | ) | 1,819 | | 2,652 | | (833 | ) |
Net foreign-exchange losses/(gains) | | — | | 116 | | (116 | ) | — | | (411 | ) | 411 | |
Unallocated revenues (tax revenue) | | 53,519 | | — | | 53,519 | | 52,914 | | — | | 52,576 | |
Net surplus of TEIs | | — | | — | | 120 | | — | | — | | 54 | |
Minority interest | | — | | — | | (6 | ) | — | | — | | (78 | ) |
Total Crown | | 77,566 | | 69,017 | | 8,663 | | 76,919 | | 65,422 | | 11,473 | |
Statement of Financial Position (functional classification)
as at 30 June 2007
| | Actual 2007 | | Actual 2006 | |
| | Physical assets | | Total assets | | Total borrowings | | Total liabilities | | Physical assets | | Total assets | | Total borrowings | | Total liabilities | |
| | $m | | $m | | $m | | $m | | $m | | $m | | $m | | $m | |
Total Crown by Functional Classification | | | | | | | | | | | | | | | | | |
Social security and welfare | | 522 | | 24,332 | | 645 | | 15,488 | | 488 | | 20,593 | | 756 | | 15,323 | |
GSF pension expenses | | — | | 4,354 | | — | | 14,313 | | — | | 4,172 | | — | | 15,231 | |
Health | | 4,055 | | 5,866 | | 539 | | 1,090 | | 3,836 | | 6,137 | | 650 | | 2,400 | |
Education | | 10,332 | | 18,508 | | 42 | | 2,557 | | 10,561 | | 17,771 | | 54 | | 954 | |
Core government services | | 2,378 | | 34,876 | | 30,303 | | 39,807 | | 2,211 | | 32,139 | | 29,787 | | 38,905 | |
Law and order | | 3,381 | | 5,378 | | 10 | | 663 | | 2,856 | | 4,395 | | 13 | | 622 | |
Defence | | 4,530 | | 5,183 | | — | | 270 | | 4,514 | | 5,020 | | — | | 195 | |
Transport and communications | | 33,428 | | 40,789 | | 6,220 | | 8,816 | | 21,649 | | 27,313 | | 4,554 | | 6,918 | |
Economic and industrial services | | 13,464 | | 17,935 | | 3,267 | | 3,985 | | 11,464 | | 15,877 | | 2,897 | | 3,943 | |
Primary services | | 1,699 | | 2,548 | | 128 | | 428 | | 1,610 | | 2,424 | | 203 | | 439 | |
Heritage, culture and recreation | | 7,506 | | 8,750 | | 117 | | 1,311 | | 6,740 | | 7,943 | | 117 | | 1,262 | |
Housing and community development | | 15,001 | | 16,200 | | 114 | | 354 | | 13,335 | | 14,305 | | 396 | | 639 | |
Other | | 247 | | 257 | | — | | 58 | | 177 | | 182 | | — | | 37 | |
Total Crown | | 96,543 | | 184,976 | | 41,385 | | 89,140 | | 79,441 | | 158,271 | | 39,427 | | 86,868 | |
Statement of Accounting Policies
Reporting Entity
The Financial Statements of the Government of New Zealand have been prepared in accordance with the requirements of the Public Finance Act 1989.
The Government reporting entity as specified in Part III of the Public Finance Act 1989 comprises:
· · Ministers of the Crown | · · Departments |
| |
· · Reserve Bank of New Zealand | · · Government Superannuation Fund |
| |
· · Offices of Parliament | · · New Zealand Superannuation Fund |
| |
· · State owned enterprises | · · Air New Zealand Limited |
| |
· · Crown entities | |
A more detailed listing of the components of the Government reporting entity is set out in the supplementary information on pages 102 and 103.
Accounting Policies
These financial statements comply with generally accepted accounting practice. The measurement base applied is historical cost adjusted for revaluations of certain property, plant and equipment, commercial forests and marketable securities held for trading purposes. The accrual basis of accounting has been used unless otherwise stated.
Reporting and forecast period
The reporting and forecast period for these financial statements is the year ended 30 June 2007.
The Budget forecast is the original forecast for the financial year, as presented in the 2006 Budget on 18 May 2006. The estimated actual forecast, as presented in the 2007 Budget on 17 May 2007, has been prepared using actual data which was available at the time of the finalisation of the Budget forecasts (9 May 2007).
Basis of combination
Ministers of the Crown, departments, Offices of Parliament, the Reserve Bank of New Zealand, the GSF, the NZS Fund, SOEs (including Air New Zealand Limited) and Crown entities (excluding TEIs) are combined using the purchase method of combination. Corresponding assets, liabilities, revenues and expenses are added together line by line. Transactions and balances between these sub-entities are eliminated on combination.
TEIs are equity accounted, which recognises these entities’ net assets, including asset revaluation movements and surpluses and deficits.
Note 13 outlines in more detail why there is a difference in the accounting treatment of TEIs from other Crown entities.
Revenue
Revenue levied through the Crown’s sovereign power
The Government provides many services and benefits that do not give rise to revenue. Further, payment of tax does not, of itself, entitle a taxpayer to an equivalent value of services or benefits, as there is no direct relationship between paying tax and receiving Crown services and transfers.
Such revenue is received through the exercise of the Crown’s sovereign power. Where possible, revenue is recognised at the time the debt to the Crown arises.
Revenue type | | Revenue recognition point |
Source deductions | | When an individual earns income that is subject to PAYE |
Fringe benefit tax (FBT) | | When benefits are provided that give rise to FBT |
Provisional tax(2) | | When taxable income is earned |
Terminal tax(2) | | Assessment filed date |
Resident withholding tax(1) | | When an individual is paid interest or dividends subject to deduction at source |
Goods and services tax | | When the liability to the Crown is incurred |
Excise duty | | When goods are subject to duty |
Road user charges and motor vehicle fees | | When payment for the fee or charge is made |
Stamp, cheque and credit card duties | | Assessment filed date |
Other indirect taxes | | When the debt to the Crown arises |
Levies (eg, ACC levies) | | When the obligation to pay the levy to the Crown is incurred |
(1) Corresponds to withholding taxes on residents’ interest and dividend income in Note 1 to the financial statements.
(2) Provisional and terminal taxes are paid by “other persons” and companies (refer to Note 1 to the financial statements).
Revenue earned through operations
If revenue has been earned by the Government in exchange for the provision of outputs (products or services) to third parties, the Government receives its revenue through operations. Such revenue is recognised when it is earned.
Investment income
Investment income is recognised in the period in which it is earned.
Premiums and discounts
Premiums arising on the issue of a debt instrument are treated as a reduction in finance cost. Discounts arising on the purchase of a monetary asset are treated as an increase in investment income.
Premiums and discounts are recognised in the Statement of Financial Position on issue, and are amortised over the period of the instrument on a yield-to-maturity basis.
For floating rate debt instruments, the amortisation is over the first interest period. Discounts on monetary assets deemed short-term securities are amortised on a straight-line basis.
The forward margin associated with forward foreign-exchange contracts is amortised over the period of the contract on a straight-line basis.
Gains
Realised gains arising from sales of assets or the early repurchase of liabilities are recognised in the Statement of Financial Performance in the period in which the transaction occurs.
Unrealised foreign-exchange gains on monetary assets and liabilities, and unrealised gains on marketable securities held for trading purposes and listed equity investments, are recognised in the Statement of Financial Performance.
Unrealised and realised gains related to hedging activity are recognised in the Statement of Financial Performance in the same period in which losses on the underlying hedged position are recognised.
Unrealised gains arising from changes in the value of property, plant and equipment are recognised in the Statement of Financial Performance to the extent that a gain reverses a loss previously charged to the Statement of Financial Performance. Otherwise, gains are credited to an asset revaluation reserve for that class of asset.
Unrealised gains arising from changes in the value of commercial forests are credited to the Statement of Financial Performance.
Unrealised gains (excluding foreign-exchange gains) arising from changes in the value of investments and marketable securities held for investment and unlisted equity investments are recognised only to the extent that they reverse a loss previously charged to the Statement of Financial Performance. Gains effecting such a reversal are credited to the Statement of Financial Performance.
Expenses
General
Expenses are recognised in the period to which they relate.
Welfare benefits
Welfare benefits are recognised in the period when an application for a benefit has been received and the eligibility criteria met.
Grants and subsidies
Where grants and subsidies are discretionary until payment, the expense is recognised when the payment is made. Otherwise, the expense is recognised when the eligibility criteria have been met and notice has been given to the Government.
Discounts and premiums
Discounts arising on the issue of a debt instrument are treated as an increase in finance cost. Premiums arising on the purchase of a monetary asset are treated as a reduction in investment income.
Discounts and premiums are recognised in the Statement of Financial Position on issue, and are amortised over the period of the instrument on a yield-to-maturity basis.
For floating rate debt instruments, the amortisation is over the first interest period. Premiums on monetary assets deemed short-term securities are amortised on a straight-line basis.
The forward margin associated with forward foreign-exchange contracts is amortised over the period of the contract on a straight-line basis.
Losses
Realised losses arising from sales of assets or the early repurchase of liabilities are recognised in the Statement of Financial Performance in the period in which the transaction occurs.
Unrealised foreign-exchange losses on monetary assets and liabilities, and unrealised losses on marketable securities held for trading purposes and listed equity investments, are recognised in the Statement of Financial Performance.
Unrealised and realised losses related to hedging activity are recognised in the Statement of Financial Performance in the same period in which gains on the underlying hedged position are recognised.
Unrealised losses (excluding foreign-exchange losses) arising from changes in the value of property, plant and equipment (including state highways), and investments and marketable securities held for investment and unlisted equity investments are recognised at balance date. Unrealised losses are first applied against any revaluation reserve for that class of asset. The balance, if any, is charged to the Statement of Financial Performance.
Unrealised losses arising from changes in the value of commercial forests are charged to the Statement of Financial Performance.
Foreign-currency transactions
Short-term transactions covered by forward exchange contracts are translated into New Zealand dollars using the forward rates specified in those contracts.
Other transactions in foreign currencies are translated into New Zealand dollars using the exchange rate on the date of the transaction. Exchange differences arising on settlement of these transactions are recognised in the Statement of Financial Performance.
Outstanding foreign-exchange contracts are translated at the closing exchange rate. Exchange gains and losses are included in the Statement of Financial Performance in the period in which they arise.
Depreciation
Depreciation is charged on a straight-line basis at rates calculated to allocate the cost or valuation of an item of property, plant and equipment, less any estimated residual value, over its estimated useful life. Typically, the estimated useful lives of different classes of property, plant and equipment are as follows:
Freehold buildings | | 25 to 60 years |
Specialist military equipment | | 5 to 25 years |
Other plant and equipment | | 3 to 25 years |
Aircraft (ex specialist military equipment) | | 10 to 20 years |
Electricity distribution network | | 2 to 80 years |
Electricity generation assets | | 25 to 55 years |
State highways: | | |
Pavement (surfacing) | | 7 years |
Pavement (other) | | 36 years |
Bridges | | 90 to 100 years |
Rail network: | | |
Track and ballast | | 40 years |
Tunnels and bridges | | 80 years |
Overhead traction and signalling | | 20 years |
Goodwill amortisation
Goodwill and identifiable intangible assets are amortised on a systematic basis to the Statement of Financial Performance over their period of expected benefit. The maximum period of amortisation is 20 years.
Assets
Foreign monetary assets
Where short-term foreign monetary assets are subject to forward exchange contracts, they are translated into New Zealand dollars at the contract rate. Otherwise, foreign monetary assets are translated at the closing exchange rate.
Exchange gains and losses are included in the Statement of Financial Performance in the period in which they arise.
Receivables and advances excluding student loans
Receivables and advances excluding student loans are recorded at the amounts expected to be ultimately collected in cash.
Student loans
Student loans are recognised initially at fair value plus transaction costs and subsequently measured at amortised cost using the effective interest rate method, less any impairment loss. The effective interest rate discounts estimated future cash receipts through the expected life of the loan to the net carrying amount of the loan but does not consider future credit losses. Interest is recognised on the loan evenly in proportion to the amount outstanding over the period to repayment.
Allowances for estimated irrecoverable amounts are recognised when there is objective evidence that the loan is impaired. Impairment losses are incurred if, and only if, there is objective evidence of impairment as a result of one or more events that occurred after the initial recognition of the loan and that a ‘loss’ event (or events) has an impact on the estimated future cash flows of the student loan book that can be reliably measured.
Interest and impairment losses are recognised in the Statement of Financial Performance.
Inventories
Inventories are recorded at the lower of cost and net realisable value. Where inventories acquired are recorded at cost, the weighted average cost method is used. Appropriate allowance has been made for obsolescence.
Investments
Marketable securities held for trading purposes
Marketable securities held for trading purposes are recorded at fair value.
Equity investments
Listed equity investments (other than those forming part of the reporting entity) are recorded at fair value.
Other equity investments (other than those forming part of the reporting entity) are recorded at lower of cost and fair value.
Other investments and marketable securities held for investment purposes
Other investments, including marketable securities held for investment purposes, are recorded at the lower of cost and fair value.
Investments held for hedging purposes are recorded on the same basis as the item being hedged.
Items of property, plant and equipment
Items of property, plant and equipment are initially recorded at cost.
For each property, plant and equipment asset project, borrowing costs incurred during the period required to complete and prepare the asset for its intended use are expensed.
Revaluations are carried out for the classes of property, plant and equipment noted below to reflect the service potential or economic benefit obtained through control of the asset. Revaluation is based on the fair value of the asset. Where an asset is recorded using depreciated replacement cost, depreciated replacement cost is based on the estimated present cost of construction, reduced by factors for age and deterioration of the asset.
Classes of property, plant and equipment assets that are revalued, are revalued at least every five years.
Classes of property, plant and equipment assets that are revalued are regularly reviewed to ensure the carrying value is not materially different from fair value.
Land and buildings
Land and buildings are recorded at fair value less accumulated depreciation on buildings. In cases where valuations conducted in accordance with the New Zealand Property Institute’s standards are not available, valuations conducted in accordance with the Rating Valuation Act 1998, which have been confirmed as appropriate by an independent valuer, have been used.
Specialist military equipment
Specialist military equipment is recorded at fair value based on depreciated replacement cost less accumulated depreciation. Valuations have been obtained through specialist assessment by New Zealand Defence Force advisers, and the basis of these valuations have been confirmed as appropriate by an independent valuer.
State highways
State highways are recorded at fair value based on depreciated replacement cost less accumulated depreciation. Replacement costs are based on the estimated present cost of constructing the existing asset by the most appropriate method of construction. Land associated with the state highways is valued using an opportunity cost based on adjacent use, as an approximation of fair value.
Rail network assets
Rail network assets are recorded at fair value based on depreciated replacement cost less accumulated depreciation. Replacement costs are based on the estimated present cost of constructing the existing asset by the most appropriate method of construction. Land associated with the rail network is valued using an opportunity cost based on adjacent use, as an approximation of fair value.
Aircraft (excluding specialist military equipment)
Aircraft (excluding SME) are recorded at fair value less accumulated depreciation.
Electricity distribution network
Electricity distribution network assets are recorded at cost less accumulated depreciation.
Electricity generation assets
Electricity generation assets are recorded at fair value less accumulated depreciation.
Other items of property, plant and equipment — at cost
Other property, plant and equipment, which include motor vehicles and office equipment, are recorded at cost less accumulated depreciation.
Other physical assets for which an objective estimate of market value is difficult to obtain
Such physical assets (national parks, for example) are recorded at fair value less accumulated depreciation.
Commercial forests
Commercial forests are recorded at fair value less estimated point-of-sale costs. This takes into account age, quality of timber and the forest management plan.
Goodwill and intangible assets
The excess of cost over the fair value of the net assets of entities acquired (subsidiaries) at the date of acquisition is recognised as goodwill. The balance of goodwill is assessed annually for evidence of impairment in excess of annual amortisation.
Identifiable intangible assets which have been purchased are initially recorded at cost and thereafter either at cost less accumulated amortisation and any accumulated impairment losses or, where in the rare case where an active market exists, at a revalued amount being fair value at the date of the revaluation less any subsequent accumulated amortisation and any subsequent accumulated impairment losses.
Liabilities
Borrowings
In the Statement of Financial Position, borrowings (including currency swaps) are recorded at nominal value adjusted for the unamortised portion of the premium or discount on issue.
Foreign monetary liabilities
Where short-term foreign monetary liabilities are subject to forward exchange contracts, they are translated into New Zealand dollars at the contract rate. Otherwise, foreign monetary liabilities are translated at the closing exchange rate.
Exchange gains and losses are recognised in the Statement of Financial Performance in the period in which they arise.
Pension liabilities
Pension liabilities in respect of the contributory service of superannuation scheme members are recorded at the latest actuarial value of the Crown’s liability for pension payments. Movements of the liability are reflected in the Statement of Financial Performance.
ACC claims liabilities
The future cost of ACC claims liabilities is revalued annually based on the latest actuarial information. Movements of the liability are reflected in the Statement of Financial Performance.
Currency issued
Currency issued represents a liability in favour of the holder. Currency issued for circulation, including an amount to cover expected future redemption of demonetised currency, is recognised at face value.
Leases
Finance leases transfer to the Government as lessee substantially all the risks and rewards incident on the ownership of a leased asset. The obligations under such leases are capitalised at the present value of the minimum lease payments. The capitalised values are amortised over the period in which the Government expects to receive benefits from their use.
Operating leases, where the lessors substantially retain the risks and rewards of ownership, are recognised in a systematic manner over the term of the lease.
Leasehold improvements are capitalised and the cost is amortised over the unexpired period of the lease or the estimated useful life of the improvements, whichever is shorter.
Employee entitlements
Employee entitlements to salaries and wages, annual leave, long service leave, retiring leave and other similar benefits are recognised when they accrue to employees. The liability for employee entitlements is carried as the present value of the estimated future cash outflows.
Other liabilities
All other liabilities are recorded at the estimated obligation to pay.
Commitments
Commitments are future expenses and liabilities to be incurred on contracts that have been entered into at balance date. Commitments include those operating and capital commitments arising from non-cancellable contractual or statutory obligations. Interest commitments on debts and commitments relating to employment contracts are not included in the Statement of Commitments.
Contingent liabilities and contingent assets
Contingent liabilities and contingent assets are recorded in the Statement of Contingent Liabilities and Contingent Assets at the point at which the contingency is evident.
Changes in Accounting Policies
The measurement basis for recording rail network assets has changed from historical cost to fair value using depreciated replacement cost. This basis provides a more current value of the rail network and is more consistent with the approach taken to other significant items of property, plant and equipment. The financial impact of this change increases property, plant and equipment by $10.3 billion and increases net worth by the same amount. The Statement of Financial Performance is consequently impacted by increases in depreciation of $155 million.
There has also been a change in the disclosure of bad debt write-offs of tax receivables. Tax write-offs are now shown as an expense rather than netted off against revenue. The impact of this change in presentation has no impact on the operating balance but does result in an increase in both revenue and expenses of $0.7 billion ($0.3 billion in 2005/06).
There have been no other changes in accounting policies. All other policies have been applied on a basis consistent with the previous year.
Comparatives
To ensure consistency with the current period, comparative figures have been restated where appropriate.
Notes to the Financial Statements
Note 1: Tax and Levies Collected through the Crown’s Sovereign Power (Accrual)
Forecast | | | | Actual | |
Original
Budget | | Estimated
Actual | | | | 30 June
2007 | | 30 June
2006 | |
$m | | $m | | | | $m | | $m | |
| | | | Direct Income Tax Revenue (accrual) (1) | | | | | |
| | | | Individuals | | | | | |
20,595 | | 21,073 | | Source deductions | | 21,085 | | 19,985 | |
4,533 | | 4,614 | | Other persons | | 4,440 | | 5,075 | |
(962 | ) | (1,085 | ) | Refunds | | (1,080 | ) | (953 | ) |
426 | | 456 | | Fringe benefit tax | | 468 | | 451 | |
24,592 | | 25,058 | | Total Individuals | | 24,913 | | 24,558 | |
| | | | Corporate Tax | | | | | |
8,353 | | 8,265 | | Gross companies tax | | 8,618 | | 9,439 | |
(205 | ) | (252 | ) | Refunds | | (296 | ) | (270 | ) |
874 | | 1,142 | | Non-resident withholding tax | | 1,189 | | 1,096 | |
220 | | 146 | | Foreign-source dividend withholding payments | | 149 | | 160 | |
9,242 | | 9,301 | | Total Corporate Tax | | 9,660 | | 10,425 | |
| | | | | | | | | |
| | | | Other Income Tax | | | | | |
2,079 | | 2,156 | | Resident withholding tax on interest income | | 2,227 | | 1,880 | |
56 | | 89 | | Resident withholding tax on dividend income | | 89 | | 74 | |
2 | | 4 | | Estate and gift duties | | 2 | | 3 | |
2,137 | | 2,249 | | Total Other Income Tax | | 2,318 | | 1,957 | |
35,971 | | 36,608 | | Total Direct Income Tax | | 36,891 | | 36,940 | |
| | | | Indirect Tax Revenue (accrual) | | | | | |
| | | | Goods and Services Tax | | | | | |
18,692 | | 19,203 | | Gross goods and services tax | | 19,527 | | 18,367 | |
(8,028 | ) | (8,332 | ) | Refunds | | (8,325 | ) | (7,664 | ) |
10,664 | | 10,871 | | Total Goods and Services Tax | | 11,202 | | 10,703 | |
| | | | Other Indirect Taxation | | | | | |
914 | | 881 | | Petroleum fuels excise | | 819 | | 852 | |
145 | | 244 | | Tobacco excise | | 238 | | 834 | |
1,773 | | 1,760 | | Customs duty | | 1,836 | | 1,083 | |
793 | | 785 | | Road user charges | | 786 | | 731 | |
537 | | 559 | | Alcohol excise | | 553 | | 516 | |
256 | | 230 | | Gaming duties | | 245 | | 275 | |
223 | | 220 | | Motor vehicle fees | | 222 | | 221 | |
58 | | 49 | | Energy resources levies | | 54 | | 73 | |
74 | | 71 | | Approved issuer levy and cheque duty | | 92 | | 83 | |
4,773 | | 4,799 | | Total Other Indirect Taxation | | 4,845 | | 4,668 | |
15,437 | | 15,670 | | Total Indirect Taxation | | 16,047 | | 15,371 | |
51,408 | | 52,278 | | Total Taxation Revenue | | 52,938 | | 52,311 | |
| | | | Levies, fees, fines and penalties (accrual) | | | | | |
2,189 | | 2,454 | | ACC levies | | 2,476 | | 2,326 | |
253 | | 259 | | Fire Service levies | | 265 | | 254 | |
83 | | 84 | | EQC levies | | 84 | | 82 | |
654 | | 711 | | Other | | 743 | | 749 | |
3,179 | | 3,508 | | Total levies, fees, fines and penalties | | 3,568 | | 3,411 | |
54,587 | | 55,786 | | Total Sovereign Revenue | | 56,506 | | 55,722 | |
(1) There has been a change in the disclosure of bad debt write-offs of tax receivables. Tax write-offs are now shown as an expense rather than netted off against revenue. To ensure consistency comparative figures have been adjusted to conform with this change in presentation.
Note 1: Tax and Levies Collected through the Crown’s Sovereign Power (Cash)
Forecast | | | | Actual | |
Original
Budget | | Estimated
Actual | | | | 30 June
2007 | | 30 June
2006 | |
$m | | $m | | | | $m | | $m | |
| | | | Direct Income Tax Receipts (cash) | | | | | |
| | | | Individuals | | | | | |
20,534 | | 21,034 | | Source deductions | | 21,069 | | 19,897 | |
5,189 | | 5,296 | | Other persons | | 5,121 | | 4,883 | |
(1,780 | ) | (1,858 | ) | Refunds | | (1,850 | ) | (1,503 | ) |
421 | | 469 | | Fringe benefit tax | | 482 | | 450 | |
24,364 | | 24,941 | | Total Individuals | | 24,822 | | 23,727 | |
| | | | Corporate Tax | | | | | |
8,602 | | 8,865 | | Gross companies tax | | 9,016 | | 8,512 | |
(746 | ) | (1,091 | ) | Refunds | | (1,153 | ) | (833 | ) |
874 | | 1,092 | | Non-resident withholding tax | | 1,135 | | 1,093 | |
220 | | 148 | | Foreign-source dividend withholding payments | | 141 | | 157 | |
8,950 | | 9,014 | | Total Corporate Tax | | 9,139 | | 8,929 | |
| | | | Other Income Tax | | | | | |
2,078 | | 2,154 | | Resident withholding tax on interest income | | 2,192 | | 1,862 | |
56 | | 91 | | Resident withholding tax on dividend income | | 90 | | 74 | |
2 | | 4 | | Estate and gift duties | | 3 | | 2 | |
2,136 | | 2,249 | | Total Other Income Tax | | 2,285 | | 1,938 | |
35,450 | | 36,204 | | Total Direct Income Tax | | 36,246 | | 34,594 | |
| | | | Indirect Tax Receipts (cash) | | | | | |
| | | | Goods and Services Tax | | | | | |
18,183 | | 18,415 | | Gross goods and services tax | | 18,713 | | 17,705 | |
(7,669 | ) | (7,604 | ) | Refunds | | (7,625 | ) | (7,216 | ) |
10,514 | | 10,811 | | Total Goods and Services Tax | | 11,088 | | 10,489 | |
| | | | Other Indirect Taxation | | | | | |
914 | | 881 | | Petroleum fuels excise | | 835 | | 847 | |
145 | | 244 | | Tobacco excise | | 265 | | 842 | |
1,773 | | 1,760 | | Customs duty | | 1,778 | | 1,074 | |
793 | | 785 | | Road user charges | | 780 | | 721 | |
537 | | 559 | | Alcohol excise | | 549 | | 514 | |
257 | | 235 | | Gaming duties | | 246 | | 273 | |
223 | | 220 | | Motor vehicle fees | | 208 | | 199 | |
58 | | 53 | | Energy resources levies | | 55 | | 73 | |
74 | | 71 | | Approved issuer levy and cheque duty | | 88 | | 80 | |
4,774 | | 4,808 | | Total Other Indirect Taxation | | 4,804 | | 4,623 | |
15,288 | | 15,619 | | Total Indirect Taxation | | 15,892 | | 15,112 | |
50,738 | | 51,823 | | Total Taxation Receipts | | 52,138 | | 49,706 | |
| | | | Levies, fees, fines and penalties (cash) | | | | | |
2,105 | | 2,401 | | ACC levies | | 2,416 | | 2,256 | |
253 | | 262 | | Fire Service levies | | 268 | | 254 | |
83 | | 85 | | EQC levies | | 84 | | 83 | |
606 | | 639 | | Other | | 650 | | 653 | |
3,047 | | 3,387 | | Total levies, fees, fines and penalties | | 3,418 | | 3,246 | |
53,785 | | 55,210 | | Total Sovereign Receipts | | 55,556 | | 52,952 | |
Note 2: Sale of Goods and Services
The Statement of Segments shows the sale of goods and services as a total for each area of the Crown (ie, total sales for core Crown, Crown entities and SOEs). The total for Crown entities includes such items as lottery sales, housing rental and Crown research institutes (CRI) sales. The total sales of SOEs (including Air NZ) represents the majority of their income from electricity generation and distribution services, postal services, advertising and air travel sales.
Note 3: Investment Income
Forecast | | | | Actual | |
Original
Budget | | Estimated
Actual | | | | 30 June
2007 | | 30 June
2006 | |
$m | | $m | | | | $m | | $m | |
| | | | Investment Income | | | | | |
856 | | 1,410 | | NZS Fund Investment Income | | 1,640 | | 1,139 | |
1,873 | | 2,852 | | Interest income | | 2,768 | | 2,145 | |
269 | | 452 | | Student loans | | 451 | | 344 | |
71 | | 147 | | Dividends | | 157 | | 117 | |
— | | — | | Gain on Sale of Southern Hydro | | — | | 630 | |
599 | | 878 | | Gains/(losses) on marketable securities, deposits and equity investments | | 775 | | 1,436 | |
19 | | 68 | | Other | | 28 | | 17 | |
3,687 | | 5,807 | | Total Investment Income | | 5,819 | | 5,828 | |
Note 4: Other Revenue
Forecast | | | | Actual | |
Original
Budget | | Estimated
Actual | | | | 30 June
2007 | | 30 June
2006 | |
$m | | $m | | | | $m | | $m | |
— | | — | | Unrealised (losses)/gains arising from changes in the value of commercial forests | | 27 | | 15 | |
75 | | 79 | | GSF contributions | | 96 | | 104 | |
55 | | 62 | | Petroleum royalties | | 66 | | 61 | |
30 | | 28 | | Cost recovery income from fisheries | | 30 | | 29 | |
2,201 | | 2,069 | | Other | | 1,937 | | 1,823 | |
2,361 | | 2,238 | | Total Other Operational Revenue | | 2,156 | | 2,032 | |
Note 5: Subsidies and Transfer Payments
Forecast | | | | Actual | |
Original
Budget | | Estimated
Actual | | | | 30 June
2007 | | 30 June
2006 | |
$m | | $m | | | | $m | | $m | |
| | | | Social Assistance Grants | | | | | |
6,782 | | 6,807 | | New Zealand Superannuation | | 6,810 | | 6,414 | |
1,504 | | 1,467 | | Domestic purposes benefit | | 1,468 | | 1,493 | |
1,845 | | 1,959 | | ACC payments | | 1,967 | | 1,708 | |
783 | | 615 | | Unemployment benefit | | 613 | | 712 | |
1,131 | | 1,136 | | Invalids benefit | | 1,132 | | 1,073 | |
1,725 | | 1,779 | | Family support | | 1,699 | | 1,285 | |
883 | | 882 | | Accommodation supplement | | 877 | | 843 | |
575 | | 573 | | Sickness benefit | | 573 | | 541 | |
364 | | 385 | | Student allowances | | 382 | | 354 | |
286 | | 270 | | Disability allowances | | 270 | | 261 | |
2,047 | | 2,028 | | Other social assistance grants | | 2,020 | | 1,675 | |
140 | | 117 | | Subsidies | | 101 | | 127 | |
| | | | Other Transfer Payments | | | | | |
88 | | 374 | | Official development assistance | | 356 | | 330 | |
36 | | 38 | | Other | | 39 | | 34 | |
18,189 | | 18,430 | | Total Subsidies and Transfer Payments | | 18,307 | | 16,850 | |
Note 6: Personnel Expenses
The Statement of Segments shows the personnel expenses as a total for each area of total Crown (ie, total personnel expenses for core Crown, Crown entities and SOEs).
Forecast | | | | Actual | |
Original
Budget | | Estimated
Actual | | | | 30 June
2007 | | 30 June
2006 | |
$m | | $m | | | | $m | | $m | |
1,068 | | 1,148 | | GSF pension costs | | 1,222 | | 1,392 | |
131 | | 139 | | Other pension expenses | | 227 | | 206 | |
13,937 | | 14,065 | | Other personnel expenses | | 14,198 | | 13,518 | |
15,136 | | 15,352 | | Total Personnel Expenses | | 15,647 | | 15,116 | |
Personnel expenses include salaries and allowances to Ministers of the Crown totalling $7.0 million (30 June 2006: $6.7 million). In addition, Ministers are provided with ministerial accommodation in Wellington and receive allowances when travelling in New Zealand.
Note 7: Operating Expenses
Operating expenses relate to those expenses incurred in the course of undertaking the functions and activities of entities included in the Government financial statements, excluding those expenses separately identified in the Statement of Financial Performance and other notes.Items disclosed separately below are those required by Financial Reporting Standards.
Other operating costs is the large residual item. Most of these costs represent payments made for services provided by third parties (roading maintenance for example) or for raw materials (fuel, medicines or inventory for example). They also include other day-to-day operating costs.
| | | | Depreciation | | | | | |
900 | | 920 | | Buildings | | 940 | | 880 | |
118 | | 97 | | Electricity distribution networks | | 110 | | 109 | |
216 | | 241 | | Electricity generation assets | | 229 | | 198 | |
216 | | 239 | | Specialist military equipment (SME) | | 238 | | 187 | |
236 | | 242 | | State highways | | 299 | | 252 | |
— | | 152 | | Rail network | | 155 | | — | |
246 | | 223 | | Aircraft (excluding SME) | | 173 | | 102 | |
913 | | 910 | | Other plant and equipment | | 954 | | 905 | |
73 | | 75 | | Other assets | | 46 | | 75 | |
2,918 | | 3,099 | | Total Depreciation | | 3,144 | | 2,708 | |
| | | | Other Operating Expenses | | | | | |
787 | | 843 | | Rental and leasing costs | | 887 | | 820 | |
254 | | 150 | | Change in provision for doubtful debts | | 508 | | 429 | |
800 | | 2,225 | | Write-off of bad debts(1) | | 1,929 | | 419 | |
89 | | 89 | | Goodwill amortised | | 99 | | 75 | |
21 | | 25 | | Audit fees | | 31 | | 28 | |
2 | | 3 | | Fees paid to auditors for other services | | 3 | | 4 | |
— | | — | | Asset impairment losses | | 33 | | 90 | |
1,162 | | 1,771 | | Grants paid | | 1,688 | | 1,578 | |
371 | | 397 | | Lottery prize payments | | 414 | | 398 | |
— | | — | | Loss/(gain) on sale of assets | | 34 | | 93 | |
— | | — | | Net revaluation losses/(gains) | | 282 | | (274) | |
— | | — | | Write down of existing student loans to fair value | | — | | 1,415 | |
381 | | 496 | | Write down of new loans to fair value | | 488 | | 328 | |
23,774 | | 22,840 | | Other operating costs | | 22,238 | | 21,504 | |
30,559 | | 31,938 | | Total Operating Expenses (including depreciation) | | 31,778 | | 29,615 | |
(1) The Inland Revenue and Ministry of Justice have updated their doubtful debt methodology to incorporate revised debt collectibility percentages that were developed as part of historical debt modelling work undertaken for the transition to NZ IFRS. This re-assessment lead to one-off accounting adjustment of $1.2 billion reflecting the economic collectibility of receivables based on newly available historical data. In addition there has been a change in the disclosure of bad debt write-offs of tax receivables. Tax write-offs are now shown as an expense rather than netted off against revenue. To ensure consistency comparative figures have been adjusted to conform with this change in presentation.
Note 8: Cash and Marketable Securities, Deposits and Equity Investments
Forecast | | | | Actual | |
Original
Budget | | Estimated
Actual | | | | 30 June
2007 | | 30 June
2006 | |
$m | | $m | | | | $m | | $m | |
| | | | By Category | | | | | |
2,902 | | 3,478 | | Total Cash | | 4,629 | | 4,168 | |
25,249 | | 35,300 | | Marketable securities and deposits (MSD) | | 33,270 | | 27,668 | |
17,708 | | 16,494 | | Equity investments (eg, shares) | | 18,036 | | 15,394 | |
275 | | 221 | | Reserve position at the IMF | | 183 | | 458 | |
43,232 | | 52,015 | | Total MSDs and Equity Investments | | 51,489 | | 43,520 | |
46,134 | | 55,493 | | Cash and MSDs and Equity Investments | | 56,118 | | 47,688 | |
| | | | MSDs and Equity Investments by Portfolio Management: | | | | | |
16,693 | | 23,317 | | Reserve Bank and NZDMO managed funds | | 22,884 | | 19,284 | |
11,765 | | 11,576 | | NZS Fund | | 11,841 | | 8,555 | |
3,449 | | 4,112 | | Government Superannuation Fund | | 4,093 | | 3,959 | |
7,940 | | 8,661 | | ACC portfolio | | 8,366 | | 7,882 | |
2,390 | | 1,963 | | EQC portfolio | | 1,894 | | 1,943 | |
995 | | 2,386 | | Other holdings | | 2,411 | | 1,897 | |
43,232 | | 52,015 | | Total MSDs and Equity Investments | | 51,489 | | 43,520 | |
The asset values above are net of any cross-holdings. For example, the asset portfolios of the NZS Fund, GSF, EQC and ACC currently all hold amounts of New Zealand Government stock. For financial reporting purposes these amounts are eliminated within the combined financial statements. The total portfolios, including cross-holdings of New Zealand Government stock, are shown below, along with commentary on the restricted nature of some of the assets (for example the GSF assets are only available for the payment of GSF benefits — because of the restricted nature of these assets they are excluded from the definition of net core Crown debt).
Nature of financial assets — some are restricted
Within the financial assets above, several portfolios are restricted in their nature in that they are only available to meet very specified purposes and are not available (by statute or other reasons) for general use by the Crown. It is for this reason that such assets are excluded from the definition of net core Crown debt — one of the Crown’s key fiscal policy indicators.
New Zealand Superannuation Fund
The assets of the NZS Fund is the Government’s means of building up assets to partially pre-fund future New Zealand superannuation expenses and may only be used for New Zealand Superannuation. The assets in this fund total $12.989 billion as at 30 June 2007. The Government’s contributions to the NZS Fund are calculated over a 40-year rolling horizon to ensure superannuation entitlements over the next 40 years can be met.
Government Superannuation Fund
The GSF Authority administers the asset portfolio of the GSF totalling $4.2 billion. These assets result from contributions by beneficiaries built up through time and can only be applied to the ongoing payment of GSF benefits (as provided by the GSF Act). Also refer Note 16.
ACC portfolio
ACC manages the ACC scheme. At present there is a substantial outstanding claims liability associated with past claims of around $13.7 billion. To manage the payment of these claims in the future, ACC is
building up a matching portfolio of assets. The target is to have the residual claims fully funded by 2014. Also refer Note 17.
EQC — Natural Disaster Fund (NDF)
The EQC is New Zealand’s primary provider of seismic disaster insurance to residential property owners. The EQC administers the NDF, comprising capital and reserves. The EQC draws on the NDF money to pay out claims for damage caused by natural disasters.
Individual Portfolio Information (including cross-holdings of New Zealand Government stock)
Forecast | | | | Actual | |
Original
Budget | | Estimated
Actual | | | | 30 June
2007 | | 30 June
2006 | |
$m | | $m | | | | $m | | $m | |
13,038 | | 12,946 | | NZS Fund | | 12,809 | | 9,726 | |
3,833 | | 4,083 | | GSF financial assets | | 4,211 | | 4,166 | |
9,443 | | 10,061 | | ACC portfolio | | 9,727 | | 9,080 | |
5,638 | | 5,433 | | EQC portfolio | | 5,291 | | 5,232 | |
Note 9: Advances
Forecast | | | | Actual | |
Original
Budget | | Estimated
Actual | | | | 30 June
2007 | | 30 June
2006 | |
$m | | $m | | | | $m | | $m | |
5,868 | | 5,761 | | Student loans (see analysis below) | | 6,011 | | 5,569 | |
3,425 | | 3,817 | | Kiwibank mortgages | | 3,632 | | 2,609 | |
75 | | 8 | | Residential care loans | | 67 | | 71 | |
63 | | 68 | | M ori development rural lending ori development rural lending | | 47 | | 80 | |
— | | — | | Forestry encouragement loans | | 24 | | 24 | |
— | | — | | Catchment authorities | | 3 | | 5 | |
590 | | 541 | | Other | | 482 | | 400 | |
10,021 | | 10,195 | | Total Advances | | 10,266 | | 8,758 | |
| | | | Analysis of Student Loans | | | | | |
| | | | Outstanding balance | | | | | |
8,784 | | 9,107 | | Nominal value Student Loans (including interest) | | 9,412 | | 8,370 | |
5,868 | | 5,761 | | Carrying value Student Loans | | 6,011 | | 5,569 | |
| | | | Movement during the year | | | | | |
5,472 | | 5,569 | | Opening balance | | 5,569 | | 6,465 | |
— | | — | | Initial fair value write down | | — | | (1,415 | ) |
(15) | | (411 | ) | Other impairment | | (151 | ) | (13 | ) |
1,157 | | 1,206 | | Amount borrowed in current year | | 1,176 | | 1,046 | |
(381) | | (496 | ) | Fair value write down on new borrowings | | (488 | ) | (328 | ) |
(634) | | (559 | ) | Repayments made during the year | | (555 | ) | (550 | ) |
87 | | 362 | | Interest unwind | | 360 | | 358 | |
182 | | 90 | | Other movements | | 100 | | 6 | |
5,868 | | 5,761 | | Closing balance | | 6,011 | | 5,569 | |
Student Loans Book Value
Student loans are recognised initially at fair value plus transaction costs, and subsequently measured at amortised cost using the effective interest rate method, less any impairment loss.
Fair value on initial recognition of student loans is determined by projecting forward contractually agreed (promised) repayments required under the scheme and discounting them back at an appropriate discount rate. The subsequent measurement at amortised cost is determined using the effective interest rate calculated at initial recognition. This rate is used to spread the Crown’s interest income across the life of the loan and determines the loan’s carrying value at each reporting date.
The valuation model has been adapted to reflect current student loans policy. As such, the carrying value is sensitive to changes on a number of underlying assumptions, including future income levels, repayment behaviour and macro economic factors such as inflation and the discount rates used to determine the effective interest rate on new borrowers. The significant assumptions are shown below.
| | 30 June 2007 | | 30 June 2006 | |
Weighted average effective interest rate | | 7.12 | % | 6.63 | % |
Interest rate applied to loans for overseas borrowers | | 6.7% - 7.2 | % | 6.9% (6.7% outyears | ) |
Cost of administration as a % of the average outstanding loan balance | | 0.15 | % | 0.15 | % |
CPI | | 2.4% - 2.6 | % | 3.2 | % |
Future salary inflation | | 3.4% - 3.6 | % | 3.6 | % |
Note 9: Advances (continued)
The data for student loans has been integrated from files provided by Inland Revenue Department, Ministry of Social Development and the Ministry of Education. The current data is up to 31 March 2006, and contains information on borrowings, repayments, income, educational factors, socio-economic factors amongst others and has been analysed and incorporated into the valuation model.
Given the lead time required between analysing the raw data and its availability for use in the valuation model, it is expected that there will always be a 15 month lag between the available data set and the valuation reported in the annual financial statements.
Student Loans Fair Value
Fair value is the amount for which the loan book could be exchanged between knowledgeable, willing parties in an arms length transaction. It is determined by discounting the estimated cash flows at an appropriate discount rate. The estimated fair value of the student loan debt at 30 June 2007 has been determined to be approximately $5,443 million ($5,538 million at 30 June 2006).
Fair values will differ from carrying values due to changes in market interest rates, as the carrying value is not adjusted for such changes. They will also differ in the treatment of credit losses, as carrying values adjust for credit losses that have been incurred while fair values capture adjustments for expected future credit losses. The difference between fair value and carrying value does not represent an impairment of the asset.
The fair value calculated is sensitive to the underlying assumptions. For example a 1% increase in the discount rate would decrease fair value by approximately $232 million, whereas a 1% decrease in the discount rate would increase fair value by approximately $258 million
Despite the increase in the nominal value of student loans outstanding, the fair value of the student loan portfolio is lower than that calculated last year (and lower than the carrying value) because of an increase in the risk free discount rates used in the fair value calculation and an increase in expected future credit losses. The risk free rates are determined by calculating forward rates from the yields and coupons of NZ Government Stock. Forward rate yield projections move from 7.7% in 2007 to 6.2% from 2016 and thereafter (projections as at June 2006 were 6.9% in 2006 to 5.8% from 2016 and thereafter).
The Student Loan Annual Report contains more information on the student loan scheme.
Through the everyday operations of the student loan scheme the Government is exposed to the risk that borrowers will default on their obligation to repay their loans or die before their loan is repaid, causing the scheme to incur a loss.
The student loan scheme policy does not require borrowers to provide any collateral or security to support advances made. As the total sum advanced is widely dispersed over a large number of borrowers, the scheme does not have any material individual concentrations of credit risk.
The credit risk is reduced by collection of repayments through the tax system.
Note 10: Receivables
Forecast | | | | Actual | |
Original
Budget | | Estimated
Actual | | | | 30 June
2007 | | 30 June
2006 | |
$m | | $m | | | | $m | | $m | |
5,607 | | 7,318 | | Taxes receivable | | 7,575 | | 8,720 | |
4,706 | | 4,619 | | Accounts receivable | | 5,268 | | 5,259 | |
32 | | 36 | | Receivable from the sale and purchase of Maui gas | | 36 | | 74 | |
189 | | 274 | | Prepayments | | 314 | | 421 | |
10,534 | | 12,247 | | Total Receivables | | 13,193 | | 14,474 | |
Included in taxes receivable at gross value less provision for doubtful debts are general tax receivables administered by the Inland Revenue Department. The net book value was $6,089 million ($7,925 million in 2005/06). The estimated fair value of the portfolio as at 30 June 2007 has been calculated as $5,849 million. The fair value has been determined by forecasting the expected repayments based on analysis of historical debt data deducting an estimate of service costs and discounting at an appropriate rate (11%). If the discount rate was 2% higher the fair value would reduce by $21 million, if the discount rate was 2% lower the fair value would increase by $19 million
Included in accounts receivables at gross value less provision for doubtful debts are debtor portfolios held by the Ministries of Social Development and Justice. Due to the nature of these portfolios the collection of outstanding amounts takes place over a significant period of time.
The debtor portfolio held by the Ministry of Justice largely relates to court fines and the associated court costs and enforcement fees. The net book value as at 30 June 2007 was $312 million ($424 million in 2005/06). The estimated fair value of the portfolio as at 30 June 2007 has been calculated as $195 million. The fair value calculation has been determined on an actuarial basis by discounting the expected flow of cash repayments, net of servicing costs, at a discount rate of 12%. If the discount rate was 2% higher the fair value would reduce by $6 million; if the discount rate was 2% lower the fair value would increase by $7 million.
The debtor portfolio held by the Ministry of Social Development largely relates to benefit overpayments, advances on benefits and recoverable special needs grant. The gross book value was $832 million. Net book value was $409 million ($413 million in 2005/06) after allowing for doubtful debts reflecting the nature of the collectability of the debtors. The estimated fair value of the portfolio at 30 June 2007 was $358 million. The fair value is determined by discounting forecast expected repayments, (using Government’s bond yield rates at 30 June 2007) and deducting the estimated collection costs.
The fair values of these debtor portfolios will differ to carrying values due to changes in market interest rates, as the carrying value is not adjusted for such changes, and in the treatment of credit losses. Carrying values adjust for credit losses that have been incurred while fair values capture adjustments for future credit losses as well. The difference between fair value and carrying value does not represent an impairment of the asset.
Note 11: Other Investments
Forecast | | | | Actual | |
Original
Budget | | Estimated
Actual | | | | 30 June
2007 | | 30 June
2006 | |
$m | | $m | | | | $m | | $m | |
| | | | International Bank for Reconstruction and | | | | | |
76 | | 86 | | Development | | 67 | | 86 | |
81 | | 92 | | Asian Development Bank | | 75 | | 92 | |
129 | | 111 | | Other | | 234 | | 145 | |
286 | | 289 | | Total Other Investments | | 376 | | 323 | |
Note 12: Property, Plant and Equipment
Forecast | | | | Actual | |
Original
Budget | | Estimated
Actual | | | | 30 June
2007 | | 30 June
2006 | |
$m | | $m | | | | $m | | $m | |
| | | | By Type | | | | | |
| | | | Gross Carrying Value | | | | | |
11,801 | | 14,111 | | Land (valuation) | | 15,639 | | 13,803 | |
22,487 | | 23,092 | | Buildings (valuation) | | 22,631 | | 21,859 | |
2,668 | | 2,540 | | Electricity distribution network (cost) | | 2,517 | | 2,311 | |
8,428 | | 9,378 | | Electricity generation assets (valuation) | | 10,285 | | 8,536 | |
2,566 | | 2,339 | | Aircraft (ex SME) (valuation) | | 2,115 | | 2,068 | |
16,757 | | 19,339 | | State highways (valuation) | | 20,193 | | 17,948 | |
— | | 10,786 | | Rail network (valuation) | | 10,573 | | — | |
4,013 | | 4,092 | | Specialist Military Equipment (valuation) | | 3,648 | | 3,422 | |
10,211 | | 10,589 | | Other plant and equipment (cost) | | 10,870 | | 9,692 | |
7,250 | | 8,368 | | Other assets (valuation) | | 8,288 | | 7,965 | |
454 | | 417 | | Properties intended for sale (lower of book value or NRV) | | 462 | | 467 | |
86,635 | | 105,051 | | Total Gross Carrying Value | | 107,221 | | 88,071 | |
| | | | Accumulated Depreciation | | | | | |
2,883 | | 2,135 | | Buildings | | 1,374 | | 1,307 | |
421 | | 388 | | Electricity distribution network | | 407 | | 299 | |
525 | | 347 | | Electricity generation assets | | 255 | | 111 | |
444 | | 223 | | Aircraft (ex SME) | | — | | — | |
689 | | 719 | | State highways | | 776 | | — | |
— | | 155 | | Rail network | | 155 | | — | |
1,017 | | 587 | | Specialist military equipment | | 573 | | 344 | |
6,420 | | 6,626 | | Other plant and equipment | | 6,806 | | 6,008 | |
373 | | 613 | | Other assets | | 332 | | 561 | |
12,772 | | 11,793 | | Total Accumulated Depreciation | | 10,678 | | 8,630 | |
| | | | Net Carrying Value | | | | | |
11,801 | | 14,111 | | Land (valuation) | | 15,639 | | 13,803 | |
19,604 | | 20,957 | | Buildings (valuation) | | 21,257 | | 20,552 | |
2,247 | | 2,152 | | Electricity distribution network (cost) | | 2,110 | | 2,012 | |
7,903 | | 9,031 | | Electricity generation assets (valuation) | | 10,030 | | 8,425 | |
2,122 | | 2,116 | | Aircraft (ex SME) (valuation) | | 2,115 | | 2,068 | |
16,068 | | 18,620 | | State highways (valuation) | | 19,417 | | 17,948 | |
— | | 10,631 | | Rail network (valuation) | | 10,418 | | — | |
2,996 | | 3,505 | | Specialist military equipment (valuation) | | 3,075 | | 3,078 | |
3,791 | | 3,963 | | Other plant and equipment (cost) | | 4,064 | | 3,684 | |
6,877 | | 7,755 | | Other assets (valuation) | | 7,956 | | 7,404 | |
454 | | 417 | | Properties intended for sale (lower of book value or NRV) | | 462 | | 467 | |
73,863 | | 93,258 | | Total Net Carrying Value | | 96,543 | | 79,441 | |
| | | | By holding | | | | | |
72,839 | | 91,683 | | Freehold assets | | 94,507 | | 77,858 | |
1,024 | | 1,575 | | Leasehold assets | | 2,036 | | 1,583 | |
73,863 | | 93,258 | | Total Net Carrying Value | | 96,543 | | 79,441 | |
Note 12: Property, Plant and Equipment Assets (continued)
State highways
State highways comprise the land, formation works, road structure, drainage works and traffic facilities of the roads, plus bridges, culverts, tunnels, stock and pedestrian underpasses, protection works and retaining structures. The land, including that held for future highway development, was valued on a fair value basis while other elements of the state highways were valued on the basis of depreciated replacement cost. After allowing for new works and depreciation during the year to 30 June 2007, the depreciated replacement cost is assessed at $19,417 million ($17,948 million as at 30 June 2006).
Replacement costs were determined by estimating the costs of new construction of the network by the most appropriate method of construction. The methodology applied used information from the road assessment and maintenance management (RAMM) database and the bridge inventory held by Transit New Zealand. This information was supplemented by local knowledge and expertise of the valuers: Opus International Consultants and land and property valuations supplied by DTZ New Zealand Limited.
Rail network assets
In 2004 the Crown purchased the national rail infrastructure and some related assets for $1. Effective from 1 July 2006 the measurement basis of rail network assets changed to depreciated replacement cost from historical cost.
The rail network assets comprise land, building, bridges, tunnels, tracks, level crossings, signals and electrification. The land was valued on a fair value basis while other elements of the rail network were valued on the basis of depreciated replacement cost. After allowing for new works and depreciation during the year to 30 June 2007, the net book value is assessed at $10,418 million ($256 million as at 30 June 2006(1)).
(1) Rail assets were recorded at historical cost less any accumulated depreciation as at 30 June 2006.
Replacement costs were determined by estimating the costs of new construction of the network by the most appropriate method of construction. This information was supplemented by Ontrack personnel knowledge and expertise of the valuers (DTZ New Zealand Limited).
Other assets
There are difficulties associated with obtaining an objective valuation for some of the Crown’s assets. These are discussed below:
National Archives Holdings
Archives in the possession of Archives New Zealand have been valued and recorded at a best estimate of fair value as at 30 June 2007. Determination of the fair value of $564 million at 30 June 2007 ($559 million as at 30 June 2006) was based on a valuation in December 2003 using a methodology that divided the collection into categories by format and age, to associate records that could be said to have a broad commonality of value. Benchmark valuations were obtained from an independent valuer, Dunbar Sloane, through market assessments and from other collections of a similar nature to Government archives. Accessions since the date of the valuation are valued on the basis of these benchmarks. The value of the Treaty of Waitangi and other exceptional items were based on a valuation from an international auction house, Sotheby’s in December 2004 and from Dunbar Sloane in January 2005 respectively, through market assessments and from other collections of similar nature.
National library collections
The Heritage Collections are valued at fair value. The valuation was performed by National Library staff at 30 June 2003, with the valuation methodology reviewed by an independent valuer. The carrying value
of $861 million as at 30 June 2007 ($858 million as at 30 June 2006) includes the value of purchases for the collections since the last revaluation and the value of material received through donation and legal deposit. Section 11 of the National Library of New Zealand (Te Puna Mātauranga o Aotearoa) Act 2003 requires the Crown to own the collections of the Alexander Turnbull Library in perpetuity. The Heritage Collections are not depreciated.
The General and Schools Collections are recorded at net book value of $20 million as at 30 June 2007 ($20 million as at 30 June 2006).
National parks, forest parks, conservation areas and recreational facilities
The Conservation Estate was recorded at their valuation of $4,667 million as at 30 June 2007 ($3,963 million as at 30 June 2006). The valuation of the Conservation Estate was based on rateable valuations prepared by Quotable Value New Zealand and was independently reviewed by valuersnet.nz.
The Department of Conservation recreational facilities were recorded at their fair valuation of $266 million as at 30 June 2007 ($256 million as at 30 June 2006). The recreational facilities are subject to an asset management plan and are recorded in the Visitor Assets Management System (VAMS).
The fences that border Conservation Estate areas or form part of the recreational facilities have been fair valued and recorded at $87 million as at 30 June 2007 ($75 million as at 30 June 2006). Fencing on land managed by 47 out of 51 Area Offices were sampled and valued by Department of Conservation staff, with the valuation methodology reviewed by an independent valuer. This was extrapolated to provide a national value.
The use and disposal of all the Crown land managed by the Department of Conservation is determined by legislation, in particular the Reserves Act 1977 and the National Parks Act 1980 and the Conservation Act 1987.
The Crown land managed by the Department is not subject to mortgages or other charges or treaty claims. Specific areas may, however, be included in the Treaty settlements if the Crown decides to offer those areas to claimants. Some areas may be subject to leases, licences or permits issued by the Department under concession provisions of the relevant legislation.
Parliamentary Library
The Parliamentary Library has been valued and recorded at $25 million ($25 million as at 30 June 2006). The reference collection is valued at historical cost and the heritage collection at current market value on a three yearly basis by the Service’s Library staff in accordance to guidelines released by the Zealand Library Association and the National Library of New Zealand.
Crown Research Institutes “collection type” asset values
The Crown, when establishing Crown Research Institutes in 1992, transferred various national databases and reference collections to individual Institutes at nil value. No reliable valuation is able to be obtained for these assets, and so they remain at nil value. Many of the databases and collections were specifically identified by the Foundation for Research, Science and Technology as being of significant importance and as such have covenants attached to them restricting an Institute’s ability to deal with them.
Note 13: Accounting Treatment of TEIs
Section 27 (2) of the Public Finance Act 1989 (the Act) requires the Crown to prepare financial statements in accordance with generally accepted accounting practice. Section 27 (3) of the Act also requires the Crown to record its interest in entities such as Offices of Parliament and Crown entities within its financial statements.
The applicable financial reporting standards (FRSs) that determine the basis of combination of entities that make up the Government reporting entity are FRS 37: Consolidating Investments in Subsidiaries and FRS 38: Accounting for Investments in Associates.
FRS 37 provides the basis for establishing whether the Crown’s interest in an entity should be line-by-line combined. The control test in FRS 37 requires consideration of both the Crown’s level of power and the benefit in relation to entities.
FRS 37 is not clear about how the definition of control in FRS 37 should be applied in some circumstances in the public sector, particularly where legislation provides certain public sector entities with some statutory autonomy and independence. Treasury’s view is that line-by-line combination of such entities would provide a more conceptually complete and consistent picture of the Government’s financial activities and position. However, given the lack of clarity in applying FRS 37, the 2007 Financial Statements of the Government equity account the TEIs as the Crown cannot unilaterally determine their operating and financing policies, but does have a number of powers in relation to these entities.
The following table shows the financial effect if the revenue, expenses, assets and liabilities of TEIs were line-by-line combined and contrasts this with the treatment in the financial statements of equity accounting TEIs’ net surpluses and net assets. If TEIs were line-by-line combined there would be an increase in total revenues and expenses, total Crown debt and total assets and liabilities. The operating balance and net worth are the same under both accounting treatments.
Note that the “impact on total Crown” column in the following table represents 3rd party revenue and expenses of TEIs. This is because the impact on total Crown from combining TEIs line by line would be to increase revenues and expenses, but only to the extent the TEI totals were not funded by the Crown. The Statement of Financial Performance and Statement of Financial Position would alter as indicated in the following table.
TEIs as at 30 June 2007 $ millions | | Equity accounting
(current treatment)
2007 | | Impact on
total Crown(2) | | Equity accounting
(current treatment)
2006 | | Impact on
total Crown | |
Operating Results | | | | | | | | ( ) = reduce item | |
Revenues | | — | | 1,804 | | — | | 1,843 | |
Expenses | | — | | 1,684 | | — | | 1,789 | |
Net surplus of TEIs | | 120 | | — | | 54 | | – | |
Operating Balance (no change) | | 120 | | 120 | | 54 | | 54 | |
Assets and Liabilities | | | | | | | | | |
Assets | | | | | | | | | |
Financial assets | | — | | 994 | | — | | 867 | |
Property, plant and equipment | | — | | 6,484 | | — | | 5,684 | |
Other assets | | | | 261 | | | | 249 | |
Net investment in TEIs | | 6,305 | | (6,305 | ) | 5,475 | | (5,475 | ) |
Total assets | | 6,305 | | 1,434 | | 5,475 | | 1,325 | |
Liabilities | | | | | | | | | |
Gross debt | | | | 252 | | | | 226 | |
Other liabilities | | | | 1,182 | | | | 1,099 | |
Total Liabilities | | | | 1,434 | | | | 1,325 | |
Net Worth (no change) | | 6,305 | | — | | 5,475 | | — | |
(2) This is the impact on the total Crown results if a full line by line combination approach was adopted.
Note 14: Intangible Assets (including goodwill)
Goodwill and intangible assets as at 30 June 2007 total $608 million ($630 million as at 30 June 2006). Intangible assets (including goodwill) comprise:
| | 30 June 2007 | | 30 June 2006 | |
| | $m | | $m | |
Intangible assets | | 282 | | 228 | |
Goodwill | | 326 | | 402 | |
Total Intangible Assets | | 608 | | 630 | |
Goodwill is primarily made up of:
· remaining goodwill on acquisition of Air New Zealand of $211 million ($258 million as at 30 June 2006). It is amortised over a 10-year period. This results in an expense of $47 million per year
· goodwill on acquisitions by SOEs.
The following table reconciles the movement in goodwill during the year.
Description ($million) | | 30 June 2007 | | 30 June 2006 | |
Opening balance | | | | | |
Gross goodwill | | 748 | | 717 | |
Accumulated amortisation | | (346 | ) | (259 | ) |
Net opening balance | | 402 | | 458 | |
Goodwill acquired during the period | | 23 | | 19 | |
Goodwill amortised during the period | | (99 | ) | (75 | ) |
Closing balance | | | | | |
Gross goodwill | | 771 | | 748 | |
Accumulated amortisation | | (445 | ) | (346 | ) |
Net closing balance | | 326 | | 402 | |
Note 15: Payables and Provisions
Forecast | | | | Actual | |
Original
Budget | | Estimated
Actual | | | | 30 June
2007 | | 30 June
2006 | |
$m | | $m | | | | $m | | $m | |
7,380 | | 7,570 | | Accounts payable and accruals | | 8,451 | | 8,899 | |
2,742 | | 3,570 | | Taxes repayable | | 4,000 | | 3,570 | |
514 | | 486 | | Provisions | | 509 | | 477 | |
582 | | 557 | | Provision for Kyoto Protocol | | 704 | | 656 | |
944 | | 998 | | National Provident Fund guarantee | | 949 | | 998 | |
1,397 | | 1,544 | | Provision for employee entitlements | | 1,736 | | 1,533 | |
13,559 | | 14,725 | | Total Payables and Provisions | | 16,349 | | 16,133 | |
The Crown guarantees the payment of benefits by the Board of Trustees of the National Provident Fund. The annual report of these schemes as at 31 March 2007 (prepared in June 2007) and updated for discount rates at 30 June 2007, has indicated the DBP Annuitants Scheme, which contains pensioners only, has a deficit of $949 million, a decrease of $49 million from 30 June 2006.
| | | | Analysis of Provisions | | | | | |
488 | | 477 | | Opening balance | | 477 | | 466 | |
142 | | 244 | | Additional provisions made in the year | | 359 | | 469 | |
(112 | ) | (232 | ) | Provisions used in period | | (300 | ) | (360 | ) |
(4 | ) | (3 | ) | Reversal of previous provision | | (27 | ) | (98 | ) |
514 | | 486 | | Closing Balance | | 509 | | 477 | |
| | | | Analysis of Provision for Kyoto Protocol | | | | | |
582 | | 656 | | Opening balance | | 656 | | 310 | |
— | | (99 | ) | Additional provisions made in the year | | 48 | | 346 | |
582 | | 557 | | Closing Balance | | 704 | | 656 | |
Note 15: Payables and Provisions (continued)
Provision for New Zealand’s obligation under the Kyoto Protocol
| | Actual
30 June 2007
Emission Units(3)
million tonnes (Mt) | | Actual
30 June 2006
Emission Units
million tonnes (Mt) | |
| | | | | |
Kyoto Target (Assigned Amount Units) | | 309.5 | | 307.6 | |
Less AAUs allocated to emission reducing projects | | 7.5 | | 7.5 | |
Total commitment target | | 302.0 | | 300.1 | |
Projected emission units | | | | | |
Agriculture | | 203.1 | | 198.7 | |
Energy (including transport) and industrial processes | | 195.1 | | 193.0 | |
Waste | | 7.0 | | 6.5 | |
Solvent and other product use | | 0.3 | | 0.3 | |
Total projected emission units | | 405.5 | | 398.5 | |
Removals via forest | | 79.0 | | 78.2 | |
Deforestation Emissions | | (21.0 | ) | (21.0 | ) |
Less net removals via forests | | 58.0 | | 57.2 | |
Net projected emission units | | 347.5 | | 341.3 | |
Deficit in units | | 45.5 | | 41.2 | |
| | $million | | $million | |
Deficit in $ millions | | 704 | | 656 | |
(3) One emission unit is equivalent to one tonne of greenhouse gas emissions converted to carbon dioxide equivalents by the global warming potential.
New Zealand ratified the Kyoto Protocol in December 2002. This international agreement commits New Zealand to reducing its average net emissions of greenhouse gases over 2008-2012 (the first commitment period of the Kyoto Protocol or CP1) to 1990 levels or to take responsibility for the difference. New Zealand can meet its commitment through emissions reductions and use of the Kyoto Protocol flexibility mechanisms such as Joint Implementation, the Clean Development Mechanism, and offsetting increased emissions against carbon removed by forests.
The estimate of New Zealand’s net obligation as at 30 June 2007 is $NZ704 million (2006: $NZ656 million). This obligation is based on a deficit of 45.5 million emission units and a carbon price of $US11.90 per unit. The carbon price in New Zealand dollars equates to $NZ15.48, using the 30 June 2007 exchange rate of $US0.7689 = $NZ1. (30 June 2006: $US0.6063 = $NZ1, and carbon price $US9.65 per unit).
Provisions by their nature are more uncertain than most other items in the statement of financial position. Fluctuations in the value of the estimate may occur through changes in the assumptions underlying the quantum, movements in the price of carbon and the exchange rate with the United States dollar.
The quantum of the deficit has been compiled from agricultural, forest sink and deforestation projections provided by the Ministry of Agriculture and Forestry, energy (including transport) and industrial processes projections from the Ministry of Economic Development and waste projections from the Ministry for the
Environment. The estimate includes the effects of refinements in modelling processes and updated assumptions on variables such as economic growth, population growth and oil prices as at May 2007. The projections use the latest information from the national inventory of greenhouse gas emissions and removals submitted to the United Nations Framework Convention on Climate Change Secretariat on 4 May 2007. Due to improvements in the Greenhouse Gas Inventory, New Zealand’s Assigned Amount Units have increased by 1.9 million. The new assigned amount has now been submitted to the Kyoto Protocol Compliance Committee and is unlikely to change from 309.5 million units.
Net removals via forests are reported after deducting 21 million tonnes for estimated deforestation of pre-1990 forests. This estimate assumes policy interventions to operationalise the Government’s current policy (established in October 2002) to cap its liability for deforestation at this amount. In the absence of policy interventions, and assuming current market conditions prevail, a deforestation intentions survey conducted in 2006 indicated likely deforestation of 41 million tonnes, which would result in a deficit for the Crown of 65.5 million units, and increase the liability to $NZ1.014 billion.
AEA Technology, an independent UK based firm, has assessed the robustness of the assumptions and methodologies underpinning the projections and found them to be sound and reasonable.
The carbon price has been determined by the Treasury. The Allen Consulting Group have reviewed this work and are satisfied that the methodology (and data sources) applied is a robust high level approach, and that $US11.90 is a reasonable carbon price estimate at this time for valuing New Zealand’s possible future liabilities under the Kyoto Protocol.
No liability or contingent liability for periods beyond 2012 has been recognised, as New Zealand currently has no specific obligations beyond the First Commitment Period. The architecture of any obligations in future periods has yet to be negotiated.
Subsequent to 30 June 2007, the Government has agreed in-principle that as part of its climate change response an Emissions Trading Scheme (ETS) will be implemented. The Government is engaging with stakeholders on the proposed ETS before final decisions are taken. The proposed ETS is a “cap and trade” scheme; that is, the level of emissions is capped with responsibility devolved to emitters to reduce emissions and/or trade emission units to ensure the net position (total emissions less purchased emission units) meet this cap. The impact on the Crown’s net obligation cannot be quantified at this stage as final decisions such as volume and allocation of units have not yet been taken. For further information on the proposed ETS, please refer to http://www.climatechange.govt.nz/.
Note 16: Government Superannuation Fund (GSF) Liability
The GSF liabilities have been calculated by the Government Actuary as at 30 June 2007. The liabilities arise from closed schemes for past and present public sector employees (set out in the GSF Act 1956). A Projected Aggregate Funding Method, based on balance-date membership data, is used for the valuation. This method requires the benefits payable from the GSF in respect of past service to be estimated and then discounted back to the valuation date.
The GSF net unfunded liability as at 30 June 2007 was $10,309 million. This is a decrease of $1,129 million compared with 30 June 2006.
The 2007 movement in the net unfunded liability of $1,129 million reflects a decrease in the gross liability of $920 million and an increase in net assets of $209 million.
The main driver of the movement in the net unfunded liability are changes to the economic assumptions since 30 June 2006 of $1,090 million.
The significant economic assumption change was an increase in the average pre-tax discount rate to 6.34% (5.63% at 30 June 2006). Other principal long-term economic assumptions used in the calculation remained unchanged, which were an inflation rate of of 2.25% and an annual salary increase rate, before any promotional effects, of 3.0%. The remaining $39 million change in the net unfunded liability is due to actual fund experience.
If the discount rate at 30 June 2007 was 1% higher (for each future year) the gross past service liability would reduce by $1,615 million, if the discount rate was 1% lower (for each future year) the gross past service liability would increase by $1,996 million.
Forecast | | | | Actual | |
Original
Budget | | Estimated
Actual | | | | 30 June
2007 | | 30 June
2006 | |
$m | | $m | | | | $m | | $m | |
| | | | GSF Liability and Asset Information | | | | | |
| | | | Gross GSF Liability | | | | | |
15,361 | | 15,231 | | Opening gross liability | | 15,231 | | 14,952 | |
(17) | | 323 | | Net projected change | | (920 | ) | 279 | |
15,344 | | 15,554 | | Closing Gross Liability | | 14,311 | | 15,231 | |
| | | | Less Net Assets Available to the GSF Scheme | | | | | |
3,768 | | 3,793 | | Opening asset value | | 3,793 | | 3,521 | |
| | | | Net projected change: | | | | | |
186 | | 382 | | - Investment valuation changes | | 465 | | 368 | |
| | | | - Contributions and other income less | | | | | |
(97) | | (167 | ) | membership payments | | (256 | ) | (96 | ) |
89 | | 215 | | Total projected change | | 209 | | 272 | |
3,857 | | 4,008 | | Closing Net Asset Values | | 4,002 | | 3,793 | |
| | | | Net Unfunded Liability of the GSF Schemes | | | | | |
11,593 | | 11,438 | | Opening unfunded liability | | 11,438 | | 11,431 | |
(106) | | 108 | | Net projected change | | (1,129 | ) | 7 | |
11,487 | | 11,546 | | Net Unfunded Liability | | 10,309 | | 11,438 | |
Reconciliation of the movement in Unfunded Liability between years
Opening balance | | 11,438 | | 11,431 | |
Expected service cost | | 213 | | 221 | |
Expected interest cost | | 669 | | 622 | |
Change in underlying valuation assumptions | | (1,090 | ) | 359 | |
Experience gains and asset gains | | (131 | ) | (197 | ) |
Expected return on assets | | (219 | ) | (207 | ) |
Change in data | | 86 | | (152 | ) |
Expected contributions | | (657 | ) | (639 | ) |
Closing Balance | | 10,309 | | 11,438 | |
Note 16: Government Superannuation Fund (GSF) Liability (continued)
| | 30 June
2007 | | 30 June
2006 | |
| | $m | | $m | |
Liabilities to Pensioners | | | | | |
Pensioners | | 8,789 | | 9,054 | |
Deferred pensioners | | 848 | | 943 | |
Liabilities to Contributors | | | | | |
General Government Superannuation Fund members | | 3,738 | | 4,051 | |
Police | | 488 | | 635 | |
Armed Forces | | 305 | | 389 | |
Judges | | 48 | | 58 | |
Prison Services | | 39 | | 41 | |
Islands | | 41 | | 45 | |
Members of Parliament | | 15 | | 15 | |
Total Liabilities in respect of Past Services | | 14,311 | | 15,231 | |
Less Assets available to schemes | | 4,002 | | 3,793 | |
Total Net Pension Liabilities | | 10,309 | | 11,438 | |
Note 17: ACC Claims Liability
Claims Obligation
The ACC claims liability is the amount of funds required to be invested now, so that together with the future investment earnings on those funds ACC has enough funding to meet the estimated future payment obligations on its current claims.
Liability Calculation
PricewaterhouseCoopers Actuarial Pty Limited have prepared the independent actuarial estimate of the ACC claims liability as at 30 June 2007. This estimate includes the expected future payments relating to accidents that occurred prior to balance date (whether or not the associated claims have been reported to, or accepted by, ACC) and also the expected administrative expenses of managing these claims.
The estimate of the claims liability as at 30 June 2007 was $13,735 million. This is an increase of
$1,020 million compared with 30 June 2006. The primary drivers of the increase were inflation, claims experience and forecast future claims costs, partially offset by an increase in the discount rate applied from 5.83% at 30 June 2006 to 6.61% at 30 June 2007.
Superimposed inflation is the increase in the cost of claims that is above general inflation. This is due to other influencing factors such as new medical treatment being available. A key assumption, which has financial significance, is the superimposed inflation for social rehabilitation for serious injury claims (which represents around 50% of rehabilitation liability) which has an allowance for superimposed inflation of 5% p.a. over the next five years and 1% thereafter. If superimposed inflation is assumed to be 0% after five years instead of 1% thereafter, this will decrease the gross liability by $442 million. If it is assumed to be 2.0%, this will increase the gross liability by $481 million.
Valuation Movement Due to Experience and Assumption Changes
If the assumptions underlying the 30 June 2006 valuation were used, the estimated 30 June 2007 valuation would be $13,434 million. The actual valuation for 30 June 2007 was $13,735 million. The difference in the two numbers was $301 million. This is shown in the following table:
| | As at
30 June
2007 | | As at
30 June
2006 | | Change
2007 | |
| | $m | | $m | | $m | |
30 June 2006 liability | | 12,715 | | 12,715 | | — | |
30 June 2007 liability | | 13,735 | | 13,434 | | (301 | ) |
Change in Liability | | 1,020 | | 719 | | (301 | ) |
Components of the 2006/07 changes in gross liability
| | $m | |
Expected change in gross liability valuation | | 719 | |
Adjusted for actual inflation | | 143 | |
Adjusted for claims experience and modelling | | 1,280 | |
Adjusted for future economic assumptions (e.g. interest rates) | | (1,122 | ) |
| | 1,020 | |
Note 17: ACC Claims Liability (continued)
Forecast | | | | Actual | |
Original
Budget | | Estimated
Actual | | | | 30 June
2007 | | 30 June
2006 | |
$m | | $m | | | | $m | | $m | |
| | | | ACC Liability and Asset Information | | | | | |
| | | | Gross ACC Liability | | | | | |
12,581 | | 12,715 | | Opening gross liability | | 12,715 | | 11,384 | |
674 | | 1,742 | | ACC claims liability movement | | 1,020 | | 1,321 | |
— | | — | | Transfer from other insurers | | — | | 10 | |
13,255 | | 14,457 | | Closing Gross Liability | | 13,735 | | 12,715 | |
| | | | Less Net Assets Available to ACC | | | | | |
8,813 | | 8,880 | | Opening net asset value | | 8,880 | | 7,217 | |
802 | | 1,290 | | Net change | | 1,291 | | 1,663 | |
9,615 | | 10,170 | | Closing Net Asset Values | | 10,171 | | 8,880 | |
| | | | Net ACC Reserves (net liability) | | | | | |
(3,768) | | (3,835 | ) | Opening reserves position | | (3,835 | ) | (4,167 | ) |
128 | | (452 | ) | Net change | | 271 | | 332 | |
(3,640) | | (4,287 | ) | Closing Reserves Position (net liability) | | (3,564 | ) | (3,835 | ) |
ACC Reserves by Account | | | | | |
Residual Claims Account | | (1,694 | ) | (1,882 | ) |
Motor Vehicle Account | | (1,673 | ) | (1,660 | ) |
Non-Earners’ Account | | (1,485 | ) | (1,309 | ) |
Treatment Injury Account | | (365 | ) | (352 | ) |
Earners’ Account | | 558 | | 532 | |
Work Account | | 1,088 | | — | |
Self-Employed Work Account | | — | | 76 | |
Employers’ Account | | — | | 757 | |
Account Reserves | | (3,571 | ) | (3,838 | ) |
Subsidiaries and revaluation reserves | | 7 | | 3 | |
Total Closing Reserves | | (3,564 | ) | (3,835 | ) |
The Self-Employed and Employers’s Accounts have been merged and their reseves transferred into the Work Account on 1 April 2007. In addition, the Medical Misadventure Account has been renamed to the Treatment Injury Account in 2006/07.
The ACC reserves disclosed above represent the net assets and liabilities for each of the various accounts operated by ACC. Details on how the unfunded liability of each Account will be managed in the future are contained in the 2007 ACC Annual Report (broadly the policy is to fully fund the major Accounts by 2014).
Note 18: Revaluation Reserves
Forecast | | | | Actual | |
Original
Budget | | Estimated
Actual | | | | 30 June
2007 | | 30 June
2006 | |
$m | | $m | | | | $m | | $m | |
27,989 | | 37,633 | | Opening Balance | | 37,633 | | 27,988 | |
| | | | Net Revaluations | | | | | |
— | | 134 | | Land and buildings | | 2,545 | | 2,386 | |
— | | — | | State highways | | 868 | | 2,559 | |
— | | 10,329 | | Rail network | | 10,285 | | — | |
— | | — | | TEIs | | 692 | | 1,705 | |
— | | — | | Electricity generation assets | | 1,455 | | 1,800 | |
| | — | | Specialist Military Equipment | | (170 | ) | 406 | |
— | | 26 | | Other assets | | 19 | | 1,013 | |
— | | 10,489 | | Total Net Revaluations | | 15,694 | | 9,869 | |
— | | 23 | | Transfers to taxpayer funds | | — | | (224 | ) |
27,989 | | 48,145 | | Closing Asset Revaluation Reserve | | 53,327 | | 37,633 | |
| | | | Asset Revaluation Reserve (by component total) | | | | | |
16,194 | | 18,513 | | Land and buildings | | 20,901 | | 18,356 | |
4,683 | | 7,242 | | State highways | | 8,110 | | 7,242 | |
— | | 10,329 | | Rail network | | 10,285 | | — | |
1,315 | | 3,020 | | TEIs | | 3,712 | | 3,020 | |
2,695 | | 4,495 | | Electricity generation assets | | 5,950 | | 4,495 | |
— | | 406 | | Specialist Military Equipment | | 236 | | 406 | |
3,102 | | 4,140 | | Other assets | | 4,133 | | 4,114 | |
27,989 | | 48,145 | | Closing Asset Revaluation Reserve | | 53,327 | | 37,633 | |
Note 19: Foreign Currencies
All monetary amounts in these financial statements are expressed in New Zealand dollars. The New Zealand dollar closing rates for major currencies were:
| | 30 June 2007 | | 30 June 2006 | |
United States dollar | | 0.76890 | | 0.60630 | |
Japanese yen | | 94.80500 | | 69.68000 | |
British pound | | 0.38420 | | 0.33075 | |
Euro | | 0.57260 | | 0.47695 | |
Note 20: Risk Management
The Crown is subject to a number of financial risks which arise as a result of its debt portfolios, investment funds and transactions with foreign and domestic suppliers that are undertaken by the entities that make up the Government reporting entity.
Individual entities that form the Government reporting entity are responsible for ensuring appropriate risk management strategies and policies are in place within any mandate provided by legislation (eg, the Public Finance Act has requirements on borrowing, investing and financial powers applying to departments). Information and risk disclosures for individual entities are disclosed in the relevant entity’s annual report. Key risk management strategies across the Crown include:
Core Crown
The core Crown is risk averse and seeks to minimise net finance costs associated with its debt and maximise returns on its specific investment funds. Key strategies of material entities forming the core Crown segment include:
· New Zealand Debt Management Office (NZDMO) is responsible for the efficient management of Crown debt and associated assets. NZDMO’s strategic objective is to maximise the long-term economic return on the Crown’s financial assets and debt in the context of the Government’s fiscal strategy, particularly its aversion to risk.
· The Crown has a foreign-reserve policy that requires the Reserve Bank to manage sufficient levels of foreign currency reserves to intervene in New Zealand’s currency markets.
· The Government Superannuation Fund and New Zealand Superannuation Fund are required to invest assets on a prudent commercial basis. In doing so they manage and administer the assets in a manner consistent with best practice portfolio management and maximising return without undue risk to the respective Fund as a whole.
SOEs and Crown entities
· The State-Owned Enterprises Act 1986 requires SOEs to operate commercially. With the varying nature of the activities of SOEs, each individual entity has its own risk management strategies (eg, the electricity industry is exposed to electricity spot rate movements).
· As with SOEs, individual Crown entities are responsible for ensuring that they have risk management strategies appropriate to their operations. For example, ACC and the EQC will have specific policies in relation to the investment portfolios they manage.
Detailed risk management policy disclosure of Government reporting entities can be found in an individual entity’s Annual Report.
Credit risk
Credit risk refers to the risk of a loss due to the non-performance by counterparties to discharge an obligation.
Financial instruments which subject the Crown to credit risk include bank balances, receivables, advances, investments, interest rate options, forward rate agreements, foreign exchange forward contracts, foreign exchange swaps, interest rate swaps and foreign currency options.
The entities within the Crown reporting entity manage their exposure to credit risk by:
· Maintaining credit exposure only with highly rated institutions, for which the probability of default is low. The creditworthiness of counterparties is continuously monitored.
· Ensuring diversification of credit exposure by limiting the exposure to any one financial institution.
· In some instances requiring a form of collateral from counterparties.
In addition the Crown is exposed to risk in relation to its holding of equity investments held largely by NZSF, GSF, ACC and EQC.
Concentration risk of credit exposure
As at 30 June 2007 the concentrations of credit exposure by industry type were as follows:
| | 30 June 2007 | | 30 June 2006 | |
| | $m | | $m | |
Sovereign issuers (excluding New Zealand sovereign-guaranteed) | | 6,311 | | 5,762 | |
Supranational financial institutions | | 405 | | 1,337 | |
Foreign banks | | 11,024 | | 11,838 | |
Other | | 38,378 | | 28,751 | |
Total Credit Exposure | | 56,118 | | 47,688 | |
As at 30 June 2007 the concentrations of credit exposure by geographical area were as follows:
| | 30 June 2007 | | 30 June 2006 | |
| | $m | | $m | |
USA | | 12,462 | | 14,411 | |
Europe | | 16,482 | | 11,612 | |
Japan | | 1,786 | | 1,722 | |
Australia | | 3,719 | | 2,363 | |
New Zealand | | 18,596 | | 12,894 | |
Supranational | | 405 | | 1,810 | |
Other | | 2,668 | | 2,876 | |
Total Credit Exposure | | 56,118 | | 47,688 | |
As at 30 June 2007 the concentrations of credit exposure by credit rating using the lower rating of Standard & Poor’s or Moody’s were as follows:
| | 30 June 2007 | | % of 2007 | | 30 June 2006 | | % of 2006 | |
| | $m | | credit exposure | | $m | | credit exposure | |
AAA | | 17,761 | | 31.7 | % | 16,681 | | 35.0 | % |
AA | | 15,180 | | 27.1 | % | 11,165 | | 23.4 | % |
A | | 2,784 | | 5.0 | % | 2,085 | | 4.4 | % |
IMF reserve position | | 183 | | 0.2 | % | 341 | | 0.7 | % |
Non-rated and other(4) | | 20,210 | | 36.0 | % | 17,416 | | 36.5 | % |
Total Credit Exposure | | 56,118 | | 100 | % | 47,688 | | 100 | % |
(4) | The non-rated and other credit rating amount largely relate to equity investments held by the NZS Fund, GSF, ACC and EQC. |
Interest rate risk
Interest rate risk refers to the risk of loss due to adverse movement in interest rates. In general interest rate risk is managed strategically by issuing a mix of fixed and floating rate debt, including interest rate swaps. Derivative transactions outstanding as at 30 June 2007 are disclosed on page 78.
Foreign exchange risk
Foreign exchange risk refers to the risk of loss due to adverse movements in foreign exchange rates. The range of instruments currently being used to minimise the Crown’s exposure to foreign exchange risk includes currency and interest rate swaps, foreign-exchange contracts and futures contracts. ACC, EQC, GSF and NZSF are exposed to foreign exchange risk through their foreign currency-denominated investments. The extent to which the foreign exchange exposure is hedged depends on the best practice and prudent policies adopted by each entity.
Refinancing/repricing risk
Refinancing/repricing risk refers to the risk that maturing debt is refinanced, maturing assets are reinvested or instruments repriced are at an unacceptable yield.
As at 30 June 2007 assets and liabilities will mature or reprice within the following periods:
| | Effective | | Total | | | | | | | | | | | |
| | interest | | 30 June | | 0-12 | | | | | | | | | |
| | rate | | 2007 | | months | | 1-2 years | | 2-5 years | | 5-10 years | | >10 years | |
| | % | | $m | | $m | | $m | | $m | | $m | | $m | |
Domestic Assets | | | | | | | | | | | | | | | |
Cash and deposits | | | | 3,618 | | 3,618 | | — | | — | | — | | — | |
Marketable securities | | 4.6-8.2 | | 25,005 | | 20,235 | | 1,879 | | 1,073 | | 869 | | 949 | |
Others | | 5.3-8.2 | | 3,642 | | 2,890 | | 618 | | 1 | | — | | 133 | |
Foreign Assets | | | | | | | | | | | | | | | |
Cash and deposits | | | | 1,098 | | 1,098 | | — | | — | | — | | — | |
Marketable securities | | 4.0-4.2 | | 6,952 | | 4,684 | | 184 | | 490 | | 1,122 | | 472 | |
Others | | | | 15,803 | | 15,799 | | — | | — | | — | | 4 | |
Total Assets | | | | 56,118 | | 48,324 | | 2,681 | | 1,564 | | 1,991 | | 1,558 | |
Domestic Liabilities | | | | | | | | | | | | | | | |
Government stock | | 6.1 | | 16,834 | | — | | 2,571 | | 6,135 | | 5,608 | | 2,520 | |
Treasury bills | | 7.5 | | 2,080 | | 2,080 | | | | | | | | | |
Retail stock | | 6.5 | | 471 | | 430 | | 33 | | 8 | | | | | |
Other | | 5-8.3 | | 25,266 | | 30,257 | | (1,195 | ) | (1,270 | ) | (1,328 | ) | (1,198 | ) |
Foreign Liabilities | | | | | | | | | | | | | | | |
Foreign currency debt | | 3.2-7.9 | | (3,266 | ) | (5,774 | ) | 354 | | 837 | | 940 | | 377 | |
Total Liabilities | | | | 41,385 | | 26,993 | | 1,763 | | 5,710 | | 5,220 | | 1,699 | |
As at 30 June 2006 assets and liabilities were to mature or reprice within the following periods:
| | Effective | | Total | | | | | | | | | | | |
| | interest | | 30 June | | 0-12 | | | | | | | | | |
| | rate(5) | | 2006 | | months | | 1-2 years | | 2-5 years | | 5-10 years | | >10 years | |
| | % | | $m | | $m | | $m | | $m | | $m | | $m | |
Domestic Assets | | | | | | | | | | | | | | | |
Cash and deposits | | | | 3,770 | | 3,770 | | | | | | | | | |
Marketable securities | | 5.8-8.2 | | 2,036 | | (1,393 | ) | 184 | | 1,797 | | 1,437 | | 11 | |
Others | | 5.3 | | 2,851 | | 2,020 | | 520 | | 33 | | 35 | | 243 | |
Foreign Assets | | | | | | | �� | | | | | | | | |
Cash and deposits | | | | 1,243 | | 1,243 | | | | | | | | | |
Marketable securities | | 2.4-4.3 | | 24,604 | | 21,192 | | 693 | | 718 | | 1,500 | | 501 | |
Others | | | | 13,184 | | 13,180 | | | | | | | | 4 | |
Total Assets | | | | 47,688 | | 40,012 | | 1,397 | | 2,548 | | 2,972 | | 759 | |
Domestic Liabilities | | | | | | | | | | | | | | | |
Government stock | | 6.3 | | 17,002 | | 2,611 | | | | 4,878 | | 7,882 | | 1,631 | |
Treasury bills | | 6.9 | | 4,860 | | 4,860 | | | | | | | | | |
Retail stock | | 6.0 | | 532 | | 471 | | 40 | | 21 | | | | | |
Other | | 5.0-8.0 | | (4,049 | ) | (3,749 | ) | 2,791 | | (670 | ) | (1,338 | ) | (1,083 | ) |
Foreign Liabilities | | | | | | | | | | | | | | | |
Foreign currency debt | | 6.0-7.6 | | 21,082 | | 17,402 | | 855 | | 835 | | 1,418 | | 572 | |
Total Liabilities | | | | 39,427 | | 21,595 | | 3,686 | | 5,064 | | 7,962 | | 1,120 | |
(5) | Where ranges of effective interest rates are provided above these are based on the weighted average rates provided by reporting entities. |
Liquidity risk
Liquidity risk refers to the loss due to the lack of liquidity preventing quick or cost-effective liquidation of products, positions or portfolios.
Liquidity risk is managed on an individual entity basis, which generally requires entities to hold assets of appropriate quantity and quality to meet all their obligations as they fall due.
Derivatives
The Crown’s involvement in derivatives comprises currency and interest rate swaps, foreign exchange and futures contracts, foreign exchange and interest rate options outstanding.
Derivatives as at 30 June 2007
| | 30 June 2007 | | 30 June 2007 | | 30 June 2007 | |
| | Book value | | Fair value | | Notional value | |
| | $m | | $m | | $m | |
Foreign exchange contracts | | 653 | | 565 | | 43,055 | |
Foreign exchange options | | 62 | | 71 | | 337 | |
Currency swaps in gain position | | 1,298 | | 1,251 | | 16,122 | |
Currency swaps in loss position | | (183 | ) | (479 | ) | 2,416 | |
Net currency swaps | | 1,115 | | 772 | | 18,538 | |
Interest rate options | | — | | 2 | | 167 | |
Interest rate swaps in gain position | | 129 | | 452 | | 15,070 | |
Interest rate swaps in loss position | | (29 | ) | (433 | ) | 8,488 | |
Net interest rate swaps | | 100 | | 19 | | 23,558 | |
Futures in gain position | | 14 | | 28 | | 242 | |
Futures in loss position | | (4 | ) | (9 | ) | 62 | |
Net futures | | 10 | | 19 | | 304 | |
Net Derivative Instruments | | 1,940 | | 1,448 | | 85,959 | |
Derivatives as at 30 June 2006
| | 30 June 2006 | | 30 June 2006 | | 30 June 2006 | |
| | Book value | | Fair value | | Notional value | |
| | $m | | $m | | $m | |
Foreign exchange contracts | | 104 | | 253 | | 21,118 | |
Foreign exchange options | | (537 | ) | (520 | ) | 11,568 | |
Currency swaps in gain position | | 257 | | 285 | | 3,668 | |
Currency swaps in loss position | | (793 | ) | (813 | ) | (1,078 | ) |
Net currency swaps | | (536 | ) | (528 | ) | 2,590 | |
Interest rate options | | 1 | | 1 | | 125 | |
Interest rate swaps in gain position | | 149 | | 269 | | 14,177 | |
Interest rate swaps in loss position | | (48 | ) | (148 | ) | 3,635 | |
Net interest rate swaps | | 101 | | 121 | | 17,812 | |
Futures in gain position | | 43 | | 85 | | 635 | |
Futures in loss position | | (11 | ) | (15 | ) | 365 | |
Net futures | | 32 | | 70 | | 1,000 | |
Net Derivative Instruments | | (835 | ) | (603 | ) | 54,213 | |
Fair value of financial instruments
As at 30 June 2007 the fair values of assets and liabilities were as follows:
| | 30 June 2007 | | 30 June 2007 | | 30 June 2006 | | 30 June 2006 | |
| | Book value | | Fair value | | Book value | | Fair value | |
| | $m | | $m | | $m | | $m | |
Domestic Assets | | | | | | | | | |
Cash and deposits | | 3,618 | | 3,618 | | 3,770 | | 3,770 | |
Marketable securities | | 25,006 | | 23,824 | | 2,036 | | 1,598 | |
Others | | 3,642 | | 4,462 | | 2,851 | | 3,422 | |
Foreign Assets | | | | | | | | | |
Cash and deposits | | 1,098 | | 1,098 | | 1,243 | | 1,243 | |
Marketable securities | | 6,951 | | 7,300 | | 24,604 | | 24,603 | |
Others | | 15,803 | | 15,803 | | 13,184 | | 13,184 | |
Total Assets | | 56,118 | | 56,105 | | 47,688 | | 47,820 | |
Domestic Liabilities | | | | | | | | | |
Government stock | | 16,834 | | 16,397 | | 17,002 | | 17,546 | |
Treasury bills | | 2,080 | | 2,098 | | 4,860 | | 4,859 | |
Retail stock | | 471 | | 468 | | 532 | | 530 | |
Other | | 25,266 | | 24,852 | | (4,049 | ) | (4,346 | ) |
Foreign Liabilities | | | | | | | | | |
Foreign currency debt | | (3,266 | ) | (2,586 | ) | 21,082 | | 21,218 | |
Total Liabilities | | 41,385 | | 41,229 | | 39,427 | | 39,807 | |
Refer to note 9 (student loans) and note 10 (accounts receivable) for discussion on carrying amounts compared to estimated fair values.
Note 21: Contingent Liabilities and Contingent Assets
| | 30 June 2007 | | 30 June 2006 | |
| | $m | | $m | |
Guarantees and indemnities | | 171 | | 405 | |
Uncalled capital | | 2,076 | | 2,592 | |
Legal proceedings and disputes | | 1,170 | | 1,032 | |
Other quantifiable contingent liabilities | | 1,829 | | 2,073 | |
Total Quantifiable Contingent Liabilities | | 5,246 | | 6,102 | |
Total Quantifiable Contingent Assets | | 86 | | 106 | |
Only contingent liabilities involving amounts of over $10 million are separately disclosed. Contingent liabilities below $10 million are included in the “other quantifiable contingent liabilities” total. Comparatives have been adjusted where appropriate to align with the disclosure of new “material” contingent liabilities. The total amount of prior years’ contingent liabilities remains unchanged.
Contingent liabilities are costs that the Crown will have to face if a particular event occurs. Typically, contingent liabilities consist of guarantees and indemnities, legal disputes and claims, and uncalled capital. The contingent liabilities facing the Crown are a mixture of operating and balance sheet risks, and they can vary greatly in magnitude and likelihood of realisation. In general, if a contingent liability was realised it would reduce the operating balance and net worth and increase gross sovereign issued debt. However, in the case of contingencies for uncalled capital, the negative impact would be restricted to gross sovereign issued debt.
Where contingent liabilities have arisen as a consequence of legal action being taken against the Crown, the amount shown is the amount claimed and thus the maximum potential cost. It does not represent either an admission that the claim is valid or an estimation of the amount of any award against the Crown.
Contingent assets are potential assets dependent on a particular event occurring. As at 30 June 2007, the Crown had quantifiable contingent assets totalling $86 million ($106 million at 30 June 2006). $85 million relates to suspensory loans issued by the Ministry of Education to integrated schools.
Guarantees and indemnities
Guarantees and indemnities are disclosed in accordance with FRS 15 Provisions, Contingent Liabilities and Contingent Assets.
Cook Islands — Asian Development Bank (ADB) loans
Before 1992, the New Zealand Government guaranteed the Cook Islands’ borrowing from the ADB. These guarantees have first call on New Zealand’s Official Development Assistance.
$13 million at 30 June 2007 ($17 million at 30 June 2006).
Indemnification of receivers and managers — Terralink Limited
The Crown has issued a Deed of Receivership indemnity to the appointed receivers of Terralink Limited against claims arising from the conduct of the receivership.
$10 million at 30 June 2007 ($10 million at 30 June 2006).
Ministry of Justice — Treaty settlements, tax liabilities
Under Deeds of Settlement completed in the Treaty settlement process the Crown has indemnified the appropriate governance entity against any goods and services tax or income tax liability arising from the payment of tangible redress.
$105 million at 30 June 2007 ($87 million at 30 June 2006).
Ministry of Transport — funding guarantee
The Minister of Finance has issued a guarantee of $10 million to the Transport Accident Investigation Commission. The guarantee allows the Commission to assure payment to suppliers of specialist salvage equipment in the event of the Commission initiating an urgent investigation of any future significant transport accident.
$10 million at 30 June 2007 ($10 million at 30 June 2006).
Guarantees and indemnities of SOEs and Crown entities
$18 million at 30 June 2007 ($19 million at 30 June 2006).
Other Guarantees and indemnities
$15 million at 30 June 2007 ($262 million at 30 June 2006).
Uncalled capital
The Crown’s uncalled capital subscriptions are as follows:
| | Uncalled capital at | | Uncalled capital at | |
| | 30 June 2007 | | 30 June 2006 | |
| | $m | | $m | |
Asian Development Bank | | 996 | | 1,223 | |
European Bank for Reconstruction and Development | | 12 | | 15 | |
International Bank for Reconstruction and Development | | 1,068 | | 1,354 | |
Legal proceedings and disputes
The amounts under quantifiable contingent liabilities for legal proceedings and disputes are shown exclusive of any interest and costs that may be claimed if these cases were decided against the Crown.
Where contingent liabilities have arisen as a consequence of legal action being taken against the Crown, the amount shown is the amount claimed and thus the maximum potential cost. It does not represent either an admission that the claim is valid or an estimation of the possible amount of any award against the Crown.
Health — legal claims
Claims against the Crown in respect of people allegedly contracting hepatitis C through contaminated blood and blood products.
$70 million at 30 June 2007 ($90 million at 30 June 2006).
Tax in dispute
Represents the outstanding debt of those tax assessments raised, against which an objection has been lodged and legal action is proceeding.
$941 million at 30 June 2007 ($784 million at 30 June 2006).
Other legal claims against SOEs and Crown entities
$33 million at 30 June 2007 ($25 million at 30 June 2006).
Other legal claims
$126 million at 30 June 2007 ($133 million at 30 June 2006).
Other quantifiable contingent liabilities
International finance organisations
The Crown has lodged promissory notes with the International Monetary Fund.
$1,431 million at 30 June 2007 ($1,806 million at 30 June 2006).
Payment of the notes depends upon the operation of the rules of the organisation.
Ministry of Economic Development
The Crown has agreed to contribute funding to increase finals venue stadium capacity in preparation for the 2011 Rugby World Cup.
$146 million at 30 June 2007 (nil at 30 June 2006).
Reserve Bank — demonetised currency
The Crown has a contingent liability for the face value of the demonetised $1 and $2 notes issued which have yet to be repatriated.
$23 million at 30 June 2007 ($37 million at 30 June 2006).
Social Development — claim for judicial review
Claim for Judicial Review of the Ministry’s interpretation and application of Special Benefit Direction. Proceeding is brought representatively - on behalf of all applicants for Special Benefit from 12 December 2000 to date, who have been declined special benefit for reasons of “no special or unusual circumstances”.
$79 million at 30 June 2007 ($67 million at 30 June 2006).
Transpower New Zealand Limited — other quantifiable contingent liabilities
In the current self-regulating environment, Transpower operates its revenue setting methodology with an Economic Value (EV) framework that analyses economic gains and losses between those attributable to shareholders and those attributable to customers. The balance of the accumulated gain (loss) from monopoly activities attributable to customers (the EV balance) may be passed on to customers over time. Any such transfer would occur after consideration by Directors of the balance of this account and its likely future movement in order to preserve stability and predictability of prices.
$98 million at 30 June 2007 ($99 million at 30 June 2006).
Other quantified contingent liabilities of SOEs and Crown entities
$26 million at 30 June 2007 ($38 million at 30 June 2006).
Other quantifiable contingent liabilities
$26 million at 30 June 2007 ($26 million at 30 June 2006).
Unquantifiable Contingent Liabilities
Accounting standard FRS 15 requires that contingent liabilities be disclosed unless the possibility of an outflow of resources embodying economic benefits is remote. Disclosure of remote contingent liabilities is only required if knowledge of the transaction or event is necessary to achieve the objectives of general purpose financial reporting. This part of the Statement provides details of those contingent liabilities of the Crown which cannot be quantified (remote contingent liabilities are excluded).
Guarantees and indemnities
Asure New Zealand Limited
The Crown has indemnified the directors of Asure New Zealand Limited in the event that they incur any personal liability for redundancies arising from any agreement by international trading partners that allows post-mortem meat inspection by parties other than the Ministry of Agriculture and Forestry, or its sub-contractor.
At Work Insurance Limited
The Crown has indemnified the liquidators of At Work Insurance Limited (Deloitte Touche Tohmatsu) against various employment-related claims.
Auckland Rail Lease
The Crown has indemnified Toll NZ Limited against any losses arising from breaches of the Sale and Purchase Agreement with the Crown relating to the purchase of the Auckland rail lease and infrastructure assets.
Bona Vacantia property
P&O NZ Ltd sought a declaratory judgement that property disclaimed by a liquidator is bona vacantia.A settlement has been reached, which includes a Crown indemnity in favour of New Zealand Aluminium Smelters and Comalco in relation to aluminium dross disposed of in their landfill, for costs that may be incurred in removing the dross and disposing of it at another site if they are required to do so by an appropriate authority. The Minister of Finance signed the indemnity on 24 November 2003. In February 2004, a similar indemnity was signed in respect of aluminium dross currently stored at another site in Invercargill.
Building Industry Authority
The Building Industry Authority (BIA) is a joint defendant in a number of claims before the courts and the Weathertight Homes Resolution Service relating to the BIA’s previous role as regulator of the building industry. The BIA has been dis-established and absorbed into the Department of Building and Housing and, to prevent conflicts of interest, Treasury was given responsibility for managing weathertight claims against the BIA on behalf of the Crown from 1 July 2005.
District Court Judges, Justices of the Peace, Coroners and Disputes Tribunal
Section 119 of the District Courts Act 1947 indemnifies District Court Judges acting in their civil jurisdiction. Section 196A of the Summary Proceedings Act 1957 also indemnifies District Court Judges for any liabilities arising as a result of an act done by a Judge in excess of, or without, jurisdiction.
Section 117 of the Coroners Act 2006 confers on Coroners acting within the Coroner Act 2006 the same privileges and immunities as District Court Judges under the Summary Proceedings Act 1957.
Under section 197 of the Summary Proceedings Act 1957, Justices of the Peace are similarly covered as long as a High Court Judge certifies that they have acted in good faith and ought to be indemnified.
Section 58 of the Disputes Tribunal Act 1988 confers on Disputes Tribunal referees acting within the Disputes Tribunal Act 1988 the same protection as Justices of the Peace under the Summary Proceedings Act 1957.
Earthquake Commission (EQC)
The Crown is liable to meet any deficiency in the EQC’s assets in meeting the Commission’s financial liabilities (section 16 of the Earthquake Commission Act 1993).
Electricity Corporation of New Zealand Limited (ECNZ)
The ECNZ Sale and Purchase Agreement provides for compensation to ECNZ for any tax, levy, or royalty imposed on ECNZ for the use of water or geothermal energy for plants in existence or under construction at the date of the Sale and Purchase Agreement. The Agreement also provides for compensation for any net costs to ECNZ arising from resumption of assets pursuant to the Treaty of Waitangi (State Enterprises) Act 1988.
The Deed of Assumption and Release between ECNZ, Contact Energy Limited and the Crown provides that the Crown is no longer liable to ECNZ in respect of those assets transferred to it from ECNZ. As a result of the split of ECNZ in 1999, Ministers have transferred the benefits of the Deed to ECNZ’s successors — Meridian Energy Limited, Mighty River Power Limited and Genesis Power Limited.
Under the Transpower New Zealand Limited (Transpower) Sale and Purchase and Debt Assumption Agreements, the Crown has indemnified ECNZ for any losses resulting from changes in tax rules applicable to transactions listed in the Agreements. Additionally, the Crown has indemnified the directors and officers of ECNZ for any liability they may incur in their personal capacities as a result of the Transpower separation process.
Following the split of ECNZ in 1999 into three new companies, the Crown has indemnified ECNZ in relation to all ECNZ’s pre-split liabilities, including:
· existing debt and swap obligations
· hedge contracts and obligations
· any liabilities that arise out of the split itself.
Ministry of Fisheries — indemnity provided for delivery of registry services
The Crown has indemnified Commercial Fisheries Services Limited against claims made by third parties arising from Commercial Fisheries Services undertaking registry services under contract to the Chief Executive of the Ministry of Fisheries. This indemnity, provided under the Fisheries Acts 1983 and 1996, expires on 30 September 2009.
Genesis Power Ltd (Genesis Energy)
The Crown has entered into a deed with Genesis Energy to share a specified and limited amount of risk around the sufficiency of Genesis Energy’s long term supply of gas to cover the Huntly e3p’s (a 385 MW combined cycle gas turbine power station) minimum needs. The agreement sees the Crown compensate Genesis Energy in the event it has less gas than it needs.
Geothermal carbon tax indemnity
As part of the sale and purchase agreement between the Crown and Mighty River Power (MRP), the Crown has agreed to provide an indemnity for the payment of carbon taxes, should legislation be passed that does not allow for an automatic pass-through of the charges to end-users. The indemnity is time bound and contractually limited in the amount that can be claimed. The indemnity is not limited to MRP and will be available to any subsequent owner of the Crown’s Kawerau geothermal assets.
Housing New Zealand Corporation (HNZC)
HNZC is liable to the owners (ANZ National Bank Limited, Ichthus Limited and Westpac Banking Corporation) of mortgages sold by HNZC during 1992 to 1999 for credit losses they may incur from specified limited aspects of their ownership of those mortgages with the Crown standing behind this obligation.
HNZC has provided a Lender’s Mortgage Insurance Indemnity under a Mortgage Guarantee Scheme.The Minister of Finance is deemed under section 24(2) of the Housing Corporation Act 1974 to have guaranteed HCNZ in respect of Homebuy first mortgages insured by HCNZ through contracted insurance agents. HNZC ceased providing mortgage guarantees from 1 November 1991.
The Crown has provided a warranty in respect of title to the assets transferred to Housing New Zealand Limited (HNZL) (HNZL was incorporated into the HNZC group as a subsidiary in 2001 as part of a legislated consolidation of government housing functions) and has indemnified HNZL against any breach of this warranty. In addition, the Crown has indemnified HNZL against any third-party claims that are a result of acts or omissions prior to 1 November 1992. It has also indemnified the directors and officers of HNZL against any liability consequent upon the assets not complying with statutory requirements, provided it is taking steps to rectify any non-compliance.
Indemnities against acts of war and terrorism
The Crown has indemnified Air New Zealand against claims arising from acts of war and terrorism that cannot be met from insurance, up to a limit of US$1 billion in respect of any one claim.
Maui Partners
The Crown has entered into confidentiality agreements with the Maui Partners in relation to the provision of gas reserves information. The deed contains an indemnity against any losses arising from a breach of the deed.
National Provident Fund
The National Provident Fund (NPF) has been indemnified for certain potential tax liabilities.Under the NPF Restructuring Act 1990, the Crown guarantees:
· the benefits payable by all NPF schemes (section 60)
· investments and interest thereon deposited with the NPF Board prior to 1 April 1991 (section 61)
· payment to certain NPF defined contribution schemes where application of the 4% minimum earnings rate causes any deficiency or increased deficiencies in reserves to arise (section 72).
A provision has been made in these financial statements in respect of the actuarially assessed deficit in the DBP (Annuitants’) Scheme (refer Note 15 of the financial statements).
New Zealand Railways Corporation
The Crown has indemnified the directors of the New Zealand Railways Corporation against any liability arising from the surrender of the licence and lease of the Auckland rail corridor.
The Crown has further indemnified the directors of New Zealand Railways Corporation against any liability arising from the transfer of the rail network and associated assets and liabilities to the Corporation on 1 September 2004.
Persons exercising investigating powers
Section 63 of the Corporations (Investigation and Management) Act 1989 indemnifies the Securities Commission, the Registrar and Deputy Registrar of Companies, members of advising committees within the Act, every statutory manager of a corporation, and persons appointed pursuant to sections 17 to 19 of the Act, in the exercise of investigating powers, unless the power has been exercised in bad faith.
Ports of Auckland
The Crown has entered into a confidentiality agreement with Ports of Auckland in relation to the purchase of two marinas. The agreement contains an indemnity against any losses arising from a breach of the agreement.
Public Trust
The Crown is liable to meet any deficiency in the Public Trust’s Common Fund (section 52 of the Public Trust Act 2001).
State Insurance and Rural Bank — Tax liabilities
The Crown has granted to the purchasers of the State Insurance Office Limited and the Rural Banking and Finance Corporation Limited an indemnity for certain potential tax liabilities.
Synfuels-Waitara Outfall Indemnity
As part of the 1990 sale of the Synfuels plant and operations to New Zealand Liquid Fuels Investment Limited (NZLFI), the Crown transferred to NZLFI the benefit and obligation of a Deed of Indemnity between the Crown and Borthwick-CWS Limited (and subsequent owners) in respect of the Waitara effluent transfer line which was laid across the Waitara meat processing plant site.
The Crown has the benefit of a counter indemnity from NZLFI which has since been transferred to Methanex Motunui Limited.
Tainui Corporation
Several leases of Tainui land at Huntly and Meremere have been transferred from ECNZ to Genesis Power. The Crown has provided guarantees to Tainui Corporation relating to Genesis Power’s obligations under the lease agreements.
Toll NZ Ltd — purchase of rail network assets
The agreement between the Crown and Toll NZ Ltd for the Crown’s purchase of the rail network and associated assets on 30 June 2004 contains the following provisions:
· the Crown has indemnified Toll NZ Ltd against any liability arising from the assigned contracts, leases, etc after their assignment dates
· the Crown has indemnified Toll NZ Ltd against certain potential claims by employees
· the Crown has an option to purchase the Tranz Scenic Stations from Toll NZ Ltd for a period of three years (to 30 June 2007).
Other unquantifiable contingent liabilities
Abuse Claims
There is ongoing legal action against the Crown in relation to historical abuse claims. At this stage the number of claimants and outcome of these cases are uncertain.
Accident Compensation Corporation (ACC) litigations
There are several legal actions against ACC in existence, arising in the main from challenges to operational decisions made by ACC. No accrual has been made for such contingent liabilities as ACC will be vigorously defending these claims.
A particular issue before the courts is access of ACC claimants to lump sum compensation for asbestos related illnesses. On 3 June 2005 the High Court overturned a decision by the District Court made in 2004 that had upheld an interpretation that a lump sum payment was required to be paid in respect of one claimant. Leave to appeal this decision to the Court of Appeal has been granted to the claimant.
If the Court of Appeal overturns the decision made in the High Court, ACC could be exposed to substantial future liability in respect of claims for asbestosis and possibly other illnesses listed under Schedule 2 of the Injury Prevention Rehabilitation and Compensation Act 2001.
Environmental Liabilities
Under common law and various statutes, the Crown may have responsibility to remedy adverse effects on the environment arising from Crown activities.
During 2002/03 departments managing significant Crown properties undertook exercises to establish the nature and quantity of any contaminated sites. These exercises continued into the 2006/07 year. Where appropriate, departmental systems have been implemented to identify, monitor and assess potential contaminated sites.
In accordance with FRS 15: Provisions, Contingent Liabilities and Contingent Assets any contaminated sites for which costs can be reliably measured have been included in the Statement of Financial Position as provisions.
Rugby World Cup 2011
The Crown has agreed in joint venture arrangements with the New Zealand Rugby Union to an uncapped underwrite of the costs of hosting the 2011 Rugby World Cup, on a loss sharing basis (Crown 67%, NZRU 33%). A provision for the forecast losses has been made in the Government’s financial statements.
The Crown has agreed to reimburse New Zealand income tax that might be incurred by the joint venture entity (Rugby New Zealand 2011 Limited) or the NZRU in relation to the joint venture entity, and has also agreed to reimburse the NZRU for New Zealand withholding tax that might be incurred on certain payments made in relation to the tournament.
The Crown has further agreed to review its level of support to the tournament if the actual tax revenue arising from the tournament exceeds forecasts.
Treaty of Waitangi claims
Under the Treaty of Waitangi Act 1975, any Maori may lodge claims relating to land or actions counter to the principles of the Treaty with the Waitangi Tribunal. Where the Tribunal finds a claim is well founded, it may recommend to the Crown that action be taken to compensate those affected. The Tribunal can make recommendations that are binding on the Crown with respect to land which has been transferred by the Crown to an SOE or tertiary institution, or is subject to the Crown Forest Assets Act 1989.
Settlement relativity payments
The Deeds of Settlement negotiated with Waikato-Tainui and Ngai Tahu include a relativity mechanism. The mechanism provides that, where the total redress amount for all historical Treaty settlements exceeds $1 billion in 1994 present-value terms, the Crown is liable to make payments to maintain the real value of Ngai Tahu’s and Waikato-Tainui’s settlements as a proportion of all Treaty settlements. The agreed relativity proportions are 17% for Waikato-Tainui and approximately 16% for Ngai Tahu. The non-quantifiable contingent liability relates to the risk that total settlement redress, including binding recommendations from the Waitangi Tribunal, will trigger these relativity payments.
Foreshore and seabed
The Foreshore and Seabed Act 2004 (FSA):
· vests the full legal and beneficial ownership of the public foreshore and seabed in the Crown
· provides for the recognition and protection of ongoing customary rights with respect to the public foreshore and seabed
· enables applications to the High Court to investigate if previously held common law rights have been adversely impacted, and if so, providing for those affected either to participate in the administration of a foreshore and seabed reserve or else enter into formal discussions on redress, and
· provides for general rights of public access and recreation in, on, over, and across the public foreshore and seabed and general rights of navigation within the foreshore and seabed.
The public foreshore and seabed means the marine area that is bounded on the landward side by the line of mean high water spring; and on the seaward side by the outer limits of the territorial sea, but does not include land subject to a specified freehold interest (refer section 5 of the FSA).
The FSA codifies the nature of the Crown’s ownership interest in the public foreshore and seabed on behalf of the public of New Zealand. Although full legal and beneficial ownership of the public foreshore and seabed has been vested in the Crown, there are significant limitations to the Crown’s rights under the FSA. As well as recognising and protecting customary rights, the FSA significantly restricts the Crown’s ability to alienate or dispose of any part of the public foreshore and seabed and significantly restricts the Crown’s ability to exclude others from entering or engaging in recreational activities or navigating in, on or within the public foreshore and seabed. Because of the complex nature of the Crown’s ownership interest in the public foreshore and seabed and because we are unable to obtain a reliable valuation of the Crown’s interest, the public foreshore and seabed has not been recognised as an asset in these financial statements.
Note 22: Impact of the Adoption of NZ IFRS
This note outlines the process for adopting New Zealand equivalents to International Financial Reporting Standards (NZ IFRS) for the Government reporting entity.
The Accounting Standards Review Board announced in December 2002 that reporting entities must adopt NZ IFRS for periods beginning after 1 January 2007, with earlier adoption optional. The Minister of Finance announced in 2003 that the Crown will first adopt NZ IFRS for its financial year beginning 1 July 2007.
Treasury is managing the adoption of NZ IFRS for the consolidated financial statements of the Government reporting entity. Individual entities included within the consolidated financial statements of the Government reporting entity are responsible for ensuring their own NZ IFRS preparedness. Treasury provides guidance to these entities and facilitates implementation on common issues.
The NZ IFRS adoption timetable required determination of the opening financial position at 1 July 2006. Comparative NZ IFRS financial information has been collected throughout 2006/07. Forecasts in Budget 2007 have been prepared on an NZ IFRS basis as will interim financial statements prepared in the 2007/08 financial year. The first set of audited financial statements prepared under NZ IFRS will be for the year ending 30 June 2008. The impact of NZ IFRS on the opening net worth at 1 July 2006 is detailed below. The impact of NZ IFRS on the financial year ended 30 June 2007 has yet to be established. A forecast of the impact was included in Budget 2007.
Draft NZ IFRS accounting policies for the Government reporting entity are available at www.treasury.govt.nz/nzifrs/. Significant changes to existing policies include:
· initial recognition of all financial instruments at fair value
· applying a risk premium to the valuation of the ACC liability, and
· valuing the GSF liability on a pay-as-needed basis.
The impact of adopting NZ IFRS will only be finalised when the first set of audited financial statements are prepared for 30 June 2008.Until this time the NZ IFRS standards, and the application of these standards, may change and any consequential impact on net worth may be material.
Estimated impact on opening net worth
($ million) | | Notes | | As at
1 July
2006 | |
Net worth per published accounts at 30 June 2006 | | | | 71,403 | |
Rail network valuation | | a | | 10,330 | |
Net worth per existing GAAP at 1 July 2006 | | | | 81,733 | |
Changes as a result of transition to NZ IFRS | | | | | |
Revaluation of GSF | | b | | 3,133 | |
Inclusion of a risk premium on ACC liability | | c | | (1,603 | ) |
Inclusion of derivatives | | d | | 304 | |
Fair value adjustments to receivables | | e | | (369 | ) |
Revaluation of NPF liability | | f | | 195 | |
Other movements | | | | 196 | |
Net worth per NZ IFRS | | | | 83,589 | |
Notes
a) On 1 July 2006 the accounting policy regarding the measurement basis of the rail network changed under existing GAAP to depreciated replacement cost. Previously this asset was reported at historical cost.
b) The reporting of the Government Superannuation Fund (GSF) has changed due to applying a specific standard for employee benefits, including pension schemes, under NZ IFRS. The main changes to the financial statements are:
· a reduction of $3.1 billion in the net liability of GSF due to valuing the liability on the basis that the Government meets its obligation on a pay-as-needed basis, rather than the amount to be invested today to fully fund future contributions under existing GAAP. This latter approach assumes the Fund would invest in assets that would generate revenue on which there would be an additional obligation to pay tax, and
· a netting of GSF plan assets of $3.8 billion against the pension liability (nil impact on net worth).
c) The reporting of the ACC liability has changed owing to the new requirements under NZ IFRS. The main changes to the financial statements are:
· the ACC liability has increased by $1.6 billion due to adding an additional risk premium ($1.4 billion) and liability adequacy test on the unearned levy liability to meet estimated future claims ($0.2 billion). The actuarially calculated liability under existing GAAP represents a mid-point estimate — that is, equal chance of actual payouts being greater than or less than the estimate. To that extent, it represents the most likely outcome. Introducing an additional risk premium and liability adequacy test under NZ IFRS does not change the relative risk of ACC’s activities; rather it simply changes how this risk is reported
· changes to the presentation of the unearned levy liability (nil impact on net worth).
d) Under NZ IFRS all derivative contracts must be recognised in the statement of financial position at fair value. The adjustment is the cumulative effect of this treatment.
e) Receivables from taxes and fines have been written down to reflect time value of money and collection costs.
f) Like the reduction in the GSF liability above, the reduction in the National Provident Fund (NPF) liability is due to the tax effect of valuing the liability on the basis of present valuing the possible payments to this scheme under the current arrangements, rather than the current approach which determines what payment would be required today to settle all future obligations.
Additional Statements on Core Crown
Core Crown Cash Flow Reconciliation to Government Stock Issues
(for the year ended 30 June 2007)
Forecast | | | | Actual | |
Original | | Estimated | | | | 30 June | | 30 June | |
Budget | | Actual | | | | 2007 | | 2006 | |
$m | | $m | | | | $m | | $m | |
Reconciliation of Net Core Crown Cash Flow from Operations with Net Cash Proceeds from Domestic Bonds | | | | | |
This statement outlines the core Crown bonds reconciliation. Government stock balances and flows between NZDMO, the NZS Fund and the GSF are not eliminated. This presents the complete activity of the NZDMO bond programme. | |
| | | | Core Crown Cash Flows from Operations | | | | | |
51,499 | | 52,868 | | Total tax receipts | | 53,321 | | 50,507 | |
503 | | 463 | | Total other sovereign receipts | | 476 | | 539 | |
1,035 | | 2,147 | | Interest, profits and dividends | | 1,991 | | 1,893 | |
1,387 | | 1,606 | | Sales of goods and services and other receipts | | 1,356 | | 1,449 | |
(16,820 | ) | (16,622 | ) | Subsidies and transfer payments | | (16,454 | ) | (15,357 | ) |
(30,815 | ) | (30,750 | ) | Personnel and operating costs | | (29,930 | ) | (28,167 | ) |
(1,781 | ) | (2,200 | ) | Finance costs | | (2,226 | ) | (2,005 | ) |
(320 | ) | (80 | ) | Forecasts for future new spending | | — | | — | |
— | | 500 | | Top-down expense adjustment | | — | | — | |
4,688 | | 7,932 | | Net Cash Flows from Operations | | 8,534 | | 8,859 | |
| | | | Investing Flows | | | | | |
| | | | Net advances | | | | | |
— | | — | | Student loans | | (658 | ) | (674 | ) |
— | | — | | Housing New Zealand Corporation | | (301 | ) | (44 | ) |
— | | — | | District health boards and RHMU | | (220 | ) | (105 | ) |
— | | — | | Tranz Rail New Zealand Limited | | (80 | ) | (57 | ) |
(957 | ) | (1,266 | ) | Other | | 72 | | 58 | |
(957 | ) | (1,266 | ) | Total Net Advances | | (1,187 | ) | (822 | ) |
(1,953 | ) | (2,141 | ) | Net Purchase of Physical Assets | | (1,806 | ) | (1,826 | ) |
| | | | Net investments | | | | | |
— | | — | | District health boards | | 11 | | (46 | ) |
— | | — | | Housing New Zealand Corporation | | (149 | ) | (216 | ) |
(441 | ) | (456 | ) | Other | | (206 | ) | (127 | ) |
(2,049 | ) | (2,049 | ) | Contributions to the NZS Fund | | (2,049 | ) | (2,337 | ) |
(500 | ) | (500 | ) | Purchase of Reserve Bank reserves | | (500 | ) | (500 | ) |
(256 | ) | — | | Forecast new capital spending | | — | | — | |
— | | 200 | | Top-down capital adjustment | | — | | — | |
(3,246 | ) | (2,805 | ) | Net (Purchase)/Sale of Investments | | (2,893 | ) | (3,226 | ) |
(1,468 | ) | 1,720 | | Available for Debt Repayment/(Required to be Financed) | | 2,648 | | 2,985 | |
| | | | | | | | | |
| | | | Financing Activity | | | | | |
2,493 | | (5,728 | ) | Other net sale/(purchase) of marketablesecurities and deposits | | (4,208 | ) | (2,039 | ) |
(1,132 | ) | 4,437 | | Net issue/(repayment) of other New Zealand-dollar borrowing | | 2,539 | | 419 | |
502 | | (497 | ) | Net (repayment)/issue of foreign currency borrowing | | (228 | ) | (1,801 | ) |
(23 | ) | (76 | ) | Net (inflows)/outflows of cash | | (508 | ) | 105 | |
— | | 272 | | Issues of circulating currency | | 91 | | 165 | |
372 | | 128 | | Net Cash Inflows/(Outflows) to be Offset by Domestic Bonds | | 334 | | (166 | ) |
| | | | Gross Cash Proceeds from Domestic Bonds | | | | | |
2,438 | | 2,511 | | Domestic bonds (market) | | 2,294 | | 2,375 | |
406 | | 559 | | Domestic bonds (non-market) | | 570 | | 740 | |
2,844 | | 3,070 | | Total Gross Cash Proceeds from Domestic Bonds | | 2,864 | | 3,115 | |
(2,777 | ) | (2,777 | ) | Repayment of domestic bonds (market) | | (2,777 | ) | (2,574 | ) |
(439 | ) | (421 | ) | Repayment of domestic bonds (non-market) | | (421 | ) | (375 | ) |
(372 | ) | (128 | ) | Net (Repayments of)/Cash Proceeds from Domestic Bonds | | (334 | ) | 166 | |
Statement of Unappropriated Expenditure
(for the year ended 30 June 2007)
An appropriation is a statutory authorisation by Parliament for the incurring of expenses or capital expenditure. This Statement reports expenses or capital expenditure without appropriation and in excess, or outside the scope, of existing appropriations. This Statement also reports breaches of projected net asset balance limits set by section 22(3) of the Public Finance Act 1989.
Section 26B of the Public Finance Act 1989 authorises the Minister of Finance to approve limited amounts of expenses or capital expenditure in excess of, but within the scope, of an existing appropriation.Unappropriated amounts incurred in terms of such an approval are shown separately in this Statement.
Expenses or capital expenditure incurred without or outside the scope of appropriation or any other authority is unlawful unless validated by Parliament. Unappropriated expenses or capital expenditure in excess of the limits which the Minister of Finance can approve under section 26B of the Public Finance Act 1989 require validating legislation. Such validating legislation will be accompanied by a report to the House of Representatives that sets out the unappropriated items together with an explanation of the Minister Responsible for the expenses or capital expenditure.
Amounts in this Statement are expressed in thousands of dollars, reflecting the level at which appropriations are made.
| | The | | | |
| | Supplementary | | Amount in | |
Unappropriated expenditure approved under | | Estimates of | | excess of | |
Section 26B of the Public Finance Act 1989 | | Appropriations | | Appropriation | |
Department | | ($000) | | ($000) | |
Vote — | | | | | |
Appropriation | | | | | |
| | | | | |
Crown Law Office | | | | | |
Attorney-General — | | | | | |
Departmental Output Expenses — | | | | | |
Supervision and Conduct of Crown Prosecutions | | 31,510 | | 609 | |
Customs Service | | | | | |
Customs — | | | | | |
Departmental Output Expenses — | | | | | |
Clearance of International Passengers, Crew and Craft | | 35,847 | | 98 | |
Surveillance, Search and Containment | | 6,042 | | 36 | |
Ministry of Education | | | | | |
Education — | | | | | |
Departmental Output Expenses — | | | | | |
Provision of Teacher and Caretaker Housing | | 18,857 | | 89 | |
Special Education Services | | 175,147 | | 823 | |
Other Expenses to be Incurred by the Crown — | | | | | |
Primary Education | | 2,069,445 | | 4,628 | |
Ministry of Fisheries | | | | | |
Fisheries — | | | | | |
Departmental Output Expenses — | | | | | |
Fisheries Operations | | 23,714 | | 266 | |
Statement of Unappropriated Expenditure
(for the year ended 30 June 2007) — continued
| | The | | | |
Unappropriated expenditure approved under | | Supplementary | | Amount in | |
Section 26B of the Public Finance Act 1989 | | Estimates of | | excess of | |
(continued) | | Appropriations | | Appropriation | |
Department | | ($000) | | ($000) | |
Vote — | | | | | |
Appropriation | | | | | |
| | | | | |
Ministry of Health | | | | | |
Health — | | | | | |
Departmental Output Expenses — | | | | | |
DHB Funding and Performance | | 16,206 | | 136 | |
Departmental Output Expenses (Restricted by Revenue) — | | | | | |
Information Services | | 61,873 | | 720 | |
Department of Internal Affairs | | | | | |
Emergency Management — | | | | | |
Other Expenses to be Incurred by the Crown — | | | | | |
Emergency Expenses | | 7,681 | | 19 | |
Office of the Ombudsmen | | | | | |
Ombudsmen — | | | | | |
Departmental Output Expenses — | | | | | |
Investigation and Resolution of Complaints About Government Administration | | 5,055 | | 39 | |
Parliamentary Service | | | | | |
Parliamentary Service — | | | | | |
Other Expenses to be Incurred by the Crown — | | | | | |
Member Support — Independent | | 24 | | 3 | |
Ministry of Social Development | | | | | |
Child, Youth and Family Services — | | | | | |
Departmental Output Expenses — | | | | | |
Care and Protection Services | | 293,974 | | 666 | |
Veterans’ Affairs — | | | | | |
Benefits and Other Unrequited Expense — | | | | | |
War Disablement Pensions | | 122,187 | | 249 | |
Statement of Unappropriated Expenditure
(for the year ended 30 June 2007) — continued
| | The | | | |
| | Supplementary | | Amount in | |
Unappropriated expenditure | | Estimates of | | excess of | |
– Expenses and capital expenditure incurred in excess of appropriation | | Appropriations | | Appropriation | |
Department | | ($000) | | ($000) | |
Vote — | | | | | |
Appropriation | | | | | |
| | | | | |
Crown Law Office | | | | | |
Attorney-General — | | | | | |
Departmental Output Expenses — | | | | | |
Conduct of Criminal Appeals | | 1,933 | | 218 | |
Ministry of Economic Development | | | | | |
Economic, Industry and Regional Development — | | | | | |
Non-Departmental Output Expenses — | | | | | |
Foundation Services — Business Information and Advice | | 9,083 | | 25 | |
Growth Services — Customised Information and Advice | | 12,430 | | 140 | |
Growth Services — Identifying and Leveraging New Business Opportunities | | 26,946 | | 1,985 | |
Ministry of Education | | | | | |
Education — | | | | | |
Departmental Output Expenses — | | | | | |
Provision of School Sector Property | | 1,121,429 | | 21,472 | |
Other Expenses to be Incurred by the Crown — | | | | | |
Special Needs Support | | 261,258 | | 1,577 | |
Inland Revenue Department | | | | | |
Revenue — | | | | | |
Other Expenses to be Incurred by the Crown — | | | | | |
Child Support Doubtful Debt Provision | | 58,171 | | 6,335 | |
General Tax Doubtful Debt Provision | | 22,230 | | 513,776 | |
Ministry of Justice | | | | | |
Courts — | | | | | |
Other Expenses to be Incurred by the Crown — | | | | | |
Fines Writedowns | | 49,302 | | 4,370 | |
Judicial Review Costs | | 650 | | 75 | |
Treaty Negotiations — | | | | | |
Departmental Output Expenses — | | | | | |
Property Portfolio Management | | 5,745 | | 280 | |
Land Information New Zealand | | | | | |
Lands — | | | | | |
Capital Expenditure — | | | | | |
Crown Obligatory Acquisitions | | 267 | | 329 | |
(1) The figure of $1,933,000 was the authority provided by the Appropriation (2006/07 Estimates) Act 2006, which was the authority in place when the in—year breach occurred.
Statement of Unappropriated Expenditure
(for the year ended 30 June 2007) — continued
| | The | | | |
| | Supplementary | | Amount in | |
Unappropriated expenditure | | Estimates of | | excess of | |
– Expenses and capital expenditure incurred in excess of appropriation (continued) | | Appropriations | | Appropriation | |
Department | | ($000) | | ($000) | |
Vote — | | | | | |
Appropriation | | | | | |
| | | | | |
Ministry of Maori Development | | | | | |
Maori Affairs — | | | | | |
Departmental Output Expenses — | | | | | |
Services to the Maori Trustee | | 4,689 | | 92 | |
Other Expenses to be Incurred by the Crown — | | | | | |
Provision for Maori Trustee Debt | | 4,649 | | 92 | |
New Zealand Defence Force | | | | | |
Defence Force — | | | | | |
Departmental Output Expenses — | | | | | |
Land Combat Service Support Forces | | 121,629 | (1) | 751 | |
Maritime Patrol Forces | | 159,898 | (2) | 100 | |
Naval Combat Forces | | 417,686 | (3) | 578 | |
Veterans’ Affairs — | | | | | |
Departmental Output Expenses — | | | | | |
Policy and Administration | | 2,783 | | 30 | |
Services to Veterans | | 2,190 | | 34 | |
Ministry of Pacific Island Affairs | | | | | |
Pacific Island Affairs — | | | | | |
Departmental Output Expenses — | | | | | |
Communications | | 626 | | 51 | |
Policy Advice | | 5,289 | | 79 | |
Parliamentary Service | | | | | |
Parliamentary Service — | | | | | |
Other Expenses to be Incurred by the Crown — | | | | | |
Travel of Members and Others | | 9,854 | | 660 | |
Ministry of Social Development | | | | | |
Youth Development — | | | | | |
Departmental Output Expenses — | | | | | |
Youth Development Policy Advice | | 2,548 | | 53 | |
(1) The Supplementary Estimates of Appropriations of $121,052,000 has been increased by $577,000 transferred into this Output Class by the Public Finance (Transfers Between Outputs) Order 2007 (SR 2007/174).
(2) The Supplementary Estimates of Appropriations of $160,375,000 has been reduced by $477,000 transferred out of this Output Class by the Public Finance (Transfers Between Outputs) Order 2007 (SR 2007/174).
(3) The Supplementary Estimates of Appropriations of $413,096,000 has been increased by $4,590,000 transferred into this Output Class by the Public Finance (Transfers Between Outputs) Order 2007 (SR 2007/174).
Statement of Unappropriated Expenditure
(for the year ended 30 June 2007) — continued
| | The | | | |
| | Supplementary | | Amount | |
Unappropriated expenditure | | Estimates of | | without | |
– Expenses and capital expenditure without appropriation or other authority | | Appropriations | | Appropriation | |
Department | | ($000) | | ($000) | |
Vote — | | | | | |
Appropriation | | | | | |
| | | | | |
Inland Revenue Department | | | | | |
Revenue — | | | | | |
Other Expenses to be Incurred by the Crown — | | | | | |
Tax receivable write-off | | — | | 811,055 | |
Department of Labour | | | | | |
Immigration — | | | | | |
Departmental Output Expenses — | | | | | |
Services to Increase the Capacity of New Zealand Through Immigration | | 145,528 | | 882 | |
Services to Position New Zealand as an Inter-national Citizen with Immigration-Related interests and Obligations | | 16,591 | | 935 | |
Ministry of Social Development | | | | | |
Social Development — | | | | | |
Non-Departmental Output Expenses — | | | | | |
Capacity Building Initiatives | | 1,950 | | 260 | |
Benefits and Other Unrequited Expenses — | | | | | |
Transition to Work | | 4,861 | | 655 | |
State Services Commission | | | | | |
State Services — | | | | | |
Departmental Output Expenses — | | | | | |
Government Shared Network | | — | (1) | 1,772 | |
Ministry of Transport | | | | | |
Transport — | | | | | |
Capital Expenditure — | | | | | |
New Zealand Railway Corporation | | 500 | | 500 | (2) |
| | | | Amount in | |
| | | | excess of Net | |
| | Net Assets Limit | | Asset balance | |
Breaches of Projected Departmental Net Asset Schedules | | per Estimates | | limit | |
| | ($000) | | ($000) | |
Department | | | | | |
Ministry of Foreign Affairs and Trade | | 337,208 | | 4,368 | |
State Services Commission | | 22,663 | | 2,159 | |
(1) The figure of $nil was the authority provided by the Appropriation (2006/07 Estimates) Act 2006, which was the authority in place when the in-year breach occurred.
(2) The payment to undertake public safety works was paid as a capital grant. Under the scope of the appropriation it should have been paid as a capital contribution.
Statement of Emergency Expenditure, Expenses or Liabilities
(for the year ended 30 June 2007)
Under section 25 of the Public Finance Act 1989, if a state of national emergency is declared under the Civil Defence Act 1983 or if the Government declares an emergency because of any situation that affects the public health or safety of New Zealand, the Minister of Finance may approve expenditure of public money or incurrence of expenses or liabilities to meet such emergency or disaster whether or not an appropriation by Parliament is available for the purpose. Once expenditure, expenses or liabilities have been incurred, the amounts that have not been appropriated must be disclosed in the annual financial statements of the Crown for the financial year and sanctioned by Parliament in an Appropriation Act.
During the year, no such emergency expenditure, expenses or liabilities were incurred.
Statement of Trust Money
(as at 30 June 2007)
| | As at | | | | | | | | | | | | As at | |
Department | | 30 June | | | | | | | | | | | | 30 June | |
Trust Account | | 2006 | | Transfers | | Contributions | | Distributions | | Revenue | | Expenses | | 2007 | |
| | ($000) | | | | ($000) | | ($000) | | ($000) | | ($000) | | ($000) | |
Agriculture and Forestry | | | | | | | | | | | | | | | |
Meat Board Levies Trust | | — | | — | | 59,371 | | (59,386 | ) | 15 | | — | | — | |
Audit | | | | | | | | | | | | | | — | |
South Pacific Association of Supreme Audit Institutions Trust | | 28 | | — | | — | | — | | 6 | | (12 | ) | 22 | |
Building and Housing | | | | | | | | | | | | | | | |
Certifiers Bond Trust | | 178 | | — | | — | | — | | — | | — | | 178 | |
Housing Tenancy Bonds Trust (1) | | — | | — | | — | | — | | — | | — | | — | |
Residential Tenancies Bond Trust | | 207,519 | | — | | 130,895 | | (107,438 | ) | — | | — | | 230,976 | |
Child, Youth and Family Services | | | | | | | | | | | | | | | |
Children and Young Persons and Their Families Agency Trust (3) | | 368 | | (368 | ) | — | | — | | — | | — | | — | |
Conservation | | | | | | | | | | | | | | | |
Bonds/Deposits Trust | | 5,777 | | — | | 859 | | (632 | ) | 215 | | — | | 6,219 | |
Conservation Project Trust | | 1,100 | | — | | 852 | | (675 | ) | 50 | | — | | 1,327 | |
National Parks Trust | | 45 | | — | | 60 | | (7 | ) | 3 | | 101 | | | |
Walkways Trust | | 13 | | — | | — | | — | | 1 | | — | | 14 | |
Wildlife and Reserves Trusts (2) | | — | | — | | — | | — | | — | | — | | — | |
Corrections | | | | | | | | | | | | | | | |
Prisons Trust | | 546 | | — | | — | | — | | 12,431 | | (12,136 | ) | 841 | |
Crown Law Office | | | | | | | | | | | | | | | |
Legal Claims Trust | | 49 | | — | | — | | — | | 874 | | (858 | ) | 65 | |
Culture and Heritage | | | | | | | | | | | | | | | |
Australian Trust for Oral History Archives Trust | | 1,490 | | — | | — | | (95 | ) | 110 | | — | | 1,505 | |
Dictionary of New Zealand Biography Trust | | 348 | | — | | — | | — | | 20 | | (109 | ) | 259 | |
New Zealand Encyclopaedia Trust | | 1 | | — | | — | | — | | — | | — | | 1 | |
New Zealand Historical Atlas Trust | | 86 | | — | | — | | — | | 11 | | — | | 97 | |
New Zealand History Research Trust | | 1,479 | | — | | — | | (45 | ) | 97 | | — | | 1,531 | |
War History Trust (2) | | — | | — | | — | | — | | — | | — | | — | |
Customs | | | | | | | | | | | | | | | |
Alcohol Liquor Advisory Council Trust | | 1,054 | | — | | 13,595 | | (13,609 | ) | 17 | | — | | 1,057 | |
Customs Regional Deposit/Bonds Trust | | 3,110 | | — | | 6,099 | | (5,233 | ) | — | | — | | 3,976 | |
Heavy Engineering Research Association Trust | | 68 | | — | | 883 | | (889 | ) | — | | — | | 62 | |
Maritime Safety Authority Trust (2) | | — | | — | | — | | — | | — | | — | | — | |
New Zealand Customs Service MDS Release Trust (4) | | — | | — | | 5,429 | | (5,315 | ) | — | | — | | 114 | |
New Zealand Customs Service MDS Suspense Trust (4) | | — | | — | | 6,128 | | (6,102 | ) | — | | — | | 26 | |
Economic Development | | | | | | | | | | | | | | | |
Coal and Minerals Deposits Trust | | 235 | | — | | 72 | | (44 | ) | — | | — | | 263 | |
Official Assignee’s Office Trust | | 9,804 | | — | | 11,563 | | (8,776 | ) | 660 | | (3,725 | ) | 9,526 | |
Patent Co-operation Treaty Fees Trust | | 101 | | — | | 1,164 | | (1,139 | ) | 13 | | (9 | ) | 130 | |
Petroleum Deposits Trust | | 1,085 | | — | | — | | — | | 1 | | — | | 1,086 | |
Proceeds of Crime Trust | | 3,358 | | — | | 2,968 | | (1,287 | ) | 263 | | (1,213 | ) | 4,089 | |
Radio Frequencies Tender Trust | | 281 | | — | | 4 | | (73 | ) | 13 | | — | | 225 | |
Education | | | | | | | | | | | | | | | |
Code of Practice for Providers who Enrol International Students Trust | | 3,933 | | — | | — | | — | | 4,886 | | (6,398 | ) | 2,421 | |
Conferences Trust | | 2 | | — | | — | | — | | — | | — | | 2 | |
Subtotal (carried forward) | | 242,058 | | (368 | ) | 239,942 | | (210,745 | ) | 19,686 | | (24,460 | ) | 266,113 | |
(1) Account closed
(2) Inoperative account
(3) Account transferred to/from another department
(4) New account
Statement of Trust Money (continued)
| | As at | | | | | | | | | | | | As at | |
Department | | 30 June | | | | | | | | | | | | 30 June | |
Trust Account | | 2006 | | Transfers | | Contributions | | Distributions | | Revenue | | Expenses | | 2007 | |
| | ($000) | | | | ($000) | | ($000) | | ($000) | | ($000) | | ($000) | |
Subtotal (brought forward) | | 242,058 | | (368 | ) | 239,942 | | (210,745 | ) | 19,686 | | (24,460 | ) | 266,113 | |
Fisheries | | | | | | | | | | | | | | | |
MAF Overfishing Account Trust | | 2,604 | | — | | 17,154 | | (15,761 | ) | 341 | | (284 | ) | 4,054 | |
MAFFish Forfeit Property Trust | | 255 | | — | | 275 | | (235 | ) | 23 | | — | | 318 | |
Foreign Affairs and Trade | | | | | | | | | | | | | | | |
British Government/Tongan Parliamentary Services Trust (2) | | — | | — | | — | | — | | — | | — | | — | |
Cook Island Trust | | 11 | | — | | 1,712 | | (1,734 | ) | 14 | | — | | 3 | |
Judicial Development Trust (4) | | — | | — | | 391 | | — | | — | | — | | 391 | |
New Zealand/France Friendship Trust | | 10 | | — | | 105 | | (102 | ) | 1 | | (1 | ) | 13 | |
Niue Trust | | 23,086 | | — | | 595 | | — | | 1,342 | | — | | 25,023 | |
Samoa Trust (4) | | — | | — | | 461 | | (461 | ) | — | | — | | — | |
Health | | | | | | | | | | | | | | | |
Health Benefits Offices Trust | | 300 | | — | | — | | (497 | ) | 4,332,794 | | (4,332,514 | ) | 83 | |
Medicines Review Objectors Deposit Trust (2) | | — | | — | | — | | — | | — | | — | | — | |
Inland Revenue | | | | | | | | | | | | | | | |
Child Support Agency Trust Account | | 9,061 | | — | | 188,499 | | (173,451 | ) | — | | — | | 24,109 | |
Reciprocal Child Support Agreement Trust | | 178 | | — | | 10,223 | | (10,248 | ) | — | | — | | 153 | |
Internal Affairs | | | | | | | | | | | | | | | |
New Zealand 1990 Scholarship Trust | | 545 | | — | | — | | — | | 42 | | — | | 587 | |
Unlimited Potential Programme Trust | | 339 | | — | | — | | — | | 17 | | (217 | ) | 139 | |
Vogel House Trust | | — | | — | | 2 | | (2 | ) | — | | — | | — | |
Justice | | | | | | | | | | | | | | | |
Chief Electoral Trust (2) | | — | | — | | — | | — | | — | | — | | — | |
Courts Law Trust | | 10,245 | | — | | — | | — | | 16,477 | | (19,375 | ) | 7,347 | |
Employment Court Trust | | 120 | | — | | — | | — | | 820 | | (809 | ) | 131 | |
Fines Trust | | 27,043 | | — | | — | | — | | 202,914 | | (202,803 | ) | 27,154 | |
Foreign Currency Trust(2) | | — | | — | | — | | — | | — | | — | | — | |
Maori Land Court Trust | | 38 | | — | | — | | — | | 15 | | (1 | ) | 52 | |
Supreme Court Trust (2) | | — | | — | | 157 | | (123 | ) | — | | — | | 34 | |
Victims’ Claims Trust | | 40 | | — | | — | | — | | 74 | | (67 | ) | 47 | |
Labour | | | | | | | | | | | | | | | |
Employment Relations Service Trust | | 45 | | — | | 282 | | (304 | ) | 1 | | — | | 24 | |
Industrial Relations Act Securityof Costs Trust | | — | | — | | 6 | | — | | — | | — | | 6 | |
New Zealand Immigration Service Trust | | 7,216 | | — | | 5,484 | | (5,641 | ) | 331 | | (33 | ) | 7,357 | |
Land Information New Zealand | | | | | | | | | | | | | | | |
Crown Forestry Licences Trust | | 972 | | — | | 32,511 | | (32,619 | ) | 15 | | — | | 879 | |
Deposits Trust | | 2,254 | | — | | 13 | | (3 | ) | — | | — | | 2,264 | |
Endowment Rentals Trust | | 1 | | — | | 139 | | (132 | ) | — | | (7 | ) | 1 | |
Hunter Gift for the Settlement ofDischarged Soldiers Trust | | 50 | | — | | 1 | | — | | — | | — | | 51 | |
National Library | | | | | | | | | | | | | | | |
Interloan Billing System Trust(4) | | — | | — | | 40 | | — | | 390 | | (425 | ) | 5 | |
Macklin Bequest Fund Trust | | 220 | | — | | — | | — | | 15 | | — | | 235 | |
New Zealand Defence Force | | | | | | | | | | | | | | | |
New Zealand Defence Force Trust | | — | | — | | — | | — | | 10,713 | | (10,713 | ) | — | |
Year of the Veteran(4) | | — | | — | | — | | — | | 12 | | — | | 12 | |
Police | | | | | | | | | | | | | | | |
Bequests, Donations and AppealsTrust | | 61 | | — | | 22 | | (21 | ) | — | | — | | 62 | |
Found Money Trust | | 166 | | — | | 91 | | (73 | ) | — | | — | | 184 | |
Money in Custody Trust | | 3,056 | | — | | 7,390 | | (1,603 | ) | — | | — | | 8,843 | |
Reparation Trust | | 7 | | — | | 14 | | (13 | ) | — | | — | | 8 | |
Rewards Money Trust (2) | | — | | — | | — | | — | | — | | — | | — | |
Social Development | | | | | | | | | | | | | | | |
Australian Recovery Debt Trust | | 5 | | — | | 48 | | (49 | ) | — | | — | | 4 | |
Australian Dollar Reciprocal Trust (3) | | 183 | | (183 | ) | — | | — | | — | | — | | — | |
Australian Dollar Embargoed Arrears Trust (3) | | — | | 183 | | 1,931 | | (1,923 | ) | — | | — | | 191 | |
Children and Young Persons and | | | | | | | | | | | | | | | |
Their Families Agency Trust (3) | | — | | 368 | | — | | (10 | ) | 23 | | — | | 381 | |
Maintenance Trust | | 123 | | — | | 1,134 | | (1,210 | ) | — | | — | | 47 | |
Netherlands Recovery Debt Trust | | — | | — | | 55 | | (54 | ) | — | | — | | 1 | |
Overseas Debt Recovery Trust (2) | | — | | — | | — | | — | | — | | — | | — | |
Treasury | | | | | | | | | | | | | | | |
Trustee Act 1956 Trust | | 849 | | — | | 293 | | (236 | ) | 35 | | — | | 941 | |
Total | | 331,141 | | — | | 508,970 | | (457,250 | ) | 4,586,095 | | (4,591,709 | ) | 377,247 | |
(1) Account closed
(2) Inoperative account
(3) Account transferred to/from another department
(4) New account
Supplementary Information
Government Reporting Entity as at 30 June 2007
These financial statements are for the Government reporting entity as specified in Part III of the Public Finance Act 1989. This comprises Ministers of the Crown and the following entities:
Departments | | Departments | | State-owned enterprises |
| | | | |
Agriculture and Forestry | | Justice | | Agriquality Limited |
Archives New Zealand
Building and Housing | | Land Information New Zealand
Maori Development | | Airways Corporation of New Zealand Limited |
Conservation | | National Library | | Animal Control Products Limited |
Corrections | | New Zealand Defence Force | | Asure New Zealand Limited |
Crown Law
Culture and Heritage | | Office of the Clerk
Pacific Island Affairs | | Electricity Corporation of New Zealand Limited |
Customs | | Parliamentary Counsel Office | | Genesis Power Limited |
Defence | | Parliamentary Service | | Kordia Group Limited |
Economic Development | | Police | | Landcorp Farming Limited |
Education | | Prime Minister and Cabinet | | Learning Media Limited |
Education Review Office | | Research, Science and Technology | | Meridian Energy Limited |
Environment
Fisheries | | Security Intelligence Service
Serious Fraud Office | | Meteorological Service of New Zealand Limited |
Foreign Affairs and Trade | | Social Development | | Mighty River Power Limited |
Government Communications Security Bureau | | State Services Commission
Statistics | | New Zealand Post Limited
New Zealand Railways Corporation |
Health | | Transport | | Quotable Value Limited |
Inland Revenue | | Treasury | | Solid Energy New Zealand Limited |
Internal Affairs | | Women’s Affairs | | Terralink New Zealand Limited (in liquidation) |
| | | | Timberlands West Coast Limited |
| | | | Transpower New Zealand Limited |
| | | | |
Others | | Offices of Parliament | | |
| | | | Air New Zealand Limited (included for |
Government Superannuation Fund
New Zealand Superannuation Fund | | Office of the Controller and Auditor-General | | disclosure purposes as if it were a SOE) |
Reserve Bank of New Zealand | | Office of the Ombudsmen | | |
| | Parliamentary Commissioner for the Environment | | |
Crown entities | | |
Accident Compensation Corporation | | New Zealand Film Commission |
Accounting Standards Review Board | | New Zealand Fire Service Commission |
Alcohol Advisory Council of New Zealand | | New Zealand Historic Places Trust (Pouhere Toanga) |
Arts Council of New Zealand Toi Aotearoa | | New Zealand Lotteries Commission |
Broadcasting Commission | | New Zealand Qualifications Authority |
Broadcasting Standards Authority | | New Zealand Sports Drug Agency |
Career Services | | New Zealand Symphony Orchestra |
Charities Commission | | New Zealand Teachers Council |
Children’s Commissioner | | New Zealand Tourism Board |
Civil Aviation Authority of New Zealand | | New Zealand Trade and Enterprise |
Commerce Commission | | New Zealand Venture Investment Fund Limited |
Crown Health Financing Agency | | Office of Film and Literature Classification |
Crown research institutes (9) | | Pharmaceutical Management Agency |
District health boards (21) | | Police Complaints Authority |
Earthquake Commission | | Privacy Commissioner |
Electoral Commission | | Public Trust |
Electricity Commission | | Radio New Zealand Limited |
Energy Efficiency and Conservation Authority | | Retirement Commissioner |
Environmental Risk Management Authority | | School boards of trustees (2,468) |
Families Commission | | Securities Commission |
Foundation for Research, Science and Technology | | Social Workers Registration Board |
Government Superannuation Fund Authority | | Sport and Recreation New Zealand |
Guardians of New Zealand Superannuation | | Standards Council |
Health and Disability Commissioner | | Takeovers Panel |
Health Research Council of New Zealand | | Te Reo Whakapuaki Irirangi (Te Mangai Phao) |
Health Sponsorship Council | | Te Taura Whiri i te Reo Maori (Maori Language Commission) |
Housing New Zealand Corporation | | Television New Zealand Limited |
Human Rights Commission | | Tertiary Education Commission |
Land Transport New Zealand | | Tertiary education institutions (31) |
Law Commission | | Testing Laboratory Registration Council |
Legal Services Agency | | Transit New Zealand |
Maritime New Zealand | | Transport Accident Investigation Commission |
Mental Health Commission | | |
Museum of New Zealand Te Papa Tongarewa Board | | |
New Zealand Antarctic Institute | | |
New Zealand Artificial Limb Board | | |
New Zealand Blood Service | | |
| | |
Organisations named or described in Schedule 4 to the Public Finance Act 1989 |
| | |
Agriculture and Marketing Research and Development Trust | | New Zealand Lottery Grants Board |
Asia New Zealand Foundation | | Ngai Tahu Ancillary Claims Trust |
Fish and game councils (12) | | Pacific Co-operation Foundation |
Leadership Development Centre Trust | | Pacific Islands Business Development Trust |
New Zealand Fish and Game Council
New Zealand Game Bird Habitat Trust Board | | Research and Education Advanced Network New Zealand Limited |
New Zealand Government Property Corporation | | Reserves boards (24) |
| | Road Safety Trust |
Information on Property, Plant and Equipment
This section provides supplementary information on certain assets that are contained in the Statement of Financial Position.
State Highway Network
The map shows the state highway network that has a total length of 10,894 kilometres. Of this 5,972 kilometres are in the North Island and the remaining 4,922 kilometres in the South Island.
The Crown recognises 100% (by value) of the network in the Statement of Financial Position.
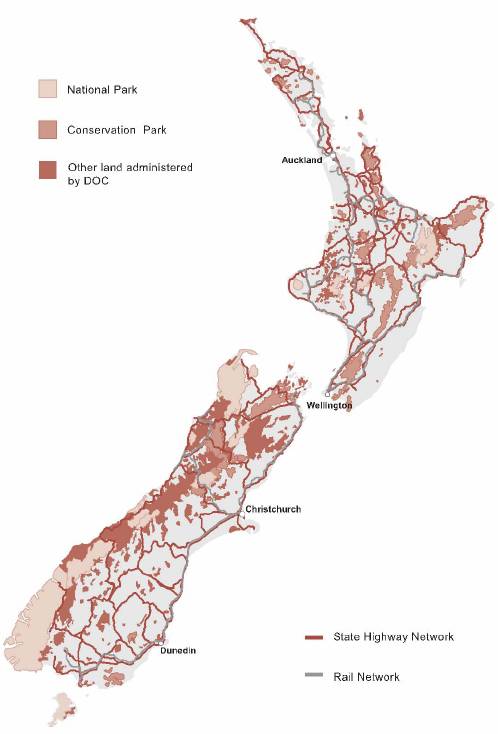
National Parks, Forest Parks and Conservation Areas
The map shows the area covered by national parks, forest parks, conservation areas and reserves. The areas of each are:
| | Hectares | |
National parks | | 3,085,447 | |
Conservation areas | | 4,657,609 | |
Reserves | | 792,954 | |
Total Area | | 8,536,010 | |
Fiordland National Park covers 1,260,742 hectares (15 % of the total area).
National Archives
The National Archives, administered by Archives New Zealand, contains historically important archives, both textual and non-textual (including maps and plans, photographic prints and negatives and artworks). The collections held in Auckland, Wellington, Christchurch and Dunedin were completely revalued in December 2003.
Items of exceptional value held by Archives include the Declaration of Independence of the Northern Chiefs (1835), the Treaty of Waitangi (1840), the Letters Patent constituting New Zealand as a separate colony (1840), the proclamation of the Constitution Act (1853), and the Women’s Suffrage Petition (1893).
National Library Collections
The National Library’s Heritage Collections are mainly in the Alexander Turnbull Library and provide a documentary record of New Zealand’s economic, social and cultural history. The collections, containing both published and unpublished material, include books, newspapers, manuscripts and archives, drawings and prints, scores and sound recordings, and cartographic and photographic items.
The General and Schools Collections provide a knowledge base for lending. The major collections are lending, schools and serials.
Specialist Military Equipment
The major items of specialist military equipment included in the Statement of Financial Position are:
· two ANZAC class frigates, including electronic sensors for surface and air surveillance
· a fleet tanker
· a multi role vessel
· other ships, including a hydrographic/oceanographic surveying ship, a diving tender and five inshore patrol craft
· six P3K Orion aircraft, equipped with sensors for conducting maritime air operations
· a fixed wing transport force consisting of five C130 Hercules and two Boeing 757s
· other aircraft, 14 Iroquois helicopters, five Sioux helicopters, and five Seasprite helicopters
· 24 light gun howitzers
· 12 Matra Mistral firing stations with Very Low Level Air Defence (VLLAD) capability
· 105 Light Armoured Vehicles (NZ LAV)
· 313 Light Operational Vehicles (LOVs).
There are major items of specialist military equipment held by the Crown, which are included in the Statement of Financial Position at zero value as they have been devalued. These include:
· the air combat force, comprising the fleet of A4 Skyhawk and Air Macchi MB339 aircraft including all associated rotables, inventory and munitions
· 77 armoured personnel carrier (APC) variants.
Information on SOEs and Crown Entities
Accounting Policies
The Crown’s financial interest in SOEs and Crown entities is reported in accordance with the Crown’s accounting policies. Adjustments have been made to restate the financial position and financial performance of certain entities, as reported in their own financial statements, to a basis consistent with the Crown’s accounting policies.
The Crown has line-by-line combined all SOEs and Crown entities (except TEIs).
The Crown has equity accounted 100% of the net assets of TEIs on the basis that, in the event of disestablishment of a TEI (which is subject to a resolution of the House), 100% of the net assets revert to the Crown in the absence of a decision to transfer the assets to a new or existing institution and, in the meantime, the Crown enjoys the benefits of the provision of a higher education to the public of New Zealand. Refer Note 13 for an explanation as to why TEIs are equity accounted.
Minority Interests
The ownership interest in Air New Zealand Limited is 76.5%. The interest in Air New Zealand Limited is included within the total SOE information.
Balance Dates
Except for those entities listed below, all SOEs and significant Crown entities have a balance date of 30 June, and the information reported in these financial statements is for the period ended 30 June 2007:
SOEs | | Balance date | | Information reported to | |
Asure New Zealand Limited | | 30 September | | 30 June 2007 | |
Timberlands West Coast Limited | | 31 March | | 31 March 2007 | |
Crown entities: | | | | | |
School boards of trustees | | 31 December | | 31 December 2006 | |
TEIs | | 31 December | | 30 June 2007 | |
Financial Interest in SOEs, Crown entities and Air New Zealand Limited
| | 30 June 2007 | | 30 June 2006 | |
| | Total
revenue | | Attributable
surplus/
(deficit) | | Distributions
to Crown | | Attributable
surplus/
(deficit) | | Distributions
to Crown | |
| | $m | | $m | | $m | | $m | | $m | |
SOEs | | | | | | | | | | | |
Agriquality New Zealand Limited | | 85 | | (1 | ) | — | | 1 | | (2 | ) |
Airways Corporation of New Zealand Limited | | 132 | | 9 | | (6 | ) | 8 | | (8 | ) |
Asure New Zealand Limited | | 53 | | 2 | | (2 | ) | 1 | | (2 | ) |
Electricity Corporation of New Zealand Limited | | 1 | | — | | — | | 5 | | (5 | ) |
Genesis Power Limited | | 1,779 | | 61 | | (10 | ) | 84 | | — | |
Landcorp Farming Limited | | 138 | | 25 | | (3 | ) | 20 | | (5 | ) |
Meridian Energy Limited | | 1,774 | | 219 | | (368 | ) | 849 | | (878 | ) |
Meteorological Service of New Zealand Limited | | 31 | | 2 | | (2 | ) | 3 | | (3 | ) |
Mighty River Power Limited | | 778 | | 116 | | (50 | ) | 101 | | (36 | ) |
New Zealand Post Limited | | 1,461 | | 70 | | (33 | ) | 69 | | (48 | ) |
New Zealand Railways Corporation | | 225 | | (17 | ) | — | | 153 | | — | |
Solid Energy New Zealand Limited | | 553 | | 94 | | — | | 86 | | (20 | ) |
Timberlands West Coast Limited | | 19 | | (5 | ) | — | | (9 | ) | — | |
Transpower New Zealand Limited | | 652 | | 137 | | — | | 97 | | (10 | ) |
Kordia Group Limited | | 264 | | 12 | | (5 | ) | 6 | | (12 | ) |
Animal Control Products | | 6 | | 1 | | (1 | ) | 1 | | (2 | ) |
Learning Media Limited | | 25 | | — | | — | | 1 | | — | |
Quotable Value New Zealand | | 42 | | 2 | | (1 | ) | 1 | | (1 | ) |
Total State-owned Enterprises | | 8,018 | | 727 | | (481 | ) | 1,477 | | (1,032 | ) |
Air New Zealand Limited(1) | | 4,381 | | 19 | | (162 | ) | 322 | | (45 | ) |
Total SOEs and Air New Zealand Limited | | 12,399 | | 746 | | (643 | ) | 1,799 | | (1,077 | ) |
Intra-segmental eliminations | | (369 | ) | — | | — | | — | | — | |
Total per statement of segments | | 12,030 | | 746 | | (643 | ) | 1,799 | | (1,077 | ) |
Crown Entities | | | | | | | | | | | |
Accident Compensation Corporation | | 3,900 | | 268 | | — | | 330 | | — | |
Crown research institutes | | 612 | | 9 | | (1 | ) | 31 | | (18 | ) |
District health boards (including the Crown Health Funding Agency) | | 8,979 | | 2 | | — | | (23 | ) | — | |
Earthquake Commission | | 498 | | 52 | | — | | 706 | | — | |
Housing New Zealand Corporation | | 817 | | 13 | | (20 | ) | 36 | | (14 | ) |
Museum of New Zealand Te Papa Tongarewa | | 47 | | (9 | ) | — | | (11 | ) | — | |
New Zealand Fire Service Commission | | 282 | | 17 | | — | | 9 | | — | |
Public Trust | | 109 | | 3 | | — | | 2 | | — | |
School boards of trustees | | 4,485 | | 33 | | — | | 57 | | — | |
Tertiary education commission | | 2,405 | | 5 | | — | | 16 | | — | |
Tertiary education institutions | | — | | 120 | | — | | 54 | | — | |
Transit New Zealand | | 1,154 | | 565 | | — | | 481 | | — | |
Television New Zealand Limited | | 375 | | (5 | ) | (15 | ) | 15 | | (80 | ) |
Other | | 4,959 | | 414 | | — | | 26 | | — | |
Total Crown Entities | | 28,622 | | 1,487 | | (36 | ) | 1,729 | | (112 | ) |
Intra-segmental eliminations | | (1,909 | ) | (147 | ) | — | | (136 | ) | — | |
Total per statement of segments | | 26,713 | | 1,340 | | (36 | ) | 1,593 | | (112 | ) |
Total Financial Interest in SOEs, Crown Entities and Air New Zealand Limited | | 38,743 | | 2,086 | | (679 | ) | 3,392 | | (1,189 | ) |
(1) As outlined on page 81 of the 2002 Crown financial statements, on acquisition of Air New Zealand Limited, aircraft assets were recorded at fair value. Crown accounting policy is to revalue the aircraft assets annually, whereas the treatment adopted in Air New Zealand Limited’s financial statements is to record aircraft values at the lower of carrying value or recoverable amount, the latter being defined as the higher of market value or value-in-use. Ongoing revaluation movements will impact on the result as presented under Crown accounting policies which is largely the reason the result included in the Financial Statements of the Government differs from that published in the financial statements of Air New Zealand Limited.
Financial Interest in SOEs, Crown entities and Air New Zealand Limited
| | Cashflow net
purchase
of assets | | Property,
plant and
equipment | | Total
assets | | Total
borrowings | | Total
liabilities | | Equity at
30 June
2007 | | Equity at
30 June
2006 | |
| | $m | | $m | | $m | | $m | | $m | | $m | | $m | |
SOEs | | | | | | | | | | | | | | | |
Agriquality New Zealand Limited | | 5 | | 31 | | 54 | | 21 | | 28 | | 26 | | 27 | |
Airways Corporation of New Zealand Limited | | 13 | | 103 | | 142 | | 29 | | 100 | | 42 | | 39 | |
Asure New Zealand Limited | | — | | 1 | | 20 | | — | | 12 | | 8 | | 8 | |
Electricity Corporation of New Zealand Limited | | — | | — | | 18 | | 16 | | 17 | | 1 | | 1 | |
Genesis Power Limited | | 163 | | 1,625 | | 2,162 | | 405 | | 657 | | 1,505 | | 1,453 | |
Landcorp Farming Limited | | 5 | | 1,170 | | 1,429 | | 205 | | 250 | | 1,179 | | 1,145 | |
Meridian Energy Limited | | 174 | | 6,319 | | 6,668 | | 755 | | 1,125 | | 5,543 | | 4,237 | |
Meteorological Service of New Zealand Limited | | 5 | | 10 | | 17 | | 4 | | 9 | | 8 | | 7 | |
Mighty River Power Limited | | 178 | | 2,567 | | 2,867 | | 516 | | 702 | | 2,165 | | 2,097 | |
New Zealand Post Limited | | 76 | | 441 | | 5,487 | | 4,649 | | 4,894 | | 593 | | 536 | |
New Zealand Railways Corporation | | 208 | | 10,651 | | 10,743 | | 151 | | 191 | | 10,552 | | 283 | |
Solid Energy New Zealand Limited | | 54 | | 314 | | 545 | | 15 | | 217 | | 328 | | 234 | |
Timberlands West Coast Limited | | 2 | | 49 | | 57 | | 1 | | 2 | | 55 | | 59 | |
Transpower New Zealand Limited | | 299 | | 2,413 | | 3,089 | | 1,593 | | 1,677 | | 1,412 | | 1,254 | |
Kordia Group Limited | | 30 | | 153 | | 222 | | 75 | | 114 | | 108 | | 97 | |
Animal Control Products | | — | | 1 | | 5 | | — | | 1 | | 4 | | 4 | |
Learning Media Limited | | 1 | | 2 | | 16 | | — | | 11 | | 5 | | 5 | |
Quotable Value New Zealand | | 5 | | 7 | | 18 | | 3 | | 9 | | 9 | | 8 | |
Total State-owned Enterprises | | 1,218 | | 25,857 | | 33,559 | | 8,438 | | 10,016 | | 23,543 | | 11,494 | |
Air New Zealand Limited | | 507 | | 2,748 | | 4,696 | | 1,384 | | 3,107 | | 1,589 | | 1,621 | |
Total SOEs and Air New Zealand Limited | | 1,725 | | 28,605 | | 38,255 | | 9,822 | | 13,123 | | 25,132 | | 13,115 | |
Minority Interest | | — | | — | | — | | — | | — | | — | | — | |
Intra-segmental eliminations | | — | | — | | (47 | ) | (18 | ) | (47 | ) | — | | — | |
Total per statement of segments | | 1,725 | | 28,605 | | 38,208 | | 9,804 | | 13,076 | | 25,132 | | 13,115 | |
Crown Entities | | | | | | | | | | | | | | | |
Accident Compensation Corporation | | 50 | | 196 | | 10,987 | | — | | 14,551 | | (3,564 | ) | (3,835 | ) |
Crown research institutes | | 59 | | 339 | | 503 | | 52 | | 163 | | 340 | | 332 | |
District health boards (including the Crown Health Funding Agency) | | 412 | | 4,011 | | 4,929 | | 1,363 | | 2,888 | | 2,041 | | 1,986 | |
Earthquake Commission | | 4 | | 13 | | 5,386 | | — | | 74 | | 5,312 | | 5,260 | |
Housing New Zealand Corporation | | 314 | | 14,888 | | 15,061 | | 1,803 | | 1,962 | | 13,099 | | 11,447 | |
Museum of New Zealand Te Papa Tongarewa | | 8 | | 954 | | 988 | | — | | 7 | | 981 | | 975 | |
New Zealand Fire Service Commission | | 26 | | 471 | | 534 | | 9 | | 81 | | 453 | | 403 | |
Public Trust | | 1 | | 8 | | 840 | | 785 | | 794 | | 46 | | 43 | |
School boards of trustees | | 188 | | 858 | | 1,838 | | 41 | | 694 | | 1,144 | | 1,044 | |
Television New Zealand Limited | | 13 | | 134 | | 318 | | 43 | | 121 | | 197 | | 211 | |
Tertiary education commission | | 4 | | 7 | | 125 | | — | | 108 | | 17 | | 18 | |
Tertiary education institutions | | 396 | | — | | 6,305 | | — | | — | | 6,305 | | 5,475 | |
Transit New Zealand | | 877 | | 19,428 | | 19,608 | | — | | 174 | | 19,434 | | 17,963 | |
Other | | 41 | | 197 | | 3,058 | | 1,373 | | 2,253 | | 805 | | 500 | |
Total Crown Entities | | 2,393 | | 41,504 | | 70,480 | | 5,469 | | 23,870 | | 46,610 | | 41,822 | |
Intra-segmental eliminations | | — | | — | | (1,354 | ) | (1,184 | ) | (1,354 | ) | — | | — | |
Total per statement of segments | | 2,393 | | 41,504 | | 69,126 | | 4,285 | | 22,516 | | 46,610 | | 41,822 | |
Total Financial Interest in SOEs, Crown Entities and Air New Zealand Limited | | 4,118 | | 70,109 | | 107,334 | | 14,089 | | 35,592 | | 71,742 | | 54,937 | |