Her Majesty The Queen In Right Of New Zealand Inactive
Filed: 20 Jun 08, 12:00am
Exhibit 99.(e)(4)
Economic and Fiscal Update
On the basis of the economic and fiscal information available to it, the Treasury has used its best professional judgement in supplying the Minister of Finance with this Economic and Fiscal Update. The Update incorporates the fiscal and economic implications both of Government decisions and circumstances as at 9 May 2008 that were communicated to me, and of other economic and fiscal information available to the Treasury in accordance with the provisions of the Public Finance Act 1989.
John Whitehead
Secretary to the Treasury
14 May 2008
This Economic and Fiscal Update has been prepared in accordance with the Public Finance Act 1989. I accept overall responsibility for the integrity of the disclosures contained in this Update, and the consistency and completeness of the Update information in accordance with the requirements of the Public Finance Act 1989.
To enable the Treasury to prepare this Update, I have ensured that the Secretary to the Treasury has been advised of all Government decisions and other circumstances as at 9 May 2008 of which I was aware and that had material economic or fiscal implications.
Hon Dr Michael Cullen
Minister of Finance
14 May 2008
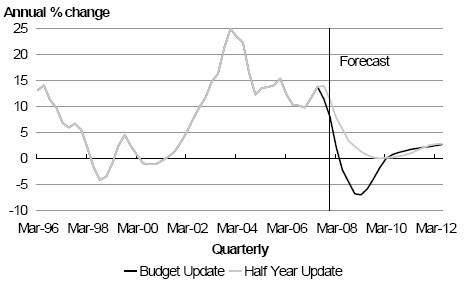
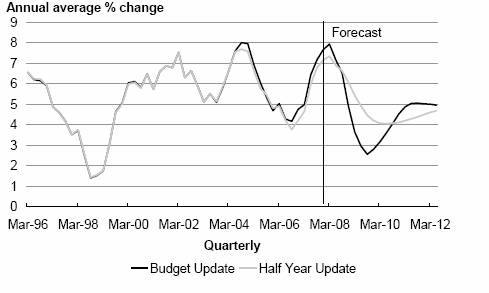
After annual average growth of 3.1% in the year to March 2008, the economy is forecast to record two years of sub-trend growth of 1.5% in the year to March 2009 and 2.3% in the year to March 2010. These Budget Update forecasts show a more cyclical path for the economy than in the Half Year Update.
The operating balance before gains and losses (OBEGAL) is forecast to fall from 2.9% of GDP in the year to June 2008 to 0.7% in the year to June 2009, consistent with keeping gross sovereign-issued debt excluding Reserve Bank Settlement Cash around 20% of GDP. The fall in OBEGAL reflects past and Budget 2008 decisions, including the incorporation of a cut in personal taxes from 1 October 2008.
In addition to the usual risks to any economic and fiscal forecast, there are now greater risks on the downside, particularly those arising from a lack of stability in global financial markets.
The New Zealand economy is expected to grow by 2.5% per annum on average during the forecast period, somewhat below the 3.1% per annum experienced over the past decade. Real GDP growth is expected to fall from 3.1% in the year to March 2008 to 1.5% the next year because of factors such as recent drought conditions, high interest rates, falling house prices and higher petrol and food prices. From the year to March 2011, real GDP growth is forecast to rebound to around 3% per annum.
Table 1 – Major economic parameters
March years |
| 2007/08 |
| 2008/09 |
| 2009/10 |
| 2010/11 |
| 2011/12 |
|
Real GDP |
| 3.1 |
| 1.5 |
| 2.3 |
| 3.2 |
| 3.0 |
|
Employment |
| 1.4 |
| 1.4 |
| 0.2 |
| 0.3 |
| 1.0 |
|
Wages |
| 4.1 |
| 4.2 |
| 4.7 |
| 4.4 |
| 4.0 |
|
Consumer prices |
| 3.4 |
| 3.2 |
| 2.8 |
| 2.8 |
| 2.8 |
|
Note: Employment is on a full-time equivalent basis; consumer price inflation is measured as an annual % change.
Source: The Treasury
Domestic demand slowed from mid-2007, and is forecast to remain subdued, as a result of factors such as higher interest rates, falling house prices, lower net migration inflows and higher prices for petrol and food. Interest rates have been elevated because of ongoing inflation pressures and global credit constraints. Personal income tax cuts, growing labour incomes and high farm incomes (albeit lower owing to drought) partially offset these forces.
The recent drought in much of the country will negatively affect agricultural production and commodity exports in the coming year. Weaker growth in the world economy is also expected to dampen export growth. However, strong export prices are expected to provide a large boost to export receipts. Higher world prices for dairy products boosted the terms of trade to a 33-year high in late 2007 and are forecast to fall but stay relatively high.
Consumer price inflation is expected to remain elevated despite a period of sub-trend growth in the economy. Ongoing inflation reflects high food and energy prices and a decline in the exchange rate from early 2009.
Nominal GDP growth is forecast to slow over the next two years, largely as a result of lower growth in real GDP. Nevertheless, strong terms of trade, driven by high world dairy prices, and an outlook for relatively high inflation continue to support nominal GDP.
There are a number of risks to the forecasts. These include the usual upside and downside risks to any economic and fiscal forecast such as different profiles for the terms of trade, the exchange rate and domestic demand. There is also a set of more extreme risks, albeit with a smaller probability, that could arise if recent financial market turmoil is more prolonged and/or deeper than we have assumed in the main forecast.
The fiscal position has strengthened over recent times, and operating and cash surpluses have risen to a level in excess of that required to meet the Government’s long-term fiscal objectives.
Looking forward, core Crown revenue (excluding the New Zealand Superannuation (NZS) Fund), while continuing to grow in nominal terms, is forecast to fall from 34.3% of GDP in the June 2008 year to 32.6% in the June 2012 year. This fall primarily results from last year’s decision to cut the corporate tax rate and the incorporation of the cut in personal taxes announced in Budget 2008.
Core Crown expenses are forecast to increase by around 1.2% of GDP between the June 2008 year and the June 2012 year. The increase in expenses largely arises from recent initiatives and KiwiSaver costs.
As a result, OBEGAL falls and cash surpluses become deficits. These deficits are met with a reduction in financial assets while gross sovereign-issued debt (GSID) excluding Reserve Bank Settlement Cash falls from 17.6% to 16.8% of GDP by the end of the forecast period.
Table 2 – Summary of fiscal aggregates
June years |
| 2007/08 |
| 2008/09 |
| 2009/10 |
| 2010/11 |
| 2011/12 |
|
OBEGAL ($b)(a) |
| 5.2 |
| 1.4 |
| 1.0 |
| 0.5 |
| 0.2 |
|
% of GDP |
| 2.9 |
| 0.7 |
| 0.5 |
| 0.3 |
| 0.1 |
|
Residual cash |
| 0.9 |
| (3.5 | ) | (3.3 | ) | (3.4 | ) | (3.5 | ) |
% of GDP |
| 0.5 |
| (1.9 | ) | (1.7 | ) | (1.7 | ) | (1.6 | ) |
GSID (% of GDP)(b) |
| 17.6 |
| 17.5 |
| 16.8 |
| 17.8 |
| 16.8 |
|
Net core Crown debt (% of GDP)(c) |
| (6.2 | ) | (6.1 | ) | (6.1 | ) | (6.1 | ) | (6.1 | ) |
Note: (a) excludes NZS Fund; (b) gross sovereign-issued debt excluding Reserve Bank Settlement Cash;
(c) includes NZS Fund financial assets.
Source: The Treasury
Economic and Fiscal Forecasts – Finalisation Dates and Key Assumptions
Finalisation dates
Text finalised |
| 14 May |
Economic data |
| 15 April |
Economic forecasts (refer Chapter 1) |
| 1 May |
Tax revenue forecasts |
| 2 May |
Fiscal forecasts (refer Chapter 2), including: |
| 9 May |
· Government decisions and circumstances |
| 9 May |
· Actual asset revaluations |
| 29 Feb |
· Foreign exchange rates |
| 29 Feb |
Specific fiscal risks (refer Chapter 4) |
| 7 May |
Contingent liabilities and commitments (refer Chapter 4) |
| 31 Mar |
Key assumptions
Global economic activity – Economic growth for our top 20 trading partners (eg, Australia, the United States, China) is expected to fall from an estimated 4.0% in 2007 to 3.0% in 2008 and 3.2% in 2009, compared with 3.8% in 2008 and 3.7% in 2009 in the Half Year Update. Trading partner growth forecasts are based on March 2008 Consensus Forecasts with additional judgements. We assume trading partner growth will be 0.3 percentage points lower than March 2008 Consensus Forecasts in 2008 and 2009 because Consensus Forecasts tend to adjust slowly during a slowdown of growth. There are considerable risks associated with this outlook, which are discussed in the Economic and Tax Outlook and Risks and Scenarios chapters.
Global inflation and interest rates – As a result of previous robust economic growth and rising prices for food and energy, inflation among our major trading partners is expected to be higher than at the time of the Half Year Update. However, the outlook is for lower interest rates in the United States, Japan and the Euro area because of the weaker economic outlook. The outlook is for higher rates in Australia than in the Half Year Update owing to recent high inflation outturns.
Oil prices – We have assumed the price of West Texas Intermediate (WTI) crude oil will rise from US$98 per barrel in the March 2008 quarter to US$111 per barrel in the June 2008 quarter and then fall to just above US$100 per barrel in the first quarter of 2012. These projections, which are based on the futures prices from the New York Mercantile Exchange recorded on 15 April 2008, are around 35% higher than in the Half Year Update over the forecast period. There are upside risks to this forecast, at least in the short term, as oil prices rose over US$125 in May 2008, after these forecasts were finalised.
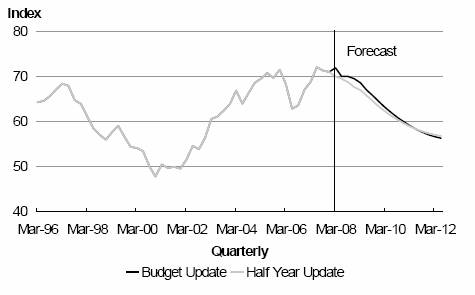
Terms of trade – Forecasts for the goods terms of trade (measured on a System of National Accounts basis) are similar to the Half Year Update. The terms of trade are expected to have peaked in the first quarter of 2008 and decline 8% by the end of the forecast period.
Monetary conditions – It is assumed that the New Zealand dollar exchange rate will decline from 71.9 on the Trade Weighted Index (TWI) in the first quarter of 2008 to 56.3 at the end of the forecast period. Ninety-day interest rates were 8.8% in the March 2008 quarter and are assumed to remain around this level until the first quarter of 2009, when they will start to decline, reaching 7.1% at the end of the period.
Net migration – The net inflow of permanent and long-term migrants is expected to decline to around 4,000 in the year to September 2008, before recovering to around 6,000 in the year to March 2009, 8,000 in the year to March 2010 and 10,000 per annum in subsequent years (its average over the past decade).
Emissions Trading Scheme (ETS) – The economic forecasts now include a provision for the ETS, which is being introduced by the Government to encourage efforts to reduce greenhouse gas emissions and to help meet New Zealand’s obligations under the Kyoto Protocol. At an aggregate level, the scheme is considered unlikely to lead to any significant reduction in output, but there will be different effects on different sectors of the economy and it will result in higher prices for carbon-sourced energy.
Climate – Following the recent drought, agricultural growing conditions and the level of hydro electricity storage lakes are assumed to be normal over the remainder of the forecast period.
Fiscal forecasts – The fiscal forecasts have been prepared in accordance with the Public Finance Act 1989. They are based on the Crown’s accounting policies and assumptions. The financial statements presented in the Budget Update 2008 have been prepared in accordance with New Zealand equivalents to International Financial Reporting Standards. A summary of the key economic assumptions that are particularly relevant to the fiscal forecasts is provided below (Table 3). These figures are on a June-year-end basis to align with the Crown’s balance date of 30 June. The figures in Table 1 above and in the Economic and Tax Outlook chapter are for the year to 31 March.
Table 3 – Key economic data for fiscal forecasts
|
| 2007/08 |
| 2008/09 |
| 2009/10 |
| 2010/11 |
| 2011/12 |
| ||
June years |
| HYEFU |
| BEFU |
| BEFU |
| BEFU |
| BEFU |
| BEFU |
|
Real GDP (ann avg % chg) |
| 2.7 |
| 2.8 |
| 1.6 |
| 2.7 |
| 3.2 |
| 2.9 |
|
Nominal GDP ($m) |
| 178,199 |
| 180,137 |
| 185,478 |
| 192,125 |
| 201,802 |
| 211,800 |
|
CPI (ann avg % change) |
| 2.7 |
| 2.9 |
| 3.2 |
| 2.7 |
| 2.9 |
| 2.7 |
|
Govt 10-year bonds (ann avg %) |
| 6.4 |
| 6.4 |
| 6.3 |
| 6.3 |
| 6.2 |
| 6.1 |
|
90-day bill rate (ann avg %) |
| 8.6 |
| 8.8 |
| 8.6 |
| 8.0 |
| 7.9 |
| 7.3 |
|
Unemployment rate (ann avg %) |
| 3.8 |
| 3.5 |
| 3.7 |
| 4.4 |
| 4.5 |
| 4.4 |
|
Full-time equivalent employment (ann avg % change) |
| 1.3 |
| 1.5 |
| 1.2 |
| 0.1 |
| 0.5 |
| 1.1 |
|
Current account (% of GDP) |
| -6.9 |
| -6.8 |
| -7.2 |
| -7.3 |
| -6.9 |
| -6.3 |
|
Source: The Treasury
This chapter outlines our view of the most likely path for the New Zealand economy and the expected impact on tax revenue over the next four years. The first part of the chapter discusses the recent course of the economy and focuses on what has happened since the Half Year Update. The second part of the chapter examines the external and domestic factors that are expected to influence the economy over the forecast period.
There is an unusual amount of uncertainty associated with the current economic and tax outlook. In addition to the usual upside and downside risks to any forecast, there are risks that have a low probability of happening but may have a significant negative impact on the economy should they eventuate. The key risks are introduced in this chapter and are discussed in more detail in the Risks and Scenarios chapter.
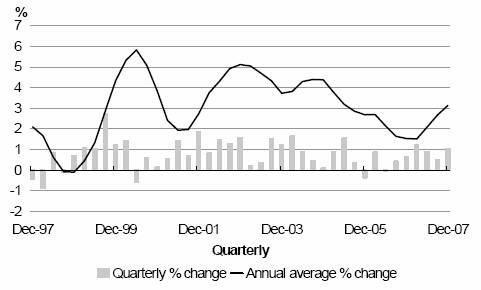
Figure 1.1 – Real GDP
Source: Statistics New Zealand
The New Zealand economy experienced an upturn in 2007. Quarterly real GDP growth averaged almost 1% in the five quarters to December 2007, up from ¼% in the previous five quarters, and annual average growth rose to 3.1% in 2007, the fastest pace since mid-2005 (Figure 1.1). The economy has now expanded in each of the nine years since the recession of 1997/98 and, with annual growth averaging 3.5% over this period, has outperformed the OECD average of 2.6%. The drivers of this strong performance have been well canvassed in the past (see pages 19-20 of the Half Year Update 2007).
The economy evolved broadly as expected in the second half of 2007 relative to the Half Year Update forecasts (finalised in early November 2007). Excluding data revisions, real expenditure GDP in the December 2007 quarter was 0.1% higher than expected as a result of higher business investment and exports, while both private consumption and residential investment slowed as expected.
Economic growth had been expected to slow in the Half Year Update, but several factors have had a greater negative influence on the economy in early 2008. There are signs the slowdown in housing activity has been faster and larger than expected, drought conditions have affected agricultural production, the world economic environment has weakened, credit availability has tightened and oil prices have risen further. As a result, real GDP is expected to fall slightly in the March 2008 quarter and modest quarterly growth of 0.3% to 0.4% is forecast during the remainder of 2008.
The slowing of property activity has been faster and larger than forecast (Figure 1.2). House prices were forecast to rise 6% in the year to June 2008 in the Half Year Update, but are now forecast to fall 2% over this period and decline further the following year. These house price falls represent a correction after house prices nearly doubled since 2002. Weaker property activity was precipitated by higher mortgage interest rates, lower net migration inflows and declining affordability, and has already contributed to a slowing of consumer spending. Risks to house prices are mainly on the downside and are examined in the Risks and Scenarios chapter.
Figure 1.2 – House Prices
Source: Quotable Value New Zealand, The Treasuy
… drought conditions lowered agricultural production, especially dairy …
Another negative event since the Half Year Update is the emergence of drought conditions. The current climate setting, reflecting the influence of a strong La Niña weather pattern that appeared at the end of 2007, brought dry conditions to much of New Zealand through until April 2008.
Agricultural production in 2007/08 is expected to be around 1% lower than the year before because of the drought. The largest impact is likely to be on dairy production as dry conditions have been most severe in dairy regions such as Waikato, which accounts for around a third of the country’s dairy cattle. Drought has led dairy farmers to dry off poor-performing cows, use high-cost supplementary feeding and move to once-a-day milking, although greater use of irrigation has helped insulate dairy farmers from dry conditions in areas such as Canterbury. For sheep and beef farmers, the drought is expected to have increased culling and exports in early 2008, but exports will then fall away and remain subdued as farmers look to rebuild their stock.
Although rainfall in April has eased the drought situation significantly, the full impact of recent dry conditions on the economy is uncertain. The extent to which the drought will also impact on next year’s agricultural production, and on other aspects of the economy such as electricity generation, will be dependent on future rainfall and winter weather conditions.
Other significant developments since the Half Year Update relate to world events. Data from the United States have been weak, with concern the United States economy may be in recession. Economic data have also been weak in other major economies, including Europe and the United Kingdom. In response to developments in the United States, the Federal Reserve has reduced its official interest rate by 225 basis points since January and the United States Congress passed a US$168 billion fiscal stimulus package.
Financial market turmoil in the second half of 2007, combined with continuing weakness in the United States housing market, has led to further difficulties in the financial sector of the United States. Some financial institutions have been exposed to losses from sub-prime mortgages (ie, loans made to people with poor credit histories) and the risk of credit downgrades increased the need for banks to raise and hold higher amounts of capital. Large losses have also been announced by European financial institutions.
Equity markets have reacted nervously to economic and financial market developments with stock markets down significantly from levels that prevailed late last year. The risk of flow-on effects from these developments in major developed economies to other parts of the world was highlighted by large falls in Asian and Australasian equity markets.
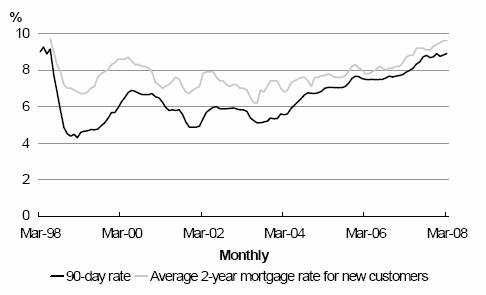
Figure 1.3 – Interest rates
Source: Reserve Bank of New Zealand
There are several channels by which recent developments in the world economy can affect New Zealand. The most immediate is through financial markets. Commercial interest rates have risen because of the risks associated with investments in sub-prime mortgages in the United States, raising the cost of credit globally. The borrowing costs of New Zealand banks have risen as a result, which, together with some restoration of margins by banks, has seen 2-year fixed term home loans in New Zealand rise by over ½ a percentage point since September 2007 to above 9.5% (Figure 1.3). There will be a larger increase in mortgage interest rates faced by those people rolling off existing lower mortgage rates (eg, the 2-year mortgage interest rate in March 2006 was around 7.8%). Higher interest rates are contributing to a slowing in consumer spending, housing activity
and business investment. Other transmission channels by which developments in the world economy can affect New Zealand are less direct and immediate and are examined in the next section covering the economic outlook.
There are some positive factors that supported the economy in the second half of 2007 and in early 2008. The most important of these, the terms of trade, rose to a 33-year high in late 2007 mainly as a result of higher dairy prices. A number of factors lifted dairy prices in 2007 (eg, income growth in developing nations, drought in Australia, biofuel production competing for land use and rising grain prices) and they have held up well despite the weaker global economy. The boost to national income from high dairy prices is, in aggregate, expected to more than offset the negative impact on the economy from drought and the reduction in the spending power of households from higher food prices. The rising terms of trade have also contributed to a fall in the current account deficit from 8.6% of GDP in the year to December 2006 to 7.9% in the year to December 2007, as forecast in the Half Year Update, with a further fall to 6.7% expected in the year to September 2008.
The labour market has been another positive factor. With the unemployment rate falling to a 21-year low of 3.4% in late 2007, labour market conditions were slightly tighter than expected in the Half Year Update. Ongoing high wage growth and relatively low unemployment mean the labour market will likely remain a positive influence throughout most of 2008, although data released since the forecasts were finalised suggest there are downside risks to labour market conditions (see Risks and Scenarios chapter for more discussion).
Inflation remained elevated in early 2008. Consumer price inflation of 3.4% in the year to March 2008 was above the Half Year Update forecast of 3.1%. Some of the major sources of inflation pressure have not been affected by lower demand, especially fuel and food prices. In the year to March 2008, petrol prices rose 20.5% as world oil prices rose above US$100 a barrel on a West Texas Intermediate basis (and have since risen above US$125). In addition, food prices rose 5.1% in the year to March 2008 on the back of higher prices for soft commodities, with price rises of at least 20% for many dairy products. So far, the effects of easing demand on inflation have not been fully felt.
Monetary conditions are tighter than expected, partly because of global credit conditions. In the March 2008 quarter, 90-day bank bill rates averaged 8.8% (the Half Year Update forecast was 8.5%) and the Trade Weighted Index (TWI) averaged 71.9 (the Half Year Update forecast was 70.0).
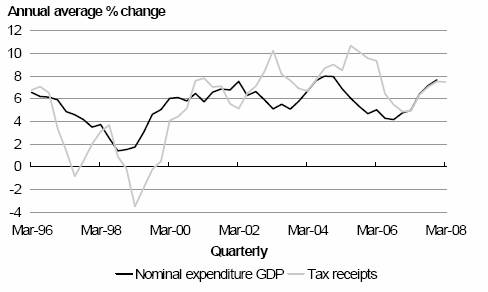
Nominal GDP has continued to expand at a fast pace. Excluding data revisions, nominal GDP in the December 2007 quarter was around 1% above forecast as a result of higher terms of trade and, to a lesser extent, higher economic growth and inflation. Annual average growth in nominal GDP rose to 7.7% at December 2007 and is expected to have risen to 7.9% at March 2008, similar to growth in tax receipts (Figure 1.4). Growth in tax receipts remained high at March 2008 and was similar to that expected in the Half Year Update.
Figure 1.4 – Nominal GDP and tax receipts
Sources: Statistic New Zealand, The Tueaury
Source deductions, largely PAYE on wages and salaries, maintained higher-than-expected growth into early 2008, consistent with growth in jobs and wages. Company tax receipts over the nine months to March 2008 were similar to the Half Year Update forecast. Despite a slowing of consumer spending in early 2008, GST receipts were also similar to forecast, partly owing to higher inflation.
Figure 1.5 – Real GDP

Sources: Statistics New Zealand, The Treasury
The Budget Update forecasts show a more cyclical path for the economy than the Half Year Update. Economic growth in the second half of 2007 was slightly higher than expected in the Half Year Update, but a deeper slowdown in the years to March 2009 and 2010 is now forecast (Figure 1.5). After real GDP growth of 3.1% in the year to March 2008, the economy is forecast to record two years of sub-trend growth of 1.5% and 2.3% in the years to March 2009 and 2010 respectively. Growth is forecast to rebound to 3.2% in 2011 and then return to trend of around 3% in 2012.
Compared to the Half Year Update, several factors play more important roles in shaping the outlook for the economy. These factors relate to the world economy and financial markets, drought conditions and the housing market. Importantly, the key positive factors in the Half Year Update, strength in the terms of trade and personal tax cuts, are still predicted to support the economy.
The outlook for economic growth among New Zealand’s trading partners has been revised down significantly in recent months. In the Consensus Forecasts for March 2008 (the latest when these forecasts were finalised), the growth outlook for our top 20 trading partners was revised to 3.3% in calendar year 2008 and 3.5% in 2009 from 3.8% and 3.7% respectively in October 2007. The downward revisions were mainly in the major economies, with forecasts for the United States, Japan and the Euro area revised down considerably for 2008 and 2009. The outlook was revised down only slightly for non-Japan Asia and Australia.
Consensus Forecasts are used as the basis of our trading partner growth forecasts, but they are typically slow to adjust to changing economic conditions so are likely to understate the extent of the current downturn. As a result, we assume trading partner growth will be 3.0% in calendar year 2008 and 3.2% in 2009, 0.3 percentage points below the March 2008 Consensus Forecasts. We expect that developments in the world economy will affect the New Zealand economy through four main channels:
· Credit constraints: The increased cost and reduced availability of credit will have a negative impact on private consumption, residential investment and business investment directly. This effect is already being felt as higher funding costs are being reflected in higher mortgage rates. The consequent cooling in the property market is expected to have a knock-on effect on private consumption and residential investment. We assume the credit constraint will gradually unwind in the year ahead but, in the Risks and Scenarios chapter, we acknowledge the risk it could worsen and continue for longer than expected in an alternative scenario for the economy.
Table 1.1 – Economic forecast(1)
Annual average % change, |
| 2007 |
| 2008 |
| 2009 |
| 2010 |
| 2011 |
| 2012 |
|
Private consumption |
| 2.7 |
| 3.6 |
| 1.9 |
| 1.9 |
| 1.6 |
| 1.4 |
|
Public consumption(2) |
| 4.3 |
| 4.6 |
| 3.7 |
| 3.1 |
| 3.3 |
| 3.3 |
|
Total consumption |
| 3.1 |
| 3.8 |
| 2.3 |
| 2.2 |
| 2.0 |
| 1.8 |
|
Residential investment |
| -2.7 |
| 4.5 |
| -9.7 |
| -3.1 |
| 2.4 |
| 3.0 |
|
Central government investment |
| -4.9 |
| 1.9 |
| 22.7 |
| 4.2 |
| 2.0 |
| 2.0 |
|
Other investment |
| -1.2 |
| 6.8 |
| 2.8 |
| -0.9 |
| 2.1 |
| 3.5 |
|
Total investment |
| -2.3 |
| 5.2 |
| 1.1 |
| -0.9 |
| 2.2 |
| 3.4 |
|
Stock change(3) |
| -0.9 |
| 0.7 |
| 0.1 |
| 0.0 |
| 0.0 |
| 0.0 |
|
Gross national expenditure |
| 1.0 |
| 5.0 |
| 2.0 |
| 1.4 |
| 2.0 |
| 2.2 |
|
Exports |
| 3.1 |
| 3.1 |
| -0.9 |
| 4.0 |
| 4.4 |
| 4.1 |
|
Imports |
| -1.7 |
| 9.6 |
| 0.9 |
| 1.3 |
| 1.0 |
| 2.0 |
|
GDP (production measure) |
| 1.5 |
| 3.1 |
| 1.5 |
| 2.3 |
| 3.2 |
| 3.0 |
|
- annual % change |
| 2.3 |
| 2.4 |
| 1.6 |
| 2.9 |
| 3.2 |
| 2.8 |
|
Real GDP per capita |
| 0.3 |
| 2.1 |
| 0.6 |
| 1.4 |
| 2.2 |
| 2.0 |
|
Nominal GDP (expenditure basis) |
| 5.0 |
| 7.9 |
| 3.6 |
| 3.2 |
| 4.9 |
| 5.0 |
|
GDP deflator |
| 2.5 |
| 4.8 |
| 2.3 |
| 0.8 |
| 1.7 |
| 2.0 |
|
Employment(4) |
| 2.0 |
| 1.4 |
| 1.4 |
| 0.2 |
| 0.3 |
| 1.0 |
|
Unemployment(5) |
| 3.7 |
| 3.5 |
| 3.7 |
| 4.4 |
| 4.5 |
| 4.3 |
|
Wages(6) |
| 4.8 |
| 4.1 |
| 4.2 |
| 4.7 |
| 4.4 |
| 4.0 |
|
CPI inflation(7) |
| 2.5 |
| 3.4 |
| 3.2 |
| 2.8 |
| 2.8 |
| 2.8 |
|
Export prices(8) |
| 9.1 |
| 2.5 |
| 7.4 |
| 3.1 |
| 6.1 |
| 4.7 |
|
Import prices(8) |
| 7.2 |
| -4.8 |
| 4.2 |
| 5.0 |
| 7.5 |
| 5.6 |
|
Current account balance |
|
|
|
|
|
|
|
|
|
|
|
|
|
- $billion |
| -13.5 |
| -13.1 |
| -13.3 |
| -13.7 |
| -14.1 |
| -13.8 |
|
- % of GDP |
| -8.2 |
| -7.4 |
| -7.2 |
| -7.2 |
| -7.1 |
| -6.6 |
|
TWI(9) |
| 68.8 |
| 71.9 |
| 68.6 |
| 63.1 |
| 59.1 |
| 56.7 |
|
90-day bank bill rate(9) |
| 7.8 |
| 8.8 |
| 8.5 |
| 7.9 |
| 7.9 |
| 7.2 |
|
10-year bond rate(9) |
| 5.9 |
| 6.3 |
| 6.3 |
| 6.3 |
| 6.2 |
| 6.1 |
|
Notes: | (1) | Forecast finalised 1 May 2008 incorporating data up until 15 April 2008. |
| (2) | The forecast profile for public consumption is influenced by government defence spending. |
| (3) | Contribution to GDP growth. |
| (4) | Household Labour Force Survey, full-time equivalent employment. |
| (5) | Household Labour Force Survey, percentage of the labour force, March quarter, seasonally adjusted. |
| (6) | Quarterly Employment Survey, average ordinary-time hourly earnings. |
| (7) | Annual percentage change. |
| (8) | Overseas Trade Index basis, annual average percentage change. |
| (9) | Average for the March quarter. |
Sources: Statistics New Zealand, Reserve Bank of New Zealand, The Treasury
· Wealth effects: Falls in share and other asset prices will make consumers more cautious in their spending plans. This effect will also negatively affect businesses’ ability to raise capital and their investment plans.
· Confidence: A lower level of confidence among firms and consumers, partly due to a slowdown in the global economy, is expected to increase precautionary saving and thus reduce consumption growth. It is difficult to separate out the impact that global developments are having in this area from local ones (eg, the weaker housing market), but they will compound the effect of local developments.
· Export demand: Weaker world growth will affect demand for New Zealand export products and their prices, particularly for commodities. Although this effect has yet to have any material impact, it is expected to take longer to show up than the first three channels.
… but the extent of this weakness and its impact on New Zealand remain uncertain
The outlook for trading partner growth remains uncertain. The overall effect of a downturn in the United States on the New Zealand economy depends on how it spreads to the rest of the world. The downturn in the United States could affect New Zealand via Asia and demand from that region for New Zealand exports, particularly soft commodities. So far, there is little sign of a severe slowing in emerging Asian economies and, while some commodity prices are down a little, they remain high. Although still dependent on exports to the United States, there is also now significant intra-regional trade in Asia and investment is a major source of growth in China, along with exports. A further channel would be the effect of a downturn in Asia on Australia via demand for hard commodities and the effect that might have on New Zealand exports to Australia of manufactured products and tourism services. The Risks and Scenarios chapter has more discussion of these risks and how they might affect the New Zealand economy.
Despite developments in the world economy, the terms of trade follow a similar profile to the Half Year Update, with dairy continuing to dominate (Figure 1.6). As expected, the terms of trade rose sharply in late 2007 to their highest level since 1974 as dairy prices rose sharply. The outlook for the terms of trade became much more positive in 2007 as spot dairy prices rose by 120% in the year to August 2007. In April 2008, the ANZ dairy price index was down 10% from its peak in November 2007, but was still more than double its level of 20 months earlier.
Figure 1.6 – SNA goods terms of trade
Sources:statistics New Zealand The Treasury
World dairy prices for New Zealand products are expected to peak in the June 2008 quarter before declining from late 2008. The levelling off and decline in prices reflects increasing production from the United States (high dairy prices have more than covered the higher feed costs caused by increasing biofuel production), Europe (as production quotas have increased), Australia (recovery from drought), and “newer” producers (eg, Argentina, Uruguay, Brazil, Ukraine for export markets and China for the domestic market). High prices for consumer products will also reduce demand, leading in turn to lower prices. However, continuing strong demand for protein products from developing countries is expected to help maintain dairy prices, and thus the terms of trade, at high levels throughout the forecast period.
Prices for some other New Zealand exports are also expected to rise. World meat prices are expected to recover over the forecast period largely because of income growth in developing countries leading to demand for protein and supply reductions in Europe and Australasia. Prices for non-commodity exports are forecast to continue their upward trend in the forecast period as New Zealand manufacturers move out of low-end manufacturing into high-end or niche products, although this rise will be dampened by other countries such as China also broadening their manufacturing base towards the higher end.
West Texas Intermediate (WTI) oil prices are expected to be around 35% higher than in the Half Year Update across the forecast period (Figure 1.7). Based on futures prices, we expect oil prices to still be relatively high at US$100 per barrel at the end of the period. Income growth in China, the Middle East and other developing countries continues to underpin demand for oil, despite the recent slowdown in parts of the developed world. In addition, oil supply remains tight and geo-political events pose risks to prices. There are still upside risks to this forecast, at least in the short term, as oil prices rose over US$125 in May 2008, after these forecasts were finalised.
Figure 1.7 – WTI oil prices

Sources: Datastream, The Treasury
Higher oil prices will offset some of the increase in dairy prices on the terms of trade and, as discussed below, will lower the spending power of households. However, high oil prices are also a factor supporting world demand for dairy products owing to strong demand from oil-exporting countries, and have also been a positive for New Zealand exports of oil.
The higher terms of trade, particularly high dairy prices, are expected to bring a fall in the current account deficit to 6.7% in the year to September 2008. However, this fall will be temporary as the current account deficit will rise back to 7.4% of GDP once the terms of trade begin to fall. Although an export recovery leads to a fall back towards 6% of GDP by the end of the forecast period, this remains a large deficit and the main risk is of a smaller narrowing of the deficit. In particular, financial market turmoil has raised the funding costs of debt acquired overseas and, if it persists, higher funding costs could result in a wider investment income deficit.
The high exchange rate, the impact of drought conditions and weak trading partner growth are all expected to weigh on export volumes in the coming year (Figure 1.8). Export volumes in the year to March 2009 are expected to be down nearly 1% from the year before compared with a forecast rise of almost 3% in the Half Year Update. As dairy areas were particularly affected by drought, this fall will be driven by a fall in the volume of dairy exports. Services export growth is picked to remain relatively low with the high exchange rate making New Zealand a more expensive destination for overseas visitors.
Figure 1.8 – Export volumes
Sources: Statistics New Zealand, The Treasury
Exports are expected to be a key driver of the rebound in economic growth over the year to March 2010. The turnaround in exports occurs as agricultural production recovers from the recent drought, with a strong rebound in dairy exports as dairy production was particularly affected by drought and will also benefit from further dairy conversions. Another positive for export growth will be higher economic growth among our trading partners of 3.6% per annum from the calendar year 2010. Export volumes are expected to rise by 4.0% over the year to March 2010 and this robust pace of growth will continue in the final two years of the forecast period, also helped by a decline in the exchange rate.
The TWI is expected to remain around 70 over the course of 2008 and depreciate from 2009 onwards (Figure 1.9). The exchange rate is expected to fall by around 20% over the forecast period as a result of a projected fall in soft commodity prices, a slowing in the New Zealand economy and a reduction in interest rate differentials versus the United States and Japan (as interest rates rise in those economies as they recover from weak growth and interest rates fall in New Zealand).
Figure 1.9 – TWI exchange rate
Sources : Reserve Bank of Zealand, The Tresury
Despite a slowing in the economy, short-term (90-day) interest rates are expected to remain around their current level of 8.8% until early 2009 because of ongoing inflation pressures in the economy and funding difficulties arising from turmoil in global financial markets. After a period of lower economic growth, resource constraints are expected to have eased sufficiently for the Reserve Bank to begin easing monetary policy in early 2009. Interest rates are also expected to be lower as we assume that financial market turmoil and credit constraints will gradually unwind over the year ahead.
As well as external events, the future path of the economy will be determined by some developments in the domestic economy. Domestic demand was expected to slow in the Half Year Update as a result of restrictive monetary conditions combined with high debt levels for households, slowing housing activity and a fall in net migration inflows. These factors are now expected to have a greater influence on domestic demand as monetary conditions are tighter than expected owing to global credit constraints, housing activity has slowed by more than expected and net migration inflows have tracked slightly below forecast. Additional factors have emerged since the Half Year Update, particularly higher fuel and food costs, general financial uncertainty and lower farm incomes than previously forecast owing to drought.
These factors will be offset to some degree by supportive factors such as personal income tax cuts and continuing momentum in the labour market, both of which will support private consumption. The net effect on the domestic economy is that growth in domestic demand (ie, real Gross National Expenditure) will fall from 5.0% in the year to March 2008 to around 2.0% the following year and 1.4% in the year to March 2010, picking up slightly to over 2% in the final year of the forecasts.
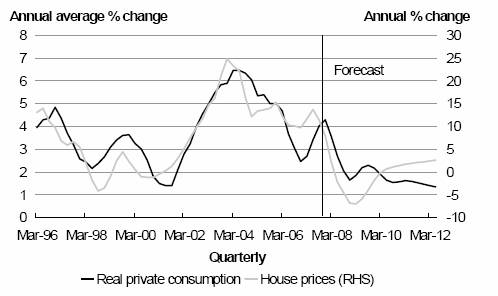
Real private consumption growth is fairly subdued over the forecast period (Figure 1.10). Growth in consumer spending slows sharply from 4.3% in the calendar year 2007 to 1.9% in the years to March 2009 and 2010. The main factors dampening this growth are higher mortgage servicing costs, higher fuel and food prices, a lower exchange rate
making imports more expensive, and falling house values lowering wealth. Whereas no decline was forecast in the Half Year Update, house prices are now expected to fall 7% over the year to March 2009 and this fall already appears to be underway. A gradual recovery in house prices is expected from late 2009.
Figure 1.10 – Consumption and house prices
Sources: Statistics New Zealand Quotable Value New Zealand, The Treasury
The forecasts contain the personal tax cut in Budget 2008. Households will benefit from higher disposable incomes of $1.5 billion in 2008/09, $2.3 billion in 2009/10, $3.1 billion in 2010/11 and $3.8 billion in 2011/12 (June years). See Personal Income Tax Cuts box below for more details. This is larger than the assumption used in the Half Year Update, where the increase in disposable incomes was around $1.5 billion per annum from April 2009, rising to $1.7 billion in the year to June 2012. The boost to incomes helps support consumer spending growth of just under 2% in the years to March 2009 and 2010 during a time in which consumers face pressure from factors such as high interest rates and falling house prices.
Personal Income Tax Cuts
Personal income taxes will be reduced over the forecast period. Personal income tax rates and thresholds will be adjusted over the forecast period as per Table 1.2.
Table 1.2 – Personal income tax rates and thresholds
For 1 April 2008 |
| From 1 October 2008 |
| From 1 April 2010 |
| From 1 April 2011 |
| ||||||||||||
Income over… |
| is taxed |
| Income over… |
| is taxed |
| Income over… |
| is taxed |
| Income over… |
| is taxed |
| ||||
$ | 0 |
| 15 | % | $ | 0 |
| 12.5 | % | $ | 0 |
| 12.5 | % | $ | 0 |
| 12.5 | % |
$ | 9,500 |
| 21 | % | $ | 14,000 |
| 21 | % | $ | 17,500 |
| 21 | % | $ | 20,000 |
| 21 | % |
$ | 38,000 |
| 33 | % | $ | 40,000 |
| 33 | % | $ | 40,000 |
| 33 | % | $ | 42,500 |
| 33 | % |
$ | 60,000 |
| 39 | % | $ | 70,000 |
| 39 | % | $ | 75,000 |
| 39 | % | $ | 80,000 |
| 39 | % |
The Budget Update incorporates the actual policy change, whereas the Half Year Update incorporated a revenue reduction contingency assumption of $1.5 billion per annum from April 2009, rising to $1.7 billion in the year to June 2012. The personal income tax cuts will deliver an increase in disposable income to New Zealand households of $1.5 billion in 2008/09, $2.3 billion in 2009/10, $3.1 billion in 2010/11 and $3.8 billion in 2011/12 (June years).
In terms of fiscal cost, the increase in disposable income for households represents the headline reduction in Crown revenue, adjusted for the consequential changes in Crown expenditure on benefits and superannuation. These changes are explained on page 92 of the Fiscal Outlook chapter.
The impact of personal income tax cuts on the economic forecasts is mainly through higher private consumption as a result of higher disposable income. The cut in personal taxes raises growth in real GDP by about 0.3% over the year to March 2009. Although the personal income tax cuts do not come into effect until the December 2008 quarter, they impact on consumer spending from the previous quarter as we assume workers anticipate an increase in discretionary income and spend more accordingly. Consumer spending is boosted further when tax cuts are realised from the December 2008 quarter onwards. We assume the tax cuts will only impact on the labour market via increased employment (ie, higher consumer spending boosts the demand for labour) as we have not assumed any change in the supply of labour from the tax cuts.
The exact nature of the response to personal tax cuts is uncertain. The effect could be smaller if the weaker economic environment encourages households to save more of the tax cuts than we expect. However, the effect could be greater as the percentage increases in take-home pay are highest for people at the lower end of the income scale, who tend to spend more of a given increase in income.
Government consumption and investment are expected to support overall economic growth in the years to March 2009 and March 2010. Non-market investment (ie, central government and Crown entities) is forecast to grow strongly over this period as the Government expands infrastructure. The Government’s current expenditure is also forecast to increase throughout the forecast period, averaging growth of around 3.5% per annum in real terms.
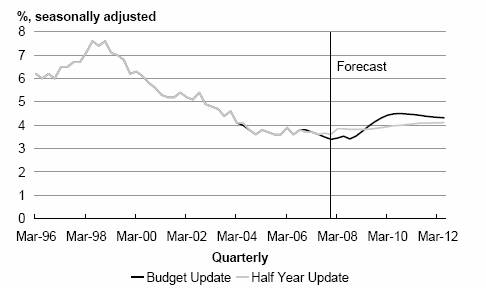
The labour market is fairly robust throughout the forecast period but the weak patch in economic growth does affect employment growth with a lag. While employment growth is not expected to be as strong as in recent years, firms are expected to be reluctant to shed staff for fear of not being able to hire people when growth begins to pick up, given recent difficulty attracting labour. Lower employment growth means the unemployment rate rises to 4.5% in the March 2011 quarter, higher than in the Half Year Update (Figure 1.11). This rise comes from a lower starting point than assumed in the Half Year Update, and is expected to be muted by slower labour force growth (as a result of lower net migration inflows).
Figure 1.11 – Unemployment rate
Sources: Statistics New Zealand, The Treasury
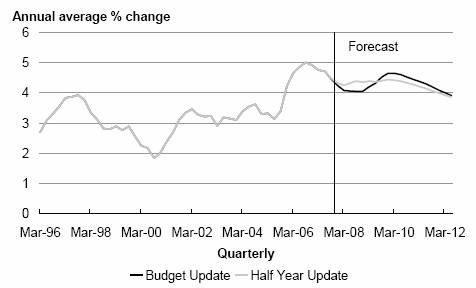
With earlier lower unemployment and continuing difficulties for firms in recruiting staff, as well as higher inflation, nominal wage growth is expected to be slightly higher than in the Half Year Update over the forecast period (albeit lower in the short term). Annual growth in average ordinary-time hourly earnings is forecast to rise to 4.7% at March 2010 before falling back towards 4% per annum (Figure 1.12). Ongoing wage growth is expected to keep growth in labour income near or above 5% per annum over the forecast period.
Figure 1.12 – Average hourly earnings
Sources: Statistics New Zealand, The Treasury
Real wage growth (ie, adjusted for inflation) averages around 1.5% per annum in the forecast period, supported by growth in labour productivity (output per work hour). On an economy-wide basis, labour productivity growth rose to a 7-year high of 2.6% in the calendar year 2007, partly reflecting the upturn in the economy and previous business investment. Although it eases in the short term as firms hoard labour amidst a slowing economy, labour productivity growth is expected to average 1.8% per annum over the forecast period.(8)
Business investment slows sharply, with a weakening of growth in the year to March 2009 and a fall the next year. This coincides with predicted falls in business operating surpluses, prior to a recovery in both business investment and operating surplus growth over the final two forecast years. Capacity constraints and labour shortages continue to support market investment in the short term as firms seek to expand output and supplement or complement labour input. The increase in the terms of trade, plus the associated higher exchange rate, are also expected to support market investment in the near term. However, as the economy slows and the exchange rate declines, growth in market investment is also expected to ease.
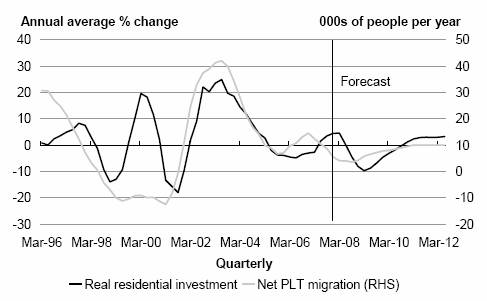
The net inflow of permanent and long-term (PLT) migrants tracked down steadily from a recent peak of 14,800 in the November 2006 year to 4,600 in the February 2008 year, the lowest since 2001 (Figure 1.13). Arrivals of overseas citizens to New Zealand increased over the past year as New Zealand remained an attractive destination for migrants with an upturn in the economy and ongoing tight labour market. However, a larger-than-expected increase in New Zealanders departing to Australia, where wages are higher and the labour market is similarly tight, more than offset the rise in arrivals and led to the larger fall in net migration inflows.
Net PLT migration inflows are expected to remain subdued, rising slightly to around 6,000 in the year to March 2009. A gradual rise back towards the average for the past decade of around 10,000 per annum is expected as arrivals increase slightly and departures fall. Immigration approvals, for both permanent residency and work permits, have been running at a high level recently, pointing to steady PLT arrivals. Economic weakness in
the United Kingdom could result in more New Zealanders returning home. Departures to Australia are expected to fall from their recent high level as growth eases there.
Along with lower net migration inflows, residential investment is expected to be constrained by continuing high interest rates over the year ahead. Growth in residential investment is expected to recover by the end of the forecast period, with lower official interest rates from early 2009 flowing through to retail mortgage interest rates with a lag and net PLT migration inflows gradually recovering to 10,000 per annum (Figure 1.13).
Figure 1.13 – Residential investment and net PLT migration
Sources: Statistics New Zealand, The Treasury
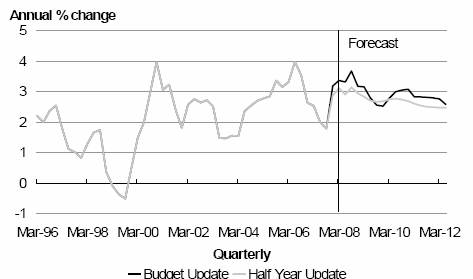
Consumer price inflation is expected to be elevated for much of the forecast period above or near the top of the Reserve Bank’s medium-term target range. After peaking at 3.7% in the year to September 2008, inflation is expected to ease to 3.2% in the year to March 2009 and 2.8% in each of the next three March years (Figure 1.14). The inflation profile is higher than in the Half Year Update and, from the start of the 2010 calendar year, is influenced by the incorporation of the Emissions Trading Scheme (ETS), which impacts on the price of energy and vehicle fuels. We estimate an impact on consumer price inflation of about 0.4 percentage points in 2010 as the ETS impacts on the price of stationary energy (eg, coal, gas and geothermal) from 1 January 2010 and about 0.4 percentage points in 2011 as the ETS affects fuel prices from 1 January 2011. These estimates are based on a carbon price for tradable units of NZD$25/tonne and indirect effects from the rise in the price of electricity and fuels of half the initial impact.
Figure 1.14 – Consumer price inflation
Sources: Statistics New Zealand, The The Treasury
Inflation pressures from higher fuel and food prices dominate in the short term and mean inflation does not fall away at a time when demand growth is easing. An assumed fall in oil prices is expected to lower tradables inflation from 2.8% in calendar year 2007 to 2.3% and 1.6% in the following two years respectively. As oil prices stabilise and a lower New Zealand dollar raises import prices, tradables inflation is forecast to rebound to 2.3% in the calendar year 2010. Despite easing domestic demand in the year ahead, non-tradables inflation remains elevated over much of the forecast period, peaking at 4.0% in the year to December 2008.
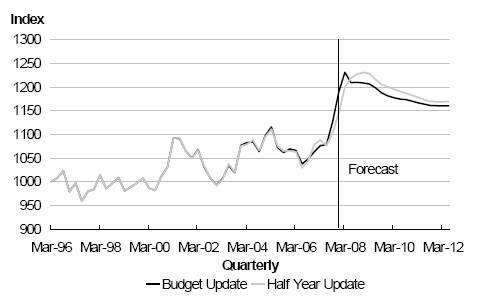
Despite higher inflation, weaker growth in real GDP leads to slower growth in nominal GDP than previously forecast (Figure 1.15). Nominal GDP is weaker from 2009 onwards and around a cumulative $9 billion lower than in the Half Year Update (excluding data revisions). This compares with an upward revision of around $22 billion for the 2008 to 2011 period from the Budget Update 2007 forecasts to the Half Year Update.
Figure 1.15 – Nominal GDP
Sources: Statistics New Zealand, The Treasury
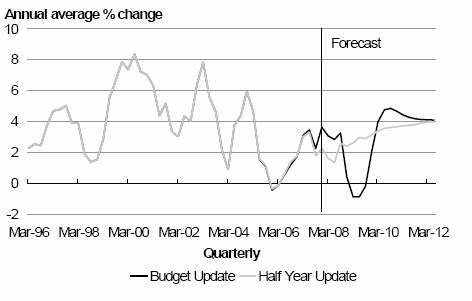
Growth in nominal GDP is forecast to slow from 7.9% in the year to March 2008 to 3.6% in the year to March 2009 and 3.2% in the year to March 2010 as a result of weaker real GDP growth and the fall in the terms of trade. As real GDP growth recovers and the terms of trade stabilise in subsequent years, annual average growth in nominal GDP picks up again to 4.9% in March 2011 and 5.0% in March 2012.
Slower growth in nominal GDP results in lower core Crown tax revenue of about $1 billion in total across the forecast period compared to the Half Year Update, excluding the effects of the personal tax package and other tax policy initiatives. The reductions in tax forecasts are weighted more towards the early part of the forecast horizon rather than the later part, with the reduction in the total core Crown tax forecast being about $0.1 billion in the year to June 2012. The largest changes to the forecasts by tax type are as follows:
· Indirect taxes, mainly customs duty, excise duties and road user charges are negatively affected by high fuel prices, which will reduce volumes of fuel sold. Forecasts have been reduced by increasingly large amounts, with the forecast for the year to June 2012 being down by about $300 million on the Half Year Update.
· Other persons tax forecasts have been reduced by $200 to $350 million per year owing to lower entrepreneurial income (including farm incomes) and a lower assumed effective tax rate.
· Forecasts of GST are lower than in the Half Year Update by as much as $300 million in some years owing mainly to lower forecast paths for nominal consumption and residential investment.
· Source deductions (mostly PAYE) forecasts are higher than in the Half Year Update, supported by an increase in employment forecasts over the next couple of years and increased wage growth forecasts from 2010 onwards.
· Corporate tax forecasts are broadly similar to those in the Half Year Update.
Fiscal Policy and the Macroeconomy
The financial statements of the government, described in the Fiscal Outlook chapter of the Budget Update, summarise the financial position of the government. The information in the accounts is used in the economic forecasts presented in this chapter, which in turn feed into the fiscal forecasts. The information can also be utilised to develop summary indicators of fiscal sustainability and the effect of fiscal policy on the macroeconomy. Adjustments are made to the GAAP-based figures in the accounts dependent on the purpose of the measure being looked at. This box discusses the measures used to assess the impact of fiscal policy on the economy.
Economic forecasts
Forecasts of government spending enter the economic forecasts in the Budget Update directly. Adjustments to the spending figures in the GAAP-based financial statements are made to convert them to the System of National Accounts (SNA) framework used in Table 1.1 on page 76. Government operating spending is split into government consumption and transfers. The former adds to domestic demand directly. The latter forms part of household income and enters domestic demand indirectly via private consumption and residential investment. Capital spending that results in additions to fixed assets shows up in central government investment spending. Direct taxes also enter the economic forecasts indirectly. Taxes are a withdrawal from income, partially offsetting household and corporate income and affecting household and firm spending decisions.
The fiscal impulse is an indicator of whether discretionary fiscal policy is adding to demand in the economy
One useful indicator that combines both spending and tax information to provide a summary guide to the impact of fiscal policy on demand in the economy is the fiscal impulse (see page 52 of the Fiscal Strategy Report). It is constructed from cash-flow information contained in the financial statements. A cash-based measure of the operating balance is constructed and then adjusted to remove the effect of the business cycle on taxes and transfers. From this, capital expenditure is deducted. The change in the resulting fiscal balance is the fiscal impulse. Because the impact of the business cycle is removed it represents a measure of changes in discretionary fiscal policy.
The fiscal impulse is interpreted as expansionary fiscal policy when the fiscal balance decreases (the government is adding to aggregate demand growth through the above channels) or contractionary when the fiscal balance increases (the government is reducing its contribution to aggregate demand). The fiscal impulse, however, does not provide any information on how a change in fiscal policy will be transmitted through the economy. In particular, it ignores any supply-side impacts of policy and does not contain any information about second-round effects, such as changes in the spending decision of households and businesses resulting from changes in interest rates, inflation and the exchange rate.
The fiscal impulse is not a measure of the impact of fiscal policy on inflation. Even if the fiscal impulse is unchanged between forecast rounds it does not mean that the inflation impact will be the same in each forecast. In particular, a changed cyclical position may mean a different inflationary impact from the same fiscal policy change; if there is more pressure on resources then the same changes in discretionary fiscal policy may have a greater inflation impact. In addition, a different make-up of spending and taxation could mean that the same fiscal impulse could have a different impact on inflation.
The Cyclically Adjusted Balance is an indicator of the underlying fiscal position
The Cyclically Adjusted Balance (CAB) removes the cyclical components from the accrual measures of government spending, taxes and transfers contained in the operating balance in the government’s accounts. The CAB is a measure of the underlying fiscal position and shows what the government’s operating balance would be if GDP was at an assumed level of potential GDP. This measure provides a useful indicator of the sustainability of fiscal policy as in the medium term GDP should fluctuate around its potential level. For example, a positive value of the CAB indicates that current operating surpluses are not the result of temporary factors impacting on the economy.
Additional methods, including macro-models, are also used to inform understanding of the effects of discretionary fiscal policy on the economy
Another approach used in the Treasury is to estimate the impact of fiscal policy changes using time series statistical methods applied to fiscal data. The advantage of this approach is that it can take account of the different impacts of the composition of fiscal measures and estimates how a change in fiscal policy is transmitted through the economy by allowing feedback between economic activity and the fiscal position.
The fiscal position has strengthened over recent times. Operating and cash surpluses over the past few years have led to a build up of financial assets and to a lowering of debt (as a percentage of GDP).
Looking forward, growth in nominal GDP is forecast to slow resulting in a corresponding slowing in tax revenue growth. Additionally, Budget 2008 introduces personal tax cuts which results in core Crown revenue falling as a percentage of GDP. This is the main contributor to a reduction in OBEGAL and cash surpluses becoming deficits. These cash deficits are met by reducing financial assets accumulated in recent years and borrowing consistent with the debt objective of around 20% of GDP.
This chapter outlines the key trends for each of the indicators along with a comparison to the forecasts provided in the Half Year Update and should be read in conjunction with the financial statements (chapter 5) and the executive summary on pages 1 to 22. The chapter covers the fiscal results for the forecast period (2007/08 to 2011/12). The long-term fiscal outlook can be found on pages 42 to 64.
Each section in the chapter follows the five components of the fiscal strategy (outlined on page 45):
· Revenue and expenses
· Surpluses
· Cash position
· Debt, and
· The New Zealand Superannuation Fund (NZS Fund).
Table 2.1 – Fiscal indicators(9)
Year ended 30 June |
| 2007 |
| 2008 |
| 2009 |
| 2010 |
| 2011 |
| 2012 |
|
$ million |
| Actual |
| Forecast |
| Forecast |
| Forecast |
| Forecast |
| Forecast |
|
Revenue and expenses |
|
|
|
|
|
|
|
|
|
|
|
|
|
Core Crown revenue excl NZS Fund |
| 58,482 |
| 61,814 |
| 61,787 |
| 63,552 |
| 66,284 |
| 69,004 |
|
Core Crown expenses |
| 54,003 |
| 57,364 |
| 61,883 |
| 63,890 |
| 67,016 |
| 69,943 |
|
Surpluses |
|
|
|
|
|
|
|
|
|
|
|
|
|
Total Crown OBEGAL |
| 5,860 |
| 5,227 |
| 1,318 |
| 1,004 |
| 493 |
| 154 |
|
Total Crown OBEGAL excl NZS Fund retained revenue |
| 6,250 |
| 5,219 |
| 1,354 |
| 1,048 |
| 543 |
| 207 |
|
Total Crown operating balance |
| 8,023 |
| 2,559 |
| 3,105 |
| 3,009 |
| 2,779 |
| 2,734 |
|
Cash position |
|
|
|
|
|
|
|
|
|
|
|
|
|
Core Crown residual cash |
| 2,877 |
| 908 |
| (3,478 | ) | (3,302 | ) | (3,447 | ) | (3,457 | ) |
Debt |
|
|
|
|
|
|
|
|
|
|
|
|
|
GSID (excl Settlement Cash) |
| 30,647 |
| 31,763 |
| 32,498 |
| 32,251 |
| 35,974 |
| 35,499 |
|
Net core Crown debt (incl NZS Fund financial assets) |
| (7,467 | ) | (11,254 | ) | (11,337 | ) | (11,787 | ) | (12,348 | ) | (12,970 | ) |
Net core Crown debt |
| 4,109 |
| 1,846 |
| 4,578 |
| 7,272 |
| 10,145 |
| 13,193 |
|
NZS Fund |
|
|
|
|
|
|
|
|
|
|
|
|
|
NZS Fund net worth |
| 12,973 |
| 14,461 |
| 17,721 |
| 21,152 |
| 24,947 |
| 29,011 |
|
Nominal GDP |
| 168,106 |
| 180,137 |
| 185,478 |
| 192,125 |
| 201,802 |
| 211,800 |
|
% of GDP |
|
|
|
|
|
|
|
|
|
|
|
|
|
Revenue and expenses |
|
|
|
|
|
|
|
|
|
|
|
|
|
Core Crown revenue excl NZS Fund |
| 34.8 |
| 34.3 |
| 33.3 |
| 33.1 |
| 32.8 |
| 32.6 |
|
Core Crown expenses |
| 32.1 |
| 31.8 |
| 33.4 |
| 33.3 |
| 33.2 |
| 33.0 |
|
Surpluses |
|
|
|
|
|
|
|
|
|
|
|
|
|
Total Crown OBEGAL |
| 3.5 |
| 2.9 |
| 0.7 |
| 0.5 |
| 0.2 |
| 0.1 |
|
Total Crown OBEGAL excl NZS Fund retained revenue |
| 3.7 |
| 2.9 |
| 0.7 |
| 0.5 |
| 0.3 |
| 0.1 |
|
Total Crown operating balance |
| 4.8 |
| 1.4 |
| 1.7 |
| 1.6 |
| 1.4 |
| 1.3 |
|
Cash position |
|
|
|
|
|
|
|
|
|
|
|
|
|
Core Crown residual cash |
| 1.7 |
| 0.5 |
| (1.9 | ) | (1.7 | ) | (1.7 | ) | (1.6 | ) |
Debt |
|
|
|
|
|
|
|
|
|
|
|
|
|
GSID (excl Settlement Cash) |
| 18.2 |
| 17.6 |
| 17.5 |
| 16.8 |
| 17.8 |
| 16.8 |
|
Net core Crown debt (incl NZS Fund financial assets) |
| (4.4 | ) | (6.2 | ) | (6.1 | ) | (6.1 | ) | (6.1 | ) | (6.1 | ) |
Net core Crown debt |
| 2.4 |
| 1.0 |
| 2.5 |
| 3.8 |
| 5.0 |
| 6.2 |
|
NZS Fund |
|
|
|
|
|
|
|
|
|
|
|
|
|
NZS Fund net worth |
| 7.7 |
| 8.0 |
| 9.6 |
| 11.0 |
| 12.4 |
| 13.7 |
|
Source: The Treasury
Core Crown vs Total Crown
The Fiscal Outlook chapter refers to both core Crown and total Crown results.
Core Crown includes Ministers, Departments, Offices of Parliament, the NZS Fund and the Reserve Bank of New Zealand.
Total Crown includes the Core Crown, State-Owned Enterprises and Crown Entities.
(9) An historical trend series of the above indicators is available on page 188. The glossary on pages 184 to 187 includes a definition of these indicators.
Figure 2.1 – Core Crown revenue excluding the NZS Fund
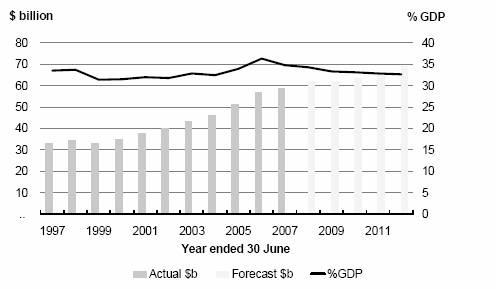
Source: The Treasury
Core Crown revenue consists mainly of tax revenue. Also included are interest and dividend revenues, and sales of goods and services.
The key indicator used to measure core Crown revenue is core Crown revenue excluding the NZS Fund. This best represents the revenue available to meet the Government’s spending needs.
Core Crown revenue excluding the NZS Fund treats the NZS Fund as a third party (ie, its revenue is not included but the tax it pays is).
While core Crown revenue excluding the NZS Fund grows over the period from $58.5 billion in 2006/07 to $69 billion by 2011/12, it falls as a percentage of GDP as initiatives such as the personal tax cuts and business tax reform (announced in Budget 2007) take effect.
Figure 2.2 – Core Crown tax revenue
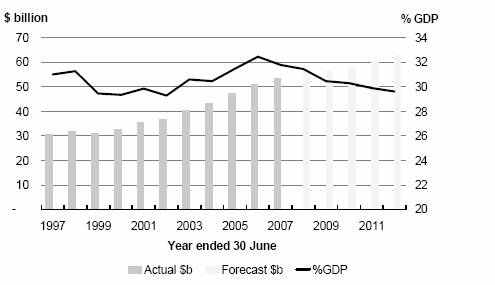
Source: The Treasury
Core Crown tax revenue increases over the period from $53.5 billion in 2006/07 to $62.7 billion by 2011/12, but falls as a percentage of GDP.
The fall in percentage of GDP is due, in the main, to the introduction of personal tax cuts. The resulting core Crown tax revenue reduction is detailed in Table 2.2 and ranges from $1.6 billion in 2008/09 to $4.2 billion in 2011/12.
· These tax cuts have now been incorporated into the tax forecasts, whereas in the Half Year Update it was separately identified as a revenue reduction contingency that appeared below the tax revenue line in the forecast financial statements. Further detail of personal tax cuts can be found on page 81.
Table 2.2 Reconciliation of reduction in core Crown tax revenue
Year ended 30 June |
| 2008 |
| 2009 |
| 2010 |
| 2011 |
| 2012 |
|
|
|
$ million |
| Forecast |
| Forecast |
| Forecast |
| Forecast |
| Forecast |
| Total |
|
|
|
|
|
|
|
|
|
|
|
|
|
|
|
Reduction in core Crown tax revenue |
| — |
| 1,633 |
| 2,440 |
| 3,351 |
| 4,152 |
| 11,576 |
|
Change to benefits and superannuation |
| — |
| (118 | ) | (166 | ) | (290 | ) | (393 | ) | (967 | ) |
Increase in taxpayers’ disposable income |
| — |
| 1,515 |
| 2,274 |
| 3,061 |
| 3,759 |
| 10,609 |
|
Source: The Treasury
The tax package will result in a reduction in core crown tax revenue of nearly $11.6 billion over the forecast period. Part of this revenue reduction represents reduced tax on benefits and superannuation payments. Under the personal tax reductions, after-tax benefit payments do not change while after-tax New Zealand Superannuation (NZS) payments increase. Given this, gross benefit appropriations are reduced to the extent that tax paid on them is lower following the personal tax changes. With NZS, the increased after-tax payments are accompanied by decreased tax paid stemming from the tax changes, meaning gross NZS appropriations change. The change in disposable income (being $10.6 billion over the forecast period) represents the reduction in tax paid by those working and the increase in the after-tax income of superannuitants.
In addition to the personal tax cuts, there have been two changes to tax forecasts in comparison to the Half Year Update:
· Forecasting changes mainly related to changes in the macroeconomic forecasts. However, some other factors have also led to forecasting changes, eg, changes in the estimated effective tax rate on “other persons” taxpayers’ income and changes in the assumed future rate of growth of fuel consumption in response to historically-high fuel prices. Further detail on the tax forecasting changes can be found on page 85.
· Other tax policy changes have also reduced forecasts of tax revenue compared to the Half Year Update. Details of these policies can be found on page 95.
Other core Crown revenue increases slightly over the forecast period from $5 billion in 2006/07 to $6.3 billion in 2011/12. The main highlights are:
· The Emissions Trading Scheme (ETS) revenue is forecast to increase to $0.9 billion by 2011/12. Forecasts of carbon units to be surrendered by emitters under the ETS have been reduced reflecting the decision to defer introducing liquid fossil fuels to the scheme until 2011. Compared to the Half Year Update, revenue forecasts associated with the surrender of units have reduced by $0.3 billion over the forecast period.
· Forecasts for the Kyoto liability incorporate revised expectations of net emissions over the commitment period 2008 to 2012. Forecasts assume the net position will be 21.7 m tonnes compared with 45.5 m tonnes reported in the Half Year Update. The $0.4 billion reduction in the liability in 2007/08 due to fewer expected emissions is recognised as revenue. Changes to the liability from carbon prices and exchange rates are reported in Table 2.8 on page 100 as a change in gains and losses.
· Investment income increases slightly over the forecast period but reduces in comparison to the Half Year Update in line with a reduction in financial assets in addition to netting out interest on the Crown settlement account (with a corresponding reduction in interest expense).
Table 2.3 – Core Crown revenue excluding the NZS Fund comparison to the Half Year Update
Year ended 30 June |
| 2008 |
| 2009 |
| 2010 |
| 2011 |
| 2012 |
|
$ million |
| Forecast |
| Forecast |
| Forecast |
| Forecast |
| Forecast |
|
Core Crown revenue excluding NZS Fund |
|
|
|
|
|
|
|
|
|
|
|
Half Year Update |
| 62,130 |
| 63,147 |
| 65,412 |
| 68,965 |
| 72,168 |
|
Personal tax cuts |
| — |
| (1,633 | ) | (2,440 | ) | (3,351 | ) | (4,152 | ) |
Tax forecasting changes |
| (491 | ) | 170 |
| (336 | ) | (277 | ) | (96 | ) |
Other tax policy changes |
| (2 | ) | (86 | ) | (114 | ) | (184 | ) | (247 | ) |
Revenue reduction contingency |
| — |
| 375 |
| 1,500 |
| 1,600 |
| 1,700 |
|
Decrease in core Crown tax revenue |
| (493 | ) | (1,174 | ) | (1,390 | ) | (2,212 | ) | (2,795 | ) |
Kyoto valuation due to emissions |
| 368 |
| — |
| — |
| — |
| — |
|
Emissions trading scheme |
| — |
| 47 |
| (191 | ) | (148 | ) | 30 |
|
Investment income |
| (254 | ) | (366 | ) | (445 | ) | (509 | ) | (615 | ) |
Other core Crown revenue |
| 63 |
| 133 |
| 166 |
| 188 |
| 216 |
|
Increase/(decrease) in other core Crown revenue |
| 177 |
| (186 | ) | (470 | ) | (469 | ) | (369 | ) |
Budget update |
| 61,814 |
| 61,787 |
| 63,552 |
| 66,284 |
| 69,004 |
|
Source: The Treasury
Inland Revenue Tax Forecasts
In line with established practice, Inland Revenue has also prepared a set of tax forecasts, which, like the Treasury’s tax forecast, is based on the Treasury’s macroeconomic forecast. Inland Revenue’s forecasts are shown here for comparative purposes. The Treasury’s forecasts remain the Crown’s official forecasts.
The main differences between the Treasury’s and Inland Revenue’s forecasts (Table 2.4) are in:
· source deductions (mostly PAYE), where Inland Revenue is more optimistic than the Treasury in the current year and the gap widens in later years in line with forecast growth in underlying incomes, and
· GST, in which the departments have taken different views on the extent to which the housing downturn will affect the tax take, causing the Treasury’s forecast to be generally lower than Inland Revenue’s forecast.
These differences are not large compared to differences between the two sets of forecasts in the past.
Table 2.4 – The Treasury and Inland Revenue core Crown tax revenue forecasts
Year ended 30 June |
| 2008 |
| 2009 |
| 2010 |
| 2011 |
| 2012 |
|
$ billion |
| Forecast |
| Forecast |
| Forecast |
| Forecast |
| Forecast |
|
Source deductions |
|
|
|
|
|
|
|
|
|
|
|
Treasury |
| 22.7 |
| 22.9 |
| 23.6 |
| 24.4 |
| 25.3 |
|
Inland Revenue |
| 22.9 |
| 23.1 |
| 24.0 |
| 24.8 |
| 25.7 |
|
Difference |
| (0.2 | ) | (0.2 | ) | (0.4 | ) | (0.4 | ) | (0.4 | ) |
Net other persons tax |
|
|
|
|
|
|
|
|
|
|
|
Treasury |
| 3.7 |
| 3.8 |
| 3.9 |
| 3.9 |
| 4.0 |
|
Inland Revenue |
| 3.8 |
| 3.8 |
| 3.9 |
| 4.0 |
| 4.0 |
|
Difference |
| (0.1 | ) | — |
| — |
| (0.1 | ) | — |
|
Corporate tax |
|
|
|
|
|
|
|
|
|
|
|
Treasury |
| 10.4 |
| 9.7 |
| 10.1 |
| 10.7 |
| 11.3 |
|
Inland Revenue |
| 10.2 |
| 9.4 |
| 10.1 |
| 10.7 |
| 11.1 |
|
Difference |
| 0.2 |
| 0.3 |
| — |
| — |
| 0.2 |
|
Goods and services tax |
|
|
|
|
|
|
|
|
|
|
|
Treasury |
| 11.8 |
| 11.9 |
| 12.3 |
| 13.0 |
| 13.5 |
|
Inland Revenue |
| 11.7 |
| 12.1 |
| 12.6 |
| 13.3 |
| 13.9 |
|
Difference |
| 0.1 |
| (0.2 | ) | (0.3 | ) | (0.3 | ) | (0.4 | ) |
Other tax |
|
|
|
|
|
|
|
|
|
|
|
Treasury |
| 8.1 |
| 8.2 |
| 8.3 |
| 8.3 |
| 8.6 |
|
Inland Revenue |
| 8.1 |
| 8.4 |
| 8.5 |
| 8.4 |
| 8.5 |
|
Difference |
| — |
| (0.2 | ) | (0.2 | ) | (0.1 | ) | 0.1 |
|
Total tax revenue |
|
|
|
|
|
|
|
|
|
|
|
Treasury |
| 56.7 |
| 56.5 |
| 58.2 |
| 60.3 |
| 62.7 |
|
Inland Revenue |
| 56.7 |
| 56.8 |
| 59.1 |
| 61.2 |
| 63.2 |
|
Difference |
| — |
| (0.3 | ) | (0.9 | ) | (0.9 | ) | (0.5 | ) |
Total tax revenue (% of GDP) |
|
|
|
|
|
|
|
|
|
|
|
Treasury |
| 31.5 |
| 30.5 |
| 30.3 |
| 29.9 |
| 29.6 |
|
Inland Revenue |
| 31.5 |
| 30.6 |
| 30.8 |
| 30.3 |
| 29.8 |
|
Difference |
| — |
| (0.1 | ) | (0.5 | ) | (0.4 | ) | (0.2 | ) |
Sources: The Treasury, Inland Revenue
Tax Policy Changes
Table 2.5 – Effect of policy changes on tax forecasts since the Half Year Update
Year ended 30 June |
| 2008 |
| 2009 |
| 2010 |
| 2011 |
| 2012 |
|
$ million |
| Forecast |
| Forecast |
| Forecast |
| Forecast |
| Forecast |
|
|
|
|
|
|
|
|
|
|
|
|
|
Personal tax cuts(1) |
| — |
| (1,633 | ) | (2,440 | ) | (3,351 | ) | (4,152 | ) |
Petrol tax - no indexation(2) |
| — |
| (30 | ) | (56 | ) | (81 | ) | (107 | ) |
Tariff rate reductions(3) |
| — |
| — |
| (10 | ) | (50 | ) | (90 | ) |
Gas exploration(4) |
| (2 | ) | (17 | ) | (24 | ) | (31 | ) | (38 | ) |
Life insurance - taxing risk income(5) |
| — |
| — |
| 8 |
| 22 |
| 35 |
|
Life insurance - extending PIE treatment(6) |
| — |
| — |
| (21 | ) | (23 | ) | (26 | ) |
SMEs - thresholds(7) |
| — |
| (16 | ) | (5 | ) | (15 | ) | (15 | ) |
Other(8) |
| — |
| (23 | ) | (6 | ) | (6 | ) | (6 | ) |
|
| (2 | ) | (1,719 | ) | (2,554 | ) | (3,535 | ) | (4,399 | ) |
Source: The Treasury
Summary of Policy Changes
(1) Personal income tax rates and thresholds will be adjusted (refer table 2.2).
(2) Annual indexation of the National Land Transport Fund (NLTF) portion of the petroleum fuel excise rate has been suspended so as to better align the contributions to the NLTF from the various transport-related taxes.
(3) As a result of the Free Trade Agreement signed with China, tariff rates on some goods imports will be gradually reduced.
(4) A number of tax measures intended to remove disincentives that may affect investment in oil and gas exploration and development in New Zealand.
(5) The taxation of risk income of life insurers will be comprehensively reformed.
(6) The Portfolio Investment Entity rules will be extended to include certain life insurance products.
(7) A number of tax thresholds will be raised in order to lower compliance costs for businesses, especially small and medium enterprises.
(8) A range of policy measures, each of which is below the materiality threshold of $10 million.
Core Crown expenses represent the day-to-day operating spending of the Government (ie, it does not include purchases of physical assets or capital spending).
Figure 2.3 – Core Crown expenses
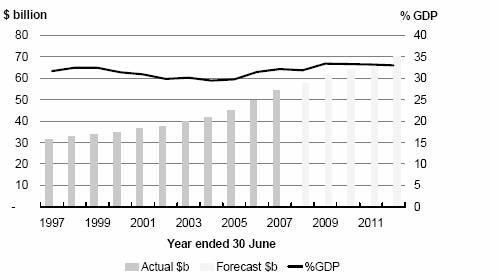
Source: The Treasury
The forecast growth in expenses largely arises from expense initiatives introduced in recent Budgets. These policy decisions tend to have rising profiles to allow sufficient time for full implementation.
Core Crown expenses grow over the forecast period from $54 billion in 2006/07 to $69.9 billion by 2011/12 (an increase of $15.9 billion).
These expenses rise as a percentage of GDP in 2008/09 as the full impact of past Budget decisions such as KiwiSaver ($1 billion in 2008/09) and the Emissions Trading Scheme ($0.7 billion in 2008/09) take effect. Subsequent forecast years remain at around 33% of GDP.
Page 5 presents an overview of the new operating expenditure committed in Budget 2008. The Budget 2008 package includes a revenue reduction relating to business tax reform and the personal tax cuts. These have been deducted in Table 2.6 to show the impact on core Crown expenses.
Table 2.6 – Net amounts of new operating expenditure
Year ended 30 June |
| 2008 |
| 2009 |
| 2010 |
| 2011 |
| 2012 |
|
$ million |
| Forecast |
| Forecast |
| Forecast |
| Forecast |
| Forecast |
|
Budget 2008 operating initiatives |
| — |
| 4,752 |
| 5,417 |
| 6,236 |
| 6,972 |
|
Less increase in taxpayers’ disposable income |
| — |
| (1,515 | ) | (2,274 | ) | (3,061 | ) | (3,759 | ) |
Less business tax reform revenue decrease |
| — |
| (916 | ) | (915 | ) | (870 | ) | (870 | ) |
New operating expenditure |
| — |
| 2,321 |
| 2,228 |
| 2,305 |
| 2,343 |
|
Source: The Treasury
Budget 2008 operating initiatives increase expenditure by $2 billion by 2011/12 including:
· Health spending of $0.75 billion
· Education receive almost $0.6 billion
· Non Government Organisations receive $0.2 billion to improve partnership with community-based social services, and
· Strengthening New Zealand’s international connections receive $0.1 billion.
The fiscal forecasts include indicative amounts for new operating initiatives for future Budgets. The allowance for these initiatives has been set at $1.75 billion for each of the forecast years (adjusted for inflation), resulting in an increase of $5.4 billion by the end of the forecast horizon. These allocations have reduced from the $2.0 billion annual increase included in the Half Year Update.
Figure 2.4 – Net amounts of forecast new operating initiatives

Source: The Treasury
Benefit expenses are forecast to grow in line with the forecast growth in the economy. In nominal terms they are expected to increase $4.4 billion over the forecast period.
Around $2 billion of this reflects cost of living adjustments for New Zealand Superannuation (NZS) payments, welfare benefits and Working For Families (WFF) Tax Credits.
Most benefits are adjusted each April by the CPI movement over the previous calendar year and NZS rates are increased by the greater of average wage or CPI growth at the same time. Cumulative inflation increases to Family Tax Credit rates and WFF abatement thresholds are also encapsulated in the forecasts.
Partly offsetting this nominal growth in forecasted benefit expenses are the impacts of personal tax reductions, which lower the tax paid on both benefits and NZ Superannuation and hence result in reduced gross payments.
In addition, expenses associated with the KiwiSaver scheme (including the $1,000 kickstart subsidy, fees subsidy, member tax credit and employer tax credit) increase to $1.5 billion by the end of the forecast period (Figure 2.5).
Figure 2.5 – KiwiSaver expenses
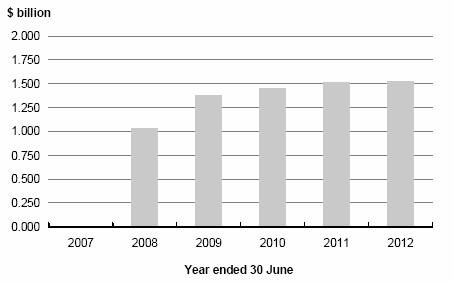
Source: The Treasury
An adjustment is made to core Crown expenses as department forecasts are often based on maximum spending limits (or appropriations) rather than mid-point estimates. This reduces forecast expenditure and is referred to as a “top down adjustment”. The top down adjustment ranges is $0.2 billion in 2007/08 and $0.5 billion in the remaining years reflecting the increased uncertainty of forecasts in the later forecast years. This is slightly higher than the Half Year Update.
Table 2.7 – Core Crown expenses comparison to the Half Year Update
Year ended 30 June |
| 2008 |
| 2009 |
| 2010 |
| 2011 |
| 2012 |
| |
$ million |
| Forecast |
| Forecast |
| Forecast |
| Forecast |
| Forecast |
| |
Core Crown expenses |
|
|
|
|
|
|
|
|
|
|
| |
Half Year Update |
| 57,137 |
| 60,537 |
| 63,106 |
| 66,632 |
| 70,034 |
| |
Increase in baseline expenses |
| 266 |
| 158 |
| 143 |
| 114 |
| 78 |
| |
Expenditure above allocations |
| 186 |
| 332 |
| 200 |
| 164 |
| 328 |
| |
Reduction in operating allowances |
| — |
| — |
| (178 | ) | (359 | ) | (552 | ) | |
Expense transfers |
| (494 | ) | 339 |
| 131 |
| 117 |
| (91 | ) | |
Kiwisaver |
| 195 |
| 390 |
| 285 |
| 211 |
| 67 |
| |
Benefits |
| 42 |
| 170 |
| 386 |
| 98 |
| 192 |
| |
Finance costs(1) |
| (277 | ) | (317 | ) | (305 | ) | (219 | ) | (159 | ) | |
Asset impairment (eg, student loans, tax receivables) |
| 303 |
| 169 |
| 187 |
| 207 |
| 226 |
| |
Emissions Trading Scheme |
| — |
| 152 |
| (121 | ) | 46 |
| 46 |
| |
Top down adjustment |
| — |
| (100 | ) | (100 | ) | (150 | ) | (200 | ) | |
Other core Crown expenses |
| 6 |
| 53 |
| 156 |
| 155 |
| (26 | ) | |
Total core Crown expense impact |
| 227 |
| 1,346 |
| 784 |
| 384 |
| (91 | ) | |
Budget update |
| 57,364 |
| 61,883 |
| 63,890 |
| 67,016 |
| 69,943 |
| |
Source: The Treasury
(1) Finance costs reduced in comparison to the Half Year Update due in the main to netting out interest on the Crown settlement account (with a corresponding reduction in interest income).
OBEGAL is the operating balance before gains and losses for the total Crown. By excluding gains and losses the OBEGAL gives a more direct indication of the underlying stewardship of the Government than the operating balance.
Figure 2.6 – Total Crown OBEGAL
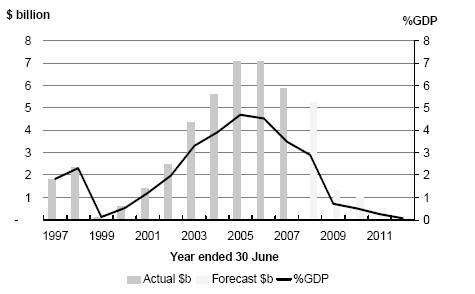
Source: The Treasury
The OBEGAL reduces over the forecast period from $5.9 billion in 2006/07 to $0.2 billion in 2011/12.
This fall reflects Budget decisions, including the reduction in core Crown tax revenue discussed earlier. State-Owned Enterprises (SOEs) and Crown Entities (CEs) OBEGAL forecasts have declined in line with tighter market conditions associated with macroeconomic forecasts of slower growth.
The OBEGAL (excluding the NZS Fund retained revenue) is a measure of the operating balance that recognises that the NZS Fund has been set up to meet future spending pressures and as a result the returns it earns are not available to the Crown to meet current spending requirements. OBEGAL (excluding the NZS Fund retained revenue) reduces over the forecast period from $6.3 billion in 2006/07 to $0.2 billion in 2011/12.
The operating balance shows whether the government sector has generated enough revenues to cover its expenses in any given year.
Figure 2.7 – Total Crown gains and losses
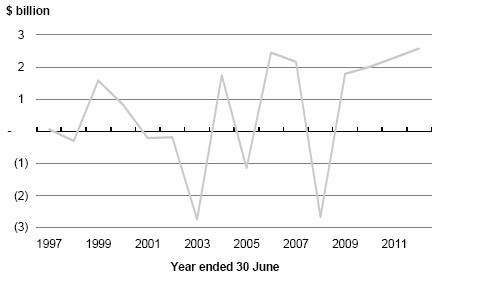
Source: The Treasury
Losses of $2.7 billion are forecast in 2007/08. This is a reflection of the recent decline in overseas equity markets and increases in the ACC claims liability and GSF liability. Looking forward, net gains are forecast to range from $1.6 billion in 2008/09 to $2.4 billion in 2011/12. These later forecasts are based on long term benchmark rates of return, in conjunction with the exchange rates and interest rate curves prevailing at the forecast reference date.
The operating balance is forecast to remain positive over the forecast period from $2.6 billion in 2007/08 to $2.7 billion in 2011/12.
Figure 2.8 – Total Crown operating balance
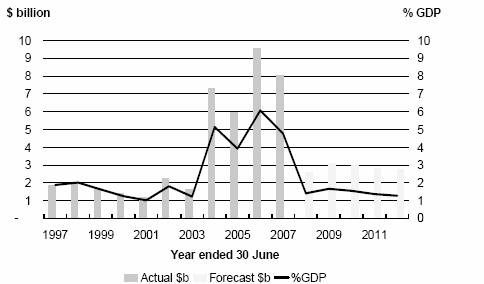
Source: The Treasury
The total Crown operating balance is not available to be drawn upon to fund core Crown operations, as current policy is for the NZS Fund, SOEs and CEs to retain a portion of their surpluses for the purpose of achieving their long-term objectives. Over the forecast period SOE and CE surpluses total $7.6 billion. Approximately $2.3 billion of these surpluses will be returned as dividends. This becomes cash available to the core Crown.
Table 2.8 – Total Crown OBEGAL and operating balance comparison to the Half Year Update
Year ended 30 June |
| 2008 |
| 2009 |
| 2010 |
| 2011 |
| 2012 |
|
$ million |
| Forecast |
| Forecast |
| Forecast |
| Forecast |
| Forecast |
|
OBEGAL |
|
|
|
|
|
|
|
|
|
|
|
Half Year Update |
| 6,574 |
| 4,327 |
| 4,062 |
| 3,984 |
| 3,850 |
|
Core Crown revenue impact |
| (316 | ) | (1,360 | ) | (1,860 | ) | (2,681 | ) | (3,164 | ) |
Core Crown expense impact |
| (227 | ) | (1,346 | ) | (784 | ) | (384 | ) | 91 |
|
CE/SOE results |
| (648 | ) | (64 | ) | (111 | ) | (64 | ) | (230 | ) |
Other items |
| (156 | ) | (239 | ) | (303 | ) | (362 | ) | (393 | ) |
Total OBEGAL impact |
| (1,347 | ) | (3,009 | ) | (3,058 | ) | (3,491 | ) | (3,696 | ) |
Budget Update |
| 5,227 |
| 1,318 |
| 1,004 |
| 493 |
| 154 |
|
Operating balance |
|
|
|
|
|
|
|
|
|
|
|
Half Year Update |
| 7,388 |
| 6,053 |
| 5,924 |
| 6,094 |
| 6,228 |
|
Decrease in OBEGAL |
| (1,347 | ) | (3,009 | ) | (3,058 | ) | (3,491 | ) | (3,696 | ) |
GSF valuation |
| (643 | ) | — |
| — |
| — |
| — |
|
Kyoto valuation due to changes in carbon price |
| (145 | ) | — |
| — |
| — |
| — |
|
Core Crown gains and losses |
| (1,099 | ) | 195 |
| 289 |
| 353 |
| 404 |
|
CE/SOE gains and losses |
| (1,704 | ) | (152 | ) | (165 | ) | (357 | ) | (336 | ) |
Other gains |
| 109 |
| 18 |
| 19 |
| 180 |
| 134 |
|
Total operating balance impact |
| (4,829 | ) | (2,948 | ) | (2,915 | ) | (3,315 | ) | (3,494 | ) |
Budget Update |
| 2,559 |
| 3,105 |
| 3,009 |
| 2,779 |
| 2,734 |
|
Source: The Treasury
Core Crown residual cash represents core Crown operating cash flows less capital investment and contributions to the NZS Fund.
Table 2.9 – Reconciliation of residual core Crown cash
|
| Year ended 30 June |
| ||||||||||||
|
| 2007 |
| 2008 |
| 2009 |
| 2010 |
| 2011 |
| 2012 |
| ||
$ million |
| Actual |
| Forecast |
| Forecast |
| Forecast |
| Forecast |
| Forecast |
| ||
|
| Core Crown revenue |
| 58,211 |
| 61,936 |
| 61,891 |
| 63,664 |
| 66,416 |
| 69,159 |
|
Less |
| Core Crown expenses |
| (54,003 | ) | (57,364 | ) | (61,883 | ) | (63,890 | ) | (67,016 | ) | (69,943 | ) |
Plus |
| Core Crown gains/(losses) and other items |
| 2,395 |
| (841 | ) | 1,422 |
| 1,670 |
| 1,925 |
| 2,172 |
|
Plus |
| Net surpluses/(deficits) of SOEs and CEs |
| 1,420 |
| (1,172 | ) | 1,675 |
| 1,565 |
| 1,454 |
| 1,346 |
|
Equals |
| Operating balance |
| 8,023 |
| 2,559 |
| 3,105 |
| 3,009 |
| 2,779 |
| 2,734 |
|
Less |
| Net total Crown (gains)/losses and other items |
| (2,163 | ) | 2,668 |
| (1,787 | ) | (2,005 | ) | (2,286 | ) | (2,580 | ) |
Equals |
| Operating balance before gains and losses (OBEGAL) |
| 5,860 |
| 5,227 |
| 1,318 |
| 1,004 |
| 493 |
| 154 |
|
Less |
| NZS Fund net revenue after tax |
| 390 |
| (8 | ) | 36 |
| 44 |
| 50 |
| 53 |
|
Equals |
| OBEGAL excluding NZS Fund retained revenue |
| 6,250 |
| 5,219 |
| 1,354 |
| 1,048 |
| 543 |
| 207 |
|
Less |
| Net retained surpluses of SOEs and CEs |
| (1,652 | ) | (655 | ) | (1,310 | ) | (1,230 | ) | (1,093 | ) | (938 | ) |
|
| Non-cash items and working capital movements |
| 3,988 |
| 2,454 |
| 2,507 |
| 2,171 |
| 2,455 |
| 2,275 |
|
Equals |
| Net core Crown cash flow from operations |
| 8,586 |
| 7,018 |
| 2,551 |
| 1,989 |
| 1,905 |
| 1,544 |
|
Less |
| Contribution to NZS Fund |
| (2,048 | ) | (2,103 | ) | (2,242 | ) | (2,151 | ) | (2,270 | ) | (2,290 | ) |
Equals |
| Net core Crown cash flow from operations after contributions to NZS Fund |
| 6,538 |
| 4,915 |
| 309 |
| (162 | ) | (365 | ) | (746 | ) |
Less |
| Purchase of physical assets |
| (1,755 | ) | (1,544 | ) | (1,541 | ) | (1,683 | ) | (1,327 | ) | (1,146 | ) |
|
| Advances and capital injections |
| (1,906 | ) | (1,773 | ) | (1,985 | ) | (855 | ) | (978 | ) | (638 | ) |
|
| Forecast for future new capital spending |
| — |
| (690 | ) | (261 | ) | (602 | ) | (777 | ) | (927 | ) |
Equals |
| Core Crown residual cash |
| 2,877 |
| 908 |
| (3,478 | ) | (3,302 | ) | (3,447 | ) | (3,457 | ) |
Source: The Treasury
Core Crown residual cash is in deficit for most of the forecast period. The cash deficits are around $3.5 billion for each forecast year from 2008/09.
Net core Crown cash flow from operations decreases in line with movements in core Crown revenue and core Crown expenses.
Figure 2.9 – Core Crown residual cash
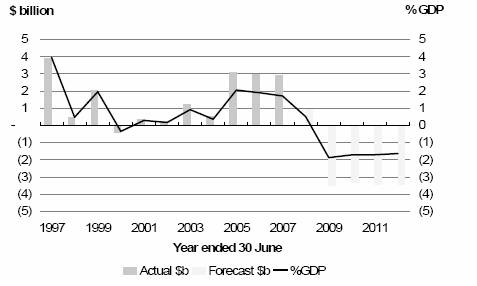
Source: The Treasury
Table 2.10 – Application of core Crown residual cash from 2007/08 to 2011/12 inclusive ($ billion)
Source: The Treasury
After taking into account contributions to the NZS Fund of $11.1 billion, purchases of physical assets (including new capital spending) of $10.5 billion and advances and capital injections of $6.2 billion, there is a residual financing requirement of $12.8 billion. This will be met by a decrease in net financial assets of $6.4 billion and monies raised from the Government’s domestic bond programme, after meeting repayments on maturing debt of $6.4 billion.
New capital commitments are $0.813 billion in 2007/08 and $1.911 billion for 2008/09 to 2011/12, totalling $2.7 billion. In addition $2.2 billion is committed in future Budgets at $0.9 billion per year phased over four years (Table 2.11). The total new capital investment is $4.9 billion ($2.7 billion plus $2.2 billion).
Table 2.11 – Forecast future new capital allowances
Year ended 30 June |
| 2008 |
| 2009 |
| 2010 |
| 2011 |
| 2012 |
|
|
|
$ million |
| Forecast |
| Forecast |
| Forecast |
| Forecast |
| Forecast |
| Total |
|
Budget 2009 |
| — |
| 20 |
| 480 |
| 250 |
| 150 |
| 900 |
|
Budget 2010 (three years of phasing) |
| — |
| — |
| 20 |
| 480 |
| 250 |
| 750 |
|
Budget 2011 (two years of phasing) |
| — |
| — |
| — |
| 20 |
| 480 |
| 500 |
|
Budget 2012 (first year of phasing) |
| — |
| — |
| — |
|
|
| 20 |
| 20 |
|
Future capital allowances |
| — |
| 20 |
| 500 |
| 750 |
| 900 |
| 2,170 |
|
Source: The Treasury
Core Crown forecasts for the purchase of physical assets ($10.5 billion) and advances and capital injections ($6.2 billion) comprise purchases met from existing baselines plus the $4.9 billion new capital allocation above.
To give an indication of how core Crown capital investment is distributed by sector, it is necessary to consider the purchase of physical assets by both the core Crown and Crown entities (Figure 2.10).
Figure 2.10 – Core Crown and Crown Entity purchase of physical assets by sector ($billion and % of total spend)
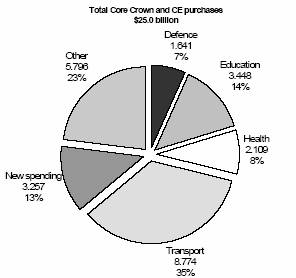
Source: The Treasury
These purchases will include new capital spending in addition to the replacement of exisiting physical assets. The recently announced purchase of Toll Holdings Limited ($0.690 billion) and the NZ Fast Forward initiative ($0.7 billion) are included as new spending.
Table 2.12 – Residual cash comparison to the Half Year Update
Year ended 30 June |
| 2008 |
| 2009 |
| 2010 |
| 2011 |
| 2012 |
|
$ million |
| Forecast |
| Forecast |
| Forecast |
| Forecast |
| Forecast |
|
Residual cash |
|
|
|
|
|
|
|
|
|
|
|
Half Year Update |
| 759 |
| (763 | ) | (779 | ) | (851 | ) | (937 | ) |
Tax receipts |
| 180 |
| (1,790 | ) | (1,506 | ) | (2,229 | ) | (2,917 | ) |
Changes to baselines |
| 3 |
| (3 | ) | 41 |
| 96 |
| 112 |
|
Expense transfers (operating and capital) |
| 761 |
| (546 | ) | (175 | ) | (158 | ) | 91 |
|
Payments (above)/below allocations |
| (952 | ) | (505 | ) | (368 | ) | (231 | ) | (161 | ) |
Reduction in operating allowances |
| — |
| — |
| 178 |
| 359 |
| 552 |
|
Benefits |
| (42 | ) | (170 | ) | (386 | ) | (98 | ) | (192 | ) |
KiwiSaver |
| 54 |
| (45 | ) | (188 | ) | (210 | ) | (57 | ) |
Net finance costs |
| (57 | ) | (54 | ) | (168 | ) | (347 | ) | (560 | ) |
Top down adjustment |
| — |
| 345 |
| — |
| 50 |
| 100 |
|
Other items |
| 202 |
| 53 |
| 49 |
| 172 |
| 512 |
|
Total residual cash impact |
| 149 |
| (2,715 | ) | (2,523 | ) | (2,596 | ) | (2,520 | ) |
Budget Update |
| 908 |
| (3,478 | ) | (3,302 | ) | (3,447 | ) | (3,457 | ) |
Source: The Treasury
GSID (excluding Settlement Cash) represents the debt issued by the sovereign (ie, core Crown) and includes Government stock held by the NZS Fund, ACC and EQC but excludes money deposited with the Reserve Bank by banks (Settlement Cash).
Figure 2.11 – GSID (excluding Settlement Cash)

Source: The Treasury
Although GSID (excluding Settlement Cash) increases over the forecast period from $30.6 billion in 2006/07 to $35.5 billion by 2011/12 it falls as a percentage of GDP from 18.2% to 16.8% over the same period.
The $4.9 billion nominal increase in GSID (excluding Settlement Cash) is primarily due to the net bond issuance of $6.4 billion (Table 2.13); partially offset by a $1.5 billion decrease in other core Crown financial liabilities such as Treasury bills.
Table 2.13 – Net increase in domestic bonds(10)
Year ended 30 June | 2008 |
| 2009 |
| 2010 |
| 2011 |
| 2012 |
|
|
| |
$ million |
| Forecast |
| Forecast |
| Forecast |
| Forecast |
| Forecast |
| Total |
|
Issue of domestic bonds (market) |
| 2,415 |
| 3,314 |
| 3,393 |
| 3,394 |
| 3,365 |
| 15,881 |
|
Repayment of domestic bonds (market) |
| — |
| (2,700 | ) | (3,947 | ) | — |
| (3,976 | ) | (10,623 | ) |
Net increase in domestic bonds (market) |
| 2,415 |
| 614 |
| (554 | ) | 3,394 |
| (611 | ) | 5,258 |
|
|
|
|
|
|
|
|
|
|
|
|
|
|
|
Issue of domestic bonds (non-market) |
| 189 |
| 662 |
| 851 |
| 245 |
| 1,286 |
| 3,233 |
|
Repayment of domestic bonds (non-market) |
| — |
| (451 | ) | (599 | ) | — |
| (1,046 | ) | (2,096 | ) |
Net increase in domestic bonds (non-market)(3) |
| 189 |
| 211 |
| 252 |
| 245 |
| 240 |
| 1,137 |
|
Net bond issuance |
| 2,604 |
| 825 |
| (302 | ) | 3,639 |
| (371 | ) | 6,395 |
|
Source: The Treasury
(10) Non-market domestic bonds are bonds held by the Earthquake Commission.
Table 2.14 – GSID (excluding Settlement Cash) comparison to the Half Year Update
Year ended 30 June |
| 2008 |
| 2009 |
| 2010 |
| 2011 |
| 2012 |
|
$ million |
| Forecast |
| Forecast |
| Forecast |
| Forecast |
| Forecast |
|
GSID (excluding Settlement Cash) |
|
|
|
|
|
|
|
|
|
|
|
Half Year Update |
| 33,303 |
| 33,034 |
| 31,779 |
| 34,566 |
| 33,172 |
|
Domestic bonds (market) |
| (38 | ) | 817 |
| 1,753 |
| 2,640 |
| 3,508 |
|
Domestic bonds (non-market) |
| (30 | ) | (37 | ) | (16 | ) | (17 | ) | (28 | ) |
Reduction in treasury bills |
| (1,387 | ) | (1,289 | ) | (1,289 | ) | (1,289 | ) | (1,289 | ) |
Movements in other financial liabilities |
| (85 | ) | (27 | ) | 24 |
| 74 |
| 136 |
|
|
| (1,540 | ) | (536 | ) | 472 |
| 1,408 |
| 2,327 |
|
Budget Update |
| 31,763 |
| 32,498 |
| 32,251 |
| 35,974 |
| 35,499 |
|
Source: The Treasury
Figure 2.12 – Net core Crown debt
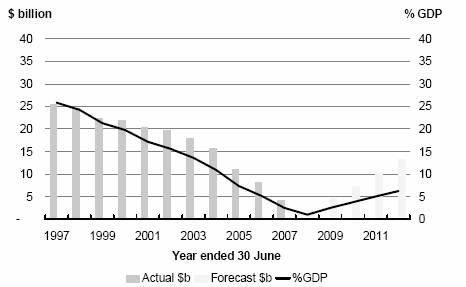
Source: The Treasury
Net core Crown debt equates to core Crown borrowings less core Crown financial assets (excluding the financial assets of the NZS Fund).
By deducting financial assets (excluding the NZS Fund), net debt can provide additional information about the sustainability of the Government’s accounts. However, it is important to view net debt alongside GSID (excluding Settlement Cash) as some financial assets are not very easily converted to cash.
Figure 2.13 – DMO/RB financial assets
(excluding Settlement Cash impact)

Source: The Treasury
Net debt increases …
Net debt rises from $1.9 billion in 2007/08 to $13.2 billion by 2011/12 (from 1.0% to 6.2% as a percentage of GDP).
Net debt increases as a result of cash deficits of almost $13 billion over the forecast period. Funding of these deficits is met through a combination of domestic bond issuance and a reduction in the financial assets which have been built up by the New Zealand Debt Management Office (NZDMO) over the past few years.
Financial assets of the NZS Fund are excluded from the calculation of net debt as they are set aside to partially pre-fund the future cost of New Zealand Superannuation.
Table 2.15 – Net core Crown debt comparison to the Half Year Update
Year ended 30 June |
| 2008 |
| 2009 |
| 2010 |
| 2011 |
| 2012 |
|
$ million |
| Forecast |
| Forecast |
| Forecast |
| Forecast |
| Forecast |
|
Net core Crown debt |
|
|
|
|
|
|
|
|
|
|
|
Half Year Update |
| 1,983 |
| 1,756 |
| 1,705 |
| 1,792 |
| 2,105 |
|
Core Crown residual cash impact |
| (149 | ) | 2,566 |
| 5,089 |
| 7,685 |
| 10,205 |
|
Valuation of financial instruments |
| 181 |
| 438 |
| 386 |
| 558 |
| 659 |
|
Other items |
| (169 | ) | (182 | ) | 92 |
| 110 |
| 224 |
|
Total net debt impact |
| (137 | ) | 2,822 |
| 5,567 |
| 8,353 |
| 11,088 |
|
Budget Update |
| 1,846 |
| 4,578 |
| 7,272 |
| 10,145 |
| 13,193 |
|
Source: The Treasury
Figure 2.14 – NZS Fund net worth
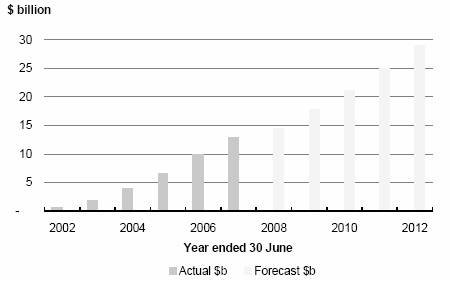
Source: The Treasury
The NZS Fund is an important component of the Government’s fiscal strategy. The NZS Fund’s assets provide the means for the Government to partially pre-fund future fiscal pressures, particularly those pressures arising from an ageing population.
The NZS Fund is forecasting an operating deficit of $0.6 billion in 2007/08. This is a result of the recent downturn in overseas equity markets (particularly in the United States).
Despite the 2007/08 deficit the Fund’s net assets are forecast to grow to $29 billion by 2011/12, an increase of $16 billion. More than $4.9 billion of this increase is expected to come from the NZS Fund’s investment performance; with the remaining $11.1 billion increase from Government contributions.
Table 2.16 – NZS Fund net worth
Year ended 30 June |
| 2007 |
| 2008 |
| 2009 |
| 2010 |
| 2011 |
| 2012 |
|
$ million |
| Actual |
| Forecast |
| Forecast |
| Forecast |
| Forecast |
| Forecast |
|
Opening net worth |
| 9,855 |
| 12,973 |
| 14,461 |
| 17,721 |
| 21,152 |
| 24,947 |
|
Revenue |
| 436 |
| 381 |
| 427 |
| 516 |
| 612 |
| 715 |
|
Other expenses |
| 52 |
| (51 | ) | (154 | ) | (177 | ) | (204 | ) | (231 | ) |
Tax expenses |
| (707 | ) | (259 | ) | (323 | ) | (404 | ) | (480 | ) | (560 | ) |
Gains/(losses) |
| 1,313 |
| (686 | ) | 1,068 |
| 1,345 |
| 1,597 |
| 1,850 |
|
Gross contributions from the Crown |
| 2,049 |
| 2,103 |
| 2,242 |
| 2,151 |
| 2,270 |
| 2,290 |
|
Other movements in reserves |
| (25 | ) | — |
| — |
| — |
| — |
| — |
|
Closing net worth |
| 12,973 |
| 14,461 |
| 17,721 |
| 21,152 |
| 24,947 |
| 29,011 |
|
Source: The Treasury
The Government’s contributions to the NZS Fund are calculated over a 40-year rolling horizon to ensure that superannuation entitlements over the next 40 years can be met if the contribution rate were to be held to be constant at that level. The Government is forecast to make the required minimum annual contribution for 2007/08 and 2008/09 as
calculated by the formula set out in the New Zealand Superannuation and Retirement Income Act 2001.
The underlying assumptions in calculating the contributions for 2008 are the nominal GDP series to 2048, the NZS expense series to 2048 and the expected long-term, net after-tax annual return of the NZS Fund (6.6%) (6.6% in the Half Year Update). The forecast rate of return is based on the Treasury’s assumptions for the rate of return on financial portfolios of Crown financial institutions. The Treasury website contains further information on the NZS Fund, as well as a copy of the NZS Fund model (http://www.treasury.govt.nz/government/assets/nzsf/contributionratemodel).
Table 2.17 – NZS Fund net worth comparison to Half Year Update
Year ended 30 June | 2008 |
| 2009 |
| 2010 |
| 2011 |
| 2012 |
| |
$ million |
| Forecast |
| Forecast |
| Forecast |
| Forecast |
| Forecast |
|
NZS Fund net worth |
|
|
|
|
|
|
|
|
|
|
|
Half Year Update |
| 15,993 |
| 19,488 |
| 23,140 |
| 27,016 |
| 31,102 |
|
Change in contributions |
| — |
| (134 | ) | (170 | ) | (45 | ) | 9 |
|
Change in Fund performance |
| (1,532 | ) | (1,633 | ) | (1,818 | ) | (2,024 | ) | (2,100 | ) |
Total net worth impact |
| (1,532 | ) | (1,767 | ) | (1,988 | ) | (2,069 | ) | (2,091 | ) |
Budget Update |
| 14,461 |
| 17,721 |
| 21,152 |
| 24,947 |
| 29,011 |
|
Source: The Treasury
The fiscal forecasts were finalised on 9 May 2008 in accordance with forecast accounting policies. There are certain risks associated with the forecast results. To assist in evaluating such risks, the following chapters should be read in conjunction with the fiscal forecasts:
· Risks and Scenarios (Chapter 3) – The fiscal forecasts are based on the economic forecasts presented in Chapter 1 and any variation from the economic forecast will affect the fiscal forecasts, in particular tax revenue and benefit expenses. The Risks and Scenarios chapter discusses the effect on the forecasts under different circumstances.
· Specific Fiscal Risks (Chapter 4) – The fiscal forecasts incorporate Government decisions up to 7 May 2008. The Specific Fiscal Risks chapter covers specific policy decisions that are under active consideration by the Government at the time of the finalisation of the forecasts.
In addition to the specific fiscal risks and the link to the economic forecasts, there are a number of forecasting issues explained below that may arise in future.
The tax forecasts prepared for this Budget Update are based on current tax policy and on the macroeconomic central forecast. Sensitivities of tax revenue to changes in economic conditions are also presented in the Risks and Scenarios chapter on page 111.
Baselines reported by IRD incorporate an assumed take-up profile for the KiwiSaver regime. Actual take-up could be higher or lower than assumed, or faster or slower than assumed, representing an unquantified risk to the operating balance.
Baselines reported by the Ministry for the Environment on the Emission Trading Scheme are based on a number of assumptions and projections, all of which can change through time. Notably they incorporate an assumed take-up profile for forestry participation in the scheme. Actual take-up could be higher or lower than assumed. These potential changes represent an unquantified risk to the operating balance.
The forecasts for large SOEs and CEs were based on results to 29 February 2008 and their best assessments at that time.
Crown accounting policy is to revalue certain classes of property, plant and equipment on a regular basis. In certain circumstances the valuation will be affected by foreign exchange rates, so any appreciation in the NZ dollar (from 30 June 2008) will adversely affect the current physical asset values included in the fiscal forecasts.
The GSF and ACC liabilities included in these forecasts have been valued as at 29 February 2008 and 31 March 2008 respectively. The liabilities will next be valued as at 30 June 2008. Any change in discount rates will affect the present fiscal forecast. For example, if the discount rate rises, the value of the liabilities will decrease.
Forecasts use the exchange rates, interest rate curves and electricity pricing curves prevailing at the forecast reference date. Any subsequent change to these rates will affect the fiscal outcome.
The forecast information presented in the 2008 Budget Update combined Tertiary Education Institutes (TEIs) on an equity accounting basis. This treatment has been under consideration by accounting standard setters. The Financial Reporting Standards Board has recently advised that the question of whether to consolidate autonomous and independent entities will be considered by delivering its deliberations of the International Accounting Standards Board (IASB) project on consolidation
The combination method adopted in these forecasts is to equity account for the TEIs’ net surpluses and net investment (ie, TEI revenues, expenses, assets and liabilities are not included on a line-by-line basis). This is consistent with the treatment adopted in the 2007 Financial Statements of the Government.
The forecasts presented in the Economic and Tax Outlook chapter incorporate a number of judgements about how both the New Zealand and the world economies evolve. Some judgements relate to the cyclical drivers of activity, others to the structural characteristics of the New Zealand and the world economies. These judgements have a number of risks surrounding them. In balancing these risks we have arrived at our view of how the economy is going to evolve, as presented in the Economic and Tax Outlook chapter.
The risks to our forecasts can be characterised as two types. The first are the risks we traditionally identify that could lead to more or less nominal GDP – examples of such risks include different profiles for the terms of trade, domestic demand and the exchange rate (see the 2007 Half Year Update, for example). Associated with this forecast, there is a second set of more extreme risks, albeit with a smaller probability, that would arise if recent financial market developments were more prolonged and severe than we have assumed in the main forecast.
The first part of this chapter, Economic Risks, focuses on describing both sets of risks around our forecasts and describing the possible impact on the economy if these risks were to occur. Given the significance of more prolonged and severe weakness in financial markets on the New Zealand economy and the Government’s fiscal position, we consider such a scenario in the second part of the chapter. In such an environment, with high levels of risk aversion prevalent and confidence low, a significant gap would exist between the interest rates faced by borrowers and official policy rates both in New Zealand and abroad, slowing domestic demand and trading partner growth relative to our main forecast.
The third part of this chapter, Fiscal Scenarios, considers the implications of the alternative scenario for the fiscal position, while the fourth part, Fiscal Sensitivities, examines how sensitive the fiscal position is to changes in specific variables.
As stated in the Economic and Tax Outlook chapter, the turmoil in international financial markets has worsened since the Half Year Update, with financial markets characterised by increased risk aversion and investor uncertainty. In our main forecasts, we have assumed a reasonably orderly resolution of the financial crisis in the year ahead. Figure 3.1 shows the Chicago Board Options Exchange Volatility Index. It represents one measure of the market’s expectation of volatility over the next 30-day period (a higher number means more volatility is expected). Since mid-March the index has been falling – consistent with the assumption in our main forecasts – but, as Figure 3.1 indicates, in the past year uncertainty has come in cycles with stresses intensifying and easing in waves. With risk appetite being so volatile in the current environment, further write-downs of debt and bank funding problems internationally could see the markets become even more risk averse. If the period of financial market uncertainty and risk aversion is more protracted
and severe than expected, New Zealand could be affected in two main ways – a higher cost of credit to firms and households and a lower exchange rate.
Figure 3.1 – Chicago Board Options Exchange Volatility Index
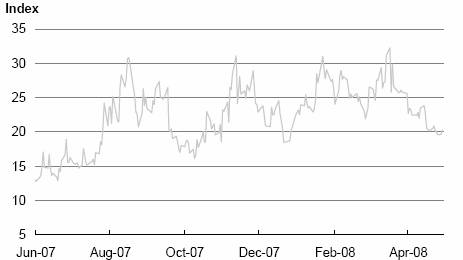
Source: Chicago Board Options Exchange
Banks operating in New Zealand have passed on some of the increased costs of funding their loans to New Zealand households and firms in the form of higher interest rates. Banks have also become more reluctant to lend to some firms in some sectors. In our main forecasts this contributes to the slowing in domestic demand which began late 2007, continuing throughout 2008. A further rise in interest rates (or in the more extreme case if credit availability becomes severely restricted) would mean the easing in domestic demand is sharper and longer than we have forecast.
Rising global risk aversion could exacerbate any depreciation of the currency. If, as assumed in our forecasts, the official cash rate moves towards a more neutral position, heightened risk aversion could cause large exits in carry trade positions.(11) A lower exchange rate would boost exports but would also likely slow consumption and business investment relative to our main forecasts as imports become more expensive.
In the Economic and Tax Outlook chapter we noted that a key risk to our forecast would be weaker than assumed growth in Asia. Rapid growth in emerging Asia (notably China and India) has accounted for much of the incremental demand for commodities over the past five years and has therefore been a key driver of the large run-up in commodity prices in that time period. Lower income growth in Asia – driven by lower export receipts as the result of a more severe than expected downturn in the United States and Europe – could see international prices for New Zealand’s exports (particularly commodity exports) fall more rapidly than expected. Lower export prices would lower incomes for agricultural producers and therefore slow domestic demand. Lower export prices would also likely result in a lower exchange rate which would provide some offset to lower agricultural incomes but also lower private consumption and business investment through making imports more expensive. Slower growth in Asia could also slow growth in so-called “hard” commodity prices (eg, metals and coal). Lower hard commodity prices could indirectly
(11) The carry trade is an investment strategy in which an investor sells a certain currency with a relatively low interest rate, eg, the Yen, and uses the funds to purchase a different currency yielding a higher interest rate, eg, the NZD. These transactions are leveraged, so a small movement in exchange rates can result in large losses.
affect New Zealand through slowing income growth in Australia thus lowering manufacturing revenue (Australia is the largest export market for New Zealand’s manufactured items) and services revenue (fewer Australians visiting).
As outlined in the Economic and Tax Outlook chapter, our trading partner growth forecasts are based on March Consensus Forecasts – albeit adjusted downwards to take into account of the way Consensus Forecasts tend to lag recent developments. Given the heightened level of uncertainty at the moment, there is a range of views on what growth tracks our trading partners (particularly the United States and Europe) could take. The International Monetary Fund (IMF), for example, has a more pessimistic view of the world growth outlook and expects a more severe downturn than Consensus Forecasts and ourselves, particularly in the United States.
Figure 3.2 – Impact of a lower commodity price track on nominal GDP
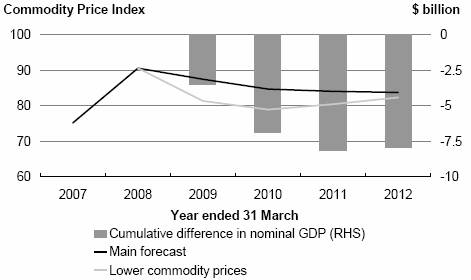
Source: The Treasury
The exact impact of lower export prices depends on the type of export affected and the nature of the deviation from the forecast track. Figure 3.2 shows the impact on nominal GDP if international commodity prices for New Zealand’s exports were 10% lower than forecast for the first two and a half years of the forecast period. This would lead to about $8 billion less GDP over the forecast period, which translates into about $2.6 billion less tax revenue.
At the time of writing, West Texas Intermediate (WTI) oil prices were sitting above US$125 a barrel on reports of low stock levels and supply disruptions. Such a starting point poses upside risks to our oil price track. If the level of oil prices were to be higher over the forecast period this could result in higher petrol prices dampening consumption relative to our main forecast and placing further pressure on firms (particularly in the transport industry). The impact of higher oil prices would be partially offset by increased incomes to New Zealand oil producers and to oil-exporting countries. Higher incomes for oil-exporting countries would support prices for some of our exports, particularly commodities.
The prices of other commodities we import, particularly metals, have also experienced strong growth of late. Further large increases in these prices would put further upward pressure on firms’ input costs, lowering profits therefore presenting a downside risk to our business investment and labour market forecasts. Any increases in costs that are passed on to the domestic consumer would place downside risk to our private consumption profile but upside risk to our inflation track.
The Economic and Tax Outlook chapter outlined a number of forces that have been operating to slow the domestic economy. These forces include higher financing costs for firms and households (owing to both restrictive monetary policy and financial market issues), a slowing housing market, rising food and fuel prices and slowing net inward migration. If any of these factors were to prove more severe than assumed in our forecasts then this would lead to weaker domestic demand and a weaker housing market than we currently have in our forecasts.
Our main forecast is for house prices to contract 7% in the March 2009 year. A more marked fall in house prices could be caused by lower than forecast net inward migration and/or higher debt servicing costs (owing to further turmoil in financial markets). The risk of a more marked fall in house prices is also implied by housing affordability measures. Measures of housing affordability show that housing affordability is very low relative to historical standards.(12) Home ownership affordability is highly cyclical, moving in line with changes in house prices, interest rates and income and while in our forecasts interest rates, house prices and incomes do move in a direction that would help increase affordability, they would not move enough to return affordability to its average – a more marked fall in house prices would be required to achieve this.
A more rapid drop in house prices than forecast could lower the consumption profile by making people less wealthy and also by lowering the value of collateral to borrow against. A weaker housing market would also decrease demand for consumer durables to furnish new houses. A larger fall in house prices would also be indicative of a greater slowing in the housing market (eg, house sales), resulting in a sharper fall in residential investment than forecast.
In our main forecasts, the labour market is fairly robust throughout the forecast period and provides support to domestic demand. However, there is a risk that the labour market may be weaker than presented in the main forecast. While such data are volatile, March quarter labour market data – released after the finalisation of the forecasts – showed the largest fall in employment since the March 1989 quarter. In particular, weaker labour market places downside risk to our consumption profile. As well as less consumption due to lower income in aggregate, households facing a sluggish employment market are also more likely to engage in precautionary saving – including saving more of the tax reductions than assumed in our main forecast.
A further risk surrounds climatic conditions. Variability in climatic conditions, and the effect of these fluctuations on agricultural production, has been a significant influence on New Zealand’s economic growth in past years– most notably in 1998 when the drought precipitated a recession. The Economic and Tax Outlook chapter noted that during the summer months of 2007/08, the dry weather reduced agricultural production relative to a “normal” season. Should the next summer be dry there is the potential for a further significant impact on agricultural production in the 2008/09 season as stock condition has already been affected by this season’s drought. This would reduce rural incomes and
(12) See: Final Report of the House Prices Unit: House Price Increases and Housing in New Zealand – March 2008 – available at http://www.dpmc.govt.nz/dpmc/publications/hpr-report; and Regional Economic Outlook: Asia and Pacific, International Monetary Fund, 2007 – available at: http://www.imf.org/external/pubs/ft/reo/2007/apd/eng/areo0407.pdf
confidence and potentially flow on to other parts of the economy. Other climatic events that may have significant effects in the economy are flooding and severe snow.
If any of the above risks were to occur, the result would be lower nominal GDP and therefore less tax revenue. Table 3.1, in the Fiscal Sensitivities section of this chapter, provides some rules of thumb for calculating the impact of lower GDP growth on tax revenue.
Some or all of the factors below could interact to produce stronger nominal GDP than in our forecasts.
One key driver of a stronger economy would be a higher terms of trade. Relative to forecast, higher export commodity prices would result in increased exports and stronger domestic demand through boosting agricultural incomes and keeping the exchange rate higher and consequently making imports cheaper. We expect commodity export prices to remain high in the near term before easing back. However, higher than forecast commodity prices could arise for several reasons:
· even stronger protein demand from emerging Asia than assumed in our forecasts
· the world supply response is more muted (particularly in the case of dairy) than we have assumed, owing to higher feed costs as the cost of grain increases (relating to the alternative use of grain as an input into biofuel production) and/or adverse climatic conditions
· higher oil prices increase oil-exporters’ demand for soft commodities as well as increasing input costs for producers (especially of crops), and
· increased speculative activity in commodity markets.
It is possible there may be a quicker than expected resolution to the problems in financial markets than we have assumed – with recent market volatility and weakness proving to be (at least in part) an overreaction to the market correcting for a “mis-pricing” of risk that has been associated with certain asset types over recent years. A quicker than expected resolution to the financial market problems would lower the risk premium being charged on lending to firms and consumers, resulting in stronger than forecast domestic demand growth than in our main forecast.
Such a return of confidence to financial markets could mean the exchange rate is higher than assumed in the main track as investors are attracted by the interest rate differential that exists between New Zealand and other countries (notably the United States and Japan). This interest rate differential has been reinforced by the significant loosening in United States monetary policy (325 basis points since mid-2007), although this differential may decrease if normality were to return to markets faster than expected. A higher exchange rate would provide further upside risk to our domestic demand forecasts but downside risk for our export forecasts.
There is a risk that the housing cycle is less deep and protracted than we have assumed. Contributing factors would include a faster resolution of the financial market problems (meaning the cost of borrowing faced by households declines), or (relative to our main forecast) the labour market is stronger (making debt servicing easier) and/or net inward migration is higher (increasing the demand for houses).
Higher house prices than forecast could result in higher private consumption and residential investment. Figure 3.3 shows that nominal GDP could be around $3.4 billion higher across the forecast period if real private consumption and real residential investment growth in the March 2009 year were to be half a percentage point and two percentage points higher respectively than in our main forecasts as the result of a shallower house price cycle.
Figure 3.3 – Impact on nominal GDP of a shallower housing cycle
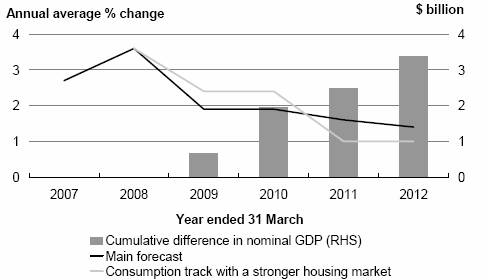
Sources: Statistics New Zealand, The Treasury
Relative to our main forecast, a stronger domestic economy (placing more pressure on the economy’s productive capacity) or more rapid food and fuel price growth represent upside risks to our inflation forecasts. Prices of staples (particularly food and fuel) have increased rapidly lately. While implicitly in our forecasts we have some further increases built in, further increases over and above this would also result in higher inflation and therefore higher inflation expectations, meaning inflation takes longer to unwind than in our main forecast. Higher food and fuel prices would also provide downside risk to our real private consumption forecasts.
The Emissions Trading Scheme (ETS) offers a further risk to our inflation forecasts. Currently we have assumed an emissions unit price of $25 a tonne with 50% of the price impacts on directly affected prices (electricity and petrol) passed on to other prices. This results in approximately 0.4 percentage points additional CPI inflation in the June 2010 and 2011 years. If the emissions price were to be higher than this, or alternatively if the pass-through to other prices is greater than assumed, this would result in higher CPI inflation.
Higher inflation, coupled with a higher terms of trade and a stronger real economy, would result in higher nominal GDP and therefore higher tax revenue.
In this section, a scenario is presented to represent a situation where the downturn in financial market developments is more severe and protracted than in our main forecast and this impacts on the growth path of economies worldwide. In the scenario, the severity of the financial downturn leads to a lack of confidence and a high level of risk aversion in financial markets, meaning a significant gap exists between the interest rates faced by borrowers and official policy rates in both New Zealand and abroad. Monetary measures in key global economies, especially the United States, are therefore not successful in their attempts at boosting real economies. While this is a relatively extreme scenario, with a low but not negligible probability, such a development would have significant impacts on the global economy and New Zealand and would have major implications for the New Zealand Government’s fiscal position.
Figure 3.4 – Real GDP
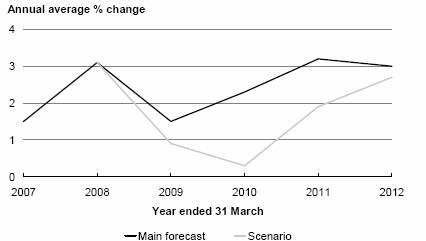
Sources: Statistics New Zealand, The Treasury
Figure 3.5 – Real GNE
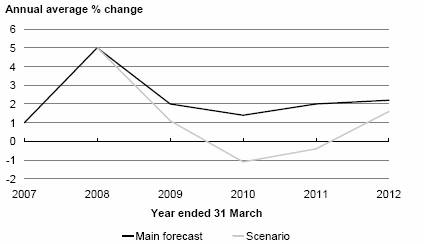
Sources: Statistics New Zealand, The Treasury
Figure 3.6 – Nominal GDP
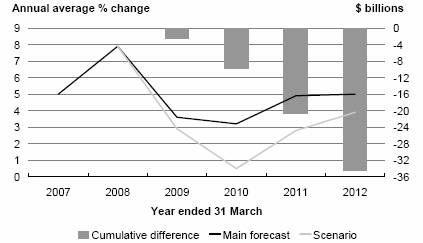
Sources: Statistics New Zealand, The Treasury
Figure 3.7– Inflation
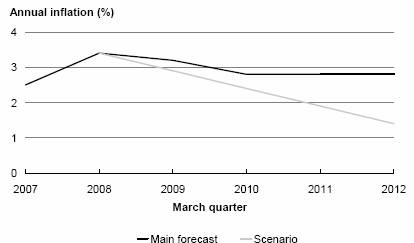
Sources: Statistics New Zealand, The Treasury
Such a scenario could have the following consequences (expressed relative to the main forecast):
· As a result of investor uncertainty and risk aversion remaining higher in financial markets until the March 2011 year, banks operating in New Zealand face significantly higher funding costs. These increased funding costs are passed on to firms and households as higher borrowing costs. Financial markets begin to normalise again in the March 2012 year.
· Key trading partners experience slower growth for longer, including slower growth in emerging Asia, which has so far been largely unaffected by developed country weakness. Trading partner growth is about 1 to 2 percentage points lower in each year until the March 2011 year than currently assumed in our forecasts, before recovering to similar levels as in our main forecasts in the March 2012 year. Lower trading partner growth reduces demand for exports, particularly commodities and tourist services.
· The heightened uncertainty means New Zealand households become more cautious in their spending behaviour and firms are reluctant to invest.
Relative to the main forecast, higher interest rates – owing to a longer period of more pronounced risk aversion in financial markets – make mortgage debt servicing difficult for a larger number of households and property investors. For the majority of households, higher debt servicing costs reduce disposable incomes, lowering consumption. However for some households (and more than in the main forecast) the strain of servicing this debt would mean they are forced to sell their home or investment property. More houses on the market would lower house prices and lower the demand for the construction of new housing. Residential investment is therefore weaker for longer in this scenario, falling cumulatively by 23% in the forecast period until the March 2011 year.
Figure 3.8 – Real private consumption growth
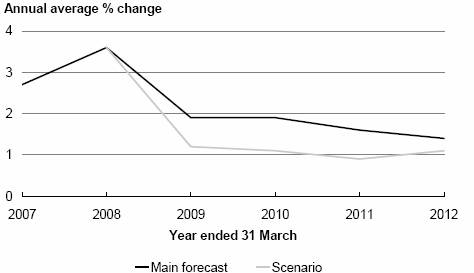
Sources: Statistics New Zealand, The Treasury
Real private consumption undergoes a period of weak growth (around 1%) throughout the forecast period owing to higher mortgage servicing costs reducing discretionary incomes, falling house values lowering perceptions of wealth and collateral, households engaging in more precautionary saving (particularly of the tax cut) as the result of global uncertainty and a lower exchange rate making imports more expensive.
In this scenario, firms face less demand for their products as a result of weak domestic and international markets. Lower demand, coupled with higher borrowing costs, a lower exchange rate (increasing the cost of importing plant and machinery) and heightened uncertainty mean business investment is cumulatively 14 percentage points lower across the forecast period than in our main forecast.
Slower domestic demand means that firms lower their demand for labour, resulting in a contraction in employment, slower wage growth and a higher unemployment rate than the main forecast. The weaker labour market reinforces the slowdown in the domestic economy.
Domestic demand recovers in the March 2012 year as financial markets recover lowering the risk premium on interest rates. A lower risk premium, combined with looser monetary policy, results in lower market interest rates, which boost private consumption and investment.
Weaker domestic demand and a lower exchange rate slow import growth until the March 2010 year resulting in a narrowing of the current account deficit to 4.5%. The narrowing of the current account deficit is somewhat muted by increased debt servicing costs as higher world interest rates result in a larger investment income deficit.
From 2010 the lower exchange rate helps to drive the rebound in exports of goods and services but a softer world economy than in our main forecasts means the response of exports to the lower exchange rate is somewhat muted (see Figure 3.9). The response of exports of services (including tourism receipts) to the lower exchange rate is particularly weak as the slower global economy reduces discretionary incomes available for travel.
Figure 3.9 – Real exports
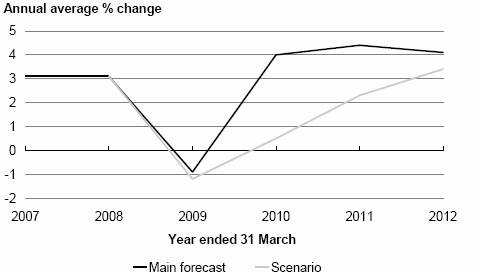
Sources: Statistics New Zealand, The Treasury
The weak domestic economy means real GDP growth is sub 1% in the March 2009 and 2010 years. Real GDP growth does rebound to 2.8% in the 2012 March year – although still below trend – owing to lower market interest rates boosting domestic demand and stronger exports as the world economy recovers and the exchange rate is lower.
CPI inflation averages 2% across the forecast period in this scenario as opposed to around 2.9% in the main forecast. Lower inflation is mainly driven by a weaker domestic economy lowering non-tradables inflation. While the sharp depreciation of the exchange rate does lead to an increase in tradables inflation, it is limited somewhat by a weaker economy, meaning firms facing increased import prices are not able to fully pass through cost increases. The lower inflation pressures see official interest rates cut significantly more than in the main forecast but this does not fully translate into lower market interest rates owing to the heightened risk aversion in the financial markets. The exchange rate depreciates more sharply than in the main forecasts as slower economic growth and relatively lower domestic interest rates make the New Zealand dollar less attractive.
Lower consumer price inflation, coupled with a weaker real economy, results in slower nominal GDP growth throughout the period and therefore the level of nominal GDP is a cumulative $34.4 billion lower, resulting in lower tax revenues across the whole period. See the Fiscal Scenarios section for more details.
The fiscal position is strongly influenced by the economy. The major economic determinants, and how they impact on the fiscal position, are listed below. While each effect is expressed in terms of an increase in the determinant, the opposite impact applies for a decrease.
· Nominal GDP – higher GDP levels are reflected in higher tax revenue, which increases the operating balance and lowers the Government’s net debt.
· Interest rates – higher interest rates lead to increased debt-financing costs, although this would be partially offset by higher interest-based revenue on assets.
· The level of unemployment – higher levels of unemployment translate to an increase in spending because the number of unemployment beneficiaries rises. This decreases the operating balance and raises net debt levels.
· CPI inflation – as most benefits are indexed to CPI movements, higher inflation results in increased benefit costs. This reduces the operating balance and increases debt.
Figure 3.10 – Gross sovereign-issued debt
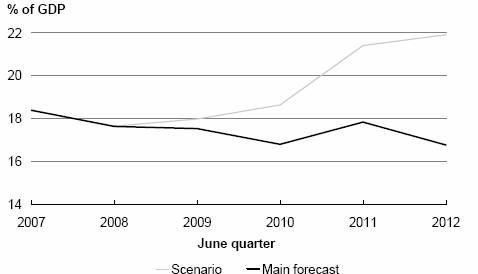
Source: The Treasury
The scenario is characterised by weaker domestic demand and lower inflation throughout the forecast period compared with the main forecast. The weaker domestic demand and lower inflation – plus a muted export response to the lower exchange rate – lead to lower nominal GDP reducing tax revenue. Relative to the main forecast, there is cumulatively $10.4 billion less tax by June 2012.
Figure 3.11 – OBEGAL (excluding NZS Fund retained revenue)

Source: The Treasury
Expenses are lower overall relative to the main forecast, as the increase in debt financing costs owing to the larger stock of debt (see below) and the increase in the number of unemployed are offset by the lower cost of inflation-indexed benefits owing to lower inflation.
Despite the lower expenses, lower tax revenue means the OBEGAL (excluding NZS Fund retained revenue) is lower over the forecast period and is, when expressed as a percentage of GDP, 1.5 percentage points lower in the final year of the forecast than in our main forecast (see Figure 3.11). As a result, gross sovereign-issued debt is 21.9% of GDP at the end of the forecast period compared to 16.8% of GDP in the main forecast.
Table 3.1 provides some “rules of thumb” on the sensitivities of the fiscal position to changes in specific variables.
Table 3.1 – Fiscal sensitivity analysis
Year ending 30 June |
| 2008 |
| 2009 |
| 2010 |
| 2011 |
| 2012 |
|
1% lower nominal GDP growth per annum |
|
|
|
|
|
|
|
|
|
|
|
Revenue |
| (550 | ) | (1,100 | ) | (1,725 | ) | (2,365 | ) | (3,055 | ) |
Addition to financing costs |
| 17 |
| 68 |
| 152 |
| 271 |
| 425 |
|
Impact on the operating balance |
| (567 | ) | (1167 | ) | (1878 | ) | (2636 | ) | (3480 | ) |
Revenue impact of a 1% decrease in the growth rates of: |
|
|
|
|
|
|
|
|
|
|
|
Wages and salaries |
| (245 | ) | (490 | ) | (765 | ) | (1,045 | ) | (1,355 | ) |
Taxable business profits |
| (125 | ) | (265 | ) | (420 | ) | (590 | ) | (770 | ) |
One percentage point lower interest rates |
|
|
|
| �� |
|
|
|
|
|
|
Interest income |
| (41 | ) | (89 | ) | (57 | ) | (70 | ) | (49 | ) |
Expenses |
| (21 | ) | (88 | ) | (130 | ) | (167 | ) | (201 | ) |
Impact on the operating balance |
| (20 | ) | (0 | ) | 72 |
| 97 |
| 152 |
|
The forecasts of capital contributions to the New Zealand Superannuation (NZS) Fund are sensitive to the rate of return assumed on the Fund’s assets.
Table 3.2 – NZS Fund contributions sensitivity analysis
|
| Marginal |
| Effect on |
| Effect on Capital Contribution |
| ||||||
Variable |
| (%age points) |
| (%age points) |
| 2008/09 |
| 2009/10 |
| 2010/11 |
| 2011/12 |
|
Expected gross rate of return |
| -1 |
| -0.76 |
| 220 |
| 230 |
| 243 |
| 256 |
|
This chapter describes the specific fiscal risks to the Crown, including contingent liabilities. The Public Finance Act 1989 (PFA) requires disclosure of all Government decisions and other circumstances that may put pressure on the forecast spending amounts, and/or have a material effect on the fiscal and economic outlook.
To ensure a practicable and consistent disclosure approach, fiscal risks are disclosed based on the following criteria, consistent with the principles of the PFA:
· Reasonable certainty criterion - risks have not been included in the fiscal forecasts because they reflect Government decisions or legislative commitments with uncertain fiscal consequences or timing.
· Materiality criterion - risks have an impact on the fiscal forecasts (operating balance, net worth or gross debt) of $10 million or more in any one forecast year.
· Active consideration criterion - risks are being actively considered by the Minister of Finance and responsible Ministers (eg, are the subject of written reports) or are decisions that have been deferred until a later date.
The PFA requires that all specific fiscal risks be disclosed, except where it is determined by the Minister of Finance that disclosing a risk is likely to:
· prejudice the substantial economic interests of New Zealand
· prejudice the security or defence of New Zealand or international relations of the Government
· compromise the Crown in a material way in negotiation, litigation or commercial activity, or
· result in a material loss of value to the Crown.
Specific fiscal risks do not include:
· normal forecasting risks, such as uncertainty around welfare benefits, State-Owned Enterprise/Crown entity surpluses, the impact of regular revaluations of physical assets, finance costs or fluctuations in external markets
· possible changes to the interpretation of accounting policies, such as the changes to revenue recognition rules and recognition of liabilities, or
· discussion documents containing proposals that the Minister of Finance and responsible Ministers will not actively consider until the consultation process has been completed.
In addition, the Minister of Finance has to determine that there is no reasonable or prudent way the Government can avoid this prejudice, compromise or material loss by making a decision on the fiscal risk before the finalisation of the forecasts, or by disclosing the fiscal risk without reference to its fiscal implications.
Contingent liabilities are also included according to materiality. Contingent liabilities below $10 million are included in the “other quantifiable contingent liabilities” total. Comparatives have been adjusted where appropriate to align with the disclosure of new “material” contingent liabilities. The total amount of prior years’ contingent liabilities remains unchanged.
· The risks disclosed may not eventuate into Government policy and the final cost or saving may differ from the amount disclosed if the policy is developed.
· All risks, should they eventuate, would impact on the Government’s forecast operating and/or capital spending amounts. There are new spending amounts already incorporated into the forecasts to accommodate policy initiatives on which decisions have yet to be made. Most risks outlined in this chapter, if they eventuate, would be covered by these amounts and therefore have no impact on the overall level of the forecasts. The risks have been disclosed to indicate the pressure the risks place upon the forecast spending amounts.
· If the total of all risks considered exceeds the forecast new operating spending amounts in the forecasts, this would impact on the operating balance.
· The impact of capital spending initiatives is described as increasing the Government’s gross debt position. This is correct but because the Government also holds some financial assets the actual impact could equivalently be described as reducing the Government’s assets.
· There are a number of other pressures on the fiscal position that have not been included as risks. These pressures comprise proposals largely generated within individual departments and not yet considered by the Minister of Finance and responsible Ministers. Such items are expected to be managed within forecast spending amounts noted above.
As part of its Budget strategy, the Government has put in place some longer-term funding paths for particular sectors. This aids long-term planning and demonstrates the Government’s commitment to specific policies.
Charges against future Budgets do not meet the definition of a “risk” under the PFA, as these items are incorporated in the fiscal forecasts. This section is provided to increase transparency about the provisions for future Budgets.
The Defence Funding Package (DFP) is designed to provide the New Zealand Defence Force (NZDF) with the funding required to address issues identified by the Defence Capability and Resourcing Review, including capability, and maintaining equipment and reserves. Budget 2008 included $69.1 million per annum as the fourth tranche of the 10-year plan. The following table shows the additional tranches to be charged against future Budgets.
Budget to be Charged |
| 2009/10 |
| 2010/11 |
| 2011/12 |
| 2012/13 |
| 2013/14 |
| 2014/15 |
|
Budget 2009 |
| 85.700 |
| 85.700 |
| 85.700 |
| 85.700 |
| 85.700 |
| 85.700 |
|
Budget 2010 |
| — |
| 108.100 |
| 108.100 |
| 108.100 |
| 108.100 |
| 108.100 |
|
Budget 2011 |
| — |
| — |
| 66.900 |
| 66.900 |
| 66.900 |
| 66.900 |
|
Budget 2012 |
| — |
| — |
| — |
| 14.200 |
| 14.200 |
| 14.200 |
|
Budget 2013 |
| — |
| — |
| — |
| — |
| 58.600 |
| 54.200 |
|
Budget 2014 |
| — |
| — |
| — |
| — |
| — |
| 0.00 |
|
Budget 2008 included significant funding for Economic Transformation: Innovation. In addition to this, the Government has agreed that the following funding for this purpose will be pre-committed against future budgets:
Budget to be Charged |
| 2009/10 |
| 2010/11 |
| 2011/12 |
| 2012/13 and |
|
Budget 2009 |
| 93.000 |
| 100.000 |
| 100.000 |
| 100.000 |
|
Budget 2010 |
| — |
| 75.000 |
| 75.000 |
| 75.000 |
|
Budget 2011 |
| — |
| — |
| 25.000 |
| 25.000 |
|
The Foreign Affairs and Trade Package is designed to provide the Ministry of Foreign Affairs and Trade (MFAT) with certainty to progress growth plans while also providing the Government and MFAT the flexibility to respond to emerging issues that may arise as a result of an increasingly complex international environment. The pre-commitment is $133 million operating and $39 million in capital funding to be allocated in Budget 2009 to Budget 2012.
Operating:
Budget to be Charged |
| 2009/10 |
| 2010/11 |
| 2011/12 |
| 2012/13 |
|
Budget 2009 |
| 8.298 |
| 8.035 |
| 8.035 |
| 8.035 |
|
Budget 2010 |
| — |
| 13.557 |
| 13.369 |
| 13.369 |
|
Budget 2011 |
| — |
| — |
| 18.267 |
| 17.68 |
|
Budget 2012 |
| — |
| — |
| — |
| 24.493 |
|
Capital:
Budget to be Charged |
| 2009/10 |
| 2010/11 |
| 2011/12 |
| 2012/13 |
|
Budget 2009 |
| 7.031 |
| — |
| — |
| — |
|
Budget 2010 |
| — |
| 5.007 |
| — |
|
|
|
Budget 2011 |
| — |
| — |
| 15.655 |
| — |
|
Budget 2012 |
| — |
| — |
| — |
| 11.307 |
|
The Government has agreed that the indicative Health allocation of $800 million for Budget 2009 may be pre-committed by $2.233 million in 2010/11 rising to $13.736 million per annum in 2012/13 and outyears.
Budget to be Charged |
| 2009/10 |
| 2010/11 |
| 2011/12 |
| 2012/13 and |
|
Budget 2009 |
| — |
| 2.233 |
| 16.000 |
| 13.736 |
|
The Government previously set aside funding for the Teachers’ and Principals’ Collective Agreements in Budgets 2007 and 2008. These Collective Agreements have now been settled, and the remaining costs are $169.128 million in 2009/10 rising to $192.414 million in 2010/11 and outyears. These costs will be charged against Budget 2009.
Budget to be Charged |
| 2009/10 |
| 2010/11 |
| 2011/12 |
| 2012/13 and Outyears |
|
Budget 2009 |
| 169.128 |
| 192.414 |
| 192.414 |
| 192.414 |
|
Time-limited funding does not meet the definition of a “risk” under the PFA, but is further information that is prepared to increase transparency about initiatives with funding profiles that cease or decrease during the forecast period.
The following table outlines those areas where initiatives have time-limited funding that decreases or ceases at some point in the forecast period and may potentially be extended, using a $5 million materiality threshold. Time-limited funding often relates to pilot programmes, and in some cases Multi-Year Appropriations (MYAs) if they are likely to require further funding in the future.
Vote |
| Description of Initiative |
| Impact of Continuing Funding |
Biosecurity |
| Southern Saltmarsh Mosquito Eradication Programme |
| 7.000 in 2008/09, 9.000 in 2009/10 and 11.000 in 2010/11 and outyears |
|
|
|
|
|
Child, Youth and Family Services |
| Demand driven pressures on care and protection Services |
| 6.800 in 2008/09 and outyears |
|
|
|
|
|
Finance |
| Funding for ONTRACK’s revenue shortfall as a consequence of the extension of Toll’s interim track access charge pending the outcome of the expert determination process |
| 28.000 in 2009/10 and outyears |
|
|
|
|
|
Finance |
| Funding to ONTRACK to cover the cost of Wellington Railway Station, land released by Toll NZ Ltd and specific expenditure |
| 26.350 capital in 2008/09, 42.750 capital in 2009/10 and outyears |
|
|
|
|
|
Finance |
| Loan facility to ONTRACK to build a range of infrastructure projects |
| 46.995 capital in 2008/09, 110.000 capital in 2009/10 and outyears |
|
|
|
|
|
Finance |
| National rail network improvements |
| 25.000 capital in 2009/10 and outyears |
|
|
|
|
|
Health |
| Meningococcal Vaccine - Ongoing Delivery |
| 7.000 ongoing from 2009/10 |
|
|
|
|
|
Health |
| Healthy Housing Programme |
| 15.000 ongoing from 2010/11 |
|
|
|
|
|
Housing |
| Shared Equity Home Ownership Pilot |
| 17.500 capital ongoing from 2010/11 |
|
|
|
|
|
Revenue |
| Property Audit Strategy |
| 23.567 in 2010/11 and outyears |
|
|
|
|
|
Transport |
| Canterbury Transport Project |
| 9.000 in 2011/12, 14.000 in 2012/13 and outyears |
The following table shows the debt and operating impact if funding were to be appropriated to maintain funding levels for these initiatives (ie, extend the initiatives beyond their current scheduled completion dates). These amounts would need to be managed within the forecast spending.
Impact ($ million) |
| 2007/08 |
| 2008/09 |
| 2009/10 |
| 2010/11 |
| 2011/12 and |
|
Funding to Extend Operating Initiatives (Impact on Operating Balance) |
| — |
| 13.800 |
| 50.800 |
| 91.367 |
| 100.367 |
|
Funding to Extend Capital Initiatives (Impact on Debt) |
| — |
| 73.345 |
| 177.750 |
| 195.250 |
| 195.250 |
|
The risks outlined in these tables would, if they eventuated, impact on the Government’s forecast new operating and/or capital spending amounts.
The Minister of Finance has yet to fully consider the quantum of these risks.
Quantified Risks as at |
| Operating |
| Gross |
| Value of Risk |
| Funding in Budget |
|
New Risks |
|
|
|
|
|
|
|
|
|
|
|
|
|
|
|
|
|
|
|
Finance - Restructuring the Rail Industry |
| Decrease |
| Increase |
| 80-120 million capital in 2008/09 |
| 690 million capital in 2007/08 |
|
|
|
|
|
|
|
|
|
|
|
Changed Risks |
|
|
|
|
|
|
|
|
|
|
|
|
|
|
|
|
|
|
|
Customs - Border Management System (CusMod) Replacement |
| Decrease |
| Increase |
| 22 per annum operating and 100 capital |
| 1 operating one-off to further develop the business case |
|
|
|
|
|
|
|
|
|
|
|
Education - School Property |
| Decrease |
| Increase |
| Up to 84 capital in each of the next four years |
| Operating: 6 in 2008/09, 5 in 2009/10 and outyears |
|
|
|
|
|
|
|
|
|
|
|
Finance - Upgrade of National Rail Network |
| — |
| Increase |
| 375-425 capital over four years |
| 65 capital in 2008/09 |
|
|
|
|
|
|
|
|
|
|
|
Health - Indicative Funding for Budgets 2009 and 2010 |
| Decrease |
| — |
| 800 in 2009/10, 1648 in 2010/11, 1634 in 2011/12 and 1636 in 2009/10 |
| 750 per annum from 2008/09 |
|
|
|
|
|
|
|
|
|
|
|
Maori Affairs - Maori Business Aotearoa New Zealand |
| Increase |
| Increase |
| 40 capital in 2008/09 and ongoing operating savings of 4 |
| — |
|
|
|
|
|
|
|
|
|
|
|
Police - Increases to Police Staff |
| — |
| Increase |
| 45 capital over the forecast period |
| 41 per annum operating and 10 capital in 2008/09 |
|
|
|
|
|
|
|
|
|
|
|
Police - International Deployment Capability |
| Decrease |
| — |
| 20 per annum operating |
| — |
|
|
|
|
|
|
|
|
|
|
|
Unchanged Risks |
|
|
|
|
|
|
|
|
|
|
|
|
|
|
|
|
|
|
|
Economic Development - Venture Investment Fund |
| — |
| Increase |
| 40 capital in 2009/10 and 2010/11 |
| — |
|
|
|
|
|
|
|
|
|
|
|
Education - Early Childhood Education Ratio Changes |
| Decrease |
| — |
| 51 per annum operating from 2011/12 |
| — |
|
|
|
|
|
|
|
|
|
|
|
Education (Tertiary) - Vocational Training |
| Decrease |
| — |
| 2.5 in 2008/09, 7.5 in 2009/10, 15 in 2010/11, and 20 in 2011/12 and outyears |
| — |
|
|
|
|
|
|
|
|
|
|
|
Housing - Wellington City Council Social Housing Assistance |
| Decrease |
| — |
| 220 operating spread over a 10-15 year period |
| Funding set aside in a contingency but has not been appropriated |
|
|
|
|
|
|
|
|
|
|
|
New Zealand Defence Force - Sale of Skyhawks and Aermacchi Trainers |
| — |
| Decrease |
| US$110 capital |
| — |
|
|
|
|
|
|
|
|
|
|
|
New Zealand Defence Force - Defence - Capital Injections |
| — |
| Increase |
| 210 capital from 2008/09 to 2010/11 |
| — |
|
|
|
|
|
|
|
|
|
|
|
Social Development - Youth Court Sentencing Orders |
| Decrease |
| Increase |
| 12 per annum operating and 4 capital |
| — |
|
The risks outlined in these tables would, if they eventuated, impact on the Government’s forecast new operating and/or capital spending amounts.
Unquantified Risks as at |
| Operating |
| Gross |
| Funding Received in Budget |
New Risks |
|
|
|
|
|
|
|
|
|
|
|
|
|
Economic Development - Implementation of the New Zealand Tourism Strategy |
| Decrease |
| Increase |
| — |
|
|
|
|
|
|
|
Economic Development - Review of Financial Products and Providers |
| Decrease |
| Increase |
| — |
|
|
|
|
|
|
|
Education - Schools Plus |
| Decrease |
| Increase |
| — |
|
|
|
|
|
|
|
Education/Social Development - Inter-agency Plan for Conduct Disorder/Severe Antisocial Behaviour |
| Decrease |
| — |
| — |
|
|
|
|
|
|
|
Housing - Local Government and NGO Housing Projects |
| Decrease |
| Increase |
| — |
|
|
|
|
|
|
|
Housing - Urban Development Agencies |
| Decrease |
| Increase |
| — |
|
|
|
|
|
|
|
Housing - Hobsonville Urban Development |
| — |
| Increase |
| 33 capital and 5 operating between 2008/09 and 20011/12 |
|
|
|
|
|
|
|
Revenue - Investment in the Tax System and Related Business |
| Decrease |
| Increase |
| — |
|
|
|
|
|
|
|
Social Development - Five-Year Action Plan for Out of School Services |
| Decrease |
| — |
| — |
|
|
|
|
|
|
|
Social Development - New Zealand Superannuation and Veteran’s Pension |
| Decrease |
| — |
| — |
|
|
|
|
|
|
|
Social Development - Energy Subsidy for SuperGold Card Holders |
| Decrease |
| — |
| — |
|
|
|
|
|
|
|
Changed Risks |
|
|
|
|
|
|
|
|
|
|
|
|
|
Corrections - Capital Projects |
| Decrease |
| Increase |
| 110 capital and a total of 13.5 operating for Mt Eden |
|
|
|
|
|
|
|
Corrections - Collective Employment Contract Negotiations |
| Decrease |
| — |
| 16.5 operating in outyears |
|
|
|
|
|
|
|
Environment - Purchase of Kyoto Compliant Emission Units |
| — |
| Increase |
| — |
|
|
|
|
|
|
|
Health - District Health Board Deficits |
| Decrease |
| Increase |
| — |
|
|
|
|
|
|
|
Housing - Tamaki |
| — |
| Increase |
| — |
|
|
|
|
|
|
|
Justice - Strengthening the National Court Infrastructure |
| Decrease |
| Increase |
| 11 capital and 2 operating between 2008/09 and 2011/12 |
|
|
|
|
|
|
|
Justice - Greater Auckland Region Service Delivery Strategy |
| Decrease |
| Increase |
| 6 operating between 2008/09 and 2011/12 |
|
|
|
|
|
|
|
Justice Sector and Other Agencies - Effective Interventions |
| Decrease |
| — |
| .5 capital and 6 operating between 2008/09 and 2011/12 |
|
|
|
|
|
|
|
Local Government - Response to Rates Inquiry |
| Decrease |
| Increase |
| 41 operating over four years |
|
|
|
|
|
|
|
Revenue - Reducing Compliance Costs for Small- and Medium-Sized Enterprises |
| Unclear |
| — |
| — |
Unquantified Risks as at |
| Operating |
| Gross |
| Funding Received in Budget |
Transport - Regional transport projects |
| — |
| Increase |
| 33.5 operating between 2008/09 and 2011/12 |
|
|
|
|
|
|
|
Unchanged Risks |
|
|
|
|
|
|
|
|
|
|
|
|
|
Economic Development - Radio Spectrum Rights |
| Increase |
| — |
| — |
|
|
|
|
|
|
|
Education (Tertiary) - Tertiary Education Institutions - Capital Injection |
| — |
| Increase |
| — |
|
|
|
|
|
|
|
Education (Tertiary) - Wananga Capital Injections |
| — |
| Increase |
| — |
|
|
|
|
|
|
|
Finance - SOE Long-term Hold Reviews |
| — |
| Decrease |
| — |
|
|
|
|
|
|
|
Finance - Crown Overseas Properties |
| — |
| Increase |
| — |
|
|
|
|
|
|
|
Fisheries - Civilian Maritime Aerial Surveillance |
| Decrease |
| Increase |
| — |
|
|
|
|
|
|
|
Immigration - New Immigration Service Delivery Strategy |
| Decrease |
| Increase |
| 5 operating in 2007/08 |
|
|
|
|
|
|
|
Justice - Financial Action Taskforce Recommendations |
| Decrease |
| — |
| — |
|
|
|
|
|
|
|
New Zealand Agency for International Development - Adjustment of Official Development Assistance Fund |
| Unknown |
| — |
| Operating: 10 in 2008/09, 15 in 2009/10, 12 in 2010/11 and outyears |
|
|
|
|
|
|
|
Police - Wage Negotiations |
| Decrease |
| — |
| — |
|
|
|
|
|
|
|
Revenue - Management of Inland Revenue’s Lease Portfolio in Auckland |
| Decrease |
| — |
| — |
|
|
|
|
|
|
|
Revenue - Rebuild of the Student Loan IT System |
| Decrease |
| Increase |
| 4 operating in 2008/09 |
|
|
|
|
|
|
|
Revenue - Renegotiation of Double Tax Agreements |
| Decrease |
| — |
| — |
|
|
|
|
|
|
|
Revenue - Working for Families Review of Rates |
| Decrease |
| — |
| — |
|
|
|
|
|
|
|
Social Development - Working New Zealand: Work-focused Support |
| Decrease |
| — |
| — |
|
|
|
|
|
|
|
Social Development - Children, Young Persons and their Families Act |
| Decrease |
| Increase |
| — |
The following risks have been removed since the 2007 Half-Year Economic and Fiscal Update:
Expired Risks |
| Reason |
| Funding Received |
Agriculture and Forestry - Industry Partnership for Food and Pastoral Innovation |
| Funded in Budget 2008 |
| 700 capital in 2008/09 |
|
|
|
|
|
Culture and Heritage - Broadcasting Initiatives |
| Funding provided in Budget 2008 means the remainder of the risk is below the materiality threshold |
| 3 operating per annum ongoing |
|
|
|
|
|
Economic Development - Shanghai Expo 2010: New Zealand Participation |
| Funded in Budget 2008 |
| 27 operating over three years |
|
|
|
|
|
Education - Schools ICT Network Infrastructure Upgrade |
| Funded in Budget 2008 |
| 9 operating in 2008/09, 19 operating in 2009/10 and outyears |
|
|
|
|
|
Education - Performance Based Research Fund |
| Funded in Budget 2008 |
| Operating: 4 in 3007/08, 7 in 2008/09, 9 in 2009/10, 13 in 2010/11 and outyears |
|
|
|
|
|
Education - Upskilling the Workforce Strategy |
| Funded in Budget 2008 |
| Operating: 29 in 2008/09, 38 in 2009/10, 48 in 2010/11, 50 in 2011/12 and outyears |
|
|
|
|
|
Education - Year One Class Sizes |
| Funded in Budget 2008 |
| Operating: 22 in 2008/09, 53 in 2009/10, 54 in 2010/11 and outyears |
|
|
|
|
|
Education - Tertiary Student Support Changes |
| Funded in Budget 2008 |
| Operating: 18 in 2008/09, 34 in 2009/10, 38 in 2010/11, 40 in 2011/12 and outyears |
|
|
|
|
|
Finance - National Rail Access Agreement Amendments |
| Funded in Budget 2008 |
| 690 capital in 2007/08 |
|
|
|
|
|
Fisheries - Maori Interest in Marine Farming |
| Funded in Budget 2008 - liability now in financial statements |
| 72 operating in 2007/08 |
|
|
|
|
|
Foreign Affairs and Trade - Additional Baseline Funding |
| Funded in Budget 2008 |
| 242 operating and 59 capital over four years. Additional funding has also been set aside in the pre-commitment |
|
|
|
|
|
Health - National Systems Development Project Tranche 2 |
| Project may be met from within current baselines |
| 10 operating in 2008/09 and outyears |
|
|
|
|
|
Health - Strengthening Child and Adolescent Oral Health Services |
| Funded in Budget 2008 |
| Operating: 14 in 2008/09, 15 in 2009/10, 20 in 2010/11 and 30 in 2011/12 and outyears |
|
|
|
|
|
Housing - Rural Housing |
| Not Funded in Budget 2008 |
| — |
|
|
|
|
|
Housing - Shared Equity Home Ownership |
| Funded in Budget 2008 |
| 18 capital in 2008/09 and 2009/10 |
|
|
|
|
|
Justice Sector Agencies - |
| The risk has been partially funded, and other measures are |
| 2 per annum operating ongoing |
Expired Risks |
| Reason |
| Funding Received |
Extra Police |
| being taken to mitigate the risk |
|
|
|
|
|
|
|
National Library - National Library Building Redevelopment |
| Funded in Budget 2008 |
| Operating: 10 in 2007/08, 6 in 2008/09, 5 in 2009/10, 8 in 2010/11 and 7 in 2011/12 and outyears |
|
|
|
|
|
Prime Minister and Cabinet - Government House Wellington |
| Funded in Budget 2008 |
| 47 capital and 1 operating over the forecast period |
|
|
|
|
|
Research, Science and Technology - Multi-year Funding Profile |
| Superseded by Economic Transformation: Innovation funding and pre-commitment |
| Operating: 44 in 2008/09, 40 in 2009/10, 56 in 2010/11 and 65 in 2011/12 and outyears |
|
|
|
|
|
Revenue - Life Insurance |
| The Government has taken final decisions on this risk |
| — |
|
|
|
|
|
Revenue - Changes to the Petroleum Mining Tax Rules |
| The Government has taken final decisions on changes to the rules |
| — |
|
|
|
|
|
Revenue - International Tax Review |
| The Government has taken final decisions on the review |
| — |
|
|
|
|
|
Social Development/Housing - Accommodation Supplement Review |
| Review process now complete |
| — |
|
|
|
|
|
Transport - Cost Guarantee for State Highway Construction |
| Funded by transferring existing funding from 2007/08 to 2008/09 |
| — |
The Government is currently considering a range of options to address continued forecast growth in the prison population, including the asset management of current Corrections facilities, and increased prison capacity. This risk is unquantified as the quantum of the risk will vary greatly depending on the options chosen. If approved, any capital injections would increase gross debt while operating funding would decrease the operating balance.
The Government will be entering into negotiations with the Public Service Association and the Corrections Association of New Zealand to settle six new collective employment agreements. Current agreements expire in the first half of 2008.
This risk is unquantified as disclosure may compromise the Crown in negotiations, however any additional funding would decrease the operating balance.
Customs’ border management systems (CusMod) are over 10 years old. Customs received funding in Budgets 2007 and 2008 to develop a business case for replacement
systems for consideration in Budget 2009. In accordance with the two-stage approval process for major IT projects, funding for CusMod replacement is dependent on approval of the two business cases. The indicative cost of the project is $105 million capital over five years and up to $15 million operating per annum. If approved, this would decrease the operating balance and increase gross debt.
The Minister of Finance has yet to fully consider the quantum of this risk.
Source: New Zealand Customs Service
In Budget 2006, the Government agreed to additional investment commitments in the Venture Investment Fund of $60 million over the period of 2006/07 to 2008/09. The Government is also considering further commitments of $40 million over two years (2009/10 and 2010/11). This depends on the results of the evaluation of the Venture Investment Fund scheduled for completion by 31 March 2009. If approved, this would increase gross debt.
The Minister of Finance has yet to fully consider the quantum of this risk.
Source: Ministry of Economic Development
The New Zealand Tourism Strategy 2015 is a joint document between the Government and industry. It includes a range of actions to progress key sector goals. Funding for these actions will come from a range of stakeholders, including Government. Ministers are yet to decide the appropriate funding mix to support high-priority actions within the Strategy, however additional capital funding would increase gross debt and additional operating funding would decrease the operating balance.
As part of the Review of Financial Products and Providers the Government is strengthening the regulatory regimes for the non-bank financial sector. These regimes are intended to come into force from 2010. This will have resource implications for the Reserve Bank, the Securities Commission and the Ministry of Economic Development. Final costs are unknown at this time, however additional capital funding would increase gross debt and additional operating funding would decrease the operating balance.
The Government sets the processes for the renewal or auction of property rights to radio spectrum in consultation with industry. Any revenue from sale of rights would increase the operating balance by the full amount of the sales less the cost of sales as charged to the Spectrum Sales Appropriation. Offers for rights of renewal to existing owners of spectrum rights are set approximately five years in advance of rights expiring from 2010 onwards with settlement being required prior to granting the new right. If any offers are rejected then they will be allocated by way of auction on the open market. (For this reason the expected revenue from sale of renewal rights is not reflected in current forecasts of revenue.)
This risk is unquantified as disclosure could compromise the Crown in negotiations.
The Government is considering a range of policies to increase student participation and achievement in education, skills and structured learning. This could result in increased costs for compulsory and tertiary education. The impact of any further funding would reduce the operating balance and/or increase gross debt, but the quantum is unclear as it would depend on the options chosen.
The Government has approved and published a six-year Inter-agency Plan for Conduct Disorder/Severe Antisocial Behaviour (2007-2012). The Inter-agency Plan commits the Government to deliver a range of initiatives including new services for 3-7-year-olds and shared infrastructure across sectors. While amounts would depend on the policy and scaling options chosen, any additional operating funding would decrease the operating balance.
The Government has committed to increasing adult-to-child ratios as part of the Early Childhood Education Strategic Plan, and consulted on options for new ratios in 2004 and 2005. In October 2006, the Government agreed to initial changes to ratios to implement part of one option consulted on, to be gradually introduced from July 2009. The Government has also communicated that further changes are being considered. The current funding is thought to be insufficient for further changes, so additional funding of approximately up to $51 million per annum from 2011/12 will be considered as part of Budget 2009. Any increased funding would reduce the operating balance.
The Minister of Finance has yet to fully consider the quantum of this risk.
Source: Ministry of Education
The Government is considering a number of policies regarding the expansion of vocational training. One of these is to have 250,000 people participating in industry training.
As at Budget 2008, funding supports participation of approximately 220,000 trainees by 2011. To achieve participation of 250,000 trainees in 2011, the Industry Training Fund would need to increase by approximately $7.5 million in 2009/10, $15 million in 2010/11 and $20 million in 2011/12 and outyears.
If approved, this proposal would decrease the operating balance.
The Minister of Finance has yet to fully consider the quantum of this risk.
Source: Tertiary Education Commission
Additional capital injections for school accommodation will be required in future years to meet roll growth and to establish new schools. They could cost up to $84 million in each of
the next four years. In addition to capital injections, consequential operating costs are likely to increase by approximately $13 million per annum (including $7 million in capital charge). New expenditure rules have been put in place to time limit new capital budget approvals, but this will take some time to take effect. It is expected that the liability for schools’ unspent property entitlements and delayed projects will continue to increase until 2010/11 before levelling off and then declining. If approved, any capital funding would increase debt, and any operating funding would decrease the operating balance.
The Minister of Finance has yet to fully consider the quantum of this risk.
Source: Ministry of Education
The Government is considering making loans or capital injections to tertiary education institutions where ongoing educational provision or financial viability are at risk.
The Government may also consider making capital injections to tertiary education institutions when a strategic investment to support the development of their infrastructure is warranted.
The provision of any capital injections would increase gross debt, but the total quantum is unclear as it would depend on progress made by institutions in managing their pressures, and on decisions taken by Government.
The Government is currently negotiating with Te Wananga o Raukawa over settlement of its Waitangi Tribunal claim. The Waitangi Tribunal has recommended that the Wananga be compensated for capital expenditure it has incurred on facilities to date, and be provided with funding to bring its facilities up to a standard comparable with other tertiary institutions and to meet additional capital requirements. Negotiations are also taking place with Te Whare Wananga o Awanuiarangi in relation to an outstanding item from the original settlement.
This risk is unquantified as disclosure could compromise the Crown in negotiations with the Wananga, but any capital injections would increase gross debt.
The government faces a potential net-exposure to the international market for Kyoto-compliant emission units. This net-exposure would come about if the emission units that are built up by government over the first commitment period as a result of the operation of the Emission Trading Scheme (ETS), are less than the size of the governments Kyoto liability.
Currently the forecasts indicate that the government may have to purchase Kyoto-compliant emission units to meet its Kyoto obligations. However, there is significant uncertainty around both the Kyoto liability and the units that may be built up as a result of the ETS (largely given the inherent uncertainty around forecasts of NZ net emissions and the assumed take-up rate of forestry into the ETS).
The risk is unquantified given the large degree of uncertainty. Any purchasing would increase gross debt.
To implement its long-term hold ownership policy, the Government has conducted reviews of State-Owned Enterprises (SOEs). These reviews have examined appropriate capital structures to support the strategies of SOEs. One possible outcome of these reviews is that some capital could be returned to the Crown. This may be in the form of a special dividend, which would decrease gross debt.
The Government is considering options relating to the continued use of certain Crown overseas properties.
The risk is unquantified as disclosure could compromise any negotiations the Crown may enter, but any additional operating funding would decrease the operating balance, and/or any additional capital funding would increase gross debt.
The Government has committed significant expenditure to upgrade and renew the national rail network, and has signalled an intention to continue investment in rail infrastructure. In particular, the government it is considering a package of renewals and upgrades to the rail network of approximately $375 million to $425 million between 2008/09 and 2012/13 (this is in addition to the $25 million for national network upgrades that was funded in Budget 2007). If approved, this funding would increase gross debt.
The Minister of Finance has yet to fully consider the quantum of this risk.
Source: The Treasury
Ministers are considering options around ensuring the viability of the rail industry, including medium-term capital investment. These options include the refinancing of between $80 million and $120 million of debt held by the new rail operator company with a loan from the Crown in 2008/09, and the purchase of rolling stock for the new rail operator company - the timing and scale of which is uncertain at this stage. If approved, any funding of this nature would increase gross debt and/or reduce the operating balance.
The Minister of Finance has yet to fully consider the quantum of this risk.
Source: The Treasury
The Government is considering options to provide increased maritime aerial surveillance for civilian agencies in the short to medium range. Options include delivery of a range of different surveillance capabilities by either military or commercial providers. The amount of funding required would depend on the option chosen, if any. Any capital injections required would increase gross debt, while operating funding would decrease the operating balance.
The risk is unquantified as the amount or timing of any funding is unclear.
The Government is considering indicative operating allocations of $800 million and $850 million for Budgets 2009 and 2010 respectively. These amounts indicate the likely level of increased funding to be provided to Vote Health in future Budgets and to assist the Minister of Health to plan spending priorities over the period. The final allocations will depend on economic and fiscal conditions at the time of each Budget. Finalising the amounts and details of how these allocations will be spent will be subject to normal budget processes.
The Government has also agreed that the indicative allocation for Budget 2009 above may be pre-committed up to $13.736 million per annum in 2012/13 and outyears. This was shown in the Charges Against Future Budgets section of this chapter. The operating balance would be decreased by the totals as follows:
Budget to be Charged |
| 2009/10 |
| 2010/11 |
| 2011/12 |
| 2012/13 and |
|
Budget 2009 |
| 800 |
| 798 |
| 784 |
| 786 |
|
Budget 2010 |
| — |
| 850 |
| 850 |
| 850 |
|
The Minister of Finance has yet to fully consider the quantum of this risk.
Source: Ministry of Health
Draft District Annual Plans from Hawkes Bay, Auckland, Counties Manukau, Whanganui, West Coast, Southland, Otago, Tarawhiti and Capital and Coast District Health Boards (DHBs) indicate projected operating deficits in 2008/09. The Government does not view DHB deficits as acceptable and cost containment strategies are in place.
Any decision to fund such deficits would decrease the operating balance and/or increase gross debt. Specific potential pressures for DHBs include wage bargaining and financing costs of capital projects.
This risk has changed since the 2007 Half Year Economic and Fiscal Update to take into account the new projections of DHB deficits.
The Government has agreed to provide the Wellington City Council with a conditional grant of $220 million over an investment period of 10 to 15 years (representing approximately $150 million in net present value terms) to upgrade its social housing portfolio. The funding has been set aside in contingency, pending conclusion of negotiations with the Council about the details of the assistance. The conditional grant will decrease the operating balance.
The Minister of Finance has yet to fully consider the quantum of this risk.
Source: Department of Building and Housing
The Government is considering how best to encourage the growth of not-for-profit providers of affordable rental and owner-occupier housing. The amount and timing of costs would depend on the option chosen, however additional capital funding would increase gross debt and additional operating funding would decrease the operating balance.
The Government is considering how Urban Development Agencies could be established in New Zealand for housing developments that would provide for sustainable communities, including the supply of affordable housing. The amount and timing of costs would depend on the option chosen, however additional capital funding would increase gross debt and additional operating funding would decrease the operating balance.
The Government is considering the redevelopment of the Tamaki area. Any capital funding would increase gross debt while operating funding would decrease the operating balance. This risk is unquantified as disclosure could compromise the Crown in negotiations.
The Government has agreed to the creation of an integrated urban community at Hobsonville. While funding is being provided in Budget 2008 for Precinct One, as well as any other costs that need to occur concurrently with Precinct One, capital funding will need to be provided for the remaining four precincts in future Budgets. This will increase gross debt. This risk is unquantified as disclosure could compromise the Crown in negotiations.
The Government is in the process of developing a stage-two business case for a new immigration service delivery strategy, which would aim to allow better management of the risk surrounding immigration decision-making and improve delivery of immigration services. Cabinet is likely to consider the stage-two business case later in 2008. A portion of the additional funding is expected to be funded by third-party revenue and the rest would reduce the operating balance and increase gross debt.
In order to implement the recommendations of the Financial Action Taskforce, the Government is considering a new Anti-money Laundering and Counter-terrorist Financing regime. Increased supervision and enforcement is expected to result in increased costs to the following agencies: the Reserve Bank, the Securities Commission, the Department of Internal Affairs, the Financial Intelligence Unit of the New Zealand Police and the Ministry of Justice. The risk is unquantified as costs are still being finalised but would reduce the operating balance.
The Government is considering options to ensure that court facilities in Gisborne, Christchurch, Nelson and Auckland are able to adequately deliver court and associated justice services to the regions. This risk is unquantified as disclosure could compromise any
commercial property negotiations the Crown may enter into. Any additional operating funding would decrease the operating balance and any additional capital would increase gross debt.
The Government is developing a strategy to address courts needs in the greater Auckland region. A wide range of stakeholders are currently being consulted over a variety of service delivery options.
The risk is unquantifed as disclosure may compromise the Crown in negotiations to purchase land or enter into future construction contracts. Any impact on the operating balance or gross debt will depend on the options chosen.
As part of a comprehensive approach to reducing crime and the pressures on the prison population, the Government is considering measures to address the precursors of crime, and measures to reduce re-offending. The measures focus on early interventions for vulnerable children, youth offending, restorative justice, preventing crime in local communities, reintegrating offenders and drug and alcohol treatment for offenders.
Funding of $37 million per annum was approved in 2006. Further operating funding will depend on the specific options chosen. This would decrease the operating balance.
This risk was quantified in HYEFU 2007, however this only reflected Phase 1 initiatives. Work has since commenced on Phase 2 initiatives, but these have not yet been developed and as such the risk is now unquantified.
The Independent Inquiry into Local Government Rates reported in August 2007. The Government has established a series of work streams to assist development of its response to issues outlined in the report. Some initiatives have already been undertaken as part of the Government’s response, including $38.1 million in new funding over four years for enhancements to the rates rebate scheme. However, the total potential impact of this risk on the operating balance and/or gross debt is unknown at this stage, as this would depend on the nature and scope of any additional measures subsequently pursued.
The Government has agreed to establish an independent statutory corporation for the purposes of furthering Maori economic development, to be known as Maori Business Aotearoa New Zealand (MBANZ), subject to enactment of the Maori Trustee and Maori Development Bill.
New Crown funding required is estimated to be $40 million capital in 2008/09, with an associated ongoing operating saving of approximately $4 million per annum. If approved, this would increase the operating balance and increase gross debt.
The Minister of Finance has yet to fully consider the quantum of this risk.
Source: Te Puni Kokiri
Budget 2008 includes funding to take Government Official Development Assistance to an equivalent percentage of Gross National Income (GNI) - 0.30% in 2008/09, 0.33% in 2009/10 and 0.35% in 2010/11. However, because GNI forecasts will change in subsequent years, there is a risk that further funding may be required to maintain these percentages of GNI. Any such changes will be considered in future Budgets. The net impact of this risk is unclear and thus may increase or reduce the operating balance.
Implementing the Government’s decisions on the future structure of the New Zealand Defence Force (NZDF) will involve a series of capital acquisitions across all three armed services and for Headquarters NZDF to achieve the required capability upgrades. The Government has agreed to a capital injection of up to $1.244 billion over the 10-year period from 2002 to 2012.
Of the $1.244 billion, $1.034 billion has been appropriated with the remaining $210 million likely to be required within the forecast period. The actual expenditure profile will depend on the specification and timing of the individual projects, the contracted prices, and the prevailing exchange rate at the time of purchase.
Any further capital injections would increase gross debt.
The Minister of Finance has yet to fully consider the quantum of this risk.
Source: New Zealand Defence Force
As a result of the Government’s decisions on the future structure of the NZDF, NZDF has signed an agreement with Tactical Air Services Inc for the sale of the Skyhawks and Aermacchi trainers for US$110 million. A formal contract has yet to be signed, but proceeds from the sale would decrease gross debt and increase the operating balance.
The Minister of Finance has yet to fully consider the quantum of this risk.
Source: New Zealand Defence Force
The Government will consider increases in Police staff in future Budgets with a view to achieving Police Officer ratios comparable with those of Australia by 2010. The amount of funding that could be required is unclear at this point.
The Government has funded an additional 1,000 sworn Police and 250 non-sworn Police staff over Budgets 2006-08. Additional funding for property associated with these staff will be considered in future Budgets, and may be in the order of $45 million capital. If approved, additional capital injections would increase gross debt and additional operating funding would decrease the operating balance.
The Minister of Finance has yet to fully consider the quantum of this risk.
Source: New Zealand Police
The Government is considering options to ensure that the New Zealand Police has sufficient capability to manage requests for assistance overseas. The funding required depends on the quantity of personnel and the funding structure associated with the option chosen, but could be in the order of $20 million operating per annum. Any additional operating funding would decrease the operating balance.
The Minister of Finance has yet to fully consider the quantum of this risk.
Source: New Zealand Police
The Police collective employment agreements expire on 30 June 2008. The Government will be entering into negotiations with police service organisations to settle new collective employment agreements prior to the expiration date of the current agreements. Any additional funding would decrease the operating balance. This risk is unquantified as disclosure may compromise the Crown in negotiations.
The Government is considering measures to simplify the tax rules for small- and medium-sized enterprises, pursuant to a Government discussion document released in December 2007. Consultation on a number of the measures proposed in this discussion document is underway. Some changes have been adopted as part of Budget 2008 while other changes may be adopted subsequently. The potential overall impact on the operating balance is unknown at this stage, as it would depend on the nature and scope of any measures that are subsequently pursued.
Inland Revenue is currently exploring options to consolidate its lease portfolio in Auckland. A report back that will consider options and risks is due in June 2008. This risk is unquantified as disclosure could compromise the Crown in negotiations, but any additional operating funding would decrease the operating balance.
Inland Revenue is investigating options around investment in the tax system and related business processes, including replacing the FIRST tax system. Part of this work includes investigating options for transforming employer information and payments. The potential impact and timing of this are unknown at this stage, as it would depend on the nature and scope of any options that are subsequently pursued. Any additional capital funding would increase gross debt and additional operating funding would decrease the operating balance.
The Government is considering options for redesigning the student loans IT system. The redesign aims to enable greater efficiency and enhanced student services while delivering increased integrity of the system, produce greater information to inform policy decisions and increased flexibility for future policy changes. This risk is unquantified as disclosure
could compromise the Crown in negotiations. If approved, any funding would decrease the operating balance and/or increase gross debt.
A Government discussion document released in December 2006 considered the case for negotiating lower rates of Non-Resident Withholding Tax (NRWT) in New Zealand’s Double Tax Agreements (DTAs). Subsequently, it has been announced that the renegotiation of the New Zealand and Australia DTA is expected to commence shortly. Although any effect on the operating balance will depend on the outcome of bilateral treaty negotiations, to the extent that lower rates are agreed, this will likely have the effect of decreasing the operating balance.
Working for Families legislation requires a review of the amounts of the In-Work Tax Credit and Parental Tax Credits to be undertaken no later than June 2008. This review is to assess whether the current rates still meet the policy objectives behind Working for Families. This policy cannot be quantified until the review is completed.
The Government is considering a number of changes to the Children, Young Persons and Their Families Act 1989. Most of the costs relating to these changes arise from the proposal to increase the age of a young person from 17 to 18. The fiscal impacts would depend on what proposals are finally approved and the details of the legislation. Any additional operating funding would decrease the operating balance and any additional capital would increase gross debt.
Working New Zealand: Work-focused Support is a package of policy and operational changes aimed at simplifying the benefit system and enhancing the opportunities for beneficiaries to participate in the labour market. The first stage has already been implemented and focused on getting services and support in place to help people move into work and stay employed. The Government is considering further options and costs to simplify the benefit system and further support people to stay in work. The next stage will be submitted for consideration in future Budgets. The remaining proposals are still being developed, but any additional funding would decrease the operating balance.
The Government has approved, in principle, a Five-year Action Plan for Out of School Services. The Action Plan proposes a range of initiatives that represent a number of policy options available to Government. While the amounts are unclear and would depend on the policy options chosen, any additional operating funding would decrease the operating balance.
The Government is considering the inclusion of new Youth Court orders in the Children, Young Persons and Their Families Act 1989. These new Youth Court orders are extended supervision with residents and extended supervision with activity. The estimated cost is approximately $12 million in operating funding and $4 million in capital funding. This would have the effect of decreasing the operating balance and increasing debt.
The Minister of Finance has yet to fully consider the quantum of this risk.
Source: Ministry of Social Development
The Government has ensured that the net married couple rate of New Zealand Superannuation (NZS) applying for the tax year from 1 April 2008 is equivalent to 66% of the net average ordinary time weekly wage (known as the 66% wage floor). This also applies to the Veteran’s Pension, which is set at the same rates as NZS. Each year the Government will review the level to be set for the following tax year. Under the 2008 Budget Economic and Fiscal Update (BEFU) forecasts CPI-indexation of NZS rates is predicted to be enough to maintain the 66% wage floor next year. However, because the rates of NZS applied on 1 April 2009 will depend on the actual CPI and wage statistics that occur, there is a risk that maintaining the 66% wage floor at that time will exceed the cost of CPI-indexing. This would decrease the operating balance.
The SuperGold Card is a discounts and concessions card issued free to senior citizens and veterans. When the card was introduced in 2006, it was with the intention of having a range of services gradually included. A major enhancement being considered by Government would offer SuperGold Card holders a winter heating subsidy, to mitigate the increasing cost of energy prices. The total cost of the subsidy would depend on policy and implementation decisions yet to be made.
The Government is considering funding options for a number of regional transport projects. There is potential for some of these projects to be debt funded and repaid via a regional fuel tax in those regions. This would increase gross debt. In Budget 2008 the Crown provided $33.5 million of such funding over the forecast period for the Canterbury Transport Project.
Contingent liabilities are costs that the Crown will have to face if a particular event occurs. Typically, contingent liabilities consist of guarantees and indemnities, legal disputes and claims, and uncalled capital. The contingent liabilities facing the Crown are a mixture of operating and balance sheet risks, and they can vary greatly in magnitude and likelihood of realisation. In general, if a contingent liability were realised it would reduce the operating balance and net worth, and increase gross sovereign issued debt. However, in
the case of contingencies for uncalled capital, the negative impact would be restricted to gross sovereign issued debt.
Where contingent liabilities have arisen as a consequence of legal action being taken against the Crown, the amount shown is the estimation of the possible amount of any award against the Crown. It does not represent either an admission that the claim is valid or an estimation of the amount of any award against the Crown.
Only contingent liabilities involving amounts of over $10 million are separately disclosed. Contingent liabilities below $10 million are included in the “other quantifiable contingent liabilities” total. Comparatives have been adjusted where appropriate to align with the disclosure of new “material” contingent liabilities. The total amount of prior years’ contingent liabilities remains unchanged.
Contingent liabilities have been stated as at 31 March 2008, being the latest set of published contingent liabilities.
Details of each of the following contingent liabilities can be accessed from the Treasury website at http://www.treasury.govt.nz/budget/forecasts/befu2008.
|
| Status(13) |
| ($ million) |
|
Guarantees and indemnities |
|
|
|
|
|
Cook Islands – Asian Development Bank loans |
| Unchanged |
| 14 |
|
Indemnification of receivers and managers – Terralink Limited |
| Unchanged |
| 10 |
|
Ministry of Justice – Treaty settlement, tax liabilities |
| Unchanged |
| 105 |
|
Ministry of Transport – funding guarantee |
| Unchanged |
| 10 |
|
Guarantees and indemnities of SOEs and Crown entities |
| Unchanged |
| 18 |
|
Other guarantees and indemnities |
| Changed |
| 10 |
|
|
|
|
| 167 |
|
Uncalled capital |
|
|
|
|
|
Asian Development Bank |
| Changed |
| 1,005 |
|
Bank for International Settlements |
| Unchanged |
| 25 |
|
European Bank for Reconstruction and Development |
| Changed |
| 14 |
|
International Bank for Reconstruction and Development |
| Changed |
| 1,036 |
|
|
|
|
| 2,080 |
|
Legal proceedings and disputes |
|
|
|
|
|
Health – legal claims |
| Changed |
| 39 |
|
Tax in dispute |
| Changed |
| 220 |
|
Other legal claims against SOEs and Crown entities |
| Changed |
| 3 |
|
Other legal claims |
| Changed |
| 87 |
|
|
|
|
| 349 |
|
Other quantifiable contingent liabilities |
|
|
|
|
|
International finance organisations |
| Changed |
| 1,647 |
|
New Zealand Export Credit Office – export guarantees |
| Changed |
| 33 |
|
Reserve Bank – demonetised currency |
| Unchanged |
| 23 |
|
Social Development – claim for judicial review |
| Changed |
| 88 |
|
Transpower New Zealand Limited |
| Changed |
| 37 |
|
Other quantifiable contingent liabilities of SOEs and Crown entities |
| Changed |
| 85 |
|
Other quantifiable contingent liabilities |
| Changed |
| 71 |
|
|
|
|
| 1,984 |
|
Total quantifiable contingent liabilities |
|
|
| 4,580 |
|
(13) Relative to reporting in the Half Year Economic and Fiscal Update 2007.
|
| Status |
|
Guarantees and indemnities |
|
|
|
AgriQuality Limited (formerly Asure New Zealand Limited) |
| Unchanged |
|
At Work Insurance Limited |
| Unchanged |
|
Auckland Rail lease |
| Unchanged |
|
Bona Vacantia property |
| Unchanged |
|
Building Industry Authority |
| Unchanged |
|
District Court Judges, Justices of the Peace, Coroners and Disputes Tribunal |
| Unchanged |
|
Earthquake Commission (EQC) |
| Unchanged |
|
Electricity Corporation of New Zealand Limited (ECNZ) |
| Changed |
|
Ministry of Fisheries – indemnity provided for delivery of registry services |
| Unchanged |
|
Genesis Power Ltd (Genesis Energy) |
| Unchanged |
|
Geothermal carbon tax indemnity |
| Unchanged |
|
Housing New Zealand Corporation (HNZC) |
| Unchanged |
|
Indemnities against acts of war and terrorism |
| Unchanged |
|
Maui Partners |
| Unchanged |
|
National Provident Fund |
| Unchanged |
|
New Zealand Railways Corporation |
| Unchanged |
|
Persons exercising investigating powers |
| Unchanged |
|
Ports of Auckland |
| Unchanged |
|
Public Trust |
| Unchanged |
|
State Insurance and Rural Bank – Tax liabilities |
| Unchanged |
|
Synfuels-Waitara Outfall Indemnity |
| Unchanged |
|
Tainui Corporation |
| Unchanged |
|
Toll NZ Ltd – purchase of rail network assets |
| Unchanged |
|
Other unquantifiable contingent liabilities |
|
|
|
Abuse claims |
| Unchanged |
|
Accident Compensation Corporation (ACC) litigations |
| Unchanged |
|
Environmental liabilities |
| Unchanged |
|
Rugby World Cup 2011 – joint venture arrangements |
| Unchanged |
|
Treaty of Waitangi claims |
| Unchanged |
|
Treaty of Waitangi claims – settlement relativity payments |
| Unchanged |
|
Other contingencies |
|
|
|
Foreshore and seabed |
| Unchanged |
|
These forecasts have been prepared in accordance with the Public Finance Act 1989.
They are based on the accounting policies and assumptions that follow. As with all such assumptions, there is a degree of uncertainty surrounding them. This uncertainty increases as the forecast horizon extends.
The forecasts have been prepared in accordance with the Statement of Responsibility and reflect the judgements and information known at the time they were prepared. They reflect all Government decisions and circumstances communicated to 9 May 2008.
The finalisation dates and key assumptions that underpin the preparation of the GAAP tables are outlined in the Summary on page 69 to 70.
These Forecast Financial Statements have been prepared in accordance with the accounting policies that are expected to be used in the comparable audited actual Financial Statements of the Government.
These Forecast Financial Statements comply with generally accepted accounting policies (GAAP) as required by the Public Finance Act 1989 and have been prepared in accordance with New Zealand equivalents to International Financial Reporting Standards (NZ IFRS), as appropriate for public benefit entities.
All forecasts use the accrual basis of accounting. Forecasts have been prepared for the consolidated financial statements of the Government reporting entity, which includes all entities controlled by the Government (as defined by applicable financial reporting standards).
All policies have been applied on a consistent basis during the forecast period. There have been no changes in accounting policies during the period.
These Forecast Financial Statements have been prepared on the basis of Treasury’s best professional judgment. Key assumptions used are set out on page 69 to 70.
For the purposes of the Forecast Financial Statements, no revaluations of property, plant and equipment are projected beyond the current year.
The specific accounting and forecasting policies are reproduced in full on Treasury’s website at http://www.treasury.govt.nz/budget/2008/.
These forecast financial statements are for the Government reporting entity as specified in section 26Q(4) of the Public Finance Act 1989. This comprises Ministers of the Crown and the following entities:
Core Crown segment |
|
| ||
Departments |
| Departments |
| State-owned enterprises |
Agriculture and Forestry |
| Land Information New Zealand |
| Airways Corporation of New Zealand |
Archives New Zealand |
| Maori Development |
| Limited |
Building and Housing |
| National Library of New Zealand |
| Animal Control Products Limited |
Conservation |
| New Zealand Customs Service |
| AsureQuality Limited |
Corrections |
| New Zealand Defence Force |
| Electricity Corporation of New Zealand |
Crown Law Office |
| Office of the Clerk |
| Limited |
Culture and Heritage |
| Pacific Island Affairs |
| Genesis Power Limited |
Defence |
| Parliamentary Counsel Office |
| Kordia Group Limited |
Economic Development |
| Parliamentary Service |
| Landcorp Farming Limited |
Education |
| Police |
| Learning Media Limited |
Education Review Office |
| Prime Minister and Cabinet |
| Meridian Energy Limited |
Environment |
| Research, Science and |
| Meteorological Service of New Zealand |
Fisheries |
| Technology |
| Limited |
Food Safety Authority |
| Security Intelligence Service |
| Mighty River Power Limited |
Foreign Affairs and Trade |
| Serious Fraud Office |
| New Zealand Post Limited |
Government Communications Security Bureau |
| Social Development |
| New Zealand Railways Corporation |
Health |
| State Services Commission |
| Quotable Value Limited |
Inland Revenue |
| Statistics |
| Solid Energy New Zealand Limited |
Internal Affairs |
| Transport |
| Terralink Limited (in liquidation) |
Justice |
| Treasury |
| Timberlands West Coast Limited |
Labour |
| Women’s Affairs |
| Transpower New Zealand Limited |
Others |
| Offices of Parliament |
|
|
Government Superannuation Fund |
| Office of the Controller and Auditor-General |
| Air New Zealand Limited (included for disclosure purposes as if it were a SOE) |
Reserve Bank of New Zealand |
| Office of the Ombudsmen |
|
|
|
| Parliamentary Commissioner for the Environment |
|
|
Crown entities | ||
Accident Compensation Corporation |
| New Zealand Film Commission |
Accounting Standards Review Board |
| New Zealand Fire Service Commission |
Alcohol Advisory Council of New Zealand |
| New Zealand Historic Places Trust (Pouhere Taonga) |
Arts Council of New Zealand Toi Aotearoa |
| New Zealand Lotteries Commission |
Broadcasting Commission |
| New Zealand Qualifications Authority |
Broadcasting Standards Authority |
| New Zealand Symphony Orchestra |
Career Services |
| New Zealand Teachers Council |
Charities Commission |
| New Zealand Tourism Board |
Children’s Commissioner |
| New Zealand Trade and Enterprise |
Civil Aviation Authority of New Zealand |
| New Zealand Venture Investment Fund Limited |
Commerce Commission |
| Office of Film and Literature Classification |
Crown Health Financing Agency |
| Pharmaceutical Management Agency |
Crown research institutes (9) |
| Privacy Commissioner |
District health boards (21) |
| Public Trust |
Drug Free Sport New Zealand |
| Radio New Zealand Limited |
Earthquake Commission |
| Retirement Commissioner |
Electoral Commission |
| School boards of trustees (2,462) |
Electricity Commission |
| Securities Commission |
Energy Efficiency and Conservation Authority |
| Social Workers Registration Board |
Environmental Risk Management Authority |
| Sport and Recreation New Zealand |
Families Commission |
| Standards Council |
Foundation for Research, Science and Technology |
| Takeovers Panel |
Government Superannuation Fund Authority |
| Te Reo Whakapuaki Irirangi (Te Mangai Paho) |
Guardians of New Zealand Superannuation |
| Te Taura Whiri i te Reo Maori (Maori Language Commission) |
Health and Disability Commissioner |
| Television New Zealand Limited |
Health Research Council of New Zealand |
| Tertiary Education Commission |
Health Sponsorship Council |
| Tertiary education institutions (31) |
Housing New Zealand Corporation |
| Testing Laboratory Registration Council |
Human Rights Commission |
| Transit New Zealand |
Independent Police Conduct Authority |
| Transport Accident Investigation Commission |
Land Transport New Zealand |
|
|
Law Commission |
|
|
Legal Services Agency |
|
|
Maritime New Zealand |
|
|
Mental Health Commission |
| Crown entity subsidiaries are consolidated by their |
Museum of New Zealand Te Papa Tongarewa Board |
| parents and are not listed separately in this table |
New Zealand Antarctic Institute |
|
|
New Zealand Artificial Limb Board |
|
|
New Zealand Blood Service |
|
|
Organisations named or described in Schedule 4 to the Public Finance Act 1989 | ||
Agriculture and Marketing Research and Development |
| New Zealand Lottery Grants Board |
Trust |
| Ngai Tahu Ancillary Claims Trust |
Asia New Zealand Foundation |
| Pacific Co-operation Foundation |
Fish and game councils (12) |
| Pacific Islands Business Development Trust |
Leadership Development Centre Trust |
| Research and Education Advanced Network New Zealand Limited |
New Zealand Fish and Game Council |
| Reserves boards (24) |
New Zealand Game Bird Habitat Trust Board |
| Road Safety Trust |
New Zealand Government Property Corporation |
| Sentencing Council |
Purchase of Rail and Ferry Network from Toll Holding Limited
On 5 May 2008 the Government reached an agreement with Toll Holding Limited for the purchase of Toll New Zealand’s rail and ferry business with the date of acquisition set for 30 June 2008.
With the closeness of the purchase announcement to the finalisation date of the Budget Update Toll New Zealand’s rail and ferry business are not incorporated on a line by line basis in the fiscal forecasts. Instead the 2007/08 forecast for new capital spending has increased by the value of the purchase price.
Looking ahead, the rail and ferry operating revenues and expenses and the assets acquired and liabilities assumed will be incorporated into future forecasts and Government Financial Statements from the date of effective ownership.
There are a number of valuation issues that need to be considered before the assets and liabilities are combined into the whole-of-Government financial statements on acquisition.
There is a risk that if any differential in the purchase price and the value of Toll New Zealand’s rail and ferry assets and liabilities cannot be recovered through rail operations, a write-down in the Government Financial Statements will be required.
|
|
|
| 2007 |
| 2008 |
| 2008 |
| 2009 |
| 2010 |
| 2011 |
| 2012 |
|
|
| Note |
| Actual |
| Budget |
| Forecast |
| Forecast |
| Forecast |
| Forecast |
| Forecast |
|
|
|
|
| $m |
| $m |
| $m |
| $m |
| $m |
| $m |
| $m |
|
Revenue |
|
|
|
|
|
|
|
|
|
|
|
|
|
|
|
|
|
Taxation revenue |
| 1 |
| 53,064 |
| 54,173 |
| 56,186 |
| 55,911 |
| 57,645 |
| 59,743 |
| 62,134 |
|
Other sovereign revenue |
| 1 |
| 3,496 |
| 3,693 |
| 3,851 |
| 4,037 |
| 4,342 |
| 4,876 |
| 5,162 |
|
Total Revenue Levied through the Crown’s Sovereign Power |
|
|
| 56,560 |
| 57,866 |
| 60,037 |
| 59,948 |
| 61,987 |
| 64,619 |
| 67,296 |
|
|
|
|
|
|
|
|
|
|
|
|
|
|
|
|
|
|
|
Sales of goods and services |
|
|
| 12,613 |
| 13,253 |
| 13,682 |
| 14,222 |
| 14,864 |
| 15,784 |
| 16,287 |
|
|
|
|
|
|
|
|
|
|
|
|
|
|
|
|
|
|
|
Interest revenue and dividends |
| 2 |
| 2,995 |
| 3,366 |
| 3,203 |
| 3,358 |
| 3,252 |
| 3,410 |
| 3,461 |
|
|
|
|
|
|
|
|
|
|
|
|
|
|
|
|
|
|
|
Other revenue |
|
|
| 2,421 |
| 2,387 |
| 2,891 |
| 2,591 |
| 2,738 |
| 2,881 |
| 3,008 |
|
Total Revenue Earned through the Crown’s Operations |
|
|
| 18,029 |
| 19,006 |
| 19,776 |
| 20,171 |
| 20,854 |
| 22,075 |
| 22,756 |
|
Total Revenue (excluding gains) |
|
|
| 74,589 |
| 76,872 |
| 79,813 |
| 80,119 |
| 82,841 |
| 86,694 |
| 90,052 |
|
|
|
|
|
|
|
|
|
|
|
|
|
|
|
|
|
|
|
Expenses |
|
|
|
|
|
|
|
|
|
|
|
|
|
|
|
|
|
Social assistance and official development assistance |
| 3 |
| 16,346 |
| 17,892 |
| 18,520 |
| 19,681 |
| 20,528 |
| 21,273 |
| 22,327 |
|
|
|
|
|
|
|
|
|
|
|
|
|
|
|
|
|
|
|
Personnel expenses |
| 4 |
| 15,284 |
| 15,657 |
| 16,422 |
| 17,061 |
| 17,268 |
| 17,572 |
| 17,616 |
|
|
|
|
|
|
|
|
|
|
|
|
|
|
|
|
|
|
|
Depreciation and amortisation |
| 5 |
| 3,397 |
| 3,296 |
| 3,618 |
| 3,950 |
| 4,153 |
| 4,448 |
| 4,580 |
|
|
|
|
|
|
|
|
|
|
|
|
|
|
|
|
|
|
|
Other operating expenses |
| 5 |
| 27,579 |
| 28,997 |
| 29,217 |
| 32,053 |
| 31,934 |
| 32,781 |
| 33,087 |
|
|
|
|
|
|
|
|
|
|
|
|
|
|
|
|
|
|
|
Interest expenses |
| 6 |
| 2,885 |
| 2,748 |
| 2,954 |
| 2,503 |
| 2,490 |
| 2,769 |
| 2,886 |
|
|
|
|
|
|
|
|
|
|
|
|
|
|
|
|
|
|
|
Insurance expenses |
| 7 |
| 3,238 |
| 3,010 |
| 4,095 |
| 3,799 |
| 4,140 |
| 4,432 |
| 4,735 |
|
|
|
|
|
|
|
|
|
|
|
|
|
|
|
|
|
|
|
Forecast new operating spending |
| 8 |
| — |
| 314 |
| — |
| 249 |
| 1,774 |
| 3,376 |
| 5,117 |
|
|
|
|
|
|
|
|
|
|
|
|
|
|
|
|
|
|
|
Top-down expense adjustment |
| 8 |
| — |
| — |
| (240 | ) | (495 | ) | (450 | ) | (450 | ) | (450 | ) |
Total Expenses (excluding losses) |
|
|
| 68,729 |
| 71,914 |
| 74,586 |
| 78,801 |
| 81,837 |
| 86,201 |
| 89,898 |
|
Operating Balance before gains/(losses) |
|
|
| 5,860 |
| 4,958 |
| 5,227 |
| 1,318 |
| 1,004 |
| 493 |
| 154 |
|
Net gains/(losses) on financial instruments |
| 9 |
| 1,566 |
| 1,377 |
| (824 | ) | 1,424 |
| 1,625 |
| 1,890 |
| 2,171 |
|
Net gains/(losses) on non-financial instruments |
| 10 |
| 486 |
| — |
| (2,007 | ) | 170 |
| 176 |
| 183 |
| 190 |
|
Total Gains/(losses) |
|
|
| 2,052 |
| 1,377 |
| (2,831 | ) | 1,594 |
| 1,801 |
| 2,073 |
| 2,361 |
|
Net surplus/(deficit) from associates and joint ventures |
|
|
| 191 |
| 96 |
| 166 |
| 193 |
| 204 |
| 213 |
| 219 |
|
Operating Balance from continuing activities |
|
|
| 8,103 |
| 6,431 |
| 2,562 |
| 3,105 |
| 3,009 |
| 2,779 |
| 2,734 |
|
Gain/(loss) from discontinued operations |
|
|
| (92 | ) | — |
| (3 | ) | — |
| — |
| — |
| — |
|
Operating Balance (including minority interest) |
|
|
| 8,011 |
| 6,431 |
| 2,559 |
| 3,105 |
| 3,009 |
| 2,779 |
| 2,734 |
|
Attributable to minority interest |
|
|
| 12 |
| — |
| — |
| — |
| — |
| — |
| — |
|
Operating Balance |
| 11 |
| 8,023 |
| 6,431 |
| 2,559 |
| 3,105 |
| 3,009 |
| 2,779 |
| 2,734 |
|
The accompanying Notes and Accounting policies are an integral part of these Statements.
for the years ending 30 June
|
| 2007 |
| 2008 |
| 2008 |
| 2009 |
| 2010 |
| 2011 |
| 2012 |
|
|
| Actual |
| Budget |
| Forecast |
| Forecast |
| Forecast |
| Forecast |
| Forecast |
|
|
| $m |
| $m |
| $m |
| $m |
| $m |
| $m |
| $m |
|
Total Crown |
|
|
|
|
|
|
|
|
|
|
|
|
|
|
|
Total Crown expenses |
|
|
|
|
|
|
|
|
|
|
|
|
|
|
|
By functional classification |
|
|
|
|
|
|
|
|
|
|
|
|
|
|
|
Social security and welfare |
| 19,829 |
| 21,271 |
| 22,274 |
| 22,843 |
| 23,888 |
| 24,814 |
| 26,179 |
|
GSF pension expenses |
| 645 |
| 629 |
| 714 |
| 652 |
| 625 |
| 610 |
| 582 |
|
Health |
| 10,661 |
| 11,699 |
| 10,765 |
| 12,024 |
| 11,949 |
| 11,923 |
| 11,911 |
|
Education |
| 9,853 |
| 10,321 |
| 10,803 |
| 11,017 |
| 11,335 |
| 11,551 |
| 11,687 |
|
Core government services |
| 4,628 |
| 2,132 |
| 3,163 |
| 3,412 |
| 3,463 |
| 3,639 |
| 3,675 |
|
Law and order |
| 2,822 |
| 3,076 |
| 3,192 |
| 3,341 |
| 3,334 |
| 3,342 |
| 3,357 |
|
Defence |
| 1,478 |
| 1,597 |
| 1,524 |
| 1,697 |
| 1,755 |
| 1,845 |
| 1,917 |
|
Transport and communications |
| 6,990 |
| 7,671 |
| 7,185 |
| 8,027 |
| 8,156 |
| 8,540 |
| 8,540 |
|
Economic and industrial services |
| 4,723 |
| 5,879 |
| 7,433 |
| 7,918 |
| 8,306 |
| 8,789 |
| 8,976 |
|
Primary services |
| 1,233 |
| 1,319 |
| 1,404 |
| 1,364 |
| 1,349 |
| 1,351 |
| 1,358 |
|
Heritage, culture and recreation |
| 2,043 |
| 2,218 |
| 2,366 |
| 3,130 |
| 2,765 |
| 2,997 |
| 3,043 |
|
Housing and community development |
| 865 |
| 961 |
| 965 |
| 1,036 |
| 1,015 |
| 1,022 |
| 1,037 |
|
Other |
| 74 |
| 79 |
| 84 |
| 83 |
| 83 |
| 83 |
| 83 |
|
Finance costs |
| 2,885 |
| 2,748 |
| 2,954 |
| 2,503 |
| 2,490 |
| 2,769 |
| 2,886 |
|
Forecast for future new spending |
| — |
| 314 |
| — |
| 249 |
| 1,774 |
| 3,376 |
| 5,117 |
|
Top-down expense adjustment |
| — |
| — |
| (240 | ) | (495 | ) | (450 | ) | (450 | ) | (450 | ) |
Total Crown Expenses excluding losses |
| 68,729 |
| 71,914 |
| 74,586 |
| 78,801 |
| 81,837 |
| 86,201 |
| 89,898 |
|
Below is an analysis of core Crown expenses by functional classification. Core Crown expenses include expenses incurred by the Crown, Departments, Reserve Bank and the NZS Fund, but not Crown entities and SOEs.
|
| 2007 |
| 2008 |
| 2008 |
| 2009 |
| 2010 |
| 2011 |
| 2012 |
|
|
| Actual |
| Budget |
| Forecast |
| Forecast |
| Forecast |
| Forecast |
| Forecast |
|
|
| $m |
| $m |
| $m | $m |
| $m |
| $m |
| $m |
| |
Core Crown |
|
|
|
|
|
|
|
|
|
|
|
|
|
|
|
Core Crown expenses |
|
|
|
|
|
|
|
|
|
|
|
|
|
|
|
By functional classification |
|
|
|
|
|
|
|
|
|
|
|
|
|
|
|
Social security and welfare |
| 16,768 |
| 17,698 |
| 18,071 |
| 18,898 |
| 19,566 |
| 20,175 |
| 21,212 |
|
GSF pension expenses |
| 645 |
| 629 |
| 714 |
| 652 |
| 625 |
| 610 |
| 582 |
|
Health |
| 10,355 |
| 11,613 |
| 11,343 |
| 12,586 |
| 12,538 |
| 12,522 |
| 12,526 |
|
Education |
| 9,269 |
| 9,719 |
| 10,046 |
| 10,524 |
| 10,892 |
| 11,096 |
| 11,217 |
|
Core government services |
| 4,816 |
| 2,479 |
| 3,222 |
| 3,448 |
| 3,508 |
| 3,678 |
| 3,728 |
|
Law and order |
| 2,699 |
| 2,836 |
| 2,943 |
| 3,101 |
| 3,078 |
| 3,085 |
| 3,086 |
|
Defence |
| 1,517 |
| 1,641 |
| 1,566 |
| 1,741 |
| 1,800 |
| 1,891 |
| 1,964 |
|
Transport and communications |
| 2,405 |
| 2,792 |
| 2,290 |
| 2,823 |
| 2,731 |
| 2,635 |
| 2,488 |
|
Economic and industrial services |
| 1,595 |
| 2,276 |
| 2,828 |
| 3,244 |
| 3,281 |
| 3,414 |
| 3,461 |
|
Primary services |
| 438 |
| 494 |
| 565 |
| 520 |
| 499 |
| 494 |
| 499 |
|
Heritage, culture and recreation |
| 844 |
| 977 |
| 1,123 |
| 1,769 |
| 1,322 |
| 1,502 |
| 1,485 |
|
Housing and community development |
| 255 |
| 304 |
| 282 |
| 334 |
| 302 |
| 299 |
| 297 |
|
Other |
| 68 |
| 80 |
| 84 |
| 83 |
| 83 |
| 83 |
| 83 |
|
Finance costs |
| 2,329 |
| 2,244 |
| 2,527 |
| 2,406 |
| 2,341 |
| 2,606 |
| 2,648 |
|
Forecast for future new spending |
| — |
| 314 |
| — |
| 249 |
| 1,774 |
| 3,376 |
| 5,117 |
|
Top-down expense adjustment |
| — |
| — |
| (240 | ) | (495 | ) | (450 | ) | (450 | ) | (450 | ) |
Total Core Crown Expenses excluding losses |
| 54,003 |
| 56,096 |
| 57,364 |
| 61,883 |
| 63,890 |
| 67,016 |
| 69,943 |
|
The accompanying Notes and Accounting policies are an integral part of these Statements.
for the years ending 30 June
|
| 2007 |
| 2008 |
| 2008 |
| 2009 |
| 2010 |
| 2011 |
| 2012 |
|
|
| Actual |
| Budget |
| Forecast |
| Forecast |
| Forecast |
| Forecast |
| Forecast |
|
|
| $m |
| $m |
| $m |
| $m |
| $m |
| $m |
| $m |
|
Cash Flows From Operations |
|
|
|
|
|
|
|
|
|
|
|
|
|
|
|
Cash was provided from |
|
|
|
|
|
|
|
|
|
|
|
|
|
|
|
Taxation receipts |
| 52,157 |
| 54,266 |
| 55,662 |
| 54,681 |
| 57,087 |
| 59,198 |
| 61,473 |
|
Other sovereign receipts |
| 3,415 |
| 3,472 |
| 3,496 |
| 3,675 |
| 3,812 |
| 3,932 |
| 4,028 |
|
Sales of goods and services |
| 12,806 |
| 13,394 |
| 14,001 |
| 14,596 |
| 15,180 |
| 16,019 |
| 16,529 |
|
Interest and dividends |
| 2,491 |
| 2,760 |
| 2,718 |
| 2,807 |
| 2,658 |
| 2,781 |
| 2,798 |
|
Other operating receipts |
| 2,222 |
| 2,302 |
| 2,532 |
| 2,527 |
| 2,617 |
| 2,727 |
| 2,870 |
|
Total cash provided from operations |
| 73,091 |
| 76,194 |
| 78,409 |
| 78,286 |
| 81,354 |
| 84,657 |
| 87,698 |
|
Cash was disbursed to |
|
|
|
|
|
|
|
|
|
|
|
|
|
|
|
Social assistance and official development assistance |
| 16,344 |
| 19,529 |
| 18,242 |
| 19,123 |
| 20,241 |
| 21,052 |
| 22,036 |
|
Personnel and operating payments |
| 41,845 |
| 44,025 |
| 46,643 |
| 49,961 |
| 50,597 |
| 51,821 |
| 52,029 |
|
Interest payments |
| 2,441 |
| 2,530 |
| 2,705 |
| 2,284 |
| 2,335 |
| 2,472 |
| 2,613 |
|
Forecast for future new spending |
| — |
| 314 |
| — |
| 249 |
| 1,774 |
| 3,376 |
| 5,117 |
|
Top-down expense adjustment |
| — |
| — |
| (240 | ) | (355 | ) | (310 | ) | (310 | ) | (310 | ) |
Total cash disbursed to operations |
| 60,630 |
| 66,398 |
| 67,350 |
| 71,262 |
| 74,637 |
| 78,411 |
| 81,485 |
|
Net Cash Flows From Operations |
| 12,461 |
| 9,796 |
| 11,059 |
| 7,024 |
| 6,717 |
| 6,246 |
| 6,213 |
|
Cash Flows From Investing Activities |
|
|
|
|
|
|
|
|
|
|
|
|
|
|
|
Cash was provided from/(disbursed to) |
|
|
|
|
|
|
|
|
|
|
|
|
|
|
|
Net purchase of physical assets |
| (5,214 | ) | (6,661 | ) | (5,826 | ) | (6,583 | ) | (6,156 | ) | (6,337 | ) | (5,440 | ) |
Net purchase of shares and other securities |
| (8,132 | ) | (4,491 | ) | (4,963 | ) | (576 | ) | 15 |
| (3,758 | ) | 202 |
|
Net purchase of intangible assets |
| (232 | ) | (144 | ) | (299 | ) | (324 | ) | (255 | ) | (236 | ) | (204 | ) |
Net issue/(repayment) of advances |
| (1,153 | ) | (1,628 | ) | (1,153 | ) | (590 | ) | (658 | ) | (200 | ) | (837 | ) |
Net acquisition of investments in associates |
| (295 | ) | (95 | ) | (994 | ) | (230 | ) | (6 | ) | (23 | ) | (1 | ) |
Capital contingency provision |
| — |
| (184 | ) | (690 | ) | (261 | ) | (602 | ) | (777 | ) | (927 | ) |
Top-down capital adjustment |
| — |
| — |
| — |
| 350 |
| — |
| — |
| — |
|
Net Cash Flows From Investing Activities |
| (15,026 | ) | (13,203 | ) | (13,925 | ) | (8,214 | ) | (7,662 | ) | (11,331 | ) | (7,207 | ) |
Net Cash Flows From Operating and Investing Activities |
| (2,565 | ) | (3,407 | ) | (2,866 | ) | (1,190 | ) | (945 | ) | (5,085 | ) | (994 | ) |
Cash Flows From Financing Activities |
|
|
|
|
|
|
|
|
|
|
|
|
|
|
|
Cash was provided from/(disbursed to) |
|
|
|
|
|
|
|
|
|
|
|
|
|
|
|
Issues of circulating currency |
| 81 |
| 178 |
| 260 |
| 181 |
| 190 |
| 200 |
| 210 |
|
Net repayment/(issues) of Government stock(1) |
| (3,758 | ) | 2,223 |
| 2,357 |
| 1,235 |
| 218 |
| 4,211 |
| 242 |
|
Net repayment of foreign-currency borrowing |
| 1,780 |
| (1,130 | ) | (419 | ) | (299 | ) | (95 | ) | (10 | ) | (274 | ) |
Net repayment/(issues) of other New Zealand dollar borrowing |
| 4,992 |
| 2,225 |
| 1,735 |
| 1,255 |
| 932 |
| 1,273 |
| 1,158 |
|
Net Cash Flows From Financing Activities |
| 3,095 |
| 3,496 |
| 3,933 |
| 2,372 |
| 1,245 |
| 5,674 |
| 1,336 |
|
Net Movement in Cash |
| 530 |
| 89 |
| 1,067 |
| 1,182 |
| 300 |
| 589 |
| 342 |
|
Opening Cash Balance |
| 3,676 |
| 3,107 |
| 4,163 |
| 5,217 |
| 6,412 |
| 6,725 |
| 7,327 |
|
Foreign-exchange (losses)/gains on opening cash |
| (43 | ) | — |
| (13 | ) | 13 |
| 13 |
| 13 |
| 13 |
|
Closing Cash Balance |
| 4,163 |
| 3,196 |
| 5,217 |
| 6,412 |
| 6,725 |
| 7,327 |
| 7,682 |
|
(1) Net issues of Government stock include movements within government stock holdings of entities such as NZS Fund, ACC and EQC. The Bonds reconciliation at the end of these accounts outlines the proceeds and repayments of domestic bonds.
The accompanying Notes and Accounting policies are an integral part of these Statements.
|
| 2007 |
| 2008 |
| 2008 |
| 2009 |
| 2010 |
| 2011 |
| 2012 |
|
|
| Actual |
| Budget |
| Forecast |
| Forecast |
| Forecast |
| Forecast |
| Forecast |
|
|
| $m |
| $m |
| $m |
| $m |
| $m |
| $m |
| $m |
|
Reconciliation Between the Net Cash Flows from Operations and the Operating Balance |
|
|
|
|
|
|
|
|
|
|
|
|
|
|
|
Net Cash Flows from Operations |
| 12,461 |
| 9,796 |
| 11,059 |
| 7,024 |
| 6,717 |
| 6,246 |
| 6,213 |
|
Items included in the operating balance but not in net cash flows from operations |
|
|
|
|
|
|
|
|
|
|
|
|
|
|
|
Gains/(losses) |
|
|
|
|
|
|
|
|
|
|
|
|
|
|
|
Gains/(losses) on financial instruments |
| 1,566 |
| 1,377 |
| (824 | ) | 1,424 |
| 1,625 |
| 1,890 |
| 2,171 |
|
Gains/(losses) on non-financial instruments |
| 486 |
| — |
| (2,007 | ) | 170 |
| 176 |
| 183 |
| 190 |
|
Total Gains/(losses) |
| 2,052 |
| 1,377 |
| (2,831 | ) | 1,594 |
| 1,801 |
| 2,073 |
| 2,361 |
|
Movements in Working Capital |
|
|
|
|
|
|
|
|
|
|
|
|
|
|
|
Increase/(decrease) in receivables |
| (1,591 | ) | 218 |
| 267 |
| 422 |
| (153 | ) | (93 | ) | (65 | ) |
Increase/(decrease) in inventories |
| 83 |
| 41 |
| 107 |
| 63 |
| 72 |
| 112 |
| 83 |
|
Increase/(decrease) in prepayments |
| (89 | ) | (2 | ) | (49 | ) | 13 |
| 20 |
| — |
| — |
|
Decrease/(increase) in deferred revenue |
| (73 | ) | — |
| (80 | ) | (18 | ) | 1 |
| — |
| 4 |
|
Decrease/(increase) in payables |
| 2 |
| (569 | ) | 82 |
| (515 | ) | 176 |
| 504 |
| 329 |
|
|
| (1,668 | ) | (312 | ) | 327 |
| (35 | ) | 116 |
| 523 |
| 351 |
|
Other Non-cash Items in Operating Balance |
|
|
|
|
|
|
|
|
|
|
|
|
|
|
|
Depreciation and amortisation |
| (3,397 | ) | (3,296 | ) | (3,618 | ) | (3,950 | ) | (4,153 | ) | (4,448 | ) | (4,580 | ) |
Write-down on initial recognition of loans |
| (629 | ) | (518 | ) | (628 | ) | (667 | ) | (705 | ) | (739 | ) | (773 | ) |
Impairment on financial assets (excl receivables) |
| 37 |
| (38 | ) | 201 |
| 1 |
| 1 |
| 1 |
| 1 |
|
Net interest revenue |
| 61 |
| 389 |
| 237 |
| 333 |
| 439 |
| 331 |
| 390 |
|
Decrease/(increase) in defined benefit retirement plan liabilities |
| 13 |
| (51 | ) | (78 | ) | (75 | ) | (33 | ) | (4 | ) | 37 |
|
Decrease/(increase) in insurance liabilities |
| (1,098 | ) | (1,013 | ) | (2,276 | ) | (1,313 | ) | (1,378 | ) | (1,417 | ) | (1,485 | ) |
Other |
| 191 |
| 97 |
| 166 |
| 193 |
| 204 |
| 213 |
| 219 |
|
Total Other Non-cash Items |
| (4,822 | ) | (4,430 | ) | (5,996 | ) | (5,478 | ) | (5,625 | ) | (6,063 | ) | (6,191 | ) |
Operating Balance |
| 8,023 |
| 6,431 |
| 2,559 |
| 3,105 |
| 3,009 |
| 2,779 |
| 2,734 |
|
The accompanying Notes and Accounting policies are an integral part of these Statements.
for the years ending 30 June
|
| 2007 |
| 2008 |
| 2008 |
| 2009 |
| 2010 |
| 2011 |
| 2012 |
|
|
| Actual |
| Budget |
| Forecast |
| Forecast |
| Forecast |
| Forecast |
| Forecast |
|
|
| $m |
| $m |
| $m |
| $m |
| $m |
| $m |
| $m |
|
Revaluation of physical assets |
| 5,262 |
| — |
| 43 |
| — |
| — |
| — |
| — |
|
Effective portion of changes in value of fair-value hedges |
| (331 | ) | 39 |
| (2 | ) | 58 |
| 19 |
| 13 |
| 17 |
|
Net change in fair value of cash flow hedges transferred to the operating statement |
| (60 | ) | 74 |
| (15 | ) | — |
| (1 | ) | 1 |
| (2 | ) |
Net change in fair value of cash flow hedges transferred to the hedged item |
| (13 | ) | — |
| (36 | ) | — |
| — |
| — |
| — |
|
Foreign currency translation differences for foreign operations |
| (66 | ) | — |
| 2 |
| — |
| — |
| 1 |
| 2 |
|
Valuation gain/(losses) on investments available for sale taken to reserves |
| 10 |
| — |
| 6 |
| 6 |
| — |
| — |
| — |
|
Other movements |
| 11 |
| — |
| (1 | ) | 2 |
| (3 | ) | 1 |
| — |
|
Total income/(expense) recognised directly in Net Worth |
| 4,813 |
| 113 |
| (3 | ) | 66 |
| 15 |
| 16 |
| 17 |
|
Operating Balance (including minority interest) |
| 8,011 |
| 6,431 |
| 2,559 |
| 3,105 |
| 3,009 |
| 2,779 |
| 2,734 |
|
Total recognised income and expense |
| 12,824 |
| 6,544 |
| 2,556 |
| 3,171 |
| 3,024 |
| 2,795 |
| 2,751 |
|
Attributable to: |
|
|
|
|
|
|
|
|
|
|
|
|
|
|
|
- minority interest |
| (12 | ) | — |
| — |
| — |
| — |
| — |
| — |
|
- the Crown |
| 12,836 |
| 6,544 |
| 2,556 |
| 3,171 |
| 3,024 |
| 2,795 |
| 2,751 |
|
Total recognised income and expense |
| 12,824 |
| 6,544 |
| 2,556 |
| 3,171 |
| 3,024 |
| 2,795 |
| 2,751 |
|
as at 30 June
|
|
|
| 2007 |
| 2008 |
| 2008 |
| 2009 |
| 2010 |
| 2011 |
| 2012 |
|
|
| Note |
| Actual |
| Budget |
| Forecast |
| Forecast |
| Forecast |
| Forecast |
| Forecast |
|
|
|
|
| $m |
| $m |
| $m |
| $m |
| $m | $m |
| $m |
| |
Assets |
|
|
|
|
|
|
|
|
|
|
|
|
|
|
|
|
|
Cash and cash equivalents |
| 12 |
| 4,163 |
| 3,196 |
| 5,217 |
| 6,412 |
| 6,725 |
| 7,327 |
| 7,682 |
|
Receivables |
| 12 |
| 12,058 |
| 12,547 |
| 12,326 |
| 12,749 |
| 12,595 |
| 12,503 |
| 12,438 |
|
Marketable securities and derivatives in gain |
| 12 |
| 32,125 |
| 32,885 |
| 34,473 |
| 33,351 |
| 32,636 |
| 34,995 |
| 33,690 |
|
Share investments |
| 12 |
| 13,581 |
| 17,273 |
| 12,790 |
| 13,700 |
| 15,608 |
| 17,603 |
| 19,517 |
|
Advances |
| 12 |
| 11,793 |
| 15,087 |
| 15,799 |
| 18,648 |
| 21,043 |
| 20,981 |
| 21,623 |
|
Inventory |
|
|
| 826 |
| 982 |
| 933 |
| 997 |
| 1,069 |
| 1,181 |
| 1,264 |
|
Prepayments and other assets |
|
|
| 1,527 |
| 1,205 |
| 1,171 |
| 1,307 |
| 1,385 |
| 1,434 |
| 1,470 |
|
Property, plant & equipment |
| 14 |
| 95,598 |
| 95,950 |
| 98,355 |
| 101,276 |
| 103,885 |
| 106,481 |
| 107,902 |
|
Equity accounted investments(1) |
|
|
| 7,001 |
| 6,647 |
| 7,519 |
| 8,683 |
| 8,294 |
| 8,516 |
| 8,693 |
|
Intangible assets and goodwill |
|
|
| 1,677 |
| 1,555 |
| 1,772 |
| 1,929 |
| 1,952 |
| 1,958 |
| 1,917 |
|
Forecast for new capital spending |
|
|
| — |
| 234 |
| 690 |
| 951 |
| 1,553 |
| 2,330 |
| 3,257 |
|
Top-down capital adjustment |
|
|
| — |
| (250 | ) | — |
| (350 | ) | (350 | ) | (350 | ) | (350 | ) |
Total Assets |
|
|
| 180,349 |
| 187,311 |
| 191,045 |
| 199,653 |
| 206,395 |
| 214,959 |
| 219,103 |
|
Liabilities |
|
|
|
|
|
|
|
|
|
|
|
|
|
|
|
|
|
Issued currency |
|
|
| 3,444 |
| 3,730 |
| 3,704 |
| 3,885 |
| 4,075 |
| 4,275 |
| 4,484 |
|
Payables |
| 16 |
| 8,075 |
| 9,036 |
| 8,423 |
| 8,497 |
| 8,524 |
| 8,492 |
| 8,619 |
|
Deferred revenue |
|
|
| 966 |
| 845 |
| 1,046 |
| 1,064 |
| 1,063 |
| 1,063 |
| 1,059 |
|
Borrowings |
|
|
| 41,898 |
| 46,364 |
| 45,546 |
| 48,656 |
| 50,616 |
| 54,959 |
| 54,910 |
|
Insurance liabilities |
| 17 |
| 17,418 |
| 19,011 |
| 20,752 |
| 22,065 |
| 23,444 |
| 24,861 |
| 26,346 |
|
Retirement plan liabilities |
| 18 |
| 7,161 |
| 8,414 |
| 8,146 |
| 8,221 |
| 8,254 |
| 8,258 |
| 8,222 |
|
Provisions |
| 19 |
| 4,560 |
| 3,850 |
| 4,045 |
| 4,711 |
| 4,841 |
| 4,678 |
| 4,339 |
|
Total Liabilities |
|
|
| 83,522 |
| 91,250 |
| 91,662 |
| 97,099 |
| 100,817 |
| 106,586 |
| 107,979 |
|
Total Assets less Total Liabilities |
|
|
| 96,827 |
| 96,061 |
| 99,383 |
| 102,554 |
| 105,578 |
| 108,373 |
| 111,124 |
|
Net Worth |
|
|
|
|
|
|
|
|
|
|
|
|
|
|
|
|
|
Taxpayer funds |
| 20 |
| 44,222 |
| 48,239 |
| 46,767 |
| 49,886 |
| 52,892 |
| 55,672 |
| 58,406 |
|
Revaluation reserve |
| 20 |
| 52,442 |
| 47,402 |
| 52,498 |
| 52,486 |
| 52,486 |
| 52,486 |
| 52,486 |
|
Other reserves |
| 20 |
| (133 | ) | 127 |
| (178 | ) | (114 | ) | (96 | ) | (81 | ) | (64 | ) |
Total Net Worth attributable to the Crown |
|
|
| 96,531 |
| 95,768 |
| 99,087 |
| 102,258 |
| 105,282 |
| 108,077 |
| 110,828 |
|
Net worth attributable to minority interest |
|
|
| 296 |
| 293 |
| 296 |
| 296 |
| 296 |
| 296 |
| 296 |
|
Total Net Worth |
|
|
| 96,827 |
| 96,061 |
| 99,383 |
| 102,554 |
| 105,578 |
| 108,373 |
| 111,124 |
|
(1) Tertiary education institutions constitute most equity accounted investments.
The accompanying Notes and Accounting policies are an integral part of these Statements.
for the years ending 30 June
|
| 2007 |
| 2008 |
| 2008 |
| 2009 |
| 2010 |
| 2011 |
| 2012 |
|
|
| Actual |
| Budget |
| Forecast |
| Forecast |
| Forecast |
| Forecast |
| Forecast |
|
|
| $m |
| $m |
| $m |
| $m |
| $m |
| $m |
| $m |
|
Borrowings |
|
|
|
|
|
|
|
|
|
|
|
|
|
|
|
Government stock |
| 15,778 |
| 17,732 |
| 18,683 |
| 19,073 |
| 18,271 |
| 21,423 |
| 20,529 |
|
Treasury bills |
| 2,098 |
| 2,786 |
| 1,389 |
| 1,289 |
| 1,289 |
| 1,289 |
| 1,289 |
|
Government retail stock |
| 364 |
| 358 |
| 386 |
| 381 |
| 381 |
| 381 |
| 381 |
|
Settlement Cash with Reserve Bank |
| 7,507 |
| 7,523 |
| 7,465 |
| 7,465 |
| 7,465 |
| 7,465 |
| 7,465 |
|
Derivatives in loss(1) |
| 1,126 |
| 300 |
| 780 |
| 493 |
| 472 |
| 451 |
| 410 |
|
Finance lease liabilities |
| 954 |
| 958 |
| 1,251 |
| 993 |
| 853 |
| 1,183 |
| 1,331 |
|
Other borrowings |
| 14,071 |
| 16,707 |
| 15,592 |
| 18,962 |
| 21,885 |
| 22,767 |
| 23,505 |
|
Total Borrowings(2) |
| 41,898 |
| 46,364 |
| 45,546 |
| 48,656 |
| 50,616 |
| 54,959 |
| 54,910 |
|
Total Sovereign-Guaranteed Debt(3) |
| 31,163 |
| 33,167 |
| 32,912 |
| 32,534 |
| 31,473 |
| 34,666 |
| 33,552 |
|
Total Non-Sovereign-Guaranteed Debt |
| 10,735 |
| 13,197 |
| 12,634 |
| 16,122 |
| 19,143 |
| 20,293 |
| 21,358 |
|
Total Borrowings(2) |
| 41,898 |
| 46,364 |
| 45,546 |
| 48,656 |
| 50,616 |
| 54,959 |
| 54,910 |
|
Gross and Net Debt analysis: |
|
|
|
|
|
|
|
|
|
|
|
|
|
|
|
Core Crown borrowings |
| 35,892 |
| 38,876 |
| 37,035 |
| 37,640 |
| 37,173 |
| 40,631 |
| 39,815 |
|
Add back NZS Fund holdings of sovereign-issued debt and NZS Fund borrowings |
| 913 |
| 1,524 |
| 638 |
| 768 |
| 988 |
| 1,253 |
| 1,594 |
|
Gross sovereign-issued debt(4) |
| 36,805 |
| 40,400 |
| 37,673 |
| 38,408 |
| 38,161 |
| 41,884 |
| 41,409 |
|
Less core Crown financial assets(6) |
| 44,272 |
| 51,184 |
| 48,927 |
| 49,745 |
| 49,948 |
| 54,232 |
| 54,379 |
|
Net Core Crown debt (incl. NZS Fund)(7) |
| (7,467 | ) | (10,784 | ) | (11,254 | ) | (11,337 | ) | (11,787 | ) | (12,348 | ) | (12,970 | ) |
Add back NZS Fund financial assets |
| 11,576 |
| 15,439 |
| 13,100 |
| 15,915 |
| 19,059 |
| 22,493 |
| 26,163 |
|
Net Core Crown Debt (excl. NZS Fund)(8) |
| 4,109 |
| 4,655 |
| 1,846 |
| 4,578 |
| 7,272 |
| 10,145 |
| 13,193 |
|
Gross sovereign-issued debt excluding Reserve Bank Settlement Cash: |
|
|
|
|
|
|
|
|
|
|
|
|
|
|
|
Gross sovereign-issued debt(4) |
| 36,805 |
| 40,400 |
| 37,673 |
| 38,408 |
| 38,161 |
| 41,884 |
| 41,409 |
|
Less Reserve Bank settlement cash (incl. Kiwibank) |
| (7,758 | ) | (7,523 | ) | (7,510 | ) | (7,510 | ) | (7,510 | ) | (7,510 | ) | (7,510 | ) |
Add back changes to DMO borrowing due to settlement cash(5) |
| 1,600 |
| 1,600 |
| 1,600 |
| 1,600 |
| 1,600 |
| 1,600 |
| 1,600 |
|
Gross sovereign-issued debt excluding Reserve Bank settlement cash |
| 30,647 |
| 34,477 |
| 31,763 |
| 32,498 |
| 32,251 |
| 35,974 |
| 35,499 |
|
Notes on Borrowings
(1) Derivatives are included in either borrowings or marketable securities, deposits and equity investments depending on their value at balance date. This treatment leads to fluctuations in individual items within the Statement of Borrowings, primarily due to exchange rate movements.
(2) Total Borrowings (Gross Debt) is the total borrowings (both sovereign-guaranteed and non-sovereign-guaranteed) of the total Crown. This equates to the amount in the total Crown balance sheet and represents the complete picture of whole-of-Crown debt obligations to external parties.
(3) Total Borrowings (Gross Debt) can be split into sovereign-guaranteed and non-sovereign-guaranteed debt. This split reflects the fact that borrowings by SOEs and Crown entities are not explicitly guaranteed by the Crown. No debt of SOEs and Crown entities is currently guaranteed by the Crown.
(4) Gross sovereign-issued debt is debt issued by the sovereign (i.e., core Crown) and includes Government stock held by the NZS Fund, ACC or EQC for example. In other words, the total sovereign-issued debt does not eliminate any internal cross-holdings held by these entities.
(5) The Reserve Bank has used $1.6b of settlement cash to purchase reserves that were to have been funded by DMO borrowing. Therefore the impact of Settlement Cash on GSID is adjusted by this amount.
(6) Core Crown financial assets exclude receivables.
(7) Net core Crown debt is the Government Sovereign-issued debt less financial assets. This can provide information about the sustainability of the Government’s accounts, and is used by some international agencies when determining the credit-worthiness of a country. However, as some financial assets are not easily converted into cash, and some are restricted, it is important to view net debt alongside gross sovereign-issued debt.
(8) Adding back the NZ Superannuation Fund Assets provides the financial liabilities less financial assets of the Core Crown, excluding those assets set aside to meet part of the future cost of New Zealand superannuation.
The accompanying Notes and Accounting policies are an integral part of these Statements.
as at 31 March
|
| As at |
| As at |
|
|
| $m |
| $m |
|
Capital Commitments |
|
|
|
|
|
Specialist military equipment |
| 832 |
| 823 |
|
Land and buildings |
| 704 |
| 605 |
|
Other property, plant and equipment |
| 2,608 |
| 2,617 |
|
Other capital commitments |
| 167 |
| 184 |
|
Tertiary Education Institutions |
| 90 |
| 90 |
|
Total capital commitments |
| 4,401 |
| 4,319 |
|
Operating Commitments |
|
|
|
|
|
Non-cancellable accommodation leases |
| 2,262 |
| 2,296 |
|
Other non-cancellable leases |
| 2,327 |
| 2,355 |
|
Non-cancellable contracts for the supply of goods and services |
| 1,813 |
| 1,626 |
|
Other operating commitments |
| 7,445 |
| 7,278 |
|
Tertiary Education Institutions |
| 303 |
| 303 |
|
Total operating commitments |
| 14,150 |
| 13,858 |
|
Total commitments |
| 18,551 |
| 18,177 |
|
Total Commitments by Segment |
|
|
|
|
|
Core Crown |
| 12,932 |
| 19,944 |
|
Crown entities |
| 9,907 |
| 9,835 |
|
State Owned Enterprises |
| 3,509 |
| 3,508 |
|
Inter-segment eliminations |
| (7,797 | ) | (15,110 | ) |
Total commitments |
| 18,551 |
| 18,177 |
|
as at 31 March
|
| As at |
| As at |
|
|
| $m |
| $m |
|
Quantifiable Contingent Liabilities |
|
|
|
|
|
Guarantees and indemnities |
| 168 |
| 171 |
|
Uncalled capital |
| 2,080 |
| 2,076 |
|
Legal proceedings and disputes |
| 349 |
| 1,170 |
|
Other contingent liabilities |
| 1,984 |
| 1,829 |
|
Total quantifiable contingent liabilities |
| 4,581 |
| 5,246 |
|
Total Quantifiable Contingent Liabilities by Segment |
|
|
|
|
|
Core Crown |
| 4,474 |
| 5,071 |
|
Crown entities |
| 52 |
| 45 |
|
State Owned Enterprises |
| 91 |
| 150 |
|
Inter-segment eliminations |
| (36 | ) | (20 | ) |
Total quantifiable contingent liabilities |
| 4,581 |
| 5,246 |
|
Quantifiable Contingent Assets |
|
|
|
|
|
Core Crown |
| 85 |
| 86 |
|
Crown entities |
| 5 |
| — |
|
Total quantifiable contingent assets |
| 90 |
| 86 |
|
The accompanying Notes and Accounting policies are an integral part of these Statements.
A detailed Statement of Contingent Liabilities and Assets (quantified and unquantified) is outlined on pages 146 to 148 of the Specific Fiscal Risk chapter.
The Statement of Specific Risks (quantified and unquantified) is outlined on pages 123 to 145 of the Specific Fiscal Risk chapter.
|
| 2007 |
| 2008 |
| 2008 |
| 2009 |
| 2010 |
| 2011 |
| 2012 |
|
|
| Actual |
| Budget |
| Forecast |
| Forecast |
| Forecast |
| Forecast |
| Forecast |
|
|
| $m |
| $m |
| $m |
| $m |
| $m |
| $m |
| $m |
|
NOTE 1: Revenue Collected Through the Crown’s Sovereign Power |
|
|
|
|
|
|
|
|
|
|
|
|
|
|
|
Taxation Revenue (accrual) |
|
|
|
|
|
|
|
|
|
|
|
|
|
|
|
Individuals |
|
|
|
|
|
|
|
|
|
|
|
|
|
|
|
Source deductions |
| 20,980 |
| 22,334 |
| 22,735 |
| 22,874 |
| 23,639 |
| 24,368 |
| 25,325 |
|
Other persons |
| 4,440 |
| 4,553 |
| 4,986 |
| 4,986 |
| 5,162 |
| 5,205 |
| 5,317 |
|
Refunds |
| (1,080 | ) | (1,102 | ) | (1,290 | ) | (1,199 | ) | (1,277 | ) | (1,288 | ) | (1,322 | ) |
Fringe benefit tax |
| 468 |
| 474 |
| 521 |
| 523 |
| 541 |
| 571 |
| 595 |
|
Total Individuals |
| 24,808 |
| 26,259 |
| 26,952 |
| 27,184 |
| 28,065 |
| 28,856 |
| 29,915 |
|
Corporate Tax |
|
|
|
|
|
|
|
|
|
|
|
|
|
|
|
Gross companies tax |
| 8,849 |
| 8,222 |
| 8,403 |
| 7,817 |
| 8,135 |
| 8,773 |
| 9,372 |
|
Refunds |
| (296 | ) | (255 | ) | (310 | ) | (300 | ) | (300 | ) | (300 | ) | (300 | ) |
Non-resident withholding tax |
| 1,189 |
| 1,005 |
| 1,653 |
| 1,402 |
| 1,364 |
| 1,303 |
| 1,375 |
|
Foreign-source dividend w/holding payments |
| 149 |
| 102 |
| 122 |
| 109 |
| 109 |
| 109 |
| 109 |
|
Total Corporate Tax |
| 9,891 |
| 9,074 |
| 9,868 |
| 9,028 |
| 9,308 |
| 9,885 |
| 10,556 |
|
Other Income Tax |
|
|
|
|
|
|
|
|
|
|
|
|
|
|
|
Resident w/holding tax on interest income |
| 2,227 |
| 2,340 |
| 2,596 |
| 2,740 |
| 2,719 |
| 2,646 |
| 2,719 |
|
Resident w/holding tax on dividend income |
| 89 |
| 92 |
| 63 |
| 91 |
| 221 |
| 269 |
| 271 |
|
Estate and gift duties |
| 2 |
| 2 |
| 3 |
| 3 |
| 3 |
| 3 |
| 3 |
|
Total Other Income Tax |
| 2,318 |
| 2,434 |
| 2,662 |
| 2,834 |
| 2,943 |
| 2,918 |
| 2,993 |
|
Total Income Tax |
| 37,017 |
| 37,767 |
| 39,482 |
| 39,046 |
| 40,316 |
| 41,659 |
| 43,464 |
|
Goods and Services Tax |
|
|
|
|
|
|
|
|
|
|
|
|
|
|
|
Gross goods and services tax |
| 19,540 |
| 19,726 |
| 20,655 |
| 20,458 |
| 21,432 |
| 23,034 |
| 24,398 |
|
Refunds |
| (8,325 | ) | (8,231 | ) | (8,841 | ) | (8,578 | ) | (9,143 | ) | (10,042 | ) | (10,871 | ) |
Total Goods and Services Tax |
| 11,215 |
| 11,495 |
| 11,814 |
| 11,880 |
| 12,289 |
| 12,992 |
| 13,527 |
|
Other Indirect Taxation |
|
|
|
|
|
|
|
|
|
|
|
|
|
|
|
Petroleum fuels excise |
| 819 |
| 903 |
| 818 |
| 813 |
| 831 |
| 841 |
| 849 |
|
Tobacco excise |
| 238 |
| 148 |
| 144 |
| 151 |
| 154 |
| 157 |
| 160 |
|
Customs duty |
| 1,836 |
| 1,865 |
| 1,880 |
| 1,859 |
| 1,862 |
| 1,861 |
| 1,854 |
|
Road user charges |
| 786 |
| 877 |
| 867 |
| 940 |
| 925 |
| 933 |
| 944 |
|
Alcohol excise |
| 553 |
| 586 |
| 573 |
| 605 |
| 636 |
| 660 |
| 687 |
|
Gaming duties |
| 230 |
| 215 |
| 245 |
| 254 |
| 262 |
| 269 |
| 276 |
|
Motor vehicle fees |
| 222 |
| 219 |
| 227 |
| 229 |
| 230 |
| 232 |
| 234 |
|
Energy resources levies |
| 54 |
| 34 |
| 47 |
| 43 |
| 43 |
| 43 |
| 43 |
|
Approved issuer levy and cheque duty |
| 94 |
| 64 |
| 89 |
| 91 |
| 97 |
| 96 |
| 96 |
|
Total Other Indirect Taxation |
| 4,832 |
| 4,911 |
| 4,890 |
| 4,985 |
| 5,040 |
| 5,092 |
| 5,143 |
|
Total Indirect Taxation |
| 16,047 |
| 16,406 |
| 16,704 |
| 16,865 |
| 17,329 |
| 18,084 |
| 18,670 |
|
Total Taxation Revenue |
| 53,064 |
| 54,173 |
| 56,186 |
| 55,911 |
| 57,645 |
| 59,743 |
| 62,134 |
|
Other Sovereign Revenue (accrual) |
|
|
|
|
|
|
|
|
|
|
|
|
|
|
|
ACC levies |
| 2,468 |
| 2,654 |
| 2,770 |
| 2,780 |
| 2,907 |
| 2,993 |
| 3,077 |
|
Fire Service levies |
| 268 |
| 261 |
| 285 |
| 303 |
| 309 |
| 315 |
| 322 |
|
EQC levies |
| 84 |
| 86 |
| 86 |
| 87 |
| 89 |
| 90 |
| 92 |
|
Other miscellaneous items |
| 676 |
| 692 |
| 710 |
| 867 |
| 1,037 |
| 1,478 |
| 1,671 |
|
Total Other Sovereign Revenue |
| 3,496 |
| 3,693 |
| 3,851 |
| 4,037 |
| 4,342 |
| 4,876 |
| 5,162 |
|
Total Sovereign Revenue |
| 56,560 |
| 57,866 |
| 60,037 |
| 59,948 |
| 61,987 |
| 64,619 |
| 67,296 |
|
Notes to the Forecast Financial Statements
|
| 2007 |
| 2008 |
| 2008 |
| 2009 |
| 2010 |
| 2011 |
| 2012 |
|
|
| Actual |
| Budget |
| Forecast |
| Forecast |
| Forecast |
| Forecast |
| Forecast |
|
|
| $m |
| $m |
| $m |
| $m |
| $m |
| $m |
| $m |
|
NOTE 1 (continued): Receipts Collected Through the Crown’s Sovereign Power |
|
|
|
|
|
|
|
|
|
|
|
|
|
|
|
Income Tax Receipts (cash) |
|
|
|
|
|
|
|
|
|
|
|
|
|
|
|
Individuals |
|
|
|
|
|
|
|
|
|
|
|
|
|
|
|
Source deductions |
| 21,009 |
| 22,334 |
| 22,676 |
| 22,737 |
| 23,570 |
| 24,296 |
| 25,251 |
|
Other persons |
| 5,121 |
| 5,430 |
| 5,669 |
| 5,570 |
| 5,813 |
| 5,895 |
| 5,928 |
|
Refunds |
| (1,850 | ) | (2,017 | ) | (2,238 | ) | (2,065 | ) | (2,093 | ) | (2,117 | ) | (2,122 | ) |
Fringe benefit tax |
| 482 |
| 470 |
| 486 |
| 513 |
| 535 |
| 560 |
| 586 |
|
Total Individuals |
| 24,762 |
| 26,217 |
| 26,593 |
| 26,755 |
| 27,825 |
| 28,634 |
| 29,643 |
|
Corporate Tax |
|
|
|
|
|
|
|
|
|
|
|
|
|
|
|
Gross companies tax |
| 9,120 |
| 9,184 |
| 9,327 |
| 7,948 |
| 8,631 |
| 9,291 |
| 9,911 |
|
Refunds |
| (1,153 | ) | (1,041 | ) | (1,000 | ) | (1,000 | ) | (880 | ) | (949 | ) | (1,012 | ) |
Non-resident withholding tax |
| 1,135 |
| 981 |
| 1,615 |
| 1,373 |
| 1,335 |
| 1,340 |
| 1,396 |
|
Foreign-source dividend w/holding payments |
| 141 |
| 102 |
| 122 |
| 109 |
| 109 |
| 109 |
| 109 |
|
Total Corporate Tax |
| 9,243 |
| 9,226 |
| 10,064 |
| 8,430 |
| 9,195 |
| 9,791 |
| 10,404 |
|
Other Income Tax |
|
|
|
|
|
|
|
|
|
|
|
|
|
|
|
Resident w/holding tax on interest income |
| 2,192 |
| 2,340 |
| 2,567 |
| 2,740 |
| 2,719 |
| 2,646 |
| 2,719 |
|
Resident w/holding tax on dividend income |
| 90 |
| 92 |
| 63 |
| 90 |
| 220 |
| 267 |
| 269 |
|
Estate and gift duties |
| 3 |
| 2 |
| 3 |
| 3 |
| 3 |
| 3 |
| 3 |
|
Total Other Income Tax |
| 2,285 |
| 2,434 |
| 2,633 |
| 2,833 |
| 2,942 |
| 2,916 |
| 2,991 |
|
Total Income Tax |
| 36,290 |
| 37,877 |
| 39,290 |
| 38,018 |
| 39,962 |
| 41,341 |
| 43,038 |
|
Goods and Services Tax |
|
|
|
|
|
|
|
|
|
|
|
|
|
|
|
Gross goods and services tax |
| 18,701 |
| 19,354 |
| 20,038 |
| 19,944 |
| 20,917 |
| 22,496 |
| 23,852 |
|
Refunds |
| (7,625 | ) | (7,877 | ) | (8,561 | ) | (8,267 | ) | (8,832 | ) | (9,731 | ) | (10,560 | ) |
Total Goods and Services Tax |
| 11,076 |
| 11,477 |
| 11,477 |
| 11,677 |
| 12,085 |
| 12,765 |
| 13,292 |
|
Other Indirect Taxation |
|
|
|
|
|
|
|
|
|
|
|
|
|
|
|
Petroleum fuels excise |
| 835 |
| 903 |
| 818 |
| 813 |
| 831 |
| 841 |
| 849 |
|
Tobacco excise |
| 265 |
| 148 |
| 144 |
| 151 |
| 154 |
| 157 |
| 160 |
|
Customs duty |
| 1,778 |
| 1,865 |
| 1,880 |
| 1,859 |
| 1,862 |
| 1,861 |
| 1,854 |
|
Road user charges |
| 791 |
| 877 |
| 867 |
| 940 |
| 925 |
| 933 |
| 944 |
|
Alcohol excise |
| 549 |
| 586 |
| 573 |
| 605 |
| 636 |
| 660 |
| 687 |
|
Gaming duties |
| 236 |
| 215 |
| 245 |
| 254 |
| 262 |
| 269 |
| 276 |
|
Motor vehicle fees |
| 208 |
| 219 |
| 227 |
| 229 |
| 230 |
| 232 |
| 234 |
|
Energy resources levies |
| 55 |
| 35 |
| 52 |
| 43 |
| 43 |
| 43 |
| 43 |
|
Approved issuer levy and cheque duty |
| 74 |
| 64 |
| 89 |
| 92 |
| 97 |
| 96 |
| 96 |
|
Total Other Indirect Taxation |
| 4,791 |
| 4,912 |
| 4,895 |
| 4,986 |
| 5,040 |
| 5,092 |
| 5,143 |
|
Total Indirect Taxation |
| 15,867 |
| 16,389 |
| 16,372 |
| 16,663 |
| 17,125 |
| 17,857 |
| 18,435 |
|
Total Tax Receipts Collected |
| 52,157 |
| 54,266 |
| 55,662 |
| 54,681 |
| 57,087 |
| 59,198 |
| 61,473 |
|
Other Sovereign Receipts (cash) |
|
|
|
|
|
|
|
|
|
|
|
|
|
|
|
ACC levies |
| 2,599 |
| 2,561 |
| 2,565 |
| 2,688 |
| 2,808 |
| 2,908 |
| 2,985 |
|
Fire Service levies |
| 268 |
| 263 |
| 285 |
| 303 |
| 309 |
| 316 |
| 322 |
|
EQC levies |
| 84 |
| 86 |
| 86 |
| 87 |
| 88 |
| 90 |
| 92 |
|
Other miscellaneous items |
| 464 |
| 562 |
| 560 |
| 597 |
| 607 |
| 618 |
| 629 |
|
Total Other Sovereign Receipts |
| 3,415 |
| 3,472 |
| 3,496 |
| 3,675 |
| 3,812 |
| 3,932 |
| 4,028 |
|
Total Sovereign Receipts |
| 55,572 |
| 57,738 |
| 59,158 |
| 58,356 |
| 60,899 |
| 63,130 |
| 65,501 |
|
Notes to the Forecast Financial Statements
|
| 2007 |
| 2008 |
| 2008 |
| 2009 |
| 2010 |
| 2011 |
| 2012 |
|
|
| Actual |
| Budget |
| Forecast |
| Forecast |
| Forecast |
| Forecast |
| Forecast |
|
|
| $m |
| $m |
| $m |
| $m |
| $m |
| $m |
| $m |
|
NOTE 2: Interest Revenue and Dividends |
|
|
|
|
|
|
|
|
|
|
|
|
|
|
|
By type |
|
|
|
|
|
|
|
|
|
|
|
|
|
|
|
Interest revenue |
| 2,555 |
| 2,865 |
| 2,864 |
| 2,967 |
| 2,802 |
| 2,896 |
| 2,886 |
|
Dividends |
| 440 |
| 501 |
| 339 |
| 391 |
| 450 |
| 514 |
| 575 |
|
Total Interest Revenue and Dividends |
| 2,995 |
| 3,366 |
| 3,203 |
| 3,358 |
| 3,252 |
| 3,410 |
| 3,461 |
|
By source |
|
|
|
|
|
|
|
|
|
|
|
|
|
|
|
Core Crown |
| 2,580 |
| 2,587 |
| 2,562 |
| 2,835 |
| 2,702 |
| 2,879 |
| 2,981 |
|
Crown entities |
| 756 |
| 880 |
| 1,085 |
| 1,083 |
| 1,136 |
| 1,183 |
| 1,242 |
|
State-owned enterprises |
| 484 |
| 481 |
| 509 |
| 239 |
| 263 |
| 225 |
| 243 |
|
Inter-segment eliminations |
| (825 | ) | (582 | ) | (953 | ) | (799 | ) | (849 | ) | (877 | ) | (1,005 | ) |
Total Interest Revenue and Dividends |
| 2,995 |
| 3,366 |
| 3,203 |
| 3,358 |
| 3,252 |
| 3,410 |
| 3,461 |
|
NOTE 3: Social Assistance and Official Development Assistance |
|
|
|
|
|
|
|
|
|
|
|
|
|
|
|
New Zealand superannuation |
| 6,810 |
| 7,292 |
| 7,347 |
| 7,741 |
| 8,196 |
| 8,622 |
| 9,219 |
|
Domestic purposes benefit |
| 1,468 |
| 1,456 |
| 1,475 |
| 1,455 |
| 1,463 |
| 1,469 |
| 1,535 |
|
Unemployment benefit |
| 613 |
| 497 |
| 455 |
| 403 |
| 431 |
| 419 |
| 421 |
|
Invalids benefit |
| 1,132 |
| 1,201 |
| 1,214 |
| 1,264 |
| 1,298 |
| 1,327 |
| 1,397 |
|
Family support |
| 1,699 |
| 1,964 |
| 2,081 |
| 2,132 |
| 2,132 |
| 2,137 |
| 2,236 |
|
Accommodation supplement |
| 877 |
| 909 |
| 888 |
| 911 |
| 935 |
| 953 |
| 977 |
|
Sickness benefit |
| 573 |
| 608 |
| 580 |
| 548 |
| 538 |
| 530 |
| 541 |
|
Student allowances |
| 382 |
| 402 |
| 384 |
| 398 |
| 418 |
| 429 |
| 446 |
|
Disability allowances |
| 270 |
| 279 |
| 278 |
| 387 |
| 410 |
| 433 |
| 456 |
|
KiwiSaver subsidies |
| — |
| 491 |
| 1,030 |
| 1,370 |
| 1,441 |
| 1,502 |
| 1,507 |
|
Other social assistance benefits |
| 2,192 |
| 2,392 |
| 2,390 |
| 2,638 |
| 2,767 |
| 2,884 |
| 3,024 |
|
Total Social Assistance |
| 16,016 |
| 17,491 |
| 18,122 |
| 19,247 |
| 20,029 |
| 20,705 |
| 21,759 |
|
Official development assistance |
| 330 |
| 401 |
| 398 |
| 434 |
| 499 |
| 568 |
| 568 |
|
Total Social Assistance and Official Development Assistance |
| 16,346 |
| 17,892 |
| 18,520 |
| 19,681 |
| 20,528 |
| 21,273 |
| 22,327 |
|
ACC payments are now classified as insurance expenses under NZ IFRS (refer note 7). |
|
|
|
|
|
|
|
|
|
|
|
|
|
|
|
NOTE 4: Personnel Expenses |
|
|
|
|
|
|
|
|
|
|
|
|
|
|
|
Core Crown |
| 5,092 |
| 5,434 |
| 5,621 |
| 5,846 |
| 5,800 |
| 5,857 |
| 5,870 |
|
Crown entities |
| 8,183 |
| 8,213 |
| 8,624 |
| 8,976 |
| 9,162 |
| 9,321 |
| 9,313 |
|
State-owned enterprises |
| 2,018 |
| 2,011 |
| 2,186 |
| 2,248 |
| 2,316 |
| 2,404 |
| 2,443 |
|
Inter-segment eliminations |
| (9 | ) | (1 | ) | (9 | ) | (9 | ) | (10 | ) | (10 | ) | (10 | ) |
Total Personnel Expenses |
| 15,284 |
| 15,657 |
| 16,422 |
| 17,061 |
| 17,268 |
| 17,572 |
| 17,616 |
|
NOTE 5: Operating Expenses |
|
|
|
|
|
|
|
|
|
|
|
|
|
|
|
Core Crown |
| 30,120 |
| 30,102 |
| 30,791 |
| 34,027 |
| 33,741 |
| 34,194 |
| 34,269 |
|
Crown entities |
| 13,485 |
| 15,291 |
| 14,789 |
| 15,773 |
| 15,898 |
| 16,053 |
| 16,150 |
|
State-owned enterprises |
| 8,294 |
| 9,180 |
| 9,434 |
| 10,017 |
| 10,549 |
| 11,098 |
| 11,357 |
|
Inter-segment eliminations |
| (20,922 | ) | (22,280 | ) | (22,179 | ) | (23,814 | ) | (24,101 | ) | (24,116 | ) | (24,109 | ) |
Total Operating Expenses |
| 30,977 |
| 32,293 |
| 32,835 |
| 36,003 |
| 36,087 |
| 37,229 |
| 37,667 |
|
Notes to the Forecast Financial Statements
|
| 2007 |
| 2008 |
| 2008 |
| 2009 |
| 2010 |
| 2011 |
| 2012 |
|
|
| Actual |
| Budget |
| Forecast |
| Forecast |
| Forecast |
| Forecast |
| Forecast |
|
|
| $m |
| $m |
| $m |
| $m |
| $m |
| $m |
| $m |
|
NOTE 6: Interest Expenses |
|
|
|
|
|
|
|
|
|
|
|
|
|
|
|
By type |
|
|
|
|
|
|
|
|
|
|
|
|
|
|
|
Interest on financial liabilities |
| 2,867 |
| 2,335 |
| 2,930 |
| 2,482 |
| 2,469 |
| 2,748 |
| 2,866 |
|
Interest unwind on provisions |
| 18 |
| 413 |
| 24 |
| 21 |
| 21 |
| 21 |
| 20 |
|
Total Interest Expenses |
| 2,885 |
| 2,748 |
| 2,954 |
| 2,503 |
| 2,490 |
| 2,769 |
| 2,886 |
|
By source |
|
|
|
|
|
|
|
|
|
|
|
|
|
|
|
Core Crown |
| 2,330 |
| 2,245 |
| 2,527 |
| 2,406 |
| 2,341 |
| 2,606 |
| 2,648 |
|
Crown entities |
| 265 |
| 306 |
| 275 |
| 294 |
| 301 |
| 297 |
| 310 |
|
State-owned Enterprises |
| 685 |
| 704 |
| 734 |
| 442 |
| 511 |
| 553 |
| 630 |
|
Inter-segment eliminations |
| (395 | ) | (507 | ) | (582 | ) | (639 | ) | (663 | ) | (687 | ) | (702 | ) |
Total Interest Expenses |
| 2,885 |
| 2,748 |
| 2,954 |
| 2,503 |
| 2,490 |
| 2,769 |
| 2,886 |
|
NOTE 7: Insurance Expenses |
|
|
|
|
|
|
|
|
|
|
|
|
|
|
|
By type |
|
|
|
|
|
|
|
|
|
|
|
|
|
|
|
ACC |
| 3,143 |
| 2,965 |
| 4,001 |
| 3,749 |
| 4,088 |
| 4,380 |
| 4,682 |
|
Earthquake Commission |
| 77 |
| 37 |
| 82 |
| 39 |
| 40 |
| 40 |
| 41 |
|
Other insurance expenses |
| 18 |
| 8 |
| 12 |
| 11 |
| 12 |
| 12 |
| 12 |
|
Total Insurance Expenses |
| 3,238 |
| 3,010 |
| 4,095 |
| 3,799 |
| 4,140 |
| 4,432 |
| 4,735 |
|
NOTE 8: Forecast New Operating Spending |
|
|
|
|
|
|
|
|
|
|
|
|
|
|
|
New operating spending up to Budget 2009 |
| — |
| 314 |
| — |
| 249 |
| 210 |
| 209 |
| 219 |
|
Forecast for future new spending |
| — |
| — |
| — |
| — |
| 1,564 |
| 3,167 |
| 4,898 |
|
Total Forecast New Operating Spending |
| — |
| 314 |
| — |
| 249 |
| 1,774 |
| 3,376 |
| 5,117 |
|
Top-down expense adjustment |
| — |
| — |
| (240 | ) | (495 | ) | (450 | ) | (450 | ) | (450 | ) |
New operating spending up to Budget 2009 represents expenses included in Budget 2008 that have yet to be allocated.
Forecast new operating spending indicates in broad terms the potential spending increases that could be introduced in each future remaining budget round. As some of this spending has already been allocated to the Defence funding package, this line represents the unallocated portion. Total potential spending increases included in the forecasts are $1.75 billion for the next four Budgets.
|
| 2007 |
| 2008 |
| 2008 |
| 2009 |
| 2010 |
| 2011 |
| 2012 |
|
|
| Actual |
| Budget |
| Forecast |
| Forecast |
| Forecast |
| Forecast |
| Forecast |
|
|
| $m |
| $m |
| $m |
| $m |
| $m |
| $m |
| $m |
|
NOTE 9: Gains and Losses on Financial Instruments |
|
|
|
|
|
|
|
|
|
|
|
|
|
|
|
By source |
|
|
|
|
|
|
|
|
|
|
|
|
|
|
|
Core Crown |
| 1,179 |
| 1,155 |
| 200 |
| 1,377 |
| 1,612 |
| 1,864 |
| 2,105 |
|
Crown entities |
| 365 |
| 485 |
| (691 | ) | 354 |
| 335 |
| 367 |
| 398 |
|
State-owned enterprises |
| 63 |
| 18 |
| (138 | ) | (50 | ) | (60 | ) | (76 | ) | (69 | ) |
Inter-segment eliminations |
| (41 | ) | (281 | ) | (195 | ) | (257 | ) | (262 | ) | (265 | ) | (263 | ) |
Net Gains/(Losses) on Financial Instruments |
| 1,566 |
| 1,377 |
| (824 | ) | 1,424 |
| 1,625 |
| 1,890 |
| 2,171 |
|
NOTE 10: Gains and Losses on Non-Financial Instruments |
|
|
|
|
|
|
|
|
|
|
|
|
|
|
|
Actuarial gains/(losses) on GSF liability |
| 1,133 |
| — |
| (906 | ) | — |
| — |
| — |
| — |
|
Actuarial gains/(losses) on ACC outstanding claims |
| (481 | ) | — |
| (1,059 | ) | — |
| — |
| — |
| — |
|
Other |
| (166 | ) | — |
| (42 | ) | 170 |
| 176 |
| 183 |
| 190 |
|
Net Gains/(Losses) on Non-Financial Instruments |
| 486 |
| — |
| (2,007 | ) | 170 |
| 176 |
| 183 |
| 190 |
|
By source |
|
|
|
|
|
|
|
|
|
|
|
|
|
|
|
Core Crown |
| 1,163 |
| — |
| (1,057 | ) | 8 |
| 9 |
| 9 |
| 10 |
|
Crown entities |
| (495 | ) | — |
| (1,078 | ) | — |
| — |
| — |
| — |
|
State-owned enterprises |
| (181 | ) | — |
| 128 |
| 162 |
| 167 |
| 174 |
| 180 |
|
Inter-segment eliminations |
| (1 | ) | — |
| — |
| — |
| — |
| — |
| — |
|
Net Gains/(Losses) on Non-Financial Instruments |
| 486 |
| — |
| (2,007 | ) | 170 |
| 176 |
| 183 |
| 190 |
|
Notes to the Forecast Financial Statements
|
| 2007 |
| 2008 |
| 2008 |
| 2009 |
| 2010 |
| 2011 |
| 2012 |
|
|
| Actual |
| Budget |
| Forecast |
| Forecast |
| Forecast |
| Forecast |
| Forecast |
|
|
| $m |
| $m |
| $m |
| $m |
| $m |
| $m |
| $m |
|
NOTE 11: Source of Operating Balance |
|
|
|
|
|
|
|
|
|
|
|
|
|
|
|
Core Crown |
| 6,510 |
| 4,464 |
| 3,729 |
| 1,436 |
| 1,445 |
| 1,329 |
| 1,391 |
|
Crown entities |
| 1,023 |
| 1,242 |
| (1,285 | ) | 1,147 |
| 925 |
| 914 |
| 861 |
|
State-owned enterprises |
| 807 |
| 1,068 |
| 747 |
| 1,067 |
| 1,137 |
| 1,028 |
| 1,020 |
|
Inter-segment eliminations |
| (317 | ) | (343 | ) | (632 | ) | (545 | ) | (498 | ) | (492 | ) | (538 | ) |
Total Operating Balance |
| 8,023 |
| 6,431 |
| 2,559 |
| 3,105 |
| 3,009 |
| 2,779 |
| 2,734 |
|
NOTE 12: Financial Assets |
|
|
|
|
|
|
|
|
|
|
|
|
|
|
|
Cash and cash equivalents |
| 4,163 |
| 3,196 |
| 5,217 |
| 6,412 |
| 6,725 |
| 7,327 |
| 7,682 |
|
Tax receivables |
| 6,368 |
| 7,078 |
| 6,005 |
| 6,139 |
| 5,823 |
| 5,567 |
| 5,384 |
|
Trade and other receivables |
| 5,690 |
| 5,469 |
| 6,321 |
| 6,610 |
| 6,772 |
| 6,936 |
| 7,054 |
|
Student loans (refer note 13) |
| 6,011 |
| 6,252 |
| 6,278 |
| 6,718 |
| 7,161 |
| 7,604 |
| 8,044 |
|
Kiwibank mortgages |
| 3,637 |
| 5,127 |
| 5,751 |
| 8,137 |
| 10,067 |
| 10,067 |
| 10,067 |
|
Long-term deposits |
| 2,110 |
| 2,037 |
| 1,741 |
| 1,785 |
| 1,812 |
| 1,339 |
| 1,561 |
|
Reserve position at the IMF |
| 183 |
| 212 |
| 151 |
| 141 |
| 131 |
| 120 |
| 109 |
|
Other advances |
| 2,145 |
| 1,459 |
| 1,878 |
| 1,867 |
| 1,872 |
| 1,851 |
| 1,842 |
|
Share investments |
| 13,581 |
| 17,273 |
| 12,790 |
| 13,700 |
| 15,608 |
| 17,603 |
| 19,517 |
|
Derivatives in gain |
| 2,352 |
| 464 |
| 1,167 |
| 565 |
| 496 |
| 465 |
| 436 |
|
Other marketable securities |
| 27,480 |
| 32,421 |
| 33,306 |
| 32,786 |
| 32,140 |
| 34,530 |
| 33,254 |
|
Total Financial Assets |
| 73,720 |
| 80,988 |
| 80,605 |
| 84,860 |
| 88,607 |
| 93,409 |
| 94,950 |
|
Financial assets by portfolio |
|
|
|
|
|
|
|
|
|
|
|
|
|
|
|
Reserve Bank and DMO managed funds |
| 22,577 |
| 26,013 |
| 23,559 |
| 21,026 |
| 17,661 |
| 17,836 |
| 13,859 |
|
NZ Superannuation Fund |
| 12,576 |
| 15,439 |
| 13,816 |
| 16,821 |
| 20,149 |
| 23,867 |
| 27,896 |
|
Other core Crown |
| 14,403 |
| 14,311 |
| 16,021 |
| 16,382 |
| 16,465 |
| 16,690 |
| 16,999 |
|
Intra-segment eliminations |
| (952 | ) | (1,536 | ) | (587 | ) | (775 | ) | (1,000 | ) | (1,270 | ) | (1,614 | ) |
Total Core Crown |
| 48,604 |
| 54,227 |
| 52,809 |
| 53,454 |
| 53,275 |
| 57,123 |
| 57,140 |
|
ACC portfolio |
| 10,588 |
| 11,695 |
| 11,864 |
| 12,916 |
| 13,953 |
| 14,959 |
| 15,897 |
|
EQC portfolio |
| 1,920 |
| 2,174 |
| 1,814 |
| 1,963 |
| 2,124 |
| 2,298 |
| 2,485 |
|
Other Crown entities |
| 4,078 |
| 3,670 |
| 3,894 |
| 3,895 |
| 3,999 |
| 4,117 |
| 4,255 |
|
Total Crown Entities |
| 16,586 |
| 17,539 |
| 17,572 |
| 18,774 |
| 20,076 |
| 21,374 |
| 22,637 |
|
Total State-Owned Enterprises |
| 8,530 |
| 9,222 |
| 10,224 |
| 12,632 |
| 15,256 |
| 14,912 |
| 15,173 |
|
Total Financial Assets by portfolio |
| 73,720 |
| 80,988 |
| 80,605 |
| 84,860 |
| 88,607 |
| 93,409 |
| 94,950 |
|
NOTE 13: Student Loans |
|
|
|
|
|
|
|
|
|
|
|
|
|
|
|
Nominal value (including accrued interest) |
| 9,413 |
| 9,983 |
| 10,012 |
| 10,642 |
| 11,284 |
| 11,928 |
| 12,573 |
|
Opening book value |
| 5,569 |
| 5,761 |
| 6,011 |
| 6,278 |
| 6,718 |
| 7,161 |
| 7,604 |
|
Amount borrowed in the year |
| 1,176 |
| 1,278 |
| 1,210 |
| 1,305 |
| 1,399 |
| 1,483 |
| 1,568 |
|
Initial fair value write down on new borrowings |
| (488 | ) | (526 | ) | (487 | ) | (525 | ) | (563 | ) | (597 | ) | (631 | ) |
Repayments made during the year |
| (555 | ) | (621 | ) | (611 | ) | (675 | ) | (758 | ) | (838 | ) | (924 | ) |
Interest unwind |
| 360 |
| 391 |
| 414 |
| 445 |
| 475 |
| 506 |
| 536 |
|
Impairment |
| (151 | ) | (31 | ) | (260 | ) | (110 | ) | (110 | ) | (110 | ) | (110 | ) |
Other movements |
| 100 |
| — |
| 1 |
| — |
| — |
| (1 | ) | 1 |
|
Closing book value |
| 6,011 |
| 6,252 |
| 6,278 |
| 6,718 |
| 7,161 |
| 7,604 |
| 8,044 |
|
Notes to the Forecast Financial Statements
|
| 2007 |
| 2008 |
| 2008 |
| 2009 |
| 2010 |
| 2011 |
| 2012 |
|
|
| Actual |
| Budget |
| Forecast |
| Forecast |
| Forecast |
| Forecast |
| Forecast |
|
|
| $m |
| $m |
| $m |
| $m |
| $m |
| $m |
| $m |
|
NOTE 14: Property, Plant and Equipment |
|
|
|
|
|
|
|
|
|
|
|
|
|
|
|
By Class of asset |
|
|
|
|
|
|
|
|
|
|
|
|
|
|
|
Net Carrying Value |
|
|
|
|
|
|
|
|
|
|
|
|
|
|
|
Land (valuation) |
| 21,140 |
| 18,963 |
| 21,418 |
| 21,586 |
| 21,751 |
| 21,891 |
| 21,952 |
|
Buildings (valuation) |
| 20,777 |
| 21,349 |
| 21,368 |
| 21,775 |
| 22,227 |
| 22,327 |
| 22,312 |
|
Electricity distribution network (cost) |
| 1,972 |
| 2,219 |
| 2,060 |
| 2,343 |
| 2,790 |
| 3,387 |
| 3,824 |
|
Electricity generation assets (valuation) |
| 10,402 |
| 10,057 |
| 11,059 |
| 11,882 |
| 12,541 |
| 13,151 |
| 14,043 |
|
Aircraft (excl military) (valuation) |
| 2,104 |
| 2,064 |
| 1,955 |
| 1,756 |
| 1,808 |
| 2,695 |
| 2,848 |
|
State highways (valuation) |
| 19,400 |
| 19,415 |
| 20,220 |
| 20,937 |
| 21,470 |
| 22,040 |
| 22,667 |
|
Rail network (valuation) |
| 10,568 |
| 10,804 |
| 10,581 |
| 10,917 |
| 11,248 |
| 11,348 |
| 11,221 |
|
Specialist military equipment (valuation) |
| 3,079 |
| 3,628 |
| 3,157 |
| 3,160 |
| 3,148 |
| 2,891 |
| 2,464 |
|
Other plant and equipment (cost) |
| 3,805 |
| 5,882 |
| 4,146 |
| 4,513 |
| 4,478 |
| 4,305 |
| 4,104 |
|
Specified cultural and heritage assets (valuation) |
| 2,351 |
| 1,569 |
| 2,391 |
| 2,407 |
| 2,424 |
| 2,446 |
| 2,467 |
|
Total Property, Plant and Equipment |
| 95,598 |
| 95,950 |
| 98,355 |
| 101,276 |
| 103,885 |
| 106,481 |
| 107,902 |
|
By source |
|
|
|
|
|
|
|
|
|
|
|
|
|
|
|
Core Crown |
| 26,213 |
| 26,492 |
| 26,458 |
| 26,827 |
| 27,079 |
| 26,860 |
| 26,416 |
|
Crown entities |
| 41,296 |
| 40,327 |
| 42,683 |
| 43,868 |
| 44,723 |
| 45,479 |
| 46,165 |
|
State-owned enterprises |
| 28,087 |
| 29,131 |
| 29,214 |
| 30,580 |
| 32,083 |
| 34,143 |
| 35,320 |
|
Inter-segment eliminations |
| 2 |
| — |
| — |
| 1 |
| — |
| (1 | ) | 1 |
|
Total Property, Plant and Equipment |
| 95,598 |
| 95,950 |
| 98,355 |
| 101,276 |
| 103,885 |
| 106,481 |
| 107,902 |
|
NOTE 15: NZ Superannuation Fund |
|
|
|
|
|
|
|
|
|
|
|
|
|
|
|
Revenue |
| 436 |
| 447 |
| 381 |
| 427 |
| 516 |
| 612 |
| 715 |
|
Other expenses |
| (52 | ) | 109 |
| 51 |
| 154 |
| 177 |
| 204 |
| 231 |
|
Tax expenses |
| 707 |
| 349 |
| 259 |
| 323 |
| 404 |
| 480 |
| 560 |
|
Gains/(losses) |
| 1,313 |
| 866 |
| (686 | ) | 1,068 |
| 1,345 |
| 1,597 |
| 1,850 |
|
Operating Balance |
| 1,094 |
| 855 |
| (615 | ) | 1,018 |
| 1,280 |
| 1,525 |
| 1,774 |
|
Opening net worth |
| 9,855 |
| 12,973 |
| 12,973 |
| 14,461 |
| 17,721 |
| 21,152 |
| 24,947 |
|
Gross contribution from the Crown |
| 2,049 |
| 2,103 |
| 2,103 |
| 2,242 |
| 2,151 |
| 2,270 |
| 2,290 |
|
Income after tax |
| 1,094 |
| 855 |
| (615 | ) | 1,018 |
| 1,280 |
| 1,525 |
| 1,774 |
|
Other movements in reserves |
| (25 | ) | — |
| — |
| — |
| — |
| — |
| — |
|
Closing Net Worth |
| 12,973 |
| 15,931 |
| 14,461 |
| 17,721 |
| 21,152 |
| 24,947 |
| 29,011 |
|
comprising: |
|
|
|
|
|
|
|
|
|
|
|
|
|
|
|
Financial assets |
| 12,576 |
| 15,439 |
| 13,816 |
| 16,821 |
| 20,149 |
| 23,867 |
| 27,896 |
|
Net other assets |
| 397 |
| 492 |
| 645 |
| 900 |
| 1,003 |
| 1,080 |
| 1,115 |
|
Closing Net Worth |
| 12,973 |
| 15,931 |
| 14,461 |
| 17,721 |
| 21,152 |
| 24,947 |
| 29,011 |
|
Reconciliation Core Crown to Core Crown excluding NZSF net revenue |
|
|
|
|
|
|
|
|
|
|
|
|
|
|
|
Core Crown revenue |
| 58,211 |
| 59,402 |
| 61,936 |
| 61,891 |
| 63,664 |
| 66,416 |
| 69,159 |
|
Less NZSF revenue |
| 436 |
| 447 |
| 381 |
| 427 |
| 516 |
| 612 |
| 715 |
|
Add back NZSF tax |
| 707 |
| 349 |
| 259 |
| 323 |
| 404 |
| 480 |
| 560 |
|
Core Crown revenue excluding NZS Fund |
| 58,482 |
| 59,304 |
| 61,814 |
| 61,787 |
| 63,552 |
| 66,284 |
| 69,004 |
|
OBEGAL |
| 5,860 |
| 4,958 |
| 5,227 |
| 1,318 |
| 1,004 |
| 493 |
| 154 |
|
Less NZSF revenue |
| 436 |
| 447 |
| 381 |
| 427 |
| 516 |
| 612 |
| 715 |
|
Less NZSF expenses |
| 119 |
| 110 |
| 114 |
| 140 |
| 156 |
| 182 |
| 208 |
|
Add back NZSF tax |
| 707 |
| 349 |
| 259 |
| 323 |
| 404 |
| 480 |
| 560 |
|
OBEGAL excluding NZS Fund |
| 6,250 |
| 4,970 |
| 5,219 |
| 1,354 |
| 1,048 |
| 543 |
| 207 |
|
Notes to the Forecast Financial Statements
|
| 2007 |
| 2008 |
| 2008 |
| 2009 |
| 2010 |
| 2011 |
| 2012 |
|
|
| Actual |
| Budget |
| Forecast |
| Forecast |
| Forecast |
| Forecast |
| Forecast |
|
|
| $m |
| $m |
| $m |
| $m |
| $m |
| $m |
| $m |
|
NOTE 16: Payables |
|
|
|
|
|
|
|
|
|
|
|
|
|
|
|
Accounts payable |
| 4,896 |
| 5,556 |
| 5,244 |
| 5,318 |
| 5,345 |
| 5,313 |
| 5,440 |
|
Taxes repayable |
| 3,179 |
| 3,480 |
| 3,179 |
| 3,179 |
| 3,179 |
| 3,179 |
| 3,179 |
|
Total Payables |
| 8,075 |
| 9,036 |
| 8,423 |
| 8,497 |
| 8,524 |
| 8,492 |
| 8,619 |
|
By source |
|
|
|
|
|
|
|
|
|
|
|
|
|
|
|
Core Crown |
| 5,334 |
| 5,181 |
| 5,256 |
| 5,235 |
| 5,010 |
| 5,050 |
| 5,187 |
|
Crown entities |
| 4,169 |
| 4,164 |
| 3,917 |
| 3,910 |
| 3,919 |
| 3,866 |
| 3,839 |
|
State-owned enterprises |
| 3,719 |
| 3,446 |
| 4,124 |
| 4,079 |
| 4,237 |
| 4,152 |
| 4,224 |
|
Inter-segment eliminations |
| (5,147 | ) | (3,755 | ) | (4,874 | ) | (4,727 | ) | (4,642 | ) | (4,576 | ) | (4,631 | ) |
Total Payables |
| 8,075 |
| 9,036 |
| 8,423 |
| 8,497 |
| 8,524 |
| 8,492 |
| 8,619 |
|
NOTE 17: Insurance Liabilities |
|
|
|
|
|
|
|
|
|
|
|
|
|
|
|
ACC liability |
| 17,328 |
| 18,949 |
| 20,663 |
| 21,976 |
| 23,354 |
| 24,771 |
| 26,255 |
|
EQC liability |
| 68 |
| 42 |
| 79 |
| 79 |
| 79 |
| 79 |
| 79 |
|
Other insurance liabilities |
| 22 |
| 20 |
| 10 |
| 10 |
| 11 |
| 11 |
| 12 |
|
Total Insurance Liabilities |
| 17,418 |
| 19,011 |
| 20,752 |
| 22,065 |
| 23,444 |
| 24,861 |
| 26,346 |
|
ACC liability
Calculation information
PricewaterhouseCoopers Actuarial Pty Ltd have prepared an independent actuarial estimate of the ACC outstanding claims liability as at 31 December 2007. This estimate includes the expected future payments relating to accidents that occurred prior to balance date (whether or not the associated claims have been reported to, or accepted by, ACC) and also the expected future administrative expenses of managing these claims. The estimate has been updated as at 31 March 2008 to reflect material changes to those expected future payments identified since 31 December 2007.
The key economic variables that impact on changes to the valuation are the long-term Labour Cost Index (LCI), average weekly earnings and the discount rate of 6.23% (6.61% at 30 June 2007). Other key variables in each valuation are the forecast increases in claim costs over and above the economic variables above, and the assumed rate at which long-term claimants will leave the scheme over the period. This assessment is largely based on scheme history.
Presentation approach
The projected outstanding claims liability is included within total liabilities. ACC has available to it a portfolio of assets that partially offset the claims liability. The assets (less cross holdings of NZ Government stock) are included in the asset portion of the Crown’s overall Statement of Financial Position.
|
| 2007 |
| 2008 |
| 2008 |
| 2009 |
| 2010 |
| 2011 |
| 2012 |
|
|
| Actual |
| Budget |
| Forecast |
| Forecast |
| Forecast |
| Forecast |
| Forecast |
|
|
| $m |
| $m |
| $m |
| $m |
| $m |
| $m |
| $m |
|
Gross ACC liability |
|
|
|
|
|
|
|
|
|
|
|
|
|
|
|
Opening gross liability |
| 15,761 |
| 17,924 |
| 17,328 |
| 20,663 |
| 21,976 |
| 23,354 |
| 24,771 |
|
Net change |
| 1,567 |
| 1,025 |
| 3,335 |
| 1,313 |
| 1,378 |
| 1,417 |
| 1,484 |
|
Closing gross liability |
| 17,328 |
| 18,949 |
| 20,663 |
| 21,976 |
| 23,354 |
| 24,771 |
| 26,255 |
|
|
|
|
|
|
|
|
|
|
|
|
|
|
|
|
|
Less net assets available to ACC |
|
|
|
|
|
|
|
|
|
|
|
|
|
|
|
Opening net asset value |
| 10,298 |
| 11,724 |
| 11,757 |
| 12,735 |
| 13,826 |
| 14,740 |
| 15,520 |
|
Net change |
| 1,459 |
| 1,024 |
| 978 |
| 1,091 |
| 914 |
| 780 |
| 646 |
|
Closing net asset value |
| 11,757 |
| 12,748 |
| 12,735 |
| 13,826 |
| 14,740 |
| 15,520 |
| 16,166 |
|
|
|
|
|
|
|
|
|
|
|
|
|
|
|
|
|
Net ACC reserves (net liability) |
|
|
|
|
|
|
|
|
|
|
|
|
|
|
|
Opening reserves position |
| (5,463 | ) | (6,200 | ) | (5,571 | ) | (7,928 | ) | (8,150 | ) | (8,614 | ) | (9,251 | ) |
Net change |
| (108 | ) | (1 | ) | (2,357 | ) | (222 | ) | (464 | ) | (637 | ) | (838 | ) |
Closing reserves position (net liability) |
| (5,571 | ) | (6,201 | ) | (7,928 | ) | (8,150 | ) | (8,614 | ) | (9,251 | ) | (10,089 | ) |
Notes to the Forecast Financial Statements
|
| 2007 |
| 2008 |
| 2008 |
| 2009 |
| 2010 |
| 2011 |
| 2012 |
|
|
| Actual |
| Budget |
| Forecast |
| Forecast |
| Forecast |
| Forecast |
| Forecast |
|
|
| $m |
| $m |
| $m |
| $m |
| $m |
| $m |
| $m |
|
NOTE 18: Retirement Plan Liabilities |
|
|
|
|
|
|
|
|
|
|
|
|
|
|
|
Government Superannuation Fund |
| 7,160 |
| 8,402 |
| 8,141 |
| 8,216 |
| 8,249 |
| 8,253 |
| 8,216 |
|
Other funds |
| 1 |
| 12 |
| 5 |
| 5 |
| 5 |
| 5 |
| 6 |
|
Total Retirement Plan Liabilities |
| 7,161 |
| 8,414 |
| 8,146 |
| 8,221 |
| 8,254 |
| 8,258 |
| 8,222 |
|
The net liability of the Government Superannuation Fund (GSF), as at 29 February 2008 (the valuation date), has been calculated by the Government Actuary for inclusion within the 2008 Budget Update. The GSF net liability arises from closed schemes for past and present public sector employees (set out in the GSF Act 1956). The Projected Unit Credit Method, based on 29 February 2008 membership data, was used for the valuation. This method requires the benefits payable from the GSF in respect of past service to be calculated and then discounted back to the valuation date.
The projected GSF net liability included in the 2008 Budget Update was calculated using discount rates derived from the market yield curve as at 29 February 2008. This resulted in long-term before-tax discount rates ranging from 7.31% in 2008 to 5.73% in 2017 and beyond. The principal long-term financial assumptions used in the calculation were an inflation rate of 2.25% and an annual salary increases rate, before any promotional effects, of 3.0%.
The 2007/08 projected movement in the net liability is $981 million, reflecting an increase in the GSF liability of $659 million and a decrease in the GSF assets of $322 million.
The increase in the projected GSF liability of $659 million includes an actuarial loss of $563 million at 29 February 2008, of which $75 million resulted from experience adjustments with the balance due to a change in discount rate assumptions on valuation date. The remainder of the increase in the GSF liability is the net of the current service cost, interest cost and benefits paid to members.
The decrease in the projected GSF assets of $322 million includes an actuarial loss of $363 million at 31 October 2007 reflecting the recent equity market downturn resulting from the US economic slowdown. The remaining increase in GSF assets is the net of expected investments returns, contributions received by the GSF and benefits paid to members.
The changes in the projected GSF net liability from 2007/08 onwards reflects the net of the expected current service cost, interest cost, investment returns and contributions.
|
| 2007 |
| 2008 |
| 2008 |
| 2009 |
| 2010 |
| 2011 |
| 2012 |
|
|
| Actual |
| Budget |
| Forecast |
| Forecast |
| Forecast |
| Forecast |
| Forecast |
|
|
| $m |
| $m |
| $m |
| $m |
| $m |
| $m |
| $m |
|
GSF net defined benefit retirement liability |
|
|
|
|
|
|
|
|
|
|
|
|
|
|
|
GSF liability |
|
|
|
|
|
|
|
|
|
|
|
|
|
|
|
Opening GSF liability |
| 12,098 |
| 12,365 |
| 11,167 |
| 11,826 |
| 11,947 |
| 12,016 |
| 12,049 |
|
Net projected change |
| (931 | ) | 158 |
| 659 |
| 121 |
| 69 |
| 33 |
| (16 | ) |
Closing GSF liability |
| 11,167 |
| 12,523 |
| 11,826 |
| 11,947 |
| 12,016 |
| 12,049 |
| 12,033 |
|
|
|
|
|
|
|
|
|
|
|
|
|
|
|
|
|
Less net assets available to GSF |
|
|
|
|
|
|
|
|
|
|
|
|
|
|
|
Opening net asset value |
| 3,799 |
| 4,014 |
| 4,007 |
| 3,685 |
| 3,731 |
| 3,767 |
| 3,796 |
|
Investment valuation changes |
| 354 |
| 225 |
| (143 | ) | 222 |
| 225 |
| 228 |
| 230 |
|
Contribution and other income less membership payments |
| (146 | ) | (118 | ) | (179 | ) | (176 | ) | (189 | ) | (199 | ) | (209 | ) |
Closing net asset value |
| 4,007 |
| 4,121 |
| 3,685 |
| 3,731 |
| 3,767 |
| 3,796 |
| 3,817 |
|
|
|
|
|
|
|
|
|
|
|
|
|
|
|
|
|
Net GSF liability |
|
|
|
|
|
|
|
|
|
|
|
|
|
|
|
Opening unfunded liability |
| 8,299 |
| 8,351 |
| 7,160 |
| 8,141 |
| 8,216 |
| 8,249 |
| 8,253 |
|
Net projected change |
| (1,139 | ) | 51 |
| 981 |
| 75 |
| 33 |
| 4 |
| (37 | ) |
Closing unfunded liability |
| 7,160 |
| 8,402 |
| 8,141 |
| 8,216 |
| 8,249 |
| 8,253 |
| 8,216 |
|
Notes to the Forecast Financial Statements
|
| 2007 |
| 2008 |
| 2008 |
| 2009 |
| 2010 |
| 2011 |
| 2012 |
|
|
| Actual |
| Budget |
| Forecast |
| Forecast |
| Forecast |
| Forecast |
| Forecast |
|
|
| $m |
| $m |
| $m |
| $m |
| $m |
| $m |
| $m |
|
NOTE 19: Provisions |
|
|
|
|
|
|
|
|
|
|
|
|
|
|
|
Provision for Kyoto |
| 704 |
| 557 |
| 482 |
| 482 |
| 482 |
| 482 |
| 482 |
|
Provision for ETS credits |
| — |
| — |
| — |
| 618 |
| 685 |
| 492 |
| 121 |
|
Provision for National Provident Fund guarantee |
| 771 |
| 805 |
| 780 |
| 780 |
| 780 |
| 780 |
| 780 |
|
Provision for employee entitlements |
| 1,828 |
| 1,621 |
| 1,738 |
| 1,747 |
| 1,768 |
| 1,782 |
| 1,793 |
|
Other provisions |
| 1,257 |
| 867 |
| 1,045 |
| 1,084 |
| 1,126 |
| 1,142 |
| 1,163 |
|
Total Provisions |
| 4,560 |
| 3,850 |
| 4,045 |
| 4,711 |
| 4,841 |
| 4,678 |
| 4,339 |
|
By source |
|
|
|
|
|
|
|
|
|
|
|
|
|
|
|
Core Crown |
| 2,537 |
| 2,267 |
| 2,353 |
| 2,862 |
| 2,978 |
| 2,833 |
| 2,519 |
|
Crown entities |
| 1,195 |
| 1,042 |
| 1,214 |
| 1,220 |
| 1,236 |
| 1,243 |
| 1,247 |
|
State-owned enterprises |
| 852 |
| 757 |
| 610 |
| 652 |
| 660 |
| 644 |
| 635 |
|
Inter-segment eliminations |
| (24 | ) | (216 | ) | (132 | ) | (23 | ) | (33 | ) | (42 | ) | (62 | ) |
Total Provisions |
| 4,560 |
| 3,850 |
| 4,045 |
| 4,711 |
| 4,841 |
| 4,678 |
| 4,339 |
|
Analysis of Provision for Kyoto |
|
|
|
|
|
|
|
|
|
|
|
|
|
|
|
Opening balance |
| 656 |
| 557 |
| 704 |
| 482 |
| 482 |
| 482 |
| 482 |
|
Change in price of carbon |
| (20 | ) | — |
| 145 |
| — |
| — |
| — |
| — |
|
Change in net projected emission units |
| 68 |
| — |
| (367 | ) | — |
| — |
| — |
| — |
|
Closing balance |
| 704 |
| 557 |
| 482 |
| 482 |
| 482 |
| 482 |
| 482 |
|
Analysis of Provision for ETS credits
The Emissions Trading Scheme (ETS) was established to encourage reduction in greenhouse gas emissions. The ETS creates a limited number of tradable units (the NZ Unit) which the Government can allocate freely or sell to entities. The allocation of NZ Units creates a provision (and an expense if allocated for free). The provision is reduced, and revenue recognised, as NZ Units are surrended to the Crown by emitters. Emitters can also use international Kyoto units to settle their emission obligation, which will occur where emissions exceed the number of allocated NZ units.
|
| 2007 |
| 2008 |
| 2008 |
| 2009 |
| 2010 |
| 2011 |
| 2012 |
|
|
| Actual |
| Budget |
| Forecast |
| Forecast |
| Forecast |
| Forecast |
| Forecast |
|
|
| $m |
| $m |
| $m |
| $m |
| $m |
| $m |
| $m |
|
The ETS impact on the fiscal forecast is as follows: |
|
|
|
|
|
|
|
|
|
|
|
|
|
|
|
Revenue |
| — |
| — |
| — |
| 131 |
| 289 |
| 716 |
| 894 |
|
Expenses |
| — |
| — |
| — |
| 749 |
| 356 |
| 523 |
| 523 |
|
OBEGAL |
| — |
| — |
| — |
| (618 | ) | (67 | ) | 193 |
| 371 |
|
Provision for ETS credits |
| — |
| — |
| — |
| 618 |
| 685 |
| 492 |
| 121 |
|
Notes to the Forecast Financial Statements
|
| 2007 |
| 2008 |
| 2008 |
| 2009 |
| 2010 |
| 2011 |
| 2012 |
|
|
| Actual |
| Budget |
| Forecast |
| Forecast |
| Forecast |
| Forecast |
| Forecast |
|
|
| $m |
| $m |
| $m |
| $m |
| $m |
| $m |
| $m |
|
NOTE 20: Net Worth attributable to the Crown |
|
|
|
|
|
|
|
|
|
|
|
|
|
|
|
Taxpayers funds |
| 44,222 |
| 48,239 |
| 46,767 |
| 49,886 |
| 52,892 |
| 55,672 |
| 58,406 |
|
Property, plant and equipment revaluation reserve |
| 52,442 |
| 47,402 |
| 52,498 |
| 52,486 |
| 52,486 |
| 52,486 |
| 52,486 |
|
Investment revaluation reserve |
| 23 |
| 13 |
| 29 |
| 35 |
| 35 |
| 35 |
| 35 |
|
Cash flow hedge reserve |
| (122 | ) | 97 |
| (175 | ) | (117 | ) | (99 | ) | (85 | ) | (70 | ) |
Foreign currency translation reserve |
| (34 | ) | 17 |
| (32 | ) | (32 | ) | (32 | ) | (31 | ) | (29 | ) |
Total net worth attributable to the Crown |
| 96,531 |
| 95,768 |
| 99,087 |
| 102,258 |
| 105,282 |
| 108,077 |
| 110,828 |
|
Taxpayers Funds |
|
|
|
|
|
|
|
|
|
|
|
|
|
|
|
Opening taxpayers funds |
| 36,214 |
| 42,219 |
| 44,222 |
| 46,767 |
| 49,886 |
| 52,892 |
| 55,672 |
|
Operating balance excluding minority interest |
| 8,023 |
| 6,431 |
| 2,559 |
| 3,105 |
| 3,009 |
| 2,779 |
| 2,734 |
|
Transfers from/(to) other reserves |
| (15 | ) | (411 | ) | (14 | ) | 14 |
| (3 | ) | 1 |
| — |
|
Closing Taxpayers Funds |
| 44,222 |
| 48,239 |
| 46,767 |
| 49,886 |
| 52,892 |
| 55,672 |
| 58,406 |
|
Property, Plant and Equipment Revaluation Reserve |
|
|
|
|
|
|
|
|
|
|
|
|
|
|
|
Opening revaluation reserve |
| 47,153 |
| 47,459 |
| 52,442 |
| 52,498 |
| 52,486 |
| 52,486 |
| 52,486 |
|
Net revaluations |
| 5,262 |
| 2 |
| 43 |
| — |
| — |
| — |
| — |
|
Transfers from/(to) other reserves |
| 27 |
| (59 | ) | 13 |
| (12 | ) | — |
| — |
| — |
|
Closing Property, Plant and Equipment Revaluation Reserve |
| 52,442 |
| 47,402 |
| 52,498 |
| 52,486 |
| 52,486 |
| 52,486 |
| 52,486 |
|
Investment Revaluation Reserve |
|
|
|
|
|
|
|
|
|
|
|
|
|
|
|
Opening investment revaluation reserve |
| 13 |
| 13 |
| 23 |
| 29 |
| 35 |
| 35 |
| 35 |
|
Valuation gain/(losses) on investments available for sale taken to reserves |
| 10 |
| — |
| 6 |
| 6 |
| — |
| — |
| — |
|
Closing Investment Revaluation Reserve |
| 23 |
| 13 |
| 29 |
| 35 |
| 35 |
| 35 |
| 35 |
|
Cash Flow Hedge Reserve |
|
|
|
|
|
|
|
|
|
|
|
|
|
|
|
Opening cash flow hedge reserve |
| 281 |
| 62 |
| (122 | ) | (175 | ) | (117 | ) | (99 | ) | (85 | ) |
Transfer into reserve |
| (331 | ) | (39 | ) | (2 | ) | 58 |
| 19 |
| 13 |
| 17 |
|
Transfer to the statement of financial performance |
| (59 | ) | 74 |
| (15 | ) | — |
| (1 | ) | 1 |
| (2 | ) |
Transfer to initial carrying value of hedged item |
| (13 | ) | — |
| (36 | ) | — |
| — |
| — |
| — |
|
Closing Cash Flow Hedge Reserve |
| (122 | ) | 97 |
| (175 | ) | (117 | ) | (99 | ) | (85 | ) | (70 | ) |
Foreign Currency Translation Reserve |
|
|
|
|
|
|
|
|
|
|
|
|
|
|
|
Opening foreign currency translation reserve |
| 31 |
| 17 |
| (34 | ) | (32 | ) | (32 | ) | (32 | ) | (31 | ) |
Movement arising from translation of foreign operations |
| (65 | ) | — |
| 2 |
| — |
| — |
| 1 |
| 2 |
|
Closing Foreign Currency Translation Reserve |
| (34 | ) | 17 |
| (32 | ) | (32 | ) | (32 | ) | (31 | ) | (29 | ) |
Notes to the Forecast Financial Statements
|
| 2007 |
| 2008 |
| 2008 |
| 2009 |
| 2010 |
| 2011 |
| 2012 |
|
|
| Actual |
| Budget |
| Forecast |
| Forecast |
| Forecast |
| Forecast |
| Forecast |
|
|
| $m |
| $m |
| $m |
| $m |
| $m |
| $m |
| $m |
|
NOTE 21: Reconciliation of core Crown operating cash flows to residual core Crown cash |
|
|
|
|
|
|
|
|
|
|
|
|
|
|
|
Core Crown Cash Flows from Operations |
|
|
|
|
|
|
|
|
|
|
|
|
|
|
|
Total tax receipts |
| 53,278 |
| 55,121 |
| 56,392 |
| 55,599 |
| 58,066 |
| 60,276 |
| 62,615 |
|
Total other sovereign receipts |
| 395 |
| 477 |
| 494 |
| 530 |
| 539 |
| 551 |
| 561 |
|
Interest, profits and dividends |
| 1,896 |
| 1,857 |
| 1,980 |
| 2,232 |
| 1,990 |
| 2,055 |
| 2,031 |
|
Sale of goods & services and other receipts |
| 1,433 |
| 1,472 |
| 1,654 |
| 1,658 |
| 1,656 |
| 1,691 |
| 1,742 |
|
Subsidies and transfer payments |
| (17,234 | ) | (18,789 | ) | (19,931 | ) | (21,068 | ) | (22,259 | ) | (23,084 | ) | (24,095 | ) |
Personnel and operating costs |
| (28,962 | ) | (32,610 | ) | (31,478 | ) | (34,224 | ) | (34,257 | ) | (34,094 | ) | (33,982 | ) |
Finance costs |
| (2,220 | ) | (2,176 | ) | (2,333 | ) | (2,282 | ) | (2,282 | ) | (2,424 | ) | (2,521 | ) |
Forecast for future new operating spending |
| — |
| (314 | ) | — |
| (249 | ) | (1,774 | ) | (3,376 | ) | (5,117 | ) |
Top-down expense adjustment |
| — |
| — |
| 240 |
| 355 |
| 310 |
| 310 |
| 310 |
|
Net Cash Flows from core Crown Operations |
| 8,586 |
| 5,038 |
| 7,018 |
| 2,551 |
| 1,989 |
| 1,905 |
| 1,544 |
|
Net purchase of physical assets |
| (1,755 | ) | (1,803 | ) | (1,544 | ) | (1,891 | ) | (1,683 | ) | (1,327 | ) | (1,146 | ) |
Net increase in advances |
| (1,125 | ) | (1,088 | ) | (1,254 | ) | (821 | ) | (626 | ) | (760 | ) | (541 | ) |
Net purchase of investments |
| (281 | ) | (636 | ) | (519 | ) | (1,164 | ) | (229 | ) | (218 | ) | (97 | ) |
Contribution to NZ Superannuation Fund |
| (2,048 | ) | (2,103 | ) | (2,103 | ) | (2,242 | ) | (2,151 | ) | (2,270 | ) | (2,290 | ) |
Purchase of Reserve Bank reserves |
| (500 | ) | (200 | ) | — |
| — |
| — |
| — |
| — |
|
Forecast for future new capital spending |
| — |
| (184 | ) | (690 | ) | (261 | ) | (602 | ) | (777 | ) | (927 | ) |
Top-down capital adjustment |
| — |
| — |
| — |
| 350 |
| — |
| — |
| — |
|
Residual Cash |
| 2,877 |
| (976 | ) | 908 |
| (3,478 | ) | (3,302 | ) | (3,447 | ) | (3,457 | ) |
Financed by: |
|
|
|
|
|
|
|
|
|
|
|
|
|
|
|
Other net sale/(purchase) of marketable securities and deposits |
| (5,040 | ) | (1,649 | ) | (2,863 | ) | 2,643 |
| 3,401 |
| (279 | ) | 3,807 |
|
Total Operating and Investing Activities |
| (2,163 | ) | (2,625 | ) | (1,955 | ) | (835 | ) | 99 |
| (3,726 | ) | 350 |
|
Used in: |
|
|
|
|
|
|
|
|
|
|
|
|
|
|
|
Net repayment/(issue) of other New Zealand-dollar borrowing |
| 1,120 |
| 709 |
| 167 |
| 399 |
| 121 |
| (49 | ) | 238 |
|
Net repayment/(issue) of foreign currency borrowing |
| 1,775 |
| (993 | ) | (504 | ) | (541 | ) | (163 | ) | (49 | ) | (479 | ) |
Issues of circulating currency |
| 81 |
| 178 |
| 260 |
| 181 |
| 190 |
| 200 |
| 210 |
|
Decrease/(increase) in cash |
| (479 | ) | 3 |
| (572 | ) | (29 | ) | 55 |
| (15 | ) | 52 |
|
|
| 2,497 |
| (103 | ) | (649 | ) | 10 |
| 203 |
| 87 |
| 21 |
|
Net Cash Inflow/(Outflow) to be Offset by Domestic Bonds |
| 334 |
| (2,728 | ) | (2,604 | ) | (825 | ) | 302 |
| (3,639 | ) | 371 |
|
Gross Cash Proceeds from Domestic Bonds |
|
|
|
|
|
|
|
|
|
|
|
|
|
|
|
Domestic bonds (market) |
| 2,294 |
| 2,520 |
| 2,415 |
| 3,314 |
| 3,393 |
| 3,394 |
| 3,365 |
|
Domestic bonds (non-market) |
| 570 |
| 208 |
| 189 |
| 662 |
| 851 |
| 245 |
| 1,286 |
|
Total Gross Cash Proceeds from Domestic Bonds |
| 2,864 |
| 2,728 |
| 2,604 |
| 3,976 |
| 4,244 |
| 3,639 |
| 4,651 |
|
Repayment of domestic bonds (market) |
| (2,777 | ) | — |
| — |
| (2,700 | ) | (3,947 | ) | — |
| (3,976 | ) |
Repayment of domestic bonds (non-market) |
| (421 | ) | — |
| — |
| (451 | ) | (599 | ) | — |
| (1,046 | ) |
Net (Repayments of)/Cash Proceeds from Domestic Bonds |
| (334 | ) | 2,728 |
| 2,604 |
| 825 |
| (302 | ) | 3,639 |
| (371 | ) |
Forecast Statement of Segments
Statement of Financial Performance
for the year ended 30 June 2007
|
| Core Crown |
| Crown |
| State-owned |
| Inter- |
| Total Crown |
|
|
| 2007 |
| 2007 |
| 2007 |
| 2007 |
| 2007 |
|
|
| Actual |
| Actual |
| Actual |
| Actual |
| Actual |
|
|
| $m |
| $m |
| $m |
| $m |
| $m |
|
Revenue |
|
|
|
|
|
|
|
|
|
|
|
Taxation revenue |
| 53,477 |
| — |
| — |
| (413 | ) | 53,064 |
|
Other sovereign revenue |
| 636 |
| 3,640 |
| — |
| (780 | ) | 3,496 |
|
Sales of goods and services |
| 1,095 |
| 11,322 |
| 10,701 |
| (10,505 | ) | 12,613 |
|
Interest revenue and dividends |
| 2,580 |
| 756 |
| 484 |
| (825 | ) | 2,995 |
|
Other revenue |
| 423 |
| 10,482 |
| 703 |
| (9,187 | ) | 2,421 |
|
Total Revenue (excluding gains) |
| 58,211 |
| 26,200 |
| 11,888 |
| (21,710 | ) | 74,589 |
|
|
|
|
|
|
|
|
|
|
|
|
|
Expenses |
|
|
|
|
|
|
|
|
|
|
|
Social assistance and official development assistance |
| 16,453 |
| — |
| — |
| (107 | ) | 16,346 |
|
Personnel expenses |
| 5,092 |
| 8,183 |
| 2,018 |
| (9 | ) | 15,284 |
|
Other operating expenses |
| 30,128 |
| 16,709 |
| 8,301 |
| (20,924 | ) | 34,214 |
|
Interest expenses |
| 2,330 |
| 265 |
| 685 |
| (395 | ) | 2,885 |
|
Forecast for future new spending |
| — |
| — |
| — |
| — |
| — |
|
Total Expenses (excluding losses) |
| 54,003 |
| 25,157 |
| 11,004 |
| (21,435 | ) | 68,729 |
|
|
|
|
|
|
|
|
|
|
|
|
|
Operating Balance before gains/(losses) |
| 4,208 |
| 1,043 |
| 884 |
| (275 | ) | 5,860 |
|
Total Gains/(losses) |
| 2,342 |
| (130 | ) | (118 | ) | (42 | ) | 2,052 |
|
Net surplus/(deficit) from associates and joint ventures |
| 53 |
| 108 |
| 30 |
| — |
| 191 |
|
Gain/(loss) from discontinued operations |
| (92 | ) | — |
| — |
| — |
| (92 | ) |
Attributable to minority interest in Air NZ |
| — |
| — |
| 12 |
| — |
| 12 |
|
Operating Balance |
| 6,511 |
| 1,021 |
| 808 |
| (317 | ) | 8,023 |
|
|
|
|
|
|
|
|
|
|
|
|
|
Expenses by functional classification |
|
|
|
|
|
|
|
|
|
|
|
Social security and welfare |
| 16,768 |
| 3,665 |
| — |
| (604 | ) | 19,829 |
|
Health |
| 10,355 |
| 8,972 |
| — |
| (8,666 | ) | 10,661 |
|
Education |
| 9,269 |
| 6,900 |
| 24 |
| (6,340 | ) | 9,853 |
|
Transport and communications |
| 2,405 |
| 1,598 |
| 5,338 |
| (2,351 | ) | 6,990 |
|
Other |
| 12,876 |
| 3,757 |
| 4,957 |
| (3,079 | ) | 18,511 |
|
Finance costs |
| 2,330 |
| 265 |
| 685 |
| (395 | ) | 2,885 |
|
Forecast for future new spending |
| — |
| — |
| — |
| — |
| — |
|
Total Crown Expenses excluding losses |
| 54,003 |
| 25,157 |
| 11,004 |
| (21,435 | ) | 68,729 |
|
Statement of Financial Position
as at 30 June 2007
|
| Core Crown |
| Crown |
| State-owned |
| Inter- |
| Total Crown |
|
|
| 2007 |
| 2007 |
| 2007 |
| 2007 |
| 2007 |
|
|
| Actual |
| Actual |
| Actual |
| Actual |
| Actual |
|
|
| $m |
| $m |
| $m |
| $m |
| $m |
|
Assets |
|
|
|
|
|
|
|
|
|
|
|
Cash and cash equivalents |
| 1,118 |
| 2,812 |
| 492 |
| (259 | ) | 4,163 |
|
Receivables |
| 7,590 |
| 3,687 |
| 1,729 |
| (948 | ) | 12,058 |
|
Other financial assets |
| 43,377 |
| 16,044 |
| 6,721 |
| (8,643 | ) | 57,499 |
|
Property, plant & equipment |
| 26,213 |
| 41,296 |
| 28,087 |
| 2 |
| 95,598 |
|
Equity accounted investments |
| 25,049 |
| 6,331 |
| 88 |
| (24,467 | ) | 7,001 |
|
Intangible assets and goodwill |
| 804 |
| 377 |
| 495 |
| 1 |
| 1,677 |
|
Other assets |
| 1,062 |
| 244 |
| 829 |
| 218 |
| 2,353 |
|
Forecast for new capital spending |
| — |
| — |
| — |
| — |
| — |
|
Total Assets |
| 105,213 |
| 70,791 |
| 38,441 |
| (34,096 | ) | 180,349 |
|
|
|
|
|
|
|
|
|
|
|
|
|
Liabilities |
|
|
|
|
|
|
|
|
|
|
|
Borrowings |
| 35,885 |
| 4,430 |
| 10,293 |
| (8,710 | ) | 41,898 |
|
Other liabilities |
| 18,538 |
| 23,032 |
| 5,346 |
| (5,292 | ) | 41,624 |
|
Total Liabilities |
| 54,423 |
| 27,462 |
| 15,639 |
| (14,002 | ) | 83,522 |
|
Total Assets less Total Liabilities |
| 50,790 |
| 43,329 |
| 22,802 |
| (20,094 | ) | 96,827 |
|
|
|
|
|
|
|
|
|
|
|
|
|
Net Worth |
|
|
|
|
|
|
|
|
|
|
|
Taxpayer funds |
| 39,110 |
| 20,978 |
| 7,139 |
| (23,005 | ) | 44,222 |
|
Reserves |
| 11,680 |
| 22,351 |
| 15,261 |
| 3,017 |
| 52,309 |
|
Net worth attributable to minority interest in Air NZ |
| — |
| — |
| 402 |
| (106 | ) | 296 |
|
Total Net Worth |
| 50,790 |
| 43,329 |
| 22,802 |
| (20,094 | ) | 96,827 |
|
Statement of Financial Performance
for the year ended 30 June 2008
|
| Core Crown |
| Crown |
| State-owned |
| Inter- |
| Total Crown |
|
|
| 2008 |
| 2008 |
| 2008 |
| 2008 |
| 2008 |
|
|
| Forecast |
| Forecast |
| Forecast |
| Forecast |
| Forecast |
|
|
| $m |
| $m |
| $m |
| $m |
| $m |
|
Revenue |
|
|
|
|
|
|
|
|
|
|
|
Taxation revenue |
| 56,673 |
| — |
| — |
| (487 | ) | 56,186 |
|
Other sovereign revenue |
| 673 |
| 4,061 |
| — |
| (883 | ) | 3,851 |
|
Sales of goods and services |
| 1,161 |
| 12,080 |
| 11,711 |
| (11,270 | ) | 13,682 |
|
Interest revenue and dividends |
| 2,562 |
| 1,085 |
| 509 |
| (953 | ) | 3,203 |
|
Other revenue |
| 867 |
| 10,911 |
| 874 |
| (9,761 | ) | 2,891 |
|
Total Revenue (excluding gains) |
| 61,936 |
| 28,137 |
| 13,094 |
| (23,354 | ) | 79,813 |
|
|
|
|
|
|
|
|
|
|
|
|
|
Expenses |
|
|
|
|
|
|
|
|
|
|
|
Social assistance and official development assistance |
| 18,666 |
| — |
| — |
| (146 | ) | 18,520 |
|
Personnel expenses |
| 5,621 |
| 8,624 |
| 2,186 |
| (9 | ) | 16,422 |
|
Other operating expenses |
| 30,790 |
| 18,874 |
| 9,443 |
| (22,177 | ) | 36,930 |
|
Interest expenses |
| 2,527 |
| 275 |
| 734 |
| (582 | ) | 2,954 |
|
Forecast for future new spending and top down adjustment |
| (240 | ) | — |
| — |
| — |
| (240 | ) |
Total Expenses (excluding losses) |
| 57,364 |
| 27,773 |
| 12,363 |
| (22,914 | ) | 74,586 |
|
|
|
|
|
|
|
|
|
|
|
|
|
Operating Balance before gains/(losses) |
| 4,572 |
| 364 |
| 731 |
| (440 | ) | 5,227 |
|
Total Gains/(losses) |
| (860 | ) | (1,768 | ) | (10 | ) | (193 | ) | (2,831 | ) |
Net surplus/(deficit) from associates and joint ventures |
| 19 |
| 120 |
| 26 |
| 1 |
| 166 |
|
Gain/(loss) from discontinued operations |
| (3 | ) | — |
| — |
| — |
| (3 | ) |
Attributable to minority interest in Air NZ |
| — |
| — |
| — |
| — |
| — |
|
Operating Balance |
| 3,728 |
| (1,284 | ) | 747 |
| (632 | ) | 2,559 |
|
|
|
|
|
|
|
|
|
|
|
|
|
Expenses by functional classification |
|
|
|
|
|
|
|
|
|
|
|
Social security and welfare |
| 18,071 |
| 4,870 |
| — |
| (667 | ) | 22,274 |
|
Health |
| 11,343 |
| 9,512 |
| — |
| (10,090 | ) | 10,765 |
|
Education |
| 10,046 |
| 7,563 |
| 24 |
| (6,830 | ) | 10,803 |
|
Transport and communications |
| 2,290 |
| 1,492 |
| 5,827 |
| (2,424 | ) | 7,185 |
|
Other |
| 13,327 |
| 4,061 |
| 5,778 |
| (2,321 | ) | 20,845 |
|
Finance costs |
| 2,527 |
| 275 |
| 734 |
| (582 | ) | 2,954 |
|
Forecast for future new spending and top down adjustment |
| (240 | ) | — |
| — |
| — |
| (240 | ) |
Total Crown Expenses excluding losses |
| 57,364 |
| 27,773 |
| 12,363 |
| (22,914 | ) | 74,586 |
|
Statement of Financial Position
as at 30 June 2008
|
| Core Crown |
| Crown |
| State-owned |
| Inter- |
| Total Crown |
| |||||
|
| 2008 |
| 2008 |
| 2008 |
| 2008 |
| 2008 |
| |||||
|
| Forecast |
| Forecast |
| Forecast |
| Forecast |
| Forecast |
| |||||
|
| $ | m |
| $ | m |
| $ | m |
| $ | m |
| $ | m |
|
Assets |
|
|
|
|
|
|
|
|
|
|
| |||||
Cash and cash equivalents |
| 1,846 |
| 3,203 |
| 415 |
| (247 | ) | 5,217 |
| |||||
Receivables |
| 7,108 |
| 4,260 |
| 1,742 |
| (784 | ) | 12,326 |
| |||||
Other financial assets |
| 47,336 |
| 16,018 |
| 8,243 |
| (8,535 | ) | 63,062 |
| |||||
Property, plant & equipment |
| 26,458 |
| 42,683 |
| 29,215 |
| (1 | ) | 98,355 |
| |||||
Equity accounted investments |
| 25,709 |
| 6,606 |
| 193 |
| (24,989 | ) | 7,519 |
| |||||
Intangible assets and goodwill |
| 915 |
| 312 |
| 546 |
| (1 | ) | 1,772 |
| |||||
Other assets |
| 1,040 |
| 252 |
| 860 |
| (48 | ) | 2,104 |
| |||||
Forecast for new capital spending |
| 690 |
| — |
| — |
| — |
| 690 |
| |||||
Total Assets |
| 111,102 |
| 73,334 |
| 41,214 |
| (34,605 | ) | 191,045 |
| |||||
|
|
|
|
|
|
|
|
|
|
|
| |||||
Liabilities |
|
|
|
|
|
|
|
|
|
|
| |||||
Borrowings |
| 37,034 |
| 4,650 |
| 12,608 |
| (8,746 | ) | 45,546 |
| |||||
Other liabilities |
| 19,513 |
| 26,130 |
| 5,732 |
| (5,259 | ) | 46,116 |
| |||||
Total Liabilities |
| 56,547 |
| 30,780 |
| 18,340 |
| (14,005 | ) | 91,662 |
| |||||
Total Assets less Total Liabilities |
| 54,555 |
| 42,554 |
| 22,874 |
| (20,600 | ) | 99,383 |
| |||||
|
|
|
|
|
|
|
|
|
|
|
| |||||
Net Worth |
|
|
|
|
|
|
|
|
|
|
| |||||
Taxpayer funds |
| 42,825 |
| 20,191 |
| 7,366 |
| (23,615 | ) | 46,767 |
| |||||
Reserves |
| 11,730 |
| 22,363 |
| 15,212 |
| 3,015 |
| 52,320 |
| |||||
Net worth attributable to minority interest in Air NZ |
| — |
| — |
| 296 |
| — |
| 296 |
| |||||
Total Net Worth |
| 54,555 |
| 42,554 |
| 22,874 |
| (20,600 | ) | 99,383 |
| |||||
Statement of Financial Performance
for the year ended 30 June 2009
|
| Core Crown |
| Crown |
| State-owned |
| Inter- |
| Total Crown |
|
|
| 2009 |
| 2009 |
| 2009 |
| 2009 |
| 2009 |
|
|
| Forecast |
| Forecast |
| Forecast |
| Forecast |
| Forecast |
|
|
| $m |
| $m |
| $m |
| $m |
| $m |
|
Revenue |
|
|
|
|
|
|
|
|
|
|
|
Taxation revenue |
| 56,523 |
| — |
| — |
| (612 | ) | 55,911 |
|
Other sovereign revenue |
| 828 |
| 4,149 |
| — |
| (940 | ) | 4,037 |
|
Sales of goods and services |
| 1,238 |
| 12,004 |
| 12,358 |
| (11,378 | ) | 14,222 |
|
Interest revenue and dividends |
| 2,835 |
| 1,083 |
| 239 |
| (799 | ) | 3,358 |
|
Other revenue |
| 467 |
| 12,268 |
| 1,042 |
| (11,186 | ) | 2,591 |
|
Total Revenue (excluding gains) |
| 61,891 |
| 29,504 |
| 13,639 |
| (24,915 | ) | 80,119 |
|
|
|
|
|
|
|
|
|
|
|
|
|
Expenses |
|
|
|
|
|
|
|
|
|
|
|
Social assistance and official development assistance |
| 19,846 |
| — |
| — |
| (165 | ) | 19,681 |
|
Personnel expenses |
| 5,846 |
| 8,976 |
| 2,248 |
| (9 | ) | 17,061 |
|
Other operating expenses |
| 34,031 |
| 19,563 |
| 10,025 |
| (23,817 | ) | 39,802 |
|
Interest expenses |
| 2,406 |
| 294 |
| 442 |
| (639 | ) | 2,503 |
|
Forecast for future new spending and top down adjustment |
| (246 | ) | — |
| — |
| — |
| (246 | ) |
Total Expenses (excluding losses) |
| 61,883 |
| 28,833 |
| 12,715 |
| (24,630 | ) | 78,801 |
|
|
|
|
|
|
|
|
|
|
|
|
|
Operating Balance before gains/(losses) |
| 8 |
| 671 |
| 924 |
| (285 | ) | 1,318 |
|
Total Gains/(losses) |
| 1,381 |
| 354 |
| 112 |
| (253 | ) | 1,594 |
|
Net surplus/(deficit) from associates and joint ventures |
| 41 |
| 122 |
| 31 |
| (1 | ) | 193 |
|
Gain/(loss) from discontinued operations |
| — |
| — |
| — |
| — |
| — |
|
Attributable to minority interest in Air NZ |
| — |
| — |
| — |
| — |
| — |
|
Operating Balance |
| 1,430 |
| 1,147 |
| 1,067 |
| (539 | ) | 3,105 |
|
|
|
|
|
|
|
|
|
|
|
|
|
Expenses by functional classification |
|
|
|
|
|
|
|
|
|
|
|
Social security and welfare |
| 18,898 |
| 4,663 |
| — |
| (718 | ) | 22,843 |
|
Health |
| 12,586 |
| 9,959 |
| — |
| (10,521 | ) | 12,024 |
|
Education |
| 10,524 |
| 7,720 |
| 24 |
| (7,251 | ) | 11,017 |
|
Transport and communications |
| 2,823 |
| 1,912 |
| 6,234 |
| (2,942 | ) | 8,027 |
|
Other |
| 14,892 |
| 4,285 |
| 6,015 |
| (2,559 | ) | 22,633 |
|
Finance costs |
| 2,406 |
| 294 |
| 442 |
| (639 | ) | 2,503 |
|
Forecast for future new spending and top down adjustment |
| (246 | ) | — |
| — |
| — |
| (246 | ) |
Total Crown Expenses excluding losses |
| 61,883 |
| 28,833 |
| 12,715 |
| (24,630 | ) | 78,801 |
|
STATEMENT OF FINANCIAL POSITION
as at 30 June 2009
|
| Core Crown |
| Crown |
| State-owned |
| Inter- |
| Total Crown |
|
|
| 2009 |
| 2009 |
| 2009 |
| 2009 |
| 2009 |
|
|
| Forecast |
| Forecast |
| Forecast |
| Forecast |
| Forecast |
|
|
| $m |
| $m |
| $m |
| $m |
| $m |
|
Assets |
|
|
|
|
|
|
|
|
|
|
|
Cash and cash equivalents |
| 3,047 |
| 3,224 |
| 389 |
| (248 | ) | 6,412 |
|
Receivables |
| 7,201 |
| 4,437 |
| 1,909 |
| (798 | ) | 12,749 |
|
Other financial assets |
| 46,952 |
| 17,300 |
| 10,512 |
| (9,065 | ) | 65,699 |
|
Property, plant & equipment |
| 26,827 |
| 43,868 |
| 30,582 |
| (1 | ) | 101,276 |
|
Equity accounted investments |
| 27,019 |
| 6,832 |
| 246 |
| (25,414 | ) | 8,683 |
|
Intangible assets and goodwill |
| 1,053 |
| 337 |
| 538 |
| 1 |
| 1,929 |
|
Other assets |
| 1,183 |
| 272 |
| 893 |
| (44 | ) | 2,304 |
|
Forecast for new capital spending |
| 601 |
| — |
| — |
| — |
| 601 |
|
Total Assets |
| 113,883 |
| 76,270 |
| 45,069 |
| (35,569 | ) | 199,653 |
|
|
|
|
|
|
|
|
|
|
|
|
|
Liabilities |
|
|
|
|
|
|
|
|
|
|
|
Borrowings |
| 37,639 |
| 4,621 |
| 15,719 |
| (9,323 | ) | 48,656 |
|
Other liabilities |
| 20,252 |
| 27,439 |
| 5,751 |
| (4,999 | ) | 48,443 |
|
Total Liabilities |
| 57,891 |
| 32,060 |
| 21,470 |
| (14,322 | ) | 97,099 |
|
Total Assets less Total Liabilities |
| 55,992 |
| 44,210 |
| 23,599 |
| (21,247 | ) | 102,554 |
|
|
|
|
|
|
|
|
|
|
|
|
|
Net Worth |
|
|
|
|
|
|
|
|
|
|
|
Taxpayer funds |
| 44,274 |
| 21,836 |
| 8,054 |
| (24,278 | ) | 49,886 |
|
Reserves |
| 11,718 |
| 22,374 |
| 15,249 |
| 3,031 |
| 52,372 |
|
Net worth attributable to minority interest in Air NZ |
| — |
| — |
| 296 |
| — |
| 296 |
|
Total Net Worth |
| 55,992 |
| 44,210 |
| 23,599 |
| (21,247 | ) | 102,554 |
|
Statement of Financial Performance
for the year ended 30 June 2010
|
| Core Crown |
| Crown |
| State-owned Enterprises |
| Inter- |
| Total Crown |
|
|
| 2010 |
| 2010 |
| 2010 |
| 2010 |
| 2010 |
|
|
| Forecast |
| Forecast |
| Forecast |
| Forecast |
| Forecast |
|
|
| $m |
| $m |
| $m |
| $m |
| $m |
|
Revenue |
|
|
|
|
|
|
|
|
|
|
|
Taxation revenue |
| 58,228 |
| — |
| — |
| (583 | ) | 57,645 |
|
Other sovereign revenue |
| 998 |
| 4,301 |
| — |
| (957 | ) | 4,342 |
|
Sales of goods and services |
| 1,265 |
| 12,052 |
| 12,992 |
| (11,445 | ) | 14,864 |
|
Interest revenue and dividends |
| 2,702 |
| 1,136 |
| 263 |
| (849 | ) | 3,252 |
|
Other revenue |
| 471 |
| 12,468 |
| 1,131 |
| (11,332 | ) | 2,738 |
|
Total Revenue (excluding gains) |
| 63,664 |
| 29,957 |
| 14,386 |
| (25,166 | ) | 82,841 |
|
|
|
|
|
|
|
|
|
|
|
|
|
Expenses |
|
|
|
|
|
|
|
|
|
|
|
Social assistance and official development assistance |
| 20,684 |
| — |
| — |
| (156 | ) | 20,528 |
|
Personnel expenses |
| 5,800 |
| 9,162 |
| 2,316 |
| (10 | ) | 17,268 |
|
Other operating expenses |
| 33,741 |
| 20,029 |
| 10,558 |
| (24,101 | ) | 40,227 |
|
Interest expenses |
| 2,341 |
| 301 |
| 511 |
| (663 | ) | 2,490 |
|
Forecast for future new spending and top down adjustment |
| 1,324 |
| — |
| — |
| — |
| 1,324 |
|
Total Expenses (excluding losses) |
| 63,890 |
| 29,492 |
| 13,385 |
| (24,930 | ) | 81,837 |
|
|
|
|
|
|
|
|
|
|
|
|
|
Operating Balance before gains/(losses) |
| (226 | ) | 465 |
| 1,001 |
| (236 | ) | 1,004 |
|
Total Gains/(losses) |
| 1,620 |
| 335 |
| 107 |
| (261 | ) | 1,801 |
|
Net surplus/(deficit) from associates and joint ventures |
| 50 |
| 125 |
| 29 |
| — |
| 204 |
|
Gain/(loss) from discontinued operations |
| — |
| — |
| — |
| — |
| — |
|
Attributable to minority interest in Air NZ |
| — |
| — |
| — |
| — |
| — |
|
Operating Balance |
| 1,444 |
| 925 |
| 1,137 |
| (497 | ) | 3,009 |
|
|
|
|
|
|
|
|
|
|
|
|
|
Expenses by functional classification |
|
|
|
|
|
|
|
|
|
|
|
Social security and welfare |
| 19,566 |
| 5,057 |
| — |
| (735 | ) | 23,888 |
|
Health |
| 12,538 |
| 9,980 |
| — |
| (10,569 | ) | 11,949 |
|
Education |
| 10,892 |
| 7,958 |
| 24 |
| (7,539 | ) | 11,335 |
|
Transport and communications |
| 2,731 |
| 1,890 |
| 6,406 |
| (2,871 | ) | 8,156 |
|
Other |
| 14,498 |
| 4,306 |
| 6,444 |
| (2,553 | ) | 22,695 |
|
Finance costs |
| 2,341 |
| 301 |
| 511 |
| (663 | ) | 2,490 |
|
Forecast for future new spending and top down adjustment |
| 1,324 |
| — |
| — |
| — |
| 1,324 |
|
Total Crown Expenses excluding losses |
| 63,890 |
| 29,492 |
| 13,385 |
| (24,930 | ) | 81,837 |
|
Statement of Financial Position
as at 30 June 2010
|
|
|
| Crown |
| State-owned |
| Inter- |
|
|
|
|
| Core Crown |
| Entities |
| Enterprises |
| eliminations |
| Total Crown |
|
|
| 2010 |
| 2010 |
| 2010 |
| 2010 |
| 2010 |
|
|
| Forecast |
| Forecast |
| Forecast |
| Forecast |
| Forecast |
|
|
| $m |
| $m |
| $m |
| $m |
| $m |
|
Assets |
|
|
|
|
|
|
|
|
|
|
|
Cash and cash equivalents |
| 3,361 |
| 3,264 |
| 344 |
| (244 | ) | 6,725 |
|
Receivables |
| 6,871 |
| 4,636 |
| 1,902 |
| (814 | ) | 12,595 |
|
Other financial assets |
| 46,841 |
| 18,697 |
| 12,488 |
| (8,739 | ) | 69,287 |
|
Property, plant & equipment |
| 27,079 |
| 44,723 |
| 32,082 |
| 1 |
| 103,885 |
|
Equity accounted investments |
| 27,276 |
| 6,984 |
| 315 |
| (26,281 | ) | 8,294 |
|
Intangible assets and goodwill |
| 1,089 |
| 328 |
| 535 |
| — |
| 1,952 |
|
Other assets |
| 1,253 |
| 256 |
| 970 |
| (25 | ) | 2,454 |
|
Forecast for new capital spending |
| 1,203 |
| — |
| — |
| — |
| 1,203 |
|
Total Assets |
| 114,973 |
| 78,888 |
| 48,636 |
| (36,102 | ) | 206,395 |
|
|
|
|
|
|
|
|
|
|
|
|
|
Liabilities |
|
|
|
|
|
|
|
|
|
|
|
Borrowings |
| 37,173 |
| 4,719 |
| 18,406 |
| (9,682 | ) | 50,616 |
|
Other liabilities |
| 20,364 |
| 28,822 |
| 5,917 |
| (4,902 | ) | 50,201 |
|
Total Liabilities |
| 57,537 |
| 33,541 |
| 24,323 |
| (14,584 | ) | 100,817 |
|
|
|
|
|
|
|
|
|
|
|
|
|
Total Assets less Total Liabilities |
| 57,436 |
| 45,347 |
| 24,313 |
| (21,518 | ) | 105,578 |
|
|
|
|
|
|
|
|
|
|
|
|
|
Net Worth |
|
|
|
|
|
|
|
|
|
|
|
Taxpayer funds |
| 45,718 |
| 22,955 |
| 8,768 |
| (24,549 | ) | 52,892 |
|
Reserves |
| 11,718 |
| 22,392 |
| 15,249 |
| 3,031 |
| 52,390 |
|
Net worth attributable to minority interest in Air NZ |
| — |
| — |
| 296 |
| — |
| 296 |
|
Total Net Worth |
| 57,436 |
| 45,347 |
| 24,313 |
| (21,518 | ) | 105,578 |
|
Statement of Financial Performance
for the year ended 30 June 2011
|
| Core Crown |
| Crown |
| State-owned Enterprises |
| Inter- |
| Total Crown |
|
|
| 2011 |
| 2011 |
| 2011 |
| 2011 |
| 2011 |
|
|
| Forecast |
| Forecast |
| Forecast |
| Forecast |
| Forecast |
|
|
| $m |
| $m |
| $m |
| $m |
| $m |
|
Revenue |
|
|
|
|
|
|
|
|
|
|
|
Taxation revenue |
| 60,319 |
| — |
| — |
| (576 | ) | 59,743 |
|
Other sovereign revenue |
| 1,439 |
| 4,437 |
| — |
| (1,000 | ) | 4,876 |
|
Sales of goods and services |
| 1,308 |
| 12,113 |
| 13,842 |
| (11,479 | ) | 15,784 |
|
Interest revenue and dividends |
| 2,879 |
| 1,183 |
| 225 |
| (877 | ) | 3,410 |
|
Other revenue |
| 471 |
| 12,779 |
| 897 |
| (11,266 | ) | 2,881 |
|
Total Revenue (excluding gains) |
| 66,416 |
| 30,512 |
| 14,964 |
| (25,198 | ) | 86,694 |
|
|
|
|
|
|
|
|
|
|
|
|
|
Expenses |
|
|
|
|
|
|
|
|
|
|
|
Social assistance and official development assistance |
| 21,432 |
| — |
| — |
| (159 | ) | 21,273 |
|
Personnel expenses |
| 5,857 |
| 9,321 |
| 2,404 |
| (10 | ) | 17,572 |
|
Other operating expenses |
| 34,195 |
| 20,475 |
| 11,108 |
| (24,117 | ) | 41,661 |
|
Interest expenses |
| 2,606 |
| 297 |
| 553 |
| (687 | ) | 2,769 |
|
Forecast for future new spending and top down adjustment |
| 2,926 |
| — |
| — |
| — |
| 2,926 |
|
Total Expenses (excluding losses) |
| 67,016 |
| 30,093 |
| 14,065 |
| (24,973 | ) | 86,201 |
|
|
|
|
|
|
|
|
|
|
|
|
|
Operating Balance before gains/(losses) |
| (600 | ) | 419 |
| 899 |
| (225 | ) | 493 |
|
Total Gains/(losses) |
| 1,870 |
| 367 |
| 98 |
| (262 | ) | 2,073 |
|
Net surplus/(deficit) from associates and joint ventures |
| 55 |
| 128 |
| 30 |
| — |
| 213 |
|
Gain/(loss) from discontinued operations |
| — |
| — |
| — |
| — |
| — |
|
Attributable to minority interest in Air NZ |
| — |
| — |
| — |
| — |
| — |
|
Operating Balance |
| 1,325 |
| 914 |
| 1,027 |
| (487 | ) | 2,779 |
|
|
|
|
|
|
|
|
|
|
|
|
|
Expenses by functional classification |
|
|
|
|
|
|
|
|
|
|
|
Social security and welfare |
| 20,175 |
| 5,403 |
| — |
| (764 | ) | 24,814 |
|
Health |
| 12,522 |
| 10,002 |
| — |
| (10,601 | ) | 11,923 |
|
Education |
| 11,096 |
| 8,021 |
| 24 |
| (7,590 | ) | 11,551 |
|
Transport and communications |
| 2,635 |
| 1,992 |
| 6,686 |
| (2,773 | ) | 8,540 |
|
Other |
| 15,056 |
| 4,378 |
| 6,802 |
| (2,558 | ) | 23,678 |
|
Finance costs |
| 2,606 |
| 297 |
| 553 |
| (687 | ) | 2,769 |
|
Forecast for future new spending and top down adjustment |
| 2,926 |
| — |
| — |
| — |
| 2,926 |
|
Total Crown Expenses excluding losses |
| 67,016 |
| 30,093 |
| 14,065 |
| (24,973 | ) | 86,201 |
|
Statement of Financial Position
as at 30 June 2011
|
| Core Crown |
| Crown |
| State-owned Enterprises |
| Inter- |
| Total Crown |
|
|
| 2011 |
| 2011 |
| 2011 |
| 2011 |
| 2011 |
|
|
| Forecast |
| Forecast |
| Forecast |
| Forecast |
| Forecast |
|
|
| $m |
| $m |
| $m |
| $m |
| $m |
|
Assets |
|
|
|
|
|
|
|
|
|
|
|
Cash and cash equivalents |
| 3,746 |
| 3,332 |
| 498 |
| (249 | ) | 7,327 |
|
Receivables |
| 6,579 |
| 4,786 |
| 1,931 |
| (793 | ) | 12,503 |
|
Other financial assets |
| 50,739 |
| 20,115 |
| 11,965 |
| (9,240 | ) | 73,579 |
|
Property, plant & equipment |
| 26,860 |
| 45,479 |
| 34,143 |
| (1 | ) | 106,481 |
|
Equity accounted investments |
| 27,527 |
| 7,125 |
| 320 |
| (26,456 | ) | 8,516 |
|
Intangible assets and goodwill |
| 1,114 |
| 313 |
| 531 |
| — |
| 1,958 |
|
Other assets |
| 1,314 |
| 257 |
| 1,068 |
| (24 | ) | 2,615 |
|
Forecast for new capital spending |
| 1,980 |
| — |
| — |
| — |
| 1,980 |
|
Total Assets |
| 119,859 |
| 81,407 |
| 50,456 |
| (36,763 | ) | 214,959 |
|
|
|
|
|
|
|
|
|
|
|
|
|
Liabilities |
|
|
|
|
|
|
|
|
|
|
|
Borrowings |
| 40,631 |
| 4,880 |
| 19,718 |
| (10,270 | ) | 54,959 |
|
Other liabilities |
| 20,462 |
| 30,191 |
| 5,819 |
| (4,845 | ) | 51,627 |
|
Total Liabilities |
| 61,093 |
| 35,071 |
| 25,537 |
| (15,115 | ) | 106,586 |
|
Total Assets less Total Liabilities |
| 58,766 |
| 46,336 |
| 24,919 |
| (21,648 | ) | 108,373 |
|
|
|
|
|
|
|
|
|
|
|
|
|
Net Worth |
|
|
|
|
|
|
|
|
|
|
|
Taxpayer funds |
| 47,048 |
| 23,936 |
| 9,370 |
| (24,682 | ) | 55,672 |
|
Reserves |
| 11,718 |
| 22,400 |
| 15,253 |
| 3,034 |
| 52,405 |
|
Net worth attributable to minority interest in Air NZ |
| — |
| — |
| 296 |
| — |
| 296 |
|
Total Net Worth |
| 58,766 |
| 46,336 |
| 24,919 |
| (21,648 | ) | 108,373 |
|
Statement of Financial Performance
for the year ended 30 June 2012
|
| Core Crown |
| Crown |
| State-owned |
| Inter- |
| Total Crown |
|
|
| 2012 |
| 2012 |
| 2012 |
| 2012 |
| 2012 |
|
|
| Forecast |
| Forecast |
| Forecast |
| Forecast |
| Forecast |
|
|
| $m |
| $m |
| $m |
| $m |
| $m |
|
Revenue |
|
|
|
|
|
|
|
|
|
|
|
Taxation revenue |
| 62,712 |
| — |
| — |
| (578 | ) | 62,134 |
|
Other sovereign revenue |
| 1,632 |
| 4,568 |
| — |
| (1,038 | ) | 5,162 |
|
Sales of goods and services |
| 1,360 |
| 12,193 |
| 14,254 |
| (11,520 | ) | 16,287 |
|
Interest revenue and dividends |
| 2,981 |
| 1,242 |
| 243 |
| (1,005 | ) | 3,461 |
|
Other revenue |
| 474 |
| 12,829 |
| 823 |
| (11,118 | ) | 3,008 |
|
Forecast revenue reduction contingency |
| — |
| — |
| — |
| — |
| — |
|
Total Revenue (excluding gains) |
| 69,159 |
| 30,832 |
| 15,320 |
| (25,259 | ) | 90,052 |
|
|
|
|
|
|
|
|
|
|
|
|
|
Expenses |
|
|
|
|
|
|
|
|
|
|
|
Social assistance and official development assistance |
| 22,487 |
| — |
| — |
| (160 | ) | 22,327 |
|
Personnel expenses |
| 5,870 |
| 9,313 |
| 2,443 |
| (10 | ) | 17,616 |
|
Other operating expenses |
| 34,271 |
| 20,875 |
| 11,366 |
| (24,110 | ) | 42,402 |
|
Interest expenses |
| 2,648 |
| 310 |
| 630 |
| (702 | ) | 2,886 |
|
Forecast for future new spending and top down adjustment |
| 4,667 |
| — |
| — |
| — |
| 4,667 |
|
Total Expenses (excluding losses) |
| 69,943 |
| 30,498 |
| 14,439 |
| (24,982 | ) | 89,898 |
|
|
|
|
|
|
|
|
|
|
|
|
|
Operating Balance before gains/(losses) |
| (784 | ) | 334 |
| 881 |
| (277 | ) | 154 |
|
Total Gains/(losses) |
| 2,112 |
| 398 |
| 110 |
| (259 | ) | 2,361 |
|
Net surplus/(deficit) from associates and joint ventures |
| 60 |
| 129 |
| 30 |
| — |
| 219 |
|
Gain/(loss) from discontinued operations |
| — |
| — |
| — |
| — |
| — |
|
Attributable to minority interest in Air NZ |
| — |
| — |
| — |
| — |
| — |
|
Operating Balance |
| 1,388 |
| 861 |
| 1,021 |
| (536 | ) | 2,734 |
|
|
|
|
|
|
|
|
|
|
|
|
|
Expenses by functional classification |
|
|
|
|
|
|
|
|
|
|
|
Social security and welfare |
| 21,212 |
| 5,762 |
| — |
| (795 | ) | 26,179 |
|
Health |
| 12,526 |
| 10,044 |
| — |
| (10,659 | ) | 11,911 |
|
Education |
| 11,217 |
| 8,035 |
| 24 |
| (7,589 | ) | 11,687 |
|
Transport and communications |
| 2,488 |
| 1,899 |
| 6,778 |
| (2,625 | ) | 8,540 |
|
Other |
| 15,185 |
| 4,448 |
| 7,007 |
| (2,612 | ) | 24,028 |
|
Finance costs |
| 2,648 |
| 310 |
| 630 |
| (702 | ) | 2,886 |
|
Forecast for future new spending and top down adjustment |
| 4,667 |
| — |
| — |
| — |
| 4,667 |
|
Total Crown Expenses excluding losses |
| 69,943 |
| 30,498 |
| 14,439 |
| (24,982 | ) | 89,898 |
|
Statement of Financial Position
as at 30 June 2012
|
| Core Crown |
| Crown |
| State-owned Enterprises |
| Inter- |
| Total Crown |
|
|
| 2012 |
| 2012 |
| 2012 |
| 2012 |
| 2012 |
|
|
| Forecast |
| Forecast |
| Forecast |
| Forecast |
| Forecast |
|
|
| $m |
| $m |
| $m |
| $m |
| $m |
|
Assets |
|
|
|
|
|
|
|
|
|
|
|
Cash and cash equivalents |
| 3,972 |
| 3,389 |
| 570 |
| (249 | ) | 7,682 |
|
Receivables |
| 6,388 |
| 4,917 |
| 1,931 |
| (798 | ) | 12,438 |
|
Other financial assets |
| 50,661 |
| 21,529 |
| 12,150 |
| (9,510 | ) | 74,830 |
|
Property, plant & equipment |
| 26,416 |
| 46,165 |
| 35,320 |
| 1 |
| 107,902 |
|
Equity accounted investments |
| 27,643 |
| 7,254 |
| 319 |
| (26,523 | ) | 8,693 |
|
Intangible assets and goodwill |
| 1,091 |
| 300 |
| 527 |
| (1 | ) | 1,917 |
|
Other assets |
| 1,348 |
| 258 |
| 1,153 |
| (25 | ) | 2,734 |
|
Forecast for new capital spending |
| 2,907 |
| — |
| — |
| — |
| 2,907 |
|
Total Assets |
| 120,426 |
| 83,812 |
| 51,970 |
| (37,105 | ) | 219,103 |
|
|
|
|
|
|
|
|
|
|
|
|
|
Liabilities |
|
|
|
|
|
|
|
|
|
|
|
Borrowings |
| 39,815 |
| 4,982 |
| 20,673 |
| (10,560 | ) | 54,910 |
|
Other liabilities |
| 20,455 |
| 31,653 |
| 5,880 |
| (4,919 | ) | 53,069 |
|
Total Liabilities |
| 60,270 |
| 36,635 |
| 26,553 |
| (15,479 | ) | 107,979 |
|
Total Assets less Total Liabilities |
| 60,156 |
| 47,177 |
| 25,417 |
| (21,626 | ) | 111,124 |
|
|
|
|
|
|
|
|
|
|
|
|
|
Net Worth |
|
|
|
|
|
|
|
|
|
|
|
Taxpayer funds |
| 48,438 |
| 24,768 |
| 9,859 |
| (24,659 | ) | 58,406 |
|
Reserves |
| 11,718 |
| 22,409 |
| 15,262 |
| 3,033 |
| 52,422 |
|
Net worth attributable to minority interest in Air NZ |
| — |
| — |
| 296 |
| — |
| 296 |
|
Total Net Worth |
| 60,156 |
| 47,177 |
| 25,417 |
| (21,626 | ) | 111,124 |
|
|
| 2003 |
| 2004 |
| 2005 |
| 2006 |
| 2007 |
| 2008 |
| 2009 |
| 2010 |
| 2011 |
| 2012 |
|
($ million) |
| Actual |
| Actual |
| Actual |
| Actual |
| Actual |
| Forecast |
| Forecast |
| Forecast |
| Forecast |
| Forecast |
|
|
|
|
|
|
|
|
|
|
|
|
|
|
|
|
|
|
|
|
|
|
|
Social security and welfare |
| 13,907 |
| 14,252 |
| 14,682 |
| 15,598 |
| 16,768 |
| 18,071 |
| 18,898 |
| 19,566 |
| 20,175 |
| 21,212 |
|
GSF |
| 541 |
| 591 |
| 718 |
| 761 |
| 645 |
| 714 |
| 652 |
| 625 |
| 610 |
| 582 |
|
Health |
| 7,501 |
| 8,111 |
| 8,813 |
| 9,547 |
| 10,355 |
| 11,343 |
| 12,586 |
| 12,538 |
| 12,522 |
| 12,526 |
|
Education |
| 7,016 |
| 7,585 |
| 7,930 |
| 9,914 |
| 9,269 |
| 10,046 |
| 10,524 |
| 10,892 |
| 11,096 |
| 11,217 |
|
Core government services |
| 2,130 |
| 2,091 |
| 2,567 |
| 2,507 |
| 4,816 |
| 3,222 |
| 3,448 |
| 3,508 |
| 3,678 |
| 3,728 |
|
Law and order |
| 1,734 |
| 1,843 |
| 1,977 |
| 2,235 |
| 2,699 |
| 2,943 |
| 3,101 |
| 3,078 |
| 3,085 |
| 3,086 |
|
Defence |
| 1,199 |
| 1,311 |
| 1,275 |
| 1,383 |
| 1,517 |
| 1,566 |
| 1,741 |
| 1,800 |
| 1,891 |
| 1,964 |
|
Transport and communications |
| 1,408 |
| 1,461 |
| 1,635 |
| 1,818 |
| 2,405 |
| 2,290 |
| 2,823 |
| 2,731 |
| 2,635 |
| 2,488 |
|
Economic and industrial services |
| 1,054 |
| 1,192 |
| 1,444 |
| 1,592 |
| 1,595 |
| 2,828 |
| 3,244 |
| 3,281 |
| 3,414 |
| 3,461 |
|
Primary services |
| 355 |
| 368 |
| 394 |
| 467 |
| 438 |
| 565 |
| 520 |
| 499 |
| 494 |
| 499 |
|
Heritage, culture and recreation |
| 515 |
| 634 |
| 991 |
| 891 |
| 844 |
| 1,123 |
| 1,769 |
| 1,322 |
| 1,502 |
| 1,485 |
|
Housing and community development |
| 102 |
| 139 |
| 163 |
| 202 |
| 255 |
| 282 |
| 334 |
| 302 |
| 299 |
| 297 |
|
Other |
| 75 |
| 52 |
| 32 |
| 49 |
| 68 |
| 84 |
| 83 |
| 83 |
| 83 |
| 83 |
|
Finance costs |
| 2,360 |
| 2,252 |
| 2,274 |
| 2,356 |
| 2,329 |
| 2,527 |
| 2,406 |
| 2,341 |
| 2,606 |
| 2,648 |
|
Net foreign exchange (gains)/losses |
| — |
| — |
| — |
| — |
| — |
| — |
| — |
| — |
| — |
| — |
|
Forecast for future new spending |
| — |
| — |
| — |
| — |
| — |
| — |
| 249 |
| 1,774 |
| 3,376 |
| 5,117 |
|
Top- down expense adjustment |
| — |
| — |
| — |
| — |
| — |
| (240 | ) | (495 | ) | (450 | ) | (450 | ) | (450 | ) |
Core Crown expenses |
| 39,897 |
| 41,882 |
| 44,895 |
| 49,320 |
| 54,003 |
| 57,364 |
| 61,883 |
| 63,890 |
| 67,016 |
| 69,943 |
|
Source: The Treasury
Table 6.1 – Social security and welfare expenses
|
| 2003 |
| 2004 |
| 2005 |
| 2006 |
| 2007 |
| 2008 |
| 2009 |
| 2010 |
| 2011 |
| 2012 |
|
($ million) |
| Actual |
| Actual |
| Actual |
| Actual |
| Actual |
| Forecast |
| Forecast |
| Forecast |
| Forecast |
| Forecast |
|
|
|
|
|
|
|
|
|
|
|
|
|
|
|
|
|
|
|
|
|
|
|
Welfare benefits |
| 12,884 |
| 13,181 |
| 13,326 |
| 14,246 |
| 15,435 |
| 16,448 |
| 16,972 |
| 17,608 |
| 18,163 |
| 19,144 |
|
Social rehabilitation & compensation |
| 146 |
| 118 |
| 152 |
| 145 |
| 163 |
| 199 |
| 223 |
| 215 |
| 221 |
| 225 |
|
Departmental expenses |
| 666 |
| 705 |
| 781 |
| 858 |
| 845 |
| 866 |
| 1,101 |
| 1,091 |
| 1,083 |
| 1,073 |
|
Other non-departmental expenses |
| 211 |
| 248 |
| 423 |
| 349 |
| 325 |
| 558 |
| 602 |
| 652 |
| 708 |
| 770 |
|
Social security and welfare expenses |
| 13,907 |
| 14,252 |
| 14,682 |
| 15,598 |
| 16,768 |
| 18,071 |
| 18,898 |
| 19,566 |
| 20,175 |
| 21,212 |
|
Source: The Treasury
(20) Historical data contained in the expense tables have been restated on a NZ IFRS basis for material changes.
Table 6.2 – New Zealand superannuation and welfare benefit expenses
|
| 2003 |
| 2004 |
| 2005 |
| 2006 |
| 2007 |
| 2008 |
| 2009 |
| 2010 |
| 2011 |
| 2012 |
|
($ million) |
| Actual |
| Actual |
| Actual |
| Actual |
| Actual |
| Forecast |
| Forecast |
| Forecast |
| Forecast |
| Forecast |
|
|
|
|
|
|
|
|
|
|
|
|
|
|
|
|
|
|
|
|
|
|
|
New Zealand Superannuation |
| 5,642 |
| 5,889 |
| 6,083 |
| 6,414 |
| 6,810 |
| 7,347 |
| 7,741 |
| 8,196 |
| 8,622 |
| 9,219 |
|
Domestic Purposes Benefit |
| 1,520 |
| 1,569 |
| 1,547 |
| 1,493 |
| 1,468 |
| 1,475 |
| 1,455 |
| 1,463 |
| 1,469 |
| 1,535 |
|
Unemployment Benefit |
| 1,274 |
| 1,084 |
| 831 |
| 712 |
| 613 |
| 455 |
| 403 |
| 431 |
| 419 |
| 421 |
|
Invalids Benefit |
| 914 |
| 976 |
| 1,026 |
| 1,073 |
| 1,132 |
| 1,214 |
| 1,264 |
| 1,298 |
| 1,327 |
| 1,397 |
|
Family Support |
| 862 |
| 833 |
| 846 |
| 1,285 |
| 1,699 |
| 2,081 |
| 2,132 |
| 2,132 |
| 2,137 |
| 2,236 |
|
Accommodation Supplement |
| 706 |
| 702 |
| 750 |
| 843 |
| 877 |
| 888 |
| 911 |
| 935 |
| 953 |
| 977 |
|
Sickness Benefit |
| 421 |
| 470 |
| 510 |
| 541 |
| 573 |
| 580 |
| 548 |
| 538 |
| 530 |
| 541 |
|
Disability Allowance |
| 241 |
| 257 |
| 267 |
| 261 |
| 270 |
| 278 |
| 387 |
| 410 |
| 433 |
| 456 |
|
Transitional Retirement Benefit |
| 47 |
| 11 |
| — |
| — |
| — |
| — |
| — |
| — |
| — |
| — |
|
Income Related Rents |
| 296 |
| 340 |
| 370 |
| 395 |
| 434 |
| 463 |
| 496 |
| 527 |
| 556 |
| 587 |
|
In Work Tax Credit |
| — |
| — |
| — |
| 70 |
| 461 |
| 557 |
| 587 |
| 578 |
| 583 |
| 605 |
|
Child Tax Credit |
| 143 |
| 155 |
| 141 |
| 154 |
| 44 |
| 10 |
| 6 |
| 4 |
| 3 |
| 3 |
|
Special Benefit |
| 82 |
| 140 |
| 175 |
| 162 |
| 106 |
| 71 |
| — |
| — |
| — |
| — |
|
Benefits paid in Australia |
| 121 |
| 103 |
| 91 |
| 80 |
| 71 |
| 58 |
| 51 |
| 45 |
| 38 |
| 33 |
|
Paid Parental Leave |
| 56 |
| 63 |
| 76 |
| 96 |
| 122 |
| 137 |
| 146 |
| 158 |
| 167 |
| 177 |
|
Other benefits |
| 559 |
| 589 |
| 613 |
| 667 |
| 755 |
| 834 |
| 845 |
| 893 |
| 926 |
| 957 |
|
Welfare benefit expenses |
| 12,884 |
| 13,181 |
| 13,326 |
| 14,246 |
| 15,435 |
| 16,448 |
| 16,972 |
| 17,608 |
| 18,163 |
| 19,144 |
|
Source: The Treasury
Table 6.3 – Beneficiary numbers
|
| 2003 |
| 2004 |
| 2005 |
| 2006 |
| 2007 |
| 2008 |
| 2009 |
| 2010 |
| 2011 |
| 2012 |
|
(Thousands) |
| Actual |
| Actual |
| Actual |
| Actual |
| Actual |
| Forecast |
| Forecast |
| Forecast |
| Forecast |
| Forecast |
|
|
|
|
|
|
|
|
|
|
|
|
|
|
|
|
|
|
|
|
|
|
|
New Zealand Superannuation |
| 454 |
| 461 |
| 469 |
| 482 |
| 495 |
| 509 |
| 521 |
| 535 |
| 549 |
| 569 |
|
Domestic Purposes Benefit |
| 110 |
| 110 |
| 109 |
| 106 |
| 100 |
| 97 |
| 97 |
| 96 |
| 95 |
| 95 |
|
Unemployment Benefit |
| 126 |
| 104 |
| 78 |
| 64 |
| 52 |
| 37 |
| 33 |
| 35 |
| 33 |
| 32 |
|
Accommodation Supplement |
| 261 |
| 249 |
| 243 |
| 249 |
| 251 |
| 244 |
| 244 |
| 248 |
| 250 |
| 253 |
|
Invalids Benefit |
| 67 |
| 70 |
| 74 |
| 76 |
| 78 |
| 82 |
| 86 |
| 88 |
| 89 |
| 90 |
|
Sickness Benefit |
| 38 |
| 42 |
| 45 |
| 47 |
| 48 |
| 48 |
| 45 |
| 44 |
| 43 |
| 42 |
|
Source: The Treasury
Table 6.4 – GSF pension expenses
|
| 2003 |
| 2004 |
| 2005 |
| 2006 |
| 2007 |
| 2008 |
| 2009 |
| 2010 |
| 2011 |
| 2012 |
|
($ million) |
| Actual |
| Actual |
| Actual |
| Actual |
| Actual |
| Forecast |
| Forecast |
| Forecast |
| Forecast |
| Forecast |
|
|
|
|
|
|
|
|
|
|
|
|
|
|
|
|
|
|
|
|
|
|
|
Pension expenses |
| 541 |
| 591 |
| 718 |
| 761 |
| 645 |
| 714 |
| 652 |
| 625 |
| 610 |
| 582 |
|
GSF pension expenses |
| 541 |
| 591 |
| 718 |
| 761 |
| 645 |
| 714 |
| 652 |
| 625 |
| 610 |
| 582 |
|
Source: The Treasury
Table 6.5 – Health expenses
|
| 2003 |
| 2004 |
| 2005 |
| 2006 |
| 2007 |
| 2008 |
| 2009 |
| 2010 |
| 2011 |
| 2012 |
|
($ million) |
| Actual |
| Actual |
| Actual |
| Actual |
| Actual |
| Forecast |
| Forecast |
| Forecast |
| Forecast |
| Forecast |
|
|
|
|
|
|
|
|
|
|
|
|
|
|
|
|
|
|
|
|
|
|
|
Departmental outputs |
| 148 |
| 161 |
| 157 |
| 174 |
| 180 |
| 204 |
| 224 |
| 216 |
| 212 |
| 210 |
|
Health service purchasing |
| 6,783 |
| 7,452 |
| 8,113 |
| 8,805 |
| 9,614 |
| 10,531 |
| 11,704 |
| 11,633 |
| 11,588 |
| 11,557 |
|
Other non-departmental outputs |
| 59 |
| 71 |
| 160 |
| 135 |
| 99 |
| 99 |
| 104 |
| 98 |
| 92 |
| 91 |
|
Health payments to ACC |
| 482 |
| 409 |
| 356 |
| 372 |
| 425 |
| 467 |
| 511 |
| 548 |
| 586 |
| 624 |
|
Other expenses |
| 29 |
| 18 |
| 27 |
| 61 |
| 37 |
| 42 |
| 43 |
| 43 |
| 44 |
| 44 |
|
Health expenses |
| 7,501 |
| 8,111 |
| 8,813 |
| 9,547 |
| 10,355 |
| 11,343 |
| 12,586 |
| 12,538 |
| 12,522 |
| 12,526 |
|
Source: The Treasury
Table 6.6 – Health service purchasing
|
| 2003 |
| 2004 |
| 2005 |
| 2006 |
| 2007 |
| 2008 |
| 2009 |
| 2010 |
| 2011 |
| 2012 |
|
($ million) |
| Actual |
| Actual |
| Actual |
| Actual |
| Actual |
| Forecast |
| Forecast |
| Forecast |
| Forecast |
| Forecast |
|
|
|
|
|
|
|
|
|
|
|
|
|
|
|
|
|
|
|
|
|
|
|
Payments to District Health Boards |
| 5,328 |
| 6,441 |
| 7,262 |
| 7,814 |
| 8,547 |
| 9,339 |
| 10,276 |
| 10,217 |
| 10,184 |
| 10,194 |
|
National Disability Support Services |
| 1,260 |
| 793 |
| 620 |
| 699 |
| 755 |
| 834 |
| 880 |
| 875 |
| 875 |
| 875 |
|
Public Health Service Purchasing |
| 195 |
| 218 |
| 231 |
| 292 |
| 312 |
| 358 |
| 548 |
| 541 |
| 529 |
| 488 |
|
Health service purchasing |
| 6,783 |
| 7,452 |
| 8,113 |
| 8,805 |
| 9,614 |
| 10,531 |
| 11,704 |
| 11,633 |
| 11,588 |
| 11,557 |
|
Source: The Treasury
Table 6.7 – Education expenses
|
| 2003 |
| 2004 |
| 2005 |
| 2006 |
| 2007 |
| 2008 |
| 2009 |
| 2010 |
| 2011 |
| 2012 |
|
($ million) |
| Actual |
| Actual |
| Actual |
| Actual |
| Actual |
| Forecast |
| Forecast |
| Forecast |
| Forecast |
| Forecast |
|
|
|
|
|
|
|
|
|
|
|
|
|
|
|
|
|
|
|
|
|
|
|
Early childhood education |
| 373 |
| 393 |
| 444 |
| 555 |
| 617 |
| 841 |
| 917 |
| 997 |
| 1,065 |
| 1,100 |
|
Primary and secondary schools |
| 3,449 |
| 3,692 |
| 3,934 |
| 4,153 |
| 4,325 |
| 4,583 |
| 4,876 |
| 5,033 |
| 5,038 |
| 5,052 |
|
Tertiary funding |
| 2,470 |
| 2,535 |
| 2,496 |
| 4,047 |
| 3,322 |
| 3,623 |
| 3,737 |
| 3,890 |
| 4,023 |
| 4,097 |
|
Departmental expenses |
| 621 |
| 679 |
| 737 |
| 821 |
| 875 |
| 854 |
| 881 |
| 865 |
| 860 |
| 860 |
|
Other education expenses |
| 103 |
| 286 |
| 319 |
| 338 |
| 130 |
| 145 |
| 113 |
| 107 |
| 110 |
| 108 |
|
Education expenses |
| 7,016 |
| 7,585 |
| 7,930 |
| 9,914 |
| 9,269 |
| 10,046 |
| 10,524 |
| 10,892 |
| 11,096 |
| 11,217 |
|
Source: The Treasury
Table 6.8 – Primary and secondary education expenses
|
| 2003 |
| 2004 |
| 2005 |
| 2006 |
| 2007 |
| 2008 |
| 2009 |
| 2010 |
| 2011 |
| 2012 |
|
($ million) |
| Actual |
| Actual |
| Actual |
| Actual |
| Actual |
| Forecast |
| Forecast |
| Forecast |
| Forecast |
| Forecast |
|
|
|
|
|
|
|
|
|
|
|
|
|
|
|
|
|
|
|
|
|
|
|
Primary |
| 1,749 |
| 1,884 |
| 1,964 |
| 2,062 |
| 2,141 |
| 2,275 |
| 2,423 |
| 2,563 |
| 2,578 |
| 2,591 |
|
Secondary |
| 1,269 |
| 1,385 |
| 1,524 |
| 1,618 |
| 1,682 |
| 1,773 |
| 1,893 |
| 1,906 |
| 1,899 |
| 1,900 |
|
School transport |
| 103 |
| 106 |
| 109 |
| 118 |
| 125 |
| 132 |
| 139 |
| 142 |
| 146 |
| 150 |
|
Special needs support |
| 227 |
| 221 |
| 231 |
| 245 |
| 263 |
| 280 |
| 294 |
| 305 |
| 304 |
| 303 |
|
Professional Development |
| 86 |
| 84 |
| 95 |
| 101 |
| 104 |
| 111 |
| 114 |
| 104 |
| 98 |
| 95 |
|
Schooling Improvement |
| 15 |
| 12 |
| 11 |
| 9 |
| 10 |
| 12 |
| 13 |
| 13 |
| 13 |
| 13 |
|
Primary and secondary education expenses |
| 3,449 |
| 3,692 |
| 3,934 |
| 4,153 |
| 4,325 |
| 4,583 |
| 4,876 |
| 5,033 |
| 5,038 |
| 5,052 |
|
Sources: Ministry of Education, The Treasury
Table 6.9 – Tertiary education expenses
|
| 2003 |
| 2004 |
| 2005 |
| 2006 |
| 2007 |
| 2008 |
| 2009 |
| 2010 |
| 2011 |
| 2012 |
|
($ million) |
| Actual |
| Actual |
| Actual |
| Actual |
| Actual |
| Forecast |
| Forecast |
| Forecast |
| Forecast |
| Forecast |
|
|
|
|
|
|
|
|
|
|
|
|
|
|
|
|
|
|
|
|
|
|
|
Tuition |
| 1,729 |
| 1,770 |
| 1,647 |
| 1,865 |
| 1,962 |
| 2,183 |
| 2,206 |
| 2,295 |
| 2,370 |
| 2,385 |
|
Other tertiary funding |
| 62 |
| 66 |
| 68 |
| 110 |
| 339 |
| 369 |
| 558 |
| 564 |
| 577 |
| 585 |
|
Tertiary student allowances |
| 388 |
| 380 |
| 359 |
| 354 |
| 382 |
| 384 |
| 398 |
| 418 |
| 429 |
| 446 |
|
Initial fair value change in student loans |
| — |
| — |
| — |
| 1,415 |
| — |
| — |
| — |
| — |
| — |
| — |
|
Student loans |
| 291 |
| 319 |
| 422 |
| 303 |
| 639 |
| 687 |
| 575 |
| 613 |
| 647 |
| 681 |
|
Tertiary education expenses |
| 2,470 |
| 2,535 |
| 2,496 |
| 4,047 |
| 3,322 |
| 3,623 |
| 3,737 |
| 3,890 |
| 4,023 |
| 4,097 |
|
Sources: Ministry of Education, The Treasury
Table 6.10 – Core Government service expenses
|
| 2003 |
| 2004 |
| 2005 |
| 2006 |
| 2007 |
| 2008 |
| 2009 |
| 2010 |
| 2011 |
| 2012 |
|
($ million) |
| Actual |
| Actual |
| Actual |
| Actual |
| Actual |
| Forecast |
| Forecast |
| Forecast |
| Forecast |
| Forecast |
|
|
|
|
|
|
|
|
|
|
|
|
|
|
|
|
|
|
|
|
|
|
|
Official development assistance |
| 230 |
| 237 |
| 297 |
| 330 |
| 330 |
| 413 |
| 434 |
| 499 |
| 568 |
| 568 |
|
Indemnity and guarantee expenses |
| 197 |
| 9 |
| — |
| — |
| — |
| — |
| — |
| — |
| — |
| — |
|
Departmental expenses |
| 1,025 |
| 1,096 |
| 1,570 |
| 1,403 |
| 1,402 |
| 1,509 |
| 1,607 |
| 1,583 |
| 1,618 |
| 1,614 |
|
Non-Departmental Expenses |
| — |
| — |
| — |
| — |
| 237 |
| 197 |
| 244 |
| 389 |
| 433 |
| 462 |
|
Tax receivable write-down |
| 350 |
| 350 |
| 350 |
| 338 |
| 2,479 |
| 713 |
| 722 |
| 614 |
| 633 |
| 653 |
|
Science expenses |
| 250 |
| 283 |
| 170 |
| 157 |
| 163 |
| 169 |
| 186 |
| 192 |
| 193 |
| 195 |
|
Other expenses |
| 78 |
| 116 |
| 180 |
| 279 |
| 205 |
| 221 |
| 255 |
| 231 |
| 233 |
| 236 |
|
Core Government service expenses |
| 2,130 |
| 2,091 |
| 2,567 |
| 2,507 |
| 4,816 |
| 3,222 |
| 3,448 |
| 3,508 |
| 3,678 |
| 3,728 |
|
Source: �� The Treasury
Table 6.11 – Law and order expenses
|
| 2003 |
| 2004 |
| 2005 |
| 2006 |
| 2007 |
| 2008 |
| 2009 |
| 2010 |
| 2011 |
| 2012 |
|
($ million) |
| Actual |
| Actual |
| Actual |
| Actual |
| Actual |
| Forecast |
| Forecast |
| Forecast |
| Forecast |
| Forecast |
|
|
|
|
|
|
|
|
|
|
|
|
|
|
|
|
|
|
|
|
|
|
|
Police |
| 800 |
| 844 |
| 896 |
| 976 |
| 1,086 |
| 1,209 |
| 1,264 |
| 1,256 |
| 1,259 |
| 1,260 |
|
Ministry of Justice |
| 15 |
| 178 |
| 257 |
| 299 |
| 454 |
| 368 |
| 390 |
| 374 |
| 369 |
| 370 |
|
Department of Corrections |
| 403 |
| 439 |
| 483 |
| 572 |
| 662 |
| 787 |
| 830 |
| 841 |
| 845 |
| 844 |
|
Department for Courts |
| 211 |
| 53 |
| — |
| — |
| — |
| — |
| — |
| — |
| — |
| — |
|
Other departments |
| 77 |
| 81 |
| 72 |
| 76 |
| 60 |
| 105 |
| 119 |
| 124 |
| 129 |
| 129 |
|
Department expenses |
| 1,506 |
| 1,595 |
| 1,708 |
| 1,923 |
| 2,262 |
| 2,469 |
| 2,603 |
| 2,595 |
| 2,602 |
| 2,603 |
|
Source: The Treasury
Table 6.12 – Defence expenses
|
| 2003 |
| 2004 |
| 2005 |
| 2006 |
| 2007 |
| 2008 |
| 2009 |
| 2010 |
| 2011 |
| 2012 |
|
($ million) |
| Actual |
| Actual |
| Actual |
| Actual |
| Actual |
| Forecast |
| Forecast |
| Forecast |
| Forecast |
| Forecast |
|
|
|
|
|
|
|
|
|
|
|
|
|
|
|
|
|
|
|
|
|
|
|
NZDF Core expenses |
| 1,095 |
| 1,182 |
| 1,203 |
| 1,306 |
| 1,459 |
| 1,520 |
| 1,685 |
| 1,741 |
| 1,819 |
| 1,903 |
|
NZDF write-offs |
| 23 |
| 72 |
| — |
| — |
| — |
| — |
| — |
| — |
| — |
| — |
|
NZDF East Timor deployment |
| 20 |
| — |
| — |
| — |
| — |
| — |
| — |
| — |
| — |
| — |
|
Other expenses |
| 61 |
| 57 |
| 72 |
| 77 |
| 58 |
| 46 |
| 56 |
| 59 |
| 72 |
| 61 |
|
Defence expenses |
| 1,199 |
| 1,311 |
| 1,275 |
| 1,383 |
| 1,517 |
| 1,566 |
| 1,741 |
| 1,800 |
| 1,891 |
| 1,964 |
|
Source: The Treasury
Table 6.13 – Transport and communication expenses
|
| 2003 |
| 2004 |
| 2005 |
| 2006 |
| 2007 |
| 2008 |
| 2009 |
| 2010 |
| 2011 |
| 2012 |
|
($ million) |
| Actual |
| Actual |
| Actual |
| Actual |
| Actual |
| Forecast |
| Forecast |
| Forecast |
| Forecast |
| Forecast |
|
|
|
|
|
|
|
|
|
|
|
|
|
|
|
|
|
|
|
|
|
|
|
Land Transport NZ(1) |
| 1,131 |
| 1,222 |
| 1,346 |
| 1,482 |
| 1,874 |
| 1,860 |
| 2,175 |
| 2,006 |
| 2,150 |
| 2,138 |
|
Departmental outputs |
| 80 |
| 83 |
| 97 |
| 101 |
| 113 |
| 133 |
| 130 |
| 128 |
| 127 |
| 127 |
|
Other non-departmental expenses |
| 61 |
| 84 |
| 79 |
| 109 |
| 221 |
| 120 |
| 134 |
| 143 |
| 140 |
| 119 |
|
Goodwill amortisation |
| 47 |
| 47 |
| 47 |
| 47 |
| 47 |
| — |
| — |
| — |
| — |
| — |
|
Rail write-offs |
| 81 |
| 19 |
| — |
| — |
| — |
| — |
| — |
| — |
| — |
| — |
|
Rail costs |
|
|
| 3 |
| 63 |
| 77 |
| 142 |
| 163 |
| 359 |
| 435 |
| 199 |
| 85 |
|
Other expenses |
| 8 |
| 3 |
| 3 |
| 2 |
| 8 |
| 14 |
| 25 |
| 19 |
| 19 |
| 19 |
|
Transport and communication expenses |
| 1,408 |
| 1,461 |
| 1,635 |
| 1,818 |
| 2,405 |
| 2,290 |
| 2,823 |
| 2,731 |
| 2,635 |
| 2,488 |
|
(1) Since 2004/05 funding has been provided to Land Transport NZ. Prior to this, funding was received by Transfund.
Source: The Treasury
Table 6.14 – Economic and industrial services expenses
|
| 2003 |
| 2004 |
| 2005 |
| 2006 |
| 2007 |
| 2008 |
| 2009 |
| 2010 |
| 2011 |
| 2012 |
|
($ million) |
| Actual |
| Actual |
| Actual |
| Actual |
| Actual |
| Forecast |
| Forecast |
| Forecast |
| Forecast |
| Forecast |
|
|
|
|
|
|
|
|
|
|
|
|
|
|
|
|
|
|
|
|
|
|
|
Departmental outputs |
| 424 |
| 478 |
| 508 |
| 549 |
| 546 |
| 600 |
| 399 |
| 382 |
| 377 |
| 374 |
|
Employment initiatives |
| 217 |
| 222 |
| 224 |
| 202 |
| 207 |
| 207 |
| 196 |
| 182 |
| 182 |
| 182 |
|
Non-departmental outputs |
| 277 |
| 444 |
| 549 |
| 751 |
| 873 |
| 826 |
| 909 |
| 849 |
| 845 |
| 840 |
|
Reserve Electricity Generation |
| — |
| — |
| — |
| 26 |
| 16 |
| 39 |
| 26 |
| 26 |
| 26 |
| 25 |
|
Flood relief |
| — |
| 15 |
| 52 |
| 8 |
| — |
| — |
| — |
| — |
| — |
| — |
|
KiwiSaver |
| — |
| — |
| — |
| — |
| — |
| 1,031 |
| 1,370 |
| 1,441 |
| 1,502 |
| 1,507 |
|
Research & Development tax credits |
| — |
| — |
| — |
| — |
| — |
| 37 |
| 208 |
| 250 |
| 290 |
| 332 |
|
Other expenses |
| 136 |
| 33 |
| 111 |
| 56 |
| (47 | ) | 88 |
| 136 |
| 151 |
| 192 |
| 201 |
|
Economic and industrial service expenses |
| 1,054 |
| 1,192 |
| 1,444 |
| 1,592 |
| 1,595 |
| 2,828 |
| 3,244 |
| 3,281 |
| 3,414 |
| 3,461 |
|
Source: The Treasury
Table 6.15 – Employment initiatives
|
| 2003 |
| 2004 |
| 2005 |
| 2006 |
| 2007 |
| 2008 |
| 2009 |
| 2010 |
| 2011 |
| 2012 |
|
($ million) |
| Actual |
| Actual |
| Actual |
| Actual |
| Actual |
| Forecast |
| Forecast |
| Forecast |
| Forecast |
| Forecast |
|
|
|
|
|
|
|
|
|
|
|
|
|
|
|
|
|
|
|
|
|
|
|
Training incentive allowance |
| 37 |
| 42 |
| 36 |
| 32 |
| 29 |
| 29 |
| 26 |
| 26 |
| 26 |
| 26 |
|
Community employment projects |
| 21 |
| 16 |
| 6 |
| — |
| — |
| — |
| — |
| — |
| — |
| — |
|
Subsidised work |
| 95 |
| 100 |
| 102 |
| 84 |
| 88 |
| 85 |
| 75 |
| 61 |
| 60 |
| 59 |
|
Employment support for disabled |
| 61 |
| 61 |
| 74 |
| 82 |
| 86 |
| 89 |
| 91 |
| 91 |
| 92 |
| 93 |
|
Other employment assistance schemes |
| 3 |
| 3 |
| 6 |
| 4 |
| 4 |
| 4 |
| 4 |
| 4 |
| 4 |
| 4 |
|
Employment initiatives |
| 217 |
| 222 |
| 224 |
| 202 |
| 207 |
| 207 |
| 196 |
| 182 |
| 182 |
| 182 |
|
Source: The Treasury
Table 6.16 – Primary service expenses
|
| 2003 |
| 2004 |
| 2005 |
| 2006 |
| 2007 |
| 2008 |
| 2009 |
| 2010 |
| 2011 |
| 2012 |
|
($ million) |
| Actual |
| Actual |
| Actual |
| Actual |
| Actual |
| Forecast |
| Forecast |
| Forecast |
| Forecast |
| Forecast |
|
|
|
|
|
|
|
|
|
|
|
|
|
|
|
|
|
|
|
|
|
|
|
Departmental expenses |
| 265 |
| 269 |
| 272 |
| 350 |
| 342 |
| 375 |
| 390 |
| 377 |
| 377 |
| 379 |
|
Non-departmental outputs |
| 80 |
| 81 |
| 114 |
| 97 |
| 80 |
| 107 |
| 111 |
| 107 |
| 102 |
| 105 |
|
Other expenses |
| 10 |
| 18 |
| 8 |
| 20 |
| 16 |
| 83 |
| 19 |
| 15 |
| 15 |
| 15 |
|
Primary service expenses |
| 355 |
| 368 |
| 394 |
| 467 |
| 438 |
| 565 |
| 520 |
| 499 |
| 494 |
| 499 |
|
Source: The Treasury
Table 6.17 – Heritage, culture and recreation expenses
|
| 2003 |
| 2004 |
| 2005 |
| 2006 |
| 2007 |
| 2008 |
| 2009 |
| 2010 |
| 2011 |
| 2012 |
|
($ million) |
| Actual |
| Actual |
| Actual |
| Actual |
| Actual |
| Forecast |
| Forecast |
| Forecast |
| Forecast |
| Forecast |
|
|
|
|
|
|
|
|
|
|
|
|
|
|
|
|
|
|
|
|
|
|
|
Community grants |
| 6 |
| 3 |
| 6 |
| 7 |
| 7 |
| 7 |
| 8 |
| 9 |
| 9 |
| 10 |
|
Kyoto protocol |
| — |
| — |
| 310 |
| 42 |
| — |
| — |
| — |
| — |
| — |
| — |
|
Emmission Trading Scheme |
| — |
| — |
| — |
| — |
| — |
| — |
| 762 |
| 369 |
| 536 |
| 536 |
|
Departmental outputs |
| 253 |
| 269 |
| 292 |
| 322 |
| 357 |
| 413 |
| 456 |
| 440 |
| 451 |
| 451 |
|
Non-departmental outputs |
| 212 |
| 258 |
| 317 |
| 351 |
| 411 |
| 456 |
| 486 |
| 454 |
| 453 |
| 429 |
|
Other expenses |
| 44 |
| 104 |
| 66 |
| 169 |
| 69 |
| 247 |
| 57 |
| 50 |
| 53 |
| 59 |
|
Heritage, culture and recreation expenses |
| 515 |
| 634 |
| 991 |
| 891 |
| 844 |
| 1,123 |
| 1,769 |
| 1,322 |
| 1,502 |
| 1,485 |
|
Source: The Treasury
Table 6.18 – Housing and community development expenses
|
| 2003 |
| 2004 |
| 2005 |
| 2006 |
| 2007 |
| 2008 |
| 2009 |
| 2010 |
| 2011 |
| 2012 |
|
($ million) |
| Actual |
| Actual |
| Actual |
| Actual |
| Actual |
| Forecast |
| Forecast |
| Forecast |
| Forecast |
| Forecast |
|
|
|
|
|
|
|
|
|
|
|
|
|
|
|
|
|
|
|
|
|
|
|
Housing subsidies |
| 25 |
| 27 |
| 31 |
| 23 |
| 25 |
| 28 |
| 33 |
| 32 |
| 32 |
| 31 |
|
Departmental outputs |
| 57 |
| 77 |
| 100 |
| 117 |
| 134 |
| 152 |
| 167 |
| 145 |
| 139 |
| 135 |
|
Other non-departmental expenses |
| 20 |
| 35 |
| 32 |
| 62 |
| 96 |
| 102 |
| 134 |
| 125 |
| 128 |
| 131 |
|
Housing and community development expenses |
| 102 |
| 139 |
| 163 |
| 202 |
| 255 |
| 282 |
| 334 |
| 302 |
| 299 |
| 297 |
|
Source: The Treasury
Glossary of Terms
ACC insurance liability
The ACC insurance liability is the gross liability of the future cost of past ACC claims. The net ACC liability is the gross liability less the asset reserves held to meet these claims.
Baselines
The level of funding approved for any given spending area (eg, Education). All amounts within baselines are included in the forecasts.
Consumers Price Index (CPI)
A measure of change in the prices of goods and services bought by households.
Contingent liability
Contingent liabilities are costs, which the Crown will have to face if a particular uncertain and not probable event occurs. Typically, contingent liabilities consist of guarantees and indemnities, legal disputes and claims, and uncalled capital.
Contingent assets
Contingent assets are potential assets dependent on an uncertain event occurring.
Core Crown
The core Crown represents the revenues, expenses, assets and liabilities of the Crown, departments, Offices of Parliament, the Reserve Bank, and the NZS Fund.
Core Crown revenue
Core Crown revenue mostly consists of tax revenue collected by the Government, but also includes investment income, sales of goods and services and other receipts.
Core Crown expenses
The day-to-day spending (eg, salaries, welfare benefit payments, finance costs and maintaining national defence etc) that does not build physical assets for the Government. This is an accrual measure of expenses and includes items such as depreciation on physical assets.
Corporate tax
The sum of net company tax, non-resident withholding tax (NRWT), foreign-source dividend withholding payments (FDWP).
Current account (Balance of Payments)
A measure of the flows of income between New Zealand and the rest of the world. A net inflow to New Zealand is a current account surplus, while a net outflow is a deficit. The current account balance is commonly expressed as a percentage of GDP.
Cyclically adjusted or structural fiscal balance
An estimate of the fiscal balance (eg, OBEGAL) adjusted for short-term fluctuations of actual GDP around trend GDP. The estimate provides a picture of the underlying trend fiscal position and an indication of the effects of policy decisions. Because it is based on a number of assumptions and is sensitive to new information, the estimate is subject to some uncertainty.
Demographic changes
Changes to the structure of the population. For example the age, gender or ethnic make-up of the population.
Domestic bond programme
The amount and timing of new government stock expected to be issued over the financial year.
Excise duties
Tax levied on the domestic production of alcohol, tobacco and light petroleum products (CNG, LPG and petrol).
Financial assets
Cash or shares (equity) or a right to receive cash or shares (equity), or a right to exchange a financial asset or liability on favourable terms.
Fiscal impulse
A summary measure of how changes in fiscal policy affect aggregate demand. To isolate discretionary changes, fiscal impulse is calculated on a cyclically-adjusted basis and excluding net interest payments. To better capture the role of capital spending the indicator is derived from cash flow information.
Fiscal intentions (short-term)
Under the Public Finance Act 1989, the Government must indicate explicitly its intentions for operating expenses, operating revenues, the operating balance, debt and net worth over (at least) the next three years.
Fiscal objectives (long-term)
The Government’s long-term goals for operating expenses, operating revenue, the operating balance, debt and net worth, as required by the Public Finance Act 1989. The objectives must be consistent with the principles of responsible fiscal management outlined in the Act and cover a period of ten or more years.
Forecast new capital spending
An amount provided in the forecasts to represent the balance sheet impact of capital initiatives expected to be introduced over the forecast period.
Forecast new operating spending
An amount included in the forecasts to provide for the operating balance impact of policy initiatives and changes to demographics and other forecasting changes expected to occur over the forecast period.
Gross Crown debt
The total borrowings (both sovereign guaranteed and non-sovereign guaranteed and including derivatives in loss) of the total Crown. This is the amount in the total Crown Statement of Financial Position for Reserve Bank settlement deposits plus other borrowings. It represents the complete picture of whole-of-Crown debt obligations to external parties, excluding payables.
Gross domestic product (GDP)
A measure of the value of all goods and services produced in New Zealand; changes in GDP measure growth in economic activity or output. GDP can be measured as the actual dollar value of
goods and services measured at today’s prices (nominal GDP), or excluding the effects of price changes over time (real GDP).
Gross domestic product (expenditure)
This is the sum of total final expenditures on goods and services in the economy.
Gross national expenditure (GNE)
Measures total expenditure on goods and services by New Zealand residents.
Gross sovereign-issued debt (GSID)
Debt issued by the sovereign (ie, Core Crown) and includes Government stock held by the NZS Fund, ACC or EQC for example. The gross sovereign-issued debt indicator does not eliminate any internal cross-holdings.
GSID (excluding settlement cash)
GSID less Reserve Bank settlement cash.
Labour force participation rate
Measures the percentage of the working-age population in work or actively looking for and available for work.
Labour productivity
Measures output per input of labour (where labour inputs might be measured as hours worked or people).
Line-by-line consolidation
This is a term used to refer to the general approach to the presentation of the Crown financial statements. It means that the individual line items for revenues, expenses, assets and liabilities in the Crown financial statements include all departments, Offices of Parliament, the Reserve Bank, SOEs, Crown entities, and other entities controlled by the Government.
Marketable securities
Assets held with financial institutions. These assets are held for both cash flow and investment purposes, and include any funds the Government has invested in the International Monetary Fund.
Monetary conditions
The combination of interest rates and the exchange rate.
Monetary policy
Action taken by the Reserve Bank to affect interest rates and the exchange rate in order to control inflation. Tightening monetary policy refers to actions taken by the Reserve Bank to raise interest rates (which can influence the exchange rate) in order to moderate aggregate demand pressures and so reduce inflationary pressures.
Net core Crown cashflow from operations
OBEGAL less retained items (eg, net surplus of SOEs, CEs and NZS Fund net revenue) less non-cash items (eg, depreciation).
Net core Crown debt
Debt after deducting financial assets of the Core Crown from gross sovereign-issued debt. Share investments in supranational organisations, such as the International Bank for Reconstruction and Development & Bank for International Settlements, are excluded from the net Core Crown debt measure as are the assets of the NZS Fund.
Net worth
Total assets less total liabilities (also referred to as the Crown balance). The change in net worth in any given forecast year is largely driven by the operating balance.
NZ IFRS
New Zealand equivalents to International Financial Reporting Standards. These standards are approved by the Accounting Standards Review Board in New Zealand and are based on the requirements of the international financial reporting standards issued by the International Accounting Standards Board adjusted where appropriate for entities that are not profit oriented.
Operating allowance
The amount included in the Fiscal Strategy Report projections for new initiatives, including spending and cost pressures. The allowance is a projection assumption. The projections in the Fiscal Strategy Report also include an allowance for capital spending.
Operating balance
The operating balance is the residual of revenues less expenses plus surpluses from state-owned enterprises and Crown entities. It includes gains and losses not reported directly as a movement against net worth.
Operating balance before gains and losses (OBEGAL)
The OBEGAL is the operating balance excluding gains and losses.
OBEGAL excluding NZS Fund net revenue
A measure of the operating balance that recognises that NZS Fund net revenues are not available to the Crown.
Projections
Projections of the key fiscal indicators beyond the five-year forecast period. The projections are based on long-run economic and fiscal assumptions. For example, the projections assume no economic cycle and constant long-run interest, inflation and unemployment rates.
Residual cash
The level of money the Government has available to repay debt or, alternatively, needs to borrow in any given year. Residual cash is alternatively termed “Cash available/(shortfall to be funded)”.
Residual cash is equal to net core crown cashflow from operations excluding NZS Fund activity less core Crown capital commitments (eg, contributions to NZS Fund, purchase of assets, loans to others).
Settlement cash
This is the amount of money deposited with the Reserve Bank by banks. It is a liquidity mechanism used to settle wholesale obligations between banks and provides the basis for settling most of the retail banking transactions that occur every working day between corporates and individuals.
Specific fiscal risks
These are a category of Government decisions or circumstances which may have a material impact on the fiscal position (excluding contingent liabilities). They are not included in the main forecasts because their fiscal impact cannot be reasonably quantified, the likelihood of realisation is uncertain and/or the timing is uncertain.
System of National Accounts (SNA)
SNA is a comprehensive, consistent and flexible set of macroeconomic accounts to meet the needs of government and private sector analysts, policy-makers, and decision-takers.
Tax revenue
The accrual, rather than the cash (“tax receipts”) measure of taxation. It is a measure of tax due, regardless of whether or not it has actually been paid.
Top-down adjustment
The adjustment to expenditure forecasts to reflect the extent to which departments use appropriations (upper spending limits) for their expenditure forecasts. As appropriations apply to the core Crown only, no adjustment is required to SOE or Crown Entity forecasts.
Trade weighted index (TWI)
A measure of movements in the New Zealand dollar against the currencies of our major trading partners. The currencies comprise the US dollar, the Australian dollar, the Japanese yen, the euro and the UK pound.
Unit labour costs
The wages and other costs associated with employment per unit of output.
Year ended
Graphs and tables use different expressions of the timeframe. For example, 2008/09 or 2009 will generally mean “year ended 30 June” unless otherwise stated.
|
| 1997 |
| 1998 |
| 1999 |
| 2000 |
| 2001 |
| 2002 |
| 2003 |
| 2004 |
| 2005 |
| 2006 |
| 2007 |
| 2008 |
| 2009 |
| 2010 |
| 2011 |
| 2012 |
|
Years ended 30 June - |
| Actual |
| Actual |
| Actual |
| Actual |
| Actual |
| Actual |
| Actual |
| Actual |
| Actual |
| Actual |
| Actual |
| Forecast |
| Forecast |
| Forecast |
| Forecast |
| Forecast |
|
Revenue and Expenses |
|
|
|
|
|
|
|
|
|
|
|
|
|
|
|
|
|
|
|
|
|
|
|
|
|
|
|
|
|
|
|
|
|
Core Crown revenue excl NZS Fund |
| 33,131 |
| 34,242 |
| 32,880 |
| 34,946 |
| 37,842 |
| 39,945 |
| 43,440 |
| 46,219 |
| 51,045 |
| 56,951 |
| 58,482 |
| 61,814 |
| 61,787 |
| 63,552 |
| 66,284 |
| 69,004 |
|
Core Crown expenses |
| 31,368 |
| 32,982 |
| 33,939 |
| 34,829 |
| 36,559 |
| 37,513 |
| 39,897 |
| 41,882 |
| 44,895 |
| 49,320 |
| 54,003 |
| 57,364 |
| 61,883 |
| 63,890 |
| 67,016 |
| 69,943 |
|
Surpluses |
|
|
|
|
|
|
|
|
|
|
|
|
|
|
|
|
|
|
|
|
|
|
|
|
|
|
|
|
|
|
|
|
|
Total Crown OBEGAL |
| 1,801 |
| 2,345 |
| 128 |
| 594 |
| 1,422 |
| 2,471 |
| 4,366 |
| 5,573 |
| 7,075 |
| 7,091 |
| 5,860 |
| 5,227 |
| 1,318 |
| 1,004 |
| 493 |
| 154 |
|
Total Crown OBEGAL excl NZS Fund |
| 1,801 |
| 2,345 |
| 128 |
| 594 |
| 1,422 |
| 2,456 |
| 4,297 |
| 5,526 |
| 7,140 |
| 7,252 |
| 6,250 |
| 5,219 |
| 1,354 |
| 1,048 |
| 543 |
| 207 |
|
Total Crown operating surplus |
| 1,863 |
| 2,048 |
| 1,705 |
| 1,405 |
| 1,208 |
| 2,286 |
| 1,621 |
| 7,309 |
| 5,931 |
| 9,542 |
| 8,023 |
| 2,559 |
| 3,105 |
| 3,009 |
| 2,779 |
| 2,734 |
|
Cash Position |
|
|
|
|
|
|
|
|
|
|
|
|
|
|
|
|
|
|
|
|
|
|
|
|
|
|
|
|
|
|
|
|
|
Core Crown residual cash |
| 3,913 |
| 484 |
| 2,048 |
| (386 | ) | 349 |
| 216 |
| 1,217 |
| 520 |
| 3,104 |
| 2,985 |
| 2,877 |
| 908 |
| (3,478 | ) | (3,302 | ) | (3,447 | ) | (3,457 | ) |
Debt |
|
|
|
|
|
|
|
|
|
|
|
|
|
|
|
|
|
|
|
|
|
|
|
|
|
|
|
|
|
|
|
|
|
GSID (excluding settlement cash) |
| 36,236 |
| 38,475 |
| 37,307 |
| 36,580 |
| 37,194 |
| 36,650 |
| 36,617 |
| 36,017 |
| 35,478 |
| 33,903 |
| 30,647 |
| 31,763 |
| 32,498 |
| 32,251 |
| 35,974 |
| 35,499 |
|
Net core Crown debt (incl NZS Fund) |
| 25,562 |
| 24,635 |
| 22,275 |
| 21,900 |
| 20,293 |
| 19,051 |
| 16,093 |
| 11,613 |
| 4,538 |
| (1,817 | ) | (7,467 | ) | (11,254 | ) | (11,337 | ) | (11,787 | ) | (12,348 | ) | (12,970 | ) |
Net core Crown debt |
| 25,562 |
| 24,635 |
| 22,275 |
| 21,900 |
| 20,293 |
| 19,666 |
| 17,977 |
| 15,569 |
| 11,093 |
| 8,044 |
| 4,109 |
| 1,846 |
| 4,578 |
| 7,272 |
| 10,145 |
| 13,193 |
|
NZS Fund |
|
|
|
|
|
|
|
|
|
|
|
|
|
|
|
|
|
|
|
|
|
|
|
|
|
|
|
|
|
|
|
|
|
NZS Fund net worth |
| — |
| — |
| — |
| — |
| — |
| 615 |
| 1,884 |
| 3,956 |
| 6,555 |
| 9,861 |
| 12,973 |
| 14,461 |
| 17,721 |
| 21,152 |
| 24,947 |
| 29,011 |
|
Years ended 30 June - % GDP |
|
|
|
|
|
|
|
|
|
|
|
|
|
|
|
|
|
|
|
|
|
|
|
|
|
|
|
|
|
|
|
|
|
Revenue and Expenses |
|
|
|
|
|
|
|
|
|
|
|
|
|
|
|
|
|
|
|
|
|
|
|
|
|
|
|
|
|
|
|
|
|
Core Crown revenue excl NZS Fund |
| 33.5 |
| 33.7 |
| 31.4 |
| 31.5 |
| 32.0 |
| 31.8 |
| 32.8 |
| 32.5 |
| 33.9 |
| 36.3 |
| 34.8 |
| 34.3 |
| 33.3 |
| 33.1 |
| 32.8 |
| 32.6 |
|
Core Crown expenses |
| 31.7 |
| 32.5 |
| 32.4 |
| 31.4 |
| 30.9 |
| 29.8 |
| 30.1 |
| 29.4 |
| 29.8 |
| 31.4 |
| 32.1 |
| 31.8 |
| 33.4 |
| 33.3 |
| 33.2 |
| 33.0 |
|
Surpluses |
|
|
|
|
|
|
|
|
|
|
|
|
|
|
|
|
|
|
|
|
|
|
|
|
|
|
|
|
|
|
|
|
|
Total Crown OBEGAL |
| 1.8 |
| 2.3 |
| 0.1 |
| 0.5 |
| 1.2 |
| 2.0 |
| 3.3 |
| 3.9 |
| 4.7 |
| 4.5 |
| 3.5 |
| 2.9 |
| 0.7 |
| 0.5 |
| 0.2 |
| 0.1 |
|
Total Crown OBEGAL excl NZS Fund |
| 1.8 |
| 2.3 |
| 0.1 |
| 0.5 |
| 1.2 |
| 2.0 |
| 3.2 |
| 3.9 |
| 4.7 |
| 4.6 |
| 3.7 |
| 2.9 |
| 0.7 |
| 0.5 |
| 0.3 |
| 0.1 |
|
Total Crown operating surplus |
| 1.9 |
| 2.0 |
| 1.6 |
| 1.3 |
| 1.0 |
| 1.8 |
| 1.2 |
| 5.1 |
| 3.9 |
| 6.1 |
| 4.8 |
| 1.4 |
| 1.7 |
| 1.6 |
| 1.4 |
| 1.3 |
|
Cash Position |
|
|
|
|
|
|
|
|
|
|
|
|
|
|
|
|
|
|
|
|
|
|
|
|
|
|
|
|
|
|
|
|
|
Core Crown residual cash |
| 4.0 |
| 0.5 |
| 2.0 |
| (0.3 | ) | 0.3 |
| 0.2 |
| 0.9 |
| 0.4 |
| 2.1 |
| 1.9 |
| 1.7 |
| 0.5 |
| (1.9 | ) | (1.7 | ) | (1.7 | ) | (1.6 | ) |
Debt |
|
|
|
|
|
|
|
|
|
|
|
|
|
|
|
|
|
|
|
|
|
|
|
|
|
|
|
|
|
|
|
|
|
GSID (excluding settlement cash) |
| 36.6 |
| 37.9 |
| 35.6 |
| 32.9 |
| 31.4 |
| 29.1 |
| 27.7 |
| 25.3 |
| 23.5 |
| 21.6 |
| 18.2 |
| 17.6 |
| 17.5 |
| 16.8 |
| 17.8 |
| 16.8 |
|
Net core Crown debt (incl NZS Fund) |
| 25.8 |
| 24.3 |
| 21.3 |
| 19.7 |
| 17.1 |
| 15.1 |
| 12.2 |
| 8.2 |
| 3.0 |
| (1.2 | ) | (4.4 | ) | (6.2 | ) | (6.1 | ) | (6.1 | ) | (6.1 | ) | (6.1 | ) |
Net core Crown debt |
| 25.8 |
| 24.3 |
| 21.3 |
| 19.7 |
| 17.1 |
| 15.6 |
| 13.6 |
| 10.9 |
| 7.4 |
| 5.1 |
| 2.4 |
| 1.0 |
| 2.5 |
| 3.8 |
| 5.0 |
| 6.2 |
|
NZS Fund |
|
|
|
|
|
|
|
|
|
|
|
|
|
|
|
|
|
|
|
|
|
|
|
|
|
|
|
|
|
|
|
|
|
NZS Fund net worth |
| — |
| — |
| — |
| — |
| — |
| 0.5 |
| 1.4 |
| 2.8 |
| 4.3 |
| 6.3 |
| 7.7 |
| 8.0 |
| 9.6 |
| 11.0 |
| 12.4 |
| 13.7 |
|
Years ended 31 March (annual |
| 1997 |
| 1998 |
| 1999 |
| 2000 |
| 2001 |
| 2002 |
| 2003 |
| 2004 |
| 2005 |
| 2006 |
| 2007 |
| 2008 |
| 2009 |
| 2010 |
| 2011 |
| 2012 |
|
Private consumption |
| 4.4 |
| 2.4 |
| 3.1 |
| 3.3 |
| 1.5 |
| 2.8 |
| 5.0 |
| 6.5 |
| 5.3 |
| 4.7 |
| 2.7 |
| 3.6 |
| 1.9 |
| 1.9 |
| 1.6 |
| 1.4 |
|
Public consumption |
| 1.4 |
| 8.1 |
| -0.5 |
| 5.7 |
| -2.0 |
| 4.0 |
| 1.4 |
| 4.6 |
| 4.0 |
| 5.1 |
| 4.3 |
| 4.6 |
| 3.7 |
| 3.1 |
| 3.3 |
| 3.3 |
|
Total consumption |
| 3.7 |
| 3.7 |
| 2.2 |
| 3.8 |
| 0.7 |
| 3.1 |
| 4.2 |
| 6.0 |
| 5.1 |
| 4.8 |
| 3.1 |
| 3.8 |
| 2.3 |
| 2.2 |
| 2.0 |
| 1.8 |
|
Residential investment |
| 4.9 |
| 3.0 |
| -13.0 |
| 19.5 |
| -13.3 |
| 2.0 |
| 23.5 |
| 14.4 |
| 2.7 |
| -4.5 |
| -2.7 |
| 4.5 |
| -9.7 |
| -3.1 |
| 2.4 |
| 3.0 |
|
Non-market investment |
| 18.3 |
| 14.0 |
| -4.8 |
| 13.0 |
| -13.8 |
| 21.9 |
| 13.7 |
| 11.9 |
| 15.7 |
| 0.9 |
| -4.9 |
| 1.9 |
| 22.7 |
| 4.2 |
| 2.0 |
| 2.0 |
|
Market investment |
| 4.3 |
| -2.2 |
| 2.6 |
| 6.9 |
| 8.0 |
| 6.9 |
| 2.3 |
| 12.2 |
| 9.4 |
| 9.5 |
| -1.2 |
| 6.8 |
| 2.8 |
| -0.9 |
| 2.1 |
| 3.5 |
|
Total investment |
| 5.1 |
| 0.2 |
| -2.3 |
| 10.6 |
| 0.4 |
| 6.8 |
| 7.8 |
| 12.8 |
| 7.6 |
| 5.2 |
| -2.3 |
| 5.2 |
| 1.1 |
| -0.9 |
| 2.2 |
| 3.4 |
|
Stock change (contribution to growth) |
| -0.4 |
| -0.2 |
| -0.3 |
| 1.1 |
| -0.4 |
| 0.1 |
| -0.1 |
| 0.2 |
| 0.3 |
| -0.6 |
| -0.9 |
| 0.7 |
| 0.1 |
| 0.0 |
| 0.0 |
| 0.0 |
|
Gross national expenditure |
| 3.6 |
| 2.7 |
| 0.9 |
| 6.3 |
| 0.3 |
| 3.9 |
| 4.8 |
| 7.6 |
| 5.9 |
| 4.2 |
| 1.0 |
| 5.0 |
| 2.0 |
| 1.4 |
| 2.0 |
| 2.2 |
|
Exports |
| 4.7 |
| 3.9 |
| 2.9 |
| 7.4 |
| 6.3 |
| 3.0 |
| 7.8 |
| 0.9 |
| 4.7 |
| -0.1 |
| 3.1 |
| 3.1 |
| -0.9 |
| 4.0 |
| 4.4 |
| 4.1 |
|
Imports |
| 6.4 |
| 2.5 |
| 2.1 |
| 11.3 |
| -0.7 |
| 4.0 |
| 7.2 |
| 12.7 |
| 12.5 |
| 4.1 |
| -1.7 |
| 9.6 |
| 0.9 |
| 1.3 |
| 1.0 |
| 2.0 |
|
GDP (production measure) |
| 3.5 |
| 1.7 |
| 0.5 |
| 5.3 |
| 2.4 |
| 3.8 |
| 5.1 |
| 3.8 |
| 3.8 |
| 2.7 |
| 1.5 |
| 3.1 |
| 1.5 |
| 2.3 |
| 3.2 |
| 3.0 |
|
- annual % change |
| 2.0 |
| 0.3 |
| 2.5 |
| 6.5 |
| 0.7 |
| 4.8 |
| 4.5 |
| 4.8 |
| 2.4 |
| 2.5 |
| 2.3 |
| 2.4 |
| 1.6 |
| 2.9 |
| 3.2 |
| 2.8 |
|
|
|
|
|
|
|
|
|
|
|
|
|
|
|
|
|
|
|
|
|
|
|
|
|
|
|
|
|
|
|
|
|
|
|
Real GDP per capita |
| 2.0 |
| 0.5 |
| -0.3 |
| 4.8 |
| 1.8 |
| 2.9 |
| 3.2 |
| 1.9 |
| 2.4 |
| 1.5 |
| 0.3 |
| 2.1 |
| 0.6 |
| 1.4 |
| 2.2 |
| 2.0 |
|
Nominal GDP (expenditure basis) |
| 4.9 |
| 3.7 |
| 1.7 |
| 6.0 |
| 5.7 |
| 7.5 |
| 5.1 |
| 6.7 |
| 6.9 |
| 5.0 |
| 5.0 |
| 7.9 |
| 3.6 |
| 3.2 |
| 4.9 |
| 5.0 |
|
GDP deflator |
| 1.7 |
| 0.6 |
| 0.5 |
| 0.9 |
| 3.1 |
| 3.9 |
| 0.1 |
| 2.7 |
| 3.2 |
| 2.0 |
| 2.5 |
| 4.8 |
| 2.3 |
| 0.8 |
| 1.7 |
| 2.0 |
|
|
|
|
|
|
|
|
|
|
|
|
|
|
|
|
|
|
|
|
|
|
|
|
|
|
|
|
|
|
|
|
|
|
|
Employment (full-time equivalent) |
| 2.2 |
| 0.0 |
| -0.8 |
| 2.0 |
| 2.2 |
| 2.6 |
| 2.5 |
| 2.9 |
| 3.6 |
| 2.7 |
| 2.0 |
| 1.4 |
| 1.4 |
| 0.2 |
| 0.3 |
| 1.0 |
|
Unemployment (% March quarter s.a.) |
| 6.5 |
| 7.1 |
| 7.1 |
| 6.3 |
| 5.3 |
| 5.2 |
| 4.8 |
| 4.1 |
| 3.8 |
| 3.9 |
| 3.7 |
| 3.5 |
| 3.7 |
| 4.4 |
| 4.5 |
| 4.3 |
|
|
|
|
|
|
|
|
|
|
|
|
|
|
|
|
|
|
|
|
|
|
|
|
|
|
|
|
|
|
|
|
|
|
|
Wages (average ordinary-time hourly) |
| 3.8 |
| 3.3 |
| 2.9 |
| 2.2 |
| 2.4 |
| 3.5 |
| 2.9 |
| 3.4 |
| 3.3 |
| 4.7 |
| 4.8 |
| 4.1 |
| 4.2 |
| 4.7 |
| 4.4 |
| 4.0 |
|
CPI inflation (annual % change) |
| 1.8 |
| 1.3 |
| -0.1 |
| 1.5 |
| 3.1 |
| 2.6 |
| 2.5 |
| 1.5 |
| 2.8 |
| 3.3 |
| 2.5 |
| 3.4 |
| 3.2 |
| 2.8 |
| 2.8 |
| 2.8 |
|
Export prices (merchandise, OTI) |
| -4.2 |
| -0.2 |
| 3.4 |
| 4.0 |
| 20.5 |
| 3.1 |
| -13.3 |
| -8.2 |
| 3.7 |
| 1.0 |
| 9.1 |
| 2.5 |
| 7.4 |
| 3.1 |
| 6.1 |
| 4.7 |
|
Import price (merchandise, OTI) |
| -3.4 |
| 0.8 |
| 3.7 |
| 4.3 |
| 15.3 |
| -0.9 |
| -8.2 |
| -11.6 |
| -2.0 |
| 1.8 |
| 7.2 |
| -4.8 |
| 4.2 |
| 5.0 |
| 7.5 |
| 5.6 |
|
|
|
|
|
|
|
|
|
|
|
|
|
|
|
|
|
|
|
|
|
|
|
|
|
|
|
|
|
|
|
|
|
|
|
Current account balance - $billion |
| -5.8 |
| -5.4 |
| -4.4 |
| -7.0 |
| -5.1 |
| -3.9 |
| -4.5 |
| -6.7 |
| -10.3 |
| -14.5 |
| -13.5 |
| -13.1 |
| -13.3 |
| -13.7 |
| -14.1 |
| -13.8 |
|
Current account balance - % of GDP |
| -6.0 |
| -5.3 |
| -4.2 |
| -6.4 |
| -4.4 |
| -3.1 |
| -3.4 |
| -4.8 |
| -6.9 |
| -9.3 |
| -8.2 |
| -7.4 |
| -7.2 |
| -7.2 |
| -7.1 |
| -6.6 |
|
|
|
|
|
|
|
|
|
|
|
|
|
|
|
|
|
|
|
|
|
|
|
|
|
|
|
|
|
|
|
|
|
|
|
TWI (March quarter) |
| 68.4 |
| 61.2 |
| 57.6 |
| 54.1 |
| 50.5 |
| 51.6 |
| 60.6 |
| 66.9 |
| 69.6 |
| 68.3 |
| 68.8 |
| 71.9 |
| 68.6 |
| 63.1 |
| 59.1 |
| 56.7 |
|
90-day bank bill rate (March quarter) |
| 7.5 |
| 8.9 |
| 4.5 |
| 6.0 |
| 6.4 |
| 5.0 |
| 5.8 |
| 5.5 |
| 6.9 |
| 7.6 |
| 7.8 |
| 8.8 |
| 8.5 |
| 7.9 |
| 7.9 |
| 7.2 |
|
10-year bond rate (March quarter) |
| 7.5 |
| 6.8 |
| 5.7 |
| 7.3 |
| 6.0 |
| 6.7 |
| 6.0 |
| 5.9 |
| 6.0 |
| 5.7 |
| 5.9 |
| 6.3 |
| 6.3 |
| 6.3 |
| 6.2 |
| 6.1 |
|