Her Majesty The Queen In Right Of New Zealand Inactive
Filed: 14 Nov 08, 12:00am
Exhibit 99.(f)(2)
6 October 2008
978-0-478-33024-3 (Print)
978-0-478-33025-0 (Online)
1
Contents
Introduction
Summary
Fiscal Strategy
Revenue
Expenses
Surpluses
Cash Position
Debt
NZS Fund
Historical Financial Information
Statement of Financial Performance
Analysis of Expenses by Functional Classification
Statement of Cash Flows
Statement of Recognised Income and Expense
Statement of Financial Position
Notes to the Financial Statements
Note 1: Summary of Accounting Policies
Note 2: Taxes and Levies Collected through the Crown’s Sovereign Power
Note 3: Sales of Goods and Services
Note 4: Interest Revenue and Dividends
Note 5: Other Revenue
Note 6: Transfer Payments and Subsidies
Note 7: Personnel Expenses
Note 8: Depreciation and Amortisation
Note 9: Other Operating Expenses
Note 10: Interest Expenses
Note 11: Insurance Expenses
Note 12: Gains and Losses on Financial Instruments
Note 13: Gains and Losses on Non-Financial Instruments
Note 14: Receivables
Note 15: Marketable Securities, Deposits and Derivatives in Gain
Note 16: Share Investments
Note 17: Advances
Note 18: Inventory
Note 19: Other Assets
Note 20: Property, Plant and Equipment
Note 21: Equity Accounted Investments
Note 22: Payables
Note 23: Borrowings
Note 24: Insurance Liabilities
Note 25: Retirement Plan Liabilities
Note 26: Provisions
Note 27: Net Worth
Note 28: Capital Objectives and Fiscal Policy
Note 29: Segment Analysis
Note 30: Commitments
Note 31: Contingent Liabilities and Contingent Assets
Note 32: Financial Instruments
Note 33: Impact of Adoption of NZ IFRS
Note 34: Subsequent Events
Supplementary Statements
Statement of Borrowings
Statement of Unappropriated Expenditure
Statement of Expenses or Capital Expenditure Incurred in Emergencies
Statement of Trust Money
Fiscal Indicator Analysis
Performance
Core Crown Residual Cash
Debt
NZ Superannuation Fund
Information on State-owned Entities and Crown Entities
Government Reporting Entity
Since 2000, New Zealand has enjoyed the longest uninterrupted period of economic expansion since World War II.
That growth, accompanied by a dramatic rise in employment, big fall in unemployment, strong increases in workers’ wages and firms’ profits, all assisted Crown revenue growth which in turn assisted the government to dramatically lift public investment in health, education, infrastructure and other public goods.
But just as important, the government has been utilising favourable economic conditions to position the Crown in a strong financial position to better withstand any future external shocks to our economy and society.
Since 1999, the government has driven gross sovereign-issued debt down, from over 35 percent of GDP to be nearer the government’s long-term target of 20 percent of GDP, while simultaneously building up the financial assets of the New Zealand Superannuation Fund to part pre-fund future pension liabilities.
In 2006, the New Zealand Government’s net financial asset position moved into positive territory for the first time in the nation’s history, a position maintained in the 2007/08 financial statements for the year ended 30 June.
These statements are the first prepared under New Zealand International Financial Reporting Standards (NZ IFRS). The statements show an operating profit before gains and losses (OBEGAL) of $5,637 million, $410 million higher than forecast in the 2008 Budget Economic and Fiscal Update. The operating balance was on target at $2,384 million. This result compares with the previous year’s operating balance of $8,022 million which included some large actuarial gains on the Government’s long term liabilities while this year’s result has been impacted by the decline in overseas equity markets.
Core Crown residual cash was $736 million less than in the previous year but $1,149 million higher than forecast. The delay in the $690 million KiwiRail purchase to 1 July drove most of this surplus with operating cash flows $274 million higher than forecast.
Gross sovereign-issued debt (excluding Reserve Bank settlement cash) continued to fall as a percentage of GDP at 17.4 percent in 2008 compared with 18.2 percent last year. This continues to be consistent with the Government’s long term debt objective to keep gross sovereign-issued debt broadly stable at 20 percent of GDP over the next ten years.
As at 30 June 2008 the financial statements show that the Crown’s net financial asset position inclusive of the assets of the New Zealand Superannuation Fund was equivalent to a positive 7.9 percent of GDP, compared with a positive 5.3 percent of GDP a year earlier.
The New Zealand Superannuation Fund grew by $1,239 million over the year to a net worth of $14,212 million. The Fund was adversely impacted by the downturn in overseas equity markets, making an $881 million operating loss for the year ended 30 June 2008. The Fund’s annualised return since inception remains positive at 10.34% (over 3% above the risk free rate of return for the same period).
Hon Dr Michael Cullen
Minister of Finance
30 September 2008
These financial statements have been prepared by the Treasury in accordance with the provisions of the Public Finance Act 1989. The financial statements comply with generally accepted accounting practice.
The Treasury is responsible for establishing and maintaining a system of internal control designed to provide reasonable assurance that the transactions recorded are within statutory authority and properly record the use of all public financial resources by the Crown. To the best of my knowledge, this system of internal control has operated adequately throughout the reporting period.
John Whitehead
Secretary to the Treasury
30 September 2008
I accept responsibility for the integrity of these financial statements, the information they contain and their compliance with the Public Finance Act 1989.
In my opinion, these financial statements fairly reflect the financial position of the Crown as at 30 June 2008 and its operations for the year ended on that date.
Hon Dr Michael Cullen
Minister of Finance
30 September 2008
This commentary outlines the key trends for each of the fiscal indicators along with a comparison to the forecasts provided in the 2008 Budget Economic and Fiscal Update. It should be read in conjunction with the financial statements on pages 24 to 157.
These are the first set of annual audited financial statements of the Government prepared in accordance with NZ IFRS. Comparative figures have been restated to align with NZ IFRS. Restated data prior to 30 June 2007 has not been subject to audit.
Each section in the commentary follows the components of the Government’s fiscal strategy (outlined in the 2008 Fiscal Strategy Report – which is summarised on page 5):
· Revenue (including taxes)
· Expenses
· Surpluses
· Cash Position
· Debt, and
· The New Zealand Superannuation Fund (NZS Fund).
The financial statements of the Government of New Zealand refer to both core Crown and total Crown results. Core Crown includes Ministers, Departments, Offices of Parliament, the NZS Fund and the Reserve Bank of New Zealand but excludes state-owned enterprises (SOEs) and Crown entities (CEs). Total Crown includes the core Crown, SOEs and CEs.
The key results were:
· both the operating balance and OBEGAL for the year were in line with the 2008 Budget forecasts (after taking into account a reclassification of the ACC actuarial loss)
· residual cash was $1,149 million higher than forecast for the year although this was essentially timing in nature (eg, the $690 million purchase of KiwiRail expected on 30 June took place on 1 July)
· debt was also lower than forecast at year end, primarily driven by the higher than expected residual cash surplus and, as such, is also considered to be timing in nature, and
· the NZS Fund recorded an operating deficit of $881 million for the year ended 30 June 2008 as a result of the downturn in equity markets (particularly the United States). The Fund’s net worth at 30 June 2008 was $14,212 million.
The Government’s fiscal strategy (outlined in more detail in the 2008 Fiscal Strategy Report) is to strengthen its fiscal position so that it is well placed to respond to future challenges such as those associated with population ageing. The strategy is summarised in Figure 1.
The Government is implementing this strategy primarily by building up financial assets in the New Zealand Superannuation Fund (NZS Fund) and maintaining gross sovereign-issued debt at around 20% of GDP. In order to keep debt at around 20% of GDP, the Government has said it intends to run its cash flow position so that borrowing tracks in line with GDP over time. In practice, this means running operating surpluses, on average, that are sufficient to cover the contributions to the NZS Fund and some capital spending needs.
The Financial Statements of the Government provide a record of the Government’s financial performance over financial year ended 30 June 2008 and its financial position as at 30 June 2008. They provide a comparison with the fiscal forecasts in the 2008 Budget Economic and Fiscal Update. They also provide the public with a snapshot of the progress the Government has made in implementing its fiscal strategy as set out in the Fiscal Strategy Report.
Figure 1 – Fiscal strategy at a glance
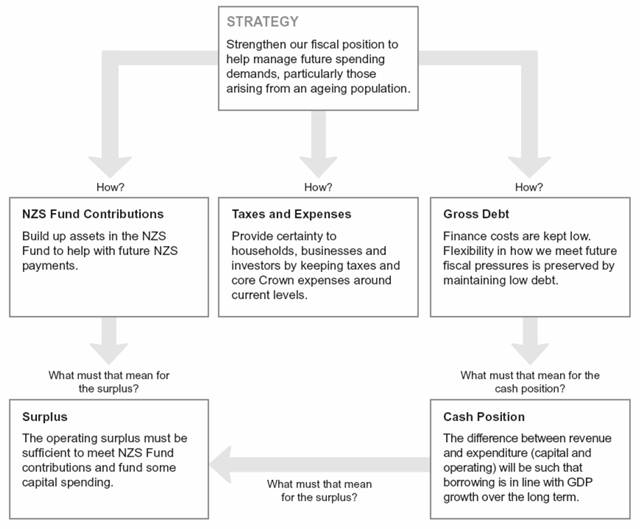
Table 1 – Fiscal indicators
Year ended 30 June |
| 2003 |
| 2004 |
| 2005 |
| 2006 |
| 2007 |
| Original |
| Est |
| 2008 |
|
Revenue and expenses |
|
|
|
|
|
|
|
|
|
|
|
|
|
|
|
|
|
Core Crown revenue excl NZS Fund |
| 43,371 |
| 46,165 |
| 51,088 |
| 55,844 |
| 58,482 |
| 59,304 |
| 61,814 |
| 61,671 |
|
Core Crown expenses |
| 39,897 |
| 41,882 |
| 44,895 |
| 49,320 |
| 54,004 |
| 56,096 |
| 57,364 |
| 56,997 |
|
Surpluses |
|
|
|
|
|
|
|
|
|
|
|
|
|
|
|
|
|
Total Crown OBEGAL |
| 4,366 |
| 5,573 |
| 7,075 |
| 7,091 |
| 5,860 |
| 4,958 |
| 5,227 |
| 5,637 |
|
Total Crown OBEGAL excl NZS Fund retained revenue |
| 4,297 |
| 5,526 |
| 7,140 |
| 7,252 |
| 6,250 |
| 4,860 |
| 5,219 |
| 5,586 |
|
Total Crown operating balance |
| 1,621 |
| 7,309 |
| 5,931 |
| 9,542 |
| 8,022 |
| 6,431 |
| 2,559 |
| 2,384 |
|
Cash position |
|
|
|
|
|
|
|
|
|
|
|
|
|
|
|
|
|
Core Crown residual cash |
| 1,217 |
| 520 |
| 3,104 |
| 2,985 |
| 2,793 |
| (976 | ) | 908 |
| 2,057 |
|
Debt |
|
|
|
|
|
|
|
|
|
|
|
|
|
|
|
|
|
GSID (excl settlement cash) |
| 36,617 |
| 36,017 |
| 35,478 |
| 33,903 |
| 30,647 |
| 34,477 |
| 31,763 |
| 31,390 |
|
Net core Crown debt incl NZS Fund financial assets |
| 16,093 |
| 11,613 |
| 4,538 |
| (1,817 | ) | (7,467 | ) | (10,784 | ) | (11,254 | ) | (12,953 | ) |
Net core Crown debt |
| 17,977 |
| 15,569 |
| 11,093 |
| 8,044 |
| 4,109 |
| 4,655 |
| 1,846 |
| (19 | ) |
NZS Fund |
|
|
|
|
|
|
|
|
|
|
|
|
|
|
|
|
|
NZS Fund net worth |
| 1,884 |
| 3,956 |
| 6,555 |
| 9,855 |
| 12,973 |
| 15,977 |
| 14,461 |
| 14,212 |
|
Nominal GDP(1) |
| 132,738 |
| 143,170 |
| 151,993 |
| 158,321 |
| 168,672 |
| 173,187 |
| 180,137 |
| 180,077 |
|
% of GDP |
|
|
|
|
|
|
|
|
|
|
|
|
|
|
|
|
|
Revenue and expenses |
|
|
|
|
|
|
|
|
|
|
|
|
|
|
|
|
|
Core Crown revenue excl NZS Fund |
| 32.7 |
| 32.2 |
| 33.6 |
| 35.3 |
| 34.7 |
| 34.2 |
| 34.3 |
| 34.2 |
|
Core Crown expenses |
| 30.1 |
| 29.3 |
| 29.5 |
| 31.2 |
| 32.0 |
| 32.4 |
| 31.8 |
| 31.7 |
|
Surpluses |
|
|
|
|
|
|
|
|
|
|
|
|
|
|
|
|
|
Total Crown OBEGAL |
| 3.3 |
| 3.9 |
| 4.7 |
| 4.5 |
| 3.5 |
| 2.9 |
| 2.9 |
| 3.1 |
|
Total Crown OBEGAL excl NZS Fund retained revenue |
| 3.2 |
| 3.9 |
| 4.7 |
| 4.6 |
| 3.7 |
| 2.8 |
| 2.9 |
| 3.1 |
|
Total Crown operating balance |
| 1.2 |
| 5.1 |
| 3.9 |
| 6.0 |
| 4.8 |
| 3.7 |
| 1.4 |
| 1.3 |
|
Cash position |
|
|
|
|
|
|
|
|
|
|
|
|
|
|
|
|
|
Core Crown residual cash |
| 0.9 |
| 0.4 |
| 2.0 |
| 1.9 |
| 1.7 |
| (0.6 | ) | 0.5 |
| 1.1 |
|
Debt |
|
|
|
|
|
|
|
|
|
|
|
|
|
|
|
|
|
GSID (excl settlement cash) |
| 27.6 |
| 25.2 |
| 23.3 |
| 21.4 |
| 18.2 |
| 19.9 |
| 17.6 |
| 17.4 |
|
Net core Crown debt incl NZS Fund financial assets |
| 12.1 |
| 8.1 |
| 3.0 |
| (1.1 | ) | (4.4 | ) | (6.2 | ) | (6.2 | ) | (7.2 | ) |
Net core Crown debt |
| 13.5 |
| 10.9 |
| 7.3 |
| 5.1 |
| 2.4 |
| 2.7 |
| 1.0 |
| (0.0 | ) |
NZS Fund |
|
|
|
|
|
|
|
|
|
|
|
|
|
|
|
|
|
NZS Fund net worth |
| 1.4 |
| 2.8 |
| 4.3 |
| 6.2 |
| 7.7 |
| 9.2 |
| 8.0 |
| 7.9 |
|
(1) GDP for the year ended 30 June 2008 is the forecast GDP published in the 2008 Pre-election Economic and Fiscal Update (Source: Treasury).
The following table shows how the fiscal strategy is represented in the financial results.
Table 2 – Fiscal Strategy Perspective
Fiscal Strategy |
| Fiscal Indicators/Financial |
| Actual |
| Forecast |
| Forecast |
| Actual |
|
Taxes ... |
| Taxation as % of GDP |
| 31.7 | % | 31.6 | % | 31.5 | % | 31.5 | % |
|
| Core Crown taxation |
| 53,477 |
| 54,707 |
| 56,673 |
| 56,747 |
|
... combined with other revenue ... |
| Other Core Crown operating items |
| 7,037 |
| 5,852 |
| 4,420 |
| 4,141 |
|
... fund core crown expenses ... |
| Core Crown expenses |
| (54,004 | ) | (56,096 | ) | (57,364 | ) | (56,997 | ) |
... and with the results of entities outside the budget process ... |
| Net surpluses/(deficits) of SOEs and Crown entities |
| 1,512 |
| 1,968 |
| (1,170 | ) | (1,507 | ) |
... results in a surplus or deficit... |
| Operating balance |
| 8,022 |
| 6,431 |
| 2,559 |
| 2,384 |
|
... part of which is gains or losses set aside for fiscal strategy purposes... |
| Other (gains)/losses |
| (2,162 | ) | (1,473 | ) | 2,668 |
| 3,253 |
|
... and so we have developed an operating indicator excluding these items. |
| OBEGAL |
| 5,860 |
| 4,958 |
| 5,227 |
| 5,637 |
|
Some of this is income retained that is not available for fiscal purposes |
| Net return on NZS Fund (excl. revaluations) |
| 390 |
| (98 | ) | (8 | ) | (51 | ) |
“ ” “ ” “ ” |
| Net retained surpluses of SOEs and CEs |
| (1,652 | ) | (1,652 | ) | (655 | ) | (814 | ) |
and some is income and expenses not impacting cash |
| Non-cash items and working capital movements |
| 3,988 |
| 1,830 |
| 2,454 |
| 2,520 |
|
The Operating cash flow that results, needs to provide sufficient funds for |
| Core Crown Cash flow from Operations |
| 8,586 |
| 5,038 |
| 7,018 |
| 7,292 |
|
- building up assets in NZ Superannuation |
| Contribution to NZS Fund |
| (2,048 | ) | (2,103 | ) | (2,103 | ) | (2,104 | ) |
- meeting the capital expenditure budget, and |
| Purchase of physical assets |
| (1,755 | ) | (1,803 | ) | (1,544 | ) | (1,433 | ) |
- making advances (e.g. to students and DHBs) |
| Advances and capital injections |
| (1,990 | ) | (2,108 | ) | (2,463 | ) | (1,698 | ) |
with a residual impact on debt consistent with fiscal strategy |
| Residual Cash |
| 2,793 |
| (976 | ) | 908 |
| 2,057 |
|
|
| ... and as a percentage of GDP |
| 1.7 | % | -0.6 | % | 0.5 | % | 1.1 | % |
Table 3 – Breakdown of revenue
Year ended 30 June |
| Actual |
| Actual |
| Actual |
| Actual |
| Actual |
| Forecast |
| Forecast |
| Actual |
|
Core Crown tax revenue |
| 40,518 |
| 43,358 |
| 47,468 |
| 50,973 |
| 53,477 |
| 54,707 |
| 56,673 |
| 56,747 |
|
Core Crown other revenue |
| 2,922 |
| 2,861 |
| 3,577 |
| 4,762 |
| 4,734 |
| 4,695 |
| 5,263 |
| 5,072 |
|
Core Crown revenue |
| 43,440 |
| 46,219 |
| 51,045 |
| 55,735 |
| 58,211 |
| 59,402 |
| 61,936 |
| 61,819 |
|
Crown entities, SOE and eliminations |
| 13,170 |
| 13,051 |
| 14,322 |
| 15,690 |
| 16,378 |
| 17,470 |
| 17,877 |
| 19,660 |
|
Total Crown revenue |
| 56,611 |
| 59,271 |
| 65,367 |
| 71,425 |
| 74,589 |
| 76,872 |
| 79,813 |
| 81,479 |
|
Core Crown revenue |
| 43,440 |
| 46,219 |
| 51,045 |
| 55,735 |
| 58,211 |
| 59,402 |
| 61,936 |
| 61,819 |
|
Less NZS Fund revenue |
| (69 | ) | (131 | ) | (191 | ) | (359 | ) | (436 | ) | (447 | ) | (381 | ) | (385 | ) |
Add back NZS Fund intra-segment revenue |
| — |
| 77 |
| 234 |
| 468 |
| 707 |
| 349 |
| 259 |
| 237 |
|
Core Crown revenue (excl NZS Fund) |
| 43,371 |
| 46,165 |
| 51,088 |
| 55,844 |
| 58,482 |
| 59,304 |
| 61,814 |
| 61,671 |
|
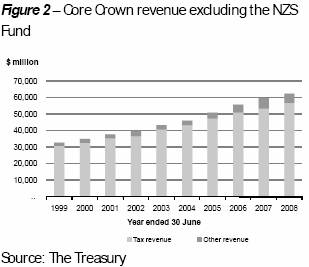
Revenue consists mainly of tax revenue. Other revenue includes interest, dividends, and sales of goods and services.
Core crown revenue excluding the NZS Fund represents the revenue available to meet the Government’s spending needs and treats the NZS Fund as a third party (ie, its revenue is not included but the tax it pays is).
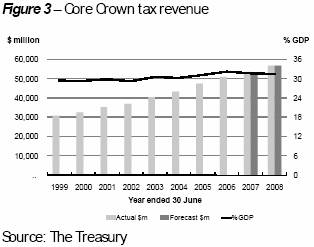
Core Crown revenue excluding the NZS Fund was $143 million (0.2%) lower than forecast at $61,671 million. While interest revenue was $219 million (8.5%) lower than forecast due to changes in interest rates and investment levels, this was partially offset by core Crown tax revenue being $74 million (0.1%) higher than forecast. While core Crown tax revenue was largely on target, there were two compensating variances within this result.
· source deduction revenue was $613 million (2.7%) higher than forecast largely due to higher than forecast wage growth, offset by
· GST revenue was $662 million (5.6%) lower than forecast due in the main to weaker-than-expected domestic consumption. In addition the forecast assumed the gap would close between GST revenue and receipts but this did not eventuate.
Compared to last year, core Crown revenue excluding the NZS Fund increased by $3,189 million (5.5%). This increase was mainly in source deductions tax revenue, caused by high wage and employment growth.
Core Crown tax revenue has increased as a percentage of GDP since 1999 as a result of the progressive nature of the personal tax scale (coupled with the introduction of the 39% personal income tax rate), growth in taxable corporate profits ahead of GDP growth, and increases in interest rates which have led to increases in withholding taxes on interest-bearing deposits.
Table 4 – Breakdown of expenses
Year ended 30 June |
| Actual |
| Actual |
| Actual |
| Actual |
| Actual |
| Forecast |
| Forecast |
| Actual |
|
Social security and welfare |
| 13,907 |
| 14,252 |
| 14,682 |
| 15,598 |
| 16,768 |
| 17,698 |
| 18,071 |
| 17,877 |
|
Health |
| 7,501 |
| 8,111 |
| 8,813 |
| 9,547 |
| 10,355 |
| 11,613 |
| 11,343 |
| 11,297 |
|
Education |
| 7,016 |
| 7,585 |
| 7,930 |
| 9,914 |
| 9,269 |
| 9,719 |
| 10,046 |
| 9,551 |
|
Core government services |
| 2,130 |
| 2,091 |
| 2,567 |
| 2,507 |
| 4,817 |
| 2,479 |
| 3,222 |
| 3,371 |
|
Other core Crown expenses |
| 9,343 |
| 9,843 |
| 10,903 |
| 11,754 |
| 12,795 |
| 14,587 |
| 14,682 |
| 14,901 |
|
Core Crown expenses |
| 39,897 |
| 41,882 |
| 44,895 |
| 49,320 |
| 54,004 |
| 56,096 |
| 57,364 |
| 56,997 |
|
Crown entities, SOE and eliminations |
| 12,347 |
| 11,816 |
| 13,397 |
| 15,015 |
| 14,725 |
| 15,818 |
| 17,222 |
| 18,845 |
|
Total Crown expenses |
| 52,245 |
| 53,698 |
| 58,292 |
| 64,334 |
| 68,729 |
| 71,914 |
| 74,586 |
| 75,842 |
|
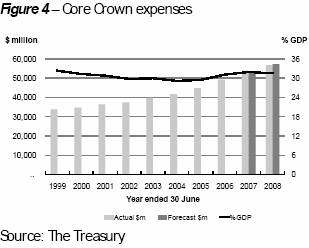
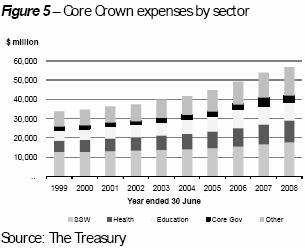
Core Crown expenses represent the day-to-day operating spending of the Government (ie, it does not include purchases of physical assets or capital spending).
Core Crown expenses were $367 million (0.6%) lower than forecast at $56,997 million. The main variances were:
· social security and welfare expenses were $194 million (1.1%) lower than forecast mainly relating to lower than forecast family assistance expenditure
· education expenses were $495 million (4.9%) lower than forecast as the impairment of student loans was $491 million lower than expected
· core government expenses were $149 million (4.6%) higher then forecast. Impairment of tax receivables was $265 million higher than expected reflecting an increase in the underlying overdue debt. This variance was partially offset by underspends across a number of departments (none of which was individually significant), and
· other core Crown expenses were $219 million (1.5%) higher than forecast due in the main to treaty settlements being earlier than forecast.
In comparison to the previous year, Core Crown expenses were $2,993 million (5.5%) higher. Significant expenditure increases were:
· annual indexation of welfare benefits
· expense initiatives introduced in the 2007 Budget (including the introduction of KiwiSaver), and
· higher demand-driven education expenses.
This increase was partially offset by a decrease in sovereign receivable impairment expenses resulting from a large one-off tax receivable impairment in the year ended 30 June 2007.
Core Crown expenses have increased as a percentage of GDP by 1.6% since 2003 (30.1% in 2003 to 31.7% in 2008) with the introduction of major Government policies such as Working for Families and KiwiSaver.
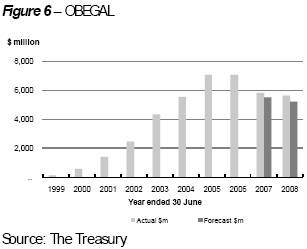
Table 5 – Total Crown OBEGAL and total Crown operating balance
Year ended 30 June |
| Actual |
| Actual |
| Actual |
| Actual |
| Actual |
| Forecast |
| Forecast |
| Actual |
|
|
|
|
|
|
|
|
|
|
|
|
|
|
|
|
|
|
|
Total Crown OBEGAL |
| 4,366 |
| 5,573 |
| 7,075 |
| 7,091 |
| 5,860 |
| 4,958 |
| 5,227 |
| 5,637 |
|
Total Crown gains/(losses) |
| (2,745 | ) | 1,736 |
| (1,144 | ) | 2,451 |
| 2,162 |
| 1,473 |
| (2,668 | ) | (3,253 | ) |
Total Crown Operating balance |
| 1,621 |
| 7,309 |
| 5,931 |
| 9,542 |
| 8,022 |
| 6,431 |
| 2,559 |
| 2,384 |
|
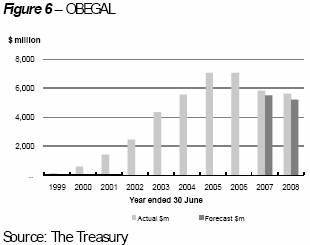
OBEGAL is the operating balance before gains and losses for the total Crown. By excluding gains and losses the OBEGAL gives a more direct indication of the underlying stewardship of the Government.
OBEGAL was $410 million (7.8%) higher than forecast for the year ended 30 June 2008 primarily as a result of a forecasting error included in the Budget. A portion of ACC’s actuarial loss was forecast as an insurance expense. This error does not impact on the operating balance as it was a reclassification between expenses and losses.
Within this result, the electricity generating SOEs reported large, equal, and opposite variances in both revenue and expenses of approximately $1,400 million. These variances resulted from higher than expected electricity spot prices.
The OBEGAL (excluding the NZS Fund retained revenue) is a measure of the operating balance that recognises that the NZS Fund has been set up to meet future spending pressures and as a result the returns it earns are not available to the Crown to meet current spending requirements. OBEGAL (excluding the NZS Fund retained revenue) was $5,586 million for the year; $367 million lower than forecast.
The operating balance shows whether the government sector has generated enough revenues (including gains) to cover its expenses (including losses) in any given year.
The operating balance for the total Crown was $175 million (6.8%) lower than forecast at $2,384 million.
Losses of $3,253 million resulted in a decline in the operating balance for the year ended 30 June 2008 and were $585 million (21.9%) more than forecast. These losses compare to gains of $2,162 million for the previous year. The difference is a reflection of the recent decline in overseas equity markets and increases in the ACC claims and GSF liabilities.
The total Crown operating balance is not drawn upon to fund core Crown operations, as current policy is for the NZS Fund, SOEs and CEs to retain a portion of their surpluses for the purpose of achieving their long-term objectives. For the year ended 30 June 2008 SOEs and CEs recorded an overall deficit of $803 million. This deficit includes an operating deficit of $2,408 million in ACC due to equity market and ACC claims liability losses mentioned above. When ACC is excluded the SOE and CE surpluses totalled $1,605 million (refer pages 164 to 166 for a breakdown by individual entity).
During the year $575 million was returned to the Crown as dividends.
Table 6 – Residual cash reconciliation
Year ended 30 June |
| Actual |
| Actual |
| Actual |
| Actual |
| Actual |
| Forecast |
| Forecast |
| Actual |
|
|
|
|
|
|
|
|
|
|
|
|
|
|
|
|
|
|
|
Net core Crown cash flow from operations |
| 4,856 |
| 5,443 |
| 8,560 |
| 8,859 |
| 8,586 |
| 5,038 |
| 7,018 |
| 7,292 |
|
Contributions to NZS Fund |
| (1,200 | ) | (1,879 | ) | (2,107 | ) | (2,337 | ) | (2,048 | ) | (2,103 | ) | (2,103 | ) | (2,104 | ) |
Purchase of physical assets |
| (1,059 | ) | (1,299 | ) | (1,372 | ) | (1,826 | ) | (1,755 | ) | (1,803 | ) | (1,544 | ) | (1,433 | ) |
Advances and capital injections |
| (1,380 | ) | (1,745 | ) | (1,977 | ) | (1,711 | ) | (1,990 | ) | (2,108 | ) | (2,463 | ) | (1,698 | ) |
Core Crown residual cash |
| 1,217 |
| 520 |
| 3,104 |
| 2,985 |
| 2,793 |
| (976 | ) | 908 |
| 2,057 |
|
Core Crown residual cash represents the core Crown cash surplus (or deficit) after operating and investing cash requirements (including contributions to the NZS Fund) are met. It represents the money available to the Government to invest, repay debt or, alternatively, the money the Government needs to fund in any given year.
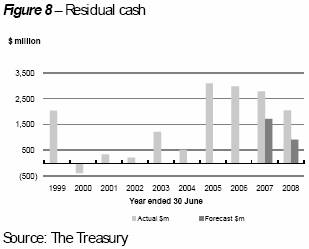
Residual cash was $1,149 million higher than forecast for the year ended 30 June 2008 at $2,057 million. Increases in the cash surplus were mainly due to:
· the delay in the $690 million KiwiRail purchase from 30 June to 1 July
· KiwiSaver payments being $210 million lower than forecast with regards to kick-start payments and employer tax credits, and
· department cash requirements being $545 million less than expected.
These surpluses were partially offset by tax receipts which were $417 million (0.7%) lower than forecast. In particular, the following tax types were lower than forecast:
· corporate tax receipts were $419 million (4.0%) lower than forecast due in the main to lower-than-expected provisional tax receipts through May and June from large corporate entities
· GST receipts were $148 million (1.3%) lower than forecast reflecting the effects of recent economic activity, and
· net other individuals tax receipts were $130 million (3.3%) lower than forecast due to lower than expected provisional tax payments from the agricultural sector.
In contrast, stronger than expected wage growth contributed to source deduction tax receipts being $124 million (0.5%) higher than forecast.
Over recent years residual cash surpluses have reflected strong economic growth coupled with some departmental underspending.
Table 7 – Application of core Crown residual cash for the year ended 30 June 2008 ($ billion)
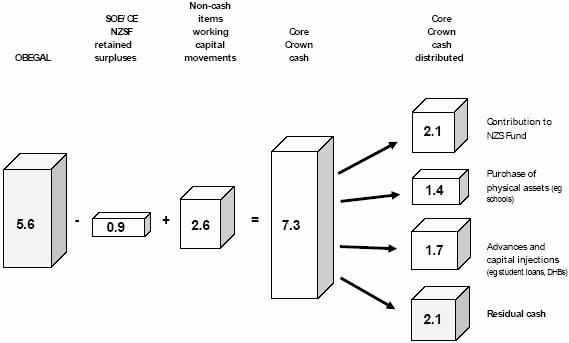
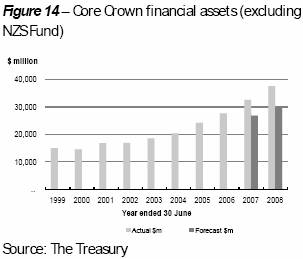
The residual cash of $2,057 million has resulted in an increase in core Crown financial assets as discussed on page 15.
Core Crown purchases of physical assets ($1,433 million) and advances and capital injections ($1,698 million) represent the capital investment of the core Crown (refer Table 6).
Advances and capital injections are often used by CEs and SOEs to purchase physical assets (such as roading and rail assets). Therefore, to obtain a complete picture of the Government’s capital investment it is necessary to “look through” core Crown advances and capital injections and consider total Crown physical asset purchases.
Figures 9 to 11, therefore, show the purchase of physical assets (referred to as “PPE”) of the total Crown, offset by asset disposals.
Total Crown net PPE purchases for the current financial year included:
· $986 million on state highway roading
· $571 million on electricity generation assets
· $509 million on education facilities such as schools
· $446 million by district health boards
· $320 million on specialist military equipment, and
· $234 million on rail assets (excluding KiwiRail).
The $690 million purchase of KiwiRail occurred on 1 July and is therefore not included in this capital investment analysis.
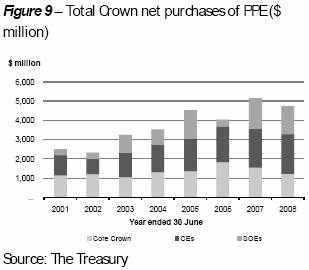
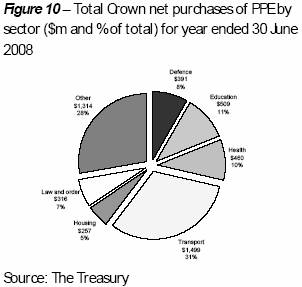
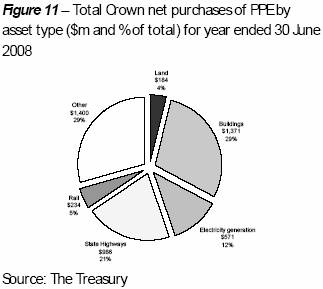
Table 8 – Gross sovereign-issued debt (GSID) and net core Crown debt
Year ended 30 June |
| Actual |
| Actual |
| Actual |
| Actual |
| Actual |
| Forecast |
| Forecast |
| Actual |
|
Gross sovereign-issued debt |
| 36,617 |
| 36,017 |
| 35,478 |
| 35,867 |
| 36,805 |
| 40,400 |
| 37,673 |
| 37,745 |
|
Less Reserve Bank settlement cash (incl. Kiwibank) |
| — |
| — |
| — |
| (1,964 | ) | (7,758 | ) | (7,523 | ) | (7,510 | ) | (7,955 | ) |
Add back changes to DMO borrowing due to settlement cash |
| — |
| — |
| — |
| — |
| 1,600 |
| 1,600 |
| 1,600 |
| 1,600 |
|
Gross sovereign-issued debt excluding settlement cash |
| 36,617 |
| 36,017 |
| 35,478 |
| 33,903 |
| 30,647 |
| 34,477 |
| 31,763 |
| 31,390 |
|
Gross sovereign-issued debt |
| 36,617 |
| 36,017 |
| 35,478 |
| 35,867 |
| 36,805 |
| 40,400 |
| 37,673 |
| 37,745 |
|
Less core Crown financial assets |
| (20,524 | ) | (24,404 | ) | (30,940 | ) | (37,684 | ) | (44,272 | ) | (51,184 | ) | (48,927 | ) | (50,698 | ) |
Net core Crown debt (incl NZS Fund) |
| 16,093 |
| 11,613 |
| 4,538 |
| (1,817 | ) | (7,467 | ) | (10,784 | ) | (11,254 | ) | (12,953 | ) |
Add back NZS Fund holdings of core Crown financial assets and NZS Fund financial assets |
| 1,884 |
| 3,956 |
| 6,555 |
| 9,861 |
| 11,576 |
| 15,439 |
| 13,100 |
| 12,934 |
|
Net core Crown debt |
| 17,977 |
| 15,569 |
| 11,093 |
| 8,044 |
| 4,109 |
| 4,655 |
| 1,846 |
| (19 | ) |

GSID (excluding settlement cash) represents the debt issued by the sovereign (ie, core Crown) and includes Government stock held by the NZS Fund, ACC and EQC but excludes money deposited with the Reserve Bank by banks (settlement cash).
GSID (excluding settlement cash) was lower than forecast by $373 million (1.2%) at $31,390 million (17.4% of GDP). This result reflected lower than forecast levels of domestic bonds issuance (refer table 9) partially offset by higher than forecast derivative liabilities.
One of the key components of GSID is the domestic bond programme. Table 9 sets out the historical net issuances and repayments.
Table 9 – Net bond issuance
Year ended 30 June |
| Actual |
| Actual |
| Actual |
| Actual |
| Actual |
| Forecast |
| Forecast |
| Actual |
|
Domestic bonds (market) |
| 2,551 |
| 2,212 |
| 2,146 |
| 2,375 |
| 2,294 |
| 2,520 |
| 2,415 |
| 1,757 |
|
Repayment of domestic bonds (market) |
| (2,823 | ) | (3,044 | ) | (2,797 | ) | (2,574 | ) | (2,777 | ) | — |
| — |
| — |
|
Net increase/(decrease) in market domestic bonds |
| (272 | ) | (832 | ) | (651 | ) | (199 | ) | (483 | ) | 2,520 |
| 2,415 |
| 1,757 |
|
Domestic bonds (non-market) |
| 279 |
| 478 |
| 459 |
| 740 |
| 570 |
| 208 |
| 189 |
| 130 |
|
Repayment of domestic bonds (non-market) |
| (737 | ) | (357 | ) | (338 | ) | (375 | ) | (421 | ) | — |
| — |
| — |
|
Net increase/(decrease) in non-market domestic bonds |
| (458 | ) | 121 |
| 121 |
| 365 |
| 149 |
| 208 |
| 189 |
| 130 |
|
Net total bond issuance/(repayment) |
| (730 | ) | (711 | ) | (530 | ) | 166 |
| (334 | ) | 2,728 |
| 2,604 |
| 1,887 |
|
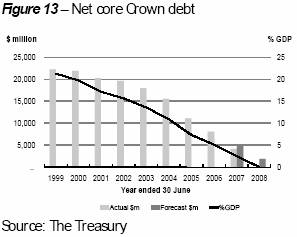
Net core Crown debt equates to core Crown borrowings (gross sovereign-issued debt) less core Crown financial assets (excluding the financial assets of the NZS Fund).
By deducting financial assets (excluding the NZS Fund), net debt can provide additional information about the sustainability of the Government’s accounts. However, it is important to view net debt alongside GSID (excluding settlement cash) as some financial assets are not very easily converted to cash (eg, student loans) in the short term.
Net core Crown debt was lower than forecast by $1,865 million (101%) which resulted in a net asset position of $19 million at 30 June 2008. This position is a result of the higher than forecast residual cash surplus in addition to net valuation gains on financial assets and financial liabilities.
Net core Crown debt has decreased by $4,128 million since 30 June 2007. Table 10 provides a breakdown of core Crown net debt by portfolio.
The majority of the decrease in net core Crown debt was in the financial instruments administered by the New Zealand Debt Management Office (NZDMO) ($2,776 million).
NZDMO financial assets have increased by $3,594 million which has been primarily financed by:
· the current year’s residual cash surplus of $2,057 million, and
· additional borrowings as NZDMO has continued its recent practice of maintaining a smooth bond issuance program year to year.
NZDMO borrowings have increased by around $818 million. As mentioned above the majority of the additional borrowings have been invested in financial assets, so are net debt neutral.
Table 10 – Net core Crown debt by portfolio
|
| Year ended 30 June 2008 |
| Year ended 30 June 2007 |
| ||||||||||||||||
$ million |
| NZDMO |
| Reserve |
| Student |
| Other |
| Total |
| NZDMO |
| Reserve |
| Student |
| Other |
| Total |
|
Core Crown borrowings |
| 28,861 |
| 8,689 |
| — |
| 195 |
| 37,745 |
| 28,043 |
| 8,508 |
| — |
| 254 |
| 36,805 |
|
Core Crown financial assets |
| 17,001 |
| 13,735 |
| 6,741 |
| 287 |
| 37,764 |
| 13,407 |
| 13,023 |
| 6,011 |
| 255 |
| 32,696 |
|
Net core Crown debt |
| 11,860 |
| (5,046 | ) | (6,741 | ) | (92 | ) | (19 | ) | 14,636 |
| (4,515 | ) | (6,011 | ) | (1 | ) | 4,109 |
|
Table 11 – NZS Fund net worth
Year ended 30 June |
| Actual |
| Actual |
| Actual |
| Actual |
| Actual |
| Forecast |
| Forecast |
| Actual |
|
Opening net worth |
| 615 |
| 1,884 |
| 3,956 |
| 6,555 |
| 9,855 |
| 12,910 |
| 12,973 |
| 12,973 |
|
Revenue |
| 69 |
| 131 |
| 191 |
| 359 |
| 436 |
| 447 |
| 381 |
| 385 |
|
Less current tax expense |
| — |
| (77 | ) | (234 | ) | (468 | ) | (707 | ) | (349 | ) | (259 | ) | (237 | ) |
Less other expenses |
| — |
| (7 | ) | (22 | ) | (52 | ) | 52 |
| — |
| (51 | ) | (34 | ) |
Gains/(losses) |
| — |
| 146 |
| 557 |
| 1,130 |
| 1,313 |
| 866 |
| (686 | ) | (995 | ) |
Operating balance |
| 69 |
| 193 |
| 492 |
| 969 |
| 1,094 |
| 964 |
| (615 | ) | (881 | ) |
Gross contribution from the Crown |
| 1,200 |
| 1,879 |
| 2,107 |
| 2,337 |
| 2,048 |
| 2,103 |
| 2,103 |
| 2,104 |
|
Other movements in reserves |
| — |
| — |
| — |
| (6 | ) | (24 | ) | — |
| — |
| 16 |
|
Closing net worth |
| 1,884 |
| 3,956 |
| 6,555 |
| 9,855 |
| 12,973 |
| 15,977 |
| 14,461 |
| 14,212 |
|
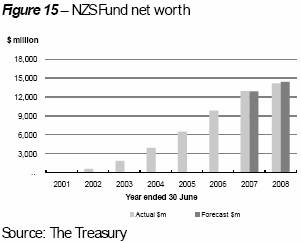
The NZS Fund (“the Fund”) is an important component of the Government’s fiscal strategy. The Fund’s assets provide the means for the Government to partially pre-fund future fiscal pressures, particularly those pressures arising from an ageing population.
The Government’s contributions to the Fund are calculated over a 40 year rolling horizon to ensure that superannuation entitlements over the next 40 years can be met.
The Fund made an operating loss of $881 million for the year ended 30 June 2008. This compares to an operating profit of $1,094 million in the previous year and a forecast loss of $615 million for the current year. This loss results from the downturn in equity markets (particularly the United States). The Fund’s full year return was -4.92% bringing its annualised return since inception to 10.34%. This return compares to the risk-free rate of return for the same period of 6.73%.
The Fund’s net worth at 30 June 2008 was $14,212 million, an increase of $1,239 million since 30 June 2007. $2,104 million of this increase is from Government contributions which were offset by the Fund’s investment performance.
Year ended 30 June |
| 1999 |
| 2000 |
| 2001 |
| 2002 |
| 2003 |
| 2004 |
| 2005 |
| 2006 |
| 2007 |
| 2008 |
|
Statement of financial performance |
|
|
|
|
|
|
|
|
|
|
|
|
|
|
|
|
|
|
|
|
|
Core Crown tax revenue |
| 30,875 |
| 32,598 |
| 35,345 |
| 36,809 |
| 40,518 |
| 43,358 |
| 47,468 |
| 50,973 |
| 53,477 |
| 56,747 |
|
Core Crown other revenue |
| 2,005 |
| 2,348 |
| 2,497 |
| 3,136 |
| 2,922 |
| 2,861 |
| 3,577 |
| 4,762 |
| 4,734 |
| 5,072 |
|
Core Crown revenue |
| 32,880 |
| 34,946 |
| 37,842 |
| 39,945 |
| 43,440 |
| 46,219 |
| 51,045 |
| 55,735 |
| 58,211 |
| 61,819 |
|
Crown entities, SOE revenue and eliminations |
| 7,086 |
| 6,666 |
| 7,259 |
| 10,003 |
| 13,170 |
| 13,051 |
| 14,322 |
| 15,690 |
| 16,378 |
| 19,660 |
|
Total Crown revenue |
| 39,966 |
| 41,612 |
| 45,101 |
| 49,948 |
| 56,611 |
| 59,271 |
| 65,367 |
| 71,425 |
| 74,589 |
| 81,479 |
|
Social security and welfare |
| 12,889 |
| 12,883 |
| 13,207 |
| 13,485 |
| 13,907 |
| 14,252 |
| 14,682 |
| 15,598 |
| 16,768 |
| 17,877 |
|
Health |
| 5,875 |
| 6,146 |
| 6,660 |
| 7,032 |
| 7,501 |
| 8,111 |
| 8,813 |
| 9,547 |
| 10,355 |
| 11,297 |
|
Education |
| 5,337 |
| 5,712 |
| 6,136 |
| 6,473 |
| 7,016 |
| 7,585 |
| 7,930 |
| 9,914 |
| 9,269 |
| 9,551 |
|
Core government services |
| 1,984 |
| 1,992 |
| 2,148 |
| 1,890 |
| 2,130 |
| 2,091 |
| 2,567 |
| 2,507 |
| 4,817 |
| 3,371 |
|
Other core Crown expenses |
| 7,854 |
| 8,096 |
| 8,408 |
| 8,633 |
| 9,343 |
| 9,843 |
| 10,903 |
| 11,754 |
| 12,795 |
| 14,901 |
|
Core Crown expenses |
| 33,939 |
| 34,829 |
| 36,559 |
| 37,513 |
| 39,897 |
| 41,882 |
| 44,895 |
| 49,320 |
| 54,004 |
| 56,997 |
|
Crown entities, SOE expenses and eliminations |
| 5,899 |
| 6,189 |
| 7,120 |
| 9,964 |
| 12,347 |
| 11,816 |
| 13,397 |
| 15,015 |
| 14,725 |
| 18,845 |
|
Total Crown expenses |
| 39,838 |
| 41,018 |
| 43,679 |
| 47,476 |
| 52,245 |
| 53,698 |
| 58,292 |
| 64,334 |
| 68,729 |
| 75,842 |
|
OBEGAL |
| 128 |
| 594 |
| 1,422 |
| 2,471 |
| 4,366 |
| 5,573 |
| 7,075 |
| 7,091 |
| 5,860 |
| 5,637 |
|
Gains/(losses) |
| 1,577 |
| 811 |
| (214 | ) | (185 | ) | (2,745 | ) | 1,736 |
| (1,144 | ) | 2,451 |
| 2,162 |
| (3,253 | ) |
Operating balance |
| 1,705 |
| 1,405 |
| 1,208 |
| 2,286 |
| 1,621 |
| 7,309 |
| 5,931 |
| 9,542 |
| 8,022 |
| 2,384 |
|
Statement of financial position |
|
|
|
|
|
|
|
|
|
|
|
|
|
|
|
|
|
|
|
|
|
Property, plant and equipment |
| 42,102 |
| 43,609 |
| 45,954 |
| 50,536 |
| 52,667 |
| 57,940 |
| 67,494 |
| 89,141 |
| 95,598 |
| 103,329 |
|
Financial assets |
| 18,564 |
| 18,756 |
| 21,419 |
| 22,497 |
| 27,799 |
| 32,654 |
| 42,005 |
| 66,396 |
| 73,719 |
| 85,063 |
|
Other assets |
| 11,305 |
| 11,459 |
| 11,467 |
| 14,846 |
| 18,461 |
| 18,756 |
| 19,714 |
| 9,503 |
| 11,031 |
| 12,443 |
|
Total assets |
| 71,971 |
| 73,824 |
| 78,840 |
| 87,879 |
| 98,927 |
| 109,351 |
| 129,212 |
| 165,040 |
| 180,348 |
| 200,835 |
|
Borrowings |
| 38,715 |
| 37,527 |
| 38,130 |
| 38,492 |
| 39,327 |
| 37,720 |
| 37,728 |
| 40,027 |
| 41,898 |
| 46,110 |
|
Other liabilities |
| 23,134 |
| 23,692 |
| 25,260 |
| 26,562 |
| 31,588 |
| 32,036 |
| 37,243 |
| 41,042 |
| 41,623 |
| 49,211 |
|
Total liabilities |
| 61,850 |
| 61,219 |
| 63,390 |
| 65,055 |
| 70,915 |
| 69,756 |
| 74,972 |
| 81,069 |
| 83,521 |
| 95,321 |
|
Net worth |
| 10,121 |
| 12,605 |
| 15,450 |
| 22,825 |
| 28,012 |
| 39,595 |
| 54,240 |
| 83,971 |
| 96,827 |
| 105,514 |
|
Fiscal Indicators |
|
|
|
|
|
|
|
|
|
|
|
|
|
|
|
|
|
|
|
|
|
Core Crown revenue (excl NZS Fund) |
| 32,880 |
| 34,946 |
| 37,842 |
| 39,930 |
| 43,371 |
| 46,165 |
| 51,088 |
| 55,844 |
| 58,482 |
| 61,671 |
|
Core Crown expenses |
| 33,939 |
| 34,829 |
| 36,559 |
| 37,513 |
| 39,897 |
| 41,882 |
| 44,895 |
| 49,320 |
| 54,004 |
| 56,997 |
|
OBEGAL |
| 128 |
| 594 |
| 1,422 |
| 2,471 |
| 4,366 |
| 5,573 |
| 7,075 |
| 7,091 |
| 5,860 |
| 5,637 |
|
OBEGAL (excl NZS Fund) |
| 128 |
| 594 |
| 1,422 |
| 2,456 |
| 4,297 |
| 5,526 |
| 7,140 |
| 7,252 |
| 6,250 |
| 5,586 |
|
Operating balance |
| 1,705 |
| 1,405 |
| 1,208 |
| 2,286 |
| 1,621 |
| 7,309 |
| 5,931 |
| 9,542 |
| 8,022 |
| 2,384 |
|
Core Crown residual cash |
| 2,048 |
| (386 | ) | 349 |
| 216 |
| 1,217 |
| 520 |
| 3,104 |
| 2,985 |
| 2,793 |
| 2,057 |
|
GSID (excluding settlement cash) |
| 37,307 |
| 36,580 |
| 37,194 |
| 36,650 |
| 36,617 |
| 36,017 |
| 35,478 |
| 33,903 |
| 30,647 |
| 31,390 |
|
Net core Crown debt |
| 22,275 |
| 21,900 |
| 20,293 |
| 19,666 |
| 17,977 |
| 15,569 |
| 11,093 |
| 8,044 |
| 4,109 |
| (19 | ) |
NZS Fund net worth |
| — |
| — |
| — |
| 615 |
| 1,884 |
| 3,956 |
| 6,555 |
| 9,855 |
| 12,973 |
| 14,212 |
|
Year ended 30 June |
| 1999 |
| 2000 |
| 2001 |
| 2002 |
| 2003 |
| 2004 |
| 2005 |
| 2006 |
| 2007 |
| 2008 |
|
GDP |
| 104,651 |
| 111,039 |
| 118,357 |
| 125,808 |
| 132,738 |
| 143,170 |
| 151,993 |
| 158,321 |
| 168,672 |
| 180,077 |
|
Statement of financial performance |
|
|
|
|
|
|
|
|
|
|
|
|
|
|
|
|
|
|
|
|
|
Core Crown tax revenue |
| 29.5 | % | 29.4 | % | 29.9 | % | 29.3 | % | 30.5 | % | 30.3 | % | 31.2 | % | 32.2 | % | 31.7 | % | 31.5 | % |
Core Crown other revenue |
| 1.9 | % | 2.1 | % | 2.1 | % | 2.5 | % | 2.2 | % | 2.0 | % | 2.4 | % | 3.0 | % | 2.8 | % | 2.8 | % |
Core Crown revenue |
| 31.4 | % | 31.5 | % | 32.0 | % | 31.8 | % | 32.7 | % | 32.3 | % | 33.6 | % | 35.2 | % | 34.5 | % | 34.3 | % |
Crown entities, SOE and elimination revenue |
| 6.8 | % | 6.0 | % | 6.1 | % | 8.0 | % | 9.9 | % | 9.1 | % | 9.4 | % | 9.9 | % | 9.7 | % | 10.9 | % |
Total Crown revenue |
| 38.2 | % | 37.5 | % | 38.1 | % | 39.7 | % | 42.6 | % | 41.4 | % | 43.0 | % | 45.1 | % | 44.2 | % | 45.2 | % |
Social security and welfare |
| 12.3 | % | 11.6 | % | 11.2 | % | 10.7 | % | 10.5 | % | 10.0 | % | 9.7 | % | 9.9 | % | 9.9 | % | 9.9 | % |
Health |
| 5.6 | % | 5.5 | % | 5.6 | % | 5.6 | % | 5.7 | % | 5.7 | % | 5.8 | % | 6.0 | % | 6.1 | % | 6.3 | % |
Education |
| 5.1 | % | 5.1 | % | 5.2 | % | 5.1 | % | 5.3 | % | 5.3 | % | 5.2 | % | 6.3 | % | 5.5 | % | 5.3 | % |
Core government services |
| 1.9 | % | 1.8 | % | 1.8 | % | 1.5 | % | 1.6 | % | 1.5 | % | 1.7 | % | 1.6 | % | 2.9 | % | 1.9 | % |
Other core Crown expenses |
| 7.5 | % | 7.3 | % | 7.1 | % | 6.9 | % | 7.0 | % | 6.9 | % | 7.2 | % | 7.4 | % | 7.6 | % | 8.3 | % |
Core Crown expenses |
| 32.4 | % | 31.4 | % | 30.9 | % | 29.8 | % | 30.1 | % | 29.3 | % | 29.5 | % | 31.2 | % | 32.0 | % | 31.7 | % |
Crown entities, SOE and elimination expenses |
| 5.6 | % | 5.6 | % | 6.0 | % | 7.9 | % | 9.3 | % | 8.3 | % | 8.8 | % | 9.5 | % | 8.7 | % | 10.5 | % |
Total Crown expenses |
| 38.1 | % | 36.9 | % | 36.9 | % | 37.7 | % | 39.4 | % | 37.5 | % | 38.4 | % | 40.6 | % | 40.7 | % | 42.1 | % |
OBEGAL |
| 0.1 | % | 0.5 | % | 1.2 | % | 2.0 | % | 3.3 | % | 3.9 | % | 4.7 | % | 4.5 | % | 3.5 | % | 3.1 | % |
Gains/(losses) |
| 1.5 | % | 0.7 | % | -0.2 | % | -0.1 | % | -2.1 | % | 1.2 | % | -0.8 | % | 1.5 | % | 1.3 | % | -1.8 | % |
Operating balance |
| 1.6 | % | 1.3 | % | 1.0 | % | 1.8 | % | 1.2 | % | 5.1 | % | 3.9 | % | 6.0 | % | 4.8 | % | 1.3 | % |
Statement of financial position |
|
|
|
|
|
|
|
|
|
|
|
|
|
|
|
|
|
|
|
|
|
Property, plant and equipment |
| 40.2 | % | 39.3 | % | 38.8 | % | 40.2 | % | 39.7 | % | 40.5 | % | 44.4 | % | 56.3 | % | 56.7 | % | 57.4 | % |
Financial assets |
| 17.7 | % | 16.9 | % | 18.1 | % | 17.9 | % | 20.9 | % | 22.8 | % | 27.6 | % | 41.9 | % | 43.7 | % | 47.2 | % |
Other assets |
| 10.8 | % | 10.3 | % | 9.7 | % | 11.8 | % | 13.9 | % | 13.1 | % | 13.0 | % | 6.0 | % | 6.5 | % | 6.9 | % |
Total assets |
| 68.8 | % | 66.5 | % | 66.6 | % | 69.9 | % | 74.5 | % | 76.4 | % | 85.0 | % | 104.2 | % | 106.9 | % | 111.5 | % |
Borrowings |
| 37.0 | % | 33.8 | % | 32.2 | % | 30.6 | % | 29.6 | % | 26.3 | % | 24.8 | % | 25.3 | % | 24.8 | % | 25.6 | % |
Other liabilities |
| 22.1 | % | 21.3 | % | 21.3 | % | 21.1 | % | 23.8 | % | 22.4 | % | 24.5 | % | 25.9 | % | 24.7 | % | 27.3 | % |
Total liabilities |
| 59.1 | % | 55.1 | % | 53.6 | % | 51.7 | % | 53.4 | % | 48.7 | % | 49.3 | % | 51.2 | % | 49.5 | % | 52.9 | % |
Net worth |
| 9.7 | % | 11.4 | % | 13.1 | % | 18.1 | % | 21.1 | % | 27.7 | % | 35.7 | % | 53.0 | % | 57.4 | % | 58.6 | % |
Fiscal Indicators |
|
|
|
|
|
|
|
|
|
|
|
|
|
|
|
|
|
|
|
|
|
Core Crown revenue (excl NZS Fund) |
| 31.4 | % | 31.5 | % | 32.0 | % | 31.7 | % | 32.7 | % | 32.2 | % | 33.6 | % | 35.3 | % | 34.7 | % | 34.2 | % |
Core Crown expenses |
| 32.4 | % | 31.4 | % | 30.9 | % | 29.8 | % | 30.1 | % | 29.3 | % | 29.5 | % | 31.2 | % | 32.0 | % | 31.7 | % |
OBEGAL |
| 0.1 | % | 0.5 | % | 1.2 | % | 2.0 | % | 3.3 | % | 3.9 | % | 4.7 | % | 4.5 | % | 3.5 | % | 3.1 | % |
OBEGAL (excl NZS Fund) |
| 0.1 | % | 0.5 | % | 1.2 | % | 2.0 | % | 3.2 | % | 3.9 | % | 4.7 | % | 4.6 | % | 3.7 | % | 3.1 | % |
Operating balance |
| 1.6 | % | 1.3 | % | 1.0 | % | 1.8 | % | 1.2 | % | 5.1 | % | 3.9 | % | 6.0 | % | 4.8 | % | 1.3 | % |
Core Crown residual cash |
| 2.0 | % | -0.3 | % | 0.3 | % | 0.2 | % | 0.9 | % | 0.4 | % | 2.0 | % | 1.9 | % | 1.7 | % | 1.1 | % |
GSID (excluding settlement cash) |
| 35.6 | % | 32.9 | % | 31.4 | % | 29.1 | % | 27.6 | % | 25.2 | % | 23.3 | % | 21.4 | % | 18.2 | % | 17.4 | % |
Net core Crown debt |
| 21.3 | % | 19.7 | % | 17.1 | % | 15.6 | % | 13.5 | % | 10.9 | % | 7.3 | % | 5.1 | % | 2.4 | % | 0.0 | % |
NZS Fund net worth |
| 0.0 | % | 0.0 | % | 0.0 | % | 0.5 | % | 1.4 | % | 2.8 | % | 4.3 | % | 6.2 | % | 7.7 | % | 7.9 | % |
I have audited the financial statements of the Government of New Zealand for the year ended 30 June 2008, using my staff, resources and appointed auditors and their staff.
In our opinion, the financial statements of the Government of New Zealand on pages 24 to 157:
· comply with generally accepted accounting practice in New Zealand; and
· fairly reflect:
· the Government of New Zealand’s financial position as at 30 June 2008; and
· the results of its operations and cash flows for the year ended on that date.
The audit was completed on 30 September 2008, and is the date at which our opinion is expressed.
The basis of our opinion is explained below. In addition, we outline the responsibilities of the Government and the Auditor, and explain our independence.
We carried out the audit in accordance with the Auditor-General’s Auditing Standards, which incorporate the New Zealand Auditing Standards.
We planned and performed the audit to obtain all the information and explanations we considered necessary in order to obtain reasonable assurance that the financial statements did not have material misstatements, whether caused by fraud or error.
Material misstatements are differences or omissions of amounts and disclosures that would affect a reader’s overall understanding of the financial statements. If we had found material misstatements that were not corrected, we would have referred to them in our opinion.
The audit involved performing procedures to test the information presented in the financial statements. We assessed the results of those procedures in forming our opinion.
Audit procedures generally include:
· determining whether significant financial and management controls are working and can be relied on to produce complete and accurate data;
· verifying samples of transactions and account balances;
· performing analyses to identify anomalies in the reported data;
· reviewing significant estimates and judgements made;
· confirming year-end balances;
· determining whether accounting policies are appropriate and consistently applied; and
· determining whether all financial statement disclosures are adequate.
We did not examine every transaction, nor do we guarantee complete accuracy of the financial statements.
We evaluated the overall adequacy of the presentation of information in the financial statements. We obtained all the information and explanations we required to support our opinion above.
The Treasury is responsible for preparing financial statements for the Government in accordance with generally accepted accounting practice in New Zealand. Those financial statements must fairly reflect the financial position of the Government as at 30 June 2008. They must also fairly reflect the results of its operations and cash flows for the year ended on that date. The Minister of Finance is responsible for forming an opinion that those financial statements fairly reflect the financial position and operations of the Government for that year. The responsibilities of the Treasury and the Minister of Finance arise from the Public Finance Act 1989.
We are responsible for expressing an independent opinion on the financial statements and reporting that opinion to you. This responsibility arises from section 15 of the Public Audit Act 2001 and section 30 of the Public Finance Act 1989.
The Auditor-General, as an Officer of Parliament, is constitutionally and operationally independent of the Government. Other than in exercising functions and powers under the Public Audit Act 2001 as the auditor of public entities, the Auditor-General has no relationship with or interest in the Government.
K B Brady
Controller and Auditor-General
Wellington
New Zealand
Forecast |
|
|
|
|
| Actual |
| ||||
Original |
| Estimated |
|
|
|
|
| 30 June |
| 30 June |
|
$m |
| $m |
|
|
| Note |
| $m |
| $m |
|
|
|
|
|
|
|
|
|
|
|
|
|
|
|
|
| Revenue |
|
|
|
|
|
|
|
54,173 |
| 56,186 |
| Taxation revenue |
| 2 |
| 56,372 |
| 53,064 |
|
3,693 |
| 3,851 |
| Other sovereign revenue |
| 2 |
| 3,879 |
| 3,496 |
|
57,866 |
| 60,037 |
| Total revenue levied through the Crown’s sovereign power |
|
|
| 60,251 |
| 56,560 |
|
13,253 |
| 13,682 |
| Sales of goods and services |
| 3 |
| 15,399 |
| 12,613 |
|
3,366 |
| 3,203 |
| Interest revenue and dividends |
| 4 |
| 3,214 |
| 2,995 |
|
2,387 |
| 2,891 |
| Other revenue |
| 5 |
| 2,615 |
| 2,421 |
|
19,006 |
| 19,776 |
| Total revenue earned through operations |
|
|
| 21,228 |
| 18,029 |
|
76,872 |
| 79,813 |
| Total revenue (excluding gains) |
|
|
| 81,479 |
| 74,589 |
|
|
|
|
| Expenses |
|
|
|
|
|
|
|
17,892 |
| 18,520 |
| Transfer payments and subsidies |
| 6 |
| 18,374 |
| 16,346 |
|
15,657 |
| 16,422 |
| Personnel expenses |
| 7 |
| 16,478 |
| 15,284 |
|
3,296 |
| 3,618 |
| Depreciation and amortisation |
| 8 |
| 3,670 |
| 3,397 |
|
28,997 |
| 29,217 |
| Other operating expenses |
| 9 |
| 30,656 |
| 27,842 |
|
2,748 |
| 2,954 |
| Interest expenses |
| 10 |
| 3,101 |
| 2,885 |
|
3,010 |
| 4,095 |
| Insurance expenses |
| 11 |
| 3,563 |
| 2,975 |
|
314 |
| — |
| Forecast new operating spending |
|
|
| — |
| — |
|
— |
| (240 | ) | Top-down expense adjustment |
|
|
| — |
| — |
|
71,914 |
| 74,586 |
| Total expenses (excluding losses) |
|
|
| 75,842 |
| 68,729 |
|
4,958 |
| 5,227 |
|
|
|
|
| 5,637 |
| 5,860 |
|
1,377 |
| (824 | ) | Net gains/(losses) on financial instruments |
| 12 |
| (617 | ) | 1,565 |
|
— |
| (2,007 | ) | Net gains/(losses) on non-financial instruments |
| 13 |
| (2,925 | ) | 486 |
|
1,377 |
| (2,831 | ) | Total gains/(losses) |
|
|
| (3,542 | ) | 2,051 |
|
96 |
| 166 |
| Net surplus/(deficit) from associates and joint ventures |
|
|
| 334 |
| 191 |
|
6,431 |
| 2,562 |
| Operating balance from continuing activities |
|
|
| 2,429 |
| 8,102 |
|
— |
| (3 | ) | Gain/(loss) from discontinued operations |
|
|
| 22 |
| (92 | ) |
6,431 |
| 2,559 |
| Operating balance (including minority interest) |
|
|
| 2,451 |
| 8,010 |
|
— |
| — |
| Operating balance attributable to minority interest in Air New Zealand |
|
|
| (67 | ) | 12 |
|
6,431 |
| 2,559 |
| Operating balance |
|
|
| 2,384 |
| 8,022 |
|
The accompanying Notes and Accounting Policies are an integral part of these Statements.
Forecast |
|
|
| Actual |
| ||||
Original |
| Estimated |
|
|
| 30 June |
| 30 June |
|
$m |
| $m |
|
|
| $m |
| $m |
|
|
|
|
| Total Crown expenses |
|
|
|
|
|
21,271 |
| 22,274 |
| Social security and welfare |
| 21,509 |
| 19,829 |
|
629 |
| 714 |
| GSF pension expenses |
| 690 |
| 645 |
|
11,699 |
| 10,765 |
| Health |
| 10,809 |
| 9,989 |
|
10,321 |
| 10,803 |
| Education |
| 10,397 |
| 9,853 |
|
2,132 |
| 3,163 |
| Core government services |
| 3,274 |
| 4,763 |
|
3,076 |
| 3,192 |
| Law and order |
| 3,082 |
| 2,822 |
|
1,597 |
| 1,524 |
| Defence |
| 1,525 |
| 1,478 |
|
7,671 |
| 7,185 |
| Transport and communications |
| 7,424 |
| 6,855 |
|
5,879 |
| 7,433 |
| Economic and industrial services |
| 9,038 |
| 5,395 |
|
1,319 |
| 1,404 |
| Primary services |
| 1,459 |
| 1,233 |
|
2,218 |
| 2,366 |
| Heritage, culture and recreation |
| 2,337 |
| 2,043 |
|
961 |
| 965 |
| Housing and community development |
| 938 |
| 865 |
|
79 |
| 84 |
| Other |
| 259 |
| 74 |
|
2,748 |
| 2,954 |
| Finance costs |
| 3,101 |
| 2,885 |
|
314 |
| — |
| Forecast new operating spending |
| — |
| — |
|
— |
| (240 | ) | Top-down expense adjustment |
| — |
| — |
|
71,914 |
| 74,586 |
| Total Crown expenses excluding losses |
| 75,842 |
| 68,729 |
|
Below is an analysis of core Crown expenses by functional classification. Core Crown expenses include expenses incurred by the Crown, Departments and the Reserve Bank, but not Crown entities and SOEs.
Forecast |
|
|
| Actual |
| ||||
Original |
| Estimated |
|
|
| 30 June |
| 30 June |
|
$m |
| $m |
|
|
| $m |
| $m |
|
|
|
|
| Core Crown expenses |
|
|
|
|
|
17,698 |
| 18,071 |
| Social security and welfare |
| 17,877 |
| 16,768 |
|
629 |
| 714 |
| GSF pension expenses |
| 690 |
| 645 |
|
11,613 |
| 11,343 |
| Health |
| 11,297 |
| 10,355 |
|
9,719 |
| 10,046 |
| Education |
| 9,551 |
| 9,269 |
|
2,479 |
| 3,222 |
| Core government services |
| 3,371 |
| 4,817 |
|
2,836 |
| 2,943 |
| Law and order |
| 2,894 |
| 2,699 |
|
1,641 |
| 1,566 |
| Defence |
| 1,562 |
| 1,517 |
|
2,792 |
| 2,290 |
| Transport and communications |
| 2,244 |
| 2,405 |
|
2,276 |
| 2,828 |
| Economic and industrial services |
| 2,889 |
| 1,595 |
|
494 |
| 565 |
| Primary services |
| 541 |
| 438 |
|
977 |
| 1,123 |
| Heritage, culture and recreation |
| 1,107 |
| 844 |
|
304 |
| 282 |
| Housing and community development |
| 260 |
| 255 |
|
80 |
| 84 |
| Other |
| 254 |
| 68 |
|
2,244 |
| 2,527 |
| Finance costs |
| 2,460 |
| 2,329 |
|
314 |
| — |
| Forecast new operating spending |
| — |
| — |
|
— |
| (240 | ) | Top-down expense adjustment |
| — |
| — |
|
56,096 |
| 57,364 |
| Total core Crown expenses excluding losses |
| 56,997 |
| 54,004 |
|
The accompanying Notes and Accounting Policies are an integral part of these Statements.
Forecast |
|
|
|
|
| Actual |
| ||||
Original |
| Estimated |
|
|
|
|
| 30 June |
| 30 June |
|
$m |
| $m |
|
|
| Note |
| $m |
| $m |
|
|
|
|
| Cash Flows From Operations |
|
|
|
|
|
|
|
|
|
|
| Cash was provided from |
|
|
|
|
|
|
|
54,266 |
| 55,662 |
| Taxation receipts |
| 2 |
| 55,168 |
| 52,157 |
|
3,472 |
| 3,496 |
| Other sovereign receipts |
| 2 |
| 3,460 |
| 3,224 |
|
13,394 |
| 14,001 |
| Sales of goods and services |
|
|
| 14,635 |
| 12,996 |
|
2,760 |
| 2,718 |
| Interest and dividend receipts |
|
|
| 3,111 |
| 2,491 |
|
2,302 |
| 2,532 |
| Other operating receipts |
|
|
| 2,211 |
| 2,222 |
|
76,194 |
| 78,409 |
| Total cash provided from operations |
|
|
| 78,585 |
| 73,090 |
|
|
|
|
| Cash was disbursed to |
|
|
|
|
|
|
|
19,529 |
| 18,242 |
| Transfer payments and subsidies |
|
|
| 18,026 |
| 16,344 |
|
44,025 |
| 46,643 |
| Personnel and operating payments |
|
|
| 45,972 |
| 41,845 |
|
2,530 |
| 2,705 |
| Interest payments |
|
|
| 2,820 |
| 2,441 |
|
314 |
| — |
| Forecast new operating spending |
|
|
| — |
| — |
|
— |
| (240 | ) | Top-down expense adjustment |
|
|
| — |
| — |
|
66,398 |
| 67,350 |
| Total cash disbursed to operations |
|
|
| 66,818 |
| 60,630 |
|
9,796 |
| 11,059 |
| Net cash flows from operations |
|
|
| 11,767 |
| 12,460 |
|
|
|
|
| Cash Flows From Investing Activities |
|
|
|
|
|
|
|
|
|
|
| Cash was provided from |
|
|
|
|
|
|
|
226 |
| 384 |
| Sale of physical assets |
|
|
| 401 |
| 432 |
|
9,237 |
| 23,050 |
| Sale of shares and other securities |
|
|
| 26,208 |
| 20,017 |
|
— |
| 13 |
| Sale of intangible assets |
|
|
| 26 |
| — |
|
1,091 |
| 2,144 |
| Repayment of advances |
|
|
| 1,173 |
| 2,156 |
|
— |
| 2 |
| Sale of investments in associates |
|
|
| 109 |
| 28 |
|
10,554 |
| 25,593 |
| Total cash provided from investing activities |
|
|
| 27,917 |
| 22,633 |
|
|
|
|
| Cash was disbursed to |
|
|
|
|
|
|
|
6,887 |
| 6,210 |
| Purchase of physical assets |
|
|
| 5,323 |
| 5,646 |
|
13,728 |
| 28,013 |
| Purchase of shares and other securities |
|
|
| 32,288 |
| 28,558 |
|
144 |
| 312 |
| Purchase of intangible assets |
|
|
| 346 |
| 232 |
|
2,719 |
| 3,297 |
| Issue of advances |
|
|
| 3,819 |
| 2,900 |
|
95 |
| 996 |
| Acquisition of investments in associates |
|
|
| 472 |
| 323 |
|
184 |
| 690 |
| Capital contingency provision |
|
|
| — |
| — |
|
23,757 |
| 39,518 |
| Total cash disbursed to investing activities |
|
|
| 42,248 |
| 37,659 |
|
(13,203 | ) | (13,925 | ) | Net cash flows from investing activities |
|
|
| (14,331 | ) | (15,026 | ) |
(3,407 | ) | (2,866 | ) | Net cash flows from operating and investing activities |
|
|
| (2,564 | ) | (2,566 | ) |
The accompanying Notes and Accounting Policies are an integral part of these Statements.
Forecast |
|
|
| Actual |
| ||||
Original |
| Estimated |
|
|
| 30 June |
| 30 June |
|
$m |
| $m |
|
|
| $m |
| $m |
|
(3,407 | ) | (2,866 | ) | Net cash flows from operating and investing activities |
| (2,564 | ) | (2,566 | ) |
|
|
|
| Cash Flows From Financing Activities |
|
|
|
|
|
|
|
|
| Cash was provided from |
|
|
|
|
|
178 |
| 260 |
| Issues of circulating currency |
| 86 |
| 81 |
|
3,860 |
| 3,335 |
| Issue of Government stock and treasury bills(1) |
| 2,769 |
| 2,883 |
|
3 |
| 922 |
| Issue of foreign currency borrowing |
| 1,278 |
| 2,493 |
|
2,225 |
| 1,735 |
| Issue of other New Zealand dollar borrowing |
| 2,147 |
| 5,999 |
|
6,266 |
| 6,252 |
| Total cash provided from financing activities |
| 6,280 |
| 11,456 |
|
|
|
|
| Cash was disbursed to |
|
|
|
|
|
1,637 |
| 978 |
| Repayment of Government stock and treasury bills(1) |
| 1,095 |
| 6,640 |
|
1,133 |
| 1,341 |
| Repayment of foreign currency borrowing |
| 179 |
| 713 |
|
— |
| — |
| Repayment of other New Zealand dollar borrowing |
| 2,819 |
| 971 |
|
— |
| — |
| Dividends paid to minority interests |
| 25 |
| 37 |
|
2,770 |
| 2,319 |
| Total cash disbursed to financing activities |
| 4,118 |
| 8,361 |
|
3,496 |
| 3,933 |
| Net cash flows from financing activities |
| 2,162 |
| 3,095 |
|
89 |
| 1,067 |
| Net movement in cash |
| (402 | ) | 529 |
|
3,107 |
| 4,163 |
| Opening cash balance |
| 4,162 |
| 3,676 |
|
— |
| (13 | ) | Foreign-exchange gains/(losses) on opening cash |
| 44 |
| (43 | ) |
3,196 |
| 5,217 |
| Closing cash balance |
| 3,804 |
| 4,162 |
|
(1) Net issues of Government stock and treasury bills is after elimination of holdings by entities such as NZS Fund, ACC and EQC. Further information on the proceeds and repayments of Government stock (“domestic bonds”) is available on page 161.
Forecast |
|
|
| Actual |
| ||||
Original |
| Estimated |
|
|
| 30 June |
| 30 June |
|
$m |
| $m |
|
|
| $m |
| $m |
|
|
|
|
| Reconciliation Between the Net Cash Flows from Operations and the Operating Balance |
|
|
|
|
|
9,796 |
| 11,059 |
| Net Cash Flows from Operations |
| 11,767 |
| 12,460 |
|
|
|
|
| Items included in the operating balance |
|
|
|
|
|
|
|
|
| but not in net cash flows from operations |
|
|
|
|
|
|
|
|
| Gains/(losses) |
|
|
|
|
|
1,377 |
| (824 | ) | Gains/(losses) on other financial instruments |
| (617 | ) | 1,565 |
|
— |
| (2,007 | ) | Gains/(losses) on other non-financial instruments |
| (2,925 | ) | 486 |
|
1,377 |
| (2,831 | ) | Total gains/(losses) |
| (3,542 | ) | 2,051 |
|
|
|
|
| Other Non-cash Items in Operating Balance |
|
|
|
|
|
(3,296 | ) | (3,618 | ) | Depreciation and amortisation |
| (3,670 | ) | (3,397 | ) |
(518 | ) | (628 | ) | Write-down on initial recognition of financial assets |
| (559 | ) | (629 | ) |
(38) |
| 201 |
| Impairment on financial assets (excl receivables) |
| 213 |
| 37 |
|
(51 | ) | (78 | ) | Decrease/(increase) in defined benefit retirement plan liabilities |
| 2 |
| 13 |
|
(1,013 | ) | (2,276 | ) | Decrease/(increase) in insurance liabilities |
| (1,358 | ) | (1,098 | ) |
97 |
| 166 |
| Other |
| 334 |
| 191 |
|
(4,819 | ) | (6,233 | ) | Total other non-cash Items |
| (5,038 | ) | (4,883 | ) |
|
|
|
| Movements in Working Capital |
|
|
|
|
|
218 |
| 267 |
| Increase/(decrease) in receivables |
| 2,100 |
| (1,591 | ) |
389 |
| 237 |
| Increase/(decrease) in accrued interest |
| (179 | ) | 61 |
|
41 |
| 107 |
| Increase/(decrease) in inventories |
| 138 |
| 83 |
|
(2) |
| (49 | ) | Increase/(decrease) in prepayments |
| 77 |
| (89 | ) |
— |
| (80 | ) | Decrease/(increase) in deferred revenue |
| (326 | ) | (73 | ) |
(569 | ) | 82 |
| Decrease/(increase) in payables |
| (2,613 | ) | 3 |
|
77 |
| 564 |
| Total movements in working capital |
| (803 | ) | (1,606 | ) |
6,431 |
| 2,559 |
| Operating balance |
| 2,384 |
| 8,022 |
|
The accompanying Notes and Accounting Policies are an integral part of these Statements.
Forecast |
|
|
| Actual |
| ||||
Original |
| Estimated |
|
|
| 30 June |
| 30 June |
|
— |
| 43 |
| Revaluation of physical assets |
| 5,896 |
| 4,791 |
|
— |
| — |
| Share of associates revaluation of physical assets |
| 318 |
| 471 |
|
39 |
| (2 | ) | Effective portion of changes in the fair value of cash flow hedges |
| 9 |
| (331 | ) |
74 |
| (15 | ) | Net change in fair value of cash flow hedges transferred to operating profit |
| 22 |
| (59 | ) |
— |
| (36 | ) | Net change in fair value of cash flow hedges transferred to the hedged item |
| (60 | ) | (13 | ) |
— |
| 3 |
| Foreign currency translation differences for foreign operations |
| 17 |
| (65 | ) |
— |
| 7 |
| Valuation gain/(losses) on investments available for sale taken to reserves |
| 11 |
| 10 |
|
— |
| — |
| Other movements |
| — |
| 11 |
|
113 |
| — |
| Total income/(expense) recognised directly in net worth |
| 6,213 |
| 4,815 |
|
6,431 |
| 2,559 |
| Operating Balance (including minority interest) |
| 2,451 |
| 8,010 |
|
6,544 |
| 2,559 |
| Total recognised income and expense |
| 8,664 |
| 12,825 |
|
|
|
|
| Attributable to: |
|
|
|
|
|
— |
| — |
| - minority interest in Air New Zealand |
| 83 |
| (80 | ) |
6,544 |
| 2,559 |
| - the Crown |
| 8,581 |
| 12,905 |
|
6,544 |
| 2,559 |
| Total recognised income and expense |
| 8,664 |
| 12,825 |
|
This statement reports changes in net worth due to the operating balance, items of income or expense that are recognised directly in net worth and the effect of certain accounting changes.
The accompanying Notes and Accounting Policies are an integral part of these Statements.
Forecast |
|
|
|
|
| Actual |
| ||||
Original |
| Estimated |
|
|
| Note |
| 30 June |
| 30 June |
|
|
|
|
| Assets |
|
|
|
|
|
|
|
3,196 |
| 5,217 |
| Cash and cash equivalents |
|
|
| 3,804 |
| 4,162 |
|
12,547 |
| 12,326 |
| Receivables |
| 14 |
| 14,158 |
| 12,057 |
|
35,134 |
| 36,365 |
| Marketable securities, deposits and derivatives in gain |
| 15 |
| 41,189 |
| 33,190 |
|
16,986 |
| 12,536 |
| Share investments |
| 16 |
| 12,964 |
| 13,581 |
|
12,838 |
| 13,907 |
| Advances |
| 17 |
| 12,948 |
| 10,728 |
|
982 |
| 933 |
| Inventory |
| 18 |
| 964 |
| 826 |
|
1,492 |
| 1,425 |
| Other assets |
| 19 |
| 1,663 |
| 1,527 |
|
95,950 |
| 98,355 |
| Property, plant & equipment |
| 20 |
| 103,329 |
| 95,598 |
|
6,647 |
| 7,519 |
| Equity accounted investments |
| 21 |
| 8,065 |
| 7,001 |
|
1,555 |
| 1,772 |
| Intangible assets and goodwill |
|
|
| 1,751 |
| 1,677 |
|
184 |
| 690 |
| Forecast for new capital spending |
|
|
| — |
| — |
|
(200 | ) | — |
| Top-down capital adjustment |
|
|
| — |
| — |
|
187,311 |
| 191,045 |
| Total assets |
|
|
| 200,835 |
| 180,347 |
|
|
|
|
| Liabilities |
|
|
|
|
|
|
|
3,730 |
| 3,704 |
| Issued currency |
|
|
| 3,530 |
| 3,444 |
|
9,036 |
| 8,423 |
| Payables |
| 22 |
| 10,895 |
| 8,077 |
|
845 |
| 1,046 |
| Deferred revenue |
|
|
| 1,292 |
| 966 |
|
46,364 |
| 45,546 |
| Borrowings |
| 23 |
| 46,110 |
| 41,898 |
|
19,011 |
| 20,752 |
| Insurance liabilities |
| 24 |
| 20,484 |
| 17,418 |
|
8,414 |
| 8,146 |
| Retirement plan liabilities |
| 25 |
| 8,257 |
| 7,161 |
|
3,850 |
| 4,045 |
| Provisions |
| 26 |
| 4,753 |
| 4,556 |
|
91,250 |
| 91,662 |
| Total liabilities |
|
|
| 95,321 |
| 83,520 |
|
96,061 |
| 99,383 |
| Total assets less total liabilities |
|
|
| 105,514 |
| 96,827 |
|
|
|
|
| Net Worth |
|
|
|
|
|
|
|
48,239 |
| 46,767 |
| Taxpayer funds |
|
|
| 46,700 |
| 44,222 |
|
47,402 |
| 52,498 |
| Property, plant and equipment revaluation reserve |
|
|
| 58,566 |
| 52,442 |
|
127 |
| (178 | ) | Other reserves |
|
|
| (134 | ) | (133 | ) |
95,768 |
| 99,087 |
| Total net worth attributable to the Crown |
| 27 |
| 105,132 |
| 96,531 |
|
293 |
| 296 |
| Net worth attributable to minority interest in Air New Zealand |
|
|
| 382 |
| 296 |
|
96,061 |
| 99,383 |
| Total net worth |
|
|
| 105,514 |
| 96,827 |
|
The accompanying Notes and Accounting Policies are an integral part of these Statements.
These financial statements are prepared in accordance with the Public Finance Act 1989 and with New Zealand generally accepted accounting practice (NZ GAAP). For this purpose, the Government Reporting entity is designated as a public benefit entity. The financial statements comply with New Zealand equivalents to International Financial Reporting Standards (NZ IFRS) as appropriate for public benefit entities. These are the first set of annual audited financial statements of the Government prepared in accordance with NZ IFRS.
The Financial Statements were authorised for issue by the Minister of Finance on 30 September 2008.
The consolidated financial statements for the Government Reporting entity (financial statements of the Government of New Zealand), as defined in section 2(1) of the Public Finance Act 1989, means:
· the Sovereign in right of New Zealand, and
· the legislative, executive, and judicial branches of the Government of New Zealand.
The description “Consolidated financial statements for the Government Reporting entity” and the description “Financial statements of the Government” have the same meaning and can be used interchangeably.
The financial statements have been prepared on the basis of historic cost modified by the revaluation of certain assets and liabilities.
The financial statements are prepared on an accrual basis.
The financial statements are presented in New Zealand dollars rounded to the nearest million, unless separately identified.
The preparation of these financial statements requires judgements, estimates and assumptions that affect the application of policies and reported amounts of assets and liabilities, income and expenses. The estimates and associated assumptions are based on historical experience and various other factors that are believed to be reasonable under the circumstances. Actual results may differ from these estimates.
The estimates and underlying assumptions are reviewed on an ongoing basis. Revisions to accounting estimates are recognised in the period in which the estimate is revised if the revision affects only that period, or in the period of the revision and future periods if the revision affects both current and future periods.
Where these judgments significantly affect the amounts recognised in the financial statements they are described below and in the following notes.
The Government has elected to adopt the following Standards and Interpretations in advance of their effective dates:
· NZ IFRS 3 Business Combinations amendments with consequential amendments to other standards revising the application of the acquisition method (effective for reporting periods beginning on or after 1 January 2009)
· NZ IFRS 2 Share Based Payments amendment relating to vesting conditions and cancellations (effective for reporting periods beginning on or after 1 January 2009)
· NZ IAS 32 Financial Instruments: Presentation amendments relating to puttable instruments and obligations arising on liquidation (effective for reporting periods beginning on or after 1 January 2009)
· NZ IFRIC 12 Service Concession Arrangements (effective for reporting periods beginning on or after 1 January 2008)
· NZ IFRIC 13 Customer Loyalty Programmes (effective for reporting periods beginning on or after 1 July 2008), and
· NZ IFRIC 14/ IAS 19 The Limit on a Defined Benefit Asset, Minimum Funding Requirements and their Interaction (effective for reporting periods beginning on or after 1 January 2008).
The adoption of these standards and interpretations has had no impact on these financial statements of the Government.
At the date of authorisation of these financial statements, other than the Standards and Interpretations adopted by the Government in advance of their effective dates (as described above) the following amended standards and interpretations were issued but not yet effective:
· NZ IAS 1 (Amended) Presentation of Financial Statements requiring a statement of comprehensive income (effective from 1 January 2009)
· NZ IFRS 8 Operating Segments (effective for accounting periods beginning on or after 1 January 2009), and
· NZ IAS 23 (Revised) Borrowing Costs (effective for accounting periods beginning on or after 1 January 2009).
NZ IAS 1 is a presentation Standard which will result in changes in presentation and a number of additional disclosures but which is not expected to impact on the operating balance, net worth or other key fiscal indicators of the Government.
Public benefit entities are not required to comply with the requirements of NZ IFRS 8 and therefore this standard will not impact on the financial statements. These financial statements continue to show segmental information as appropriate for a Government Reporting entity.
The revision to NZ IAS 23 requires directly attributable borrowing costs relating to qualifying assets to be capitalised. Application of this revised standard will increase the depreciation expense, reduce the interest expense reported in the statement of financial performance and increase the reported carrying values of tangible assets and the net worth of the Government. The amounts involved depend on a variety of assumptions required to be made and therefore it is not possible to reasonably estimate the financial impact of this change.
The reporting and forecast period for the financial statements of the Government of New Zealand is the financial year from 1 July to 30 June.
Where necessary the financial information for State-owned enterprises and Crown entities that have a balance date other than 30 June will be adjusted for any transactions or events that have occurred since their most recent balance date and that are significant for the Government’s financial statements. Such entities are primarily in the education sector.
These financial statements combine the following entities using the purchase method of combination:
Core Entities
· Ministers of the Crown
· Government departments
· Offices of Parliament
· the Reserve Bank of New Zealand
· New Zealand Superannuation Fund
Other entities
· State-owned enterprises
· Crown entities (excl. Tertiary Education Institutions)
· Air New Zealand Limited
· Organisations listed in Schedule 4 of the Public Finance Act 1989
Corresponding assets, liabilities, income and expenses, are added together line by line. Transactions and balances between these sub-entities are eliminated on combination. Where necessary, adjustments are made to the financial statements of subsidiaries to bring the accounting policies into line with those used by the Government Reporting entity.
Tertiary education institutions are equity accounted for the reasons explained in note 21. This recognises these entities’ net assets, including asset revaluation movements and surpluses and deficits.
The basis of combination for joint ventures depends on the form of the joint venture.
· Jointly controlled operations: The Government reporting entity recognises the assets it controls, the liabilities and expenses that it incurs, and its share of the jointly controlled operations’ income
· Jointly controlled assets: The Government reporting entity recognises its share of the jointly controlled assets, its share of any liabilities and expenses incurred jointly, any other liabilities and expenses it has incurred in respect of the jointly controlled asset, and income from the sale or use of its share of the output of the jointly controlled asset, and
· Jointly controlled entities: Jointly controlled entities are equity accounted, whereby the Government reporting entity initially recognises its share of interest in these entities’ net assets at cost and subsequently adjusts the cost for changes in net assets. The Government reporting entity’s share of the jointly controlled entity’s surpluses and deficits are recognised in the statement of financial performance.
Business combinations that occurred prior to the transition to NZ IFRS are not restated retrospectively.
The Government provides many services and benefits that do not give rise to revenue. Further, payment of tax does not of itself entitle a taxpayer to an equivalent value of services or benefits, since there is no relationship between paying tax and receiving Crown services and transfers. Such revenue is received through the exercise of the sovereign power of the Crown in Parliament.
Where possible, taxation revenue is recognised at the time the debt to the Crown arises.
Revenue type |
| Revenue recognition point |
Source deductions |
| When an individual earns income that is subject to PAYE |
Resident withholding tax (RWT) |
| When an individual is paid interest or dividends subject to deduction at source |
Fringe benefit tax (FBT) |
| When benefits are provided that give rise to FBT |
Provisional tax |
| When taxable income is earned |
Terminal tax |
| Assessment filed date |
Goods and services tax (GST) |
| When the liability to the Crown is incurred |
Customs and excise duty |
| When goods become subject to duty |
Road user charges and motor vehicle fees |
| When payment of the fee or charge is made |
Stamp, cheque and credit card duties |
| When the liability to the Crown is incurred |
Exhaustible resources levy |
| When the resource is extracted |
Other indirect taxes |
| When the debt to the Crown arises |
Levies (eg, ACC levies) |
| When the obligation to pay the levy is incurred |
Revenue from the supply of goods and services to third parties is measured at the fair value of consideration received. Revenue from the supply of goods is recognised when the significant risks and rewards of ownership have been transferred to the buyer. Revenue from the supply of services is recognised on a straight-line basis over the specified period for the services unless an alternative method better represents the stage of completion of the transaction.
Interest income is accrued using the effective interest rate method.
The effective interest rate exactly discounts estimated future cash receipts through the expected life of the financial asset to that asset’s net carrying amount. The method applies this rate to the principal outstanding to determine interest income each period.
Dividend income from investments is recognised when the Government’s rights as a shareholder to receive payment have been established.
Rental income is recognised in the statement of financial performance on a straight-line basis over the term of the lease. Lease incentives granted are recognised evenly over the term of the lease as a reduction in total rental income.
Where an asset is acquired for nil or nominal consideration, the fair value of the asset received is recognised as income in the statement of financial performance.
Expenses are recognised in the period to which they relate.
Welfare benefits and entitlements, including New Zealand Superannuation, are recognised in the period when an application for a benefit has been received and the eligibility criteria met.
Where grants and subsidies are discretionary until payment, the expense is recognised when the payment is made. Otherwise, the expense is recognised when the specified criteria have been fulfilled and notice has been given to the Crown.
Interest expense is accrued using the effective interest rate method.
The effective interest rate exactly discounts estimated future cash payments through the expected life of the financial liability to that liability’s net carrying amount. The method applies this rate to the principal outstanding to determine interest expense each period.
Transactions in foreign currencies are initially translated at the foreign exchange rate at the date of the transaction. Foreign exchange gains and losses resulting from the settlement of such transactions and from the translation at year-end exchange rates of monetary assets and liabilities denominated in foreign currencies are recognised in the statement of financial performance, except when deferred in net worth when hedge accounting is applied.
Non-monetary assets and liabilities measured at historical cost in a foreign currency are translated using the exchange rate at the date of the transaction. Non-monetary assets and liabilities denominated in foreign currencies and measured at fair value are translated into New Zealand dollars at the exchange rate applicable at the fair value date. The associated foreign exchange gains or losses follow the fair value gains or losses to either the statement of financial performance or directly to net worth.
Foreign exchange gains and losses arising from translating monetary items that form part of the net investment in a foreign operation are reported in a translation reserve in net worth.
Financial assets are designated into the following categories: loans and receivables, financial instruments available-for-sale, financial assets held for trading, and financial instruments designated as fair value through profit and loss. This designation is made by reference to the purpose of the financial instruments, policies and practices for their management, their relationship with other instruments and the reporting costs and benefits associated with each designation.
Although they do not arise out of a contract, receivables from taxes, levies and fines (and any penalties associated with these activities) as well as social benefit receivables are for ease of presentation purposes included as a financial instrument. These non-contract receivables, collectively referred to as sovereign receivables, are designated separately from other financial assets.
Major financial asset type |
| Designation |
Tax, levy, fine and social benefit receivables |
| All designated as sovereign receivables |
Trade and other receivables |
| All designated as loans and receivables |
Student loans |
| All designated as loans and receivables |
Kiwibank mortgages |
| Generally designated as fair value through profit and loss |
Other advances |
| Generally designated as loans and receivables |
Reserve position at the IMF |
| Generally designated as available for sale |
Share Investments |
| Generally designated as fair value through profit and loss |
Marketable securities |
| Generally designated as fair value through profit and loss |
Sovereign receivables are initially assessed at nominal amount or face value; that is, the receivable reflects the amount of tax owed, levy, fine charged, or social benefit debt payable. These receivables are subsequently adjusted for penalties and interest as they are charged, and tested for impairment. Interest and penalties charged on tax receivables is presented as tax revenue in the statement of financial performance.
Loans and receivables are recognised initially at fair value plus transaction costs and subsequently measured at amortised cost using the effective interest rate method (refer interest revenue policy). Loans and receivables issued with a duration of less than 12 months are recognised at their nominal value, unless the effect of discounting is material. Allowances for estimated irrecoverable amounts are recognised when there is objective evidence that the asset is impaired. Interest, impairment losses and foreign exchange gains and losses are recognised in the statement of financial performance.
In accordance with this general policy, student loans are recognised initially at fair value plus transaction costs, and subsequently measured at amortised cost using the effective interest rate method, less any impairment loss. Fair value on initial recognition of student loans is determined by projecting forward expected repayments required under the scheme and discounting them back at an appropriate discount rate. The difference between the amount lent and the fair value on initial recognition is expensed on initial recognition. The subsequent measurement at amortised cost is determined using the effective interest rate calculated at initial recognition. This
rate is used to spread the Crown’s interest income across the life of the loan and determines the loan’s carrying value at each reporting date.
The student loans valuation model has been adapted to reflect current student loans policy. As such, the carrying value is sensitive to changes on a number of underlying assumptions, including future income levels, repayment behaviour and macro economic factors such as inflation and the discount rates used to determine the effective interest rate on new borrowers.
The data for valuation of student loans has been integrated from files provided by Inland Revenue Department, Ministry of Social Development and the Ministry of Education. The current data is up to 31 March 2007, and contains information on borrowings, repayments, income, educational factors, and socio-economic factors amongst others and has been analysed and incorporated into the valuation model. This integrated data has been supplemented by less detailed, but more recent data to value student loans at balance date. Given the lead time required to compile and analyse the detailed, integrated data, it is expected that there is a lag between the availability of this data set and balance date.
Financial assets held for trading and financial assets designated at fair value through profit or loss are recorded at fair value with any realised and unrealised gains or losses recognised in the statement of financial performance.
A financial asset is designated at fair value through profit and loss if acquired principally for the purpose of trading in the short term. It may also be designated into this category if the accounting treatment results in more relevant information because it either significantly reduces an accounting mismatch with related liabilities or is part of a group of financial assets that is managed and evaluated on a fair value basis, such as with the NZ Superannuation Fund. Gains or losses from interest, foreign exchange and other fair value movements are separately reported in the statement of financial performance. Transaction costs are expensed as they are incurred.
Available-for-sale financial assets are initially recorded at fair value plus transaction costs. They are subsequently recorded at fair value with any resultant fair value gains or losses recognised directly in net worth except for impairment losses, any interest calculated using the effective interest method and, in the case of monetary items (such as debt securities), foreign exchange gains and losses resulting from translation differences due to changes in amortised cost of the asset. These latter items are recognised in the statement of financial performance. For non-monetary available-for-sale financial assets (eg, some unlisted equity instruments) the fair value movements recognised in net worth include any related foreign exchange component. At derecognition, the cumulative fair value gain or loss previously recognised directly in net worth is recognised in the statement of financial performance.
Cash and cash equivalents include cash on hand, cash in transit, bank accounts and deposits with a maturity of no more than three months from date of acquisition.
Fair values of quoted investments are based on current bid prices. Regular way purchases and sales of all financial assets are accounted for at trade date. If the market for a financial asset is not active, fair values for initial recognition and, where appropriate, subsequent measurement are established by using valuation techniques, as set out in the following notes. At each balance date an assessment is made whether there is objective evidence that a financial asset or group of financial assets is impaired.
Major financial liability type |
| Designation |
Accounts payable |
| All designated at amortised cost |
Taxes repayable |
| All designated at amortised cost |
Government stock |
| Generally designated at amortised cost |
Treasury bills |
| Generally designated as fair value through profit and loss |
Government retail stock |
| Generally designated as fair value through profit and loss |
Settlement deposits with Reserve Bank |
| Generally designated as fair value through profit and loss |
Issued currency |
| Not designated: Recognised at face value |
Financial liabilities held for trading and financial liabilities designated at fair value through profit or loss are recorded at fair value with any realised and unrealised gains or losses recognised in the statement of financial performance. A financial liability is designated at fair value through profit and loss if acquired principally for the purpose of trading in the short term. It may also be designated into this category if the accounting treatment results in more relevant information because it either eliminates or significantly reduces an accounting mismatch with related assets or is part of a group of financial liabilities that is managed and evaluated on a fair value basis. Gains or losses from interest, foreign exchange and other fair value movements are separately reported in the statement of financial performance. Transaction costs are expensed as they are incurred.
Other financial liabilities are recognised initially at fair value less transaction costs and subsequently measured at amortised cost using the effective interest rate method. Financial liabilities entered into with a duration of less than 12 months are recognised at their nominal value. Amortisation and, in the case of monetary items, foreign exchange gains and losses, are recognised in the statement of financial performance as is any gain or loss when the liability is derecognised.
Currency issued for circulation, including demonetised currency after 1 July 2004, is recognised at face value. Currency issued represents a liability in favour of the holder.
Derivative financial instruments are recognised both initially and subsequently at fair value. They are reported as either assets or liabilities depending on whether the derivative is in a net gain or net loss position respectively. Recognition of the movements in the value of derivatives depends on whether the derivative is designated as a hedging instrument and, if so, the nature of the item being hedged (see Hedging section below).
Derivatives that are not designated for hedge accounting are classified as held-for-trading financial instruments with fair value gains or losses recognised in the statement of financial performance. Such derivatives may be entered into for risk management purposes, although not formally designated for hedge accounting, or for tactical trading.
Individual entities consolidated within the Government reporting entity apply hedge accounting after considering the costs and benefits of adopting hedge accounting, including whether an economic hedge exists and the effectiveness of that hedge, whether the hedge accounting qualifications could be met, and the extent it would improve the relevance of reported results.
Transactions between entities within the Government reporting entity do not qualify for hedge accounting in the financial statements of the Government (although they may qualify for hedge accounting in the separate financial statements of the individual entities). Where a derivative is used to hedge the foreign exchange exposure of a monetary asset or liability, the effects of the hedge relationship are automatically reflected in the statement of financial performance so hedge accounting is not necessary.
Where a derivative qualifies as a hedge of variability in asset or liability cash flows (cash flow hedge), the effective part of any gain or loss on the derivative is recognised in net worth and the ineffective part is recognised in the statement of financial performance. Where the hedge of a forecast transaction subsequently results in the recognition of a non-financial asset or non-financial liability (eg, where the hedge relates to purchase of an asset in a foreign currency), the amount recognised directly in net worth is included in the initial cost of the asset or liability. Otherwise, gains or losses recognised in net worth transfer to the statement of financial performance in the same periods as when the hedged item affects the statement of financial performance (eg, when the forecast sale occurs). Effective parts of the hedge are recognised in the same area of the statement of financial performance as the hedged item.
When a hedging instrument expires or is sold, or when a hedge no longer meets the criteria for hedge accounting, any cumulative gain or loss existing in net worth at that time remains in net worth and is recognised when the forecast transaction is ultimately recognised in the statement of financial performance. When a forecast transaction is no longer expected to occur, the cumulative gain or loss that was reported in net worth is transferred to the statement of financial performance.
Where a derivative qualifies as a hedge of the exposure to changes in fair value of an asset or liability (fair value hedge) any gain or loss on the derivative is recognised in the statement of financial performance together with any changes in the fair value of the hedged asset or liability.
The carrying amount of the hedged item is adjusted by the fair value gain or loss on the hedged item in respect of the risk being hedged. Effective parts of the hedge are recognised in the same area of the statement of financial performance as the hedged item.
Inventories are recorded at the lower of cost (calculated using weighted average method) and net realisable value. Inventories held for distribution for public benefit purposes are recorded at cost adjusted where applicable for any loss of service potential. Where inventories are acquired at no cost, or for nominal consideration, the cost is deemed to be the current replacement cost at the date of acquisition.
Inventories include unissued currency and harvested agricultural produce (eg, logs, wool).
The cost of harvested agricultural produce is measured at fair value less estimated point-of-sale costs at the point of harvest.
Items of property, plant and equipment are initially recorded at cost. Cost may include transfers from net worth of any gains/losses on qualifying cash flow hedges of foreign currency purchases of property, plant and equipment. Where an asset is acquired for nil or nominal consideration the asset is recognised initially at fair value, where fair value can be reliably determined, and as income in the statement of financial performance.
Revaluations are carried out for a number of classes of property, plant and equipment to reflect the service potential or economic benefit obtained through control of the asset. Revaluation is based on the fair value of the asset, with changes reported by class of asset.
Subsequent to initial recognition, classes of property, plant and equipment are accounted for as set out below.
Class of PPE |
| Accounting policy |
Land & Buildings |
| Land and buildings are recorded at fair value less impairment losses and, for buildings, less depreciation accumulated since the assets were last revalued.
Valuations undertaken in accordance with standards issued by the New Zealand Property Institute are used where available.
Otherwise, valuations conducted in accordance with the Rating Valuation Act 1998, may be used if they have been confirmed as appropriate by an independent valuer.
When revaluing buildings, there must be componentisation to the level required to ensure adequate representation of the material components of the buildings. At a minimum, this requires componentisation to three levels: structure, building services and fit-out. |
|
|
|
Specialist Military Equipment |
| Specialist military equipment is recorded on a depreciated replacement cost basis less depreciation and impairment losses accumulated since the assets were last revalued.
Valuations are obtained through specialist assessment by New Zealand Defence Force advisers, and the bases of these valuations are confirmed as appropriate by an independent valuer. |
|
|
|
State Highways |
| State highways are recorded on a depreciated replacement cost basis less depreciation and impairment losses accumulated since the assets were last revalued. Land associated with the state highways is valued using an opportunity cost based on adjacent use, as an approximation to fair value. |
|
|
|
Rail Network |
| The Rail Network is recorded on a depreciated replacement cost basis less depreciation and impairment losses accumulated since the assets were last revalued. Land associated with the rail network is valued using an opportunity cost based on adjacent use, as an approximation to fair value. |
|
|
|
Aircraft |
| Aircraft (excluding Specialised Military Equipment) are recorded at fair value less depreciation and impairment losses accumulated since the assets were last revalued. |
|
|
|
Electricity Distribution |
| Electricity distribution network assets are recorded at cost, less accumulated depreciation and accumulated impairment losses. |
|
|
|
Electricity Generation |
| Electricity generation assets are recorded at fair value less depreciation and impairment losses accumulated since the assets were last revalued. |
|
|
|
Other Plant and Equipment |
| Other plant and equipment, which include motor vehicles and office equipment, are recorded at cost less accumulated depreciation and accumulated impairment losses. |
|
|
|
Specified cultural and heritage assets |
| Specified cultural and heritage assets comprise national parks, conservation areas and related recreational facilities, as well as National Archives holdings and the collections of the National Library, Parliamentary Library and Te Papa. Such physical assets are recorded at fair value less subsequent impairment losses and, for non-land assets, less subsequent accumulated depreciation. Assets are not reported with a financial value in cases where they are not realistically able to be reproduced or replaced, and when they do not generate cash flows and where no market exists to provide a valuation. |
Classes of property, plant and equipment that are revalued, are revalued at least every five years or whenever the carrying amount differs materially to fair value.
Items of property are revalued to fair value for the highest and best use of the item on the basis of the market value of the item, or on the basis of market based evidence, such as discounted cash flow calculations. If no market
based evidence of fair value exists, an optimised depreciated replacement cost approach is used as the best proxy for fair value. Where an item of property is recorded at its optimised depreciated replacement cost, optimised depreciated replacement cost is based on the estimated present cost of constructing the existing item of property by the most appropriate method of construction, less allowances for physical deterioration and optimisation for obsolescence and relevant surplus capacity. Where an item of property is recorded at its optimised depreciated replacement cost, the cost does not include any borrowing costs.
Unrealised gains and losses arising from changes in the value of property, plant and equipment are recognised as at balance date. To the extent that a gain reverses a loss previously charged to the statement of financial performance for the asset class, the gain is credited to the statement of financial performance. Otherwise, gains are credited to an asset revaluation reserve for that class of asset. To the extent that there is a balance in the asset revaluation reserve for the asset class any loss is debited to the reserve. Otherwise, losses are reported in the statement of financial performance.
Realised gains and losses arising from disposal of property, plant and equipment are recognised in the statement of financial performance in the period in which the transaction occurs. Any balance attributable to the disposed asset in the asset revaluation reserve is transferred to retained earnings.
Generally, Government borrowings are not directly attributable to individual assets. Therefore, any borrowing costs incurred during the period required to complete and prepare assets for their intended use are expensed rather than capitalised.
Where an asset’s recoverable amount is less than its carrying amount, it is reported at its recoverable amount and an impairment loss is recognised. Losses resulting from impairment are reported in the statement of financial performance, unless the asset is carried at a revalued amount in which case any impairment loss is treated as a revaluation decrease.
Depreciation is charged on a straight-line basis at rates calculated to allocate the cost or valuation of an item of property, plant and equipment, less any estimated residual value, over its remaining useful life.
Typically, the estimated useful lives of different classes of property, plant and equipment are as follows:
Class of PPE |
| Estimated useful lives |
Buildings |
| 25 to 60 years |
Specialist military equipment |
| 5 to 25 years |
State highways: Pavement (surfacing) Pavement (other) Bridges |
| 7 years 36 years 90 to 100 years |
Rail Network: Track and ballast Tunnels and bridges Overhead traction and signalling |
| 40 years 80 years 20 years |
Aircraft (ex specialist military equipment) |
| 10 to 20 years |
Electricity distribution network |
| 2 to 80 years |
Electricity generation assets |
| 25 to 55 years |
Other plant and equipment |
| 3 to 25 years |
Specified heritage and cultural assets are generally not depreciated.
The applicable financial reporting standards that determine the basis of combination of entities that make up the Government reporting entity are NZ IAS 27: Consolidated and Separate Financial Statements and NZ IAS 28: Investments in Associates. NZ IAS 27 refers to guidance provided in IPSAS 6: Consolidated and Separate Financial Statements and FRS 37: Consolidating Investments in Subsidiaries which shall be used by public benefit entities in determining whether they control another entity.
These standards are, however, not clear about how the definitions of control and significant influence should be applied in some circumstances in the public sector, particularly where legislation provides public sector entities with statutory autonomy and independence, in particular with Tertiary Education Institutions. Treasury’s view is that because the Government cannot determine their operating and financing policies, but does have a number of powers in relation to these entities, it is appropriate to treat them as associates.
Biological assets (eg, trees, sheep) managed for harvesting into agricultural produce (eg, logs, wool) or for transforming into additional biological assets are measured at fair value less estimated point-of-sale costs, with any realised and unrealised gains or losses reported in the statement of financial performance. Where fair value cannot be reliably determined, the asset is recorded at cost less accumulated depreciation and accumulated impairment losses. For commercial forests, fair value takes into account age, quality of timber and the forest management plan.
Biological assets not managed for harvesting into agricultural produce, or being transformed into additional biological assets are reported as property, plant and equipment in accordance with the policies for property, plant and equipment.
Intangible assets are initially recorded at cost. Where an intangible asset is created for nil or nominal consideration it is still initially carried at cost, which by definition is nil/nominal.
The cost of an internally generated intangible asset represents expenditure incurred in the development phase of the asset only. The development phase occurs after the following can be demonstrated: technical feasibility; ability to complete the asset; intention and ability to sell or use; and development expenditure can be reliably measured. Research is “original and planned investigation undertaken with the prospect of gaining new scientific or technical knowledge and understanding”. Expenditure incurred on the research phase of an internally generated intangible asset is expensed when it is incurred. Where the research phase cannot be distinguished from the development phase, the expenditure is expensed when it is incurred.
Intangible assets with finite lives are subsequently recorded at cost less any amortisation and impairment losses. Amortisation is charged to the statement of financial performance on a straight-line basis over the useful life of the asset. Typically, the estimated useful life of computer software is three to five years.
Intangible assets with indefinite useful lives are not amortised, but are tested annually for impairment.
Realised gains and losses arising from disposal of intangible assets are recognised in the statement of financial performance in the period in which the transaction occurs.
Intangible assets with finite lives are reviewed annually to determine if there is any indication of impairment. All intangible assets with an indefinite life are tested for impairment annually. Where an intangible asset’s recoverable amount is less than its carrying amount, it is reported at its recoverable amount and an impairment loss is recognised. Losses resulting from impairment are reported in the statement of financial performance.
Goodwill in Air New Zealand is tested for impairment annually.
Non-current assets or disposal groups are separately classified where their carrying amount will be recovered through a sale transaction rather than continuing use; that is, where such assets are available for immediate sale and where sale is highly probable. Non-current assets or disposal groups are recorded at the lower of their carrying amount and fair value less costs to sell.
Investment property is property held primarily to earn rentals or for capital appreciation or both. It does not include property held primarily for strategic purposes or to provide a social service (eg, affordable housing) even though such property may earn rentals or appreciate in value – such property is reported as property, plant and equipment.
Investment properties are measured at fair value. Gains or losses arising from fair value changes are included in the statement of financial performance. Valuations are undertaken in accordance with standards issued by the New Zealand Property Institute.
Obligations for contributions to defined contribution retirement plans are recognised in the statement of financial performance as they fall due. Obligations for defined benefit retirement plans are recorded at the latest actuarial value of the Crown liability. All movements in the liability, including actuarial gains and losses, are recognised in full in the statement of financial performance in the period in which they occur.
Employee entitlements to salaries and wages, annual leave, long service leave, retiring leave and other similar benefits are recognised in the statement of financial performance when they accrue to employees. Employee entitlements to be settled within 12 months are reported at the amount expected to be paid. The liability for long-term employee entitlements is reported as the present value of the estimated future cash outflows.
Termination benefits are recognised in the statement of financial performance only when there is a demonstrable commitment to either terminate employment prior to normal retirement date or to provide such benefits as a result of an offer to encourage voluntary redundancy. Termination benefits settled within 12 months are reported at the amount expected to be paid, otherwise they are reported as the present value of the estimated future cash outflows.
The future cost of ACC claims liabilities is revalued annually based on the latest actuarial information. Movements of the liability are reflected in the statement of financial performance. Financial assets backing the liability are designated at fair value through profit and loss.
Finance leases transfer to the Crown as lessee substantially all the risks and rewards incident on the ownership of a leased asset. Initial recognition of a finance lease results in an asset and liability being recognised at amounts equal to the lower of the fair value of the leased property or the present value of the minimum lease payments. The capitalised values are amortised over the period in which the Crown expects to receive benefits from their use.
Operating leases, where the lessor substantially retains the risks and rewards of ownership, are recognised in a systematic manner over the term of the lease. Leasehold improvements are capitalised and the cost is amortised over the unexpired period of the lease or the estimated useful life of the improvements, whichever is shorter. Lease incentives received are recognised evenly over the term of the lease as a reduction in rental expense.
Other liabilities and provisions are recorded at the best estimate of the expenditure required to settle the obligation. Liabilities and provisions to be settled beyond 12 months are recorded at the present value of their estimated future cash outflows.
Contingent liabilities and contingent assets are reported at the point at which the contingency is evident. Contingent liabilities are disclosed if the possibility that they will crystallise is not remote. Contingent assets are disclosed if it is probable that the benefits will be realised.
Commitments are future expenses and liabilities to be incurred on contracts that have been entered into at balance date.
Cancellable commitments that have penalty or exit costs explicit in the agreement on exercising the option to cancel are reported at the value of that penalty or exit cost (ie, the minimum future payments).
Commitments are classified as:
· capital commitments: aggregate amount of capital expenditure contracted for but not recognised as paid or provided for at period end
· non-cancellable operating leases with a lease term of more than one year
· other non-cancellable commitments: these may include consulting contracts, cleaning contracts and ship charters.
Interest commitments on debts and commitments relating to employment contracts are not included in the Statement of Commitments.
When presentation or classification of items in the financial statements is amended or accounting policies are changed voluntarily, comparative figures have been restated to ensure consistency with the current period unless it is impracticable to do so.
Comparatives referred to as Original Budget were forecasts published in the 2007 Budget Economic and Fiscal Update while Estimated Actuals were forecasts published in the 2008 Budget Economic and Fiscal Update. These forecasts include budget adjustments for new unallocated spending during the year (both operating and capital)
and top-down adjustments which reduce the bias for forecast expenditure by departments to reflect maximum spending limits instead of mid-point estimates.
The Government Reporting Entity is not required to provide segment reporting as it is a public benefit entity. Nevertheless, information is presented for material institutional components and major economic activities within or undertaken by the Government Reporting Entity. The three major institutional components of the Crown are:
· Core Crown: This group, which includes Ministers, government departments, offices of Parliament, the Reserve Bank of New Zealand and the New Zealand Superannuation Fund most closely represents the budget sector and provides information that is useful for fiscal analysis purposes.
· State-owned enterprises including entities governed by the State –owned Enterprises Act, and for the purposes of these statements also includes Air New Zealand, represents entities that undertake commercial activity.
· Crown entities: This group includes entities governed by the Crown Entities Act 2004. These entities have separate legal form and specified government frameworks (including the degree to which each Crown entity is required to give effect to, or be independent of, government policy).
Functional analysis is also provided of a number of financial statements items. This functional analysis is drawn from the Classification of the Functions of Government produced by the International Monetary Fund.
The Government comprises a large number of commonly controlled entities. These entities, and their key management personnel, transact among themselves and with the Government Reporting Entity on a regular basis, for example, for the purchase of postage stamps or the registration of vehicles. The Public Finance Act 1989 requires separate reporting by these individual entities and these entities will report transactions with the Crown and other related parties as appropriate in these individual financial statements.
With the exception of key management personnel, no other parties control the Government, are controlled by the Government without being consolidated, or are under common control of another entity with the government. Tertiary education institutions, joint ventures and the Government Superannuation Fund are however considered related parties due to government influence and transactions between the rest of the Government Reporting Entity and these entities are separately disclosed where material.
Key management personnel, defined as Ministers of the Crown that are in Cabinet, are also considered to be related parties.
Forecast |
|
|
|
|
| ||||
Original |
| Estimated |
|
|
| Actual |
| ||
Budget |
| Actuals |
|
|
| 30 June 2008 |
| 30 June 2007 |
|
|
|
|
| Direct Income Tax Revenue (accrual) |
|
|
|
|
|
|
|
|
| Individuals |
|
|
|
|
|
22,334 |
| 22,735 |
| Source deductions |
| 23,345 |
| 20,980 |
|
4,553 |
| 4,986 |
| Other persons |
| 5,071 |
| 4,440 |
|
(1,102 | ) | (1,290 | ) | Refunds |
| (1,470 | ) | (1,080 | ) |
474 |
| 521 |
| Fringe benefit tax |
| 522 |
| 468 |
|
26,259 |
| 26,952 |
| Total individuals |
| 27,468 |
| 24,808 |
|
|
|
|
| Corporate Tax |
|
|
|
|
|
8,222 |
| 8,403 |
| Gross companies tax |
| 8,787 |
| 8,849 |
|
(255 | ) | (310 | ) | Refunds |
| (242 | ) | (296 | ) |
1,005 |
| 1,653 |
| Non-resident withholding tax |
| 1,506 |
| 1,189 |
|
102 |
| 122 |
| Foreign-source dividend withholding payments |
| 71 |
| 149 |
|
9,074 |
| 9,868 |
| Total corporate tax |
| 10,122 |
| 9,891 |
|
|
|
|
| Other Direct Income Tax |
|
|
|
|
|
2,340 |
| 2,596 |
| Resident withholding tax on interest income |
| 2,699 |
| 2,227 |
|
92 |
| 63 |
| Resident withholding tax on dividend income |
| 69 |
| 89 |
|
2 |
| 3 |
| Estate and gift duties |
| 3 |
| 2 |
|
2,434 |
| 2,662 |
| Total other direct income tax |
| 2,771 |
| 2,318 |
|
37,767 |
| 39,482 |
| Total direct income tax |
| 40,361 |
| 37,017 |
|
|
|
|
| Indirect Income Tax Revenue (accrual) |
|
|
|
|
|
|
|
|
| Goods and Services Tax |
|
|
|
|
|
19,726 |
| 20,655 |
| Gross goods and services tax |
| 20,631 |
| 19,540 |
|
(8,231 | ) | (8,841 | ) | Refunds |
| (9,516 | ) | (8,325 | ) |
11,495 |
| 11,814 |
| Total goods and services tax |
| 11,115 |
| 11,215 |
|
|
|
|
| Other Indirect Taxation |
|
|
|
|
|
1,865 |
| 1,880 |
| Customs duty |
| 1,857 |
| 1,836 |
|
877 |
| 867 |
| Road user charges |
| 851 |
| 786 |
|
903 |
| 818 |
| Petroleum fuels excise |
| 819 |
| 819 |
|
586 |
| 573 |
| Alcohol excise |
| 573 |
| 553 |
|
148 |
| 144 |
| Tobacco excise |
| 159 |
| 238 |
|
215 |
| 245 |
| Gaming duties |
| 260 |
| 230 |
|
219 |
| 227 |
| Motor vehicle fees |
| 226 |
| 222 |
|
64 |
| 89 |
| Approved issuer levy and cheque duty |
| 105 |
| 94 |
|
34 |
| 47 |
| Energy resources levies |
| 46 |
| 54 |
|
4,911 |
| 4,890 |
| Total other indirect taxation |
| 4,896 |
| 4,832 |
|
16,406 |
| 16,704 |
| Total indirect taxation |
| 16,011 |
| 16,047 |
|
54,173 |
| 56,186 |
| Total taxation revenue |
| 56,372 |
| 53,064 |
|
|
|
|
| Other Sovereign Revenue (accrual) |
|
|
|
|
|
2,654 |
| 2,770 |
| ACC levies |
| 2,718 |
| 2,468 |
|
261 |
| 285 |
| Fire Service levies |
| 279 |
| 268 |
|
86 |
| 86 |
| EQC levies |
| 86 |
| 84 |
|
243 |
| 268 |
| Child Support |
| 308 |
| 242 |
|
236 |
| 264 |
| Court Fines |
| 262 |
| 250 |
|
213 |
| 178 |
| Other miscellaneous items |
| 226 |
| 184 |
|
3,693 |
| 3,851 |
| Total other sovereign revenue |
| 3,879 |
| 3,496 |
|
57,866 |
| 60,037 |
| Total sovereign revenue |
| 60,251 |
| 56,560 |
|
Forecast |
|
|
|
|
| ||||
Original |
| Estimated |
|
|
| Actual |
| ||
Budget |
| Actuals |
|
|
| 30 June 2008 |
| 30 June 2007 |
|
|
|
|
| Direct Income Tax Receipts (cash) |
|
|
|
|
|
|
|
|
| Individuals |
|
|
|
|
|
22,334 |
| 22,676 |
| Source deductions |
| 22,830 |
| 21,009 |
|
5,430 |
| 5,669 |
| Other persons |
| 5,469 |
| 5,121 |
|
(2,017 | ) | (2,238 | ) | Refunds |
| (2,171 | ) | (1,850 | ) |
470 |
| 486 |
| Fringe benefit tax |
| 489 |
| 482 |
|
26,217 |
| 26,593 |
| Total individuals |
| 26,617 |
| 24,762 |
|
|
|
|
| Corporate Tax |
|
|
|
|
|
9,184 |
| 9,327 |
| Gross companies tax |
| 9,075 |
| 9,120 |
|
(1,041 | ) | (1,000 | ) | Refunds |
| (1,026 | ) | (1,153 | ) |
981 |
| 1,615 |
| Non-resident withholding tax |
| 1,638 |
| 1,135 |
|
102 |
| 122 |
| Foreign-source dividend withholding payments |
| 72 |
| 141 |
|
9,226 |
| 10,064 |
| Total corporate tax |
| 9,759 |
| 9,243 |
|
|
|
|
| Other Direct Income Tax |
|
|
|
|
|
2,340 |
| 2,567 |
| Resident withholding tax on interest income |
| 2,616 |
| 2,192 |
|
92 |
| 63 |
| Resident withholding tax on dividend income |
| 40 |
| 90 |
|
2 |
| 3 |
| Estate and gift duties |
| 2 |
| 3 |
|
2,434 |
| 2,633 |
| Total direct other income tax |
| 2,658 |
| 2,285 |
|
37,877 |
| 39,290 |
| Total direct income tax |
| 39,034 |
| 36,290 |
|
|
|
|
| Indirect Tax Receipts (cash) |
|
|
|
|
|
|
|
|
| Goods and Services Tax |
|
|
|
|
|
19,354 |
| 20,038 |
| Gross goods and services tax |
| 20,085 |
| 18,701 |
|
(7,877 | ) | (8,561 | ) | Refunds |
| (8,859 | ) | (7,625 | ) |
11,477 |
| 11,477 |
| Total goods and services tax |
| 11,226 |
| 11,076 |
|
|
|
|
| Other Indirect Taxation |
|
|
|
|
|
1,865 |
| 1,880 |
| Customs duty |
| 1,946 |
| 1,778 |
|
877 |
| 867 |
| Road user charges |
| 851 |
| 791 |
|
903 |
| 818 |
| Petroleum fuels excise |
| 809 |
| 835 |
|
586 |
| 573 |
| Alcohol excise |
| 554 |
| 549 |
|
148 |
| 144 |
| Tobacco excise |
| 160 |
| 265 |
|
215 |
| 245 |
| Gaming duties |
| 238 |
| 236 |
|
219 |
| 227 |
| Motor vehicle fees |
| 223 |
| 208 |
|
64 |
| 89 |
| Approved issuer levy and cheque duty |
| 85 |
| 74 |
|
35 |
| 52 |
| Energy resources levies |
| 42 |
| 55 |
|
4,912 |
| 4,895 |
| Total other indirect taxation |
| 4,908 |
| 4,791 |
|
16,389 |
| 16,372 |
| Total indirect taxation |
| 16,134 |
| 15,867 |
|
54,266 |
| 55,662 |
| Total tax receipts collected |
| 55,168 |
| 52,157 |
|
|
|
|
| Other Sovereign Receipts (cash) |
|
|
|
|
|
2,561 |
| 2,565 |
| ACC levies |
| 2,561 |
| 2,408 |
|
263 |
| 285 |
| Fire Service levies |
| 281 |
| 268 |
|
86 |
| 86 |
| EQC levies |
| 86 |
| 84 |
|
197 |
| 183 |
| Child Support |
| 171 |
| 178 |
|
156 |
| 167 |
| Court Fines |
| 169 |
| 160 |
|
209 |
| 210 |
| Other miscellaneous items |
| 192 |
| 126 |
|
3,472 |
| 3,496 |
| Total other sovereign receipts |
| 3,460 |
| 3,224 |
|
57,738 |
| 59,158 |
| Total sovereign receipts |
| 58,628 |
| 55,381 |
|
Forecast |
|
|
|
|
| ||||
Original |
| Estimated |
|
|
| Actual |
| ||
Budget |
| Actuals |
|
|
| 30 June 2008 |
| 30 June 2007 |
|
|
|
|
| By type |
|
|
|
|
|
7,550 |
| 6,972 |
| Sales of goods |
| 8,617 |
| 6,706 |
|
5,703 |
| 6,710 |
| Rendering of services |
| 6,782 |
| 5,907 |
|
13,253 |
| 13,682 |
| Total sales of goods and services |
| 15,399 |
| 12,613 |
|
|
|
|
| By source |
|
|
|
|
|
1,057 |
| 1,161 |
| Core Crown |
| 1,097 |
| 1,095 |
|
11,928 |
| 12,080 |
| Crown entities |
| 12,502 |
| 11,322 |
|
11,510 |
| 11,711 |
| State-owned Enterprises |
| 13,201 |
| 10,701 |
|
(11,242 | ) | (11,270 | ) | Inter-segment eliminations |
| (11,401 | ) | (10,505 | ) |
13,253 |
| 13,682 |
| Total sales of goods and services |
| 15,399 |
| 12,613 |
|
Forecast |
|
|
|
|
| ||||
Original |
| Estimated |
|
|
| Actual |
| ||
Budget |
| Actuals |
|
|
| 30 June 2008 |
| 30 June 2007 |
|
|
|
|
| By type |
|
|
|
|
|
132 |
| 80 |
| Sovereign receivables |
| 45 |
| 66 |
|
391 |
| 414 |
| Student loans (interest unwind) |
| 407 |
| 451 |
|
307 |
| 329 |
| Other financial assets classified as amortised cost or available for sale |
| 435 |
| 333 |
|
320 |
| 295 |
| Financial assets classified as held for trading |
| 14 |
| 269 |
|
1,715 |
| 1,746 |
| Financial assets classified as fair value through profit and loss |
| 1,902 |
| 1,436 |
|
2,865 |
| 2,864 |
| Total interest revenue |
| 2,803 |
| 2,555 |
|
501 |
| 339 |
| Dividends |
| 411 |
| 440 |
|
3,366 |
| 3,203 |
| Total interest revenue and dividends |
| 3,214 |
| 2,995 |
|
|
|
|
| By source |
|
|
|
|
|
2,587 |
| 2,562 |
| Core Crown |
| 2,344 |
| 2,580 |
|
880 |
| 1,085 |
| Crown entities |
| 1,233 |
| 756 |
|
481 |
| 509 |
| State-owned Enterprises |
| 704 |
| 484 |
|
(582 | ) | (953 | ) | Inter-segment eliminations |
| (1,067 | ) | (825 | ) |
3,366 |
| 3,203 |
| Total interest revenue and dividends |
| 3,214 |
| 2,995 |
|
|
|
|
| Included in total interest revenue above is interest on impaired financial assets of: |
|
|
|
|
|
|
|
|
| Impaired sovereign receivables |
| 45 |
| 44 |
|
|
|
|
| Impaired student loans |
| 407 |
| 451 |
|
|
|
|
| Impaired other financial assets classified as amortised cost or available for sale |
| 5 |
| 45 |
|
|
|
|
| Total interest revenue on impaired financial assets |
| 457 |
| 540 |
|
Forecast |
|
|
| Actual |
| ||||
Original |
| Estimated |
|
|
| 30 June |
| 30 June |
|
72 |
| 99 |
| Sale of royalties |
| 112 |
| 89 |
|
898 |
| 962 |
| Rental income |
| 965 |
| 898 |
|
1,417 |
| 1,830 |
| Other revenue |
| 1,538 |
| 1,434 |
|
2,387 |
| 2,891 |
| Total other revenue |
| 2,615 |
| 2,421 |
|
Forecast |
|
|
| Actual |
| ||||
Original |
| Estimated |
|
|
| 30 June |
| 30 June |
|
|
|
|
| Social Assistance Grants |
|
|
|
|
|
7,292 |
| 7,347 |
| New Zealand superannuation |
| 7,348 |
| 6,810 |
|
1,964 |
| 2,081 |
| Family tax credit |
| 1,897 |
| 1,699 |
|
1,456 |
| 1,475 |
| Domestic purposes benefit |
| 1,478 |
| 1,468 |
|
1,201 |
| 1,214 |
| Invalids benefit |
| 1,216 |
| 1,132 |
|
909 |
| 888 |
| Accommodation supplement |
| 891 |
| 877 |
|
608 |
| 580 |
| Sickness benefit |
| 582 |
| 573 |
|
560 |
| 557 |
| In-work tax credit |
| 563 |
| 461 |
|
475 |
| 473 |
| Income related rents |
| 474 |
| 440 |
|
497 |
| 455 |
| Unemployment benefit |
| 458 |
| 613 |
|
402 |
| 384 |
| Student allowances |
| 386 |
| 382 |
|
279 |
| 278 |
| Disability allowances |
| 278 |
| 270 |
|
1,357 |
| 1,360 |
| Other social assistance benefits |
| 1,339 |
| 1,291 |
|
17,000 |
| 17,092 |
| Total social assistance grants |
| 16,910 |
| 16,016 |
|
|
|
|
| Subsidies |
|
|
|
|
|
491 |
| 1,030 |
| KiwiSaver subsidies |
| 1,102 |
| — |
|
|
|
|
| Other transfer payments |
|
|
|
|
|
401 |
| 398 |
| Official development assistance |
| 362 |
| 330 |
|
17,892 |
| 18,520 |
| Total transfer payments and subsidies |
| 18,374 |
| 16,346 |
|
Forecast |
|
|
| Actual |
| ||||
Original |
| Estimated |
|
|
| 30 June |
| 30 June |
|
|
|
|
| By type |
|
|
|
|
|
14,494 |
| 15,035 |
| Salaries and wages |
| 14,948 |
| 14,088 |
|
637 |
| 764 |
| Costs incurred on GSF and other defined benefit plans |
| 711 |
| 661 |
|
214 |
| 195 |
| Costs incurred on SSRSS and other defined contribution plans |
| 274 |
| 180 |
|
312 |
| 428 |
| Other personnel expenses |
| 545 |
| 355 |
|
15,657 |
| 16,422 |
| Total personnel expenses |
| 16,478 |
| 15,284 |
|
|
|
|
| By source |
|
|
|
|
|
5,434 |
| 5,621 |
| Core Crown |
| 5,584 |
| 5,092 |
|
8,213 |
| 8,624 |
| Crown entities |
| 8,741 |
| 8,183 |
|
2,011 |
| 2,186 |
| State-owned Enterprises |
| 2,164 |
| 2,018 |
|
(1 | ) | (9 | ) | Inter-segment eliminations |
| (11 | ) | (9 | ) |
15,657 |
| 16,422 |
| Total personnel expenses |
| 16,478 |
| 15,284 |
|
|
|
|
| Key management personnel compensation |
|
|
|
|
|
|
|
|
| Salaries and other short-tem employee benefits |
| 7 |
| 7 |
|
|
|
|
|
|
| 7 |
| 7 |
|
Key management personnel are Ministers of the Crown who are members of Cabinet.
The Cabinet Manual sets out guidance in respect of Ministers’ conduct, public duty, and personal interests. Ministers are responsible for ensuring that no conflict exists or appears to exist between their personal interests and their public duty. Therefore, there is a clear expectation that Ministers will not influence or affect any transactions and outstanding balances between the Government and themselves or their family, whanau, and close associates.
Forecast |
|
|
| Actual |
| ||||
Original |
| Estimated |
|
|
| 30 June |
| 30 June |
|
|
|
|
| Depreciation expense |
|
|
|
|
|
989 |
| 1,000 |
| Buildings |
| 980 |
| 936 |
|
87 |
| 89 |
| Electricity distribution network |
| 136 |
| 110 |
|
276 |
| 294 |
| Electricity generation assets |
| 266 |
| 228 |
|
215 |
| 253 |
| Aircraft (excluding military) |
| 166 |
| 192 |
|
255 |
| 256 |
| State highways |
| 302 |
| 299 |
|
177 |
| 177 |
| Rail network |
| 163 |
| 149 |
|
286 |
| 224 |
| Specialist military equipment |
| 222 |
| 238 |
|
854 |
| 816 |
| Other plant and equipment |
| 819 |
| 743 |
|
— |
| 16 |
| Specified cultural and heritage assets |
| 20 |
| 16 |
|
3,139 |
| 3,125 |
| Total depreciation expense |
| 3,074 |
| 2,911 |
|
157 |
| 493 |
| Amortisation and impairment of non-financial assets |
| 596 |
| 486 |
|
3,296 |
| 3,618 |
| Total depreciation and amortisation |
| 3,670 |
| 3,397 |
|
Forecast |
|
|
| Actual |
| ||||
Original |
| Estimated |
|
|
| 30 June |
| 30 June |
|
|
|
|
| By type |
|
|
|
|
|
— |
| — |
| Inventory expenses |
| 300 |
| 280 |
|
2,085 |
| 3,061 |
| Donations and ex gratia payments |
| 3,190 |
| 2,580 |
|
10 |
| 6 |
| Fees paid to audit firms (refer below) |
| 3 |
| 4 |
|
133 |
| 1,407 |
| Impairment of financial assets |
| 1,189 |
| 2,904 |
|
231 |
| 215 |
| Impairment of inventory |
| 2 |
| 15 |
|
412 |
| 417 |
| Lottery prize payments |
| 432 |
| 414 |
|
823 |
| 909 |
| Rental and leasing costs |
| 952 |
| 907 |
|
518 |
| 628 |
| Write-down on initial recognition of financial assets |
| 559 |
| 629 |
|
24,785 |
| 22,574 |
| Other operating expenses |
| 24,029 |
| 20,109 |
|
28,997 |
| 29,217 |
| Total other operating expenses |
| 30,656 |
| 27,842 |
|
|
|
|
|
|
|
|
|
|
|
|
|
|
| By source |
|
|
|
|
|
28,785 |
| 29,564 |
| Core Crown |
| 29,219 |
| 28,951 |
|
14,323 |
| 13,478 |
| Crown entities |
| 14,391 |
| 12,452 |
|
8,168 |
| 8,353 |
| State-owned Enterprises |
| 9,853 |
| 7,363 |
|
(22,279 | ) | (22,178 | ) | Inter-segment eliminations |
| (22,807 | ) | (20,924 | ) |
28,997 |
| 29,217 |
| Total operating expenses |
| 30,656 |
| 27,842 |
|
Operating expenses relate to those expenses incurred in the course of undertaking the functions and activities of entities included in the Government financial statements, excluding those expenses separately identified in the statement of financial performance and other notes. Items disclosed separately are those required by Financial Reporting Standards.
Other operating costs is the large residual item. Most of these costs represent payments made for services provided by third parties (roading maintenance for example) or for raw materials (fuel, medicines or inventory for example). They also include other day-to-day operating costs.
|
| Actual |
| ||
|
| 30 June |
| 30 June |
|
Audit related expenses |
|
|
|
|
|
Office of the Auditor General fees (including Audit NZ) |
|
|
|
|
|
Fees for the audit of financial statements(1) |
| 30 |
| 26 |
|
Fees for assurance and related services |
| 1 |
| 1 |
|
Fees for other services |
| 2 |
| 1 |
|
Other auditors’ fees |
|
|
|
|
|
Fees for assurance and related services |
| 1 |
| 2 |
|
Fees for tax services |
| 1 |
| 1 |
|
Fees for other services |
| 1 |
| 1 |
|
Inter-segment eliminations |
| (33 | ) | (28 | ) |
Fees paid to audit firms |
| 3 |
| 4 |
|
(1) The audit of financial statements are those of the Government reporting entity and its sub-entities.
Forecast |
|
|
| Actual |
| ||||
Original |
| Estimated |
|
|
| 30 June |
| 30 June |
|
$m |
| $m |
|
|
| $m |
| $m |
|
|
|
|
| By type |
|
|
|
|
|
1,671 |
| 1,864 |
| Financial liabilities classified as amortised cost |
| 1,297 |
| 1,328 |
|
17 |
| 2 |
| Financial liabilities classified as held for trading |
| 1 |
| 11 |
|
647 |
| 1,064 |
| Financial liabilities classified as fair value through profit and loss |
| 1,717 |
| 1,528 |
|
413 |
| 24 |
| Interest unwind on provisions |
| 86 |
| 18 |
|
2,748 |
| 2,954 |
| Total interest expenses |
| 3,101 |
| 2,885 |
|
|
|
|
| By source |
|
|
|
|
|
2,245 |
| 2,527 |
| Core Crown |
| 2,460 |
| 2,330 |
|
306 |
| 275 |
| Crown entities |
| 248 |
| 265 |
|
704 |
| 734 |
| State-owned Enterprises |
| 870 |
| 685 |
|
(507 | ) | (582 | ) | Inter-segment eliminations |
| (477 | ) | (395 | ) |
2,748 |
| 2,954 |
| Total interest expenses |
| 3,101 |
| 2,885 |
|
Forecast |
|
|
| Actual |
| ||||
Original |
| Estimated |
|
|
| 30 June |
| 30 June |
|
$m |
| $m |
|
|
| $m |
| $m |
|
|
|
|
| By entity |
|
|
|
|
|
2,965 |
| 4,001 |
| Accident Compensation |
| 3,423 |
| 2,880 |
|
37 |
| 82 |
| Earthquake Commission |
| 130 |
| 77 |
|
8 |
| 12 |
| Other |
| 10 |
| 18 |
|
3,010 |
| 4,095 |
| Total insurance expenses |
| 3,563 |
| 2,975 |
|
|
|
|
| By type |
|
|
|
|
|
|
|
|
| Claims expense |
| 5,257 |
| 3,590 |
|
|
|
|
| Outwards reinsurance premium expense |
| 36 |
| 31 |
|
|
|
|
| Movement in unexpired risk liability |
| 298 |
| 115 |
|
|
|
|
| Other underwriting expenses |
| 93 |
| 83 |
|
|
|
|
| Total claims and other expenses |
| 5,684 |
| 3,819 |
|
|
|
|
| less actuarial gain/(loss) |
| (1,709 | ) | (481 | ) |
|
|
|
| less operating costs relating to claims |
| (412 | ) | (363 | ) |
|
|
|
| Total insurance expenses (excl gains/losses and operations) |
| 3,563 |
| 2,975 |
|
Claims expense is the sum of claims settled and claims management expenses relating to claims incurred plus the movement in the outstanding claims liability.
Total claims and other expenses are those related to claims that have occurred prior to reporting date. Within these expenses are expenses relating to actuarial gains/(losses) and operating costs (e.g. costs for processing claims and injury prevention promotion) which due to their nature are reported elsewhere in the statement of financial performance eg. under gains/losses or personnel expenses.
Insurance expenses represents underwriting expenses less those expenses reported elsewhere i.e. insurance expenses largely comprise direct settlement of claims and expected movements in the outstanding liability and unexpired risk liability.
|
| Actual |
| ||
|
| 30 June |
| 30 June |
|
|
| $m |
| $m |
|
Net Underwriting Result |
|
|
|
|
|
Premium revenue |
| 2,804 |
| 2,552 |
|
Recoveries revenue (inc reinsurance recovery) |
| — |
| — |
|
Underwriting revenue |
| 2,804 |
| 2,552 |
|
Less claims and other expenses |
| (5,684 | ) | (3,819 | ) |
Net underwriting surplus/(deficit) |
| (2,880 | ) | (1,267 | ) |
The underwriting surplus/(deficit) represents the net effect on the statement of financial performance from claims incurred prior to reporting date. It includes actuarial gains/(losses).
Underwriting revenue is reported separately in the financial statements under other sovereign revenue.
|
| Actual |
| ||
|
| 30 June |
| 30 June |
|
|
| $m |
| $m |
|
Operating cash flows associated with the underwriting result are: |
|
|
|
|
|
Cash receipts |
| 2,647 |
| 2,492 |
|
Cash payments |
| (3,041 | ) | (2,776 | ) |
Net operating cash flows |
| (394 | ) | (284 | ) |
Forecast |
|
|
| Actual |
| ||||
Original |
| Estimated |
|
|
| 30 June |
| 30 June |
|
$m |
| $m |
|
|
| $m |
| $m |
|
|
|
|
| By type |
|
|
|
|
|
1 |
| 12 |
| Foreign exchange gains on financial assets measured at amortised cost |
| 70 |
| — |
|
— |
| 1 |
| Foreign exchange losses on financial assets measured at amortised cost |
| — |
| (136 | ) |
282 |
| (426 | ) | Change in fair value of financial assets classified as held for trading |
| (18 | ) | 146 |
|
4 |
| (6 | ) | Gain/(loss) on disposal of financial assets classified at amortised cost |
| (5 | ) | (39 | ) |
899 |
| (1,007 | ) | Change in fair value of financial assets classified as fair value through profit and loss |
| (226 | ) | (5,162 | ) |
1,186 |
| (1,426 | ) | Net gains/(losses) on financial assets |
| (179 | ) | (5,191 | ) |
— |
| 1 |
| Foreign exchange gains on financial liabilities measured at amortised cost |
| 2 |
| 156 |
|
— |
| (116 | ) | Foreign exchange losses on financial liabilities measured at amortised cost |
| (148 | ) | (2 | ) |
— |
| (2 | ) | Change in fair value of financial liabilities classified as held for trading |
| (2 | ) | 58 |
|
— |
| — |
| Gain/(loss) on disposal of financial liabilities classified at amortised cost |
| (7 | ) | (1 | ) |
— |
| (329 | ) | Change in fair value of financial liabilities classified as fair value through profit and loss |
| (591 | ) | 913 |
|
— |
| (446 | ) | Net gains/(losses) on financial liabilities |
| (746 | ) | 1,124 |
|
191 |
| 1,048 |
| Net gains/(losses) on derivatives |
| 308 |
| 5,632 |
|
1,377 |
| (824 | ) | Net gains/(losses) on financial instruments |
| (617 | ) | 1,565 |
|
|
|
|
| By source |
|
|
|
|
|
1,155 |
| 200 |
| Core Crown |
| 353 |
| 1,179 |
|
485 |
| (691 | ) | Crown entities |
| (743 | ) | 365 |
|
18 |
| (138 | ) | State-owned Enterprises |
| (37 | ) | 63 |
|
(281 | ) | (195 | ) | Inter-segment eliminations |
| (190 | ) | (42 | ) |
1,377 |
| (824 | ) | Net gains/(losses) on financial instruments |
| (617 | ) | 1,565 |
|
Forecast |
|
|
| Actual |
| ||||
Original |
| Estimated |
|
|
| 30 June |
| 30 June |
|
$m |
| $m |
|
|
| $m |
| $m |
|
|
|
|
| By type |
|
|
|
|
|
— |
| (29 | ) | Foreign exchange gains/(losses) |
| (91 | ) | (5 | ) |
— |
| (906 | ) | Actuarial gains/(losses) on GSF liability |
| (1,098 | ) | 1,133 |
|
— |
| (1,059 | ) | Actuarial gains/(losses) on ACC outstanding claims |
| (1,709 | ) | (481 | ) |
— |
| (98 | ) | Other gains/(losses) on non-financial liabilities |
| (183 | ) | (3 | ) |
— |
| (46 | ) | Gains/(losses) on sale or disposals of property, plant and equipment |
| (1 | ) | (323 | ) |
— |
| 129 |
| Gains/(losses) on agricultural assets |
| 130 |
| 144 |
|
— |
| — |
| Gains/(losses) on intangible assets |
| 18 |
| (2 | ) |
— |
| 2 |
| Other gains/(losses) on non-financial assets |
| 9 |
| 23 |
|
— |
| (2,007 | ) | Net gains/(losses) on non-financial instruments |
| (2,925 | ) | 486 |
|
|
|
|
| By source |
|
|
|
|
|
— |
| (1,057 | ) | Core Crown |
| (1,369 | ) | 1,163 |
|
— |
| (1,078 | ) | Crown entities |
| (1,725 | ) | (495 | ) |
— |
| 128 |
| State-owned Enterprises |
| 170 |
| (181 | ) |
— |
| — |
| Inter-segment eliminations |
| (1 | ) | (1 | ) |
— |
| (2,007 | ) | Net gains/(losses) on non-financial instruments |
| (2,925 | ) | 486 |
|
The GSF and ACC liabilities are valued by an independent actuary (refer notes 24 and 25). Actuarial gains/(losses) represent differences between actual results and what the actuary had assumed when originally calculating the liability. They are also known as experience adjustments.
Forecast |
|
|
| Actual |
| ||||
Original |
| Estimated |
|
|
| 30 June |
| 30 June |
|
$m |
| $m |
|
|
| $m |
| $m |
|
|
|
|
| By type |
|
|
|
|
|
7,078 |
| 6,005 |
| Tax receivables |
| 7,398 |
| 6,369 |
|
2,843 |
| 3,171 |
| Levies, fines and penalty receivables |
| 3,106 |
| 2,589 |
|
217 |
| 344 |
| Social benefit receivables |
| 440 |
| 394 |
|
2,409 |
| 2,806 |
| Trade and other receivables |
| 3,214 |
| 2,705 |
|
12,547 |
| 12,326 |
| Total receivables |
| 14,158 |
| 12,057 |
|
|
|
|
| By maturity |
|
|
|
|
|
12,121 |
| 11,758 |
| Expected to be realised within one year |
| 13,564 |
| 11,431 |
|
426 |
| 568 |
| Expected to be held for more than one year |
| 594 |
| 626 |
|
12,547 |
| 12,326 |
| Total receivables |
| 14,158 |
| 12,057 |
|
|
|
|
| By source |
|
|
|
|
|
8,285 |
| 7,108 |
| Core Crown |
| 9,031 |
| 7,590 |
|
3,507 |
| 4,260 |
| Crown entities |
| 4,444 |
| 3,687 |
|
1,647 |
| 1,744 |
| State-owned Enterprises |
| 2,247 |
| 1,729 |
|
(892 | ) | (786 | ) | Inter-segment eliminations |
| (1,564 | ) | (949 | ) |
12,547 |
| 12,326 |
| Total receivables |
| 14,158 |
| 12,057 |
|
In determining the recoverability of a tax or other sovereign receivables, the Government uses information about the extent to which the tax or levy payer is contesting the assessment and experience of the outcomes of such disputes, from lateness of payment, and other information obtained from credit collection actions taken. Due to the size of the tax base, the concentration of credit risk is limited and this is not a risk that is managed.
The Government does not hold any collateral or any other credit enhancements over receivables which are past due.
|
| Actual |
| ||
|
| 30 June |
| 30 June |
|
|
| $m |
| $m |
|
Tax Receivables |
|
|
|
|
|
Gross tax receivable |
| 10,423 |
| 9,151 |
|
Impairment of tax receivables |
| (3,025 | ) | (2,782 | ) |
Total tax receivables |
| 7,398 |
| 6,369 |
|
Gross Tax Receivable |
|
|
|
|
|
Current |
| 6,218 |
| 5,646 |
|
Past due |
| 4,205 |
| 3,505 |
|
Total gross tax receivable |
| 10,423 |
| 9,151 |
|
% past due |
| 40 | % | 38 | % |
Impairment of tax receivables |
|
|
|
|
|
Balance at beginning of the year |
| 2,782 |
| 984 |
|
Impairment losses recognised on receivables |
| 944 |
| 2,581 |
|
Amounts written off as uncollectible |
| (701 | ) | (783 | ) |
Balance at end of the year |
| 3,025 |
| 2,782 |
|
|
| Actual |
| ||
|
| 30 June |
| 30 June |
|
|
| $m |
| $m |
|
Ageing of tax receivables past due |
|
|
|
|
|
Less than six months |
| 1,458 |
| 960 |
|
Between six months and one year |
| 458 |
| 365 |
|
Between one year and two years |
| 701 |
| 755 |
|
Greater than two years |
| 1,588 |
| 1,425 |
|
Tax receivables past due |
| 4,205 |
| 3,505 |
|
The Inland Revenue Department (IRD) administers the majority of the tax receivable portfolio. The recoverable amount of the portfolio administered by IRD is calculated by forecasting the expected repayments based on analysis of historical debt data, deducting an estimate of service costs and then discounting at the current use of money interest (UOMI) rate. If the recoverable amount of the IRD portfolio is less than the carrying amount, the carrying amount is reduced to the recoverable amount.
|
| Actual |
| ||
|
| 30 June |
| 30 June |
|
|
| $m |
| $m |
|
The estimated recoverable amount of this portfolio and key assumptions underpinning the valuation are: |
|
|
|
|
|
Recoverable amount of tax receivables current |
| 6,218 |
| 5,646 |
|
Recoverable amount of tax receivables past due |
| 1,180 |
| 723 |
|
Discount rate (UOMI) |
| 14.24 | % | 14.24 | % |
Impact on recoverable amount of a 2% increase in discount rate |
| (18 | ) | (19 | ) |
Impact on recoverable amount of a 2% decrease in discount rate |
| 19 |
| 21 |
|
Tax receivables are classified as past due when any outstanding tax is not paid by the taxpayer’s due date. Due dates will vary depending on the type of tax outstanding (e.g. GST, income tax, PAYE) and the taxpayer’s balance date. Past due debt includes debt collected under instalment, debt under dispute, default assessments and debts of taxpayers who are bankrupt, in receivership or in liquidation. IRD has debt management policies and procedures to actively manage the collection of past due debt.
The fair value of tax receivables is not materially different from the carrying value.
|
| Actual |
| ||
|
| 30 June |
| 30 June |
|
|
| $m |
| $m |
|
Levies, fines and penalty receivables |
|
|
|
|
|
Gross ACC levy receivables |
| 2,895 |
| 2,425 |
|
Gross other levies, fines and penalty receivables |
| 1,529 |
| 1,321 |
|
Total gross levies, fines and penalty receivables |
| 4,424 |
| 3,746 |
|
Impairment of ACC levy receivables |
| (73 | ) | (73 | ) |
Impairment of other levies, fines and penalty receivables |
| (1,245 | ) | (1,084 | ) |
Total impairment of receivables |
| (1,318 | ) | (1,157 | ) |
Total levies, fines and penalty receivables |
| 3,106 |
| 2,589 |
|
Impairment of ACC levy receivables |
|
|
|
|
|
Balance at beginning of the year |
| 73 |
| 71 |
|
Impairment losses recognised on receivables |
| 1 |
| 3 |
|
Amounts written off as uncollectible |
| (1 | ) | (1 | ) |
Balance at end of the year |
| 73 |
| 73 |
|
Collective impairment allowance |
| 73 |
| 73 |
|
Individual impairment allowance |
| — |
| — |
|
Balance at end of the year |
| 73 |
| 73 |
|
Impairment of other levies, fines and penalty receivables |
|
|
|
|
|
Balance at beginning of the year |
| 1,084 |
| 989 |
|
Impairment losses recognised on receivables |
| 206 |
| 116 |
|
Amounts written off as uncollectible |
| (45 | ) | (21 | ) |
Balance at end of the year |
| 1,245 |
| 1,084 |
|
Collective impairment allowance |
| 1,245 |
| 1,084 |
|
Individual impairment allowance |
| — |
| — |
|
Balance at end of the year |
| 1,245 |
| 1,084 |
|
Ageing of levies, fines and penalty receivables past due but not impaired |
|
|
|
|
|
Less than six months |
| 20 |
| 16 |
|
Between six months and one year |
| — |
| — |
|
Greater than one year |
| — |
| — |
|
Total levies, fines and penalty receivables past due but not impaired |
| 20 |
| 16 |
|
The ACC levy receivables are short term, so their carrying amount provides a reasonable approximation of their fair value. Of the other levy, fines and penalties receivables, the majority is in the debtor portfolio administered by the Ministry of Justice (ie, court fines, associated court fees and enforcement fees) with a carrying value of $206 million (2007: $195 million). Their carrying amount provides a reasonable approximation of their fair value. The carrying value of these Justice receivables is calculated using discounted cash flows (net of estimated service costs).
|
| Actual |
| ||
|
| 30 June |
| 30 June |
|
|
| $m |
| $m |
|
Social benefit receivables |
|
|
|
|
|
Gross social benefit receivables |
| 942 |
| 842 |
|
Impairment of social benefit receivables |
| (502 | ) | (448 | ) |
Total social benefit receivables |
| 440 |
| 394 |
|
Impairment of social benefit receivables |
|
|
|
|
|
Balance at beginning of the year |
| 448 |
| 446 |
|
Impairment losses recognised on receivables |
| 49 |
| 2 |
|
Amounts written off as uncollectible |
| 5 |
| — |
|
Balance at end of the year |
| 502 |
| 448 |
|
Collective impairment allowance |
| 502 |
| 488 |
|
Individual impairment allowance |
| — |
| — |
|
Balance at end of the year |
| 502 |
| 488 |
|
Ageing of social benefit receivables past due but not impaired |
|
|
|
|
|
Less than six months |
| — |
| 4 |
|
Between six months and one year |
| — |
| — |
|
Greater than one year |
| — |
| — |
|
Total social benefit receivables past due but not impaired |
| — |
| 4 |
|
Social benefit receivables comprise benefit overpayments, advances on benefits and recoverable special needs grants primarily administered by the Ministry of Social Development with a carrying value of $374 million (2007: $375 million). Their carrying amount provides a reasonable approximation of their fair value. The carrying value of these receivables is calculated using forecast discounted cash flows (net of estimated service costs).
|
| Actual |
| ||
|
| 30 June |
| 30 June |
|
|
| $m |
| $m |
|
Trade and other receivables |
|
|
|
|
|
Gross trade and other receivables |
| 3,258 |
| 2,775 |
|
Impairment of trade and other receivables |
| (44 | ) | (70 | ) |
Total trade and other receivables |
| 3,214 |
| 2,705 |
|
Impairment of trade and other receivables |
|
|
|
|
|
Balance at beginning of the year |
| 70 |
| 53 |
|
Impairment losses recognised on receivables |
| 10 |
| 14 |
|
Amounts written off as uncollectible |
| (32 | ) | 3 |
|
Impairment losses reversed |
| (4 | ) | — |
|
Balance at end of the year |
| 44 |
| 70 |
|
Collective impairment allowance |
| 42 |
| 70 |
|
Individual impairment allowance |
| 2 |
| — |
|
Balance at end of the year |
| 44 |
| 70 |
|
Ageing of trade and other receivables past due but not impaired |
|
|
|
|
|
Less than six months |
| 183 |
| 423 |
|
Between six months and one year |
| 13 |
| 8 |
|
Greater than one year |
| 4 |
| 7 |
|
Total trade and other receivables past due but not impaired |
| 200 |
| 438 |
|
Most trade and other receivables are short term, with $2,974 million (2007: $2,324 million) expected to be settled in the next year. Their carrying amount provides a reasonable approximation of their fair value.
Forecast |
|
|
| Actual |
| ||||
Original |
| Estimated |
|
|
| 30 June |
| 30 June |
|
$m |
| $m |
|
|
| $m |
| $m |
|
|
|
|
| By type |
|
|
|
|
|
32,421 |
| 33,306 |
| Marketable securities |
| 36,651 |
| 27,481 |
|
2,037 |
| 1,741 |
| Long term deposits |
| 2,787 |
| 3,174 |
|
464 |
| 1,167 |
| Derivatives in gain |
| 1,563 |
| 2,352 |
|
212 |
| 151 |
| IMF special drawing rights |
| 188 |
| 183 |
|
35,134 |
| 36,365 |
| Total marketable securities, deposits and derivatives in gain |
| 41,189 |
| 33,190 |
|
|
|
|
| By maturity |
|
|
|
|
|
30,127 |
| 34,460 |
| Expected to be realised within one year |
| 37,431 |
| 31,600 |
|
5,007 |
| 1,905 |
| Expected to be held for more than one year |
| 3,758 |
| 1,590 |
|
35,134 |
| 36,365 |
| Total marketable securities, deposits and derivatives in gain |
| 41,189 |
| 33,190 |
|
|
|
|
| By source |
|
|
|
|
|
27,859 |
| 28,809 |
| Core Crown |
| 32,108 |
| 26,291 |
|
11,595 |
| 10,210 |
| Crown entities |
| 10,790 |
| 9,881 |
|
1,296 |
| 2,124 |
| State-owned Enterprises |
| 3,029 |
| 2,150 |
|
(5,616 | ) | (4,778 | ) | Inter-segment eliminations |
| (4,738 | ) | (5,132 | ) |
35,134 |
| 36,365 |
| Total marketable securities, deposits and derivatives in gain |
| 41,189 |
| 33,190 |
|
Marketable securities comprise bonds, commercial paper, debentures and similar tradable financial assets held by the Government for the purposes of realising capital gains or interest revenue. Marketable securities and derivatives in gain are reported at their fair value. Fair value is either based on quoted market price or using a valuation model where there is no active market. The valuation models used generally calculate the expected cash flows under the terms of each specific contract and then discounts these values back to present value.
Long-term deposits are instruments with maturities greater than three months that are not traded in an active market. Long-term deposits are measured at amortised cost. Their carrying amount provides a reasonable approximation of their fair value.
Forecast |
|
|
| Actual |
| ||||
Original |
| Estimated |
|
|
| 30 June |
| 30 June |
|
$m |
| $m |
|
|
| $m |
| $m |
|
|
|
|
| By maturity |
|
|
|
|
|
12,590 |
| 8,624 |
| Expected to be realised within one year |
| 8,934 |
| 9,401 |
|
4,396 |
| 3,912 |
| Expected to be held for more than one year |
| 4,030 |
| 4,180 |
|
16,986 |
| 12,536 |
| Total share investments |
| 12,964 |
| 13,581 |
|
|
|
|
| By source |
|
|
|
|
|
10,734 |
| 7,133 |
| Core Crown |
| 7,340 |
| 7,755 |
|
6,174 |
| 5,373 |
| Crown entities |
| 5,583 |
| 5,784 |
|
84 |
| 67 |
| State-owned Enterprises |
| 63 |
| 85 |
|
(6 | ) | (37 | ) | Inter-segment eliminations |
| (22 | ) | (43 | ) |
16,986 |
| 12,536 |
| Total share investments |
| 12,964 |
| 13,581 |
|
Share investments are reported at fair value. The fair value of listed share investments are based on quoted market price. The fair value of unlisted share investments is determined from the initial cost of the investment and adjusted for performance of the business and changes in equity market conditions since inception date.
Forecast |
|
|
| Actual |
| ||||
Original |
| Estimated |
|
|
| 30 June |
| 30 June |
|
$m |
| $m |
|
|
| $m |
| $m |
|
|
|
|
| By type |
|
|
|
|
|
6,252 |
| 6,278 |
| Student loans |
| 6,741 |
| 6,011 |
|
5,127 |
| 5,751 |
| Kiwibank mortgages |
| 5,581 |
| 3,637 |
|
1,459 |
| 1,878 |
| Other advances |
| 626 |
| 1,080 |
|
12,838 |
| 13,907 |
| Total advances |
| 12,948 |
| 10,728 |
|
|
|
|
| By source |
|
|
|
|
|
10,788 |
| 11,140 |
| Core Crown |
| 10,278 |
| 9,087 |
|
419 |
| 433 |
| Crown entities |
| 434 |
| 376 |
|
5,194 |
| 6,052 |
| State-owned Enterprises |
| 5,857 |
| 4,486 |
|
(3,563 | ) | (3,718 | ) | Inter-segment eliminations |
| (3,621 | ) | (3,221 | ) |
12,838 |
| 13,907 |
| Total advances |
| 12,948 |
| 10,728 |
|
The maximum loss due to default on advances is the carrying value reported in the statement of financial position.
Forecast |
|
|
| Actual |
| ||||
Original |
| Estimated |
|
|
| 30 June |
| 30 June |
|
$m |
| $m |
|
|
| $m |
| $m |
|
|
|
|
| Student Loans |
|
|
|
|
|
9,983 |
| 10,012 |
| Nominal value(1) |
| 9,573 |
| 9,413 |
|
3,731 |
| 3,734 |
| Write-down on initial recognition and impairment |
| 2,832 |
| 3,402 |
|
6,252 |
| 6,278 |
| Total student loans |
| 6,741 |
| 6,011 |
|
|
|
|
| Gross carrying value |
| 7,044 |
| 6,544 |
|
|
|
|
| Impairment of student loans |
| (303 | ) | (533 | ) |
|
|
|
| Total student loans |
| 6,741 |
| 6,011 |
|
|
|
|
| Expected to be repaid within one year |
| 630 |
| 628 |
|
|
|
|
| Expected to be held for more than one year |
| 6,111 |
| 5,383 |
|
|
|
|
| Total student loans |
| 6,741 |
| 6,011 |
|
|
|
|
| Movement during the year |
|
|
|
|
|
5,761 |
| 6,011 |
| Opening balance |
| 6,011 |
| 5,569 |
|
1,278 |
| 1,210 |
| Amount borrowed in current year |
| 1,201 |
| 1,176 |
|
(526 | ) | (487 | ) | Less initial write down to fair value |
| (487 | ) | (488 | ) |
(621 | ) | (611 | ) | Repayments made during the year |
| (629 | ) | (555 | ) |
391 |
| 414 |
| Interest unwind |
| 407 |
| 451 |
|
(31 | ) | (260 | ) | (Impairment)/reversal of impairment |
| 231 |
| (151 | ) |
— |
| 1 |
| Other movements |
| 7 |
| 9 |
|
6,252 |
| 6,278 |
| Closing balance student loans |
| 6,741 |
| 6,011 |
|
(1) The nominal loan balance for 2008 excludes accrued interest whereas in the prior year the nominal balance included accrued interest of $493 million. Accrued interest is written off each year when certain criteria are met. On review of the nominal balance it was concluded that it was more appropriate to exclude the accrued interest from the disclosure of the nominal balance as this will be written off for New Zealand based borrowers.
|
| Actual |
| ||
|
| 30 June |
| 30 June |
|
|
| 2008 |
| 2007 |
|
|
| $m |
| $m |
|
Impairment allowance of student loans |
|
|
|
|
|
Balance at beginning of the year |
| 533 |
| 382 |
|
Impairment losses recognised on receivables |
| — |
| 151 |
|
Impairment losses reversed |
| (230 | ) | — |
|
Balance at end of the year |
| 303 |
| 533 |
|
The carrying value of student loans reflects current student loans policy. It is sensitive to changes in a number of underlying assumptions, including future income levels, repayment behaviour and macro economic factors such as inflation and the discount rates used to determine the effective interest on new borrowers. The data for student loans has been integrated from files provided by the Inland Revenue Department, Ministry of Social Development and the Ministry of Education. The current data used for the valuation model is up to 31 March 2007, and contains information on borrowings, repayments, income, educational factors and socio-economic factors. This integrated data has been supplemented by less detailed, but more recent data to value student loans at balance date. Given the lead time required to compile and analyse the integrated data, it is expected that there is a lag between the availability of this data set and balance date.
|
| Actual |
| ||
|
| 30 June |
| 30 June |
|
Significant assumptions behind the carrying value are: |
|
|
|
|
|
Effective interest rate |
| 8.4% |
| 7.1% |
|
Interest rate applied to loans for overseas borrowers |
| 6.7%-6.8% |
| 6.7%-7.2% |
|
CPI |
| 2.5%-4.0% |
| 2.4%-2.6% |
|
Future salary inflation |
| 3.5%-4.7% |
| 3.4%-3.6% |
|
The estimated fair value of the student loan portfolio and key assumptions underpinning the fair valuation are: |
|
|
|
|
|
assumptions underpinning the fair valuation are: |
|
|
|
|
|
Fair value |
| 5,521 |
| 5,443 |
|
Fair value discount rate |
| 9.2 | % | 7.8 | % |
Impact on fair value of a 1% increase in discount rate |
| (321 | ) | (232 | ) |
Impact on fair value of a 1% decrease in discount rate |
| 366 |
| 258 |
|
Fair value is the amount for which the loan book value could be exchanged between knowledgeable, willing parties in an arm’s-length transaction as at 30 June 2008. It is determined by discounting the cash flows at an appropriate discount rate.
Fair values will differ from carrying values due to changes in market interest rates, as the carrying value is not adjusted for such changes whereas the fair value was calculated on a discount rate that was current at 30 June 2008. At that date the fair value was calculated on a discount rate of 9.19% whereas a weighted average discount rate of 6.56% was used for the carrying value. Therefore, the difference between fair value and carrying value does not represent an impairment of the asset.
Through the everyday operations of the student loan scheme the Government is exposed to the risk that borrowers will default on their obligation to repay their loans or die before their loan is repaid. The student loan scheme does not require borrowers to provide any collateral or security to support their borrowings. As the total sum advanced is widely dispersed over a large number of borrowers, the scheme does not have any material individual concentrations of credit risk. The credit risk is reduced by collection of repayments through the tax system.
The Student Loan Scheme Annual Report contains more information on the student loan scheme.
Forecast |
|
|
| Actual |
| ||||
Original |
| Estimated |
|
|
| 30 June |
| 30 June |
|
|
|
|
| Kiwibank Mortgages |
|
|
|
|
|
|
|
|
| By maturity |
|
|
|
|
|
|
|
|
| Expected to be repaid within one year |
| 619 |
| 308 |
|
|
|
|
| Expected to be held for more than one year |
| 4,962 |
| 3,329 |
|
5,127 |
| 5,751 |
| Total Kiwibank mortgages |
| 5,581 |
| 3,637 |
|
|
|
|
| Ageing of Kiwibank mortgages past due but not impaired |
|
|
|
|
|
|
|
|
| Less than six months |
| 26 |
| 9 |
|
|
|
|
| Between six months and one year |
| — |
| — |
|
|
|
|
| Greater than one year |
| — |
| — |
|
|
|
|
| Total Kiwibank mortgages past due but not impaired |
| 26 |
| 9 |
|
|
|
|
| Measurement basis for Kiwibank mortgages |
|
|
|
|
|
|
|
|
| Kiwibank mortgages measured at amortised cost |
| 2,427 |
| 885 |
|
|
|
|
| Kiwibank mortgages measured at fair value |
| 3,154 |
| 2,752 |
|
|
|
|
| Total Kiwibank mortgages |
| 5,581 |
| 3,637 |
|
Kiwibank mortgages originating from 1 January 2008 are measured at amortised cost. Retail fixed rate lending issued prior to 1 January 2008 has been designated at fair value through the profit and loss, as this significantly reduces an accounting mismatch, which would arise if such loans were carried at amortised cost, and the derivatives, which have been entered into to offset the interest rate risk on the retail fixed loans are held for trading. Movements in fair value are reported in the statement of financial performance.
The fair value of Kiwibank mortgages measured at amortised cost is $2,428 million (2007: $878 million). This valuation is based on a discounted cash flow model with reference to market interest rates, prepayment rates and estimated credit losses.
The maximum loss due to default on Kiwibank mortgages is the carrying value reported in the statement of financial position. Collateral is obtained to mitigate any risk of loss, which in the case of Kiwibank mortgages are primarily in the form of properties.
The carrying value of Kiwibank mortgages will be affected by changes in interest rates. Such changes may be specific to these assets (i.e. changes to credit risk on these assets) and broader market sentiment changes. The following table identifies changes in fair value attributable to credit risk alone for the current period and cumulatively for the life of the assets. It also identifies the extent that credit derivatives are used to manage credit exposure:
|
| Actual |
| ||
|
| 30 June |
| 30 June |
|
Credit risk exposure for Kiwibank Mortgages |
|
|
|
|
|
Fair value impact for the year from changes in credit risk |
| 3 |
| 2 |
|
Cumulative fair value impact from changes in credit risk |
| 1 |
| 2 |
|
Forecast |
|
|
| Actual |
| ||||
Original |
| Estimated |
|
|
| 30 June |
| 30 June |
|
|
|
|
| Other Advances |
|
|
|
|
|
|
|
|
| By maturity |
|
|
|
|
|
1,047 |
| 1,361 |
| Expected to be repaid within one year |
| 71 |
| 97 |
|
412 |
| 517 |
| Expected to be held for more than one year |
| 555 |
| 983 |
|
1,459 |
| 1,878 |
| Total other advances |
| 626 |
| 1,080 |
|
|
|
|
| Impairment of other advances |
|
|
|
|
|
|
|
|
| Balance at beginning of the year |
| 38 |
| 16 |
|
|
|
|
| Impairment losses recognised on receivables |
| 214 |
| 37 |
|
|
|
|
| Amounts written off as uncollectible |
| (2 | ) | (15 | ) |
|
|
|
| Balance at end of the year |
| 250 |
| 38 |
|
|
|
|
| Collective impairment allowance |
| 213 |
| 1 |
|
|
|
|
| Individual impairment allowance |
| 37 |
| 37 |
|
|
|
|
| Balance at end of the year |
| 250 |
| 38 |
|
|
|
|
| Measurement basis for other advances |
|
|
|
|
|
484 |
| 599 |
| Other advances measured at amortised cost |
| 578 |
| 553 |
|
975 |
| 1,279 |
| Other advances measured at fair value |
| 48 |
| 527 |
|
1,459 |
| 1,878 |
| Total other advances |
| 626 |
| 1,080 |
|
The fair value of other advances measured at amortised cost is $553 million (2007: $550 million). There are no advances past due but not impaired (2007: $nil).
Other advances measured at fair value are those that are managed and performance is evaluated on a fair value basis. As they are designated at fair value through profit and loss, the value of these instruments will be affected by changes in interest rates. Changes to interest rates may arise from features specific to these assets (i.e. changes to credit risk on these assets) and broader market sentiment changes.
Forecast |
|
|
| Actual |
| ||||
Original |
| Estimated |
|
|
| 30 June |
| 30 June |
|
|
|
|
| By type |
|
|
|
|
|
|
|
|
| Inventories held for sale |
| 43 |
| 39 |
|
|
|
|
| Military inventories |
| 254 |
| 240 |
|
|
|
|
| Other consumables |
| 667 |
| 547 |
|
982 |
| 933 |
| Total inventory |
| 964 |
| 826 |
|
|
|
|
| By maturity |
|
|
|
|
|
792 |
| 726 |
| Expected to be sold or consumed within one year |
| 758 |
| 645 |
|
190 |
| 207 |
| Expected to be sold or consumed after one year |
| 206 |
| 181 |
|
982 |
| 933 |
| Total inventory |
| 964 |
| 826 |
|
|
|
|
| By source |
|
|
|
|
|
372 |
| 375 |
| Core Crown |
| 392 |
| 347 |
|
129 |
| 145 |
| Crown entities |
| 182 |
| 131 |
|
481 |
| 413 |
| State-owned Enterprises |
| 390 |
| 348 |
|
— |
|
|
| Inter-segment eliminations |
| — |
| — |
|
982 |
| 933 |
| Total inventory |
| 964 |
| 826 |
|
Forecast |
|
|
| Actual |
| ||||
Original |
| Estimated |
|
|
| 30 June |
| 30 June |
|
|
|
|
| By type |
|
|
|
|
|
262 |
| 253 |
| Prepayments |
| 379 |
| 302 |
|
93 |
| 83 |
| Investment property |
| 99 |
| 101 |
|
747 |
| 768 |
| Agricultural assets |
| 732 |
| 743 |
|
287 |
| 254 |
| Investment in supranational organisations |
| 268 |
| 244 |
|
103 |
| 67 |
| Other |
| 185 |
| 137 |
|
1,492 |
| 1,425 |
| Total other assets |
| 1,663 |
| 1,527 |
|
|
|
|
| By maturity |
|
|
|
|
|
399 |
| 367 |
| Expected to be realised within one year |
| 608 |
| 459 |
|
1,093 |
| 1,058 |
| Expected to be held for more than one year |
| 1,055 |
| 1,068 |
|
1,492 |
| 1,425 |
| Total other assets |
| 1,663 |
| 1,527 |
|
|
|
|
| By source |
|
|
|
|
|
1,031 |
| 919 |
| Core Crown |
| 982 |
| 960 |
|
123 |
| 108 |
| Crown entities |
| 147 |
| 113 |
|
345 |
| 446 |
| State-owned Enterprises |
| 549 |
| 481 |
|
(7 | ) | (48 | ) | Inter-segment eliminations |
| (15 | ) | (27 | ) |
1,492 |
| 1,425 |
| Total other assets |
| 1,663 |
| 1,527 |
|
Note 20: Property, Plant and Equipment
Forecast |
|
|
| Actual |
| ||||
Original |
| Estimated |
|
|
| 30 June |
| 30 June |
|
|
|
|
| By Class of asset |
|
|
|
|
|
|
|
|
| Net Carrying Value |
|
|
|
|
|
15,004 |
| 16,750 |
| Land (valuation) |
| 17,609 |
| 16,473 |
|
21,349 |
| 21,368 |
| Buildings (valuation) |
| 22,257 |
| 20,777 |
|
2,219 |
| 2,060 |
| Electricity distribution network (cost) |
| 1,887 |
| 1,972 |
|
10,057 |
| 11,059 |
| Electricity generation assets (valuation) |
| 11,202 |
| 10,402 |
|
2,064 |
| 1,955 |
| Aircraft (excluding military) (valuation) |
| 2,071 |
| 2,104 |
|
19,415 |
| 20,220 |
| State highways (valuation) |
| 20,947 |
| 19,400 |
|
10,804 |
| 10,581 |
| Rail network (valuation) |
| 11,621 |
| 10,568 |
|
3,628 |
| 3,157 |
| Specialist military equipment (valuation) |
| 3,345 |
| 3,079 |
|
5,882 |
| 4,146 |
| Other plant and equipment (cost) |
| 4,412 |
| 3,805 |
|
5,528 |
| 7,059 |
| Specified cultural and heritage assets (valuation) |
| 7,978 |
| 7,018 |
|
95,950 |
| 98,355 |
| Total property, plant and equipment |
| 103,329 |
| 95,598 |
|
|
|
|
| By source |
|
|
|
|
|
26,492 |
| 26,458 |
| Core Crown |
| 28,637 |
| 26,215 |
|
40,327 |
| 42,683 |
| Crown entities |
| 43,659 |
| 41,296 |
|
29,131 |
| 29,214 |
| State-owned Enterprises |
| 31,033 |
| 28,087 |
|
— |
| — |
| Inter-segment eliminations |
| — |
| — |
|
95,950 |
| 98,355 |
| Total property, plant and equipment |
| 103,329 |
| 95,598 |
|
|
|
|
| By holding |
|
|
|
|
|
1,141 |
| 1,019 |
| Leasehold |
| 1,235 |
| 1,146 |
|
94,809 |
| 97,336 |
| Freehold |
| 102,094 |
| 94,452 |
|
95,950 |
| 98,355 |
| Total property, plant and equipment |
| 103,329 |
| 95,598 |
|
|
|
|
|
|
|
|
|
|
|
|
|
|
| Property, plant and equipment pledged to secure borrowing |
| 1,593 |
| 1,384 |
|
Borrowing by the Crown is, under Section 55 of the Public Finance Act 1989, a charge on the revenue of the Crown equally and rateably. Therefore no property, plant and equipment owned by the Core Crown has been pledged as security for liabilities. Government-owned property plant and equipment is however subject to a significant number of legislative and policy restrictions with respect to its use and disposal.
These carrying values critically depend on judgments of useful lives to determine depreciation and the assumptions used in revaluations. Depreciation rates are affirmed to be appropriate each year by those responsible for managing the assets, whereas assurance on the assumptions used in valuations is provided by the use of independent valuers as noted below.
|
| Actual |
| ||
|
| 30 June |
| 30 June |
|
Cost or Valuation |
|
|
|
|
|
Opening balance |
| 103,787 |
| 96,122 |
|
Additions |
| 5,226 |
| 5,215 |
|
Disposals |
| (677 | ) | (721 | ) |
Acquisitions through business combinations |
| 58 |
| 51 |
|
Net revaluations |
| 4,120 |
| 3,323 |
|
Net foreign currency exchange differences |
| 7 |
| (20 | ) |
Other |
| (93 | ) | (183 | ) |
Total cost or valuation |
| 112,428 |
| 103,787 |
|
Accumulated Depreciation |
|
|
|
|
|
Opening balance |
| 8,189 |
| 6,999 |
|
Eliminated on disposal |
| (373 | ) | (387 | ) |
Eliminated on revaluation |
| (1,680 | ) | (1,041 | ) |
Impairment losses charged to operating balance |
| 5 |
| — |
|
Reversals of impairment losses charged to operating balance |
| (13 | ) | (5 | ) |
Depreciation expense |
| 3,074 |
| 2,911 |
|
Net foreign currency exchange differences |
| 13 |
| (213 | ) |
Other |
| (116 | ) | (75 | ) |
Total accumulated depreciation |
| 9,099 |
| 8,189 |
|
Total property, plant and equipment |
| 103,329 |
| 95,598 |
|
Land (valuation) |
|
|
|
|
|
Opening balance |
| 16,473 |
| 14,579 |
|
Additions |
| 250 |
| 309 |
|
Disposals |
| (66 | ) | (69 | ) |
Net revaluations |
| 1,036 |
| 1,635 |
|
Net foreign currency exchange differences |
| 1 |
| — |
|
Other |
| (85 | ) | 19 |
|
Carrying value of land |
| 17,609 |
| 16,473 |
|
By holding |
|
|
|
|
|
Leasehold |
| — |
| 2 |
|
Freehold |
| 17,609 |
| 16,471 |
|
Carrying value of land |
| 17,609 |
| 16,473 |
|
The value of the land underneath state highways and the rail network, as well as land set aside for cultural and heritage purposes (i.e. national parks, forest parks, conservation areas and recreational facilities) is included as a component of the value of those separate classes of assets.
|
| Actual |
| ||
|
| 30 June |
| 30 June |
|
Buildings (valuation) |
|
|
|
|
|
Opening balance |
| 21,936 |
| 21,357 |
|
Additions |
| 1,436 |
| 1,118 |
|
Disposals |
| (65 | ) | (120 | ) |
Acquisitions through business combinations |
| 1 |
| — |
|
Net revaluations |
| 354 |
| (359 | ) |
Net foreign currency exchange differences |
| 1 |
| (13 | ) |
Other |
| (4 | ) | (47 | ) |
Total buildings (valuation) |
| 23,659 |
| 21,936 |
|
Accumulated Depreciation and Impairment on Buildings |
|
|
|
|
|
Opening balance |
| 1,159 |
| 1,140 |
|
Eliminated on disposal |
| (50 | ) | 3 |
|
Eliminated on revaluation |
| (645 | ) | (682 | ) |
Reversals of impairment losses charged to operating balance |
| (7 | ) | (3 | ) |
Depreciation expense |
| 980 |
| 936 |
|
Net foreign currency exchange differences |
| 1 |
| — |
|
Other |
| (36 | ) | (235 | ) |
Accumulated depreciation and impairment on buildings |
| 1,402 |
| 1,159 |
|
Carrying value of buildings |
| 22,257 |
| 20,777 |
|
By holding |
|
|
|
|
|
Leasehold |
| 247 |
| 132 |
|
Freehold |
| 22,010 |
| 20,645 |
|
Carrying value of buildings |
| 22,257 |
| 20,777 |
|
Independent valuations of the Government’s land and buildings have been performed by a number of valuers to determine the fair value of the land and buildings. The valuations, which conform to International Valuation Standards, were determined by reference to prices for similar properties and in some cases by reference to discounted cash flows.
Valuation details for land and buildings with a carrying value over $500 million are as follows:
Category |
| Valuer/Reviewer |
| Approach |
| Timing |
| Land and |
|
Housing stock |
| Quotable Value NZ Limited |
| Valuations based on market evidence or adjusted current rating valuations. |
| Annual valuation cycle. Latest valuation completed as at 30 June 2008. |
| 15,103 (2007: 14,751) |
|
School property |
| Quotable Value NZ Limited or experienced ministry staff (reviewed by Quotable Value) |
| Valuations based on market evidence where possible, or depreciated replacement cost. |
| Annual valuation cycle. Latest valuation completed as at 30 June 2008. |
| 10,466 (2007: 9,705) |
|
Corrections Land and Buildings |
| Valuersnet.nz Limited |
| The last full valuation was based on market evidence, except for prison buildings, which were valued at optimised depreciated replacement cost. A desktop valuation was undertaken during 2007/08 to ensure that the value of the assets had not materially changed since the last full valuation. |
| Two-year valuation cycle. Latest full valuation completed as at 30 June 2007. |
| 1,648 (2007: 1,689) |
|
NZ Defence Force Land and Buildings |
| Beca Valuations Limited |
| Valuations were based on market evidence or rating valuations. |
| Five-year valuation cycle. Latest full valuation completed as at 31 December 2007. |
| 1,634 (2007: 1,290) |
|
Landcorp Land and Buildings |
| Quotable Value NZ Limited |
| Valuations based on market evidence where possible. |
| Annual valuation cycle. Latest valuation completed as at 30 June 2008. |
| 1,322 (2007: 1,099) |
|
Land Information NZ Managed Properties |
| Quotable Value NZ Limited (rated property) and experienced department staff (non-rated property) (reviewed by Telfer Young) |
| Valuations were based on market evidence or discounted cash flows from licence and rental agreements. |
| Annual valuation cycle. Latest valuation completed as at 30 June 2008. |
| 769 (2007: 692) |
|
|
| Actual |
| ||
|
| 30 June |
| 30 June |
|
Electricity Distribution Network (cost) |
|
|
|
|
|
Opening balance |
| 2,369 |
| 2,306 |
|
Additions |
| 46 |
| 75 |
|
Disposals |
| — |
| (12 | ) |
Total electricity distribution network (cost) |
| 2,415 |
| 2,369 |
|
Accumulated Depreciation and Impairment on Electricity Distribution Network |
|
|
|
|
|
Opening balance |
| 397 |
| 299 |
|
Eliminated on disposal |
| (5 | ) | (12 | ) |
Depreciation expense |
| 136 |
| 110 |
|
Accumulated depreciation and impairment on electricity distribution network |
| 528 |
| 397 |
|
Carrying value of electricity distribution network |
| 1,887 |
| 1,972 |
|
By holding |
|
|
|
|
|
Leasehold |
| — |
| — |
|
Freehold |
| 1,887 |
| 1,972 |
|
Carrying value of electricity distribution network |
| 1,887 |
| 1,972 |
|
Electricity Generation Assets (valuation) |
|
|
|
|
|
Opening balance |
| 10,674 |
| 8,635 |
|
Additions |
| 573 |
| 546 |
|
Disposals |
| (2 | ) | (40 | ) |
Net revaluations |
| 640 |
| 1,356 |
|
Other |
| (354 | ) | 177 |
|
Total electricity generation assets |
| 11,531 |
| 10,674 |
|
Accumulated Depreciation and Impairment on Electricity Generation Assets |
|
|
|
|
|
Opening balance |
| 272 |
| 142 |
|
Eliminated on disposal |
| — |
| (101 | ) |
Eliminated on revaluation |
| (196 | ) | — |
|
Depreciation expense |
| 266 |
| 228 |
|
Other |
| (13 | ) | 3 |
|
Accumulated depreciation and impairment on electricity generation assets |
| 329 |
| 272 |
|
Carrying value of electricity generation assets |
| 11,202 |
| 10,402 |
|
By holding |
|
|
|
|
|
Leasehold |
| 4 |
| 24 |
|
Freehold |
| 11,198 |
| 10,378 |
|
Carrying value of electricity generation assets |
| 11,202 |
| 10,402 |
|
Independent valuations of the Government’s electricity generation assets have been performed by a number of valuers as detailed below:
Entity |
| Valuer/Reviewer |
| Approach |
| Timing |
| Carrying value |
|
Genesis Power Limited |
| Directors’ valuation based on an independent review of cash flows by First NZ Capital |
| Valuations based on net present value of future earnings of the assets on an existing use basis, excluding disposal and restoration costs. |
| Five-year valuation cycle. Latest valuation completed as at 30 June 2005. |
| 1,817 (2007: 1,611) |
|
Meridian Energy Limited |
| Pricewaterhouse Coopers |
| Valuations based on net present value of future earnings of the assets on an existing use basis, excluding disposal and restoration costs. |
| Five-year valuation cycle. Latest valuation completed as at 30 June 2007. |
| 6,316
(2007: 6,215) |
|
Mighty River Power Limited |
| Pricewaterhouse Coopers |
| Valuations based on net present value of future earnings of the assets on an existing use basis, excluding disposal and restoration costs. |
| Five-year valuation cycle. Hydro and co-generation assets were last valued as at 30 June 2008. Geothermal and landfill assets were last valued as at 30 June 2005. |
| 2,981
(2007: 2,473) |
|
|
| Actual |
| ||
|
| 30 June |
| 30 June |
|
Aircraft (excluding military) (valuation) |
|
|
|
|
|
Opening balance |
| 2,165 |
| 2,061 |
|
Additions |
| 112 |
| 397 |
|
Disposals |
| (2 | ) | (100 | ) |
Acquisitions through business combinations |
| 11 |
| — |
|
Net revaluations |
| (204 | ) | (414 | ) |
Other |
| (9 | ) | 221 |
|
Total aircraft (excluding military) |
| 2,073 |
| 2,165 |
|
Accumulated Depreciation and Impairment on Aircraft |
|
|
|
|
|
Opening balance |
| 61 |
| — |
|
Eliminated on disposal |
| (1 | ) | (28 | ) |
Eliminated on revaluation |
| (224 | ) | — |
|
Depreciation expense |
| 166 |
| 192 |
|
Net foreign currency exchange differences |
| — |
| (102 | ) |
Other |
| — |
| (1 | ) |
Accumulated depreciation and impairment on aircraft |
| 2 |
| 61 |
|
Carrying value of aircraft (excluding military) |
| 2,071 |
| 2,104 |
|
By holding |
|
|
|
|
|
Leasehold |
| 935 |
| 914 |
|
Freehold |
| 1,136 |
| 1,190 |
|
Carrying value of aircraft (excluding military) |
| 2,071 |
| 2,104 |
|
Aircraft and related assets are valued annually. Independent valuations as at 30 June 2008 have been obtained from The Aircraft Value Analysis Company and Ascend Worldwide Limited (previously named Airclaims Limited) to ascertain indicative market values of each aircraft on a stand-alone basis. The carrying value of the aircraft is recorded at an average of the valuations provided by the two valuers.
The related assets include spare engines and flight simulators.
|
| Actual |
| ||
|
| 30 June |
| 30 June |
|
State Highways (valuation) |
|
|
|
|
|
Opening balance |
| 19,400 |
| 17,930 |
|
Additions |
| 1,012 |
| 912 |
|
Disposals |
| (26 | ) | (27 | ) |
Net revaluations |
| 561 |
| 586 |
|
Other |
| — |
| (1 | ) |
Total state highways |
| 20,947 |
| 19,400 |
|
Accumulated Depreciation and Impairment on State Highways |
|
|
|
|
|
Opening balance |
| — |
| — |
|
Eliminated on revaluation |
| (302 | ) | (298 | ) |
Depreciation expense |
| 302 |
| 299 |
|
Other |
| — |
| (1 | ) |
Accumulated depreciation and impairment on state highways |
| — |
| — |
|
Carrying value of state highways |
| 20,947 |
| 19,400 |
|
By holding |
|
|
|
|
|
Leasehold |
| — |
| — |
|
Freehold |
| 20,947 |
| 19,400 |
|
Carrying value of state highways |
| 20,947 |
| 19,400 |
|
State highways comprise the land, formation works, road structure, drainage works and traffic facilities of the roads, plus bridges, culverts, tunnels, stock and pedestrian underpasses, protection works and retaining structures. The state highways valuation is performed by an independent valuer, Opus International Consultants Limited with property valuations supplied by DTZ New Zealand Limited. The State Highways are subject to a full revaluation on a cyclical basis as at 30 June so that each region is revalued at an interval not exceeding five years. Those regions that are not subject to a full revaluation in a particular year are subject to a valuation update by an independent valuer through the use of price indices. This ensures that the carrying amount of state highways does not differ materially from that which would be determined if a full valuation was done each year.
State highways are valued at depreciated replacement cost based on the estimated present cost of constructing the existing assets by the most appropriate method of construction, reduced by factors for the age and condition of the asset. State highway corridor land, is included as part of the state highway, and is valued using an opportunity cost based on adjacent use, as an approximation to fair value. Borrowing costs have not been capitalised.
|
| Actual |
| ||
|
| 30 June |
| 30 June |
|
Rail Network (valuation) |
|
|
|
|
|
Opening balance |
| 10,721 |
| 10,561 |
|
Additions |
| 242 |
| 277 |
|
Disposals |
| (8 | ) | (118 | ) |
Net revaluations |
| 1,051 |
| — |
|
Other |
| (72 | ) | 1 |
|
Total rail network |
| 11,934 |
| 10,721 |
|
Accumulated Depreciation and Impairment on Rail Network |
|
|
|
|
|
Opening balance |
| 153 |
| — |
|
Eliminated on disposal |
| (3 | ) | 4 |
|
Depreciation expense |
| 163 |
| 149 |
|
Accumulated depreciation and impairment on rail network |
| 313 |
| 153 |
|
Carrying value of rail network |
| 11,621 |
| 10,568 |
|
By holding |
|
|
|
|
|
Leasehold |
| — |
| — |
|
Freehold |
| 11,621 |
| 10,568 |
|
Carrying value of rail network |
| 11,621 |
| 10,568 |
|
The rail network assets comprise land, buildings, and rail infrastructure assets (bridges, tunnels, tracks, level crossings, signals and electrification). The assets are recorded at their fair value at the date of the last revaluation, less any subsequent accumulated depreciation and subsequent accumulated impairment losses.
Revaluations are performed with sufficient regularity such that the carrying amount does not differ materially from that which would be determined using fair values at the balance sheet date.
Valuations are undertaken in accordance with the standards issued by the New Zealand Property Institute. Land and buildings were valued at 30 June 2008 by DTZ New Zealand Limited. The last valuation of rail infrastructure assets was as at 1 July 2006 and was also conducted by DTZ New Zealand Limited.
Railway infrastructure assets and specialised land and buildings are valued using Depreciated Replacement Cost (optimised). Non-specialised land and buildings which could be sold with relative ease are valued at market value. Land associated with the rail corridor is valued using an opportunity cost based on adjacent use, as an approximation to fair value. Borrowing costs have not been capitalised.
|
| Actual |
| ||
|
| 30 June |
| 30 June |
|
Specialist Military Equipment (valuation) |
|
|
|
|
|
Opening balance |
| 3,652 |
| 3,550 |
|
Additions |
| 336 |
| 295 |
|
Disposals |
| (16 | ) | (28 | ) |
Net revaluations |
| (164 | ) | (163 | ) |
Other |
| — |
| (2 | ) |
Total specialist military equipment |
| 3,808 |
| 3,652 |
|
Accumulated Depreciation and Impairment on Specialist Military Equipment |
|
|
|
|
|
Opening balance |
| 573 |
| 344 |
|
Eliminated on disposal |
| (13 | ) | (25 | ) |
Eliminated on revaluation |
| (330 | ) | 8 |
|
Depreciation expense |
| 222 |
| 238 |
|
Net foreign currency exchange differences |
| 10 |
| 9 |
|
Other |
| 1 |
| (1 | ) |
Accumulated depreciation and impairment on specialist military equipment |
| 463 |
| 573 |
|
Carrying value of specialist military equipment |
| 3,345 |
| 3,079 |
|
By holding |
|
|
|
|
|
Leasehold |
| — |
| — |
|
Freehold |
| 3,345 |
| 3,079 |
|
Carrying value of specialist military equipment |
| 3,345 |
| 3,079 |
|
Specialist Military Equipment (SME) assets are subject to revaluation with sufficient regularity to ensure that the carrying amount does not differ materially from fair value and at least once every five years. Valuations use a market based approach, except where reliable market evidence is unavailable and then Optimised Depreciated Replacement Cost (ODRC) is used to calculate fair value. The carrying values of revalued items are reviewed at each balance date to ensure that those values are not materially different to fair value.
Specialist Military Equipment with a net carrying value of $2 million or more, or groups of like assets with a total carrying value of $4 million or more are revalued annually using an internally assessed valuation. All other SME is stated at depreciated replacement cost based on a historic internal valuation or depreciated historical cost.
The internally assessed valuation for SME is reviewed by an independent registered valuer (Beca Valuations Limited).
|
| Actual |
| ||
|
| 30 June |
| 30 June |
|
Other Plant and Equipment (cost) |
|
|
|
|
|
Opening balance |
| 9,066 |
| 9,690 |
|
Additions |
| 1,099 |
| 1,268 |
|
Disposals |
| (464 | ) | (207 | ) |
Acquisitions through business combinations |
| 46 |
| 51 |
|
Net revaluations |
| (1 | ) | — |
|
Net foreign currency exchange differences |
| 5 |
| (7 | ) |
Other |
| 404 |
| (1,729 | ) |
Total other plant and equipment |
| 10,155 |
| 9,066 |
|
Accumulated Depreciation and Impairment on Other Plant and Equipment |
|
|
|
|
|
Opening balance |
| 5,261 |
| 5,074 |
|
Eliminated on disposal |
| (286 | ) | (212 | ) |
Eliminated on revaluation |
| 15 |
| (69 | ) |
Impairment losses charged to operating balance |
| 5 |
| — |
|
Reversals of impairment losses charged to operating balance |
| (6 | ) | (14 | ) |
Depreciation expense |
| 819 |
| 743 |
|
Net foreign currency exchange differences |
| 2 |
| (128 | ) |
Other |
| (67 | ) | (133 | ) |
Accumulated depreciation and impairment on other plant and equipment |
| 5,743 |
| 5,261 |
|
Carrying value of other plant and equipment |
| 4,412 |
| 3,805 |
|
By holding |
|
|
|
|
|
Leasehold |
| 49 |
| 75 |
|
Freehold |
| 4,363 |
| 3,730 |
|
Carrying value of other plant and equipment |
| 4,412 |
| 3,805 |
|
Specified Cultural and Heritage Assets (valuation) |
|
|
|
|
|
Opening balance |
| 7,331 |
| 5,453 |
|
Additions |
| 120 |
| 18 |
|
Disposals |
| (28 | ) | — |
|
Net revaluations |
| 847 |
| 682 |
|
Other |
| 27 |
| 1,178 |
|
Total specified cultural and heritage assets |
| 8,297 |
| 7,331 |
|
|
| Actual |
| ||
|
| 30 June |
| 30 June |
|
Accumulated Depreciation and Impairment on Specified Cultural and Heritage Assets |
|
|
|
|
|
Opening balance |
| 313 |
| — |
|
Eliminated on disposal |
| (15 | ) | (16 | ) |
Eliminated on revaluation |
| 2 |
| — |
|
Reversals of impairment losses charged to operating balance |
| — |
| 12 |
|
Depreciation expense |
| 20 |
| 16 |
|
Net foreign currency exchange differences |
| — |
| 8 |
|
Other |
| (1 | ) | 293 |
|
Accumulated depreciation and impairment on specified cultural and heritage assets |
| 319 |
| 313 |
|
Carrying value of specified cultural and heritage assets |
| 7,978 |
| 7,018 |
|
By holding |
|
|
|
|
|
Leasehold |
| — |
| — |
|
Freehold |
| 7,978 |
| 7,018 |
|
Carrying value of specified cultural and heritage assets |
| 7,978 |
| 7,018 |
|
By group |
|
|
|
|
|
National Archives |
| 506 |
| 564 |
|
National Library |
| 1,004 |
| 881 |
|
Conservation property |
| 5,787 |
| 4,939 |
|
Parliament Library |
| 35 |
| 34 |
|
Te Papa |
| 641 |
| 598 |
|
Other |
| 5 |
| 2 |
|
Carrying value of specified cultural and heritage assets |
| 7,978 |
| 7,018 |
|
There are difficulties associated with obtaining an objective valuation for the specified cultural and heritage assets of the Government. These are discussed below:
Archives in the possession of Archives New Zealand have been valued and recorded at a best estimate of fair value as at 30 June 2008. Determination of the fair value was based on a valuation by Dunbar Sloane in June 2008 using a methodology that divided the collection into categories by format and age, to associate records that could be said to have a broad commonality of value. Benchmark valuations were obtained from an independent valuer, Dunbar Sloane, through market assessments and from other collections of a similar nature to Government archives.
The value of the Treaty of Waitangi was based on a valuation as at 30 June 2008, supported by Sotheby’s, independent valuer. The values of other items of exceptional value were based on a valuation from Dunbar Sloane, also obtained in June 2008. These valuations were based on market assessments and comparisons with other items of a similar nature.
The Protected New Zealand Objects Act 1975 requires protected records to be kept in safe custody in accordance with the directions of the Minister. Also, the Public Records Act 2005 establishes a recordkeeping framework, focusing on supporting good recordkeeping in Government.
The Heritage Collections are valued at fair value. The valuation was performed by National Library staff as at 30 June 2008, with the valuation methodology reviewed by an independent valuer (Rowan Gibbs of Smiths Books). The carrying value includes the value of purchases for the collections since the last revaluation and the value of material received through donation and legal deposit.
Section 11 of the National Library of New Zealand (Te Puna Matauranga o Aotearoa) Act 2003 requires the Crown to own the collections of the Alexander Turnbull Library in perpetuity. The Heritage Collections are not depreciated.
Conservation property includes the Conservation Estate (national parks, forest parks, conservation areas) and recreational facilities. The Conservation Estate valuation at 30 June 2008 was based on rateable valuations prepared by Quotable Value New Zealand and independently reviewed by valuersnet.nz
The Department of Conservation recreational facilities were recorded at their fair valuation. The recreational facilities are subject to an asset management plan and are recorded in the Visitor Assets Management System (VAMS).
The fences that border Conservation Estate areas or form part of the recreational facilities have been valued on a depreciated replacement cost basis. The valuation methodology has been reviewed by an independent valuer.
The use and disposal of all the Crown land managed by the Department of Conservation is determined by legislation, in particular the Reserves Act 1977, the National Parks Act 1980 and the Conservation Act 1987. The Crown land managed by the Department is not subject to mortgages or other charges or treaty claims. Specific areas may, however, be included in the Treaty settlements if the Crown decides to offer those areas to claimants. Some areas may be subject to leases, licences or permits issued by the Department under concession provisions of the relevant legislation.
The Library Heritage collection was valued at 30 June 2008 at current market value on an annual basis by the Service’s library staff in accordance with guidelines released by the New Zealand Library Association and the National Library of New Zealand.
Library Reference Collections are valued at historic cost.
Te Papa’s collections have been valued at cost or market value, with the exception of the Natural Environment collections, which are shown at replacement cost. Collections are valued annually, with each class of collection valued once every three years. Acquisitions to collections between revaluations are recorded at cost. As the collections tend to have an indefinite life and are generally not of a depreciable nature, depreciation is not applicable. The collections were valued by Robin Watt & Associates, cultural and forensic specialists.
The Crown, when establishing Crown Research Institutes in 1992, transferred various national databases and reference collections to individual Institutes at nil value. No reliable valuation is able to be obtained for these assets, and so they remain at nil value. Many of the databases and collections were specifically identified by the Foundation for Research, Science and Technology as being of significant importance and as such have covenants attached to them restricting an Institute’s ability to deal with them.
Forecast |
|
|
| Actual |
| ||||
Original |
| Estimated |
|
|
| 30 June |
| 30 June |
|
5,989 |
| 6,588 |
| Tertiary Education Institutions |
| 7,037 |
| 6,310 |
|
658 |
| 931 |
| Other |
| 1,028 |
| 691 |
|
6,647 |
| 7,519 |
| Total equity accounted investments |
| 8,065 |
| 7,001 |
|
TEIs are Crown entities, and the Government has a number of legislative powers with respect to them in the interests of public accountability and has some significant reserve controls in the event of an institution facing financial risk. However the Government does not determine the operating and financing policies of TEIs, if they are not at financial risk, but rather is committed to safeguarding their academic freedom and autonomy. By so doing, the Government obtains the benefits of an effective tertiary education sector. Their relationship to the Crown is managed by a Plan agreed between them and the Tertiary Education Commission.
The applicability of the test for consolidation in accounting standards as it applies to TEIs and the Government is unclear, and is still under consideration by the relevant accounting authorities. In the interim the TEIs have been included in the accounts as a 100% equity accounted investment.
The financial year of TEIs is the academic year ending 31 December. Half-year information is used to incorporate TEI information into the financial statements. All other associates have a 30 June balance date.
Summarised financial information in respect of TEIs is set out below:
Forecast |
|
|
| Actual |
| ||||
Original |
| Estimated |
|
|
| 30 June |
| 30 June |
|
|
|
|
| Operating Results |
|
|
|
|
|
1,941 |
| 1,994 |
| Revenue from Crown |
| 2,018 |
| 1,811 |
|
1,989 |
| 1,830 |
| Other revenue |
| 1,912 |
| 1,794 |
|
(3,867 | ) | (3,703 | ) | Expenses |
| (3,705 | ) | (3,497 | ) |
63 |
| 121 |
| Net surplus |
| 225 |
| 108 |
|
|
|
|
| Net worth |
|
|
|
|
|
|
|
|
| Assets |
|
|
|
|
|
885 |
| 1,000 |
| Financial assets |
| 766 |
| 1,000 |
|
6,125 |
| 6,735 |
| Property, plant and equipment |
| 6,928 |
| 6,458 |
|
326 |
| 297 |
| Other assets |
| 692 |
| 296 |
|
7,336 |
| 8,032 |
| Total assets |
| 8,386 |
| 7,754 |
|
|
|
|
| Liabilities |
|
|
|
|
|
259 |
| 223 |
| Borrowings |
| 176 |
| 223 |
|
1,088 |
| 1,221 |
| Other liabilities |
| 1,173 |
| 1,221 |
|
1,347 |
| 1,444 |
| Total liabilities |
| 1,349 |
| 1,444 |
|
5,989 |
| 6,588 |
| Net worth |
| 7,037 |
| 6,310 |
|
Forecast |
|
|
| Actual |
| ||||
Original |
| Estimated |
|
|
| 30 June |
| 30 June |
|
|
|
|
| By type |
|
|
|
|
|
5,556 |
| 5,244 |
| Accounts payable |
| 6,444 |
| 4,898 |
|
3,480 |
| 3,179 |
| Taxes repayable |
| 4,451 |
| 3,179 |
|
9,036 |
| 8,423 |
| Total payables |
| 10,895 |
| 8,077 |
|
|
|
|
| By maturity |
|
|
|
|
|
8,684 |
| 8,086 |
| Expected to be settled within one year |
| 10,707 |
| 7,773 |
|
352 |
| 337 |
| Expected to be outstanding for more than one year |
| 188 |
| 304 |
|
9,036 |
| 8,423 |
| Total payables |
| 10,895 |
| 8,077 |
|
|
|
|
| By source |
|
|
|
|
|
5,317 |
| 5,256 |
| Core Crown |
| 7,425 |
| 5,334 |
|
4,276 |
| 3,917 |
| Crown entities |
| 4,042 |
| 4,169 |
|
3,447 |
| 4,124 |
| State-owned Enterprises |
| 4,877 |
| 3,719 |
|
(4,004 | ) | (4,874 | ) | Inter-segment eliminations |
| (5,449 | ) | (5,145 | ) |
9,036 |
| 8,423 |
| Total payables |
| 10,895 |
| 8,077 |
|
Government entities have financial internal control procedures in place to ensure that accounts payable are settled accurately and on a timely basis. The carrying value is a reasonable approximation of the fair value for accounts payable, as they are typically short-term in nature.
Inland Revenue repays taxes repayable as appropriate. The dates are aimed to be those that maximise credit use-of-money interest, or minimise the differential use-of-money interest for taxpayers within the constraints of the tax rules. The carrying value is a reasonable approximation of the fair value for taxes repayable.
Forecast |
|
|
| Actual |
| ||||
Original |
| Estimated |
|
|
| 30 June |
| 30 June |
|
$m |
| $m |
|
|
| $m |
| $m |
|
|
|
|
| By type |
|
|
|
|
|
17,732 |
| 18,683 |
| Government stock |
| 18,516 |
| 15,778 |
|
2,786 |
| 1,389 |
| Treasury bills |
| 1,484 |
| 2,098 |
|
358 |
| 386 |
| Government retail stock |
| 423 |
| 364 |
|
7,523 |
| 7,465 |
| Settlement deposits with Reserve Bank |
| 7,750 |
| 7,507 |
|
300 |
| 780 |
| Derivatives in loss |
| 1,591 |
| 1,126 |
|
958 |
| 1,251 |
| Finance lease liabilities |
| 955 |
| 954 |
|
16,707 |
| 15,592 |
| Other borrowings |
| 15,391 |
| 14,071 |
|
46,364 |
| 45,546 |
| Total borrowings |
| 46,110 |
| 41,898 |
|
|
|
|
| By source |
|
|
|
|
|
38,876 |
| 37,034 |
| Core Crown |
| 37,167 |
| 35,885 |
|
4,773 |
| 4,650 |
| Crown entities |
| 4,705 |
| 4,430 |
|
12,155 |
| 12,608 |
| State-owned Enterprises |
| 12,817 |
| 10,293 |
|
(9,440 | ) | (8,746 | ) | Inter-segment eliminations |
| (8,579 | ) | (8,710 | ) |
46,364 |
| 45,546 |
| Total borrowings |
| 46,110 |
| 41,898 |
|
|
|
|
| By maturity |
|
|
|
|
|
26,862 |
| 24,342 |
| Expected to be settled within one year |
| 21,610 |
| 19,973 |
|
19,502 |
| 21,204 |
| Expected to be outstanding for more than one year |
| 24,500 |
| 21,925 |
|
46,364 |
| 45,546 |
| Total borrowings |
| 46,110 |
| 41,898 |
|
All principal, interest and other money payable in relation to money borrowed by the core Crown is a charge on, and payable out of, the revenues of the core Crown equally and rateably with all other general borrowing obligations of the core Crown.
Except for sums the Government is liable for under any Act, any guarantee given by the Government, by virtue of an action a creditor has against the Government, or liability the Government has to a creditor of the Reserve Bank, the Government is not liable to contribute towards the payments of debts of Government entities, their subsidiaries or any entity in which the Government has an interest or that is controlled or wholly owned by the Government.
Forecast |
|
|
| Actual |
| ||||
Original |
| Estimated |
|
|
| 30 June |
| 30 June |
|
$m |
| $m |
|
|
| $m |
| $m |
|
11,044 |
| 13,202 |
| Government stock measured at amortised cost |
| 13,722 |
| 12,873 |
|
6,688 |
| 5,481 |
| Government stock measured at fair value |
| 4,794 |
| 2,905 |
|
17,732 |
| 18,683 |
| Total Government stock |
| 18,516 |
| 15,778 |
|
Government stock is measured at amortised cost, unless it is managed and its performance is evaluated on a fair value basis. Where it is evaluated on a fair value basis it is reported at fair value with movements in fair value reported in the statement of financial performance.
The fair value of government stock measured at amortised cost is $13,778 million (2007: $12,561 million). This valuation is based on observable market prices.
The valuation of government stock reported at fair value is also based on observable market prices. There have been no changes in the international credit rating for New Zealand accordingly changes in fair value are due to factors other than Sovereign credit risk.
|
| Actual |
| ||
|
| 30 June |
| 30 June |
|
|
| $m |
| $m |
|
Government stock measured at fair value |
|
|
|
|
|
Carrying value |
| 4,794 |
| 2,905 |
|
Amount payable on maturity |
| 5,608 |
| 4,281 |
|
Treasury bills are reported at fair value, with fair value based on observable market price. As these are short-term sovereign-issued instruments, the carrying value is not materially affected by changes in Sovereign credit risk and the carrying value approximates the amount payable at maturity.
Settlement deposits with the Reserve Bank represent the level of money deposited with the Reserve Bank by commercial banks. It is a liquidity mechanism used to settle wholesale obligations between the banks and provides the basis for settling most of the retail transactions that occur every working day between corporates and individuals.
Settlement deposits with the Reserve Bank are financed from commercial banks and not by government funding. Settlement deposits with the Reserve Bank are technically a form of borrowing by the Reserve Bank, where the liability is matched by a corresponding financial asset (reported as an element of marketable securities and deposits – refer note 15). Settlement deposits are reported at fair value, which is equivalent to the amount payable to depositors given the short term (ie, overnight) nature of these liabilities. The value of these deposits is not affected by the Crown’s credit rating.
Settlement accounts are administered through the Exchange Settlement Account System (ESAS). ESAS account holders receive interest at the Official Cash Rate on their end-of-day balances. The Reserve Bank provides collateralised overnight borrowing facilities for banks, at an interest rate set at a margin over the Official Cash Rate.
Forecast |
|
|
| Actual |
| ||||
Original |
| Estimated |
|
|
| 30 June |
| 30 June |
|
$m |
| $m |
|
|
| $m |
| $m |
|
|
|
|
| Finance Lease Liabilities |
|
|
|
|
|
|
|
|
| By source |
|
|
|
|
|
5 |
| 7 |
| Core Crown |
| 6 |
| 8 |
|
39 |
| 43 |
| Crown entities |
| 43 |
| 44 |
|
914 |
| 1,202 |
| State-owned Enterprises |
| 906 |
| 902 |
|
— |
| (1 | ) | Inter-segment eliminations |
| — |
| — |
|
958 |
| 1,251 |
| Total finance lease liabilities |
| 955 |
| 954 |
|
|
|
|
| Minimum Lease Payments |
|
|
|
|
|
|
|
|
| No later than one year |
| 133 |
| 151 |
|
|
|
|
| Later than one year and not later than five years |
| 473 |
| 456 |
|
|
|
|
| Later than five years |
| 710 |
| 769 |
|
|
|
|
| Total minimum lease payments |
| 1,316 |
| 1,376 |
|
|
|
|
| Present Value of Minimum Lease Payments |
|
|
|
|
|
|
|
|
| No later than one year |
| 67 |
| 88 |
|
|
|
|
| Later than one year and not later than five years |
| 289 |
| 258 |
|
|
|
|
| Later than five years |
| 569 |
| 600 |
|
|
|
|
| Total present value of minimum lease payments |
| 925 |
| 946 |
|
|
|
|
| Future finance charges |
| 391 |
| 430 |
|
Finance leases relate to aircraft, electricity generation and transmission equipment and office equipment. The Government entities entering into finance leases generally have options to purchase the equipment for a nominal amount at the conclusion of the lease agreements. The Government’s obligations under finance leases are secured by the lessors’ title to the leased assets.
The fair value of finance lease liabilities is approximately equal to their carrying value.
Forecast |
|
|
| Actual |
| ||||
Original |
| Estimated |
|
|
| 30 June |
| 30 June |
|
$m |
| $m |
|
|
| $m |
| $m |
|
9,049 |
| 9,641 |
| Other borrowings measured at amortised cost |
| 10,737 |
| 7,920 |
|
7,658 |
| 5,951 |
| Other borrowings measured at fair value |
| 4,654 |
| 6,151 |
|
16,707 |
| 15,592 |
| Total other borrowings |
| 15,391 |
| 14,071 |
|
Other borrowings are reported at fair value with movements in fair value reported in the statement of financial performance when they are held for trading or they are managed and performance is evaluated on a fair value basis.
The fair value of other borrowings measured at amortised cost is $10,933 million (2007: $8,142 million). The fair value of financial liabilities with standard terms and conditions traded on active liquid markets are determined by reference to quoted market prices. Where such prices are not available use is made of estimated discounted cash flows models with reference to market interest rates.
For those other borrowings designated at fair value through profit and loss, the value of these instruments will be affected by changes in interest rates due to credit risk and broader market influences.
Of these borrowings, $3,393 million (2007: $4,486 million) is Sovereign-issued debt administered by the Reserve Bank and NZDMO. As there have been no changes in the international credit rating for Sovereign debt there has been no value change attributable to credit risk for these borrowings.
The remaining borrowings of $11,998 million (2007: $9,585 million) comprise non-sovereign-issued debt of Crown entities and State-owned enterprises. The following table identifies the difference between the carrying amount and amount payable at maturity as well as the extent that fair value movements have resulted from changes in credit risk of the issuing entity. The carrying value can differ to the amount actually payable on maturity where the effect of discounting cash flows is material.
|
| Actual |
| ||
|
| 30 June |
| 30 June |
|
|
| $m |
| $m |
|
Other borrowings measured at fair value |
|
|
|
|
|
Carrying value |
| 4,654 |
| 6,151 |
|
Amount payable on maturity |
| 4,809 |
| 6,220 |
|
Fair value impact from changes in credit risk for the year |
| (158 | ) | 122 |
|
Cumulative fair value impact from changes in credit risk |
| (79 | ) | 130 |
|
Forecast |
|
|
| Actual |
| ||||
Original |
| Estimated |
|
|
| 30 June |
| 30 June |
|
$m |
| $m |
|
|
| $m |
| $m |
|
|
|
|
| By entity |
|
|
|
|
|
18,949 |
| 20,663 |
| ACC liability |
| 20,374 |
| 17,328 |
|
42 |
| 79 |
| EQC - property damage claims |
| 97 |
| 68 |
|
20 |
| 10 |
| Other insurance liabilities |
| 13 |
| 22 |
|
19,011 |
| 20,752 |
| Total insurance liabilities |
| 20,484 |
| 17,418 |
|
|
|
|
| By type |
|
|
|
|
|
|
|
|
| Outstanding claims liability |
| 18,039 |
| 15,438 |
|
|
|
|
| Unearned premium liability |
| 1,828 |
| 1,661 |
|
|
|
|
| Unearned premium liability deficiency |
| 617 |
| 319 |
|
|
|
|
| Other |
| — |
| — |
|
|
|
|
| Total insurance liabilities |
| 20,484 |
| 17,418 |
|
|
|
|
| By maturity |
|
|
|
|
|
3,899 |
| 4,757 |
| Expected to be settled within one year |
| 4,615 |
| 3,804 |
|
15,112 |
| 15,995 |
| Expected to be outstanding for more than one year |
| 15,869 |
| 13,614 |
|
19,011 |
| 20,752 |
| Total insurance liabilities |
| 20,484 |
| 17,418 |
|
|
|
|
| Assets arising from insurance obligations are: |
|
|
|
|
|
|
|
|
| Receivables for premiums |
| 2,822 |
| 2,352 |
|
Insurance obligations arise primarily from the accident compensation scheme provision of personal injury cover for all New Zealand citizens, residents and temporary visitors to New Zealand and the earthquake commission provision of natural disaster insurance to residential property owners.
The objectives, policies and procedures for managing these risks are set out in the governing statutes and policy documents of the Accident Compensation Corporation (ACC) and the Earthquake Commission (EQC).
At balance date, EQC recognises a liability in respect of outstanding claims and assesses the adequacy of its unearned premium liability. As required by financial reporting standards, a risk premium is applied to a central estimate to increase to 75% the likelihood that claims will be settled within this amount. No discount factor or inflation factor is applied to the claims liability as claims are generally settled within one year.
All assets held by ACC and EQC are considered available to back present and future claims obligations. ACC and EQC have not deferred any acquisition costs in respect of insurance obligations at the reporting date.
The material insurance obligations of the Crown at balance date are managed by ACC. The accounting for these claims is made complex by the existence of a long “tail” to these claims. The rest of this note therefore focuses on these claims. PricewaterhouseCoopers Actuarial Pty Limited have prepared the independent actuarial estimate of the ACC outstanding claims liability as at 30 June 2008. The actuary is satisfied with the nature, sufficiency and accuracy of the data used to determine the outstanding claims liability.
|
| Actual |
| ||
|
| 30 June |
| 30 June |
|
|
| $m |
| $m |
|
Analysis of Outstanding ACC Claims Liability |
|
|
|
|
|
Undiscounted outstanding claims liability |
| 47,461 |
| 38,702 |
|
Discounted adjustment |
| (31,463 | ) | (24,967 | ) |
Risk margin |
| 2,008 |
| 1,657 |
|
Total outstanding ACC claims liability |
| 18,006 |
| 15,392 |
|
Expected future claims payments - central estimate |
| 15,059 |
| 12,831 |
|
Claims handling expenses |
| 939 |
| 904 |
|
Risk margin |
| 2,008 |
| 1,657 |
|
Total outstanding ACC claims liability |
| 18,006 |
| 15,392 |
|
The outstanding claims liability is the present value of expected payments for claims incurred plus a risk premium.
|
| Actual |
| ||
|
| 30 June |
| 30 June |
|
|
| $m |
| $m |
|
Movement in Outstanding ACC Claims Liability |
|
|
|
|
|
Opening balance |
| 15,392 |
| 14,114 |
|
Claims incurred for the year |
| 2,881 |
| 2,768 |
|
Claims paid out in the year |
| (3,023 | ) | (2,692 | ) |
Discount rate unwind |
| 953 |
| 770 |
|
Experience adjustments (actuarial gains and losses): |
|
|
|
|
|
- actual and assumed claim experience |
| 1,021 |
| 1,583 |
|
- change in discount rate |
| 126 |
| (1,311 | ) |
- change in inflation rate |
| 492 |
| 159 |
|
- change in other economic assumptions |
| 70 |
| 50 |
|
Other movements |
| 94 |
| (49 | ) |
Closing outstanding ACC claims liability |
| 18,006 |
| 15,392 |
|
Movement in ACC Unearned Premium Liability |
|
|
|
|
|
Opening balance |
| 1,617 |
| 1,443 |
|
Deferral of premiums on current year contracts |
| 1,783 |
| 1,617 |
|
Earning of premiums previously deferred |
| (1,617 | ) | (1,443 | ) |
Other |
| — |
| — |
|
Closing ACC unearned premium liability |
| 1,783 |
| 1,617 |
|
The unearned premium liability represents premiums received in advance of the insured period.
|
| Actual |
| ||
|
| 30 June |
| 30 June |
|
|
| $m |
| $m |
|
Analysis of ACC Unexpired Risk Liability |
|
|
|
|
|
Unearned premium liability |
| 1,783 |
| 1,617 |
|
Adjusted for unearned premium relating to residual claims |
| (472 | ) | (382 | ) |
Adjusted ACC unearned premium liability |
| 1,311 |
| 1,235 |
|
Central estimate of discounted cash flows for future claims |
| 1,630 |
| 1,338 |
|
Central estimate of discounted future reinsurance recoveries |
| — |
| — |
|
Risk margin |
| 266 |
| 216 |
|
Present value of expected cash flows for future accident claims |
| 1,896 |
| 1,554 |
|
Total ACC unexpired risk liability |
| 585 |
| 319 |
|
The unexpired risk liability is the extent that the unearned premium liability is insufficient to cover expected future claims (i.e. payments for future accidents within the period covered by the premiums received). Unearned premiums relating to residual claims are excluded from this calculation as they relate to accidents that occurred prior to 1999.
|
| Actual |
| ||
|
| 30 June |
| 30 June |
|
|
| $m |
| $m |
|
ACC Claims Development |
|
|
|
|
|
Current year net ACC claims incurred |
|
|
|
|
|
Gross claims incurred and related expenses – undiscounted |
| 5,804 |
| 4,433 |
|
Reinsurance and other recoveries – undiscounted |
| — |
| — |
|
Net claims incurred – undiscounted |
| 5,804 |
| 4,433 |
|
Discount and discount movement |
|
|
|
|
|
– gross claims incurred |
| 2,923 |
| 2,126 |
|
– reinsurance and other recoveries |
| — |
| — |
|
Net discount movement |
| 2,923 |
| 2,126 |
|
Total current year net claims incurred |
| 2,881 |
| 2,307 |
|
Previous years’ net ACC claims incurred |
|
|
|
|
|
Gross claims incurred and related expenses – undiscounted |
| 6,763 |
| 7,423 |
|
Reinsurance and other recoveries – undiscounted |
| — |
| — |
|
Net claims incurred – undiscounted |
| 6,763 |
| 7,423 |
|
Discount and discount movement |
|
|
|
|
|
– gross claims incurred |
| 4,522 |
| 6,221 |
|
– reinsurance and other recoveries |
| — |
| — |
|
Net discount movement |
| 4,522 |
| 6,221 |
|
Total previous years’ net claims incurred |
| 2,241 |
| 1,202 |
|
Net ACC insurance claims incurred |
| 5,122 |
| 3,509 |
|
Given the uncertainty over insurance claims, it is likely that the final cost will be different from the original liability established.
Claims development refers to the adjustment in the liability arising from claims incurred in the current financial year and reassessment of claims incurred in previous periods. This reassessment results from new information on these claims and changes in assumptions.
Key assumptions and methodology applied in the valuation of outstanding ACC claims obligation are as follows:
(i) Risk-free discount rates
A risk-free discount rate based on a “U.S. Treasury Arbitrage” yield curve in New Zealand dollars that relate as closely as possible to the nature, structure and term of the future obligations is used. This yield curve is based on U.S. Treasury bonds and forward currency agreements adjusted for risk and market premiums.
(ii) Risk premium
The outstanding claims liability includes a risk margin that relates to the inherent uncertainty in the central estimate of the present value of expected future payments. The risk premium ensures that the liability provided for will be sufficient at a set probability of possible outcomes (probability of adequacy), and is therefore based on the determination of that probability.
(iii) Inflation and indexation
ACC claims and costs are subject to inflation. Some costs are assumed to increase higher than the general rate of inflation due to factors such as medical treatment becoming available.
(iv) Case management and the ‘tail’ of claims
Assumptions for the incidence of settlements and claims closures are primarily based on investigations of previous experience over the past three years. Given the variety of influences affecting the tail of claims, the range of voluntary discontinuance rates is extremely diverse.
(v) Claims expected to be settled within one year
The best estimate of claims expected to be settled within one year is the amount of the claim. No discounting, risk premiums or indexation has been applied to these claims.
(vi) Liability adequacy test
An unearned premium liability deficiency is recognised when the amount that the present value of expected future claim cash outflows plus a risk margin exceeds the unearned premium liability.
|
| Actual |
| ||
|
| 30 June |
| 30 June |
|
|
| % |
| % |
|
Summary of assumptions |
|
|
|
|
|
Average weighted term to settle claims |
| 11 years |
| 10 years |
|
|
| 1 month |
| 8 months |
|
Risk margin |
| 12.5 | % | 12.1 | % |
Probability of adequacy of liability |
| 75.0 | % | 75.0 | % |
Risk margin for liability adequacy test |
| 16.3 | % | 16.1 | % |
Probability of adequacy of liability to cover unearned premiums |
| 75.0 | % | 75.0 | % |
For following year |
|
|
|
|
|
Risk-free discount rate |
| 6.63 | % | 6.61 | % |
Inflation rates: |
|
|
|
|
|
Weekly compensation |
| 4.1 | % | 3.8 | % |
Impairment benefits |
| 3.1 | % | 2.9 | % |
Rehabilitation and other benefits |
| 3.3 | % | 3.0 | % |
Medical costs |
| 3.3 | % | 3.0 | % |
Beyond next year |
|
|
|
|
|
Risk-free discount rate |
| 6.63 | % | 6.61 | % |
Inflation rates: |
|
|
|
|
|
Weekly compensation |
| 3.7 | % | 3.4 | % |
Impairment benefits |
| 2.7 | % | 2.3 | % |
Rehabilitation and other benefits |
| 2.9 | % | 2.6 | % |
Medical costs |
| 2.9 | % | 2.6 | % |
Sensitivity Analysis
If the assumptions described above were to change, this would impact the measurement of insurance liabilities as per the table below:
|
|
|
| Impact on liability |
| ||
|
|
|
| Actual |
| ||
|
|
|
| 30 June |
| 30 June |
|
|
| Change |
| $m |
| $m |
|
Sensitivity of assumptions |
|
|
|
|
|
|
|
Risk-free discount rate |
| +1 | % | 1,683 |
| 1,394 |
|
|
| -1 | % | (2,095 | ) | (1,725 | ) |
Inflation rate |
| +1 | % | (2,229 | ) | (1,733 | ) |
|
| -1 | % | 1,813 |
| 1,557 |
|
Superimposed inflation rate excluding |
| +1 | % | (432 | ) | (824 | ) |
social rehabilitation for serious injury claims |
| -1 | % | 325 |
| 936 |
|
Superimposed inflation rate for |
| +1 | % | (750 | ) | (543 | ) |
social rehabilitation for serious injury claims after four years |
| -1 | % | 591 |
| 499 |
|
Discounted mean term |
| +1 | % | 620 |
| 582 |
|
|
| -1 | % | (643 | ) | (582 | ) |
Forecast |
|
|
| Actual |
| ||||
Original |
| Estimated |
|
|
| 30 June |
| 30 June |
|
$m |
| $m |
|
|
| $m |
| $m |
|
8,402 |
| 8,141 |
| Government Superannuation Fund (GSF) |
| 8,257 |
| 7,160 |
|
12 |
| 5 |
| Other funds |
| — |
| 1 |
|
8,414 |
| 8,146 |
| Total retirement plan liabilities |
| 8,257 |
| 7,161 |
|
The Government operates a defined benefit superannuation plan for qualifying employees who are members of the Government Superannuation Fund scheme (GSF). The members’ entitlements are defined in the Government Superannuation Fund Act 1956. Members make regular payments to GSF and in return, on retirement, receive a defined level of income. GSF is closed to employees who were not members at 1 July 1992.
The GSF obligation has been calculated by the Government Actuary as at 30 June 2008. A Projected Unit Credit Method, based on balance-date membership data, is used for the valuation. This method requires the benefits payable from the GSF in respect of past service to be estimated and then discounted back to the valuation date.
|
| Actual |
| ||
|
| 30 June |
| 30 June |
|
|
| $m |
| $m |
|
Amounts recognised in the statement of financial position in respect of GSF are as follows: |
|
|
|
|
|
Net GSF Obligation |
|
|
|
|
|
Present value of defined benefit obligation |
| 11,831 |
| 11,167 |
|
Fair value of plan assets |
| (3,574 | ) | (4,007 | ) |
Present value of unfunded defined benefit obligation |
| 8,257 |
| 7,160 |
|
Present value of defined benefit obligation |
|
|
|
|
|
Opening defined benefit obligation |
| 11,167 |
| 12,098 |
|
Expected current service cost |
| 141 |
| 163 |
|
Expected unwind of discount rate |
| 833 |
| 789 |
|
Actuarial losses/(gains) |
| 617 |
| (997 | ) |
Benefits paid |
| (947 | ) | (886 | ) |
Past service cost |
| 20 |
| — |
|
Closing defined benefit obligation |
| 11,831 |
| 11,167 |
|
Fair value of plan assets |
|
|
|
|
|
Opening fair value of plan assets |
| 4,007 |
| 3,793 |
|
Expected return on plan assets |
| 220 |
| 218 |
|
Actuarial gains/(losses) |
| (481 | ) | 136 |
|
Funding of benefits paid by Government |
| 691 |
| 653 |
|
Contributions from other entities |
| 15 |
| 15 |
|
Contributions from members |
| 68 |
| 73 |
|
Benefits paid |
| (947 | ) | (886 | ) |
Other |
| 1 |
| 5 |
|
Closing fair value of plan assets |
| 3,574 |
| 4,007 |
|
Amounts recognised in the statement of financial performance in respect of GSF are as follows:
Forecast |
|
|
| Actual |
| ||||
Original |
| Estimated |
|
|
| 30 June |
| 30 June |
|
$m |
| $m |
|
|
| $m |
| $m |
|
|
|
|
| Personnel Expenses |
|
|
|
|
|
|
|
|
| Expected current service cost |
| 141 |
| 163 |
|
|
|
|
| Expected unwind of discount rate on GSF obligation |
| 833 |
| 789 |
|
|
|
|
| Expected return on plan assets |
| (220 | ) | (218 | ) |
|
|
|
| Contribution from funding employers |
| (84 | ) | (89 | ) |
|
|
|
| Past service cost |
| 20 |
| — |
|
629 |
| 714 |
| Total included in personnel expenses |
| 690 |
| 645 |
|
|
|
|
| Net (Gains)/Losses on Non-Financial Instruments |
|
|
|
|
|
— |
| 906 |
| Actuarial (gains)/losses recognised in the year |
| 1,098 |
| (1,133 | ) |
629 |
| 1,620 |
| Total GSF expense |
| 1,788 |
| (488 | ) |
The Government expects to make a contribution of $660 million to GSF in the year ended 30 June 2009.
In addition to its obligations to past and present employees, because GSF is liable to income tax under section HJ 1 of the Income Tax Act 2004, the Crown will be required to make additional contributions equivalent to the tax on future investment income.
The principal assumptions used for the purposes of the GSF actuarial valuations are as follows:
|
| Actual |
| ||
|
| 30 June |
| 30 June |
|
|
| % |
| % |
|
Summary of assumptions |
|
|
|
|
|
For following year |
|
|
|
|
|
Discount rate |
| 6.95% |
| 7.46% |
|
Expected return on plan assets |
| 5.50% |
| 5.75% |
|
Expected rate of salary increases |
| 3.00% |
| 3.00% |
|
Expected rate of inflation |
| 2.25% |
| 2.25% |
|
Beyond next year |
|
|
|
|
|
|
|
|
|
|
|
Discount rate |
| 6.06% to 6.95% |
| 6.34% to 7.20% |
|
Expected return on plan assets |
| 5.50% |
| 5.75% |
|
Expected rate of salary increases |
| 3.00% |
| 3.00% |
|
Expected rate of inflation |
| 2.25% |
| 2.25% |
|
|
| Actual |
| ||
|
| 30 June |
| 30 June |
|
|
| $m |
| $m |
|
|
|
|
|
|
|
Equity instruments |
| 1,838 |
| 2,143 |
|
Debt instruments of the Government |
| 34 |
| 95 |
|
Other debt instruments |
| 830 |
| 1,019 |
|
Property |
| 229 |
| 291 |
|
Other |
| 643 |
| 459 |
|
Fair value of plan assets |
| 3,574 |
| 4,007 |
|
The expected rate of return on the plan assets of 5.50% (2007: 5.75%) has been calculated by taking the expected long term returns from each asset class, reduced by tax and investment expenses (using the current rates of tax and investment expenses). The main asset classes are equities and debt instruments.
The actual return on plan assets was -6.66%, or -$261 million (2007: 9.50% or $354 million).
If the assumptions described above were to change, this would impact the measurement of GSF obligation as per the table below:
|
|
|
| Impact on obligation |
| ||
|
|
|
| Actual |
| ||
|
|
|
| 30 June |
| 30 June |
|
|
| Change |
| $m |
| $m |
|
Sensitivity of assumptions |
|
|
|
|
|
|
|
Discount rate |
| + 1 | % | (1,139 | ) | (1,069 | ) |
|
| - 1 | % | 1,371 |
| 1,360 |
|
Actual gains and losses comprise experience adjustments (the effects of differences between the previous actuarial assumptions and what has actually occurred in the year) and the effects of changes in actuarial assumptions on valuation date. The two year history of the present value of the unfunded defined benefit obligation and experience adjustments is as follows:
|
| Actual |
| ||
|
| 30 June |
| 30 June |
|
|
| $m |
| $m |
|
Present value of defined benefit obligation |
| 11,831 |
| 11,167 |
|
Fair value of plan assets |
| (3,574 | ) | (4,007 | ) |
Present value of unfunded defined benefit obligation |
| 8,257 |
| 7,160 |
|
Experience adjustment - increase/(decrease) in plan liabilities |
| 164 |
| 129 |
|
Experience adjustment - increase/(decrease) in plan assets |
| (479 | ) | 136 |
|
Forecast |
|
|
| Actual |
| ||||
Original |
| Estimated |
|
|
| 30 June |
| 30 June |
|
$m |
| $m |
|
|
| $m |
| $m |
|
|
|
|
| By type |
|
|
|
|
|
1,621 |
| 1,738 |
| Provision for employee entitlements |
| 2,220 |
| 1,828 |
|
557 |
| 482 |
| Provision for Kyoto |
| 562 |
| 704 |
|
805 |
| 780 |
| Provision for National Provident Fund guarantee |
| 907 |
| 771 |
|
867 |
| 1,045 |
| Other provisions |
| 1,064 |
| 1,253 |
|
3,850 |
| 4,045 |
| Total provisions |
| 4,753 |
| 4,556 |
|
|
|
|
| By source |
|
|
|
|
|
2,267 |
| 2,353 |
| Core Crown |
| 2,763 |
| 2,537 |
|
1,042 |
| 1,214 |
| Crown entities |
| 1,500 |
| 1,195 |
|
757 |
| 610 |
| State-owned Enterprises |
| 684 |
| 852 |
|
(216 | ) | (132 | ) | Inter-segment eliminations |
| (194 | ) | (28 | ) |
3,850 |
| 4,045 |
| Total provisions |
| 4,753 |
| 4,556 |
|
|
|
|
| By maturity |
|
|
|
|
|
1,849 |
| 1,536 |
| Expected to be settled within one year |
| 2,281 |
| 2,171 |
|
2,001 |
| 2,509 |
| Expected to be outstanding for more than one year |
| 2,472 |
| 2,385 |
|
3,850 |
| 4,045 |
| Total provisions |
| 4,753 |
| 4,556 |
|
|
|
|
| Provision for employee entitlements |
|
|
|
|
|
|
|
|
| Opening provision |
| 1,828 |
| 1,636 |
|
|
|
|
| Additional provisions recognised |
| 1,467 |
| 1,134 |
|
|
|
|
| Provision used during the period |
| (976 | ) | (803 | ) |
|
|
|
| Reversal of previous provision |
| (99 | ) | (137 | ) |
|
|
|
| Unwind of discount rate |
| — |
| (2 | ) |
|
|
|
| Closing provision |
| 2,220 |
| 1,828 |
|
The provision for employee entitlements represents annual leave, accrued long service leave and retiring leave, and sick leave entitlements accrued by employees. Probability assumptions about continued future service affecting entitlements accrued as at reporting date have been made using previous employment data. For entitlements that vest over a period exceeding one year a discount rate of 5.5% has been used.
|
| Actual |
| ||
|
| 30 June |
| 30 June |
|
|
| $m |
| $m |
|
Provision for Kyoto |
|
|
|
|
|
Opening provision |
| 704 |
| 656 |
|
Change in the price of carbon and foreign exchange rate |
| 226 |
| (20 | ) |
Change in net projected emission units |
| (368 | ) | 68 |
|
Closing provision |
| 562 |
| 704 |
|
|
| 30 June |
| 30 June |
|
|
| (Mt) |
| (Mt) |
|
Provision for Kyoto |
|
|
|
|
|
Kyoto target (assigned amount units) |
| 309.6 |
| 309.5 |
|
Less AAUs allocated to emission reducing projects |
| 7.0 |
| 7.5 |
|
Total commitment target |
| 302.6 |
| 302.0 |
|
Projected emission units |
|
|
|
|
|
Agriculture |
| 198.5 |
| 203.1 |
|
Energy (incl. transport) and industrial processes |
| 185.6 |
| 195.1 |
|
Waste |
| 7.2 |
| 7.0 |
|
Solvent and other product use |
| 0.2 |
| 0.3 |
|
Total projected emission units |
| 391.5 |
| 405.5 |
|
Removals via forest |
| 84.1 |
| 79.0 |
|
Deforestation emissions |
| (16.9 | ) | (21.0 | ) |
Less net removals via forests |
| 67.2 |
| 58.0 |
|
Net projected emission units |
| 324.3 |
| 347.5 |
|
Deficit in units |
| 21.7 |
| 45.5 |
|
New Zealand has committed under the Kyoto Protocol to reducing its average net emissions of greenhouse gases over 2008-2012 (the first commitment period of the Kyoto Protocol or CP1) to 1990 levels or to take responsibility for the difference. New Zealand can meet its commitment through emissions reductions and use of the Kyoto Protocol flexibility mechanisms such as Joint Implementation, the Clean Development Mechanism, and offsetting increased emissions against carbon removed by forests. This obligation will crystallise when the first Kyoto commitment period is settled up post-2012.
New Zealand’s net obligation as at 30 June 2008 of $NZ562 million (2007: $NZ704 million) is based on a deficit of 21.7 million Kyoto Protocol emission units and a carbon price of €12.50 per unit. The carbon price in New Zealand dollars equates to $NZ25.89, using the 30 June 2008 exchange rate of €0.48285 = $NZ1 (30 June 2007: €0.5726 = $NZ1, and a carbon price of €8.86 per unit).
The quantum of the deficit has been compiled from agricultural, forest sink and deforestation projections provided by the Ministry of Agriculture and Forestry, energy (including transport) and industrial processes projections from the Ministry of Economic Development and waste projections from the Ministry for the Environment. The projections use the latest information from the national inventory of greenhouse gas emissions and removals submitted to the United Nations Framework Convention on Climate Change Secretariat on 14 April 2008.
AEA Technology, an independent UK based firm, has assessed the robustness of the assumptions and methodologies underpinning the projections and found them to be sound and reasonable.
The movement in the projected balance of Kyoto Protocol units is set out in the Net Position Report 2008. Projected balance of Kyoto Protocol units during the first commitment period which is published by the Ministry for the Environment. The movement in the projected emission units deficit is primarily related to the following key factors: transport sector emissions are projected to be lower than in 2007 due to actual fuel use data in 2007 being lower than projected and fuel prices being higher; agriculture emissions are projected to be lower due to the effects of drought early in 2008 and a continuing decline in sheep numbers; based on an intentions survey, emissions from deforestation are projected to be lower than in 2007 mainly due to the implementation of an Emissions Trading Scheme; and there is an increase in the estimate of removals due to the implementation of recommendations made by AEA Technology. A full copy of this report can be found on the Ministry’s website: www.mfe.govt.nz .
The carbon price has been determined by the Treasury. The Allen Consulting Group have reviewed this work and are satisfied that the methodology (and data sources) applied is a robust high level approach, and that €12.50 is a reasonable carbon price estimate at this time for valuing the New Zealand Government’s possible future liabilities under the Kyoto Protocol.
Provisions by their nature are more uncertain than most other items in the statement of financial position. Fluctuations in the value of the estimate may occur through changes in the assumptions underlying the quantum, movements in the price of carbon and the exchange rate with the European currency unit, and government policy changes.
The Climate Change (Emissions Trading and Renewable Preference) Bill had its third and final reading on 10 September 2008. This Bill establishes an Emissions Trading Scheme (ETS) in New Zealand. The Net Position Report 2008 has been prepared on the basis of the government decision to introduce an ETS in New Zealand.
No liability or contingent liability for periods beyond 2012 has been recognised, as New Zealand currently has no specific obligations beyond the First Commitment Period. The architecture of any obligations in future periods has yet to be negotiated.
|
| Actual |
| ||
|
| 30 June |
| 30 June |
|
|
| $m |
| $m |
|
|
|
|
|
|
|
Provision for National Provident Fund guarantee |
|
|
|
|
|
Opening provision |
| 771 |
| 803 |
|
Additional provisions recognised |
| 46 |
| — |
|
Reversal of previous provision |
| — |
| (18 | ) |
Unwind of discount rate and effect of changes in discount rate |
| 90 |
| (14 | ) |
Closing provision |
| 907 |
| 771 |
|
The Government has guaranteed superannuation schemes managed by the National Provident Fund (NPF) (refer to note 31 Contingent Liabilities and Contingent Assets for details of the guarantee). As at 30 June 2008 the NPF’s DBP Annuitants’ scheme was in a net deficit position of $907 million (2007:$771 million), represented by a gross estimated pension obligation of $1,020 million (2007: $994 million) with net investment assets valued at $ 113 million (2007: $223 million). No additional provision was required in the year for other pension schemes managed by NPF under the Government’s guarantee .
|
| Actual |
| ||
|
| 30 June |
| 30 June |
|
Other provisions |
|
|
|
|
|
Opening provision |
| 1,253 |
| 1,038 |
|
Additional provisions recognised |
| 309 |
| 495 |
|
Provision used during the period |
| (479 | ) | (264 | ) |
Reversal of previous provision |
| (22 | ) | (78 | ) |
Unwind of discount rate and effect of changes in discount rate |
| 3 |
| 62 |
|
Closing provision |
| 1,064 |
| 1,253 |
|
Forecast |
|
|
| Actual |
| ||||
Original |
| Estimated |
|
|
| 30 June |
| 30 June |
|
48,239 |
| 46,767 |
| Taxpayer funds |
| 46,700 |
| 44,222 |
|
47,402 |
| 52,498 |
| Property, plant and equipment revaluation reserve |
| 58,566 |
| 52,442 |
|
13 |
| 29 |
| Investment revaluation reserve |
| 34 |
| 23 |
|
97 |
| (175 | ) | Cash flow hedge reserve |
| (151 | ) | (122 | ) |
17 |
| (32 | ) | Foreign currency translation reserve |
| (17 | ) | (34 | ) |
95,768 |
| 99,087 |
| Total net worth attributable to the Crown |
| 105,132 |
| 96,531 |
|
|
|
|
| Taxpayer Funds |
|
|
|
|
|
42,219 |
| 44,222 |
| Opening taxpayers funds |
| 44,222 |
| 36,214 |
|
6,431 |
| 2,559 |
| Operating balance excluding minority interest |
| 2,384 |
| 8,022 |
|
(470 | ) | (1 | ) | Other movements |
| 4 |
| 13 |
|
59 |
| (13 | ) | Transfers from/(to) property, plant and equipment revaluation reserve |
| 90 |
| (27 | ) |
48,239 |
| 46,767 |
| Closing taxpayers funds |
| 46,700 |
| 44,222 |
|
|
|
|
| Property, Plant and Equipment Revaluation Reserve |
|
|
|
|
|
47,459 |
| 52,442 |
| Opening revaluation reserve |
| 52,442 |
| 47,153 |
|
2 |
| 43 |
| Net Revaluations |
| 6,214 |
| 5,262 |
|
(59 | ) | 13 |
| Transfers from/(to) taxpayer funds |
| (90 | ) | 27 |
|
47,402 |
| 52,498 |
| Closing revaluation reserve |
| 58,566 |
| 52,442 |
|
The property, plant and equipment revaluation reserve arises on the revaluation of physical assets. Where revalued property, plant or equipment is sold, the portion of the property, plant and equipment revaluation reserve that relates to that asset, and is effectively realised, is transferred to taxpayer funds.
Forecast |
|
|
| Actual |
| ||||
Original |
| Estimated |
|
|
| 30 June |
| 30 June |
|
|
|
|
| Investment Revaluation Reserve |
|
|
|
|
|
13 |
| 23 |
| Opening investment revaluation reserve |
| 23 |
| 13 |
|
— |
| 6 |
| Increase arising on revaluation of available-for-sale financial assets |
| 14 |
| 10 |
|
— |
| — |
| Cumulative (gain)/loss transferred to the statement of financial performance on sale of available-for-sale financial assets |
| (3 | ) | — |
|
13 |
| 29 |
| Closing investment revaluation reserve |
| 34 |
| 23 |
|
The investments revaluation reserve arises on the revaluation of available-for-sale financial assets. Where a revalued financial asset is sold, the portion of the reserve that relates to that financial asset, and is effectively realised, is recognised in the statement of financial performance. Where a revalued financial asset is impaired, the portion of the reserve that relates to that financial asset is recognised in the statement of financial performance.
Forecast |
|
|
| Actual |
| ||||
Original |
| Estimated |
|
|
| 30 June |
| 30 June |
|
|
|
|
| Cash Flow Hedge Reserve |
|
|
|
|
|
62 |
| (122 | ) | Opening cash flow hedge reserve |
| (122 | ) | 281 |
|
(39 | ) | (2 | ) | Transfer into reserve |
| 9 |
| (331 | ) |
74 |
| (15 | ) | Transfer to the statement of financial performance |
| 22 |
| (59 | ) |
— |
| (36 | ) | Transfer to initial carrying value of hedged item |
| (60 | ) | (13 | ) |
97 |
| (175 | ) | Closing cash flow hedge reserve |
| (151 | ) | (122 | ) |
The cash flow hedge reserve represents hedging gains and losses recognised on the effective portion of cash flow hedges. The cumulative deferred gain or loss on the hedge is recognised in the statement of financial performance when the hedged transaction impacts the statement of financial performance, or is included as a basis adjustment to the non-financial hedged item, consistent with the applicable accounting policy.
Forecast |
|
|
| Actual |
| ||||
Original |
| Estimated |
|
|
| 30 June |
| 30 June |
|
|
|
|
| Foreign currency translation reserve |
|
|
|
|
|
17 |
| (34 | ) | Opening foreign currency translation reserve |
| (34 | ) | 31 |
|
— |
| 2 |
| Arising from translation of foreign operations |
| 17 |
| (65 | ) |
17 |
| (32 | ) | Closing foreign currency translation reserve |
| (17 | ) | (34 | ) |
The foreign currency translation reserve holds foreign exchange gains and losses arising from translating monetary items that form part of the net investment in a foreign operation into New Zealand dollars, and foreign exchange gains and losses associated with translating non-monetary assets into New Zealand dollars if revaluations of those assets are reflected in another reserve rather than in the statement of financial performance.
The Government’s fiscal policy is pursued in accordance with the principles of responsible fiscal management set out in the Public Finance Act 1989:
· reducing total debt to prudent levels so as to provide a buffer against factors that may impact adversely on the level of total debt in the future by ensuring that, until those levels have been achieved, total operating expenses in each financial year are less than total operating revenues in the same financial year
· once prudent levels of total debt have been achieved, maintaining those levels by ensuring that, on average, over a reasonable period of time, total operating expenses do not exceed total operating revenues
· achieving and maintaining levels of total net worth that provide a buffer against factors that may impact adversely on total net worth in the future
· managing prudently the fiscal risks facing the Government, and
· pursuing policies that are consistent with a reasonable degree of predictability about the level and stability of tax rates for future years.
Consistent with these principles, the Government seeks to strengthen its fiscal position to help manage future spending demands, particularly those arising from an ageing population by maintaining debt at prudent levels and accumulating assets through the New Zealand Superannuation fund.
The Government’s fiscal strategy can be expressed through its long term objectives and short term intentions for fiscal policy.
Long-term fiscal objectives |
| To achieve the objectives, the Government’s high-level focus is on: |
Operating balance
Operating surpluses on average over the economic cycle sufficient to meet the requirements for contributions to the NZS Fund and ensure consistency with the debt objective.
Revenue
Ensure sufficient revenue to meet the operating balance objective.
Expenses
Ensure expenses are consistent with the operating balance objective. |
| · Operating surpluses during the build-up phase of the NZS Fund. The Government’s focus is on maintaining the OBEGAL excluding NZS Fund revenue at a level sufficient, on average, to meet the requirements for contributions to the NZS Fund.
· The Government’s focus in meeting this objective is on core Crown revenues and expenses, maintaining tax-to-GDP and core Crown expenses-to-GDP around current levels.
· As set out in the Government’s revenue strategy, tax policy decisions will be consistent with the overall fiscal strategy including the Government’s long-term revenue objective.
· SOEs and Crown entities contributing to surpluses, consistent with their legislation and Government policy. |
|
|
|
Debt
Manage total debt at prudent levels. Gross sovereign-issued debt broadly stable at around 20% of GDP over the next 10 years. |
| · Gross sovereign-issued debt-to-GDP will be broadly stable over the period ahead of the major demographic changes associated with population ageing.
· The Government is effectively targeting a level of gross sovereign-issued debt excluding the increase in debt on the Reserve Bank balance sheet as a result of the change in the liquidity management regime.
· SOEs will have debt structures that reflect best commercial practice. Changes in the level of debt will reflect specific circumstances. |
|
|
|
Net worth
Increase net worth consistent with the operating balance objective. |
| · The NZS Fund will continue to accumulate assets through its retained earnings and Crown contributions.
· Consistent with the net worth objective, there will also be a focus on quality investment. |
Short Term Fiscal Intentions
Fiscal Strategy Report 2007 |
| Fiscal Strategy Report 2008 |
| Fiscal Position 2008 |
Operating balance
Based on operating amounts for the 2007 Budget, and indicative amounts for the 2008 and 2009 Budgets, the OBEGAL excluding NZS Fund revenue is forecast to be 3.4% of GDP in 2007/08, decreasing to 1.7% of GDP by 2010/11. This remains consistent with the long-term objective for the operating balance. |
| Operating balance
Based on operating amounts for the 2008 Budget, and indicative amounts for the 2009 and 2010 Budgets, the OBEGAL excluding NZS Fund retained revenue is forecast to be 0.7% of GDP in 2008/09, decreasing to 0.1% of GDP by 2011/12. This remains consistent with the long-term objective for the operating balance. |
| Operating balance
For the year ended 30 June 2008 the OBEGAL excluding NZS Fund retained revenue was 3.1% of GDP (30 June 2007: 3.7%). |
|
|
|
|
|
Debt
Total debt (including Reserve Bank settlement cash) is forecast to be 25.3% of GDP in 2010/11. Gross sovereign-issued debt including net settlement cash is forecast to be 21.8% of GDP in 2010/11. Excluding net settlement cash, gross sovereign-issued debt is forecast to be 18.8% of GDP in 2010/11.The Government will set forecast new operating and capital spending amounts over the next three years that are consistent with the long-term objective for debt. |
| Debt
Total debt (including Reserve Bank Settlement Cash) is forecast to be 25.9% of GDP in 2011/12. Gross sovereign-issued debt including Settlement Cash is forecast to be 19.6% of GDP in 2011/12. Excluding Settlement Cash, gross sovereign-issued debt is forecast to be 16.8% of GDP in 2011/12. The Government will set forecast new operating and capital spending amounts over the next three years that are consistent with the long-term objective for debt. |
| Debt
Total debt (including Reserve Bank Settlement Cash) was 25.6% of GDP as at 30 June 2008 (30 June 2007: 24.8%). Gross sovereign-issued debt including Settlement was 21.0% of GDP as at 30 June 2008 (30 June 2007: 21.8%). Excluding Settlement Cash, gross sovereign-issued debt was 17.4% of GDP as at 30 June 2008 (30 June 2007: 18.2%). |
Fiscal Strategy Report 2007 |
| Fiscal Strategy Report 2008 |
| Fiscal Position 2008 |
Expenses
Total Crown expenses are forecast to be 42.5% of GDP in 2010/11. Core Crown expenses are forecast to average 32.7% over the forecast period and be 33.1% of GDP in 2010/11. This assumes new operating expense amounts of $1.97 billion for the 2007 Budget, $2.0 billion for the 2008 Budget and $2.0 billion for the 2009 Budget (GST exclusive). |
| Expenses
Total Crown expenses are forecast to be 42.4% of GDP in 2011/12. Core Crown expenses are forecast to average 32.9% over the forecast period and be 33.0% of GDP in 2011/12. This assumes new operating expense amounts of $1.75 billion per annum for the 2009 Budget, $1.79 billion per annum for the 2010 Budget and $1.82 billion per annum for the 2011 Budget (GST exclusive). |
| Expenses
Total Crown expenses are 42.1% of GDP for the year ended 30 June 2008 (30 June 2007: 40.8%). Core Crown expenses were 31.7% GDP for the year ended 30 June 2008 (30 June 2007: 32.0%). |
|
|
|
|
|
Revenues
Total Crown revenues are forecast to be 44.3% of GDP in 2010/11. Within this, core Crown revenues are forecast to be 34.1% of GDP in 2010/11.This assumes new revenue initiatives in the 2008 Budget resulting in a $1.13 billion reduction in revenue from 2008/09.The Government will set revenue plans over the next three years that ensure progress is made towards the long-term revenue objective. |
| Revenues
Total Crown revenues are forecast to be 42.5% of GDP in 2011/12. Within this, core Crown revenues are forecast to be 32.7% of GDP in 2011/12. Budget 2008 introduces personal tax reductions. As a result, core Crown tax-to-GDP is forecast to decline from 31.5% in 2007/08 to 29.6% in 2011/12. |
| Revenues
Total Crown revenues were 45.3% of GDP for the year ended 30 June 2008 (30 June 2007: 44.2%). Within this, core Crown revenues were 34.3% of GDP for the year ended 30 June 2008 (30 June 2007: 34.5%). |
|
|
|
|
|
Net worth
Total Crown net worth is forecast to be 54.4% of GDP in 2006/07, rising to 57.3% of GDP in 2010/11. Excluding NZS Fund assets total Crown net worth is forecast to be 43.5% of GDP in 2010/11. Core Crown net worth is forecast to be 33% of GDP in 2010/11. |
| Net worth
Total Crown net worth is forecast to be 52.5% of GDP in 2011/12. Core Crown net worth is forecast to be 28.4% of GDP in 2011/12. |
| Net worth
Total Crown net worth, defined as the residual between assets and liabilities, was 58.6% of GDP as at 30 June 2008 (30 June 2007: 57.4%). Core Crown net worth, ie, the net of assets and liabilities of the Crown, departments, Offices of Parliament, the Reserve Bank and the New Zealand Superannuation Fund, was 31.6% of GDP as at 30 June 2008 (30 June 2007: 30.1%). |
|
| Current Year Actual vs Estimated Actual |
| ||||||||||||||||||
|
| Core Crown |
| Crown Entities |
| State-owned Enterprises |
| Inter-segment eliminations |
| Total Crown |
| ||||||||||
|
| Actual |
| Estimated |
| Actual |
| Estimated |
| Actual |
| Estimated |
| Actual |
| Estimated |
| Actual |
| Estimated |
|
|
| $m |
| $m |
| $m |
| $m |
| $m |
| $m |
| $m |
| $m |
| $m |
| $m |
|
Revenue |
|
|
|
|
|
|
|
|
|
|
|
|
|
|
|
|
|
|
|
|
|
Taxation revenue |
| 56,747 |
| 56,673 |
| — |
| — |
| — |
| — |
| (375 | ) | (487 | ) | 56,372 |
| 56,186 |
|
Other sovereign revenue |
| 733 |
| 673 |
| 4,039 |
| 4,061 |
| — |
| — |
| (893 | ) | (883 | ) | 3,879 |
| 3,851 |
|
Revenue from core Crown funding |
| — |
| — |
| 20,259 |
| 19,583 |
| — |
| — |
| (20,259 | ) | (19,583 | ) | — |
| — |
|
Sales of goods and services |
| 1,097 |
| 1,161 |
| 1,797 |
| 1,619 |
| 13,201 |
| 11,711 |
| (696 | ) | (809 | ) | 15,399 |
| 13,682 |
|
Interest revenue and dividends |
| 2,344 |
| 2,562 |
| 1,233 |
| 1,085 |
| 704 |
| 509 |
| (1,067 | ) | (953 | ) | 3,214 |
| 3,203 |
|
Other revenue |
| 898 |
| 867 |
| 1,685 |
| 1,789 |
| 692 |
| 874 |
| (660 | ) | (639 | ) | 2,615 |
| 2,891 |
|
Total Revenue (excluding gains) |
| 61,819 |
| 61,936 |
| 29,013 |
| 28,137 |
| 14,597 |
| 13,094 |
| (23,950 | ) | (23,354 | ) | 81,479 |
| 79,813 |
|
Expenses |
|
|
|
|
|
|
|
|
|
|
|
|
|
|
|
|
|
|
|
|
|
Transfer payments and subsidies |
| 18,519 |
| 18,666 |
| — |
| — |
| — |
| — |
| (145 | ) | (146 | ) | 18,374 |
| 18,520 |
|
Personnel expenses |
| 5,584 |
| 5,621 |
| 8,741 |
| 8,624 |
| 2,164 |
| 2,186 |
| (11 | ) | (9 | ) | 16,478 |
| 16,422 |
|
Other operating expenses |
| 30,434 |
| 30,790 |
| 19,307 |
| 18,874 |
| 10,955 |
| 9,443 |
| (22,807 | ) | (22,177 | ) | 37,889 |
| 36,930 |
|
Interest expenses |
| 2,460 |
| 2,527 |
| 248 |
| 275 |
| 870 |
| 734 |
| (477 | ) | (582 | ) | 3,101 |
| 2,954 |
|
Operating and finance expenses |
| 38,478 |
| 38,938 |
| 28,296 |
| 27,773 |
| 13,989 |
| 12,363 |
| (23,295 | ) | (22,768 | ) | 57,468 |
| 56,306 |
|
Forecast new operating spending and top down adjustment |
| — |
| (240 | ) | — |
| — |
| — |
| — |
| — |
| — |
| — |
| (240 | ) |
Total Expenses (excluding losses) |
| 56,997 |
| 57,364 |
| 28,296 |
| 27,773 |
| 13,989 |
| 12,363 |
| (23,440 | ) | (22,914 | ) | 75,842 |
| 74,586 |
|
Operating Balance before gains/(losses) |
| 4,822 |
| 4,572 |
| 717 |
| 364 |
| 608 |
| 731 |
| (510 | ) | (440 | ) | 5,637 |
| 5,227 |
|
Total Gains/(losses) |
| (931 | ) | (843 | ) | (2,243 | ) | (1,649 | ) | 115 |
| 16 |
| (194 | ) | (192 | ) | (3,253 | ) | (2,668 | ) |
Operating Balance |
| 3,891 |
| 3,729 |
| (1,526 | ) | (1,285 | ) | 723 |
| 747 |
| (704 | ) | (632 | ) | 2,384 |
| 2,559 |
|
Assets |
|
|
|
|
|
|
|
|
|
|
|
|
|
|
|
|
|
|
|
|
|
Financial assets |
| 59,629 |
| 56,036 |
| 23,891 |
| 23,479 |
| 11,727 |
| 10,402 |
| (10,184 | ) | (9,566 | ) | 85,063 |
| 80,351 |
|
Property, plant and equipment |
| 28,637 |
| 26,458 |
| 43,659 |
| 42,683 |
| 31,033 |
| 29,214 |
| — |
| — |
| 103,329 |
| 98,355 |
|
Investments in associates, CEs and SOEs |
| 25,696 |
| 25,709 |
| 7,073 |
| 6,606 |
| 224 |
| 193 |
| (24,928 | ) | (24,989 | ) | 8,065 |
| 7,519 |
|
Other assets |
| 2,220 |
| 2,209 |
| 715 |
| 565 |
| 1,458 |
| 1,405 |
| (15 | ) | (49 | ) | 4,378 |
| 4,130 |
|
Forecast for new capital spending |
| — |
| 690 |
| — |
| — |
| — |
| — |
| — |
| — |
| — |
| 690 |
|
Total Assets |
| 116,182 |
| 111,102 |
| 75,338 |
| 73,333 |
| 44,442 |
| 41,214 |
| (35,127 | ) | (34,604 | ) | 200,835 |
| 191,045 |
|
Liabilities |
|
|
|
|
|
|
|
|
|
|
|
|
|
|
|
|
|
|
|
|
|
Borrowings |
| 37,167 |
| 37,034 |
| 4,705 |
| 4,650 |
| 12,817 |
| 12,608 |
| (8,579 | ) | (8,746 | ) | 46,110 |
| 45,546 |
|
Other liabilities |
| 22,032 |
| 19,513 |
| 26,256 |
| 26,130 |
| 6,648 |
| 5,626 |
| (5,725 | ) | (5,153 | ) | 49,211 |
| 46,116 |
|
Total Liabilities |
| 59,199 |
| 56,547 |
| 30,961 |
| 30,780 |
| 19,465 |
| 18,234 |
| (14,304 | ) | (13,899 | ) | 95,321 |
| 91,662 |
|
Net Worth |
| 56,983 |
| 54,555 |
| 44,377 |
| 42,553 |
| 24,977 |
| 22,980 |
| (20,823 | ) | (20,705 | ) | 105,514 |
| 99,383 |
|
|
| Current Year Actual vs Estimated Actual |
| ||||||||||||||||||
|
| Core Crown |
| Crown Entities |
| State-owned Enterprises |
| Inter-segment eliminations |
| Total Crown |
| ||||||||||
|
| Actual |
| Estimated |
| Actual |
| Estimated |
| Actual |
| Estimated |
| Actual |
| Estimated |
| Actual |
| Estimated |
|
|
| $m |
| $m |
| $m |
| $m |
| $m |
| $m |
| $m |
| $m |
| $m |
| $m |
|
Revenue |
|
|
|
|
|
|
|
|
|
|
|
|
|
|
|
|
|
|
|
|
|
Taxation revenue |
| 56,747 |
| 53,477 |
| — |
| — |
| — |
| — |
| (375 | ) | (413 | ) | 56,372 |
| 53,064 |
|
Other sovereign revenue |
| 733 |
| 636 |
| 4,039 |
| 3,640 |
| — |
| — |
| (893 | ) | (780 | ) | 3,879 |
| 3,496 |
|
Revenue from core Crown funding |
| — |
| — |
| 20,259 |
| 18,751 |
| — |
| — |
| (20,259 | ) | (18,751 | ) | — |
| — |
|
Sales of goods and services |
| 1,097 |
| 1,095 |
| 1,797 |
| 1,389 |
| 13,201 |
| 10,701 |
| (696 | ) | (572 | ) | 15,399 |
| 12,613 |
|
Interest revenue and dividends |
| 2,344 |
| 2,580 |
| 1,233 |
| 756 |
| 704 |
| 484 |
| (1,067 | ) | (825 | ) | 3,214 |
| 2,995 |
|
Other revenue |
| 898 |
| 423 |
| 1,685 |
| 1,664 |
| 692 |
| 703 |
| (660 | ) | (369 | ) | 2,615 |
| 2,421 |
|
Total Revenue (excluding gains) |
| 61,819 |
| 58,211 |
| 29,013 |
| 26,200 |
| 14,597 |
| 11,888 |
| (23,950 | ) | (21,710 | ) | 81,479 |
| 74,589 |
|
Expenses |
|
|
|
|
|
|
|
|
|
|
|
|
|
|
|
|
|
|
|
|
|
Transfer payments and subsidies |
| 18,519 |
| 16,453 |
| — |
| — |
| — |
| — |
| (145 | ) | (107 | ) | 18,374 |
| 16,346 |
|
Personnel expenses |
| 5,584 |
| 5,092 |
| 8,741 |
| 8,183 |
| 2,164 |
| 2,018 |
| (11 | ) | (9 | ) | 16,478 |
| 15,284 |
|
Other operating expenses |
| 30,434 |
| 30,129 |
| 19,307 |
| 16,709 |
| 10,955 |
| 8,301 |
| (22,807 | ) | (20,925 | ) | 37,889 |
| 34,214 |
|
Interest expenses |
| 2,460 |
| 2,330 |
| 248 |
| 265 |
| 870 |
| 685 |
| (477 | ) | (395 | ) | 3,101 |
| 2,885 |
|
Operating and finance expenses |
| 38,478 |
| 37,551 |
| 28,296 |
| 25,157 |
| 13,989 |
| 11,004 |
| (23,295 | ) | (21,329 | ) | 57,468 |
| 52,383 |
|
Total Expenses (excluding losses) |
| 56,997 |
| 54,004 |
| 28,296 |
| 25,157 |
| 13,989 |
| 11,004 |
| (23,440 | ) | (21,436 | ) | 75,842 |
| 68,729 |
|
Operating Balance before gains/(losses) |
| 4,822 |
| 4,207 |
| 717 |
| 1,043 |
| 608 |
| 884 |
| (510 | ) | (274 | ) | 5,637 |
| 5,860 |
|
Total Gains/(losses) |
| (931 | ) | 2,303 |
| (2,243 | ) | (20 | ) | 115 |
| (77 | ) | (194 | ) | (44 | ) | (3,253 | ) | 2,162 |
|
Operating Balance |
| 3,891 |
| 6,510 |
| (1,526 | ) | 1,023 |
| 723 |
| 807 |
| (704 | ) | (318 | ) | 2,384 |
| 8,022 |
|
Assets |
|
|
|
|
|
|
|
|
|
|
|
|
|
|
|
|
|
|
|
|
|
Financial assets |
| 59,629 |
| 51,841 |
| 23,891 |
| 22,540 |
| 11,727 |
| 8,942 |
| (10,184 | ) | (9,605 | ) | 85,063 |
| 73,718 |
|
Property, plant and equipment |
| 28,637 |
| 26,215 |
| 43,659 |
| 41,296 |
| 31,033 |
| 28,087 |
| — |
| — |
| 103,329 |
| 95,598 |
|
Investments in associates, CEs and SOEs |
| 25,696 |
| 25,049 |
| 7,073 |
| 6,331 |
| 224 |
| 88 |
| (24,928 | ) | (24,467 | ) | 8,065 |
| 7,001 |
|
Other assets |
| 2,220 |
| 2,111 |
| 715 |
| 621 |
| 1,458 |
| 1,324 |
| (15 | ) | (26 | ) | 4,378 |
| 4,030 |
|
Total Assets |
| 116,182 |
| 105,216 |
| 75,338 |
| 70,788 |
| 44,442 |
| 38,441 |
| (35,127 | ) | (34,098 | ) | 200,835 |
| 180,347 |
|
Liabilities |
|
|
|
|
|
|
|
|
|
|
|
|
|
|
|
|
|
|
|
|
|
Borrowings |
| 37,167 |
| 35,885 |
| 4,705 |
| 4,430 |
| 12,817 |
| 10,293 |
| (8,579 | ) | (8,710 | ) | 46,110 |
| 41,898 |
|
Other liabilities |
| 22,032 |
| 18,538 |
| 26,256 |
| 23,032 |
| 6,648 |
| 5,348 |
| (5,725 | ) | (5,296 | ) | 49,211 |
| 41,622 |
|
Total Liabilities |
| 59,199 |
| 54,423 |
| 30,961 |
| 27,462 |
| 19,465 |
| 15,641 |
| (14,304 | ) | (14,006 | ) | 95,321 |
| 83,520 |
|
Net Worth |
| 56,983 |
| 50,793 |
| 44,377 |
| 43,326 |
| 24,977 |
| 22,800 |
| (20,823 | ) | (20,092 | ) | 105,514 |
| 96,827 |
|
Cost of Acquisition of Physical Assets |
| 1,387 |
| 1,547 |
| 2,002 |
| 1,800 |
| 1,895 |
| 1,920 |
| — |
| (1 | ) | 5,284 |
| 5,266 |
|
|
| Actual |
| ||
|
| 30 June |
| 30 June |
|
|
| $m |
| $m |
|
Capital Commitments |
|
|
|
|
|
Specialist military equipment |
| 873 |
| 823 |
|
Land and buildings |
| 1,121 |
| 605 |
|
Other property, plant and equipment |
| 4,303 |
| 2,617 |
|
Other capital commitments |
| 304 |
| 184 |
|
Tertiary Education Institutions |
| 209 |
| 90 |
|
Total capital commitments |
| 6,810 |
| 4,319 |
|
Operating Commitments |
|
|
|
|
|
Non-cancellable accommodation leases |
| 2,460 |
| 2,296 |
|
Other non-cancellable leases |
| 2,390 |
| 2,355 |
|
Non-cancellable contracts for the supply of goods and services |
| 2,157 |
| 1,626 |
|
Other operating commitments |
| 7,995 |
| 7,278 |
|
Tertiary Education Institutions |
| 315 |
| 303 |
|
Total operating commitments |
| 15,317 |
| 13,858 |
|
Total commitments |
| 22,127 |
| 18,177 |
|
Total Commitments by Segment |
|
|
|
|
|
Core Crown |
| 19,627 |
| 19,944 |
|
Crown entities |
| 15,830 |
| 9,835 |
|
State-owned Enterprises |
| 4,724 |
| 3,508 |
|
Inter-segment eliminations |
| (18,054 | ) | (15,110 | ) |
Total commitments |
| 22,127 |
| 18,177 |
|
By Term |
|
|
|
|
|
Capital Commitments |
|
|
|
|
|
One year or less |
| 3,013 |
| 1,821 |
|
From one year to two years |
| 1,131 |
| 609 |
|
From two to five years |
| 2,376 |
| 1,352 |
|
Over five years |
| 290 |
| 537 |
|
Capital Commitments |
| 6,810 |
| 4,319 |
|
Operating Commitments |
|
|
|
|
|
One year or less |
| 7,128 |
| 5,993 |
|
From one year to two years |
| 2,783 |
| 2,709 |
|
From two to five years |
| 3,208 |
| 2,908 |
|
Over five years |
| 2,198 |
| 2,248 |
|
Operating Commitments |
| 15,317 |
| 13,858 |
|
Total Commitments |
| 22,127 |
| 18,177 |
|
|
| Actual |
| ||
|
| 30 June |
| 30 June |
|
|
| $m |
| $m |
|
Quantifiable Contingent Liabilities |
|
|
|
|
|
Guarantees and indemnities |
|
|
|
|
|
Cook Islands - Asian Development Bank loans |
| 14 |
| 13 |
|
Terralink Limited - indemnification of receivers and managers |
| 10 |
| 10 |
|
Ministry of Justice - Treaty settlements, tax liabilities |
| 200 |
| 105 |
|
Ministry of Transport - funding guarantee |
| 10 |
| 10 |
|
Guarantees and indemnities of Crown entities and State-owned Enterprises |
| 40 |
| 18 |
|
Other guarantees and indemnities |
| 12 |
| 15 |
|
Total guarantees and indemnities |
| 286 |
| 171 |
|
Uncalled capital |
|
|
|
|
|
Asian Development Bank |
| 1,081 |
| 996 |
|
European Bank for Reconstruction and Development |
| 14 |
| 12 |
|
International Bank for Reconstruction and Development |
| 1,077 |
| 1,068 |
|
Other |
| 33 |
| — |
|
Total uncalled capital |
| 2,205 |
| 2,076 |
|
Legal proceedings and disputes |
|
|
|
|
|
Health - legal claims |
| 39 |
| 70 |
|
Tax disputes |
| 249 |
| 941 |
|
Other legal claims against Crown entities and State-owned Enterprises |
| — |
| 33 |
|
Other legal proceedings and disputes |
| 95 |
| 126 |
|
Total legal proceedings and disputes |
| 383 |
| 1,170 |
|
Other contingent liabilities |
|
|
|
|
|
International finance organisations |
| 1,727 |
| 1,431 |
|
New Zealand Export Credit Office |
| 37 |
| 8 |
|
Ministry of Economic Development |
| — |
| 146 |
|
Reserve Bank - demonetised currency |
| 23 |
| 23 |
|
Social Development - claim for judicial review |
| — |
| 79 |
|
Transpower New Zealand Limited |
| — |
| 98 |
|
Other contingent liabilities of Crown entities and State-owned Enterprises |
| 142 |
| 26 |
|
Other contingent liabilities |
| 66 |
| 18 |
|
Total other contingent liabilities |
| 1,995 |
| 1,829 |
|
Total quantifiable contingent liabilities |
| 4,869 |
| 5,246 |
|
Total Quantifiable Contingent Liabilities by Segment |
|
|
|
|
|
Core Crown |
| 4,685 |
| 5,071 |
|
Crown entities |
| 86 |
| 45 |
|
State-owned Enterprises |
| 98 |
| 150 |
|
Inter-segment eliminations |
| — |
| (20 | ) |
Total quantifiable contingent liabilities |
| 4,869 |
| 5,246 |
|
Quantifiable Contingent Assets |
|
|
|
|
|
Suspensory loans to integrated schools |
| 77 |
| 85 |
|
Legal proceedings and disputes |
| 307 |
| — |
|
Other contingent assets |
| 5 |
| 1 |
|
Total quantifiable contingent assets |
| 389 |
| 86 |
|
Contingent liabilities are costs that the Crown will have to face if a particular event occurs. Typically, contingent liabilities consist of guarantees and indemnities, legal disputes and claims, and uncalled capital. The contingent liabilities facing the Crown are a mixture of operating and balance sheet risks, and they can vary greatly in magnitude and likelihood of realisation. In general, if a contingent liability was realised it would reduce the operating balance and net worth and increase gross sovereign issued debt. However, in the case of contingencies for uncalled capital, the negative impact would be restricted to gross sovereign issued debt.
Where contingent liabilities have arisen as a consequence of legal action being taken against the Crown, the amount shown is the amount claimed and thus the maximum potential cost. It does not represent either an admission that the claim is valid or an estimation of the amount of any award against the Crown.
Guarantees and indemnities are disclosed in accordance with NZ IAS 37 Provisions, Contingent Liabilities and Contingent Assets.
Before 1992, the New Zealand Government guaranteed the Cook Islands’ borrowing from the ADB. These guarantees have first call on New Zealand’s Official Development Assistance.
The Crown has issued a Deed of Receivership indemnity to the appointed receivers of Terralink Limited against claims arising from the conduct of the receivership.
Under Deeds of Settlement completed in the Treaty settlement process the Crown has indemnified the appropriate governance entity against any goods and services tax or income tax liability arising from the payment of tangible redress.
The Minister of Finance has issued a guarantee of $10 million to the Transport Accident Investigation Commission. The guarantee allows the Commission to assure payment to suppliers of specialist salvage equipment in the event of the Commission initiating an urgent investigation of any future significant transport accident.
The amounts under quantifiable contingent liabilities for legal proceedings and disputes are shown exclusive of any interest and costs that may be claimed if these cases were decided against the Crown.
Where contingent liabilities have arisen as a consequence of legal action being taken against the Crown, the amount shown is the amount claimed and thus the maximum potential cost. It does not represent either an admission that the claim is valid or an estimation of the possible amount of any award against the Crown.
Claims against the Crown in respect of alleged negligence for failing to screen blood for Hepatitis C when screening had first become available, resulting in people allegedly contracting Hepatitis C through contaminated blood and blood products.
Tax in dispute represents the outstanding debt of those tax assessments raised, against which an objection has been lodged and legal action is proceeding. When a taxpayer disagrees with an assessment issued following the dispute process, the taxpayer may challenge that decision by filing proceedings with the Taxation Review Authority or the High Court.
The Crown has lodged promissory notes with the International Monetary Fund. Payment of the notes depends upon the operation of the rules of the organisation.
The New Zealand Export Credit Office (NZECO) provides a range of guarantee products to assist New Zealand exporters. These NZECO guarantees are recorded by the Crown as contingent liabilities. The amount of future liabilities arising from these guarantees is expected to be minor.
The Crown has a contingent liability for the face value of the demonetised $1 and $2 notes issued which have yet to be repatriated.
Accounting standard NZ IAS 37 Provisions, Contingent Liabilities and Contingent Assets requires that contingent liabilities be disclosed unless the possibility of an outflow of resources embodying economic benefits is remote. Disclosure of remote contingent liabilities is only required if knowledge of the transaction or event is necessary to achieve the objectives of general purpose financial reporting. This part of the Statement provides details of those contingent liabilities of the Crown which cannot be quantified (remote contingent liabilities are excluded).
The Crown has indemnified the directors of AsureQuality Limited in the event that they incur any personal liability for redundancies arising from any agreement by international trading partners that allows post-mortem meat inspection by parties other than the Ministry of Agriculture and Forestry, or its sub-contractor.
The Crown has indemnified the liquidators of At Work Insurance Limited (Deloitte Touche Tohmatsu) against various employment-related claims.
The Crown has indemnified Toll NZ Limited against any losses arising from breaches of the Sale and Purchase Agreement with the Crown relating to the purchase of the Auckland rail lease and infrastructure assets.
P&O NZ Ltd sought a declaratory judgement that property disclaimed by a liquidator is bona vacantia. A settlement has been reached, which includes a Crown indemnity in favour of New Zealand Aluminium Smelters and Comalco in relation to aluminium dross disposed of in their landfill, for costs that may be incurred in removing the dross and disposing of it at another site if they are required to do so by an appropriate authority. The Minister of Finance signed the indemnity on 24 November 2003. In February 2004, a similar indemnity was signed in respect of aluminium dross currently stored at another site in Invercargill.
The Building Industry Authority (BIA) is a joint defendant in a number of claims before the courts and the Weathertight Homes Resolution Service relating to the BIA’s previous role as regulator of the building industry. The BIA has been dis-established and absorbed into the Department of Building and Housing and, to prevent conflicts of interest, Treasury was given responsibility for managing weathertight claims against the BIA on behalf of the Crown from 1 July 2005.
The Crown is liable to meet any deficiency in the EQC’s assets in meeting the Commission’s financial liabilities (section 16 of the Earthquake Commission Act 1993). In the event of a major natural disaster the Crown may be called upon to meet any financial shortfall incurred by the Commission. Refer to note 24 for additional information regarding EQC’s insurance liability.
The ECNZ Sale and Purchase Agreement provides for compensation to ECNZ for any tax, levy, or royalty imposed on ECNZ for the use of water or geothermal energy for plants in existence or under construction at the date of the Sale and Purchase Agreement. The Agreement also provides for compensation for any net costs to ECNZ arising from resumption of assets pursuant to the Treaty of Waitangi (State Enterprises) Act 1988.
The Deed of Assumption and Release between ECNZ, Contact Energy Limited and the Crown provides that the Crown is no longer liable to ECNZ in respect of those assets transferred to it from ECNZ. As a result of the split of ECNZ in 1999, Ministers have transferred the benefits of the Deed to ECNZ’s successors – Meridian Energy Limited, Mighty River Power Limited and Genesis Power Limited.
Under the Transpower New Zealand Limited (Transpower) Sale and Purchase and Debt Assumption Agreements, the Crown has indemnified ECNZ for any losses resulting from changes in tax rules applicable to transactions listed in the Agreements. Additionally, the Crown has indemnified the directors and officers of ECNZ for any liability they may incur in their personal capacities as a result of the Transpower separation process.
Following the split of ECNZ in 1999 into three new companies, the Crown has indemnified ECNZ in relation to all ECNZ’s pre-split liabilities, including:
· existing debt and swap obligations
· hedge contracts and obligations
· any liabilities that arise out of the split itself.
The Crown has indemnified Commercial Fisheries Services Limited against claims made by third parties arising from Commercial Fisheries Services undertaking registry services under contract to the Chief Executive of the Ministry of Fisheries. This indemnity, provided under the Fisheries Acts 1983 and 1996, expires on 30 September 2009.
The Crown has entered into a deed with Genesis Energy to share a specified and limited amount of risk around the sufficiency of Genesis Energy’s long term supply of gas to cover the Huntly e3p’s (a 385 MW combined cycle gas turbine power station) minimum needs. The agreement sees the Crown compensate Genesis Energy in the event it has less gas than it needs.
As part of the sale and purchase agreement between the Crown and Mighty River Power (MRP), the Crown has agreed to provide an indemnity for the payment of carbon taxes, should legislation be passed that does not allow for an automatic pass-through of the charges to end-users. The indemnity is time bound and contractually limited in the amount that can be claimed. The indemnity is not limited to MRP and will be available to any subsequent owner of the Crown’s Kawerau geothermal assets.
HNZC is liable to the owners (ANZ National Bank Limited, Ichthus Limited and Westpac Banking Corporation) of mortgages sold by HNZC during 1992 to 1999 for credit losses they may incur from specified limited aspects of their ownership of those mortgages with the Crown standing behind this obligation.
The Crown has provided a warranty in respect of title to the assets transferred to Housing New Zealand Limited (HNZL) (HNZL was incorporated into the HNZC group as a subsidiary in 2001 as part of a legislated consolidation of government housing functions) and has indemnified HNZL against any breach of this warranty. In addition, the Crown has indemnified HNZL against any third-party claims that are a result of acts or omissions prior to 1 November 1992. It has also indemnified the directors and officers of HNZL against any liability consequent upon the assets not complying with statutory requirements, provided it is taking steps to rectify any non-compliance.
The Crown has indemnified Air New Zealand against claims arising from acts of war and terrorism that cannot be met from insurance, up to a limit of US$1 billion in respect of any one claim.
Section 197 of the Summary Proceedings Act 1957, requires the Crown to indemnify Justices of the Peace and Community Magistrates against damages or costs awarded against them as a result of them exceeding their jurisdiction, provided a High Court Judge certifies that they have exceeded their jurisdiction in good faith and ought to be indemnified.
Section 58 of the Disputes Tribunal Act 1988 confers a similar indemnity on Disputes Tribunal Referees.
The Crown has entered into confidentiality agreements with the Maui Partners in relation to the provision of gas reserves information. The deed contains an indemnity against any losses arising from a breach of the deed.
The National Provident Fund (NPF) has been indemnified for certain potential tax liabilities. Under the NPF Restructuring Act 1990, the Crown guarantees:
· the benefits payable by all NPF schemes (section 60)
· investments and interest thereon deposited with the NPF Board prior to 1 April 1991 (section 61)
· payment to certain NPF defined contribution schemes where application of the 4% minimum earnings rate causes any deficiency or increased deficiencies in reserves to arise (section 72).
A provision has been made in these financial statements in respect of the actuarially assessed deficit in the DBP (Annuitants’) Scheme (refer to note 26).
The Crown has indemnified the directors of the New Zealand Railways Corporation against any liability arising from the surrender of the licence and lease of the Auckland rail corridor.
The Crown has further indemnified the directors of New Zealand Railways Corporation against any liability arising from the transfer of the rail network and associated assets and liabilities to the Corporation on 1 September 2004.
Section 63 of the Corporations (Investigation and Management) Act 1989 indemnifies the Securities Commission, the Registrar and Deputy Registrar of Companies, members of advising committees within the Act, every statutory manager of a corporation, and persons appointed pursuant to sections 17 to 19 of the Act, in the exercise of investigating powers, unless the power has been exercised in bad faith.
The Crown has entered into a confidentiality agreement with Ports of Auckland in relation to the purchase of two marinas. The agreement contains an indemnity against any losses arising from a breach of the agreement.
The Crown is liable to meet any deficiency in the Public Trust’s Common Fund (section 52 of the Public Trust Act 2001).
As part of the 1990 sale of the Synfuels plant and operations to New Zealand Liquid Fuels Investment Limited (NZLFI), the Crown transferred to NZLFI the benefit and obligation of a Deed of Indemnity between the Crown and Borthwick-CWS Limited (and subsequent owners) in respect of the Waitara effluent transfer line which was laid across the Waitara meat processing plant site.
The Crown has the benefit of a counter indemnity from NZLFI which has since been transferred to Methanex Motunui Limited.
Several leases of Tainui land at Huntly and Meremere have been transferred from ECNZ to Genesis Power. The Crown has provided guarantees to Tainui Corporation relating to Genesis Power’s obligations under the lease agreements.
The agreement between the Crown and Toll NZ Ltd for the Crown’s purchase of the rail network and associated assets on 30 June 2004 contains the following provisions:
· the Crown has indemnified Toll NZ Ltd against any liability arising from the assigned contracts, leases, etc after their assignment dates
· the Crown has indemnified Toll NZ Ltd against certain potential claims by employees
There is ongoing legal action against the Crown in relation to historical abuse claims. At this stage the number of claimants and outcome of these cases are uncertain.
There are several legal actions against ACC in existence, arising in the main from challenges to operational decisions made by ACC. ACC will be vigorously defending these claims.
Air New Zealand has been named in four class actions. One, in Australia, claims travel agents commission on fuel surcharges and two (one in Australia and the other in the United States) make allegations against more than 30 airlines, of anti competitive conduct in relation to pricing in the air cargo business. The allegations made in relation to the air cargo business are also the subject of investigations by regulators in a number of jurisdictions including the United States and the European Union. A formal Statement of Objections has been issued by the European Commission to 25 airlines including Air New Zealand and has been responded to. In the event that a court determined, or it was agreed with a regulator, that Air New Zealand had breached relevant laws, the Company would have potential liability for pecuniary penalties and to third party damages under the laws of the relevant jurisdictions. The fourth class action alleges (in the United States) that Air New Zealand together with 11 other airlines conspired in respect of fares and surcharges on trans-Pacific routes. All class actions are being defended.
Under common law and various statutes, the Crown may have responsibility to remedy adverse effects on the environment arising from Crown activities.
Departments managing significant Crown properties have implemented systems to identify, monitor and assess potential contaminated sites.
In accordance with NZ IAS 37: Provisions, Contingent Liabilities and Contingent Assets any contaminated sites for which costs can be reliably measured have been included in the statement of financial position as provisions.
The Crown has agreed in joint venture arrangements with the New Zealand Rugby Union to an uncapped underwrite of the costs of hosting the 2011 Rugby World Cup, on a loss sharing basis (Crown 67%, NZRU 33%). A provision for the forecast losses has been made in the Government’s financial statements.
The Crown has agreed to reimburse New Zealand income tax that might be incurred by the joint venture entity (Rugby New Zealand 2011 Limited) or the NZRU in relation to the joint venture entity, and has also agreed to
reimburse the NZRU for New Zealand withholding tax that might be incurred on certain payments made in relation to the tournament.
The Crown has further agreed to review its level of support to the tournament if the actual tax revenue arising from the tournament exceeds forecasts.
Under the Treaty of Waitangi Act 1975, any Maori may lodge claims relating to land or actions counter to the principles of the Treaty with the Waitangi Tribunal. Where the Tribunal finds a claim is well founded, it may recommend to the Crown that action be taken to compensate those affected. The Tribunal can make recommendations that are binding on the Crown with respect to land which has been transferred by the Crown to an SOE or tertiary institution, or is subject to the Crown Forest Assets Act 1989.
The Deeds of Settlement negotiated with Waikato-Tainui and Ngai Tahu include a relativity mechanism. The mechanism provides that, where the total redress amount for all historical Treaty settlements exceeds $1 billion in 1994 present-value terms, the Crown is liable to make payments to maintain the real value of Ngai Tahu’s and Waikato-Tainui’s settlements as a proportion of all Treaty settlements. The agreed relativity proportions are 17% for Waikato-Tainui and approximately 16% for Ngai Tahu. The non-quantifiable contingent liability relates to the risk that total settlement redress, including binding recommendations from the Waitangi Tribunal, will trigger these relativity payments.
Foreshore and seabed
The Foreshore and Seabed Act 2004 (FSA):
· vests the full legal and beneficial ownership of the public foreshore and seabed in the Crown
· provides for the recognition and protection of ongoing customary rights with respect to the public foreshore and seabed
· enables applications to the High Court to investigate if previously held common law rights have been adversely impacted, and if so, providing for those affected either to participate in the administration of a foreshore and seabed reserve or else enter into formal discussions on redress, and
· provides for general rights of public access and recreation in, on, over, and across the public foreshore and seabed and general rights of navigation within the foreshore and seabed.
The public foreshore and seabed means the marine area that is bounded on the landward side by the line of mean high water spring; and on the seaward side by the outer limits of the territorial sea, but does not include land subject to a specified freehold interest (refer section 5 of the FSA).
The FSA codifies the nature of the Crown’s ownership interest in the public foreshore and seabed on behalf of the public of New Zealand. Although full legal and beneficial ownership of the public foreshore and seabed has been vested in the Crown, there are significant limitations to the Crown’s rights under the FSA. As well as recognising and protecting customary rights, the FSA significantly restricts the Crown’s ability to alienate or dispose of any part of the public foreshore and seabed and significantly restricts the Crown’s ability to exclude others from entering or engaging in recreational activities or navigating in, on or within the public foreshore and seabed. Because of the complex nature of the Crown’s ownership interest in the public foreshore and seabed and because we are unable to obtain a reliable valuation of the Crown’s interest, the public foreshore and seabed has not been recognised as an asset in these financial statements.
Legal proceedings and disputes are contingent assets in relation to Inland Revenue pending assessments. When a taxpayer disagrees with a proposed adjustment following an audit by the Inland Revenue, the Department issues a Notice of Proposed Adjustment (“NOPA”) which quantifies the proposed adjustment. The taxpayer is entitled to dispute this.
In addition, the Crown is currently in dispute with a number of financial institutions regarding the tax treatment of certain structured finance transactions. However, it was not possible to recognise revenue and a receivable for the transactions because of fundamental uncertainty with the application of tax law to the structured finance transactions, which will be tested in court in due course, and the fact that the likelihood of success of a court case cannot be reliably predicted.
The Government has devolved responsibility for the financial management of its financial portfolios to its sub-entities such as NZDMO, Reserve Bank, NZ Superannuation Fund, Inland Revenue and ACC. The financial management objectives of each of these portfolios are influenced by the purpose and associated governance framework for which the portfolio is held. The purposes of a portfolio may cover:
· public policy considerations eg, the provision of student loans to support tertiary education policy
· liquidity management eg, Treasury bills and Government Stock are the primary debt instruments for funding core Government operations, and
· long-term economic return eg, the function of the NZ Superannuation Fund.
These purposes are not mutually exclusive, with portfolios typically established for, or arising from, a public policy objective, such as pre-funding future superannuation expenses, but in doing so are managed to maximise economic returns consistent with the policy objective.
Reporting to Ministers on these portfolios is done on a portfolio-by-portfolio basis. The institutional frameworks and policy objectives of these portfolios are reviewed periodically. Otherwise reporting on the consolidated financial management and performance of these portfolios is done in the context of the interim and annual Financial Statements of the Government and the forecasts reported in the Half-Year and Budget economic and fiscal updates.
Sub-entities with responsibility for managing significant financial assets or financial liabilities are:
Manager |
| Financial Instrument Portfolio |
| Risk Management |
|
|
|
|
|
New Zealand Debt Management Office (NZDMO) |
| Financial assets and liabilities held to:
· finance the Government’s gross borrowing requirements
· provide funds to Government entities, and
· provide capital market services and derivative transactions to Government entities. |
| NZDMO operates within a risk management framework that is approved by the Minister of Finance. The framework specifies NZDMO’s policies for managing market risk, credit risk, liquidity risk, funding risk and operational risk. The risk management framework is subject to continuous improvement. |
|
|
|
|
|
The Reserve Bank of New Zealand |
| Financial assets and liabilities held for the purpose of effective foreign exchange intervention capability, wholesale banking liquidity (settlement cash) and circulating currency |
| The overall risk management framework is designed to strongly encourage the sound and prudent management of the banks risk in a way that’s consistent with financial market best practice. |
|
|
|
|
|
Inland Revenue Department |
| Student Loans and tax receivables |
| The department has debt management policies and procedures to ensure debt can be collected in a timely manner in accordance with Government policy. |
Manager |
| Financial Instrument Portfolio |
| Risk Management |
|
|
|
|
|
The New Zealand Superannuation Fund (NZS Fund) |
| Investment Fund assets |
| The Guardians manage the NZS Fund’s risks by adopting an appropriate risk profile that is commensurate with the return objective and time horizon of the Fund. The objective is to:
· avoid concentration of risk by ensuring there is adequate diversification between and within asset classes and geographically
· careful selection and monitoring of managers to ensure the Guardians have sufficient conviction that each manager will maximise the probability that return expectations will be met
· to ensure that there are no unintended biases away from the intended investment strategy, and
· perform rigorous measurement and management of market and manager risk. |
|
|
|
|
|
Accident Compensation Corporation |
| ACC Reserves |
| The investment committee sets investment guidelines by requiring investment managers to manage their portfolios within defined market exposure limits. These limits include limits on percentage weight of any particular company in the portfolio relative to its benchmark weight; limits on aggregate investment in companies not represented in the benchmark; limits on the maximum investment in any individual company; duration limits relative to the duration of the benchmark; and maximum credit exposure to single entities. Compliance with the investment guidelines is reviewed by the internal auditors on a half yearly basis. |
|
|
|
|
|
New Zealand Post (including Kiwbank) |
| Financial instruments from its debt portfolio and investment activity. This includes activities as a financial intermediary and financial market participant (Kiwibank). |
| The Board is responsible for risk management policies and procedures. This includes appointing a finance risk committee to monitor risk management. |
|
|
|
|
|
Air New Zealand |
| Financial instruments arising from its business activity |
| The Board of directors approve risk management policies. Compliance with these policies is reviewed and reported monthly to the Board and is included as part of the internal audit programme. Group policy is not to enter, issue or hold financial instruments for speculative purposes. |
Manager |
| Financial Instrument Portfolio |
| Risk Management |
|
|
|
|
|
Earthquake Commission |
| Assets in National Disaster Fund |
| Best-practice portfolio management that maximises return without undue risk to the Fund as a whole while avoiding prejudice to New Zealand’s reputation as a responsible member of the world community. |
|
|
|
|
|
Transpower |
| Financial instruments arising from its business activity |
| The Board has approved policy and guidelines and authorised the use of various financial instruments. The policy adopted by the Board prohibits the use of financial instruments for speculative purposes. All derivatives must be directly related to underlying physical debt or firm capital commitments on Board approved projects. |
|
|
|
|
|
New Zealand Customs Service |
| Tax receivables |
| The Service has debt management policies and procedures to ensure debt can be collected in a timely manner in accordance with Government policy. |
|
|
|
|
|
Ministry of Social Development |
| Benefit receivables and student loans |
| The Ministry has a series of policies to manage the risks associated with financial instruments. These policies do not allow any transactions that are speculative in nature. |
|
|
|
|
|
Mighty River Power |
| Financial instruments arising from its business activity |
| The Group’s overall risk management programme focuses on the unpredictability of financial markets and seeks to minimise potential adverse impacts on its financial performance. The Group uses derivative financial instruments to hedge these risk exposures. |
|
|
|
|
|
Meridian Energy |
| Financial instruments arising from its business activity |
| Meridian’s overall risk management programme focuses on the unpredictability of financial markets and the electricity spot price and seeks to minimise potential adverse effects on the financial performance and economic value of the Group. The Group uses financial instruments to hedge these risk exposures. |
|
|
|
|
|
Genesis Energy |
| Financial instruments arising from its business activity |
| Genesis’s overall risk management programme focuses on the unpredictability of financial markets and the electricity spot price and seeks to minimise potential adverse effects on the financial performance and economic value of the Group. The Group uses financial instruments to hedge these risk exposures. |
The size of these portfolios on an unconsolidated basis (ie, including cross-holdings of government stock and other Crown instruments) are:
|
| 30 June 2008 $m |
| 30 June 2007 $m |
| ||||
|
| Unconsolidated |
| Unconsolidated |
| Unconsolidated |
| Unconsolidated |
|
NZDMO |
| 16,578 |
| 32,952 |
| 12,939 |
| 32,370 |
|
Reserve Bank |
| 18,159 |
| 16,160 |
| 17,718 |
| 16,176 |
|
Inland Revenue |
| 14,294 |
| 4,575 |
| 13,193 |
| 3,294 |
|
NZ Superannuation Fund |
| 13,791 |
| 494 |
| 12,576 |
| 90 |
|
ACC |
| 12,958 |
| 720 |
| 12,169 |
| 570 |
|
NZ Post |
| 7,385 |
| 7,243 |
| 5,119 |
| 4,943 |
|
Air New Zealand |
| 2,065 |
| 1,932 |
| 1,749 |
| 2,069 |
|
EQC |
| 5,615 |
| 6 |
| 5,484 |
| 5 |
|
Transpower |
| 283 |
| 1,266 |
| 762 |
| 1,642 |
|
Customs |
| 1,570 |
| 4 |
| 1,335 |
| 4 |
|
Ministry of Social Development |
| 1,407 |
| 368 |
| 1,261 |
| 311 |
|
Mighty River Power |
| 459 |
| 1,096 |
| 308 |
| 729 |
|
Meridian Energy |
| 689 |
| 1,649 |
| 327 |
| 960 |
|
Genesis Energy |
| 510 |
| 1,035 |
| 295 |
| 682 |
|
Details of the significant accounting policies and methods adopted including the criteria for recognition, the basis of measurement and the basis on which income and expenses are recognised, in respect of each class of financial asset and financial liability are disclosed in Note 1 of the financial statements.
Financial instruments are measured at either fair value or amortised cost. Changes in the value of an instrument may be reported in the operating balance or directly in net worth depending on its designation. The following table details the value of financial assets and financial liabilities by class of instrument and by designation category, as defined in the accounting policies in Note 1.
|
| Designation |
| ||||||||||
|
| Sovereign |
| Amortised |
| Available |
| Held for |
| Fair value |
| Total |
|
Financial assets as at 30 June 2008 |
| $m |
| $m |
| $m |
| $m |
| $m |
| $m |
|
Cash and cash equivalents |
| — |
| 3,804 |
| — |
| — |
| — |
| 3,804 |
|
Tax receivables (note 14) |
| 7,398 |
| — |
| — |
| — |
| — |
| 7,398 |
|
Levies, fines and penalty receivables (note 14) |
| 3,106 |
| — |
| — |
| — |
| — |
| 3,106 |
|
Social benefit receivables |
| 440 |
| — |
| — |
| — |
| — |
| 440 |
|
Trade and other receivables |
| — |
| 3,214 |
| — |
| — |
| — |
| 3,214 |
|
Student loans (note 17) |
| — |
| 6,741 |
| — |
| — |
| — |
| 6,741 |
|
Kiwibank mortgages (note 17) |
| — |
| 2,427 |
| — |
| — |
| 3,154 |
| 5,581 |
|
Other advances (note 17) |
| — |
| 578 |
| — |
| — |
| 48 |
| 626 |
|
Long-term deposits (note 15) |
| — |
| 2,787 |
| — |
| — |
| — |
| 2,787 |
|
Share investments (note 16) |
| — |
| — |
| 76 |
| — |
| 12,888 |
| 12,964 |
|
Derivatives in gain (note 15) |
| — |
| — |
| — |
| 1,563 |
| — |
| 1,563 |
|
Marketable securities (note 15) |
| — |
| — |
| 759 |
| 490 |
| 35,402 |
| 36,651 |
|
IMF special drawing rights |
| — |
| 188 |
| — |
| — |
| — |
| 188 |
|
Total financial assets by designation |
| 10,944 |
| 19,739 |
| 835 |
| 2,053 |
| 51,492 |
| 85,063 |
|
|
| Designation |
| ||||||||||
|
| Sovereign |
| Amortised |
| Available |
| Held for |
| Fair value |
| Total |
|
Financial assets as at 30 June 2007 |
| $m |
| $m |
| $m |
| $m |
| $m |
| $m |
|
Cash and cash equivalents |
| — |
| 4,162 |
| — |
| — |
| — |
| 4,162 |
|
Tax receivables (note 14) |
| 6,369 |
| — |
| — |
| — |
| — |
| 6,369 |
|
Levies, fines and penaltyreceivables |
| 2,589 |
| — |
| — |
| — |
| — |
| 2,589 |
|
Social benefit receivables |
| 394 |
| — |
| — |
| — |
| — |
| 394 |
|
Trade and other receivables |
| — |
| 2,703 |
| 2 |
| — |
| — |
| 2,705 |
|
Student loans (note 17) |
| — |
| 6,011 |
| — |
| — |
| — |
| 6,011 |
|
Kiwibank mortgages (note 17) |
| — |
| 885 |
| — |
| — |
| 2,752 |
| 3,637 |
|
Other advances (note 17) |
| — |
| 553 |
| — |
| — |
| 527 |
| 1,080 |
|
Long-term deposits (note 15) |
| — |
| 3,174 |
| — |
| — |
| — |
| 3,174 |
|
Share investments (note 16) |
| — |
| — |
| 77 |
| — |
| 13,504 |
| 13,581 |
|
Derivatives in gain (note 15) |
| — |
| — |
| — |
| 2,352 |
| — |
| 2,352 |
|
Marketable securities (note 15) |
| — |
| — |
| 533 |
| 299 |
| 26,649 |
| 27,481 |
|
IMF special drawing rights |
| — |
| 183 |
| — |
| — |
| — |
| 183 |
|
Total financial assets by designation |
| 9,352 |
| 17,671 |
| 612 |
| 2,651 |
| 43,432 |
| 73,718 |
|
|
| Designation |
| ||||||
|
| Amortised |
| Held for |
| Fair value |
| Total |
|
Financial liabilities as at 30 June 2008 |
| $m |
| $m |
| $m |
| $m |
|
Issued currency |
| 3,530 |
| — |
| — |
| 3,530 |
|
Accounts payable (note 22) |
| 6,444 |
| — |
| — |
| 6,444 |
|
Taxes repayable (note 22) |
| 4,451 |
| — |
| — |
| 4,451 |
|
Borrowings: (note 23) |
|
|
|
|
|
|
|
|
|
Government stock |
| 13,722 |
| — |
| 4,794 |
| 18,516 |
|
Treasury bills |
| — |
| — |
| 1,484 |
| 1,484 |
|
Government retail stock |
| 423 |
| — |
| — |
| 423 |
|
Settlement deposits with Reserve Bank |
| — |
| — |
| 7,750 |
| 7,750 |
|
Derivatives in loss |
| — |
| 1,591 |
| — |
| 1,591 |
|
Finance lease liabilities |
| 955 |
| — |
| — |
| 955 |
|
Other borrowings |
| 10,784 |
| — |
| 4,607 |
| 15,391 |
|
Total borrowings |
| 25,884 |
| 1,591 |
| 18,635 |
| 46,110 |
|
Total financial liabilities by designation |
| 40,309 |
| 1,591 |
| 18,635 |
| 60,535 |
|
|
| Designation |
| ||||||
|
| Amortised |
| Held for |
| Fair value |
| Total |
|
Financial liabilities as at 30 June 2007 |
| $m |
| $m |
| $m |
| $m |
|
Issued currency |
| 3,444 |
| — |
| — |
| 3,444 |
|
Accounts payable (note 22) |
| 4,898 |
| — |
| — |
| 4,898 |
|
Taxes repayable (note 22) |
| 3,179 |
| — |
| — |
| 3,179 |
|
Borrowings: (note 23) |
|
|
|
|
|
|
|
|
|
Government stock |
| 12,873 |
| — |
| 2,905 |
| 15,778 |
|
Treasury bills |
| — |
| — |
| 2,098 |
| 2,098 |
|
Government retail stock |
| 364 |
| — |
| — |
| 364 |
|
Settlement deposits with Reserve Bank |
| — |
| — |
| 7,507 |
| 7,507 |
|
Derivatives in loss |
| — |
| 1,126 |
| — |
| 1,126 |
|
Finance lease liabilities |
| 954 |
| — |
| — |
| 954 |
|
Other borrowings |
| 7,920 |
| 350 |
| 5,801 |
| 14,071 |
|
Total borrowings |
| 22,111 |
| 1,476 |
| 18,311 |
| 41,898 |
|
Total financial liabilities by designation |
| 33,632 |
| 1,476 |
| 18,311 |
| 53,419 |
|
The Government’s activities expose it primarily to the financial risks of changes in interest rates (see (e) below), foreign exchange rates (see (f) below) and equity markets (see (g) below). These risks are managed at portfolio level consistent with the policy purpose of the portfolio and risk management objectives. Detailed information on the exposure to market risk and policies for managing this risk are available in the separate financial statements prepared by each entity.
The Government’s exposure to market risk reflects the combination of these portfolio management practices. These practices include use of Value-at-Risk (VaR) limits and stop-loss limits to manage risk. While NZDMO and Reserve Bank’s activities collectively manage the core Crown’s exposure to foreign exchange, there is no other centralised management of market or other risk.
There has been no change to the manner in which the Government, or more precisely the Crown reporting entities that manage the Government’s portfolios, manage and measure risks from the year ended 30 June 2007.
A variety of derivative financial instruments are used across the portfolios to manage exposure to interest rate, foreign currency and electricity sector risk including:
· foreign exchange contracts and options to hedge exchange rate risk arising from foreign investments and liabilities as well as budgeted overseas purchases. Under foreign exchange contracts the Government agrees to exchange one currency for another at a future date using an exchange rate determined when the contract is entered into
· interest rate swaps and options to manage interest rate risk. Under interest rate swap contracts, the Government agrees to exchange the difference between fixed and floating rate interest amounts calculated on agreed notional principal amounts. Such contracts enable the Government to mitigate the risk of changing interest rates on the fair value of issued fixed rate debt and the cash flow exposures on the issued variable rate debt
· cross currency swaps combine an interest rate swap and a currency swap whereby the interest rate in one currency is fixed, and the interest rate in the other is floating. In doing so, they manage both interest rate and currency risk, and
· electricity derivatives are typically “contracts for differences” entered into by the electricity generation State-owned enterprises to hedge against volatility in electricity prices.
|
| Carrying |
| Notional |
| Carrying |
| Notional |
| Net |
|
Derivatives as at 30 June 2008 |
| $m |
| $m |
| $m |
| $m |
| $m |
|
Foreign exchange contracts |
| 206 |
| 6,028 |
| 510 |
| 15,524 |
| (304 | ) |
Foreign exchange options |
| 5 |
| 320 |
| — |
| 12 |
| 5 |
|
Cross currency swaps |
| 570 |
| 2,861 |
| 521 |
| 2,985 |
| 49 |
|
Interest rate swaps |
| 347 |
| 17,786 |
| 218 |
| 9,244 |
| 129 |
|
Interest rate options |
| — |
| 25 |
| — |
| 110 |
| — |
|
Futures |
| — |
| 1,119 |
| 1 |
| 303 |
| (1 | ) |
Other derivatives |
| 435 |
| 8,553 |
| 341 |
| 4,264 |
| 94 |
|
Total derivatives |
| 1,563 |
| 36,692 |
| 1,591 |
| 32,442 |
| (28 | ) |
Derivatives as at 30 June 2007 |
| Carrying |
| Notional |
| Carrying value in |
| Notional |
| Net |
|
Foreign exchange contracts |
| 901 |
| 15,669 |
| 292 |
| 4,000 |
| 609 |
|
Foreign exchange options |
| 11 |
| 143 |
| — |
| — |
| 11 |
|
Cross currency swaps |
| 872 |
| 4,053 |
| 470 |
| 2,614 |
| 403 |
|
Interest rate swaps |
| 372 |
| 16,334 |
| 346 |
| 8,949 |
| 27 |
|
Interest rate options |
| 1 |
| 40 |
| — |
| — |
| 1 |
|
Futures |
| 1 |
| 290 |
| 3 |
| 708 |
| (2 | ) |
Other derivatives |
| 192 |
| 4,315 |
| 15 |
| 1,066 |
| 177 |
|
Total derivatives |
| 2,352 |
| 40,845 |
| 1,126 |
| 17,338 |
| 1,226 |
|
Some derivatives are reported using the hedge accounting approaches available under financial reporting standards. These approaches permit the effective portion of a cash flow hedging instrument to be initially reported in equity and subsequently transferred to the statement of financial performance or value of the hedged asset, while a fair value hedge enables the hedged item to be adjusted by the effective portion of the fair value hedge and for this adjustment to be reported in the statement of financial performance. The carrying values of hedge accounted derivatives are:
|
| Carrying |
| Carrying |
| Net |
|
Hedge accounted derivatives as at 30 June 2008 |
|
|
|
|
|
|
|
Derivatives hedging fair value |
| 1 |
| 64 |
| (63 | ) |
Derivatives hedging cash flows |
| 343 |
| 338 |
| 5 |
|
Hedge accounted derivatives as at 30 June 2007 |
|
|
|
|
|
|
|
Derivatives hedging fair value |
| — |
| 122 |
| (122 | ) |
Derivatives hedging cash flows |
| 109 |
| 212 |
| (103 | ) |
Note 32: Financial Instruments (continued)
(d) Market risk (continued)
As a result of fair value hedge accounting, the hedged items were adjusted by a loss of $22 million (2007: gain of $59 million), which is included in the statement of financial performance along with the change in fair value of the hedging derivative.
The periods when cash flows are expected to occur from activities subject to cash flow hedge accounting and when they are expected to affect the operating balance are:
|
| >12 |
| 1-2 years |
| 2-5 years |
| >5 years |
| Total |
|
|
| $m |
| $m |
| $m |
| $m |
| $m |
|
As at 30 June 2008 |
|
|
|
|
|
|
|
|
|
|
|
Timing of cash flows |
| (135 | ) | (15 | ) | 13 |
| — |
| (137 | ) |
Effect on operating balance |
| (160 | ) | 19 |
| 42 |
| (84 | ) | (183 | ) |
|
|
|
|
|
|
|
|
|
|
|
|
As at 30 June 2007 |
|
|
|
|
|
|
|
|
|
|
|
Timing of cash flows |
| (193 | ) | (10 | ) | 4 |
| (1 | ) | (200 | ) |
Effect on operating balance |
| (103 | ) | (11 | ) | 9 |
| 11 |
| (94 | ) |
(e) Interest rate risk management
The Government is exposed to interest rate risk as entities in the government borrow and invest funds at both fixed and floating interest rates. The risk is managed at the entity level in accordance with their capital objectives and risk management policies. These objectives and policies include maintaining an appropriate mix between fixed and floating rate borrowings, by the use of interest rate swap contracts and forward interest rate contracts, and by the use of Value-at-Risk and stop-loss limits. Hedging activities are evaluated regularly to align with interest rate views and defined risk appetite; ensuring optimal hedging strategies are applied, by either positioning the balance sheet or protecting interest expense through different interest rate cycles.
Interest rate sensitivity analysis
The following analysis of financial instruments shows how the operating balance and equity reserves would have been affected by a 100 basis point increase or decrease in New Zealand interest rates while holding all other variables constant. The effect on the operating balance is primarily from changes in interest revenue and interest expense on floating rate instruments and changes in value of instruments measured at fair value through profit and loss. The Government does not have material exposure to foreign interest rates.
The sensitivity analyses below have been determined based on the exposure to interest rates for both derivatives and non-derivative financial instruments at the balance sheet date. The effect of exposure to interest rates on the valuation of non-financial instruments, such as the ACC liability and GSF defined benefit plan, are provided in the relevant notes to the financial statements.
Movements in interest rates affect the financial results of the Government in the following manner:
· the resulting valuation changes for fixed interest instruments that are measured at fair value through profit and loss will affect the operating balance, while the valuation changes of fixed interest instruments designated as available-for-sale will affect equity reserves
· the resulting changes in interest expense and interest revenue on floating rate instruments will affect the operating balance, and
· where derivatives are designated as cash flow hedges of floating rate instruments, equity reserves will be affected by the resulting changes in the fair value of these derivatives.
Note 32: Financial Instruments (continued)
(e) Interest rate risk management (continued)
If interest rates had been 100 basis points higher/(lower) at balance date and all other variables were held constant, the effect of financial instruments would increase/(decrease) the Government’s financial results as outlined in the following table. The impact is net of hedging via interest rate derivatives.
Change in New Zealand Interest Rates
|
| Impact on operating balance |
| Impact on net worth |
| ||||
|
| 2008 |
| 2007 |
| 2008 |
| 2007 |
|
|
| $m |
| $m |
| $m |
| $m |
|
Increase 1% (100 basis points) |
| (408 | ) | (379 | ) | (401 | ) | (369 | ) |
Decrease 1% (100 basis points) |
| 467 |
| 444 |
| 459 |
| 433 |
|
The Government’s sensitivity to interest rates has not materially changed from the previous year.
(f) Foreign currency risk management
The Government undertakes transactions denominated in foreign currencies. Hence, exposures to exchange rate fluctuations arise. Exchange rate exposures are managed within approved policy parameters utilising forward foreign exchange contracts. The carrying amounts of the Government’s foreign currency denominated financial assets and financial liabilities translated to NZD at the reporting date are as follows:
As at 30 June 2008 |
| NZD |
| USD |
| Yen |
| Euro |
| Other |
| Total |
|
Cash and cash equivalents |
| 2,745 |
| 517 |
| 97 |
| 115 |
| 330 |
| 3,804 |
|
Tax receivables |
| 7,398 |
| — |
| — |
| — |
| — |
| 7,398 |
|
Levies, fines and penalty receivables |
| 3,106 |
| — |
| — |
| — |
| — |
| 3,106 |
|
Social benefit receivables |
| 440 |
| — |
| — |
| — |
| — |
| 440 |
|
Trade and other receivables |
| 2,778 |
| 185 |
| 31 |
| 97 |
| 123 |
| 3,214 |
|
Student loans |
| 6,741 |
| — |
| — |
| — |
| — |
| 6,741 |
|
Kiwibank mortgages |
| 5,581 |
| — |
| — |
| — |
| — |
| 5,581 |
|
Other advances |
| 622 |
| — |
| — |
| — |
| 4 |
| 626 |
|
Long-term deposits |
| 1,968 |
| 409 |
| 31 |
| 83 |
| 296 |
| 2,787 |
|
Share investments |
| 1,949 |
| 5,715 |
| 621 |
| 1,190 |
| 3,489 |
| 12,964 |
|
Derivatives in gain |
| 13,575 |
| (11,696 | ) | (1,224 | ) | 43 |
| 865 |
| 1,563 |
|
Marketable securities |
| 7,650 |
| 21,345 |
| 1,686 |
| 4,996 |
| 974 |
| 36,651 |
|
IMF special drawing rights |
| — |
| — |
| — |
| — |
| 188 |
| 188 |
|
Total financial assets |
| 54,553 |
| 16,475 |
| 1,242 |
| 6,524 |
| 6,269 |
| 85,063 |
|
Issued currency |
| 3,530 |
| — |
|
|
|
|
| — |
| 3,530 |
|
Accounts payable |
| 5,674 |
| 323 |
| 31 |
| 279 |
| 137 |
| 6,444 |
|
Taxes repayable |
| 4,451 |
| — |
| — |
| — |
| — |
| 4,451 |
|
Government stock |
| 18,516 |
| — |
| — |
| — |
| — |
| 18,516 |
|
Treasury bills |
| 1,484 |
| — |
| — |
| — |
| — |
| 1,484 |
|
Government retail stock |
| 423 |
| — |
| — |
| — |
| — |
| 423 |
|
Settlement deposits with Reserve Bank |
| 7,750 |
| — |
| — |
| — |
| — |
| 7,750 |
|
Derivatives in loss |
| (16,296 | ) | 9,975 |
| 860 |
| 4,491 |
| 2,561 |
| 1,591 |
|
Finance lease liabilities |
| 606 |
| 349 |
| — |
| — |
| — |
| 955 |
|
Other borrowings |
| 11,543 |
| 2,288 |
| 358 |
| — |
| 1,202 |
| 15,391 |
|
Total financial liabilities |
| 37,681 |
| 12,935 |
| 1,249 |
| 4,770 |
| 3,900 |
| 60,535 |
|
Net financial currency holdings |
| 16,872 |
| 3,540 |
| (7 | ) | 1,754 |
| 2,369 |
| 24,528 |
|
Note 32: Financial Instruments (continued)
(f) Foreign currency risk management (continued)
As at 30 June 2007 |
| NZD |
| USD |
| Yen |
| Euro |
| Other |
| Total |
|
Cash and cash equivalents |
| 2,875 |
| 900 |
| 55 |
| 147 |
| 185 |
| 4,162 |
|
Tax receivables |
| 6,369 |
| — |
| — |
| — |
| — |
| 6,369 |
|
Levies, fines and penalty receivables |
| 2,589 |
| — |
| — |
| — |
| — |
| 2,589 |
|
Social benefit receivables |
| 394 |
| — |
| — |
| — |
| — |
| 394 |
|
Trade and other receivables |
| 2,597 |
| 50 |
| 2 |
| 7 |
| 49 |
| 2,705 |
|
Student loans |
| 6,011 |
| — |
| — |
| — |
| — |
| 6,011 |
|
Kiwibank mortgages |
| 3,637 |
| — |
| — |
| — |
| — |
| 3,637 |
|
Other advances |
| 1,078 |
| — |
| — |
| — |
| 2 |
| 1,080 |
|
Long-term deposits |
| 2,109 |
| 684 |
| 15 |
| 172 |
| 194 |
| 3,174 |
|
Share investments |
| 2,165 |
| 5,650 |
| 633 |
| 1,337 |
| 3,796 |
| 13,581 |
|
Derivatives in gain |
| 26,718 |
| (20,092 | ) | (1,301 | ) | (1,611 | ) | (1,362 | ) | 2,352 |
|
Marketable securities |
| 4,996 |
| 18,368 |
| 530 |
| 2,694 |
| 893 |
| 27,481 |
|
IMF special drawing rights |
| — |
| — |
| — |
| — |
| 183 |
| 183 |
|
Total financial assets |
| 61,538 |
| 5,560 |
| (66 | ) | 2,746 |
| 3,940 |
| 73,718 |
|
Issued currency |
| 3,444 |
| — |
| — |
| — |
| — |
| 3,444 |
|
Accounts payable |
| 4,807 |
| 19 |
| 1 |
| 1 |
| 70 |
| 4,898 |
|
Taxes repayable |
| 3,179 |
| — |
| — |
| — |
| — |
| 3,179 |
|
Government stock |
| 15,778 |
| — |
| — |
| — |
| — |
| 15,778 |
|
Treasury bills |
| 2,098 |
| — |
| — |
| — |
| — |
| 2,098 |
|
Government Retail stock |
| 364 |
| — |
| — |
| — |
| — |
| 364 |
|
Settlement deposits with Reserve Bank |
| 7,507 |
| — |
| — |
| — |
| — |
| 7,507 |
|
Derivatives in loss |
| (688 | ) | (176 | ) | (275 | ) | 1,556 |
| 710 |
| 1,126 |
|
Finance lease liabilities |
| 642 |
| 312 |
| — |
| — |
| — |
| 954 |
|
Other borrowings |
| 9,568 |
| 2,892 |
| 458 |
| 17 |
| 1,137 |
| 14,071 |
|
Total financial liabilities |
| 46,699 |
| 3,046 |
| 184 |
| 1,574 |
| 1,916 |
| 53,419 |
|
Net financial currency holdings |
| 14,839 |
| 2,514 |
| (250 | ) | 1,172 |
| 2,024 |
| 20,299 |
|
The following table details the Government’s sensitivity to a 10% strengthening and weakening in the New Zealand dollar with all other variables held constant. The sensitivity analysis includes outstanding foreign currency denominated monetary items and adjusts their translation at the period end for a 10% change in foreign currency rates.
The sensitivity analysis is net of hedging via foreign exchange derivatives, but does not include the impact on prices of goods and services purchased or sold in foreign currencies.
Change in New Zealand exchange rate
|
| Impact on operating balance |
| Impact on net worth |
| ||||
|
| 2008 |
| 2007 |
| 2008 |
| 2007 |
|
Strengthen by 10% |
| (961 | ) | (474 | ) | (830 | ) | (541 | ) |
Weaken by 10% |
| 860 |
| 364 |
| 819 |
| 444 |
|
The Government’s sensitivity to foreign currency has increased during the current period mainly in relation to financial instrument portfolios held by NZDMO, the Reserve Bank and ACC.
Note 32: Financial Instruments (continued)
(g) Other price risks
The Government is exposed to share price risks arising from its holding of share investments.
Share price sensitivity analysis
Share investments are reported at fair value. Movements in share prices therefore directly translate into movements in the value of the share investment portfolio.
The sensitivity analyses below have been determined based on the New Zealand Superannuation Fund’s, ACC’s and EQC’s exposure to share price risks at the reporting date. The combined portfolios of these three portfolios makes up 96% (2007: 96%) of the Government’s total share investments.
Change in share prices
|
| Impact on operating balance |
| Impact on net worth |
| ||||
|
| 2008 |
| 2007 |
| 2008 |
| 2007 |
|
Strengthen/weaken by 10% |
| 1,275 |
| 1,334 |
| 1,275 |
| 1,334 |
|
The Government’s sensitivity to share prices has not changed significantly from the prior year.
Note 32: Financial Instruments (continued)
(h) Credit risk management
Credit risk refers to the risk that a counterparty will default on its contractual obligations resulting in financial loss to the Group. The carrying value of financial assets equates to the maximum exposure to credit risk as at balance date.
The entities within the Government Reporting entity are responsible for managing their exposure to credit risk. The credit risk management of sub-entities with financial asset portfolios (excluding tax and student loan receivables) greater than $1,000 million are outlined on page 120.
The current New Zealand Sovereign credit rating from Standard & Poor’s is AA+.
Entity |
| Credit Risk Management |
|
|
|
|
|
Reserve Bank |
| Credit risk for foreign reserves management is monitored and managed daily. Exposures are controlled through comprehensive individual counterparty and issuer credit limits. Individual credit limits are set on the basis of the rating of the counterparty or issuers. The Bank also manages credit risk by receiving collateral. Collateral is likely to take the form of cash or government securities. The value of collateral held is required to be within a prescribed range of the value of the exposure to the counterparty. Valuations are updated daily and as a result additional collateral may be called for or excess collateral returned to the counterparty.
The Domestic Market Operations function gives rise to credit risk primarily by transacting foreign currency swaps and reverse repurchase transactions. The Bank accepts a wide range of pre-approved securities for reverse repurchase transactions. Acceptable securities include government securities, securities issued by registered banks, highly-rated entities including supranational organisations, local authorities and state-owned enterprises. |
|
|
|
|
|
NZDMO |
| NZDMO manages credit risk through the credit screening of counterparties, use of credit exposure limits, and collateral requirements. Credit exposures are maintained only with highly rated institutions for which the probability of default is low. To diversify credit exposure, NZDMO limits its exposure to any one institution. The creditworthiness of counterparties is continuously monitored. Credit risk is further controlled by incorporating credit support annexes into master swap agreements with swap and foreign exchange counterparties. |
|
|
|
|
|
NZS Fund |
| The instruments managers may use, and the credit worthiness of the counterparties, are detailed in the investment management agreements with managers. Derivative contracts and other particular investments entered into must be with entities that have an appropriate minimum credit rating as determined by an international credit rating agency. |
|
|
|
|
|
EQC |
| The Commission reduces counterparty risk by investing funds only in securities with approved New Zealand banks with satisfactory credit ratings and which have significant presence in the New Zealand market. Exposure to any one bank is restricted in accordance with the Commission’s investment policy. |
|
|
|
|
|
ACC |
| ACC’s investment committee has approved an authorised set of credit criteria (and in the case of New Zealand banks, an authorised list of bank counterparties) which are subject to credit limits and portfolio limits. The riskier a credit (the lower the credit rating and the more likely a default), the lower the approved credit limit. Investment in unrated debt is allowed if approved by ACC’s credit committee. All transactions involving fixed interest income security, derivative financial instruments and security lending must be undertaken with authorised banks or approved counterparties which have a long term Standard and Poor’s credit rating of AA- or better. Rating information is supplied by independent rating agencies. ACC’s exposure and the credit ratings of its counterparties are continuously monitored. |
|
Entity |
| Credit Risk Management |
| |
|
|
|
| |
Air New Zealand |
| Air New Zealand places cash, short term deposits and derivative financial instruments with good credit quality counterparties, having a minimum Standard and Poors credit rating of A. Limits are placed on the exposure to any one financial institution.
Credit evaluations are performed on all customers requiring direct credit. Air New Zealand is not exposed to any concentrations of credit risk within receivables, other assets and derivatives. Air New Zealand does not require collateral or other security to support financial instruments with credit risk. A significant proportion of receivables are settled through the International Aviation Travel Association (IATA) clearing mechanism which undertakes its own credit review of members.
|
| |
|
|
|
| |
NZ Post (including Kiwibank) |
| NZ Post has policies and processes for managing risks: specific policy benchmarks and parameters set by its Board. The policy benchmarks are measured and monitored on an on-going basis.
Kiwibank’s credit risks arise from lending to customers and from inter-bank, treasury, international and capital market activities. Key elements of the management framework are: |
| |
|
|
|
| |
|
| · | The Board of Kiwibank employs a structure of delegated authorities to implement and monitor the multiple facets of credit risk management. |
|
|
|
|
|
|
|
| · | The overall composition and quality of the credit portfolios is monitored taking into account the potential changes in economic conditions. |
|
|
|
|
|
|
|
| · | Kiwibank has clearly defined credit underwriting policies and standards for all lending. |
|
|
|
|
|
|
|
| · | Credit exposures are monitored regularly through the examination of irregular and delinquent accounts. |
|
|
|
|
|
|
|
| · | Operationally, credit risk is controlled through a combination of approvals, limits, monitoring and review procedures. |
|
Note 32: Financial Instruments (continued)
(h) Credit risk management (continued)
Concentrations of credit exposure classified by credit rating, geography and industry of the counterparty are provided in the following tables.
Concentration of credit exposure by credit rating (using the lower rating of Standard & Poor’s or Moody’s)
As at 30 June 2008 |
| AAA |
| AA |
| A |
| Other |
| Non-rated |
| Total |
|
Cash and cash equivalents |
| 551 |
| 2,592 |
| 45 |
| 36 |
| 580 |
| 3,804 |
|
Tax receivables (note 14)(1) |
| — |
| — |
| — |
| — |
| 7,398 |
| 7,398 |
|
Levies, fines and penaltyreceivables (note 14) |
| — |
| — |
| — |
| — |
| 3,106 |
| 3,106 |
|
Social benefit receivables (note 14) |
| — |
| — |
| — |
| — |
| 440 |
| 440 |
|
Trade and other receivables (note 14) |
| — |
| — |
| — |
| — |
| 3,214 |
| 3,214 |
|
Student loans (note 17) |
| — |
| — |
| — |
| — |
| 6,741 |
| 6,741 |
|
Kiwibank mortgages (note 17)(2) |
| — |
| — |
| — |
| — |
| 5,581 |
| 5,581 |
|
Other advances (note 17) |
| — |
| 15 |
| — |
| 96 |
| 515 |
| 626 |
|
Long-term deposits (note 15) |
| 280 |
| 2,436 |
| 54 |
| 1 |
| 16 |
| 2,787 |
|
Derivatives in gain (note 15) |
| 55 |
| 1,231 |
| 43 |
| 68 |
| 166 |
| 1,563 |
|
Marketable securities (note 15) |
| 18,046 |
| 9,330 |
| 1,278 |
| 4,375 |
| 3,622 |
| 36,651 |
|
IMF special drawing rights (note 15) |
| — |
| — |
| — |
| 188 |
| — |
| 188 |
|
Share investments (note 16) |
| 158 |
| 587 |
| 1,337 |
| 4,976 |
| 5,906 |
| 12,964 |
|
Total credit exposure by credit rating |
| 19,090 |
| 16,191 |
| 2,757 |
| 9,740 |
| 37,285 |
| 85,063 |
|
As at 30 June 2007 |
| AAA |
| AA |
| A |
| Other |
| Non-rated |
| Total |
|
Cash and cash equivalents |
| 782 |
| 2,845 |
| 43 |
| 16 |
| 476 |
| 4,162 |
|
Tax receivables (note 14)(1) |
| — |
| — |
| — |
| — |
| 6,369 |
| 6,369 |
|
Levies, fines and penaltyreceivables (note 14) |
| — |
| — |
| — |
| — |
| 2,589 |
| 2,589 |
|
Social benefit receivables (note 14) |
| — |
| — |
| — |
| — |
| 394 |
| 394 |
|
Trade and other receivables (note 14) |
| — |
| — |
| — |
| — |
| 2,705 |
| 2,705 |
|
Student loans (note 17) |
| — |
| — |
| — |
| — |
| 6,011 |
| 6,011 |
|
Kiwibank mortgages (note 17)(2) |
| — |
| — |
| — |
| — |
| 3,637 |
| 3,637 |
|
Other advances (note 17) |
| — |
| 562 |
| — |
| 75 |
| 443 |
| 1,080 |
|
Long-term deposits (note 15) |
| 557 |
| 2,586 |
| — |
| 9 |
| 22 |
| 3,174 |
|
Derivatives in gain (note 15) |
| 82 |
| 2,061 |
| 30 |
| 78 |
| 101 |
| 2,352 |
|
Marketable securities (note 15) |
| 12,043 |
| 8,947 |
| 986 |
| 2,806 |
| 2,699 |
| 27,481 |
|
IMF special drawing rights (note 15) |
| — |
| — |
| — |
| 183 |
| — |
| 183 |
|
Share investments (note 16) |
| 200 |
| 683 |
| 1,640 |
| 5,905 |
| 5,153 |
| 13,581 |
|
Total credit exposure by credit rating |
| 13,664 |
| 17,684 |
| 2,699 |
| 9,072 |
| 30,599 |
| 73,718 |
|
(1) In determining the recoverability of tax receivables Inland Revenue uses information about the extent to which the taxpayer is contesting the assessment and experience of the outcomes of such disputes, from lateness of payment and other information obtained from credit collection actions taken. Credit ratings of taxpayers are not relevant to the tax collection process and therefore tax receivables have been classified as non-rated.
(2) Kiwibank mortgages consist mainly of residential lending. Therefore these financial assets have been classified as non-rated for the purposes of credit risk.
Note 32: Financial Instruments (continued)
(h) Credit risk management (continued)
Concentration of credit exposure by geographical area:
As at 30 June 2008 |
| United |
| Europe |
| Japan |
| Australia |
| New |
| Supra- |
| Other |
| Total |
|
Cash and cash equivalents |
| 441 |
| 170 |
| 96 |
| 134 |
| 2,357 |
| 4 |
| 602 |
| 3,804 |
|
Tax receivables (note 14) |
| — |
| — |
| — |
| — |
| 7,398 |
| — |
| — |
| 7,398 |
|
Levies, fines and penalty receivables (note 14) |
| — |
| — |
| — |
| — |
| 3,106 |
| — |
| — |
| 3,106 |
|
Social benefit receivables (note 14) |
| — |
| — |
| — |
| — |
| 440 |
| — |
| — |
| 440 |
|
Trade and other receivables (note 14) |
| — |
| — |
| — |
| — |
| 3,214 |
| — |
| — |
| 3,214 |
|
Student loans (note 17)(1) |
| — |
| — |
| — |
| — |
| 6,741 |
| — |
| — |
| 6,741 |
|
Kiwibank mortgages (note 17) |
| — |
| — |
| — |
| — |
| 5,581 |
| — |
| — |
| 5,581 |
|
Other advances (note 17) |
| 10 |
| — |
| — |
| — |
| 615 |
| — |
| 1 |
| 626 |
|
Long-term deposits (note 15) |
| 261 |
| 75 |
| 1 |
| 27 |
| 2,227 |
| — |
| 196 |
| 2,787 |
|
Derivatives in gain (note 15) |
| 318 |
| 291 |
| 1 |
| 246 |
| 691 |
| — |
| 16 |
| 1,563 |
|
Marketable securities (note 15) |
| 4,200 |
| 16,434 |
| 1,667 |
| 2,009 |
| 7,221 |
| 2,397 |
| 2,723 |
| 36,651 |
|
IMF special drawing rights (note 15) |
| — |
| — |
| — |
| — |
| — |
| 188 |
| — |
| 188 |
|
Share investments (note 16) |
| 4,069 |
| 3,361 |
| 927 |
| 1,460 |
| 2,155 |
| — |
| 992 |
| 12,964 |
|
Total credit exposure by geographical area |
| 9,299 |
| 20,331 |
| 2,692 |
| 3,876 |
| 41,746 |
| 2,589 |
| 4,530 |
| 85,063 |
|
(1) At 30 June 2008 14.5% of student loan borrowers were overseas. The majority of these individuals are overseas for a short time and therefore the credit risk is not significantly impacted by their current location.
Note 32: Financial Instruments (continued)
(h) Credit risk management (continued)
Concentration of credit exposure by geographical area:
As at 30 June 2007 |
| United |
| Europe |
| Japan |
| Australia |
| New |
| Supra- |
| Other |
| Total |
|
Cash and cash equivalents |
| 872 |
| 62 |
| 50 |
| 37 |
| 3,082 |
| 7 |
| 52 |
| 4,162 |
|
Tax receivables (note 14) |
| — |
| — |
| — |
| — |
| 6,369 |
| — |
| — |
| 6,369 |
|
Levies, fines and penalty receivables (note 14) |
| — |
| — |
| — |
| — |
| 2,589 |
| — |
| — |
| 2,589 |
|
Social benefit receivables (note 14) |
| — |
| — |
| — |
| — |
| 394 |
| — |
| — |
| 394 |
|
Trade and other receivables (note 14) |
| — |
| — |
| — |
| — |
| 2,705 |
| — |
| — |
| 2,705 |
|
Student loans (note 17)(1) |
| — |
| — |
| — |
| — |
| 6,011 |
| — |
| — |
| 6,011 |
|
Kiwibank mortgages (note 17) |
|
|
|
|
|
|
|
|
|
|
| 3,637 |
| — |
| 3,637 |
|
Other advances (note 17) |
| 545 |
| — |
| — |
| — |
| 535 |
| — |
| — |
| 1,080 |
|
Long-term deposits (note 15) |
| 554 |
| 110 |
| 1 |
| 52 |
| 2,429 |
| — |
| 28 |
| 3,174 |
|
Derivatives in gain (note 15) |
| 298 |
| 544 |
| — |
| 448 |
| 999 |
| — |
| 63 |
| 2,352 |
|
Marketable securities (note 15) |
| 3,933 |
| 12,310 |
| 1,023 |
| 1,715 |
| 4,936 |
| 2,654 |
| 910 |
| 27,481 |
|
IMF special drawing rights (note 15) |
| — |
| — |
| — |
| — |
| — |
| 183 |
| — |
| 183 |
|
Share investments (note 16) |
| 4,087 |
| 3,624 |
| 957 |
| 1,625 |
| 2,393 |
| — |
| 895 |
| 13,581 |
|
Total credit exposure by geographical area |
| 10,289 |
| 16,650 |
| 2,031 |
| 3,877 |
| 36,079 |
| 2,844 |
| 1,948 |
| 73,718 |
|
(1) At 30 June 2007 12.9% of student loan borrowers were overseas. The majority of these individuals are overseas for a short time and therefore the credit risk is not significantly impacted by their current location.
Note 32: Financial Instruments (continued)
(h) Credit risk management (continued)
Concentration of credit exposure by industry:
As at 30 June 2008 |
| Sovereign |
| Supra- |
| NZ banking |
| Foreign |
| Other |
| Other |
| Total |
|
Cash and cash equivalents |
| 484 |
| 4 |
| 2,394 |
| 381 |
| 541 |
| — |
| 3,804 |
|
Tax receivables (note 14)(1) |
| — |
| — |
| — |
| — |
| 7,398 |
| — |
| 7,398 |
|
Levies, fines and penalty receivables (note 14) |
| — |
| — |
| — |
| — |
| — |
| 3,106 |
| 3,106 |
|
Social benefit receivables (note 14) |
| — |
| — |
| — |
| — |
| — |
| 440 |
| 440 |
|
Trade and other receivables (note 14) |
| — |
| — |
| — |
| — |
| 3,214 |
| — |
| 3,214 |
|
Student loans (note 17) |
| — |
| — |
| — |
| — |
| — |
| 6,741 |
| 6,741 |
|
Kiwibank mortgages (note 17)(2) |
| — |
| — |
| — |
| — |
| — |
| 5,581 |
| 5,581 |
|
Other advances (note 17) |
| — |
| — |
| 108 |
| 11 |
| 178 |
| 329 |
| 626 |
|
Long-term deposits (note 15) |
| 261 |
| — |
| 2,227 |
| 299 |
| — |
| — |
| 2,787 |
|
Derivatives in gain (note 15) |
| — |
| — |
| 388 |
| 786 |
| 389 |
| — |
| 1,563 |
|
Marketable securities (note 15) |
| 6,383 |
| 2,499 |
| 921 |
| 7,743 |
| 19,105 |
| — |
| 36,651 |
|
IMF special drawing rights (note 15) |
| — |
| 188 |
| — |
| — |
| — |
| — |
| 188 |
|
Share investments (note 16) |
| — |
| — |
| 2 |
| 446 |
| 12,471 |
| 45 |
| 12,964 |
|
Total credit exposure by industry |
| 7,128 |
| 2,691 |
| 6,040 |
| 9,666 |
| 43,296 |
| 16,242 |
| 85,063 |
|
(1) In determining the recoverability of tax receivables Inland Revenue uses information about the extent to which the taxpayer is contesting the assessment and experience of the outcomes of such disputes, from lateness of payment and other information obtained from credit collection actions taken. The industry of taxpayers is not relevant to the collection process and therefore tax receivables have been classified as other.
(2) Kiwibank mortgages consist mainly of residential lending. Therefore these financial assets have been classified as other individual for the purposes of credit risk.
Note 32: Financial Instruments (continued)
(h) Credit risk management (continued)
Concentration of credit exposure by industry:
As at 30 June 2007 |
| Sovereign |
| Supra- |
| NZ banking |
| Foreign |
| Other |
| Other |
| Total |
|
Cash and cash equivalents |
| 667 |
| 4 |
| 2,607 |
| 454 |
| 430 |
| — |
| 4,162 |
|
Tax receivables (note 14)(1) |
| — |
| — |
| — |
| — |
| 6,369 |
| — |
| 6,369 |
|
Levies, fines and penalty receivables (note 14) |
| — |
| — |
| — |
| — |
| — |
| 2,589 |
| 2,589 |
|
Social benefit receivables (note 14) |
| — |
| — |
| — |
| — |
| — |
| 394 |
| 394 |
|
Trade and other receivables (note 14) |
| — |
| — |
| — |
| — |
| 2,705 |
| — |
| 2,705 |
|
Student loans (note 17) |
| — |
| — |
| — |
| — |
| — |
| 6,011 |
| 6,011 |
|
Kiwibank mortgages (note 17)(2) |
| — |
| — |
| — |
| — |
| — |
| 3,637 |
| 3,637 |
|
Other advances (note 17) |
| — |
| — |
| 97 |
| — |
| 736 |
| 247 |
| 1,080 |
|
Long-term deposits (note 15) |
| 554 |
| — |
| 2,416 |
| 196 |
| 8 |
| — |
| 3,174 |
|
Derivatives in gain (note 15) |
| — |
| — |
| 764 |
| 1,218 |
| 370 |
| — |
| 2,352 |
|
Marketable securities (note 15) |
| 4,724 |
| 2,654 |
| 747 |
| 7,836 |
| 11,520 |
| — |
| 27,481 |
|
IMF special drawing rights (note 15) |
| — |
| 183 |
| — |
| — |
| — |
| — |
| 183 |
|
Share investments (note 16) |
| — |
| — |
| 3 |
| 646 |
| 12,901 |
| 31 |
| 13,581 |
|
Total credit exposure by industry |
| 5,945 |
| 2,841 |
| 6,634 |
| 10,350 |
| 35,039 |
| 12,909 |
| 73,718 |
|
(1) In determining the recoverability of tax receivables Inland Revenue uses information about the extent to which the taxpayer is contesting the assessment and experience of the outcomes of such disputes, from lateness of payment and other information obtained from credit collection actions taken. The industry of taxpayers is not relevant to the collection process and therefore tax receivables have been classified as other.
(2) Kiwibank mortgages consist mainly of residential lending. Therefore these financial assets have been classified as other individual for the purposes of credit risk.
The credit quality of financial assets that are neither past due nor impaired (using the lower of Standard & Poor’s or Moody’s rating) are:
Concentration of credit quality by credit rating for financial assets neither past due nor impaired - loans, marketable securities, deposits and derivatives in gain
|
| AAA |
| AA |
| A |
| Other |
| Non-rated |
| Total |
|
As at 30 June 2008 |
| $m |
| $m |
| $m |
| $m |
| $m |
| $m |
|
Kiwibank mortgages (note 17) |
| — |
| — |
| — |
| — |
| 5,555 |
| 5,555 |
|
Other advances (note 17) |
| — |
| 39 |
| — |
| — |
| 480 |
| 519 |
|
Long-term deposits (note 15) |
| 280 |
| 2,436 |
| 54 |
| 1 |
| 16 |
| 2,787 |
|
Derivatives in gain (note 15) |
| 55 |
| 1,231 |
| 43 |
| 68 |
| 166 |
| 1,563 |
|
Marketable securities (note 15) |
| 18,046 |
| 9,330 |
| 1,278 |
| 4,375 |
| 3,622 |
| 36,651 |
|
Total credit exposure by credit rating |
| 18,381 |
| 13,036 |
| 1,375 |
| 4,444 |
| 9,839 |
| 47,075 |
|
As at 30 June 2007 |
| AAA |
| AA |
| A |
| Other |
| Non-rated |
| Total |
|
Kiwibank mortgages (note 17) |
| — |
| — |
| — |
| — |
| 3,628 |
| 3,628 |
|
Other advances (note 17) |
| — |
| 543 |
| — |
| — |
| 408 |
| 951 |
|
Long-term deposits (note 15) |
| 557 |
| 2,586 |
| — |
| 9 |
| 22 |
| 3,174 |
|
Derivatives in gain (note 15) |
| 82 |
| 2,061 |
| 30 |
| 78 |
| 101 |
| 2,352 |
|
Marketable securities (note 15) |
| 12,043 |
| 8,947 |
| 986 |
| 2,806 |
| 2,699 |
| 27,481 |
|
Total credit exposure by credit rating |
| 12,682 |
| 14,137 |
| 1,016 |
| 2,893 |
| 6,858 |
| 37,586 |
|
Financial asset portfolios administered by Inland Revenue and the Ministry of Social Development are excluded from the above analysis as discussion on credit risk is included in notes 14 and 17.
In some instances, financial assets would be reported as either past their due date or impaired if it were not for the fact that their terms had been renegotiated. The carrying value of these renegotiated assets is:
|
| 30 June |
| 30 June |
|
|
| 2008 |
| 2007 |
|
Financial assets |
| 26 |
| 3 |
|
Liquidity risk refers to the loss due to the lack of liquidity preventing quick or cost-effective liquidation of products, positions or portfolios.
Liquidity risk is managed on an individual entity basis generally by maintaining adequate reserves, banking facilities and reserve borrowing facilities, by continuously monitoring forecast and actual cash flows.
The following table details the Government’s remaining contractual maturity for its financial liabilities. The table has been drawn up based on:
· the undiscounted cash flows of financial liabilities based on the earliest date on which the Government can be required to pay, and
· both interest and principal cash flows.
As at 30 June 2008 |
| Carrying |
| Contractual |
| 0-12 |
| 1-2 years |
| 2-5 years |
| 5-10 years |
| > 10 years |
|
Issued currency |
| 3,530 |
| 3,530 |
| 3,530 |
| — |
| — |
| — |
| — |
|
Accounts payable |
| 6,444 |
| 6,601 |
| 6,503 |
| 93 |
| 5 |
| — |
| — |
|
Taxes repayable |
| 4,451 |
| 4,451 |
| 4,451 |
| — |
| — |
| — |
| — |
|
Government stock |
| 18,516 |
| 22,841 |
| 3,761 |
| 4,792 |
| 8,142 |
| 6,146 |
| — |
|
Treasury bills |
| 1,484 |
| 1,497 |
| 1,497 |
| — |
| — |
| — |
| — |
|
Government retail stock |
| 423 |
| 434 |
| 397 |
| 37 |
| — |
| — |
| — |
|
Settlement deposits with Reserve Bank |
| 7,750 |
| 7,750 |
| 7,750 |
| — |
| — |
| — |
| — |
|
Finance lease liabilities |
| 955 |
| 1,304 |
| 130 |
| 123 |
| 342 |
| 708 |
| 1 |
|
Other borrowings |
| 15,391 |
| 16,430 |
| 9,768 |
| 823 |
| 2,208 |
| 2,989 |
| 642 |
|
Total non-derivative liabilities |
| 58,944 |
| 64,838 |
| 37,787 |
| 5,868 |
| 10,697 |
| 9,843 |
| 643 |
|
Derivatives in loss settled net |
| 1,591 |
| 662 |
| 418 |
| 60 |
| 40 |
| 105 |
| 39 |
|
Derivatives settled gross: |
|
|
|
|
|
|
|
|
|
|
|
|
|
|
|
- inflow |
|
|
| 40,239 |
| 28,576 |
| 2,364 |
| 4,701 |
| 4,490 |
| 108 |
|
- outflow |
|
|
| 39,724 |
| 28,744 |
| 2,168 |
| 4,392 |
| 4,296 |
| 124 |
|
As at 30 June 2007 |
| Carrying |
| Contractual |
| 0-12 |
| 1-2 years |
| 2-5 years |
| 5-10 years |
| > 10 years |
|
Issued currency |
| 3,444 |
| 3,444 |
| 3,444 |
| — |
| — |
| — |
| — |
|
Accounts payable |
| 4,898 |
| 5,195 |
| 5,092 |
| 97 |
| 6 |
| — |
| — |
|
Taxes repayable |
| 3,179 |
| 3,179 |
| 3,179 |
| — |
| — |
| — |
| — |
|
Government stock |
| 15,778 |
| 20,447 |
| 979 |
| 3,598 |
| 8,031 |
| 5,215 |
| 2,624 |
|
Treasury bills |
| 2,098 |
| 2,118 |
| 2,118 |
| — |
| — |
| — |
| — |
|
Government Retail stock |
| 364 |
| 372 |
| 329 |
| 35 |
| 8 |
| — |
| — |
|
Settlement deposits with Reserve Bank |
| 7,507 |
| 7,507 |
| 7,507 |
| — |
| — |
| — |
| — |
|
Finance Lease Liabilities |
| 954 |
| 956 |
| 93 |
| 71 |
| 194 |
| 597 |
| 1 |
|
Other borrowings |
| 14,071 |
| 14,783 |
| 9,090 |
| 940 |
| 1,215 |
| 3,234 |
| 304 |
|
Total non-derivative liabilities |
| 52,293 |
| 58,001 |
| 31,831 |
| 4,741 |
| 9,454 |
| 9,046 |
| 2,929 |
|
Derivatives in loss settled net |
| 1,126 |
| 519 |
| 226 |
| 63 |
| 109 |
| 120 |
| 1 |
|
Derivatives settled gross: |
|
|
|
|
|
|
|
|
|
|
|
|
|
|
|
- inflow |
| 36,518 |
| 25,975 |
| 2,259 |
| 3,414 |
| 3,691 |
| 1,179 |
| 36,518 |
|
- outflow |
| 34,377 |
| 24,640 |
| 2,097 |
| 3,079 |
| 3,440 |
| 1,121 |
| 34,377 |
|
The Government has access to financing facilities, of which the total unused amount at 30 June 2008 was $1,044 million (2007: $1,457 million). The Government expects to meet its obligations from operating cash flows, from the results of bond tenders, and proceeds of maturing financial assets.
The aim of this section is to explain how the transition from previous GAAP to NZ IFRS has affected the reported financial position and financial performance of the Government of New Zealand.
The Government is reporting in compliance with NZ IFRS for periods beginning on and after 1 July 2007. Previous reporting has been on the basis of approved accounting standards applicable in New Zealand at the time. The following pages describe the impact of the adoption of NZ IFRS by providing reconciliations between the previous GAAP and the comparative information shown in these financial statements for:
· net worth as at 1 July 2006 and as at 30 June 2007, and
· the operating balance for the year ended 30 June 2007.
In addition to changes in measurement and recognition rules, NZ IFRS has resulted in a number of changes to the format of the financial statements. The major reclassifications are:
· depreciation and amortisation previously classified under operating expenses now separately disclosed
· share investments previously classified under marketable securities now separately disclosed
· some properties held by Land Information New Zealand (LINZ) have been reclassified from assets for sale to property, plant and equipment and as a result have been fair valued
· settlement deposits with the Reserve Bank previously classified under borrowings – sovereign guaranteed now separately disclosed
· separation of borrowings between sovereign guaranteed and non-sovereign guaranteed no longer in the statement of financial position (transferred to the statement of borrowings)
· payables and provisions previously classified as one category now split
· some interest, dividend income, and interest expense are now classified as gains and losses on financial instruments
· sales of goods and services are now classified as other revenue and vice versa, and
· social assistance in relation to ACC payments is now classified under insurance expenses.
|
|
|
| As at |
| As at |
|
|
|
|
| 1 July |
| 30 June |
|
|
|
|
| 2006 |
| 2007 |
|
|
| Note |
| $m |
| $m |
|
Net worth per published accounts (previous GAAP) |
|
|
| 71,403 |
| 95,836 |
|
Rail network valuation |
| a |
| 10,330 |
| — |
|
Increase in investment in associates |
| a |
| 277 |
| — |
|
Amended net worth (previous GAAP) |
|
|
| 82,010 |
| 95,836 |
|
Changes as a result of transition to NZ IFRS |
|
|
|
|
|
|
|
Revaluation of GSF |
| b |
| 3,133 |
| 3,234 |
|
Inclusion of a risk premium on ACC liability |
| c |
| (1,603 | ) | (1,976 | ) |
Inclusion of derivatives |
| d |
| 304 |
| (386 | ) |
Fair value adjustments to receivables |
| e |
| (369 | ) | (481 | ) |
Revaluation of NPF liability |
| f |
| 195 |
| 178 |
|
Goodwill amortisation |
| g |
| — |
| 98 |
|
Increase in investment in associates |
| h |
| 73 |
| 172 |
|
Other movements |
|
|
| 228 |
| 152 |
|
Net worth per NZ IFRS published accounts |
|
|
| 83,971 |
| 96,827 |
|
|
| Note |
| Year to |
|
Operating balance published accounts (previous GAAP) |
|
|
| 8,663 |
|
Changes as a result of transition to NZ IFRS |
|
|
|
|
|
Revaluation of GSF |
| b |
| 4 |
|
Inclusion of a risk premium on ACC liability |
| c |
| (373 | ) |
Inclusion of derivatives |
| d |
| (226 | ) |
Fair value adjustments to receivables |
| e |
| (202 | ) |
Revaluation of NPF liability |
| f |
| (12 | ) |
Goodwill amortisation |
| g |
| 98 |
|
Other movements |
|
|
| 70 |
|
Operating balance per NZ IFRS published accounts |
|
|
| 8,022 |
|
a) On 1 July 2006 the accounting policy regarding the valuation basis of the rail network changed to depreciated replacement cost. Previously this asset was reported at historical cost. In addition, the Crown’s investment in Massey University increased on 1 July 2006 by $277 million in relation to asset revaluations.
b) The reporting of the Government Superannuation Fund (GSF) has changed due to applying a specific standard for employee benefits, including pension schemes, under NZ IFRS. The main changes to the financial statements were:
· a reduction in the net liability of GSF due to valuing the liability on the basis that the Government meets its obligation on a pay-as-needed basis, rather than the amount to be invested today to fully fund future contributions under pre adoption of NZ IFRS. This latter approach assumes the Fund would invest in assets that would generate revenue on which there would be an additional obligation to pay tax, and
· a netting of GSF plan assets against the pension liability (nil impact on net worth).
c) The reporting of the ACC liability has changed owing to new requirements under NZ IFRS. The main changes to the financial statements were:
· the ACC liability has increased due to adding an additional risk premium and liability adequacy test on the unearned levy liability to meet estimated future claims. The actuarially calculated liability under pre adoption of NZ IFRS represented a mid-point estimate – that is, equal chance of actual payouts being greater than or less than the estimate. To that extent, it represented the most likely outcome. Introducing an additional risk premium and liability adequacy test under NZ IFRS does not change the relative risk of ACC’s activities; rather it simply changes how this risk is reported, and
· changes to the presentation of the unearned levy liability (nil impact on net worth).
d) Under NZ IFRS all derivative contracts must be recognised in the statement of financial position at fair value.
e) Receivables from taxes and fines have been written down to reflect the time value of money and collection costs.
f) The reduction in the National Provident Fund (NPF) liability is due to the tax effect of valuing the liability on the basis of determining present value of payments to this scheme under current arrangements, rather than the current approach which determines what payment would be required today to settle all future obligations.
g) Under NZ IFRS goodwill is not amortised over a specified period. Instead, an annual impairment test is conducted.
h) The Crown’s investment in Christchurch and Invercargill airports was deemed significant influence under NZ IFRS increasing the investment at 1 July 2006 and 30 June 2007 by $73 million and $172 million respectively.
On 1 July 2008, negotiations were completed and an agreement was signed for the purchase of 100% of the shares in Toll (New Zealand) Limited. Prior to the acquisition, assets and operations not integral to the rail operation were separated out of Toll (New Zealand) Limited. On acquisition by the Government, the company was renamed KiwiRail Limited.
Ownership of the rail business is intended to place the Government in a better position to integrate rail planning and funding with its wider transport policy, and to ensure capital investment for improving the rolling stock.
The cost of acquisition of the company was $690 million, settled in cash on 1 July. The assets acquired and liabilities assumed as a result of this purchase will be consolidated into the Financial Statements of Government from 1 July 2008, and the process to identify and value these individual items in accordance with NZ IFRS 3 Business Combinations has begun. Until this task is completed, an estimation of the full financial effect of this acquisition is not available.
as at 30 June 2008
Forecast |
|
|
| Actual |
| ||||
Original Budget |
| Estimated Actuals |
|
|
| 30 June |
| 30 June |
|
|
|
|
| Borrowings |
|
|
|
|
|
17,732 |
| 18,683 |
| Government stock(1) |
| 18,516 |
| 15,778 |
|
2,786 |
| 1,389 |
| Treasury bills |
| 1,484 |
| 2,098 |
|
358 |
| 386 |
| Government retail stock |
| 423 |
| 364 |
|
7,523 |
| 7,465 |
| Settlement deposits with Reserve Bank |
| 7,750 |
| 7,507 |
|
300 |
| 780 |
| Derivatives in loss(2) |
| 1,591 |
| 1,126 |
|
958 |
| 1,251 |
| Finance lease liabilities |
| 955 |
| 954 |
|
16,707 |
| 15,592 |
| Other borrowings |
| 15,391 |
| 14,071 |
|
46,364 |
| 45,546 |
| Total borrowings(3) |
| 46,110 |
| 41,898 |
|
33,167 |
| 32,912 |
| Sovereign-guaranteed debt(4) |
| 33,192 |
| 31,163 |
|
13,197 |
| 12,634 |
| Non-sovereign debt |
| 12,918 |
| 10,735 |
|
46,364 |
| 45,546 |
| Total borrowings(3) |
| 46,110 |
| 41,898 |
|
Notes on Borrowings
(1) Government stock includes $295 million of infrastructure bonds.
(2) Derivatives are included in either borrowings or marketable securities depending on their gain or loss position at balance date. This treatment leads to fluctuations in individual items within the Statement of Borrowings, primarily due to exchange rate movements.
(3) Total Borrowings (Gross Debt) is the total borrowings (both sovereign-guaranteed and non-sovereign guaranteed) of the total Crown. This equates to the amount in the total Crown balance sheet and represents the complete picture of whole-of-Crown debt obligations to external parties.
(4) Total Borrowings (Gross Debt) can be split into sovereign-guaranteed and non-sovereign-guaranteed debt. This split reflects the fact that borrowings by SOEs and Crown entities is not explicitly guaranteed by the Crown. No debt of SOEs and Crown entities is currently guaranteed by the Crown.
for the year ended 30 June 2008
An appropriation is a statutory authorisation by Parliament for the incurring of expenses or capital expenditure. This Statement reports expenses or capital expenditure without appropriation and in excess, or outside the scope, of existing appropriations. This Statement also reports breaches of projected net asset balance limits set by section 22(3) of the Public Finance Act 1989.
Section 26B of the Public Finance Act 1989 authorises the Minister of Finance to approve limited amounts of expenses or capital expenditure in excess of, but within the scope, of an existing appropriation. Unappropriated amounts incurred in terms of such an approval are shown separately in this Statement.
Expenses or capital expenditure incurred without or outside the scope of appropriation or any other authority is unlawful unless validated by Parliament. Unappropriated expenses or capital expenditure in excess of the limits which the Minister of Finance can approve under section 26B of the Public Finance Act 1989 require validating legislation. Such validating legislation will be accompanied by a report to the House of Representatives that sets out the unappropriated items together with an explanation of the Minister Responsible for the expenses or capital expenditure.
Amounts in this Statement are expressed in thousands of dollars, reflecting the level at which appropriations are made.
for the year ended 30 June 2008
Department |
| Appropriation |
| Supplementary |
| Amount in |
|
Department of Building and Housing |
|
|
|
|
|
|
|
Housing |
| Benefit and Other Unrequited Expenses |
|
|
|
|
|
|
| Income Related Rental Subsidy |
| 463,363 |
| 1,802 |
|
Department of Corrections |
|
|
|
|
|
|
|
Corrections |
| Departmental Output Expenses |
|
|
|
|
|
|
| Community-Based Sentences and Orders(1) |
| 105,149 |
| 584 |
|
|
| Custody of Remand Prisoners(2) |
| 128,061 |
| 591 |
|
|
| Information Services(3) |
| 41,176 |
| 194 |
|
|
| Prisoner Employment(4) |
| 45,067 |
| 84 |
|
|
| Rehabilitative Progammes and Reintegrative Services(5) |
| 56,928 |
| 273 |
|
Crown Law Office |
|
|
|
|
|
|
|
Attorney-General |
| Departmental Output Expenses |
|
|
|
|
|
|
| Supervision and Conduct of Crown Prosecutions |
| 34,515 |
| 168 |
|
Government Communications Security Bureau |
|
|
|
|
|
|
|
Communications Security and Intelligence |
| Intelligence and Security Department Expenses and Capital Expenditure |
|
|
|
|
|
|
| Communications Security and Intelligence |
| 40,345 |
| 788 |
|
Department of Internal Affairs |
|
|
|
|
|
|
|
Ministerial Services |
| Other Expenses to be Incurred by the Crown |
|
|
|
|
|
|
| Ministers’ Internal and External Travel |
| 10,440 |
| 156 |
|
(1) The Supplementary Estimates of Appropriations of $104,909,000 has been increased by $240,000 by a transfer under section 26A of the Public Finance Act 1989.
(2) The Supplementary Estimates of Appropriations of $122,951,000 has been increased by $5,110,000 by a transfer under section 26A of the Public Finance Act 1989.
(3) The Supplementary Estimates of Appropriations of $39,216,000 has been increased by $1,960,000 by a transfer under section 26A of the Public Finance Act 1989.
(4) The Supplementary Estimates of Appropriations of $44,567,000 has been increased by $500,000 by a transfer under section 26A of the Public Finance Act 1989.
(5) The Supplementary Estimates of Appropriations of $59,128,000 has been decreased by $2,200,000 by a transfer under section 26A of the Public Finance Act 1989.
for the year ended 30 June 2008
Department |
| Appropriation |
| Supplementary |
| Amount in |
|
Department of Labour |
|
|
|
|
|
|
|
Immigration |
| Departmental Output Expenses |
|
|
|
|
|
|
| Services to Position New Zealand as an International Citizen with Immigration-Related Interests and Obligations |
| 16,553 |
| 46 |
|
Labour |
| Departmental Output Expenses |
|
|
|
|
|
|
| Services to Promote and Support the Safe Management of Hazardous Substances in the Workplace and Amusement Devices |
| 4,533 |
| 5 |
|
Office of the Ombudsmen |
|
|
|
|
|
|
|
Ombudsmen |
| Departmental Output Expenses |
|
|
|
|
|
|
| Investigation and Resolution of Complaints about Government Administration |
| 6,092 |
| 56 |
|
Parliamentary Commissioner for the Environment |
|
|
|
|
|
|
|
Parliamentary Commissioner for the Environment |
| Departmental Output Expenses |
|
|
|
|
|
|
| Reports and Advice |
| 2,040 |
| 12 |
|
Ministry of Social Development |
|
|
|
|
|
|
|
Social Development |
| Benefit and Other Unrequited Expenses |
|
|
|
|
|
|
| Orphans’/Unsupported Child’s Benefit |
| 80,616 |
| 6 |
|
|
| Sickness Benefit |
| 581,357 |
| 511 |
|
|
| Special Benefit |
| 71,055 |
| 129 |
|
|
| Temporary Additional Support |
| 53,246 |
| 692 |
|
|
| Unemployment Benefit |
| 456,694 |
| 986 |
|
|
| Capital Expenditure to be Incurred by the Crown |
|
|
|
|
|
|
| Recoverable Assistance |
| 118,287 |
| 876 |
|
Veterans’ Affairs - Social Development |
| Benefit and Other Unrequited Expenses |
|
|
|
|
|
|
| Medical Treatment |
| 18,884 |
| 340 |
|
|
| War Disablement Pensions |
| 133,235 |
| 1,076 |
|
for the year ended 30 June 2008
Department |
| Appropriation |
| Supplementary |
| Amount in |
|
Ministry of Economic Development |
|
|
|
|
|
|
|
Energy |
| Non-Departmental Output Expenses |
|
|
|
|
|
|
| Maintenance and Operation of Whirinaki(1) |
| 33,500 |
| 16,763 |
|
Ministry of Education |
|
|
|
|
|
|
|
Education |
| Other Expenses to be Incurred by the Crown |
|
|
|
|
|
|
| Early Childhood Education(2) |
| 807,230 |
| 21,647 |
|
Department of Labour |
|
|
|
|
|
|
|
Labour |
| Non-Departmental Output Expenses |
|
|
|
|
|
|
| Employment Relations Education Contestable |
| 2,169 |
| 242 |
|
New Zealand Food Safety Authority |
|
|
|
|
|
|
|
Food Safety |
| Departmental Output Expenses |
|
|
|
|
|
|
| Response to Food Safety Emergencies(4) |
| 355 |
| 288 |
|
New Zealand Police |
|
|
|
|
|
|
|
Police |
| Departmental Output Expenses |
|
|
|
|
|
|
| Case Resolution and Support to Judicial Process(5) |
| 74,740 |
| 18,768 |
|
State Services Commission |
|
|
|
|
|
|
|
State Services |
| Departmental Output Expenses |
|
|
|
|
|
|
| Government Shared Network(6) |
| 13,221 |
| 8,491 |
|
(1) Additional authority of $40,000,000 was granted subsequent to the Supplementary Estimates of Appropriations 2007/08 and prior to the expense being incurred.
(2) Additional authority of $23,800,000 was granted subsequent to the Supplementary Estimates of Appropriations 2007/08 and prior to the expense being incurred.
(3) Additional authority of $330,000 was granted subsequent to the Supplementary Estimates of Appropriations 2007/08 and prior to the expense being incurred.
(4) Additional authority of $297,000 was granted subsequent to the Supplementary Estimates of Appropriations 2007/08 and prior to the expense being incurred.
(5) Additional authority of $19,444,000 was granted subsequent to the Supplementary Estimates of Appropriations 2007/08 and prior to the expense being incurred.
(6) Additional authority of $15,146,000 was granted subsequent to the Supplementary Estimates of Appropriations 2007/08 and prior to the expense being incurred.
for the year ended 30 June 2008
Unappropriated expenditure without appropriation or outside scope of an appropriation, with Cabinet approval to use imprest supply
Department |
| Appropriation |
| Supplementary |
| Amount in |
|
The Treasury |
|
|
|
|
|
|
|
Finance |
| Other Expenses to be Incurred by the Crown |
|
|
|
|
|
|
| Atihau-Whanganui Incorporation Ex-Gratia Payment(1) |
| — |
| 23,000 |
|
Unappropriated expenditure in excess of appropriation, without Cabinet approval to use imprest supply
Department |
| Appropriation |
| Supplementary |
| Amount in |
|
Ministry of Education |
|
|
|
|
|
|
|
Education |
| Other Expenses to be Incurred by the Crown |
|
|
|
|
|
|
| Interest Subsidy for Schools |
| 740 |
| 116 |
|
Ministry of Health |
|
|
|
|
|
|
|
Health |
| Non-Departmental Output Expenses |
|
|
|
|
|
|
| National Maternity Services |
| 109,576 |
| 15,048 |
|
|
| Departmental Output Expenses |
|
|
|
|
|
|
| Administration of Legislation and Regulations(2) |
| 19,826 |
| 3,012 |
|
|
| Funding and Performance of Crown Entities(2) |
| 7,982 |
| 1,235 |
|
|
| Information Services(2) |
| 45,190 |
| 1,139 |
|
|
| Servicing of Ministers and Ministerial Committees(2) | 13,810 |
| 474 |
| |
(1) Additional authority of $23,000,000 was granted subsequent to the Supplementary Estimates of Appropriations 2007/08 and prior to the expense being incurred.
(2) This figure was the authority provided by the Appropriation (2007/08 Estimates) Act 2007 plus in-year cabinet approvals, which together represent the authority in place when the in-year breach occurred.
for the year ended 30 June 2008
Unappropriated expenditure in excess of appropriation, without Cabinet approval to use imprest supply (continued)
Department |
| Appropriation |
| Supplementary $000 |
| Amount in |
|
Inland Revenue Department |
|
|
|
|
|
|
|
Revenue |
| Benefits and Other Unrequited Expenses |
|
|
|
|
|
|
| KiwiSaver: Fee Subsidy |
| 13,000 |
| 9,815 |
|
|
| KiwiSaver: Interest |
| 4,800 |
| 252 |
|
|
| KiwiSaver: Kickstart Payment |
| 663,000 |
| 43,662 |
|
|
| KiwiSaver: Member Tax Credit |
| 248,000 |
| 80,731 |
|
|
| Payroll Subsidy |
| 820 |
| 142 |
|
|
| Other Expenses to be Incurred by the Crown |
|
|
|
|
|
|
| Impairment of Debt Relating to Child Support |
| 85,000 |
| 62,044 |
|
|
| Impairment of Debt Relating to General Tax and Family Support |
| 150,000 |
| 95,239 |
|
Ministry of Justice |
|
|
|
|
|
|
|
Courts |
| Other Expenses to be Incurred by the Crown |
|
|
|
|
|
|
| Costs in Criminal Cases |
| 300 |
| 301 |
|
|
| Family Court Professional Services |
| 30,740 |
| 771 |
|
|
| MVDT Adjudicator Remuneration and Assessors Costs |
| 292 |
| 13 |
|
Ministry of Justice - OTS |
|
|
|
|
|
|
|
Treaty Negotiations |
| Departmental Output Expenses |
|
|
|
|
|
|
| Policy Advice - Treaty Negotiations |
| 11,213 |
| 1,391 |
|
for the year ended 30 June 2008
Unappropriated expenditure in excess of appropriation, without Cabinet approval to use imprest supply (continued)
Department |
| Appropriation |
| Supplementary |
| Amount in |
|
New Zealand Defence Force |
|
|
|
|
|
|
|
Defence Force |
| Departmental Output Expenses |
|
|
|
|
|
|
| Fixed Wing Transport Forces (1) |
| 174,948 |
| 408 |
|
|
| Land Combat Forces (2) |
| 328,882 |
| 98 |
|
|
| Land Combat Service Support Forces (3) |
| 137,584 |
| 224 |
|
|
| Maritime Patrol Forces (4) |
| 145,261 |
| 2,023 |
|
|
| Rotary Wing Transport Forces (5) |
| 118,309 |
| 302 |
|
New Zealand Police |
|
|
|
|
|
|
|
Police |
| Departmental Output Expenses |
|
|
|
|
|
|
| Investigations(6) |
| 336,389 |
| 9,846 |
|
|
| Policy Advice and Ministerial Servicing(7) |
| 1,728 |
| 940 |
|
Ministry of Transport |
|
|
|
|
|
|
|
Transport |
| Departmental Output Expenses |
|
|
|
|
|
|
| Next Steps Review Implementation |
| 2,400 |
| 343 |
|
|
| Sector Leadership and Support(8) |
| 1,785 |
| 258 |
|
(1) The Supplementary Estimates of Appropriations of $178,023,000 has been reduced by $3,075,000 transferred out of this Output Class by the Public Finance (Transfers Between Outputs) Order 2008 (SR 2008/168).
(2) The Supplementary Estimates of Appropriations of $324,682,000 has been increased by $4,200,000 transferred into this Output Class by the Public Finance (Transfers Between Outputs) Order 2008 (SR 2008/168).
(3) The Supplementary Estimates of Appropriations of $135,134,000 has been increased by $2,450,000 transferred into this Output Class by the Public Finance (Transfers Between Outputs) Order 2008 (SR 2008/168).
(4) The Supplementary Estimates of Appropriations of $149,736,000 has been reduced by $4,475,000 transferred out of this Output Class by the Public Finance (Transfers Between Outputs) Order 2008 (SR 2008/168).
(5) The Supplementary Estimates of Appropriations of $118,859,000 has been reduced by $550,000 transferred out of this Output Class by the Public Finance (Transfers Between Outputs) Order 2008 (SR 2008/168).
(6) Additional authority of $7,649,000 was granted subsequent to the Supplementary Estimates of Appropriations 2007/08 and prior to the expense being incurred, but the actual expense exceeded the additional authority.
(7) Additional authority of $934,000 was granted subsequent to the Supplementary Estimates of Appropriations 2007/08 and prior to the expense being incurred, but the actual expense exceeded the additional authority.
(8) The Supplementary Estimates of Appropriations of $1,700,000 has been increased by $85,000 by a transfer under section 26A of the Public Finance Act 1989.
for the year ended 30 June 2008
Department |
| Appropriation |
| Supplementary |
| Amount in |
|
Department of Conservation |
|
|
|
|
|
|
|
Conservation |
| Capital Expenditure to be Incurred by the Crown |
|
|
|
|
|
|
| Crown Land Acquisitions |
| 476 |
| 44,988 |
|
Inland Revenue Department |
|
|
|
|
|
|
|
Revenue |
| Non-Departmental Output Expenses |
|
|
|
|
|
|
| Retirement Commissioner |
| — |
| 380 |
|
|
| Other Expenses to be Incurred by the Crown |
|
|
|
|
|
|
| General Tax and Family Support Bad Debt Write-Offs |
| — |
| 123,897 |
|
Ministry of Justice |
|
|
|
|
|
|
|
|
| Other Expenses to be Incurred by the Crown |
|
|
|
|
|
|
| Personal Property Protection Rights Costs |
| 1,700 |
| 571 |
|
The Treasury |
| Capital Expenditure to be Incurred by the Crown |
|
|
|
|
|
|
| Landcorp Protected Land Agreement |
| — |
| 64,200 |
|
|
| Other Expenses to be Incurred by the Crown |
|
|
|
|
|
|
| Write-off of Capital Charge Receivable |
| — |
| 3,180 |
|
for the year ended 30 June 2008
Section 22 of the Public Finance Act 1989 requires that the net asset holding of a department must not exceed the most recent projected balance of net assets for that department as set out in an Appropriation Act, except where Ministers agree a surplus may be retained or where assets or liabilities have been remeasured. The following schedule discloses departments that have breached this requirement during the year.
Department |
| Supplementary |
| Amount in |
|
Ministry of Foreign Affairs and Trade(1) |
| 348,156 |
| 2,300 |
|
Department of Internal Affairs(2) |
| 42,267 |
| 2,425 |
|
Excess departmental net asset holding, without Cabinet approval to use imprest supply
Department |
| Supplementary |
| Amount in |
|
Ministry of Agriculture and Forestry |
| 32,765 |
| 193 |
|
Archives New Zealand |
| 64,749 |
| 4 |
|
Ministry of Economic Development |
| 20,939 |
| 584 |
|
Ministry for the Environment |
| 3,341 |
| 371 |
|
Ministry of Justice |
| 634,609 |
| 183 |
|
National Library of New Zealand |
| 105,410 |
| 397 |
|
Office of the Clerk |
| 4,529 |
| 237 |
|
(1) Additional authority of $2,300,000 was granted subsequent to the Supplementary Estimates of Appropriations 2007/08 and prior to the department increasing its net assets.
(2) Additional authority of $2,425,000 was granted subsequent to the Supplementary Estimates of Appropriations 2007/08 and prior to the department increasing its net assets.
for the year ended 30 June 2008
Under section 25 of the Public Finance Act 1989, if a state of national emergency is declared under the Civil Defence Emergency Management Act 2002, or if the Government declares an emergency because of any situation that affects the public health or safety of New Zealand, the Minister of Finance may approve expenses or capital expenditure to meet such emergency or disaster whether or not an appropriation by Parliament is available for the purpose. Once expenses or capital expenditure have been incurred, the amounts that have not been appropriated must be disclosed in the annual financial statements of the Government for the financial year and sanctioned by Parliament in an Appropriation Act.
During the year, no such emergency expenses or capital expenditure were incurred.
for the year ended 30 June 2008
Department |
| As at |
| Contributions |
| Distributions |
| Revenue |
| Expense |
| As at |
|
Agriculture and Forestry |
|
|
|
|
|
|
|
|
|
|
|
|
|
Meat Board Levies Trust |
| — |
| 58,115 |
| (58,129 | ) | 17 |
| — |
| 3 |
|
Audit |
|
|
|
|
|
|
|
|
|
|
|
|
|
South Pacific Association of |
| 22 |
| — |
| — |
| 2 |
| (2 | ) | 22 |
|
Building and Housing |
|
|
|
|
|
|
|
|
|
|
|
|
|
Certifiers Bond Trust |
| 178 |
| 9 |
| — |
| — |
| — |
| 187 |
|
Licensed Building Practitioners Trust (1), (2) |
| — |
| — |
| — |
| — |
| — |
| — |
|
Residential Tenancies Bond Trust |
| 230,976 |
| 144,604 |
| (115,135 | ) | — |
| — |
| 260,445 |
|
Residential Tenancies Bond Trust No.2 Account (2) |
| — |
| — |
| — |
| — |
| — |
| — |
|
Conservation |
|
|
|
|
|
|
|
|
|
|
|
|
|
Bonds/Deposits Trust |
| 6,219 |
| 497 |
| (273 | ) | 365 |
| — |
| 6,808 |
|
Conservation Project Trust |
| 1,327 |
| 637 |
| (759 | ) | 59 |
| — |
| 1,264 |
|
National Parks Trust |
| 101 |
| 60 |
| (122 | ) | 3 |
| — |
| 42 |
|
Walkways Trust |
| 14 |
| — |
| — |
| 1 |
| — |
| 15 |
|
Wildlife and Reserves Trusts (2) |
| — |
| — |
| — |
| — |
| — |
| — |
|
Corrections |
|
|
|
|
|
|
|
|
|
|
|
|
|
Prisons Trust |
| 841 |
| 14,611 |
| (14,186 | ) | — |
| — |
| 1,266 |
|
Crown Law Office |
|
|
|
|
|
|
|
|
|
|
|
|
|
Legal Claims Trust |
| 65 |
| 2,988 |
| (2,933 | ) | — |
| — |
| 120 |
|
Culture and Heritage |
|
|
|
|
|
|
|
|
|
|
|
|
|
Australian Trust for Oral History Archives Trust |
| 1,505 |
| — |
| (105 | ) | 48 |
| — |
| 1,448 |
|
Dictionary of New Zealand Biography Trust |
| 259 |
| — |
| — |
| 11 |
| (8 | ) | 262 |
|
New Zealand Encyclopaedia Trust |
| 1 |
| — |
| — |
| — |
| — |
| 1 |
|
New Zealand Historical Atlas Trust |
| 97 |
| — |
| — |
| 9 |
| — |
| 106 |
|
New Zealand History Research Trust |
| 1,531 |
| — |
| — |
| 95 |
| — |
| 1,626 |
|
War History Trust (1) |
| — |
| 481 |
| — |
| 34 |
| — |
| 515 |
|
Customs |
|
|
|
|
|
|
|
|
|
|
|
|
|
Alcohol Liquor Advisory Council Trust |
| 1,057 |
| 13,840 |
| (13,817 | ) | — |
| — |
| 1,080 |
|
Customs Regional Deposit/Bonds Trust No.1, No.2 & No.3 |
| 3,976 |
| 4,632 |
| (5,125 | ) | — |
| — |
| 3,483 |
|
Heavy Engineering Research Association Trust |
| 62 |
| 903 |
| (892 | ) | — |
| — |
| 73 |
|
Maritime Safety Authority Trust (2) |
| — |
| — |
| — |
| — |
| — |
| — |
|
New Zealand Customs Service MDS Release Trust |
| 114 |
| 5,202 |
| (5,228 | ) | 11 |
| — |
| 99 |
|
New Zealand Customs Service MDS Suspense Trust |
| 26 |
| 4,654 |
| (4,646 | ) | — |
| — |
| 34 |
|
Balance carried forward |
| 248,371 |
| 251,233 |
| (221,350 | ) | 655 |
| (10 | ) | 278,899 |
|
Department |
| As at |
| Contributions |
| Distributions |
| Revenue |
| Expense |
| As at |
|
Balance brought forward |
| 248,371 |
| 251,233 |
| (221,350 | ) | 655 |
| (10 | ) | 278,899 |
|
Economic Development |
|
|
|
|
|
|
|
|
|
|
|
|
|
Coal and Minerals Deposits Trust |
| 263 |
| — |
| (17 | ) | 9 |
| (5 | ) | 250 |
|
Official Assignee’s Office Trust |
| 9,526 |
| 12,377 |
| (7,496 | ) | 852 |
| (4,535 | ) | 10,724 |
|
Patent Co-operation Treaty Fees Trust |
| 130 |
| 1,322 |
| (1,222 | ) | 168 |
| (178 | ) | 220 |
|
Petroleum Deposits Trust |
| 1,086 |
| — |
| — |
| 1 |
| — |
| 1,087 |
|
Proceeds of Crime Trust |
| 4,089 |
| 3,273 |
| (1,964 | ) | 353 |
| (958 | ) | 4,793 |
|
Radio Frequencies Tender Trust |
| 225 |
| 21,800 |
| (21,910 | ) | 110 |
| — |
| 225 |
|
Education |
|
|
|
|
|
|
|
|
|
|
|
|
|
Code of Practice for Providers who Enrol International Students Trust |
| 2,421 |
| — |
| — |
| 3,837 |
| (3,890 | ) | 2,368 |
|
Conferences Trust |
| 2 |
| — |
| — |
| — |
| — |
| 2 |
|
Fisheries |
|
|
|
|
|
|
|
|
|
|
|
|
|
MAF Overfishing Account Trust |
| 4,054 |
| 9,281 |
| (12,214 | ) | 305 |
| (304 | ) | 1,122 |
|
MAF Fish Forfeit Property Trust |
| 318 |
| 2,092 |
| (971 | ) | 57 |
| — |
| 1,496 |
|
Foreign Affairs and Trade |
|
|
|
|
|
|
|
|
|
|
|
|
|
Cook Island Trust |
| 3 |
| 3,072 |
| (3,075 | ) | 68 |
| — |
| 68 |
|
Government Administration Building, Niue Trust (2) |
| — |
| — |
| — |
| — |
| — |
| — |
|
Judicial Development Trust |
| 391 |
| 1,500 |
| (985 | ) | 37 |
| — |
| 943 |
|
New Zealand/France Friendship Trust |
| 13 |
| 137 |
| (103 | ) | 2 |
| — |
| 49 |
|
Niue Trust |
| 25,023 |
| — |
| (26,306 | ) | 1,283 |
| — |
| — |
|
Samoa Trust |
| — |
| 443 |
| (443 | ) | — |
| — |
| — |
|
Pacific Gender and Aid Effectiveness Trust (1) |
| — |
| 63 |
| — |
| — |
| — |
| 63 |
|
Pacific Islands Chief of Police Women’s Advisory Network |
| — |
| 312 |
| — |
| — |
| — |
| 312 |
|
Health |
|
|
|
|
|
|
|
|
|
|
|
|
|
Health Benefits Offices Trust |
| 83 |
| 4,415,590 |
| (4,415,039 | ) | — |
| — |
| 634 |
|
Medicines Review Objectors Deposit Trust (2) |
| — |
| — |
| — |
| — |
| — |
| — |
|
Inland Revenue |
|
|
|
|
|
|
|
|
|
|
|
|
|
Child Support Agency Trust Account |
| 24,109 |
| 185,778 |
| (208,574 | ) | — |
| — |
| 1,313 |
|
KiwiSaver Employer Trust (2) |
| — |
| — |
| — |
| — |
| — |
| — |
|
KiwiSaver Returned Transactions Trust (2) |
| — |
| — |
| — |
| — |
| — |
| — |
|
Reciprocal Child Support Agreement Trust |
| 153 |
| 9,234 |
| (9,258 | ) | — |
| — |
| 129 |
|
Balance carried forward |
| 320,260 |
| 4,917,507 |
| (4,930,927 | ) | 7,737 |
| (9,880 | ) | 304,697 |
|
Department |
| As at |
| Contributions |
| Distributions |
| Revenue |
| Expense |
| As at |
|
Balance brought forward |
| 320,260 |
| 4,917,507 |
| (4,930,927 | ) | 7,737 |
| (9,880 | ) | 304,697 |
|
Internal Affairs |
|
|
|
|
|
|
|
|
|
|
|
|
|
New Zealand 1990 Scholarship Trust |
| 587 |
| — |
| — |
| 50 |
| — |
| 637 |
|
Unlimited Potential Programme Trust |
| 139 |
| — |
| (12 | ) | 4 |
| (131 | ) | — |
|
Vogel House Trust |
| — |
| 1 |
| (1 | ) | — |
| — |
| — |
|
Justice |
|
|
|
|
|
|
|
|
|
|
|
|
|
Chief Electoral Trust (2) |
| — |
| — |
| — |
| — |
| — |
| — |
|
Courts Law Trust |
| 7,347 |
| 18,147 |
| (15,485 | ) | — |
| — |
| 10,009 |
|
Employment Court Trust |
| 131 |
| 220 |
| (199 | ) | — |
| — |
| 152 |
|
Fines Trust |
| 27,154 |
| 71,309 |
| (71,837 | ) | — |
| — |
| 26,626 |
|
Foreign Currency Trust (2) |
| — |
| — |
| — |
| — |
| — |
| — |
|
Maori Land Court Trust |
| 52 |
| — |
| — |
| 22 |
| (10 | ) | 64 |
|
Supreme Court Trust |
| 34 |
| — |
| — |
| 97 |
| (48 | ) | 83 |
|
Victims’ Claims Trust |
| 47 |
| — |
| — |
| 21 |
| (56 | ) | 12 |
|
Labour |
|
|
|
|
|
|
|
|
|
|
|
|
|
Employment Relations Service Trust |
| 24 |
| 268 |
| (274 | ) | 1 |
| — |
| 19 |
|
Industrial Relations Act Security of Costs Trust |
| 6 |
| — |
| — |
| — |
| — |
| 6 |
|
New Zealand Immigration Service Trust |
| 7,357 |
| 5,250 |
| (5,625 | ) | 396 |
| (27 | ) | 7,351 |
|
Land Information New Zealand |
|
|
|
|
|
|
|
|
|
|
|
|
|
Crown Forestry Licences Trust |
| 879 |
| 453,899 |
| (448,199 | ) | (416,805 | ) | 413,954 |
| 3,728 |
|
Deposits Trust |
| 2,264 |
| 26 |
| (156 | ) | — |
| (1 | ) | 2,133 |
|
Endowment Rentals Trust |
| 1 |
| 352 |
| (352 | ) | — |
| — |
| 1 |
|
Hunter Gift for the Settlement of Discharged Soldiers Trust |
| 51 |
| 4 |
| — |
| — |
| — |
| 55 |
|
National Library |
|
|
|
|
|
|
|
|
|
|
|
|
|
Interloan Billing System Trust |
| 5 |
| — |
| — |
| 391 |
| (389 | ) | 7 |
|
Macklin Bequest Fund Trust |
| 235 |
| — |
| — |
| 17 |
| (20 | ) | 232 |
|
New Zealand Defence Force |
|
|
|
|
|
|
|
|
|
|
|
|
|
New Zealand Defence Force Trust (3) |
| — |
| — |
| — |
| — |
| — |
| — |
|
New Zealand Defence Force - Year of the Veteran Trust |
| 12 |
| — |
| — |
| — |
| — |
| 12 |
|
Police |
|
|
|
|
|
|
|
|
|
|
|
|
|
Bequests, Donations and Appeals |
|
|
|
|
|
|
|
|
|
|
|
|
|
Trust |
| 62 |
| — |
| — |
| 300 |
| (201 | ) | 161 |
|
Found Money Trust |
| 184 |
| — |
| — |
| 160 |
| (30 | ) | 314 |
|
Money in Custody Trust |
| 8,843 |
| — |
| — |
| 5,494 |
| (2,568 | ) | 11,769 |
|
Reparation Trust |
| 8 |
| — |
| — |
| 10 |
| (9 | ) | 9 |
|
Rewards Monies Trust (2) |
| — |
| — |
| — |
| — |
| — |
| — |
|
Balance carried forward |
| 375,682 |
| 5,466,983 |
| (5,473,067 | ) | (402,105 | ) | 400,584 |
| 368,077 |
|
Department |
| As at |
| Contributions |
| Distributions |
| Revenue |
| Expense |
| As at |
|
Balance brought forward |
| 375,682 |
| 5,466,983 |
| (5,473,067 | ) | (402,105 | ) | 400,584 |
| 368,077 |
|
Social Development |
|
|
|
|
|
|
|
|
|
|
|
|
|
Australian Recovery Debt Trust |
| 4 |
| — |
| — |
| 42 |
| (42 | ) | 4 |
|
Australian Dollar Embargoed Arrears Trust |
| 191 |
| 3,053 |
| (2,922 | ) | — |
| — |
| 322 |
|
Australian Dollar Reciprocal Trust (3) |
| — |
| — |
| — |
| — |
| — |
| — |
|
Children and Young Persons and Their Families Agency Trust (4) |
| 381 |
| — |
| — |
| (381 | ) | — |
| — |
|
Maintenance Trust |
| 47 |
| — |
| — |
| 999 |
| (997 | ) | 49 |
|
Netherlands Recovery Debt Trust |
| 1 |
| — |
| — |
| 43 |
| (33 | ) | 11 |
|
Overseas Debt Recovery Trust (2) |
| — |
| — |
| — |
| — |
| — |
| — |
|
WR Wallace Trust (4) |
| — |
| — |
| — |
| 411 |
| (18 | ) | 393 |
|
Treasury |
|
|
|
|
|
|
|
|
|
|
|
|
|
Trustee Act 1956 Trust |
| 941 |
| 769 |
| (68 | ) | 78 |
| — |
| 1,720 |
|
Total |
| 377,247 |
| 5,470,805 |
| (5,476,057 | ) | (400,913 | ) | 399,494 |
| 370,576 |
|
Forecast |
|
|
| Actual |
| ||||
Original |
| Estimated |
|
|
| 30 June |
| 30 June |
|
$m |
| $m |
|
|
| $m |
| $m |
|
|
|
|
| Core Crown revenue (excl NZS Fund) |
|
|
|
|
|
59,402 |
| 61,936 |
| Core Crown revenue per segment analysis |
| 61,819 |
| 58,211 |
|
(447 | ) | (381 | ) | Less NZS Fund revenue(1) |
| (385 | ) | (436 | ) |
349 |
| 259 |
| Add back NZS Fund intra-segment revenue(1) |
| 237 |
| 707 |
|
59,304 |
| 61,814 |
| Core Crown revenue (excl NZS Fund) |
| 61,671 |
| 58,482 |
|
|
|
|
| OBEGAL excluding NZS Fund |
|
|
|
|
|
4,958 |
| 5,227 |
| Total Crown OBEGAL per statement of financial performance |
| 5,637 |
| 5,860 |
|
(447 | ) | (381 | ) | Less NZS Fund revenue(1) |
| (385 | ) | (436 | ) |
— |
| 114 |
| Add NZS Fund other expenses(1) |
| 97 |
| 119 |
|
349 |
| 259 |
| Add back NZS Fund intra-segment revenue(1) |
| 237 |
| 707 |
|
4,860 |
| 5,219 |
| OBEGAL excluding NZS Fund |
| 5,586 |
| 6,250 |
|
(1) Refer to Fiscal Indicator Analysis - NZS Fund on page 163.
for the year ended 30 June 2008
Forecast |
|
|
| Actual |
| ||||
Original |
| Estimated |
|
|
| 30 June |
| 30 June |
|
$m |
| $m |
|
|
| $m |
| $m |
|
|
|
|
| Core Crown Cash Flows from Operations |
|
|
|
|
|
55,121 |
| 56,392 |
| Total tax receipts |
| 55,975 |
| 53,278 |
|
477 |
| 494 |
| Total other sovereign receipts |
| 486 |
| 395 |
|
1,857 |
| 1,980 |
| Interest, profits and dividends |
| 2,128 |
| 1,896 |
|
1,472 |
| 1,654 |
| Sale of goods & services and other receipts |
| 1,411 |
| 1,433 |
|
(18,789 | ) | (19,931 | ) | Subsidies and transfer payments |
| (19,562 | ) | (17,234 | ) |
(32,610 | ) | (31,478 | ) | Personnel and operating costs |
| (30,792 | ) | (28,962 | ) |
(2,176 | ) | (2,333 | ) | Finance costs |
| (2,354 | ) | (2,220 | ) |
(314 | ) | — |
| Forecast for future new operating spending |
| — |
| — |
|
— |
| 240 |
| Top-down expense adjustment |
| — |
| — |
|
5,038 |
| 7,018 |
| Net cash flows from core Crown operations |
| 7,292 |
| 8,586 |
|
(1,803 | ) | (1,544 | ) | Net purchase of physical assets |
| (1,433 | ) | (1,755 | ) |
(1,088 | ) | (1,254 | ) | Net increase in advances |
| (1,254 | ) | (1,125 | ) |
(636 | ) | (519 | ) | Net purchase of investments |
| (444 | ) | (365 | ) |
(2,103 | ) | (2,103 | ) | Contribution to NZ Superannuation Fund |
| (2,104 | ) | (2,048 | ) |
(200 | ) | — |
| Purchase of Reserve Bank reserves |
| — |
| (500 | ) |
(184 | ) | (690 | ) | Top-down capital adjustment |
| — |
| — |
|
(976 | ) | 908 |
| Residual cash |
| 2,057 |
| 2,793 |
|
|
|
|
| Financed by: |
|
|
|
|
|
(1,649 | ) | (2,863 | ) | Other net sale/(purchase) of marketable securities and deposits |
| (3,595 | ) | (4,956 | ) |
(2,625 | ) | (1,955 | ) | Total operating and investing activities |
| (1,538 | ) | (2,163 | ) |
|
|
|
|
|
|
|
|
|
|
|
|
|
| Used in: |
|
|
|
|
|
709 |
| 167 |
| Net (repayment)/issue of other New Zealand dollar borrowing |
| (1,585 | ) | 1,120 |
|
(993 | ) | (504 | ) | Net (repayment)/issue of foreign currency borrowing |
| 901 |
| 1,775 |
|
178 |
| 260 |
| Issues of circulating currency |
| 86 |
| 81 |
|
3 |
| (572 | ) | Decrease/(increase) in cash |
| 249 |
| (479 | ) |
(103 | ) | (649 | ) |
|
| (349 | ) | 2,497 |
|
(2,728 | ) | (2,604 | ) | Net cash inflow/(outflow) to be offset by domestic bonds |
| (1,887 | ) | 334 |
|
|
|
|
| Gross Cash Proceeds from Domestic Bonds |
|
|
|
|
|
2,520 |
| 2,415 |
| Domestic bonds (market) |
| 1,757 |
| 2,294 |
|
208 |
| 189 |
| Domestic bonds (non-market) |
| 130 |
| 570 |
|
2,728 |
| 2,604 |
| Total gross cash proceeds from domestic bonds |
| 1,887 |
| 2,864 |
|
— |
| — |
| Repayment of domestic bonds (market) |
| — |
| (2,777 | ) |
— |
| — |
| Repayment of domestic bonds (non-market) |
| — |
| (421 | ) |
— |
| — |
| Total repayments of domestic bonds |
| — |
| (3,198 | ) |
2,728 |
| 2,604 |
| Net (repayments of)/cash proceeds from domestic bonds |
| 1,887 |
| (334 | ) |
This note illustrates how the financial activities of the core Crown reported in the financial statements relate to the Domestic Bond Programme.
as at 30 June 2008
Forecast |
|
|
| Actual |
| ||||
Original |
| Estimated |
|
|
| 30 June |
| 30 June |
|
$m |
| $m |
|
|
| $m |
| $m |
|
|
|
|
| Gross and net debt analysis: |
|
|
|
|
|
46,364 |
| 45,546 |
| Total borrowings |
| 46,110 |
| 41,898 |
|
38,876 |
| 37,035 |
| Core Crown borrowings |
| 37,336 |
| 35,892 |
|
|
|
|
| Add back NZS Fund holdings of sovereign-issued debt and |
|
|
|
|
|
1,524 |
| 638 |
| NZS Fund borrowings |
| 409 |
| 913 |
|
40,400 |
| 37,673 |
| Gross sovereign-issued debt(1) |
| 37,745 |
| 36,805 |
|
51,184 |
| 48,927 |
| Less core Crown financial assets(2) |
| 50,698 |
| 44,272 |
|
(10,784 | ) | (11,254 | ) | Net core Crown debt (incl NZS Fund(3) |
| (12,953 | ) | (7,467 | ) |
15,439 |
| 13,100 |
| Add back NZS Fund holdings of core Crown financial assets and NZS Fund financial assets(4) |
| 12,934 |
| 11,576 |
|
4,655 |
| 1,846 |
| Net core Crown debt (excl NZS Fund)(3) |
| (19 | ) | 4,109 |
|
|
|
|
| Gross sovereign-issued debt excluding settlement cash: |
|
|
|
|
|
40,400 |
| 37,673 |
| Gross sovereign-issued debt(1) |
| 37,745 |
| 36,805 |
|
(7,523 | ) | (7,510 | ) | Less Reserve Bank settlement cash (incl. Kiwibank) |
| (7,955 | ) | (7,758 | ) |
1,600 |
| 1,600 |
| Add back changes to DMO borrowing due to settlement cash(5) |
| 1,600 |
| 1,600 |
|
34,477 |
| 31,763 |
| Gross sovereign-issued debt excluding settlement cash |
| 31,390 |
| 30,647 |
|
(1) Gross sovereign-issued debt is debt issued by the sovereign (i.e. core Crown) and includes Government stock held by the NZS Fund, ACC or EQC for example. In other words, the total sovereign-issued debt does not eliminate any internal cross-holdings held by these entities. The Government’s debt objective uses this measure of debt.
(2) Core Crown financial assets exclude receivables.
(3) Net core Crown debt is the Government Sovereign issued debt less financial assets. This can provide information about the sustainability of the Government’s accounts, and is used by some international agencies when determining the creditworthiness of a country. However, as some financial assets are not easily converted into cash, and some are restricted, it is important to view net debt alongside gross sovereign-issued debt.
(4) Adding back the NZ Superannuation Fund Assets provides the financial liabilities less financial assets of the Core Crown, excluding those assets set aside to meet part of the future cost of New Zealand superannuation.
(5) The Reserve Bank has used $1.6 billion of settlement cash to purchase reserves that were to have been funded by DMO borrowing. Therefore the impact of settlement cash on gross sovereign-issued debt is adjusted by this amount.
for the year ended 30 June 2008
Forecast |
|
|
| Actual |
| ||||
Original |
| Estimated |
|
|
| 30 June |
| 30 June |
|
$m |
| $m |
|
|
| $m |
| $m |
|
447 |
| 381 |
| Revenue |
| 385 |
| 436 |
|
(349 | ) | (259 | ) | Less current tax expense |
| (237 | ) | (707 | ) |
— |
| 63 |
| Less inter-entity expenses(1) |
| 63 |
| 171 |
|
— |
| (114 | ) | Less other expenses |
| (97 | ) | (119 | ) |
866 |
| (686 | ) | Gains/(losses) |
| (995 | ) | 1,313 |
|
964 |
| (615 | ) | Operating balance |
| (881 | ) | 1,094 |
|
12,910 |
| 12,973 |
| Opening net worth |
| 12,973 |
| 9,855 |
|
2,103 |
| 2,103 |
| Gross contribution from the Crown |
| 2,104 |
| 2,048 |
|
964 |
| (615 | ) | Operating balance |
| (881 | ) | 1,094 |
|
— |
| — |
| Other movements in reserves |
| 16 |
| (24 | ) |
15,977 |
| 14,461 |
| Closing net worth |
| 14,212 |
| 12,973 |
|
|
|
|
| comprising: |
|
|
|
|
|
15,439 |
| 13,816 |
| Financial assets |
| 13,791 |
| 12,576 |
|
538 |
| 645 |
| Net other assets |
| 421 |
| 397 |
|
15,977 |
| 14,461 |
| Closing net worth |
| 14,212 |
| 12,973 |
|
(1) NZS Fund inter-entity expenses include deferred tax expense/(credits).
The NZS Fund is an important component of the Government’s fiscal strategy. The Fund’s assets provide the means for the Government to partially pre-fund future fiscal pressures, particularly those pressures arising from an ageing population.
The results of the NZS Fund, as they have been incorporated into the Crown financial statements, are shown above.
The Crown’s financial interest in State-owned entities (“SOE’s”) and Crown entities (“CE’s”) is reported in accordance with the Crown’s accounting policies. Adjustments have been made to restate the financial position and financial performance of certain entities, as reported in their own financial statements, to a basis consistent with the Crown’s accounting policies.
With the exception of Tertiary Education Institutions (“TEI’s”) the Crown has line-by-line combined all SOE’s and Crown entities.
The Crown has equity accounted 100% of the net assets of TEI’s on the basis that, in the event of disestablishment of a TEI (which is subject to a resolution of the House), 100% of the net assets revert to the Crown in the absence of a decision to transfer the assets to a new or existing institution and, in the meantime, the Crown enjoys the benefits of the provision of a higher education to the public of New Zealand (refer note 21).
The ownership interest in Air New Zealand Limited is 76.07% (2007: 76.50%). The interest in Air New Zealand Limited is included within the SOE segment.
Except for those entities listed below, all SOEs and significant CE’s have a balance date of 30 June, and the information reported in these financial statements is for the period ended 30 June 2008:
SOE’s |
| Balance date |
| Information reported |
AsureQuality Limited |
| 30 September |
| 30 June 2008 |
Crown entities: |
|
|
|
|
School boards of trustees |
| 31 December |
| 31 December 2007 |
TEI’s |
| 31 December |
| 30 June 2008 |
|
| 30 June 2008 |
| 30 June 2007 |
| ||||||||
|
| Total |
| Operating |
| Distributions |
| Total |
| Operating |
| Distributions |
|
|
| revenue |
| balance |
| to Crown |
| revenue |
| balance |
| to Crown |
|
|
| $m |
| $m |
| $m |
| $m |
| $m |
| $m |
|
State-owned enterprises |
|
|
|
|
|
|
|
|
|
|
|
|
|
AgriQuality New Zealand Limited |
| 17 |
| (5 | ) | — |
| 85 |
| — |
| — |
|
Airways Corporation of New Zealand Limited |
| 139 |
| 11 |
| (6 | ) | 132 |
| 7 |
| (6 | ) |
Asure New Zealand Limited |
| 10 |
| 1 |
| (2 | ) | 53 |
| 3 |
| (2 | ) |
AsureQuality Limited |
| 104 |
| 5 |
| — |
| — |
| — |
| — |
|
Electricity Corporation of New Zealand Limited |
| 1 |
| — |
| — |
| 1 |
| — |
| — |
|
Genesis Power Limited |
| 2,545 |
| 99 |
| (29 | ) | 1,776 |
| 89 |
| (10 | ) |
Landcorp Farming Limited |
| 8 |
| 59 |
| (12 | ) | 6 |
| 20 |
| (3 | ) |
Meridian Energy Limited |
| 2,609 |
| 129 |
| (298 | ) | 1,774 |
| 241 |
| (368 | ) |
Meteorological Service of New Zealand Limited |
| 35 |
| 3 |
| — |
| 31 |
| 2 |
| (2 | ) |
Mighty River Power Limited |
| 1,176 |
| 113 |
| (56 | ) | 789 |
| 98 |
| (50 | ) |
New Zealand Post Limited |
| 1,729 |
| 110 |
| (27 | ) | 1,486 |
| 86 |
| (31 | ) |
New Zealand Railways Corporation |
| 241 |
| (45 | ) | — |
| 223 |
| (20 | ) | — |
|
Solid Energy New Zealand Limited |
| 555 |
| 36 |
| — |
| 540 |
| 95 |
| — |
|
Timberlands West Coast Limited |
| 19 |
| (24 | ) | — |
| 18 |
| (4 | ) | — |
|
Transpower New Zealand Limited |
| 642 |
| 76 |
| — |
| 626 |
| 206 |
| — |
|
Kordia Group Limited |
| 239 |
| 1 |
| (9 | ) | 261 |
| 14 |
| (5 | ) |
Animal Control Products Limited |
| 6 |
| 1 |
| (1 | ) | 6 |
| 1 |
| (1 | ) |
Learning Media Limited |
| 24 |
| (2 | ) | — |
| 25 |
| — |
| — |
|
Quotable Value New Zealand |
| 41 |
| 18 |
| (5 | ) | 42 |
| 2 |
| (1 | ) |
Total State-owned enterprises |
| 10,140 |
| 586 |
| (445 | ) | 7,874 |
| 840 |
| (479 | ) |
Air New Zealand Limited |
| 4,784 |
| 278 |
| (105 | ) | 4,380 |
| (50 | ) | (162 | ) |
Total SOE’s and Air New Zealand Limited |
| 14,924 |
| 864 |
| (550 | ) | 12,254 |
| 790 |
| (641 | ) |
Intra-segmental eliminations |
| (327 | ) | (141 | ) | — |
| (366 | ) | 17 |
| — |
|
Total per statement of segments |
| 14,597 |
| 723 |
| (550 | ) | 11,888 |
| 807 |
| (641 | ) |
Crown Entities |
|
|
|
|
|
|
|
|
|
|
|
|
|
Accident Compensation Corporation |
| 4,200 |
| (2,408 | ) | — |
| 3,684 |
| (112 | ) | — |
|
Crown research institutes |
| 644 |
| 21 |
| — |
| 594 |
| 8 |
| — |
|
District health boards (including the |
|
|
|
|
|
|
|
|
|
|
|
|
|
Crown Health Funding Agency) |
| 9,896 |
| (24 | ) | — |
| 9,046 |
| 2 |
| — |
|
Earthquake Commission |
| 439 |
| 107 |
| — |
| 215 |
| 16 |
| — |
|
Housing New Zealand Corporation |
| 891 |
| 18 |
| (13 | ) | 826 |
| 97 |
| (20 | ) |
Museum of New Zealand Te Papa |
| 44 |
| (14 | ) | — |
| 46 |
| (9 | ) | — |
|
New Zealand Fire Service Commission |
| 296 |
| 3 |
| — |
| 282 |
| 14 |
| — |
|
Public Trust |
| 124 |
| (28 | ) | — |
| 105 |
| 4 |
| — |
|
Schools |
| 5,403 |
| 52 |
| — |
| 4,487 |
| 33 |
| — |
|
Tertiary Education Commission |
| 2,642 |
| 2 |
| — |
| 2,404 |
| 5 |
| — |
|
TEIs |
| — |
| 225 |
| — |
| — |
| 108 |
| — |
|
Transit New Zealand |
| 1,206 |
| 600 |
| — |
| 1,156 |
| 550 |
| — |
|
Television New Zealand |
| 392 |
| 19 |
| (10 | ) | 375 |
| (8 | ) | (15 | ) |
Other |
| 4,925 |
| 47 |
| (2 | ) | 4,918 |
| 410 |
| (1 | ) |
Total Crown Entities |
| 31,102 |
| (1,380 | ) | (25 | ) | 28,138 |
| 1,118 |
| (36 | ) |
Intra-segmental eliminations |
| (2,089 | ) | (146 | ) | — |
| (1,938 | ) | (95 | ) | — |
|
Total per statement of segments |
| 29,013 |
| (1,526 | ) | (25 | ) | 26,200 |
| 1,023 |
| (36 | ) |
Total Financial Interest in SOEs, Crown Entities and Air New Zealand Limited |
| 43,610 |
| (803 | ) | (575 | ) | 38,088 |
| 1,830 |
| (677 | ) |
|
| 30 June 2008 |
| ||||||||||||
|
| Purchase |
| Total |
| Total |
| Total |
| Total |
| Equity |
| 30 June |
|
State-owned enterprises |
|
|
|
|
|
|
|
|
|
|
|
|
|
|
|
AgriQuality New Zealand Limited |
| (2 | ) | — |
| — |
| — |
| — |
| — |
| 25 |
|
Airways Corporation of New Zealand Limited |
| (17 | ) | 107 |
| 132 |
| 27 |
| 78 |
| 54 |
| 46 |
|
Asure New Zealand Limited |
| — |
| — |
| — |
| — |
| — |
| — |
| 10 |
|
AsureQuality Limited |
| (2 | ) | 27 |
| 63 |
| 13 |
| 32 |
| 31 |
| — |
|
Electricity Corporation of New Zealand Limited |
| — |
| — |
| 18 |
| 16 |
| 16 |
| 2 |
| 2 |
|
Genesis Power Limited |
| (218 | ) | 1,851 |
| 2,680 |
| 573 |
| 1,273 |
| 1,407 |
| 1,326 |
|
Landcorp Farming Limited |
| (131 | ) | 1,365 |
| 1,729 |
| 251 |
| 280 |
| 1,449 |
| 1,185 |
|
Meridian Energy Limited |
| — |
| 6,433 |
| 7,189 |
| 1,114 |
| 2,984 |
| 4,205 |
| 4,402 |
|
Meteorological Service of New Zealand Limited |
| (7 | ) | 11 |
| 19 |
| 5 |
| 10 |
| 9 |
| 6 |
|
Mighty River Power Limited |
| (303 | ) | 3,499 |
| 4,038 |
| 865 |
| 1,782 |
| 2,256 |
| 1,694 |
|
New Zealand Post Limited |
| (45 | ) | 328 |
| 8,028 |
| 7,073 |
| 7,361 |
| 667 |
| 588 |
|
New Zealand Railways Corporation |
| (213 | ) | 11,799 |
| 11,907 |
| 223 |
| 282 |
| 11,626 |
| 10,549 |
|
Solid Energy New Zealand Limited |
| (55 | ) | 352 |
| 626 |
| 28 |
| 258 |
| 368 |
| 340 |
|
Timberlands West Coast Limited |
| — |
| 6 |
| 32 |
| — |
| 10 |
| 22 |
| 43 |
|
Transpower New Zealand Limited |
| (321 | ) | 2,554 |
| 2,867 |
| 1,192 |
| 1,533 |
| 1,334 |
| 1,265 |
|
Kordia Group Limited |
| (37 | ) | 167 |
| 259 |
| 116 |
| 158 |
| 101 |
| 106 |
|
Animal Control Products Limited |
| (1 | ) | 2 |
| 6 |
| — |
| 1 |
| 5 |
| 4 |
|
Learning Media Limited |
| — |
| 2 |
| 8 |
| — |
| 4 |
| 4 |
| 6 |
|
Quotable Value New Zealand |
| (2 | ) | 2 |
| 31 |
| — |
| 9 |
| 22 |
| 9 |
|
Total State-owned enterprises |
| (1,354 | ) | 28,505 |
| 39,632 |
| 11,496 |
| 16,071 |
| 23,562 |
| 21,606 |
|
Air New Zealand Limited |
| (238 | ) | 2,671 |
| 5,316 |
| 1,412 |
| 3,488 |
| 1,828 |
| 1,577 |
|
Total SOE’s and Air New Zealand Limited |
| (1,592 | ) | 31,176 |
| 44,948 |
| 12,908 |
| 19,559 |
| 25,390 |
| 23,183 |
|
Intra-segmental eliminations |
| (303 | ) | (143 | ) | (506 | ) | (91 | ) | (94 | ) | (413 | ) | (383 | ) |
Total per statement of segments |
| (1,895 | ) | 31,033 |
| 44,442 |
| 12,817 |
| 19,465 |
| 24,977 |
| 22,800 |
|
Crown Entities |
|
|
|
|
|
|
|
|
|
|
|
|
|
|
|
Accident Compensation Corporation |
| (54 | ) | 64 |
| 13,186 |
| 29 |
| 21,163 |
| (7,977 | ) | (5,571 | ) |
Crown research institutes |
| (57 | ) | 472 |
| 668 |
| 38 |
| 177 |
| 490 |
| 450 |
|
District health boards (including the Crown Health Funding Agency) |
| (449 | ) | 4,173 |
| 6,846 |
| 2,968 |
| 4,696 |
| 2,150 |
| 2,014 |
|
Earthquake Commission |
| (3 | ) | 13 |
| 5,637 |
| — |
| 102 |
| 5,535 |
| 5,429 |
|
Housing New Zealand Corporation |
| (283 | ) | 15,177 |
| 15,493 |
| 1,833 |
| 3,197 |
| 12,296 |
| 11,591 |
|
Museum of New Zealand Te Papa |
| (17 | ) | 1,006 |
| 1,038 |
| — |
| 14 |
| 1,024 |
| 978 |
|
New Zealand Fire Service Commission |
| (48 | ) | 491 |
| 559 |
| 7 |
| 87 |
| 471 |
| 448 |
|
Public Trust |
| (1 | ) | 8 |
| 1,011 |
| 979 |
| 991 |
| 20 |
| 49 |
|
Schools |
| (109 | ) | 1,300 |
| 2,343 |
| 84 |
| 675 |
| 1,668 |
| 1,436 |
|
Tertiary Education Commission |
| (2 | ) | 6 |
| 161 |
| 20 |
| 145 |
| 16 |
| 21 |
|
TEIs |
| (478 | ) | — |
| 8,386 |
| — |
| — |
| 7,037 |
| 6,310 |
|
Transit New Zealand |
| (1,034 | ) | 20,956 |
| 21,164 |
| — |
| 195 |
| 20,969 |
| 19,418 |
|
Television New Zealand Limited |
| (16 | ) | 127 |
| 316 |
| 30 |
| 114 |
| 201 |
| 192 |
|
Other |
| (37 | ) | 184 |
| 1,723 |
| 43 |
| 948 |
| 778 |
| 858 |
|
Total Crown Entities |
| (2,588 | ) | 43,977 |
| 78,531 |
| 6,278 |
| 32,504 |
| 44,678 |
| 43,623 |
|
Intra-segmental eliminations |
| 586 |
| (318 | ) | (3,193 | ) | (1,573 | ) | (1,543 | ) | (301 | ) | (297 | ) |
Total per statement of segments |
| (2,002 | ) | 43,659 |
| 75,338 |
| 4,705 |
| 30,961 |
| 44,377 |
| 43,326 |
|
Total Financial Interest in SOEs, Crown Entities and Air New Zealand Limited |
| (3,897 | ) | 74,692 |
| 119,780 |
| 17,522 |
| 50,426 |
| 69,354 |
| 66,126 |
|
These financial statements are for the Government Reporting entity as specified in Part III of the Public Finance Act 1989. This comprises Ministers of the Crown and the following entities:
Departments
Agriculture and Forestry
Archives New Zealand
Building and Housing
Conservation
Corrections
Crown Law Office
Culture and Heritage
Defence
Economic Development
Education
Education Review Office
Environment
Fisheries
Food Safety Authority
Foreign Affairs and Trade
Government Communications Security Bureau
Health
Inland Revenue
Internal Affairs
Justice
Labour
Land Information New Zealand
Maori Development
National Library of New Zealand
New Zealand Customs Service
New Zealand Defence Force
Office of the Clerk
Pacific Island Affairs
Parliamentary Counsel Office
Parliamentary Service
Police
Prime Minister and Cabinet
Research, Science and Technology
Security Intelligence Service
Serious Fraud Office
Social Development
State Services Commission
Statistics
Transport
Treasury
Women’s Affairs
Others
New Zealand Superannuation Fund
Reserve Bank of New Zealand
Offices of Parliament
Office of the Controller and Auditor-General
Office of the Ombudsmen
Parliamentary Commissioner for the Environment
State-owned enterprises
Airways Corporation of New Zealand Limited
Animal Control Products Limited
AsureQuality Limited
Electricity Corporation of New Zealand Limited
Genesis Power Limited
Kordia Group Limited
Landcorp Farming Limited
Learning Media Limited
Meridian Energy Limited
Meteorological Service of New Zealand Limited
Mighty River Power Limited
New Zealand Post Limited
New Zealand Railways Corporation
Quotable Value Limited
Solid Energy New Zealand Limited
Terralink Limited (in liquidation)
Timberlands West Coast Limited
Transpower New Zealand Limited
Air New Zealand Limited (included for disclosure purposes as if it were an SOE)
Organisations named or described in Schedule 4 of the Public Finance Act 1989
Agriculture and Marketing Research and Development Trust
Asia New Zealand Foundation
Fish and game councils (12)
Leadership Development Centre Trust
New Zealand Fish and Game Council
New Zealand Game Bird Habitat Trust Board
New Zealand Government Property Corporation
New Zealand Lottery Grants Board
Ngai Tahu Ancillary Claims Trust
Pacific Co-operation Foundation
Pacific Island Development Trust
Research and Education Advanced Network New Zealand Limited
Reserves boards (24)
Road Safety Trust
Sentencing Council
Accident Compensation Corporation
Accounting Standards Review Board
Alcohol Advisory Council of New Zealand
Arts Council of New Zealand Toi Aotearoa
Broadcasting Commission
Broadcasting Standards Authority
Career Services
Charities Commission
Children’s Commissioner
Civil Aviation Authority of New Zealand
Commerce Commission
Crown Health Financing Agency
Crown research institutes (9)
District health boards (21)
Drug Free Sport New Zealand
Earthquake Commission
Electoral Commission
Electricity Commission
Energy Efficiency and Conservation Authority
Environmental Risk Management Authority
Families Commission
Foundation for Research, Science and Technology
Government Superannuation Fund Authority
Guardians of New Zealand Superannuation
Health and Disability Commissioner
Health Research Council of New Zealand
Health Sponsorship Council
Housing New Zealand Corporation
Human Rights Commission
Independent Police Conduct Authority
Land Transport New Zealand
Law Commission
Legal Services Agency
Maritime New Zealand
Mental Health Commission
Museum of New Zealand Te Papa Tongarewa Board
New Zealand Antarctic Institute
New Zealand Artificial Limb Board
New Zealand Blood Service
New Zealand Film Commission
New Zealand Fire Service Commission
New Zealand Historic Places Trust (Pouhere Taonga)
New Zealand Lotteries Commission
New Zealand Qualifications Authority
New Zealand Symphony Orchestra
New Zealand Teachers Council
New Zealand Tourism Board
New Zealand Trade and Enterprise
New Zealand Venture Investment Fund Limited
Office of Film and Literature Classification
Pharmaceutical Management Agency
Privacy Commissioner
Public Trust
Radio New Zealand Limited
Retirement Commissioner
School boards of trustees (2,463)
Securities Commission
Social Workers Registration Board
Sport and Recreation New Zealand
Standards Council
Takeovers Panel
Te Reo Whakapuaki Irirangi (Te Mangai Paho)
Te Taura Whiri i te Reo Maori (Maori Language Commission)
Television New Zealand Limited
Tertiary Education Commission
Tertiary education institutions (31)
Testing Laboratory Registration Council
Transit New Zealand
Transport Accident Investigation Commission