Her Majesty The Queen In Right Of New Zealand Inactive
Filed: 17 Jun 09, 12:00am
Exhibit 99.(e)(4)
Statement of Responsibility
On the basis of the economic and fiscal information available to it, the Treasury has used its best professional judgement in supplying the Minister of Finance with this Economic and Fiscal Update. The Update incorporates the fiscal and economic implications both of Government decisions and circumstances as at 5 May 2009 that were communicated to me, and of other economic and fiscal information available to the Treasury in accordance with the provisions of the Public Finance Act 1989.

John Whitehead
Secretary to the Treasury
20 May 2009
This Economic and Fiscal Update has been prepared in accordance with the Public Finance Act 1989. I accept overall responsibility for the integrity of the disclosures contained in this Update, and the consistency and completeness of the Update information in accordance with the requirements of the Public Finance Act 1989.
To enable the Treasury to prepare this Update, I have ensured that the Secretary to the Treasury has been advised of all Government decisions and other circumstances as at 5 May 2009 of which I was aware and that had material economic or fiscal implications.

Hon Bill English
Minister of Finance
20 May 2009
1
Economic and Fiscal Update
The depth of the current global slowdown and the extent of its synchronisation across countries are unprecedented in the period since World War II. The economic performance of New Zealand’s trading partners will play a crucial role in the performance of the New Zealand economy over the next few years. This outlook is highly uncertain, and will be partly dependent on the effectiveness of the numerous large-scale policy responses introduced by governments in response to the financial crisis. A number of the policies undertaken, at least on the current scale, are relatively untested and as such many governments find themselves in uncharted waters.
Uncertainty surrounds how long disruptions in financial markets will continue, as well as the ramifications for world growth. Although not independent, this is complicated by the fact that current adjustments in the world economy are occurring at a time when a number of countries, including New Zealand, have imbalances such as large current account deficits. A number of countries also now face the added complication of significant deteriorations in their fiscal positions and consequential increases in debt. Judgements around such factors have significant impacts on the outlook for an economy. The main forecasts presented here represent the Treasury’s view as to the most likely path the New Zealand economy will take over the next several years. Two alternatives are also presented that fall within the range of possible outcomes. Given the considerable uncertainty surrounding forecasts in the current environment, these alternatives represent an integral part of the forecast story.
The weaker outlook for New Zealand’s trading partners has resulted in further downward revisions to the forecasts for New Zealand economic activity, with the outlook for the New Zealand economy now weaker than the main track and downside scenario of the December Forecasts. As a result, forecasts of tax revenue are substantially lower, which leads to an increase in the size of forecast fiscal deficits and government debt levels. While some recent data have been less negative, it is too early to tell if this indicates a faster recovery than is incorporated in the main forecasts. An upturn in economic indicators is necessary for quarterly growth to return to positive territory by the end of the year, which is incorporated in the main forecast.
Table 1.1 – Forecast developments over the past year
|
| 2008 |
| 2009 |
| 2010 |
| 2011 |
| 2012 |
| 2013 |
|
|
| Est./Actual |
| Forecast |
| Forecast |
| Forecast |
| Forecast |
| Forecast |
|
|
|
|
|
|
|
|
|
|
|
|
|
|
|
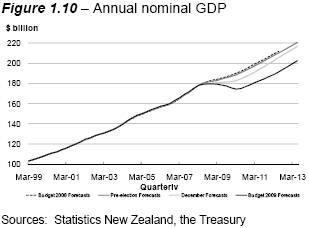
Nominal expenditure GDP ($billion, March year) |
|
|
|
|
|
|
|
|
|
|
|
|
|
Budget 2008 Forecasts |
| 178 |
| 184 |
| 190 |
| 199 |
| 209 |
| — |
|
Pre-election Forecasts |
| 178 |
| 183 |
| 189 |
| 197 |
| 208 |
| 218 |
|
December Forecasts |
| 178 |
| 180 |
| 183 |
| 191 |
| 202 |
| 214 |
|
Budget 2009 Forecasts |
| 178 |
| 179 |
| 175 |
| 181 |
| 189 |
| 200 |
|
Real production GDP (AAPC, March year) |
|
|
|
|
|
|
|
|
|
|
|
|
|
Budget 2008 Forecasts |
| 3.1 |
| 1.5 |
| 2.3 |
| 3.2 |
| 3.0 |
| — |
|
Pre-election Forecasts |
| 3.0 |
| 0.1 |
| 1.8 |
| 3.3 |
| 3.4 |
| 3.1 |
|
December Forecasts |
| 3.2 |
| 0.3 |
| 0.8 |
| 2.9 |
| 3.9 |
| 3.8 |
|
Budget 2009 Forecasts |
| 3.1 |
| -0.9 |
| -1.7 |
| 1.8 |
| 2.9 |
| 4.0 |
|
Unemployment rate (%, March quarter) |
|
|
|
|
|
|
|
|
|
|
|
|
|
Budget 2008 Forecasts |
| 3.5 |
| 3.7 |
| 4.4 |
| 4.5 |
| 4.3 |
| — |
|
Pre-election Forecasts |
| 3.7 |
| 4.4 |
| 5.1 |
| 5.1 |
| 4.8 |
| 4.6 |
|
December Forecasts |
| 3.7 |
| 4.7 |
| 6.4 |
| 6.2 |
| 5.4 |
| 4.6 |
|
Budget 2009 Forecasts |
| 3.7 |
| 5.0 |
| 7.5 |
| 7.5 |
| 6.3 |
| 5.1 |
|
OBEGAL(1) (% GDP, June year) |
|
|
|
|
|
|
|
|
|
|
|
|
|
Budget 2008 Forecasts |
| 2.9 |
| 0.7 |
| 0.5 |
| 0.2 |
| 0.1 |
| — |
|
Pre-election Forecasts |
| 3.1 |
| 0.0 |
| -0.9 |
| -1.2 |
| -1.5 |
| -1.5 |
|
December Forecasts |
| 3.1 |
| -0.3 |
| -2.2 |
| -3.1 |
| -3.1 |
| -2.9 |
|
Budget 2009 Forecasts |
| 3.1 |
| -1.6 |
| -4.4 |
| -5.1 |
| -5.0 |
| -4.2 |
|
Gross debt(2) (% GDP, June year) |
|
|
|
|
|
|
|
|
|
|
|
|
|
Budget 2008 Forecasts |
| 17.6 |
| 17.5 |
| 16.8 |
| 17.8 |
| 16.8 |
| — |
|
Pre-election Forecasts |
| 17.4 |
| 17.4 |
| 18.0 |
| 21.9 |
| 23.1 |
| 24.3 |
|
December Forecasts |
| 17.5 |
| 19.2 |
| 21.0 |
| 26.0 |
| 29.4 |
| 33.1 |
|
Budget 2009 Forecasts |
| 17.5 |
| 24.8 |
| 29.1 |
| 34.2 |
| 36.9 |
| 38.7 |
|
Net debt(3) (% GDP, June year) |
|
|
|
|
|
|
|
|
|
|
|
|
|
Budget 2008 Forecasts |
| 6.5 |
| 8.1 |
| 9.5 |
| 10.8 |
| 11.9 |
| — |
|
Pre-election Forecasts |
| 5.7 |
| 8.9 |
| 11.4 |
| 14.2 |
| 16.7 |
| 19.1 |
|
December Forecasts |
| 5.7 |
| 9.3 |
| 13.5 |
| 18.5 |
| 22.7 |
| 26.7 |
|
Budget 2009 Forecasts |
| 5.7 |
| 8.7 |
| 15.6 |
| 21.8 |
| 27.1 |
| 30.9 |
|
Notes: |
| (1) |
| Operating balance before gains and losses |
|
| (2) |
| Gross sovereign-issued debt excluding Reserve Bank settlement cash and Reserve Bank bills |
|
| (3) |
| Net core Crown debt excluding the NZS Fund and advances |
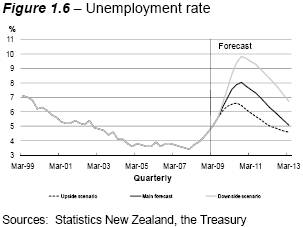
The New Zealand economy is forecast to continue contracting through to the September quarter of 2009, with positive, albeit weak, growth occurring from the end of 2009. This is expected to result in an annual average decline in real gross domestic product (GDP) of 0.9% in the March 2009 year, followed by a further decline of 1.7% in the 2010 March year. This is significantly below the 0.3% and 0.8% positive rates of growth predicted in the December Forecasts. The slower growth reflects lower levels of export and domestic demand, with the outlook for investment particularly affected by tight credit conditions and business uncertainty. The impact of the downturn on households will intensify with household spending declining. Rising unemployment, which is expected to peak at 8% in September 2010, will be a contributing factor. A gradual improvement in world growth prospects, combined with a low dollar and low interest rates, sees real GDP growth staging a relatively hesitant recovery with growth of 1.8% in the March 2011 year, increasing to 2.9% and 4.0% in 2012 and 2013 respectively.
Weaker income flows throughout the economy affect tax revenue which, despite the postponement of the 2010 and 2011 personal income tax changes, is forecast to be around a cumulative $15 billion below the December Forecasts over the 2009 to 2013 June years. More people will receive benefits and debt-servicing costs also increase. A decision to reduce the size of future budget allowances is the main driver for forecast core Crown expenses being a cumulative $5.9 billion lower over the 2009 to 2013 June years than forecast in the December Forecasts.
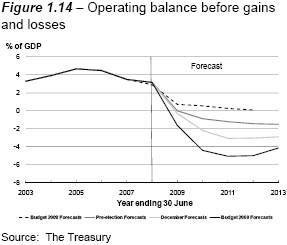
The operating balance before gains and losses (OBEGAL) deficit is expected to be larger than that predicted in the December Forecasts throughout the forecast period, peaking at 5.1% of GDP before declining to 4.2% of GDP by 2013. The financing of larger deficits sees debt rising more steeply than previously forecast with gross debt forecast to reach slightly below 39% of GDP by 2013 and net debt just below 31% of GDP.
Considerable uncertainty surrounds the evolution of growth in our trading partners with alternative economic forecasts illustrating the potential impacts on the New Zealand economy should trading partner growth differ from the main forecasts. The scenarios give rise to significantly different fiscal outcomes. Under a scenario of higher trading partner growth, New Zealand’s GDP growth is also higher and the peak in unemployment lower. Nominal GDP is forecast to be a cumulative $37 billion higher over the 2009 to 2013 fiscal years than in the main forecast, generating around an additional $13 billion of tax revenue. This flows through to less rapid debt accumulation with net debt just below 23% of GDP in 2013.
Table 1.2 – Key Budget 2009 forecasts and scenarios
|
| 2008 |
| 2009 |
| 2010 |
| 2011 |
| 2012 |
| 2013 |
|
|
| Actual |
| Forecast |
| Forecast |
| Forecast |
| Forecast |
| Forecast |
|
Nominal expenditure GDP ($billion, March year) |
|
|
|
|
|
|
|
|
|
|
|
|
|
Upside scenario |
| 178 |
| 179 |
| 179 |
| 188 |
| 200 |
| 211 |
|
Main forecast |
| 178 |
| 179 |
| 175 |
| 181 |
| 189 |
| 200 |
|
Downside scenario |
| 178 |
| 179 |
| 168 |
| 170 |
| 178 |
| 189 |
|
Real production GDP (AAPC, March year) |
|
|
|
|
|
|
|
|
|
|
|
|
|
Upside scenario |
| 3.1 |
| -0.9 |
| -1.2 |
| 3.5 |
| 4.3 |
| 3.4 |
|
Main forecast |
| 3.1 |
| -0.9 |
| -1.7 |
| 1.8 |
| 2.9 |
| 4.0 |
|
Downside scenario |
| 3.1 |
| -1.0 |
| -2.8 |
| 0.8 |
| 2.1 |
| 4.3 |
|
Unemployment rate (%, March quarter) |
|
|
|
|
|
|
|
|
|
|
|
|
|
Upside scenario |
| 3.7 |
| 5.0 |
| 6.5 |
| 5.9 |
| 5.0 |
| 4.6 |
|
Main forecast |
| 3.7 |
| 5.0 |
| 7.5 |
| 7.5 |
| 6.3 |
| 5.1 |
|
Downside scenario |
| 3.7 |
| 5.0 |
| 8.6 |
| 9.5 |
| 8.3 |
| 6.7 |
|
OBEGAL (% GDP, June year) |
|
|
|
|
|
|
|
|
|
|
|
|
|
Upside scenario |
| 3.1 |
| -1.6 |
| -3.5 |
| -3.4 |
| -2.4 |
| -1.7 |
|
Main forecast |
| 3.1 |
| -1.6 |
| -4.4 |
| -5.1 |
| -5.0 |
| -4.2 |
|
Downside scenario |
| 3.1 |
| -1.8 |
| -5.9 |
| -7.6 |
| -7.8 |
| -6.9 |
|
Gross debt (% GDP, June year) |
|
|
|
|
|
|
|
|
|
|
|
|
|
Upside scenario |
| 17.5 |
| 24.6 |
| 27.5 |
| 30.4 |
| 30.3 |
| 30.3 |
|
Main forecast |
| 17.5 |
| 24.8 |
| 29.1 |
| 34.2 |
| 36.9 |
| 38.7 |
|
Downside scenario |
| 17.5 |
| 25.1 |
| 31.9 |
| 39.8 |
| 45.0 |
| 48.8 |
|
Net debt (% GDP, June year) |
|
|
|
|
|
|
|
|
|
|
|
|
|
Upside scenario |
| 5.7 |
| 8.6 |
| 14.4 |
| 18.6 |
| 21.1 |
| 22.9 |
|
Main forecast |
| 5.7 |
| 8.7 |
| 15.6 |
| 21.8 |
| 27.1 |
| 30.9 |
|
Downside scenario |
| 5.7 |
| 8.9 |
| 17.7 |
| 26.6 |
| 34.6 |
| 40.5 |
|
A more pessimistic assumption regarding trading partner growth would result in higher unemployment and nominal GDP being a cumulative $43 billion lower over the 2009 to 2013 fiscal years. Lower tax revenue leads to net debt being forecast to reach nearly 41% of GDP in 2013. This would lead to a Government response to prevent this occurring as this result would breach the Government’s debt objective.
The main forecasts presented in this chapter are heavily influenced by the weak outlook for the global economy over the next few years. The world is currently facing the weakest conditions for economic growth since World War II. Such conditions represent a difficult environment for economies, such as New Zealand’s, that need to shift the composition of their growth away from domestic demand towards exports in an effort to unwind imbalances such as a large current account deficit.
The New Zealand economy contracted in every quarter during 2008. Drought conditions were particularly intense over the 2007/08 summer and this contributed to low agricultural production over the first half of 2008, with significant declines in the export volumes of important categories such as dairy. Also, domestic demand was easing as the lagged impact of monetary policy took effect after an extended period of growth. The impact of the global slowdown began to play an increasingly significant role over the second half of 2008 and into 2009.
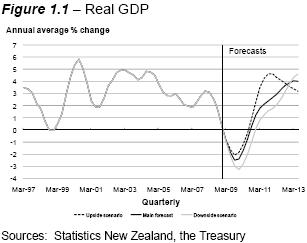
New Zealand is forecast to experience a continued period of weak economic growth over the next couple of years as the economy continues to be affected by low global growth and the need to unwind past imbalances. Real production GDP is estimated to have declined by 0.9% in the year to March 2009, with a further 1.7% decline forecast for the March 2010 year. This is materially lower than both the main and downside outlooks that were presented in the December Forecasts. In addition, the recovery from current weakness in New Zealand and abroad is expected to be relatively drawn-out. Real GDP growth is expected to lift to around 1.8% in 2011 and just below 3% in 2012 before reaching 4% in 2013.
Quarterly growth is forecast to remain negative through to the September quarter of 2009. The current forecast means that by September 2009 the level of real GDP will be 3.5% below its level at the end of 2007. This is a slightly smaller decline than the recession of the mid-1970s. However, faster population growth relative to that in the mid-1970s means that the decline in GDP per capita is forecast to be larger, with the level of real GDP per capita 5.2% lower in December 2009 compared with two years earlier.
The effects of the slowdown have been felt over the first part of 2009 and are likely to intensify as the year progresses. Firms can expect a continuation of weak demand, both domestically and abroad. Their profits are forecast to fall and they are likely to exercise caution when making investment and employment decisions. Households have experienced reduced job security and unemployment is likely to rise further over the next 18 months. Combined with constraints on borrowing, this will place pressure on household spending. Government will be affected through lower tax revenue, increased welfare payments and higher debt-servicing expenses as debt grows and it increasingly needs to borrow to fund its expenditure.
Table 1.3 – Economic forecasts(1)
(Annual average % change, March |
| 2008 |
| 2009 |
| 2010 |
| 2011 |
| 2012 |
| 2013 |
|
years) |
| Actual |
| Forecast |
| Forecast |
| Forecast |
| Forecast |
| Forecast |
|
Private consumption |
| 3.2 |
| -0.4 |
| -1.3 |
| -1.5 |
| -0.1 |
| 1.9 |
|
Public consumption |
| 4.3 |
| 3.6 |
| 3.3 |
| 2.8 |
| 1.9 |
| 1.5 |
|
Total consumption |
| 3.5 |
| 0.5 |
| -0.3 |
| -0.5 |
| 0.4 |
| 1.8 |
|
Residential investment |
| 4.3 |
| -25.2 |
| -22.7 |
| 7.1 |
| 18.7 |
| 20.6 |
|
Non-market investment |
| 7.4 |
| 15.9 |
| 5.2 |
| -2.2 |
| -3.6 |
| 3.8 |
|
Market Investment |
| 4.7 |
| -5.0 |
| -23.4 |
| 3.1 |
| 18.4 |
| 11.5 |
|
Total investment |
| 4.3 |
| -9.6 |
| -21.0 |
| 6.0 |
| 17.4 |
| 12.8 |
|
Stock change(2) |
| 0.8 |
| 0.2 |
| -1.0 |
| 0.5 |
| 0.1 |
| -0.1 |
|
Gross national expenditure |
| 4.4 |
| -1.9 |
| -5.8 |
| 1.3 |
| 3.9 |
| 4.2 |
|
Exports |
| 2.9 |
| -4.2 |
| -1.5 |
| 2.4 |
| 4.1 |
| 6.0 |
|
Imports |
| 9.6 |
| -3.1 |
| -14.3 |
| 0.6 |
| 7.3 |
| 6.4 |
|
GDP (expenditure measure) |
| 2.3 |
| -1.8 |
| -1.9 |
| 2.0 |
| 2.9 |
| 4.0 |
|
GDP (production measure) |
| 3.1 |
| -0.9 |
| -1.7 |
| 1.8 |
| 2.9 |
| 4.0 |
|
|
|
|
|
|
|
|
|
|
|
|
|
|
|
Real GDP per capita |
| 2.1 |
| -1.9 |
| -2.7 |
| 0.8 |
| 1.9 |
| 3.1 |
|
Nominal GDP (expenditure basis) |
| 7.4 |
| 0.7 |
| -2.7 |
| 3.7 |
| 4.5 |
| 5.7 |
|
GDP deflator |
| 4.9 |
| 2.5 |
| -0.7 |
| 1.7 |
| 1.5 |
| 1.6 |
|
Output gap (% deviation, March quarter) |
| 1.9 |
| -0.9 |
| -1.9 |
| -2.2 |
| -1.5 |
| 0.0 |
|
|
|
|
|
|
|
|
|
|
|
|
|
|
|
Employment(3) |
| 0.8 |
| 0.7 |
| -3.4 |
| -2.2 |
| 1.8 |
| 3.5 |
|
Unemployment(4) |
| 3.7 |
| 5.0 |
| 7.5 |
| 7.5 |
| 6.3 |
| 5.1 |
|
|
|
|
|
|
|
|
|
|
|
|
|
|
|
Wages(5) |
| 4.6 |
| 4.2 |
| 2.2 |
| 1.2 |
| 1.3 |
| 1.6 |
|
CPI inflation(6) |
| 3.4 |
| 3.0 |
| 2.4 |
| 1.7 |
| 1.2 |
| 1.6 |
|
Merchandise terms of trade(7) |
| 8.4 |
| 0.9 |
| -11.8 |
| 0.8 |
| 3.6 |
| 2.4 |
|
|
|
|
|
|
|
|
|
|
|
|
|
|
|
Current account balance |
|
|
|
|
|
|
|
|
|
|
|
|
|
- $billion |
| -14.2 |
| -15.4 |
| -12.0 |
| -9.8 |
| -10.3 |
| -11.1 |
|
- % of GDP |
| -8.0 |
| -8.6 |
| -6.9 |
| -5.4 |
| -5.5 |
| -5.5 |
|
|
|
|
|
|
|
|
|
|
|
|
|
|
|
TWI(8) |
| 71.9 |
| 53.7 |
| 49.5 |
| 52.0 |
| 52.1 |
| 52.1 |
|
90-day bank bill rate(8) |
| 8.8 |
| 3.7 |
| 2.5 |
| 2.5 |
| 3.8 |
| 5.4 |
|
10-year bond rate(8) |
| 6.3 |
| 4.6 |
| 5.2 |
| 5.2 |
| 5.6 |
| 5.8 |
|
Notes: |
| (1) |
| Forecasts finalised 18 April 2009 |
|
| (2) |
| Contribution to GDP growth |
|
| (3) |
| Household Labour Force Survey, full-time equivalent employment |
|
| (4) |
| Household Labour Force Survey, percentage of the labour force, March quarter, seasonally adjusted |
|
| (5) |
| Quarterly Employment Survey, average ordinary time hourly earnings, annual percentage change |
|
| (6) |
| Annual percentage change |
|
| (7) |
| SNA basis, annual average percentage change |
|
| (8) |
| Average for the March quarter |
Sources: Statistics New Zealand, Reserve Bank of New Zealand, the Treasury
The magnitude of the current financial market crisis and the severity of its impact on real economies throughout the world became increasingly apparent at the end of 2008 and start of 2009. Forecasts for the growth of our trading partners have been consistently downgraded. The extent of synchronisation across countries of the current global slowdown and its depth are unprecedented in recent history. The International Monetary Fund (IMF) now characterises the current downturn as the deepest post-World War II.
A feature of downturns associated with financial stress is that they tend to be deep and relatively long-lasting. The synchronised nature of the downturn also offers less opportunity for individual countries to boost their growth via an export-led recovery. One
challenge facing many economies is how to unwind imbalances that have emerged over recent years, including large current account imbalances, and more recently the considerable build-up of government debt.
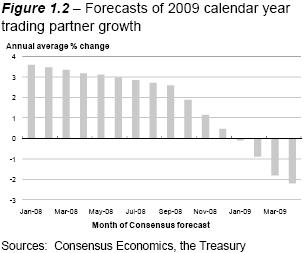
The path taken by the global economy is the most important factor underpinning the outlook for the New Zealand economy. The rate of annual average growth across our top 12 trading partners slowed to 1.8% in the 2008 calendar year, down from 4% in 2007. Over the 2009 calendar year, New Zealand’s top 12 trading partners are on average expected to contract by 2.5%, significantly weaker than the 0.9% increase assumed in the December Forecasts.(8) The slowdown is also assumed to be considerably more prolonged than the assumption in the December Forecasts, and the recovery in 2010 fairly modest with our top 12 trading partners growing only 1% in the 2010 calendar year and 2.2% in 2011.

Given the uncertainty over the current world outlook, alternative assumptions regarding the outlook for our trading partners and the resulting impacts on the New Zealand economy are considered as scenarios presented later in the chapter.
Although forecasts for the world economy have been revised down in recent months, there is increasing evidence that the rate of decline in the global economy is slowing and some positive signs have appeared. There has been a strengthening of industrial production and exports in Asia, possibly in response to the large investment in infrastructure in China. Other positive developments include 2% annualised growth in private consumption in the US in the March quarter of 2009 and a slowing in the rate of job-shedding in the US in April. There have also been noticeable upturns in business and consumer confidence in the major economies in May, although most of these measures still point to a contraction in activity.
(8) |
| The Treasury’s measure of trading partner growth has changed from the top 20 measure used in the December Forecasts to a top 12 measure. The 0.9% figure quoted here is the assumption from the December Forecasts on a top 12 basis. |
Rudimentary signs of stability have also been evident in global markets. Share markets have recovered from their low point in early March and in some cases have recouped their 2009 losses, but remain well down on previous peaks. Commodity prices have also risen, with the Commodity Research Bureau futures index up 20% from its low in early March. West Texas Intermediate oil prices have increased from their low of US$34/barrel in February to just under US$60/barrel in early May and world prices for New Zealand’s major commodity exports rose in spot markets in March and April 2009. Financial markets have also shown some signs of stabilisation with a narrowing of spreads between interbank and effective policy rates, particularly in the US; safe-haven demand for US dollar-denominated assets has declined, and – combined with higher commodity prices – this has led to the appreciation of the New Zealand dollar from below US 50 cents in early March to above US 60 cents in early May.
So far, the developments indicate only a slowing in the rate of decline, but may be the first step towards an eventual recovery. It is too early to conclude that these recent economic developments will result in an upswing in growth greater than that in our main forecasts. In fact an upturn in these indicators is necessary if quarterly growth is to return to positive territory by the end of the year, which is incorporated in our main forecast. Risks lie in both directions: this incipient recovery may die out, for example, as further financial sector adjustment occurs, or the recovery may strengthen and stability and growth return sooner than currently forecast. There is also the possibility that growth may occur in a manner that sees less of an unwinding of imbalances than occurs in the main forecasts.
The global slowdown is being transmitted to New Zealand via four main channels: the cost and availability of credit in New Zealand; lower demand for New Zealand’s goods and services from abroad, including the impact this has on international commodity prices; impacts on the confidence of New Zealand businesses and consumers; and lower wealth levels. Uncertainty associated with developments abroad translates into uncertainty for New Zealand firms and households and hence the exact impact that each of these channels will have on the New Zealand economy is also uncertain.
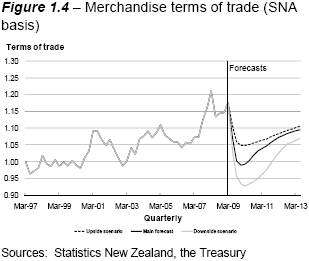
Declining world growth has seen the world price of a number of our exports fall. International spot prices for dairy products, as measured by the ANZ commodity price index, fell by 58% between November 2007 and February 2009, and while there are some tentative signs that dairy prices may have reached a floor, the lag between spot prices and prices received by New Zealand producers should see further significant falls occurring as 2009 progresses. At the same time world prices for imports are also likely to be lower, but on balance the terms of trade are expected to be lower than previously forecast. Although some improvement is expected to occur as the world economy recovers, it is unlikely that the peaks experienced over 2008 will be reached again over the forecast period.
…contributing to a negative outlook for many businesses…
Firms are experiencing decreased demand for their goods and services as overseas consumers and New Zealand households respond to the difficult economic environment. The NZIER’s Quarterly Survey of Business Opinion (QSBO) showed business confidence near historically low levels with a net 47% of firms reporting a decrease in their own activity in the March quarter 2009, a deterioration from the net 43% who reported a decrease in December 2008. A net 38% of firms expect their own activity to fall further over the June quarter.
In a difficult trading environment firms are less able to increase prices in New Zealand. As discussed, falling world demand brought lower commodity prices, and the international prices of other goods and services are also being affected. While price developments will have different impacts across firms depending on individual firms’ input and output mixes, overall it is likely that a number of firms will find margins compressed, which – combined with lower volumes – will mean falling profits.
As a consequence, the amount of corporate tax revenue forecast to flow to Government has been revised down. The ability of firms to use past losses to offset profits in future periods means that the impact of the current downturn on the corporate tax revenue received by the Government can persist into the period in which profits begin to recover. Total corporate tax revenue over the 2009 to 2013 June years is forecast to be 6% or around $3 billion lower than forecast in the December Forecasts.
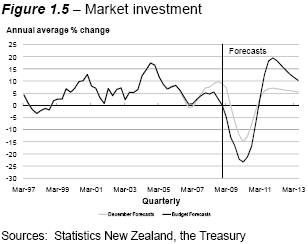
The March QSBO showed investment intentions at record lows with a net 46% of firms reporting that they intend to reduce investment in buildings over the next 12 months and a net 44% of firms intending to reduce investment in plant and machinery. Given this, it is highly likely that investment activity will experience large falls over the next year or so. Following a decline of 5% in the 2009 March year, real market investment is forecast to fall
a further 23% over the 2010 March year. Nevertheless, it should be noted that investment levels are subject to large swings over economic cycles and can also be quite volatile and therefore relatively unpredictable.
The availability of finance is another constraining factor for investment, with banks and other lenders more cautious than they have been in the past about the level of funds they provide, while falling house prices will limit the extent to which some small businesses relying on mortgage funding can secure finance. The amount of credit provided by banks and other financial institutions to businesses has experienced a considerable easing in growth, declining to 8.2% on an annual basis in March 2009, down from rates in excess of 16% during parts of 2007. In addition, monthly declines have been experienced over each of the first three months of 2009. The relatively muted concerns of some businesses about the extent to which they can access funds for investment need to be viewed in the current context of declining investment intentions and therefore could come more to the fore in the event that investment were to recover rapidly.
Unemployment is expected to rise with firms needing fewer workers as a result of lower demand. Firms are looking at areas they can cut costs and staff levels will be a key area of focus. The unemployment rate is forecast to peak at 8% in the second half of 2010, an increase relative to the 6.5% peak in the December Forecasts and also above the 7.5% peak contained in the December downside scenario. The Budget Forecasts show the number of seasonally adjusted unemployed increasing from the December 2008 level of 105,000 to 179,000 in September 2010. While unemployment is expected to rise, there is considerable uncertainty as to the exact peak it will reach. This will be dependent on how the New Zealand and overseas economies evolve and the resultant demand for labour. The scenarios presented later in this chapter show the peak in the unemployment rate varying between 6.6% and 9.8%, with the peak in the number of unemployed varying between 148,000 and 217,000.
The main Budget Forecasts incorporate a falling rate of labour force participation. Factors contributing to this include more people staying in education for longer given limited job opportunities, and people, particularly secondary income earners and older workers, no longer actively seeking employment given the increased difficulty they will face in gaining employment. Should more of these people remain in the labour force as unemployed then there is a risk that the unemployment rate may increase further. People who are close to their planned retirement age and have suffered significant losses of wealth are one group who may wish to remain in employment and the labour force for longer.
With many countries facing an economic slowdown, this could lead to higher net migration gains if fewer New Zealanders seek employment overseas and especially if more New Zealanders return home. The forecasts incorporate net migration levels returning to 10,000 per annum by mid-2010. Higher net migration could boost both aggregate demand and unemployment.
Firms are likely to try to manage costs by offering lower wage increases with a softer labour market enabling such an approach, as will forecasts of falling inflation. Changes in the composition of the workforce will also influence measures such as the Quarterly Employment Survey’s measure of average hourly earnings which is forecast to slow to under 2% annual growth in the second half of 2010, considerably slower than the experience of the past couple of years when it has generally been in the 4% to 5% range.
Lower wage growth and employment than in the December Forecasts have reduced PAYE forecasts by a total of $6.4 billion over the forecast period as a whole. However, policy changes discussed later mean average tax rates remain higher than previously forecast, resulting in the level of PAYE tax being lower than the December Forecasts by only a net $4.2 billion.
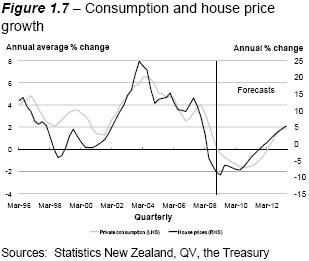
Household spending is expected to remain under considerable pressure throughout the forecast period, with real private consumption expected to contract in all but the final March year of the forecast period. In aggregate, labour incomes are forecast to decline in the March 2010 year and remain fairly flat in 2011. Slower income growth will constrain consumption growth and consumers are likely to remain cautious about taking on debt to fund discretionary purchases, particularly in light of concerns about job security.
Rising unemployment is also forecast to put further pressure on the housing market, with nominal house prices forecast to decline nearly 8% and 4% over the March 2010 and 2011 years respectively, following a 9% decline in the 2009 March year. This will not only affect households’ perceptions of wealth but will also severely constrain the ability of households to borrow against their houses to finance spending. An increase in precautionary saving should also contribute to the rate of household dis-saving narrowing considerably.
After a period of considerable debt build-up, it is possible that adjustment on the part of households may be slower than is incorporated in the Budget Forecasts. This could occur if consumers were to spend the majority of the relief they receive from relatively low mortgage rates currently available, although it should be noted that low interest rates also constrain the incomes of those relying on investment income. While higher growth in consumption would have positive implications for demand and growth over the short term, the necessary adjustment as a result of a continued build-up in household debt would need to be greater in the future, potentially affecting the outlook for growth beyond the forecast horizon.
Many of the factors that are forecast to act as a drag on consumption growth will also translate into low levels of residential investment. Banks are expected to continue to seek larger deposits before issuing home loans and funding for property developers remains constrained. Annual building consents are at their lowest level in over 25 years, contributing to the forecast that residential investment will fall by just under 23% in the March 2010 year following a 25% fall in the March 2009 year. There have been signs of a slight recovery in
house sales over April, but given the factors above it is unlikely that the housing market will stage a significant recovery any time soon, with the risks tilted towards further declines in house prices as 2009 progresses.
Slowing domestic demand, with large falls in investment and consumption, is forecast to result in a sharp 14.3% fall in import volumes in the 2010 March year with import volumes also remaining relatively flat in the March 2011 year. A low exchange rate contributes to subdued imports by making imported goods and services relatively expensive.
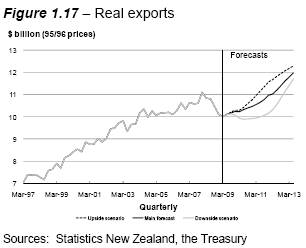
Export volumes are forecast to fall 4.2% in the year to March 2009 with a drought-affected 16% reduction in dairy export volumes and just under a 10% fall in service export volumes, which have been hampered by falling tourist arrivals. The New Zealand dollar fell 25% between the March 2008 and March 2009 quarters. Ordinarily this would be expected to provide quite an impetus for export volume growth but, despite a recovery in the growth in dairy export volumes, overall exports are expected to record a further 1.5% decline in the year to March 2010. Services export volumes are expected to fall by nearly a further 11% in the March 2010 year as global consumers cut back on discretionary expenditure including travel to distant destinations such as New Zealand.
While the outlook for overall exports over the next year or so is weak, a number of New Zealand firms and producers are relatively well placed compared to those abroad. This is because a large share of New Zealand’s exports are agriculturally-based with demand for these products likely to be relatively less affected than high-end consumer electronics or motor vehicles.
With weak domestic demand significantly freeing up capacity in the economy and constraining the ability of firms to increase prices, non-tradables inflation is forecast to fall significantly to below 2% throughout the 2011 and 2012 calendar years. The weak international environment will also see tradables inflation fall back significantly, although movements in the exchange rate will have some impact as the dollar is expected to depreciate to just below 50 on a trade weighted basis by the start of 2010 as the terms of trade decline and risk aversion remains elevated. The exchange rate is then expected to stage a relatively minor recovery with the Trade Weighted Index (TWI) increasing to around 52. Overall, this should see Consumers Price Index (CPI) inflation easing to around 1% by September 2009 and remaining significantly below 2% over the majority of the forecast period. The profile for inflation includes the assumption that the Emissions Trading Scheme will impact on stationary energy and liquid fuels from 1 January 2010 and 1 January 2011 respectively. The details of the scheme are currently under review but no decisions have been taken.
Between July 2008 and April 2009 the Reserve Bank cut the Official Cash Rate (OCR) by 575 basis points from 8.25% to 2.5%. The reduction in the OCR over this period has been larger and more rapid than in any other New Zealand easing cycle and represents a larger easing in interest rates than was possible in the US or euro area. The low inflation
environment is forecast to enable interest rates to remain at low levels for some time, with 90-day interest rates expected to fall to around 2.5% and remain around this level until the second half of 2011. The reductions in interest rates help dampen the extent of the decline in economic activity and, with interest rates remaining low, will play an important role in promoting a gradual recovery in economic growth.
As world growth begins to recover in 2010 and picks up further in 2011 and beyond, exports help contribute to stronger growth in the New Zealand economy. Sentiment becomes more positive and firms step up investment levels again. Residential investment also begins to pick up as uncertainty in financial markets diminishes and population grows. While quarterly real GDP growth is expected to return to positive territory from the final quarter of the 2009 calendar year, consumers will continue to face challenging times as unemployment continues to rise over 2010. Households will continue to face an environment where credit is not as easily attainable as in recent years. In addition, the risks associated with weak savings behaviour will still be at the forefront of many households’ minds. Consumers are not expected to emerge from their current correction for around two years, with their rate of dis-saving narrowing considerably over the forecast period.
The increase in investment activity is forecast to see import volumes increase over the final two years of the forecast period. However, the composition of this growth is weighted more towards capital goods than consumption goods. Overall, the forecast profile for nominal exports and imports implies a narrowing of the goods and services deficit in the current account, with a small surplus recorded by the end of the forecast period. Such a narrowing needs to be regarded in the context of unfavourable global conditions over much of the forecast period. These constrain a more rapid response to the lower exchange rate as well as having a negative impact on the terms of trade.
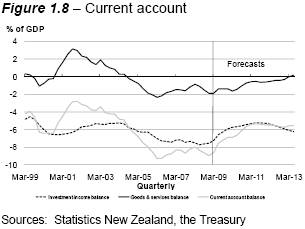
The investment income deficit is also expected to narrow as a percentage of GDP over the first half of the forecast period as profits of overseas-owned firms operating in New Zealand fall and interest rates on overseas debt fall below those of recent years. This contributes to the current account deficit narrowing to 5.4% of GDP by the beginning of 2011. The deficit is then expected to remain in this vicinity as the deficit on investment income begins to
widen again as profits accruing to overseas-owned firms operating in New Zealand recover and interest rates on debt also increase.
The widespread nature and magnitude of the current global slowdown has long-term implications for the size of the New Zealand economy. Current world economic developments appear to be of a more structural nature than just those of a typical unwinding of cyclical pressures. It is going to take some time before confidence in the financial system is fully restored. As a result there is likely to be a sustained period of more conservative behaviour on the part of investors, banks and ultimately consumers. The unwinding of imbalances, both in New Zealand and abroad, is going to require a shift in the composition of production and consumption. Accordingly, the Treasury has adjusted down its view as to the potential level of output of the economy and as a result in any particular year the level of real and nominal activity will not recover to the levels expected prior to the emergence of the crisis. This judgement is subject to considerable uncertainty.
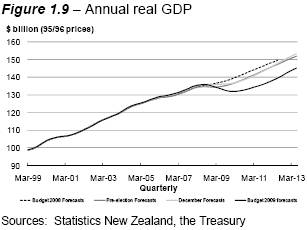
Compared to the December Forecasts, nominal GDP is expected to be a cumulative $47 billion lower over the 2009 to 2013 March years, with the difference being largest in 2013 when nominal GDP is forecast to be $14 billion lower than in the December Forecasts. This reflects the level of real GDP in the 2013 March year being 5.4% below the December Forecasts as well as the impact of lower price levels arising from the period of economic weakness. As a result of the significantly lower tax revenue that is generated from the smaller economy, as well as rising expenses, the Government would have needed greater increases in its rate of borrowing if spending were to be maintained at the levels incorporated in the December Forecasts. As a result, the Government would face an increasing interest burden over time. Even with the recovery of growth in the later years of the forecast period, debt levels would continue to rise. The Government has taken steps to avoid a situation in which debt would reach unsustainable levels. The Government’s fiscal strategy is outlined in the Fiscal Strategy Report (FSR).
The Government has made a number of policy decisions in this Budget designed to maintain debt at manageable levels. These decisions include postponing its future personal income tax cuts, reducing future budget spending and suspending contributions to the NZS Fund.
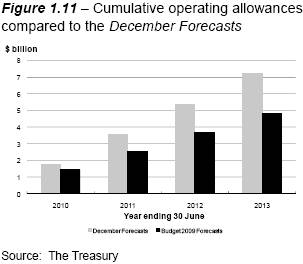
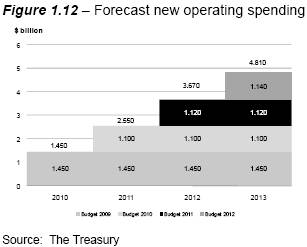
Previous Budgets included an allowance for future new spending of $1.75 billion per year. These Budget Forecasts include an operating allowance for future new spending of $1.45 billion per year in Budget 2009 and $1.1 billion per year (grown forward by 2% per year) in future Budgets, thereby reducing the rate of expenditure growth. As a result, expenditure is reduced by $5.4 billion over the forecast period as a whole.
With additions to new spending now expected to be smaller than previously outlined, government consumption will grow less rapidly than forecast in the December Forecasts. Real government consumption has consistently grown by 4% to 5% over the past five March years but is expected to slow to 1.5% by the year to March 2013. The postponement of tax cuts lowers household disposable income and therefore plays a role in constraining private consumption growth.
Since the December Forecasts the Government has also decided to temporarily suspend contributions to the NZS Fund until the Crown returns to operating surpluses sufficient to cover these contributions (currently projected to occur in the year to June 2021). A contribution of $250 million is forecast to be paid in the June 2010 year with contributions ceasing for the remainder of the forecast period. This decision reduces the Government’s cash requirements by an average of $2.3 billion a year when compared to the December Forecasts and $1.5 billion a year when compared to the contribution formula used to calculate future contributions (refer Table 1.4).
Further discussion on these policy decisions is available in the FSR.
Table 1.4 – NZS Fund contributions
Year ending 30 June |
| 2009 |
| 2010 |
| 2011 |
| 2012 |
| 2013 |
|
$ billion |
| Forecast |
| Forecast |
| Forecast |
| Forecast |
| Forecast |
|
Contributions per fund formula |
| 2.242 |
| 1.466 |
| 1.533 |
| 1.565 |
| 1.733 |
|
Forecast contributions |
| 2.242 |
| 0.250 |
| — |
| — |
| — |
|
Reduction in contributions |
| — |
| 1.216 |
| 1.533 |
| 1.565 |
| 1.733 |
|
Source: The Treasury
Relative to the December Forecasts, the total reduction in core Crown tax revenue across the 2009 to 2013 June years is around $15 billion. Forecasts of all the major tax types have been reduced.
· A weaker outlook for wage rates and employment has taken about $6 billion off PAYE, offset somewhat by changes to personal income tax rates and thresholds adding about $2 billion, meaning a net fall of around $4 billion.
· A lower forecast for domestic demand has reduced the goods and services tax (GST) forecasts by nearly $4 billion.
· The profit outlook for both incorporated and unincorporated businesses is considerably lower than in the December Forecasts, which has reduced business income taxes (corporate tax and other persons tax) by around $5 billion.
· Other taxes are also down on the December Forecasts, most notably resident withholding tax on interest as a result of lower interest rates.
Table 1.5 – Movement in core Crown tax revenue
Year ending 30 June |
| 2008 |
| 2009 |
| 2010 |
| 2011 |
| 2012 |
| 2013 |
|
$ billion |
| Est./actual |
| Forecast |
| Forecast |
| Forecast |
| Forecast |
| Forecast |
|
Nominal GDP |
|
|
|
|
|
|
|
|
|
|
|
|
|
Budget 2008 Forecasts |
| 180.1 |
| 185.5 |
| 192.1 |
| 201.8 |
| 211.8 |
| — |
|
Forecast changes |
| -0.1 |
| -1.1 |
| -1.4 |
| -1.9 |
| -1.6 |
| — |
|
Pre-election Forecasts |
| 180.1 |
| 184.4 |
| 190.7 |
| 199.9 |
| 210.2 |
| 220.6 |
|
Forecast changes |
| -1.0 |
| -3.3 |
| -6.2 |
| -6.0 |
| -4.8 |
| -4.1 |
|
December Forecasts |
| 179.0 |
| 181.1 |
| 184.5 |
| 193.9 |
| 205.4 |
| 216.5 |
|
Forecast changes |
| 0.2 |
| -2.6 |
| -9.5 |
| -11.2 |
| -13.9 |
| -14.0 |
|
Budget 2009 Forecasts |
| 179.2 |
| 178.5 |
| 175.1 |
| 182.7 |
| 191.5 |
| 202.5 |
|
Core Crown tax revenue |
|
|
|
|
|
|
|
|
|
|
|
|
|
Budget 2008 Forecasts |
| 56.7 |
| 56.5 |
| 58.2 |
| 60.3 |
| 62.7 |
| — |
|
Forecast changes |
| 0.1 |
| -0.5 |
| -0.8 |
| -1.1 |
| -0.8 |
| — |
|
Pre-election Forecasts |
| 56.7 |
| 56.1 |
| 57.4 |
| 59.3 |
| 61.9 |
| 65.1 |
|
Forecast changes |
| — |
| -0.4 |
| -2.0 |
| -2.9 |
| -2.7 |
| -2.2 |
|
Policy changes |
| — |
| -0.3 |
| -1.1 |
| -1.0 |
| -0.9 |
| -1.0 |
|
December Forecasts |
| 56.7 |
| 55.4 |
| 54.4 |
| 55.3 |
| 58.3 |
| 61.9 |
|
Forecast changes |
| — |
| -1.0 |
| -2.7 |
| -4.2 |
| -4.4 |
| -4.2 |
|
Policy changes |
| — |
| -0.3 |
| -0.1 |
| 0.7 |
| 0.7 |
| 0.7 |
|
Budget 2009 Forecasts |
| 56.7 |
| 54.1 |
| 51.6 |
| 51.8 |
| 54.6 |
| 58.4 |
|
Composition of Budget 2009 Forecasts: |
|
|
|
|
|
|
|
|
|
|
|
|
|
Source deductions |
| 23.4 |
| 23.0 |
| 21.7 |
| 21.7 |
| 22.6 |
| 23.9 |
|
Corporate tax |
| 10.4 |
| 8.4 |
| 8.5 |
| 9.3 |
| 10.3 |
| 11.4 |
|
GST |
| 11.1 |
| 11.6 |
| 11.2 |
| 11.3 |
| 11.7 |
| 12.3 |
|
Other taxes |
| 11.8 |
| 11.1 |
| 10.2 |
| 9.5 |
| 10.0 |
| 10.8 |
|
Note: Forecast changes calculated from unrounded values
Source: The Treasury
Inland Revenue tax forecasts
In line with established practice, Inland Revenue has also prepared a set of tax forecasts, which, like the Treasury’s tax forecasts, is based on the Treasury’s macroeconomic forecasts.
Table 1.6 – The Treasury and Inland Revenue core Crown tax revenue forecasts
Year ending 30 |
| 2009 |
| 2010 |
| 2011 |
| 2012 |
| 2013 |
|
$ billion |
| Forecast |
| Forecast |
| Forecast |
| Forecast |
| Forecast |
|
Source deductions |
|
|
|
|
|
|
|
|
|
|
|
Treasury |
| 23.0 |
| 21.7 |
| 21.7 |
| 22.6 |
| 23.9 |
|
Inland Revenue |
| 23.0 |
| 21.7 |
| 21.7 |
| 22.7 |
| 24.1 |
|
Difference |
| — |
| — |
| — |
| (0.1 | ) | (0.2 | ) |
Net other persons tax |
|
|
|
|
|
|
|
|
|
|
|
Treasury |
| 2.9 |
| 2.7 |
| 2.6 |
| 2.8 |
| 3.0 |
|
Inland Revenue |
| 2.8 |
| 2.7 |
| 2.6 |
| 2.8 |
| 2.9 |
|
Difference |
| 0.1 |
| — |
| — |
| — |
| 0.1 |
|
Corporate taxes |
|
|
|
|
|
|
|
|
|
|
|
Treasury |
| 8.4 |
| 8.5 |
| 9.3 |
| 10.3 |
| 11.4 |
|
Inland Revenue |
| 8.7 |
| 8.7 |
| 9.2 |
| 10.1 |
| 11.1 |
|
Difference |
| (0.3 | ) | (0.2 | ) | 0.1 |
| 0.2 |
| 0.3 |
|
Goods and services tax |
|
|
|
|
|
|
|
|
|
|
|
Treasury |
| 11.6 |
| 11.2 |
| 11.3 |
| 11.7 |
| 12.3 |
|
Inland Revenue |
| 11.3 |
| 11.2 |
| 11.5 |
| 11.8 |
| 12.3 |
|
Difference |
| 0.3 |
| — |
| (0.2 | ) | (0.1 | ) | — |
|
Other taxes |
|
|
|
|
|
|
|
|
|
|
|
Treasury |
| 8.2 |
| 7.5 |
| 6.9 |
| 7.2 |
| 7.8 |
|
Inland Revenue |
| 8.2 |
| 7.5 |
| 7.0 |
| 7.0 |
| 7.6 |
|
Difference |
| — |
| — |
| (0.1 | ) | 0.2 |
| 0.2 |
|
Total tax |
|
|
|
|
|
|
|
|
|
|
|
Treasury |
| 54.1 |
| 51.6 |
| 51.8 |
| 54.6 |
| 58.4 |
|
Inland Revenue |
| 54.0 |
| 51.8 |
| 52.0 |
| 54.4 |
| 58.0 |
|
Difference |
| 0.1 |
| (0.2 | ) | (0.2 | ) | 0.2 |
| 0.4 |
|
Total tax (% of GDP) |
|
|
|
|
|
|
|
|
|
|
|
Treasury |
| 30.3 |
| 29.5 |
| 28.4 |
| 28.5 |
| 28.8 |
|
Inland Revenue |
| 30.3 |
| 29.6 |
| 28.5 |
| 28.4 |
| 28.6 |
|
Difference |
| — |
| (0.1 | ) | (0.1 | ) | 0.1 |
| 0.2 |
|
Sources: The Treasury, Inland Revenue
As can be seen from the table above, the Treasury’s and Inland Revenue’s tax forecasts are similar. The largest difference occurs in the year to June 2013, when the Treasury has forecast a slightly stronger recovery in corporate taxes than has Inland Revenue.
Effect of policy changes on tax forecasts since the December Forecasts
Table 1.7 – Tax forecasting effects of tax policy changes
|
| 2009 |
| 2010 |
| 2011 |
| 2012 |
| 2013 |
|
$ million |
| Forecast |
| Forecast |
| Forecast |
| Forecast |
| Forecast |
|
2009 Budget personal tax changes |
| — |
| 98 |
| 494 |
| 810 |
| 836 |
|
February 2009 SME package |
| (294 | ) | (189 | ) | 214 |
| (108 | ) | (108 | ) |
Total |
| (294 | ) | (91 | ) | 708 |
| 702 |
| 728 |
|
2009 Budget personal tax changes
The personal income tax rate and threshold changes scheduled to occur on 1 April 2010 and 1 April 2011, and the increase in the Independent Earner Tax Credit scheduled to occur on 1 April 2010, have been postponed. Table 1.7 shows only the tax effects of policy changes, incidental changes to NZS and benefit appropriations are not included in the table.
February 2009 SME package
In February, the Government announced measures to help small and medium-sized enterprises through the current economic downturn. Those measures that affected the tax forecasts included the reduction in the provisional tax uplift factor, the reduction of use-of-money interest rates and the increase in the GST registration threshold.
While the number of beneficiaries is forecast to increase compared to the December Forecasts, the resulting increase in benefit costs is mitigated by a decrease in the CPI forecast (meaning that CPI-linked benefits will grow at a slower rate than previously forecast).
Across the forecast period, benefit expenses are forecast to be a cumulative $2.5 billion higher than the December Forecasts.
The operating balance before gains and losses is expected to remain in deficit throughout the forecast period, peaking at $9.6 billion in the year to June 2012. As a percentage of GDP the operating deficit peaks in the 2011 June year at 5.1%. By the end of the forecast period, tax is forecast to rise, and this, combined with the cumulative effect of smaller levels of incremental spending, sees the deficit reducing to $8.4 billion (4.2% of GDP) in the final year of the forecast.
The operating balance including gains and losses is also in deficit across the forecast period with the deficit peaking at $9.3 billion in 2009. This deficit is forecast to be smaller than the operating balance before gains and losses as Crown financial institutions such as the NZS Fund are forecasting, on average, to make gains over the forecast period.
The medium-term projections in the FSR show that the operating balance is expected to return to surplus in 2016 (and the operating balance before gains and losses in 2019).
Table 1.8 — Comparisons of the total Crown operating balance before gains and losses
Year ending 30 June |
| 2009 |
| 2010 |
| 2011 |
| 2012 |
| 2013 |
|
$ billion |
| Forecast |
| Forecast |
| Forecast |
| Forecast |
| Forecast |
|
Budget 2008 Forecasts |
| 1.3 |
| 1.0 |
| 0.5 |
| 0.2 |
|
|
|
Total OBEGAL change from Budget 2008 Forecasts |
| (1.4 | ) | (2.7 | ) | (3.0 | ) | (3.3 | ) |
|
|
Pre-election Forecasts |
| (0.1 | ) | (1.7 | ) | (2.5 | ) | (3.1 | ) | (3.4 | ) |
Total OBEGAL change from Pre-election Forecasts |
| (0.5 | ) | (2.4 | ) | (3.5 | ) | (3.2 | ) | (2.9 | ) |
December Forecasts |
| (0.6 | ) | (4.1 | ) | (6.0 | ) | (6.3 | ) | (6.3 | ) |
Economic-driven changes |
|
|
|
|
|
|
|
|
|
|
|
Tax revenue |
| (1.0 | ) | (2.6 | ) | (4.1 | ) | (4.4 | ) | (4.1 | ) |
Benefit expenses |
| (0.1 | ) | (0.6 | ) | (0.7 | ) | (0.6 | ) | (0.5 | ) |
Total economic-driven changes |
| (1.1 | ) | (3.2 | ) | (4.8 | ) | (5.0 | ) | (4.6 | ) |
Policy changes |
|
|
|
|
|
|
|
|
|
|
|
Tax revenue |
| (0.3 | ) | (0.1 | ) | 0.7 |
| 0.7 |
| 0.7 |
|
Reduction in operating allowances |
| — |
| — |
| 1.3 |
| 1.7 |
| 2.4 |
|
Total policy changes |
| (0.3 | ) | (0.1 | ) | 2.0 |
| 2.4 |
| 3.1 |
|
Other forecast changes |
|
|
|
|
|
|
|
|
|
|
|
Net finance costs |
| (0.5 | ) | (0.2 | ) | (0.3 | ) | (0.4 | ) | (0.3 | ) |
Expense transfers |
| 0.6 |
| (0.6 | ) | — |
| — |
| — |
|
Emissions Trading Scheme |
| 0.2 |
| 0.4 |
| (0.2 | ) | (0.1 | ) | (0.8 | ) |
Top down adjustment |
| (1.0 | ) | (0.1 | ) | (0.1 | ) | (0.1 | ) | — |
|
Goodwill impairment |
| (0.3 | ) | — |
| — |
| — |
| — |
|
Other changes |
| 0.1 |
| 0.2 |
| 0.1 |
| (0.1 | ) | 0.5 |
|
Total OBEGAL change from December Forecasts |
| (2.3 | ) | (3.6 | ) | (3.3 | ) | (3.3 | ) | (2.1 | ) |
Budget 2009 Forecasts |
| (2.9 | ) | (7.7 | ) | (9.3 | ) | (9.6 | ) | (8.4 | ) |
Source: The Treasury
In addition to policy decisions detailed earlier, the forecasts have also been affected by the following factors (refer Table 1.8):
· Net finance costs have increased since the December Forecasts with the increase in net debt partially offset by a reduction in interest rates.
· Expense transfers (core Crown expenses which have been approved in the current financial year but, for reasons other than underspending, are deferred) of $0.6 billion have been transferred to later forecast years.
· Expenses in relation to the Emissions Trading Scheme (representing the cost of free allocation of New Zealand units) have reduced in the short term but increased overall when compared to the December Forecasts. Expenditure increases near the end of the forecast period as uptake of the scheme is forecast to rise.
· Expenditure forecasts have traditionally been reduced by way of a “top-down adjustment” to compensate for department expenditure forecasts that are traditionally too high. The 2009 top down adjustment has been reduced significantly since the December Forecasts as expense transfers and savings have reduced the risk of expenditure forecasts being too high.
· Each year the Crown assesses whether there is any indication that its assets have been impaired. As part of this assessment, valuations are currently underway with regards to goodwill on acquisitions held on the Crown’s balance sheet ($0.5 billion at 31 March 2009) and these will be completed by 30 June 2009. Given the expected life of the goodwill asset and the deteriorating economic conditions, an impairment of $0.3 billion has been forecast.
Table 1.9 — Residual cash comparisons
Year ending 30 June |
| 2009 |
| 2010 |
| 2011 |
| 2012 |
| 2013 |
|
$ billion |
| Forecast |
| Forecast |
| Forecast |
| Forecast |
| Forecast |
|
Budget 2008 Forecasts |
| (3.5 | ) | (3.3 | ) | (3.4 | ) | (3.5 | ) |
|
|
Total residual cash change from Budget 2008 Forecasts |
| (2.4 | ) | (2.0 | ) | (3.2 | ) | (3.3 | ) |
|
|
Pre-election Forecasts |
| (5.9 | ) | (5.3 | ) | (6.6 | ) | (6.8 | ) | (7.3 | ) |
Total residual cash change from Pre-election Forecasts |
| (0.7 | ) | (2.8 | ) | (4.3 | ) | (4.1 | ) | (4.1 | ) |
December Forecasts |
| (6.6 | ) | (8.1 | ) | (10.9 | ) | (10.9 | ) | (11.4 | ) |
Economic-driven changes |
|
|
|
|
|
|
|
|
|
|
|
Tax receipts |
| (0.7 | ) | (3.4 | ) | (4.5 | ) | (5.1 | ) | (4.6 | ) |
Benefit expenses |
| (0.2 | ) | (0.7 | ) | (0.8 | ) | (0.7 | ) | (0.5 | ) |
Total economic-driven changes |
| (0.9 | ) | (4.1 | ) | (5.3 | ) | (5.8 | ) | (5.1 | ) |
Policy changes |
|
|
|
|
|
|
|
|
|
|
|
Tax receipts |
| (0.4 | ) | (0.1 | ) | 0.7 |
| 0.7 |
| 0.7 |
|
Reduction in operating allowances |
| — |
| — |
| 1.3 |
| 1.7 |
| 2.4 |
|
Rephasing of capital allowance |
| — |
| (0.3 | ) | 0.2 |
| 0.3 |
| — |
|
NZS Fund contribution holiday |
| — |
| 2.0 |
| 2.3 |
| 2.2 |
| 2.4 |
|
Total policy changes |
| (0.4 | ) | 1.6 |
| 4.5 |
| 4.9 |
| 5.5 |
|
Other forecast changes |
|
|
|
|
|
|
|
|
|
|
|
Net finance costs |
| (0.4 | ) | (0.4 | ) | (0.4 | ) | (0.5 | ) | (0.4 | ) |
Expense transfers |
| 0.6 |
| (0.6 | ) | — |
| — |
| — |
|
Capital transfers |
| 0.1 |
| (0.1 | ) | — |
| — |
| — |
|
Top down adjustment |
| (1.2 | ) | — |
| — |
| — |
| — |
|
Other changes |
| 0.3 |
| (0.2 | ) | (0.4 | ) | — |
| 0.5 |
|
Total residual cash change from December Forecasts(1) |
| (1.9 | ) | (3.8 | ) | (1.6 | ) | (1.4 | ) | 0.5 |
|
Budget 2009 Forecasts |
| (8.5 | ) | (11.9 | ) | (12.5 | ) | (12.3 | ) | (10.9 | ) |
Note: 1 Cumulative effect of residual cash change |
| (1.9 | ) | (5.7 | ) | (7.3 | ) | (8.7 | ) | (8.2 | ) |
Source: The Treasury
As with operating deficits, residual cash is expected to remain in deficit throughout the forecast period. As well as the cash impact of changes to the operating balance mentioned above, the cash deficits are reduced by the temporary suspension of the NZS Fund contributions (reducing the deficit by $8.9 billion across the forecast period when compared with the December Forecasts).
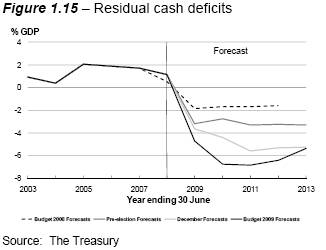
Residual cash deficits rise to $12.5 billion (6.9% of GDP) in the June 2011 year before reducing to $10.9 billion (5.4% of GDP) by the June 2013 year.
Another reason cash deficits are expected to be higher than the operating deficits is that they also include spending on capital items such as the purchase of property, plant and equipment. The forecasts include an allowance of $1.45 billion for new capital initiatives in future Budgets.
Table 1.10 demonstrates how the operating deficits flow through to the residual cash deficits.
Table 1.10 — Reconciliation of residual core Crown cash
Year ending 30 June |
| 2008 |
| 2009 |
| 2010 |
| 2011 |
| 2012 |
| 2013 |
|
$ billion |
| Actual |
| Forecast |
| Forecast |
| Forecast |
| Forecast |
| Forecast |
|
Core Crown revenue |
| 61.8 |
| 58.9 |
| 56.8 |
| 57.5 |
| 60.5 |
| 65.0 |
|
Core Crown expenses |
| (57.0 | ) | (62.4 | ) | (65.3 | ) | (67.5 | ) | (70.4 | ) | (73.4 | ) |
Core Crown gains/(losses) and other items |
| (0.9 | ) | (3.2 | ) | 1.4 |
| 1.6 |
| 1.6 |
| 1.7 |
|
Net surpluses/(deficits) of SOEs and CEs |
| (1.5 | ) | (2.6 | ) | 1.4 |
| 1.3 |
| 1.2 |
| 0.9 |
|
Operating balance |
| 2.4 |
| (9.3 | ) | (5.7 | ) | (7.1 | ) | (7.1 | ) | (5.8 | ) |
Net total Crown (gains)/losses and other items |
| 3.2 |
| 6.4 |
| (2.0 | ) | (2.2 | ) | (2.5 | ) | (2.6 | ) |
Operating balance before gains and losses (OBEGAL) |
| 5.6 |
| (2.9 | ) | (7.7 | ) | (9.3 | ) | (9.6 | ) | (8.4 | ) |
NZS Fund net revenue after tax |
| — |
| (0.4 | ) | (0.3 | ) | (0.3 | ) | (0.2 | ) | 0.1 |
|
OBEGAL (excluding NZS Fund retained revenue) |
| 5.6 |
| (3.3 | ) | (8.0 | ) | (9.6 | ) | (9.8 | ) | (8.3 | ) |
Net retained surpluses of SOEs and CEs |
| (0.8 | ) | (0.6 | ) | (0.8 | ) | (0.7 | ) | (0.3 | ) | 0.0 |
|
Non-cash items and working capital movements |
| 2.5 |
| 2.8 |
| 2.1 |
| 2.2 |
| 2.0 |
| 1.8 |
|
Net core Crown cash flow from operations |
| 7.3 |
| (1.1 | ) | (6.7 | ) | (8.1 | ) | (8.1 | ) | (6.5 | ) |
Contribution to NZS Fund |
| (2.1 | ) | (2.2 | ) | (0.3 | ) | — |
| — |
| — |
|
Net core Crown cash flow from operations after contributions to NZS Fund |
| 5.2 |
| (3.3 | ) | (7.0 | ) | (8.1 | ) | (8.1 | ) | (6.5 | ) |
Purchase of physical assets |
| (1.4 | ) | (1.5 | ) | (2.3 | ) | (1.7 | ) | (1.4 | ) | (1.3 | ) |
Advances and capital injections |
| (1.7 | ) | (3.6 | ) | (2.5 | ) | (2.0 | ) | (1.7 | ) | (1.6 | ) |
Forecast for future new capital spending |
| — |
| — |
| (0.1 | ) | (0.7 | ) | (1.1 | ) | (1.5 | ) |
Core Crown residual cash |
| 2.1 |
| (8.4 | ) | (11.9 | ) | (12.5 | ) | (12.3 | ) | (10.9 | ) |
Source: The Treasury
Cash deficits represent the amount the Government has to fund (either by raising debt or reducing investments).
The basis for measuring both gross debt and net debt has been amended since the December Forecasts. Gross debt now excludes Reserve Bank bills used for liquidity management while the net debt measure excludes advances; for example, student loans. A full description of the change and the rationale for the change are outlined in the FSR.

As a result of the forecast cash deficits, net debt is expected to rise to $62.6 billion (30.9% of GDP) by the end of the forecast period (compared to $57.9 billion, or 26.7% of GDP, in the December Forecasts).
Gross debt is expected to increase to $78.5 billion (38.7% of GDP) by the end of the forecast period (compared to $71.6 billion, or 33.1% of GDP, in the December Forecasts).
Table 1.11 — Net debt comparisons
Year ending 30 June |
| 2009 |
| 2010 |
| 2011 |
| 2012 |
| 2013 |
|
$ billion |
| Forecast |
| Forecast |
| Forecast |
| Forecast |
| Forecast |
|
Budget 2008 Forecasts |
| 15.1 |
| 18.3 |
| 21.7 |
| 25.1 |
|
|
|
Total net debt change from Budget 2008 Forecasts |
| 1.3 |
| 3.4 |
| 6.6 |
| 9.9 |
|
|
|
Pre-election Forecasts |
| 16.4 |
| 21.7 |
| 28.3 |
| 35.0 |
| 42.2 |
|
Total net debt change from Pre-election Forecasts |
| 0.4 |
| 3.2 |
| 7.5 |
| 11.7 |
| 15.7 |
|
December Forecasts |
| 16.8 |
| 24.9 |
| 35.8 |
| 46.7 |
| 57.9 |
|
Increase in residual cash deficits |
| 1.9 |
| 5.7 |
| 7.3 |
| 8.7 |
| 8.2 |
|
Movement in circulating currency |
| (0.3 | ) | (0.3 | ) | (0.3 | ) | (0.3 | ) | (0.3 | ) |
Valuation changes to financial instruments |
| (2.5 | ) | (2.6 | ) | (2.7 | ) | (2.8 | ) | (2.8 | ) |
Other |
| (0.4 | ) | (0.4 | ) | (0.3 | ) | (0.4 | ) | (0.4 | ) |
Total net debt change from December Forecasts |
| (1.3 | ) | 2.4 |
| 4.0 |
| 5.2 |
| 4.7 |
|
Budget 2009 Forecasts |
| 15.5 |
| 27.3 |
| 39.8 |
| 51.9 |
| 62.6 |
|
Source: The Treasury
Projections beyond 2013, as contained in the FSR, show that both gross debt and net debt are expected to peak in the June 2017 year and then decline.
The majority of the borrowing requirement will be met through the issuance of bonds in the New Zealand domestic market (refer Table 1.12). Issuances total $54.8 billion over the forecast period (taking the current year into account). After meeting debt maturities, net bond issuances total $36.9 billion (including net non-market issuances to the Earthquake Commission).
Table 1.12 — Net increase in domestic bonds
Year ending 30 June |
| 2009 |
| 2010 |
| 2011 |
| 2012 |
| 2013 |
|
|
|
$ billion |
| Forecast |
| Forecast |
| Forecast |
| Forecast |
| Forecast |
| Total |
|
Issue of domestic bonds (market) |
| 5.8 |
| 8.9 |
| 11.4 |
| 14.5 |
| 14.2 |
| 54.8 |
|
Repayment of domestic bonds (market) |
| (2.7 | ) | (4.2 | ) | — |
| (6.0 | ) | (6.0 | ) | (18.9 | ) |
Net increase in domestic bonds (market) |
| 3.1 |
| 4.7 |
| 11.4 |
| 8.5 |
| 8.2 |
| 35.9 |
|
Issue of domestic bonds (non-market) |
| 0.6 |
| 0.9 |
| 0.2 |
| 1.3 |
| 1.5 |
| 4.5 |
|
Repayment of domestic bonds (non-market) |
| (0.5 | ) | (0.7 | ) | — |
| (1.0 | ) | (1.3 | ) | (3.5 | ) |
Net increase in domestic bonds (non-market) |
| 0.1 |
| 0.2 |
| 0.2 |
| 0.3 |
| 0.2 |
| 1.0 |
|
Net bond issuance |
| 3.2 |
| 4.9 |
| 11.6 |
| 8.8 |
| 8.4 |
| 36.9 |
|
Source: The Treasury
Further new funding is generated by an increase in forecast short-term borrowing, through an increase in Treasury Bills from $1.5 billion at 30 June 2008 to $9.5 billion by June 2013. Issuance in off-shore markets is also an option but any foreign currency borrowing would depend on the relative cost compared to New Zealand-dollar denominated issuance.
Global conditions mean that the level of uncertainty associated with any forecast made in the current environment is significantly larger than normal. This reflects the extent to which the world economy is in the most significant and synchronised downturn since World War II. In addition, policy responses to the downturn are increasingly occurring outside the realm of past experience and therefore the effectiveness and potential side-effects associated with such policy responses are yet to be fully understood.
Two alternative scenarios are presented below that consider how the economy and therefore fiscal outcomes could differ from the main forecast in the event that trading partner growth turns out to be different from that assumed in the main forecast. While the scenarios below do not represent the most likely track for the economy, the probability of such outcomes occurring should not be ignored and as such the scenarios provide an integral part of the overall information provided in the Budget Forecasts.
The upside scenario assumes higher levels of economic activity in New Zealand’s trading partners than is assumed in the main forecasts. New Zealand’s top 12 trading partners are assumed to experience a 1.8% decline in their real GDP over the 2009 calendar year followed by a 2.6% increase in 2010. This represents less of a decline and a greater recovery over 2010. As well as uncertainty associated with the outlook for the world economy over the next few years, there is also considerable uncertainty as to how the
New Zealand economy will be affected by any particular global outcome. Therefore the upside scenario could also broadly be interpreted as reflecting a view that the New Zealand economy will be less affected by a global downturn of similar magnitude to that incorporated in the main forecast.
A stronger global economy relative to the main forecast would result in increased demand for New Zealand’s exports, in particular non-commodity goods and services. This would also be reflected in higher prices for New Zealand’s exports with the outlook for the terms of trade likely to be more positive than in the main forecast, and the low point in the terms of trade assumed to be nearly 6% higher than in the main forecast.
Higher export incomes and improved sentiment abroad are assumed to translate into a reduction in risk aversion (both in New Zealand and abroad) with access to credit freeing up more rapidly than in the main forecast, and confidence increasing. As a result, consumption would contract less over the 2010 March year with annual average growth returning to around 1% in the 2011 to 2013 March years. This is significantly stronger than in the main forecasts which incorporated contractions in both the 2011 and 2012 years.
Table 1.13 — Key economic features of the upside scenario
(Annual average % change, |
| 2008 |
| 2009 |
| 2010 |
| 2011 |
| 2012 |
| 2013 |
|
Year ending 31 March) |
| Actual |
| Forecast |
| Forecast |
| Forecast |
| Forecast |
| Forecast |
|
Real GDP components: |
|
|
|
|
|
|
|
|
|
|
|
|
|
Private consumption |
| 3.2 |
| -0.3 |
| -0.4 |
| 0.9 |
| 0.9 |
| 1.0 |
|
Residential investment |
| 4.3 |
| -25.2 |
| -22.0 |
| 13.6 |
| 23.3 |
| 19.9 |
|
Market investment |
| 4.7 |
| -4.8 |
| -20.7 |
| 3.8 |
| 17.5 |
| 11.4 |
|
Gross national expenditure |
| 4.4 |
| -1.8 |
| -4.4 |
| 3.1 |
| 4.9 |
| 4.0 |
|
Exports of goods and services |
| 2.9 |
| -4.1 |
| -1.1 |
| 4.5 |
| 7.0 |
| 4.9 |
|
Imports of goods and services |
| 9.6 |
| -3.4 |
| -12.5 |
| 3.1 |
| 8.9 |
| 6.8 |
|
GDP (production measure) |
| 3.1 |
| -0.9 |
| -1.2 |
| 3.5 |
| 4.3 |
| 3.4 |
|
Unemployment rate(1) |
| 3.7 |
| 5.0 |
| 6.5 |
| 5.9 |
| 5.0 |
| 4.6 |
|
90-day bank bill rate(2) |
| 8.8 |
| 3.7 |
| 2.7 |
| 4.0 |
| 5.0 |
| 5.8 |
|
TWI(2) |
| 71.9 |
| 53.7 |
| 52.0 |
| 53.4 |
| 53.9 |
| 53.8 |
|
CPI(3) |
| 3.4 |
| 3.0 |
| 2.6 |
| 2.3 |
| 2.2 |
| 2.2 |
|
Current account balance (% GDP) |
| -8.0 |
| -8.6 |
| -5.9 |
| -5.0 |
| -5.1 |
| -6.3 |
|
Nominal GDP level (deviation from main forecast, $billion) |
| 0.0 |
| 0.2 |
| 4.3 |
| 7.5 |
| 11.4 |
| 11.4 |
|
Notes: |
| (1) |
| Percentage of labour force, March quarter, seasonally adjusted |
|
| (2) |
| Average for March quarter |
|
| (3) |
| Annual percentage change, March quarter |
Sources: Statistics New Zealand, Reserve Bank of New Zealand, the Treasury
While house prices would continue to decline in this scenario, the decline would not be as deep as in the main forecast, and prices would begin to recover earlier than in the main forecasts, as a result of improved confidence, in part stemming from higher employment. The upside scenario incorporates a smaller decline in house prices, with prices falling 14.7% from the peak in December 2007 whereas in the main forecasts, house prices fall 20.4%. With consumer confidence higher and weakness in the housing market easing more rapidly, growth in residential investment would be more rapid, particularly over the 2011 and 2012 March years.
The stronger outlook for the economy would flow through to a stronger real GDP profile than in the main economic forecasts with a smaller contraction of 1.2% in the March 2010 year, followed by growth of 3.5% and 4.3% in the 2011 and 2012 March years. This results in growth being 0.5% higher than the main forecasts in 2010 and 1.7% and 1.4% higher in 2011 and 2012 respectively. Relative to the main forecast, the level of real GDP in the March 2013 year is 2.9% higher. Higher levels of activity would see greater demand for labour relative to the main forecast, with the unemployment rate peaking at 6.6% in mid-2010.
Stronger demand in the New Zealand economy would flow through to greater demand for imports. Nevertheless, on balance the stronger growth in exports and the higher terms of trade would see the current account deficit narrow more rapidly owing to a faster narrowing of the goods and services balance over the next year. This would be partly offset by a larger investment income deficit as overseas-owned firms operating in New Zealand would be more profitable and a stronger global economy would also see interest rates on overseas debt higher than in the main forecast. Overall, the annual current account deficit in the upside scenario is forecast to narrow to 5.9% of GDP in March 2010 compared to 6.9% in the main forecast, before continuing to narrow to under 5% throughout the 2011 calendar year.
The higher terms of trade and reduced risk aversion result in a higher exchange rate relative to the main forecast with the TWI 3% to 5% higher over most of the forecast period. Greater demand for imports contributes to the current account deficit widening a little by the end of the forecast period to just over 6% of GDP as does the larger investment income deficit, although it should be noted that the level of net overseas liabilities as a percentage of GDP would still be lower than under the main forecast.
A combination of stronger real activity, a higher terms of trade and increased inflation contributes to nominal GDP being significantly higher than in the main forecasts, with nominal GDP in the final March year of the forecasts $11.4 billion higher, taking the cumulative difference over the 2009 to 2013 fiscal (June) years to $37 billion.
Higher incomes relative to the main forecast translate into higher personal and corporate income tax revenue, while the boost in domestic demand boosts GST revenue. In addition, higher interest rates cause a significant increase in tax on interest income. Altogether, core Crown tax revenue would be about $4 billion higher than in the main forecast by the end of the forecast period with a cumulative difference of around $13 billion across the 2009 to 2013 June years.
Government expenses are only slightly lower than in the main forecasts. While there are fewer people on the unemployment benefit, higher inflation adjustments for benefits and the impact of higher inflation and wage growth on superannuation payments see overall welfare payments rise. This is offset by lower debt-servicing costs as a result of lower debt levels.
The OBEGAL measure of the operating deficit under the upside scenario in the June 2010 year is estimated at $6.3 billion, declining to $3.7 billion by 2013. Smaller deficits relative to the main forecast mean that borrowings would be lower under the upside scenario. This would mean that both gross and net debt would be smaller under the upside scenario, with an estimated gross debt level of $64.7 billion or 30.3% of GDP by June 2013, with net debt totalling $48.9 billion or 22.9% of GDP.
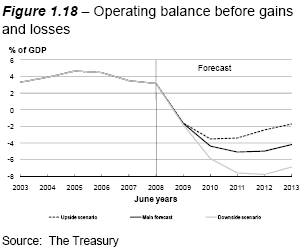
Should the current financial crisis deteriorate further then the outlook for growth in our trading partners could be slower than that contained in the main forecasts. Further reductions in trade could result and economies dependent on trade flows, including many
Asian economies, may show much more limited responses to recent monetary and fiscal policy easing.
In the downside scenario, our top 12 trading partners are assumed to contract 3.5% in the 2009 calendar year and 0.5% in 2010 before growing 2.5% in 2011. This contributes to a larger decline in the terms of trade relative to the main forecasts, with the trough in the terms of trade just over 6% lower than in the main forecasts.
Lower demand from abroad would adversely affect New Zealand’s exports. As a result, export volumes are forecast to decline in each of the 2009, 2010 and 2011 March years, with areas such as tourism particularly affected.
New Zealand households would face further losses in wealth and incomes and consequently reduce their spending. With lower demand, employment levels would be lower and the unemployment rate would peak just below 10%. Higher unemployment would lead to more mortgagee sales and lower demand for houses with house prices falling further than in the main forecast. This would compound weakness in the housing market and, with a deepening in the financial crisis, credit levels would be constrained further, contributing to greater falls in residential investment.
Table 1.14 — Key economic features of the downside scenario
(Annual average % change, |
| 2008 |
| 2009 |
| 2010 |
| 2011 |
| 2012 |
| 2013 |
|
Year ending 31 March) |
| Actual |
| Forecast |
| Forecast |
| Forecast |
| Forecast |
| Forecast |
|
Real GDP components: |
|
|
|
|
|
|
|
|
|
|
|
|
|
Private consumption |
| 3.2 |
| -0.4 |
| -1.9 |
| -1.8 |
| -1.1 |
| 1.3 |
|
Residential investment |
| 4.3 |
| -25.3 |
| -30.5 |
| -4.7 |
| 12.2 |
| 21.5 |
|
Market investment |
| 4.7 |
| -5.2 |
| -26.0 |
| 1.1 |
| 19.1 |
| 13.9 |
|
Gross national expenditure |
| 4.4 |
| -1.9 |
| -6.6 |
| 0.3 |
| 2.8 |
| 3.9 |
|
Exports of goods and services |
| 2.9 |
| -4.1 |
| -2.7 |
| -1.3 |
| 2.2 |
| 8.5 |
|
Imports of goods and services |
| 9.6 |
| -3.4 |
| -15.5 |
| -2.8 |
| 4.5 |
| 7.1 |
|
GDP (production measure) |
| 3.1 |
| -1.0 |
| -2.8 |
| 0.8 |
| 2.1 |
| 4.3 |
|
Unemployment rate(1) |
| 3.7 |
| 5.0 |
| 8.6 |
| 9.5 |
| 8.3 |
| 6.7 |
|
90-day bank bill rate(2) |
| 8.8 |
| 3.7 |
| 1.5 |
| 1.5 |
| 2.0 |
| 3.4 |
|
TWI(2) |
| 71.9 |
| 53.7 |
| 47.0 |
| 45.8 |
| 47.6 |
| 49.7 |
|
CPI(3) |
| 3.4 |
| 3.0 |
| 1.7 |
| 1.7 |
| 0.6 |
| 0.8 |
|
Current account balance (% GDP) |
| -8.0 |
| -8.6 |
| -7.9 |
| -7.1 |
| -6.5 |
| -4.3 |
|
Nominal GDP level (deviation from main forecast, $billion) |
| 0.0 |
| -0.7 |
| -6.8 |
| -10.5 |
| -11.4 |
| -10.7 |
|
Notes: |
| (1) |
| Percentage of labour force, March quarter, seasonally adjusted |
|
| (2) |
| Average for March quarter |
|
| (3) |
| Annual percentage change, March quarter |
|
|
|
|
|
Sources: |
| Statistics New Zealand, Reserve Bank of New Zealand, the Treasury | ||
Under the downside scenario, real GDP would decline further in the 2010 March year, with the economy contracting by 2.8%. The recovery would also be slower, with the economy not recording positive quarterly growth until 2010 and annual average growth in the year to March 2011 a modest 0.8%. Relative to the main forecast, the level of real GDP in the March 2013 year is 2.7% lower.
An assumed increase in risk aversion, lower interest rates and the lower terms of trade would all contribute to a lower New Zealand dollar which might fall as low as 45.7 on a TWI basis and remain below 50 over the entire forecast period. Lower demand would see low rates of inflation across the forecast period, although the fall in the exchange rate would increase the price of imported goods and therefore limit the extent to which inflation could initially fall.
An eventual recovery in trading partner growth coupled with low interest rates and the low exchange rate would eventually result in increased investment, export and consumption growth at the end of the forecast period. However, the level of nominal GDP is predicted to be significantly lower than the main forecast across the entire forecast period, with the difference being greatest in the 2012 March year when nominal GDP is $11.4 billion lower. Over the 2009 to 2013 fiscal years, nominal GDP would be a cumulative $43 billion lower.
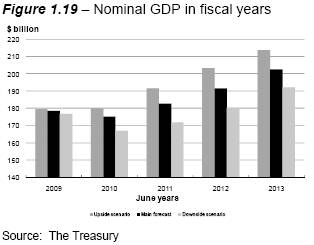
The effect on tax revenue would be similar in magnitude, but in the opposite direction, to that of the upside scenario. Tax revenue is estimated to be about $4 billion lower than the main forecast in the 2013 June year and is forecast to be around $14 billion lower across the forecast period. Lower incomes and domestic demand would produce less income tax and GST revenue, and a lower interest rate profile would result in less tax on interest income.
As in the upside scenario, different levels of tax revenue relative to the main forecasts play a greater role in the differing fiscal outlook than do expenses. In the downside scenario a greater number of people would receive benefits but the adjustments to benefit rates because of inflation would be lower.
Predominantly owing to the impact of lower tax revenue, the operating deficit would be $2 billion larger than in the main forecast in the June 2010 year, with the difference increasing to $4.8 billion in 2013 when the OBEGAL would be just above $13 billion.
The need to finance larger deficits would result in higher debt levels relative to the main forecasts, with gross debt rising to $93.7 billion by June 2013 or 48.8% of nominal GDP. Net debt would rise to $77.9 billion by June 2013 or 40.5% of GDP. This would mean that both gross and net debt would be approximately 10 percentage points of GDP higher at the end of the forecast period than in the main forecast.
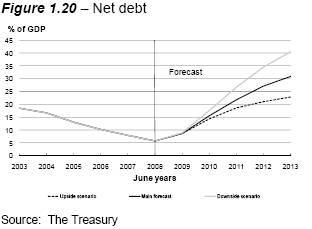
Should economic events unfold similarly to the downside scenario, then the Government would respond with further steps to prevent debt reaching these levels. As noted in the FSR, the Government has a stated objective of ensuring that net debt remains consistently below 40% of GDP, and is brought back to around 30% no later than the early 2020s.
Table 1.15 — Fiscal implications of the scenarios
Year ending 30 June |
| 2008 |
| 2009 |
| 2010 |
| 2011 |
| 2012 |
| 2013 |
|
$ billion |
| Actual |
| Forecast |
| Forecast |
| Forecast |
| Forecast |
| Forecast |
|
Core Crown tax revenue |
|
|
|
|
|
|
|
|
|
|
|
|
|
Upside scenario |
| 56.7 |
| 54.1 |
| 52.9 |
| 54.4 |
| 59.1 |
| 62.7 |
|
Main forecast |
| 56.7 |
| 54.1 |
| 51.6 |
| 51.8 |
| 54.6 |
| 58.4 |
|
Downside scenario |
| 56.7 |
| 53.9 |
| 49.6 |
| 48.3 |
| 50.6 |
| 54.2 |
|
Core Crown expenses |
|
|
|
|
|
|
|
|
|
|
|
|
|
Upside scenario |
| 57.0 |
| 62.4 |
| 65.2 |
| 67.3 |
| 70.0 |
| 73.0 |
|
Main forecast |
| 57.0 |
| 62.4 |
| 65.3 |
| 67.4 |
| 70.4 |
| 73.4 |
|
Downside scenario |
| 57.0 |
| 62.4 |
| 65.3 |
| 67.7 |
| 70.8 |
| 74.1 |
|
OBEGAL |
|
|
|
|
|
|
|
|
|
|
|
|
|
Upside scenario |
| 5.6 |
| -2.9 |
| -6.3 |
| -6.5 |
| -4.8 |
| -3.7 |
|
Main forecast |
| 5.6 |
| -2.9 |
| -7.7 |
| -9.3 |
| -9.6 |
| -8.4 |
|
Downside scenario |
| 5.6 |
| -3.1 |
| -9.8 |
| -13.0 |
| -14.0 |
| -13.3 |
|
Gross debt |
|
|
|
|
|
|
|
|
|
|
|
|
|
Upside scenario |
| 31.4 |
| 44.2 |
| 49.5 |
| 58.2 |
| 61.6 |
| 64.7 |
|
Main forecast |
| 31.4 |
| 44.2 |
| 51.0 |
| 62.4 |
| 70.7 |
| 78.5 |
|
Downside scenario |
| 31.4 |
| 44.4 |
| 53.2 |
| 68.4 |
| 81.0 |
| 93.7 |
|
Core Crown net debt |
|
|
|
|
|
|
|
|
|
|
|
|
|
Upside scenario |
| 10.3 |
| 15.4 |
| 25.8 |
| 35.5 |
| 42.9 |
| 48.9 |
|
Main forecast |
| 10.3 |
| 15.5 |
| 27.3 |
| 39.8 |
| 51.9 |
| 62.6 |
|
Downside scenario |
| 10.3 |
| 15.7 |
| 29.5 |
| 45.7 |
| 62.3 |
| 77.9 |
|
Percentages of GDP |
|
|
|
|
|
|
|
|
|
|
|
|
|
OBEGAL |
|
|
|
|
|
|
|
|
|
|
|
|
|
Upside scenario |
| 3.1 |
| -1.6 |
| -3.5 |
| -3.4 |
| -2.4 |
| -1.7 |
|
Main forecast |
| 3.1 |
| -1.6 |
| -4.4 |
| -5.1 |
| -5.0 |
| -4.2 |
|
Downside scenario |
| 3.1 |
| -1.8 |
| -5.9 |
| -7.6 |
| -7.8 |
| -6.9 |
|
Gross debt |
|
|
|
|
|
|
|
|
|
|
|
|
|
Upside scenario |
| 17.5 |
| 24.6 |
| 27.5 |
| 30.4 |
| 30.3 |
| 30.3 |
|
Main forecast |
| 17.5 |
| 24.8 |
| 29.1 |
| 34.2 |
| 36.9 |
| 38.7 |
|
Downside scenario |
| 17.5 |
| 25.1 |
| 31.9 |
| 39.8 |
| 45.0 |
| 48.8 |
|
Core Crown net debt |
|
|
|
|
|
|
|
|
|
|
|
|
|
Upside scenario |
| 5.7 |
| 8.6 |
| 14.4 |
| 18.6 |
| 21.1 |
| 22.9 |
|
Main forecast |
| 5.7 |
| 8.7 |
| 15.6 |
| 21.8 |
| 27.1 |
| 30.9 |
|
Downside scenario |
| 5.7 |
| 8.9 |
| 17.7 |
| 26.6 |
| 34.6 |
| 40.5 |
|
Source: The Treasury
Other paths are also possible, particularly if the response to the unprecedented policy measures put in place as a result of the financial crisis were to have impacts that differ from those envisaged. Globally, such measures have included facilitating liquidity through central banks acting as lenders of last resort, the guarantee of bank debt, recapitalising banks, the purchase of distressed assets, quantitative easing and fiscal stimulus measures aimed at promoting demand. A number of the policies undertaken, at least on the current scale, are relatively untested and many governments find themselves in uncharted waters. As a result there is the risk that the longer-term impacts may not be as benign as hoped.
One possibility is that during the recovery process, New Zealand’s vulnerability associated with its large negative external position is further exposed. This could occur if, as growth re-emerges in the New Zealand economy, interest rates rise and at the same time people’s concerns about the need for adjustment in the New Zealand economy subside earlier than is perhaps justified. This could lead to the New Zealand dollar rising significantly on the back of this optimism, with the high exchange rate choking off the necessary rebalancing in growth towards exports while also stimulating imports. This may result in the current account deficit rising again. At some point this could trigger an adverse response from international investors leading to a rapid depreciation of the exchange rate. If such a set of events were to occur then the recovery process could be much more drawn-out and volatile.
Another possibility is that, given the extent of policy easing, any pick-up in growth could be associated with elevated rates of inflation. There would be cause for some concern if
inflationary pressures were to rise considerably. While high rates of inflation would deflate the value of debt accumulated during the current crisis, purchasing power would be reduced and efforts to get on top of any inflation problem would require a period of subdued activity sometime in the future, potentially during a period when some governments are counting on relatively high rates of growth to further offset recent weakness. Counting against the risk of rapidly rising inflation is the extent to which falls in demand mean that economies are operating below potential and hence there is a greater chance of there being sufficient room for growth to occur without igniting inflationary concerns.
The two situations above are not considered likely but nevertheless have a small probability attached to their occurrence. Should the economy show signs of heading in either of these directions, it would be important to detect this early.
After the forecasts were finalised, the threat of “swine-flu” emerged. Should this outbreak become widespread with high numbers of fatalities, the movement of people between countries could be seriously affected. This would have severe implications for sectors such as tourism but could also hinder non-essential trade flows.
The forecasts do not incorporate the impact of intense, prolonged and widespread drought conditions. Dry conditions in parts of the east coast of the North Island have intensified since the forecasts were finalised and should these conditions intensify further and spread to other major agricultural regions, then production levels would be adversely affected.
Table 1.16 provides some “rules of thumb” on the sensitivities of the fiscal position to changes in specific variables.
Table 1.16 — Fiscal sensitivity analysis
Year ending 30 June |
| 2009 |
| 2010 |
| 2011 |
| 2012 |
| 2013 |
|
($ million) |
| Forecast |
| Forecast |
| Forecast |
| Forecast |
| Forecast |
|
1% lower nominal GDP growth per annum on |
|
|
|
|
|
|
|
|
|
|
|
Tax revenue |
| (580 | ) | (1,105 | ) | (1,630 | ) | (2,250 | ) | (2,975 | ) |
Revenue impact of a 1% decrease in growth of |
|
|
|
|
|
|
|
|
|
|
|
Wages and salaries |
| (260 | ) | (500 | ) | (750 | ) | (1,030 | ) | (1,345 | ) |
Taxable business profits |
| (135 | ) | (265 | ) | (405 | ) | (565 | ) | (760 | ) |
One percentage point lower interest rates |
|
|
|
|
|
|
|
|
|
|
|
Interest income |
| (45 | ) | (150 | ) | (130 | ) | (65 | ) | 30 |
|
Expenses |
| (45 | ) | (255 | ) | (345 | ) | (435 | ) | (530 | ) |
Impact on the operating balance |
| 0 |
| 105 |
| 215 |
| 370 |
| 560 |
|
Source: The Treasury
Finalisation dates and assumptions for the forecasts
Economic and fiscal forecasts — finalisation dates
Economic data |
| 17 April |
Economic forecasts |
| 18 April |
Tax revenue forecasts |
| 23 April |
Fiscal forecasts |
| 5 May |
Text finalised |
| 20 May |
Economic Forecast Assumptions
Trading partner growth — Consensus forecasts for economic growth in New Zealand’s top 12 trading partners continued to be revised down in 2009. In anticipation of further revisions, we have reduced the March Consensus forecasts from -1.8% and 2.1% in calendar 2009 and 2010 (respectively) to -2.5% and 1%. Growth is then assumed to recover to 2.2% in 2011 and 3.8% in 2012. Given the considerable uncertainty around these numbers we consider scenarios based on different rates of world growth.
Global inflation and interest rates — Both inflation and interest-rate projections have been revised lower in these forecasts as inflation pressures have eased and the outlook for economic activity has declined further. Consumer prices are now expected to decline in the US and Japan in 2009 and inflation is expected to be low in the other major economies. Significant falls in commodity prices have contributed to the fall in consumer inflation. As a result, the outlook for interest rates has also been revised down and short-term rates are now expected to remain low for an extended period of time.
Oil prices — The average price of West Texas Intermediate (WTI) oil on a quarterly basis peaked at US$124/barrel in the June quarter of 2008 but had declined to US$43/barrel by the March 2009 quarter as demand fell with the slowing of the world economy. Based on the average futures prices for WTI oil in March 2009, it is assumed that the price of oil will gradually increase over time, reaching US$60/barrel by the end of 2010 and around US$68/barrel by the end of the forecast period. Over most of the forecast period the oil price assumption contained in the Budget Forecasts is approximately 20% below that assumed in the December Forecasts.
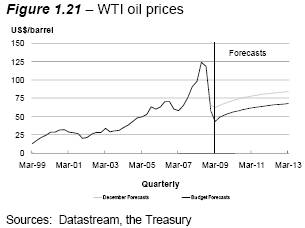
Terms of trade — The merchandise terms of trade (as measured in the System of National Accounts) are estimated to decline nearly 12% on an annual average basis over the March 2010 year. After reaching a low in the December 2009 quarter, the terms of trade are
expected to recover by around 10% over the remainder of the forecast period when they will be nearly 10% below their March 2008 peak.
Monetary conditions — After having fallen 25% between the March 2008 and 2009 quarters, the New Zealand dollar exchange rate is assumed to appreciate to an average of 55.5 on the TWI in the June 2009 quarter before depreciating a further 11% to 49.5 by the beginning of 2010. The TWI is expected to end the forecast period around 52. Ninety-day interest rates are assumed to fall to 2.5% in the June quarter of 2009 and remain around this level for the best part of two years before increasing over the final two years of the forecast.
External migration — The net inflow of permanent and long-term migrants is assumed to increase from under 6,200 in the year to February 2009 to 10,000 per annum by mid-2010.
Policy and tax — The economic forecasts incorporate the decision to postpone the changes to personal tax rates and thresholds which were due to occur from 1 April 2010 and 1 April 2011. As a result, personal tax rates and thresholds are assumed to remain at their current rates and levels throughout the forecast period which ends in June 2013. The Emissions Trading Scheme is assumed to impact on stationary energy and liquid fuels from 1 January 2010 and 1 January 2011 respectively, as assumed in the December Forecasts. This scheme is currently under review but no decisions have been taken.
Fiscal Forecast Assumptions
The fiscal forecasts are based on assumptions and judgements developed from the best information available on 5 May 2009, when the forecasts were finalised. Actual events are likely to differ from some of these assumptions and judgements. Furthermore, uncertainty around the forecast assumptions and judgements increases over the forecast period.
The fiscal forecasts are prepared on the basis of underlying economic forecasts. Such forecasts are critical for determining revenue and expense estimates. For example:
· a nominal GDP forecast is needed in order to forecast tax revenue
· a forecast of CPI inflation is needed because social assistance benefits are generally indexed to inflation
· an unemployment forecast is needed to underpin the projected number of unemployment benefit recipients, and
· forecasts of interest rates are needed to forecast finance costs, interest income and discount rates.
A summary of the key economic assumptions that are particularly relevant to the fiscal forecasts is provided in the table below (on a June-year-end basis to align with the Government’s balance date).
|
| 2008/09 |
| 2009/10 |
| 2010/11 |
| 2011/12 |
| 2012/13 |
| ||
June years |
| December |
| Budget |
| Budget |
| Budget |
| Budget |
| Budget |
|
Real GDP (P) (ann avg % chg) |
| 0.1 |
| -1.9 |
| -0.8 |
| 2.1 |
| 3.3 |
| 4.0 |
|
Nominal GDP (E) ($m) |
| 181,139 |
| 178,523 |
| 175,051 |
| 182,717 |
| 191,528 |
| 202,524 |
|
CPI (annual avg % change) |
| 3.6 |
| 3.3 |
| 2.0 |
| 1.8 |
| 1.2 |
| 1.5 |
|
Govt 10-year bonds (ann avg %) |
| 5.9 |
| 5.4 |
| 5.2 |
| 5.3 |
| 5.6 |
| 5.7 |
|
5-year bonds (ann avg %) |
| 5.7 |
| 4.9 |
| 4.4 |
| 4.7 |
| 5.2 |
| 5.6 |
|
90-day bill rate (ann avg %) |
| 6.3 |
| 5.3 |
| 2.5 |
| 2.5 |
| 3.6 |
| 5.2 |
|
Unemployment rate (HLFS) basis ann avg %) |
| 4.6 |
| 4.8 |
| 7.1 |
| 7.6 |
| 6.4 |
| 5.2 |
|
Full-time equivalent employment (ann avg % change) |
| 0.0 |
| 0.2 |
| -3.9 |
| -1.1 |
| 2.4 |
| 3.7 |
|
Current account (% of GDP) |
| -9.0 |
| -7.5 |
| -6.6 |
| -5.3 |
| -5.5 |
| -5.5 |
|
In addition there are also a number of other key assumptions that are critical in the preparation of the fiscal forecasts.
Government decisions |
| Incorporate government decisions up to 5 May 2009. | |||||||||||
|
|
| |||||||||||
Future operating allowances |
| Net $1.1 billion in 2010/11, growing by the rate of 2% per annum for subsequent Budgets. | |||||||||||
|
|
| |||||||||||
Future capital allowances |
| $1.45 billion in Budget 2010, 2011 and 2012 allocated as follows over the forecast period: | |||||||||||
|
|
| |||||||||||
|
| $ billion |
| 2009 |
| 2010 |
| 2011 |
| 2012 |
| 2013 |
|
|
| Budget 10 |
| — |
| 0.02 |
| 0.63 |
| 0.45 |
| 0.35 |
|
|
| Budget 11 |
| — |
| — |
| 0.02 |
| 0.63 |
| 0.45 |
|
|
| Budget 12 |
| — |
| — |
| — |
| 0.02 |
| 0.63 |
|
|
|
|
|
|
|
|
|
|
|
|
|
|
|
Investment rate of returns |
| Incorporate the actual results to 28 February 2009. Beyond the June 2009 year, gains on financial instruments are based on long-term benchmark rate of returns for each portfolio. | |||||||||||
|
|
| |||||||||||
Finance cost on new bond issuances |
| Based on 5-year rate from the central economic forecasts and adjusted for differing maturity. | |||||||||||
|
|
| |||||||||||
Top-down adjustment |
| Top-down adjustment to operating and capital as follows: | |||||||||||
|
|
| |||||||||||
|
| $ billion |
| 2009 |
| 2010 |
| 2011 |
| 2012 |
| 2013 |
|
|
| Operating |
| 0.50 | (1) | 0.30 |
| 0.23 |
| 0.15 |
| 0.15 |
|
|
| Capital |
| 0.28 |
| 0.10 |
| — |
| — |
| — |
|
|
|
| |||||||||||
|
| ||||||||||||
|
| (1) The cash equivalent is $0.4 billion. | |||||||||||
|
|
| |||||||||||
Borrowing requirements |
| The forecast cash deficits would be met by reducing financial assets and issuing debt. | |||||||||||
|
|
| |||||||||||
Property plant and equipment |
| For the purposes of the forecast financial statements, no revaluations of property, plant and equipment are projected beyond the current year. Valuations as recorded for the 2008 annual financial statements and any additional valuations that have occurred up to 28 February 2009 are included in these forecasts. A number of revaluation exercises are currently underway and are planned to be completed in time for the 2009 annual financial statements (published in early October). The results of these valuations are, therefore, not reported in these forecast financial statements. | |||||||||||
Student loans |
| The carrying value of student loans is based on a valuation model that has been adapted to reflect current student loans policy. As such, the carrying value over the forecast period is sensitive to changes in a number of underlying assumptions, including future income levels, repayment behaviour and macroeconomic factors such as inflation and discount rates used to determine the effective interest rate for new borrowers. Any change in these assumptions would affect the present fiscal forecast. |
|
|
|
Government Superannuation Fund and ACC liabilities |
| The Government Superannuation Fund and ACC liabilities included in these forecasts have been valued as at 28 February 2009 and 31 December 2008 respectively, with the ACC valuation being adjusted for the 31 March 2009 discount rate. Both liabilities are valued by projecting future cash payments, and discounting them to present value. These valuations rely on historical data to predict future trends and use of economic assumptions such as inflation and discount rates. Any change in actual payments or economic assumptions would affect the present fiscal forecast. For example, if the discount rate decreases, the value of the liabilities would increase.
The Government Superannuation Fund’s assets are offset against the gross liability and have been updated to reflect market values at 28 February 2009. The value of assets over the forecast period reflects long-run rate of return assumptions appropriate to the forecast portfolio mix. |
2
Fiscal Risks
This chapter describes the fiscal risks to the Government, including changes to the fiscal forecasts, specific fiscal risks, and contingent liabilities.
The Public Finance Act 1989 (PFA) requires an economic and fiscal update to incorporate, to the fullest extent possible consistent with the limits on disclosure requirements set out below, all government decisions and other circumstances that may have a material effect on the fiscal and economic outlook. If the fiscal implications of government decisions and other circumstances can be quantified for particular years with reasonable certainty, these fiscal implications must be included in the forecast financial statements. If the fiscal implications of government decisions and other circumstances cannot be quantified for particular years with reasonable certainty, those government decisions or other circumstances must be disclosed in the statement of specific fiscal risks.
The PFA requires the Minister of Finance and the Secretary to the Treasury to sign a statement of responsibility for each economic and fiscal update that:
· the Minister of Finance has communicated to the Secretary to the Treasury before the economic and fiscal update is finalised, all policy decisions with material economic or fiscal implications that the Government has made, and all other circumstances with material economic or fiscal implications of which the Minister is aware, and
· the Secretary to the Treasury has incorporated in the economic and fiscal update the fiscal and economic implications of those decisions and other circumstances, using the Treasury’s best professional judgement (on the basis of the economic and fiscal information available to the Treasury on the day before the economic and fiscal update was finalised).
The PFA also requires the statement of specific fiscal risks of the Government to disclose the rules used to determine what is and what is not a specific fiscal risk.
The PFA requires that the fiscal forecasts must be prepared in accordance with generally accepted accounting practice (GAAP).
FRS-42 Prospective Financial Statements provides guidance for preparing fiscal forecasts. The general principle of the standard is that forecasts should be prepared using the best information that is reasonable and supportable. To ensure the accuracy of the fiscal forecasts the forecast assumptions are:
· based on the best information that could be reasonably expected to be available at the time the forecasts are prepared (eg, latest economic conditions)
· consistent with the current plans of the Government (eg, include current policies and other policies the Government are considering), and
· have a reasonable and supportable basis (eg, events are probable and measurable).
There will always be an element of judgement surrounding the assumptions that are made in preparing the fiscal forecasts. To provide a more comprehensive picture of the fiscal position FRS-42 also requires disclosure of factors that may lead to a material difference between the forecasts and the actual results. This includes matters such as new policies the Government may be considering and sensitivity around key assumptions (eg, economic conditions).
The criteria used in previous economic and fiscal updates to determine if matters were disclosed as specific fiscal risks were based around a materiality level of $10 million in any one year and whether or not the matter was being actively considered by Ministers. The Treasury has reviewed the criteria and rules for the disclosure of matters in the fiscal forecasts or as specific fiscal risks. As a result, the “under active consideration” criterion has been replaced by an assessment of the likelihood of a matter being approved or occurring within the forecast period, and the degree of certainty with which the matter can be quantified.
Matters are considered against the criteria and rules set out below to determine if they are to be incorporated into the fiscal forecasts, disclosed as specific fiscal risks, or in some circumstances excluded from disclosure.
Matters are incorporated into the fiscal forecasts provided they meet all of the following criteria:
· The quantum is more than $10 million in any one year.
· The matter can be quantified for particular years with reasonable certainty.
· A decision has been taken; or a decision has not yet been taken, but it is reasonably probable(9) the matter will be approved, or it is reasonably probable the situation will occur.
Additionally, any other matters may be incorporated into the forecasts if the Secretary to the Treasury considers, using his or her best professional judgement, that the matters may have a material effect on the fiscal and economic outlook and are certain enough to include in the fiscal forecasts.
Matters are disclosed as specific fiscal risks if:
· the likely cost is more than $10 million in any one year, and either
· a decision has not yet been taken, but it is reasonably possible(10) (but not probable) that the matter will be approved or the situation will occur, or
· it is reasonably probable that the matter will be approved or the situation will occur, but the matter cannot be quantified for or assigned to particular years with reasonable certainty.
Additionally, any other matters may be disclosed as specific fiscal risks if the Secretary to the Treasury considers, using his or her best professional judgement, that the matters may have a material effect (more than $10 million in any one year) on the fiscal and economic outlook, but are not certain enough to include in the fiscal forecasts.
Matters are excluded from disclosure as specific fiscal risks if they fail to meet the materiality criteria (ie, are less than $10m in any one year), or if it is not reasonably possible they will be approved or occur within the forecasting period.
Additionally, the Minister of Finance may determine that an item included in the fiscal forecasts or a specific fiscal risk not be disclosed, if such disclosure would be likely to:
· prejudice the substantial economic interests of New Zealand
· prejudice the security or defence of New Zealand or international relations of the Government
· compromise the Crown in a material way in negotiation, litigation or commercial activity, or
· result in a material loss of value to the Crown.
Furthermore, the Minister of Finance has to determine that there is no reasonable or prudent way the Government can avoid this prejudice, compromise or material loss by making a decision on the fiscal risk before the finalisation of the forecasts, or by disclosing the forecast item or fiscal risk without reference to its fiscal implications.
(9) For these purposes “reasonably probable” is taken to mean that the matter is more likely than not to be approved within the forecast period (by considering, for example, whether there is a better than 50% chance of the matter occurring or being approved).
(10) For these purposes “reasonably possible” taken to mean that the matter might be approved within the forecast period (by considering, for example, whether there is a 20% to 50% chance of the matter occurring or being approved).
Allowances for additional operating and capital spending in future Budgets are incorporated into the fiscal forecasts. From Budget 2010 the operating allowance will be $1.1 billion per Budget (grown forward at 2% per annum) and the capital allowance will be $1.45 billion per Budget from 2010 to 2012, increasing to $1.65 billion in Budget 2013.
The risks outlined in this chapter, should they eventuate, would only have an effect on the operating balance and/or net debt to the extent that they could not be funded from within the allowances, by reprioritising existing expenditure, or through third party funding.
Policy options for many risks require further development, and the quantum of the risk is often uncertain. Consequently, the final cost or saving may differ from the amounts disclosed in this chapter.
The PFA requires that if the fiscal implications of government decisions and other circumstances can be quantified for particular years with reasonable certainty, these fiscal implications must be included in the forecast financial statements. This applies irrespective of whether or not a decision has been taken by the Government to provide additional funding for the matter.
Based on the criteria outlined on pages 98 and 99 above it is probable that additional funding for the matters listed below will be approved by the Government during the forecast period. Consequently, these matters have been incorporated into the fiscal forecasts as potential charges against the operating allowances for future Budgets.
ACC updated its scheme valuation as at 31 December 2008 and has advised of potential changes to the Non-Earner’s Account baselines in 2009/10 and outyears.
Budget to be charged |
|
|
|
|
|
|
|
|
|
($million) |
| 2009/10 |
| 2010/11 |
| 2011/12 |
| 2012/13 |
|
Budget 2010 |
| 86.752 |
| 61.977 |
| 54.160 |
| 97.778 |
|
There is also a specific fiscal risk for further changes in ACC, beyond the revaluation shown above.
The Finance and Expenditure Select Committee is currently considering changes to the July 2008 tax bill, including changes recommended by officials. Although the cost of the Committee’s final recommendations is unknown, there is a high probability that the changes recommended to the Committee for inclusion in the version of the Bill to be reported back to Parliament will be adopted.
Budget to be charged |
|
|
|
|
|
|
|
|
|
($million) |
| 2009/10 |
| 2010/11 |
| 2011/12 |
| 2012/13 |
|
Budget 2010 |
| (15.200 | ) | 16.000 |
| 17.000 |
| 18.000 |
|
The matters listed below are disclosed as specific fiscal risks as they meet the rules for disclosure outlined on page 99 above.
Quantified and unquantified risks are listed separately. Within each list the risks have been categorised as new or changed/unchanged since the last economic and fiscal update.
Risks are unquantified if the amount of the risk is unknown, or if the matter is partially disclosed as an unquantified risk (as full disclosure would be likely to prejudice New Zealand’s substantial economic interests, security, defence or international relations; or compromise the Crown in a material way in negotiation, litigation or commercial activity; or result in a material loss of value to the Crown).
In previous economic and fiscal updates some matters have been disclosed as time-limited funding in order to increase transparency about initiatives with funding profiles that cease or decrease during the forecast period and that may potentially be extended. The changes that have been made to the criteria for disclosure of matters as specific fiscal risks have negated the need to separately disclose time-limited funding. Matters that would previously have been disclosed as time-limited funding are disclosed within the specific fiscal risks listed below.
Fuller descriptions of the risks listed below are included on pages 109 to 123.
If they were to eventuate the risks outlined in these tables would, to the extent that they cannot be funded from future Budget allowances, by reprioritising existing expenditure, or through third party revenue, impact the Government’s forecast financial position (as indicated in the table below).
A negative fiscal impact means an increase in net debt and possibly an increase in the deficit in the operating balance.
Quantified risks as at 5 May 2009 |
| Impact on |
| Value of risk |
|
|
|
|
|
New risks |
|
|
|
|
|
|
|
|
|
Corrections — Community Probation and Psychological Services |
| Negative |
| 30 operating per annum and 72 capital |
|
|
|
|
|
Economic Development — Broadband Investment Initiative |
| Negative |
| 1,210 capital |
|
|
|
|
|
Education — Early Childhood Education Funding |
| Negative |
| 63 operating between 2009/10 and 2012/13 |
|
|
|
|
|
Education — Early Childhood Education Ratio Changes |
| Negative |
| 55 operating per annum |
|
|
|
|
|
Education — IT Broadband Funding |
| Negative |
| 116 capital |
|
|
|
|
|
Education — School Operational Grants |
| Negative |
| 70 operating between 2009/10 and 2012/13 |
Quantified risks as at 5 May 2009 |
| Impact on |
| Value of risk |
Education — School Staffing Entitlements |
| Negative |
| 45 operating in 2011/12 and 50 in 2012/13 and outyears |
|
|
|
|
|
Education — Trades Academies |
| Negative |
| 10 to 20 capital |
|
|
|
|
|
Education — Youth Guarantee |
| Negative |
| 65 operating per annum |
|
|
|
|
|
Education, Social Development and Revenue — Medical Training Places |
| Negative |
| 11 operating and 3 capital per annum by 2012/13, growing beyond the forecast period |
|
|
|
|
|
Finance — Crown Retail Deposit Guarantee Scheme |
| Negative |
| 650 to 700 operating |
|
|
|
|
|
Health — Additional WellChild Visits |
| Negative |
| 15 operating per annum |
|
|
|
|
|
Health — Building Dedicated Elective Theatres |
| Negative |
| 20 operating in 2010/11, 40 operating per annum from 2011/12 and 36 capital |
|
|
|
|
|
Health — Funding Increase for Subsidised Medicines |
| Negative |
| 60 operating in 2010/11, and 80 operating per annum from 2011/12 |
|
|
|
|
|
Health — Payment of Family Caregivers |
| Negative |
| Up to 600 operating per annum |
|
|
|
|
|
Health — Sector Capital |
| Negative |
| 150 to 400 capital |
|
|
|
|
|
Housing — Gateway Housing |
| Negative |
| 60 to 96 capital between 2009/10 and 2012/13 |
|
|
|
|
|
Immigration — Redevelopment of Mangere Refugee Centre |
| Negative |
| 5 operating, 24 capital one—off |
|
|
|
|
|
Police and Corrections — Property and Flow-on Impacts of Additional Police Staff |
| Negative |
| 20 operating and 64 capital between 2011/12 and 2012/13 |
|
|
|
|
|
Revenue — Aligning PIE Rates with New Personal Tax Rates |
| Negative |
| 20 operating per annum |
|
|
|
|
|
Revenue — Bad Debt Write-offs Relating to Crown Debt Administered by Inland Revenue |
| Positive or Negative |
| 75 capital |
|
|
|
|
|
Revenue — GST — Business to Business Transactions |
| Positive |
| 50 operating per annum |
|
|
|
|
|
Revenue — Impairment of Crown Debt Administered by Inland Revenue |
| Positive or Negative |
| 200 capital increase to 50 capital decrease |
|
|
|
|
|
Revenue — Reinstatement of Deferred Tax Cuts |
| Negative |
| 900 operating per annum |
|
|
|
|
|
Revenue — Student Loan Early Repayment Bonus |
| Positive or Negative |
| 75 operating increase to 189 operating decrease |
|
|
|
|
|
Revenue — Tax Consequences of Residential Mortgage Backed Securities |
| Positive or Negative |
| 100 operating per annum |
|
|
|
|
|
Revenue and Social Development — Impairment of Debt Relating to Student Loans |
| Positive or Negative |
| 500 capital |
|
|
|
|
|
Social Development — Increasing the Abatement-free Income Threshold |
| Negative |
| 27 operating per annum |
|
|
|
|
|
Transport — Auckland Metro Rail |
| Negative |
| 500 capital |
|
|
|
|
|
Transport — New Zealand Railways Corporation Operating Support |
| Negative |
| Up to 90 in 2010/11 and outyears |
Quantified risks as at 5 May 2009 |
| Impact on |
| Value of risk |
|
|
|
|
|
Changed risks |
|
|
|
|
|
|
|
|
|
Corrections — Prison Construction |
| Negative |
| 284 operating per annum by 2018/19 and 1,566 capital between 2009/10 and 2017/18 |
|
|
|
|
|
Customs — Joint Border Management System Replacement |
| Negative |
| 31 operating per annum and 121 capital |
|
|
|
|
|
Housing — Tamaki |
| Negative |
| 320 operating and 1,200 capital |
|
|
|
|
|
Immigration — Immigration Business Transformation |
| Negative |
| 107 operating between 2009/10 and 2012/13 and 22 operating per annum from 2013/14 |
|
|
|
|
|
New Zealand Defence Force — Future Operationally Deployed Forces Activity |
| Negative |
| 30 operating per annum from 2010/11 |
|
|
|
|
|
New Zealand Defence Force — Sale of Skyhawks and Aermacchi Trainers |
| Positive |
| 170 capital |
|
|
|
|
|
Police — Digital Radio Network Full Implementation |
| Negative |
| 76 operating and 150 capital |
|
|
|
|
|
Unchanged risks |
|
|
|
|
|
|
|
|
|
Finance — Crown Overseas Properties |
| Negative |
| 150 capital between 2009/10 and 2013/14 |
|
|
|
|
|
Justice — Greater Auckland Region Service Delivery Strategy |
| Negative |
| 265 operating or capital |
If they were to eventuate the risks outlined in these tables would, to the extent that they cannot be funded from future Budget allowances, by reprioritising existing expenditure, or through third party revenue, impact the Government’s forecast financial position (as indicated in the table below).
A negative fiscal impact means an increase in net debt and possibly an increase in the deficit in the operating balance.
Unquantified risks as at 5 May 2009 |
| Impact on fiscal |
|
|
|
New risks |
|
|
|
|
|
ACC – Revaluation of Outstanding Claim Liability |
| Negative |
Education – Additional Funding for School Property |
| Negative |
Education – Early Childhood Education Participation |
| Negative |
Education – Integrated School Property |
| Negative |
Finance – Government Commitments to International Financial Institutions |
| Negative |
Finance – KiwiSaver |
| Positive or Negative |
Finance – New Zealand Superannuation Fund |
| Positive or Negative |
Finance – Potential Merger of Lincoln University and AgResearch |
| Negative |
Health – Caregiver Employment Conditions |
| Negative |
Health – Demographic and Cost Pressures |
| Negative |
Health – National Systems Development Programme |
| Negative |
Health – Purchase of Pandemic Strain Vaccine |
| Negative |
Justice – Review of the Legal Aid System |
| Positive or Negative |
New Zealand Defence Force – Defence Review 2009 |
| Negative |
Revenue – Base Maintenance and Broadening |
| Positive |
Revenue – Cash Held in Tax Pools |
| Negative |
Revenue – Charitable Giving |
| Negative |
Revenue – Child Support – Shared Care |
| Negative |
Revenue – Imputation |
| Negative |
Revenue – Inland Revenue Operations |
| Positive or Negative |
Revenue – International Tax Review |
| Negative |
Revenue – Mutual Recognition and the Australian Tax Review |
| Negative |
Revenue – Potential Tax Policy Changes |
| Positive or Negative |
Revenue – Resident Withholding Tax Alignment |
| Negative |
Revenue – Revenue Implications of Recommendations from the Capital Market Development Taskforce |
| Positive or Negative |
Revenue – Revenue Implications of Recommendations from the Jobs Summit |
| Positive or Negative |
Revenue – Tax treatment of Social Assistance Programmes |
| Positive |
Unquantified risks as at 5 May 2009 |
| Impact on fiscal |
Reviews of the Delivery of Public Services |
| Positive |
Risks to Third Party Revenue |
| Negative |
Social Development – Extending Part-time Work Obligations |
| Positive |
State Sector Employment Agreements |
| Negative |
Treaty Negotiations – Office of Treaty Settlements Landbank |
| Negative |
|
|
|
Changed risks |
|
|
|
|
|
Climate Change – International Climate Change Obligations and the Review and Implementation of the Emissions Trading Scheme |
| Positive or Negative |
Education – Te Whare Wānanga o Awanuiārangi |
| Negative |
Health – District Health Board Deficits |
| Negative |
Revenue – Investment in the Tax System and Related Business |
| Positive |
Revenue – Rebuild of the Student Loan IT System |
| Positive |
Revenue – Reducing Compliance Costs for SMEs |
| Negative |
Revenue – Renegotiation of Double Tax Agreements |
| Negative |
|
|
|
Unchanged risks |
|
|
|
|
|
Economic Development – Radio Spectrum Rights |
| Positive |
The following risks have been removed since the 2008 Pre-Election Economic and Fiscal Update:
Expired risks |
| Reason |
Agriculture and Forestry – New Zealand Fast Forward Fund |
| The fund has been replaced by the Primary Growth Partnership. |
Economic Development – Implementation of the New Zealand Tourism Strategy |
| Superseded by new government policy. |
Economic Development – Trilateral Projects |
| Superseded by new government policy. |
Economic Development – Venture Investment Fund |
| Superseded by new government policy. |
Education – Caretakers, Cleaners and Ground-staff Negotiations |
| Funding provided in Budget 2009 for the caretakers, cleaners and ground-staff collective agreement. |
Education – Schools Plus |
| Superseded by new government policy. |
Education (Tertiary) – Vocational Training |
| Superseded by new government policy. |
Energy – ETS Household Assistance Package |
| Superseded by new government policy. |
Fisheries – Civilian Maritime Aerial Surveillance |
| Superseded by new government policy. |
Housing – Housing Innovation Fund |
| Superseded by new government policy. |
Health – Indicative Funding for Budgets 2009 and 2010 |
| The Government has decided to not set an indicative allocation for Budget 2010. |
Housing – Affordable Home Ownership |
| This risk has been incorporated in the Gateway Housing risk to address affordable home ownership. |
Internal Affairs – Property Strategy |
| Superseded by new government policy. |
Justice – Financial Action Taskforce Recommendations |
| A tagged contingency has been set aside for this matter in Budget 2009. |
Justice – Supreme Court Construction Cost Pressures |
| Funding provided in 2008. |
Justice Sector and Other Agencies – Effective Interventions |
| Superseded by new government policy. |
Local Government – Response to Rates Inquiry |
| Superseded by new government policy. |
New Zealand Agency for International Development – Adjustment of Official Development Assistance Fund |
| The Government has decided that future funding increases would not be based on a set percentage of Gross National Income. |
Police – Increases to Police Staff |
| Superseded by new government policy. |
Revenue – Paid Parental Leave Review |
| Superseded by new government policy. |
Social Development – Children, Young Persons and their Families Act |
| Superseded by new government policy. |
Social Development – Energy Subsidy for SuperGold Card Holders |
| Superseded by new government policy. |
Expired risks |
| Reason |
Social Development – Five-year Action Plan for Out of School Services |
| Superseded by new government policy. |
Social Development – Working New Zealand: Work-focused Support |
| Superseded by new government policy. |
Social Development – Youth Court Sentencing Orders |
| This matter has been superseded by the Government’s fresh start policy. |
Transport – Waterview Connection, risk of not tolling project |
| The Government has decided that if this project proceeds it will be funded through the National Land Transport Fund. |
Transport – Canterbury Transport Project |
| The Government has decided to not fund the remainder of this project. |
Transport – Penlink Roading Project |
| The Government has decided that if this project proceeds it will be funded through the National Land Transport Fund. |
Transport – Waterview Connection |
| The Government has decided that if this project proceeds it will be funded through the National Land Transport Fund. |
The ACC Chair has stated that ACC’s liability for future claims appears to be significantly understated because the underlying assumptions are uniformly optimistic. The liability could increase when those assumptions are next reviewed and updated.
The Emissions Trading Scheme (ETS) is under review. Owing to this review, and emissions trading policy priorities of the Government, it is probable that some changes will be made.
For instance, delaying entry of sectors into the ETS, changing the ETS forestry rules, increasing the levels of free allocation or providing other forms of compensation all would come with some fiscal cost to the Government.
Notwithstanding policy changes, there is inherent uncertainty in the level of fiscal impact the ETS and Kyoto obligation place on the Government. For instance, carbon prices can change and levels of net-emissions and the amount of uptake of post-1989 forest owners into the ETS are uncertain. Changes in these forecasts and assumptions may mean that the Government will have to purchase Kyoto Protocol emission units before 2015 to meet article 3.1 of the Kyoto Protocol.
Currently there is no obligation recognised in the Government’s accounts for any possible post-2012 International Climate Change agreement given the Government has yet to ratify any such agreement, and given there are high levels of uncertainty around its nature and size. It is possible that the Government will enter into a post-2012 agreement within the forecast period. This will need to be recognised at the time of signing, as will any related ETS revenues and expenses (currently there is no net ETS fiscal impact in the forecast and projections post-2012). Accounting policy in this area is also subject to change.
The number of offenders being managed by Community Probation and Psychological Services (CPPS) has grown significantly in recent years. Funding received in Budget 2009 will enable CPPS to manage the estimated volume of offenders based on annualising year-to-date actual volumes to December 2008. The Department of Corrections has not estimated any growth beyond these levels, so there is a risk that offender volumes over the forecast period will exceed funded levels. It is estimated that a 5% per annum cumulative increase in offender volumes would result in additional operating costs of $30 million per annum by 2012/13, and total additional capital expenditure of $72 million over the forecast period.
The Government is considering options to address forecast growth in the prison population. The Department of Corrections faces significant prison capacity demands over the next 10 years, and has developed a plan to respond to this demand by increasing
prison capacity and replacing obsolete capacity. If the Government’s chosen response to the growth in the prison population is to increase prison capacity, it is estimated that this would cost up to $1.566 billion capital over the next nine years, and up to $284 million operating per annum by 2018/19.
Customs’ border management systems (CusMod) are over 10 years old. Customs received funding in Budgets 2007 and 2008 to develop a business case for replacement systems. In accordance with the two-stage approval process for major information technology projects, funding for the CusMod replacement is dependent on approval of the two business cases. The second business case is scheduled to be considered by Cabinet prior to the end of 2009. The indicative total cost of the project is $121 million capital over five years and up to $31 million operating per annum (excluding $7 million capital charge).
The Government has committed to spend $1.5 billion on a new broadband network delivering “ultra fast” broadband services. Of this amount, $290 million has been appropriated through Budget 2009. The timing and amount of further funding has not yet been determined.
The Government sets the processes for the renewal or auction of property rights to radio spectrum in consultation with industry. Offers for rights of renewal to existing owners of spectrum rights are set approximately five years in advance of rights expiring from 2010 onwards with settlement being required prior to granting the new right. If any offers are rejected then they will be allocated by way of auction on the open market. (For this reason the expected revenue from the sale of renewal rights is not reflected in current forecasts of revenue.)
The Government is considering providing additional funding of $500 million for school property. It provided significant funding in Budget 2009 towards this objective ($325.6 million in capital and $197.7 million in operating), on top of a further $28 million earlier in 2009. Additional funds may be required in order to meet roll growth and demographic change. The Government is also committed to increasing the range of schools that parents can choose to send their children to, which could potentially increase the level of property or other funding required. The cost would depend on the option chosen and the ability of the proposal to be funded within existing baselines.
The Government may consider increasing early childhood education (ECE) funding in future years. Any additional costs would depend on the option chosen and the ability of the proposal to be funded within existing baselines. Inflation adjustments for non-salary ECE costs would cost $63 million over the forecast period. Funding has been set aside in Budget 2009 in contingency for an adjustment to 2009/10 ECE funding rates.
The Government is considering ways in which ECE participation of groups which are currently under-represented might be increased. Any costs would depend on the option chosen and the ability of the proposal to be funded within existing baselines.
The Government is considering decreasing the adult to child ratio in ECE centres for under-two-year-olds from 1:5 to 1:4. The Ministry of Education has estimated that the cost of implementing this ratio change would be approximately $55 million per annum.
Requests have been made by integrated schools for the Government to provide funding support for property costs at new schools. The Government has not yet considered these proposals; any costs would depend on the decisions taken by the Government.
The Government is considering providing $150 million of extra funding to upgrade schools to make them ready for fast broadband access. The Government has to date committed $34 million towards this objective. Any additional costs would depend on the option chosen and the ability of the proposal to be funded within existing baselines.
The Government has historically increased school operating grants in each Budget. Any funding for school operations grants would depend on the circumstances and the ability of the proposal to be funded within existing baselines. It has been estimated that increases equivalent to forecast inflation between 2010/11 and 2012/13 would cost $70 million over the forecast period.
The Government has indicated it will review the complexity of formula-driven staffing entitlements and funding streams administered by the Ministry of education and schools. If there was no change this would have operating costs of $45 million in 20011/12 and $50 million in 2012/13 and outyears.
Te Whare Wānanga o Awanuiārangi has declared its wish to discuss in the context of the Wai 718 treaty settlement process the repatriation of funding from the Crown based on its concern that there may have been a breach of the Deed of Settlement. This is in addition to the $8.5 million that was agreed with Te Whare Wānanga o Awanuiārangi as part of its settlement with the Crown in 2003. The facts of this allegation are currently being investigated by the Crown Law Office.
The Government intends to establish five trades academies by the end of 2011. Trades academies will offer secondary students new options for training towards vocational qualifications and transitions to employment. The Government has announced that the first trades academy is being planned to open in 2010 at Southern Cross Campus, Mangere. Capital funding of up to $6 million for this is included in Budget 2009 provisions for school property, and will be subject to approval of a detailed business case and implementation plan.
The cost of establishing four more trades academies will depend on how they are designed and operated, and could range between $10 million and $20 million. Trades academies will be funded in part from existing capital and operating appropriations for schooling and tertiary education.
Decisions are required on the timing and nature of the full roll-out of the Youth Guarantee. The programme could eventually have an operating cost of as much as $65 million per annum. Any costs would depend on the development of the Youth Guarantee programme and the ability to fund proposals within existing baselines.
The Government has considered funding 200 additional medical training places over five years. Sixty additional medical places have been funded in Budget 2009. Proceeding with the remaining 140 places would require additional funding, although final costs would depend on the option chosen and the ability of the proposal to be funded within existing baselines. This is currently estimated to be $10.9 million per annum operating and $2.5 million per annum capital by 2013/14, and grows beyond the forecast period.
The Government owns a number of overseas properties, including New Zealand House in London. Depending on the Government’s future intentions for this building, an upgrade may be required. Preliminary cost estimates for this upgrade total $150 million over the five-year period 2009/10 to 2013/14.
The Government operates an opt-in Retail Deposit Guarantee Scheme over financial institution deposits. The objective of the two-year scheme is to ensure ongoing retail depositor confidence in New Zealand’s financial system, given the international financial market turbulence. A total of 86 financial institutions have been approved under the scheme. These are listed on the Treasury website. Deposits totalling $126 billion are
(11) | The Government has also established a Wholesale Funding Guarantee Facility. This facility is not included as a specific fiscal risk as the Government assesses the likelihood of a call on this scheme as remote. |
under guarantee. The Government is also considering possible successor arrangements for the Deposit Guarantee Scheme, which is scheduled to expire in October 2010.
The Government reviews monthly the need for a provision against its contingent liability under the guarantees. Although calls on the guarantees remain a possibility, the Government does not assess the likelihood of further defaults by any individual deposit-takers as being probable at this stage. Therefore, provision has only been included in the financial statements of Government for those entities that are currently in default. Any call on the guarantees would be offset against the recovery of the remaining assets of the relevant financial institution.
The Government assesses the potential loss associated with the guaranteed entities as being in the range of $650 million to $700 million under a liquidation scenario for all guaranteed non-bank deposit-taker (NBDT) entities. The liquidation scenario assumes that all guaranteed NBDT entities default, but that default does not expose the Crown to a potential loss in all instances.
The Government’s assessment of its potential loss of $650 million to $700 million is in line with the original publicly released estimate, in which the Government assessed the potential loss associated with the guaranteed entities as being in the range of $462 million to $945 million, with a midpoint of $704 million.
The forecast level of government commitments to international financial institutions is subject to change, depending on the Government’s response to any changed financial plans on the part of these institutions.
The forecasts in relation to KiwiSaver policies are dependent on a number of assumptions and projections, such as uptake and contribution rates, all of which may change through time. In the current economic environment, factors such as reduced automatic enrolment, financial market disruption and low consumer confidence increase forecast uncertainty.
The Government has suspended contributions to the New Zealand Superannuation Fund for the period until the operating balance returns to a sufficient surplus. The Government will make a one-off contribution to the fund of $250 million in 2009/10 and will consider, on an annual basis, whether to make any further one-off contributions before the required rates of contribution are resumed. The level of contribution to the fund, and any changes to the rate of return or remeasurements of the fund, would have fiscal implications which could increase or decrease net debt.
Lincoln University and AgResearch Limited are currently preparing a business case for a proposed merger of the two entities. This may lead to the seeking of a capital injection from the Government to support transition, and there may also be other fiscal implications associated with any merger.
The Government is considering providing funding for three additional WellChild visits during the first nine weeks of a baby’s life. The initiative has not been funded in Budget 2009, and has been deferred for consideration in future Budgets.
If approved, the indicative cost of this initiative would be $15.360 million operating in 2010/11 and outyears.
The Government is considering funding 20 dedicated elective surgery theatres, with associated beds and facilities. In Budget 2009, $20 million in 2009/10 and outyears has been allocated to ensure that the appropriate number and mix of staff for the new theatres are trained. However, funding has not been allocated for the operating costs and capital funding above what is being provisioned for these theatres in Budget 2009.
If approved, the indicative cost of this initiative would be $20 million operating in 2010/11 and $40 million in 2011/12 and outyears and $36 million capital.
An Employment Court case regarding caregiver sleepover employment conditions for third party employed caregivers is currently awaiting judgement. A judgement in favour of the caregivers would require consideration of the repercussions for the Crown.
Several District Health Boards (DHBs) have projected operating deficits in 2009/10. The Government has stated that it does not view projected DHB operating deficits as acceptable and the Ministry of Health is working with DHBs to develop financial recovery plans. The Government has set aside funding in Vote Health to meet deficit requirements anticipating that the DHB deficit position will improve in the future.
Demographic and cost pressures have historically been allocated specific funding. The Government is considering how best to enable the sector to manage pressures from input-price inflation and demographic changes to maintain service access levels.
Budget 2009 provided $40 million per annum to increase spending on pharmaceuticals. The Government is considering an increase of $180 million over three years. If approved, the indicative cost of this initiative would be $60 million operating in 2010/11, and $80 million in 2011/12 and outyears.
The National Systems Development Programme (NSDP) is a major IT project to stabilise and upgrade core national health systems and collections. The project was originally scoped and signalled to Cabinet as a $104 million capital project, of which $35 million has been appropriated to date. The deliverables for the programme are currently under review and the scope and total cost may change.
An Employment Court case regarding compensation for family member carers of disabled children is currently awaiting judgement. Further policy work will need to be developed should the Employment Court find in favour of family caregivers. At this time, possible costs are indicatively estimated to be up to $600 million in 2009/10 and outyears.
In the event of a pandemic, the Government would likely have to purchase sufficient vaccine to protect the population.
DHBs have identified a range of capital expenditure projects to replace or update assets, and to provide for population growth, especially in the Auckland region. The Government is considering how to address these pressures and improve service planning and asset management capability. At this time, possible costs are indicatively estimated to be between $150 million and $400 million per annum.
The Government is considering developing Crown-owned land for first-home buyers to have use of the “ready-to-build” sections (either free or leased for a maximum of 10 years) to build new homes on provided construction commences within one year. The Government may consider funding the development of this land for new houses and subsidising the cost of leasing the land to first-home buyers over 10 years. This initiative may be provided directly, or in partnership with community housing organisations.
The indicative capital cost for developing Gateway land between now and June 2011 is estimated to be $30 million to $48 million. Assuming the same level of uptake and land development, this could equate to $60 million to $96 million over the forecast period.
The Government is considering the Tamaki Transformation Programme, a multi-agency initiative to regenerate this Auckland suburb over 20 years. The initial phase of the redevelopment proposal can be undertaken over the next three years within the existing baselines of the agencies involved. There is a risk that some options for the remainder of the development, beyond the initial phase, may require additional capital and operating funding.
It is estimated that the gross capital requirement of the further options could be up to $1.2 billion and the gross operating requirement could be up to $320 million.
In late 2008 the Department of Labour completed a Stage 2 Business Case for Immigration Business Transformation. It proposes an integrated approach to upgrading immigration services with a focus on securing New Zealand’s borders and bringing the immigration system up to date with emerging international requirements such as biometrics and identity management. Were this project to go ahead the major costs would be a rebuild existing ICT infrastructure.
The recommended option includes a mix of Government funding and fee revenue. Estimated implementation costs (less fee revenue) are $106.78 million over four years from 2009/10 to 2013/14, and there are ongoing operating costs of $21.7 million from 2013/14.
The existing refugee facilities at Mangere may need refurbishment. Initial estimated costs of the refurbishment are $5 million operating and $24 million capital.
The Government is developing a strategy to address court needs in the greater Auckland region. A wide range of stakeholders are currently being consulted over a variety of service delivery options.
Initiatives that are likely to be put forward for consideration as part of this strategy include establishing dedicated civil and family courthouses, establishing specialist and purpose-built jury courthouses, establishing a service centre to deal with customer enquiries and process bulk work, moving to electronic filing and an electronic court record, moving file storage offsite to a specialist external provider and establishing Community Justice Centre(s). As the strategy develops, full business cases are expected to identify priority projects and more detailed costings.
The total cost could be up to $265 million.
The Government has initiated a review of the Legal Aid System is required to consider how the system can be best structured to deliver effective legal services in a cost-effective, sustainable way. The outcomes of the review will be presented to Cabinet in December 2009, with implementation planned for early 2010.
The Government has approved terms of reference for a Defence Review and subsequent Defence White Paper. This process is expected to be completed by 30 March 2010. Included in the Defence Review is an examination of financial management procedures to meet the long-term defence funding requirements.
The Defence Review is likely to present a range of options with different funding implications.
There are currently over 400 New Zealand Defence Force personnel deployed overseas on Peace Keeping and United Nations missions. Existing baseline funding is expected to provide for the deployments in Afghanistan, East Timor, the Solomon Islands and several other locations during 2008/09 and 2009/10.
The forthcoming Defence Review 2009 will consider future funding requirements for a range of operational commitments in the context of Government’s wider defence, foreign policy and fiscal position. Maintaining existing deployment levels would result in an increased annual operating balance impact of some $30 million from 2010/11.
New Zealand’s application to sell the former Air Combat Force aircraft awaits approval by the US Congress.
Should the sale be permitted, at a contract value of US$110 million, the net proceeds from the sale are expected to be around NZ$170 million.
The Government has agreed to fund an additional 600 Police staff in Budget 2009. Property requirements for these staff have been funded for the first two years of implementation. There will be additional property requirements (mainly relating to new or replacement Police Stations) in 2011/12 and 2012/13, which are expected to cost up to $64 million capital, with an associated operating cost of up to $20 million.
The additional Police are expected to have a further impact on Vote Corrections. Depending on how the additional Police are deployed, higher numbers of offenders may be sentenced to both custodial and community sentence.
The Government has previously funded the partial implementation of a Digital Radio Network in Wellington, Auckland and Christchurch, to be completed by December 2010. The next phase is to move to full implementation of a National Digital Radio Network, beginning in 2011.
Full implementation is expected cost up to $150 million capital and up to $76 million operating.
The Government is working towards aligning the Portfolio Investment Entity (PIE) tax rates with the new personal tax rate structure. Depending on design decisions, this is expected to cost around $20 million operating per annum.
Inland Revenue forecasts the level of bad debt write-offs based on historical information and assumptions about future debt levels. There is a risk that bad debt write-offs vary from the amount included in forecasts.
Such variance could have a positive or negative fiscal impact of up to $75 million.
The Government has established a Tax Working Group to consider the medium-term direction of the tax system and assist the government in assessing policy options, including options to broaden and maintain the tax base, the structure of personal income tax, corporate tax, GST and tax integrity. Depending on the options chosen, any changes implemented would either decrease or increase tax revenue.
Funds held in tax pools are recognised as an asset to the Crown. There is a risk that funds held in these pools, over and above a customer’s provisional tax liability, may be withdrawn, resulting in an unquantified cash loss to the Crown.
Officials are investigating possible tax incentives for charitable giving, including gift aid and changes in the tax treatment of non-monetary gifts.
A government discussion document will be released this year on shared care in the child support formula, including taking into account the incomes of both parents and the costs of children. Any changes would have administrative costs for Inland Revenue.
The Government is considering options around GST on property transactions. The options considered include both administrative and legislative changes, and could increase revenue collections by up to $50 million per annum.
Inland Revenue administers Crown debt relating to general tax and family support. The Crown debt included in these forecasts was last tested for impairment at 30 June 2008. The asset will be next tested for impairment at 30 June 2009. The outcome of the valuation could have a negative impact of up to $50 million or a positive impact of up to $200 million.
Aspects of the current imputation system are being reviewed. This includes whether companies should be able to stream imputation credits, and the refundability of imputation credits, particularly to charities.
As part of a broader programme to change the way that Inland Revenue operates, changes could be made to policies implemented by Inland Revenue. Student Loans, Working for Families, the Pay As You Earn (PAYE) collection system and company tax forms could all be materially changed, with corresponding impacts on tax revenue.
A number of proposals will be considered, and possibly progressed, as part of Phase II of the international tax review. Since all these proposals involve exempting income in particular circumstances, they may, if progressed, have a negative impact on tax revenue.
Inland Revenue is investigating options around investment in the tax system and related business processes, including replacing the FIRST tax system. Part of this work includes investigating options for transforming employer information and payments.
The Government made a submission in October 2008 to the review, Australia’s Future Tax System, making a case for mutual recognition of imputation/franking credits. The review will be reported to the Australian Government in December 2009. The outcome of the review may affect tax revenue in New Zealand.
The Government is considering changes to various tax policies. Areas under consideration include Use of Money Interest (UOMI), provisional tax, deductions for certain capital expenditure and the treatment of cross-border leases and hybrid financial arrangements. It is unclear what policy changes, if any, will be made at this stage.
Depending on the options chosen, any changes implemented would either decrease or increase tax revenue.
The Government is considering options for redesigning the Student Loan IT system.
The Government is considering measures to simplify the tax rules for small- and
medium-sized enterprises, pursuant to a government discussion document released in December 2007. Any measures that are pursued could have a material impact on tax revenue.
The Government has agreed to delay the April 2010 and April 2011 tranches of the planned tax cuts. The Government will reconsider these tax cuts when economic and fiscal conditions permit.
Reinstating these particular tax cuts would cost around $900 million per annum (dependent on when they are reintroduced).
Lower rates of Non-Resident Withholding Tax (NRWT) were included in a Protocol amending the United States Double Tax Agreement (DTA). A government discussion document has suggested lower rates be included in the Australian DTA, which is currently being renegotiated. A lower NRWT rate in the Australian DTA would decrease tax revenue.
The Government is considering changes to resident withholding tax (RWT) rates to align with the new personal tax rates.
The Capital Markets Development Taskforce is expected to report to Government later in the year. Recommendations could include tax changes and regulatory changes which impact on tax revenue.
Depending on the options chosen, any changes implemented would either decrease or increase tax revenue.
The Jobs Summit has made recommendations for possible tax and regulatory changes. Possible tax reforms may be considered and consulted on as a result of the Jobs Summit.
The cost of the 10% bonus for voluntary student loan repayments has been built into the forecasts. This policy increases uncertainty of forecasts which are already sensitive to assumptions and projections. Incorrect assumptions of take up and other factors could increase revenue by up to $75 million or increase costs by up to $189 million.
The Reserve Bank has recently commenced longer-term lending to trading banks. In return for funds, the banks provide security by way of residential mortgage backed securities (RMBS). The Government is reviewing the tax consequences of RMBS, with a view to ensuring that their creation does not automatically trigger a base price adjustment under the financial arrangement rules. Remaining with the status quo could lead to tax revenue volatility of more than $100 million per annum.
The Government is investigating legislative solutions to fix loopholes in the tax treatment of social assistance programmes. Specific measures have not yet been identified but any changes are likely to have a positive impact on tax revenue.
The student loan assets included in these forecasts were last tested for impairment at 30June 2008. The assets have been updated subsequently to reflect new borrowings, interest unwind and repayments. The assets will be tested for impairment at 30 June 2009.
The outcome of the valuation could have a positive or negative impact of up to $500 million on the student loan assets.
The Government has announced its intention to deliver more public services, more effectively, for fewer resources. The Government may undertake one or a number of value-for-money in-depth reviews over the next 12 months. Reviews may be tasked with identifying areas of expenditure that are not efficient, effective or aligned to government policy, or could be delivered differently. Reviews may recommend changes to service delivery and/or free up resources for reprioritisation within the vote (or within the organisation) or be returned to the centre to meet pressures in other areas. Reviews of government activities which result in improved cost-effectiveness are likely to have a positive impact on the fiscal position.
A wide range of government activities are funded through third party fees and charges. With a decrease in economic activity, there is a risk that decreases in third party revenue streams will require changes to service delivery with transitional costs to the Crown. For example, decreases in Customs revenue or in levies on building activity may mean that some activities are temporarily unable to be fully cost-recovered and the Government will need to transition out of an activity or temporarily subsidise that activity.
The Government is considering introducing part-time work obligations for sickness and invalid beneficiaries assessed as able to work part time, and for domestic purposes beneficiaries when their youngest dependent child turns six.
The introduction of a more graduated system of benefit sanctions for non-compliance with work obligations is also being considered.
The Government is considering increasing the abatement-free income threshold for main benefits from $80 per week to $100 per week, including non-qualifying spouses of people receiving New Zealand Superannuation.
Increasing the abatement-free threshold to $100 would mean that people who receive a main benefit will be able to earn an additional $20 a week before their benefit payment is reduced.
If approved, the cost of this initiative would be approximately $26.5 million per annum.
A number of large collective agreements are due to be renegotiated in the short to medium term. As well as direct fiscal implications from any changes to remuneration, the renegotiation of these agreements can have flow-on effects to remuneration in other sectors. The Government has signalled an expectation for restraint given the current economic environment and conditions in the private sector.
The Government is considering the purchase of a higher number and value of properties, as a result of a higher number and value of properties being identified as of interest to iwi as part of the Treaty settlement process. Any increase in 2009/10 might be offset by reductions in Landbank spending in future years.
The Government has decided in principle that the new Auckland Metro rail units will be owned by KiwiRail. The total cost of rolling stock is estimated at $500 million. Final decisions on the structure of the acquisition are likely in 2009 and these will impact on the Government’s exposure.
Budget 2009 provided operating support of $90 million for KiwiRail for 2009/10 only. If KiwiRail is unable to operate in a fully commercial manner from 2010/11 onwards, the Government may decide to provide operating support beyond 2009/10.
Contingent liabilities are costs that the Government will have to face if a particular event occurs. Typically, contingent liabilities consist of guarantees and indemnities, legal disputes and claims, and uncalled capital. The contingent liabilities facing the Government are a mixture of operating and balance sheet risks, and they can vary greatly in magnitude and likelihood of realisation.
In general, if a contingent liability were realised it would reduce the operating balance and increase net debt. However, in the case of contingencies for uncalled capital, the negative impact would be restricted to net debt.
Where contingent liabilities have arisen as a consequence of legal action being taken against the Crown, the amount shown is the amount claimed and thus the maximum potential cost. It does not represent either an admission that the claim is valid or an estimation of the amount of any award against the Crown.
Only contingent liabilities involving amounts of over $10 million are separately disclosed. Contingent liabilities below $10 million are included in the “other quantifiable contingent liabilities” total.
Contingent liabilities have been stated as at 31 March 2009, being the latest set of contingent liabilities received.
Guarantees and indemnities |
| Status(12) |
| ($ million) |
|
Cook Islands – Asian Development Bank loans |
| Changed |
| 17 |
|
Glenharrow Holdings Limited – LINZ |
| New |
| 12 |
|
Indemnification of receivers and managers – Terralink Limited |
| Unchanged |
| 10 |
|
Ministry of Transport – funding guarantee |
| Unchanged |
| 10 |
|
Guarantees and indemnities of SOEs and Crown entities |
| Changed |
| 40 |
|
Other guarantees and indemnities |
| Changed |
| 18 |
|
|
|
|
| 107 |
|
Uncalled capital |
|
|
|
|
|
|
|
|
|
|
|
Asian Development Bank |
| Changed |
| 1,459 |
|
European Bank for Reconstruction and Development |
| Changed |
| 16 |
|
International Bank for Reconstruction and Development |
| Changed |
| 1,455 |
|
Other |
| Changed |
| 42 |
|
|
|
|
| 2,972 |
|
Legal proceedings and disputes |
|
|
|
|
|
|
|
|
|
|
|
Health – legal claims |
| Changed |
| 16 |
|
Kapiti West Link Road |
| New |
| 25 |
|
Tax in dispute |
| Changed |
| 209 |
|
Other legal claims |
| Changed |
| 97 |
|
|
|
|
| 347 |
|
Other quantifiable contingent liabilities |
|
|
|
|
|
|
|
|
|
|
|
Air New Zealand Limited |
| New |
| 36 |
|
International finance organisations |
| Changed |
| 2,136 |
|
New Zealand Export Credit Office – export guarantees |
| Changed |
| 127 |
|
Reserve Bank – demonetised currency |
| Unchanged |
| 23 |
|
Other quantifiable contingent liabilities of SOEs and Crown entities |
| Changed |
| 43 |
|
Other quantifiable contingent liabilities |
| Changed |
| 72 |
|
|
|
|
| 2,437 |
|
Total quantifiable contingent liabilities |
|
|
| 5,863 |
|
(12) | Relative to reporting in the 30 June 2008 Financial Statements of the Government of New Zealand. |
Guarantees and indemnities |
| Status |
Airways New Zealand |
| New |
Asure Quality New Zealand Limited (formerly AgriQuality Limited) |
| Changed |
At Work Insurance Limited |
| Unchanged |
Bona Vacantia property |
| Unchanged |
Building Industry Authority |
| Unchanged |
Earthquake Commission (EQC) |
| Unchanged |
Electricity Corporation of New Zealand Limited (ECNZ) |
| Unchanged |
Ministry of Fisheries – indemnity provided for delivery of registry services |
| Unchanged |
Genesis Power Ltd (Genesis Energy) |
| Unchanged |
Geothermal carbon tax indemnity |
| Unchanged |
Housing New Zealand Corporation (HNZC) |
| Unchanged |
Huntly East Subsidence Policy |
| New |
Indemnification of touring exhibitions |
| New |
Indemnities against acts of war and terrorism |
| Unchanged |
Justices of the Peace, Community Magistrates and Disputes Tribunal Referees |
| Unchanged |
Maui Partners |
| Unchanged |
National Provident Fund |
| Unchanged |
New Zealand Railways Corporation |
| Unchanged |
Persons exercising investigating powers |
| Unchanged |
Public Trust |
| Unchanged |
Reserve Bank of New Zealand |
| New |
State Insurance and Rural Bank – tax liabilities |
| New |
Synfuels-Waitara Outfall Indemnity |
| Unchanged |
Tainui Corporation |
| Unchanged |
|
|
|
Other unquantifiable contingent liabilities |
|
|
|
|
|
Abuse claims |
| Unchanged |
Accident Compensation Corporation (ACC) litigations |
| Unchanged |
Air New Zealand litigation |
| Unchanged |
Environmental liabilities |
| Unchanged |
Rugby World Cup 2011 – joint venture arrangements |
| Unchanged |
Treaty of Waitangi claims |
| Unchanged |
Treaty of Waitangi claims – settlement relativity payments |
| Changed |
|
|
|
Other contingencies |
|
|
|
|
|
Foreshore and seabed |
| Unchanged |
The following unquantified contingent liabilities have been removed from the above list:
· Auckland Rail Lease
· Ports of Auckland
· Toll NZ Limited – purchase of rail network assets
Guarantees and indemnities are disclosed in accordance with IAS 37: Provisions, Contingent Liabilities and Contingent Assets. In addition, guarantees given under Section 65ZD of the Public Finance Act 1989 are disclosed in accordance with Section 26Q(3)(b)(i)(B) of the same act.
Before 1992, the New Zealand Government guaranteed the Cook Islands’ borrowing from the ADB. These guarantees have first call on New Zealand’s Official Development Assistance.
$17 million at 31 March 2009 ($14 million at 30 June 2008).
Glenharrow Holdings Limited is suing the Crown and the West Coast Regional Council for damages for the cancellation of its mining licence.
$12 million at 31 March 2009 ($12 million at 30 June 2008).
The Crown has issued a Deed of Receivership indemnity to the appointed receivers of Terralink Limited against claims arising from the conduct of the receivership.
$10 million at 31 March 2009 ($10 million at 30 June 2008).
The Minister of Finance has issued a guarantee of $10 million to the Transport Accident Investigation Commission. The guarantee allows the Commission to assure payment to suppliers of specialist salvage equipment in the event of the Commission initiating an urgent investigation of any future significant transport accident.
$10 million at 31 March 2009 ($10 million at 30 June 2008).
$40 million at 31 March 2009 ($40 million at 30 June 2008).
$18 million at 31 March 2009 (nil at 30 June 2008).
The Crown’s uncalled capital subscriptions are as follows:
|
| Uncalled capital |
| Uncalled capital |
|
Asian Development Bank |
| 1,459 |
| 1,081 |
|
European Bank for Reconstruction and Development |
| 16 |
| 14 |
|
International Bank for Reconstruction and Development |
| 1,455 |
| 1,077 |
|
Miscellaneous |
| 42 |
| 33 |
|
|
| 2,972 |
| 2,205 |
|
The amounts under quantifiable contingent liabilities for legal proceedings and disputes are shown exclusive of any interest and costs that may be claimed if these cases were decided against the Crown.
Where contingent liabilities have arisen as a consequence of legal action being taken against the Crown, the amount shown is the amount claimed and thus the maximum potential cost. It does not represent either an admission that the claim is valid or an estimation of the possible amount of any award against the Crown.
Claims against the Crown in respect of alleged negligence for failing to screen blood for Hepatitis C when screening had first become available, resulting in people allegedly contracting Hepatitis C through contaminated blood and blood products.
$16 million at 31 March 2009 ($39 million at 30 June 2008).
Court action has been filed against the New Zealand Transport Agency to have the land held for the Kapiti West Link Road released for sale. The maximum liability is $25 million.
$25 million at 31 March 2009 (nil at 30 June 2008)
Represents the outstanding debt of those tax assessments raised, against which an objection has been lodged and legal action is proceeding.
$209 million at 31 March 2009 ($249 million at 30 June 2008).
$97 million at 31 March 2009 ($95 million at 30 June 2008).
The Group has a partnership agreement with Christchurch Engineering Centre in which it holds a 49 percent interest. By the nature of the agreement joint and several liability exists between the two parties.
$36 million at 31 March 2009 ($36 million at 30 June 2008).
The Crown has lodged promissory notes with the International Monetary Fund. Payment of the notes depends upon the operation of the rules of the organisation.
$2,136 million at 31 March 2009 ($1,727 million at 30 June 2008).
The New Zealand Export Credit Office (NZECO) provides a range of guarantee products to assist New Zealand exporters. These NZECO guarantees are recorded by the Crown as contingent liabilities. The amount of future liabilities arising from these guarantees is expected to be minor.
$127 million at 31 March 2009 ($37 million at 30 June 2008).
The Crown has a contingent liability for the face value of the demonetised $1 and $2 notes issued which have yet to be repatriated.
$23 million at 31 March 2009 ($23 million at 30 June 2008).
$43 million at 31 March 2009 ($106 million at 30 June 2008).
$72 million at 31 March 2009 ($66 million at 30 June 2008).
Accounting standard NZ IAS 37 requires that contingent liabilities be disclosed unless the possibility of an outflow of resources embodying economic benefits is remote. Disclosure of remote contingent liabilities is only required if knowledge of the transaction or event is necessary to achieve the objectives of general purpose financial reporting. This part of the Statement provides details of those contingent liabilities of the Crown which cannot be quantified (remote contingent liabilities are excluded).
The Crown has indemnified the directors of AsureQuality Limited in the event that they incur any personal liability for redundancies arising from any agreement by international trading partners that allows post-mortem meat inspection by parties other than the Ministry of Agriculture and Forestry, or its sub-contractor.
The Crown has indemnified the liquidators of At Work Insurance Limited (Deloitte Touche Tohmatsu) against various employment-related claims.
P&O NZ Ltd sought a declaratory judgement that property disclaimed by a liquidator is bona vacantia. A settlement has been reached, which includes a Crown indemnity in favour of New Zealand Aluminium Smelters Limited and Comalco in relation to aluminium dross disposed of in their landfill, for costs that may be incurred in removing the dross and disposing of it at another site if they are required to do so by an appropriate authority. The Minister of Finance signed the indemnity on 24 November 2003. In February 2004, a similar indemnity was signed in respect of aluminium dross currently stored at another site in Invercargill.
The Building Industry Authority (BIA) is a joint defendant in a number of claims before the courts and the Weathertight Homes Resolution Service relating to the BIA’s previous role as regulator of the building industry. The BIA has been dis-established and absorbed into the Department of Building & Housing and, to prevent conflicts of interest, Treasury was given responsibility for managing weathertight claims against the BIA on behalf of the Crown from 1 July 2005.
The Crown is liable to meet any deficiency in the EQC’s assets in meeting the Commission’s financial liabilities (section 16 of the Earthquake Commission Act 1993).
The ECNZ Sale and Purchase Agreement provides for compensation to ECNZ for any tax, levy, or royalty imposed on ECNZ for the use of water or geothermal energy for plants in existence or under construction at the date of the Sale and Purchase Agreement. The Agreement also provides for compensation for any net costs to ECNZ arising from resumption of assets pursuant to the Treaty of Waitangi (State Enterprises) Act 1988.
The Deed of Assumption and Release between ECNZ, Contact Energy Limited and the Crown provides that Contact Energy stands in place of ECNZ for those assets transferred to Contact Energy from ECNZ. As a result of the split of ECNZ in 1999, Ministers have transferred the benefits of the Deed to ECNZ’s successors – Meridian Energy Limited, Mighty River Power Limited and Genesis Power Limited.
Under the Transpower New Zealand Limited (Transpower) Sale and Purchase and Debt Assumption Agreements, the Crown has indemnified ECNZ for any losses resulting from changes in tax rules applicable to transactions listed in the Agreements. Additionally, the Crown has indemnified the directors and officers of ECNZ for any liability they may incur in their personal capacities as a result of the Transpower separation process.
Following the split of ECNZ in 1999 into three new companies, the Crown has indemnified ECNZ in relation to all ECNZ’s pre-split liabilities, including:
· existing debt and swap obligations
· hedge contracts and obligations
· any liabilities that arise out of the split itself.
The Crown has indemnified Commercial Fisheries Services Limited against claims made by third parties arising from Commercial Fisheries Services undertaking registry services under contract to the Chief Executive of the Ministry of Fisheries. This indemnity, provided under the Fisheries Acts 1983 and 1996, expires on 30 September 2009.
The Crown has entered into a deed with Genesis Energy to share a specified and limited amount of risk around the sufficiency of Genesis Energy’s long term supply of gas to cover the Huntly e3p’s (a 385 MW combined cycle gas turbine power station) minimum needs. The agreement sees the Crown compensate Genesis Energy in the event it has less gas than it needs.
As part of the sale and purchase agreement between the Crown and Mighty River Power (MRP), the Crown has agreed to provide an indemnity for the payment of carbon taxes, should legislation be passed that does not allow for an automatic pass-through of the charges to end-users. The indemnity is time bound and contractually limited in the amount that can be claimed. The indemnity is not limited to MRP and will be available to any subsequent owner of the Crown’s Kawerau geothermal assets.
Housing New Zealand Corporation (HNZC) is liable to the owners (ANZ National Bank Limited, Ichthus Limited and Westpac Banking Corporation) of mortgages sold by HNZC during 1992 to 1999 for certain losses they may incur from specified limited aspects of their ownership of those mortgage. The amount of the liability cannot be estimated.
The Crown has provided a warranty in respect of title to the assets transferred to Housing New Zealand Limited (HNZL) and has indemnified HNZL against any breach of this warranty. In addition, the Crown has indemnified HNZL against any third-party claims that are a result of
acts or omissions prior to 1 November 1992. It has also indemnified the directors and officers of HNZL against any liability consequent upon the assets not complying with statutory requirements, provided they are taking steps to rectify any non-compliance.
The Crown has an obligation to purchase properties affected by mining in the Huntly East area (CAB (97) M 33/7A Refers). The Huntly East Subsidence Policy states that if a property is not sold on the open market within six months, the Crown will buy the property from the vendor at current market value. Until all properties have been purchased by the Crown, this policy will continue. Properties purchased by the Crown are covenanted to protect the Crown from future liability then onsold (generally at a lower value as a result of the covenant on the title).
The Crown has a contingent liability for damages and losses under the scheme for indemnifying touring exhibitions. The amount is not disclosed because it is commercially sensitive.
The Crown has indemnified Air New Zealand against claims arising from acts of war and terrorism that cannot be met from insurance, up to a limit of US$1 billion in respect of any one claim.
Section 197 of the Summary Proceedings Act 1957, requires the Crown to indemnify Justices of the Peace and Community Magistrates against damages or costs awarded against them as a result of them exceeding their jurisdiction, provided a High Court Judge certifies that they have exceeded their jurisdiction in good faith and ought to be indemnified.
Section 58 of the Disputes Tribunal Act 1988 confers a similar indemnity on Disputes Tribunal Referees.
The Crown has entered into confidentiality agreements with the Maui Partners in relation to the provision of gas reserves information. The deed contains an indemnity against any losses arising from a breach of the deed.
The National Provident Fund (NPF) has been indemnified for certain potential tax liabilities. Under the NPF Restructuring Act 1990, the Crown guarantees:
· the benefits payable by all NPF schemes (section 60)
· investments and interest thereon deposited with the NPF Board prior to 1 April 1991 (section 61)
· payment to certain NPF defined contribution schemes where application of the 4% minimum earnings rate causes any deficiency or increased deficiencies in reserves to arise (section 72).
A provision has been made in these financial statements in respect of the actuarially assessed deficit in the DBP Annuitants Scheme (refer to Note 18 in the Forecast Financial Statements).
The Crown has indemnified the directors of the New Zealand Railways Corporation against any liability arising from the surrender of the licence and lease of the Auckland rail corridor.
The Crown has further indemnified the directors of New Zealand Railways Corporation against any liability arising from the transfer of the rail network and associated assets and liabilities to the Corporation on 1 September 2004.
Section 63 of the Corporations (Investigation and Management) Act 1989 indemnifies the Securities Commission, the Registrar and Deputy Registrar of Companies, members of advising committees within the Act, every statutory manager of a corporation, and persons appointed pursuant to sections 17 to 19 of the Act, in the exercise of investigating powers, unless the power has been exercised in bad faith.
The Crown is liable to meet any deficiency in the Public Trust’s Common Fund (section 52 of the Public Trust Act 2001). On 7 November 2008 the Minister of Finance guaranteed interest payable on estates whose money constitutes the Common Fund.
Section 21(2) of the Reserve Bank of NZ Act 1989 requires the Crown to pay the Reserve Bank the amount of any exchange losses incurred by the Bank as a result of dealing in foreign exchange under Sections 17 and 18 of the Act. This is a permanent (legislated) liability.
The Crown has granted to the purchasers of the State Insurance Office Limited and the Rural Banking and Finance Corporation Limited an indemnity for certain potential tax liabilities.
As part of the 1990 sale of the Synfuels plant and operations to New Zealand Liquid Fuels Investment Limited (NZLFIL), the Crown transferred to NZLFIL the benefit and obligation of a Deed of Indemnity between the Crown and Borthwick-CWS Limited (and subsequent owners) in respect of the Waitara effluent transfer line which was laid across the Waitara meat processing plant site.
The Crown has the benefit of a counter indemnity from NZLFIL which has since been transferred to Methanex Motunui Limited.
Several leases of Tainui land at Huntly and Meremere have been transferred from ECNZ to Genesis Power. The Crown has provided guarantees to Tainui Corporation relating to Genesis Power’s obligations under the lease agreements.
There is ongoing legal action against the Crown in relation to historical abuse claims. At this stage the number of claimants and outcome of these cases are uncertain.
There are several legal actions against the Accident Compensation Corporation (ACC) in existence, arising in the main from challenges to operational decisions made by ACC. ACC is defending these claims.
Air New Zealand has been named in four class actions. One, in Australia, claims travel agents commission on fuel surcharges and two (one in Australia and the other in the United States) make allegations against more than 30 airlines, of anti competitive conduct in relation to pricing in the air cargo business. The allegations made in relation to the air cargo business are also the subject of investigations by regulators in a number of jurisdictions including the United States and the European Union. A formal Statement of Objections has been issued by the European Commission to 25 airlines including Air New Zealand and has been responded to. In the event that a court determined, or it was agreed with a regulator, that Air New Zealand had breached relevant laws, the Company would have potential liability for pecuniary penalties and to third party damages under the laws of the relevant jurisdictions. The fourth class action alleges (in the United States) that Air New Zealand together with 11 other airlines conspired in respect of fares and surcharges on trans-Pacific routes. All class actions are being defended.
Under common law and various statutes, the Crown may have responsibility to remedy adverse effects on the environment arising from Crown activities.
Departments managing significant Crown properties have implemented systems to identify, monitor and assess potential contaminated sites.
In accordance with IAS 37: Provisions, Contingent Liabilities and Contingent Assets any contaminated sites for which costs can be reliably measured have been included in the Statement of Financial Position as provisions.
The Government has agreed in joint venture arrangements with the New Zealand Rugby Union (NZRU) to an uncapped underwrite of the costs of hosting the 2011 Rugby World Cup, on a loss sharing basis (Crown 67%, NZRU 33%). A provision for the forecast losses has been made in the Government’s financial statements.
The Government has agreed to reimburse New Zealand income tax that might be incurred by the joint venture entity (Rugby New Zealand 2011 Limited) or the NZRU in relation to the joint venture entity, and has also agreed to reimburse the NZRU for New Zealand withholding tax that might be incurred on certain payments made in relation to the tournament.
The Government has further agreed to review its level of support to the tournament if the actual tax revenue arising from the tournament exceeds forecasts.
Under the Treaty of Waitangi Act 1975, any Māori may lodge claims relating to land or actions counter to the principles of the Treaty with the Waitangi Tribunal. Where the Tribunal finds a claim is well founded, it may recommend to the Government that action be taken to compensate those affected. The Tribunal can make recommendations that are binding on the Crown with respect to land which has been transferred by the Crown to an SOE or tertiary institution, or is subject to the Crown Forest Assets Act 1989.
The Deeds of Settlement negotiated with Waikato-Tainui and Ngāi Tahu include a relativity mechanism. The mechanism provides that, where the total redress amount for all historical Treaty settlements exceeds $1 billion in 1994 present-value terms, the Crown is liable to make payments to maintain the real value of Ngāi Tahu’s and Waikato-Tainui’s settlements as a proportion of all Treaty settlements. The agreed relativity proportions are 17% for Waikato-Tainui and approximately 16% for Ngāi Tahu. The non-quantifiable contingent liability relates to the risk the amounts payable to Waikato-Tainui and Ngāi Tahu under the relativity mechanism maybe higher than has been provided for in the fiscal forecasts.
The Foreshore and Seabed Act 2004 (FSA):
· vests the full legal and beneficial ownership of the public foreshore and seabed in the Crown
· provides for the recognition and protection of ongoing customary rights with respect to the public foreshore and seabed
· enables applications to the High Court to investigate if previously held common law rights have been adversely impacted, and if so, providing for those affected either to participate in the administration of a foreshore and seabed reserve or else enter into formal discussions on redress, and
· provides for general rights of public access and recreation in, on, over, and across the public foreshore and seabed and general rights of navigation within the foreshore and seabed.
The public foreshore and seabed means the marine area that is bounded on the landward side by the line of mean high water spring; and on the seaward side by the outer limits of the territorial sea, but does not include land subject to a specified freehold interest (refer section 5 of the FSA).
The FSA codifies the nature of the Crown’s ownership interest in the public foreshore and seabed on behalf of the public of New Zealand. Although full legal and beneficial ownership of the public foreshore and seabed has been vested in the Crown, there are significant limitations to the Crown’s rights under the FSA. As well as recognising and protecting customary rights, the FSA significantly restricts the Crown’s ability to alienate or dispose of any part of the public foreshore and seabed and significantly restricts the
Crown’s ability to exclude others from entering or engaging in recreational activities or navigating in, on or within the public foreshore and seabed. Because of the complex nature of the Crown’s ownership interest in the public foreshore and seabed and because we are unable to obtain a reliable valuation of the Crown’s interest, the public foreshore and seabed has not been recognised as an asset in these financial statements.
The Crown is currently in dispute with a number of financial institutions regarding the tax treatment of certain structured finance transactions. However, it is not possible to recognise revenue and a tax receivable in the forecast for the transactions because of the fundamental uncertainty regarding the application of tax law to the structured finance transactions. Litigation against these institutions has begun in the High Court in March 2009. It is too early to determine a likely outcome. Court costs awarded for or against the Crown at the resolution of these court cases have also not been forecast in these financial statements.
Some of the financial institutions involved in the dispute have deposited funds into Inland Revenue’s tax pooling accounts to mitigate any potential use of money. While these deposits are included the Crown’s cash balances, a corresponding liability is recognised until the uncertainty with this application of the tax law to the structured finance transactions is clarified. No repayment of tax pool amounts relating to these structure finance transactions has been forecast.
Contingent assets are potential assets dependent on a particular event occurring. As at 31 March 2009, the Crown held quantifiable contingent assets totalling $318 million ($389 million at 30 June 2008).
The major component being:
· $237 million relates to Inland Revenue ($307 million at 30 June 2008), and
· $74 million relates to suspensory loans issued by the Ministry of Education to integrated schools. ($77 million at 30 June 2008).
3
Forecast Financial Statements
These forecasts have been prepared in accordance with the Public Finance Act 1989.
They are based on the accounting policies and assumptions that follow. As with all such assumptions, there is a degree of uncertainty surrounding them. This uncertainty increases as the forecast horizon extends.
The forecasts have been prepared in accordance with the Statement of Responsibility and reflect the judgements and information known at the time they were prepared. They reflect all Government decisions and circumstances communicated to 5 May 2009.
The finalisation dates and key assumptions that underpin the preparation of the Forecast Financial Statements are outlined on pages 93 to 96.
These Forecast Financial Statements have been prepared in accordance with the accounting policies that are expected to be used in the comparable audited actual Financial Statements of the Government.
These Forecast Financial Statements comply with generally accepted accounting policies (GAAP) as required by the Public Finance Act 1989 and have been prepared in accordance with New Zealand equivalents to International Financial Reporting Standards (NZ IFRS), as appropriate for public benefit entities.
All forecasts use the accrual basis of accounting. Forecasts have been prepared for the consolidated financial statements of the Government reporting entity, which includes all entities controlled by the Government (as defined by applicable financial reporting standards).
All policies have been applied on a consistent basis during the forecast period. There have been no changes in accounting policies during the period.
These Forecast Financial Statements have been prepared on the basis of Treasury’s best professional judgment. Key assumptions used are set out on page 94 to 96.
For the purposes of the Forecast Financial Statements, no revaluations of property, plant and equipment are projected beyond the current year.
The specific accounting and forecasting policies are reproduced in full on Treasury’s website at http://www.treasury.govt.nz/budget/forecasts/befu2009.
These forecast financial statements are for the Government reporting entity as specified in section 26Q(4) of the Public Finance Act 1989. This comprises Ministers of the Crown and the following entities:
Core Crown segment |
|
| ||
|
|
| ||
Departments |
| Departments |
| State-owned enterprises |
|
|
|
|
|
Agriculture and Forestry Archives New Zealand Building and Housing Conservation Corrections Crown Law Office Culture and Heritage Defence Economic Development Education Education Review Office Environment Fisheries Foreign Affairs and Trade Government Communications Security Bureau Health Inland Revenue Internal Affairs Justice Labour |
| Land Information New Zealand Māori Development National Library of New Zealand New Zealand Customs Service New Zealand Defence Force New Zealand Food Safety Authority New Zealand Police New Zealand Security Intelligence Service Office of the Clerk Pacific Island Affairs Parliamentary Counsel Office Parliamentary Service Prime Minister and Cabinet Research, Science and Technology Serious Fraud Office Social Development State Services Commission Statistics Transport Treasury Women’s Affairs |
| Airways Corporation of New Zealand Limited Animal Control Products Limited AsureQuality Limited Electricity Corporation of New Zealand Limited Genesis Power Limited Kordia Group Limited Landcorp Farming Limited Learning Media Limited Meridian Energy Limited Meteorological Service of New Zealand Limited Mighty River Power Limited New Zealand Post Limited New Zealand Railways Corporation * Quotable Value Limited Solid Energy New Zealand Limited Terralink Limited (in liquidation) Timberlands West Coast Limited Transpower New Zealand Limited |
|
|
|
|
|
Others
Government Superannuation Fund New Zealand Superannuation Fund Reserve Bank of New Zealand |
|
Offices of Parliament
Office of the Controller and Auditor-General Office of the Ombudsmen Parliamentary Commissioner for the Environment |
| Air New Zealand Limited |
* | KiwiRail Holdings Limited was acquired by the Crown on 1 July 2008 and in turn was transferred to New Zealand Railways Corporation on 1 October 2008. |
Crown entities |
|
|
|
|
|
Accident Compensation Corporation Accounting Standards Review Board Alcohol Advisory Council of New Zealand Arts Council of New Zealand Toi Aotearoa Broadcasting Commission Broadcasting Standards Authority Career Services Charities Commission Children’s Commissioner Civil Aviation Authority of New Zealand Commerce Commission Crown Health Financing Agency Crown research institutes (9) District health boards (21) Drug Free Sport New Zealand Earthquake Commission Electoral Commission Electricity Commission Energy Efficiency and Conservation Authority Environmental Risk Management Authority Families Commission Foundation for Research, Science and Technology Government Superannuation Fund Authority Guardians of New Zealand Superannuation Health and Disability Commissioner Health Research Council of New Zealand Health Sponsorship Council Housing New Zealand Corporation Human Rights Commission Independent Police Conduct Authority Law Commission Legal Services Agency Maritime New Zealand Mental Health Commission Museum of New Zealand Te Papa Tongarewa Board New Zealand Antarctic Institute New Zealand Artificial Limb Board New Zealand Blood Service |
| New Zealand Fast Forward Fund Limited New Zealand Film Commission New Zealand Fire Service Commission New Zealand Historic Places Trust (Pouhere Taonga) New Zealand Lotteries Commission New Zealand Qualifications Authority New Zealand Symphony Orchestra New Zealand Teachers Council New Zealand Tourism Board New Zealand Trade and Enterprise New Zealand Transport Agency New Zealand Venture Investment Fund Limited New Zealand Walking Access Commission Office of Film and Literature Classification Pharmaceutical Management Agency Privacy Commissioner Public Trust Radio New Zealand Limited Real Estate Agents Authority Retirement Commissioner School boards of trustees (2,484) Securities Commission Social Workers Registration Board Sport and Recreation New Zealand Standards Council Takeovers Panel Te Reo Whakapuaki Irirangi (Te Māngai Pāho) Te Taura Whiri i te Reo Māori (Māori Language Commission) Television New Zealand Limited Tertiary Education Commission Tertiary education institutions (31) Testing Laboratory Registration Council Transport Accident Investigation Commission
Crown entity subsidiaries are consolidated by their parents and are not listed separately in this table |
Organisations named or described in Schedule 4 to the Public Finance Act 1989
Agriculture and Marketing Research and Development Trust Asia New Zealand Foundation Fish and game councils (12) Leadership Development Centre Trust National Pacific Radio Trust New Zealand Fast Forward Limited New Zealand Fish and Game Council New Zealand Game Bird Habitat Trust Board New Zealand Government Property Corporation |
| New Zealand Lottery Grants Board Ngāi Tahu Ancillary Claims Trust Pacific Co-operation Foundation Pacific Island Business Development Trust Research and Education Advanced Network New Zealand Limited Reserves boards (24) Road Safety Trust Sentencing Council |
for the years ending 30 June
|
|
|
| 2008 |
| 2009 |
| 2009 |
| 2010 |
| 2011 |
| 2012 |
| 2013 |
|
|
|
|
| Actual |
| Budget |
| Forecast |
| Forecast |
| Forecast |
| Forecast |
| Forecast |
|
|
| Note |
| $m |
| $m |
| $m |
| $m |
| $m |
| $m |
| $m |
|
Revenue |
|
|
|
|
|
|
|
|
|
|
|
|
|
|
|
|
|
Taxation revenue |
| 1 |
| 56,372 |
| 55,911 |
| 53,523 |
| 51,052 |
| 51,326 |
| 54,013 |
| 57,781 |
|
Other sovereign revenue |
| 1 |
| 3,879 |
| 4,037 |
| 4,114 |
| 4,860 |
| 5,403 |
| 5,700 |
| 6,299 |
|
Total revenue levied through the Crown’s sovereign power |
|
|
| 60,251 |
| 59,948 |
| 57,637 |
| 55,912 |
| 56,729 |
| 59,713 |
| 64,080 |
|
Sales of goods and services |
|
|
| 15,399 |
| 14,222 |
| 15,248 |
| 16,049 |
| 17,415 |
| 17,742 |
| 18,377 |
|
Interest revenue and dividends |
| 2 |
| 3,214 |
| 3,358 |
| 2,999 |
| 3,159 |
| 3,331 |
| 3,363 |
| 3,442 |
|
Other revenue |
|
|
| 2,615 |
| 2,591 |
| 3,075 |
| 2,814 |
| 3,014 |
| 3,035 |
| 3,213 |
|
Total revenue earned through the Crown’s operations |
|
|
| 21,228 |
| 20,171 |
| 21,322 |
| 22,022 |
| 23,760 |
| 24,140 |
| 25,032 |
|
Total Revenue (excluding gains) |
|
|
| 81,479 |
| 80,119 |
| 78,959 |
| 77,934 |
| 80,489 |
| 83,853 |
| 89,112 |
|
Expenses |
|
|
|
|
|
|
|
|
|
|
|
|
|
|
|
|
|
Transfer payments and subsidies |
| 3 |
| 18,374 |
| 19,681 |
| 20,182 |
| 21,175 |
| 22,196 |
| 22,987 |
| 23,658 |
|
Personnel expenses |
| 4 |
| 16,478 |
| 17,061 |
| 18,031 |
| 18,324 |
| 18,681 |
| 18,995 |
| 19,189 |
|
Depreciation and amortisation |
| 5 |
| 3,670 |
| 3,950 |
| 4,283 |
| 4,126 |
| 4,365 |
| 4,529 |
| 4,617 |
|
Other operating expenses |
| 5 |
| 30,656 |
| 32,053 |
| 32,605 |
| 34,855 |
| 35,057 |
| 35,330 |
| 36,208 |
|
Interest expenses |
| 6 |
| 3,101 |
| 2,503 |
| 3,358 |
| 3,349 |
| 4,019 |
| 4,625 |
| 5,460 |
|
Insurance expenses |
| 7 |
| 3,563 |
| 3,799 |
| 3,916 |
| 3,890 |
| 4,225 |
| 4,587 |
| 4,931 |
|
Forecast new operating spending |
| 8 |
| — |
| 249 |
| — |
| 254 |
| 1,436 |
| 2,533 |
| 3,622 |
|
Top-down expense adjustment |
| 8 |
| — |
| (495 | ) | (500 | ) | (300 | ) | (225 | ) | (150 | ) | (150 | ) |
Total Expenses (excluding losses) |
|
|
| 75,842 |
| 78,801 |
| 81,875 |
| 85,673 |
| 89,754 |
| 93,436 |
| 97,535 |
|
Operating Balance before gains/(losses) |
|
|
| 5,637 |
| 1,318 |
| (2,916 | ) | (7,739 | ) | (9,265 | ) | (9,583 | ) | (8,423 | ) |
Net gains/(losses) on financial instruments |
| 9 |
| (617 | ) | 1,424 |
| (3,266 | ) | 1,416 |
| 1,529 |
| 1,838 |
| 2,044 |
|
Net gains/(losses) on non-financial instruments |
| 10 |
| (2,925 | ) | 170 |
| (3,450 | ) | 205 |
| 224 |
| 231 |
| 225 |
|
Total gains/(losses) |
|
|
| (3,542 | ) | 1,594 |
| (6,716 | ) | 1,621 |
| 1,753 |
| 2,069 |
| 2,269 |
|
Net surplus/(deficit) from associates and joint ventures |
|
|
| 334 |
| 193 |
| 333 |
| 390 |
| 402 |
| 400 |
| 382 |
|
Operating Balance from continuing activities |
|
|
| 2,429 |
| 3,105 |
| (9,299 | ) | (5,728 | ) | (7,110 | ) | (7,114 | ) | (5,772 | ) |
Gain/(loss) from discontinued operations |
|
|
| 22 |
| — |
| (4 | ) | (1 | ) | (1 | ) | (1 | ) | (1 | ) |
Operating Balance (including minority interest) |
|
|
| 2,451 |
| 3,105 |
| (9,303 | ) | (5,729 | ) | (7,111 | ) | (7,115 | ) | (5,773 | ) |
Attributable to minority interest |
|
|
| (67 | ) | — |
| — |
| — |
| — |
| — |
| — |
|
Operating balance |
| 11 |
| 2,384 |
| 3,105 |
| (9,303 | ) | (5,729 | ) | (7,111 | ) | (7,115 | ) | (5,773 | ) |
The accompanying Notes and Accounting policies are an integral part of these Statements.
for the years ending 30 June
|
| 2008 |
| 2009 |
| 2009 |
| 2010 |
| 2011 |
| 2012 |
| 2013 |
|
|
| Actual |
| Budget |
| Forecast |
| Forecast |
| Forecast |
| Forecast |
| Forecast |
|
|
| $m |
| $m |
| $m |
| $m |
| $m |
| $m |
| $m |
|
Total Crown |
|
|
|
|
|
|
|
|
|
|
|
|
|
|
|
Total Crown expenses |
|
|
|
|
|
|
|
|
|
|
|
|
|
|
|
By functional classification |
|
|
|
|
|
|
|
|
|
|
|
|
|
|
|
Social security and welfare |
| 21,509 |
| 22,843 |
| 23,409 |
| 25,073 |
| 26,409 |
| 27,604 |
| 28,607 |
|
GSF pension expenses |
| 690 |
| 652 |
| 680 |
| 370 |
| 390 |
| 437 |
| 494 |
|
Health |
| 10,809 |
| 12,024 |
| 11,947 |
| 12,815 |
| 12,754 |
| 12,713 |
| 12,692 |
|
Education |
| 10,397 |
| 11,017 |
| 11,844 |
| 12,147 |
| 12,198 |
| 12,237 |
| 12,290 |
|
Core government services |
| 3,274 |
| 3,412 |
| 3,813 |
| 3,582 |
| 3,602 |
| 3,656 |
| 3,733 |
|
Law and order |
| 3,082 |
| 3,341 |
| 3,358 |
| 3,515 |
| 3,549 |
| 3,565 |
| 3,588 |
|
Defence |
| 1,525 |
| 1,697 |
| 1,687 |
| 1,761 |
| 1,757 |
| 1,746 |
| 1,744 |
|
Transport and communications |
| 7,424 |
| 8,027 |
| 9,349 |
| 8,868 |
| 9,178 |
| 9,240 |
| 9,485 |
|
Economic and industrial services |
| 9,038 |
| 7,918 |
| 8,055 |
| 8,246 |
| 8,811 |
| 8,884 |
| 8,969 |
|
Primary services |
| 1,459 |
| 1,364 |
| 1,437 |
| 1,510 |
| 1,452 |
| 1,465 |
| 1,473 |
|
Heritage, culture and recreation |
| 2,337 |
| 3,130 |
| 2,414 |
| 2,806 |
| 3,031 |
| 2,967 |
| 4,060 |
|
Housing and community development |
| 938 |
| 1,036 |
| 904 |
| 1,115 |
| 1,146 |
| 1,175 |
| 1,184 |
|
Other |
| 259 |
| 83 |
| 120 |
| 562 |
| 247 |
| 739 |
| 284 |
|
Finance costs |
| 3,101 |
| 2,503 |
| 3,358 |
| 3,349 |
| 4,019 |
| 4,625 |
| 5,460 |
|
Forecast for future new spending |
| — |
| 249 |
| — |
| 254 |
| 1,436 |
| 2,533 |
| 3,622 |
|
Top-down expense adjustment |
| — |
| (495 | ) | (500 | ) | (300 | ) | (225 | ) | (150 | ) | (150 | ) |
Total Crown Expenses excluding losses |
| 75,842 |
| 78,801 |
| 81,875 |
| 85,673 |
| 89,754 |
| 93,436 |
| 97,535 |
|
Below is an analysis of core Crown expenses by functional classification. Core Crown expenses include expenses incurred by the Crown, Departments, Reserve Bank and the NZS Fund, but not Crown entities and SOEs.
|
| 2008 |
| 2009 |
| 2009 |
| 2010 |
| 2011 |
| 2012 |
| 2013 |
|
|
| Actual |
| Budget |
| Forecast |
| Forecast |
| Forecast |
| Forecast |
| Forecast |
|
|
| $m |
| $m |
| $m |
| $m |
| $m |
| $m |
| $m |
|
Core Crown |
|
|
|
|
|
|
|
|
|
|
|
|
|
|
|
Core Crown expenses |
|
|
|
|
|
|
|
|
|
|
|
|
|
|
|
By functional classification |
|
|
|
|
|
|
|
|
|
|
|
|
|
|
|
Social security and welfare |
| 17,877 |
| 18,898 |
| 19,475 |
| 21,139 |
| 22,114 |
| 22,925 |
| 23,572 |
|
GSF pension expenses |
| 690 |
| 652 |
| 680 |
| 370 |
| 390 |
| 437 |
| 494 |
|
Health |
| 11,297 |
| 12,586 |
| 12,395 |
| 13,397 |
| 13,371 |
| 13,358 |
| 13,324 |
|
Education |
| 9,551 |
| 10,524 |
| 10,964 |
| 11,284 |
| 11,304 |
| 11,311 |
| 11,332 |
|
Core government services |
| 3,371 |
| 3,448 |
| 3,853 |
| 3,620 |
| 3,632 |
| 3,697 |
| 3,774 |
|
Law and order |
| 2,894 |
| 3,101 |
| 3,116 |
| 3,267 |
| 3,302 |
| 3,302 |
| 3,319 |
|
Defence |
| 1,562 |
| 1,741 |
| 1,735 |
| 1,810 |
| 1,807 |
| 1,797 |
| 1,796 |
|
Transport and communications |
| 2,244 |
| 2,823 |
| 2,954 |
| 2,253 |
| 1,864 |
| 1,740 |
| 1,615 |
|
Economic and industrial services |
| 2,889 |
| 3,244 |
| 3,145 |
| 2,673 |
| 2,594 |
| 2,590 |
| 2,585 |
|
Primary services |
| 541 |
| 520 |
| 545 |
| 611 |
| 545 |
| 553 |
| 559 |
|
Heritage, culture and recreation |
| 1,107 |
| 1,769 |
| 1,062 |
| 1,507 |
| 1,711 |
| 1,594 |
| 2,638 |
|
Housing and community development |
| 260 |
| 334 |
| 312 |
| 365 |
| 356 |
| 360 |
| 346 |
|
Other |
| 254 |
| 83 |
| 120 |
| 562 |
| 247 |
| 739 |
| 284 |
|
Finance costs |
| 2,460 |
| 2,406 |
| 2,507 |
| 2,470 |
| 2,998 |
| 3,575 |
| 4,330 |
|
Forecast for future new spending |
| — |
| 249 |
| — |
| 254 |
| 1,436 |
| 2,533 |
| 3,622 |
|
Top-down expense adjustment |
| — |
| (495 | ) | (500 | ) | (300 | ) | (225 | ) | (150 | ) | (150 | ) |
Total Core Crown Expenses excluding losses |
| 56,997 |
| 61,883 |
| 62,363 |
| 65,282 |
| 67,446 |
| 70,361 |
| 73,440 |
|
The accompanying Notes and Accounting policies are an integral part of these Statements.
for the years ending 30 June
|
| 2008 |
| 2009 |
| 2009 |
| 2010 |
| 2011 |
| 2012 |
| 2013 |
|
|
| Actual |
| Budget |
| Forecast |
| Forecast |
| Forecast |
| Forecast |
| Forecast |
|
|
| $m |
| $m |
| $m |
| $m |
| $m |
| $m |
| $m |
|
Cash Flows From Operations |
|
|
|
|
|
|
|
|
|
|
|
|
|
|
|
Cash was provided from |
|
|
|
|
|
|
|
|
|
|
|
|
|
|
|
Taxation receipts |
| 55,168 |
| 54,681 |
| 52,266 |
| 50,268 |
| 50,791 |
| 53,223 |
| 56,647 |
|
Other sovereign receipts |
| 3,460 |
| 3,675 |
| 3,733 |
| 4,290 |
| 4,446 |
| 4,550 |
| 4,660 |
|
Sales of goods and services |
| 14,635 |
| 14,596 |
| 16,458 |
| 16,472 |
| 17,825 |
| 18,244 |
| 18,898 |
|
Interest and dividend receipts |
| 3,111 |
| 2,807 |
| 2,731 |
| 2,697 |
| 2,788 |
| 2,764 |
| 2,776 |
|
Other operating receipts |
| 2,211 |
| 2,527 |
| 2,707 |
| 2,734 |
| 2,659 |
| 2,657 |
| 2,832 |
|
Total cash provided from operations |
| 78,585 |
| 78,286 |
| 77,895 |
| 76,461 |
| 78,509 |
| 81,438 |
| 85,813 |
|
Cash was disbursed to |
|
|
|
|
|
|
|
|
|
|
|
|
|
|
|
Transfer payments and subsidies |
| 18,026 |
| 19,123 |
| 19,863 |
| 21,159 |
| 22,095 |
| 22,756 |
| 24,382 |
|
Personnel and operating payments |
| 45,972 |
| 49,961 |
| 52,281 |
| 54,128 |
| 55,094 |
| 55,308 |
| 55,236 |
|
Interest payments |
| 2,820 |
| 2,284 |
| 2,907 |
| 3,042 |
| 3,676 |
| 4,389 |
| 5,232 |
|
Forecast for future new spending |
| — |
| 249 |
| — |
| 254 |
| 1,436 |
| 2,533 |
| 3,622 |
|
Top-down expense adjustment |
| — |
| (355 | ) | (400 | ) | (300 | ) | (225 | ) | (150 | ) | (150 | ) |
Total cash disbursed to operations |
| 66,818 |
| 71,262 |
| 74,651 |
| 78,283 |
| 82,076 |
| 84,836 |
| 88,322 |
|
Net cash flows from operations |
| 11,767 |
| 7,024 |
| 3,244 |
| (1,822 | ) | (3,567 | ) | (3,398 | ) | (2,509 | ) |
Cash Flows From Investing Activities |
|
|
|
|
|
|
|
|
|
|
|
|
|
|
|
Cash was provided from/(disbursed to) |
|
|
|
|
|
|
|
|
|
|
|
|
|
|
|
Net purchase of physical assets |
| (4,922 | ) | (6,583 | ) | (6,106 | ) | (7,679 | ) | (7,009 | ) | (5,772 | ) | (6,167 | ) |
Net purchase of shares and other securities |
| (6,080 | ) | (576 | ) | (7,678 | ) | 3,887 |
| 797 |
| 3,920 |
| 2,645 |
|
Net purchase of intangible assets |
| (320 | ) | (324 | ) | (391 | ) | (350 | ) | (290 | ) | (284 | ) | (284 | ) |
Net repayment/(issues) of advances |
| (2,646 | ) | (590 | ) | (1,013 | ) | (651 | ) | (695 | ) | (1,118 | ) | (1,381 | ) |
Net acquisition of investments in associates |
| (363 | ) | (230 | ) | (313 | ) | (46 | ) | 52 |
| 67 |
| 67 |
|
Forecast for new capital spending |
| — |
| (261 | ) | — |
| (72 | ) | (702 | ) | (1,152 | ) | (1,450 | ) |
Top-down capital adjustment |
| — |
| 350 |
| 275 |
| 100 |
| — |
| — |
| — |
|
Net cash flows from investing activities |
| (14,331 | ) | (8,214 | ) | (15,226 | ) | (4,811 | ) | (7,847 | ) | (4,339 | ) | (6,570 | ) |
Net cash flows from operating and investing activities |
| (2,564 | ) | (1,190 | ) | (11,982 | ) | (6,633 | ) | (11,414 | ) | (7,737 | ) | (9,079 | ) |
Cash Flows From Financing Activities |
|
|
|
|
|
|
|
|
|
|
|
|
|
|
|
Cash was provided from/(disbursed to) |
|
|
|
|
|
|
|
|
|
|
|
|
|
|
|
Issues of circulating currency |
| 86 |
| 181 |
| 509 |
| 181 |
| 190 |
| 200 |
| 210 |
|
Net issue/(repayment) of Government stock(1) |
| 1,674 |
| 1,235 |
| 2,451 |
| 3,870 |
| 10,542 |
| 7,538 |
| 7,125 |
|
Net issue/(repayment) of foreign-currency borrowing |
| 1,099 |
| (299 | ) | (5,636 | ) | (3,708 | ) | 35 |
| (1,020 | ) | (506 | ) |
Net issue/(repayment) of other New Zealand dollar borrowing |
| (697 | ) | 1,255 |
| 16,076 |
| 5,968 |
| 639 |
| 1,333 |
| 1,976 |
|
Net cash flows from financing activities |
| 2,162 |
| 2,372 |
| 13,400 |
| 6,311 |
| 11,406 |
| 8,051 |
| 8,805 |
|
Net movement in cash |
| (402 | ) | 1,182 |
| 1,418 |
| (322 | ) | (8 | ) | 314 |
| (274 | ) |
Opening cash balance |
| 4,162 |
| 5,217 |
| 3,804 |
| 5,353 |
| 5,042 |
| 5,045 |
| 5,370 |
|
Foreign-exchange gains/(losses) on opening cash |
| 44 |
| 13 |
| 131 |
| 11 |
| 11 |
| 11 |
| 11 |
|
Closing cash balance |
| 3,804 |
| 6,412 |
| 5,353 |
| 5,042 |
| 5,045 |
| 5,370 |
| 5,107 |
|
(1) Net issues of Government stock include movements in the government stock holdings of entities such as NZS Fund, ACC and EQC.
Further information on the proceeds and repayments of Government stock (“domestic bonds”) is available in note 21.
The accompanying Notes and Accounting policies are an integral part of these Statements.
for the years ending 30 June
|
|
|
| 2009 |
|
|
|
|
|
|
|
|
|
|
|
|
| 2008 |
| Previous |
| 2009 |
| 2010 |
| 2011 |
| 2012 |
| 2013 |
|
|
| $m |
| $m |
| $m |
| $m |
| $m |
| $m |
| $m |
|
Reconciliation Between the Net Cash Flows from Operations and the Operating Balance |
|
|
|
|
|
|
|
|
|
|
|
|
|
|
|
Net Cash Flows from Operations |
| 11,767 |
| 7,024 |
| 3,244 |
| (1,822 | ) | (3,567 | ) | (3,398 | ) | (2,509 | ) |
Items included in the operating balance but not in net cash flows from operations |
|
|
|
|
|
|
|
|
|
|
|
|
|
|
|
Gains/(losses) |
|
|
|
|
|
|
|
|
|
|
|
|
|
|
|
Gains/(losses) on other financial instruments |
| (617 | ) | 1,424 |
| (3,266 | ) | 1,416 |
| 1,529 |
| 1,838 |
| 2,044 |
|
Gains/(losses) on other non-financial instruments |
| (2,925 | ) | 170 |
| (3,450 | ) | 205 |
| 224 |
| 231 |
| 225 |
|
Total Gains/(losses) |
| (3,542 | ) | 1,594 |
| (6,716 | ) | 1,621 |
| 1,753 |
| 2,069 |
| 2,269 |
|
Other Non-cash Items in Operating Balance |
|
|
|
|
|
|
|
|
|
|
|
|
|
|
|
Depreciation and amortisation |
| (3,670 | ) | (3,950 | ) | (4,283 | ) | (4,126 | ) | (4,365 | ) | (4,529 | ) | (4,617 | ) |
Write-down on initial recognition of financial assets |
| (559 | ) | (667 | ) | (718 | ) | (578 | ) | (606 | ) | (619 | ) | (631 | ) |
Impairment on financial assets (excl receivables) |
| 213 |
| 1 |
| 15 |
| 3 |
| 1 |
| 1 |
| 2 |
|
Decrease/(increase) in defined benefit retirement plan liabilities |
| 2 |
| (75 | ) | (39 | ) | 274 | �� | 268 |
| 241 |
| 186 |
|
Decrease/(increase) in insurance liabilities |
| (1,358 | ) | (1,313 | ) | (1,557 | ) | (1,209 | ) | (1,317 | ) | (1,549 | ) | (1,739 | ) |
Other |
| 334 |
| 193 |
| 333 |
| 390 |
| 402 |
| 400 |
| 382 |
|
Total other non-cash Items |
| (5,038 | ) | (5,811 | ) | (6,249 | ) | (5,246 | ) | (5,617 | ) | (6,055 | ) | (6,417 | ) |
Movements in Working Capital |
|
|
|
|
|
|
|
|
|
|
|
|
|
|
|
Increase/(decrease) in receivables |
| 2,100 |
| 422 |
| (371 | ) | 305 |
| (75 | ) | 11 |
| 410 |
|
Increase/(decrease) in accrued interest |
| (179 | ) | 333 |
| (182 | ) | 155 |
| 199 |
| 362 |
| 437 |
|
Increase/(decrease) in inventories |
| 138 |
| 63 |
| 134 |
| 67 |
| 83 |
| 14 |
| 3 |
|
Increase/(decrease) in prepayments |
| 77 |
| 13 |
| (8 | ) | 8 |
| 8 |
| (1 | ) | 6 |
|
Decrease/(increase) in deferred revenue |
| (326 | ) | (18 | ) | 74 |
| 5 |
| (10 | ) | (10 | ) | (6 | ) |
Decrease/(increase) in payables |
| (2,613 | ) | (515 | ) | 771 |
| (822 | ) | 115 |
| (107 | ) | 34 |
|
Total movements in working capital |
| (803 | ) | 298 |
| 418 |
| (282 | ) | 320 |
| 269 |
| 884 |
|
Operating Balance |
| 2,384 |
| 3,105 |
| (9,303 | ) | (5,729 | ) | (7,111 | ) | (7,115 | ) | (5,773 | ) |
The accompanying Notes and Accounting policies are an integral part of these Statements.
for the years ending 30 June
|
|
|
| 2009 |
|
|
|
|
|
|
|
|
|
|
|
|
| 2008 |
| Previous |
| 2009 |
| 2010 |
| 2011 |
| 2012 |
| 2013 |
|
|
| $m |
| $m |
| $m |
| $m |
| $m |
| $m |
| $m |
|
Revaluation of physical assets |
| 6,214 |
| — |
| (707 | ) | (1 | ) | (1 | ) | — |
| (1 | ) |
Effective portion of changes in value of cash flow hedges |
| 9 |
| 58 |
| 4 |
| (18 | ) | (22 | ) | (6 | ) | (29 | ) |
Net change in fair value of cash flow hedges transferred to operating balance |
| 22 |
| — |
| (1 | ) | — |
| (1 | ) | — |
| — |
|
Net change in fair value of cash flow hedges transferred to the hedged item |
| (60 | ) | — |
| 65 |
| 3 |
| 1 |
| 1 |
| — |
|
Foreign currency translation differences for foreign operations |
| 17 |
| — |
| 76 |
| — |
| — |
| — |
| — |
|
Valuation gain/(losses) on investments available for sale taken to reserves |
| 11 |
| 6 |
| 49 |
| (3 | ) | — |
| — |
| — |
|
Other movements |
| — |
| 2 |
| 1 |
| (1 | ) | (3 | ) | 2 |
| 1 |
|
Other comprehensive income for the year |
| 6,213 |
| 66 |
| (513 | ) | (20 | ) | (26 | ) | (3 | ) | (29 | ) |
Operating Balance (including minority interest) |
| 2,451 |
| 3,105 |
| (9,303 | ) | (5,729 | ) | (7,111 | ) | (7,115 | ) | (5,773 | ) |
Total comprehensive income |
| 8,664 |
| 3,171 |
| (9,816 | ) | (5,749 | ) | (7,137 | ) | (7,118 | ) | (5,802 | ) |
Attributable to: |
|
|
|
|
|
|
|
|
|
|
|
|
|
|
|
- minority interest |
| 83 |
| — |
| — |
| — |
| — |
| — |
| — |
|
- the Crown |
| 8,581 |
| 3,171 |
| (9,816 | ) | (5,749 | ) | (7,137 | ) | (7,118 | ) | (5,802 | ) |
Total comprehensive income |
| 8,664 |
| 3,171 |
| (9,816 | ) | (5,749 | ) | (7,137 | ) | (7,118 | ) | (5,802 | ) |
This statement reports changes in net worth due to the operating balance, items of income or expense that are recognised directly in net worth, the effect of certain accounting changes and corrections of errors.
The accompanying Notes and Accounting policies are an integral part of these Statements.
as at 30 June
|
|
|
|
|
| 2009 |
|
|
|
|
|
|
|
|
|
|
|
|
|
|
| 2008 |
| Previous Budget |
| 2009 |
| 2010 |
| 2011 |
| 2012 |
| 2013 |
|
|
| Note |
| $m |
| $m |
| $m |
| $m |
| $m |
| $m |
| $m |
|
Assets |
|
|
|
|
|
|
|
|
|
|
|
|
|
|
|
|
|
Cash and cash equivalents |
| 12 |
| 3,804 |
| 6,412 |
| 5,353 |
| 5,042 |
| 5,045 |
| 5,370 |
| 5,107 |
|
Receivables |
| 12 |
| 14,158 |
| 12,749 |
| 13,787 |
| 14,093 |
| 14,018 |
| 14,029 |
| 14,439 |
|
Marketable securities, deposits and derivatives in gain |
| 12 |
| 41,189 |
| 35,277 |
| 54,676 |
| 49,683 |
| 49,010 |
| 46,439 |
| 45,151 |
|
Share investments |
| 12 |
| 12,964 |
| 13,700 |
| 10,664 |
| 12,184 |
| 13,544 |
| 15,170 |
| 17,232 |
|
Advances |
| 12 |
| 12,948 |
| 16,722 |
| 15,042 |
| 17,268 |
| 18,905 |
| 19,502 |
| 20,124 |
|
Inventory |
|
|
| 964 |
| 997 |
| 1,099 |
| 1,165 |
| 1,248 |
| 1,262 |
| 1,265 |
|
Other assets |
|
|
| 1,663 |
| 1,307 |
| 1,547 |
| 1,519 |
| 1,490 |
| 1,478 |
| 1,438 |
|
Property, plant & equipment |
| 14 |
| 103,329 |
| 101,276 |
| 106,498 |
| 110,251 |
| 113,517 |
| 115,764 |
| 118,486 |
|
Equity accounted investments(1) |
|
|
| 8,065 |
| 8,683 |
| 8,805 |
| 9,197 |
| 9,532 |
| 9,729 |
| 9,686 |
|
Intangible assets and goodwill |
|
|
| 1,751 |
| 1,929 |
| 1,928 |
| 2,133 |
| 2,281 |
| 2,333 |
| 2,239 |
|
Forecast for new capital spending |
|
|
| — |
| 951 |
| — |
| 72 |
| 774 |
| 1,926 |
| 3,376 |
|
Top-down capital adjustment |
|
|
| — |
| (350 | ) | (275 | ) | (375 | ) | (375 | ) | (375 | ) | (375 | ) |
Total assets |
|
|
| 200,835 |
| 199,653 |
| 219,124 |
| 222,232 |
| 228,989 |
| 232,627 |
| 238,168 |
|
Liabilities |
|
|
|
|
|
|
|
|
|
|
|
|
|
|
|
|
|
Issued currency |
|
|
| 3,530 |
| 3,885 |
| 4,039 |
| 4,220 |
| 4,410 |
| 4,610 |
| 4,819 |
|
Payables |
| 16 |
| 10,895 |
| 8,497 |
| 9,949 |
| 10,296 |
| 10,672 |
| 11,313 |
| 11,405 |
|
Deferred revenue |
|
|
| 1,292 |
| 1,064 |
| 1,218 |
| 1,213 |
| 1,223 |
| 1,233 |
| 1,239 |
|
Borrowings |
|
|
| 46,110 |
| 48,656 |
| 69,156 |
| 76,423 |
| 88,656 |
| 97,420 |
| 106,621 |
|
Insurance liabilities |
| 17 |
| 20,484 |
| 22,065 |
| 24,136 |
| 25,345 |
| 26,662 |
| 28,211 |
| 29,950 |
|
Retirement plan liabilities |
| 18 |
| 8,257 |
| 8,221 |
| 10,557 |
| 10,307 |
| 10,063 |
| 9,850 |
| 9,693 |
|
Provisions |
| 19 |
| 4,753 |
| 4,711 |
| 4,371 |
| 4,479 |
| 4,491 |
| 4,296 |
| 4,549 |
|
Total liabilities |
|
|
| 95,321 |
| 97,099 |
| 123,426 |
| 132,283 |
| 146,177 |
| 156,933 |
| 168,276 |
|
Total assets less total liabilities |
|
|
| 105,514 |
| 102,554 |
| 95,698 |
| 89,949 |
| 82,812 |
| 75,694 |
| 69,892 |
|
Net Worth |
|
|
|
|
|
|
|
|
|
|
|
|
|
|
|
|
|
Taxpayer funds |
| 20 |
| 46,700 |
| 49,886 |
| 37,534 |
| 31,803 |
| 24,689 |
| 17,577 |
| 11,805 |
|
Property, plant and equipment revaluation reserve |
| 20 |
| 58,566 |
| 52,486 |
| 57,723 |
| 57,723 |
| 57,722 |
| 57,721 |
| 57,720 |
|
Other reserves |
| 20 |
| (134 | ) | (114 | ) | 59 |
| 41 |
| 19 |
| 14 |
| (15 | ) |
Total net worth attributable to the Crown |
|
|
| 105,132 |
| 102,258 |
| 95,316 |
| 89,567 |
| 82,430 |
| 75,312 |
| 69,510 |
|
Net worth attributable to minority interest |
|
|
| 382 |
| 296 |
| 382 |
| 382 |
| 382 |
| 382 |
| 382 |
|
Total net worth |
|
|
| 105,514 |
| 102,554 |
| 95,698 |
| 89,949 |
| 82,812 |
| 75,694 |
| 69,892 |
|
(1) Tertiary education institutions constitute most equity accounted investments.
The accompanying Notes and Accounting policies are an integral part of these Statements.
as at 30 June
|
|
|
| 2009 |
|
|
|
|
|
|
|
|
|
|
|
|
| 2008 |
| Previous Budget |
| 2009 |
| 2010 |
| 2011 |
| 2012 |
| 2013 |
|
|
| $m |
| $m |
| $m |
| $m |
| $m |
| $m |
| $m |
|
Borrowings |
|
|
|
|
|
|
|
|
|
|
|
|
|
|
|
Government stock |
| 18,516 |
| 19,073 |
| 21,237 |
| 25,629 |
| 36,749 |
| 45,057 |
| 53,052 |
|
Treasury bills |
| 1,484 |
| 1,289 |
| 7,140 |
| 9,550 |
| 9,548 |
| 9,517 |
| 9,486 |
|
Government retail stock |
| 423 |
| 381 |
| 581 |
| 581 |
| 581 |
| 581 |
| 581 |
|
Settlement deposits with Reserve Bank |
| 7,750 |
| 7,465 |
| 9,432 |
| 9,432 |
| 9,432 |
| 9,432 |
| 9,432 |
|
Derivatives in loss(1) |
| 1,591 |
| 493 |
| 4,127 |
| 3,237 |
| 3,130 |
| 2,681 |
| 2,084 |
|
Finance lease liabilities |
| 955 |
| 993 |
| 1,444 |
| 1,247 |
| 1,431 |
| 2,018 |
| 2,875 |
|
Other borrowings |
| 15,391 |
| 18,962 |
| 25,195 |
| 26,747 |
| 27,785 |
| 28,134 |
| 29,111 |
|
Total borrowings |
| 46,110 |
| 48,656 |
| 69,156 |
| 76,423 |
| 88,656 |
| 97,420 |
| 106,621 |
|
Total sovereign-guaranteed debt |
| 33,192 |
| 32,534 |
| 51,654 |
| 58,076 |
| 69,106 |
| 76,885 |
| 84,249 |
|
Total non sovereign-guaranteed debt |
| 12,918 |
| 16,122 |
| 17,502 |
| 18,347 |
| 19,550 |
| 20,535 |
| 22,372 |
|
Total borrowings |
| 46,110 |
| 48,656 |
| 69,156 |
| 76,423 |
| 88,656 |
| 97,420 |
| 106,621 |
|
Net Debt: |
|
|
|
|
|
|
|
|
|
|
|
|
|
|
|
Core Crown borrowings |
| 37,336 |
| 37,640 |
| 57,329 |
| 64,116 |
| 75,570 |
| 83,801 |
| 91,614 |
|
Add back NZS Fund holdings of sovereign-issued debt and NZS Fund borrowings |
| 409 |
| 768 |
| (528 | ) | (559 | ) | (559 | ) | (560 | ) | (561 | ) |
Gross sovereign-issued debt |
| 37,745 |
| 38,408 |
| 56,801 |
| 63,557 |
| 75,011 |
| 83,241 |
| 91,053 |
|
Less core Crown financial assets |
| 40,421 |
| 37,948 |
| 52,987 |
| 49,496 |
| 50,077 |
| 48,063 |
| 47,031 |
|
Net core Crown debt (incl. NZS Fund)(2) |
| (2,676 | ) | 460 |
| 3,814 |
| 14,061 |
| 24,934 |
| 35,178 |
| 44,022 |
|
Add back NZS Fund holdings of core Crown financial assets and NZS Fund financial assets |
| 12,934 |
| 15,915 |
| 11,668 |
| 13,258 |
| 14,825 |
| 16,732 |
| 18,612 |
|
Net core Crown debt (excl. NZS Fund)(3) |
| 10,258 |
| 16,375 |
| 15,482 |
| 27,319 |
| 39,759 |
| 51,910 |
| 62,634 |
|
Gross Debt: |
|
|
|
|
|
|
|
|
|
|
|
|
|
|
|
Gross sovereign-issued debt |
| 37,745 |
| 38,408 |
| 56,801 |
| 63,557 |
| 75,011 |
| 83,241 |
| 91,053 |
|
Less Reserve Bank settlement cash and bank bills |
| (7,955 | ) | (7,510 | ) | (14,184 | ) | (14,184 | ) | (14,184 | ) | (14,184 | ) | (14,184 | ) |
Add back changes to DMO borrowing due to settlement cash |
| 1,600 |
| 1,600 |
| 1,600 |
| 1,600 |
| 1,600 |
| 1,600 |
| 1,600 |
|
Gross sovereign-issued debt excluding Reserve Bank settlement cash and bank bills(4) |
| 31,390 |
| 32,498 |
| 44,217 |
| 50,973 |
| 62,427 |
| 70,657 |
| 78,469 |
|
Notes on Borrowings
Total Borrowings represents the Government’s debt obligations to external parties. Total borrowings can be split into sovereign-guaranteed debt and non-sovereign-guaranteed debt. Non sovereign-guaranteed debt represents the debt obligations of SOEs and Crown entities that are not explicitly guaranteed by the Crown.
(1) Derivatives are included in either borrowings (as a liability) or marketable securities, deposits and equity investments (as an asset) depending on their value at balance date. This treatment leads to fluctuations in individual items within the Statement of Borrowings, primarily due to exchange rate movements.
(2) Net Core Crown Debt represents GSID less financial assets. This can provide information about the sustainability of the Government’s accounts, and is used by some international agencies when determining the credit-worthiness of a country. However, as some financial assets are held for public policy rather than treasury management purposes, they are excluded from the net debt indicator (eg advances and receivables).
(3) NZS Fund is excluded from net core Crown debt as these assets are set aside to meet part of the future cost of New Zealand superannuation.
(4) Gross Sovereign-Issued Debt (GSID) represents debt issued by the sovereign (the core Crown) and includes Government stock held by the NZS Fund, ACC and EQC. GSID excludes debt instruments issued by the Reserve Bank for liquidity management purposes (specifically settlement cash and bank bills). In addition, the Reserve
Bank has used $1.6b of settlement cash to purchase reserves that were to have been funded by DMO borrowing. Therefore, the impact of settlement cash on GSID is adjusted by this amount.
The composition of these debt indicators has been re-specified as part of the reformulation of the Government’s fiscal strategy (refer to the Fiscal Strategy Report). The two main changes were:
i) Reserve Bank bills are now deducted from GSID as, like settlement cash, these bills are a vehicle for managing liquidity in financial markets.
ii) The definition of net debt now excludes advances.
The accompanying Notes and Accounting policies are an integral part of these Statements.
as at 31 March 2009
|
| As at 31 |
| As at 30 June |
|
|
| $m |
| $m |
|
Capital Commitments |
|
|
|
|
|
Specialist military equipment |
| 895 |
| 873 |
|
Land and buildings |
| 1,211 |
| 1,121 |
|
Other property, plant and equipment |
| 4,097 |
| 4,303 |
|
Other capital commitments |
| 371 |
| 304 |
|
Tertiary Education Institutions |
| 209 |
| 209 |
|
Total capital commitments |
| 6,783 |
| 6,810 |
|
Operating Commitments |
|
|
|
|
|
Non-cancellable accommodation leases |
| 2,440 |
| 2,460 |
|
Other non-cancellable leases |
| 2,658 |
| 2,390 |
|
Non-cancellable contracts for the supply of goods and services |
| 2,397 |
| 2,157 |
|
Other operating commitments |
| 6,784 |
| 7,995 |
|
Tertiary Education Institutions |
| 315 |
| 315 |
|
Total operating commitments |
| 14,594 |
| 15,317 |
|
Total commitments |
| 21,377 |
| 22,127 |
|
Total Commitments by Segment |
|
|
|
|
|
Core Crown |
| 11,980 |
| 19,627 |
|
Crown entities |
| 12,959 |
| 15,830 |
|
State-owned Enterprises |
| 4,895 |
| 4,724 |
|
Inter-segment eliminations |
| (8,457 | ) | (18,054 | ) |
Total commitments |
| 21,377 |
| 22,127 |
|
as at 31 March 2009
|
| As at 31 |
| As at 30 |
|
|
| $m |
| $m |
|
Quantifiable Contingent Liabilities |
|
|
|
|
|
Guarantees and indemnities |
| 107 |
| 286 |
|
Uncalled capital |
| 2,972 |
| 2,205 |
|
Legal proceedings and disputes |
| 347 |
| 383 |
|
Other contingent liabilities |
| 2,437 |
| 1,995 |
|
Total quantifiable contingent liabilities |
| 5,863 |
| 4,869 |
|
Total Quantifiable Contingent Liabilities by Segment |
|
|
|
|
|
Core Crown |
| 5,717 |
| 4,685 |
|
Crown entities |
| 79 |
| 86 |
|
State-owned Enterprises |
| 67 |
| 98 |
|
Inter-segment eliminations |
| — |
| — |
|
Total quantifiable contingent liabilities |
| 5,863 |
| 4,869 |
|
Quantifiable Contingent Assets |
|
|
|
|
|
Core Crown |
| 318 |
| 389 |
|
Crown entities |
| — |
| — |
|
Total quantifiable contingent assets |
| 318 |
| 389 |
|
The accompanying Notes and Accounting policies are an integral part of these Statements.
More information on contingent liabilities (quantified and unquantified) is outlined on pages 124 to 136 of the Fiscal Risks chapter.
|
|
|
| 2009 |
|
|
|
|
|
|
|
|
|
|
|
|
| 2008 |
| Previous |
| 2009 |
| 2010 |
| 2011 |
| 2012 |
| 2013 |
|
|
| Actual |
| Budget |
| Forecast |
| Forecast |
| Forecast |
| Forecast |
| Forecast |
|
|
| $m |
| $m |
| $m |
| $m |
| $m |
| $m |
| $m |
|
NOTE 1: Revenue Collected Through the Crown’s Sovereign Power |
|
|
|
|
|
|
|
|
|
|
|
|
|
|
|
Taxation Revenue (accrual) |
|
|
|
|
|
|
|
|
|
|
|
|
|
|
|
Individuals |
|
|
|
|
|
|
|
|
|
|
|
|
|
|
|
Source deductions |
| 23,345 |
| 22,874 |
| 22,967 |
| 21,699 |
| 21,732 |
| 22,594 |
| 23,909 |
|
Other persons |
| 5,071 |
| 4,986 |
| 4,639 |
| 4,387 |
| 4,235 |
| 4,469 |
| 4,713 |
|
Refunds |
| (1,470 | ) | (1,199 | ) | (1,731 | ) | (1,651 | ) | (1,651 | ) | (1,671 | ) | (1,763 | ) |
Fringe benefit tax |
| 522 |
| 523 |
| 499 |
| 487 |
| 496 |
| 520 |
| 544 |
|
Total individuals |
| 27,468 |
| 27,184 |
| 26,374 |
| 24,922 |
| 24,812 |
| 25,912 |
| 27,403 |
|
Corporate Tax |
|
|
|
|
|
|
|
|
|
|
|
|
|
|
|
Gross companies tax |
| 8,787 |
| 7,817 |
| 7,014 |
| 7,077 |
| 7,728 |
| 8,592 |
| 9,595 |
|
Refunds |
| (242 | ) | (300 | ) | (535 | ) | (345 | ) | (348 | ) | (369 | ) | (402 | ) |
Non-resident withholding tax |
| 1,506 |
| 1,402 |
| 1,409 |
| 1,107 |
| 1,135 |
| 1,247 |
| 1,366 |
|
Foreign-source dividend w/holding payments |
| 71 |
| 109 |
| 5 |
| 13 |
| 13 |
| 13 |
| 13 |
|
Total corporate tax |
| 10,122 |
| 9,028 |
| 7,893 |
| 7,852 |
| 8,528 |
| 9,483 |
| 10,572 |
|
Other Direct Income Tax |
|
|
|
|
|
|
|
|
|
|
|
|
|
|
|
Resident w/holding tax on interest income |
| 2,699 |
| 2,740 |
| 2,763 |
| 2,049 |
| 1,522 |
| 1,619 |
| 1,982 |
|
Resident w/holding tax on dividend income |
| 69 |
| 91 |
| 61 |
| 211 |
| 253 |
| 258 |
| 264 |
|
Estate and gift duties |
| 3 |
| 3 |
| 2 |
| 2 |
| 2 |
| 2 |
| 2 |
|
Total other direct income tax |
| 2,771 |
| 2,834 |
| 2,826 |
| 2,262 |
| 1,777 |
| 1,879 |
| 2,248 |
|
Total direct income tax |
| 40,361 |
| 39,046 |
| 37,093 |
| 35,036 |
| 35,117 |
| 37,274 |
| 40,223 |
|
Goods and Services Tax |
|
|
|
|
|
|
|
|
|
|
|
|
|
|
|
Gross goods and services tax |
| 20,631 |
| 20,458 |
| 22,248 |
| 21,121 |
| 21,856 |
| 23,105 |
| 24,546 |
|
Refunds |
| (9,516 | ) | (8,578 | ) | (10,655 | ) | (9,960 | ) | (10,605 | ) | (11,445 | ) | (12,211 | ) |
Total goods and services tax |
| 11,115 |
| 11,880 |
| 11,593 |
| 11,161 |
| 11,251 |
| 11,660 |
| 12,335 |
|
Other Indirect Taxation |
|
|
|
|
|
|
|
|
|
|
|
|
|
|
|
Petroleum fuels excise |
| 819 |
| 813 |
| 811 |
| 802 |
| 802 |
| 807 |
| 814 |
|
Tobacco excise |
| 159 |
| 151 |
| 170 |
| 172 |
| 175 |
| 178 |
| 181 |
|
Customs duty |
| 1,857 |
| 1,859 |
| 1,828 |
| 1,818 |
| 1,819 |
| 1,820 |
| 1,859 |
|
Road user charges |
| 851 |
| 940 |
| 883 |
| 885 |
| 955 |
| 1,036 |
| 1,100 |
|
Alcohol excise |
| 573 |
| 605 |
| 630 |
| 657 |
| 682 |
| 708 |
| 734 |
|
Gaming duties |
| 260 |
| 254 |
| 215 |
| 224 |
| 227 |
| 229 |
| 232 |
|
Motor vehicle fees |
| 226 |
| 229 |
| 171 |
| 167 |
| 168 |
| 171 |
| 173 |
|
Energy resources levies |
| 46 |
| 43 |
| 37 |
| 38 |
| 38 |
| 38 |
| 38 |
|
Approved issuer levy and cheque duty |
| 105 |
| 91 |
| 92 |
| 92 |
| 92 |
| 92 |
| 92 |
|
Total other indirect taxation |
| 4,896 |
| 4,985 |
| 4,837 |
| 4,855 |
| 4,958 |
| 5,079 |
| 5,223 |
|
Total indirect taxation |
| 16,011 |
| 16,865 |
| 16,430 |
| 16,016 |
| 16,209 |
| 16,739 |
| 17,558 |
|
Total taxation revenue |
| 56,372 |
| 55,911 |
| 53,523 |
| 51,052 |
| 51,326 |
| 54,013 |
| 57,781 |
|
Other Sovereign Revenue (accrual) |
|
|
|
|
|
|
|
|
|
|
|
|
|
|
|
ACC levies |
| 2,718 |
| 2,780 |
| 2,885 |
| 3,226 |
| 3,338 |
| 3,426 |
| 3,520 |
|
Fire Service levies |
| 279 |
| 303 |
| 303 |
| 307 |
| 314 |
| 322 |
| 330 |
|
EQC levies |
| 86 |
| 87 |
| 87 |
| 88 |
| 90 |
| 91 |
| 93 |
|
Other miscellaneous items |
| 796 |
| 867 |
| 839 |
| 1,239 |
| 1,661 |
| 1,861 |
| 2,356 |
|
Total other sovereign revenue |
| 3,879 |
| 4,037 |
| 4,114 |
| 4,860 |
| 5,403 |
| 5,700 |
| 6,299 |
|
Total sovereign revenue |
| 60,251 |
| 59,948 |
| 57,637 |
| 55,912 |
| 56,729 |
| 59,713 |
| 64,080 |
|
|
|
|
| 2009 |
|
|
|
|
|
|
|
|
|
|
|
|
| 2008 |
| Previous |
| 2009 |
| 2010 |
| 2011 |
| 2012 |
| 2013 |
|
|
| Actual |
| Budget |
| Forecast |
| Forecast |
| Forecast |
| Forecast |
| Forecast |
|
|
| $m |
| $m |
| $m |
| $m |
| $m |
| $m |
| $m |
|
NOTE 1 (continued): Receipts Collected Through the Crown’s Sovereign Power |
|
|
|
|
|
|
|
|
|
|
|
|
|
|
|
Income Tax Receipts (cash) |
|
|
|
|
|
|
|
|
|
|
|
|
|
|
|
Individuals |
|
|
|
|
|
|
|
|
|
|
|
|
|
|
|
Source deductions |
| 22,830 |
| 22,737 |
| 22,767 |
| 21,630 |
| 21,662 |
| 22,521 |
| 23,831 |
|
Other persons |
| 5,469 |
| 5,570 |
| 5,050 |
| 4,983 |
| 4,884 |
| 5,095 |
| 5,375 |
|
Refunds |
| (2,171 | ) | (2,065 | ) | (2,465 | ) | (2,393 | ) | (2,383 | ) | (2,512 | ) | (2,624 | ) |
Fringe benefit tax |
| 489 |
| 513 |
| 500 |
| 487 |
| 490 |
| 513 |
| 539 |
|
Total individuals |
| 26,617 |
| 26,755 |
| 25,852 |
| 24,707 |
| 24,653 |
| 25,617 |
| 27,121 |
|
Corporate Tax |
|
|
|
|
|
|
|
|
|
|
|
|
|
|
|
Gross companies tax |
| 9,075 |
| 7,948 |
| 7,965 |
| 7,801 |
| 8,642 |
| 9,471 |
| 10,232 |
|
Refunds |
| (1,026 | ) | (1,000 | ) | (1,741 | ) | (1,379 | ) | (1,388 | ) | (1,472 | ) | (1,607 | ) |
Non-resident withholding tax |
| 1,638 |
| 1,373 |
| 1,378 |
| 1,106 |
| 1,134 |
| 1,246 |
| 1,365 |
|
Foreign-source dividend w/holding payments |
| 72 |
| 109 |
| 5 |
| 13 |
| 13 |
| 13 |
| 13 |
|
Total corporate tax |
| 9,759 |
| 8,430 |
| 7,607 |
| 7,541 |
| 8,401 |
| 9,258 |
| 10,003 |
|
Other Direct Income Tax |
|
|
|
|
|
|
|
|
|
|
|
|
|
|
|
Resident w/holding tax on interest income |
| 2,616 |
| 2,740 |
| 2,746 |
| 2,051 |
| 1,524 |
| 1,621 |
| 1,984 |
|
Resident w/holding tax on dividend income |
| 40 |
| 90 |
| 86 |
| 210 |
| 252 |
| 257 |
| 262 |
|
Estate and gift duties |
| 2 |
| 3 |
| 2 |
| 2 |
| 2 |
| 2 |
| 2 |
|
Total other direct income tax |
| 2,658 |
| 2,833 |
| 2,834 |
| 2,263 |
| 1,778 |
| 1,880 |
| 2,248 |
|
Total direct income tax |
| 39,034 |
| 38,018 |
| 36,293 |
| 34,511 |
| 34,832 |
| 36,755 |
| 39,372 |
|
Goods and Services Tax |
|
|
|
|
|
|
|
|
|
|
|
|
|
|
|
Gross goods and services tax |
| 20,085 |
| 19,944 |
| 20,566 |
| 20,252 |
| 20,996 |
| 22,224 |
| 23,653 |
|
Refunds |
| (8,859 | ) | (8,267 | ) | (9,455 | ) | (9,360 | ) | (10,005 | ) | (10,845 | ) | (11,611 | ) |
Total goods and services tax |
| 11,226 |
| 11,677 |
| 11,111 |
| 10,892 |
| 10,991 |
| 11,379 |
| 12,042 |
|
Other Indirect Taxation |
|
|
|
|
|
|
|
|
|
|
|
|
|
|
|
Petroleum fuels excise |
| 809 |
| 813 |
| 811 |
| 802 |
| 802 |
| 807 |
| 814 |
|
Tobacco excise |
| 160 |
| 151 |
| 170 |
| 172 |
| 175 |
| 178 |
| 181 |
|
Customs duty |
| 1,946 |
| 1,859 |
| 1,828 |
| 1,818 |
| 1,819 |
| 1,820 |
| 1,859 |
|
Road user charges |
| 851 |
| 940 |
| 883 |
| 885 |
| 955 |
| 1,036 |
| 1,100 |
|
Alcohol excise |
| 554 |
| 605 |
| 630 |
| 657 |
| 682 |
| 708 |
| 734 |
|
Gaming duties |
| 238 |
| 254 |
| 224 |
| 224 |
| 227 |
| 229 |
| 232 |
|
Motor vehicle fees |
| 223 |
| 229 |
| 171 |
| 167 |
| 168 |
| 171 |
| 173 |
|
Energy resources levies |
| 42 |
| 43 |
| 43 |
| 38 |
| 38 |
| 38 |
| 38 |
|
Approved issuer levy and cheque duty |
| 85 |
| 92 |
| 102 |
| 102 |
| 102 |
| 102 |
| 102 |
|
Total other indirect taxation |
| 4,908 |
| 4,986 |
| 4,862 |
| 4,865 |
| 4,968 |
| 5,089 |
| 5,233 |
|
Total indirect taxation |
| 16,134 |
| 16,663 |
| 15,973 |
| 15,757 |
| 15,959 |
| 16,468 |
| 17,275 |
|
Total tax receipts collected |
| 55,168 |
| 54,681 |
| 52,266 |
| 50,268 |
| 50,791 |
| 53,223 |
| 56,647 |
|
Other Sovereign Receipts (cash) |
|
|
|
|
|
|
|
|
|
|
|
|
|
|
|
ACC levies |
| 2,561 |
| 2,688 |
| 2,795 |
| 3,170 |
| 3,282 |
| 3,367 |
| 3,456 |
|
Fire Service levies |
| 281 |
| 303 |
| 304 |
| 308 |
| 314 |
| 322 |
| 330 |
|
EQC levies |
| 86 |
| 87 |
| 86 |
| 88 |
| 90 |
| 91 |
| 93 |
|
Other miscellaneous items |
| 532 |
| 597 |
| 548 |
| 724 |
| 760 |
| 770 |
| 781 |
|
Total other sovereign receipts |
| 3,460 |
| 3,675 |
| 3,733 |
| 4,290 |
| 4,446 |
| 4,550 |
| 4,660 |
|
Total sovereign receipts |
| 58,628 |
| 58,356 |
| 55,999 |
| 54,558 |
| 55,237 |
| 57,773 |
| 61,307 |
|
|
|
|
| 2009 |
|
|
|
|
|
|
|
|
|
|
|
|
| 2008 |
| Previous |
| 2009 |
| 2010 |
| 2011 |
| 2012 |
| 2013 |
|
|
| Actual |
| Budget |
| Forecast |
| Forecast |
| Forecast |
| Forecast |
| Forecast |
|
|
| $m |
| $m |
| $m |
| $m |
| $m |
| $m |
| $m |
|
NOTE 2: Interest Revenue and Dividends |
|
|
|
|
|
|
|
|
|
|
|
|
|
|
|
By type |
|
|
|
|
|
|
|
|
|
|
|
|
|
|
|
Interest revenue |
| 2,803 |
| 2,967 |
| 2,621 |
| 2,765 |
| 2,900 |
| 2,910 |
| 2,967 |
|
Dividends |
| 411 |
| 391 |
| 378 |
| 394 |
| 431 |
| 453 |
| 475 |
|
Total interest revenue and dividends |
| 3,214 |
| 3,358 |
| 2,999 |
| 3,159 |
| 3,331 |
| 3,363 |
| 3,442 |
|
By source |
|
|
|
|
|
|
|
|
|
|
|
|
|
|
|
Core Crown |
| 2,344 |
| 2,835 |
| 1,897 |
| 2,076 |
| 2,165 |
| 2,243 |
| 2,456 |
|
Crown entities |
| 1,233 |
| 1,083 |
| 1,329 |
| 832 |
| 856 |
| 878 |
| 891 |
|
State-owned enterprises |
| 704 |
| 239 |
| 739 |
| 927 |
| 1,031 |
| 1,028 |
| 1,033 |
|
Inter-segment eliminations |
| (1,067 | ) | (799 | ) | (966 | ) | (676 | ) | (721 | ) | (786 | ) | (938 | ) |
Total interest revenue and dividends |
| 3,214 |
| 3,358 |
| 2,999 |
| 3,159 |
| 3,331 |
| 3,363 |
| 3,442 |
|
NOTE 3: Transfer Payments and Subsidies |
|
|
|
|
|
|
|
|
|
|
|
|
|
|
|
New Zealand superannuation |
| 7,348 |
| 7,741 |
| 7,746 |
| 8,246 |
| 8,665 |
| 9,186 |
| 9,666 |
|
Domestic purposes benefit |
| 1,478 |
| 1,455 |
| 1,528 |
| 1,647 |
| 1,711 |
| 1,759 |
| 1,786 |
|
Unemployment benefit |
| 458 |
| 403 |
| 588 |
| 1,078 |
| 1,268 |
| 1,283 |
| 1,205 |
|
Invalids benefit |
| 1,216 |
| 1,264 |
| 1,258 |
| 1,297 |
| 1,337 |
| 1,375 |
| 1,391 |
|
Family tax credit |
| 1,897 |
| 2,132 |
| 2,123 |
| 2,158 |
| 2,191 |
| 2,204 |
| 2,298 |
|
Accommodation supplement |
| 891 |
| 911 |
| 988 |
| 1,166 |
| 1,248 |
| 1,282 |
| 1,296 |
|
Sickness benefit |
| 582 |
| 548 |
| 610 |
| 692 |
| 736 |
| 747 |
| 751 |
|
Student allowances |
| 386 |
| 398 |
| 429 |
| 462 |
| 470 |
| 473 |
| 470 |
|
Disability allowances |
| 278 |
| 387 |
| 390 |
| 417 |
| 439 |
| 461 |
| 479 |
|
Other social assistance benefits |
| 2,376 |
| 2,638 |
| 2,628 |
| 2,632 |
| 2,705 |
| 2,751 |
| 2,775 |
|
Total social assistance grants |
| 16,910 |
| 17,877 |
| 18,288 |
| 19,795 |
| 20,770 |
| 21,521 |
| 22,117 |
|
Subsidies |
|
|
|
|
|
|
|
|
|
|
|
|
|
|
|
KiwiSaver subsidies |
| 1,102 |
| 1,370 | �� | 1,420 |
| 919 |
| 940 |
| 956 |
| 982 |
|
Other transfer payments |
|
|
|
|
|
|
|
|
|
|
|
|
|
|
|
Official development assistance |
| 362 |
| 434 |
| 474 |
| 461 |
| 486 |
| 510 |
| 559 |
|
Total transfer payments and subsidies |
| 18,374 |
| 19,681 |
| 20,182 |
| 21,175 |
| 22,196 |
| 22,987 |
| 23,658 |
|
NOTE 4: Personnel Expenses |
|
|
|
|
|
|
|
|
|
|
|
|
|
|
|
Core Crown |
| 5,584 |
| 5,846 |
| 6,102 |
| 5,924 |
| 5,996 |
| 6,055 |
| 6,142 |
|
Crown entities |
| 8,741 |
| 8,976 |
| 9,513 |
| 9,902 |
| 10,069 |
| 10,270 |
| 10,298 |
|
State-owned enterprises |
| 2,164 |
| 2,248 |
| 2,419 |
| 2,501 |
| 2,619 |
| 2,673 |
| 2,752 |
|
Inter-segment eliminations |
| (11 | ) | (9 | ) | (3 | ) | (3 | ) | (3 | ) | (3 | ) | (3 | ) |
Total personnel expenses |
| 16,478 |
| 17,061 |
| 18,031 |
| 18,324 |
| 18,681 |
| 18,995 |
| 19,189 |
|
NOTE 5: Other Operating Expenses |
|
|
|
|
|
|
|
|
|
|
|
|
|
|
|
Core Crown |
| 30,432 |
| 34,027 |
| 33,789 |
| 35,487 |
| 34,786 |
| 35,107 |
| 35,586 |
|
Crown entities |
| 15,754 |
| 15,773 |
| 16,469 |
| 17,172 |
| 17,133 |
| 17,039 |
| 17,171 |
|
State-owned enterprises |
| 10,945 |
| 10,017 |
| 10,696 |
| 11,506 |
| 12,437 |
| 12,568 |
| 12,894 |
|
Inter-segment eliminations |
| (22,805 | ) | (23,814 | ) | (24,066 | ) | (25,184 | ) | (24,934 | ) | (24,855 | ) | (24,826 | ) |
Total other operating expenses |
| 34,326 |
| 36,003 |
| 36,888 |
| 38,981 |
| 39,422 |
| 39,859 |
| 40,825 |
|
|
|
|
| 2009 |
|
|
|
|
|
|
|
|
|
|
|
|
| 2008 |
| Previous |
| 2009 |
| 2010 |
| 2011 |
| 2012 |
| 2013 |
|
|
| Actual |
| Budget |
| Forecast |
| Forecast |
| Forecast |
| Forecast |
| Forecast |
|
|
| $m |
| $m |
| $m |
| $m |
| $m |
| $m |
| $m |
|
NOTE 6: Interest Expenses |
|
|
|
|
|
|
|
|
|
|
|
|
|
|
|
By type |
|
|
|
|
|
|
|
|
|
|
|
|
|
|
|
Interest on financial liabilities |
| 3,015 |
| 2,482 |
| 3,221 |
| 3,233 |
| 3,875 |
| 4,481 |
| 5,279 |
|
Interest unwind on provisions |
| 86 |
| 21 |
| 137 |
| 116 |
| 144 |
| 144 |
| 181 |
|
Total interest expenses |
| 3,101 |
| 2,503 |
| 3,358 |
| 3,349 |
| 4,019 |
| 4,625 |
| 5,460 |
|
By source |
|
|
|
|
|
|
|
|
|
|
|
|
|
|
|
Core Crown |
| 2,460 |
| 2,406 |
| 2,507 |
| 2,470 |
| 2,998 |
| 3,575 |
| 4,330 |
|
Crown entities |
| 248 |
| 294 |
| 248 |
| 140 |
| 160 |
| 180 |
| 150 |
|
State-owned Enterprises |
| 870 |
| 442 |
| 1,185 |
| 1,198 |
| 1,342 |
| 1,363 |
| 1,472 |
|
Inter-segment eliminations |
| (477 | ) | (639 | ) | (582 | ) | (459 | ) | (481 | ) | (493 | ) | (492 | ) |
Total interest expenses |
| 3,101 |
| 2,503 |
| 3,358 |
| 3,349 |
| 4,019 |
| 4,625 |
| 5,460 |
|
NOTE 7: Insurance Expenses |
|
|
|
|
|
|
|
|
|
|
|
|
|
|
|
By entity |
|
|
|
|
|
|
|
|
|
|
|
|
|
|
|
ACC |
| 3,423 |
| 3,749 |
| 3,818 |
| 3,834 |
| 4,168 |
| 4,529 |
| 4,873 |
|
Earthquake Commission |
| 130 |
| 39 |
| 81 |
| 39 |
| 39 |
| 39 |
| 39 |
|
Other |
| 10 |
| 11 |
| 17 |
| 17 |
| 18 |
| 19 |
| 19 |
|
Total insurance expenses |
| 3,563 |
| 3,799 |
| 3,916 |
| 3,890 |
| 4,225 |
| 4,587 |
| 4,931 |
|
NOTE 8: Forecast New Operating Spending |
|
|
|
|
|
|
|
|
|
|
|
|
|
|
|
Forecast new spending up to Budget 10 |
| — |
| 249 |
| — |
| 254 |
| 336 |
| 313 |
| 262 |
|
Forecast for future new spending |
| — |
| — |
| — |
| — |
| 1,100 |
| 2,220 |
| 3,360 |
|
Total Forecast new operating spending |
| — |
| 249 |
| — |
| 254 |
| 1,436 |
| 2,533 |
| 3,622 |
|
Top-down expense adjustment |
| — |
| (495 | ) | (500 | ) | (300 | ) | (225 | ) | (150 | ) | (150 | ) |
Forecast new spending up to Budget 10 represents the unallocated allowance from Budget 2009.
Forecast for future new spending indicates expected spending increases that will be introduced in future budgets.
|
|
|
| 2009 |
|
|
|
|
|
|
|
|
|
|
|
|
| 2008 |
| Previous |
| 2009 |
| 2010 |
| 2011 |
| 2012 |
| 2013 |
|
|
| Actual |
| Budget |
| Forecast |
| Forecast |
| Forecast |
| Forecast |
| Forecast |
|
|
| $m |
| $m |
| $m |
| $m |
| $m |
| $m |
| $m |
|
NOTE 9: Gains and Losses on Financial Instruments |
|
|
|
|
|
|
|
|
|
|
|
|
|
|
|
By source |
|
|
|
|
|
|
|
|
|
|
|
|
|
|
|
Core Crown |
| 353 |
| 1,377 |
| (1,788 | ) | 1,256 |
| 1,386 |
| 1,477 |
| 1,595 |
|
Crown entities |
| (743 | ) | 354 |
| (1,037 | ) | 117 |
| 309 |
| 538 |
| 663 |
|
State-owned enterprises |
| (37 | ) | (50 | ) | (179 | ) | 140 |
| (67 | ) | (60 | ) | (65 | ) |
Inter-segment eliminations |
| (190 | ) | (257 | ) | (262 | ) | (97 | ) | (99 | ) | (117 | ) | (149 | ) |
Net gains/(losses) on financial instruments |
| (617 | ) | 1,424 |
| (3,266 | ) | 1,416 |
| 1,529 |
| 1,838 |
| 2,044 |
|
NOTE 10: Gains and Losses on Non-Financial Instruments |
|
|
|
|
|
|
|
|
|
|
|
|
|
|
|
By type |
|
|
|
|
|
|
|
|
|
|
|
|
|
|
|
Actuarial gains/(losses) on GSF liability |
| (1,098 | ) | — |
| (2,262 | ) | (12 | ) | (12 | ) | (14 | ) | (14 | ) |
Actuarial gains/(losses) on ACC liability |
| (1,709 | ) | — |
| (2,095 | ) | — |
| — |
| — |
| — |
|
Other |
| (118 | ) | 170 |
| 907 |
| 217 |
| 236 |
| 245 |
| 239 |
|
Net gains/(losses) on non-financial instruments |
| (2,925 | ) | 170 |
| (3,450 | ) | 205 |
| 224 |
| 231 |
| 225 |
|
By source |
|
|
|
|
|
|
|
|
|
|
|
|
|
|
|
Core Crown |
| (1,369 | ) | 8 |
| (1,529 | ) | 39 |
| 43 |
| 43 |
| 33 |
|
Crown entities |
| (1,725 | ) | — |
| (2,082 | ) | (12 | ) | (11 | ) | (12 | ) | (13 | ) |
State-owned enterprises |
| 170 |
| 162 |
| 162 |
| 178 |
| 192 |
| 200 |
| 205 |
|
Inter-segment eliminations |
| (1 | ) | — |
| (1 | ) | — |
| — |
| — |
| — |
|
Net Gains/(Losses) on Non-Financial Instruments |
| (2,925 | ) | 170 |
| (3,450 | ) | 205 |
| 224 |
| 231 |
| 225 |
|
|
|
|
| 2009 |
|
|
|
|
|
|
|
|
|
|
|
|
| 2008 |
| Previous |
| 2009 |
| 2010 |
| 2011 |
| 2012 |
| 2013 |
|
|
| Actual |
| Budget |
| Forecast |
| Forecast |
| Forecast |
| Forecast |
| Forecast |
|
|
| $m |
| $m |
| $m |
| $m |
| $m |
| $m |
| $m |
|
NOTE 11: Source of Operating Balance |
|
|
|
|
|
|
|
|
|
|
|
|
|
|
|
Core Crown |
| 3,891 |
| 1,436 |
| (6,744 | ) | (7,119 | ) | (8,402 | ) | (8,205 | ) | (6,686 | ) |
Crown entities |
| (1,526 | ) | 1,147 |
| (2,368 | ) | 328 |
| 320 |
| 294 |
| 156 |
|
State-owned enterprises |
| 723 |
| 1,067 |
| 665 |
| 1,351 |
| 1,206 |
| 1,107 |
| 1,205 |
|
Inter-segment eliminations |
| (704 | ) | (545 | ) | (856 | ) | (289 | ) | (235 | ) | (311 | ) | (448 | ) |
Total operating balance |
| 2,384 |
| 3,105 |
| (9,303 | ) | (5,729 | ) | (7,111 | ) | (7,115 | ) | (5,773 | ) |
NOTE 12: Financial Assets |
|
|
|
|
|
|
|
|
|
|
|
|
|
|
|
Cash and cash equivalents |
| 3,804 |
| 6,412 |
| 5,353 |
| 5,042 |
| 5,045 |
| 5,370 |
| 5,107 |
|
Tax receivables |
| 7,398 |
| 6,139 |
| 7,248 |
| 7,378 |
| 7,103 |
| 6,972 |
| 7,205 |
|
Trade and other receivables |
| 6,760 |
| 6,610 |
| 6,539 |
| 6,715 |
| 6,915 |
| 7,057 |
| 7,234 |
|
Student loans (refer note 13) |
| 6,741 |
| 6,718 |
| 7,131 |
| 7,658 |
| 8,196 |
| 8,720 |
| 9,232 |
|
Kiwibank mortgages |
| 5,581 |
| 8,137 |
| 7,219 |
| 8,843 |
| 9,913 |
| 9,913 |
| 9,913 |
|
Long-term deposits |
| 2,787 |
| 1,785 |
| 2,789 |
| 2,635 |
| 2,168 |
| 2,170 |
| 2,505 |
|
Reserve position at the IMF |
| 188 |
| 141 |
| 899 |
| 901 |
| 902 |
| 902 |
| 903 |
|
Other advances |
| 626 |
| 1,867 |
| 692 |
| 767 |
| 796 |
| 869 |
| 979 |
|
Share investments |
| 12,964 |
| 13,700 |
| 10,664 |
| 12,184 |
| 13,544 |
| 15,170 |
| 17,232 |
|
Derivatives in gain |
| 1,563 |
| 565 |
| 2,934 |
| 1,176 |
| 929 |
| 767 |
| 600 |
|
Other marketable securities |
| 36,651 |
| 32,786 |
| 48,054 |
| 44,971 |
| 45,011 |
| 42,600 |
| 41,143 |
|
Total financial assets |
| 85,063 |
| 84,860 |
| 99,522 |
| 98,270 |
| 100,522 |
| 100,510 |
| 102,053 |
|
Financial assets by entity |
|
|
|
|
|
|
|
|
|
|
|
|
|
|
|
NZDMO |
| 20,536 |
| 14,514 |
| 20,999 |
| 15,593 |
| 14,570 |
| 10,013 |
| 7,185 |
|
Reserve Bank of New Zealand |
| 18,159 |
| 17,185 |
| 29,413 |
| 28,823 |
| 28,887 |
| 28,250 |
| 27,415 |
|
NZ Superannuation Fund |
| 13,791 |
| 16,821 |
| 11,996 |
| 13,340 |
| 14,918 |
| 16,836 |
| 18,725 |
|
Other core Crown |
| 17,006 |
| 15,189 |
| 17,653 |
| 17,625 |
| 17,881 |
| 18,556 |
| 19,253 |
|
Intra-segment eliminations |
| (9,595 | ) | (6,510 | ) | (6,797 | ) | (4,722 | ) | (4,723 | ) | (3,719 | ) | (3,094 | ) |
Total core Crown segment |
| 59,897 |
| 57,199 |
| 73,264 |
| 70,659 |
| 71,533 |
| 69,936 |
| 69,484 |
|
ACC portfolio |
| 12,958 |
| 14,063 |
| 13,503 |
| 14,543 |
| 15,872 |
| 17,335 |
| 18,729 |
|
EQC portfolio |
| 5,615 |
| 6,001 |
| 5,820 |
| 6,148 |
| 6,498 |
| 6,872 |
| 7,273 |
|
Other Crown entities |
| 6,844 |
| 6,130 |
| 6,424 |
| 6,288 |
| 6,270 |
| 6,359 |
| 6,429 |
|
Intra-segment eliminations |
| (1,517 | ) | (1,233 | ) | (1,420 | ) | (1,425 | ) | (1,423 | ) | (1,430 | ) | (1,437 | ) |
Total Crown entities segment |
| 23,900 |
| 24,961 |
| 24,327 |
| 25,554 |
| 27,217 |
| 29,136 |
| 30,994 |
|
Total State-owned enterprises segment |
| 11,726 |
| 12,811 |
| 13,991 |
| 14,451 |
| 14,649 |
| 14,765 |
| 15,148 |
|
Inter-segment eliminations |
| (10,460 | ) | (10,111 | ) | (12,060 | ) | (12,394 | ) | (12,877 | ) | (13,327 | ) | (13,573 | ) |
Total financial assets |
| 85,063 |
| 84,860 |
| 99,522 |
| 98,270 |
| 100,522 |
| 100,510 |
| 102,053 |
|
NOTE 13: Student Loans |
|
|
|
|
|
|
|
|
|
|
|
|
|
|
|
Nominal value (including accrued interest) |
| 9,573 |
| 10,642 |
| 10,320 |
| 11,110 |
| 11,907 |
| 12,673 |
| 13,410 |
|
Opening book value |
| 6,011 |
| 6,278 |
| 6,741 |
| 7,131 |
| 7,658 |
| 8,196 |
| 8,720 |
|
Amount borrowed during the year |
| 1,201 |
| 1,305 |
| 1,366 |
| 1,478 |
| 1,551 |
| 1,585 |
| 1,616 |
|
Initial fair value write down on new borrowings |
| (487 | ) | (525 | ) | (539 | ) | (573 | ) | (601 | ) | (614 | ) | (626 | ) |
Repayments made during the year |
| (629 | ) | (675 | ) | (717 | ) | (794 | ) | (869 | ) | (944 | ) | (1,013 | ) |
Interest unwind |
| 407 |
| 445 |
| 480 |
| 516 |
| 557 |
| 597 |
| 635 |
|
Impairment |
| 231 |
| (110 | ) | (210 | ) | (110 | ) | (110 | ) | (110 | ) | (110 | ) |
Other movements |
| 7 |
| — |
| 10 |
| 10 |
| 10 |
| 10 |
| 10 |
|
Closing book value |
| 6,741 |
| 6,718 |
| 7,131 |
| 7,658 |
| 8,196 |
| 8,720 |
| 9,232 |
|
|
|
|
| 2009 |
|
|
|
|
|
|
|
|
|
|
|
|
| 2008 |
| Previous |
| 2009 |
| 2010 |
| 2011 |
| 2012 |
| 2013 |
|
|
| Actual |
| Budget |
| Forecast |
| Forecast |
| Forecast |
| Forecast |
| Forecast |
|
|
| $m |
| $m |
| $m |
| $m |
| $m |
| $m |
| $m |
|
NOTE 14: Property, Plant and Equipment |
|
|
|
|
|
|
|
|
|
|
|
|
|
|
|
By Class of asset |
|
|
|
|
|
|
|
|
|
|
|
|
|
|
|
Net Carrying Value |
|
|
|
|
|
|
|
|
|
|
|
|
|
|
|
Land (valuation) |
| 17,609 |
| 16,918 |
| 17,394 |
| 17,348 |
| 17,547 |
| 17,862 |
| 18,050 |
|
Buildings (valuation) |
| 22,257 |
| 21,775 |
| 22,429 |
| 23,417 |
| 23,929 |
| 23,998 |
| 23,972 |
|
Electricity distribution network (cost) |
| 1,887 |
| 2,343 |
| 2,255 |
| 2,572 |
| 2,982 |
| 3,367 |
| 3,766 |
|
Electricity generation assets (valuation) |
| 11,202 |
| 11,882 |
| 11,800 |
| 12,221 |
| 12,683 |
| 12,915 |
| 13,807 |
|
Aircraft (excluding military) (valuation) |
| 2,071 |
| 1,756 |
| 2,133 |
| 2,344 |
| 3,219 |
| 4,051 |
| 4,869 |
|
State highways (valuation) |
| 20,947 |
| 20,937 |
| 21,787 |
| 22,628 |
| 23,203 |
| 23,773 |
| 24,393 |
|
Rail network (valuation) |
| 11,621 |
| 10,917 |
| 11,993 |
| 12,482 |
| 12,601 |
| 12,502 |
| 12,460 |
|
Specialist military equipment (valuation) |
| 3,345 |
| 3,160 |
| 3,340 |
| 3,464 |
| 3,386 |
| 3,206 |
| 3,085 |
|
Other plant and equipment (cost) |
| 4,412 |
| 4,513 |
| 5,397 |
| 5,785 |
| 5,960 |
| 6,069 |
| 6,043 |
|
Specified cultural and heritage assets (valuation) |
| 7,978 |
| 7,075 |
| 7,970 |
| 7,990 |
| 8,007 |
| 8,021 |
| 8,041 |
|
Total property, plant and equipment |
| 103,329 |
| 101,276 |
| 106,498 |
| 110,251 |
| 113,517 |
| 115,764 |
| 118,486 |
|
By source |
|
|
|
|
|
|
|
|
|
|
|
|
|
|
|
Core Crown |
| 28,637 |
| 26,827 |
| 29,094 |
| 29,740 |
| 29,913 |
| 29,765 |
| 29,562 |
|
Crown entities |
| 43,659 |
| 43,868 |
| 44,157 |
| 45,757 |
| 46,883 |
| 47,887 |
| 48,802 |
|
State-owned enterprises |
| 31,033 |
| 30,580 |
| 33,246 |
| 34,755 |
| 36,721 |
| 38,113 |
| 40,122 |
|
Inter-segment eliminations |
| — |
| 1 |
| 1 |
| (1 | ) | — |
| (1 | ) | — |
|
Total property, plant and equipment |
| 103,329 |
| 101,276 |
| 106,498 |
| 110,251 |
| 113,517 |
| 115,764 |
| 118,486 |
|
NOTE 15: NZ Superannuation Fund |
|
|
|
|
|
|
|
|
|
|
|
|
|
|
|
Revenue |
| 385 |
| 427 |
| 399 |
| 397 |
| 424 |
| 458 |
| 498 |
|
Less current tax expense |
| 237 |
| 323 |
| (83 | ) | — |
| — |
| 165 |
| 400 |
|
Less other expenses |
| 34 |
| 154 |
| (840 | ) | 461 |
| 500 |
| 370 |
| 159 |
|
Add gains/(losses) |
| (995 | ) | 1,068 |
| (4,582 | ) | 1,129 |
| 1,277 |
| 1,410 |
| 1,541 |
|
Operating balance |
| (881 | ) | 1,018 |
| (3,260 | ) | 1,065 |
| 1,201 |
| 1,333 |
| 1,480 |
|
Opening net worth |
| 12,973 |
| 14,461 |
| 14,212 |
| 13,275 |
| 14,590 |
| 15,791 |
| 17,124 |
|
Gross contribution from the Crown |
| 2,104 |
| 2,242 |
| 2,242 |
| 250 |
| — |
| — |
| — |
|
Operating balance |
| (881 | ) | 1,018 |
| (3,260 | ) | 1,065 |
| 1,201 |
| 1,333 |
| 1,480 |
|
Other movements in reserves |
| 16 |
| — |
| 81 |
| — |
| — |
| — |
| — |
|
Closing net worth |
| 14,212 |
| 17,721 |
| 13,275 |
| 14,590 |
| 15,791 |
| 17,124 |
| 18,604 |
|
comprising: |
|
|
|
|
|
|
|
|
|
|
|
|
|
|
|
Financial assets |
| 13,791 |
| 16,821 |
| 11,996 |
| 13,340 |
| 14,918 |
| 16,836 |
| 18,725 |
|
Net other assets |
| 421 |
| 900 |
| 1,279 |
| 1,250 |
| 873 |
| 288 |
| (121 | ) |
Closing net worth |
| 14,212 |
| 17,721 |
| 13,275 |
| 14,590 |
| 15,791 |
| 17,124 |
| 18,604 |
|
Core Crown revenue (excl NZS Fund) |
|
|
|
|
|
|
|
|
|
|
|
|
|
|
|
Core Crown revenue |
| 61,819 |
| 61,891 |
| 58,874 |
| 56,771 |
| 57,518 |
| 60,538 |
| 65,046 |
|
Less NZS Fund revenue |
| 385 |
| 427 |
| 399 |
| 397 |
| 424 |
| 458 |
| 498 |
|
Add back NZS Fund intra-segment revenue |
| 237 |
| 323 |
| (83 | ) | — |
| — |
| 165 |
| 400 |
|
Core Crown revenue excluding NZS Fund |
| 61,671 |
| 61,787 |
| 58,392 |
| 56,374 |
| 57,094 |
| 60,245 |
| 64,948 |
|
OBEGAL (excl NZS Fund) |
|
|
|
|
|
|
|
|
|
|
|
|
|
|
|
Total Crown OBEGAL |
| 5,637 |
| 1,318 |
| (2,916 | ) | (7,739 | ) | (9,265 | ) | (9,583 | ) | (8,423 | ) |
Less NZS Fund revenue |
| 385 |
| 427 |
| 399 |
| 397 |
| 424 |
| 458 |
| 498 |
|
Less NZS Fund external expenses |
| 97 |
| 140 |
| 103 |
| 111 |
| 115 |
| 125 |
| 136 |
|
Add back NZS Fund tax |
| 237 |
| 323 |
| (83 | ) | — |
| — |
| 165 |
| 400 |
|
OBEGAL excluding NZS Fund |
| 5,586 |
| 1,354 |
| (3,295 | ) | (8,025 | ) | (9,574 | ) | (9,751 | ) | (8,385 | ) |
|
|
|
| 2009 |
|
|
|
|
|
|
|
|
|
|
|
|
| 2008 |
| Previous |
| 2009 |
| 2010 |
| 2011 |
| 2012 |
| 2013 |
|
|
| Actual |
| Budget |
| Forecast |
| Forecast |
| Forecast |
| Forecast |
| Forecast |
|
|
| $m |
| $m |
| $m |
| $m |
| $m |
| $m |
| $m |
|
NOTE 16: Payables |
|
|
|
|
|
|
|
|
|
|
|
|
|
|
|
By type |
|
|
|
|
|
|
|
|
|
|
|
|
|
|
|
Accounts payable |
| 6,444 |
| 5,318 |
| 5,498 |
| 5,845 |
| 6,221 |
| 6,862 |
| 6,954 |
|
Taxes repayable |
| 4,451 |
| 3,179 |
| 4,451 |
| 4,451 |
| 4,451 |
| 4,451 |
| 4,451 |
|
Total payables |
| 10,895 |
| 8,497 |
| 9,949 |
| 10,296 |
| 10,672 |
| 11,313 |
| 11,405 |
|
By source |
|
|
|
|
|
|
|
|
|
|
|
|
|
|
|
Core Crown |
| 7,425 |
| 5,235 |
| 7,232 |
| 7,373 |
| 7,410 |
| 7,947 |
| 7,918 |
|
Crown entities |
| 4,042 |
| 3,910 |
| 3,451 |
| 3,457 |
| 3,481 |
| 3,567 |
| 3,617 |
|
State-owned enterprises |
| 4,877 |
| 4,079 |
| 4,558 |
| 4,715 |
| 4,960 |
| 5,088 |
| 5,093 |
|
Inter-segment eliminations |
| (5,449 | ) | (4,727 | ) | (5,292 | ) | (5,249 | ) | (5,179 | ) | (5,289 | ) | (5,223 | ) |
Total payables |
| 10,895 |
| 8,497 |
| 9,949 |
| 10,296 |
| 10,672 |
| 11,313 |
| 11,405 |
|
NOTE 17: Insurance Liabilities |
|
|
|
|
|
|
|
|
|
|
|
|
|
|
|
By entity |
|
|
|
|
|
|
|
|
|
|
|
|
|
|
|
ACC liability |
| 20,374 |
| 21,976 |
| 23,958 |
| 25,171 |
| 26,516 |
| 28,071 |
| 29,815 |
|
EQC property damage claims |
| 97 |
| 79 |
| 91 |
| 91 |
| 91 |
| 91 |
| 91 |
|
Other insurance liabilities |
| 13 |
| 10 |
| 87 |
| 83 |
| 55 |
| 49 |
| 44 |
|
Total insurance liabilities |
| 20,484 |
| 22,065 |
| 24,136 |
| 25,345 |
| 26,662 |
| 28,211 |
| 29,950 |
|
ACC liability
Calculation information
PricewaterhouseCoopers Actuarial Pty Ltd have prepared an independent actuarial estimate of the ACC outstanding claims liability as at 31 December 2008. This estimate includes the expected future payments relating to accidents that occurred prior to balance date (whether or not the associated claims have been reported to, or accepted by, ACC) and also the expected future administrative expenses of managing these claims. The estimate has been updated as at 31 March 2009 to reflect material changes to those expected future payments identified since 31 December 2008.
The key economic variables that impact on changes to the valuation are the long-term Labour Cost Index (LCI), average weekly earnings and the discount rate of 5.40% (6.63% at 30 June 2008). Other key variables in each valuation are the forecast increases in claim costs over and above the economic variables above, and the assumed rate at which long-term claimants will leave the scheme over the period. This assessment is largely based on scheme history.
Presentation approach
The projected outstanding claims liability is included within total liabilities. ACC has available to it a portfolio of assets that partially offset the claims liability. The assets (less cross holdings of NZ Government stock) are included in the asset portion of the Crown’s overall Statement of Financial Position.
|
|
|
| 2009 |
|
|
|
|
|
|
|
|
|
|
|
|
| 2008 |
| Previous |
| 2009 |
| 2010 |
| 2011 |
| 2012 |
| 2013 |
|
|
| Actual |
| Budget |
| Forecast |
| Forecast |
| Forecast |
| Forecast |
| Forecast |
|
|
| $m |
| $m |
| $m |
| $m |
| $m |
| $m |
| $m |
|
Gross ACC liability |
|
|
|
|
|
|
|
|
|
|
|
|
|
|
|
Opening gross liability |
| 17,328 |
| 20,663 |
| 20,374 |
| 23,958 |
| 25,171 |
| 26,516 |
| 28,071 |
|
Net change |
| 3,046 |
| 1,313 |
| 3,584 |
| 1,213 |
| 1,345 |
| 1,555 |
| 1,744 |
|
Closing gross liability |
| 20,374 |
| 21,976 |
| 23,958 |
| 25,171 |
| 26,516 |
| 28,071 |
| 29,815 |
|
Less net assets available to ACC |
|
|
|
|
|
|
|
|
|
|
|
|
|
|
|
Opening net asset value |
| 11,757 |
| 12,735 |
| 12,397 |
| 13,135 |
| 14,388 |
| 15,715 |
| 17,171 |
|
Net change |
| 640 |
| 1,091 |
| 738 |
| 1,253 |
| 1,327 |
| 1,456 |
| 1,450 |
|
Closing net asset value |
| 12,397 |
| 13,826 |
| 13,135 |
| 14,388 |
| 15,715 |
| 17,171 |
| 18,621 |
|
Net ACC reserves (net liability) |
|
|
|
|
|
|
|
|
|
|
|
|
|
|
|
Opening reserves position |
| (5,571 | ) | (7,928 | ) | (7,977 | ) | (10,823 | ) | (10,783 | ) | (10,801 | ) | (10,900 | ) |
Net change |
| (2,406 | ) | (222 | ) | (2,846 | ) | 40 |
| (18 | ) | (99 | ) | (294 | ) |
Closing reserves position (net liability) |
| (7,977 | ) | (8,150 | ) | (10,823 | ) | (10,783 | ) | (10,801 | ) | (10,900 | ) | (11,194 | ) |
|
|
|
| 2009 |
|
|
|
|
|
|
|
|
|
|
|
|
| 2008 |
| Previous |
| 2009 |
| 2010 |
| 2011 |
| 2012 |
| 2013 |
|
|
| Actual |
| Budget |
| Forecast |
| Forecast |
| Forecast |
| Forecast |
| Forecast |
|
|
| $m |
| $m |
| $m |
| $m |
| $m |
| $m |
| $m |
|
NOTE 18: Retirement Plan Liabilities |
|
|
|
|
|
|
|
|
|
|
|
|
|
|
|
Government Superannuation Fund |
| 8,257 |
| 8,216 |
| 10,557 |
| 10,307 |
| 10,063 |
| 9,850 |
| 9,693 |
|
Other funds |
| — |
| 5 |
| — |
| — |
| — |
| — |
| — |
|
Total retirement plan liabilities |
| 8,257 |
| 8,221 |
| 10,557 |
| 10,307 |
| 10,063 |
| 9,850 |
| 9,693 |
|
The net liability of the Government Superannuation Fund (GSF), as at 28 February 2009 (the valuation date), has been calculated by the Government Actuary for inclusion in the 2009 Budget Update. The GSF net liability arises from closed schemes for past and present public sector employees (set out in the GSF Act 1956). The Projected Unit Credit Method, based on 28 February 2009 membership data, was used for the valuation. This method requires the benefits payable from the GSF in respect of past service to be calculated and then discounted back to the valuation date.
The projected GSF net liability included in the 2009 Budget Update was calculated using discount rates derived from the market yield curve as at 28 February 2009. This resulted in long-term before-tax discount rates ranging from 3.35% in 2010 to 5.39% in 2017 and beyond. The principal long-term financial assumptions used in the calculation were an inflation rate of 2% and an annual salary increases rate, before any promotional effects of 2.5%.
The 2008/09 projected movement in the net liability is $2,299 million, reflecting an increase in the GSF liability of $1,284 million and a decrease in the GSF assets of $1,015 million.
The increase in the projected GSF liability of $1,284 million includes an actuarial loss of $1,355 million at 28 February 2009, of which $1,821 million resulted from a change in the discount rate assumption and $31 million due to experience adjustments. This is offset by $497 million due to the change in the inflation assumption on valuation date. The remainder of the change in the GSF liability is the net of the current service cost, interest cost and benefits paid to members.
The decrease in the projected GSF assets of $1,015 million includes an actuarial loss of $1,023 million at 28 February 2009 reflecting the continuing turmoil in global financial markets. The remaining change in GSF assets is the net of expected investments returns, contributions received by the GSF and benefits paid to members.
The changes in the projected GSF net liability from 2009/10 onwards reflects the net of the expected current service cost, interest cost, investment returns and contributions.
|
|
|
| 2009 |
|
|
|
|
|
|
|
|
|
|
|
|
| 2008 |
| Previous |
| 2009 |
| 2010 |
| 2011 |
| 2012 |
| 2013 |
|
|
| Actual |
| Budget |
| Forecast |
| Forecast |
| Forecast |
| Forecast |
| Forecast |
|
|
| $m |
| $m |
| $m |
| $m |
| $m |
| $m |
| $m |
|
GSF net defined benefit retirement liability |
|
|
|
|
|
|
|
|
|
|
|
|
|
|
|
GSF liability |
|
|
|
|
|
|
|
|
|
|
|
|
|
|
|
Opening GSF liability |
| 11,167 |
| 11,826 |
| 11,831 |
| 13,115 |
| 12,833 |
| 12,544 |
| 12,271 |
|
Net projected change |
| 664 |
| 121 |
| 1,284 |
| (282 | ) | (289 | ) | (273 | ) | (225 | ) |
Closing GSF liability |
| 11,831 |
| 11,947 |
| 13,115 |
| 12,833 |
| 12,544 |
| 12,271 |
| 12,046 |
|
Less net assets available to GSF |
|
|
|
|
|
|
|
|
|
|
|
|
|
|
|
Opening net asset value |
| 4,007 |
| 3,685 |
| 3,574 |
| 2,559 |
| 2,527 |
| 2,481 |
| 2,422 |
|
Investment valuation changes |
| (261 | ) | 222 |
| (800 | ) | 121 |
| 118 |
| 114 |
| 110 |
|
Contribution and other income less membership payments |
| (172 | ) | (176 | ) | (215 | ) | (153 | ) | (164 | ) | (173 | ) | (178 | ) |
Closing net asset value |
| 3,574 |
| 3,731 |
| 2,559 |
| 2,527 |
| 2,481 |
| 2,422 |
| 2,354 |
|
Net GSF liability |
|
|
|
|
|
|
|
|
|
|
|
|
|
|
|
Opening unfunded liability |
| 7,160 |
| 8,141 |
| 8,257 |
| 10,557 |
| 10,307 |
| 10,063 |
| 9,850 |
|
Net projected change |
| 1,097 |
| 75 |
| 2,300 |
| (250 | ) | (244 | ) | (213 | ) | (157 | ) |
Closing unfunded liability |
| 8,257 |
| 8,216 |
| 10,557 |
| 10,307 |
| 10,063 |
| 9,850 |
| 9,693 |
|
|
| 2008 |
| 2009 |
| 2009 |
| 2010 |
| 2011 |
| 2012 |
| 2013 |
|
|
| $m |
| $m |
| $m |
| $m |
| $m |
| $m |
| $m |
|
|
|
|
|
|
|
|
|
|
|
|
|
|
|
|
|
NOTE 19: Provisions |
|
|
|
|
|
|
|
|
|
|
|
|
|
|
|
|
|
|
|
|
|
|
|
|
|
|
|
|
|
|
|
Provision for Kyoto (1) |
| 562 |
| 482 |
| — |
| — |
| — |
| — |
| — |
|
Provision for ETS credits |
| — |
| 618 |
| 23 |
| 173 |
| 197 |
| — |
| 238 |
|
Provision for National Provident Fund guarantee |
| 907 |
| 780 |
| 978 |
| 919 |
| 892 |
| 866 |
| 839 |
|
Provision for employee entitlements |
| 2,220 |
| 1,747 |
| 2,358 |
| 2,369 |
| 2,418 |
| 2,444 |
| 2,457 |
|
Other provisions |
| 1,064 |
| 1,084 |
| 1,012 |
| 1,018 |
| 984 |
| 986 |
| 1,015 |
|
Total provisions |
| 4,753 |
| 4,711 |
| 4,371 |
| 4,479 |
| 4,491 |
| 4,296 |
| 4,549 |
|
|
|
|
|
|
|
|
|
|
|
|
|
|
|
|
|
By source |
|
|
|
|
|
|
|
|
|
|
|
|
|
|
|
Core Crown |
| 2,763 |
| 2,862 |
| 2,114 |
| 2,231 |
| 2,254 |
| 2,073 |
| 2,302 |
|
Crown entities |
| 1,500 |
| 1,220 |
| 1,475 |
| 1,496 |
| 1,512 |
| 1,526 |
| 1,532 |
|
State-owned enterprises |
| 684 |
| 652 |
| 808 |
| 798 |
| 783 |
| 774 |
| 803 |
|
Inter-segment eliminations |
| (194 | ) | (23 | ) | (26 | ) | (46 | ) | (58 | ) | (77 | ) | (88 | ) |
Total provisions |
| 4,753 |
| 4,711 |
| 4,371 |
| 4,479 |
| 4,491 |
| 4,296 |
| 4,549 |
|
Analysis of Provision for Kyoto
(1) The Crown’s net position under the Kyoto protocol has shifted from a 21.7 million tonne unit deficit ($562 million net liability as at 30 June 2008) to a 9.6 million tonne unit surplus ($228 million net asset forecast as at 30 June 2009 increasing to $235 million at 30 June 2013) with the release of the 2009 Net Position Report. The net asset is included in the intangible asset line in these forecast financial statements. A full copy of the Net Position Report 2009 can be found on the Ministry for the Environment’s website: www.mfe.govt.nz
Analysis of Provision for ETS credits
The Emissions Trading Scheme (ETS) was established to encourage reduction in greenhouse gas emissions. The ETS creates a limited number of tradable units (the NZ Unit) which the Government can allocate freely or sell to entities. The allocation of NZ Units creates a provision (and an expense if allocated for free). The provision is reduced, and revenue recognised, as NZ Units are surrendered to the Crown by emitters. Emitters can also use international Kyoto units to settle their emission obligation, which will occur where emissions exceed the number of allocated NZ units.
The ETS impact on the fiscal forecast is as follows:
|
| 2008 |
| 2009 |
| 2009 |
| 2010 |
| 2011 |
| 2012 |
| 2013 |
|
|
| $m |
| $m |
| $m |
| $m |
| $m |
| $m |
| $m |
|
Revenue |
| — |
| 131 |
| — |
| 321 |
| 720 |
| 902 |
| 1,377 |
|
Expenses |
| — |
| 749 |
| 23 |
| 471 |
| 744 |
| 636 |
| 1,684 |
|
OBEGAL |
| — |
| (618 | ) | (23 | ) | (150 | ) | (24 | ) | 266 |
| (307 | ) |
|
|
|
|
|
|
|
|
|
|
|
|
|
|
|
|
Provision for ETS credits |
| — |
| 618 |
| 23 |
| 173 |
| 197 |
| (69 | ) | 238 |
|
|
| 2008 |
| 2009 |
| 2009 |
| 2010 |
| 2011 |
| 2012 |
| 2013 |
|
|
| $m |
| $m |
| $m |
| $m |
| $m |
| $m |
| $m |
|
NOTE 20: Net Worth attributable to the Crown |
|
|
|
|
|
|
|
|
|
|
|
|
|
|
|
Taxpayers funds |
| 46,700 |
| 49,886 |
| 37,534 |
| 31,803 |
| 24,689 |
| 17,577 |
| 11,805 |
|
Property, plant and equipment revaluation reserve |
| 58,566 |
| 52,486 |
| 57,723 |
| 57,723 |
| 57,722 |
| 57,721 |
| 57,720 |
|
Investment revaluation reserve |
| 34 |
| 35 |
| 83 |
| 80 |
| 80 |
| 80 |
| 80 |
|
Cash flow hedge reserve |
| (151 | ) | (117 | ) | (83 | ) | (98 | ) | (120 | ) | (125 | ) | (154 | ) |
Foreign currency translation reserve |
| (17 | ) | (32 | ) | 59 |
| 59 |
| 59 |
| 59 |
| 59 |
|
Total net worth attributable to the Crown |
| 105,132 |
| 102,258 |
| 95,316 |
| 89,567 |
| 82,430 |
| 75,312 |
| 69,510 |
|
Taxpayers Funds |
|
|
|
|
|
|
|
|
|
|
|
|
|
|
|
Opening taxpayers funds |
| 44,222 |
| 46,767 |
| 46,700 |
| 37,534 |
| 31,803 |
| 24,689 |
| 17,577 |
|
Operating balance excluding minority interest |
| 2,384 |
| 3,105 |
| (9,303 | ) | (5,729 | ) | (7,111 | ) | (7,115 | ) | (5,773 | ) |
Transfers from/(to) other reserves |
| 94 |
| 14 |
| 137 |
| (2 | ) | (3 | ) | 3 |
| 1 |
|
Closing taxpayers funds |
| 46,700 |
| 49,886 |
| 37,534 |
| 31,803 |
| 24,689 |
| 17,577 |
| 11,805 |
|
Property, Plant and Equipment Revaluation Reserve |
|
|
|
|
|
|
|
|
|
|
|
|
|
|
|
Opening revaluation reserve |
| 52,442 |
| 52,498 |
| 58,566 |
| 57,723 |
| 57,723 |
| 57,722 |
| 57,721 |
|
Net revaluations |
| 6,214 |
| — |
| (707 | ) | (1 | ) | (1 | ) | — |
| (1 | ) |
Transfers from/(to) other reserves |
| (90 | ) | (12 | ) | (136 | ) | 1 |
| — |
| (1 | ) | — |
|
Closing property, plant and equipment revaluation reserve |
| 58,566 |
| 52,486 |
| 57,723 |
| 57,723 |
| 57,722 |
| 57,721 |
| 57,720 |
|
Investment Revaluation Reserve |
|
|
|
|
|
|
|
|
|
|
|
|
|
|
|
Opening investment revaluation reserve |
| 23 |
| 29 |
| 34 |
| 83 |
| 80 |
| 80 |
| 80 |
|
Valuation gain/(losses) on investments available for sale taken to reserves |
| 11 |
| 6 |
| 49 |
| (3 | ) | — |
| — |
| — |
|
Closing investment revaluation reserve |
| 34 |
| 35 |
| 83 |
| 80 |
| 80 |
| 80 |
| 80 |
|
Cash Flow Hedge Reserve |
|
|
|
|
|
|
|
|
|
|
|
|
|
|
|
Opening cash flow hedge reserve |
| (122 | ) | (175 | ) | (151 | ) | (83 | ) | (98 | ) | (120 | ) | (125 | ) |
Transfer into reserve |
| 9 |
| 58 |
| 4 |
| (18 | ) | (22 | ) | (6 | ) | (29 | ) |
Transfer to the statement of financial performance |
| 22 |
| — |
| (1 | ) | — |
| (1 | ) | — |
| — |
|
Transfer to initial carrying value of hedged item |
| (60 | ) | — |
| 65 |
| 3 |
| 1 |
| 1 |
| — |
|
Closing cash flow hedge reserve |
| (151 | ) | (117 | ) | (83 | ) | (98 | ) | (120 | ) | (125 | ) | (154 | ) |
Foreign Currency Translation Reserve |
|
|
|
|
|
|
|
|
|
|
|
|
|
|
|
Opening foreign currency translation reserve |
| (34 | ) | (32 | ) | (17 | ) | 59 |
| 59 |
| 59 |
| 59 |
|
Movement arising from translation of foreign operations |
| 17 |
| — |
| 76 |
| — |
| — |
| — |
| — |
|
Closing foreign currency translation reserve |
| (17 | ) | (32 | ) | 59 |
| 59 |
| 59 |
| 59 |
| 59 |
|
|
| 2008 |
| 2009 |
| 2009 |
| 2010 |
| 2011 |
| 2012 |
| 2013 |
|
|
| $m |
| $m |
| $m |
| $m |
| $m |
| $m |
| $m |
|
NOTE 21: Reconciliation of core Crown operating cash flows to residual core Crown cash |
|
|
|
|
|
|
|
|
|
|
|
|
|
|
|
Core Crown Cash Flows from Operations |
|
|
|
|
|
|
|
|
|
|
|
|
|
|
|
Total tax receipts |
| 55,975 |
| 55,599 |
| 52,488 |
| 50,742 |
| 51,320 |
| 53,733 |
| 57,756 |
|
Total other sovereign receipts |
| 486 |
| 530 |
| 503 |
| 678 |
| 713 |
| 723 |
| 734 |
|
Interest, profits and dividends |
| 2,128 |
| 2,232 |
| 1,417 |
| 1,338 |
| 1,312 |
| 1,325 |
| 1,475 |
|
Sale of goods & services and other receipts |
| 1,411 |
| 1,658 |
| 2,203 |
| 1,943 |
| 1,807 |
| 1,826 |
| 1,815 |
|
Transfer payments and subsidies |
| (19,562 | ) | (21,068 | ) | (22,087 | ) | (24,211 | ) | (24,943 | ) | (25,681 | ) | (26,603 | ) |
Personnel and operating costs |
| (30,792 | ) | (34,224 | ) | (33,781 | ) | (35,049 | ) | (34,473 | ) | (34,316 | ) | (34,068 | ) |
Finance costs |
| (2,354 | ) | (2,282 | ) | (2,284 | ) | (2,159 | ) | (2,653 | ) | (3,346 | ) | (4,163 | ) |
Forecast for future new operating spending |
| — |
| (249 | ) | — |
| (254 | ) | (1,436 | ) | (2,533 | ) | (3,622 | ) |
Top-down expense adjustment |
| — |
| 355 |
| 400 |
| 300 |
| 225 |
| 150 |
| 150 |
|
Net cash flows from core Crown operations |
| 7,292 |
| 2,551 |
| (1,141 | ) | (6,672 | ) | (8,128 | ) | (8,119 | ) | (6,526 | ) |
Net purchase of physical assets |
| (1,433 | ) | (1,891 | ) | (1,778 | ) | (2,375 | ) | (1,696 | ) | (1,390 | ) | (1,333 | ) |
Net increase in advances |
| (1,254 | ) | (821 | ) | (1,640 | ) | (953 | ) | (731 | ) | (607 | ) | (518 | ) |
Net purchase of investments |
| (444 | ) | (1,164 | ) | (1,932 | ) | (1,643 | ) | (1,264 | ) | (1,036 | ) | (1,064 | ) |
Contribution to NZ Superannuation Fund |
| (2,104 | ) | (2,242 | ) | (2,242 | ) | (250 | ) | — |
| — |
| — |
|
Forecast for future new capital spending |
| — |
| (261 | ) | — |
| (72 | ) | (702 | ) | (1,152 | ) | (1,450 | ) |
Top-down capital adjustment |
| — |
| 350 |
| 275 |
| 100 |
| — |
| — |
| — |
|
Residual Cash |
| 2,057 |
| (3,478 | ) | (8,458 | ) | (11,865 | ) | (12,521 | ) | (12,304 | ) | (10,891 | ) |
Financed by: |
|
|
|
|
|
|
|
|
|
|
|
|
|
|
|
Other net sale/(purchase) of marketable securities and deposits |
| (3,595 | ) | 2,643 |
| (4,335 | ) | 4,579 |
| 603 |
| 3,558 |
| 2,248 |
|
Total operating and investing activities |
| (1,538 | ) | (835 | ) | (12,793 | ) | (7,286 | ) | (11,918 | ) | (8,746 | ) | (8,643 | ) |
Used in: |
|
|
|
|
|
|
|
|
|
|
|
|
|
|
|
Net (repayment)/issue of other New Zealand-dollar borrowing |
| (1,585 | ) | 399 |
| 16,266 |
| 6,056 |
| 170 |
| 698 |
| 636 |
|
Net (repayment)/issue of foreign currency borrowing |
| 901 |
| (541 | ) | (6,069 | ) | (3,783 | ) | (95 | ) | (994 | ) | (703 | ) |
Issues of circulating currency |
| 86 |
| 181 |
| 509 |
| 181 |
| 190 |
| 200 |
| 210 |
|
Decrease/(increase) in cash |
| 249 |
| (29 | ) | (1,143 | ) | (116 | ) | 6 |
| 6 |
| 14 |
|
|
| (349 | ) | 10 |
| 9,563 |
| 2,338 |
| 271 |
| (90 | ) | 157 |
|
Net cash inflow/(outflow) to be offset by domestic bonds |
| (1,887 | ) | (825 | ) | (3,230 | ) | (4,948 | ) | (11,647 | ) | (8,836 | ) | (8,486 | ) |
Gross Cash Proceeds from Domestic Bonds |
|
|
|
|
|
|
|
|
|
|
|
|
|
|
|
Domestic bonds (market) |
| 1,757 |
| 3,314 |
| 5,852 |
| 8,919 |
| 11,434 |
| 14,540 |
| 14,243 |
|
Domestic bonds (non-market) |
| 130 |
| 662 |
| 593 |
| 948 |
| 213 |
| 1,264 |
| 1,518 |
|
Total gross cash proceeds from domestic bonds |
| 1,887 |
| 3,976 |
| 6,445 |
| 9,867 |
| 11,647 |
| 15,804 |
| 15,761 |
|
Repayment of domestic bonds (market) |
| — |
| (2,700 | ) | (2,700 | ) | (4,247 | ) | — |
| (5,953 | ) | (5,985 | ) |
Repayment of domestic bonds (non-market) |
| — |
| (451 | ) | (515 | ) | (672 | ) | — |
| (1,015 | ) | (1,290 | ) |
Net cash proceeds from domestic bonds |
| 1,887 |
| 825 |
| 3,230 |
| 4,948 |
| 11,647 |
| 8,836 |
| 8,486 |
|
for the year ended 30 June 2008
|
| Core Crown |
| Crown Entities |
| State-owned |
| Inter-segment |
| Total Crown |
|
|
| 2008 |
| 2008 |
| 2008 |
| 2008 |
| 2008 |
|
|
| Actual |
| Actual |
| Actual |
| Actual |
| Actual |
|
|
| $m |
| $m |
| $m |
| $m |
| $m |
|
Revenue |
|
|
|
|
|
|
|
|
|
|
|
Taxation revenue |
| 56,747 |
| — |
| — |
| (375 | ) | 56,372 |
|
Other sovereign revenue |
| 733 |
| 4,039 |
| — |
| (893 | ) | 3,879 |
|
Sales of goods and services |
| 1,097 |
| 12,502 |
| 13,201 |
| (11,401 | ) | 15,399 |
|
Interest revenue and dividends |
| 2,344 |
| 1,233 |
| 704 |
| (1,067 | ) | 3,214 |
|
Other revenue |
| 898 |
| 11,239 |
| 692 |
| (10,214 | ) | 2,615 |
|
Total Revenue (excluding gains) |
| 61,819 |
| 29,013 |
| 14,597 |
| (23,950 | ) | 81,479 |
|
Expenses |
|
|
|
|
|
|
|
|
|
|
|
Social assistance and official development assistance |
| 18,519 |
| — |
| — |
| (145 | ) | 18,374 |
|
Personnel expenses |
| 5,584 |
| 8,741 |
| 2,164 |
| (11 | ) | 16,478 |
|
Other operating expenses |
| 30,434 |
| 19,307 |
| 10,955 |
| (22,807 | ) | 37,889 |
|
Interest expenses |
| 2,460 |
| 248 |
| 870 |
| (477 | ) | 3,101 |
|
Forecast for future new spending and top down adjustment |
| — |
| — |
| — |
| — |
| — |
|
Total Expenses (excluding losses) |
| 56,997 |
| 28,296 |
| 13,989 |
| (23,440 | ) | 75,842 |
|
Operating Balance before gains/(losses) |
| 4,822 |
| 717 |
| 608 |
| (510 | ) | 5,637 |
|
Total Gains/(losses) |
| (1,014 | ) | (2,468 | ) | 134 |
| (194 | ) | (3,542 | ) |
Net surplus/(deficit) from associates and joint ventures |
| 85 |
| 225 |
| 24 |
| — |
| 334 |
|
Gain/(loss) from discontinued operations |
| (2 | ) | — |
| 24 |
| — |
| 22 |
|
Attributable to minority interest in Air NZ |
| — |
| — |
| (67 | ) | — |
| (67 | ) |
Operating Balance |
| 3,891 |
| (1,526 | ) | 723 |
| (704 | ) | 2,384 |
|
Expenses by functional classification |
|
|
|
|
|
|
|
|
|
|
|
Social security and welfare |
| 17,877 |
| 4,307 |
| — |
| (675 | ) | 21,509 |
|
Health |
| 11,297 |
| 9,791 |
| — |
| (10,279 | ) | 10,809 |
|
Education |
| 9,551 |
| 8,069 |
| 25 |
| (7,248 | ) | 10,397 |
|
Transport and communications |
| 2,244 |
| 1,737 |
| 5,832 |
| (2,389 | ) | 7,424 |
|
Other |
| 13,568 |
| 4,144 |
| 7,262 |
| (2,372 | ) | 22,602 |
|
Finance costs |
| 2,460 |
| 248 |
| 870 |
| (477 | ) | 3,101 |
|
Forecast for future new spending and top down adjustment |
| — |
| — |
| — |
| — |
| — |
|
Total Crown Expenses excluding losses |
| 56,997 |
| 28,296 |
| 13,989 |
| (23,440 | ) | 75,842 |
|
as at 30 June 2008
|
| Core Crown |
| Crown |
| State-owned |
| Inter-segment |
| Total Crown |
|
|
| 2008 |
| 2008 |
| 2008 |
| 2008 |
| 2008 |
|
|
| Actual |
| Actual |
| Actual |
| Actual |
| Actual |
|
|
| $m |
| $m |
| $m |
| $m |
| $m |
|
Assets |
|
|
|
|
|
|
|
|
|
|
|
Cash and cash equivalents |
| 872 |
| 2,640 |
| 531 |
| (239 | ) | 3,804 |
|
Receivables |
| 9,031 |
| 4,444 |
| 2,247 |
| (1,564 | ) | 14,158 |
|
Other financial assets |
| 49,726 |
| 16,807 |
| 8,949 |
| (8,381 | ) | 67,101 |
|
Property, plant & equipment |
| 28,637 |
| 43,659 |
| 31,033 |
| — |
| 103,329 |
|
Equity accounted investments |
| 25,696 |
| 7,073 |
| 224 |
| (24,928 | ) | 8,065 |
|
Intangible assets and goodwill |
| 845 |
| 386 |
| 520 |
| — |
| 1,751 |
|
Other assets |
| 1,375 |
| 329 |
| 938 |
| (15 | ) | 2,627 |
|
Forecast for new capital spending and top down adjustment |
| — |
| — |
| — |
| — |
| — |
|
Total Assets |
| 116,182 |
| 75,338 |
| 44,442 |
| (35,127 | ) | 200,835 |
|
Liabilities |
|
|
|
|
|
|
|
|
|
|
|
Borrowings |
| 37,167 |
| 4,705 |
| 12,817 |
| (8,579 | ) | 46,110 |
|
Other liabilities |
| 22,032 |
| 26,256 |
| 6,648 |
| (5,725 | ) | 49,211 |
|
Total Liabilities |
| 59,199 |
| 30,961 |
| 19,465 |
| (14,304 | ) | 95,321 |
|
Total Assets less Total Liabilities |
| 56,983 |
| 44,377 |
| 24,977 |
| (20,823 | ) | 105,514 |
|
Net Worth |
|
|
|
|
|
|
|
|
|
|
|
Taxpayer funds |
| 42,677 |
| 19,994 |
| 7,722 |
| (23,693 | ) | 46,700 |
|
Reserves |
| 14,306 |
| 24,383 |
| 16,776 |
| 2,967 |
| 58,432 |
|
Net worth attributable to minority interest in Air NZ |
| — |
| — |
| 479 |
| (97 | ) | 382 |
|
Total Net Worth |
| 56,983 |
| 44,377 |
| 24,977 |
| (20,823 | ) | 105,514 |
|
for the year ended 30 June 2009
|
| Core Crown |
| Crown Entities |
| State-owned Enterprises |
| Inter-segment eliminations |
| Total Crown |
|
|
| 2009 |
| 2009 |
| 2009 |
| 2009 |
| 2009 |
|
|
| Forecast |
| Forecast |
| Forecast |
| Forecast |
| Forecast |
|
|
| $m |
| $m |
| $m |
| $m |
| $m |
|
Revenue |
|
|
|
|
|
|
|
|
|
|
|
Taxation revenue |
| 54,053 |
| — |
| — |
| (530 | ) | 53,523 |
|
Other sovereign revenue |
| 779 |
| 4,433 |
| — |
| (1,098 | ) | 4,114 |
|
Sales of goods and services |
| 1,266 |
| 12,959 |
| 13,066 |
| (12,043 | ) | 15,248 |
|
Interest revenue and dividends |
| 1,897 |
| 1,329 |
| 739 |
| (966 | ) | 2,999 |
|
Other revenue |
| 879 |
| 11,918 |
| 1,165 |
| (10,887 | ) | 3,075 |
|
Total Revenue (excluding gains) |
| 58,874 |
| 30,639 |
| 14,970 |
| (25,524 | ) | 78,959 |
|
Expenses |
|
|
|
|
|
|
|
|
|
|
|
Social assistance and official development assistance |
| 20,463 |
| — |
| — |
| (281 | ) | 20,182 |
|
Personnel expenses |
| 6,102 |
| 9,513 |
| 2,419 |
| (3 | ) | 18,031 |
|
Other operating expenses |
| 33,791 |
| 20,368 |
| 10,712 |
| (24,067 | ) | 40,804 |
|
Interest expenses |
| 2,507 |
| 248 |
| 1,185 |
| (582 | ) | 3,358 |
|
Forecast for future new spending and top down adjustment |
| (500 | ) | — |
| — |
| — |
| (500 | ) |
Total Expenses (excluding losses) |
| 62,363 |
| 30,129 |
| 14,316 |
| (24,933 | ) | 81,875 |
|
Operating Balance before gains/(losses) |
| (3,489 | ) | 510 |
| 654 |
| (591 | ) | (2,916 | ) |
Total Gains/(losses) |
| (3,317 | ) | (3,119 | ) | (17 | ) | (263 | ) | (6,716 | ) |
Net surplus/(deficit) from associates and joint ventures |
| 65 |
| 241 |
| 29 |
| (3 | ) | 333 |
|
Gain/(loss) from discontinued operations |
| (3 | ) | — |
| (1 | ) | — |
| (4 | ) |
Attributable to minority interest in Air NZ |
| — |
| — |
| — |
| — |
| — |
|
Operating Balance |
| (6,744 | ) | (2,368 | ) | 665 |
| (857 | ) | (9,303 | ) |
Expenses by functional classification |
|
|
|
|
|
|
|
|
|
|
|
Social security and welfare |
| 19,475 |
| 4,762 |
| — |
| (828 | ) | 23,409 |
|
Health |
| 12,395 |
| 10,323 |
| — |
| (10,771 | ) | 11,947 |
|
Education |
| 10,964 |
| 8,663 |
| 23 |
| (7,806 | ) | 11,844 |
|
Transport and communications |
| 2,954 |
| 1,976 |
| 6,950 |
| (2,531 | ) | 9,349 |
|
Other |
| 14,568 |
| 4,157 |
| 6,158 |
| (2,415 | ) | 22,468 |
|
Finance costs |
| 2,507 |
| 248 |
| 1,185 |
| (582 | ) | 3,358 |
|
Forecast for future new spending and top down adjustment |
| (500 | ) | — |
| — |
| — |
| (500 | ) |
Total Crown Expenses excluding losses |
| 62,363 |
| 30,129 |
| 14,316 |
| (24,933 | ) | 81,875 |
|
as at 30 June 2009
|
| Core Crown |
| Crown |
| State-owned Enterprises |
| Inter-segment eliminations |
| Total Crown |
|
|
| 2009 |
| 2009 |
| 2009 |
| 2009 |
| 2009 |
|
|
| Forecast |
| Forecast |
| Forecast |
| Forecast |
| Forecast |
|
|
| $m |
| $m |
| $m |
| $m |
| $m |
|
Assets |
|
|
|
|
|
|
|
|
|
|
|
Cash and cash equivalents |
| 2,432 |
| 2,716 |
| 432 |
| (227 | ) | 5,353 |
|
Receivables |
| 8,786 |
| 4,514 |
| 2,165 |
| (1,678 | ) | 13,787 |
|
Other financial assets |
| 62,046 |
| 17,097 |
| 11,395 |
| (10,156 | ) | 80,382 |
|
Property, plant & equipment |
| 29,094 |
| 44,157 |
| 33,246 |
| 1 |
| 106,498 |
|
Equity accounted investments |
| 27,462 |
| 7,464 |
| 334 |
| (26,455 | ) | 8,805 |
|
Intangible assets and goodwill |
| 933 |
| 404 |
| 591 |
| — |
| 1,928 |
|
Other assets |
| 1,334 |
| 357 |
| 986 |
| (31 | ) | 2,646 |
|
Forecast for new capital spending and top down adjustment |
| (275 | ) | — |
| — |
| — |
| (275 | ) |
Total Assets |
| 131,812 |
| 76,709 |
| 49,149 |
| (38,546 | ) | 219,124 |
|
Liabilities |
|
|
|
|
|
|
|
|
|
|
|
Borrowings |
| 57,131 |
| 5,172 |
| 16,976 |
| (10,123 | ) | 69,156 |
|
Other liabilities |
| 24,076 |
| 29,204 |
| 6,368 |
| (5,378 | ) | 54,270 |
|
Total Liabilities |
| 81,207 |
| 34,376 |
| 23,344 |
| (15,501 | ) | 123,426 |
|
Total Assets less Total Liabilities |
| 50,605 |
| 42,333 |
| 25,805 |
| (23,045 | ) | 95,698 |
|
Net Worth |
|
|
|
|
|
|
|
|
|
|
|
Taxpayer funds |
| 36,071 |
| 18,778 |
| 8,470 |
| (25,785 | ) | 37,534 |
|
Reserves |
| 14,534 |
| 23,555 |
| 16,856 |
| 2,837 |
| 57,782 |
|
Net worth attributable to minority interest in Air NZ |
| — |
| — |
| 479 |
| (97 | ) | 382 |
|
Total Net Worth |
| 50,605 |
| 42,333 |
| 25,805 |
| (23,045 | ) | 95,698 |
|
for the year ended 30 June 2010
|
| Core Crown |
| Crown Entities |
| State-owned Enterprises |
| Inter-segment eliminations |
| Total Crown |
|
|
| 2010 |
| 2010 |
| 2010 |
| 2010 |
| 2010 |
|
|
| Forecast |
| Forecast |
| Forecast |
| Forecast |
| Forecast |
|
|
| $m |
| $m |
| $m |
| $m |
| $m |
|
Revenue |
|
|
|
|
|
|
|
|
|
|
|
Taxation revenue |
| 51,580 |
| — |
| — |
| (528 | ) | 51,052 |
|
Other sovereign revenue |
| 1,178 |
| 4,823 |
| — |
| (1,141 | ) | 4,860 |
|
Sales of goods and services |
| 1,357 |
| 13,858 |
| 13,795 |
| (12,961 | ) | 16,049 |
|
Interest revenue and dividends |
| 2,076 |
| 832 |
| 927 |
| (676 | ) | 3,159 |
|
Other revenue |
| 580 |
| 11,544 |
| 1,492 |
| (10,802 | ) | 2,814 |
|
Total Revenue (excluding gains) |
| 56,771 |
| 31,057 |
| 16,214 |
| (26,108 | ) | 77,934 |
|
Expenses |
|
|
|
|
|
|
|
|
|
|
|
Social assistance and official development assistance |
| 21,445 |
| — |
| — |
| (270 | ) | 21,175 |
|
Personnel expenses |
| 5,924 |
| 9,902 |
| 2,501 |
| (3 | ) | 18,324 |
|
Other operating expenses |
| 35,489 |
| 21,045 |
| 11,522 |
| (25,185 | ) | 42,871 |
|
Interest expenses |
| 2,470 |
| 140 |
| 1,198 |
| (459 | ) | 3,349 |
|
Forecast for future new spending and top down adjustment |
| (46 | ) | — |
| — |
| — |
| (46 | ) |
Total Expenses (excluding losses) |
| 65,282 |
| 31,087 |
| 15,221 |
| (25,917 | ) | 85,673 |
|
Operating Balance before gains/(losses) |
| (8,511 | ) | (30 | ) | 993 |
| (191 | ) | (7,739 | ) |
Total Gains/(losses) |
| 1,295 |
| 105 |
| 318 |
| (97 | ) | 1,621 |
|
Net surplus/(deficit) from associates and joint ventures |
| 97 |
| 253 |
| 40 |
| — |
| 390 |
|
Gain/(loss) from discontinued operations |
| — |
| — |
| — |
| (1 | ) | (1 | ) |
Attributable to minority interest in Air NZ |
| — |
| — |
| — |
| — |
| — |
|
Operating Balance |
| (7,119 | ) | 328 |
| 1,351 |
| (289 | ) | (5,729 | ) |
Expenses by functional classification |
|
|
|
|
|
|
|
|
|
|
|
Social security and welfare |
| 21,139 |
| 4,787 |
| — |
| (853 | ) | 25,073 |
|
Health |
| 13,397 |
| 10,816 |
| — |
| (11,398 | ) | 12,815 |
|
Education |
| 11,284 |
| 8,939 |
| 23 |
| (8,099 | ) | 12,147 |
|
Transport and communications |
| 2,253 |
| 2,016 |
| 6,980 |
| (2,381 | ) | 8,868 |
|
Other |
| 14,785 |
| 4,389 |
| 7,020 |
| (2,727 | ) | 23,467 |
|
Finance costs |
| 2,470 |
| 140 |
| 1,198 |
| (459 | ) | 3,349 |
|
Forecast for future new spending and top down adjustment |
| (46 | ) | — |
| — |
| — |
| (46 | ) |
Total Crown Expenses excluding losses |
| 65,282 |
| 31,087 |
| 15,221 |
| (25,917 | ) | 85,673 |
|
as at 30 June 2010
|
| Core Crown |
| Crown |
| State-owned Enterprises |
| Inter-segment eliminations |
| Total Crown |
|
|
| 2010 |
| 2010 |
| 2010 |
| 2010 |
| 2010 |
|
|
| Forecast |
| Forecast |
| Forecast |
| Forecast |
| Forecast |
|
|
| $m |
| $m |
| $m |
| $m |
| $m |
|
Assets |
|
|
|
|
|
|
|
|
|
|
|
Cash and cash equivalents |
| 2,247 |
| 2,722 |
| 301 |
| (228 | ) | 5,042 |
|
Receivables |
| 8,877 |
| 4,661 |
| 2,067 |
| (1,512 | ) | 14,093 |
|
Other financial assets |
| 59,535 |
| 18,172 |
| 12,082 |
| (10,654 | ) | 79,135 |
|
Property, plant & equipment |
| 29,740 |
| 45,757 |
| 34,755 |
| (1 | ) | 110,251 |
|
Equity accounted investments |
| 29,205 |
| 7,724 |
| 370 |
| (28,102 | ) | 9,197 |
|
Intangible assets and goodwill |
| 1,036 |
| 404 |
| 693 |
| — |
| 2,133 |
|
Other assets |
| 1,325 |
| 359 |
| 1,030 |
| (30 | ) | 2,684 |
|
Forecast for new capital spending and top down adjustment |
| (303 | ) | — |
| — |
| — |
| (303 | ) |
Total Assets |
| 131,662 |
| 79,799 |
| 51,298 |
| (40,527 | ) | 222,232 |
|
Liabilities |
|
|
|
|
|
|
|
|
|
|
|
Borrowings |
| 63,915 |
| 5,168 |
| 17,962 |
| (10,622 | ) | 76,423 |
|
Other liabilities |
| 24,261 |
| 30,429 |
| 6,512 |
| (5,342 | ) | 55,860 |
|
Total Liabilities |
| 88,176 |
| 35,597 |
| 24,474 |
| (15,964 | ) | 132,283 |
|
Total Assets less Total Liabilities |
| 43,486 |
| 44,202 |
| 26,824 |
| (24,563 | ) | 89,949 |
|
Net Worth |
|
|
|
|
|
|
|
|
|
|
|
Taxpayer funds |
| 28,952 |
| 20,673 |
| 9,486 |
| (27,308 | ) | 31,803 |
|
Reserves |
| 14,534 |
| 23,529 |
| 16,859 |
| 2,842 |
| 57,764 |
|
Net worth attributable to minority interest in Air NZ |
| — |
| — |
| 479 |
| (97 | ) | 382 |
|
Total Net Worth |
| 43,486 |
| 44,202 |
| 26,824 |
| (24,563 | ) | 89,949 |
|
for the year ended 30 June 2011
|
| Core Crown |
| Crown Entities |
| State-owned |
| Inter-segment |
| Total Crown |
|
|
| 2011 |
| 2011 |
| 2011 |
| 2011 |
| 2011 |
|
|
| Forecast |
| Forecast |
| Forecast |
| Forecast |
| Forecast |
|
|
| $m |
| $m |
| $m |
| $m |
| $m |
|
|
|
|
|
|
|
|
|
|
|
|
|
Revenue |
|
|
|
|
|
|
|
|
|
|
|
Taxation revenue |
| 51,844 |
| — |
| — |
| (518 | ) | 51,326 |
|
Other sovereign revenue |
| 1,600 |
| 4,999 |
| — |
| (1,196 | ) | 5,403 |
|
Sales of goods and services |
| 1,321 |
| 13,839 |
| 15,186 |
| (12,931 | ) | 17,415 |
|
Interest revenue and dividends |
| 2,165 |
| 856 |
| 1,031 |
| (721 | ) | 3,331 |
|
Other revenue |
| 588 |
| 11,641 |
| 1,231 |
| (10,446 | ) | 3,014 |
|
Total Revenue (excluding gains) |
| 57,518 |
| 31,335 |
| 17,448 |
| (25,812 | ) | 80,489 |
|
|
|
|
|
|
|
|
|
|
|
|
|
Expenses |
|
|
|
|
|
|
|
|
|
|
|
Social assistance and official development assistance |
| 22,457 |
| — |
| — |
| (261 | ) | 22,196 |
|
Personnel expenses |
| 5,996 |
| 10,069 |
| 2,619 |
| (3 | ) | 18,681 |
|
Other operating expenses |
| 34,784 |
| 21,341 |
| 12,454 |
| (24,932 | ) | 43,647 |
|
Interest expenses |
| 2,998 |
| 160 |
| 1,342 |
| (481 | ) | 4,019 |
|
Forecast for future new spending and top down adjustment |
| 1,211 |
| — |
| — |
| — |
| 1,211 |
|
Total Expenses (excluding losses) |
| 67,446 |
| 31,570 |
| 16,415 |
| (25,677 | ) | 89,754 |
|
|
|
|
|
|
|
|
|
|
|
|
|
Operating Balance before gains/(losses) |
| (9,928 | ) | (235 | ) | 1,033 |
| (135 | ) | (9,265 | ) |
Total Gains/(losses) |
| 1,430 |
| 298 |
| 124 |
| (99 | ) | 1,753 |
|
Net surplus/(deficit) from associates and joint ventures |
| 96 |
| 257 |
| 50 |
| (1 | ) | 402 |
|
Gain/(loss) from discontinued operations |
| — |
| — |
| (1 | ) | — |
| (1 | ) |
Attributable to minority interest in Air NZ |
| — |
| — |
| — |
| — |
| — |
|
Operating Balance |
| (8,402 | ) | 320 |
| 1,206 |
| (235 | ) | (7,111 | ) |
|
|
|
|
|
|
|
|
|
|
|
|
Expenses by functional classification |
|
|
|
|
|
|
|
|
|
|
|
Social security and welfare |
| 22,114 |
| 5,168 |
| — |
| (873 | ) | 26,409 |
|
Health |
| 13,371 |
| 10,817 |
| — |
| (11,434 | ) | 12,754 |
|
Education |
| 11,304 |
| 8,968 |
| 23 |
| (8,097 | ) | 12,198 |
|
Transport and communications |
| 1,864 |
| 2,033 |
| 7,335 |
| (2,054 | ) | 9,178 |
|
Other |
| 14,584 |
| 4,424 |
| 7,715 |
| (2,738 | ) | 23,985 |
|
Finance costs |
| 2,998 |
| 160 |
| 1,342 |
| (481 | ) | 4,019 |
|
Forecast for future new spending and top down adjustment |
| 1,211 |
| — |
| — |
| — |
| 1,211 |
|
Total Crown Expenses excluding losses |
| 67,446 |
| 31,570 |
| 16,415 |
| (25,677 | ) | 89,754 |
|
as at 30 June 2011
|
| Core Crown |
| Crown |
| State-owned |
| Inter-segment |
| Total Crown |
|
|
| 2011 |
| 2011 |
| 2011 |
| 2011 |
| 2011 |
|
|
| Forecast |
| Forecast |
| Forecast |
| Forecast |
| Forecast |
|
|
| $m |
| $m |
| $m |
| $m |
| $m |
|
Assets |
|
|
|
|
|
|
|
|
|
|
|
Cash and cash equivalents |
| 2,279 |
| 2,676 |
| 317 |
| (227 | ) | 5,045 |
|
Receivables |
| 8,572 |
| 4,763 |
| 2,216 |
| (1,533 | ) | 14,018 |
|
Other financial assets |
| 60,682 |
| 19,778 |
| 12,118 |
| (11,119 | ) | 81,459 |
|
Property, plant & equipment |
| 29,913 |
| 46,883 |
| 36,721 |
| — |
| 113,517 |
|
Equity accounted investments |
| 30,495 |
| 7,980 |
| 413 |
| (29,356 | ) | 9,532 |
|
Intangible assets and goodwill |
| 1,049 |
| 406 |
| 826 |
| — |
| 2,281 |
|
Other assets |
| 1,307 |
| 354 |
| 1,106 |
| (29 | ) | 2,738 |
|
Forecast for new capital spending and top down adjustment |
| 399 |
| — |
| — |
| — |
| 399 |
|
Total Assets |
| 134,696 |
| 82,840 |
| 53,717 |
| (42,264 | ) | 228,989 |
|
Liabilities |
|
|
|
|
|
|
|
|
|
|
|
Borrowings |
| 75,371 |
| 5,301 |
| 19,302 |
| (11,318 | ) | 88,656 |
|
Other liabilities |
| 24,241 |
| 31,816 |
| 6,748 |
| (5,284 | ) | 57,521 |
|
Total Liabilities |
| 99,612 |
| 37,117 |
| 26,050 |
| (16,602 | ) | 146,177 |
|
Total Assets less Total Liabilities |
| 35,084 |
| 45,723 |
| 27,667 |
| (25,662 | ) | 82,812 |
|
Net Worth |
|
|
|
|
|
|
|
|
|
|
|
Taxpayer funds |
| 20,550 |
| 22,218 |
| 10,326 |
| (28,405 | ) | 24,689 |
|
Reserves |
| 14,534 |
| 23,505 |
| 16,862 |
| 2,840 |
| 57,741 |
|
Net worth attributable to minority interest in Air NZ |
| — |
| — |
| 479 |
| (97 | ) | 382 |
|
Total Net Worth |
| 35,084 |
| 45,723 |
| 27,667 |
| (25,662 | ) | 82,812 |
|
for the year ended 30 June 2012
|
| Core Crown |
| Crown Entities |
| State-owned |
| Inter-segment |
| Total Crown |
|
|
| 2012 |
| 2012 |
| 2012 |
| 2012 |
| 2012 |
|
|
| Forecast |
| Forecast |
| Forecast |
| Forecast |
| Forecast |
|
|
| $m |
| $m |
| $m |
| $m |
| $m |
|
Revenue |
|
|
|
|
|
|
|
|
|
|
|
Taxation revenue |
| 54,591 |
| — |
| — |
| (578 | ) | 54,013 |
|
Other sovereign revenue |
| 1,799 |
| 5,145 |
| — |
| (1,244 | ) | 5,700 |
|
Sales of goods and services |
| 1,314 |
| 13,860 |
| 15,466 |
| (12,898 | ) | 17,742 |
|
Interest revenue and dividends |
| 2,243 |
| 878 |
| 1,028 |
| (786 | ) | 3,363 |
|
Other revenue |
| 591 |
| 11,686 |
| 1,048 |
| (10,290 | ) | 3,035 |
|
Total Revenue (excluding gains) |
| 60,538 |
| 31,569 |
| 17,542 |
| (25,796 | ) | 83,853 |
|
Expenses |
|
|
|
|
|
|
|
|
|
|
|
Social assistance and official development assistance |
| 23,238 |
| — |
| — |
| (251 | ) | 22,987 |
|
Personnel expenses |
| 6,055 |
| 10,270 |
| 2,673 |
| (3 | ) | 18,995 |
|
Other operating expenses |
| 35,110 |
| 21,607 |
| 12,585 |
| (24,856 | ) | 44,446 |
|
Interest expenses |
| 3,575 |
| 180 |
| 1,363 |
| (493 | ) | 4,625 |
|
Forecast for future new spending and top down adjustment |
| 2,383 |
| — |
| — |
| — |
| 2,383 |
|
Total Expenses (excluding losses) |
| 70,361 |
| 32,057 |
| 16,621 |
| (25,603 | ) | 93,436 |
|
Operating Balance before gains/(losses) |
| (9,823 | ) | (488 | ) | 921 |
| (193 | ) | (9,583 | ) |
Total Gains/(losses) |
| 1,520 |
| 526 |
| 140 |
| (117 | ) | 2,069 |
|
Net surplus/(deficit) from associates and joint ventures |
| 98 |
| 256 |
| 47 |
| (1 | ) | 400 |
|
Gain/(loss) from discontinued operations |
| — |
| — |
| (1 | ) | — |
| (1 | ) |
Attributable to minority interest in Air NZ |
| — |
| — |
| — |
| — |
| — |
|
Operating Balance |
| (8,205 | ) | 294 |
| 1,107 |
| (311 | ) | (7,115 | ) |
Expenses by functional classification |
|
|
|
|
|
|
|
|
|
|
|
Social security and welfare |
| 22,925 |
| 5,579 |
| — |
| (900 | ) | 27,604 |
|
Health |
| 13,358 |
| 10,800 |
| — |
| (11,445 | ) | 12,713 |
|
Education |
| 11,311 |
| 8,946 |
| 23 |
| (8,043 | ) | 12,237 |
|
Transport and communications |
| 1,740 |
| 2,054 |
| 7,393 |
| (1,947 | ) | 9,240 |
|
Other |
| 15,069 |
| 4,498 |
| 7,842 |
| (2,775 | ) | 24,634 |
|
Finance costs |
| 3,575 |
| 180 |
| 1,363 |
| (493 | ) | 4,625 |
|
Forecast for future new spending and top down adjustment |
| 2,383 |
| — |
| — |
| — |
| 2,383 |
|
Total Crown Expenses excluding losses |
| 70,361 |
| 32,057 |
| 16,621 |
| (25,603 | ) | 93,436 |
|
as at 30 June 2012
|
| Core Crown |
| Crown |
| State-owned |
| Inter-segment |
| Total Crown |
|
|
| 2012 |
| 2012 |
| 2012 |
| 2012 |
| 2012 |
|
|
| Forecast |
| Forecast |
| Forecast |
| Forecast |
| Forecast |
|
|
| $m |
| $m |
| $m |
| $m |
| $m |
|
Assets |
|
|
|
|
|
|
|
|
|
|
|
Cash and cash equivalents |
| 2,504 |
| 2,693 |
| 399 |
| (226 | ) | 5,370 |
|
Receivables |
| 8,490 |
| 4,889 |
| 2,255 |
| (1,605 | ) | 14,029 |
|
Other financial assets |
| 58,943 |
| 21,554 |
| 12,111 |
| (11,497 | ) | 81,111 |
|
Property, plant & equipment |
| 29,765 |
| 47,887 |
| 38,113 |
| (1 | ) | 115,764 |
|
Equity accounted investments |
| 31,420 |
| 8,240 |
| 456 |
| (30,387 | ) | 9,729 |
|
Intangible assets and goodwill |
| 1,103 |
| 380 |
| 850 |
| — |
| 2,333 |
|
Other assets |
| 1,293 |
| 356 |
| 1,120 |
| (29 | ) | 2,740 |
|
Forecast for new capital spending and top down adjustment |
| 1,551 |
| — |
| — |
| — |
| 1,551 |
|
Total Assets |
| 135,069 |
| 85,999 |
| 55,304 |
| (43,745 | ) | 232,627 |
|
Liabilities |
|
|
|
|
|
|
|
|
|
|
|
Borrowings |
| 83,600 |
| 5,517 |
| 20,075 |
| (11,772 | ) | 97,420 |
|
Other liabilities |
| 24,590 |
| 33,468 |
| 6,865 |
| (5,410 | ) | 59,513 |
|
Total Liabilities |
| 108,190 |
| 38,985 |
| 26,940 |
| (17,182 | ) | 156,933 |
|
Total Assets less Total Liabilities |
| 26,879 |
| 47,014 |
| 28,364 |
| (26,563 | ) | 75,694 |
|
Net Worth |
|
|
|
|
|
|
|
|
|
|
|
Taxpayer funds |
| 12,345 |
| 23,521 |
| 11,019 |
| (29,308 | ) | 17,577 |
|
Reserves |
| 14,534 |
| 23,493 |
| 16,866 |
| 2,842 |
| 57,735 |
|
Net worth attributable to minority interest in Air NZ |
| — |
| — |
| 479 |
| (97 | ) | 382 |
|
Total Net Worth |
| 26,879 |
| 47,014 |
| 28,364 |
| (26,563 | ) | 75,694 |
|
for the year ended 30 June 2013
|
| Core Crown |
| Crown Entities |
| State-owned |
| Inter-segment |
| Total Crown |
|
|
| 2013 |
| 2013 |
| 2013 |
| 2013 |
| 2013 |
|
|
| Forecast |
| Forecast |
| Forecast |
| Forecast |
| Forecast |
|
|
| $m |
| $m |
| $m |
| $m |
| $m |
|
Revenue |
|
|
|
|
|
|
|
|
|
|
|
Taxation revenue |
| 58,406 |
| — |
| — |
| (625 | ) | 57,781 |
|
Other sovereign revenue |
| 2,295 |
| 5,253 |
| — |
| (1,249 | ) | 6,299 |
|
Sales of goods and services |
| 1,298 |
| 13,920 |
| 16,066 |
| (12,907 | ) | 18,377 |
|
Interest revenue and dividends |
| 2,456 |
| 891 |
| 1,033 |
| (938 | ) | 3,442 |
|
Other revenue |
| 591 |
| 11,717 |
| 1,055 |
| (10,150 | ) | 3,213 |
|
Total Revenue (excluding gains) |
| 65,046 |
| 31,781 |
| 18,154 |
| (25,869 | ) | 89,112 |
|
Expenses |
|
|
|
|
|
|
|
|
|
|
|
Social assistance and official development assistance |
| 23,908 |
| — |
| — |
| (250 | ) | 23,658 |
|
Personnel expenses |
| 6,142 |
| 10,298 |
| 2,752 |
| (3 | ) | 19,189 |
|
Other operating expenses |
| 35,588 |
| 22,083 |
| 12,912 |
| (24,827 | ) | 45,756 |
|
Interest expenses |
| 4,330 |
| 150 |
| 1,472 |
| (492 | ) | 5,460 |
|
Forecast for future new spending and top down adjustment |
| 3,472 |
| — |
| — |
| — |
| 3,472 |
|
Total Expenses (excluding losses) |
| 73,440 |
| 32,531 |
| 17,136 |
| (25,572 | ) | 97,535 |
|
Operating Balance before gains/(losses) |
| (8,394 | ) | (750 | ) | 1,018 |
| (297 | ) | (8,423 | ) |
Total Gains/(losses) |
| 1,628 |
| 650 |
| 140 |
| (149 | ) | 2,269 |
|
Net surplus/(deficit) from associates and joint ventures |
| 80 |
| 256 |
| 48 |
| (2 | ) | 382 |
|
Gain/(loss) from discontinued operations |
| — |
| — |
| (1 | ) | — |
| (1 | ) |
Attributable to minority interest in Air NZ |
| — |
| — |
| — |
| — |
| — |
|
Operating Balance |
| (6,686 | ) | 156 |
| 1,205 |
| (448 | ) | (5,773 | ) |
Expenses by functional classification |
|
|
|
|
|
|
|
|
|
|
|
Social security and welfare |
| 23,572 |
| 5,969 |
| — |
| (934 | ) | 28,607 |
|
Health |
| 13,324 |
| 10,797 |
| — |
| (11,429 | ) | 12,692 |
|
Education |
| 11,332 |
| 8,983 |
| 23 |
| (8,048 | ) | 12,290 |
|
Transport and communications |
| 1,615 |
| 2,072 |
| 7,627 |
| (1,829 | ) | 9,485 |
|
Other |
| 15,795 |
| 4,560 |
| 8,014 |
| (2,840 | ) | 25,529 |
|
Finance costs |
| 4,330 |
| 150 |
| 1,472 |
| (492 | ) | 5,460 |
|
Forecast for future new spending and top down adjustment |
| 3,472 |
| — |
| — |
| — |
| 3,472 |
|
Total Crown Expenses excluding losses |
| 73,440 |
| 32,531 |
| 17,136 |
| (25,572 | ) | 97,535 |
|
as at 30 June 2013
|
| Core Crown |
| Crown |
| State-owned |
| Inter-segment |
| Total Crown |
|
|
| 2013 |
| 2013 |
| 2013 |
| 2013 |
| 2013 |
|
|
| Forecast |
| Forecast |
| Forecast |
| Forecast |
| Forecast |
|
|
| $m |
| $m |
| $m |
| $m |
| $m |
|
Assets |
|
|
|
|
|
|
|
|
|
|
|
Cash and cash equivalents |
| 2,256 |
| 2,655 |
| 422 |
| (226 | ) | 5,107 |
|
Receivables |
| 8,621 |
| 5,020 |
| 2,324 |
| (1,526 | ) | 14,439 |
|
Other financial assets |
| 58,608 |
| 23,319 |
| 12,402 |
| (11,822 | ) | 82,507 |
|
Property, plant & equipment |
| 29,562 |
| 48,802 |
| 40,122 |
| — |
| 118,486 |
|
Equity accounted investments |
| 32,135 |
| 8,496 |
| 496 |
| (31,441 | ) | 9,686 |
|
Intangible assets and goodwill |
| 1,019 |
| 369 |
| 851 |
| — |
| 2,239 |
|
Other assets |
| 1,247 |
| 356 |
| 1,130 |
| (30 | ) | 2,703 |
|
Forecast for new capital spending and top down adjustment |
| 3,001 |
| — |
| — |
| — |
| 3,001 |
|
Total Assets |
| 136,449 |
| 89,017 |
| 57,747 |
| (45,045 | ) | 238,168 |
|
Liabilities |
|
|
|
|
|
|
|
|
|
|
|
Borrowings |
| 91,414 |
| 5,583 |
| 21,808 |
| (12,184 | ) | 106,621 |
|
Other liabilities |
| 24,842 |
| 35,266 |
| 6,898 |
| (5,351 | ) | 61,655 |
|
Total Liabilities |
| 116,256 |
| 40,849 |
| 28,706 |
| (17,535 | ) | 168,276 |
|
Total Assets less Total Liabilities |
| 20,193 |
| 48,168 |
| 29,041 |
| (27,510 | ) | 69,892 |
|
Net Worth |
|
|
|
|
|
|
|
|
|
|
|
Taxpayer funds |
| 5,659 |
| 24,708 |
| 11,692 |
| (30,254 | ) | 11,805 |
|
Reserves |
| 14,534 |
| 23,460 |
| 16,870 |
| 2,841 |
| 57,705 |
|
Net worth attributable to minority interest in Air NZ |
| — |
| — |
| 479 |
| (97 | ) | 382 |
|
Total Net Worth |
| 20,193 |
| 48,168 |
| 29,041 |
| (27,510 | ) | 69,892 |
|
4
Core Crown Expense Tables(18)
|
| 2004 |
| 2005 |
| 2006 |
| 2007 |
| 2008 |
| 2009 |
| 2010 |
| 2011 |
| 2012 |
| 2013 |
|
($ million) |
| Actual |
| Actual |
| Actual |
| Actual |
| Actual |
| Forecast |
| Forecast |
| Forecast |
| Forecast |
| Forecast |
|
Social security and welfare |
| 14,252 |
| 14,682 |
| 15,598 |
| 16,768 |
| 17,877 |
| 19,475 |
| 21,139 |
| 22,114 |
| 22,925 |
| 23,572 |
|
GSF |
| 591 |
| 718 |
| 761 |
| 645 |
| 690 |
| 680 |
| 370 |
| 390 |
| 437 |
| 494 |
|
Health |
| 8,111 |
| 8,813 |
| 9,547 |
| 10,355 |
| 11,297 |
| 12,395 |
| 13,397 |
| 13,371 |
| 13,358 |
| 13,324 |
|
Education |
| 7,585 |
| 7,930 |
| 9,914 |
| 9,269 |
| 9,551 |
| 10,964 |
| 11,284 |
| 11,304 |
| 11,311 |
| 11,332 |
|
Core government services |
| 2,091 |
| 2,567 |
| 2,507 |
| 4,816 |
| 3,371 |
| 3,853 |
| 3,620 |
| 3,632 |
| 3,697 |
| 3,774 |
|
Law and order |
| 1,843 |
| 1,977 |
| 2,235 |
| 2,699 |
| 2,894 |
| 3,116 |
| 3,267 |
| 3,302 |
| 3,302 |
| 3,319 |
|
Defence |
| 1,311 |
| 1,275 |
| 1,383 |
| 1,517 |
| 1,562 |
| 1,735 |
| 1,810 |
| 1,807 |
| 1,797 |
| 1,796 |
|
Transport and communications |
| 1,461 |
| 1,635 |
| 1,818 |
| 2,405 |
| 2,244 |
| 2,954 |
| 2,253 |
| 1,864 |
| 1,740 |
| 1,615 |
|
Economic and industrial services |
| 1,192 |
| 1,444 |
| 1,592 |
| 1,595 |
| 2,889 |
| 3,145 |
| 2,673 |
| 2,594 |
| 2,590 |
| 2,585 |
|
Primary services |
| 368 |
| 394 |
| 467 |
| 438 |
| 541 |
| 545 |
| 611 |
| 545 |
| 553 |
| 559 |
|
Heritage, culture and recreation |
| 634 |
| 991 |
| 891 |
| 844 |
| 1,107 |
| 1,062 |
| 1,507 |
| 1,711 |
| 1,594 |
| 2,638 |
|
Housing and community development |
| 139 |
| 163 |
| 202 |
| 255 |
| 260 |
| 312 |
| 365 |
| 356 |
| 360 |
| 346 |
|
Other |
| 52 |
| 32 |
| 49 |
| 68 |
| 254 |
| 120 |
| 562 |
| 247 |
| 739 |
| 284 |
|
Finance costs |
| 2,252 |
| 2,274 |
| 2,356 |
| 2,329 |
| 2,460 |
| 2,507 |
| 2,470 |
| 2,998 |
| 3,575 |
| 4,330 |
|
Forecast for future new spending |
| — |
| — |
| — |
| — |
| — |
| — |
| 254 |
| 1,436 |
| 2,533 |
| 3,622 |
|
Top- down expense adjustment |
| — |
| — |
| — |
| — |
| — |
| (500 | ) | (300 | ) | (225 | ) | (150 | ) | (150 | ) |
Core Crown expenses |
| 41,882 |
| 44,895 |
| 49,320 |
| 54,003 |
| 56,997 |
| 62,363 |
| 65,282 |
| 67,446 |
| 70,361 |
| 73,440 |
|
Source: The Treasury
Table 4.1 — Social security and welfare expenses
|
| 2004 |
| 2005 |
| 2006 |
| 2007 |
| 2008 |
| 2009 |
| 2010 |
| 2011 |
| 2012 |
| 2013 |
|
($ million) |
| Actual |
| Actual |
| Actual |
| Actual |
| Actual |
| Forecast |
| Forecast |
| Forecast |
| Forecast |
| Forecast |
|
Welfare benefits |
| 13,181 |
| 13,326 |
| 14,246 |
| 15,435 |
| 16,288 |
| 17,427 |
| 19,059 |
| 20,036 |
| 20,775 |
| 21,388 |
|
Social rehabilitation & compensation |
| 118 |
| 152 |
| 145 |
| 163 |
| 199 |
| 336 |
| 329 |
| 322 |
| 319 |
| 319 |
|
Departmental expenses |
| 705 |
| 781 |
| 858 |
| 845 |
| 850 |
| 1,107 |
| 1,124 |
| 1,123 |
| 1,102 |
| 1,102 |
|
Other non-departmental expenses |
| 248 |
| 423 |
| 349 |
| 325 |
| 540 |
| 605 |
| 627 |
| 633 |
| 729 |
| 763 |
|
Social security and welfare expenses |
| 14,252 |
| 14,682 |
| 15,598 |
| 16,768 |
| 17,877 |
| 19,475 |
| 21,139 |
| 22,114 |
| 22,925 |
| 23,572 |
|
(18) Historical data contained in the expense tables have been restated on a NZ IFRS basis for material changes.
Source: The Treasury
Table 4.2 — New Zealand superannuation and welfare benefit expenses
|
| 2004 |
| 2005 |
| 2006 |
| 2007 |
| 2008 |
| 2009 |
| 2010 |
| 2011 |
| 2012 |
| 2013 |
|
($ million) |
| Actual |
| Actual |
| Actual |
| Actual |
| Actual |
| Forecast |
| Forecast |
| Forecast |
| Forecast |
| Forecast |
|
New Zealand Superannuation |
| 5,889 |
| 6,083 |
| 6,414 |
| 6,810 |
| 7,348 |
| 7,746 |
| 8,246 |
| 8,665 |
| 9,186 |
| 9,666 |
|
Domestic Purposes Benefit |
| 1,569 |
| 1,547 |
| 1,493 |
| 1,468 |
| 1,478 |
| 1,528 |
| 1,647 |
| 1,711 |
| 1,759 |
| 1,786 |
|
Unemployment Benefit |
| 1,084 |
| 831 |
| 712 |
| 613 |
| 458 |
| 588 |
| 1,078 |
| 1,268 |
| 1,283 |
| 1,205 |
|
Invalids Benefit |
| 976 |
| 1,026 |
| 1,073 |
| 1,132 |
| 1,216 |
| 1,258 |
| 1,297 |
| 1,337 |
| 1,375 |
| 1,391 |
|
Family Tax Credit |
| 833 |
| 846 |
| 1,285 |
| 1,699 |
| 1,897 |
| 2,123 |
| 2,158 |
| 2,191 |
| 2,204 |
| 2,298 |
|
Accommodation Supplement |
| 702 |
| 750 |
| 843 |
| 877 |
| 891 |
| 988 |
| 1,166 |
| 1,248 |
| 1,282 |
| 1,296 |
|
Sickness Benefit |
| 470 |
| 510 |
| 541 |
| 573 |
| 582 |
| 610 |
| 692 |
| 736 |
| 747 |
| 751 |
|
Disability Allowance |
| 257 |
| 267 |
| 261 |
| 270 |
| 278 |
| 390 |
| 417 |
| 439 |
| 461 |
| 479 |
|
Income Related Rents |
| 340 |
| 370 |
| 395 |
| 434 |
| 465 |
| 501 |
| 540 |
| 586 |
| 635 |
| 683 |
|
In Work Tax Credit |
| — |
| — |
| 70 |
| 461 |
| 563 |
| 586 |
| 578 |
| 552 |
| 529 |
| 498 |
|
Child Tax Credit |
| 155 |
| 141 |
| 154 |
| 44 |
| 11 |
| 6 |
| 3 |
| 2 |
| 2 |
| 1 |
|
Special Benefit |
| 140 |
| 175 |
| 162 |
| 106 |
| 71 |
| — |
| — |
| — |
| — |
| — |
|
Benefits paid in Australia |
| 103 |
| 91 |
| 80 |
| 71 |
| 58 |
| 52 |
| 45 |
| 39 |
| 35 |
| 22 |
|
Paid Parental Leave |
| 63 |
| 76 |
| 96 |
| 122 |
| 135 |
| 143 |
| 150 |
| 159 |
| 163 |
| 168 |
|
Childcare Assistance |
| 58 |
| 79 |
| 110 |
| 139 |
| 150 |
| 160 |
| 178 |
| 189 |
| 202 |
| 212 |
|
War Disablement Pensions |
| 102 |
| 107 |
| 113 |
| 122 |
| 134 |
| 143 |
| 150 |
| 156 |
| 163 |
| 168 |
|
Veteran’s Pension |
| 110 |
| 119 |
| 128 |
| 143 |
| 161 |
| 176 |
| 189 |
| 201 |
| 212 |
| 220 |
|
Other benefits |
| 330 |
| 308 |
| 316 |
| 351 |
| 392 |
| 429 |
| 525 |
| 557 |
| 537 |
| 544 |
|
Benefit expenses |
| 13,181 |
| 13,326 |
| 14,246 |
| 15,435 |
| 16,288 |
| 17,427 |
| 19,059 |
| 20,036 |
| 20,775 |
| 21,388 |
|
Source: The Treasury
Table 4.3 — Beneficiary numbers
|
| 2004 |
| 2005 |
| 2006 |
| 2007 |
| 2008 |
| 2009 |
| 2010 |
| 2011 |
| 2012 |
| 2013 |
|
(Thousands) |
| Actual |
| Actual |
| Actual |
| Actual |
| Actual |
| Forecast |
| Forecast |
| Forecast |
| Forecast |
| Forecast |
|
|
|
|
|
|
|
|
|
|
|
|
|
|
|
|
|
|
|
|
|
|
|
New Zealand Superannuation |
| 461 |
| 469 |
| 482 |
| 495 |
| 508 |
| 522 |
| 538 |
| 553 |
| 573 |
| 596 |
|
Domestic Purposes Benefit |
| 110 |
| 109 |
| 106 |
| 100 |
| 97 |
| 101 |
| 107 |
| 109 |
| 109 |
| 110 |
|
Unemployment Benefit |
| 104 |
| 78 |
| 64 |
| 52 |
| 37 |
| 47 |
| 85 |
| 99 |
| 98 |
| 91 |
|
Accommodation Supplement |
| 249 |
| 243 |
| 249 |
| 251 |
| 245 |
| 266 |
| 311 |
| 328 |
| 331 |
| 331 |
|
Invalids Benefit |
| 70 |
| 74 |
| 76 |
| 78 |
| 82 |
| 86 |
| 88 |
| 89 |
| 91 |
| 92 |
|
Sickness Benefit |
| 42 |
| 45 |
| 47 |
| 48 |
| 48 |
| 50 |
| 56 |
| 58 |
| 58 |
| 58 |
|
Source: The Treasury
Table 4.4 — GSF pension expenses
|
| 2004 |
| 2005 |
| 2006 |
| 2007 |
| 2008 |
| 2009 |
| 2010 |
| 2011 |
| 2012 |
| 2013 |
|
($ million) |
| Actual |
| Actual |
| Actual |
| Actual |
| Actual |
| Forecast |
| Forecast |
| Forecast |
| Forecast |
| Forecast |
|
|
|
|
|
|
|
|
|
|
|
|
|
|
|
|
|
|
|
|
|
|
|
Pension expenses |
| 591 |
| 718 |
| 761 |
| 645 |
| 690 |
| 680 |
| 370 |
| 390 |
| 437 |
| 494 |
|
GSF pension expenses |
| 591 |
| 718 |
| 761 |
| 645 |
| 690 |
| 680 |
| 370 |
| 390 |
| 437 |
| 494 |
|
Source: The Treasury
Table 4.5 — Health expenses
|
| 2004 |
| 2005 |
| 2006 |
| 2007 |
| 2008 |
| 2009 |
| 2010 |
| 2011 |
| 2012 |
| 2013 |
|
($ million) |
| Actual |
| Actual |
| Actual |
| Actual |
| Actual |
| Forecast |
| Forecast |
| Forecast |
| Forecast |
| Forecast |
|
Departmental outputs |
| 161 |
| 157 |
| 174 |
| 180 |
| 206 |
| 208 |
| 212 |
| 213 |
| 213 |
| 213 |
|
Health service purchasing |
| 7,452 |
| 8,113 |
| 8,805 |
| 9,614 |
| 10,503 |
| 11,376 |
| 12,346 |
| 12,292 |
| 12,253 |
| 12,241 |
|
Other non-departmental outputs |
| 71 |
| 160 |
| 135 |
| 99 |
| 97 |
| 98 |
| 107 |
| 102 |
| 101 |
| 99 |
|
Health payments to ACC |
| 409 |
| 356 |
| 372 |
| 425 |
| 463 |
| 667 |
| 686 |
| 719 |
| 745 |
| 725 |
|
Other expenses |
| 18 |
| 27 |
| 61 |
| 37 |
| 28 |
| 46 |
| 46 |
| 45 |
| 46 |
| 46 |
|
Health expenses |
| 8,111 |
| 8,813 |
| 9,547 |
| 10,355 |
| 11,297 |
| 12,395 |
| 13,397 |
| 13,371 |
| 13,358 |
| 13,324 |
|
Source: The Treasury
Table 4.6 — Health service purchasing
|
| 2004 |
| 2005 |
| 2006 |
| 2007 |
| 2008 |
| 2009 |
| 2010 |
| 2011 |
| 2012 |
| 2013 |
|
($ million) |
| Actual |
| Actual |
| Actual |
| Actual |
| Actual |
| Forecast |
| Forecast |
| Forecast |
| Forecast |
| Forecast |
|
Payments to District Health Boards |
| 6,441 |
| 7,262 |
| 7,814 |
| 8,547 |
| 9,312 |
| 10,040 |
| 10,936 |
| 10,913 |
| 10,895 |
| 10,888 |
|
National Disability Support Services |
| 793 |
| 620 |
| 699 |
| 755 |
| 834 |
| 890 |
| 895 |
| 898 |
| 898 |
| 898 |
|
Public Health Service Purchasing |
| 218 |
| 231 |
| 292 |
| 312 |
| 357 |
| 446 |
| 515 |
| 481 |
| 460 |
| 455 |
|
Health service purchasing |
| 7,452 |
| 8,113 |
| 8,805 |
| 9,614 |
| 10,503 |
| 11,376 |
| 12,346 |
| 12,292 |
| 12,253 |
| 12,241 |
|
Source: The Treasury
Table 4.7 — Education expenses
|
| 2004 |
| 2005 |
| 2006 |
| 2007 |
| 2008 |
| 2009 |
| 2010 |
| 2011 |
| 2012 |
| 2013 |
|
($ million) |
| Actual |
| Actual |
| Actual |
| Actual |
| Actual |
| Forecast |
| Forecast |
| Forecast |
| Forecast |
| Forecast |
|
Early childhood education |
| 393 |
| 444 |
| 555 |
| 617 |
| 860 |
| 1,049 |
| 1,125 |
| 1,189 |
| 1,237 |
| 1,255 |
|
Primary and secondary schools |
| 3,692 |
| 3,934 |
| 4,153 |
| 4,325 |
| 4,552 |
| 4,986 |
| 5,111 |
| 5,109 |
| 5,104 |
| 5,133 |
|
Tertiary funding |
| 2,535 |
| 2,496 |
| 4,047 |
| 3,322 |
| 3,266 |
| 3,921 |
| 4,013 |
| 3,992 |
| 3,963 |
| 3,954 |
|
Departmental expenses |
| 679 |
| 737 |
| 821 |
| 875 |
| 828 |
| 916 |
| 926 |
| 915 |
| 912 |
| 909 |
|
Other education expenses |
| 286 |
| 319 |
| 338 |
| 130 |
| 45 |
| 92 |
| 109 |
| 99 |
| 95 |
| 81 |
|
Education expenses |
| 7,585 |
| 7,930 |
| 9,914 |
| 9,269 |
| 9,551 |
| 10,964 |
| 11,284 |
| 11,304 |
| 11,311 |
| 11,332 |
|
Places |
| 2004 |
| 2005 |
| 2006 |
| 2007 |
| 2008 |
| 2009 |
| 2010 |
| 2011 |
| 2012 |
| 2013 |
|
ECE(1) |
| 109,513 |
| 113,009 |
| 115,903 |
| 123,196 |
| 133,903 |
| 143,863 |
| 147,541 |
| 150,228 |
| 151,460 |
| 151,797 |
|
(1) Full-time equivalent based on 1,000 funded child hours per year.
Sources: Ministry of Education, The Treasury
Table 4.8 — Primary and secondary education expenses
|
| 2004 |
| 2005 |
| 2006 |
| 2007 |
| 2008 |
| 2009 |
| 2010 |
| 2011 |
| 2012 |
| 2013 |
|
($ million) |
| Actual |
| Actual |
| Actual |
| Actual |
| Actual |
| Forecast |
| Forecast |
| Forecast |
| Forecast |
| Forecast |
|
Primary |
| 1,884 |
| 1,964 |
| 2,062 |
| 2,141 |
| 2,262 |
| 2,504 |
| 2,583 |
| 2,593 |
| 2,589 |
| 2,611 |
|
Secondary |
| 1,385 |
| 1,524 |
| 1,618 |
| 1,682 |
| 1,761 |
| 1,925 |
| 1,957 |
| 1,949 |
| 1,946 |
| 1,946 |
|
School transport |
| 106 |
| 109 |
| 118 |
| 125 |
| 131 |
| 149 |
| 158 |
| 163 |
| 168 |
| 173 |
|
Special needs support |
| 221 |
| 231 |
| 245 |
| 263 |
| 278 |
| 290 |
| 295 |
| 296 |
| 297 |
| 298 |
|
Professional Development |
| 84 |
| 95 |
| 101 |
| 104 |
| 108 |
| 105 |
| 104 |
| 94 |
| 90 |
| 91 |
|
Schooling Improvement |
| 12 |
| 11 |
| 9 |
| 10 |
| 12 |
| 13 |
| 14 |
| 14 |
| 14 |
| 14 |
|
Primary and secondary education expenses |
| 3,692 |
| 3,934 |
| 4,153 |
| 4,325 |
| 4,552 |
| 4,986 |
| 5,111 |
| 5,109 |
| 5,104 |
| 5,133 |
|
Places |
| 2004 |
| 2005 |
| 2006 |
| 2007 |
| 2008 |
| 2009 |
| 2010 |
| 2011 |
| 2012 |
| 2013 |
|
Primary(1) |
| 484,456 |
| 482,571 |
| 481,007 |
| 479,230 |
| 475,820 |
| 476,503 |
| 477,410 |
| 478,308 |
| 484,026 |
| 489,957 |
|
Secondary(1) |
| 269,206 |
| 273,905 |
| 275,869 |
| 277,619 |
| 277,582 |
| 276,230 |
| 274,259 |
| 273,872 |
| 272,396 |
| 273,089 |
|
(1) From 2004, these have been restated and are now snapshots based as at 1 July for primary year-levels and 1 March for secondary year-levels.
Sources: Ministry of Education, The Treasury
Table 4.9 — Tertiary education expenses
|
| 2004 |
| 2005 |
| 2006 |
| 2007 |
| 2008 |
| 2009 |
| 2010 |
| 2011 |
| 2012 |
| 2013 |
|
($ million) |
| Actual |
| Actual |
| Actual |
| Actual |
| Actual |
| Forecast |
| Forecast |
| Forecast |
| Forecast |
| Forecast |
|
Tuition |
| 1,770 |
| 1,647 |
| 1,865 |
| 1,962 |
| 2,172 |
| 2,204 |
| 2,331 |
| 2,305 |
| 2,268 |
| 2,267 |
|
Other tertiary funding |
| 66 |
| 68 |
| 110 |
| 339 |
| 358 |
| 539 |
| 537 |
| 506 |
| 498 |
| 481 |
|
Tertiary student allowances |
| 380 |
| 359 |
| 354 |
| 382 |
| 386 |
| 429 |
| 462 |
| 470 |
| 473 |
| 470 |
|
Initial fair value change in student loans |
| — |
| — |
| 1,415 |
| — |
| — |
| — |
| — |
| — |
| — |
| — |
|
Student loans |
| 319 |
| 422 |
| 303 |
| 639 |
| 350 |
| 749 |
| 683 |
| 711 |
| 724 |
| 736 |
|
Tertiary education expenses |
| 2,535 |
| 2,496 |
| 4,047 |
| 3,322 |
| 3,266 |
| 3,921 |
| 4,013 |
| 3,992 |
| 3,963 |
| 3,954 |
|
Places (year) |
| 2004 |
| 2005 |
| 2006 |
| 2007 |
| 2008 |
| 2009 |
| 2010 |
| 2011 |
| 2012 |
| 2013 |
|
EFT students |
| 247,975 |
| 240,734 |
| 227,416 |
| 226,238 |
| 226,787 |
| 233,942 |
| 234,850 |
| 234,503 |
| 234,106 |
| 234,097 |
|
Sources: Ministry of Education, The Treasury
Table 4.10 — Core Government service expenses
|
| 2004 |
| 2005 |
| 2006 |
| 2007 |
| 2008 |
| 2009 |
| 2010 |
| 2011 |
| 2012 |
| 2013 |
|
($ million) |
| Actual |
| Actual |
| Actual |
| Actual |
| Actual |
| Forecast |
| Forecast |
| Forecast |
| Forecast |
| Forecast |
|
Official development assistance |
| 237 |
| 297 |
| 330 |
| 330 |
| 362 |
| 474 |
| 461 |
| 486 |
| 510 |
| 559 |
|
Indemnity and guarantee expenses |
| 9 |
| — |
| — |
| — |
| — |
| 140 |
| 62 |
| 60 |
| 59 |
| 58 |
|
Departmental expenses |
| 1,096 |
| 1,570 |
| 1,403 |
| 1,402 |
| 1,557 |
| 1,657 |
| 1,667 |
| 1,663 |
| 1,647 |
| 1,625 |
|
Non-Departmental Expenses |
|
|
|
|
|
|
| 237 |
| 277 |
| 423 |
| 288 |
| 309 |
| 327 |
| 338 |
|
Tax receivable write-down |
| 350 |
| 350 |
| 338 |
| 2,479 |
| 701 |
| 685 |
| 660 |
| 668 |
| 703 |
| 745 |
|
Science expenses |
| 283 |
| 170 |
| 157 |
| 163 |
| 168 |
| 180 |
| 193 |
| 195 |
| 195 |
| 195 |
|
Other expenses |
| 116 |
| 180 |
| 279 |
| 205 |
| 306 |
| 294 |
| 289 |
| 251 |
| 256 |
| 254 |
|
Core Government service expenses |
| 2,091 |
| 2,567 |
| 2,507 |
| 4,816 |
| 3,371 |
| 3,853 |
| 3,620 |
| 3,632 |
| 3,697 |
| 3,774 |
|
Source: The Treasury
Table 4.11 — Law and order expenses
|
| 2004 |
| 2005 |
| 2006 |
| 2007 |
| 2008 |
| 2009 |
| 2010 |
| 2011 |
| 2012 |
| 2013 |
|
($ million) |
| Actual |
| Actual |
| Actual |
| Actual |
| Actual |
| Forecast |
| Forecast |
| Forecast |
| Forecast |
| Forecast |
|
Police |
| 844 |
| 896 |
| 976 |
| 1,086 |
| 1,198 |
| 1,330 |
| 1,340 |
| 1,361 |
| 1,362 |
| 1,365 |
|
Ministry of Justice |
| 178 |
| 257 |
| 299 |
| 454 |
| 367 |
| 386 |
| 399 |
| 387 |
| 391 |
| 389 |
|
Department of Corrections |
| 439 |
| 483 |
| 572 |
| 662 |
| 787 |
| 838 |
| 921 |
| 967 |
| 967 |
| 981 |
|
Department for Courts |
| 53 |
| — |
| — |
| — |
| — |
| — |
| — |
| — |
| — |
| — |
|
Other departments |
| 81 |
| 72 |
| 76 |
| 60 |
| 91 |
| 112 |
| 121 |
| 120 |
| 119 |
| 119 |
|
Department expenses |
| 1,595 |
| 1,708 |
| 1,923 |
| 2,262 |
| 2,443 |
| 2,666 |
| 2,781 |
| 2,835 |
| 2,839 |
| 2,854 |
|
Non-departmental outputs |
| 178 |
| 218 |
| 262 |
| 354 |
| 326 |
| 360 |
| 389 |
| 355 |
| 350 |
| 350 |
|
Other expenses |
| 70 |
| 51 |
| 50 |
| 83 |
| 125 |
| 90 |
| 97 |
| 112 |
| 113 |
| 115 |
|
Law and order expenses |
| 1,843 |
| 1,977 |
| 2,235 |
| 2,699 |
| 2,894 |
| 3,116 |
| 3,267 |
| 3,302 |
| 3,302 |
| 3,319 |
|
Source: The Treasury
Table 4.12 — Defence expenses
|
| 2004 |
| 2005 |
| 2006 |
| 2007 |
| 2008 |
| 2009 |
| 2010 |
| 2011 |
| 2012 |
| 2013 |
|
($ million) |
| Actual |
| Actual |
| Actual |
| Actual |
| Actual |
| Forecast |
| Forecast |
| Forecast |
| Forecast |
| Forecast |
|
|
|
|
|
|
|
|
|
|
|
|
|
|
|
|
|
|
|
|
|
|
|
NZDF Core expenses |
| 1,182 |
| 1,203 |
| 1,306 |
| 1,459 |
| 1,517 |
| 1,675 |
| 1,750 |
| 1,738 |
| 1,741 |
| 1,740 |
|
NZDF write-offs |
| 72 |
| — |
| — |
| — |
| — |
| — |
| — |
| — |
| — |
| — |
|
Other expenses |
| 57 |
| 72 |
| 77 |
| 58 |
| 45 |
| 60 |
| 60 |
| 69 |
| 56 |
| 56 |
|
|
|
|
|
|
|
|
|
|
|
|
|
|
|
|
|
|
|
|
|
|
|
Defence expenses |
| 1,311 |
| 1,275 |
| 1,383 |
| 1,517 |
| 1,562 |
| 1,735 |
| 1,810 |
| 1,807 |
| 1,797 |
| 1,796 |
|
Source: The Treasury
Table 4.13 — Transport and communication expenses
|
| 2004 |
| 2005 |
| 2006 |
| 2007 |
| 2008 |
| 2009 |
| 2010 |
| 2011 |
| 2012 |
| 2013 |
|
($ million) |
| Actual |
| Actual |
| Actual |
| Actual |
| Actual |
| Forecast |
| Forecast |
| Forecast |
| Forecast |
| Forecast |
|
New Zealand Transport Agency(1) |
| 1,222 |
| 1,346 |
| 1,482 |
| 1,874 |
| 1,966 |
| 1,656 |
| 1,322 |
| 1,355 |
| 1,395 |
| 1,394 |
|
Departmental outputs |
| 83 |
| 97 |
| 101 |
| 113 |
| 137 |
| 90 |
| 67 |
| 63 |
| 63 |
| 63 |
|
Other non-departmental expenses |
| 84 |
| 79 |
| 109 |
| 221 |
| 104 |
| 174 |
| 158 |
| 101 |
| 80 |
| 75 |
|
Asset impairments |
| 66 |
| 47 |
| 47 |
| 47 |
| — |
| 587 |
| — |
| — |
| — |
| — |
|
Rail costs |
| 3 |
| 63 |
| 77 |
| 142 |
| 24 |
| 421 |
| 682 |
| 320 |
| 177 |
| 58 |
|
Other expenses |
| 3 |
| 3 |
| 2 |
| 8 |
| 13 |
| 26 |
| 24 |
| 25 |
| 25 |
| 25 |
|
Transport and communication expenses |
| 1,461 |
| 1,635 |
| 1,818 |
| 2,405 |
| 2,244 |
| 2,954 |
| 2,253 |
| 1,864 |
| 1,740 |
| 1,615 |
|
(1) Since 2008/09 funding has been provided to New Zealand Transport Agency. From 2004/05 to 2007/08 funding was received by Land Transport NZ. Prior to this, funding was received by Transfund.
Prior to 2008/09 all NZTA funding was recognised as operating expenditure. However from 2008/09 some funding is now classified as capital resulting in a reduction to operating expenditure.
Source: The Treasury
Table 4.14 — Economic and industrial services expenses
|
| 2004 |
| 2005 |
| 2006 |
| 2007 |
| 2008 |
| 2009 |
| 2010 |
| 2011 |
| 2012 |
| 2013 |
|
($ million) |
| Actual |
| Actual |
| Actual |
| Actual |
| Actual |
| Forecast |
| Forecast |
| Forecast |
| Forecast |
| Forecast |
|
Departmental outputs |
| 478 |
| 508 |
| 549 |
| 546 |
| 603 |
| 395 |
| 394 |
| 381 |
| 375 |
| 373 |
|
Employment initiatives |
| 222 |
| 224 |
| 202 |
| 207 |
| 186 |
| 187 |
| 176 |
| 171 |
| 168 |
| 166 |
|
Non-departmental outputs |
| 444 |
| 549 |
| 751 |
| 873 |
| 822 |
| 828 |
| 851 |
| 804 |
| 779 |
| 779 |
|
Reserve Electricity Generation |
| — |
| — |
| 26 |
| 16 |
| 81 |
| 16 |
| 27 |
| 27 |
| 26 |
| 17 |
|
Flood relief |
| 15 |
| 52 |
| 8 |
| — |
| — |
| — |
| — |
| — |
| — |
| — |
|
KiwiSaver |
| — |
| — |
| — |
| — |
| 1,102 |
| 1,420 |
| 919 |
| 940 |
| 956 |
| 982 |
|
Research & Development tax credits |
| — |
| — |
| — |
| — |
| 37 |
| 154 |
| 7 |
| — |
| — |
| — |
|
Other expenses |
| 33 |
| 111 |
| 56 |
| (47 | ) | 58 |
| 145 |
| 299 |
| 271 |
| 286 |
| 268 |
|
Economic and industrial services expenses |
| 1,192 |
| 1,444 |
| 1,592 |
| 1,595 |
| 2,889 |
| 3,145 |
| 2,673 |
| 2,594 |
| 2,590 |
| 2,585 |
|
Source: The Treasury
Table 4.15 — Employment initiatives
|
| 2004 |
| 2005 |
| 2006 |
| 2007 |
| 2008 |
| 2009 |
| 2010 |
| 2011 |
| 2012 |
| 2013 |
|
($ million) |
| Actual |
| Actual |
| Actual |
| Actual |
| Actual |
| Forecast |
| Forecast |
| Forecast |
| Forecast |
| Forecast |
|
Training incentive allowance |
| 42 |
| 36 |
| 32 |
| 29 |
| 27 |
| 30 |
| 23 |
| 20 |
| 16 |
| 15 |
|
Community employment projects |
| 16 |
| 6 |
| — |
| — |
| — |
| — |
| — |
| — |
| — |
| — |
|
Subsidised work |
| 100 |
| 102 |
| 84 |
| 88 |
| 67 |
| 65 |
| 61 |
| 60 |
| 59 |
| 59 |
|
Employment support for disabled |
| 61 |
| 74 |
| 82 |
| 86 |
| 88 |
| 88 |
| 88 |
| 88 |
| 88 |
| 88 |
|
Other employment assistance schemes |
| 3 |
| 6 |
| 4 |
| 4 |
| 4 |
| 4 |
| 4 |
| 3 |
| 5 |
| 4 |
|
Employment initiatives |
| 222 |
| 224 |
| 202 |
| 207 |
| 186 |
| 187 |
| 176 |
| 171 |
| 168 |
| 166 |
|
Source: The Treasury
Table 4.16 — Primary service expenses
|
| 2004 |
| 2005 |
| 2006 |
| 2007 |
| 2008 |
| 2009 |
| 2010 |
| 2011 |
| 2012 |
| 2013 |
|
($ million) |
| Actual |
| Actual |
| Actual |
| Actual |
| Actual |
| Forecast |
| Forecast |
| Forecast |
| Forecast |
| Forecast |
|
Departmental expenses |
| 269 |
| 272 |
| 350 |
| 342 |
| 354 |
| 381 |
| 385 |
| 376 |
| 375 |
| 375 |
|
Non-departmental outputs |
| 81 |
| 114 |
| 97 |
| 80 |
| 109 |
| 80 |
| 200 |
| 155 |
| 164 |
| 169 |
|
Other expenses |
| 18 |
| 8 |
| 20 |
| 16 |
| 78 |
| 84 |
| 26 |
| 14 |
| 14 |
| 15 |
|
Primary service expenses |
| 368 |
| 394 |
| 467 |
| 438 |
| 541 |
| 545 |
| 611 |
| 545 |
| 553 |
| 559 |
|
Source: The Treasury
Table 4.17 — Heritage, culture and recreation expenses
|
| 2004 |
| 2005 |
| 2006 |
| 2007 |
| 2008 |
| 2009 |
| 2010 |
| 2011 |
| 2012 |
| 2013 |
|
($ million) |
| Actual |
| Actual |
| Actual |
| Actual |
| Actual |
| Forecast |
| Forecast |
| Forecast |
| Forecast |
| Forecast |
|
Community grants |
| 3 |
| 6 |
| 7 |
| 7 |
| 7 |
| 9 |
| 8 |
| 8 |
| 10 |
| 10 |
|
Kyoto protocol |
| — |
| 310 |
| 42 |
| — |
| — |
| — |
| — |
| — |
| — |
| — |
|
Emmission Trading Scheme |
| — |
| — |
| — |
| — |
| — |
| 23 |
| 484 |
| 757 |
| 649 |
| 1,698 |
|
Departmental outputs |
| 269 |
| 292 |
| 322 |
| 357 |
| 392 |
| 440 |
| 442 |
| 431 |
| 440 |
| 444 |
|
Non-departmental outputs |
| 258 |
| 317 |
| 351 |
| 411 |
| 469 |
| 464 |
| 494 |
| 466 |
| 438 |
| 432 |
|
Other expenses |
| 104 |
| 66 |
| 169 |
| 69 |
| 239 |
| 126 |
| 79 |
| 49 |
| 57 |
| 54 |
|
Heritage, culture and recreation expenses |
| 634 |
| 991 |
| 891 |
| 844 |
| 1,107 |
| 1,062 |
| 1,507 |
| 1,711 |
| 1,594 |
| 2,638 |
|
Source: The Treasury
Table 4.18 — Housing and community development expenses
|
| 2004 |
| 2005 |
| 2006 |
| 2007 |
| 2008 |
| 2009 |
| 2010 |
| 2011 |
| 2012 |
| 2013 |
|
($ million) |
| Actual |
| Actual |
| Actual |
| Actual |
| Actual |
| Forecast |
| Forecast |
| Forecast |
| Forecast |
| Forecast |
|
Housing subsidies |
| 27 |
| 31 |
| 23 |
| 25 |
| 28 |
| 38 |
| 38 |
| 62 |
| 68 |
| 59 |
|
Departmental outputs |
| 77 |
| 100 |
| 117 |
| 134 |
| 141 |
| 153 |
| 160 |
| 152 |
| 150 |
| 144 |
|
Other non-departmental expenses |
| 35 |
| 32 |
| 62 |
| 96 |
| 91 |
| 121 |
| 167 |
| 142 |
| 142 |
| 143 |
|
Housing and community development expenses |
| 139 |
| 163 |
| 202 |
| 255 |
| 260 |
| 312 |
| 365 |
| 356 |
| 360 |
| 346 |
|
Source: The Treasury
ACC insurance liability
The ACC insurance liability is the gross liability of the future cost of past ACC claims. The net ACC liability is the gross liability less the asset reserves held to meet these claims.
Baselines
The level of funding approved for any given spending area (eg, Education). All amounts within baselines are included in the forecasts.
Consumers Price Index (CPI)
A measure of change in the prices of goods and services bought by households.
Contingent liability
Contingent liabilities are potential liabilities dependent on an uncertain event occurring. Contingent liabilities are not recognised in the Statement of Financial Position because either it is not probable the event will occur, or the amount of the obligation cannot be reliably measured. Typically, contingent liabilities consist of guarantees and indemnities, legal disputes and claims, and uncalled capital.
Contingent assets
Contingent assets are potential assets dependent on an uncertain event occurring.
Core Crown
The core Crown is a segment representing the Crown, departments, Offices of Parliament, the Reserve Bank, and the NZS Fund.
Core Crown revenue
Core Crown revenue mostly consists of tax revenue collected by the Government, but also includes investment income, sales of goods and services and other revenue.
Core Crown expenses
The day-to-day spending (eg, salaries, welfare benefit payments, finance costs and maintaining national defence etc) that does not build physical assets for the Government. This is an accrual measure of expenses and includes items such as depreciation on physical assets.
Corporate tax
The sum of net company tax, non-resident withholding tax (NRWT), foreign-source dividend withholding payments (FDWP).
Current account (Balance of Payments)
A measure of the flows of income between New Zealand and the rest of the world. A net inflow to New Zealand is a current account surplus, while a net outflow is a deficit. The current account balance is commonly expressed as a percentage of GDP.
Cyclically adjusted or structural fiscal balance
An estimate of the fiscal balance (eg, OBEGAL) adjusted for short-term fluctuations of actual GDP around trend GDP. The estimate provides a picture of the underlying trend fiscal position and an indication of the effects of policy decisions. Because it is based on a number of assumptions and is sensitive to new information, the estimate is subject to some uncertainty.
Demographic changes
Changes to the structure of the population. For example the age, sex or ethnic make-up of the population.
Domestic bond programme
The amount and timing of new government stock expected to be issued over the financial year.
Excise duties
Tax levied on the domestic production of alcohol, tobacco and light petroleum products (CNG, LPG and petrol).
Financial assets
Cash or shares (equity), a right to receive cash or shares (equity), or a right to exchange a financial asset or liability on favourable terms.
Fiscal drag
In a tax system with multiple tax thresholds, as taxable incomes increase, tax revenues increase more than proportionately. This occurs because a higher proportion of an individual’s income is taxed at the higher rate as their income increases. The additional increase in taxes is known as fiscal drag because it has the effect of removing aggregate demand from the economy.
Fiscal impulse
A summary measure of how changes in fiscal policy affect aggregate demand. To isolate discretionary changes, fiscal impulse is calculated on a cyclically-adjusted basis and excludes net interest payments. To better capture the role of capital spending the indicator is derived from cash flow information.
Fiscal intentions (short-term)
Under the Public Finance Act 1989, the Government must indicate explicitly its intentions for operating expenses, operating revenues, the operating balance, debt and net worth over (at least) the next three years.
Fiscal objectives (long-term)
The Government’s long-term goals for operating expenses, operating revenue, the operating balance, debt and net worth, as required by the Public Finance Act 1989. The objectives must be consistent with the principles of responsible fiscal management outlined in the Act and cover a period of ten or more years.
Forecast new capital spending
An amount provided in the forecasts to represent the balance sheet impact of capital initiatives expected to be introduced over the forecast period.
Forecast new operating spending
An amount included in the forecasts to provide for the operating balance impact of policy initiatives and changes to demographics and other forecasting changes expected to occur over the forecast period.
Gross Crown debt
The total borrowings (both sovereign-guaranteed and non sovereign-guaranteed and including derivatives in loss) of the total Crown. This is the amount in the total Crown Statement of Financial Position for Reserve Bank settlement deposits plus other borrowings. It represents the Government’s debt obligations to external parties.
Gross domestic product (GDP)
A measure of the value of all goods and services produced in New Zealand; changes in GDP measure growth in economic activity or output. GDP can be measured as the actual dollar value of goods and services measured at today’s prices (nominal GDP), or excluding the effects of price changes over time (real GDP).
Gross domestic product (expenditure)
This is the sum of total final expenditures on goods and services in the economy.
Gross national expenditure (GNE)
Measures total expenditure on goods and services by New Zealand residents.
Gross sovereign-issued debt (GSID)
Debt issued by the sovereign (ie, Core Crown) and includes Government stock held by the NZS Fund, ACC or EQC for example. The gross sovereign-issued debt indicator does not eliminate any internal cross-holdings.
GSID (excluding settlement cash)
GSID less Reserve Bank settlement cash.
Labour force participation rate
Measures the percentage of the working-age population in work or actively looking for and available for work.
Labour productivity
Measures output per input of labour (where labour inputs might be measured as hours worked or people).
Line-by-line consolidation
This is a term used to refer to the general approach to the presentation of the Crown financial statements. It means that the individual line items for revenues, expenses, assets and liabilities in
the Crown financial statements include all departments, Offices of Parliament, the Reserve Bank, SOEs, Crown entities, and other entities controlled by the Government.
Marketable securities
Assets held with financial institutions. These assets are held for both cash flow and investment purposes, and include any funds the Government has invested in the International Monetary Fund.
Monetary conditions
The combination of interest rates and the exchange rate.
Monetary policy
Action taken by the Reserve Bank to affect interest rates and the exchange rate in order to control inflation. Tightening monetary policy refers to actions taken by the Reserve Bank to raise interest rates (which can influence the exchange rate) in order to moderate aggregate demand pressures and so reduce inflationary pressures.
Net core Crown cash flow from operations
OBEGAL less retained items (eg, net surplus of SOEs, CEs and NZS Fund net revenue) less non-cash items (eg, depreciation).
Net core Crown debt
Debt after deducting financial assets of the core Crown from gross sovereign-issued debt. Share investments in supranational organisations, such as the International Bank for Reconstruction and Development and the Bank for International Settlements, are excluded from the net core Crown debt measure as are the assets of the NZS Fund. Advances such as student loans and loans to District Health Boards are also excluded.
Net worth
Total assets less total liabilities (also referred to as the Crown balance). The change in net worth in any given forecast year is largely driven by the operating balance.
NZ IFRS
New Zealand equivalents to International Financial Reporting Standards. These standards are approved by the Accounting Standards Review Board in New Zealand and are based on the requirements of the international financial reporting standards issued by the International Accounting Standards Board adjusted where appropriate for entities that are not profit oriented.
Operating allowance
The amount included in the Fiscal Strategy Report projections for new initiatives, including spending and cost pressures. The allowance is a projection assumption. The projections in the Fiscal Strategy Report also include an allowance for capital spending.
Operating balance
The operating balance is the residual of revenues less expenses plus surpluses from state-owned enterprises and Crown entities. It includes gains and losses not reported directly as a movement against net worth.
Operating balance before gains and losses (OBEGAL)
The OBEGAL is the operating balance before gains and losses.
OBEGAL excluding NZS Fund net revenue
A measure of the operating balance that recognises that NZS Fund net revenues are not available to the Crown.
Projections
Projections of the key fiscal indicators beyond the five-year forecast period. The projections are based on long-run economic and fiscal assumptions. For example, the projections assume no economic cycle and constant long-run interest, inflation and unemployment rates.
Residual cash
The level of money the Government has available to repay debt or, alternatively, needs to borrow in any given year. Residual cash is alternatively termed “Cash available/(shortfall to be funded)”.
Residual cash is equal to net core Crown cash flow from operations excluding NZS Fund activity less core Crown capital commitments (eg, contributions to NZS Fund, purchase of assets, loans to others).
Settlement cash
This is the amount of money deposited with the Reserve Bank by banks. It is a liquidity mechanism used to settle wholesale obligations between banks and provides the basis for settling most of the retail banking transactions that occur every working day between corporate and individuals.
Specific fiscal risks
These are a category of Government decisions or circumstances which may have a material impact on the fiscal position (excluding contingent liabilities). They are not included in the main forecasts because their fiscal impact cannot be reasonably quantified, the likelihood of realisation is uncertain and/or the timing is uncertain.
System of National Accounts (SNA)
SNA is a comprehensive, consistent and flexible set of macroeconomic accounts to meet the needs of government and private sector analysts, policy-makers, and decision-takers.
Tax revenue
The accrual, rather than the cash (“tax receipts”) measure of taxation. It is a measure of tax due, regardless of whether or not it has actually been paid.
Top-down adjustment
The adjustment to expenditure forecasts to reflect the extent to which departments use appropriations (upper spending limits) for their expenditure forecasts. As appropriations apply to the core Crown only, no adjustment is required to SOE or Crown Entity forecasts.
Trade weighted index (TWI)
A measure of movements in the New Zealand dollar against the currencies of our major trading partners. The currencies comprise the US dollar, the Australian dollar, the Japanese yen, the Euro and the UK sterling.
Unit labour costs
The wages and other costs associated with employment per unit of output.
Year ended
Graphs and tables use different expressions of the timeframe. For example, 2008/09 or 2009 will generally mean “year ended 30 June” unless otherwise stated.
June Years |
| 1997 |
| 1998 |
| 1999 |
| 2000 |
| 2001 |
| 2002 |
| 2003 |
| 2004 |
| 2005 |
| 2006 |
| 2007 |
| 2008 |
| 2009 |
| 2010 |
| 2011 |
| 2012 |
| 2013 |
|
$ millions |
| Actual |
| Actual |
| Actual |
| Actual |
| Actual |
| Actual |
| Actual |
| Actual |
| Actual |
| Actual |
| Actual |
| Actual |
| Forecast |
| Forecast |
| Forecast |
| Forecast |
| Forecast |
|
|
|
|
|
|
|
|
|
|
|
|
|
|
|
|
|
|
|
|
|
|
|
|
|
|
|
|
|
|
|
|
|
|
|
|
|
Revenue and Expenses |
|
|
|
|
|
|
|
|
|
|
|
|
|
|
|
|
|
|
|
|
|
|
|
|
|
|
|
|
|
|
|
|
|
|
|
Core Crown revenue excl NZS Fund |
| 33,131 |
| 34,242 |
| 32,880 |
| 34,946 |
| 37,842 |
| 39,945 |
| 43,440 |
| 46,219 |
| 51,045 |
| 56,951 |
| 58,482 |
| 61,671 |
| 58,392 |
| 56,374 |
| 57,094 |
| 60,245 |
| 64,948 |
|
Core Crown expenses |
| 31,368 |
| 32,982 |
| 33,939 |
| 34,829 |
| 36,559 |
| 37,513 |
| 39,897 |
| 41,882 |
| 44,895 |
| 49,320 |
| 54,003 |
| 56,997 |
| 62,363 |
| 65,282 |
| 67,446 |
| 70,361 |
| 73,440 |
|
Surpluses |
|
|
|
|
|
|
|
|
|
|
|
|
|
|
|
|
|
|
|
|
|
|
|
|
|
|
|
|
|
|
|
|
|
|
|
Total Crown OBEGAL |
| 1,801 |
| 2,345 |
| 128 |
| 594 |
| 1,422 |
| 2,471 |
| 4,366 |
| 5,573 |
| 7,075 |
| 7,091 |
| 5,860 |
| 5,637 |
| (2,916 | ) | (7,739 | ) | (9,265 | ) | (9,583 | ) | (8,423 | ) |
Total Crown OBEGAL excl NZS Fund |
| 1,801 |
| 2,345 |
| 128 |
| 594 |
| 1,422 |
| 2,456 |
| 4,297 |
| 5,526 |
| 7,140 |
| 7,252 |
| 6,250 |
| 5,586 |
| (3,295 | ) | (7,948 | ) | (9,410 | ) | (9,605 | ) | (8,214 | ) |
Total Crown operating balance |
| 1,863 |
| 2,048 |
| 1,705 |
| 1,405 |
| 1,208 |
| 2,286 |
| 1,621 |
| 7,309 |
| 5,931 |
| 9,542 |
| 8,023 |
| 2,384 |
| (9,303 | ) | (5,729 | ) | (7,111 | ) | (7,115 | ) | (5,773 | ) |
Cash Position |
|
|
|
|
|
|
|
|
|
|
|
|
|
|
|
|
|
|
|
|
|
|
|
|
|
|
|
|
|
|
|
|
|
|
|
Core Crown residual cash |
| 3,913 |
| 484 |
| 2,048 |
| (386 | ) | 349 |
| 216 |
| 1,217 |
| 520 |
| 3,104 |
| 2,985 |
| 2,877 |
| 2,057 |
| (8,458 | ) | (11,865 | ) | (12,521 | ) | (12,304 | ) | (10,891 | ) |
Debt |
|
|
|
|
|
|
|
|
|
|
|
|
|
|
|
|
|
|
|
|
|
|
|
|
|
|
|
|
|
|
|
|
|
|
|
GSID (excluding liquidity mgmt) |
| 36,236 |
| 38,475 |
| 37,307 |
| 36,580 |
| 37,194 |
| 36,650 |
| 36,617 |
| 36,017 |
| 35,478 |
| 33,903 |
| 30,647 |
| 31,390 |
| 44,217 |
| 50,973 |
| 62,427 |
| 70,657 |
| 78,469 |
|
Net core Crown debt (incl NZS Fund) |
| 30,317 |
| 30,472 |
| 25,923 |
| 25,895 |
| 24,908 |
| 24,773 |
| 22,647 |
| 19,902 |
| 13,324 |
| 6,302 |
| 1,620 |
| (2,676 | ) | 3,814 |
| 14,061 |
| 24,934 |
| 35,178 |
| 44,022 |
|
Net core Crown debt |
| 30,317 |
| 30,472 |
| 25,923 |
| 25,895 |
| 24,908 |
| 25,388 |
| 24,531 |
| 23,858 |
| 19,879 |
| 16,163 |
| 13,380 |
| 10,258 |
| 15,482 |
| 27,319 |
| 39,759 |
| 51,910 |
| 62,634 |
|
NZS Fund |
|
|
|
|
|
|
|
|
|
|
|
|
|
|
|
|
|
|
|
|
|
|
|
|
|
|
|
|
|
|
|
|
|
|
|
NZS Fund net worth |
| — |
| — |
| — |
| — |
| — |
| 615 |
| 1,884 |
| 3,956 |
| 6,555 |
| 9,861 |
| 12,973 |
| 14,212 |
| 13,275 |
| 14,590 |
| 15,791 |
| 17,124 |
| 18,604 |
|
% GDP |
|
|
|
|
|
|
|
|
|
|
|
|
|
|
|
|
|
|
|
|
|
|
|
|
|
|
|
|
|
|
|
|
|
|
|
Revenue and Expenses |
|
|
|
|
|
|
|
|
|
|
|
|
|
|
|
|
|
|
|
|
|
|
|
|
|
|
|
|
|
|
|
|
|
|
|
Core Crown revenue excl NZS Fund |
| 33.5 |
| 33.7 |
| 31.4 |
| 31.5 |
| 32.0 |
| 31.7 |
| 32.7 |
| 32.3 |
| 33.6 |
| 35.9 |
| 34.6 |
| 34.4 |
| 32.7 |
| 32.2 |
| 31.2 |
| 31.5 |
| 32.1 |
|
Core Crown expenses |
| 31.7 |
| 32.5 |
| 32.4 |
| 31.4 |
| 30.9 |
| 29.8 |
| 30.1 |
| 29.2 |
| 29.5 |
| 31.1 |
| 31.9 |
| 31.8 |
| 34.9 |
| 37.3 |
| 36.9 |
| 36.7 |
| 36.3 |
|
Surpluses |
|
|
|
|
|
|
|
|
|
|
|
|
|
|
|
|
|
|
|
|
|
|
|
|
|
|
|
|
|
|
|
|
|
|
|
Total Crown OBEGAL |
| 1.8 |
| 2.3 |
| 0.1 |
| 0.5 |
| 1.2 |
| 2.0 |
| 3.3 |
| 3.9 |
| 4.7 |
| 4.5 |
| 3.5 |
| 3.1 |
| (1.6 | ) | (4.4 | ) | (5.1 | ) | (5.0 | ) | (4.2 | ) |
Total Crown OBEGAL excl NZS Fund |
| 1.8 |
| 2.3 |
| 0.1 |
| 0.5 |
| 1.2 |
| 2.0 |
| 3.2 |
| 3.9 |
| 4.7 |
| 4.6 |
| 3.7 |
| 3.1 |
| (1.8 | ) | (4.5 | ) | (5.2 | ) | (5.0 | ) | (4.1 | ) |
Total Crown operating balance |
| 1.9 |
| 2.0 |
| 1.6 |
| 1.3 |
| 1.0 |
| 1.8 |
| 1.2 |
| 5.1 |
| 3.9 |
| 6.0 |
| 4.7 |
| 1.3 |
| (5.2 | ) | (3.3 | ) | (3.9 | ) | (3.7 | ) | (2.9 | ) |
Cash Position |
|
|
|
|
|
|
|
|
|
|
|
|
|
|
|
|
|
|
|
|
|
|
|
|
|
|
|
|
|
|
|
|
|
|
|
Core Crown residual cash |
| 4.0 |
| 0.5 |
| 2.0 |
| (0.3 | ) | 0.3 |
| 0.2 |
| 0.9 |
| 0.4 |
| 2.0 |
| 1.9 |
| 1.7 |
| 1.1 |
| (4.7 | ) | (6.8 | ) | (6.9 | ) | (6.4 | ) | (5.4 | ) |
Debt |
|
|
|
|
|
|
|
|
|
|
|
|
|
|
|
|
|
|
|
|
|
|
|
|
|
|
|
|
|
|
|
|
|
|
|
GSID (excluding liquidity mgmt) |
| 36.6 |
| 37.9 |
| 35.6 |
| 32.9 |
| 31.4 |
| 29.1 |
| 27.6 |
| 25.2 |
| 23.3 |
| 21.4 |
| 18.1 |
| 17.5 |
| 24.8 |
| 29.1 |
| 34.2 |
| 36.9 |
| 38.7 |
|
Net core Crown debt (incl NZS Fund) |
| 30.6 |
| 30.0 |
| 24.8 |
| 23.3 |
| 21.0 |
| 19.7 |
| 17.1 |
| 13.9 |
| 8.8 |
| 4.0 |
| 1.0 |
| (1.5 | ) | 2.1 |
| 8.0 |
| 13.6 |
| 18.4 |
| 21.7 |
|
Net core Crown debt |
| 30.6 |
| 30.0 |
| 24.8 |
| 23.3 |
| 21.0 |
| 20.2 |
| 18.5 |
| 16.7 |
| 13.1 |
| 10.2 |
| 7.9 |
| 5.7 |
| 8.7 |
| 15.6 |
| 21.8 |
| 27.1 |
| 30.9 |
|
NZS Fund |
|
|
|
|
|
|
|
|
|
|
|
|
|
|
|
|
|
|
|
|
|
|
|
|
|
|
|
|
|
|
|
|
|
|
|
NZS Fund net worth |
| — |
| — |
| — |
| — |
| — |
| 0.5 |
| 1.4 |
| 2.8 |
| 4.3 |
| 6.2 |
| 7.7 |
| 7.9 |
| 7.4 |
| 8.3 |
| 8.6 |
| 8.9 |
| 9.2 |
|
March Years |
| 1997 |
| 1998 |
| 1999 |
| 2000 |
| 2001 |
| 2002 |
| 2003 |
| 2004 |
| 2005 |
| 2006 |
| 2007 |
| 2008 |
| 2009 |
| 2010 |
| 2011 |
| 2012 |
| 2013 |
|
Annual average % change |
| Actual |
| Actual |
| Actual |
| Actual |
| Actual |
| Actual |
| Actual |
| Actual |
| Actual |
| Actual |
| Actual |
| Actual |
| Forecast |
| Forecast |
| Forecast |
| Forecast |
| Forecast |
|
|
|
|
|
|
|
|
|
|
|
|
|
|
|
|
|
|
|
|
|
|
|
|
|
|
|
|
|
|
|
|
|
|
|
|
|
Private consumption |
| 4.3 |
| 2.3 |
| 3.1 |
| 3.3 |
| 1.4 |
| 2.8 |
| 4.9 |
| 6.5 |
| 5.1 |
| 4.6 |
| 2.8 |
| 3.2 |
| -0.4 |
| -1.3 |
| -1.5 |
| -0.1 |
| 1.9 |
|
Public consumption |
| 1.4 |
| 7.4 |
| -0.4 |
| 5.8 |
| -2.1 |
| 4.1 |
| 1.3 |
| 4.9 |
| 4.2 |
| 4.9 |
| 4.0 |
| 4.3 |
| 3.6 |
| 3.3 |
| 2.8 |
| 1.9 |
| 1.5 |
|
TOTAL CONSUMPTION |
| 3.7 |
| 3.5 |
| 2.3 |
| 3.8 |
| 0.6 |
| 3.1 |
| 4.1 |
| 6.2 |
| 4.9 |
| 4.6 |
| 3.1 |
| 3.5 |
| 0.5 |
| -0.3 |
| -0.5 |
| 0.4 |
| 1.8 |
|
Residential investment |
| 4.9 |
| 3.0 |
| -13.0 |
| 19.5 |
| -13.3 |
| 2.0 |
| 23.6 |
| 15.0 |
| 2.9 |
| -5.2 |
| -2.3 |
| 4.3 |
| -25.2 |
| -22.7 |
| 7.1 |
| 18.7 |
| 20.6 |
|
Non-market investment |
| 18.3 |
| 14.0 |
| -4.8 |
| 13.0 |
| -13.8 |
| 21.9 |
| 13.7 |
| 15.6 |
| 14.2 |
| -0.3 |
| -5.6 |
| 7.4 |
| 15.9 |
| 5.2 |
| -2.2 |
| -3.6 |
| 3.8 |
|
Market investment |
| 4.3 |
| -2.2 |
| 2.6 |
| 6.9 |
| 8.0 |
| 6.9 |
| 2.3 |
| 12.2 |
| 11.9 |
| 8.2 |
| 0.7 |
| 4.7 |
| -5.0 |
| -23.4 |
| 3.1 |
| 18.4 |
| 11.5 |
|
TOTAL INVESTMENT |
| 5.1 |
| 0.2 |
| -2.3 |
| 10.6 |
| 0.4 |
| 6.8 |
| 7.8 |
| 13.1 |
| 9.2 |
| 4.4 |
| -0.6 |
| 4.3 |
| -9.6 |
| -21.0 |
| 6.0 |
| 17.4 |
| 12.8 |
|
Stock change (contribution to growth) |
| -0.4 |
| -0.2 |
| -0.3 |
| 1.2 |
| -0.3 |
| 0.1 |
| -0.1 |
| 0.2 |
| 0.3 |
| -0.4 |
| -0.9 |
| 0.8 |
| 0.2 |
| -1.0 |
| 0.5 |
| 0.1 |
| -0.1 |
|
GROSS NATIONAL EXPENDITURE |
| 3.5 |
| 2.6 |
| 0.9 |
| 6.3 |
| 0.3 |
| 3.9 |
| 4.7 |
| 7.7 |
| 6.2 |
| 4.2 |
| 1.4 |
| 4.4 |
| -1.9 |
| -5.8 |
| 1.3 |
| 3.9 |
| 4.2 |
|
Exports |
| 4.7 |
| 3.9 |
| 2.9 |
| 7.4 |
| 6.3 |
| 3.0 |
| 7.8 |
| 0.9 |
| 4.6 |
| 0.0 |
| 3.1 |
| 2.9 |
| -4.2 |
| -1.5 |
| 2.4 |
| 4.1 |
| 6.0 |
|
Imports |
| 6.4 |
| 2.5 |
| 2.1 |
| 11.3 |
| -0.7 |
| 4.0 |
| 7.2 |
| 12.7 |
| 12.5 |
| 4.2 |
| -1.6 |
| 9.6 |
| -3.1 |
| -14.3 |
| 0.6 |
| 7.3 |
| 6.4 |
|
EXPENDITURE ON GDP |
| 3.1 |
| 2.9 |
| 1.2 |
| 5.2 |
| 2.4 |
| 3.5 |
| 5.0 |
| 4.0 |
| 3.8 |
| 3.0 |
| 2.7 |
| 2.3 |
| -1.8 |
| -1.9 |
| 2.0 |
| 2.9 |
| 4.0 |
|
GDP (production measure) |
| 3.5 |
| 1.7 |
| 0.5 |
| 5.3 |
| 2.4 |
| 3.6 |
| 4.9 |
| 4.3 |
| 3.8 |
| 3.0 |
| 1.8 |
| 3.1 |
| -0.9 |
| -1.7 |
| 1.8 |
| 2.9 |
| 4.0 |
|
- annual % change |
| 2.0 |
| 0.3 |
| 2.6 |
| 6.4 |
| 0.7 |
| 4.6 |
| 4.6 |
| 5.3 |
| 2.3 |
| 2.9 |
| 2.4 |
| 2.1 |
| -2.7 |
| 0.1 |
| 2.3 |
| 3.4 |
| 4.1 |
|
Real GDP per capita |
| 1.9 |
| 0.5 |
| -0.3 |
| 4.7 |
| 1.8 |
| 2.7 |
| 3.0 |
| 2.4 |
| 2.4 |
| 1.8 |
| 0.6 |
| 2.1 |
| -1.9 |
| -2.7 |
| 0.8 |
| 1.9 |
| 3.1 |
|
Nominal GDP (expenditure basis) |
| 4.9 |
| 3.7 |
| 1.7 |
| 6.0 |
| 5.7 |
| 7.5 |
| 5.1 |
| 6.8 |
| 7.2 |
| 5.0 |
| 5.4 |
| 7.4 |
| 0.7 |
| -2.7 |
| 3.7 |
| 4.5 |
| 5.7 |
|
GDP deflator |
| 1.8 |
| 0.8 |
| 0.5 |
| 0.9 |
| 3.2 |
| 3.9 |
| 0.2 |
| 2.7 |
| 3.2 |
| 1.9 |
| 2.5 |
| 4.9 |
| 2.5 |
| -0.7 |
| 1.7 |
| 1.5 |
| 1.6 |
|
Output gap (% deviation, March qtr) |
| 0.6 |
| -1.7 |
| -1.7 |
| 1.8 |
| -0.6 |
| 0.4 |
| 1.0 |
| 2.5 |
| 1.6 |
| 1.8 |
| 2.0 |
| 1.9 |
| -0.9 |
| -1.9 |
| -2.2 |
| -1.5 |
| 0.0 |
|
Employment (full-time equivalent) |
| 2.2 |
| 0.0 |
| -0.8 |
| 2.0 |
| 2.2 |
| 2.6 |
| 2.5 |
| 2.9 |
| 3.6 |
| 2.7 |
| 2.0 |
| 0.8 |
| 0.7 |
| -3.4 |
| -2.2 |
| 1.8 |
| 3.5 |
|
Unemployment (% March quarter s.a.) |
| 6.5 |
| 7.1 |
| 7.1 |
| 6.3 |
| 5.3 |
| 5.2 |
| 4.8 |
| 4.1 |
| 3.8 |
| 3.9 |
| 3.7 |
| 3.7 |
| 5.0 |
| 7.5 |
| 7.5 |
| 6.3 |
| 5.1 |
|
Wages (average ordinary-time hourly, ann % change) |
| 4.3 |
| 2.6 |
| 3.0 |
| 1.7 |
| 3.2 |
| 3.7 |
| 2.3 |
| 3.4 |
| 3.5 |
| 5.3 |
| 4.6 |
| 4.6 |
| 4.2 |
| 2.2 |
| 1.2 |
| 1.3 |
| 1.6 |
|
CPI inflation (ann % change) |
| 1.8 |
| 1.3 |
| -0.1 |
| 1.5 |
| 3.1 |
| 2.6 |
| 2.5 |
| 1.5 |
| 2.8 |
| 3.3 |
| 2.5 |
| 3.4 |
| 3.0 |
| 2.4 |
| 1.7 |
| 1.2 |
| 1.6 |
|
Merchandise terms of trade (SNA basis) |
| 0.0 |
| -1.8 |
| 0.9 |
| 0.2 |
| 3.4 |
| 4.0 |
| -5.6 |
| 4.3 |
| 3.5 |
| -2.1 |
| -1.1 |
| 8.4 |
| 0.9 |
| -11.8 |
| 0.8 |
| 3.6 |
| 2.4 |
|
Current account balance - $billion |
| -5.8 |
| -5.4 |
| -4.4 |
| -7.0 |
| -5.1 |
| -3.9 |
| -4.5 |
| -6.7 |
| -10.3 |
| -14.6 |
| -13.8 |
| -14.2 |
| -15.4 |
| -12.0 |
| -9.8 |
| -10.3 |
| -11.1 |
|
Current account balance - % of GDP |
| -6.0 |
| -5.3 |
| -4.2 |
| -6.4 |
| -4.4 |
| -3.1 |
| -3.4 |
| -4.8 |
| -6.8 |
| -9.3 |
| -8.3 |
| -8.0 |
| -8.6 |
| -6.9 |
| -5.4 |
| -5.5 |
| -5.5 |
|
TWI (March quarter) |
| 68.4 |
| 61.2 |
| 57.6 |
| 54.1 |
| 50.5 |
| 51.6 |
| 60.6 |
| 66.9 |
| 69.6 |
| 68.3 |
| 68.8 |
| 71.9 |
| 53.7 |
| 49.5 |
| 52.0 |
| 52.1 |
| 52.1 |
|
90-day bank bill rate (March quarter) |
| 7.5 |
| 8.9 |
| 4.5 |
| 6.0 |
| 6.4 |
| 5.0 |
| 5.8 |
| 5.5 |
| 6.9 |
| 7.6 |
| 7.8 |
| 8.8 |
| 3.7 |
| 2.5 |
| 2.5 |
| 3.8 |
| 5.4 |
|
10-year bond rate (March quarter) |
| 7.5 |
| 6.8 |
| 5.7 |
| 7.3 |
| 6.0 |
| 6.7 |
| 6.0 |
| 5.9 |
| 6.0 |
| 5.7 |
| 5.9 |
| 6.3 |
| 4.6 |
| 5.2 |
| 5.2 |
| 5.6 |
| 5.8 |
|