| UNITED STATES | |||
| SECURITIES AND EXCHANGE COMMISSION | |||
| Washington, D.C. 20549 | |||
| FORM N-CSR | |||
| CERTIFIED SHAREHOLDER REPORT OF REGISTERED | |||
| MANAGEMENT INVESTMENT COMPANIES | |||
| Investment Company Act file number: (811-02742) | |||
| Exact name of registrant as specified in charter: | Putnam Equity Income Fund | ||
| Address of principal executive offices: One Post Office Square, Boston, Massachusetts 02109 | |||
| Name and address of agent for service: | Beth S. Mazor, Vice President | ||
| One Post Office Square | |||
| Boston, Massachusetts 02109 | |||
| Copy to: | John W. Gerstmayr, Esq. | ||
| Ropes & Gray LLP | |||
| One International Place | |||
| Boston, Massachusetts 02110 | |||
| Registrant’s telephone number, including area code: | (617) 292-1000 | ||
| Date of fiscal year end: November 30, 2010 | |||
| Date of reporting period: December 1, 2009 — May 31, 2010 | |||
Item 1. Report to Stockholders:
The following is a copy of the report transmitted to stockholders pursuant to Rule 30e-1 under the Investment Company Act of 1940:
Putnam
Equity Income
Fund
Semiannual report
5 | 31 | 10
| Message from the Trustees | 1 |
| About the fund | 2 |
| Performance snapshot | 4 |
| Interview with your fund’s portfolio manager | 5 |
| Your fund’s performance | 10 |
| Your fund’s expenses | 12 |
| Terms and definitions | 14 |
| Other information for shareholders | 15 |
| Financial statements | 16 |
Message from the Trustees
Dear Fellow Shareholder:
The U.S. economy is on the mend, albeit at a slower pace than we would like. Economic growth continues despite the serious national debt issues of a handful of European nations. In the United States, the outlook is one of guarded optimism, with most economists agreeing that a second recession is unlikely and that growth will continue for the balance of the year.
During the spring and early summer, volatility returned to both fixed-income and equity markets. Compared with the solid rebound of 2009, the investment environment for 2010 has become somewhat more challenging — one that requires analysis, insight, innovation, and expertise. We believe these attributes form the very core of Putnam’s analytic, active-management approach.
In other developments, Barbara M. Baumann has been elected to the Board of Trustees of the Putnam Funds, effective July 1, 2010. Ms. Baumann is president and owner of Cross Creek Energy Corporation of Denver, Colorado, a strategic consultant to domestic energy firms and direct investor in energy assets. We also want to thank Elizabeth T. Kennan, who recently retired from the Board of Trustees, for her many years of dedicated and thoughtful leadership.

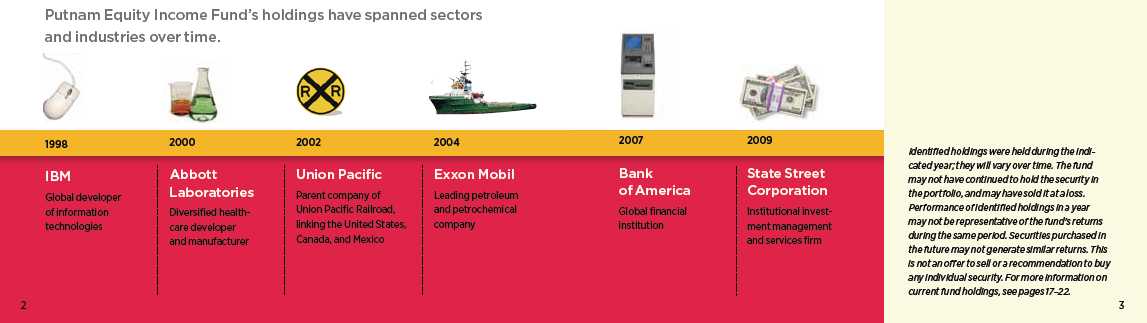
About the fund
Seeking to harness the power of stock dividends since 1977
When a company is in a building phase, profits are generally reinvested in areas such as research or infrastructure. However, a large, mature company that has progressed beyond the growth stage will often use a portion of its profits for dividends, paid directly to its shareholders. Putnam Equity Income Fund is composed primarily of stocks of large U.S. companies that pay dividends to their shareholders.
The issuance of dividends can be a positive indicator, often signaling that a company is profitable and has excess funds after its expenses are paid. It also represents management’s confidence in the company’s continued financial health. Dividends can act as tangible evidence of a company’s ability and commitment to create shareholder value. In addition, dividends can also act as an incentive for investors to hold stock in a stable company that is not experiencing a great deal of growth.
Investors historically have turned to dividend-paying stocks for several reasons. They can offer a cash-in-hand return (versus future capital appreciation that may or may not occur), even in a bear market. They can also be reinvested, allowing an investor to take advantage of the power of compounding, which can serve as a valuable wealth-building benefit.
In addition to targeting dividend-paying companies, the fund’s manager seeks stocks whose issuing companies are undervalued and poised for positive change. The goal is to uncover stocks that will appreciate in value as the market recognizes their long-term worth. Together with a team of analysts, the manager researches the universe of U.S. mid- and large-capitalization stocks to find companies that are not only well established with solid fundamentals, but that continue to find ways to grow and remain profitable.
In a process that is grounded in fundamental research and stock analysis, the manager seeks to build a portfolio that offers a combination of income and capital appreciation potential.
Consider these risks before investing:
Value stocks may fail to rebound, and the market may not favor value-style investing.
Employing a rigorous
approach to stock selection
In building the fund’s portfolio, the manager draws on the expertise of a dedicated team of stock analysts. Once a stock is selected, it is regularly assessed to ensure that it continues to meet certain criteria, such as:
Quality Looking for high-quality companies, seeking characteristics such as sound balance sheets, profitable business models, and competent management.
Valuation Carefully considering how each stock is valued, seeking stocks whose valuations are attractive relative to the company’s profit potential.
Change Focusing on company fundamentals against the broader context of industry trends to identify whether individual companies possess a catalyst for positive change.
Performance
snapshot
Annualized total return (%) comparison as of 5/31/10
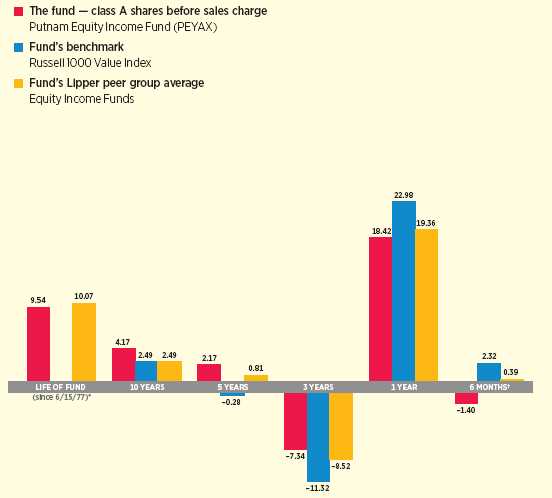
Current performance may be lower or higher than the quoted past performance, which cannot guarantee future results. Share price, principal value, and return will fluctuate, and you may have a gain or a loss when you sell your shares. Performance of class A shares assumes reinvestment of distributions and does not account for taxes. Fund returns in the bar chart do not reflect a sales charge of 5.75%; had they, returns would have been lower. See pages 5 and 10–12 for additional performance information. For a portion of the periods, this fund may have limited expenses, without which returns would have been lower. A 1% short-term trading fee may apply. To obtain the most recent month-end performance, visit putnam.com.
* The fund’s benchmark, the Russell 1000 Value Index, was introduced on 12/31/78, which post-dates the inception date of the fund’s class A shares.
† Returns for the six-month period are not annualized, but cumulative.
4
Interview with your
fund’s portfolio manager
Bartlett Geer
Bart, how did Putnam Equity Income Fund
perform for the six-month period?
In an increasingly difficult market environment, the fund’s class A shares retreated slightly, posting a return of –1.40%. This performance lagged that of the fund’s benchmark, the Russell 1000 Value Index, which returned 2.32%, and the average return of the fund’s Lipper peer group, Equity Income Funds, which was 0.39%.
Tell us about market conditions during
the period.
Over the past six months, financial markets were characterized by high volatility and low returns for stocks overall. The period started on a strong note when, other than a small pullback in January, we saw a continuation of the bull market that began in March 2009, when stocks exploded off their lows and began a broad-based recovery.
However, in the final weeks of the period, volatility returned to the market in full force. A major cause of concern for investors was a debt crisis in Greece that led to broader worries about debt issues in other European Union countries. This, along with signs of deceleration in China’s economy, led to global market jitters and a market correction, with U.S. stock indexes declining sharply in late April and May.
The strongest-performing sectors for the period were consumer goods, capital goods, and transportation, while the weakest sectors were energy, health care, and utilities.
Why did the fund’s performance lag that of
its benchmark and peers?
Our stock selections and sector allocations were primarily responsible for the fund’s underperformance for the period. In particular, in the financials portion of the portfolio,
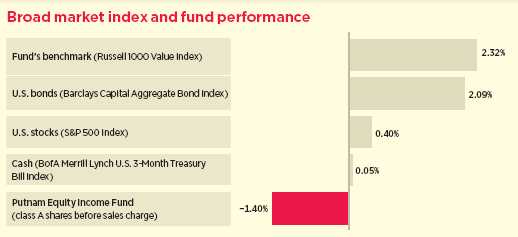
This comparison shows your fund’s performance in the context of broad market indexes for the six months ended 5/31/10. See pages 4 and 10–12 for additional fund performance information. Index descriptions can be found on page 14.
5
relative performance was hurt by our decision to focus primarily on large banks, while stocks of midsize banks fared better. Stocks in the technology sector of the portfolio delivered disappointing returns, and performance was also hindered by our decision to maintain an overweight position in health-care stocks, with an emphasis on the weak-performing pharmaceuticals industry.
For much of the period, the fund held posi-
tions in stocks of companies involved in the
catastrophic oil spill in the Gulf of Mexico.
How did this affect performance?
The fund’s portfolio included three companies with involvement in the disaster: energy company BP, which operated the drilling rig that exploded; Transocean, which owned and leased the rig to BP; and Anadarko Petroleum, which owns a portion of the well in the Gulf of Mexico.
Declines in these stocks hurt fund performance for the period, and BP was the top detractor. By the close of the period, we had completely eliminated the fund’s position in BP, and we eliminated our Transocean and Anadarko positions shortly after the close of the period.
By the close of the period, companies directly involved with the oil spill made up less than 1% of the fund’s portfolio. Prior to the April 2010 rig explosion, our analysis found BP to offer an attractive risk/reward profile relative to other integrated U.S. oil companies, and it had been a strong performer for the fund over the past year. Our decision to sell the stock was based on our analysis of potential liability costs and how much of the disaster’s effects were already discounted into the stock price.
What are some other holdings that
detracted from performance?
In the financials sector, the stock of credit card issuer Discover Financial Services was a detractor as investors grew concerned that new financial regulations might crimp the company’s future profits. We disagree with these concerns and believe the company, whose credit trends are improving, continues to represent an attractive opportunity.
Another detractor for the period was AES Corporation, a global power company that
Sector allocations as of 5/31/10
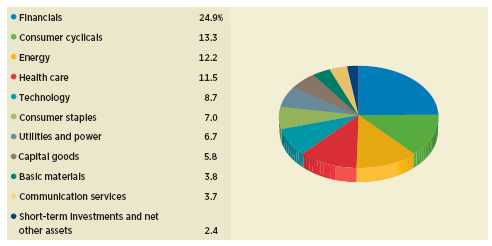
Allocations are represented as a percentage of the fund’s net assets. Holdings and allocations may vary over time.
6
operates in nearly 30 countries. AES makes relatively high use of debt, which was worrisome to investors during the market meltdown. More recently, the stock was hurt in the aftermath of the 8.8-magnitude earthquake that struck Chile in February, and it declined again due to fears about weakening global economies. AES stock remained in the portfolio at the close of the period. The company has several new projects in its pipeline, which we believe bodes well for revenue growth, particularly in a strengthening economy.
“ We believe that the recent pullback
in stock performance is no more than
a long overdue correction from the
extraordinary surge we witnessed after
the market bottom in March 2009. ”
Bart Geer
Finally, we have been surprised by the declines in the stock of Abbott Laboratories, a pharmaceutical and medical device company. Earnings continue to be strong, the stock’s valuation is attractive, its dividend has a healthy yield that continues to grow, and we believe management is doing a good job of positioning the company for the challenges confronting the industry.
Like other stocks in the health-care industry, Abbott declined as debate raged over the health-care reform bill, and it continued to decline after the bill was passed. Abbott stock remained in the portfolio at the close of the period.
What are some stocks that made a posi-
tive contribution to performance during
the period?
One notable contributor was Big Lots, a retailer of bargain merchandise with over 1,300 stores in 47 states. The company continues to grow, in part because its low price points are attracting new shoppers who are looking to stretch their spending in this economy.
The Interpublic Group of Companies [IPG], a global advertising and marketing services company, was another portfolio highlight for the period. One of the few multinational advertising firms in the world, IPG’s agencies create programs for clients in every global
Top 10 holdings
| HOLDING (percentage of fund’s net assets) | SECTOR | INDUSTRY | ||
| Chevron Corp. (5.0%) | Energy | Oil and gas | ||
| Total SA (France) (3.5%) | Energy | Oil and gas | ||
| Pfizer, Inc. (3.4%) | Health care | Pharmaceuticals | ||
| JPMorgan Chase & Co. (2.9%) | Financials | Banking | ||
| Abbott Laboratories (2.8%) | Health care | Pharmaceuticals | ||
| State Street Corp. (2.8%) | Financials | Banking | ||
| Bank of America Corp. (2.5%) | Financials | Banking | ||
| Microsoft Corp. (2.2%) | Technology | Software | ||
| Wells Fargo & Co. (2.2%) | Financials | Banking | ||
| Kimberly-Clark Corp. (2.1%) | Consumer staples | Consumer goods | ||
This table shows the fund’s top 10 holdings and the percentage of the fund’s net assets that each represented as of 5/31/10. Short-term holdings are excluded. Holdings will vary over time.
7
market. Its services include advertising, direct marketing, public relations, events marketing, Internet and search engine marketing, and social media marketing. We believe the company has a strong balance sheet, and its stock continues to offer a solid valuation.
Another strong performer was the stock of Lubrizol Corporation, a specialty chemical company. Lubrizol supplies additives and compounds for the global transportation, industrial, and consumer markets. This stock has been a solid holding for the fund, due to the company’s robust fundamental growth. Its valuation is still attractive, and we believe it has solid growth opportunities and a strong and growing dividend.
What is your outlook for the markets and
the economy?
We believe that the recent pullback in stock performance is no more than a long overdue correction from the extraordinary surge we witnessed after the market bottom in March 2009. Having said that, however, we also believe we will begin to see a “new normal,” characterized by GDP rates lower than the historic 5% to 6%. The slower rate of economic growth will likely be due to increased government regulation and taxation, and deleveraging on the consumer side of our economy.
How are you positioning the fund
in this environment?
Over the last few months, we have trimmed some of the fund’s holdings in more defensive sectors, such as utilities, energy, consumer staples, health care, and telecommunications.
At the same time, we’ve added to holdings in more cyclical areas such as consumer discretionary, industrials, technology, and materials. We also harvested some of our winners — sold stocks that had appreciated significantly — to redeploy the money into stocks that we believe will have more upside potential.
Our outlook for stocks remains reasonably constructive, and we believe we can continue to find attractive investment opportunities across a range of industries. However, stocks are unlikely to deliver returns as robust as those we saw over the past year.
As uncertainty and a bit of turbulence has returned to the stock market, it is important to note that our disciplined investment strategy
Comparison of top sector weightings
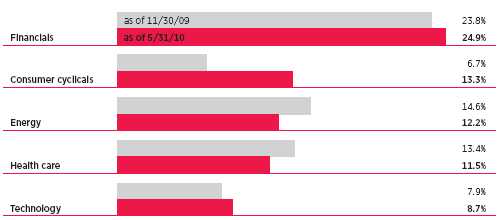
This chart shows how the fund’s top weightings have changed over the past six months. Weightings are shown as a percentage of net assets. Holdings will vary over time.
8
has not changed. We believe that our diversified, actively managed, risk-controlled style of value investing and yield investing will continue to serve our shareholders, regardless of the direction the markets take in the months ahead.
Thank you, Bart, for your time and
insights today.
The views expressed in this report are exclusively those of Putnam Management. They are not meant as investment advice.
Please note that the holdings discussed in this report may not have been held by the fund for the entire period. Portfolio composition is subject to review in accordance with the fund’s investment strategy and may vary in the future. Current and future portfolio holdings are subject to risk.

Portfolio Manager Bartlett Geer has an M.B.A. from the Tuck School of Business at Dartmouth College and a B.A. from Dartmouth College. A CFA charterholder, he joined Putnam in 2000 and has been in the investment industry since 1991.
IN THE NEWS
Despite headlines about market volatility and a slow economic recovery, cash on U.S. corporate balance sheets has hit a record high. The Federal Reserve recently reported that nonfinancial companies were holding $1.84 trillion in cash and other liquid assets as of the end of March. The amount of cash is up 26% from a year ago, the largest increase on record, according to the central bank. Many firms implemented cost-cutting measures and other efficiencies in 2009. Concerned about the strength of the economic recovery and the debt crisis in Europe, companies have been reluctant to spend in recent months. Ultimately, that cash may be deployed on hiring, dividends, mergers, stock repurchases, and other shareholder-friendly activities.
9
Your fund’s performance
This section shows your fund’s performance, price, and distribution information for periods ended May 31, 2010, the end of the first half of its current fiscal year. In accordance with regulatory requirements for mutual funds, we also include performance as of the most recent calendar quarter-end and expense information taken from the fund’s current prospectus. Performance should always be considered in light of a fund’s investment strategy. Data represents past performance. Past performance does not guarantee future results. More recent returns may be less or more than those shown. Investment return and principal value will fluctuate, and you may have a gain or a loss when you sell your shares. Performance information does not reflect any deduction for taxes a shareholder may owe on fund distributions or on the redemption of fund shares. For the most recent month-end performance, please visit the Individual Investors section at putnam.c om or call Putnam at 1-800-225-1581. Class Y shares are generally only available to corporate and institutional clients and clients in other approved programs. See the Terms and Definitions section in this report for definitions of the share classes offered by your fund.
Fund performance Total return for periods ended 5/31/10
| Class A | Class B | Class C | Class M | Class R | Class Y | |||||
| (inception dates) | (6/15/77) | (9/13/93) | (2/1/99) | (12/2/94) | (1/21/03) | (10/1/98) | ||||
| NAV | POP | NAV | CDSC | NAV | CDSC | NAV | POP | NAV | NAV | |
| Annual average | ||||||||||
| (life of fund) | 9.54% | 9.35% | 8.61% | 8.61% | 8.72% | 8.72% | 8.88% | 8.76% | 9.27% | 9.64% |
| 10 years | 50.53 | 41.85 | 39.56 | 39.56 | 39.59 | 39.59 | 43.11 | 38.06 | 46.85 | 54.30 |
| Annual average | 4.17 | 3.56 | 3.39 | 3.39 | 3.39 | 3.39 | 3.65 | 3.28 | 3.92 | 4.43 |
| 5 years | 11.35 | 4.97 | 7.18 | 5.66 | 7.27 | 7.27 | 8.52 | 4.74 | 9.93 | 12.73 |
| Annual average | 2.17 | 0.97 | 1.40 | 1.11 | 1.41 | 1.41 | 1.65 | 0.93 | 1.91 | 2.43 |
| 3 years | –20.44 | –25.00 | –22.28 | –24.32 | –22.23 | –22.23 | –21.67 | –24.42 | –21.05 | –19.88 |
| Annual average | –7.34 | –9.14 | –8.06 | –8.87 | –8.04 | –8.04 | –7.82 | –8.91 | –7.58 | –7.12 |
| 1 year | 18.42 | 11.61 | 17.43 | 12.43 | 17.44 | 16.44 | 17.74 | 13.58 | 18.08 | 18.59 |
| 6 months | –1.40 | –7.06 | –1.86 | –6.75 | –1.83 | –2.81 | –1.73 | –5.14 | –1.57 | –1.36 |
Current performance may be lower or higher than the quoted past performance, which cannot guarantee future results. After-sales-charge returns (public offering price, or POP) for class A and M shares reflect a maximum 5.75% and 3.50% load, respectively. Class B share returns reflect the applicable contingent deferred sales charge (CDSC), which is 5% in the first year, declining to 1% in the sixth year, and is eliminated thereafter. Class C shares reflect a 1% CDSC for the first year that is eliminated thereafter. Class R and Y shares have no initial sales charge or CDSC. Performance for class B, C, M, R, and Y shares before their inception is derived from the historical performance of class A shares, adjusted for the applicable sales charge (or CDSC) and, except for class Y shares, the higher operating expenses for such shares.
For a portion of the periods, this fund may have limited expenses, without which returns would have been lower.
A 1% short-term trading fee may be applied to shares exchanged or sold within 7 days of purchase.
10
Comparative index returns For periods ended 5/31/10
| Lipper Equity Income Funds | ||
| Russell 1000 Value Index | category average* | |
| Annual average (life of fund) | —† | 10.07% |
| 10 years | 27.90% | 30.45 |
| Annual average | 2.49 | 2.49 |
| 5 years | –1.37 | 4.68 |
| Annual average | –0.28 | 0.81 |
| 3 years | –30.25 | –23.17 |
| Annual average | –11.32 | –8.52 |
| 1 year | 22.98 | 19.36 |
| 6 months | 2.32 | 0.39 |
Index and Lipper results should be compared to fund performance at net asset value.
* Over the 6-month, 1-year, 3-year, 5-year, 10-year, and life-of-fund periods ended 5/31/10, there were 285, 279, 237, 192, 109, and 4 funds, respectively, in this Lipper category.
† The fund’s benchmark, the Russell 1000 Value Index, was introduced on 12/31/78, which post-dates the inception date of the fund’s class A shares.
Fund price and distribution information For the six-month period ended 5/31/10
| Distributions | Class A | Class B | Class C | Class M | Class R | Class Y | ||
| Number | 2 | 2 | 2 | 2 | 2 | 2 | ||
| Income | $0.128 | $0.075 | $0.079 | $0.094 | $0.115 | $0.144 | ||
| Capital gains | — | — | — | — | — | — | ||
| Total | $0.128 | $0.075 | $0.079 | $0.094 | $0.115 | $0.144 | ||
| Share value | NAV | POP | NAV | NAV | NAV | POP | NAV | NAV |
| 11/30/09 | $13.47 | $14.29 | $13.34 | $13.38 | $13.35 | $13.83 | $13.41 | $13.48 |
| 5/31/10 | 13.16 | 13.96 | 13.02 | 13.06 | 13.03 | 13.50 | 13.09 | 13.16 |
| Current yield (end of period) | NAV | POP | NAV | NAV | NAV | POP | NAV | NAV |
| Current dividend rate 1 | 1.46% | 1.38% | 0.65% | 0.70% | 0.95% | 0.92% | 1.28% | 1.70% |
| Current 30-day SEC yield 2 | N/A | 1.45 | 0.77 | 0.77 | N/A | 0.99 | 1.28 | 1.80 |
The classification of distributions, if any, is an estimate. Final distribution information will appear on your year-end tax forms.
1 Most recent distribution, excluding capital gains, annualized and divided by NAV or POP at end of period.
2 Based only on investment income and calculated using the maximum offering price for each share class, in accordance with SEC guidelines.
11
Fund performance as of most recent calendar quarter
Total return for periods ended 6/30/10
| Class A | Class B | Class C | Class M | Class R | Class Y | |||||
| (inception dates) | (6/15/77) | (9/13/93) | (2/1/99) | (12/2/94) | (1/21/03) | (10/1/98) | ||||
| NAV | POP | NAV | CDSC | NAV | CDSC | NAV | POP | NAV | NAV | |
| Annual average | ||||||||||
| (life of fund) | 9.30% | 9.10% | 8.37% | 8.37% | 8.48% | 8.48% | 8.64% | 8.52% | 9.02% | 9.39% |
| 10 years | 47.47 | 39.04 | 36.91 | 36.91 | 36.92 | 36.92 | 40.37 | 35.47 | 43.89 | 51.29 |
| Annual average | 3.96 | 3.35 | 3.19 | 3.19 | 3.19 | 3.19 | 3.45 | 3.08 | 3.71 | 4.23 |
| 5 years | 2.74 | –3.15 | –1.00 | –2.40 | –1.02 | –1.02 | 0.20 | –3.31 | 1.40 | 4.03 |
| Annual average | 0.54 | –0.64 | –0.20 | –0.48 | –0.20 | –0.20 | 0.04 | –0.67 | 0.28 | 0.79 |
| 3 years | –24.02 | –28.38 | –25.66 | –27.61 | –25.65 | –25.65 | –25.14 | –27.76 | –24.57 | –23.43 |
| Annual average | –8.75 | –10.53 | –9.41 | –10.21 | –9.41 | –9.41 | –9.20 | –10.27 | –8.97 | –8.51 |
| 1 year | 8.57 | 2.33 | 7.80 | 2.80 | 7.85 | 6.85 | 8.10 | 4.34 | 8.29 | 8.84 |
| 6 months | –9.21 | –14.43 | –9.51 | –14.02 | –9.53 | –10.43 | –9.38 | –12.56 | –9.34 | –9.09 |
Your fund’s expenses
As a mutual fund investor, you pay ongoing expenses, such as management fees, distribution fees (12b-1 fees), and other expenses. Using the following information, you can estimate how these expenses affect your investment and compare them with the expenses of other funds. You may also pay one-time transaction expenses, including sales charges (loads) and redemption fees, which are not shown in this section and would have resulted in higher total expenses. For more information, see your fund’s prospectus or talk to your financial representative.
Expense ratios
| Class A | Class B | Class C | Class M | Class R | Class Y | |
| Total annual operating expenses for the fiscal year | ||||||
| ended 11/30/09* | 1.16% | 1.91% | 1.91% | 1.66% | 1.41% | 0.91% |
| Annualized expense ratio for the six-month period | ||||||
| ended 5/31/10 | 1.15% | 1.90% | 1.90% | 1.65% | 1.40% | 0.90% |
Fiscal-year expense information in this table is taken from the most recent prospectus, is subject to change, and may differ from that shown for the annualized expense ratio and in the financial highlights of this report. Expenses are shown as a percentage of average net assets.
* Reflects projected expenses under a new management contract effective 1/1/10 and a new expense arrangement, which gives effect to changes in the fund’s investor servicing contract.
12
Expenses per $1,000
The following table shows the expenses you would have paid on a $1,000 investment in Putnam Equity Income Fund from December 1, 2009, to May 31, 2010. It also shows how much a $1,000 investment would be worth at the close of the period, assuming actual returns and expenses.
| Class A | Class B | Class C | Class M | Class R | Class Y | |
| Expenses paid per $1,000*† | $5.69 | $9.39 | $9.39 | $8.16 | $6.93 | $4.46 |
| Ending value (after expenses) | $986.00 | $981.40 | $981.70 | $982.70 | $984.30 | $986.40 |
* Expenses for each share class are calculated using the fund’s annualized expense ratio for each class, which represents the ongoing expenses as a percentage of average net assets for the six months ended 5/31/10. The expense ratio may differ for each share class.
† Expenses are calculated by multiplying the expense ratio by the average account value for the period; then multiplying the result by the number of days in the period; and then dividing that result by the number of days in the year.
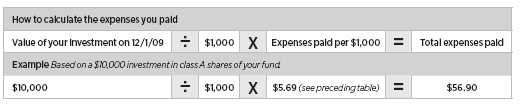
Estimate the expenses you paid
To estimate the ongoing expenses you paid for the six months ended May 31, 2010, use the following calculation method. To find the value of your investment on December 1, 2009, call Putnam at 1-800-225-1581.
Compare expenses using the SEC’s method
The Securities and Exchange Commission (SEC) has established guidelines to help investors assess fund expenses. Per these guidelines, the following table shows your fund’s expenses based on a $1,000 investment, assuming a hypothetical 5% annualized return. You can use this information to compare the ongoing expenses (but not transaction expenses or total costs) of investing in the fund with those of other funds. All mutual fund shareholder reports will provide this information to help you make this comparison. Please note that you cannot use this information to estimate your actual ending account balance and expenses paid during the period.
| Class A | Class B | Class C | Class M | Class R | Class Y | |
| Expenses paid per $1,000*† | $5.79 | $9.55 | $9.55 | $8.30 | $7.04 | $4.53 |
| Ending value (after expenses) | $1,019.20 | $1,015.46 | $1,015.46 | $1,016.70 | $1,017.95 | $1,020.44 |
* Expenses for each share class are calculated using the fund’s annualized expense ratio for each class, which represents the ongoing expenses as a percentage of average net assets for the six months ended 5/31/10. The expense ratio may differ for each share class.
† Expenses are calculated by multiplying the expense ratio by the average account value for the period; then multiplying the result by the number of days in the period; and then dividing that result by the number of days in the year.
13
Terms and definitions
Important terms
Current yield is the annual rate of return earned from dividends or interest of an investment. Current yield is expressed as a percentage of the price of a security, fund share, or principal investment.
Total return shows how the value of the fund’s shares changed over time, assuming you held the shares through the entire period and reinvested all distributions in the fund.
Net asset value (NAV) is the price, or value, of one share of a mutual fund, without a sales charge. NAVs fluctuate with market conditions. NAV is calculated by dividing the net assets of each class of shares by the number of outstanding shares in the class.
Public offering price (POP) is the price of a mutual fund share plus the maximum sales charge levied at the time of purchase. POP performance figures shown here assume the 5.75% maximum sales charge for class A shares and 3.50% for class M shares.
Contingent deferred sales charge (CDSC) is generally a charge applied at the time of the redemption of class B or C shares and assumes redemption at the end of the period. Your fund’s class B CDSC declines from a 5% maximum during the first year to 1% during the sixth year. After the sixth year, the CDSC no longer applies. The CDSC for class C shares is 1% for one year after purchase.
Share classes
Class A shares are generally subject to an initial sales charge and no CDSC (except on certain redemptions of shares bought without an initial sales charge).
Class B shares are not subject to an initial sales charge. They may be subject to a CDSC.
Class C shares are not subject to an initial sales charge and are subject to a CDSC only if the shares are redeemed during the first year.
Class M shares have a lower initial sales charge and a higher 12b-1 fee than class A shares and no CDSC (except on certain redemptions of shares bought without an initial sales charge).
Class R shares are not subject to an initial sales charge or CDSC and are available only to certain defined contribution plans.
Class Y shares are not subject to an initial sales charge or CDSC, and carry no 12b-1 fee. They are generally only available to corporate and institutional clients and clients in other approved programs.
Comparative indexes
Barclays Capital Aggregate Bond Index is an unmanaged index of U.S. investment-grade fixed-income securities.
BofA (Bank of America) Merrill Lynch U.S. 3-Month Treasury Bill Index is an unmanaged index that seeks to measure the performance of U.S. Treasury bills available in the marketplace.
Russell 1000 Value Index is an unmanaged index of those companies in the large-cap Russell 1000 Index chosen for their value orientation.
S&P 500 Index is an unmanaged index of common stock performance.
Indexes assume reinvestment of all distributions and do not account for fees. Securities and performance of a fund and an index will differ. You cannot invest directly in an index.
Lipper is a third-party industry-ranking entity that ranks mutual funds. Its rankings do not reflect sales charges. Lipper rankings are based on total return at net asset value relative to other funds that have similar current investment styles or objectives as determined by Lipper. Lipper may change a fund’s category assignment at its discretion. Lipper category averages reflect performance trends for funds within a category.
14
Other information for shareholders
Important notice regarding delivery
of shareholder documents
In accordance with SEC regulations, Putnam sends a single copy of annual and semiannual shareholder reports, prospectuses, and proxy statements to Putnam shareholders who share the same address, unless a shareholder requests otherwise. If you prefer to receive your own copy of these documents, please call Putnam at 1-800-225-1581, and Putnam will begin sending individual copies within 30 days.
Proxy voting
Putnam is committed to managing our mutual funds in the best interests of our shareholders. The Putnam funds’ proxy voting guidelines and procedures, as well as information regarding how your fund voted proxies relating to portfolio securities during the 12-month period ended June 30, 2009, are available in the Individual Investors section of putnam.com, and on the SEC’s Web site, www.sec.gov. If you have questions about finding forms on the SEC’s Web site, you may call the SEC at 1-800-SEC-0330. You may also obtain the Putnam funds’ proxy voting guidelines and procedures at no charge by calling Putnam’s Shareholder Services at 1-800-225-1581.
Fund portfolio holdings
The fund will file a complete schedule of its portfolio holdings with the SEC for the first and third quarters of each fiscal year on Form N-Q. Shareholders may obtain the fund’s Forms N-Q on the SEC’s Web site at www.sec.gov. In addition, the fund’s Forms N-Q may be reviewed and copied at the SEC’s Public Reference Room in Washington, D.C. You may call the SEC at 1-800-SEC-0330 for information about the SEC’s Web site or the operation of the Public Reference Room.
Trustee and employee
fund ownership
Putnam employees and members of the Board of Trustees place their faith, confidence, and, most importantly, investment dollars in Putnam mutual funds. As of May 31, 2010, Putnam employees had approximately $335,000,000 and the Trustees had approximately $57,000,000 invested in Putnam mutual funds. These amounts include investments by the Trustees’ and employees’ immediate family members as well as investments through retirement and deferred compensation plans.
15
Financial statements
A guide to financial statements
These sections of the report, as well as the accompanying Notes, constitute the fund’s financial statements.
The fund’s portfolio lists all the fund’s investments and their values as of the last day of the reporting period. Holdings are organized by asset type and industry sector, country, or state to show areas of concentration and diversification.
Statement of assets and liabilities shows how the fund’s net assets and share price are determined. All investment and non-investment assets are added together. Any unpaid expenses and other liabilities are subtracted from this total. The result is divided by the number of shares to determine the net asset value per share, which is calculated separately for each class of shares. (For funds with preferred shares, the amount subtracted from total assets includes the liquidation preference of preferred shares.)
Statement of operations shows the fund’s net investment gain or loss. This is done by first adding up all the fund’s earnings — from dividends and interest income — and subtracting its operating expenses to determine net investment income (or loss). Then, any net gain or loss the fund realized on the sales of its holdings — as well as any unrealized gains or losses over the period — is added to or subtracted from the net investment result to determine the fund’s net gain or loss for the fiscal period.
Statement of changes in net assets shows how the fund’s net assets were affected by the fund’s net investment gain or loss, by distributions to shareholders, and by changes in the number of the fund’s shares. It lists distributions and their sources (net investment income or realized capital gains) over the current reporting period and the most recent fiscal year-end. The distributions listed here may not match the sources listed in the Statement of operations because the distributions are determined on a tax basis and may be paid in a different period from the one in which they were earned. Dividend sources are estimated at the time of declaration. Actual results may vary. Any non-taxable return of capital cannot be determined until final tax calculations are completed after the end of the fund’s fiscal year.
Financial highlights provide an overview of the fund’s investment results, per-share distributions, expense ratios, net investment income ratios, and portfolio turnover in one summary table, reflecting the five most recent reporting periods. In a semiannual report, the highlights table also includes the current reporting period.
16
| The fund’s portfolio 5/31/10 (Unaudited) | ||
| COMMON STOCKS (92.1%)* | Shares | Value |
| Advertising and marketing services (0.5%) | ||
| Omnicom Group, Inc. | 360,900 | $13,696,155 |
| 13,696,155 | ||
| Aerospace and defense (3.1%) | ||
| Empresa Brasileira de Aeronautica SA (Embraer) ADR (Brazil) † S | 143,500 | 3,125,430 |
| L-3 Communications Holdings, Inc. S | 96,900 | 8,006,847 |
| Northrop Grumman Corp. S | 276,300 | 16,713,387 |
| Raytheon Co. S | 872,800 | 45,743,448 |
| United Technologies Corp. | 322,600 | 21,736,788 |
| 95,325,900 | ||
| Airlines (0.1%) | ||
| US Airways Group, Inc. † S | 303,400 | 2,679,022 |
| 2,679,022 | ||
| Automotive (0.7%) | ||
| TRW Automotive Holdings Corp. † S | 748,300 | 22,508,864 |
| 22,508,864 | ||
| Banking (11.4%) | ||
| Bank of America Corp. | 4,832,096 | 76,057,191 |
| Bank of New York Mellon Corp. (The) | 181,200 | 4,928,640 |
| JPMorgan Chase & Co. | 2,191,891 | 86,755,046 |
| Popular, Inc. (Puerto Rico) † | 2,044,263 | 6,194,117 |
| State Street Corp. | 2,241,800 | 85,569,506 |
| SunTrust Banks, Inc. | 55,900 | 1,506,505 |
| U.S. Bancorp | 692,100 | 16,582,716 |
| Wells Fargo & Co. S | 2,332,550 | 66,920,860 |
| 344,514,581 | ||
| Beverage (0.4%) | ||
| Molson Coors Brewing Co. Class B S | 280,655 | 11,518,081 |
| 11,518,081 | ||
| Biotechnology (1.1%) | ||
| Genzyme Corp. † S | 706,100 | 34,351,765 |
| 34,351,765 | ||
| Broadcasting (0.4%) | ||
| DISH Network Corp. Class A | 523,000 | 10,904,550 |
| 10,904,550 | ||
| Cable television (2.2%) | ||
| Comcast Corp. Special Class A | 2,194,400 | 37,787,568 |
| DIRECTV Class A † | 564,800 | 21,287,312 |
| Time Warner Cable, Inc. | 158,700 | 8,685,651 |
| 67,760,531 | ||
| Chemicals (2.3%) | ||
| Ashland, Inc. | 245,200 | 13,145,172 |
| Celanese Corp. Ser. A | 205,100 | 5,880,217 |
| CF Industries Holdings, Inc. | 47,700 | 3,271,743 |
| FMC Corp. S | 299,200 | 18,116,560 |
| Lubrizol Corp. (The) S | 337,000 | 29,848,090 |
| 70,261,782 | ||
| Combined utilities (0.2%) | ||
| El Paso Corp. | 430,200 | 4,878,468 |
| 4,878,468 | ||
| Commercial and consumer services (0.5%) | ||
| Dun & Bradstreet Corp. (The) | 224,900 | 16,415,451 |
| 16,415,451 | ||
17
| COMMON STOCKS (92.1%)* cont. | Shares | Value |
| Communications equipment (0.7%) | ||
| Harris Corp. | 271,000 | $12,712,610 |
| Qualcomm, Inc. | 243,300 | 8,651,748 |
| 21,364,358 | ||
| Computers (2.6%) | ||
| Brocade Communications Systems, Inc. † | 557,100 | 3,036,195 |
| Dell, Inc. † | 1,702,600 | 22,695,658 |
| EMC Corp. † S | 1,208,100 | 22,494,822 |
| IBM Corp. | 248,100 | 31,077,006 |
| 79,303,681 | ||
| Conglomerates (1.3%) | ||
| SPX Corp. S | 103,200 | 6,099,120 |
| Tyco International, Ltd. | 895,900 | 32,422,621 |
| 38,521,741 | ||
| Consumer (0.3%) | ||
| Jarden Corp. | 308,200 | 8,971,702 |
| 8,971,702 | ||
| Consumer goods (2.2%) | ||
| Kimberly-Clark Corp. S | 1,034,200 | 62,775,940 |
| Newell Rubbermaid, Inc. S | 170,500 | 2,840,530 |
| 65,616,470 | ||
| Containers (0.7%) | ||
| Owens-Illinois, Inc. † S | 660,300 | 20,026,899 |
| 20,026,899 | ||
| Electric utilities (4.3%) | ||
| Ameren Corp. S | 987,500 | 24,351,750 |
| Edison International | 159,200 | 5,151,712 |
| Great Plains Energy, Inc. | 1,774,938 | 31,150,162 |
| NV Energy, Inc. S | 2,497,100 | 29,440,809 |
| Pepco Holdings, Inc. | 2,425,100 | 39,116,863 |
| 129,211,296 | ||
| Electrical equipment (0.7%) | ||
| Hubbell, Inc. Class B | 481,600 | 20,540,240 |
| 20,540,240 | ||
| Electronics (1.2%) | ||
| Integrated Device Technology, Inc. † | 913,300 | 5,333,672 |
| Texas Instruments, Inc. S | 1,320,900 | 32,256,378 |
| 37,590,050 | ||
| Energy (oil field) (0.5%) | ||
| National-Oilwell Varco, Inc. | 92,200 | 3,515,586 |
| Transocean, Ltd. (Switzerland) † | 210,000 | 11,921,700 |
| 15,437,286 | ||
| Financial (3.5%) | ||
| Assurant, Inc. | 1,275,600 | 44,263,320 |
| Discover Financial Services | 4,553,124 | 61,239,518 |
| MGIC Investment Corp. † | 172,900 | 1,618,344 |
| 107,121,182 | ||
| Food (1.4%) | ||
| Campbell Soup Co. S | 810,706 | 29,031,382 |
| Kraft Foods, Inc. Class A S | 421,800 | 12,063,480 |
| 41,094,862 | ||
| Forest products and packaging (1.4%) | ||
| Bemis Co., Inc. | 238,500 | 6,840,180 |
| International Paper Co. | 588,200 | 13,663,886 |
| Sonoco Products Co. S | 671,400 | 20,752,974 |
| 41,257,040 | ||
18
| COMMON STOCKS (92.1%)* cont. | Shares | Value |
| Health-care services (1.7%) | ||
| Aetna, Inc. | 272,900 | $7,957,764 |
| AmerisourceBergen Corp. S | 136,000 | 4,254,080 |
| McKesson Corp. | 507,500 | 35,525,000 |
| WellPoint, Inc. † | 82,000 | 4,206,600 |
| 51,943,444 | ||
| Insurance (3.4%) | ||
| Aflac, Inc. | 101,300 | 4,487,590 |
| Allied World Assurance Company Holdings, Ltd. (Bermuda) | 257,100 | 11,546,361 |
| Arch Capital Group, Ltd. † S | 106,400 | 7,822,528 |
| Assured Guaranty, Ltd. (Bermuda) S | 1,396,121 | 23,454,833 |
| Endurance Specialty Holdings, Ltd. (Bermuda) | 33,800 | 1,253,980 |
| Hartford Financial Services Group, Inc. (The) S | 1,141,300 | 28,612,391 |
| PartnerRe, Ltd. | 128,899 | 9,403,182 |
| Validus Holdings, Ltd. (Bermuda) | 670,900 | 16,477,304 |
| 103,058,169 | ||
| Investment banking/Brokerage (2.1%) | ||
| Goldman Sachs Group, Inc. (The) | 47,900 | 6,910,054 |
| Invesco, Ltd. | 415,400 | 7,709,824 |
| Morgan Stanley | 1,767,200 | 47,908,792 |
| 62,528,670 | ||
| Lodging/Tourism (0.2%) | ||
| Wyndham Worldwide Corp. S | 235,100 | 5,548,360 |
| 5,548,360 | ||
| Manufacturing (0.7%) | ||
| Cooper Industries PLC Class A | 145,500 | 6,834,135 |
| Ingersoll-Rand PLC S | 416,700 | 15,547,077 |
| 22,381,212 | ||
| Media (3.4%) | ||
| Interpublic Group of Companies, Inc. (The) † S | 4,731,200 | 39,505,520 |
| Time Warner, Inc. S | 1,194,500 | 37,017,555 |
| Viacom, Inc. Class B † | 804,500 | 27,039,245 |
| 103,562,320 | ||
| Medical technology (1.5%) | ||
| Baxter International, Inc. | 87,100 | 3,678,233 |
| Boston Scientific Corp. † S | 3,118,900 | 18,869,345 |
| Covidien PLC (Ireland) | 109,475 | 4,640,645 |
| Medtronic, Inc. | 442,600 | 17,341,068 |
| 44,529,291 | ||
| Oil and gas (11.7%) | ||
| Anadarko Petroleum Corp. | 106,700 | 5,583,611 |
| Apache Corp. | 110,200 | 9,867,308 |
| Chevron Corp. | 2,038,400 | 150,576,608 |
| Exxon Mobil Corp. S | 224,000 | 13,543,040 |
| Hess Corp. | 84,300 | 4,484,760 |
| Marathon Oil Corp. S | 808,400 | 25,133,156 |
| Newfield Exploration Co. † S | 133,600 | 6,955,216 |
| Occidental Petroleum Corp. | 82,400 | 6,798,824 |
| Royal Dutch Shell PLC ADR (United Kingdom) S | 489,400 | 25,644,560 |
| Total SA (France) S | 2,257,601 | 105,480,805 |
| 354,067,888 | ||
19
| COMMON STOCKS (92.1%)* cont. | Shares | Value |
| Pharmaceuticals (7.2%) | ||
| Abbott Laboratories | 1,806,200 | $85,902,872 |
| Johnson & Johnson | 363,600 | 21,197,880 |
| Merck & Co., Inc. † | 220,600 | 7,432,014 |
| Pfizer, Inc. | 6,774,200 | 103,171,066 |
| 217,703,832 | ||
| Power producers (1.3%) | ||
| AES Corp. (The) † S | 3,781,800 | 38,839,086 |
| 38,839,086 | ||
| Publishing (0.6%) | ||
| R. R. Donnelley & Sons Co. S | 1,005,300 | 19,261,548 |
| 19,261,548 | ||
| Real estate (1.3%) | ||
| Annaly Capital Management, Inc. R S | 2,005,500 | 34,013,280 |
| Chimera Investment Corp. R | 550,400 | 2,168,576 |
| MFA Mortgage Investments, Inc. R | 553,700 | 4,058,621 |
| 40,240,477 | ||
| Regional Bells (1.5%) | ||
| AT&T, Inc. S | 1,854,800 | 45,071,640 |
| 45,071,640 | ||
| Restaurants (0.1%) | ||
| Brinker International, Inc. | 178,278 | 3,169,783 |
| 3,169,783 | ||
| Retail (4.6%) | ||
| Big Lots, Inc. † S | 966,800 | 34,157,044 |
| CVS Caremark Corp. | 1,286,600 | 44,554,958 |
| Foot Locker, Inc. S | 830,800 | 12,387,228 |
| Macy’s, Inc. | 407,900 | 9,059,459 |
| Office Depot, Inc. † | 748,000 | 4,338,400 |
| OfficeMax, Inc. † | 730,000 | 13,015,900 |
| Wal-Mart Stores, Inc. | 456,600 | 23,085,696 |
| 140,598,685 | ||
| Semiconductor (0.9%) | ||
| Atmel Corp. † S | 2,930,000 | 14,957,650 |
| KLA-Tencor Corp. S | 412,400 | 12,689,548 |
| 27,647,198 | ||
| Software (3.2%) | ||
| BMC Software, Inc. † | 41,500 | 1,535,915 |
| CA, Inc. | 1,054,200 | 21,347,550 |
| Microsoft Corp. | 2,617,788 | 67,538,930 |
| Parametric Technology Corp. † | 372,751 | 6,142,936 |
| 96,565,331 | ||
| Textiles (0.5%) | ||
| Hanesbrands, Inc. † | 528,000 | 14,403,840 |
| 14,403,840 | ||
| Tire and rubber (1.0%) | ||
| Goodyear Tire & Rubber Co. (The) † | 2,671,100 | 31,786,090 |
| 31,786,090 | ||
| Tobacco (1.5%) | ||
| Philip Morris International, Inc. | 1,060,500 | 46,789,260 |
| 46,789,260 | ||
| Trucks and parts (—%) | ||
| Autoliv, Inc. (Sweden) † | 32,200 | 1,529,500 |
| 1,529,500 | ||
20
| COMMON STOCKS (92.1%)* cont. | Shares | Value | ||
| Waste Management (—%) | ||||
| Republic Services, Inc. | 22,500 | $655,200 | ||
| 655,200 | ||||
| Total common stocks (cost $2,535,494,565) | $2,792,752,781 | |||
| CONVERTIBLE BONDS AND NOTES (3.5%)* | Principal amount | Value | ||
| Alexandria Real Estate Equities, Inc. 144A cv. sr. unsec. | ||||
| notes 8s, 2029 R | $5,821,000 | $10,288,618 | ||
| Alliance Data Systems Corp. 144A cv. sr. notes 4 3/4s, 2014 | 34,266,000 | 55,339,590 | ||
| Ford Motor Co. cv. sr. unsec. notes 4 1/4s, 2016 | 3,813,000 | 5,355,625 | ||
| MGIC Investment Corp. cv. sr. notes 5s, 2017 | 16,482,000 | 17,564,867 | ||
| Steel Dynamics, Inc. cv. sr. notes 5 1/8s, 2014 | 2,114,000 | 2,334,649 | ||
| WESCO International, Inc. cv. company guaranty sr. unsec. | ||||
| notes 6s, 2029 | 10,209,000 | 15,603,434 | ||
| Total convertible bonds and notes (cost $81,393,960) | $106,486,783 | |||
| CONVERTIBLE PREFERRED STOCKS (2.2%)* | Shares | Value | ||
| Great Plains Energy, Inc. $6.00 cv. pfd. | 502,551 | $30,228,443 | ||
| Hartford Financial Services Group, Inc. (The) $1.182 cv. pfd. | 673,870 | 16,044,845 | ||
| XL Capital, Ltd. $2.687 cv. pfd. | 805,270 | 21,750,343 | ||
| Total convertible preferred stocks (cost $61,729,655) | $68,023,631 | |||
| INVESTMENT COMPANIES (0.6%)* | Shares | Value | ||
| Apollo Investment Corp. | 1,831,000 | $19,097,330 | ||
| Total investment companies (cost $17,897,180) | $19,097,330 | |||
| WARRANTS (0.4%)* † | Expiration | Strike | ||
| date | Price | Warrants | Value | |
| JPMorgan Chase & Co. | 10/28/18 | 42.42 | 922,795 | $12,753,027 |
| Raytheon Co. | 6/16/11 | 37.50 | 12,408 | 192,200 |
| Total warrants (cost $11,948,931) | $12,945,227 | |||
| SHORT-TERM INVESTMENTS (13.6%)* | Principal amount/shares | Value | ||
| Short-term investments held as collateral for loaned | ||||
| securities with yields ranging from 0.07% to 0.28% and due | ||||
| dates ranging from June 1, 2010 to June 21, 2010 d | $382,823,040 | $382,813,396 | ||
| Putnam Money Market Liquidity Fund – 0.24% e | 28,499,650 | 28,499,650 | ||
| Total short-term investments (cost $411,313,046) | $411,313,046 | |||
| TOTAL INVESTMENTS | ||||
| Total investments (cost $3,119,777,337) | $3,410,618,798 | |||
Key to holding’s abbreviations
| ADR | American Depository Receipts |
Notes to the fund’s portfolio
Unless noted otherwise, the notes to the fund’s portfolio are for the close of the fund’s reporting period, which ran from December 1, 2009 through May 31, 2010.
* Percentages indicated are based on net assets of $3,033,345,205.
† Non-income-producing security.
21
d See Note 1 to the financial statements regarding securities lending.
e See Note 6 to the financial statements regarding investments in Putnam Money Market Liquidity Fund. The rate quoted in the security description is the annualized 7-day yield of the fund at the close of the reporting period.
R Real Estate Investment Trust.
S Securities on loan, in part or in entirety, at the close of the reporting period.
144A after the name of an issuer represents securities exempt from registration under Rule 144A under the Securities Act of 1933, as amended. These securities may be resold in transactions exempt from registration, normally to qualified institutional buyers.
ADR after the name of a foreign holding represents ownership of foreign securities on deposit with a custodian bank.
The dates shown on debt obligations are the original maturity dates.
Accounting Standards Codification ASC 820 Fair Value Measurements and Disclosures (ASC 820) establishes a three-level hierarchy for disclosure of fair value measurements. The valuation hierarchy is based upon the transparency of inputs to the valuation of the fund’s investments. The three levels are defined as follows:
Level 1 — Valuations based on quoted prices for identical securities in active markets.
Level 2 — Valuations based on quoted prices in markets that are not active or for which all significant inputs are observable, either directly or indirectly.
Level 3 — Valuations based on inputs that are unobservable and significant to the fair value measurement.
The following is a summary of the inputs used to value the fund’s net assets as of the close of the reporting period:
| Valuation inputs | |||
| Investments in securities: | Level 1 | Level 2 | Level 3 |
| Common stocks: | |||
| Basic materials | $111,518,822 | $— | $— |
| Capital goods | 160,458,951 | — | — |
| Communication services | 112,832,171 | — | — |
| Conglomerates | 38,521,741 | — | — |
| Consumer cyclicals | 343,102,607 | — | — |
| Consumer staples | 212,743,414 | — | — |
| Energy | 264,024,369 | 105,480,805 | — |
| Financial | 657,463,079 | — | — |
| Health care | 348,528,332 | — | — |
| Technology | 262,470,618 | — | — |
| Transportation | 2,679,022 | — | — |
| Utilities and power | 172,928,850 | — | — |
| Total common stocks | 2,687,271,976 | 105,480,805 | — |
| Convertible bonds and notes | — | 106,486,783 | — |
| Convertible preferred stocks | — | 68,023,631 | — |
| Investment companies | 19,097,330 | — | — |
| Warrants | 12,945,227 | — | — |
| Short-term investments | 28,499,650 | 382,813,396 | — |
| Totals by level | $2,747,814,183 | $662,804,615 | $— |
The accompanying notes are an integral part of these financial statements.
22
| Statement of assets and liabilities 5/31/10 (Unaudited) | ||
| ASSETS | ||
| Investment in securities, at value, including $367,427,453 of securities on loan (Note 1): | ||
| Unaffiliated issuers (identified cost $3,091,277,687) | $3,382,119,148 | |
| Affiliated issuers (identified cost $28,499,650) (Note 6) | 28,499,650 | |
| Dividends, interest and other receivables | 12,515,032 | |
| Receivable for shares of the fund sold | 6,262,896 | |
| Receivable for investments sold | 14,452,068 | |
| Total assets | 3,443,848,794 | |
| LIABILITIES | ||
| Payable for investments purchased | 19,479,466 | |
| Payable for shares of the fund repurchased | 4,059,288 | |
| Payable for compensation of Manager (Note 2) | 1,283,733 | |
| Payable for investor servicing fees (Note 2) | 688,275 | |
| Payable for custodian fees (Note 2) | 27,708 | |
| Payable for Trustee compensation and expenses (Note 2) | 417,246 | |
| Payable for administrative services (Note 2) | 10,758 | |
| Payable for distribution fees (Note 2) | 1,287,738 | |
| Collateral on securities loaned, at value (Note 1) | 382,813,396 | |
| Other accrued expenses | 435,981 | |
| Total liabilities | 410,503,589 | |
| Net assets | $3,033,345,205 | |
| REPRESENTED BY | ||
| Paid-in capital (Unlimited shares authorized) (Notes 1 and 4) | $3,659,656,700 | |
| Undistributed net investment income (Note 1) | 34,338,131 | |
| Accumulated net realized loss on investments and | ||
| foreign currency transactions (Note 1) | (951,511,214) | |
| Net unrealized appreciation of investments and assets and | ||
| liabilities in foreign currencies | 290,861,588 | |
| Total — Representing net assets applicable to capital shares outstanding | $3,033,345,205 | |
| COMPUTATION OF NET ASSET VALUE AND OFFERING PRICE | ||
| Net asset value and redemption price per class A share | ||
| ($2,340,654,879 divided by 177,890,720 shares) | $13.16 | |
| Offering price per class A share (100/94.25 of $13.16)* | $13.96 | |
| Net asset value and offering price per class B share ($145,686,294 divided by 11,185,970 shares)** | $13.02 | |
| Net asset value and offering price per class C share ($79,122,154 divided by 6,058,505 shares)** | $13.06 | |
| Net asset value and redemption price per class M share ($32,201,237 divided by 2,470,380 shares) | $13.03 | |
| Offering price per class M share (100/96.50 of $13.03)* | $13.50 | |
| Net asset value, offering price and redemption price per class R share | ||
| ($33,394,542 divided by 2,551,701 shares) | $13.09 | |
| Net asset value, offering price and redemption price per class Y share | ||
| ($402,286,099 divided by 30,564,581 shares) | $13.16 | |
* On single retail sales of less than $50,000. On sales of $50,000 or more the offering price is reduced.
** Redemption price per share is equal to net asset value less any applicable contingent deferred sales charge.
The accompanying notes are an integral part of these financial statements.
23
| Statement of operations Six months ended 5/31/10 (Unaudited) | |
| INVESTMENT INCOME | |
| Dividends (net of foreign tax of $487,346) | $40,111,313 |
| Interest (including interest income of $28,208 from investments in affiliated issuers) (Note 6) | 978,430 |
| Securities lending | 576,385 |
| Total investment income | 41,666,128 |
| EXPENSES | |
| Compensation of Manager (Note 2) | 7,657,756 |
| Investor servicing fees (Note 2) | 5,705,869 |
| Custodian fees (Note 2) | 34,329 |
| Trustee compensation and expenses (Note 2) | 119,536 |
| Administrative services (Note 2) | 86,701 |
| Distribution fees — Class A (Note 2) | 3,024,251 |
| Distribution fees — Class B (Note 2) | 845,891 |
| Distribution fees — Class C (Note 2) | 398,613 |
| Distribution fees — Class M (Note 2) | 127,476 |
| Distribution fees — Class R (Note 2) | 67,496 |
| Other | 480,165 |
| Total expenses | 18,548,083 |
| Expense reduction (Note 2) | (251,504) |
| Net expenses | 18,296,579 |
| Net investment income | 23,369,549 |
| Net realized gain on investments (Notes 1 and 3) | 163,510,433 |
| Net realized gain on foreign currency transactions (Note 1) | 7,126 |
| Net unrealized appreciation of assets and liabilities in foreign currencies during the period | 20,979 |
| Net unrealized depreciation of investments during the period | (234,743,751) |
| Net loss on investments | (71,205,213) |
| Net decrease in net assets resulting from operations | $(47,835,664) |
The accompanying notes are an integral part of these financial statements.
24
| Statement of changes in net assets | ||
| INCREASE IN NET ASSETS | Six months ended 5/31/10* | Year ended 11/30/09 |
| Operations: | ||
| Net investment income | $23,369,549 | $52,148,809 |
| Net realized gain (loss) on investments and | ||
| foreign currency transactions | 163,517,559 | (358,715,512) |
| Net unrealized appreciation (depreciation) of investments | ||
| and assets and liabilities in foreign currencies | (234,722,772) | 990,810,933 |
| Net increase (decrease) in net assets resulting from operations | (47,835,664) | 684,244,230 |
| Distributions to shareholders (Note 1): | ||
| From ordinary income Net investment income | ||
| Class A | (22,258,377) | (38,730,142) |
| Class B | (976,104) | (2,264,897) |
| Class C | (452,290) | (721,258) |
| Class M | (233,638) | (429,325) |
| Class R | (187,367) | (175,170) |
| Class Y | (4,247,852) | (6,075,015) |
| Redemption fees (Note 1) | 7,116 | 8,598 |
| Increase from capital share transactions (Notes 4 and 7) | 118,744,398 | 214,750,670 |
| Total increase in net assets | 42,560,222 | 850,607,691 |
| NET ASSETS | ||
| Beginning of period | 2,990,784,983 | 2,140,177,292 |
| End of period (including undistributed net investment | ||
| income of $34,338,131 and $39,324,210, respectively) | $3,033,345,205 | $2,990,784,983 |
* Unaudited
The accompanying notes are an integral part of these financial statements.
25
Financial highlights (For a common share outstanding throughout the period)
| INVESTMENT OPERATIONS: | LESS DISTRIBUTIONS: | RATIOS AND SUPPLEMENTAL DATA: | ||||||||||||
| Ratio of net | ||||||||||||||
| Net realized | From net | Ratio | investment | |||||||||||
| Net asset value, | and unrealized | Total from | From net | realized | Net asset | Total return | Net assets, | of expenses | income (loss) | |||||
| beginning | Net investment | gain (loss) on | investment | investment | gain on | Total | Redemption | value, end | at net asset | end of period | to average | to average | Portfolio | |
| Period ended | of period | income (loss) a | investments | operations | income | investments | distributions | fees b | of period | value (%) c | (in thousands) | net assets (%) d | net assets (%) | turnover (%) |
| Class A | ||||||||||||||
| May 31, 2010 ** | $13.47 | .10 | (.28) | (.18) | (.13) | — | (.13) | — | $13.16 | (1.40) * | $2,340,655 | .57 * | .76 * | 40.77 * |
| November 30, 2009 | 10.59 | .24 | 2.87 | 3.11 | (.23) | — | (.23) | — | 13.47 | 29.85 | 2,318,615 | 1.21 e | 2.09 e | 102.49 |
| November 30, 2008 | 16.27 | .30 | (5.69) | (5.39) | (.28) | (.01) | (.29) | — | 10.59 | (33.60) | 1,729,477 | 1.04 e | 2.09 e | 69.23 |
| November 30, 2007 | 17.35 | .30 | .55 | .85 | (.30) | (1.63) | (1.93) | — | 16.27 | 5.39 | 2,796,331 | .98 e | 1.64 e | 73.01 |
| November 30, 2006 | 16.71 | .31 f | 2.62 | 2.93 | (.26) | (2.03) | (2.29) | — | 17.35 | 17.73 | 2,732,861 | .95 e,f | 1.74 e,f | 76.99 |
| November 30, 2005 | 16.83 | .28 g | 1.23 | 1.51 | (.23) | (1.40) | (1.63) | — | 16.71 | 8.99 | 2,387,387 | .98 e | 1.58 e,g | 52.27 |
| Class B | ||||||||||||||
| May 31, 2010 ** | $13.34 | .05 | (.29) | (.24) | (.08) | — | (.08) | — | $13.02 | (1.86) * | $145,686 | .95 * | .37 * | 40.77 * |
| November 30, 2009 | 10.48 | .15 | 2.85 | 3.00 | (.14) | — | (.14) | — | 13.34 | 28.96 | 183,148 | 1.96 e | 1.35 e | 102.49 |
| November 30, 2008 | 16.09 | .19 | (5.63) | (5.44) | (.16) | (.01) | (.17) | — | 10.48 | (34.11) | 163,856 | 1.79 e | 1.30 e | 69.23 |
| November 30, 2007 | 17.18 | .16 | .54 | .70 | (.16) | (1.63) | (1.79) | — | 16.09 | 4.55 | 434,031 | 1.73 e | .88 e | 73.01 |
| November 30, 2006 | 16.56 | .17 f | 2.61 | 2.78 | (.13) | (2.03) | (2.16) | — | 17.18 | 16.86 | 598,199 | 1.70 e,f | .96 e,f | 76.99 |
| November 30, 2005 | 16.68 | .14 g | 1.24 | 1.38 | (.10) | (1.40) | (1.50) | — | 16.56 | 8.24 | 725,437 | 1.73 e | .83 e,g | 52.27 |
| Class C | ||||||||||||||
| May 31, 2010 ** | $13.38 | .05 | (.29) | (.24) | (.08) | — | (.08) | — | $13.06 | (1.83) * | $79,122 | .95 * | .39 * | 40.77 * |
| November 30, 2009 | 10.51 | .15 | 2.87 | 3.02 | (.15) | — | (.15) | — | 13.38 | 29.03 | 74,761 | 1.96 e | 1.34 e | 102.49 |
| November 30, 2008 | 16.15 | .19 | (5.66) | (5.47) | (.16) | (.01) | (.17) | — | 10.51 | (34.15) | 45,378 | 1.79 e | 1.32 e | 69.23 |
| November 30, 2007 | 17.24 | .16 | .55 | .71 | (.17) | (1.63) | (1.80) | — | 16.15 | 4.58 | 92,850 | 1.73 e | .88 e | 73.01 |
| November 30, 2006 | 16.61 | .17 f | 2.62 | 2.79 | (.13) | (2.03) | (2.16) | — | 17.24 | 16.90 | 96,929 | 1.70 e,f | .98 e,f | 76.99 |
| November 30, 2005 | 16.74 | .14 g | 1.23 | 1.37 | (.10) | (1.40) | (1.50) | — | 16.61 | 8.18 | 90,222 | 1.73 e | .83 e,g | 52.27 |
| Class M | ||||||||||||||
| May 31, 2010 ** | $13.35 | .07 | (.30) | (.23) | (.09) | — | (.09) | — | $13.03 | (1.73) * | $32,201 | .82 * | .51 * | 40.77 * |
| November 30, 2009 | 10.49 | .18 | 2.85 | 3.03 | (.17) | — | (.17) | — | 13.35 | 29.30 | 32,972 | 1.71 e | 1.59 e | 102.49 |
| November 30, 2008 | 16.12 | .22 | (5.64) | (5.42) | (.20) | (.01) | (.21) | — | 10.49 | (33.96) | 24,102 | 1.54 e | 1.57 e | 69.23 |
| November 30, 2007 | 17.21 | .21 | .54 | .75 | (.21) | (1.63) | (1.84) | — | 16.12 | 4.85 | 53,415 | 1.48 e | 1.14 e | 73.01 |
| November 30, 2006 | 16.59 | .21 f | 2.62 | 2.83 | (.18) | (2.03) | (2.21) | — | 17.21 | 17.15 | 56,203 | 1.45 e,f | 1.23 e,f | 76.99 |
| November 30, 2005 | 16.70 | .19 g | 1.23 | 1.42 | (.13) | (1.40) | (1.53) | — | 16.59 | 8.49 | 53,673 | 1.48 e | 1.11 e,g | 52.27 |
| Class R | ||||||||||||||
| May 31, 2010 ** | $13.41 | .09 | (.29) | (.20) | (.12) | — | (.12) | — | $13.09 | (1.57) * | $33,395 | .70 * | .66 * | 40.77 * |
| November 30, 2009 | 10.54 | .21 | 2.87 | 3.08 | (.21) | — | (.21) | — | 13.41 | 29.61 | 16,767 | 1.46 e | 1.84 e | 102.49 |
| November 30, 2008 | 16.20 | .27 | (5.67) | (5.40) | (.25) | (.01) | (.26) | — | 10.54 | (33.79) | 7,136 | 1.29 e | 1.89 e | 69.23 |
| November 30, 2007 | 17.29 | .25 | .56 | .81 | (.27) | (1.63) | (1.90) | — | 16.20 | 5.13 | 7,492 | 1.23 e | 1.39 e | 73.01 |
| November 30, 2006 | 16.67 | .27 f | 2.60 | 2.87 | (.22) | (2.03) | (2.25) | — | 17.29 | 17.38 | 3,734 | 1.20 e,f | 1.51 e,f | 76.99 |
| November 30, 2005 | 16.79 | .23 g | 1.24 | 1.47 | (.19) | (1.40) | (1.59) | — | 16.67 | 8.75 | 2,417 | 1.23 e | 1.33 e,g | 52.27 |
| Class Y | ||||||||||||||
| May 31, 2010 ** | $13.48 | .12 | (.30) | (.18) | (.14) | — | (.14) | — | $13.16 | (1.36) * | $402,286 | .45 * | .88 * | 40.77 * |
| November 30, 2009 | 10.59 | .27 | 2.88 | 3.15 | (.26) | — | (.26) | — | 13.48 | 30.28 | 364,522 | .96 e | 2.33 e | 102.49 |
| November 30, 2008 | 16.27 | .34 | (5.69) | (5.35) | (.32) | (.01) | (.33) | — | 10.59 | (33.43) | 170,229 | .79 e | 2.34 e | 69.23 |
| November 30, 2007 | 17.36 | .34 | .55 | .89 | (.35) | (1.63) | (1.98) | — | 16.27 | 5.58 | 326,482 | .73 e | 1.88 e | 73.01 |
| November 30, 2006 | 16.72 | .35 f | 2.63 | 2.98 | (.31) | (2.03) | (2.34) | — | 17.36 | 18.01 | 297,560 | .70 e,f | 1.97 e,f | 76.99 |
| November 30, 2005 | 16.83 | .32 g | 1.24 | 1.56 | (.27) | (1.40) | (1.67) | — | 16.72 | 9.31 | 311,701 | .73 e | 1.84 e,g | 52.27 |
See notes to financial highlights at the end of this section.
The accompanying notes are an integral part of these financial statements.
| 26 | 27 |
Financial highlights (Continued)
* Not annualized.
** Unaudited.
a Per share net investment income (loss) has been determined on the basis of the weighted average number of shares outstanding during the period.
b Amount represent less than $0.01 per share.
c Total return assumes dividend reinvestment and does not reflect the effect of sales charges.
d Includes amounts paid through expense offset and brokerage/service arrangements (Note 2).
e Reflects an involuntary contractual expense limitation in effect during the period. For periods prior to November 30, 2009, certain fund expenses were waived in connection with the fund’s investment in Putnam Prime Money Market Fund. As a result of such limitation and/or waivers, the expenses of each class reflect a reduction of the following amounts:
| Percentage of | |
| average net assets | |
| November 30, 2009 | 0.02% |
| November 30, 2008 | <0.01 |
| November 30, 2007 | <0.01 |
| November 30, 2006 | <0.01 |
| November 30, 2005 | <0.01 |
f Reflects a non-recurring accrual related to a reimbursement to the fund from Putnam Investments relating to the calculation of certain amounts paid by the fund to Putnam in previous years for transfer agent services, which amounted to less than $0.01 per share and 0.02% of average net assets for the period ended November 30, 2006.
g Reflects a non-recurring accrual related to Putnam Management’s settlement with the Securities and Exchange Commission (the SEC) regarding brokerage allocation practices. As a result, the expenses of each class reflect a reduction of the following amounts:
| Percentage of | ||
| Per share | average net assets | |
| Class A | <$0.01 | 0.01% |
| Class B | <0.01 | 0.01 |
| Class C | <0.01 | 0.01 |
| Class M | <0.01 | 0.01 |
| Class R | <0.01 | 0.01 |
| Class Y | <0.01 | 0.01 |
The accompanying notes are an integral part of these financial statements.
28
Notes to financial statements 5/31/10 (Unaudited)
Note 1: Significant accounting policies
Putnam Equity Income Fund (the fund), is a Massachusetts business trust, which is registered under the Investment Company Act of 1940, as amended, as a diversified, open-end management investment company. The objective of the fund is to seek current income by investing primarily in a diversified portfolio of income-producing equity securities. Capital growth is a secondary objective when consistent with seeking current income.
The fund offers class A, class B, class C, class M, class R and class Y shares. Class A and class M shares are sold with a maximum front-end sales charge of 5.75% and 3.50%, respectively, and generally do not pay a contingent deferred sales charge. Class B shares, which convert to class A shares after approximately eight years, do not pay a front-end sales charge and are subject to a contingent deferred sales charge, if those shares are redeemed within six years of purchase. Class C shares have a one-year 1.00% contingent deferred sales charge and do not convert to class A shares. Class R shares, which are offered to qualified employee-benefit plans, are sold at net asset value. The expenses for class A, class B, class C, class M and class R shares may differ based on the distribution fee of each class, which is identified in Note 2. Class Y shares, which are sold at net asset value, are generally subject to the same expenses as class A, class B, class C, class M and class R shares, but do not bear a distribution fee. Class Y shares are generally only available to corporate and institutional clients and clients in other approved programs.
A 1.00% redemption fee may apply on any shares that are redeemed (either by selling or exchanging into another fund) within 7 days of purchase. The redemption fee is accounted for as an addition to paid-in-capital.
Investment income, realized and unrealized gains and losses and expenses of the fund are borne pro-rata based on the relative net assets of each class to the total net assets of the fund, except that each class bears expenses unique to that class (including the distribution fees applicable to such classes). Each class votes as a class only with respect to its own distribution plan or other matters on which a class vote is required by law or determined by the Trustees. If the fund were liquidated, shares of each class would receive their pro-rata share of the net assets of the fund. In addition, the Trustees declare separate dividends on each class of shares.
In the normal course of business, the fund enters into contracts that may include agreements to indemnify another party under given circumstances. The fund’s maximum exposure under these arrangements is unknown as this would involve future claims that may be, but have not yet been, made against the fund. However, the fund’s management team expects the risk of material loss to be remote.
The following is a summary of significant accounting policies consistently followed by the fund in the preparation of its financial statements. The preparation of financial statements is in conformity with accounting principles generally accepted in the United States of America and requires management to make estimates and assumptions that affect the reported amounts of assets and liabilities in the financial statements and the reported amounts of increases and decreases in net assets from operations during the period from December 1, 2009 through May 31, 2010 (the reporting period). Actual results could differ from those estimates. Subsequent events after the Statement of assets and liabilities date through the date that the financial statements were issued have been evaluated in the preparation of the financial statements.
A) Security valuation Investments for which market quotations are readily available are valued at the last reported sales price on their principal exchange, or official closing price for certain markets and are classified as Level 1 securities. If no sales are reported — as in the case of some securities traded over-the-counter — a security is valued at its last reported bid price and is generally categorized as a Level 2 security.
Market quotations are not considered to be readily available for certain debt obligations; such investments are valued on the basis of valuations furnished by an independent pricing service approved by the Trustees or dealers selected by Putnam Investment Management, LLC (“Putnam Management”), the fund’s manager, an indirect wholly-owned subsidiary of Putnam Investments, LLC. Such services or dealers determine valuations for normal institutional-size trading units of such securities using methods based on market transactions for comparable securities and various relationships, generally recognized by institutional traders, between securities (which considers such factors as security prices, yields, maturities and ratings). These securities will generally be categorized as Level 2.
Many securities markets and exchanges outside the U.S. close prior to the close of the New York Stock Exchange and therefore the closing prices for securities in such markets or on such exchanges may not fully reflect events that occur after such close but before the close of the New York Stock Exchange. Accordingly, on certain days, the fund will fair value foreign equity securities taking into account multiple factors including movements in the U.S. securities
29
markets, currency valuations and comparisons to the valuation of American Depository Receipts, exchange-traded funds and futures contracts. These securities, which will generally represent a transfer from a Level 1 to a Level 2 security, will be classified as Level 2. The number of days on which fair value prices will be used will depend on market activity and it is possible that fair value prices will be used by the fund to a significant extent. At the close of the reporting period, fair value pricing was used for certain foreign securities in the portfolio. Securities quoted in foreign currencies, if any, are translated into U.S. dollars at the current exchange rate.
To the extent a pricing service or dealer is unable to value a security or provides a valuation that Putnam Management does not believe accurately reflects the security’s fair value, the security will be valued at fair value by Putnam Management. Certain investments, including certain restricted and illiquid securities and derivatives, are also valued at fair value following procedures approved by the Trustees. These valuations consider such factors as significant market or specific security events such as interest rate or credit quality changes, various relationships with other securities, discount rates, U.S. Treasury, U.S. swap and credit yields, index levels, convexity exposures and recovery rates. These securities are classified as Level 2 or as Level 3 depending on the priority of the significant inputs.
Such valuations and procedures are reviewed periodically by the Trustees. The fair value of securities is generally determined as the amount that the fund could reasonably expect to realize from an orderly disposition of such securities over a reasonable period of time. By its nature, a fair value price is a good faith estimate of the value of a security in a current sale and does not reflect an actual market price, which may be different by a material amount.
B) Joint trading account Pursuant to an exemptive order from the Securities and Exchange Commission (the SEC), the fund may transfer uninvested cash balances, including cash collateral received under security lending arrangements, into a joint trading account along with the cash of other registered investment companies and certain other accounts managed by Putnam Management. These balances may be invested in issues of short-term investments having maturities of up to 397 days for collateral received under security lending arrangements and up to 90 days for other cash investments.
C) Security transactions and related investment income Security transactions are recorded on the trade date (the date the order to buy or sell is executed). Gains or losses on securities sold are determined on the identified cost basis.
Interest income is recorded on the accrual basis. Dividend income, net of applicable withholding taxes, is recognized on the ex-dividend date except that certain dividends from foreign securities, if any, are recognized as soon as the fund is informed of the ex-dividend date. Non-cash dividends, if any, are recorded at the fair market value of the securities received. Dividends representing a return of capital or capital gains, if any, are reflected as a reduction of cost and/or as a realized gain. All premiums/discounts are amortized/accreted on a yield-to-maturity basis.
D) Foreign currency translation The accounting records of the fund are maintained in U.S. dollars. The market value of foreign securities, currency holdings, and other assets and liabilities is recorded in the books and records of the fund after translation to U.S. dollars based on the exchange rates on that day. The cost of each security is determined using historical exchange rates. Income and withholding taxes are translated at prevailing exchange rates when earned or incurred. The fund does not isolate that portion of realized or unrealized gains or losses resulting from changes in the foreign exchange rate on investments from fluctuations arising from changes in the market prices of the securities. Such gains and losses are included with the net realized and unrealized gain or loss on investments. Net realized gains and losses on foreign currency transactions represent net realized exchange gains or losse s on closed forward currency contracts, disposition of foreign currencies, currency gains and losses realized between the trade and settlement dates on securities transactions and the difference between the amount of investment income and foreign withholding taxes recorded on the fund’s books and the U.S. dollar equivalent amounts actually received or paid. Net unrealized appreciation and depreciation of assets and liabilities in foreign currencies arise from changes in the value of open forward currency contracts and assets and liabilities other than investments at the period end, resulting from changes in the exchange rate. Investments in foreign securities involve certain risks, including those related to economic instability, unfavorable political developments, and currency fluctuations, not present with domestic investments.
E) Securities lending The fund may lend securities, through its agents, to qualified borrowers in order to earn additional income. The loans are collateralized by cash and/or securities in an amount at least equal to the market value of the securities loaned. The market value of securities loaned is determined daily and any additional required collateral is allocated to the fund on the next business day. The risk of borrower default will be borne by the fund’s agents; the fund will bear the risk of loss with respect to the investment of the cash collateral. Income from securities lending is included in investment income on the Statement of operations. At the close of the reporting period, the value of securities loaned amounted to $367,427,453. The fund received cash collateral of $382,813,396 which is pooled with collateral of other Putnam funds into 24 issues of short-term investments.
30
F) Federal taxes It is the policy of the fund to distribute all of its taxable income within the prescribed time and otherwise comply with the provisions of the Internal Revenue Code of 1986, as amended (the Code), applicable to regulated investment companies. It is also the intention of the fund to distribute an amount sufficient to avoid imposition of any excise tax under Section 4982 of the Code. The fund is subject to the provisions of Accounting Standards Codification ASC 740 Income Taxes (ASC 740). ASC 740 sets forth a minimum threshold for financial statement recognition of the benefit of a tax position taken or expected to be taken in a tax return. The fund did not have any unrecognized tax benefits in the accompanying financial statements. No provision has been made for federal taxes on income, capital gains or unrealized a ppreciation on securities held nor for excise tax on income and capital gains. Each of the fund’s federal tax returns for the prior three fiscal years remains subject to examination by the Internal Revenue Service.
At November 30, 2009, the fund had a capital loss carryover of $1,094,226,150 available to the extent allowed by the Code to off set future net capital gain, if any. This amount includes $223,239,098 of capital loss carryover acquired in connection with the acquisition of Putnam New Value Fund, but does not include $17,609,609 of additional capital loss carryover acquired in connection with the acquisition, which the fund will be unable to use due to limitations imposed by the Code. The amounts of the combined carryovers and the expiration dates are:
| Loss Carryover | Expiration | |
| $320,635,065 | November 30, 2016 | |
| 773,591,085 | November 30, 2017 | |
Pursuant to federal income tax regulations applicable to regulated investment companies, the fund has elected to defer to its fiscal year ending November 30, 2010 $2,891,300 of losses recognized during the period November 1, 2008 to November 30, 2009 a portion of which could be subject to limitations imposed by the Code.
The aggregate identified cost on a tax basis is $3,137,688,660, resulting in gross unrealized appreciation and depreciation of $414,099,306 and $141,169,168, respectively, or net unrealized appreciation of $272,930,138.
G) Distributions to shareholders Distributions to shareholders from net investment income are recorded by the fund on the ex-dividend date. Distributions from capital gains, if any, are recorded on the ex-dividend date and paid at least annually. The amount and character of income and gains to be distributed are determined in accordance with income tax regulations, which may differ from generally accepted accounting principles. Dividend sources are estimated at the time of declaration. Actual results may vary. Any non-taxable return of capital cannot be determined until final tax calculations are completed after the end of the fund’s fiscal year. Reclassifications are made to the fund’s capital accounts to reflect income and gains available for distribution (or available capital loss carryovers) under income tax regulations.
Note 2: Management fee, administrative services and other transactions
Effective January 1, 2010, the fund pays Putnam Management a management fee (based on the fund’s average net assets and computed and paid monthly) at annual rates that may vary based on the average of the aggregate net assets of most open-end funds, as defined in the fund’s management contract, sponsored by Putnam Management. Such annual rates may vary as follows: 0.63% of the first $5 billion, 0.58% of the next $5 billion, 0.53% of the next $10 billion, 0.48% of the next $10 billion, 0.43% of the next $50 billion, 0.41% of the next $50 billion, 0.40% of the next $100 billion and 0.395% thereafter.
Prior to January 1, 2010, the fund paid Putnam Management for management and investment advisory services quarterly based on the average net assets of the fund. Such fee was based on the following annual rates: 0.65% of the first $500 million of average net assets, 0.55% of the next $500 million, 0.50% of the next $500 million, 0.45% of the next $5 billion, 0.425% of the next $5 billion, 0.405% of the next $5 billion, 0.39% of the next $5 billion and 0.38% thereafter.
Effective August 1, 2009 through June 30, 2011, Putnam Management has contractually agreed to reimburse the fund’s expenses to the extent necessary to limit the cumulative expenses of the fund, exclusive of brokerage, interest, taxes, investment-related expenses, extraordinary expenses and payments under the fund’s investor servicing contract, investment management contract and distribution plans, on a fiscal year-to-date basis (or from August 1, 2009 through the fund’s next fiscal year end, as applicable), to an annual rate of 0.20% of the fund’s average net assets over such fiscal year-to-date period (or since August 1, 2009, as applicable). During the reporting period, the fund’s expenses were not reduced as a result of this limit.
31
Effective March 30, 2010, Putnam Investments Limited (PIL), an affiliate of Putnam Management, is authorized by the Trustees to manage a separate portion of the assets of the fund as determined by Putnam Management from time to time. Putnam Management pays a quarterly sub-management fee to PIL for its services at an annual rate of 0.35% of the average net assets of the portion of the fund managed by PIL.
The fund reimburses Putnam Management an allocated amount for the compensation and related expenses of certain officers of the fund and their staff who provide administrative services to the fund. The aggregate amount of all such reimbursements is determined annually by the Trustees.
Custodial functions for the fund’s assets are provided by State Street Bank and Trust Company (State Street). Custody fees are based on the fund’s asset level, the number of its security holdings and transaction volumes.
Putnam Investor Services, Inc., an affiliate of Putnam Management, provided investor servicing agent functions to the fund. Putnam Investor Services, Inc. received fees for investor servicing, subject to certain limitations, based on the fund’s retail asset level, the number of shareholder accounts in the fund and the level of defined contribution plan assets in the fund. The amounts incurred for investor servicing agent functions during the reporting period are included in Investor servicing fees in the Statement of operations.
The fund has entered into expense offset arrangements with Putnam Investor Services, Inc. and State Street whereby Putnam Investor Services, Inc.’s and State Street’s fees are reduced by credits allowed on cash balances. The fund also reduced expenses through brokerage/service arrangements. For the reporting period, the fund’s expenses were reduced by $2,545 under the expense offset arrangements and by $248,959 under the brokerage/ service arrangements.
Each independent Trustee of the fund receives an annual Trustee fee, of which $2,303, as a quarterly retainer, has been allocated to the fund, and an additional fee for each Trustees meeting attended. Trustees receive additional fees for attendance at certain committee meetings and industry seminars and for certain compliance-related matters. Trustees also are reimbursed for expenses they incur relating to their services as Trustees.
The fund has adopted a Trustee Fee Deferral Plan (the Deferral Plan) which allows the Trustees to defer the receipt of all or a portion of Trustees fees payable on or after July 1, 1995. The deferred fees remain invested in certain Putnam funds until distribution in accordance with the Deferral Plan.
The fund has adopted an unfunded noncontributory defined benefit pension plan (the Pension Plan) covering all Trustees of the fund who have served as a Trustee for at least five years and were first elected prior to 2004. Benefits under the Pension Plan are equal to 50% of the Trustee’s average annual attendance and retainer fees for the three years ended December 31, 2005. The retirement benefit is payable during a Trustee’s lifetime, beginning the year following retirement, for the number of years of service through December 31, 2006. Pension expense for the fund is included in Trustee compensation and expenses in the Statement of operations. Accrued pension liability is included in Payable for Trustee compensation and expenses in the Statement of assets and liabilities. The Trustees have terminated the Pension Plan with respect to any Trustee first elected after 2003.
The fund has adopted distribution plans (the Plans) with respect to its class A, class B, class C, class M and class R shares pursuant to Rule 12b-1 under the Investment Company Act of 1940. The purpose of the Plans is to compensate Putnam Retail Management Limited Partnership, a wholly-owned subsidiary of Putnam Investments, LLC and Putnam Retail Management GP, Inc., for services provided and expenses incurred in distributing shares of the fund. The Plans provide for payments by the fund to Putnam Retail Management Limited Partnership at an annual rate of up to 0.35%, 1.00%, 1.00%, 1.00% and 1.00% of the average net assets attributable to class A, class B, class C, class M and class R shares, respectively. The Trustees have approved payment by the fund at an annual rate of 0.25%, 1.00%, 1.00%, 0.75% and 0.50% of the average net assets attributable to class A, class B, class C, class M and class R shares, respectively.
For the reporting period, Putnam Retail Management Limited Partnership, acting as underwriter, received net commissions of $160,741 and $2,146 from the sale of class A and class M shares, respectively, and received $69,500 and $2,195 in contingent deferred sales charges from redemptions of class B and class C shares, respectively.
A deferred sales charge of up to 1.00% and 0.65% is assessed on certain redemptions of class A and class M shares, respectively. For the reporting period, Putnam Retail Management Limited Partnership, acting as underwriter, received $2,000 and no monies on class A and class M redemptions, respectively.
32
Note 3: Purchases and sales of securities
During the reporting period, cost of purchases and proceeds from sales of investment securities other than short-term investments aggregated $1,364,802,053 and $1,254,946,488, respectively. There were no purchases or proceeds from sales of U.S. government securities.
Note 4: Capital shares
At the close of the reporting period, there was an unlimited number of shares of beneficial interest authorized. Transactions in capital shares were as follows:
| Six months ended 5/31/10 | Year ended 11/30/09 | |||
| Class A | Shares | Amount | Shares | Amount |
| Shares sold | 26,370,063 | $363,457,475 | 38,826,768 | $442,975,719 |
| Shares issued in connection with | ||||
| reinvestment of distributions | 1,504,126 | 20,893,861 | 3,269,498 | 36,354,913 |
| Shares issues in connection with the | ||||
| merger of Putnam New Value Fund | — | — | 34,782,491 | 363,108,361 |
| 27,874,189 | 384,351,336 | 76,878,757 | 842,438,993 | |
| Shares repurchased | (22,060,876) | (303,447,880) | (68,180,490) | (749,548,478) |
| Net increase | 5,813,313 | $80,903,456 | 8,698,267 | $92,890,515 |
| Six months ended 5/31/10 | Year ended 11/30/09 | |||
| Class B | Shares | Amount | Shares | Amount |
| Shares sold | 580,119 | $7,933,187 | 1,629,571 | $17,794,881 |
| Shares issued in connection with | ||||
| reinvestment of distributions | 66,997 | 919,676 | 196,051 | 2,118,773 |
| Shares issues in connection with the | ||||
| merger of Putnam New Value Fund | — | — | 6,045,798 | 62,554,665 |
| 647,116 | 8,852,863 | 7,871,420 | 82,468,319 | |
| Shares repurchased | (3,193,244) | (43,666,375) | (9,775,619) | (106,436,952) |
| Net decrease | (2,546,128) | $(34,813,512) | (1,904,199) | $(23,968,633) |
| Six months ended 5/31/10 | Year ended 11/30/09 | |||
| Class C | Shares | Amount | Shares | Amount |
| Shares sold | 1,025,218 | $14,050,565 | 1,377,191 | $16,307,812 |
| Shares issued in connection with | ||||
| reinvestment of distributions | 26,597 | 366,490 | 55,860 | 612,312 |
| Shares issues in connection with the | ||||
| merger of Putnam New Value Fund | — | — | 1,672,616 | 17,363,096 |
| 1,051,815 | 14,417,055 | 3,105,667 | 34,283,220 | |
| Shares repurchased | (581,863) | (7,958,804) | (1,833,293) | (19,859,613) |
| Net increase | 469,952 | $6,458,251 | 1,272,374 | $14,423,607 |
33
| Six months ended 5/31/10 | Year ended 11/30/09 | |||
| Class M | Shares | Amount | Shares | Amount |
| Shares sold | 224,273 | $3,022,335 | 212,471 | $2,337,969 |
| Shares issued in connection with | ||||
| reinvestment of distributions | 16,201 | 222,839 | 37,242 | 407,539 |
| Shares issues in connection with the | ||||
| merger of Putnam New Value Fund | — | — | 828,160 | 8,573,936 |
| 240,474 | 3,245,174 | 1,077,873 | 11,319,444 | |
| Shares repurchased | (239,935) | (3,288,324) | (905,677) | (9,744,180) |
| Net increase (decrease) | 539 | $(43,150) | 172,196 | $1,575,264 |
| Six months ended 5/31/10 | Year ended 11/30/09 | |||
| Class R | Shares | Amount | Shares | Amount |
| Shares sold | 1,487,419 | $20,507,032 | 772,678 | $9,046,119 |
| Shares issued in connection with | ||||
| reinvestment of distributions | 12,677 | 175,693 | 14,956 | 166,297 |
| Shares issues in connection with the | ||||
| merger of Putnam New Value Fund | — | — | 128,908 | 1,339,934 |
| 1,500,096 | 20,682,725 | 916,542 | 10,552,350 | |
| Shares repurchased | (199,019) | (2,707,667) | (343,141) | (3,893,527) |
| Net increase | 1,301,077 | $17,975,058 | 573,401 | $6,658,823 |
| Six months ended 5/31/10 | Year ended 11/30/09 | |||
| Class Y | Shares | Amount | Shares | Amount |
| Shares sold | 7,938,831 | $109,328,286 | 18,299,132 | $204,304,003 |
| Shares issued in connection with | ||||
| reinvestment of distributions | 284,686 | 3,957,234 | 538,882 | 6,013,109 |
| Shares issues in connection with the | ||||
| merger of Putnam New Value Fund | — | — | 964,280 | 10,064,285 |
| 8,223,517 | 113,285,520 | 19,802,294 | 220,381,397 | |
| Shares repurchased | (4,706,503) | (65,021,225) | (8,830,974) | (97,210,303) |
| Net increase | 3,517,014 | $48,264,295 | 10,971,320 | $123,171,094 |
Note 5: Summary of derivative activity
The following is a summary of the market values of derivative instruments as of the close of the reporting period:
| Asset derivatives | Liability derivatives | |||
| Derivatives not | ||||
| accounted for as | Statement of | Statement of | ||
| hedging instruments | assets and | assets and | ||
| under ASC 815 | liabilities location | Market value | liabilities location | Market value |
| Equity contracts | Investments | $12,945,227 | $— | |
| Total | $12,945,227 | $— | ||
34
The following is a summary of change in unrealized gains or losses of derivative instruments on the Statement of operations for the reporting period (see Note 1):
Change in unrealized appreciation or (depreciation) on derivatives recognized in net gain or
(loss) on investments
| Derivatives not accounted for as hedging instruments under | ||
| ASC 815 | Warrants | Total |
| Equity contracts | $824,640 | $824,640 |
| Total | $824,640 | $824,640 |
Note 6: Investment in Putnam Money Market Liquidity Fund
The fund invested in Putnam Money Market Liquidity Fund, an open-end management investment company managed by Putnam Management. Investments in Putnam Money Market Liquidity Fund are valued at its closing net asset value each business day. Income distributions earned by the fund are recorded as interest income in the Statement of operations and totaled $28,208 for the reporting period. During the reporting period, cost of purchases and proceeds of sales of investments in Putnam Money Market Liquidity Fund aggregated $312,731,367 and $308,569,899, respectively. Management fees charged to Putnam Money Market Liquidity Fund have been waived by Putnam Management.
Note 7: Regulatory matters and litigation
In late 2003 and 2004, Putnam Management settled charges brought by the SEC and the Massachusetts Securities Division in connection with excessive short-term trading in Putnam funds. Distribution of payments from Putnam Management to certain open-end Putnam funds and their shareholders is expected to be completed in the next several months. These allegations and related matters have served as the general basis for certain lawsuits, including purported class action lawsuits against Putnam Management and, in a limited number of cases, some Putnam funds. Putnam Management believes that these lawsuits will have no material adverse effect on the funds or on Putnam Management’s ability to provide investment management services. In addition, Putnam Management has agreed to bear any costs incurred by the Putnam funds as a result of these matters.
Note 8: Acquisition of Putnam New Value Fund
On December 29, 2008, the fund issued 34,782,491, 6,045,798, 1,672,616, 828,160, 128,908 and 964,280 class A, class B, class C, class M, class R and class Y shares, respectively, for 45,682,009, 7,885,529, 2,213,463, 1,073,983, 170,486 and 1,268,861 class A, class B, class C, class M, class R and class Y shares of Putnam New Value Fund to acquire that fund’s net assets in a tax-free exchange approved by the shareholders. The net assets of the fund and Putnam New Value Fund on December 26, 2008, were $2,101,542,138 and $463,004,277, respectively. On December 26, 2008, Putnam New Value Fund had distributions in excess of net investment income of $656,815, accumulated net realized loss of $478,809,618 and unrealized depreciation of $25,923,528. The aggregate net assets of the fund immediately following the acquisition were $2,564,546,415.
Information presented in the Statement of changes in net assets for the period ended May 31, 2010 reflect only the operations of Putnam Equity Income Fund.
Note 9: Market and credit risk
In the normal course of business, the fund trades financial instruments and enters into financial transactions where risk of potential loss exists due to changes in the market (market risk) or failure of the contracting party to the transaction to perform (credit risk). The fund may be exposed to additional credit risk that an institution or other entity with which the fund has unsettled or open transactions will default.
35
Services for shareholders
Investor services
Systematic investment plan Tell us how much you wish to invest regularly — weekly, semimonthly, or monthly — and the amount you choose will be transferred automatically from your checking or savings account. There’s no additional fee for this service, and you can suspend it at any time. This plan may be a great way to save for college expenses or to plan for your retirement.
Please note that regular investing does not guarantee a profit or protect against loss in a declining market. Before arranging a systematic investment plan, consider your financial ability to continue making purchases in periods when prices are low.
Systematic exchange You can make regular transfers from one Putnam fund to another Putnam fund. There are no additional fees for this service, and you can cancel or change your options at any time.
Dividends PLUS You can choose to have the dividend distributions from one of your Putnam funds automatically reinvested in another Putnam fund at no additional charge.
Free exchange privilege You can exchange money between Putnam funds free of charge, as long as they are the same class of shares. A signature guarantee is required if you are exchanging more than $500,000.
Reinstatement privilege If you’ve sold Putnam shares or received a check for a dividend or capital gain, you may reinvest the proceeds with Putnam within 90 days of the transaction and they will be reinvested at the fund’s current net asset value — with no sales charge. However, reinstatement of class B shares may have special tax consequences. Ask your financial or tax representative for details.
Check-writing service You have ready access to many Putnam accounts. It’s as simple as writing a check, and there are no special fees or service charges. For more information about the check-writing service, call Putnam or visit our Web site.
Dollar cost averaging When you’re investing for long-term goals, it’s time, not timing, that counts. Investing on a systematic basis is a better strategy than trying to figure out when the markets will go up or down. This means investing the same amount of money regularly over a long period. This method of investing is called dollar cost averaging. When a fund’s share price declines, your investment dollars buy more shares at lower prices. When it increases, they buy fewer shares. Over time, you will pay a lower average price per share.
For more information
Visit the Individual Investors section at putnam.com A secure section of our Web site contains complete information on your account, including balances and transactions, updated daily. You may also conduct transactions, such as exchanges, additional investments, and address changes. Log on today to get your password.
Call us toll free at 1-800-225-1581 Ask a helpful Putnam representative or your finan-cial advisor for details about any of these or other services, or see your prospectus.
36
Fund information
Founded over 70 years ago, Putnam Investments was built around the concept that a balance between risk and reward is the hallmark of a well-rounded financial program. We manage over 100 funds across income, value, blend, growth, asset allocation, absolute return, and global sector categories.
| Investment Manager | George Putnam, III | Francis J. McNamara, III |
| Putnam Investment | Robert L. Reynolds | Vice President and |
| Management, LLC | W. Thomas Stephens | Chief Legal Officer |
| One Post Office Square | Richard B. Worley | |
| Boston, MA 02109 | Robert R. Leveille | |
| Officers | Vice President and Chief | |
| Investment Sub-Manager | Robert L. Reynolds | Compliance Officer |
| Putnam Investments Limited | President | |
| 57–59 St James’s Street | Mark C. Trenchard | |
| London, England SW1A 1LD | Jonathan S. Horwitz | Vice President and |
| Executive Vice President, | BSA Compliance Officer | |
| Marketing Services | Principal Executive Officer, | |
| Putnam Retail Management | Treasurer and | Judith Cohen |
| One Post Office Square | Compliance Liaison | Vice President, Clerk and |
| Boston, MA 02109 | Assistant Treasurer | |
| Steven D. Krichmar | ||
| Custodian | Vice President and | Wanda M. McManus |
| State Street Bank | Principal Financial Officer | Vice President, Senior Associate |
| and Trust Company | Treasurer and Assistant Clerk | |
| Janet C. Smith | ||
| Legal Counsel | Vice President, Principal | Nancy E. Florek |
| Ropes & Gray LLP | Accounting Officer and | Vice President, Assistant Clerk, |
| Assistant Treasurer | Assistant Treasurer and | |
| Trustees | Proxy Manager | |
| John A. Hill, Chairman | Susan G. Malloy | |
| Jameson A. Baxter, | Vice President and | |
| Vice Chairman | Assistant Treasurer | |
| Ravi Akhoury | ||
| Barbara M. Baumann | Beth S. Mazor | |
| Charles B. Curtis | Vice President | |
| Robert J. Darretta | ||
| Myra R. Drucker | James P. Pappas | |
| Paul L. Joskow | Vice President | |
| Kenneth R. Leibler | ||
| Robert E. Patterson | ||
This report is for the information of shareholders of Putnam Equity Income Fund. It may also be used as sales literature when preceded or accompanied by the current prospectus, the most recent copy of Putnam’s Quarterly Performance Summary, and Putnam’s Quarterly Ranking Summary. For more recent performance, please visit putnam.com. Investors should carefully consider the investment objective, risks, charges, and expenses of a fund, which are described in its prospectus. For this and other information or to request a prospectus, or a summary prospectus if available, call 1-800-225-1581 toll free. Please read the prospectus carefully before investing. The fund’s Statement of Additional Information contains additional information about the fund’s Trustees and is available without charge upon request by calling 1-800-225-1581.
Item 2. Code of Ethics:
Not applicable
Item 3. Audit Committee Financial Expert:
Not applicable
Item 4. Principal Accountant Fees and Services:
Not applicable
Item 5. Audit Committee of Listed Registrants
Not applicable
Item 6. Schedule of Investments:
The registrant’s schedule of investments in unaffiliated issuers is included in the report to shareholders in Item 1 above.
Item 7. Disclosure of Proxy Voting Policies and Procedures For Closed-End Management Investment Companies:
Not applicable
Item 8. Portfolio Managers of Closed-End Investment Companies
Not Applicable
Item 9. Purchases of Equity Securities by Closed-End Management Investment Companies and Affiliated Purchasers:
Not applicable
Item 10. Submission of Matters to a Vote of Security Holders:
Not applicable
Item 11. Controls and Procedures:
(a) The registrant's principal executive officer and principal financial officer have concluded, based on their evaluation of the effectiveness of the design and operation of the registrant's disclosure controls and procedures as of a date within 90 days of the filing date of this report, that the design and operation of such procedures are generally effective to provide reasonable assurance that information required to be disclosed by the registrant in this report is recorded, processed, summarized and reported within the time periods specified in the Commission's rules and forms.
(b) Changes in internal control over financial reporting: Not applicable
Item 12. Exhibits:
(a)(1) Not applicable
(a)(2) Separate certifications for the principal executive officer and principal financial officer of the registrant as required by Rule 30a-2(a) under the Investment Company Act of 1940, as amended, are filed herewith.
(b) The certifications required by Rule 30a-2(b) under the Investment Company Act of 1940, as amended, are filed herewith.
Putnam Equity Income Fund
By (Signature and Title):
/s/Janet C. Smith
Janet C. Smith
Principal Accounting Officer
Date: July 29, 2010
Pursuant to the requirements of the Securities Exchange Act of 1934 and the Investment Company Act of 1940, this report has been signed below by the following persons on behalf of the registrant and in the capacities and on the dates indicated.
By (Signature and Title):
/s/Jonathan S. Horwitz
Jonathan S. Horwitz
Principal Executive Officer
Date: July 29, 2010
By (Signature and Title):
/s/Steven D. Krichmar
Steven D. Krichmar
Principal Financial Officer
Date: July 29, 2010