Exhibit 99.3
TEXTRON INC.
UPDATES TO ANNUAL REPORT ON FORM 10-K
(UPDATED BY THIS CURRENT REPORT ON FORM 8-K)
FOR THE FISCAL YEAR ENDED DECEMBER 29, 2007
Item 7. Management’s Discussion and Analysis of Financial Condition and Results of Operations
Business Overview
2007 was an exceptional year in many respects. We experienced strong sales and organic growth, particularly in our aerospace and defense businesses. Cessna set a new record with 773 jet orders, while demand for commercial helicopters remained strong with Bell recording 268 orders. Our aircraft and defense backlog increased to $18.8 billion, up 45% from a year ago.
We strategically acquired businesses to complement our core growth areas, the most significant of which was the acquisition of United Industrial Corporation (“UIC”). UIC, operating through its wholly owned subsidiary, AAI Corporation (“AAI”), is a leading provider of intelligent aerospace and defense systems, including unmanned aircraft and ground control stations, aircraft and satellite test equipment, training systems and countersniper devices. In addition to AAI, we acquired certain assets of CAV-Air LLC, a helicopter maintenance and service center; Columbia Aircraft Manufacturing Corporation, which produces high-performance, single engine aircraft; and Paladin Tools, a provider of tools and accessories for the telecommunications industry. We paid approximately $1.1 billion in cash for these four acquisitions.
We also made considerable investments in innovation, new product development and capacity expansion across our businesses, including the continued development of our commercial aircraft product offerings, with the Bell Model 429 and the Cessna CJ4.
In our Finance segment, we generated significant growth in our managed finance receivables, while portfolio quality statistics remained relatively stable.
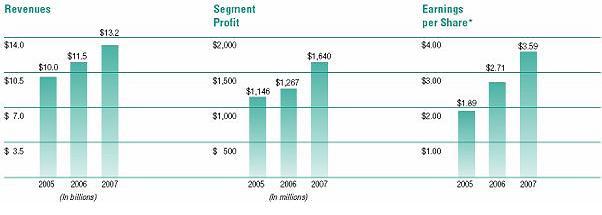
In July, our Board of Directors approved a two-for-one stock split of our common stock and increased our annual dividend by 19% to $0.92 per share. We have continued to repurchase our common stock, spending $295 million in 2007 to acquire approximately 6 million shares. With a 30% increase in income from continuing operations during 2007 and these share repurchases, our diluted earnings per share from continuing operations increased 32% to $3.59 per share.
* Diluted earnings per share are for continuing operations only.
Consolidated Results of Operations
Revenues
Revenues increased $1.7 billion, or 15%, to $13.2 billion in 2007, compared with 2006. The primary reasons for this increase are:
| | · Higher manufacturing volume of $1.0 billion, reflecting: |
-$631 million in higher volume at Cessna, primarily related to an increase in business jet deliveries;
-A $148 million increase in the Industrial segment, principally due to higher demand at Kautex;
-$142 million in higher volume at the Bell segment, largely related to the H-1 program; and
-$93 million in increased volume at the Defense & Intelligence segment from higher armored security vehicle (“ASV”)
deliveries;
| | · Higher pricing of $344 million, with $212 million at Cessna, $87 million in Bell’s commercial business and $46 million in the Industrial segment; |
| | · Additional revenues from newly acquired businesses of $166 million, primarily the acquisitions of Overwatch Systems and AAI in the Defense & Intelligence segment; |
| | · Favorable foreign exchange impact of $148 million in the Industrial segment; and |
| | · A $66 million impact from higher average finance receivables due to growth in the aviation and resort finance businesses in the Finance segment. |
In 2006, our revenues increased $1.5 billion, or 14%, compared with 2005, primarily due to higher manufacturing sales volume of $1.0 billion, higher pricing of $274 million and higher revenues in the Finance segment of $170 million.
Segment Profit
Segment profit increased $373 million, or 29%, to $1.6 billion in 2007, compared with 2006. This increase is primarily due to the following factors, which were partially offset by inflation of $256 million:
| | · Higher pricing of $344 million, with $212 million at Cessna, $87 million in Bell’s commercial business and $46 million in the Industrial segment; |
| | · Favorable cost performance of $164 million, which includes net charges in 2007 for the Armed Reconnaissance Helicopter (“ARH”) Low Rate Initial Production (“LRIP”) program of $50 million, the $32 million favorable impact of the recovery of ARH System Development and Demonstration (“SDD”) launch-related costs written off in 2006 and lower charges related to the H-1 LRIP program of $43 million; |
| | · A $148 million net benefit from higher volume, partially offset by unfavorable product mix; and |
| | · Profit from newly acquired businesses of $20 million. |
In 2006, our segment profit increased $121 million, or 11%, compared with 2005, primarily due to higher pricing of $274 million, higher sales volume of $198 million, improved cost performance of $54 million in the Industrial segment, favorable warranty performance at Cessna of $39 million and higher profit in the Finance segment of $39 million. These increases were partially offset by inflation of $272 million, higher spending for engineering and new product development of $74 million, higher overhead of $55 million in Bell’s commercial business and increased charges related to the H-1 LRIP program of $68 million.
Corporate Expenses and Other, net
Corporate expenses and other, net increased $51 million in 2007, compared with 2006, primarily due to the following:
| | · $26 million of higher compensation expenses, largely related to stock appreciation; |
| | · $14 million of higher professional and consulting fees, related to corporate initiatives; |
| | · $11 million of increased costs for divested operations, primarily due to higher pension costs and other retained liabilities; and |
| | · A $6 million increase in our contribution to the Textron Charitable Trust; |
| | · Partially offset by an $8 million gain on an insurance settlement. |
Corporate expenses and other, net increased $3 million in 2006, compared with 2005, principally due to $7 million of higher share-based compensation expense and $4 million of higher incentive compensation, partially offset by $8 million of lower expenses related to corporate initiatives.
Special Charges
There were no special charges in 2007 or 2006. In 2005, special charges totaled $118 million and included $112 million related to the 2001 disposition of the Automotive Trim (“Trim”) business and $6 million in restructuring expense in the Industrial segment.
In 2005, the $112 million in special charges that were incurred in connection with the disposition of Trim included $91 million in impairment charges to write down preferred stock acquired in the disposition and $21 million to cover exposures related to certain guarantees for leases, environmental and workers’ compensation matters.
Income Taxes
Our effective tax rate increased to 29.6% in 2007 from 27.6% in 2006. In comparison with the Federal statutory rate, in 2007 we had a 1.7% less favorable impact attributed to our foreign tax rate differential, a 1.2% favorable impact on the 2006 rate related to the adoption of the Canadian dollar as the functional currency for U.S. tax purposes of one of our Canadian subsidiaries, and a 1.3% less favorable impact from tax settlements in 2007, compared with settlements in 2006, partially offset by a 1.3% impact from lower state income taxes and a 1% benefit related to the manufacturing deduction. The effective tax rate decreased to 27.6% in 2006 from 30.2% in 2005, largely due to the impact of these items on the 2006 effective tax rate.
Discontinued Operations
Discontinued operations primarily reflect after-tax results of the Fastening Systems business, which was sold in 2006. Operating results of our discontinued businesses are summarized in Note 2 to the Consolidated Financial Statements.
In 2006, the loss from discontinued operations primarily includes a $120 million after-tax impairment charge for the Fastening Systems business based on the estimated fair value less cost to sell at the time according to offers received from potential purchasers. In 2005, the loss from discontinued operations includes a $335 million goodwill impairment charge related to the Fastening Systems business. In addition, we recorded an after-tax charge of approximately $52 million, which included $37 million related to previously deferred foreign currency translation losses and $7 million in curtailment losses for employee retirement plans. The gain on disposal, net of income taxes, of $46 million in 2005 primarily related to a tax benefit recorded upon the sale of InteSys.
Segment Analysis
Through fiscal 2007, we reported segment financial results within four segments: Bell, Cessna, Industrial and Finance. The Bell segment consisted of Bell Helicopter and the Textron Systems division. With recent acquisitions and organic growth, the Textron Systems division now provides a significant portion of our consolidated revenues. As Textron Systems and Bell Helicopter both continue to grow, these businesses require autonomy from each other and dedicated management focus. Effective at the beginning of fiscal 2008, we changed our segment reporting to separate Textron Systems into a new segment, Defense & Intelligence, and to report Bell Helicopter as its own segment, Bell. The Cessna, Industrial and Finance segments have not been changed. We now operate in, and will report financial information for, the following five business segments: Cessna, Bell, Defense & Intelligence, Industrial and Finance. These segments reflect the manner in which we now manage our operations. All periods presented herein have been restated to reflect the new segment reporting structure. Segment profit is an important measure used for evaluating performance and for decision-making purposes. Segment profit for the manufacturing segments excludes interest expense, certain corporate expenses and special charges. The measurement for the Finance segment includes interest income and expense and excludes special charges.

Each segment’s revenues and profit as a percentage of consolidated revenues and profit are provided below:
Cessna
| (Dollars in millions) | | 2007 | | | 2006 | | | 2005 | |
| Revenues | | $ | 5,000 | | | $ | 4,156 | | | $ | 3,480 | |
| Segment profit | | $ | 865 | | | $ | 645 | | | $ | 457 | |
| Profit margin | | | 17 | % | | | 16 | % | | | 13 | % |
| Backlog | | $ | 12,583 | | | $ | 8,467 | | | $ | 6,342 | |
Demand in the business jet market continued to strengthen in 2007, which was reflected in a 49% increase in our backlog, in addition to a 26% increase in business jet deliveries. Over the past three years, Cessna has increased its annual production rate and has continued to focus on improving margins while investing in engineering, research and development in Cessna’s continual effort to bring new technology and products to market. Citation business jets are the largest component of Cessna’s revenues. We delivered 387, 307 and 252 Citation business jets in 2007, 2006 and 2005, respectively.
Cessna Revenues
In 2007, Cessna’s revenues increased $844 million, compared with 2006, due to higher volume of $631 million, primarily due to higher Citation business jet deliveries, and improved pricing of $212 million. In 2006, revenues increased $676 million, compared with 2005, due to higher volume of $493 million, primarily related to Citation business jets, and improved pricing of $183 million.
Cessna Segment Profit
In 2007, Cessna’s segment profit increased $220 million, compared with 2006, primarily due to improved pricing, along with the $139 million impact of higher volume and favorable warranty performance of $14 million, partially offset by inflation of $106 million and increased engineering and product development expense of $41 million. Favorable warranty performance included the $19 million impact of lower estimated warranty costs for aircraft sold in 2007 related to initial model launches as discussed below, partially offset by a lower benefit of $5 million from other favorable warranty performance (a $28 million benefit in 2007, compared with $33 million in 2006).
Segment profit increased $188 million at Cessna in 2006, compared with 2005, primarily due to improved pricing, the $102 million impact of higher volume and favorable warranty performance of $39 million, partially offset by inflation of $112 million and higher engineering and product development costs of $41 million. Favorable warranty performance included the $24 million impact of lower estimated warranty costs for aircraft sold in 2006 related to initial model launches as discussed below, as well as a $15 million incremental benefit from other favorable warranty performance in 2006 (a $33 million benefit in 2006, compared with $18 million in 2005).
During initial model launches, Cessna typically incurs higher warranty-related costs until the production process matures, at which point warranty costs generally moderate. For the Sovereign and CJ3 production lines, in the second half of 2006 management estimated that the production lines had reached this maturity level based on historical production and warranty patterns, resulting in lower estimated warranty costs than earlier production aircraft. Accordingly, Cessna has had favorable warranty performance in the past two years due to the lower point-of-sale warranty costs for Sovereign and CJ3 aircraft sold. Management expects improved performance on these models to continue in the foreseeable future.
Bell
| (Dollars in millions) | | 2007 | | | 2006 | | | 2005 | |
| Revenues | | $ | 2,581 | | | $ | 2,347 | | | $ | 2,075 | |
| Segment profit | | $ | 144 | | | $ | 108 | | | $ | 269 | |
| Profit margin | | | 6 | % | | | 5 | % | | | 13 | % |
| Backlog | | $ | 3,809 | | | $ | 3,119 | | | $ | 2,812 | |
Bell is in the early stages of development or production for a number of government and commercial programs that are anticipated to significantly drive revenue and profit growth in future years. Government programs generally follow a three-phase cycle consisting of: development, transition to production and full-rate production. Each phase has specific risks and operational challenges. Over the next few years, the segment’s major government programs will be transitioning through various phases of this cycle. Bell’s U.S. Government programs include the V-22 tiltrotor, the H-1 and the ARH. Bell’s commercial business has invested in the commercial version of the tiltrotor aircraft and the new Model 429 during 2007; we expect to receive FAA certification of the Model 429 in the 2008-2009 time-frame.
In the past two years, we have made significant investments to conduct research and development, transition development contracts to production, increase our production capacity and implement improved operational systems to manage anticipated growth in Bell’s government programs and commercial product lines. The costs of investing in improved operational systems resulted in higher overhead expenses during 2006. Due to the shorter production cycle for our commercial business, the higher overhead costs in 2006 were reflected in lower earnings in that year; however, since our government business has a longer production cycle, a portion of these costs was also absorbed into work-in-progress inventory, particularly for the V-22. Accordingly, as V-22 aircraft were delivered in 2007, the overhead expenses reflected in inventory resulted in lower margins. While overhead expenses moderated in 2007, we expect higher overhead costs in the future largely due to costs incurred to support significant ramp-up to full-rate production of the
V-22 aircraft.
Bell Revenues
U.S. Government Business
Revenues increased $156 million in 2007 for the U.S. Government business, compared with 2006, primarily due to higher volume and mix of $152 million. H-1 program revenue was up $161 million, principally due to delivery of the first 10 production units, and V-22 program revenue was up $70 million, primarily due to higher spares revenues. These increases were partially offset by $74 million in lower spares and service sales for military helicopters other than the V-22.
In 2006, revenues increased $67 million, compared with 2005, primarily due to higher net volume and mix of $39 million and the benefit from acquisitions of $21 million. The volume increase is primarily due to higher ARH SDD development revenues of $94 million and increased spares and service sales of $37 million, partially offset by lower V-22 volume of $80 million and lower H-1 revenue of $18 million.
Commercial Business
In 2007, revenues for the commercial business increased $78 million, compared with 2006, primarily due to higher pricing of $87 million, partially offset by lower volume of $11 million. Volume decreased as higher helicopter deliveries of $50 million were more than offset by lower Huey II kit deliveries of $44 million and lower spares and service volume of $18 million.
In 2006, commercial revenues increased $205 million, compared with 2005, due to higher volume of $164 million and pricing of $41 million. The volume increase is primarily due to higher civil aircraft deliveries of $176 million, higher spares and service sales of $53 million and additional deliveries of Huey II kits of $10 million, partially offset by lower international military deliveries of $66 million.
Bell Segment Profit
U.S. Government Business
Segment profit in our U.S. Government business increased $6 million in 2007, compared with 2006, primarily due to improved cost performance. Bell’s cost performance was impacted by the following significant items:
Year-over-year Profit Improvements:
| · | $43 million in lower charges for the H-1 LRIP program, which are discussed in more detail below; and |
| · | $25 million in lower costs related to the ARH SDD contract due to a $14 million 2006 write-off of launch-related costs and the $11 million impact of the subsequent partial recovery of these costs. |
Year-over-year Profit Decreases:
| · | $50 million in ARH LRIP 2007 net charges as discussed below; and |
| · | $22 million in lower V-22 profitability largely due to a $15 million impact from lower margin units, which have been unfavorably impacted by higher overhead costs associated with increasing production capacity, and a $6 million award fee recognized in 2006. |
In 2006, profit in our U.S. Government business decreased $72 million, compared with 2005. The decrease was primarily due to unfavorable cost performance of $58 million and inflation of $21million. The unfavorable performance reflected higher anticipated costs for the H-1 LRIP contracts of $68 million and charges of $14 million related to the ARH SDD contract, partially offset by improved performance on spares and support services of $12 million.
H-1 Program — The H-1 program continues in development while we are concurrently working on the initial production aircraft under firm fixed-price LRIP contracts with the U.S. Government. In 2006, we recorded program charges of $82 million related to the LRIP contracts. Through the third quarter of 2006, we recorded $29 million in charges based on our estimate that the costs to complete would exceed contractual reimbursement during the transition to production phase. These charges primarily reflected the impact of higher estimated incremental costs for resources added to meet the contractual schedule requirements and higher anticipated efforts in final assembly. In the fourth quarter of 2006, acceptance of the initial aircraft by the U.S. Government was delayed, and no aircraft were delivered. This delay was a result of changes in the development and engineering requirements that were identified in the final stages of assembly and acceptance testing. Due to this delay and the costs associated with the additional development efforts, rework of in-process units and resulting inefficiencies, and a reduction in previously anticipated learning curve improvements, we increased our estimate of the completion costs and recorded an additional $53 million charge in the fourth quarter of 2006.
During 2007, the production process has continued to mature, and we have completed delivery of all the Lot 1 aircraft as well as the first Lot 2 aircraft. Our manufacturing performance during the year has been substantially consistent with our expectations.
Prospectively, our costs are anticipated to increase primarily due to anticipated delays in receiving cabins from a supplier. Additionally, during the fourth quarter, we committed to higher pricing levels on an anticipated Lot 5 contract that will likely result in a loss once contract negotiations are finalized, primarily due to higher cabin supplier costs. Accordingly, in the fourth quarter of 2007, we recorded a net charge of $30 million to reflect the higher cost estimates for existing contract completion resulting from supplier delays, as well as the estimated loss resulting from our price commitment on the Lot 5 contract.
ARH Program — The ARH SDD contract is a cost plus incentive fee contract under which our eligibility for fees is reduced as total contract costs increase. In 2006, we continued our development activities as costs exceeded the original contract amount for this program and expensed $14 million in unreimbursed costs related to this effort. In the third quarter of 2007, we reached an agreement with our customer under which we recovered $18 million of launch-related costs previously written off. The amount included $11 million that had been charged to our U.S. Government business and $7 million that had been charged to our Commercial business through overheads. In December 2007, we agreed to expand the scope of the development contract efforts on a funded basis.
In the fourth quarter of 2006, we completed certain phases of the critical design review under the ARH SDD contract and determined the initial production configuration of the aircraft, including aircraft configuration changes required by the U.S. Government. Our cost estimates based on this configuration, which included anticipated transition to production costs, exceeded the fixed pricing contained in two options the U.S. Government had under this program for the first two LRIP lots. The option for the first LRIP lot expired in 2006, while the option for the second lot (for 18-36 aircraft) was set to expire in December 2007. At that time, we were in discussions with the U.S. Government related to the possible reinstatement of the first option, extension of the second option, delivery schedule, number of units to be exercised under the options and possible additional aircraft to be contracted, in addition to those under the options, at revised pricing. At the end of 2006, due to the uncertainty of this exposure and the ultimate outcome of our discussions with the U.S. Government, we did not believe that a loss was probable under the guidelines established by Statement of Financial Accounting Standards (“SFAS”) No. 5, “Accounting for Contingencies.”
In March 2007, we received correspondence from the U.S. Government that created uncertainty about whether it would proceed into the production phase of the ARH program. Accordingly, we provided for losses of $18 million in supplier obligations for long-lead component production incurred at our own risk to support anticipated ARH LRIP contract awards.
In the second quarter of 2007, the U.S. Army agreed to re-plan the ARH program, and we reached a non-binding memorandum of understanding (“MOU”) related to aircraft specifications, pricing methodology and delivery schedules for initial LRIP aircraft. We also agreed to conduct additional SDD activities on a funded basis. Based on the plan at that time and our related estimates of aircraft production costs, including costs related to risks associated with achieving learning curve and schedule assumptions, we expected to lose approximately $73 million on the production of the proposed initial LRIP aircraft. Accordingly, an additional charge of $55 million was taken in the second quarter of 2007 for estimated LRIP contract losses.
In December 2007, the U.S. Government’s remaining option related to production of aircraft under the original ARH program expired unexercised. We are continuing to restructure the program through negotiations with the U.S. Government, including reducing the number of units and modifying the pricing and delivery schedules previously reached under the MOU. Based on the current status of these negotiations and our contractual commitments with our vendors related to materials for the anticipated production units we have procured at our risk, we have revised our best estimate of the expected loss to $50 million, resulting in a $23 million reduction of previously established reserves. We expect that the initial LRIP contract awards will be finalized in mid-2008. Until the contract negotiations are finalized, including pricing, aircraft specifications and delivery schedules, losses related to future contract awards or additional recovery of our vendor obligations are uncertain.
Commercial Business
In 2007, profit increased $30 million, compared with 2006, primarily due to higher pricing of $87 million and lower engineering, research and development expense of $16 million, partially offset by inflation of $41million and the net impact of an unfavorable product mix of $21 million. Lower overhead expense of $36 million, which included a $7 million recovery discussed above related to the ARH program, was offset by higher costs of $37 million as we streamlined our legacy commercial product line, resulting in certain vendor termination costs.
In 2006, commercial profit decreased $89 million, compared with 2005, primarily due to unfavorable cost performance of $148 million and inflation of $17 million, partially offset by the impact of increased volume and mix of $51 million and higher pricing of $41 million. The unfavorable cost performance reflected increased overhead costs of $55 million, the impact of the $30 million gain on the sale of our interest in the Model AB139 program in 2005, higher net research and development expense of $29 million, and the $13 million prior year impact of the resolution of uncertainties and receipt of cash related to a collaborative research and development agreement. Defense & Intelligence
| (Dollars in millions) | | 2007 | | | 2006 | | | 2005 | |
| Revenues | | $ | 1,334 | | | $ | 1,061 | | | $ | 806 | |
| Segment profit | | $ | 191 | | | $ | 141 | | | $ | 99 | |
| Profit margin | | | 14 | % | | | 13 | % | | | 12 | % |
| Backlog | | $ | 2,379 | | | $ | 1,335 | | | $ | 1,169 | |
During 2007, the Defense & Intelligence segment successfully integrated its fourth quarter 2006 acquisition, Overwatch Systems, a developer and provider of intelligence analysis software tools for the defense industry, into its business and completed the acquisition of AAI. As a leading provider of intelligent aerospace and defense systems, including unmanned aircraft and ground control stations, aircraft and satellite test equipment, training systems and countersniper devices, AAI significantly augments our product offering to the U.S. Government. Major programs for the Defense & Intelligence segment include the ASV, unmanned aircraft systems, Intelligent Battlefield Systems (“IBS”), Sensor Fused Weapons (“SFW”) and Joint Direct Attack Munitions (JDAM”).
Defense & Intelligence Revenues
Revenues increased $273 million in 2007 compared with 2006, primarily due to newly acquired businesses, which contributed $163 million, higher volume of $93 million and $21 million in higher reimbursement of costs related to Hurricane Katrina. The volume increase is primarily due to $78 million in higher ASV revenue due to a 21% increase in deliveries to 576 units, $56 million in higher revenue for IBS and a $16 million increase from SFW deliveries. These increases were partially offset by lower JDAM volume of $63 million.
In 2006, revenues increased $255 million, compared with 2005, primarily due to higher net volume of $245 million. The volume increase is primarily due to higher ASV deliveries of $286 million and additional IBS volume of $22 million, partially offset by lower armored personnel carrier deliveries to an international military customer of $50 million.
Defense & Intelligence Segment Profit
Segment profit increased $50 million in 2007, compared with 2006, primarily due to improved cost performance of $61 million and $22 million in profit contributions from acquisitions, partially offset by the net unfavorable impact from inflation and pricing of $23 million. The favorable cost performance includes $21 million of ASV improvements resulting from increased productivity and lower indirect costs, and the favorable impact from a Hurricane Katrina cost reimbursement of $21 million.
In 2006, profit increased $42 million, compared with 2005, primarily due to the impact of higher net volume of $29 million and favorable cost performance of $42 million, partially offset by inflation of $22 million. The favorable cost performance includes a $23 million reimbursement of costs related to Hurricane Katrina and an $18 million non-recurring charge recorded by Lycoming in 2005 for a crankshaft retirement program and related service bulletins.
Industrial
| (Dollars in millions) | | 2007 | | | 2006 | | | 2005 | |
| Revenues | | $ | 3,435 | | | $ | 3,128 | | | $ | 3,054 | |
| Segment profit | | $ | 218 | | | $ | 163 | | | $ | 150 | |
| Profit | | | 6 | % | | | 5 | % | | | 5 | % |
The Industrial segment includes the businesses of Kautex, Fluid & Power, Greenlee, E-Z-GO and Jacobsen. During 2007, we experienced positive organic revenue growth, largely due to double-digit increases at Fluid & Power and Greenlee, including record sales at Fluid & Power. In the fourth quarter, Greenlee expanded its product offerings through its acquisition of Paladin Tools, and
E-Z-GO introduced its new energy-efficient RXV golf car.
Industrial Revenues
Revenues in the Industrial segment increased $307 million in 2007, compared with 2006, primarily due to higher volume of $148 million, favorable foreign exchange impact of $148 million and higher pricing of $46 million, partially offset by the 2006 divestiture of non-core product lines of $37 million.
Revenues in the Industrial segment increased $74 million in 2006, compared with 2005, primarily due to higher volume of $89 million, higher pricing of $46 million and a favorable foreign exchange impact of $10 million, partially offset by the divestiture of non-core product lines of $72 million. Industrial Segment Profit
Segment profit in the Industrial segment increased $55 million in 2007, compared with 2006, mainly due to improved cost performance of $60 million, higher pricing of $46 million, the $20 million impact of higher volume and mix, and a $15 million gain on the sale of land, partially offset by inflation of $83 million. Improved cost performance was primarily attributable to cost reduction efforts at Kautex, while inflation largely reflects increases in material costs.
Segment profit in the Industrial segment increased $13 million in 2006, compared with 2005, mainly due to $54 million of improved cost performance, higher pricing of $46 million and the $24 million impact of higher net volume and mix, partially offset by $100 million of inflation and a $7 million impact from divestitures of non-core product lines.
Finance
| (Dollars in millions) | | 2007 | | | 2006 | | | 2005 | |
| Revenues | | $ | 875 | | | $ | 798 | | | $ | 628 | |
| Segment profit | | $ | 222 | | | $ | 210 | | | $ | 171 | |
| Profit | | | 25 | % | | | 26 | % | | | 27 | % |
During 2007, our Finance segment’s managed finance receivables grew by 9% to $11 billion, while our portfolio quality statistics remained relatively stable. As a percentage of finance receivables, our 60+ day delinquency decreased to 0.43% at the end of 2007 from 0.77% at the end of 2006, while nonperforming assets as a percentage of finance assets increased to 1.34% from 1.28%, respectively. Managed finance receivables include finance receivables that are owned and reported on our balance sheet, along with securitized or sold finance receivables for which risks of ownership are retained to the extent of our subordinated interests. In 2008, we expect continued growth in our managed finance receivables at a moderate pace and continued stability in our portfolio quality statistics.
The disruption in the credit market during the second half of 2007 had minimal impact on our Finance segment’s ability to access the capital markets to refinance its maturing debt obligations and to fund growth in the finance receivable portfolio. However, this disruption in the credit markets did result in an increase in our borrowing costs. The increase in the spread between the London Interbank Offered Rate (“LIBOR”), the primary index against which our variable-rate debt is priced, and the Federal Funds rate had an $11 million negative impact on borrowing spreads. This negative impact was almost completely mitigated by the issuances of new lower cost debt.
Finance Revenues
Revenues in the Finance segment increased $77 million in 2007, compared with 2006. Our revenue growth is primarily attributed to the following factors:
| | · Higher average finance receivables of $722 million, primarily due to growth in the aviation and resort finance businesses, which resulted in additional revenues of $66 million; |
| | · $21 million gain on the sale of a leveraged lease investment; and |
| | · $20 million increase in securitization income, primarily related to a $588 million increase in the level of receivables sold into the distribution finance revolving securitization. |
These increases were partially offset by the following decreases:
| | · $17 million decrease in portfolio yields related to competitive pricing pressures; |
| | · $13 million in lower leveraged lease earnings due to an unfavorable cumulative earnings adjustment attributable to the recognition of residual value impairments; and |
| | · $8 million reduction in leveraged lease earnings from the adoption of a new accounting standard. |
Revenues in the Finance segment increased $170 million in 2006, compared with 2005. The increase was primarily due to a $103 million increase related to higher average finance receivables and a $90 million increase from the higher interest rate environment, partially offset by an $18 million decrease in other income, largely due to lower fees and securitization income. Average finance receivables increased $1.3 billion from levels in the corresponding period in 2005, primarily due to growth in the distribution, golf and aviation finance businesses. Finance Segment Profit
Segment profit in the Finance segment increased $12 million in 2007, compared with 2006, primarily due to a $30 million increase in net interest margin, partially offset by an $11 million increase in selling and administrative expenses, largely attributable to finance receivable portfolio growth and a $7 million increase in provision for loan losses, reflecting an increase in nonperforming assets and net charge-offs in the distribution finance portfolio. Net interest margin increased due to a number of factors, including the following:
| | · An increase of $56 million in securitization and other fee income as described above, and |
| | · An increase of $30 million related to growth in average finance receivables; |
| | · Partially offset by a $17 million decrease in portfolio yields related to competitive pricing pressures; |
| | · Lower leveraged lease earnings of $13 million due to an unfavorable cumulative earnings
adjustment attributable to the recognition of residual value impairments; |
| | · Higher borrowing costs of $11 million relative to the Federal Funds rate; |
| | · A reduction in leveraged lease earnings of $8 million from the adoption of a new accounting standard; and |
| | · Lower leveraged lease earnings of $7 million due to a gain in 2006 on the sale of an option related to a leveraged lease asset. |
Segment profit in the Finance segment increased $39 million in 2006, compared with 2005, due to an increase in net interest margin. The growth in average finance receivables generated $54 million of higher net margin, which was partially offset by an $18 million decrease in other income.
Finance Portfolio Quality
The following table presents information about the Finance segment’s portfolio quality:
| (In millions, except for ratios) | | 2007 | | | 2006 | | | 2005 | |
| Finance receivables | | $ | 8,603 | | | $ | 8,310 | | | $ | 6,763 | |
| Allowance for losses on finance receivables | | $ | 89 | | | $ | 93 | | | $ | 96 | |
| Nonperforming assets | | $ | 123 | | | $ | 113 | | | $ | 111 | |
| Provision for loan losses | | $ | 33 | | | $ | 26 | | | $ | 29 | |
| Net charge-offs | | $ | 37 | | | $ | 29 | | | $ | 32 | |
| Ratio of nonperforming assets to total finance assets | | | 1.34 | % | | | 1.28 | % | | | 1.53 | % |
| Ratio of allowance for losses on receivables to nonaccrual finance receivables | | | 111.7 | % | | | 123.1 | % | | | 108 | % |
| 60+ days contractual delinquency as a percentage of finance receivables | | | 0.43 | % | | | 0.77 | % | | | 0.79 | % |
The Finance segment’s portfolio quality continues to be strong as indicated by low rates of delinquency and nonperforming assets. Net charge-offs as a percentage of average finance receivables also remain stable and relatively low at 0.45% during 2007 as compared with 0.38% and 0.51% during 2006 and 2005, respectively.
Nonperforming assets by business, and as a percentage of the owned finance assets for each business, are as follows:
| (Dollars in millions) | | 2007 | | | 2006 | | | 2005 | |
| Asset-based lending | | $ | 23 | | | | 2.31 | % | | $ | 16 | | | | 1.81 | % | | $ | 6 | | | | 0.81 | % |
| Distribution finance | | | 23 | | | | 1.20 | % | | | 7 | | | | 0.28 | % | | | 2 | | | | 0.11 | % |
| Golf finance | | | 21 | | | | 1.24 | % | | | 29 | | | | 1.89 | % | | | 13 | | | | 0.99 | % |
| Aviation finance | | | 20 | | | | 0.89 | % | | | 12 | | | | 0.70 | % | | | 14 | | | | 1.07 | % |
| Resort finance | | | 9 | | | | 0.57 | % | | | 16 | | | | 1.22 | % | | | 31 | | | | 2.67 | % |
| Liquidating portfolios | | | 27 | | | | 24.73 | % | | | 33 | | | | 19.74 | % | | | 45 | | | | 13.64 | % |
| Total nonperforming assets | | $ | 123 | | | | 1.34 | % | | $ | 113 | | | | 1.28 | % | | $ | 111 | | | | 1.53 | % |
Nonperforming assets include nonaccrual finance receivables and repossessed assets that are not guaranteed by our Manufacturing group. We believe that nonperforming assets generally will be in the range of 1% to 4% of finance assets, depending on economic conditions.
In 2007, the increases in nonperforming assets as a percentage of owned finance assets for asset-based lending and distribution finance, compared with 2006, relate to weakening U.S. economic conditions, which began to have a negative impact on borrowers in certain industries.
In 2006, the $16 million increase in golf finance was primarily the result of two delinquent golf course mortgage loans whose operations were affected by the prolonged effects of Hurricane Katrina, while the $10 million increase in asset-based lending is the result of two loans in unrelated industries. Liquidity and Capital Resources
Our financings are conducted through two separate borrowing groups. The Manufacturing group consists of Textron Inc., consolidated with the entities that operate in the Cessna, Bell, Defense & Intelligence and Industrial segments, while the Finance group consists of the Finance segment, comprised of Textron Financial Corporation and its subsidiaries. We designed this framework to enhance our borrowing power by separating the Finance group. Our Manufacturing group operations include the development, production and delivery of tangible goods and services, while our Finance group provides financial services. Due to the fundamental differences between each borrowing group’s activities, investors, rating agencies and analysts use different measures to evaluate each group’s performance. To support those evaluations, we present balance sheet and cash flow information for each borrowing group within the Consolidated Financial Statements.
We assess liquidity for our Manufacturing group in terms of our ability to provide adequate cash to fund our operating, investing and financing activities. Our principal source of liquidity is operating cash flows. We also have liquidity available to us via committed bank lines of credit and the commercial paper market, as well as access to the public capital markets that provide us with long-term capital at satisfactory terms.
For 2008, we expect future significant uses of cash for our Manufacturing group to include investments in businesses and new product development, capital expenditures, repurchases of common stock, dividends to shareholders and debt retirement. For 2008, we expect capital expenditures of about $550 million and stock repurchases in the range of 3 million to 4 million shares. We expect to fund both of these future uses of cash with cash generated by operating activities.
Our Finance group mitigates liquidity risk (i.e., the risk that we will be unable to fund maturing liabilities or the origination of new finance receivables) by developing and preserving reliable sources of capital. We use a variety of financial resources to meet these capital needs. Cash for the Finance group is provided from finance receivable collections, sales and securitizations, as well as the issuance of commercial paper and term debt in the public and private markets. This diversity of capital resources enhances its funding flexibility, limits dependence on any one source of funds, and results in cost-effective funding. The Finance group also can borrow from the Manufacturing group when the availability of such borrowings creates an economic advantage to Textron in comparison with borrowings from other sources. In making particular funding decisions, management considers market conditions, prevailing interest rates and credit spreads, and the maturity profile of its assets and liabilities.
On July 18, 2007, our Board of Directors approved a two-for-one split of our common stock to be effected in the form of a 100% stock dividend. The additional shares resulting from the stock split were distributed on August 24, 2007 to shareholders of record on August 3, 2007. Also, on July 18, 2007, our Board of Directors approved a 19% increase in our annualized common stock dividend rate from $0.775 per share to $0.92 per share and authorized the repurchase of up to 24 million shares of our common stock. The rate at which we expect to repurchase shares under this authorization will depend on various factors, including prevailing share price and alternate uses of cash.
Manufacturing Group Cash Flows of Continuing Operations
| (In millions) | | 2007 | | 2006 | | 2005 | |
| Operating activities | | $ | 1,186 | | $ | 1,119 | | $ | 894 | |
| Investing activities | | (1,474 | ) | (742 | ) | (362 | ) |
| Financing activities | | (77 | ) | (1,072 | ) | (403 | ) |
Operating cash flows have increased over the past three years, primarily due to earnings growth. Changes in our working capital components resulted in a $50 million use of cash in 2007, a $206 million source of cash in 2006 and a $21 million use of cash in 2005. A significant use of operating cash is related to increased production and inventory build-up primarily to support increasing sales at Bell and Cessna. Cash used for inventories totaled $473 million, $379 million and $181 million in 2007, 2006 and 2005, respectively. Partially offsetting the use of cash for inventories, and also related to increasing sales, were customer deposits within accrued liabilities, which provided a significant source of operating cash. Net cash received from customers on deposit totaled $297 million, $141 million and $(28) million in 2007, 2006 and 2005, respectively.
Investing cash flows have largely been driven by cash outflows for acquisitions that totaled $1.1 billion in 2007, largely due to the acquisition of AAI, and $338 million in 2006, primarily due to Overwatch Systems. Other significant investing cash outflows include capital expenditures of $391 million in 2007, $419 million in 2006 and $356 million in 2005.
We used $995 million less cash for financing activities in 2007, compared with 2006. The decrease is due principally to the issuance of $350 million in 10-year notes in 2007, the paydown of $242 million of short-term debt in 2006 and a $457 million decrease in 2007 in purchases of our common stock from 2006. In 2007, 2006 and 2005, we repurchased approximately 6 million, 17 million and 16 million shares of common stock, respectively, under Board-authorized share repurchase programs.
Dividend payments to shareholders totaled $154 million, $244 million and $189 million in 2007, 2006 and 2005, respectively. The
timing of our quarterly dividend payments resulted in three payments in 2007, five payments in 2006 and four payments in 2005.
Finance Group Cash Flows of Continuing Operations
| (In millions) | | 2007 | | 2006 | | 2005 | |
| Operating activities | | $ | 262 | | $ | 338 | | $ | 247 | |
| Investing activities | | (281 | ) | (1,680 | ) | (950 | ) |
| Financing activities | | 29 | | 1,391 | | 587 | |
Cash used for investing activities decreased in 2007, compared with 2006, largely due to a $774 million decrease in finance receivable originations, net of collections, a $481 million increase in proceeds from receivable sales and securitizations, and the $164 million impact in 2006 of cash used for an acquisition. Proceeds from receivable sales increased primarily due to the sale of $588 million of receivables into the distribution finance revolving securitization in the first quarter of 2007. In 2006, more cash was used for investing activities resulting in higher net cash outflows for originations of $655 million, primarily due to increased growth in the finance receivable portfolio, partially offset by higher proceeds from receivable sales of $130 million.
The decrease in financing cash inflows in 2007 primarily reflects a reduction in borrowings due to lower managed receivable growth in comparison with 2006. In addition, during 2007, we used the proceeds from the sale of receivables, including securitizations to fund asset growth, instead of additional borrowings. In 2006, more cash was obtained from financing activities, principally due to an increase in debt outstanding to fund asset growth.
Consolidated Cash Flows of Continuing Operations
| (In millions) | | 2007 | | 2006 | | 2005 | |
| Operating activities | | $ | 1,027 | | $ | 1,017 | | $ | 952 | |
| Investing activities | | (1,469 | ) | (2,062 | ) | (1,223 | ) |
| Financing activities | | 87 | | 399 | | 284 | |
Operating cash flows have increased over the past three years, primarily due to earnings growth. Other sources and uses of cash from operating activities are primarily related to our Manufacturing group and are discussed in more detail within the “Manufacturing Group Cash Flows of Continuing Operations” section above.
Cash used for investing activities decreased in 2007, compared with 2006, largely due to a $786 million decrease in finance receivable originations, net of collections (excluding $12 million from captive financing activities) and a $424 million increase in proceeds from receivable sales and securitizations collections (excluding $57 million from captive financing activities). These decreases were partially offset by $590 million in higher cash outflows for acquisitions. In 2007, we acquired four businesses, including AAI, for a total outflow of $1.1 billion, while in 2006, we acquired three businesses for $502 million, including the Overwatch Systems and Electrolux Financial Corporation acquisitions.
We received less cash from financing activities in 2007, primarily due to a reduction in borrowings, largely a result of lower managed receivable growth in comparison with 2006. In addition, during 2007, we used the proceeds from the sale of receivables, including securitizations to fund asset growth, instead of additional borrowings. The decrease in cash borrowed by the Finance group in 2007 from 2006 was partially offset by proceeds from the issuance of $350 million in 10-year notes by the Manufacturing group in 2007, a $457 million decrease in the purchases of our common stock and $90 million in lower dividend payments due to timing.
Captive Financing
Through our Finance group, we provide diversified commercial financing to third parties. In addition, this group finances retail purchases and leases for new and used aircraft and equipment manufactured by our Manufacturing group, otherwise known as captive financing. In the Consolidated Statements of Cash Flows, cash received from customers or from securitizations is reflected as operating activities when received from third parties. However, in the cash flow information provided for the separate borrowing groups, cash flows related to captive financing activities are reflected based on the operations of each group. For example, when product is sold by our Manufacturing group to a customer and is financed by the Finance group, the origination of the finance receivable is recorded within investing activities as a cash outflow in the Finance group’s Statement of Cash Flows. Meanwhile, in the Manufacturing group’s Statement of Cash Flows, the cash received from the Finance group on the customer’s behalf is recorded within operating cash flows as a cash inflow. Although cash is transferred between the two borrowing groups, there is no cash transaction reported in the consolidated cash flows at the time of the original financing. These captive financing activities, along with all significant intercompany transactions, are reclassified or eliminated from the Consolidated Statements of Cash Flows. Reclassification and elimination adjustments included in the Consolidated Statement of Cash Flows are summarized below:
| (In millions) | | 2007 | | 2006 | | 2005 | |
| Reclassifications from investing activities: | | | | | | | |
| Finance receivable originations for Manufacturing group inventory sales | | $ | (1,160 | ) | $ | (1,015 | ) | $ | (824 | ) |
| Cash received from customers, sale of receivables and securitizations | | 881 | | 691 | | 724 | |
| Other | | (7 | ) | (36 | ) | 11 | |
| Total reclassifications from investing activities | | (286 | ) | (360 | ) | (89 | ) |
| Dividends paid by Finance group to Manufacturing group | | (135 | ) | (80 | ) | (100 | ) |
| Total reclassifications and adjustments | | $ | (421 | ) | $ | (440 | ) | $ | (189 | ) |
Consolidated Discontinued Operations Cash Flows
| (In millions) | | 2007 | | 2006 | | 2005 | |
| Operating activities | | $ | 22 | | $ | (48 | ) | $ | 84 | |
| Investing activities | | 63 | | 653 | | 28 | |
| Financing activities | | — | | 2 | | (1 | ) |
Discontinued operations cash flows in 2007 are primarily related to the realization of cash tax benefits. In 2006, cash inflows from investing activities are primarily due to net cash proceeds of $636 million for the sale of the Fastening Systems business. See Note 2 to the Consolidated Financial Statements for details concerning this sale.
Capital Resources
The debt (net of cash)-to-capital ratio for our Manufacturing group as of December 29, 2007 was 32%, compared with 29% at December 30, 2006, and the gross debt-to-capital ratio as of December 29, 2007 was 38%, compared with 40% at December 30, 2006.
Our Manufacturing group targets a gross debt-to-capital ratio that is consistent with an A rated company. Consistent with the methodology used by members of the financial community, leverage of the Manufacturing group excludes the debt of our Finance group. In turn, our Finance group limits its borrowings to an amount, taking into account the risk profile of its assets, consistent with a single A credit rating. Surplus capital of Textron Financial Corporation is returned to Textron Inc.
Borrowings historically have been a secondary source of funds for our Manufacturing group and, along with the collection of finance receivables, are a primary source of funds for our Finance group. Both borrowing groups utilize a broad base of financial sources for their respective liquidity and capital needs. Our credit ratings are predominantly a function of our ability to generate operating cash flows and satisfy certain financial ratios. Since high-quality credit ratings provide us with access to a broad base of global investors at an attractive cost, we target a long-term A rating from the independent debt-rating agencies. The credit ratings and outlooks of these three debt-rating agencies by borrowing group are as follows:
| | | Fitch | | Moody’s | | Standard & Poor’s | |
| Long-term ratings: | | | | | | | |
| Manufacturing | | A- | | A3 | | A- | |
| Finance | | A- | | A3 | | A- | |
| Short-term ratings: | | | | | | | |
| Manufacturing | | F2 | | P2 | | A2 | |
| Finance | | F2 | | P2 | | A2 | |
| Outlook | | Positive | | Stable | | Stable | |
Under separate shelf registration statements filed with the Securities and Exchange Commission, we may issue public debt and other securities in one or more offerings up to a total maximum offering of $2.0 billion, and the Finance group may issue an unlimited amount of public debt securities. In the fourth quarter of 2007, we issued $350 million in 10-year notes under our registration statement. At December 29, 2007, we had $1.2 billion available under our registration statement. During 2007, the Finance group issued $1.4 billion of term debt and CAD 220 million of term debt under its registration statement. In addition, the Finance group issued $300 million of 6% Fixed-to-Floating Rate Junior Subordinated Notes, which mature in 2067. The Finance group has the right to redeem the notes at par beginning in 2017 and is obligated to redeem the notes beginning in 2042. We have a policy of maintaining unused committed bank lines of credit in an amount not less than outstanding commercial paper balances. These facilities are in support of commercial paper and letters of credit issuances only, and neither of these lines of credit was drawn at December 29, 2007 or December 30, 2006.
Our primary committed credit facilities at December 29, 2007 include the following:
| | | | | | | | | Amount Not | |
| | | | | | | | | Reserved as | |
| | | | | | | | | Support for | |
| | | | | Commercial | | Letters of | | Commercial | |
| | | Facility | | Paper | | Credit | | Paper and | |
| (In millions) | | Amount | | Outstanding | | Outstanding | | Letters of Credit | |
| Manufacturing group - multi-year facility expiring in 2012* | | $ | 1,250 | | $ | — | | $ | 22 | | $ | 1,228 | |
| Finance group - multi-year facility expiring in 2012 | | 1,750 | | 1,447 | | 13 | | 290 | |
* The Finance group is permitted to borrow under this multi-year facility.
In connection with the acquisition of AAI, we entered into an interim $750 million credit facility that was subsequently terminated in January 2008.
Under a support agreement, Textron Inc. is required to maintain 100% ownership of Textron Financial Corporation. The agreement also requires Textron Inc. to ensure that Textron Financial Corporation maintains fixed charge coverage of no less than 125% and consolidated shareholder’s equity of no less than $200 million.
Contractual Obligations
Manufacturing Group
The following table summarizes the known contractual obligations, as defined by reporting regulations, of our Manufacturing group as of December 29, 2007, as well as an estimate of the timing in which these obligations are expected to be satisfied:
| | | Payments Due by Period | |
| | | Less than | | | | | | | | | | More than | | | |
| (In millions) | | 1 Year | | 2 Years | | 3 Years | | 4 Years | | 5 Years | | 5 Years | | Total | |
| Liabilities reflected in balance sheet: | | | | | | | | | | | | | | | |
| Long-term debt* | | $ | 350 | | $ | — | | $ | 251 | | $ | 16 | | $ | 300 | | $ | 1,068 | | $ | 1,985 | |
| Capital lease obligations* | | 5 | | 5 | | 6 | | 6 | | 6 | | 135 | | 163 | |
| Pension benefits for unfunded plans | | 15 | | 16 | | 15 | | 17 | | 18 | | 195 | | 276 | |
| Postretirement benefits other than pensions | | 76 | | 74 | | 70 | | 66 | | 61 | | 489 | | 836 | |
| Other long-term liabilities | | 139 | | 85 | | 53 | | 48 | | 37 | | 295 | | 657 | |
| Liabilities not reflected in balance sheet: | | | | | | | | | | | | | | | |
| Operating leases | | 60 | | 52 | | 43 | | 32 | | 27 | | 171 | | 385 | |
| Purchase obligations | | 2,499 | | 593 | | 228 | | 45 | | 13 | | 23 | | 3,401 | |
| Total Manufacturing group | | $ | 3,144 | | $ | 825 | | $ | 666 | | $ | 230 | | $ | 462 | | $ | 2,376 | | $ | 7,703 | |
* Amounts exclude interest payments.
We maintain defined benefit pension plans and postretirement benefit plans other than pensions as discussed in Note 12 to the Consolidated Financial Statements. Included in the above table are discounted estimated benefit payments we expect to make related to unfunded pension and other postretirement benefit plans. Actual benefit payments are dependent on a number of factors, including mortality assumptions, expected retirement age, rate of compensation increases and medical trend rates, which are subject to change in future years. We also expect to make contributions to our funded pension plans in the range of approximately $53 million to $73 million per year over the next five years, which are not reflected in the above table.
Other long-term liabilities included in the table consist primarily of undiscounted amounts on the Consolidated Balance Sheet as of December 29, 2007 representing obligations under deferred compensation arrangements and estimated environmental remediation costs. Payments under deferred compensation arrangements have been estimated based on management’s assumptions of expected retirement age, mortality, stock price and rates of return on participant deferrals. The timing of cash flows associated with environmental remediation costs is largely based on historical experience. Other long-term liabilities, such as deferred taxes and unrecognized tax benefits, have been excluded from the table due to the uncertainty of the timing of payments combined with the absence of historical trends to be used as a predictor for such payments.
Operating leases represent undiscounted obligations under noncancelable leases. Purchase obligations represent undiscounted obligations for which we are committed to purchase goods and services as of December 29, 2007. The ultimate liability for these obligations may be reduced based upon termination provisions included in certain purchase contracts, the costs incurred to date by vendors under these contracts or by recourse under firm contracts with the U.S. Government under normal termination clauses.
In January 2005, we contracted with a third-party service provider for the oversight of our information technology infrastructure, including maintenance, operational oversight and purchases of hardware (the “IT Contract”). The IT Contract covers a 10-year period and is subject to variable pricing and quantity provisions for both purchases of computer hardware and system design modifications. We have retained the right to approve significant design, equipment purchase and related decisions by the service provider. We can terminate the IT Contract for convenience prior to its full term and would consequently be subject to variable termination fees that decline over time and do not exceed $46 million at December 29, 2007.
Finance Group
The following table summarizes our Finance group’s known contractual obligations, as defined by reporting regulations. Due to the nature of finance companies, we also have contractual cash receipts that will be received in the future. We generally borrow funds at various contractual maturities to match the maturities of our finance receivables. The contractual payments and receipts as of December 29, 2007 are detailed below:
| | | Payments/Receipts Due by Period | |
| (In millions) | | Less than 1 Year | | 2 Years | | 3 Years | | 4 Years | | 5 Years | | More than 5 Years | | Total | |
| Contractual payments: | | | | | | | | | | | | | | | |
| Commercial paper and other short-term debt | | $ | 1,461 | | $ | — | | $ | — | | $ | — | | $ | — | | $ | — | | $ | 1,461 | |
| Term debt | | 1,259 | | 1,551 | | 1,913 | | 592 | | 42 | | 477 | | 5,834 | |
| Loan commitments | | 49 | | 2 | | — | | 3 | | — | | — | | 54 | |
| Operating leases | | 6 | | 5 | | 4 | | 4 | | 1 | | 2 | | 22 | |
| Total contractual payments | | 2,775 | | 1,558 | | 1,917 | | 599 | | 43 | | 479 | | 7,371 | |
| Cash and receipts: | | | | | | | | | | | | | | | |
| Finance receivables | | 3,362 | | 1,484 | | 669 | | 645 | | 686 | | 1,757 | | 8,603 | |
| Operating leases | | 28 | | 23 | | 22 | | 19 | | 15 | | 30 | | 137 | |
| Total receipts | | 3,390 | | 1,507 | | 691 | | 664 | | 701 | | 1,787 | | 8,740 | |
| Cash | | 60 | | — | | — | | — | | — | | — | | 60 | |
| Total cash and receipts | | 3,450 | | 1,507 | | 691 | | 664 | | 701 | | 1,787 | | 8,800 | |
| Net cash and receipts (payments) | | $ | 675 | | $ | (51 | ) | $ | (1,226 | ) | $ | 65 | | $ | 658 | | $ | 1,308 | | $ | 1,429 | |
| Cumulative net cash and receipts | | $ | 675 | | $ | 624 | | $ | (602 | ) | $ | (537 | ) | $ | 121 | | $ | 1,429 | | | |
Finance receivable receipts related to finance leases and term loans are based on contractual cash flows, while receipts related to revolving loans are based on historical cash flow experience. These amounts could differ due to prepayments, charge-offs and other factors. Receipts and contractual payments exclude finance charges from receivables, debt interest payments, proceeds from sale of operating lease equipment and other items.
As shown in the preceding table, our cash and receipts are expected to be sufficient to cover maturing debt and other contractual liabilities for the next two years. At December 29, 2007, our Finance group had $2.7 billion in debt and $406 million in other liabilities that are payable within the next 12 months.
At December 29, 2007, our Finance group had unused commitments to fund new and existing customers under $1.6 billion of committed revolving lines of credit, compared with $1.3 billion at December 30, 2006. These loan commitments generally have an original duration of less than three years and do not necessarily represent future cash requirements since many of the agreements will not be used to the extent committed or will expire unused. We are not exposed to interest rate changes on these commitments since the interest rates are not set until the loans are funded. Off-Balance Sheet Arrangements
Performance Guarantee
In 2004, through our Bell Helicopter business, we formed AgustaWestlandBell LLC (“AWB LLC”) with AgustaWestland North America Inc. (“AWNA”). This venture was created for the joint design, development, manufacture, sale, customer training and product support of the VH-71 helicopter, and certain variations and derivatives thereof, to be offered and sold to departments or agencies of the U.S. Government. In March 2005, AWB LLC received a $1.2 billion cost reimbursement-type subcontract from Lockheed Martin for the System Development and Demonstration phase of the U.S. Marine Corps Helicopter Squadron Program. We guaranteed to Lockheed Martin the due and prompt performance by AWB LLC of all its obligations under this subcontract, provided that our liability under the guaranty shall not exceed 49% of AWB LLC’s aggregate liability to Lockheed Martin under the subcontract. AgustaWestland N.V., AWNA’s parent company, has guaranteed the remaining 51% to Lockheed Martin. We have entered into cross-indemnification agreements with AgustaWestland N.V. in which each party indemnifies the other related to any payments required under these agreements that result from the indemnifying party’s workshare under any subcontracts received. AWB LLC’s maximum obligation is 50% of the total contract value, which equates to $613 million, for a maximum amount of our liability under the guarantee of $300 million at December 29, 2007 through completion.
Finance Receivable Sales and Securitizations
Our Finance group sells finance receivables utilizing both whole-loan sales and securitizations, primarily utilizing asset-backed securitization structures. As a result of these transactions, finance receivables are removed from the balance sheet, and the proceeds received are used to reduce the recorded debt levels. Despite the reduction in the recorded balance sheet position, we generally retain a subordinated interest in the finance receivables sold through securitizations, which may affect operating results through periodic fair value adjustments. These retained interests are more fully discussed in the “Securitizations” section of Note 5 to the Consolidated Financial Statements. We utilize these off-balance sheet financing arrangements to further diversify funding alternatives. These arrangements provided net proceeds of $731 million, $50 million and $361 million in 2007, 2006 and 2005, respectively, and net pre-tax gains of $62 million, $42 million and $49 million, respectively. Proceeds from securitizations include amounts received related to incremental increases in the level of distribution finance receivables sold into a revolving conduit and exclude amounts received related to the ongoing replenishment of the outstanding sold balance of these short-duration receivables.
As of December 29, 2007, our Finance group had two significant off-balance sheet financing arrangements: the distribution finance revolving securitization trust and the aviation finance securitization trust. The distribution finance revolving securitization trust is a master trust that purchases inventory finance receivables from the Finance group and issues asset-backed notes to investors. The distribution finance revolving securitization trust had $2.0 billion of one-month LIBOR-based variable-rate asset-backed notes outstanding as of December 29, 2007. These notes each have a three-year term and mature in May 2008, 2009 and 2010. The aviation finance securitization trust purchases finance leases and installment contracts secured by general aviation aircraft. This trust is funded through a commercial paper conduit commitment of a $600 million revolving credit facility which expires in December 2008. As of December 31, 2007, the aviation securitization trust had $433 million outstanding under its facility. The amount of pre-tax gains recorded upon the ongoing sale of receivables in these arrangements and the value of our subordinated interest are impacted by the pricing of the investor notes issued by the distribution finance securitization trust and the interest rate obtained by the commercial paper conduit which funds the aviation finance securitization trust. The trusts have not experienced any material disruption to their funding; however, the commercial paper conduit, which provides funding to the aviation finance securitization trust, did experience an increase in borrowing spreads in 2007.
Critical Accounting Policies
To prepare our Consolidated Financial Statements to be in conformity with generally accepted accounting principles, we must make complex and subjective judgments in the selection and application of accounting policies. The accounting policies that we believe are most critical to the portrayal of our financial condition and results of operations are listed below. We believe these policies require our most difficult, subjective and complex judgments in estimating the effect of inherent uncertainties. This section should be read in conjunction with Note 1 to the Consolidated Financial Statements, which includes other significant accounting policies.
Allowance for Losses on Finance Receivables
Our allowance for losses on finance receivables is intended to provide for losses inherent in the portfolio, which requires the application of estimates and significant judgment as to the ultimate outcome of collection efforts and realization of collateral values, among other factors. Therefore, changes in economic conditions or credit metrics, including past due and nonperforming accounts, or other events affecting specific obligors or industries may require additions or reductions to our reserves. For homogeneous loan pools, we examine current delinquencies, characteristics of the existing accounts, historical loss experience, underlying collateral value, and general economic conditions and trends. We estimate losses will range from 0.3% to 6.0% of finance receivables depending on the specific homogeneous loan pool. For larger balance commercial loans, we also consider borrower specific information, industry trends and estimated discounted cash flows. Our process involves the use of estimates and a high degree of management judgment. While we believe that our consideration of the factors and assumptions referred to above results in an accurate evaluation of existing losses in the portfolio based on prior trends and experience, changes in the assumptions or trends within reasonable historical volatility may have a material impact on our allowance for losses. The allowance for losses on finance receivables currently represents 1.03% of total finance receivables. During the last five years, net charge-offs as a percentage of average finance receivables have ranged from 0.38% to 2.08%.
Long-Term Contracts
We make a substantial portion of our sales to government customers pursuant to long-term contracts. These contracts require development and delivery of products over multiple years and may contain fixed-price purchase options for additional products. We account for these long-term contracts under the percentage-of-completion method of accounting.
Under the percentage-of-completion method, we estimate profit as the difference between total estimated revenue and cost of a contract. We then recognize that estimated profit over the contract term based on either the costs incurred (under the cost-to-cost method, which typically is used for development effort) or the units delivered (under the units-of-delivery method, which is used for production effort), as appropriate under the circumstances. The percentage-of-completion method of accounting involves the use of various estimating techniques to project costs at completion and, in some cases, includes estimates of recoveries asserted against the customer for changes in specifications. Due to the size, length of time and nature of many of our contracts, the estimation of total contract costs and revenue through completion is complicated and subject to many variables relative to the outcome of future events over a period of several years. We are required to make numerous assumptions and estimates relating to items such as expected engineering requirements, complexity of design and related development costs, performance of subcontractors, availability and cost of materials, labor productivity and cost, overhead and capital costs, manufacturing efficiencies and the achievement of contract milestones, including product deliveries.
Our cost estimation process is based on the professional knowledge and experience of engineers and program managers along with finance professionals. We update our projections of costs at least semiannually or when circumstances significantly change. Adjustments to projected costs are recognized in earnings when determinable. Anticipated losses on contracts are recognized in full in the period in which the losses become probable and estimable. Due to the significance of judgment in the estimation process described above, it is likely that materially different revenues and/or cost of sales amounts could be recorded if we used different assumptions or if the underlying circumstances were to change. Our earnings could be reduced by a material amount resulting in a charge to earnings if (a) total estimated contract costs are significantly higher than expected due to changes in customer specifications prior to contract amendment, (b) total estimated contract costs are significantly higher than previously estimated due to cost overruns or inflation, (c) there is a change in engineering efforts required during the development stage of the contract or (d) we are unable to meet contract milestones.
Goodwill
We evaluate the recoverability of goodwill annually in the fourth quarter or more frequently if events or changes in circumstances, such as declines in sales, earnings or cash flows, or material adverse changes in the business climate, indicate that the carrying value of an asset might be impaired. We completed our annual impairment test in the fourth quarter of 2007 using the estimates from our long-term strategic plans. No adjustment was required to the carrying value of our goodwill based on the analysis performed.
Goodwill is considered to be impaired when the net book value of a reporting unit exceeds its estimated fair value. Fair values are primarily established using a discounted cash flow methodology using assumptions consistent with market participants. The determination of discounted cash flows is based on the businesses’ strategic plans and long-range planning forecasts. The revenue growth rates included in the forecasts represent our best estimates based on current and forecasted market conditions, and the profit margin assumptions are projected by each reporting unit based on the current cost structure and anticipated net cost reductions. If different assumptions were used in these forecasts, the related undiscounted cash flows used in measuring impairment could be different, potentially resulting in an impairment charge. The impact of reducing our fair value estimates by 10% would have no impact on our goodwill assessment, with the exception of our Fluid Handling Products (“FHP”) and Golf & Turfcare (“G&T”) components. Assuming a 10% reduction in our fair value estimates, the carrying value of these components may approximate or exceed fair value.
Our operating plans and projections anticipate continued investments in capital expenditures at our FHP component to capture additional business in the oil and gas markets. During 2007, FHP achieved revenue growth of 20% and operating profit growth of approximately 25%. We anticipate continued sales growth over the five-year planning period as well as operating margin improvements. Should the revenue growth rates and operating margins over the planning period approximate historical levels, the estimated fair value would be reduced by up to approximately $50 million and may result in the carrying value of the component exceeding its estimated fair value, potentially resulting in an impairment charge. At December 29, 2007, the goodwill allocated to this component totaled approximately $216 million.
Our operating plans and projections for our G&T component anticipate operating margin improvements over the five-year planning period resulting in high single-digit margins and assume annual revenue growth of approximately 4%. A 100-basis-point decline in our operating margin assumptions would reduce the estimated fair value by up to approximately $35 million and may result in the carrying value of the component exceeding its estimated fair value, potentially resulting in an impairment charge. At December 29, 2007, the goodwill allocated to this component totaled approximately $141 million.
Retirement Benefits
We maintain various pension and postretirement plans for our employees globally. These plans include significant pension and postretirement benefit obligations, which are calculated based on actuarial valuations. Key assumptions used in determining these obligations and related expenses include expected long-term rates of return on plan assets, discount rates and healthcare cost projections. We also make assumptions regarding employee demographic factors such as retirement patterns, mortality, turnover and the rate of compensation increases. We evaluate and update these assumptions annually.
To determine the expected long-term rate of return on plan assets, we consider the current and expected asset allocation, as well as historical and expected returns on each plan asset class. A lower expected rate of return on plan assets will increase pension expense. For 2007, the assumed expected long-term rate of return on plan assets used in calculating pension expense was 8.53%, compared with 8.54% in 2006. In 2007 and 2006, the assumed rate of return for our qualified domestic plans, which represent approximately 88% of our total pension assets, was 8.74% and 8.75%, respectively. A 50-basis-point decrease in this long-term rate of return would result in a $22 million annual increase in pension expense for our qualified domestic plans.
The discount rate enables us to state expected future benefit payments as a present value on the measurement date, reflecting the current rate at which the pension liabilities could be effectively settled. This rate should be in line with rates for high-quality fixed income investments available for the period to maturity of the pension benefits, which fluctuate as long-term interest rates change. A lower discount rate increases the present value of the benefit obligations and increases pension expense. In 2007, the weighted-average discount rate used in calculating pension expense was 5.59%, compared with 5.55% in 2006. For our qualified domestic plans, the assumed discount rate was 5.66% in 2007, compared with 5.65% for 2006. A 50-basis-point decrease in this discount rate would result in a $34 million annual increase in pension expense for our qualified domestic plans.
The trend in healthcare costs is difficult to estimate, and it has an important effect on postretirement liabilities. The 2007 medical and prescription drug healthcare cost trend rates represent the weighted-average annual projected rate of increase in the per capita cost of covered benefits. The 2007 medical rate of 8% is assumed to decrease to 5% by 2015 and then remain at that level. The 2007 prescription drug rate of 12% is assumed to decrease to 5% by 2015 and then remain at that level. See Note 12 to the Consolidated Financial Statements for the impact of a one-percentage-point change in the cost trend rate.
Warranty Liabilities
We provide limited warranty and product maintenance programs, including parts and labor, for certain products for periods ranging from one to five years. A significant portion of these liabilities arises from our commercial aircraft businesses. We also may incur costs related to product recalls.
We estimate the costs that may be incurred under warranty programs and record a liability in the amount of such costs at the time product revenue is recognized. Factors that affect this liability include the number of products sold, historical costs per claim, contractual recoveries from vendors, and historical and anticipated rates of warranty claims, including production and warranty patterns for new models. During our initial aircraft model launches, we typically incur higher warranty-related costs until the production process matures, at which point warranty costs moderate. We assess the adequacy of our recorded warranty and product maintenance liabilities periodically and adjust the amounts as necessary. Adjustments are made to accruals as claim data and actual experience warrant. Should future warranty experience differ materially from our historical experience, we may be required to record additional warranty liabilities, which could have a material adverse effect on our results of operations and cash flows in the period in which these additional liabilities are required.
Securitized Transactions
Securitized transactions involve the sale of finance receivables to qualified special purpose trusts. We may retain an interest in the assets sold in the form of interest-only securities, seller certificates, cash reserve accounts and servicing rights and obligations. At the time of sale, a gain or loss is recorded based on the difference between the proceeds received and the allocated carrying value of the finance receivables sold. The allocated carrying value is determined based on the relative fair values of the finance receivables sold and the interests retained. As such, the fair value estimate of the retained interests has a direct impact on the gain or loss recorded. We estimate fair value based on the present value of future cash flows expected under management’s best estimates of key assumptions – credit losses, prepayment speeds and discount rates commensurate with the risks involved. Retained interests are recorded at fair value as a component of other assets in the Consolidated Balance Sheets.
We review the fair values of the retained interests quarterly using updated assumptions and compare such amounts with the carrying value of the retained interests. When the carrying value exceeds the fair value of the retained interests, we determine whether the decline in fair value is other than temporary. When we determine the value of the decline is other than temporary, we write down the retained interests to fair value with a corresponding charge to income. When a change in fair value of the retained interests is deemed temporary, we record a corresponding credit or charge to other comprehensive income for any unrealized gains or losses. A hypothetical adverse change of 10% and 20% to the expected credit losses, residual cash flows discount rates or prepayment rate assumptions would not have a material impact on the current value of the residual cash flows associated with the retained interests. Hypothetical sensitivities should be used with caution, as the effect of a variation in a particular assumption on the fair value of the retained interest is calculated without changing any other assumption. In reality, a change in one factor may magnify or counteract the sensitivities losses. For example, increases in interest rates may result in lower prepayments and increased credit losses.
Income Taxes
Deferred tax assets and liabilities are determined based on temporary differences between the financial reporting and tax bases of assets and liabilities, applying enacted tax rates that we expect to be in effect for the year in which we expect the differences will reverse or settle. Based on the evaluation of available evidence, we recognize future tax benefits, such as net operating loss carryforwards, to the extent that we believe it is more likely than not that we will realize these benefits. We periodically assess the likelihood that we will be able to recover our deferred tax assets and reflect any changes in our estimates in the valuation allowance, with a corresponding adjustment to earnings or other comprehensive income (loss), as appropriate.
In assessing the need for a valuation allowance, we look to the future reversal of existing taxable temporary differences, taxable income in carryback years, the feasibility of tax planning strategies and estimated future taxable income. The valuation allowance can be affected by changes to tax laws, changes to statutory tax rates and changes to future taxable income estimates.
The amount of income taxes we pay is subject to ongoing audits by federal, state and foreign tax authorities, which may result in proposed assessments. Our estimate for the potential outcome for any uncertain tax issue is highly judgmental. We assess our income tax positions and record tax benefits for all years subject to examination based upon our evaluation of the facts, circumstances and information available at the reporting date. For those tax positions for which it is more likely than not that a tax benefit will be sustained, we record the amount that has a greater than 50% likelihood of being realized upon settlement with a taxing authority that has full knowledge of all relevant information. Interest and penalties are accrued, where applicable. If we do not believe that it is more likely than not that a tax benefit will be sustained, no tax benefit is recognized. However, our future results may include favorable or unfavorable adjustments to our estimated tax liabilities due to closure of income tax examinations, new regulatory or judicial pronouncements, or other relevant events. As a result, our effective tax rate may fluctuate significantly on a quarterly and annual basis.