Exhibit 99.(c)(2)
PROJECT CHARIOT
OCTOBER 31, 2005
Robert C. Oliver
Managing Director
(502) 425-3081
Lisa A. Marquard |
| Rutvik A. Mehta |
(314) 342-2029 |
| (314) 342-2992 |
Stifel, Nicolaus & Company, Incorporated
501 North Broadway
St. Louis, MO 63102
(314) 342-2000
www.stifel.com
Project Chariot
Table of Contents
| Tab | |
Executive Summary |
| |
| 1 | |
| 2 | |
| 3 | |
|
|
|
Valuation Analysis |
| |
| 4 | |
| 5 | |
| Guideline Merger & Acquisition Transaction Method | 6 |
| Discounted Cash Flow Method | 7 |
| 8 | |
| Common Stock Trading History | 9 |
|
|
|
Appendix |
| |
| Calculation of Required Holding Period Rate of Return (CAPM) | 10 |
| 11 | |
1
Project Chariot
Stifel, Nicolaus & Company, Inc. (“Stifel”) has been engaged by the Special Committee of the Board of Directors of Chariot (“Chariot” or “Company”), a Missouri corporation, to perform a valuation analysis (the “Valuation”) indicating the going concern value of the Company’s common stock and render a written opinion (the “Opinion”) as to the fairness of the consideration (the “Consideration”) to be paid to holders (the “Holders”) of the Company’s common stock that are to be cashed out in a shareholder reduction transaction (the “Transaction”). Stifel performed the valuation analysis and delivered the results to the Special Committee on October 28, 2005. Based on the valuation, the Special Committee arrived at a price per share of $7.70 to be paid to shareholders who will be cashed out as a result of this transaction. Our Opinion, the analysis of which is detailed in this book, addresses the fairness, from a financial point of view, of the Consideration.
Purpose of the Transaction
The objective of the Transaction is to reduce the number of holders of Chariot’s Class A Common Stock below 300. If the number of record holders of Chariot’s Class A Common Stock is below 300, Chariot would be able to deregister its stock with the Securities and Exchange Commission (SEC) thereby becoming a private company and terminating its SEC reporting obligations and the considerable time, effort and expense of complying with those obligations.
The Company has considered the benefits as well as the obligations of being a registered company, and has determined that, on balance, the costs outweigh the benefits. The Company currently believes that a shareholder reduction strategy in the form of a reverse-forward stock split will achieve its goals in the most efficient manner, although the Special Committee of the Board has been empowered to examine other alternatives.
1
Standard and Definition of Value: Fair Value
Although in the proposed Transaction the Holders will not be entitled to dissenters’ rights or appraisal rights under Missouri law, the concept of “fair value” in a transaction that provides for dissenters’ rights and appraisal rights is analogous to and appropriate to consider in the proposed Transaction. The Missouri Revised Statutes, Section 351.455 states:
351.455. 1. If a shareholder of a corporation which is a party to a merger or consolidation and, in the case of a shareholder owning voting stock as of the record date, at the meeting of shareholders at which the plan of merger or consolidation is submitted to a vote shall file with such corporation prior to or at such meeting a written objection to such plan of merger or consolidation, and shall not vote in favor thereof, and such shareholder, within twenty days after the merger or consolidation is effected, shall make written demand on the surviving or new corporation for payment of the fair value of his or her shares as of the day prior to the date on which the vote was taken approving the merger or consolidation, the surviving or new corporation shall pay to such shareholder, upon surrender of his or her certificate or certificates representing said shares, the fair value thereof. Such demand shall state the number and class of the shares owned by such dissenting shareholder. Any shareholder failing to make demand within the twenty- day period shall be conclusively presumed to have consented to the merger or consolidation and shall be bound by the terms thereof.
The Revised Model Business Corporation Act (RMBCA) defines Fair Value as:
…the value of the shares immediately before the effectuation of the corporate action to which the dissenter objects, excluding any appreciation or depreciation in anticipation of the corporate action unless exclusion would be inequitable.
Many jurisdictions have similar appraisal statutes; however the precise definition of “fair value” varies depending on the jurisdiction. In Missouri, although the Missouri statute provides that corporations are required to pay shareholders the fair value of their shares in certain types of merger transactions, the statute does not provide
2
how “fair value” is calculated. The Missouri Supreme Court discussed the meaning of “fair value” in Phelps v. Watson-Stillman Co.:
In the various statutes the terms “value,” “fair value,” “fair cash value,” and “fair market value” are abstract and in a sense perhaps meaningless . . . . They nevertheless have the same general meaning and purposefully if not wisely establish a flexible general standard for fixing value between parties who are either unable or unwilling to voluntarily agree. As previously noted, there is no simple mathematical formula and each case presents its particular problem, but in general some of the factors to be considered and weighted are asset value, earnings, dividends, management, and “every relevant fact and circumstance which enters into the value of the corporate property and which reflects itself in the worth of corporate stock.”
3
Approaches to Value
The following three approaches to value are generally considered acceptable in the financial community and were considered by Stifel in this assignment:
1. The Market Approach.
2. The Income Approach.
3. The Asset-based Approach.
The objective of using more than one approach to value is to develop mutually supporting evidence as to the conclusion of value. Stifel considered all of the approaches and a variety of methodologies within each approach and ultimately concluded that the Market Approach and the Income Approach were the most relevant to the valuation of the Company’s stock for the Transaction. Although the Asset-based Approach can be used with all premises of value – including value in use as a going concern business enterprise – due to the characteristics of the industry, Stifel believes the Market and Income Approaches are more relevant.
4
Within each approach to value, there are many methodologies which are generally considered to be acceptable within the financial community. The following is a brief description of Stifel’s methodologies for this analysis:
Market Approach
1. The Guideline Publicly Traded Comparable Company Method – Stifel utilized the Comparable Company Method of valuation by:
1. Identifying a selected group of publicly traded companies which are similar to the Company through a combination of quantitative and qualitative methods;
2. Calculating market-derived pricing multiples based upon the guideline companies’ trading prices and financial fundamentals;
3. Selecting appropriate market-derived pricing multiples to be applied to the corresponding financial fundamentals of the Company;
4. Calculating a range of indicated values for the Company based upon the application of the selected market pricing multiples; and
5. Adjusting the indicated values to reconcile the differential between an “As-if-freely-tradable” minority value and a “Going concern” enterprise value.
1
2. The Guideline Merger & Acquisition Transactions Method – Stifel utilized the Merger & Acquisition Transactions Method of valuation by:
1. Choosing a group of comparable mergers and acquisition (control basis) with publicly disclosed transactions values;
2. Selecting appropriate transaction-derived pricing multiples to be applied to the corresponding financial fundamentals of the Company;
3. Calculating a range of indicated values for the Company based upon the application of the selected transaction pricing multiples; and
4. Adjusting the indicated values to reconcile the differential between a “Synergistic” change of control value and a “Going concern” enterprise value.
2
Income Approach
1. Discounted Cash Flow Method – If reasonable projections are available the income approach, and specifically the discounted cash flow method (or DCF) is considered a very relevant valuation method. The DCF method estimates value based on the free cash flow of the Company over an investment horizon or into perpetuity using empirical market data, industry trends and the underlying fundamental financial performance of the Company. This free cash flow stream is then discounted to estimate the present value of future cash flows. The discount rate was developed through the use of the Capital Asset Pricing Model (“CAPM”) which includes a measure of systematic risk for an industrial company.
2. Present Value of a Share Method - Utilizing an additional valuation method under the income approach, Stifel examined the cash flow management expects to be paid to shareholders over the next five years based on its expectations for earnings and dividend payout levels. In addition to the present value of this dividend stream, Stifel determined a terminal value for the stock after five years based on normalized earnings and the trading multiples of the Company’s peer group. The terminal value was also assigned a discount rate to determine its present value. Stifel adjusted the indicated values to reconcile the differential between an “As-if-freely-tradable” minority value resulting from the use of publicly observed price to earnings multiples and a “Going concern” enterprise value. As in the prior DCF method, the discount rate was developed through the use of the Capital Asset Pricing Model (“CAPM”).
3
There are numerous valuation discounts and premiums used in valuation. The three most distinct valuation adjustment factors (one premium and two discounts) are listed below:
Control Premium. The additional value inherent in the controlling interest of a company that reflects the power of control, as contrasted to a minority interest which does not have the power to alter the capital structure, force a sale of the company or impact other factors which may influence the value of the company. The control premium can be divided into two distinct components: the control (or “governance”) premium representing the power of control described above and the synergy premium which represents the additional benefit a third party buyer of the company may receive due to cost savings or revenue enhancements recognized when combining operations. Premiums above market trading prices observed in merger transactions involving public companies are frequently comprised of both the governance and the synergy components of the control premium.
We are valuing the Company on the basis of Fair Value as a going concern which assumes the Company will continue to operate consistent with its intended business purpose without being liquidated, nor conversely, sold to a buyer which may realize synergistic cost savings or revenue enhancements. As further detailed herein, we have adjusted our analysis to exclude the synergy component of the control premium. In certain analysis methods such as the Guideline Merger & Acquisition Transactions Method, this is achieved by reducing the observed transaction multiples by the calculated synergy component of the control premium. In other methods, such as the Guideline Publicly Traded Comparable Company Method, this is achieved by increasing the observed public market multiples by the calculated control, or governance, component of the control premium.
1
Minority Interest Discount.(1) The minority interest discount is applied to interests of less than 50% of the total voting stock of an enterprise. This discount represents a reduction to the pro rata share of the value of the entire business (which includes the power of control but not synergies), to reflect the absence of the power of control.
Because we are valuing the Company under a Fair Value standard and as a going concern we did not take a minority interest discount and in some cases, adjusted upward for the governance component of the control premium as described above.
Marketability Discount. An amount or percentage deducted from an equity interest to reflect lack of marketability. Marketability refers to the liquidity of the interest or how quickly and certainly it can be converted to cash at the owner’s discretion.
Under the standard utilized for this assignment a marketability discount was inappropriate and we did not take this discount.
(1) In some jurisdictions, including Missouri, “control” of a corporation can be presumed for some purposes at well under the level of 50% ownership of the company’s voting stock. (Missouri Revised Statutes, Sections 351.407 and 351.015).
2
Valuation Process, Materials Reviewed & Assumptions
Prior to delivery of the valuation analysis, Stifel has reviewed or considered the following:
1. Interviews with management in order to gain an understanding of the history of the Company, review financial performance and discuss the outlook.
2. The economic outlook in general and the condition and outlook of the industry in particular.
3. The operating performance and the financial condition of the business.
4. The trading history of the Company’s common stock.
For the purposes of our valuation analysis, Stifel collected information from numerous sources including but not limited to the following:
1. Restated financial statements for the six years ended October 31, 2004 (audited as available) as well as year-to-date financial statements for the Company.
2. 10-K filings for the six years ended October 31, 2004.
3. 10-Q filings for 2005.
4. Financial forecasts supplied to Stifel by Company Management.
5. A draft of the proxy statement for the proposed Transaction, albeit with regard to structure of the transaction and not as to price.
6. Stock trading / issuance history of the Company.
3
Stifel has made the following assumptions:
1. Stifel relied upon and assumed, without independent verification, the accuracy and completeness of all of the financial and other information that was provided to it or that was otherwise reviewed by it and did not assume any responsibility for independently verifying any of such information.
2. With respect to the financial forecasts supplied to Stifel, Stifel assumed that they were reasonably prepared on the basis reflecting the best currently available estimates and judgments of the management of the Company as to the future operating and financial performance of the Company and that they would be substantially achieved in the amounts and over the time periods indicated.
3. Stifel also assumed that there were no material changes in the assets, liabilities, financial condition, results of operations, business or prospects of the Company since the date of the interim last financial statements made available to it.
4. Stifel also assumed, without independent verification and with the Company’s consent, that the aggregate allowances for insurance, workers compensation claims and the like which are set forth in the financial statements are in the aggregate adequate to cover all such losses.
5. Stifel did not make or obtain any independent evaluation, appraisal or physical inspection of the Company’s assets or liabilities.
6. Because of the proximity to the end of the Company’s fiscal year, 2005 projected earnings were used for both 2005 and LTM ratios.
7. Stifel relied on advice of the Company’s counsel as to certain legal matters with respect to the Company and the proposed Transaction.
4
As further described herein, Stifel utilized four valuation methods in estimating the range of going concern value of the Company’s common stock. The methods and their resultant values are as follows:
Market Approach
1. Guideline Publicly Traded Comparable Company Method
2. Guideline Merger & Acquisition Transactions Method
Income Approach
1. Discounted Cash Flow Method
2. Present Value of a Share Method
Result
|
| Range of Values |
| Weighted |
| Final Value |
| Final Value |
| |||||||||||
Method |
| Minimum |
| Maximum |
| Value |
| Weighting Range |
| Range |
| |||||||||
Comparable Companies |
| $ | 6.23 | to | $ | 17.12 |
| $ | 9.53 |
| 20.0 | % | 40.0 | % | $ | 1.91 |
| $ | 3.81 |
|
Merger & Acquisition Transactions |
| $ | 3.91 | to | $ | 27.62 |
| $ | 8.34 |
| 20.0 | % | 40.0 | % | $ | 1.67 |
| $ | 3.34 |
|
Discounted Cash Flow |
| $ | 2.90 | to | $ | 6.65 |
| $ | 4.36 |
| 30.0 | % | 10.0 | % | $ | 1.31 |
| $ | 0.44 |
|
Present Value of a Share |
| $ | 3.58 | to | $ | 7.55 |
| $ | 5.27 |
| 30.0 | % | 10.0 | % | $ | 1.58 |
| $ | 0.53 |
|
|
|
|
|
|
| Range of Value |
| $ | 6.46 | - | $ | 8.11 |
| |||||||
Goint Concern Value
The Special Committee and the Board of Directors have agreed on a price of $7.70 per share to be paid to the holders of the Company’s common stock that are to be cashed out as a result of the shareholder reduction transaction.
1
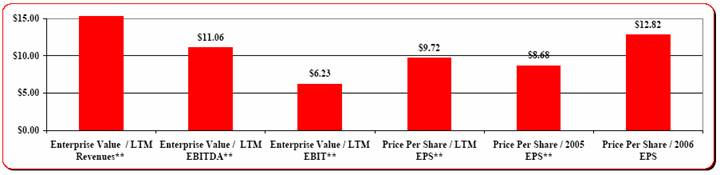
Guideline Publicly Traded Comparable Company Method
• Through a combination of quantitative and qualitative methods Stifel identified a selected group of publicly traded companies which are deemed to be comparable to the Company.
• Stifel then calculated market-derived pricing multiples based upon the guideline companies’ trading prices and applied these multiples to the corresponding financial fundamentals of the Company.
• Stifel adjusted the equity portion of indicated values upwards by 13.1% to reconcile the difference between an “As-if-freely-tradable” minority value from the use of observed price to earnings multiples and a “Going concern” enterprise value.
• Weighting the results gives a value of $9.53.
1
Guideline Publicly Traded Comparable Company Method
|
| Values Based on the Median Multiples of Comparable Companies |
|
|
|
|
| ||||||
|
| Actual |
| Actual Per |
| Adjusted |
| Adjusted Per |
| Weighting |
| Weighted |
|
Enterprise Value / LTM Revenues** |
| 43.6% |
| $15.73 |
| 46.9% |
| $17.12 |
| 5.0% |
| $0.86 |
|
Enterprise Value / LTM EBITDA** |
| 8.3x |
| 9.32 |
| 9.4x |
| 11.06 |
| 15.0% |
| 1.66 |
|
Enterprise Value / LTM EBIT** |
| 10.2x |
| 5.82 |
| 10.7x |
| 6.23 |
| 30.0% |
| 1.87 |
|
Price Per Share / LTM EPS** |
| 14.2x |
| 8.59 |
| 16.1x |
| 9.72 |
| 17.5% |
| 1.70 |
|
Price Per Share / 2005 EPS** |
| 12.7x |
| 7.67 |
| 14.4x |
| 8.68 |
| 17.5% |
| 1.52 |
|
Price Per Share / 2006 EPS |
| 11.5x |
| 11.34 |
| 13.0x |
| 12.82 |
| 15.0% |
| 1.92 |
|
|
|
|
|
|
|
|
|
|
|
|
|
|
|
|
|
|
|
|
|
|
| Implied Value |
| $9.53 |
| ||
*Values based on 10/28/05 closing prices plus a control premium of 13.1% which includes goverance considerations but excludes synergies. |
** Because of the proximity to the end of the fiscal year, 2005 projected earnings were used for both 2005 and LTM ratios. Chariot’s closing price on 10/28/05 was $6.70. |
2
Guideline Publicly Traded Comparable Company Method
Summary Financial and Market Analysis of Selected Companies
(Dollars in millions, except per share amounts)
|
|
|
|
|
| Price |
| 52 Week |
| % Change 52 Week |
| EPS |
| P/E Multiple |
| Market |
| Enterprise |
| ||||||||||||
|
| Selected Companies |
| Ticker |
| 10/28/2005 |
| Low |
| High |
| Low |
| High |
| LTM |
| CY 2005 E |
| CY 2006 E |
| LTM |
| CY 2005 E |
| CY 2006 E |
| Cap. (1) |
| Value (2) |
|
|
|
|
|
|
|
|
|
|
|
|
|
|
|
|
|
|
|
|
|
|
|
|
|
|
|
|
|
|
|
|
|
1. |
| Coachmen Industries Inc. |
| COA |
| $11.51 |
| $10.76 |
| $17.99 |
| 7.0% |
| (36.0%) |
| $(0.68) |
| NA |
| NA |
| NM |
| NA |
| NA |
| $179.0 |
| $183.2 |
|
2. |
| Featherlite Inc. |
| FTHR |
| $3.96 |
| $2.52 |
| $7.00 |
| 57.1% |
| (43.4%) |
| $0.43 |
| NA |
| NA |
| 9.2x |
| NA |
| NA |
| $43.4 |
| $84.3 |
|
3. |
| Monaco Coach Corp. |
| MNC |
| $11.99 |
| $11.85 |
| $20.80 |
| 1.2% |
| (42.4%) |
| $0.64 |
| $0.25 |
| $0.96 |
| 18.7x |
| 48.9x |
| 12.6x |
| $353.8 |
| $382.8 |
|
4. |
| Navistar International Corp. |
| NAV |
| $26.70 |
| $25.55 |
| $45.07 |
| 4.5% |
| (40.8%) |
| $4.16 |
| $4.83 |
| $5.48 |
| 6.4x |
| 5.5x |
| 4.9x |
| $1,871.7 |
| $5,168.7 |
|
5. |
| Oshkosh Truck Corp. |
| OSK |
| $42.82 |
| $27.90 |
| $44.48 |
| 53.5% |
| (3.7%) |
| $2.06 |
| $2.16 |
| $2.75 |
| 20.8x |
| 19.8x |
| 15.6x |
| $3,139.4 |
| $3,157.2 |
|
6. |
| Paccar Inc. |
| PCAR |
| $68.45 |
| $63.30 |
| $81.42 |
| 8.1% |
| (15.9%) |
| $6.14 |
| $6.90 |
| $7.55 |
| 11.1x |
| 9.9x |
| 9.1x |
| $11,677.6 |
| $9,997.5 |
|
7. |
| Spartan Motors Inc. |
| SPAR |
| $10.50 |
| $8.62 |
| $12.57 |
| 21.8% |
| (16.5%) |
| $0.55 |
| $0.83 |
| $1.00 |
| 19.0x |
| 12.7x |
| 10.5x |
| $131.5 |
| $115.3 |
|
8. |
| Supreme Industries Inc. |
| STS |
| $8.85 |
| $5.90 |
| $9.56 |
| 50.0% |
| (7.4%) |
| $0.64 |
| NA |
| NA |
| 13.8x |
| NA |
| NA |
| $110.5 |
| $140.4 |
|
9. |
| Thor Industries Inc. |
| THO |
| $32.76 |
| $26.27 |
| $37.99 |
| 24.7% |
| (13.8%) |
| $2.15 |
| $2.58 |
| $2.86 |
| 15.3x |
| 12.7x |
| 11.5x |
| $1,856.7 |
| $1,693.1 |
|
10. |
| Winnebago Industries Inc. |
| WGO |
| $27.77 |
| $26.14 |
| $40.64 |
| 6.2% |
| (31.7%) |
| $1.95 |
| $1.86 |
| $2.20 |
| 14.2x |
| 14.9x |
| 12.6x |
| $914.2 |
| $894.8 |
|
|
|
|
|
|
|
|
|
|
|
|
|
|
|
|
|
|
|
|
|
|
|
|
|
|
|
|
|
|
|
|
|
|
| 75th Percentile |
|
|
|
|
|
|
|
|
| 43.7% |
| (14.3%) |
|
|
|
|
|
|
| 18.7x |
| 17.4x |
| 12.6x |
|
|
|
|
|
|
| 25th Percentile |
|
|
|
|
|
|
|
|
| 6.4% |
| (39.6%) |
|
|
|
|
|
|
| 11.1x |
| 11.3x |
| 9.8x |
|
|
|
|
|
|
| Average |
|
|
|
|
|
|
|
|
| 23.4% |
| (25.2%) |
|
|
|
|
|
|
| 14.3x |
| 17.8x |
| 10.9x |
|
|
|
|
|
|
| Median |
|
|
|
|
|
|
|
|
| 15.0% |
| (24.1%) |
|
|
|
|
|
|
| 14.2x |
| 12.7x |
| 11.5x |
|
|
|
|
|
(1) Market Cap. represents shares outstanding multiplied by current stock price.
(2) Enterprise Value represents market value of common stock plus book value of debt, preferred stock and minority interest net of cash.
Source: FactSet
3
Guideline Publicly Traded Comparable Company Method
Summary Financial and Market Analysis of Selected Companies
(Dollars in millions, except per share amounts)
|
|
|
| LTM |
| FY |
| LTM |
| Enterprise Value/LTM |
| LTM Margins |
| Debt/ |
| Debt/ |
| Bk. Val/ |
| Price/ |
| ||||||||
|
| Selected Companies |
| Ending |
| Ending |
| Revenues |
| Revenue |
| EBITDA |
| EBIT |
| EBITDA |
| EBIT |
| Net Income |
| Equity |
| Total Cap. |
| Share |
| Book |
|
|
|
|
|
|
|
|
|
|
|
|
|
|
|
|
|
|
|
|
|
|
|
|
|
|
|
|
|
|
|
1. |
| Coachmen Industries Inc. |
| 09/2005 |
| 12/2004 |
| $805.6 |
| 22.7% |
| NM |
| NM |
| NM |
| NM |
| NM |
| 9.7% |
| 9.7% |
| 13.40 |
| 0.86 |
|
2. |
| Featherlite Inc. |
| 06/2005 |
| 12/2004 |
| $212.3 |
| 39.7% |
| 7.5x |
| 9.6x |
| 5.3% |
| 4.1% |
| 2.2% |
| 145.9% |
| 145.9% |
| 2.57 |
| 1.54 |
|
3. |
| Monaco Coach Corp. |
| 06/2005 |
| 12/2004 |
| $1,322.2 |
| 28.9% |
| 8.6x |
| 11.2x |
| 3.4% |
| 2.6% |
| 1.4% |
| 9.0% |
| 9.0% |
| 10.94 |
| 1.10 |
|
4. |
| Navistar International Corp. |
| 07/2005 |
| 10/2004 |
| $11,573.0 |
| 44.7% |
| 6.6x |
| 10.2x |
| 6.8% |
| 4.4% |
| 2.5% |
| 568.7% |
| 568.7% |
| 9.76 |
| 2.74 |
|
5. |
| Oshkosh Truck Corp. |
| 06/2005 |
| 09/2004 |
| $2,787.3 |
| 113.3% |
| 11.4x |
| 13.0x |
| 9.9% |
| 8.7% |
| 5.3% |
| 7.7% |
| 7.7% |
| 10.79 |
| 3.97 |
|
6. |
| Paccar Inc. |
| 09/2005 |
| 12/2004 |
| $13,612.8 |
| 73.4% |
| 4.8x |
| 5.0x |
| 15.4% |
| 14.8% |
| 7.8% |
| 0.7% |
| 0.7% |
| 23.61 |
| 2.90 |
|
7. |
| Spartan Motors Inc. |
| 06/2005 |
| 12/2004 |
| $350.2 |
| 32.9% |
| 8.5x |
| 10.3x |
| 3.9% |
| 3.2% |
| 2.0% |
| 0.2% |
| 0.2% |
| 5.63 |
| 1.87 |
|
8. |
| Supreme Industries Inc. |
| 06/2005 |
| 12/2004 |
| $329.3 |
| 42.6% |
| 8.6x |
| 11.2x |
| 5.0% |
| 3.8% |
| 2.4% |
| 41.3% |
| 41.3% |
| 5.85 |
| 1.51 |
|
9. |
| Thor Industries Inc. |
| 07/2005 |
| 07/2005 |
| $2,558.4 |
| 66.2% |
| 8.3x |
| 8.7x |
| 8.0% |
| 7.6% |
| 4.8% |
| — |
| — |
| 10.54 |
| 3.11 |
|
10. |
| Winnebago Industries Inc. |
| 08/2005 |
| 08/2005 |
| $992.0 |
| 90.2% |
| 8.1x |
| 8.9x |
| 11.2% |
| 10.2% |
| 6.6% |
| — |
| — |
| 7.17 |
| 3.88 |
|
|
|
|
|
|
|
|
|
|
|
|
|
|
|
|
|
|
|
|
|
|
|
|
|
|
|
|
|
|
|
|
| 75th Percentile |
|
|
|
|
|
|
| 71.6% |
| 8.6x |
| 11.2x |
| 9.9% |
| 8.7% |
| 5.3% |
| 33.4% |
| 33.4% |
| $10.91 |
| 3.1x |
|
|
| 25th Percentile |
|
|
|
|
|
|
| 34.6% |
| 7.5x |
| 8.9x |
| 5.0% |
| 3.8% |
| 2.2% |
| 0.3% |
| 0.3% |
| $6.18 |
| 1.5x |
|
|
| Average |
|
|
|
|
|
|
| 55.5% |
| 8.0x |
| 9.8x |
| 7.6% |
| 6.6% |
| 3.9% |
| 78.3% |
| 78.3% |
| $10.03 |
| 2.3x |
|
|
| Median |
|
|
|
|
|
|
| 43.6% |
| 8.3x |
| 10.2x |
| 6.8% |
| 4.4% |
| 2.5% |
| 8.3% |
| 8.3% |
| $10.15 |
| 2.3x |
|
4
Guideline Publicly Traded Comparable Company Method - Premium Adjusted
Summary Financial and Market Analysis of Selected Companies
(Dollars in millions, except per share amounts)
|
|
|
|
|
| Price (3) |
| 52 Week (3) |
| % Change 52 Week |
| EPS |
| P/E Multiple |
| Market |
| Enterprise |
| ||||||||||||
|
| Selected Companies |
| Ticker |
| 10/28/2005 |
| Low |
| High |
| Low |
| High |
| LTM |
| CY 2005 E |
| CY 2006 E |
| LTM |
| CY 2005 E |
| CY 2006 E |
| Cap. (1) |
| Value (2) |
|
|
|
|
|
|
|
|
|
|
|
|
|
|
|
|
|
|
|
|
|
|
|
|
|
|
|
|
|
|
|
|
|
1. |
| Coachmen Industries Inc. |
| COA |
| $13.02 |
| $12.17 |
| $20.35 |
| 7.0% |
| (36.0%) |
| $(0.68) |
| NA |
| NA |
| NM |
| NA |
| NA |
| $202.5 |
| $206.6 |
|
2. |
| Featherlite Inc. |
| FTHR |
| $4.48 |
| $2.85 |
| $7.92 |
| 57.1% |
| (43.4%) |
| $0.43 |
| NA |
| NA |
| 10.4x |
| NA |
| NA |
| $49.0 |
| $89.9 |
|
3. |
| Monaco Coach Corp. |
| MNC |
| $13.56 |
| $13.40 |
| $23.52 |
| 1.2% |
| (42.4%) |
| $0.64 |
| $0.25 |
| $0.96 |
| 21.1x |
| 55.3x |
| 14.2x |
| $400.2 |
| $429.1 |
|
4. |
| Navistar International Corp. |
| NAV |
| $30.20 |
| $28.90 |
| $50.97 |
| 4.5% |
| (40.8%) |
| $4.16 |
| $4.83 |
| $5.48 |
| 7.3x |
| 6.3x |
| 5.5x |
| $2,116.9 |
| $5,413.9 |
|
5. |
| Oshkosh Truck Corp. |
| OSK |
| $48.43 |
| $31.55 |
| $50.31 |
| 53.5% |
| (3.7%) |
| $2.06 |
| $2.16 |
| $2.75 |
| 23.5x |
| 22.4x |
| 17.6x |
| $3,550.7 |
| $3,568.4 |
|
6. |
| Paccar Inc. |
| PCAR |
| $77.42 |
| $71.59 |
| $92.09 |
| 8.1% |
| (15.9%) |
| $6.14 |
| $6.90 |
| $7.55 |
| 12.6x |
| 11.2x |
| 10.3x |
| $13,207.3 |
| $11,527.2 |
|
7. |
| Spartan Motors Inc. |
| SPAR |
| $11.88 |
| $9.75 |
| $14.22 |
| 21.8% |
| (16.5%) |
| $0.55 |
| $0.83 |
| $1.00 |
| 21.5x |
| 14.3x |
| 11.9x |
| $148.7 |
| $132.5 |
|
8. |
| Supreme Industries Inc. |
| STS |
| $10.01 |
| $6.67 |
| $10.81 |
| 50.0% |
| (7.4%) |
| $0.64 |
| NA |
| NA |
| 15.6x |
| NA |
| NA |
| $125.0 |
| $154.8 |
|
9. |
| Thor Industries Inc. |
| THO |
| $37.05 |
| $29.71 |
| $42.97 |
| 24.7% |
| (13.8%) |
| $2.15 |
| $2.58 |
| $2.86 |
| 17.3x |
| 14.4x |
| 13.0x |
| $2,100.0 |
| $1,936.4 |
|
10. |
| Winnebago Industries Inc. |
| WGO |
| $31.41 |
| $29.56 |
| $45.96 |
| 6.2% |
| (31.7%) |
| $1.95 |
| $1.86 |
| $2.20 |
| 16.1x |
| 16.9x |
| 14.3x |
| $1,034.0 |
| $1,014.5 |
|
|
|
|
|
|
|
|
|
|
|
|
|
|
|
|
|
|
|
|
|
|
|
|
|
|
|
|
|
|
|
|
|
|
| 75th Percentile |
|
|
|
|
|
|
|
|
| 43.7% |
| (14.3%) |
|
|
|
|
|
|
| 21.1x |
| 19.7x |
| 14.2x |
|
|
|
|
|
|
| 25th Percentile |
|
|
|
|
|
|
|
|
| 6.4% |
| (39.6%) |
|
|
|
|
|
|
| 12.6x |
| 12.8x |
| 11.1x |
|
|
|
|
|
|
| Average |
|
|
|
|
|
|
|
|
| 23.4% |
| (25.2%) |
|
|
|
|
|
|
| 16.1x |
| 20.1x |
| 12.4x |
|
|
|
|
|
|
| Median |
|
|
|
|
|
|
|
|
| 15.0% |
| (24.1%) |
|
|
|
|
|
|
| 16.1x |
| 14.4x |
| 13.0x |
|
|
|
|
|
|
| (1) Market Cap. represents shares outstanding multiplied by current stock price. |
|
| (2) Enterprise Value represents market value of common stock plus book value of debt, preferred stock and minority interest net of cash. |
|
| (3) A premium of 13.1% is used. |
|
|
|
|
| Source: FactSet |
5
Guideline Publicly Traded Comparable Company Method - Premium Adjusted
Summary Financial and Market Analysis of Stated Companies
(Dollars in millions, except per share amounts)
|
|
|
| LTM |
| FY |
| LTM |
| Enterprise Value/LTM |
| LTM Margins |
| Debt/ |
| Debt/ |
| Bk. Val/ |
| Price/ |
| ||||||||
|
| Selected Companies |
| Ending |
| Ending |
| Revenues |
| Revenue |
| EBITDA |
| EBIT |
| EBITDA |
| EBIT |
| Net Income |
| Equity |
| Total Cap. |
| Share |
| Book |
|
|
|
|
|
|
|
|
|
|
|
|
|
|
|
|
|
|
|
|
|
|
|
|
|
|
|
|
|
|
|
1. |
| Coachmen Industries Inc. |
| 09/2005 |
| 12/2004 |
| $805.6 |
| 25.6% |
| NM |
| NM |
| NM |
| NM |
| NM |
| 9.7% |
| 9.7% |
| 13.40 |
| 0.97 |
|
2. |
| Featherlite Inc. |
| 06/2005 |
| 12/2004 |
| $212.3 |
| 42.4% |
| 8.0x |
| 10.3x |
| 5.3% |
| 4.1% |
| 2.2% |
| 145.9% |
| 145.9% |
| 2.57 |
| 1.74 |
|
3. |
| Monaco Coach Corp. |
| 06/2005 |
| 12/2004 |
| $1,322.2 |
| 32.5% |
| 9.6x |
| 12.6x |
| 3.4% |
| 2.6% |
| 1.4% |
| 9.0% |
| 9.0% |
| 10.94 |
| 1.24 |
|
4. |
| Navistar International Corp. |
| 07/2005 |
| 10/2004 |
| $11,573.0 |
| 46.8% |
| 6.9x |
| 10.7x |
| 6.8% |
| 4.4% |
| 2.5% |
| 568.7% |
| 568.7% |
| 9.76 |
| 3.09 |
|
5. |
| Oshkosh Truck Corp. |
| 06/2005 |
| 09/2004 |
| $2,787.3 |
| 128.0% |
| 12.9x |
| 14.7x |
| 9.9% |
| 8.7% |
| 5.3% |
| 7.7% |
| 7.7% |
| 10.79 |
| 4.49 |
|
6. |
| Paccar Inc. |
| 09/2005 |
| 12/2004 |
| $13,612.8 |
| 84.7% |
| 5.5x |
| 5.7x |
| 15.4% |
| 14.8% |
| 7.8% |
| 0.7% |
| 0.7% |
| 23.61 |
| 3.28 |
|
7. |
| Spartan Motors Inc. |
| 06/2005 |
| 12/2004 |
| $350.2 |
| 37.8% |
| 9.7x |
| 11.8x |
| 3.9% |
| 3.2% |
| 2.0% |
| 0.2% |
| 0.2% |
| 5.63 |
| 2.11 |
|
8. |
| Supreme Industries Inc. |
| 06/2005 |
| 12/2004 |
| $329.3 |
| 47.0% |
| 9.5x |
| 12.4x |
| 5.0% |
| 3.8% |
| 2.4% |
| 41.3% |
| 41.3% |
| 5.85 |
| 1.71 |
|
9. |
| Thor Industries Inc. |
| 07/2005 |
| 07/2005 |
| $2,558.4 |
| 75.7% |
| 9.4x |
| 10.0x |
| 8.0% |
| 7.6% |
| 4.8% |
| — |
| — |
| 10.54 |
| 3.52 |
|
10. |
| Winnebago Industries Inc. |
| 08/2005 |
| 08/2005 |
| $992.0 |
| 102.3% |
| 9.1x |
| 10.1x |
| 11.2% |
| 10.2% |
| 6.6% |
| — |
| — |
| 7.17 |
| 4.38 |
|
|
|
|
|
|
|
|
|
|
|
|
|
|
|
|
|
|
|
|
|
|
|
|
|
|
|
|
|
|
|
|
| 75th Percentile |
|
|
|
|
|
|
| 82.4% |
| 9.6x |
| 12.4x |
| 9.9% |
| 8.7% |
| 5.3% |
| 33.4% |
| 33.4% |
| $10.91 |
| 3.5x |
|
|
| 25th Percentile |
|
|
|
|
|
|
| 39.0% |
| 8.0x |
| 10.1x |
| 5.0% |
| 3.8% |
| 2.2% |
| 0.3% |
| 0.3% |
| $6.18 |
| 1.7x |
|
|
| Average |
|
|
|
|
|
|
| 62.3% |
| 9.0x |
| 10.9x |
| 7.6% |
| 6.6% |
| 3.9% |
| 78.3% |
| 78.3% |
| $10.03 |
| 2.7x |
|
|
| Median |
|
|
|
|
|
|
| 46.9% |
| 9.4x |
| 10.7x |
| 6.8% |
| 4.4% |
| 2.5% |
| 8.3% |
| 8.3% |
| $10.15 |
| 2.6x |
|
6
Comparable Transaction Analysis:
• Stifel examined a universe of mergers and acquisitions based on SIC codes and industry classifications. Through a combination of quantitative and qualitative methods, Stifel narrowed this universe down to 2 deals which it deems to be comparable.
• After calculating appropriate transaction-derived pricing multiples Stifel applied these multiples to the corresponding financial fundamentals of the Company and calculated a range of indicated values for the Company.
• Stifel adjusted the comparable transaction values downward to remove the synergy portion of the change of control premiums and return from a “Synergistic” change of control value to a “Going concern” enterprise value. The composition of the governance portion and synergy portion of the change of control premium was determined based upon a study of announced premiums in the industry since 1993.
• Stifel examined the 1 month premium to stock price paid in deals since 1993 and found the median premium to be approximately 30%. Based on experience, Stifel deemed 13.1% to be the control premium and 16.9% to be the synergistic premium. The results were discounted by the synergistic premium to attain a going concern value.
• Weighting the implied per share prices gives a value of $8.34.
1
Comparable Transaction Analysis:

|
| Implied Per Share Value Based on Merger Market Multiples |
|
|
|
|
| ||||||
|
| Actual |
| Actual Per |
| Multiple Net |
| Net of |
|
|
|
|
|
|
| Median |
| Share |
| of Synergy |
| Synergy |
|
|
| Weighted |
|
|
| Multiple |
| Value |
| Premium |
| Premium |
| Weighting |
| Value |
|
Enterprise Value / LTM Sales |
| 77.6% |
| $30.16 |
| 71.6% |
| $27.62 |
| 10.0% |
| $2.76 |
|
Enterprise Value / LTM EBITDA |
| 7.9x |
| 8.83 |
| 7.3x |
| 7.92 |
| 50.0% |
| $3.96 |
|
Enterprise Value / LTM EBIT |
| 8.6x |
| 4.48 |
| 7.9x |
| 3.91 |
| 25.0% |
| $0.98 |
|
Enterprise Value / LTM Net Income |
| 19.3x |
| 4.86 |
| 17.8x |
| 4.27 |
| 15.0% |
| $0.64 |
|
|
|
|
|
|
|
|
|
|
|
|
|
|
|
Implied Value |
|
|
| $8.34 |
| ||||||||
Chariot’s closing price on 10/28/05 was $6.70. |
|
|
|
|
|
|
* Because of the proximity to the end of the fiscal year, 2005 projected earnings were used for LTM ratios. |
2
Comparable Transaction Analysis:
|
|
|
|
|
|
|
| Enterprise Value / LTM |
| |||||||
Announc. |
|
|
|
|
| Enterprise |
|
|
|
|
|
|
| Net |
| |
Date |
| Target Name |
| Acquiror Name |
| Value |
| Sales |
| EBITDA |
| EBIT |
| Income |
| |
|
|
|
|
|
|
|
|
|
|
|
|
|
|
|
| |
10/31/01 |
| Keystone RV Co. |
| Thor Industries, Inc. |
| $ | 217.2 |
| 57.1 | % | 8.3 | x | 8.5 | x | 14.8 | x |
9/1/99 |
| Blue Bird Corp. |
| Henlys Group PLC |
| $ | 657.1 |
| 98.1 | % | 7.6 | x | 8.7 | x | 23.9 | x |
|
|
|
|
|
|
|
|
|
|
|
|
|
|
|
| |
|
|
|
| Median |
|
|
| 77.6 | % | 7.9 | x | 8.6 | x | 19.3 | x | |
|
|
|
| 75th Percentile |
|
|
| 87.8 | % | 8.1 | x | 8.7 | x | 21.6 | x | |
|
|
|
| 25th Percentile |
|
|
| 67.4 | % | 7.8 | x | 8.6 | x | 17.1 | x | |
Comparable Transaction Analysis -Excluding Synergies:*
|
|
|
|
|
|
|
| Enterprise Value / |
| |||||||
Announc. |
|
|
|
|
| Enterprise |
|
|
|
|
|
|
| Net |
| |
Date |
| Target Name |
| Acquiror Name |
| Value |
| Sales |
| EBITDA |
| EBIT |
| Income |
| |
|
|
|
|
|
|
|
|
|
|
|
|
|
|
|
| |
10/31/01 |
| Keystone RV Co. |
| Thor Industries, Inc. |
| $ | 199.2 |
| 52.4 | % | 7.6 | x | 7.8 | x | 13.5 | x |
9/1/99 |
| Blue Bird Corp. |
| Henlys Group PLC |
| $ | 608.8 |
| 90.8 | % | 7.0 | x | 8.1 | x | 22.1 | x |
|
|
|
|
|
|
|
|
|
|
|
|
|
|
|
| |
|
|
|
| Median |
|
|
| 71.6 | % | 7.3 | x | 7.9 | x | 17.8 | x | |
|
|
|
| 75th Percentile |
|
|
| 81.2 | % | 7.4 | x | 8.0 | x | 20.0 | x | |
|
|
|
| 25th Percentile |
|
|
| 62.0 | % | 7.2 | x | 7.9 | x | 15.7 | x | |
* A discount of 13.0% from the synergistic change of control value is used to equate to the observed 16.9% synergy premium.
3
Discounted Cash Flow To Firm Analysis:
• The DCF analysis presents the free cash flow of the Company on an unlevered basis based on estimated future operating performance of the Company.
• The analysis is based on the following outlook for EBITDA growth into perpetuity:
2006 - 2010: Management Estimates
2011: 24.6% annual growth
2012: 19.7% annual growth
2013 - Perpetuity: 5.0% growth based on Management Estimates
• The present value of these payments are calculated using dicount rates of 16.45%, 21.77% and 24.98%.
• Evenly weighting all nine results shown below results in a per share value of $4.36.
|
| Present Value of Equity Per Share |
| |||||||
|
| Based on Discount Rates of: |
| |||||||
Perpetuity Growth Rate Assumptions |
| 16.45% |
| 21.77% |
| 24.98% |
| |||
|
| Dollar Value |
| Dollar Value |
| Dollar Value |
| |||
|
|
|
|
|
|
|
| |||
4.00% |
| $ | 5.93 |
| $ | 3.71 |
| $ | 2.90 |
|
|
|
|
|
|
|
|
| |||
5.00% |
| $ | 6.26 |
| $ | 3.83 |
| $ | 2.97 |
|
|
|
|
|
|
|
|
| |||
6.00% |
| $ | 6.65 |
| $ | 3.96 |
| $ | 3.05 |
|
Chariot’s closing price on 10/28/05 was $6.70.
1
Discounted Cash Flow To Firm Analysis:
The following page provides additional detail on the DCF analysis for Chariot.
Table 1 - Calculation of Free Cash Flows
|
| 2006 |
| 2007 |
| 2008 |
| 2009 |
| 2010 |
|
Net Income |
| 6,284 |
| 3,931 |
| 2,755 |
| 1,800 |
| 1,905 |
|
Net Interest Expense / (Income) |
| 1,520 |
| 1,435 |
| 1,330 |
| 1,264 |
| 1,200 |
|
Tax Effect |
| 62 | % | 62 | % | 62 | % | 62 | % | 62 | % |
After Tax Net Interest Expense / (Income) |
| 943 |
| 890 |
| 825 |
| 783 |
| 744 |
|
Net Income Plus Net Interest Income |
| 7,227 |
| 4,821 |
| 3,579 |
| 2,583 |
| 2,649 |
|
|
|
|
|
|
|
|
|
|
|
|
|
Non-Cash Items: |
|
|
|
|
|
|
|
|
|
|
|
Depreciation |
| 3,625 |
| 3,768 |
| 3,911 |
| 4,053 |
| 4,196 |
|
Other Non Cash Charges |
| 405 |
| 335 |
| 195 |
| 103 |
| 0 |
|
Total Non-Cash Charges |
| 4,030 |
| 4,103 |
| 4,106 |
| 4,156 |
| 4,196 |
|
|
|
|
|
|
|
|
|
|
|
|
|
Cash Items: |
|
|
|
|
|
|
|
|
|
|
|
Change in Working Capital Increase / (Decrease) |
| (6,107 | ) | (2,031 | ) | (2,168 | ) | 771 |
| (33 | ) |
Capital Expenditures |
| 2,000 |
| 2,000 |
| 2,000 |
| 2,000 |
| 2,000 |
|
Other |
| 0 |
| 0 |
| 0 |
| 0 |
| 0 |
|
Total Cash Charges |
| (4,107 | ) | (31 | ) | (168 | ) | 2,771 |
| 1,967 |
|
|
|
|
|
|
|
|
|
|
|
|
|
Free Cash Flow to the Firm |
| 15,364 |
| 8,954 |
| 7,853 |
| 3,969 |
| 4,879 |
|
Table 2 - Present Value of the Firm
Growth Rate |
| Discount Rate |
| ||||
2013 - Perpetuity |
| 16.45% |
| 21.77% |
| 24.98% |
|
4.0% |
| 55,081 |
| 41,057 |
| 35,970 |
|
5.0% |
| 57,128 |
| 41,806 |
| 36,426 |
|
6.0% |
| 59,566 |
| 42,650 |
| 36,929 |
|
Table 3 - Present Value of Equity
Growth Rate |
| Discount Rate |
| ||||
2013 - Perpetuity |
| 16.45% |
| 21.77% |
| 24.98% |
|
4.0% |
| 37,388 |
| 23,364 |
| 18,278 |
|
5.0% |
| 39,435 |
| 24,113 |
| 18,733 |
|
6.0% |
| 41,874 |
| 24,957 |
| 19,237 |
|
Table 4 - Present Value of Equity Per Share
Growth Rate |
| Discount Rate |
| ||||
2013 - Perpetuity |
| 16.45% |
| 21.77% |
| 24.98% |
|
4.0% |
| 5.93 |
| 3.71 |
| 2.90 |
|
5.0% |
| 6.26 |
| 3.83 |
| 2.97 |
|
6.0% |
| 6.65 |
| 3.96 |
| 3.05 |
|
Dollars in thousands, except per share amounts.
2
Present Value of a Share Method
• Present Value of One Share of Chariot Stock (Including Dividends)
• The present value of one share of Chariot stock represents the stream of dividends estimated to be paid by the Company through 2010 when a terminal value based on normalized earnings is applied.
• The present value analysis is based upon Management estimated earnings through 2010, a range of assumed price / earnings ratios for publicly traded companies, and discount rates of 16.45%, 21.77% and 24.98% derived from the CAPM.
• The range of price to earnings ratios used to determine possible future stock prices was 10.0x - 16.0x earnings. These ratios were derived from the trading multiples of the Company’s peer group over a period of 10 years.
• Stifel adjusted the indicated values upwards by 13.1% to reconcile the difference between an “As-if-freely-tradable” minority value from the use of observed price to earnings multiples and a “Going concern” enterprise value.
• Evenly weighting each of the 15 values including the control premium results in a per share value of $5.27.
Present Value of One Share of Chariot Stock
Discount Rate Range |
| 16.45% - 24.98 | % |
Price to Earnings Ratio Range |
| 10.0x - 16.0 | x |
Range of Present Value of One Share of Chariot Stock Excluding Control Premium |
| $3.17 - $6.68 |
|
Range of Present Value of One Share of Chariot Stock Including Control Premium* |
| $3.58 - $7.55 |
|
* A control premium of 13.1% was used which includes goverance considerations but excludes synergies. |
Chariot’s closing price on 10/28/05 was $6.70. |
1
Present Value of a Share Method
• Present Value of One Share of Chariot Stock (Including Dividends)
Excluding Control Premium
Discount |
| Price to Earnings Ratio |
| |||||||||||||
Rates |
| 10.00x |
| 11.50x |
| 13.00x |
| 14.50x |
| 16.00x |
| |||||
16.45 | % | $ | 4.38 |
| $ | 4.96 |
| $ | 5.53 |
| $ | 6.10 |
| $ | 6.68 |
|
21.77 | % | 3.57 |
| 4.02 |
| 4.48 |
| 4.94 |
| 5.40 |
| |||||
24.98 | % | 3.17 |
| 3.57 |
| 3.97 |
| 4.37 |
| 4.78 |
| |||||
Including Control Premium
Discount |
| Price to Earnings Ratio |
| |||||||||||||
Rates |
| 10.0x |
| 11.5x |
| 13.0x |
| 14.5x |
| 16.0x |
| |||||
16.45 | % | $ | 4.96 |
| $ | 5.60 |
| $ | 6.25 |
| $ | 6.90 |
| $ | 7.55 |
|
21.77 | % | 4.03 |
| 4.55 |
| 5.07 |
| 5.59 |
| 6.11 |
| |||||
24.98 | % | 3.58 |
| 4.04 |
| 4.49 |
| 4.95 |
| 5.40 |
| |||||
2

|
| Open |
| High |
| Low |
| Close |
|
|
|
Project Chariot |
| $3.59 |
| $7.05 |
| $2.70 |
| $6.70 |
| — |
|
Date |
| 10/27/00 |
| 9/20/05 |
| 10/11/02 |
| 10/28/05 |
| — |
|
% Chg from Open |
| — |
| 96.2% |
| (24.9%) |
| 86.4% |
| — |
|
Average Daily Volume (‘000) |
| — |
| — |
| — |
| — |
| 7.5 |
|
Excludes the Company’s tender offer in 2004 and option/share repurchases.
Source: FactSet Data Systems
1
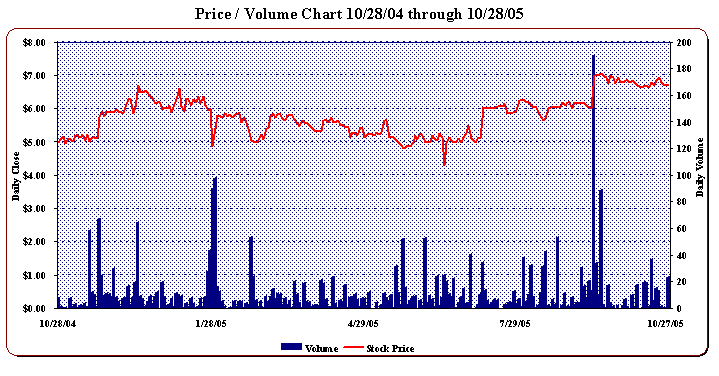
|
| Open |
| High |
| Low |
| Close |
|
|
|
Project Chariot |
| $4.98 |
| $7.05 |
| $4.30 |
| $6.70 |
| — |
|
Date |
| 10/28/04 |
| 9/20/05 |
| 6/17/05 |
| 10/28/05 |
| — |
|
% Chg from Open |
| — |
| 41.6% |
| (13.7%) |
| 34.5% |
| — |
|
Average Daily Volume (‘000) |
| — |
| — |
| — |
| — |
| 11.0 |
|
Excludes the Company’s tender offer in 2004 and option/share repurchases.
Source: FactSet Data Systems
2
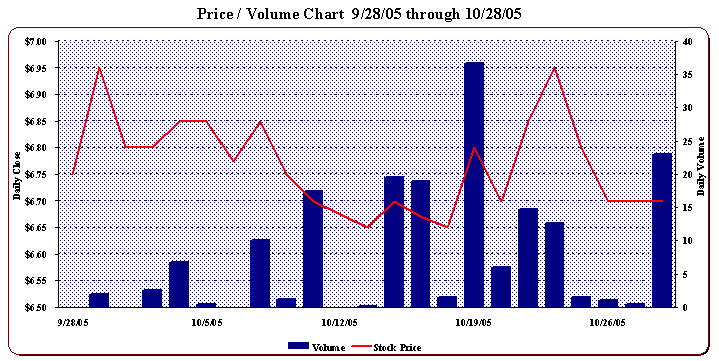
|
| Open |
| High |
| Low |
| Close |
|
|
|
Project Chariot |
| $6.75 |
| $6.95 |
| $6.65 |
| $6.70 |
| — |
|
Date |
| 9/28/05 |
| 9/29/05 |
| 10/13/05 |
| 10/28/05 |
| — |
|
% Chg from Open |
| — |
| 3.0% |
| (1.5%) |
| (0.7%) |
| — |
|
Average Daily Volume (‘000) |
| — |
| — |
| — |
| — |
| 7.7 |
|
Excludes the Company’s tender offer in 2004 and option/share repurchases.
Source: FactSet Data Systems
3
Historical Price Summary
2000 - 2005 YTD
High Close |
| $ | 7.05 |
|
Low Close |
| $ | 2.70 |
|
High Volume |
| 212,300 |
| |
Low Volume |
| 0 |
| |
Average Volume |
| 8,258 |
| |
2004
High Close |
| $ | 6.70 |
|
Low Close |
| $ | 4.30 |
|
High Volume |
| 84,941 |
| |
Low Volume |
| 0 |
| |
Average Volume |
| 8,158 |
| |
2003
High Close |
| $ | 5.40 |
|
Low Close |
| $ | 3.05 |
|
High Volume |
| 110,032 |
| |
Low Volume |
| 0 |
| |
Average Volume |
| 6,916 |
| |
2002
High Close |
| $ | 5.30 |
|
Low Close |
| $ | 2.70 |
|
High Volume |
| 65,900 |
| |
Low Volume |
| 0 |
| |
Average Volume |
| 4,967 |
| |
2001
High Close |
| $ | 4.50 |
|
Low Close |
| $ | 2.94 |
|
High Volume |
| 81,300 |
| |
Low Volume |
| 0 |
| |
Average Volume |
| 5,624 |
| |
2005 First Quarter
High Close |
| $ | 6.60 |
|
Low Close |
| $ | 4.85 |
|
High Volume |
| 97,609 |
| |
Low Volume |
| 0 |
| |
Average Volume |
| 10,364 |
| |
2004 First Quarter
High Close |
| $ | 5.35 |
|
Low Close |
| $ | 4.30 |
|
High Volume |
| 36,591 |
| |
Low Volume |
| 0 |
| |
Average Volume |
| 7,064 |
| |
2003 First Quarter
High Close |
| $ | 4.25 |
|
Low Close |
| $ | 3.41 |
|
High Volume |
| 11,200 |
| |
Low Volume |
| 0 |
| |
Average Volume |
| 2,735 |
| |
2002 First Quarter
High Close |
| $ | 4.57 |
|
Low Close |
| $ | 3.28 |
|
High Volume |
| 65,900 |
| |
Low Volume |
| 0 |
| |
Average Volume |
| 4,334 |
| |
2001 First Quarter
High Close |
| $ | 3.77 |
|
Low Close |
| $ | 2.97 |
|
High Volume |
| 77,300 |
| |
Low Volume |
| 0 |
| |
Average Volume |
| 7,662 |
| |
2005 Second Quarter
High Close |
| $ | 5.75 |
|
Low Close |
| $ | 4.30 |
|
High Volume |
| 52,600 |
| |
Low Volume |
| 0 |
| |
Average Volume |
| 9,176 |
| |
2004 Second Quarter
High Close |
| $ | 5.99 |
|
Low Close |
| $ | 4.75 |
|
High Volume |
| 84,941 |
| |
Low Volume |
| 0 |
| |
Average Volume |
| 9,992 |
| |
2003 Second Quarter
High Close |
| $ | 3.62 |
|
Low Close |
| $ | 3.05 |
|
High Volume |
| 58,900 |
| |
Low Volume |
| 0 |
| |
Average Volume |
| 8,279 |
| |
2002 Second Quarter
High Close |
| $ | 5.30 |
|
Low Close |
| $ | 4.01 |
|
High Volume |
| 43,300 |
| |
Low Volume |
| 0 |
| |
Average Volume |
| 7,233 |
| |
2001Second Quarter
High Close |
| $ | 4.12 |
|
Low Close |
| $ | 2.94 |
|
High Volume |
| 55,800 |
| |
Low Volume |
| 0 |
| |
Average Volume |
| 4,895 |
| |
2005 Third Quarter
High Close |
| $ | 7.05 |
|
Low Close |
| $ | 5.00 |
|
High Volume |
| 190,230 |
| |
Low Volume |
| 0 |
| |
Average Volume |
| 13,968 |
| |
2004 Third Quarter
High Close |
| $ | 6.00 |
|
Low Close |
| $ | 4.95 |
|
High Volume |
| 27,354 |
| |
Low Volume |
| 0 |
| |
Average Volume |
| 5,995 |
| |
2003 Third Quarter
High Close |
| $ | 4.05 |
|
Low Close |
| $ | 3.20 |
|
High Volume |
| 25,100 |
| |
Low Volume |
| 0 |
| |
Average Volume |
| 5,256 |
| |
2002 Third Quarter
High Close |
| $ | 5.10 |
|
Low Close |
| $ | 3.36 |
|
High Volume |
| 56,300 |
| |
Low Volume |
| 0 |
| |
Average Volume |
| 5,095 |
| |
2001 Third Quarter
High Close |
| $ | 4.50 |
|
Low Close |
| $ | 3.05 |
|
High Volume |
| 81,300 |
| |
Low Volume |
| 0 |
| |
Average Volume |
| 6,258 |
| |
2005 Fourth Quarter
High Close |
| $ | 6.95 |
|
Low Close |
| $ | 6.65 |
|
High Volume |
| 36,633 |
| |
Low Volume |
| 0 |
| |
Average Volume |
| 8,301 |
| |
2004 Fourth Quarter
High Close |
| $ | 6.70 |
|
Low Close |
| $ | 4.95 |
|
High Volume |
| 66,550 |
| |
Low Volume |
| 0 |
| |
Average Volume |
| 9,621 |
| |
2003 Fourth Quarter
High Close |
| $ | 5.40 |
|
Low Close |
| $ | 3.55 |
|
High Volume |
| 110,032 |
| |
Low Volume |
| 200 |
| |
Average Volume |
| 11,284 |
| |
2002 Fourth Quarter
High Close |
| $ | 4.45 |
|
Low Close |
| $ | 2.70 |
|
High Volume |
| 29,100 |
| |
Low Volume |
| 0 |
| |
Average Volume |
| 3,177 |
| |
2001 Fourth Quarter
High Close |
| $ | 4.12 |
|
Low Close |
| $ | 3.06 |
|
High Volume |
| 47,600 |
| |
Low Volume |
| 0 |
| |
Average Volume |
| 3,805 |
| |
Excludes the Company’s tender offer in 2004 and option/share repurchases.
Source: FactSet Data Systems
4
Calculation of the Required Holding Period Rate Of Return
• The following table uses the Capital Asset Pricing Model to calculate the required rate of return.
|
| Range |
|
|
| ||||
|
| Low |
| Midpoint |
| High |
| Source of data: |
|
30-Year Treasury yield |
| 4.77 | % | 4.77 | % | 4.77 | % | 10/28/05 yield |
|
|
|
|
|
|
|
|
|
|
|
Long-term average return on large company stocks |
| 12.40 | % | 12.40 | % | 12.40 | % | Ibbotson Associates |
|
Market risk premium |
| 7.63 | % | 7.63 | % | 7.63 | % |
|
|
Adjusted Beta |
| 0.86 |
| 1.56 |
| 1.98 |
| Bloomberg LP |
|
Beta adjusted risk premium |
| 6.58 | % | 11.90 | % | 15.11 | % |
|
|
Long-term average small stock premium |
| 5.10 | % | 5.10 | % | 5.10 | % | Ibbotson Associates |
|
Total equity premium |
| 11.68 | % | 17.00 | % | 20.21 | % |
|
|
|
|
|
|
|
|
|
|
|
|
Base holding period required return |
| 16.45 | % | 21.77 | % | 24.98 | % |
|
|
|
|
|
|
|
|
|
|
|
|
Estimated range of required holding period returns |
| 16.45 | % | 21.77 | % | 24.98 | % |
|
|
* The betas are based on the 10th percentile, the median and the 90th percentile of the betas of comparable companies.
1
Calculation of the Required Holding Period Rate Of Return
• The following table shows the calculation of Beta which is used in the Capital Asset Pricing Model to calculate the required rate of return.
|
| Adjusted |
| Raw |
| |
Comparable companies: |
| Beta |
| Beta |
| |
|
|
|
|
|
| |
Coachmen Industries Inc. (COA) |
| 1.66 |
| 1.99 |
| |
Featherlite Inc. (FTHR) |
| 1.30 |
| 1.44 |
| |
Monaco Coach Corp. (MNC) |
| 1.79 |
| 2.18 |
| |
Navistar International (NAV) |
| 1.84 |
| 2.26 |
| |
Oshkosh Truck Corp. (OSK) |
| 1.25 |
| 1.38 |
| |
Paccar Inc. (PCAR) |
| 1.46 |
| 1.69 |
| |
Spartan Motors Inc. (SPAR) |
| 0.90 |
| 0.84 |
| |
Supreme Industries Inc. (STS) |
| 0.53 |
| 0.30 |
| |
Thor Industries Inc. (THO) |
| 1.99 |
| 2.49 |
| |
Winnebago Industries (WGO) |
| 1.98 |
| 2.48 |
| |
|
|
|
|
|
| |
| 10th Percentile |
| 0.86 |
| 0.79 |
|
| 50th Percentile / Median |
| 1.56 |
| 1.84 |
|
| 90th Percentile |
| 1.98 |
| 2.48 |
|
Adjusted Beta = ..67*Raw Beta + .33*1
2
Income Statement
|
|
|
|
|
|
|
|
|
|
|
|
|
| Projected twelve months ended October 31, |
| ||||||||||||||||||||||
($in 000’s, except per share) |
| 1999 |
| 2000 |
| 2001 |
| 2002 |
| 2003 |
| 2004 |
| 2005 |
| 2006 |
| 2007 |
| 2008 |
| 2009 |
| 2010 |
| ||||||||||||
Sales |
| $ | 196,398 |
| $ | 220,912 |
| $ | 207,626 |
| $ | 200,843 |
| $ | 204,618 |
| $ | 208,203 |
| $ | 267,645 |
| $ | 308,729 |
| $ | 273,107 |
| $ | 250,992 |
| $ | 231,107 |
| $ | 232,212 |
|
Cost of Sales |
| 165,978 |
| 194,141 |
| 183,143 |
| 177,705 |
| 181,608 |
| 184,128 |
| 240,924 |
| 275,780 |
| 244,553 |
| 224,642 |
| 206,463 |
| 207,562 |
| ||||||||||||
Gross Profit |
| 30,420 |
| 26,771 |
| 24,483 |
| 23,138 |
| 23,010 |
| 24,075 |
| 26,721 |
| 32,949 |
| 28,554 |
| 26,350 |
| 24,644 |
| 24,650 |
| ||||||||||||
SG&A, R&D, M&S |
| 20,047 |
| 20,725 |
| 19,625 |
| 18,387 |
| 18,653 |
| 19,263 |
| 20,877 |
| 21,293 |
| 20,779 |
| 20,578 |
| 20,478 |
| 20,378 |
| ||||||||||||
Operating Profit |
| 10,373 |
| 6,046 |
| 4,858 |
| 4,751 |
| 4,357 |
| 4,812 |
| 5,845 |
| 11,656 |
| 7,775 |
| 5,773 |
| 4,167 |
| 4,273 |
| ||||||||||||
|
|
|
|
|
|
|
|
|
|
|
|
|
|
|
|
|
|
|
|
|
|
|
|
|
| ||||||||||||
Interest / Other income (net) |
| 1,504 |
| 1,618 |
| 2,029 |
| 1,501 |
| 1,722 |
| 951 |
| 1,816 |
| 1,520 |
| 1,435 |
| 1,330 |
| 1,264 |
| 1,200 |
| ||||||||||||
Total Net Interest Expense |
| 1,504 |
| 1,618 |
| 2,029 |
| 1,501 |
| 1,722 |
| 951 |
| 1,816 |
| 1,520 |
| 1,435 |
| 1,330 |
| 1,264 |
| 1,200 |
| ||||||||||||
Income Taxes |
| 3,460 |
| 1,210 |
| 950 |
| 1,260 |
| 990 |
| 1,530 |
| 1,531 |
| 3,852 |
| 2,409 |
| 1,688 |
| 1,103 |
| 1,167 |
| ||||||||||||
Net Income |
| 5,409 |
| 3,218 |
| 1,879 |
| 1,990 |
| 1,645 |
| 2,331 |
| 2,498 |
| 6,284 |
| 3,931 |
| 2,755 |
| 1,800 |
| 1,905 |
| ||||||||||||
Straight Preferred Dividends |
| 0 |
| 0 |
| 0 |
| 0 |
| 0 |
| 0 |
| 0 |
| 0 |
| 0 |
| 0 |
| 0 |
| 0 |
| ||||||||||||
Convertible Pref. Dividends |
| 0 |
| 0 |
| 0 |
| 0 |
| 0 |
| 0 |
| 0 |
| 0 |
| 0 |
| 0 |
| 0 |
| 0 |
| ||||||||||||
Net Income to Common |
| $ | 5,409 |
| $ | 3,218 |
| $ | 1,879 |
| $ | 1,990 |
| $ | 1,645 |
| $ | 2,331 |
| $ | 2,498 |
| $ | 6,284 |
| $ | 3,931 |
| $ | 2,755 |
| $ | 1,800 |
| $ | 1,905 |
|
Earnings Per Share (including non-recurring items) |
| 0.72 |
| 0.42 |
| 0.26 |
| 0.29 |
| 0.24 |
| 0.38 |
| 0.40 |
| 0.99 |
| 0.61 |
| 0.43 |
| 0.28 |
| 0.30 |
| ||||||||||||
Earnings Per Share (excluding non-recurring items) |
| 0.72 |
| 0.42 |
| 0.26 |
| 0.29 |
| 0.24 |
| 0.33 |
| 0.60 |
| 0.99 |
| 0.61 |
| 0.43 |
| 0.28 |
| 0.30 |
| ||||||||||||
Wtd. Avg. Shares Outstanding |
| 7,551,247 |
| 7,574,915 |
| 7,131,734 |
| 6,854,222 |
| 6,855,955 |
| 6,211,112 |
| 6,300,000 |
| 6,350,000 |
| 6,400,000 |
| 6,450,000 |
| 6,455,000 |
| 6,455,000 |
| ||||||||||||
Actual Shares Outstanding |
| 7,465,406 |
| 7,424,455 |
| 7,291,755 |
| 7,115,629 |
| 7,247,865 |
| 6,369,327 |
| 6,111,513 |
| 6,233,598 |
| 6,349,582 |
| 6,423,364 |
| 6,454,413 |
| 6,454,413 |
| ||||||||||||
EBITDA (excludes non-reccuring items) |
| 11,437 |
| 7,527 |
| 6,354 |
| 6,756 |
| 5,955 |
| 6,965 |
| 9,248 |
| 14,166 |
| 10,443 |
| 8,548 |
| 7,060 |
| 7,269 |
| ||||||||||||
EBIT (excludes non-recurring items) |
| 8,869 |
| 4,428 |
| 2,829 |
| 3,250 |
| 2,635 |
| 3,572 |
| 5,331 |
| 10,136 |
| 6,340 |
| 4,443 |
| 2,903 |
| 3,072 |
| ||||||||||||
EBITDA / Total Interest Expense |
| 7.60 |
| 4.65 |
| 3.13 |
| 4.50 |
| 3.46 |
| 4.91 |
| 5.09 |
| 9.32 |
| 7.28 |
| 6.43 |
| 5.59 |
| 6.06 |
| ||||||||||||
EBIT / Total Interest Expense |
| 5.90 |
| 2.74 |
| 1.39 |
| 2.17 |
| 1.53 |
| 2.52 |
| 2.94 |
| 6.67 |
| 4.42 |
| 3.34 |
| 2.30 |
| 2.56 |
| ||||||||||||
EBITDA / Revenues |
| 5.8 | % | 3.4 | % | 3.1 | % | 3.4 | % | 2.9 | % | 3.3 | % | 3.5 | % | 4.6 | % | 3.8 | % | 3.4 | % | 3.1 | % | 3.1 | % | ||||||||||||
EBIT / Revenues |
| 4.5 | % | 2.0 | % | 1.4 | % | 1.6 | % | 1.3 | % | 1.7 | % | 2.0 | % | 3.3 | % | 2.3 | % | 1.8 | % | 1.3 | % | 1.3 | % | ||||||||||||
|
|
|
|
|
|
|
|
|
|
|
|
|
|
|
|
|
|
|
|
|
|
|
|
|
| ||||||||||||
Return on Average Common Equity |
|
|
| 42.2 |
| 19.8 |
| 20.0 |
| 15.8 |
| 20.2 |
| 19.2 |
| 38.3 |
| 19.2 |
| 12.1 |
| 7.5 |
| 7.7 |
| ||||||||||||
Return on Average Assets |
|
|
| 4.3 |
| 2.5 |
| 2.7 |
| 2.2 |
| 3.0 |
| 3.0 |
| 7.3 |
| 4.5 |
| 3.2 |
| 2.1 |
| 2.2 |
| ||||||||||||
* Years 2000 - 2004 have been adjusted to reflect the Company’s financial restatement except for actual shares outstanding. 1999 financials and actual shares outstanding are based on originally reported financials.
1
Cash Flow Statement
Chariot Financial Summary
|
|
|
|
|
|
|
|
|
|
|
|
|
| Projected twelve months ended October 31, |
| ||||||||||||||||
($in 000’s, except per share) |
| 1999 |
| 2000 |
| 2001 |
| 2002 |
| 2003 |
| 2004 |
| 2005 |
| 2006 |
| 2007 |
| 2008 |
| 2009 |
| 2010 |
| ||||||
Net Income to Common |
|
|
|
|
|
|
|
|
|
|
|
|
| $ | 2,498 |
| $ | 6,284 |
| $ | 3,931 |
| $ | 2,755 |
| $ | 1,800 |
| $ | 1,905 |
|
Depreciation & Amortization |
|
|
|
|
|
|
|
|
|
|
|
|
| 3,943 |
| 4,030 |
| 4,103 |
| 4,106 |
| 4,156 |
| 4,196 |
| ||||||
Funds From Operations |
|
|
|
|
|
|
|
|
|
|
|
|
| 6,441 |
| 10,314 |
| 8,034 |
| 6,860 |
| 5,956 |
| 6,101 |
| ||||||
(Increase) / Decrease in NWC |
|
|
|
|
|
|
|
|
|
|
|
|
| (2,773 | ) | 6,107 |
| 2,031 |
| 2,168 |
| (771 | ) | 33 |
| ||||||
Cash Flow From Operations |
|
|
|
|
|
|
|
|
|
|
|
|
| 3,668 |
| 16,421 |
| 10,065 |
| 9,028 |
| 5,186 |
| 6,134 |
| ||||||
Capital Expenditures |
|
|
|
|
|
|
|
|
|
|
|
|
| (2,000 | ) | (2,000 | ) | (2,000 | ) | (2,000 | ) | (2,000 | ) | (2,000 | ) | ||||||
Free Cash Flow |
|
|
|
|
|
|
|
|
|
|
|
|
| 1,668 |
| 14,421 |
| 8,065 |
| 7,028 |
| 3,186 |
| 4,134 |
| ||||||
|
|
|
|
|
|
|
|
|
|
|
|
|
|
|
|
|
|
|
|
|
|
|
|
|
| ||||||
Debt Issuance, (Repayments): |
|
|
|
|
|
|
|
|
|
|
|
|
|
|
|
|
|
|
|
|
|
|
|
|
| ||||||
Existing Straight Debt |
|
|
|
|
|
|
|
|
|
|
|
|
| (660 | ) | (3,773 | ) | (1,088 | ) | (1,340 | ) | (848 | ) | (806 | ) | ||||||
Additional Debt Financing |
|
|
|
|
|
|
|
|
|
|
|
|
| 0 |
| 0 |
| 0 |
| 0 |
| 0 |
| 0 |
| ||||||
Debt Issuance, (Repayments) |
|
|
|
|
|
|
|
|
|
|
|
|
| (660 | ) | (3,773 | ) | (1,088 | ) | (1,340 | ) | (848 | ) | (806 | ) | ||||||
Common Stock Dividends |
|
|
|
|
|
|
|
|
|
|
|
|
| (1,008 | ) | (1,016 | ) | (1,024 | ) | (1,032 | ) | (1,033 | ) | (1,033 | ) | ||||||
Equity (Reduction) Issuance |
|
|
|
|
|
|
|
|
|
|
|
|
| 0 |
| 0 |
| 0 |
| 0 |
| 0 |
| 0 |
| ||||||
Other |
|
|
|
|
|
|
|
|
|
|
|
|
| 0 |
| 0 |
| 0 |
| 0 |
| 0 |
| 0 |
| ||||||
Change in Cash and Equivalents |
|
|
|
|
|
|
|
|
|
|
|
|
| (0 | ) | 9,632 |
| 5,953 |
| 4,657 |
| 1,304 |
| 2,296 |
| ||||||
Beginning Cash and Equivalents |
|
|
|
|
|
|
|
|
|
|
|
|
| 163 |
| 163 |
| 9,795 |
| 15,747 |
| 20,404 |
| 21,708 |
| ||||||
Ending Cash and Equivalents |
|
|
|
|
|
|
|
|
|
|
|
|
| $ | 163 |
| $ | 9,795 |
| $ | 15,747 |
| $ | 20,404 |
| $ | 21,708 |
| $ | 24,004 |
|
|
|
|
|
|
|
|
|
|
|
|
|
|
|
|
|
|
|
|
|
|
|
|
|
|
| ||||||
|
|
|
|
|
|
|
|
|
|
|
|
|
|
|
|
|
|
|
|
|
|
|
|
|
| ||||||
Funds From Operations Per Share |
|
|
|
|
|
|
|
|
|
|
|
|
| $ | 1.02 |
| $ | 1.62 |
| $ | 1.26 |
| $ | 1.06 |
| $ | 0.92 |
| $ | 0.95 |
|
|
|
|
|
|
|
|
|
|
|
|
|
|
|
|
|
|
|
|
|
|
|
|
|
|
| ||||||
Cash Flow From Operations Per Share |
|
|
|
|
|
|
|
|
|
|
|
|
| $ | 0.58 |
| $ | 2.59 |
| $ | 1.57 |
| $ | 1.40 |
| $ | 0.80 |
| $ | 0.95 |
|
|
|
|
|
|
|
|
|
|
|
|
|
|
|
|
|
|
|
|
|
|
|
|
|
|
| ||||||
Free Cash Flow From Operations Per Share |
|
|
|
|
|
|
|
|
|
|
|
|
| $ | 0.26 |
| $ | 2.27 |
| $ | 1.26 |
| $ | 1.09 |
| $ | 0.49 |
| $ | 0.64 |
|
2