UNITED STATES SECURITIES AND EXCHANGE COMMISSION
Washington, D.C. 20549
FORM 10-K
(Mark One)
X | ANNUAL REPORT PURSUANT TO SECTION 13 OR 15(d) OF THE SECURITIES EXCHANGE ACT OF 1934 |
| For the Fiscal Year ended December 31, 2006 |
OR
| TRANSITION REPORT PURSUANT TO SECTION 13 OR 15(d) OF THE SECURITIES EXCHANGE ACT OF 1934 |
For the Transition Period from ___to __
Commission File Number 1-7908
ADAMS RESOURCES & ENERGY, INC.
(Exact name of registrant as specified in its charter)
Delaware | 74-1753147 |
| (State of Incorporation) | (I.R.S. Employer Identification No.) |
4400 Post Oak Parkway Ste. 2700 | |
Houston, Texas | 77027 |
| (Address of Principal executive offices) | (Zip Code) |
Registrant's telephone number, including area code: (713) 881-3600
Securities registered pursuant to Section 12(b) of the Act: None
| Title of each class | Name of each exchange on which registered |
Common Stock, $.10 Par Value | American Stock Exchange |
Indicate by check mark whether the Registrant is a well-known seasoned issuer, as defined in Rule 405 of the Securities Act. YES ___NO _X_
Indicate by check mark whether the registrant is not required to file reports pursuant to Section 13 or Section 15(d) of the Exchange Act. YES ____ NO _X_
Indicate by check mark whether the Registrant (1) has filed all reports required to be filed by Section 13 or 15(d) of the Securities Exchange Act of 1934 during the preceding 12 months (or for such shorter period that the registrant was required to file such reports and (2) has been subject to the filing requirements for the past 90 days. YES_X_ NO ___
Indicate by check mark if disclosure of delinquent filers pursuant to Item 405 of Regulation S-K is not contained herein, and will not be contained, to the best of registrant’s knowledge, in definitive proxy or information statements incorporated by reference in Part III of this Form 10-K or any amendment to this Form 10-K. ______
Indicate by check mark whether the registrant is a large accelerated filer, an accelerated filer, or a non-accelerated filer. See definition of “accelerated filer” and “larger accelerated filer” in Rule 12b-2 of the Exchange Act.
Large accelerated filer ____ Accelerated filer ____ Non-accelerated filer _X_
Indicate by check mark whether the registrant is a shell company (as defined by Rule 12b-2 of the Act).
YES ___NO _X_
The aggregate market value of the voting stock held by nonaffiliates as of June 30, 2006 based on the closing price of the common stock on the American Stock Exchange for such date was $67,588,696. A total of 4,217,596 shares of Common Stock were outstanding at March 10, 2007.
DOCUMENTS INCORPORATED BY REFERENCE
Portions of the Proxy Statement for Annual Meeting of Stockholders to be held May 21, 2007 is incorporated by reference in Part III.
PART I
ITEMS 1 and 2. BUSINESS AND PROPERTIES
Forward-Looking Statements -Safe Harbor Provisions
This annual report on Form 10-K for the year ended December 31, 2006 contains certain forward-looking statements covered by the safe harbors provided under Federal securities law and regulations. To the extent such statements are not recitations of historical fact, forward-looking statements involve risks and uncertainties. In particular, statements under the captions (a) Production and Reserve Information, (b) Regulatory Status and Potential Environmental Liability, (c) Management’s Discussion and Analysis of Financial Condition and Results of Operations, (d) Critical Accounting Policies and Use of Estimates, (e) Quantitative and Qualitative Disclosures about Market Risk, (f) Income Taxes, (g) Concentration of Credit Risk, (h) Price Risk Management Activities, and (i) Commitments and Contingencies, among others, contain forward-looking statements. Where the Company expresses an expectation or belief regarding future results of events, such expression is made in good faith and believed to have a reasonable basis in fact. However, there can be no assurance that such expectation or belief will actually result or be achieved.
With the uncertainties of forward looking statements in mind, the reader should consider the risks discussed elsewhere in this report and other documents filed with the Securities and Exchange Commission from time to time and the following important factors that could cause actual results to differ materially from those expressed in any forward-looking statement made by or on behalf of the Company.
Business Activities
Adams Resources & Energy, Inc. and its subsidiaries (the "Company") are engaged in the business of marketing crude oil, natural gas and petroleum products; tank truck transportation of liquid chemicals; and oil and gas exploration and production. Adams Resources & Energy, Inc. is a Delaware corporation organized in 1973. The revenues, operating results and identifiable assets of each industry segment for the three years ended December 31, 2006 are set forth in Note (10) of Notes to Consolidated Financial Statements included elsewhere herein.
Crude Oil, Natural Gas and Refined Products Marketing
The Company’s subsidiary, Gulfmark Energy, Inc. (“Gulfmark”), purchases crude oil and arranges sales and deliveries to refiners and other customers. Activity is concentrated primarily onshore in Texas and Louisiana with additional operations in Michigan. During 2006, Gulfmark purchased approximately 61,800 barrels per day of crude oil at the wellhead or lease level. Gulfmark also operates 70 tractor-trailer rigs and maintains over 50 pipeline inventory locations or injection stations. Gulfmark has the ability to barge oil from nine oil storage facilities along the intercoastal waterway of Texas and Louisiana and maintains 120,000 barrels of storage capacity at certain of the dock facilities in order to access waterborne markets for its products. Gulfmark arranges transportation for sales to customers or enters into exchange transactions with third parties when the cost of the exchange is less than the alternate cost incurred in transporting or storing the crude oil.
The Company’s subsidiary, Adams Resources Marketing, Ltd. (“ARM”), operates as a wholesale purchaser, distributor and marketer of natural gas. ARM’s focus is on the purchase of natural gas at the producer level. During 2006, ARM purchased approximately 354,000 mmbtu’s of natural gas per day at the wellhead and pipeline pooling points. Business is concentrated among approximately 60 independent producers with the primary production areas being the Louisiana and Texas Gulf Coast and the offshore Gulf of Mexico region. ARM provides value added services to its customers by providing access to common carrier pipelines and handling daily volume balancing requirements as well as risk management services.
1
The Company’s subsidiary, Ada Resources, Inc. (“Ada”), markets branded and unbranded refined petroleum products, such as motor fuels and lubricants. Ada makes purchases based on the supplier’s established distributor prices, with such prices generally being lower than Ada’s sales price to its customers. Motor fuel sales include automotive gasoline, aviation gasoline, distillates and jet fuel. Lubricants consist of passenger car motor oils as well as a full complement of industrial oils and greases. Ada is also involved in the railroad servicing industry, including fueling and lubricating locomotives as well as performing routine maintenance on the power units. Further, the United States Coast Guard has certified Ada as a direct-to-vessel approved marine fuel and lube vendor. In addition, the Internal Revenue Service has approved Ada as a Certified Biodiesel Blender, which provides enhanced margin opportunities. Ada’s marketing area primarily includes the Texas Gulf Coast and southern Louisiana. The primary product distribution and warehousing facility is located on 5.5 Company-owned acres in Houston, Texas. The property includes a 60,000 square foot warehouse, 11,000 square feet of office space and bulk storage for 320,000 gallons of lubricating oil.
Generally, as the Company purchases physical quantities of crude oil and natural gas, it establishes a margin by selling the product for delivery to third parties, such as independent refiners, utilities and/or major energy companies and other industrial concerns. Through these transactions, the Company seeks to maintain a position that is substantially balanced between commodity purchase volumes versus sales or future delivery obligations (a “balanced book”). Crude oil and natural gas are generally purchased at indexed prices that fluctuate with market conditions. The product is transported and either sold outright at the field level, or buy-sell arrangements (trades) are made in order to minimize transportation costs or maximize the sales price. Except where matching fixed price arrangements are in place, the contracted sales price is also tied to an index that fluctuates with market conditions. This reduces the Company's loss exposure from sudden changes in commodity prices. A key element of profitability is the differential between market prices at the field level and at the various sales points. Such price differentials vary with local supply and demand conditions. Unforeseen fluctuations can impact financial results either favorably or unfavorably. In addition to maintaining a “balanced book” set of transactions, the Company may also purchase or sell hydrocarbon commodities for speculative purposes (a “spec book”). The Company’s spec book activity is conducted under a set of internal guidelines designed to monitor and control such activity. The estimated market value of spec book transactions is calculated and reported in the accompanying financial statements under the caption “Risk Management Assets and Risk Management Liabilities”. While the Company's policies are designed to minimize market risk, some degree of exposure to unforeseen fluctuations in market conditions remains.
Operating results are sensitive to a number of factors. Such factors include commodity location, grades of product, individual customer demand for grades or location of product, localized market price structures, availability of transportation facilities, actual delivery volumes that vary from expected quantities and timing and costs to deliver the commodity to the customer. The term “basis risk” is used to describe the inherent market price risk created when a commodity of a certain location or grade is purchased, sold or exchanged versus a purchase, sale or exchange of a like commodity of varying location or grade. The Company attempts to reduce its exposure to basis risk by grouping its purchase and sale activities by geographical region in order to stay balanced within such designated region. However, there can be no assurance that all basis risk is or will be eliminated.
Tank Truck Transportation
The Company’s subsidiary, Service Transport Company (“STC”), transports liquid chemicals on a "for hire" basis throughout the continental United States and Canada. Transportation service is provided to over 400 customers under multiple load contracts in addition to loads covered under STC’s standard price list. Pursuant to regulatory requirements, STC holds a Hazardous Materials Certificate of Registration issued by the U.S. Department of Transportation. Presently, STC operates 314 truck tractors of which 29 are independent owner-operator units. The Company also maintains 446 tank trailers. In addition, STC maintains truck terminals in Houston, Corpus Christi, and Nederland, Texas as well as Baton Rouge (St. Gabriel), Louisiana and Mobile (Saraland), Alabama. Transportation operations are headquartered at a Houston terminal facility situated on 22 Company-owned acres and includes maintenance facilities, an office building, tank wash rack facilities and a water treatment system. The St. Gabriel, Louisiana terminal is situated on 11.5 Company-owned acres and includes an office building, maintenance bays and tank cleaning facilities.
2
STC is compliant with ISO 9001:2000 Standard. The scope of this Quality System Certificate covers the carriage of bulk liquids throughout the Company’s area of operations as well as the tank trailer cleaning facilities and equipment maintenance. STC’s quality management process is one of its major assets. The practice of using statistical process control covering safety, on-time performance and customer satisfaction aids continuous improvement in all areas of quality service. In addition to its ISO 9001:2000 practices, the American Chemistry Council recognizes STC as a Responsible CareÓ Partner. Responsible CareÓ Partners are those companies that serve the chemical industry and implement and monitor the seven Codes of Management Practices. The seven codes address compliance and continuing improvement in (1) Community Awareness and Emergency Response, (2) Pollution Prevention, (3) Process Safety, (4) Distribution, (5) Employee Health and Safety, (6) Product Stewardship and (7) Security.
Oil and Gas Exploration and Production
The Company’s subsidiary, Adams Resources Exploration Corporation, is actively engaged in the exploration and development of domestic oil and gas properties primarily along the Louisiana and Texas Gulf Coast. Exploration offices are maintained at the Company's headquarters in Houston and the Company holds an interest in 316 wells of which 42 are Company operated.
Producing Wells--The following table sets forth the Company's gross and net productive wells as of December 31, 2006. Gross wells are the total number of wells in which the Company has an interest, while net wells are the sum of the fractional interests owned.
| Oil Wells | Gas Wells | Total Wells | |||||||||||||||||
| Gross | Net | Gross | Net | Gross | Net | ||||||||||||||
| Texas | 57 | 13.02 | 65 | 4.59 | 122 | 17.61 | |||||||||||||
| Louisiana | 24 | 1.36 | 48 | 4.37 | 72 | 5.73 | |||||||||||||
| Other | 73 | 1.75 | 49 | 6.64 | 122 | 8.39 | |||||||||||||
| 154 | 16.13 | 162 | 15.60 | 316 | 31.73 | ||||||||||||||
Acreage--The following table sets forth the Company's gross and net developed and undeveloped acreage as of December 31, 2006. Gross acreage represents the Company’s direct ownership and net acreage represents the sum of the fractional interests owned.
| Developed Acreage | Undeveloped Acreage | ||||||||||||
| Gross | Net | Gross | Net | ||||||||||
| Texas | 68,436 | 11,909 | 121,770 | 13,677 | |||||||||
| Louisiana | 7,550 | 622 | 3,228 | 216 | |||||||||
| Other | 4,261 | 754 | 16,307 | 2,402 | |||||||||
| 80,247 | 13,285 | 141,305 | 16,295 | ||||||||||
Drilling Activity--The following table sets forth the Company's drilling activity for each of the three years ended December 31, 2006. All drilling activity was onshore in Texas, Louisiana and Alabama.
| 2006 | 2005 | 2004 | |||||||||||||||||
| Gross | Net | Gross | Net | Gross | Net | ||||||||||||||
| Exploratory wells drilled | |||||||||||||||||||
| - Productive | 6 | .52 | 4 | .33 | 12 | .59 | |||||||||||||
| - Dry | 3 | .35 | 6 | .58 | 6 | .44 | |||||||||||||
| Development wells drilled | |||||||||||||||||||
| - Productive | 26 | 1.89 | 20 | 1.12 | 8 | .42 | |||||||||||||
| - Dry | 2 | .08 | 5 | .44 | 1 | .01 | |||||||||||||
3
Production and Reserve Information--The Company's estimated net quantities of proved oil and gas reserves and the standardized measure of discounted future net cash flows calculated at a 10% discount rate for the three years ended December 31, 2006, are presented in the table below (in thousands).
| December 31, | ||||||||||
| 2006 | 2005 | 2004 | ||||||||
| Crude oil (barrels) | 396 | 396 | 436 | |||||||
| Natural gas (mcf) | 8,300 | 9,643 | 10,950 | |||||||
| Standardized measure of discounted future | ||||||||||
| net cash flows from oil and gas reserves | $ | 18,770 | $ | 29,960 | $ | 22,797 | ||||
The estimated value of oil and gas reserves and future net revenues from oil and gas reserves was made by the Company's independent petroleum engineers. The reserve value estimates provided at December 31, 2006, 2005 and 2004 are based on year-end market prices of $57.00, $57.45 and $40.50 per barrel for crude oil and $5.58, $9.12 and $6.06 per mcf for natural gas, respectively.
Reserve estimates are based on many subjective factors. The accuracy of reserve estimates depends on the quantity and quality of geological data, production performance data, the current prices being received and reservoir engineering data, as well as the skill and judgment of petroleum engineers in interpreting such data. The process of estimating reserves requires frequent revision of estimates (usually on an annual basis) as additional information is made available through drilling, testing, reservoir studies and acquiring historical pressure and production data. In addition, the discounted present value of estimated future net revenues should not be construed as the fair market value of oil and gas producing properties. Such estimates do not necessarily portray a realistic assessment of current value or future performance of such properties. Such revenue calculations are based on estimates as to the timing of oil and gas production, and there is no assurance that the actual timing of production will conform to or approximate such estimates. Also, certain assumptions have been made with respect to pricing. The estimates assume prices will remain constant from the date of the engineer's estimates, except for changes reflected under natural gas sales contracts. There can be no assurance that actual future prices will not vary as industry conditions, governmental regulation and other factors impact the market price for oil and gas.
The Company's oil and gas production for the three years ended December 31, 2006 was as follows:
| Years Ended | Crude Oil | Natural | |||||
| December 31, | (barrels) | Gas (mcf) | |||||
| 2006 | 75,900 | 1,604,000 | |||||
| 2005 | 66,600 | 1,388,000 | |||||
| 2004 | 71,300 | 1,309,000 | |||||
Certain financial information relating to the Company's oil and gas activities is summarized as follows:
| Years Ended December 31, | ||||||||||
| 2006 | 2005 | 2004 | ||||||||
| Average oil and condensate | ||||||||||
| sales price per barrel | $ | 64.26 | $ | 54.76 | $ | 39.48 | ||||
| Average natural gas | ||||||||||
| sales price per mcf | $ | 7.53 | $ | 8.43 | $ | 6.09 | ||||
| Average production cost, per equivalent | ||||||||||
| barrel, charged to expense | $ | 12.40 | $ | 9.48 | $ | 10.30 | ||||
For comparative purposes, prices received by the Company’s oil and gas division at varying points in time during 2006 were as follows:
| Crude Oil | Natural Gas | ||||||
| Average Annual Price for 2006 | $ | 64.26 | $ | 7.53 | |||
| Average Price for December 2006 | $ | 60.35 | $ | 7.84 | |||
| Average Price on December 31, 2006 | $ | 57.00 | $ | 5.58 | |||
4
North Sea Exploration Licenses-- In the United Kingdom’s Central Sector of the North Sea, the Company holds an undivided 30 percent working interest in Blocks 21-1b, 21-2b and 21-3d. These Blocks are located approximately 200 miles east of Aberdeen, Scotland not far from the Forties and Buchan Fields. Together with its joint interest partners, the Company obtained its interests through the United Kingdom’s “Promote License” program and the license was awarded in February 2007. A Promote License affords the opportunity to analyze and assess the licensed acreage for an initial two-year period without the stringent financial requirements of the more traditional Exploration License. The two-year licensing period should provide sufficient time to promote the actual drilling of a well to potential third party investors. The Company and its joint interest partners expect to confirm the existence of an exploration prospect to promote to other investors prior to drilling. The Company also holds an approximate nine percent equity interest in a promote licensing right to Block 42-27b located in the Southern Sector of the U. K. North Sea. None of the Company’s joint interest partners are affiliates of the Company.
The Company has had no reports to federal authorities or agencies of estimated oil and gas reserves except for a required report on the Department of Energy’s “Annual Survey of Domestic Oil and Gas Reserves.” The Company is not obligated to provide any fixed and determinable quantities of oil or gas in the future under existing contracts or agreements associated with its oil and gas exploration and production segment.
Reference is made to Note (12) of the Notes to Consolidated Financial Statements for additional disclosures relating to oil and gas exploration and production activities.
Environmental Compliance and Regulation
The Company is subject to an extensive variety of evolving United States federal, state and local laws, rules and regulations governing the storage, transportation, manufacture, use, discharge, release and disposal of product and contaminants into the environment, or otherwise relating to the protection of the environment. Presented below is a non-exclusive listing of the environmental laws that potentially impact the Company’s activities. Also presented is additional discussion about the regulatory environment of the Company.
| - | The Solid Waste Disposal Act, as amended by the Resource Conservation and Recovery Act of 1976, as amended. |
| - | Comprehensive Environmental Response, Compensation and Liability Act of 1980 ("CERCLA" or "Superfund"), as amended. |
| - | The Clean Water Act of 1972, as amended. |
| - | Federal Oil Pollution Act of 1990, as amended. |
| - | The Clean Air Act of 1970, as amended. |
| - | The Toxic Substances Control Act of 1976, as amended. |
| - | The Emergency Planning and Community Right-to-Know Act. |
| - | The Occupational Safety and Health Act of 1970, as amended. |
| - | Texas Clean Air Act. |
| - | Texas Solid Waste Disposal Act. |
| - | Texas Water Code. |
| - | Texas Oil Spill Prevention and Response Act of 1991, as amended. |
Railroad Commission of Texas (“RRC”)--The RRC regulates, among other things, the drilling and operation of oil and gas wells, the operation of oil and gas pipelines, the disposal of oil and gas production wastes and certain storage of unrefined oil and gas. RRC regulations govern the generation, management and disposal of waste from such oil and gas operations and provide for the clean up of contamination from oil and gas operations. The RRC has promulgated regulations that provide for civil and/or criminal penalties and/or injunctive relief for violations of the RRC regulations.
5
Louisiana Office of Conservation (“LOC”)--has primary statutory responsibility for regulation and conservation of oil, gas, and other natural resources. The LOC’s objectives are to (i) regulate the exploration and production of oil, gas and other hydrocarbons; (ii) control and allocate energy supplies and distribution; and (iii) protect public safety and the State’s environment from oilfield waste, including regulation of underground injection and disposal practices.
State and Local Government Regulation--Many states are authorized by the Environmental Protection Agency (“EPA”) to enforce regulations promulgated under various federal statutes. In addition, there are numerous other state and local authorities that regulate the environment, some of which impose more stringent environmental standards than federal laws and regulations. The penalties for violations of state law vary, but typically include injunctive relief, recovery of damages for injury to air, water or property and fines for non-compliance.
Oil and Gas Operations--The Company's oil and gas drilling and production activities are subject to laws and regulations relating to environmental quality and pollution control. One aspect of the Company's oil and gas operation is the disposal of used drilling fluids, saltwater, and crude oil sediments. In addition, low-level naturally occurring radiation may, at times, occur with the production of crude oil and natural gas. The Company's policy is to comply with environmental regulations and industry standards. Environmental compliance has become more stringent and the Company, from time to time, may be required to remediate past practices. Management believes that such required remediation in the future, if any, will not have a material adverse impact on the Company's financial position or results of operations.
All states in which the Company owns producing oil and gas properties have statutory provisions regulating the production and sale of crude oil and natural gas. Regulations typically require permits for the drilling of wells and regulate the spacing of wells, the prevention of waste, protection of correlative rights, the rate of production, prevention and clean-up of pollution and other matters.
Marketing Operations--The Company's marketing facilities are subject to a number of state and federal environmental statutes and regulations, including the regulation of underground fuel storage tanks. While the Company does not own or operate underground tanks as of December 31, 2006, historically, the Company has been an owner and operator of underground storage tanks. The EPA's Office of Underground Tanks and applicable state laws establish regulations requiring owners or operators of underground fuel tanks to demonstrate evidence of financial responsibility for the costs of corrective action and the compensation of third parties for bodily injury and property damage caused by sudden and non-sudden accidental releases arising from operating underground tanks. In addition, the EPA requires the installation of leak detection devices and stringent monitoring of the ongoing condition of underground tanks. Should leakage develop in an underground tank, the operator is obligated for clean up costs. During the period when the Company was an operator of underground tanks, it secured insurance covering both third party liability and clean up costs.
Transportation Operations--The Company's tank truck operations are conducted pursuant to authority of the United States Department of Transportation (“DOT”) and various state regulatory authorities. The Company's transportation operations must also be conducted in accordance with various laws relating to pollution and environmental control. Interstate motor carrier operations are subject to safety requirements prescribed by DOT. Matters such as weight and dimension of equipment are also subject to federal and state regulations. DOT regulations also require mandatory drug testing of drivers and require certain tests for alcohol levels in drivers and other safety personnel. The trucking industry is subject to possible regulatory and legislative changes such as increasingly stringent environmental regulations or limits on vehicle weight and size. Regulatory change may affect the economics of the industry by requiring changes in operating practices or by changing the demand for common or contract carrier services or the cost of providing truckload services. In addition, the Company’s tank wash facilities are subject to increasingly more stringent local, state and federal environmental regulations.
6
The Company has implemented security procedures for drivers and terminal facilities. Satellite tracking transponders installed in the power units are used to communicate en route emergencies to the Company and to maintain constant information as to the unit’s location. If necessary, the Company’s terminal personnel will notify local law enforcement agencies. The “Track and Trace” feature of the Company’s website is able to advise a customer of the status and location of their loads. Remote cameras and better lighting coverage in the staging and parking areas have augmented terminal security.
Regulatory Status and Potential Environmental Liability--The operations and facilities of the Company are subject to numerous federal, state and local environmental laws and regulations including those described above, as well as associated permitting and licensing requirements. The Company regards compliance with applicable environmental regulations as a critical component of its overall operation, and devotes significant attention to providing quality service and products to its customers, protecting the health and safety of its employees, and protecting the Company’s facilities from damage. Management believes the Company has obtained or applied for all permits and approvals required under existing environmental laws and regulations to operate its current business. Management has reported that the Company is not subject to any pending or threatened environmental litigation or enforcement action(s), which could materially and adversely affect the Company's business. While the Company has, where appropriate, implemented operating procedures at each of its facilities designed to assure compliance with environmental laws and regulation, the Company, given the nature of its business, is subject to environmental risks and the possibility remains that the Company's ownership of its facilities and its operations and activities could result in civil or criminal enforcement and public as well as private action(s) against the Company, which may necessitate or generate mandatory clean up activities, revocation of required permits or licenses, denial of application for future permits, or significant fines, penalties or damages, any and all of which could have a material adverse effect on the Company. At December 31, 2006, the Company is unaware of any unresolved environmental issues for which additional accounting accruals are necessary.
Employees
At December 31, 2006 the Company employed 748 persons, 14 of whom were employed in the exploration and production of oil and gas, 264 in the marketing of crude oil, natural gas and petroleum products, 456 in transportation operations, and 14 in administrative capacities. None of the Company's employees are represented by a union. Management believes its employee relations are satisfactory.
Federal and State Taxation
The Company is subject to the provisions of the Internal Revenue Code of 1986, as amended (the “Code”). In accordance with the Code, the Company computes its income tax provision based on a 34 percent tax rate. The Company's operations are, in large part, conducted within the State of Texas. As such, the Company is subject to a 4.5 percent state tax on corporate net taxable income as computed for federal income tax purposes. Oil and gas activities are also subject to state and local income, severance, property and other taxes. Management believes the Company is currently in compliance with all federal and state tax regulations.
Available Information
As a public company, the Company is required to file periodic reports, as well as other information, with the Securities and Exchange Commission (SEC) within established deadlines. Any document filed with the SEC may be viewed or copied at the SEC’s Public Reference Room at 100 F Street, N.E., Washington, D.C. 20549. Additional information regarding the Public Reference Room can be obtained by calling the SEC at (800) SEC-0330. The Company’s SEC filings are also available to the public through the SEC’s web site located at http://www.sec.gov.
7
The Company maintains a corporate website at http://www.adamsresources.com, on which investors may access free of charge the annual report on Form 10-K, quarterly reports on Form 10-Q, current reports on Form 8-K and amendments to those reports as soon as is reasonably practicable after filing or furnishing such material with the SEC. The information contained on or accessible from the Company’s website does not constitute a part of this report and is not incorporated by reference herein. The Company will also provide a printed copy of any of these aforementioned documents free of charge upon request.
ITEM 1A RISK FACTORS
Fluctuations in oil and gas prices could have an effect on the Company.
The Company’s future financial condition, revenues, results of operations and future rate of growth are materially affected by oil and gas prices. Oil and gas prices historically have been volatile and are likely to continue to be volatile in the future. Moreover, oil and gas prices depend on factors outside the control of the Company. These factors include:
| · | supply and demand for oil and gas and expectations regarding supply and demand; |
| · | political conditions in other oil-producing countries, including the possibility of insurgency or war in such areas; |
| · | economic conditions in the United States and worldwide; |
| · | governmental regulations; |
| · | the price and availability of alternative fuel sources; |
| · | weather conditions; and |
| · | market uncertainty. |
Revenues are generated under contracts that must be periodically renegotiated.
Substantially all of the Company’s revenues are generated under contracts which expire periodically or which must be frequently renegotiated, extended or replaced. Whether these contracts are renegotiated, extended or replaced is often times subject to factors beyond the Company’s control. Such factors include sudden fluctuations in oil and gas prices, counterparty ability to pay for or accept the contracted volumes and most importantly, an extremely competitive marketplace for the services offered by the Company. There is no assurance that the costs and pricing of the Company’s services can remain competitive in the marketplace or that the Company will be successful in renegotiating its contracts.
Anticipated or scheduled volumes will differ from actual or delivered volumes.
The Company’s crude oil and natural gas marketing operation purchases initial production of crude oil and natural gas at the wellhead under contracts requiring the Company to accept the actual volume produced. The resale of such production is generally under contracts requiring a fixed volume to be delivered. The Company estimates its anticipated supply and matches such supply estimate for both volume and pricing formulas with committed sales volumes. Since actual wellhead volumes produced will never equal anticipated supply, the Company’s marketing margins may be adversely impacted. In many instances, any losses resulting from the difference between actual supply volumes compared to committed sales volumes must be absorbed by the Company.
Environmental liabilities and environmental regulations may have an adverse effect on the Company.
The Company’s business is subject to environmental hazards such as spills, leaks or any discharges of petroleum products and hazardous substances. These environmental hazards could expose the Company to material liabilities for property damage, personal injuries and/or environmental harms, including the costs of investigating and rectifying contaminated properties.
8
Environmental laws and regulations govern several aspects of the Company’s business, such as drilling and exploration, production, transportation and waste management. Compliance with environmental laws and regulations can require significant costs or may require a decrease in production. Moreover, noncompliance with these laws and regulations could subject the Company to significant administrative, civil or criminal fines or penalties.
Counterparty credit default could have an adverse effect on the Company.
The Company’s revenues are generated under contracts with various counterparties. Results of operations would be adversely affected as a result of non-performance by any of these counterparties of their contractual obligations under the various contracts. A counterparty’s default or non-performance could be caused by factors beyond the Company’s control. A default could occur as a result of circumstances relating directly to the counterparty, or due to circumstances caused by other market participants having a direct or indirect relationship with such counterparty. The Company seeks to mitigate the risk of default by evaluating the financial strength of potential counterparties; however, despite our mitigation efforts, defaults by counterparties may occur from time to time.
The Company’s business is dependent on the ability to obtain credit.
The Company’s future development and growth depends in part on its ability to successfully enter into credit arrangements with banks, suppliers and other parties. Credit agreements are relied upon as a significant source of liquidity for capital requirements not satisfied by operating cash flow. If the Company is unable to obtain credit on reasonable and competitive terms, its ability to continue exploration, pursue improvements, make acquisitions and continue future growth will be limited. There is no assurance that the Company will be able to enter into such future credit arrangements on commercially reasonable terms.
Operations could result in liabilities that may not be fully covered by insurance.
The oil and gas business involves certain operating hazards such as well blowouts, explosions, fires and pollution. Any of these operating hazards could cause serious injuries, fatalities or property damage, which could expose the Company to liability. The payment of any of these liabilities could reduce, or even eliminate, the funds available for exploration, development, and acquisition, or could result in a loss of the Company’s properties and may even threaten survival of the enterprise.
Consistent with the industry standard, the Company’s insurance policies provide limited coverage for losses or liabilities relating to pollution, with broader coverage for sudden and accidental occurrences. Insurance might be inadequate to cover all liabilities. Moreover, from time to time, obtaining insurance for the Company’s line of business can become difficult and costly. Typically, when insurance cost escalates, the Company may reduce its level of coverage and more risk may be retained to offset cost increases. If substantial liability is incurred and damages are not covered by insurance or exceed policy limits, the Company’s operation and financial condition could be materially adversely affected.
Changes in tax laws or regulations could adversely affect the Company.
The Internal Revenue Service, the United States Treasury Department and Congress frequently review federal income tax legislation. The Company cannot predict whether, when or to what extent new federal tax laws, regulations, interpretations or rulings will be adopted. Any such legislative action may prospectively or retroactively modify tax treatment and, therefore, may adversely affect taxation of the Company.
9
The Company’s business is subject to changing government regulations.
Federal, state or local government agencies may impose environmental, labor or other regulations that increase costs and/or terminate or suspend operations. The Company’s business is subject to federal, state and local laws and regulations. These regulations relate to, among other things, the exploration, development, production and transportation of oil and gas. Existing laws and regulations could be changed, and any changes could increase costs of compliance and costs of operations.
Estimating reserves, production and future net cash flow is difficult.
Estimating oil and gas reserves is a complex process that involves significant interpretations and assumptions. It requires interpretation of technical data and assumptions relating to economic factors, such as future commodity prices, production costs, severance and excise taxes, capital expenditures and remedial costs, and the assumed effect of governmental regulation. As a result, actual results may differ from our estimates. Also, the use of a 10 percent discount factor for reporting purposes, as prescribed by the SEC, may not necessarily represent the most appropriate discount factor, given actual interest rates and risks to which the Company’s business is subject. Any significant variations from the Company’s estimates could cause the estimated quantities and net present value of the Company’s reserves to differ materially.
The reserve data included in this report is only an estimate. The reader should not assume that the present values referred to in this report represent the current market value of the Company’s estimated oil and gas reserves. The timing of the production and the expenses from development and production of oil and gas properties will affect both the timing of actual future net cash flows from the Company’s proved reserves and their present value.
The Company’s business is dependent on the ability to replace reserves.
Future success depends in part on the Company’s ability to find, develop and acquire additional oil and gas reserves. Without successful acquisition or exploration activities, reserves and revenues will decline as a result of current reserves being depleted by production. The successful acquisition, development or exploration of oil and gas properties requires an assessment of recoverable reserves, future oil and gas prices and operating costs, potential environmental and other liabilities, and other factors. These assessments are necessarily inexact. As a result, the Company may not recover the purchase price of a property from the sale of production from the property, or may not recognize an acceptable return from properties acquired. In addition, exploration and development operations may not result in any increases in reserves. Exploration or development may be delayed or canceled as a result of inadequate capital, compliance with governmental regulations or price controls or mechanical difficulties. In the future, the cost to find or acquire additional reserves may become unacceptable.
Fluctuations in commodity prices could have an adverse effect on the Company.
Revenues depend on volumes and rates, both of which can be affected by the prices of oil and gas. Decreased prices could result in a reduction of the volumes purchased or transported by the Company’s customers. The success of the Company’s operations is subject to continued development of additional oil and gas reserves. A decline in energy prices could precipitate a decrease in these development activities and could cause a decrease in the volume of reserves available for processing and transmission. Fluctuations in energy prices are caused by a number of factors, including:
| · | regional, domestic and international supply and demand; |
| · | availability and adequacy of transportation facilities; |
| · | energy legislation; |
| · | federal and state taxes, if any, on the sale or transportation of natural gas; |
| · | abundance of supplies of alternative energy sources; |
| · | political unrest among oil producing countries; and |
| · | opposition to energy development in environmentally sensitive areas. |
10
Revenues are dependent on the ability to successfully complete drilling activity.
Drilling and exploration are one of the main methods of replacing reserves. However, drilling and exploration operations may not result in any increases in reserves for various reasons. Drilling and exploration may be curtailed, delayed or cancelled as a result of:
| · | lack of acceptable prospective acreage; |
| · | inadequate capital resources; |
| · | weather; |
| · | title problems; |
| · | compliance with governmental regulations; and |
| · | mechanical difficulties. |
Moreover, the costs of drilling and exploration may greatly exceed initial estimates. In such a case, the Company would be required to make additional expenditures to develop its drilling projects. Such additional and unanticipated expenditures could adversely affect the Company’s financial condition and results of operations.
Current and future litigation could have an adverse effect on the Company.
The Company is currently involved in several administrative and civil legal proceedings in the ordinary course of its business. Moreover, as incident to operations, the Company sometimes becomes involved in various lawsuits and/or disputes. Lawsuits and other legal proceedings can involve substantial costs, including the cost associated with investigation, litigation and possible settlement, judgment, penalty or fine. Although insurance is maintained to mitigate these costs, there can be no assurance that costs associated with lawsuits or other legal proceedings will not exceed the limits of insurance policies. The Company’s results of operations could be adversely affected if a judgment, penalty or fine is not fully covered by insurance.
Item 3. LEGAL PROCEEDINGS
In March 2004, a suit styled Le Petit Chateau De Luxe, et. al. vs Great Southern Oil & Gas Co., et. al. was filed in the Civil District Court for Orleans Parish, Louisiana against the Company and its subsidiary, Adams Resources Exploration Corporation, among other defendants. The suit alleges that certain property in Acadia Parish, Louisiana was environmentally contaminated by oil and gas exploration and production activities during the 1970s and 1980s. An alleged amount of damage has not been specified. Management believes the Company has consistently conducted its oil and gas exploration and production activities in accordance with all environmental rules and regulations in effect at the time of operation. Management notified its insurance carrier about this claim, and thus far the insurance carrier has declined to offer coverage. The Company intends to litigate this matter with its insurance carrier if this matter is not resolved to the Company’s satisfaction. In any event, management does not believe the outcome of this matter will have a material adverse effect on the Company’s financial position or results of operations.
From time to time as incident to its operations, the Company becomes involved in various lawsuits and/or disputes. Primarily as an operator of an extensive trucking fleet, the Company is a party to motor vehicle accidents, worker compensation claims and other items of general liability as would be typical for the industry. Except as disclosed herein, management of the Company is presently unaware of any claims against the Company that are either outside the scope of insurance coverage, or that may exceed the level of insurance coverage, and could potentially represent a material adverse effect on the Company’s financial position or results of operations.
Item 4. SUBMISSION OF MATTER TO A VOTE OF SECURITY HOLDERS
None.
11
PART II
Item 5. MARKET FOR THE REGISTRANT'S COMMON STOCK, RELATED SECURITY HOLDER MATTERS AND ISSUER REPURCHASE OF EQUITY SECURITIES
The Company's common stock is traded on the American Stock Exchange. The following table sets forth the high and low sales prices of the common stock as reported by the American Stock Exchange for each calendar quarter since January 1, 2005.
| American Stock Exchange | |||||||
| High | Low | ||||||
| 2005 | |||||||
| First Quarter | $ | 25.55 | $ | 17.10 | |||
| Second Quarter | 22.90 | 15.00 | |||||
| Third Quarter | 23.99 | 18.20 | |||||
| Fourth Quarter | 23.45 | 18.60 | |||||
| 2006 | |||||||
| First Quarter | $ | 29.00 | $ | 22.70 | |||
| Second Quarter | 44.60 | 25.30 | |||||
| Third Quarter | 44.33 | 33.00 | |||||
| Fourth Quarter | 39.30 | 28.73 | |||||
At March 21, 2007, there were 328 holders of record of the Company's common stock and the closing stock price was $37.50 per share. The Company has no securities authorized for issuance under equity compensation plans. The Company made no repurchases of its stock during 2005 and 2006.
On December 15, 2006, the Company paid an annual cash dividend of $.42 per common share to common stockholders of record on December 1, 2006. On December 15, 2005, the Company paid an annual cash dividend of $.37 per common share to common stockholders of record on December 2, 2005 On December 15, 2004, the Company paid an annual cash dividend of $.30 per common share to common stockholders of record on December 2, 2004. Such dividends totaled $1,771,390, $1,560,510 and $1,265,276 for each of 2006, 2005 and 2004, respectively.
The terms of the Company's bank loan agreement require the Company to maintain consolidated net worth in excess of $52,001,000. Should the Company’s net worth fall below this threshold, the Company may be restricted from payment of additional cash dividends on the Company's common stock.
12
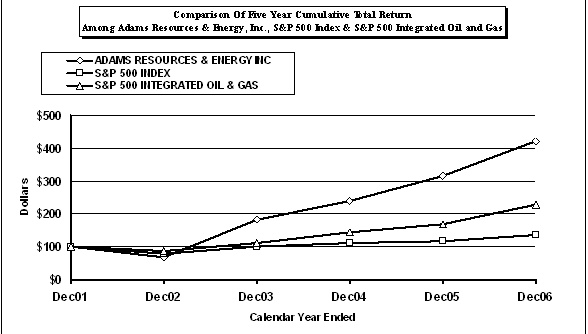
Performance Graph
The performance graph shown below was prepared under the applicable rules of the Securities and Exchange Commission based on data supplied by Standard & Poor’s Compustat. The purpose of the graph is to show comparative total stockholder returns for the Company versus other investment options for a specified period of time. The graph was prepared based upon the following assumptions:
| 1. | $100.00 was invested on December 31, 2001 in the Company’s common stock, the S&P 500 Index, and the S&P 500 Integrated Oil and Gas Index. |
| 2. | Dividends are reinvested on the ex-dividend dates. |
Note: The stock price performance shown on the graph below is not necessarily indicative of future price performance.
INDEXED RETURNS | ||||||
Base | Years Ending | |||||
Period | ||||||
Company / Index | Dec01 | Dec02 | Dec03 | Dec04 | Dec05 | Dec06 |
ADAMS RESOURCES & ENERGY INC | 100 | 68.96 | 181.00 | 239.62 | 315.42 | 421.59 |
S&P 500 INDEX | 100 | 77.90 | 100.25 | 111.15 | 116.61 | 135.03 |
S&P 500 INTEGRATED OIL & GAS | 100 | 87.80 | 111.25 | 143.32 | 168.59 | 227.32 |
13
Item 6. SELECTED FINANCIAL DATA
FIVE YEAR REVIEW OF SELECTED FINANCIAL DATA
| Years Ended December 31, | ||||||||||||||||
| 2006 | 2005 | 2004 | 2003 | 2002 | ||||||||||||
| Revenues: | (In thousands, except per share data) | |||||||||||||||
| Marketing | $ | 2,167,502 | $ | 2,292,029 | $ | 2,010,968 | $ | 1,676,727 | $ | 1,725,042 | ||||||
| Transportation | 62,151 | 57,458 | 47,323 | 35,806 | 36,406 | |||||||||||
| Oil and gas | 16,950 | 15,346 | 10,796 | 8,395 | 4,750 | |||||||||||
$ | 2,246,603 | $ | 2,364,833 | $ | 2,069,087 | $ | 1,720,928 | $ | 1,766,198 | |||||||
| Operating Earnings: | ||||||||||||||||
| Marketing | $ | 12,975 | $ | 22,481 | $ | 13,597 | $ | 12,117 | $ | 10,471 | ||||||
| Transportation | 5,173 | 5,714 | 5,687 | 973 | 2,142 | |||||||||||
| Oil and gas | 5,355 | 6,765 | 2,362 | 2,310 | (633 | ) | ||||||||||
| General and administrative | (8,536 | ) | (9,668 | ) | (7,867 | ) | (6,299 | ) | (7,259 | ) | ||||||
14,967 | 25,292 | 13,779 | 9,101 | 4,721 | ||||||||||||
| Other income (expense): | ||||||||||||||||
| Interest income | 965 | 188 | 62 | 362 | 115 | |||||||||||
| Interest expense | (159 | ) | (128 | ) | (107 | ) | (108 | ) | (117 | ) | ||||||
| Earnings from continuing operations | ||||||||||||||||
| before income taxes and cumulative | ||||||||||||||||
| effect of accounting change | 15,773 | 25,352 | 13,734 | 9,355 | 4,719 | |||||||||||
| Income tax provision | 5,290 | 8,583 | 4,996 | 3,013 | 1,615 | |||||||||||
| Earnings from continuing operations | 10,483 | 16,769 | 8,738 | 6,342 | 3,104 | |||||||||||
| Earnings (loss) from discontinued | ||||||||||||||||
| operations, net of taxes | - | 872 | (130 | ) | (3,148 | ) | (1,652 | ) | ||||||||
| Earnings before cumulative effect | ||||||||||||||||
| of accounting change | 10,483 | 17,641 | 8,608 | 3,194 | 1,452 | |||||||||||
| Cumulative effect of accounting | ||||||||||||||||
| change, net of taxes | - | - | - | (92 | ) | - | ||||||||||
| Net earnings | $ | 10,483 | $ | 17,641 | $ | 8,608 | $ | 3,102 | $ | 1,452 | ||||||
Earnings (Loss) Per Share | ||||||||||||||||
| From continuing operations | $ | 2.49 | $ | 3.97 | $ | 2.07 | $ | 1.50 | $ | .73 | ||||||
| From discontinued operations | - | .21 | (.03 | ) | (.74 | ) | (.39 | ) | ||||||||
| Cumulative effect of | ||||||||||||||||
| accounting change | - | - | - | (.02 | ) | - | ||||||||||
| Basic earnings per share | $ | 2.49 | $ | 4.18 | $ | 2.04 | $ | .74 | $ | .34 | ||||||
| Dividends per common share | $ | .42 | $ | .37 | $ | .30 | $ | .23 | $ | .13 | ||||||
Financial Position | ||||||||||||||||
| Working capital | $ | 35,208 | $ | 39,321 | $ | 35,789 | $ | 32,758 | $ | 30,628 | ||||||
| Total assets | 289,287 | 312,662 | 238,854 | 210,607 | 202,120 | |||||||||||
| Long-term debt, net of | ||||||||||||||||
current maturities | 3,000 | 11,475 | 11,475 | 11,475 | 11,475 | |||||||||||
| Shareholders’ equity | 74,368 | 65,656 | 49,575 | 42,232 | 40,100 | |||||||||||
| Dividends on common shares | 1,771 | 1,560 | 1,265 | 970 | 548 | |||||||||||
________________________________
Notes:
| - | In 2002, oil and gas operating earnings sustained a loss of $633,000. This loss includes $1.7 million in dry hole costs and property valuation write-down. |
14
Item 7. MANAGEMENT'S DISCUSSION AND ANALYSIS OF FINANCIAL CONDITION AND RESULTS OF OPERATIONS
Results of Operations
- Marketing
Marketing segment revenues, operating earnings and depreciation are as follows (in thousands):
| 2006 | 2005 | 2004 | ||||||||
| Revenues | $ | 2,167,502 | $ | 2,292,029 | $ | 2,010,968 | ||||
| Operating earnings | $ | 12,975 | $ | 22,481 | $ | 13,597 | ||||
| Depreciation | $ | 1,344 | $ | 1,252 | $ | 1,211 | ||||
Marketing segment revenues result from sales of crude oil, natural gas and refined products such as gasoline and diesel. Required reporting for certain sales transactions is on a gross revenue basis as title passes to the customer, while other transactions are reported on a net revenue basis (i.e. the commodity acquisition cost is netted against gross sales value). Components of marketing segment revenues are as follows (in thousands):
| 2006 | 2005 | 2004 | ||||||||
| Crude oil sales, net of proceeds from buy/sell | ||||||||||
| arrangements | $ | 1,975,972 | $ | 1,427,388 | $ | 1,149,745 | ||||
Crude oil sales proceeds from buy/sell arrangements | - | 690,190 | 735,476 | |||||||
| Natural gas sales | 13,621 | 13,063 | 8,675 | |||||||
| Refined product sales | 177,909 | 161,388 | 117,072 | |||||||
| Total marketing revenues | $ | 2,167,502 | $ | 2,292,029 | $ | 2,010,968 | ||||
Prior to January 1, 2006, proceeds from transactions involving crude oil buy/sell arrangements were reported on a gross revenue basis. Beginning in 2006, such buy/sell transactions are reported on a net revenue basis. The table above shows comparative revenues. This required accounting change for the presentation of revenue transactions has no impact on net earnings or reported earnings from operations.
Crude oil sales, net of proceeds from buy/sell arrangements, increased by 38 percent to $1,975,972,000 for 2006. The revenue increase was due, in part to a 17 percent increase in average crude oil prices as shown in the table below. Also contributing to the revenue increase was an increase in crude oil sale volumes at major trade locations in order to support the Company’s wellhead level crude oil purchasing business. During 2006, future month crude oil prices tended to exceed current or “spot” month sales. In order to retain its supplier base, the Company increasingly offered to purchase wellhead volumes based on future month’s crude oil pricing scenarios. This pricing strategy necessitated increasing crude oil sales volumes at trade locations in order to profitably respond to this marketing need.
Natural gas transactions are presented on a net revenue or gross margin basis and margins for 2006 at $13,621,000 were consistent with 2005 results. The refined product sales increase to $177,909,000 for the current period reflects higher commodity prices consistent with the trend for crude oil partially offset by reduced sales volumes as the Company improved its operating earnings by reducing sales to marginal accounts.
15
Supplemental volume and price information is:
| 2006 | 2005 | 2004 | ||||||||
Field Level Purchases per day (1) | ||||||||||
| - Crude Oil | 61,800 bbls | 66,900 bbls | 76,000 bbls | |||||||
| - Natural Gas | 354,000 mmbtu | 289,000 mmbtu | 294,000 mmbtu | |||||||
| Average Purchase Price | ||||||||||
| - Crude Oil | $ | 62.40/bbl | $ | 53.51/bbl | $ | 39.88/bbl | ||||
| - Natural Gas | $ | 6.62/mmbtu | $ | 7.98/mmbtu | $ | 5.75/mmbtu | ||||
(1) Reflects the volume purchased from third parties at the oil and gas field level and pipeline pooling points.
The components of marketing segment operating earnings (loss) are as follows (in thousands):
| 2006 | 2005 | 2004 | ||||||||
| Crude oil | $ | 5,088 | $ | 13,489 | $ | 10,684 | ||||
| Natural gas | 6,558 | 8,436 | 3,810 | |||||||
| Refined products | 1,329 | 556 | (897 | ) | ||||||
$ | 12,975 | $ | 22,481 | $ | 13,597 | |||||
Crude oil operating earnings are reduced in 2006 relative to 2005 for a combination of reasons. First, during 2005 the Company recognized as a reduction in operating expenses $3,565,000 due to the reversal of certain previously recorded accrual items following the final “true-up” of the accounting for such items as well as a $2,716,000 expense reduction resulting from the cash collection of certain previously disputed and fully reserved items. Such items did not recur in 2006. Second, during 2005, crude oil prices rose from the $43 per barrel range in December 2004 to the $59 per barrel range in December 2005 producing a gain of approximately $3,255,000 during 2005 as the Company liquidated relatively lower priced inventory into a higher priced market. During 2006, crude oil prices fluctuated with limited net impact or valuation during the year. However, as of December 31, 2006, the Company recognized a $718,000 lower of cost or market write-down on the carrying value of its crude oil inventory as crude oil prices fell from the $59 per barrel level at year-end 2005 to an estimated market value at the $53 per barrel level for year end 2006 valuation purposes. As of December 31, 2006, the Company held 113,755 barrels of crude oil inventory valued at $52.60 per barrel. The adverse items affecting 2006 as described above were partially offset by improved per unit sales margins within the crude oil segment for 2006.
Natural gas operating earnings declined to $6,558,000 in 2006 compared to $8,436,000 in 2005 because the marketplace in 2005 offered improved margins due to a tightening of supply. Results for 2006 benefited, however, due to increased volumes as shown in the table above. Refined products operating earnings improved to $1,329,000 in 2006 as the Company enhanced its capability to deliver biodiesel to the marketplace during a period of strong demand for such product.
In comparing 2005 operating earnings to 2004, the crude oil component benefited in 2005 from the $3,565,000 reversal of certain accrual items as discussed above. The natural gas and refined products business improved in 2005 relative to 2004 due to product shortages which served to boost margins in 2005.
16
- Transportation
The transportation segment revenues and operating earnings were as follows (in thousands):
| 2006 | 2005 | 2004 | |||||||||||||||||
| Amount | Change(1) | Amount | Change(1) | Amount | Change(1) | ||||||||||||||
| Revenues | $ | 62,151 | 8 | % | $ | 57,458 | 21 | % | $ | 47,323 | 32 | % | |||||||
| Operating earnings | $ | 5,173 | (9 | )% | $ | 5,714 | - | $ | 5,687 | 484 | % | ||||||||
| Depreciation | $ | 4,538 | 45 | % | $ | 3,130 | 47 | % | $ | 2,125 | 2 | % | |||||||
______________
(1) Represents the percentage increase (decrease) from the prior year.
Beginning in April 2004, the Company experienced increased demand for its petrochemical trucking services. This demand surge continued for the remainder of 2004 and remained strong into the fourth quarter of 2006. The demand increase boosted comparative 2006 revenues by 21 percent in 2005 and an additional 8 percent in 2006 to $62,151,000 for the year. Although revenues increased in 2006, operating earnings were reduced by 9 percent to $5,173,000. This apparently contradictory result was caused by a shortage of available qualified drivers for Company owned trucks. The driver shortage caused the Company to sub-contract more of its business to truck owner-operators, while Company owned trucks remained idle. Thus, higher fixed costs such as depreciation were not being absorbed by higher revenues. The increase in depreciation expense as shown above for 2006 resulted from new equipment additions over the course of the last three years in anticipation of expanded sales activity.
Based on the current level of infrastructure, the Company’s transportation segment is designed to maximize efficiency when revenues are in the $60 million per year range. Demand for the Company’s trucking service is closely tied to the domestic petrochemical industry and has generally remained strong with some weakness in recent months. The Company’s business is spurred by a relatively strong United States and world economy coupled with a relatively weak exchange value for the U.S. dollar. Other important factors include reduced levels of competition as the trucking industry has experienced a general “shake-out” in recent years coupled with the competing railroad industry experiencing intermittent service delays. An additional important factor is a general lack of available qualified drivers limiting the Company’s ability to expand in its market areas. Thus far in 2007, due to reduced customer demand, the Company’s transportation business is operating somewhat below its target level for maximizing efficiency.
- Oil and Gas
Oil and gas segment revenues and operating earnings are primarily derived from crude oil and natural gas production volumes prices. Comparative oil and gas segment revenues and operating earnings were as follows (in thousands):
| 2006 | 2005 | 2004 | |||||||||||||||||
| Amount | Change(1) | Amount | Change(1) | Amount | Change(1) | ||||||||||||||
| Revenues | $ | 16,950 | 10 | % | $ | 15,346 | 42 | % | $ | 10,796 | 29 | % | |||||||
| Operating earnings | 5,355 | (21 | )% | 6,765 | 186 | % | 2,362 | 2 | % | ||||||||||
| Depreciation and depletion | 3,603 | 35 | % | 2,678 | (9 | )% | 2,949 | 36 | % | ||||||||||
______________
(1) Represents the percentage increase (decrease) from the prior year.
17
Oil and gas revenues improved during the three year period presented as a result of generally improving prices as well as increased production sales volumes from recent exploration efforts. Operating earnings generally improved consistent with revenues but were reduced in 2006 relative to 2005. As shown above, for 2006, the Company experienced an increased rate of depreciation and depletion due to a reduction in projected future oil and gas volumes as a result of reduced pricing for natural gas in the Company’s year-end reserve estimate. Operating earnings for 2006 were also burdened by an impairment provision of $841,000 on certain producing properties where drilling costs incurred and capitalized exceeded the estimated fair value of the properties. Similar impairment provision for 2005 and 2004 totaled $429,000 and $309,000, respectively.
Crude oil and natural gas production volumes and comparative prices were as follows:
| 2006 | 2005 | 2004 | ||||||||
| Production Volumes | ||||||||||
| - Crude Oil | 75,900 bbls | 66,600 bbls | 71,300 bbls | |||||||
| - Natural Gas | 1,604,000 mcf | 1,388,000 mcf | 1,309,000 mcf | |||||||
| Average Price | ||||||||||
| - Crude Oil | $ | 64.26/bbl | $ | 54.76/bbl | $ | 39.48/bbl | ||||
| - Natural Gas | $ | 7.53/mcf | $ | 8.43/mcf | $ | 6.09/mcf | ||||
An important item impacting operating earnings is the amount of exploration expenses incurred. During 2006, exploration expense totaled $2,895,000 compared to $3,078,000 for 2005 and $2,504,000 for 2004. Such expenses included $564,000, $391,000 and $616,000, respectively, of impairment provision on non-producing properties as well as $2,331,000, $2,687,000 and $1,888,000 of dry hole and geophysical costs for 2006, 2005 and 2004, respectively. Additionally, 2005 operating earnings benefited from a $601,000 gain from the sale of certain Calcasieu Parish, Louisiana oil and gas producing properties.
During 2006, the Company participated in the drilling of thirty-seven wells. Thirty-two wells were successfully completed with five dry holes. Converting natural gas volumes to equate with crude oil volumes at a ratio of six to one, oil and gas production and proved reserve volumes summarize as follows on an equivalent barrel (Eq. Bbls) basis:
| 2006 | 2005 | 2004 | ||||||||
| (Eq. Bbls.) | (Eq. Bbls.) | (Eq. Bbls.) | ||||||||
| Beginning of year | 2,003,000 | 2,261,000 | 1,933,000 | |||||||
| Estimated reserve additions | 577,000 | 320,000 | 649,000 | |||||||
| Production | (343,000 | ) | (298,000 | ) | (289,000 | ) | ||||
| Reserves sold | - | (135,000 | ) | - | ||||||
| Revisions of previous estimates | (458,000 | ) | (145,000 | ) | (32,000 | ) | ||||
| End of year | 1,779,000 | 2,003,000 | 2,261,000 | |||||||
During 2006 and in total for the three year period ended December 31, 2006, estimated reserve additions represented 168 percent and 166 percent, respectively, of production volumes. The 458,000 equivalent barrel downward reserve revision in 2006 reflects the impact of lower natural gas prices as of December 31, 2006 that were used as the basis for the year-end oil and gas reserve estimate. As used for oil and gas reserve valuation purposes, natural gas prices at year-end 2006 were $5.58 compared to $9.12 per mcf at year-end 2005.
18
The Company’s current drilling and exploration efforts are primarily focused as follows:
Eaglewood Project
The Eaglewood project area encompasses a ten county area from South Texas along the Gulf Coast and into East Texas. In this area, the Company purchased existing 3-D seismic data and reprocessed it using proprietary techniques. During 2006, four wells were successfully drilled in the Brushy Creek area of this project with four additional Wilcox test wells planned for 2007.
Calcasieu Parish
This area includes the Sugar Cane, Louisiana Five and GED prospect areas of Louisiana. To date, nine wells have been drilled with six successful and three dry holes. In addition to a successful Hackberry formation play, exploration has been expanded to include the Deep Yegua. Seismic evaluation continues with eight additional prospects identified for drilling in 2007.
Southern Alabama
During 2006, three wells were spud in this area to test the Smackover formation with one productive well and two dry holes. Seismic interpretation continues to determine Smackover viability in this area. One well is currently drilling in the area to test the Norphlet formation with a second well planned for later in 2007.
Elm Grove
During 2006, ten successful wells were drilled in the Elm Grove Field in North Louisiana. This activity is in-field development of the Cotton Valley formation and provides very low risk opportunities. Five additional wells are planned for drilling in 2007.
James Lime Project
Beginning in 2006, the Company agreed to participate in this geological trend play of Nacogdoches County, East Texas. This trend play covers over 33,000 acres extending into adjacent counties. Five marginally successful wells were drilled in this area during 2006. The Company remains very optimistic about this area and refinements in exploitation technique continue with four additional wells planned for 2007.
Seismic Surveys
The company is currently participating in a number of other seismic surveys and interpretation efforts. Specific projects include a 3-D seismic survey of the Napoleonville Salt Dome and reprocessing of 3-D seismic data covering the Sorrento Dome, both located in Assumption Parish, Louisiana. The Company is also participating in the purchase and reprocessing of seismic data in several counties in South Texas as well as Liberty and Montgomery Counties of Texas.
In the peripheral fault trend of southwestern Arkansas, the Company is participating in two 3-D seismic surveys. The first survey has been completed with interpretation currently in process and drilling planned for later in 2007. Field work has also begun on the second survey.
19
United Kingdom North Sea
Previously, the Company held exploration licenses in the United Kingdom’s North Sea Block 21-1b and Block 48-16c. Over the last three years, the Company expended approximately $950,000 on seismic evaluation of these two prospective areas. Evaluations of Block 48-16c were completed without identifying a commercially viable prospect and hence the Block was relinquished in January 2007. For Block 21-1b, the Company was unable to fully complete its evaluation and identification of a financing partner prior to expiration of the two-year license period. Although the 21-1b block was relinquished in 2006, the Company continued its evaluation efforts and reapplied for licensing. In February 2007, the Company together with its joint interest partners was awarded a promote license in Blocks 21-1b, 21-2b, and 21-3d. The Company holds a 30 percent equity interest in these blocks located in the Central Sector of the North Sea. The Company has two years to confirm an exploration prospect and identify a partner to finance, on a promoted basis, the drilling of the first well on the Block. The terms of the license do not include a well commitment. In connections with the acquisition of these blocks, the Company also acquired an approximate nine percent equity interest in a promote licensing right to Block 42-27b, located in the Southern Sector of the U.K. North Sea.
| - | General and administrative, interest income and income tax |
General and administrative expenses were elevated in 2005 relative to both 2006 and 2004 due to accounting compliance costs totaling $1,085,000 resulting from the use of consultants to assist in the implementation of accounting procedure documentation as required by the Sarbanes-Oxley Act of 2002. Based on the Company’s current market capitalization, the Company expects to be fully Sarbanes-Oxley compliant as of December 31, 2008 and $400,000 of such costs were incurred in 2006. Substantial additional costs will continue to be incurred in connection with the Company’s ongoing Sarbanes-Oxley effort.
Interest income is increased in 2006 due to larger cash balances available during the year for overnight investment coupled with interest earned on its insurance related cash deposits. The provision for income taxes is based on Federal and State tax rates and variations are consistent with taxable income in the respective accounting periods.
| - | Discontinued operations |
Effective September 30, 2005, the Company sold its ownership in its offshore Gulf of Mexico crude oil gathering pipeline. The sale was completed to eliminate abandonment obligations and because the Company was no longer purchasing crude oil in the affected region. The pipeline was sold for $550,000 in cash, plus assignment of future abandonment obligations. The Company recognized a $451,000 pre-tax gain from the sale. The activities for this operation including the gain on sale are included with discontinued operations.
In October 2005, certain oil and gas properties held by the Company’s Chairman and Chief Executive Officer achieved “payout status”. This event caused the Company to earn a pre-tax gain of $942,000 for the value of certain residual interests held by the Company in the properties. This gain is non-recurring and has been included in discontinued operations for 2005. See also Note (3) of Notes to Consolidated Financial Statements.
20
- Outlook
Hydrocarbon commodity prices have been in a period of high volatility but are generally holding strong. Given these conditions, marketing segment earnings are expected to remain consistent with 2006 while oil and gas segment earnings are expected to improve somewhat as additional production comes on line. For the transportation segment, the United States economy appears to be slowing and availability of qualified drivers remains a concern. Given these conditions for transportation, management remains optimistic in its ability to maintain transportation earnings near the 2006 level. The Company has the following major objectives for 2007:
| - | Maintain marketing operating earnings at the $13 million level. |
| - | Maintain transportation operating earnings at the $5 million level. |
| - | Increase oil and gas operating earnings to the $6 million level and replace 110 percent of 2006 production with current reserve additions. |
Liquidity and Capital Resources
During 2006, 2005 and 2004 net cash provided by operating activities totaled $28,015,000, $18,282,000 and $2,490,000, respectively. Management generally balances the cash flow requirements of the Company’s investment activity with available cash generated from operations. Over time, cash utilized for property and equipment additions, tracks with earnings from continuing operations plus the non-cash provision for depreciation, depletion and amortization. Presently, management intends to restrict investment decisions to available cash flow. Significant, if any, additions to debt are not anticipated. A summary of this relationship follows (in thousands):
| Years Ended December 31, | |||||||||||||
| 2006 | 2005 | 2004 | Total | ||||||||||
Earnings from continuing operations | $ | 10,483 | $ | 16,769 | $ | 8,738 | $ | 35,990 | |||||
Depreciation, depletion and amortization | 9,485 | 7,060 | 6,285 | 22,830 | |||||||||
Property and equipment additions | (14,602 | ) | (19,128 | ) | (12,161 | ) | (45,891 | ) | |||||
| Debt repayment | (8,475 | ) | - | - | (8,475 | ) | |||||||
Cash available (used) for other uses | $ | (3,109 | ) | $ | 4,701 | $ | 2,862 | $ | 4,454 | ||||
Banking Relationships
The Company’s bank loan agreement with Bank of America provides for two separate lines of credit with interest at the bank’s prime rate minus ¼ of one percent. The working capital loan provides for borrowings up to $10 million based on 80 percent of eligible accounts receivable and 50 percent of eligible inventories. Available capacity under the line is calculated monthly and as of December 31, 2006 was established at $10 million. The oil and gas production loan provides for flexible borrowings subject to a borrowing base established semi-annually by the bank. The borrowing base was established at $10 million as of December 31, 2006 with no amounts outstanding. The line of credit loans are scheduled to expire on October 31, 2008, with the then present balance outstanding converting to a term loan payable in eight equal quarterly installments. As of December 31, 2006, bank debt outstanding under the Company’s two revolving credit facilities totaled $3 million and such debt was repaid in full on January 2, 2007.
21
The Bank of America loan agreement, among other things, places certain restrictions with respect to additional borrowings and the purchase or sale of assets, as well as requiring the Company to comply with certain financial covenants, including maintaining a 1.0 to 1.0 ratio of consolidated current assets to consolidated current liabilities, maintaining a 3.0 to 1.0 ratio of pre-tax net income to interest expense, and consolidated net worth in excess of $52,001,000. Should the Company’s net worth fall below this threshold, the Company may be restricted from payment of additional cash dividends on its common stock. The Company was in compliance with these covenants at December 31, 2006.
The Company’s Gulfmark subsidiary maintains a separate banking relationship with BNP Paribas in order to support its crude oil purchasing activities. In addition to providing up to $60 million in letters of credit, the facility also finances up to $6 million of crude oil inventory and certain accounts receivable associated with crude oil sales. Such financing is provided on a demand note basis with interest at the bank’s prime rate plus one percent. As of December 31, 2006, the Company had $3.5 million of eligible borrowing capacity under this facility and no working capital advances were outstanding. Letters of credit outstanding under this facility totaled approximately $25.9 million as of December 31, 2006. The letter of credit and demand note facilities are secured by substantially all of Gulfmark’s and ARM’s assets. Under this facility, BNP Paribas has the right to discontinue the issuance of letters of credit without prior notification to the Company.
The Company’s ARM subsidiary also maintains a separate banking relationship with BNP Paribas in order to support its natural gas purchasing activities. In addition to providing up to $25 million in letters of credit, the facility finances up to $4 million of general working capital needs. Such financing is provided on a demand note basis with interest at the bank’s prime rate plus one percent. No working capital advances were outstanding under this facility as of December 31, 2006. Letters of credit outstanding under this facility totaled approximately $5.8 million as of December 31, 2006. The letter of credit and demand note facilities are secured by substantially all of Gulfmark’s and ARM’s assets. Under this facility, BNP Paribas has the right to discontinue the issuance of letters of credit without prior notification to the Company.
Off-balance Sheet Arrangements
The Company maintains certain operating lease arrangements to provide tractor and trailer equipment for the Company’s truck fleet. All such operating lease commitments qualify for off-balance sheet treatment as provided by Statement of Financial Accounting Standards No. 13, “Accounting for Leases”. The Company has operating lease arrangements for tractors, trailers, office space, and other equipment and facilities. Rental expense for the years ended December 31, 2006, 2005, and 2004 was $9,887,000, $8,121,000, and $6,650,000, respectively. At December 31, 2006, commitments under long-term non-cancelable operating leases for the next five years and thereafter are payable as follows: 2007 - $4,060,000; 2008 - $3,861,000; 2009 - $1,539,000; 2010 - $548,000; 2011 - $186,000 and thereafter - $104,000.
Contractual Cash Obligations
In addition to its banking relationships and obligations, the Company enters into certain operating leasing arrangements for tractors, trailers, office space and other equipment and facilities. The Company has no capital lease obligations. A summary of the payment periods for contractual debt and lease obligations is as follows (in thousands)
22
:
| 2007 | 2008 | 2009 | 2010 | 2011 | Thereafter | Total | ||||||||||||||||
| Long-term debt | $ | - | $ | 375 | $ | 1,500 | $ | 1,125 | $ | - | $ | - | $ | 3,000 | ||||||||
Interest Rate Payments (1) | 1 | - | - | - | - | - | 1 | |||||||||||||||
| Operating leases | 4,060 | 3,861 | 1,538 | 548 | 186 | 104 | 10,297 | |||||||||||||||
| Total | $ | 4,061 | $ | 4,236 | $ | 3,038 | $ | 1,673 | $ | 186 | $ | 104 | $ | 13,298 | ||||||||
(1) On January 2, 2007, the Company fully repaid the outstanding balance on its working capital loan. As a result, no amounts of interest are shown for future periods.
In addition to its bank debt and lease financing obligations, the Company is also committed to purchase certain quantities of crude oil and natural gas in connection with its marketing activities. Such commodity purchase obligations are the basis for commodity sales, which generate the cash flow necessary to meet such purchase obligations. Approximate commodity purchase obligations as of December 31, 2006 are as follows (in thousands):
| January | Remaining | �� | |||||||||||||||||
| 2007 | 2007 | 2008 | 2009 | Thereafter | Total | ||||||||||||||
| Crude Oil | $ | 191,752 | $ | 56,037 | $ | - | $ | - | $ | - | $ | 247,789 | |||||||
| Natural Gas | 70,000 | 39,824 | 24,265 | - | - | 134,089 | |||||||||||||
$ | 261,752 | $ | 95,861 | $ | 24,265 | $ | - | $ | - | $ | 381,878 | ||||||||
Investment Activities
During 2006, the Company invested approximately $13,250,000 for oil and gas projects, of which $10,348,000 was capitalized as additional property with $2,902,000 expensed as exploration costs. An additional $2,912,000 and $1,342,000 was expended during 2006 for equipment additions for the marketing and transportation businesses, respectively. Oil and gas exploration and development efforts continue, and the Company plans to invest approximately $13 million toward such projects in 2007, including $1.5 million of seismic costs to be expensed during the year. An additional approximate $2 million is projected in 2007 for equipment additions and replacements within the Company’s marketing and transportation businesses.
Insurance
From time to time, the marketplace for all forms of insurance enters into periods of severe cost increases. In the past, during such cyclical periods, the Company has seen costs escalate to the point where desired levels of insurance were either unavailable or unaffordable. The Company’s primary insurance needs are in the areas of worker’s compensation, automobile and umbrella coverage for its trucking fleet and medical insurance for employees. During 2006 and 2005, insurance cost stabilized and totaled $9.5 million and $9.9 million, respectively. Overall insurance cost may experience renewed rate increases during 2007. Since the Company is generally unable to pass on such cost increases, any increase will need to be absorbed by existing operations.
Competition
In all phases of its operations, the Company encounters strong competition from a number of entities. Many of these competitors possess financial resources substantially in excess of those of the Company. The Company faces competition principally in establishing trade credit, pricing of available materials and quality of service. In its oil and gas operation, the Company also competes for the acquisition of mineral properties. The Company's marketing division competes with major oil companies and other large industrial concerns that own or control significant refining and marketing facilities. These major oil companies may offer their products to others on more favorable terms than those available to the Company. From time to time in recent years, there have been supply imbalances for crude oil and natural gas in the marketplace. This in turn has led to significant fluctuations in prices for crude oil and natural gas. As a result, there is a high degree of uncertainty regarding both the future market price for crude oil and natural gas and the available margin spread between wholesale acquisition costs and sales realization.
23
Critical Accounting Policies and Use of Estimates
Fair Value Accounting
As an integral part of its marketing operation, the Company enters into certain forward commodity contracts that are required to be recorded at fair value in accordance with Statement of Financial Accounting Standards No. 133, “Accounting for Derivative Instruments and Hedging Activities” and related accounting pronouncements. Management believes this required accounting, known as mark-to-market accounting, creates variations in reported earnings and the reported earnings trend. Under mark-to-market accounting, significant levels of earnings are recognized in the period of contract initiation rather than the period when the service is provided and title passes from supplier to customer. As it affects the Company’s operation, management believes mark-to-market accounting impacts reported earnings and the presentation of financial condition in three important ways.
| 1. | Gross margins, derived from certain aspects of the Company’s ongoing business, are front-ended into the period in which contracts are executed. Meanwhile, personnel and other costs associated with servicing accounts as well as substantially all risks associated with the execution of contracts are incurred during the period of physical product flow and title passage. |
| 2. | Mark-to-market earnings are calculated based on stated contract volumes. A significant risk associated with the Company’s business is the conversion of stated contract or planned volumes into actual physical commodity movement volumes without a loss of margin. Again, any planned profit from such commodity contracts is bunched and front-ended into one period while the risk of loss associated with the difference between actual versus planned production or usage volumes falls in a subsequent period. |
| 3. | Cash flows, by their nature, match physical movements and passage of title. Mark-to-market accounting, on the other hand, creates a mismatch between reported earnings and cash flows. This complicates and confuses the picture of stated financial conditions and liquidity. |
The Company attempts to mitigate the identified risks by only entering into contracts where current market quotes in actively traded, liquid markets are available to determine the fair value of contracts. In addition, substantially all of the Company’s forward contracts are less than 18 months in duration. However, the reader is cautioned to develop a full understanding of how fair value or mark-to-market accounting creates reported results that differ from those presented under conventional accrual accounting.
Trade Accounts
Accounts receivable and accounts payable typically represent the most significant assets and liabilities of the Company. Particularly within the Company’s energy marketing, oil and gas exploration, and production operations, there is a high degree of interdependence with and reliance upon third parties, (including transaction counterparties) to provide adequate information for the proper recording of amounts receivable or payable. Substantially all such third parties are larger firms providing the Company with the source documents for recording trade activity. It is commonplace for these entities to retroactively adjust or correct such documents. This typically requires the Company to either absorb, benefit from, or pass along such corrections to another third party.
Due to the volume of and complexity of transactions and the high degree of interdependence with third parties, this is a difficult area to control and manage. The Company manages this process by participating in a monthly settlement process with each of its counterparties. Ongoing account balances are monitored monthly and the Company attempts to gain the cooperation of such counterparties to reconcile outstanding balances. The Company also places great emphasis on collecting cash balances due and paying only bonafide and properly supported claims. In addition, the Company maintains and monitors its bad debt allowance. Nevertheless a degree of risk remains, however, due to the custom and practices of the industry.
24
Oil and Gas Reserve Estimate
The value of capitalized cost of oil and gas exploration and production related assets are dependent on underlying oil and gas reserve estimates. Reserve estimates are based on many subjective factors. The accuracy of reserve estimates depends on the quantity and quality of geological data, production performance data and reservoir engineering data, changing prices, as well as the skill and judgment of petroleum engineers in interpreting such data. The process of estimating reserves requires frequent revision of estimates (usually on an annual basis) as additional information becomes available. Calculations of estimated future oil and gas revenues are also based on estimates of the timing of oil and gas production, and there are no assurances that the actual timing of production will conform to or approximate such estimates. Also, certain assumptions must be made with respect to pricing. The Company’s estimates assume prices will remain constant from the date of the engineer’s estimates, except for changes reflected under natural gas sales contracts. There can be no assurance that actual future prices will not vary as industry conditions, governmental regulation, political conditions, economic conditions, weather conditions, market uncertainty and other factors impact the market price for oil and gas.
The Company follows the successful efforts method of accounting, so only costs (including development dry hole costs) associated with producing oil and gas wells are capitalized. Estimated oil and gas reserve quantities are the basis for the rate of amortization under the Company’s units of production method for depreciating, depleting and amortizing of oil and gas properties. Estimated oil and gas reserve values also provide the standard for the Company’s periodic review of oil and gas properties for impairment.
Contingencies
From time to time as incident to its operations, the Company becomes involved in various accidents, lawsuits and/or disputes. Primarily as an operator of an extensive trucking fleet, the Company is a party to motor vehicle accidents, worker compensation claims or other items of general liability as are typical for the industry. In addition, the Company has extensive operations that must comply with a wide variety of tax laws, environmental laws and labor laws, among others. Should an incident occur, management evaluates the claim based on its nature, the facts and circumstances and the applicability of insurance coverage. To the extent management believes that such event may impact the financial condition of the Company, management will estimate the monetary value of the claim and make appropriate accruals or disclosure as provided in the guidelines of Statement of Financial Accounting Standards No. 5, “Accounting for Contingencies”.
Revenue Recognition
The Company’s crude oil, natural gas and refined products marketing customers are invoiced based on contractually agreed upon terms on an at least monthly basis. Revenue is recognized in the month in which the physical product is delivered to the customer. Where required, the Company also recognizes fair value or mark-to-market gains and losses related to its commodity activities. A detailed discussion of the Company’s risk management activities is included in Note (1) of Notes to Consolidated Financial Statements.
Transportation segment customers are invoiced, and the related revenue is recognized as the service is provided. Oil and gas revenue from the Company’s interests in producing wells is recognized as title and physical possession of the oil and gas passes to the purchaser.
Recent Accounting Pronouncements
In December 2004, the Financial Accounting Standards Board (“FASB”) issued Statement of Financial Accounting Standards (“SFAS”) No. 123(R), “Share-Based Payment”, which established accounting standards for all transactions in which an entity exchanges its equity instruments for goods and services. SFAS No. 123(R) focuses primarily on accounting for such transactions with employees. As of December 31, 2006 the Company had no stock-based employee compensation plans, nor any other share-based payment arrangements.
25
In November 2004, the FASB issued SFAS No. 151, “Inventory Costs”. This statement clarifies the accounting for abnormal amounts of idle facility expense, freight, handling costs, and wasted material (spoilage). SFAS No. 151 requires that these items be charged to expense regardless of whether they meet the “so abnormal” criterion outlined in Accounting Research Bulletin No. 43. This statement was effective for inventory costs incurred during fiscal years beginning after June 15, 2005. The adoption of this statement did not have any effect on the Company’s financial position, results of operations or cash flows.
In May 2005, the FASB issued SFAS No. 154, “Accounting Changes and Error Corrections”. This statement establishes new standards on the accounting for and reporting of changes in accounting principles and error corrections. SFAS No. 154 requires retrospective application to the financial statements of prior periods for all such changes, unless it is impracticable to do so. SFAS No. 154 became effective for the Company in the first quarter of 2006.
In July 2006, the FASB issued Financial Interpretation (“FIN”) No. 48, “Accounting for Uncertainty in Income Taxes - an Interpretation of FASB Statement No. 109.” FIN 48 addresses the accounting for uncertainty in income taxes recognized in an enterprise’s financial statements in accordance with SFAS No. 109, “Accounting for Income Taxes.” FIN 48 prescribes specific criteria for the financial statement recognition and measurement of the tax effects of a position taken or expected to be taken in a tax return. This interpretation also provides guidance on de-recognition of previously recognized tax benefits, classification of tax liabilities on the balance sheet, recording interest and penalties on tax underpayments, accounting in interim periods, and disclosure requirements. FIN 48 is effective for fiscal period beginning after December 15, 2006 and management does not believe the impact of adjusting FIN 48 will be material.
ITEM 7A. QUANTITATIVE AND QUALITATIVE DISCLOSURES ABOUT MARKET RISK
The Company’s exposure to market risk includes potential adverse changes in interest rates and commodity prices.
Interest Rate Risk
Total long-term debt at December 31, 2006 included $3 million of floating rate debt. As a result, the Company’s annual interest costs fluctuate based on interest rate changes. Because the interest rate on the Company’s long-term debt is a floating rate, the fair value approximates carrying value as of December 31, 2006. A hypothetical 10 percent adverse change in the floating rate would not have had a material effect on the Company’s results of operations for the fiscal year ended December 31, 2006.
Commodity Price Risk
The Company’s major market risk exposure is in the pricing applicable to its marketing and production of crude oil and natural gas. Realized pricing is primarily driven by the prevailing spot prices applicable to oil and gas. Commodity price risk in the Company’s marketing operations represents the potential loss that may result from a change in the market value of an asset or a commitment. From time to time, the Company enters into forward contracts to minimize or hedge the impact of market fluctuations on its purchases of crude oil and natural gas. The Company may also enter into price support contracts with certain customers to secure a floor price on the purchase of certain supply. In each instance, the Company locks in a separate matching price support contract with a third party in order to minimize the risk of these financial instruments. Substantially all forward contracts fall within a six-month to one-year term with no contracts extending longer than three years in duration. The Company monitors all commitments and positions and endeavors to maintain a balanced portfolio.
26
Certain forward contracts are recorded at fair value, depending on management’s assessments of numerous accounting standards and positions that comply with generally accepted accounting principles. The fair value of such contracts is reflected on the Company’s balance sheet as risk management assets and liabilities. The undiscounted revaluation of such contracts is recognized on a net basis in the Company’s results of operations. Current market price quotes from actively traded liquid markets are used in all cases to determine the contracts’ fair value. Regarding net risk management assets, all of the presented values as of December 31, 2006 and 2005 were based on readily available market quotations. Risk management assets and liabilities are classified as short-term or long-term depending on contract terms. The estimated future net cash inflow based on year-end market prices is $1,464,000 with substantially all to be received in 2007. The estimated future cash inflow approximates the net fair value recorded in the Company’s risk management assets and liabilities.
The following table illustrates the factors impacting the change in the net value of the Company’s risk management assets and liabilities for the year ended December 31, 2006 (in thousands).
| 2006 | ||||
| Net fair value on January 1, | $ | 1,781 | ||
| Activity during 2006 | ||||
| - Cash received from settled contracts | (2,121 | ) | ||
| - Net realized gain from prior years’ contracts | 472 | |||
| - Net unrealized gain from current year contracts | 1,332 | |||
| Net fair value on December 31, | $ | 1,464 | ||
Historically, prices received for oil and gas production have been volatile and unpredictable. Price volatility is expected to continue. From January 1, 2005 through December 31, 2006 natural gas price realizations ranged from a monthly low of $3.42 mmbtu to a monthly high of $15.22 per mmbtu. Oil prices ranged from a low of $46.45 per barrel to a high of $73.64 per barrel during the same period. A hypothetical 10 percent adverse change in average natural gas and crude oil prices, assuming no changes in volume levels, would have reduced earnings by approximately $2,293,000 and $2,527,000, respectively, for the comparative years ended December 31, 2006 and 2005.
27
ITEM 8. FINANCIAL STATEMENTS
ADAMS RESOURCES & ENERGY, INC. AND SUBSIDIARIES
INDEX TO FINANCIAL STATEMENTS
| Page | ||||
| REPORT OF INDEPENDENT REGISTERED PUBLIC ACCOUNTING FIRM | 30 | |||
| FINANCIAL STATEMENTS: | ||||
| Consolidated Balance Sheets as of December 31, 2006 and 2005 | 31 | |||
| Consolidated Statements of Operations for the Years Ended | ||||
| December 31, 2006, 2005 and 2004 | 32 | |||
| Consolidated Statements of Shareholders’ Equity for the Years Ended | ||||
| December 31, 2006, 2005 and 2004 | 33 | |||
| Consolidated Statements of Cash Flows for the Years Ended | ||||
| December 31, 2006, 2005 and 2004 | 34 | |||
| Notes to Consolidated Financial Statements | 35 | |||
28
REPORT OF INDEPENDENT REGISTERED PUBLIC ACCOUNTING FIRM
To the Shareholders of Adams Resources & Energy, Inc.:
We have audited the accompanying consolidated balance sheets of Adams Resources and Energy, Inc. and subsidiaries (the “Company”) as of December 31, 2006 and 2005, and the related consolidated statements of operations, shareholders’ equity and cash flows for each of the three years in the period ended December 31, 2006. These financial statements are the responsibility of the Company’s management. Our responsibility is to express an opinion on the financial statements based on our audits.
We conducted our audits in accordance with the standards of the Public Company Accounting Oversight Board (United States). Those standards require that we plan and perform the audit to obtain reasonable assurance about whether the financial statements are free of material misstatement. The Company is not required to have, nor were we engaged to perform, an audit of its internal control over financial reporting. Our audit included consideration of internal control over financial reporting as a basis for designing audit procedures that are appropriate in the circumstances, but not for the purpose of expressing an opinion on the effectiveness of the Company’s internal control over financial reporting. Accordingly, we express no such opinion. An audit includes examining, on a test basis, evidences supporting the amounts and disclosures in the financial statements, assessing the accounting principles used and significant estimates made by management, as well as evaluating the overall financial statement presentation. We believe that our audits provide a reasonable basis for our opinion.
As discussed in Note 1, effective January 1, 2006, the Company changed its method of accounting for buy/sell arrangements.
In our opinion, such consolidated financial statements present fairly, in all material respects, the financial position of the Company as of December 31, 2006 and 2005, and the results of its operations and its cash flows for the each of the three years in the period ended December 31, 2006, in conformity with accounting principles generally accepted in the United States of America.
DELOITTE & TOUCHE LLP
Houston, Texas
March 29, 2007
29
ADAMS RESOURCES & ENERGY, INC. AND SUBSIDIARIES
CONSOLIDATED BALANCE SHEETS
(In thousands)
| December 31, | |||||||
| ASSETS | 2006 | 2005 | |||||
| CURRENT ASSETS: | |||||||
Cash and cash equivalents | $ | 20,668 | $ | 18,817 | |||
| Accounts receivable, net of allowance for doubtful accounts of | |||||||
$225 and $608, respectively | 194,097 | 217,727 | |||||
Inventories | 7,950 | 11,692 | |||||
Risk management receivables | 13,140 | 13,324 | |||||
Income tax receivable | 1,396 | 1,304 | |||||
Prepayments | 4,539 | 7,586 | |||||
Total current assets | 241,790 | 270,450 | |||||
| PROPERTY AND EQUIPMENT: | |||||||
Marketing | 14,051 | 14,332 | |||||
Transportation | 32,068 | 32,319 | |||||
Oil and gas (successful efforts method) | 61,003 | 52,111 | |||||
Other | 99 | 99 | |||||
107,221 | 98,861 | ||||||
Less - Accumulated depreciation, depletion and amortization | (63,905 | ) | (58,965 | ) | |||
43,316 | 39,896 | ||||||
| OTHER ASSETS: | |||||||
Risk management assets | 644 | 47 | |||||
Other assets | 3,537 | 2,269 | |||||
$ | 289,287 | $ | 312,662 | ||||
| LIABILITIES AND SHAREHOLDERS’ EQUITY | |||||||
| CURRENT LIABILITIES: | |||||||
Accounts payable | $ | 185,735 | $ | 213,668 | |||
Risk management payables | 11,897 | 11,542 | |||||
Accrued and other liabilities | 7,897 | 4,790 | |||||
Current deferred income taxes | 1,053 | 1,129 | |||||
Total current liabilities | 206,582 | 231,129 | |||||
| LONG-TERM DEBT | 3,000 | 11,475 | |||||
| OTHER LIABILITIES: | |||||||
Asset retirement obligations | 1,152 | 1,058 | |||||
Deferred income taxes and other | 3,762 | 3,296 | |||||
Risk management liabilities | 423 | 48 | |||||
214,919 | 247,006 | ||||||
| COMMITMENTS AND CONTINGENCIES (NOTE 8) | |||||||
| SHAREHOLDERS’ EQUITY: | |||||||
| Preferred stock, $1.00 par value, 960,000 shares authorized, | |||||||
none outstanding | - | - | |||||
| Common stock, $.10 par value, 7,500,000 shares authorized, | |||||||
4,217,596 issued and outstanding | 422 | 422 | |||||
Contributed capital | 11,693 | 11,693 | |||||
Retained earnings | 62,253 | 53,541 | |||||
Total shareholders’ equity | 74,368 | 65,656 | |||||
$ | 289,287 | $ | 312,662 | ||||
The accompanying notes are an integral part of these consolidated financial statements.
30
ADAMS RESOURCES & ENERGY, INC. AND SUBSIDIARIES
CONSOLIDATED STATEMENTS OF OPERATIONS
(In thousands, except per share data)
| Years Ended December 31, | ||||||||||
| 2006 | 2005 | 2004 | ||||||||
| REVENUES: | ||||||||||
| Marketing | $ | 2,167,502 | $ | 2,292,029 | $ | 2,010,968 | ||||
| Transportation | 62,151 | 57,458 | 47,323 | |||||||
| Oil and gas | 16,950 | 15,346 | 10,796 | |||||||
2,246,603 | 2,364,833 | 2,069,087 | ||||||||
| COSTS AND EXPENSES: | ||||||||||
| Marketing | 2,153,183 | 2,268,296 | 1,996,160 | |||||||
| Transportation | 52,440 | 48,614 | 39,511 | |||||||
| Oil and gas | 7,992 | 5,903 | 5,485 | |||||||
| General and administrative | 8,536 | 9,668 | 7,867 | |||||||
| Depreciation, depletion and amortization | 9,485 | 7,060 | 6,285 | |||||||
2,231,636 | 2,339,541 | 2,055,308 | ||||||||
| Operating Earnings | 14,967 | 25,292 | 13,779 | |||||||
| Other Income (Expense): | ||||||||||
| Interest income | 965 | 188 | 62 | |||||||
| Interest expense | (159 | ) | (128 | ) | (107 | ) | ||||
| Earnings from continuing operations before income tax | ||||||||||
| and cumulative effect of accounting change | 15,773 | 25,352 | 13,734 | |||||||
| Income Tax Provision: | ||||||||||
| Current | 4,878 | 7,765 | 4,603 | |||||||
| Deferred | 412 | 818 | 393 | |||||||
5,290 | 8,583 | 4,996 | ||||||||
| Earnings from continuing operations | 10,483 | 16,769 | 8,738 | |||||||
| Earnings (loss) from discontinued operations, net of tax | ||||||||||
| (provision) benefit of zero, $(443) and $67, respectively | - | 872 | (130 | ) | ||||||
| Net Earnings | $ | 10,483 | $ | 17,641 | $ | 8,608 | ||||
| EARNINGS (LOSS) PER SHARE: | ||||||||||
| From continuing operations | $ | 2.49 | $ | 3.97 | $ | 2.07 | ||||
| From discontinued operations | - | .21 | (.03 | ) | ||||||
| Basic and diluted net earnings per share | $ | 2.49 | $ | 4.18 | $ | 2.04 | ||||
| DIVIDENDS PER COMMON SHARE | $ | .42 | $ | .37 | $ | .30 | ||||
The accompanying notes are an integral part of these consolidated financial statements.
31
ADAMS RESOURCES & ENERGY, INC. AND SUBSIDIARIES
CONSOLIDATED STATEMENTS OF SHAREHOLDERS' EQUITY
(In thousands)
Total | |||||||||||||
Common | Contributed | Retained | Shareholders’ | ||||||||||
Stock | Capital | Earnings | Equity | ||||||||||
| BALANCE, January 1, 2004 | $ | 422 | $ | 11,693 | $ | 30,117 | $ | 42,232 | |||||
| Net earnings | - | - | 8,608 | 8,608 | |||||||||
| Dividends paid on common stock | - | - | (1,265 | ) | (1,265 | ) | |||||||
| BALANCE, December 31, 2004 | $ | 422 | $ | 11,693 | $ | 37,460 | $ | 49,575 | |||||
| Net earnings | - | - | 17,641 | 17,641 | |||||||||
| Dividends paid on common stock | - | - | (1,560 | ) | (1,560 | ) | |||||||
| BALANCE, December 31, 2005 | $ | 422 | $ | 11,693 | $ | 53,541 | $ | 65,656 | |||||
| Net earnings | - | - | 10,483 | 10,483 | |||||||||
| Dividends paid on common stock | - | - | (1,771 | ) | (1,771 | ) | |||||||
| BALANCE, December 31, 2006 | $ | 422 | $ | 11,693 | $ | 62,253 | $ | 74,368 | |||||
The accompanying notes are an integral part of these consolidated financial statements.
32
ADAMS RESOURCES & ENERGY, INC. AND SUBSIDIARIES
CONSOLIDATED STATEMENTS OF CASH FLOWS
(In thousands)
| Years Ended December 31, | ||||||||||
| 2006 | 2005 | 2004 | ||||||||
| CASH PROVIDED BY OPERATIONS: | ||||||||||
| Earnings from continuing operations | $ | 10,483 | $ | 16,769 | $ | 8,738 | ||||
| Adjustments to reconcile net earnings to net cash | ||||||||||
| provided by (used in) operating activities- | ||||||||||
| Depreciation, depletion and amortization | 9,485 | 7,060 | 6,285 | |||||||
| Gains on property sales | (101 | ) | (1,159 | ) | (1,438 | ) | ||||
| Impairment of oil and gas properties | 1,405 | 391 | 616 | |||||||
| Other, net | 262 | (157 | ) | (188 | ) | |||||
| Decrease (increase) in accounts receivable | 23,630 | (55,842 | ) | (26,579 | ) | |||||
| Decrease (increase) in inventories | 3,742 | (320 | ) | (5,072 | ) | |||||
| Risk management activities | 317 | (1,151 | ) | 62 | ||||||
| Decrease (increase) in tax receivable | (92 | ) | (1,304 | ) | 1,310 | |||||
| Decrease (increase) in prepayments | 3,047 | 759 | (3,475 | ) | ||||||
| Increase (decrease) in accounts payable | (27,682 | ) | 53,200 | 15,138 | ||||||
| Increase (decrease) in accrued liabilities | 3,107 | (1,114 | ) | 2,540 | ||||||
| Deferred income taxes | 412 | 818 | 393 | |||||||
| Net cash provided by (used in) continuing operations | 28,015 | 17,950 | (1,670 | ) | ||||||
| Net cash provided by discontinued operations | - | 332 | 4,160 | |||||||
| Net cash provided by operating activities | 28,015 | 18,282 | 2,490 | |||||||
| INVESTING ACTIVITIES: | ||||||||||
| Property and equipment additions | (14,602 | ) | (19,128 | ) | (12,161 | ) | ||||
| Insurance and tax deposits | (1,458 | ) | (1,787 | ) | - | |||||
| Proceeds from property sales | 142 | 2,078 | 2,536 | |||||||
| Net cash used in continuing operations | (15,918 | ) | (18,837 | ) | (9,625 | ) | ||||
| Proceeds from sale of discontinued operations | - | 990 | - | |||||||
| Net cash used in investing activities | (15,918 | ) | (17,847 | ) | (9,625 | ) | ||||
| FINANCING ACTIVITIES: | ||||||||||
| Net repayments under credit agreements | (8,475 | ) | - | - | ||||||
| Dividend payments | (1,771 | ) | (1,560 | ) | (1,265 | ) | ||||
| Net cash used in financing activities | (10,246 | ) | (1,560 | ) | (1,265 | ) | ||||
| Increase (decrease) in cash and cash equivalents | 1,851 | (1,125 | ) | (8,400 | ) | |||||
| Cash and cash equivalents at beginning of year | 18,817 | 19,942 | 28,342 | |||||||
| Cash and cash equivalents at end of year | $ | 20,668 | $ | 18,817 | $ | 19,942 | ||||
The accompanying notes are an integral part of these consolidated financial statements.
33
(1) Summary of Significant Accounting Policies
Principles of Consolidation
The accompanying consolidated financial statements include the accounts of Adams Resources & Energy, Inc., a Delaware corporation, and its wholly owned subsidiaries (the "Company") after elimination of all significant intercompany accounts and transactions.
Nature of Operations
The Company is engaged in the business of crude oil, natural gas and petroleum products marketing, as well as tank truck transportation of liquid chemicals and oil and gas exploration and production. Its primary area of operation is within a 1,000-mile radius of Houston, Texas.
Cash and Cash Equivalents
Cash and cash equivalents include any treasury bill, commercial paper, money market fund or federal fund with a maturity of 30 days or less.
Inventories
Crude oil and petroleum product inventories are carried at the lower of cost or market. Petroleum products inventory includes gasoline, lubricating oils and other petroleum products purchased for resale and are valued at cost determined on the first-in, first-out basis, while crude oil inventory is valued at average cost. Components of inventory are as follows (in thousands):
| DDecember 31, | |||||||
| 2006 | 2005 | ||||||
| Crude oil | $ | 5,983 | $ | 9,924 | |||
| Petroleum products | 1,967 | 1,768 | |||||
$ | 7,950 | $ | 11,692 | ||||
Property and Equipment
Expenditures for major renewals and betterments are capitalized, and expenditures for maintenance and repairs are expensed as incurred. Interest costs incurred in connection with major capital expenditures are capitalized and amortized over the lives of the related assets. When properties are retired or sold, the related cost and accumulated depreciation, depletion and amortization ("DD&A") is removed from the accounts and any gain or loss is reflected in earnings.
Oil and gas exploration and development expenditures are accounted for in accordance with the successful efforts method of accounting. Direct costs of acquiring developed or undeveloped leasehold acreage, including lease bonus, brokerage and other fees, are capitalized. Exploratory drilling costs are initially capitalized until the properties are evaluated and determined to be either productive or nonproductive. Such evaluations are made on a quarterly basis. If an exploratory well is determined to be nonproductive, the capitalized costs of drilling the well are charged to expense. Costs incurred to drill and complete development wells, including dry holes, are capitalized. As of December 31, 2006, the Company had no unevaluated or suspended drilling costs.
34
Producing oil and gas leases, equipment and intangible drilling costs are depleted or amortized over the estimated proved producing reserves using the units-of-production method. Other property and equipment is depreciated using the straight-line method over the estimated average useful lives of three to twenty years for marketing, three to fifteen years for transportation and ten to twenty years for all others.
The Company is required to periodically review long-lived assets for impairment whenever there is evidence that the carrying value of such assets may not be recoverable. This consists of comparing the carrying value of the asset with the asset’s expected future undiscounted cash flows without interest costs. Estimates of expected future cash flows represent management’s best estimate based on reasonable and supportable assumptions. Proved oil and gas properties are reviewed for impairment on a field-by-field basis. Any impairment recognized is permanent and may not be restored. In addition, management evaluates the carrying value of non-producing properties and may deem them impaired for lack of drilling activity. Such evaluations are made on a quarterly basis. Accordingly, impairment provisions on non-producing properties totaling $564,000, $391,000 and $616,000 were recorded as additional operating expense in 2006, 2005 and 2004, respectively. Also for 2006, 2005 and 2004 impairment provision on producing oil and gas properties totaling $841,000, $429,000 and $309,000, respectively, were recorded as additional operating expense as a result of relatively high costs incurred on certain properties relative to their oil and gas reserve valuations.
Other Assets
Other assets primarily consist of cash deposits associated with the Company’s business activities. The Company established certain deposits to support its participation in its liability insurance program and such deposits totaled $2,275,000 and $817,000 as of December 31, 2006 and 2005, respectively. In addition, the Company maintains deposits to support the collection and remittance of state crude oil severance taxes. Such deposits totaled $795,000 and $970,000 as of December 31, 2006 and 2005, respectively.
Revenue Recognition
Commodity purchases and sales associated with the Company’s natural gas marketing activities qualify as derivative instruments under Statement of Financial Accounting Standards (“SFAS”) No. 133. Therefore, natural gas purchases and sales are recorded on a net revenue basis in the accompanying financial statements in accordance with Emerging Issues Task Force (“EITF”) 02-3 “Issues Involved in Accounting for Derivative Contracts Held for Trading Purposes and Contracts Involved in Energy Trading and Risk Management Activities”. In contrast, a significant portion of crude oil purchases and sales qualify, and have been designated as, normal purchases and sales. Therefore, such crude oil purchases and sales are recorded on a gross revenue basis in the accompanying financial statements. Those purchases and sales of crude oil that do not qualify as “normal purchases and sales” are recorded on a net revenue basis in the accompanying financial statements. For “normal purchase and sale” activities, the Company’s customers are invoiced monthly based on contractually agreed upon terms and revenue is recognized in the month in which the physical product is delivered to the customer. Where required, the Company recognizes fair value or mark-to-market gains and losses related to its natural gas and crude oil trading activities. A detailed discussion of the Company’s risk management activities is included later in this footnote.
Substantially all of the Company’s petroleum products marketing activity qualify as a “normal purchase and sale” and revenue is recognized in the period when the customer physically takes possession and title to the product upon delivery at their facility. The Company recognizes fair value or mark to market gains and losses on refined product marketing activities that do not qualify as “normal purchases and sales”.
Transportation customers are invoiced, and the related revenue is recognized, as the service is provided. Oil and gas revenue from the Company’s interests in producing wells is recognized as title and physical possession of the oil and gas passes to the purchaser.
35
Included in 2005 and 2004 reported marketing segment revenues and costs is the gross proceeds and costs associated with certain crude oil buy/sell arrangements. Crude oil buy/sell arrangements result from a single contract or concurrent contracts with a single counterparty to provide for similar quantities of crude oil to be bought and sold at two different locations. Such contracts may be entered into for a variety of reasons including to effect the transportation of the commodity, to minimize credit exposure, and to meet the competitive demands of the customer. In September 2005, the EITF of the Financial Accounting Standards Board (“FASB”) reached consensus in the issue of accounting for buy/sell arrangements as part of its EITF Issue No. 04-13, “Accounting for Purchases and Sales of Inventory with the Same Counterparty” (“Issue 04-13”). As part of Issue 04-13, the EITF is required that all buy/sell arrangements be reflected on a net basis, such that the purchase and sale are netted and shown as either a net purchase or a net sale in the income statement. This requirement affected new arrangements, and modifications or renewals of existing arrangements, and the Company adopted Issue 04-13 effective January 1, 2006. Prior period amounts for marketing revenues and marketing costs and expenses in the accompanying condensed consolidated statements of operations were not restated to reflect the requirements of Issue 04-13. Such buy/sell amounts totaled approximately $690,190,000 and $735,476,000 for marketing revenues and costs during 2005 and 2004, respectively.
Statement of Cash Flows
Interest paid totaled $158,000, $120,000 and $120,000 during the years ended December 31, 2006, 2005 and 2004, respectively. Income taxes paid during these same periods totaled $4,941,000, $10,855,000 and $2,957,000, respectively. Federal tax refunds received totaled $2,200,000 during 2005. Non-cash investing activities for property and equipment in accounts payable were $172,000 and $283,000 as of December 31, 2006 and 2005, respectively. There were no significant non-cash financing activities in any of the periods reported.
Earnings Per Share
The Company computes and presents earnings per share in accordance with SFAS No. 128, “Earnings Per Share”, which requires the presentation of basic earnings per share and diluted earnings per share for potentially dilutive securities. Earnings per share are based on the weighted average number of shares of common stock and potentially dilutive common stock shares outstanding during the period. The weighted average number of shares outstanding averaged 4,217,596 for 2006, 2005 and 2004. There were no potentially dilutive securities during 2006, 2005 and 2004.
Use of Estimates
The preparation of financial statements in conformity with accounting principles generally accepted in the United States requires management to make estimates and assumptions that affect the reported amounts of assets and liabilities at the date of the financial statements and the reported amounts of revenues and expenses during the reporting period. Actual results could differ from those estimates. Examples of significant estimates used in the accompanying Consolidated Financial Statements include the accounting for depreciation, depletion and amortization, oil and gas property impairments, the provision for bad debts, income taxes, contingencies and price risk management activities.
Price Risk Management Activities
SFAS No. 133, “Accounting for Derivative Instruments and Hedging Activities”, as amended by SFAS No. 137 and No. 138, establishes accounting and reporting standards that require every derivative instrument (including certain derivative instruments embedded in other contracts) be recorded on the balance sheet as either an asset or liability measured at its fair value, unless the derivative qualifies and has been designated as a normal purchase or sale. Changes in fair value are recognized immediately in earnings unless the derivatives qualify for, and the Company elects, cash flow hedge accounting. The Company had no contracts designated for hedge accounting under SFAS No. 133 during any current reporting periods.
36
The Company’s trading and non-trading transactions give rise to market risk, which represents the potential loss that may result from a change in the market value of a particular commitment. The Company closely monitors and manages its exposure to market risk to ensure compliance with the Company’s risk management policies. Such policies are regularly assessed to ensure their appropriateness given management’s objectives, strategies and current market conditions.
Crude oil, natural gas and refined products energy trading contracts that do not qualify as “normal purchase and sales” are recorded at fair value, depending on management’s assessments of the numerous accounting standards and positions that comply with generally accepted accounting principles. The undiscounted fair value of such contracts is reflected on the Company’s balance sheet as risk management assets and liabilities. The revaluation of such contracts is recognized in the Company’s results of operations. Current market price quotes from actively traded liquid markets are used in all cases to determine the contracts’ fair value. Risk management assets and liabilities are classified as short-term or long-term depending on contract terms. The estimated future net cash inflow based on market prices as of December 31, 2006 is $1,464,000 with substantially all to be received in 2007. The estimated future cash inflow approximates the net fair value recorded in the Company’s risk management assets and liabilities.
The following table illustrates the factors impacting the change in the net value of the Company’s risk management assets and liabilities for the years ended December 31, 2006 and 2005 (in thousands):
| 2006 | 2005 | ||||||
| Net fair value on January 1, | $ | 1,781 | $ | 630 | |||
| Activity during 2006 | |||||||
| - Cash received from settled contracts | (2,121 | ) | (913 | ) | |||
| - Net realized gain from prior years’ contracts | 472 | 283 | |||||
| - Net unrealized gain from current years’ contracts | 1,332 | 1,781 | |||||
| Net fair value on December 31, | $ | 1,464 | $ | 1,781 | |||
Asset Retirement Obligations
SFAS No. 143 “Accounting for Asset Retirement Obligations” established an accounting model for accounting and reporting obligations associated with retirement of tangible long-lived assets and associated retirement costs. SFAS No. 143 requires that the fair value of a liability for an asset's retirement obligation be recorded in the period in which it is incurred and the corresponding cost capitalized by increasing the carrying amount of the related long-lived asset. The liability is accreted to its then present value each period, and the capitalized cost is depreciated over the useful life of the related asset. If the liability is settled for an amount other than the recorded amount, a gain or loss is recognized.
A summary of the recording of the estimated fair value of the Company’s asset retirement obligations is presented as follows (in thousands):
| 2006 | 2005 | ||||||
| Balance on January 1, | $ | 1,058 | $ | 723 | |||
| Liabilities incurred | 46 | 50 | |||||
| Accretion of discount | 62 | 63 | |||||
| Liabilities settled | (14 | ) | (103 | ) | |||
| Revisions to estimates | - | 325 | |||||
| Balance on December 31, | $ | 1,152 | $ | 1,058 | |||
37
In addition to an accrual for asset retirement obligations, the Company maintains $75,000 in escrow cash, which is legally restricted for the potential purpose of settling asset retirement costs in accordance with certain state regulations. Such cash deposits are included in other assets on the accompanying consolidated balance sheet.
Recent Accounting Pronouncements
In December 2004, the FASB issued SFAS No. 123(R), “Share-Based Payment”, which established accounting standards for all transactions in which an entity exchanges its equity instruments for goods and services. SFAS No. 123(R) focuses primarily on accounting for such transactions with employees. As of December 31, 2006, the Company had no stock-based employee compensation plans, nor any other share-based payment arrangements.
In November 2004, the FASB issued SFAS No. 151, “Inventory Costs.” This statement clarifies the accounting for abnormal amounts of idle facility expense, freight, handling costs, and wasted material (spoilage). SFAS No. 151 requires that these items be charged to expense regardless of whether they meet the “so abnormal” criterion outlined in Accounting Research Bulletin No. 43. This statement was effective for inventory costs incurred during fiscal years beginning after June 15, 2006. The adoption of this statement did not have any effect on the Company’s financial position, results of operations or cash flows.
In May 2005, the FASB issued SFAS No. 154, “Accounting Changes and Error Corrections”. This statement establishes new standards on the accounting for and reporting of changes in accounting principles and error corrections. SFAS No. 154 requires retrospective application to the financial statements of prior periods for all such changes, unless it is impracticable to do so. SFAS No. 154 is effective for the Company in the first quarter of 2006.
In July 2006, the FASB issued FIN No. 48, “Accounting for Uncertainty in Income Taxes - an Interpretation of FASB Statement No. 109.” FIN 48 addresses the accounting for uncertainty in income taxes recognized in an enterprise’s financial statements in accordance with SFAS No. 109, “Accounting for Income Taxes.” FIN 48 prescribes specific criteria for the financial statement recognition and measurement of the tax effects of a position taken or expected to be taken in a tax return. This interpretation also provides guidance on derecognition of previously recognized tax benefits, classification of tax liabilities on the balance sheet, recording interest and penalties on tax underpayments, accounting in interim periods, and disclosure requirements. FIN 48 is effective for fiscal periods beginning after December 15, 2006 and management does not believe the impact of adopting FIN 48 will be material.
(2) Long-Term Debt
The Company's bank loan agreement with Bank of America provides for two separate lines of credit with interest at the bank's prime rate minus ¼ of one percent. The working capital loan provides for borrowings up to $10 million based on the total of 80 percent of eligible accounts receivable and 50 percent of eligible inventories. Available capacity under the working capital line is calculated monthly and as of December 31, 2006 was established at $10 million with $3 million of such amount outstanding at December 31, 2006. The oil and gas production loan provides for flexible borrowings, subject to a borrowing base established semi-annually by the bank. The borrowing base was established at $10 million as of December 31, 2006 with no amount outstanding. The working capital loans also provide for the issuance of letters of credit. The amount of each letter of credit obligation is deducted from the borrowing capacity. As of December 31, 2006, letters of credit under this facility totaled $25,000. The line of credit loans are scheduled to expire on October 31, 2008, with the then present balance outstanding converting to a term loan payable in eight equal quarterly installments.
38
Long-term debt is summarized as follows (in thousands):
December 31, | |||||||
| 2006 | 2005 | ||||||
| Bank lines of credit, secured by substantially all of the Company’s | |||||||
| assets (excluding Gulfmark and ARM), due in eight quarterly | |||||||
| installments commencing on October 31, 2008 | 3,000 | 11,475 | |||||
| Less - current maturities | - | - | |||||
| Long-term debt | $ | 3,000 | $ | 11,475 | |||
The Bank of America loan agreement, among other things, places certain restrictions with respect to additional borrowings and the purchase or sale of assets, as well as requiring the Company to comply with certain financial covenants, including maintaining a 1.0 to 1.0 ratio of consolidated current assets to consolidated current liabilities, maintaining a 3.0 to 1.0 ratio of pre-tax net income to interest expense, and consolidated net worth in excess of $52,001,000. Should the Company’s net worth fall below this threshold, the Company may be restricted from payment of additional cash dividends on its common stock. At December 31, 2006, the Company was in compliance with these covenants. Further, all such debt was repaid in full on January 2, 2007.
A subsidiary of the Company, Gulfmark Energy, Inc. (“Gulfmark”), maintains a separate banking relationship with BNP Paribas in order to provide up to $60 million in letters of credit and to provide financing for up to $6 million of crude oil inventories and certain accounts receivable associated with sales of crude oil. Such financing is provided on a demand note basis with interest at the bank's prime rate plus one percent. The letter of credit and demand note facilities are secured by substantially all of Gulfmark's and ARM’s assets. At year-end 2006 and 2005, Gulfmark had no amounts outstanding under the inventory-based line of credit. Gulfmark had approximately $25.9 million and $24.9 million in letters of credit outstanding as of December 31, 2006 and 2005, respectively, in support of its crude oil purchasing activities. As of December 31, 2006, the Company had $3.5 million of eligible borrowing capacity under the Gulfmark facility. Under this facility, BNP Paribas has the right to discontinue the issuance of letters of credit without prior notification to the Company.
The Company’s Adams Resources Marketing, Ltd. subsidiary (“ARM”) maintains a separate banking relationship with BNP Paribas in order to support its natural gas purchasing activities. In addition to providing up to $25 million in letters of credit, the facility finances up to $4 million of general working capital needs. Such financing is provided on a demand note basis with interest at the bank’s prime rate plus one percent. The letter of credit and demand note facilities are secured by substantially all of ARM’s and Gulfmark’s assets. At year-end 2006 and 2005, ARM had no working capital advances outstanding. ARM had approximately $5.8 million and $10.5 million in letters of credit outstanding at December 31, 2006 and 2005, respectively. Under this facility, BNP Paribas has the right to discontinue the issuance of letters of credit without prior notification to the Company.
The Company's weighted average effective interest rate for 2006, 2005 and 2004 was 7.5%, 5.7%, and 4.8%, respectively. No interest was capitalized during 2006, 2005 or 2004. At December 31, 2006, the scheduled aggregate principal maturities of the Company's long-term debt are: 2008 - $375,000; 2009 - $1,500,000; and 2010 - $1,125,000.
(3) Discontinued Operations
Effective September 30, 2005, the Company sold its ownership in its offshore Gulf of Mexico crude oil gathering pipeline. The sale was completed to eliminate abandonment obligations and because the Company was no longer purchasing crude oil in the affected region. The pipeline was sold for $550,000 in cash, plus assumption of future abandonment obligations. The Company recognized a $451,000 pre-tax gain from the sale. The operating results for the pipeline are included in the accompanying consolidated statements of operations as income from discontinued operations. As of December 31, 2006 and 2005, the Company had no assets or liabilities associated with this former operation. Activities associated with the pipeline were previously included in marketing segment results. Marketing segment revenue reclassified in prior years to conform to current year presentation totaled $701,000 for 2004.
39
As further discussed in Note (7) of Notes to Consolidated Financial Statements, in October 2005, certain oil and gas properties held by the Company’s Chairman and Chief Executive Officer achieved “payout status”. This event caused the Company to earn $942,000 for the value of certain residual interests held by the Company in the properties. This gain, which is non-recurring, culminated the Company’s operations in this area and has been included in discontinued operations.
(4) Income Taxes
The following table shows the components of the Company's income tax provision (benefit) (in thousands):
| Years ended December 31, | ||||||||||
| 2006 | 2005 | 2004 | ||||||||
| Current: | ||||||||||
| Federal | $ | 4,506 | $ | 7,244 | $ | 4,076 | ||||
| State | 372 | 964 | 460 | |||||||
4,878 | 8,208 | 4,536 | ||||||||
| Deferred: | ||||||||||
| Federal | 504 | 704 | 214 | |||||||
| State | (92 | ) | 114 | 179 | ||||||
$ | 5,290 | $ | 9,026 | $ | 4,929 | |||||
The following table summarizes the components of the income tax provision (benefit) (in thousands):
| Years ended December 31, | ||||||||||
| 2006 | 2005 | 2004 | ||||||||
| From continuing operations | $ | 5,290 | $ | 8,583 | $ | 4,996 | ||||
| From discontinued operations | - | 443 | (67 | ) | ||||||
$ | 5,290 | $ | 9,026 | $ | 4,929 | |||||
Taxes computed at the corporate federal income tax rate reconcile to the reported income tax provision as follows (in thousands):
| Years ended December 31, | ||||||||||
| 2006 | 2005 | 2004 | ||||||||
| Statutory federal income tax provision | $ | 5,521 | $ | 9,333 | $ | 4,603 | ||||
| State income tax provision (net of federal benefit), | 266 | 751 | 321 | |||||||
| Federal statutory depletion | (537 | ) | (630 | ) | (306 | ) | ||||
| Foreign tax rate change | (108 | ) | - | - | ||||||
| Valuation Allowance - Foreign | 475 | - | - | |||||||
| Book/tax basis adjustment | (208 | ) | (291 | ) | 120 | |||||
| State net operating loss valuation allowance | - | (147 | ) | 152 | ||||||
| Texas rate change adjustment | (108 | ) | - | - | ||||||
| Other | (11 | ) | 10 | 39 | ||||||
$ | 5,290 | $ | 9,026 | $ | 4,929 | |||||
Deferred income taxes primarily reflect the net difference between the financial statement carrying amount in excess of the underlying tax basis of property and equipment. Effective January 1, 2007, the State of Texas revised its state income tax regulations. For the Company, such revisions reduce the effective tax rate and the deferred tax liability has been adjusted accordingly.
40
The components of the federal deferred tax liability are as follows (in thousands):
| Years Ended December 31, | |||||||
| 2006 | 2005 | ||||||
| Current deferred taxes | |||||||
| Bad debts | $ | 84 | $ | 231 | |||
| Prepaid insurance | (590 | ) | (684 | ) | |||
| Mark-to-market contracts | (547 | ) | (676 | ) | |||
| Net current deferred tax asset (liability) | (1,053 | ) | (1,129 | ) | |||
| Long-term deferred taxes | |||||||
| State net operating losses | 44 | 56 | |||||
| --Less valuation allowance | - | (5 | ) | ||||
| Basis difference in foreign investments | 475 | 281 | |||||
| --Less valuation allowance | (475 | ) | - | ||||
| Property | (3,876 | ) | (3,649 | ) | |||
| Other | 201 | 174 | |||||
| Net long-term deferred tax (liability) | (3,631 | ) | (3,143 | ) | |||
| Net deferred tax (liability) | $ | (4,684 | ) | $ | (4,272 | ) | |
The Company recognizes the amount of taxes payable or refundable for the current year and recognizes deferred tax liabilities and assets for the expected future tax consequences of events and transactions that have been recognized in the Company’s financial statements or tax returns. Deferred tax assets are reduced by a valuation allowance when, in the opinion of management, it is more likely than not that some or all of its deferred tax assets will not be realized. Realization of the deferred income tax assets is dependent on generating sufficient taxable income in future years.
(5) Fair Value of Financial Instruments and Concentration of Credit Risk
Fair Value of Financial Instruments
The carrying amounts of cash equivalents are believed to approximate their fair values because of the short maturities of these instruments. Substantially all of the Company’s long and short-term debt obligations bear interest at floating rates. As such, carrying amounts approximate fair values. For a discussion of the fair value of commodity financial instruments see “Price Risk Management Activities” in Note (1) of Notes to Consolidated Financial Statements.
Concentration of Credit Risk
Credit risk represents the amount of loss the Company would absorb if its customers failed to perform pursuant to contractual terms. Management of credit risk involves a number of considerations, such as the financial profile of the customer, the value of collateral held, if any, specific terms and duration of the contractual agreement, and the customer's sensitivity to economic developments. The Company has established various procedures to manage credit exposure, including initial credit approval, credit limits, and rights of offset. Letters of credit and guarantees are also utilized to limit credit risk.
41
The Company's largest customers consist of large multinational integrated oil companies and utilities. In addition, the Company transacts business with independent oil producers, major chemical concerns, crude oil and natural gas trading companies and a variety of commercial energy users. Accounts receivable associated with crude oil and natural gas marketing activities comprise approximately 88 percent of the Company's total receivables as of December 31, 2006, and industry practice requires payment for purchases of crude oil to take place on the 20th of the month following a transaction, while natural gas transactions are settled on the 25th of the month following a transaction. The Company's credit policy and the relatively short duration of receivables mitigate the uncertainty typically associated with receivables management. The Company had accounts receivable from one customer that comprised 13.7 percent of total receivables at December 31, 2006. Such customer also comprised more than 10 percent of the Company’s revenues in 2006. Two customers represent 12.9 and 13.5 percent of total accounts receivable, respectively, as of December 31, 2005.
During 2006, the Company had one significant bad debt write-off within its transportation segment totaling $477,000 when such customer filed bankruptcy. There were no single significant bad debt write-offs in 2005 and 2004. An allowance for doubtful accounts is provided where appropriate and accounts receivable presented herein are net of allowances for doubtful accounts of $225,000 and $608,000 at December 31, 2006 and 2005, respectively. An analysis of the changes in the allowance for doubtful accounts is presented as follows (in thousands):
| 2006 | 2005 | 2004 | ||||||||
| Balance, beginning of year | $ | 608 | $ | 384 | $ | 1,935 | ||||
| Provisions for bad debts | 346 | 390 | 90 | |||||||
| Less: Write-offs and recoveries | (729 | ) | (166 | ) | (1,641 | ) | ||||
| Balance, end of year | $ | 225 | $ | 608 | $ | 384 | ||||
(6) Employee Benefits
The Company maintains a 401(k) savings plan for the benefit of its employees. Company contributions to the plan were $541,000, $487,000 and $454,000 in 2006, 2005 and 2004, respectively. No other pension or retirement plans are maintained by the Company.
(7) Transactions with Related Parties
Mr. K. S. Adams, Jr., Chairman and Chief Executive Officer, and certain of his family partnerships and affiliates have participated as working interest owners with the Company’s subsidiary, Adams Resources Exploration Corporation. Mr. Adams and such affiliates participate on terms no better than those afforded the non-affiliated working interest owners. In recent years, such related party transactions generally result after the Company has first identified oil and gas prospects of interest. Typically the available dollar commitment to participate in such transactions is greater than the amount management is comfortable putting at risk. In such event, the Company first determines the percentage of the transaction it wants to obtain, which allows a related party to participate in the investment to the extent there is excess available. In those instances where there was no excess availability there has been no related party participation. Similarly, related parties are not required to participate, nor is the Company obligated to offer any such participation to a related or other party. When such related party transactions occur, they are individually reviewed and approved by the Audit Committee comprised of the independent directors on the Company’s Board of Directors. During 2006, the Company’s investment commitments totaled approximately $6.9 million in those oil and gas projects where a related party was also participating in such investment. As of December 31, 2006 and 2005, the Company owed a combined net total of $146,338 and $112,800, respectively, to these related parties. In connection with the operation of certain oil and gas properties, the Company also charges such related parties for administrative overhead primarily as prescribed by the Council of Petroleum Accountants Society (“COPAS”) Bulletin 5. Such overhead recoveries totaled $118,000 in 2006 and $147,000 in 2005.
42
In August 2000, the Company was approached by a third party to join in an acquisition of certain producing reserves in Escambia County, Alabama. The Company’s share of the acquisition would have been approximately $12 million. Due to capital constraints at the time, the Company decided against direct participation, but rather promoted Mr. Adams for a 15 percent back-in interest after payout. In October 2005, Mr. Adams elected to sell his purchased interest causing the property to achieve payout status. The Company’s resulting share of the gain was $942,000, which Mr. Adams paid in cash to the Company in 2005.
David B. Hurst, Secretary of the Company, is a partner in the law firm of Chaffin & Hurst. The Company has been represented by Chaffin & Hurst since 1974 and plans to use the services of that firm in the future. Chaffin & Hurst currently leases office space from the Company. Legal services provided by Chaffin & Hurst are on the same terms as those prevailing at the time for comparable transactions with unrelated entities.
The Company also enters into certain transactions in the normal course of business with other affiliated entities. These transactions with affiliated companies are on the same terms as those prevailing at the time for comparable transactions with unrelated entities.
(8) Commitments and Contingencies
The Company has operating lease arrangements for tractors, trailers, office space, and other equipment and facilities. Rental expense for the years ended December 31, 2006, 2005, and 2004 was $9,887,000, $8,121,000 and $6,650,000, respectively. At December 31, 2006, commitments under long-term non-cancelable operating leases for the next five years and thereafter are payable as follows: 2007 - $4,060,000; 2008 - $3,861,000; 2009 - $1,539,000; 2010 - $548,000; 2011 - $186,000 and thereafter - $104,000.
In March 2004, a suit styled Le Petit Chateau Le Luxe, et. al. vs Great Southern Oil & Gas Co., et. al. was filed in the Civil District Court for Orleans Parish, Louisiana against the Company and its subsidiary, Adams Resources Exploration Corporation, among other defendants. The suit alleges that certain property in Acadia Parish, Louisiana was environmentally contaminated by oil and gas exploration and production activities during the 1970s and 1980s. An alleged amount of damage has not been specified. Management believes the Company has consistently conducted its oil and gas exploration and production activities in accordance with all environmental rules and regulations in effect at the time of operation. Management notified its insurance carrier about this claim, and thus far the insurance carrier has declined to offer coverage. The Company intends to litigate this matter with its insurance carrier if this matter is not resolved to the Company’s satisfaction. In any event, management does not believe the outcome of this matter will have a material adverse effect on the Company’s financial position or results of operations.
From time to time as incident to its operations, the Company becomes involved in various lawsuits and/or disputes. Primarily as an operator of an extensive trucking fleet, the Company is a party to motor vehicle accidents, worker compensation claims and other items of general liability as would be typical for the industry. Except as disclosed herein, management of the Company is presently unaware of any claims against the Company that are either outside the scope of insurance coverage, or that may exceed the level of insurance coverage, and could potentially represent a material adverse effect on the Company’s financial position or results of operations.
(9) Guarantees
Pursuant to arranging operating lease financing for truck tractors and tank trailers, individual subsidiaries of the Company may guarantee the lessor a minimum residual sales value upon the expiration of a lease and sale of the underlying equipment. The Company believes performance under these guarantees to be remote. Aggregate guaranteed residual values for tractors and trailers under operating leases as of December 31, 2006 are as follows (in thousands):
| 2007 | 2008 | 2009 | 2010 | Thereafter | Total | ||||||||||||||
| Lease residual values | $ | - | $ | 304 | $ | 1,475 | $ | 217 | $ | 469 | $ | 2,465 | |||||||
43
In connection with certain contracts for the purchase and resale of branded motor fuels, the Company has received certain price discounts from its suppliers toward the purchase of gasoline and diesel fuel. Such discounts have been passed through to the Company’s customers as an incentive to offset a portion of the costs associated with offering branded motor fuels for sale to the general public. Under the terms of the supply contracts, the Company and its customers are not obligated to return the price discounts, provided the gasoline service station offering such product for sale remains as a branded station for periods ranging from three to ten years. The Company has a number of customers and stations operating under such arrangements, and the Company’s customers are contractually obligated to remain a branded dealer for the required periods of time. Should the Company’s customers seek to void such contracts, the Company would be obligated to return a portion of such discounts received to its suppliers. As of December 31, 2006, the maximum amount of such potential obligation is approximately $1,561,000. Management of the Company believes its customers will adhere to their branding obligations and no such refunds will result.
Presently, neither the Company nor any of its subsidiaries has any other types of guarantees outstanding that require liability recognition under the provisions of Financial Accounting Standards Board Interpretation No. 45, “Guarantor’s Accounting and Disclosure Requirements for Guarantees, Including Indirect Guarantees of Indebtedness of Others”.
Adams Resources & Energy, Inc. frequently issues parent guarantees of commitments resulting from the ongoing activities of its subsidiary companies. The guarantees generally result from subsidiary commodity purchase obligations, subsidiary lease commitments and subsidiary bank debt. The nature of such guarantees is to guarantee the performance of the subsidiary companies in meeting their respective underlying obligations. Except for operating lease commitments and letters of credit, all such underlying obligations are recorded on the books of the subsidiary companies and are included in the consolidated financial statements included herein. Therefore, no such obligation is recorded again on the books of the parent. The parent would only be called upon to perform under the guarantee in the event of a payment default by the applicable subsidiary company. In satisfying such obligations, the parent would first look to the assets of the defaulting subsidiary company. As of December 31, 2006, the amount of parental guaranteed obligations are approximately as follows (in thousands):
| 2007 | 2008 | 2009 | 2010 | Thereafter | Total | ||||||||||||||
| Bank Debt | $ | - | $ | 375 | $ | 1,500 | $ | 1,125 | $ | - | $ | 3,000 | |||||||
| Operating leases | 4,060 | 3,861 | 1,538 | 548 | 290 | 10,297 | |||||||||||||
| Lease residual values | - | 304 | 1,475 | 217 | 469 | 2,465 | |||||||||||||
| Commodity purchases | 22,477 | - | - | - | - | 22,477 | |||||||||||||
| Letters of credit | 31,732 | - | - | - | - | 31,732 | |||||||||||||
$ | 58,269 | $ | 4,540 | $ | 4,513 | $ | 1,890 | $ | 759 | $ | 69,971 | ||||||||
(10) Segment Reporting
The Company is engaged in the business of crude oil, natural gas and petroleum products marketing as well as tank truck transportation of liquid chemicals, and oil and gas exploration and production. Information concerning the Company's various business activities is summarized as follows (in thousands):
44
| Segment Operating | Depreciation Depletion and | Property and Equipment | |||||||||||
| Revenues | Earnings | Amortization | Additions | ||||||||||
| Year ended December 31, 2006- | |||||||||||||
| Marketing | |||||||||||||
| - Crude oil | $ | 1,975,972 | $ | 5,088 | $ | 857 | $ | 1,395 | |||||
| - Natural gas | 13,621 | 6,558 | 59 | 432 | |||||||||
| - Refined products | 177,909 | 1,329 | 428 | 1,085 | |||||||||
| Marketing Total | 2,167,502 | 12,975 | 1,344 | 2,912 | |||||||||
| Transportation | 62,151 | 5,173 | 4,538 | 1,342 | |||||||||
| Oil and gas | 16,950 | 5,355 | 3,603 | 10,348 | |||||||||
$ | 2,246,603 | $ | 23,503 | $ | 9,485 | $ | 14,602 | ||||||
| Year ended December 31, 2005- | |||||||||||||
| Marketing | |||||||||||||
| - Crude oil | $ | 2,117,578 | $ | 13,489 | $ | 733 | $ | 167 | |||||
| - Natural gas | 13,063 | 8,436 | 58 | 12 | |||||||||
| - Refined products | 161,388 | 556 | 461 | 337 | |||||||||
| Marketing Total | 2,292,029 | 22,481 | 1,252 | 516 | |||||||||
| Transportation | 57,458 | 5,714 | 3,130 | 11,188 | |||||||||
| Oil and gas | 15,346 | 6,765 | 2,678 | 7,424 | |||||||||
$ | 2,364,833 | $ | 34,960 | $ | 7,060 | $ | 19,128 | ||||||
| Year ended December 31, 2004- | |||||||||||||
| Marketing | |||||||||||||
| - Crude oil | $ | 1,885,221 | $ | 10,684 | $ | 571 | $ | 1,157 | |||||
| - Natural gas | 8,675 | 3,810 | 46 | 38 | |||||||||
| - Refined products | 117,072 | (897 | ) | 594 | 83 | ||||||||
| Marketing Total | 2,010,968 | 13,597 | 1,211 | 1,278 | |||||||||
| Transportation | 47,323 | 5,687 | 2,125 | 6,736 | |||||||||
| Oil and gas | 10,796 | 2,362 | 2,949 | 4,147 | |||||||||
$ | 2,069,087 | $ | 21,646 | $ | 6,285 | $ | 12,161 | ||||||
Intersegment sales are insignificant. All sales by the Company occurred in the United States. In 2006, the Company had sales to three customers that totaled $361,926,000, $338,807,000 and $237,921,000, respectively. In 2005, the Company had sales to four customers that totaled $253,024,000, $301,765,000, $224,982,000 and $298,856,000, respectively. In 2004, the Company had sales to one customer that totaled $249,482,000. All such sales were attributable to the Company’s marketing segment. No other customers accounted for greater than 10 percent of sales in any of the three years presented herein. The loss of any of the Company’s 10 percent customers would not have a material adverse effect on the Company’s future operating results and all such customers could be readily replaced.
Segment operating earnings reflect revenues net of operating costs and depreciation, depletion and amortization and are reconciled to earnings from continuing operations before income taxes, as follows (in thousands):
| Years Ended December 31, | ||||||||||
| 2006 | 2005 | 2004 | ||||||||
| Segment operating earnings | $ | 23,503 | $ | 34,960 | $ | 21,646 | ||||
| - General and administrative expenses | (8,536 | ) | (9,668 | ) | (7,867 | ) | ||||
| Operating earnings | 14,967 | 25,292 | 13,779 | |||||||
| - Interest income | 965 | 188 | 62 | |||||||
| - Interest expense | (159 | ) | (128 | ) | (107 | ) | ||||
| Earnings from continuing operations | ||||||||||
| before income taxes | $ | 15,773 | $ | 25,352 | $ | 13,734 | ||||
45
Identifiable assets by industry segment are as follows (in thousands):
| Years Ended December 31, | |||||||
| 2006 | 2005 | ||||||
| Marketing | |||||||
| - Crude oil | $ | 116,917 | $ | 135,235 | |||
| - Natural gas | 80,346 | 90,344 | |||||
| - Refined products | 16,286 | 14,730 | |||||
| Marketing Total | 213,549 | 240,309 | |||||
| Transportation | 23,764 | 28,412 | |||||
| Oil and gas | 25,918 | 20,780 | |||||
| Other | 26,056 | 23,161 | |||||
$ | 289,287 | $ | 312,662 | ||||
Other identifiable assets are primarily corporate cash, accounts receivable, and properties not identified with any specific segment of the Company's business.
(11) Quarterly Financial Data (Unaudited) -
Selected quarterly financial data and earnings per share of the Company are presented below for the years ended December 31, 2006 and 2005 (in thousands, except per share data):
| Earnings from | ||||||||||||||||||||||
| Continuing | ||||||||||||||||||||||
| Operations | Net Earnings | Dividends | ||||||||||||||||||||
| Per | Per | Per | ||||||||||||||||||||
| Revenues | Amount | Share | Amount | Share | Amount | Share | ||||||||||||||||
2006 - | ||||||||||||||||||||||
| March 31 | $ | 488,028 | $ | 3,644 | $ | .86 | $ | 3,644 | $ | .86 | $ | - | $ | - | ||||||||
| June 30 | 595,000 | 4,038 | .96 | 4,038 | .96 | - | - | |||||||||||||||
| September 30 | 624,998 | 1,677 | .40 | 1,677 | .40 | - | - | |||||||||||||||
| December 31 | 538,577 | 1,124 | .27 | 1,124 | .27 | 1,771 | .42 | |||||||||||||||
$ | 2,246,603 | $ | 10,483 | $ | 2.49 | $ | 10,483 | $ | 2.49 | $ | 1,771 | $ | .42 | |||||||||
2005 - | ||||||||||||||||||||||
| March 31 | $ | 527,643 | $ | 2,910 | $ | .69 | $ | 2,851 | $ | .68 | $ | - | $ | - | ||||||||
| June 30 | 542,195 | 1,849 | .44 | 1,886 | .44 | - | - | |||||||||||||||
| September 30 | 637,007 | 4,996 | 1.18 | 5,297 | 1.26 | - | - | |||||||||||||||
| December 31 | 657,988 | 7,014 | 1.66 | 7,607(1 | ) | 1.80 | 1,560 | .37 | ||||||||||||||
$ | 2,364,833 | $ | 16,769 | $ | 3.97 | $ | 17,641 | $ | 4.18 | $ | 1,560 | $ | .37 | |||||||||
Note (1) Fourth quarter 2005 earnings include $2,210,000 of net of tax earnings attributable to a reduction in operating expenses from the reversal of certain previously recorded accrual items following the final “true-up” of the accounting for such items. Also included is $1,011,000 of net of tax earnings following the collection of cash from certain previously disputed and fully reserved items.
The above unaudited interim financial data reflect all adjustments that are in the opinion of management necessary to a fair statement of the results for the period presented. All such adjustments are of a normal recurring nature.
46
(12) Oil and Gas Producing Activities (Unaudited)
The following information concerning the Company’s oil and gas segment has been provided pursuant to SFAS No. 69, “Disclosures about Oil and Gas Producing Activities.” The Company’s oil and gas exploration and production activities are conducted in the United States, primarily along the Gulf Coast of Texas and Louisiana.
Oil and Gas Producing Activities (Unaudited) -
Total costs incurred in oil and gas exploration and development activities, all incurred within the United States, were as follows (in thousands, except per barrel information):
| Years Ended December 31, | ||||||||||
| 2006 | 2005 | 2004 | ||||||||
| Property acquisition costs | ||||||||||
| Unproved | $ | 1,885 | $ | 1,460 | $ | 574 | ||||
| Proved | - | - | - | |||||||
| Exploration costs | ||||||||||
| Expensed | 2,902 | 3,078 | 2,504 | |||||||
| Capitalized | 2,173 | 927 | 1,565 | |||||||
| Development costs | 6,290 | 5,037 | 2,210 | |||||||
| Total costs incurred | $ | 13,250 | $ | 10,502 | $ | 6,853 | ||||
The aggregate capitalized costs relative to oil and gas producing activities are as follows (in thousands):
| December 31, | |||||||
| 2006 | 2005 | ||||||
| Unproved oil and gas properties | $ | 4,166 | $ | 5,857 | |||
| Proved oil and gas properties | 56,837 | 46,254 | |||||
61,003 | 52,111 | ||||||
| Accumulated depreciation, depletion | |||||||
| and amortization | (38,139 | ) | (34,536 | ) | |||
| Net capitalized cost | $ | 22,864 | $ | 17,575 | |||
Estimated Oil and Natural Gas Reserves (Unaudited) -
The following information regarding estimates of the Company's proved oil and gas reserves, all located in the United States, is based on reports prepared on behalf of the Company by its independent petroleum engineers. Because oil and gas reserve estimates are inherently imprecise and require extensive judgments of reservoir engineering data, they are generally less precise than estimates made in conjunction with financial disclosures. The revisions of previous estimates as reflected in the table below result from more precise engineering calculations based upon additional production histories and price changes. Proved developed and undeveloped reserves are presented as follows (in thousands):
47
| Years Ended December 31, | |||||||||||||||||||
| 2006 | 2005 | 2004 | |||||||||||||||||
| Natural | Natural | Natural | |||||||||||||||||
| Gas | Oil | Gas | Oil | Gas | Oil | ||||||||||||||
| (Mcf’s) | (Bbls.) | (Mcf’s) | (Bbls.) | (Mcf’s) | (Bbls.) | ||||||||||||||
| Total proved reserves- | |||||||||||||||||||
| Beginning of year | 9,643 | 396 | 10,950 | 436 | 8,971 | 438 | |||||||||||||
| Revisions of previous estimates | (2,473 | ) | (45 | ) | (1,120 | ) | 42 | 122 | (52 | ) | |||||||||
| Oil and gas reserves sold | - | - | (441 | ) | (61 | ) | - | - | |||||||||||
| Extensions, discoveries and | |||||||||||||||||||
| other reserve additions | 2,734 | 121 | 1,642 | 46 | 3,166 | 121 | |||||||||||||
| Production | (1,604 | ) | (76 | ) | (1,388 | ) | (67 | ) | (1,309 | ) | (71 | ) | |||||||
| End of year | 8,300 | 396 | 9,643 | 396 | 10,950 | 436 | |||||||||||||
| Proved developed reserves- | |||||||||||||||||||
| End of year | 8,300 | 396 | 9,643 | 396 | 10,220 | 410 | |||||||||||||
Standardized Measure of Discounted Future Net Cash Flows from Oil and Gas Operations and Changes Therein (Unaudited) -
The standardized measure of discounted future net cash flows was determined based on the economic conditions in effect at the end of the years presented, except in those instances where fixed and determinable gas price escalations are included in contracts. The disclosures below do not purport to present the fair market value of the Company's oil and gas reserves. An estimate of the fair market value would also take into account, among other things, the recovery of reserves in excess of proved reserves, anticipated future changes in prices and costs, a discount factor more representative of the time value of money and risks inherent in reserve estimates. The standardized measure of discounted future net cash flows is presented as follows (in thousands):
Y Years Ended December 31, | ||||||||||
| 2006 | 2005 | 2004 | ||||||||
| Future gross revenues | $ | 69,540 | $ | 110,720 | $ | 83,668 | ||||
| Future costs - | ||||||||||
| Lease operating expenses | (20,677 | ) | (26,674 | ) | (20,128 | ) | ||||
| Development costs | (684 | ) | (600 | ) | (1,228 | ) | ||||
| Future net cash flows before income taxes | 48,179 | 83,446 | 62,312 | |||||||
| Discount at 10% per annum | (17,904 | ) | (35,124 | ) | (27,771 | ) | ||||
| Discounted future net cash flows | ||||||||||
| before income taxes | 30,275 | 48,322 | 34,541 | |||||||
| Future income taxes, net of discount at | ||||||||||
| 10% per annum | (11,505 | ) | (18,362 | ) | (11,744 | ) | ||||
| Standardized measure of discounted | ||||||||||
| future net cash flows | $ | 18,770 | $ | 29,960 | $ | 22,797 | ||||
The reserve estimates provided at December 31, 2006, 2005 and 2004 are based on year-end market prices of $57.00, $57.45 and $40.50 per barrel for crude oil and $5.58, $9.12 and $6.06 per mcf for natural gas, respectively. The year-end December 31, 2006 price used in the 2006 reserve estimate compares to average actual December 2006 price received for sales of crude oil ($60.35per barrel) and natural gas ($7.84 per mcf).
48
The following are the principal sources of changes in the standardized measure of discounted future net cash flows (in thousands):
| Years Ended December 31, | ||||||||||
| 2006 | 2005 | 2004 | ||||||||
| Beginning of year | $ | 29,960 | $ | 22,797 | $ | 18,371 | ||||
| Revisions to reserves proved in prior years - | ||||||||||
| Net change in prices and production costs | (14,234 | ) | 16,308 | 2,306 | ||||||
| Net change due to revisions in quantity estimates | (12,078 | ) | (6,334 | ) | (534 | ) | ||||
| Accretion of discount | 3,512 | 2,777 | 1,835 | |||||||
| Production rate changes and other | (998 | ) | 2,405 | (1,280 | ) | |||||
| Total revisions | (23,798 | ) | 15,156 | 2,327 | ||||||
| Sale of oil and gas reserves | - | (1,623 | ) | - | ||||||
| New field discoveries and extensions, net of future | ||||||||||
| production costs | 18,445 | 12,769 | 12,194 | |||||||
| Sales of oil and gas produced, net of production costs | (12,694 | ) | (12,521 | ) | (7,815 | ) | ||||
| Net change in income taxes | 6,857 | (6,618 | ) | (2,280 | ) | |||||
| Net change in standardized measure of discounted | ||||||||||
| future net cash flows | (11,190 | ) | 7,163 | 4,426 | ||||||
| End of year | $ | 18,770 | $ | 29,960 | $ | 22,797 | ||||
Results of Operations for Oil and Gas Producing Activities (Unaudited) -
The results of oil and gas producing activities, excluding corporate overhead and interest costs, are as follows (in thousands):
| Years Ended December 31, | ||||||||||
| 2006 | 2005 | 2004 | ||||||||
| Revenues | $ | 16,950 | $ | 15,346 | $ | 10,796 | ||||
| Costs and expenses - | ||||||||||
| Production | (4,256 | ) | (2,825 | ) | (2,981 | ) | ||||
| Producing property impairment | (841 | ) | - | - | ||||||
| Exploration | (2,895 | ) | (3,078 | ) | (2,504 | ) | ||||
| Depreciation, depletion and amortization | (3,603 | ) | (2,678 | ) | (2,949 | ) | ||||
| Operating income before income taxes | 5,355 | 6,765 | 2,362 | |||||||
| Income tax expense | (1,875 | ) | (2,368 | ) | (803 | ) | ||||
| Operating income from continuing operations | $ | 3,480 | $ | 4,397 | $ | 1,559 | ||||
49
ITEM 9. CHANGES IN AND DISAGREEMENTS WITH ACCOUNTANTS ON ACCOUNTING AND FINANCIAL DISCLOSURE
None
ITEM 9A. CONTROLS AND PROCEDURES
The Company maintains “disclosure controls and procedures” (as defined in Rule 13a-15(e) and 15d-15(e) under the Securities and Exchange Act of 1934, as amended (the “Exchange Act”) that are designed to ensure that information required to be disclosed in the reports that the Company files or submits under the Exchange Act are recorded, processed, summarized and reported within the time periods specified in the SEC’s rules and forms and is accumulated and communicated to management, including the Company’s Chief Executive Officer and Chief Financial Officer, as appropriate, to allow timely discussions regarding required disclosure. As of the end of the period covered by this annual report, an evaluation was carried out under the supervision and with the participation of the Company’s management, including the Company’s Chief Executive Officer and Chief Financial Officer, of the effectiveness of the design and operation of the Company’s disclosure controls and procedures. Based upon that evaluation, the Chief Executive Officer and the Chief Financial Officer concluded that the design and operation of these disclosure controls and procedures were effective. During the Company’s fourth fiscal quarter, there have not been any changes in the Company’s internal controls over financial reporting (as defined in Rules 13a-13(f) and 15d-15(f) of the Exchange Act) that have materially affected, or are reasonably likely to materially affect, the Company’s internal control over financial reporting.
ITEM 9B. OTHER
None
50
PART III
ITEM 10. DIRECTORS, EXECUTIVE OFFICERS AND CORPORATE GOVERNANCE
The information concerning directors and executive officers of the Company is incorporated by reference from the Company’s definitive Proxy Statement for the Annual Meeting of Shareholders to be held May 21, 2007, under the heading “Election of Directors” and “Executive Officers”, respectively, to be filed with the Commission not later than 120 days after the end of the fiscal year covered by this Form 10-K.
ITEM 11 EXECUTIVE COMPENSATION
The information required by Item 11 is incorporated by reference from the Company’s definitive Proxy Statement for the Annual Meeting of Shareholders to be held May 21, 2007, under the heading “Executive Compensation” to be filed with the Commission not later than 120 days after the end of the fiscal year covered by this Form 10-K.
ITEM 12 SECURITY OWNERSHIP OF CERTAIN BENEFICIAL OWNERS AND MANAGEMENT AND RELATED STOCKHOLDER MATTERS
The information required by Item 12 is incorporated by reference from the Company’s definitive Proxy Statement for the Annual Meeting of Shareholders to be held May 21, 2007, under the heading “Voting Securities and Principal Holders Thereof” to be filed with the Commission not later than 120 days after the end of the fiscal year covered by this Form 10-K.
ITEM 13. CERTAIN RELATIONSHIPS, RELATED PARTY TRANSACTIONS AND DIRECTOR INDEPENDENCE
The information required by Item 13 is incorporated by reference from the Company’s definitive Proxy Statement for the Annual Meeting of Shareholders to be held May 21, 2007, under the headings “Transactions with Related Parties” and “Director Independence” to be filed with the Commission not later than 120 days after the end of the fiscal year covered by this Form 10-K.
ITEM 14. PRINCIPAL ACCOUNTING FEES AND SERVICES
The information required by Item 14 is incorporated by reference from the Company’s definitive Proxy Statement for the Annual Meeting of Shareholders to be held May 21, 2007, under the heading “Principal Accounting Fees and Services” to be filed with the Commission not later than 120 days after the end of the fiscal year covered by this Form 10-K.
51
PART IV
Item 15. EXHIBITS AND FINANCIAL STATEMENT SCHEDULES
(a) The following documents are filed as a part of this Form 10-K:
1. Financial Statements
Report of Independent Public Accountants
Consolidated Balance Sheets as of December 31, 2006 and 2005
Consolidated Statements of Operations for the Years Ended
December 31, 2006, 2005 and 2004
Consolidated Statements of Shareholders' Equity for the Years Ended
December 31, 2006, 2005 and 2004
Consolidated Statements of Cash Flows for the Years Ended
December 31, 2006, 2005 and 2004
Notes to Consolidated Financial Statements
| 2. | All financial schedules have been omitted because they are not applicable or the required information is shown in the financial statements or notes thereto. |
| 3. | Exhibits required to be filed |
3(a) - Certificate of Incorporation of the Company, as amended. (Incorporated by reference to Exhibit 3(a) filed with the Annual Report on Form 10-K (-File No. 1-7908) of the Company for the fiscal year ended December 31, 1987)
3(b) - Bylaws of the Company, as amended (Incorporated by reference to Exhibits 3.2 and 3.2.1 of Amendment No. 1 to the Registration Statement on Form S-1 filed with the Securities and Exchange Commission on October 29, 1973 - File No. 2-48144)
3(c) - Amendment to the Bylaws of the Company to add an Article VII, Section 8. Indemnification of Directors, Officers, Employees and Agents (Incorporated by reference to Exhibit 3(c) of the Annual Report on Form 10-K (-File No. 1-7908) of the Company for the fiscal year ended December 31, 1986)
3(d) - Adams Resources & Energy, Inc. and Subsidiaries’ Code of Ethics (Incorporated by reference to Exhibit 3(d) of the Annual Report on Form 10-K (-File No. 1-7908) of the Company for the fiscal year ended December 31, 2002)
4(a) - Specimen common stock Certificate (Incorporated by reference to Exhibit 4(a) of the Annual Report on Form 10-K of the Company (-File No. 1-7908) for the fiscal year ended December 31, 1991)
52
4(b) - Loan Agreement between Adams Resources & Energy, Inc. and NationsBank Texas N.A. dated October 27, 1993 (Incorporated by reference to Exhibit 4(b) of the Annual Report on Form 10-K of the Company for the fiscal year ended December 31, 1993)
4(c)* - Fifteenth Amendment to Loan Agreement between Service Transport Company et al and Bank of America, N.A. dated February 7, 2007.
21* - Subsidiaries of the Registrant
31.1* - Adams Resources & Energy, Inc. Certification Pursuant To 17 CFR 13a-14 (a)/15d-14(a), As Adopted Pursuant To Section 302 of the Sarbanes-Oxley Act of 2002
31.2* - Adams Resources & Energy, Inc. Certification Pursuant To 17 CFR 13a-14(a)/15d-14(a), as Adopted Pursuant To Section 302 of the Sarbanes-Oxley Act of 2002
32.1* - Certification Pursuant to 18 U.S.C. Section 1350, as Adopted Pursuant To Section 906 of the Sarbanes-Oxley Act of 2002
32.2* - Certification Pursuant to 18 U.S.C. Section 1350, as Adopted Pursuant To Section 906 of the Sarbanes-Oxley Act of 2002
______________________________
* - Filed herewith
Copies of all agreements defining the rights of holders of long-term debt of the Company and its subsidiaries, which agreements authorize amounts not in excess of 10% of the total consolidated assets of the Company, are not filed herewith but will be furnished to the Commission upon request.
53
SIGNATURES
Pursuant to the requirements of Section 13 or 15(d) of the Securities Exchange Act of 1934, the registrant has duly caused this report to be signed on its behalf by the undersigned, thereunto duly authorized.
| ADAMS RESOURCES & ENERGY, INC. | |
| (Registrant) | |
| By /s/Richard B. Abshire | By /s/ K. S. Adams, Jr. |
| (Richard B. Abshire, | (K. S. Adams, Jr., |
| Vice President, Director | Chairman of the Board and |
| and Chief Financial Officer) | Chief Executive Officer) |
Date: March 29, 2007
Pursuant to the requirements of the Securities Exchange Act of 1934, this report has been signed below by the following persons on behalf of the Registrant and in the capacities and on the date indicated.
| By /s/ Frank T. Webster | By /s/ E. C. Reinauer, Jr. |
| (Frank T. Webster, Director) | (E. C. Reinauer, Jr., Director) |
| By /s/ Larry E. Bell | By /s/ E. Jack Webster, Jr. |
| (Larry E. Bell, Director) | (E. Jack Webster, Jr., Director) |
| By /s/ William B. Wiener III | |
| (William B. Wiener III, Director) | |
EXHIBIT INDEX
Exhibit
Number Description
3(a) - Certificate of Incorporation of the Company, as amended. (Incorporated by reference to Exhibit 3(a) filed with the Annual Report on Form 10-K of the Company for the fiscal year ended December 31, 1987)
3(b) - Bylaws of the Company, as amended (Incorporated by reference to Exhibits 3.2 and 3.2.1 of Amendment No. 1 to the Registration Statement on Form S-1 filed with the Securities and Exchange Commission on October 29, 1973 - File No. 2-48144)
3(c) - Amendment to the Bylaws of the Company to add an Article VII, Section 8. Indemnification of Directors, Officers, Employees and Agents (Incorporated by reference to Exhibit 3(c) of the Annual Report on Form 10-K of the Company for the fiscal year ended December 31, 1986)
3(d) - Adams Resources & Energy, Inc. and Subsidiaries’ Code of Ethics (Incorporated by reference to Exhibit 3(d) of the Annual Report on Form 10-K of the Company for the fiscal year ended December 31, 2002)
4(a) - Specimen common stock Certificate (Incorporated by reference to Exhibit 4(a) of the Annual Report on Form 10-K of the Company for the fiscal year ended December 31, 1991)
4(b) - Loan Agreement between Adams Resources & Energy, Inc. and NationsBank Texas N.A. dated October 27, 1993 (Incorporated by reference to Exhibit 4(b) of the Annual Report on Form 10-K of the Company for the fiscal year ended December 31, 1993)
4(c)* - Fifteenth Amendment to Loan Agreement between Service Transport Company et al and Bank of America, N.A. dated February 7, 2007.
21* - Subsidiaries of the Registrant
31.1* - Certification Pursuant to 17 CFR 13a-14(a)/15d-14(a), As Adopted Pursuant to Section 302 of the Sarbarnes-Oxley Act of 2002
31.2* - Certification Pursuant to 17 CFR 13a-14(a)/15d-14(a), As Adopted Pursuant to Section302 of the Sarbarnes-Oxley Act of 2002
32.1* - Certification Pursuant to 18 U.S.C. Section 1350, As Adopted Pursuant to Section 906 of the Sarbanes-Oxley Act of 2002
32.2* - Certification Pursuant To 18 U..S.C. Section 1350, As Adopted Pursuant to Section 906 of the Sarbanes-Oxley Act of 2002
______________________________
* - Filed herewith