
COMMERCE BANCSHARES, INC. EARNINGS HIGHLIGHTS 3rd Quarter 2022
CAUTIONARY STATEMENT A number of statements we will be making in our presentation and in the accompanying slides are “forward-looking statements” within the meaning of the Private Securities Litigation Reform Act of 1995, such as statements of the Corporation’s plans, goals, objectives, expectations, projections, estimates and intentions. These forward- looking statements involve significant risks and uncertainties and are subject to change based on various factors (some of which are beyond the Corporation’s control). Factors that could cause the Corporation’s actual results to differ materially from such forward- looking statements made herein or by management of the Corporation are set forth in the Corporation’s 2021 Annual Report on Form 10-K, 2ND Quarter 2022 Report on Form 10-Q and the Corporation’s Current Reports on Form 8-K. 2
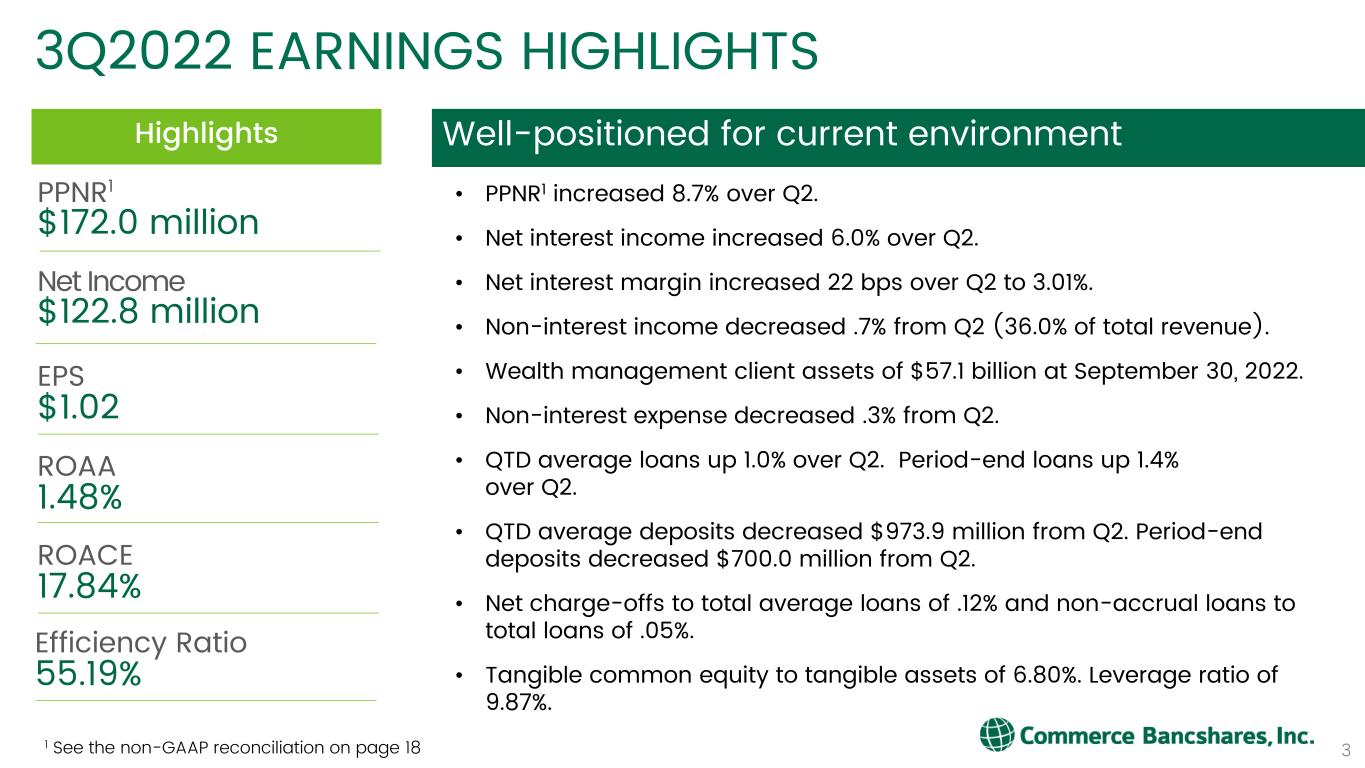
$1.02 EPS 3 • PPNR1 increased 8.7% over Q2. • Net interest income increased 6.0% over Q2. • Net interest margin increased 22 bps over Q2 to 3.01%. • Non-interest income decreased .7% from Q2 (36.0% of total revenue). • Wealth management client assets of $57.1 billion at September 30, 2022. • Non-interest expense decreased .3% from Q2. • QTD average loans up 1.0% over Q2. Period-end loans up 1.4% over Q2. • QTD average deposits decreased $973.9 million from Q2. Period-end deposits decreased $700.0 million from Q2. • Net charge-offs to total average loans of .12% and non-accrual loans to total loans of .05%. • Tangible common equity to tangible assets of 6.80%. Leverage ratio of 9.87%. Highlights Well-positioned for current environment 3Q2022 EARNINGS HIGHLIGHTS $172.0 million PPNR1 $122.8 million Net Income 17.84% ROACE 1 See the non-GAAP reconciliation on page 18 1.48% ROAA 55.19% Efficiency Ratio
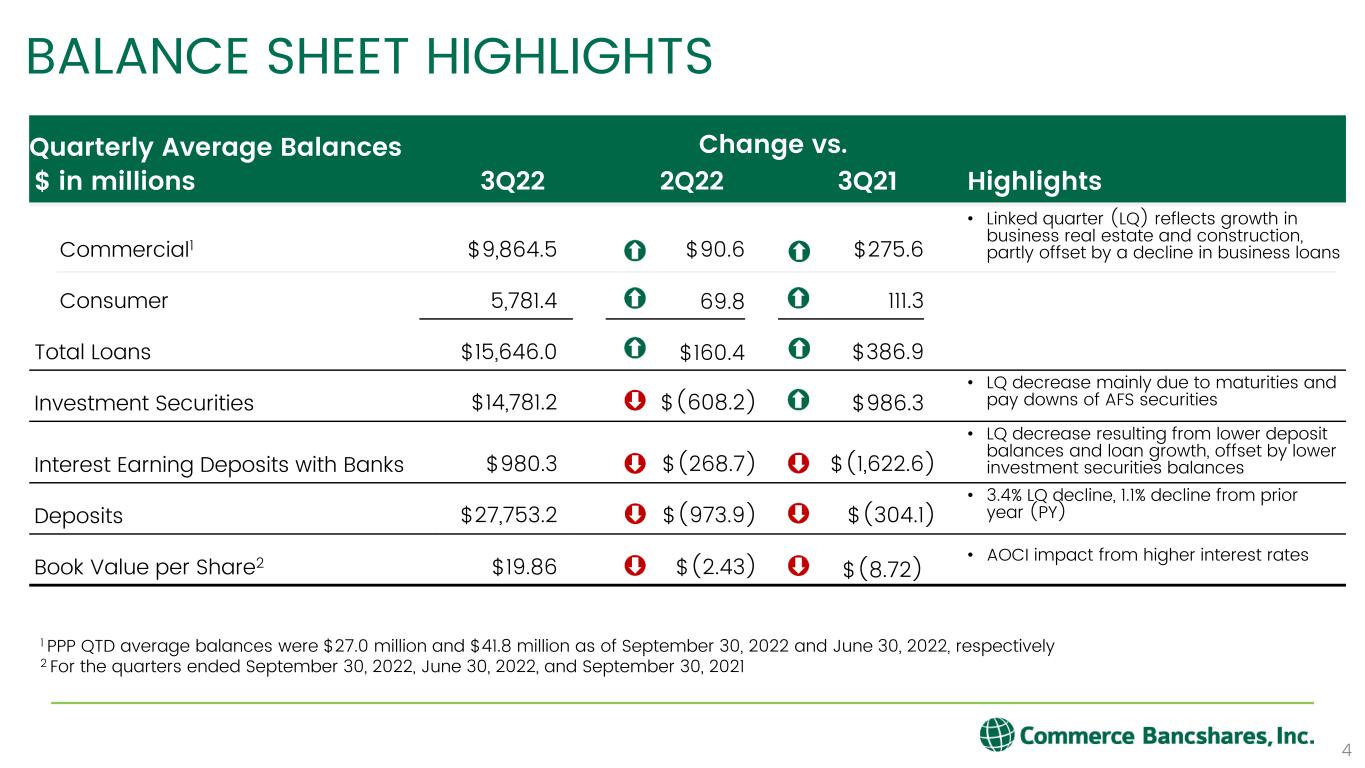
Quarterly Average Balances Change vs. $ in millions 3Q22 2Q22 3Q21 Highlights Commercial1 $9,864.5 $90.6 $275.6 • Linked quarter (LQ) reflects growth in business real estate and construction, partly offset by a decline in business loans Consumer 5,781.4 69.8 111.3 Total Loans $15,646.0 $160.4 $386.9 Investment Securities $14,781.2 $(608.2) $986.3 • LQ decrease mainly due to maturities and pay downs of AFS securities Interest Earning Deposits with Banks $980.3 $(268.7) $(1,622.6) • LQ decrease resulting from lower deposit balances and loan growth, offset by lower investment securities balances Deposits $27,753.2 $(973.9) $(304.1) • 3.4% LQ decline, 1.1% decline from prior year (PY) Book Value per Share2 $19.86 $(2.43) $(8.72) • AOCI impact from higher interest rates BALANCE SHEET HIGHLIGHTS 4 1 PPP QTD average balances were $27.0 million and $41.8 million as of September 30, 2022 and June 30, 2022, respectively 2 For the quarters ended September 30, 2022, June 30, 2022, and September 30, 2021
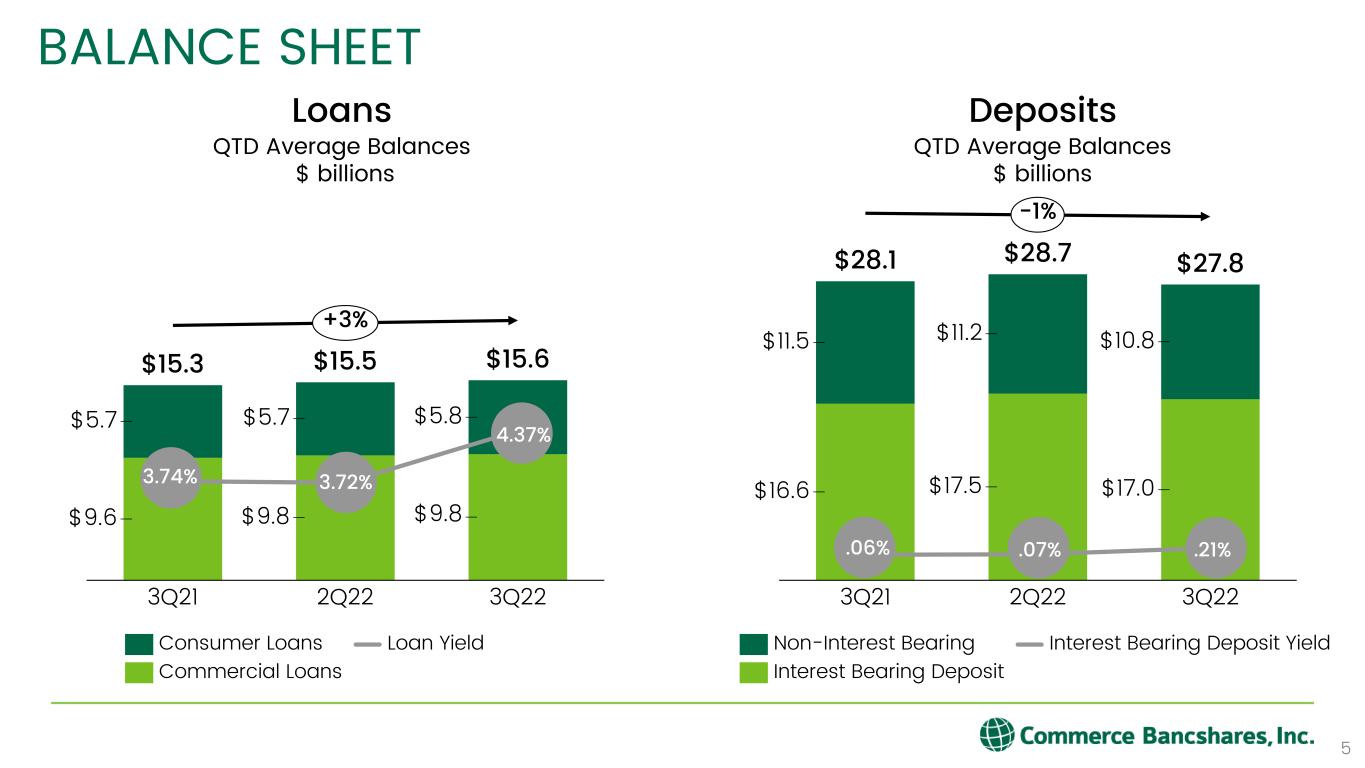
$16.6 $17.5 $17.0 $11.5 $11.2 $10.8 $27.8 3Q21 2Q22 3Q22 $28.1 $28.7 -1% $9.6 $9.8 $5.7 $5.7 $5.8 $15.3 2Q223Q21 3Q22 $15.5 $15.6 $9.8 +3% BALANCE SHEET 5 Loans Consumer Loans Commercial Loans Loan Yield Deposits QTD Average Balances $ billions Non-Interest Bearing Interest Bearing Deposit Interest Bearing Deposit Yield QTD Average Balances $ billions 3.74% 3.72% 4.37% .06% .07% .21%
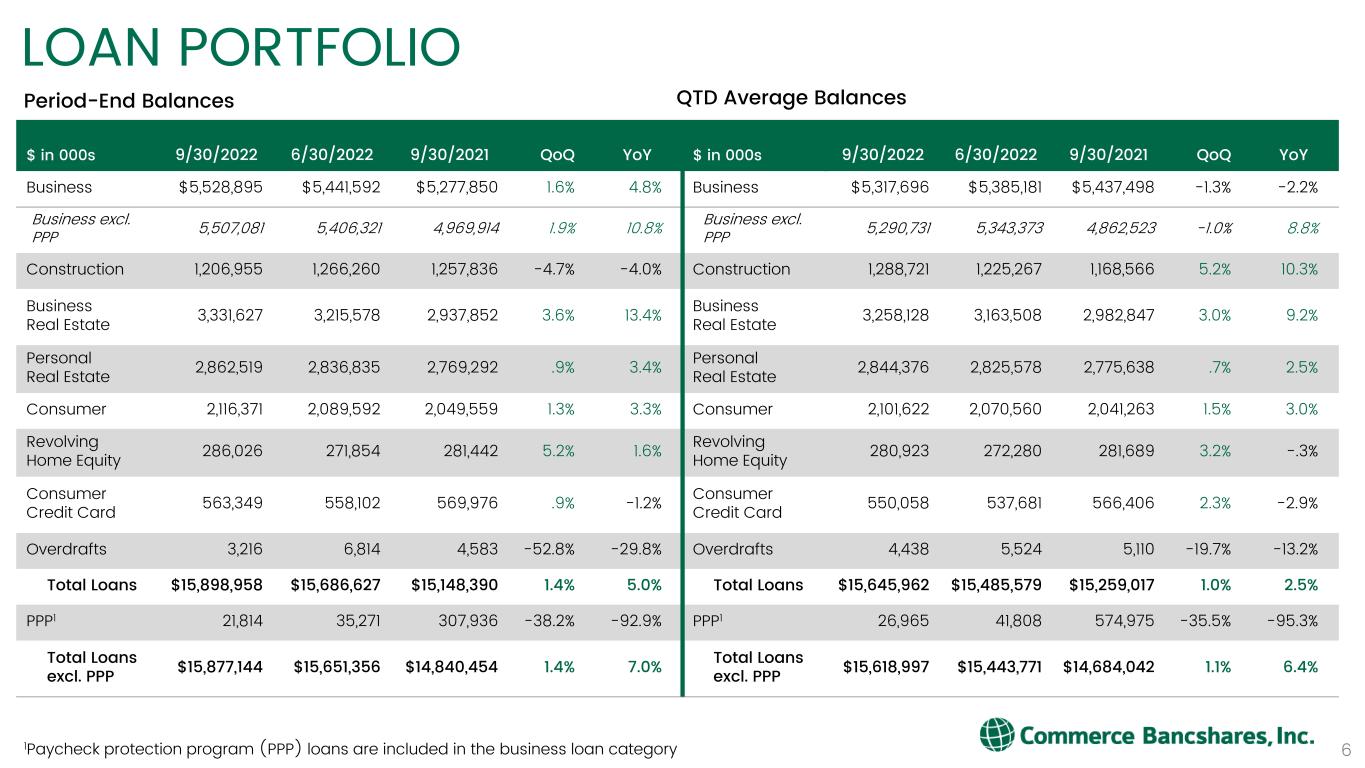
LOAN PORTFOLIO 6 $ in 000s 9/30/2022 6/30/2022 9/30/2021 QoQ YoY Business $5,528,895 $5,441,592 $5,277,850 1.6% 4.8% Business excl. PPP 5,507,081 5,406,321 4,969,914 1.9% 10.8% Construction 1,206,955 1,266,260 1,257,836 -4.7% -4.0% Business Real Estate 3,331,627 3,215,578 2,937,852 3.6% 13.4% Personal Real Estate 2,862,519 2,836,835 2,769,292 .9% 3.4% Consumer 2,116,371 2,089,592 2,049,559 1.3% 3.3% Revolving Home Equity 286,026 271,854 281,442 5.2% 1.6% Consumer Credit Card 563,349 558,102 569,976 .9% -1.2% Overdrafts 3,216 6,814 4,583 -52.8% -29.8% Total Loans $15,898,958 $15,686,627 $15,148,390 1.4% 5.0% PPP1 21,814 35,271 307,936 -38.2% -92.9% Total Loans excl. PPP $15,877,144 $15,651,356 $14,840,454 1.4% 7.0% Period-End Balances $ in 000s 9/30/2022 6/30/2022 9/30/2021 QoQ YoY Business $5,317,696 $5,385,181 $5,437,498 -1.3% -2.2% Business excl. PPP 5,290,731 5,343,373 4,862,523 -1.0% 8.8% Construction 1,288,721 1,225,267 1,168,566 5.2% 10.3% Business Real Estate 3,258,128 3,163,508 2,982,847 3.0% 9.2% Personal Real Estate 2,844,376 2,825,578 2,775,638 .7% 2.5% Consumer 2,101,622 2,070,560 2,041,263 1.5% 3.0% Revolving Home Equity 280,923 272,280 281,689 3.2% -.3% Consumer Credit Card 550,058 537,681 566,406 2.3% -2.9% Overdrafts 4,438 5,524 5,110 -19.7% -13.2% Total Loans $15,645,962 $15,485,579 $15,259,017 1.0% 2.5% PPP1 26,965 41,808 574,975 -35.5% -95.3% Total Loans excl. PPP $15,618,997 $15,443,771 $14,684,042 1.1% 6.4% QTD Average Balances 1Paycheck protection program (PPP) loans are included in the business loan category
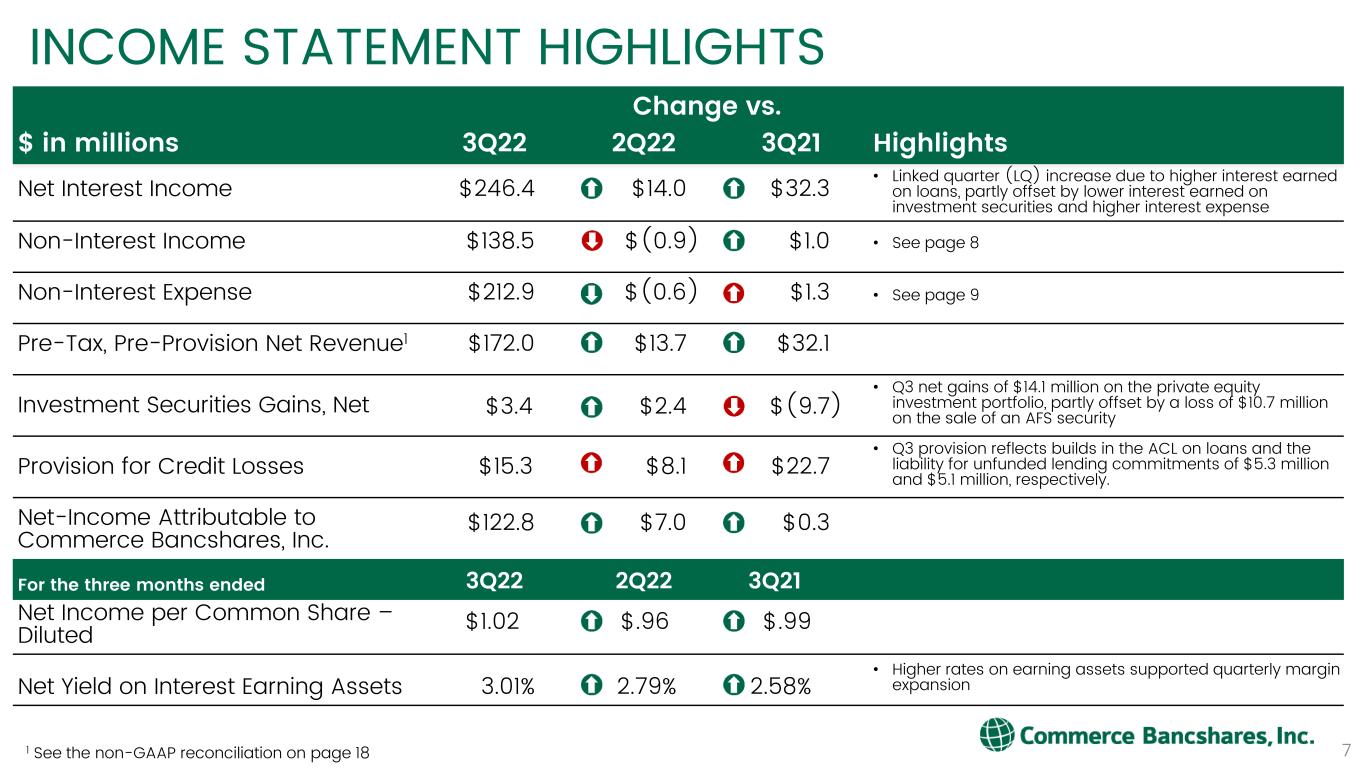
Change vs. $ in millions 3Q22 2Q22 3Q21 Highlights Net Interest Income $246.4 $14.0 $32.3 • Linked quarter (LQ) increase due to higher interest earned on loans, partly offset by lower interest earned on investment securities and higher interest expense Non-Interest Income $138.5 $(0.9) $1.0 • See page 8 Non-Interest Expense $212.9 $(0.6) $1.3 • See page 9 Pre-Tax, Pre-Provision Net Revenue1 $172.0 $13.7 $32.1 Investment Securities Gains, Net $3.4 $2.4 $(9.7) • Q3 net gains of $14.1 million on the private equity investment portfolio, partly offset by a loss of $10.7 million on the sale of an AFS security Provision for Credit Losses $15.3 $8.1 $22.7 • Q3 provision reflects builds in the ACL on loans and the liability for unfunded lending commitments of $5.3 million and $5.1 million, respectively. Net-Income Attributable to Commerce Bancshares, Inc. $122.8 $7.0 $0.3 For the three months ended 3Q22 2Q22 3Q21 Net Income per Common Share – Diluted $1.02 $.96 $.99 Net Yield on Interest Earning Assets 3.01% 2.79% 2.58% • Higher rates on earning assets supported quarterly margin expansion INCOME STATEMENT HIGHLIGHTS 1 See the non-GAAP reconciliation on page 18 7
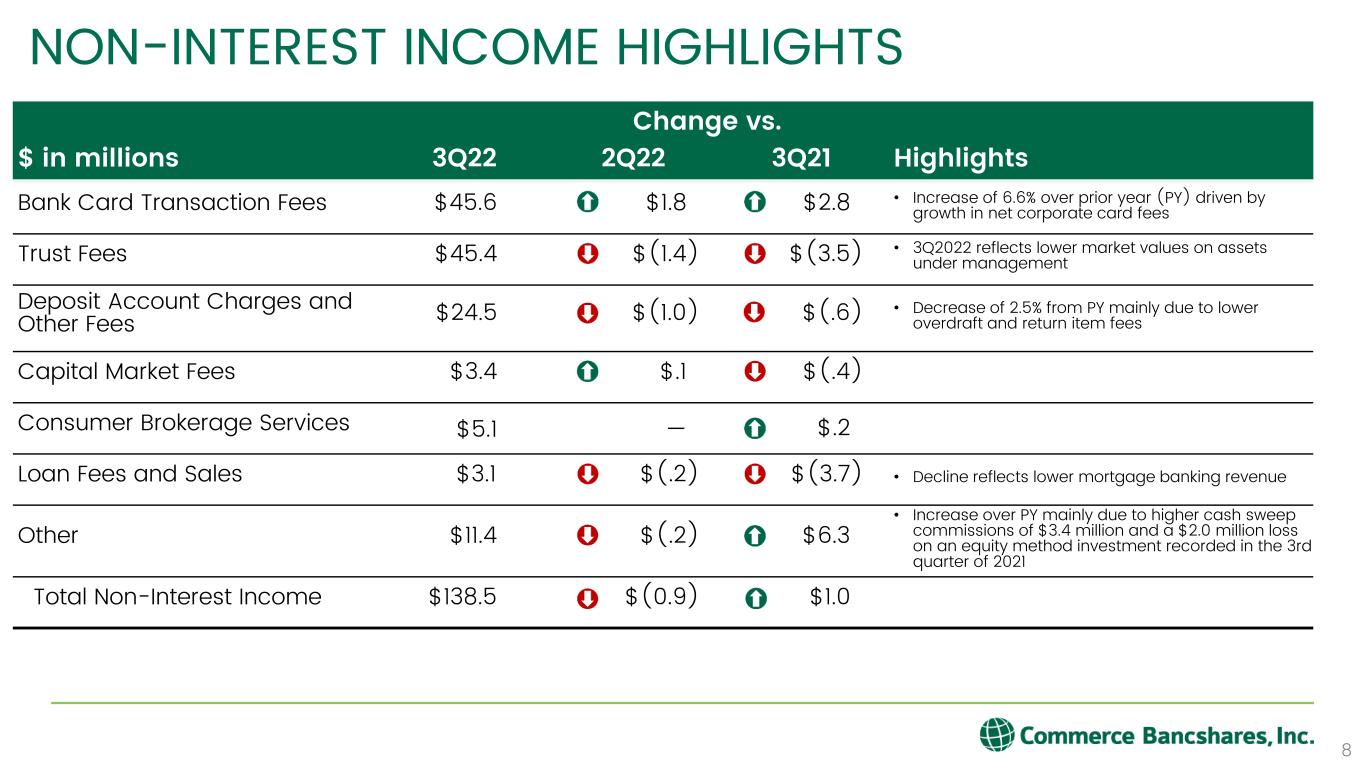
Change vs. $ in millions 3Q22 2Q22 3Q21 Highlights Bank Card Transaction Fees $45.6 $1.8 $2.8 • Increase of 6.6% over prior year (PY) driven by growth in net corporate card fees Trust Fees $45.4 $(1.4) $(3.5) • 3Q2022 reflects lower market values on assets under management Deposit Account Charges and Other Fees $24.5 $(1.0) $(.6) • Decrease of 2.5% from PY mainly due to lower overdraft and return item fees Capital Market Fees $3.4 $.1 $(.4) Consumer Brokerage Services $5.1 — $.2 Loan Fees and Sales $3.1 $(.2) $(3.7) • Decline reflects lower mortgage banking revenue Other $11.4 $(.2) $6.3 • Increase over PY mainly due to higher cash sweep commissions of $3.4 million and a $2.0 million loss on an equity method investment recorded in the 3rd quarter of 2021 Total Non-Interest Income $138.5 $(0.9) $1.0 NON-INTEREST INCOME HIGHLIGHTS 8
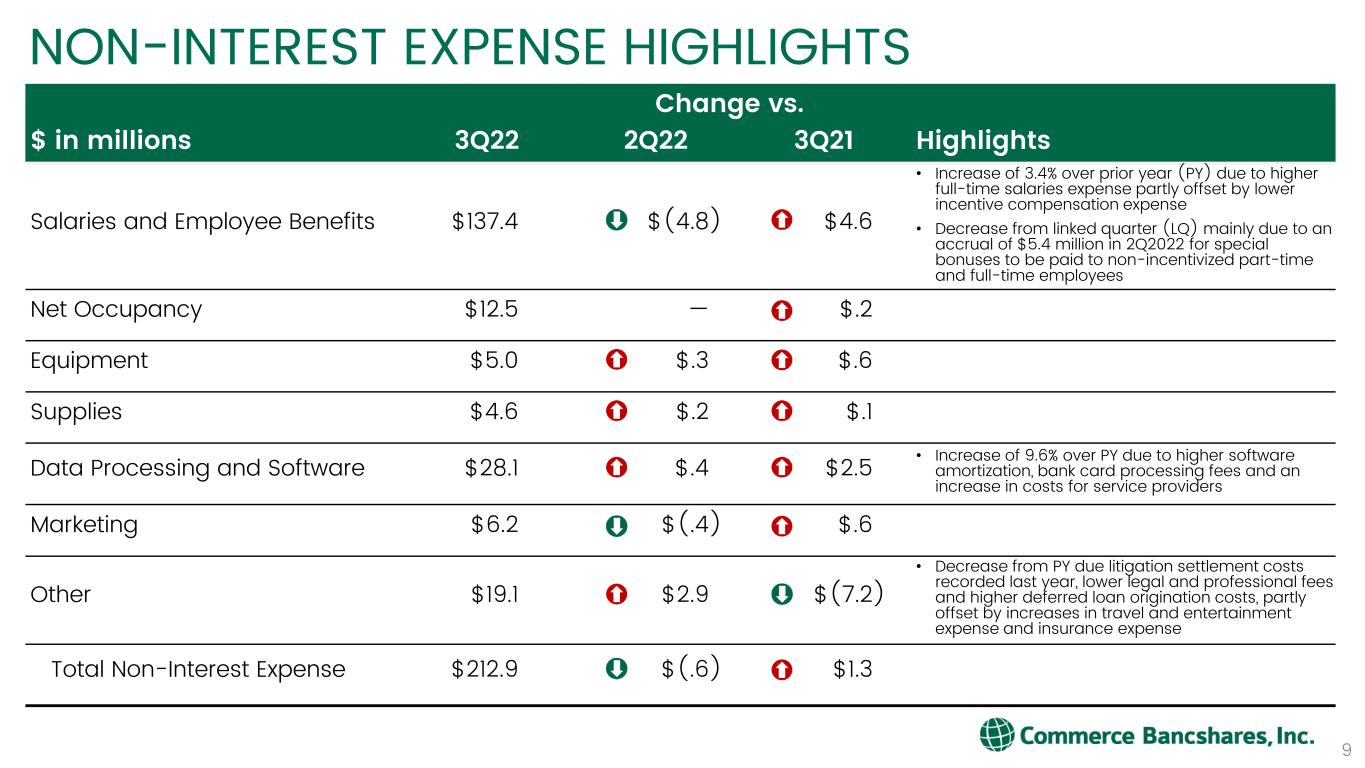
Change vs. $ in millions 3Q22 2Q22 3Q21 Highlights Salaries and Employee Benefits $137.4 $(4.8) $4.6 • Increase of 3.4% over prior year (PY) due to higher full-time salaries expense partly offset by lower incentive compensation expense • Decrease from linked quarter (LQ) mainly due to an accrual of $5.4 million in 2Q2022 for special bonuses to be paid to non-incentivized part-time and full-time employees Net Occupancy $12.5 — $.2 Equipment $5.0 $.3 $.6 Supplies $4.6 $.2 $.1 Data Processing and Software $28.1 $.4 $2.5 • Increase of 9.6% over PY due to higher software amortization, bank card processing fees and an increase in costs for service providers Marketing $6.2 $(.4) $.6 Other $19.1 $2.9 $(7.2) • Decrease from PY due litigation settlement costs recorded last year, lower legal and professional fees and higher deferred loan origination costs, partly offset by increases in travel and entertainment expense and insurance expense Total Non-Interest Expense $212.9 $(.6) $1.3 NON-INTEREST EXPENSE HIGHLIGHTS 9
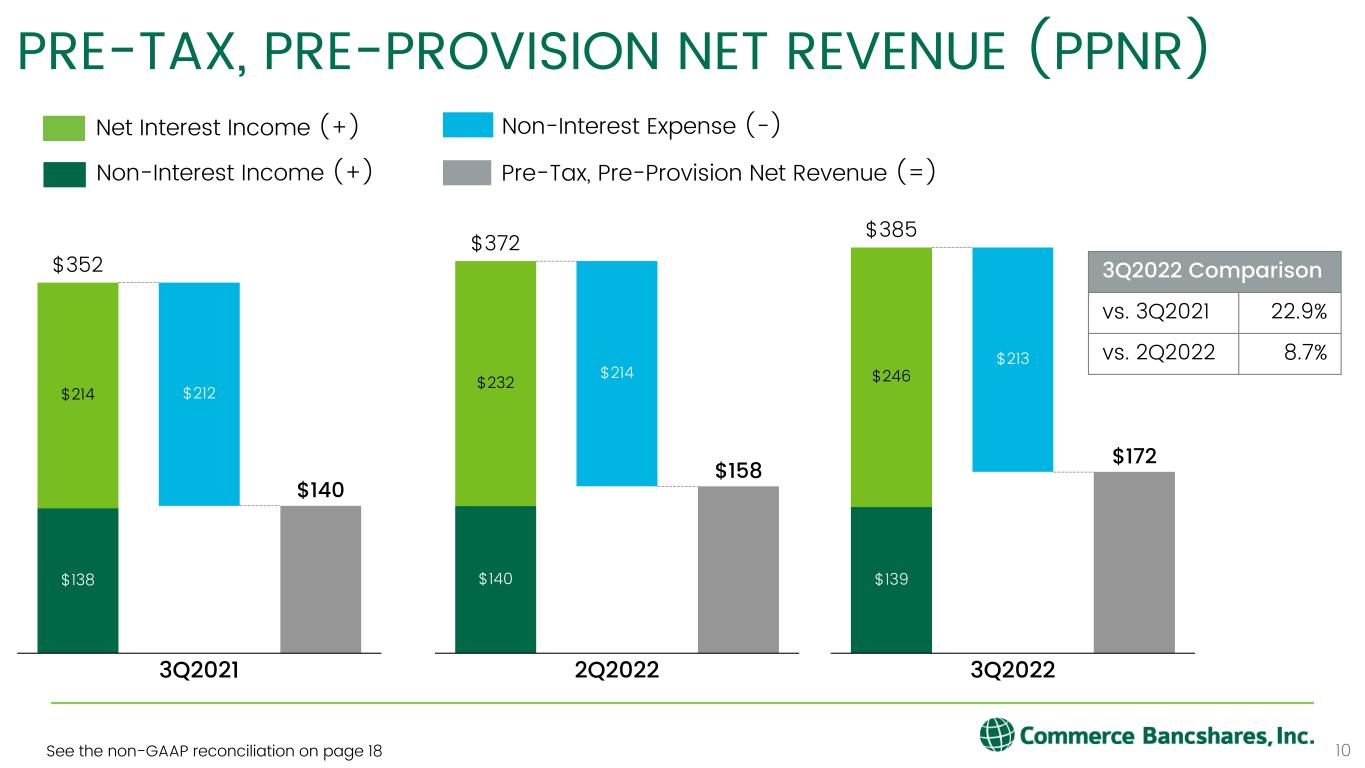
10 PRE-TAX, PRE-PROVISION NET REVENUE (PPNR) $138 $140 $214 $212 3Q2021 $352 $140 $158 $232 $214 2Q2022 $372 $139 $172 $246 $213 3Q2022 $385 Non-Interest Income (+) Net Interest Income (+) Non-Interest Expense (-) Pre-Tax, Pre-Provision Net Revenue (=) 3Q2022 Comparison vs. 3Q2021 22.9% vs. 2Q2022 8.7% See the non-GAAP reconciliation on page 18
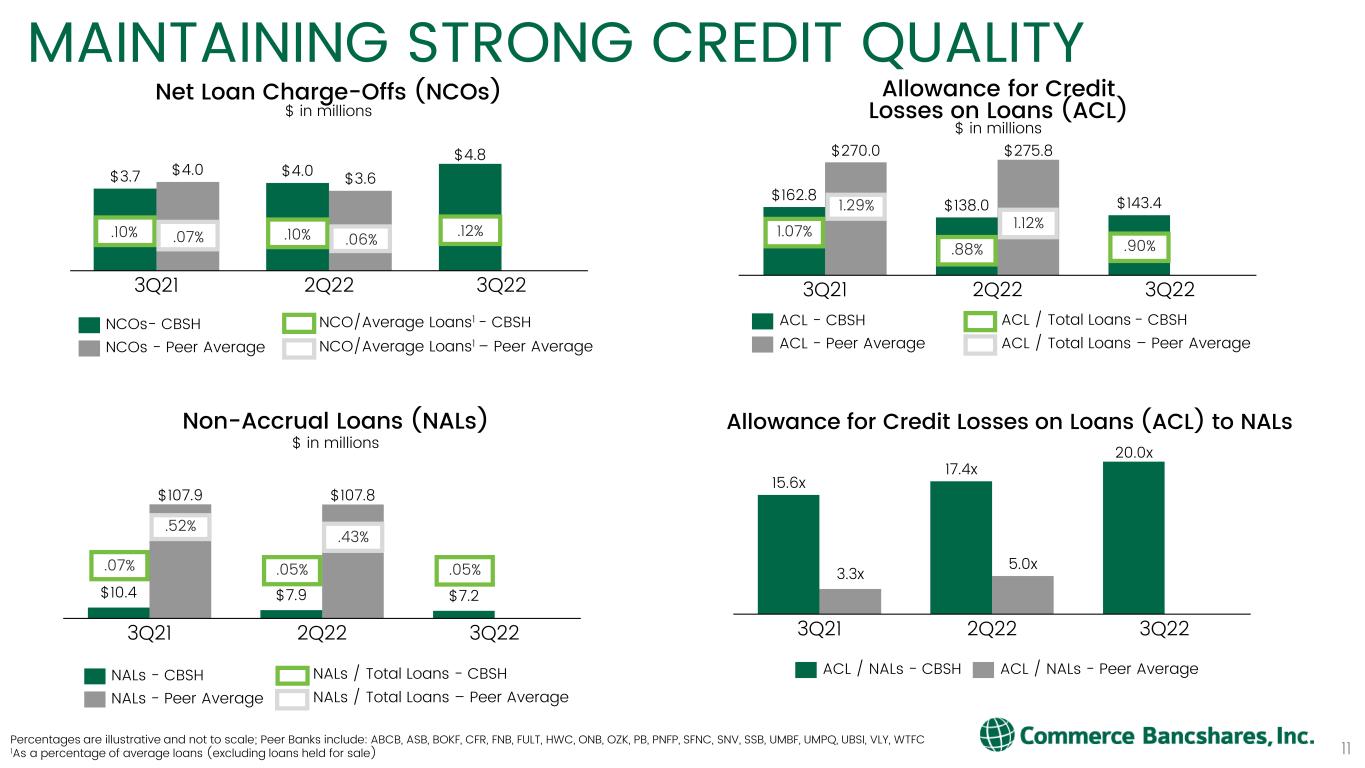
$3.7 $4.0 $4.8 $4.0 $3.6 3Q21 2Q22 3Q22 MAINTAINING STRONG CREDIT QUALITY 11 Net Loan Charge-Offs (NCOs) $ in millions NCOs- CBSH NCOs - Peer Average NCO/Average Loans1 - CBSH $162.8 $138.0 $143.4 $270.0 $275.8 3Q21 2Q22 3Q22 Allowance for Credit Losses on Loans (ACL) $ in millions ACL - CBSH ACL - Peer Average ACL / Total Loans - CBSH $10.4 $7.9 $7.2 $107.9 $107.8 3Q21 2Q22 3Q22 Non-Accrual Loans (NALs) $ in millions NALs - CBSH NALs - Peer Average 15.6x 17.4x 20.0x 3.3x 5.0x 2Q223Q21 3Q22 Allowance for Credit Losses on Loans (ACL) to NALs ACL / NALs - CBSH ACL / NALs - Peer Average Percentages are illustrative and not to scale; Peer Banks include: ABCB, ASB, BOKF, CFR, FNB, FULT, HWC, ONB, OZK, PB, PNFP, SFNC, SNV, SSB, UMBF, UMPQ, UBSI, VLY, WTFC 1As a percentage of average loans (excluding loans held for sale) NALs / Total Loans - CBSH NCO/Average Loans1 – Peer Average .07% NALs / Total Loans – Peer Average .05% .05% .52% .43% ACL / Total Loans – Peer Average 1.07% .88% .90% 1.29% 1.12%.10% .10% .12%.07% .06%

ALLOCATION OF ALLOWANCE 12 CECL allowances reflect the economic and market outlook June 30, 2022 September 30, 2022 $ in millions Allowance for Credit Losses (ACL) % of Outstanding Loans Allowance for Credit Losses (ACL) % of Outstanding Loans Business $ 41.5 .76% $ 45.0 .81% Bus R/E 29.9 .93% 28.7 .86% Construction 28.1 2.22% 29.4 2.44% Commercial total $ 99.5 1.00% $ 103.1 1.02% Consumer 9.3 .45% 9.8 .46% Consumer CC 21.3 3.81% 22.5 4.00% Personal R/E 6.5 .23% 6.6 .23% Revolving H/E 1.3 .47% 1.3 .47% Overdrafts .1 1.22% .1 2.71% Consumer total $ 38.5 .67% $ 40.3 .69% Allowance for credit losses on loans $ 138.0 .88% $ 143.4 .90% 1.47% 1.44% 1.35% 1.22% 1.07% 0.88%0.90% 0.60% 0.80% 1.00% 1.20% 1.40% 1.60% $150 $100 $200 $250 3Q $171.7 0.95% 0.99%$220.8 $139.6 $143.4 1/1 1Q1Q1Q $240.7 2Q $236.4 3Q 2Q4Q 1.10% $200.5 $134.7 $172.4 2Q $162.8 $150.0 4Q 0.87% $138.0 3Q 1.14% Allowance for Credit Losses (ACL) on Loans ACL / Total Loans (right)ACL - Loans (left) $ in millions 202220212020
13 WELL-POSITIONED FOR CURRENT ENVIRONMENT
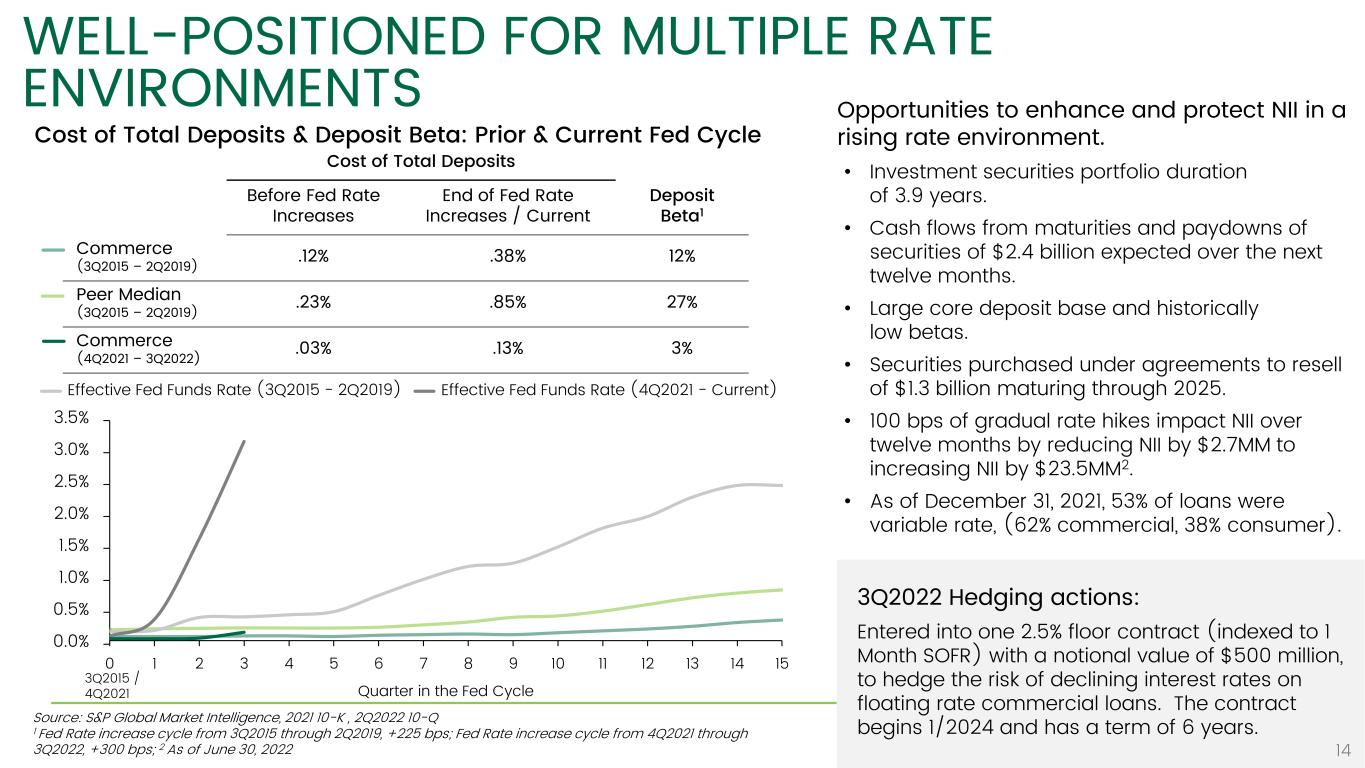
0.0% 0.5% 1.0% 1.5% 2.0% 2.5% 3.0% 3.5% 3Q2022 Hedging actions: Entered into one 2.5% floor contract (indexed to 1 Month SOFR) with a notional value of $500 million, to hedge the risk of declining interest rates on floating rate commercial loans. The contract begins 1/2024 and has a term of 6 years. WELL-POSITIONED FOR MULTIPLE RATE ENVIRONMENTS 14 Opportunities to enhance and protect NII in a rising rate environment. • Investment securities portfolio duration of 3.9 years. • Cash flows from maturities and paydowns of securities of $2.4 billion expected over the next twelve months. • Large core deposit base and historically low betas. • Securities purchased under agreements to resell of $1.3 billion maturing through 2025. • 100 bps of gradual rate hikes impact NII over twelve months by reducing NII by $2.7MM to increasing NII by $23.5MM2. • As of December 31, 2021, 53% of loans were variable rate, (62% commercial, 38% consumer). Cost of Total Deposits & Deposit Beta: Prior & Current Fed Cycle Source: S&P Global Market Intelligence, 2021 10-K , 2Q2022 10-Q 1 Fed Rate increase cycle from 3Q2015 through 2Q2019, +225 bps; Fed Rate increase cycle from 4Q2021 through 3Q2022, +300 bps; 2 As of June 30, 2022 Cost of Total Deposits Before Fed Rate Increases End of Fed Rate Increases / Current Deposit Beta1 Commerce (3Q2015 – 2Q2019) .12% .38% 12% Peer Median (3Q2015 – 2Q2019) .23% .85% 27% Commerce (4Q2021 – 3Q2022) .03% .13% 3% 0 1 2 3 4 5 6 7 8 9 10 11 12 13 14 15 Quarter in the Fed Cycle Effective Fed Funds Rate (3Q2015 - 2Q2019) Effective Fed Funds Rate (4Q2021 - Current) 3Q2015 / 4Q2021
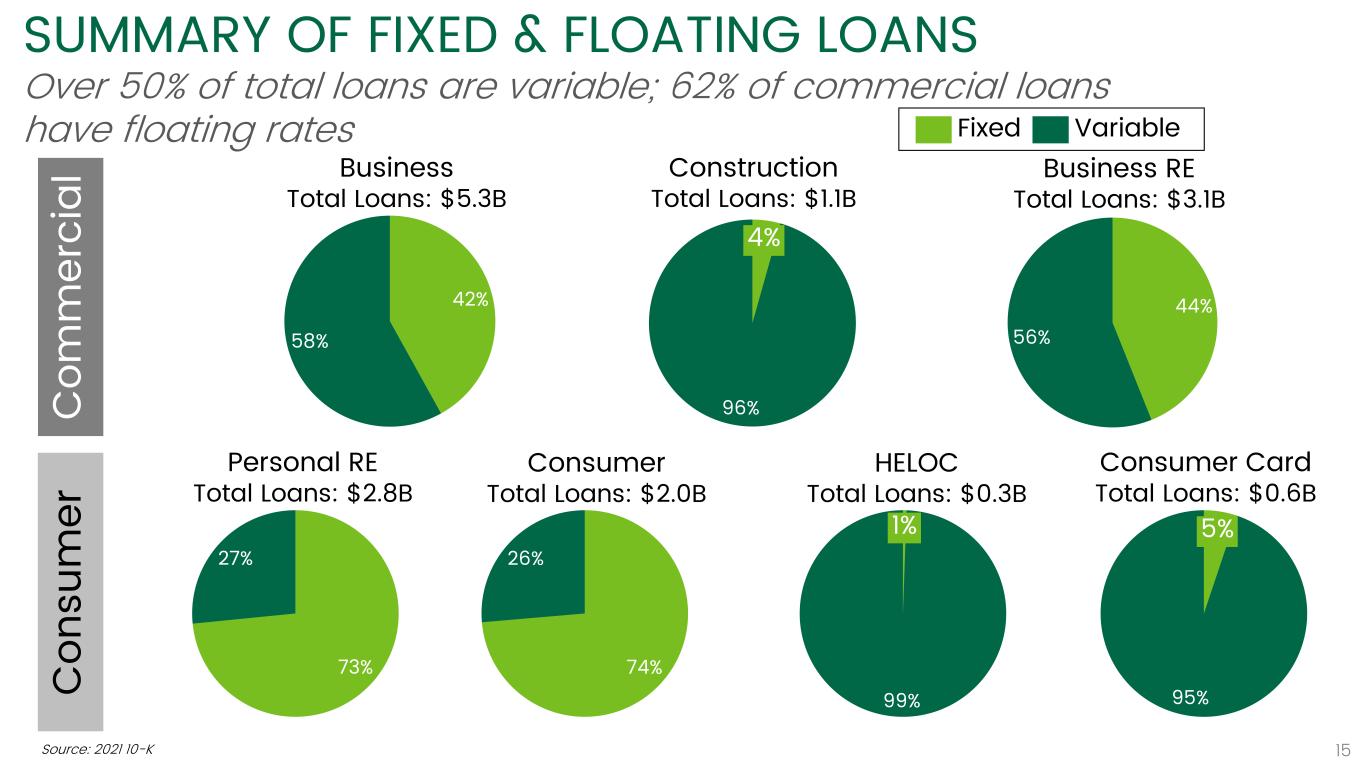
Over 50% of total loans are variable; 62% of commercial loans have floating rates SUMMARY OF FIXED & FLOATING LOANS 42% 58% Business Total Loans: $5.3B Fixed Variable Co m m er ci al 73% 27% Personal RE Total Loans: $2.8B Co ns um er 99% 1% HELOC Total Loans: $0.3B 44% 56% Business RE Total Loans: $3.1B 95% 5% Consumer Card Total Loans: $0.6B 74% 26% Consumer Total Loans: $2.0B 15 96% 4% Construction Total Loans: $1.1B Source: 2021 10-K
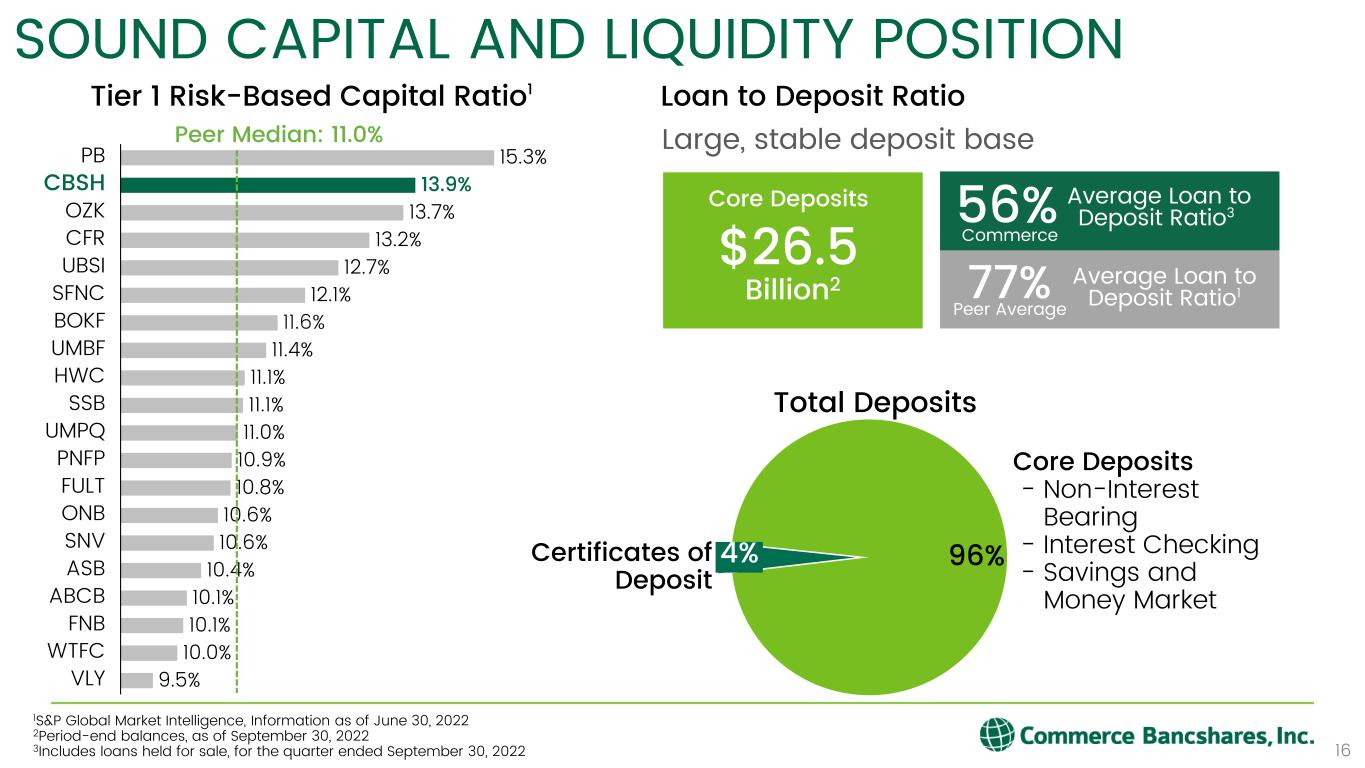
Average Loan to Deposit Ratio3 SOUND CAPITAL AND LIQUIDITY POSITION 16 Tier 1 Risk-Based Capital Ratio1 1S&P Global Market Intelligence, Information as of June 30, 2022 2Period-end balances, as of September 30, 2022 3Includes loans held for sale, for the quarter ended September 30, 2022 15.3% 13.9% 13.7% 13.2% 12.7% 12.1% 11.6% 11.4% 11.1% 11.1% 11.0% 10.9% 10.8% 10.6% 10.6% 10.4% 10.1% 10.1% 10.0% 9.5% UMBF BOKF SSB SFNC FNB PB CFR CBSH OZK UBSI HWC UMPQ PNFP FULT ONB SNV ASB ABCB WTFC VLY Peer Median: 11.0% Core Deposits $26.5 Billion2 Large, stable deposit base Loan to Deposit Ratio Total Deposits 56% Average Loan to Deposit Ratio177% Peer Average Commerce 96% Core Deposits - Non-Interest Bearing - Interest Checking - Savings and Money Market 4%Certificates of Deposit
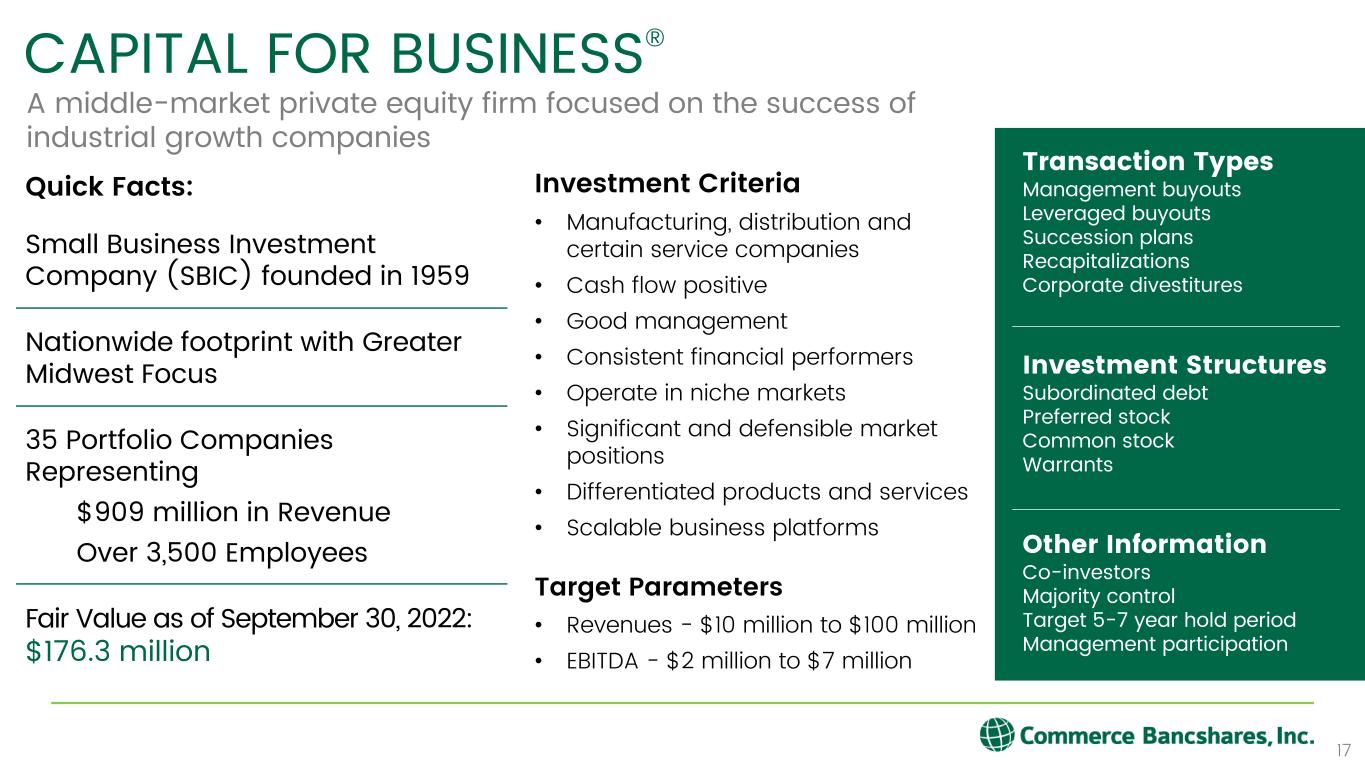
Quick Facts: Small Business Investment Company (SBIC) founded in 1959 Nationwide footprint with Greater Midwest Focus 35 Portfolio Companies Representing $909 million in Revenue Over 3,500 Employees Fair Value as of September 30, 2022: $176.3 million Investment Criteria • Manufacturing, distribution and certain service companies • Cash flow positive • Good management • Consistent financial performers • Operate in niche markets • Significant and defensible market positions • Differentiated products and services • Scalable business platforms Target Parameters • Revenues - $10 million to $100 million • EBITDA - $2 million to $7 million CAPITAL FOR BUSINESS® A middle-market private equity firm focused on the success of industrial growth companies Transaction Types Management buyouts Leveraged buyouts Succession plans Recapitalizations Corporate divestitures Investment Structures Subordinated debt Preferred stock Common stock Warrants Other Information Co-investors Majority control Target 5-7 year hold period Management participation 17
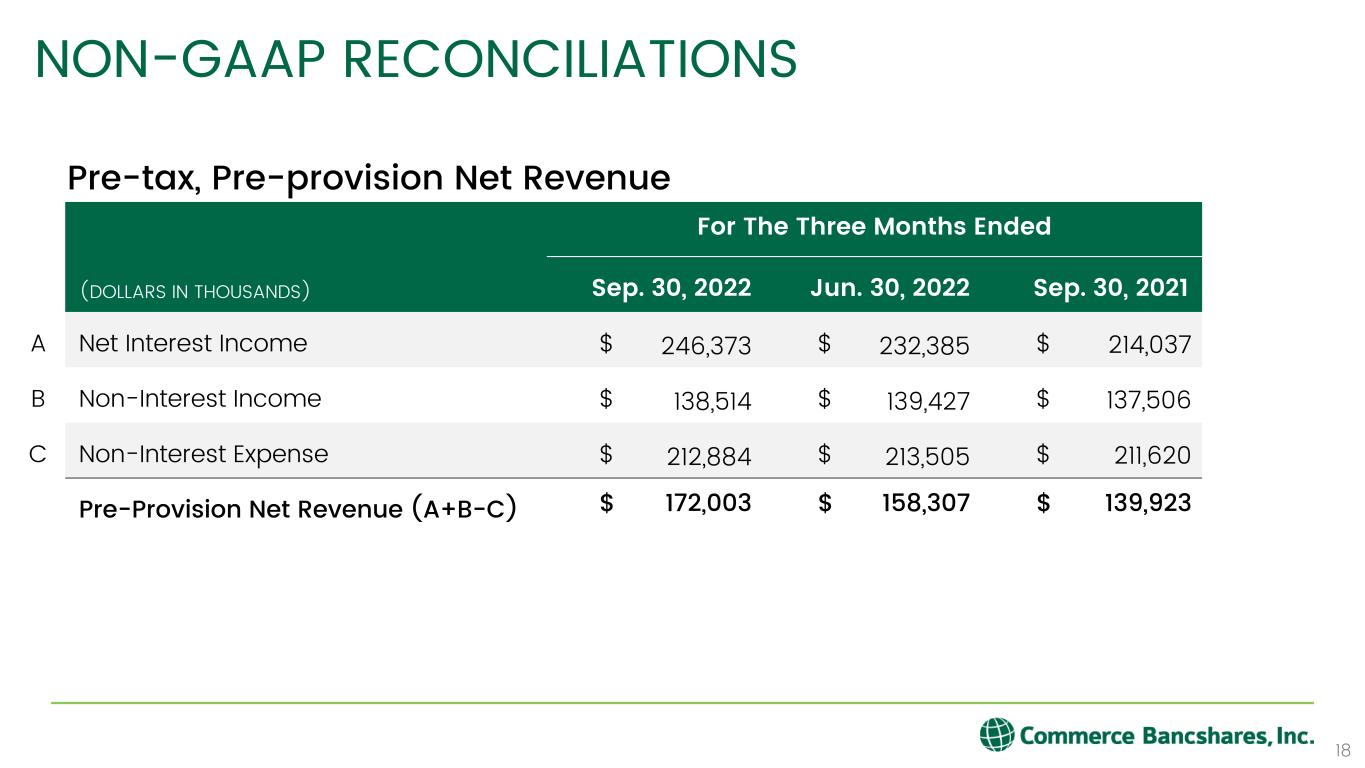
NON-GAAP RECONCILIATIONS 18 For The Three Months Ended (DOLLARS IN THOUSANDS) Sep. 30, 2022 Jun. 30, 2022 Sep. 30, 2021 A Net Interest Income $ 246,373 $ 232,385 $ 214,037 B Non-Interest Income $ 138,514 $ 139,427 $ 137,506 C Non-Interest Expense $ 212,884 $ 213,505 $ 211,620 Pre-Provision Net Revenue (A+B-C) $ 172,003 $ 158,307 $ 139,923 Pre-tax, Pre-provision Net Revenue


