COMMERCE BANCSHARES, INC. EARNINGS HIGHLIGHTS 3rd Quarter 2023 PEOPLE, GROWTH AND POSSIBILITIES
CAUTIONARY STATEMENT A number of statements we will be making in our presentation and in the accompanying slides are “forward-looking statements” within the meaning of the Private Securities Litigation Reform Act of 1995, such as statements of the Corporation’s plans, goals, objectives, expectations, projections, estimates and intentions. These forward- looking statements involve significant risks and uncertainties and are subject to change based on various factors (some of which are beyond the Corporation’s control). Factors that could cause the Corporation’s actual results to differ materially from such forward- looking statements made herein or by management of the Corporation are set forth in the Corporation’s 2022 Annual Report on Form 10-K, 2ND Quarter 2023 Report on Form 10- Q and the Corporation’s Current Reports on Form 8-K. 2
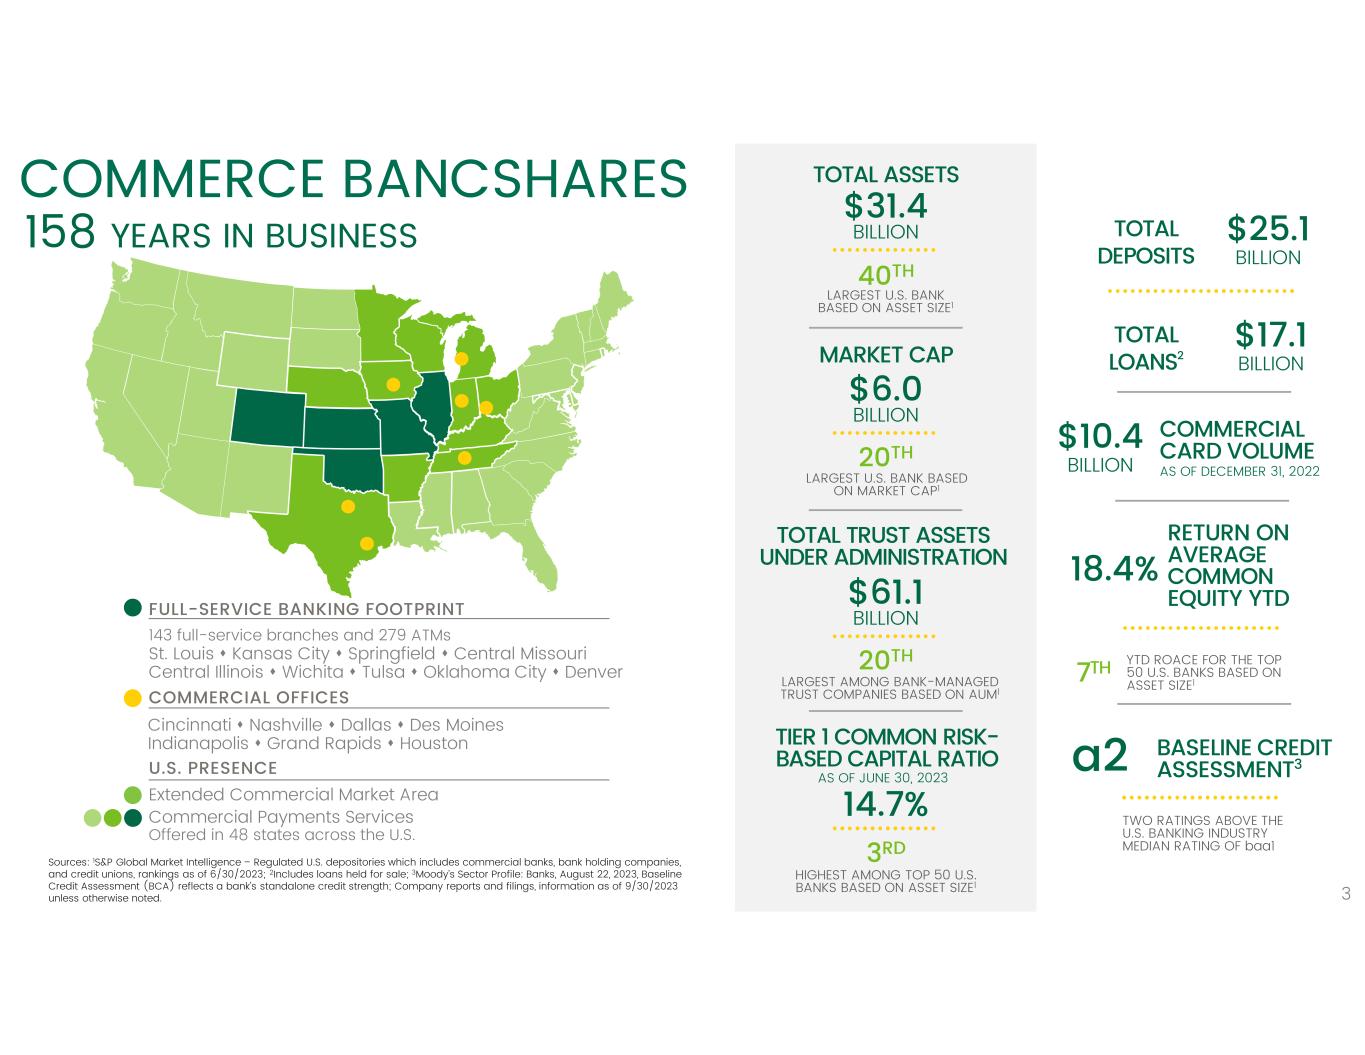
COMMERCE BANCSHARES 158 YEARS IN BUSINESS FULL-SERVICE BANKING FOOTPRINT 143 full-service branches and 279 ATMs St. Louis Kansas City Springfield Central Missouri Central Illinois Wichita Tulsa Oklahoma City Denver COMMERCIAL OFFICES Cincinnati Nashville Dallas Des Moines Indianapolis Grand Rapids Houston U.S. PRESENCE Extended Commercial Market Area Commercial Payments Services Offered in 48 states across the U.S. Sources: 1S&P Global Market Intelligence – Regulated U.S. depositories which includes commercial banks, bank holding companies, and credit unions, rankings as of 6/30/2023; 2Includes loans held for sale; 3Moody’s Sector Profile: Banks, August 22, 2023, Baseline Credit Assessment (BCA) reflects a bank’s standalone credit strength; Company reports and filings, information as of 9/30/2023 unless otherwise noted. 3 $31.4 BILLION TOTAL ASSETS 40TH LARGEST U.S. BANK BASED ON ASSET SIZE1 $6.0 BILLION MARKET CAP 20TH LARGEST U.S. BANK BASED ON MARKET CAP1 $61.1 BILLION TOTAL TRUST ASSETS UNDER ADMINISTRATION 20TH LARGEST AMONG BANK-MANAGED TRUST COMPANIES BASED ON AUM1 14.7% TIER 1 COMMON RISK- BASED CAPITAL RATIO 3RD HIGHEST AMONG TOP 50 U.S. BANKS BASED ON ASSET SIZE1 a2 BASELINE CREDIT ASSESSMENT3 TWO RATINGS ABOVE THE U.S. BANKING INDUSTRY MEDIAN RATING OF baa1 $25.1 BILLION TOTAL DEPOSITS $17.1 BILLION TOTAL LOANS2 $10.4 BILLION COMMERCIAL CARD VOLUME 18.4% RETURN ON AVERAGE COMMON EQUITY YTD 7TH YTD ROACE FOR THE TOP 50 U.S. BANKS BASED ON ASSET SIZE1 AS OF DECEMBER 31, 2022 AS OF JUNE 30, 2023
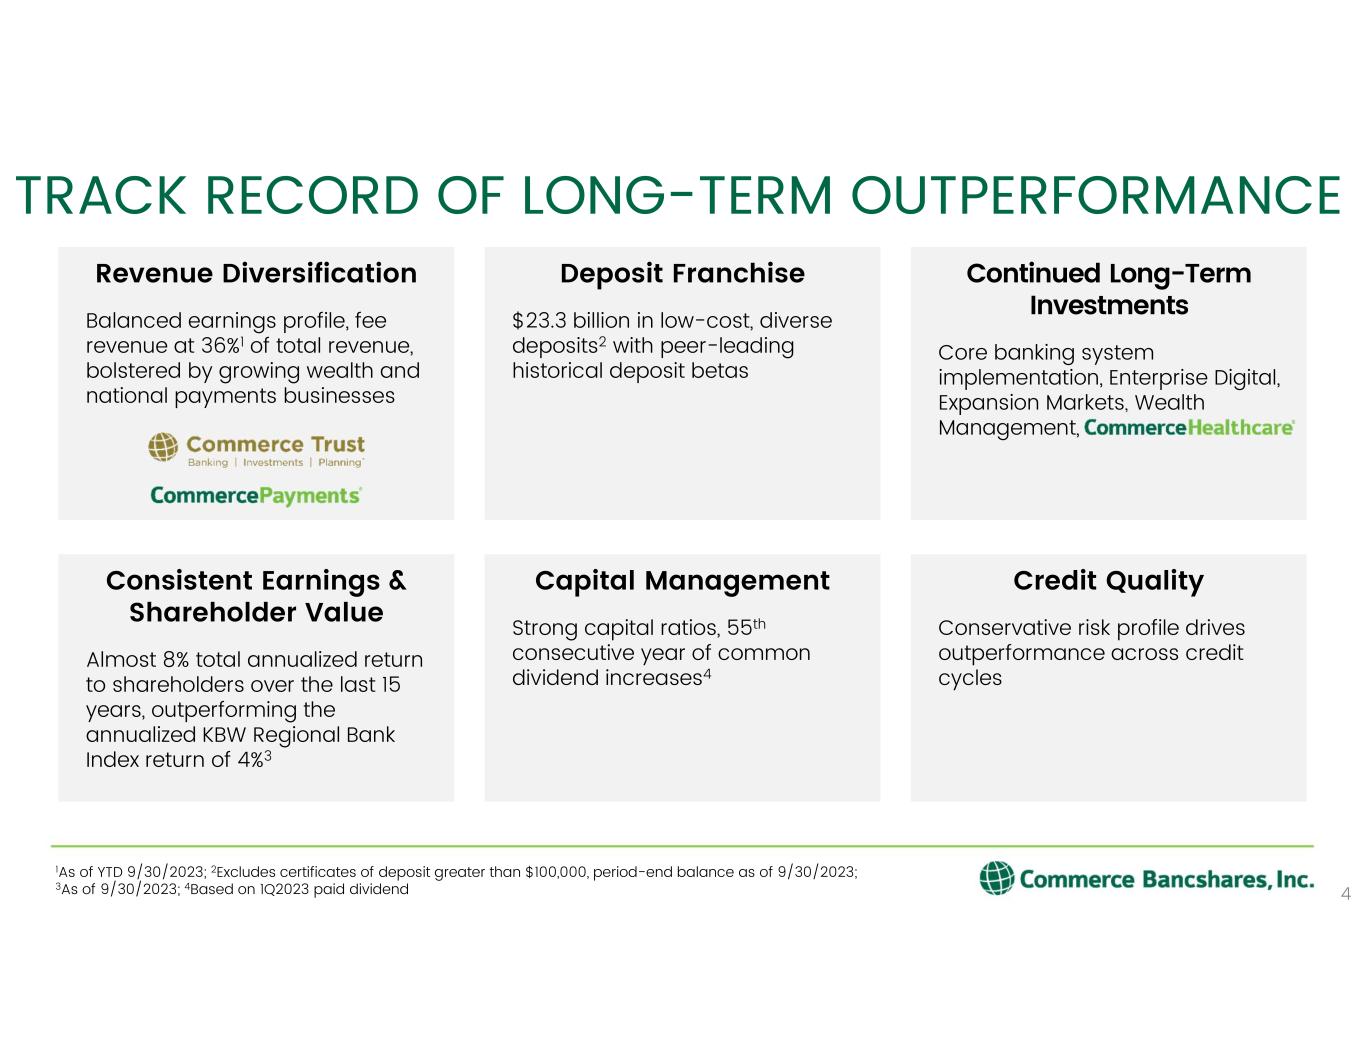
4 TRACK RECORD OF LONG-TERM OUTPERFORMANCE Revenue Diversification Balanced earnings profile, fee revenue at 36%1 of total revenue, bolstered by growing wealth and national payments businesses Deposit Franchise $23.3 billion in low-cost, diverse deposits2 with peer-leading historical deposit betas Continued Long-Term Investments Core banking system implementation, Enterprise Digital, Expansion Markets, Wealth Management, Consistent Earnings & Shareholder Value Almost 8% total annualized return to shareholders over the last 15 years, outperforming the annualized KBW Regional Bank Index return of 4%3 Capital Management Strong capital ratios, 55th consecutive year of common dividend increases4 Credit Quality Conservative risk profile drives outperformance across credit cycles 1As of YTD 9/30/2023; 2Excludes certificates of deposit greater than $100,000, period-end balance as of 9/30/2023; 3As of 9/30/2023; 4Based on 1Q2023 paid dividend
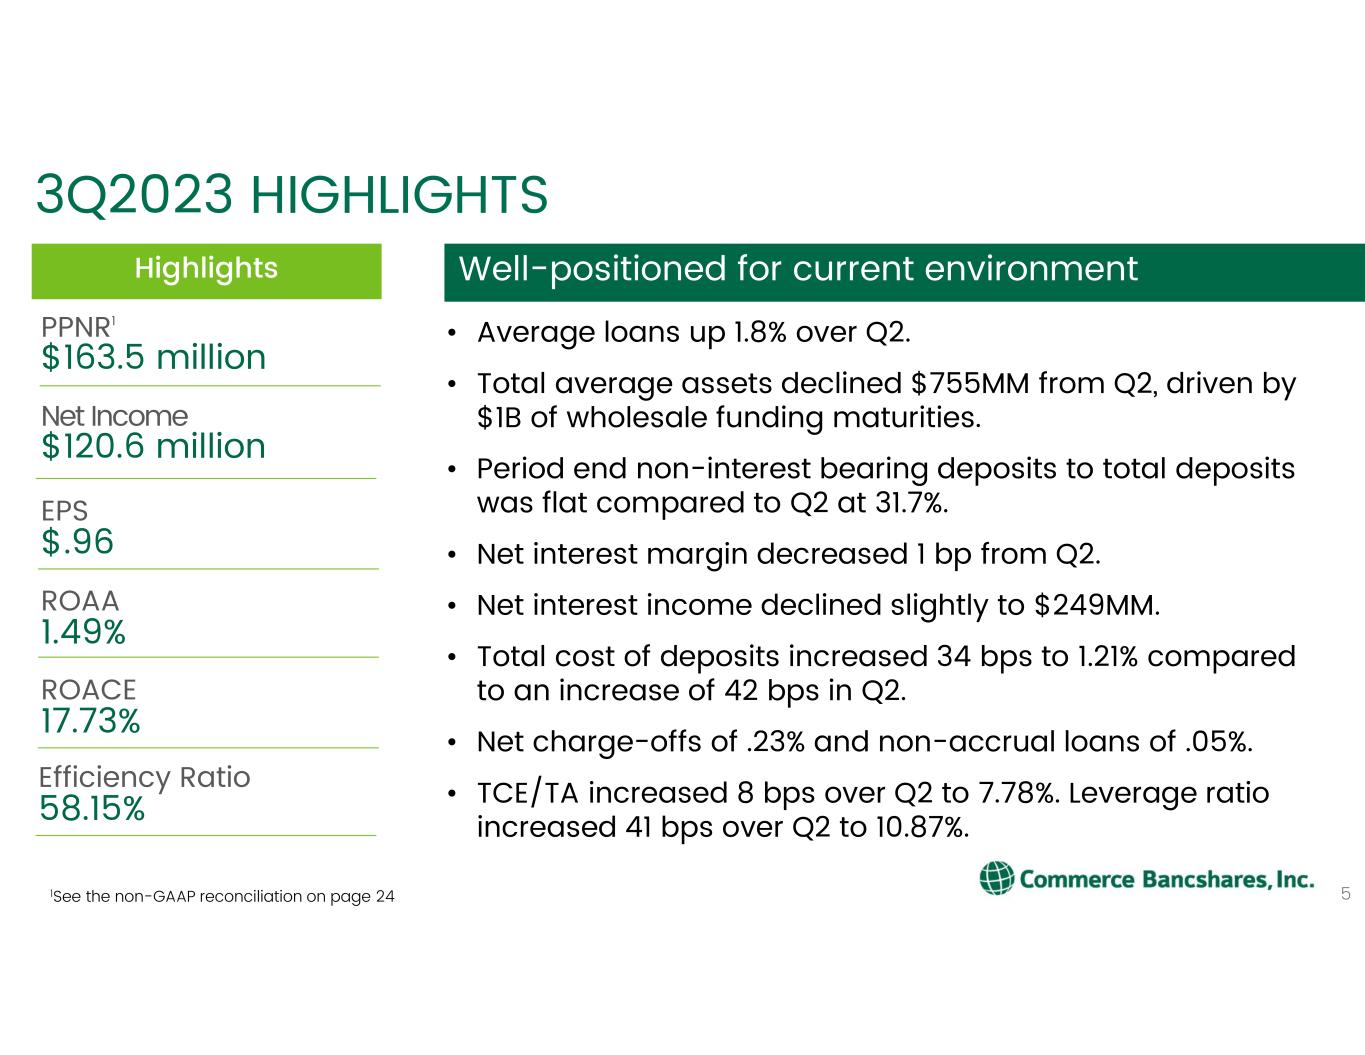
$.96 EPS 5 • Average loans up 1.8% over Q2. • Total average assets declined $755MM from Q2, driven by $1B of wholesale funding maturities. • Period end non-interest bearing deposits to total deposits was flat compared to Q2 at 31.7%. • Net interest margin decreased 1 bp from Q2. • Net interest income declined slightly to $249MM. • Total cost of deposits increased 34 bps to 1.21% compared to an increase of 42 bps in Q2. • Net charge-offs of .23% and non-accrual loans of .05%. • TCE/TA increased 8 bps over Q2 to 7.78%. Leverage ratio increased 41 bps over Q2 to 10.87%. Highlights Well-positioned for current environment 3Q2023 HIGHLIGHTS $163.5 million PPNR1 $120.6 million Net Income 17.73% ROACE 1.49% ROAA 58.15% Efficiency Ratio 1See the non-GAAP reconciliation on page 24
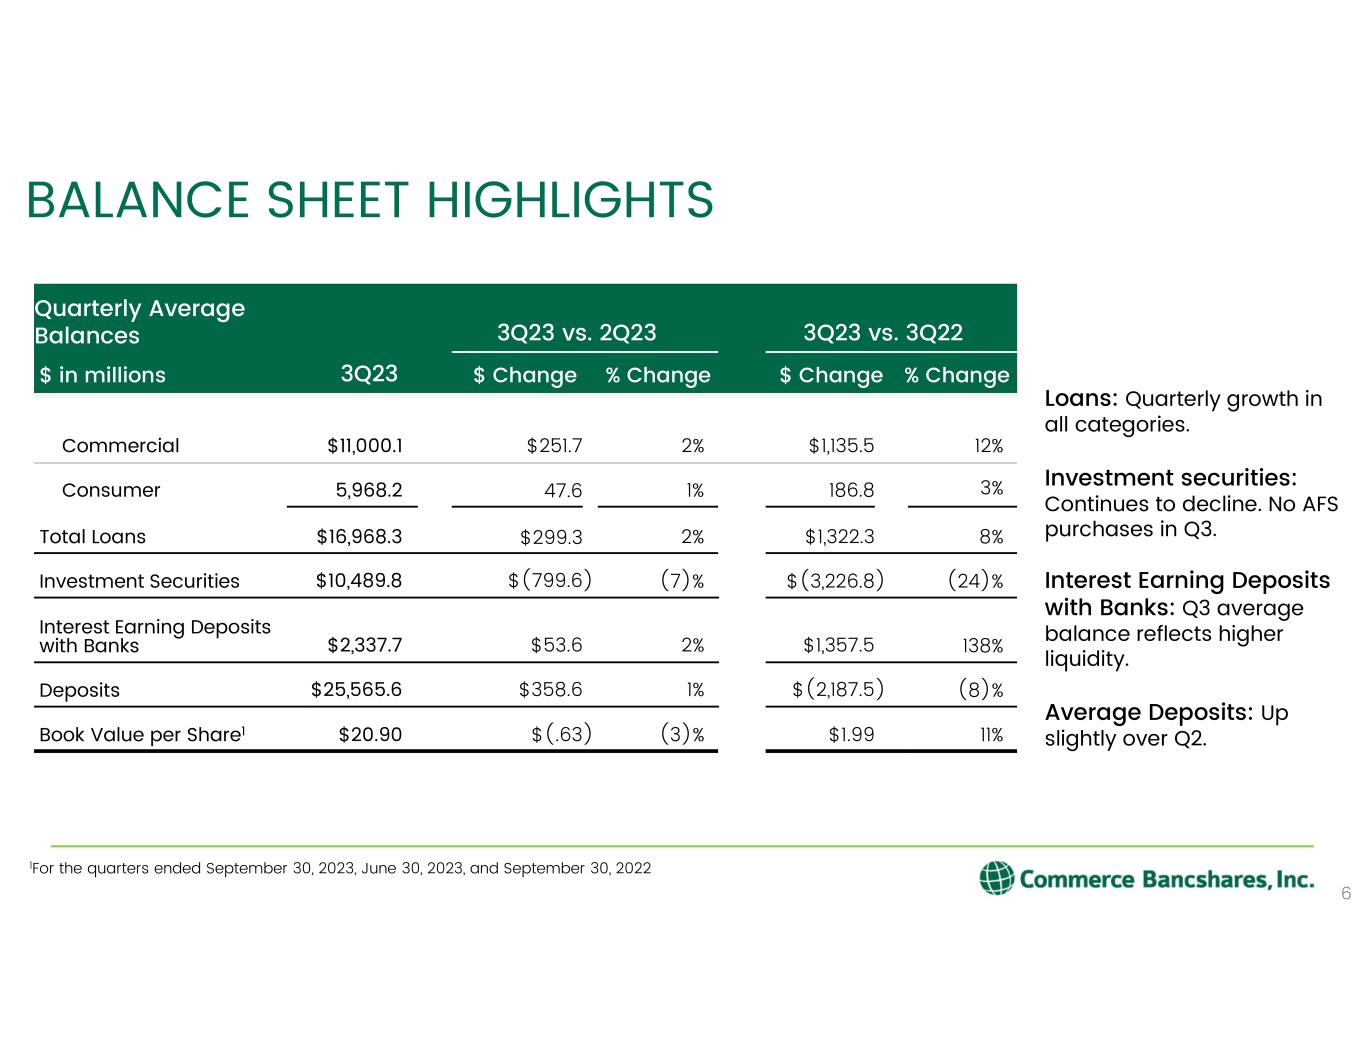
Quarterly Average Balances 3Q23 vs. 2Q23 3Q23 vs. 3Q22 $ in millions 3Q23 $ Change % Change $ Change % Change Commercial $11,000.1 $251.7 2% $1,135.5 12% Consumer 5,968.2 47.6 1% 186.8 3% Total Loans $16,968.3 $299.3 2% $1,322.3 8% Investment Securities $10,489.8 $(799.6) (7)% $(3,226.8) (24)% Interest Earning Deposits with Banks $2,337.7 $53.6 2% $1,357.5 138% Deposits $25,565.6 $358.6 1% $(2,187.5) (8)% Book Value per Share1 $20.90 $(.63) (3)% $1.99 11% BALANCE SHEET HIGHLIGHTS 6 1For the quarters ended September 30, 2023, June 30, 2023, and September 30, 2022 Loans: Quarterly growth in all categories. Investment securities: Continues to decline. No AFS purchases in Q3. Interest Earning Deposits with Banks: Q3 average balance reflects higher liquidity. Average Deposits: Up slightly over Q2.
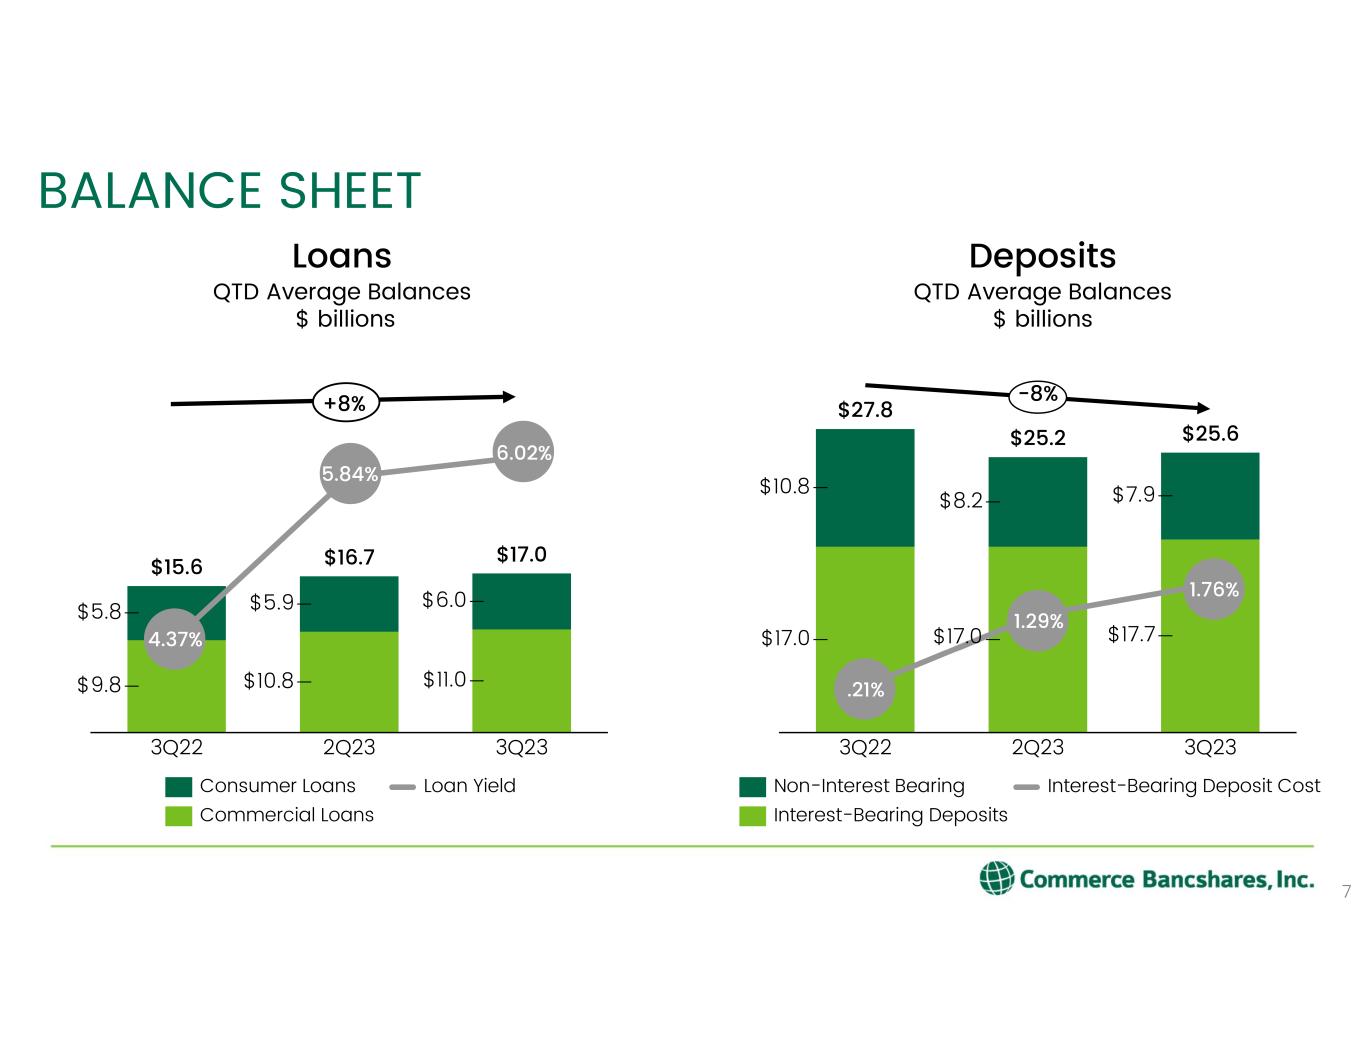
$17.0 $17.7 $10.8 $8.2 $7.9 $25.6 2Q233Q22 $17.0 3Q23 $25.2 $27.8 -8% $9.8 $10.8 $11.0 $5.8 $5.9 $6.0 2Q233Q22 3Q23 $15.6 $16.7 $17.0 BALANCE SHEET 7 Loans Loan YieldConsumer Loans Commercial Loans Deposits QTD Average Balances $ billions Interest-Bearing Deposit CostNon-Interest Bearing Interest-Bearing Deposits QTD Average Balances $ billions 4.37% 5.84% 6.02% .21% 1.29% 1.76% +8%

LOAN PORTFOLIO 8 $ in 000s 9/30/2023 6/30/2023 9/30/2022 QoQ YoY Business $5,908,330 $5,906,493 $5,528,895 0.0% 6.9% Construction 1,539,566 1,451,783 1,206,955 6.0% 27.6% Business Real Estate 3,647,168 3,621,222 3,331,627 0.7% 9.5% Personal Real Estate 3,024,639 2,980,599 2,862,519 1.5% 5.7% Consumer 2,125,804 2,110,605 2,116,371 0.7% 0.4% Revolving Home Equity 305,237 303,845 286,026 0.5% 6.7% Consumer Credit Card 574,829 574,755 563,349 0.0% 2.0% Overdrafts 3,753 7,237 3,216 -48.1% 16.7% Total Loans $17,129,326 $16,956,539 $15,898,958 1.0% 7.7% Period-End Balances $ in 000s 9/30/2023 6/30/2023 9/30/2022 QoQ YoY Business $5,849,227 $5,757,388 $5,317,696 1.6% 10.0% Construction 1,508,850 1,450,196 1,288,721 4.0% 17.1% Business Real Estate 3,642,010 3,540,851 3,258,128 2.9% 11.8% Personal Real Estate 2,992,500 2,960,962 2,844,376 1.1% 5.2% Consumer 2,102,281 2,098,523 2,101,622 0.2% 0.0% Revolving Home Equity 304,055 300,623 280,923 1.1% 8.2% Consumer Credit Card 564,039 555,875 550,058 1.5% 2.5% Overdrafts 5,341 4,630 4,438 15.4% 20.3% Total Loans $16,968,303 $16,669,048 $15,645,962 1.8% 8.5% QTD Average Balances

Real Estate - Business Loans: Office Outstanding Balances by Geography1 Real Estate - Business Loans % of Total Loans Owner – Occupied 6.6% Industrial 3.4% Office 3.0% Retail 2.1% Multi-family 1.6% Hotels 1.7% Farm 1.2% Senior living 1.0% Other .7% Total 21.3% COMMERCIAL REAL ESTATE BREAKDOWN 9 31.0% 14.0% 16.1% 9.7% 7.7% 8.0% 5.5% 4.5% Owner- occupied Hotels Office Industrial Senior living Retail Farm Multi-family 3.5% Other Real Estate - Business Loans $3.6 billion 1Geography determined by location of collateral. Includes only loans with a balance of $1 million and above, which represents 93% of outstanding balance of the stabilized, non-owner occupied office loans 2Critized is defined as special mention, substandard, and non-accrual loans 3LTV based on current exposure and property value at time of most recent valuation. Includes only loans with a balance of $1 million and above, which represents 93% of outstanding balance of the stabilized, non- owner occupied office loans Real Estate - Business Loans: Office Attributes as of September 30, 2023 49.3% 10.6% 20.1% 7.3% MO TX KS 2.7% 1.9% OK IL 4.9% CO 2.4% OH Other Midwest States 0.8% Other States • TTM Net Charge-offs on Office loans: .00% • Delinquent Office Loans: .00% • Non-Performing Office Loans: .00% • Criticized2 Office Loans to Total Office Loans: .65% • Weighted Average LTV of Office Loans: 60.4%3 • Percent of loans at floating interest rate: 75.9%
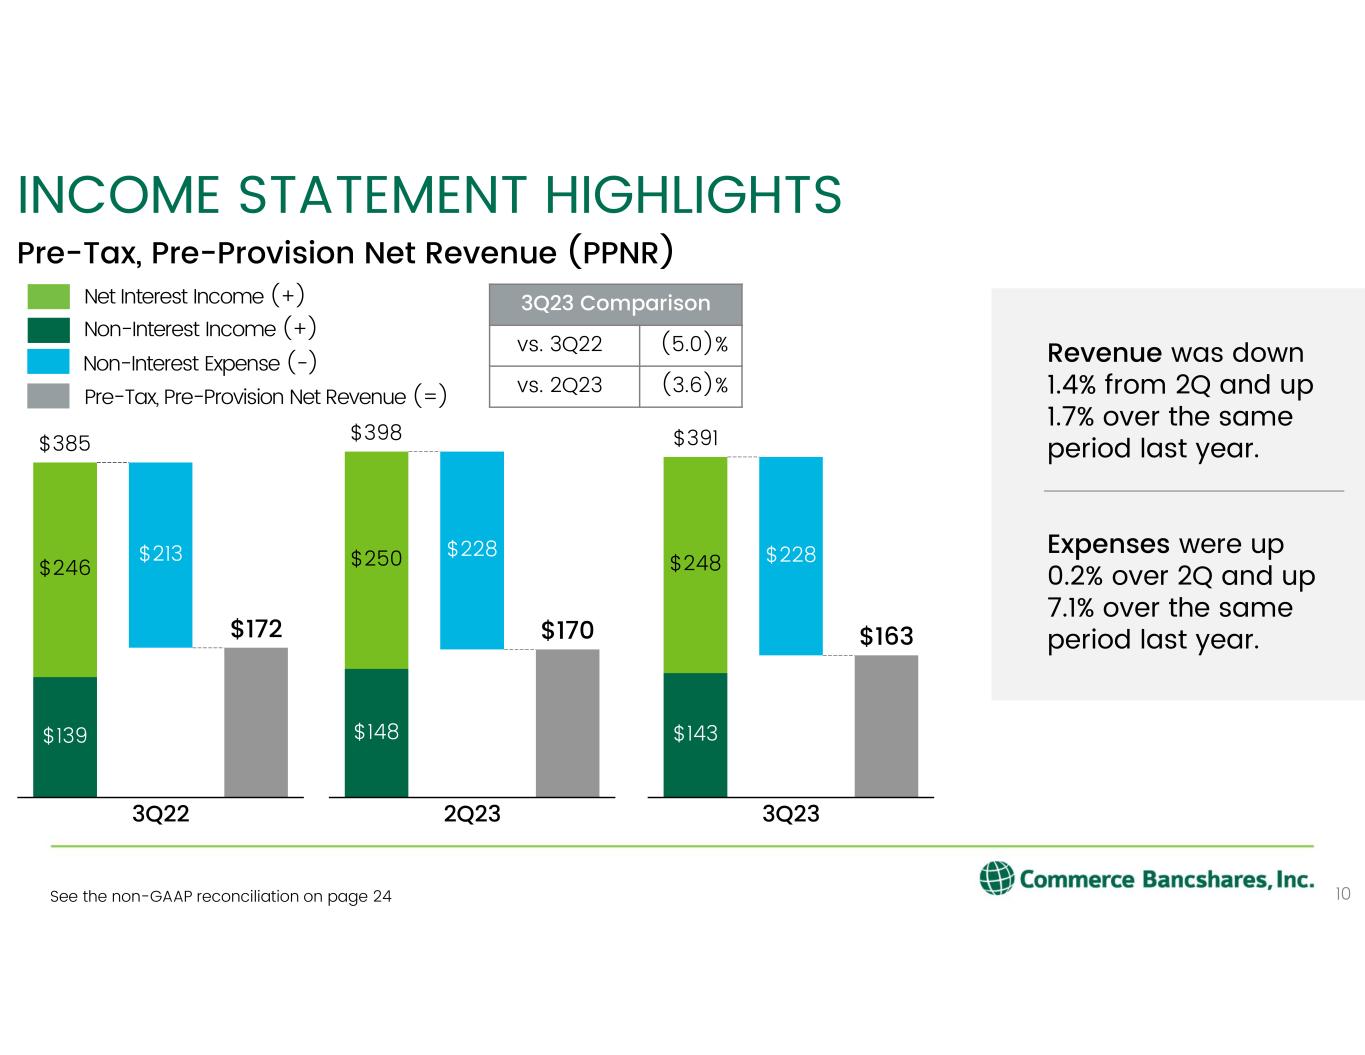
10 INCOME STATEMENT HIGHLIGHTS $139 $172 $246 $213 $385 3Q22 $148 $170 $250 $228 2Q23 $398 $143 $163 $248 $228 3Q23 $391 Non-Interest Income (+) Net Interest Income (+) Non-Interest Expense (-) Pre-Tax, Pre-Provision Net Revenue (=) 3Q23 Comparison vs. 3Q22 (5.0)% vs. 2Q23 (3.6)% Pre-Tax, Pre-Provision Net Revenue (PPNR) Revenue was down 1.4% from 2Q and up 1.7% over the same period last year. Expenses were up 0.2% over 2Q and up 7.1% over the same period last year. See the non-GAAP reconciliation on page 24
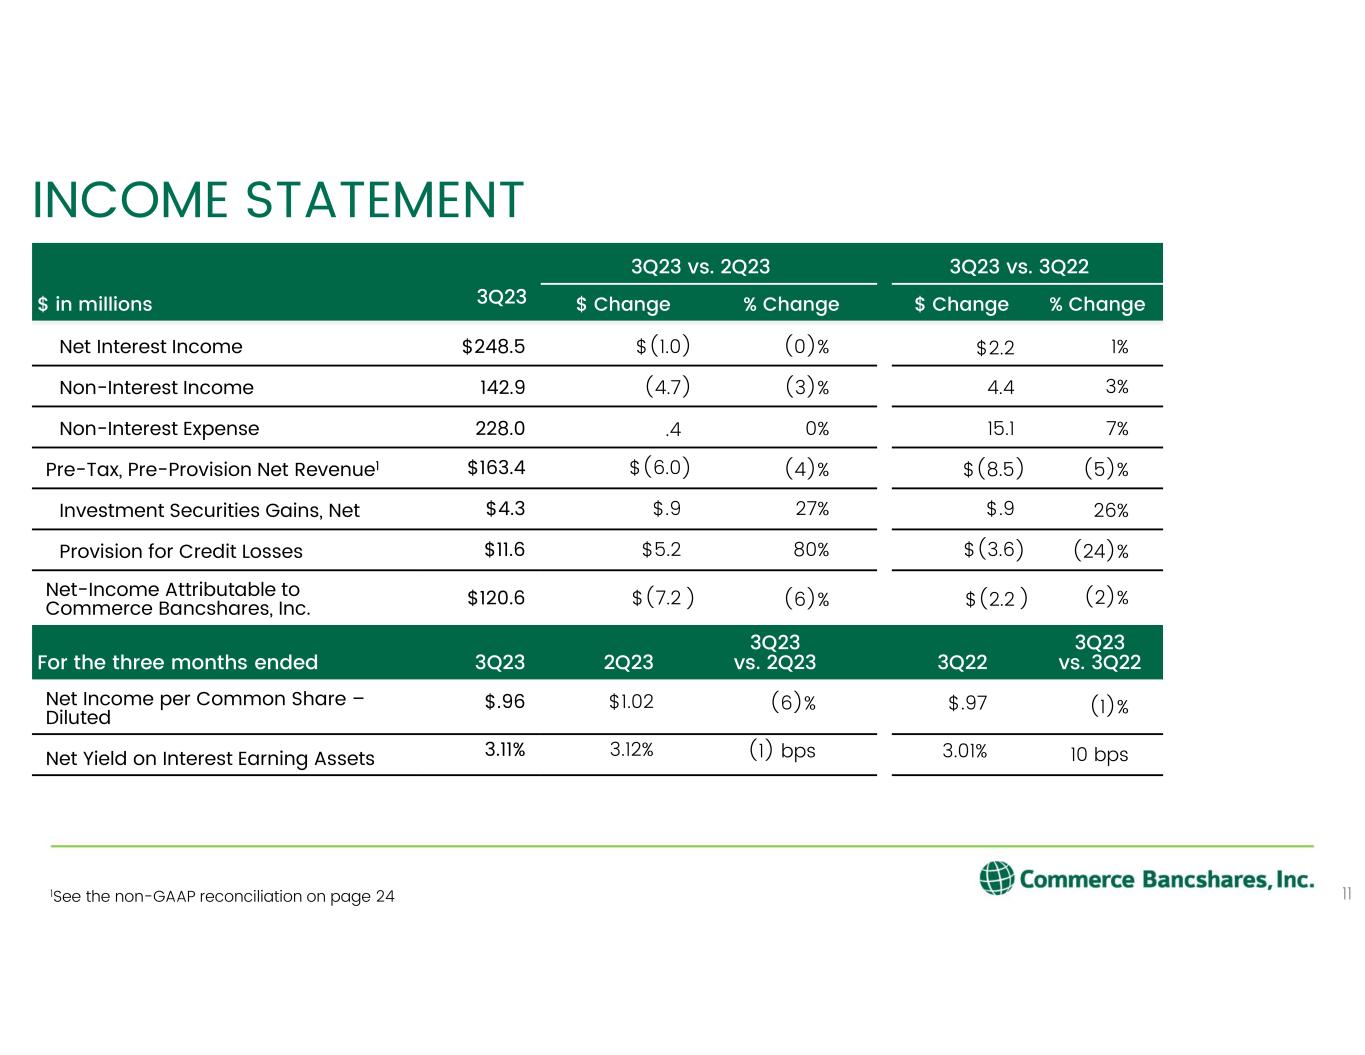
3Q23 vs. 2Q23 3Q23 vs. 3Q22 $ in millions 3Q23 $ Change % Change $ Change % Change Net Interest Income $248.5 $(1.0) (0)% $2.2 1% Non-Interest Income 142.9 (4.7) (3)% 4.4 3% Non-Interest Expense 228.0 .4 0% 15.1 7% Pre-Tax, Pre-Provision Net Revenue1 $163.4 $(6.0) (4)% $(8.5) (5)% Investment Securities Gains, Net $4.3 $.9 27% $.9 26% Provision for Credit Losses $11.6 $5.2 80% $(3.6) (24)% Net-Income Attributable to Commerce Bancshares, Inc. $120.6 $(7.2 ) (6)% $(2.2 ) (2)% For the three months ended 3Q23 2Q23 3Q23 vs. 2Q23 3Q22 3Q23 vs. 3Q22 Net Income per Common Share – Diluted $.96 $1.02 (6)% $.97 (1)% Net Yield on Interest Earning Assets 3.11% 3.12% (1) bps 3.01% 10 bps INCOME STATEMENT 111See the non-GAAP reconciliation on page 24
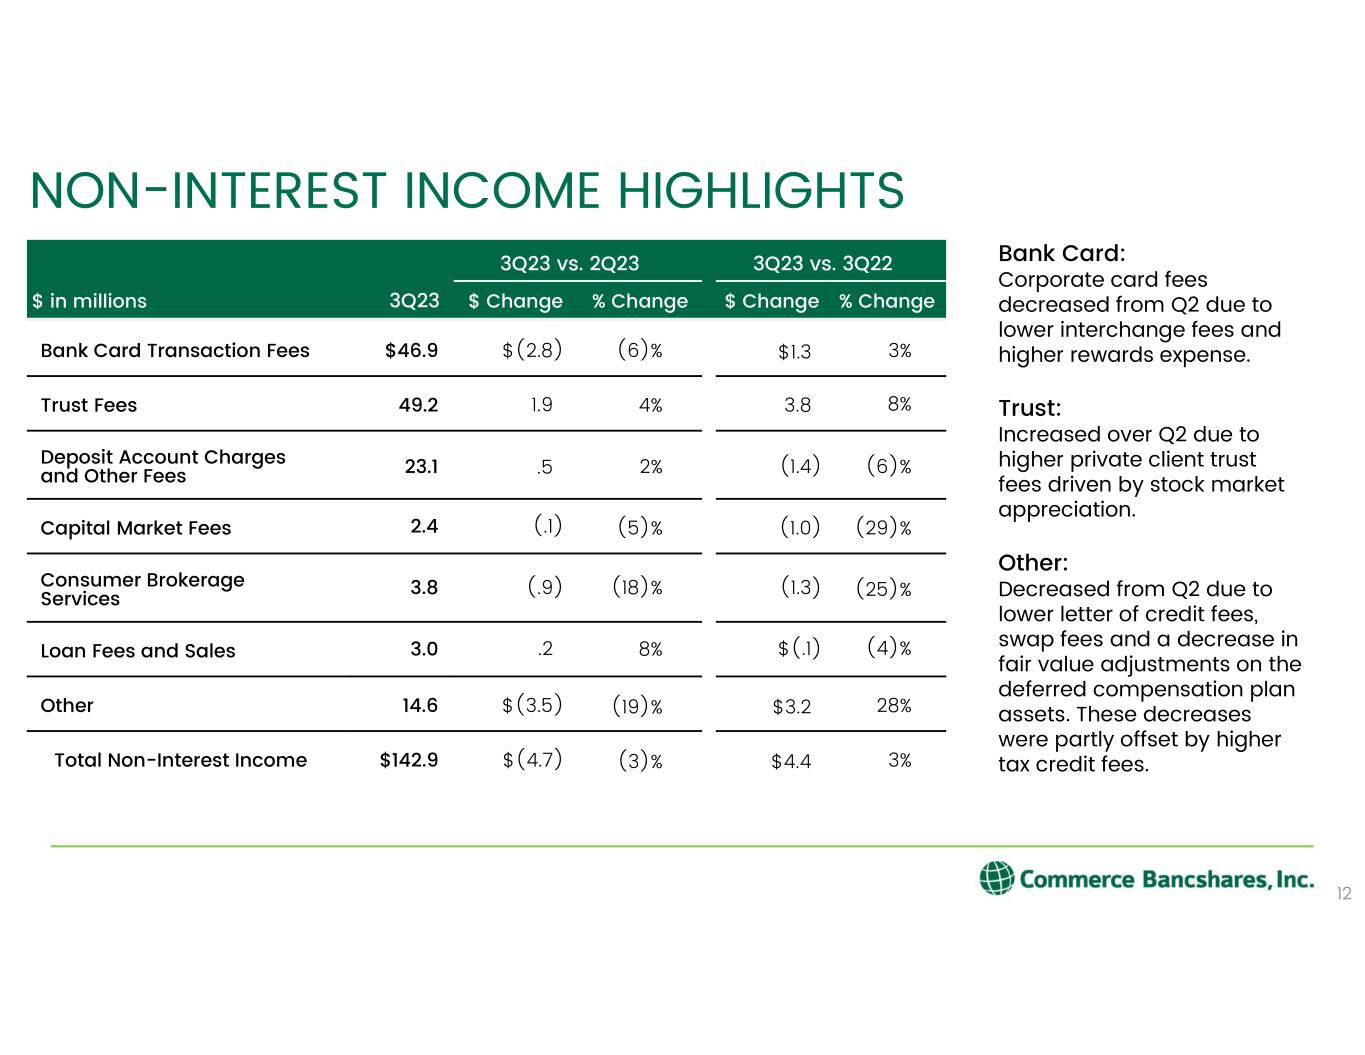
NON-INTEREST INCOME HIGHLIGHTS 12 3Q23 vs. 2Q23 3Q23 vs. 3Q22 $ in millions 3Q23 $ Change % Change $ Change % Change Bank Card Transaction Fees $46.9 $(2.8) (6)% $1.3 3% Trust Fees 49.2 1.9 4% 3.8 8% Deposit Account Charges and Other Fees 23.1 .5 2% (1.4) (6)% Capital Market Fees 2.4 (.1) (5)% (1.0) (29)% Consumer Brokerage Services 3.8 (.9) (18)% (1.3) (25)% Loan Fees and Sales 3.0 .2 8% $(.1) (4)% Other 14.6 $(3.5) (19)% $3.2 28% Total Non-Interest Income $142.9 $(4.7) (3)% $4.4 3% Bank Card: Corporate card fees decreased from Q2 due to lower interchange fees and higher rewards expense. Trust: Increased over Q2 due to higher private client trust fees driven by stock market appreciation. Other: Decreased from Q2 due to lower letter of credit fees, swap fees and a decrease in fair value adjustments on the deferred compensation plan assets. These decreases were partly offset by higher tax credit fees.
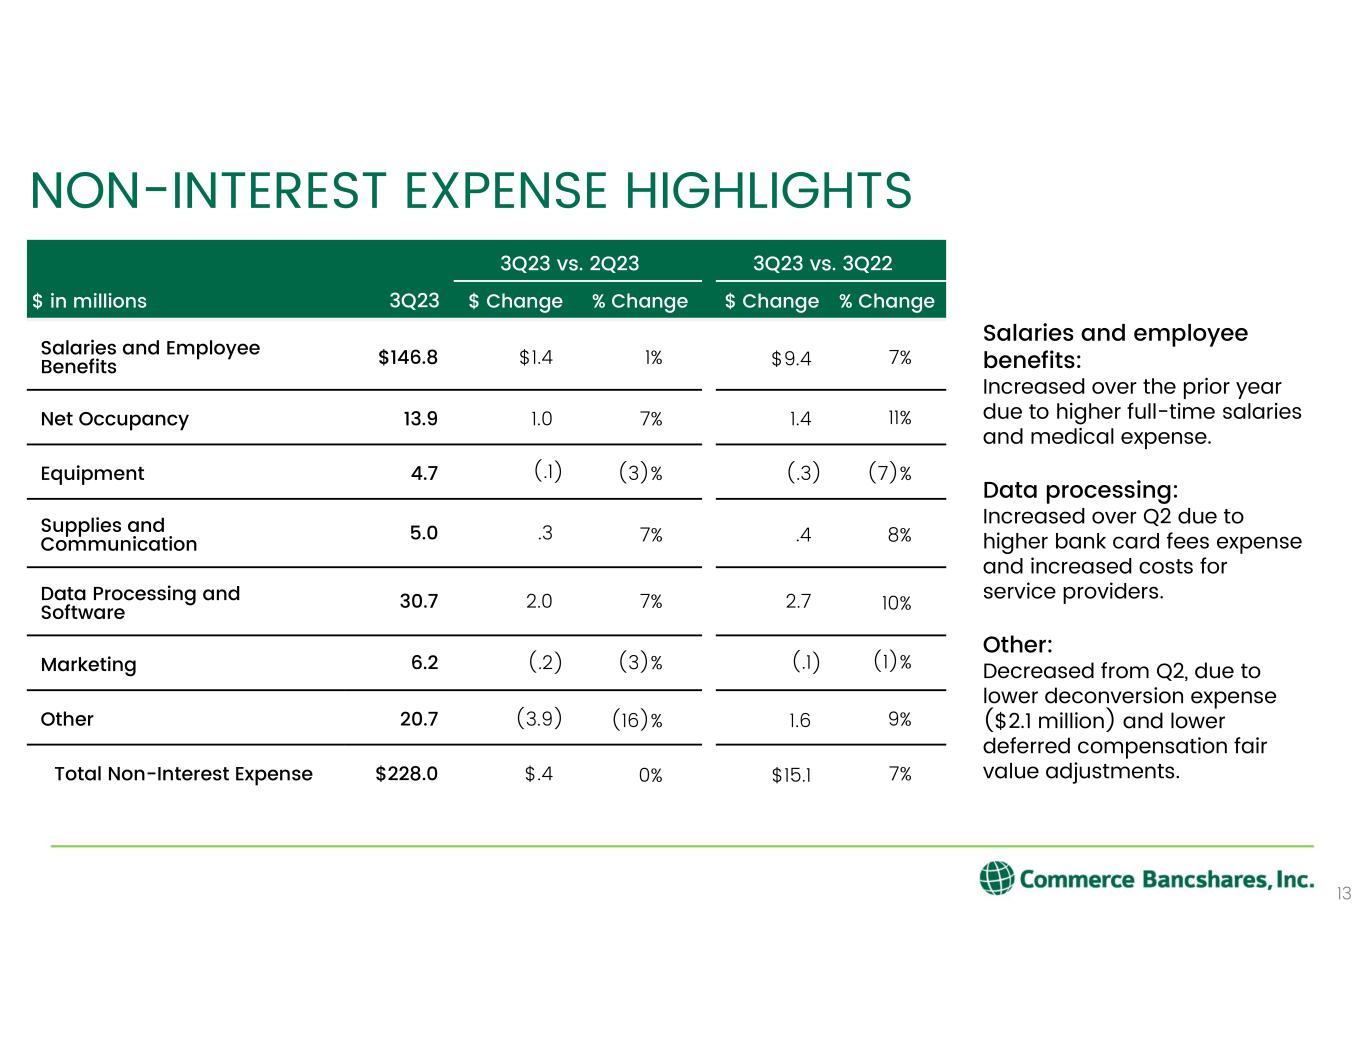
NON-INTEREST EXPENSE HIGHLIGHTS 13 3Q23 vs. 2Q23 3Q23 vs. 3Q22 $ in millions 3Q23 $ Change % Change $ Change % Change Salaries and Employee Benefits $146.8 $1.4 1% $9.4 7% Net Occupancy 13.9 1.0 7% 1.4 11% Equipment 4.7 (.1) (3)% (.3) (7)% Supplies and Communication 5.0 .3 7% .4 8% Data Processing and Software 30.7 2.0 7% 2.7 10% Marketing 6.2 (.2) (3)% (.1) (1)% Other 20.7 (3.9) (16)% 1.6 9% Total Non-Interest Expense $228.0 $.4 0% $15.1 7% Salaries and employee benefits: Increased over the prior year due to higher full-time salaries and medical expense. Data processing: Increased over Q2 due to higher bank card fees expense and increased costs for service providers. Other: Decreased from Q2, due to lower deconversion expense ($2.1 million) and lower deferred compensation fair value adjustments.
14 LIQUIDITY AND CAPITAL
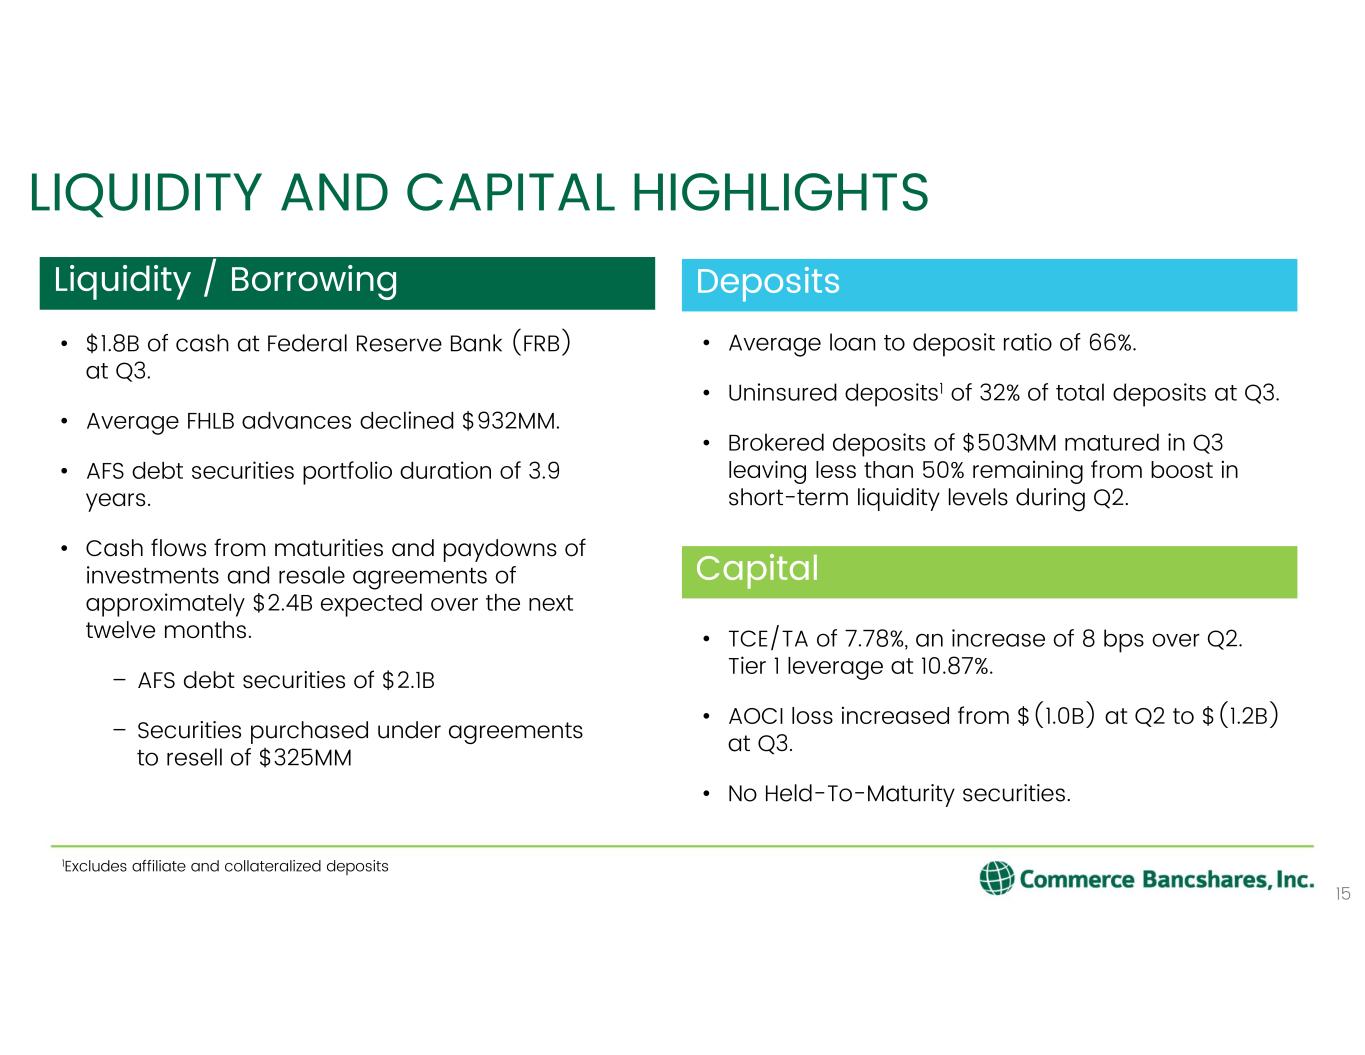
LIQUIDITY AND CAPITAL HIGHLIGHTS 15 • $1.8B of cash at Federal Reserve Bank (FRB) at Q3. • Average FHLB advances declined $932MM. • AFS debt securities portfolio duration of 3.9 years. • Cash flows from maturities and paydowns of investments and resale agreements of approximately $2.4B expected over the next twelve months. – AFS debt securities of $2.1B – Securities purchased under agreements to resell of $325MM Liquidity / Borrowing • TCE/TA of 7.78%, an increase of 8 bps over Q2. Tier 1 leverage at 10.87%. • AOCI loss increased from $(1.0B) at Q2 to $(1.2B) at Q3. • No Held-To-Maturity securities. Capital • Average loan to deposit ratio of 66%. • Uninsured deposits1 of 32% of total deposits at Q3. • Brokered deposits of $503MM matured in Q3 leaving less than 50% remaining from boost in short-term liquidity levels during Q2. Deposits 1Excludes affiliate and collateralized deposits
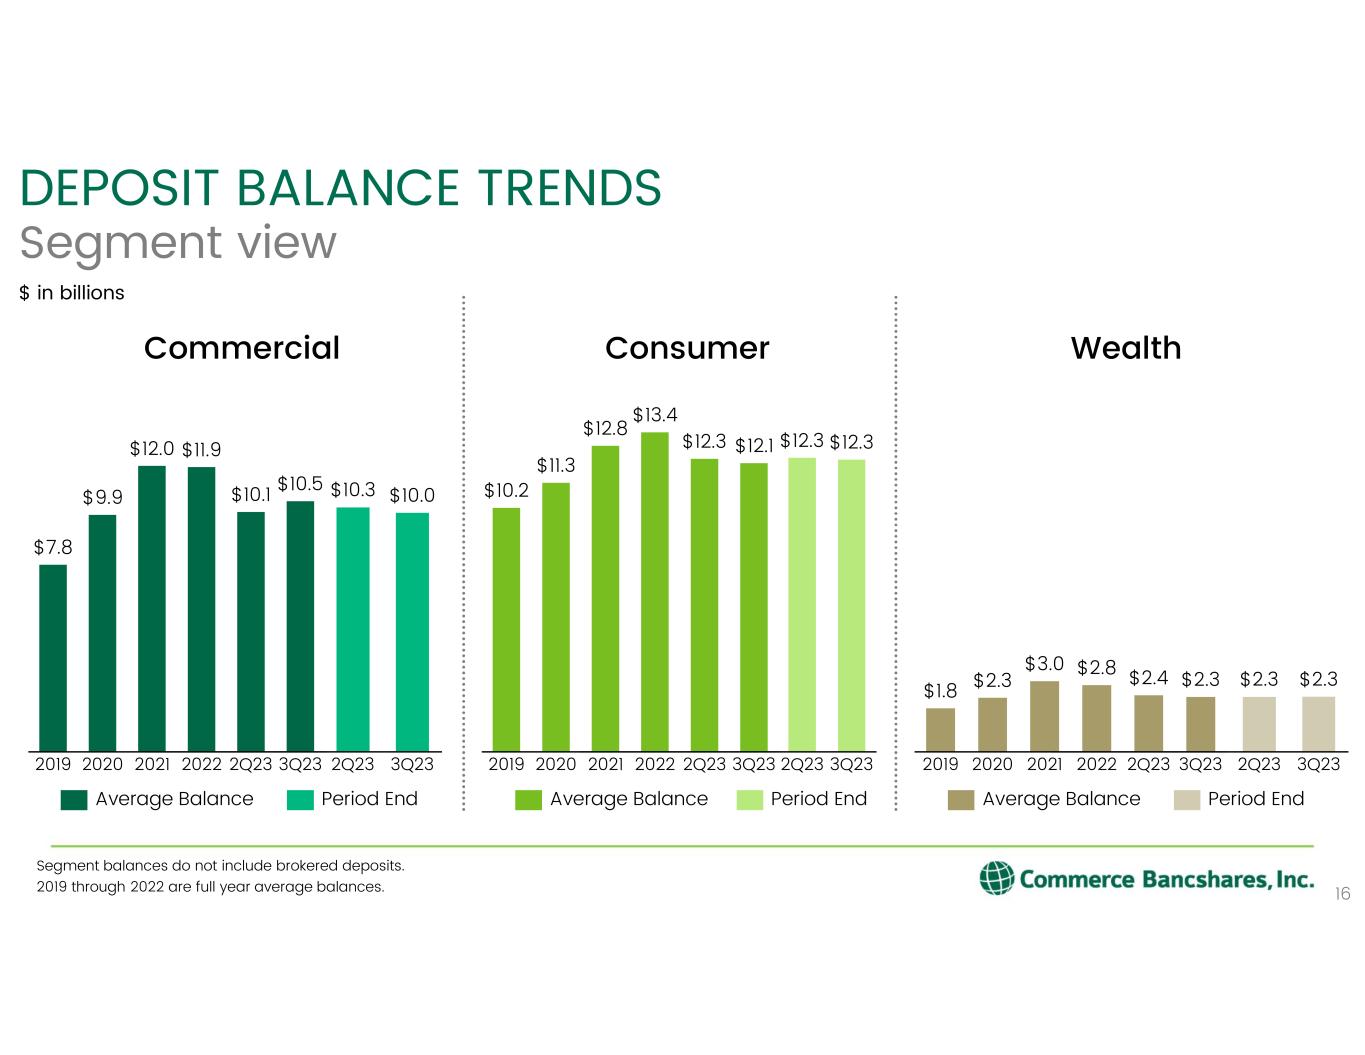
$2.3 20212019 $1.8 20222020 2Q23 3Q23 $3.0 $2.8 $2.4 $2.3 $2.3 2Q23 3Q23 $2.3 DEPOSIT BALANCE TRENDS Segment view $ in billions 16 3Q23 $10.5 $11.9 $7.8 2Q232019 2020 $9.9 2021 2022 $12.0 $10.1 $12.8 $11.3 2Q232019 2020 2021 2022 $10.2 3Q23 $13.4 $12.3 $12.1 Commercial Consumer Wealth Average Balance Period End 2Q23 3Q23 $12.3 $12.3 Period EndAverage Balance Average Balance Period End Segment balances do not include brokered deposits. 2019 through 2022 are full year average balances. 2Q23 3Q23 $10.3 $10.0
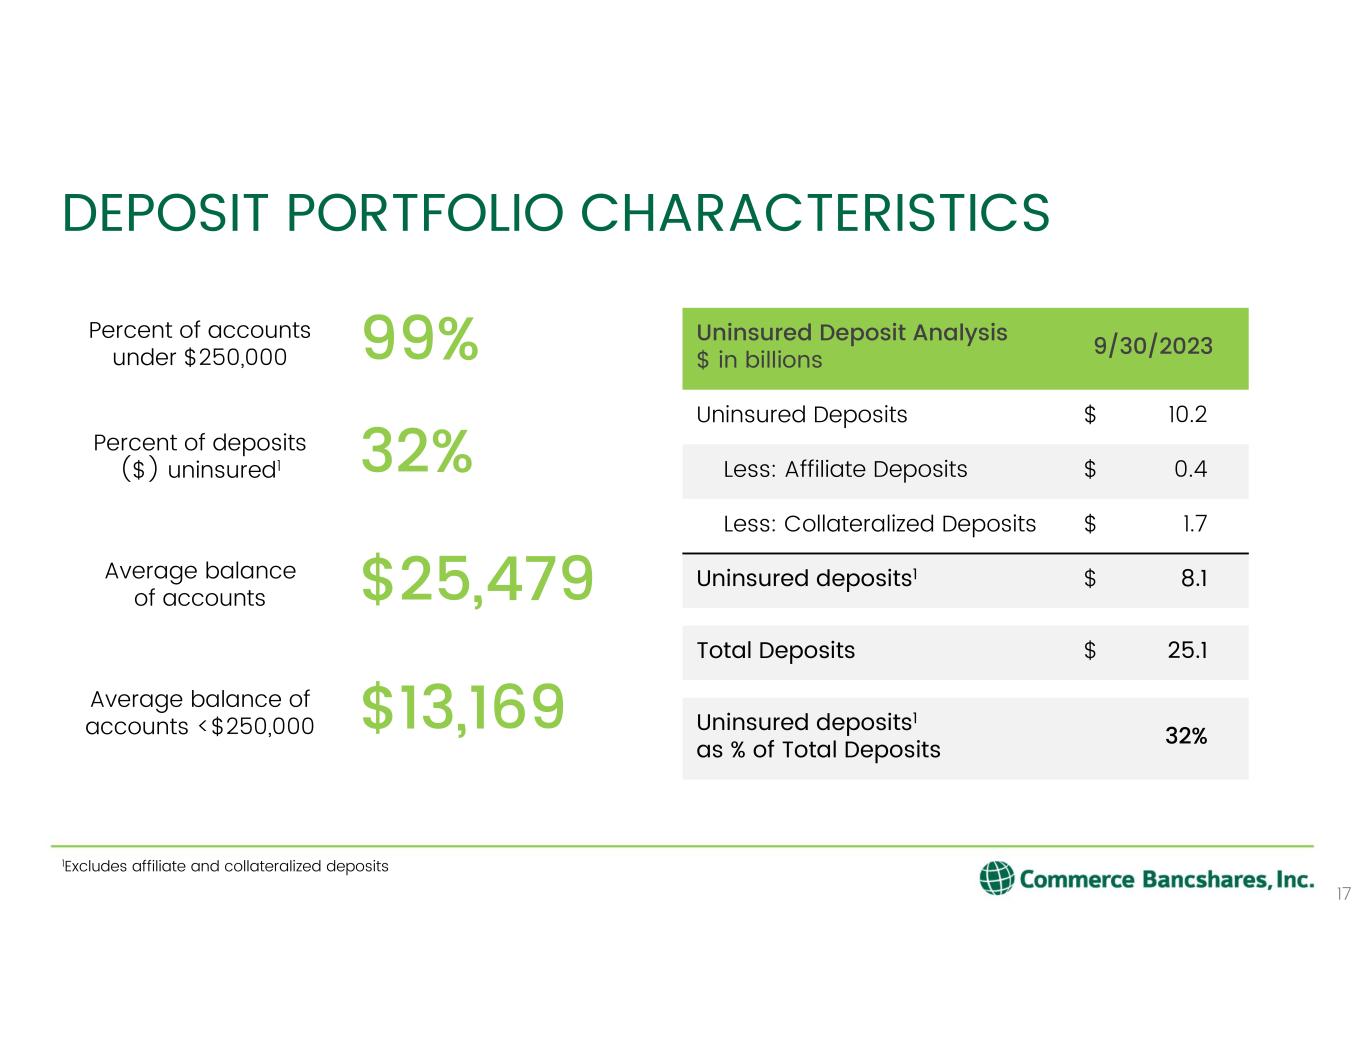
DEPOSIT PORTFOLIO CHARACTERISTICS 17 Percent of accounts under $250,000 Percent of deposits ($) uninsured1 Average balance of accounts <$250,000 Average balance of accounts 99% 32% $13,169 $25,479 Uninsured Deposit Analysis $ in billions 9/30/2023 Uninsured Deposits $ 10.2 Less: Affiliate Deposits $ 0.4 Less: Collateralized Deposits $ 1.7 Uninsured deposits1 $ 8.1 Total Deposits $ 25.1 Uninsured deposits1 as % of Total Deposits 32% 1Excludes affiliate and collateralized deposits

FHLB ADVANCES & BROKERED CDS $1,000MM $500MM $904MM $401MM 6/30/2023 9/30/2023 $0MM $1,904MM 12/31/2023 $901MM FHLB AdvanceBrokered CDs Weighted average rate 5.21% 5.21% 0.00% 18 • Short-term, wholesale funding decreased as short-term brokered CDs and FHLB advances matured • Remaining FHLB advances and brokered CDs mature by December 31, 2023 Current Maturity Schedule as of 9/30/2023 Balance1 as of: 1Actual balances for 6/30/2023 and 9/30/2023. The balance for 12/31/2023 is based upon the maturities of the FHLB advances and brokered CDs.
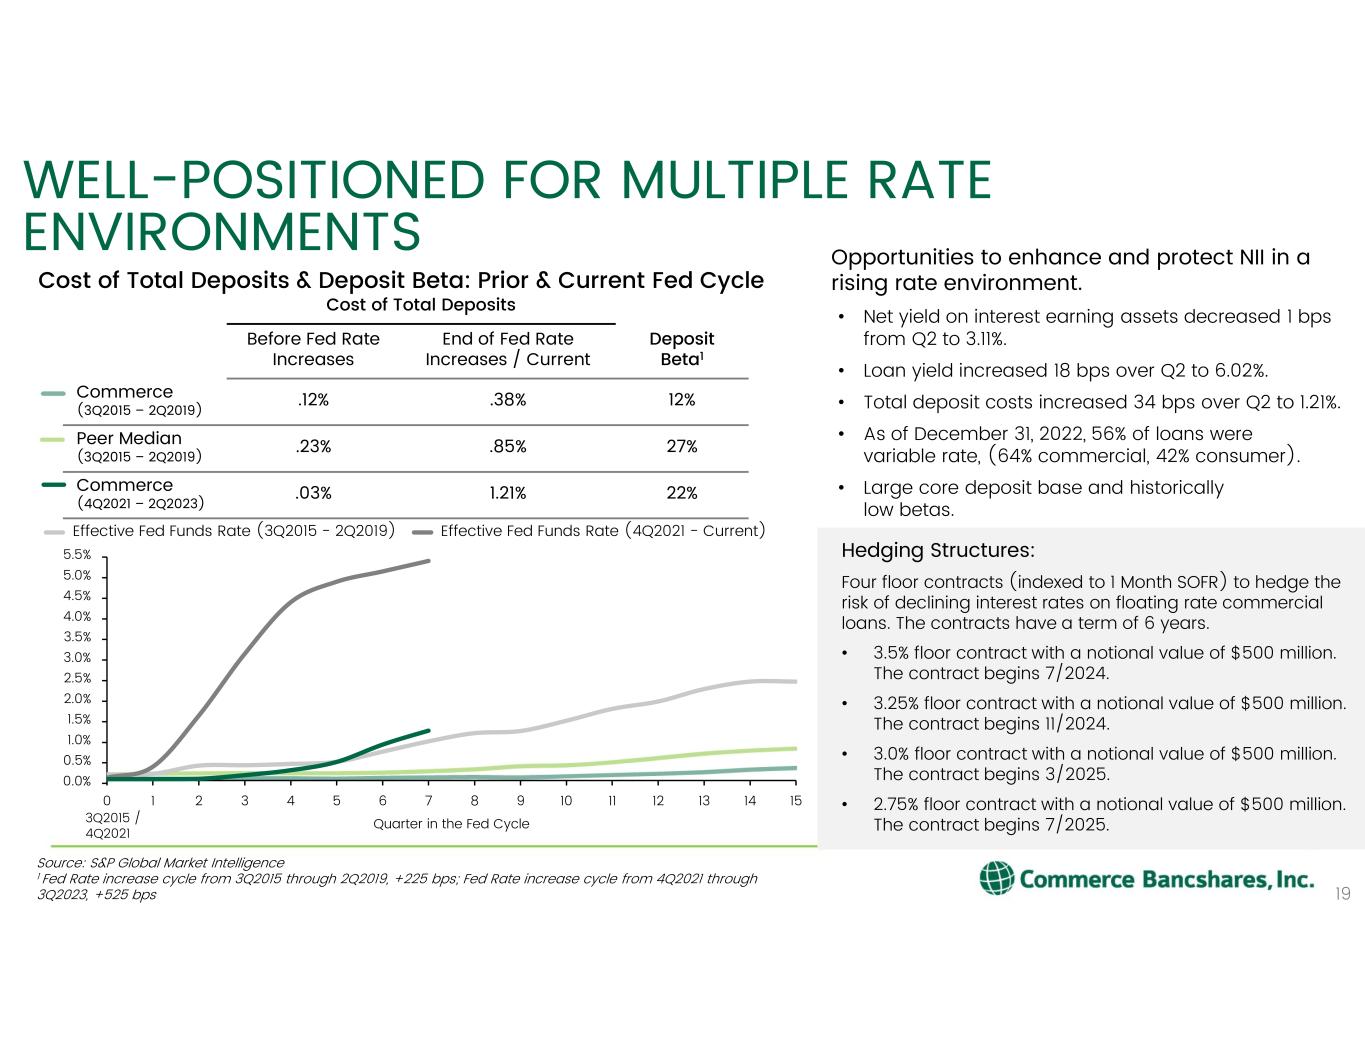
Hedging Structures: Four floor contracts (indexed to 1 Month SOFR) to hedge the risk of declining interest rates on floating rate commercial loans. The contracts have a term of 6 years. • 3.5% floor contract with a notional value of $500 million. The contract begins 7/2024. • 3.25% floor contract with a notional value of $500 million. The contract begins 11/2024. • 3.0% floor contract with a notional value of $500 million. The contract begins 3/2025. • 2.75% floor contract with a notional value of $500 million. The contract begins 7/2025. WELL-POSITIONED FOR MULTIPLE RATE ENVIRONMENTS 19 Opportunities to enhance and protect NII in a rising rate environment. • Net yield on interest earning assets decreased 1 bps from Q2 to 3.11%. • Loan yield increased 18 bps over Q2 to 6.02%. • Total deposit costs increased 34 bps over Q2 to 1.21%. • As of December 31, 2022, 56% of loans were variable rate, (64% commercial, 42% consumer). • Large core deposit base and historically low betas. Cost of Total Deposits & Deposit Beta: Prior & Current Fed Cycle Cost of Total Deposits Before Fed Rate Increases End of Fed Rate Increases / Current Deposit Beta1 Commerce (3Q2015 – 2Q2019) .12% .38% 12% Peer Median (3Q2015 – 2Q2019) .23% .85% 27% Commerce (4Q2021 – 2Q2023) .03% 1.21% 22% 0.0% 0.5% 1.0% 1.5% 2.0% 2.5% 3.0% 3.5% 4.0% 4.5% 5.0% 5.5% 0 1 2 3 4 5 6 7 8 9 10 11 12 13 14 15 Quarter in the Fed Cycle Source: S&P Global Market Intelligence 1 Fed Rate increase cycle from 3Q2015 through 2Q2019, +225 bps; Fed Rate increase cycle from 4Q2021 through 3Q2023, +525 bps Effective Fed Funds Rate (3Q2015 - 2Q2019) Effective Fed Funds Rate (4Q2021 - Current) 3Q2015 / 4Q2021
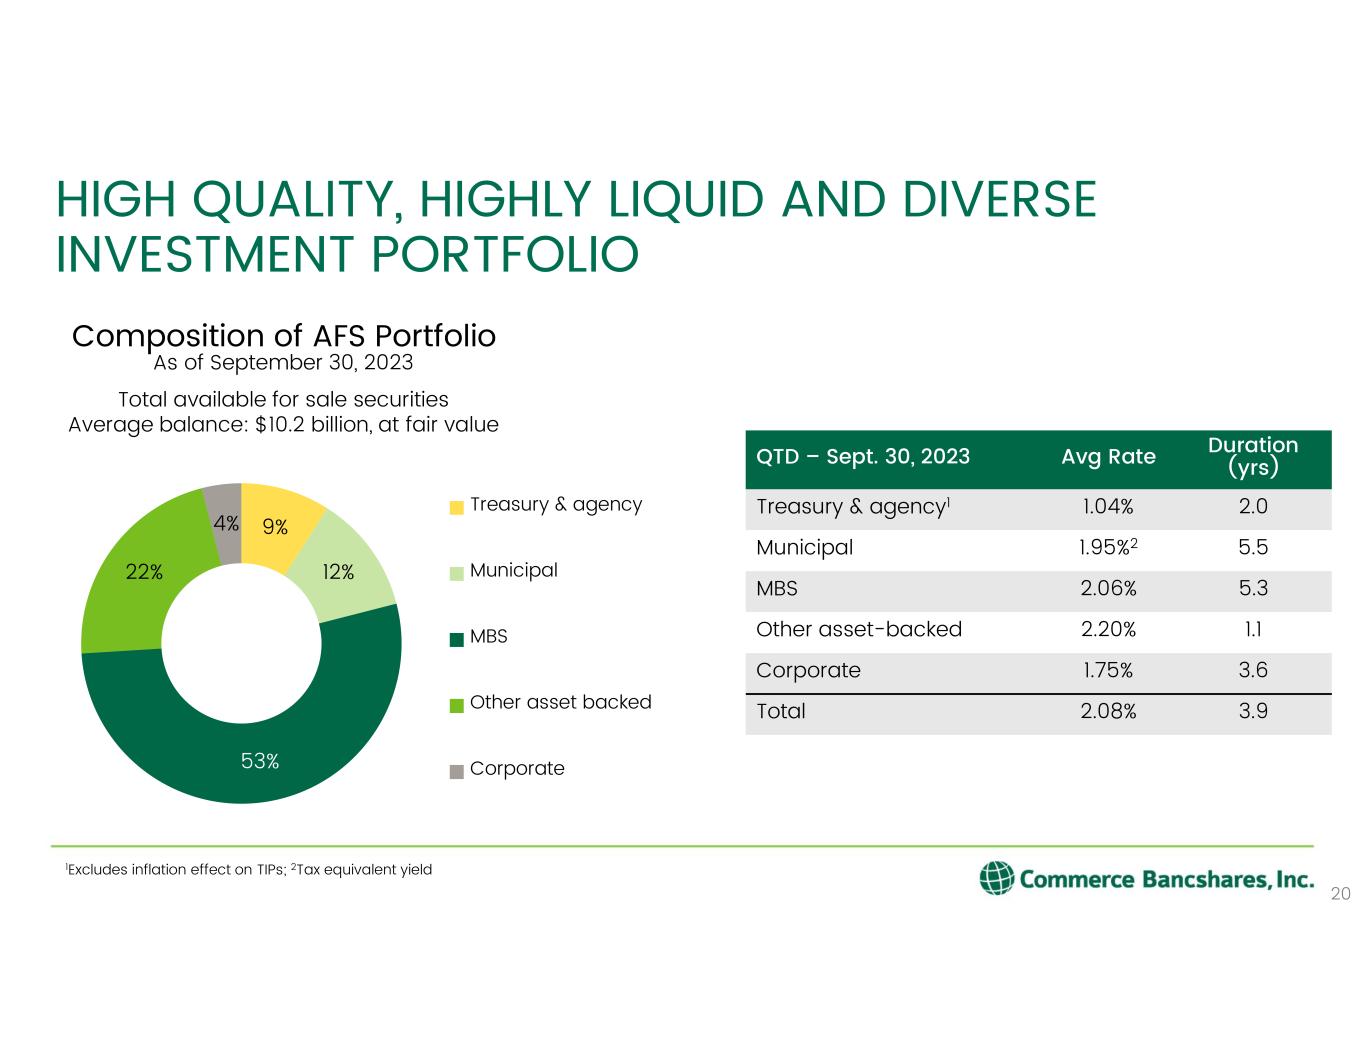
9% 12% 53% 22% 4% Composition of AFS Portfolio Treasury & agency Municipal MBS Other asset backed Corporate HIGH QUALITY, HIGHLY LIQUID AND DIVERSE INVESTMENT PORTFOLIO 1Excludes inflation effect on TIPs; 2Tax equivalent yield QTD – Sept. 30, 2023 Avg Rate Duration (yrs) Treasury & agency1 1.04% 2.0 Municipal 1.95%2 5.5 MBS 2.06% 5.3 Other asset-backed 2.20% 1.1 Corporate 1.75% 3.6 Total 2.08% 3.9 20 Total available for sale securities Average balance: $10.2 billion, at fair value As of September 30, 2023
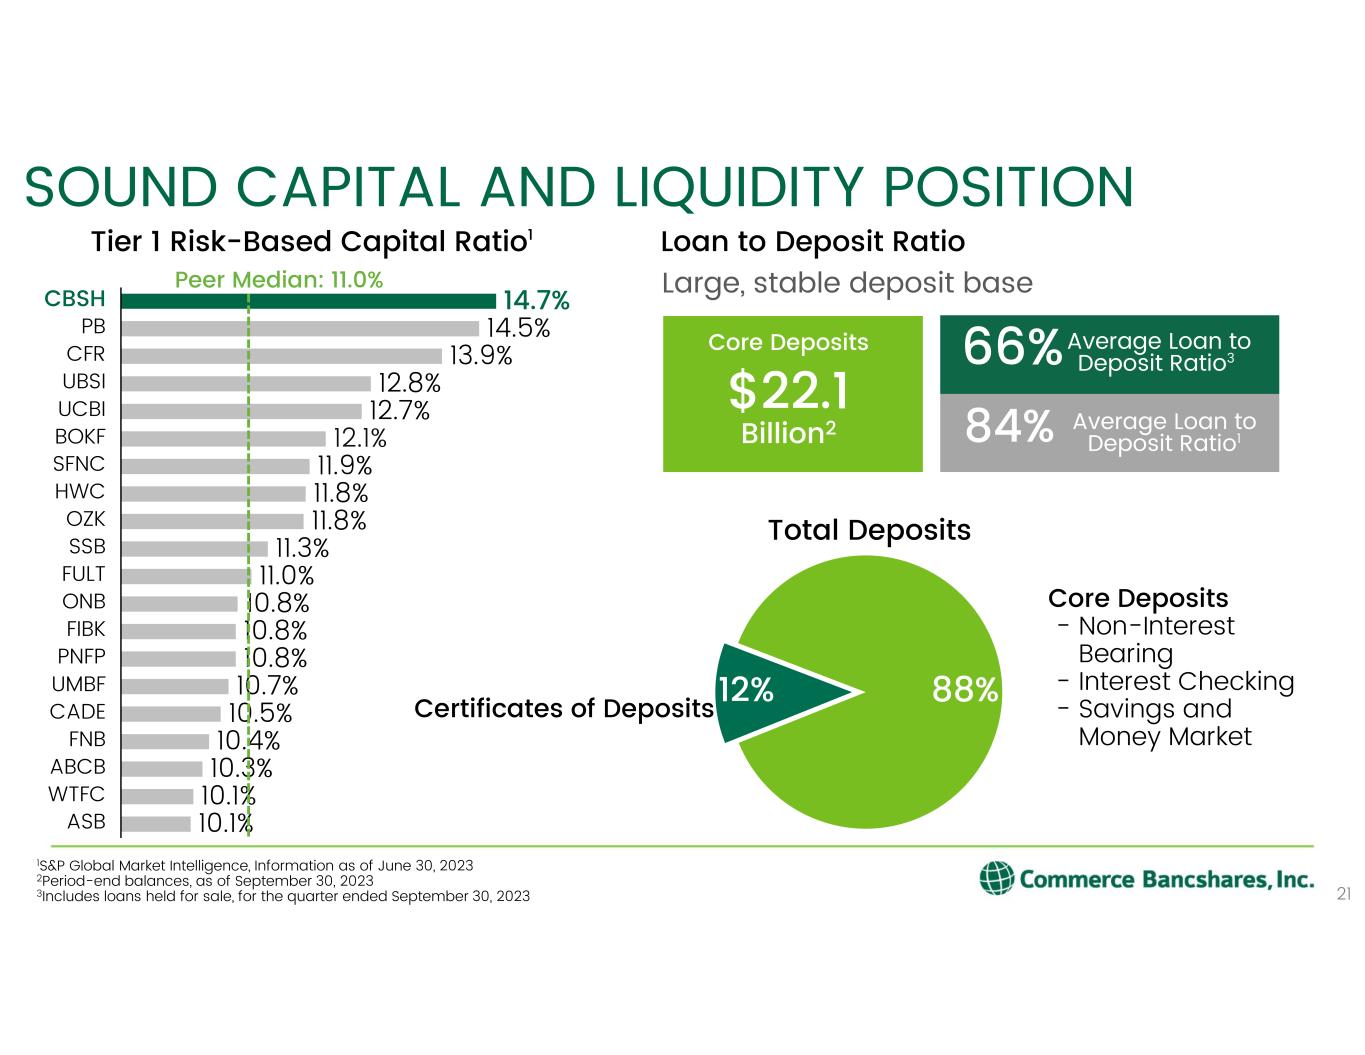
Average Loan to Deposit Ratio3 SOUND CAPITAL AND LIQUIDITY POSITION 21 Tier 1 Risk-Based Capital Ratio1 1S&P Global Market Intelligence, Information as of June 30, 2023 2Period-end balances, as of September 30, 2023 3Includes loans held for sale, for the quarter ended September 30, 2023 14.7% 14.5% 13.9% 12.8% 12.7% 12.1% 11.9% 11.8% 11.8% 11.3% 11.0% 10.8% 10.8% 10.8% 10.7% 10.5% 10.4% 10.3% 10.1% 10.1% PNFP BOKF CBSH HWC UCBI PB CFR UBSI SFNC OZK SSB FULT ONB ASB FIBK UMBF CADE FNB ABCB WTFC Peer Median: 11.0% Core Deposits $22.1 Billion2 Large, stable deposit base Loan to Deposit Ratio Total Deposits 66% Average Loan to Deposit Ratio184% 88%12% Core Deposits - Non-Interest Bearing - Interest Checking - Savings and Money Market Certificates of Deposits

$4.8 $6.5 $9.8 $3.4 $8.2 3Q233Q22 2Q23 MAINTAINING STRONG CREDIT QUALITY 22 Net Loan Charge-Offs (NCOs) $ in millions NCOs- CBSH NCOs - Peer Average NCO/Average Loans1 - CBSH $143.4 $158.7 $162.2 $260.6 $298.0 2Q233Q22 3Q23 Allowance for Credit Losses on Loans (ACL) $ in millions ACL - CBSH ACL - Peer Average ACL / Total Loans - CBSH $7.2 $6.2 $8.2 $96.0 $107.9 3Q22 2Q23 3Q23 Non-Accrual Loans (NALs) $ in millions NALs - CBSH NALs - Peer Average 20.0x 25.8x 19.8x 4.7x 3.8x 3Q233Q22 2Q23 Allowance for Credit Losses on Loans (ACL) to NALs ACL / NALs - CBSH ACL / NALs - Peer AverageNALs / Total Loans - CBSH NCO/Average Loans1 – Peer Average .05% NALs / Total Loans – Peer Average .04% .05% .42% .43% ACL / Total Loans – Peer Average .90% .94% .95% 1.15% 1.21% .12% .16% .23% .06% .14% Percentages are illustrative and not to scale; Peer Banks include: ABCB, ASB, BOKF, CADE, CFR, FIBK, FNB, FULT, HWC, ONB, OZK, PB, PNFP, SFNC, SSB, UBSI, UCBI, UMBF, WTFC 1As a percentage of average loans (excluding loans held for sale)

ALLOCATION OF ALLOWANCE 23 CECL allowances reflect the economic and market outlook June 30, 2023 Sept. 30, 2023 $ in millions Allowance for Credit Losses (ACL) % of Outstanding Loans Allowance for Credit Losses (ACL) % of Outstanding Loans Business $ 47.1 .80% $ 48.0 .81% Bus R/E 29.9 .83% 30.2 .83% Construction 31.0 2.14% 32.4 2.10% Commercial total $ 108.0 .98% $ 110.6 1.00% Consumer 11.5 .55% 11.4 .54% Consumer CC 26.7 4.65% 27.5 4.79% Personal R/E 10.7 .36% 10.9 .36% Revolving H/E 1.6 .52% 1.7 .54% Overdrafts .1 1.92% .1 3.33% Consumer total $ 50.7 .85% $ 51.6 .86% Allowance for credit losses on loans $ 158.7 .94% $ 162.2 .95% 1.47% 1.44% 1.35% 1.22% 1.07% 0.88% 0.90% 0.92% 0.96% 0.95% 0.60% 0.80% 1.00% 1.20% 1.40% 1.60% $150 $100 $200 $250 2Q 0.99% 0.95% 4Q1/1 1Q $240.7 4Q $200.5 2Q $236.4 3Q 2Q $220.8 3Q 1.14% 1Q $162.2 $172.4 $150.1 1.10% 2Q $162.8 3Q $150.0 $171.7 0.87% 1Q $138.0$143.4$139.6 $134.7 4Q $159.3 1Q $158.7 0.94% 3Q Allowance for Credit Losses (ACL) on Loans ACL - Loans (left) ACL / Total Loans (right) $ in millions 202220212020 2023
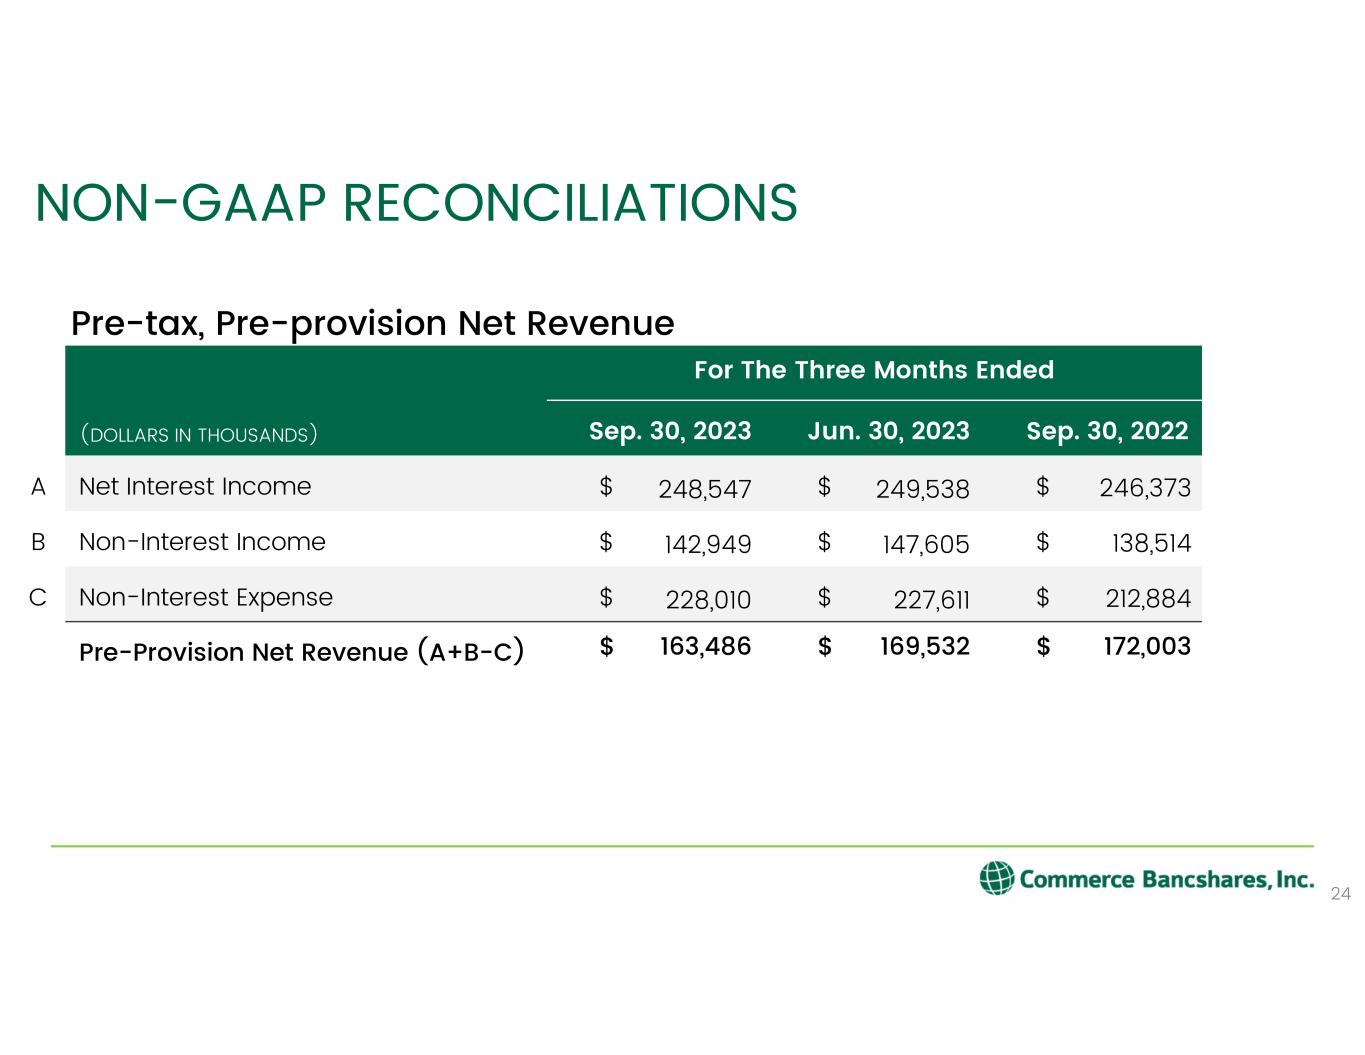
NON-GAAP RECONCILIATIONS 24 For The Three Months Ended (DOLLARS IN THOUSANDS) Sep. 30, 2023 Jun. 30, 2023 Sep. 30, 2022 A Net Interest Income $ 248,547 $ 249,538 $ 246,373 B Non-Interest Income $ 142,949 $ 147,605 $ 138,514 C Non-Interest Expense $ 228,010 $ 227,611 $ 212,884 Pre-Provision Net Revenue (A+B-C) $ 163,486 $ 169,532 $ 172,003 Pre-tax, Pre-provision Net Revenue


