UNITED STATES
SECURITIES AND EXCHANGE COMMISSION
Washington, D.C. 20549
FORM N-CSR
CERTIFIED SHAREHOLDER REPORT OF REGISTERED
MANAGEMENT INVESTMENT COMPANIES
Investment Company Act file number 811- 00560
John Hancock Investment Trust
(Exact name of registrant as specified in charter)
200 Berkeley Street, Boston, Massachusetts 02116 (Address of principal executive offices) (Zip code)
Salvatore Schiavone
Treasurer
200 Berkeley Street
Boston, Massachusetts 02116
(Name and address of agent for service) Registrant's telephone number, including area code: 617-543-9634
Date of fiscal year end: | October 31 |
Date of reporting period: | October 31, 2023 |
ITEM 1. REPORTS TO STOCKHOLDERS.
The Registrant prepared the following annual reports to shareholders for the period ended October 31, 2023:
John Hancock Balanced Fund
John Hancock Disciplined Value International Fund
John Hancock Diversified Macro Fund
John Hancock Emerging Markets Equity Fund
John Hancock Infrastructure Fund
John Hancock Seaport Long/Short Fund


United States and Europe
Manulife Investment Management
John Hancock Investment Management
| ANNUAL REPORT | JOHN HANCOCK BALANCED FUND | 1 |
| 2 | JOHN HANCOCK BALANCED FUND | ANNUAL REPORT |
| ANNUAL REPORT | JOHN HANCOCK BALANCED FUND | 3 |
| 4 | JOHN HANCOCK BALANCED FUND | ANNUAL REPORT |
| TOP 5 EQUITY HOLDINGS AS OF 10/31/2023 (% of net assets) | |
| Microsoft Corp. | 5.1 |
| Alphabet, Inc., Class A | 4.5 |
| Amazon.com, Inc. | 4.3 |
| Walmart, Inc. | 2.9 |
| Eli Lilly & Company | 2.6 |
| TOTAL | 19.4 |
| Cash and cash equivalents are not included. | |
| TOP 5 BOND ISSUERS AS OF 10/31/2023 (% of net assets) | |
| U.S. Treasury | 7.1 |
| Federal National Mortgage Association | 6.5 |
| Federal Home Loan Mortgage Corp. | 4.8 |
| Government National Mortgage Association | 0.4 |
| American Airlines | 0.3 |
| TOTAL | 19.1 |
| Cash and cash equivalents are not included. | |
| ANNUAL REPORT | JOHN HANCOCK BALANCED FUND | 5 |

| 6 | JOHN HANCOCK BALANCED FUND | ANNUAL REPORT |
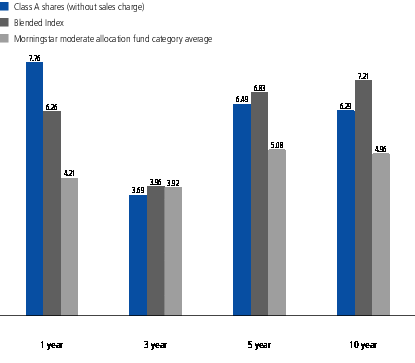
| Average annual total returns (%) with maximum sales charge | Cumulative total returns (%) with maximum sales charge | SEC 30-day yield (%) subsidized | SEC 30-day yield (%) unsubsidized† | |||||
| 1-year | 5-year | 10-year | 5-year | 10-year | as of 10-31-23 | as of 10-31-23 | ||
| Class A | 2.90 | 5.52 | 5.80 | 30.81 | 75.74 | 1.80 | 1.79 | |
| Class C | 6.02 | 5.75 | 5.55 | 32.26 | 71.66 | 1.16 | 1.15 | |
| Class I1 | 8.04 | 6.81 | 6.61 | 39.04 | 89.75 | 2.19 | 2.19 | |
| Class R21 | 7.66 | 6.41 | 6.22 | 36.44 | 82.78 | 1.81 | 1.80 | |
| Class R41 | 7.93 | 6.67 | 6.46 | 38.08 | 87.01 | 2.06 | 1.95 | |
| Class R51 | 8.11 | 6.87 | 6.67 | 39.42 | 90.69 | 2.26 | 2.26 | |
| Class R61 | 8.19 | 6.93 | 6.73 | 39.77 | 91.80 | 2.32 | 2.31 | |
| Index 1†† | 10.14 | 11.01 | 11.18 | 68.59 | 188.47 | — | — | |
| Index 2†† | 0.36 | -0.06 | 0.88 | -0.28 | 9.21 | — | — | |
| Index 3†† | 6.26 | 6.83 | 7.21 | 39.14 | 100.53 | — | — | |
| Class A | Class C | Class I | Class R2 | Class R4 | Class R5 | Class R6 | |
| Gross (%) | 1.04 | 1.74 | 0.74 | 1.13 | 0.98 | 0.68 | 0.63 |
| Net (%) | 1.03 | 1.73 | 0.73 | 1.12 | 0.87 | 0.67 | 0.62 |
| ANNUAL REPORT | JOHN HANCOCK BALANCED FUND | 7 |
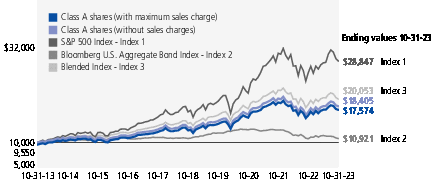
| Start date | With maximum sales charge ($) | Without sales charge ($) | Index 1 ($) | Index 2 ($) | Index 3 ($) | |
| Class C2 | 10-31-13 | 17,166 | 17,166 | 28,847 | 10,921 | 20,053 |
| Class I1 | 10-31-13 | 18,975 | 18,975 | 28,847 | 10,921 | 20,053 |
| Class R21 | 10-31-13 | 18,278 | 18,278 | 28,847 | 10,921 | 20,053 |
| Class R41 | 10-31-13 | 18,701 | 18,701 | 28,847 | 10,921 | 20,053 |
| Class R51 | 10-31-13 | 19,069 | 19,069 | 28,847 | 10,921 | 20,053 |
| Class R61 | 10-31-13 | 19,180 | 19,180 | 28,847 | 10,921 | 20,053 |
| 1 | For certain types of investors, as described in the fund’s prospectus. |
| 2 | The contingent deferred sales charge is not applicable. |
| 8 | JOHN HANCOCK BALANCED FUND | ANNUAL REPORT |
| ANNUAL REPORT | JOHN HANCOCK BALANCED FUND | 9 |
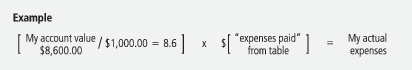
| Account value on 5-1-2023 | Ending value on 10-31-2023 | Expenses paid during period ended 10-31-20231 | Annualized expense ratio | ||
| Class A | Actual expenses/actual returns | $1,000.00 | $998.10 | $5.29 | 1.05% |
| Hypothetical example | 1,000.00 | 1,019.90 | 5.35 | 1.05% | |
| Class C | Actual expenses/actual returns | 1,000.00 | 995.00 | 8.75 | 1.74% |
| Hypothetical example | 1,000.00 | 1,016.40 | 8.84 | 1.74% | |
| Class I | Actual expenses/actual returns | 1,000.00 | 999.60 | 3.78 | 0.75% |
| Hypothetical example | 1,000.00 | 1,021.40 | 3.82 | 0.75% | |
| Class R2 | Actual expenses/actual returns | 1,000.00 | 998.10 | 5.59 | 1.11% |
| Hypothetical example | 1,000.00 | 1,019.60 | 5.65 | 1.11% | |
| Class R4 | Actual expenses/actual returns | 1,000.00 | 999.30 | 4.43 | 0.88% |
| Hypothetical example | 1,000.00 | 1,020.80 | 4.48 | 0.88% | |
| Class R5 | Actual expenses/actual returns | 1,000.00 | 999.90 | 3.43 | 0.68% |
| Hypothetical example | 1,000.00 | 1,021.80 | 3.47 | 0.68% | |
| Class R6 | Actual expenses/actual returns | 1,000.00 | 1,000.20 | 3.18 | 0.63% |
| Hypothetical example | 1,000.00 | 1,022.00 | 3.21 | 0.63% |
| 1 | Expenses are equal to the annualized expense ratio, multiplied by the average account value over the period, multiplied by 184/365 (to reflect the one-half year period). |
| 10 | JOHN HANCOCK BALANCED FUND | ANNUAL REPORT |
| Shares | Value | ||||
| Common stocks 63.8% | $2,690,542,867 | ||||
| (Cost $1,677,570,658) | |||||
| Communication services 4.8% | 204,123,002 | ||||
| Interactive media and services 4.5% | |||||
| Alphabet, Inc., Class A (A) | 1,534,722 | 190,428,306 | |||
| Media 0.3% | |||||
| Comcast Corp., Class A | 331,671 | 13,694,696 | |||
| Consumer discretionary 8.1% | 340,682,501 | ||||
| Broadline retail 4.3% | |||||
| Amazon.com, Inc. (A) | 1,348,944 | 179,530,957 | |||
| Specialty retail 3.1% | |||||
| Dick’s Sporting Goods, Inc. (B) | 274,217 | 29,327,508 | |||
| Lowe’s Companies, Inc. | 288,140 | 54,910,840 | |||
| Ulta Beauty, Inc. (A) | 41,936 | 15,990,616 | |||
| Valvoline, Inc. (B) | 1,082,835 | 32,127,714 | |||
| Textiles, apparel and luxury goods 0.7% | |||||
| Lululemon Athletica, Inc. (A) | 73,180 | 28,794,866 | |||
| Consumer staples 5.5% | 233,336,133 | ||||
| Beverages 0.9% | |||||
| Anheuser-Busch InBev SA/NV | 689,563 | 39,234,793 | |||
| Consumer staples distribution and retail 3.5% | |||||
| Sysco Corp. | 381,156 | 25,343,062 | |||
| Walmart, Inc. | 755,131 | 123,395,957 | |||
| Household products 1.1% | |||||
| The Procter & Gamble Company | 302,355 | 45,362,321 | |||
| Energy 4.9% | 205,372,937 | ||||
| Oil, gas and consumable fuels 4.9% | |||||
| ConocoPhillips | 420,296 | 49,931,165 | |||
| Devon Energy Corp. | 700,907 | 32,641,239 | |||
| Pioneer Natural Resources Company | 154,803 | 36,997,917 | |||
| Suncor Energy, Inc. (B) | 987,014 | 31,979,254 | |||
| Valero Energy Corp. | 423,806 | 53,823,362 | |||
| Financials 6.1% | 259,005,277 | ||||
| Banks 2.4% | |||||
| Citizens Financial Group, Inc. | 634,936 | 14,876,550 | |||
| JPMorgan Chase & Co. | 611,924 | 85,094,151 | |||
| Capital markets 1.1% | |||||
| The Charles Schwab Corp. | 564,603 | 29,381,940 | |||
| The Goldman Sachs Group, Inc. | 59,231 | 17,983,124 | |||
| SEE NOTES TO FINANCIAL STATEMENTS | ANNUAL REPORT | JOHN HANCOCK BALANCED FUND | 11 |
| Shares | Value | ||||
| Financials (continued) | |||||
| Consumer finance 0.4% | |||||
| Discover Financial Services | 239,459 | $19,654,795 | |||
| Financial services 2.2% | |||||
| Berkshire Hathaway, Inc., Class B (A) | 269,577 | 92,014,717 | |||
| Health care 10.6% | 445,812,773 | ||||
| Biotechnology 2.4% | |||||
| Genmab A/S (A) | 30,901 | 8,735,185 | |||
| Gilead Sciences, Inc. | 562,513 | 44,179,771 | |||
| Regeneron Pharmaceuticals, Inc. (A) | 24,652 | 19,225,848 | |||
| Vertex Pharmaceuticals, Inc. (A) | 78,942 | 28,585,688 | |||
| Health care equipment and supplies 1.1% | |||||
| Abbott Laboratories | 257,150 | 24,313,533 | |||
| Stryker Corp. | 81,740 | 22,087,783 | |||
| Health care providers and services 2.6% | |||||
| McKesson Corp. | 61,387 | 27,953,184 | |||
| UnitedHealth Group, Inc. | 153,782 | 82,359,488 | |||
| Life sciences tools and services 1.1% | |||||
| Revvity, Inc. | 98,257 | 8,140,592 | |||
| Thermo Fisher Scientific, Inc. | 80,952 | 36,005,021 | |||
| Pharmaceuticals 3.4% | |||||
| AstraZeneca PLC | 264,661 | 33,136,572 | |||
| Eli Lilly & Company | 200,549 | 111,090,108 | |||
| Industrials 5.3% | 221,276,963 | ||||
| Construction and engineering 1.2% | |||||
| Vinci SA | 446,412 | 49,361,752 | |||
| Industrial conglomerates 1.2% | |||||
| Honeywell International, Inc. | 262,097 | 48,031,896 | |||
| Machinery 2.9% | |||||
| Deere & Company | 203,798 | 74,459,637 | |||
| Ingersoll Rand, Inc. | 814,497 | 49,423,678 | |||
| Information technology 15.0% | 634,015,404 | ||||
| Communications equipment 0.9% | |||||
| Cisco Systems, Inc. | 755,220 | 39,369,619 | |||
| Electronic equipment, instruments and components 0.8% | |||||
| TE Connectivity, Ltd. | 274,689 | 32,372,099 | |||
| Semiconductors and semiconductor equipment 4.1% | |||||
| ASML Holding NV, NYRS | 72,871 | 43,635,884 | |||
| Broadcom, Inc. | 123,042 | 103,523,848 | |||
| Micron Technology, Inc. | 413,671 | 27,662,180 | |||
| 12 | JOHN HANCOCK BALANCED FUND | ANNUAL REPORT | SEE NOTES TO FINANCIAL STATEMENTS |
| Shares | Value | ||||
| Information technology (continued) | |||||
| Software 7.2% | |||||
| Microsoft Corp. | 640,677 | $216,619,277 | |||
| Salesforce, Inc. (A) | 217,881 | 43,757,041 | |||
| SAP SE, ADR (B) | 311,133 | 41,691,822 | |||
| Technology hardware, storage and peripherals 2.0% | |||||
| Apple, Inc. | 499,992 | 85,383,634 | |||
| Materials 2.5% | 105,332,330 | ||||
| Chemicals 0.9% | |||||
| Linde PLC | 96,328 | 36,812,708 | |||
| Metals and mining 1.6% | |||||
| Freeport-McMoRan, Inc. | 2,028,408 | 68,519,622 | |||
| Real estate 1.0% | 40,833,274 | ||||
| Specialized REITs 1.0% | |||||
| American Tower Corp. | 92,163 | 16,422,525 | |||
| Digital Realty Trust, Inc. | 196,291 | 24,410,749 | |||
| Utilities 0.0% | 752,273 | ||||
| Multi-utilities 0.0% | |||||
| Algonquin Power & Utilities Corp. | 40,250 | 752,273 | |||
| Preferred securities 0.0% | $648,145 | ||||
| (Cost $1,024,438) | |||||
| Communication services 0.0% | 489,700 | ||||
| Wireless telecommunication services 0.0% | |||||
| Telephone & Data Systems, Inc., 6.625% | 33,200 | 489,700 | |||
| Financials 0.0% | 158,445 | ||||
| Banks 0.0% | |||||
| Wells Fargo & Company, 7.500% | 150 | 158,445 | |||
| Rate (%) | Maturity date | Par value^ | Value | ||
| U.S. Government and Agency obligations 18.4% | $778,725,892 | ||||
| (Cost $863,743,582) | |||||
| U.S. Government 7.1% | 302,043,467 | ||||
| U.S. Treasury | |||||
| Bond | 2.250 | 02-15-52 | 5,142,000 | 2,959,663 | |
| Bond | 3.000 | 08-15-52 | 18,482,000 | 12,677,497 | |
| Bond | 3.375 | 08-15-42 | 41,523,000 | 32,126,799 | |
| Bond | 3.375 | 11-15-48 | 8,387,000 | 6,207,363 | |
| Bond | 3.625 | 05-15-53 | 39,441,000 | 30,745,492 | |
| Bond | 4.000 | 11-15-42 | 38,713,000 | 32,818,341 | |
| Bond | 4.125 | 08-15-53 | 1,317,000 | 1,126,652 | |
| Bond | 4.375 | 08-15-43 | 40,550,000 | 36,165,531 | |
| SEE NOTES TO FINANCIAL STATEMENTS | ANNUAL REPORT | JOHN HANCOCK BALANCED FUND | 13 |
| Rate (%) | Maturity date | Par value^ | Value | ||
| U.S. Government (continued) | |||||
| Note | 3.875 | 08-15-33 | 64,287,000 | $59,174,175 | |
| Note | 4.875 | 10-31-28 | 24,862,000 | 24,914,443 | |
| Note | 4.875 | 10-31-30 | 63,256,000 | 63,127,511 | |
| U.S. Government Agency 11.3% | 476,682,425 | ||||
| Federal Home Loan Mortgage Corp. | |||||
| 15 Yr Pass Thru | 2.000 | 06-01-36 | 4,282,879 | 3,647,107 | |
| 15 Yr Pass Thru | 2.500 | 11-01-34 | 1,401,050 | 1,241,864 | |
| 15 Yr Pass Thru | 4.500 | 12-01-37 | 962,930 | 913,348 | |
| 15 Yr Pass Thru | 4.500 | 02-01-38 | 6,420,381 | 6,085,776 | |
| 30 Yr Pass Thru | 2.500 | 08-01-51 | 4,891,148 | 3,802,786 | |
| 30 Yr Pass Thru | 2.500 | 11-01-51 | 3,616,885 | 2,808,676 | |
| 30 Yr Pass Thru | 2.500 | 12-01-51 | 1,242,857 | 958,921 | |
| 30 Yr Pass Thru | 3.000 | 03-01-43 | 413,792 | 351,497 | |
| 30 Yr Pass Thru | 3.000 | 12-01-45 | 1,829,838 | 1,516,011 | |
| 30 Yr Pass Thru | 3.000 | 10-01-46 | 6,310,660 | 5,194,822 | |
| 30 Yr Pass Thru | 3.000 | 10-01-46 | 2,007,080 | 1,653,447 | |
| 30 Yr Pass Thru | 3.000 | 12-01-46 | 1,529,683 | 1,258,252 | |
| 30 Yr Pass Thru | 3.000 | 12-01-46 | 1,394,618 | 1,149,332 | |
| 30 Yr Pass Thru | 3.000 | 04-01-47 | 2,448,276 | 2,010,695 | |
| 30 Yr Pass Thru | 3.000 | 10-01-49 | 3,291,274 | 2,677,825 | |
| 30 Yr Pass Thru | 3.000 | 10-01-49 | 2,575,752 | 2,090,837 | |
| 30 Yr Pass Thru | 3.000 | 12-01-49 | 737,392 | 599,491 | |
| 30 Yr Pass Thru | 3.000 | 12-01-49 | 3,500,427 | 2,833,773 | |
| 30 Yr Pass Thru | 3.000 | 01-01-50 | 4,693,083 | 3,815,421 | |
| 30 Yr Pass Thru | 3.500 | 10-01-46 | 2,226,832 | 1,893,920 | |
| 30 Yr Pass Thru | 3.500 | 12-01-46 | 957,790 | 819,089 | |
| 30 Yr Pass Thru | 3.500 | 11-01-48 | 753,772 | 643,674 | |
| 30 Yr Pass Thru | 3.500 | 03-01-52 | 2,012,541 | 1,687,944 | |
| 30 Yr Pass Thru | 3.500 | 03-01-52 | 3,036,997 | 2,532,933 | |
| 30 Yr Pass Thru | 3.500 | 04-01-52 | 7,201,902 | 6,038,078 | |
| 30 Yr Pass Thru | 4.000 | 11-01-47 | 363,143 | 320,440 | |
| 30 Yr Pass Thru | 4.000 | 08-01-48 | 431,618 | 381,807 | |
| 30 Yr Pass Thru | 4.000 | 04-01-52 | 6,540,866 | 5,674,416 | |
| 30 Yr Pass Thru | 4.000 | 05-01-52 | 195,701 | 171,306 | |
| 30 Yr Pass Thru | 4.500 | 03-01-41 | 676,754 | 629,676 | |
| 30 Yr Pass Thru | 4.500 | 07-01-52 | 1,665,428 | 1,497,363 | |
| 30 Yr Pass Thru | 4.500 | 07-01-52 | 6,120,666 | 5,503,007 | |
| 30 Yr Pass Thru | 4.500 | 08-01-52 | 1,045,027 | 940,876 | |
| 30 Yr Pass Thru | 4.500 | 08-01-52 | 4,994,010 | 4,493,167 | |
| 30 Yr Pass Thru | 4.500 | 08-01-52 | 4,150,680 | 3,734,414 | |
| 30 Yr Pass Thru | 4.500 | 09-01-52 | 2,570,968 | 2,310,719 | |
| 30 Yr Pass Thru | 4.500 | 09-01-52 | 2,867,583 | 2,581,789 | |
| 30 Yr Pass Thru | 4.500 | 09-01-52 | 17,697,614 | 15,928,275 | |
| 30 Yr Pass Thru | 4.500 | 12-01-52 | 1,447,273 | 1,299,414 | |
| 14 | JOHN HANCOCK BALANCED FUND | ANNUAL REPORT | SEE NOTES TO FINANCIAL STATEMENTS |
| Rate (%) | Maturity date | Par value^ | Value | ||
| U.S. Government Agency (continued) | |||||
| 30 Yr Pass Thru | 4.500 | 12-01-52 | 6,605,958 | $5,964,100 | |
| 30 Yr Pass Thru | 4.500 | 04-01-53 | 1,365,073 | 1,228,171 | |
| 30 Yr Pass Thru | 4.500 | 04-01-53 | 6,145,443 | 5,513,869 | |
| 30 Yr Pass Thru (C) | 4.500 | 05-01-53 | 1,314,306 | 1,188,243 | |
| 30 Yr Pass Thru | 4.500 | 08-01-53 | 4,907,563 | 4,410,728 | |
| 30 Yr Pass Thru | 5.000 | 09-01-52 | 9,382,870 | 8,660,564 | |
| 30 Yr Pass Thru | 5.000 | 10-01-52 | 3,485,765 | 3,217,426 | |
| 30 Yr Pass Thru | 5.000 | 11-01-52 | 6,642,619 | 6,129,185 | |
| 30 Yr Pass Thru | 5.000 | 12-01-52 | 1,757,422 | 1,627,076 | |
| 30 Yr Pass Thru | 5.000 | 12-01-52 | 3,504,416 | 3,248,878 | |
| 30 Yr Pass Thru | 5.000 | 12-01-52 | 5,911,168 | 5,456,118 | |
| 30 Yr Pass Thru | 5.000 | 02-01-53 | 5,603,093 | 5,168,257 | |
| 30 Yr Pass Thru | 5.000 | 07-01-53 | 9,266,469 | 8,575,036 | |
| 30 Yr Pass Thru | 5.000 | 07-01-53 | 4,170,802 | 3,856,245 | |
| 30 Yr Pass Thru | 5.000 | 08-01-53 | 4,124,946 | 3,818,072 | |
| 30 Yr Pass Thru | 5.500 | 11-01-39 | 444,687 | 439,878 | |
| 30 Yr Pass Thru | 5.500 | 09-01-52 | 7,120,231 | 6,789,731 | |
| 30 Yr Pass Thru | 5.500 | 03-01-53 | 3,464,899 | 3,297,464 | |
| 30 Yr Pass Thru | 5.500 | 06-01-53 | 2,841,190 | 2,703,204 | |
| 30 Yr Pass Thru | 5.500 | 07-01-53 | 3,140,744 | 2,990,699 | |
| 30 Yr Pass Thru | 5.500 | 09-01-53 | 789,144 | 750,221 | |
| 30 Yr Pass Thru | 6.000 | 08-01-53 | 2,383,831 | 2,325,082 | |
| 30 Yr Pass Thru | 6.000 | 09-01-53 | 5,427,633 | 5,296,796 | |
| 30 Yr Pass Thru | 6.000 | 10-01-53 | 1,509,319 | 1,473,598 | |
| 30 Yr Pass Thru | 6.000 | 10-01-53 | 6,066,642 | 5,925,615 | |
| Federal National Mortgage Association | |||||
| 15 Yr Pass Thru | 2.000 | 04-01-37 | 4,374,182 | 3,731,691 | |
| 15 Yr Pass Thru | 2.500 | 01-01-36 | 4,802,034 | 4,256,431 | |
| 15 Yr Pass Thru | 4.500 | 11-01-37 | 5,029,892 | 4,770,898 | |
| 15 Yr Pass Thru | 4.500 | 12-01-37 | 1,613,410 | 1,530,334 | |
| 30 Yr Pass Thru | 2.500 | 09-01-50 | 9,445,320 | 7,370,143 | |
| 30 Yr Pass Thru | 2.500 | 08-01-51 | 6,623,001 | 5,143,063 | |
| 30 Yr Pass Thru | 2.500 | 08-01-51 | 3,495,353 | 2,714,301 | |
| 30 Yr Pass Thru | 2.500 | 10-01-51 | 1,719,273 | 1,334,557 | |
| 30 Yr Pass Thru | 2.500 | 11-01-51 | 3,719,923 | 2,899,152 | |
| 30 Yr Pass Thru | 2.500 | 01-01-52 | 3,972,447 | 3,078,580 | |
| 30 Yr Pass Thru | 2.500 | 03-01-52 | 35,768,592 | 27,708,880 | |
| 30 Yr Pass Thru | 3.000 | 02-01-43 | 262,968 | 221,393 | |
| 30 Yr Pass Thru | 3.000 | 03-01-43 | 99,499 | 84,478 | |
| 30 Yr Pass Thru | 3.000 | 05-01-43 | 161,095 | 135,761 | |
| 30 Yr Pass Thru | 3.000 | 12-01-45 | 1,894,697 | 1,567,307 | |
| 30 Yr Pass Thru | 3.000 | 02-01-47 | 1,539,350 | 1,266,627 | |
| 30 Yr Pass Thru | 3.000 | 10-01-47 | 3,233,369 | 2,655,468 | |
| 30 Yr Pass Thru | 3.000 | 12-01-47 | 862,006 | 707,940 | |
| SEE NOTES TO FINANCIAL STATEMENTS | ANNUAL REPORT | JOHN HANCOCK BALANCED FUND | 15 |
| Rate (%) | Maturity date | Par value^ | Value | ||
| U.S. Government Agency (continued) | |||||
| 30 Yr Pass Thru | 3.000 | 10-01-49 | 3,723,340 | $3,030,523 | |
| 30 Yr Pass Thru | 3.000 | 11-01-49 | 663,404 | 538,511 | |
| 30 Yr Pass Thru | 3.000 | 02-01-52 | 2,238,329 | 1,802,598 | |
| 30 Yr Pass Thru | 3.500 | 06-01-42 | 1,587,721 | 1,380,451 | |
| 30 Yr Pass Thru | 3.500 | 06-01-43 | 2,998,587 | 2,595,617 | |
| 30 Yr Pass Thru | 3.500 | 12-01-44 | 549,533 | 471,633 | |
| 30 Yr Pass Thru | 3.500 | 04-01-45 | 497,780 | 426,906 | |
| 30 Yr Pass Thru | 3.500 | 04-01-45 | 193,452 | 165,908 | |
| 30 Yr Pass Thru | 3.500 | 07-01-47 | 4,508,021 | 3,860,531 | |
| 30 Yr Pass Thru | 3.500 | 12-01-47 | 717,470 | 609,935 | |
| 30 Yr Pass Thru | 3.500 | 06-01-49 | 3,903,171 | 3,315,721 | |
| 30 Yr Pass Thru | 3.500 | 09-01-49 | 401,988 | 339,791 | |
| 30 Yr Pass Thru | 3.500 | 01-01-50 | 1,417,122 | 1,196,973 | |
| 30 Yr Pass Thru | 3.500 | 03-01-50 | 2,483,094 | 2,097,347 | |
| 30 Yr Pass Thru | 3.500 | 02-01-52 | 1,822,789 | 1,543,607 | |
| 30 Yr Pass Thru | 3.500 | 04-01-52 | 2,454,584 | 2,056,391 | |
| 30 Yr Pass Thru | 4.000 | 01-01-41 | 891,235 | 805,495 | |
| 30 Yr Pass Thru | 4.000 | 09-01-41 | 408,757 | 368,164 | |
| 30 Yr Pass Thru | 4.000 | 10-01-41 | 2,774,671 | 2,505,189 | |
| 30 Yr Pass Thru | 4.000 | 01-01-47 | 3,097,917 | 2,751,681 | |
| 30 Yr Pass Thru | 4.000 | 04-01-48 | 455,381 | 403,205 | |
| 30 Yr Pass Thru | 4.000 | 10-01-48 | 421,725 | 372,351 | |
| 30 Yr Pass Thru | 4.000 | 01-01-49 | 366,802 | 322,024 | |
| 30 Yr Pass Thru | 4.000 | 07-01-49 | 505,876 | 445,069 | |
| 30 Yr Pass Thru | 4.000 | 07-01-49 | 1,110,363 | 978,283 | |
| 30 Yr Pass Thru | 4.000 | 08-01-49 | 2,226,306 | 1,960,788 | |
| 30 Yr Pass Thru | 4.000 | 02-01-50 | 1,798,238 | 1,579,277 | |
| 30 Yr Pass Thru | 4.000 | 03-01-51 | 7,205,656 | 6,337,273 | |
| 30 Yr Pass Thru | 4.000 | 08-01-51 | 3,886,308 | 3,424,026 | |
| 30 Yr Pass Thru | 4.000 | 04-01-52 | 760,732 | 660,911 | |
| 30 Yr Pass Thru | 4.000 | 05-01-52 | 9,358,749 | 8,119,022 | |
| 30 Yr Pass Thru | 4.000 | 06-01-52 | 214,913 | 187,720 | |
| 30 Yr Pass Thru (C) | 4.000 | 06-01-52 | 2,215,134 | 1,939,886 | |
| 30 Yr Pass Thru | 4.000 | 07-01-52 | 12,337,126 | 10,745,270 | |
| 30 Yr Pass Thru | 4.500 | 11-01-39 | 770,508 | 717,787 | |
| 30 Yr Pass Thru | 4.500 | 09-01-40 | 419,847 | 390,013 | |
| 30 Yr Pass Thru | 4.500 | 05-01-41 | 255,112 | 237,134 | |
| 30 Yr Pass Thru | 4.500 | 07-01-41 | 981,022 | 911,452 | |
| 30 Yr Pass Thru | 4.500 | 01-01-43 | 304,613 | 282,672 | |
| 30 Yr Pass Thru | 4.500 | 04-01-48 | 1,638,245 | 1,492,122 | |
| 30 Yr Pass Thru | 4.500 | 07-01-48 | 663,456 | 602,828 | |
| 30 Yr Pass Thru | 4.500 | 06-01-52 | 3,102,038 | 2,791,908 | |
| 30 Yr Pass Thru | 4.500 | 06-01-52 | 7,192,011 | 6,466,239 | |
| 30 Yr Pass Thru | 4.500 | 07-01-52 | 5,901,716 | 5,306,152 | |
| 16 | JOHN HANCOCK BALANCED FUND | ANNUAL REPORT | SEE NOTES TO FINANCIAL STATEMENTS |
| Rate (%) | Maturity date | Par value^ | Value | ||
| U.S. Government Agency (continued) | |||||
| 30 Yr Pass Thru | 4.500 | 08-01-52 | 3,492,532 | $3,123,717 | |
| 30 Yr Pass Thru | 4.500 | 08-01-52 | 806,409 | 726,040 | |
| 30 Yr Pass Thru | 4.500 | 08-01-52 | 5,853,495 | 5,235,359 | |
| 30 Yr Pass Thru | 4.500 | 09-01-52 | 4,897,431 | 4,421,579 | |
| 30 Yr Pass Thru | 4.500 | 09-01-52 | 1,523,238 | 1,370,475 | |
| 30 Yr Pass Thru | 4.500 | 10-01-52 | 4,325,904 | 3,905,583 | |
| 30 Yr Pass Thru | 4.500 | 10-01-52 | 1,974,995 | 1,775,074 | |
| 30 Yr Pass Thru | 4.500 | 11-01-52 | 2,020,526 | 1,816,628 | |
| 30 Yr Pass Thru | 4.500 | 04-01-53 | 5,745,944 | 5,160,264 | |
| 30 Yr Pass Thru | 4.500 | 05-01-53 | 1,215,217 | 1,092,490 | |
| 30 Yr Pass Thru | 5.000 | 08-01-52 | 11,364,461 | 10,546,432 | |
| 30 Yr Pass Thru | 5.000 | 09-01-52 | 7,286,253 | 6,725,347 | |
| 30 Yr Pass Thru | 5.000 | 10-01-52 | 3,314,801 | 3,068,946 | |
| 30 Yr Pass Thru | 5.000 | 12-01-52 | 3,494,495 | 3,235,312 | |
| 30 Yr Pass Thru | 5.000 | 01-01-53 | 7,862,000 | 7,291,169 | |
| 30 Yr Pass Thru | 5.000 | 04-01-53 | 9,014,783 | 8,337,715 | |
| 30 Yr Pass Thru | 5.000 | 05-01-53 | 10,123,797 | 9,369,762 | |
| 30 Yr Pass Thru | 5.000 | 05-01-53 | 4,058,026 | 3,758,314 | |
| 30 Yr Pass Thru | 5.000 | 07-01-53 | 3,175,472 | 2,940,495 | |
| 30 Yr Pass Thru | 5.500 | 10-01-52 | 6,531,098 | 6,223,862 | |
| 30 Yr Pass Thru | 5.500 | 12-01-52 | 5,631,883 | 5,370,468 | |
| 30 Yr Pass Thru | 5.500 | 12-01-52 | 2,099,290 | 2,001,847 | |
| 30 Yr Pass Thru | 5.500 | 12-01-52 | 3,727,832 | 3,552,467 | |
| 30 Yr Pass Thru | 5.500 | 12-01-52 | 2,161,113 | 2,065,528 | |
| 30 Yr Pass Thru | 5.500 | 12-01-52 | 2,001,850 | 1,907,679 | |
| 30 Yr Pass Thru | 5.500 | 12-01-52 | 1,820,823 | 1,730,616 | |
| 30 Yr Pass Thru | 5.500 | 04-01-53 | 2,695,667 | 2,563,803 | |
| 30 Yr Pass Thru | 5.500 | 05-01-53 | 4,105,001 | 3,903,503 | |
| 30 Yr Pass Thru | 7.000 | 06-01-32 | 487 | 499 | |
| 30 Yr Pass Thru | 7.500 | 04-01-31 | 897 | 927 | |
| 30 Yr Pass Thru | 8.000 | 01-01-31 | 667 | 693 | |
| Corporate bonds 13.1% | $552,871,872 | ||||
| (Cost $634,204,200) | |||||
| Communication services 1.0% | 44,373,782 | ||||
| Diversified telecommunication services 0.2% | |||||
| C&W Senior Financing DAC (D) | 6.875 | 09-15-27 | 1,185,000 | 1,018,863 | |
| Connect Finco SARL (D) | 6.750 | 10-01-26 | 1,637,000 | 1,526,562 | |
| GCI LLC (D) | 4.750 | 10-15-28 | 1,396,038 | 1,197,940 | |
| Telesat Canada (D) | 5.625 | 12-06-26 | 652,000 | 416,165 | |
| Total Play Telecomunicaciones SA de CV (D) | 6.375 | 09-20-28 | 1,376,000 | 658,882 | |
| Total Play Telecomunicaciones SA de CV (D) | 7.500 | 11-12-25 | 2,286,000 | 1,650,232 | |
| Zayo Group Holdings, Inc. (D) | 4.000 | 03-01-27 | 1,055,000 | 794,038 | |
| SEE NOTES TO FINANCIAL STATEMENTS | ANNUAL REPORT | JOHN HANCOCK BALANCED FUND | 17 |
| Rate (%) | Maturity date | Par value^ | Value | ||
| Communication services (continued) | |||||
| Diversified telecommunication services (continued) | |||||
| Zayo Group Holdings, Inc. (D) | 6.125 | 03-01-28 | 978,000 | $647,875 | |
| Entertainment 0.2% | |||||
| Netflix, Inc. | 4.875 | 04-15-28 | 2,344,000 | 2,258,295 | |
| Netflix, Inc. (D) | 5.375 | 11-15-29 | 435,000 | 421,764 | |
| Netflix, Inc. | 5.875 | 11-15-28 | 2,340,000 | 2,340,874 | |
| WarnerMedia Holdings, Inc. | 4.279 | 03-15-32 | 1,456,000 | 1,207,192 | |
| WarnerMedia Holdings, Inc. | 5.050 | 03-15-42 | 820,000 | 607,397 | |
| WarnerMedia Holdings, Inc. | 5.141 | 03-15-52 | 4,705,000 | 3,329,336 | |
| WMG Acquisition Corp. (D) | 3.875 | 07-15-30 | 1,066,000 | 886,015 | |
| Interactive media and services 0.0% | |||||
| Match Group Holdings II LLC (D) | 3.625 | 10-01-31 | 470,000 | 360,725 | |
| Match Group Holdings II LLC (D) | 4.125 | 08-01-30 | 1,051,000 | 853,969 | |
| Meta Platforms, Inc. | 4.800 | 05-15-30 | 807,000 | 778,142 | |
| Media 0.3% | |||||
| Charter Communications Operating LLC | 4.200 | 03-15-28 | 2,897,000 | 2,636,526 | |
| Charter Communications Operating LLC | 5.750 | 04-01-48 | 3,088,000 | 2,342,947 | |
| Charter Communications Operating LLC | 6.384 | 10-23-35 | 2,313,000 | 2,090,512 | |
| Globo Comunicacao e Participacoes SA (D) | 4.875 | 01-22-30 | 1,192,000 | 945,910 | |
| LCPR Senior Secured Financing DAC (D) | 5.125 | 07-15-29 | 625,000 | 486,766 | |
| News Corp. (D) | 3.875 | 05-15-29 | 1,198,000 | 1,025,464 | |
| Sirius XM Radio, Inc. (D) | 4.000 | 07-15-28 | 1,220,000 | 1,037,527 | |
| Sirius XM Radio, Inc. (D) | 5.000 | 08-01-27 | 1,935,000 | 1,774,202 | |
| Wireless telecommunication services 0.3% | |||||
| Millicom International Cellular SA (D) | 6.250 | 03-25-29 | 1,066,500 | 926,960 | |
| T-Mobile USA, Inc. | 2.875 | 02-15-31 | 245,000 | 195,093 | |
| T-Mobile USA, Inc. | 3.375 | 04-15-29 | 2,210,000 | 1,924,153 | |
| T-Mobile USA, Inc. | 3.875 | 04-15-30 | 5,386,000 | 4,689,608 | |
| T-Mobile USA, Inc. | 5.650 | 01-15-53 | 1,500,000 | 1,296,520 | |
| Vodafone Group PLC | 5.625 | 02-10-53 | 996,000 | 837,709 | |
| Vodafone Group PLC (7.000% to 4-4-29, then 5 Year U.S. Swap Rate + 4.873% to 4-4-49, then 5 Year U.S. Swap Rate + 5.623%) | 7.000 | 04-04-79 | 1,251,000 | 1,209,619 | |
| Consumer discretionary 1.2% | 52,453,617 | ||||
| Automobile components 0.0% | |||||
| Dealer Tire LLC (D) | 8.000 | 02-01-28 | 642,000 | 602,174 | |
| Automobiles 0.6% | |||||
| Ford Motor Company | 3.250 | 02-12-32 | 980,000 | 739,654 | |
| Ford Motor Credit Company LLC | 2.900 | 02-16-28 | 330,000 | 280,719 | |
| Ford Motor Credit Company LLC | 4.000 | 11-13-30 | 1,045,000 | 860,753 | |
| Ford Motor Credit Company LLC | 4.125 | 08-17-27 | 1,975,000 | 1,793,118 | |
| Ford Motor Credit Company LLC | 5.113 | 05-03-29 | 2,689,000 | 2,447,411 | |
| 18 | JOHN HANCOCK BALANCED FUND | ANNUAL REPORT | SEE NOTES TO FINANCIAL STATEMENTS |
| Rate (%) | Maturity date | Par value^ | Value | ||
| Consumer discretionary (continued) | |||||
| Automobiles (continued) | |||||
| Ford Motor Credit Company LLC | 6.800 | 05-12-28 | 4,677,000 | $4,663,635 | |
| General Motors Company | 5.400 | 10-15-29 | 2,000,000 | 1,877,981 | |
| General Motors Company | 5.400 | 04-01-48 | 905,000 | 678,462 | |
| General Motors Financial Company, Inc. | 2.400 | 10-15-28 | 3,917,000 | 3,229,387 | |
| General Motors Financial Company, Inc. | 3.600 | 06-21-30 | 4,847,000 | 3,999,555 | |
| Hyundai Capital America (D) | 2.375 | 10-15-27 | 726,000 | 625,316 | |
| Nissan Motor Acceptance Company LLC (D) | 1.850 | 09-16-26 | 2,048,000 | 1,772,840 | |
| Nissan Motor Acceptance Company LLC (D) | 2.000 | 03-09-26 | 1,011,000 | 902,231 | |
| Broadline retail 0.0% | |||||
| Macy’s Retail Holdings LLC (D) | 5.875 | 04-01-29 | 617,000 | 543,947 | |
| Macy’s Retail Holdings LLC (D) | 5.875 | 03-15-30 | 529,000 | 447,527 | |
| Macy’s Retail Holdings LLC (D) | 6.125 | 03-15-32 | 972,000 | 802,736 | |
| Distributors 0.0% | |||||
| LKQ Corp. (D) | 5.750 | 06-15-28 | 565,000 | 547,540 | |
| Diversified consumer services 0.0% | |||||
| GEMS MENASA Cayman, Ltd. (D) | 7.125 | 07-31-26 | 576,000 | 554,400 | |
| Sotheby’s (D) | 7.375 | 10-15-27 | 707,000 | 631,411 | |
| Hotels, restaurants and leisure 0.3% | |||||
| Affinity Interactive (D) | 6.875 | 12-15-27 | 579,000 | 471,935 | |
| Booking Holdings, Inc. | 4.625 | 04-13-30 | 1,822,000 | 1,697,520 | |
| Caesars Entertainment, Inc. (D) | 7.000 | 02-15-30 | 524,000 | 505,709 | |
| CCM Merger, Inc. (D) | 6.375 | 05-01-26 | 503,000 | 476,128 | |
| Choice Hotels International, Inc. | 3.700 | 12-01-29 | 744,000 | 609,326 | |
| Choice Hotels International, Inc. | 3.700 | 01-15-31 | 959,000 | 754,276 | |
| Full House Resorts, Inc. (D) | 8.250 | 02-15-28 | 730,000 | 614,682 | |
| Hilton Grand Vacations Borrower Escrow LLC (D) | 5.000 | 06-01-29 | 1,285,000 | 1,076,185 | |
| Jacobs Entertainment, Inc. (D) | 6.750 | 02-15-29 | 568,000 | 482,800 | |
| MGM Resorts International | 4.750 | 10-15-28 | 1,967,000 | 1,716,372 | |
| Midwest Gaming Borrower LLC (D) | 4.875 | 05-01-29 | 1,433,000 | 1,192,973 | |
| Mohegan Tribal Gaming Authority (D) | 8.000 | 02-01-26 | 1,197,000 | 1,099,744 | |
| Resorts World Las Vegas LLC (D) | 4.625 | 04-16-29 | 1,290,000 | 990,785 | |
| Resorts World Las Vegas LLC (D) | 4.625 | 04-06-31 | 600,000 | 423,000 | |
| Resorts World Las Vegas LLC (D) | 8.450 | 07-27-30 | 1,000,000 | 919,733 | |
| Travel + Leisure Company (D) | 4.625 | 03-01-30 | 628,000 | 514,109 | |
| Yum! Brands, Inc. (D) | 4.750 | 01-15-30 | 908,000 | 808,311 | |
| Household durables 0.1% | |||||
| Brookfield Residential Properties, Inc. (D) | 5.000 | 06-15-29 | 773,000 | 603,318 | |
| Century Communities, Inc. (D) | 3.875 | 08-15-29 | 1,092,000 | 881,200 | |
| KB Home | 4.000 | 06-15-31 | 1,246,000 | 972,885 | |
| MDC Holdings, Inc. | 2.500 | 01-15-31 | 632,000 | 462,665 | |
| SEE NOTES TO FINANCIAL STATEMENTS | ANNUAL REPORT | JOHN HANCOCK BALANCED FUND | 19 |
| Rate (%) | Maturity date | Par value^ | Value | ||
| Consumer discretionary (continued) | |||||
| Specialty retail 0.2% | |||||
| Asbury Automotive Group, Inc. (D) | 4.625 | 11-15-29 | 274,000 | $231,774 | |
| Asbury Automotive Group, Inc. | 4.750 | 03-01-30 | 884,000 | 750,162 | |
| AutoNation, Inc. | 4.750 | 06-01-30 | 1,698,000 | 1,487,236 | |
| Group 1 Automotive, Inc. (D) | 4.000 | 08-15-28 | 616,000 | 530,220 | |
| Lithia Motors, Inc. (D) | 3.875 | 06-01-29 | 577,000 | 477,237 | |
| Lithia Motors, Inc. (D) | 4.375 | 01-15-31 | 577,000 | 467,165 | |
| Lithia Motors, Inc. (D) | 4.625 | 12-15-27 | 288,000 | 259,821 | |
| The Michaels Companies, Inc. (D) | 5.250 | 05-01-28 | 1,383,000 | 1,002,066 | |
| The Michaels Companies, Inc. (D) | 7.875 | 05-01-29 | 1,615,000 | 900,363 | |
| Valvoline, Inc. (D) | 3.625 | 06-15-31 | 1,412,000 | 1,073,120 | |
| Consumer staples 0.3% | 14,118,282 | ||||
| Beverages 0.0% | |||||
| Anheuser-Busch Companies LLC | 4.700 | 02-01-36 | 1,968,000 | 1,731,917 | |
| Food products 0.3% | |||||
| Coruripe Netherlands BV (D) | 10.000 | 02-10-27 | 731,000 | 516,547 | |
| JBS USA LUX SA | 3.625 | 01-15-32 | 1,400,000 | 1,076,178 | |
| JBS USA LUX SA | 3.750 | 12-01-31 | 434,000 | 337,245 | |
| JBS USA LUX SA | 5.125 | 02-01-28 | 909,000 | 853,639 | |
| JBS USA LUX SA | 5.750 | 04-01-33 | 2,277,000 | 2,011,089 | |
| Kraft Heinz Foods Company | 4.375 | 06-01-46 | 3,248,000 | 2,376,418 | |
| Kraft Heinz Foods Company | 5.000 | 06-04-42 | 960,000 | 791,226 | |
| MARB BondCo PLC (D) | 3.950 | 01-29-31 | 1,895,000 | 1,391,095 | |
| NBM US Holdings, Inc. (D) | 6.625 | 08-06-29 | 1,623,000 | 1,459,605 | |
| Pilgrim’s Pride Corp. | 6.250 | 07-01-33 | 1,712,000 | 1,573,323 | |
| Energy 1.8% | 77,050,006 | ||||
| Oil, gas and consumable fuels 1.8% | |||||
| Aker BP ASA (D) | 3.100 | 07-15-31 | 840,000 | 659,729 | |
| Aker BP ASA (D) | 3.750 | 01-15-30 | 534,000 | 455,689 | |
| Aker BP ASA (D) | 4.000 | 01-15-31 | 2,536,000 | 2,140,289 | |
| Antero Midstream Partners LP (D) | 5.375 | 06-15-29 | 1,269,000 | 1,152,313 | |
| Antero Resources Corp. (D) | 5.375 | 03-01-30 | 230,000 | 209,880 | |
| Ascent Resources Utica Holdings LLC (D) | 5.875 | 06-30-29 | 1,338,000 | 1,181,997 | |
| Ascent Resources Utica Holdings LLC (D) | 8.250 | 12-31-28 | 274,000 | 272,073 | |
| Cheniere Energy Partners LP | 4.000 | 03-01-31 | 2,216,000 | 1,855,603 | |
| Cheniere Energy Partners LP | 4.500 | 10-01-29 | 2,031,000 | 1,818,452 | |
| Civitas Resources, Inc. (D) | 8.625 | 11-01-30 | 757,000 | 770,494 | |
| Columbia Pipelines Operating Company LLC (D) | 5.927 | 08-15-30 | 606,000 | 585,138 | |
| Columbia Pipelines Operating Company LLC (D) | 6.036 | 11-15-33 | 940,000 | 892,667 | |
| Continental Resources, Inc. | 4.900 | 06-01-44 | 1,129,000 | 797,186 | |
| 20 | JOHN HANCOCK BALANCED FUND | ANNUAL REPORT | SEE NOTES TO FINANCIAL STATEMENTS |
| Rate (%) | Maturity date | Par value^ | Value | ||
| Energy (continued) | |||||
| Oil, gas and consumable fuels (continued) | |||||
| Enbridge, Inc. (5.500% to 7-15-27, then 3 month CME Term SOFR + 3.680% to 7-15-47, then 3 month CME Term SOFR + 4.430%) | 5.500 | 07-15-77 | 1,750,000 | $1,488,901 | |
| Enbridge, Inc. (5.750% to 7-15-30, then 5 Year CMT + 5.314% to 7-15-50, then 5 Year CMT + 6.064%) | 5.750 | 07-15-80 | 2,143,000 | 1,786,307 | |
| Enbridge, Inc. (6.250% to 3-1-28, then 3 month CME Term SOFR + 3.903% to 3-1-48, then 3 month CME Term SOFR + 4.653%) | 6.250 | 03-01-78 | 1,355,000 | 1,186,770 | |
| Enbridge, Inc. (8.500% to 1-15-34, then 5 Year CMT + 4.431% to 1-15-54, then 5 Year CMT + 5.181%) | 8.500 | 01-15-84 | 991,000 | 949,346 | |
| Energean Israel Finance, Ltd. (D) | 5.375 | 03-30-28 | 439,000 | 359,071 | |
| Energean Israel Finance, Ltd. (D) | 5.875 | 03-30-31 | 772,000 | 615,593 | |
| Energy Transfer LP | 4.200 | 04-15-27 | 1,199,000 | 1,122,870 | |
| Energy Transfer LP | 5.150 | 03-15-45 | 1,708,000 | 1,322,679 | |
| Energy Transfer LP | 5.250 | 04-15-29 | 1,790,000 | 1,698,837 | |
| Energy Transfer LP | 5.400 | 10-01-47 | 1,683,000 | 1,321,757 | |
| Energy Transfer LP | 5.500 | 06-01-27 | 1,681,000 | 1,639,527 | |
| Energy Transfer LP (6.500% to 11-15-26, then 5 Year CMT + 5.694%) (E) | 6.500 | 11-15-26 | 3,084,000 | 2,793,117 | |
| Energy Transfer LP (7.125% to 5-15-30, then 5 Year CMT + 5.306%) (E) | 7.125 | 05-15-30 | 2,595,000 | 2,154,960 | |
| Enterprise Products Operating LLC (5.250% to 8-16-27, then 3 month CME Term SOFR + 3.295%) | 5.250 | 08-16-77 | 3,087,000 | 2,649,331 | |
| EQM Midstream Partners LP (D) | 7.500 | 06-01-27 | 226,000 | 223,826 | |
| EQM Midstream Partners LP (D) | 7.500 | 06-01-30 | 128,000 | 125,585 | |
| Hess Midstream Operations LP (D) | 4.250 | 02-15-30 | 399,000 | 341,415 | |
| Hess Midstream Operations LP (D) | 5.500 | 10-15-30 | 178,000 | 161,589 | |
| Kinder Morgan Energy Partners LP | 7.750 | 03-15-32 | 981,000 | 1,026,434 | |
| Leviathan Bond, Ltd. (D) | 6.500 | 06-30-27 | 2,080,000 | 1,824,514 | |
| Leviathan Bond, Ltd. (D) | 6.750 | 06-30-30 | 256,000 | 216,477 | |
| MC Brazil Downstream Trading SARL (D) | 7.250 | 06-30-31 | 1,334,393 | 949,421 | |
| MPLX LP | 4.125 | 03-01-27 | 310,000 | 291,131 | |
| MPLX LP | 4.250 | 12-01-27 | 1,156,000 | 1,075,327 | |
| MPLX LP | 4.950 | 09-01-32 | 1,038,000 | 921,491 | |
| MPLX LP | 5.000 | 03-01-33 | 1,064,000 | 942,206 | |
| Occidental Petroleum Corp. | 6.450 | 09-15-36 | 1,593,000 | 1,547,249 | |
| Occidental Petroleum Corp. | 6.600 | 03-15-46 | 874,000 | 841,579 | |
| Occidental Petroleum Corp. | 6.625 | 09-01-30 | 2,093,000 | 2,099,397 | |
| ONEOK, Inc. | 5.650 | 11-01-28 | 754,000 | 735,754 | |
| ONEOK, Inc. | 6.050 | 09-01-33 | 2,826,000 | 2,708,318 | |
| ONEOK, Inc. | 6.625 | 09-01-53 | 1,805,000 | 1,686,863 | |
| SEE NOTES TO FINANCIAL STATEMENTS | ANNUAL REPORT | JOHN HANCOCK BALANCED FUND | 21 |
| Rate (%) | Maturity date | Par value^ | Value | ||
| Energy (continued) | |||||
| Oil, gas and consumable fuels (continued) | |||||
| Ovintiv, Inc. | 5.650 | 05-15-28 | 584,000 | $567,002 | |
| Ovintiv, Inc. | 6.250 | 07-15-33 | 586,000 | 557,038 | |
| Ovintiv, Inc. | 7.200 | 11-01-31 | 318,000 | 320,664 | |
| Parkland Corp. (D) | 4.500 | 10-01-29 | 823,000 | 707,862 | |
| Parkland Corp. (D) | 4.625 | 05-01-30 | 949,000 | 809,023 | |
| Petroleos Mexicanos | 7.690 | 01-23-50 | 3,137,000 | 1,937,345 | |
| Petroleos Mexicanos | 8.750 | 06-02-29 | 855,000 | 756,123 | |
| Sabine Pass Liquefaction LLC | 4.200 | 03-15-28 | 1,070,000 | 984,531 | |
| Sabine Pass Liquefaction LLC | 4.500 | 05-15-30 | 2,863,000 | 2,568,047 | |
| Sabine Pass Liquefaction LLC | 5.000 | 03-15-27 | 890,000 | 857,125 | |
| Southwestern Energy Company | 4.750 | 02-01-32 | 727,000 | 625,211 | |
| Sunoco LP | 4.500 | 05-15-29 | 363,000 | 314,442 | |
| Sunoco LP | 4.500 | 04-30-30 | 1,361,000 | 1,162,463 | |
| Targa Resources Corp. | 4.950 | 04-15-52 | 1,820,000 | 1,327,997 | |
| Targa Resources Partners LP | 4.000 | 01-15-32 | 1,616,000 | 1,330,016 | |
| The Williams Companies, Inc. | 3.750 | 06-15-27 | 1,569,000 | 1,449,506 | |
| The Williams Companies, Inc. | 4.650 | 08-15-32 | 1,169,000 | 1,030,034 | |
| Var Energi ASA (D) | 7.500 | 01-15-28 | 380,000 | 388,806 | |
| Var Energi ASA (D) | 8.000 | 11-15-32 | 3,215,000 | 3,316,369 | |
| Venture Global Calcasieu Pass LLC (D) | 3.875 | 08-15-29 | 476,000 | 396,117 | |
| Venture Global Calcasieu Pass LLC (D) | 4.125 | 08-15-31 | 834,000 | 670,542 | |
| Venture Global LNG, Inc. (D) | 9.500 | 02-01-29 | 1,557,000 | 1,581,818 | |
| Western Midstream Operating LP | 4.050 | 02-01-30 | 1,625,000 | 1,408,787 | |
| Western Midstream Operating LP | 6.150 | 04-01-33 | 406,000 | 383,986 | |
| Financials 3.6% | 150,737,998 | ||||
| Banks 2.4% | |||||
| Banco Santander SA | 4.379 | 04-12-28 | 1,603,000 | 1,457,773 | |
| Bank of America Corp. (2.087% to 6-14-28, then Overnight SOFR + 1.060%) | 2.087 | 06-14-29 | 2,617,000 | 2,160,715 | |
| Bank of America Corp. (2.592% to 4-29-30, then Overnight SOFR + 2.150%) | 2.592 | 04-29-31 | 2,889,000 | 2,277,586 | |
| Bank of America Corp. (2.687% to 4-22-31, then Overnight SOFR + 1.320%) | 2.687 | 04-22-32 | 4,958,000 | 3,801,541 | |
| Bank of America Corp. (3.846% to 3-8-32, then 5 Year CMT + 2.000%) | 3.846 | 03-08-37 | 2,364,000 | 1,864,931 | |
| Bank of America Corp. (3.970% to 3-5-28, then 3 month CME Term SOFR + 1.332%) | 3.970 | 03-05-29 | 2,086,000 | 1,887,489 | |
| Bank of America Corp. (6.300% to 3-10-26, then 3 month CME Term SOFR + 4.815%) (E) | 6.300 | 03-10-26 | 2,765,000 | 2,690,386 | |
| 22 | JOHN HANCOCK BALANCED FUND | ANNUAL REPORT | SEE NOTES TO FINANCIAL STATEMENTS |
| Rate (%) | Maturity date | Par value^ | Value | ||
| Financials (continued) | |||||
| Banks (continued) | |||||
| Barclays PLC (4.375% to 9-15-28, then 5 Year CMT + 3.410%) (B)(E) | 4.375 | 03-15-28 | 1,977,000 | $1,351,218 | |
| Barclays PLC (8.000% to 9-15-29, then 5 Year CMT + 5.431%) (B)(E) | 8.000 | 03-15-29 | 959,000 | 848,236 | |
| BNP Paribas SA (9.250% to 11-17-27, then 5 Year CMT + 4.969%) (D)(E) | 9.250 | 11-17-27 | 781,000 | 793,878 | |
| BPCE SA (D) | 4.500 | 03-15-25 | 1,695,000 | 1,635,118 | |
| Citigroup, Inc. | 4.600 | 03-09-26 | 2,922,000 | 2,800,560 | |
| Citigroup, Inc. (4.700% to 1-30-25, then Overnight SOFR + 3.234%) (E) | 4.700 | 01-30-25 | 2,303,000 | 2,059,227 | |
| Citigroup, Inc. (6.174% to 5-25-33, then Overnight SOFR + 2.661%) | 6.174 | 05-25-34 | 1,994,000 | 1,853,492 | |
| Citigroup, Inc. (6.250% to 8-15-26, then 3 month CME Term SOFR + 4.779%) (E) | 6.250 | 08-15-26 | 1,970,000 | 1,849,359 | |
| Citizens Financial Group, Inc. | 3.250 | 04-30-30 | 2,588,000 | 1,996,119 | |
| Credit Agricole SA (D) | 3.250 | 01-14-30 | 3,030,000 | 2,462,328 | |
| Credit Agricole SA (6.316% to 10-3-28, then Overnight SOFR + 1.860%) (D) | 6.316 | 10-03-29 | 1,910,000 | 1,876,651 | |
| Credit Agricole SA (7.875% to 1-23-24, then 5 Year U.S. Swap Rate + 4.898%) (D)(E) | 7.875 | 01-23-24 | 1,142,000 | 1,136,290 | |
| Fifth Third Bancorp (3 month CME Term SOFR + 3.295%) (E)(F) | 8.689 | 12-01-23 | 1,193,000 | 1,075,937 | |
| HSBC Holdings PLC (6.375% to 3-30-25, then 5 Year ICE Swap Rate + 4.368%) (E) | 6.375 | 03-30-25 | 342,000 | 322,399 | |
| Huntington Bancshares, Inc. (6.208% to 8-21-28, then Overnight SOFR + 2.020%) | 6.208 | 08-21-29 | 1,127,000 | 1,083,375 | |
| ING Groep NV (6.114% to 9-11-33, then Overnight SOFR + 2.090%) | 6.114 | 09-11-34 | 809,000 | 758,068 | |
| ING Groep NV (6.500% to 4-16-25, then 5 Year U.S. Swap Rate + 4.446%) (E) | 6.500 | 04-16-25 | 375,000 | 350,869 | |
| JPMorgan Chase & Co. (2.522% to 4-22-30, then Overnight SOFR + 2.040%) | 2.522 | 04-22-31 | 2,981,000 | 2,370,896 | |
| JPMorgan Chase & Co. (2.956% to 5-13-30, then 3 month CME Term SOFR + 2.515%) | 2.956 | 05-13-31 | 2,703,000 | 2,179,651 | |
| JPMorgan Chase & Co. (4.600% to 2-1-25, then 3 month CME Term SOFR + 3.125%) (E) | 4.600 | 02-01-25 | 2,088,000 | 1,945,313 | |
| Lloyds Banking Group PLC (7.500% to 6-27-24, then 5 Year U.S. Swap Rate + 4.760%) (E) | 7.500 | 06-27-24 | 1,600,000 | 1,559,314 | |
| M&T Bank Corp. (5.125% to 11-1-26, then 3 month LIBOR + 3.520%) (E) | 5.125 | 11-01-26 | 755,000 | 569,363 | |
| NatWest Group PLC (3.754% to 11-1-24, then 5 Year CMT + 2.100%) | 3.754 | 11-01-29 | 918,000 | 876,051 | |
| SEE NOTES TO FINANCIAL STATEMENTS | ANNUAL REPORT | JOHN HANCOCK BALANCED FUND | 23 |
| Rate (%) | Maturity date | Par value^ | Value | ||
| Financials (continued) | |||||
| Banks (continued) | |||||
| NatWest Group PLC (6.000% to 6-29-26, then 5 Year CMT + 5.625%) (B)(E) | 6.000 | 12-29-25 | 2,020,000 | $1,850,539 | |
| NatWest Markets PLC (D) | 1.600 | 09-29-26 | 2,562,000 | 2,246,839 | |
| Popular, Inc. | 7.250 | 03-13-28 | 1,510,000 | 1,497,029 | |
| Santander Holdings USA, Inc. (2.490% to 1-6-27, then Overnight SOFR + 1.249%) | 2.490 | 01-06-28 | 1,711,000 | 1,473,037 | |
| Santander Holdings USA, Inc. | 3.244 | 10-05-26 | 3,634,000 | 3,263,692 | |
| Santander Holdings USA, Inc. | 3.450 | 06-02-25 | 3,299,000 | 3,121,145 | |
| Santander Holdings USA, Inc. | 4.400 | 07-13-27 | 870,000 | 800,428 | |
| Societe Generale SA (5.375% to 11-18-30, then 5 Year CMT + 4.514%) (D)(E) | 5.375 | 11-18-30 | 1,688,000 | 1,210,644 | |
| Societe Generale SA (6.221% to 6-15-32, then 1 Year CMT + 3.200%) (D) | 6.221 | 06-15-33 | 1,152,000 | 1,014,726 | |
| Societe Generale SA (6.446% to 1-10-28, then 1 Year CMT + 2.550%) (D) | 6.446 | 01-10-29 | 2,945,000 | 2,877,385 | |
| Synovus Bank | 5.625 | 02-15-28 | 301,000 | 267,329 | |
| The PNC Financial Services Group, Inc. | 3.150 | 05-19-27 | 97,000 | 87,693 | |
| The PNC Financial Services Group, Inc. (3.400% to 9-15-26, then 5 Year CMT + 2.595%) (E) | 3.400 | 09-15-26 | 2,601,000 | 1,871,527 | |
| The PNC Financial Services Group, Inc. (5.582% to 6-12-28, then Overnight SOFR + 1.841%) | 5.582 | 06-12-29 | 2,923,000 | 2,798,651 | |
| The PNC Financial Services Group, Inc. (5.939% to 8-18-33, then Overnight SOFR + 1.946%) | 5.939 | 08-18-34 | 1,688,000 | 1,573,440 | |
| The PNC Financial Services Group, Inc. (6.250% to 3-15-30, then 7 Year CMT + 2.808%) (E) | 6.250 | 03-15-30 | 1,507,000 | 1,240,262 | |
| The PNC Financial Services Group, Inc. (3 month CME Term SOFR + 3.302%) (E)(F) | 8.711 | 12-01-23 | 1,001,000 | 987,152 | |
| The PNC Financial Services Group, Inc. (3 month CME Term SOFR + 3.940%) (E)(F) | 9.312 | 11-01-23 | 1,861,000 | 1,861,000 | |
| Truist Financial Corp. (5.867% to 6-8-33, then Overnight SOFR + 2.361%) | 5.867 | 06-08-34 | 1,739,000 | 1,581,969 | |
| Truist Financial Corp. (7.161% to 10-30-28, then Overnight SOFR + 2.446%) | 7.161 | 10-30-29 | 1,115,000 | 1,121,575 | |
| U.S. Bancorp (5.836% to 6-10-33, then Overnight SOFR + 2.260%) | 5.836 | 06-12-34 | 1,949,000 | 1,795,161 | |
| U.S. Bancorp (6.787% to 10-26-26, then Overnight SOFR + 1.880%) | 6.787 | 10-26-27 | 1,851,000 | 1,864,846 | |
| Wells Fargo & Company (2.393% to 6-2-27, then Overnight SOFR + 2.100%) | 2.393 | 06-02-28 | 4,667,000 | 4,068,072 | |
| 24 | JOHN HANCOCK BALANCED FUND | ANNUAL REPORT | SEE NOTES TO FINANCIAL STATEMENTS |
| Rate (%) | Maturity date | Par value^ | Value | ||
| Financials (continued) | |||||
| Banks (continued) | |||||
| Wells Fargo & Company (2.879% to 10-30-29, then 3 month CME Term SOFR + 1.432%) | 2.879 | 10-30-30 | 3,702,000 | $3,027,304 | |
| Wells Fargo & Company (3.350% to 3-2-32, then Overnight SOFR + 1.500%) | 3.350 | 03-02-33 | 4,371,000 | 3,441,579 | |
| Wells Fargo & Company (5.875% to 6-15-25, then 9.865% thereafter) (E) | 5.875 | 06-15-25 | 4,624,000 | 4,492,468 | |
| Capital markets 0.8% | |||||
| Ares Capital Corp. | 2.150 | 07-15-26 | 1,902,000 | 1,670,513 | |
| Ares Capital Corp. | 2.875 | 06-15-28 | 1,511,000 | 1,250,596 | |
| Ares Capital Corp. | 3.250 | 07-15-25 | 967,000 | 906,804 | |
| Ares Capital Corp. | 3.875 | 01-15-26 | 1,447,000 | 1,353,236 | |
| Blackstone Private Credit Fund | 2.350 | 11-22-24 | 1,627,000 | 1,547,987 | |
| Blackstone Private Credit Fund | 2.700 | 01-15-25 | 1,287,000 | 1,221,360 | |
| Blackstone Private Credit Fund | 3.250 | 03-15-27 | 450,000 | 388,168 | |
| Blackstone Private Credit Fund | 4.000 | 01-15-29 | 1,945,000 | 1,627,209 | |
| Deutsche Bank AG (2.311% to 11-16-26, then Overnight SOFR + 1.219%) | 2.311 | 11-16-27 | 1,632,000 | 1,411,564 | |
| Deutsche Bank AG (3.742% to 1-7-32, then Overnight SOFR + 2.257%) (B) | 3.742 | 01-07-33 | 2,055,000 | 1,437,186 | |
| Jefferies Financial Group, Inc. | 5.875 | 07-21-28 | 1,410,000 | 1,361,081 | |
| Lazard Group LLC | 4.375 | 03-11-29 | 1,466,000 | 1,330,842 | |
| Macquarie Bank, Ltd. (D) | 3.624 | 06-03-30 | 1,265,000 | 1,008,891 | |
| Morgan Stanley (2.239% to 7-21-31, then Overnight SOFR + 1.178%) | 2.239 | 07-21-32 | 1,170,000 | 862,927 | |
| Morgan Stanley (2.484% to 9-16-31, then Overnight SOFR + 1.360%) | 2.484 | 09-16-36 | 2,911,000 | 2,059,284 | |
| Morgan Stanley (4.431% to 1-23-29, then 3 month CME Term SOFR + 1.890%) | 4.431 | 01-23-30 | 393,000 | 357,836 | |
| Morgan Stanley (5.123% to 2-1-28, then Overnight SOFR + 1.730%) | 5.123 | 02-01-29 | 755,000 | 718,829 | |
| Morgan Stanley (5.164% to 4-20-28, then Overnight SOFR + 1.590%) | 5.164 | 04-20-29 | 2,360,000 | 2,245,370 | |
| Morgan Stanley (5.449% to 7-20-28, then Overnight SOFR + 1.630%) | 5.449 | 07-20-29 | 1,169,000 | 1,124,274 | |
| MSCI, Inc. (D) | 3.625 | 11-01-31 | 2,061,000 | 1,636,260 | |
| The Charles Schwab Corp. (5.643% to 5-19-28, then Overnight SOFR + 2.210%) | 5.643 | 05-19-29 | 1,965,000 | 1,891,603 | |
| The Goldman Sachs Group, Inc. (2.615% to 4-22-31, then Overnight SOFR + 1.281%) | 2.615 | 04-22-32 | 5,327,000 | 4,058,637 | |
| The Goldman Sachs Group, Inc. (2.650% to 10-21-31, then Overnight SOFR + 1.264%) | 2.650 | 10-21-32 | 1,979,000 | 1,487,918 | |
| SEE NOTES TO FINANCIAL STATEMENTS | ANNUAL REPORT | JOHN HANCOCK BALANCED FUND | 25 |
| Rate (%) | Maturity date | Par value^ | Value | ||
| Financials (continued) | |||||
| Capital markets (continued) | |||||
| UBS Group AG (6.301% to 9-22-33, then 1 Year CMT + 2.000%) (D) | 6.301 | 09-22-34 | 1,145,000 | $1,084,575 | |
| Consumer finance 0.1% | |||||
| Ally Financial, Inc. (6.992% to 6-13-28, then Overnight SOFR + 3.260%) | 6.992 | 06-13-29 | 1,542,000 | 1,473,913 | |
| Ally Financial, Inc. | 7.100 | 11-15-27 | 1,157,000 | 1,133,587 | |
| Discover Financial Services | 4.100 | 02-09-27 | 621,000 | 557,425 | |
| OneMain Finance Corp. | 9.000 | 01-15-29 | 656,000 | 638,395 | |
| Financial services 0.1% | |||||
| Block, Inc. | 3.500 | 06-01-31 | 643,000 | 496,238 | |
| Corebridge Financial, Inc. (6.875% to 12-15-27, then 5 Year CMT + 3.846%) | 6.875 | 12-15-52 | 767,000 | 708,603 | |
| Nationstar Mortgage Holdings, Inc. (D) | 5.125 | 12-15-30 | 491,000 | 397,310 | |
| Nationstar Mortgage Holdings, Inc. (D) | 5.500 | 08-15-28 | 887,000 | 783,842 | |
| Nationstar Mortgage Holdings, Inc. (D) | 6.000 | 01-15-27 | 254,000 | 236,098 | |
| Insurance 0.2% | |||||
| Athene Holding, Ltd. | 3.500 | 01-15-31 | 865,000 | 690,807 | |
| CNA Financial Corp. | 2.050 | 08-15-30 | 627,000 | 478,766 | |
| CNO Financial Group, Inc. | 5.250 | 05-30-29 | 2,053,000 | 1,894,413 | |
| Liberty Mutual Group, Inc. (4.125% to 12-15-26, then 5 Year CMT + 3.315%) (D) | 4.125 | 12-15-51 | 1,338,000 | 1,062,252 | |
| MetLife, Inc. (6.400% to 12-15-36, then 3 month LIBOR + 2.205%) | 6.400 | 12-15-36 | 1,635,000 | 1,532,774 | |
| Nippon Life Insurance Company (2.750% to 1-21-31, then 5 Year CMT + 2.653%) (D) | 2.750 | 01-21-51 | 710,000 | 545,152 | |
| SBL Holdings, Inc. (D) | 5.000 | 02-18-31 | 1,703,000 | 1,287,395 | |
| Teachers Insurance & Annuity Association of America (D) | 4.270 | 05-15-47 | 1,996,000 | 1,448,453 | |
| Health care 0.6% | 24,065,390 | ||||
| Biotechnology 0.2% | |||||
| AbbVie, Inc. | 3.200 | 11-21-29 | 4,987,000 | 4,346,013 | |
| Amgen, Inc. | 5.250 | 03-02-30 | 631,000 | 605,757 | |
| Star Parent, Inc. (D) | 9.000 | 10-01-30 | 768,000 | 762,151 | |
| Health care equipment and supplies 0.0% | |||||
| Varex Imaging Corp. (D) | 7.875 | 10-15-27 | 701,000 | 687,078 | |
| Health care providers and services 0.3% | |||||
| AdaptHealth LLC (D) | 5.125 | 03-01-30 | 915,000 | 693,113 | |
| Cencora, Inc. | 2.800 | 05-15-30 | 1,569,000 | 1,289,853 | |
| Centene Corp. | 2.450 | 07-15-28 | 507,000 | 426,483 | |
| Centene Corp. | 3.000 | 10-15-30 | 1,327,000 | 1,050,152 | |
| Centene Corp. | 3.375 | 02-15-30 | 935,000 | 773,104 | |
| 26 | JOHN HANCOCK BALANCED FUND | ANNUAL REPORT | SEE NOTES TO FINANCIAL STATEMENTS |
| Rate (%) | Maturity date | Par value^ | Value | ||
| Health care (continued) | |||||
| Health care providers and services (continued) | |||||
| CVS Health Corp. | 3.750 | 04-01-30 | 1,436,000 | $1,249,337 | |
| CVS Health Corp. | 5.050 | 03-25-48 | 1,492,000 | 1,172,838 | |
| CVS Health Corp. | 5.250 | 01-30-31 | 377,000 | 354,818 | |
| DaVita, Inc. (D) | 3.750 | 02-15-31 | 1,091,000 | 784,217 | |
| DaVita, Inc. (D) | 4.625 | 06-01-30 | 1,677,000 | 1,314,282 | |
| Fresenius Medical Care US Finance III, Inc. (D) | 2.375 | 02-16-31 | 2,609,000 | 1,776,686 | |
| Universal Health Services, Inc. | 1.650 | 09-01-26 | 1,349,000 | 1,189,823 | |
| Universal Health Services, Inc. | 2.650 | 10-15-30 | 1,611,000 | 1,231,553 | |
| Life sciences tools and services 0.0% | |||||
| Thermo Fisher Scientific, Inc. | 4.977 | 08-10-30 | 959,000 | 914,776 | |
| Pharmaceuticals 0.1% | |||||
| Royalty Pharma PLC | 1.750 | 09-02-27 | 909,000 | 773,996 | |
| Viatris, Inc. | 2.700 | 06-22-30 | 2,122,000 | 1,629,742 | |
| Viatris, Inc. | 4.000 | 06-22-50 | 1,807,000 | 1,039,618 | |
| Industrials 2.0% | 82,400,226 | ||||
| Aerospace and defense 0.2% | |||||
| Huntington Ingalls Industries, Inc. | 4.200 | 05-01-30 | 989,000 | 875,677 | |
| The Boeing Company | 3.200 | 03-01-29 | 857,000 | 740,514 | |
| The Boeing Company | 5.040 | 05-01-27 | 3,058,000 | 2,961,050 | |
| The Boeing Company | 5.150 | 05-01-30 | 4,079,000 | 3,821,819 | |
| TransDigm, Inc. | 5.500 | 11-15-27 | 1,094,000 | 1,018,464 | |
| Building products 0.1% | |||||
| Builders FirstSource, Inc. (D) | 4.250 | 02-01-32 | 1,355,000 | 1,078,386 | |
| Builders FirstSource, Inc. (D) | 6.375 | 06-15-32 | 964,000 | 882,321 | |
| Owens Corning | 3.875 | 06-01-30 | 257,000 | 221,710 | |
| Owens Corning | 3.950 | 08-15-29 | 1,662,000 | 1,473,680 | |
| Commercial services and supplies 0.1% | |||||
| Albion Financing 1 SARL (D) | 6.125 | 10-15-26 | 959,000 | 887,075 | |
| Allied Universal Holdco LLC (D) | 6.000 | 06-01-29 | 489,000 | 353,303 | |
| APX Group, Inc. (D) | 5.750 | 07-15-29 | 1,358,000 | 1,128,992 | |
| Prime Security Services Borrower LLC (D) | 3.375 | 08-31-27 | 192,000 | 168,809 | |
| Prime Security Services Borrower LLC (D) | 6.250 | 01-15-28 | 792,000 | 734,424 | |
| Construction and engineering 0.0% | |||||
| Global Infrastructure Solutions, Inc. (D) | 5.625 | 06-01-29 | 1,265,000 | 1,012,000 | |
| MasTec, Inc. (D) | 4.500 | 08-15-28 | 887,000 | 777,922 | |
| Electrical equipment 0.1% | |||||
| Emerald Debt Merger Sub LLC (D) | 6.625 | 12-15-30 | 985,000 | 936,981 | |
| Regal Rexnord Corp. (D) | 6.050 | 02-15-26 | 1,253,000 | 1,232,457 | |
| Regal Rexnord Corp. (D) | 6.400 | 04-15-33 | 1,074,000 | 985,282 | |
| SEE NOTES TO FINANCIAL STATEMENTS | ANNUAL REPORT | JOHN HANCOCK BALANCED FUND | 27 |
| Rate (%) | Maturity date | Par value^ | Value | ||
| Industrials (continued) | |||||
| Ground transportation 0.0% | |||||
| Uber Technologies, Inc. (D) | 4.500 | 08-15-29 | 1,938,000 | $1,709,189 | |
| Machinery 0.0% | |||||
| Flowserve Corp. | 3.500 | 10-01-30 | 1,019,000 | 819,648 | |
| Ingersoll Rand, Inc. | 5.400 | 08-14-28 | 352,000 | 342,985 | |
| Passenger airlines 0.9% | |||||
| Air Canada 2013-1 Class A Pass Through Trust (D) | 4.125 | 05-15-25 | 593,391 | 563,852 | |
| Air Canada 2017-1 Class B Pass Through Trust (D) | 3.700 | 01-15-26 | 564,704 | 527,248 | |
| Air Canada 2020-1 Class C Pass Through Trust (D) | 10.500 | 07-15-26 | 930,000 | 1,000,244 | |
| Alaska Airlines 2020-1 Class B Pass Through Trust (D) | 8.000 | 08-15-25 | 667,972 | 667,006 | |
| American Airlines 2015-1 Class A Pass Through Trust | 3.375 | 05-01-27 | 4,302,549 | 3,798,204 | |
| American Airlines 2016-1 Class A Pass Through Trust | 4.100 | 01-15-28 | 1,625,787 | 1,443,875 | |
| American Airlines 2016-1 Class AA Pass Through Trust | 3.575 | 01-15-28 | 464,824 | 423,574 | |
| American Airlines 2016-3 Class A Pass Through Trust | 3.250 | 10-15-28 | 225,403 | 191,241 | |
| American Airlines 2017-1 Class A Pass Through Trust | 4.000 | 02-15-29 | 825,559 | 713,924 | |
| American Airlines 2017-1 Class AA Pass Through Trust | 3.650 | 02-15-29 | 1,391,029 | 1,244,418 | |
| American Airlines 2017-2 Class A Pass Through Trust | 3.600 | 10-15-29 | 783,093 | 665,565 | |
| American Airlines 2019-1 Class A Pass Through Trust | 3.500 | 02-15-32 | 1,651,069 | 1,317,414 | |
| American Airlines 2019-1 Class AA Pass Through Trust | 3.150 | 02-15-32 | 1,680,234 | 1,400,245 | |
| American Airlines 2019-1 Class B Pass Through Trust | 3.850 | 02-15-28 | 572,632 | 497,932 | |
| American Airlines 2021-1 Class A Pass Through Trust | 2.875 | 07-11-34 | 1,264,359 | 1,018,132 | |
| American Airlines 2021-1 Class B Pass Through Trust | 3.950 | 07-11-30 | 1,721,720 | 1,477,526 | |
| American Airlines, Inc. (D) | 7.250 | 02-15-28 | 1,146,000 | 1,065,577 | |
| British Airways 2018-1 Class A Pass Through Trust (D) | 4.125 | 09-20-31 | 468,963 | 412,768 | |
| British Airways 2020-1 Class A Pass Through Trust (D) | 4.250 | 11-15-32 | 600,655 | 537,107 | |
| British Airways 2020-1 Class B Pass Through Trust (D) | 8.375 | 11-15-28 | 302,474 | 306,272 | |
| Delta Air Lines, Inc. | 4.375 | 04-19-28 | 1,731,000 | 1,589,958 | |
| Delta Air Lines, Inc. (D) | 4.750 | 10-20-28 | 2,263,559 | 2,127,704 | |
| 28 | JOHN HANCOCK BALANCED FUND | ANNUAL REPORT | SEE NOTES TO FINANCIAL STATEMENTS |
| Rate (%) | Maturity date | Par value^ | Value | ||
| Industrials (continued) | |||||
| Passenger airlines (continued) | |||||
| JetBlue 2019-1 Class AA Pass Through Trust | 2.750 | 05-15-32 | 1,304,314 | $1,092,052 | |
| United Airlines 2014-2 Class A Pass Through Trust | 3.750 | 09-03-26 | 1,987,578 | 1,853,814 | |
| United Airlines 2016-1 Class A Pass Through Trust | 3.450 | 07-07-28 | 1,661,363 | 1,454,502 | |
| United Airlines 2016-1 Class B Pass Through Trust | 3.650 | 01-07-26 | 1,400,620 | 1,311,182 | |
| United Airlines 2018-1 Class B Pass Through Trust | 4.600 | 03-01-26 | 691,107 | 647,947 | |
| United Airlines 2019-1 Class A Pass Through Trust | 4.550 | 08-25-31 | 1,482,147 | 1,275,681 | |
| United Airlines 2020-1 Class A Pass Through Trust | 5.875 | 10-15-27 | 2,876,488 | 2,832,019 | |
| United Airlines 2020-1 Class B Pass Through Trust | 4.875 | 01-15-26 | 954,560 | 914,627 | |
| United Airlines 2023-1 Class A Pass Through Trust | 5.800 | 01-15-36 | 1,871,000 | 1,753,331 | |
| United Airlines, Inc. (D) | 4.375 | 04-15-26 | 140,000 | 129,866 | |
| United Airlines, Inc. (D) | 4.625 | 04-15-29 | 288,000 | 243,275 | |
| US Airways 2012-2 Class A Pass Through Trust | 4.625 | 06-03-25 | 765,925 | 728,897 | |
| Professional services 0.1% | |||||
| Concentrix Corp. | 6.600 | 08-02-28 | 1,832,000 | 1,758,812 | |
| TriNet Group, Inc. (D) | 3.500 | 03-01-29 | 608,000 | 502,053 | |
| Trading companies and distributors 0.5% | |||||
| AerCap Ireland Capital DAC | 1.750 | 01-30-26 | 1,878,000 | 1,688,745 | |
| AerCap Ireland Capital DAC | 2.450 | 10-29-26 | 5,952,000 | 5,294,477 | |
| AerCap Ireland Capital DAC | 3.000 | 10-29-28 | 2,792,000 | 2,351,547 | |
| Air Lease Corp. | 2.100 | 09-01-28 | 1,159,000 | 951,127 | |
| Air Lease Corp. | 2.875 | 01-15-26 | 923,000 | 856,685 | |
| Air Lease Corp. | 3.625 | 12-01-27 | 1,180,000 | 1,057,224 | |
| Ashtead Capital, Inc. (D) | 2.450 | 08-12-31 | 1,113,000 | 820,852 | |
| Ashtead Capital, Inc. (D) | 4.250 | 11-01-29 | 601,000 | 523,873 | |
| Ashtead Capital, Inc. (D) | 4.375 | 08-15-27 | 1,075,000 | 995,345 | |
| Ashtead Capital, Inc. (D) | 5.550 | 05-30-33 | 709,000 | 635,354 | |
| Ashtead Capital, Inc. (D) | 5.950 | 10-15-33 | 784,000 | 715,293 | |
| Beacon Roofing Supply, Inc. (D) | 4.125 | 05-15-29 | 699,000 | 586,807 | |
| BlueLinx Holdings, Inc. (D) | 6.000 | 11-15-29 | 1,187,000 | 998,938 | |
| SMBC Aviation Capital Finance DAC (D) | 2.300 | 06-15-28 | 666,000 | 552,885 | |
| United Rentals North America, Inc. | 3.875 | 11-15-27 | 785,000 | 720,542 | |
| Information technology 0.8% | 33,121,141 | ||||
| Communications equipment 0.1% | |||||
| Motorola Solutions, Inc. | 2.300 | 11-15-30 | 2,428,000 | 1,855,796 | |
| SEE NOTES TO FINANCIAL STATEMENTS | ANNUAL REPORT | JOHN HANCOCK BALANCED FUND | 29 |
| Rate (%) | Maturity date | Par value^ | Value | ||
| Information technology (continued) | |||||
| Communications equipment (continued) | |||||
| Motorola Solutions, Inc. | 2.750 | 05-24-31 | 2,034,000 | $1,576,785 | |
| IT services 0.1% | |||||
| Gartner, Inc. (D) | 4.500 | 07-01-28 | 1,677,000 | 1,508,828 | |
| VeriSign, Inc. | 2.700 | 06-15-31 | 1,093,000 | 844,081 | |
| Semiconductors and semiconductor equipment 0.5% | |||||
| Broadcom, Inc. (D) | 3.419 | 04-15-33 | 2,537,000 | 1,972,579 | |
| Broadcom, Inc. | 4.750 | 04-15-29 | 5,911,000 | 5,496,690 | |
| Foundry JV Holdco LLC (D) | 5.875 | 01-25-34 | 1,627,000 | 1,509,323 | |
| Marvell Technology, Inc. | 2.450 | 04-15-28 | 2,255,000 | 1,929,347 | |
| Micron Technology, Inc. | 2.703 | 04-15-32 | 1,289,000 | 957,007 | |
| Micron Technology, Inc. | 4.185 | 02-15-27 | 3,214,000 | 3,008,689 | |
| Micron Technology, Inc. | 5.327 | 02-06-29 | 3,605,000 | 3,425,212 | |
| Micron Technology, Inc. | 6.750 | 11-01-29 | 948,000 | 952,608 | |
| NXP BV | 3.875 | 06-18-26 | 2,319,000 | 2,193,321 | |
| Qorvo, Inc. (D) | 3.375 | 04-01-31 | 1,276,000 | 989,404 | |
| Software 0.1% | |||||
| Autodesk, Inc. | 2.850 | 01-15-30 | 773,000 | 644,971 | |
| Consensus Cloud Solutions, Inc. (D) | 6.500 | 10-15-28 | 827,000 | 685,376 | |
| Oracle Corp. | 2.950 | 04-01-30 | 2,040,000 | 1,690,761 | |
| Technology hardware, storage and peripherals 0.0% | |||||
| CDW LLC | 3.250 | 02-15-29 | 460,000 | 388,360 | |
| Dell International LLC | 5.300 | 10-01-29 | 1,564,000 | 1,492,003 | |
| Materials 0.6% | 23,518,916 | ||||
| Chemicals 0.1% | |||||
| Braskem Idesa SAPI (D) | 6.990 | 02-20-32 | 1,072,000 | 632,724 | |
| Braskem Netherlands Finance BV (D) | 4.500 | 01-31-30 | 1,932,000 | 1,487,390 | |
| Braskem Netherlands Finance BV (D) | 5.875 | 01-31-50 | 540,000 | 348,638 | |
| OCI NV (D) | 6.700 | 03-16-33 | 1,058,000 | 976,167 | |
| Sasol Financing USA LLC | 5.500 | 03-18-31 | 1,103,000 | 844,477 | |
| Construction materials 0.1% | |||||
| Cemex SAB de CV (D) | 3.875 | 07-11-31 | 1,360,000 | 1,103,989 | |
| Cemex SAB de CV (D) | 5.200 | 09-17-30 | 1,176,000 | 1,065,835 | |
| Standard Industries, Inc. (D) | 3.375 | 01-15-31 | 706,000 | 534,242 | |
| Standard Industries, Inc. (D) | 4.375 | 07-15-30 | 873,000 | 713,261 | |
| Standard Industries, Inc. (D) | 5.000 | 02-15-27 | 196,000 | 181,158 | |
| Containers and packaging 0.1% | |||||
| Graphic Packaging International LLC (D) | 3.500 | 03-01-29 | 1,120,000 | 930,407 | |
| Mauser Packaging Solutions Holding Company (D) | 7.875 | 08-15-26 | 805,000 | 753,978 | |
| Owens-Brockway Glass Container, Inc. (D) | 6.625 | 05-13-27 | 689,000 | 654,550 | |
| Owens-Brockway Glass Container, Inc. (D) | 7.250 | 05-15-31 | 521,000 | 476,715 | |
| 30 | JOHN HANCOCK BALANCED FUND | ANNUAL REPORT | SEE NOTES TO FINANCIAL STATEMENTS |
| Rate (%) | Maturity date | Par value^ | Value | ||
| Materials (continued) | |||||
| Containers and packaging (continued) | |||||
| Pactiv Evergreen Group Issuer, Inc. (D) | 4.000 | 10-15-27 | 1,715,000 | $1,496,207 | |
| Metals and mining 0.3% | |||||
| Anglo American Capital PLC (D) | 4.750 | 04-10-27 | 1,170,000 | 1,118,968 | |
| Arsenal AIC Parent LLC (D) | 8.000 | 10-01-30 | 639,000 | 631,013 | |
| First Quantum Minerals, Ltd. (D) | 6.875 | 10-15-27 | 1,946,000 | 1,657,458 | |
| First Quantum Minerals, Ltd. (D) | 8.625 | 06-01-31 | 838,000 | 707,357 | |
| Freeport-McMoRan, Inc. | 4.250 | 03-01-30 | 1,852,000 | 1,605,123 | |
| Freeport-McMoRan, Inc. | 5.400 | 11-14-34 | 1,358,000 | 1,201,427 | |
| Freeport-McMoRan, Inc. | 5.450 | 03-15-43 | 2,134,000 | 1,755,194 | |
| Hudbay Minerals, Inc. (D) | 4.500 | 04-01-26 | 288,000 | 268,046 | |
| Newmont Corp. | 2.800 | 10-01-29 | 819,000 | 686,976 | |
| Novelis Corp. (D) | 4.750 | 01-30-30 | 1,989,000 | 1,687,616 | |
| Real estate 0.4% | 18,540,311 | ||||
| Hotel and resort REITs 0.0% | |||||
| Host Hotels & Resorts LP | 3.375 | 12-15-29 | 1,433,000 | 1,180,816 | |
| Real estate management and development 0.0% | |||||
| CoStar Group, Inc. (D) | 2.800 | 07-15-30 | 2,114,000 | 1,641,575 | |
| Cushman & Wakefield US Borrower LLC (D) | 8.875 | 09-01-31 | 116,000 | 109,978 | |
| Residential REITs 0.0% | |||||
| American Homes 4 Rent LP | 4.250 | 02-15-28 | 1,050,000 | 966,102 | |
| Specialized REITs 0.4% | |||||
| American Tower Corp. | 3.550 | 07-15-27 | 1,347,000 | 1,225,020 | |
| American Tower Corp. | 3.800 | 08-15-29 | 2,862,000 | 2,505,818 | |
| American Tower Trust I (D) | 5.490 | 03-15-28 | 2,114,000 | 2,075,763 | |
| Crown Castle, Inc. | 3.800 | 02-15-28 | 1,024,000 | 923,512 | |
| GLP Capital LP | 3.250 | 01-15-32 | 878,000 | 664,080 | |
| GLP Capital LP | 4.000 | 01-15-30 | 858,000 | 716,040 | |
| GLP Capital LP | 5.375 | 04-15-26 | 1,454,000 | 1,393,516 | |
| Iron Mountain Information Management Services, Inc. (D) | 5.000 | 07-15-32 | 382,000 | 312,574 | |
| Iron Mountain, Inc. (D) | 5.250 | 07-15-30 | 931,000 | 808,176 | |
| SBA Tower Trust (D) | 6.599 | 01-15-28 | 659,000 | 657,577 | |
| VICI Properties LP (D) | 3.875 | 02-15-29 | 798,000 | 677,447 | |
| VICI Properties LP (D) | 4.125 | 08-15-30 | 854,000 | 704,507 | |
| VICI Properties LP (D) | 4.625 | 12-01-29 | 1,845,000 | 1,595,852 | |
| VICI Properties LP | 5.125 | 05-15-32 | 442,000 | 381,958 | |
| Utilities 0.8% | 32,492,203 | ||||
| Electric utilities 0.6% | |||||
| American Electric Power Company, Inc. | 5.625 | 03-01-33 | 654,000 | 613,860 | |
| Atlantica Transmision Sur SA (D) | 6.875 | 04-30-43 | 796,376 | 775,472 | |
| Constellation Energy Generation LLC | 6.125 | 01-15-34 | 549,000 | 530,674 | |
| SEE NOTES TO FINANCIAL STATEMENTS | ANNUAL REPORT | JOHN HANCOCK BALANCED FUND | 31 |
| Rate (%) | Maturity date | Par value^ | Value | ||
| Utilities (continued) | |||||
| Electric utilities (continued) | |||||
| Constellation Energy Generation LLC | 6.500 | 10-01-53 | 937,000 | $880,070 | |
| Duke Energy Corp. | 2.450 | 06-01-30 | 594,000 | 473,362 | |
| Duke Energy Corp. | 5.750 | 09-15-33 | 1,922,000 | 1,825,644 | |
| Electricite de France SA (9.125% to 6-15-33, then 5 Year CMT + 5.411%) (D)(E) | 9.125 | 03-15-33 | 1,251,000 | 1,283,988 | |
| Emera US Finance LP | 3.550 | 06-15-26 | 1,414,000 | 1,325,187 | |
| FirstEnergy Corp. | 2.650 | 03-01-30 | 1,064,000 | 858,205 | |
| FirstEnergy Corp. | 3.400 | 03-01-50 | 475,000 | 287,260 | |
| Georgia Power Company | 4.950 | 05-17-33 | 989,000 | 902,720 | |
| NextEra Energy Capital Holdings, Inc. | 2.250 | 06-01-30 | 800,000 | 623,387 | |
| NRG Energy, Inc. (D) | 2.450 | 12-02-27 | 1,613,000 | 1,358,173 | |
| NRG Energy, Inc. (D) | 3.375 | 02-15-29 | 420,000 | 341,837 | |
| NRG Energy, Inc. (D) | 3.625 | 02-15-31 | 1,054,000 | 795,387 | |
| NRG Energy, Inc. (D) | 3.875 | 02-15-32 | 1,747,000 | 1,298,309 | |
| NRG Energy, Inc. (D) | 4.450 | 06-15-29 | 1,165,000 | 1,007,015 | |
| NRG Energy, Inc. (D) | 7.000 | 03-15-33 | 1,663,000 | 1,571,844 | |
| NRG Energy, Inc. (10.250% to 3-15-28, then 5 Year CMT + 5.920%) (D)(E) | 10.250 | 03-15-28 | 1,308,000 | 1,262,707 | |
| The Southern Company | 5.700 | 03-15-34 | 961,000 | 914,200 | |
| Vistra Operations Company LLC (D) | 3.700 | 01-30-27 | 3,050,000 | 2,773,108 | |
| Vistra Operations Company LLC (D) | 4.300 | 07-15-29 | 2,537,000 | 2,207,568 | |
| Vistra Operations Company LLC (D) | 6.950 | 10-15-33 | 1,107,000 | 1,054,403 | |
| Independent power and renewable electricity producers 0.1% | |||||
| AES Panama Generation Holdings SRL (D) | 4.375 | 05-31-30 | 1,190,248 | 971,004 | |
| DPL, Inc. | 4.125 | 07-01-25 | 945,000 | 889,290 | |
| LLPL Capital Pte, Ltd. (D) | 6.875 | 02-04-39 | 120,690 | 105,079 | |
| NextEra Energy Operating Partners LP (D) | 3.875 | 10-15-26 | 1,340,000 | 1,218,354 | |
| NextEra Energy Operating Partners LP (D) | 4.500 | 09-15-27 | 255,000 | 228,326 | |
| Multi-utilities 0.1% | |||||
| Dominion Energy, Inc. | 3.375 | 04-01-30 | 1,191,000 | 1,001,585 | |
| NiSource, Inc. | 1.700 | 02-15-31 | 594,000 | 435,050 | |
| NiSource, Inc. | 3.600 | 05-01-30 | 1,041,000 | 891,045 | |
| NiSource, Inc. | 5.250 | 03-30-28 | 380,000 | 368,936 | |
| Sempra | 5.500 | 08-01-33 | 1,526,000 | 1,419,154 | |
| Municipal bonds 0.0% | $1,659,896 | ||||
| (Cost $2,230,000) | |||||
| Golden State Tobacco Securitization Corp. (California) | 4.214 | 06-01-50 | 1,307,000 | 857,185 | |
| State Board of Administration Finance Corp. (Florida) | 1.705 | 07-01-27 | 923,000 | 802,711 | |
| 32 | JOHN HANCOCK BALANCED FUND | ANNUAL REPORT | SEE NOTES TO FINANCIAL STATEMENTS |
| Rate (%) | Maturity date | Par value^ | Value | ||
| Collateralized mortgage obligations 1.4% | $59,564,714 | ||||
| (Cost $71,572,012) | |||||
| Commercial and residential 1.0% | 43,258,928 | ||||
| Angel Oak Mortgage Trust LLC | |||||
| Series 2020-R1, Class A1 (D)(G) | 0.990 | 04-25-53 | 563,082 | 505,350 | |
| Series 2021-2, Class A1 (D)(G) | 0.985 | 04-25-66 | 518,585 | 414,072 | |
| Series 2021-4, Class A1 (D)(G) | 1.035 | 01-20-65 | 1,397,165 | 1,071,228 | |
| Series 2021-5, Class A1 (D)(G) | 0.951 | 07-25-66 | 1,632,516 | 1,320,492 | |
| Arroyo Mortgage Trust | |||||
| Series 2021-1R, Class A1 (D)(G) | 1.175 | 10-25-48 | 903,082 | 697,328 | |
| BAMLL Commercial Mortgage Securities Trust | |||||
| Series 2019-BPR, Class ENM (D)(G) | 3.719 | 11-05-32 | 575,000 | 186,509 | |
| Barclays Commercial Mortgage Trust | |||||
| Series 2019-C5, Class A2 | 3.043 | 11-15-52 | 665,000 | 641,571 | |
| BBCMS Mortgage Trust | |||||
| Series 2020-C6, Class A2 | 2.690 | 02-15-53 | 822,000 | 736,250 | |
| BBCMS Trust | |||||
| Series 2015-SRCH, Class D (D)(G) | 4.957 | 08-10-35 | 840,000 | 582,463 | |
| Benchmark Mortgage Trust | |||||
| Series 2019-B12, Class A2 | 3.001 | 08-15-52 | 902,970 | 802,747 | |
| Series 2019-B13, Class A2 | 2.889 | 08-15-57 | 780,000 | 679,845 | |
| BRAVO Residential Funding Trust | |||||
| Series 2021-NQM1, Class A1 (D)(G) | 0.941 | 02-25-49 | 668,703 | 580,118 | |
| BX Trust | |||||
| Series 2022-CLS, Class A (D) | 5.760 | 10-13-27 | 1,528,000 | 1,469,036 | |
| Citigroup Commercial Mortgage Trust | |||||
| Series 2023-SMRT, Class A (D)(G) | 5.820 | 10-12-40 | 1,109,000 | 1,068,226 | |
| COLT Mortgage Loan Trust | |||||
| Series 2021-2, Class A1 (D)(G) | 0.924 | 08-25-66 | 1,052,264 | 802,599 | |
| Series 2021-3, Class A1 (D)(G) | 0.956 | 09-27-66 | 1,534,643 | 1,160,027 | |
| Series 2021-HX1, Class A1 (D)(G) | 1.110 | 10-25-66 | 1,192,842 | 949,940 | |
| COLT Trust | |||||
| Series 2020-RPL1, Class A1 (D)(G) | 1.390 | 01-25-65 | 2,478,831 | 1,982,347 | |
| Commercial Mortgage Trust (Cantor Fitzgerald/Deutsche Bank AG) | |||||
| Series 2012-CR3, Class XA IO | 0.879 | 10-15-45 | 79,105 | 1 | |
| Commercial Mortgage Trust (Citigroup/Deutsche Bank AG) | |||||
| Series 2018-COR3, Class XA IO | 0.432 | 05-10-51 | 9,542,301 | 152,447 | |
| Commercial Mortgage Trust (Deutsche Bank AG) | |||||
| Series 2013-300P, Class D (D)(G) | 4.394 | 08-10-30 | 880,000 | 677,277 | |
| Series 2017-PANW, Class A (D) | 3.244 | 10-10-29 | 305,000 | 278,740 | |
| Series 2020-CBM, Class A2 (D) | 2.896 | 02-10-37 | 987,000 | 931,273 | |
| Credit Suisse Mortgage Capital Certificates | |||||
| Series 2020-NET, Class A (D) | 2.257 | 08-15-37 | 671,716 | 607,807 | |
| Series 2021-NQM2, Class A1 (D)(G) | 1.179 | 02-25-66 | 969,590 | 794,474 | |
| Series 2021-NQM3, Class A1 (D)(G) | 1.015 | 04-25-66 | 828,161 | 662,514 | |
| Series 2021-NQM5, Class A1 (D)(G) | 0.938 | 05-25-66 | 579,648 | 438,741 | |
| Series 2021-NQM6, Class A1 (D)(G) | 1.174 | 07-25-66 | 1,719,135 | 1,310,537 | |
| Ellington Financial Mortgage Trust | |||||
| Series 2021-1, Class A1 (D)(G) | 0.797 | 02-25-66 | 585,910 | 470,873 | |
| SEE NOTES TO FINANCIAL STATEMENTS | ANNUAL REPORT | JOHN HANCOCK BALANCED FUND | 33 |
| Rate (%) | Maturity date | Par value^ | Value | ||
| Commercial and residential (continued) | |||||
| Series 2021-2, Class A1 (D)(G) | 0.931 | 06-25-66 | 971,578 | $734,026 | |
| Flagstar Mortgage Trust | |||||
| Series 2021-1, Class A2 (D)(G) | 2.500 | 02-01-51 | 1,880,819 | 1,371,602 | |
| GCAT Trust | |||||
| Series 2021-NQM1, Class A1 (D)(G) | 0.874 | 01-25-66 | 608,852 | 474,079 | |
| Series 2021-NQM2, Class A1 (D)(G) | 1.036 | 05-25-66 | 733,056 | 572,610 | |
| Series 2021-NQM3, Class A1 (D)(G) | 1.091 | 05-25-66 | 1,094,356 | 861,098 | |
| GS Mortgage Securities Trust | |||||
| Series 2015-590M, Class C (D)(G) | 3.805 | 10-10-35 | 320,000 | 276,962 | |
| Series 2017-485L, Class C (D)(G) | 3.982 | 02-10-37 | 250,000 | 201,262 | |
| Series 2020-UPTN, Class A (D) | 2.751 | 02-10-37 | 650,000 | 605,558 | |
| GS Mortgage-Backed Securities Trust | |||||
| Series 2020-NQM1, Class A1 (D)(G) | 1.382 | 09-27-60 | 154,521 | 137,570 | |
| Series 2021-NQM1, Class A1 (D)(G) | 1.017 | 07-25-61 | 454,799 | 371,182 | |
| Imperial Fund Mortgage Trust | |||||
| Series 2021-NQM1, Class A1 (D)(G) | 1.071 | 06-25-56 | 695,960 | 553,355 | |
| JPMorgan Chase Commercial Mortgage Securities Trust | |||||
| Series 2020-NNN, Class AFX (D) | 2.812 | 01-16-37 | 1,161,000 | 1,033,290 | |
| MFA Trust | |||||
| Series 2021-NQM1, Class A1 (D)(G) | 1.153 | 04-25-65 | 459,220 | 398,553 | |
| Natixis Commercial Mortgage Securities Trust | |||||
| Series 2018-285M, Class D (D)(G) | 3.790 | 11-15-32 | 464,000 | 284,200 | |
| Series 2018-ALXA, Class C (D)(G) | 4.316 | 01-15-43 | 380,000 | 295,904 | |
| NYMT Loan Trust | |||||
| Series 2022-CP1, Class A1 (D) | 2.042 | 07-25-61 | 803,553 | 708,017 | |
| OBX Trust | |||||
| Series 2020-EXP2, Class A3 (D)(G) | 2.500 | 05-25-60 | 402,752 | 307,718 | |
| Series 2021-NQM2, Class A1 (D)(G) | 1.101 | 05-25-61 | 1,046,323 | 760,326 | |
| Series 2021-NQM3, Class A1 (D)(G) | 1.054 | 07-25-61 | 1,672,761 | 1,201,317 | |
| Provident Funding Mortgage Trust | |||||
| Series 2020-F1, Class A2 (D)(G) | 2.000 | 01-25-36 | 1,472,923 | 1,206,037 | |
| SLG Office Trust | |||||
| Series 2021-OVA, Class D (D) | 2.851 | 07-15-41 | 1,738,000 | 1,220,333 | |
| Starwood Mortgage Residential Trust | |||||
| Series 2022-1, Class A1 (D)(G) | 2.447 | 12-25-66 | 1,758,946 | 1,432,439 | |
| Towd Point Mortgage Trust | |||||
| Series 2018-4, Class A1 (D)(G) | 3.000 | 06-25-58 | 715,104 | 641,723 | |
| Series 2019-1, Class A1 (D)(G) | 3.750 | 03-25-58 | 784,950 | 725,143 | |
| Series 2019-4, Class A1 (D)(G) | 2.900 | 10-25-59 | 809,788 | 738,295 | |
| Series 2020-4, Class A1 (D) | 1.750 | 10-25-60 | 1,225,280 | 1,047,084 | |
| Verus Securitization Trust | |||||
| Series 2020-5, Class A1 (1.218% to 10-1-24, then 2.218% thereafter) (D) | 1.218 | 05-25-65 | 282,273 | 255,155 | |
| Series 2021-3, Class A1 (D)(G) | 1.046 | 06-25-66 | 1,253,628 | 998,809 | |
| Series 2021-4, Class A1 (D)(G) | 0.938 | 07-25-66 | 707,119 | 535,492 | |
| Series 2021-5, Class A1 (D)(G) | 1.013 | 09-25-66 | 1,151,729 | 890,785 | |
| Series 2021-R1, Class A1 (D)(G) | 0.820 | 10-25-63 | 500,782 | 444,172 | |
| 34 | JOHN HANCOCK BALANCED FUND | ANNUAL REPORT | SEE NOTES TO FINANCIAL STATEMENTS |
| Rate (%) | Maturity date | Par value^ | Value | ||
| U.S. Government Agency 0.4% | $16,305,786 | ||||
| Government National Mortgage Association | |||||
| Series 2012-114, Class IO | 0.621 | 01-16-53 | 774,254 | 11,975 | |
| Series 2016-174, Class IO | 0.891 | 11-16-56 | 1,518,974 | 60,065 | |
| Series 2017-109, Class IO | 0.230 | 04-16-57 | 1,810,178 | 28,899 | |
| Series 2017-124, Class IO | 0.628 | 01-16-59 | 1,480,291 | 46,581 | |
| Series 2017-135, Class IO | 0.718 | 10-16-58 | 2,765,891 | 102,542 | |
| Series 2017-140, Class IO | 0.486 | 02-16-59 | 1,295,162 | 39,033 | |
| Series 2017-159, Class IO | 0.433 | 06-16-59 | 1,972,365 | 54,711 | |
| Series 2017-169, Class IO | 0.582 | 01-16-60 | 23,263,105 | 708,773 | |
| Series 2017-20, Class IO | 0.528 | 12-16-58 | 2,289,505 | 53,796 | |
| Series 2017-22, Class IO | 0.755 | 12-16-57 | 821,134 | 28,963 | |
| Series 2017-41, Class IO | 0.591 | 07-16-58 | 1,437,181 | 40,508 | |
| Series 2017-46, Class IO | 0.644 | 11-16-57 | 2,282,224 | 78,642 | |
| Series 2017-61, Class IO | 0.745 | 05-16-59 | 1,114,925 | 40,232 | |
| Series 2018-158, Class IO | 0.776 | 05-16-61 | 2,988,756 | 147,467 | |
| Series 2018-35, Class IO | 0.531 | 03-16-60 | 3,809,346 | 129,696 | |
| Series 2018-43, Class IO | 0.437 | 05-16-60 | 4,788,216 | 149,664 | |
| Series 2018-68, Class IO | 0.427 | 01-16-60 | 5,942,761 | 181,047 | |
| Series 2018-69, Class IO | 0.612 | 04-16-60 | 3,296,170 | 141,641 | |
| Series 2018-81, Class IO | 0.483 | 01-16-60 | 4,748,841 | 179,475 | |
| Series 2018-9, Class IO | 0.443 | 01-16-60 | 6,132,489 | 182,833 | |
| Series 2019-131, Class IO | 0.802 | 07-16-61 | 3,039,877 | 158,014 | |
| Series 2020-100, Class IO | 0.783 | 05-16-62 | 4,133,887 | 231,336 | |
| Series 2020-108, Class IO | 0.847 | 06-16-62 | 23,847,030 | 1,344,119 | |
| Series 2020-114, Class IO | 0.800 | 09-16-62 | 11,130,888 | 627,188 | |
| Series 2020-118, Class IO | 0.882 | 06-16-62 | 9,251,476 | 553,001 | |
| Series 2020-119, Class IO | 0.602 | 08-16-62 | 4,589,282 | 213,728 | |
| Series 2020-120, Class IO | 0.761 | 05-16-62 | 2,774,675 | 153,656 | |
| Series 2020-137, Class IO | 0.795 | 09-16-62 | 19,157,675 | 1,040,831 | |
| Series 2020-150, Class IO | 0.962 | 12-16-62 | 8,701,261 | 565,566 | |
| Series 2020-170, Class IO | 0.834 | 11-16-62 | 11,198,679 | 678,497 | |
| Series 2020-92, Class IO | 0.878 | 02-16-62 | 9,701,401 | 583,786 | |
| Series 2021-110, Class IO | 0.873 | 11-16-63 | 7,359,941 | 466,603 | |
| Series 2021-163, Class IO | 0.801 | 03-16-64 | 9,242,719 | 532,557 | |
| Series 2021-183, Class IO | 0.871 | 01-16-63 | 7,183,904 | 427,293 | |
| Series 2021-3, Class IO | 0.868 | 09-16-62 | 20,589,231 | 1,246,149 | |
| Series 2021-40, Class IO | 0.824 | 02-16-63 | 4,135,332 | 247,945 | |
| Series 2021-47, Class IO | 0.992 | 03-16-61 | 26,696,868 | 1,824,189 | |
| Series 2022-17, Class IO | 0.802 | 06-16-64 | 11,397,000 | 705,758 | |
| Series 2022-181, Class IO | 0.716 | 07-16-64 | 5,381,848 | 351,464 | |
| Series 2022-21, Class IO | 0.783 | 10-16-63 | 4,802,450 | 291,402 | |
| Series 2022-53, Class IO | 0.712 | 06-16-64 | 17,762,280 | 879,181 | |
| Series 2022-57, Class IO | 0.755 | 09-16-63 | 13,392,574 | 776,980 | |
| SEE NOTES TO FINANCIAL STATEMENTS | ANNUAL REPORT | JOHN HANCOCK BALANCED FUND | 35 |
| Rate (%) | Maturity date | Par value^ | Value | ||
| Asset backed securities 2.1% | $86,245,245 | ||||
| (Cost $97,511,328) | |||||
| Asset backed securities 2.1% | 86,245,245 | ||||
| ABPCI Direct Lending Fund I, Ltd. | |||||
| Series 2020-1A, Class A (D) | 3.199 | 12-20-30 | 648,781 | 613,654 | |
| Aligned Data Centers Issuer LLC | |||||
| Series 2021-1A, Class A2 (D) | 1.937 | 08-15-46 | 3,455,000 | 3,010,144 | |
| AMSR Trust | |||||
| Series 2020-SFR4, Class A (D) | 1.355 | 11-17-37 | 301,000 | 273,501 | |
| Series 2021-SFR4, Class A (D) | 2.117 | 12-17-38 | 439,000 | 387,882 | |
| Applebee’s Funding LLC | |||||
| Series 2023-1A, Class A2 (D) | 7.824 | 03-05-53 | 1,003,000 | 982,363 | |
| Aqua Finance Trust | |||||
| Series 2021-A, Class A (D) | 1.540 | 07-17-46 | 655,852 | 575,277 | |
| Arby’s Funding LLC | |||||
| Series 2020-1A, Class A2 (D) | 3.237 | 07-30-50 | 2,298,780 | 2,023,074 | |
| BRE Grand Islander Timeshare Issuer LLC | |||||
| Series 2019-A, Class A (D) | 3.280 | 09-26-33 | 439,232 | 412,980 | |
| CARS-DB4 LP | |||||
| Series 2020-1A, Class B1 (D) | 4.170 | 02-15-50 | 1,485,000 | 1,405,588 | |
| CF Hippolyta Issuer LLC | |||||
| Series 2020-1, Class A1 (D) | 1.690 | 07-15-60 | 2,545,449 | 2,308,636 | |
| Series 2021-1A, Class A1 (D) | 1.530 | 03-15-61 | 2,197,788 | 1,924,158 | |
| CLI Funding VI LLC | |||||
| Series 2020-1A, Class A (D) | 2.080 | 09-18-45 | 2,511,414 | 2,164,091 | |
| CLI Funding VIII LLC | |||||
| Series 2021-1A, Class A (D) | 1.640 | 02-18-46 | 1,753,848 | 1,492,087 | |
| Series 2022-1A, Class A (D) | 2.720 | 01-18-47 | 1,503,690 | 1,259,281 | |
| CyrusOne Data Centers Issuer I LLC | |||||
| Series 2023-1A, Class A2 (D) | 4.300 | 04-20-48 | 2,001,000 | 1,752,824 | |
| DataBank Issuer | |||||
| Series 2021-1A, Class A2 (D) | 2.060 | 02-27-51 | 1,281,000 | 1,128,244 | |
| DB Master Finance LLC | |||||
| Series 2017-1A, Class A2II (D) | 4.030 | 11-20-47 | 921,375 | 835,241 | |
| Series 2021-1A, Class A2I (D) | 2.045 | 11-20-51 | 3,703,043 | 3,242,091 | |
| Diamond Infrastructure Funding LLC | |||||
| Series 2021-1A, Class C (D) | 3.475 | 04-15-49 | 514,000 | 446,374 | |
| Domino’s Pizza Master Issuer LLC | |||||
| Series 2017-1A, Class A23 (D) | 4.118 | 07-25-47 | 2,470,293 | 2,275,819 | |
| Series 2021-1A, Class A2I (D) | 2.662 | 04-25-51 | 1,889,550 | 1,577,823 | |
| Driven Brands Funding LLC | |||||
| Series 2020-2A, Class A2 (D) | 3.237 | 01-20-51 | 1,745,638 | 1,484,701 | |
| Series 2021-1A, Class A2 (D) | 2.791 | 10-20-51 | 2,348,080 | 1,920,103 | |
| FirstKey Homes Trust | |||||
| Series 2020-SFR1, Class A (D) | 1.339 | 08-17-37 | 2,708,140 | 2,476,635 | |
| Series 2020-SFR2, Class A (D) | 1.266 | 10-19-37 | 1,380,255 | 1,251,118 | |
| Series 2021-SFR1, Class A (D) | 1.538 | 08-17-38 | 1,477,866 | 1,296,814 | |
| Series 2021-SFR1, Class D (D) | 2.189 | 08-17-38 | 1,729,000 | 1,496,431 | |
| Ford Credit Auto Owner Trust | |||||
| Series 2023-2, Class A (D) | 5.280 | 02-15-36 | 1,998,000 | 1,949,544 | |
| 36 | JOHN HANCOCK BALANCED FUND | ANNUAL REPORT | SEE NOTES TO FINANCIAL STATEMENTS |
| Rate (%) | Maturity date | Par value^ | Value | ||
| Asset backed securities (continued) | |||||
| Golub Capital Partners Funding, Ltd. | |||||
| Series 2020-1A, Class A2 (D) | 3.208 | 01-22-29 | 825,464 | $760,213 | |
| Series 2021-1A, Class A2 (D) | 2.773 | 04-20-29 | 1,714,930 | 1,607,928 | |
| HI-FI Music IP Issuer LP | |||||
| Series 2022-1A, Class A2 (D) | 3.939 | 02-01-62 | 1,696,000 | 1,535,691 | |
| Hilton Grand Vacations Trust | |||||
| Series 2022-1D, Class B (D) | 4.100 | 06-20-34 | 148,935 | 140,575 | |
| Home Partners of America Trust | |||||
| Series 2021-2, Class A (D) | 1.901 | 12-17-26 | 819,188 | 715,443 | |
| Jack in the Box Funding LLC | |||||
| Series 2019-1A, Class A23 (D) | 4.970 | 08-25-49 | 787,800 | 696,163 | |
| Series 2022-1A, Class A2I (D) | 3.445 | 02-26-52 | 2,135,940 | 1,897,402 | |
| MetroNet Infrastructure Issuer LLC | |||||
| Series 2023-1A, Class A2 (D) | 6.560 | 04-20-53 | 1,176,000 | 1,127,752 | |
| Navient Private Education Refi Loan Trust | |||||
| Series 2019-FA, Class A2 (D) | 2.600 | 08-15-68 | 757,906 | 695,042 | |
| Navient Student Loan Trust | |||||
| Series 2020-2A, Class A1A (D) | 1.320 | 08-26-69 | 1,097,503 | 906,149 | |
| Neighborly Issuer LLC | |||||
| Series 2021-1A, Class A2 (D) | 3.584 | 04-30-51 | 2,849,925 | 2,350,242 | |
| Series 2022-1A, Class A2 (D) | 3.695 | 01-30-52 | 1,442,310 | 1,161,442 | |
| New Economy Assets Phase 1 Sponsor LLC | |||||
| Series 2021-1, Class A1 (D) | 1.910 | 10-20-61 | 2,951,000 | 2,523,524 | |
| Series 2021-1, Class B1 (D) | 2.410 | 10-20-61 | 1,005,000 | 837,409 | |
| NRZ Excess Spread-Collateralized Notes | |||||
| Series 2021-FHT1, Class A (D) | 3.104 | 07-25-26 | 346,404 | 311,707 | |
| Progress Residential Trust | |||||
| Series 2020-SFR1, Class A (D) | 1.732 | 04-17-37 | 1,126,955 | 1,055,130 | |
| Series 2021-SFR8, Class B (D) | 1.681 | 10-17-38 | 1,093,000 | 950,504 | |
| Renaissance Home Equity Loan Trust | |||||
| Series 2005-2, Class AF4 | 5.434 | 08-25-35 | 113,741 | 111,911 | |
| Retained Vantage Data Centers Issuer LLC | |||||
| Series 2023-1A, Class A2A (D) | 5.000 | 09-15-48 | 1,897,000 | 1,709,792 | |
| Sesac Finance LLC | |||||
| Series 2019-1, Class A2 (D) | 5.216 | 07-25-49 | 2,109,373 | 1,991,045 | |
| SMB Private Education Loan Trust | |||||
| Series 2019-B, Class A2A (D) | 2.840 | 06-15-37 | 1,112,410 | 1,035,216 | |
| Series 2020-PTA, Class A2A (D) | 1.600 | 09-15-54 | 1,006,850 | 886,314 | |
| Series 2021-A, Class APT2 (D) | 1.070 | 01-15-53 | 807,688 | 687,051 | |
| Sonic Capital LLC | |||||
| Series 2020-1A, Class A2I (D) | 3.845 | 01-20-50 | 2,051,898 | 1,856,689 | |
| Series 2021-1A, Class A2I (D) | 2.190 | 08-20-51 | 1,515,750 | 1,214,423 | |
| Sunbird Engine Finance LLC | |||||
| Series 2020-1A, Class A (D) | 3.671 | 02-15-45 | 370,714 | 312,478 | |
| Taco Bell Funding LLC | |||||
| Series 2021-1A, Class A2I (D) | 1.946 | 08-25-51 | 3,096,840 | 2,668,934 | |
| TIF Funding II LLC | |||||
| Series 2021-1A, Class A (D) | 1.650 | 02-20-46 | 1,202,097 | 987,592 | |
| SEE NOTES TO FINANCIAL STATEMENTS | ANNUAL REPORT | JOHN HANCOCK BALANCED FUND | 37 |
| Rate (%) | Maturity date | Par value^ | Value | ||
| Asset backed securities (continued) | |||||
| Triton Container Finance VIII LLC | |||||
| Series 2020-1A, Class A (D) | 2.110 | 09-20-45 | 2,508,917 | $2,141,612 | |
| Series 2021-1A, Class A (D) | 1.860 | 03-20-46 | 1,555,371 | 1,295,094 | |
| Vantage Data Centers LLC | |||||
| Series 2020-1A, Class A2 (D) | 1.645 | 09-15-45 | 1,835,000 | 1,662,127 | |
| Series 2020-2A, Class A2 (D) | 1.992 | 09-15-45 | 1,650,000 | 1,376,896 | |
| VR Funding LLC | |||||
| Series 2020-1A, Class A (D) | 2.790 | 11-15-50 | 2,107,216 | 1,845,978 | |
| Wendy’s Funding LLC | |||||
| Series 2021-1A, Class A2I (D) | 2.370 | 06-15-51 | 1,993,123 | 1,614,296 | |
| Willis Engine Structured Trust V | |||||
| Series 2020-A, Class A (D) | 3.228 | 03-15-45 | 351,847 | 292,505 | |
| Zaxby’s Funding LLC | |||||
| Series 2021-1A, Class A2 (D) | 3.238 | 07-30-51 | 1,611,898 | 1,316,498 | |
| Par value^ | Value | ||||
| Escrow certificates 0.0% | $17,263 | ||||
| (Cost $30,400) | |||||
| LSC Communications, Inc. (A)(D)(H) | 1,058,000 | 2,063 | |||
| Teekay Offshore Partners LP (A) | 1,216,000 | 15,200 | |||
| Yield* (%) | Maturity date | Par value^ | Value | ||
| Short-term investments 1.6% | $67,490,416 | ||||
| (Cost $67,483,207) | |||||
| U.S. Government Agency 0.8% | 35,000,000 | ||||
| Federal Agricultural Mortgage Corp. Discount Note | 5.200 | 11-01-23 | 35,000,000 | 35,000,000 |
| Yield (%) | Shares | Value | |||
| Short-term funds 0.8% | 32,490,416 | ||||
| John Hancock Collateral Trust (I) | 5.5153(J) | 3,250,147 | 32,490,416 | ||
| Total investments (Cost $3,415,369,825) 100.4% | $4,237,766,310 | ||||
| Other assets and liabilities, net (0.4%) | (17,996,072) | ||||
| Total net assets 100.0% | $4,219,770,238 | ||||
| The percentage shown for each investment category is the total value of the category as a percentage of the net assets of the fund. | |
| ^All par values are denominated in U.S. dollars unless otherwise indicated. | |
| Security Abbreviations and Legend | |
| ADR | American Depositary Receipt |
| CME | Chicago Mercantile Exchange |
| CMT | Constant Maturity Treasury |
| ICE | Intercontinental Exchange |
| IO | Interest-Only Security - (Interest Tranche of Stripped Mortgage Pool). Rate shown is the annualized yield at the end of the period. |
| LIBOR | London Interbank Offered Rate |
| 38 | JOHN HANCOCK BALANCED FUND | ANNUAL REPORT | SEE NOTES TO FINANCIAL STATEMENTS |
| NYRS | New York Registry Shares |
| SOFR | Secured Overnight Financing Rate |
| (A) | Non-income producing security. |
| (B) | All or a portion of this security is on loan as of 10-31-23. |
| (C) | Security purchased or sold on a when-issued or delayed delivery basis. |
| (D) | These securities are exempt from registration under Rule 144A of the Securities Act of 1933. Such securities may be resold, normally to qualified institutional buyers, in transactions exempt from registration. |
| (E) | Perpetual bonds have no stated maturity date. Date shown as maturity date is next call date. |
| (F) | Variable rate obligation. The coupon rate shown represents the rate at period end. |
| (G) | Variable or floating rate security, the interest rate of which adjusts periodically based on a weighted average of interest rates and prepayments on the underlying pool of assets. The interest rate shown is the current rate as of period end. |
| (H) | Security is valued using significant unobservable inputs and is classified as Level 3 in the fair value hierarchy. Refer to Note 2 to the financial statements. |
| (I) | Investment is an affiliate of the fund, the advisor and/or subadvisor. This security represents the investment of cash collateral received for securities lending. |
| (J) | The rate shown is the annualized seven-day yield as of 10-31-23. |
| * | Yield represents either the annualized yield at the date of purchase, the stated coupon rate or, for floating rate securities, the rate at period end. |
| SEE NOTES TO FINANCIAL STATEMENTS | ANNUAL REPORT | JOHN HANCOCK BALANCED FUND | 39 |
| Assets | |
| Unaffiliated investments, at value (Cost $3,382,886,618) including $49,992,769 of securities loaned | $4,205,275,894 |
| Affiliated investments, at value (Cost $32,483,207) | 32,490,416 |
| Total investments, at value (Cost $3,415,369,825) | 4,237,766,310 |
| Cash | 3,121,943 |
| Foreign currency, at value (Cost $535) | 527 |
| Dividends and interest receivable | 14,346,267 |
| Receivable for fund shares sold | 7,551,968 |
| Receivable for investments sold | 240,423 |
| Receivable for delayed delivery securities sold | 1,941,925 |
| Receivable for securities lending income | 14,827 |
| Other assets | 448,622 |
| Total assets | 4,265,432,812 |
| Liabilities | |
| Payable for delayed delivery securities purchased | 5,077,381 |
| Payable for fund shares repurchased | 6,951,130 |
| Payable upon return of securities loaned | 32,528,618 |
| Payable to affiliates | |
| Accounting and legal services fees | 308,818 |
| Transfer agent fees | 364,441 |
| Distribution and service fees | 145,986 |
| Trustees’ fees | 6,259 |
| Other liabilities and accrued expenses | 279,941 |
| Total liabilities | 45,662,574 |
| Net assets | $4,219,770,238 |
| Net assets consist of | |
| Paid-in capital | $3,528,750,290 |
| Total distributable earnings (loss) | 691,019,948 |
| Net assets | $4,219,770,238 |
| 40 | JOHN HANCOCK Balanced Fund | ANNUAL REPORT | SEE NOTES TO FINANCIAL STATEMENTS |
| Net asset value per share | |
| Based on net asset value and shares outstanding - the fund has an unlimited number of shares authorized with no par value | |
| Class A ($2,624,905,205 ÷ 111,262,011 shares)1 | $23.59 |
| Class C ($162,646,627 ÷ 6,908,784 shares)1 | $23.54 |
| Class I ($691,680,099 ÷ 29,354,163 shares) | $23.56 |
| Class R2 ($10,311,504 ÷ 437,590 shares) | $23.56 |
| Class R4 ($24,189,629 ÷ 1,020,066 shares) | $23.71 |
| Class R5 ($2,379,576 ÷ 100,529 shares) | $23.67 |
| Class R6 ($703,657,598 ÷ 29,811,809 shares) | $23.60 |
| Maximum offering price per share | |
| Class A (net asset value per share ÷ 95.5%)2 | $24.70 |
| 1 | Redemption price per share is equal to net asset value less any applicable contingent deferred sales charge. |
| 2 | On single retail sales of less than $50,000. On sales of $50,000 or more and on group sales the offering price is reduced. |
| SEE NOTES TO FINANCIAL STATEMENTS | ANNUAL REPORT | JOHN HANCOCK Balanced Fund | 41 |
| Investment income | |
| Interest | $66,455,690 |
| Dividends | 41,802,978 |
| Securities lending | 260,996 |
| Less foreign taxes withheld | (345,711) |
| Total investment income | 108,173,953 |
| Expenses | |
| Investment management fees | 24,147,015 |
| Distribution and service fees | 9,802,495 |
| Accounting and legal services fees | 890,530 |
| Transfer agent fees | 4,145,363 |
| Trustees’ fees | 106,111 |
| Custodian fees | 593,701 |
| State registration fees | 234,105 |
| Printing and postage | 181,285 |
| Professional fees | 216,692 |
| Other | 209,623 |
| Total expenses | 40,526,920 |
| Less expense reductions | (328,255) |
| Net expenses | 40,198,665 |
| Net investment income | 67,975,288 |
| Realized and unrealized gain (loss) | |
| Net realized gain (loss) on | |
| Unaffiliated investments and foreign currency transactions | (80,786,358) |
| Affiliated investments | 8,960 |
| Futures contracts | (1,281,827) |
| (82,059,225) | |
| Change in net unrealized appreciation (depreciation) of | |
| Unaffiliated investments and translation of assets and liabilities in foreign currencies | 320,107,346 |
| Affiliated investments | 12,360 |
| 320,119,706 | |
| Net realized and unrealized gain | 238,060,481 |
| Increase in net assets from operations | $306,035,769 |
| 42 | JOHN HANCOCK Balanced Fund | ANNUAL REPORT | SEE NOTES TO FINANCIAL STATEMENTS |
| Year ended 10-31-23 | Year ended 10-31-22 | |
| Increase (decrease) in net assets | ||
| From operations | ||
| Net investment income | $67,975,288 | $53,969,998 |
| Net realized loss | (82,059,225) | (32,532,671) |
| Change in net unrealized appreciation (depreciation) | 320,119,706 | (741,307,013) |
| Increase (decrease) in net assets resulting from operations | 306,035,769 | (719,869,686) |
| Distributions to shareholders | ||
| From earnings | ||
| Class A | (41,551,163) | (79,419,058) |
| Class C | (1,741,633) | (6,660,725) |
| Class I | (13,425,000) | (27,729,529) |
| Class R2 | (154,598) | (321,884) |
| Class R4 | (427,201) | (859,121) |
| Class R5 | (46,275) | (88,375) |
| Class R6 | (13,684,054) | (22,432,649) |
| Total distributions | (71,029,924) | (137,511,341) |
| From fund share transactions | 50,525,786 | 323,608,726 |
| Total increase (decrease) | 285,531,631 | (533,772,301) |
| Net assets | ||
| Beginning of year | 3,934,238,607 | 4,468,010,908 |
| End of year | $4,219,770,238 | $3,934,238,607 |
| SEE NOTES TO FINANCIAL STATEMENTS | ANNUAL REPORT | JOHN HANCOCK Balanced Fund | 43 |
| CLASS A SHARES Period ended | 10-31-23 | 10-31-22 | 10-31-21 | 10-31-20 | 10-31-19 |
| Per share operating performance | |||||
| Net asset value, beginning of period | $22.25 | $27.14 | $22.51 | $20.90 | $20.18 |
| Net investment income1 | 0.36 | 0.30 | 0.25 | 0.27 | 0.32 |
| Net realized and unrealized gain (loss) on investments | 1.36 | (4.40) | 4.75 | 1.79 | 1.84 |
| Total from investment operations | 1.72 | (4.10) | 5.00 | 2.06 | 2.16 |
| Less distributions | |||||
| From net investment income | (0.38) | (0.34) | (0.30) | (0.30) | (0.33) |
| From net realized gain | — | (0.45) | (0.07) | (0.15) | (1.11) |
| Total distributions | (0.38) | (0.79) | (0.37) | (0.45) | (1.44) |
| Net asset value, end of period | $23.59 | $22.25 | $27.14 | $22.51 | $20.90 |
| Total return (%)2,3 | 7.76 | (15.46) | 22.38 | 10.06 | 11.63 |
| Ratios and supplemental data | |||||
| Net assets, end of period (in millions) | $2,625 | $2,396 | $2,592 | $1,618 | $1,063 |
| Ratios (as a percentage of average net assets): | |||||
| Expenses before reductions | 1.05 | 1.04 | 1.04 | 1.08 | 1.08 |
| Expenses including reductions | 1.04 | 1.03 | 1.03 | 1.07 | 1.07 |
| Net investment income | 1.53 | 1.22 | 0.96 | 1.25 | 1.60 |
| Portfolio turnover (%) | 62 | 61 | 65 | 89 | 76 |
| 1 | Based on average daily shares outstanding. |
| 2 | Total returns would have been lower had certain expenses not been reduced during the applicable periods. |
| 3 | Does not reflect the effect of sales charges, if any. |
| 44 | JOHN HANCOCK Balanced Fund | ANNUAL REPORT | SEE NOTES TO FINANCIAL STATEMENTS |
| CLASS C SHARES Period ended | 10-31-23 | 10-31-22 | 10-31-21 | 10-31-20 | 10-31-19 |
| Per share operating performance | |||||
| Net asset value, beginning of period | $22.22 | $27.09 | $22.48 | $20.86 | $20.15 |
| Net investment income1 | 0.20 | 0.09 | 0.07 | 0.13 | 0.18 |
| Net realized and unrealized gain (loss) on investments | 1.34 | (4.35) | 4.74 | 1.79 | 1.83 |
| Total from investment operations | 1.54 | (4.26) | 4.81 | 1.92 | 2.01 |
| Less distributions | |||||
| From net investment income | (0.22) | (0.16) | (0.13) | (0.15) | (0.19) |
| From net realized gain | — | (0.45) | (0.07) | (0.15) | (1.11) |
| Total distributions | (0.22) | (0.61) | (0.20) | (0.30) | (1.30) |
| Net asset value, end of period | $23.54 | $22.22 | $27.09 | $22.48 | $20.86 |
| Total return (%)2,3 | 7.02 | (16.03) | 21.48 | 9.34 | 10.81 |
| Ratios and supplemental data | |||||
| Net assets, end of period (in millions) | $163 | $200 | $314 | $314 | $351 |
| Ratios (as a percentage of average net assets): | |||||
| Expenses before reductions | 1.75 | 1.74 | 1.74 | 1.78 | 1.78 |
| Expenses including reductions | 1.74 | 1.73 | 1.73 | 1.77 | 1.77 |
| Net investment income | 0.83 | 0.28 | 0.26 | 0.60 | 0.91 |
| Portfolio turnover (%) | 62 | 61 | 65 | 89 | 76 |
| 1 | Based on average daily shares outstanding. |
| 2 | Total returns would have been lower had certain expenses not been reduced during the applicable periods. |
| 3 | Does not reflect the effect of sales charges, if any. |
| SEE NOTES TO FINANCIAL STATEMENTS | ANNUAL REPORT | JOHN HANCOCK Balanced Fund | 45 |
| CLASS I SHARES Period ended | 10-31-23 | 10-31-22 | 10-31-21 | 10-31-20 | 10-31-19 |
| Per share operating performance | |||||
| Net asset value, beginning of period | $22.23 | $27.11 | $22.49 | $20.88 | $20.16 |
| Net investment income1 | 0.43 | 0.36 | 0.32 | 0.33 | 0.38 |
| Net realized and unrealized gain (loss) on investments | 1.35 | (4.38) | 4.75 | 1.80 | 1.84 |
| Total from investment operations | 1.78 | (4.02) | 5.07 | 2.13 | 2.22 |
| Less distributions | |||||
| From net investment income | (0.45) | (0.41) | (0.38) | (0.37) | (0.39) |
| From net realized gain | — | (0.45) | (0.07) | (0.15) | (1.11) |
| Total distributions | (0.45) | (0.86) | (0.45) | (0.52) | (1.50) |
| Net asset value, end of period | $23.56 | $22.23 | $27.11 | $22.49 | $20.88 |
| Total return (%)2 | 8.04 | (15.18) | 22.71 | 10.41 | 11.98 |
| Ratios and supplemental data | |||||
| Net assets, end of period (in millions) | $692 | $681 | $874 | $626 | $469 |
| Ratios (as a percentage of average net assets): | |||||
| Expenses before reductions | 0.75 | 0.74 | 0.74 | 0.78 | 0.79 |
| Expenses including reductions | 0.74 | 0.73 | 0.73 | 0.77 | 0.78 |
| Net investment income | 1.83 | 1.47 | 1.26 | 1.55 | 1.90 |
| Portfolio turnover (%) | 62 | 61 | 65 | 89 | 76 |
| 1 | Based on average daily shares outstanding. |
| 2 | Total returns would have been lower had certain expenses not been reduced during the applicable periods. |
| 46 | JOHN HANCOCK Balanced Fund | ANNUAL REPORT | SEE NOTES TO FINANCIAL STATEMENTS |
| CLASS R2 SHARES Period ended | 10-31-23 | 10-31-22 | 10-31-21 | 10-31-20 | 10-31-19 |
| Per share operating performance | |||||
| Net asset value, beginning of period | $22.22 | $27.10 | $22.47 | $20.86 | $20.15 |
| Net investment income1 | 0.35 | 0.27 | 0.22 | 0.25 | 0.30 |
| Net realized and unrealized gain (loss) on investments | 1.35 | (4.39) | 4.76 | 1.79 | 1.83 |
| Total from investment operations | 1.70 | (4.12) | 4.98 | 2.04 | 2.13 |
| Less distributions | |||||
| From net investment income | (0.36) | (0.31) | (0.28) | (0.28) | (0.31) |
| From net realized gain | — | (0.45) | (0.07) | (0.15) | (1.11) |
| Total distributions | (0.36) | (0.76) | (0.35) | (0.43) | (1.42) |
| Net asset value, end of period | $23.56 | $22.22 | $27.10 | $22.47 | $20.86 |
| Total return (%)2 | 7.66 | (15.49) | 22.26 | 10.03 | 11.48 |
| Ratios and supplemental data | |||||
| Net assets, end of period (in millions) | $10 | $9 | $11 | $11 | $4 |
| Ratios (as a percentage of average net assets): | |||||
| Expenses before reductions | 1.12 | 1.11 | 1.12 | 1.16 | 1.17 |
| Expenses including reductions | 1.11 | 1.10 | 1.11 | 1.15 | 1.17 |
| Net investment income | 1.46 | 1.11 | 0.88 | 1.18 | 1.51 |
| Portfolio turnover (%) | 62 | 61 | 65 | 89 | 76 |
| 1 | Based on average daily shares outstanding. |
| 2 | Total returns would have been lower had certain expenses not been reduced during the applicable periods. |
| SEE NOTES TO FINANCIAL STATEMENTS | ANNUAL REPORT | JOHN HANCOCK Balanced Fund | 47 |
| CLASS R4 SHARES Period ended | 10-31-23 | 10-31-22 | 10-31-21 | 10-31-20 | 10-31-19 |
| Per share operating performance | |||||
| Net asset value, beginning of period | $22.37 | $27.27 | $22.62 | $21.00 | $20.27 |
| Net investment income1 | 0.40 | 0.32 | 0.29 | 0.28 | 0.35 |
| Net realized and unrealized gain (loss) on investments | 1.36 | (4.40) | 4.77 | 1.83 | 1.85 |
| Total from investment operations | 1.76 | (4.08) | 5.06 | 2.11 | 2.20 |
| Less distributions | |||||
| From net investment income | (0.42) | (0.37) | (0.34) | (0.34) | (0.36) |
| From net realized gain | — | (0.45) | (0.07) | (0.15) | (1.11) |
| Total distributions | (0.42) | (0.82) | (0.41) | (0.49) | (1.47) |
| Net asset value, end of period | $23.71 | $22.37 | $27.27 | $22.62 | $21.00 |
| Total return (%)2 | 7.93 | (15.29) | 22.55 | 10.24 | 11.79 |
| Ratios and supplemental data | |||||
| Net assets, end of period (in millions) | $24 | $23 | $29 | $23 | $13 |
| Ratios (as a percentage of average net assets): | |||||
| Expenses before reductions | 0.99 | 0.98 | 0.98 | 1.01 | 1.03 |
| Expenses including reductions | 0.88 | 0.87 | 0.88 | 0.90 | 0.92 |
| Net investment income | 1.69 | 1.29 | 1.12 | 1.33 | 1.77 |
| Portfolio turnover (%) | 62 | 61 | 65 | 89 | 76 |
| 1 | Based on average daily shares outstanding. |
| 2 | Total returns would have been lower had certain expenses not been reduced during the applicable periods. |
| 48 | JOHN HANCOCK Balanced Fund | ANNUAL REPORT | SEE NOTES TO FINANCIAL STATEMENTS |
| CLASS R5 SHARES Period ended | 10-31-23 | 10-31-22 | 10-31-21 | 10-31-20 | 10-31-19 |
| Per share operating performance | |||||
| Net asset value, beginning of period | $22.33 | $27.23 | $22.58 | $20.96 | $20.24 |
| Net investment income1 | 0.45 | 0.36 | 0.34 | 0.36 | 0.39 |
| Net realized and unrealized gain (loss) on investments | 1.35 | (4.39) | 4.77 | 1.79 | 1.84 |
| Total from investment operations | 1.80 | (4.03) | 5.11 | 2.15 | 2.23 |
| Less distributions | |||||
| From net investment income | (0.46) | (0.42) | (0.39) | (0.38) | (0.40) |
| From net realized gain | — | (0.45) | (0.07) | (0.15) | (1.11) |
| Total distributions | (0.46) | (0.87) | (0.46) | (0.53) | (1.51) |
| Net asset value, end of period | $23.67 | $22.33 | $27.23 | $22.58 | $20.96 |
| Total return (%)2 | 8.11 | (15.14) | 22.83 | 10.48 | 11.98 |
| Ratios and supplemental data | |||||
| Net assets, end of period (in millions) | $2 | $2 | $3 | $2 | $2 |
| Ratios (as a percentage of average net assets): | |||||
| Expenses before reductions | 0.69 | 0.68 | 0.68 | 0.71 | 0.73 |
| Expenses including reductions | 0.68 | 0.67 | 0.67 | 0.70 | 0.72 |
| Net investment income | 1.89 | 1.48 | 1.32 | 1.65 | 1.95 |
| Portfolio turnover (%) | 62 | 61 | 65 | 89 | 76 |
| 1 | Based on average daily shares outstanding. |
| 2 | Total returns would have been lower had certain expenses not been reduced during the applicable periods. |
| SEE NOTES TO FINANCIAL STATEMENTS | ANNUAL REPORT | JOHN HANCOCK Balanced Fund | 49 |
| CLASS R6 SHARES Period ended | 10-31-23 | 10-31-22 | 10-31-21 | 10-31-20 | 10-31-19 |
| Per share operating performance | |||||
| Net asset value, beginning of period | $22.26 | $27.15 | $22.52 | $20.91 | $20.19 |
| Net investment income1 | 0.46 | 0.40 | 0.35 | 0.35 | 0.40 |
| Net realized and unrealized gain (loss) on investments | 1.36 | (4.40) | 4.76 | 1.80 | 1.84 |
| Total from investment operations | 1.82 | (4.00) | 5.11 | 2.15 | 2.24 |
| Less distributions | |||||
| From net investment income | (0.48) | (0.44) | (0.41) | (0.39) | (0.41) |
| From net realized gain | — | (0.45) | (0.07) | (0.15) | (1.11) |
| Total distributions | (0.48) | (0.89) | (0.48) | (0.54) | (1.52) |
| Net asset value, end of period | $23.60 | $22.26 | $27.15 | $22.52 | $20.91 |
| Total return (%)2 | 8.19 | (15.10) | 22.86 | 10.52 | 12.07 |
| Ratios and supplemental data | |||||
| Net assets, end of period (in millions) | $704 | $623 | $645 | $366 | $226 |
| Ratios (as a percentage of average net assets): | |||||
| Expenses before reductions | 0.64 | 0.63 | 0.64 | 0.66 | 0.68 |
| Expenses including reductions | 0.63 | 0.62 | 0.63 | 0.65 | 0.67 |
| Net investment income | 1.94 | 1.66 | 1.37 | 1.67 | 2.00 |
| Portfolio turnover (%) | 62 | 61 | 65 | 89 | 76 |
| 1 | Based on average daily shares outstanding. |
| 2 | Total returns would have been lower had certain expenses not been reduced during the applicable periods. |
| 50 | JOHN HANCOCK Balanced Fund | ANNUAL REPORT | SEE NOTES TO FINANCIAL STATEMENTS |
| ANNUAL REPORT | JOHN HANCOCK Balanced Fund | 51 |
| Total value at 10-31-23 | Level 1 quoted price | Level 2 significant observable inputs | Level 3 significant unobservable inputs | |
| Investments in securities: | ||||
| Assets | ||||
| Common stocks | $2,690,542,867 | $2,560,074,565 | $130,468,302 | — |
| Preferred securities | 648,145 | 648,145 | — | — |
| U.S. Government and Agency obligations | 778,725,892 | — | 778,725,892 | — |
| Corporate bonds | 552,871,872 | — | 552,871,872 | — |
| Municipal bonds | 1,659,896 | — | 1,659,896 | — |
| Collateralized mortgage obligations | 59,564,714 | — | 59,564,714 | — |
| Asset backed securities | 86,245,245 | — | 86,245,245 | — |
| Escrow certificates | 17,263 | — | 15,200 | $2,063 |
| Short-term investments | 67,490,416 | 32,490,416 | 35,000,000 | — |
| Total investments in securities | $4,237,766,310 | $2,593,213,126 | $1,644,551,121 | $2,063 |
| 52 | JOHN HANCOCK Balanced Fund | ANNUAL REPORT |
| ANNUAL REPORT | JOHN HANCOCK Balanced Fund | 53 |
| 54 | JOHN HANCOCK Balanced Fund | ANNUAL REPORT |
| October 31, 2023 | October 31, 2022 | |
| Ordinary income | $71,029,924 | $61,759,116 |
| Long-term capital gains | — | 75,752,225 |
| Total | $71,029,924 | $137,511,341 |
| ANNUAL REPORT | JOHN HANCOCK Balanced Fund | 55 |
| Statement of operations location - Net realized gain (loss) on: | |
| Risk | Futures contracts |
| Interest rate | $(1,281,827) |
| 56 | JOHN HANCOCK Balanced Fund | ANNUAL REPORT |
| Class | Expense reduction |
| Class A | $187,223 |
| Class C | 13,604 |
| Class I | 50,967 |
| Class R2 | 745 |
| Class | Expense reduction |
| Class R4 | $1,765 |
| Class R5 | 171 |
| Class R6 | 49,332 |
| Total | $303,807 |
| ANNUAL REPORT | JOHN HANCOCK Balanced Fund | 57 |
| Class | Rule 12b-1 Fee | Service fee |
| Class A | 0.30% | — |
| Class C | 1.00% | — |
| Class R2 | 0.25% | 0.25% |
| Class R4 | 0.25% | 0.10% |
| Class R5 | — | 0.05% |
| Class | Distribution and service fees | Transfer agent fees |
| Class A | $7,780,233 | $3,045,603 |
| Class C | 1,886,610 | 221,263 |
| Class I | — | 828,988 |
| Class R2 | 49,565 | 709 |
| Class R4 | 84,916 | 1,690 |
| Class R5 | 1,171 | 164 |
| 58 | JOHN HANCOCK Balanced Fund | ANNUAL REPORT |
| Class | Distribution and service fees | Transfer agent fees |
| Class R6 | — | $46,946 |
| Total | $9,802,495 | $4,145,363 |
| Borrower or Lender | Weighted Average Loan Balance | Days Outstanding | Weighted Average Interest Rate | Interest Income (Expense) |
| Lender | $15,816,667 | 6 | 5.769% | $15,207 |
| Year Ended 10-31-23 | Year Ended 10-31-22 | |||
| Shares | Amount | Shares | Amount | |
| Class A shares | ||||
| Sold | 30,177,694 | $714,950,415 | 35,357,748 | $878,826,121 |
| Distributions reinvested | 1,737,496 | 40,633,344 | 3,052,807 | 77,352,792 |
| Repurchased | (28,318,545) | (669,909,088) | (26,261,750) | (640,080,496) |
| Net increase | 3,596,645 | $85,674,671 | 12,148,805 | $316,098,417 |
| Class C shares | ||||
| Sold | 910,132 | $21,479,594 | 972,211 | $24,236,100 |
| Distributions reinvested | 72,234 | 1,678,133 | 246,033 | 6,377,311 |
| Repurchased | (3,074,525) | (72,738,595) | (3,791,488) | (93,202,943) |
| Net decrease | (2,092,159) | $(49,580,868) | (2,573,244) | $(62,589,532) |
| Class I shares | ||||
| Sold | 6,217,266 | $147,344,897 | 7,079,367 | $174,892,081 |
| Distributions reinvested | 521,714 | 12,182,829 | 993,477 | 25,125,613 |
| Repurchased | (8,027,583) | (189,452,477) | (9,653,868) | (234,311,660) |
| Net decrease | (1,288,603) | $(29,924,751) | (1,581,024) | $(34,293,966) |
| Class R2 shares | ||||
| Sold | 84,881 | $2,009,393 | 58,364 | $1,454,208 |
| Distributions reinvested | 5,973 | 139,628 | 11,203 | 285,072 |
| Repurchased | (69,377) | (1,657,375) | (76,647) | (1,933,370) |
| Net increase (decrease) | 21,477 | $491,646 | (7,080) | $(194,090) |
| ANNUAL REPORT | JOHN HANCOCK Balanced Fund | 59 |
| Year Ended 10-31-23 | Year Ended 10-31-22 | |||
| Shares | Amount | Shares | Amount | |
| Class R4 shares | ||||
| Sold | 89,514 | $2,126,268 | 87,499 | $2,176,913 |
| Distributions reinvested | 18,171 | 427,201 | 33,704 | 859,121 |
| Repurchased | (116,305) | (2,765,934) | (158,044) | (3,987,045) |
| Net decrease | (8,620) | $(212,465) | (36,841) | $(951,011) |
| Class R5 shares | ||||
| Sold | 4,660 | $109,978 | 4,476 | $109,367 |
| Distributions reinvested | 1,972 | 46,275 | 3,484 | 88,375 |
| Repurchased | (6,366) | (147,317) | (9,481) | (250,048) |
| Net increase (decrease) | 266 | $8,936 | (1,521) | $(52,306) |
| Class R6 shares | ||||
| Sold | 7,594,355 | $180,339,534 | 8,676,856 | $213,273,765 |
| Distributions reinvested | 580,882 | 13,599,934 | 890,577 | 22,395,203 |
| Repurchased | (6,328,762) | (149,870,851) | (5,363,657) | (130,077,754) |
| Net increase | 1,846,475 | $44,068,617 | 4,203,776 | $105,591,214 |
| Total net increase | 2,075,481 | $50,525,786 | 12,152,871 | $323,608,726 |
| Dividends and distributions | |||||||||
| Affiliate | Ending share amount | Beginning value | Cost of purchases | Proceeds from shares sold | Realized gain (loss) | Change in unrealized appreciation (depreciation) | Income distributions received | Capital gain distributions received | Ending value |
| John Hancock Collateral Trust* | 3,250,147 | $39,113,494 | $216,411,099 | $(223,055,497) | $8,960 | $12,360 | $260,996 | — | $32,490,416 |
| * | Refer to the Securities lending note within Note 2 for details regarding this investment. |
| 60 | JOHN HANCOCK Balanced Fund | ANNUAL REPORT |
| ANNUAL REPORT | JOHN HANCOCK Balanced Fund | 61 |
| 62 | JOHN HANCOCK BALANCED FUND | ANNUAL REPORT |
| ANNUAL REPORT | JOHN HANCOCK BALANCED FUND | 63 |
| 64 | JOHN HANCOCK BALANCED FUND | ANNUAL REPORT |
| (a) | the skills and competency with which the Advisor has in the past managed the Trust’s affairs and its subadvisory relationship, the Advisor’s oversight and monitoring of the Subadvisor’s investment performance and compliance programs, such as the Subadvisor’s compliance with fund policies and objectives, review of brokerage matters, including with respect to trade allocation and best execution and the Advisor’s timeliness in responding to performance issues; |
| (b) | the background, qualifications and skills of the Advisor’s personnel; |
| (c) | the Advisor’s compliance policies and procedures and its responsiveness to regulatory changes and fund industry developments; |
| (d) | the Advisor’s administrative capabilities, including its ability to supervise the other service providers for the fund, as well as the Advisor’s oversight of any securities lending activity, its monitoring of class action litigation and collection of class action settlements on behalf of the fund, and bringing loss recovery actions on behalf of the fund; |
| (e) | the financial condition of the Advisor and whether it has the financial wherewithal to provide a high level and quality of services to the fund; |
| ANNUAL REPORT | JOHN HANCOCK BALANCED FUND | 65 |
| (f) | the Advisor’s initiatives intended to improve various aspects of the Trust’s operations and investor experience with the fund; and |
| (g) | the Advisor’s reputation and experience in serving as an investment advisor to the Trust and the benefit to shareholders of investing in funds that are part of a family of funds offering a variety of investments. |
| (a) | reviewed information prepared by management regarding the fund’s performance; |
| (b) | considered the comparative performance of an applicable benchmark index; |
| (c) | considered the performance of comparable funds, if any, as included in the report prepared by an independent third-party provider of fund data; and |
| (d) | took into account the Advisor’s analysis of the fund’s performance and its plans and recommendations regarding the Trust’s subadvisory arrangements generally. |
| 66 | JOHN HANCOCK BALANCED FUND | ANNUAL REPORT |
| (a) | reviewed financial information of the Advisor; |
| (b) | reviewed and considered information presented by the Advisor regarding the net profitability to the Advisor and its affiliates with respect to the fund; |
| (c) | received and reviewed profitability information with respect to the John Hancock Fund Complex as a whole and with respect to the fund; |
| (d) | received information with respect to the Advisor’s allocation methodologies used in preparing the profitability data and considered that the Advisor hired an independent third-party consultant to provide an analysis of the Advisor’s allocation methodologies; |
| (e) | considered that the John Hancock insurance companies that are affiliates of the Advisor, as shareholders of the Trust directly or through their separate accounts, receive certain tax credits or deductions relating to foreign taxes paid and dividends received by certain funds of the Trust and noted that these tax benefits, which are not available to participants in qualified retirement plans under applicable income tax law, are reflected in the profitability information reviewed by the Board; |
| (f) | considered that the Advisor also provides administrative services to the fund on a cost basis pursuant to an administrative services agreement; |
| (g) | noted that affiliates of the Advisor provide transfer agency services and distribution services to the fund, and that the fund’s distributor also receives Rule 12b-1 payments to support distribution of the fund; |
| (h) | noted that the fund’s Subadvisor is an affiliate of the Advisor; |
| (i) | noted that the Advisor also derives reputational and other indirect benefits from providing advisory services to the fund; |
| (j) | noted that the subadvisory fee for the fund is paid by the Advisor; |
| (k) | considered the Advisor’s ongoing costs and expenditures necessary to improve services, meet new regulatory and compliance requirements, and adapt to other challenges impacting the fund industry; and |
| (l) | considered that the Advisor should be entitled to earn a reasonable level of profits in exchange for the level of services it provides to the fund and the risks that it assumes as Advisor, including entrepreneurial, operational, reputational, litigation and regulatory risk. |
| ANNUAL REPORT | JOHN HANCOCK BALANCED FUND | 67 |
| (a) | considered that the Advisor has contractually agreed to waive a portion of its management fee for certain funds of the John Hancock Fund Complex, including the fund (the participating portfolios) or otherwise reimburse the expenses of the participating portfolios (the reimbursement). This waiver is based upon aggregate net assets of all the participating portfolios. The amount of the reimbursement is calculated daily and allocated among all the participating portfolios in proportion to the daily net assets of each fund; |
| (b) | reviewed the fund’s advisory fee structure and concluded that: (i) the fund’s fee structure contains breakpoints at the subadvisory fee level and that such breakpoints are reflected as breakpoints in the advisory fees for the fund; and (ii) although economies of scale cannot be measured with precision, these arrangements permit shareholders of the fund to benefit from economies of scale if the fund grows. The Board also took into account management’s discussion of the fund’s advisory fee structure; and |
| (c) | the Board also considered the effect of the fund’s growth in size on its performance and fees. The Board also noted that if the fund’s assets increase over time, the fund may realize other economies of scale. |
| (1) | information relating to the Subadvisor’s business, including current subadvisory services to the Trust (and other funds in the John Hancock Fund Complex); |
| (2) | the historical and current performance of the fund and comparative performance information relating to an applicable benchmark index and comparable funds; and |
| (3) | the subadvisory fee for the fund, including any breakpoints, and to the extent available, comparable fee information prepared by an independent third party provider of fund data. |
| 68 | JOHN HANCOCK BALANCED FUND | ANNUAL REPORT |
| (1) | the Subadvisor has extensive experience and demonstrated skills as a manager; |
| (2) | the performance of the fund has generally been in line with or outperformed the historical performance of comparable funds; |
| (3) | the subadvisory fee is reasonable in relation to the level and quality of services being provided under the Subadvisory Agreement; and |
| (4) | noted that the subadvisory fees are paid by the Advisor not the fund and that the subadvisory fee breakpoints are reflected as breakpoints in the advisory fees for the fund in order to permit shareholders to benefit from economies of scale if the fund grows. |
| ANNUAL REPORT | JOHN HANCOCK BALANCED FUND | 69 |
| Independent Trustees | ||
| Name, year of birth Position(s) held with Trust Principal occupation(s) and other directorships during past 5 years | Trustee of the Trust since1 | Number of John Hancock funds overseen by Trustee |
| Hassell H. McClellan,2 Born: 1945 | 2012 | 179 |
| Trustee and Chairperson of the Board | ||
| Director/Trustee, Virtus Funds (2008-2020); Director, The Barnes Group (2010-2021); Associate Professor, The Wallace E. Carroll School of Management, Boston College (retired 2013). Trustee (since 2005) and Chairperson of the Board (since 2017) of various trusts within the John Hancock Fund Complex. | ||
| James R. Boyle, Born: 1959 | 2015 | 175 |
| Trustee | ||
| Board Member, United of Omaha Life Insurance Company (since 2022). Board Member, Mutual of Omaha Investor Services, Inc. (since 2022). Foresters Financial, Chief Executive Officer (2018–2022) and board member (2017–2022). Manulife Financial and John Hancock, more than 20 years, retiring in 2012 as Chief Executive Officer, John Hancock and Senior Executive Vice President, Manulife Financial. Trustee of various trusts within the John Hancock Fund Complex (2005–2014 and since 2015). | ||
| William H. Cunningham,3 Born: 1944 | 1986 | 177 |
| Trustee | ||
| Professor, University of Texas, Austin, Texas (since 1971); former Chancellor, University of Texas System and former President of the University of Texas, Austin, Texas; Director (since 2006), Lincoln National Corporation (insurance); Director, Southwest Airlines (since 2000). Trustee of various trusts within the John Hancock Fund Complex (since 1986). | ||
| Noni L. Ellison, Born: 1971 | 2022 | 175 |
| Trustee | ||
| Senior Vice President, General Counsel & Corporate Secretary, Tractor Supply Company (rural lifestyle retailer) (since 2021); General Counsel, Chief Compliance Officer & Corporate Secretary, Carestream Dental, L.L.C. (2017–2021); Associate General Counsel & Assistant Corporate Secretary, W.W. Grainger, Inc. (global industrial supplier) (2015–2017); Board Member, Goodwill of North Georgia, 2018 (FY2019)–2020 (FY2021); Board Member, Howard University School of Law Board of Visitors (since 2021); Board Member, University of Chicago Law School Board of Visitors (since 2016); Board member, Children’s Healthcare of Atlanta Foundation Board (2021–2023). Trustee of various trusts within the John Hancock Fund Complex (since 2022). | ||
| Grace K. Fey, Born: 1946 | 2012 | 179 |
| Trustee | ||
| Chief Executive Officer, Grace Fey Advisors (since 2007); Director and Executive Vice President, Frontier Capital Management Company (1988–2007); Director, Fiduciary Trust (since 2009). Trustee of various trusts within the John Hancock Fund Complex (since 2008). | ||
| Dean C. Garfield, Born: 1968 | 2022 | 175 |
| Trustee | ||
| Vice President, Netflix, Inc. (since 2019); President & Chief Executive Officer, Information Technology Industry Council (2009–2019); NYU School of Law Board of Trustees (since 2021); Member, U.S. Department of Transportation, Advisory Committee on Automation (since 2021); President of the United States Trade Advisory Council (2010–2018); Board Member, College for Every Student (2017–2021); Board Member, The Seed School of Washington, D.C. (2012–2017); Advisory Board Member of the Block Center for Technology and Society (since 2019). Trustee of various trusts within the John Hancock Fund Complex (since 2022). | ||
| 70 | JOHN HANCOCK BALANCED FUND | ANNUAL REPORT |
| Independent Trustees (continued) | ||
| Name, year of birth Position(s) held with Trust Principal occupation(s) and other directorships during past 5 years | Trustee of the Trust since1 | Number of John Hancock funds overseen by Trustee |
| Deborah C. Jackson, Born: 1952 | 2008 | 177 |
| Trustee | ||
| President, Cambridge College, Cambridge, Massachusetts (since 2011); Board of Directors, Amwell Corporation (since 2020); Board of Directors, Massachusetts Women’s Forum (2018-2020); Board of Directors, National Association of Corporate Directors/New England (2015-2020); Chief Executive Officer, American Red Cross of Massachusetts Bay (2002–2011); Board of Directors of Eastern Bank Corporation (since 2001); Board of Directors of Eastern Bank Charitable Foundation (since 2001); Board of Directors of Boston Stock Exchange (2002–2008); Board of Directors of Harvard Pilgrim Healthcare (health benefits company) (2007–2011). Trustee of various trusts within the John Hancock Fund Complex (since 2008). | ||
| Steven R. Pruchansky, Born: 1944 | 1994 | 175 |
| Trustee and Vice Chairperson of the Board | ||
| Managing Director, Pru Realty (since 2017); Chairman and Chief Executive Officer, Greenscapes of Southwest Florida, Inc. (2014-2020); Director and President, Greenscapes of Southwest Florida, Inc. (until 2000); Member, Board of Advisors, First American Bank (until 2010); Managing Director, Jon James, LLC (real estate) (since 2000); Partner, Right Funding, LLC (2014-2017); Director, First Signature Bank & Trust Company (until 1991); Director, Mast Realty Trust (until 1994); President, Maxwell Building Corp. (until 1991). Trustee (since 1992), Chairperson of the Board (2011–2012), and Vice Chairperson of the Board (since 2012) of various trusts within the John Hancock Fund Complex. | ||
| Frances G. Rathke,3 Born: 1960 | 2020 | 175 |
| Trustee | ||
| Director, Audit Committee Chair, Oatly Group AB (plant-based drink company) (since 2021); Director, Audit Committee Chair and Compensation Committee Member, Green Mountain Power Corporation (since 2016); Director, Treasurer and Finance & Audit Committee Chair, Flynn Center for Performing Arts (since 2016); Director and Audit Committee Chair, Planet Fitness (since 2016); Chief Financial Officer and Treasurer, Keurig Green Mountain, Inc. (2003-retired 2015). Trustee of various trusts within the John Hancock Fund Complex (since 2020). | ||
| Gregory A. Russo, Born: 1949 | 2009 | 175 |
| Trustee | ||
| Director and Audit Committee Chairman (2012-2020), and Member, Audit Committee and Finance Committee (2011-2020), NCH Healthcare System, Inc. (holding company for multi-entity healthcare system); Director and Member (2012-2018), and Finance Committee Chairman (2014-2018), The Moorings, Inc. (nonprofit continuing care community); Global Vice Chairman, Risk & Regulatory Matters, KPMG LLP (KPMG) (2002–2006); Vice Chairman, Industrial Markets, KPMG (1998–2002). Trustee of various trusts within the John Hancock Fund Complex (since 2008). | ||
| ANNUAL REPORT | JOHN HANCOCK BALANCED FUND | 71 |
| Non-Independent Trustees4 | ||
| Name, year of birth Position(s) held with Trust Principal occupation(s) and other directorships during past 5 years | Trustee of the Trust since1 | Number of John Hancock funds overseen by Trustee |
| Andrew G. Arnott, Born: 1971 | 2017 | 177 |
| Non-Independent Trustee | ||
| Global Head of Retail for Manulife (since 2022); Head of Wealth and Asset Management, United States and Europe, for John Hancock and Manulife (2018-2023); Director and Chairman, John Hancock Investment Management LLC (since 2005, including prior positions); Director and Chairman, John Hancock Variable Trust Advisers LLC (since 2006, including prior positions); Director and Chairman, John Hancock Investment Management Distributors LLC (since 2004, including prior positions); President of various trusts within the John Hancock Fund Complex (2007-2023, including prior positions). Trustee of various trusts within the John Hancock Fund Complex (since 2017). | ||
| Paul Lorentz, Born: 1968 | 2022 | 175 |
| Non-Independent Trustee | ||
| Global Head, Manulife Wealth and Asset Management (since 2017); General Manager, Manulife, Individual Wealth Management and Insurance (2013–2017); President, Manulife Investments (2010–2016). Trustee of various trusts within the John Hancock Fund Complex (since 2022). | ||
| Principal officers who are not Trustees | |
| Name, year of birth Position(s) held with Trust Principal occupation(s) during past 5 years | Current Position(s) with the Trust since |
| Kristie M. Feinberg, Born: 1975 | 2023 |
| President | |
| Head of Wealth and Asset Management, United States and Europe, for John Hancock and Manulife (since 2023); CFO and Global Head of Strategy, Manulife Investment Management (2021-2023, including prior positions); CFO Americas & Global Head of Treasury, Invesco, Ltd., Invesco US (2019-2020, including prior positions); Senior Vice President, Corporate Treasurer and Business Controller, Oppenheimer Funds (2001-2019, including prior positions); President of various trusts within the John Hancock Fund Complex (since 2023). | |
| Charles A. Rizzo, Born: 1957 | 2007 |
| Chief Financial Officer | |
| Vice President, John Hancock Financial Services (since 2008); Senior Vice President, John Hancock Investment Management LLC and John Hancock Variable Trust Advisers LLC (since 2008); Chief Financial Officer of various trusts within the John Hancock Fund Complex (since 2007). | |
| Salvatore Schiavone, Born: 1965 | 2010 |
| Treasurer | |
| Assistant Vice President, John Hancock Financial Services (since 2007); Vice President, John Hancock Investment Management LLC and John Hancock Variable Trust Advisers LLC (since 2007); Treasurer of various trusts within the John Hancock Fund Complex (since 2007, including prior positions). | |
| 72 | JOHN HANCOCK BALANCED FUND | ANNUAL REPORT |
| Principal officers who are not Trustees (continued) | |
| Name, year of birth Position(s) held with Trust Principal occupation(s) during past 5 years | Current Position(s) with the Trust since |
| Christopher (Kit) Sechler, Born: 1973 | 2018 |
| Secretary and Chief Legal Officer | |
| Vice President and Deputy Chief Counsel, John Hancock Investment Management (since 2015); Assistant Vice President and Senior Counsel (2009–2015), John Hancock Investment Management; Assistant Secretary of John Hancock Investment Management LLC and John Hancock Variable Trust Advisers LLC (since 2009); Chief Legal Officer and Secretary of various trusts within the John Hancock Fund Complex (since 2009, including prior positions). | |
| Trevor Swanberg, Born: 1979 | 2005 |
| Chief Compliance Officer | |
| Chief Compliance Officer, John Hancock Investment Management LLC and John Hancock Variable Trust Advisers LLC (since 2020); Deputy Chief Compliance Officer, John Hancock Investment Management LLC and John Hancock Variable Trust Advisers LLC (2019–2020); Assistant Chief Compliance Officer, John Hancock Investment Management LLC and John Hancock Variable Trust Advisers LLC (2016–2019); Vice President, State Street Global Advisors (2015–2016); Chief Compliance Officer of various trusts within the John Hancock Fund Complex (since 2016, including prior positions). | |
| 1 | Each Trustee holds office until his or her successor is duly elected and qualified, or until the Trustee’s death, retirement, resignation, or removal. Mr. Boyle has served as Trustee at various times prior to the date listed in the table. |
| 2 | Member of the Audit Committee as of September 26, 2023. |
| 3 | Member of the Audit Committee. |
| 4 | The Trustee is a Non-Independent Trustee due to current or former positions with the Advisor and certain affiliates. |
| ANNUAL REPORT | JOHN HANCOCK BALANCED FUND | 73 |
Steven R. Pruchansky, Vice Chairperson
Andrew G. Arnott†
James R. Boyle
William H. Cunningham*
Grace K. Fey
Noni L. Ellison
Dean C. Garfield
Deborah C. Jackson
Paul Lorentz†
Frances G. Rathke*
Gregory A. Russo
President
Chief Financial Officer
Treasurer
Secretary and Chief Legal Officer
Chief Compliance Officer
Jeffrey N. Given, CFA
Michael J. Scanlon, Jr., CFA
| You can also contact us: | ||
| 800-225-5291 | Regular mail: | Express mail: |
| jhinvestments.com | John Hancock Signature Services, Inc. P.O. Box 219909 Kansas City, MO 64121-9909 | John Hancock Signature Services, Inc. 430 W 7th Street Suite 219909 Kansas City, MO 64105-1407 |
| 74 | JOHN HANCOCK BALANCED FUND | ANNUAL REPORT |
GOVERNANCE FUNDS
with a heritage of financial stewardship dating back to 1862. Helping
our shareholders pursue their financial goals is at the core of everything
we do. It’s why we support the role of professional financial advice
and operate with the highest standards of conduct and integrity.
We search the world to find proven portfolio teams with specialized
expertise for every strategy we offer, then we apply robust investment
oversight to ensure they continue to meet our uncompromising
standards and serve the best interests of our shareholders.
a diverse set of investments backed by some of the world’s best
managers, along with strong risk-adjusted returns across asset classes.
200 Berkeley Street, Boston, MA 02116-5010, 800-225-5291, jhinvestments.com
| MF3208575 | 36A 10/23 |


United States and Europe
Manulife Investment Management
John Hancock Investment Management
| ANNUAL REPORT | JOHN HANCOCK DISCIPLINED VALUE INTERNATIONAL FUND | 1 |
| 2 | JOHN HANCOCK DISCIPLINED VALUE INTERNATIONAL FUND | ANNUAL REPORT |
| ANNUAL REPORT | JOHN HANCOCK DISCIPLINED VALUE INTERNATIONAL FUND | 3 |
| TOP 10 HOLDINGS AS OF 10/31/2023 (% of net assets) | |
| Cenovus Energy, Inc. | 3.2 |
| Novartis AG | 3.2 |
| Asahi Group Holdings, Ltd. | 2.4 |
| CRH PLC | 2.3 |
| Shell PLC | 2.3 |
| Samsung Electronics Company, Ltd. | 2.2 |
| Sony Group Corp. | 2.1 |
| BP PLC | 2.1 |
| Everest Group, Ltd. | 1.9 |
| Kinross Gold Corp. | 1.9 |
| TOTAL | 23.6 |
| Cash and cash equivalents are not included. | |
| TOP 10 COUNTRIES AS OF 10/31/2023 (% of net assets) | |
| United Kingdom | 21.5 |
| Japan | 17.9 |
| France | 8.4 |
| Canada | 7.9 |
| Switzerland | 7.1 |
| Netherlands | 5.1 |
| Germany | 4.9 |
| Ireland | 3.9 |
| South Korea | 3.0 |
| Bermuda | 2.5 |
| TOTAL | 82.2 |
| Cash and cash equivalents are not included. | |
| 4 | JOHN HANCOCK DISCIPLINED VALUE INTERNATIONAL FUND | ANNUAL REPORT |

| ANNUAL REPORT | JOHN HANCOCK DISCIPLINED VALUE INTERNATIONAL FUND | 5 |
| Average annual total returns (%) with maximum sales charge | Cumulative total returns (%) with maximum sales charge | ||||
| 1-year | 5-year | 10-year | 5-year | 10-year | |
| Class A 1 | 10.74 | 3.72 | 2.61 | 20.05 | 29.42 |
| Class C1 | 14.64 | 4.00 | 2.47 | 21.65 | 27.57 |
| Class I1,2 | 16.85 | 5.06 | 3.41 | 28.00 | 39.78 |
| Class R21,2 | 16.40 | 4.68 | 3.06 | 25.72 | 35.21 |
| Class R41,2 | 16.70 | 4.89 | 3.28 | 26.97 | 38.11 |
| Class R61,2 | 16.95 | 5.17 | 3.51 | 28.65 | 41.16 |
| Class NAV1,2 | 17.06 | 5.18 | 3.51 | 28.71 | 41.23 |
| Index† | 14.40 | 4.10 | 3.05 | 22.24 | 35.11 |
| Class A | Class C | Class I | Class R2 | Class R4 | Class R6 | Class NAV | |
| Gross (%) | 1.14 | 1.89 | 0.89 | 1.29 | 1.14 | 0.79 | 0.78 |
| Net (%) | 1.13 | 1.88 | 0.88 | 1.28 | 1.03 | 0.78 | 0.77 |
| 6 | JOHN HANCOCK DISCIPLINED VALUE INTERNATIONAL FUND | ANNUAL REPORT |
| Start date | With maximum sales charge ($) | Without sales charge ($) | Index ($) | |
| Class C1,3 | 10-31-13 | 12,757 | 12,757 | 13,511 |
| Class I1,2 | 10-31-13 | 13,978 | 13,978 | 13,511 |
| Class R21,2 | 10-31-13 | 13,521 | 13,521 | 13,511 |
| Class R41,2 | 10-31-13 | 13,811 | 13,811 | 13,511 |
| Class R61,2 | 10-31-13 | 14,116 | 14,116 | 13,511 |
| Class NAV1,2 | 10-31-13 | 14,123 | 14,123 | 13,511 |
| 1 | The fund is the successor to Robeco Boston Partners International Equity Fund (predecessor fund) and Class A, Class C, Class I, Class R2, Class R4, and Class R6 shares were first offered on 9-29-14. Class NAV shares were first offered on 4-13-15. Returns prior to this date are those of the predecessor fund’s institutional class shares, that have not been adjusted for class-specific expenses; otherwise, returns would vary. |
| 2 | For certain types of investors, as described in the fund’s prospectuses. |
| 3 | The contingent deferred sales charge is not applicable. |
| ANNUAL REPORT | JOHN HANCOCK DISCIPLINED VALUE INTERNATIONAL FUND | 7 |

| 8 | JOHN HANCOCK DISCIPLINED VALUE INTERNATIONAL FUND | ANNUAL REPORT |
| Account value on 5-1-2023 | Ending value on 10-31-2023 | Expenses paid during period ended 10-31-20231 | Annualized expense ratio | ||
| Class A | Actual expenses/actual returns | $1,000.00 | $955.00 | $5.62 | 1.14% |
| Hypothetical example | 1,000.00 | 1,019.50 | 5.80 | 1.14% | |
| Class C | Actual expenses/actual returns | 1,000.00 | 950.80 | 9.24 | 1.88% |
| Hypothetical example | 1,000.00 | 1,015.70 | 9.55 | 1.88% | |
| Class I | Actual expenses/actual returns | 1,000.00 | 955.80 | 4.39 | 0.89% |
| Hypothetical example | 1,000.00 | 1,020.70 | 4.53 | 0.89% | |
| Class R2 | Actual expenses/actual returns | 1,000.00 | 953.80 | 6.25 | 1.27% |
| Hypothetical example | 1,000.00 | 1,018.80 | 6.46 | 1.27% | |
| Class R4 | Actual expenses/actual returns | 1,000.00 | 955.10 | 5.03 | 1.02% |
| Hypothetical example | 1,000.00 | 1,020.10 | 5.19 | 1.02% | |
| Class R6 | Actual expenses/actual returns | 1,000.00 | 956.50 | 3.80 | 0.77% |
| Hypothetical example | 1,000.00 | 1,021.30 | 3.92 | 0.77% | |
| Class NAV | Actual expenses/actual returns | 1,000.00 | 957.20 | 3.75 | 0.76% |
| Hypothetical example | 1,000.00 | 1,021.40 | 3.87 | 0.76% |
| 1 | Expenses are equal to the annualized expense ratio, multiplied by the average account value over the period, multiplied by 184/365 (to reflect the one-half year period). |
| ANNUAL REPORT | JOHN HANCOCK DISCIPLINED VALUE INTERNATIONAL FUND | 9 |
| Shares | Value | ||||
| Common stocks 96.1% | $2,414,821,389 | ||||
| (Cost $2,409,178,946) | |||||
| Austria 0.9% | 21,795,294 | ||||
| ANDRITZ AG | 473,511 | 21,795,294 | |||
| Belgium 0.5% | 11,878,442 | ||||
| Azelis Group NV | 696,463 | 11,878,442 | |||
| Bermuda 2.5% | 62,928,300 | ||||
| Everest Group, Ltd. | 118,870 | 47,027,349 | |||
| RenaissanceRe Holdings, Ltd. | 72,412 | 15,900,951 | |||
| Brazil 1.0% | 25,768,126 | ||||
| Banco do Brasil SA | 2,687,000 | 25,768,126 | |||
| Canada 7.9% | 199,380,563 | ||||
| Allied Gold Corp. (A) | 2,092,231 | 6,638,411 | |||
| Cenovus Energy, Inc. | 4,250,558 | 80,980,529 | |||
| Kinross Gold Corp. | 8,913,030 | 46,533,504 | |||
| Suncor Energy, Inc. | 733,726 | 23,761,770 | |||
| Teck Resources, Ltd., Class B | 1,173,540 | 41,466,349 | |||
| China 1.0% | 24,275,796 | ||||
| Alibaba Group Holding, Ltd. (A) | 2,358,000 | 24,275,796 | |||
| Finland 1.9% | 47,891,284 | ||||
| Fortum OYJ | 2,036,952 | 24,185,613 | |||
| Metso OYJ | 960,417 | 8,461,686 | |||
| Nordea Bank ABP | 1,447,367 | 15,243,985 | |||
| France 8.4% | 211,637,149 | ||||
| Airbus SE | 157,191 | 21,075,580 | |||
| AXA SA | 1,269,579 | 37,618,176 | |||
| Capgemini SE | 73,975 | 13,073,516 | |||
| Cie de Saint-Gobain SA | 234,871 | 12,785,006 | |||
| Imerys SA | 358,540 | 9,506,805 | |||
| Kering SA | 19,194 | 7,806,234 | |||
| Rexel SA | 1,081,602 | 22,089,328 | |||
| Sanofi SA | 486,080 | 44,139,100 | |||
| SPIE SA | 680,976 | 17,907,983 | |||
| STMicroelectronics NV | 403,186 | 15,369,498 | |||
| Technip Energies NV | 468,555 | 10,265,923 | |||
| Germany 4.9% | 122,998,081 | ||||
| Allianz SE | 104,603 | 24,502,480 | |||
| Commerzbank AG | 3,524,835 | 38,017,306 | |||
| Daimler Truck Holding AG | 650,751 | 20,446,748 | |||
| 10 | JOHN HANCOCK DISCIPLINED VALUE INTERNATIONAL FUND | ANNUAL REPORT | SEE NOTES TO FINANCIAL STATEMENTS |
| Shares | Value | ||||
| Germany (continued) | |||||
| Infineon Technologies AG | 327,529 | $9,567,197 | |||
| Siemens AG | 229,575 | 30,464,350 | |||
| Greece 0.6% | 14,971,948 | ||||
| Hellenic Telecommunications Organization SA | 1,068,174 | 14,971,948 | |||
| India 1.3% | 31,581,874 | ||||
| HDFC Bank, Ltd., ADR | 558,477 | 31,581,874 | |||
| Ireland 3.9% | 98,494,447 | ||||
| CRH PLC | 1,085,251 | 58,242,076 | |||
| Ryanair Holdings PLC, ADR (A) | 458,978 | 40,252,371 | |||
| Italy 0.5% | 11,919,695 | ||||
| Iveco Group NV (A) | 1,414,334 | 11,919,695 | |||
| Japan 17.9% | 450,134,721 | ||||
| Asahi Group Holdings, Ltd. | 1,685,400 | 60,961,616 | |||
| Chugai Pharmaceutical Company, Ltd. | 603,200 | 17,888,840 | |||
| Kansai Paint Company, Ltd. | 1,577,500 | 23,086,255 | |||
| KDDI Corp. | 1,470,600 | 43,992,620 | |||
| Komatsu, Ltd. | 824,100 | 18,934,850 | |||
| Mitsubishi Electric Corp. | 1,007,900 | 11,557,097 | |||
| Mitsubishi Heavy Industries, Ltd. | 688,000 | 35,435,222 | |||
| Panasonic Holdings Corp. | 2,991,900 | 26,249,410 | |||
| Renesas Electronics Corp. (A) | 2,694,200 | 35,389,988 | |||
| Resona Holdings, Inc. | 4,590,100 | 24,526,384 | |||
| Ryohin Keikaku Company, Ltd. | 1,760,500 | 24,821,775 | |||
| Sony Group Corp. | 649,900 | 54,031,962 | |||
| Sumitomo Mitsui Financial Group, Inc. | 770,900 | 37,163,531 | |||
| Suzuki Motor Corp. | 930,000 | 36,095,171 | |||
| Jordan 0.4% | 9,729,547 | ||||
| Hikma Pharmaceuticals PLC | 419,928 | 9,729,547 | |||
| Luxembourg 1.0% | 24,297,805 | ||||
| Tenaris SA | 1,523,042 | 24,297,805 | |||
| Netherlands 5.1% | 128,706,167 | ||||
| Aalberts NV | 487,889 | 15,233,001 | |||
| ING Groep NV | 2,739,217 | 35,118,221 | |||
| Koninklijke Ahold Delhaize NV | 1,180,605 | 34,959,835 | |||
| Stellantis NV | 2,321,318 | 43,395,110 | |||
| Singapore 2.2% | 56,269,333 | ||||
| Genting Singapore, Ltd. | 22,543,400 | 14,163,015 | |||
| United Overseas Bank, Ltd. | 2,134,700 | 42,106,318 | |||
| SEE NOTES TO FINANCIAL STATEMENTS | ANNUAL REPORT | JOHN HANCOCK DISCIPLINED VALUE INTERNATIONAL FUND | 11 |
| Shares | Value | ||||
| South Korea 3.0% | $76,324,640 | ||||
| Hana Financial Group, Inc. | 712,294 | 20,711,219 | |||
| Samsung Electronics Company, Ltd. | 1,117,299 | 55,613,421 | |||
| Spain 2.1% | 53,454,227 | ||||
| Banco Bilbao Vizcaya Argentaria SA (B) | 4,106,118 | 32,303,802 | |||
| Bankinter SA | 3,344,754 | 21,150,425 | |||
| Sweden 0.5% | 11,264,815 | ||||
| Svenska Handelsbanken AB, A Shares | 1,321,278 | 11,264,815 | |||
| Switzerland 7.1% | 178,337,386 | ||||
| Glencore PLC | 5,204,798 | 27,568,953 | |||
| Novartis AG | 857,908 | 80,316,976 | |||
| Swiss Re AG | 296,590 | 32,406,263 | |||
| The Swatch Group AG, Bearer Shares | 73,197 | 18,736,686 | |||
| UBS Group AG | 821,763 | 19,308,508 | |||
| United Kingdom 21.5% | 540,781,749 | ||||
| AstraZeneca PLC | 227,981 | 28,544,096 | |||
| BAE Systems PLC | 3,191,975 | 42,920,544 | |||
| Beazley PLC | 4,949,873 | 31,007,841 | |||
| BP PLC | 8,594,775 | 52,479,900 | |||
| Coca-Cola Europacific Partners PLC | 363,831 | 21,287,752 | |||
| CVS Group PLC | 462,559 | 8,258,601 | |||
| Endeavour Mining PLC | 728,394 | 14,901,415 | |||
| Ferroglobe PLC (A) | 2,550,900 | 11,606,595 | |||
| Future PLC | 1,528,751 | 16,506,713 | |||
| IMI PLC | 1,458,270 | 26,043,338 | |||
| Inchcape PLC | 1,878,517 | 15,230,056 | |||
| Informa PLC | 2,038,636 | 17,663,736 | |||
| JD Sports Fashion PLC | 14,819,813 | 23,042,401 | |||
| NatWest Group PLC | 11,881,249 | 25,851,443 | |||
| Nomad Foods, Ltd. (A) | 1,044,005 | 14,428,149 | |||
| Reckitt Benckiser Group PLC | 579,260 | 38,756,552 | |||
| Shell PLC | 1,783,712 | 57,483,463 | |||
| SSE PLC | 2,038,080 | 40,503,951 | |||
| Tesco PLC | 9,183,120 | 30,135,002 | |||
| WH Smith PLC | 1,708,415 | 24,130,201 | |||
| Yield (%) | Shares | Value | |||
| Short-term investments 3.7% | $92,132,263 | ||||
| (Cost $92,132,398) | |||||
| Short-term funds 3.7% | 92,132,263 | ||||
| Fidelity Government Portfolio, Institutional Class | 5.2729(C) | 76,127,718 | 76,127,718 | ||
| John Hancock Collateral Trust (D) | 5.5153(C) | 1,600,999 | 16,004,545 | ||
| 12 | JOHN HANCOCK DISCIPLINED VALUE INTERNATIONAL FUND | ANNUAL REPORT | SEE NOTES TO FINANCIAL STATEMENTS |
| Total investments (Cost $2,501,311,344) 99.8% | $2,506,953,652 | ||||
| Other assets and liabilities, net 0.2% | 6,000,769 | ||||
| Total net assets 100.0% | $2,512,954,421 | ||||
| The percentage shown for each investment category is the total value of the category as a percentage of the net assets of the fund. | |
| Security Abbreviations and Legend | |
| ADR | American Depositary Receipt |
| (A) | Non-income producing security. |
| (B) | All or a portion of this security is on loan as of 10-31-23. |
| (C) | The rate shown is the annualized seven-day yield as of 10-31-23. |
| (D) | Investment is an affiliate of the fund, the advisor and/or subadvisor. This security represents the investment of cash collateral received for securities lending. |
| SEE NOTES TO FINANCIAL STATEMENTS | ANNUAL REPORT | JOHN HANCOCK DISCIPLINED VALUE INTERNATIONAL FUND | 13 |
| Assets | |
| Unaffiliated investments, at value (Cost $2,485,306,664) including $15,179,371 of securities loaned | $2,490,949,107 |
| Affiliated investments, at value (Cost $16,004,680) | 16,004,545 |
| Total investments, at value (Cost $2,501,311,344) | 2,506,953,652 |
| Cash | 29,297 |
| Foreign currency, at value (Cost $3,858,830) | 3,835,847 |
| Dividends and interest receivable | 9,247,031 |
| Receivable for fund shares sold | 5,275,440 |
| Receivable for investments sold | 14,975,912 |
| Receivable for securities lending income | 4,753 |
| Other assets | 341,960 |
| Total assets | 2,540,663,892 |
| Liabilities | |
| Payable for investments purchased | 9,560,344 |
| Payable for fund shares repurchased | 1,571,685 |
| Payable upon return of securities loaned | 16,000,597 |
| Payable to affiliates | |
| Accounting and legal services fees | 185,648 |
| Transfer agent fees | 71,684 |
| Distribution and service fees | 1,132 |
| Trustees’ fees | 3,331 |
| Other liabilities and accrued expenses | 315,050 |
| Total liabilities | 27,709,471 |
| Net assets | $2,512,954,421 |
| Net assets consist of | |
| Paid-in capital | $2,569,641,582 |
| Total distributable earnings (loss) | (56,687,161) |
| Net assets | $2,512,954,421 |
| 14 | JOHN HANCOCK Disciplined Value International Fund | ANNUAL REPORT | SEE NOTES TO FINANCIAL STATEMENTS |
| Net asset value per share | |
| Based on net asset value and shares outstanding - the fund has an unlimited number of shares authorized with no par value | |
| Class A ($146,362,266 ÷ 10,601,524 shares)1 | $13.81 |
| Class C ($5,334,830 ÷ 388,709 shares)1 | $13.72 |
| Class I ($512,096,606 ÷ 36,992,039 shares) | $13.84 |
| Class R2 ($5,264,907 ÷ 380,849 shares) | $13.82 |
| Class R4 ($169,698 ÷ 12,277 shares) | $13.82 |
| Class R6 ($522,759,584 ÷ 37,743,089 shares) | $13.85 |
| Class NAV ($1,320,966,530 ÷ 95,404,765 shares) | $13.85 |
| Maximum offering price per share | |
| Class A (net asset value per share ÷ 95%)2 | $14.54 |
| 1 | Redemption price per share is equal to net asset value less any applicable contingent deferred sales charge. |
| 2 | On single retail sales of less than $50,000. On sales of $50,000 or more and on group sales the offering price is reduced. |
| SEE NOTES TO FINANCIAL STATEMENTS | ANNUAL REPORT | JOHN HANCOCK Disciplined Value International Fund | 15 |
| Investment income | |
| Dividends | $82,429,962 |
| Interest | 54,194 |
| Securities lending | 417,513 |
| Less foreign taxes withheld | (7,690,023) |
| Total investment income | 75,211,646 |
| Expenses | |
| Investment management fees | 17,628,676 |
| Distribution and service fees | 424,239 |
| Accounting and legal services fees | 512,801 |
| Transfer agent fees | 666,709 |
| Trustees’ fees | 58,368 |
| Custodian fees | 631,336 |
| State registration fees | 181,424 |
| Printing and postage | 81,353 |
| Professional fees | 171,699 |
| Other | 101,854 |
| Total expenses | 20,458,459 |
| Less expense reductions | (175,518) |
| Net expenses | 20,282,941 |
| Net investment income | 54,928,705 |
| Realized and unrealized gain (loss) | |
| Net realized gain (loss) on | |
| Unaffiliated investments and foreign currency transactions | 166,452,631 |
| Affiliated investments | (16,865) |
| 166,435,766 | |
| Change in net unrealized appreciation (depreciation) of | |
| Unaffiliated investments and translation of assets and liabilities in foreign currencies | 94,686,923 |
| Affiliated investments | (135) |
| 94,686,788 | |
| Net realized and unrealized gain | 261,122,554 |
| Increase in net assets from operations | $316,051,259 |
| 16 | JOHN HANCOCK Disciplined Value International Fund | ANNUAL REPORT | SEE NOTES TO FINANCIAL STATEMENTS |
| Year ended 10-31-23 | Year ended 10-31-22 | |
| Increase (decrease) in net assets | ||
| From operations | ||
| Net investment income | $54,928,705 | $46,870,104 |
| Net realized gain | 166,435,766 | 18,241,874 |
| Change in net unrealized appreciation (depreciation) | 94,686,788 | (352,820,875) |
| Increase (decrease) in net assets resulting from operations | 316,051,259 | (287,708,897) |
| Distributions to shareholders | ||
| From earnings | ||
| Class A | (2,524,753) | (3,567,029) |
| Class C | (80,076) | (147,560) |
| Class I | (6,358,018) | (2,232,886) |
| Class R2 | (120,448) | (21,948) |
| Class R4 | (3,871) | (5,774) |
| Class R6 | (10,877,291) | (12,677,795) |
| Class NAV | (33,875,441) | (55,772,157) |
| Total distributions | (53,839,898) | (74,425,149) |
| From fund share transactions | 355,013,543 | 26,525,490 |
| Total increase (decrease) | 617,224,904 | (335,608,556) |
| Net assets | ||
| Beginning of year | 1,895,729,517 | 2,231,338,073 |
| End of year | $2,512,954,421 | $1,895,729,517 |
| SEE NOTES TO FINANCIAL STATEMENTS | ANNUAL REPORT | JOHN HANCOCK Disciplined Value International Fund | 17 |
| CLASS A SHARES Period ended | 10-31-23 | 10-31-22 | 10-31-21 | 10-31-20 | 10-31-19 |
| Per share operating performance | |||||
| Net asset value, beginning of period | $12.11 | $14.54 | $10.57 | $12.21 | $12.42 |
| Net investment income1 | 0.27 | 0.26 | 0.33 | 0.16 | 0.25 |
| Net realized and unrealized gain (loss) on investments | 1.72 | (2.25) | 3.80 | (1.53) | —2 |
| Total from investment operations | 1.99 | (1.99) | 4.13 | (1.37) | 0.25 |
| Less distributions | |||||
| From net investment income | (0.23) | (0.44) | (0.16) | (0.27) | (0.14) |
| From net realized gain | (0.06) | — | — | — | (0.32) |
| Total distributions | (0.29) | (0.44) | (0.16) | (0.27) | (0.46) |
| Net asset value, end of period | $13.81 | $12.11 | $14.54 | $10.57 | $12.21 |
| Total return (%)3,4 | 16.60 | (14.05) | 39.23 | (11.53) | 2.34 |
| Ratios and supplemental data | |||||
| Net assets, end of period (in millions) | $146 | $105 | $118 | $91 | $114 |
| Ratios (as a percentage of average net assets): | |||||
| Expenses before reductions | 1.17 | 1.20 | 1.20 | 1.23 | 1.28 |
| Expenses including reductions | 1.16 | 1.19 | 1.19 | 1.23 | 1.27 |
| Net investment income | 1.93 | 1.95 | 2.35 | 1.42 | 2.13 |
| Portfolio turnover (%) | 71 | 70 | 76 | 995 | 96 |
| 1 | Based on average daily shares outstanding. |
| 2 | Less than $0.005 per share. |
| 3 | Total returns would have been lower had certain expenses not been reduced during the applicable periods. |
| 4 | Does not reflect the effect of sales charges, if any. |
| 5 | Excludes merger activity. |
| 18 | JOHN HANCOCK Disciplined Value International Fund | ANNUAL REPORT | SEE NOTES TO FINANCIAL STATEMENTS |
| CLASS C SHARES Period ended | 10-31-23 | 10-31-22 | 10-31-21 | 10-31-20 | 10-31-19 |
| Per share operating performance | |||||
| Net asset value, beginning of period | $12.04 | $14.45 | $10.51 | $12.16 | $12.35 |
| Net investment income1 | 0.16 | 0.16 | 0.22 | 0.07 | 0.17 |
| Net realized and unrealized gain (loss) on investments | 1.71 | (2.24) | 3.79 | (1.54) | —2 |
| Total from investment operations | 1.87 | (2.08) | 4.01 | (1.47) | 0.17 |
| Less distributions | |||||
| From net investment income | (0.13) | (0.33) | (0.07) | (0.18) | (0.04) |
| From net realized gain | (0.06) | — | — | — | (0.32) |
| Total distributions | (0.19) | (0.33) | (0.07) | (0.18) | (0.36) |
| Net asset value, end of period | $13.72 | $12.04 | $14.45 | $10.51 | $12.16 |
| Total return (%)3,4 | 15.64 | (14.67) | 38.27 | (12.30) | 1.67 |
| Ratios and supplemental data | |||||
| Net assets, end of period (in millions) | $5 | $5 | $6 | $6 | $11 |
| Ratios (as a percentage of average net assets): | |||||
| Expenses before reductions | 1.92 | 1.95 | 1.95 | 1.98 | 2.00 |
| Expenses including reductions | 1.91 | 1.94 | 1.94 | 1.98 | 1.99 |
| Net investment income | 1.17 | 1.22 | 1.58 | 0.63 | 1.44 |
| Portfolio turnover (%) | 71 | 70 | 76 | 995 | 96 |
| 1 | Based on average daily shares outstanding. |
| 2 | Less than $0.005 per share. |
| 3 | Total returns would have been lower had certain expenses not been reduced during the applicable periods. |
| 4 | Does not reflect the effect of sales charges, if any. |
| 5 | Excludes merger activity. |
| SEE NOTES TO FINANCIAL STATEMENTS | ANNUAL REPORT | JOHN HANCOCK Disciplined Value International Fund | 19 |
| CLASS I SHARES Period ended | 10-31-23 | 10-31-22 | 10-31-21 | 10-31-20 | 10-31-19 |
| Per share operating performance | |||||
| Net asset value, beginning of period | $12.14 | $14.58 | $10.59 | $12.24 | $12.45 |
| Net investment income1 | 0.33 | 0.28 | 0.36 | 0.19 | 0.27 |
| Net realized and unrealized gain (loss) on investments | 1.69 | (2.25) | 3.81 | (1.54) | 0.02 |
| Total from investment operations | 2.02 | (1.97) | 4.17 | (1.35) | 0.29 |
| Less distributions | |||||
| From net investment income | (0.26) | (0.47) | (0.18) | (0.30) | (0.18) |
| From net realized gain | (0.06) | — | — | — | (0.32) |
| Total distributions | (0.32) | (0.47) | (0.18) | (0.30) | (0.50) |
| Net asset value, end of period | $13.84 | $12.14 | $14.58 | $10.59 | $12.24 |
| Total return (%)2 | 16.85 | (13.79) | 39.55 | (11.36) | 2.73 |
| Ratios and supplemental data | |||||
| Net assets, end of period (in millions) | $512 | $112 | $69 | $42 | $88 |
| Ratios (as a percentage of average net assets): | |||||
| Expenses before reductions | 0.92 | 0.95 | 0.95 | 0.98 | 1.01 |
| Expenses including reductions | 0.91 | 0.94 | 0.94 | 0.98 | 0.98 |
| Net investment income | 2.29 | 2.13 | 2.57 | 1.62 | 2.22 |
| Portfolio turnover (%) | 71 | 70 | 76 | 993 | 96 |
| 1 | Based on average daily shares outstanding. |
| 2 | Total returns would have been lower had certain expenses not been reduced during the applicable periods. |
| 3 | Excludes merger activity. |
| 20 | JOHN HANCOCK Disciplined Value International Fund | ANNUAL REPORT | SEE NOTES TO FINANCIAL STATEMENTS |
| CLASS R2 SHARES Period ended | 10-31-23 | 10-31-22 | 10-31-21 | 10-31-20 | 10-31-19 |
| Per share operating performance | |||||
| Net asset value, beginning of period | $12.12 | $14.55 | $10.58 | $12.22 | $12.42 |
| Net investment income1 | 0.25 | 0.09 | 0.31 | 0.15 | 0.24 |
| Net realized and unrealized gain (loss) on investments | 1.72 | (2.10) | 3.80 | (1.53) | 0.01 |
| Total from investment operations | 1.97 | (2.01) | 4.11 | (1.38) | 0.25 |
| Less distributions | |||||
| From net investment income | (0.21) | (0.42) | (0.14) | (0.26) | (0.13) |
| From net realized gain | (0.06) | — | — | — | (0.32) |
| Total distributions | (0.27) | (0.42) | (0.14) | (0.26) | (0.45) |
| Net asset value, end of period | $13.82 | $12.12 | $14.55 | $10.58 | $12.22 |
| Total return (%)2 | 16.40 | (14.12) | 39.06 | (11.61) | 2.32 |
| Ratios and supplemental data | |||||
| Net assets, end of period (in millions) | $5 | $5 | $1 | $1 | $1 |
| Ratios (as a percentage of average net assets): | |||||
| Expenses before reductions | 1.30 | 1.33 | 1.29 | 1.32 | 1.35 |
| Expenses including reductions | 1.29 | 1.32 | 1.28 | 1.32 | 1.34 |
| Net investment income | 1.76 | 0.71 | 2.26 | 1.30 | 1.98 |
| Portfolio turnover (%) | 71 | 70 | 76 | 993 | 96 |
| 1 | Based on average daily shares outstanding. |
| 2 | Total returns would have been lower had certain expenses not been reduced during the applicable periods. |
| 3 | Excludes merger activity. |
| SEE NOTES TO FINANCIAL STATEMENTS | ANNUAL REPORT | JOHN HANCOCK Disciplined Value International Fund | 21 |
| CLASS R4 SHARES Period ended | 10-31-23 | 10-31-22 | 10-31-21 | 10-31-20 | 10-31-19 |
| Per share operating performance | |||||
| Net asset value, beginning of period | $12.12 | $14.55 | $10.58 | $12.22 | $12.44 |
| Net investment income1 | 0.29 | 0.27 | 0.34 | 0.18 | 0.22 |
| Net realized and unrealized gain (loss) on investments | 1.71 | (2.25) | 3.80 | (1.54) | 0.04 |
| Total from investment operations | 2.00 | (1.98) | 4.14 | (1.36) | 0.26 |
| Less distributions | |||||
| From net investment income | (0.24) | (0.45) | (0.17) | (0.28) | (0.16) |
| From net realized gain | (0.06) | — | — | — | (0.32) |
| Total distributions | (0.30) | (0.45) | (0.17) | (0.28) | (0.48) |
| Net asset value, end of period | $13.82 | $12.12 | $14.55 | $10.58 | $12.22 |
| Total return (%)2 | 16.70 | (13.94) | 39.33 | (11.44) | 2.45 |
| Ratios and supplemental data | |||||
| Net assets, end of period (in millions) | $—3 | $—3 | $—3 | $—3 | $—3 |
| Ratios (as a percentage of average net assets): | |||||
| Expenses before reductions | 1.15 | 1.20 | 1.20 | 1.21 | 1.25 |
| Expenses including reductions | 1.05 | 1.09 | 1.09 | 1.11 | 1.14 |
| Net investment income | 2.04 | 2.03 | 2.45 | 1.68 | 1.84 |
| Portfolio turnover (%) | 71 | 70 | 76 | 994 | 96 |
| 1 | Based on average daily shares outstanding. |
| 2 | Total returns would have been lower had certain expenses not been reduced during the applicable periods. |
| 3 | Less than $500,000. |
| 4 | Excludes merger activity. |
| 22 | JOHN HANCOCK Disciplined Value International Fund | ANNUAL REPORT | SEE NOTES TO FINANCIAL STATEMENTS |
| CLASS R6 SHARES Period ended | 10-31-23 | 10-31-22 | 10-31-21 | 10-31-20 | 10-31-19 |
| Per share operating performance | |||||
| Net asset value, beginning of period | $12.15 | $14.58 | $10.59 | $12.24 | $12.46 |
| Net investment income1 | 0.33 | 0.30 | 0.38 | 0.20 | 0.31 |
| Net realized and unrealized gain (loss) on investments | 1.71 | (2.24) | 3.81 | (1.54) | (0.01) |
| Total from investment operations | 2.04 | (1.94) | 4.19 | (1.34) | 0.30 |
| Less distributions | |||||
| From net investment income | (0.28) | (0.49) | (0.20) | (0.31) | (0.20) |
| From net realized gain | (0.06) | — | — | — | (0.32) |
| Total distributions | (0.34) | (0.49) | (0.20) | (0.31) | (0.52) |
| Net asset value, end of period | $13.85 | $12.15 | $14.58 | $10.59 | $12.24 |
| Total return (%)2 | 16.95 | (13.68) | 39.77 | (11.28) | 2.77 |
| Ratios and supplemental data | |||||
| Net assets, end of period (in millions) | $523 | $391 | $382 | $287 | $186 |
| Ratios (as a percentage of average net assets): | |||||
| Expenses before reductions | 0.80 | 0.85 | 0.85 | 0.87 | 0.89 |
| Expenses including reductions | 0.80 | 0.84 | 0.84 | 0.86 | 0.88 |
| Net investment income | 2.31 | 2.27 | 2.74 | 1.86 | 2.57 |
| Portfolio turnover (%) | 71 | 70 | 76 | 993 | 96 |
| 1 | Based on average daily shares outstanding. |
| 2 | Total returns would have been lower had certain expenses not been reduced during the applicable periods. |
| 3 | Excludes merger activity. |
| SEE NOTES TO FINANCIAL STATEMENTS | ANNUAL REPORT | JOHN HANCOCK Disciplined Value International Fund | 23 |
| CLASS NAV SHARES Period ended | 10-31-23 | 10-31-22 | 10-31-21 | 10-31-20 | 10-31-19 |
| Per share operating performance | |||||
| Net asset value, beginning of period | $12.14 | $14.58 | $10.59 | $12.24 | $12.46 |
| Net investment income1 | 0.32 | 0.31 | 0.38 | 0.20 | 0.32 |
| Net realized and unrealized gain (loss) on investments | 1.73 | (2.26) | 3.81 | (1.54) | (0.02) |
| Total from investment operations | 2.05 | (1.95) | 4.19 | (1.34) | 0.30 |
| Less distributions | |||||
| From net investment income | (0.28) | (0.49) | (0.20) | (0.31) | (0.20) |
| From net realized gain | (0.06) | — | — | — | (0.32) |
| Total distributions | (0.34) | (0.49) | (0.20) | (0.31) | (0.52) |
| Net asset value, end of period | $13.85 | $12.14 | $14.58 | $10.59 | $12.24 |
| Total return (%)2 | 17.06 | (13.75) | 39.80 | (11.28) | 2.77 |
| Ratios and supplemental data | |||||
| Net assets, end of period (in millions) | $1,321 | $1,277 | $1,655 | $1,254 | $1,305 |
| Ratios (as a percentage of average net assets): | |||||
| Expenses before reductions | 0.80 | 0.84 | 0.84 | 0.86 | 0.88 |
| Expenses including reductions | 0.79 | 0.83 | 0.83 | 0.85 | 0.87 |
| Net investment income | 2.28 | 2.34 | 2.73 | 1.82 | 2.73 |
| Portfolio turnover (%) | 71 | 70 | 76 | 993 | 96 |
| 1 | Based on average daily shares outstanding. |
| 2 | Total returns would have been lower had certain expenses not been reduced during the applicable periods. |
| 3 | Excludes merger activity. |
| 24 | JOHN HANCOCK Disciplined Value International Fund | ANNUAL REPORT | SEE NOTES TO FINANCIAL STATEMENTS |
| ANNUAL REPORT | JOHN HANCOCK Disciplined Value International Fund | 25 |
| Total value at 10-31-23 | Level 1 quoted price | Level 2 significant observable inputs | Level 3 significant unobservable inputs | |
| Investments in securities: | ||||
| Assets | ||||
| Common stocks | ||||
| Austria | $21,795,294 | — | $21,795,294 | — |
| Belgium | 11,878,442 | — | 11,878,442 | — |
| Bermuda | 62,928,300 | $62,928,300 | — | — |
| Brazil | 25,768,126 | 25,768,126 | — | — |
| Canada | 199,380,563 | 199,380,563 | — | — |
| China | 24,275,796 | — | 24,275,796 | — |
| Finland | 47,891,284 | — | 47,891,284 | — |
| France | 211,637,149 | — | 211,637,149 | — |
| Germany | 122,998,081 | — | 122,998,081 | — |
| Greece | 14,971,948 | — | 14,971,948 | — |
| India | 31,581,874 | 31,581,874 | — | — |
| Ireland | 98,494,447 | 40,252,371 | 58,242,076 | — |
| Italy | 11,919,695 | — | 11,919,695 | — |
| Japan | 450,134,721 | — | 450,134,721 | — |
| Jordan | 9,729,547 | — | 9,729,547 | — |
| Luxembourg | 24,297,805 | — | 24,297,805 | — |
| Netherlands | 128,706,167 | — | 128,706,167 | — |
| Singapore | 56,269,333 | — | 56,269,333 | — |
| South Korea | 76,324,640 | — | 76,324,640 | — |
| Spain | 53,454,227 | — | 53,454,227 | — |
| Sweden | 11,264,815 | — | 11,264,815 | — |
| Switzerland | 178,337,386 | — | 178,337,386 | — |
| 26 | JOHN HANCOCK Disciplined Value International Fund | ANNUAL REPORT |
| Total value at 10-31-23 | Level 1 quoted price | Level 2 significant observable inputs | Level 3 significant unobservable inputs | |
| United Kingdom | $540,781,749 | $62,223,911 | $478,557,838 | — |
| Short-term investments | 92,132,263 | 92,132,263 | — | — |
| Total investments in securities | $2,506,953,652 | $514,267,408 | $1,992,686,244 | — |
| ANNUAL REPORT | JOHN HANCOCK Disciplined Value International Fund | 27 |
| 28 | JOHN HANCOCK Disciplined Value International Fund | ANNUAL REPORT |
| October 31, 2023 | October 31, 2022 | |
| Ordinary income | $44,712,494 | $74,425,149 |
| Long-term capital gains | 9,127,404 | — |
| Total | $53,839,898 | $74,425,149 |
| ANNUAL REPORT | JOHN HANCOCK Disciplined Value International Fund | 29 |
| Class | Expense reduction |
| Class A | $9,814 |
| Class C | 404 |
| Class I | 28,732 |
| Class R2 | 409 |
| Class | Expense reduction |
| Class R4 | $13 |
| Class R6 | 35,099 |
| Class NAV | 100,865 |
| Total | $175,336 |
| 30 | JOHN HANCOCK Disciplined Value International Fund | ANNUAL REPORT |
| Class | Rule 12b-1 Fee | Service fee |
| Class A | 0.25% | — |
| Class C | 1.00% | — |
| Class R2 | 0.25% | 0.25% |
| Class R4 | 0.25% | 0.10% |
| ANNUAL REPORT | JOHN HANCOCK Disciplined Value International Fund | 31 |
| Class | Distribution and service fees | Transfer agent fees |
| Class A | $339,653 | $159,673 |
| Class C | 56,042 | 6,574 |
| Class I | — | 466,873 |
| Class R2 | 27,909 | 396 |
| Class R4 | 635 | 13 |
| Class R6 | — | 33,180 |
| Total | $424,239 | $666,709 |
| Borrower or Lender | Weighted Average Loan Balance | Days Outstanding | Weighted Average Interest Rate | Interest Income (Expense) | |
| Lender | $10,966,667 | 6 | 5.242% | $9,581 |
| Year Ended 10-31-23 | Year Ended 10-31-22 | |||
| Shares | Amount | Shares | Amount | |
| Class A shares | ||||
| Sold | 3,081,171 | $43,845,643 | 1,435,044 | $19,123,562 |
| Distributions reinvested | 193,743 | 2,501,228 | 259,411 | 3,530,587 |
| Repurchased | (1,329,421) | (18,743,534) | (1,183,221) | (15,763,785) |
| Net increase | 1,945,493 | $27,603,337 | 511,234 | $6,890,364 |
| Class C shares | ||||
| Sold | 117,055 | $1,621,132 | 89,728 | $1,155,183 |
| Distributions reinvested | 6,203 | 80,076 | 10,834 | 147,560 |
| Repurchased | (142,035) | (2,013,249) | (140,764) | (1,863,139) |
| Net decrease | (18,777) | $(312,041) | (40,202) | $(560,396) |
| 32 | JOHN HANCOCK Disciplined Value International Fund | ANNUAL REPORT |
| Year Ended 10-31-23 | Year Ended 10-31-22 | |||
| Shares | Amount | Shares | Amount | |
| Class I shares | ||||
| Sold | 33,879,247 | $475,105,619 | 6,924,472 | $91,790,627 |
| Distributions reinvested | 492,244 | 6,354,871 | 163,444 | 2,226,107 |
| Repurchased | (6,631,965) | (94,855,379) | (2,553,761) | (33,421,298) |
| Net increase | 27,739,526 | $386,605,111 | 4,534,155 | $60,595,436 |
| Class R2 shares | ||||
| Sold | 24,604 | $351,389 | 413,495 | $5,595,831 |
| Distributions reinvested | 9,308 | 120,448 | 1,608 | 21,929 |
| Repurchased | (103,649) | (1,415,092) | (15,877) | (207,287) |
| Net increase (decrease) | (69,737) | $(943,255) | 399,226 | $5,410,473 |
| Class R4 shares | ||||
| Sold | 913 | $12,963 | 1,358 | $17,995 |
| Distributions reinvested | 300 | 3,871 | 424 | 5,774 |
| Repurchased | (2,168) | (30,922) | (967) | (13,480) |
| Net increase (decrease) | (955) | $(14,088) | 815 | $10,289 |
| Class R6 shares | ||||
| Sold | 12,738,220 | $182,087,051 | 8,526,378 | $111,245,299 |
| Distributions reinvested | 842,541 | 10,877,205 | 931,488 | 12,677,552 |
| Repurchased | (8,018,801) | (114,440,497) | (3,473,541) | (46,184,352) |
| Net increase | 5,561,960 | $78,523,759 | 5,984,325 | $77,738,499 |
| Class NAV shares | ||||
| Sold | 6,173,093 | $88,180,881 | 5,206,733 | $68,253,384 |
| Distributions reinvested | 2,626,003 | 33,875,441 | 4,097,881 | 55,772,157 |
| Repurchased | (18,567,568) | (258,505,602) | (17,630,666) | (247,584,716) |
| Net decrease | (9,768,472) | $(136,449,280) | (8,326,052) | $(123,559,175) |
| Total net increase | 25,389,038 | $355,013,543 | 3,063,501 | $26,525,490 |
| ANNUAL REPORT | JOHN HANCOCK Disciplined Value International Fund | 33 |
| Fund | Affiliated Concentration |
| John Hancock Funds II Multimanager Lifestyle Growth Portfolio | 13.9% |
| John Hancock Funds II Multimanager Lifestyle Balanced Portfolio | 10.5% |
| John Hancock Funds II Multimanager Lifestyle Aggressive Portfolio | 6.4% |
| Dividends and distributions | |||||||||
| Affiliate | Ending share amount | Beginning value | Cost of purchases | Proceeds from shares sold | Realized gain (loss) | Change in unrealized appreciation (depreciation) | Income distributions received | Capital gain distributions received | Ending value |
| John Hancock Collateral Trust* | 1,600,999 | — | $593,417,121 | $(577,395,576) | $(16,865) | $(135) | $417,513 | — | $16,004,545 |
| * | Refer to the Securities lending note within Note 2 for details regarding this investment. |
| 34 | JOHN HANCOCK Disciplined Value International Fund | ANNUAL REPORT |
| ANNUAL REPORT | JOHN HANCOCK DISCIPLINED VALUE INTERNATIONAL FUND | 35 |
| 36 | JOHN HANCOCK DISCIPLINED VALUE INTERNATIONAL FUND | ANNUAL REPORT |
| ANNUAL REPORT | JOHN HANCOCK DISCIPLINED VALUE INTERNATIONAL FUND | 37 |
| (a) | the skills and competency with which the Advisor has in the past managed the Trust’s affairs and its subadvisory relationship, the Advisor’s oversight and monitoring of the Subadvisor’s investment performance and compliance programs, such as the Subadvisor’s compliance with fund policies and objectives, review of brokerage matters, including with respect to trade allocation and best execution and the Advisor’s timeliness in responding to performance issues; |
| (b) | the background, qualifications and skills of the Advisor’s personnel; |
| (c) | the Advisor’s compliance policies and procedures and its responsiveness to regulatory changes and fund industry developments; |
| (d) | the Advisor’s administrative capabilities, including its ability to supervise the other service providers for the fund, as well as the Advisor’s oversight of any securities lending activity, its monitoring of class action litigation and collection of class action settlements on behalf of the fund, and bringing loss recovery actions on behalf of the fund; |
| (e) | the financial condition of the Advisor and whether it has the financial wherewithal to provide a high level and quality of services to the fund; |
| 38 | JOHN HANCOCK DISCIPLINED VALUE INTERNATIONAL FUND | ANNUAL REPORT |
| (f) | the Advisor’s initiatives intended to improve various aspects of the Trust’s operations and investor experience with the fund; and |
| (g) | the Advisor’s reputation and experience in serving as an investment advisor to the Trust and the benefit to shareholders of investing in funds that are part of a family of funds offering a variety of investments. |
| (a) | reviewed information prepared by management regarding the fund’s performance; |
| (b) | considered the comparative performance of an applicable benchmark index; |
| (c) | considered the performance of comparable funds, if any, as included in the report prepared by an independent third-party provider of fund data; and |
| (d) | took into account the Advisor’s analysis of the fund’s performance and its plans and recommendations regarding the Trust’s subadvisory arrangements generally. |
| ANNUAL REPORT | JOHN HANCOCK DISCIPLINED VALUE INTERNATIONAL FUND | 39 |
| (a) | reviewed financial information of the Advisor; |
| (b) | reviewed and considered information presented by the Advisor regarding the net profitability to the Advisor and its affiliates with respect to the fund; |
| (c) | received and reviewed profitability information with respect to the John Hancock Fund Complex as a whole and with respect to the fund; |
| (d) | received information with respect to the Advisor’s allocation methodologies used in preparing the profitability data and considered that the Advisor hired an independent third-party consultant to provide an analysis of the Advisor’s allocation methodologies |
| (e) | considered that the John Hancock insurance companies that are affiliates of the Advisor, as shareholders of the Trust directly or through their separate accounts, receive certain tax credits or deductions relating to foreign taxes paid and dividends received by certain funds of the Trust and noted that these tax benefits, which are not available to participants in qualified retirement plans under applicable income tax law, are reflected in the profitability information reviewed by the Board; |
| (f) | considered that the Advisor also provides administrative services to the fund on a cost basis pursuant to an administrative services agreement; |
| (g) | noted that affiliates of the Advisor provide transfer agency services and distribution services to the fund, and that the fund’s distributor also receives Rule 12b-1 payments to support distribution of the fund; |
| (h) | noted that the Advisor also derives reputational and other indirect benefits from providing advisory services to the fund; |
| (i) | noted that the subadvisory fee for the fund is paid by the Advisor and is negotiated at arm’s length; |
| (j) | considered the Advisor’s ongoing costs and expenditures necessary to improve services, meet new regulatory and compliance requirements, and adapt to other challenges impacting the fund industry; and |
| (k) | considered that the Advisor should be entitled to earn a reasonable level of profits in exchange for the level of services it provides to the fund and the risks that it assumes as Advisor, including entrepreneurial, operational, reputational, litigation and regulatory risk. |
| 40 | JOHN HANCOCK DISCIPLINED VALUE INTERNATIONAL FUND | ANNUAL REPORT |
| (a) | considered that the Advisor has contractually agreed to waive a portion of its management fee for certain funds of the John Hancock Fund Complex, including the fund (the participating portfolios) or otherwise reimburse the expenses of the participating portfolios (the reimbursement). This waiver is based upon aggregate net assets of all the participating portfolios. The amount of the reimbursement is calculated daily and allocated among all the participating portfolios in proportion to the daily net assets of each fund; |
| (b) | reviewed the fund’s advisory fee structure and concluded that: (i) the fund’s fee structure contains breakpoints at the subadvisory fee level and that such breakpoints are reflected as breakpoints in the advisory fees for the fund; and (ii) although economies of scale cannot be measured with precision, these arrangements permit shareholders of the fund to benefit from economies of scale if the fund grows. The Board also took into account management’s discussion of the fund’s advisory fee structure; and |
| (c) | the Board also considered the effect of the fund’s growth in size on its performance and fees. The Board also noted that if the fund’s assets increase over time, the fund may realize other economies of scale. |
| (1) | information relating to the Subadvisor’s business, including current subadvisory services to the Trust (and other funds in the John Hancock Fund Complex); |
| (2) | the historical and current performance of the fund and comparative performance information relating to an applicable benchmark index and comparable funds; |
| (3) | the subadvisory fee for the fund, including any breakpoints, and to the extent available, comparable fee information prepared by an independent third-party provider of fund data; and |
| (4) | information relating to the nature and scope of any material relationships and their significance to the Trust’s Advisor and Subadvisor. |
| ANNUAL REPORT | JOHN HANCOCK DISCIPLINED VALUE INTERNATIONAL FUND | 41 |
| (1) | the Subadvisor has extensive experience and demonstrated skills as a manager; |
| (2) | the performance of the fund has generally been in line with or outperformed the benchmark index and the historical performance of comparable funds; |
| (3) | the subadvisory fee is reasonable in relation to the level and quality of services being provided under the Subadvisory Agreement; and |
| 42 | JOHN HANCOCK DISCIPLINED VALUE INTERNATIONAL FUND | ANNUAL REPORT |
| (4) | noted that the subadvisory fees are paid by the Advisor not the fund and that the subadvisory fee breakpoints are reflected as breakpoints in the advisory fees for the fund in order to permit shareholders to benefit from economies of scale if the fund grows. |
| ANNUAL REPORT | JOHN HANCOCK DISCIPLINED VALUE INTERNATIONAL FUND | 43 |
| Independent Trustees | ||
| Name, year of birth Position(s) held with Trust Principal occupation(s) and other directorships during past 5 years | Trustee of the Trust since1 | Number of John Hancock funds overseen by Trustee |
| Hassell H. McClellan,2 Born: 1945 | 2012 | 179 |
| Trustee and Chairperson of the Board | ||
| Director/Trustee, Virtus Funds (2008-2020); Director, The Barnes Group (2010-2021); Associate Professor, The Wallace E. Carroll School of Management, Boston College (retired 2013). Trustee (since 2005) and Chairperson of the Board (since 2017) of various trusts within the John Hancock Fund Complex. | ||
| James R. Boyle, Born: 1959 | 2015 | 175 |
| Trustee | ||
| Board Member, United of Omaha Life Insurance Company (since 2022). Board Member, Mutual of Omaha Investor Services, Inc. (since 2022). Foresters Financial, Chief Executive Officer (2018–2022) and board member (2017–2022). Manulife Financial and John Hancock, more than 20 years, retiring in 2012 as Chief Executive Officer, John Hancock and Senior Executive Vice President, Manulife Financial. Trustee of various trusts within the John Hancock Fund Complex (2005–2014 and since 2015). | ||
| William H. Cunningham,3 Born: 1944 | 1986 | 177 |
| Trustee | ||
| Professor, University of Texas, Austin, Texas (since 1971); former Chancellor, University of Texas System and former President of the University of Texas, Austin, Texas; Director (since 2006), Lincoln National Corporation (insurance); Director, Southwest Airlines (since 2000). Trustee of various trusts within the John Hancock Fund Complex (since 1986). | ||
| Noni L. Ellison, Born: 1971 | 2022 | 175 |
| Trustee | ||
| Senior Vice President, General Counsel & Corporate Secretary, Tractor Supply Company (rural lifestyle retailer) (since 2021); General Counsel, Chief Compliance Officer & Corporate Secretary, Carestream Dental, L.L.C. (2017–2021); Associate General Counsel & Assistant Corporate Secretary, W.W. Grainger, Inc. (global industrial supplier) (2015–2017); Board Member, Goodwill of North Georgia, 2018 (FY2019)–2020 (FY2021); Board Member, Howard University School of Law Board of Visitors (since 2021); Board Member, University of Chicago Law School Board of Visitors (since 2016); Board member, Children’s Healthcare of Atlanta Foundation Board (2021–2023). Trustee of various trusts within the John Hancock Fund Complex (since 2022). | ||
| Grace K. Fey, Born: 1946 | 2012 | 179 |
| Trustee | ||
| Chief Executive Officer, Grace Fey Advisors (since 2007); Director and Executive Vice President, Frontier Capital Management Company (1988–2007); Director, Fiduciary Trust (since 2009). Trustee of various trusts within the John Hancock Fund Complex (since 2008). | ||
| Dean C. Garfield, Born: 1968 | 2022 | 175 |
| Trustee | ||
| Vice President, Netflix, Inc. (since 2019); President & Chief Executive Officer, Information Technology Industry Council (2009–2019); NYU School of Law Board of Trustees (since 2021); Member, U.S. Department of Transportation, Advisory Committee on Automation (since 2021); President of the United States Trade Advisory Council (2010–2018); Board Member, College for Every Student (2017–2021); Board Member, The Seed School of Washington, D.C. (2012–2017); Advisory Board Member of the Block Center for Technology and Society (since 2019). Trustee of various trusts within the John Hancock Fund Complex (since 2022). | ||
| 44 | JOHN HANCOCK DISCIPLINED VALUE INTERNATIONAL FUND | ANNUAL REPORT |
| Independent Trustees (continued) | ||
| Name, year of birth Position(s) held with Trust Principal occupation(s) and other directorships during past 5 years | Trustee of the Trust since1 | Number of John Hancock funds overseen by Trustee |
| Deborah C. Jackson, Born: 1952 | 2008 | 177 |
| Trustee | ||
| President, Cambridge College, Cambridge, Massachusetts (since 2011); Board of Directors, Amwell Corporation (since 2020); Board of Directors, Massachusetts Women’s Forum (2018-2020); Board of Directors, National Association of Corporate Directors/New England (2015-2020); Chief Executive Officer, American Red Cross of Massachusetts Bay (2002–2011); Board of Directors of Eastern Bank Corporation (since 2001); Board of Directors of Eastern Bank Charitable Foundation (since 2001); Board of Directors of Boston Stock Exchange (2002–2008); Board of Directors of Harvard Pilgrim Healthcare (health benefits company) (2007–2011). Trustee of various trusts within the John Hancock Fund Complex (since 2008). | ||
| Steven R. Pruchansky, Born: 1944 | 1994 | 175 |
| Trustee and Vice Chairperson of the Board | ||
| Managing Director, Pru Realty (since 2017); Chairman and Chief Executive Officer, Greenscapes of Southwest Florida, Inc. (2014-2020); Director and President, Greenscapes of Southwest Florida, Inc. (until 2000); Member, Board of Advisors, First American Bank (until 2010); Managing Director, Jon James, LLC (real estate) (since 2000); Partner, Right Funding, LLC (2014-2017); Director, First Signature Bank & Trust Company (until 1991); Director, Mast Realty Trust (until 1994); President, Maxwell Building Corp. (until 1991). Trustee (since 1992), Chairperson of the Board (2011–2012), and Vice Chairperson of the Board (since 2012) of various trusts within the John Hancock Fund Complex. | ||
| Frances G. Rathke,3 Born: 1960 | 2020 | 175 |
| Trustee | ||
| Director, Audit Committee Chair, Oatly Group AB (plant-based drink company) (since 2021); Director, Audit Committee Chair and Compensation Committee Member, Green Mountain Power Corporation (since 2016); Director, Treasurer and Finance & Audit Committee Chair, Flynn Center for Performing Arts (since 2016); Director and Audit Committee Chair, Planet Fitness (since 2016); Chief Financial Officer and Treasurer, Keurig Green Mountain, Inc. (2003-retired 2015). Trustee of various trusts within the John Hancock Fund Complex (since 2020). | ||
| Gregory A. Russo, Born: 1949 | 2009 | 175 |
| Trustee | ||
| Director and Audit Committee Chairman (2012-2020), and Member, Audit Committee and Finance Committee (2011-2020), NCH Healthcare System, Inc. (holding company for multi-entity healthcare system); Director and Member (2012-2018), and Finance Committee Chairman (2014-2018), The Moorings, Inc. (nonprofit continuing care community); Global Vice Chairman, Risk & Regulatory Matters, KPMG LLP (KPMG) (2002–2006); Vice Chairman, Industrial Markets, KPMG (1998–2002). Trustee of various trusts within the John Hancock Fund Complex (since 2008). | ||
| ANNUAL REPORT | JOHN HANCOCK DISCIPLINED VALUE INTERNATIONAL FUND | 45 |
| Non-Independent Trustees4 | ||
| Name, year of birth Position(s) held with Trust Principal occupation(s) and other directorships during past 5 years | Trustee of the Trust since1 | Number of John Hancock funds overseen by Trustee |
| Andrew G. Arnott, Born: 1971 | 2017 | 177 |
| Non-Independent Trustee | ||
| Global Head of Retail for Manulife (since 2022); Head of Wealth and Asset Management, United States and Europe, for John Hancock and Manulife (2018-2023); Director and Chairman, John Hancock Investment Management LLC (since 2005, including prior positions); Director and Chairman, John Hancock Variable Trust Advisers LLC (since 2006, including prior positions); Director and Chairman, John Hancock Investment Management Distributors LLC (since 2004, including prior positions); President of various trusts within the John Hancock Fund Complex (2007-2023, including prior positions). Trustee of various trusts within the John Hancock Fund Complex (since 2017). | ||
| Paul Lorentz, Born: 1968 | 2022 | 175 |
| Non-Independent Trustee | ||
| Global Head, Manulife Wealth and Asset Management (since 2017); General Manager, Manulife, Individual Wealth Management and Insurance (2013–2017); President, Manulife Investments (2010–2016). Trustee of various trusts within the John Hancock Fund Complex (since 2022). | ||
| Principal officers who are not Trustees | |
| Name, year of birth Position(s) held with Trust Principal occupation(s) during past 5 years | Current Position(s) with the Trust since |
| Kristie M. Feinberg, Born: 1975 | 2023 |
| President | |
| Head of Wealth and Asset Management, United States and Europe, for John Hancock and Manulife (since 2023); CFO and Global Head of Strategy, Manulife Investment Management (2021-2023, including prior positions); CFO Americas & Global Head of Treasury, Invesco, Ltd., Invesco US (2019-2020, including prior positions); Senior Vice President, Corporate Treasurer and Business Controller, Oppenheimer Funds (2001-2019, including prior positions); President of various trusts within the John Hancock Fund Complex (since 2023). | |
| Charles A. Rizzo, Born: 1957 | 2007 |
| Chief Financial Officer | |
| Vice President, John Hancock Financial Services (since 2008); Senior Vice President, John Hancock Investment Management LLC and John Hancock Variable Trust Advisers LLC (since 2008); Chief Financial Officer of various trusts within the John Hancock Fund Complex (since 2007). | |
| Salvatore Schiavone, Born: 1965 | 2010 |
| Treasurer | |
| Assistant Vice President, John Hancock Financial Services (since 2007); Vice President, John Hancock Investment Management LLC and John Hancock Variable Trust Advisers LLC (since 2007); Treasurer of various trusts within the John Hancock Fund Complex (since 2007, including prior positions). | |
| 46 | JOHN HANCOCK DISCIPLINED VALUE INTERNATIONAL FUND | ANNUAL REPORT |
| Principal officers who are not Trustees (continued) | |
| Name, year of birth Position(s) held with Trust Principal occupation(s) during past 5 years | Current Position(s) with the Trust since |
| Christopher (Kit) Sechler, Born: 1973 | 2018 |
| Secretary and Chief Legal Officer | |
| Vice President and Deputy Chief Counsel, John Hancock Investment Management (since 2015); Assistant Vice President and Senior Counsel (2009–2015), John Hancock Investment Management; Assistant Secretary of John Hancock Investment Management LLC and John Hancock Variable Trust Advisers LLC (since 2009); Chief Legal Officer and Secretary of various trusts within the John Hancock Fund Complex (since 2009, including prior positions). | |
| Trevor Swanberg, Born: 1979 | 2020 |
| Chief Compliance Officer | |
| Chief Compliance Officer, John Hancock Investment Management LLC and John Hancock Variable Trust Advisers LLC (since 2020); Deputy Chief Compliance Officer, John Hancock Investment Management LLC and John Hancock Variable Trust Advisers LLC (2019–2020); Assistant Chief Compliance Officer, John Hancock Investment Management LLC and John Hancock Variable Trust Advisers LLC (2016–2019); Vice President, State Street Global Advisors (2015–2016); Chief Compliance Officer of various trusts within the John Hancock Fund Complex (since 2016, including prior positions). | |
| 1 | Each Trustee holds office until his or her successor is duly elected and qualified, or until the Trustee’s death, retirement, resignation, or removal. Mr. Boyle has served as Trustee at various times prior to the date listed in the table. |
| 2 | Member of the Audit Committee as of September 26, 2023. |
| 3 | Member of the Audit Committee. |
| 4 | The Trustee is a Non-Independent Trustee due to current or former positions with the Advisor and certain affiliates. |
| ANNUAL REPORT | JOHN HANCOCK DISCIPLINED VALUE INTERNATIONAL FUND | 47 |
Steven R. Pruchansky, Vice Chairperson
Andrew G. Arnott†
James R. Boyle
William H. Cunningham*
Grace K. Fey
Noni L. Ellison
Dean C. Garfield
Deborah C. Jackson
Paul Lorentz†
Frances G. Rathke*
Gregory A. Russo
President
Chief Financial Officer
Treasurer
Secretary and Chief Legal Officer
Chief Compliance Officer
Christopher K. Hart, CFA
Joshua M. Jones, CFA
| You can also contact us: | ||
| 800-225-5291 | Regular mail: | Express mail: |
| jhinvestments.com | John Hancock Signature Services, Inc. P.O. Box 219909 Kansas City, MO 64121-9909 | John Hancock Signature Services, Inc. 430 W 7th Street Suite 219909 Kansas City, MO 64105-1407 |
| 48 | JOHN HANCOCK DISCIPLINED VALUE INTERNATIONAL FUND | ANNUAL REPORT |
GOVERNANCE FUNDS
with a heritage of financial stewardship dating back to 1862. Helping
our shareholders pursue their financial goals is at the core of everything
we do. It’s why we support the role of professional financial advice
and operate with the highest standards of conduct and integrity.
We search the world to find proven portfolio teams with specialized
expertise for every strategy we offer, then we apply robust investment
oversight to ensure they continue to meet our uncompromising
standards and serve the best interests of our shareholders.
a diverse set of investments backed by some of the world’s best
managers, along with strong risk-adjusted returns across asset classes.
200 Berkeley Street, Boston, MA 02116-5010, 800-225-5291, jhinvestments.com
| MF3208587 | 455A 10/23 |


United States and Europe
Manulife Investment Management
John Hancock Investment Management
| ANNUAL REPORT | JOHN HANCOCK DIVERSIFIED MACRO FUND | 1 |
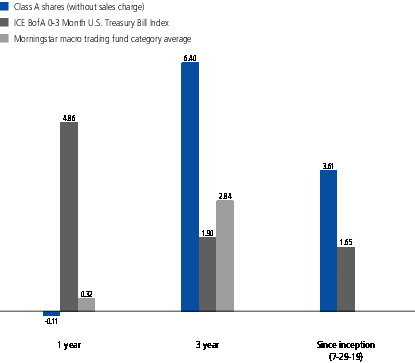
| 2 | JOHN HANCOCK DIVERSIFIED MACRO FUND | ANNUAL REPORT |
| FUTURES CONTRACTS EXPOSURE AS OF 10/31/2023 (Notional basis as a % of net assets) | |
| Energy | 10.7 |
| Equity | 6.6 |
| Currency | 1.7 |
| Ags/Softs | (2.0) |
| Base Metals | (4.7) |
| Precious Metals | (7.9) |
| Long Term/Intermediate Rates | (71.6) |
| Short Term Rates | (134.4) |
| TOTAL | (201.6) |
| ANNUAL REPORT | JOHN HANCOCK DIVERSIFIED MACRO FUND | 3 |
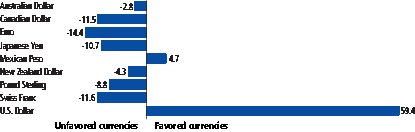
| 4 | JOHN HANCOCK DIVERSIFIED MACRO FUND | ANNUAL REPORT |
| ANNUAL REPORT | JOHN HANCOCK DIVERSIFIED MACRO FUND | 5 |

| 6 | JOHN HANCOCK DIVERSIFIED MACRO FUND | ANNUAL REPORT |
| Average annual total returns (%) with maximum sales charge | Cumulative total returns (%) with maximum sales charge | ||
| 1-year | Since inception (7-29-19) | Since inception (7-29-19) | |
| Class A | -5.08 | 2.37 | 10.47 |
| Class C | -1.84 | 2.82 | 12.59 |
| Class I1 | 0.17 | 3.90 | 17.70 |
| Class R61 | 0.20 | 3.99 | 18.16 |
| Class NAV1 | 0.30 | 4.01 | 18.21 |
| Index† | 4.86 | 1.65 | 7.23 |
| Class A | Class C | Class I | Class R6 | Class NAV | |
| Gross (%) | 1.65 | 2.40 | 1.40 | 1.29 | 1.28 |
| Net (%) | 1.64 | 2.39 | 1.39 | 1.28 | 1.27 |
| ANNUAL REPORT | JOHN HANCOCK DIVERSIFIED MACRO FUND | 7 |
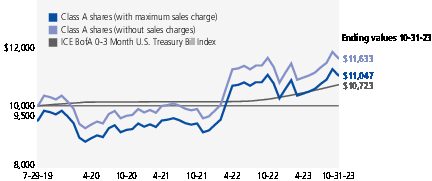
| Start date | With maximum sales charge ($) | Without sales charge ($) | Index ($) | |
| Class C2 | 7-29-19 | 11,259 | 11,259 | 10,723 |
| Class I1 | 7-29-19 | 11,770 | 11,770 | 10,723 |
| Class R61 | 7-29-19 | 11,816 | 11,816 | 10,723 |
| Class NAV1 | 7-29-19 | 11,821 | 11,821 | 10,723 |
| 1 | For certain types of investors, as described in the fund’s prospectuses. |
| 2 | The contingent deferred sales charge is not applicable. |
| 8 | JOHN HANCOCK DIVERSIFIED MACRO FUND | ANNUAL REPORT |

| ANNUAL REPORT | JOHN HANCOCK DIVERSIFIED MACRO FUND | 9 |
| Account value on 5-1-2023 | Ending value on 10-31-2023 | Expenses paid during period ended 10-31-20231 | Annualized expense ratio | ||
| Class A | Actual expenses/actual returns | $1,000.00 | $1,060.60 | $8.57 | 1.65% |
| Hypothetical example | 1,000.00 | 1,016.90 | 8.39 | 1.65% | |
| Class C | Actual expenses/actual returns | 1,000.00 | 1,055.40 | 12.38 | 2.39% |
| Hypothetical example | 1,000.00 | 1,013.20 | 12.13 | 2.39% | |
| Class I | Actual expenses/actual returns | 1,000.00 | 1,061.50 | 7.22 | 1.39% |
| Hypothetical example | 1,000.00 | 1,018.20 | 7.07 | 1.39% | |
| Class R6 | Actual expenses/actual returns | 1,000.00 | 1,061.50 | 6.60 | 1.27% |
| Hypothetical example | 1,000.00 | 1,018.80 | 6.46 | 1.27% | |
| Class NAV | Actual expenses/actual returns | 1,000.00 | 1,062.60 | 6.60 | 1.27% |
| Hypothetical example | 1,000.00 | 1,018.80 | 6.46 | 1.27% |
| 1 | Expenses are equal to the annualized expense ratio, multiplied by the average account value over the period, multiplied by 184/365 (to reflect the one-half year period). |
| 10 | JOHN HANCOCK DIVERSIFIED MACRO FUND | ANNUAL REPORT |
| Yield* (%) | Maturity date | Par value^ | Value | ||
| Short-term investments 69.7% | $957,496,447 | ||||
| (Cost $957,497,160) | |||||
| U.S. Government 69.7% | 957,496,447 | ||||
| U.S. Treasury Bill | 5.247 | 12-14-23 | 130,000,000 | 129,178,192 | |
| U.S. Treasury Bill | 5.281 | 11-14-23 | 150,000,000 | 149,713,526 | |
| U.S. Treasury Bill | 5.287 | 11-07-23 | 97,000,000 | 96,914,640 | |
| U.S. Treasury Bill | 5.295 | 12-21-23 | 132,000,000 | 131,027,875 | |
| U.S. Treasury Bill | 5.298 | 11-21-23 | 152,000,000 | 151,552,973 | |
| U.S. Treasury Bill | 5.300 | 12-07-23 | 132,500,000 | 131,800,400 | |
| U.S. Treasury Bill | 5.327 | 11-30-23 | 84,000,000 | 83,642,111 | |
| U.S. Treasury Bill | 5.335 | 11-28-23 | 84,000,000 | 83,666,730 |
| Total investments (Cost $957,497,160) 69.7% | $957,496,447 | ||||
| Other assets and liabilities, net 30.3% | 416,741,364 | ||||
| Total net assets 100.0% | $1,374,237,811 | ||||
| The percentage shown for each investment category is the total value of the category as a percentage of the net assets of the fund. | |
| ^All par values are denominated in U.S. dollars unless otherwise indicated. | |
| Security Abbreviations and Legend | |
| * | Yield represents either the annualized yield at the date of purchase, the stated coupon rate or, for floating rate securities, the rate at period end. |
| SEE NOTES TO CONSOLIDATED FINANCIAL STATEMENTS | ANNUAL REPORT | JOHN HANCOCK DIVERSIFIED MACRO FUND | 11 |
| Open contracts | Number of contracts | Position | Expiration date | Notional basis^ | Notional value^ | Unrealized appreciation (depreciation) |
| 3-Month SONIA Index Futures | 455 | Long | Mar 2025 | $131,601,651 | $131,752,513 | $150,862 |
| Australian 10-Year Bond Futures | 474 | Long | Dec 2023 | 33,572,987 | 32,424,087 | (1,148,900) |
| Brent Crude Futures | 455 | Long | Dec 2023 | 40,809,008 | 38,811,500 | (1,997,508) |
| CAC40 Index Futures | 683 | Long | Nov 2023 | 50,639,472 | 49,955,427 | (684,045) |
| Canadian 10-Year Bond Futures | 73 | Long | Dec 2023 | 6,046,126 | 6,046,879 | 753 |
| Cocoa Futures | 84 | Long | Dec 2023 | 2,736,399 | 3,460,097 | 723,698 |
| Cocoa Futures | 171 | Long | Mar 2024 | 6,892,751 | 6,964,789 | 72,038 |
| Cotton No. 2 Futures | 228 | Long | Dec 2023 | 9,440,897 | 9,260,220 | (180,677) |
| DAX Index Futures | 173 | Long | Dec 2023 | 71,170,880 | 68,269,001 | (2,901,879) |
| Euro STOXX 50 Index Futures | 2,741 | Long | Dec 2023 | 121,663,392 | 118,446,328 | (3,217,064) |
| Euro-BOBL Futures | 1,539 | Long | Dec 2023 | 188,452,673 | 189,156,842 | 704,169 |
| FTSE 100 Index Futures | 1,193 | Long | Dec 2023 | 109,856,789 | 106,490,411 | (3,366,378) |
| Gasoline RBOB Futures | 246 | Long | Dec 2023 | 23,762,151 | 22,953,571 | (808,580) |
| Long Gilt Futures | 501 | Long | Dec 2023 | 56,566,395 | 56,686,305 | 119,910 |
| Low Sulphur Gasoil Futures | 474 | Long | Dec 2023 | 41,477,923 | 40,076,700 | (1,401,223) |
| Nikkei 225 Index Futures | 264 | Long | Dec 2023 | 56,474,379 | 54,602,672 | (1,871,707) |
| NY Harbor ULSD Futures | 237 | Long | Dec 2023 | 29,667,890 | 29,105,496 | (562,394) |
| Soybean Meal Futures | 364 | Long | Dec 2023 | 13,848,534 | 15,706,600 | 1,858,066 |
| Soybean Oil Futures | 264 | Long | Dec 2023 | 8,788,979 | 8,162,352 | (626,627) |
| Sugar No. 11 (World) Futures | 756 | Long | Mar 2024 | 22,561,828 | 22,954,579 | 392,751 |
| TOPIX Index Futures | 173 | Long | Dec 2023 | 26,578,174 | 26,348,045 | (230,129) |
| U.S. Dollar Index Futures | 228 | Long | Dec 2023 | 23,816,252 | 24,284,280 | 468,028 |
| WTI Crude Futures | 519 | Long | Nov 2023 | 43,082,456 | 42,158,370 | (924,086) |
| 10-Year U.S. Treasury Note Futures | 774 | Short | Dec 2023 | (84,356,106) | (82,080,281) | 2,275,825 |
| 2-Year U.S. Treasury Note Futures | 3,552 | Short | Jan 2024 | (721,154,473) | (719,113,500) | 2,040,973 |
| 3-Month EURIBOR Futures | 712 | Short | Jun 2024 | (182,587,906) | (181,514,459) | 1,073,447 |
| 3-Month EURIBOR Futures | 1,938 | Short | Dec 2024 | (495,883,709) | (496,475,495) | (591,786) |
| 3-Month SOFR Index Futures | 5,437 | Short | Mar 2025 | (1,300,613,847) | (1,296,248,763) | 4,365,084 |
| 5-Year U.S. Treasury Note Futures | 492 | Short | Jan 2024 | (52,399,362) | (51,390,938) | 1,008,424 |
| Coffee ’C’ Futures | 182 | Short | Dec 2023 | (10,461,988) | (11,373,863) | (911,875) |
| Corn Futures | 1,485 | Short | Dec 2023 | (36,405,196) | (35,565,750) | 839,446 |
| Dow Jones Industrial Average E-Mini Index Futures | 556 | Short | Dec 2023 | (96,335,978) | (92,115,300) | 4,220,678 |
| Electrolytic Copper Futures | 200 | Short | Dec 2023 | (41,800,843) | (40,417,500) | 1,383,343 |
| Euro-Bund Futures | 219 | Short | Dec 2023 | (30,356,553) | (29,811,288) | 545,265 |
| Euro-Schatz Futures | 3,261 | Short | Dec 2023 | (363,829,542) | (362,799,146) | 1,030,396 |
| Gold 100 Oz Futures | 474 | Short | Dec 2023 | (90,906,357) | (94,496,640) | (3,590,283) |
| Hang Seng Index Futures | 410 | Short | Nov 2023 | (44,587,698) | (44,953,074) | (365,376) |
| Hard Red Winter Wheat Futures | 455 | Short | Dec 2023 | (16,444,882) | (14,332,500) | 2,112,382 |
| Nasdaq 100 E-Mini Index Futures | 209 | Short | Dec 2023 | (62,573,265) | (60,569,245) | 2,004,020 |
| Natural Gas Futures | 911 | Short | Nov 2023 | (31,240,420) | (32,832,440) | (1,592,020) |
| 12 | JOHN HANCOCK DIVERSIFIED MACRO FUND | ANNUAL REPORT | SEE NOTES TO CONSOLIDATED FINANCIAL STATEMENTS |
| Open contracts | Number of contracts | Position | Expiration date | Notional basis^ | Notional value^ | Unrealized appreciation (depreciation) |
| Primary Aluminum Futures | 237 | Short | Dec 2023 | $(13,183,341) | $(13,314,364) | $(131,023) |
| Russell 2000 E-Mini Index Futures | 1,047 | Short | Dec 2023 | (93,898,150) | (87,340,740) | 6,557,410 |
| S&P 500 E-Mini Index Futures | 228 | Short | Dec 2023 | (47,678,653) | (48,019,650) | (340,997) |
| Silver Futures | 164 | Short | Dec 2023 | (18,236,465) | (18,847,700) | (611,235) |
| Soybean Futures | 100 | Short | Mar 2024 | (6,580,544) | (6,628,750) | (48,206) |
| U.S. Treasury Long Bond Futures | 146 | Short | Dec 2023 | (16,371,436) | (15,904,875) | 466,561 |
| Wheat Futures | 638 | Short | Dec 2023 | (21,361,016) | (17,800,200) | 3,560,816 |
| Zinc Futures | 146 | Short | Dec 2023 | (9,074,362) | (8,868,588) | 205,774 |
| $10,076,121 |
| Contract to buy | Contract to sell | Counterparty (OTC) | Contractual settlement date | Unrealized appreciation | Unrealized depreciation | ||
| AUD | 54,168,000 | USD | 34,637,032 | BOA | 12/22/2023 | — | $(216,159) |
| CAD | 32,536,000 | USD | 24,143,118 | BOA | 12/22/2023 | — | (659,754) |
| CHF | 4,960,000 | USD | 5,502,490 | BOA | 12/22/2023 | — | (17,569) |
| EUR | 40,466,000 | USD | 42,606,151 | BOA | 12/22/2023 | $314,963 | — |
| GBP | 126,117,000 | USD | 157,092,979 | BOA | 12/22/2023 | — | (3,739,970) |
| JPY | 776,251,000 | USD | 5,266,716 | BOA | 12/22/2023 | — | (100,460) |
| MXN | 1,179,867,000 | USD | 67,428,125 | BOA | 12/22/2023 | — | (2,533,180) |
| NZD | 74,904,000 | USD | 44,518,847 | BOA | 12/22/2023 | — | (872,058) |
| USD | 72,856,363 | AUD | 113,346,000 | BOA | 12/22/2023 | 831,029 | — |
| USD | 182,120,351 | CAD | 249,810,000 | BOA | 12/22/2023 | 1,816,104 | — |
| USD | 165,583,569 | CHF | 147,041,000 | BOA | 12/22/2023 | 2,981,097 | — |
| USD | 240,212,909 | EUR | 225,140,000 | BOA | 12/22/2023 | 1,413,431 | — |
| USD | 277,717,230 | GBP | 226,777,000 | BOA | 12/22/2023 | 1,965,862 | — |
| USD | 152,104,689 | JPY | 22,122,522,000 | BOA | 12/22/2023 | 4,870,590 | — |
| USD | 2,259,861 | MXN | 41,399,000 | BOA | 12/22/2023 | — | (17,163) |
| USD | 103,531,938 | NZD | 176,553,000 | BOA | 12/22/2023 | 653,967 | — |
| $14,847,043 | $(8,156,313) | ||||||
| Derivatives Currency Abbreviations | |
| AUD | Australian Dollar |
| CAD | Canadian Dollar |
| CHF | Swiss Franc |
| EUR | Euro |
| GBP | Pound Sterling |
| JPY | Japanese Yen |
| MXN | Mexican Peso |
| NZD | New Zealand Dollar |
| USD | U.S. Dollar |
| SEE NOTES TO CONSOLIDATED FINANCIAL STATEMENTS | ANNUAL REPORT | JOHN HANCOCK DIVERSIFIED MACRO FUND | 13 |
| Derivatives Abbreviations | |
| BOA | Bank of America, N.A. |
| EURIBOR | Euro Interbank Offered Rate |
| OTC | Over-the-counter |
| RBOB | Reformulated Blendstock for Oxygenate Blending |
| SOFR | Secured Overnight Financing Rate |
| SONIA | Sterling Overnight Interbank Average Rate |
| WTI | West Texas Intermediate |
| 14 | JOHN HANCOCK DIVERSIFIED MACRO FUND | ANNUAL REPORT | SEE NOTES TO CONSOLIDATED FINANCIAL STATEMENTS |
| Assets | |
| Unaffiliated investments, at value (Cost $957,497,160) | $957,496,447 |
| Unrealized appreciation on forward foreign currency contracts | 14,847,043 |
| Receivable for futures variation margin | 4,389,784 |
| Cash | 277,021,847 |
| Collateral held at broker for futures contracts | 105,568,981 |
| Cash segregated at custodian for OTC derivative | 14,240,000 |
| Interest receivable | 619,917 |
| Receivable for fund shares sold | 9,425,301 |
| Other assets | 124,206 |
| Total assets | 1,383,733,526 |
| Liabilities | |
| Unrealized depreciation on forward foreign currency contracts | 8,156,313 |
| Payable for fund shares repurchased | 976,611 |
| Payable to affiliates | |
| Accounting and legal services fees | 93,843 |
| Transfer agent fees | 91,974 |
| Trustees’ fees | 1,355 |
| Other liabilities and accrued expenses | 175,619 |
| Total liabilities | 9,495,715 |
| Net assets | $1,374,237,811 |
| Net assets consist of | |
| Paid-in capital | $1,334,064,154 |
| Total distributable earnings (loss) | 40,173,657 |
| Net assets | $1,374,237,811 |
| Net asset value per share | |
| Based on net asset value and shares outstanding - the fund has an unlimited number of shares authorized with no par value | |
| Class A ($173,596,517 ÷ 18,049,984 shares)1 | $9.62 |
| Class C ($798,448 ÷ 83,839 shares)1 | $9.52 |
| Class I ($748,935,063 ÷ 77,556,095 shares) | $9.66 |
| Class R6 ($255,489,897 ÷ 26,414,170 shares) | $9.67 |
| Class NAV ($195,417,886 ÷ 20,220,806 shares) | $9.66 |
| Maximum offering price per share | |
| Class A (net asset value per share ÷ 95%)2 | $10.13 |
| 1 | Redemption price per share is equal to net asset value less any applicable contingent deferred sales charge. |
| 2 | On single retail sales of less than $50,000. On sales of $50,000 or more and on group sales the offering price is reduced. |
| SEE NOTES TO CONSOLIDATED FINANCIAL STATEMENTS | ANNUAL REPORT | JOHN HANCOCK Diversified Macro Fund | 15 |
| Investment income | |
| Interest | $38,627,502 |
| Expenses | |
| Investment management fees | 12,535,567 |
| Distribution and service fees | 174,916 |
| Accounting and legal services fees | 224,475 |
| Transfer agent fees | 737,100 |
| Trustees’ fees | 22,943 |
| Custodian fees | 201,899 |
| State registration fees | 157,704 |
| Printing and postage | 99,377 |
| Professional fees | 122,146 |
| Other | 58,008 |
| Total expenses | 14,334,135 |
| Less expense reductions | (75,769) |
| Net expenses | 14,258,366 |
| Net investment income | 24,369,136 |
| Realized and unrealized gain (loss) | |
| Net realized gain (loss) on | |
| Unaffiliated investments and foreign currency transactions | (397,480) |
| Futures contracts | 12,702,365 |
| Forward foreign currency contracts | 1,019,987 |
| 13,324,872 | |
| Change in net unrealized appreciation (depreciation) of | |
| Unaffiliated investments and translation of assets and liabilities in foreign currencies | 123,181 |
| Futures contracts | (5,700,873) |
| Forward foreign currency contracts | (8,136,788) |
| (13,714,480) | |
| Net realized and unrealized loss | (389,608) |
| Increase in net assets from operations | $23,979,528 |
| 16 | JOHN HANCOCK Diversified Macro Fund | ANNUAL REPORT | SEE NOTES TO CONSOLIDATED FINANCIAL STATEMENTS |
| Year ended 10-31-23 | Year ended 10-31-22 | |
| Increase (decrease) in net assets | ||
| From operations | ||
| Net investment income (loss) | $24,369,136 | $(4,204,424) |
| Net realized gain | 13,324,872 | 69,278,519 |
| Change in net unrealized appreciation (depreciation) | (13,714,480) | 29,834,207 |
| Increase in net assets resulting from operations | 23,979,528 | 94,908,302 |
| Distributions to shareholders | ||
| From earnings | ||
| Class A | (1,356,789) | (7,402) |
| Class C | (117,413) | (2,387) |
| Class I | (31,572,455) | (1,259,681) |
| Class R6 | (22,395,863) | (6,077,007) |
| Class NAV | (19,675,494) | (10,343,589) |
| Total distributions | (75,118,014) | (17,690,066) |
| From fund share transactions | 665,628,995 | 171,230,977 |
| Total increase | 614,490,509 | 248,449,213 |
| Net assets | ||
| Beginning of year | 759,747,302 | 511,298,089 |
| End of year | $1,374,237,811 | $759,747,302 |
| SEE NOTES TO CONSOLIDATED FINANCIAL STATEMENTS | ANNUAL REPORT | JOHN HANCOCK Diversified Macro Fund | 17 |
| CLASS A SHARES Period ended | 10-31-23 | 10-31-22 | 10-31-21 | 10-31-20 | 10-31-191 |
| Per share operating performance | |||||
| Net asset value, beginning of period | $10.68 | $9.36 | $9.31 | $10.22 | $10.00 |
| Net investment income (loss)2 | 0.24 | (0.06) | (0.16) | (0.12) | 0.01 |
| Net realized and unrealized gain (loss) on investments | (0.32) | 1.66 | 0.38 | (0.42) | 0.21 |
| Total from investment operations | (0.08) | 1.60 | 0.22 | (0.54) | 0.22 |
| Less distributions | |||||
| From net investment income | (0.98) | (0.28) | (0.17) | — | — |
| From net realized gain | — | — | — | (0.37) | — |
| Total distributions | (0.98) | (0.28) | (0.17) | (0.37) | — |
| Net asset value, end of period | $9.62 | $10.68 | $9.36 | $9.31 | $10.22 |
| Total return (%)3,4 | (0.11) | 17.74 | 2.41 | (5.49) | 2.205 |
| Ratios and supplemental data | |||||
| Net assets, end of period (in millions) | $174 | $13 | $—6 | $—6 | $—6 |
| Ratios (as a percentage of average net assets): | |||||
| Expenses before reductions | 1.65 | 1.65 | 1.67 | 1.84 | 1.847 |
| Expenses including reductions | 1.64 | 1.64 | 1.66 | 1.71 | 1.707 |
| Net investment income (loss) | 2.60 | (0.60) | (1.66) | (1.29) | 0.237 |
| Portfolio turnover (%) | 08 | 08 | 08 | 08 | 08 |
| 1 | Period from 7-29-19 (commencement of operations) to 10-31-19. |
| 2 | Based on average daily shares outstanding. |
| 3 | Total returns would have been lower had certain expenses not been reduced during the applicable periods. |
| 4 | Does not reflect the effect of sales charges, if any. |
| 5 | Not annualized. |
| 6 | Less than $500,000. |
| 7 | Annualized. |
| 8 | The calculation of portfolio turnover excludes amounts from securities whose maturities or expiration dates at the time of acquisition were one year or less, which represents a significant amount of the investments held by the fund. As a result, the portfolio turnover is 0%. |
| 18 | JOHN HANCOCK Diversified Macro Fund | ANNUAL REPORT | SEE NOTES TO CONSOLIDATED FINANCIAL STATEMENTS |
| CLASS C SHARES Period ended | 10-31-23 | 10-31-22 | 10-31-21 | 10-31-20 | 10-31-191 |
| Per share operating performance | |||||
| Net asset value, beginning of period | $10.58 | $9.27 | $9.22 | $10.20 | $10.00 |
| Net investment income (loss)2 | 0.08 | (0.13) | (0.22) | (0.18) | (0.01) |
| Net realized and unrealized gain (loss) on investments | (0.23) | 1.65 | 0.37 | (0.43) | 0.21 |
| Total from investment operations | (0.15) | 1.52 | 0.15 | (0.61) | 0.20 |
| Less distributions | |||||
| From net investment income | (0.91) | (0.21) | (0.10) | — | — |
| From net realized gain | — | — | — | (0.37) | — |
| Total distributions | (0.91) | (0.21) | (0.10) | (0.37) | — |
| Net asset value, end of period | $9.52 | $10.58 | $9.27 | $9.22 | $10.20 |
| Total return (%)3,4 | (0.94) | 16.87 | 1.67 | (6.22) | 2.005 |
| Ratios and supplemental data | |||||
| Net assets, end of period (in millions) | $1 | $3 | $—6 | $—6 | $—6 |
| Ratios (as a percentage of average net assets): | |||||
| Expenses before reductions | 2.40 | 2.40 | 2.42 | 2.59 | 2.597 |
| Expenses including reductions | 2.39 | 2.39 | 2.41 | 2.46 | 2.457 |
| Net investment income (loss) | 0.81 | (1.24) | (2.41) | (1.93) | (0.52)7 |
| Portfolio turnover (%) | 08 | 08 | 08 | 08 | 08 |
| 1 | Period from 7-29-19 (commencement of operations) to 10-31-19. |
| 2 | Based on average daily shares outstanding. |
| 3 | Total returns would have been lower had certain expenses not been reduced during the applicable periods. |
| 4 | Does not reflect the effect of sales charges, if any. |
| 5 | Not annualized. |
| 6 | Less than $500,000. |
| 7 | Annualized. |
| 8 | The calculation of portfolio turnover excludes amounts from securities whose maturities or expiration dates at the time of acquisition were one year or less, which represents a significant amount of the investments held by the fund. As a result, the portfolio turnover is 0%. |
| SEE NOTES TO CONSOLIDATED FINANCIAL STATEMENTS | ANNUAL REPORT | JOHN HANCOCK Diversified Macro Fund | 19 |
| CLASS I SHARES Period ended | 10-31-23 | 10-31-22 | 10-31-21 | 10-31-20 | 10-31-191 |
| Per share operating performance | |||||
| Net asset value, beginning of period | $10.72 | $9.39 | $9.35 | $10.23 | $10.00 |
| Net investment income (loss)2 | 0.22 | (0.04) | (0.13) | (0.10) | 0.01 |
| Net realized and unrealized gain (loss) on investments | (0.27) | 1.68 | 0.37 | (0.41) | 0.22 |
| Total from investment operations | (0.05) | 1.64 | 0.24 | (0.51) | 0.23 |
| Less distributions | |||||
| From net investment income | (1.01) | (0.31) | (0.20) | — | — |
| From net realized gain | — | — | — | (0.37) | — |
| Total distributions | (1.01) | (0.31) | (0.20) | (0.37) | — |
| Net asset value, end of period | $9.66 | $10.72 | $9.39 | $9.35 | $10.23 |
| Total return (%)3 | 0.17 | 18.08 | 2.59 | (5.18) | 2.304 |
| Ratios and supplemental data | |||||
| Net assets, end of period (in millions) | $749 | $343 | $37 | $23 | $2 |
| Ratios (as a percentage of average net assets): | |||||
| Expenses before reductions | 1.40 | 1.40 | 1.42 | 1.59 | 1.595 |
| Expenses including reductions | 1.39 | 1.39 | 1.41 | 1.46 | 1.455 |
| Net investment income (loss) | 2.33 | (0.42) | (1.41) | (1.09) | 0.305 |
| Portfolio turnover (%) | 06 | 06 | 06 | 06 | 06 |
| 1 | Period from 7-29-19 (commencement of operations) to 10-31-19. |
| 2 | Based on average daily shares outstanding. |
| 3 | Total returns would have been lower had certain expenses not been reduced during the applicable periods. |
| 4 | Not annualized. |
| 5 | Annualized. |
| 6 | The calculation of portfolio turnover excludes amounts from securities whose maturities or expiration dates at the time of acquisition were one year or less, which represents a significant amount of the investments held by the fund. As a result, the portfolio turnover is 0%. |
| 20 | JOHN HANCOCK Diversified Macro Fund | ANNUAL REPORT | SEE NOTES TO CONSOLIDATED FINANCIAL STATEMENTS |
| CLASS R6 SHARES Period ended | 10-31-23 | 10-31-22 | 10-31-21 | 10-31-20 | 10-31-191 |
| Per share operating performance | |||||
| Net asset value, beginning of period | $10.74 | $9.41 | $9.36 | $10.23 | $10.00 |
| Net investment income (loss)2 | 0.21 | (0.07) | (0.12) | (0.10) | 0.02 |
| Net realized and unrealized gain (loss) on investments | (0.26) | 1.72 | 0.37 | (0.40) | 0.21 |
| Total from investment operations | (0.05) | 1.65 | 0.25 | (0.50) | 0.23 |
| Less distributions | |||||
| From net investment income | (1.02) | (0.32) | (0.20) | — | — |
| From net realized gain | — | — | — | (0.37) | — |
| Total distributions | (1.02) | (0.32) | (0.20) | (0.37) | — |
| Net asset value, end of period | $9.67 | $10.74 | $9.41 | $9.36 | $10.23 |
| Total return (%)3 | 0.20 | 18.18 | 2.77 | (5.09) | 2.304 |
| Ratios and supplemental data | |||||
| Net assets, end of period (in millions) | $255 | $207 | $169 | $29 | $—5 |
| Ratios (as a percentage of average net assets): | |||||
| Expenses before reductions | 1.29 | 1.29 | 1.31 | 1.48 | 1.486 |
| Expenses including reductions | 1.28 | 1.28 | 1.30 | 1.34 | 1.346 |
| Net investment income (loss) | 2.28 | (0.72) | (1.30) | (1.09) | 0.596 |
| Portfolio turnover (%) | 07 | 07 | 07 | 07 | 07 |
| 1 | Period from 7-29-19 (commencement of operations) to 10-31-19. |
| 2 | Based on average daily shares outstanding. |
| 3 | Total returns would have been lower had certain expenses not been reduced during the applicable periods. |
| 4 | Not annualized. |
| 5 | Less than $500,000. |
| 6 | Annualized. |
| 7 | The calculation of portfolio turnover excludes amounts from securities whose maturities or expiration dates at the time of acquisition were one year or less, which represents a significant amount of the investments held by the fund. As a result, the portfolio turnover is 0%. |
| SEE NOTES TO CONSOLIDATED FINANCIAL STATEMENTS | ANNUAL REPORT | JOHN HANCOCK Diversified Macro Fund | 21 |
| CLASS NAV SHARES Period ended | 10-31-23 | 10-31-22 | 10-31-21 | 10-31-20 | 10-31-191 |
| Per share operating performance | |||||
| Net asset value, beginning of period | $10.73 | $9.40 | $9.36 | $10.23 | $10.00 |
| Net investment income (loss)2 | 0.21 | (0.08) | (0.12) | (0.07) | 0.02 |
| Net realized and unrealized gain (loss) on investments | (0.26) | 1.73 | 0.37 | (0.43) | 0.21 |
| Total from investment operations | (0.05) | 1.65 | 0.25 | (0.50) | 0.23 |
| Less distributions | |||||
| From net investment income | (1.02) | (0.32) | (0.21) | — | — |
| From net realized gain | — | — | — | (0.37) | — |
| Total distributions | (1.02) | (0.32) | (0.21) | (0.37) | — |
| Net asset value, end of period | $9.66 | $10.73 | $9.40 | $9.36 | $10.23 |
| Total return (%)3 | 0.30 | 18.21 | 2.69 | (5.09) | 2.304 |
| Ratios and supplemental data | |||||
| Net assets, end of period (in millions) | $195 | $193 | $305 | $195 | $213 |
| Ratios (as a percentage of average net assets): | |||||
| Expenses before reductions | 1.28 | 1.28 | 1.30 | 1.46 | 1.475 |
| Expenses including reductions | 1.27 | 1.27 | 1.29 | 1.33 | 1.335 |
| Net investment income (loss) | 2.26 | (0.81) | (1.29) | (0.76) | 0.605 |
| Portfolio turnover (%) | 06 | 06 | 06 | 06 | 06 |
| 1 | Period from 7-29-19 (commencement of operations) to 10-31-19. |
| 2 | Based on average daily shares outstanding. |
| 3 | Total returns would have been lower had certain expenses not been reduced during the applicable periods. |
| 4 | Not annualized. |
| 5 | Annualized. |
| 6 | The calculation of portfolio turnover excludes amounts from securities whose maturities or expiration dates at the time of acquisition were one year or less, which represents a significant amount of the investments held by the fund. As a result, the portfolio turnover is 0%. |
| 22 | JOHN HANCOCK Diversified Macro Fund | ANNUAL REPORT | SEE NOTES TO CONSOLIDATED FINANCIAL STATEMENTS |
| ANNUAL REPORT | JOHN HANCOCK Diversified Macro Fund | 23 |
| Total value at 10-31-23 | Level 1 quoted price | Level 2 significant observable inputs | Level 3 significant unobservable inputs | |
| Investments in securities: | ||||
| Assets | ||||
| Short-term investments | $957,496,447 | — | $957,496,447 | — |
| Total investments in securities | $957,496,447 | — | $957,496,447 | — |
| Derivatives: | ||||
| Assets | ||||
| Futures | $38,180,119 | $38,180,119 | — | — |
| Forward foreign currency contracts | 14,847,043 | — | $14,847,043 | — |
| Liabilities | ||||
| Futures | (28,103,998) | (27,738,622) | (365,376) | — |
| Forward foreign currency contracts | (8,156,313) | — | (8,156,313) | — |
| 24 | JOHN HANCOCK Diversified Macro Fund | ANNUAL REPORT |
| ANNUAL REPORT | JOHN HANCOCK Diversified Macro Fund | 25 |
| October 31, 2023 | October 31, 2022 | |
| Ordinary income | $75,118,014 | $17,690,066 |
| 26 | JOHN HANCOCK Diversified Macro Fund | ANNUAL REPORT |
| ANNUAL REPORT | JOHN HANCOCK Diversified Macro Fund | 27 |
| Risk | Consolidated statement of assets and liabilities location | Financial instruments location | Assets derivatives fair value | Liabilities derivatives fair value |
| Interest rate | Receivable/payable for futures variation margin1 | Futures | $13,781,669 | $(1,740,686) |
| Currency | Receivable/payable for futures variation margin1 | Futures | 468,028 | — |
| Commodity | Receivable/payable for futures variation margin1 | Futures | 11,148,314 | (13,385,737) |
| Equity | Receivable/payable for futures variation margin1 | Futures | 12,782,108 | (12,977,575) |
| Currency | Unrealized appreciation (depreciation) on forward foreign currency contracts | Forward foreign currency contracts | 14,847,043 | (8,156,313) |
| $53,027,162 | $(36,260,311) |
| 1 | Reflects cumulative appreciation/depreciation on open futures as disclosed in the Derivatives section of Consolidated Fund’s investments. Only the year end variation margin receivable/payable is separately reported on the Consolidated statement of assets and liabilities. |
| OTC Financial Instruments | Asset | Liability |
| Forward foreign currency contracts | $14,847,043 | $(8,156,313) |
| Totals | $14,847,043 | $(8,156,313) |
| Counterparty | Assets | Liabilities | Total Market Value of OTC Derivatives | Collateral Posted by Counterparty1 | Collateral Posted by Fund1 | Net Exposure |
| Bank of America, N.A. | $14,847,043 | ($8,156,313) | $6,690,730 | — | — | $6,690,730 |
| 1 Reflects collateral posted by the counterparty or posted by the fund, excluding any excess collateral amounts. | ||||||
| 28 | JOHN HANCOCK Diversified Macro Fund | ANNUAL REPORT |
| Consolidated statement of operations location - Net realized gain (loss) on: | |||
| Risk | Futures contracts | Forward foreign currency contracts | Total |
| Interest rate | $30,380,369 | — | $30,380,369 |
| Currency | (145,891) | $1,019,987 | 874,096 |
| Commodity | (19,556,206) | — | (19,556,206) |
| Equity | 2,024,093 | — | 2,024,093 |
| Total | $12,702,365 | $1,019,987 | $13,722,352 |
| Consolidated statement of operations location - Change in net unrealized appreciation (depreciation) of: | |||
| Risk | Futures contracts | Forward foreign currency contracts | Total |
| Interest rate | $6,769,996 | — | $6,769,996 |
| Currency | 233,601 | $(8,136,788) | (7,903,187) |
| Commodity | (9,352,821) | — | (9,352,821) |
| Equity | (3,351,649) | — | (3,351,649) |
| Total | $(5,700,873) | $(8,136,788) | $(13,837,661) |
| ANNUAL REPORT | JOHN HANCOCK Diversified Macro Fund | 29 |
| Class | Expense reduction |
| Class A | $4,793 |
| Class C | 73 |
| Class I | 39,212 |
| Class | Expense reduction |
| Class R6 | $17,109 |
| Class NAV | 14,582 |
| Total | $75,769 |
| Class | Rule 12b-1 Fee |
| Class A | 0.25% |
| Class C | 1.00% |
| 30 | JOHN HANCOCK Diversified Macro Fund | ANNUAL REPORT |
| Class | Distribution and service fees | Transfer agent fees |
| Class A | $164,731 | $78,096 |
| Class C | 10,185 | 1,192 |
| Class I | — | 641,430 |
| Class R6 | — | 16,382 |
| Total | $174,916 | $737,100 |
| Year Ended 10-31-23 | Year Ended 10-31-22 | |||
| Shares | Amount | Shares | Amount | |
| Class A shares | ||||
| Sold | 17,917,678 | $166,608,538 | 1,755,356 | $18,182,825 |
| Distributions reinvested | 126,688 | 1,141,460 | 671 | 5,984 |
| Repurchased | (1,240,913) | (11,627,343) | (533,398) | (5,546,335) |
| Net increase | 16,803,453 | $156,122,655 | 1,222,629 | $12,642,474 |
| ANNUAL REPORT | JOHN HANCOCK Diversified Macro Fund | 31 |
| Year Ended 10-31-23 | Year Ended 10-31-22 | |||
| Shares | Amount | Shares | Amount | |
| Class C shares | ||||
| Sold | 61,549 | $599,479 | 294,960 | $3,087,392 |
| Distributions reinvested | 11,111 | 99,775 | 149 | 1,322 |
| Repurchased | (275,012) | (2,733,667) | (20,125) | (208,671) |
| Net increase (decrease) | (202,352) | $(2,034,413) | 274,984 | $2,880,043 |
| Class I shares | ||||
| Sold | 68,227,134 | $636,040,940 | 32,535,331 | $338,928,518 |
| Distributions reinvested | 2,019,612 | 18,237,099 | 141,220 | 1,259,681 |
| Repurchased | (24,720,553) | (233,237,951) | (4,589,158) | (46,916,199) |
| Net increase | 45,526,193 | $421,040,088 | 28,087,393 | $293,272,000 |
| Class R6 shares | ||||
| Sold | 14,363,669 | $138,499,975 | 8,880,850 | $87,908,517 |
| Distributions reinvested | 2,478,979 | 22,385,178 | 680,455 | 6,076,463 |
| Repurchased | (9,737,091) | (90,537,151) | (8,170,014) | (80,258,345) |
| Net increase | 7,105,557 | $70,348,002 | 1,391,291 | $13,726,635 |
| Class NAV shares | ||||
| Sold | 3,945,450 | $37,546,843 | 1,901,303 | $19,186,083 |
| Distributions reinvested | 2,178,903 | 19,675,494 | 1,158,297 | 10,343,589 |
| Repurchased | (3,873,700) | (37,069,674) | (17,575,144) | (180,819,847) |
| Net increase (decrease) | 2,250,653 | $20,152,663 | (14,515,544) | $(151,290,175) |
| Total net increase | 71,483,504 | $665,628,995 | 16,460,753 | $171,230,977 |
| 32 | JOHN HANCOCK Diversified Macro Fund | ANNUAL REPORT |
| ANNUAL REPORT | JOHN HANCOCK DIVERSIFIED MACRO FUND | 33 |
| 34 | JOHN HANCOCK DIVERSIFIED MACRO FUND | ANNUAL REPORT |
| ANNUAL REPORT | JOHN HANCOCK DIVERSIFIED MACRO FUND | 35 |
| (a) | the skills and competency with which the Advisor has in the past managed the Trust’s affairs and its subadvisory relationship, the Advisor’s oversight and monitoring of the Subadvisor’s investment performance and compliance programs, such as the Subadvisor’s compliance with fund policies and objectives, review of brokerage matters, including with respect to trade allocation and best execution and the Advisor’s timeliness in responding to performance issues; |
| (b) | the background, qualifications and skills of the Advisor’s personnel; |
| (c) | the Advisor’s compliance policies and procedures and its responsiveness to regulatory changes and fund industry developments; |
| 36 | JOHN HANCOCK DIVERSIFIED MACRO FUND | ANNUAL REPORT |
| (d) | the Advisor’s administrative capabilities, including its ability to supervise the other service providers for the fund, as well as the Advisor’s oversight of any securities lending activity, its monitoring of class action litigation and collection of class action settlements on behalf of the fund, and bringing loss recovery actions on behalf of the fund; |
| (e) | the financial condition of the Advisor and whether it has the financial wherewithal to provide a high level and quality of services to the fund; |
| (f) | the Advisor’s initiatives intended to improve various aspects of the Trust’s operations and investor experience with the fund; and |
| (g) | the Advisor’s reputation and experience in serving as an investment advisor to the Trust and the benefit to shareholders of investing in funds that are part of a family of funds offering a variety of investments. |
| (a) | reviewed information prepared by management regarding the fund’s performance; |
| (b) | considered the comparative performance of an applicable benchmark index; |
| (c) | considered the performance of comparable funds, if any, as included in the report prepared by an independent third-party provider of fund data; and |
| (d) | took into account the Advisor’s analysis of the fund’s performance and its plans and recommendations regarding the Trust’s subadvisory arrangements generally. |
| ANNUAL REPORT | JOHN HANCOCK DIVERSIFIED MACRO FUND | 37 |
| (a) | reviewed financial information of the Advisor; |
| (b) | reviewed and considered information presented by the Advisor regarding the net profitability to the Advisor and its affiliates with respect to the fund; |
| (c) | received and reviewed profitability information with respect to the John Hancock Fund Complex as a whole and with respect to the fund; |
| (d) | received information with respect to the Advisor’s allocation methodologies used in preparing the profitability data and considered that the Advisor hired an independent third-party consultant to provide an analysis of the Advisor’s allocation methodologies; |
| (e) | considered that the John Hancock insurance companies that are affiliates of the Advisor, as shareholders of the Trust directly or through their separate accounts, receive certain tax credits or deductions relating to foreign taxes paid and dividends received by certain funds of the Trust and noted that these tax benefits, which are not available to participants in qualified retirement plans under applicable income tax law, are reflected in the profitability information reviewed by the Board; |
| (f) | considered that the Advisor also provides administrative services to the fund on a cost basis pursuant to an administrative services agreement; |
| (g) | noted that affiliates of the Advisor provide transfer agency services and distribution services to the fund, and that the fund’s distributor also receives Rule 12b-1 payments to support distribution of the fund; |
| (h) | noted that the Advisor also derives reputational and other indirect benefits from providing advisory services to the fund; |
| (i) | noted that the subadvisory fee for the fund is paid by the Advisor and is negotiated at arm’s length; |
| (j) | considered the Advisor’s ongoing costs and expenditures necessary to improve services, meet new regulatory and compliance requirements, and adapt to other challenges impacting the fund industry; and |
| 38 | JOHN HANCOCK DIVERSIFIED MACRO FUND | ANNUAL REPORT |
| (k) | considered that the Advisor should be entitled to earn a reasonable level of profits in exchange for the level of services it provides to the fund and the risks that it assumes as Advisor, including entrepreneurial, operational, reputational, litigation and regulatory risk. |
| (a) | considered that the Advisor has contractually agreed to waive a portion of its management fee for certain funds of the John Hancock Fund Complex, including the fund (the participating portfolios) or otherwise reimburse the expenses of the participating portfolios (the reimbursement). This waiver is based upon aggregate net assets of all the participating portfolios. The amount of the reimbursement is calculated daily and allocated among all the participating portfolios in proportion to the daily net assets of each fund; |
| (b) | reviewed the fund’s advisory fee structure and concluded that: (i) the fund’s fee structure contains breakpoints at the subadvisory fee level and that such breakpoints are reflected as breakpoints in the advisory fees for the fund; and (ii) although economies of scale cannot be measured with precision, these arrangements permit shareholders of the fund to benefit from economies of scale if the fund grows. The Board also took into account management’s discussion of the fund’s advisory fee structure; and |
| (c) | the Board also considered the effect of the fund’s growth in size on its performance and fees. The Board also noted that if the fund’s assets increase over time, the fund may realize other economies of scale. |
| (1) | information relating to the Subadvisor’s business, including current subadvisory services to the Trust (and other funds in the John Hancock Fund Complex); |
| (2) | the historical and current performance of the fund and comparative performance information relating to an applicable benchmark index and comparable funds; |
| (3) | the subadvisory fee for the fund, including any breakpoints, and to the extent available, comparable fee information prepared by an independent third-party provider of fund data; and |
| (4) | information relating to the nature and scope of any material relationships and their significance to the Trust’s Advisor and Subadvisor. |
| ANNUAL REPORT | JOHN HANCOCK DIVERSIFIED MACRO FUND | 39 |
| (1) | the Subadvisor has extensive experience and demonstrated skills as a manager; |
| 40 | JOHN HANCOCK DIVERSIFIED MACRO FUND | ANNUAL REPORT |
| (2) | the performance of the fund has generally been in line with or outperformed the historical performance of comparable funds and the fund’s benchmark index; |
| (3) | the subadvisory fee is reasonable in relation to the level and quality of services being provided under the Subadvisory Agreement; and |
| (4) | noted that the subadvisory fees are paid by the Advisor not the fund and that the subadvisory fee breakpoints are reflected as breakpoints in the advisory fees for the fund in order to permit shareholders to benefit from economies of scale if the fund grows. |
| ANNUAL REPORT | JOHN HANCOCK DIVERSIFIED MACRO FUND | 41 |
| Independent Trustees | ||
| Name, year of birth Position(s) held with Trust Principal occupation(s) and other directorships during past 5 years | Trustee of the Trust since1 | Number of John Hancock funds overseen by Trustee |
| Hassell H. McClellan,2 Born: 1945 | 2012 | 179 |
| Trustee and Chairperson of the Board | ||
| Director/Trustee, Virtus Funds (2008-2020); Director, The Barnes Group (2010-2021); Associate Professor, The Wallace E. Carroll School of Management, Boston College (retired 2013). Trustee (since 2005) and Chairperson of the Board (since 2017) of various trusts within the John Hancock Fund Complex. | ||
| James R. Boyle, Born: 1959 | 2015 | 175 |
| Trustee | ||
| Board Member, United of Omaha Life Insurance Company (since 2022). Board Member, Mutual of Omaha Investor Services, Inc. (since 2022). Foresters Financial, Chief Executive Officer (2018–2022) and board member (2017–2022). Manulife Financial and John Hancock, more than 20 years, retiring in 2012 as Chief Executive Officer, John Hancock and Senior Executive Vice President, Manulife Financial. Trustee of various trusts within the John Hancock Fund Complex (2005–2014 and since 2015). | ||
| William H. Cunningham,3 Born: 1944 | 1986 | 177 |
| Trustee | ||
| Professor, University of Texas, Austin, Texas (since 1971); former Chancellor, University of Texas System and former President of the University of Texas, Austin, Texas; Director (since 2006), Lincoln National Corporation (insurance); Director, Southwest Airlines (since 2000). Trustee of various trusts within the John Hancock Fund Complex (since 1986). | ||
| Noni L. Ellison, Born: 1971 | 2022 | 175 |
| Trustee | ||
| Senior Vice President, General Counsel & Corporate Secretary, Tractor Supply Company (rural lifestyle retailer) (since 2021); General Counsel, Chief Compliance Officer & Corporate Secretary, Carestream Dental, L.L.C. (2017–2021); Associate General Counsel & Assistant Corporate Secretary, W.W. Grainger, Inc. (global industrial supplier) (2015–2017); Board Member, Goodwill of North Georgia, 2018 (FY2019)–2020 (FY2021); Board Member, Howard University School of Law Board of Visitors (since 2021); Board Member, University of Chicago Law School Board of Visitors (since 2016); Board member, Children’s Healthcare of Atlanta Foundation Board (2021–2023). Trustee of various trusts within the John Hancock Fund Complex (since 2022). | ||
| Grace K. Fey, Born: 1946 | 2012 | 179 |
| Trustee | ||
| Chief Executive Officer, Grace Fey Advisors (since 2007); Director and Executive Vice President, Frontier Capital Management Company (1988–2007); Director, Fiduciary Trust (since 2009). Trustee of various trusts within the John Hancock Fund Complex (since 2008). | ||
| Dean C. Garfield, Born: 1968 | 2022 | 175 |
| Trustee | ||
| Vice President, Netflix, Inc. (since 2019); President & Chief Executive Officer, Information Technology Industry Council (2009–2019); NYU School of Law Board of Trustees (since 2021); Member, U.S. Department of Transportation, Advisory Committee on Automation (since 2021); President of the United States Trade Advisory Council (2010–2018); Board Member, College for Every Student (2017–2021); Board Member, The Seed School of Washington, D.C. (2012–2017); Advisory Board Member of the Block Center for Technology and Society (since 2019). Trustee of various trusts within the John Hancock Fund Complex (since 2022). | ||
| 42 | JOHN HANCOCK DIVERSIFIED MACRO FUND | ANNUAL REPORT |
| Independent Trustees (continued) | ||
| Name, year of birth Position(s) held with Trust Principal occupation(s) and other directorships during past 5 years | Trustee of the Trust since1 | Number of John Hancock funds overseen by Trustee |
| Deborah C. Jackson, Born: 1952 | 2008 | 177 |
| Trustee | ||
| President, Cambridge College, Cambridge, Massachusetts (since 2011); Board of Directors, Amwell Corporation (since 2020); Board of Directors, Massachusetts Women’s Forum (2018-2020); Board of Directors, National Association of Corporate Directors/New England (2015-2020); Chief Executive Officer, American Red Cross of Massachusetts Bay (2002–2011); Board of Directors of Eastern Bank Corporation (since 2001); Board of Directors of Eastern Bank Charitable Foundation (since 2001); Board of Directors of Boston Stock Exchange (2002–2008); Board of Directors of Harvard Pilgrim Healthcare (health benefits company) (2007–2011). Trustee of various trusts within the John Hancock Fund Complex (since 2008). | ||
| Steven R. Pruchansky, Born: 1944 | 1994 | 175 |
| Trustee and Vice Chairperson of the Board | ||
| Managing Director, Pru Realty (since 2017); Chairman and Chief Executive Officer, Greenscapes of Southwest Florida, Inc. (2014-2020); Director and President, Greenscapes of Southwest Florida, Inc. (until 2000); Member, Board of Advisors, First American Bank (until 2010); Managing Director, Jon James, LLC (real estate) (since 2000); Partner, Right Funding, LLC (2014-2017); Director, First Signature Bank & Trust Company (until 1991); Director, Mast Realty Trust (until 1994); President, Maxwell Building Corp. (until 1991). Trustee (since 1992), Chairperson of the Board (2011–2012), and Vice Chairperson of the Board (since 2012) of various trusts within the John Hancock Fund Complex. | ||
| Frances G. Rathke,3 Born: 1960 | 2020 | 175 |
| Trustee | ||
| Director, Audit Committee Chair, Oatly Group AB (plant-based drink company) (since 2021); Director, Audit Committee Chair and Compensation Committee Member, Green Mountain Power Corporation (since 2016); Director, Treasurer and Finance & Audit Committee Chair, Flynn Center for Performing Arts (since 2016); Director and Audit Committee Chair, Planet Fitness (since 2016); Chief Financial Officer and Treasurer, Keurig Green Mountain, Inc. (2003-retired 2015). Trustee of various trusts within the John Hancock Fund Complex (since 2020). | ||
| Gregory A. Russo, Born: 1949 | 2009 | 175 |
| Trustee | ||
| Director and Audit Committee Chairman (2012-2020), and Member, Audit Committee and Finance Committee (2011-2020), NCH Healthcare System, Inc. (holding company for multi-entity healthcare system); Director and Member (2012-2018), and Finance Committee Chairman (2014-2018), The Moorings, Inc. (nonprofit continuing care community); Global Vice Chairman, Risk & Regulatory Matters, KPMG LLP (KPMG) (2002–2006); Vice Chairman, Industrial Markets, KPMG (1998–2002). Trustee of various trusts within the John Hancock Fund Complex (since 2008). | ||
| ANNUAL REPORT | JOHN HANCOCK DIVERSIFIED MACRO FUND | 43 |
| Non-Independent Trustees4 | ||
| Name, year of birth Position(s) held with Trust Principal occupation(s) and other directorships during past 5 years | Trustee of the Trust since1 | Number of John Hancock funds overseen by Trustee |
| Andrew G. Arnott, Born: 1971 | 2017 | 177 |
| Non-Independent Trustee | ||
| Global Head of Retail for Manulife (since 2022); Head of Wealth and Asset Management, United States and Europe, for John Hancock and Manulife (2018-2023); Director and Chairman, John Hancock Investment Management LLC (since 2005, including prior positions); Director and Chairman, John Hancock Variable Trust Advisers LLC (since 2006, including prior positions); Director and Chairman, John Hancock Investment Management Distributors LLC (since 2004, including prior positions); President of various trusts within the John Hancock Fund Complex (2007-2023, including prior positions). Trustee of various trusts within the John Hancock Fund Complex (since 2017). | ||
| Paul Lorentz, Born: 1968 | 2022 | 175 |
| Non-Independent Trustee | ||
| Global Head, Manulife Wealth and Asset Management (since 2017); General Manager, Manulife, Individual Wealth Management and Insurance (2013–2017); President, Manulife Investments (2010–2016). Trustee of various trusts within the John Hancock Fund Complex (since 2022). | ||
| Principal officers who are not Trustees | |
| Name, year of birth Position(s) held with Trust Principal occupation(s) during past 5 years | Current Position(s) with the Trust since |
| Kristie M. Feinberg, Born: 1975 | 2023 |
| President | |
| Head of Wealth and Asset Management, United States and Europe, for John Hancock and Manulife (since 2023); CFO and Global Head of Strategy, Manulife Investment Management (2021-2023, including prior positions); CFO Americas & Global Head of Treasury, Invesco, Ltd., Invesco US (2019-2020, including prior positions); Senior Vice President, Corporate Treasurer and Business Controller, Oppenheimer Funds (2001-2019, including prior positions); President of various trusts within the John Hancock Fund Complex (since 2023). | |
| Charles A. Rizzo, Born: 1957 | 2007 |
| Chief Financial Officer | |
| Vice President, John Hancock Financial Services (since 2008); Senior Vice President, John Hancock Investment Management LLC and John Hancock Variable Trust Advisers LLC (since 2008); Chief Financial Officer of various trusts within the John Hancock Fund Complex (since 2007). | |
| Salvatore Schiavone, Born: 1965 | 2010 |
| Treasurer | |
| Assistant Vice President, John Hancock Financial Services (since 2007); Vice President, John Hancock Investment Management LLC and John Hancock Variable Trust Advisers LLC (since 2007); Treasurer of various trusts within the John Hancock Fund Complex (since 2007, including prior positions). | |
| 44 | JOHN HANCOCK DIVERSIFIED MACRO FUND | ANNUAL REPORT |
| Principal officers who are not Trustees (continued) | |
| Name, year of birth Position(s) held with Trust Principal occupation(s) during past 5 years | Current Position(s) with the Trust since |
| Christopher (Kit) Sechler, Born: 1973 | 2018 |
| Secretary and Chief Legal Officer | |
| Vice President and Deputy Chief Counsel, John Hancock Investment Management (since 2015); Assistant Vice President and Senior Counsel (2009–2015), John Hancock Investment Management; Assistant Secretary of John Hancock Investment Management LLC and John Hancock Variable Trust Advisers LLC (since 2009); Chief Legal Officer and Secretary of various trusts within the John Hancock Fund Complex (since 2009, including prior positions). | |
| Trevor Swanberg, Born: 1979 | 2020 |
| Chief Compliance Officer | |
| Chief Compliance Officer, John Hancock Investment Management LLC and John Hancock Variable Trust Advisers LLC (since 2020); Deputy Chief Compliance Officer, John Hancock Investment Management LLC and John Hancock Variable Trust Advisers LLC (2019–2020); Assistant Chief Compliance Officer, John Hancock Investment Management LLC and John Hancock Variable Trust Advisers LLC (2016–2019); Vice President, State Street Global Advisors (2015–2016); Chief Compliance Officer of various trusts within the John Hancock Fund Complex (since 2016, including prior positions). | |
| 1 | Each Trustee holds office until his or her successor is duly elected and qualified, or until the Trustee’s death, retirement, resignation, or removal. Mr. Boyle has served as Trustee at various times prior to the date listed in the table. |
| 2 | Member of the Audit Committee as of September 26, 2023. |
| 3 | Member of the Audit Committee. |
| 4 | The Trustee is a Non-Independent Trustee due to current or former positions with the Advisor and certain affiliates. |
| ANNUAL REPORT | JOHN HANCOCK DIVERSIFIED MACRO FUND | 45 |
Steven R. Pruchansky, Vice Chairperson
Andrew G. Arnott†
James R. Boyle
William H. Cunningham*
Grace K. Fey
Noni L. Ellison
Dean C. Garfield
Deborah C. Jackson
Paul Lorentz†
Frances G. Rathke*
Gregory A. Russo
President
Chief Financial Officer
Treasurer
Secretary and Chief Legal Officer
Chief Compliance Officer
Kenneth G. Tropin
| You can also contact us: | ||
| 800-225-5291 | Regular mail: | Express mail: |
| jhinvestments.com | John Hancock Signature Services, Inc. P.O. Box 219909 Kansas City, MO 64121-9909 | John Hancock Signature Services, Inc. 430 W 7th Street Suite 219909 Kansas City, MO 64105-1407 |
| 46 | JOHN HANCOCK DIVERSIFIED MACRO FUND | ANNUAL REPORT |
GOVERNANCE FUNDS
with a heritage of financial stewardship dating back to 1862. Helping
our shareholders pursue their financial goals is at the core of everything
we do. It’s why we support the role of professional financial advice
and operate with the highest standards of conduct and integrity.
We search the world to find proven portfolio teams with specialized
expertise for every strategy we offer, then we apply robust investment
oversight to ensure they continue to meet our uncompromising
standards and serve the best interests of our shareholders.
a diverse set of investments backed by some of the world’s best
managers, along with strong risk-adjusted returns across asset classes.
200 Berkeley Street, Boston, MA 02116-5010, 800-225-5291, jhinvestments.com
| MF3208591 | 473A 10/23 |


United States and Europe
Manulife Investment Management
John Hancock Investment Management
| ANNUAL REPORT | JOHN HANCOCK EMERGING MARKETS EQUITY FUND | 1 |

| 2 | JOHN HANCOCK EMERGING MARKETS EQUITY FUND | ANNUAL REPORT |

| ANNUAL REPORT | JOHN HANCOCK EMERGING MARKETS EQUITY FUND | 3 |
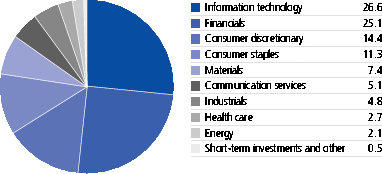
| 4 | JOHN HANCOCK EMERGING MARKETS EQUITY FUND | ANNUAL REPORT |
| TOP 10 HOLDINGS AS OF 10/31/2023 (% of net assets) | |
| Samsung Electronics Company, Ltd. | 5.3 |
| Taiwan Semiconductor Manufacturing Company, Ltd. | 5.2 |
| Tencent Holdings, Ltd. | 3.6 |
| Alibaba Group Holding, Ltd. | 3.6 |
| HDFC Bank, Ltd. | 3.0 |
| AIA Group, Ltd. | 2.9 |
| Anglo American PLC | 2.8 |
| SK Hynix, Inc. | 2.8 |
| MediaTek, Inc. | 2.6 |
| Lenovo Group, Ltd. | 2.6 |
| TOTAL | 34.4 |
| Cash and cash equivalents are not included. | |
| TOP 10 COUNTRIES AS OF 10/31/2023 (% of net assets) | |
| China | 25.2 |
| India | 18.7 |
| Taiwan | 12.5 |
| South Korea | 10.0 |
| Brazil | 7.0 |
| Hong Kong | 6.3 |
| Mexico | 4.9 |
| Indonesia | 3.9 |
| United Kingdom | 2.8 |
| Uruguay | 2.4 |
| TOTAL | 93.7 |
| Cash and cash equivalents are not included. | |
| ANNUAL REPORT | JOHN HANCOCK EMERGING MARKETS EQUITY FUND | 5 |

| 6 | JOHN HANCOCK EMERGING MARKETS EQUITY FUND | ANNUAL REPORT |
| Average annual total returns (%) with maximum sales charge | Cumulative total returns (%) with maximum sales charge | ||||
| 1-year | 5-year | Since inception (6-16-15) | 5-year | Since inception (6-16-15) | |
| Class A | 1.01 | -0.36 | 0.20 | -1.79 | 1.67 |
| Class C | 4.44 | -0.04 | 0.11 | -0.19 | 0.92 |
| Class I1 | 6.49 | 0.96 | 1.10 | 4.89 | 9.57 |
| Class R21 | 6.39 | 0.75 | 0.90 | 3.79 | 7.75 |
| Class R41 | 6.41 | 0.90 | 1.04 | 4.61 | 9.04 |
| Class R61 | 6.60 | 1.09 | 1.21 | 5.59 | 10.62 |
| Class NAV1 | 6.75 | 1.11 | 1.22 | 5.66 | 10.67 |
| Index† | 10.80 | 1.59 | 1.76 | 8.23 | 15.78 |
| Class A | Class C | Class I | Class R2 | Class R4 | Class R6 | Class NAV | |
| Gross (%) | 1.44 | 2.14 | 1.14 | 1.53 | 1.38 | 1.03 | 1.02 |
| Net (%) | 1.28 | 1.98 | 0.98 | 1.37 | 1.12 | 0.87 | 0.86 |
| ANNUAL REPORT | JOHN HANCOCK EMERGING MARKETS EQUITY FUND | 7 |
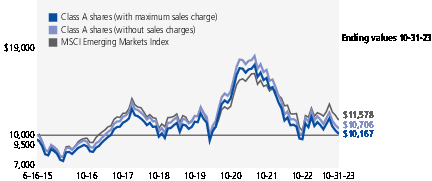
| Start date | With maximum sales charge ($) | Without sales charge ($) | Index ($) | |
| Class C2 | 6-16-15 | 10,092 | 10,092 | 11,578 |
| Class I1 | 6-16-15 | 10,957 | 10,957 | 11,578 |
| Class R21 | 6-16-15 | 10,775 | 10,775 | 11,578 |
| Class R41 | 6-16-15 | 10,904 | 10,904 | 11,578 |
| Class R61 | 6-16-15 | 11,062 | 11,062 | 11,578 |
| Class NAV1 | 6-16-15 | 11,067 | 11,067 | 11,578 |
| 1 | For certain types of investors, as described in the fund’s prospectuses. |
| 2 | The contingent deferred sales charge is not applicable. |
| 8 | JOHN HANCOCK EMERGING MARKETS EQUITY FUND | ANNUAL REPORT |

| ANNUAL REPORT | JOHN HANCOCK EMERGING MARKETS EQUITY FUND | 9 |
| Account value on 5-1-2023 | Ending value on 10-31-2023 | Expenses paid during period ended 10-31-20231 | Annualized expense ratio | ||
| Class A | Actual expenses/actual returns | $1,000.00 | $923.80 | $6.45 | 1.33% |
| Hypothetical example | 1,000.00 | 1,018.50 | 6.77 | 1.33% | |
| Class C | Actual expenses/actual returns | 1,000.00 | 920.00 | 9.78 | 2.02% |
| Hypothetical example | 1,000.00 | 1,015.00 | 10.26 | 2.02% | |
| Class I | Actual expenses/actual returns | 1,000.00 | 925.10 | 4.95 | 1.02% |
| Hypothetical example | 1,000.00 | 1,020.10 | 5.19 | 1.02% | |
| Class R2 | Actual expenses/actual returns | 1,000.00 | 924.90 | 5.14 | 1.06% |
| Hypothetical example | 1,000.00 | 1,019.90 | 5.40 | 1.06% | |
| Class R4 | Actual expenses/actual returns | 1,000.00 | 925.00 | 5.24 | 1.08% |
| Hypothetical example | 1,000.00 | 1,019.80 | 5.50 | 1.08% | |
| Class R6 | Actual expenses/actual returns | 1,000.00 | 925.10 | 4.42 | 0.91% |
| Hypothetical example | 1,000.00 | 1,020.60 | 4.63 | 0.91% | |
| Class NAV | Actual expenses/actual returns | 1,000.00 | 926.20 | 4.42 | 0.91% |
| Hypothetical example | 1,000.00 | 1,020.60 | 4.63 | 0.91% |
| 1 | Expenses are equal to the annualized expense ratio, multiplied by the average account value over the period, multiplied by 184/365 (to reflect the one-half year period). |
| 10 | JOHN HANCOCK EMERGING MARKETS EQUITY FUND | ANNUAL REPORT |
| Shares | Value | ||||
| Common stocks 92.5% | $1,350,457,184 | ||||
| (Cost $1,313,508,075) | |||||
| Brazil 5.3% | 77,886,787 | ||||
| Banco BTG Pactual SA | 2,367,300 | 13,898,365 | |||
| Localiza Rent a Car SA | 1,160,600 | 11,710,165 | |||
| Suzano SA | 2,106,400 | 21,545,505 | |||
| WEG SA | 1,984,200 | 12,991,212 | |||
| XP, Inc., Class A | 887,077 | 17,741,540 | |||
| China 25.2% | 367,285,151 | ||||
| Alibaba Group Holding, Ltd. (A) | 5,121,620 | 52,727,484 | |||
| Baidu, Inc., Class A (A) | 1,624,400 | 21,326,437 | |||
| Centre Testing International Group Company, Ltd., Class A | 4,247,808 | 8,788,918 | |||
| JD.com, Inc., Class A | 725,312 | 9,221,009 | |||
| Kingdee International Software Group Company, Ltd. (A) | 15,373,000 | 20,397,949 | |||
| Kweichow Moutai Company, Ltd., Class A | 70,476 | 16,230,895 | |||
| Lenovo Group, Ltd. | 31,966,000 | 37,199,861 | |||
| Li Ning Company, Ltd. | 3,476,500 | 10,653,400 | |||
| Meituan, Class B (A)(B) | 1,839,090 | 26,069,127 | |||
| NARI Technology Company, Ltd., Class A | 7,721,180 | 23,839,340 | |||
| Ping An Insurance Group Company of China, Ltd., Class A | 4,070,819 | 25,293,265 | |||
| Sungrow Power Supply Company, Ltd., Class A | 1,158,946 | 13,355,300 | |||
| Tencent Holdings, Ltd. | 1,425,900 | 52,770,785 | |||
| Trip.com Group, Ltd. (A) | 534,200 | 18,206,404 | |||
| Trip.com Group, Ltd., ADR (A) | 256,244 | 8,712,296 | |||
| WuXi Biologics Cayman, Inc. (A)(B) | 3,617,500 | 22,492,681 | |||
| Hong Kong 6.3% | 91,415,459 | ||||
| AIA Group, Ltd. | 4,841,400 | 42,041,788 | |||
| China Resources Beer Holdings Company, Ltd. | 3,932,000 | 20,806,836 | |||
| Hong Kong Exchanges & Clearing, Ltd. | 816,600 | 28,566,835 | |||
| India 18.7% | 272,458,652 | ||||
| Apollo Hospitals Enterprise, Ltd. | 276,427 | 16,079,372 | |||
| Britannia Industries, Ltd. | 53,154 | 2,828,535 | |||
| Godrej Consumer Products, Ltd. (A) | 820,028 | 9,781,011 | |||
| HDFC Bank, Ltd. | 2,469,881 | 43,782,375 | |||
| Hindustan Unilever, Ltd. | 778,545 | 23,234,420 | |||
| ICICI Bank, Ltd. | 2,465,653 | 27,154,781 | |||
| Kotak Mahindra Bank, Ltd. | 903,720 | 18,855,183 | |||
| KPIT Technologies, Ltd. | 625,385 | 9,205,054 | |||
| Mahindra & Mahindra, Ltd. | 980,922 | 17,254,579 | |||
| MakeMyTrip, Ltd. (A) | 385,292 | 14,922,359 | |||
| PB Fintech, Ltd. (A) | 1,780,570 | 14,967,779 | |||
| SEE NOTES TO FINANCIAL STATEMENTS | ANNUAL REPORT | JOHN HANCOCK EMERGING MARKETS EQUITY FUND | 11 |
| Shares | Value | ||||
| India (continued) | |||||
| Reliance Industries, Ltd. | 1,136,345 | $31,261,998 | |||
| Tata Consumer Products, Ltd. | 1,889,574 | 20,435,223 | |||
| UltraTech Cement, Ltd. | 223,788 | 22,695,983 | |||
| Indonesia 3.9% | 57,597,922 | ||||
| Bank Mandiri Persero Tbk PT | 60,794,000 | 21,718,786 | |||
| Bank Negara Indonesia Persero Tbk PT | 68,990,600 | 20,820,438 | |||
| Sumber Alfaria Trijaya Tbk PT | 82,741,600 | 15,058,698 | |||
| Mexico 4.9% | 71,458,550 | ||||
| Fomento Economico Mexicano SAB de CV | 1,534,500 | 17,349,408 | |||
| Grupo Financiero Banorte SAB de CV, Series O | 3,683,700 | 29,841,055 | |||
| Wal-Mart de Mexico SAB de CV | 6,772,900 | 24,268,087 | |||
| Netherlands 1.2% | 17,865,557 | ||||
| Prosus NV (A) | 637,285 | 17,865,557 | |||
| Peru 1.5% | 22,123,793 | ||||
| Credicorp, Ltd. | 177,047 | 22,123,793 | |||
| Philippines 0.2% | 2,557,195 | ||||
| Universal Robina Corp. | 1,326,460 | 2,557,195 | |||
| Poland 0.8% | 11,743,500 | ||||
| Dino Polska SA (A)(B) | 123,935 | 11,743,500 | |||
| Russia 0.0% | 195,439 | ||||
| Sberbank of Russia PJSC, ADR (A)(C) | 558,398 | 195,439 | |||
| Saudi Arabia 1.1% | 16,241,576 | ||||
| Saudi Tadawul Group Holding Company | 366,154 | 16,241,576 | |||
| South Korea 4.7% | 69,058,378 | ||||
| Koh Young Technology, Inc. | 652,500 | 5,347,188 | |||
| LG Chem, Ltd. | 69,483 | 22,772,510 | |||
| SK Hynix, Inc. | 471,415 | 40,938,680 | |||
| Taiwan 12.5% | 181,708,819 | ||||
| ASE Technology Holding Company, Ltd. | 6,935,000 | 24,279,304 | |||
| eMemory Technology, Inc. | 521,000 | 32,641,404 | |||
| MediaTek, Inc. | 1,431,000 | 37,348,188 | |||
| Taiwan Semiconductor Manufacturing Company, Ltd. | 4,640,000 | 75,782,889 | |||
| Yageo Corp. | 715,000 | 11,657,034 | |||
| United Arab Emirates 1.0% | 14,675,068 | ||||
| Americana Restaurants International PLC | 14,524,802 | 14,675,068 | |||
| United Kingdom 2.8% | 41,545,399 | ||||
| Anglo American PLC | 1,630,534 | 41,545,399 | |||
| 12 | JOHN HANCOCK EMERGING MARKETS EQUITY FUND | ANNUAL REPORT | SEE NOTES TO FINANCIAL STATEMENTS |
| Shares | Value | ||||
| Uruguay 2.4% | $34,639,939 | ||||
| Globant SA (A) | 87,664 | 14,928,303 | |||
| MercadoLibre, Inc. (A) | 15,887 | 19,711,636 | |||
| Preferred securities 7.0% | $101,622,231 | ||||
| (Cost $80,165,631) | |||||
| Brazil 1.7% | 24,485,502 | ||||
| Itau Unibanco Holding SA | 4,602,900 | 24,485,502 | |||
| South Korea 5.3% | 77,136,729 | ||||
| Samsung Electronics Company, Ltd. | 1,932,054 | 77,136,729 | |||
| Rights 0.0% | $11,811 | ||||
| (Cost $0) | |||||
| Localiza Rent a Car SA (Expiration Date: 11-13-23; Strike Price: BRL 47.13) (A) | 8,507 | 11,811 | |||
| Yield (%) | Shares | Value | |||
| Short-term investments 1.5% | $21,540,007 | ||||
| (Cost $21,540,007) | |||||
| Short-term funds 1.5% | 21,540,007 | ||||
| JPMorgan U.S. Treasury Plus Money Market Fund, Institutional Class | 5.1814(D) | 21,540,007 | 21,540,007 | ||
| Total investments (Cost $1,415,213,713) 101.0% | $1,473,631,233 | ||||
| Other assets and liabilities, net (1.0%) | (14,047,656) | ||||
| Total net assets 100.0% | $1,459,583,577 | ||||
| The percentage shown for each investment category is the total value of the category as a percentage of the net assets of the fund. | |
| Currency Abbreviations | |
| BRL | Brazilian Real |
| Security Abbreviations and Legend | |
| ADR | American Depositary Receipt |
| (A) | Non-income producing security. |
| (B) | These securities are exempt from registration under Rule 144A of the Securities Act of 1933. Such securities may be resold, normally to qualified institutional buyers, in transactions exempt from registration. |
| (C) | Security is valued using significant unobservable inputs and is classified as Level 3 in the fair value hierarchy. Refer to Note 2 to the financial statements. |
| (D) | The rate shown is the annualized seven-day yield as of 10-31-23. |
| SEE NOTES TO FINANCIAL STATEMENTS | ANNUAL REPORT | JOHN HANCOCK EMERGING MARKETS EQUITY FUND | 13 |
| Assets | |
| Unaffiliated investments, at value (Cost $1,415,213,713) | $1,473,631,233 |
| Cash | 110 |
| Foreign currency, at value (Cost $336,481) | 336,478 |
| Dividends and interest receivable | 1,048,284 |
| Receivable for fund shares sold | 385,865 |
| Receivable for investments sold | 7,228,937 |
| Other assets | 205,253 |
| Total assets | 1,482,836,160 |
| Liabilities | |
| Foreign capital gains tax payable | 2,208,289 |
| Payable for investments purchased | 20,279,392 |
| Payable for fund shares repurchased | 229,724 |
| Payable to affiliates | |
| Accounting and legal services fees | 106,394 |
| Transfer agent fees | 13,731 |
| Distribution and service fees | 2 |
| Trustees’ fees | 2,663 |
| Other liabilities and accrued expenses | 412,388 |
| Total liabilities | 23,252,583 |
| Net assets | $1,459,583,577 |
| Net assets consist of | |
| Paid-in capital | $1,824,085,474 |
| Total distributable earnings (loss) | (364,501,897) |
| Net assets | $1,459,583,577 |
| Net asset value per share | |
| Based on net asset value and shares outstanding - the fund has an unlimited number of shares authorized with no par value | |
| Class A ($23,129,925 ÷ 2,808,849 shares)1 | $8.23 |
| Class C ($382,177 ÷ 48,122 shares)1 | $7.94 |
| Class I ($104,894,358 ÷ 12,684,760 shares) | $8.27 |
| Class R2 ($38,043 ÷ 4,613 shares) | $8.25 |
| Class R4 ($48,608 ÷ 5,886 shares) | $8.26 |
| Class R6 ($47,761,936 ÷ 5,769,898 shares) | $8.28 |
| Class NAV ($1,283,328,530 ÷ 155,086,752 shares) | $8.27 |
| Maximum offering price per share | |
| Class A (net asset value per share ÷ 95%)2 | $8.66 |
| 1 | Redemption price per share is equal to net asset value less any applicable contingent deferred sales charge. |
| 2 | On single retail sales of less than $50,000. On sales of $50,000 or more and on group sales the offering price is reduced. |
| 14 | JOHN HANCOCK Emerging Markets Equity Fund | ANNUAL REPORT | SEE NOTES TO FINANCIAL STATEMENTS |
| Investment income | |
| Dividends | $40,129,671 |
| Interest | 7,018 |
| Less foreign taxes withheld | (4,776,980) |
| Total investment income | 35,359,709 |
| Expenses | |
| Investment management fees | 16,414,046 |
| Distribution and service fees | 78,634 |
| Accounting and legal services fees | 359,589 |
| Transfer agent fees | 294,688 |
| Trustees’ fees | 45,452 |
| Custodian fees | 886,578 |
| State registration fees | 126,462 |
| Printing and postage | 110,762 |
| Professional fees | 135,544 |
| Other | 151,894 |
| Total expenses | 18,603,649 |
| Less expense reductions | (2,716,463) |
| Net expenses | 15,887,186 |
| Net investment income | 19,472,523 |
| Realized and unrealized gain (loss) | |
| Net realized gain (loss) on | |
| Unaffiliated investments and foreign currency transactions | (226,271,376)1 |
| (226,271,376) | |
| Change in net unrealized appreciation (depreciation) of | |
| Unaffiliated investments and translation of assets and liabilities in foreign currencies | 342,606,7162 |
| 342,606,716 | |
| Net realized and unrealized gain | 116,335,340 |
| Increase in net assets from operations | $135,807,863 |
| 1 | Net of foreign capital gains taxes of $(2,493,050). |
| 2 | Net of $1,647,544 decrease in deferred foreign capital gains taxes. |
| SEE NOTES TO FINANCIAL STATEMENTS | ANNUAL REPORT | JOHN HANCOCK Emerging Markets Equity Fund | 15 |
| Year ended 10-31-23 | Year ended 10-31-22 | |
| Increase (decrease) in net assets | ||
| From operations | ||
| Net investment income | $19,472,523 | $23,135,755 |
| Net realized loss | (226,271,376) | (208,028,670) |
| Change in net unrealized appreciation (depreciation) | 342,606,716 | (844,490,412) |
| Increase (decrease) in net assets resulting from operations | 135,807,863 | (1,029,383,327) |
| Distributions to shareholders | ||
| From earnings | ||
| Class A | (201,547) | (2,213,269) |
| Class C | (780) | (227,187) |
| Class I | (3,585,044) | (36,979,763) |
| Class R2 | (337) | (30,547) |
| Class R4 | (609) | (9,380) |
| Class R6 | (590,189) | (4,477,713) |
| Class NAV | (19,320,958) | (198,324,133) |
| Total distributions | (23,699,464) | (242,261,992) |
| From fund share transactions | (320,084,551) | 822,733,904 |
| Total decrease | (207,976,152) | (448,911,415) |
| Net assets | ||
| Beginning of year | 1,667,559,729 | 2,116,471,144 |
| End of year | $1,459,583,577 | $1,667,559,729 |
| 16 | JOHN HANCOCK Emerging Markets Equity Fund | ANNUAL REPORT | SEE NOTES TO FINANCIAL STATEMENTS |
| CLASS A SHARES Period ended | 10-31-23 | 10-31-22 | 10-31-21 | 10-31-20 | 10-31-19 |
| Per share operating performance | |||||
| Net asset value, beginning of period | $7.82 | $14.45 | $12.99 | $10.95 | $10.19 |
| Net investment income1 | 0.07 | 0.08 | 0.06 | —2 | 0.19 |
| Net realized and unrealized gain (loss) on investments | 0.42 | (5.35) | 1.96 | 2.27 | 1.27 |
| Total from investment operations | 0.49 | (5.27) | 2.02 | 2.27 | 1.46 |
| Less distributions | |||||
| From net investment income | (0.08) | — | (0.07) | (0.23) | (0.04) |
| From net realized gain | — | (1.36) | (0.49) | — | (0.66) |
| Total distributions | (0.08) | (1.36) | (0.56) | (0.23) | (0.70) |
| Net asset value, end of period | $8.23 | $7.82 | $14.45 | $12.99 | $10.95 |
| Total return (%)3,4 | 6.31 | (39.72) | 15.37 | 21.04 | 15.56 |
| Ratios and supplemental data | |||||
| Net assets, end of period (in millions) | $23 | $20 | $22 | $4 | $3 |
| Ratios (as a percentage of average net assets): | |||||
| Expenses before reductions | 1.47 | 1.43 | 1.40 | 1.44 | 1.42 |
| Expenses including reductions | 1.32 | 1.27 | 1.24 | 1.43 | 1.42 |
| Net investment income | 0.78 | 0.78 | 0.41 | 0.02 | 1.80 |
| Portfolio turnover (%) | 37 | 27 | 46 | 54 | 38 |
| 1 | Based on average daily shares outstanding. |
| 2 | Less than $0.005 per share. |
| 3 | Total returns would have been lower had certain expenses not been reduced during the applicable periods. |
| 4 | Does not reflect the effect of sales charges, if any. |
| SEE NOTES TO FINANCIAL STATEMENTS | ANNUAL REPORT | JOHN HANCOCK Emerging Markets Equity Fund | 17 |
| CLASS C SHARES Period ended | 10-31-23 | 10-31-22 | 10-31-21 | 10-31-20 | 10-31-19 |
| Per share operating performance | |||||
| Net asset value, beginning of period | $7.54 | $14.07 | $12.69 | $10.71 | $10.00 |
| Net investment income (loss)1 | —2 | —2 | (0.05) | (0.08) | 0.11 |
| Net realized and unrealized gain (loss) on investments | 0.41 | (5.17) | 1.92 | 2.22 | 1.26 |
| Total from investment operations | 0.41 | (5.17) | 1.87 | 2.14 | 1.37 |
| Less distributions | |||||
| From net investment income | (0.01) | — | — | (0.16) | — |
| From net realized gain | — | (1.36) | (0.49) | — | (0.66) |
| Total distributions | (0.01) | (1.36) | (0.49) | (0.16) | (0.66) |
| Net asset value, end of period | $7.94 | $7.54 | $14.07 | $12.69 | $10.71 |
| Total return (%)3,4 | 5.44 | (40.12) | 14.56 | 20.26 | 14.74 |
| Ratios and supplemental data | |||||
| Net assets, end of period (in millions) | $—5 | $1 | $2 | $1 | $—5 |
| Ratios (as a percentage of average net assets): | |||||
| Expenses before reductions | 2.17 | 2.13 | 2.10 | 2.14 | 2.12 |
| Expenses including reductions | 2.02 | 1.97 | 1.94 | 2.13 | 2.12 |
| Net investment income (loss) | (0.02) | (0.04) | (0.36) | (0.70) | 1.08 |
| Portfolio turnover (%) | 37 | 27 | 46 | 54 | 38 |
| 1 | Based on average daily shares outstanding. |
| 2 | Less than $0.005 per share. |
| 3 | Total returns would have been lower had certain expenses not been reduced during the applicable periods. |
| 4 | Does not reflect the effect of sales charges, if any. |
| 5 | Less than $500,000. |
| 18 | JOHN HANCOCK Emerging Markets Equity Fund | ANNUAL REPORT | SEE NOTES TO FINANCIAL STATEMENTS |
| CLASS I SHARES Period ended | 10-31-23 | 10-31-22 | 10-31-21 | 10-31-20 | 10-31-19 |
| Per share operating performance | |||||
| Net asset value, beginning of period | $7.86 | $14.50 | $13.03 | $10.98 | $10.22 |
| Net investment income1 | 0.08 | 0.11 | 0.08 | 0.01 | 0.26 |
| Net realized and unrealized gain (loss) on investments | 0.44 | (5.36) | 1.98 | 2.30 | 1.24 |
| Total from investment operations | 0.52 | (5.25) | 2.06 | 2.31 | 1.50 |
| Less distributions | |||||
| From net investment income | (0.11) | (0.03) | (0.10) | (0.26) | (0.08) |
| From net realized gain | — | (1.36) | (0.49) | — | (0.66) |
| Total distributions | (0.11) | (1.39) | (0.59) | (0.26) | (0.74) |
| Net asset value, end of period | $8.27 | $7.86 | $14.50 | $13.03 | $10.98 |
| Total return (%)2 | 6.49 | (39.50) | 15.69 | 21.51 | 15.81 |
| Ratios and supplemental data | |||||
| Net assets, end of period (in millions) | $105 | $268 | $67 | $6 | $—3 |
| Ratios (as a percentage of average net assets): | |||||
| Expenses before reductions | 1.17 | 1.13 | 1.10 | 1.14 | 1.13 |
| Expenses including reductions | 1.01 | 0.97 | 0.94 | 1.12 | 1.12 |
| Net investment income | 0.85 | 1.08 | 0.51 | 0.07 | 2.53 |
| Portfolio turnover (%) | 37 | 27 | 46 | 54 | 38 |
| 1 | Based on average daily shares outstanding. |
| 2 | Total returns would have been lower had certain expenses not been reduced during the applicable periods. |
| 3 | Less than $500,000. |
| SEE NOTES TO FINANCIAL STATEMENTS | ANNUAL REPORT | JOHN HANCOCK Emerging Markets Equity Fund | 19 |
| CLASS R2 SHARES Period ended | 10-31-23 | 10-31-22 | 10-31-21 | 10-31-20 | 10-31-19 |
| Per share operating performance | |||||
| Net asset value, beginning of period | $7.82 | $14.45 | $12.98 | $10.95 | $10.19 |
| Net investment income1 | 0.08 | 0.08 | 0.06 | 0.01 | 0.21 |
| Net realized and unrealized gain (loss) on investments | 0.42 | (5.35) | 1.97 | 2.26 | 1.27 |
| Total from investment operations | 0.50 | (5.27) | 2.03 | 2.27 | 1.48 |
| Less distributions | |||||
| From net investment income | (0.07) | — | (0.07) | (0.24) | (0.06) |
| From net realized gain | — | (1.36) | (0.49) | — | (0.66) |
| Total distributions | (0.07) | (1.36) | (0.56) | (0.24) | (0.72) |
| Net asset value, end of period | $8.25 | $7.82 | $14.45 | $12.98 | $10.95 |
| Total return (%)2 | 6.39 | (39.76) | 15.57 | 21.15 | 15.67 |
| Ratios and supplemental data | |||||
| Net assets, end of period (in millions) | $—3 | $—3 | $—3 | $—3 | $—3 |
| Ratios (as a percentage of average net assets): | |||||
| Expenses before reductions | 1.32 | 1.47 | 1.29 | 1.42 | 1.34 |
| Expenses including reductions | 1.16 | 1.31 | 1.13 | 1.40 | 1.33 |
| Net investment income | 0.92 | 0.73 | 0.42 | 0.05 | 2.02 |
| Portfolio turnover (%) | 37 | 27 | 46 | 54 | 38 |
| 1 | Based on average daily shares outstanding. |
| 2 | Total returns would have been lower had certain expenses not been reduced during the applicable periods. |
| 3 | Less than $500,000. |
| 20 | JOHN HANCOCK Emerging Markets Equity Fund | ANNUAL REPORT | SEE NOTES TO FINANCIAL STATEMENTS |
| CLASS R4 SHARES Period ended | 10-31-23 | 10-31-22 | 10-31-21 | 10-31-20 | 10-31-19 |
| Per share operating performance | |||||
| Net asset value, beginning of period | $7.85 | $14.48 | $13.02 | $10.97 | $10.21 |
| Net investment income1 | 0.09 | 0.09 | 0.07 | 0.03 | 0.20 |
| Net realized and unrealized gain (loss) on investments | 0.42 | (5.34) | 1.98 | 2.27 | 1.29 |
| Total from investment operations | 0.51 | (5.25) | 2.05 | 2.30 | 1.49 |
| Less distributions | |||||
| From net investment income | (0.10) | (0.02) | (0.10) | (0.25) | (0.07) |
| From net realized gain | — | (1.36) | (0.49) | — | (0.66) |
| Total distributions | (0.10) | (1.38) | (0.59) | (0.25) | (0.73) |
| Net asset value, end of period | $8.26 | $7.85 | $14.48 | $13.02 | $10.97 |
| Total return (%)2 | 6.41 | (39.56) | 15.66 | 21.47 | 15.77 |
| Ratios and supplemental data | |||||
| Net assets, end of period (in millions) | $—3 | $—3 | $—3 | $—3 | $—3 |
| Ratios (as a percentage of average net assets): | |||||
| Expenses before reductions | 1.34 | 1.31 | 1.27 | 1.29 | 1.28 |
| Expenses including reductions | 1.08 | 1.05 | 1.02 | 1.17 | 1.17 |
| Net investment income | 0.98 | 0.88 | 0.45 | 0.26 | 1.93 |
| Portfolio turnover (%) | 37 | 27 | 46 | 54 | 38 |
| 1 | Based on average daily shares outstanding. |
| 2 | Total returns would have been lower had certain expenses not been reduced during the applicable periods. |
| 3 | Less than $500,000. |
| SEE NOTES TO FINANCIAL STATEMENTS | ANNUAL REPORT | JOHN HANCOCK Emerging Markets Equity Fund | 21 |
| CLASS R6 SHARES Period ended | 10-31-23 | 10-31-22 | 10-31-21 | 10-31-20 | 10-31-19 |
| Per share operating performance | |||||
| Net asset value, beginning of period | $7.87 | $14.52 | $13.04 | $10.99 | $10.22 |
| Net investment income1 | 0.11 | 0.12 | 0.15 | 0.05 | 0.26 |
| Net realized and unrealized gain (loss) on investments | 0.42 | (5.37) | 1.94 | 2.27 | 1.26 |
| Total from investment operations | 0.53 | (5.25) | 2.09 | 2.32 | 1.52 |
| Less distributions | |||||
| From net investment income | (0.12) | (0.04) | (0.12) | (0.27) | (0.09) |
| From net realized gain | — | (1.36) | (0.49) | — | (0.66) |
| Total distributions | (0.12) | (1.40) | (0.61) | (0.27) | (0.75) |
| Net asset value, end of period | $8.28 | $7.87 | $14.52 | $13.04 | $10.99 |
| Total return (%)2 | 6.60 | (39.44) | 15.86 | 21.61 | 16.08 |
| Ratios and supplemental data | |||||
| Net assets, end of period (in millions) | $48 | $40 | $43 | $2 | $1 |
| Ratios (as a percentage of average net assets): | |||||
| Expenses before reductions | 1.06 | 1.02 | 0.99 | 1.03 | 1.02 |
| Expenses including reductions | 0.90 | 0.87 | 0.84 | 1.02 | 1.01 |
| Net investment income | 1.19 | 1.19 | 0.97 | 0.48 | 2.48 |
| Portfolio turnover (%) | 37 | 27 | 46 | 54 | 38 |
| 1 | Based on average daily shares outstanding. |
| 2 | Total returns would have been lower had certain expenses not been reduced during the applicable periods. |
| 22 | JOHN HANCOCK Emerging Markets Equity Fund | ANNUAL REPORT | SEE NOTES TO FINANCIAL STATEMENTS |
| CLASS NAV SHARES Period ended | 10-31-23 | 10-31-22 | 10-31-21 | 10-31-20 | 10-31-19 |
| Per share operating performance | |||||
| Net asset value, beginning of period | $7.86 | $14.51 | $13.04 | $10.99 | $10.22 |
| Net investment income1 | 0.11 | 0.12 | 0.10 | 0.05 | 0.24 |
| Net realized and unrealized gain (loss) on investments | 0.42 | (5.36) | 1.98 | 2.27 | 1.28 |
| Total from investment operations | 0.53 | (5.24) | 2.08 | 2.32 | 1.52 |
| Less distributions | |||||
| From net investment income | (0.12) | (0.05) | (0.12) | (0.27) | (0.09) |
| From net realized gain | — | (1.36) | (0.49) | — | (0.66) |
| Total distributions | (0.12) | (1.41) | (0.61) | (0.27) | (0.75) |
| Net asset value, end of period | $8.27 | $7.86 | $14.51 | $13.04 | $10.99 |
| Total return (%)2 | 6.75 | (39.46) | 15.79 | 21.62 | 16.10 |
| Ratios and supplemental data | |||||
| Net assets, end of period (in millions) | $1,283 | $1,339 | $1,982 | $1,830 | $2,010 |
| Ratios (as a percentage of average net assets): | |||||
| Expenses before reductions | 1.06 | 1.01 | 0.98 | 1.02 | 1.01 |
| Expenses including reductions | 0.90 | 0.86 | 0.83 | 1.00 | 1.00 |
| Net investment income | 1.17 | 1.16 | 0.65 | 0.46 | 2.29 |
| Portfolio turnover (%) | 37 | 27 | 46 | 54 | 38 |
| 1 | Based on average daily shares outstanding. |
| 2 | Total returns would have been lower had certain expenses not been reduced during the applicable periods. |
| SEE NOTES TO FINANCIAL STATEMENTS | ANNUAL REPORT | JOHN HANCOCK Emerging Markets Equity Fund | 23 |
| 24 | JOHN HANCOCK Emerging Markets Equity Fund | ANNUAL REPORT |
| Total value at 10-31-23 | Level 1 quoted price | Level 2 significant observable inputs | Level 3 significant unobservable inputs | |
| Investments in securities: | ||||
| Assets | ||||
| Common stocks | ||||
| Brazil | $77,886,787 | $77,886,787 | — | — |
| China | 367,285,151 | 8,712,296 | $358,572,855 | — |
| Hong Kong | 91,415,459 | — | 91,415,459 | — |
| India | 272,458,652 | 14,922,359 | 257,536,293 | — |
| Indonesia | 57,597,922 | — | 57,597,922 | — |
| Mexico | 71,458,550 | 71,458,550 | — | — |
| Netherlands | 17,865,557 | — | 17,865,557 | — |
| Peru | 22,123,793 | 22,123,793 | — | — |
| Philippines | 2,557,195 | — | 2,557,195 | — |
| Poland | 11,743,500 | — | 11,743,500 | — |
| Russia | 195,439 | — | — | $195,439 |
| Saudi Arabia | 16,241,576 | — | 16,241,576 | — |
| South Korea | 69,058,378 | — | 69,058,378 | — |
| Taiwan | 181,708,819 | — | 181,708,819 | — |
| United Arab Emirates | 14,675,068 | — | 14,675,068 | — |
| United Kingdom | 41,545,399 | — | 41,545,399 | — |
| Uruguay | 34,639,939 | 34,639,939 | — | — |
| Preferred securities | ||||
| Brazil | 24,485,502 | 24,485,502 | — | — |
| South Korea | 77,136,729 | — | 77,136,729 | — |
| ANNUAL REPORT | JOHN HANCOCK Emerging Markets Equity Fund | 25 |
| Total value at 10-31-23 | Level 1 quoted price | Level 2 significant observable inputs | Level 3 significant unobservable inputs | |
| Rights | $11,811 | $11,811 | — | — |
| Short-term investments | 21,540,007 | 21,540,007 | — | — |
| Total investments in securities | $1,473,631,233 | $275,781,044 | $1,197,654,750 | $195,439 |
| 26 | JOHN HANCOCK Emerging Markets Equity Fund | ANNUAL REPORT |
| October 31, 2023 | October 31, 2022 | |
| Ordinary income | $23,699,464 | $24,979,182 |
| Long-term capital gains | — | 217,282,810 |
| Total | $23,699,464 | $242,261,992 |
| ANNUAL REPORT | JOHN HANCOCK Emerging Markets Equity Fund | 27 |
| Class | Expense reduction |
| Class A | $38,343 |
| Class C | 831 |
| Class I | 352,190 |
| Class R2 | 65 |
| Class | Expense reduction |
| Class R4 | $85 |
| Class R6 | 77,434 |
| Class NAV | 2,247,461 |
| Total | $2,716,409 |
| 28 | JOHN HANCOCK Emerging Markets Equity Fund | ANNUAL REPORT |
| Class | Rule 12b-1 Fee | Service fee |
| Class A | 0.30% | — |
| Class C | 1.00% | — |
| Class R2 | 0.25% | 0.25% |
| Class R4 | 0.25% | 0.10% |
| ANNUAL REPORT | JOHN HANCOCK Emerging Markets Equity Fund | 29 |
| Class | Distribution and service fees | Transfer agent fees |
| Class A | $73,081 | $28,594 |
| Class C | 5,297 | 621 |
| Class I | — | 262,074 |
| Class R2 | 105 | 3 |
| Class R4 | 151 | 4 |
| Class R6 | — | 3,392 |
| Total | $78,634 | $294,688 |
| Borrower or Lender | Weighted Average Loan Balance | Days Outstanding | Weighted Average Interest Rate | Interest Income (Expense) |
| Borrower | $6,800,000 | 1 | 3.31% | $(624) |
| Year Ended 10-31-23 | Year Ended 10-31-22 | |||
| Shares | Amount | Shares | Amount | |
| Class A shares | ||||
| Sold | 873,733 | $7,865,242 | 1,494,907 | $15,379,542 |
| Distributions reinvested | 23,043 | 201,391 | 184,593 | 2,213,269 |
| Repurchased | (632,019) | (5,618,504) | (673,250) | (6,750,046) |
| Net increase | 264,757 | $2,448,129 | 1,006,250 | $10,842,765 |
| Class C shares | ||||
| Sold | 5,693 | $49,214 | 16,366 | $178,052 |
| Distributions reinvested | 92 | 780 | 19,535 | 227,187 |
| Repurchased | (49,115) | (424,091) | (117,195) | (1,166,601) |
| Net decrease | (43,330) | $(374,097) | (81,294) | $(761,362) |
| 30 | JOHN HANCOCK Emerging Markets Equity Fund | ANNUAL REPORT |
| Year Ended 10-31-23 | Year Ended 10-31-22 | |||
| Shares | Amount | Shares | Amount | |
| Class I shares | ||||
| Sold | 4,348,106 | $39,034,256 | 36,098,613 | $459,726,290 |
| Distributions reinvested | 409,719 | 3,585,044 | 3,076,935 | 36,953,995 |
| Repurchased | (26,163,445) | (231,975,356) | (9,674,840) | (97,285,184) |
| Net increase (decrease) | (21,405,620) | $(189,356,056) | 29,500,708 | $399,395,101 |
| Class R2 shares | ||||
| Sold | 123 | $1,092 | 12,297 | $171,145 |
| Distributions reinvested | 3 | 26 | 2,073 | 24,850 |
| Repurchased | (244) | (2,158) | (20,703) | (171,749) |
| Net increase (decrease) | (118) | $(1,040) | (6,333) | $24,246 |
| Class R4 shares | ||||
| Sold | 639 | $5,704 | 193 | $1,943 |
| Distributions reinvested | 22 | 195 | 300 | 3,601 |
| Repurchased | (902) | (8,151) | (2,220) | (26,306) |
| Net decrease | (241) | $(2,252) | (1,727) | $(20,762) |
| Class R6 shares | ||||
| Sold | 2,178,412 | $19,600,112 | 3,282,718 | $34,081,880 |
| Distributions reinvested | 67,450 | 590,189 | 372,829 | 4,477,675 |
| Repurchased | (1,526,609) | (13,620,057) | (1,599,129) | (16,131,851) |
| Net increase | 719,253 | $6,570,244 | 2,056,418 | $22,427,704 |
| Class NAV shares | ||||
| Sold | 4,728,780 | $42,838,533 | 19,172,412 | $211,321,715 |
| Distributions reinvested | 2,208,110 | 19,320,958 | 16,513,250 | 198,324,133 |
| Repurchased | (22,170,288) | (201,528,970) | (1,903,733) | (18,819,636) |
| Net increase (decrease) | (15,233,398) | $(139,369,479) | 33,781,929 | $390,826,212 |
| Total net increase (decrease) | (35,698,697) | $(320,084,551) | 66,255,951 | $822,733,904 |
| ANNUAL REPORT | JOHN HANCOCK Emerging Markets Equity Fund | 31 |
| Fund | Affiliated Concentration |
| John Hancock Funds II Multimanager Lifestyle Growth Portfolio | 20.6% |
| John Hancock Variable Insurance Trust Managed Volatility Growth Portfolio | 14.4% |
| John Hancock Funds II Multimanager Lifestyle Balanced Portfolio | 12.1% |
| John Hancock Funds II Multimanager Lifestyle Aggressive Portfolio | 11.1% |
| John Hancock Variable Insurance Trust Managed Volatility Balanced Portfolio | 7.0% |
| 32 | JOHN HANCOCK Emerging Markets Equity Fund | ANNUAL REPORT |
| ANNUAL REPORT | JOHN HANCOCK EMERGING MARKETS EQUITY FUND | 33 |
| 34 | JOHN HANCOCK EMERGING MARKETS EQUITY FUND | ANNUAL REPORT |
| ANNUAL REPORT | JOHN HANCOCK EMERGING MARKETS EQUITY FUND | 35 |
| (a) | the skills and competency with which the Advisor has in the past managed the Trust’s affairs and its subadvisory relationship, the Advisor’s oversight and monitoring of the Subadvisor’s investment performance and compliance programs, such as the Subadvisor’s compliance with fund policies and objectives, review of brokerage matters, including with respect to trade allocation and best execution and the Advisor’s timeliness in responding to performance issues; |
| (b) | the background, qualifications and skills of the Advisor’s personnel; |
| (c) | the Advisor’s compliance policies and procedures and its responsiveness to regulatory changes and fund industry developments; |
| (d) | the Advisor’s administrative capabilities, including its ability to supervise the other service providers for the fund, as well as the Advisor’s oversight of any securities lending activity, its monitoring of class action litigation and collection of class action settlements on behalf of the fund, and bringing loss recovery actions on behalf of the fund; |
| (e) | the financial condition of the Advisor and whether it has the financial wherewithal to provide a high level and quality of services to the fund; |
| 36 | JOHN HANCOCK EMERGING MARKETS EQUITY FUND | ANNUAL REPORT |
| (f) | the Advisor’s initiatives intended to improve various aspects of the Trust’s operations and investor experience with the fund; and |
| (g) | the Advisor’s reputation and experience in serving as an investment advisor to the Trust and the benefit to shareholders of investing in funds that are part of a family of funds offering a variety of investments. |
| (a) | reviewed information prepared by management regarding the fund’s performance; |
| (b) | considered the comparative performance of an applicable benchmark index; |
| (c) | considered the performance of comparable funds, if any, as included in the report prepared by an independent third-party provider of fund data; and |
| (d) | took into account the Advisor’s analysis of the fund’s performance and its plans and recommendations regarding the Trust’s subadvisory arrangements generally. |
| ANNUAL REPORT | JOHN HANCOCK EMERGING MARKETS EQUITY FUND | 37 |
| (a) | reviewed financial information of the Advisor; |
| (b) | reviewed and considered information presented by the Advisor regarding the net profitability to the Advisor and its affiliates with respect to the fund; |
| (c) | received and reviewed profitability information with respect to the John Hancock Fund Complex as a whole and with respect to the fund; |
| (d) | received information with respect to the Advisor’s allocation methodologies used in preparing the profitability data and considered that the Advisor hired an independent third-party consultant to provide an analysis of the Advisor’s allocation methodologies; |
| (e) | considered that the John Hancock insurance companies that are affiliates of the Advisor, as shareholders of the Trust directly or through their separate accounts, receive certain tax credits or deductions relating to foreign taxes paid and dividends received by certain funds of the Trust and noted that these tax benefits, which are not available to participants in qualified retirement plans under applicable income tax law, are reflected in the profitability information reviewed by the Board; |
| (f) | considered that the Advisor also provides administrative services to the fund on a cost basis pursuant to an administrative services agreement; |
| (g) | noted that affiliates of the Advisor provide transfer agency services and distribution services to the fund, and that the fund’s distributor also receives Rule 12b-1 payments to support distribution of the fund; |
| (h) | noted that the fund’s Subadvisor is an affiliate of the Advisor; |
| (i) | noted that the Advisor also derives reputational and other indirect benefits from providing advisory services to the fund; |
| (j) | noted that the subadvisory fee for the fund is paid by the Advisor; |
| (k) | considered the Advisor’s ongoing costs and expenditures necessary to improve services, meet new regulatory and compliance requirements, and adapt to other challenges impacting the fund industry; and |
| (l) | considered that the Advisor should be entitled to earn a reasonable level of profits in exchange for the level of services it provides to the fund and the risks that it assumes as Advisor, including entrepreneurial, operational, reputational, litigation and regulatory risk. |
| 38 | JOHN HANCOCK EMERGING MARKETS EQUITY FUND | ANNUAL REPORT |
| (a) | considered that the Advisor has contractually agreed to waive a portion of its management fee for certain funds of the John Hancock Fund Complex, including the fund (the participating portfolios) or otherwise reimburse the expenses of the participating portfolios (the reimbursement). This waiver is based upon aggregate net assets of all the participating portfolios. The amount of the reimbursement is calculated daily and allocated among all the participating portfolios in proportion to the daily net assets of each fund; |
| (b) | reviewed the fund’s advisory fee structure and concluded that: (i) the fund’s fee structure contains breakpoints at the subadvisory fee level and that such breakpoints are reflected as breakpoints in the advisory fees for the fund; and (ii) although economies of scale cannot be measured with precision, these arrangements permit shareholders of the fund to benefit from economies of scale if the fund grows. The Board also took into account management’s discussion of the fund’s advisory fee structure; and |
| (c) | the Board also considered the effect of the fund’s growth in size on its performance and fees. The Board also noted that if the fund’s assets increase over time, the fund may realize other economies of scale. |
| (1) | information relating to the Subadvisor’s business, including current subadvisory services to the Trust (and other funds in the John Hancock Fund Complex); |
| (2) | the historical and current performance of the fund and comparative performance information relating to an applicable benchmark index and comparable funds; and |
| (3) | the subadvisory fee for the fund, including any breakpoints, and to the extent available, comparable fee information prepared by an independent third-party provider of fund data. |
| ANNUAL REPORT | JOHN HANCOCK EMERGING MARKETS EQUITY FUND | 39 |
| (1) | the Subadvisor has extensive experience and demonstrated skills as a manager; |
| (2) | the performance of the fund is being monitored and reasonably addressed, where appropriate; |
| (3) | the subadvisory fee is reasonable in relation to the level and quality of services being provided under the Subadvisory Agreement; and |
| (4) | noted that the subadvisory fees are paid by the Advisor not the fund and that the subadvisory fee breakpoints are reflected as breakpoints in the advisory fees for the fund in order to permit shareholders to benefit from economies of scale if the fund grows. |
| 40 | JOHN HANCOCK EMERGING MARKETS EQUITY FUND | ANNUAL REPORT |
| Independent Trustees | ||
| Name, year of birth Position(s) held with Trust Principal occupation(s) and other directorships during past 5 years | Trustee of the Trust since1 | Number of John Hancock funds overseen by Trustee |
| Hassell H. McClellan,2 Born: 1945 | 2012 | 179 |
| Trustee and Chairperson of the Board | ||
| Director/Trustee, Virtus Funds (2008-2020); Director, The Barnes Group (2010-2021); Associate Professor, The Wallace E. Carroll School of Management, Boston College (retired 2013). Trustee (since 2005) and Chairperson of the Board (since 2017) of various trusts within the John Hancock Fund Complex. | ||
| James R. Boyle, Born: 1959 | 2015 | 175 |
| Trustee | ||
| Board Member, United of Omaha Life Insurance Company (since 2022). Board Member, Mutual of Omaha Investor Services, Inc. (since 2022). Foresters Financial, Chief Executive Officer (2018–2022) and board member (2017–2022). Manulife Financial and John Hancock, more than 20 years, retiring in 2012 as Chief Executive Officer, John Hancock and Senior Executive Vice President, Manulife Financial. Trustee of various trusts within the John Hancock Fund Complex (2005–2014 and since 2015). | ||
| William H. Cunningham,3 Born: 1944 | 1986 | 177 |
| Trustee | ||
| Professor, University of Texas, Austin, Texas (since 1971); former Chancellor, University of Texas System and former President of the University of Texas, Austin, Texas; Director (since 2006), Lincoln National Corporation (insurance); Director, Southwest Airlines (since 2000). Trustee of various trusts within the John Hancock Fund Complex (since 1986). | ||
| Noni L. Ellison, Born: 1971 | 2022 | 175 |
| Trustee | ||
| Senior Vice President, General Counsel & Corporate Secretary, Tractor Supply Company (rural lifestyle retailer) (since 2021); General Counsel, Chief Compliance Officer & Corporate Secretary, Carestream Dental, L.L.C. (2017–2021); Associate General Counsel & Assistant Corporate Secretary, W.W. Grainger, Inc. (global industrial supplier) (2015–2017); Board Member, Goodwill of North Georgia, 2018 (FY2019)–2020 (FY2021); Board Member, Howard University School of Law Board of Visitors (since 2021); Board Member, University of Chicago Law School Board of Visitors (since 2016); Board member, Children’s Healthcare of Atlanta Foundation Board (2021–2023). Trustee of various trusts within the John Hancock Fund Complex (since 2022). | ||
| Grace K. Fey, Born: 1946 | 2012 | 179 |
| Trustee | ||
| Chief Executive Officer, Grace Fey Advisors (since 2007); Director and Executive Vice President, Frontier Capital Management Company (1988–2007); Director, Fiduciary Trust (since 2009). Trustee of various trusts within the John Hancock Fund Complex (since 2008). | ||
| Dean C. Garfield, Born: 1968 | 2022 | 175 |
| Trustee | ||
| Vice President, Netflix, Inc. (since 2019); President & Chief Executive Officer, Information Technology Industry Council (2009–2019); NYU School of Law Board of Trustees (since 2021); Member, U.S. Department of Transportation, Advisory Committee on Automation (since 2021); President of the United States Trade Advisory Council (2010–2018); Board Member, College for Every Student (2017–2021); Board Member, The Seed School of Washington, D.C. (2012–2017); Advisory Board Member of the Block Center for Technology and Society (since 2019). Trustee of various trusts within the John Hancock Fund Complex (since 2022). | ||
| ANNUAL REPORT | JOHN HANCOCK EMERGING MARKETS EQUITY FUND | 41 |
| Independent Trustees (continued) | ||
| Name, year of birth Position(s) held with Trust Principal occupation(s) and other directorships during past 5 years | Trustee of the Trust since1 | Number of John Hancock funds overseen by Trustee |
| Deborah C. Jackson, Born: 1952 | 2008 | 177 |
| Trustee | ||
| President, Cambridge College, Cambridge, Massachusetts (since 2011); Board of Directors, Amwell Corporation (since 2020); Board of Directors, Massachusetts Women’s Forum (2018-2020); Board of Directors, National Association of Corporate Directors/New England (2015-2020); Chief Executive Officer, American Red Cross of Massachusetts Bay (2002–2011); Board of Directors of Eastern Bank Corporation (since 2001); Board of Directors of Eastern Bank Charitable Foundation (since 2001); Board of Directors of Boston Stock Exchange (2002–2008); Board of Directors of Harvard Pilgrim Healthcare (health benefits company) (2007–2011). Trustee of various trusts within the John Hancock Fund Complex (since 2008). | ||
| Steven R. Pruchansky, Born: 1944 | 1994 | 175 |
| Trustee and Vice Chairperson of the Board | ||
| Managing Director, Pru Realty (since 2017); Chairman and Chief Executive Officer, Greenscapes of Southwest Florida, Inc. (2014-2020); Director and President, Greenscapes of Southwest Florida, Inc. (until 2000); Member, Board of Advisors, First American Bank (until 2010); Managing Director, Jon James, LLC (real estate) (since 2000); Partner, Right Funding, LLC (2014-2017); Director, First Signature Bank & Trust Company (until 1991); Director, Mast Realty Trust (until 1994); President, Maxwell Building Corp. (until 1991). Trustee (since 1992), Chairperson of the Board (2011–2012), and Vice Chairperson of the Board (since 2012) of various trusts within the John Hancock Fund Complex. | ||
| Frances G. Rathke,3 Born: 1960 | 2020 | 175 |
| Trustee | ||
| Director, Audit Committee Chair, Oatly Group AB (plant-based drink company) (since 2021); Director, Audit Committee Chair and Compensation Committee Member, Green Mountain Power Corporation (since 2016); Director, Treasurer and Finance & Audit Committee Chair, Flynn Center for Performing Arts (since 2016); Director and Audit Committee Chair, Planet Fitness (since 2016); Chief Financial Officer and Treasurer, Keurig Green Mountain, Inc. (2003-retired 2015). Trustee of various trusts within the John Hancock Fund Complex (since 2020). | ||
| Gregory A. Russo, Born: 1949 | 2009 | 175 |
| Trustee | ||
| Director and Audit Committee Chairman (2012-2020), and Member, Audit Committee and Finance Committee (2011-2020), NCH Healthcare System, Inc. (holding company for multi-entity healthcare system); Director and Member (2012-2018), and Finance Committee Chairman (2014-2018), The Moorings, Inc. (nonprofit continuing care community); Global Vice Chairman, Risk & Regulatory Matters, KPMG LLP (KPMG) (2002–2006); Vice Chairman, Industrial Markets, KPMG (1998–2002). Trustee of various trusts within the John Hancock Fund Complex (since 2008). | ||
| 42 | JOHN HANCOCK EMERGING MARKETS EQUITY FUND | ANNUAL REPORT |
| Non-Independent Trustees4 | ||
| Name, year of birth Position(s) held with Trust Principal occupation(s) and other directorships during past 5 years | Trustee of the Trust since1 | Number of John Hancock funds overseen by Trustee |
| Andrew G. Arnott, Born: 1971 | 2017 | 177 |
| Non-Independent Trustee | ||
| Global Head of Retail for Manulife (since 2022); Head of Wealth and Asset Management, United States and Europe, for John Hancock and Manulife (2018-2023); Director and Chairman, John Hancock Investment Management LLC (since 2005, including prior positions); Director and Chairman, John Hancock Variable Trust Advisers LLC (since 2006, including prior positions); Director and Chairman, John Hancock Investment Management Distributors LLC (since 2004, including prior positions); President of various trusts within the John Hancock Fund Complex (2007-2023, including prior positions). Trustee of various trusts within the John Hancock Fund Complex (since 2017). | ||
| Paul Lorentz, Born: 1968 | 2022 | 175 |
| Non-Independent Trustee | ||
| Global Head, Manulife Wealth and Asset Management (since 2017); General Manager, Manulife, Individual Wealth Management and Insurance (2013–2017); President, Manulife Investments (2010–2016). Trustee of various trusts within the John Hancock Fund Complex (since 2022). | ||
| Principal officers who are not Trustees | |
| Name, year of birth Position(s) held with Trust Principal occupation(s) during past 5 years | Current Position(s) with the Trust since |
| Kristie M. Feinberg, Born: 1975 | 2023 |
| President | |
| Head of Wealth and Asset Management, United States and Europe, for John Hancock and Manulife (since 2023); CFO and Global Head of Strategy, Manulife Investment Management (2021-2023, including prior positions); CFO Americas & Global Head of Treasury, Invesco, Ltd., Invesco US (2019-2020, including prior positions); Senior Vice President, Corporate Treasurer and Business Controller, Oppenheimer Funds (2001-2019, including prior positions); President of various trusts within the John Hancock Fund Complex (since 2023). | |
| Charles A. Rizzo, Born: 1957 | 2007 |
| Chief Financial Officer | |
| Vice President, John Hancock Financial Services (since 2008); Senior Vice President, John Hancock Investment Management LLC and John Hancock Variable Trust Advisers LLC (since 2008); Chief Financial Officer of various trusts within the John Hancock Fund Complex (since 2007). | |
| Salvatore Schiavone, Born: 1965 | 2010 |
| Treasurer | |
| Assistant Vice President, John Hancock Financial Services (since 2007); Vice President, John Hancock Investment Management LLC and John Hancock Variable Trust Advisers LLC (since 2007); Treasurer of various trusts within the John Hancock Fund Complex (since 2007, including prior positions). | |
| ANNUAL REPORT | JOHN HANCOCK EMERGING MARKETS EQUITY FUND | 43 |
| Principal officers who are not Trustees (continued) | |
| Name, year of birth Position(s) held with Trust Principal occupation(s) during past 5 years | Current Position(s) with the Trust since |
| Christopher (Kit) Sechler, Born: 1973 | 2018 |
| Secretary and Chief Legal Officer | |
| Vice President and Deputy Chief Counsel, John Hancock Investment Management (since 2015); Assistant Vice President and Senior Counsel (2009–2015), John Hancock Investment Management; Assistant Secretary of John Hancock Investment Management LLC and John Hancock Variable Trust Advisers LLC (since 2009); Chief Legal Officer and Secretary of various trusts within the John Hancock Fund Complex (since 2009, including prior positions). | |
| Trevor Swanberg, Born: 1979 | 2020 |
| Chief Compliance Officer | |
| Chief Compliance Officer, John Hancock Investment Management LLC and John Hancock Variable Trust Advisers LLC (since 2020); Deputy Chief Compliance Officer, John Hancock Investment Management LLC and John Hancock Variable Trust Advisers LLC (2019–2020); Assistant Chief Compliance Officer, John Hancock Investment Management LLC and John Hancock Variable Trust Advisers LLC (2016–2019); Vice President, State Street Global Advisors (2015–2016); Chief Compliance Officer of various trusts within the John Hancock Fund Complex (since 2016, including prior positions). | |
| 1 | Each Trustee holds office until his or her successor is duly elected and qualified, or until the Trustee’s death, retirement, resignation, or removal. Mr. Boyle has served as Trustee at various times prior to the date listed in the table. |
| 2 | Member of the Audit Committee as of September 26, 2023. |
| 3 | Member of the Audit Committee. |
| 4 | The Trustee is a Non-Independent Trustee due to current or former positions with the Advisor and certain affiliates. |
| 44 | JOHN HANCOCK EMERGING MARKETS EQUITY FUND | ANNUAL REPORT |
Steven R. Pruchansky, Vice Chairperson
Andrew G. Arnott†
James R. Boyle
William H. Cunningham*
Grace K. Fey
Noni L. Ellison
Dean C. Garfield
Deborah C. Jackson
Paul Lorentz†
Frances G. Rathke*
Gregory A. Russo
President
Chief Financial Officer
Treasurer
Secretary and Chief Legal Officer
Chief Compliance Officer
David Dugdale, PhD, CFA
Philip Ehrmann
Kathryn Langridge
Bhupinder Sachdev, CFA
Talib Saifee
| You can also contact us: | ||
| 800-225-5291 | Regular mail: | Express mail: |
| jhinvestments.com | John Hancock Signature Services, Inc. P.O. Box 219909 Kansas City, MO 64121-9909 | John Hancock Signature Services, Inc. 430 W 7th Street Suite 219909 Kansas City, MO 64105-1407 |
| ANNUAL REPORT | JOHN HANCOCK EMERGING MARKETS EQUITY FUND | 45 |
GOVERNANCE FUNDS
with a heritage of financial stewardship dating back to 1862. Helping
our shareholders pursue their financial goals is at the core of everything
we do. It’s why we support the role of professional financial advice
and operate with the highest standards of conduct and integrity.
We search the world to find proven portfolio teams with specialized
expertise for every strategy we offer, then we apply robust investment
oversight to ensure they continue to meet our uncompromising
standards and serve the best interests of our shareholders.
a diverse set of investments backed by some of the world’s best
managers, along with strong risk-adjusted returns across asset classes.
200 Berkeley Street, Boston, MA 02116-5010, 800-225-5291, jhinvestments.com
| MF3208593 | 456A 10/23 |


United States and Europe
Manulife Investment Management
John Hancock Investment Management
| ANNUAL REPORT | JOHN HANCOCK INFRASTRUCTURE FUND | 1 |
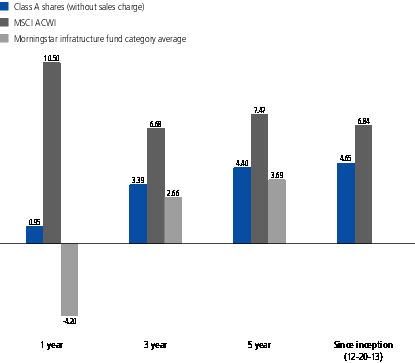
| 2 | JOHN HANCOCK INFRASTRUCTURE FUND | ANNUAL REPORT |
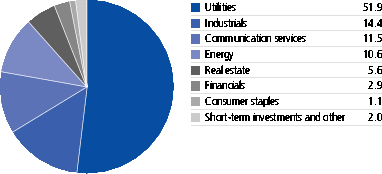
| ANNUAL REPORT | JOHN HANCOCK INFRASTRUCTURE FUND | 3 |
| TOP 10 HOLDINGS AS OF 10/31/2023 (% of net assets) | |
| Vinci SA | 4.4 |
| Engie SA | 4.3 |
| Nippon Telegraph & Telephone Corp. | 3.9 |
| Targa Resources Corp. | 3.8 |
| KDDI Corp. | 3.6 |
| Sempra | 3.5 |
| SK Telecom Company, Ltd. | 3.4 |
| The Williams Companies, Inc. | 3.4 |
| Exelon Corp. | 3.4 |
| Aena SME SA | 3.3 |
| TOTAL | 37.0 |
| Cash and cash equivalents are not included. | |
| TOP 10 COUNTRIES AS OF 10/31/2023 (% of net assets) | |
| United States | 47.0 |
| France | 8.7 |
| Japan | 7.5 |
| Spain | 6.9 |
| Canada | 6.5 |
| China | 4.4 |
| South Korea | 3.4 |
| United Kingdom | 3.4 |
| Italy | 3.2 |
| Brazil | 2.8 |
| TOTAL | 93.8 |
| Cash and cash equivalents are not included. | |
| 4 | JOHN HANCOCK INFRASTRUCTURE FUND | ANNUAL REPORT |

| ANNUAL REPORT | JOHN HANCOCK INFRASTRUCTURE FUND | 5 |
| Average annual total returns (%) with maximum sales charge | Cumulative total returns (%) with maximum sales charge | SEC 30-day yield (%) subsidized | SEC 30-day yield (%) unsubsidized† | |||||
| 1-year | 5-year | Since inception (12-20-13) | 5-year | Since inception (12-20-13) | as of 10-31-23 | as of 10-31-23 | ||
| Class A | -4.13 | 3.34 | 4.10 | 17.84 | 48.70 | 2.08 | 2.07 | |
| Class C1 | -0.76 | 3.68 | 3.94 | 19.81 | 46.47 | 1.50 | 1.50 | |
| Class I2 | 1.17 | 4.72 | 4.96 | 25.94 | 61.16 | 2.49 | 2.48 | |
| Class R62 | 1.28 | 4.82 | 5.07 | 26.51 | 62.87 | 2.61 | 2.60 | |
| Class NAV2 | 1.29 | 4.83 | 5.08 | 26.58 | 63.10 | 2.61 | 2.61 | |
| Index†† | 10.50 | 7.47 | 6.84 | 43.39 | 92.02 | — | — | |
| Class A | Class C | Class I | Class R6 | Class NAV | |
| Gross (%) | 1.25 | 1.95 | 0.95 | 0.85 | 0.84 |
| Net (%) | 1.24 | 1.94 | 0.94 | 0.84 | 0.83 |
| 6 | JOHN HANCOCK INFRASTRUCTURE FUND | ANNUAL REPORT |
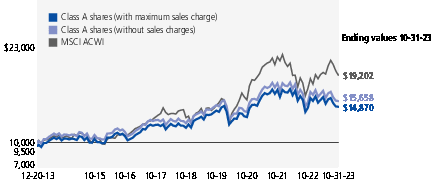
| Start date | With maximum sales charge ($) | Without sales charge ($) | Index ($) | |
| Class C1,3 | 12-20-13 | 14,647 | 14,647 | 19,202 |
| Class I2 | 12-20-13 | 16,116 | 16,116 | 19,202 |
| Class R62 | 12-20-13 | 16,287 | 16,287 | 19,202 |
| Class NAV2 | 12-20-13 | 16,310 | 16,310 | 19,202 |
| 1 | Class C shares were first offered on 5-16-14. Returns prior to this date are those of Class A shares that have not been adjusted for class-specific expenses; otherwise, returns would vary. |
| 2 | For certain types of investors, as described in the fund’s prospectuses. |
| 3 | The contingent deferred sales charge is not applicable. |
| ANNUAL REPORT | JOHN HANCOCK INFRASTRUCTURE FUND | 7 |

| 8 | JOHN HANCOCK INFRASTRUCTURE FUND | ANNUAL REPORT |
| Account value on 5-1-2023 | Ending value on 10-31-2023 | Expenses paid during period ended 10-31-20231 | Annualized expense ratio | ||
| Class A | Actual expenses/actual returns | $1,000.00 | $917.80 | $6.19 | 1.28% |
| Hypothetical example | 1,000.00 | 1,018.80 | 6.51 | 1.28% | |
| Class C | Actual expenses/actual returns | 1,000.00 | 914.80 | 9.56 | 1.98% |
| Hypothetical example | 1,000.00 | 1,015.20 | 10.06 | 1.98% | |
| Class I | Actual expenses/actual returns | 1,000.00 | 919.30 | 4.74 | 0.98% |
| Hypothetical example | 1,000.00 | 1,020.30 | 4.99 | 0.98% | |
| Class R6 | Actual expenses/actual returns | 1,000.00 | 919.20 | 4.16 | 0.86% |
| Hypothetical example | 1,000.00 | 1,020.90 | 4.38 | 0.86% | |
| Class NAV | Actual expenses/actual returns | 1,000.00 | 919.90 | 4.16 | 0.86% |
| Hypothetical example | 1,000.00 | 1,020.90 | 4.38 | 0.86% |
| 1 | Expenses are equal to the annualized expense ratio, multiplied by the average account value over the period, multiplied by 184/365 (to reflect the one-half year period). |
| ANNUAL REPORT | JOHN HANCOCK INFRASTRUCTURE FUND | 9 |
| Shares | Value | ||||
| Common stocks 98.0% | $595,263,161 | ||||
| (Cost $558,100,589) | |||||
| Brazil 2.8% | 17,047,617 | ||||
| Cia de Saneamento Basico do Estado de Sao Paulo | 1,472,500 | 17,047,617 | |||
| Canada 6.5% | 39,384,838 | ||||
| Alimentation Couche-Tard, Inc. | 118,321 | 6,440,997 | |||
| Canadian National Railway Company | 185,414 | 19,618,386 | |||
| Pembina Pipeline Corp. | 432,968 | 13,325,455 | |||
| China 4.4% | 26,892,295 | ||||
| China Longyuan Power Group Corp., Ltd., H Shares | 16,874,068 | 14,284,366 | |||
| Shanghai International Airport Company, Ltd., Class A (A) | 2,478,400 | 12,607,929 | |||
| France 8.7% | 53,010,977 | ||||
| Engie SA | 1,630,656 | 25,935,395 | |||
| Vinci SA | 244,863 | 27,075,582 | |||
| Germany 2.8% | 16,717,964 | ||||
| RWE AG | 436,895 | 16,717,964 | |||
| Hong Kong 1.4% | 8,441,125 | ||||
| CK Hutchison Holdings, Ltd. | 1,667,454 | 8,441,125 | |||
| Italy 3.2% | 19,246,347 | ||||
| Enel SpA | 3,032,076 | 19,246,347 | |||
| Japan 7.5% | 45,710,999 | ||||
| KDDI Corp. | 726,300 | 21,727,065 | |||
| Nippon Telegraph & Telephone Corp. | 20,381,075 | 23,983,934 | |||
| South Korea 3.4% | 20,841,580 | ||||
| SK Telecom Company, Ltd. | 571,520 | 20,841,580 | |||
| Spain 6.9% | 42,001,274 | ||||
| Aena SME SA (B) | 140,575 | 20,397,524 | |||
| Cellnex Telecom SA (A)(B) | 122,330 | 3,596,024 | |||
| Iberdrola SA | 1,619,106 | 18,007,726 | |||
| United Kingdom 3.4% | 20,341,228 | ||||
| National Grid PLC | 1,706,054 | 20,341,228 | |||
| United States 47.0% | 285,626,917 | ||||
| American Electric Power Company, Inc. | 250,192 | 18,899,504 | |||
| American Tower Corp. | 104,689 | 18,654,533 | |||
| Atmos Energy Corp. | 185,079 | 19,925,605 | |||
| Berkshire Hathaway, Inc., Class B (A) | 52,252 | 17,835,175 | |||
| Constellation Energy Corp. | 113,579 | 12,825,341 | |||
| 10 | JOHN HANCOCK INFRASTRUCTURE FUND | ANNUAL REPORT | SEE NOTES TO FINANCIAL STATEMENTS |
| Shares | Value | ||||
| United States (continued) | |||||
| Dominion Energy, Inc. | 371,771 | $14,989,807 | |||
| Duke Energy Corp. | 197,369 | 17,544,130 | |||
| Edison International | 310,680 | 19,591,481 | |||
| Exelon Corp. | 522,398 | 20,342,178 | |||
| FirstEnergy Corp. | 380,638 | 13,550,713 | |||
| ONEOK, Inc. | 108,114 | 7,049,033 | |||
| Public Service Enterprise Group, Inc. | 187,806 | 11,578,240 | |||
| Sempra | 304,433 | 21,319,443 | |||
| Sun Communities, Inc. | 136,560 | 15,190,934 | |||
| Targa Resources Corp. | 278,779 | 23,308,712 | |||
| The Williams Companies, Inc. | 598,260 | 20,580,144 | |||
| Vistra Corp. | 380,255 | 12,441,944 | |||
| Par value^ | Value | ||||
| Short-term investments 1.3% | $7,900,000 | ||||
| (Cost $7,900,000) | |||||
| Repurchase agreement 1.3% | 7,900,000 | ||||
| Royal Bank of Scotland Tri-Party Repurchase Agreement dated 10-31-23 at 5.280% to be repurchased at $7,901,159 on 11-1-23, collateralized by $8,408,700 U.S Treasury Notes, 4.000% due 2-28-30 (valued at $8,058,026) | 7,900,000 | 7,900,000 | |||
| Total investments (Cost $566,000,589) 99.3% | $603,163,161 | ||||
| Other assets and liabilities, net 0.7% | 4,054,037 | ||||
| Total net assets 100.0% | $607,217,198 | ||||
| The percentage shown for each investment category is the total value of the category as a percentage of the net assets of the fund. | |
| ^All par values are denominated in U.S. dollars unless otherwise indicated. | |
| Security Abbreviations and Legend | |
| (A) | Non-income producing security. |
| (B) | These securities are exempt from registration under Rule 144A of the Securities Act of 1933. Such securities may be resold, normally to qualified institutional buyers, in transactions exempt from registration. |
| SEE NOTES TO FINANCIAL STATEMENTS | ANNUAL REPORT | JOHN HANCOCK INFRASTRUCTURE FUND | 11 |
| Assets | |
| Unaffiliated investments, at value (Cost $566,000,589) | $603,163,161 |
| Cash | 64,986 |
| Foreign currency, at value (Cost $50,935) | 51,119 |
| Dividends and interest receivable | 1,239,394 |
| Receivable for fund shares sold | 561,760 |
| Receivable for investments sold | 3,331,895 |
| Other assets | 82,849 |
| Total assets | 608,495,164 |
| Liabilities | |
| Payable for fund shares repurchased | 1,059,770 |
| Payable to affiliates | |
| Accounting and legal services fees | 44,987 |
| Transfer agent fees | 46,793 |
| Trustees’ fees | 889 |
| Other liabilities and accrued expenses | 125,527 |
| Total liabilities | 1,277,966 |
| Net assets | $607,217,198 |
| Net assets consist of | |
| Paid-in capital | $654,561,782 |
| Total distributable earnings (loss) | (47,344,584) |
| Net assets | $607,217,198 |
| Net asset value per share | |
| Based on net asset value and shares outstanding - the fund has an unlimited number of shares authorized with no par value | |
| Class A ($55,479,406 ÷ 4,644,065 shares)1 | $11.95 |
| Class C ($8,878,578 ÷ 753,894 shares)1 | $11.78 |
| Class I ($385,530,945 ÷ 32,242,556 shares) | $11.96 |
| Class R6 ($82,261,682 ÷ 6,864,148 shares) | $11.98 |
| Class NAV ($75,066,587 ÷ 6,265,452 shares) | $11.98 |
| Maximum offering price per share | |
| Class A (net asset value per share ÷ 95%)2 | $12.58 |
| 1 | Redemption price per share is equal to net asset value less any applicable contingent deferred sales charge. |
| 2 | On single retail sales of less than $50,000. On sales of $50,000 or more and on group sales the offering price is reduced. |
| 12 | JOHN HANCOCK Infrastructure Fund | ANNUAL REPORT | SEE NOTES TO FINANCIAL STATEMENTS |
| Investment income | |
| Dividends | $23,097,459 |
| Interest | 614,991 |
| Non-cash dividends | 1,449,792 |
| Securities lending | 185,353 |
| Other income | 50,450 |
| Less foreign taxes withheld | (1,974,836) |
| Total investment income | 23,423,209 |
| Expenses | |
| Investment management fees | 5,438,957 |
| Distribution and service fees | 301,232 |
| Accounting and legal services fees | 148,031 |
| Transfer agent fees | 621,069 |
| Trustees’ fees | 18,796 |
| Custodian fees | 185,137 |
| State registration fees | 101,123 |
| Printing and postage | 53,689 |
| Professional fees | 79,164 |
| Other | 53,115 |
| Total expenses | 7,000,313 |
| Less expense reductions | (51,304) |
| Net expenses | 6,949,009 |
| Net investment income | 16,474,200 |
| Realized and unrealized gain (loss) | |
| Net realized gain (loss) on | |
| Unaffiliated investments and foreign currency transactions | (32,144,685) |
| Affiliated investments | 1,526 |
| (32,143,159) | |
| Change in net unrealized appreciation (depreciation) of | |
| Unaffiliated investments and translation of assets and liabilities in foreign currencies | 28,845,749 |
| 28,845,749 | |
| Net realized and unrealized loss | (3,297,410) |
| Increase in net assets from operations | $13,176,790 |
| SEE NOTES TO FINANCIAL STATEMENTS | ANNUAL REPORT | JOHN HANCOCK Infrastructure Fund | 13 |
| Year ended 10-31-23 | Year ended 10-31-22 | |
| Increase (decrease) in net assets | ||
| From operations | ||
| Net investment income | $16,474,200 | $13,980,013 |
| Net realized loss | (32,143,159) | (39,505,523) |
| Change in net unrealized appreciation (depreciation) | 28,845,749 | (86,530,271) |
| Increase (decrease) in net assets resulting from operations | 13,176,790 | (112,055,781) |
| Distributions to shareholders | ||
| From earnings | ||
| Class A | (1,239,689) | (4,213,098) |
| Class C | (133,659) | (702,758) |
| Class I | (9,849,595) | (30,962,148) |
| Class R6 | (2,519,926) | (7,153,988) |
| Class NAV | (1,822,434) | (5,360,320) |
| Total distributions | (15,565,303) | (48,392,312) |
| From fund share transactions | (98,732,333) | 172,112,111 |
| Total increase (decrease) | (101,120,846) | 11,664,018 |
| Net assets | ||
| Beginning of year | 708,338,044 | 696,674,026 |
| End of year | $607,217,198 | $708,338,044 |
| 14 | JOHN HANCOCK Infrastructure Fund | ANNUAL REPORT | SEE NOTES TO FINANCIAL STATEMENTS |
| CLASS A SHARES Period ended | 10-31-23 | 10-31-22 | 10-31-21 | 10-31-20 | 10-31-19 |
| Per share operating performance | |||||
| Net asset value, beginning of period | $12.07 | $15.03 | $11.99 | $13.39 | $11.60 |
| Net investment income1 | 0.26 | 0.22 | 0.19 | 0.19 | 0.21 |
| Net realized and unrealized gain (loss) on investments | (0.14) | (2.27) | 3.11 | (1.00) | 2.02 |
| Total from investment operations | 0.12 | (2.05) | 3.30 | (0.81) | 2.23 |
| Less distributions | |||||
| From net investment income | (0.24) | (0.42) | (0.20) | (0.19) | (0.20) |
| From net realized gain | — | (0.49) | (0.06) | (0.40) | (0.24) |
| Total distributions | (0.24) | (0.91) | (0.26) | (0.59) | (0.44) |
| Net asset value, end of period | $11.95 | $12.07 | $15.03 | $11.99 | $13.39 |
| Total return (%)2,3 | 0.95 | (14.26) | 27.67 | (6.23) | 19.69 |
| Ratios and supplemental data | |||||
| Net assets, end of period (in millions) | $55 | $64 | $63 | $33 | $24 |
| Ratios (as a percentage of average net assets): | |||||
| Expenses before reductions | 1.27 | 1.25 | 1.29 | 1.32 | 1.35 |
| Expenses including reductions | 1.27 | 1.25 | 1.28 | 1.31 | 1.31 |
| Net investment income | 2.04 | 1.63 | 1.35 | 1.55 | 1.66 |
| Portfolio turnover (%) | 20 | 33 | 27 | 34 | 26 |
| 1 | Based on average daily shares outstanding. |
| 2 | Total returns would have been lower had certain expenses not been reduced during the period. |
| 3 | Does not reflect the effect of sales charges, if any. |
| SEE NOTES TO FINANCIAL STATEMENTS | ANNUAL REPORT | JOHN HANCOCK Infrastructure Fund | 15 |
| CLASS C SHARES Period ended | 10-31-23 | 10-31-22 | 10-31-21 | 10-31-20 | 10-31-19 |
| Per share operating performance | |||||
| Net asset value, beginning of period | $11.91 | $14.85 | $11.86 | $13.26 | $11.50 |
| Net investment income1 | 0.17 | 0.13 | 0.09 | 0.11 | 0.12 |
| Net realized and unrealized gain (loss) on investments | (0.14) | (2.24) | 3.07 | (1.00) | 2.01 |
| Total from investment operations | 0.03 | (2.11) | 3.16 | (0.89) | 2.13 |
| Less distributions | |||||
| From net investment income | (0.16) | (0.34) | (0.11) | (0.11) | (0.13) |
| From net realized gain | — | (0.49) | (0.06) | (0.40) | (0.24) |
| Total distributions | (0.16) | (0.83) | (0.17) | (0.51) | (0.37) |
| Net asset value, end of period | $11.78 | $11.91 | $14.85 | $11.86 | $13.26 |
| Total return (%)2,3 | 0.23 | (14.85) | 26.81 | (6.92) | 18.93 |
| Ratios and supplemental data | |||||
| Net assets, end of period (in millions) | $9 | $11 | $12 | $6 | $6 |
| Ratios (as a percentage of average net assets): | |||||
| Expenses before reductions | 1.97 | 1.95 | 1.99 | 2.02 | 2.05 |
| Expenses including reductions | 1.97 | 1.95 | 1.98 | 2.01 | 2.01 |
| Net investment income | 1.32 | 0.99 | 0.66 | 0.89 | 0.94 |
| Portfolio turnover (%) | 20 | 33 | 27 | 34 | 26 |
| 1 | Based on average daily shares outstanding. |
| 2 | Total returns would have been lower had certain expenses not been reduced during the period. |
| 3 | Does not reflect the effect of sales charges, if any. |
| 16 | JOHN HANCOCK Infrastructure Fund | ANNUAL REPORT | SEE NOTES TO FINANCIAL STATEMENTS |
| CLASS I SHARES Period ended | 10-31-23 | 10-31-22 | 10-31-21 | 10-31-20 | 10-31-19 |
| Per share operating performance | |||||
| Net asset value, beginning of period | $12.09 | $15.05 | $12.00 | $13.41 | $11.61 |
| Net investment income1 | 0.30 | 0.26 | 0.24 | 0.23 | 0.26 |
| Net realized and unrealized gain (loss) on investments | (0.15) | (2.27) | 3.11 | (1.01) | 2.02 |
| Total from investment operations | 0.15 | (2.01) | 3.35 | (0.78) | 2.28 |
| Less distributions | |||||
| From net investment income | (0.28) | (0.46) | (0.24) | (0.23) | (0.24) |
| From net realized gain | — | (0.49) | (0.06) | (0.40) | (0.24) |
| Total distributions | (0.28) | (0.95) | (0.30) | (0.63) | (0.48) |
| Net asset value, end of period | $11.96 | $12.09 | $15.05 | $12.00 | $13.41 |
| Total return (%)2 | 1.17 | (13.96) | 28.12 | (5.99) | 20.13 |
| Ratios and supplemental data | |||||
| Net assets, end of period (in millions) | $386 | $445 | $463 | $246 | $213 |
| Ratios (as a percentage of average net assets): | |||||
| Expenses before reductions | 0.97 | 0.95 | 0.99 | 1.02 | 1.05 |
| Expenses including reductions | 0.97 | 0.95 | 0.98 | 1.00 | 1.00 |
| Net investment income | 2.33 | 1.93 | 1.67 | 1.85 | 2.08 |
| Portfolio turnover (%) | 20 | 33 | 27 | 34 | 26 |
| 1 | Based on average daily shares outstanding. |
| 2 | Total returns would have been lower had certain expenses not been reduced during the period. |
| SEE NOTES TO FINANCIAL STATEMENTS | ANNUAL REPORT | JOHN HANCOCK Infrastructure Fund | 17 |
| CLASS R6 SHARES Period ended | 10-31-23 | 10-31-22 | 10-31-21 | 10-31-20 | 10-31-19 |
| Per share operating performance | |||||
| Net asset value, beginning of period | $12.11 | $15.08 | $12.02 | $13.43 | $11.63 |
| Net investment income1 | 0.32 | 0.23 | 0.25 | 0.25 | 0.27 |
| Net realized and unrealized gain (loss) on investments | (0.16) | (2.23) | 3.12 | (1.02) | 2.02 |
| Total from investment operations | 0.16 | (2.00) | 3.37 | (0.77) | 2.29 |
| Less distributions | |||||
| From net investment income | (0.29) | (0.48) | (0.25) | (0.24) | (0.25) |
| From net realized gain | — | (0.49) | (0.06) | (0.40) | (0.24) |
| Total distributions | (0.29) | (0.97) | (0.31) | (0.64) | (0.49) |
| Net asset value, end of period | $11.98 | $12.11 | $15.08 | $12.02 | $13.43 |
| Total return (%)2 | 1.28 | (13.91) | 28.28 | (5.88) | 20.18 |
| Ratios and supplemental data | |||||
| Net assets, end of period (in millions) | $82 | $112 | $77 | $53 | $50 |
| Ratios (as a percentage of average net assets): | |||||
| Expenses before reductions | 0.86 | 0.85 | 0.88 | 0.91 | 0.94 |
| Expenses including reductions | 0.86 | 0.84 | 0.87 | 0.90 | 0.92 |
| Net investment income | 2.47 | 1.68 | 1.75 | 1.97 | 2.11 |
| Portfolio turnover (%) | 20 | 33 | 27 | 34 | 26 |
| 1 | Based on average daily shares outstanding. |
| 2 | Total returns would have been lower had certain expenses not been reduced during the period. |
| 18 | JOHN HANCOCK Infrastructure Fund | ANNUAL REPORT | SEE NOTES TO FINANCIAL STATEMENTS |
| CLASS NAV SHARES Period ended | 10-31-23 | 10-31-22 | 10-31-21 | 10-31-20 | 10-31-19 |
| Per share operating performance | |||||
| Net asset value, beginning of period | $12.11 | $15.08 | $12.02 | $13.43 | $11.63 |
| Net investment income1 | 0.31 | 0.29 | 0.25 | 0.24 | 0.26 |
| Net realized and unrealized gain (loss) on investments | (0.14) | (2.29) | 3.12 | (1.01) | 2.03 |
| Total from investment operations | 0.17 | (2.00) | 3.37 | (0.77) | 2.29 |
| Less distributions | |||||
| From net investment income | (0.30) | (0.48) | (0.25) | (0.24) | (0.25) |
| From net realized gain | — | (0.49) | (0.06) | (0.40) | (0.24) |
| Total distributions | (0.30) | (0.97) | (0.31) | (0.64) | (0.49) |
| Net asset value, end of period | $11.98 | $12.11 | $15.08 | $12.02 | $13.43 |
| Total return (%)2 | 1.29 | (13.90) | 28.29 | (5.87) | 20.19 |
| Ratios and supplemental data | |||||
| Net assets, end of period (in millions) | $75 | $76 | $82 | $76 | $84 |
| Ratios (as a percentage of average net assets): | |||||
| Expenses before reductions | 0.86 | 0.84 | 0.87 | 0.90 | 0.93 |
| Expenses including reductions | 0.85 | 0.83 | 0.86 | 0.89 | 0.92 |
| Net investment income | 2.43 | 2.15 | 1.76 | 1.95 | 2.06 |
| Portfolio turnover (%) | 20 | 33 | 27 | 34 | 26 |
| 1 | Based on average daily shares outstanding. |
| 2 | Total returns would have been lower had certain expenses not been reduced during the period. |
| SEE NOTES TO FINANCIAL STATEMENTS | ANNUAL REPORT | JOHN HANCOCK Infrastructure Fund | 19 |
| 20 | JOHN HANCOCK Infrastructure Fund | ANNUAL REPORT |
| Total value at 10-31-23 | Level 1 quoted price | Level 2 significant observable inputs | Level 3 significant unobservable inputs | |
| Investments in securities: | ||||
| Assets | ||||
| Common stocks | ||||
| Brazil | $17,047,617 | $17,047,617 | — | — |
| Canada | 39,384,838 | 39,384,838 | — | — |
| China | 26,892,295 | — | $26,892,295 | — |
| France | 53,010,977 | — | 53,010,977 | — |
| Germany | 16,717,964 | — | 16,717,964 | — |
| Hong Kong | 8,441,125 | — | 8,441,125 | — |
| Italy | 19,246,347 | — | 19,246,347 | — |
| Japan | 45,710,999 | — | 45,710,999 | — |
| South Korea | 20,841,580 | — | 20,841,580 | — |
| Spain | 42,001,274 | — | 42,001,274 | — |
| United Kingdom | 20,341,228 | — | 20,341,228 | — |
| United States | 285,626,917 | 285,626,917 | — | — |
| Short-term investments | 7,900,000 | — | 7,900,000 | — |
| Total investments in securities | $603,163,161 | $342,059,372 | $261,103,789 | — |
| ANNUAL REPORT | JOHN HANCOCK Infrastructure Fund | 21 |
| 22 | JOHN HANCOCK Infrastructure Fund | ANNUAL REPORT |
| ANNUAL REPORT | JOHN HANCOCK Infrastructure Fund | 23 |
| October 31, 2023 | October 31, 2022 | |
| Ordinary income | $15,565,303 | $24,152,217 |
| Long-term capital gains | — | 24,240,095 |
| Total | $15,565,303 | $48,392,312 |
| 24 | JOHN HANCOCK Infrastructure Fund | ANNUAL REPORT |
| Class | Expense reduction |
| Class A | $4,741 |
| Class C | 752 |
| Class I | 32,264 |
| Class | Expense reduction |
| Class R6 | $7,918 |
| Class NAV | 5,629 |
| Total | $51,304 |
| Class | Rule 12b-1 Fee |
| Class A | 0.30% |
| Class C | 1.00% |
| ANNUAL REPORT | JOHN HANCOCK Infrastructure Fund | 25 |
| Class | Distribution and service fees | Transfer agent fees |
| Class A | $197,031 | $77,000 |
| Class C | 104,201 | 12,217 |
| Class I | — | 524,067 |
| Class R6 | — | 7,785 |
| Total | $301,232 | $621,069 |
| Borrower or Lender | Weighted Average Loan Balance | Days Outstanding | Weighted Average Interest Rate | Interest Income (Expense) |
| Lender | $10,771,429 | 7 | 3.699% | $7,747 |
| 26 | JOHN HANCOCK Infrastructure Fund | ANNUAL REPORT |
| Year Ended 10-31-23 | Year Ended 10-31-22 | |||
| Shares | Amount | Shares | Amount | |
| Class A shares | ||||
| Sold | 882,556 | $11,348,425 | 2,025,592 | $27,709,972 |
| Distributions reinvested | 98,885 | 1,234,997 | 307,611 | 4,185,603 |
| Repurchased | (1,652,397) | (21,014,737) | (1,224,810) | (16,304,441) |
| Net increase (decrease) | (670,956) | $(8,431,315) | 1,108,393 | $15,591,134 |
| Class C shares | ||||
| Sold | 78,571 | $999,427 | 210,028 | $2,892,655 |
| Distributions reinvested | 10,831 | 133,626 | 52,135 | 702,758 |
| Repurchased | (241,984) | (3,035,502) | (160,827) | (2,156,310) |
| Net increase (decrease) | (152,582) | $(1,902,449) | 101,336 | $1,439,103 |
| Class I shares | ||||
| Sold | 7,777,688 | $99,351,791 | 16,696,562 | $228,918,364 |
| Distributions reinvested | 650,416 | 8,124,835 | 1,853,883 | 25,181,513 |
| Repurchased | (13,046,852) | (165,693,307) | (12,442,522) | (166,094,417) |
| Net increase (decrease) | (4,618,748) | $(58,216,681) | 6,107,923 | $88,005,460 |
| Class R6 shares | ||||
| Sold | 2,110,229 | $27,155,864 | 5,287,259 | $72,480,165 |
| Distributions reinvested | 201,109 | 2,517,062 | 524,756 | 7,141,103 |
| Repurchased | (4,678,407) | (59,244,590) | (1,668,381) | (22,490,341) |
| Net increase (decrease) | (2,367,069) | $(29,571,664) | 4,143,634 | $57,130,927 |
| Class NAV shares | ||||
| Sold | 1,107,362 | $13,924,977 | 1,550,600 | $19,788,219 |
| Distributions reinvested | 145,686 | 1,822,434 | 393,299 | 5,360,320 |
| Repurchased | (1,270,318) | (16,357,635) | (1,102,653) | (15,203,052) |
| Net increase (decrease) | (17,270) | $(610,224) | 841,246 | $9,945,487 |
| Total net increase (decrease) | (7,826,625) | $(98,732,333) | 12,302,532 | $172,112,111 |
| ANNUAL REPORT | JOHN HANCOCK Infrastructure Fund | 27 |
| Fund | Affiliated Concentration |
| John Hancock Funds II Alternative Asset Allocation | 5.8% |
| Dividends and distributions | |||||||||
| Affiliate | Ending share amount | Beginning value | Cost of purchases | Proceeds from shares sold | Realized gain (loss) | Change in unrealized appreciation (depreciation) | Income distributions received | Capital gain distributions received | Ending value |
| John Hancock Collateral Trust* | — | — | $244,385,529 | $(244,387,055) | $1,526 | — | $185,353 | — | — |
| * | Refer to the Securities lending note within Note 2 for details regarding this investment. |
| 28 | JOHN HANCOCK Infrastructure Fund | ANNUAL REPORT |
| ANNUAL REPORT | JOHN HANCOCK INFRASTRUCTURE FUND | 29 |
| 30 | JOHN HANCOCK INFRASTRUCTURE FUND | ANNUAL REPORT |
| ANNUAL REPORT | JOHN HANCOCK INFRASTRUCTURE FUND | 31 |
| (a) | the skills and competency with which the Advisor has in the past managed the Trust’s affairs and its subadvisory relationship, the Advisor’s oversight and monitoring of the Subadvisor’s investment performance and compliance programs, such as the Subadvisor’s compliance with fund policies and objectives, review of brokerage matters, including with respect to trade allocation and best execution and the Advisor’s timeliness in responding to performance issues; |
| (b) | the background, qualifications and skills of the Advisor’s personnel; |
| (c) | the Advisor’s compliance policies and procedures and its responsiveness to regulatory changes and fund industry developments; |
| (d) | the Advisor’s administrative capabilities, including its ability to supervise the other service providers for the fund, as well as the Advisor’s oversight of any securities lending activity, its monitoring of class action litigation and collection of class action settlements on behalf of the fund, and bringing loss recovery actions on behalf of the fund; |
| (e) | the financial condition of the Advisor and whether it has the financial wherewithal to provide a high level and quality of services to the fund; |
| 32 | JOHN HANCOCK INFRASTRUCTURE FUND | ANNUAL REPORT |
| (f) | the Advisor’s initiatives intended to improve various aspects of the Trust’s operations and investor experience with the fund; and |
| (g) | the Advisor’s reputation and experience in serving as an investment advisor to the Trust and the benefit to shareholders of investing in funds that are part of a family of funds offering a variety of investments. |
| (a) | reviewed information prepared by management regarding the fund’s performance; |
| (b) | considered the comparative performance of an applicable benchmark index; |
| (c) | considered the performance of comparable funds, if any, as included in the report prepared by an independent third-party provider of fund data; and |
| (d) | took into account the Advisor’s analysis of the fund’s performance and its plans and recommendations regarding the Trust’s subadvisory arrangements generally. |
| ANNUAL REPORT | JOHN HANCOCK INFRASTRUCTURE FUND | 33 |
| (a) | reviewed financial information of the Advisor; |
| (b) | reviewed and considered information presented by the Advisor regarding the net profitability to the Advisor and its affiliates with respect to the fund; |
| (c) | received and reviewed profitability information with respect to the John Hancock Fund Complex as a whole and with respect to the fund; |
| (d) | received information with respect to the Advisor’s allocation methodologies used in preparing the profitability data and considered that the Advisor hired an independent third-party consultant to provide an analysis of the Advisor’s allocation methodologies; |
| (e) | considered that the John Hancock insurance companies that are affiliates of the Advisor, as shareholders of the Trust directly or through their separate accounts, receive certain tax credits or deductions relating to foreign taxes paid and dividends received by certain funds of the Trust and noted that these tax benefits, which are not available to participants in qualified retirement plans under applicable income tax law, are reflected in the profitability information reviewed by the Board; |
| (f) | considered that the Advisor also provides administrative services to the fund on a cost basis pursuant to an administrative services agreement; |
| (g) | noted that affiliates of the Advisor provide transfer agency services and distribution services to the fund, and that the fund’s distributor also receives Rule 12b-1 payments to support distribution of the fund; |
| (h) | noted that the Advisor also derives reputational and other indirect benefits from providing advisory services to the fund; |
| (i) | noted that the subadvisory fee for the fund is paid by the Advisor and is negotiated at arm’s length; |
| (j) | considered the Advisor’s ongoing costs and expenditures necessary to improve services, meet new regulatory and compliance requirements, and adapt to other challenges impacting the fund industry; and |
| (k) | considered that the Advisor should be entitled to earn a reasonable level of profits in exchange for the level of services it provides to the fund and the risks that it assumes as Advisor, including entrepreneurial, operational, reputational, litigation and regulatory risk. |
| 34 | JOHN HANCOCK INFRASTRUCTURE FUND | ANNUAL REPORT |
| (a) | considered that the Advisor has contractually agreed to waive a portion of its management fee for certain funds of the John Hancock Fund Complex, including the fund (the participating portfolios) or otherwise reimburse the expenses of the participating portfolios (the reimbursement). This waiver is based upon aggregate net assets of all the participating portfolios. The amount of the reimbursement is calculated daily and allocated among all the participating portfolios in proportion to the daily net assets of each fund; |
| (b) | reviewed the fund’s advisory fee structure and concluded that: (i) the fund’s fee structure contains breakpoints at the subadvisory fee level and that such breakpoints are reflected as breakpoints in the advisory fees for the fund; and (ii) although economies of scale cannot be measured with precision, these arrangements permit shareholders of the fund to benefit from economies of scale if the fund grows. The Board also took into account management’s discussion of the fund’s advisory fee structure; and |
| (c) | the Board also considered the effect of the fund’s growth in size on its performance and fees. The Board also noted that if the fund’s assets increase over time, the fund may realize other economies of scale. |
| (1) | information relating to the Subadvisor’s business, including current subadvisory services to the Trust (and other funds in the John Hancock Fund Complex); |
| (2) | the historical and current performance of the fund and comparative performance information relating to an applicable benchmark index and comparable funds; |
| (3) | the subadvisory fee for the fund, including any breakpoints, and to the extent available, comparable fee information prepared by an independent third-party provider of fund data; and |
| (4) | information relating to the nature and scope of any material relationships and their significance to the Trust’s Advisor and Subadvisor. |
| ANNUAL REPORT | JOHN HANCOCK INFRASTRUCTURE FUND | 35 |
| (1) | the Subadvisor has extensive experience and demonstrated skills as a manager; |
| (2) | the performance of the fund has generally been in line with or outperformed its benchmark index and the historical performance of comparable funds; |
| (3) | the subadvisory fee is reasonable in relation to the level and quality of services being provided under the Subadvisory Agreement; and |
| 36 | JOHN HANCOCK INFRASTRUCTURE FUND | ANNUAL REPORT |
| (4) | noted that the subadvisory fees are paid by the Advisor not the fund and that the subadvisory fee breakpoints are reflected as breakpoints in the advisory fees for the fund in order to permit shareholders to benefit from economies of scale if the fund grows. |
| ANNUAL REPORT | JOHN HANCOCK INFRASTRUCTURE FUND | 37 |
| Independent Trustees | ||
| Name, year of birth Position(s) held with Trust Principal occupation(s) and other directorships during past 5 years | Trustee of the Trust since1 | Number of John Hancock funds overseen by Trustee |
| Hassell H. McClellan,2 Born: 1945 | 2012 | 179 |
| Trustee and Chairperson of the Board | ||
| Director/Trustee, Virtus Funds (2008-2020); Director, The Barnes Group (2010-2021); Associate Professor, The Wallace E. Carroll School of Management, Boston College (retired 2013). Trustee (since 2005) and Chairperson of the Board (since 2017) of various trusts within the John Hancock Fund Complex. | ||
| James R. Boyle, Born: 1959 | 2015 | 175 |
| Trustee | ||
| Board Member, United of Omaha Life Insurance Company (since 2022). Board Member, Mutual of Omaha Investor Services, Inc. (since 2022). Foresters Financial, Chief Executive Officer (2018–2022) and board member (2017–2022). Manulife Financial and John Hancock, more than 20 years, retiring in 2012 as Chief Executive Officer, John Hancock and Senior Executive Vice President, Manulife Financial. Trustee of various trusts within the John Hancock Fund Complex (2005–2014 and since 2015). | ||
| William H. Cunningham,3 Born: 1944 | 1986 | 177 |
| Trustee | ||
| Professor, University of Texas, Austin, Texas (since 1971); former Chancellor, University of Texas System and former President of the University of Texas, Austin, Texas; Director (since 2006), Lincoln National Corporation (insurance); Director, Southwest Airlines (since 2000). Trustee of various trusts within the John Hancock Fund Complex (since 1986). | ||
| Noni L. Ellison, Born: 1971 | 2022 | 175 |
| Trustee | ||
| Senior Vice President, General Counsel & Corporate Secretary, Tractor Supply Company (rural lifestyle retailer) (since 2021); General Counsel, Chief Compliance Officer & Corporate Secretary, Carestream Dental, L.L.C. (2017–2021); Associate General Counsel & Assistant Corporate Secretary, W.W. Grainger, Inc. (global industrial supplier) (2015–2017); Board Member, Goodwill of North Georgia, 2018 (FY2019)–2020 (FY2021); Board Member, Howard University School of Law Board of Visitors (since 2021); Board Member, University of Chicago Law School Board of Visitors (since 2016); Board member, Children’s Healthcare of Atlanta Foundation Board (2021–2023). Trustee of various trusts within the John Hancock Fund Complex (since 2022). | ||
| Grace K. Fey, Born: 1946 | 2012 | 179 |
| Trustee | ||
| Chief Executive Officer, Grace Fey Advisors (since 2007); Director and Executive Vice President, Frontier Capital Management Company (1988–2007); Director, Fiduciary Trust (since 2009). Trustee of various trusts within the John Hancock Fund Complex (since 2008). | ||
| Dean C. Garfield, Born: 1968 | 2022 | 175 |
| Trustee | ||
| Vice President, Netflix, Inc. (since 2019); President & Chief Executive Officer, Information Technology Industry Council (2009–2019); NYU School of Law Board of Trustees (since 2021); Member, U.S. Department of Transportation, Advisory Committee on Automation (since 2021); President of the United States Trade Advisory Council (2010–2018); Board Member, College for Every Student (2017–2021); Board Member, The Seed School of Washington, D.C. (2012–2017); Advisory Board Member of the Block Center for Technology and Society (since 2019). Trustee of various trusts within the John Hancock Fund Complex (since 2022). | ||
| 38 | JOHN HANCOCK INFRASTRUCTURE FUND | ANNUAL REPORT |
| Independent Trustees (continued) | ||
| Name, year of birth Position(s) held with Trust Principal occupation(s) and other directorships during past 5 years | Trustee of the Trust since1 | Number of John Hancock funds overseen by Trustee |
| Deborah C. Jackson, Born: 1952 | 2008 | 177 |
| Trustee | ||
| President, Cambridge College, Cambridge, Massachusetts (since 2011); Board of Directors, Amwell Corporation (since 2020); Board of Directors, Massachusetts Women’s Forum (2018-2020); Board of Directors, National Association of Corporate Directors/New England (2015-2020); Chief Executive Officer, American Red Cross of Massachusetts Bay (2002–2011); Board of Directors of Eastern Bank Corporation (since 2001); Board of Directors of Eastern Bank Charitable Foundation (since 2001); Board of Directors of Boston Stock Exchange (2002–2008); Board of Directors of Harvard Pilgrim Healthcare (health benefits company) (2007–2011). Trustee of various trusts within the John Hancock Fund Complex (since 2008). | ||
| Steven R. Pruchansky, Born: 1944 | 1994 | 175 |
| Trustee and Vice Chairperson of the Board | ||
| Managing Director, Pru Realty (since 2017); Chairman and Chief Executive Officer, Greenscapes of Southwest Florida, Inc. (2014-2020); Director and President, Greenscapes of Southwest Florida, Inc. (until 2000); Member, Board of Advisors, First American Bank (until 2010); Managing Director, Jon James, LLC (real estate) (since 2000); Partner, Right Funding, LLC (2014-2017); Director, First Signature Bank & Trust Company (until 1991); Director, Mast Realty Trust (until 1994); President, Maxwell Building Corp. (until 1991). Trustee (since 1992), Chairperson of the Board (2011–2012), and Vice Chairperson of the Board (since 2012) of various trusts within the John Hancock Fund Complex. | ||
| Frances G. Rathke,3 Born: 1960 | 2020 | 175 |
| Trustee | ||
| Director, Audit Committee Chair, Oatly Group AB (plant-based drink company) (since 2021); Director, Audit Committee Chair and Compensation Committee Member, Green Mountain Power Corporation (since 2016); Director, Treasurer and Finance & Audit Committee Chair, Flynn Center for Performing Arts (since 2016); Director and Audit Committee Chair, Planet Fitness (since 2016); Chief Financial Officer and Treasurer, Keurig Green Mountain, Inc. (2003-retired 2015). Trustee of various trusts within the John Hancock Fund Complex (since 2020). | ||
| Gregory A. Russo, Born: 1949 | 2009 | 175 |
| Trustee | ||
| Director and Audit Committee Chairman (2012-2020), and Member, Audit Committee and Finance Committee (2011-2020), NCH Healthcare System, Inc. (holding company for multi-entity healthcare system); Director and Member (2012-2018), and Finance Committee Chairman (2014-2018), The Moorings, Inc. (nonprofit continuing care community); Global Vice Chairman, Risk & Regulatory Matters, KPMG LLP (KPMG) (2002–2006); Vice Chairman, Industrial Markets, KPMG (1998–2002). Trustee of various trusts within the John Hancock Fund Complex (since 2008). | ||
| ANNUAL REPORT | JOHN HANCOCK INFRASTRUCTURE FUND | 39 |
| Non-Independent Trustees4 | ||
| Name, year of birth Position(s) held with Trust Principal occupation(s) and other directorships during past 5 years | Trustee of the Trust since1 | Number of John Hancock funds overseen by Trustee |
| Andrew G. Arnott, Born: 1971 | 2017 | 177 |
| Non-Independent Trustee | ||
| Global Head of Retail for Manulife (since 2022); Head of Wealth and Asset Management, United States and Europe, for John Hancock and Manulife (2018-2023); Director and Chairman, John Hancock Investment Management LLC (since 2005, including prior positions); Director and Chairman, John Hancock Variable Trust Advisers LLC (since 2006, including prior positions); Director and Chairman, John Hancock Investment Management Distributors LLC (since 2004, including prior positions); President of various trusts within the John Hancock Fund Complex (2007-2023, including prior positions). Trustee of various trusts within the John Hancock Fund Complex (since 2017). | ||
| Paul Lorentz, Born: 1968 | 2022 | 175 |
| Non-Independent Trustee | ||
| Global Head, Manulife Wealth and Asset Management (since 2017); General Manager, Manulife, Individual Wealth Management and Insurance (2013–2017); President, Manulife Investments (2010–2016). Trustee of various trusts within the John Hancock Fund Complex (since 2022). | ||
| Principal officers who are not Trustees | |
| Name, year of birth Position(s) held with Trust Principal occupation(s) during past 5 years | Current Position(s) with the Trust since |
| Kristie M. Feinberg, Born: 1975 | 2023 |
| President | |
| Head of Wealth and Asset Management, United States and Europe, for John Hancock and Manulife (since 2023); CFO and Global Head of Strategy, Manulife Investment Management (2021-2023, including prior positions); CFO Americas & Global Head of Treasury, Invesco, Ltd., Invesco US (2019-2020, including prior positions); Senior Vice President, Corporate Treasurer and Business Controller, Oppenheimer Funds (2001-2019, including prior positions); President of various trusts within the John Hancock Fund Complex (since 2023). | |
| Charles A. Rizzo, Born: 1957 | 2007 |
| Chief Financial Officer | |
| Vice President, John Hancock Financial Services (since 2008); Senior Vice President, John Hancock Investment Management LLC and John Hancock Variable Trust Advisers LLC (since 2008); Chief Financial Officer of various trusts within the John Hancock Fund Complex (since 2007). | |
| Salvatore Schiavone, Born: 1965 | 2010 |
| Treasurer | |
| Assistant Vice President, John Hancock Financial Services (since 2007); Vice President, John Hancock Investment Management LLC and John Hancock Variable Trust Advisers LLC (since 2007); Treasurer of various trusts within the John Hancock Fund Complex (since 2007, including prior positions). | |
| 40 | JOHN HANCOCK INFRASTRUCTURE FUND | ANNUAL REPORT |
| Principal officers who are not Trustees (continued) | |
| Name, year of birth Position(s) held with Trust Principal occupation(s) during past 5 years | Current Position(s) with the Trust since |
| Christopher (Kit) Sechler, Born: 1973 | 2018 |
| Secretary and Chief Legal Officer | |
| Vice President and Deputy Chief Counsel, John Hancock Investment Management (since 2015); Assistant Vice President and Senior Counsel (2009–2015), John Hancock Investment Management; Assistant Secretary of John Hancock Investment Management LLC and John Hancock Variable Trust Advisers LLC (since 2009); Chief Legal Officer and Secretary of various trusts within the John Hancock Fund Complex (since 2009, including prior positions). | |
| Trevor Swanberg, Born: 1979 | 2020 |
| Chief Compliance Officer | |
| Chief Compliance Officer, John Hancock Investment Management LLC and John Hancock Variable Trust Advisers LLC (since 2020); Deputy Chief Compliance Officer, John Hancock Investment Management LLC and John Hancock Variable Trust Advisers LLC (2019–2020); Assistant Chief Compliance Officer, John Hancock Investment Management LLC and John Hancock Variable Trust Advisers LLC (2016–2019); Vice President, State Street Global Advisors (2015–2016); Chief Compliance Officer of various trusts within the John Hancock Fund Complex (since 2016, including prior positions). | |
| 1 | Each Trustee holds office until his or her successor is duly elected and qualified, or until the Trustee’s death, retirement, resignation, or removal. Mr. Boyle has served as Trustee at various times prior to the date listed in the table. |
| 2 | Member of the Audit Committee as of September 26, 2023. |
| 3 | Member of the Audit Committee. |
| 4 | The Trustee is a Non-Independent Trustee due to current or former positions with the Advisor and certain affiliates. |
| ANNUAL REPORT | JOHN HANCOCK INFRASTRUCTURE FUND | 41 |
Steven R. Pruchansky, Vice Chairperson
Andrew G. Arnott†
James R. Boyle
William H. Cunningham*
Grace K. Fey
Noni L. Ellison
Dean C. Garfield
Deborah C. Jackson
Paul Lorentz†
Frances G. Rathke*
Gregory A. Russo
President
Chief Financial Officer
Treasurer
Secretary and Chief Legal Officer
Chief Compliance Officer
G. Thomas Levering
| You can also contact us: | ||
| 800-225-5291 | Regular mail: | Express mail: |
| jhinvestments.com | John Hancock Signature Services, Inc. P.O. Box 219909 Kansas City, MO 64121-9909 | John Hancock Signature Services, Inc. 430 W 7th Street Suite 219909 Kansas City, MO 64105-1407 |
| 42 | JOHN HANCOCK INFRASTRUCTURE FUND | ANNUAL REPORT |
GOVERNANCE FUNDS
with a heritage of financial stewardship dating back to 1862. Helping
our shareholders pursue their financial goals is at the core of everything
we do. It’s why we support the role of professional financial advice
and operate with the highest standards of conduct and integrity.
We search the world to find proven portfolio teams with specialized
expertise for every strategy we offer, then we apply robust investment
oversight to ensure they continue to meet our uncompromising
standards and serve the best interests of our shareholders.
a diverse set of investments backed by some of the world’s best
managers, along with strong risk-adjusted returns across asset classes.
200 Berkeley Street, Boston, MA 02116-5010, 800-225-5291, jhinvestments.com
| MF3208628 | 438A 10/23 |


United States and Europe
Manulife Investment Management
John Hancock Investment Management
| ANNUAL REPORT | JOHN HANCOCK SEAPORT LONG/SHORT FUND | 1 |
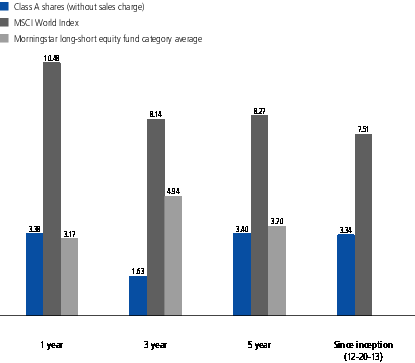
| 2 | JOHN HANCOCK SEAPORT LONG/SHORT FUND | ANNUAL REPORT |
| Common stocks | 76.0 |
| Financials | 19.4 |
| Health care | 17.6 |
| Information technology | 12.2 |
| Energy | 7.6 |
| Consumer discretionary | 5.2 |
| Industrials | 4.6 |
| Communication services | 4.3 |
| Materials | 2.1 |
| Utilities | 1.6 |
| Consumer staples | 1.3 |
| Real estate | 0.1 |
| Exchange-traded funds | 0.7 |
| Corporate bonds | 0.2 |
| Purchased options | 0.1 |
| Short-term investments and other | 23.0 |
| TOTAL | 100.0 |
| ANNUAL REPORT | JOHN HANCOCK SEAPORT LONG/SHORT FUND | 3 |
| TOP 10 HOLDINGS AS OF 10/31/2023 (% of net assets) | |
| Amazon.com, Inc. | 1.8 |
| NVIDIA Corp. | 1.4 |
| Tradeweb Markets, Inc., Class A | 1.3 |
| Ares Management Corp., Class A | 1.3 |
| JPMorgan Chase & Co. | 1.2 |
| Microsoft Corp. | 1.1 |
| Eli Lilly & Company | 1.1 |
| Meta Platforms, Inc., Class A | 1.1 |
| Cenovus Energy, Inc. | 1.1 |
| Shell PLC | 1.0 |
| TOTAL | 12.4 |
| Cash and cash equivalents are not included. | |
| COUNTRY COMPOSITION AS OF 10/31/2023 (% of net assets) | |
| United States | 72.7 |
| Japan | 4.0 |
| United Kingdom | 4.0 |
| Canada | 3.1 |
| China | 3.0 |
| Germany | 2.3 |
| Netherlands | 1.6 |
| Ireland | 1.6 |
| Switzerland | 1.0 |
| Other countries | 6.7 |
| TOTAL | 100.0 |
| 4 | JOHN HANCOCK SEAPORT LONG/SHORT FUND | ANNUAL REPORT |
managed by a team of portfolio
managers at Wellington
Management Company LLP.

| ANNUAL REPORT | JOHN HANCOCK SEAPORT LONG/SHORT FUND | 5 |
| Average annual total returns (%) with maximum sales charge | Cumulative total returns (%) with maximum sales charge | ||||
| 1-year | 5-year | Since inception (12-20-13) | 5-year | Since inception (12-20-13) | |
| Class A | -1.80 | 2.34 | 2.80 | 12.24 | 31.31 |
| Class C1 | 1.66 | 2.66 | 2.64 | 14.03 | 29.28 |
| Class I2 | 3.79 | 3.72 | 3.66 | 20.05 | 42.62 |
| Class R62 | 3.86 | 3.84 | 3.80 | 20.74 | 44.43 |
| Class NAV2 | 3.87 | 3.85 | 3.80 | 20.76 | 44.46 |
| Index† | 10.48 | 8.27 | 7.51 | 48.75 | 104.25 |
| Class A | Class C | Class I | Class R6 | Class NAV | |
| Gross (%) | 1.92 | 2.62 | 1.62 | 1.52 | 1.51 |
| Net (%) | 1.91 | 2.61 | 1.61 | 1.51 | 1.50 |
| 6 | JOHN HANCOCK SEAPORT LONG/SHORT FUND | ANNUAL REPORT |
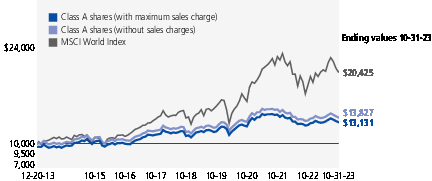
| Start date | With maximum sales charge ($) | Without sales charge ($) | Index ($) | |
| Class C1,3 | 12-20-13 | 12,928 | 12,928 | 20,425 |
| Class I2 | 12-20-13 | 14,262 | 14,262 | 20,425 |
| Class R62 | 12-20-13 | 14,443 | 14,443 | 20,425 |
| Class NAV2 | 12-20-13 | 14,446 | 14,446 | 20,425 |
| 1 | Class C shares were first offered on 5-16-14. Returns prior to this date are those of Class A shares that have not been adjusted for class-specific expenses; otherwise, returns would vary. |
| 2 | For certain types of investors, as described in the fund’s prospectuses. |
| 3 | The contingent deferred sales charge is not applicable. |
| ANNUAL REPORT | JOHN HANCOCK SEAPORT LONG/SHORT FUND | 7 |

| 8 | JOHN HANCOCK SEAPORT LONG/SHORT FUND | ANNUAL REPORT |
| Account value on 5-1-2023 | Ending value on 10-31-2023 | Expenses paid during period ended 10-31-20231 | Annualized expense ratio | ||
| Class A | Actual expenses/actual returns | $1,000.00 | $1,003.80 | $9.95 | 1.97% |
| Hypothetical example | 1,000.00 | 1,015.30 | 10.01 | 1.97% | |
| Class C | Actual expenses/actual returns | 1,000.00 | 1,000.00 | 13.41 | 2.66% |
| Hypothetical example | 1,000.00 | 1,011.80 | 13.49 | 2.66% | |
| Class I | Actual expenses/actual returns | 1,000.00 | 1,005.50 | 8.34 | 1.65% |
| Hypothetical example | 1,000.00 | 1,016.90 | 8.39 | 1.65% | |
| Class R6 | Actual expenses/actual returns | 1,000.00 | 1,006.30 | 7.84 | 1.55% |
| Hypothetical example | 1,000.00 | 1,017.40 | 7.88 | 1.55% | |
| Class NAV | Actual expenses/actual returns | 1,000.00 | 1,006.30 | 7.79 | 1.54% |
| Hypothetical example | 1,000.00 | 1,017.40 | 7.83 | 1.54% |
| 1 | Expenses are equal to the annualized expense ratio, multiplied by the average account value over the period, multiplied by 184/365 (to reflect the one-half year period). |
| ANNUAL REPORT | JOHN HANCOCK SEAPORT LONG/SHORT FUND | 9 |
| Shares | Value | ||||
| Common stocks 76.0% | $447,394,893 | ||||
| (Cost $421,891,677) | |||||
| Communication services 4.3% | 25,268,074 | ||||
| Diversified telecommunication services 0.2% | |||||
| United Internet AG | 60,072 | 1,250,906 | |||
| Entertainment 1.0% | |||||
| Liberty Media Corp.-Liberty Formula One, Series C (A) | 24,569 | 1,589,369 | |||
| Netflix, Inc. (A) | 3,413 | 1,405,098 | |||
| Roku, Inc. (A) | 24,852 | 1,480,434 | |||
| Spotify Technology SA (A) | 858 | 141,364 | |||
| Take-Two Interactive Software, Inc. (A) | 8,872 | 1,186,630 | |||
| Interactive media and services 2.0% | |||||
| Alphabet, Inc., Class A (A) | 27,845 | 3,455,008 | |||
| Alphabet, Inc., Class C (A) | 1,666 | 208,750 | |||
| Meta Platforms, Inc., Class A (A) | 21,366 | 6,436,935 | |||
| Pinterest, Inc., Class A (A) | 12,205 | 364,685 | |||
| Tencent Holdings, Ltd. | 38,032 | 1,407,516 | |||
| Media 0.4% | |||||
| Comcast Corp., Class A | 38,481 | 1,588,880 | |||
| Publicis Groupe SA | 10,630 | 809,403 | |||
| Wireless telecommunication services 0.7% | |||||
| Bharti Airtel, Ltd. | 199,707 | 2,192,464 | |||
| T-Mobile US, Inc. (A) | 12,169 | 1,750,632 | |||
| Consumer discretionary 5.2% | 30,416,470 | ||||
| Automobiles 0.1% | |||||
| Rivian Automotive, Inc., Class A (A) | 52,369 | 849,425 | |||
| XPeng, Inc., A Shares (A) | 1,176 | 8,546 | |||
| Broadline retail 2.9% | |||||
| Alibaba Group Holding, Ltd. (A) | 590,239 | 6,076,554 | |||
| Amazon.com, Inc. (A) | 80,914 | 10,768,836 | |||
| JD.com, Inc., Class A | 4,765 | 60,578 | |||
| MercadoLibre, Inc. (A) | 15 | 18,611 | |||
| Diversified consumer services 0.1% | |||||
| Hope Education Group Company, Ltd. (A)(B) | 128,922 | 7,594 | |||
| WW International, Inc. (A) | 81,306 | 635,813 | |||
| Hotels, restaurants and leisure 0.2% | |||||
| Airbnb, Inc., Class A (A) | 1,774 | 209,846 | |||
| Booking Holdings, Inc. (A) | 394 | 1,099,087 | |||
| Sands China, Ltd. (A) | 3,972 | 10,693 | |||
| Wynn Macau, Ltd. (A) | 12,247 | 10,846 | |||
| 10 | JOHN HANCOCK SEAPORT LONG/SHORT FUND | ANNUAL REPORT | SEE NOTES TO FINANCIAL STATEMENTS |
| Shares | Value | ||||
| Consumer discretionary (continued) | |||||
| Household durables 0.8% | |||||
| Nikon Corp. | 21,712 | $206,143 | |||
| Panasonic Holdings Corp. | 66,195 | 580,761 | |||
| Skyline Champion Corp. (A) | 20,884 | 1,224,429 | |||
| Sony Group Corp. | 28,806 | 2,394,898 | |||
| Specialty retail 0.7% | |||||
| Bath & Body Works, Inc. | 36,603 | 1,085,279 | |||
| RH (A) | 3,090 | 673,496 | |||
| Ross Stores, Inc. | 20,950 | 2,429,572 | |||
| Textiles, apparel and luxury goods 0.4% | |||||
| ANTA Sports Products, Ltd. | 79,849 | 903,051 | |||
| Cie Financiere Richemont SA, A Shares | 9,853 | 1,162,412 | |||
| Consumer staples 1.3% | 7,684,185 | ||||
| Food products 0.3% | |||||
| Cranswick PLC | 41,317 | 1,756,709 | |||
| Personal care products 0.8% | |||||
| e.l.f. Beauty, Inc. (A) | 18,076 | 1,674,380 | |||
| Haleon PLC | 433,232 | 1,736,431 | |||
| Proya Cosmetics Company, Ltd., Class A | 56,960 | 808,756 | |||
| Shiseido Company, Ltd. | 25,000 | 792,887 | |||
| Tobacco 0.2% | |||||
| British American Tobacco PLC | 30,631 | 915,022 | |||
| Energy 7.6% | 44,565,655 | ||||
| Energy equipment and services 0.8% | |||||
| Seadrill, Ltd. (A) | 43,724 | 1,727,972 | |||
| Tenaris SA, ADR | 58,326 | 1,826,770 | |||
| Valaris, Ltd. (A) | 12,550 | 828,802 | |||
| Oil, gas and consumable fuels 6.8% | |||||
| Antero Resources Corp. (A) | 125,956 | 3,708,145 | |||
| ARC Resources, Ltd. | 90,832 | 1,461,303 | |||
| Cenovus Energy, Inc. | 331,704 | 6,328,912 | |||
| Cheniere Energy, Inc. | 14,215 | 2,365,660 | |||
| Chesapeake Energy Corp. | 58,753 | 5,057,458 | |||
| ConocoPhillips | 11,558 | 1,373,090 | |||
| Coterra Energy, Inc. | 77,638 | 2,135,045 | |||
| Diamondback Energy, Inc. | 28,322 | 4,540,583 | |||
| EQT Corp. | 107,140 | 4,540,593 | |||
| Phillips 66 | 4,312 | 491,870 | |||
| Shell PLC | 192,404 | 6,200,570 | |||
| Southwestern Energy Company (A) | 277,543 | 1,978,882 | |||
| SEE NOTES TO FINANCIAL STATEMENTS | ANNUAL REPORT | JOHN HANCOCK SEAPORT LONG/SHORT FUND | 11 |
| Shares | Value | ||||
| Financials 19.4% | $114,091,507 | ||||
| Banks 7.0% | |||||
| AIB Group PLC | 495,787 | 2,152,470 | |||
| Banco Bradesco SA, ADR | 422,436 | 1,178,596 | |||
| BAWAG Group AG (A)(B) | 50,453 | 2,247,196 | |||
| Commerzbank AG | 156,240 | 1,685,135 | |||
| Concordia Financial Group, Ltd. | 426,000 | 1,979,366 | |||
| Danske Bank A/S | 24,642 | 578,070 | |||
| FinecoBank SpA | 27,717 | 326,968 | |||
| FNB Corp. | 91,102 | 973,880 | |||
| Hokuhoku Financial Group, Inc. | 13,800 | 161,116 | |||
| Iyogin Holdings, Inc. | 38,800 | 279,295 | |||
| JPMorgan Chase & Co. | 52,781 | 7,339,726 | |||
| KBC Group NV | 2,540 | 139,789 | |||
| Kyushu Financial Group, Inc. | 32,700 | 206,058 | |||
| Mitsubishi UFJ Financial Group, Inc. | 131,600 | 1,104,012 | |||
| Nordea Bank ABP | 78,065 | 822,527 | |||
| OTP Bank NYRT | 29,114 | 1,083,623 | |||
| Permanent TSB Group Holdings PLC (A) | 116,404 | 231,195 | |||
| Resona Holdings, Inc. | 147,900 | 790,277 | |||
| Royal Bank of Canada | 20,184 | 1,612,100 | |||
| Security Bank Corp. | 5,582 | 7,578 | |||
| Sumitomo Mitsui Trust Holdings, Inc. | 27,000 | 1,012,413 | |||
| The Bank of Nagoya, Ltd. | 4,700 | 189,692 | |||
| The Chiba Bank, Ltd. | 363,800 | 2,709,779 | |||
| The Shiga Bank, Ltd. | 47,300 | 1,250,864 | |||
| Unicaja Banco SA (B) | 1,206,864 | 1,257,450 | |||
| UniCredit SpA | 160,745 | 4,029,815 | |||
| Wells Fargo & Company | 148,448 | 5,903,777 | |||
| Capital markets 6.7% | |||||
| Ares Management Corp., Class A | 74,751 | 7,369,701 | |||
| Federated Hermes, Inc. | 33,534 | 1,063,028 | |||
| Intercontinental Exchange, Inc. | 23,100 | 2,481,864 | |||
| KKR & Company, Inc. | 79,866 | 4,424,576 | |||
| M&A Capital Partners Company, Ltd. | 51,500 | 934,854 | |||
| Morgan Stanley | 15,017 | 1,063,504 | |||
| Morningstar, Inc. | 4,692 | 1,188,202 | |||
| Northern Trust Corp. | 35,413 | 2,334,071 | |||
| S&P Global, Inc. | 6,305 | 2,202,400 | |||
| StepStone Group, Inc., Class A | 25,900 | 732,970 | |||
| Tel Aviv Stock Exchange, Ltd. (A) | 63,192 | 281,117 | |||
| The Bank of New York Mellon Corp. | 37,565 | 1,596,513 | |||
| The Goldman Sachs Group, Inc. | 17,024 | 5,168,657 | |||
| Tradeweb Markets, Inc., Class A | 85,791 | 7,722,048 | |||
| WisdomTree, Inc. | 157,815 | 978,453 | |||
| 12 | JOHN HANCOCK SEAPORT LONG/SHORT FUND | ANNUAL REPORT | SEE NOTES TO FINANCIAL STATEMENTS |
| Shares | Value | ||||
| Financials (continued) | |||||
| Consumer finance 0.3% | |||||
| American Express Company | 11,878 | $1,734,544 | |||
| Financial services 2.1% | |||||
| Block, Inc. (A) | 91,198 | 3,670,720 | |||
| EXOR NV | 48,221 | 4,138,768 | |||
| Global Payments, Inc. | 1,542 | 163,791 | |||
| Mastercard, Inc., Class A | 102 | 38,388 | |||
| WEX, Inc. (A) | 16,836 | 2,802,857 | |||
| Wise PLC, Class A (A) | 188,798 | 1,534,501 | |||
| Insurance 3.3% | |||||
| Admiral Group PLC | 35,863 | 1,065,588 | |||
| AIA Group, Ltd. | 328,007 | 2,848,348 | |||
| Allianz SE | 8,142 | 1,907,202 | |||
| ASR Nederland NV | 54,886 | 2,048,261 | |||
| Beazley PLC | 117,719 | 737,434 | |||
| Intact Financial Corp. | 10,282 | 1,444,633 | |||
| Japan Post Insurance Company, Ltd. | 51,300 | 987,837 | |||
| Lancashire Holdings, Ltd. | 190,072 | 1,312,425 | |||
| Linea Directa Aseguradora SA Cia de Seguros y Reaseguros | 613,421 | 528,786 | |||
| Muenchener Rueckversicherungs-Gesellschaft AG | 6,698 | 2,687,961 | |||
| Ping An Insurance Group Company of China, Ltd., H Shares | 7,664 | 38,875 | |||
| Talanx AG | 43,978 | 2,771,460 | |||
| Trupanion, Inc. (A) | 40,505 | 834,403 | |||
| Health care 17.6% | 103,941,237 | ||||
| Biotechnology 7.5% | |||||
| Abcam PLC, ADR (A) | 12,408 | 284,391 | |||
| Akero Therapeutics, Inc. (A) | 18,654 | 222,356 | |||
| Alkermes PLC (A) | 56,532 | 1,367,509 | |||
| Alnylam Pharmaceuticals, Inc. (A) | 12,634 | 1,917,841 | |||
| Amoy Diagnostics Company, Ltd., Class A | 77,854 | 231,225 | |||
| Apellis Pharmaceuticals, Inc. (A) | 25,383 | 1,235,137 | |||
| Argenx SE, ADR (A) | 5,194 | 2,438,947 | |||
| Ascendis Pharma A/S, ADR (A) | 15,552 | 1,388,949 | |||
| Biogen, Inc. (A) | 11,994 | 2,849,055 | |||
| Blueprint Medicines Corp. (A) | 7,915 | 465,877 | |||
| Bridgebio Pharma, Inc. (A) | 27,500 | 716,100 | |||
| Clementia Pharmaceuticals, Inc. (A)(C) | 9,185 | 0 | |||
| Crinetics Pharmaceuticals, Inc. (A) | 30,387 | 890,035 | |||
| Cytokinetics, Inc. (A) | 47,802 | 1,666,378 | |||
| Denali Therapeutics, Inc. (A) | 13,266 | 249,799 | |||
| Exact Sciences Corp. (A) | 47,175 | 2,905,508 | |||
| Genmab A/S (A) | 2,801 | 791,795 | |||
| Genus PLC | 12,033 | 313,012 | |||
| SEE NOTES TO FINANCIAL STATEMENTS | ANNUAL REPORT | JOHN HANCOCK SEAPORT LONG/SHORT FUND | 13 |
| Shares | Value | ||||
| Health care (continued) | |||||
| Biotechnology (continued) | |||||
| Geron Corp. (A) | 220,381 | $418,724 | |||
| Gilead Sciences, Inc. | 14,365 | 1,128,227 | |||
| Immatics NV (A) | 3,234 | 24,740 | |||
| ImmunoGen, Inc. (A) | 66,835 | 993,168 | |||
| Karuna Therapeutics, Inc. (A) | 8,122 | 1,353,206 | |||
| Keymed Biosciences, Inc. (A)(B) | 48,500 | 360,331 | |||
| Kymera Therapeutics, Inc. (A) | 17,901 | 208,905 | |||
| Legend Biotech Corp., ADR (A) | 8,960 | 591,987 | |||
| Merus NV (A) | 34,242 | 688,607 | |||
| Moderna, Inc. (A) | 7,994 | 607,224 | |||
| MoonLake Immunotherapeutics (A) | 6,205 | 321,481 | |||
| Nuvalent, Inc., Class A (A) | 13,676 | 712,383 | |||
| Prothena Corp. PLC (A) | 10,053 | 366,532 | |||
| RayzeBio, Inc. (A) | 11,645 | 225,913 | |||
| Regeneron Pharmaceuticals, Inc. (A) | 1,491 | 1,162,816 | |||
| Remegen Company, Ltd., H Shares (A)(B) | 14,988 | 85,358 | |||
| REVOLUTION Medicines, Inc. (A) | 7,179 | 142,144 | |||
| Rocket Pharmaceuticals, Inc. (A) | 38,870 | 703,547 | |||
| Roivant Sciences, Ltd. (A) | 108,503 | 937,466 | |||
| Sage Therapeutics, Inc. (A) | 334 | 6,256 | |||
| Seagen, Inc. (A) | 13,215 | 2,812,284 | |||
| Sichuan Kelun-Biotech Biopharmaceutical Company, Ltd. (A) | 32,300 | 344,191 | |||
| United Therapeutics Corp. (A) | 10,963 | 2,443,214 | |||
| Veracyte, Inc. (A) | 6,197 | 128,402 | |||
| Vertex Pharmaceuticals, Inc. (A) | 16,510 | 5,978,436 | |||
| Xenon Pharmaceuticals, Inc. (A) | 17,019 | 527,589 | |||
| Zai Lab, Ltd., ADR (A) | 29,982 | 755,546 | |||
| Health care equipment and supplies 2.8% | |||||
| Abbott Laboratories | 19,668 | 1,859,609 | |||
| Alcon, Inc. | 14,561 | 1,042,220 | |||
| AtriCure, Inc. (A) | 18,836 | 652,479 | |||
| Becton, Dickinson and Company | 4,555 | 1,151,413 | |||
| Boston Scientific Corp. (A) | 575 | 29,434 | |||
| DexCom, Inc. (A) | 40,343 | 3,583,669 | |||
| DiaSorin SpA | 10,205 | 914,596 | |||
| Edwards Lifesciences Corp. (A) | 10,487 | 668,232 | |||
| Hologic, Inc. (A) | 16,113 | 1,066,197 | |||
| Inspire Medical Systems, Inc. (A) | 5,663 | 833,367 | |||
| Intuitive Surgical, Inc. (A) | 8,341 | 2,187,177 | |||
| Lifetech Scientific Corp. (A) | 30,082 | 9,243 | |||
| QuidelOrtho Corp. (A) | 1,184 | 72,319 | |||
| Shockwave Medical, Inc. (A) | 10,493 | 2,164,286 | |||
| Stryker Corp. | 1,339 | 361,825 | |||
| 14 | JOHN HANCOCK SEAPORT LONG/SHORT FUND | ANNUAL REPORT | SEE NOTES TO FINANCIAL STATEMENTS |
| Shares | Value | ||||
| Health care (continued) | |||||
| Health care equipment and supplies (continued) | |||||
| Venus MedTech Hangzhou, Inc., H Shares (A)(B) | 114,500 | $64,951 | |||
| Health care providers and services 2.1% | |||||
| Acadia Healthcare Company, Inc. (A) | 15,765 | 1,158,885 | |||
| Addus HomeCare Corp. (A) | 7,560 | 596,484 | |||
| agilon health, Inc. (A) | 22,808 | 410,544 | |||
| Alignment Healthcare, Inc. (A) | 129,477 | 890,802 | |||
| Cencora, Inc. | 8,282 | 1,533,412 | |||
| Centene Corp. (A) | 19,455 | 1,342,006 | |||
| Hapvida Participacoes e Investimentos SA (A)(B) | 704,030 | 515,272 | |||
| HCA Healthcare, Inc. | 2,325 | 525,776 | |||
| Humana, Inc. | 3,836 | 2,008,875 | |||
| Molina Healthcare, Inc. (A) | 301 | 100,218 | |||
| Privia Health Group, Inc. (A) | 27,399 | 575,927 | |||
| Surgery Partners, Inc. (A) | 36,431 | 842,649 | |||
| UnitedHealth Group, Inc. | 3,931 | 2,105,286 | |||
| Health care technology 0.3% | |||||
| Health Catalyst, Inc. (A) | 30,985 | 232,078 | |||
| Veeva Systems, Inc., Class A (A) | 7,885 | 1,519,518 | |||
| Life sciences tools and services 1.1% | |||||
| Danaher Corp. | 10,034 | 1,926,729 | |||
| ICON PLC (A) | 6,254 | 1,525,726 | |||
| Illumina, Inc. (A) | 9,288 | 1,016,293 | |||
| Repligen Corp. (A) | 3,573 | 480,783 | |||
| Tecan Group AG | 1,568 | 451,271 | |||
| WuXi AppTec Company, Ltd., H Shares (B) | 74,700 | 897,636 | |||
| Pharmaceuticals 3.8% | �� | ||||
| Aclaris Therapeutics, Inc. (A) | 51,862 | 258,273 | |||
| AstraZeneca PLC | 26,120 | 3,270,318 | |||
| Bayer AG | 6,904 | 298,312 | |||
| Chugai Pharmaceutical Company, Ltd. | 58,400 | 1,731,943 | |||
| Daiichi Sankyo Company, Ltd. | 27,167 | 700,479 | |||
| Eisai Company, Ltd. | 11,687 | 619,158 | |||
| Elanco Animal Health, Inc. (A) | 54,950 | 484,110 | |||
| Eli Lilly & Company | 11,850 | 6,564,071 | |||
| Merck & Company, Inc. | 29,170 | 2,995,759 | |||
| Novartis AG | 7,334 | 686,606 | |||
| Otsuka Holdings Company, Ltd. | 45,300 | 1,524,161 | |||
| Pfizer, Inc. | 701 | 21,423 | |||
| Sandoz Group AG (A) | 1,466 | 38,115 | |||
| Structure Therapeutics, Inc., ADR (A) | 12,113 | 899,996 | |||
| UCB SA | 19,221 | 1,405,824 | |||
| Ventyx Biosciences, Inc. (A) | 16,583 | 239,127 | |||
| SEE NOTES TO FINANCIAL STATEMENTS | ANNUAL REPORT | JOHN HANCOCK SEAPORT LONG/SHORT FUND | 15 |
| Shares | Value | ||||
| Health care (continued) | |||||
| Pharmaceuticals (continued) | |||||
| Verona Pharma PLC, ADR (A) | 35,305 | $492,505 | |||
| Zoetis, Inc. | 2,747 | 431,279 | |||
| Industrials 4.6% | 27,126,885 | ||||
| Aerospace and defense 1.1% | |||||
| BWX Technologies, Inc. (D) | 36,630 | 2,720,876 | |||
| Dassault Aviation SA | 5,968 | 1,186,374 | |||
| Rheinmetall AG | 9,122 | 2,618,866 | |||
| Building products 0.4% | |||||
| Builders FirstSource, Inc. (A) | 15,631 | 1,696,276 | |||
| The AZEK Company, Inc. (A) | 35,455 | 928,921 | |||
| Construction and engineering 0.1% | |||||
| Fluor Corp. (A) | 16,156 | 537,833 | |||
| IRB Infrastructure Developers, Ltd. | 39,609 | 15,947 | |||
| Electrical equipment 0.4% | |||||
| Contemporary Amperex Technology Company, Ltd., Class A | 98,886 | 2,510,894 | |||
| Vicor Corp. (A) | 158 | 6,121 | |||
| Ground transportation 1.0% | |||||
| ALD SA (B) | 39,912 | 268,462 | |||
| Uber Technologies, Inc. (A) | 136,374 | 5,902,267 | |||
| Machinery 0.5% | |||||
| Ebara Corp. | 23,200 | 1,027,378 | |||
| IMI PLC | 99,179 | 1,771,242 | |||
| Zoomlion Heavy Industry Science and Technology Company, Ltd., Class A | 12,884 | 11,306 | |||
| Marine transportation 0.7% | |||||
| Irish Continental Group PLC | 870,925 | 3,973,601 | |||
| Professional services 0.2% | |||||
| Ceridian HCM Holding, Inc. (A) | 16,579 | 1,061,222 | |||
| Trading companies and distributors 0.2% | |||||
| Applied Industrial Technologies, Inc. | 5,716 | 877,463 | |||
| Transportation infrastructure 0.0% | |||||
| Adani Ports & Special Economic Zone, Ltd. | 1,255 | 11,836 | |||
| Information technology 12.2% | 71,842,068 | ||||
| Communications equipment 0.0% | |||||
| Accton Technology Corp. | 5,869 | 90,936 | |||
| Electronic equipment, instruments and components 0.5% | |||||
| Flex, Ltd. (A) | 77,353 | 1,989,519 | |||
| Omron Corp. | 386 | 13,829 | |||
| Sunny Optical Technology Group Company, Ltd. | 107,000 | 896,438 | |||
| Unimicron Technology Corp. | 57,116 | 254,732 | |||
| 16 | JOHN HANCOCK SEAPORT LONG/SHORT FUND | ANNUAL REPORT | SEE NOTES TO FINANCIAL STATEMENTS |
| Shares | Value | ||||
| Information technology (continued) | |||||
| IT services 1.4% | |||||
| EPAM Systems, Inc. (A) | 3,799 | $826,548 | |||
| MongoDB, Inc. (A) | 6,451 | 2,222,950 | |||
| Okta, Inc. (A) | 19,768 | 1,332,561 | |||
| Shopify, Inc., Class A (A) | 59,852 | 2,824,416 | |||
| Squarespace, Inc., Class A (A) | 20,948 | 595,133 | |||
| VeriSign, Inc. (A) | 2,551 | 509,333 | |||
| Semiconductors and semiconductor equipment 5.1% | |||||
| Advanced Micro Devices, Inc. (A) | 14,325 | 1,411,013 | |||
| ASML Holding NV, NYRS | 600 | 359,286 | |||
| Broadcom, Inc. | 2,529 | 2,127,825 | |||
| Disco Corp. | 1,217 | 214,921 | |||
| Intel Corp. (D) | 37,130 | 1,355,245 | |||
| KLA Corp. | 5,695 | 2,674,942 | |||
| Lam Research Corp. | 2,300 | 1,352,906 | |||
| Marvell Technology, Inc. | 68,241 | 3,222,340 | |||
| Micron Technology, Inc. | 24,607 | 1,645,470 | |||
| Nova, Ltd. (A) | 6,742 | 640,288 | |||
| NVIDIA Corp. | 20,333 | 8,291,797 | |||
| ON Semiconductor Corp. (A) | 19,194 | 1,202,312 | |||
| Rambus, Inc. (A) | 12,720 | 691,078 | |||
| Renesas Electronics Corp. (A) | 3,086 | 40,537 | |||
| SCREEN Holdings Company, Ltd. | 9,916 | 461,016 | |||
| Shibaura Mechatronics Corp. | 3,136 | 135,461 | |||
| Taiwan Semiconductor Manufacturing Company, Ltd. | 115,698 | 1,889,638 | |||
| Taiwan Semiconductor Manufacturing Company, Ltd., ADR | 7,679 | 662,774 | |||
| Tokyo Electron, Ltd. | 2,134 | 281,982 | |||
| Tokyo Seimitsu Company, Ltd. | 6,928 | 323,852 | |||
| Ulvac, Inc. | 22,352 | 768,666 | |||
| Wolfspeed, Inc. (A) | 7,740 | 261,922 | |||
| Software 4.8% | |||||
| Atlassian Corp., Class A (A) | 2,132 | 385,124 | |||
| BILL Holdings, Inc. (A) | 2,851 | 260,268 | |||
| Datadog, Inc., Class A (A) | 18,436 | 1,501,981 | |||
| Dynatrace, Inc. (A) | 32,666 | 1,460,497 | |||
| Gitlab, Inc., Class A (A) | 38,723 | 1,675,931 | |||
| HubSpot, Inc. (A) | 7,505 | 3,180,394 | |||
| Intuit, Inc. | 4,719 | 2,335,669 | |||
| Microsoft Corp. | 19,443 | 6,573,873 | |||
| Oracle Corp. | 8,628 | 892,135 | |||
| Palo Alto Networks, Inc. (A) | 3,406 | 827,726 | |||
| Salesforce, Inc. (A) | 13,195 | 2,649,952 | |||
| ServiceNow, Inc. (A) | 7,400 | 4,305,690 | |||
| SEE NOTES TO FINANCIAL STATEMENTS | ANNUAL REPORT | JOHN HANCOCK SEAPORT LONG/SHORT FUND | 17 |
| Shares | Value | ||||
| Information technology (continued) | |||||
| Software (continued) | |||||
| Workday, Inc., Class A (A) | 8,908 | $1,885,913 | |||
| Technology hardware, storage and peripherals 0.4% | |||||
| Quanta Computer, Inc. | 60,584 | 357,706 | |||
| Samsung Electronics Company, Ltd. | 30,889 | 1,537,496 | |||
| Wiwynn Corp. | 9,287 | 440,047 | |||
| Materials 2.1% | 12,710,201 | ||||
| Chemicals 0.3% | |||||
| Hansol Chemical Company, Ltd. | 3,767 | 420,380 | |||
| Sinoma Science & Technology Company, Ltd., Class A | 511,755 | 1,209,804 | |||
| SKC Company, Ltd. | 1,272 | 74,389 | |||
| Yunnan Energy New Material Company, Ltd., Class A | 2,915 | 26,755 | |||
| Construction materials 0.0% | |||||
| Ambuja Cements, Ltd. | 3,951 | 20,135 | |||
| Anhui Conch Cement Company, Ltd., H Shares | 6,614 | 16,460 | |||
| China National Building Material Company, Ltd., H Shares | 27,629 | 13,151 | |||
| Metals and mining 1.8% | |||||
| Anglo American PLC | 75,916 | 1,934,308 | |||
| Barrick Gold Corp. | 222,946 | 3,562,677 | |||
| Boliden AB | 12,207 | 312,904 | |||
| Foran Mining Corp. (A) | 205,306 | 641,049 | |||
| Fresnillo PLC | 39,857 | 268,261 | |||
| Glencore PLC | 446,388 | 2,364,439 | |||
| Vale SA, ADR | 134,609 | 1,845,489 | |||
| Real estate 0.1% | 521,720 | ||||
| Real estate management and development 0.1% | |||||
| LEG Immobilien SE (A) | 7,166 | 447,958 | |||
| Specialized REITs 0.0% | |||||
| Weyerhaeuser Company | 2,571 | 73,762 | |||
| Utilities 1.6% | 9,226,891 | ||||
| Electric utilities 0.6% | |||||
| American Electric Power Company, Inc. | 43,981 | 3,322,325 | |||
| Gas utilities 0.4% | |||||
| Atmos Energy Corp. | 15,679 | 1,688,001 | |||
| China Resources Gas Group, Ltd. | 36,400 | 107,603 | |||
| ENN Energy Holdings, Ltd. | 66,091 | 500,649 | |||
| Kunlun Energy Company, Ltd. | 182,000 | 151,625 | |||
| Independent power and renewable electricity producers 0.0% | |||||
| China Longyuan Power Group Corp., Ltd., H Shares | 183,500 | 155,338 | |||
| 18 | JOHN HANCOCK SEAPORT LONG/SHORT FUND | ANNUAL REPORT | SEE NOTES TO FINANCIAL STATEMENTS |
| Shares | Value | ||||
| Utilities (continued) | |||||
| Multi-utilities 0.6% | |||||
| Dominion Energy, Inc. | 60,258 | $2,429,603 | |||
| Engie SA | 54,810 | 871,747 | |||
| Exchange-traded funds 0.7% | $3,813,197 | ||||
| (Cost $4,088,635) | |||||
| VanEck Gold Miners ETF | 136,137 | 3,813,197 | |||
| Rate (%) | Maturity date | Par value^ | Value | ||
| Corporate bonds 0.2% | $752,683 | ||||
| (Cost $739,215) | |||||
| Health care 0.2% | 752,683 | ||||
| Health care providers and services 0.2% | |||||
| AthenaHealth Group, Inc. (B) | 6.500 | 02-15-30 | 921,000 | 752,683 | |
| Contracts/Notional amount | Value | ||||
| Purchased options 0.1% | $744,054 | ||||
| (Cost $1,290,307) | |||||
| Calls 0.1% | 403,939 | ||||
| Exchange Traded Option on Cboe Global Markets, Inc. (Expiration Date: 3-15-24; Strike Price: $185.00; Notional Amount: 45,100) (A) | 451 | 83,435 | |||
| Exchange Traded Option on Intel Corp. (Expiration Date: 6-21-24; Strike Price: $50.00; Notional Amount: 126,000) (A) | 1,260 | 105,210 | |||
| Exchange Traded Option on JD.com, Inc., Class A (Expiration Date: 12-15-23; Strike Price: $37.50; Notional Amount: 80,200) (A) | 802 | 6,015 | |||
| Exchange Traded Option on S&P 500 Index (Expiration Date: 1-31-24; Strike Price: $4,450.00; Notional Amount: 3,100) (A) | 31 | 124,156 | |||
| Exchange Traded Option on Shopify, Inc., Class A (Expiration Date: 2-16-24; Strike Price: $65.00; Notional Amount: 21,500) (A) | 215 | 28,380 | |||
| Over the Counter Dual Digital Option on S&P 500 Index and Brent Crude Oil Futures (Expiration Date: 1-26-24; Strike Price: S&P 500 Index less than $4,159.11 and Brent Crude Oil Futures greater than $99.81; Counterparty: Goldman Sachs International) (A)(E) | 734,132 | 19,168 |
| SEE NOTES TO FINANCIAL STATEMENTS | ANNUAL REPORT | JOHN HANCOCK SEAPORT LONG/SHORT FUND | 19 |
| Contracts/Notional amount | Value | ||||
| Calls (continued) | |||||
| Over the Counter Dual Digital Option on S&P 500 Index and Brent Crude Oil Futures (Expiration Date: 2-26-24; Strike Price: S&P 500 Index less than $4,146.25 and Brent Crude Oil Futures greater than $99.19; Counterparty: Citibank, N.A.) (A)(E) | 285,278 | $8,255 | |||
| Over the Counter Option on China Vanke Company, Ltd., H Shares (Expiration Date: 12-28-23; Strike Price: CNY 16.11; Counterparty: Goldman Sachs International) (A)(E) | 23,400 | 38 | |||
| Over the Counter Option on Hong Kong Exchanges & Clearing, Ltd. (Expiration Date: 11-29-23; Strike Price: HKD 320.65; Counterparty: Morgan Stanley & Company International PLC) (A)(E) | 1,330 | 68 | |||
| Over the Counter Option on JD.com, Inc., Class A (Expiration Date: 12-28-23; Strike Price: HKD 145.86; Counterparty: JPMorgan Chase Bank, N.A.) (A)(E) | 2,386 | 107 | |||
| Over the Counter Option on JD.com, Inc., Class A (Expiration Date: 12-28-23; Strike Price: HKD 165.88; Counterparty: Morgan Stanley & Company International PLC) (A)(E) | 3,650 | 52 | |||
| Over the Counter Option on KBC Group NV (Expiration Date: 11-17-23; Strike Price: EUR 54.00; Counterparty: Goldman Sachs International) (A)(E) | 41,800 | 28,819 | |||
| Over the Counter Option on Kweichow Moutai Company, Ltd., Class A (Expiration Date: 11-29-23; Strike Price: CNY 1,988.82; Counterparty: Morgan Stanley & Company International PLC) (A)(E) | 260 | 0 | |||
| Over the Counter Option on Li Ning Company, Ltd. (Expiration Date: 12-28-23; Strike Price: HKD 47.01; Counterparty: Goldman Sachs International) (A)(E) | 11,441 | 5 | |||
| Over the Counter Option on Panasonic Holdings Corp. (Expiration Date: 12-8-23; Strike Price: JPY 1,938.20; Counterparty: JPMorgan Chase Bank, N.A.) (A)(E) | 5,914 | 0 | |||
| Over the Counter Option on Ping An Insurance Group Company of China, Ltd., H Shares (Expiration Date: 12-28-23; Strike Price: HKD 54.89; Counterparty: Morgan Stanley & Company International PLC) (A)(E) | 12,500 | 69 |
| 20 | JOHN HANCOCK SEAPORT LONG/SHORT FUND | ANNUAL REPORT | SEE NOTES TO FINANCIAL STATEMENTS |
| Contracts/Notional amount | Value | ||||
| Calls (continued) | |||||
| Over the Counter Option on Shanghai International Airport Company, Ltd., Class A (Expiration Date: 11-30-23; Strike Price: CNY 50.90; Counterparty: Morgan Stanley & Company International PLC) (A)(E) | 8,756 | $1 | |||
| Over the Counter Option on Tencent Holdings, Ltd. (Expiration Date: 11-29-23; Strike Price: HKD 332.86; Counterparty:JPMorgan Chase Bank, N.A.) (A)(E) | 1,420 | 161 | |||
| Puts 0.0% | 340,115 | ||||
| Exchange Traded Option on Datadog, Inc., Class A (Expiration Date: 11-17-23; Strike Price: $80.00; Notional Amount: 12,700) (A) | 127 | 56,515 | |||
| Exchange Traded Option on Gitlab, Inc., Class A (Expiration Date: 11-17-23; Strike Price: $38.00; Notional Amount: 22,400) (A) | 224 | 10,640 | |||
| Exchange Traded Option on HubSpot, Inc. (Expiration Date: 11-17-23; Strike Price: $400.00; Notional Amount: 4,500) (A) | 45 | 52,200 | |||
| Exchange Traded Option on Invesco QQQ Trust Series 1 (Expiration Date: 11-17-23; Strike Price: $339.00; Notional Amount: 16,300) (A) | 163 | 44,173 | |||
| Exchange Traded Option on iShares Expanded Tech-Software Sector ETF (Expiration Date: 11-17-23; Strike Price: $325.00; Notional Amount: 16,200) (A) | 162 | 45,765 | |||
| Exchange Traded Option on MongoDB, Inc. (Expiration Date: 11-3-23; Strike Price: $300.00; Notional Amount: 6,800) (A) | 68 | 952 | |||
| Exchange Traded Option on NVIDIA Corp. (Expiration Date: 11-24-23; Strike Price: $390.00; Notional Amount: 3,400) (A) | 34 | 54,060 | |||
| Exchange Traded Option on NVIDIA Corp. (Expiration Date: 11-24-23; Strike Price: $400.00; Notional Amount: 3,800) (A) | 38 | 75,810 | |||
| Yield* (%) | Maturity date | Par value^ | Value | ||
| Short-term investments 24.1% | $141,925,262 | ||||
| (Cost $141,924,874) | |||||
| U.S. Government 14.4% | 84,751,731 | ||||
| U.S. Treasury Bill | 5.257 | 11-02-23 | 335,000 | 334,951 | |
| U.S. Treasury Bill (D) | 5.277 | 01-18-24 | 10,000 | 9,885 | |
| U.S. Treasury Bill | 5.287 | 11-07-23 | 335,000 | 334,705 | |
| U.S. Treasury Bill (D) | 5.288 | 11-24-23 | 1,400,000 | 1,395,270 |
| SEE NOTES TO FINANCIAL STATEMENTS | ANNUAL REPORT | JOHN HANCOCK SEAPORT LONG/SHORT FUND | 21 |
| Yield* (%) | Maturity date | Par value^ | Value | ||
| U.S. Government (continued) | |||||
| U.S. Treasury Bill (D) | 5.289 | 11-21-23 | 1,785,000 | $1,779,750 | |
| U.S. Treasury Bill (D) | 5.290 | 11-09-23 | 4,710,000 | 4,704,457 | |
| U.S. Treasury Bill (D) | 5.295 | 11-16-23 | 2,095,000 | 2,090,401 | |
| U.S. Treasury Bill (D) | 5.310 | 01-25-24 | 12,830,000 | 12,669,245 | |
| U.S. Treasury Bill (D) | 5.316 | 12-21-23 | 1,180,000 | 1,171,310 | |
| U.S. Treasury Bill (D) | 5.326 | 11-30-23 | 59,470,000 | 59,216,623 | |
| U.S. Treasury Bill (D) | 5.330 | 11-28-23 | 370,000 | 368,532 | |
| U.S. Treasury Bill (D) | 5.355 | 12-05-23 | 680,000 | 676,602 |
| Yield (%) | Shares | Value | |||
| Short-term funds 9.7% | 57,173,531 | ||||
| State Street Institutional U.S. Government Money Market Fund, Premier Class | 5.2868(F) | 57,173,531 | 57,173,531 | ||
| Total investments (Cost $569,934,708) 101.1% | $594,630,089 | ||||
| Other assets and liabilities, net (1.1%) | (6,300,840) | ||||
| Total net assets 100.0% | $588,329,249 | ||||
| The percentage shown for each investment category is the total value of the category as a percentage of the net assets of the fund. | |
| ^All par values are denominated in U.S. dollars unless otherwise indicated. | |
| Currency Abbreviations | |
| CNY | Chinese Yuan Renminbi |
| EUR | Euro |
| HKD | Hong Kong Dollar |
| JPY | Japanese Yen |
| Security Abbreviations and Legend | |
| ADR | American Depositary Receipt |
| NYRS | New York Registry Shares |
| (A) | Non-income producing security. |
| (B) | These securities are exempt from registration under Rule 144A of the Securities Act of 1933. Such securities may be resold, normally to qualified institutional buyers, in transactions exempt from registration. |
| (C) | Security is valued using significant unobservable inputs and is classified as Level 3 in the fair value hierarchy. Refer to Note 2 to the financial statements. |
| (D) | All or a portion of this security is segregated at the custodian as collateral for certain derivatives. |
| (E) | For this type of option, notional amounts are equivalent to number of contracts. |
| (F) | The rate shown is the annualized seven-day yield as of 10-31-23. |
| * | Yield represents either the annualized yield at the date of purchase, the stated coupon rate or, for floating rate securities, the rate at period end. |
| 22 | JOHN HANCOCK SEAPORT LONG/SHORT FUND | ANNUAL REPORT | SEE NOTES TO FINANCIAL STATEMENTS |
| Open contracts | Number of contracts | Position | Expiration date | Notional basis^ | Notional value^ | Unrealized appreciation (depreciation) |
| MSCI Singapore Index Futures | 3 | Short | Nov 2023 | $(59,842) | $(59,588) | $254 |
| TOPIX Index Futures | 12 | Short | Dec 2023 | (1,847,287) | (1,784,463) | 62,824 |
| $63,078 |
| Contract to buy | Contract to sell | Counterparty (OTC) | Contractual settlement date | Unrealized appreciation | Unrealized depreciation | ||
| AUD | 7,640,000 | USD | 4,828,990 | JPM | 11/30/2023 | $21,845 | — |
| CAD | 5,745,000 | USD | 4,160,974 | JPM | 11/30/2023 | — | $(16,575) |
| CHF | 4,805,000 | USD | 5,361,004 | GSI | 11/30/2023 | — | (63,155) |
| DKK | 10,480,000 | USD | 1,482,673 | GSI | 11/30/2023 | 5,131 | — |
| EUR | 4,703,000 | USD | 4,980,926 | SCB | 11/30/2023 | 892 | — |
| GBP | 3,948,000 | USD | 4,773,787 | JPM | 11/30/2023 | 25,586 | — |
| GBP | 2,273,000 | USD | 2,834,675 | BNP | 12/20/2023 | — | (70,915) |
| GBP | 2,256,000 | USD | 2,812,867 | MSI | 12/20/2023 | — | (69,777) |
| HKD | 11,855,000 | USD | 1,516,751 | CITI | 11/30/2023 | — | (857) |
| JPY | 431,500,000 | USD | 2,883,492 | JPM | 11/30/2023 | — | (24,144) |
| JPY | 582,973,000 | USD | 3,933,037 | BNP | 12/20/2023 | — | (56,398) |
| JPY | 1,466,300,000 | USD | 10,165,554 | MSI | 12/20/2023 | — | (414,991) |
| JPY | 16,300,000 | USD | 109,859 | SCB | 12/20/2023 | — | (1,468) |
| KRW | 5,255,910,000 | USD | 3,900,142 | BNP | 11/30/2023 | — | (9,364) |
| SEK | 22,110,000 | USD | 1,977,979 | GSI | 11/30/2023 | 4,948 | — |
| USD | 6,618,907 | CNY | 48,136,000 | SSB | 12/20/2023 | — | (55,317) |
| USD | 14,631,538 | EUR | 13,849,000 | DB | 11/30/2023 | — | (38,501) |
| USD | 2,954,083 | EUR | 2,796,000 | MSI | 11/30/2023 | — | (7,678) |
| USD | 4,240,002 | EUR | 3,942,000 | DB | 12/20/2023 | 59,674 | — |
| USD | 1,264,400 | HUF | 464,200,000 | MSI | 11/30/2023 | — | (13,946) |
| USD | 1,199,673 | JPY | 179,600,000 | MSI | 11/30/2023 | 9,547 | — |
| USD | 1,379,385 | JPY | 207,500,000 | CITI | 12/20/2023 | — | (443) |
| USD | 4,041,631 | JPY | 582,973,000 | MSI | 12/20/2023 | 164,993 | — |
| USD | 3,875,242 | KRW | 5,255,390,000 | SSB | 11/30/2023 | — | (15,152) |
| $292,616 | $(858,681) | ||||||
| SEE NOTES TO FINANCIAL STATEMENTS | ANNUAL REPORT | JOHN HANCOCK SEAPORT LONG/SHORT FUND | 23 |
| Options on securities | ||||||||
| Counterparty (OTC)/ Exchange- traded | Name of issuer | Currency | Exercise price | Expiration date | Number of contracts | Notional amount | Premium | Value |
| Calls | ||||||||
| GSI | China Vanke Company, Ltd., H Shares | CNY | 19.04 | Dec 2023 | 23,400 | 23,400 | $481 | $(10) |
| MSI | Hong Kong Exchanges & Clearing, Ltd. | HKD | 349.80 | Nov 2023 | 1,330 | 1,330 | 411 | (11) |
| JPM | JD.com, Inc., Class A | HKD | 165.75 | Dec 2023 | 2,386 | 2,386 | 1,033 | (35) |
| MSI | JD.com, Inc., Class A | HKD | 187.52 | Dec 2023 | 3,650 | 3,650 | 3,972 | (16) |
| MSI | Kweichow Moutai Company, Ltd., Class A | CNY | 2,169.62 | Nov 2023 | 260 | 260 | 13 | — |
| GSI | Li Ning Company, Ltd. | HKD | 53.73 | Dec 2023 | 11,441 | 11,441 | 3,842 | (1) |
| MSI | Ping An Insurance Group Company of China, Ltd., H Shares | HKD | 62.37 | Dec 2023 | 12,500 | 12,500 | 1,895 | (18) |
| MSI | Shanghai International Airport Company, Ltd., Class A | CNY | 57.84 | Nov 2023 | 8,756 | 8,756 | 250 | — |
| JPM | Tencent Holdings, Ltd. | HKD | 363.12 | Nov 2023 | 1,420 | 1,420 | 379 | (38) |
| $12,276 | $(129) | |||||||
| Exchange-traded | Cboe Global Markets, Inc. | USD | 200.00 | Mar 2024 | 451 | 45,100 | 18,196 | (21,423) |
| Exchange-traded | Datadog, Inc., Class A | USD | 105.00 | Nov 2023 | 127 | 12,700 | 12,525 | (4,382) |
| Exchange-traded | Gitlab, Inc., Class A | USD | 50.00 | Nov 2023 | 224 | 22,400 | 6,618 | (6,720) |
| Exchange-traded | HubSpot, Inc. | USD | 530.00 | Nov 2023 | 51 | 5,100 | 20,509 | (3,953) |
| Exchange-traded | JD.com, Inc., Class A | USD | 42.50 | Dec 2023 | 802 | 80,200 | 65,931 | (2,406) |
| Exchange-traded | NVIDIA Corp. | USD | 500.00 | Nov 2023 | 34 | 3,400 | 16,709 | (7,412) |
| Exchange-traded | NVIDIA Corp. | USD | 510.00 | Nov 2023 | 38 | 3,800 | 19,395 | (6,156) |
| $159,883 | $(52,452) | |||||||
| Puts | ||||||||
| MSI | JD.com, Inc., Class A | HKD | 100.97 | Dec 2023 | 3,650 | 3,650 | $1,795 | $(3,395) |
| JPM | JD.com, Inc., Class A | HKD | 106.08 | Dec 2023 | 2,386 | 2,386 | 666 | (3,137) |
| GSI | Li Ning Company, Ltd. | HKD | 38.06 | Dec 2023 | 11,441 | 11,441 | 3,103 | (20,136) |
| $5,564 | $(26,668) | |||||||
| Exchange-traded | JD.com, Inc., Class A | USD | 27.50 | Dec 2023 | 802 | 80,200 | 45,400 | (230,573) |
| $223,123 | $(309,822) | |||||||
| 24 | JOHN HANCOCK SEAPORT LONG/SHORT FUND | ANNUAL REPORT | SEE NOTES TO FINANCIAL STATEMENTS |
| Total return swaps | ||||||||||
| Pay/ receive total return* | Reference entity | Floating/ fixed rate | Payment frequency | Currency | Notional amount | Maturity date | Counterparty (OTC) | Unamortized upfront payment paid (received) | Unrealized appreciation (depreciation) | Value |
| Pay | ARK Innovation ETF | 1-Day USD OBFR - 2.85% | Monthly | USD | 1,780,278 | May 2033 | GSI | — | $49,164 | $49,164 |
| Pay | Consumer Discretionary Select Sector SPDR Fund | 1-Day USD OBFR - 0.34% | Monthly | USD | 328,399 | May 2033 | GSI | — | (966) | (966) |
| Pay | GS Custom Basket | 1-Day USD OBFR - 0.50% | Monthly | USD | 2,402,351 | May 2033 | GSI | — | 32,810 | 32,810 |
| Pay | Invesco QQQ Trust Series 1 | 1-Day USD OBFR - 0.20% | Monthly | USD | 101,792 | May 2033 | GSI | — | 800 | 800 |
| Pay | iShares Russell Mid-Cap Growth ETF | 1-Day USD OBFR - 0.55% | Monthly | USD | 9,067,848 | May 2033 | GSI | — | 198,478 | 198,478 |
| Pay | iShares Semiconductor ETF | 1-Day USD OBFR - 0.74% | Monthly | USD | 1,299,167 | May 2033 | GSI | — | 34,984 | 34,984 |
| Pay | SPDR S&P 500 ETF | 1-Day USD OBFR - 0.05% | Monthly | USD | 7,165,705 | May 2033 | GSI | — | 26,478 | 26,478 |
| Pay | SPDR S&P Pharmaceuticals ETF | 1-Day USD OBFR - 1.70% | Monthly | USD | 1,655,999 | May 2033 | GSI | — | 42,095 | 42,095 |
| Pay | SPDR S&P Regional Banking ETF | 1-Day USD OBFR - 0.70% | Monthly | USD | 9,774,498 | May 2033 | GSI | — | (89,296) | (89,296) |
| Pay | TOPIX Banks Index | 1-Day JPY TONAR Compounded OIS - 0.25% | Monthly | JPY | 174,594,824 | May 2033 | GSI | — | (18,129) | (18,129) |
| Pay | Vanguard FTSE Developed Markets ETF | 1-Day USD OBFR - 0.39% | Monthly | USD | 983,635 | May 2033 | GSI | — | (704) | (704) |
| Pay | iShares Expanded Tech Sector ETF | 1-Day USD OBFR - 0.82% | Monthly | USD | 1,903,089 | May 2028 | JPM | — | 57,032 | 57,032 |
| Pay | iShares MSCI Eurozone ETF | 1-Day USD OBFR - 0.95% | Monthly | USD | 95,317 | May 2028 | JPM | — | 1,138 | 1,138 |
| Pay | iShares Russell Mid-Cap Growth ETF | 1-Day USD OBFR - 0.20% | Monthly | USD | 3,479,697 | May 2028 | JPM | — | 136,448 | 136,448 |
| Pay | iShares Semiconductor ETF | 1-Day USD OBFR - 0.44% | Monthly | USD | 8,244,909 | May 2028 | JPM | — | 513,854 | 513,854 |
| Pay | SPDR S&P Biotech ETF | 1-Day USD OBFR - 2.07% | Monthly | USD | 11,848,112 | May 2028 | JPM | — | 1,010,672 | 1,010,672 |
| Pay | SPDR S&P Regional Banking ETF | 1-Day USD OBFR - 1.00% | Monthly | USD | 928,156 | May 2028 | JPM | — | 31,372 | 31,372 |
| SEE NOTES TO FINANCIAL STATEMENTS | ANNUAL REPORT | JOHN HANCOCK SEAPORT LONG/SHORT FUND | 25 |
| Total return swaps (continued) | ||||||||||
| Pay/ receive total return* | Reference entity | Floating/ fixed rate | Payment frequency | Currency | Notional amount | Maturity date | Counterparty (OTC) | Unamortized upfront payment paid (received) | Unrealized appreciation (depreciation) | Value |
| Pay | VanEck Semiconductor ETF | 1-Day USD OBFR - 0.44% | Monthly | USD | 21,201 | May 2028 | JPM | — | $986 | $986 |
| Pay | ARK Innovation ETF | 1-Day USD OBFR - 3.23% | Monthly | USD | 1,674,003 | May 2033 | MSI | — | 141,283 | 141,283 |
| Pay | Consumer Discretionary Select Sector SPDR Fund | 1-Day USD OBFR - 0.20% | Monthly | USD | 32,249,996 | May 2033 | MSI | — | 1,588,210 | 1,588,210 |
| Pay | Euro STOXX 50 Index | 1-Day EUR ESTR Compounded OIS - 0.40% | Monthly | EUR | 1,581,097 | May 2033 | MSI | — | 37,979 | 37,979 |
| Pay | Financial Select Sector SPDR Fund | 1-Day USD OBFR - 0.20% | Monthly | USD | 21,108,363 | May 2033 | MSI | — | 766,542 | 766,542 |
| Pay | Health Care Select Sector SPDR Fund | 1-Day USD OBFR - 0.20% | Monthly | USD | 20,946,144 | May 2033 | MSI | — | 1,102,060 | 1,102,060 |
| Pay | Industrial Select Sector SPDR Fund | 1-Day USD OBFR - 0.20% | Monthly | USD | 4,331,611 | May 2033 | MSI | — | 197,256 | 197,256 |
| Pay | Invesco QQQ Trust Series 1 | 1-Day USD OBFR - 0.20% | Monthly | USD | 7,518,602 | May 2033 | MSI | — | 392,900 | 392,900 |
| Pay | iShares Biotechnology ETF | 1-Day USD OBFR - 1.38% | Monthly | USD | 5,940,600 | May 2033 | MSI | — | 430,998 | 430,998 |
| Pay | iShares Expanded Tech-Software Sector ETF | 1-Day USD OBFR - 3.98% | Monthly | USD | 2,938,666 | May 2033 | MSI | — | 137,837 | 137,837 |
| Pay | iShares MSCI EAFE Value ETF | 1-Day USD OBFR - 0.20% | Monthly | USD | 7,426,994 | May 2033 | MSI | — | 258,724 | 258,724 |
| Pay | iShares MSCI Eurozone ETF | 1-Day USD OBFR - 0.58% | Monthly | USD | 5,230,351 | May 2033 | MSI | — | 108,234 | 108,234 |
| Pay | iShares MSCI Indonesia ETF | 1-Day USD OBFR - 2.78% | Monthly | USD | 23,098 | May 2033 | MSI | — | 1,540 | 1,540 |
| Pay | iShares Russell 2000 ETF | 1-Day USD OBFR - 0.68% | Monthly | USD | 12,970,209 | May 2033 | MSI | — | 580,246 | 580,246 |
| Pay | iShares Russell 2000 Value ETF | 1-Day USD OBFR - 0.98% | Monthly | USD | 20,903,062 | May 2033 | MSI | — | 703,426 | 703,426 |
| Pay | iShares Russell Mid-Cap Growth ETF | 1-Day USD OBFR - 0.88% | Monthly | USD | 43,308,747 | May 2033 | MSI | — | 2,511,101 | 2,511,101 |
| Pay | iShares Semiconductor ETF | 1-Day USD OBFR - 0.88% | Monthly | USD | 7,461,413 | May 2033 | MSI | — | 649,003 | 649,003 |
| Pay | SPDR S&P 500 ETF | 1-Day USD OBFR - 0.20% | Monthly | USD | 1,742,416 | May 2033 | MSI | — | 68,429 | 68,429 |
| 26 | JOHN HANCOCK SEAPORT LONG/SHORT FUND | ANNUAL REPORT | SEE NOTES TO FINANCIAL STATEMENTS |
| Total return swaps (continued) | ||||||||||
| Pay/ receive total return* | Reference entity | Floating/ fixed rate | Payment frequency | Currency | Notional amount | Maturity date | Counterparty (OTC) | Unamortized upfront payment paid (received) | Unrealized appreciation (depreciation) | Value |
| Pay | SPDR S&P Biotech ETF | 1-Day USD OBFR - 3.08% | Monthly | USD | 3,940,045 | May 2033 | MSI | — | $231,501 | $231,501 |
| Pay | SPDR S&P Homebuilders ETF | 1-Day USD OBFR - 1.28% | Monthly | USD | 4,456,773 | May 2033 | MSI | — | (45,731) | (45,731) |
| Pay | SPDR S&P Oil & Gas Exploration & Production ETF | 1-Day USD OBFR - 1.08% | Monthly | USD | 19,718,632 | May 2033 | MSI | $(26,267) | 663,125 | 636,858 |
| Pay | SPDR S&P Pharmaceuticals ETF | 1-Day USD OBFR - 2.13% | Monthly | USD | 3,184,302 | May 2033 | MSI | — | 237,355 | 237,355 |
| Pay | SPDR S&P Regional Banking ETF | 1-Day USD OBFR - 1.38% | Monthly | USD | 13,371,513 | May 2033 | MSI | — | 639,717 | 639,717 |
| Pay | SPDR S&P Retail ETF | 1-Day USD OBFR - 2.43% | Monthly | USD | 4,237,079 | May 2033 | MSI | — | 116,417 | 116,417 |
| Pay | VanEck Oil Services ETF | 1-Day USD OBFR - 1.48% | Monthly | USD | 3,479,509 | May 2033 | MSI | — | 210,593 | 210,593 |
| Pay | Vanguard FTSE Developed Markets ETF | 1-Day USD OBFR - 0.53% | Monthly | USD | 71,120,009 | May 2033 | MSI | — | 2,381,673 | 2,381,673 |
| Pay | Vanguard FTSE Europe ETF | 1-Day USD OBFR - 0.20% | Monthly | USD | 10,345,291 | May 2033 | MSI | — | 275,047 | 275,047 |
| Pay | iShares iBoxx $ High Yield Corporate Bond ETF | 1-Day USD OBFR - 3.68% | Monthly | USD | 92,222 | May 2033 | MSI | — | 402 | 402 |
| Receive | Agilent Technologies, Inc. | 1-Day USD OBFR + 0.25% | Monthly | USD | 845,877 | May 2033 | GSI | — | (44,318) | (44,318) |
| Receive | Alcon, Inc. | 1-Day CHF SARON Compounded OIS + 0.20% | Monthly | CHF | 389,420 | May 2033 | GSI | — | 2,575 | 2,575 |
| Receive | Alphabet, Inc., Class A | 1-Day USD OBFR + 0.25% | Monthly | USD | 692,509 | May 2033 | GSI | — | (59,651) | (59,651) |
| Receive | Amazon.com, Inc. | 1-Day USD OBFR + 0.25% | Monthly | USD | 660,647 | May 2033 | GSI | — | 41,021 | 41,021 |
| Receive | Amoy Diagnostics Company, Ltd., Class A | 1-Day USD OBFR + 0.75% | Monthly | USD | 263,190 | May 2033 | GSI | — | (10,530) | (10,530) |
| Receive | Ares Management Corp., Class A | 1-Day USD OBFR + 0.25% | Monthly | USD | 542,287 | May 2033 | GSI | — | — | — |
| Receive | AstraZeneca PLC | 1-Day GBP SONIA Compounded OIS + 0.20% | Monthly | GBP | 302,470 | May 2033 | GSI | — | (4,999) | (4,999) |
| SEE NOTES TO FINANCIAL STATEMENTS | ANNUAL REPORT | JOHN HANCOCK SEAPORT LONG/SHORT FUND | 27 |
| Total return swaps (continued) | ||||||||||
| Pay/ receive total return* | Reference entity | Floating/ fixed rate | Payment frequency | Currency | Notional amount | Maturity date | Counterparty (OTC) | Unamortized upfront payment paid (received) | Unrealized appreciation (depreciation) | Value |
| Receive | Bayer AG | 1-Day EUR ESTR Compounded OIS + 0.20% | Monthly | EUR | 709,886 | May 2033 | GSI | — | $(12,225) | $(12,225) |
| Receive | Boliden AB | 1-Month SEK STIBOR + 0.20% | Monthly | SEK | 4,683,021 | May 2033 | GSI | — | 26,337 | 26,337 |
| Receive | Boston Scientific Corp. | 1-Day USD OBFR + 0.25% | Monthly | USD | 2,997,695 | May 2033 | GSI | — | 64,735 | 64,735 |
| Receive | China Gas Holdings, Ltd. | 1-Day HKD HONIA Compounded OIS + 0.20% | Monthly | HKD | 1,530,865 | May 2033 | GSI | — | 233 | 233 |
| Receive | China Longyuan Power Group Corp, Ltd., H Shares | 1-Day HKD HONIA Compounded OIS + 0.20% | Monthly | HKD | 3,329,304 | May 2033 | GSI | — | 22,871 | 22,871 |
| Receive | China Resources Gas Group, Ltd. | 1-Day HKD HONIA Compounded OIS + 0.20% | Monthly | HKD | 2,461,758 | May 2033 | GSI | — | 18,507 | 18,507 |
| Receive | Contemporary Amperex Technology Company, Ltd., Class A | 1-Day USD OBFR + 0.75% | Monthly | USD | 135,459 | May 2033 | GSI | — | 3,528 | 3,528 |
| Receive | Daiichi Sankyo Company, Ltd. | 1-Day JPY TONAR Compounded OIS + 0.20% | Monthly | JPY | 325,769,535 | May 2033 | GSI | — | (89,098) | (89,098) |
| Receive | Danske Bank A/S | 1-Month DKK CIBOR + 0.20% | Monthly | DKK | 2,137,596 | May 2033 | GSI | — | 8,948 | 8,948 |
| Receive | Datadog, Inc., Class A | 1-Day USD OBFR + 0.25% | Monthly | USD | 847,285 | May 2033 | GSI | — | (46,378) | (46,378) |
| Receive | Edwards Lifesciences Corp. | 1-Day USD OBFR + 0.25% | Monthly | USD | 121,590 | May 2033 | GSI | — | (10,224) | (10,224) |
| Receive | Eisai Company, Ltd. | 1-Day JPY TONAR Compounded OIS + 0.20% | Monthly | JPY | 84,116,340 | May 2033 | GSI | — | 1,729 | 1,729 |
| Receive | Elanco Animal Health, Inc. | 1-Day USD OBFR + 0.25% | Monthly | USD | 3,435 | May 2033 | GSI | — | (135) | (135) |
| Receive | Encompass Health Corp. | 1-Day USD OBFR + 0.25% | Monthly | USD | 722,375 | May 2033 | GSI | — | (6,354) | (6,354) |
| Receive | EXOR NV | 1-Day EUR ESTR Compounded OIS + 0.20% | Monthly | EUR | 261,996 | May 2033 | GSI | — | — | — |
| Receive | FinecoBank SpA | 1-Day EUR ESTR Compounded OIS + 0.20% | Monthly | EUR | 81,227 | May 2033 | GSI | — | 1,399 | 1,399 |
| 28 | JOHN HANCOCK SEAPORT LONG/SHORT FUND | ANNUAL REPORT | SEE NOTES TO FINANCIAL STATEMENTS |
| Total return swaps (continued) | ||||||||||
| Pay/ receive total return* | Reference entity | Floating/ fixed rate | Payment frequency | Currency | Notional amount | Maturity date | Counterparty (OTC) | Unamortized upfront payment paid (received) | Unrealized appreciation (depreciation) | Value |
| Receive | FNB Corp. | 1-Day USD OBFR + 0.25% | Monthly | USD | 59,116 | May 2033 | GSI | — | $(70) | $(70) |
| Receive | Genmab A/S | 1-Month DKK CIBOR + 0.20% | Monthly | DKK | 2,707,968 | May 2033 | GSI | — | (13,429) | (13,429) |
| Receive | Global Payments, Inc. | 1-Day USD OBFR + 0.25% | Monthly | USD | 852,478 | May 2033 | GSI | — | (38,672) | (38,672) |
| Receive | GSK PLC | 1-Day GBP SONIA Compounded OIS + 0.20% | Monthly | GBP | 1,130,492 | May 2033 | GSI | — | 1,981 | 1,981 |
| Receive | Humana, Inc. | 1-Day USD OBFR + 0.25% | Monthly | USD | 142,274 | May 2033 | GSI | — | 767 | 767 |
| Receive | IMI PLC | 1-Day GBP SONIA Compounded OIS + 0.20% | Monthly | GBP | 175,141 | May 2033 | GSI | — | 393 | 393 |
| Receive | Immatics NV | 1-Day USD OBFR + 0.25% | Monthly | USD | 540,614 | May 2033 | GSI | — | (66,976) | (66,976) |
| Receive | Inari Medical, Inc. | 1-Day USD OBFR + 0.25% | Monthly | USD | 89,242 | May 2033 | GSI | — | 8,820 | 8,820 |
| Receive | Intercontinental Exchange, Inc. | 1-Day USD OBFR + 0.25% | Monthly | USD | 415,985 | May 2033 | GSI | — | (2,725) | (2,725) |
| Receive | JPMorgan Chase & Co. | 1-Day USD OBFR + 0.25% | Monthly | USD | 810,384 | May 2033 | GSI | — | (10,721) | (10,721) |
| Receive | KKR & Company, Inc. | 1-Day USD OBFR + 0.25% | Monthly | USD | 184,607 | May 2033 | GSI | — | 1,429 | 1,429 |
| Receive | Kunlun Energy Company, Ltd. | 1-Day HKD HONIA Compounded OIS + 0.20% | Monthly | HKD | 3,898,571 | May 2033 | GSI | — | (8,051) | (8,051) |
| Receive | Molina Healthcare, Inc. | 1-Day USD OBFR + 0.25% | Monthly | USD | 579,855 | May 2033 | GSI | — | (27,178) | (27,178) |
| Receive | MongoDB, Inc. | 1-Day USD OBFR + 0.25% | Monthly | USD | 67,525 | May 2033 | GSI | — | (409) | (409) |
| Receive | Nikon Corp. | 1-Day JPY TONAR Compounded OIS + 0.20% | Monthly | JPY | 57,067,000 | May 2033 | GSI | — | (6,541) | (6,541) |
| Receive | Novartis AG | 1-Day CHF SARON Compounded OIS + 0.20% | Monthly | CHF | 864,536 | May 2033 | GSI | — | 4,046 | 4,046 |
| Receive | Panasonic Holdings Corp. | 1-Day JPY TONAR Compounded OIS + 0.20% | Monthly | JPY | 16,337,213 | May 2033 | GSI | — | (6,461) | (6,461) |
| Receive | Pfizer, Inc. | 1-Day USD OBFR + 0.25% | Monthly | USD | 3,093,014 | May 2033 | GSI | — | (12,739) | (12,739) |
| SEE NOTES TO FINANCIAL STATEMENTS | ANNUAL REPORT | JOHN HANCOCK SEAPORT LONG/SHORT FUND | 29 |
| Total return swaps (continued) | ||||||||||
| Pay/ receive total return* | Reference entity | Floating/ fixed rate | Payment frequency | Currency | Notional amount | Maturity date | Counterparty (OTC) | Unamortized upfront payment paid (received) | Unrealized appreciation (depreciation) | Value |
| Receive | PTC Therapeutics, Inc. | 1-Day USD OBFR + 0.25% | Monthly | USD | 525,126 | May 2033 | GSI | — | $(101,528) | $(101,528) |
| Receive | Remegen Company, Ltd., H Shares | 1-Day HKD HONIA Compounded OIS + 0.20% | Monthly | HKD | 2,158,691 | May 2033 | GSI | — | 56,013 | 56,013 |
| Receive | Resona Holdings, Inc. | 1-Day JPY TONAR Compounded OIS + 0.20% | Monthly | JPY | 119,737,420 | May 2033 | GSI | — | 17,293 | 17,293 |
| Receive | REVOLUTION Medicines, Inc. | 1-Day USD OBFR + 0.25% | Monthly | USD | 1,057,769 | May 2033 | GSI | — | (310,224) | (310,224) |
| Receive | RH | 1-Day USD OBFR + 0.25% | Monthly | USD | 180,846 | May 2033 | GSI | — | (11,487) | (11,487) |
| Receive | Sage Therapeutics, Inc. | 1-Day USD OBFR + 0.25% | Monthly | USD | 125,488 | May 2033 | GSI | — | 2,102 | 2,102 |
| Receive | Sandoz Group AG | 1-Day CHF SARON Compounded OIS + 0.20% | Monthly | CHF | 55,675 | May 2033 | GSI | — | (8,195) | (8,195) |
| Receive | ServiceNow, Inc. | 1-Day USD OBFR + 0.25% | Monthly | USD | 551,190 | May 2033 | GSI | — | 39,318 | 39,318 |
| Receive | Shandong Weigao Group Medical Polymer Company, Ltd., H Shares | 1-Day HKD HONIA Compounded OIS + 0.20% | Monthly | HKD | 1,391,784 | May 2033 | GSI | — | 18,650 | 18,650 |
| Receive | Shell PLC | 1-Day GBP SONIA Compounded OIS + 0.20% | Monthly | GBP | 703,695 | May 2033 | GSI | — | (24,808) | (24,808) |
| Receive | Shopify, Inc., Class A | 1-Day USD OBFR + 0.25% | Monthly | USD | 785,459 | May 2033 | GSI | — | (61,597) | (61,597) |
| Receive | Spotify Technology SA | 1-Day USD OBFR + 0.25% | Monthly | USD | 558,152 | May 2033 | GSI | — | 54,589 | 54,589 |
| Receive | StepStone Group, Inc., Class A | 1-Day USD OBFR + 0.25% | Monthly | USD | 117,324 | May 2033 | GSI | — | 152 | 152 |
| Receive | Sumitomo Mitsui Trust Holdings, Inc. | 1-Day JPY TONAR Compounded OIS + 0.20% | Monthly | JPY | 182,097,500 | May 2033 | GSI | — | 48,918 | 48,918 |
| Receive | Syndax Pharmaceuticals, Inc. | 1-Day USD OBFR + 0.25% | Monthly | USD | 375,640 | May 2033 | GSI | — | 83,430 | 83,430 |
| Receive | Tecan Group AG | 1-Day CHF SARON Compounded OIS + 0.20% | Monthly | CHF | 5,958 | May 2033 | GSI | — | (218) | (218) |
| 30 | JOHN HANCOCK SEAPORT LONG/SHORT FUND | ANNUAL REPORT | SEE NOTES TO FINANCIAL STATEMENTS |
| Total return swaps (continued) | ||||||||||
| Pay/ receive total return* | Reference entity | Floating/ fixed rate | Payment frequency | Currency | Notional amount | Maturity date | Counterparty (OTC) | Unamortized upfront payment paid (received) | Unrealized appreciation (depreciation) | Value |
| Receive | The Bank of New York Mellon Corp. | 1-Day USD OBFR + 0.25% | Monthly | USD | 5,312,358 | May 2033 | GSI | — | $154,391 | $154,391 |
| Receive | Tokyo Electron, Ltd. | 1-Day JPY TONAR Compounded OIS + 0.20% | Monthly | JPY | 66,280,500 | May 2033 | GSI | — | 1,562 | 1,562 |
| Receive | Veracyte, Inc. | 1-Day USD OBFR + 0.25% | Monthly | USD | 71,664 | May 2033 | GSI | — | (804) | (804) |
| Receive | Vodafone Group PLC | 1-Day GBP SONIA Compounded OIS + 0.20% | Monthly | GBP | 659,071 | May 2033 | GSI | — | (508) | (508) |
| Receive | Wolfspeed, Inc. | 1-Day USD OBFR + 0.25% | Monthly | USD | 500,612 | May 2033 | GSI | — | 30,186 | 30,186 |
| Receive | Zoetis, Inc. | 1-Day USD OBFR + 0.25% | Monthly | USD | 304,438 | May 2033 | GSI | — | (18,061) | (18,061) |
| Receive | Admiral Group PLC | 1-Day GBP SONIA Compounded OIS + 0.20% | Monthly | GBP | 1,047,885 | May 2028 | JPM | — | 81,172 | 81,172 |
| Receive | Agilent Technologies, Inc. | 1-Day USD OBFR + 0.25% | Monthly | USD | 480,133 | May 2028 | JPM | — | (29,962) | (29,962) |
| Receive | Alphabet, Inc., Class A | 1-Day USD OBFR + 0.25% | Monthly | USD | 2,100,339 | May 2028 | JPM | — | (177,723) | (177,723) |
| Receive | Alphabet, Inc., Class C | 1-Day USD OBFR + 0.25% | Monthly | USD | 2,390,160 | May 2028 | JPM | — | (195,658) | (195,658) |
| Receive | Amazon.com, Inc. | 1-Day USD OBFR + 0.25% | Monthly | USD | 1,370,697 | May 2028 | JPM | — | 73,132 | 73,132 |
| Receive | Antero Resources Corp. | 1-Day USD OBFR + 0.25% | Monthly | USD | 771,700 | May 2028 | JPM | — | 150,712 | 150,712 |
| Receive | ASML Holding NV, NYRS | 1-Day USD OBFR + 0.25% | Monthly | USD | 1,942,263 | May 2028 | JPM | — | 50,849 | 50,849 |
| Receive | ASPEED Technology, Inc. | 1-Day USD OBFR + 0.50% | Monthly | USD | 1,301,335 | May 2028 | JPM | — | (117,382) | (117,382) |
| Receive | AstraZeneca PLC | 1-Day GBP SONIA Compounded OIS + 0.20% | Monthly | GBP | 1,208,378 | May 2028 | JPM | — | (85,675) | (85,675) |
| Receive | Atlassian Corp., Class A | 1-Day USD OBFR + 0.25% | Monthly | USD | 630,612 | May 2028 | JPM | — | (26,254) | (26,254) |
| Receive | Becton Dickinson & Company | 1-Day USD OBFR + 0.25% | Monthly | USD | 277,235 | May 2028 | JPM | — | (9,684) | (9,684) |
| Receive | BFF Bank SpA | 1-Day EUR ESTR Compounded OIS + 0.20% | Monthly | EUR | 373,060 | May 2028 | JPM | — | (15,813) | (15,813) |
| Receive | Blueprint Medicines Corp. | 1-Day USD OBFR + 0.25% | Monthly | USD | 190,886 | May 2028 | JPM | — | 36,164 | 36,164 |
| SEE NOTES TO FINANCIAL STATEMENTS | ANNUAL REPORT | JOHN HANCOCK SEAPORT LONG/SHORT FUND | 31 |
| Total return swaps (continued) | ||||||||||
| Pay/ receive total return* | Reference entity | Floating/ fixed rate | Payment frequency | Currency | Notional amount | Maturity date | Counterparty (OTC) | Unamortized upfront payment paid (received) | Unrealized appreciation (depreciation) | Value |
| Receive | Chesapeake Energy Corp. | 1-Day USD OBFR + 0.25% | Monthly | USD | 110,182 | May 2028 | JPM | — | $2,381 | $2,381 |
| Receive | Daiichi Sankyo Company, Ltd. | 1-Day JPY TONAR Compounded OIS + 0.20% | Monthly | JPY | 29,016,000 | May 2028 | JPM | — | (4,976) | (4,976) |
| Receive | Disco Corp. | 1-Day JPY TONAR Compounded OIS + 0.20% | Monthly | JPY | 106,928,455 | May 2028 | JPM | — | (24,305) | (24,305) |
| Receive | Dynatrace, Inc. | 1-Day USD OBFR + 0.25% | Monthly | USD | 233,642 | May 2028 | JPM | — | (12,238) | (12,238) |
| Receive | Eisai Company, Ltd. | 1-Day JPY TONAR Compounded OIS + 0.20% | Monthly | JPY | 11,546,400 | May 2028 | JPM | — | (465) | (465) |
| Receive | Elanco Animal Health, Inc. | 1-Day USD OBFR + 0.25% | Monthly | USD | 179,194 | May 2028 | JPM | — | (18,025) | (18,025) |
| Receive | Encompass Health Corp. | 1-Day USD OBFR + 0.25% | Monthly | USD | 243,651 | May 2028 | JPM | — | (13,043) | (13,043) |
| Receive | EPAM Systems, Inc. | 1-Day USD OBFR + 0.25% | Monthly | USD | 47,602 | May 2028 | JPM | — | (4,243) | (4,243) |
| Receive | FinecoBank SpA | 1-Day EUR ESTR Compounded OIS + 0.20% | Monthly | EUR | 67,135 | May 2028 | JPM | — | 2,186 | 2,186 |
| Receive | HCA Healthcare, Inc. | 1-Day USD OBFR + 0.25% | Monthly | USD | 1,364,345 | May 2028 | JPM | — | (111,669) | (111,669) |
| Receive | Health Catalyst, Inc. | 1-Day USD OBFR + 0.25% | Monthly | USD | 201,982 | May 2028 | JPM | — | (46,996) | (46,996) |
| Receive | Hokuhoku Financial Group, Inc. | 1-Day JPY TONAR Compounded OIS + 0.20% | Monthly | JPY | 26,256,590 | May 2028 | JPM | — | 15,246 | 15,246 |
| Receive | Hologic, Inc. | 1-Day USD OBFR + 0.25% | Monthly | USD | 36,152 | May 2028 | JPM | — | (1,795) | (1,795) |
| Receive | Humana, Inc. | 1-Day USD OBFR + 0.25% | Monthly | USD | 529,565 | May 2028 | JPM | — | 36,828 | 36,828 |
| Receive | Immunocore Holdings PLC, ADR | 1-Day USD OBFR + 0.25% | Monthly | USD | 800,378 | May 2028 | JPM | — | (45,428) | (45,428) |
| Receive | Insulet Corp. | 1-Day USD OBFR + 0.25% | Monthly | USD | 68,512 | May 2028 | JPM | — | (6,559) | (6,559) |
| Receive | KKR & Company, Inc. | 1-Day USD OBFR + 0.25% | Monthly | USD | 253,160 | May 2028 | JPM | — | (21,857) | (21,857) |
| Receive | Laboratory Corp of America Holdings | 1-Day USD OBFR + 0.25% | Monthly | USD | 2,111,307 | May 2028 | JPM | — | (18,010) | (18,010) |
| Receive | Lam Research Corp. | 1-Day USD OBFR + 0.25% | Monthly | USD | 521,598 | May 2028 | JPM | — | (19,352) | (19,352) |
| 32 | JOHN HANCOCK SEAPORT LONG/SHORT FUND | ANNUAL REPORT | SEE NOTES TO FINANCIAL STATEMENTS |
| Total return swaps (continued) | ||||||||||
| Pay/ receive total return* | Reference entity | Floating/ fixed rate | Payment frequency | Currency | Notional amount | Maturity date | Counterparty (OTC) | Unamortized upfront payment paid (received) | Unrealized appreciation (depreciation) | Value |
| Receive | Lifetech Scientific Corp. | 1-Day HKD HONIA Compounded OIS + 0.30% | Monthly | HKD | 47,677 | May 2028 | JPM | — | $98 | $98 |
| Receive | Micron Technology, Inc. | 1-Day USD OBFR + 0.25% | Monthly | USD | 313,763 | May 2028 | JPM | — | (10,304) | (10,304) |
| Receive | Microsoft Corp. | 1-Day USD OBFR + 0.25% | Monthly | USD | 125,508 | May 2028 | JPM | — | 6,942 | 6,942 |
| Receive | Muenchener Rueckversicherungs Gesellschaft AG | 1-Day EUR ESTR Compounded OIS + 0.20% | Monthly | EUR | 51,730 | May 2028 | JPM | — | 1,311 | 1,311 |
| Receive | Nikon Corp. | 1-Day JPY TONAR Compounded OIS + 0.20% | Monthly | JPY | 111,438,000 | May 2028 | JPM | — | (22,341) | (22,341) |
| Receive | Novartis AG | 1-Day CHF SARON Compounded OIS + 0.20% | Monthly | CHF | 732,732 | May 2028 | JPM | — | (19,106) | (19,106) |
| Receive | ON Semiconductor Corp. | 1-Day USD OBFR + 0.25% | Monthly | USD | 306,479 | May 2028 | JPM | — | (89,739) | (89,739) |
| Receive | Onto Innovation, Inc. | 1-Day USD OBFR + 0.25% | Monthly | USD | 483,701 | May 2028 | JPM | — | — | — |
| Receive | Palo Alto Networks, Inc. | 1-Day USD OBFR + 0.25% | Monthly | USD | 1,640,175 | May 2028 | JPM | — | 37,892 | 37,892 |
| Receive | Panasonic Holdings Corp. | 1-Day JPY TONAR Compounded OIS + 0.20% | Monthly | JPY | 13,222,601 | May 2028 | JPM | — | (12,443) | (12,443) |
| Receive | Pfizer, Inc. | 1-Day USD OBFR + 0.25% | Monthly | USD | 1,944,373 | May 2028 | JPM | — | (175,372) | (175,372) |
| Receive | Quanta Computer, Inc. | 1-Day USD OBFR + 0.50% | Monthly | USD | 544,903 | May 2028 | JPM | — | (130,286) | (130,286) |
| Receive | QuidelOrtho Corp. | 1-Day USD OBFR + 0.25% | Monthly | USD | 393,215 | May 2028 | JPM | — | (68,875) | (68,875) |
| Receive | Renesas Electronics Corp. | 1-Day JPY TONAR Compounded OIS + 0.20% | Monthly | JPY | 194,059,028 | May 2028 | JPM | — | (120,291) | (120,291) |
| Receive | Sandoz Group AG | 1-Day CHF SARON Compounded OIS + 0.20% | Monthly | CHF | 42,168 | May 2028 | JPM | — | (2,678) | (2,678) |
| Receive | Shandong Weigao Group Medical Polymer Company, Ltd., H Shares | 1-Day HKD HONIA Compounded OIS + 0.30% | Monthly | HKD | 1,444,272 | May 2028 | JPM | — | 19,635 | 19,635 |
| SEE NOTES TO FINANCIAL STATEMENTS | ANNUAL REPORT | JOHN HANCOCK SEAPORT LONG/SHORT FUND | 33 |
| Total return swaps (continued) | ||||||||||
| Pay/ receive total return* | Reference entity | Floating/ fixed rate | Payment frequency | Currency | Notional amount | Maturity date | Counterparty (OTC) | Unamortized upfront payment paid (received) | Unrealized appreciation (depreciation) | Value |
| Receive | Shibaura Mechatronics Corp. | 1-Day JPY TONAR Compounded OIS + 0.20% | Monthly | JPY | 166,485,420 | May 2028 | JPM | — | $(66,605) | $(66,605) |
| Receive | Shopify, Inc., Class A | 1-Day USD OBFR + 0.25% | Monthly | USD | 581,605 | May 2028 | JPM | — | (57,611) | (57,611) |
| Receive | SKC Company, Ltd. | 1-Day USD OBFR + 0.50% | Monthly | USD | 591,081 | May 2028 | JPM | — | 59,799 | 59,799 |
| Receive | Sony Group Corp. | 1-Day JPY TONAR Compounded OIS + 0.20% | Monthly | JPY | 152,386,081 | May 2028 | JPM | — | 26,257 | 26,257 |
| Receive | Spotify Technology SA | 1-Day USD OBFR + 0.25% | Monthly | USD | 487,818 | May 2028 | JPM | — | 21,516 | 21,516 |
| Receive | Taiwan Semiconductor Manufacturing Company, Ltd. | 1-Day USD OBFR + 0.50% | Monthly | USD | 486,969 | May 2028 | JPM | — | 2,665 | 2,665 |
| Receive | Teleflex, Inc. | 1-Day USD OBFR + 0.25% | Monthly | USD | 593,143 | May 2028 | JPM | — | (36,942) | (36,942) |
| Receive | The Bank of New York Mellon Corp. | 1-Day USD OBFR + 0.25% | Monthly | USD | 301,912 | May 2028 | JPM | — | 18,060 | 18,060 |
| Receive | The Hachijuni Bank, Ltd. | 1-Day JPY TONAR Compounded OIS + 0.20% | Monthly | JPY | 43,701,300 | May 2028 | JPM | — | 18,167 | 18,167 |
| Receive | Thermo Fisher Scientific, Inc. | 1-Day USD OBFR + 0.25% | Monthly | USD | 1,904,927 | May 2028 | JPM | — | (208,476) | (208,476) |
| Receive | Tokyo Electron, Ltd. | 1-Day JPY TONAR Compounded OIS + 0.20% | Monthly | JPY | 114,361,695 | May 2028 | JPM | — | 15,344 | 15,344 |
| Receive | Tokyo Seimitsu Company, Ltd. | 1-Day JPY TONAR Compounded OIS + 0.20% | Monthly | JPY | 25,139,091 | May 2028 | JPM | — | (3,167) | (3,167) |
| Receive | Trupanion, Inc. | 1-Day USD OBFR + 0.25% | Monthly | USD | 20,917 | May 2028 | JPM | — | (3,784) | (3,784) |
| Receive | Unimicron Technology Corp. | 1-Day USD OBFR + 0.50% | Monthly | USD | 665,590 | May 2028 | JPM | — | (112,352) | (112,352) |
| Receive | UnitedHealth Group, Inc. | 1-Day USD OBFR + 0.25% | Monthly | USD | 2,977,098 | May 2028 | JPM | — | 101,797 | 101,797 |
| Receive | Vaxcyte, Inc. | 1-Day USD OBFR + 0.25% | Monthly | USD | 1,077,732 | May 2028 | JPM | — | (22,218) | (22,218) |
| Receive | Vodafone Group PLC | 1-Day GBP SONIA Compounded OIS + 0.20% | Monthly | GBP | 758,899 | May 2028 | JPM | — | (7,365) | (7,365) |
| 34 | JOHN HANCOCK SEAPORT LONG/SHORT FUND | ANNUAL REPORT | SEE NOTES TO FINANCIAL STATEMENTS |
| Total return swaps (continued) | ||||||||||
| Pay/ receive total return* | Reference entity | Floating/ fixed rate | Payment frequency | Currency | Notional amount | Maturity date | Counterparty (OTC) | Unamortized upfront payment paid (received) | Unrealized appreciation (depreciation) | Value |
| Receive | Waters Corp. | 1-Day USD OBFR + 0.25% | Monthly | USD | 866,861 | May 2028 | JPM | — | $(92,310) | $(92,310) |
| Receive | Weyerhaeuser Company | 1-Day USD OBFR + 0.25% | Monthly | USD | 752,211 | May 2028 | JPM | — | (35,771) | (35,771) |
| Receive | Wiwynn Corp. | 1-Day USD OBFR + 0.50% | Monthly | USD | 557,055 | May 2028 | JPM | — | (32,775) | (32,775) |
| Receive | Wolfspeed, Inc. | 1-Day USD OBFR + 0.25% | Monthly | USD | 854,834 | May 2028 | JPM | — | 24,199 | 24,199 |
| Receive | Abcam PLC, ADR | 1-Day USD OBFR + 0.25% | Monthly | USD | 211,760 | May 2033 | MSI | — | (807) | (807) |
| Receive | Accton Technology Corp. | 1-Day USD OBFR + 0.55% | Monthly | USD | 836,665 | May 2033 | MSI | — | (54,371) | (54,371) |
| Receive | Alnylam Pharmaceuticals, Inc. | 1-Day USD OBFR + 0.25% | Monthly | USD | 392,703 | May 2033 | MSI | — | (37,089) | (37,089) |
| Receive | Alphabet, Inc., Class C | 1-Day USD OBFR + 0.25% | Monthly | USD | 452,518 | May 2033 | MSI | — | (49,863) | (49,863) |
| Receive | Amicus Therapeutics, Inc. | 1-Day USD OBFR + 0.25% | Monthly | USD | 606,038 | May 2033 | MSI | — | 22,276 | 22,276 |
| Receive | ASML Holding NV, NYRS | 1-Day USD OBFR + 0.25% | Monthly | USD | 120,760 | May 2033 | MSI | — | (1,248) | (1,248) |
| Receive | AstraZeneca PLC | 1-Day GBP SONIA Compounded OIS + 0.30% | Monthly | GBP | 530,496 | May 2033 | MSI | — | (40,691) | (40,691) |
| Receive | Atlassian Corp., Class A | 1-Day USD OBFR + 0.25% | Monthly | USD | 786,454 | May 2033 | MSI | — | (64,257) | (64,257) |
| Receive | Bayer AG | 1-Day EUR ESTR Compounded OIS + 0.30% | Monthly | EUR | 548,120 | May 2033 | MSI | — | (37,585) | (37,585) |
| Receive | BILL Holdings, Inc. | 1-Day USD OBFR + 0.25% | Monthly | USD | 552,886 | May 2033 | MSI | — | (104,061) | (104,061) |
| Receive | Boston Scientific Corp. | 1-Day USD OBFR + 0.25% | Monthly | USD | 749,997 | May 2033 | MSI | — | 14,766 | 14,766 |
| Receive | British American Tobacco PLC | 1-Day GBP SONIA Compounded OIS + 0.30% | Monthly | GBP | 2,930,646 | May 2033 | MSI | — | 59,140 | 59,140 |
| Receive | Broadcom, Inc. | 1-Day USD OBFR + 0.25% | Monthly | USD | 1,456,748 | May 2033 | MSI | — | (101,791) | (101,791) |
| Receive | Canadian Natural Resources, Ltd. | 1-Day USD OBFR + 0.25% | Monthly | USD | 1,798,426 | May 2033 | MSI | — | (107,738) | (107,738) |
| Receive | Celldex Therapeutics, Inc. | 1-Day USD OBFR + 0.25% | Monthly | USD | 726,729 | May 2033 | MSI | — | (89,970) | (89,970) |
| Receive | Ceridian HCM Holding, Inc. | 1-Day USD OBFR + 0.25% | Monthly | USD | 677,292 | May 2033 | MSI | — | (94,730) | (94,730) |
| SEE NOTES TO FINANCIAL STATEMENTS | ANNUAL REPORT | JOHN HANCOCK SEAPORT LONG/SHORT FUND | 35 |
| Total return swaps (continued) | ||||||||||
| Pay/ receive total return* | Reference entity | Floating/ fixed rate | Payment frequency | Currency | Notional amount | Maturity date | Counterparty (OTC) | Unamortized upfront payment paid (received) | Unrealized appreciation (depreciation) | Value |
| Receive | Datadog, Inc., Class A | 1-Day USD OBFR + 0.25% | Monthly | USD | 409,241 | May 2033 | MSI | — | $(41,762) | $(41,762) |
| Receive | Disco Corp. | 1-Day JPY TONAR Compounded OIS + 0.35% | Monthly | JPY | 106,499,200 | May 2033 | MSI | — | (51,106) | (51,106) |
| Receive | Dynatrace, Inc. | 1-Day USD OBFR + 0.25% | Monthly | USD | 134,841 | May 2033 | MSI | — | (10,379) | (10,379) |
| Receive | Eisai Company, Ltd. | 1-Day JPY TONAR Compounded OIS + 0.35% | Monthly | JPY | 37,858,380 | May 2033 | MSI | — | (5,565) | (5,565) |
| Receive | Encompass Health Corp. | 1-Day USD OBFR + 0.25% | Monthly | USD | 648,987 | May 2033 | MSI | — | (13,657) | (13,657) |
| Receive | FinecoBank SpA | 1-Day EUR ESTR Compounded OIS + 0.30% | Monthly | EUR | 251,246 | May 2033 | MSI | — | 7,046 | 7,046 |
| Receive | Fluor Corp. | 1-Day USD OBFR + 0.25% | Monthly | USD | 473,911 | May 2033 | MSI | — | (43,486) | (43,486) |
| Receive | FNB Corp. | 1-Day USD OBFR + 0.25% | Monthly | USD | 1,827,261 | May 2033 | MSI | — | (63,311) | (63,311) |
| Receive | Genus PLC | 1-Day GBP SONIA Compounded OIS + 0.30% | Monthly | GBP | 70,365 | May 2033 | MSI | — | (2,113) | (2,113) |
| Receive | Humana, Inc. | 1-Day USD OBFR + 0.25% | Monthly | USD | 52,421 | May 2033 | MSI | — | (72) | (72) |
| Receive | Inari Medical, Inc. | 1-Day USD OBFR + 0.25% | Monthly | USD | 456,715 | May 2033 | MSI | — | 21,220 | 21,220 |
| Receive | Insulet Corp. | 1-Day USD OBFR + 0.25% | Monthly | USD | 510,070 | May 2033 | MSI | — | (13,590) | (13,590) |
| Receive | Intellia Therapeutics, Inc. | 1-Day USD OBFR + 0.25% | Monthly | USD | 412,627 | May 2033 | MSI | — | (64,635) | (64,635) |
| Receive | Intuitive Surgical, Inc. | 1-Day USD OBFR + 0.25% | Monthly | USD | 12,611 | May 2033 | MSI | — | (575) | (575) |
| Receive | Japan Post Insurance Company, Ltd. | 1-Day JPY TONAR Compounded OIS + 0.35% | Monthly | JPY | 82,134,500 | May 2033 | MSI | — | 68,088 | 68,088 |
| Receive | Kymera Therapeutics, Inc. | 1-Day USD OBFR + 0.25% | Monthly | USD | 34,779 | May 2033 | MSI | — | (2,817) | (2,817) |
| Receive | Lifetech Scientific Corp. | 1-Day HKD HONIA Compounded OIS + 0.40% | Monthly | HKD | 3,591,714 | May 2033 | MSI | — | 5,834 | 5,834 |
| Receive | MercadoLibre, Inc. | 1-Day USD OBFR + 0.25% | Monthly | USD | 841,173 | May 2033 | MSI | — | 8,234 | 8,234 |
| Receive | Molina Healthcare, Inc. | 1-Day USD OBFR + 0.25% | Monthly | USD | 70,790 | May 2033 | MSI | — | (4,680) | (4,680) |
| 36 | JOHN HANCOCK SEAPORT LONG/SHORT FUND | ANNUAL REPORT | SEE NOTES TO FINANCIAL STATEMENTS |
| Total return swaps (continued) | ||||||||||
| Pay/ receive total return* | Reference entity | Floating/ fixed rate | Payment frequency | Currency | Notional amount | Maturity date | Counterparty (OTC) | Unamortized upfront payment paid (received) | Unrealized appreciation (depreciation) | Value |
| Receive | MongoDB, Inc. | 1-Day USD OBFR + 0.25% | Monthly | USD | 967,524 | May 2033 | MSI | — | $(63,944) | $(63,944) |
| Receive | Morphic Holding, Inc. | 1-Day USD OBFR + 0.25% | Monthly | USD | 351,028 | May 2033 | MSI | — | (26,789) | (26,789) |
| Receive | Netflix, Inc. | 1-Day USD OBFR + 0.25% | Monthly | USD | 74,329 | May 2033 | MSI | — | 10,325 | 10,325 |
| Receive | Nova, Ltd. | 1-Day USD OBFR + 0.25% | Monthly | USD | 249,120 | May 2033 | MSI | — | (22,277) | (22,277) |
| Receive | Panasonic Holdings Corp. | 1-Day JPY TONAR Compounded OIS + 0.35% | Monthly | JPY | 24,734,900 | May 2033 | MSI | — | (20,443) | (20,443) |
| Receive | Pinterest, Inc., Class A | 1-Day USD OBFR + 0.25% | Monthly | USD | 103,493 | May 2033 | MSI | — | 8,702 | 8,702 |
| Receive | QuidelOrtho Corp. | 1-Day USD OBFR + 0.25% | Monthly | USD | 47,042 | May 2033 | MSI | — | (4,872) | (4,872) |
| Receive | Rambus, Inc. | 1-Day USD OBFR + 0.25% | Monthly | USD | 482,368 | May 2033 | MSI | — | (38,349) | (38,349) |
| Receive | Regeneron Pharmaceuticals, Inc. | 1-Day USD OBFR + 0.25% | Monthly | USD | 2,110,837 | May 2033 | MSI | — | (163,920) | (163,920) |
| Receive | Rheinmetall AG | 1-Day EUR ESTR Compounded OIS + 0.30% | Monthly | EUR | 393,616 | May 2033 | MSI | — | 1,715 | 1,715 |
| Receive | Rivian Automotive, Inc., Class A | 1-Day USD OBFR + 0.25% | Monthly | USD | 417,598 | May 2033 | MSI | — | (73,933) | (73,933) |
| Receive | Ross Stores, Inc. | 1-Day USD OBFR + 0.25% | Monthly | USD | 257,455 | May 2033 | MSI | — | (1,462) | (1,462) |
| Receive | Rotork PLC | 1-Day GBP SONIA Compounded OIS + 0.30% | Monthly | GBP | 946,810 | May 2033 | MSI | — | (58,761) | (58,761) |
| Receive | Royal Bank of Canada | 1-Day CAD CORRA Compounded OIS + 0.25% | Monthly | CAD | 3,998,326 | May 2033 | MSI | — | (106,920) | (106,920) |
| Receive | Sage Therapeutics, Inc. | 1-Day USD OBFR + 0.25% | Monthly | USD | 294,272 | May 2033 | MSI | — | (12,807) | (12,807) |
| Receive | Sandoz Group AG | 1-Day CHF SARON Compounded OIS + 0.30% | Monthly | CHF | 43,673 | May 2033 | MSI | — | (9,350) | (9,350) |
| Receive | Sarepta Therapeutics, Inc. | 1-Day USD OBFR + 0.25% | Monthly | USD | 1,585,985 | May 2033 | MSI | — | (681,119) | (681,119) |
| Receive | SCREEN Holdings Company, Ltd. | 1-Day JPY TONAR Compounded OIS + 0.35% | Monthly | JPY | 76,437,474 | May 2033 | MSI | — | (14,244) | (14,244) |
| SEE NOTES TO FINANCIAL STATEMENTS | ANNUAL REPORT | JOHN HANCOCK SEAPORT LONG/SHORT FUND | 37 |
| Total return swaps (continued) | ||||||||||
| Pay/ receive total return* | Reference entity | Floating/ fixed rate | Payment frequency | Currency | Notional amount | Maturity date | Counterparty (OTC) | Unamortized upfront payment paid (received) | Unrealized appreciation (depreciation) | Value |
| Receive | ServiceNow, Inc. | 1-Day USD OBFR + 0.25% | Monthly | USD | 324,358 | May 2033 | MSI | — | $17,098 | $17,098 |
| Receive | Shandong Weigao Group Medical Polymer Company, Ltd., H Shares | 1-Day HKD HONIA Compounded OIS + 0.40% | Monthly | HKD | 28,958 | May 2033 | MSI | — | 277 | 277 |
| Receive | Shopify, Inc., Class A | 1-Day USD OBFR + 0.25% | Monthly | USD | 1,017,328 | May 2033 | MSI | — | (118,387) | (118,387) |
| Receive | Stryker Corp. | 1-Day USD OBFR + 0.25% | Monthly | USD | 1,264,199 | May 2033 | MSI | — | 30,319 | 30,319 |
| Receive | Talanx AG | 1-Day EUR ESTR Compounded OIS + 0.30% | Monthly | EUR | 295,547 | May 2033 | MSI | — | (428) | (428) |
| Receive | The Azek Company, Inc. | 1-Day USD OBFR + 0.25% | Monthly | USD | 206,371 | May 2033 | MSI | — | (14,175) | (14,175) |
| Receive | The Chiba Bank, Ltd. | 1-Day JPY TONAR Compounded OIS + 0.35% | Monthly | JPY | 14,516,951 | May 2033 | MSI | — | 11,654 | 11,654 |
| Receive | Tokyo Kiraboshi Financial Group, Inc. | 1-Day JPY TONAR Compounded OIS + 0.35% | Monthly | JPY | 46,204,152 | May 2033 | MSI | — | 2,858 | 2,858 |
| Receive | Tokyo Seimitsu Company, Ltd. | 1-Day JPY TONAR Compounded OIS + 0.35% | Monthly | JPY | 47,168,000 | May 2033 | MSI | — | (8,426) | (8,426) |
| Receive | Trupanion, Inc. | 1-Day USD OBFR + 0.25% | Monthly | USD | 343,876 | May 2033 | MSI | — | (79,672) | (79,672) |
| Receive | Ultragenyx Pharmaceutical, Inc. | 1-Day USD OBFR + 0.25% | Monthly | USD | 533,273 | May 2033 | MSI | — | (24,439) | (24,439) |
| Receive | Ulvac, Inc. | 1-Day JPY TONAR Compounded OIS + 0.35% | Monthly | JPY | 85,816,200 | May 2033 | MSI | — | (26,254) | (26,254) |
| Receive | Unimicron Technology Corp. | 1-Day USD OBFR + 0.55% | Monthly | USD | 402,387 | May 2033 | MSI | — | (50,943) | (50,943) |
| Receive | Veracyte, Inc. | 1-Day USD OBFR + 0.25% | Monthly | USD | 255,977 | May 2033 | MSI | — | (7,266) | (7,266) |
| Receive | Zoetis, Inc. | 1-Day USD OBFR + 0.25% | Monthly | USD | 1,074,554 | May 2033 | MSI | — | (111,439) | (111,439) |
| Receive | Airbnb, Inc., Class A | 1-Day USD OBFR + 0.25% | Monthly | USD | 108,540 | May 2033 | MSI | — | (6,207) | (6,207) |
| Receive | Alphabet, Inc., Class A | 1-Day USD OBFR + 0.25% | Monthly | USD | 1,427,949 | May 2033 | MSI | — | (157,098) | (157,098) |
| Receive | Danaher Corp. | 1-Day USD OBFR + 0.25% | Monthly | USD | 63,766 | May 2033 | MSI | — | (5,634) | (5,634) |
| 38 | JOHN HANCOCK SEAPORT LONG/SHORT FUND | ANNUAL REPORT | SEE NOTES TO FINANCIAL STATEMENTS |
| Total return swaps (continued) | ||||||||||
| Pay/ receive total return* | Reference entity | Floating/ fixed rate | Payment frequency | Currency | Notional amount | Maturity date | Counterparty (OTC) | Unamortized upfront payment paid (received) | Unrealized appreciation (depreciation) | Value |
| Receive | Mastercard, Inc., Class A | 1-Day USD OBFR + 0.25% | Monthly | USD | 1,932,789 | May 2033 | MSI | — | $(120,394) | $(120,394) |
| Receive | Meta Platforms, Inc., Class A | 1-Day USD OBFR + 0.25% | Monthly | USD | 1,128,200 | May 2033 | MSI | — | (72,173) | (72,173) |
| Receive | Microsoft Corp. | 1-Day USD OBFR + 0.25% | Monthly | USD | 789,687 | May 2033 | MSI | — | 11,352 | 11,352 |
| Receive | Northern Trust Corp. | 1-Day USD OBFR + 0.25% | Monthly | USD | 529,498 | May 2033 | MSI | — | — | — |
| Receive | Novartis AG | 1-Day CHF SARON Compounded OIS + 0.30% | Monthly | CHF | 648,681 | May 2033 | MSI | — | (16,674) | (16,674) |
| Receive | NVIDIA Corp. | 1-Day USD OBFR + 0.25% | Monthly | USD | 11,985 | May 2033 | MSI | — | (1,407) | (1,407) |
| Receive | Palo Alto Networks, Inc. | 1-Day USD OBFR + 0.25% | Monthly | USD | 905,382 | May 2033 | MSI | — | (65,920) | (65,920) |
| Receive | Spotify Technology SA | 1-Day USD OBFR + 0.25% | Monthly | USD | 248,565 | May 2033 | MSI | — | 9,924 | 9,924 |
| $(26,267) | $11,600,874 | $11,574,607 | ||||||||
| Derivatives Currency Abbreviations | |
| AUD | Australian Dollar |
| CAD | Canadian Dollar |
| CHF | Swiss Franc |
| CNY | Chinese Yuan Renminbi |
| DKK | Danish Krone |
| EUR | Euro |
| GBP | Pound Sterling |
| HKD | Hong Kong Dollar |
| HUF | Hungarian Forint |
| JPY | Japanese Yen |
| KRW | Korean Won |
| SEK | Swedish Krona |
| USD | U.S. Dollar |
| Derivatives Abbreviations | |
| ADR | American Depositary Receipt |
| BNP | BNP Paribas |
| CIBOR | Copenhagen Interbank Offered Rate |
| CITI | Citibank, N.A. |
| CORRA | Canadian Overnight Repo Rate Average |
| SEE NOTES TO FINANCIAL STATEMENTS | ANNUAL REPORT | JOHN HANCOCK SEAPORT LONG/SHORT FUND | 39 |
| DB | Deutsche Bank AG |
| ESTR | Euro Short-Term Rate |
| GSI | Goldman Sachs International |
| HONIA | Hong Kong Overnight Index Average Rate |
| JPM | JPMorgan Chase Bank, N.A. |
| MSI | Morgan Stanley & Co. International PLC |
| NYRS | New York Registry Shares |
| OBFR | Overnight Bank Funding Rate |
| OIS | Overnight Index Swap |
| OTC | Over-the-counter |
| SARON | Swiss Average Rate Overnight |
| SCB | Standard Chartered Bank |
| SONIA | Sterling Overnight Interbank Average Rate |
| SSB | State Street Bank and Trust Company |
| STIBOR | Stockholm Interbank Offered Rate |
| TONAR | Tokyo Overnight Average Rate |
| 40 | JOHN HANCOCK SEAPORT LONG/SHORT FUND | ANNUAL REPORT | SEE NOTES TO FINANCIAL STATEMENTS |
| Assets | |
| Unaffiliated investments, at value (Cost $569,934,708) | $594,630,089 |
| Swap contracts, at value (net unamortized upfront payment of $(26,267)) | 18,370,745 |
| Unrealized appreciation on forward foreign currency contracts | 292,616 |
| Foreign currency, at value (Cost $2,965) | 3,714 |
| Collateral held at broker for futures contracts | 76,821 |
| Dividends and interest receivable | 873,869 |
| Receivable for fund shares sold | 181,511 |
| Receivable for investments sold | 2,552,437 |
| Receivable for securities lending income | 991 |
| Other assets | 124,033 |
| Total assets | 617,106,826 |
| Liabilities | |
| Unrealized depreciation on forward foreign currency contracts | 858,681 |
| Written options, at value (Premiums received $223,123) | 309,822 |
| Swap contracts, at value | 6,796,138 |
| Payable for futures variation margin | 18,724 |
| Due to custodian | 1,037,783 |
| Foreign capital gains tax payable | 15,065 |
| Payable for collateral on OTC derivatives | 14,723,000 |
| Payable for investments purchased | 3,884,051 |
| Payable for fund shares repurchased | 818,836 |
| Payable to affiliates | |
| Accounting and legal services fees | 48,803 |
| Transfer agent fees | 38,202 |
| Trustees’ fees | 1,045 |
| Other liabilities and accrued expenses | 227,427 |
| Total liabilities | 28,777,577 |
| Net assets | $588,329,249 |
| Net assets consist of | |
| Paid-in capital | $619,519,932 |
| Total distributable earnings (loss) | (31,190,683) |
| Net assets | $588,329,249 |
| SEE NOTES TO FINANCIAL STATEMENTS | ANNUAL REPORT | JOHN HANCOCK Seaport Long/Short Fund | 41 |
| Net asset value per share | |
| Based on net asset value and shares outstanding - the fund has an unlimited number of shares authorized with no par value | |
| Class A ($13,459,057 ÷ 1,263,093 shares)1 | $10.66 |
| Class C ($1,871,778 ÷ 186,349 shares)1 | $10.04 |
| Class I ($252,874,137 ÷ 23,036,381 shares) | $10.98 |
| Class R6 ($239,206,208 ÷ 21,508,644 shares) | $11.12 |
| Class NAV ($80,918,069 ÷ 7,274,593 shares) | $11.12 |
| Maximum offering price per share | |
| Class A (net asset value per share ÷ 95%)2 | $11.22 |
| 1 | Redemption price per share is equal to net asset value less any applicable contingent deferred sales charge. |
| 2 | On single retail sales of less than $50,000. On sales of $50,000 or more and on group sales the offering price is reduced. |
| 42 | JOHN HANCOCK Seaport Long/Short Fund | ANNUAL REPORT | SEE NOTES TO FINANCIAL STATEMENTS |
| Investment income | |
| Dividends | $11,700,640 |
| Interest | 6,945,257 |
| Securities lending | 16,778 |
| Less foreign taxes withheld | (457,488) |
| Total investment income | 18,205,187 |
| Expenses | |
| Investment management fees | 10,902,803 |
| Distribution and service fees | 58,802 |
| Accounting and legal services fees | 161,369 |
| Transfer agent fees | 641,742 |
| Trustees’ fees | 20,674 |
| Custodian fees | 284,145 |
| State registration fees | 93,931 |
| Printing and postage | 43,017 |
| Professional fees | 183,498 |
| Other | 120,858 |
| Total expenses | 12,510,839 |
| Less expense reductions | (55,549) |
| Net expenses | 12,455,290 |
| Net investment income | 5,749,897 |
| Realized and unrealized gain (loss) | |
| Net realized gain (loss) on | |
| Unaffiliated investments and foreign currency transactions | 2,269,226 |
| Affiliated investments | 1,529 |
| Futures contracts | (302,155) |
| Forward foreign currency contracts | (1,937,960) |
| Written options | 1,011,985 |
| Swap contracts | (24,253,838) |
| (23,211,213) | |
| Change in net unrealized appreciation (depreciation) of | |
| Unaffiliated investments and translation of assets and liabilities in foreign currencies | 29,106,892 |
| Affiliated investments | 109 |
| Futures contracts | 223,504 |
| Forward foreign currency contracts | (641,510) |
| Written options | 598,048 |
| Swap contracts | 20,817,667 |
| 50,104,710 | |
| Net realized and unrealized gain | 26,893,497 |
| Increase in net assets from operations | $32,643,394 |
| SEE NOTES TO FINANCIAL STATEMENTS | ANNUAL REPORT | JOHN HANCOCK Seaport Long/Short Fund | 43 |
| Year ended 10-31-23 | Year ended 10-31-22 | |
| Increase (decrease) in net assets | ||
| From operations | ||
| Net investment income (loss) | $5,749,897 | $(1,624,993) |
| Net realized loss | (23,211,213) | (21,576,089) |
| Change in net unrealized appreciation (depreciation) | 50,104,710 | (93,823,763) |
| Increase (decrease) in net assets resulting from operations | 32,643,394 | (117,024,845) |
| Distributions to shareholders | ||
| From earnings | ||
| Class A | (322,770) | (958,141) |
| Class C | (67,590) | (268,997) |
| Class I | (21,284,340) | (61,631,044) |
| Class R6 | (1,219,858) | (3,086,648) |
| Class NAV | (2,596,800) | (3,588,697) |
| Total distributions | (25,491,358) | (69,533,527) |
| From fund share transactions | (237,118,793) | (142,510,196) |
| Total decrease | (229,966,757) | (329,068,568) |
| Net assets | ||
| Beginning of year | 818,296,006 | 1,147,364,574 |
| End of year | $588,329,249 | $818,296,006 |
| 44 | JOHN HANCOCK Seaport Long/Short Fund | ANNUAL REPORT | SEE NOTES TO FINANCIAL STATEMENTS |
| CLASS A SHARES Period ended | 10-31-23 | 10-31-22 | 10-31-21 | 10-31-20 | 10-31-19 |
| Per share operating performance | |||||
| Net asset value, beginning of period | $10.61 | $12.73 | $11.60 | $11.02 | $10.73 |
| Net investment income (loss)1 | 0.04 | (0.05) | (0.15) | (0.10) | (0.03) |
| Net realized and unrealized gain (loss) on investments | 0.32 | (1.25) | 1.73 | 0.78 | 0.67 |
| Total from investment operations | 0.36 | (1.30) | 1.58 | 0.68 | 0.64 |
| Less distributions | |||||
| From net investment income | (0.31) | — | — | (0.10) | — |
| From net realized gain | — | (0.82) | (0.45) | — | (0.35) |
| Total distributions | (0.31) | (0.82) | (0.45) | (0.10) | (0.35) |
| Net asset value, end of period | $10.66 | $10.61 | $12.73 | $11.60 | $11.02 |
| Total return (%)2,3 | 3.38 | (10.69) | 13.69 | 6.15 | 6.09 |
| Ratios and supplemental data | |||||
| Net assets, end of period (in millions) | $13 | $11 | $16 | $12 | $11 |
| Ratios (as a percentage of average net assets): | |||||
| Expenses before reductions | 1.95 | 1.93 | 1.97 | 2.00 | 1.98 |
| Expenses including reductions | 1.94 | 1.92 | 1.96 | 1.99 | 1.97 |
| Net investment income (loss) | 0.39 | (0.47) | (1.18) | (0.87) | (0.25) |
| Portfolio turnover (%) | 178 | 214 | 259 | 221 | 170 |
| 1 | Based on average daily shares outstanding. |
| 2 | Total returns would have been lower had certain expenses not been reduced during the applicable periods. |
| 3 | Does not reflect the effect of sales charges, if any. |
| SEE NOTES TO FINANCIAL STATEMENTS | ANNUAL REPORT | JOHN HANCOCK Seaport Long/Short Fund | 45 |
| CLASS C SHARES Period ended | 10-31-23 | 10-31-22 | 10-31-21 | 10-31-20 | 10-31-19 |
| Per share operating performance | |||||
| Net asset value, beginning of period | $10.01 | $12.13 | $11.16 | $10.61 | $10.42 |
| Net investment loss1 | (0.03) | (0.13) | (0.23) | (0.17) | (0.10) |
| Net realized and unrealized gain (loss) on investments | 0.29 | (1.17) | 1.65 | 0.74 | 0.64 |
| Total from investment operations | 0.26 | (1.30) | 1.42 | 0.57 | 0.54 |
| Less distributions | |||||
| From net investment income | (0.23) | — | — | (0.02) | — |
| From net realized gain | — | (0.82) | (0.45) | — | (0.35) |
| Total distributions | (0.23) | (0.82) | (0.45) | (0.02) | (0.35) |
| Net asset value, end of period | $10.04 | $10.01 | $12.13 | $11.16 | $10.61 |
| Total return (%)2,3 | 2.66 | (11.33) | 12.86 | 5.33 | 5.39 |
| Ratios and supplemental data | |||||
| Net assets, end of period (in millions) | $2 | $3 | $5 | $5 | $6 |
| Ratios (as a percentage of average net assets): | |||||
| Expenses before reductions | 2.65 | 2.63 | 2.67 | 2.70 | 2.68 |
| Expenses including reductions | 2.64 | 2.62 | 2.66 | 2.69 | 2.67 |
| Net investment loss | (0.30) | (1.20) | (1.89) | (1.56) | (0.99) |
| Portfolio turnover (%) | 178 | 214 | 259 | 221 | 170 |
| 1 | Based on average daily shares outstanding. |
| 2 | Total returns would have been lower had certain expenses not been reduced during the applicable periods. |
| 3 | Does not reflect the effect of sales charges, if any. |
| 46 | JOHN HANCOCK Seaport Long/Short Fund | ANNUAL REPORT | SEE NOTES TO FINANCIAL STATEMENTS |
| CLASS I SHARES Period ended | 10-31-23 | 10-31-22 | 10-31-21 | 10-31-20 | 10-31-19 |
| Per share operating performance | |||||
| Net asset value, beginning of period | $10.92 | $13.04 | $11.84 | $11.24 | $10.92 |
| Net investment income (loss)1 | 0.08 | (0.02) | (0.11) | (0.07) | —2 |
| Net realized and unrealized gain (loss) on investments | 0.33 | (1.28) | 1.76 | 0.80 | 0.67 |
| Total from investment operations | 0.41 | (1.30) | 1.65 | 0.73 | 0.67 |
| Less distributions | |||||
| From net investment income | (0.35) | — | — | (0.13) | — |
| From net realized gain | — | (0.82) | (0.45) | — | (0.35) |
| Total distributions | (0.35) | (0.82) | (0.45) | (0.13) | (0.35) |
| Net asset value, end of period | $10.98 | $10.92 | $13.04 | $11.84 | $11.24 |
| Total return (%)3 | 3.79 | (10.49) | 14.00 | 6.57 | 6.36 |
| Ratios and supplemental data | |||||
| Net assets, end of period (in millions) | $253 | $691 | $1,019 | $616 | $565 |
| Ratios (as a percentage of average net assets): | |||||
| Expenses before reductions | 1.65 | 1.63 | 1.67 | 1.70 | 1.69 |
| Expenses including reductions | 1.64 | 1.62 | 1.66 | 1.69 | 1.68 |
| Net investment income (loss) | 0.73 | (0.16) | (0.86) | (0.58) | —4 |
| Portfolio turnover (%) | 178 | 214 | 259 | 221 | 170 |
| 1 | Based on average daily shares outstanding. |
| 2 | Less than $0.005 per share. |
| 3 | Total returns would have been lower had certain expenses not been reduced during the applicable periods. |
| 4 | Less than 0.005%. |
| SEE NOTES TO FINANCIAL STATEMENTS | ANNUAL REPORT | JOHN HANCOCK Seaport Long/Short Fund | 47 |
| CLASS R6 SHARES Period ended | 10-31-23 | 10-31-22 | 10-31-21 | 10-31-20 | 10-31-19 |
| Per share operating performance | |||||
| Net asset value, beginning of period | $11.06 | $13.18 | $11.95 | $11.34 | $11.00 |
| Net investment income (loss)1 | 0.09 | (0.01) | (0.10) | (0.06) | 0.01 |
| Net realized and unrealized gain (loss) on investments | 0.33 | (1.29) | 1.78 | 0.81 | 0.68 |
| Total from investment operations | 0.42 | (1.30) | 1.68 | 0.75 | 0.69 |
| Less distributions | |||||
| From net investment income | (0.36) | — | — | (0.14) | — |
| From net realized gain | — | (0.82) | (0.45) | — | (0.35) |
| Total distributions | (0.36) | (0.82) | (0.45) | (0.14) | (0.35) |
| Net asset value, end of period | $11.12 | $11.06 | $13.18 | $11.95 | $11.34 |
| Total return (%)2 | 3.86 | (10.37) | 14.22 | 6.62 | 6.50 |
| Ratios and supplemental data | |||||
| Net assets, end of period (in millions) | $239 | $40 | $51 | $37 | $27 |
| Ratios (as a percentage of average net assets): | |||||
| Expenses before reductions | 1.54 | 1.53 | 1.56 | 1.59 | 1.58 |
| Expenses including reductions | 1.53 | 1.52 | 1.55 | 1.58 | 1.57 |
| Net investment income (loss) | 0.82 | (0.07) | (0.76) | (0.51) | 0.12 |
| Portfolio turnover (%) | 178 | 214 | 259 | 221 | 170 |
| 1 | Based on average daily shares outstanding. |
| 2 | Total returns would have been lower had certain expenses not been reduced during the applicable periods. |
| 48 | JOHN HANCOCK Seaport Long/Short Fund | ANNUAL REPORT | SEE NOTES TO FINANCIAL STATEMENTS |
| CLASS NAV SHARES Period ended | 10-31-23 | 10-31-22 | 10-31-21 | 10-31-20 | 10-31-19 |
| Per share operating performance | |||||
| Net asset value, beginning of period | $11.06 | $13.18 | $11.96 | $11.35 | $11.00 |
| Net investment income (loss)1 | 0.09 | —2 | (0.10) | (0.04) | 0.01 |
| Net realized and unrealized gain (loss) on investments | 0.33 | (1.30) | 1.77 | 0.79 | 0.69 |
| Total from investment operations | 0.42 | (1.30) | 1.67 | 0.75 | 0.70 |
| Less distributions | |||||
| From net investment income | (0.36) | — | — | (0.14) | — |
| From net realized gain | — | (0.82) | (0.45) | — | (0.35) |
| Total distributions | (0.36) | (0.82) | (0.45) | (0.14) | (0.35) |
| Net asset value, end of period | $11.12 | $11.06 | $13.18 | $11.96 | $11.35 |
| Total return (%)3 | 3.87 | (10.38) | 14.12 | 6.64 | 6.59 |
| Ratios and supplemental data | |||||
| Net assets, end of period (in millions) | $81 | $74 | $57 | $59 | $134 |
| Ratios (as a percentage of average net assets): | |||||
| Expenses before reductions | 1.53 | 1.52 | 1.55 | 1.58 | 1.56 |
| Expenses including reductions | 1.53 | 1.51 | 1.54 | 1.57 | 1.55 |
| Net investment income (loss) | 0.82 | 0.01 | (0.78) | (0.35) | 0.13 |
| Portfolio turnover (%) | 178 | 214 | 259 | 221 | 170 |
| 1 | Based on average daily shares outstanding. |
| 2 | Less than $0.005 per share. |
| 3 | Total returns would have been lower had certain expenses not been reduced during the applicable periods. |
| SEE NOTES TO FINANCIAL STATEMENTS | ANNUAL REPORT | JOHN HANCOCK Seaport Long/Short Fund | 49 |
| 50 | JOHN HANCOCK Seaport Long/Short Fund | ANNUAL REPORT |
| Total value at 10-31-23 | Level 1 quoted price | Level 2 significant observable inputs | Level 3 significant unobservable inputs | |
| Investments in securities: | ||||
| Assets | ||||
| Common stocks | ||||
| Communication services | $25,268,074 | $19,607,785 | $5,660,289 | — |
| Consumer discretionary | 30,416,470 | 18,994,394 | 11,422,076 | — |
| Consumer staples | 7,684,185 | 1,674,380 | 6,009,805 | — |
| Energy | 44,565,655 | 38,365,085 | 6,200,570 | — |
| Financials | 114,091,507 | 66,023,402 | 48,068,105 | — |
| Health care | 103,941,237 | 88,160,492 | 15,780,745 | — |
| Industrials | 27,126,885 | 13,730,979 | 13,395,906 | — |
| ANNUAL REPORT | JOHN HANCOCK Seaport Long/Short Fund | 51 |
| Total value at 10-31-23 | Level 1 quoted price | Level 2 significant observable inputs | Level 3 significant unobservable inputs | |
| Information technology | $71,842,068 | $64,134,811 | $7,707,257 | — |
| Materials | 12,710,201 | 6,049,215 | 6,660,986 | — |
| Real estate | 521,720 | 73,762 | 447,958 | — |
| Utilities | 9,226,891 | 7,439,929 | 1,786,962 | — |
| Exchange-traded funds | 3,813,197 | 3,813,197 | — | — |
| Corporate bonds | 752,683 | — | 752,683 | — |
| Purchased options | 744,054 | 687,311 | 56,743 | — |
| Short-term investments | 141,925,262 | 57,173,531 | 84,751,731 | — |
| Total investments in securities | $594,630,089 | $385,928,273 | $208,701,816 | — |
| Derivatives: | ||||
| Assets | ||||
| Futures | $63,078 | $63,078 | — | — |
| Forward foreign currency contracts | 292,616 | — | $292,616 | — |
| Swap contracts | 18,370,745 | — | 18,370,745 | — |
| Liabilities | ||||
| Forward foreign currency contracts | (858,681) | — | (858,681) | — |
| Written options | (309,822) | (283,025) | (26,797) | — |
| Swap contracts | (6,796,138) | — | (6,796,138) | — |
| Level 3 includes securities valued at $0. Refer to Fund’s investments. | ||||
| 52 | JOHN HANCOCK Seaport Long/Short Fund | ANNUAL REPORT |
| ANNUAL REPORT | JOHN HANCOCK Seaport Long/Short Fund | 53 |
| October 31, 2023 | October 31, 2022 | |
| Ordinary income | $25,491,358 | $10,424,594 |
| Long-term capital gains | — | 59,108,933 |
| Total | $25,491,358 | $69,533,527 |
| 54 | JOHN HANCOCK Seaport Long/Short Fund | ANNUAL REPORT |
| ANNUAL REPORT | JOHN HANCOCK Seaport Long/Short Fund | 55 |
| 56 | JOHN HANCOCK Seaport Long/Short Fund | ANNUAL REPORT |
| Risk | Statement of assets and liabilities location | Financial instruments location | Assets derivatives fair value | Liabilities derivatives fair value |
| Equity | Receivable/payable for futures variation margin1 | Futures | $63,078 | — |
| Currency | Unrealized appreciation (depreciation) on forward foreign currency contracts | Forward foreign currency contracts | 292,616 | $(858,681) |
| Equity | Unaffiliated investments, at value2 | Purchased options | 744,054 | — |
| Equity | Written options, at value | Written options | — | (309,822) |
| Equity | Swap contracts, at value | Total return swaps | 18,370,745 | (6,796,138) |
| $19,470,493 | $(7,964,641) |
| 1 | Reflects cumulative appreciation/depreciation on open futures as disclosed in the Derivatives section of Fund’s investments. Only the year end variation margin receivable/payable is separately reported on the Statement of assets and liabilities. |
| 2 | Purchased options are included in Fund’s investments. |
| ANNUAL REPORT | JOHN HANCOCK Seaport Long/Short Fund | 57 |
| OTC Financial Instruments | Asset | Liability |
| Forward foreign currency contracts | $292,616 | $(858,681) |
| Purchased options | 56,743 | — |
| Swap contracts | 18,370,745 | (6,796,138) |
| Written options | — | (26,797) |
| Totals | $18,720,104 | $(7,681,616) |
| Counterparty | Assets | Liabilities | Total Market Value of OTC Derivatives | Collateral Posted by Counterparty1 | Collateral Posted by Fund1 | Net Exposure |
| BNP Paribas | — | $(136,677) | $(136,677) | — | $136,677 | — |
| Citibank, N.A. | $8,255 | (1,300) | 6,955 | — | — | $6,955 |
| Deutsche Bank AG | 59,674 | (38,501) | 21,173 | $21,173 | — | — |
| Goldman Sachs International | 1,158,841 | (1,207,711) | (48,870) | — | 48,870 | — |
| JPMorgan Chase Bank, N.A. | 2,601,553 | (2,381,852) | 219,701 | — | — | 219,701 |
| Morgan Stanley & Co. International PLC | 14,890,889 | (3,843,638) | 11,047,251 | 11,047,251 | — | — |
| Standard Chartered Bank | 892 | (1,468) | (576) | — | — | (576) |
| State Street Bank and Trust Company | — | (70,469) | (70,469) | — | — | (70,469) |
| Totals | $18,720,104 | $(7,681,616) | $11,038,488 | $11,068,424 | $185,547 | $155,611 |
| 1 Reflects cash and/or non-cash collateral posted by the counterparty or posted by the fund, excluding any excess collateral amounts. | ||||||
| 58 | JOHN HANCOCK Seaport Long/Short Fund | ANNUAL REPORT |
| Statement of operations location - Net realized gain (loss) on: | ||||||
| Risk | Unaffiliated investments and foreign currency transactions1 | Futures contracts | Forward foreign currency contracts | Written options | Swap contracts | Total |
| Currency | $(99,382) | — | $(1,937,960) | $52,582 | — | $(1,984,760) |
| Equity | (8,964,890) | $(302,155) | — | 959,403 | $(24,253,838) | (32,561,480) |
| Total | $(9,064,272) | $(302,155) | $(1,937,960) | $1,011,985 | $(24,253,838) | $(34,546,240) |
| 1 | Realized gain (loss) associated with purchased options is included in this caption on the Statement of operations. |
| Statement of operations location - Change in net unrealized appreciation (depreciation) of: | ||||||
| Risk | Unaffiliated investments and translation of assets and liabilities in foreign currencies1 | Futures contracts | Forward foreign currency contracts | Written options | Swap contracts | Total |
| Currency | — | — | $(641,510) | — | — | $(641,510) |
| Equity | $3,763,487 | $223,504 | — | $598,048 | $20,817,667 | 25,402,706 |
| Total | $3,763,487 | $223,504 | $(641,510) | $598,048 | $20,817,667 | $24,761,196 |
| 1 | Change in unrealized appreciation (depreciation) associated with purchased options is included in this caption on the Statement of operations. |
| ANNUAL REPORT | JOHN HANCOCK Seaport Long/Short Fund | 59 |
| Class | Expense reduction |
| Class A | $812 |
| Class C | 180 |
| Class I | 37,957 |
| Class | Expense reduction |
| Class R6 | $10,684 |
| Class NAV | 5,916 |
| Total | $55,549 |
| Class | Rule 12b-1 Fee |
| Class A | 0.30% |
| Class C | 1.00% |
| 60 | JOHN HANCOCK Seaport Long/Short Fund | ANNUAL REPORT |
| Class | Distribution and service fees | Transfer agent fees |
| Class A | $33,789 | $13,231 |
| Class C | 25,013 | 2,931 |
| Class I | — | 617,735 |
| Class R6 | — | 7,845 |
| Total | $58,802 | $641,742 |
| Borrower or Lender | Weighted Average Loan Balance | Days Outstanding | Weighted Average Interest Rate | Interest Income (Expense) |
| Lender | $7,044,444 | 9 | 3.517% | $6,195 |
| Year Ended 10-31-23 | Year Ended 10-31-22 | |||
| Shares | Amount | Shares | Amount | |
| Class A shares | ||||
| Sold | 933,208 | $10,021,606 | 672,552 | $7,686,103 |
| Distributions reinvested | 28,137 | 294,036 | 75,489 | 874,923 |
| Repurchased | (722,674) | (7,788,025) | (972,689) | (11,071,543) |
| Net increase (decrease) | 238,671 | $2,527,617 | (224,648) | $(2,510,517) |
| ANNUAL REPORT | JOHN HANCOCK Seaport Long/Short Fund | 61 |
| Year Ended 10-31-23 | Year Ended 10-31-22 | |||
| Shares | Amount | Shares | Amount | |
| Class C shares | ||||
| Sold | 2,268 | $22,769 | 54,787 | $593,786 |
| Distributions reinvested | 5,498 | 54,484 | 19,582 | 215,399 |
| Repurchased | (119,891) | (1,220,785) | (168,041) | (1,871,379) |
| Net decrease | (112,125) | $(1,143,532) | (93,672) | $(1,062,194) |
| Class I shares | ||||
| Sold | 14,592,992 | $160,910,222 | 33,722,531 | $389,847,452 |
| Distributions reinvested | 1,171,689 | 12,583,936 | 3,588,613 | 42,704,495 |
| Repurchased | (56,023,787) | (616,158,715) | (52,171,102) | (595,467,568) |
| Net decrease | (40,259,106) | $(442,664,557) | (14,859,958) | $(162,915,621) |
| Class R6 shares | ||||
| Sold | 22,085,321 | $244,617,324 | 14,564 | $174,804 |
| Distributions reinvested | 106,341 | 1,155,922 | 244,458 | 2,940,827 |
| Repurchased | (4,257,426) | (48,090,873) | (533,876) | (6,402,803) |
| Net increase (decrease) | 17,934,236 | $197,682,373 | (274,854) | $(3,287,172) |
| Class NAV shares | ||||
| Sold | 1,595,931 | $17,825,931 | 2,506,591 | $28,883,481 |
| Distributions reinvested | 238,896 | 2,596,800 | 298,065 | 3,588,697 |
| Repurchased | (1,236,757) | (13,943,425) | (439,074) | (5,206,870) |
| Net increase | 598,070 | $6,479,306 | 2,365,582 | $27,265,308 |
| Total net decrease | (21,600,254) | $(237,118,793) | (13,087,550) | $(142,510,196) |
| Fund | Affiliated Concentration |
| John Hancock Funds II Alternative Asset Allocation Fund | 13.7% |
| 62 | JOHN HANCOCK Seaport Long/Short Fund | ANNUAL REPORT |
| Dividends and distributions | |||||||||
| Affiliate | Ending share amount | Beginning value | Cost of purchases | Proceeds from shares sold | Realized gain (loss) | Change in unrealized appreciation (depreciation) | Income distributions received | Capital gain distributions received | Ending value |
| John Hancock Collateral Trust* | — | $3,545,902 | $24,181,190 | $(27,728,730) | $1,529 | $109 | $16,778 | — | — |
| * | Refer to the Securities lending note within Note 2 for details regarding this investment. |
| ANNUAL REPORT | JOHN HANCOCK Seaport Long/Short Fund | 63 |
| 64 | JOHN HANCOCK SEAPORT LONG/SHORT FUND | ANNUAL REPORT |
| ANNUAL REPORT | JOHN HANCOCK SEAPORT LONG/SHORT FUND | 65 |
| 66 | JOHN HANCOCK SEAPORT LONG/SHORT FUND | ANNUAL REPORT |
| (a) | the skills and competency with which the Advisor has in the past managed the Trust’s affairs and its subadvisory relationship, the Advisor’s oversight and monitoring of the Subadvisor’s investment performance and compliance programs, such as the Subadvisor’s compliance with fund policies and objectives, review of brokerage matters, including with respect to trade allocation and best execution and the Advisor’s timeliness in responding to performance issues; |
| (b) | the background, qualifications and skills of the Advisor’s personnel; |
| (c) | the Advisor’s compliance policies and procedures and its responsiveness to regulatory changes and fund industry developments; |
| (d) | the Advisor’s administrative capabilities, including its ability to supervise the other service providers for the fund, as well as the Advisor’s oversight of any securities lending activity, its monitoring of class action litigation and collection of class action settlements on behalf of the fund, and bringing loss recovery actions on behalf of the fund; |
| (e) | the financial condition of the Advisor and whether it has the financial wherewithal to provide a high level and quality of services to the fund; |
| ANNUAL REPORT | JOHN HANCOCK SEAPORT LONG/SHORT FUND | 67 |
| (f) | the Advisor’s initiatives intended to improve various aspects of the Trust’s operations and investor experience with the fund; and |
| (g) | the Advisor’s reputation and experience in serving as an investment advisor to the Trust and the benefit to shareholders of investing in funds that are part of a family of funds offering a variety of investments. |
| (a) | reviewed information prepared by management regarding the fund’s performance; |
| (b) | considered the comparative performance of an applicable benchmark index; |
| (c) | considered the performance of comparable funds, if any, as included in the report prepared by an independent third-party provider of fund data; and |
| (d) | took into account the Advisor’s analysis of the fund’s performance and its plans and recommendations regarding the Trust’s subadvisory arrangements generally. |
| 68 | JOHN HANCOCK SEAPORT LONG/SHORT FUND | ANNUAL REPORT |
| (a) | reviewed financial information of the Advisor; |
| (b) | reviewed and considered information presented by the Advisor regarding the net profitability to the Advisor and its affiliates with respect to the fund; |
| (c) | received and reviewed profitability information with respect to the John Hancock Fund Complex as a whole and with respect to the fund; |
| (d) | received information with respect to the Advisor’s allocation methodologies used in preparing the profitability data and considered that the Advisor hired an independent third-party consultant to provide an analysis of the Advisor’s allocation methodologies; |
| (e) | considered that the John Hancock insurance companies that are affiliates of the Advisor, as shareholders of the Trust directly or through their separate accounts, receive certain tax credits or deductions relating to foreign taxes paid and dividends received by certain funds of the Trust and noted that these tax benefits, which are not available to participants in qualified retirement plans under applicable income tax law, are reflected in the profitability information reviewed by the Board; |
| (f) | considered that the Advisor also provides administrative services to the fund on a cost basis pursuant to an administrative services agreement; |
| (g) | noted that affiliates of the Advisor provide transfer agency services and distribution services to the fund, and that the fund’s distributor also receives Rule 12b-1 payments to support distribution of the fund; |
| (h) | noted that the Advisor also derives reputational and other indirect benefits from providing advisory services to the fund; |
| (i) | noted that the subadvisory fee for the fund is paid by the Advisor and is negotiated at arm’s length; |
| (j) | considered the Advisor’s ongoing costs and expenditures necessary to improve services, meet new regulatory and compliance requirements, and adapt to other challenges impacting the fund industry; and |
| (k) | considered that the Advisor should be entitled to earn a reasonable level of profits in exchange for the level of services it provides to the fund and the risks that it assumes as Advisor, including entrepreneurial, operational, reputational, litigation and regulatory risk. |
| ANNUAL REPORT | JOHN HANCOCK SEAPORT LONG/SHORT FUND | 69 |
| (a) | considered that the Advisor has contractually agreed to waive a portion of its management fee for certain funds of the John Hancock Fund Complex, including the fund (the participating portfolios) or otherwise reimburse the expenses of the participating portfolios (the reimbursement). This waiver is based upon aggregate net assets of all the participating portfolios. The amount of the reimbursement is calculated daily and allocated among all the participating portfolios in proportion to the daily net assets of each fund; |
| (b) | reviewed the fund’s advisory fee structure and concluded that: (i) the fund’s fee structure contains breakpoints at the subadvisory fee level and that such breakpoints are reflected as breakpoints in the advisory fees for the fund; and (ii) although economies of scale cannot be measured with precision, these arrangements permit shareholders of the fund to benefit from economies of scale if the fund grows. The Board also took into account management’s discussion of the fund’s advisory fee structure; and |
| (c) | the Board also considered the effect of the fund’s growth in size on its performance and fees. The Board also noted that if the fund’s assets increase over time, the fund may realize other economies of scale. |
| (1) | information relating to the Subadvisor’s business, including current subadvisory services to the Trust (and other funds in the John Hancock Fund Complex); |
| (2) | the historical and current performance of the fund and comparative performance information relating to an applicable benchmark index and comparable funds; |
| (3) | the subadvisory fee for the fund, including any breakpoints, and to the extent available, comparable fee information prepared by an independent third-party provider of fund data; and |
| (4) | information relating to the nature and scope of any material relationships and their significance to the Trust’s Advisor and Subadvisor. |
| 70 | JOHN HANCOCK SEAPORT LONG/SHORT FUND | ANNUAL REPORT |
| (1) | the Subadvisor has extensive experience and demonstrated skills as a manager; |
| (2) | the performance of the fund has generally been in line with or outperformed the historical performance of comparable funds; |
| (3) | the subadvisory fee is reasonable in relation to the level and quality of services being provided under the Subadvisory Agreement; and |
| ANNUAL REPORT | JOHN HANCOCK SEAPORT LONG/SHORT FUND | 71 |
| (4) | noted that the subadvisory fees are paid by the Advisor not the fund and that the subadvisory fee breakpoints are reflected as breakpoints in the advisory fees for the fund in order to permit shareholders to benefit from economies of scale if the fund grows. |
| 72 | JOHN HANCOCK SEAPORT LONG/SHORT FUND | ANNUAL REPORT |
| Independent Trustees | ||
| Name, year of birth Position(s) held with Trust Principal occupation(s) and other directorships during past 5 years | Trustee of the Trust since1 | Number of John Hancock funds overseen by Trustee |
| Hassell H. McClellan,2 Born: 1945 | 2012 | 179 |
| Trustee and Chairperson of the Board | ||
| Director/Trustee, Virtus Funds (2008-2020); Director, The Barnes Group (2010-2021); Associate Professor, The Wallace E. Carroll School of Management, Boston College (retired 2013). Trustee (since 2005) and Chairperson of the Board (since 2017) of various trusts within the John Hancock Fund Complex. | ||
| James R. Boyle, Born: 1959 | 2015 | 175 |
| Trustee | ||
| Board Member, United of Omaha Life Insurance Company (since 2022). Board Member, Mutual of Omaha Investor Services, Inc. (since 2022). Foresters Financial, Chief Executive Officer (2018–2022) and board member (2017–2022). Manulife Financial and John Hancock, more than 20 years, retiring in 2012 as Chief Executive Officer, John Hancock and Senior Executive Vice President, Manulife Financial. Trustee of various trusts within the John Hancock Fund Complex (2005–2014 and since 2015). | ||
| William H. Cunningham,3 Born: 1944 | 1986 | 177 |
| Trustee | ||
| Professor, University of Texas, Austin, Texas (since 1971); former Chancellor, University of Texas System and former President of the University of Texas, Austin, Texas; Director (since 2006), Lincoln National Corporation (insurance); Director, Southwest Airlines (since 2000). Trustee of various trusts within the John Hancock Fund Complex (since 1986). | ||
| Noni L. Ellison, Born: 1971 | 2022 | 175 |
| Trustee | ||
| Senior Vice President, General Counsel & Corporate Secretary, Tractor Supply Company (rural lifestyle retailer) (since 2021); General Counsel, Chief Compliance Officer & Corporate Secretary, Carestream Dental, L.L.C. (2017–2021); Associate General Counsel & Assistant Corporate Secretary, W.W. Grainger, Inc. (global industrial supplier) (2015–2017); Board Member, Goodwill of North Georgia, 2018 (FY2019)–2020 (FY2021); Board Member, Howard University School of Law Board of Visitors (since 2021); Board Member, University of Chicago Law School Board of Visitors (since 2016); Board member, Children’s Healthcare of Atlanta Foundation Board (2021–2023). Trustee of various trusts within the John Hancock Fund Complex (since 2022). | ||
| Grace K. Fey, Born: 1946 | 2012 | 179 |
| Trustee | ||
| Chief Executive Officer, Grace Fey Advisors (since 2007); Director and Executive Vice President, Frontier Capital Management Company (1988–2007); Director, Fiduciary Trust (since 2009). Trustee of various trusts within the John Hancock Fund Complex (since 2008). | ||
| Dean C. Garfield, Born: 1968 | 2022 | 175 |
| Trustee | ||
| Vice President, Netflix, Inc. (since 2019); President & Chief Executive Officer, Information Technology Industry Council (2009–2019); NYU School of Law Board of Trustees (since 2021); Member, U.S. Department of Transportation, Advisory Committee on Automation (since 2021); President of the United States Trade Advisory Council (2010–2018); Board Member, College for Every Student (2017–2021); Board Member, The Seed School of Washington, D.C. (2012–2017); Advisory Board Member of the Block Center for Technology and Society (since 2019). Trustee of various trusts within the John Hancock Fund Complex (since 2022). | ||
| ANNUAL REPORT | JOHN HANCOCK SEAPORT LONG/SHORT FUND | 73 |
| Independent Trustees (continued) | ||
| Name, year of birth Position(s) held with Trust Principal occupation(s) and other directorships during past 5 years | Trustee of the Trust since1 | Number of John Hancock funds overseen by Trustee |
| Deborah C. Jackson, Born: 1952 | 2008 | 177 |
| Trustee | ||
| President, Cambridge College, Cambridge, Massachusetts (since 2011); Board of Directors, Amwell Corporation (since 2020); Board of Directors, Massachusetts Women’s Forum (2018-2020); Board of Directors, National Association of Corporate Directors/New England (2015-2020); Chief Executive Officer, American Red Cross of Massachusetts Bay (2002–2011); Board of Directors of Eastern Bank Corporation (since 2001); Board of Directors of Eastern Bank Charitable Foundation (since 2001); Board of Directors of Boston Stock Exchange (2002–2008); Board of Directors of Harvard Pilgrim Healthcare (health benefits company) (2007–2011). Trustee of various trusts within the John Hancock Fund Complex (since 2008). | ||
| Steven R. Pruchansky, Born: 1944 | 1994 | 175 |
| Trustee and Vice Chairperson of the Board | ||
| Managing Director, Pru Realty (since 2017); Chairman and Chief Executive Officer, Greenscapes of Southwest Florida, Inc. (2014-2020); Director and President, Greenscapes of Southwest Florida, Inc. (until 2000); Member, Board of Advisors, First American Bank (until 2010); Managing Director, Jon James, LLC (real estate) (since 2000); Partner, Right Funding, LLC (2014-2017); Director, First Signature Bank & Trust Company (until 1991); Director, Mast Realty Trust (until 1994); President, Maxwell Building Corp. (until 1991). Trustee (since 1992), Chairperson of the Board (2011–2012), and Vice Chairperson of the Board (since 2012) of various trusts within the John Hancock Fund Complex. | ||
| Frances G. Rathke,3 Born: 1960 | 2020 | 175 |
| Trustee | ||
| Director, Audit Committee Chair, Oatly Group AB (plant-based drink company) (since 2021); Director, Audit Committee Chair and Compensation Committee Member, Green Mountain Power Corporation (since 2016); Director, Treasurer and Finance & Audit Committee Chair, Flynn Center for Performing Arts (since 2016); Director and Audit Committee Chair, Planet Fitness (since 2016); Chief Financial Officer and Treasurer, Keurig Green Mountain, Inc. (2003-retired 2015). Trustee of various trusts within the John Hancock Fund Complex (since 2020). | ||
| Gregory A. Russo, Born: 1949 | 2009 | 175 |
| Trustee | ||
| Director and Audit Committee Chairman (2012-2020), and Member, Audit Committee and Finance Committee (2011-2020), NCH Healthcare System, Inc. (holding company for multi-entity healthcare system); Director and Member (2012-2018), and Finance Committee Chairman (2014-2018), The Moorings, Inc. (nonprofit continuing care community); Global Vice Chairman, Risk & Regulatory Matters, KPMG LLP (KPMG) (2002–2006); Vice Chairman, Industrial Markets, KPMG (1998–2002). Trustee of various trusts within the John Hancock Fund Complex (since 2008). | ||
| 74 | JOHN HANCOCK SEAPORT LONG/SHORT FUND | ANNUAL REPORT |
| Non-Independent Trustees4 | ||
| Name, year of birth Position(s) held with Trust Principal occupation(s) and other directorships during past 5 years | Trustee of the Trust since1 | Number of John Hancock funds overseen by Trustee |
| Andrew G. Arnott, Born: 1971 | 2017 | 177 |
| Non-Independent Trustee | ||
| Global Head of Retail for Manulife (since 2022); Head of Wealth and Asset Management, United States and Europe, for John Hancock and Manulife (2018-2023); Director and Chairman, John Hancock Investment Management LLC (since 2005, including prior positions); Director and Chairman, John Hancock Variable Trust Advisers LLC (since 2006, including prior positions); Director and Chairman, John Hancock Investment Management Distributors LLC (since 2004, including prior positions); President of various trusts within the John Hancock Fund Complex (2007-2023, including prior positions). Trustee of various trusts within the John Hancock Fund Complex (since 2017). | ||
| Paul Lorentz, Born: 1968 | 2022 | 175 |
| Non-Independent Trustee | ||
| Global Head, Manulife Wealth and Asset Management (since 2017); General Manager, Manulife, Individual Wealth Management and Insurance (2013–2017); President, Manulife Investments (2010–2016). Trustee of various trusts within the John Hancock Fund Complex (since 2022). | ||
| Principal officers who are not Trustees | |
| Name, year of birth Position(s) held with Trust Principal occupation(s) during past 5 years | Current Position(s) with the Trust since |
| Kristie M. Feinberg, Born: 1975 | 2023 |
| President | |
| Head of Wealth and Asset Management, United States and Europe, for John Hancock and Manulife (since 2023); CFO and Global Head of Strategy, Manulife Investment Management (2021-2023, including prior positions); CFO Americas & Global Head of Treasury, Invesco, Ltd., Invesco US (2019-2020, including prior positions); Senior Vice President, Corporate Treasurer and Business Controller, Oppenheimer Funds (2001-2019, including prior positions); President of various trusts within the John Hancock Fund Complex (since 2023). | |
| Charles A. Rizzo, Born: 1957 | 2007 |
| Chief Financial Officer | |
| Vice President, John Hancock Financial Services (since 2008); Senior Vice President, John Hancock Investment Management LLC and John Hancock Variable Trust Advisers LLC (since 2008); Chief Financial Officer of various trusts within the John Hancock Fund Complex (since 2007). | |
| Salvatore Schiavone, Born: 1965 | 2010 |
| Treasurer | |
| Assistant Vice President, John Hancock Financial Services (since 2007); Vice President, John Hancock Investment Management LLC and John Hancock Variable Trust Advisers LLC (since 2007); Treasurer of various trusts within the John Hancock Fund Complex (since 2007, including prior positions). | |
| ANNUAL REPORT | JOHN HANCOCK SEAPORT LONG/SHORT FUND | 75 |
| Principal officers who are not Trustees (continued) | |
| Name, year of birth Position(s) held with Trust Principal occupation(s) during past 5 years | Current Position(s) with the Trust since |
| Christopher (Kit) Sechler, Born: 1973 | 2018 |
| Secretary and Chief Legal Officer | |
| Vice President and Deputy Chief Counsel, John Hancock Investment Management (since 2015); Assistant Vice President and Senior Counsel (2009–2015), John Hancock Investment Management; Assistant Secretary of John Hancock Investment Management LLC and John Hancock Variable Trust Advisers LLC (since 2009); Chief Legal Officer and Secretary of various trusts within the John Hancock Fund Complex (since 2009, including prior positions). | |
| Trevor Swanberg, Born: 1979 | 2020 |
| Chief Compliance Officer | |
| Chief Compliance Officer, John Hancock Investment Management LLC and John Hancock Variable Trust Advisers LLC (since 2020); Deputy Chief Compliance Officer, John Hancock Investment Management LLC and John Hancock Variable Trust Advisers LLC (2019–2020); Assistant Chief Compliance Officer, John Hancock Investment Management LLC and John Hancock Variable Trust Advisers LLC (2016–2019); Vice President, State Street Global Advisors (2015–2016); Chief Compliance Officer of various trusts within the John Hancock Fund Complex (since 2016, including prior positions). | |
| 1 | Each Trustee holds office until his or her successor is duly elected and qualified, or until the Trustee’s death, retirement, resignation, or removal. Mr. Boyle has served as Trustee at various times prior to the date listed in the table. |
| 2 | Member of the Audit Committee as of September 26, 2023. |
| 3 | Member of the Audit Committee. |
| 4 | The Trustee is a Non-Independent Trustee due to current or former positions with the Advisor and certain affiliates. |
| 76 | JOHN HANCOCK SEAPORT LONG/SHORT FUND | ANNUAL REPORT |
Steven R. Pruchansky, Vice Chairperson
Andrew G. Arnott†
James R. Boyle
William H. Cunningham*
Grace K. Fey
Noni L. Ellison
Dean C. Garfield
Deborah C. Jackson
Paul Lorentz†
Frances G. Rathke*
Gregory A. Russo
President
Chief Financial Officer
Treasurer
Secretary and Chief Legal Officer
Chief Compliance Officer
Ann C. Gallo1
Bruce L. Glazer
Wen Shi, Phd, CFA1
Rebecca D. Sykes, CFA
Michael G. Toman
Keith E. White
| You can also contact us: | ||
| 800-225-5291 | Regular mail: | Express mail: |
| jhinvestments.com | John Hancock Signature Services, Inc. P.O. Box 219909 Kansas City, MO 64121-9909 | John Hancock Signature Services, Inc. 430 W 7th Street Suite 219909 Kansas City, MO 64105-1407 |
| ANNUAL REPORT | JOHN HANCOCK SEAPORT LONG/SHORT FUND | 77 |
GOVERNANCE FUNDS
with a heritage of financial stewardship dating back to 1862. Helping
our shareholders pursue their financial goals is at the core of everything
we do. It’s why we support the role of professional financial advice
and operate with the highest standards of conduct and integrity.
We search the world to find proven portfolio teams with specialized
expertise for every strategy we offer, then we apply robust investment
oversight to ensure they continue to meet our uncompromising
standards and serve the best interests of our shareholders.
a diverse set of investments backed by some of the world’s best
managers, along with strong risk-adjusted returns across asset classes.
200 Berkeley Street, Boston, MA 02116-5010, 800-225-5291, jhinvestments.com
| MF3208654 | 437A 10/23 |
ITEM 2. CODE OF ETHICS.
As of the end of the period, October 31, 2023, the registrant has adopted a code of ethics, as defined in Item 2 of Form N-CSR, that applies to its Chief Executive Officer, Chief Financial Officer and Treasurer (respectively, the principal executive officer, the principal financial officer and the principal accounting officer, the "Covered Officers"). A copy of the code of ethics is filed as an exhibit to this Form N-CSR.
ITEM 3. AUDIT COMMITTEE FINANCIAL EXPERT.
Frances G. Rathke is the audit committee financial expert and is "independent", pursuant to general instructions on Form N-CSR Item 3.
ITEM 4. PRINCIPAL ACCOUNTANT FEES AND SERVICES.
(a) Audit Fees
The aggregate fees billed for professional services rendered by the principal accountant for the audits of the registrant's annual financial statements or services that are normally provided by the accountant in connection with statutory and regulatory filings or engagements amounted to the following for the fiscal years ended October 31, 2023 and 2022. These fees were billed to the registrant and were approved by the registrant's audit committee.
Fund | October 31, 2023 | October 31, 2022 |
John Hancock Balanced Fund | $48,939 | $49,204 |
John Hancock Disciplined Value International Fund | $59,068 | $58,295 |
John Hancock Diversified Macro Fund | $72,469 | $70,381 |
John Hancock Emerging Markets Equity Fund | $46,490 | $45,527 |
John Hancock Infrastructure Fund | $44,224 | $43,359 |
John Hancock Seaport Long/Short Fund | $117,124 | $116,022 |
(b) Audit-Related Services
Audit-related service fees for assurance and related services by the principal accountant are billed to the registrant or to the registrant's investment adviser (not including any sub-adviser whose role is primarily portfolio management and is subcontracted with or overseen by another investment adviser), and any entity controlling, controlled by, or under common control with the adviser ("control affiliates") that provides ongoing services to the registrant. The nature of the services provided related to regulatory filings and affiliated service provider internal controls reviews.
Fund | October 31, 2023 | October 31, 2022 |
John Hancock Balanced Fund | $628 | $585 |
John Hancock Disciplined Value International Fund | $628 | $585 |
John Hancock Diversified Macro Fund | $628 | $585 |
John Hancock Emerging Markets Equity Fund | $628 | $585 |
John Hancock Infrastructure Fund | $628 | $585 |
John Hancock Seaport Long/Short Fund | $628 | $585 |
In addition, amounts billed to control affiliates for service provider internal controls reviews were $127,986 and $121,890 for the fiscal years ended October 31, 2023 and 2022, respectively.
(c) Tax Fees
The aggregate fees billed for professional services rendered by the principal accountant for tax compliance, tax advice and tax planning ("tax fees") amounted to the following for the fiscal years ended October 31, 2023 and 2022. The nature of the services comprising the tax fees was the review of the registrant's tax returns and tax distribution requirements. These fees were billed to the registrant and were approved by the registrant's audit committee.
Fund | October 31, 2023 | October 31, 2022 |
John Hancock Balanced Fund | $6,622 | $5,360 |
John Hancock Disciplined Value International Fund | $6,622 | $4,716 |
John Hancock Diversified Macro Fund | $8,566 | $4,110 |
John Hancock Emerging Markets Equity Fund | $5,253 | $5,360 |
John Hancock Infrastructure Fund | $5,253 | $5,360 |
John Hancock Seaport Long/Short Fund | $8,306 | $5,442 |
(d) All Other Fees
Other fees billed for professional services rendered by the principal accountant to the registrant or to the control affiliates for the fiscal years ended October 31, 2023 and 2022 amounted to the following:
Fund | October 31, 2023 | October 31, 2022 |
John Hancock Balanced Fund | $0 | $163 |
John Hancock Disciplined Value International Fund | $0 | $163 |
John Hancock Diversified Macro Fund | $0 | $163 |
John Hancock Emerging Markets Equity Fund | $0 | $163 |
John Hancock Infrastructure Fund | $0 | $163 |
John Hancock Seaport Long/Short Fund | $0 | $163 |
The nature of the services comprising all other fees is advisory services provided to the investment manager.
(e)(1) Audit Committee Pre-Approval Policies and Procedures:
The trust's Audit Committee must pre-approve all audit and non-audit services provided by the independent registered public accounting firm (the "Auditor") relating to the operations or financial reporting of the funds. Prior to the commencement of any audit or non-audit services to a fund, the Audit Committee reviews the services to determine whether they are appropriate and permissible under applicable law.
The trust's Audit Committee has adopted policies and procedures to, among other purposes, provide a framework for the Committee's consideration of audit-related and non-audit services by the Auditor. The policies and procedures require that any audit-related and non-audit service provided by the Auditor and any non-audit service provided by the Auditor to a fund service provider that relates directly to the operations and financial reporting of a fund are subject to approval by the Audit Committee before such service is provided. Audit-related services provided by the Auditor that are expected to exceed $25,000 per instance/per fund are subject to specific pre-approval by the Audit Committee. Tax services provided by the Auditor that are expected to exceed $30,000 per instance/per fund are subject to specific pre-approval by the Audit Committee.
All audit services, as well as the audit-related and non-audit services that are expected to exceed the amounts stated above, must be approved in advance of provision of the service by formal
resolution of the Audit Committee. At the regularly scheduled Audit Committee meetings, the Committee reviews a report summarizing the services, including fees, provided by the Auditor.
(e)(2) Services approved pursuant to paragraph (c)(7)(i)(C) of Rule 2-01 of Regulation S-X:
Audit-Related Fees, Tax Fees and All Other Fees:
There were no amounts that were approved by the Audit Committee pursuant to the de minimis exception under Rule 2-01 of Regulation S-X.
(f) According to the registrant's principal accountant, for the fiscal period ended October 31, 2023, the percentage of hours spent on the audit of the registrant's financial statements for the most recent fiscal year that were attributed to work performed by persons who were not full-time, permanent employees of principal accountant was less than 50%.
(g) The aggregate non-audit fees billed by the registrant's accountant for non- audit services rendered to the registrant and rendered to the registrant's control affiliates for the fiscal years ended October 31, 2023 and 2022 amounted to the following:
Trust | October 31, 2022 | October 31, 2022 |
John Hancock Investment Trust | $1,244,869 | $1,085,917 |
(h) The audit committee of the registrant has considered the non-audit services provided by the registrant's principal accountant(s) to the control affiliates and has determined that the services that were not pre-approved are compatible with maintaining the principal accountant(s)' independence.
(i) Not applicable
(j) Not applicable
ITEM 5. AUDIT COMMITTEE OF LISTED REGISTRANTS.
The registrant has a separately-designated standing audit committee comprised of independent trustees. The members of the audit committee are as follows:
Frances G. Rathke – Chairperson William H. Cunningham
Hassell H. McClellan – Member of the Audit Committee as of September 26, 2023
ITEM 6. SCHEDULE OF INVESTMENTS.
(a)Not applicable.
(b)Not applicable.
ITEM 7. DISCLOSURE OF PROXY VOTING POLICIES AND PROCEDURES FOR CLOSED- END MANAGEMENT INVESTMENT COMPANIES.
Not applicable.
ITEM 8. PORTFOLIO MANAGERS OF CLOSED-END MANAGEMENT INVESTMENT COMPANIES.
Not applicable.
ITEM 9. PURCHASES OF EQUITY SECURITIES BY CLOSED-END MANAGEMENT INVESTMENT COMPANY AND AFFILIATED PURCHASERS.
Not applicable.
ITEM 10. SUBMISSION OF MATTERS TO A VOTE OF SECURITY HOLDERS.
The registrant has adopted procedures by which shareholders may recommend nominees to the registrant's Board of Trustees. A copy of the procedures is filed as an exhibit to this Form N-CSR. See attached "John Hancock Funds – Nominating and Governance Committee Charter".
ITEM 11. CONTROLS AND PROCEDURES.
(a)Based upon their evaluation of the registrant's disclosure controls and procedures as
conducted within 90 days of the filing date of this Form N-CSR, the registrant's principal executive officer and principal financial officer have concluded that those disclosure controls and procedures provide reasonable assurance that the material information required to be disclosed by the registrant on this report is recorded, processed, summarized and reported within the time periods specified in the Securities and Exchange Commission's rules and forms.
(b)There were no changes in the registrant's internal control over financial reporting that occurred during the period covered by this report that have materially affected, or are reasonably likely to materially affect, the registrant's internal control over financial reporting.
ITEM 12. DISCLOSURE OF SECURITIES LENDING ACTIVITIES FOR CLOSED-END MANAGEMENT INVESTMENT COMPANIES.
Not applicable.
ITEM 13. EXHIBITS.
SIGNATURES
Pursuant to the requirements of the Securities Exchange Act of 1934 and the Investment Company Act of 1940, the registrant has duly caused this report to be signed on its behalf by the undersigned, thereunto duly authorized.
John Hancock Investment Trust
By: | /s/ Kristie M. Feinberg |
| ------------------------------ |
| Kristie M. Feinberg |
| President |
Date: | December 15, 2023 |
Pursuant to the requirements of the Securities Exchange Act of 1934 and the Investment Company Act of 1940, this report has been signed below by the following persons on behalf of the registrant and in the capacities and on the dates indicated.
By: | /s/ Kristie M. Feinberg |
| ------------------------------- |
| Kristie M. Feinberg |
| President |
Date: | December 15, 2023 |
By: | /s/ Charles A. Rizzo |
| -------------------------------- |
| Charles A. Rizzo |
| Chief Financial Officer |
Date: | December 15, 2023 |