| As filed with the Securities and Exchange Commission on February 5, 2015 | Registration No. |
UNITED STATES
SECURITIES AND EXCHANGE COMMISSION
Washington, D.C. 20549
FORM S-1
REGISTRATION STATEMENT
UNDER
THE SECURITIES ACT OF 1933
One Horizon Group, Inc.
(Exact name of Registrant as specified in its charter)
| Delaware | 7372 | 46-3561419 | ||
| (State or Other Jurisdiction of Incorporation or Organization) | (Primary Standard Industrial Classification Code Number) | (I.R.S. Employer Identification Number) |
Weststrasse 1, Baar
Switzerland CH6340
(Address, including zip code, and telephone number,
including area code, of Registrant’s principal executive offices)
Copies to:
Louis E. Taubman, Esq.
Hunter Taubman Weiss LLP
130 w. 42nd Street, Suite 1050
New York, NY 10036
Approximate date of commencement of proposed sale to the public: From time to time after this Registration Statement becomes effective.
If any of the securities being registered on this Form are to be offered on a delayed or continuous basis pursuant to Rule 415 under the Securities Act of 1933, check the following box. þ
If this Form is filed to register additional securities for an offering pursuant to Rule 462(b) under the Securities Act, check the following box and list the Securities Act registration statement number of the earlier effective registration statement for the same offering. o
If this Form is a post-effective amendment filed pursuant to Rule 462(c) under the Securities Act, check the following box and list the Securities Act registration statement number of the earlier effective registration statement for the same offering. o
If this Form is a post-effective amendment filed pursuant to Rule 462(d) under the Securities Act, check the following box and list the Securities Act registration statement number of the earlier effective registration statement for the same offering. o
Indicate by check mark whether the registrant is a large accelerated filer, an accelerated filer, a non-accelerated filer, or a smaller reporting company. See definitions of “large accelerated filer”, “accelerated filer” and “smaller reporting company” in Rule 12b-2 of the Exchange Act. (Check one):
| Large accelerated filer | o | Accelerated filer | o | |
| Non-accelerated filer | o | Smaller reporting company | þ | |
| (Do not check if a smaller reporting company) | ||||
CALCULATION OF REGISTRATION FEE
| Title of each class of securities to be registered | Amount to be Registered (1) | Proposed maximum offering price per share(2) | Proposed maximum aggregate offering price | Amount of registration fee | ||||||||||||
| Common Stock underlying Class C Warrants | 404,445 | (3) | $ | 1.42 | $ | 574,311.9 | $ | 66.74 | ||||||||
| Common Stock underlying Class D Warrants | 404,445 | (4) | 1.42 | 574,311.9 | 66.74 | |||||||||||
| Common Stock underlying Placement Agent Warrants | 62,222 | (5) | 1.42 | 88,355.24 | 10.27 | |||||||||||
| Common Stock underlying Performance Warrants | 310,800 | (6) | 1.42 | 441,336.00 | 51.28 | |||||||||||
| Common Stock | 2,093,723 | (7) | 1.42 | 2,973,086.66 | 345.47 | |||||||||||
| Total | 3,275,635 | $ | 4,651,401.70 | $ | 540.49 | |||||||||||
| (1) | Pursuant to Rule 416 under the Securities Act of 1933, this registration statement includes an indeterminate number of additional shares as may be issuable as a result of stock splits or stock dividends which occur during this continuous offering. |
| (2) | Estimated solely for purposes of calculating the registration fee in accordance with Rule 457(c) under the Securities Act of 1933, as amended based upon the average of the bid and asked price of the Registrant's common stock as quoted on the Nasdaq Capital Market of $1.42 on February 3, 2015. |
| (3) | Represents shares of common stock underlying Class C Warrants at an exercise price of $3.00 per share that the Company issued to an investor and the placement agent pursuant to the financing they closed on December 22, 2014 (the “Class C Warrant(s)”). |
| (4) | Represents shares of common stock underlying Class D Warrants at an exercise price of $3.50 per share that the Company issued to an investor and the placement agent pursuant to the financing they closed on December 22, 2014 (the “Class D Warrant(s)”). |
| (5) | Represents shares of common stock underlying Placement Agent Warrants at an exercise price of $2.25 per share that the Company issued to the placement agent pursuant to the financing they closed on December 22, 2014 (the “Placement Agent Warrant(s)”). |
| (6) | Represents the maximum amount of shares of common stock underlying Performance Warrants issuable based on the Company’s annual reported subscriber numbers, twenty four (24) months after December 22, 2014 as reflected in the Company’s Annual Report on Form 10-K for the year ending December 31, 2016 (the “2016 Form 10-K”) that the Company agreed to issue to an investor pursuant to the financing they closed on December 22, 2014 (the “Performance Warrant(s), together with Class C Warrants, Class D Warrants and Placement Agent Warrants, are referred as “Warrants” herein below). |
| (7) | Represents amount of shares of Common Stock that the Company issued to investors pursuant to various financings the Company conducted before and after the Share Exchange. |
The Registrant hereby amends this registration statement on such date or dates as may be necessary to delay its effective date until the Registrant shall file a further amendment which specifically states that this registration statement shall thereafter become effective in accordance with section 8(a) of the Securities Act of 1933, as amended, or until the registration statement shall become effective on such date as the Commission, acting pursuant to said section 8(a), may determine.
THE INFORMATION IN THIS PROSPECTUS IS NOT COMPLETE AND MAY BE CHANGED. THE SELLING STOCKHOLDERS MAY NOT SELL THESE SECURITIES PUBLICLY UNTIL THE REGISTRATION STATEMENT FILED WITH THE SECURITIES AND EXCHANGE COMMISSION IS EFFECTIVE. THIS PROSPECTUS IS NOT AN OFFER TO SELL THESE SECURITIES AND IT IS NOT SOLICITING AN OFFER TO BUY THESE SECURITIES IN ANY STATE WHERE THE OFFER OR SALE IS NOT PERMITTED.
SUBJECT TO COMPLETION, DATED FEBRUARY 5, 2015
PROSPECTUS
One Horizon Group, Inc.
3,275,635 Shares of Common Stock
This prospectus relates to the resale of up to 3,275,635 shares of common stock of One Horizon Group, Inc., a Delaware corporation (the “Company”), $0.0001 par value (the “Common Stock”), including (a) 404,445 shares of Common Stock issuable upon exercise of Class C Warrants; (b) 404,445 shares of Common Stock issuable upon exercise of Class D Warrants; (c) 62,222 shares of Common Stock issuable upon exercise of Placement Agent Warrants: (d) up to 310,800 shares of Common Stock issuable upon exercise of Performance Warrants issuable based on our annual reported subscriber numbers, twenty four (24) months after December 22, 2014 as reflected in the 2016 Form 10-K, and (e) 2,093,723 shares of Common Stock issued to investors pursuant to various financings the Company closed before and after the Share Exchange (defined herein below). The selling stockholders named herein may sell common stock from time to time in the principal market on which the stock is traded at the prevailing market price, at prices related to such prevailing market price, in negotiated transactions or a combination of such methods of sale. We will not receive any proceeds from the sales by the selling stockholders.
Our common stock is quoted on the NASDAQ Capital Market under the symbol OHGI. Prior to July 9, 2014, our common stock was quoted on the OTCBB under the symbol OHGI. Prior to January 31, 2013, our common stock was quoted under the symbol ICMC.
The selling stockholders, and any broker-dealer executing sell orders on behalf of the selling stockholders, may be deemed to be “underwriters” within the meaning of the Securities Act of 1933, as amended. Commissions received by any broker-dealer may be deemed underwriting commissions under the Securities Act of 1933, as amended.
THIS INVESTMENT INVOLVES A HIGH DEGREE OF RISK. YOU SHOULD PURCHASE SHARES ONLY IF YOU CAN AFFORD A COMPLETE LOSS OF YOUR INVESTMENT.
NEITHER THE SECURITIES AND EXCHANGE COMMISSION NOR ANY STATE SECURITIES COMMISSION HAS APPROVED OR DISAPPROVED THESE SECURITIES, OR DETERMINED IF THIS PROSPECTUS IS TRUTHFUL OR COMPLETE. ANY REPRESENTATION TO THE CONTRARY IS A CRIMINAL OFFENSE.
The date of this prospectus is February 5, 2015.
Item 3. Summary Information, Risk Factors and Ratio of Earnings to Fixed Charges | 1 | |||
Item 4. Use of Proceeds | 12 | |||
Item 5. Determination of Offering Price | 12 | |||
Item 6. Dilution | 12 | |||
Item 7. Selling Security Holders | 12 | |||
Item 8. Plan of Distribution | 16 | |||
Item 9. Description of Securities | 18 | |||
Item 10. Interests of Named Experts and Counsel | 21 | |||
Item 11. Information with respect to the Registrant | 21 | |||
Item 11A. Material Changes | 100 | |||
Item 12. Incorporation of Certain Information by Reference | 100 | |||
Item 12A. Disclosure of Commission Position on Indemnification for Securities Act Liabilities | 100 | |||
| PART II. INFORMATION NOT REQUIRED IN PROSPECTUS | ||||
Item 13. Other Expenses of Issuances and Distribution | 101 | |||
Item 14. Indemnification of Directors and Officers | 101 | |||
Item 15. Recent Sales of Unregistered Securities | 101 | |||
Item 16. Exhibits and Financial Statement Schedule | 101 | |||
Item 17. Undertakings | 103 |
We have not authorized any person to give you any supplemental information or to make any representations for us. You should not rely upon any information about us that is not contained in this prospectus or in one of our public reports filed with the Securities and Exchange Commission (“SEC”) and incorporated into this prospectus. Information contained in this prospectus or in our public reports may become stale. You should not assume that the information contained in this prospectus, any prospectus supplement or the documents incorporated by reference are accurate as of any date other than their respective dates, regardless of the time of delivery of this prospectus or of any sale of the shares. Our business, financial condition, results of operations and prospects may have changed since those dates. The selling stockholders are offering to sell, and seeking offers to buy, shares of our common stock only in jurisdictions where offers and sales are permitted.
In this prospectus the “Company,” “we,” “us,” and “our” refer to One Horizon Group, Inc., a Delaware corporation and its subsidiaries.
All dealers that effect transactions in these securities, whether or not participating in this offering, may be required to deliver a prospectus. This is in addition to the dealers’ obligation to deliver a prospectus when acting as underwriters.
This summary highlights selected information appearing elsewhere in this prospectus. While this summary highlights what we consider to be the most important information about us, you should carefully read this prospectus and the registration statement of which this prospectus is a part in their entirety before investing in our common stock, and our financial statements and related notes beginning on page 31 and 37, respectively. Unless the context requires otherwise, the words the “Company,” “One Horizon” “we,” “us” or “our” are references to the combined business of One Horizon Group, Inc. and its consolidated subsidiaries. References to “Horizon Globex” are references to our wholly-owned subsidiary, Horizon Globex GmbH; references to “Abbey Technology” are references to our wholly-owned subsidiary, Abbey Technology GmbH; References to “China” or “PRC” are references to the People’s Republic of China. References to “RMB” are to Renminbi, the legal currency of China, and all references to “$” and dollar are to the U.S. dollar, the legal currency of the United States. All market and industry data provided in this prospectus represents information that is generally available to the public and was not prepared for us for a fee. We did not fund nor were we otherwise affiliated with these sources and we are not attempting to incorporate the information on external web sites into this prospectus. We are only providing textual reference of the information of market and industry data and the web addresses provided in this prospectus are not intended to be hyperlinks and we do not assure that those external web sites will remain active and current.
Special Note Regarding Forward-Looking Statements
This report contains forward-looking statements and information that are based on the beliefs of our management as well as assumptions made by and information currently available to us. Such statements should not be unduly relied upon. When used in this report, forward-looking statements include, but are not limited to, the words “anticipate,” “believe,” “estimate,” “expect,” “intend,” “plan” and similar expressions, as well as statements regarding new and existing products, technologies and opportunities, statements regarding market and industry segment growth and demand and acceptance of new and existing products, any projections of sales, earnings, revenue, margins or other financial items, any statements of the plans, strategies and objectives of management for future operations, any statements regarding future economic conditions or performance, uncertainties related to conducting business in China, any statements of belief or intention, and any statements or assumptions underlying any of the foregoing. These statements reflect our current view concerning future events and are subject to risks, uncertainties and assumptions. There are important factors that could cause actual results to vary materially from those described in this report as anticipated, estimated or expected, including, but not limited to: competition in the industry in which we operate and the impact of such competition on pricing, revenues and margins, volatility in the securities market due to the general economic downturn; Securities and Exchange Commission (the “SEC”) regulations which affect trading in the securities of “penny stocks,” and other risks and uncertainties. Except as required by law, we assume no obligation to update any forward-looking statements publicly, or to update the reasons actual results could differ materially from those anticipated in any forward- looking statements, even if new information becomes available in the future. Depending on the market for our stock and other conditional tests, a specific safe harbor under the Private Securities Litigation Reform Act of 1995 may be available. Notwithstanding the above, Section 27A of the Securities Act of 1933, as amended (the “Securities Act”) and Section 21E of the Securities Exchange Act of 1934, as amended (the “Exchange Act”) expressly state that the safe harbor for forward-looking statements does not apply to companies that issue penny stock. Because we may from time to time be considered to be an issuer of penny stock, the safe harbor for forward-looking statements may not apply to us at certain times.
1
Our Company
We develop and license software to telecommunications operators through our wholly-owned subsidiaries Horizon Globex GmbH and Abbey Technology GmbH, each incorporated under the laws of Switzerland (“Horizon Globex” and “Abbey Technology,” respectively). Specifically, Horizon Globex and Abbey Technology develop software application platforms that optimize mobile voice, instant messaging and advertising communications over the internet, collectively, the “Horizon Platform.” Our proprietary software techniques (“SmartPacket™”) use internet bandwidth more efficiently than other techniques that are unable to provide a low-bandwidth solution. The Horizon Platform is a bandwidth-efficient Voice over Internet Protocol (“VoIP”) platform for smartphones and tablets, and also provides optimized data applications including multi-media messaging and mobile advertising. Using our SmartPacket™ platform, we have been able to significantly improve the efficiency by which voice signals are transmitted by radio over the Internet resulting in a 10X reduction in mobile spectrum required to transmit a VoIP call. We license our software solutions to telecommunications network operators and service providers in the mobile, fixed line, cable TV and satellite communications markets. We are an ISO 9001 and ISO 20000-1 certified company with assets and operations in Switzerland, Ireland, the United Kingdom, China, India, Russia, Singapore and Hong Kong.
The Horizon Platform delivers a turnkey mobile VoIP solution to telecommunications operators. We believe that the technology underlying SmartPacket™, is the world’s most bandwidth-efficient VoIP technology. Our VoIP platform allows voice calls over the Internet that use as little as 4kbps of data compared to around 48kbps offered by other optimized VoIP platforms, thereby enabling voice communications over limited bandwidth and congested cellular telecom data networks including 2G, 3G and 4G. The kbps rates above include bi-directional voice communication including IP overhead.
History and Background
| (1) | Share Exchange |
On November 30, 2012, the Company (then known as Intelligent Communication Enterprise Corporation, referred herein below as “ICE Corp.”), and One Horizon Group PLC, a public limited company incorporated in the United Kingdom (“One Horizon UK”), consummated a share exchange (the “Share Exchange”), pursuant to which ICE Corp. acquired One Horizon UK stock from its then existing shareholders in exchange for 17,853,476,138 shares of ICE Corp.’s common stock. Upon completion of this transaction, the shareholders of One Horizon UK controlled approximately 96% of the outstanding stock of ICE Corp. and One Horizon UK became a subsidiary of ICE Corp. The transaction has been accounted for as a reverse acquisition, whereby ICE Corp. is the legal acquirer and One Horizon UK is the legal acquiree and accounting acquirer. On December 27, 2012, the Company changed its name to One Horizon Group, Inc.
To record the accounting effects of the reverse acquisition, the assets and liabilities of One Horizon UK (the accounting acquirer) are recognized and measured at their precombination carrying amounts. The assets and liabilities of ICE Corp. (the accounting acquiree) are recognized and measured consistent with accounting for business combinations, including recognition of fair values, effective as of November 30, 2012, the date of the Share Exchange transaction.
2
| (2) | History of ICE Corp before the Share Exchange |
ICE Corp was incorporated in Pennsylvania in 1972 as Coratomic, Inc. It changed its name to Biocontrol Technology, Inc. in 1986; BICO, Inc. in 2000; Mobiclear Inc. in 2006; and Intelligent Communication Enterprise Corporation in 2009.
Prior to the Share Exchange, ICE Corp had two operational businesses: Modizo, and Global Integrated Media Limited (GIM). The Modizo business consisted of a celebrity blogging application, while the GIM business consisted of custom publishing, advertising design, brand building, media representation, website design and development and market research programs. These operations had employees and expenses, and generated gross revenue of roughly $205,000 for the nine months ended September 30, 2012. As the GIM and Modizo businesses did not fit within the Company’s business plan after the Share Exchange, both operational businesses were sold on December 31, 2012 for the return of 70,000 shares of the Company’s common stock held by the purchaser, which had a fair value of $420,000.
(3) One Horizon UK
One Horizon UK, was incorporated in the United Kingdom on March 8, 2004. Prior to the Share Exchange, the consolidated financial statements of One Horizon UK for its fiscal years ended June 30, 2012 and 2011 consisted of two main business segments: (1) the Horizon Globex business segment including One Horizon UK and two of its subsidiaries, Abbey Technology and Horizon Globex; and (2) the Satcom Global business segment. However, the Satcom Global business was sold on October 25, 2012 as it became unprofitable. One the same day, Abbey Technology sold certain satellite billing software utilized in the Satcom Global business to the same purchaser. The entire purchase price for the software was paid by means of an offset against amounts owed by Abbey Technology and its affiliates to Satcom Global FZE, an entity acquired by the purchaser in connection with the purchase of the Satcom Global business.
The financial statements for the 6 months ended December 31, 2012 and the years ended June 30, 2012 and 2011 do not show any results of Satcom Global operation as that division was treated as discontinued operations.
Abbey Technology, founded in 1999 by our director and Chief Executive Officer, Brian Collins, is a software development company and licenses proprietary software solutions for the banking sector. The Horizon software platform was invented/developed in Abbey Technology by Brian Collins and Claude Dziedzic. Mr. Collins and Dziedzic have irrevocably assigned the patent for the Horizon Platform to Abbey Technology. Abbey Technology was subsequently acquired by One Horizon UK in September 2010.
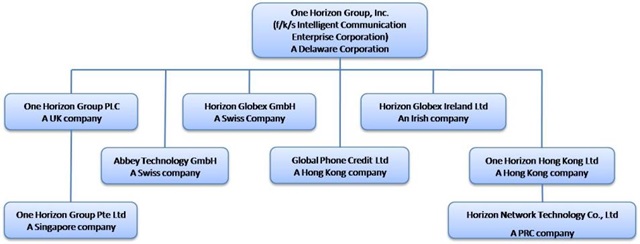
(4) Current Shareholding Structure of the Company
Global Phone Credit Ltd, incorporated in Hong Kong on December 15, 2012, is a wholly subsidiary of the Company. One Horizon Group Pte Ltd, incorporated in Singapore on November 28, 2012, is a wholly owned subsidiary of One Horizon UK. One Horizon Hong Kong Ltd is a wholly-owned subsidiary of the Company, and was formed in 2012. One Horizon Hong Kong Ltd currently holds the Company’s 75% equity interest in Horizon Network Technology Co., Ltd., a subsidiary incorporated in China during 2013. Horizon Globex Ireland Ltd, an Irish company incorporated on August 7, 2013, is a wholly owned subsidiary of the Company.
3
(e) Reverse Stock Split, Change of Domicile and Change of Fiscal Year
On August 29, 2013, our 1-for-600 reverse stock split became effective for purposes of the securities markets. As a result of the reverse stock split, our issued and outstanding shares of common stock decreased from approximately 18.9 billion pre-reverse stock split shares to approximately 31.5 million post-reverse stock split shares.
In addition, our change of domicile from Pennsylvania to Delaware became effective on August 26, 2013. The change of domicile had also been approved by the Board of Directors and by shareholders at our Annual Meeting held on August 6, 2013.
Additional information regarding the reverse stock split and change of domicile can be found in a definitive information statement filed with the Securities and Exchange Commission on June 26, 2013 and which was mailed to all shareholders of record as of July 5, 2013.
On February 13, 2013, we changed the Company's fiscal year end from June 30 to December 31. As a result of this change, the Company filed transition report on Form 10-KT on May 13, 2013 to include the financial information for the six-month transition period from July 1, 2012 to December 31, 2012 (the "Transition Period").
Developments in Fiscal Years 2014 and 2013
| (a) | Business Operation |
In February 2015, we announced the rollout of our platform in China, brand named Aishuo. This rollout entails multiple strategies including advertisements, search engine optimization, press releases, event marketing, business-traveler direct marketing, as well as other on and off-line promotions as well as leveraging the brand new One Horizon Sponsored-Call platform. Brand building and technology awareness activities will start in App Stores, Internet forums and social media outlets immediately and will run indefinitely. The Aishuo product has just been delivered to major stores in China app marketplace including Baidu’s 91.com and Baidu.com, the Tencent App store MyApp.com, 360 Qihoo store 360.cn and the every growing Xiaomi store mi.com. The Aishuo smartphone app is expected to drive multiple revenue streams from the supply of its value-added services including the rental of Chinese telephone phone numbers linked to the app, low cost local and international calling plans and sponsorship from advertisers. Subscribers can top up their app credit from major online payment services in China including AliPay (from Alibaba), Union Pay, PayPal and Tenent’s WeChat payment service.
4
In December 2014, Tier 1 Telecom operators, including Smartfren Telcom, Tbk in Indonesia and the Philippines, will make One Horizon software available to customers as a standard feature upon activation of devices. This will give users the ability to acquire a free virtual SIM, a unique identifier that allows for calls from ‘application to application’ or ‘application to landline/mobile phones’, by simply registering the App. Having the App on the device eliminates the step of the user needing to seek out and download the App. It is anticipated that Smartfren Telcom will target to pre-install the smartcall app in more than 4 million units of their Andromax phones in 2015.
During the three months ended September 30, 2014, our One Horizon mobile VoIP app was added by SingTel to their existing One Horizon software platform for mobile satellite services. SingTel is Asia's leading communications group with over 500 million mobile customers in 25 countries, including Bangladesh, India, Indonesia, the Philippines and Thailand.
SingTel AIO Connect is a comprehensive unified communications service for both business users and crew onboard ships. It enables instant messaging, email, Internet surfing, Voice-over-IP (VoIP) and voicemail in a single, integrated application. This service has already succeeded in bringing optimized VoIP, Messaging over IP and compressed Internet surfing to SingTel's mobile satellite subscribers connected using mobile Internet over satellite; the toughest of all mobile Internet environments. This mobile VoIP app can be downloaded from the Apple App Store and Google's Play Store
Our optimized software platform is being used by a pre-paid VoIP Smartphone application launched by Smart Communications, Inc, (“Smart”). Smart is the Philippines' leading wireless services provider with 57.3 million subscribers on its GSM network as of end-June 2013. Smart rolled out its smartphone mobile app, branded Link Plus, as a pre-paid Over The Top ("OTT") Android App that is available to download from the Google Play Store. Once Link Plus is installed on the smartphone, the user's app will receive a new Virtual SIM Filipino telephone number from Smart.
We believe that winning new business with SingTel and Smart demonstrates the acceptance of our carrier-grade technology by tier 1 operators, especially in Asia. Our current contract backlog of $65.81 million, of which only $9.65 million was recognized through September 30, 2014, which indicates great potential of our existing contracts.
During the first nine months of 2014 fiscal year, we commenced the first phase of its infrastructure rollout in six cities in China: Tianjin, Beijing, Chongqing, Changchun, Nanjing and Shijiazhuang. These initial locations will connect to the national telephone network to commence the commissioning of the VoIP service in China, brand name Aishuo. To date, we have successfully installed eight servers in support of Chinese smart phone app with interconnecgs to the ALiPay and UnionPay credit card and micro-payments services in China. The smart phone app will be able to provide various optimized internet value added services to its mobile subscribers including but not limited to voice and social media services including text, picture, video and geo-location messaging. These value added services are made possible through the creation of a "Virtual SIM" and One Horizon's proprietary communication software, an industry first. Combined with One Horizon's location aware mobile advertising services, the Aishuo branded smart phone app is expected to drive multiple revenue streams from the supply of its value-added services. The service will seek to acquire 100 million new app subscribers for the smartphone app over a three-year period and expects to achieve industry average revenues per user (ARPU) for similar social media apps.
We continued building up the Chinese core network rollout. The Global Exchange (network control center) was placed in a high availability Data Center in Shanghai and eight (8) Horizon line servers were connected to the telecommunications network. This level of rollout allowed us to issue a preliminary Android Application (App) to a group of Chinese students in Nanjing for them to evaluate the user Interface and the core features of our optimized smartphone App. Based on this feedback the research and development teams in Ireland and China made some adjustments to the Application look and feel service to accommodate this target user community.
During the first nine months of 2014, we continued our product refinement and commercial integration efforts with Smartfren Telecom, Tbk of Indonesia. The service, branded SmartCall, will be available in Google Play later in the year. This service rollout represents yet another tier 1 mobile carrier deployment in Asia. According to a study from Australian market research company Roy Morgan Research, the amount of smartphone ownerships doubled from 12% of the population to 24% in Indonesia during March 2012 to March 2013, which are approximately 60 million. Delivered by the worldwide tier 1 operators, the One Horizon Solution shows its innovation making a new virtual SIM service available to all Indonesian at home and abroad.
5
On May 20, 2013, we announced the launch of new social networking features in its Horizon Call app on Android, enabling service providers to further differentiate themselves from over-the-top ("OTT") players by offering innovative, integrated mobile Voice, Messaging and Advertising services over Internet Protocol ("IP").
On July 29, 2013, we announced the release of our voice over IP (VoIP) technology as a software-library for smartphone App developers. The Horizon software library allows smartphone app developers to integrate the Horizon VoIP optimizations with their current and their future apps. Apps such as on-line gaming can now carry the gamer's voice in a high-quality and reliable way especially while on wireless networks such as 3G, bringing a new level of mobility to games that benefit from voice communications. Another use for the library is in the plethora of existing VoIP apps that currently employ inefficient SIP protocols. App-based gaming developers can now upgrade their users' voice-communication experience by deploying Horizon and integrating the Horizon software library in their apps.
On September 17, 2013, we opened a new software research and development office in the Nexus Innovation Centre on the campus of the University of Limerick in Ireland employing 3 software engineers. This on campus R&D office is focused on the research of the core software architecture as opposed to the mobile application developments and a lot of engineering and academics surrounding is required. We believe we will benefit from Irish Software Foundation’s creative thinking and further advance ourselves in research of our unique mobile VoIP solutions.
On November 4, 2013, we announced that we have further expanded our software suite of products by embedding a GPS location and tracking service into our smart phone App; the service is designed to work in conjunction with its advanced mobile App advertising service.
6
| (b) | Offering and Market Related |
On December 22, 2014, we closed a private placement of $3,500,000 (the “Closing”) in reliance upon the exemption from securities registration afforded by Regulation S (“Regulation S”) as promulgated under the Securities Act of 1933, as amended (the “December 2014 Offering”). In connection with the Offering, we issued to an investor (the “Investor”) a convertible debenture that is convertible into 1,555,556 shares of common stock, par value $0.0001 per share (the “Common Stock”), Class C warrant to purchase 388,889 shares of Common Stock and Class D warrant to purchase 388,889 shares of Common Stock. Furthermore, the Investor is eligible to receive additional consideration in the form of a performance warrant to purchase certain amount of shares of Common Stock based on our annual reported subscriber numbers, twenty four (24) months after the Closing, as is reflected in our Annual Report on Form 10-K for the year ending December 31, 2016 (the “Form 10-K”), if we fail to achieve 15.0 million subscribers at that time. In addition, the placement agent in the Offering received placement agent warrant, Class C warrant and Class D warrant to purchase 62,222, 15,556 and 15,556 shares of Common Stock, respectively; and a cash fee of $280,000.
Our common stock commenced trading on the NASDAQ Capital Market on July 9, 2014 under the same ticker symbol "OHGI". In July 2014, we also closed a private placement of $1,000,000 for a total of 10 units at a purchase price of $100,000 per Unit, each consisting of, (i) 17,094 shares of the Company’s Series A Redeemable Convertible Preferred Stock, par value $0.0001 per share, initially convertible into 17,094 shares of the Company’s common stock, par value $0.0001 per share, and (ii) 10,000 Class B Warrants, each exercisable to purchase 1 share of Common Stock at an exercise price of $4.00 per share (the “July 2014 Offering”). The July 2014 Offering was completed in reliance upon the exemption from securities registration afforded by Regulation S.
In February 2013, we closed a Reg. S offering whereby we issued an aggregate of 806,451 shares of our common stock and a three-year warrant to purchase 403,225 shares of our Common stock at an exercise price of $7.44 per share for a total consideration of $6,000,000 ( the “February 2013 Offering”). In August 2013, we amended the offering with the investor in the offering whereby we reduced the exercise price of the warrant from $7.44 per share to $5.94 per share.
| (c) | Corporate Governance |
On November 10, 2014, as one of our continuous measures to improve our internal controls and procedure over the financial reporting and disclosure, our Board of Directors adopted a tracking form which was designed to track related party transactions. Upon adoption, management will review and pre-approve related party transaction and submit the tracking form to the Board for review and ratification on quarterly basis.
On July 28, 2014, we appointed Brian Collins, Vice President and the Chief Technology officer of the Company, the Chief Executive Officer of the Company. Mr. Collins is the co-inventor of the Horizon Platform, and has over 20 years’ experience in the technology sector with a background in software engineering. Mr. Collins brings experience in founding and operating technology companies along with his extensive knowledge of software engineering.
| (d) | Research & Development |
During the last quarter of 2014, the expansion of the Horizon advertising platform to allow the industry first of User-Selectable-Sponsored-Calls was developed in Switzerland and Ireland R&D centers, and released on the Horizon product suite in China by the Chinese team, brand name Aishuo. A User-Selectable-Sponsored-Calls allows would-be advertisers to sponsor a call or calls to a certain amount in time or price. Further to this, in Ireland, the R&D team developed a brand new multi-ring solution of our App to be able to receive incoming calls on multiple devices at the same time. This differs from existing app technologies in that it also includes the functionality to receive the call to apps, home, office and mobile at the same time so that no call will be missed.
7
During the nine months ended September 30, 2014, we expanded our Irish software development team with the addition of a new senior software developer at our recently opened software research and development office at the Nexus Innovation Center on the campus of the University of Limerick. As part of this process, we signed an agreement with the Industrial Development Agency (IDA) Ireland whereby IDA granted certain financial assistance toward the cost of establishing and carrying a service undertaking for a software development center in Ireland in connection with our VoIP software platform. The software development center is intended to give employment of 25 persons and could allow us to more quickly increase the size of this research and development team. We believe that the further expansion of our Irish development team will allow the further advance of our unique mobile VoIP solutions.
We completed the development and continued to refine the Horizon billing system. The completion of the Horizon Billing System software add-on package allows one Horizon to deliver an additional turn-key element to our customers that will allow our customers to invoice their customers and enterprise on a postpaid monthly basis. This adds greater flexibility and reach to the Horizon platform as offered by our customers to those subscribers that wish to utilize the service on a post paid basis.
We expanded our software development capabilities for China by hiring 4 new junior software developers in our Horizon Nanjing JV, known as Horizon Network Technology Co. Ltd.. We believe that the expansion of our software development team at our Chinese joint venture will support the company’s strategy of continuing to develop our products in areas with high population density, high penetration of mobile phones, congested mobile cellular networks and high growth in the adoption of smartphones while working within the constraints of local regulations.
We continued our research and development of the Horizon product platform. The Swiss based team made significant strides towards the next generation of the product suite with particular emphasis going to the User Interface (UI) re-engineering. Further to the UI the Research and Development for version 2.0, our Irish based team made progress on the latest multi-core solution with a view to releasing this software in the third quarter of 2014. The software team in China is pushing ahead with integrating the user feedback garnered from Chinese students using our Application on the smartphone and also working on a new and exciting method for Direct Inward Dial number rental for the Chinese marketplace.
Principal Executive Office
Our principal executive offices are located at Weststrasse 1, Baar, Switzerland, Zip Code:CH6340, Tel: +41-41-7605820.
Risk Factors
The securities offered by this prospectus are speculative and involve a high degree of risks associated with our business.
8
The Offering
| Common Stock being offered by Selling Stockholders | Up to 3,275,635 shares(1) |
| Common Stock outstanding | 32,933,209 shares as of the date of this Prospectus |
| Common Stock outstanding after the Offering | 32,933,209 |
| Use of Proceeds | We will not receive any proceeds from the sale of shares by the Selling Stockholders, although we may receive proceeds of up to $2,768,892 if all of Class C Warrants, Class D Warrants and Placement Agent Warrants are exercised for cash. In addition, we may receive additional proceeds if any Performance Warrants are issued and exercised for cash. We will not receive any additional proceeds to the extent that the Warrants are exercised by cashless exercise. |
| Trading Symbol | OHGI |
| Risk Factors | The securities offered by this prospectus are speculative and involve a high degree of risk and investors purchasing securities should not purchase the securities unless they can afford the loss of their entire investment. |
| (1) | This prospectus relates to the resale by the Selling Stockholders of up to 3,275,635 shares of our Common Stock, including (a) 404,445 shares of Common Stock underlying Class C Warrants; (b)404,445 shares of Common Stock underlying Class D Warrants; (c) 62,222 shares of Common Stock underlying Placement Agent Warrants, and (d) up to 310,800 shares of Common Stock issuable upon exercise of Performance Warrants (defined herein below) issuable based on our annual reported subscriber numbers, twenty four (24) months after December 22, 2014 as reflected in the 2016 Form 10-K, and € 2,093,723 shares of Common Stock issued by the Company to investors in various financings before and after the Share Exchange. The selling stockholders named herein may sell common stock from time to time in the principal market on which the stock is traded at the prevailing market price, at prices related to such prevailing market price, in negotiated transactions or a combination of such methods of sale. We will not receive any proceeds from the sales by the selling stockholders. |
Summary Financial Information
On November 30, 2012, ICE Corp. and One Horizon UK consummated the Share Exchange, as a result of which One Horizon UK became a subsidiary of the Company, with former One Horizon UK shareholders holding approximately 96% of the issued and outstanding shares of ICE Corp. The Company’s name was subsequently changed to One Horizon Group, Inc. Prior to the Share Exchange, One Horizon UK had a June 30th fiscal year end, which, by virtue of One Horizon UK being deemed the accounting acquirer, became the fiscal year end of the Company. As a result, the Company changed its fiscal year end from June 30 to December 31 and filed transition report on Form 10-KT on May 13, 2013 to include the financial information for the six-month transition period from July 1, 2012 to December 31, 2012 (the "Transition Period").
The following summary financial data for the Transition Period, the fiscal year ended December 31, 2013, the three and nine months ended September 30, 2014 as well as the historical data for the fiscal year ended June 30, 2012, were derived from the consolidated financial statements. This information is only a summary and does not provide all of the information contained in our financial statements and related notes. You should read the “Management’s Discussion and Analysis or Plan of Operation” beginning on page 72 of this prospectus and our financial statements and related notes included elsewhere in this prospectus.
9
Statement of Operations Data: ((in thousands, except per share data)
Year ended December 31, 2013 | Six months ended December 31, 2012 | Year ended June 30, 2012 | Three months ended September 30, 2014 | Nine months ended September 30, 2014 | ||||||||||||||||
| Revenue | $ | 9,106 | $ | 6,959 | $ | 2,612 | $ | 1,641 | $ | 4,130 | ||||||||||
| Cost of revenue | 2,453 | 994 | 1,735 | 762 | 1,859 | |||||||||||||||
| Gross margin | 6,653 | 5,965 | 877 | 879 | 2,271 | |||||||||||||||
| Expenses: | ||||||||||||||||||||
| General and administrative | 6,706 | 4,023 | 4,570 | 1,259 | 3,577 | |||||||||||||||
| Depreciation | 166 | 73 | 884 | 26 | 120 | |||||||||||||||
| Income (loss) from operations | (219 | ) | 1,869 | (4,577 | ) | (406 | ) | (1,426 | ) | |||||||||||
| Other income and expense: | ||||||||||||||||||||
| Interest expense | (322 | ) | (87 | ) | (218 | ) | 0 | (2 | ) | |||||||||||
| Interest expense-related party | - | - | - | (14 | ) | (107 | ) | |||||||||||||
| Foreign exchange | (158 | ) | 16 | 49 | (5 | ) | (24 | ) | ||||||||||||
| Interest income | 1 | 1 | - | - | 2 | |||||||||||||||
| (479 | ) | (70 | ) | (169 | ) | (19 | ) | (131 | ) | |||||||||||
| Income (loss) from continuing operations before income taxes | (698 | ) | 1,799 | (4,746 | ) | (425 | ) | (1,557 | ) | |||||||||||
| Income taxes expense (benefit) | - | - | - | (54 | ) | (210 | ) | |||||||||||||
| Income (loss) from continuing operations | (698 | ) | 1,799 | (4,746 | ) | (371 | ) | (1,347 | ) | |||||||||||
| Discontinued operations: | ||||||||||||||||||||
| Loss from discontinued operations | - | (40 | ) | - | ||||||||||||||||
| Loss on sale of discontinued businesses | - | (81 | ) | - | - | - | ||||||||||||||
| Loss from discontinued operations | - | (121 | ) | - | - | - | ||||||||||||||
| Net Income (Loss) for the period | $ | (698 | ) | $ | 1,678 | $ | (4,746 | ) | (371 | ) | (1,347 | ) | ||||||||
| Net income (loss) attributable to the non-controlling interest | (104 | ) | - | - | (23 | ) | (88 | ) | ||||||||||||
| Net Income (Loss) for the period attributable to One Horizon Group, Inc. | $ | (594 | ) | $ | 1,678 | $ | 4,746 | $ | (348 | ) | $ | (1,259 | ) | |||||||
| Earnings per share | ||||||||||||||||||||
| Basic net income (loss) per share | $ | (0.02 | ) | $ | 0.06 | $ | (0.21 | ) | $ | (0.01 | ) | $ | (0.04 | ) | ||||||
| Diluted net income (loss) per share | $ | (0.02 | ) | $ | 0.06 | $ | (0.21 | ) | (0.01 | ) | (0.04 | ) | ||||||||
| Weighted average number of shares outstanding | ||||||||||||||||||||
| Basic | 31,661 | 27,331 | 22,695 | 33,029 | 32,966 | |||||||||||||||
| Diluted | - | 29,268 | - | 33,029 | 33,966 | |||||||||||||||
10
Balance Sheet Data:
| December 31, | September 30, | |||||||||||
| 2013 | 2012 | 2014 | ||||||||||
| Assets | (restated) | |||||||||||
| Current assets: | ||||||||||||
| Cash | $ | 2,070 | $ | 699 | $ | 650 | ||||||
| Accounts receivable | 7,264 | 977 | 8,916 | |||||||||
| Other assets | 139 | 136 | 624 | |||||||||
| Total current assets | 9,473 | 1,812 | 10,190 | |||||||||
| Property and equipment, net | 315 | 350 | 239 | |||||||||
| Intangible assets, net | 12,760 | 12,329 | 11,515 | |||||||||
| Investment | 23 | - | 20 | |||||||||
| Total assets | $ | 22,571 | $ | 14,491 | $ | 21,964 | ||||||
| Liabilities and Stockholders' Equity | ||||||||||||
| Total current liabilities | 5,366 | 4,874 | 5,621 | |||||||||
| Long-term liabilities | ||||||||||||
| Long-term debt | 184 | 219 | 129 | |||||||||
| Deferred income taxes | 445 | 445 | 235 | |||||||||
| Mandatorily redeemable preferred shares | 90 | 90 | 90 | |||||||||
| Total liabilities | 6,085 | 5,628 | 6,075 | |||||||||
| Stockholders' Equity | ||||||||||||
| Total liabilities and stockholders' equity | $ | 22,571 | $ | 14,491 | $ | 21,964 | ||||||
11
RISK FACTORS
Not applicable
We will not receive any proceeds from the sale of shares by the Selling Stockholders, although we may receive proceeds of up to $2,768,892 if all of Class C Warrants, Class D Warrants and Placement Agent Warrants are exercised for cash. In addition, we may receive additional proceeds if any Performance Warrants are issued and exercised for cash. We will not receive any additional proceeds to the extent that the Warrants are exercised by cashless exercise. We expect to use the proceeds received from the exercise of the Warrants, if any, for general working capital purposes. We cannot assure you however that any of the Warrants will ever be exercised.
Not applicable.
ITEM 6. DILUTION
Not applicable.
We are registering for resale shares of our Common Stock underlying Warrants issued and issuable pursuant to a financing we closed on December 22, 2014. We are registering the shares to permit the Selling Stockholders and their pledgees, donees, transferees and other successors-in-interest that receive their shares from a Selling Stockholder as a gift, partnership distribution or other non-sale related transfer after the date of this prospectus to resell the shares when and as they deem appropriate in the manner described in the “Plan of Distribution.” As of the date of this prospectus there are 32,921,533 shares of Common Stock issued and outstanding.
The following table sets forth:
| ● | the name of the Selling Stockholders, |
| ● | the number of shares of our Common Stock that the Selling Stockholders beneficially owned prior to the offering for resale of the shares under this prospectus, |
| ● | the maximum number of shares of our Common Stock that may be offered for resale for the account of the Selling Stockholders under this prospectus, and |
| ● | the number and percentage of shares of our Common Stock beneficially owned by the Selling Stockholders after the offering of the shares (assuming all of the offered shares are sold by the Selling Stockholders). |
Except Tripoint Global Equities, LLC, we have not had a material relationship with any of the Selling Stockholders within the last three years.
12
Each Selling Stockholder may offer for sale all or part of the Shares from time to time. The table below assumes that the Selling Stockholders will sell all of the Shares offered for sale. A Selling Stockholder is under no obligation, however, to sell any Shares pursuant to this prospectus.
| Name of Selling Stockholder | Shares of Common Stock Beneficially Owned Prior to Offering (1) | Maximum Number of Shares of Common Stock to be Sold (2) | Number of Shares of Common Stock Owned After Offering (3) | Percentage Ownership After Offering (4) | ||||||||||||
| Da Chao Asset Management (Shanghai) Co., Ltd(5) | 1,088,578 | 1,088,578 | 0 | * | ||||||||||||
TriPoint Global Equities, LLC (6) | 209,210 | 209,210 | 0 | * | ||||||||||||
| Primary Capital LLC (7) | 46,667 | 46,667 | 0 | * | ||||||||||||
| Almaro Holding AG (8) | 291,900 | 291,900 | 0 | * | ||||||||||||
| Jean Arnaud Estienne Albert (9) | 97,300 | 97,300 | 0 | * | ||||||||||||
| Niall O’Riordan (10) | 194,600 | 194,600 | 0 | * | ||||||||||||
| Robert Vogler (11) | 194,600 | 194,600 | 0 | * | ||||||||||||
| Patrik Schidknecht (12) | 195,573 | 195,573 | 0 | * | ||||||||||||
| Roland Leutwiler (13) | 150,000 | 150,000 | 0 | * | ||||||||||||
| Martin Eberhard (14) | 135,000 | 135,000 | 0 | * | ||||||||||||
| Mark Hawtin (15) | 100,000 | 100,000 | 0 | * | ||||||||||||
| Iroko Holding AG (16) | 97,300 | 97,300 | 0 | * | ||||||||||||
| PMG Partners SICAV PLC (17) | 88,333 | 88,333 | 0 | * | ||||||||||||
| Hans Wick (18) | 87,570 | 87,570 | 0 | * | ||||||||||||
| Adelheid Schidknecht (19) | 53,000 | 53,000 | 0 | * | ||||||||||||
| PMG Focus Funds SICAV (20) | 58,333 | 58,333 | 0 | * | ||||||||||||
| Hinvest Holding GMBH (21) | 39,150 | 39,150 | 0 | * | ||||||||||||
| Annette Witschi (22) | 33,333 | 33,333 | 0 | * | ||||||||||||
| Stefan Laeng (23) | 29,190 | 29,190 | 0 | * | ||||||||||||
| Oscar Weber (24) | 20,000 | 20,000 | 0 | * | ||||||||||||
| Michael Fullemann (25) | 16,666 | 16,666 | 0 | * | ||||||||||||
| Marc Schumacher (26) | 25,000 | 25,000 | 0 | * | ||||||||||||
| Willy Scgynacger (27) | 16,666 | 16,666 | 0 | * | ||||||||||||
| Aline Lara Schildknecht (28) | 3,000 | 3,000 | 0 | * | ||||||||||||
| Leonie S Schildknecht (29) | 3,000 | 3,000 | 0 | * | ||||||||||||
| Maya Ringler (30) | 1,666 | 1,666 | 0 | * | ||||||||||||
| TOTAL | 3,275,635 | 3,275,635 | 0 | * | ||||||||||||
* Represents beneficial ownership of less than one percent of our outstanding shares.
| 1) | Unless otherwise noted, the Selling Stockholder became one of our shareholders pursuant to the Private Placement we closed on December 22, 2014 (the “December 2014 Private Placement”). Accordingly, prior to the Offering, the Selling Stockholder may own shares of Common Stock underlying the convertible debenture and/or Warrants received in December 2014 Private Placement (the “Securities”). However, based upon the terms of both the convertible debenture and Warrants, holders may not convert the convertible debenture and/or exercise the Warrants, if on any date, such holder would be deemed to the beneficial owner of more than 19.99%, depending upon their agreement, of the then outstanding shares of our Common Stock. Therefore, unless otherwise noted, this number represents the number of Securities the Selling Stockholder received in December 2014 Private Placement that he/she can own based upon the 19.99% ownership cap. See “Prospectus Summary – Recent Developments - Financing” and “Description of Securities.” |
| 2) | This number represents shares of Common Stock underlying all Warrants issued and issuable in December 2014 Private Placement, which we agreed to register in this Registration Statement pursuant to the Registration Rights Agreement we entered into in connection with December 2014 Private Placement. |
13
| 3) | Since we do not have the ability to control how many, if any, of their shares each of the selling shareholders listed above will sell, we have assumed that the selling shareholders will sell all of the shares offered herein for purposes of determining how many shares they will own after the Offering and their percentage of ownership following the offering. |
| 4) | All Percentages have been rounded up to the nearest one hundredth of one percent. |
| 5) | Consists of (1) 388,889 shares of Common Stock underlying Class C Warrant, (2) 388,889 shares of Common Stock underlying Class D Warrant, and (3) up to 310,800 shares of Common Stock underlying Performance Warrant that are issuable pursuant to December 2014 Private Placement, subject to a 19.99% limitation on beneficial ownership of our Common Stock as more fully described in note 1 above. The person having voting, dispositive or investment powers over Da Chao Asset Management (Shanghai) Co., Ltd is Mr. Wu, Zhan Ming. The address for Da Chao Asset Management (Shanghai) Co., Ltd is 1502 15F, Aurora Plaza, 99 Fucheng Road, Shanghai China, 200120 |
| 6) | Consists of (1) 7,778 shares of Common Stock underlying Class C Warrant, (2) 7,778 shares of Common Stock underlying Class D Warrant, (3) 31,111 shares of Common Stock underlying Placement Agent Warrant, (4) 62,452 shares of Common Stock issued pursuant to an advisory agreement dated April 15, 2013 between Tripoint Global Equities, LLC and the Company; (5) 75,000 shares of Common Stock issued pursuant to an advisory agreement dated July 1, 2014 between Tripoint Global Equities LLC and the Company, and (6) 25,000 shares of Common Stock issued as compensation shares to Tripoint Global Equities LLC as exclusive placement agent in $1M offering the Company closed on July 21, 2014. A sum of (1), (2) and (3) is subject to a 19.99% limitation on beneficial ownership of our Common Stock as more fully described in note 1 above; Mark Elenowitz and Michael Boswell share voting and dispositive power over the securities held by TriPoint Global Equities, LLC. The address for TriPoint Global Equities, LLC is 130 West 42nd Street, 10th FL.NY, NY 10036. Tripoint Global Equities, LLC is the placement agent in December 2014 Private Placement. |
| 7) | Consists of (1) 7,778 shares of Common Stock underlying Class C Warrant, (2) 7,778 shares of Common Stock underlying Class D Warrant, and (3) 31,111 shares of Common Stock underlying Placement Agent Warrant, subject to a 19.99% limitation on beneficial ownership of our Common Stock as more fully described in note 1 above. The Person having voting and dispositive power over Primary Capital LLC is John Leo. The address for Primary Capital LLC is 90 Broad Street, Suite 905, New York, NY 10004. Tripoint Global Equities, LLC hired Primary Capital LLC as its sub placement agent and assigned portion of Warrants as its compensation. |
| 8) | Represents 291,100 shares of Common Stock held by Almaro Holding AG. The Person having voting and dispositive power over Almaro Holding AG is Jurg Schaeppi. The address for Almaro Holding AG is Paradiesweg 23 8645 Jona Switzerland |
| 9) | Represents 97,300 shares of Common Stock held by Jean Arnaud Estienne Albert. The address for Jean Arnaud Estienne Albert is Route Suisse 9 Mies Ch-1295 Switzerland. |
| 10) | Represents 194,552 shares of Common Stock held by Mr. Niall O’Riordan. The address is Breitenacher 11 Zumikon 8126 , Switzerland |
| 11) | Represents 194,600 shares of Common Stock acquired by Mr. Robert Vogler. Mr. Vogler has served on the Company’s Board of Directors since January 8, 2014. The address for Mr. Vogler is C/O Kreivo AG, PO Box 4459 ZUG CH 6304 , Switzerland |
| 12) | Represents 195,573 shares of Common Stock held by Mr. Patrik Schidknecht. The address for Mr. Schidlknecht is Lattenstrasse 17 Uitikon 8142, Switzerland |
| 13) | Represents 150,000 shares of Common Stock held by Mr. Roland Leutwiler. The address for Mr. Roland Leutwiler is Etzelweg 1, 8704 Erlenbach, Switzerland |
14
| 14) | Represents 135,000 shares of Common Stock held by Mr. Martin Eberhard. The address is Aegerisaumweg 6B, ZuG CH 6300, Switzerland |
| 15) | Represents 100,000 shares of Common Stock held by Mr. Mark Hawtin. The address is 7 First St, London SW# 2LB, United Kingdom |
| 16) | Represents 97,300 shares of Common Stock held by Iroko Holding Ag. The Person having voting and dispositive power over Iroko Holding Ag is John Kelly. The address is C/O Walser & Partner AG Zug, Bahnhofstrasse 11, ZUG CH-6301, Switzerland |
| 17) | Represents 88,333 shares of Common Stock held by PMG Partners SICAV PLC. The Person having voting and dispositive power over PMG Partners SICAV PLC is Dr. Raowl Dobal. The address is 168 St. Christopher St, Valletta VLT 1467, Malta |
| 18) | Represents 87,570 shares of Common Stock held by Hans Wick. The address is Gartenstrasse 3B, Zurick CH-8002, Swizerland |
| 19) | Represents 53,000 shares of Common Stock held by Adelheid Schidknecht. The address is Gugelstrasse 2, 8115 Huettikon, Switzerland |
| 20) | Represents 43,333 shares of Common Stock held by PMG Focus Funds. The Person having voting and dispositive power over PMG Focus Funds is Dr. Raoul Dobal. The address is 168 St Christopher St, Valletta VLT 1467, Malta |
| 21) | Represents 39,150 shares of Common Stock held by Hinvest Holding GMBH. The Person having voting and dispositive power over Hinvest Holding GMBH is Oliver Von Hoff. The address isBlegistrasse 19, 6345 Barr, Switzerland |
| 22) | Represents 33,333 shares of Common Stock held by Annette Witschi. The address is Himmelistrasse 6, Kusnacht 8700, Switzerland |
| 23) | Represents 29,190 shares of Common Stock held by Stefan Laeng. The address is Haldenacherstrasse 3, Uitikon 8142, Switzerland |
| 24) | Represents 20,000 shares of Common Stock held by Oscar Weber. The address is Soumerstr. 31, CH-8832 Wollerau, Switzerland |
| 25) | Represents 16,666 shares of Common Stock held by Michael Fullemann. The address is Pflugsteinstrasse 50, Erlenbach 8703, Switzerland |
| 26) | Represents 25,000 shares of Common Stock held by Marc Schumacher. The address is Chrattengass 5, Gutenswil 8605, Switzerland |
| 27) | Represents 16,666 shares of Common Stock held by Willy Schumacher. The address is Raubbuhlstrasse 13, Dubendorf 8600, Switzerland |
| 28) | Represents 3,000 shares of Common Stock held by Aline Lara Schildknecht. The address is Lattenstrasse 17 Uitikon 8142, Switzerland |
| 29) | Represents 3,000 shares of Common Stock held by Leonie S Schildknecht. The address is Lattenstrasse 17 Uitikon 8142, Switzerland |
| 30) | Represents 1,666 shares of Common Stock held by Maya Ringler. The address is IM Gruet 4, CH-8805 Richterswil, Switzerland |
15
ITEM 8. PLAN OF DISTRIBUTION
The Selling Stockholders and any of their pledgees, donees, transferees, assignees and successors-in-interest may, from time to time, sell any or all of their Shares on any stock exchange, market or trading facility on which the Shares are traded or quoted or in private transactions. These sales may be at fixed prices, at prevailing market prices at the time of sale, at prices related to the prevailing market price, at varying prices determined at the time of sale, or at negotiated prices. The Selling Stockholders may use any one or more of the following methods when selling Shares:
● | ordinary brokerage transactions and transactions in which the broker-dealer solicits Investors; |
● | block trades in which the broker-dealer will attempt to sell the Shares as agent but may position and resell a portion of the block as principal to facilitate the transaction; |
● | purchases by a broker-dealer as principal and resale by the broker-dealer for its account; |
● | an exchange distribution in accordance with the rules of the applicable exchange; |
● | privately negotiated transactions; |
● | to cover short sales made after the date that this registration statement is declared effective by the SEC; |
● | broker-dealers may agree with the Selling Stockholders to sell a specified number of such Shares at a stipulated price per share; |
● | through the writing or settlement of options or other hedging transactions, whether through an options exchange or otherwise; |
● | a combination of any such methods of sale; and |
● | any other method permitted pursuant to applicable law. |
The Selling Stockholders may also sell Shares under Rule 144 under the Securities Act, if all of the conditions in Rule 144(i)(2) are satisfied at the time of the proposed sale, rather than under this prospectus.
In connection with the sale of the Common Stock or interests therein, the Selling Stockholders may enter into hedging transactions with broker-dealers or other financial institutions, which may in turn engage in short sales of the Common Stock in the course of hedging the positions they assume. The Selling Stockholders may also sell shares of the Common Stock short and deliver these securities to close out their short positions, or loan or pledge the Common Stock to broker-dealers that in turn may sell these securities. The Selling Stockholders may also enter into option or other transactions with broker-dealers or other financial institutions or the creation of one or more derivative securities which require the delivery to such broker-dealer or other financial institution of Shares offered by this prospectus, which shares such broker-dealer or other financial institution may resell pursuant to this prospectus (as supplemented or amended to reflect such transaction).
Broker-dealers engaged by the Selling Stockholders may arrange for other brokers-dealers to participate in sales. Broker-dealers may receive commissions or discounts from the Selling Stockholders (or, if any broker-dealer acts as agent for the purchaser of shares, from the purchaser) in amounts to be negotiated. The Selling Stockholders do not expect these commissions and discounts to exceed what is customary in the types of transactions involved.
16
The Selling Stockholders may from time to time pledge or grant a security interest in some or all of the Shares owned by them and, if they default in the performance of their secured obligations, the amendment or supplement to this prospectus under Rule 424(b)(3) or other applicable provision of the Securities Act of 1933 will be filed amending the list of Selling Stockholders to include the pledgee, transferee or other successors in interest as Selling Stockholders under this prospectus and the pledgees or secured parties may offer and sell shares of Common Stock from time to time under the supplement or amendment to this prospectus.
The Selling Stockholders also may transfer the shares of Common Stock in other circumstances, in which case the transferees, pledgees or other successors in interest will be the selling beneficial owners for purposes of this prospectus.
The Selling Stockholders and any broker-dealers or agents that are involved in selling the Shares may be deemed to be “underwriters” within the meaning of the Securities Act in connection with such sales. In such event, any commissions received by such broker-dealers or agents and any profit on the resale of the Shares purchased by them may be deemed to be underwriting commissions or discounts under the Securities Act. Discounts, concessions, commissions and similar selling expenses, if any, that can be attributed to the sale of Shares will be paid by the Selling Stockholder and/or the purchasers. Each Selling Stockholder has represented and warranted to the Company that it acquired the securities subject to this registration statement in the ordinary course of such Selling Stockholder’s business and, at the time of its purchase of such securities such Selling Stockholder had no agreements or understandings, directly or indirectly, with any person to distribute any such securities.
TriPoint Global Equities, LLC (“TriPoint Global”) and Primary Capital LLC (“Primary Capital”) are registered broker dealers and FINRA member firms; and listed as Selling Stockholders in this prospectus. They served as placement agent for December 2014 Private Placement.
FINRA Rule 5110 requires FINRA member firms (unless an exemption applies) to satisfy the filing requirements of Rule 5110 in connection with the resale, on behalf of Selling Stockholders, of the securities on a principal or agency basis. NASD Notice to Members 88-101 states that in the event a Selling Stockholder intends to sell any of the shares registered for resale in this prospectus through a member of FINRA participating in a distribution of our securities, such member is responsible for insuring that a timely filing, if required, is first made with the Corporate Finance Department of FINRA and disclosing to FINRA the following:
● | it intends to take possession of the registered securities or to facilitate the transfer of such certificates; |
● | the complete details of how the selling shareholders’ shares are and will be held, including location of the particular accounts; |
● | whether the member firm or any direct or indirect affiliates thereof have entered into, will facilitate or otherwise participate in any type of payment transaction with the selling shareholders, including details regarding any such transactions; and |
● | in the event any of the securities offered by the selling shareholders are sold, transferred, assigned or hypothecated by any selling shareholder in a transaction that directly or indirectly involves a member firm of FINRA or any affiliates thereof, that prior to or at the time of said transaction the member firm will timely file all relevant documents with respect to such transaction(s) with the Corporate Finance Department of FINRA for review. |
No FINRA member firm may receive compensation in excess of that allowable under FINRA rules, including Rule 2710, in connection with the resale of the securities by the selling shareholders, which total compensation may not exceed 8%.
We have advised each Selling Stockholder that it may not use Shares registered on this registration statement to cover short sales of Common Stock made prior to the date on which this registration statement shall have been declared effective by the Commission. If a Selling Stockholder uses this prospectus for any sale of the Common Stock, it will be subject to the prospectus delivery requirements of the Securities Act. The Selling Stockholders will be responsible to comply with the applicable provisions of the Securities Act and Exchange Act, and the rules and regulations thereunder promulgated, including, without limitation, Regulation M, as applicable to such Selling Stockholders in connection with resales of their respective Shares under this registration statement.
17
We are required to pay all fees and expenses incident to the registration of the Shares, but the Company will not receive any proceeds from the sale of the Common Stock. The Company has agreed to indemnify the Selling Stockholders against certain losses, claims, damages and liabilities, including liabilities under the Securities Act.
Authorized Capital Stock
We have 250,000,000 shares of authorized capital stock, consisting of 200 million shares of Common Stock, par value $0.0001, and 50 million shares of the Company’s Preferred Stock, par value $0.0001.
Common Stock
As of the date hereof, 32,921,533 shares of our Common Stock are issued and outstanding. Holders of Common Stock are entitled to cast one vote for each share on all matters submitted to a vote of shareholders, including the election of directors. The holders of Common Stock are entitled to receive ratably such dividends, if any, as may be declared by the Board out of funds legally available therefore. See “Dividend Policy.” Such holders do not have any preemptive or other rights to subscribe for additional shares. All holders of Common Stock are entitled to share ratably in any assets for distribution to shareholders upon the liquidation, dissolution or winding up of the Company. There are no conversion, redemption or sinking fund provisions applicable to the Common Stock. All outstanding shares of Common Stock are fully paid and nonassessable.
Preferred Stock
The Board is authorized, without further action by the shareholders, to issue, from time to time, up to 50 million shares of preferred stock in one or more classes or series. Similarly, the Board will be authorized to fix or alter the designations, powers, preferences, and the number of shares which constitute each such class or series of preferred stock. Such designations, powers or preferences may include, without limitation, dividend rights (and whether dividends are cumulative), conversion rights, if any, voting rights (including the number of votes, if any, per share), redemption rights (including sinking fund provisions, if any), and liquidation preferences of any unissued shares or wholly unissued series of preferred stock.
Series A Preferred Stock
On July 21, 2014, the Company completed a private placement of 170,940 shares of Series A Preferred Stock that also included 100,000 Class B warrants convertible into common stock on a one-to-one basis at an exercise price of $4.00 per share. The proceeds of the offering were $1,000,000 (the “July 2014 Private Placement”). As the date hereof, 170,940 shares of Series A Preferred Stock remain outstanding. Unless converted earlier, each share of Series A Preferred Stock will automatically convert on July 20, 2016, into Common Stock at a conversion price of $5.85 per share, subject to anti-dilution adjustments. Subject to certain restrictions, at any time prior to July 20, 2016, holders of Series A Preferred Stock may elect to convert all or a portion of their shares into common stock at the conversion rate.
The holders of Series A Preferred Stock are entitled to receive cumulative dividends during a period of twenty-four (24) months from and after July 21, 2014. During that period for each outstanding share of Series A Preferred Stock, dividends shall be payable quarterly in cash, at the rate of 10% per annum on or before each ninety (90) day period following July 21, 2014, with the first payment date to occur promptly following the three month period following July 21, 2014, and continuing until the end of the dividend payment period. Following the expiration of the dividend payment period, the holders of Series A Preferred Stock shall not be entitled to any additional dividend payment or coupon rate.
Shares of Series A Preferred Stock are redeemable, at the option of the holders commencing any time after 12 months from and after the closing at a price equal to the original purchase price plus all accrued but unpaid dividends. In the event that the Company completes a financing of $10 million or greater prior to July 20, 2016, the Series A Preferred Stock will be redeemed at a price equal to the original purchase price plus all accrued but unpaid dividends.
18
Convertible Debenture
In connection with December 2014 Private Placement, we issued a Convertible Debenture that is convertible into 1,555,556 shares of Common Stock; the Convertible Debenture will, by its principal terms,
| (a) | Carry a dividend at an annual rate of 8%, payable quarterly in arrears, in cash or shares of Common Stock, or a combination of cash and shares of Common Stock at the Investors’ option; |
| (b) | Mature on the thirty six (36) month anniversary of the Closing including principal and any unpaid interest (the “Maturity Date”) |
| (c) | Convertible at any time after the issuance until the Maturity Date into one (1) Share of Common Stock at an initial conversion price of $2.25 per share, subject to adjustment pursuant to the terms of the Convertible Debenture; and |
| (d) | Carry a prepayment clause pursuant to which we may repurchase any or all outstanding Convertible Debenture in cash for 120% of their face value on ten(10) business days’ notice at any time after the twelve (12) month anniversary of the Closing while the Investors have the right to convert their Convertible Debenture within five (5) business days after written notice of such prepayment. |
The Common Stock Warrants
As of the date hereof, there are 2,811,642 Warrants issued and outstanding.
Class A Warrant
On February 18, 2013, the Company entered into a subscription agreement with a non-U.S. shareholder of the Company (the “Investor”), pursuant to which it sold an aggregate of 483,870,968 shares of the Company’s common stock for an aggregate consideration of $6,000,000 and Class A Warrant to purchase 403,225 shares of Common Stock at a price of $5.94 per share (the “February 2013 Private Placement”). In connection with July 2014 Private Placement, we reduced the exercise price of Class A Warrant from $5.94 per share to $4.25 per share and increased the amount of shares of Common Stock underlying Class A Warrant from 403,225 to 1,209,675. In addition, the expiration date of Class A warrants was extended an additional 12 months; and
19
Class B Warrant
In connection with July 2014 Private Placement, we issued 100,000 Class B Warrants. Each Class B Warrant, by its principal terms,
| (a) | entitles the holder to purchase one (1) share of Common Stock; |
| (b) | is exercisable at any time after consummation of the July 2014 Private Placement and shall expire on the date that is three (3) years following the original issuance date of the Series B Warrants; |
| (c) | is exercisable, in whole or in part, at an exercise price of $4.00 per share; |
| (d) | is exercised either for cash, or cashless subject to satisfaction of certain conditions set forth in the Class B Warrant; and |
Class C Warrants
In connection with December 2014 Private Placement, we issued 1,617,780 Class C Warrant to purchase up to 404,445 shares of Common Stock to an investor and the placement agent. Each Class C Warrant, by it principal terms,
| (a) | Entitles the holder to purchase one forth (1/4) share of Common Stock; |
| (b) | Is exercisable at any time after the issuance and shall expire on the date that is four (4) years following the original issuance date of the Class C Warrants; |
| (c) | Is exercisable, in whole or in part, at an initial exercise price of $3.00 per share of Common Stock, subject to adjustment as set forth in the Class C Warrant; and, |
| (d) | Is exercised either for cash, or cashless subject to satisfaction of certain conditions set forth in the Class C Warrant; and . |
Class D Warrants
In connection with December 2014 Private Placement, we issued 1,617,780 Class D Warrant to purchase up to 404,445 shares of Common Stock to an investor and the placement agent. Each Class D Warrant, by its principal terms,
| (a) | Entitles the holder to purchase one forth (1/4) share of Common Stock; |
| (b) | Is exercisable at any time after the issuance and shall expire on the date that is four (4) years following the original issuance date of the Class D Warrants; |
| (c) | Is exercisable, in whole or in part, at an exercise price of $3.50 per share of Common Stock, subject to adjustment as set forth in the Class D Warrant; and, |
| (d) | Is exercised either for cash, or cashless subject to satisfaction of certain conditions set forth in the Class D Warrant; and |
Performance Warrants
The Performance Warrants are issuable pursuant to December 2014 Private Placement based on our annual reported subscriber numbers, twenty four (24) months after December 22, 2014, as is reflected in our 2014 Form 10-K. After 24 months, if we fail to achieve 5.0 million subscribers, the Investor will receive 450,000 Performance Warrants. If we achieve subscriber numbers between 5.0 million and 15.0 million, the Investor will receive a pro rata number of Performance Warrants based on 450,000 Performance Warrants for 5.0 million subscribers and 0 Performance Warrants for 15.0 million subscribers. If we achieve more than 15.0 million subscribers, we will not issue any Performance Warrants.
Performance Warrants will be issued at an exercise price of the daily value weighted average price for the Common Stock for the 30 trading day period ending the day prior the date the 2014 Form 10-K is reported.
The Placement Agent Warrants
In connection with December 2014 Private Placement, we issued 62,222 Placement Agent Warrant to purchase up to 62,222 shares of Common Stock to an investor and the placement agent. Each Class D Warrant, by its principal terms,
| (a) | Entitles the holder to purchase one share of Common Stock; |
| (b) | Is exercisable at any time after the issuance and shall expire on the date that is four (4) years following the original issuance date of the Placement Agent Warrants; |
| (c) | Is exercisable, in whole or in part, at an exercise price of $2.25 per share of Common Stock, subject to adjustment as set forth in the Placement Agent Warrant; and, |
| (d) | Is exercised either for cash, or cashless subject to satisfaction of certain conditions set forth in the Placement Agent Warrant. |
20
Registration Rights
Pursuant to the Registration Rights Agreement we entered into with the investor of December 2014 Private Placement, we agreed to register all of the shares of Common Stock underlying Warrants issued and issuable in connection with December 2014 Private Placement.
Transfer Agent
The transfer agent for our common stock and preferred stock is Nevada Agency and Transfer Company 50 West Liberty Street, Suite 880, Reno NV 89501, Tel: 775-322-0626
Legal Matters
Certain legal matters with respect to the shares of common stock offered hereby will be passed upon for us by Hunter Taubman Weiss LLP, New York, New York 10004.
Experts
The audited consolidated financial statements of One Horizon Group, Inc. and subsidiaries included herein and elsewhere in the registration statement have been audited by Peterson Sullivan LLP., independent registered public accounting firm, for the periods and to the extent set forth in their Report (which includes and explanatory paragraph that relates to the restatement of the consolidated financial statements as of December 31, 2012 and for the six months then ended, and for the year ended June 30, 2012) appearing herein and elsewhere in the registration statement. Such financial statements have been so included in reliance upon the report of such firm given upon the firm’s authority as experts in accounting and auditing.
We develop and license software to telecommunications operators through our indirect wholly-owned subsidiaries Horizon Globex GmbH and Abbey Technology GmbH, each incorporated under the laws of Switzerland (“Horizon Globex” and “Abbey Technology,” respectively). Specifically, Horizon Globex and Abbey Technology develop software application platforms that optimize mobile voice, instant messaging and advertising communications over the internet, collectively, the “Horizon Platform.” Both subsidiaries do this by using proprietary software techniques that use internet bandwidth more efficiently than other technologies that are unable to provide a low-bandwidth solution. The Horizon Platform is a bandwidth-efficient Voice over Internet Protocol (“VoIP”) platform for smartphones and tablets, and also provides optimized data applications including messaging and mobile advertising. We license our software solutions to telecommunications network operators and service providers in the mobile, fixed line and satellite communications markets. We are an ISO 9001 and ISO 20000-1 certified company with assets and operations in Switzerland, the United Kingdom, China, India, Singapore and Hong Kong.
The Horizon Platform delivers a turnkey mobile VoIP solution to telecommunications operators. We believe that the technology underlying the Horizon Platform, which we call SmartPacket™, is the world’s most bandwidth-efficient VoIP technology. Our VoIP technology is able to transmit voice at 2kbps compared to around 8kbps offered by other VoIP platforms, thereby enabling voice communications over limited bandwidth and congested cellular telecom data networks including 2G, 3G and 4G.
21
Industry
Rapid Growth in Global Telecommunication Services Market
The global telecommunication services market continues to experience growth. This growth is mainly being driven by the growth in the number of mobile subscribers. Although the mobile VoIP (or “mVoIP”) is a small percentage of the total revenue generated by mobile telecommunications providers, Visiongain, an independent business information provider for the telecommunications industry, among others, expects this market to grow significantly as a number of commercial and technological factors alter mobile voice communications (http://www.visiongain.com/Press_Release/475/The-Voice-Over-Internet-Protocol-(VoIP)-Market-2013-2018). These factors include innovative smartphone designs with improved user interfaces and acoustics, increased acceptance of VoIP and overall increases in broadband penetration. According to Visiongain. In 2013, “VoIP is poised for explosive growth, underpinned by the widespread adoption of integrated social media based VoIP solutions”; like those provided by One Horizon. Visiongain further advises that “it is very important for Operators to embrace VoIP and focus on building viable business models that are mutually beneficial to the VoIP service provider and telecom operator”. We are precisely targeting this operator market with our turnkey mobile VoIP solution branded for each of our operator customers.
The growth of smartphones and tablets is a key driver for us in increasing the number of customers and revenue. In 2013, the number of smartphones shipped exceeded one billion according to International Data Corporation (https://www.idc.com/getdoc.jsp?containerId=prUS24645514), a provider of market intelligence in the industry. This represents an increase of 38.4% on the number of smartphones shipped in 2012. Smartphones consume 24X more data than the “feature phones” that they replace due to higher usage of data, VoIP, and video services, which creates a significant strain on existing carrier infrastructure and creating potentially severe network congestion issues particularly in high density and high population markets.
The increase in mobile data consumption has been driven by the availability of cheap GSM (global system for mobile communications) data and the massive uptake of smartphones and tablets, devices on which our mobile application, Horizon Call, was designed to run.
In its paper titled “Cisco Visual Networking Index: Global Mobile Data Traffic Forecast Update, 2013–2018” Cisco projects global mobile data traffic to increase 13-fold between 2013 and 2018 (source link:http://www.cisco.com/c/en/us/solutions/collateral/service-provider/visual-networking-index-vni/white_paper_c11-520862.html). According to Cisco, at the end of 2012, the number of mobile-connected devices exceeded the number of people on earth, and by 2017, it is expected that there will be 1.4 mobile devices per capita. According to Cisco, in 2017, it is expected that 4G will account for ten percent of connections, but 45 percent of total traffic. Horizon Call addresses the need for efficient data on the next generation networks while tackling the need for efficient data usage on legacy networks in the world’s most populous countries.
Our Technology
SmartPacket™, our technology underlying the Horizon Platform, enables greater bandwidth efficiency by reducing IP overhead and optimizing packet flow, delivery and playback. It is also extremely efficient in the way it handles silence. Traditional VoIP calls send the same amount of data in both directions, regardless of whether someone is speaking or not. SmartPacket™ detects silence and sends “heartbeats” so that it does not sound like the line has been dropped. These heartbeats get sent at only 0.25kbps compared to approximately 24kbps on other VoIP platforms. In addition to low-bandwidth VoIP, SmartPacket™ can also be utilized to enhance data applications for personal computers (i.e., email, web browsing and instant messaging) which give the user total visibility and control over how much data they consume on pay-as-you-use internet connections such as satellite data connections.
| TALKING | LISTENING | |||
| Other VoIP (G.729) | 24 kbps | 24 kbps | ||
| 4.1 kbps | ||||
| Horizon * | 5.4 kbps | 0.25 kbps | ||
| 7.4 kbps |
*These default settings are adjustable based on customers’ needs.
22
The Horizon Platform has been developed entirely in-house and is fully compatible with digital telecommunications standards. It is capable of interconnecting any phone system over IP – on mobile, fixed and satellite networks.
The Horizon Platform was initially developed for the mobile satellite market by Abbey Technology to make the best use of the limited wireless bandwidth available, to minimize the amount of data consumed and ultimately to reduce costs for the end-user.
We further developed the Horizon Platform for the broader telecommunications market, while focusing on the mobile data sector. This sector also benefits from our optimized mobile VoIP software that allows voice calls over new and legacy cellular telecom data networks. With the explosive growth in smartphone sales and increased usage of mobile data services, mobile operators face the challenge of dealing with increasingly congested networks, more dropped calls and rising levels of churn. Since the wireless spectrum is a finite resource it is not always possible, or can be cost prohibitive, to increase network capacity. For these reasons, we believe that the demand for solutions which optimize the use of IP bandwidth will inevitably increase.
Our Strategy
We have developed a mobile application, “Horizon Call,” that enables highly bandwidth-efficient VoIP calls over a smartphone using a 2G/EDGE, 3G, 4G/LTE, WiFi or WiMax connection. Our Horizon Call application is currently available for the iPhone and for Android handsets.
Unlike the majority of mobile VoIP applications, Horizon Call creates a business-to-business solution for mobile operators, who will be our customers. Telecommunications operators are able to license, brand and deploy on a “white-labeled” basis that they can optimize to their business strategies. The operators decide how to integrate our application within their portfolio, how to offer it commercially and can customize it according to their own branding. Our solution helps them to manage rising traffic volumes while also combating the competitive threat to their voice telephony revenues from other mobile VoIP applications by giving its mobile data customers a more efficient mobile VoIP solution that adds value to their mobile data network.
We are positioning ourselves as an operator-enabler by licensing our technology to the operator in a manner that can be fully customized to the needs of their subscribers. As shown below, operators are able to offer our platform to deliver branded smartphone applications to their existing customers to help reduce lost Voice/Text revenue and minimize customer churn.
23
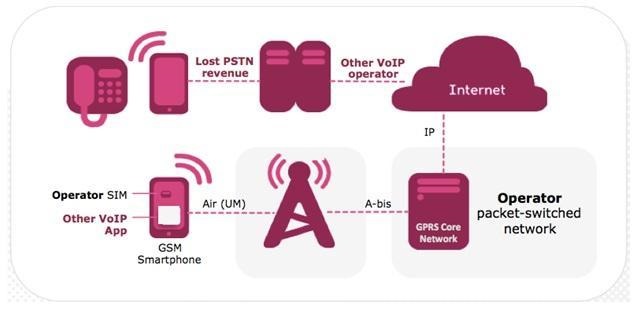
By offering Horizon Call to their existing customer base, our customers can offer innovative data-based voice and data services that differentiate themselves from the existing Over The Top (“OTT”) data applications running on their networks. OTT refers to voice and messaging services that are delivered by a third party to an end user’s smartphone, leaving the mobile network provider responsible only for transporting internet data packets and not the value-added content. The Horizon Call voice services allow the mobile operators’ customers to make VoIP calls under the mobile operators’ call plans, thereby allowing the mobile operator to capture the value-added content, including voice calls, text messaging, voice messaging, group messaging, multimedia messaging, and advertising, that would have otherwise gone to the providers of other OTT services.
Horizon Call runs on both smartphone and tablet devices and, as networks become more congested, software services such as Horizon Call become ever more relevant. We believe that although more network capacity will eventually come on stream with 4G/LTE, it, like all other highways, will quickly become congested and this is why we believe that Horizon Call is ideally placed to add value to mobile data networks.
Incumbent mobile operators are suffering a reduction in revenue per user due to the OTT software services on mobile devices. These OTT applications, such as Skype, Viber, WeChat, and WhatsApp, can negatively impact mobile operators’ traditional revenue streams of voice and SMS (short message service). As shown below, the Horizon Platform positions the Company to enable mobile operators to operate their own OTT solution branded in their image allowing use on all mobile data networks.
24
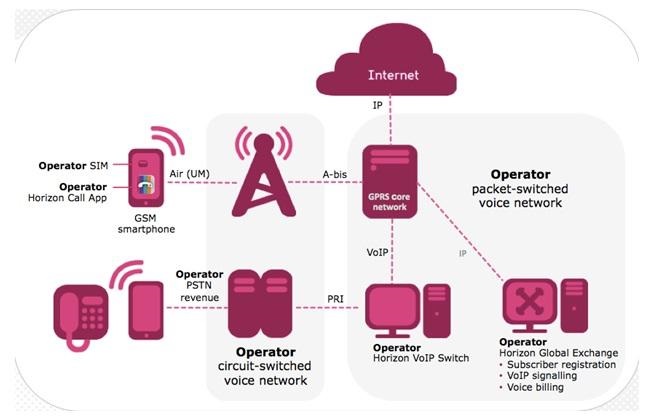
In addition to delivering new data services to their existing customers, the mobile operators can offer their brand of Horizon Call on any other operators’ handsets. Because the Horizon Call application can be installed on the smartphone from the Internet, the potential customer base for the operators’ data application surpasses the customer base that they can reach through traditional mobile phone SIM card distribution. We believe that this service innovation, coupled with the fact that the Horizon Call application can also use existing mobile operator pre-paid credit redemption and distribution services, presents a very compelling service offering from the operator compared to OTT services.
We believe that emerging markets represent a key opportunity for Horizon Call because these are significant markets with high population densities, high penetration of mobile phones, congested mobile cellular networks and high growth in the adoption of smartphones. Smartphone sales grew 36% in the fourth quarter of 2013 and accounted for 57.6% of overall mobile phone sales in the fourth quarter, up from 44 percent year over year. This increasing contribution of smartphones was led by growth in Latin America, the Middle East and Africa, Asia/Pacific and Eastern Europe, where smartphone sales grew by more than 50 percent in the fourth quarter of 2013. With a 166.8% increase in the fourth quarter of 2013, India exhibited the highest smartphone sales growth among the countries tracked by Gartner, and Latin America saw the strongest growth among all regions (96.1%) in the fourth quarter. China also contributed significantly to worldwide smartphone sales as sales grew 86.3% in 2013. (http://www.gartner.com/newsroom/id/2665715). These factors will put increased pressure on mobile operators to manage their network availability.
In this context, where necessary, we are forming a number of joint ventures with local partners in regions of various emerging markets to seize upon this opportunity.
Through one subsidiary, One Horizon Hong Kong, we invested $1.5 million for a 75% equity stake in our joint venture, Horizon Network Technology Co., Ltd, while our partner, ZTE Corporation, the second largest mobile handset manufacturer in the world and the fourth largest telecommunications equipment supplier in the world, holds a 25% equity stake in the joint venture. The Company is not a guarantor of any debt related to this joint venture.
25
During the fiscal year 2014, we commenced the first phase of its infrastructure rollout in six cities in China: Tianjin, Beijing, Chongqing, Changchun, Nanjing and Shijiazhuang. These initial locations will connect to the national telephone network to commence the commissioning of the VoIP service in China, brand name Aishuo. To date, we have successfully installed eight servers in support of Chinese smart phone app with interconnecgs to the ALiPay and UnionPay credit card and micro-payments services in China. The smart phone app will be able to provide various optimized internet value added services to its mobile subscribers including but not limited to voice and social media services including text, picture, video and geo-location messaging. These value added services are made possible through the creation of a "Virtual SIM" and One Horizon's proprietary communication software, an industry first. Combined with One Horizon's location aware mobile advertising services, the Aishuo branded smart phone app is expected to drive multiple revenue streams from the supply of its value-added services. The service will seek to acquire 100 million new app subscribers for the smartphone app over a three-year period and expects to achieve industry average revenues per user (ARPU) for similar social media apps.
Marketing
Our marketing objective is to become a broadly adopted solution in the regions of the world with large concentrations of smartphone users and high network congestion. We aim at becoming the preferred solution for carriers who wish to deploy branded VoIP solutions that enable them to minimize revenue erosion, reduce churn, increase the effective capacity of their network infrastructure and improve user experience. We employ an integrated multi-channel approach to marketing, whereby we evaluate and focus our efforts on selling through Tier 1 and Tier 2 telecommunications companies to enable them to provide the Horizon Platform to their customers. We routinely evaluate our marketing efforts and try to reallocate budgets to identify more effective media mixes.
We conduct marketing research to gain consumer insights into brand, product, and service performance, and utilize those findings to improve our messaging and media plans. Market research is also leveraged in the areas of testing, retention marketing, and product marketing to ensure we bring compelling products and services to market.
Sales
Direct Sales. Our primary sales channel for the products and services of Horizon Platform is the sale of Horizon Platforms to Tier 1 and Tier 2 telecommunications companies to enable them to provide the product and services to their customers. We continue our efforts to develop new customers in Europe, the Middle East, Asia, Africa, South America, and, in the near future, North America.
Joint Ventures. In addition to our direct sales channel, we also offer increased sales through our joint venture channel. In this context, as mentioned above, we are working towards forming a number of joint ventures in areas where regulatory issues require local representation.
Target Markets. The markets for our primary and joint venture channels will have high population density, high penetration of mobile phones, congested mobile cellular networks and high growth in the adoption of smartphones.
Competition
The Company’s direct competitors for its technology primarily consist of systems integrators that combine various elements of SIP (Session Initiation Protocol) dialers and media gateways. Other dial-back solutions exist but they are not IP-based. Because SIP dialers and media gateways currently are unable to provide a low bandwidth solution, they do not currently compete with the Company’s technology in those markets in which their high bandwidth needs are unsupported by the existing cellular networks. They do, however, compete in those markets where the cellular networks are accessible by those SIP dialers and gateways.
The Company licenses the Horizon Platform to mobile operators, who in turn may offer the application to their end-user subscribers. The Company’s principal competitors for the mobile operators’ end-users are Skype, Viber, WeChat, and WhatsApp. Having a mobile operator’s subscriber opt to use the operator’s (branded) Horizon Call service instead of existing OTT services means that the mobile operator will gain market share of some of the OTT voice and messaging traffic. We are unaware of any other companies that seek to license VoIP technology directly to mobile operators.
26
One of the Company’s key competitive advantages is that it is not a threat to mobile operators. Rather, the Company’s Horizon Platform is a tool that can be used by mobile operators to compete against the OTT provider’s applications that are running on their networks. Through the Horizon Platform, mobile operators are able to compete directly with OTT services that, by their design, divert voice and messaging services away from mobile operators. The solution is delivered completely and is easy to install and operate. This means that a mobile operator has a turnkey mobile voice and messaging solution to deploy to its customer (i.e., the end-user).
The turnkey Horizon software platform and the Horizon SmartPacket™ technology give us a competitive advantage by managing credit, routing, rating, security, performance, billing and monitoring. Horizon SmartPacket™ is the world’s lowest bandwidth voice compression and transmission protocol and is 100% developed and owned by the Company. Though other software companies can offer part of this solution space, we believe none offers it in such a complete and integrated fashion as we do. We believe it will take a substantial number of years to copy/replicate the Horizon Platform in its entirety, by which time we believe the Horizon Platform will have improved and further distanced itself from potential competition.
Intellectual Property
Our strategy with respect to our intellectual property is to patent our core software concepts wherever possible. The Company’s current software patent application, which is pending in Switzerland, reflects this strategy and protects the Horizon Platform and the central processing service of the Horizon Platform.
The Company endeavors to protect its internally developed systems and technologies. All of our software is developed “in-house,” and then licensed to our customers. We take steps, including by contracts, to ensure that any changes, modifications or additions to the Horizon Platform requested by our customers remain the sole intellectual property of the Company.
Research and Development and Software Products
The Company has spent approximately $1.1 million on research and development in the fiscal year 2014, all of which was capitalized as software development costs.
During the last quarter of 2014, our Switzerland and Ireland R&D centers developed expansion of Horizon advertising platform to allow the industry first of User-Selectable-Sponsored-Calls and it was released on the Horizon product suite in China by the Chinese team, brand name Aishuo Aishuo smartphone app is combined with One Horizon's exciting new Sponsored-Call mobile advertising service where a user is presented with a list of companies that will sponsor their calls in consideration for listening to their in-app advertisement, an industry first for China. Aishuo app is expected to drive multiple revenue streams from the supply of its value-added services including the rental of Chinese telephone phone numbers linked to the app, low cost local and international calling plans and sponsorship from advertisers. Subscribers can top up their app credit from major online payment services in China including AliPay (from Alibaba), Union Pay, PayPal and Tenent’s WeChat payment service.
27
We completed the development and continued to refine the Horizon billing system. The completion of the Horizon Billing System software add-on package allows one Horizon to deliver an additional turn-key element to our customers that will allow our customers to invoice their customers and enterprise on a postpaid monthly basis. This adds greater flexibility and reach to the Horizon platform as offered by our customers to those subscribers that wish to utilize the service on a post paid basis.
We expanded our software development capabilities for China by hiring 4 new junior software developers in our Horizon Nanjing JV, known as Horizon Network Technology Co. Ltd.. We believe that the expansion of our software development team at our Chinese joint venture will support the company’s strategy of continuing to develop our products in areas with high population density, high penetration of mobile phones, congested mobile cellular networks and high growth in the adoption of smartphones while working within the constraints of local regulations.
We continued our research and development of the Horizon product platform. The Swiss based team made significant strides towards the next generation of the product suite with particular emphasis going to the User Interface (UI) re-engineering. Further to the UI the Research and Development for version 2.0, our Irish based team made progress on the latest multi-core solution with a view to releasing this software in the third quarter of 2014. The software team in China is pushing ahead with integrating the user feedback garnered from Chinese students using our Application on the smartphone and also working on a new and exciting method for Direct Inward Dial number rental for the Chinese marketplace.
Employees
As of December 31, 2014, we had 25 employees, all of whom were full-time employees.
Description of Property
We do not currently own any real property. Our principal executive offices consist of approximately 2,600 square feet of leased space in Baar, Switzerland, for which we pay $5,600 a month. We also have an office consisting of approximately 400 square feet in London, United Kingdom, for which we pay $2,500 a month. From July 2013, we have a leased office of approximately 420 square feet with a monthly rent $1,300 in Ireland.
Executive Offices
Our offices are located at Weststrasse 1, Baar, Switzerland, CH6340
FOR ADDITIONAL INFORMATION
We are a reporting company and file annual, quarterly and current reports, proxy statements and other information with the SEC. For further information with respect to the Company, you may read and copy its reports, proxy statements and other information, at the SEC public reference rooms at 100 F. Street, N.E., Washington, D.C. 20549. You can request copies of these documents by writing to the SEC and paying a fee for the copying cost. Please call the SEC at 1-800-SEC-0330 for more information about the operation of the public reference rooms. The Company’s SEC filings are also available at the SEC’s web site at http://www.sec.gov.
Copies of Company’s Annual Reports on Form 10K, Quarterly Reports on Form 10-Q, Current Reports on Form 8-K, and amendments to those reports filed or furnished pursuant to Section 13(a) or 15(d) of the Securities Exchange Act of 1934 are all available at our website (http://www.onehorizongroup.com/) free of charge, within a week after we file same with the SEC or by sending a request for a paper copy to our outside securities counsel: Hunter Taubman Weiss LLP, 230 W 42nd Street Suite 1050, New York NY 10036.
28
Legal Proceedings
We may from time to time become a party to various legal or administrative proceedings arising in the ordinary course of our business.
We are currently not a party to any material legal or administrative proceedings and are not aware of any pending or threatened legal or administrative proceedings, to the best of our knowledge, against us.
MARKET FOR OUR COMMON STOCK, DIVIDENDS AND
RELATED STOCKHOLDER INFORMATION
Our common stock is quoted on the NASDAQ Capital Market under the symbol OHGI. Prior to July 9, 2014, our common stock was quoted on the OTCBB under the symbol OHGI. Prior to January 31, 2013, our common stock was quoted under the symbol ICMC.
The following table sets forth the high and low bid information, as reported by Nasdaq on its website, www.nasdaq.com, for our common stock for each quarterly period in 2014, 2013 and 2012. Prior to November 30, 2012, the bid information reflects bid information of the Company prior to the Share Exchange. The information reflects inter-dealer prices reflecting a reverse split on a 1 for 600 basis effective August 29, 2013, without retail mark-up, mark-down or commission and may not necessarily represent actual transactions.
| Low | High | |||||||
| Fiscal year ending December 31, 2014: | ||||||||
| Quarter ended December 31 | $ 1.91 | $ 3.20 | ||||||
| Quarter ended September 30 | 1.55 | 4.85 | ||||||
| Quarter ended June 30 | 3.50 | 5.91 | ||||||
| Quarter ended March 31 | 4.00 | 6.50 | ||||||
| Fiscal year ending December 31, 2013: | ||||||||
| Quarter ended December 31 | $ | 3.75 | $ | 6.75 | ||||
| Quarter ended September 30 | 6.50 | 6.75 | ||||||
| Quarter ended June 30 | 6.00 | 11.40 | ||||||
| Quarter ended March 31 | 3.60 | 21.60 | ||||||
| Fiscal year ended December 31, 2012: | ||||||||
| Quarter ended December 31 | $ | 3.12 | $ | 36.00 | ||||
| Quarter ended September 30 | 3.06 | 11.94 | ||||||
| Quarter ending June 30 | 0.00 | 16.80 | ||||||
| Quarter ended March 31 | 6.00 | 18.00 | ||||||
As of February 2, 2015, the closing bid price of the common stock was $1.68 and we had approximately 202 record holders of our common stock. This number excludes any estimate by us of the number of beneficial owners of shares held in street name, the accuracy of which cannot be guaranteed.
As of December 31, 2014, there are 1,084,651 options issued to employees and none exercised. We issued 116,760 warrants with an exercise price of $0.86 per share to an investor in 2012. In February 2013 Offering, we issued 403,225 Class A Warrant with an exercise price of 5.94 per share to purchase 403,225 shares of Common Stock to an investor as part of the $6.0 million subscription agreement signed. In July 2014 Offering, we issued 170,940 shares of Series A Preferred Stock convertible into 170,940 shares of Common Stock, 100,000 Class B Warrants to purchase up to 100,000 shares of Common Stock at a price of $4.00 per share; and we also issued 25,000 shares of Common Stock to the placement agent. In connection with and as a consideration to the closing of the July 2014 Offering, we reduced the exercise price of Class A warrants issued in the February 2013 Offering from $5.94 to $4.25 per share and increased the amount of shares issuable upon exercise of Class A warrants from 403,225 to 1,209,675. In December 2014 Offering, we issued a convertible debenture that is convertible into 1,555,556 shares of Common Stock, Class C warrant to purchase 388,889 shares of Common Stock and Class D warrant to purchase 388,889 shares of Common Stock. In addition, the placement agent in the December 2014 Offering received placement agent warrant, Class C warrant and Class D warrant to purchase 62,222, 15,556 and 15,556 shares of Common Stock.
29
Effective August 11, 1993, the SEC adopted Rule 15g-9, which established the definition of a "penny stock," for purposes relevant to the Company, as any equity security that has a market price of less than $5.00 per share or with an exercise price of less than $5.00 per share, subject to certain exceptions. For any transaction involving a penny stock, unless exempt, the rules require: (i) that a broker or dealer approve a person's account for transactions in penny stocks; and (ii) that the broker or dealer receive from the investor a written agreement to the transaction, setting forth the identity and quantity of the penny stock to be purchased. In order to approve a person's account for transactions in penny stocks, the broker or dealer must (i) obtain financial information and investment experience and objectives of the person; and (ii) make a reasonable determination that the transactions in penny stocks are suitable for that person and that person has sufficient knowledge and experience in financial matters to be capable of evaluating the risks of transactions in penny stocks. The broker or dealer must also deliver, prior to any transaction in a penny stock, a disclosure schedule prepared by the Commission relating to the penny stock market, which, in highlight form, (i) sets forth the basis on which the broker or dealer made the suitability determination; and (ii) states that the broker or dealer received a signed, written agreement from the investor prior to the transaction. Disclosure also has to be made about the risks of investing in penny stock in both public offerings and in secondary trading, and about commissions payable to both the broker-dealer and the registered representative, current quotations for the securities and the rights and remedies available to an investor in cases of fraud in penny stock transactions. Finally, monthly statements have to be sent disclosing recent price information for the penny stock held in the account and information on the limited market in penny stocks
Dividend Policy
The payment of cash dividends by us is within the discretion of our board of directors and depends in part upon our earnings levels, capital requirements, financial condition, any restrictive loan covenants, and other factors our board considers relevant. Since the share exchange in 2012, we have not declared or paid any dividends on our common stock and we do not anticipate paying such dividends in the foreseeable future. We intend to retain earnings, if any, to finance our operations and expansion.
Description of Equity Compensation Plans Approved By Shareholders
Prior to the Share Exchange, One Horizon UK had authorized securities for issuance under equity compensation plans that have not been approved by the stockholders, but none under equity compensation plans that were approved by the stockholders. The following table shows the aggregate amount of securities authorized for issuance under all equity compensation plans as of December 31, 2013:
| Number of securities to be issued upon exercise of outstanding options, warrants and rights (a) | Weighted-average exercise price of outstanding options, warrants and rights (b) | Number of securities remaining available for future issuance under equity compensation plans (excluding securities reflected in column (a)) (c) | ||||||||||
| Equity compensation plans approved by security holders | 0 | 0 | 0 | |||||||||
| Equity compensation plans not approved by security holders | 584,650 | $ | 0.53 | 0 | ||||||||
| Total | 584,650 | $ | 0.53 | 0 | ||||||||
The securities referenced in the table above reflect stock options granted beginning in 2005 pursuant to individual compensation arrangements with the Company’s employees. 292,750 of such options are fully vested and 291,900 of such options vest on December 31, 2015, 850 of such options are expiring in 2015; 291,900 are expiring in 2020; and 291,900 are expiring in 2022. The number of options in the table above reflect a conversion that occurred in connection with the Share Exchange, whereby the number of options (to purchase One Horizon UK shares) held by each employee was increased by 175.14 times and the exercise price was decreased by the option exercise price divided by 175.14, and additionally reflect a 1-for-600 reverse stock split effected as of August 6, 2013.
Information regarding any equity securities we have sold during the periods covered by this Report that were not registered under the Securities Act of 1933, as amended, are included in a previously filed Quarterly Report on Form 10-Q or in a Current Report on Form 8-K.
Repurchases of Equity Securities
We have not repurchased any equity securities during the periods covered by this Report.
30
| ONE HORIZON GROUP, INC. | |
| Condensed Consolidated Balance Sheets | |
| September 30, 2014 and December 31, 2013 | |
| (in thousands, except share data) |
(unaudited)
| September 30, | December 31, | |||||||
| 2014 | 2013 | |||||||
| Assets | ||||||||
| Current assets: | ||||||||
| Cash | $ | 650 | $ | 2,070 | ||||
| Accounts receivable | 8,916 | 7,264 | ||||||
| Other assets | 624 | 139 | ||||||
| Total current assets | 10,190 | 9,473 | ||||||
| Property and equipment, net | 239 | 315 | ||||||
| Intangible assets, net | 11,515 | 12,760 | ||||||
| Investments | 20 | 23 | ||||||
| Total assets | $ | 21,964 | $ | 22,571 | ||||
| Liabilities and Stockholders' Equity | ||||||||
| Current liabilities: | ||||||||
| Accounts payable | $ | 693 | $ | 661 | ||||
| Accrued expenses | 1,248 | 964 | ||||||
| Accrued compensation | 14 | 59 | ||||||
| Income taxes | 94 | 117 | ||||||
| Amounts due to related parties | 3,500 | 3,500 | ||||||
| Current portion of long-term debt | 72 | 65 | ||||||
| Total current liabilities | 5,621 | 5,366 | ||||||
| Long-term liabilities | ||||||||
| Long term debt, net of current portion | 129 | 184 | ||||||
| Deferred income taxes | 235 | 445 | ||||||
| Mandatorily redeemable preferred shares | 90 | 90 | ||||||
| Total liabilities | 6,075 | 6,085 | ||||||
| Stockholders' Equity | ||||||||
| Preferred stock: | ||||||||
$0.0001 par value; 50,000,000 shares authorized; | ||||||||
Mandatorily Convertible Preferred Stock, Series A, 170,940 and no shares issued and outstanding respectively | 1 | - | ||||||
| Common stock: | ||||||||
| $0.0001 par value, authorized 200,000,000 shares | ||||||||
| issued and outstanding 33,035,069 shares (December 2013 32,920,069) | 3 | 3 | ||||||
| Additional paid-in capital | 30,025 | 28,269 | ||||||
| Deferred compensation | (268) | - | ||||||
| Accumulated deficit | (14,578 | ) | (13,319 | ) | ||||
| Accumulated other comprehensive income | 398 | 1,137 | ||||||
| Total One Horizon Group, Inc. stockholders' equity | 15,581 | 16,090 | ||||||
| Non-controlling interest | 308 | 396 | ||||||
| Total stockholders' equity | 15,889 | 16,486 | ||||||
| Total liabilities and stockholders' equity | $ | 21,964 | $ | 22,571 | ||||
See accompanying notes to condensed consolidated financial statements.
31
| ONE HORIZON GROUP, INC. |
| Condensed Consolidated Statements of Operations |
| For the three and Nine months ended September 30, 2014 and 2013 |
| (in thousands, except share data) |
| (unaudited) |
| Three Months ended September 30, | Nine Months ended September 30, | ||||||||||||||||
| 2014 | 2013 | 2014 | 2013 | ||||||||||||||
| Revenue | $ | 1,641 | $ | 2,517 | $ | 4,130 | $ | 5,690 | |||||||||
| Cost of revenue: | |||||||||||||||||
| Hardware | 285 | 34 | 413 | 522 | |||||||||||||
| Amortization of software development costs | 477 | 509 | 1,446 | 1,359 | |||||||||||||
| Gross margin | 879 | 1,974 | 2,271 | 3,809 | |||||||||||||
| Expenses: | |||||||||||||||||
| General and administrative | 1,259 | 1,347 | 3,577 | 5,041 | |||||||||||||
| Depreciation | 26 | 45 | 120 | 120 | |||||||||||||
| 1,285 | 1,392 | 3,697 | 5,161 | ||||||||||||||
| Income (loss) from operations | (406 | ) | 582 | (1,426 | ) | (1,352 | ) | ||||||||||
| Other income and expense: | |||||||||||||||||
| Interest expense | 0 | (96 | ) | (2 | ) | (108 | ) | ||||||||||
| Interest expense - related parties | (14 | ) | (50 | ) | (107 | ) | (150 | ) | |||||||||
| Foreign exchange | (5 | ) | (38 | ) | (24 | ) | (38 | ) | |||||||||
| Interest income | - | - | 2 | - | |||||||||||||
| (19 | ) | (184 | ) | (131 | ) | (296 | ) | ||||||||||
| Income (loss) before income taxes | (425 | ) | 398 | (1,557 | ) | (1,648 | ) | ||||||||||
| Income taxes expense (benefit) | (54) | - | (210) | - | |||||||||||||
| Net income (loss) for the period | (371 | ) | 398 | (1,347 | ) | (1,648 | ) | ||||||||||
| Loss attributable to the non-controlling interest | (23 | ) | (29 | ) | (88 | ) | (73 | ) | |||||||||
| Net income (loss) for the period attributable to One Horizon Group, Inc. | $ | (348 | ) | $ | 427 | $ | (1,259 | ) | $ | (1,575 | ) | ||||||
| Less: Preferred stock dividends | (19 | ) | - | (19 | ) | - | |||||||||||
| Net income (loss) attributable to common stockholders | (367 | ) | 427 | (1,278 | ) | (1,575) | |||||||||||
| Earnings (loss) per share attributable to One Horizon Group, Inc. shareholders | |||||||||||||||||
| Basic and diluted net income (loss) per share | $ | (0.01 | ) | $ | 0.01 | $ | (0.04 | ) | $ | (0.05 | ) | ||||||
| Weighted average number of shares outstanding | |||||||||||||||||
| Basic and Diluted | 33,029 | 31,767 | 32,966 | 31,538 | |||||||||||||
See accompanying notes to condensed consolidated financial statements.
32
| ONE HORIZON GROUP, INC. |
| Condensed Consolidated Statements of Comprehensive Income (Loss) |
| For the three and nine months ended September 30, 2014 and 2013 |
| (in thousands) |
| (unaudited) |
| Three Months ended September 30, | Nine Months ended September 30, | |||||||||||||||
| 2014 | 2013 | 2014 | 2013 | |||||||||||||
| Net income (loss) | $ | (371 | ) | $ | 398 | $ | (1,347 | ) | $ | (1,648 | ) | |||||
| Other comprehensive income (loss): | ||||||||||||||||
| Foreign currency translation adjustment gain (loss) | (674 | ) | 532 | (739 | ) | 482 | ||||||||||
| Total comprehensive income (loss) | (1,045 | ) | 930 | (2,086 | ) | (1,166 | ) | |||||||||
| Comprehensive loss attributable to the non-controlling interest | (23 | ) | (29 | ) | (88 | ) | (73 | ) | ||||||||
| Comprehensive income (loss) attributable to One Horizon Group, Inc. | $ | (1,022 | ) | $ | 959 | $ | (1,998 | ) | $ | (1,093 | ) | |||||
See accompanying notes to condensed consolidated financial statements
33
ONE HORIZON GROUP, INC.
Consolidated Statement of Equity
For the nine months ended September 30, 2014
(in thousands)
(unaudited)
| Preferred Stock | Common Stock | Additional | Retained | Accumulated Other Comprehensive | Non- | |||||||||||||||||||||||||||||||||||
| Number of Shares | Amount | Number of Shares | Amount | Paid-in Capital | Deferred Compensation | Earnings (Deficit) | Income (Loss) | controlling Interest | Total Equity | |||||||||||||||||||||||||||||||
| Balance December 31, 2013 | - | $ | - | 32,921 | $ | 3 | $ | 28,269 | $ | - | $ | (13,319 | ) | $ | 1,137 | $ | 396 | $ | 16,486 | |||||||||||||||||||||
| Net income (loss) | (1,259 | ) | (88 | ) | (1,347 | ) | ||||||||||||||||||||||||||||||||||
| Foreign currency translations | (739 | ) | (739 | ) | ||||||||||||||||||||||||||||||||||||
| Common Stock issued for services received | 15 | 65 | 65 | |||||||||||||||||||||||||||||||||||||
| Common Stock issued for services to be received in the future | 75 | 323 | (323 | ) | ||||||||||||||||||||||||||||||||||||
| Amortization of deferred compensation | 55 | 55 | ||||||||||||||||||||||||||||||||||||||
| Options issued for services | 387 | 387 | ||||||||||||||||||||||||||||||||||||||
| Preferred stock issued for cash, net offering costs of $18 | 171 | 1 | 981 | 982 | ||||||||||||||||||||||||||||||||||||
| Common stock issued for services received | 25 | 108 | 108 | |||||||||||||||||||||||||||||||||||||
| Costs of financing | (108 | ) | (108 | ) | ||||||||||||||||||||||||||||||||||||
| Balance September 30, 2014 | 171 | $ | 1 | 33,036 | $ | 3 | $ | 30,025 | $ | (268 | ) | $ | (14,578 | $ | 398 | $ | 308 | $ | 15,889 | |||||||||||||||||||||
See accompanying notes to consolidated financial statements.
34
| ONE HORIZON GROUP, INC. | ||
| Condensed Consolidated Statements of Cash Flows | ||
| For the nine months ended September 30, 2014 and 2013 | ||
| (in thousands) | ||
| (unaudited) |
| 2014 | 2013 | |||||||
| Cash provided by (used in) operating activities: | ||||||||
| Net income (loss) for the period | $ | (1,259 | ) | $ | (1,575 | ) | ||
| Adjustment to reconcile net income (loss) for the period to | ||||||||
| Net cash provided by (used in) operating activities: | ||||||||
| Depreciation of property and equipment | 120 | 120 | ||||||
| Amortization of intangible assets | 1,446 | 1,359 | ||||||
| Change in allowance for doubtful accounts | 130 | - | ||||||
| Common stock issued for services received | 120 | 643 | ||||||
| Options issued for services received | 387 | - | ||||||
| Deferred income taxes | (210 | ) | - | |||||
| Net income (loss) attributable to non-controlling interest | (88 | ) | (73 | ) | ||||
| Changes in operating assets and liabilities: | ||||||||
| Accounts receivable | (1,782 | ) | (3,865 | ) | ||||
| Other assets | (482 | ) | (193 | ) | ||||
| Accounts payable and accrued expenses | 271 | 997 | ||||||
| Net cash provided by (used in) operating activities | (1,347 | ) | (2,587 | ) | ||||
| Cash used in investing activities: | ||||||||
| Acquisition of intangible assets | (874 | ) | (831 | ) | ||||
| Acquisition of property and equipment | (48 | ) | (121 | ) | ||||
| Other assets | - | (196 | ) | |||||
| Net cash (used in) investing activities | (922 | ) | (1,148 | ) | ||||
| Cash provided by (used in) financing activities: | ||||||||
| Increase (decrease) in long-term borrowing, net | (48 | ) | (10 | ) | ||||
| Net proceeds from issuance of preferred stock | 982 | - | ||||||
| Proceeds from issuance of common stock | - | 6,000 | ||||||
| Repurchase of common stock | - | (2 | ) | |||||
| Advances from related parties, net of repayment | - | 500 | ||||||
| Net cash provided by (used in) financing activities | 934 | 6,488 | ||||||
| Increase (decrease) in cash during the period | $ | (1,335 | ) | $ | 2,753 | |||
| Foreign exchange effect on cash | (85 | ) | - | |||||
| Cash at beginning of the period | 2,070 | 699 | ||||||
| Cash at end of the period | $ | 650 | $ | 3,452 | ||||
See accompanying notes to condensed consolidated financial statements.
35
| ONE HORIZON GROUP, INC. | ||
| Condensed Consolidated Statements of Cash Flows (continued) | ||
| For the nine months ended September 30, 2014 and 2013 | ||
| (in thousands) | ||
| (unaudited) |
Supplementary Information:
| 2014 | 2013 | |||||||
| Interest paid | $ | - | $ | - | ||||
| Income taxes paid | - | - | ||||||
| Non-cash transactions: | ||||||||
| Contribution of software for non-controlling interest in exchange for software with a fair value of $500 | - | 500 | ||||||
See accompanying notes to condensed consolidated financial statements.
36
NOTES TO CONSOLIDATED FINANCIAL STATEMENTS
September 30, 2014
Note 1. Description of Business, Organization and Principles of Consolidation
Description of Business
One Horizon Group, Inc., (the “Company” or “Horizon”) develops proprietary software primarily in the Voice over Internet Protocol (VoIP) and bandwidth optimization markets (“Horizon Globex”) and provides it under perpetual license arrangements (“Master License”) throughout the world. The Company sells related user licenses and software maintenance services as well.
Interim Period Financial Statements
The accompanying unaudited interim consolidated financial statements have been prepared in accordance with generally accepted accounting principles in the United States (“GAAP”) for interim financial information and with the Securities and Exchange Commission’s instructions. Accordingly, they do not include all the information and footnotes required by GAAP for complete financial statements. The results of operations reflect interim adjustments, all of which are of a normal recurring nature and, in the opinion of management, are necessary for a fair presentation of the results for such interim period. The results reported in these interim consolidated financial statements should not be regarded as necessarily indicative of results that may be expected for the entire year. Certain information and note disclosure normally included in financial statements prepared in accordance with GAAP have been condensed or omitted pursuant to the Securities and Exchange Commission’s rules and regulations. These unaudited interim consolidated financial statements should be read in conjunction with the audited consolidated financial statements included in the Company’s Annual Report on Form 10-K for the year ended December 31, 2013, as filed with the Securities and Exchange Commission on April 15, 2014.
Principles of Consolidation
The September 30, 2014 and 2013 consolidated financial statements include the accounts of One Horizon Group, Inc. and its wholly owned subsidiaries OHG, Horizon Globex GmbH, Abbey Technology GmbH, One Horizon Hong Kong Limited, Horizon Globex Ireland Limited, Global Phone Credit Limited, One Horizon Group Pte., Limited and Ishuo Network Information Co., Ltd. together with Horizon Network Technology Co. Ltd. which is a 75% owned subsidiary.
All significant intercompany balances and transactions have been eliminated.
Note 2. Summary of Significant Accounting Policies
Basis of Accounting and Presentation
These consolidated financial statements have been prepared in conformity with accounting principles generally accepted in the United States
The reporting currency of the Company is the United States dollar. Assets and liabilities of operations other than those denominated in U.S. dollars, primarily in Switzerland, the United Kingdom and China, are translated into United States dollars at the rate of exchange at the balance sheet date. Revenues and expenses are translated at the average rate of exchange throughout the period. Gains or losses from these translations are reported as a separate component of other comprehensive income (loss) until all or a part of the investment in the subsidiaries is sold or liquidated. The translation adjustments do not recognize the effect of income tax because the Company expects to reinvest the amounts indefinitely in operations.
Transaction gains and losses that arise from exchange-rate fluctuations on transactions denominated in a currency other than the functional currency are included in general and administrative expenses.
37
Cash
Cash and cash equivalents include bank demand deposit accounts and highly liquid short term investments with maturities of three months or less when purchased. Cash consists of checking accounts held at financial institutions in the United Kingdom, Switzerland, Ireland, Singapore, Hong Kong and China which, at times, balances may exceed insured limits. The Company has not experienced any losses related to these balances, and management believes the credit risk to be minimal.
Accounts Receivable
Accounts receivable result primarily from sale of software and licenses to customers and are recorded at their principal amounts. Receivables are considered past due once they exceed the terms of the sales transaction. When necessary, the Company provides an allowance for doubtful accounts that is based on a review of outstanding receivables, historical collection information, and current economic conditions. There was an allowance of $342,000 and $212,000 for doubtful accounts at September 30, 2014 and December 31, 2013, respectively. Receivables are generally unsecured. Account balances are charged off against the allowance when the Company determines it is probable the receivable will not be recovered. The Company does not have off-balance sheet credit exposure related to its customers. As at September 30, 2014 and December 31, 2013, two customers accounted for 22% and two customers accounted for 26%, respectively, of the accounts receivable balance.
Property and Equipment
Property and equipment is primarily comprised of leasehold property improvements, motor vehicles and equipment that are recorded at cost and depreciated or amortized using the straight-line method over their estimated useful lives as follows: motor vehicles – 5 years, equipment – between 3 and 5 years, leasehold property improvements, over the lesser of the estimated remaining useful life of the asset or the remaining term of the lease.
Repairs and maintenance are charged to expense as incurred. Expenditures that substantially increase the useful lives of existing assets are capitalized.
Fair Value Measurements
Fair value is defined as the exchange price that will be received for an asset or paid to transfer a liability (an exit price) in the principal. Valuation techniques used to measure fair value should maximize the use of observable inputs and minimize the use of unobservable inputs. To measure fair value, the Company uses the following fair value hierarchy based on three levels of inputs, of which the first two are considered to be observable and the third unobservable:
Level 1 – Quoted prices in active markets for identical assets or liabilities.
Level 2 – Inputs other than Level 1 that are observable, either directly or indirectly, such as quoted prices for similar assets or liabilities; quoted prices in markets that are not active; or other inputs that are observable or can be corroborated by observable market data for substantially the full term of the assets or liabilities.
Level 3 – Unobservable inputs are supported by little or no market activity and are significant to the fair value of the assets or liabilities.
Intangible Assets
Intangible assets include software development costs and customer lists and are amortized on a straight-line basis over the estimated useful lives of five years for customer lists and ten years for software development. The Company periodically evaluates whether changes have occurred that would require revision of the remaining estimated useful life. The Company performs periodic reviews of its capitalized intangible assets to determine if the assets have continuing value to the Company.
The Company expenses software development costs as incurred until technological feasibility has been established, at which time those costs are capitalized until the product is available for general release to customers. Judgement is required in determining when technological feasibility of a product is established. The Company has determined that after technological feasibility for software products is reached, the Company continues to address all high risk development issues through coding and testing prior to the release of the products to customers. The amortization of these costs is included in cost of revenue over the estimated life of the products.
38
During the nine months ended September 30, 2014 and 2013 software development costs of $874,000 and $831,000, respectively, have been capitalized.
Impairment of Other Long-Lived Assets
The Company evaluates the recoverability of its property and equipment and other long-lived assets whenever events or changes in circumstances indicate impairment may have occurred. An impairment loss is recognized when the net book value of such assets exceeds the estimated future undiscounted cash flows attributed to the assets or the business to which the assets relate. Impairment losses, if any, are measured as the amount by which the carrying value exceeds the fair value of the assets. During the nine months ended September 30, 2014 and 2013 the Company identified no impairment losses related to the Company’s long-lived assets.
Revenue Recognition
The Company recognizes revenue when it is realized or realizable and earned. The Company establishes persuasive evidence of a sales arrangement for each type of revenue transaction based on a signed contract with the customer and that delivery has occurred or services have been rendered, price is fixed and determinable, and collectability is reasonably assured.
| ● | Software and licenses – revenue from sales of perpetual licenses to customers when payments are fixed is recognized at the inception of the arrangement, unless the payment term exceeds one year and then only if the presumption that the license fee is not fixed or determinable can be overcome, presuming all other relevant revenue recognition criteria are met. If the presumption cannot be overcome, revenue is recognized as payment from the customer becomes due. Revenue from sales of perpetual licenses are payable over a period exceeding a year, and those payments are variable based upon customer usage are recognized as payments from customers become due. |
| ● | Revenues for user licenses purchased by customers are recognized when the user license is delivered. |
| ● | Revenues for maintenance services are recognized over the period of delivery of the services. |
We enter into arrangements in which a customer purchases a combination of software licenses, maintenance services and post-contract customer support (“PCS”). As a result, judgment is sometimes required to determine the appropriate accounting, including how the price should be allocated among the deliverable elements if there are multiple elements. PCS may include rights to upgrades, when and if available, support, updates and enhancements. When vendor specific objective evidence (“VSOE”) of fair value exists for all elements in a multiple element arrangement, revenue is allocated to each element based on the relative fair value of each of the elements. VSOE of fair value is established by the price charged when the same element is sold separately. Accordingly, the judgments involved in assessing the fair values of various elements of an agreement can impact the recognition of revenue in each period. Changes in the allocation of the sales price between deliverables might impact the timing of revenue recognition, but would not change the total revenue recognized on the contract. When elements such as software and services are contained in a single arrangement, or in related arrangements with the same customer, we allocate revenue to each element based on its relative fair value, provided that such element meets the criteria for treatment as a separate unit of accounting. In the absence of fair value for a delivered element, revenue is first allocated to the fair value of the undelivered elements and then allocated to the residual delivered elements. In the absence of fair value for an undelivered element, the arrangement is accounted for as a single unit of accounting, resulting in a delay of revenue recognition for the delivered elements until the undelivered elements are fulfilled. No sales arrangements to date include undelivered elements for which VSOE does not exist.
For purposes of revenue recognition for perpetual licenses, the Company considers payment terms exceeding one year as a presumption that the fee in the transaction is not fixed and determinable. This presumption however, may be overcome if persuasive evidence demonstrates that the Company has a business practice of extending payment terms and has been successful in collecting under the original terms, without providing any concessions. In doing so, the Company considers if the arrangement is sufficiently similar to historical arrangements in terms of similar customers and products is assessing whether there is evidence of a history of successful collection.
39
In order to determine if the company’s historical experience is based on sufficiently similar arrangements, the Company considers the various factors including the types of customers and products, product life cycle, elements included in the arrangement, length of payment terms and economics of license arrangement.
If the presumption cannot be overcome due to a lack of such evidence, revenue is recognized as payments become due, assuming all other revenue recognition criteria has been met.
Leases
Leases are classified as finance leases whenever the terms of the lease transfer substantially all the risks and rewards of ownership to the lessee. All other leases are classified as operating leases.
Assets held under finance leases are recognized as assets of the Company at their fair value or, if lower, at the present value of the minimum lease payments, each determined at the inception of the lease. The corresponding liability to the lessor is included in the balance sheet as finance lease obligation. Lease payments are apportioned between finance charges and reduction of the lease obligation so as to achieve a constant rate of interest on the remaining balance of the liability. Finance charges are charged directly against income.
Rentals payable under operating leases are charged to income on a straight-line basis over the term of the relevant lease.
Benefits received and receivable as an incentive to enter into an operating lease are also spread on a straight-line basis over the lease term.
Advertising Expenses
It is the Company’s policy to expense advertising costs as incurred. No advertising costs were incurred during the three and nine months ended September 30, 2014 and 2013.
Research and Development Expenses
Research and development expenses include all direct costs, primarily salaries for Company personnel and outside consultants, related to the development of new products, significant enhancements to existing products, and the portion of costs of development of internal-use software required to be expensed. Research and development costs are charged to operations as incurred with the exception of those software development costs that may qualify for capitalization. The Company incurred no research and development costs in the three and nine months ended September 30, 2014 and 2013.
Income Taxes
Deferred income tax assets and liabilities are determined based on temporary differences between financial reporting and tax bases of assets and liabilities, operating loss, and tax credit carryforwards, and are measured using the enacted income tax rates and laws that will be in effect when the differences are expected to be recovered or settled. Realization of certain deferred income tax assets is dependent upon generating sufficient taxable income in the appropriate jurisdiction. The Company records a valuation allowance to reduce deferred income tax assets to amounts that are more likely than not to be realized. The initial recording and any subsequent changes to valuation allowances are based on a number of factors (positive and negative evidence). The Company considers its actual historical results to have a stronger weight than other, more subjective, indicators when considering whether to establish or reduce a valuation allowance.
The Company continually evaluates its uncertain income tax positions and may record a liability for any unrecognized tax benefits resulting from uncertain income tax positions taken or expected to be taken in an income tax return. Estimated interest and penalties are recorded as a component of interest expense and other expense, respectively.
40
Because tax laws are complex and subject to different interpretations, significant judgment is required. As a result, the Company makes certain estimates and assumptions in: (1) calculating its income tax expense, deferred tax assets, and deferred tax liabilities; (2) determining any valuation allowance recorded against deferred tax assets; and (3) evaluating the amount of unrecognized tax benefits, as well as the interest and penalties related to such uncertain tax positions. The Company’s estimates and assumptions may differ significantly from tax benefits ultimately realized.
Net Loss per Share
For the quarter ended September 30, 2013, there were no potential issuable shares included in the diluted earnings per share calculation as the conversion price of those instruments was all out-of-the-money. For the nine months period ended September 30, 2013, potential issuable shares were not included in the computation of diluted earnings per share under the treasury stock method because their effect would be anti-dilutive due to net losses incurred. For the three and nine months ended September 30, 2014, options, warrants and convertible debt were not included in the computation of diluted earnings per share because their effect would be anti-dilutive due to net losses incurred under the treasury stock method.
Accumulated Other Comprehensive Income (Loss)
Other comprehensive income (loss), as defined, includes net income, foreign currency translation adjustment, and all changes in equity (net assets) during a period from non-owner sources. To date, the Company has not had any significant transactions that are required to be reported in other comprehensive income (loss), except for foreign currency translation adjustments.
Use of Estimates
The preparation of consolidated financial statements in conformity with GAAP requires management to make estimates and assumptions that affect the reported amounts of assets and liabilities and disclosures of contingent assets and liabilities at the date of the consolidated financial statements and the reported amounts of revenues and expenses during the fiscal year. The Company makes estimates for, among other items, useful lives for depreciation and amortization, determination of future cash flows associated with impairment testing for long-lived assets, determination of the fair value of stock options and warrants, determining fair values of assets acquired and liabilities assumed in business combinations, valuation allowance for deferred tax assets, allowances for doubtful accounts, and potential income tax assessments and other contingencies. The Company bases its estimates on historical experience, current conditions, and other assumptions that it believes to be reasonable under the circumstances. Actual results could differ from those estimates and assumptions.
Financial Instruments
The Company has the following financial instruments: cash, amounts due to related parties and long-term debt. The carrying value of these financial instruments approximates their fair value due to their liquidity or their short-term nature valued consistent with the use of level 2 inputs. The fair value of amounts due to related parties is not determinable.
Share-Based Compensation
The Company accounts for stock-based awards at fair value on date of grant and recognition of compensation over the service period for awards expected to vest. The fair value of stock options is determined using the Black-Scholes valuation model, which is consistent with the Company’s valuation techniques previously utilized for options in footnote disclosures.
Recently Issued Accounting Standards
In May 2014, the Financial Accounting Standards Board (“FASB”) issued Accounting Standard Update (“ASU”) 2014-09 – Revenue From Contracts with Customers, which will supersede nearly all existing revenue recognition guidance under U.S. GAAP. The core principle of this ASU is that an entity should recognize revenue when it transfers promised goods or services to customers in an amount that reflects the consideration to which the entity expects to be entitled in exchange for those goods or services. This ASU also requires additional disclosure about the nature, amount, timing and uncertainty of revenue and cash flows arising from customer contracts, including significant judgments and changes in judgments and assets recognized from costs incurred to obtain or fulfill a contract. This ASU will be effective for us in our first quarter of 2018. Early adoption is not permitted. The ASU allows for either full retrospective or modified retrospective adoption. The Company are evaluating the transaction method that will be elected and the potential effects of the adoption of this ASU on its financial statements.
41
Note 3. China Operations
During the year ended December 31, 2013, the Company established a subsidiary in China, Horizon Network Technology Co. Ltd. (“HNT”). The establishment of HNT is part of the Company’s strategic plan to expand the application of mobile software and related marketing efforts into emerging markets. The Company contributed $1.5 million for a 75% ownership interest in HNT. The remaining 25% ownership interest in HNT was acquired by non-related parties through the transfer of noncash assets with a fair value of $500,000.
The results of operations, assets, liabilities and cash flows of HNT have been consolidated in the accompanying condensed consolidated financial statements as the Company owns a controlling interest. The ownership interests in HNT held by parties other than the Company are presented separately from the Company’s equity on the Consolidated Balance Sheet. The amount of consolidated net loss attributable to the Company and the non-controlling interest are both presented on the face of the Consolidated Statement of Operations.
Note 4. Property and Equipment, net
Property and equipment consist of the following: (in thousands)
| September 30 | December 31 | |||||||
| 2014 | 2013 | |||||||
| Leasehold improvements | $ | 265 | $ | 265 | ||||
| Motor vehicle | 120 | 120 | ||||||
| Equipment | 351 | 310 | ||||||
| 736 | 695 | |||||||
| Less accumulated depreciation | (497 | ) | (380 | ) | ||||
| Property and equipment, net | $ | 239 | $ | 315 | ||||
Note 5. Intangible Assets
Intangible assets consist primarily of software development costs and customer and reseller relationships which are amortized over the estimated useful life, generally on a straight-line basis with the exception of customer relationships, which are generally amortized either using the straight-line method or the related asset’s pattern of economic benefit (whichever is more representative). (in thousands)
| September 30 | December 31 | |||||||
| 2014 | 2013 | |||||||
| Horizon software | $ | 17,332 | $ | 17,599 | ||||
| ZTEsoft Telecom software | 494 | 497 | ||||||
| Contractual relationships | 885 | 885 | ||||||
| 18,711 | 18,981 | |||||||
| Less accumulated amortization | (7,196 | ) | (6,221 | ) | ||||
| Intangible assets, net | $ | 11,515 | $ | 12,760 | ||||
42
Amortization of intangible assets for each of the next five years is estimated to be $1,900,000 per year
Note 6. Long-term Debt
Long – term liabilities consist of the following: (in thousands)
| September 30 | December 31 | |||||||
| 2014 | 2013 | |||||||
| Vehicle loan | $ | 39 | $ | 51 | ||||
| Equipment loan | 18 | 27 | ||||||
| Office term loan | 144 | 171 | ||||||
| 201 | 249 | |||||||
| Less current portion | (72 | ) | (65 | ) | ||||
| Balance | $ | 129 | $ | 184 | ||||
Note 7. Related-Party Transactions
Amounts due to related parties include the following: (in thousands)
| September 30 | December 31 | |||||||
| 2014 | 2013 | |||||||
| Loans due to stockholders | $ | 3,500 | $ | 3,500 | ||||
43
Loans due to stockholders include:
| ● | Balance of loans, advanced during 2011, of $1,500,000 which are unsecured and have an interest rate of 10%. During the nine months ended September 30, 2014 and 2013 interest of $107,000 and $150,000, respectively, has been accrued. |
| ● | Loans advanced by an officer and director together with a former officer and director during 2012 totaling $1,500,000 which is unsecured and has an interest rate of 0.21%. The loan is due on or before December 31, 2014 and can be repaid in cash or shares of ordinary shares of OHG at an exchange price of $5.14 per share. |
| ● | Convertible loans advanced in January 2013 from an officer and director together with a former officer and director in the amount of $250,000 each. These convertible loans bear an interest rate of 0.21% and is repayable on or before January 22, 2015. The Company has the option to repay the loans at any time, without penalty, at any time in cash or shares of common stock of the Company at a price of $5.14 per share. If the Company elects to repay the convertible loan in full by the issuance of shares the Company will issue 48,650 shares of common stock for repayment of the loan. |
During the year ended June 30, 2011, the Company entered into a sales contract, in the normal course of business with a customer in which the Company holds an equity interest. The customer purchased perpetual software license with total commitment of $2.0 million, of which $45,000 and $nil has been recognized in the nine months ended September 30, 2014 and 2013, respectively. The Company owns a cost based investment interest of 18% of the voting capital of the customer.
Note 8. Share Capital
Preferred Stock
The Company’s authorized capital includes 50,000,000 shares of preferred stock of $0.0001 par value. The designation of rights including voting powers, preferences, and restrictions shall be determined by the Board of Directors before the issuance of any shares.
On July 21, 2014, the Company completed a private placement of 170,940 shares of Series A Preferred Stock that also included 100,000 Class B warrants convertible into common stock on a one-to-one basis at an exercise price of $4.00 per share. The net proceeds of the offering were $982,000 after deducting offering costs.
Unless converted earlier, each share of the Mandatorily Convertible Series A Preferred Stock will automatically convert on July 20, 2016, into common stock at a conversion price of $5.85 per share, subject to anti-dilution adjustments. Subject to certain restrictions, at any time prior to July 20, 2016, holders of the Mandatorily Convertible Series A Preferred Stock may elect to convert all or a portion of their shares into common stock at the conversion rate.
The holders of Mandatorily Convertible Series A Preferred Stock are entitled to receive cumulative dividends during a period of twenty-four (24) months from and after the Issuance Date (the “Dividend Period”). During the Dividend Period for each outstanding share of Mandatorily Convertible Series A Preferred Stock, dividends shall be payable quarterly in cash, at the rate of 10% per annum on or before each ninety (90) day period following the Issuance Date (each a “Dividend Payment Date”), with the first Dividend Payment Date to occur promptly following the three month period following the Issuance Date, and continuing until the end of the Dividend Period. Following the expiration of the Dividend Period, the holders of Series A Preferred Stock shall not be entitled to any additional dividend payment or coupon rate.
44
Shares of Series A Preferred Stock are redeemable, at the option of the holders commencing any time after 12 months from and after the closing at a price equal to the original purchase price plus all accrued but unpaid dividends. In the event that the Company completes a financing of $10 million or greater prior to July 20, 2016, the Series A Preferred Stock will be redeemed at a price equal to the original purchase price plus all accrued but unpaid dividends.
170,940 shares of Series A preferred stock are issued and outstanding as of September 30, 2014.
Mandatorily Redeemable Preferred Shares (Deferred Stock)
The Company’s subsidiary OHG is authorized to issue 50,000 shares of deferred stock, par value of £1.These shares are non-voting, non-participating, redeemable and have been presented as a long-term liability.
Common Stock
The Company is authorized to issue 200 million shares of common stock, par value of $0.0001.
During the nine months ended September 30, 2014, the Company:
| ● | issued 15,000 shares of common stock for services received with a fair value of $64,500. |
| ● | issued 25,000 shares of common stock for services received, in connection with the $1 million private placement, with a fair value of $107,500 |
| ● | issued 75,000 shares of common stock for services to be received with a fair value of $322,500 |
During the year ended December 31, 2013, the Company:
| ● | issued 5,000 shares of common stock for services received with a fair value of $30,000 |
| ● | issued 62,543 shares of common stock for services received with a fair value of $562,891. |
| ● | issued 806,452 shares of common stock for $6 million cash. |
| ● | issued 33,333 shares of common stock for services received with a fair value of $50,000. |
| ● | issued 1,167,600 shares of common stock upon the exercise of warrants with an exercise price of $nil |
Stock Purchase Warrants
At September 30, 2014, the Company had reserved 1,426,435 shares of its common stock for the following outstanding warrants:
45
| Number of Warrants | Exercise Price | Expiry | |||||
| 116,760 | $ | 0.86 | no expiry date | ||||
| 1,209,675 | 4.25 | January 2019 | |||||
| 100,000 | 4.00 | July 2016 | |||||
During the nine months ended September 30, 2014 there were 100,000 warrants issued in connection with the $1 million private placement. In connection with and as a consideration of closing of the $1 million private placement, 403,225 warrants issued in the financing of February 2013 were increased to 1,209,675 warrants; and the exercise price was reduced to $4.25 per share and the exercise period was extended to January 2019. There were no warrants exercised during the nine months ended September 30, 2014.
Note 9. Stock-Based Compensation
The shareholders approved a stock option plan on August 6, 2013, the 2013 Equity Incentive Plan. This stock option plan is for the issuance of stock options, stock appreciation rights, restricted stock, restricted stock units, performance awards, dividend equivalents, cash bonuses and other stock-based awards to employees, directors and consultants of the Company.
There are 3,000,000 shares of common stock available for granting awards under the plan. Each year, commencing 2014, until 2016, the number of shares of common stock available for granting awards shall be increased by the lesser of 1,000,000 shares of common stock and 5% of the total number of shares of common stock outstanding.
During the nine months ended September 30, 2014, the Company issued options to purchase 500,000 shares of common stock under the 2013 Equity Incentive Plan. The options become fully vested on January 15, 2017 and are exercisable, at an exercise price of $4.54 per common share, to January 15, 2024. On January 1, 2014, the number of shares available for granting awards under the 2013 Equity Incentive Plan was increased by 1,000,000 shares.
A summary of the Company’s 2013 Equity Incentive Plan as of June 30, 2014, is as follows:
| Number of | Weighted Average | |||||||
| Options | Exercise Price | |||||||
| Outstanding at December 31, 2013 | - | $ | ||||||
| Options issued | 500,000 | 4.54 | ||||||
| Outstanding at September 30, 2014 | 500,000 | 4.54 | ||||||
The fair value of these options, using the Black-Scholes option-pricing model, is estimated to be $2,200,000. This expense, less an estimated forfeiture rate of 30%, will be recognized over the three year vesting period. The amount of $387,000 has been recognized during the nine months ended September 30, 2014. As at September 30, 2014, there was unrecognized compensation expense of approximately $1.2 million to be recognized over a period of 2.25 years.
Prior to the 2013 Equity Incentive Plan, the Company issued stock options to directors, employees, advisors, and consultants.
46
A summary of the Company’s other stock options as of September 30, 2014, is as follows:
| Number of | Weighted Average | |||||||
| Options | Exercise Price | |||||||
| Outstanding at December 31, 2013 | 584,650 | $ | 0.53 | |||||
| Options forfeited | - | - | ||||||
| Outstanding at September 30, 2014 | 584,650 | $ | 0.53 | |||||
Other than the options to purchase 500,000 common shares under the 2013 Equity Incentive Plan, there were no options issued, exercised or forfeited during the nine months ended September 30, 2014.
The following table summarizes stock options outstanding at September 30, 2014:
| Exercise Price | Number Outstanding at September 30, | Average Remaining Contractual Life (Years) | Number Exercisable at | Intrinsic Value at | ||||||||||||||
| $ | 0.51 | 850 | 1.08 | 850 | $ | 1,666 | ||||||||||||
| 0.53 | 291,900 | 5.75 | 291,900 | 566,286 | ||||||||||||||
| 0.53 | 291,900 | 8.25 | - | - | ||||||||||||||
| 4.54 | 500,000 | 9.25 | - | - | ||||||||||||||
At September 30, 2014, 4,584,650 shares of common stock were reserved for all outstanding options and future commitments under the 2013 Equity Incentive Plan.
The fair value of each option granted is estimated at the date of grant using the Black-Scholes option-pricing model. The assumptions used in calculating the fair value of the options granted were: risk-free interest rate of 1.68%, a 3 year expected life, a dividend yield of 0.0%, and a stock price volatility factor of 192%
Note 10. Commitments and Contingencies
The Company has an agreement with an employee to pay for certain services by the issuance of options to purchase 291,900 shares of common stock of the Company.
Contractual Commitments
The Company incurred total rent expense of $81,000 and $166,147, respectively, for the nine months ended September 30, 2014 and 2013.
Minimum contractual commitments, as of September 30, 2014, are as follows:
| Operating | Long-term | |||||||
| leases | Financing | |||||||
| 2014 | $ | 64,000 | $ | 18,000 | ||||
| 2015 | 75,000 | 87,000 | ||||||
| 2016 | 75,000 | 48,000 | ||||||
| 2017 | 75,000 | 45,000 | ||||||
| 2018 | - | 4,000 | ||||||
47

REPORT OF INDEPENDENT REGISTERED PUBLIC ACCOUNTING FIRM
To the Board of Directors and Shareholders
One Horizon Group, Inc.
London, United Kingdom
We have audited the accompanying consolidated balance sheets of One Horizon Group, Inc. ("the Company") as of December 31, 2013 and 2012, and the related consolidated statements of operations, comprehensive income, shareholders' equity, and cash flows for the year ended December 31, 2013, and for the period from July 1, 2012 to December 31, 2012. We have also audited the consolidated statements of operations, comprehensive loss, shareholders’ equity, and cash flows for the year ended June 30, 2012. These consolidated financial statements are the responsibility of the Company's management. Our responsibility is to express an opinion on these consolidated financial statements based on our audits.
We conducted our audits in accordance with the standards of the Public Company Accounting Oversight Board (United States). Those standards require that we plan and perform the audits to obtain reasonable assurance about whether the consolidated financial statements are free of material misstatement. The Company has determined that it is not required to have, nor were we engaged to perform, an audit of its internal control over financial reporting. Our audits included consideration of internal control over financial reporting as a basis for designing audit procedures that are appropriate in the circumstances, but not for the purpose of expressing an opinion on the effectiveness of the Company's internal control over financial reporting. Accordingly, we express no such opinion. An audit includes examining, on a test basis, evidence supporting the amounts and disclosures in the consolidated financial statements. An audit also includes assessing the accounting principles used and significant estimates made by management, as well as evaluating the overall financial statement presentation. We believe that our audits provide a reasonable basis for our opinion.
In our opinion, the consolidated financial statements referred to above present fairly, in all material respects, the financial position of One Horizon Group, Inc. as of December 31, 2013 and 2012, and the results of its operations and its cash flows for year ended 2013, for period from July 1, 2012 to December 31, 2012, and for the year ended June 30, 2012, in conformity with accounting principles generally accepted in the United States.
As discussed in Note 2, the accompanying consolidated financial statements as of December 31, 2012, and for the six months then ended, and for the year ended June 30, 2012, have been restated.
/S/ PETERSON SULLIVAN LLP
Seattle, Washington
April 15, 2014
48
ONE HORIZON GROUP, INC.
Consolidated Balance Sheets
December 31, 2013 and 2012
(in thousands, except share data)
| 2013 | 2012 | |||||||
| (restated) | ||||||||
| Assets | ||||||||
| Current assets: | ||||||||
Cash | $ | 2,070 | $ | 699 | ||||
Accounts receivable | 7,264 | 977 | ||||||
Other assets | 139 | 136 | ||||||
Total current assets | 9,473 | 1,812 | ||||||
| Property and equipment, net | 315 | 350 | ||||||
| Intangible assets, net | 12,760 | 12,329 | ||||||
| Investment | 23 | - | ||||||
| Total assets | $ | 22,571 | $ | 14,491 | ||||
| Liabilities and Stockholders' Equity | ||||||||
| Current liabilities: | ||||||||
Accounts payable | $ | 661 | $ | 747 | ||||
Accrued expenses | 964 | 436 | ||||||
Accrued compensation | 59 | 38 | ||||||
Income taxes | 117 | 94 | ||||||
Amounts due to related parties | 3,500 | 3,500 | ||||||
Current portion of long-term debt | 65 | 59 | ||||||
Total current liabilities | 5,366 | 4,874 | ||||||
| Long-term liabilities | ||||||||
Long term debt | 184 | 219 | ||||||
Deferred income taxes | 445 | 445 | ||||||
Mandatorily redeemable preferred shares | 90 | 90 | ||||||
Total liabilities | 6,085 | 5,628 | ||||||
| Equity | ||||||||
| One Horizon Group, Inc. stockholders' equity | ||||||||
| Preferred stock: | ||||||||
$0.0001 par value, authorized 50,000,000; | ||||||||
no shares issued or outstanding | - | - | ||||||
| Common stock: | ||||||||
$0.0001 par value, authorized 200,000,000 shares | ||||||||
issued and outstanding 32,920,069 shares (2012 30,845,844); | 3 | 3 | ||||||
| Additional paid-in capital | 28,269 | 21,630 | ||||||
| Stock subscriptions receivable | - | (500 | ) | |||||
| Retained Earnings (Deficit) | (13,319 | ) | (12,725 | ) | ||||
| Accumulated other comprehensive income | 1,137 | 455 | ||||||
| Total One Horizon Group, Inc. shareholders' equity | 16,090 | 8,863 | ||||||
| Non-controlling interest | 396 | - | ||||||
| Total equity | 16,486 | 8,863 | ||||||
| Total liabilities and equity | $ | 22,571 | $ | 14,491 | ||||
See accompanying notes to consolidated financial statements.
49
ONE HORIZON GROUP, INC.
Consolidated Statements of Operations
For the year ended December 31, 2013, the six months ended December 31, 2012
and the year ended June 30, 2012
(in thousands, except per share data)
| Year ended December 31, | Six months ended December 31, | Year ended June 30, | |||||||||||
| 2013 | 2012 | 2012 | |||||||||||
| (restated) | (restated) | ||||||||||||
| Revenue | $ | 9,106 | $ | 6,959 | $ | 2,612 | |||||||
| Cost of revenue | |||||||||||||
| Hardware | 545 | 121 | 80 | ||||||||||
| Amortization of software development costs | 1,908 | 873 | 1,655 | ||||||||||
| 2,453 | 994 | 1,735 | |||||||||||
| Gross margin | |||||||||||||
| 6,653 | 5,965 | 877 | |||||||||||
| Expenses: | |||||||||||||
| General and administrative | 6,706 | 4,023 | 4,570 | ||||||||||
| Depreciation | 166 | 73 | 884 | ||||||||||
| 6.872 | 4,096 | 5,454 | |||||||||||
| Income (loss) from operations | (219 | ) | 1,869 | (4,577 | ) | ||||||||
| Other income and expense: | |||||||||||||
| Interest expense | (322 | ) | (87 | ) | (218 | ) | |||||||
| Foreign exchange | (158 | ) | 16 | 49 | |||||||||
| Interest income | 1 | 1 | - | ||||||||||
| (479 | ) | (70 | ) | (169 | ) | ||||||||
| Income (loss) from continuing operations before income taxes | (698 | ) | 1,799 | (4,746 | ) | ||||||||
| Income taxes | - | - | - | ||||||||||
| Income (loss) from continuing operations | (698 | ) | 1,799 | (4,746 | ) | ||||||||
| Discontinued operations: | |||||||||||||
| Loss from discontinued operations | - | (40 | ) | - | |||||||||
| Loss on sale of discontinued businesses | - | (81 | ) | - | |||||||||
| Income from discontinued operations | - | (121 | ) | - | |||||||||
| Net Income (Loss) for the period | (698 | ) | 1,678 | (4,746 | ) | ||||||||
| Net Income (Loss) attributable to non-controlling interest | (104 | ) | - | - | |||||||||
| Net Income (Loss) for the period attributable to One Horizon Group, Inc. | $ | (594 | ) | $ | 1,678 | $ | (4,746 | ) | |||||
| Earnings per share | |||||||||||||
| Basic net income per share | $ | (0.02 | ) | $ | 0.06 | $ | (0.21 | ) | |||||
| Diluted net income per share | $ | (0.02 | ) | $ | 0.06 | $ | (0.21 | ) | |||||
| Weighted average number of shares outstanding | |||||||||||||
| Basic | 31,661 | 27,331 | 22,695 | ||||||||||
| Diluted | - | 29,268 | - | ||||||||||
See accompanying notes to consolidated financial statements.
50
ONE HORIZON GROUP, INC.
Consolidated Statements of Comprehensive Income
For the year ended December 31, 2013, the six months ended December 31, 2012
and the year ended June 30, 2012
(in thousands)
| Year ended December 31, | Six months ended December 31, | Year ended June 30, | ||||||||||
| 2013 | 2012 | 2012 | ||||||||||
| (restated) | (restated) | |||||||||||
| Net income (loss) | $ | (594 | ) | $ | 1,678 | $ | (4,746 | ) | ||||
| Other comprehensive income: | ||||||||||||
| Foreign currency translation adjustment gain (loss) | 682 | 455 | - | |||||||||
| Comprehensive income | 88 | 2,133 | (4,746 | ) | ||||||||
| Comprehensive income (loss) attributable to the non-controlling interest | (104 | ) | - | - | ||||||||
| Total comprehensive income (loss) | $ | (16 | ) | $ | 2,133 | $ | (4,746 | ) | ||||
See accompanying notes to consolidated financial statements
51
ONE HORIZON GROUP, INC.
Consolidated Statements of Stockholders' Equity
For the year ended December 31, 2013, the six months ended December 31, 2012
and the year June 30, 2012
(in thousands)
Common Stock Numberof Shares | Amount | Additional paid-in Capital | Retained Earnings (Deficit) | Subscriptions Receivable | Accumulated Other Comprehensive Income (Loss) | Non-controlling Interest | Total Stockholders' Equity | |||||||||||||||||||||||||
| Balance June 30, 2011 | 22,214 | $ | 2 | $ | 13,448 | $ | (9,657 | ) | - | $ | - | $ | - | $ | 3,793 | |||||||||||||||||
| Net loss | - | - | - | (4,746 | ) | - | (4,746 | ) | ||||||||||||||||||||||||
| Common stock issued for cash | 2,238 | - | 5,750 | 5,750 | ||||||||||||||||||||||||||||
| Options issued for services received | 6 | 6 | ||||||||||||||||||||||||||||||
| Warrants issued for services received | 400 | 400 | ||||||||||||||||||||||||||||||
| Balance June 30, 2012 | 24,452 | 2 | 19,604 | (14,403 | ) | - | - | - | 5,203 | |||||||||||||||||||||||
| Net Income | - | - | - | 1,678 | - | 1,678 | ||||||||||||||||||||||||||
| Foreign currency translations | - | - | - | - | 455 | 455 | ||||||||||||||||||||||||||
| Comprehensive income | - | - | - | - | - | 2,133 | ||||||||||||||||||||||||||
| Common stock issued for cash | 195 | - | 502 | 502 | ||||||||||||||||||||||||||||
| Common stock issued for note receivable | 1,460 | - | 500 | (500 | ) | - | ||||||||||||||||||||||||||
| Common stock issued for services received | 146 | - | 50 | 50 | ||||||||||||||||||||||||||||
| Common stock issued for services received from related parties | 3,503 | 1 | 1,199 | 1,200 | ||||||||||||||||||||||||||||
| Warrant issued for services received | 2 | 2 | ||||||||||||||||||||||||||||||
| Options issued for services received | 22 | 22 | ||||||||||||||||||||||||||||||
| Common stock accounted for in business combination | 1,160 | - | 170 | - | - | 170 | ||||||||||||||||||||||||||
| Return of stock on disposal of subsidiaries | (70 | ) | - | (419 | ) | (419 | ) | |||||||||||||||||||||||||
| Balance December 31, 2012 | 30,846 | 3 | 21,630 | (12,725 | ) | (500 | ) | 455 | - | 8,863 | ||||||||||||||||||||||
| Sale of subsidiary shares to non-controlling interest | 500 | 500 | ||||||||||||||||||||||||||||||
| Net loss | - | - | - | (594 | ) | - | (104 | ) | (698 | ) | ||||||||||||||||||||||
| Foreign currency translations | - | - | - | - | 682 | 682 | ||||||||||||||||||||||||||
| Comprehensive income | - | - | - | - | (16 | ) | ||||||||||||||||||||||||||
| Receipt of subscription receivable by offset against shareholder loan | 500 | 500 | ||||||||||||||||||||||||||||||
| Common stock issued for cash | 807 | - | 6,000 | 6,000 | ||||||||||||||||||||||||||||
| Common stock issued for services received | 101 | - | 643 | 643 | ||||||||||||||||||||||||||||
| Common stock repurchased | (1 | ) | - | (4 | ) | (4 | ) | |||||||||||||||||||||||||
| Common stock issued on exercise of warrants | 1,168 | - | - | - | ||||||||||||||||||||||||||||
| Balance December 31, 2013 | $ | 32,921 | $ | 3 | $ | 28,269 | $ | (13,319 | ) | $ | - | $ | 1,137 | $ | 396 | $ | 16,486 | |||||||||||||||
See accompanying notes to consolidated financial statements.
52
ONE HORIZON GROUP, INC.
Consolidated Statements of Cash Flows
For the year ended December 31, 2013, the six months ended December 31, 2012
and the year ended June 30, 2012
(in thousands)
| Year ended December 31, | Six months ended December 31, | Year ended June 30, | ||||||||||
| 2013 | 2012 | 2012 | ||||||||||
| (restated) | (restated) | |||||||||||
| Cash provided by (used in) operating activities: | ||||||||||||
| Operating activities: | ||||||||||||
| Net income (loss) for the period | $ | (594 | ) | $ | 1,678 | $ | (4,746 | ) | ||||
| Adjustment to reconcile net income (loss) for the period to | ||||||||||||
| net cash provided by (used in) operating activities: | ||||||||||||
| Depreciation of property and equipment | 166 | 73 | 884 | |||||||||
| Amortization of intangible assets | 1,908 | 873 | 1,655 | |||||||||
| Loss on disposal of discontinued businesses | - | 81 | - | |||||||||
| Options issued for services received | - | 22 | 6 | |||||||||
| Warrants issued for services received | - | 2 | 400 | |||||||||
| Common shares issued for services received | 643 | 50 | - | |||||||||
| Common shares issued for services received from related parties | - | 1,200 | - | |||||||||
| Net income (loss) attributable to non-controlling interest | (104 | ) | - | - | ||||||||
| Changes in operating assets and liabilities | ||||||||||||
| net of effects of acquisitions: | ||||||||||||
| Accounts receivable | (6,287 | ) | 355 | (1,724 | ) | |||||||
| Other assets | (3 | ) | (15 | ) | 182 | |||||||
| Accounts payable | 488 | (5,152 | ) | 539 | ||||||||
| Income taxes | 23 | - | (91 | ) | ||||||||
| Net cash (used in) operating activities | (3,760 | ) | (833 | ) | (2,895 | ) | ||||||
| Cash used in investing activities: | ||||||||||||
| Acquisition of intangible assets | (1,211 | ) | (486 | ) | (3,466 | ) | ||||||
| Acquisition of property and equipment | (131 | ) | - | (101 | ) | |||||||
| Other assets | (23 | ) | 55 | (55 | ) | |||||||
| Net cash (used in) investing activities | (1,365 | ) | (431 | ) | (3,622 | ) | ||||||
| Cash flow from financing activities: | ||||||||||||
| Increase (decrease) in long-term borrowing, net | - | (980 | ) | |||||||||
| Cash proceeds from issuance of common stock | 6,000 | 502 | 5,750 | |||||||||
| Repurchase of common stock | (4 | ) | - | - | ||||||||
| Advances from related parties, net of repayment | 500 | 1,500 | 1,800 | |||||||||
| Net checks issued in excess of funds | - | (39 | ) | (53 | ) | |||||||
| Net cash provided by financing activities | 6,496 | 1,963 | 6,517 | |||||||||
| Increase in cash during the period | 1,371 | 699 | - | |||||||||
| Cash at beginning of the period | 699 | - | - | |||||||||
| Cash at end of the period | $ | 2,070 | $ | 699 | $ | - | ||||||
See accompanying notes to consolidated financial statements.
53
ONE HORIZON GROUP, INC.
Consolidated Statements of Cash Flows (continued)
For the year ended December 31, 2013, the six months ended December 31, 2012
and the year ended June 30, 2012
(in thousands)
Supplementary Information:
| Year ended December 31, | Six months ended December 31, | Year ended June 30, | ||||||||||
| 2013 | 2012 | 2012 | ||||||||||
| Interest paid | $ | - | $ | - | $ | - | ||||||
| Income taxes paid | - | - | - | |||||||||
| Non-cash transactions: | ||||||||||||
| Common stock returned as part consideration for sale of division | - | 420 | - | |||||||||
| Settlement of debt with Satcom in consideration of sale of license | - | 5,000 | - | |||||||||
Settlement of subscription receivable through partial repayment of loan payable | 500 | - | - | |||||||||
| Exchange of 25% interest in subsidiary for intangible assets | 500 | - | - | |||||||||
See accompanying notes to consolidated financial statements.
54
NOTES TO CONSOLIDATED FINANCIAL STATEMENTS
December 31, 2013
Note 1. Description of Business, Organization and Principles of Consolidation
Description of Business
One Horizon Group, Inc., (the “Company” or “Horizon”) develops proprietary software primarily in the Voice over Internet Protocol (VoIP) and bandwidth optimization markets (“Horizon Globex”) and provides it under perpetual license arrangements (“Master License”) throughout the world. The Company sells related user licenses and software maintenance services as well.
Organization
On November 30, 2012, the predecessor company “ICE” acquired all of the stock of One Horizon Group plc (“OHG”), a company incorporated in the United Kingdom through the issuance of 29,755,794 shares of common stock of the Company. Upon completion of this transaction the former shareholders of OHG controlled approximately 96% of the outstanding stock of the Company and OHG was deemed the acquiring entity The share exchange has been accounted for as a reverse acquisition. The historical combined financial statements of OHG form the consolidated financial statements presented. For accounting purposes ICE was considered to have been acquired as of November 30, 2012.
The consolidated financial statements reflect the deemed acquisition of ICE by OHG and the recognition of the 1,160,051 shares of common stock, with a fair value of $170,000, at November 30, 2012.
On December 31, 2012 the Company sold the operations of Global Integrated Media Limited and Modizo for the return of 70,000 shares of common stock with a fair value of $420,000. These companies were subsidiaries and divisions of ICE.
On August 6, 2013, the Company's shareholders approved the reverse split of the Company's common stock at a ratio of 1-for-600. The reverse stock split proportionately reduced the number of all issued and outstanding common shares and adjusted the number of shares underlying outstanding stock options and warrants.
On August 26, 2013 the Company continued its corporate entity from Pennsylvania to Delaware. There was no change in authorized and issued share capital as all shareholders transferred intact.
55
Principles of Consolidation and Combination
The December 31, 2013 consolidated financial statements include the accounts of One Horizon Group, Inc., its wholly owned subsidiaries OHG, Abbey Technology GmbH, Horizon Globex GmbH, Global Phone Credit Ltd., Horizon Globex Ireland Ltd., One Horizon Hong Kong Ltd., and Global Phone Credit together with Ishuo Network Information Co., Ltd which is controlled by One Horizon Group, Inc. The consolidated financial statements also include the accounts of One Horizon Hong Kong Ltd.’s 75% owned subsidiary, Horizon Network Technology Co., Ltd, which is both controlled and managed by One Horizon Hong Kong Ltd.
The December 31, 2012 and June 30, 2012 consolidated financial statements include the accounts of One Horizon Group, Inc. and its subsidiaries, Horizon Globex GmbH (“HGG”) and Abbey Technology GmbH (“ATG”). The accounts and operations of ICE, including its subsidiaries Global Integrated Media Limited and Global Integ. Media (GIM) Ltd., Corporation, have been included from the time of the share exchange on November 30, 2012 until divestiture on December 31, 2012. For financial statement presentation prior to November 30, 2012, the reporting entity consists of the combined financial statements of OHG and its two subsidiaries, HGG and ATG.
Prior to the share exchange referred to above, OHG owned separate legal entities which operated in a separate line of business, Satcom Global. That line of business was sold in a transaction executed in October 2012, prior to the share exchange with ICE. The historical financial statements presented as it relates to dates prior to the share exchange are those of the separate combined operations of OHG and its two subsidiaries, which are presented on a carve-out basis from the discontinued historical operations of Satcom Global. Management of the Company considers the basis on which the expenses have been allocated to the combined group to be a reasonable reflection of the utilization of the services provided to or received from during the periods presented. All revenues, expenses, gains and losses, assets and liabilities related to the Satcom Global business have been eliminated from these combined financial statements.
All significant intercompany balances and transactions have been eliminated.
Note 2. Restatement of Financial Statements
One Horizon Group, Inc. (the "Company") is restating its consolidated financial statements as of December 31, 2012 for the six months ended December 31, 2012 and as of and for years ended June 30, 2012, and 2011, to correct errors related to the recognition of revenue from sales of perpetual licenses to larger, top-tier ("Tier 1") and other ("Tier 2) telecom entities. Contracts with Tier 1 entities typically require agreed-upon fixed payments over fixed future periods extending beyond one year. Contracts with Tier 2 have long-term variable payment terms based on customer usage. The Company historically recognized the present value of Tier 1 contracts at the time of delivery. Revenue from Tier 2 contracts was historically recognized over the initial 5-year term on a straight-line basis.
The Company's decision to restate the aforementioned financial statements was made as a result of management's identification of errors related to the recognition of revenue from sales of perpetual licenses to certain Tier 1 and Tier 2 telecom entities. Management subsequently determined, and the Audit Committee of the Board of Directors adopted management's conclusion that, as a result of applying the guidance in ASC 985-605-25-32, a portion of the revenue recognized at the time of the sale of perpetual licenses to certain Tier 1 entities should have been deferred and recognized in future periods as payments became due. The conclusion was also reached that revenue from contracts with Tier 2 entities should have been recognized based on the timing of when payments became due (which is based on usage). The errors impacted accounts receivable and deferred revenue in the consolidated balance sheets as well as revenue in the consolidated statements of operations. As a result, revenue and net income were misstated in the consolidated statements of operations for the six months ended December 31, 2012 and years ended June 30, 2012 and 2011. Accounts receivable and deferred revenue were misstated in the consolidated balance sheet as of December 31, 2012, June 30, 2012 and June 30, 2011. These errors were considered material to the consolidated financial statements. The effect of these errors on the consolidated results of operations for the six months ended December 31, 2012, was to reduce revenue and decrease net income by $4.75 million and $3.58 million, respectively The effect of these errors on the consolidated results of operations for the year ended June 30, 2012 was to reduce revenue and increase the net loss by $2.61 million and $2.54 million, respectively. The effect of these errors on the consolidated results of operations for the year ended June 30, 2011 was to reduce revenue and increase the net loss by $1.825 million and $1.825 million, respectively.
56
The consolidated financial statements have been restated as follows. The errors had no impact on the Company's consolidated net cash flows from investing and financing activities. The Company has also reclassified amortization of software development costs from the prior presentation as operating expenses to cost of revenue.
| Consolidated Balance Sheet | ||||||||||||
| (in thousands) | ||||||||||||
| As of December 31, 2012 | ||||||||||||
| As previously | ||||||||||||
| Reported | Adjustments | As Restated | ||||||||||
| Assets | ||||||||||||
| Accounts receivable, current portion | $ | 5,899 | (4,922 | ) | $ | 977 | ||||||
| Total current assets | 6,734 | (4,922 | ) | 1,812 | ||||||||
| Accounts receivable, net of current portion | 26,263 | (26,263 | ) | - | ||||||||
| Total assets | $ | 45,676 | (31,185 | ) | $ | 14,491 | ||||||
| Liabilities and Stockholders' Equity | ||||||||||||
| Current portion of deferred revenue | $ | 6,000 | (6,000 | ) | $ | - | ||||||
| Incom Taxes | 1,332 | (1,238 | ) | 94 | ||||||||
| Total current liabilities | 12,114 | (7,240 | ) | 4,874 | ||||||||
| Deferred revenue | 16,000 | (16,000 | ) | - | ||||||||
| Total liabilities | 28,868 | (23,240 | ) | 5,628 | ||||||||
| Accumulated deficit | (4,780 | ) | (7,945 | ) | (12,725 | ) | ||||||
| Total stockholders' equity | 16,808 | (7,945 | ) | 8,863 | ||||||||
| Total liabilities and stockholders' equity | $ | 45,676 | (31,185 | ) | $ | 14,491 | ||||||
| Consolidated Statements of Operations | ||||||||||||
| (in thousands) | ||||||||||||
| Six Months Ended December 31, 2012 | ||||||||||||
| As previously | ||||||||||||
| Reported | Adjustments | As Restated | ||||||||||
| Revenue | $ | 11,709 | (4,750 | ) | $ | 6,959 | ||||||
| Cost of revenue | 121 | 873 | 994 | |||||||||
| Gross margin | 11,588 | 5,623 | 5,965 | |||||||||
| Expenses | 4,968 | (872 | ) | 4,096 | ||||||||
| Income (loss) from operations | 6,620 | (4,751 | ) | 1,869 | ||||||||
| Other income and expense | (70 | ) | - | (70 | ) | |||||||
| Income (loss) from continuing operations before income taxes | 6,550 | (4,751 | ) | 1,799 | ||||||||
| Income taxes | 1,169 | (1,169 | ) | - | ||||||||
| Income (loss) from continuing operations | 5,381 | (3,582 | ) | 1,799 | ||||||||
| Loss from discontinued operations | (121 | ) | - | (121 | ) | |||||||
| Net income (loss) for the period | $ | 5,260 | (3,582 | ) | $ | 1,678 | ||||||
| Earning per share: | ||||||||||||
| Basic | $ | - | $ | 0.06 | ||||||||
| Diluted | $ | - | $ | 0.06 | ||||||||
57
| Consolidated Statements of Comprehensive Income | ||||||||||||
| (in thousands) | ||||||||||||
| Six months ended December 31, 2012 | ||||||||||||
| As previously | ||||||||||||
| Reported | Adjustments | As Restated | ||||||||||
| Net income | $ | 5,260 | $ | (3,582 | ) | $ | 1,678 | |||||
| Comprehensive income | 5,715 | (3,582 | ) | 2,133 | ||||||||
| Consolidated Statements of Cash Flows | ||||||||||||
| (in thousands) | ||||||||||||
| Six months ended December 31, 2012 | ||||||||||||
| As previously | ||||||||||||
| Reported | Adjustments | As Restated | ||||||||||
| Cash provided by (used in) operating activities: | ||||||||||||
| Operating activities | ||||||||||||
| Net income | $ | 5,260 | (3,582 | ) | 1,678 | |||||||
| Changes in operating assets and liabilities: | ||||||||||||
| Accounts receivable | (8,395 | ) | 8,750 | 355 | ||||||||
| Deferred revenue | 4,000 | (4,000 | ) | - | ||||||||
| Income Taxes | 1,169 | (1,169 | ) | - | ||||||||
| Net cash provided by (used in) operating activities | $ | (833 | ) | - | (833 | ) | ||||||
| Consolidated Balance Sheet | ||||||||||||
| (in thousands) | ||||||||||||
| As of June 30, 2012 | ||||||||||||
| As previously | ||||||||||||
| Reported | Adjustments | As Restated | ||||||||||
| Assets | ||||||||||||
| Accounts receivable, current portion | $ | 953 | 380 | $ | 1,333 | |||||||
| Total current assets | 1,074 | 380 | 1,454 | |||||||||
| Accounts receivable, net of current portion | 22,814 | (22,814 | ) | 0 | ||||||||
| Total assets | $ | 36,549 | (22,434 | ) | $ | 14,115 | ||||||
| Liabilities and Stockholders' Equity | ||||||||||||
| Current portion of deferred revenue | $ | 4,600 | (4,600 | ) | $ | 0 | ||||||
| Income taxes payable | 163 | (69 | ) | 94 | ||||||||
| Total current liabilities | 12,988 | (4,669 | ) | 8,319 | ||||||||
| Deferred revenue | 13,400 | (13,400 | ) | 0 | ||||||||
| Total liabilities | 26,983 | (18,069 | ) | 8,619 | ||||||||
| Accumulated deficit | (10,040 | ) | (4,365 | ) | (14,405 | ) | ||||||
| Total stockholders' equity | 9,566 | (4,365 | ) | 5,201 | ||||||||
| Total liabilities and stockholders' equity | $ | 36,549 | (22,434 | ) | $ | 14,115 | ||||||
58
| Consolidated Statements of Operations | ||||||||||||
| (in thousands) | ||||||||||||
| Year Ended June 30, 2012 | ||||||||||||
| As previously | ||||||||||||
| Reported | Adjustments | As Restated | ||||||||||
| Revenue | $ | 5,222 | (2,610 | ) | $ | 2,612 | ||||||
| Cost of revenue | 80 | 1,655 | 1,735 | |||||||||
| Gross margin | 5,142 | (4,265 | ) | 877 | ||||||||
| Expenses | 7,109 | (1,655 | ) | 5,454 | ||||||||
| Income (loss) from operations | (1,967 | ) | (2,610 | ) | (4,577 | ) | ||||||
| Other income and expense | (169 | ) | - | (169 | ) | |||||||
| Income (loss) from income taxes | (2,205 | ) | (2,541 | ) | (4,746 | ) | ||||||
| Income taxes | 69 | (69 | ) | - | ||||||||
| Net income (loss) | $ | (2,205 | ) | (2,541 | ) | $ | (4,746 | ) | ||||
| Earnings per share: | ||||||||||||
| Basic | $ | - | $ | (0.21 | ) | |||||||
| Diluted | $ | - | $ | (0.21 | ) | |||||||
| Consolidated Statements of Comprehensive Income | ||||||||||||
| (in thousands) | ||||||||||||
| Year ended June 30, 2012 | ||||||||||||
| As previously | ||||||||||||
| Reported | Adjustments | As Restated | ||||||||||
| Net loss | $ | (2,205 | ) | (2,541 | ) | $ | (4,746 | ) | ||||
| Comprehensive loss | (2,205 | ) | (2,541 | ) | (4,746 | ) | ||||||
| Consolidated Statements of Cash Flows | ||||||||||||
| (in thousands) | ||||||||||||
| Year ended June 30, 2012 | ||||||||||||
| As previously | ||||||||||||
| Reported | Adjustments | As Restated | ||||||||||
| Cash provided by (used in) operating activities: | ||||||||||||
| Operating activities | ||||||||||||
| Net income (loss) | $ | (2,205 | ) | (2,541 | ) | (4,746 | ) | |||||
| Changes in operating assets and liabilities: | ||||||||||||
| Accounts receivable | (20,734 | ) | 19,010 | (1,724 | ) | |||||||
| Deferred revenue | 16,400 | (16,400 | ) | - | ||||||||
| Income taxes | (22 | ) | (69 | (91 | ) | |||||||
| Net cash provided by (used in) operating activities | $ | (2,895 | ) | - | (2,895 | ) | ||||||
59
| Consolidated Balance Sheet | ||||||||||||
| (in thousands) | ||||||||||||
| As of June 30, 2011 | ||||||||||||
| As previously | ||||||||||||
| Reported | Adjustments | As Restated | ||||||||||
| Assets | ||||||||||||
| Accounts receivable, current portion | $ | 212 | (29 | ) | $ | 183 | ||||||
| Total current assets | 576 | (29 | ) | 547 | ||||||||
| Accounts receivable, net of current portion | 2,821 | (2,821 | ) | 0 | ||||||||
| Total assets | $ | 14,383 | (2,850 | ) | $ | 11,533 | ||||||
| Liabilities and Stockholders' Equity | ||||||||||||
| Deferred customer credit | $ | 0 | 575 | $ | 575 | |||||||
| Current portion of deferred revenue | 400 | (400 | ) | 0 | ||||||||
| Total current liabilities | 7,033 | 125 | 7,158 | |||||||||
| Deferred revenue | 1,200 | (1,200 | ) | 0 | ||||||||
| Total liabilities | 8,768 | (1,025 | ) | 7,743 | ||||||||
| Accumulated deficit | (7,835 | ) | (1,825 | ) | (9,660 | ) | ||||||
| Total stockholders' equity | 5,615 | (1,825 | ) | 3,790 | ||||||||
| Total liabilities and stockholders' equity | $ | 14,383 | (2,850 | ) | $ | 11,533 | ||||||
| Consolidated Statements of Operations | ||||||||||||
| (in thousands) | ||||||||||||
| Year Ended June 30, 2011 | ||||||||||||
| As previously | ||||||||||||
| Reported | Adjustments | As Restated | ||||||||||
| Revenue | $ | 2,726 | (1,825 | ) | $ | 901 | ||||||
| Cost of revenue | 207 | 1,307 | 1,514 | |||||||||
| Gross margin | 2,519 | (3,132 | ) | (613 | ) | |||||||
| Expenses | 3,539 | (1,307 | ) | 2,232 | ||||||||
| Income (loss) from operations | (1,020 | ) | (1,825 | ) | (2,845 | ) | ||||||
| Other income and expense | 301 | 0 | 301 | |||||||||
| Income (loss) from income taxes | (403 | ) | (1,825 | ) | (2,228 | ) | ||||||
| Income taxes | ||||||||||||
| Net income (loss) | $ | (403 | ) | (1,825 | ) | $ | (2,228 | ) | ||||
| Consolidated Statements of Comprehensive Income | ||||||||||||
| (in thousands) | ||||||||||||
| Year Ended June 30, 2011 | ||||||||||||
| As previously | ||||||||||||
| Reported | Adjustments | As Restated | ||||||||||
| Net loss | $ | (403 | ) | (1,825 | ) | $ | (2,228 | ) | ||||
| Year ended June 30, 2011 | ||||||||||||
| As previously | ||||||||||||
| Reported | Adjustments | As Restated | ||||||||||
| Cash provided by (used in) operating activities: | ||||||||||||
| Operating activites | ||||||||||||
| Net income (loss) | $ | (403 | ) | (1,825 | ) | $ | (2,228 | ) | ||||
| Changes in operating assets and liabilities: | ||||||||||||
| Accounts receivable | 2,675 | 2,850 | 5,525 | |||||||||
| Deferred customer credit | 0 | 575 | 575 | |||||||||
| Deferred revenue | 1,600 | (1,600 | ) | 0 | ||||||||
| Net cash provided by (used in) operating activities | $ | 5,363 | 0 | $ | 5,363 | |||||||
60
Note 3. Summary of Significant Accounting Policies
Basis of Accounting and Presentation
These consolidated and combined financial statements have presented in conformity with accounting principles generally accepted in the United States. The Company changed its year end to December 31 and is presenting six-months operations for the period ended December 31, 2012.
Reporting Currency and Currency Translation
The reporting currency of the Company is the United States dollar. Assets and liabilities of operations other than those denominated in U.S. dollars, primarily in Switzerland, the United Kingdom and China, are translated into United States dollars at the rate of exchange at the balance sheet date. Revenues and expenses are translated at the average rate of exchange throughout the period. Gains or losses from these translations are reported as a separate component of other comprehensive income (loss) until all or a part of the investment in the subsidiaries is sold or liquidated. The translation adjustments do not recognize the effect of income tax because the Company expects to reinvest the amounts indefinitely in operations.
Transaction gains and losses that arise from exchange-rate fluctuations on transactions denominated in a currency other than the functional currency are included in general and administrative expenses.
Cash and cash equivalents
Cash and cash equivalents include bank demand deposit accounts and highly liquid short term investments with maturities of three months or less when purchased. Cash consists of checking accounts held at financial institutions in the United Kingdom, Switzerland, Ireland, Singapore, Hong Kong and China which, at times, balances may exceed insured limits. The Company has not experienced any losses related to these balances, and management believes the credit risk to be minimal.
Accounts Receivable
Accounts receivable result primarily from sale of software licenses to customers and are recorded at their principal amounts as payments become due. Receivables are considered past due once they exceed the terms of the sales transaction. When necessary, the Company provides an allowance for doubtful accounts that is based on a review of outstanding receivables, historical collection information, and current economic conditions. There was an allowance of $212,000 and $218,000 for doubtful accounts at December 31, 2013 and December 31, 2012 respectively. Receivables are generally unsecured. Account balances are charged off against the allowance when the Company determines it is probable the receivable will not be recovered. The Company does not have off-balance sheet credit exposure related to its customers. One customer accounted for 15 percent of accounts receivable as of December 31, 2013. Two customers accounted for 26 percent of revenue for the year ended December 31, 2013.
Property and Equipment
Property and equipment is primarily comprised of leasehold property improvements, motor vehicles and equipment that are recorded at cost and depreciated or amortized using the straight-line method over their estimated useful lives as follows: motor vehicles – 5 years, equipment – between 3 and 5 years and leasehold property improvements, over the lesser of the estimated remaining useful life of the asset or the remaining term of the lease.
Repairs and maintenance are charged to expense as incurred. Expenditures that substantially increase the useful lives of existing assets are capitalized.
61
Fair Value Measurements
Fair value is defined as the exchange price that will be received for an asset or paid to transfer a liability (an exit price) in the principal. Valuation techniques used to measure fair value should maximize the use of observable inputs and minimize the use of unobservable inputs. To measure fair value, the Company uses the following fair value hierarchy based on three levels of inputs, of which the first two are considered to be observable and the third unobservable:
Level 1 – Quoted prices in active markets for identical assets or liabilities.
Level 2 – Inputs other than Level 1 that are observable, either directly or indirectly, such as quoted prices for similar assets or liabilities; quoted prices in markets that are not active; or other inputs that are observable or can be corroborated by observable market data for substantially the full term of the assets or liabilities.
Level 3 – Unobservable inputs are supported by little or no market activity and are significant to the fair value of the assets or liabilities.
Intangible Assets
Intangible assets include software development costs and customer relationships. Customer relationships are amortized on a straight-line basis over their estimated useful lives of five years. Amortization of capitalized software development costs is computed using the greater of (a) the ratio of the product’s current gross revenues to the total of current and expected gross revenues or (b) the straight-line method, computed by dividing the remaining unamortized cost by the estimated economic life of the product. The Company periodically evaluates whether changes have occurred that would require revision of the remaining estimated useful life.
The Company expenses all costs related to the development of software as incurred, other than those incurred after the achievement of technological feasibility during the application development stage. The Company expenses software development costs as incurred until technological feasibility has been established, at which time those costs are capitalized until the product is available for general release to customers. Judgment is required in determining when technological feasibility of a product is established. The Company has determined that after technological feasibility for software products is reached, the Company continues to address all high-risk development issues through coding and testing prior to the release of the products to customers. The amortization of these costs is included in cost of revenue over the estimated life of the products. During the year ended December 31, 2013, the six months ended December 31, 2012, and the year ended June 30, 2012, software development costs of $1,211,000, $486,000 and $3,466,000, respectively, have been capitalized.
Impairment of Other Long-Lived Assets
The Company evaluates the recoverability of its property and equipment and other long-lived assets including capitalized software development costs and customer relationships whenever events or changes in circumstances indicate impairment may have occurred. An impairment loss is recognized when the net book value of such assets exceeds the estimated future undiscounted cash flows attributed to the assets or the business to which the assets relate. Impairment losses, if any, are measured as the amount by which the carrying value exceeds the fair value of the assets. During the year ended December 31, 2013, the six months ended December 31, 2012, and the year ended June 30, 2012, the Company identified no impairment losses related to the Company’s long-lived assets.
62
Revenue Recognition
The Company recognizes revenue when it is realized or realizable and earned. The Company establishes persuasive evidence of a sales arrangement for each type of revenue transaction based on a signed contract with the customer and that delivery has occurred or services have been rendered, the price is fixed and determinable, and collectability is reasonably assured.
| ● | Software licenses – revenue from sales of perpetual licenses to customers when payments for the licenses are fixed is recognized at the inception of the arrangement, unless the payment term exceeds one year and then only if the presumption that the license fee is not fixed or determinable can be overcome, presuming all other relevant revenue recognition criteria are met. If the presumption cannot be overcome, revenue is recognized as payments from the customer become due. Revenue from sales of perpetual licenses when payments for the licenses are payable over a period exceeding a year, and those payments are variable based on customer usage, are recognized as payments from the customer become due. |
| ● | Revenues for user licenses purchased by customers is recognized when the user license is delivered. |
| ● | Revenues for maintenance services are recognized over the period of delivery of the services. |
The Company enters into arrangements under which a customer purchases a combination of software licenses, maintenance services and post-contract customer support (“PCS”). As a result, judgment is sometimes required to determine the appropriate accounting, including how the price should be allocated among the deliverable elements if there are multiple elements. PCS may include rights to upgrades, when and if available, support, updates and enhancements. When vendor specific objective evidence (“VSOE”) of fair value exists for all elements in a multiple element arrangement, revenue is allocated to each element based on the relative fair value of each of the elements. VSOE of fair value is established by the price charged when the same element is sold separately. Accordingly, the judgments involved in assessing the fair values of various elements of an agreement can impact the recognition of revenue in each period. Changes in the allocation of the sales price between deliverables might impact the timing of revenue recognition, but would not change the total revenue recognized on the contract. When elements such as software and services are contained in a single arrangement, or in related arrangements with the same customer, revenue is allocated to each element based on its relative fair value, provided that such element meets the criteria for treatment as a separate unit of accounting. In the absence of fair value for a delivered element, revenue is first allocated to the fair value of the undelivered elements and then allocated to the residual delivered elements. In the absence of fair value for an undelivered element, the arrangement is accounted for as a single unit of accounting, resulting in a delay of revenue recognition for the delivered elements until the undelivered elements are fulfilled. No sales arrangements to date include undelivered elements for which VSOE does not exist.
For purposes of revenue recognition for perpetual licenses, the Company considers payment terms exceeding one year as a presumption that the fee in the transaction is not fixed or determinable. This presumption however, may be overcome if persuasive evidence demonstrates that the Company has a business practice of extending payment terms and has been successful in collecting under the original terms, without providing any concessions. In doing so, the Company considers if the arrangement is sufficiently similar to historical arrangements in terms of similar customers and products is assessing whether there is evidence of a history of successful collection.
In order to determine the Company’s historical experience is based on sufficiently similar arrangements, the Company considers the various factor including the types of customers and products, product life cycle, elements included in the arrangement, length of payment terms and economics of license arrangement.
If the presumption cannot be overcome due to a lack of such evidence, revenue is recognized as payments become due, assuming all other revenue recognition criteria has been met. Through December 31, 2013, the Company had no sales contracts for which revenue had been recognized since inception of the arrangements.
63
Leases
Rentals payable under operating leases are charged to income on a straight-line basis over the term of the relevant lease.
Benefits received and receivable as an incentive to enter into an operating lease are also spread on a straight-line basis over the lease term.
Advertising Expenses
It is the Company’s policy to expense advertising costs as incurred. No advertising costs were incurred during each of the year ended December 31, 2013, the six months ended December 31, 2012, and the year ended June 30, 2012.
Research and Development Expenses
Research and development expenses include all direct costs, primarily salaries for Company personnel and outside consultants, related to the development of new products, significant enhancements to existing products, and the portion of costs of development of software required to be expensed. Research and development costs are charged to operations as incurred with the exception of those software development costs that may qualify for capitalization. The Company incurred no research and development costs in the year ended December 31, 2013, the six months ended December 31, 2012, and the year ended June 30, 2012, respectively.
Income Taxes
Deferred income tax assets and liabilities are determined based on temporary differences between financial reporting and tax bases of assets and liabilities, operating loss, and tax credit carryforwards, and are measured using the enacted income tax rates and laws that will be in effect when the differences are expected to be recovered or settled. Realization of certain deferred income tax assets is dependent upon generating sufficient taxable income in the appropriate jurisdiction. The Company records a valuation allowance to reduce deferred income tax assets to amounts that are more likely than not to be realized. The initial recording and any subsequent changes to valuation allowances are based on a number of factors (positive and negative evidence). The Company considers its actual historical results to have a stronger weight than other, more subjective, indicators when considering whether to establish or reduce a valuation allowance.
The Company continually evaluates its uncertain income tax positions and may record a liability for any unrecognized tax benefits resulting from uncertain income tax positions taken or expected to be taken in an income tax return. Estimated interest and penalties are recorded as a component of interest expense and other expense, respectively.
Because tax laws are complex and subject to different interpretations, significant judgment is required. As a result, the Company makes certain estimates and assumptions in: (1) calculating its income tax expense, deferred tax assets, and deferred tax liabilities; (2) determining any valuation allowance recorded against deferred tax assets; and (3) evaluating the amount of unrecognized tax benefits, as well as the interest and penalties related to such uncertain tax positions. The Company’s estimates and assumptions may differ significantly from tax benefits ultimately realized.
64
Net Income per Share
Basic earnings per share of common stock is computed by dividing net income by the weighted-average number of common shares outstanding for the period. Diluted earnings per share is computed by dividing net income available to common shareholders by the weighted average number of common and potential common shares outstanding during the period, which includes the additional dilution related to conversion of outstanding stock options and warrants computed under the treasury stock method.
Common shares issuable are considered outstanding as of the original approval date for purposes of earnings per share computations. (in thousands)
| December 31 | June 30 | |||||||||||
| 2013 | 2012 | 2012 | ||||||||||
| Basic | 31,661 | 27,331 | 22,695 | |||||||||
| Incremental shares under stock compensation plans | 95 | 1,937 | 1,528 | |||||||||
| Fully Diluted | 31,756 | 29,268 | 24,223 | |||||||||
��
Accumulated Other Comprehensive Income (Loss)
Other comprehensive income (loss), as defined, includes net income, foreign currency translation adjustment, and all changes in equity (net assets) during a period from non-owner sources. To date, the Company has not had any significant transactions that are required to be reported in other comprehensive income (loss), except for foreign currency translation adjustments.
Use of Estimates
The preparation of consolidated financial statements in conformity with accounting principles generally accepted in the United States (GAAP) requires management to make estimates and assumptions that affect the reported amounts of assets and liabilities and disclosures of contingent assets and liabilities at the date of the consolidated financial statements and the reported amounts of revenues and expenses during the fiscal year. The Company makes estimates for, among other items, useful lives for depreciation and amortization, determination of future cash flows associated with impairment testing for long-lived assets, determination of the fair value of stock options and warrants, determining fair values of assets acquired and liabilities assumed in business combinations, valuation allowance for deferred tax assets, allowances for doubtful accounts, and potential income tax assessments and other contingencies. The Company bases its estimates on historical experience, current conditions, and other assumptions that it believes to be reasonable under the circumstances. Actual results could differ from those estimates and assumptions.
Financial Instruments
The Company has the following financial instruments: cash, amounts due to related parties, and long-term debt. The carrying value of cash and long-term debt approximates their fair value due to their liquidity or their short-term nature valued consistent with the use of level 2 inputs. The fair value of amounts due to related parties is not determinable.
Share-Based Compensation
The Company accounts for stock-based awards at fair value on date of grant and recognition of compensation over the service period for awards expected to vest. The fair value of stock options is determined using the Black-Scholes valuation model, which is consistent with the Company’s valuation techniques previously utilized for options in footnote disclosures.
65
Note 4. China Operations
During the year ended December 31, 2013 the Company established a subsidiary in China, Horizon Network Technology Co. Ltd. (“HNT”). The establishment of HNT is part of the Company’s strategic plan to expand the application of mobile software and related marketing efforts into emerging markets. The Company contributed $1.5 million to form the subsidiary in which it now owns a 75% interest. The remaining 25% ownership interest in HNT was acquired by non-related parties through the transfer of noncash assets with a fair value of $500,000.
The results of operations, assets, liabilities and cash flows of HNT have been consolidated in the accompanying condensed consolidated financial statements as the Company owns a controlling interest in and manages HNT. The ownership interests in HNT held by parties other than the Company are presented separately from the Company’s equity on the Consolidated Balance Sheet as the Non Controlling Interest. The amount of consolidated net loss attributable to the Company and the non-controlling interest are both presented on the face of the consolidated financial statements.
Note 5. Property and Equipment, net
Property and equipment consist of the following: (in thousands)
| December 31 | ||||||||
| 2013 | 2012 | |||||||
| Leasehold improvements | $ | 265 | $ | 265 | ||||
| Motor vehicle | 120 | 120 | ||||||
| Equipment | 310 | 177 | ||||||
| 695 | 562 | |||||||
| Less accumulated depreciation | (380 | ) | ( 212 | ) | ||||
| Property and equipment, net | $ | 315 | $ | 350 | ||||
Note 6. Intangible Assets
Intangible assets consist primarily of software development costs and customer relationships (in thousands)
| December 31 | ||||||||
| 2013 | 2012 | |||||||
| Capitalized software development costs | ||||||||
| Horizon software | $ | 17,599 | $ | 16,085 | ||||
| ZTEsoft Telecom software | 497 | - | ||||||
| Customer relationships | 885 | 885 | ||||||
| 18,981 | 16,970 | |||||||
| Less accumulated amortization | (6,221 | ) | ( 4,641 | ) | ||||
| Intangible assets, net | $ | 12,760 | $ | 12,329 | ||||
Amortization of intangible assets for each of the next five years is estimated to be $1,900,000 per year
66
Note 7. Long-term Debt
Long – term liabilities consist of the following (in thousands)
| December 31 | ||||||||
| 2013 | 2012 | |||||||
| Vehicle loan | $ | 51 | $ | 67 | ||||
| Equipment loan | 27 | - | ||||||
| Office term loan | 171 | 211 | ||||||
| 249 | 278 | |||||||
| Less current portion | (65 | ) | ( 59 | ) | ||||
| Balance | $ | 184 | $ | 219 | ||||
Note 8. Related-Party Transactions
Amounts due to related parties include the following: (in thousands)
| December 31 | December 31 | |||||||
| 2013 | 2012 | |||||||
| Loans due to stockholders | $ | 3,500 | $ | 3,500 | ||||
Loans due to stockholders include
| ● | loans advanced during 2011 totaling $2,000,000 which are unsecured and have an interest rate of 10%. During the year ended December 31, 2013 and the six months ended December 31, 2012 interest of $200,000 and $100,000, respectively, has been accrued. During the year ended June 30, 2012, interest of $100,000 was accrued. During the year ended December 31, 2013 $500,000 of this loan was settled by applying it towards a stock subscription receivable. |
| ● | loans advanced by two officers and directors during 2012 totaling $1,500,000 which are unsecured and have an interest rate of 0.21%. The loans are due on or before December 31, 2014 and can be repaid in cash or shares of common stock of OHG at an exchange price of $5.14 per share. |
| ● | convertible loans advanced in January 2013 from two officers and directors in the amount of $250,000 each. These convertible loans bear an interest rate of 0.21% and are repayable on or before January 22, 2014. On January 21, 2014 the loan repayment date was extended to January 22, 2015. The Company has the option to repay the loans at any time, without penalty, at any time in cash or shares of common stock of the Company at a price of $5.14 per share. If the Company elects to repay the convertible loans in full by the issuance of shares the Company will issue 48,650 shares of common stock for each loan so repaid. |
| ● | during the year ended December 31, 2013, the Company entered into a sales contract, in the normal course of business, with a customer in which the Company is negotiating an ownership interest of 45% of the voting capital of the customer. The customer purchased a perpetual software license with a total commitment of $5.0 million, of which $700,000 has been recognized as revenue in the year ended December 31, 2013. |
| ● | during the year ended June 30, 2011, the Company entered into a sales contract, in the normal course of business with a customer in which the Company holds an equity interest. The customer purchased perpetual software license with total commitment of $2.0 million, of which $139,300 has been recognized in the year ended December 31, 2013; $72,500 was recognized in the six months ended December 31, 2012 and nil was recognized in the year ended June 30, 2012. The Company owns a cost based investment interest of 18% of the voting capital of the customer. |
| ● | during the year ended December 31, 2013, the six months ended December 31, 2012 and the year ended June 30, 2012, a company owned by a director and officer of the Company provided services in the amounts of $Nil, $Nil and $632,000, respectively. |
| ● | During the six months ended December 31, 2012 two directors and officers of the Company were granted a total of 3,502,800 shares of common stock for services received in the amount of $1,200,000. |
67
Note 9. Share Capital
Preferred Stock
The Company’s authorized capital includes 50,000,000 shares of preferred stock of $0.0001 par value. The designation of rights including voting powers, preferences, and restrictions shall be determined by the Board of Directors before the issuance of any shares.
On August 6, 2013 the shareholders approved the reduction of the authorized preferred stock to 50 million with the par value remaining unchanged at $0.0001 per preferred share.
No shares of preferred stock are issued and outstanding as of December 31, 2013 and 2012.
Mandatorily Redeemable Preferred Shares (Deferred Stock)
The Company’s subsidiary OHG is authorized to issue 50,000 shares of deferred stock, par value of £1.These shares are non-voting, non-participating, redeemable and have been presented as a long-term liability.
Common Stock
The Company is authorized to issue 200 million shares of common stock, par value of $0.0001.
On August 6, 2013, the shareholders approved the reduction of the authorized common stock to 200 million, with the par value remaining unchanged at $0.0001 per common share, and the consolidation of the issued and outstanding common stock on the basis of one new share for each 600 shares, effective upon approval of the regulatory authorities. The Company’s common stock was consolidated effective as of August 29, 2013
The application of this stock consolidation has been shown retroactively in these consolidated financial statements.
During the year ended December 31, 2013, the Company:
| ● | issued 5,000 shares of common stock for services received with a fair value of $30,000 |
| ● | issued 62,543 shares of common stock for services received with a fair value of $562,891. |
| ● | issued 806,452 shares of common stock for $6 million cash. |
| ● | issued 33,333 shares of common stock for services received with a fair value of $50,000. |
| ● | issued 1,167,600 shares of common stock upon the exercise of warrants with an exercise price of $nil |
During the six months ended December 31, 2012, the Company:
| ● | issued 195,573 shares of common stock for cash proceeds of $502,000 |
| ● | issued 1,459,500 shares of common stock for subscription receivable of $500,000. |
| ● | issued 3,502,800 shares of common stock for services received from related parties with a fair value of $1,200,000 |
| ● | issued 145,950 shares of common stock for services received with a fair value of $50,000 |
| ● | accounted for the reverse acquisition of Intelligent Communication Enterprise Corporation and subsidiaries and the issued 1,160,051 shares of common stock with a fair value of $341,000. |
| ● | returned to treasury for cancellation 70,000 shares of common stock with a fair value of $420,000 being proceeds received on the disposal of shares of Global Interactive Media Limited and the Modizo business. |
During the year ended June 30, 2012, the Company:
| ● | issued new shares of common stock for cash proceeds of $5,750,000 |
68
Stock Purchase Warrants
At December 31, 2013, the Company had reserved 519,986 shares of its common stock for the following outstanding warrants:
| Number of Warrants | Exercise Price | Expiry | |||||
| 116,760 | $ | 0.86 | no expiry date | ||||
| 403,226 | 5.94 | January 2018 | |||||
There were 403,226 warrants issued during the year ended December 31, 2013. In addition, 1,167,600 warrants were exercise with nil proceeds to the Company.
An agreement entered into in May 2013, whereby 62,545 warrants with an exercise price of $7.20 per share were issued, has been terminated and all warrants cancelled.
Note 10. Stock-Based Compensation
The shareholders approved a stock option plan on August 6, 2013, the 2013 Equity Incentive Plan. This stock option plan is for the issuance of stock options, stock appreciation rights, restricted stock, restricted stock units, performance awards, dividend equivalents, cash bonuses and other stock-based awards to employees, directors and consultants of the Company.
There are 3,000,000 shares of common stock available for granting awards under the plan. Each year, commencing 2014, until 2016, the number of shares of common stock available for granting awards shall be increased by the lesser of 1,000,000 shares of common stock and 5% of the total number of shares of common stock outstanding.
No shares were issued under this 2013 Equity Incentive Plan during the year ended December 31, 2013. As at December 31, 2013 3,000,000 shares of common stock have been reserved.
Prior to the 2013 Equity Incentive Plan the Company issued stock options to directors, employees, advisors, and consultants.
A summary of the Company’s stock options as of December 31, 2013, is as follows:
| Number of | Weighted Average | |||||||
| Options | Exercise Price | |||||||
| Outstanding at June 30, 2012 | 360,221 | $ | 0.77 | |||||
| Options issued | 291,900 | 0.53 | ||||||
| Outstanding at December 31, 2012 | 652,121 | 0.66 | ||||||
| Options forfeited | 67,471 | 1.79 | ||||||
| Outstanding at December 31, 2013 | 584,650 | $ | 0.53 | |||||
The following table summarizes stock options outstanding at December 31, 2013:
| Exercise Price | Number Outstanding at December 31, | Average Remaining Contractual Life (Years) | Number Exercisable at | Intrinsic Value at | ||||||||||||||
| $ | 0.51 | 850 | 1.83 | 850 | $ | 3,264 | ||||||||||||
| 0.53 | 291,900 | 6.50 | 291,900 | 1,115,058 | ||||||||||||||
| 0.53 | 291,900 | 9.00 | - | - | ||||||||||||||
At December 31, 2013, 584,650 shares of common stock were reserved for outstanding options.
The fair value of each option granted is estimated at the date of grant using the Black-Scholes option-pricing model. The assumptions used in calculating the fair value of the options granted were: risk-free interest rate of 5.0%, a 3 year expected life, a dividend yield of 0.0%, and a stock price volatility factor of 40%
There were no options issued or exercised and 67,471 options forfeited during the year ended December 31, 2013 and 291,900 options issued during the six months ended December 31, 2012.
69
Note 11. Income Taxes
Deferred tax assets and liabilities are determined based on the differences between the financial reporting and tax bases of assets and liabilities using the enacted tax rates and laws that will be in effect when the differences are expected to reverse. A valuation allowance is established when necessary to reduce deferred tax assets to the amounts expected to be realized.
Income (loss) before income taxes consisted of the following (in thousands):
| December 31 | June 30 | |||||||||||
| 2013 | 2012 | 2012 | ||||||||||
| United States | $ | (1,164 | ) | $ | (22 | ) | $ | - | ||||
| International | 466 | 1,821 | (4,746 | ) | ||||||||
| Total | $ | (698 | ) | $ | 1,799 | $ | (4,746 | ) | ||||
Deferred Tax Assets
As of December 31, 2013, the Company had federal net operating losses of $1.5 million available for future deduction from taxable income derived in the United States. The Company’s United Kingdom subsidiary has non-capital losses of approximately $11.7 million available for future deductions from taxable income derived in the United Kingdom, which do not expire. The potential benefit of net operating loss carryforwards has not been recognized in the combined financial statements since the Company cannot determine that it is more likely than not that such benefit will be utilized in future years. The tax years 2006 through 2012 remain open to examination by federal authorities and other jurisdictions in which the Company operates. The components of the net deferred tax asset and the amount of the valuation allowance are as follows: (in thousands)
| December 31 | June 30 | |||||||||||
| 2013 | 2012 | 2012 | ||||||||||
| Deferred tax assets | ||||||||||||
| Net operating loss carryforwards – United States | $ | 508 | $ | - | $ | - | ||||||
| Net operating loss carryforwards – International | 994 | 853 | 674 | |||||||||
| Valuation allowance | (1,502 | ) | (853 | ) | (674 | ) | ||||||
| Net deferred tax assets | $ | - | $ | - | $ | - | ||||||
The increase in the valuation allowance was $141,000 for the year ended December 31, 2013, $179,000 for the six months ended December 31, 2012, and $674,000 for year ended June 30, 2012.
A reconciliation of the Company’s effective tax income tax on income computed at the federal statutory rates to income tax expense is as follows:
| December 31, | June 30, | |||||||||||
| 2013 | 2012 | 2012 | ||||||||||
| U.S. Federal statutory rates on net income (loss) | $ | (202 | ) | $ | 571 | $ | (1,614 | ) | ||||
| Effect of foreign statutory rate differences | (63 | ) | (230 | ) | 641 | |||||||
| Permanent differences | 124 | (520 | ) | 299 | ||||||||
| Change in valuation allowance | 141 | 179 | 674 | |||||||||
| $ | - | $ | - | $ | - | |||||||
70
Note 12. Commitments and Contingencies
Contractual Commitments
The Company incurred total rent expense of $200,000; $103,000 and $191,000, for the year ended December 31, 2013, the six months ended December 31, 2012 and the year ended June 30, 2012, respectively.
Minimum contractual commitments, as of December 31, 2013,is as follows:
| Operating | Long-term | |||||||
| leases | Financing | |||||||
| 2014 | $ | 123,000 | $ | 65,000 | ||||
| 2015 | 75,000 | 87,000 | ||||||
| 2016 | 75,000 | 48,000 | ||||||
| 2017 | 75,000 | 45,000 | ||||||
| 2018 | - | 4,000 | ||||||
Note 13. Segment Information
The Company has one business segment, which is the development of software for licensing to the telecommunications industry.
The Company's revenues were generated in the following geographic areas:
| Year ended | Six months ended | Year ended | ||||
December 31, 2013 | December 31, 2012 | June 30, 2012 | ||||
| Europe | $3.7 million | $5.6 million | $0.7 million | |||
| Asia | $4.7 million | $1.4 million | $1.9 million | |||
| Russia | $0.4 million | - | - | |||
| USA | $0.3 million | - | - |
Note 14. Subsequent Events
Subsequent to December 31, 2013 the Company issued, pursuant to the 2013 Equity Incentive Plan, options to acquire 500,000 shares of common stock. The options become fully vested on January 15, 2017 and are exercisable, at an exercise price of $4.54 per common share, to January 15, 2024.
71
MANAGEMENT DISCUSSION AND ANALYSIS
The following discussion and analysis of the results of operations and financial condition of One Horizon Group, Inc for the year ended December 31, 2013 to the comparable period of 2012, and a comparison of the unaudited six month period ending December 31, 2013 to the restated audited six month transition period ending December 31, 2012, and for three and nine months six months ended September 30, 2014 should be read in conjunction with the Selected Consolidated Financial Data, and the financial statements, and the notes to those financial statements that are included elsewhere in this Registration Statement. Our discussion includes forward-looking statements based upon current expectations that involve risks and uncertainties, such as our plans, objectives, expectations and intentions. Actual results and the timing of events could differ materially from those anticipated in these forward-looking statements as a result of a number of factors, including those set forth under Cautionary Notice Regarding Forward-Looking Statements and Business sections in this Memorandum. We use words such as “anticipate,” “estimate,” “plan,” “project,” “continuing,” “ongoing,” “expect,” “believe,” “intend,” “may,” “will,” “should,” “could,” and similar expressions to identify forward-looking statements.
Overview
Operating through our wholly-owned subsidiaries, Horizon Globex GmbH and Abbey Technology GmbH, our operations include the licensing of software to telecommunications operators and the development of software application platforms that optimize mobile voice, instant messaging and advertising communications over the Internet. Both subsidiaries do this by using proprietary software techniques that use internet bandwidth more efficiently than other technologies that are unable to provide a low-bandwidth solution. The Horizon Platform is a bandwidth-efficient Voice over Internet Protocol platform for smartphones and also provides optimized data applications including messaging and mobile advertising. We license our software solutions to telecommunications network operators and service providers in the mobile, fixed line and satellite communications markets. We are an ISO 9001 and ISO 20000-1 certified company with assets and operations in Switzerland, the United Kingdom, China, India, Singapore and Hong Kong.
We have developed a mobile application, “Horizon Call,” which enables highly bandwidth-efficient VoIP calls over a smartphone using a 2G/EDGE, 3G, 4G/LTE, WiFi or WiMax connection. Our Horizon Call application is currently available for iPhones and for Android handsets.
Unlike other mobile VoIP applications, Horizon Call creates a business-to-business solution for mobile operators. It is a software solution that telecommunications operators license, brand and deploy. Mobile operators decide how to integrate Horizon Call within their portfolio and how to offer it commercially. Horizon Call can be customized according to each mobile operators’ own branding. It helps them to manage rising traffic volumes while combating the competitive threat to their voice telephony revenues from other mobile VoIP applications by giving its mobile data customers a more efficient mobile VoIP solution that adds value to their mobile data network.
We believe that emerging markets represent a key opportunity for Horizon Call because there are significant markets with high population density, high penetration of mobile phones, congested mobile cellular networks and high growth in the adoption of smartphones. These factors will put increased pressure on mobile operators to manage their network availability.
In this context, the Company is forming a number of joint ventures with local partners in the region to seize upon this opportunity. As of the date of this report, we have formed joint ventures in India, Russia and China
We plan to continue to develop our products in areas with high population density, high penetration of mobile phones, congested mobile cellular networks and high growth in the adoption of smartphones. We expect to form joint ventures when local regulations prevent us from accessing a particular market directly.
We plan to fund this proposed expansion through debt financing, cash from operations and potential equity financing. However, we may not be able to obtain additional financing at acceptable terms, or at all, and, as a result, our ability to continue to improve and expand our software products and to expand our business could be adversely affected.
72
Recent Developments
Business Operation
In February 2015, we announced the rollout of our platform in China, brand named, Aishuo. The Aishuo platform provides VoIP services, a Value Added Virtual SIM solution delivered through a PRC entity, Ishuo Network Information Co., Ltd ( “Ishuo”), which is controlled by us via various contractual arrangements. The Aishuo product has been delivered to the major stores in Chinese App marketplace including Baidu’s 91.com and Baidu.com, the Tencent App store MyApp.com, 360 Qihoo store 360.cn and the every growing Xiaomi store mi.com. The Aishuo smartphone app is expected to drive multiple revenue streams from the supply of its value-added services including the rental of Chinese telephone phone numbers linked to the app, low cost local and international calling plans and sponsorship from advertisers. Subscribers can top up their app credit from the biggest online payment services in China including AliPay (from Alibaba), Union Pay, PayPal and Tenent’s WeChat payment service.
In December 2014, Tier 1 Telecom operators, including Smartfren Telcom, Tbk in Indonesia and the Philippines, made One Horizon software available to customers as a standard feature upon activation of devices. It gives users the ability to acquire a free virtual SIM, a unique identifier that allows for calls from ‘application to application’ or ‘application to landline/mobile phones’, by simply registering the App. Having the App on the device eliminates the step of the user needing to seek out and download the App. It is anticipated that Smartfren Telcom will target to pre-install the smartcall app in more than 4 million units of their Andromax phones in 2015
In September 2014, our One Horizon mobile VoIP app was added by SingTel to their existing One Horizon software platform for mobile satellite services. SingTel is Asia's leading communications group with over 500 million mobile customers in 25 countries, including Bangladesh, India, Indonesia, the Philippines and Thailand.
SingTel AIO Connect is a comprehensive unified communications service for both business users and crew onboard ships. It enables instant messaging, email, Internet surfing, Voice-over-IP (VoIP) and voicemail in a single, integrated application. This service has already succeeded in bringing optimized VoIP, Messaging over IP and compressed Internet surfing to SingTel's mobile satellite subscribers connected using mobile Internet over satellite; the toughest of all mobile Internet environments. This mobile VoIP app can be downloaded from the Apple App Store and Google's Play Store
Our optimized software platform is being used by a pre-paid VoIP Smartphone application launched by Smart Communications, Inc, (“Smart”). Smart is the Philippines' leading wireless services provider with 57.3 million subscribers on its GSM network as of end-June 2013. Smart rolled out its smartphone mobile app, branded Link Plus, as a pre-paid Over The Top ("OTT") Android App that is available to download from the Google Play Store. Once Link Plus is installed on the smartphone, the user's app will receive a new Virtual SIM Filipino telephone number from Smart.
We believe that winning new business with SingTel and Smart demonstrates the acceptance of our carrier-grade technology by tier 1 operators, especially in Asia. Our current contract backlog of $65.81 million, of which only $9.65 million was recognized through September 30, 2014, which indicates great potential of our existing contracts.
In 2014, we continued our product refinement and commercial integration efforts with Smartfren Telecom, Tbk of Indonesia. The service, branded SmartCall, will be available in Google Play later in the year. This service rollout represents yet another tier 1 mobile carrier deployment in Asia. According to a study from Australian market research company Roy Morgan Research, the amount of smartphone ownerships doubled from 12% of the population to 24% in Indonesia during March 2012 to March 2013, which are approximately 60 million. Delivered by the worldwide tier 1 operators, the One Horizon Solution shows its innovation making a new virtual SIM service available to all Indonesian at home and abroad.
Offering and Market Related
In July 2014, we received approval by NASDAQ's Listing Qualifications Department to list our common stock on the NASDAQ Capital Market. Our common stock commenced trading on the NASDAQ Capital Market on July 9, 2014 under the same ticker symbol "OHGI".
In July 2014, we closed a private placement of $1,000,000 for a total of 10 units at a purchase price of $100,000 per Unit, each consisting of, (i) 17,094 shares of the Company’s Series A Redeemable Convertible Preferred Stock, par value $0.0001 per share, initially convertible into 17,094 shares of the Company’s common stock, par value $0.0001 per share, and (ii) 10,000 Class B Warrants, each exercisable to purchase 1 share of Common Stock at an exercise price of $4.00 per share. The Financing was completed in reliance upon the exemption from securities registration afforded by Regulation S (“Regulation S”) as promulgated under the Securities Act of 1933.
In December 2014, we closed a private placement of $3,500,000 under Regulation S whereby we issued to an investor a convertible debenture that is convertible into 1,555,556 shares of Common Stock, Class C warrant to purchase 388,889 shares of Common Stock and Class D warrant to purchase 388,889 shares of Common Stock. Furthermore, the Investor is eligible to receive additional consideration in the form of a performance warrant to purchase certain amount of shares of Common Stock based on our annual reported subscriber numbers, twenty four (24) months after the Closing, as is reflected in our Annual Report on Form 10-K for the year ending December 31, 2016, if we fail to achieve 15.0 million subscribers at that time.
73
Corporate Governance
In July 2014, we appointed Brian Collins, Vice President and the Chief Technology officer of the Company, the Chief Executive Officer of the Company,. Mr. Collins is the co-inventor of the Horizon Platform, and has over 20 years’ experience in the technology sector with a background in software engineering. Mr. Collins brings experience in founding and operating technology companies along with his extensive knowledge of software engineering.
In November 2014, as one of our continuous measures to improve our internal control and procedure over the financial reporting and disclosure, our Board of Directors adopted a tracking form which was designed to track related party transactions. Upon adoption, management will review and pre-approve related party transaction and submit the tracking form to the Board for review and ratification on quarterly basis.
Research & Development
The Company has spent approximately $1.1 million on research and development in the fiscal year 2014, all of which was capitalized as software development costs.
During the nine months ended September 30, 2014, we expanded our Irish software development team with the addition of a new senior software developer at our recently opened software research and development office at the Nexus Innovation Center on the campus of the University of Limerick. As part of this process, we signed an agreement with the Industrial Development Agency (IDA) Ireland whereby IDA granted certain financial assistance toward the cost of establishing and carrying a service undertaking for a software development center in Ireland in connection with our VoIP software platform. The software development center is intended to give employment of 25 persons and could allow us to more quickly increase the size of this research and development team. We believe that the further expansion of our Irish development team will allow the further advance of our unique mobile VoIP solutions.
We completed the development and continued to refine the Horizon billing system. The completion of the Horizon Billing System software add-on package allows one Horizon to deliver an additional turn-key element to our customers that will allow our customers to invoice their customers and enterprise on a postpaid monthly basis. This adds greater flexibility and reach to the Horizon platform as offered by our customers to those subscribers that wish to utilize the service on a post paid basis.
We expanded our software development capabilities for China by hiring 4 new junior software developers in our Horizon Nanjing JV, known as Horizon Network Technology Co. Ltd.. We believe that the expansion of our software development team at our Chinese joint venture will support the company’s strategy of continuing to develop our products in areas with high population density, high penetration of mobile phones, congested mobile cellular networks and high growth in the adoption of smartphones while working within the constraints of local regulations.
We continued our research and development of the Horizon product platform. The Swiss based team made significant strides towards the next generation of the product suite with particular emphasis going to the User Interface (UI) re-engineering. Further to the UI the Research and Development for version 2.0, our Irish based team made progress on the latest multi-core solution with a view to releasing this software in the third quarter of 2014. The software team in China is pushing ahead with integrating the user feedback garnered from Chinese students using our Application on the smartphone and also working on a new and exciting method for Direct Inward Dial number rental for the Chinese marketplace.
During the last quarter of 2014, the expansion of the Horizon advertising platform to allow the industry first of User-Selectable-Sponsored-Calls was developed in Switzerland and Ireland R&D centers, and released on the Horizon product suite in China by the Chinese team, brand name Aishuo. A User-Selectable-Sponsored-Calls allows would-be advertisers to sponsor a call or calls to a certain amount in time or price. The user selects their sponsor and then must listen to their audio advertisement prior to the call being placed. Further to this, in Ireland, the R&D team developed a brand new multi-ring solution of our App to be able to receive incoming calls on multiple devices at the same time. This differs from existing app technologies in that it also includes the functionality to receive the call to user’s apps, home, office, mobile, all at the same time so a call will never be missed.
Critical Accounting Policies and Estimates
Our discussion and analysis of our financial condition and results of operations are based upon our consolidated financial statements, which have been prepared in accordance with accounting principles generally accepted in the United States, or GAAP. Our significant accounting policies are described in notes accompanying the consolidated financial statements. The preparation of the consolidated financial statements requires our management to make estimates and judgments that affect the reported amounts of assets, liabilities, revenues, expenses, and related disclosure of contingent assets and liabilities. Estimates are based on information available as of the date of the financial statements, and accordingly, actual results in future periods could differ from these estimates. Significant judgments and estimates used in the preparation of the consolidated financial statements apply critical accounting policies described in the notes to our consolidated financial statements.
We consider our recognition of revenues, accounting for the consolidation of operations, accounting for stock-based compensation, accounting for intangible assets and related impairment analyses, accounting for equity transactions, and accounting for acquisitions to be most critical in understanding the judgments that are involved in the preparation of our consolidated financial statements.
74
Additionally, we consider certain judgments and estimates to be significant, including those relating to the timing of revenue recognition from the sales of perpetual licenses to certain Tier 1 and Tier 2 telecom entities, those relating to the determination of vendor specific objective evidence (“VSOE”) for purposes of revenue recognition, useful lives for amortization of intangibles, determination of future cash flows associated with impairment testing of long-lived assets, determination of the fair value of stock options and other assessments of fair value. We base our estimates on historical experience, current conditions and on other assumptions that we believe to be reasonable under the circumstances. Actual results may differ materially from these estimates and assumptions.
Our significant accounting policies are summarized in Note 3 of our audited financial statements as of December 31, 2013. Note 2 of our audited financial statements as of December 31, 2013 discusses our restatement of previously issued financial statements to correct errors related to the recognition of revenue from sales of perpetual licenses to certain larger, top-tier (“Tier 1”) and other (“Tier 2”) telecom clients. Our previously disclosed Revenue Recognition accounting policy has been modified to address these errors. We believe the following critical accounting policies affect our more significant judgments and estimates used in the preparation of our financial statements.
Revenue Recognition
The Company recognizes revenue when it is realized or realizable and earned. Prior to recognizing revenue the Company establishes persuasive evidence of a sales arrangement for each type of revenue transaction based on a signed contract with the customer, verifies that delivery has occurred or services have been rendered, that the price is fixed and determinable, and collectability is reasonably assured.
| ● | Software and licenses – revenue from sales of perpetual licenses to customers when payments for the licenses are fixed is recognized at the inception of the arrangement, unless the payment term exceeds one year and then only if the presumption that the license fee is not fixed or determinable can be overcome, presuming all other relevant revenue recognition criteria are met. If the presumption cannot be overcome, revenue is recognized as payments from the customer become due. Revenue from sales of perpetual licenses when payments for the licenses are payable over a period exceeding a year and those payments are variable based on customer usage is recognized as payments from the customer become due. The Company regards a “top-tier” telecom entity as a tier 1 carrier which has a direct connection to the Internet and the networks it uses to deliver voice and data services as well as a financially strong balance sheet and good credit rating. | |
| ● | Revenue for user licenses purchased by customers is recognized when the user license is delivered. | |
| ● | Revenue for maintenance services is recognized over the period of delivery of the services. |
We enter into arrangements under which a customer purchases a combination of software licenses, maintenance services and post-contract customer support (“PCS”). As a result, judgment is sometimes required to determine the appropriate accounting, including how the price should be allocated among the deliverable elements if there are multiple elements. PCS may include rights to upgrades, when and if available, support, updates and enhancements. When vendor specific objective evidence (“VSOE”) of fair value exists for all elements in a multiple element arrangement, revenue is allocated to each element based on the relative fair value of each of the elements. VSOE of fair value is established by the price charged when the same element is sold separately. Accordingly, the judgments involved in assessing the fair values of various elements of an agreement can impact the recognition of revenue in each period. Changes in the allocation of the sales price between deliverables might impact the timing of revenue recognition, but would not change the total revenue recognized on the contract. When elements such as software and services are contained in a single arrangement, or in related arrangements with the same customer, we allocate revenue to each element based on its relative fair value, provided that such element meets the criteria for treatment as a separate unit of accounting. In the absence of fair value for a delivered element, revenue is first allocated to the fair value of the undelivered elements and then allocated to the residual delivered elements. In the absence of fair value for an undelivered element, the arrangement is accounted for as a single unit of accounting, resulting in a delay of revenue recognition for the delivered elements until the undelivered elements are fulfilled. No sales arrangements to date include undelivered elements for which VSOE does not exist.
For purposes of revenue recognition for perpetual licenses, the Company considers payment terms exceeding one year as a presumption that the fee in the transaction is not fixed or determinable. This presumption however, may be overcome if persuasive evidence demonstrates that the Company has a business practice of extending payment terms and has been successful in collecting under the original terms, without providing any concessions. In doing so, the Company considers if the arrangement is sufficiently similar to historical arrangements in terms of similar customers and products is assessing whether there is evidence of a history of successful collection.
In order to determine the Company’s historical experience is based on sufficiently similar arrangements, the Company considers the various factors, including the types of customers and products, product life cycle, elements included in the arrangement, length of payment terms and economics of license arrangement.
75
If the presumption cannot be overcome due to a lack of such evidence, revenue is recognized as payments become due, assuming all other revenue recognition criteria have been met. As a result, revenue from Tier 1 entities, which require agreed-upon fixed payments over fixed future periods extending beyond one year is recognized as payments become due rather than at the inception of the arrangement, and revenue from Tier 2 entities is recognized when payments become due (which is based on usage), rather than on a straight-line basis over the term of the contract. The Company does not have any sales contracts for which the presumption has been overcome and for which revenue has been recognized at the inception of the arrangement.
As of December 31, 2013, the following table sets forth the value of all existing contracts as it related to master licenses and the amount of revenue recognized to date as well as the revenue recognized during the 12 months ended December 31, 2013. This table represents the contract value for the sale of the master license, excluding other revenues recognized under the terms of the contract for maintenance, user licenses, and other sales.
| Master License | ||||||||||||||||
| Customer Type | Contract Value | Balance to be recognized | Revenue recognized to date | Revenue for 12 months ending 12/31/2013 | ||||||||||||
| Tier 1 | $ | 13,425,000 | $ | 10,012,500 | $ | 3,412,500 | $ | 1,912,500 | ||||||||
| Tier 2 | 49,000,000 | 44,521,419 | 4,478,581 | 2,852,979 | ||||||||||||
| Total | $ | 62,425,000 | $ | 54,533,919 | $ | 7,891,081 | $ | 4,765,479 | ||||||||
In addition to the above Revenue recognized from Master Licenses of approximately $4,765,000, the Company also recognized $456,000 from the sale of Hardware and $3,885,000 from the sale of user licenses, consultancy and maintenance services.”
Divestiture
On October 25, 2012, One Horizon UK sold its Satcom Global business. Because the Satcom business was discontinued prior to the Share Exchange, the operations of Satcom Global have been excluded from the Company’s historical financial statement presentation of its fiscal years ended June 30, 2012 and 2011, and for the six-month period ended December 31, 2012. These historical financial statements are presented on a “carve out” basis, as described more fully in the notes to the financial statements. The financial statements presented are of those companies that constituted the consolidated entity at the date of the consummation of the Share Exchange, consisting of three legal entities: One Horizon UK and its subsidiaries Abbey Technology and Horizon Globex.
Change in Fiscal Year
On February 13, 2013, following the Share Exchange, the Company filed a Current Report on Form 8-K disclosing that the board of directors of the Company approved a change to the Company's fiscal year end from June 30 to December 31. As a result of this change, in addition to the financial information for the years ended December 31, 2013 and June 30, 2012, this Annual Report on Form 10-K includes the financial information for the six-month transition period from July 1, 2012 to December 31, 2012.
76
Results of Operations
Comparison of year ended December 31, 2013 and 2012 (in thousands)
The following table sets forth information from our statements of operations for the year ended December 31, 2013 and 2012. The information for the year ended December 31, 2012 has been adjusted to reflect the restatement discussed in Note 2.
| For the Year Ended December 31, | Year to Year Comparison | |||||||||||||||
2013 (audited) | 2012 (unaudited) | Increase/ (decrease) | Percentage Change | |||||||||||||
| Revenue | $ | 9,106 | $ | 10,414 | $ | (1,308) | (13 | %) | ||||||||
| Cost of revenue | ||||||||||||||||
| Hardware | 545 | 186 | 359 | 1930 | % | |||||||||||
| Amortization of software development costs | 1,908 | 1,828 | 80 | (4 | %) | |||||||||||
| 2,453 | 2,014 | |||||||||||||||
| Gross margin | 6,653 | 8,400 | (1,747) | (21 | %) | |||||||||||
| Operating Expenses | ||||||||||||||||
| General and administrative | 6,706 | 7,114 | (408) | (6 | %) | |||||||||||
| Depreciation | 166 | 891 | (725) | (81 | %) | |||||||||||
| Total Operating Expenses | 6,872 | 8,005 | (1,133) | (14 | %) | |||||||||||
| Income from Operations | (219) | 395 | (611) | (156 | %) | |||||||||||
| Other Income(Expense) | ||||||||||||||||
| Interest expense | (322) | (252) | (70) | (28 | %) | |||||||||||
| Foreign Exchange (loss) gain , net | (158) | 21 | (179) | (852 | %) | |||||||||||
| Interest income | 1 | 1 | 0 | 0 | ||||||||||||
| Income for continuing operations before income taxes | (698) | 165 | (863) | (523 | %) | |||||||||||
| Income taxes | - | - | - | - | ||||||||||||
| Net Income for the year | (698) | 165 | (863) | (523 | %) | |||||||||||
77
Comparison of six month ended December 31, 2012 and 2011 (in thousands)
For the Six Months Ended December 31, | Year to Year Comparison | |||||||||||||||
2012 (restated) | 2011 (unaudited) | Increase/ (decrease) | Percentage Change | |||||||||||||
| Revenue | $ | 6,959 | $ | 668 | $ | 6,291 | 1,062 | % | ||||||||
| Cost of revenue (including amortization of software development costs) | 994 | 627 | 367 | 58 | % | |||||||||||
| Gross margin | 5,965 | 41 | 5,924 | N/A | ||||||||||||
| Operating Expenses | ||||||||||||||||
| General and administrative | 4,023 | 1,263 | 2,760 | 218 | % | |||||||||||
| Depreciation | 73 | 66 | 7 | 10 | % | |||||||||||
| Total Operating Expenses | 4,096 | 1,329 | 2,767 | 208 | % | |||||||||||
| Income (loss) from Operations | 1,869 | (1,288) | 3,157 | N/A | % | |||||||||||
| Other Income(Expense) | ||||||||||||||||
| Interest expense | (87) | (53) | (34) | (64 | %) | |||||||||||
| Foreign Exchange gain , net | 16 | 44 | (28) | (63 | %) | |||||||||||
| Interest income | 1 | 0 | (1 | ) | N/A | |||||||||||
| Income for continuing operations before income taxes | 1,799 | (1,297) | 3,096 | N/A | ||||||||||||
| Income taxes (recovery) | - | 0 | - | N/A | ||||||||||||
| Net (Loss) Income for period | 1,799 | (1,297) | 3,096 | N/A | ||||||||||||
78
Comparison of three months ended September 30, 2014 and 2013
The following table sets forth key components of our results of operations for the periods indicated.
(All amounts, other than percentages, in thousands of U.S. dollars)
Three Months Ended September 30, | Change | |||||||||||||||
| 2014 | 2013 | Increase/ (decrease) | Percentage Change | |||||||||||||
| Revenue | $ | 1,641 | $ | 2,517 | $ | (876 | ) | (34.8% | ) | |||||||
| Cost of revenue | 762 | 543 | 219 | 40.3 | ||||||||||||
| Gross margin | 879 | 1,974 | (1,095 | ) | (55.5 | ) | ||||||||||
| Operating expenses: | ||||||||||||||||
| General and administrative | 1,259 | 1,347 | (88 | ) | 6.5 | |||||||||||
| Depreciation | 26 | 45 | (19 | ) | (42.2 | ) | ||||||||||
| Total operating expenses | 1,285 | 1,392 | (107 | ) | (7.7 | ) | ||||||||||
| Income (loss) from operations | (406 | ) | 582 | (988 | ) | (30.2 | ) | |||||||||
| Other income (expense) | (19 | ) | (184 | ) | 165 | (90.0 | ) | |||||||||
| Income (Loss) before income taxes | (425 | ) | 398 | (823 | ) | (206.8 | ) | |||||||||
| Income taxes (recovery) | (54) | - | (54) | - | ||||||||||||
| Net income (loss) for period | (371 | ) | 398 | (769 | ) | |||||||||||
| Net (loss) attributable to non-controlling interest | (23 | ) | (29 | ) | 6 | |||||||||||
| Net income (loss) attributable to One Horizon Group, Inc. | (348 | ) | 427 | (775 | ) | |||||||||||
79
Comparison of nine months ended September 30, 2014 and 2013
The following table sets forth key components of our results of operations for the periods indicated above.
(All amounts, other than percentages, in thousands of U.S. dollars)
Nine Months Ended September 30, | Change | |||||||||||||||
| 2014 | 2013 | Increase/ (decrease) | Percentage Change | |||||||||||||
| Revenue | $ | 4,130 | $ | 5,690 | $ | (1,560 | ) | (27.4% | ) | |||||||
| Cost of revenue | 1,859 | 1,881 | (22) | (1.2 | ) | |||||||||||
| Gross margin | 2,271 | 3,809 | (1,538 | ) | (40.4 | ) | ||||||||||
| Operating expenses: | ||||||||||||||||
| General and administrative | 3,577 | 5,041 | (1,464 | ) | (29.0 | ) | ||||||||||
| Depreciation | 120 | 120 | - | - | ||||||||||||
| Total operating expenses | 3,697 | 5,161 | (1,464 | ) | (28.4 | ) | ||||||||||
| Loss from operations | (1,426 | ) | (1,352 | ) | (74 | ) | (5.5 | ) | ||||||||
| Other income (expense) | ||||||||||||||||
| Income (Loss) before income taxes | (131 | ) | (296 | ) | (165 | ) | - | |||||||||
| Income taxes (recovery) | (210 | ) | - | 210 | - | |||||||||||
| Net Loss for period | (1,347 | ) | (1,648 | ) | (301 | ) | (18.3 | ) | ||||||||
| Net loss attributable to non-controlling interest | (88 | ) | (73 | ) | (15 | ) | - | |||||||||
| Net loss attributable to One Horizon Group, Inc. | (1,259 | ) | (1,575 | ) | (316 | ) | (20.0 | ) | ||||||||
Revenue: Our revenue for the year ended December 31, 2013 was approximately $9.1 million as compared to approximately $10.4 million for the year ended December 31, 2012, an decrease of roughly $1.3 million, or 13% The decrease was largely due to a one off sale of billing software totaling $5.0 million which is unlikely to recur, without that exceptional item revenue increased by approximately $3.8 million for the 12 months ending December 31, 2013.
Our revenue for the six months ended December 31, 2012 was approximately $6.7 million as compared to approximately $0.7 million for the six months ended December 31, 2011, an increase of $6.3 million, or 1,062%. The increase was significantly due to the growth in sales of the Horizon Platform following the development of the GSM application, Horizon Call, which was completed in November 2011.
80
Our revenue for the three months ended September 30, 2014 was approximately $1.641 million as compared to approximately $2.517 million for the three months ended September 30, 2013, a decrease of roughly $0.88 million, or 34.8%. The decrease was primarily due to revenue recognized on a Global Exchange sale to a major tier one telecommunications company based in Asia of $0.5 million and also amounts under contracts signed in prior periods which were recognized in the comparative period. Going forward, we expect this trend to reverse as more companies have signed up for the Horizon Platform.
As of September 30, 2014, the following table sets forth the value of all existing contracts as it related to master licenses and the amount of revenue recognized to date as well as the revenue recognized during the three months ended September 30, 2014. This table represents the contract value for the sale of the master license, excluding other revenues recognized under the terms of the contract for maintenance, user licenses, and other sales.
| Master License | ||||||||||||||||
| Customer Type | Balance | Revenue | Revenue | |||||||||||||
| to be | Recognized | for 3 months | ||||||||||||||
| Contract Value | recognized | to date | ending 9/30/2014 | |||||||||||||
| Tier 1 | $ | 13,815,000 | $ | 9,300,000 | $ | 4,515,000 | $ | 602,500 | ||||||||
| Tier 2 | 52,000,000 | 46,861,419 | 5,138,581 | - | ||||||||||||
| Total | $ | 65,815,000 | $ | 56,161,919 | $ | 9,653,581 | $ | 602,500 | ||||||||
In addition to the above revenue recognized from Master Licenses of approximately $602,000, we also recognized approximately $1,039,000 from the sale of hardware, user licenses, consultancy and maintenance services during the three months ended September 30, 2014.
Our revenue for the nine months ended September 30, 2014 was approximately $4.13 million as compared to approximately $5.69 million for the nine months ended September 30, 2013, a decrease of roughly $1.56 million, or 27.4%. The decrease was primarily due to revenue generated in 2013 for the maintenance of a banking software which is now no longer supported by One Horizon, and licenses for a customer booked in January 2013 which were due for renewal in December 2013 and consequently issued and invoiced in December 2013, two of which accounted for approximately $700,000 in revenue. In addition there were revenues recognized in the comparative period on a Global Exchange sale to a major tier one telecommunications company based in Asia of $0.5 million and also amounts under contracts signed in prior periods which were also recognized in the comparative period We expect revenue to increase as we have new companies signed up for Horizon Platform.
The following table sets forth the value of all existing contracts as it related to master licenses and the amount of revenue recognized as of September 30, 2014 as well as the revenue recognized during the 6 months ended June 30, 2014. This table represents the contract value for the sale of the master license, excluding other revenues recognized under the terms of the contract for maintenance, user licenses, and other sales.
| Master License | ||||||||||||||||
| Customer Type | Balance | Revenue | Revenue | |||||||||||||
| to be | recognized | for 9 months | ||||||||||||||
| Contract Value | recognized | to date | ending 9/30/2014 | |||||||||||||
| Tier 1 | $ | 13,815,000 | $ | 9,300,000 | $ | 4,515,000 | $ | 1,102,500 | ||||||||
| Tier 2 | 52,000,000 | 46,861,419 | 5,138,581 | 660,000 | ||||||||||||
| Total | $ | 65,815,000 | $ | 56,161,419 | $ | 9,653,581 | $ | 1,762,500 | ||||||||
81
In addition to the revenue recognized from Master Licenses of approximately $1,762,500, we also recognized an amount of approximately $2,368,000 from the sale of user licenses, consultancy and maintenance services for the nine months ended September 30, 2014.
Our revenue for the nine months ended September 30, 2014 was approximately $4.13 million as compared to approximately $5.69 million for the nine months ended September 30, 2013, a decrease of roughly $1.56 million, or 27.4%. The decrease was primarily due to revenue generated in 2013 for the maintenance of a banking software which is now no longer supported by One Horizon, and licenses for a customer booked in January 2013 which were due for renewal in December 2013 and consequently issued and invoiced in December 2013, two of which accounted for approximately $700,000 in revenue. In addition there were revenues recognized in the comparative period on a Global Exchange sale to a major tier one telecommunications company based in Asia of $0.5 million and also amounts under contracts signed in prior periods which were also recognized in the comparative period We expect revenue to increase as we have new companies signed up for Horizon Platform.
The following table sets forth the value of all existing contracts as it related to master licenses and the amount of revenue recognized as of September 30, 2014 as well as the revenue recognized during the 6 months ended June 30, 2014. This table represents the contract value for the sale of the master license, excluding other revenues recognized under the terms of the contract for maintenance, user licenses, and other sales.
| Master License | ||||||||||||||||
| Customer Type | Balance | Revenue | Revenue | |||||||||||||
| to be | recognized | for 9 months | ||||||||||||||
| Contract Value | recognized | to date | ending 9/30/2014 | |||||||||||||
| Tier 1 | $ | 13,815,000 | $ | 9,300,000 | $ | 4,515,000 | $ | 1,102,500 | ||||||||
| Tier 2 | 52,000,000 | 46,861,419 | 5,138,581 | 660,000 | ||||||||||||
| Total | $ | 65,815,000 | $ | 56,161,419 | $ | 9,653,581 | $ | 1,762,500 | ||||||||
In addition to the revenue recognized from Master Licenses of approximately $1,762,500, we also recognized an amount of approximately $2,368,000 from the sale of user licenses, consultancy and maintenance services for the nine months ended September 30, 2014.
Cost of Revenue: Cost of revenue was approximately $2.4 million, for the year ended December 31, 2013, compared to cost of sales on the same basis of approximately $2.0 million, for the year ended December 31, 2012. Cost of revenue was approximately $994,000 for the six months ended December 31, 2012, compared to cost of sales of $627,000 together with the amortization of software development costs, for the six months ended December 31, 2011.
Cost of revenue was approximately $762,000 or 47.3% of sales for the three months ended September 30, 2014, compared to cost of revenue of $543,000 or 21.6% of sales for the three months ended September 30, 2013. Cost of revenue was approximately 1.86 million for the nine months ended September 30, 2014, or 45.0% of sales, compared to cost of revenue of $1.88 million, or 33.0% of sales for the nine months ended September 30, 2013.
Our cost of sales is primarily composed of the amortization of software development costs. In addition, when a customer requires ancillary hardware, there are costs relating to the provision of that hardware. The increase in cost of sales was mainly attributed to an increase in sales of ancillary hardware and the associated cost of sale during the three months ended September 30, 2014 as compared to the same quarter in 2013.
Gross Margin: Gross profit for the year ended December 31, 2013 was approximately $6.7 million as compared to $8.4 million for the year ended December 31, 2012. Our gross profits decreased by 21% from 2012 to 2013. The main reason for the decrease was due to a one off sale of billing software totaling $5.0 million which is unlikely to recur.
Gross profit for the six months ended December 31, 2012 was approximately $6.0 million as compared to $0.04 million for the six months ended December 31, 2011. Our gross profits increased by $5.9 million from 2011 to 2012. The main reason for the increase in gross profit is the one off sale of proprietary billing software amounting to $5.0 million.
Gross profit for the three months ended September 30, 2014 was approximately $879,000 as compared to $1.97 million for the three months ended September 30, 2013, a decrease of approximately 55.5%. Gross profit for the nine months ended September 30, 2014 was approximately $2.27 million as compared to $3.81 million for the nine months ended September 30, 2013, a decrease of roughly $1.54 million or 40.4%. The decrease was mainly due to the reduced revenue as set forth above herein. Moving forward, management expects that gross profit will begin increasing with the growth in business and the smartphone market globally, as well as the Company’s ability to capitalize on market opportunities by entering areas with high population density, high penetration of mobile phones, congested mobile cellular networks and high growth in the adoption of smartphones.
82
Operating Expenses: Operating expenses, including general and administrative expenses and depreciation were approximately $6.9 million, or 75% of sales for the year ended December 31, 2013 as compared to approximately $8.0 million, or 77% of sales for the same period in 2012, a decrease of approximately $1.1 million. The decrease was due to one off none cash items including shares issued as management bonuses which occurred in 2012 but not in 2013. The costs in 2012 included a non cash bonus paid in shares (value $1.2m) to two officers.
Operating expenses, including general and administrative expenses, depreciation, and amortization of intangibles, were approximately $4.1 million, or 58.9% of sales for the six months ended December 31, 2012 as compared to $1.3 million, or 199% of sales for the same period in 2011, an increase of approximately $2.7 million. The increase was due to costs related to adding resources to deal with the new customers in both data handling and the account management roles.
Operating expenses were approximately $1.29 million and $1.39 million during the three months ended September 30, 2014 and 2013, respectively. The operating expenses reduced by approximately $88,000 from the same three month period in the previous year. In the quarter to September 30, 2013 the Company incurred compensation of $50,000 relating to the issue of 33,333 restricted shares. This represented a one-time non cash change related to management efforts to develop corporate governance and capital market strategies as well as investor and public relations program for the Company's entry into the U.S. public markets.
Operating expenses including general and administrative expenses and depreciation were approximately $3.70 million and $5.16 million during the nine months ended September 30, 2014 and 2013, respectively. Operating expenses represented 86.7% of sales for the nine months ended September 30, 2014 as compared to 90.7% of sales for the same period in 2013. The decrease was mainly due to reduced accounting and legal costs for the nine months ended September 30, 2014. For the same period in 2013, we incurred higher accounting and legal costs following the share exchange between and among Intelligent Communication Enterprise Corp. and One Horizon Group PLC closed on November 20, 2012. The decrease was also partially due to reduced staff cost in 2014 as we transited certain development positions from Switzerland to Ireland and China. Going forward, management expects operating costs to rise due to various public company-related expenses including share-based compensation, and various legal, accounting and consulting services. Despite the expected increase in operating costs, management believes that operating costs as a percentage of sales will drop as sales of the Horizon Platform solution are expected to continue to grow.
Net Income(Loss): Net loss for the year ended December 31, 2013 was approximately $698,000 as compared to a net income of $165,000 for the same period in 2012. The increase in net loss reflected was mainly due to the one off sale of billing software which occurred in 2012 and did not recur in 2013.
Net income for the six months ended December 31, 2012 was approximately $1.7 million as compared to a loss of $1.3 million for the same period in 2011. The increase in net income reflected the one off sale of billing software amounting to $5.0 million.
Net Loss for the three months ended September 30, 2014 was approximately $371,000 as compared to net income of approximately $398,000 for the same period in 2013. The decrease was primarily due to revenue recognized under amended Revenue Recognition policy on Master Licenses during the quarter ended September 30, 2013 from contracts signed in 2011, 2012 and 2013 totaling $1.55 million of which only $0.71 million related to contracts signed in the actual quarter coupled with a slight increase in cost of sales as a result of an increase in the sales of ancillary hardware and the associated cost of sale.
Net Loss for the nine months ended September 30, 2014 was approximately $1.35 million as compared to net loss of approximately $1.65 million for the same period in 2014. The decrease in net loss reflected a reduction in operating expenses for reasons set out above herein. We showed a breakeven position when adjusted for non cash items of depreciation and amortization. Management believes that the net loss will continuously decrease with our business growth, particularly as our customers roll out the service using Horizon software provided that we continue to sell the Horizon Platform solution to new telecommunications company customers globally.
Non-Controlling Interest:
The non-controlling interest holders in our China joint venture were attributed their 25% share of the net loss of the joint venture in the amount of $104,000 for the year ended December 31, 2013. The remaining portion of net loss of $138,000 for the twelve months ended December 31, 2013 was attributable to the stockholders of the Company.
The non-controlling interest holders in our Chinese subsidiary Horizon Network Technology Co Ltd were attributed their 25% share of the net loss of the Company in the amount of $23,000 for the three months ended September 30, 2014. The remaining portion of net loss of $237,000 for the three months ended September 30, 2014 was attributable to the stockholders of the Company. The non-controlling interest holders in our China joint venture were attributed their 25% share of the net loss of the joint venture in the amount of $29,000 for the three months ended September 30, 2013. The remaining portion of net income of $427,000 for the three months ended September 30, 2013 was attributable to our stockholders of the Company.
The non-controlling interest holders in our Chinese subsidiary were attributed their 25% share of the net loss of the Company in the amount of $88,000 for the nine months ended September 30, 2014. The remaining portion of net loss of $73,000 for the nine months ended September 30, 2014 was attributable to the stockholders of the Company. Going forward, management believe the Company will continue to grow the business and increase profitability if we are successful in selling the Horizon Platform solution to new telecommunications company customers globally.
83
Foreign Currency Translation Adjustment: Our reporting currency is the U.S. dollar. Our local currencies, Swiss Francs, Euro, British pounds and Chinese Renminbi, are our functional currencies. Results of operations and cash flow are translated at average exchange rates during the period, and assets and liabilities are translated at the unified exchange rate as quoted by http://www.oanda.com/currency/historical-rates/ at the end of the period. Translation adjustments resulting from this process are included in accumulated other comprehensive income in the statement of shareholders’ equity. Transaction gains and losses that arise from exchange rate fluctuations on transactions denominated in a currency other than the functional currency are included in the results of operations as incurred.
Currency translation adjustments resulting from this process are included in accumulated other comprehensive income in the consolidated statement of shareholders' equity and amounted to approximately $682,000 for the year ended December 31, 2013 and $16,000 fox the six months ended December 31, 2012, respectively. Currency translation adjustments resulting from this process are included in accumulated other comprehensive income in the consolidated statement of shareholders' equity and amounted to approximately $739,000 for the nine months ended September 30, 2014.
Liquidity and Capital Resources
Years Ended December 31, 2013 and December 31, 2012
The following table sets forth a summary of our approximate cash flows for the periods indicated:
For the Years Ended December 31 (in thousands) | ||||||||
| 2013 | 2012 (unaudited) | |||||||
| Net cash provided by (used in) operating activities | (3,760 | ) | (3,795 | ) | ||||
| Net cash used in investing activities | (1,365 | ) | (2,722 | ) | ||||
| Net cash provided by financing activities | 6,496 | 6,845 | ||||||
Net cash used by operating activities was approximately $3.7 million for the year ended December 31, 2013 as compared to approximately $3.8 million for the same period in 2012. The decrease in cash used by operations was primarily due to the increase in cash generated from sales, which offset (and reduced) the overall cash used by operating activities.
Net cash used in investing activities was approximately $1.4 million and $2.7 million for the years ended December 31, 2013 and 2012, respectively. Net cash used in investing activities was primarily focused on investment in software development costs.
Net cash provided by financing activities amounted to approximately $6.5 million for 2013 and $6.8 million for 2012. Cash provided by financing activities in 2013 was primarily due to the advances from related parties and proceeds from the sale of common stock. Cash used by financing activities in 2012 was primarily due to proceeds from sale of common stock and loan from related parties less the reduction in long term bank borrowing.
Our working capital deficiency, excluding the current portion of deferred income (attributable to licensing fees to be realized over time), as of December 31, 2013, was approximately $1.7 million, as compared to working capital of approximately $620,000 for the same period in 2012.
Six Months Ended December 31, 2012 and December 31, 2011
The following table sets forth a summary of our approximate cash flows for the periods indicated:
For the Six Months Ended December 31 (in thousands) | ||||||||
2012 (restated) | 2011 (unaudited) | |||||||
| Net cash provided by (used in) operating activities | $ | (833 | ) | $ | (1,201 | ) | ||
| Net cash used in investing activities | (431 | ) | (850 | ) | ||||
| Net cash provided by financing activities | 1,963 | 1,640 | ||||||
84
Net cash used by operating activities was approximately $833,000 for the six months ended December 31, 2012, as compared to $1,201,000 for the same period in 2011. The decrease in cash used by operations was primarily due to the increase in cash generated from sales, which offset (and reduced) the overall cash used by operating activities.
Net cash used in investing activities was approximately $431,000 and $850,000 for the six months ended December 31, 2012 and 2011, respectively. Net cash used in investing activities was primarily focused on acquisitions of intangible assets and property and equipment. Same comment as above.
Net cash provided by financing activities amounted to roughly $2.0 million for 2012 and $1.64 million for 2011. Cash provided by financing activities in 2012 was primarily due to the advances from related parties and proceeds from the sale of common stock. Cash used by financing activities in 2011 was primarily due to proceeds from sale of common stock and loan from related parties less the reduction in long term bank borrowing.
Year ended June 30, 2012 and 2011
See comments above
The following table sets forth a summary of our approximate cash flows for the periods indicated:
For the Year Ended June 30, (in thousands) | ||||||||
| 2012 | 2011 | |||||||
| Net cash provided by (used in) operating activities | $ | (2,895 | ) | $ | 5,363 | |||
| Net cash used in investing activities | (3,622 | ) | (2,661 | ) | ||||
| Net cash provided by financing activities | 6,517 | (2,702 | ) | |||||
Net cash used by operating activities was approximately $2.9 million for the year ended June 30, 2012 as compared to net cash provided by operating activities of $5.4 million for the same period in 2011. The significant increase in cash used by operations was primarily due to increase in accounts receivable during the year.
Net cash used in investing activities was approximately $3.6 million and $2.7 million for the years ended June 30, 2012 and 2011, respectively. Net cash used in investing activities was primarily focused on acquisitions of intangible assets and property and equipment, and in 2011 the acquisition of Abbey Technology GmbH.
Net cash provided by financing activities amounted to approximately $6.5 million for year ended June 30, 2012 and cash used of $2.7 million for year ended June 30, 2011. Cash provided by financing activities in 2012 was primarily due to the advances from related parties and proceeds from the sale of common stock. Cash used by financing activities in 2011 was primarily due to repayment of long term debt and payment of dividends.
Our working capital deficiency, excluding the current portion of deferred income (attributable to licensing fees to be realized over time), as of June 30, 2012, was approximately $7.3 million, as compared to a working capital deficiency of approximately $6.1 million for the same period in 2011.
Going forward, we intend to rely on the sales of our products and services, as well as on the sale of securities to, and loans from, existing stockholders and new investors, to meet our cash requirements.
On January 22, 2013, Messrs. White and Collins each made a loan to the Company of $250,000 (each, a “Loan”). In exchange for each Loan, the Company issued to each of Messrs. White and Collins a promissory note, in the initial principal amount of each Loan. Each Loan bears interest at the rate of 0.21% per annum, must be repaid in one year, and is prepayable without penalty at the option of the Company at any time following its issuance in cash or in shares of its common stock, at the rate of $5.16 per share. On January 21, 2014, the Company and each of Messrs. White and Collins agreed to extend the due date to repay each loan to January 21, 2015.
85
On February 18, 2013, the Company entered into a Subscription Agreement dated February 18, 2013 and an Amendment to Subscription Agreement dated as of February 18, 2013 (collectively, the “Subscription Agreement”) with a non-U.S. shareholder of the Company (the “Investor”), pursuant to which (i) the Company agreed to sell, and the Investor agreed to purchase, an aggregate of 806,451 shares of the Company’s Common Stock, for an aggregate consideration of $6,000,000 (the “Purchase Price”) or $7.44 per share, and (ii) the Company agreed to issue a common stock purchase warrant (the “Warrant”) to the Investor exercisable for three years to purchase 403,225 shares of Common Stock at an exercise price of $7.44 per share. The Purchase Price was payable in three equal installments of $2,000,000 on March 31, 2013, June 30, 2013 and September 30, 2013, respectively, and accrued interest at a rate of three percent (3%) per annum and was secured by a pledge by the Investor to the Company of the Shares pro rata.
On August 30, 2013, the Company entered into an amended and restated Subscription Agreement (the “Amended Subscription Agreement”) and an amended and restated warrant (the “Amended Warrant”) with the Investor. The Amended Subscription Agreement and Amended Warrant reduced the exercise price per share of Common Stock purchasable under the Warrant to $5.94 per share, and the Amended Subscription Agreement required the third installment of the Purchase Price to be paid by September 16, 2013, instead of September 30, 2013. No other terms of the Subscription Agreement or Warrant were amended. All three installments of the Purchase Price were paid on time by the Investor.
We may seek to sell common or preferred stock in private placements. We have no commitments from anyone to purchase our common or preferred stock or to loan funds. We cannot assure that we will be able to raise additional funds at terms acceptable to us or to do so at a cost economically viable.
Nine Months Ended September 30, 2014 and September 30, 2013
The following table sets forth a summary of our approximate cash flows for the periods indicated:
For the Nine Months Ended September 30 (in thousands) | ||||||||
| 2014 | 2013 | |||||||
| Net cash provided by (used in) operating activities | $ | (1,347 | ) | $ | (2,587 | ) | ||
| Net cash (used in) investing activities | $ | (922 | ) | $ | (1,148 | ) | ||
| Net cash provided by (used in) financing activities | $ | 934 | $ | 6,488 | ||||
Net cash used by operating activities was approximately $1.35 million for the nine months ended September 30, 2014 as compared to net cash used of approximately $2.59 million for the same period in 2013. The decrease in cash used by operations was primarily due to an increase in cash collected from customers as they move forward with the roll out of the Horizon service.
Net cash used in investing activities was approximately $0.92 million and $1.15 million for the nine months ended September 30, 2014 and 2013, respectively. Net cash used in investing activities was primarily focused on acquisitions of intangible assets and property and equipment.
Net cash provided in financing activities was $0.93 million for the nine months ended September 30, 2014 as compared to net cash provided by financing activities of $6.49 million for the nine months ended September 30, 2013. Cash provided by financing activities in 2014 was primarily due to proceeds from issuance of preferred stock. Cash provided by financing activities in 2013 was primarily due to proceeds from the issuance of common stock.
Our working capital as of September 30, 2014 was approximately $4.7 million. Our working capital as of December 31, 2013 was approximately $4.1 million.
Off-Balance Sheet Arrangements
We have no off-balance sheet arrangements that have, or are reasonably likely to have, a current or future effect on its financial condition, revenues or expenses, results of operations, liquidity, capital expenditures or capital resources that is material to investors.
86
CHANGES IN AND DISAGREEMENTS WITH ACCOUNTANTS ON ACCOUNTING AND FINANCIAL DISCLOSURE
(a) Dismissal of Independent Certifying Accountant.
Chantrey Vellacott DFK LLP (“CV”) served as the independent accountant for One Horizon UK for its fiscal year ended June 30, 2012. CV’s report on One Horizon UK’s financial statements as of June 30, 2012 and for the year then ended was filed as an Exhibit to Amendment No. 1 to our Current Report on Form 8-K/A which was filed on February 7, 2013. CV will continue to prepare domestic statutory and tax filings for One Horizon UK, which is now a subsidiary of the Company. On November 30, 2012, ICE Corp. completed the share exchange with One Horizon UK, which for U.S. GAAP purposes was considered to be the accounting acquirer. As such, the financial information of the Company will be that of One Horizon UK, with operations of ICE Corp. only being included from the date of the share exchange. Prior to the acquisition, OHGP was not a U.S. SEC registrant. In addition, CV is not an independent registered public accounting firm in the U.S.. As a result of the consummation of the share exchange on November 30, 2012 and the retention of Peterson Sullivan LLP to act as the Company’s independent registered public accounting firm (see below), CV was dismissed by the Company’s Board of Directors as the independent certifying accountant for U.S. SEC filing purposes.
The report of CV regarding the financial statements for the fiscal year ended June 30, 2012 did not contain any adverse opinion or disclaimer of opinion and were not qualified or modified as to uncertainty, audit scope or accounting principles.
During the year ended June 30, 2012, and during the period from June 30, 2012 to November 30, 2012, the date of dismissal, (i) there were no disagreements with CV on any matter of accounting principles or practices, financial statement disclosure or auditing scope or procedures, which disagreements, if not resolved to the satisfaction of CV would have caused it to make reference to such disagreement in its reports; and (ii) there were no reportable events as defined in Item 304(a)(1)(v) of Regulation S-K.
The Company has provided CV with a copy of the foregoing disclosures and requested that they furnish the Company with a letter addressed to the SEC stating whether or not it agrees with the above statements.
(b) Engagement of Independent Certifying Accountant.
Effective February 13, 2013, the Board of Directors of the Company engaged Peterson Sullivan LLP (“PS”) as its independent registered public accounting firm to audit the Company’s financial statements for the fiscal period ended December 31, 2012. PS was the independent registered public accounting firm for ICE Corp.
During each of One Horizon UK’s two most recent fiscal years and through the interim periods preceding the engagement of PS, One Horizon UK (a) has not engaged PS as either the principal accountant to audit One Horizon UK’s financial statements, or as an independent accountant to audit a significant subsidiary of One Horizon UK and on whom the principal accountant is expected to express reliance in its report; and (b) has not consulted with PS regarding (i) the application of accounting principles to a specific transaction, either completed or proposed, or the type of audit opinion that might be rendered on One Horizon UK’s financial statements, and no written report or oral advice was provided to One Horizon UK by PS concluding there was an important factor to be considered by One Horizon UK in reaching a decision as to an accounting, auditing or financial reporting issue; or (ii) any matter that was either the subject of a disagreement, as that term is defined in Item 304(a)(1)(iv) of Regulation S-K or a reportable event, as that term is described in Item 304(a)(1)(v) of Regulation S-K.
87
CONTROLS AND PROCEDURES
Evaluation of Disclosure Controls and Procedures
Disclosure controls are procedures that are designed with the objective of ensuring that information required to be disclosed in our reports filed under the Exchange Act, such as this Report, is recorded, processed, summarized, and reported within the time periods specified in the SEC’s rules and forms. Disclosure controls are also designed with the objective of ensuring that such information is accumulated and communicated to our management, including the chief executive officer and chief financial officer, as appropriate to allow timely decisions regarding required disclosure. Our management evaluated, with the participation of our current chief executive officer and chief financial officer (our “Certifying Officers”), the effectiveness of our disclosure controls and procedures as of December 31, 2013, pursuant to Rule 13a-15(b) under the Exchange Act. Based upon that evaluation, our Certifying Officers concluded that, because of the material weaknesses in our internal control over financial reporting described below, as of December 31, 2013, our disclosure controls and procedures were not effective.
Management’s Report on Internal Control over Financial Reporting
Our management is responsible for establishing and maintaining adequate internal control over financial reporting (as such term is defined in Exchange Act Rules 13a-15(f) and 15d-15(f)). Our internal control over financial reporting is a process designed under the supervision of our Certifying Officers to provide reasonable assurance regarding the reliability of financial reporting and the preparation of our financial statements for external purposes in accordance with accounting principles generally accepted in the United States of America.
Management, under the supervision and with the participation of our Certifying Officers, evaluated the effectiveness of our internal control over financial reporting using the criteria set forth by the Committee of Sponsoring Organizations of the Treadway Commission (COSO) in Internal Control-Integrated Framework.
Based on our evaluation and the material weaknesses described below, management concluded that we did not maintain effective internal control over financial reporting as of December 31, 2013. This Report does not include an attestation report of our registered public accounting firm regarding internal control over financial reporting. Because we are a smaller reporting company, management’s report was not subject to attestation by our registered public accounting firm.
Material Weaknesses Identified
In connection with the preparation of our financial statements for the year ended December 31, 2013, we identified a material weakness in the design and operating effectiveness of our internal controls over financial reporting relating to correctly recording the timing of revenue recognition for certain license fees. Specifically, our policy of revenue recognition did not meet all the requirements of the relevant generally accepted accounting principles applicable to software sales. Consequently, effective controls did not to ensure that revenue for these types of software sales were appropriately recorded. Previously, certain significant deficiencies in internal control over financial reporting had became evident to management that, in the aggregate, represent material weaknesses, including:
(i) Lack of sufficient independent directors. During the six months ended June 30, 2013, we had two independent directors on our board, which was comprised of five directors. These two independent directors, however, would not currently be deemed independent under NASDAQ for audit committee purposes.
(ii) Insufficient corporate governance policies. Although we have a code of ethics that provides broad guidelines for corporate governance, our corporate governance activities and processes are not always formally documented. Specifically, decisions made by the board to be carried out by management should be documented and communicated on a timely basis to reduce the likelihood of any misunderstandings regarding key decisions affecting our operations and management.
(iii) Insufficient segregation of duties in our finance and accounting functions due to limited personnel. During the year ended December 31, 2013 we had 6 on staff who performed nearly all aspects of our financial reporting process, including access to the underlying accounting records and systems, the ability to post and record journal entries, and responsibility for the preparation of the financial statements. This creates certain incompatible duties and a lack of review over the financial reporting process that would likely result in a failure to detect errors in spreadsheets, calculations, or assumptions used to compile the financial statements and related disclosures as filed with the Securities and Exchange Commission. These control deficiencies could result in a material misstatement to our interim or annual consolidated financial statements that would not be prevented or detected.
88
(iv) Lack of in-house US GAAP Expertise. Currently we do not have sufficient in-house expertise in US GAAP reporting. Instead, we rely very much on the expertise and knowledge of external financial advisors in US GAAP conversion.
(v) Maintenance of Accounting Records. We did not maintain a comprehensive set of financial records for the three months ended March 31, 2013. Certain receipts, disbursements and other transactions were recorded in the general ledger; however account reconciliations, journal entry forms or other supporting schedules were either missing or incomplete. Without adequate financial records, we may be unable to provide timely financial reporting and/or report inaccurate information.
As part of the communications respecting its audit procedures for the year ended December 31, 2013, our independent registered accountants, Peterson Sullivan, LLP (“Peterson Sullivan”), informed the board that these deficiencies constituted material weaknesses, as defined by Auditing Standard No. 5, “An Audit of Internal Control Over Financial Reporting that is Integrated with an Audit of Financial Statements and Related Independence Rule and Conforming Amendments,” established by the Public Company Accounting Oversight Board.
Plan for Remediation of Material Weaknesses
As soon as we learned of the material weakness (identified above) related to revenue recognition, we began taking steps intended to remediate this material weakness and to improve our control process and procedures with respect to revenue recognition in general as part of our efforts to become compliant with the requirements of Section 404 of the Sarbanes-Oxley Act of 2002. These activities included:
● | Implementing a revised accounting policy for our revenue recognition of certain software license fees; |
● | Hiring outside consultants with specific expertise with revenue recognition to assist with a review of both current future and licensing agreements; |
● | Establishing new policies, procedures and controls to ensure that the new revenue recognition policy is properly administered; and |
● | To the extent necessary, evaluating the proper organizational structure and accounting personnel to ensure that we have the requisite knowledge and expertise of revenue recognition under standards of U.S. GAAP. |
Aside from the measures discussed above and as of the date hereof, we have taken the following additional measures to remediate other material weaknesses:
● | We added accounting personnel to address issues of timeliness and completeness of our US GAAP financial reporting in the second and third quarter of 2013. With the additional accounting personnel, management believes that they are beginning to address the lack of in-house GAAP expertise and insufficient segregation of duties in our finance and accounting functions due to limited personnel. The increased staff also allowed us to maintain complete accounting records for the year ending December 31, 2013. |
● | We have appointed additional independent directors. As a result, we currently have four independent directors on our board, which is comprised of seven directors. These four independent directors are deemed independent under Nasdaq Rule 5605(a)(2) and one of them qualifies as an “audit committee financial expert” as such term is defined in Regulation S-K Item 407(d)(5)(ii). In addition, we formed audit, compensation and nominating committees that would meet NASDAQ rules and guidelines. We believe that the formation of an independent audit committee will increase board oversight and help us begin to remediate certain internal weaknesses. |
89
We are also in the process of designing and implementing additional remediation measures for our insufficient corporate governance policies and our ability to account for technical matters. Management intends to work with our newly formed Audit Committee and our Independent Registered Public Accounting Firm in 2014 towards identifying suitable actions and changes to certain internal polices to allow us to take appropriate and reasonable steps to make the necessary improvements to remediate these deficiencies.
Accordingly, we will continue to update the documentation of our internal control processes, including formal risk assessment of our financial reporting processes. We believe that the initial remediation measures taken to date coupled with the additional measures taken to address the material weakness identified in relation to revenue recognition and added measures that we plan to develop in 2014, if effectively implemented and maintained, will help us begin to remedy the material weaknesses discussed above. Going forward, we intend to continue to monitor our internal controls and procedures to allow us to take appropriate and reasonable steps to make the necessary improvements to remediate any current or future deficiencies.
Changes in Internal Control over Financial Reporting
In connection with the preparation of our financial statements for the fiscal year ended December 31, 2013, the management determined that our internal control environment is not properly designed due to the existence of certain material weaknesses and that it did not operate effectively to ensure that the Company’s financial statements (and related financial statement disclosures) were prepared in accordance with US generally accepted accounting principles (US GAAP). We have established a number of remediation measures, which we believe will remediate the material weaknesses identified, if such measures are effectively implemented and maintained. As of the end of the period covered by the report, we continue the process of implementing and maintaining the remediation measures, but we cannot assure when or if we will be able to successfully implement these remedial measures. For more information regarding our controls and procedures, please refer to Item 9A. Controls and Procedures in our Annual Report on Form 10-K for fiscal year ended December 31, 2013, filed with the SEC on April 15, 2014)
On November 10, 2014, as one of our continuous measures to improve our internal control and procedure over the financial reporting and disclosure, our Board of Directors adopted a tracking form which was designed to track related party transactions. Upon adoption, management will review and pre-approve related party transaction and submit the tracking form to the Board for review and ratification on quarterly basis. Except as set forth herein, there were no changes in our internal control over financial reporting (as such term is defined in Rules 13a-15(f) and 15d-15(f) under the Exchange Act) during the fiscal quarter covered by this report that has materially affected, or are reasonably likely to materially affect, our internal control over financial reporting.
DIRECTORS AND EXECUTIVE OFFICERS
The following table and text set forth the names and ages of all directors and executive officers as of February 2, 2015. There are no family relationships among our directors and executive officers. Each director is elected at our annual meeting of shareholders and holds office until the next annual meeting of shareholders, or until his successor is elected and qualified. Also provided herein are brief descriptions of the business experience of each director, executive officer and advisor during the past five years and an indication of directorships held by each director in other companies subject to the reporting requirements under the Federal securities laws. None of our officers or directors is a party adverse to us or has a material interest adverse to us. Each director has been elected to the term indicated. Directors whose term of office ends in 2014 shall serve until the next Annual Meeting of Stockholders and until their successors are elected and qualified.
| Name | Age | Principal Occupation or Employment | First Became Director | Current Board Term Expires | ||||
| Brian Collins | 47 | President, Chief Financial Officer, Chief Technology Officer, Director | 12/10/12 | 2014 | ||||
| Martin Ward | 57 | Chief Financial Officer, Director | 12/10/12 | 2014 | ||||
| Nicholas Carpinello | 65 | Owner, Carpinello Enterprises LLC, Director | 3/7/13 | Until the date of removal or resignation | ||||
| Richard Vos | 69 | Director | 8/21/2013 | Until the date of removal or resignation | ||||
| Robert Law | 64 | Director | 8/28/2013 | Until the date of removal or resignation | ||||
| Robert Vogler | 64 | Director | 1/8/14 | Until the date of removal or resignation |
90
Brian Collins
Mr. Collins was appointed as the Chief Executive Office and President on July 28, 2014. Mr. Collins also acts as the Chairman of the Board of the Company upon his appointment as the Chief Executive Officer of the Company. Mr. Collins was earlier appointed as Vice President and Chief Technology Officer on November 30, 2012 and director on December 10, 2012. Prior to his appointment as Vice President and Chief Technology Officer, Mr. Collins had served as Chief Technology Officer of One Horizon Group, PLC since 2010, following the acquisition by One Horizon Group of Abbey Technology GmbH, a company that was founded by, and employed, Mr. Collins in 1999, and which became a subsidiary of One Horizon Group upon its acquisition. He is the co-inventor of the Horizon Platform, and has over 20 years’ experience in the technology sector with a background in software engineering. Abbey Technology developed software systems for the Swiss banking industry. Prior to his employment at Abbey, he worked as a software engineer for Credit Suisse First Boston Equities in Zurich. Earlier in his career, between 1993 and 1996, he worked as a software engineer for Sybase, an information technology company, in California and Amsterdam. Mr. Collins graduated in 1990 with a BSc Hons in Computer Systems from the University of Limerick, Ireland. He also undertook further software research and development at International Computers Limited between 1990 and 1993. Mr. Collins brings experience founding and working at technology companies along with extensive knowledge of software engineering.
Martin Ward
Mr. Ward was appointed Chief Financial Officer on November 30, 2012 and director on December 10, 2012. Prior to his appointment as Chief Financial Officer, Mr. Ward had served as the Chief Financial Officer and Company Secretary of One Horizon Group, PLC since 2004. Prior to joining One Horizon Group, Mr. Ward was a partner at Langdowns DFK, a United Kingdom-based chartered accountancy practice. Earlier in his career, between 1983 and 1987, he worked for PricewaterhouseCoopers as an Audit Manager. Mr. Ward is a fellow of the Institute of Chartered Accountants of England and Wales. Mr. Ward brings significant experience in accounting, corporate finance and public company reporting.
Nicholas Carpinello
Mr. Carpinello was appointed as a director on March 7, 2013. He has been the owner of Carpinello Enterprises LLC d/b/a Cottman Transmission Center, a national auto service franchise, since 2004 and also has worked as a consultant to SatCom Distribution Inc. (“SDI”), assisting in various business, tax and financial matters of US operations of UK-based distributors of satellite communication hardware and airtime, since 2005. Prior to November 2012, SDI was a subsidiary of One Horizon Group PLC. Mr. Carpinello’s years of professional experience are extensive, and include experience as CFO and Treasurer with multinational public and private manufacturers of armored vehicles and, later in his career, CFO of privately-held companies in the computer science field. He is a Certified Public Accountant, an alumnus of Arthur Andersen & Co., and holds a BA degree in Accounting from the University of Cincinnati. The Board decided that Mr. Carpinello should serve as a director because of his significant U.S. public company experience, as well as years of experience as a certified public accountant.
Richard Vos
Mr. Vos was appointed as a director on August 28, 2013. Mr. Vos has been a non-executive director since 2007 of Avanti Communications Group plc, a public company listed on the London Stock Exchange (LSE:AVN). He is chairman of its remuneration committee and past chairman of its audit committee. In addition, since 2001, Mr. Vos has been a non-executive director of NSSC Operations Ltd., which operates the National Space Centre in the United Kingdom. He is the chairman of its audit committee. From June 2005 to June 2010, Mr. Vos was a director of our United Kingdom subsidiary, One Horizon Group plc (formerly SatCom Group Holdings plc) (“One Horizon UK”), and from October 2006 to June 2010 was also Chairman. From July 2005 to March 2010, One Horizon UK was listed on the Alternative Investment Market of the London Stock Exchange (AIM: SGH). From October 2008 to October 2010, Mr. Vos served as a director of TerreStar Europe Ltd., a former start-up business seeking to provide mobile satellite services in Europe. From April 2003 to 2009, Mr. Vos was chairman of the Telecommunications and Navigation Advisory Board of the British National Space Centre (subsequently replaced by the United Kingdom Space Agency). From September 2006 to June 2009, Mr. Vos was a director of Avanti Screenmedia Group plc, formerly listed on the London Stock Exchange (LSE:ASG), which provided satellite and other services. Mr. Vos obtained his Bachelor of Arts with Honors in Modern Languages from University of London in 1968, and his Diploma in Management Studies from Kingston Polytechnic in 1973. He is a member of the Institute of Directors
Robert Law
Mr. Law was appointed as a director on August 28, 2013. Since 1990, Mr. Law has served as chief executive officer of Langdowns DFK Limited (“Langdowns”), a United Kingdom-based accounting, tax and business advisory firm, and since 1979 has served as a director of Langdowns. Also, since 1990, Mr. Law has been the chief executive officer of Southern Business Advisers LLP (“Southern Business Advisers”), a United Kingdom-based business associated with Langdowns that also offers accounting, tax and business advisory services, and has been a member of Southern Business Advisers since 1979. Mr. Law is a Fellow of the Institute of Chartered Accountants in England and Wales (“ICAEW”), and is a member of the Valuation and Information Technology Faculties of the ICAEW. Mr. Law qualified as an ICAEW Chartered Accountant in 1976.
91
Robert Vogler
Mr. Vogler was appointed as a director on January 8, 2014. He has a long-standing history as a successful executive and business owner. He also has extensive experiences and practices as an accounting specialist. Mr. Vogler has been the owner and Chairman of the Board of Kreivo AG, an accounting and bookkeeping company serving Swiss companies in a variety of industries with operations throughout Europe since 1974. Mr. Vogler has served on the Boards of other Swiss accounting firms such as RV Revisions AG, Impe Zug AG and also served as President of Lüfta Baar, a HVAC Company also based in Switzerland. Mr. Vogler is not a director of any public companies except One Horizon.
Significant Employees
Claude Dziedzic
Mr. Dziedzic, aged 41, was appointed Chief Horizon Architect on November 30, 2012 and is the co-inventor of the Horizon software platform. Mr. Dziedzic was employed by Abbey Technology GmbH, which was subsequently acquired by the One Horizon Group, PLC, and which became a subsidiary thereof, in 2010. Mr. Dziedzic had been employed as the chief architect and in the design and development department of the Abbey Technology software platforms from 2001 to 2009. During that time, he also participated in the design and development of the Horizon software platform and the software design and development for software and messaging systems for the Swiss banking industry. Mr. Dziedzic had worked for UBS AG in Switzerland from 1997 to 2001 and DataSign AG from 1997 to 1999. Mr. Dziedzic worked in software research and development during his work for USB AG and DataSign AG. Mr. Dziedzic graduated from Ecole Superieure des Science Appliquees pour l’Ingenieur de Mulhouse with a Masters Engineer Degree in Industrial IT and Automatics in 1997. In 1994, he achieved a general degree in Science & Structure of the Matter (specializing in Industrial IT, Automatics and Electronics) from the University of Alsace, and in 1992 he was awarded a Bachelor’s Degree in Mathematics and Physics from the Academy of Strasbourg.
Qingsong Li
Mr. Li, aged 39, was appointed the General Manager of Horizon Network Technology Co., Ltd at the end of 2012. Mr. Li was the Deputy General Manager of Nanjing ZTEsoft CO., Ltd, in charge of international marketing and national business development from 2008 to 2012. Before that period, he was a Software Engineer(2002-2003), Chief of International Development Team(2003-2004), Deputy Head of International Sales Department(2004-2005) and Head of International Sales Department(2006-2007) of Nanjing ZTEsoft Co., Ltd. Mr. Li graduated from Southeast University, Nanjing with a master degree in System Engineering and Hefei University of Technology with a bachelor degree in Accounting and minor in Computer Science.
Section 16(a) Beneficial Ownership Reporting Compliance
Section 16(a) of the Exchange Act and the rules thereunder require our officers and directors, and persons that own more than 10% of a registered class of our equity securities, to file reports of ownership and changes in ownership with the Securities and Exchange Commission and to furnish us with copies. Based solely on our review of the copies of the Section 16(a) forms received by us, or written representations from certain reporting persons, we believe that none of our officers, directors, and greater than 10% beneficial owners filed on a timely basis reports required by Section 16(a) of the Exchange Act prior to the Share Exchange on November 30, 2012 during the fiscal year ended December 31, 2012. After the Share Exchange, we believe that none of our officers, directors, and greater than 10% beneficial owners failed to file on a timely basis reports required by Section 16(a) of the Exchange Act during the fiscal year ended December 31, 2014.
Board Committees
Committees of the Board of Directors
Audit Committee
Our Audit Committee consists of Nicholas Carpinello, Robert Law and Richard Vos, each of whom is independent. The Audit Committee assists the Board of Directors oversight of (i) the integrity of the our financial statements, (ii) our compliance with legal and regulatory requirements, (iii) the independent auditor’s qualifications and independence, and (iv) the performance of our internal audit function and independent auditor, and prepares the report that the Securities and Exchange Commission requires to be included in our annual proxy statement. The audit committee operates under a written charter. Mr. Carpinello is the Chairman of our audit committee.
The Board of Directors determined that Mr. Carpinello possesses accounting or related financial management experience that qualifies him as financially sophisticated within the meaning of Rule 4350(d)(2)(A) of the Nasdaq Marketplace Rules and that he is an “audit committee financial expert” as defined by the rules and regulations of the SEC.
A copy of current charter of Audit Committee is available on the Company’s website http://content.stockpr.com/onehorizongroup/media/6f6926ac07f2526da1eaa0d94f84c6d7.pdf
Nominating and Corporate Governance Committee
The purpose of the Nominating and Corporate Governance Committee is to assist the Board of Directors in identifying qualified individuals to become members of our Board of Directors, in determining the composition of the Board of Directors and in monitoring the process to assess Board effectiveness. Each of Nicholas Carpinello, Robert Law and Richard Vos are members of the Nominating and Corporate Governance Committee. The Nominating and Corporate Governance Committee operates under a written charter. Mr. Richard Vos is the Chairman of the Nominating Committee.
92
| ● | Our Nominating and Corporate Governance Committee has, among the others, the following authority and responsibilities: | |
| ● | To determine and recommend to the Board, the criteria to be considered in selecting nominees for the director; | |
| ● | To identify and screen candidate consistent with such criteria and consider any candidates recommended by our stockholders pursuant to the procedures described in our proxy statement or in accordance with applicable laws, rules and regulations and provisions of our charter documents. | |
| ● | To select and approve the nominees for director to be submitted to a stockholder vote at the annual meeting of stockholders. |
A copy of current charter of Nominating and Corporate Governance Committee is available on the Company’s website http://content.stockpr.com/onehorizongroup/media/8eccadeceb1ccc10b249cc5ab2456058.pdf
Compensation Committee
The Compensation Committee is responsible for overseeing and, as appropriate, making recommendations to the Board of Directors regarding the annual salaries and other compensation of our executive officers and general employees and other policies, and for providing assistance and recommendations with respect to our compensation policies and practices. Each of Nicholas Carpinello, Robert Law and Richard Vos are members of the Compensation Committee. The Compensation Committee operates under a written charter. Mr. Robert Law is the Chairman of Compensation Committee.
As required by Rule 10C-1(b)(2), (3) and (4)(i)-(vi) under the Securities Exchange Act of 1934 (the “Act”) , our Compensation Committee has, among the others, the following responsibilities and authority.
| ● | The compensation committee may, in its sole discretion, retain or obtain the advice of a compensation consultant, legal counsel or other adviser. | |
| ● | The compensation committee shall be directly responsible for the appointment, compensation and oversight of the work of any compensation consultant, legal counsel and other adviser retained by the compensation committee or said group. | |
| ● | The Company must provide for appropriate funding, as determined by the compensation committee, for payment of reasonable compensation to a compensation consultant, legal counsel or any other adviser retained by the compensation committee or said group. | |
| ● | The compensation committee select, or receive advice from, a compensation consultant, legal counsel or other adviser to the compensation committee or said group, other than in-house legal counsel, only after conducting an independence assessment with respect to the adviser as provided for in the Act. |
A copy of current Charter of Compensation Committee is available on the Company’s website http://content.stockpr.com/onehorizongroup/media/abf14232f92dbd65d5ee4c83d7b1fa3b.pdf
Code of Ethics
Our board of directors has adopted a Policy Statement on Business Ethics and Conflicts of Interest (“Code of Ethics”) applicable to all employees, including the Company’s chief executive officer and chief financial officer. A copy of the Code of Ethics and Business Conduct is available on the Company’s website http://content.stockpr.com/onehorizongroup/media/250c1db923f658aca6cc69dfc35c7f89.pdf
Board Leadership Structure and the Board’s Role in Risk Oversight.
The Board of Directors currently does not have a Chairman. Our Chief Executive Officer acts as the Chairman of the Board. The Board determined that in the best interest of the Company the most effective leadership structure at this time is not to separate the roles of Chairman and Chief Executive Officer. A combined structure provides the Company with a single leader who represents the company to our stockholders, regulators, business partners and other stakeholders, among other reasons set forth below. Should the Board conclude otherwise, the Board will separate the roles and appoint an independent Chairman.
93
| ● | This structure creates efficiency in the preparation of the meeting agendas and related Board materials as the Company’s Chief Executive Officer works directly with those individuals preparing the necessary Board materials and is more connected to the overall daily operations of the Company. Agendas are also prepared with the permitted input of the full Board of Directors allowing for any concerns or risks of any individual director to be discussed as deemed appropriate. The Board believes that the Company has benefited from this structure, and Mr. Collin’s continuation in the combined role of the Acting Chairman and Chief Executive Officer is in the best interest of the stockholders. | |
| ● | The Company believes that the combined structure is necessary and allows for efficient and effective oversight, given the Company’s relatively small size, its corporate strategy and focus. |
The Board of Directors does not have a specific role in risk oversight of the Company. The Chairman, President and Chief Executive Officer and other executive officers and employees of the Company provide the Board of Directors with information regarding the Company’s risks.
EXECUTIVE COMPENSATION
The following tables set forth, for each of the last two completed fiscal years of the Company and the transitional period of six months from July 1, 2012 to December 31, 2012, the total compensation awarded to, earned by or paid to any person who was a principal executive officer during the preceding fiscal year and every other highest compensated executive officers earning more than $100,000 during the last fiscal year (together, the “Named Executive Officers”). In connection with the Share Exchange on November 30, 2012, Messrs. Jeffrey and Rajasundram resigned as executive officers of the Company (the “Pre-Share Exchange Executives”) and Messrs. White, Ward and Collins were appointed as executive officers of the Company (the “Post-Share Exchange Executives”). The tables set forth below reflect the compensation of the Pre-Share Exchange Executives in their capacity as executive officers of ICE Corp., and the compensation of the Post-Share Exchange Executives in their capacity as executive officers of both One Horizon UK and the Company as a combined entity. In light of the Share Exchange having been accounted for as a reverse acquisition whereby One Horizon UK is deemed to be the accounting acquirer, the compensation information set forth in the “Summary Compensation Table: Pre-Share Exchange Executives” is not presented in the financial statements included herewith.
Summary Compensation Table: Pre-Share Exchange Executives
| Name and Principal Position | Year Ended Dec. 31 | Salary ($) | Bonus ($) | Stock Award(s) ($) | Option Awards ($) | Non-Equity Incentive Plan Compensation | Non-Qualified Deferred Compensation Earnings ($) | All Other Compensation ($) | Total ($) | |||||||||||||||||||||||||
| (a) | (b) | (c) | (d) | (e) | (f) | (g) | (h) | (i) | (j) | |||||||||||||||||||||||||
| Victor Jeffery, | Year ended 6/30/12 | 165,000 | 0 | 0 | 0 | 0 | 0 | 0 | 165,000 | |||||||||||||||||||||||||
| former CEO(1) | ||||||||||||||||||||||||||||||||||
| Viji Rajasundram, former | Year ended 6/30/12 | 165,000 | 0 | 0 | 0 | 0 | 0 | 0 | 165,000 | |||||||||||||||||||||||||
| General Manager, Modizo(2) | ||||||||||||||||||||||||||||||||||
___________
| (1) | Mr. Jeffery was appointed our chief executive officer effective June 1, 2011, and resigned on November 30, 2012. Of his remuneration as CEO, $85,000 and $150,000 was paid in shares of our stock in 2011 and 2012, respectively. Prior to his appointment, Mr. Jeffery served as editor-in-chief, for which he was paid $31,250 in shares of our stock. |
| (2) | Mr. Rajasundram was appointed general manager of Modizo on January 17, 2011, and resigned on November 30, 2012. Of his compensation, $144,193 and $150,000 was paid in shares of our stock in 2011 and 2012, respectively. |
94
Summary Compensation Table: Post-Share Exchange Executives*
| Name and Principal Position | Period | Salary ($) | Bonus ($) | Stock Award(s) ($) | Option Awards ($) | Non-Equity Incentive Plan Compensation | Non-Qualified Deferred Compensation Earnings ($) | All Other Compensation ($) | Total ($) | |||||||||||||||||||||||||
| (a) | (b) | (c) | (d) | (e) | (f) | (g) | (h) | (i) | (j) | |||||||||||||||||||||||||
| Year ended 12/31/13 | 676,000 | 0 | 0 | 0 | 0 | 0 | 0 | 676,000 | ||||||||||||||||||||||||||
Mark White, former CEO(1)(6) | 6 months. ended 12/31/12 | 323,000 | 600,000 | (4) | 0 | 0 | 0 | 0 | 0 | 923,000 | ||||||||||||||||||||||||
| Year ended 6/30/12 | 682,000 | 0 | 0 | 0 | 0 | 0 | 0 | 682,000 | ||||||||||||||||||||||||||
| Year ended 12/31/13 | 311,000 | 0 | 0 | 0 | 0 | 0 | 0 | 311,000 | ||||||||||||||||||||||||||
Martin Ward, CFO(2)(6) | 6 months. ended 12/31/12 | 116,000 | 0 | 0 | 0 | 0 | 0 | 13,200 | (5) | 129,200 | ||||||||||||||||||||||||
| Year ended 6/30/12 | 231,600 | 0 | 0 | 0 | 0 | 0 | 26,200 | (5) | 257,800 | |||||||||||||||||||||||||
| Year ended 6/30/11 | 232,000 | 0 | 0 | 0 | 0 | 0 | 26,300 | (5) | 258,300 | |||||||||||||||||||||||||
| Year ended 12/31/13 | 676,000 | 0 | 0 | 0 | 0 | 0 | 0 | 676,000 | ||||||||||||||||||||||||||
Brian Collins, CEO(3)(6) | 6 months. ended 12/31/12 | 323,000 | 600,000 | (4) | 0 | 0 | 0 | 0 | 0 | 923,000 | ||||||||||||||||||||||||
| Year ended 6/30/12 | 688,500 | 0 | 0 | 0 | 0 | 0 | 0 | 688,500 | ||||||||||||||||||||||||||
| Year ended 6/30/11 | 645,500 | 0 | 0 | 0 | 0 | 0 | 0 | 645,500 | ||||||||||||||||||||||||||
____________
| * | For periods prior to November 30, 2012, the information set forth consists of compensation as an officer of One Horizon UK. The compensation table does not include compensation for the former chief operating officer of the Satcom division, consisting of several subsidiaries which were sold on October 25, 2012 and which are treated as discontinued operations and not included in the carve-out financial statements included herewith for historical presentations purposes. |
| (1) | Mr. White was appointed our chief executive officer effective November 30, 2012. Mr. White was the chief executive officer of One Horizon UK during the periods ended June 30, 2012 and June 30, 2011, and from July 1, 2012 through November 30, 2012. For the period ended December 31, 2012, Mr. White was paid in Swiss Francs, with a conversion rates of CHF 1.00 = $1.05, which rate represents the average exchange rate for that period, as represented by http://www.oanda.com/currency/historical-rates/. For the periods ended June 30, 2012 and June 30, 2011, Mr. White’s compensation was paid through payments to SCC BVBA, an entity organized under the laws of Belgium, of which Mr. White is the sole shareholder. Payments made to SCC BVBA for such periods were paid in euros, with conversion rates of €1.00 = $1.36 and $1.34, respectively, which rates represent the average conversion rate for those periods, as represented by http://www.oanda.com/currency/historical-rates/. For the period ended December 31, 2013, Mr. White was paid in Swiss Francs, with a conversion rate of CHF 1.00 = $1.12, which rate represents the average exchange rate for that period, as represented byhttp://www.oanda.com/currency/historical-rates/. |
| (2) | Mr. Ward was appointed our chief financial officer effective November 30, 2012. Mr. Ward was the chief financial officer of One Horizon UK during the periods ended June 30, 2012 and June 30, 2011, and from July 1, 2012 through November 30, 2012. Mr. Ward was paid in pounds sterling, with conversion rates of £1.00 = $1.59, $1.58, and $1.59, respectively, which rates reflect the average exchange rates for those periods, as represented by http://www.oanda.com/currency/historical-rates/. For the period ended December 31, 2013, Mr. Ward was paid in pounds sterling, with conversion rate of £1.00 = $1.56, which rate represents the average exchange rate for that period, as represented by http://www.oanda.com/currency/historical-rates/. |
| (3) | Mr. Collins was appointed our chief technology officer effective November 30, 2012. Mr. Collins was the chief technology officer of One Horizon UK during the periods ended June 30, 2012 and June 30, 2011, and from July 1, 2012 through November 30, 2012. Mr. Collins was paid in Swiss Francs, with conversion rates of CHF 1.00 = $1.05, $1.12, and $1.05, respectively, which conversion rates reflect the average exchange rates for those periods, as represented by http://www.oanda.com/currency/historical-rates/.For the period ended December 31, 2013, Mr. Collins was paid in Swiss Francs, with a conversion rate of CHF 1.00 = $1.12, which rate represents the average exchange rate for that period, as represented by http://www.oanda.com/currency/historical-rates/. |
| (4) | On September 30, 2012, One Horizon UK issued 6,000,000 shares of One Horizon UK’s common stock, valued at $0.10 per share, to each of Messrs. White and Collins as bonus compensation. |
| (5) | Consists of contributions by the Company to Mr. Ward’s self-invested pension plan. |
| (6) | Mr. White, Collins and Ward’scompensation during 2013 consisted of a salary and during 2012 consisted of a salary and discretionary bonus. |
95
Pension Benefits
None during the periods covered in this Report
Nonqualified Deferred Compensation
None during the periods covered in this Report
Retirement/Resignation Plans
None during the periods covered in this Report
Outstanding Equity Awards at 2013 Year-End
As of the year ended December 31, 2013, there were no unexercised options, stock that has not vested or equity incentive plan awards held by any of the Company’s named executive officers.
COMPENSATION OF DIRECTORS
Our directors are reimbursed for expenses incurred by them in connection with attending Board of Directors’ meetings.. The following table sets forth all cash compensation paid by us, as well as certain other compensation paid or accrued, in 2013, to each of the following named directors.
| Name | Fees Earned or Paid in Cash ($) | Stock Awards ($) | Option Awards ($) | Non-Equity Incentive Plan Compensation ($) | Nonqualified Deferred Compensation Earnings ($) | All Other Compensation ($) | Total ($) | |||||||||||||||||||||
| Nicholas Carpinello | 12,500 | 0 | 0 | 0 | 0 | 0 | 12,500 | |||||||||||||||||||||
| Brian Collins | 0 | 0 | 0 | 0 | 0 | 0 | 0 | |||||||||||||||||||||
| Robert Law | 6,600 | 0 | 0 | 0 | 0 | 0 | 6,600 | |||||||||||||||||||||
| Richard Vos | 6,600 | 0 | 0 | 0 | 0 | 0 | 6,600 | |||||||||||||||||||||
| Martin Ward | 0 | 0 | 0 | 0 | 0 | 0 | 0 | |||||||||||||||||||||
| Mark White | 0 | 0 | 0 | 0 | 0 | 0 | 0 | |||||||||||||||||||||
SECURITY OWNERSHIP OF CERTAIN BENEFICIAL OWNERS AND MANAGEMENT
The following table sets forth certain information regarding beneficial ownership of our Common Stock as of April 14, 2014 by (i) each person (or group of affiliated persons) who is known by us to own more than five percent (5%) of the outstanding shares of our Common Stock, (ii) each director, executive officer and director nominee, and (iii) all of our directors, executive officers and director nominees as a group. As of February 2, 2015, we had 32,933,209 shares of Common Stock issued and outstanding.
Beneficial ownership is determined in accordance with SEC rules and generally includes voting or investment power with respect to securities. For purposes of this table, a person or group of persons is deemed to have “beneficial ownership” of any shares of common stock that such person has the right to acquire within 60 days of April 11, 2014. For purposes of computing the percentage of outstanding shares of our common stock held by each person or group of persons named above, any shares that such person or persons has the right to acquire within 60 days of April 11, 2014 is deemed to be outstanding for such person, but is not deemed to be outstanding for the purpose of computing the percentage ownership of any other person. The inclusion herein of any shares listed as beneficially owned does not constitute an admission of beneficial ownership.
96
| Name of Person or Group | Amount And Nature of Beneficial Ownership(1) | Percent | ||||||
| Principal Stockholders: | ||||||||
| Alexandra Mary Johnson | 2,919,666 | 8.87 | % | |||||
| 11 Washern Close | ||||||||
| Wilton Salisbury, SP2 0LX | ||||||||
| United Kingdom | ||||||||
| Adam Christie Thompson | 2,919,666 | 8.87 | % | |||||
| 547A Wellington Road | ||||||||
| Crisfield, MD 21817 | ||||||||
| Mark White(2) | 6,069,011 | 18.43 | % | |||||
| Mark White | ||||||||
| Named Executive Officers and Directors: | ||||||||
| Brian Collins | 6,069,011 | 18.43 | % | |||||
| Martin Ward | 2,919,666 | 8.87 | % | |||||
| Richard Vos | 9,729 | * | ||||||
| Nicholas Carpinello | 16 | * | ||||||
| Robert Vogler | 194,600 | * | ||||||
All Executive Officers and Directors as a Group (6 persons): | 15,262,033 | 46.34 | % | |||||
_______________
| * | Less than 1%. |
| (1) | Except as otherwise indicated, each of the stockholders listed above has sole voting and investment power over the shares beneficially owned. |
| (2) | Mr. White was appointed our chief executive officer effective November 30, 2012 and resigned on July 28, 2014 due to personal reasons. |
97
Equity Compensation Plan
Prior to the Share Exchange, One Horizon UK had authorized securities for issuance under equity compensation plans that have not been approved by the stockholders, but none under equity compensation plans that were approved by the stockholders. The following table shows the aggregate amount of securities authorized for issuance under all equity compensation plans as of December 31, 2013:
Number of securities to be issued upon exercise of outstanding options, warrants and rights (a) | Weighted-average exercise price of outstanding options, warrants and rights (b) | Number of securities remaining available for future issuance under equity compensation plans (excluding securities reflected in column (a)) (c) | ||||||||||
| Equity compensation plans approved by security holders | 0 | 0 | 0 | |||||||||
| Equity compensation plans not approved by security holders | 584,650 | $ | 0.53 | 0 | ||||||||
| Total | 584,650 | $ | 0.53 | 0 | ||||||||
The securities referenced in the table above reflect stock options granted beginning in 2005 pursuant to individual compensation arrangements with the Company’s employees. 292,750 of such options are fully vested with 850 expiring in 2015; and 291,600 expiring in 2020. The number of options reflected in the table above reflect a conversion that occurred in connection with the Share Exchange, whereby the number of options (to purchase One Horizon UK shares) held by each employee was increased by 175.14 times and the exercise price was decreased by the option exercise price divided by 175.14 and a reverse split of 1-for-600 that went effective on August 29, 2013, whereby the number of options held by each employee was decreased by 600 times and the exercise price was increased by the option exercise price multiplied by 600. Also included in the table above are options to purchase 291,900 shares of the Company’s common stock, which options were issued to an employee on December 31, 2012 and vest on December 31, 2015.
Related Party Transactions
The Company considers all transactions with the following parties to be related party transactions.
Amounts due to related parties include the following: (in thousands)
| December 31 | December 31 | |||||||
| 2013 | 2012 | |||||||
| Loans due to stockholders | $ | 3,500 | $ | 3,500 | ||||
Loans due to stockholders include
● | loans advanced by Mark White, the former CEO, Martin Ward, the CEO, Brian Collins, the CTO and two shareholders, Alexandra Johnson and Adam Thompson, during 2011 totaling $2,000,000 which are unsecured and have an interest rate of 10%. During the year ended December 31, 2013 and the six months ended December 31, 2012 interest of $200,000 and $100,000, respectively, has been accrued. During the year ended June 30, 2012, interest of $100,000 was accrued. During the year ended December 31, 2013 $500,000 of this loan was settled. |
98
| ● | loans advanced by Mark White, the former CEO and Brian Collins, the CEO, during 2012 totaling $1,500,000 which are unsecured and have an interest rate of 0.21%. The loans are due on or before December 31, 2014 and can be repaid in cash or shares of common stock of OHG at an exchange price of $5.14 per share. |
| ● | convertible loans advanced in January 2013 from Mark White, the former CEO and Brian Collins, the CEO, in the amount of $250,000 each. These convertible loans bear an interest rate of 0.21% and are repayable on or before January 22, 2014. On January 21, 2014 the loan repayment date was extended to January 22, 2015. The Company has the option to repay the loans at any time, without penalty, at any time in cash or shares of common stock of the Company at a price of $5.14 per share. If the Company elects to repay the convertible loans in full by the issuance of shares the Company will issue 48,650 shares of common stock for each loan so repaid. |
| ● | during the year ended December 31, 2013, the Company entered into a sales contract, in the normal course of business, with a PRC customer. The customer purchased a perpetual software license with a total commitment of $5.0 million, of which $700,000 has been recognized as revenue in the year ended December 31, 2013. |
| ● | during the year ended June 30, 2011, the Company entered into a sales contract, in the normal course of business with a customer in which the Company holds an equity interest. The customer purchased perpetual software license with total commitment of $2.0 million, of which $139,300 has been recognized in the year ended December 31, 2013; $72,500 was recognized in the six months ended December 31, 2012 and nil was recognized in the year ended June 30, 2012. The Company owns a cost based investment interest of 18% of the voting capital of the customer. |
| ● | during the year ended December 31, 2013, the six months ended December 31, 2012 and the year ended June 30, 2012, a company owned by Mark White, the former CEO, provided services in the amounts of $Nil, $Nil and $632,000, respectively. |
| ● | During the six months ended December 31, 2012, Mark White, the former CEO and Brian Collins, the CEO, were granted a total of 3,502,800 shares of common stock for services received in the amount of $1,200,000. |
Amounts due to related parties include the following: (in thousands)
| September 30 | December 31 | |||||||
| 2014 | 2013 | |||||||
| Loans due to stockholders | $ | 3,500 | $ | 3,500 | ||||
Loans due to stockholders include:
| ● | Balance of loans, advanced during 2011, of $1,500,000 which are unsecured and have an interest rate of 10%. During the nine months ended September 30, 2014 and 2013 interest of $107,000 and $150,000, respectively, has been accrued. |
| ● | Loans advanced by an officer and director together with a former officer and director during 2012 totaling $1,500,000 which is unsecured and has an interest rate of 0.21%. The loan is due on or before December 31, 2014 and can be repaid in cash or shares of ordinary shares of OHG at an exchange price of $5.14 per share. |
| ● | Convertible loans advanced in January 2013 from an officer and director together with a former officer and director in the amount of $250,000 each. These convertible loans bear an interest rate of 0.21% and is repayable on or before January 22, 2015. The Company has the option to repay the loans at any time, without penalty, at any time in cash or shares of common stock of the Company at a price of $5.14 per share. If the Company elects to repay the convertible loan in full by the issuance of shares the Company will issue 48,650 shares of common stock for repayment of the loan. |
During the year ended June 30, 2011, the Company entered into a sales contract, in the normal course of business with a customer in which the Company holds an equity interest. The customer purchased perpetual software license with total commitment of $2.0 million, of which $45,000 and $nil has been recognized in the nine months ended September 30, 2014 and 2013, respectively. The Company owns a cost based investment interest of 18% of the voting capital of the customer.
99
Promoters and Certain Control Persons
None of our management or other control persons were “promoters” (within the meaning of Rule 405 under the Securities Act), and none of such persons took the initiative in the formation of our business or received any of our debt or equity securities or any of the proceeds from the sale of such securities in exchange for the contribution of property or services, during the last five years.
Director Independence
Presently, we are not required to comply with the director independence requirements of any securities exchange since we are listed on OTC markets, which does not have any such listing standards. In determining whether our directors are independent, however, we intend to comply with the rules of the Nasdaq. The Board of Directors also will consult with counsel to ensure that the Board of Directors’ determinations are consistent with those rules and all relevant securities and other laws and regulations regarding the independence of directors, including those adopted under the Sarbanes-Oxley Act of 2002 with respect to the independence of audit committee members. The Nasdaq listing standards define an “independent director” generally as a person, other than an officer of a company, who does not have a relationship with the company that would interfere with the director’s exercise of independent judgment.
Under the definition of independent directors found in Nasdaq Rule 5605(a)(2),we currently have four independent directors, Nicholas Carpinello, Robert Law, Robert Vogler and Richard Vos.
The Company’s board of directors does not have a separate audit committee, nominating committee or compensation committee. Given the small size of the Company’s board and the limited number of independent directors over the Company’s history, the board of directors has determined that it is appropriate for the entire board to act as each such committee.
None.
None.
Insofar as indemnification for liabilities arising under the Securities Act of 1933 may be permitted to our directors, officers and controlling persons pursuant to the foregoing provisions, or otherwise, we have been advised that in the opinion of the SEC such indemnification is against public policy as expressed in the Securities Act and is, therefore, unenforceable. In the event that a claim for indemnification against such liabilities (other than the payment by us of expenses incurred or paid by one of our directors, officers or controlling persons in the successful defense of any action, suit or proceeding) is asserted by that director, officer or controlling person in connection with the securities being registered, we will, unless in the opinion of our counsel the matter has been settled by controlling precedent, submit to a court of appropriate jurisdiction the question whether that indemnification by us is against public policy as expressed in the Securities Act and will be governed by the final adjudication of that issue.
100
PART II
INFORMATION NOT REQUIRED IN PROSPECTUS
The following table sets forth estimated expenses we expect to incur in connection with the sale of the shares being registered. All such expenses are estimated except for the SEC and FINRA registration fees.
| SEC registration fee | $ | 540.49 | ||
| Fees and expenses of counsel for the Company | $ | 15,000.00 | ||
| Fees and expenses of accountants for Company | $ | 5,000.00 | ||
| Miscellaneous | $ | 1,500.00 | ||
| Total | $ | 22,040.49 |
Our bylaws permits us to indemnify our officers and directors by law in connection with any proceeding occurred on or after January 27, 1987 arising by reason of the fact any person is or was our officer or director against any expenses and any liability actually and in good faith paid or incurred by such person in connection with such proceeding. Notwithstanding this indemnity, a director shall be liable to the extent provided by law for any liability incurred by him by his own fraud or willful default.
Information regarding any equity securities we have sold that, during the periods covered by this Report including twelve months ended December 31, 2013 and 2012, six months ended December 31, 2013 and 2012, and three and nine months ended September 30, 2014, were not registered under the Securities Act of 1933, as amended, are included in a previously filed Periodic Report on Form 10-Q and Form 10-K, or in a Current Report on Form 8-K.
Stock Purchase Warrants
We have not repurchased any equity securities during the periods covered by this Report.
EXHIBITS
The following exhibits are filed as part of this registration statement:
| Exhibit Number | Title of Document | Location | ||
| Item 2 | Plan of Acquisition, Reorganization Arrangement, Liquidation, or Succession | |||
| 2.1 | Stock Purchase Agreement between Mobiclear Inc. and Whitefields Capital Limited entered November 12, 2009 | Incorporated by reference from the Current Report on Form 8-K filed November 17, 2009 | ||
| 2.2 | Stock Purchase Agreement between Intelligent Communication Enterprise Corporation and Whitefields Capital Limited entered January 20, 2010 | Incorporated by reference from the Current Report on Form 8-K filed January 25, 2010 | ||
| 2.3 | Sale and Purchase Agreement between Intelligent Communication Enterprise Corporation and Power Centre Holdings Limited dated June 11, 2010 | Incorporated by reference from the Current Report on Form 8-K filed June 17, 2010 | ||
| 2.4 | Agreement of Securities Exchange and Plan of Reorganization between Intelligent Communication Enterprise Corporation and One Horizon Group PLC | Incorporated by reference from the Current Report on Form 8-K filed December 6, 2012 | ||
| Item 3 | Articles of Incorporation and Bylaws | |||
| 3.1 | Amended and Restated Articles of Incorporation of BICO, Inc. as filed with the Secretary of State of the Commonwealth of Pennsylvania | Incorporated by reference from the Current Report on Form 8-K filed November 12, 2004 | ||
| 3.2 | Certificate of Designation of Series M Preferred Stock as filed with the Secretary of State of the Commonwealth of Pennsylvania | Incorporated by reference from the Current Report on Form 8-K filed November 12, 2004 | ||
| 3.3 | Joint Second Amended Plan of Reorganization dated August 3, 2004 | Incorporated by reference from the Current Report on Form 8-K filed November 12, 2004 | ||
| 3.4 | Order Approving Joint Second Amended Plan of Reorganization dated October 14, 2004 | Incorporated by reference from the Current Report on Form 8-K filed November 12, 2004 |
101
| 3.5 | Amended and Restated Certificate of Designation for Series M Preferred | Incorporated by reference from the Current Report on Form 8-K filed April 4, 2005 | ||
| 3.6 | By-Laws of MobiClear Inc. as amended on October 13, 2006 | Incorporated by reference from the Annual Report on Form 10-KSB for the year ended December 31, 2006, filed April 2, 2007 | ||
| 3.7 | Amendment to Articles of Incorporation as filed with the Secretary of State of the Commonwealth of Pennsylvania | Incorporated by reference from the Current Report on Form 8-K filed December 6, 2006 | ||
| 3.8 | Amendment to Articles of Incorporation as filed with Pennsylvania Department of State Corporate Bureau | Incorporated by reference from the Current Report on Form 8-K filed July 2, 2008 | ||
| 3.9 | Amendment to Articles of Incorporation as filed September 22, 2009, with the Pennsylvania Department of State Corporate Bureau | Incorporated by reference from the Quarterly Report on Form 10-Q for the Quarter Ended September 30, 2009, filed October 29, 2009 | ||
| 3.10 | Amendment to Articles of Incorporation as filed November 30, 2009, with the Pennsylvania Department of State Corporate Bureau | Incorporated by reference from the Current Report on Form 8-K filed December 30, 2009 | ||
| 3.11 | Amendment to Articles of Incorporation as filed December 27, 2012, with the Pennsylvania Department of State Corporate Bureau | Filed as part of this reportin Incorporated by reference from the Current Report on Form 10-KT filed on May 13, 20 Incorporated by reference from the Current Report on Form 10-K filed on May 13, 2013 | ||
| 3.12 | Certificate of Designation of Series A Preferred Stock filed with Nevada | In cIncorporated by reference from the Current Report on Form 8-K filed on July 25, 2014 | ||
| Item 4 | Instruments Defining the Rights of Security Holders, Including Debentures | |||
| 4.1 | Specimen stock certificate | Incorporated by reference from the Current Report on Form 10-KT filed on May 13, 2013 | ||
| Item 5 | Opinion re Legality | |||
| Legal Opinion of Hunter Taubman Weiss, LLP | Filed as part of this report | |||
| Item 10 | Material Contracts | |||
| 10.1 | Loan Agreement dated January 22, 2013 between the Company and Mark White | Incorporated by reference to the Quarterly Report on Form 10-Q/A filed on May 30, 2013 | ||
| 10.2 | Loan Agreement dated January 22, 2013 between the Company and Brian Collins | Incorporated by reference to the Quarterly Report on Form 10-Q/A filed on May 30, 2013 | ||
| 10.3 | Subscription Agreement, as amended, dated as of February 18, 2013, between the Company and Patrick Schildknecht | Incorporated by reference to the Quarterly Report on Form 10-Q/A filed on May 30, 2013 |
| 10.4 | Warrant Agreement, dated as of February 18, 2013, between the Company and Patrick Schildknecht | Incorporated by reference from the Current Report on Form 10-8K filed September 5, 2013 | ||
| 10.5 | Amended and Restated Subscription Agreement, dated as of August 30, 2013, between the Company and Patrick Schildknecht | Incorporated by reference from the Current Report on Form 10-8K filed September 5, 2013 | ||
| 10.6 | Amended and Restated Warrant Agreement, dated as of August 30, 2013, between the Company and Patrick Schildknecht | Incorporated by reference from the Current Report on Form 8-K filed September 5, 2013 | ||
| 10.7 | Acquisition Agreement with Clarita Ablazo Jeffery dated December 31, 2012 | Incorporated by reference from the Current Report on Form 10-KT filed on May 13, 2013 | ||
| 10.8 | Agreement Of Securities Exchange And Plan Of Reorganization Between Intelligent | Incorporated by reference from the Current Report on Form 8-K filed December 6, 2012 | ||
| 10.9 | Securities Purchase Agreement dated July 21, 2014 | Incorporated by reference from the Current Report on Form 8-K filed on July 25, 2014 | ||
| 10.10 | Form of Class B Warrant | Incorporated by reference from the Current Report on Form 8-K filed on July 25, 2014 | ||
| 10.11 | Form of Class A Warrant | Incorporated by reference from the Current Report on Form 8-K filed on July 25, 2014 | ||
| 10.12 | Amendment to Certain Transaction Documents dated August 15, 2014 | Incorporated by reference from the Current Report on Form 8-K filed on August 8, 2014 | ||
| 10.13 | Securities Purchase Agreement dated December 22, 2014 | Incorporated by reference from the Current Report on Form 8-K filed on December 29, 2014 | ||
| 10.14 | Form of Convertible Debenture | Incorporated by reference from the Current Report on Form 8-K filed on December 29, 2014 | ||
| 10.15 | Registration Rights Agreement dated December 22, 2014 | Incorporated by reference from the Current Report on Form 8-K filed on December 29, 2014 | ||
| 10.16 | Form of Amended and Restated Class C Warrant | Incorporated by reference from the Current Report on Form 8-K filed on January 23, 2015 | ||
| 10.17 | Form of Amended and Restated Class D Warrant | Incorporated by reference from the Current Report on Form 8-K filed on January 23, 2015 | ||
| 10.18 | Form of Amended and Restated Performance Warrant | Incorporated by reference from the Current Report on Form 8-K filed on January 23, 2015 | ||
| 10.19 | Form of Amended and Restated Placement Agent Warrant | Incorporated by reference from the Current Report on Form 8-K filed on January 23, 2015 | ||
| 10.20 | Form of Independent Director Agreement between the Company and Richard Vos/Nicholas Carpinello/Robert Law | Incorporated by reference from the Current Report on Form 8-K filed August 22, 2013 | ||
| 10.21 | Director Agreement between the Company and Robert Vogler dated January 8, 2014 | Incorporated by reference from the Current Report on Form 8-K filed January 13, 2014 | ||
| Item 14. | Code of Ethics | |||
| 14.1 | Policy Statement on Business Ethics and Conflicts of Interest | Incorporated by reference from the Annual Report on Form 10-KSB for the year ended December 31, 2004, filed May 23, 2005 | ||
| Insider Trading Policy | Filed as part of this report |
102
| Item 21. | Subsidiaries of the Registrant | |||
| 21.1 | Schedule of Subsidiaries | Incorporated by reference from the Current Report on Form 10-KT filed on May 13, 2013 | ||
| Item 23. | Consent of Experts and Counsel | |||
| 23.1 | Consent from Hunter Taubman Weiss LLP | Included in Exhibit 5.1 hereto | ||
| 23.2 | Consent of Peterson Sullivan LLP | Filed as a part of this filing | ||
| Item 31. | Rule 13a-14(a)/15d-14(a) Certifications | |||
| 31.1 | Certification of Principal Executive Officer Pursuant to Rule 13a-14 | Incorporated by reference from the Current Report on Form 10-KT filed on May 13, 2013 | ||
| 31.2 | Certification of Principal Financial Officer Pursuant to Rule 13a-14 | Incorporated by reference from the Current Report on Form 10-KT filed on May 13, 2013 | ||
| Item 32. | Section 1350 Certifications | |||
| 32.1 | Certification of Chief Executive Officer Pursuant to 18 U.S.C. Section 1350, as Adopted Pursuant to Section 906 of the Sarbanes-Oxley Act of 2002 | Incorporated by reference from the Current Report on Form 10-KT filed on May 13, 2013 | ||
| 32.2 | Certification of Chief Financial Officer Pursuant to 18 U.S.C. Section 1350, as Adopted Pursuant to Section 906 of the Sarbanes-Oxley Act of 2002 | Incorporated by reference from the Current Report on Form 10-KT filed on May 13, 2013 |
The undersigned registrant hereby undertakes to:
(1) File, during any period in which offers or sales are being made, a post-effective amendment to this registration statement to:
(i) Include any prospectus required by Section 10(a)(3) of the Securities Act of 1933, as amended (the "Securities Act");
(ii) Reflect in the prospectus any facts or events which, individually or together, represent a fundamental change in the information in the registration statement. Notwithstanding the foregoing, any increase or decrease in volume of securities offered (if the total dollar value of the securities offered would not exceed that which was registered) and any deviation from the low or high end of the estimated maximum offering range may be reflected in the form of a prospectus filed with the Commission pursuant to Rule 424(b) under the Securities Act if, in the aggregate, the changes in volume and price represent no more than a 20% change in the maximum aggregate offering price set forth in the "Calculation of Registration Fee" table in the effective registration statement, and
(iii) Include any additional or changed material information on the plan of distribution.
(2) For determining liability under the Securities Act, treat each post-effective amendment as a new registration statement of the securities offered, and the offering of the securities at that time to be the initial bona fide offering.
(3) File a post-effective amendment to remove from registration any of the securities that remain unsold at the end of the offering.
(4) Insofar as indemnification for liabilities arising under the Securities Act may be permitted to directors, officers and controlling persons of the registrant pursuant to the foregoing provisions, or otherwise, the registrant has been advised that in the opinion of the Securities and Exchange Commission such indemnification is against public policy as expressed in the Securities Act and is, therefore, unenforceable.
In the event that a claim for indemnification against such liabilities (other than the payment by the registrant of expenses incurred or paid by a director, officer or controlling person of the registrant in the successful defense of any action, suit or proceeding) is asserted by such director, officer or controlling person in connection with the securities being registered, the registrant will, unless in the opinion of its counsel the matter has been settled by controlling precedent, submit to a court of appropriate jurisdiction the question whether such indemnification by it is against public policy as expressed in the Securities Act and will be governed by the final adjudication of such issue.
103
SIGNATURES
Pursuant to the requirements of the Securities Act of 1933, the Registrant certifies that it has and authorized to this Registration Statement on Form S-1 to be signed on its behalf by the undersigned, thereunto duly authorized, on February 5 , 2015.
| ONE HORIZON GROUP, INC. | ||
| By: | /s/ Brian Collins | |
Brian Collins President and Chief Executive Officer | ||
| By: | /s/ Martin Ward | |
Martin Ward, Chief Financial Officer, Principal Finance and Accounting Officer and Director | ||
In accordance with the requirements of the Securities Act of 1933, this Registration Statement on Form S-1 was signed by the following persons in the capacities and on the dates stated.
| Signature | Title | Date | ||
/s/ Brian Collins | President, Chief Executive Officer, and Director | February 5, 2015 | ||
| Brian Collins | ||||
/s/ Martin Ward | Chief Financial Officer, Principal Finance and Accounting Officer and Director | February 5, 2015 | ||
| Martin Ward | ||||
/s/ Richard Vos | Director | February 5, 2015 | ||
| Richard Vos | ||||
/s/ Nicholas Carpinello | Director | February 5, 2015 | ||
| Nicholas Carpinello | ||||
/s/ Robert Vogler | Director | February 5, 2015 | ||
| Robert Vogler |
��
/s/ Robert Law | Director | February 5, 2015 | ||
| Robert Law |
104