UNITED STATES
SECURITIES AND EXCHANGE COMMISSION
Washington, D.C. 20549
FORM N-CSR
CERTIFIED SHAREHOLDER REPORT OF REGISTERED
MANAGEMENT INVESTMENT COMPANIES
Investment Company Act file number 811-02737
Fidelity Summer Street Trust
(Exact name of registrant as specified in charter)
245 Summer St., Boston, Massachusetts 02210
(Address of principal executive offices) (Zip code)
Margaret Carey, Secretary
245 Summer St.
Boston, Massachusetts 02210
(Name and address of agent for service)
Registrant's telephone number, including area code:
617-563-7000
| |
Date of fiscal year end: | April 30 |
|
|
Date of reporting period: | April 30, 2024 |
Item 1.
Reports to Stockholders
Fidelity® Women's Leadership Fund
Annual Report
April 30, 2024
Includes Fidelity and Fidelity Advisor share classes
Contents
To view a fund's proxy voting guidelines and proxy voting record for the 12-month period ended June 30, visit http://www.fidelity.com/proxyvotingresults or visit the Securities and Exchange Commission's (SEC) web site at http://www.sec.gov.
You may also call 1-800-544-8544 if you're an individual investing directly with Fidelity, call 1-800-835-5092 if you're a plan sponsor or participant with Fidelity as your recordkeeper or call 1-877-208-0098 on institutional accounts or if you're an advisor or invest through one to request a free copy of the proxy voting guidelines.
Standard & Poor's, S&P and S&P 500 are registered service marks of The McGraw-Hill Companies, Inc. and have been licensed for use by Fidelity Distributors Corporation.
Other third-party marks appearing herein are the property of their respective owners.
All other marks appearing herein are registered or unregistered trademarks or service marks of FMR LLC or an affiliated company. © 2024 FMR LLC. All rights reserved.
This report and the financial statements contained herein are submitted for the general information of the shareholders of the Fund. This report is not authorized for distribution to prospective investors in the Fund unless preceded or accompanied by an effective prospectus.
A fund files its complete schedule of portfolio holdings with the SEC for the first and third quarters of each fiscal year on Form N-PORT. Forms N-PORT are available on the SEC's web site at http://www.sec.gov. A fund's Forms N-PORT may be reviewed and copied at the SEC's Public Reference Room in Washington, DC. Information regarding the operation of the SEC's Public Reference Room may be obtained by calling 1-800-SEC-0330.
For a complete list of a fund's portfolio holdings, view the most recent holdings listing, semiannual report, or annual report on Fidelity's web site at http://www.fidelity.com, http://www.institutional.fidelity.com, or http://www.401k.com, as applicable.
NOT FDIC INSURED •MAY LOSE VALUE •NO BANK GUARANTEE
Neither the Fund nor Fidelity Distributors Corporation is a bank.
Average annual total return reflects the change in the value of an investment, assuming reinvestment of distributions from dividend income and capital gains (the profits earned upon the sale of securities that have grown in value, if any) and assuming a constant rate of performance each year. The hypothetical investment and the average annual total returns do not reflect the deduction of taxes that a shareholder would pay on fund distributions or the redemption of fund shares. During periods of reimbursement by Fidelity, a fund's total return will be greater than it would be had the reimbursement not occurred. How a fund did yesterday is no guarantee of how it will do tomorrow.
| Average Annual Total Returns |
| | | | |
Periods ended April 30, 2024 | Past 1 year | Life of Fund A |
Class A (incl. 5.75% sales charge) | 11.75% | 9.12% |
Class M (incl. 3.50% sales charge) | 14.08% | 9.34% |
Class C (incl. contingent deferred sales charge) | 16.60% | 9.59% |
| Fidelity® Women's Leadership Fund | 18.76% | 10.67% |
| Class I | 18.88% | 10.73% |
| Class Z | 19.02% | 10.87% |
A From May 1, 2019
Class C shares' contingent deferred sales charges included in the past one year and life of fund total return figures are 1% and 0%, respectively.
| $10,000 Over Life of Fund |
| |
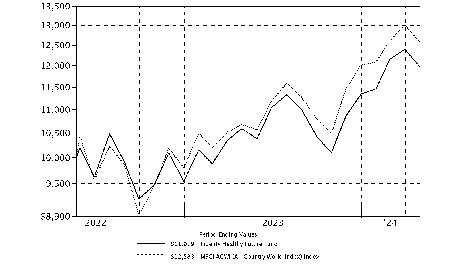
Let's say hypothetically that $10,000 was invested in Fidelity® Women's Leadership Fund, a class of the fund, on May 1, 2019, when the fund started. The chart shows how the value of your investment would have changed, and also shows how the Russell 3000® Index performed over the same period. |
|
|
Market Recap:
U.S. equities gained 22.66% for the 12 months ending April 30, 2024, according to the S&P 500® index, driven by resilient corporate profits, a frenzy over generative artificial intelligence and the Federal Reserve's likely pivot to cutting interest rates later this year. Amid this favorable backdrop for higher-risk assets, the S&P 500® continued its late-2023 momentum and ended March at its all-time high before snapping a five-month uptrend in April (-4.08%). Growth stocks led the broad rally, mostly driven by a narrow set of firms in the communication services (+41%) and information technology (+37%) sectors, largely due to excitement for AI. In particular, semiconductor-related stocks (+104%) were a standout. Following the Fed's November 1 meeting, when the central bank hinted it might be done raising rates, the S&P 500® reversed a three-month decline and gained 14.09% in the final two months of 2023 and 10.56% the first quarter. Risk assets were further aided on March 20, when the central bank held steady its benchmark federal funds rate and affirmed its projection to cut in 2024. The index then slipped in April, as inflation remained stickier than expected, spurring doubts of a soft economic landing. For the full 12 months, the financials, industrials and consumer discretionary sectors each gained about 24%. In sharp contrast, real estate and the defensive-oriented utilities sector each roughly broke even. Other notable "laggards" included consumer staples (+3%) and health care (+7%).
Comments from Portfolio Manager Nicole Connolly:
For the fiscal year ending April 30, 2024, the fund gained 18.76% versus 15.91% for the MSCI USA Women's Leadership Index and 22.30% for the broad-based Russell 3000 Index. Relative to the MSCI USA Women's Leadership Index, security selection was the primary contributor, led by consumer discretionary. Stock picking in information technology, primarily within the semiconductors & semiconductor equipment industry, also helped. Stock selection in health care, primarily within the pharmaceuticals, biotechnology & life sciences industry, also boosted relative performance. Also helping our relative result was an underweight in consumer staples. The top individual relative contributor was our non-benchmark stake in Nvidia (+214%). Nvidia was one of the fund's largest holdings. This period we decreased our investment in Nvidia. The second-largest relative contributor was an overweight in Williams-Sonoma (+145%). This period we decreased our stake in Williams-Sonoma. Not owning Paramount Global, a benchmark component that returned approximately -51%, was another notable relative contributor. In contrast, the biggest detractors from performance versus the benchmark were security selection and an overweight in utilities. Stock picking in consumer staples, primarily within the household & personal products industry, also hampered the fund's result. Also detracting from our result was an underweight in information technology. The largest individual relative detractor was our stake in Hershey (-29%). Hershey was not held at period end. Not owning Broadcom, a benchmark component that gained about 110%, was a second notable relative detractor. Another notable relative detractor this period was avoiding Western Digital, a benchmark component that gained approximately 106%. Notable changes in positioning include increased exposure to communication services and a lower allocation to consumer staples.
Application of FMR's environmental, social, and governance (ESG) ratings process and/or its sustainable investing exclusion criteria may affect the Fund's exposure to certain issuers, sectors, regions, and countries and may affect the Fund's performance.
The views expressed above reflect those of the portfolio manager(s) only through the end of the period as stated on the cover of this report and do not necessarily represent the views of Fidelity or any other person in the Fidelity organization. Any such views are subject to change at any time based upon market or other conditions and Fidelity disclaims any responsibility to update such views. These views may not be relied on as investment advice and, because investment decisions for a Fidelity fund are based on numerous factors, may not be relied on as an indication of trading intent on behalf of any Fidelity fund.
Top Holdings (% of Fund's net assets) |
| |
| Amazon.com, Inc. | 4.3 | |
| Microsoft Corp. | 3.6 | |
| NVIDIA Corp. | 2.5 | |
| The Walt Disney Co. | 2.5 | |
| Accenture PLC Class A | 1.9 | |
| WEX, Inc. | 1.8 | |
| Bank of America Corp. | 1.8 | |
| NASDAQ, Inc. | 1.8 | |
| Cigna Group | 1.7 | |
| Apple, Inc. | 1.7 | |
| | 23.6 | |
| |
| Market Sectors (% of Fund's net assets) |
| |
| Information Technology | 25.0 | |
| Financials | 14.2 | |
| Health Care | 13.6 | |
| Consumer Discretionary | 12.9 | |
| Industrials | 12.5 | |
| Communication Services | 7.0 | |
| Materials | 3.5 | |
| Energy | 3.3 | |
| Utilities | 3.2 | |
| Consumer Staples | 2.8 | |
| Real Estate | 0.9 | |
| |
Asset Allocation (% of Fund's net assets) |
|
|
Showing Percentage of Net Assets
| Common Stocks - 98.6% |
| | | Shares | Value ($) |
| COMMUNICATION SERVICES - 7.0% | | | |
| Entertainment - 3.0% | | | |
| Netflix, Inc. (a) | | 1,395 | 768,143 |
| The Walt Disney Co. | | 32,539 | 3,615,083 |
| | | | 4,383,226 |
| Interactive Media & Services - 2.8% | | | |
| Alphabet, Inc.: | | | |
| Class A | | 14,299 | 2,327,591 |
| Class C | | 11,569 | 1,904,720 |
| | | | 4,232,311 |
| Media - 1.2% | | | |
| Interpublic Group of Companies, Inc. | | 59,584 | 1,813,737 |
TOTAL COMMUNICATION SERVICES | | | 10,429,274 |
| CONSUMER DISCRETIONARY - 12.9% | | | |
| Automobiles - 0.7% | | | |
| General Motors Co. | | 22,876 | 1,018,668 |
| Broadline Retail - 5.1% | | | |
| Amazon.com, Inc. (a) | | 36,328 | 6,357,399 |
| Etsy, Inc. (a) | | 17,898 | 1,229,056 |
| | | | 7,586,455 |
| Hotels, Restaurants & Leisure - 1.9% | | | |
| Hilton Worldwide Holdings, Inc. | | 5,432 | 1,071,625 |
| Starbucks Corp. | | 11,700 | 1,035,333 |
| Vail Resorts, Inc. | | 3,853 | 729,643 |
| | | | 2,836,601 |
| Household Durables - 1.0% | | | |
| Taylor Morrison Home Corp. (a) | | 27,124 | 1,519,215 |
| Specialty Retail - 2.8% | | | |
| Aritzia, Inc. (a) | | 25,730 | 666,122 |
| Best Buy Co., Inc. | | 9,340 | 687,798 |
| Lowe's Companies, Inc. | | 4,857 | 1,107,347 |
| Warby Parker, Inc. (a) | | 63,110 | 740,911 |
| Williams-Sonoma, Inc. | | 2,960 | 848,869 |
| | | | 4,051,047 |
| Textiles, Apparel & Luxury Goods - 1.4% | | | |
| LVMH Moet Hennessy Louis Vuitton SE | | 1,189 | 976,688 |
| NIKE, Inc. Class B | | 4,683 | 432,054 |
| Tapestry, Inc. | | 17,416 | 695,247 |
| | | | 2,103,989 |
TOTAL CONSUMER DISCRETIONARY | | | 19,115,975 |
| CONSUMER STAPLES - 2.8% | | | |
| Consumer Staples Distribution & Retail - 0.6% | | | |
| Maplebear, Inc. (NASDAQ) | | 24,429 | 833,762 |
| Food Products - 0.5% | | | |
| Bunge Global SA | | 7,778 | 791,489 |
| Household Products - 0.8% | | | |
| The Clorox Co. | | 8,147 | 1,204,697 |
| Personal Care Products - 0.9% | | | |
| Estee Lauder Companies, Inc. Class A | | 8,759 | 1,285,033 |
TOTAL CONSUMER STAPLES | | | 4,114,981 |
| ENERGY - 3.3% | | | |
| Energy Equipment & Services - 0.9% | | | |
| Baker Hughes Co. Class A | | 41,006 | 1,337,616 |
| Oil, Gas & Consumable Fuels - 2.4% | | | |
| Antero Resources Corp. (a) | | 30,966 | 1,053,154 |
| EQT Corp. | | 19,889 | 797,350 |
| Equinor ASA | | 25,102 | 667,923 |
| Occidental Petroleum Corp. | | 15,224 | 1,006,915 |
| | | | 3,525,342 |
TOTAL ENERGY | | | 4,862,958 |
| FINANCIALS - 14.2% | | | |
| Banks - 5.3% | | | |
| Bank of America Corp. | | 72,137 | 2,669,790 |
| Citigroup, Inc. | | 24,047 | 1,474,803 |
| Huntington Bancshares, Inc. | | 60,554 | 815,662 |
| JPMorgan Chase & Co. | | 10,947 | 2,098,978 |
| Starling Bank Ltd. Series D (a)(b)(c) | | 34,700 | 130,512 |
| U.S. Bancorp | | 17,066 | 693,392 |
| | | | 7,883,137 |
| Capital Markets - 2.6% | | | |
| Macquarie Group Ltd. | | 10,443 | 1,250,429 |
| NASDAQ, Inc. | | 43,254 | 2,588,752 |
| | | | 3,839,181 |
| Financial Services - 2.8% | | | |
| MasterCard, Inc. Class A | | 3,390 | 1,529,568 |
| WEX, Inc. (a) | | 12,641 | 2,670,538 |
| | | | 4,200,106 |
| Insurance - 3.5% | | | |
| Hartford Financial Services Group, Inc. | | 18,283 | 1,771,440 |
| Marsh & McLennan Companies, Inc. | | 6,214 | 1,239,258 |
| Progressive Corp. | | 10,527 | 2,192,248 |
| | | | 5,202,946 |
TOTAL FINANCIALS | | | 21,125,370 |
| HEALTH CARE - 13.3% | | | |
| Biotechnology - 1.4% | | | |
| Alnylam Pharmaceuticals, Inc. (a) | | 3,919 | 564,140 |
| Moderna, Inc. (a) | | 4,688 | 517,133 |
| Sage Therapeutics, Inc. (a) | | 9,937 | 138,522 |
| Vertex Pharmaceuticals, Inc. (a) | | 1,941 | 762,444 |
| Zai Lab Ltd. ADR (a) | | 8,171 | 129,102 |
| | | | 2,111,341 |
| Health Care Equipment & Supplies - 3.2% | | | |
| Hologic, Inc. (a) | | 31,961 | 2,421,685 |
| Insulet Corp. (a) | | 5,463 | 939,308 |
| Outset Medical, Inc. (a) | | 5,606 | 14,183 |
| The Cooper Companies, Inc. | | 14,682 | 1,307,579 |
| | | | 4,682,755 |
| Health Care Providers & Services - 4.2% | | | |
| AMN Healthcare Services, Inc. (a) | | 12,432 | 745,671 |
| Centene Corp. (a) | | 21,329 | 1,558,297 |
| Cigna Group | | 7,230 | 2,581,399 |
| Elevance Health, Inc. | | 2,431 | 1,284,978 |
| | | | 6,170,345 |
| Life Sciences Tools & Services - 0.9% | | | |
| ICON PLC (a) | | 4,722 | 1,406,589 |
| Pharmaceuticals - 3.6% | | | |
| GSK PLC sponsored ADR | | 20,872 | 864,936 |
| Merck & Co., Inc. | | 8,547 | 1,104,443 |
| Merck KGaA | | 7,498 | 1,191,878 |
| UCB SA | | 10,038 | 1,334,249 |
| Zoetis, Inc. Class A | | 5,449 | 867,699 |
| | | | 5,363,205 |
TOTAL HEALTH CARE | | | 19,734,235 |
| INDUSTRIALS - 12.5% | | | |
| Air Freight & Logistics - 1.7% | | | |
| FedEx Corp. | | 4,294 | 1,124,083 |
| United Parcel Service, Inc. Class B | | 9,102 | 1,342,363 |
| | | | 2,466,446 |
| Commercial Services & Supplies - 0.3% | | | |
| Veralto Corp. | | 5,404 | 506,247 |
| Electrical Equipment - 4.3% | | | |
| Eaton Corp. PLC | | 4,864 | 1,548,017 |
| GE Vernova LLC | | 5,455 | 838,488 |
| nVent Electric PLC | | 20,493 | 1,476,931 |
| Prysmian SpA | | 17,752 | 969,602 |
| Regal Rexnord Corp. | | 6,404 | 1,033,413 |
| Sunrun, Inc. (a) | | 43,269 | 445,238 |
| | | | 6,311,689 |
| Ground Transportation - 0.4% | | | |
| ArcBest Corp. | | 4,798 | 532,146 |
| Machinery - 3.5% | | | |
| Deere & Co. | | 3,413 | 1,335,882 |
| Federal Signal Corp. | | 12,207 | 992,429 |
| Hillenbrand, Inc. | | 16,297 | 777,693 |
| Otis Worldwide Corp. | | 10,840 | 988,608 |
| Parker Hannifin Corp. | | 2,068 | 1,126,874 |
| | | | 5,221,486 |
| Professional Services - 2.3% | | | |
| Leidos Holdings, Inc. | | 9,142 | 1,281,891 |
| ManpowerGroup, Inc. | | 9,802 | 739,561 |
| Science Applications International Corp. | | 8,203 | 1,055,726 |
| UL Solutions, Inc. Class A | | 11,444 | 401,684 |
| | | | 3,478,862 |
TOTAL INDUSTRIALS | | | 18,516,876 |
| INFORMATION TECHNOLOGY - 25.0% | | | |
| Communications Equipment - 0.9% | | | |
| Arista Networks, Inc. (a) | | 4,898 | 1,256,631 |
| Electronic Equipment, Instruments & Components - 2.1% | | | |
| CDW Corp. | | 8,178 | 1,977,931 |
| Insight Enterprises, Inc. (a) | | 5,821 | 1,062,740 |
| | | | 3,040,671 |
| IT Services - 1.9% | | | |
| Accenture PLC Class A | | 9,420 | 2,834,572 |
| Semiconductors & Semiconductor Equipment - 7.9% | | | |
| Advanced Micro Devices, Inc. (a) | | 6,799 | 1,076,826 |
| First Solar, Inc. (a) | | 4,267 | 752,272 |
| Marvell Technology, Inc. | | 22,221 | 1,464,586 |
| Micron Technology, Inc. | | 13,895 | 1,569,579 |
| NVIDIA Corp. | | 4,294 | 3,710,102 |
| NXP Semiconductors NV | | 7,553 | 1,935,003 |
| SolarEdge Technologies, Inc. (a) | | 9,055 | 531,076 |
| Universal Display Corp. | | 4,677 | 738,872 |
| | | | 11,778,316 |
| Software - 10.5% | | | |
| Adobe, Inc. (a) | | 4,254 | 1,968,879 |
| Gen Digital, Inc. | | 55,501 | 1,117,790 |
| HubSpot, Inc. (a) | | 3,639 | 2,201,122 |
| Intuit, Inc. | | 3,763 | 2,354,208 |
| Microsoft Corp. | | 13,815 | 5,378,594 |
| Pagerduty, Inc. (a) | | 25,217 | 503,331 |
| Salesforce, Inc. | | 7,854 | 2,112,255 |
| | | | 15,636,179 |
| Technology Hardware, Storage & Peripherals - 1.7% | | | |
| Apple, Inc. | | 14,727 | 2,508,450 |
TOTAL INFORMATION TECHNOLOGY | | | 37,054,819 |
| MATERIALS - 3.5% | | | |
| Chemicals - 1.9% | | | |
| Cabot Corp. | | 11,110 | 1,013,565 |
| Celanese Corp. Class A | | 6,658 | 1,022,735 |
| Eastman Chemical Co. | | 8,690 | 820,684 |
| | | | 2,856,984 |
| Construction Materials - 0.6% | | | |
| Summit Materials, Inc. (a) | | 23,667 | 920,646 |
| Containers & Packaging - 0.7% | | | |
| Ball Corp. | | 15,864 | 1,103,658 |
| Metals & Mining - 0.3% | | | |
| Radius Recycling, Inc. Class A | | 21,665 | 377,404 |
TOTAL MATERIALS | | | 5,258,692 |
| REAL ESTATE - 0.9% | | | |
| Equity Real Estate Investment Trusts (REITs) - 0.9% | | | |
| Ventas, Inc. | | 28,882 | 1,278,895 |
| UTILITIES - 3.2% | | | |
| Electric Utilities - 1.5% | | | |
| NextEra Energy, Inc. | | 18,816 | 1,260,108 |
| SSE PLC | | 45,058 | 936,594 |
| | | | 2,196,702 |
| Gas Utilities - 0.6% | | | |
| Southwest Gas Holdings, Inc. | | 12,908 | 963,195 |
| Independent Power and Renewable Electricity Producers - 0.5% | | | |
| Clearway Energy, Inc. Class C | | 30,686 | 717,439 |
| Water Utilities - 0.6% | | | |
| American Water Works Co., Inc. | | 7,015 | 858,075 |
TOTAL UTILITIES | | | 4,735,411 |
| TOTAL COMMON STOCKS (Cost $116,747,202) | | | 146,227,486 |
| | | | |
| Convertible Preferred Stocks - 0.3% |
| | | Shares | Value ($) |
| HEALTH CARE - 0.3% | | | |
| Health Care Providers & Services - 0.3% | | | |
Somatus, Inc. Series E (a)(b)(c) (Cost $350,799) | | 402 | 417,839 |
| | | | |
| Money Market Funds - 0.8% |
| | | Shares | Value ($) |
Fidelity Cash Central Fund 5.39% (d) (Cost $1,195,228) | | 1,194,989 | 1,195,228 |
| | | | |
| TOTAL INVESTMENT IN SECURITIES - 99.7% (Cost $118,293,229) | 147,840,553 |
NET OTHER ASSETS (LIABILITIES) - 0.3% | 416,833 |
| NET ASSETS - 100.0% | 148,257,386 |
| | |
Legend
| (b) | Restricted securities (including private placements) - Investment in securities not registered under the Securities Act of 1933 (excluding 144A issues). At the end of the period, the value of restricted securities (excluding 144A issues) amounted to $548,351 or 0.4% of net assets. |
| (d) | Affiliated fund that is generally available only to investment companies and other accounts managed by Fidelity Investments. The rate quoted is the annualized seven-day yield of the fund at period end. A complete unaudited listing of the fund's holdings as of its most recent quarter end is available upon request. In addition, each Fidelity Central Fund's financial statements, which are not covered by the Fund's Report of Independent Registered Public Accounting Firm, are available on the SEC's website or upon request. |
| Additional information on each restricted holding is as follows: |
| Security | Acquisition Date | Acquisition Cost ($) |
| Somatus, Inc. Series E | 1/31/22 | 350,799 |
| | | |
| Starling Bank Ltd. Series D | 6/18/21 - 4/05/22 | 68,001 |
| | | |
Affiliated Central Funds
Fiscal year to date information regarding the Fund's investments in Fidelity Central Funds, including the ownership percentage, is presented below.
| Affiliate | Value, beginning of period ($) | Purchases ($) | Sales Proceeds ($) | Dividend Income ($) | Realized Gain (loss) ($) | Change in Unrealized appreciation (depreciation) ($) | Value, end of period ($) | % ownership, end of period |
| Fidelity Cash Central Fund 5.39% | 4,527,991 | 36,843,007 | 40,175,742 | 133,973 | (28) | - | 1,195,228 | 0.0% |
| Total | 4,527,991 | 36,843,007 | 40,175,742 | 133,973 | (28) | - | 1,195,228 | |
| | | | | | | | | |
Amounts in the dividend income column in the above table include any capital gain distributions from underlying funds, which are presented in the corresponding line item in the Statement of Operations, if applicable.
Amounts included in the purchases and sales proceeds columns may include in-kind transactions, if applicable.
Investment Valuation
The following is a summary of the inputs used, as of April 30, 2024, involving the Fund's assets and liabilities carried at fair value. The inputs or methodology used for valuing securities may not be an indication of the risk associated with investing in those securities. For more information on valuation inputs, and their aggregation into the levels used below, please refer to the Investment Valuation section in the accompanying Notes to Financial Statements.
| Valuation Inputs at Reporting Date: |
| Description | Total ($) | Level 1 ($) | Level 2 ($) | Level 3 ($) |
Investments in Securities: | | | | |
|
| Equities: | | | | |
Communication Services | 10,429,274 | 10,429,274 | - | - |
Consumer Discretionary | 19,115,975 | 18,139,287 | 976,688 | - |
Consumer Staples | 4,114,981 | 4,114,981 | - | - |
Energy | 4,862,958 | 4,195,035 | 667,923 | - |
Financials | 21,125,370 | 19,744,429 | 1,250,429 | 130,512 |
Health Care | 20,152,074 | 19,734,235 | - | 417,839 |
Industrials | 18,516,876 | 18,516,876 | - | - |
Information Technology | 37,054,819 | 37,054,819 | - | - |
Materials | 5,258,692 | 5,258,692 | - | - |
Real Estate | 1,278,895 | 1,278,895 | - | - |
Utilities | 4,735,411 | 3,798,817 | 936,594 | - |
|
| Money Market Funds | 1,195,228 | 1,195,228 | - | - |
| Total Investments in Securities: | 147,840,553 | 143,460,568 | 3,831,634 | 548,351 |
| Statement of Assets and Liabilities |
| | | | April 30, 2024 |
| | | | | |
| Assets | | | | |
| Investment in securities, at value - See accompanying schedule: | | | | |
Unaffiliated issuers (cost $117,098,001) | $ | 146,645,325 | | |
Fidelity Central Funds (cost $1,195,228) | | 1,195,228 | | |
| | | | | |
| | | | | |
| Total Investment in Securities (cost $118,293,229) | | | $ | 147,840,553 |
| Foreign currency held at value (cost $10,239) | | | | 10,221 |
| Receivable for investments sold | | | | 454,484 |
| Receivable for fund shares sold | | | | 25,260 |
| Dividends receivable | | | | 110,260 |
| Distributions receivable from Fidelity Central Funds | | | | 6,400 |
| Prepaid expenses | | | | 52 |
Total assets | | | | 148,447,230 |
| Liabilities | | | | |
| Payable for fund shares redeemed | $ | 69,440 | | |
| Accrued management fee | | 73,925 | | |
| Distribution and service plan fees payable | | 3,735 | | |
| Audit fee payable | | 40,270 | | |
| Other payables and accrued expenses | | 2,474 | | |
| Total liabilities | | | | 189,844 |
| Net Assets | | | $ | 148,257,386 |
| Net Assets consist of: | | | | |
| Paid in capital | | | $ | 119,007,975 |
| Total accumulated earnings (loss) | | | | 29,249,411 |
| Net Assets | | | $ | 148,257,386 |
| | | | | |
| Net Asset Value and Maximum Offering Price | | | | |
| Class A : | | | | |
Net Asset Value and redemption price per share ($7,925,595 ÷ 501,327 shares)(a) | | | $ | 15.81 |
| Maximum offering price per share (100/94.25 of $15.81) | | | $ | 16.77 |
| Class M : | | | | |
Net Asset Value and redemption price per share ($1,332,611 ÷ 84,657 shares)(a) | | | $ | 15.74 |
| Maximum offering price per share (100/96.50 of $15.74) | | | $ | 16.31 |
| Class C : | | | | |
Net Asset Value and offering price per share ($1,745,125 ÷ 112,601 shares)(a) | | | $ | 15.50 |
| Fidelity Women's Leadership Fund : | | | | |
Net Asset Value, offering price and redemption price per share ($105,831,654 ÷ 6,665,222 shares) | | | $ | 15.88 |
| Class I : | | | | |
Net Asset Value, offering price and redemption price per share ($16,278,832 ÷ 1,026,013 shares) | | | $ | 15.87 |
| Class Z : | | | | |
Net Asset Value, offering price and redemption price per share ($15,143,569 ÷ 950,674 shares) | | | $ | 15.93 |
(a)Redemption price per share is equal to net asset value less any applicable contingent deferred sales charge. |
| Statement of Operations |
| | | | Year ended April 30, 2024 |
| Investment Income | | | | |
| Dividends | | | $ | 1,975,468 |
| Income from Fidelity Central Funds | | | | 133,973 |
| Total income | | | | 2,109,441 |
| Expenses | | | | |
| Management fee | | | | |
| Basic fee | $ | 820,772 | | |
| Performance adjustment | | (127,765) | | |
| Transfer agent fees | | 263,663 | | |
| Distribution and service plan fees | | 40,348 | | |
| Accounting fees and expenses | | 43,889 | | |
| Custodian fees and expenses | | 7,419 | | |
| Independent trustees' fees and expenses | | 744 | | |
| Registration fees | | 85,916 | | |
| Audit | | 55,673 | | |
| Legal | | 380 | | |
| Interest | | 864 | | |
| Miscellaneous | | 572 | | |
| Total expenses before reductions | | 1,192,475 | | |
| Expense reductions | | (12,400) | | |
| Total expenses after reductions | | | | 1,180,075 |
| Net Investment income (loss) | | | | 929,366 |
| Realized and Unrealized Gain (Loss) | | | | |
| Net realized gain (loss) on: | | | | |
| Investment Securities: | | | | |
| Unaffiliated issuers (net of foreign taxes of $641) | | 5,094,334 | | |
| Fidelity Central Funds | | (28) | | |
| Foreign currency transactions | | 193 | | |
| Total net realized gain (loss) | | | | 5,094,499 |
| Change in net unrealized appreciation (depreciation) on: | | | | |
| Investment Securities: | | | | |
| Unaffiliated issuers (net of decrease in deferred foreign taxes of $365) | | 19,669,165 | | |
| Assets and liabilities in foreign currencies | | (337) | | |
| Total change in net unrealized appreciation (depreciation) | | | | 19,668,828 |
| Net gain (loss) | | | | 24,763,327 |
| Net increase (decrease) in net assets resulting from operations | | | $ | 25,692,693 |
| Statement of Changes in Net Assets |
| |
| | Year ended April 30, 2024 | | Year ended April 30, 2023 |
| Increase (Decrease) in Net Assets | | | | |
| Operations | | | | |
| Net investment income (loss) | $ | 929,366 | $ | 964,545 |
| Net realized gain (loss) | | 5,094,499 | | (4,429,525) |
| Change in net unrealized appreciation (depreciation) | | 19,668,828 | | 6,424,381 |
| Net increase (decrease) in net assets resulting from operations | | 25,692,693 | | 2,959,401 |
| Distributions to shareholders | | (910,957) | | (755,398) |
| | | | | |
| Share transactions - net increase (decrease) | | (24,021,691) | | 16,505,229 |
| Total increase (decrease) in net assets | | 760,045 | | 18,709,232 |
| | | | | |
| Net Assets | | | | |
| Beginning of period | | 147,497,341 | | 128,788,109 |
| End of period | $ | 148,257,386 | $ | 147,497,341 |
| | | | | |
| | | | | |
Financial Highlights
Fidelity Advisor® Women's Leadership Fund Class A |
| |
| Years ended April 30, | | 2024 | | 2023 | | 2022 | | 2021 | | 2020 A |
Selected Per-Share Data | | | | | | | | | | |
| Net asset value, beginning of period | $ | 13.39 | $ | 13.18 | $ | 15.28 | $ | 9.80 | $ | 10.00 |
| Income from Investment Operations | | | | | | | | | | |
Net investment income (loss) B,C | | .06 | | .07 | | - D | | - D | | .04 |
| Net realized and unrealized gain (loss) | | 2.42 | | .20 | | (1.70) | | 5.49 | | (.22) |
| Total from investment operations | | 2.48 | | .27 | | (1.70) | | 5.49 | | (.18) |
| Distributions from net investment income | | (.06) | | (.06) | | - D | | (.01) | | (.02) |
| Distributions from net realized gain | | - | | - | | (.40) | | - | | - |
| Total distributions | | (.06) | | (.06) | | (.40) | | (.01) | | (.02) |
| Net asset value, end of period | $ | 15.81 | $ | 13.39 | $ | 13.18 | $ | 15.28 | $ | 9.80 |
Total Return E,F | | | | 2.10% | | (11.46)% | | 56.03% | | (1.84)% |
Ratios to Average Net Assets C,G,H | | | | | | | | | | |
| Expenses before reductions | | 1.03% | | 1.09% | | 1.10% | | 1.28% | | 2.50% |
| Expenses net of fee waivers, if any | | | | 1.09% | | 1.10% | | 1.25% | | 1.25% |
| Expenses net of all reductions | | 1.02% | | 1.09% | | 1.10% | | 1.24% | | 1.25% |
| Net investment income (loss) | | .38% | | .57% | | (.01)% | | (.03)% | | .37% |
| Supplemental Data | | | | | | | | | | |
| Net assets, end of period (000 omitted) | $ | 7,926 | $ | 6,104 | $ | 5,171 | $ | 2,865 | $ | 769 |
Portfolio turnover rate I | | | | 22% | | 48% | | 35% | | 52% |
AFor the period May 1, 2019 (commencement of operations) through April 30, 2020.
BCalculated based on average shares outstanding during the period.
CNet investment income (loss) is affected by the timing of the declaration of dividends by any underlying mutual funds or exchange-traded funds (ETFs). Net investment income (loss) of any mutual funds or ETFs is not included in the Fund's net investment income (loss) ratio.
DAmount represents less than $.005 per share.
ETotal returns would have been lower if certain expenses had not been reduced during the applicable periods shown.
FTotal returns do not include the effect of the sales charges.
GFees and expenses of any underlying mutual funds or exchange-traded funds (ETFs) are not included in the Fund's expense ratio. The Fund indirectly bears its proportionate share of these expenses. For additional expense information related to investments in Fidelity Central Funds, please refer to the "Investments in Fidelity Central Funds" note found in the Notes to Financial Statements section of the most recent Annual or Semi-Annual report.
HExpense ratios reflect operating expenses of the class. Expenses before reductions do not reflect amounts reimbursed, waived, or reduced through arrangements with the investment adviser, brokerage services, or other offset arrangements, if applicable, and do not represent the amount paid by the class during periods when reimbursements, waivers or reductions occur.
IAmount does not include the portfolio activity of any underlying mutual funds or exchange-traded funds (ETFs).
Fidelity Advisor® Women's Leadership Fund Class M |
| |
| Years ended April 30, | | 2024 | | 2023 | | 2022 | | 2021 | | 2020 A |
Selected Per-Share Data | | | | | | | | | | |
| Net asset value, beginning of period | $ | 13.34 | $ | 13.14 | $ | 15.22 | $ | 9.78 | $ | 10.00 |
| Income from Investment Operations | | | | | | | | | | |
Net investment income (loss) B,C | | .02 | | .04 | | (.04) | | (.04) | | .01 |
| Net realized and unrealized gain (loss) | | 2.41 | | .20 | | (1.69) | | 5.48 | | (.22) |
| Total from investment operations | | 2.43 | | .24 | | (1.73) | | 5.44 | | (.21) |
| Distributions from net investment income | | (.03) | | (.04) | | - | | - D | | (.01) |
| Distributions from net realized gain | | - | | - | | (.35) | | - | | - |
| Total distributions | | (.03) | | (.04) | | (.35) | | - D | | (.01) |
| Net asset value, end of period | $ | 15.74 | $ | 13.34 | $ | 13.14 | $ | 15.22 | $ | 9.78 |
Total Return E,F | | | | 1.83% | | (11.66)% | | 55.65% | | (2.12)% |
Ratios to Average Net Assets C,G,H | | | | | | | | | | |
| Expenses before reductions | | 1.29% | | 1.37% | | 1.35% | | 1.52% | | 2.86% |
| Expenses net of fee waivers, if any | | | | 1.37% | | 1.35% | | 1.50% | | 1.50% |
| Expenses net of all reductions | | 1.29% | | 1.37% | | 1.35% | | 1.49% | | 1.50% |
| Net investment income (loss) | | .12% | | .28% | | (.27)% | | (.28)% | | .12% |
| Supplemental Data | | | | | | | | | | |
| Net assets, end of period (000 omitted) | $ | 1,333 | $ | 1,122 | $ | 1,054 | $ | 974 | $ | 443 |
Portfolio turnover rate I | | | | 22% | | 48% | | 35% | | 52% |
AFor the period May 1, 2019 (commencement of operations) through April 30, 2020.
BCalculated based on average shares outstanding during the period.
CNet investment income (loss) is affected by the timing of the declaration of dividends by any underlying mutual funds or exchange-traded funds (ETFs). Net investment income (loss) of any mutual funds or ETFs is not included in the Fund's net investment income (loss) ratio.
DAmount represents less than $.005 per share.
ETotal returns would have been lower if certain expenses had not been reduced during the applicable periods shown.
FTotal returns do not include the effect of the sales charges.
GFees and expenses of any underlying mutual funds or exchange-traded funds (ETFs) are not included in the Fund's expense ratio. The Fund indirectly bears its proportionate share of these expenses. For additional expense information related to investments in Fidelity Central Funds, please refer to the "Investments in Fidelity Central Funds" note found in the Notes to Financial Statements section of the most recent Annual or Semi-Annual report.
HExpense ratios reflect operating expenses of the class. Expenses before reductions do not reflect amounts reimbursed, waived, or reduced through arrangements with the investment adviser, brokerage services, or other offset arrangements, if applicable, and do not represent the amount paid by the class during periods when reimbursements, waivers or reductions occur.
IAmount does not include the portfolio activity of any underlying mutual funds or exchange-traded funds (ETFs).
Fidelity Advisor® Women's Leadership Fund Class C |
| |
| Years ended April 30, | | 2024 | | 2023 | | 2022 | | 2021 | | 2020 A |
Selected Per-Share Data | | | | | | | | | | |
| Net asset value, beginning of period | $ | 13.18 | $ | 13.00 | $ | 15.09 | $ | 9.74 | $ | 10.00 |
| Income from Investment Operations | | | | | | | | | | |
Net investment income (loss) B,C | | (.05) | | (.03) | | (.11) | | (.10) | | (.04) |
| Net realized and unrealized gain (loss) | | 2.37 | | .21 | | (1.68) | | 5.45 | | (.22) |
| Total from investment operations | | 2.32 | | .18 | | (1.79) | | 5.35 | | (.26) |
| Distributions from net realized gain | | - | | - | | (.30) | | - | | - |
| Total distributions | | - | | - | | (.30) | | - | | - |
| Net asset value, end of period | $ | 15.50 | $ | 13.18 | $ | 13.00 | $ | 15.09 | $ | 9.74 |
Total Return D,E | | | | 1.38% | | (12.12)% | | 54.93% | | (2.60)% |
Ratios to Average Net Assets C,F,G | | | | | | | | | | |
| Expenses before reductions | | 1.79% | | 1.86% | | 1.84% | | 1.99% | | 3.36% |
| Expenses net of fee waivers, if any | | | | 1.86% | | 1.84% | | 1.99% | | 2.00% |
| Expenses net of all reductions | | 1.78% | | 1.86% | | 1.84% | | 1.98% | | 2.00% |
| Net investment income (loss) | | (.37)% | | (.20)% | | (.75)% | | (.77)% | | (.38)% |
| Supplemental Data | | | | | | | | | | |
| Net assets, end of period (000 omitted) | $ | 1,745 | $ | 1,603 | $ | 1,540 | $ | 937 | $ | 468 |
Portfolio turnover rate H | | | | 22% | | 48% | | 35% | | 52% |
AFor the period May 1, 2019 (commencement of operations) through April 30, 2020.
BCalculated based on average shares outstanding during the period.
CNet investment income (loss) is affected by the timing of the declaration of dividends by any underlying mutual funds or exchange-traded funds (ETFs). Net investment income (loss) of any mutual funds or ETFs is not included in the Fund's net investment income (loss) ratio.
DTotal returns would have been lower if certain expenses had not been reduced during the applicable periods shown.
ETotal returns do not include the effect of the contingent deferred sales charge.
FFees and expenses of any underlying mutual funds or exchange-traded funds (ETFs) are not included in the Fund's expense ratio. The Fund indirectly bears its proportionate share of these expenses. For additional expense information related to investments in Fidelity Central Funds, please refer to the "Investments in Fidelity Central Funds" note found in the Notes to Financial Statements section of the most recent Annual or Semi-Annual report.
GExpense ratios reflect operating expenses of the class. Expenses before reductions do not reflect amounts reimbursed, waived, or reduced through arrangements with the investment adviser, brokerage services, or other offset arrangements, if applicable, and do not represent the amount paid by the class during periods when reimbursements, waivers or reductions occur.
HAmount does not include the portfolio activity of any underlying mutual funds or exchange-traded funds (ETFs).
Fidelity® Women's Leadership Fund |
| |
| Years ended April 30, | | 2024 | | 2023 | | 2022 | | 2021 | | 2020 A |
Selected Per-Share Data | | | | | | | | | | |
| Net asset value, beginning of period | $ | 13.45 | $ | 13.22 | $ | 15.31 | $ | 9.81 | $ | 10.00 |
| Income from Investment Operations | | | | | | | | | | |
Net investment income (loss) B,C | | .09 | | .10 | | .03 | | .03 | | .06 |
| Net realized and unrealized gain (loss) | | 2.43 | | .21 | | (1.70) | | 5.50 | | (.22) |
| Total from investment operations | | 2.52 | | .31 | | (1.67) | | 5.53 | | (.16) |
| Distributions from net investment income | | (.09) | | (.08) | | (.02) | | (.03) | | (.03) |
| Distributions from net realized gain | | - | | - | | (.40) | | - | | - |
| Total distributions | | (.09) | | (.08) | | (.42) | | (.03) | | (.03) |
| Net asset value, end of period | $ | 15.88 | $ | 13.45 | $ | 13.22 | $ | 15.31 | $ | 9.81 |
Total Return D | | | | 2.37% | | (11.25)% | | 56.44% | | (1.63)% |
Ratios to Average Net Assets C,E,F | | | | | | | | | | |
| Expenses before reductions | | .79% | | .89% | | .92% | | 1.10% | | 2.19% |
| Expenses net of fee waivers, if any | | | | .89% | | .90% | | 1.00% | | 1.00% |
| Expenses net of all reductions | | .78% | | .89% | | .90% | | .99% | | 1.00% |
| Net investment income (loss) | | .63% | | .76% | | .18% | | .22% | | .62% |
| Supplemental Data | | | | | | | | | | |
| Net assets, end of period (000 omitted) | $ | 105,832 | $ | 115,107 | $ | 101,533 | $ | 98,888 | $ | 22,272 |
Portfolio turnover rate G | | | | 22% | | 48% | | 35% | | 52% |
AFor the period May 1, 2019 (commencement of operations) through April 30, 2020.
BCalculated based on average shares outstanding during the period.
CNet investment income (loss) is affected by the timing of the declaration of dividends by any underlying mutual funds or exchange-traded funds (ETFs). Net investment income (loss) of any mutual funds or ETFs is not included in the Fund's net investment income (loss) ratio.
DTotal returns would have been lower if certain expenses had not been reduced during the applicable periods shown.
EFees and expenses of any underlying mutual funds or exchange-traded funds (ETFs) are not included in the Fund's expense ratio. The Fund indirectly bears its proportionate share of these expenses. For additional expense information related to investments in Fidelity Central Funds, please refer to the "Investments in Fidelity Central Funds" note found in the Notes to Financial Statements section of the most recent Annual or Semi-Annual report.
FExpense ratios reflect operating expenses of the class. Expenses before reductions do not reflect amounts reimbursed, waived, or reduced through arrangements with the investment adviser, brokerage services, or other offset arrangements, if applicable, and do not represent the amount paid by the class during periods when reimbursements, waivers or reductions occur.
GAmount does not include the portfolio activity of any underlying mutual funds or exchange-traded funds (ETFs).
Fidelity Advisor® Women's Leadership Fund Class I |
| |
| Years ended April 30, | | 2024 | | 2023 | | 2022 | | 2021 | | 2020 A |
Selected Per-Share Data | | | | | | | | | | |
| Net asset value, beginning of period | $ | 13.44 | $ | 13.21 | $ | 15.31 | $ | 9.81 | $ | 10.00 |
| Income from Investment Operations | | | | | | | | | | |
Net investment income (loss) B,C | | .10 | | .11 | | .04 | | .03 | | .06 |
| Net realized and unrealized gain (loss) | | 2.43 | | .21 | | (1.70) | | 5.51 | | (.22) |
| Total from investment operations | | 2.53 | | .32 | | (1.66) | | 5.54 | | (.16) |
| Distributions from net investment income | | (.10) | | (.09) | | (.04) | | (.04) | | (.03) |
| Distributions from net realized gain | | - | | - | | (.40) | | - | | - |
| Total distributions | | (.10) | | (.09) | | (.44) | | (.04) | | (.03) |
| Net asset value, end of period | $ | 15.87 | $ | 13.44 | $ | 13.21 | $ | 15.31 | $ | 9.81 |
Total Return D | | | | 2.46% | | (11.20)% | | 56.52% | | (1.63)% |
Ratios to Average Net Assets C,E,F | | | | | | | | | | |
| Expenses before reductions | | .74% | | .80% | | .81% | | .98% | | 2.22% |
| Expenses net of fee waivers, if any | | | | .79% | | .81% | | .98% | | 1.00% |
| Expenses net of all reductions | | .73% | | .79% | | .81% | | .97% | | 1.00% |
| Net investment income (loss) | | .68% | | .86% | | .28% | | .24% | | .62% |
| Supplemental Data | | | | | | | | | | |
| Net assets, end of period (000 omitted) | $ | 16,279 | $ | 13,381 | $ | 11,273 | $ | 3,874 | $ | 702 |
Portfolio turnover rate G | | | | 22% | | 48% | | 35% | | 52% |
AFor the period May 1, 2019 (commencement of operations) through April 30, 2020.
BCalculated based on average shares outstanding during the period.
CNet investment income (loss) is affected by the timing of the declaration of dividends by any underlying mutual funds or exchange-traded funds (ETFs). Net investment income (loss) of any mutual funds or ETFs is not included in the Fund's net investment income (loss) ratio.
DTotal returns would have been lower if certain expenses had not been reduced during the applicable periods shown.
EFees and expenses of any underlying mutual funds or exchange-traded funds (ETFs) are not included in the Fund's expense ratio. The Fund indirectly bears its proportionate share of these expenses. For additional expense information related to investments in Fidelity Central Funds, please refer to the "Investments in Fidelity Central Funds" note found in the Notes to Financial Statements section of the most recent Annual or Semi-Annual report.
FExpense ratios reflect operating expenses of the class. Expenses before reductions do not reflect amounts reimbursed, waived, or reduced through arrangements with the investment adviser, brokerage services, or other offset arrangements, if applicable, and do not represent the amount paid by the class during periods when reimbursements, waivers or reductions occur.
GAmount does not include the portfolio activity of any underlying mutual funds or exchange-traded funds (ETFs).
Fidelity Advisor® Women's Leadership Fund Class Z |
| |
| Years ended April 30, | | 2024 | | 2023 | | 2022 | | 2021 | | 2020 A |
Selected Per-Share Data | | | | | | | | | | |
| Net asset value, beginning of period | $ | 13.49 | $ | 13.25 | $ | 15.35 | $ | 9.83 | $ | 10.00 |
| Income from Investment Operations | | | | | | | | | | |
Net investment income (loss) B,C | | .12 | | .13 | | .06 | | .05 | | .08 |
| Net realized and unrealized gain (loss) | | 2.44 | | .21 | | (1.71) | | 5.51 | | (.22) |
| Total from investment operations | | 2.56 | | .34 | | (1.65) | | 5.56 | | (.14) |
| Distributions from net investment income | | (.12) | | (.10) | | (.05) | | (.04) | | (.03) |
| Distributions from net realized gain | | - | | - | | (.40) | | - | | - |
| Total distributions | | (.12) | | (.10) | | (.45) | | (.04) | | (.03) |
| Net asset value, end of period | $ | 15.93 | $ | 13.49 | $ | 13.25 | $ | 15.35 | $ | 9.83 |
Total Return D | | | | 2.59% | | (11.13)% | | 56.63% | | (1.43)% |
Ratios to Average Net Assets C,E,F | | | | | | | | | | |
| Expenses before reductions | | .62% | | .68% | | .69% | | .87% | | 1.88% |
| Expenses net of fee waivers, if any | | | | .67% | | .69% | | .85% | | .85% |
| Expenses net of all reductions | | .61% | | .67% | | .69% | | .84% | | .85% |
| Net investment income (loss) | | .80% | | .98% | | .40% | | .37% | | .76% |
| Supplemental Data | | | | | | | | | | |
| Net assets, end of period (000 omitted) | $ | 15,144 | $ | 10,181 | $ | 8,216 | $ | 9,043 | $ | 2,376 |
Portfolio turnover rate G | | | | 22% | | 48% | | 35% | | 52% |
AFor the period May 1, 2019 (commencement of operations) through April 30, 2020.
BCalculated based on average shares outstanding during the period.
CNet investment income (loss) is affected by the timing of the declaration of dividends by any underlying mutual funds or exchange-traded funds (ETFs). Net investment income (loss) of any mutual funds or ETFs is not included in the Fund's net investment income (loss) ratio.
DTotal returns would have been lower if certain expenses had not been reduced during the applicable periods shown.
EFees and expenses of any underlying mutual funds or exchange-traded funds (ETFs) are not included in the Fund's expense ratio. The Fund indirectly bears its proportionate share of these expenses. For additional expense information related to investments in Fidelity Central Funds, please refer to the "Investments in Fidelity Central Funds" note found in the Notes to Financial Statements section of the most recent Annual or Semi-Annual report.
FExpense ratios reflect operating expenses of the class. Expenses before reductions do not reflect amounts reimbursed, waived, or reduced through arrangements with the investment adviser, brokerage services, or other offset arrangements, if applicable, and do not represent the amount paid by the class during periods when reimbursements, waivers or reductions occur.
GAmount does not include the portfolio activity of any underlying mutual funds or exchange-traded funds (ETFs).
For the period ended April 30, 2024
1. Organization.
Fidelity Women's Leadership Fund (the Fund) is a fund of Fidelity Summer Street Trust (the Trust) and is authorized to issue an unlimited number of shares. The Trust is registered under the Investment Company Act of 1940, as amended (the 1940 Act), as an open-end management investment company organized as a Massachusetts business trust. The Fund offers Class A, Class M, Class C, Fidelity Women's Leadership Fund, Class I and Class Z shares, each of which has equal rights as to assets and voting privileges. Class A, Class M, Class C, Class I and Class Z are Fidelity Advisor classes. Each class has exclusive voting rights with respect to matters that affect that class. Class C shares will automatically convert to Class A shares after a holding period of eight years from the initial date of purchase, with certain exceptions.
2. Investments in Fidelity Central Funds.
Funds may invest in Fidelity Central Funds, which are open-end investment companies generally available only to other investment companies and accounts managed by the investment adviser and its affiliates. The Schedule of Investments lists any Fidelity Central Funds held as an investment as of period end, but does not include the underlying holdings of each Fidelity Central Fund. An investing fund indirectly bears its proportionate share of the expenses of the underlying Fidelity Central Funds.
Based on its investment objective, each Fidelity Central Fund may invest or participate in various investment vehicles or strategies that are similar to those of the investing fund. These strategies are consistent with the investment objectives of the investing fund and may involve certain economic risks which may cause a decline in value of each of the Fidelity Central Funds and thus a decline in the value of the investing fund.
| Fidelity Central Fund | Investment Manager | Investment Objective | Investment Practices | Expense RatioA |
| Fidelity Money Market Central Funds | Fidelity Management & Research Company LLC (FMR) | Each fund seeks to obtain a high level of current income consistent with the preservation of capital and liquidity. | Short-term Investments | Less than .005% |
A Expenses expressed as a percentage of average net assets and are as of each underlying Central Fund's most recent annual or semi-annual shareholder report.
A complete unaudited list of holdings for each Fidelity Central Fund is available upon request or at the Securities and Exchange Commission website at www.sec.gov. In addition, the financial statements of the Fidelity Central Funds which contain the significant accounting policies (including investment valuation policies) of those funds, and are not covered by the Report of Independent Registered Public Accounting Firm, are available on the Securities and Exchange Commission website or upon request.
3. Significant Accounting Policies.
The Fund is an investment company and applies the accounting and reporting guidance of the Financial Accounting Standards Board (FASB) Accounting Standards Codification Topic 946 Financial Services - Investment Companies. The financial statements have been prepared in conformity with accounting principles generally accepted in the United States of America (GAAP), which require management to make certain estimates and assumptions at the date of the financial statements. Actual results could differ from those estimates. Subsequent events, if any, through the date that the financial statements were issued have been evaluated in the preparation of the financial statements. The Fund's Schedule of Investments lists any underlying mutual funds or exchange-traded funds (ETFs) but does not include the underlying holdings of these funds. The following summarizes the significant accounting policies of the Fund:
Investment Valuation. Investments are valued as of 4:00 p.m. Eastern time on the last calendar day of the period. The Board of Trustees (the Board) has designated the Fund's investment adviser as the valuation designee responsible for the fair valuation function and performing fair value determinations as needed. The investment adviser has established a Fair Value Committee (the Committee) to carry out the day-to-day fair valuation responsibilities and has adopted policies and procedures to govern the fair valuation process and the activities of the Committee. In accordance with these fair valuation policies and procedures, which have been approved by the Board, the Fund attempts to obtain prices from one or more third party pricing services or brokers to value its investments. When current market prices, quotations or currency exchange rates are not readily available or reliable, investments will be fair valued in good faith by the Committee, in accordance with the policies and procedures. Factors used in determining fair value vary by investment type and may include market or investment specific events, transaction data, estimated cash flows, and market observations of comparable investments. The frequency that the fair valuation procedures are used cannot be predicted and they may be utilized to a significant extent. The Committee manages the Fund's fair valuation practices and maintains the fair valuation policies and procedures. The Fund's investment adviser reports to the Board information regarding the fair valuation process and related material matters.
The Fund categorizes the inputs to valuation techniques used to value its investments into a disclosure hierarchy consisting of three levels as shown below:
Level 1 - unadjusted quoted prices in active markets for identical investments
Level 2 - other significant observable inputs (including quoted prices for similar investments, interest rates, prepayment speeds, etc.)
Level 3 - unobservable inputs (including the Fund's own assumptions based on the best information available)
Valuation techniques used to value the Fund's investments by major category are as follows:
Equity securities, including restricted securities, for which market quotations are readily available, are valued at the last reported sale price or official closing price as reported by a third party pricing service on the primary market or exchange on which they are traded and are categorized as Level 1 in the hierarchy. In the event there were no sales during the day or closing prices are not available, securities are valued at the last quoted bid price or may be valued using the last available price and are generally categorized as Level 2 in the hierarchy. For foreign equity securities, when market or security specific events arise, comparisons to the valuation of American Depositary Receipts (ADRs), futures contracts, Exchange-Traded Funds (ETFs) and certain indexes as well as quoted prices for similar securities may be used and would be categorized as Level 2 in the hierarchy. For equity securities, including restricted securities, where observable inputs are limited, assumptions about market activity and risk are used and these securities may be categorized as Level 3 in the hierarchy.
Investments in open-end mutual funds, including the Fidelity Central Funds, are valued at their closing net asset value (NAV) each business day and are categorized as Level 1 in the hierarchy.
Changes in valuation techniques may result in transfers in or out of an assigned level within the disclosure hierarchy. The aggregate value of investments by input level as of April 30, 2024 is included at the end of the Fund's Schedule of Investments.
Foreign Currency. Certain Funds may use foreign currency contracts to facilitate transactions in foreign-denominated securities. Gains and losses from these transactions may arise from changes in the value of the foreign currency or if the counterparties do not perform under the contracts' terms.
Foreign-denominated assets, including investment securities, and liabilities are translated into U.S. dollars at the exchange rates at period end. Purchases and sales of investment securities, income and dividends received, and expenses denominated in foreign currencies are translated into U.S. dollars at the exchange rate in effect on the transaction date.
The effects of exchange rate fluctuations on investments are included with the net realized and unrealized gain (loss) on investment securities. Other foreign currency transactions resulting in realized and unrealized gain (loss) are disclosed separately.
Investment Transactions and Income. For financial reporting purposes, the Fund's investment holdings and NAV include trades executed through the end of the last business day of the period. The NAV per share for processing shareholder transactions is calculated as of the close of business of the New York Stock Exchange (NYSE), normally 4:00 p.m. Eastern time and includes trades executed through the end of the prior business day. Gains and losses on securities sold are determined on the basis of identified cost and include proceeds received from litigation. Commissions paid to certain brokers with whom the investment adviser, or its affiliates, places trades on behalf of a fund include an amount in addition to trade execution, which may be rebated back to a fund. Any such rebates are included in net realized gain (loss) on investments in the Statement of Operations. Dividend income is recorded on the ex-dividend date, except for certain dividends from foreign securities where the ex-dividend date may have passed, which are recorded as soon as the Fund is informed of the ex-dividend date. Non-cash dividends included in dividend income, if any, are recorded at the fair market value of the securities received. Income and capital gain distributions from Fidelity Central Funds, if any, are recorded on the ex-dividend date. Certain distributions received by the Fund represent a return of capital or capital gain. The Fund determines the components of these distributions subsequent to the ex-dividend date, based upon receipt of tax filings or other correspondence relating to the underlying investment. These distributions are recorded as a reduction of cost of investments and/or as a realized gain. Investment income is recorded net of foreign taxes withheld where recovery of such taxes is uncertain. Funds may file withholding tax reclaims in certain jurisdictions to recover a portion of amounts previously withheld. Any withholding tax reclaims income is included in the Statement of Operations in dividends. Any receivables for withholding tax reclaims are included in the Statement of Assets and Liabilities in dividends receivable.
Class Allocations and Expenses. Investment income, realized and unrealized capital gains and losses, common expenses of a fund, and certain fund-level expense reductions, if any, are allocated daily on a pro-rata basis to each class based on the relative net assets of each class to the total net assets of a fund. Each class differs with respect to transfer agent and distribution and service plan fees incurred, as applicable. Certain expense reductions may also differ by class, if applicable. For the reporting period, the allocated portion of income and expenses to each class as a percent of its average net assets may vary due to the timing of recording these transactions in relation to fluctuating net assets of the classes. Expenses directly attributable to a fund are charged to that fund. Expenses attributable to more than one fund are allocated among the respective funds on the basis of relative net assets or other appropriate methods. Expenses included in the accompanying financial statements reflect the expenses of that fund and do not include any expenses associated with any underlying mutual funds or exchange-traded funds (ETFs). Although not included in a fund's expenses, a fund indirectly bears its proportionate share of these expenses through the net asset value of each underlying mutual fund or exchange-traded fund (ETF). Expense estimates are accrued in the period to which they relate and adjustments are made when actual amounts are known.
Income Tax Information and Distributions to Shareholders. Each year, the Fund intends to qualify as a regulated investment company under Subchapter M of the Internal Revenue Code, including distributing substantially all of its taxable income and realized gains. As a result, no provision for U.S. Federal income taxes is required. As of April 30, 2024, the Fund did not have any unrecognized tax benefits in the financial statements; nor is the Fund aware of any tax positions for which it is reasonably possible that the total amounts of unrecognized tax benefits will significantly change in the next twelve months. The Fund files a U.S. federal tax return, in addition to state and local tax returns as required. The Fund's federal income tax returns are subject to examination by the Internal Revenue Service (IRS) for a period of three fiscal years after they are filed. State and local tax returns may be subject to examination for an additional fiscal year depending on the jurisdiction. Foreign taxes are provided for based on the Fund's understanding of the tax rules and rates that exist in the foreign markets in which it invests. The Fund is subject to a tax imposed on capital gains by certain countries in which it invests.
Distributions are declared and recorded on the ex-dividend date. Income and capital gain distributions are declared separately for each class. Income and capital gain distributions are determined in accordance with income tax regulations, which may differ from GAAP. In addition, the Fund claimed a portion of the payment made to redeeming shareholders as a distribution for income tax purposes.
Capital accounts within the financial statements are adjusted for permanent book-tax differences. These adjustments have no impact on net assets or the results of operations. Capital accounts are not adjusted for temporary book-tax differences which will reverse in a subsequent period.
Book-tax differences are primarily due to foreign currency transactions, certain foreign taxes, capital loss carryforwards and losses deferred due to wash sales.
As of period end, the cost and unrealized appreciation (depreciation) in securities, and derivatives if applicable, for federal income tax purposes were as follows:
| Gross unrealized appreciation | $36,477,207 |
| Gross unrealized depreciation | (6,989,284) |
| Net unrealized appreciation (depreciation) | $29,487,923 |
| Tax Cost | $118,352,630 |
The tax-based components of distributable earnings as of period end were as follows:
| Undistributed ordinary income | $97,995 |
| Capital loss carryforward | $(335,872) |
| Net unrealized appreciation (depreciation) on securities and other investments | $29,487,289 |
Capital loss carryforwards are only available to offset future capital gains of the Fund to the extent provided by regulations and may be limited. The capital loss carryforward information presented below, including any applicable limitation, is estimated as of fiscal period end and is subject to adjustment.
The tax character of distributions paid was as follows:
| | April 30, 2024 | April 30, 2023 |
| Ordinary Income | $910,957 | $755,398 |
Restricted Securities (including Private Placements). Funds may invest in securities that are subject to legal or contractual restrictions on resale. These securities generally may be resold in transactions exempt from registration or to the public if the securities are registered. Disposal of these securities may involve time-consuming negotiations and expense, and prompt sale at an acceptable price may be difficult. Information regarding restricted securities held at period end is included at the end of the Schedule of Investments, if applicable.
4. Purchases and Sales of Investments.
Purchases and sales of securities, other than short-term securities and in-kind transactions, as applicable, are noted in the table below.
| | Purchases ($) | Sales ($) |
| Fidelity Women's Leadership Fund | 48,921,759 | 70,609,175 |
5. Fees and Other Transactions with Affiliates.
Management Fee. Fidelity Management & Research Company LLC (the investment adviser) and its affiliates provide the Fund with investment management related services for which the Fund pays a monthly management fee.
Effective March 1, 2024, the Fund's management contract was amended to incorporate administrative services previously covered under separate services agreements (Transfer Agent and Accounting agreements). The amended contract incorporates a basic fee rate that may vary by class (subject to a performance adjustment). The investment adviser or an affiliate pays certain expenses of managing and operating the Fund out of each class's management fee. Each class of the Fund pays a management fee to the investment adviser. The management fee is calculated and paid to the investment adviser every month. The management fee is determined by calculating a basic fee and then applying a performance adjustment. When determining a class's basic fee, a mandate rate is calculated based on the monthly average net assets of a group of funds advised by FMR within a designated asset class. A discount rate is subtracted from the mandate rate once the Fund's monthly average net assets reach a certain level. The mandate rate and discount rate may vary by class. The annual basic fee rate for a class of shares of the Fund is the lesser of (1) the class's mandate rate reduced by the class's discount rate (if applicable) or (2) the amount set forth in the following table.
| | Maximum Management Fee Rate % |
| Class A | .72 |
| Class M | .72 |
| Class C | .72 |
| Fidelity Women's Leadership Fund | .72 |
| Class I | .68 |
| Class Z | .56 |
One-twelfth of the basic fee rate for a class is applied to the average net assets of the class for the month, giving a dollar amount which is the basic fee for the class for that month. A different management fee rate may be applicable to each class of the Fund. The difference between classes is the result of separate arrangements for class-level services and/or waivers of certain expenses. It is not the result of any difference in advisory or custodial fees or other expenses related to the management of the Fund's assets, which do not vary by class. For the portion of the reporting period on or after March 1, 2024, the total annualized management fee rates were as follows:
| | Total Management Fee Rate % |
| Class A | .72 |
| Class M | .72 |
| Class C | .72 |
| Fidelity Women's Leadership Fund | .68 |
| Class I | .68 |
| Class Z | .56 |
Prior to March 1, 2024, the management fee was the sum of an individual fund fee rate that was based on an annual rate of .30% of the Fund's average net assets and an annualized group fee rate that averaged .22% during the period. The group fee rate was based upon the monthly average net assets of a group of registered investment companies with which the investment adviser has management contracts. The group fee rate decreased as assets under management increased and increased as assets under management decreased. For the portion of the reporting period prior to March 1, 2024, the total annualized management fee rate was .52%.
The performance adjustment rate is calculated monthly by comparing over the performance period the Fund's performance to that of the performance adjustment index listed below.
| | Performance Adjustment Index |
| Fidelity Women's Leadership Fund | Russell 3000 Index |
For the purposes of calculating the performance adjustment for the Fund, the Fund's investment performance is based on the performance of Fidelity Women's Leadership Fund. To the extent that other classes of the Fund have higher expenses, this could result in those classes bearing a larger positive performance adjustment and smaller negative performance adjustment than would be the case if each class's own performance were considered. The performance period is the most recent 36 month period. The maximum annualized performance adjustment rate is ± .10% of the Fund's average net assets over the performance period. The performance adjustment rate is divided by twelve and multiplied by the Fund's average net assets over the performance period, and the resulting dollar amount is proportionately added to or subtracted from a class's basic fee. For the entire reporting period, the total annual performance adjustment was (.09)%.
Effective March 1, 2024, the Fund's sub-advisory agreements with FMR Investment Management (UK) Limited, Fidelity Management & Research (Hong Kong) Limited, and Fidelity Management & Research (Japan) Limited were amended to provide that the investment adviser pays each sub-adviser monthly fees equal to 110% of the sub-adviser's costs for providing sub-advisory services.
Distribution and Service Plan Fees. In accordance with Rule 12b-1 of the 1940 Act, the Fund has adopted separate Distribution and Service Plans for each class of shares. Certain classes pay Fidelity Distributors Company LLC (FDC), an affiliate of the investment adviser, separate Distribution and Service Fees, each of which is based on an annual percentage of each class' average net assets. In addition, FDC may pay financial intermediaries for selling shares of the Fund and providing shareholder support services. For the period, the Distribution and Service Fee rates, total fees and amounts retained by FDC were as follows:
| | Distribution Fee | Service Fee | Total Fees ($) | Retained by FDC ($) |
| Class A | -% | .25% | 17,415 | 215 |
| Class M | .25% | .25% | 6,118 | - |
| Class C | .75% | .25% | 16,815 | 1,694 |
| | | | 40,348 | 1,909 |
Sales Load. FDC may receive a front-end sales charge of up to 5.75% for selling Class A shares and 3.50% for selling Class M shares, some of which is paid to financial intermediaries for selling shares of the Fund. Depending on the holding period, FDC may receive contingent deferred sales charges levied on Class A, Class M and Class C redemptions. The deferred sales charges are 1.00% for Class C shares, 1.00% for certain purchases of Class A shares and .25% for certain purchases of Class M shares.
For the period, sales charge amounts retained by FDC were as follows:
| | Retained by FDC ($) |
| Class A | 6,164 |
| Class M | 193 |
Class CA | 50 |
| | 6,407 |
A When Class C shares are initially sold, FDC pays commissions from its own resources to financial intermediaries through which the sales are made.
Transfer Agent Fees. Fidelity Investments Institutional Operations Company LLC (FIIOC), an affiliate of the investment adviser, is the transfer, dividend disbursing and shareholder servicing agent for each class of the Fund. Effective March 1, 2024, the Fund's management contract was amended to incorporate transfer agent services and associated fees previously covered under a separate services agreement. FIIOC pays for typesetting, printing and mailing of shareholder reports, except proxy statements.
During November 2023, the Board approved a change in the transfer agent fees effective December 1, 2023 to a fixed annual rate of class-level average net assets as follows:
| | % of Class-Level Average Net Assets |
| Class A | 0.2000 |
| Class M | 0.2000 |
| Class C | 0.2000 |
| Fidelity Women's Leadership Fund | 0.2000 |
| Class I | 0.1597 |
Prior to December 1, 2023, FIIOC received account fees and asset-based fees that varied according to the account size and type of account of the shareholders of the respective classes of the Fund, except for Class Z. FIIOC received an asset-based fee of Class Z's average net assets. For the portion of the reporting period prior to March 1, 2024, the fees were equivalent to the following annualized rates:
| | Amount ($) | % of Class-Level Average Net Assets |
| Class A | 11,459 | .20 |
| Class M | 2,220 | .22 |
| Class C | 3,001 | .22 |
| Fidelity Women's Leadership Fund | 223,385 | .24 |
| Class I | 19,120 | .16 |
| Class Z | 4,478 | .04 |
| | 263,663 | |
Accounting Fees. Fidelity Service Company, Inc. (FSC), an affiliate of the investment adviser, maintains the Fund's accounting records. Effective March 1, 2024, the Fund's management contract was amended to incorporate accounting services and associated fees previously covered under a separate services agreement.
During November 2023, the Board approved a change in the accounting fees effective December 1, 2023 to a fixed annual rate of average net assets as follows:
| | % of Average Net Assets |
| Fidelity Women's Leadership Fund | 0.0354 |
Prior to December 1, 2023, the accounting fee was based on the level of average net assets for each month. For the portion of the reporting period prior to March 1, 2024, the fees were equivalent to the following annualized rates:
| | % of Average Net Assets |
| Fidelity Women's Leadership Fund | .04 |
Brokerage Commissions. A portion of portfolio transactions were placed with brokerage firms which are affiliates of the investment adviser. Brokerage commissions are included in net realized gain (loss) and change in net unrealized appreciation (depreciation) in the Statement of Operations. The commissions paid to these affiliated firms were as follows:
| | Amount ($) |
| Fidelity Women's Leadership Fund | 629 |
Interfund Lending Program. Pursuant to an Exemptive Order issued by the Securities and Exchange Commission (the SEC), the Fund, along with other registered investment companies having management contracts with Fidelity Management & Research Company LLC (FMR), or other affiliated entities of FMR, may participate in an interfund lending program. This program provides an alternative credit facility allowing the Fund to borrow from, or lend money to, other participating affiliated funds. At period end, there were no interfund loans outstanding. Activity in this program during the period for which loans were outstanding was as follows:
| | Borrower or Lender | Average Loan Balance ($) | Weighted Average Interest Rate | Interest Expense ($) |
| Fidelity Women's Leadership Fund | Borrower | 5,574,000 | 5.58% | 864 |
Interfund Trades. Funds may purchase from or sell securities to other Fidelity Funds under procedures adopted by the Board. The procedures have been designed to ensure these interfund trades are executed in accordance with Rule 17a-7 of the 1940 Act. Any interfund trades are included within the respective purchases and sales amounts shown in the Purchases and Sales of Investments note. Interfund trades during the period are noted in the table below.
| | Purchases ($) | Sales ($) | Realized Gain (Loss) ($) |
| Fidelity Women's Leadership Fund | 391,416 | 2,746,319 | 62,735 |
6. Committed Line of Credit.
Certain Funds participate with other funds managed by the investment adviser or an affiliate in a $4.25 billion credit facility (the "line of credit") to be utilized for temporary or emergency purposes to fund shareholder redemptions or for other short-term liquidity purposes. The participating funds have agreed to pay commitment fees on their pro-rata portion of the line of credit, which are reflected in Miscellaneous expenses on the Statement of Operations, and are listed below. During the period, there were no borrowings on this line of credit.
| | Amount ($) |
| Fidelity Women's Leadership Fund | 262 |
7. Expense Reductions.
Through arrangements with the Fund's custodian and each class' transfer agent, credits realized as a result of certain uninvested cash balances were used to reduce the Fund's expenses. During the period, transfer agent credits reduced each class' expenses as noted in the table below.
| | Expense reduction ($) |
| Class A | 34 |
| Class C | 1 |
| | 35 |
In addition, during the period the investment adviser or an affiliate reimbursed and/or waived a portion of fund-level operating expenses in the amount of $12,365.
8. Distributions to Shareholders.
Distributions to shareholders of each class were as follows:
| | Year ended April 30, 2024 | Year ended April 30, 2023 |
| Fidelity Women's Leadership Fund | | |
| Distributions to shareholders | | |
| Class A | $29,747 | $27,652 |
| Class M | 2,422 | 3,208 |
| Fidelity Women's Leadership Fund | 668,906 | 578,127 |
| Class I | 102,091 | 87,523 |
| Class Z | 107,791 | 58,888 |
Total | $910,957 | $755,398 |
9. Share Transactions.
Share transactions for each class were as follows and may contain in-kind transactions, automatic conversions between classes or exchanges between affiliated funds:
| | Shares | Shares | Dollars | Dollars |
| | Year ended April 30, 2024 | Year ended April 30, 2023 | Year ended April 30, 2024 | Year ended April 30, 2023 |
| Fidelity Women's Leadership Fund | | | | |
| Class A | | | | |
| Shares sold | 89,980 | 141,008 | $1,319,806 | $1,797,187 |
| Reinvestment of distributions | 1,938 | 2,161 | 28,972 | 27,138 |
| Shares redeemed | (46,268) | (79,981) | (685,142) | (1,015,214) |
| Net increase (decrease) | 45,650 | 63,188 | $663,636 | $809,111 |
| Class M | | | | |
| Shares sold | 3,512 | 11,061 | $51,358 | $139,353 |
| Reinvestment of distributions | 161 | 256 | 2,422 | 3,208 |
| Shares redeemed | (3,117) | (7,469) | (44,710) | (93,120) |
| Net increase (decrease) | 556 | 3,848 | $9,070 | $49,441 |
| Class C | | | | |
| Shares sold | 14,405 | 20,115 | $207,118 | $255,147 |
| Shares redeemed | (23,441) | (16,959) | (334,953) | (213,813) |
| Net increase (decrease) | (9,036) | 3,156 | $(127,835) | $41,334 |
| Fidelity Women's Leadership Fund | | | | |
| Shares sold | 963,535 | 2,347,545 | $14,042,715 | $30,916,025 |
| Reinvestment of distributions | 41,573 | 42,668 | 618,490 | 537,622 |
| Shares redeemed | (2,901,042) | (1,511,874) | (42,354,418) | (19,406,034) |
| Net increase (decrease) | (1,895,934) | 878,339 | $(27,693,213) | $12,047,613 |
| Class I | | | | |
| Shares sold | 365,609 | 444,612 | $5,078,142 | $5,699,005 |
| Reinvestment of distributions | 6,769 | 6,932 | 100,595 | 87,280 |
| Shares redeemed | (342,100) | (309,351) | (4,790,855) | (3,964,930) |
| Net increase (decrease) | 30,278 | 142,193 | $387,882 | $1,821,355 |
| Class Z | | | | |
| Shares sold | 425,187 | 325,511 | $6,183,243 | $4,239,577 |
| Reinvestment of distributions | 5,982 | 4,454 | 89,229 | 56,255 |
| Shares redeemed | (235,141) | (195,364) | (3,533,703) | (2,559,457) |
| Net increase (decrease) | 196,028 | 134,601 | $2,738,769 | $1,736,375 |
10. Other.
A fund's organizational documents provide former and current trustees and officers with a limited indemnification against liabilities arising in connection with the performance of their duties to the fund. In the normal course of business, a fund may also enter into contracts that provide general indemnifications. A fund's maximum exposure under these arrangements is unknown as this would be dependent on future claims that may be made against a fund. The risk of material loss from such claims is considered remote.
11. Risk and Uncertainties.
Many factors affect a fund's performance. Developments that disrupt global economies and financial markets, such as pandemics, epidemics, outbreaks of infectious diseases, war, terrorism, and environmental disasters, may significantly affect a fund's investment performance. The effects of these developments to a fund will be impacted by the types of securities in which a fund invests, the financial condition, industry, economic sector, and geographic location of an issuer, and a fund's level of investment in the securities of that issuer. Significant concentrations in security types, issuers, industries, sectors, and geographic locations may magnify the factors that affect a fund's performance.
To the Board of Trustees of Fidelity Summer Street Trust and the Shareholders of Fidelity Women's Leadership Fund:
Opinion on the Financial Statements and Financial Highlights
We have audited the accompanying statement of assets and liabilities of Fidelity Women's Leadership Fund (the "Fund"), a fund of Fidelity Summer Street Trust, including the schedule of investments, as of April 30, 2024, the related statement of operations for the year then ended, the statement of changes in net assets for each of the two years in the period then ended, the financial highlights for each of the four years in the period then ended and for the period from May 1, 2019 (commencement of operations) through April 30, 2020, and the related notes. In our opinion, the financial statements and financial highlights present fairly, in all material respects, the financial position of the Fund as of April 30, 2024, and the results of its operations for the year then ended, the changes in its net assets for each of the two years in the period then ended, and the financial highlights for each of the four years in the period then ended and for the period from May 1, 2019 (commencement of operations) through April 30, 2020, in conformity with accounting principles generally accepted in the United States of America.
Basis for Opinion
These financial statements and financial highlights are the responsibility of the Fund's management. Our responsibility is to express an opinion on the Fund's financial statements and financial highlights based on our audits. We are a public accounting firm registered with the Public Company Accounting Oversight Board (United States) (PCAOB) and are required to be independent with respect to the Fund in accordance with the U.S. federal securities laws and the applicable rules and regulations of the Securities and Exchange Commission and the PCAOB.
We conducted our audits in accordance with the standards of the PCAOB. Those standards require that we plan and perform the audit to obtain reasonable assurance about whether the financial statements and financial highlights are free of material misstatement, whether due to error or fraud. The Fund is not required to have, nor were we engaged to perform, an audit of its internal control over financial reporting. As part of our audits, we are required to obtain an understanding of internal control over financial reporting but not for the purpose of expressing an opinion on the effectiveness of the Fund's internal control over financial reporting. Accordingly, we express no such opinion.
Our audits included performing procedures to assess the risks of material misstatement of the financial statements and financial highlights, whether due to error or fraud, and performing procedures that respond to those risks. Such procedures included examining, on a test basis, evidence regarding the amounts and disclosures in the financial statements and financial highlights. Our audits also included evaluating the accounting principles used and significant estimates made by management, as well as evaluating the overall presentation of the financial statements and financial highlights. Our procedures included confirmation of securities owned as of April 30, 2024, by correspondence with the custodian and brokers; when replies were not received from brokers, we performed other auditing procedures. We believe that our audits provide a reasonable basis for our opinion.
/s/ Deloitte & Touche LLP
Boston, Massachusetts
June 14, 2024
We have served as the auditor of one or more of the Fidelity investment companies since 1999.
The Trustees, Members of the Advisory Board (if any), and officers of the trust and fund, as applicable, are listed below. The Board of Trustees governs the fund and is responsible for protecting the interests of shareholders. The Trustees are experienced executives who meet periodically throughout the year to oversee the fund's activities, review contractual arrangements with companies that provide services to the fund, oversee management of the risks associated with such activities and contractual arrangements, and review the fund's performance. Except for Vijay Advani, each of the Trustees oversees 323 funds. Mr. Advani oversees 216 funds.
The Trustees hold office without limit in time except that (a) any Trustee may resign; (b) any Trustee may be removed by written instrument, signed by at least two-thirds of the number of Trustees prior to such removal; (c) any Trustee who requests to be retired or who has become incapacitated by illness or injury may be retired by written instrument signed by a majority of the other Trustees; and (d) any Trustee may be removed at any special meeting of shareholders by a two-thirds vote of the outstanding voting securities of the trust. Each Trustee who is not an interested person (as defined in the 1940 Act) of the trust and the fund is referred to herein as an Independent Trustee. Each Independent Trustee shall retire not later than the last day of the calendar year in which his or her 75th birthday occurs. The Independent Trustees may waive this mandatory retirement age policy with respect to individual Trustees. Officers and Advisory Board Members hold office without limit in time, except that any officer or Advisory Board Member may resign or may be removed by a vote of a majority of the Trustees at any regular meeting or any special meeting of the Trustees. Except as indicated, each individual has held the office shown or other offices in the same company for the past five years.
The fund's Statement of Additional Information (SAI) includes more information about the Trustees. To request a free copy, call Fidelity at 1-800-544-8544 if you're an individual investing directly with Fidelity, call 1-800-835-5092 if you're a plan sponsor or participant with Fidelity as your recordkeeper or call 1-877-208-0098 on institutional accounts or if you're an advisor or invest through one.
Experience, Skills, Attributes, and Qualifications of the Trustees. The Governance and Nominating Committee has adopted a statement of policy that describes the experience, qualifications, attributes, and skills that are necessary and desirable for potential Independent Trustee candidates (Statement of Policy). The Board believes that each Trustee satisfied at the time he or she was initially elected or appointed a Trustee, and continues to satisfy, the standards contemplated by the Statement of Policy. The Governance and Nominating Committee also engages professional search firms to help identify potential Independent Trustee candidates who have the experience, qualifications, attributes, and skills consistent with the Statement of Policy. From time to time, additional criteria based on the composition and skills of the current Independent Trustees, as well as experience or skills that may be appropriate in light of future changes to board composition, business conditions, and regulatory or other developments, have also been considered by the professional search firms and the Governance and Nominating Committee. In addition, the Board takes into account the Trustees' commitment and participation in Board and committee meetings, as well as their leadership of standing and ad hoc committees throughout their tenure.
In determining that a particular Trustee was and continues to be qualified to serve as a Trustee, the Board has considered a variety of criteria, none of which, in isolation, was controlling. The Board believes that, collectively, the Trustees have balanced and diverse experience, qualifications, attributes, and skills, which allow the Board to operate effectively in governing the fund and protecting the interests of shareholders. Information about the specific experience, skills, attributes, and qualifications of each Trustee, which in each case led to the Board's conclusion that the Trustee should serve (or continue to serve) as a trustee of the fund, is provided below.
Board Structure and Oversight Function. Robert A. Lawrence is an interested person and currently serves as Chair. The Trustees have determined that an interested Chair is appropriate and benefits shareholders because an interested Chair has a personal and professional stake in the quality and continuity of services provided to the fund. Independent Trustees exercise their informed business judgment to appoint an individual of their choosing to serve as Chair, regardless of whether the Trustee happens to be independent or a member of management. The Independent Trustees have determined that they can act independently and effectively without having an Independent Trustee serve as Chair and that a key structural component for assuring that they are in a position to do so is for the Independent Trustees to constitute a substantial majority for the Board. The Independent Trustees also regularly meet in executive session. David M. Thomas serves as Lead Independent Trustee and as such (i) acts as a liaison between the Independent Trustees and management with respect to matters important to the Independent Trustees and (ii) with management prepares agendas for Board meetings.
Fidelity® funds are overseen by different Boards of Trustees. The fund's Board oversees Fidelity's high income and certain equity funds, and other Boards oversee Fidelity's alternative investment, investment-grade bond, money market, asset allocation, and other equity funds. The asset allocation funds may invest in Fidelity® funds overseen by the fund's Board. The use of separate Boards, each with its own committee structure, allows the Trustees of each group of Fidelity® funds to focus on the unique issues of the funds they oversee, including common research, investment, and operational issues. On occasion, the separate Boards establish joint committees to address issues of overlapping consequences for the Fidelity® funds overseen by each Board.
The Trustees operate using a system of committees to facilitate the timely and efficient consideration of all matters of importance to the Trustees, the fund, and fund shareholders and to facilitate compliance with legal and regulatory requirements and oversight of the fund's activities and associated risks. The Board, acting through its committees, has charged FMR and its affiliates with (i) identifying events or circumstances the occurrence of which could have demonstrably adverse effects on the fund's business and/or reputation; (ii) implementing processes and controls to lessen the possibility that such events or circumstances occur or to mitigate the effects of such events or circumstances if they do occur; and (iii) creating and maintaining a system designed to evaluate continuously business and market conditions in order to facilitate the identification and implementation processes described in (i) and (ii) above. Because the day-to-day operations and activities of the fund are carried out by or through FMR, its affiliates, and other service providers, the fund's exposure to risks is mitigated but not eliminated by the processes overseen by the Trustees. While each of the Board's committees has responsibility for overseeing different aspects of the fund's activities, oversight is exercised primarily through the Operations, Audit, and Compliance Committees. Appropriate personnel, including but not limited to the fund's Chief Compliance Officer (CCO), FMR's internal auditor, the independent accountants, the fund's Treasurer and portfolio management personnel, make periodic reports to the Board's committees, as appropriate, including an annual review of Fidelity's risk management program for the Fidelity® funds. The responsibilities of each standing committee, including their oversight responsibilities, are described further under "Standing Committees of the Trustees."
Interested Trustees*:
Correspondence intended for a Trustee who is an interested person may be sent to Fidelity Investments, 245 Summer Street, Boston, Massachusetts 02210.
Name, Year of Birth; Principal Occupations and Other Relevant Experience+
Bettina Doulton (1964)
Year of Election or Appointment: 2020
Trustee
Ms. Doulton also serves as Trustee of other Fidelity® funds. Prior to her retirement, Ms. Doulton served in a variety of positions at Fidelity Investments, including as a managing director of research (2006-2007), portfolio manager to certain Fidelity® funds (1993-2005), equity analyst and portfolio assistant (1990-1993), and research assistant (1987-1990). Ms. Doulton currently owns and operates Cellardoor Winery. Previously, Ms. Doulton served as a member of the Board of Brown Capital Management, LLC (2014-2018).
Robert A. Lawrence (1952)
Year of Election or Appointment: 2020
Trustee
Chair of the Board of Trustees
Mr. Lawrence also serves as Trustee of other funds. Previously, Mr. Lawrence served as a Trustee and Member of the Advisory Board of certain funds. Prior to his retirement in 2008, Mr. Lawrence served as Vice President of certain Fidelity® funds (2006-2008), Senior Vice President, Head of High Income Division of Fidelity Management & Research Company (investment adviser firm, 2006-2008), and President of Fidelity Strategic Investments (investment adviser firm, 2002-2005).
* Determined to be an "Interested Trustee" by virtue of, among other things, his or her affiliation with the trust or various entities under common control with FMR.
+ The information includes the Trustee's principal occupation during the last five years and other information relating to the experience, attributes, and skills relevant to the Trustee's qualifications to serve as a Trustee, which led to the conclusion that the Trustee should serve as a Trustee for the fund.
Independent Trustees:
Correspondence intended for an Independent Trustee may be sent to Fidelity Investments, P.O. Box 55235, Boston, Massachusetts 02205-5235.
Name, Year of Birth; Principal Occupations and Other Relevant Experience+
Vijay C. Advani (1960)
Year of Election or Appointment: 2023
Trustee
Mr. Advani also serves as Trustee or Member of the Advisory Board of other funds. Previously, Mr. Advani served as Executive Chairman (2020-2022), Chief Executive Officer (2017-2020) and Chief Operating Officer (2016-2017) of Nuveen (global investment manager). He also served in various capacities at Franklin Resources (global investment manager), including Co-President (2015-2016), Executive Vice President, Global Advisory Services (2008-2015), Head of Global Retail Distribution (2005-2008), Executive Managing Director, International Retail Development (2002-2005), Managing Director, Product Developments, Sales & Marketing, Asia, Eastern Europe and Africa (2000-2002) and President, Templeton Asset Management India (1995-2000). Mr. Advani also served as Senior Investment Officer of International Finance Corporation (private equity and venture capital arm of The World Bank, 1984-1995). Mr. Advani is Chairman Emeritus of the U.S. India Business Council (2018-present), a Director of The Global Impact Investing Network (2019-present), a Director of LOK Capital (Mauritius) (2022-present), a member of the Advisory Council of LOK Capital (2022-present), a Senior Advisor of Neuberger Berman (2021-present), a Senior Advisor of Seviora Holdings Pte. Ltd (Temasek-Singapore) (2021-present), a Director of Seviora Capital (Singapore) (2021-present) and an Advisor of EQUIAM (2021-present). Mr. Advani formerly served as a member of the Board of BowX Acquisition Corp. (special purpose acquisition company, 2020-2021), a member of the Board of Intellecap (advisory arm of The Aavishkaar Group, 2018-2020), a member of the Board of Nuveen Investments, Inc. (2017-2020) and a member of the Board of Docusign (software, 2016-2019).
Thomas P. Bostick (1956)
Year of Election or Appointment: 2021
Trustee
Lieutenant General Bostick also serves as Trustee of other Fidelity® funds. Prior to his retirement, General Bostick (United States Army, Retired) held a variety of positions within the U.S. Army, including Chief of Engineers and Commanding General, U.S. Army Corps of Engineers (2012-2016) and Deputy Chief of Staff and Director of Human Resources, U.S. Army (2009-2012). General Bostick currently serves as a member of the Board and Finance and Governance & Sustainability Committees of CSX Corporation (transportation, 2020-present) and a member of the Board and Corporate Governance and Nominating Committee of Perma-Fix Environmental Services, Inc. (nuclear waste management, 2020-present). General Bostick serves as Chief Executive Officer of Bostick Global Strategies, LLC (consulting, 2016-present), as a member of the Board of HireVue, Inc. (video interview and assessment, 2020-present), as a member of the Board of Allonnia (biotechnology and engineering solutions, 2022-present), on the Advisory Board of Hilco Redevelopment Partners (a real estate investment and redevelopment company, 2021-present), and on the Advisory Board of Solugen, Inc. (specialty bio-based chemicals manufacturer, 2022-present). Previously, General Bostick served as a Member of the Advisory Board of certain Fidelity® funds (2021), President, Intrexon Bioengineering (2018-2020) and Chief Operating Officer (2017-2020) and Senior Vice President of the Environment Sector (2016-2017) of Intrexon Corporation (biopharmaceutical company).
Donald F. Donahue (1950)
Year of Election or Appointment: 2018
Trustee
Mr. Donahue also serves as Trustee of other Fidelity® funds. Mr. Donahue serves as President and Chief Executive Officer of Miranda Partners, LLC (risk consulting for the financial services industry, 2012-present). Previously, Mr. Donahue served as Chief Executive Officer (2006-2012), Chief Operating Officer (2003-2006) and Managing Director, Customer Marketing and Development (1999-2003) of The Depository Trust & Clearing Corporation (financial markets infrastructure). Mr. Donahue currently serves as a member (2007-present) and Co-Chairman (2016-present) of the Board of United Way of New York. Mr. Donahue previously served as a member of the Advisory Board of certain Fidelity® funds (2015-2018) and as a member of the Board of The Leadership Academy (previously NYC Leadership Academy) (2012-2022).
Vicki L. Fuller (1957)
Year of Election or Appointment: 2020
Trustee
Ms. Fuller also serves as Trustee of other Fidelity® funds. Previously, Ms. Fuller served as a member of the Advisory Board of certain Fidelity® funds (2018-2020), Chief Investment Officer of the New York State Common Retirement Fund (2012-2018) and held a variety of positions at AllianceBernstein L.P. (global asset management, 1985-2012), including Managing Director (2006-2012) and Senior Vice President and Senior Portfolio Manager (2001-2006). Ms. Fuller currently serves as a member of the Board, Audit Committee, Compensation Committee and Nominating and Governance Committee of two Blackstone business development companies (2020-present), as a member of the Board of Treliant, LLC (consulting, 2019-present), as a member of the Board of Ariel Alternatives, LLC (private equity, 2022-present) and as a member of the Board and Chair of the Audit Committee of Gusto, Inc. (software, 2021-present). In addition, Ms. Fuller currently serves as a member of the Executive Board of New York University's Stern School of Business. Ms. Fuller previously served as a member of the Board of Roosevelt University (2019-2024) and member of the Board, Audit Committee and Nominating and Governance Committee of The Williams Companies, Inc. (natural gas infrastructure, 2018-2021).
Patricia L. Kampling (1959)
Year of Election or Appointment: 2020
Trustee
Ms. Kampling also serves as Trustee of other Fidelity® funds. Prior to her retirement, Ms. Kampling served as Chairman of the Board and Chief Executive Officer (2012-2019), President and Chief Operating Officer (2011-2012) and Executive Vice President and Chief Financial Officer (2010-2011) of Alliant Energy Corporation. Ms. Kampling currently serves as a member of the Board, Audit Committee and Governance, Compensation and Nominating Committee of Xcel Energy Inc. (utilities company, 2020-present) and as a member of the Board, Audit, Finance and Risk Committee and Safety, Environmental, Technology and Operations Committee and Chair of the Executive Development and Compensation Committee of American Water Works Company, Inc. (utilities company, 2019-present). In addition, Ms. Kampling currently serves as a member of the Board of the Nature Conservancy, Wisconsin Chapter (2019-present). Previously, Ms. Kampling served as a Member of the Advisory Board of certain Fidelity® funds (2020), a member of the Board, Compensation Committee and Executive Committee and Chair of the Audit Committee of Briggs & Stratton Corporation (manufacturing, 2011-2021), a member of the Board of Interstate Power and Light Company (2012-2019) and Wisconsin Power and Light Company (2012-2019) (each a subsidiary of Alliant Energy Corporation) and as a member of the Board and Workforce Development Committee of the Business Roundtable (2018-2019).
Thomas A. Kennedy (1955)
Year of Election or Appointment: 2021
Trustee
Mr. Kennedy also serves as Trustee of other Fidelity® funds. Previously, Mr. Kennedy served as a Member of the Advisory Board of certain Fidelity® funds (2020) and held a variety of positions at Raytheon Company (aerospace and defense, 1983-2020), including Chairman and Chief Executive Officer (2014-2020) and Executive Vice President and Chief Operating Officer (2013-2014). Mr. Kennedy served as Executive Chairman of the Board of Directors of Raytheon Technologies Corporation (aerospace and defense, 2020-2021). Mr. Kennedy serves as a Director of the Board of Directors of Textron Inc. (aerospace and defense, 2023-present).
Oscar Munoz (1959)
Year of Election or Appointment: 2021
Trustee
Mr. Munoz also serves as Trustee of other Fidelity® funds. Prior to his retirement, Mr. Munoz served as Executive Chairman (2020-2021), Chief Executive Officer (2015-2020), President (2015-2016) and a member of the Board (2010-2021) of United Airlines Holdings, Inc. Mr. Munoz currently serves as a member of the Board of CBRE Group, Inc. (commercial real estate, 2020-present), a member of the Board of Univision Communications, Inc. (Hispanic media, 2020-present), a member of the Board of Archer Aviation Inc. (2021-present), a member of the Defense Business Board of the United States Department of Defense (2021-present) and a member of the Board of Salesforce.com, Inc. (cloud-based software, 2022-present). Previously, Mr. Munoz served as a Member of the Advisory Board of certain Fidelity® funds (2021).
David M. Thomas (1949)
Year of Election or Appointment: 2008
Trustee
Lead Independent Trustee
Mr. Thomas also serves as Trustee of other Fidelity® funds. Previously, Mr. Thomas served as Executive Chairman (2005-2006) and Chairman and Chief Executive Officer (2000-2005) of IMS Health, Inc. (pharmaceutical and healthcare information solutions) and as a member of the Board of Fortune Brands Home and Security (home and security products, 2004-2023). Mr. Thomas currently serves as Director (2013-present) and Non-Executive Chairman of the Board (2022-present) of Interpublic Group of Companies, Inc. (marketing communication).
Susan Tomasky (1953)
Year of Election or Appointment: 2020
Trustee
Ms. Tomasky also serves as Trustee of other Fidelity® funds. Prior to her retirement, Ms. Tomasky served in various executive officer positions at American Electric Power Company, Inc. (1998-2011), including most recently as President of AEP Transmission (2007-2011). Ms. Tomasky currently serves as a member of the Board and Sustainability Committee and as Chair of the Audit Committee of Marathon Petroleum Corporation (2018-present) and as a member of the Board, Executive Committee, Corporate Governance Committee and Organization and Compensation Committee and as Lead Director of the Board of Public Service Enterprise Group, Inc. (utilities company, 2012-present) and as a member of the Board of its subsidiary company, Public Service Electric and Gas Co. (2021-present). In addition, Ms. Tomasky currently serves as a member (2009-present) and President (2020-present) of the Board of the Royal Shakespeare Company - America (2009-present) and as a member and Vice Chair of the Board of Kenyon College (2016-present). Previously, Ms. Tomasky served as a Member of the Advisory Board of certain Fidelity® funds (2020), as a member of the Board of the Columbus Association for the Performing Arts (2011-2023), as a member of the Board of the Columbus Regional Airport Authority (2007-2020), as a member of the Board (2011-2018) and Lead Independent Director (2015-2018) of Andeavor Corporation (previously Tesoro Corporation) (independent oil refiner and marketer) and as a member of the Board of Summit Midstream Partners LP (energy, 2012-2018).
Michael E. Wiley (1950)
Year of Election or Appointment: 2018
Trustee
Mr. Wiley also serves as Trustee of other Fidelity® funds. Previously, Mr. Wiley served as a member of the Advisory Board of certain Fidelity® funds (2018-2020), Chairman, President and CEO of Baker Hughes, Inc. (oilfield services, 2000-2004). Mr. Wiley also previously served as a member of the Board of Andeavor Corporation (independent oil refiner and marketer, 2005-2018), a member of the Board of Andeavor Logistics LP (natural resources logistics, 2015-2018) and a member of the Board of High Point Resources (exploration and production, 2005-2020).
+ The information includes the Trustee's principal occupation during the last five years and other information relating to the experience, attributes, and skills relevant to the Trustee's qualifications to serve as a Trustee, which led to the conclusion that the Trustee should serve as a Trustee for the fund.
Advisory Board Members and Officers:
Correspondence intended for a Member of the Advisory Board (if any) may be sent to Fidelity Investments, P.O. Box 55235, Boston, Massachusetts 02205-5235. Correspondence intended for an officer or Peter S. Lynch may be sent to Fidelity Investments, 245 Summer Street, Boston, Massachusetts 02210.
Name, Year of Birth; Principal Occupations+
Peter S. Lynch (1944)
Year of Election or Appointment: 2003
Member of the Advisory Board
Mr. Lynch also serves as a Member of the Advisory Board of other Fidelity® funds. Mr. Lynch is Vice Chairman and a Director of Fidelity Management & Research Company LLC (investment adviser firm). In addition, Mr. Lynch serves as a Trustee of Boston College and as the Chairman of the Inner-City Scholarship Fund. Previously, Mr. Lynch served as Vice Chairman and a Director of FMR Co., Inc. (investment adviser firm) and on the Special Olympics International Board of Directors (1997-2006).
Karen B. Peetz (1955)
Year of Election or Appointment: 2023
Member of the Advisory Board
Ms. Peetz also serves as a Member of the Advisory Board of other funds. Previously, Ms. Peetz served as Chief Administration Officer (2020-2023) of Citigroup Inc. (a diversified financial service company). She also served in various capacities at Bank of New York Mellon Corporation, including President (2013-2016), Vice Chairman, Senior Executive Vice President and Chief Executive Officer of Financial Markets & Treasury Services (2010-2013), Senior Executive Vice President and Chief Executive Officer of Global Corporate Trust (2003-2008), Senior Vice President and Division Manager of Global Payments & Trade Services (2002-2003) and Senior Vice President and Division Manager of Domestic Corporate Trust (1998-2002). Ms. Peetz also served in various capacities at Chase Manhattan Corporation (1982-1998), including Senior Vice President and Manager of Corporate Trust International Business (1996-1998), Managing Director and Manager of Corporate Trust Services (1994-1996) and Managing Director and Group Manager of Financial Institution Sales (1990-1993). Ms. Peetz currently serves as Chair of Amherst Holdings Advisory Council (2018-present), Trustee of Johns Hopkins University (2016-present), Chair of the Carey Business School Advisory Council, Member of the Johns Hopkins Medicine Board and Finance Committee and Chair of the Lyme and Tick Related Disease Institute Advisory Council. Ms. Peetz previously served as a member of the Board of Guardian Life Insurance Company of America (2019-2023), a member of the Board of Trane Technologies (2018-2022), a member of the Board of Wells Fargo Corp. (2017-2019), a member of the Board of SunCoke Energy Inc. (2012-2016), a member of the Board of Private Export Funding Corporation (2010-2016) and as a Trustee of Penn State University (2010-2014) and the United Way of New York City (2008-2010).
Heather Bonner (1977)
Year of Election or Appointment: 2023
Assistant Treasurer
Ms. Bonner also serves as an officer of other funds. Ms. Bonner is a Senior Vice President (2022-present) and is an employee of Fidelity Investments (2022-present). Ms. Bonner serves as Senior Vice President, Vice President, Treasurer, or Director of certain Fidelity entities. Prior to joining Fidelity, Ms. Bonner served as Managing Director at AQR Capital Management (2013-2022) and was the Treasurer and Principal Financial Officer of the AQR Funds (2013-2022).
Craig S. Brown (1977)
Year of Election or Appointment: 2022
Deputy Treasurer
Mr. Brown also serves as an officer of other funds. Mr. Brown is a Vice President (2015-present) and is an employee of Fidelity Investments. Mr. Brown serves as Assistant Treasurer of FIMM, LLC (2021-present). Previously, Mr. Brown served as Assistant Treasurer of certain Fidelity® funds (2019-2022).
John J. Burke III (1964)
Year of Election or Appointment: 2018
Chief Financial Officer
Mr. Burke also serves as Chief Financial Officer of other funds. Mr. Burke is Head of Fidelity Fund and Investment Operations (2018-present) and is an employee of Fidelity Investments. Mr. Burke serves as President, Executive Vice President, or Director of certain Fidelity entities. Previously Mr. Burke served as head of Asset Management Investment Operations (2012-2018).
Margaret Carey (1973)
Year of Election or Appointment: 2023
Secretary and Chief Legal Officer (CLO)
Ms. Carey also serves as an officer of other funds and as CLO of certain Fidelity entities. Ms. Carey is a Senior Vice President, Deputy General Counsel (2019-present) and is an employee of Fidelity Investments.
William C. Coffey (1969)
Year of Election or Appointment: 2019
Assistant Secretary
Mr. Coffey also serves as Assistant Secretary of other funds. Mr. Coffey is a Senior Vice President, Deputy General Counsel (2010-present) and is an employee of Fidelity Investments. Previously, Mr. Coffey served as Secretary and CLO of certain funds (2018-2019); CLO, Secretary, or Senior Vice President of certain Fidelity entities and Assistant Secretary of certain funds (2009-2018).
Timothy M. Cohen (1969)
Year of Election or Appointment: 2018
Vice President
Mr. Cohen also serves as Vice President of other funds. Mr. Cohen is Co-Head of Equity (2018-present) and is an employee of Fidelity Investments. Mr. Cohen serves as President or Director of certain Fidelity entities. Previously, Mr. Cohen served as Executive Vice President of Fidelity SelectCo, LLC (2019) and Head of Global Equity Research (2016-2018).
Jonathan Davis (1968)
Year of Election or Appointment: 2010
Assistant Treasurer
Mr. Davis also serves as an officer of other funds. Mr. Davis is a Vice President (2006-present) and is an employee of Fidelity Investments. Mr. Davis serves as Assistant Treasurer or Director of certain Fidelity entities.
Laura M. Del Prato (1964)
Year of Election or Appointment: 2018
Assistant Treasurer
Ms. Del Prato also serves as an officer of other funds. Ms. Del Prato is a Senior Vice President (2017-present) and is an employee of Fidelity Investments. Ms. Del Prato serves as Senior Vice President, Vice President, Assistant Treasurer, or Director of certain Fidelity entities. Previously, Ms. Del Prato served as President and Treasurer of The North Carolina Capital Management Trust: Cash Portfolio and Term Portfolio (2018-2020).
Colm A. Hogan (1973)
Year of Election or Appointment: 2020
Assistant Treasurer
Mr. Hogan also serves as an officer of other funds. Mr. Hogan is a Vice President (2016-present) and is an employee of Fidelity Investments. Mr. Hogan serves as Assistant Treasurer of certain Fidelity entities. Previously, Mr. Hogan served as Deputy Treasurer of certain Fidelity® funds (2016-2020) and Assistant Treasurer of certain Fidelity® funds (2016-2018).
Pamela R. Holding (1964)
Year of Election or Appointment: 2018
Vice President
Ms. Holding also serves as Vice President of other funds. Ms. Holding is Co-Head of Equity (2018-present) and is an employee of Fidelity Investments. Previously, Ms. Holding served as Executive Vice President of Fidelity SelectCo, LLC (2019) and as Chief Investment Officer of Fidelity Institutional Asset Management (2013-2018).
Chris Maher (1972)
Year of Election or Appointment: 2020
Deputy Treasurer
Mr. Maher also serves as an officer of other funds. Mr. Maher is a Vice President (2008-present) and is an employee of Fidelity Investments. Mr. Maher serves as Assistant Treasurer of certain Fidelity entities. Previously, Mr. Maher served as Assistant Treasurer of certain funds (2013-2020).
Jason P. Pogorelec (1975)
Year of Election or Appointment: 2020
Chief Compliance Officer
Mr. Pogorelec also serves as Chief Compliance Officer of other funds. Mr. Pogorelec is a Senior Vice President of Asset Management Compliance (2020-present) and is an employee of Fidelity Investments. Mr. Pogorelec serves as Compliance Officer of Fidelity Management & Research Company LLC (investment adviser firm, 2023-present) and Ballyrock Investment Advisors LLC (2023-present). Previously, Mr. Pogorelec served as a Vice President, Associate General Counsel for Fidelity Investments (2010-2020) and Assistant Secretary of certain Fidelity® funds (2015-2020).
Brett Segaloff (1972)
Year of Election or Appointment: 2021
Anti-Money Laundering (AML) Officer
Mr. Segaloff also serves as AML Officer of other funds. Mr. Segaloff is a Vice President (2022-present) and is an employee of Fidelity Investments. Mr. Segaloff serves as Anti Money Laundering Compliance Officer or Anti Money Laundering/Bank Secrecy Act Compliance Officer of certain Fidelity entities.
Stacie M. Smith (1974)
Year of Election or Appointment: 2016
President and Treasurer
Ms. Smith also serves as an officer of other funds. Ms. Smith is a Senior Vice President (2016-present) and is an employee of Fidelity Investments. Ms. Smith serves as Assistant Treasurer of certain Fidelity entities and has served in other fund officer roles.
Jim Wegmann (1979)
Year of Election or Appointment: 2019
Assistant Treasurer
Mr. Wegmann also serves as an officer of other funds. Mr. Wegmann is a Vice President (2016-present) and is an employee of Fidelity Investments. Mr. Wegmann serves as Assistant Treasurer of FIMM, LLC (2021-present). Previously, Mr. Wegmann served as Assistant Treasurer of certain Fidelity® funds (2019-2021).
+ The information includes principal occupation during the last five years.
As a shareholder, you incur two types of costs: (1) transaction costs, which may include sales charges (loads) on purchase payments or redemption proceeds, as applicable and (2) ongoing costs, which generally include management fees, distribution and/or service (12b-1) fees and other Fund expenses. This Example is intended to help you understand your ongoing costs (in dollars) of investing in a fund and to compare these costs with the ongoing costs of investing in other mutual funds.
| The Example is based on an investment of $1,000 invested at the beginning of the period and held for the entire period (November 1, 2023 to April 30, 2024). |
Actual Expenses
The first line of the accompanying table provides information about actual account values and actual expenses. You may use the information in this line, together with the amount you invested, to estimate the expenses that you paid over the period. Simply divide your account value by $1,000.00 (for example, an $8,600 account value divided by $1,000.00 = 8.6), then multiply the result by the number in the first line for a class/Fund under the heading entitled "Expenses Paid During Period" to estimate the expenses you paid on your account during this period. If any fund is a shareholder of any underlying mutual funds or exchange-traded funds (ETFs) (the Underlying Funds), such fund indirectly bears its proportional share of the expenses of the Underlying Funds in addition to the direct expenses incurred presented in the table. These fees and expenses are not included in the annualized expense ratio used to calculate the expense estimate in the table below.
Hypothetical Example for Comparison Purposes
The second line of the accompanying table provides information about hypothetical account values and hypothetical expenses based on the actual expense ratio and an assumed rate of return of 5% per year before expenses, which is not the actual return. The hypothetical account values and expenses may not be used to estimate the actual ending account balance or expenses you paid for the period. You may use this information to compare the ongoing costs of investing in the Fund and other funds. To do so, compare this 5% hypothetical example with the 5% hypothetical examples that appear in the shareholder reports of the other funds. If any fund is a shareholder of any Underlying Funds, such fund indirectly bears its proportional share of the expenses of the Underlying Funds in addition to the direct expenses as presented in the table. These fees and expenses are not included in the annualized expense ratio used to calculate the expense estimate in the table below.
Please note that the expenses shown in the table are meant to highlight your ongoing costs only and do not reflect any transaction costs. Therefore, the second line of the table is useful in comparing ongoing costs only, and will not help you determine the relative total costs of owning different funds. In addition, if these transactional costs were included, your costs would have been higher.
| | | | | Annualized Expense Ratio- A | | Beginning Account Value November 1, 2023 | | Ending Account Value April 30, 2024 | | Expenses Paid During Period- C November 1, 2023 to April 30, 2024 |
| Fidelity® Women's Leadership Fund | | | | | | | | | | |
| Class A | | | | 1.03% | | | | | | |
| Actual | | | | | | $ 1,000 | | $ 1,221.60 | | $ 5.69 |
Hypothetical-B | | | | | | $ 1,000 | | $ 1,019.74 | | $ 5.17 |
| Class M | | | | 1.28% | | | | | | |
| Actual | | | | | | $ 1,000 | | $ 1,219.70 | | $ 7.06 |
Hypothetical-B | | | | | | $ 1,000 | | $ 1,018.50 | | $ 6.42 |
| Class C | | | | 1.77% | | | | | | |
| Actual | | | | | | $ 1,000 | | $ 1,216.60 | | $ 9.75 |
Hypothetical-B | | | | | | $ 1,000 | | $ 1,016.06 | | $ 8.87 |
Fidelity® Women's Leadership Fund ** | | | | .75% | | | | | | |
| Actual | | | | | | $ 1,000 | | $ 1,222.60 | | $ 4.14 |
Hypothetical-B | | | | | | $ 1,000 | | $ 1,021.13 | | $ 3.77 |
Class I ** | | | | .73% | | | | | | |
| Actual | | | | | | $ 1,000 | | $ 1,223.60 | | $ 4.04 |
Hypothetical-B | | | | | | $ 1,000 | | $ 1,021.23 | | $ 3.67 |
Class Z ** | | | | .63% | | | | | | |
| Actual | | | | | | $ 1,000 | | $ 1,223.50 | | $ 3.48 |
Hypothetical-B | | | | | | $ 1,000 | | $ 1,021.73 | | $ 3.17 |
| |
A Annualized expense ratio reflects expenses net of applicable fee waivers.
B 5% return per year before expenses
C Expenses are equal to the annualized expense ratio, multiplied by the average account value over the period, multiplied by 182/ 366 (to reflect the one-half year period). The fees and expenses of any Underlying Funds are not included in each annualized expense ratio.
** If fees and changes to the expense contract and/or expense cap, effective March 1, 2024, had been in effect during the entire current period, the restated annualized expense ratio and the expenses paid in the actual and hypothetical examples above would have been as shown in table below:
| | | | | Annualized Expense Ratio- A | | Expenses Paid |
| Fidelity® Women's Leadership Fund | | | | | | |
| Fidelity® Women's Leadership Fund | | | | .68% | | |
| Actual | | | | | | $ 3.76 |
Hypothetical- B | | | | | | $ 3.42 |
| Class I | | | | .69% | | |
| Actual | | | | | | $ 3.82 |
Hypothetical- B | | | | | | $ 3.47 |
| Class Z | | | | .57% | | |
| Actual | | | | | | $ 3.15 |
Hypothetical- B | | | | | | $ 2.87 |
| | | | | | | |
| A Annualized expense ratio reflects expenses net of applicable fee waivers. | | | | | | |
| B 5% return per year before expenses | | | | | | |
The dividend and capital gains distributions for the fund(s) are available on Fidelity.com or Institutional.Fidelity.com.
Class A, Class M, Class I, and Class Z designate 100% of each dividend distributed during the fiscal year as qualifying for the dividends-received deduction for corporate shareholders.
Class A, Class M, Class I, and Class Z designate 100% of each dividend distributed during the fiscal year as amounts which may be taken into account as a dividend for purposes of the maximum rate under section 1(h)(11) of the Internal Revenue Code.
The fund will notify shareholders in January 2025 of amounts for use in preparing 2024 income tax returns.
Board Approval of Investment Advisory Contracts
Fidelity Women's Leadership Fund
At its January 2024 meeting, the Board of Trustees, including the Independent Trustees (together, the Board), approved an amended and restated management contract with Fidelity Management & Research Company LLC (FMR) (the Management Contract), and amended and restated sub-advisory agreements (the Sub-Advisory Contracts, and together with the Management Contract, the Advisory Contracts) for the fund, including the fund's sub-advisory agreements with FMR Investment Management (UK) Limited (FMR UK), Fidelity Management & Research (Hong Kong) Limited (FMR H.K.), and Fidelity Management & Research (Japan) Limited (FMR Japan). The Advisory Contracts will be effective March 1, 2024. The Board will consider the annual renewal of the fund's Advisory Contracts in May 2024, following its review of additional materials provided by FMR.
Management Contract. The Board approved the Management Contract, which implements a new fee structure combining the management fee, transfer agent fee (TA Fee), and pricing and bookkeeping fee (P&B Fee) of the fund and each class into a single class-level fee based on tiered schedules and subject to a maximum class-level rate (the Unified Fee). In exchange for the Unified Fee, the fund will receive investment advisory, management, administrative, transfer agent, pricing and bookkeeping services under a single agreement - the Management Contract.
In its consideration of the Management Contract over several meetings, the Board received, reviewed and discussed a comprehensive set of analyses regarding the Unified Fee including (i) the legal framework, (ii) design goals for the Unified Fee, (iii) calculation methodology for the Unified Fee and illustrative examples, (iv) annual and cumulative projected impacts under various scenarios, both in the aggregate and at the fund/class level, (v) explanations of schedules, rate levers and maximum rates and (vi) shareholder benefits and projected savings.
The Board considered that the maximum Unified Fee for each class of the fund would be no higher than the sum of (i) the lowest contractual management fee rate under the fund's existing management contract, which is the individual fund fee rate, if any, plus the lowest contractual marginal group fee rate and (ii) the TA and P&B Fee rates, which are fixed fee rates since December 1, 2023 (together, the Unified Fee Cap). The Board noted that Fidelity has represented that, as a result of this Unified Fee Cap, the Unified Fee would be no greater than the fee rates previously authorized to be charged to the fund for the same services. The Board noted that certain expenses such as performance adjustments, third-party expenses, Rule 12b-1 fees, and certain other miscellaneous expenses would be outside the scope of the Unified Fee and the calculation of such fees would not change as a result of the Unified Fee. The Board considered that, under the Management Contract, a different management fee rate will be applicable to each class of the fund. The Board noted that Fidelity has represented that the difference in expenses between classes is based on differences in class-specific expenses and not due to any difference in advisory or third-party custodial fees or other expenses related to the management of the fund's assets.
The Board considered Fidelity's representations that implementation of the Unified Fee, which includes the Unified Fee Cap, would cause all funds subject to the Unified Fee, including the fund, to experience an immediate reduction on contractual fee rates for services provided under the current management contracts. The Board considered that some funds would not experience lower net total fees as a result of existing fee caps. The Board further considered that, in addition to the contractual fee savings, the Unified Fee offers funds and their shareholders greater protection from future rate increases for services previously offered under separate agreements that are now covered by the Management Contract because such rate increases would require shareholder approval.
Sub-Advisory Contracts. In connection with the Unified Fee changes, the Board considered the Sub-Advisory Contracts, which simplified the calculation of the fees paid by FMR to the sub-advisers under the agreements. The Board noted that the agreements with FMR UK, FMR H.K., and FMR Japan were amended to provide that FMR will compensate each sub-adviser at a fee rate equal to 110% of the sub-adviser's costs incurred in providing services under the agreement. The Board considered that, under the Sub-Advisory Contracts, FMR, and not the fund, will continue to pay the sub-advisory fees to each applicable sub-adviser.
The Board further considered that the approval of the fund's Advisory Contracts will not result in any changes in the investment process or strategies employed in the management of the fund's assets or the day-to-day management of the fund or the persons primarily responsible for such management. Further, the Board considered that the Management Contract would not change the obligations and services of FMR and its affiliates on behalf of the fund, and, in particular, there would be no change in the nature and level of advisory, management, administration, transfer agent, and pricing and bookkeeping services provided to the fund by FMR, its affiliates, and each applicable sub-adviser.
In connection with its consideration of future renewals of the fund's Advisory Contracts, the Board will consider: (i) the nature, extent and quality of services provided to the funds, including shareholder and administrative services and investment performance; (ii) the competitiveness of the management fee and total expenses for the fund; (iii) the costs of the services and profitability, including the revenues earned and the expenses incurred in conducting the business of developing, marketing, distributing, managing, administering, and servicing the fund and its shareholders, to the extent applicable; and (iv) whether there have been economies of scale in respect of the Fidelity funds, whether the Fidelity funds (including the fund) have appropriately benefited from any such economies of scale, and whether there is the potential for realization of any further economies.
Based on its evaluation of all of the conclusions and representations noted above, and after considering all factors it believed relevant, the Board concluded that the fund's management fee structure is fair and reasonable, and that the fund's Advisory Contracts should be approved.
The Securities and Exchange Commission adopted Rule 22e-4 under the Investment Company Act of 1940 (the Liquidity Rule) to promote effective liquidity risk management throughout the open-end investment company industry, thereby reducing the risk that funds will be unable to meet their redemption obligations and mitigating dilution of the interests of fund shareholders.
The Fund has adopted and implemented a liquidity risk management program (the Program) reasonably designed to assess and manage the Fund's liquidity risk and to comply with the requirements of the Liquidity Rule. The Fund's Board of Trustees (the Board) has designated the Fund's investment adviser as administrator of the Program. The Fidelity advisers have established a Liquidity Risk Management Committee (the LRM Committee) to manage the Program for each of the Fidelity Funds. The LRM Committee monitors the adequacy and effectiveness of implementation of the Program and on a periodic basis assesses each Fund's liquidity risk based on a variety of factors including (1) the Fund's investment strategy, (2) portfolio liquidity and cash flow projections during normal and reasonably foreseeable stressed conditions, (3) shareholder redemptions, (4) borrowings and other funding sources and (5) certain factors specific to ETFs including the effect of the Fund's prices and spreads, market participants, and basket compositions on the overall liquidity of the Fund's portfolio, as applicable.
In accordance with the Program, each of the Fund's portfolio investments is classified into one of four defined liquidity categories based on a determination of a reasonable expectation for how long it would take to convert the investment to cash (or sell or dispose of the investment) without significantly changing its market value.
- Highly liquid investments - cash or convertible to cash within three business days or less
- Moderately liquid investments - convertible to cash in three to seven calendar days
- Less liquid investments - can be sold or disposed of, but not settled, within seven calendar days
- Illiquid investments - cannot be sold or disposed of within seven calendar days
Liquidity classification determinations take into account a variety of factors including various market, trading and investment-specific considerations, as well as market depth, and generally utilize analysis from a third-party liquidity metrics service.
The Liquidity Rule places a 15% limit on a fund's illiquid investments and requires funds that do not primarily hold assets that are highly liquid investments to determine and maintain a minimum percentage of the fund's net assets to be invested in highly liquid investments (highly liquid investment minimum or HLIM). The Program includes provisions reasonably designed to comply with the 15% limit on illiquid investments and for determining, periodically reviewing and complying with the HLIM requirement as applicable.
At a recent meeting of the Fund's Board of Trustees, the LRM Committee provided a written report to the Board pertaining to the operation, adequacy, and effectiveness of the Program for the period December 1, 2022 through November 30, 2023. The report concluded that the Program is operating effectively and is reasonably designed to assess and manage the Fund's liquidity risk.
1.9893105.104
WLF-ANN-0624
Fidelity® Short Duration High Income Fund
Annual Report
April 30, 2024
Includes Fidelity and Fidelity Advisor share classes
Contents
To view a fund's proxy voting guidelines and proxy voting record for the 12-month period ended June 30, visit http://www.fidelity.com/proxyvotingresults or visit the Securities and Exchange Commission's (SEC) web site at http://www.sec.gov.
You may also call 1-800-544-8544 if you're an individual investing directly with Fidelity, call 1-800-835-5092 if you're a plan sponsor or participant with Fidelity as your recordkeeper or call 1-877-208-0098 on institutional accounts or if you're an advisor or invest through one to request a free copy of the proxy voting guidelines.
Standard & Poor's, S&P and S&P 500 are registered service marks of The McGraw-Hill Companies, Inc. and have been licensed for use by Fidelity Distributors Corporation.
Other third-party marks appearing herein are the property of their respective owners.
All other marks appearing herein are registered or unregistered trademarks or service marks of FMR LLC or an affiliated company. © 2024 FMR LLC. All rights reserved.
This report and the financial statements contained herein are submitted for the general information of the shareholders of the Fund. This report is not authorized for distribution to prospective investors in the Fund unless preceded or accompanied by an effective prospectus.
A fund files its complete schedule of portfolio holdings with the SEC for the first and third quarters of each fiscal year on Form N-PORT. Forms N-PORT are available on the SEC's web site at http://www.sec.gov. A fund's Forms N-PORT may be reviewed and copied at the SEC's Public Reference Room in Washington, DC. Information regarding the operation of the SEC's Public Reference Room may be obtained by calling 1-800-SEC-0330.
For a complete list of a fund's portfolio holdings, view the most recent holdings listing, semiannual report, or annual report on Fidelity's web site at http://www.fidelity.com, http://www.institutional.fidelity.com, or http://www.401k.com, as applicable.
NOT FDIC INSURED •MAY LOSE VALUE •NO BANK GUARANTEE
Neither the Fund nor Fidelity Distributors Corporation is a bank.
Average annual total return reflects the change in the value of an investment, assuming reinvestment of distributions from dividend income and capital gains (the profits earned upon the sale of securities that have grown in value, if any) and assuming a constant rate of performance each year. The hypothetical investment and the average annual total returns do not reflect the deduction of taxes that a shareholder would pay on fund distributions or the redemption of fund shares. During periods of reimbursement by Fidelity, a fund's total return will be greater than it would be had the reimbursement not occurred. How a fund did yesterday is no guarantee of how it will do tomorrow.
| Average Annual Total Returns |
| | | | |
Periods ended April 30, 2024 | Past 1 year | Past 5 years | Past 10 years |
Class A (incl. 4.00% sales charge) | 3.79% | 1.98% | 2.34% |
Class M (incl. 4.00% sales charge) | 3.68% | 1.96% | 2.33% |
Class C (incl. contingent deferred sales charge) | 6.31% | 2.05% | 2.15% |
| Fidelity® Short Duration High Income Fund | 8.42% | 3.08% | 3.02% |
| Class I | 8.39% | 3.07% | 3.02% |
| Class Z | 8.48% | 3.14% | 3.07% |
Class C shares' contingent deferred sales charges included in the past one year, past five years and past ten years total return figures are 1%, 0% and 0%, respectively.
The initial offering of Class Z shares took place on October 2, 2018. Returns prior to October 2, 2018, are those of Class I.
| $10,000 Over 10 Years |
| |
Let's say hypothetically that $10,000 was invested in Fidelity® Short Duration High Income Fund, a class of the fund, on April 30, 2014. The chart shows how the value of your investment would have changed, and also shows how the ICE® BofA® 1-5 Year BB-B US Cash Pay High Yield Constrained Index performed over the same period. |
|
|
Market Recap:
High-yield bonds gained 8.89% for the 12 months ending April 30, 2024, according to the ICE BofA® US High Yield Constrained Index, driven by resilient corporate profits and the Federal Reserve's likely pivot to cutting interest rates later this year. Amid this favorable backdrop for higher-risk assets, the index advanced fairly steadily for most the period, highlighted by an especially strong final two months of 2023, when the index rose 8.72%. Following the Federal Reserve's November 1 meeting, when the central bank hinted it might be done raising rates, the high-yield index reversed a two-month decline that was due to soaring yields on longer-term government bonds and mixed earnings from some big and influential firms. High yield continued to advance in 2024 but lost some of its momentum, gaining 1.51% through March, as the central bank held steady its benchmark federal funds rate and affirmed its projection to cut in 2024. The index slipped in April (-1%), when inflation remained stickier than expected. For the full 12 months, all 18 industries within the index advanced, with retail (+14%) leading, followed by financial services (+12%) and banking (+11%), which benefited from high interest rates. Energy, the largest segment in the high-yield index this period, gained 10%. Conversely, the telecommunications (+4%) group lagged most, followed by utility, capital goods and transportation (+6% each).
Comments from Co-Managers Jared Beckerman, Benjamin Harrison and Alexandre Karam:
For the fiscal year, the fund's share classes (excluding sales charges, if applicable) gained about 7% to 8%, versus 8.96% for the Fidelity Short Duration High Income Fund Composite Index and 8.36% for the ICE BofA 1-5 Year BB-B US Cash Pay High Yield Constrained Index. The fund's core investment in high-yield bonds increased 8.05% and detracted from performance versus the Composite index. By industry, the biggest relative detractors were our picks and an underweight in financial services. Security selection and an underweight in health care also hampered the fund's result, as did security selection in energy. The biggest individual relative detractor was an overweight in Icahn Enterprises (+2%), a large holdings. A non-benchmark stake in Cano Health returned -58% and was a second notable relative detractor. An overweight in Ardagh (-22%) also detracted. In contrast, the biggest contributor to performance versus the Composite index was security selection in media. Security selection in services also boosted relative performance, along with our choices and an overweight in basic industry. Lastly, the fund's position in cash contributed. The top individual relative contributor was an overweight in Dish Network (+23%), one of the fund's biggest holdings. A second notable relative contributor was an overweight in CenturyLink (+28%). Another notable relative contributor was Altice USA (+9%). Notable changes in positioning include higher allocations to the technology & electronics and real estate industries.
Note to shareholders:
On June 8, 2023, Michael Weaver came off of the fund. On January 1, 2024, Jared Beckerman assumed co-management responsibilities for the fund and its U.S. high-yield sleeve.
The views expressed above reflect those of the portfolio manager(s) only through the end of the period as stated on the cover of this report and do not necessarily represent the views of Fidelity or any other person in the Fidelity organization. Any such views are subject to change at any time based upon market or other conditions and Fidelity disclaims any responsibility to update such views. These views may not be relied on as investment advice and, because investment decisions for a Fidelity fund are based on numerous factors, may not be relied on as an indication of trading intent on behalf of any Fidelity fund.
| Top Bond Issuers (% of Fund's net assets) |
(with maturities greater than one year) |
| TransDigm, Inc. | 2.3 | |
| Occidental Petroleum Corp. | 1.3 | |
| Royal Caribbean Cruises Ltd. | 1.2 | |
| DISH Network Corp. | 1.2 | |
| Carnival Corp. | 1.2 | |
| Univision Communications, Inc. | 1.2 | |
| Icahn Enterprises LP/Icahn Enterprises Finance Corp. | 1.1 | |
| MPT Operating Partnership LP/MPT Finance Corp. | 1.1 | |
| Community Health Systems, Inc. | 1.1 | |
| Sable International Finance Ltd. | 1.0 | |
| | 12.7 | |
| |
| Market Sectors (% of Fund's net assets) |
| |
| Energy | 14.5 | |
| Services | 8.6 | |
| Technology | 6.9 | |
| Healthcare | 5.9 | |
| Chemicals | 5.3 | |
| |
Quality Diversification (% of Fund's net assets) |
|
| |
| We have used ratings from Moody's Investors Service, Inc. Where Moody's® ratings are not available, we have used S&P® ratings. All ratings are as of the date indicated and do not reflect subsequent changes. |
Asset Allocation (% of Fund's net assets) |
|
|
Geographic Diversification (% of Fund's net assets) |
|
* Includes Short-Term investments and Net Other Assets (Liabilities). Percentages are adjusted for the effect of derivatives, if applicable. |
| |
Showing Percentage of Net Assets
| Corporate Bonds - 83.1% |
| | | Principal Amount (a) | Value ($) |
| Convertible Bonds - 1.2% | | | |
| Broadcasting - 0.7% | | | |
| DISH Network Corp. 3.375% 8/15/26 | | 2,700,000 | 1,646,995 |
| Diversified Financial Services - 0.0% | | | |
| Coinbase Global, Inc. 0.25% 4/1/30 (b) | | 10,000 | 9,031 |
| Energy - 0.0% | | | |
| Sunnova Energy International, Inc. 0.25% 12/1/26 | | 134,000 | 59,998 |
| Homebuilders/Real Estate - 0.2% | | | |
| Realogy Group LLC/Realogy Co-Issuer Corp. 0.25% 6/15/26 | | 510,000 | 415,650 |
| Technology - 0.3% | | | |
| Global Payments, Inc. 1.5% 3/1/31 (b) | | 348,000 | 345,912 |
| Wolfspeed, Inc. 1.875% 12/1/29 | | 648,000 | 372,276 |
| | | | 718,188 |
TOTAL CONVERTIBLE BONDS | | | 2,849,862 |
| Nonconvertible Bonds - 81.9% | | | |
| Aerospace - 3.7% | | | |
| Bombardier, Inc.: | | | |
| 6% 2/15/28 (b) | | 125,000 | 121,899 |
| 7.875% 4/15/27 (b) | | 720,000 | 715,513 |
| Howmet Aerospace, Inc.: | | | |
| 5.9% 2/1/27 | | 455,000 | 456,866 |
| 6.875% 5/1/25 | | 1,248,000 | 1,257,422 |
| Rolls-Royce PLC 5.75% 10/15/27 (b) | | 475,000 | 469,790 |
| Spirit Aerosystems, Inc. 9.75% 11/15/30 (b) | | 210,000 | 232,312 |
| TransDigm, Inc.: | | | |
| 5.5% 11/15/27 | | 1,235,000 | 1,199,494 |
| 6.375% 3/1/29 (b) | | 1,160,000 | 1,151,141 |
| 6.75% 8/15/28 (b) | | 2,935,000 | 2,953,348 |
| | | | 8,557,785 |
| Air Transportation - 2.2% | | | |
| American Airlines, Inc. 7.25% 2/15/28 (b) | | 380,000 | 382,151 |
| American Airlines, Inc. / AAdvantage Loyalty IP Ltd. 5.5% 4/20/26 (b) | | 1,866,667 | 1,845,012 |
| Rand Parent LLC 8.5% 2/15/30 (b) | | 1,570,000 | 1,552,600 |
| United Airlines, Inc. 4.375% 4/15/26 (b) | | 1,325,000 | 1,274,497 |
| | | | 5,054,260 |
| Automotive & Auto Parts - 0.9% | | | |
| Aston Martin Capital Holdings Ltd. 10% 3/31/29 (b) | | 200,000 | 194,750 |
| Clarios Global LP / Clarios U.S. Finance Co. 6.75% 5/15/28 (b) | | 180,000 | 180,366 |
| Macquarie AirFinance Holdings: | | | |
| 8.125% 3/30/29 (b) | | 485,000 | 507,166 |
| 8.375% 5/1/28 (b) | | 600,000 | 629,910 |
| McLaren Finance PLC 7.5% 8/1/26 (b) | | 70,000 | 60,795 |
| Phinia, Inc. 6.75% 4/15/29 (b) | | 180,000 | 180,641 |
| Real Hero Merger Sub 2 6.25% 2/1/29 (b) | | 30,000 | 25,701 |
| Wand NewCo 3, Inc. 7.625% 1/30/32 (b) | | 295,000 | 299,897 |
| | | | 2,079,226 |
| Banks & Thrifts - 0.8% | | | |
| Ally Financial, Inc. 3.875% 5/21/24 | | 970,000 | 968,712 |
| VistaJet Malta Finance PLC / XO Management Holding, Inc. 7.875% 5/1/27 (b) | | 385,000 | 342,380 |
| Western Alliance Bancorp. 3% 6/15/31 (c) | | 520,000 | 442,244 |
| | | | 1,753,336 |
| Broadcasting - 2.2% | | | |
| Clear Channel Outdoor Holdings, Inc.: | | | |
| 7.875% 4/1/30 (b) | | 235,000 | 230,408 |
| 9% 9/15/28 (b) | | 1,025,000 | 1,053,766 |
| Diamond Sports Group LLC/Diamond Sports Finance Co. 5.375% (b)(d) | | 410,000 | 10,250 |
| DISH Network Corp. 11.75% 11/15/27 (b) | | 1,130,000 | 1,139,082 |
| iHeartCommunications, Inc. 4.75% 1/15/28 (b) | | 525,000 | 374,882 |
| Sirius XM Radio, Inc. 3.125% 9/1/26 (b) | | 1,995,000 | 1,856,808 |
| Univision Communications, Inc. 8% 8/15/28 (b) | | 370,000 | 369,564 |
| | | | 5,034,760 |
| Building Materials - 0.6% | | | |
| Advanced Drain Systems, Inc. 5% 9/30/27 (b) | | 245,000 | 237,244 |
| AmeriTex Holdco Intermediate LLC 10.25% 10/15/28 (b) | | 355,000 | 373,950 |
| Beacon Roofing Supply, Inc. 6.5% 8/1/30 (b) | | 195,000 | 194,663 |
| Eco Material Technologies, Inc. 7.875% 1/31/27 (b) | | 135,000 | 135,992 |
| Global Infrastructure Solutions, Inc. 5.625% 6/1/29 (b) | | 185,000 | 166,213 |
| SRS Distribution, Inc. 4.625% 7/1/28 (b) | | 95,000 | 94,646 |
| Summit Materials LLC/Summit Materials Finance Corp. 7.25% 1/15/31 (b) | | 180,000 | 184,500 |
| | | | 1,387,208 |
| Cable/Satellite TV - 1.3% | | | |
| CCO Holdings LLC/CCO Holdings Capital Corp. 5.125% 5/1/27 (b) | | 2,425,000 | 2,272,643 |
| DISH DBS Corp. 5.25% 12/1/26 (b) | | 800,000 | 629,107 |
| Telenet Finance Luxembourg Notes SARL 5.5% 3/1/28 (b) | | 200,000 | 188,750 |
| | | | 3,090,500 |
| Capital Goods - 1.1% | | | |
| ESAB Corp. 6.25% 4/15/29 (b) | | 1,190,000 | 1,185,535 |
| TK Elevator U.S. Newco, Inc. 5.25% 7/15/27 (b) | | 1,300,000 | 1,243,539 |
| | | | 2,429,074 |
| Chemicals - 3.9% | | | |
| Axalta Coating Systems Dutch Holding B BV 7.25% 2/15/31 (b) | | 590,000 | 601,725 |
| Cerdia Finanz GmbH 10.5% 2/15/27 (b) | | 130,000 | 134,693 |
| Compass Minerals International, Inc. 6.75% 12/1/27 (b) | | 205,000 | 192,249 |
| Kobe U.S. Midco 2, Inc. 9.25% 11/1/26 pay-in-kind (b)(c) | | 814,000 | 693,935 |
| LSB Industries, Inc. 6.25% 10/15/28 (b) | | 740,000 | 701,493 |
| Methanex Corp. 5.125% 10/15/27 | | 900,000 | 865,595 |
| NOVA Chemicals Corp.: | | | |
| 5% 5/1/25 (b) | | 1,005,000 | 986,222 |
| 5.25% 6/1/27 (b) | | 400,000 | 376,282 |
| 9% 2/15/30 (b) | | 110,000 | 113,344 |
| SCIH Salt Holdings, Inc.: | | | |
| 4.875% 5/1/28 (b) | | 1,995,000 | 1,854,928 |
| 6.625% 5/1/29 (b) | | 300,000 | 276,805 |
| SPCM SA 3.125% 3/15/27 (b) | | 395,000 | 362,698 |
| The Chemours Co. LLC 5.375% 5/15/27 | | 1,075,000 | 1,017,095 |
| Tronox, Inc. 4.625% 3/15/29 (b) | | 530,000 | 472,807 |
| W.R. Grace Holding LLC 7.375% 3/1/31 (b) | | 180,000 | 182,459 |
| | | | 8,832,330 |
| Consumer Products - 1.9% | | | |
| Coty, Inc. 5% 4/15/26 (b) | | 1,100,000 | 1,078,802 |
| Gannett Holdings LLC 6% 11/1/26 (b) | | 75,000 | 69,308 |
| Kohl's Corp. 4.25% 7/17/25 | | 70,000 | 68,234 |
| Mattel, Inc. 5.875% 12/15/27 (b) | | 460,000 | 457,431 |
| Newell Brands, Inc. 5.7% 4/1/26 | | 675,000 | 664,236 |
| Tempur Sealy International, Inc. 4% 4/15/29 (b) | | 865,000 | 768,996 |
| TKC Holdings, Inc.: | | | |
| 6.875% 5/15/28 (b) | | 390,000 | 368,152 |
| 10.5% 5/15/29 (b) | | 825,000 | 789,403 |
| | | | 4,264,562 |
| Containers - 2.3% | | | |
| Ardagh Packaging Finance PLC/Ardagh MP Holdings U.S.A., Inc. 4.125% 8/15/26 (b) | | 870,000 | 725,020 |
| Berry Global, Inc. 4.875% 7/15/26 (b) | | 425,000 | 415,879 |
| Mauser Packaging Solutions Holding Co.: | | | |
| 7.875% 4/15/27 (b) | | 525,000 | 534,844 |
| 9.25% 4/15/27 (b) | | 550,000 | 538,986 |
| Owens-Brockway Glass Container, Inc. 7.25% 5/15/31 (b) | | 750,000 | 751,148 |
| Sealed Air Corp. 5% 4/15/29 (b) | | 1,500,000 | 1,411,219 |
| Sealed Air Corp./Sealed Air Corp. U.S. 6.125% 2/1/28 (b) | | 515,000 | 508,725 |
| Trivium Packaging Finance BV 8.5% 8/15/27 (b) | | 450,000 | 445,618 |
| | | | 5,331,439 |
| Diversified Financial Services - 3.3% | | | |
| Cargo Aircraft Management, Inc. 4.75% 2/1/28 (b) | | 225,000 | 202,500 |
| Encore Capital Group, Inc. 9.25% 4/1/29 (b) | | 200,000 | 204,329 |
| Fortress Transportation & Infrastructure Investors LLC 7.875% 12/1/30 (b) | | 385,000 | 399,922 |
| Freedom Mortgage Corp. 6.625% 1/15/27 (b) | | 250,000 | 240,629 |
| GGAM Finance Ltd.: | | | |
| 6.875% 4/15/29 (b) | | 295,000 | 294,723 |
| 7.75% 5/15/26 (b) | | 1,240,000 | 1,259,684 |
| Gn Bondco LLC 9.5% 10/15/31 (b) | | 410,000 | 393,732 |
| Hightower Holding LLC 6.75% 4/15/29 (b) | | 150,000 | 140,790 |
| Icahn Enterprises LP/Icahn Enterprises Finance Corp.: | | | |
| 4.75% 9/15/24 | | 690,000 | 685,922 |
| 5.25% 5/15/27 | | 1,310,000 | 1,197,013 |
| 6.25% 5/15/26 | | 750,000 | 729,424 |
| Jefferson Capital Holding 9.5% 2/15/29 (b) | | 185,000 | 188,230 |
| Navient Corp. 6.75% 6/15/26 | | 250,000 | 249,166 |
| OneMain Finance Corp.: | | | |
| 3.5% 1/15/27 | | 235,000 | 216,202 |
| 6.875% 3/15/25 | | 1,090,000 | 1,097,139 |
| | | | 7,499,405 |
| Diversified Media - 0.2% | | | |
| Advantage Sales & Marketing, Inc. 6.5% 11/15/28 (b) | | 425,000 | 395,474 |
| Energy - 14.1% | | | |
| Altus Midstream LP 6.625% 12/15/28 (b) | | 465,000 | 467,239 |
| Baytex Energy Corp. 7.375% 3/15/32 (b) | | 305,000 | 307,593 |
| Berry Petroleum Co. LLC 7% 2/15/26 (b) | | 100,000 | 99,126 |
| Buckeye Partners LP: | | | |
| 4.125% 3/1/25 (b) | | 525,000 | 513,659 |
| 4.125% 12/1/27 | | 1,400,000 | 1,303,549 |
| California Resources Corp. 7.125% 2/1/26 (b) | | 250,000 | 251,384 |
| Calumet Specialty Products Partners LP/Calumet Finance Corp.: | | | |
| 9.75% 7/15/28 (b) | | 315,000 | 302,027 |
| 11% 4/15/25 (b) | | 3,000 | 3,002 |
| Cheniere Energy, Inc. 4.625% 10/15/28 | | 625,000 | 597,442 |
| Chesapeake Energy Corp. 5.5% 2/1/26 (b) | | 180,000 | 177,722 |
| Chord Energy Corp. 6.375% 6/1/26 (b) | | 100,000 | 99,959 |
| Citgo Petroleum Corp. 6.375% 6/15/26 (b) | | 525,000 | 524,187 |
| Comstock Resources, Inc. 6.75% 3/1/29 (b) | | 120,000 | 114,253 |
| Continental Resources, Inc. 2.268% 11/15/26 (b) | | 100,000 | 91,729 |
| CrownRock LP/CrownRock Finance, Inc. 5.625% 10/15/25 (b) | | 850,000 | 845,301 |
| CVR Energy, Inc. 8.5% 1/15/29 (b) | | 585,000 | 586,443 |
| DCP Midstream Operating LP 5.375% 7/15/25 | | 335,000 | 333,321 |
| Delek Logistics Partners LP/Delek Logistics Finance Corp.: | | | |
| 7.125% 6/1/28 (b) | | 80,000 | 78,137 |
| 8.625% 3/15/29 (b) | | 630,000 | 634,767 |
| Energy Transfer LP: | | | |
| 6% 2/1/29 (b) | | 560,000 | 559,237 |
| 7.375% 2/1/31 (b) | | 525,000 | 541,386 |
| EnLink Midstream Partners LP 4.85% 7/15/26 | | 525,000 | 510,605 |
| EQM Midstream Partners LP: | | | |
| 6% 7/1/25 (b) | | 147,000 | 146,755 |
| 7.5% 6/1/27 (b) | | 850,000 | 866,001 |
| EQT Corp. 3.125% 5/15/26 (b) | | 175,000 | 165,347 |
| Genesis Energy LP/Genesis Energy Finance Corp. 8% 1/15/27 | | 1,145,000 | 1,157,920 |
| Global Partners LP/GLP Finance Corp. 7% 8/1/27 | | 2,157,000 | 2,139,935 |
| Gulfport Energy Corp. 8% 5/17/26 | | 100,000 | 101,288 |
| Harvest Midstream I LP 7.5% 5/15/32 (b) | | 430,000 | 430,533 |
| Hess Midstream Operations LP 5.625% 2/15/26 (b) | | 900,000 | 889,888 |
| HF Sinclair Corp. 6.375% 4/15/27 (b) | | 105,000 | 105,012 |
| Kodiak Gas Services LLC 7.25% 2/15/29 (b) | | 345,000 | 347,488 |
| Magnolia Oil & Gas Operating LLC/Magnolia Oil & Gas Finance Corp. 6% 8/1/26 (b) | | 475,000 | 468,671 |
| Matador Resources Co. 6.5% 4/15/32 (b) | | 400,000 | 396,436 |
| Mesquite Energy, Inc. 7.25% (b)(d)(e) | | 135,000 | 0 |
| New Fortress Energy, Inc.: | | | |
| 6.5% 9/30/26 (b) | | 615,000 | 588,102 |
| 6.75% 9/15/25 (b) | | 659,000 | 650,903 |
| 8.75% 3/15/29 (b) | | 690,000 | 672,922 |
| NGL Energy Operating LLC/NGL Energy Finance Corp. 8.125% 2/15/29 (b) | | 345,000 | 350,492 |
| Northern Oil & Gas, Inc. 8.75% 6/15/31 (b) | | 285,000 | 299,793 |
| NuStar Logistics LP 6% 6/1/26 | | 150,000 | 148,846 |
| Occidental Petroleum Corp.: | | | |
| 5.875% 9/1/25 | | 1,650,000 | 1,650,045 |
| 6.95% 7/1/24 | | 424,000 | 424,470 |
| 8.5% 7/15/27 | | 750,000 | 801,533 |
| PBF Holding Co. LLC/PBF Finance Corp. 7.875% 9/15/30 (b) | | 580,000 | 596,521 |
| PDC Energy, Inc. 5.75% 5/15/26 | | 650,000 | 649,629 |
| Prairie Acquiror LP 9% 8/1/29 (b) | | 185,000 | 188,961 |
| Precision Drilling Corp. 7.125% 1/15/26 (b) | | 556,000 | 555,968 |
| Range Resources Corp. 4.875% 5/15/25 | | 450,000 | 446,186 |
| Seadrill Finance Ltd. 8.375% 8/1/30 (b) | | 430,000 | 447,962 |
| Sitio Royalties OP / Sitio Finance Corp. 7.875% 11/1/28 (b) | | 1,002,000 | 1,030,400 |
| SM Energy Co. 6.625% 1/15/27 | | 431,000 | 428,787 |
| Southwestern Energy Co. 5.7% 1/23/25 (f) | | 428,000 | 426,055 |
| Sunnova Energy Corp. 5.875% 9/1/26 (b) | | 810,000 | 503,779 |
| Sunoco LP/Sunoco Finance Corp. 6% 4/15/27 | | 1,010,000 | 997,786 |
| Tallgrass Energy Partners LP / Tallgrass Energy Finance Corp. 6% 3/1/27 (b) | | 750,000 | 730,553 |
| Talos Production, Inc. 9% 2/1/29 (b) | | 100,000 | 105,506 |
| Transocean Aquila Ltd. 8% 9/30/28 (b) | | 540,000 | 549,231 |
| Transocean, Inc. 8.75% 2/15/30 (b) | | 585,000 | 609,967 |
| U.S.A. Compression Partners LP/U.S.A. Compression Finance Corp. 7.125% 3/15/29 (b) | | 280,000 | 278,209 |
| Valaris Ltd. 8.375% 4/30/30 (b) | | 305,000 | 313,666 |
| Venture Global Calcasieu Pass LLC 6.25% 1/15/30 (b) | | 265,000 | 262,010 |
| Western Gas Partners LP 4.65% 7/1/26 | | 1,300,000 | 1,269,798 |
| | | | 32,135,422 |
| Entertainment/Film - 0.6% | | | |
| Live Nation Entertainment, Inc. 4.75% 10/15/27 (b) | | 1,450,000 | 1,366,585 |
| Environmental - 0.4% | | | |
| Clean Harbors, Inc. 6.375% 2/1/31 (b) | | 210,000 | 208,046 |
| GFL Environmental, Inc. 6.75% 1/15/31 (b) | | 180,000 | 181,455 |
| Madison IAQ LLC 4.125% 6/30/28 (b) | | 700,000 | 649,355 |
| | | | 1,038,856 |
| Food & Drug Retail - 0.9% | | | |
| Albertsons Companies LLC/Safeway, Inc./New Albertson's, Inc./Albertson's LLC: | | | |
| 3.25% 3/15/26 (b) | | 1,100,000 | 1,044,697 |
| 6.5% 2/15/28 (b) | | 985,000 | 984,107 |
| | | | 2,028,804 |
| Food/Beverage/Tobacco - 1.1% | | | |
| C&S Group Enterprises LLC 5% 12/15/28 (b) | | 380,000 | 291,345 |
| Chobani LLC/Finance Corp., Inc. 7.625% 7/1/29 (b) | | 265,000 | 267,803 |
| Fiesta Purchaser, Inc. 7.875% 3/1/31 (b) | | 210,000 | 213,982 |
| KeHE Distributor / Nextwave 9% 2/15/29 (b) | | 345,000 | 348,352 |
| Performance Food Group, Inc. 5.5% 10/15/27 (b) | | 400,000 | 387,188 |
| Post Holdings, Inc.: | | | |
| 5.625% 1/15/28 (b) | | 125,000 | 121,307 |
| 6.25% 2/15/32 (b) | | 655,000 | 646,254 |
| Turning Point Brands, Inc. 5.625% 2/15/26 (b) | | 100,000 | 97,805 |
| United Natural Foods, Inc. 6.75% 10/15/28 (b) | | 95,000 | 72,906 |
| | | | 2,446,942 |
| Gaming - 3.6% | | | |
| Affinity Interactive 6.875% 12/15/27 (b) | | 1,030,000 | 921,906 |
| Boyd Gaming Corp. 4.75% 12/1/27 | | 475,000 | 450,011 |
| Caesars Entertainment, Inc.: | | | |
| 6.5% 2/15/32 (b) | | 665,000 | 655,187 |
| 8.125% 7/1/27 (b) | | 900,000 | 912,148 |
| Churchill Downs, Inc.: | | | |
| 4.75% 1/15/28 (b) | | 300,000 | 283,444 |
| 6.75% 5/1/31 (b) | | 495,000 | 491,411 |
| International Game Technology PLC 4.125% 4/15/26 (b) | | 825,000 | 794,466 |
| Las Vegas Sands Corp. 3.5% 8/18/26 | | 400,000 | 376,883 |
| Light & Wonder International, Inc. 7% 5/15/28 (b) | | 1,000,000 | 1,003,472 |
| Melco Resorts Finance Ltd. 5.25% 4/26/26 (b) | | 200,000 | 191,925 |
| Ontario Gaming Gta LP/Otg Co.-I 8% 8/1/30 (b) | | 275,000 | 279,210 |
| Raptor Acquisition Corp. / Raptor Co-Issuer LLC 4.875% 11/1/26 (b) | | 95,000 | 90,311 |
| Station Casinos LLC 6.625% 3/15/32 (b) | | 350,000 | 342,980 |
| Studio City Finance Ltd. 5% 1/15/29 (b) | | 225,000 | 192,938 |
| VICI Properties LP / VICI Note Co.: | | | |
| 3.5% 2/15/25 (b) | | 715,000 | 700,705 |
| 4.625% 6/15/25 (b) | | 300,000 | 295,156 |
| Wynn Las Vegas LLC/Wynn Las Vegas Capital Corp. 5.25% 5/15/27 (b) | | 325,000 | 314,071 |
| | | | 8,296,224 |
| Healthcare - 5.1% | | | |
| 1375209 BC Ltd. 9% 1/30/28 (b) | | 562,000 | 551,727 |
| Bausch Health Companies, Inc.: | | | |
| 5.5% 11/1/25 (b) | | 1,085,000 | 1,010,622 |
| 11% 9/30/28 (b) | | 850,000 | 663,417 |
| 14% 10/15/30 (b) | | 197,000 | 127,065 |
| Centene Corp. 3% 10/15/30 | | 210,000 | 176,034 |
| Community Health Systems, Inc.: | | | |
| 5.625% 3/15/27 (b) | | 1,950,000 | 1,785,501 |
| 6.875% 4/15/29 (b) | | 750,000 | 557,549 |
| HCA Holdings, Inc. 5.875% 2/15/26 | | 650,000 | 650,303 |
| IQVIA, Inc. 5% 5/15/27 (b) | | 1,675,000 | 1,617,054 |
| Medline Borrower LP / Medline Co. 6.25% 4/1/29 (b) | | 470,000 | 466,994 |
| Modivcare, Inc. 5.875% 11/15/25 (b) | | 250,000 | 243,827 |
| Molina Healthcare, Inc. 3.875% 5/15/32 (b) | | 235,000 | 196,643 |
| Organon & Co. / Organon Foreign Debt Co-Issuer BV 4.125% 4/30/28 (b) | | 550,000 | 500,916 |
| Owens & Minor, Inc. 4.5% 3/31/29 (b) | | 65,000 | 58,270 |
| RegionalCare Hospital Partners Holdings, Inc. 11% 10/15/30 (b) | | 290,000 | 308,674 |
| Surgery Center Holdings, Inc. 7.25% 4/15/32 (b) | | 345,000 | 344,529 |
| Tenet Healthcare Corp. 5.125% 11/1/27 | | 2,300,000 | 2,225,077 |
| U.S. Acute Care Solutions 9.75% 5/15/29 (b) | | 100,000 | 98,063 |
| | | | 11,582,265 |
| Homebuilders/Real Estate - 4.2% | | | |
| Beazer Homes U.S.A., Inc. 7.5% 3/15/31 (b) | | 185,000 | 182,859 |
| Brookfield Property REIT, Inc./BPR Nimbus LLC/BPR Cumulus LLC/GGSI Sellco LLC 5.75% 5/15/26 (b) | | 1,050,000 | 1,016,034 |
| Greystar Real Estate Partners 7.75% 9/1/30 (b) | | 230,000 | 236,896 |
| HAT Holdings I LLC/HAT Holdings II LLC 8% 6/15/27 (b) | | 285,000 | 292,167 |
| Landsea Homes Corp. 8.875% 4/1/29 (b) | | 230,000 | 225,688 |
| LGI Homes, Inc. 8.75% 12/15/28 (b) | | 195,000 | 202,842 |
| MPT Operating Partnership LP/MPT Finance Corp.: | | | |
| 5% 10/15/27 | | 1,700,000 | 1,390,532 |
| 5.25% 8/1/26 | | 1,285,000 | 1,170,406 |
| Railworks Holdings LP 8.25% 11/15/28 (b) | | 230,000 | 229,698 |
| Rithm Capital Corp. 8% 4/1/29 (b) | | 140,000 | 136,901 |
| Safehold Operating Partnership LP 2.85% 1/15/32 | | 710,000 | 569,445 |
| Service Properties Trust 7.5% 9/15/25 | | 800,000 | 805,904 |
| Starwood Property Trust, Inc. 4.75% 3/15/25 | | 1,500,000 | 1,481,578 |
| Uniti Group LP/Uniti Group Finance, Inc./CSL Capital LLC: | | | |
| 4.75% 4/15/28 (b) | | 500,000 | 438,525 |
| 6.5% 2/15/29 (b) | | 1,400,000 | 1,125,497 |
| | | | 9,504,972 |
| Hotels - 0.1% | | | |
| Hilton Grand Vacations Borrower Escrow LLC 6.625% 1/15/32 (b) | | 230,000 | 226,749 |
| Insurance - 0.4% | | | |
| Acrisure LLC / Acrisure Finance, Inc. 8.25% 2/1/29 (b) | | 530,000 | 525,646 |
| Alliant Holdings Intermediate LLC/Alliant Holdings Co.-Issuer: | | | |
| 6.75% 10/15/27 (b) | | 30,000 | 29,419 |
| 7% 1/15/31 (b) | | 200,000 | 200,626 |
| Enact Holdings, Inc. 6.5% 8/15/25 (b) | | 200,000 | 199,820 |
| | | | 955,511 |
| Leisure - 3.6% | | | |
| Amer Sports Co. 6.75% 2/16/31 (b) | | 235,000 | 231,434 |
| Carnival Corp.: | | | |
| 7.625% 3/1/26 (b) | | 2,430,000 | 2,445,073 |
| 10.5% 6/1/30 (b) | | 245,000 | 266,072 |
| NCL Corp. Ltd.: | | | |
| 5.875% 3/15/26 (b) | | 400,000 | 391,928 |
| 5.875% 2/15/27 (b) | | 525,000 | 512,856 |
| Royal Caribbean Cruises Ltd.: | | | |
| 5.375% 7/15/27 (b) | | 120,000 | 116,780 |
| 5.5% 8/31/26 (b) | | 1,435,000 | 1,407,638 |
| 5.5% 4/1/28 (b) | | 600,000 | 584,020 |
| 6.25% 3/15/32 (b) | | 230,000 | 226,728 |
| 7.25% 1/15/30 (b) | | 445,000 | 457,621 |
| Six Flags Entertainment Corp. 5.5% 4/15/27 (b) | | 550,000 | 530,716 |
| Viking Cruises Ltd. 9.125% 7/15/31 (b) | | 1,000,000 | 1,072,609 |
| | | | 8,243,475 |
| Metals/Mining - 1.3% | | | |
| Alcoa Nederland Holding BV 7.125% 3/15/31 (b) | | 90,000 | 91,036 |
| Arsenal AIC Parent LLC 8% 10/1/30 (b) | | 110,000 | 114,528 |
| Cleveland-Cliffs, Inc.: | | | |
| 6.75% 4/15/30 (b) | | 195,000 | 190,416 |
| 7% 3/15/32 (b) | | 350,000 | 341,821 |
| ERO Copper Corp. 6.5% 2/15/30 (b) | | 340,000 | 319,804 |
| Howmet Aerospace, Inc. 5.125% 10/1/24 | | 48,000 | 47,757 |
| HudBay Minerals, Inc. 4.5% 4/1/26 (b) | | 880,000 | 851,088 |
| Mineral Resources Ltd. 9.25% 10/1/28 (b) | | 185,000 | 193,942 |
| Novelis Corp. 3.25% 11/15/26 (b) | | 950,000 | 888,215 |
| | | | 3,038,607 |
| Paper - 0.3% | | | |
| Ardagh Metal Packaging Finance U.S.A. LLC/Ardagh Metal Packaging Finance PLC 6% 6/15/27 (b) | | 690,000 | 668,857 |
| Railroad - 0.1% | | | |
| Genesee & Wyoming, Inc. 6.25% 4/15/32 (b) | | 355,000 | 352,831 |
| Restaurants - 0.5% | | | |
| 1011778 BC Unlimited Liability Co./New Red Finance, Inc.: | | | |
| 3.875% 1/15/28 (b) | | 675,000 | 622,696 |
| 5.75% 4/15/25 (b) | | 375,000 | 373,257 |
| Garden SpinCo Corp. 8.625% 7/20/30 (b) | | 55,000 | 57,991 |
| | | | 1,053,944 |
| Services - 6.7% | | | |
| AECOM 5.125% 3/15/27 | | 930,000 | 903,500 |
| Allied Universal Holdco LLC 7.875% 2/15/31 (b) | | 340,000 | 340,751 |
| APX Group, Inc. 6.75% 2/15/27 (b) | | 1,505,000 | 1,495,017 |
| Aramark Services, Inc. 5% 4/1/25 (b) | | 1,025,000 | 1,014,888 |
| Artera Services LLC 8.5% 2/15/31 (b) | | 695,000 | 711,162 |
| Brand Industrial Services, Inc. 10.375% 8/1/30 (b) | | 765,000 | 820,921 |
| Camelot Finance SA 4.5% 11/1/26 (b) | | 950,000 | 904,743 |
| CoreCivic, Inc.: | | | |
| 4.75% 10/15/27 | | 35,000 | 32,628 |
| 8.25% 4/15/29 | | 235,000 | 242,824 |
| CoreLogic, Inc. 4.5% 5/1/28 (b) | | 590,000 | 510,484 |
| Iron Mountain, Inc. 4.875% 9/15/27 (b) | | 475,000 | 453,304 |
| Life Time, Inc. 5.75% 1/15/26 (b) | | 425,000 | 420,378 |
| Neptune BidCo U.S., Inc. 9.29% 4/15/29 (b) | | 360,000 | 339,300 |
| Prime Securities Services Borrower LLC/Prime Finance, Inc. 5.75% 4/15/26 (b) | | 875,000 | 863,994 |
| Sabre GLBL, Inc. 8.625% 6/1/27 (b) | | 758,000 | 670,736 |
| Sotheby's 7.375% 10/15/27 (b) | | 215,000 | 200,363 |
| Staples, Inc. 7.5% 4/15/26 (b) | | 700,000 | 674,882 |
| The GEO Group, Inc.: | | | |
| 8.625% 4/15/29 (b) | | 500,000 | 506,180 |
| 10.25% 4/15/31 (b) | | 470,000 | 484,542 |
| TriNet Group, Inc. 7.125% 8/15/31 (b) | | 510,000 | 512,572 |
| Uber Technologies, Inc. 7.5% 9/15/27 (b) | | 925,000 | 941,764 |
| United Rentals North America, Inc.: | | | |
| 3.875% 11/15/27 | | 550,000 | 513,487 |
| 6.125% 3/15/34 (b) | | 585,000 | 571,184 |
| WASH Multifamily Acquisition, Inc. 5.75% 4/15/26 (b) | | 1,265,000 | 1,226,431 |
| | | | 15,356,035 |
| Super Retail - 1.2% | | | |
| At Home Group, Inc. 4.875% 7/15/28 (b) | | 60,000 | 28,350 |
| Carvana Co.: | | | |
| 4.875% 9/1/29 (b) | | 80,000 | 52,175 |
| 5.875% 10/1/28 (b) | | 115,000 | 77,401 |
| EG Global Finance PLC 12% 11/30/28 (b) | | 1,610,000 | 1,661,999 |
| Hanesbrands, Inc. 4.875% 5/15/26 (b) | | 900,000 | 870,483 |
| Upbound Group, Inc. 6.375% 2/15/29 (b) | | 30,000 | 28,799 |
| | | | 2,719,207 |
| Technology - 6.1% | | | |
| Acuris Finance U.S. 5% 5/1/28 (b) | | 1,280,000 | 1,161,202 |
| CNT PRNT/CDK GLO II/FIN 8% 6/15/29 (b) | | 1,005,000 | 1,033,950 |
| CommScope, Inc. 6% 3/1/26 (b) | | 775,000 | 692,656 |
| Elastic NV 4.125% 7/15/29 (b) | | 225,000 | 200,364 |
| GrafTech Global Enterprises, Inc. 9.875% 12/15/28 (b) | | 175,000 | 131,567 |
| HTA Group Ltd. 7% 12/18/25 (b) | | 1,700,000 | 1,697,344 |
| MicroStrategy, Inc. 6.125% 6/15/28 (b) | | 85,000 | 78,776 |
| Open Text Corp. 3.875% 2/15/28 (b) | | 1,700,000 | 1,551,769 |
| Qorvo, Inc. 4.375% 10/15/29 | | 1,350,000 | 1,245,761 |
| Seagate HDD Cayman 8.25% 12/15/29 (b) | | 165,000 | 175,376 |
| Sensata Technologies BV 5% 10/1/25 (b) | | 2,300,000 | 2,270,441 |
| SS&C Technologies, Inc. 5.5% 9/30/27 (b) | | 2,000,000 | 1,944,036 |
| UKG, Inc. 6.875% 2/1/31 (b) | | 285,000 | 285,543 |
| Veritas U.S., Inc./Veritas Bermuda Ltd. 7.5% 9/1/25 (b) | | 625,000 | 568,605 |
| Virtusa Corp. 7.125% 12/15/28 (b) | | 50,000 | 45,055 |
| VM Consolidated, Inc. 5.5% 4/15/29 (b) | | 875,000 | 823,443 |
| | | | 13,905,888 |
| Telecommunications - 4.8% | | | |
| Altice Financing SA 5% 1/15/28 (b) | | 1,400,000 | 1,104,889 |
| Altice France SA: | | | |
| 5.125% 7/15/29 (b) | | 1,200,000 | 781,639 |
| 8.125% 2/1/27 (b) | | 410,000 | 308,674 |
| C&W Senior Finance Ltd. 6.875% 9/15/27 (b) | | 25,000 | 23,673 |
| Cogent Communications Group, Inc. 7% 6/15/27 (b) | | 675,000 | 666,351 |
| Consolidated Communications, Inc. 5% 10/1/28 (b) | | 385,000 | 319,596 |
| Hughes Satellite Systems Corp. 5.25% 8/1/26 | | 525,000 | 434,695 |
| Level 3 Financing, Inc.: | | | |
| 10.5% 5/15/30 (b) | | 260,000 | 257,640 |
| 11% 11/15/29 (b) | | 168,736 | 172,195 |
| Sable International Finance Ltd. 5.75% 9/7/27 (b) | | 2,402,000 | 2,282,777 |
| SBA Communications Corp. 3.875% 2/15/27 | | 1,550,000 | 1,456,685 |
| T-Mobile U.S.A., Inc.: | | | |
| 2.25% 2/15/26 | | 1,210,000 | 1,140,771 |
| 2.625% 4/15/26 | | 320,000 | 302,333 |
| Telecom Italia SpA 5.303% 5/30/24 (b) | | 800,000 | 798,046 |
| ViaSat, Inc. 5.625% 9/15/25 (b) | | 550,000 | 528,416 |
| Zayo Group Holdings, Inc. 4% 3/1/27 (b) | | 450,000 | 358,183 |
| | | | 10,936,563 |
| Transportation Ex Air/Rail - 0.5% | | | |
| Great Lakes Dredge & Dock Corp. 5.25% 6/1/29 (b) | | 70,000 | 58,748 |
| Seaspan Corp. 5.5% 8/1/29 (b) | | 645,000 | 554,719 |
| XPO, Inc. 6.25% 6/1/28 (b) | | 470,000 | 468,242 |
| | | | 1,081,709 |
| Utilities - 1.9% | | | |
| Calpine Corp. 5.125% 3/15/28 (b) | | 750,000 | 711,424 |
| NextEra Energy Partners LP: | | | |
| 4.25% 7/15/24 (b) | | 500,000 | 497,880 |
| 4.25% 9/15/24 (b) | | 41,000 | 40,430 |
| 7.25% 1/15/29 (b) | | 465,000 | 470,993 |
| PG&E Corp. 5% 7/1/28 | | 460,000 | 438,301 |
| Pike Corp. 8.625% 1/31/31 (b) | | 275,000 | 288,081 |
| Solaris Midstream Holdings LLC 7.625% 4/1/26 (b) | | 120,000 | 120,468 |
| Vistra Operations Co. LLC: | | | |
| 5% 7/31/27 (b) | | 825,000 | 785,175 |
| 5.625% 2/15/27 (b) | | 805,000 | 783,224 |
| 7.75% 10/15/31 (b) | | 255,000 | 261,526 |
| | | | 4,397,502 |
TOTAL NONCONVERTIBLE BONDS | | | 187,046,307 |
| TOTAL CORPORATE BONDS (Cost $188,944,305) | | | 189,896,169 |
| | | | |
| Common Stocks - 0.1% |
| | | Shares | Value ($) |
| Diversified Financial Services - 0.0% | | | |
| Lime Tree Bay Ltd. (e)(g) | | 80 | 5,146 |
| Energy - 0.1% | | | |
| California Resources Corp. warrants 10/27/24 (g) | | 2 | 34 |
| Forbes Energy Services Ltd. (e)(g) | | 6,468 | 1 |
| Mesquite Energy, Inc. (e)(g) | | 1,922 | 157,363 |
TOTAL ENERGY | | | 157,398 |
| TOTAL COMMON STOCKS (Cost $338,982) | | | 162,544 |
| | | | |
| Bank Loan Obligations - 10.9% |
| | | Principal Amount (a) | Value ($) |
| Automotive & Auto Parts - 0.2% | | | |
| CWGS Group LLC Tranche B 1LN, term loan CME Term SOFR 1 Month Index + 2.500% 7.9301% 6/3/28 (c)(h)(i) | | 438,579 | 429,031 |
| Broadcasting - 1.0% | | | |
| Diamond Sports Group LLC: | | | |
| 2LN, term loan CME Term SOFR 1 Month Index + 5.250% 10.6625% (c)(d)(h)(i) | | 196,992 | 4,580 |
| term loan 10% 8/2/27 (i) | | 40,404 | 64,108 |
| Univision Communications, Inc. Tranche B 1LN, term loan CME Term SOFR 1 Month Index + 3.250% 8.6802% 1/31/29 (c)(h)(i) | | 2,324,127 | 2,316,387 |
TOTAL BROADCASTING | | | 2,385,075 |
| Building Materials - 0.8% | | | |
| Acproducts Holdings, Inc. Tranche B 1LN, term loan CME Term SOFR 3 Month Index + 4.250% 9.8135% 5/17/28 (c)(h)(i) | | 612,499 | 530,271 |
| Oscar AcquisitionCo LLC 1LN, term loan CME Term SOFR 3 Month Index + 4.500% 9.9019% 4/29/29 (c)(h)(i) | | 492,500 | 494,426 |
| SRS Distribution, Inc. Tranche B 1LN, term loan CME Term SOFR 1 Month Index + 3.500% 8.9302% 6/4/28 (c)(h)(i) | | 849,119 | 855,105 |
TOTAL BUILDING MATERIALS | | | 1,879,802 |
| Chemicals - 1.4% | | | |
| ARC Falcon I, Inc. Tranche B 1LN, term loan CME Term SOFR 1 Month Index + 3.750% 8.9157% 9/30/28 (c)(h)(i) | | 395,193 | 394,699 |
| Aruba Investment Holdings LLC Tranche B 1LN, term loan CME Term SOFR 1 Month Index + 4.000% 9.4157% 11/24/27 (c)(h)(i) | | 365,531 | 354,411 |
| Consolidated Energy Finance SA Tranche B 1LN, term loan CME Term SOFR 1 Month Index + 4.500% 9.8157% 11/15/30 (c)(h)(i) | | 400,000 | 386,376 |
| Discovery Purchaser Corp. 1LN, term loan CME Term SOFR 3 Month Index + 4.370% 9.6813% 10/4/29 (c)(h)(i) | | 365,665 | 364,981 |
| Hexion Holdings Corp. 1LN, term loan CME Term SOFR 3 Month Index + 4.500% 9.9757% 3/15/29 (c)(h)(i) | | 395,211 | 387,864 |
| Olympus Water U.S. Holding Corp. Tranche B 1LN, term loan CME Term SOFR 3 Month Index + 3.750% 9.321% 11/9/28 (c)(h)(i) | | 711,065 | 712,054 |
| SCIH Salt Holdings, Inc. Tranche B 1LN, term loan CME Term SOFR 3 Month Index + 4.000% 9.4418% 3/16/27 (c)(h)(i) | | 31,876 | 31,929 |
| W.R. Grace Holding LLC Tranche B 1LN, term loan CME Term SOFR 3 Month Index + 3.750% 9.321% 9/22/28 (c)(h)(i) | | 556,602 | 556,602 |
TOTAL CHEMICALS | | | 3,188,916 |
| Consumer Products - 0.1% | | | |
| Conair Holdings LLC Tranche B 1LN, term loan CME Term SOFR 1 Month Index + 3.750% 9.1802% 5/17/28 (c)(h)(i) | | 24,375 | 24,175 |
| TKC Holdings, Inc. 1LN, term loan 13.5% 2/14/27 (c)(i) | | 242,725 | 190,540 |
TOTAL CONSUMER PRODUCTS | | | 214,715 |
| Diversified Financial Services - 0.4% | | | |
| Hightower Holding LLC Tranche B 1LN, term loan CME Term SOFR 3 Month Index + 4.000% 9.5861% 4/21/28 (c)(h)(i) | | 832,299 | 834,905 |
| Energy - 0.0% | | | |
| DT Midstream, Inc. Tranche B 1LN, term loan CME Term SOFR 1 Month Index + 2.000% 7.4302% 6/12/28 (c)(h)(i) | | 15,973 | 16,030 |
| Forbes Energy Services LLC Tranche B, term loan 0% (c)(d)(e)(i) | | 60,604 | 0 |
| Mesquite Energy, Inc.: | | | |
| 1LN, term loan 3 month U.S. LIBOR + 8.000% 0% (d)(e)(h)(i) | | 35,876 | 0 |
| term loan 0% (c)(d)(e)(i) | | 15,000 | 0 |
TOTAL ENERGY | | | 16,030 |
| Environmental - 0.3% | | | |
| LRS Holdings LLC Tranche B 1LN, term loan 1 month U.S. LIBOR + 4.250% 9.6946% 6/28/28 (c)(h)(i) | | 684,250 | 683,395 |
| Food/Beverage/Tobacco - 0.2% | | | |
| Del Monte Foods, Inc. Tranche B 1LN, term loan CME Term SOFR 1 Month Index + 4.250% 9.6802% 5/16/29 (c)(h)(i) | | 363,157 | 306,867 |
| Triton Water Holdings, Inc. Tranche B 1LN, term loan CME Term SOFR 1 Month Index + 3.250% 8.8135% 3/31/28 (c)(h)(i) | | 53,488 | 53,238 |
TOTAL FOOD/BEVERAGE/TOBACCO | | | 360,105 |
| Gaming - 0.1% | | | |
| Fertitta Entertainment LLC NV Tranche B 1LN, term loan CME Term SOFR 1 Month Index + 4.000% 9.069% 1/27/29 (c)(h)(i) | | 317,596 | 318,165 |
| Healthcare - 0.8% | | | |
| Cano Health, Inc.: | | | |
| Tranche B 1LN, term loan CME Term SOFR 1 Month Index + 4.000% 9.4626% (c)(d)(h)(i) | | 654,606 | 164,470 |
| Tranche DD 1LN, term loan CME Term SOFR 1 Month Index + 11.000% 16.3215% 10/7/24 (c)(e)(h)(i) | | 104,095 | 106,177 |
| Tranche DD, term loan CME Term SOFR 1 Month Index + 11.000% 16.3215% 10/7/24 (c)(e)(h)(i) | | 67,910 | 69,268 |
| Confluent Health LLC Tranche B 1LN, term loan CME Term SOFR 1 Month Index + 4.000% 9.4302% 11/30/28 (c)(h)(i) | | 14,713 | 14,511 |
| Insulet Corp. Tranche B 1LN, term loan CME Term SOFR 1 Month Index + 3.000% 8.3157% 5/4/28 (c)(h)(i) | | 19,450 | 19,499 |
| Jazz Financing Lux SARL Tranche B 1LN, term loan CME Term SOFR 1 Month Index + 3.000% 8.4302% 5/5/28 (c)(h)(i) | | 48,165 | 48,436 |
| MED ParentCo LP Tranche B 1LN, term loan CME Term SOFR 1 Month Index + 4.000% 9.3157% 4/5/31 (c)(h)(i) | | 438,402 | 438,503 |
| Medline Borrower LP Tranche B 1LN, term loan CME Term SOFR 1 Month Index + 2.750% 8.0683% 10/23/28 (c)(h)(i) | | 102,656 | 102,883 |
| Organon & Co. Tranche B 1LN, term loan CME Term SOFR 3 Month Index + 3.000% 8.4334% 6/2/28 (c)(h)(i) | | 804,266 | 807,532 |
| Packaging Coordinators Midco, Inc. Tranche B 1LN, term loan CME Term SOFR 3 Month Index + 3.500% 9.071% 11/30/27 (c)(h)(i) | | 14,623 | 14,664 |
| Phoenix Newco, Inc. Tranche B 1LN, term loan CME Term SOFR 1 Month Index + 3.250% 8.6918% 11/15/28 (c)(h)(i) | | 58,800 | 58,953 |
| U.S. Anesthesia Partners, Inc. Tranche B 1LN, term loan CME Term SOFR 1 Month Index + 4.250% 9.6918% 10/1/28 (c)(h)(i) | | 29,250 | 28,257 |
TOTAL HEALTHCARE | | | 1,873,153 |
| Hotels - 0.0% | | | |
| Hilton Grand Vacations Borrower LLC Tranche B 1LN, term loan CME Term SOFR 1 Month Index + 3.000% 7.8157% 8/2/28 (c)(h)(i) | | 48,750 | 48,781 |
| Insurance - 0.5% | | | |
| Alliant Holdings Intermediate LLC Tranche B6 1LN, term loan CME Term SOFR 1 Month Index + 3.500% 8.8189% 11/6/30 (c)(h)(i) | | 381,656 | 383,034 |
| Asurion LLC 1LN, term loan CME Term SOFR 3 Month Index + 4.000% 9.4157% 8/19/28 (c)(h)(i) | | 365,625 | 354,656 |
| USI, Inc. Tranche B 1LN, term loan CME Term SOFR 1 Month Index + 3.000% 8.3019% 11/22/29 (c)(h)(i) | | 365,644 | 366,353 |
TOTAL INSURANCE | | | 1,104,043 |
| Leisure - 0.2% | | | |
| Hayward Industries, Inc. Tranche B 1LN, term loan CME Term SOFR 1 Month Index + 2.750% 8.1802% 5/28/28 (c)(h)(i) | | 389,000 | 389,000 |
| MajorDrive Holdings IV LLC 1LN, term loan CME Term SOFR 1 Month Index + 4.000% 9.571% 5/12/28 (c)(h)(i) | | 24,313 | 24,404 |
TOTAL LEISURE | | | 413,404 |
| Metals/Mining - 0.1% | | | |
| American Rock Salt Co. LLC 1LN, term loan CME Term SOFR 1 Month Index + 4.000% 9.4302% 6/4/28 (c)(h)(i) | | 279,282 | 247,265 |
| Paper - 0.5% | | | |
| Clydesdale Acquisition Holdings, Inc. 1LN, term loan CME Term SOFR 1 Month Index + 3.670% 9.0907% 4/13/29 (c)(h)(i) | | 1,122,134 | 1,126,342 |
| Services - 1.9% | | | |
| ABG Intermediate Holdings 2 LLC Tranche B1 LN, term loan CME Term SOFR 1 Month Index + 3.500% 8.9183% 12/21/28 (c)(h)(i) | | 560,218 | 562,598 |
| Allied Universal Holdco LLC Tranche B 1LN, term loan 1 month U.S. LIBOR + 3.750% 9.1657% 5/14/28 (c)(h)(i) | | 1,453,293 | 1,453,570 |
| Ascend Learning LLC: | | | |
| 2LN, term loan CME Term SOFR 1 Month Index + 5.750% 11.1657% 12/10/29 (c)(h)(i) | | 20,000 | 19,583 |
| Tranche B 1LN, term loan CME Term SOFR 1 Month Index + 3.500% 8.9157% 12/10/28 (c)(h)(i) | | 879,593 | 875,925 |
| Brand Industrial Services, Inc. Tranche B 1LN, term loan CME Term SOFR 1 Month Index + 4.500% 9.819% 8/1/30 (c)(h)(i) | | 263,675 | 264,390 |
| CHG Healthcare Services, Inc. 1LN, term loan CME Term SOFR 1 Month Index + 3.250% 8.6802% 9/30/28 (c)(h)(i) | | 14,625 | 14,645 |
| CoreLogic, Inc. Tranche B 1LN, term loan CME Term SOFR 1 Month Index + 3.500% 8.9302% 6/2/28 (c)(h)(i) | | 48,750 | 46,922 |
| Neptune BidCo U.S., Inc. Tranche B 1LN, term loan CME Term SOFR 1 Month Index + 5.000% 10.4059% 4/11/29 (c)(h)(i) | | 407,368 | 382,021 |
| Spin Holdco, Inc. Tranche B 1LN, term loan CME Term SOFR 3 Month Index + 4.000% 9.5854% 3/4/28 (c)(h)(i) | | 890,420 | 783,151 |
TOTAL SERVICES | | | 4,402,805 |
| Super Retail - 0.9% | | | |
| Empire Today LLC Tranche B 1LN, term loan CME Term SOFR 1 Month Index + 5.000% 10.5911% 4/1/28 (c)(h)(i) | | 487,469 | 338,791 |
| Great Outdoors Group LLC Tranche B 1LN, term loan CME Term SOFR 1 Month Index + 3.750% 9.1802% 3/5/28 (c)(h)(i) | | 1,150,433 | 1,149,812 |
| LBM Acquisition LLC Tranche B 1LN, term loan CME Term SOFR 1 Month Index + 3.750% 9.1773% 12/18/27 (c)(h)(i) | | 503,935 | 504,146 |
TOTAL SUPER RETAIL | | | 1,992,749 |
| Technology - 0.5% | | | |
| Acuris Finance U.S., Inc. 1LN, term loan CME Term SOFR 3 Month Index + 4.000% 9.4519% 2/16/28 (c)(h)(i) | | 10,156 | 10,152 |
| Applied Systems, Inc. Tranche 2LN, term loan CME Term SOFR 1 Month Index + 5.250% 10.5594% 2/23/32 (c)(h)(i) | | 5,000 | 5,160 |
| Athenahealth Group, Inc. Tranche B 1LN, term loan CME Term SOFR 1 Month Index + 3.500% 8.5657% 2/15/29 (c)(h)(i) | | 849,028 | 846,905 |
| DG Investment Intermediate Holdings, Inc.: | | | |
| 2LN, term loan CME Term SOFR 1 Month Index + 6.750% 12.1802% 3/31/29 (c)(h)(i) | | 80,000 | 75,300 |
| Tranche B 1LN, term loan CME Term SOFR 1 Month Index + 3.750% 9.1802% 3/31/28 (c)(h)(i) | | 14,588 | 14,518 |
| Maverick Bidco, Inc. Tranche B 1LN, term loan CME Term SOFR 1 Month Index + 3.750% 9.2295% 5/18/28 (c)(h)(i) | | 292,519 | 291,056 |
TOTAL TECHNOLOGY | | | 1,243,091 |
| Telecommunications - 0.4% | | | |
| Cablevision Lightpath LLC Tranche B 1LN, term loan CME Term SOFR 1 Month Index + 3.250% 8.6855% 11/30/27 (c)(h)(i) | | 477,672 | 467,125 |
| Consolidated Communications, Inc. Tranche B 1LN, term loan CME Term SOFR 1 Month Index + 3.500% 8.9302% 10/2/27 (c)(h)(i) | | 250,000 | 234,028 |
| Windstream Services LLC Tranche B 1LN, term loan CME Term SOFR 1 Month Index + 6.250% 11.6657% 9/21/27 (c)(h)(i) | | 339,256 | 337,703 |
TOTAL TELECOMMUNICATIONS | | | 1,038,856 |
| Textiles/Apparel - 0.3% | | | |
| Tory Burch LLC Tranche B 1LN, term loan CME Term SOFR 1 Month Index + 3.500% 8.6918% 4/16/28 (c)(h)(i) | | 601,726 | 601,473 |
| Utilities - 0.3% | | | |
| Brookfield WEC Holdings, Inc. Tranche B 1LN, term loan CME Term SOFR 1 Month Index + 2.750% 8.0657% 1/20/31 (c)(h)(i) | | 602,275 | 602,528 |
| TOTAL BANK LOAN OBLIGATIONS (Cost $25,024,842) | | | 25,004,629 |
| | | | |
| Preferred Securities - 0.8% |
| | | Principal Amount (a) | Value ($) |
| Banks & Thrifts - 0.3% | | | |
| Ally Financial, Inc.: | | | |
| 4.7% (c)(j) | | 220,000 | 188,946 |
| 4.7% (c)(j) | | 230,000 | 180,266 |
| Wells Fargo & Co. 7.625% (c)(j) | | 290,000 | 306,057 |
TOTAL BANKS & THRIFTS | | | 675,269 |
| Diversified Financial Services - 0.2% | | | |
| Charles Schwab Corp. 5.375% (c)(j) | | 515,000 | 513,862 |
| Energy - 0.3% | | | |
| Energy Transfer LP 3 month U.S. LIBOR + 4.020% 9.5966% (c)(h)(j) | | 625,000 | 637,720 |
| TOTAL PREFERRED SECURITIES (Cost $1,598,661) | | | 1,826,851 |
| | | | |
| Money Market Funds - 4.1% |
| | | Shares | Value ($) |
Fidelity Cash Central Fund 5.39% (k) (Cost $9,395,617) | | 9,393,738 | 9,395,617 |
| | | | |
| TOTAL INVESTMENT IN SECURITIES - 99.0% (Cost $225,302,407) | 226,285,810 |
NET OTHER ASSETS (LIABILITIES) - 1.0% | 2,240,479 |
| NET ASSETS - 100.0% | 228,526,289 |
| | |
Legend
| (a) | Amount is stated in United States dollars unless otherwise noted. |
| (b) | Security exempt from registration under Rule 144A of the Securities Act of 1933. These securities may be resold in transactions exempt from registration, normally to qualified institutional buyers. At the end of the period, the value of these securities amounted to $146,844,376 or 64.3% of net assets. |
| (c) | Coupon rates for floating and adjustable rate securities reflect the rates in effect at period end. |
| (d) | Non-income producing - Security is in default. |
| (f) | Security initially issued at one coupon which converts to a higher coupon at a specified date. The rate shown is the rate at period end. |
| (h) | Coupon is indexed to a floating interest rate which may be multiplied by a specified factor and/or subject to caps or floors. |
| (i) | Remaining maturities of bank loan obligations may be less than the stated maturities shown as a result of contractual or optional prepayments by the borrower. Such prepayments cannot be predicted with certainty. |
| (j) | Security is perpetual in nature with no stated maturity date. |
| (k) | Affiliated fund that is generally available only to investment companies and other accounts managed by Fidelity Investments. The rate quoted is the annualized seven-day yield of the fund at period end. A complete unaudited listing of the fund's holdings as of its most recent quarter end is available upon request. In addition, each Fidelity Central Fund's financial statements, which are not covered by the Fund's Report of Independent Registered Public Accounting Firm, are available on the SEC's website or upon request. |
Affiliated Central Funds
Fiscal year to date information regarding the Fund's investments in Fidelity Central Funds, including the ownership percentage, is presented below.
| Affiliate | Value, beginning of period ($) | Purchases ($) | Sales Proceeds ($) | Dividend Income ($) | Realized Gain (loss) ($) | Change in Unrealized appreciation (depreciation) ($) | Value, end of period ($) | % ownership, end of period |
| Fidelity Cash Central Fund 5.39% | 35,169,742 | 161,718,674 | 187,492,917 | 1,082,589 | 157 | (39) | 9,395,617 | 0.0% |
| Total | 35,169,742 | 161,718,674 | 187,492,917 | 1,082,589 | 157 | (39) | 9,395,617 | |
| | | | | | | | | |
Amounts in the dividend income column in the above table include any capital gain distributions from underlying funds, which are presented in the corresponding line item in the Statement of Operations, if applicable.
Amounts included in the purchases and sales proceeds columns may include in-kind transactions, if applicable.
Investment Valuation
The following is a summary of the inputs used, as of April 30, 2024, involving the Fund's assets and liabilities carried at fair value. The inputs or methodology used for valuing securities may not be an indication of the risk associated with investing in those securities. For more information on valuation inputs, and their aggregation into the levels used below, please refer to the Investment Valuation section in the accompanying Notes to Financial Statements.
| Valuation Inputs at Reporting Date: |
| Description | Total ($) | Level 1 ($) | Level 2 ($) | Level 3 ($) |
Investments in Securities: | | | | |
|
| Equities: | | | | |
Energy | 157,398 | 34 | - | 157,364 |
Financials | 5,146 | - | - | 5,146 |
|
| Corporate Bonds | 189,896,169 | - | 189,896,169 | - |
|
| Bank Loan Obligations | 25,004,629 | - | 24,829,184 | 175,445 |
|
| Preferred Securities | 1,826,851 | - | 1,826,851 | - |
|
| Money Market Funds | 9,395,617 | 9,395,617 | - | - |
| Total Investments in Securities: | 226,285,810 | 9,395,651 | 216,552,204 | 337,955 |
| Statement of Assets and Liabilities |
| | | | April 30, 2024 |
| | | | | |
| Assets | | | | |
| Investment in securities, at value - See accompanying schedule: | | | | |
Unaffiliated issuers (cost $215,906,790) | $ | 216,890,193 | | |
Fidelity Central Funds (cost $9,395,617) | | 9,395,617 | | |
| | | | | |
| | | | | |
| Total Investment in Securities (cost $225,302,407) | | | $ | 226,285,810 |
| Cash | | | | 59,476 |
| Receivable for fund shares sold | | | | 254,344 |
| Interest receivable | | | | 3,205,826 |
| Distributions receivable from Fidelity Central Funds | | | | 48,175 |
| Prepaid expenses | | | | 171 |
| Receivable from investment adviser for expense reductions | | | | 1,370 |
| Other receivables | | | | 7 |
Total assets | | | | 229,855,179 |
| Liabilities | | | | |
| Payable for investments purchased | $ | 832,933 | | |
| Payable for fund shares redeemed | | 158,886 | | |
| Distributions payable | | 137,869 | | |
| Accrued management fee | | 126,968 | | |
| Distribution and service plan fees payable | | 8,677 | | |
| Other payables and accrued expenses | | 63,557 | | |
| Total liabilities | | | | 1,328,890 |
| Net Assets | | | $ | 228,526,289 |
| Net Assets consist of: | | | | |
| Paid in capital | | | $ | 241,001,633 |
| Total accumulated earnings (loss) | | | | (12,475,344) |
| Net Assets | | | $ | 228,526,289 |
| | | | | |
| Net Asset Value and Maximum Offering Price | | | | |
| Class A : | | | | |
Net Asset Value and redemption price per share ($26,215,370 ÷ 2,973,842 shares)(a) | | | $ | 8.82 |
| Maximum offering price per share (100/96.00 of $8.82) | | | $ | 9.19 |
| Class M : | | | | |
Net Asset Value and redemption price per share ($2,065,459 ÷ 234,338 shares)(a) | | | $ | 8.81 |
| Maximum offering price per share (100/96.00 of $8.81) | | | $ | 9.18 |
| Class C : | | | | |
Net Asset Value and offering price per share ($3,452,910 ÷ 391,645 shares)(a) | | | $ | 8.82 |
| Short Duration High Income : | | | | |
Net Asset Value, offering price and redemption price per share ($180,997,180 ÷ 20,532,299 shares) | | | $ | 8.82 |
| Class I : | | | | |
Net Asset Value, offering price and redemption price per share ($6,092,973 ÷ 691,129 shares) | | | $ | 8.82 |
| Class Z : | | | | |
Net Asset Value, offering price and redemption price per share ($9,702,397 ÷ 1,100,166 shares) | | | $ | 8.82 |
(a)Redemption price per share is equal to net asset value less any applicable contingent deferred sales charge. |
| Statement of Operations |
| | | | Year ended April 30, 2024 |
| Investment Income | | | | |
| Dividends | | | $ | 162,306 |
| Interest | | | | 28,511,363 |
| Income from Fidelity Central Funds | | | | 1,082,589 |
| Total income | | | | 29,756,258 |
| Expenses | | | | |
| Management fee | $ | 2,084,243 | | |
| Transfer agent fees | | 304,415 | | |
| Distribution and service plan fees | | 96,948 | | |
| Accounting fees and expenses | | 138,218 | | |
| Custodian fees and expenses | | 13,383 | | |
| Independent trustees' fees and expenses | | 2,076 | | |
| Registration fees | | 106,197 | | |
| Audit | | 73,016 | | |
| Legal | | 1,318 | | |
| Interest | | 35,167 | | |
| Miscellaneous | | 1,586 | | |
| Total expenses before reductions | | 2,856,567 | | |
| Expense reductions | | (32,716) | | |
| Total expenses after reductions | | | | 2,823,851 |
| Net Investment income (loss) | | | | 26,932,407 |
| Realized and Unrealized Gain (Loss) | | | | |
| Net realized gain (loss) on: | | | | |
| Investment Securities: | | | | |
| Unaffiliated issuers | | (10,127,509) | | |
| Fidelity Central Funds | | 157 | | |
| Foreign currency transactions | | (1) | | |
| Total net realized gain (loss) | | | | (10,127,353) |
| Change in net unrealized appreciation (depreciation) on: | | | | |
| Investment Securities: | | | | |
| Unaffiliated issuers | | 4,892,974 | | |
| Fidelity Central Funds | | (39) | | |
| Total change in net unrealized appreciation (depreciation) | | | | 4,892,935 |
| Net gain (loss) | | | | (5,234,418) |
| Net increase (decrease) in net assets resulting from operations | | | $ | 21,697,989 |
| Statement of Changes in Net Assets |
| |
| | Year ended April 30, 2024 | | Year ended April 30, 2023 |
| Increase (Decrease) in Net Assets | | | | |
| Operations | | | | |
| Net investment income (loss) | $ | 26,932,407 | $ | 18,111,555 |
| Net realized gain (loss) | | (10,127,353) | | (2,582,867) |
| Change in net unrealized appreciation (depreciation) | | 4,892,935 | | 2,108,837 |
| Net increase (decrease) in net assets resulting from operations | | 21,697,989 | | 17,637,525 |
| Distributions to shareholders | | (22,490,058) | | (15,367,826) |
| | | | | |
| Share transactions - net increase (decrease) | | (273,189,716) | | 372,738,743 |
| Total increase (decrease) in net assets | | (273,981,785) | | 375,008,442 |
| | | | | |
| Net Assets | | | | |
| Beginning of period | | 502,508,074 | | 127,499,632 |
| End of period | $ | 228,526,289 | $ | 502,508,074 |
| | | | | |
| | | | | |
Financial Highlights
Fidelity Advisor® Short Duration High Income Fund Class A |
| |
| Years ended April 30, | | 2024 | | 2023 | | 2022 | | 2021 | | 2020 |
Selected Per-Share Data | | | | | | | | | | |
| Net asset value, beginning of period | $ | 8.66 | $ | 8.98 | $ | 9.52 | $ | 8.87 | $ | 9.44 |
| Income from Investment Operations | | | | | | | | | | |
Net investment income (loss) A,B | | .604 | | .502 | | .307 | | .300 | | .348 |
| Net realized and unrealized gain (loss) | | .078 C | | (.429) | | (.546) | | .651 | | (.571) |
| Total from investment operations | | .682 | | .073 | | (.239) | | .951 | | (.223) |
| Distributions from net investment income | | (.522) | | (.393) | | (.301) | | (.301) | | (.347) |
| Total distributions | | (.522) | | (.393) | | (.301) | | (.301) | | (.347) |
| Net asset value, end of period | $ | 8.82 | $ | 8.66 | $ | 8.98 | $ | 9.52 | $ | 8.87 |
Total Return D,E | | | | .93% | | (2.60)% | | 10.83% | | (2.47)% |
Ratios to Average Net Assets B,F,G | | | | | | | | | | |
| Expenses before reductions | | 1.04% | | 1.10% | | 1.13% | | 1.15% | | 1.15% |
| Expenses net of fee waivers, if any | | | | 1.00% | | 1.01% | | 1.05% | | 1.05% |
| Expenses net of all reductions | | 1.01% | | 1.00% | | 1.01% | | 1.05% | | 1.05% |
| Net investment income (loss) | | 6.94% | | 5.81% | | 3.27% | | 3.21% | | 3.74% |
| Supplemental Data | | | | | | | | | | |
| Net assets, end of period (000 omitted) | $ | 26,215 | $ | 21,379 | $ | 22,554 | $ | 17,126 | $ | 12,603 |
Portfolio turnover rate H | | | | 14% | | 42% | | 74% | | 77% |
ACalculated based on average shares outstanding during the period.
BNet investment income (loss) is affected by the timing of the declaration of dividends by any underlying mutual funds or exchange-traded funds (ETFs). Net investment income (loss) of any mutual funds or ETFs is not included in the Fund's net investment income (loss) ratio.
CThe amount shown for a share outstanding does not correspond with the aggregate net gain (loss) on investments for the period due to the timing of sales and repurchases of shares in relation to fluctuating market values of the investments of the Fund.
DTotal returns would have been lower if certain expenses had not been reduced during the applicable periods shown.
ETotal returns do not include the effect of the sales charges.
FFees and expenses of any underlying mutual funds or exchange-traded funds (ETFs) are not included in the Fund's expense ratio. The Fund indirectly bears its proportionate share of these expenses. For additional expense information related to investments in Fidelity Central Funds, please refer to the "Investments in Fidelity Central Funds" note found in the Notes to Financial Statements section of the most recent Annual or Semi-Annual report.
GExpense ratios reflect operating expenses of the class. Expenses before reductions do not reflect amounts reimbursed, waived, or reduced through arrangements with the investment adviser, brokerage services, or other offset arrangements, if applicable, and do not represent the amount paid by the class during periods when reimbursements, waivers or reductions occur.
HAmount does not include the portfolio activity of any underlying mutual funds or exchange-traded funds (ETFs).
Fidelity Advisor® Short Duration High Income Fund Class M |
| |
| Years ended April 30, | | 2024 | | 2023 | | 2022 | | 2021 | | 2020 |
Selected Per-Share Data | | | | | | | | | | |
| Net asset value, beginning of period | $ | 8.66 | $ | 8.98 | $ | 9.52 | $ | 8.86 | $ | 9.44 |
| Income from Investment Operations | | | | | | | | | | |
Net investment income (loss) A,B | | .604 | | .502 | | .307 | | .300 | | .348 |
| Net realized and unrealized gain (loss) | | .068 C | | (.429) | | (.546) | | .661 | | (.581) |
| Total from investment operations | | .672 | | .073 | | (.239) | | .961 | | (.233) |
| Distributions from net investment income | | (.522) | | (.393) | | (.301) | | (.301) | | (.347) |
| Total distributions | | (.522) | | (.393) | | (.301) | | (.301) | | (.347) |
| Net asset value, end of period | $ | 8.81 | $ | 8.66 | $ | 8.98 | $ | 9.52 | $ | 8.86 |
Total Return D,E | | | | .93% | | (2.60)% | | 10.96% | | (2.58)% |
Ratios to Average Net Assets B,F,G | | | | | | | | | | |
| Expenses before reductions | | 1.06% | | 1.12% | | 1.13% | | 1.17% | | 1.16% |
| Expenses net of fee waivers, if any | | | | 1.00% | | 1.01% | | 1.05% | | 1.05% |
| Expenses net of all reductions | | 1.01% | | 1.00% | | 1.01% | | 1.05% | | 1.05% |
| Net investment income (loss) | | 6.94% | | 5.81% | | 3.27% | | 3.21% | | 3.74% |
| Supplemental Data | | | | | | | | | | |
| Net assets, end of period (000 omitted) | $ | 2,065 | $ | 2,318 | $ | 2,812 | $ | 2,289 | $ | 2,106 |
Portfolio turnover rate H | | | | 14% | | 42% | | 74% | | 77% |
ACalculated based on average shares outstanding during the period.
BNet investment income (loss) is affected by the timing of the declaration of dividends by any underlying mutual funds or exchange-traded funds (ETFs). Net investment income (loss) of any mutual funds or ETFs is not included in the Fund's net investment income (loss) ratio.
CThe amount shown for a share outstanding does not correspond with the aggregate net gain (loss) on investments for the period due to the timing of sales and repurchases of shares in relation to fluctuating market values of the investments of the Fund.
DTotal returns would have been lower if certain expenses had not been reduced during the applicable periods shown.
ETotal returns do not include the effect of the sales charges.
FFees and expenses of any underlying mutual funds or exchange-traded funds (ETFs) are not included in the Fund's expense ratio. The Fund indirectly bears its proportionate share of these expenses. For additional expense information related to investments in Fidelity Central Funds, please refer to the "Investments in Fidelity Central Funds" note found in the Notes to Financial Statements section of the most recent Annual or Semi-Annual report.
GExpense ratios reflect operating expenses of the class. Expenses before reductions do not reflect amounts reimbursed, waived, or reduced through arrangements with the investment adviser, brokerage services, or other offset arrangements, if applicable, and do not represent the amount paid by the class during periods when reimbursements, waivers or reductions occur.
HAmount does not include the portfolio activity of any underlying mutual funds or exchange-traded funds (ETFs).
Fidelity Advisor® Short Duration High Income Fund Class C |
| |
| Years ended April 30, | | 2024 | | 2023 | | 2022 | | 2021 | | 2020 |
Selected Per-Share Data | | | | | | | | | | |
| Net asset value, beginning of period | $ | 8.66 | $ | 8.98 | $ | 9.52 | $ | 8.87 | $ | 9.44 |
| Income from Investment Operations | | | | | | | | | | |
Net investment income (loss) A,B | | .539 | | .439 | | .237 | | .230 | | .278 |
| Net realized and unrealized gain (loss) | | .078 C | | (.430) | | (.546) | | .651 | | (.571) |
| Total from investment operations | | .617 | | .009 | | (.309) | | .881 | | (.293) |
| Distributions from net investment income | | (.457) | | (.329) | | (.231) | | (.231) | | (.277) |
| Total distributions | | (.457) | | (.329) | | (.231) | | (.231) | | (.277) |
| Net asset value, end of period | $ | 8.82 | $ | 8.66 | $ | 8.98 | $ | 9.52 | $ | 8.87 |
Total Return D,E | | | | .18% | | (3.33)% | | 10.01% | | (3.20)% |
Ratios to Average Net Assets B,F,G | | | | | | | | | | |
| Expenses before reductions | | 1.83% | | 1.90% | | 1.91% | | 1.94% | | 1.93% |
| Expenses net of fee waivers, if any | | | | 1.75% | | 1.76% | | 1.80% | | 1.80% |
| Expenses net of all reductions | | 1.76% | | 1.75% | | 1.76% | | 1.80% | | 1.80% |
| Net investment income (loss) | | 6.19% | | 5.06% | | 2.52% | | 2.46% | | 2.99% |
| Supplemental Data | | | | | | | | | | |
| Net assets, end of period (000 omitted) | $ | 3,453 | $ | 2,795 | $ | 3,884 | $ | 4,018 | $ | 4,017 |
Portfolio turnover rate H | | | | 14% | | 42% | | 74% | | 77% |
ACalculated based on average shares outstanding during the period.
BNet investment income (loss) is affected by the timing of the declaration of dividends by any underlying mutual funds or exchange-traded funds (ETFs). Net investment income (loss) of any mutual funds or ETFs is not included in the Fund's net investment income (loss) ratio.
CThe amount shown for a share outstanding does not correspond with the aggregate net gain (loss) on investments for the period due to the timing of sales and repurchases of shares in relation to fluctuating market values of the investments of the Fund.
DTotal returns would have been lower if certain expenses had not been reduced during the applicable periods shown.
ETotal returns do not include the effect of the contingent deferred sales charge.
FFees and expenses of any underlying mutual funds or exchange-traded funds (ETFs) are not included in the Fund's expense ratio. The Fund indirectly bears its proportionate share of these expenses. For additional expense information related to investments in Fidelity Central Funds, please refer to the "Investments in Fidelity Central Funds" note found in the Notes to Financial Statements section of the most recent Annual or Semi-Annual report.
GExpense ratios reflect operating expenses of the class. Expenses before reductions do not reflect amounts reimbursed, waived, or reduced through arrangements with the investment adviser, brokerage services, or other offset arrangements, if applicable, and do not represent the amount paid by the class during periods when reimbursements, waivers or reductions occur.
HAmount does not include the portfolio activity of any underlying mutual funds or exchange-traded funds (ETFs).
Fidelity® Short Duration High Income Fund |
| |
| Years ended April 30, | | 2024 | | 2023 | | 2022 | | 2021 | | 2020 |
Selected Per-Share Data | | | | | | | | | | |
| Net asset value, beginning of period | $ | 8.66 | $ | 8.98 | $ | 9.52 | $ | 8.87 | $ | 9.44 |
| Income from Investment Operations | | | | | | | | | | |
Net investment income (loss) A,B | | .624 | | .523 | | .331 | | .323 | | .372 |
| Net realized and unrealized gain (loss) | | .083 C | | (.428) | | (.546) | | .651 | | (.572) |
| Total from investment operations | | .707 | | .095 | | (.215) | | .974 | | (.200) |
| Distributions from net investment income | | (.547) | | (.415) | | (.325) | | (.324) | | (.370) |
| Total distributions | | (.547) | | (.415) | | (.325) | | (.324) | | (.370) |
| Net asset value, end of period | $ | 8.82 | $ | 8.66 | $ | 8.98 | $ | 9.52 | $ | 8.87 |
Total Return D | | | | 1.18% | | (2.35)% | | 11.11% | | (2.23)% |
Ratios to Average Net Assets B,E,F | | | | | | | | | | |
| Expenses before reductions | | .73% | | .76% | | .83% | | .87% | | .86% |
| Expenses net of fee waivers, if any | | | | .75% | | .75% | | .80% | | .80% |
| Expenses net of all reductions | | .73% | | .75% | | .75% | | .80% | | .80% |
| Net investment income (loss) | | 7.22% | | 6.06% | | 3.52% | | 3.46% | | 3.99% |
| Supplemental Data | | | | | | | | | | |
| Net assets, end of period (000 omitted) | $ | 180,997 | $ | 460,873 | $ | 87,949 | $ | 83,066 | $ | 63,703 |
Portfolio turnover rate G | | | | 14% | | 42% | | 74% | | 77% |
ACalculated based on average shares outstanding during the period.
BNet investment income (loss) is affected by the timing of the declaration of dividends by any underlying mutual funds or exchange-traded funds (ETFs). Net investment income (loss) of any mutual funds or ETFs is not included in the Fund's net investment income (loss) ratio.
CThe amount shown for a share outstanding does not correspond with the aggregate net gain (loss) on investments for the period due to the timing of sales and repurchases of shares in relation to fluctuating market values of the investments of the Fund.
DTotal returns would have been lower if certain expenses had not been reduced during the applicable periods shown.
EFees and expenses of any underlying mutual funds or exchange-traded funds (ETFs) are not included in the Fund's expense ratio. The Fund indirectly bears its proportionate share of these expenses. For additional expense information related to investments in Fidelity Central Funds, please refer to the "Investments in Fidelity Central Funds" note found in the Notes to Financial Statements section of the most recent Annual or Semi-Annual report.
FExpense ratios reflect operating expenses of the class. Expenses before reductions do not reflect amounts reimbursed, waived, or reduced through arrangements with the investment adviser, brokerage services, or other offset arrangements, if applicable, and do not represent the amount paid by the class during periods when reimbursements, waivers or reductions occur.
GAmount does not include the portfolio activity of any underlying mutual funds or exchange-traded funds (ETFs).
Fidelity Advisor® Short Duration High Income Fund Class I |
| |
| Years ended April 30, | | 2024 | | 2023 | | 2022 | | 2021 | | 2020 |
Selected Per-Share Data | | | | | | | | | | |
| Net asset value, beginning of period | $ | 8.66 | $ | 8.98 | $ | 9.52 | $ | 8.87 | $ | 9.44 |
| Income from Investment Operations | | | | | | | | | | |
Net investment income (loss) A,B | | .625 | | .524 | | .331 | | .323 | | .372 |
| Net realized and unrealized gain (loss) | | .079 C | | (.429) | | (.546) | | .651 | | (.572) |
| Total from investment operations | | .704 | | .095 | | (.215) | | .974 | | (.200) |
| Distributions from net investment income | | (.544) | | (.415) | | (.325) | | (.324) | | (.370) |
| Total distributions | | (.544) | | (.415) | | (.325) | | (.324) | | (.370) |
| Net asset value, end of period | $ | 8.82 | $ | 8.66 | $ | 8.98 | $ | 9.52 | $ | 8.87 |
Total Return D | | | | 1.18% | | (2.35)% | | 11.11% | | (2.23)% |
Ratios to Average Net Assets B,E,F | | | | | | | | | | |
| Expenses before reductions | | .76% | | .84% | | .88% | | .92% | | .89% |
| Expenses net of fee waivers, if any | | | | .75% | | .76% | | .80% | | .80% |
| Expenses net of all reductions | | .76% | | .75% | | .76% | | .80% | | .80% |
| Net investment income (loss) | | 7.19% | | 6.06% | | 3.52% | | 3.46% | | 3.99% |
| Supplemental Data | | | | | | | | | | |
| Net assets, end of period (000 omitted) | $ | 6,093 | $ | 4,855 | $ | 5,055 | $ | 5,023 | $ | 3,950 |
Portfolio turnover rate G | | | | 14% | | 42% | | 74% | | 77% |
ACalculated based on average shares outstanding during the period.
BNet investment income (loss) is affected by the timing of the declaration of dividends by any underlying mutual funds or exchange-traded funds (ETFs). Net investment income (loss) of any mutual funds or ETFs is not included in the Fund's net investment income (loss) ratio.
CThe amount shown for a share outstanding does not correspond with the aggregate net gain (loss) on investments for the period due to the timing of sales and repurchases of shares in relation to fluctuating market values of the investments of the Fund.
DTotal returns would have been lower if certain expenses had not been reduced during the applicable periods shown.
EFees and expenses of any underlying mutual funds or exchange-traded funds (ETFs) are not included in the Fund's expense ratio. The Fund indirectly bears its proportionate share of these expenses. For additional expense information related to investments in Fidelity Central Funds, please refer to the "Investments in Fidelity Central Funds" note found in the Notes to Financial Statements section of the most recent Annual or Semi-Annual report.
FExpense ratios reflect operating expenses of the class. Expenses before reductions do not reflect amounts reimbursed, waived, or reduced through arrangements with the investment adviser, brokerage services, or other offset arrangements, if applicable, and do not represent the amount paid by the class during periods when reimbursements, waivers or reductions occur.
GAmount does not include the portfolio activity of any underlying mutual funds or exchange-traded funds (ETFs).
Fidelity Advisor® Short Duration High Income Fund Class Z |
| |
| Years ended April 30, | | 2024 | | 2023 | | 2022 | | 2021 | | 2020 |
Selected Per-Share Data | | | | | | | | | | |
| Net asset value, beginning of period | $ | 8.66 | $ | 8.98 | $ | 9.52 | $ | 8.87 | $ | 9.45 |
| Income from Investment Operations | | | | | | | | | | |
Net investment income (loss) A,B | | .632 | | .531 | | .339 | | .331 | | .378 |
| Net realized and unrealized gain (loss) | | .080 C | | (.428) | | (.546) | | .652 | | (.579) |
| Total from investment operations | | .712 | | .103 | | (.207) | | .983 | | (.201) |
| Distributions from net investment income | | (.552) | | (.423) | | (.333) | | (.333) | | (.379) |
| Total distributions | | (.552) | | (.423) | | (.333) | | (.333) | | (.379) |
| Net asset value, end of period | $ | 8.82 | $ | 8.66 | $ | 8.98 | $ | 9.52 | $ | 8.87 |
Total Return D | | | | 1.27% | | (2.27)% | | 11.21% | | (2.24)% |
Ratios to Average Net Assets B,E,F | | | | | | | | | | |
| Expenses before reductions | | .70% | | .75% | | .78% | | .80% | | .80% |
| Expenses net of fee waivers, if any | | | | .66% | | .66% | | .71% | | .71% |
| Expenses net of all reductions | | .67% | | .66% | | .66% | | .71% | | .71% |
| Net investment income (loss) | | 7.28% | | 6.15% | | 3.61% | | 3.55% | | 4.08% |
| Supplemental Data | | | | | | | | | | |
| Net assets, end of period (000 omitted) | $ | 9,702 | $ | 10,289 | $ | 5,246 | $ | 3,815 | $ | 2,031 |
Portfolio turnover rate G | | | | 14% | | 42% | | 74% | | 77% |
ACalculated based on average shares outstanding during the period.
BNet investment income (loss) is affected by the timing of the declaration of dividends by any underlying mutual funds or exchange-traded funds (ETFs). Net investment income (loss) of any mutual funds or ETFs is not included in the Fund's net investment income (loss) ratio.
CThe amount shown for a share outstanding does not correspond with the aggregate net gain (loss) on investments for the period due to the timing of sales and repurchases of shares in relation to fluctuating market values of the investments of the Fund.
DTotal returns would have been lower if certain expenses had not been reduced during the applicable periods shown.
EFees and expenses of any underlying mutual funds or exchange-traded funds (ETFs) are not included in the Fund's expense ratio. The Fund indirectly bears its proportionate share of these expenses. For additional expense information related to investments in Fidelity Central Funds, please refer to the "Investments in Fidelity Central Funds" note found in the Notes to Financial Statements section of the most recent Annual or Semi-Annual report.
FExpense ratios reflect operating expenses of the class. Expenses before reductions do not reflect amounts reimbursed, waived, or reduced through arrangements with the investment adviser, brokerage services, or other offset arrangements, if applicable, and do not represent the amount paid by the class during periods when reimbursements, waivers or reductions occur.
GAmount does not include the portfolio activity of any underlying mutual funds or exchange-traded funds (ETFs).
For the period ended April 30, 2024
1. Organization.
Fidelity Short Duration High Income Fund (the Fund) is a fund of Fidelity Summer Street Trust (the Trust) and is authorized to issue an unlimited number of shares. The Trust is registered under the Investment Company Act of 1940, as amended (the 1940 Act), as an open-end management investment company organized as a Massachusetts business trust. The Fund offers Class A, Class M, Class C, Short Duration High Income, Class I and Class Z shares, each of which has equal rights as to assets and voting privileges. Class A, Class M, Class C, Class I and Class Z are Fidelity Advisor classes. Each class has exclusive voting rights with respect to matters that affect that class. Class C shares will automatically convert to Class A shares after a holding period of eight years from the initial date of purchase, with certain exceptions.
2. Investments in Fidelity Central Funds.
Funds may invest in Fidelity Central Funds, which are open-end investment companies generally available only to other investment companies and accounts managed by the investment adviser and its affiliates. The Schedule of Investments lists any Fidelity Central Funds held as an investment as of period end, but does not include the underlying holdings of each Fidelity Central Fund. An investing fund indirectly bears its proportionate share of the expenses of the underlying Fidelity Central Funds.
Based on its investment objective, each Fidelity Central Fund may invest or participate in various investment vehicles or strategies that are similar to those of the investing fund. These strategies are consistent with the investment objectives of the investing fund and may involve certain economic risks which may cause a decline in value of each of the Fidelity Central Funds and thus a decline in the value of the investing fund.
| Fidelity Central Fund | Investment Manager | Investment Objective | Investment Practices | Expense RatioA |
| Fidelity Money Market Central Funds | Fidelity Management & Research Company LLC (FMR) | Each fund seeks to obtain a high level of current income consistent with the preservation of capital and liquidity. | Short-term Investments | Less than .005% |
A Expenses expressed as a percentage of average net assets and are as of each underlying Central Fund's most recent annual or semi-annual shareholder report.
A complete unaudited list of holdings for each Fidelity Central Fund is available upon request or at the Securities and Exchange Commission website at www.sec.gov. In addition, the financial statements of the Fidelity Central Funds which contain the significant accounting policies (including investment valuation policies) of those funds, and are not covered by the Report of Independent Registered Public Accounting Firm, are available on the Securities and Exchange Commission website or upon request.
3. Significant Accounting Policies.
The Fund is an investment company and applies the accounting and reporting guidance of the Financial Accounting Standards Board (FASB) Accounting Standards Codification Topic 946 Financial Services - Investment Companies. The financial statements have been prepared in conformity with accounting principles generally accepted in the United States of America (GAAP), which require management to make certain estimates and assumptions at the date of the financial statements. Actual results could differ from those estimates. Subsequent events, if any, through the date that the financial statements were issued have been evaluated in the preparation of the financial statements. The Fund's Schedule of Investments lists any underlying mutual funds or exchange-traded funds (ETFs) but does not include the underlying holdings of these funds. The following summarizes the significant accounting policies of the Fund:
Investment Valuation. Investments are valued as of 4:00 p.m. Eastern time on the last calendar day of the period. The Board of Trustees (the Board) has designated the Fund's investment adviser as the valuation designee responsible for the fair valuation function and performing fair value determinations as needed. The investment adviser has established a Fair Value Committee (the Committee) to carry out the day-to-day fair valuation responsibilities and has adopted policies and procedures to govern the fair valuation process and the activities of the Committee. In accordance with these fair valuation policies and procedures, which have been approved by the Board, the Fund attempts to obtain prices from one or more third party pricing services or brokers to value its investments. When current market prices, quotations or currency exchange rates are not readily available or reliable, investments will be fair valued in good faith by the Committee, in accordance with the policies and procedures. Factors used in determining fair value vary by investment type and may include market or investment specific events, transaction data, estimated cash flows, and market observations of comparable investments. The frequency that the fair valuation procedures are used cannot be predicted and they may be utilized to a significant extent. The Committee manages the Fund's fair valuation practices and maintains the fair valuation policies and procedures. The Fund's investment adviser reports to the Board information regarding the fair valuation process and related material matters.
The Fund categorizes the inputs to valuation techniques used to value its investments into a disclosure hierarchy consisting of three levels as shown below:
Level 1 - unadjusted quoted prices in active markets for identical investments
Level 2 - other significant observable inputs (including quoted prices for similar investments, interest rates, prepayment speeds, etc.)
Level 3 - unobservable inputs (including the Fund's own assumptions based on the best information available)
Valuation techniques used to value the Fund's investments by major category are as follows:
Debt securities, including restricted securities, are valued based on evaluated prices received from third party pricing services or from brokers who make markets in such securities. Corporate bonds, bank loan obligations and preferred securities are valued by pricing services who utilize matrix pricing which considers yield or price of bonds of comparable quality, coupon, maturity and type or by broker-supplied prices. When independent prices are unavailable or unreliable, debt securities may be valued utilizing pricing methodologies which consider similar factors that would be used by third party pricing services. Debt securities are generally categorized as Level 2 in the hierarchy but may be Level 3 depending on the circumstances. The Fund invests a significant portion of its assets in below investment grade securities. The value of these securities can be more volatile due to changes in the credit quality of the issuer and is sensitive to changes in economic, market and regulatory conditions.
Equity securities, including restricted securities, for which market quotations are readily available, are valued at the last reported sale price or official closing price as reported by a third party pricing service on the primary market or exchange on which they are traded and are categorized as Level 1 in the hierarchy. In the event there were no sales during the day or closing prices are not available, securities are valued at the last quoted bid price or may be valued using the last available price and are generally categorized as Level 2 in the hierarchy. For foreign equity securities, when market or security specific events arise, comparisons to the valuation of American Depositary Receipts (ADRs), futures contracts, ETFs and certain indexes as well as quoted prices for similar securities may be used and would be categorized as Level 2 in the hierarchy. For equity securities, including restricted securities, where observable inputs are limited, assumptions about market activity and risk are used and these securities may be categorized as Level 3 in the hierarchy.
Investments in open-end mutual funds, including the Fidelity Central Funds, are valued at their closing net asset value (NAV) each business day and are categorized as Level 1 in the hierarchy.
Changes in valuation techniques may result in transfers in or out of an assigned level within the disclosure hierarchy. The aggregate value of investments by input level as of April 30, 2024 is included at the end of the Fund's Schedule of Investments.
Foreign Currency. Certain Funds may use foreign currency contracts to facilitate transactions in foreign-denominated securities. Gains and losses from these transactions may arise from changes in the value of the foreign currency or if the counterparties do not perform under the contracts' terms.
Foreign-denominated assets, including investment securities, and liabilities are translated into U.S. dollars at the exchange rates at period end. Purchases and sales of investment securities, income and dividends received, and expenses denominated in foreign currencies are translated into U.S. dollars at the exchange rate in effect on the transaction date.
The effects of exchange rate fluctuations on investments are included with the net realized and unrealized gain (loss) on investment securities. Other foreign currency transactions resulting in realized and unrealized gain (loss) are disclosed separately.
Investment Transactions and Income. For financial reporting purposes, the Fund's investment holdings and NAV include trades executed through the end of the last business day of the period. The NAV per share for processing shareholder transactions is calculated as of the close of business of the New York Stock Exchange (NYSE), normally 4:00 p.m. Eastern time and includes trades executed through the end of the prior business day. Gains and losses on securities sold are determined on the basis of identified cost and include proceeds received from litigation. Commissions paid to certain brokers with whom the investment adviser, or its affiliates, places trades on behalf of a fund include an amount in addition to trade execution, which may be rebated back to a fund. Any such rebates are included in net realized gain (loss) on investments in the Statement of Operations. Dividend income is recorded on the ex-dividend date. Income and capital gain distributions from Fidelity Central Funds, if any, are recorded on the ex-dividend date. Interest income is accrued as earned and includes coupon interest and amortization of premium and accretion of discount on debt securities as applicable. Paid in Kind (PIK) income is recorded at the fair market value of the securities received. Investment income is recorded net of foreign taxes withheld where recovery of such taxes is uncertain. Debt obligations may be placed on non-accrual status and related interest income may be reduced by ceasing current accruals and writing off interest receivables when the collection of all or a portion of interest has become doubtful based on consistently applied procedures. A debt obligation is removed from non-accrual status when the issuer resumes interest payments or when collectability of interest is reasonably assured.
Class Allocations and Expenses. Investment income, realized and unrealized capital gains and losses, common expenses of a fund, and certain fund-level expense reductions, if any, are allocated daily on a pro-rata basis to each class based on the relative net assets of each class to the total net assets of a fund. Each class differs with respect to transfer agent and distribution and service plan fees incurred, as applicable. Certain expense reductions may also differ by class, if applicable. For the reporting period, the allocated portion of income and expenses to each class as a percent of its average net assets may vary due to the timing of recording these transactions in relation to fluctuating net assets of the classes. Expenses directly attributable to a fund are charged to that fund. Expenses attributable to more than one fund are allocated among the respective funds on the basis of relative net assets or other appropriate methods. Expenses included in the accompanying financial statements reflect the expenses of that fund and do not include any expenses associated with any underlying mutual funds or exchange-traded funds (ETFs). Although not included in a fund's expenses, a fund indirectly bears its proportionate share of these expenses through the net asset value of each underlying mutual fund or exchange-traded fund (ETF). Expense estimates are accrued in the period to which they relate and adjustments are made when actual amounts are known.
Income Tax Information and Distributions to Shareholders. Each year, the Fund intends to qualify as a regulated investment company under Subchapter M of the Internal Revenue Code, including distributing substantially all of its taxable income and realized gains. As a result, no provision for U.S. Federal income taxes is required. As of April 30, 2024, the Fund did not have any unrecognized tax benefits in the financial statements; nor is the Fund aware of any tax positions for which it is reasonably possible that the total amounts of unrecognized tax benefits will significantly change in the next twelve months. The Fund files a U.S. federal tax return, in addition to state and local tax returns as required. The Fund's federal income tax returns are subject to examination by the Internal Revenue Service (IRS) for a period of three fiscal years after they are filed. State and local tax returns may be subject to examination for an additional fiscal year depending on the jurisdiction. Foreign taxes are provided for based on the Fund's understanding of the tax rules and rates that exist in the foreign markets in which it invests.
Distributions are declared and recorded daily and paid monthly from net investment income. Distributions from realized gains, if any, are declared and recorded on the ex-dividend date. Income and capital gain distributions are declared separately for each class. Income and capital gain distributions are determined in accordance with income tax regulations, which may differ from GAAP.
Capital accounts within the financial statements are adjusted for permanent book-tax differences. These adjustments have no impact on net assets or the results of operations. Capital accounts are not adjusted for temporary book-tax differences which will reverse in a subsequent period.
Book-tax differences are primarily due to market discount, partnerships, capital loss carryforwards and losses deferred due to
wash sales.
As of period end, the cost and unrealized appreciation (depreciation) in securities, and derivatives if applicable, for federal income tax purposes were as follows:
| Gross unrealized appreciation | $8,317,328 |
| Gross unrealized depreciation | (3,464,586) |
| Net unrealized appreciation (depreciation) | $4,852,742 |
| Tax Cost | $221,433,068 |
The tax-based components of distributable earnings as of period end were as follows:
| Undistributed ordinary income | $1,414,175 |
| Capital loss carryforward | $(18,742,261) |
| Net unrealized appreciation (depreciation) on securities and other investments | $4,852,742 |
Capital loss carryforwards are only available to offset future capital gains of the Fund to the extent provided by regulations and may be limited. The capital loss carryforward information presented below, including any applicable limitation, is estimated as of fiscal period end and is subject to adjustment.
Short-term | $(7,768,023) |
Long-term | (10,974,238) |
| Total capital loss carryforward | $(18,742,261) |
The tax character of distributions paid was as follows:
| | April 30, 2024 | April 30, 2023 |
| Ordinary Income | $22,490,058 | $ 15,367,826 |
Restricted Securities (including Private Placements). Funds may invest in securities that are subject to legal or contractual restrictions on resale. These securities generally may be resold in transactions exempt from registration or to the public if the securities are registered. Disposal of these securities may involve time-consuming negotiations and expense, and prompt sale at an acceptable price may be difficult. Information regarding restricted securities held at period end is included at the end of the Schedule of Investments, if applicable.
Loans and Other Direct Debt Instruments. Direct debt instruments are interests in amounts owed to lenders by corporate or other borrowers. These instruments may be in the form of loans, trade claims or other receivables and may include standby financing commitments such as revolving credit facilities that obligate a fund to supply additional cash to the borrower on demand. Loans may be acquired through assignment, participation, or may be made directly to a borrower. Such instruments are presented in the Bank Loan Obligations section in the Schedule of Investments. Certain funds may also invest in unfunded loan commitments, which are contractual obligations for future funding. Information regarding unfunded commitments is included at the end of the Schedule of Investments, if applicable.
4. Purchases and Sales of Investments.
Purchases and sales of securities, other than short-term securities and in-kind transactions, as applicable, are noted in the table below.
| | Purchases ($) | Sales ($) |
| Fidelity Short Duration High Income Fund | 102,352,612 | 347,082,138 |
5. Fees and Other Transactions with Affiliates.
Management Fee. Fidelity Management & Research Company LLC (the investment adviser) and its affiliates provide the Fund with investment management related services for which the Fund pays a monthly management fee.
Effective March 1, 2024, the Fund's management contract was amended to incorporate administrative services previously covered under separate services agreements (Transfer Agent and Accounting agreements). The amended contract incorporates a management fee rate that may vary by class. The investment adviser or an affiliate pays certain expenses of managing and operating the Fund out of each class's management fee. Each class of the Fund pays a management fee to the investment adviser. The management fee is calculated and paid to the investment adviser every month. When determining a class's management fee, a mandate rate is calculated based on the monthly average net assets of a group of funds advised by FMR within a designated asset class. A discount rate is subtracted from the mandate rate once the Fund's monthly average net assets reach a certain level. The mandate rate and discount rate may vary by class. The annual management fee rate for a class of shares of the Fund is the lesser of (1) the class's mandate rate reduced by the class's discount rate (if applicable) or (2) the amount set forth in the following table.
| | Maximum Management Fee Rate % |
| Class A | .70 |
| Class M | .72 |
| Class C | .74 |
| Short Duration High Income | .65 |
| Class I | .67 |
| Class Z | .61 |
One-twelfth of the management fee rate for a class is applied to the average net assets of the class for the month, giving a dollar amount which is the management fee for the class for that month. A different management fee rate may be applicable to each class of the Fund. The difference between classes is the result of separate arrangements for class-level services and/or waivers of certain expenses. It is not the result of any difference in advisory or custodial fees or other expenses related to the management of the Fund's assets, which do not vary by class. For the portion of the reporting period on or after March 1, 2024, the total annualized management fee rates were as follows:
| | Total Management Fee Rate % |
| Class A | .70 |
| Class M | .72 |
| Class C | .74 |
| Short Duration High Income | .65 |
| Class I | .67 |
| Class Z | .61 |
Prior to March 1, 2024, the management fee was the sum of an individual fund fee rate that was based on an annual rate of .45% of the Fund's average net assets and an annualized group fee rate that averaged .10% during the period. The group fee rate was based upon the monthly average net assets of a group of registered investment companies with which the investment adviser has management contracts. The group fee rate decreased as assets under management increased and increased as assets under management decreased. For the portion of the reporting period prior to March 1, 2024, the total annualized management fee rate was .55%.
Effective March 1, 2024, the Fund's sub-advisory agreements with Fidelity Management & Research (Hong Kong) Limited and Fidelity Management & Research (Japan) Limited was amended to provide that the investment adviser pays each sub-adviser monthly fees equal to 110% of the sub-adviser's costs for providing sub-advisory services.
Distribution and Service Plan Fees. In accordance with Rule 12b-1 of the 1940 Act, the Fund has adopted separate Distribution and Service Plans for each class of shares. Certain classes pay Fidelity Distributors Company LLC (FDC), an affiliate of the investment adviser, separate Distribution and Service Fees, each of which is based on an annual percentage of each class' average net assets. In addition, FDC may pay financial intermediaries for selling shares of the Fund and providing shareholder support services. For the period, the Distribution and Service Fee rates, total fees and amounts retained by FDC were as follows:
| | Distribution Fee | Service Fee | Total Fees ($) | Retained by FDC ($) |
| Class A | - % | .25% | 60,204 | 3,973 |
| Class M | - % | .25% | 5,276 | - |
| Class C | .75% | .25% | 31,468 | 6,405 |
| | | | 96,948 | 10,378 |
Sales Load. FDC may receive a front-end sales charge of up to 4.00% for selling Class A shares and Class M shares, some of which is paid to financial intermediaries for selling shares of the Fund. Depending on the holding period, FDC may receive contingent deferred sales charges levied on Class A, Class M and Class C redemptions. The deferred sales charges are 1.00% for Class C shares, 1.00% for certain purchases of Class A shares and .25% for certain purchases of Class M shares.
For the period, sales charge amounts retained by FDC were as follows:
| | Retained by FDC ($) |
| Class A | 6,645 |
| Class M | 69 |
Class C A | 61 |
| | 6,775 |
A When Class C shares are initially sold, FDC pays commissions from its own resources to financial intermediaries through which the sales are made.
Transfer Agent Fees. Fidelity Investments Institutional Operations Company LLC (FIIOC), an affiliate of the investment adviser, is the transfer, dividend disbursing and shareholder servicing agent for each class of the Fund. Effective March 1, 2024, the Fund's management contract was amended to incorporate transfer agent services and associated fees previously covered under a separate services agreement. FIIOC pays for typesetting, printing and mailing of shareholder reports, except proxy statements.
During November 2023, the Board approved a change in the transfer agent fees effective December 1, 2023 to a fixed annual rate of class-level average net assets as follows:
| | % of Class-Level Average Net Assets |
| Class A | 0.1459 |
| Class M | 0.1577 |
| Class C | 0.1792 |
| Short Duration High Income | 0.0869 |
| Class I | 0.1120 |
Prior to December 1, 2023, FIIOC received account fees and asset-based fees that varied according to the account size and type of account of the shareholders of the respective classes of the Fund, except for Class Z. FIIOC received an asset-based fee of Class Z's average net assets. For the portion of the reporting period prior to March 1, 2024, the fees were equivalent to the following annualized rates:
| | Amount ($) | % of Class-Level Average Net AssetsA |
| Class A | 28,969 | .15 |
| Class M | 2,899 | .16 |
| Class C | 4,668 | .18 |
| Short Duration High Income | 258,382 | .09 |
| Class I | 5,403 | .12 |
| Class Z | 4,094 | .05 |
| | 304,415 | |
A Annualized
Accounting Fees. Fidelity Service Company, Inc. (FSC), an affiliate of the investment adviser, maintains the Fund's accounting records. Effective March 1, 2024, the Fund's management contract was amended to incorporate accounting services and associated fees previously covered under a separate services agreement.
During November 2023, the Board approved a change in the accounting fees effective December 1, 2023 to a fixed annual rate of average net assets as follows:
| | % of Average Net Assets |
| Fidelity Short Duration High Income Fund | .0413 |
Prior to December 1, 2023, the accounting fee was based on the level of average net assets for each month. For the portion of the reporting period prior to March 1, 2024, the fees were equivalent to the following annualized rates:
| | % of Average Net Assets |
| Fidelity Short Duration High Income Fund | .04 |
Brokerage Commissions. A portion of portfolio transactions were placed with brokerage firms which are affiliates of the investment adviser. Brokerage commissions are included in net realized gain (loss) and change in net unrealized appreciation (depreciation) in the Statement of Operations. The commissions paid to these affiliated firms were as follows:
| | Amount ($) |
| Fidelity Short Duration High Income Fund | 5 |
Interfund Lending Program. Pursuant to an Exemptive Order issued by the Securities and Exchange Commission (the SEC), the Fund, along with other registered investment companies having management contracts with Fidelity Management & Research Company LLC (FMR), or other affiliated entities of FMR, may participate in an interfund lending program. This program provides an alternative credit facility allowing the Fund to borrow from, or lend money to, other participating affiliated funds. At period end, there were no interfund loans outstanding. Activity in this program during the period for which loans were outstanding was as follows:
| | Borrower or Lender | Average Loan Balance ($) | Weighted Average Interest Rate | Interest Expense ($) |
Fidelity Short Duration High Income Fund | Borrower | 21,479,111 | 5.57% | 29,887 |
Interfund Trades. Funds may purchase from or sell securities to other Fidelity Funds under procedures adopted by the Board. The procedures have been designed to ensure these interfund trades are executed in accordance with Rule 17a-7 of the 1940 Act. Any interfund trades are included within the respective purchases and sales amounts shown in the Purchases and Sales of Investments note. During the period, there were no interfund trades.
6. Committed Line of Credit.
Certain Funds participate with other funds managed by the investment adviser or an affiliate in a $4.25 billion credit facility (the "line of credit") to be utilized for temporary or emergency purposes to fund shareholder redemptions or for other short-term liquidity purposes. The participating funds have agreed to pay commitment fees on their pro-rata portion of the line of credit, which are reflected in Miscellaneous expenses on the Statement of Operations, and are listed below. During the period, there were no borrowings on this line of credit.
| | Amount ($) |
| Fidelity Short Duration High Income Fund | 681 |
7. Bank Borrowings.
The Fund is permitted to have bank borrowings for temporary or emergency purposes to fund shareholder redemptions or for other short-term liquidity requirements. The Fund has established borrowing arrangements with certain banks. The interest rate on the borrowings is the bank's base rate, as revised from time to time. Any open loans, including accrued interest, at period end are presented under the caption "Notes payable" in the Statement of Assets and Liabilities, if applicable. Activity in this program during the period for which loans were outstanding was as follows:
| | Average Loan Balance ($) | Weighted Average Interest Rate | Interest Expense ($) |
| Fidelity Short Duration High Income Fund | 32,601,000 | 5.83% | 5,280 |
8. Expense Reductions.
The investment adviser contractually agreed to reimburse expenses of each class to the extent annual operating expenses exceeded certain levels of class-level average net assets as noted in the table below. This reimbursement will remain in place through August 31, 2025. Some expenses, for example the compensation of the independent Trustees, and certain miscellaneous expenses such as proxy and shareholder meeting expenses, are excluded from this reimbursement.
The following classes were in reimbursement during the period:
| | Expense Limitations | Reimbursement ($) |
| Class A | 1.00% | 6,766 |
| Class M | 1.00% | 970 |
| Class C | 1.75% | 1,972 |
| Class Z | .66% | 2,274 |
| | | 11,982 |
Through arrangements with the Fund's custodian, credits realized as a result of certain uninvested cash balances were used to reduce the Fund's expenses. During the period, custodian credits reduced the Fund's expenses by $4,989.
In addition, during the period the investment adviser or an affiliate reimbursed and/or waived a portion of fund-level operating expenses in the amount of $15,745.
9. Distributions to Shareholders.
Distributions to shareholders of each class were as follows:
| | Year ended April 30, 2024 | Year ended April 30, 2023 |
| Fidelity Short Duration High Income Fund | | |
| Distributions to shareholders | | |
| Class A | $1,453,378 | $977,618 |
| Class M | 126,712 | 110,316 |
| Class C | 166,155 | 119,358 |
| Short Duration High Income | 19,772,748 | 13,395,089 |
| Class I | 358,052 | 233,578 |
| Class Z | 613,013 | 531,867 |
Total | $ 22,490,058 | $ 15,367,826 |
10. Share Transactions.
Share transactions for each class were as follows and may contain in-kind transactions, automatic conversions between classes or exchanges between affiliated funds:
| | Shares | Shares | Dollars | Dollars |
| | Year ended April 30, 2024 | Year ended April 30, 2023 | Year ended April 30, 2024 | Year ended April 30, 2023 |
| Fidelity Short Duration High Income Fund | | | | |
| Class A | | | | |
| Shares sold | 915,629 | 610,442 | $7,927,624 | $5,296,397 |
| Reinvestment of distributions | 163,493 | 111,049 | 1,426,701 | 957,537 |
| Shares redeemed | (573,870) | (764,843) | (5,000,968) | (6,627,528) |
| Net increase (decrease) | 505,252 | (43,352) | $4,353,357 | $(373,594) |
| Class M | | | | |
| Shares sold | 61,221 | 128,913 | $536,752 | $1,113,204 |
| Reinvestment of distributions | 14,180 | 12,392 | 123,623 | 106,876 |
| Shares redeemed | (108,706) | (186,791) | (948,746) | (1,605,675) |
| Net increase (decrease) | (33,305) | (45,486) | $(288,371) | $(385,595) |
| Class C | | | | |
| Shares sold | 210,769 | 110,217 | $1,836,741 | $951,412 |
| Reinvestment of distributions | 18,510 | 13,729 | 161,586 | 118,460 |
| Shares redeemed | (160,324) | (233,652) | (1,396,285) | (2,022,594) |
| Net increase (decrease) | 68,955 | (109,706) | $602,042 | $(952,722) |
| Short Duration High Income | | | | |
| Shares sold | 15,629,596 | 51,006,236 | $135,606,728 | $434,795,776 |
| Reinvestment of distributions | 2,012,341 | 1,386,203 | 17,448,514 | 11,955,926 |
| Shares redeemed | (50,323,387) | (8,974,356) | (431,331,667) | (77,559,285) |
| Net increase (decrease) | (32,681,450) | 43,418,083 | $(278,276,425) | $369,192,417 |
| Class I | | | | |
| Shares sold | 415,530 | 227,106 | $3,601,620 | $1,961,038 |
| Reinvestment of distributions | 38,900 | 24,795 | 339,483 | 213,807 |
| Shares redeemed | (323,830) | (254,191) | (2,814,401) | (2,192,726) |
| Net increase (decrease) | 130,600 | (2,290) | $1,126,702 | $(17,881) |
| Class Z | | | | |
| Shares sold | 781,037 | 1,699,944 | $6,806,516 | $14,714,297 |
| Reinvestment of distributions | 66,980 | 48,777 | 583,737 | 420,604 |
| Shares redeemed | (935,376) | (1,145,441) | (8,097,274) | (9,858,783) |
| Net increase (decrease) | (87,359) | 603,280 | $(707,021) | $5,276,118 |
11. Other.
A fund's organizational documents provide former and current trustees and officers with a limited indemnification against liabilities arising in connection with the performance of their duties to the fund. In the normal course of business, a fund may also enter into contracts that provide general indemnifications. A fund's maximum exposure under these arrangements is unknown as this would be dependent on future claims that may be made against a fund. The risk of material loss from such claims is considered remote.
12. Risk and Uncertainties.
Many factors affect a fund's performance. Developments that disrupt global economies and financial markets, such as pandemics, epidemics, outbreaks of infectious diseases, war, terrorism, and environmental disasters, may significantly affect a fund's investment performance. The effects of these developments to a fund will be impacted by the types of securities in which a fund invests, the financial condition, industry, economic sector, and geographic location of an issuer, and a fund's level of investment in the securities of that issuer. Significant concentrations in security types, issuers, industries, sectors, and geographic locations may magnify the factors that affect a fund's performance.
To the Board of Trustees of Fidelity Summer Street Trust and the Shareholders of Fidelity Short Duration High Income Fund:
Opinion on the Financial Statements and Financial Highlights
We have audited the accompanying statement of assets and liabilities of Fidelity Short Duration High Income Fund (the "Fund"), a fund of Fidelity Summer Street Trust, including the schedule of investments, as of April 30, 2024, the related statement of operations for the year then ended, the statement of changes in net assets for each of the two years in the period then ended, the financial highlights for each of the five years in the period then ended, and the related notes. In our opinion, the financial statements and financial highlights present fairly, in all material respects, the financial position of the Fund as of April 30, 2024, and the results of its operations for the year then ended, the changes in its net assets for each of the two years in the period then ended, and the financial highlights for each of the five years in the period then ended in conformity with accounting principles generally accepted in the United States of America.
Basis for Opinion
These financial statements and financial highlights are the responsibility of the Fund's management. Our responsibility is to express an opinion on the Fund's financial statements and financial highlights based on our audits. We are a public accounting firm registered with the Public Company Accounting Oversight Board (United States) (PCAOB) and are required to be independent with respect to the Fund in accordance with the U.S. federal securities laws and the applicable rules and regulations of the Securities and Exchange Commission and the PCAOB.
We conducted our audits in accordance with the standards of the PCAOB. Those standards require that we plan and perform the audit to obtain reasonable assurance about whether the financial statements and financial highlights are free of material misstatement, whether due to error or fraud. The Fund is not required to have, nor were we engaged to perform, an audit of its internal control over financial reporting. As part of our audits, we are required to obtain an understanding of internal control over financial reporting but not for the purpose of expressing an opinion on the effectiveness of the Fund's internal control over financial reporting. Accordingly, we express no such opinion.
Our audits included performing procedures to assess the risks of material misstatement of the financial statements and financial highlights, whether due to error or fraud, and performing procedures that respond to those risks. Such procedures included examining, on a test basis, evidence regarding the amounts and disclosures in the financial statements and financial highlights. Our audits also included evaluating the accounting principles used and significant estimates made by management, as well as evaluating the overall presentation of the financial statements and financial highlights. Our procedures included confirmation of securities owned as of April 30, 2024, by correspondence with the custodian, brokers, and agent banks; when replies were not received from brokers or agent banks, we performed other auditing procedures. We believe that our audits provide a reasonable basis for our opinion.
/s/ Deloitte & Touche LLP
Boston, Massachusetts
June 13, 2024
We have served as the auditor of one or more of the Fidelity investment companies since 1999.
The Trustees, Members of the Advisory Board (if any), and officers of the trust and fund, as applicable, are listed below. The Board of Trustees governs the fund and is responsible for protecting the interests of shareholders. The Trustees are experienced executives who meet periodically throughout the year to oversee the fund's activities, review contractual arrangements with companies that provide services to the fund, oversee management of the risks associated with such activities and contractual arrangements, and review the fund's performance. Except for Vijay Advani, each of the Trustees oversees 323 funds. Mr. Advani oversees 216 funds.
The Trustees hold office without limit in time except that (a) any Trustee may resign; (b) any Trustee may be removed by written instrument, signed by at least two-thirds of the number of Trustees prior to such removal; (c) any Trustee who requests to be retired or who has become incapacitated by illness or injury may be retired by written instrument signed by a majority of the other Trustees; and (d) any Trustee may be removed at any special meeting of shareholders by a two-thirds vote of the outstanding voting securities of the trust. Each Trustee who is not an interested person (as defined in the 1940 Act) of the trust and the fund is referred to herein as an Independent Trustee. Each Independent Trustee shall retire not later than the last day of the calendar year in which his or her 75th birthday occurs. The Independent Trustees may waive this mandatory retirement age policy with respect to individual Trustees. Officers and Advisory Board Members hold office without limit in time, except that any officer or Advisory Board Member may resign or may be removed by a vote of a majority of the Trustees at any regular meeting or any special meeting of the Trustees. Except as indicated, each individual has held the office shown or other offices in the same company for the past five years.
The fund's Statement of Additional Information (SAI) includes more information about the Trustees. To request a free copy, call Fidelity at 1-800-544-8544 if you're an individual investing directly with Fidelity, call 1-800-835-5092 if you're a plan sponsor or participant with Fidelity as your recordkeeper or call 1-877-208-0098 on institutional accounts or if you're an advisor or invest through one.
Experience, Skills, Attributes, and Qualifications of the Trustees. The Governance and Nominating Committee has adopted a statement of policy that describes the experience, qualifications, attributes, and skills that are necessary and desirable for potential Independent Trustee candidates (Statement of Policy). The Board believes that each Trustee satisfied at the time he or she was initially elected or appointed a Trustee, and continues to satisfy, the standards contemplated by the Statement of Policy. The Governance and Nominating Committee also engages professional search firms to help identify potential Independent Trustee candidates who have the experience, qualifications, attributes, and skills consistent with the Statement of Policy. From time to time, additional criteria based on the composition and skills of the current Independent Trustees, as well as experience or skills that may be appropriate in light of future changes to board composition, business conditions, and regulatory or other developments, have also been considered by the professional search firms and the Governance and Nominating Committee. In addition, the Board takes into account the Trustees' commitment and participation in Board and committee meetings, as well as their leadership of standing and ad hoc committees throughout their tenure.
In determining that a particular Trustee was and continues to be qualified to serve as a Trustee, the Board has considered a variety of criteria, none of which, in isolation, was controlling. The Board believes that, collectively, the Trustees have balanced and diverse experience, qualifications, attributes, and skills, which allow the Board to operate effectively in governing the fund and protecting the interests of shareholders. Information about the specific experience, skills, attributes, and qualifications of each Trustee, which in each case led to the Board's conclusion that the Trustee should serve (or continue to serve) as a trustee of the fund, is provided below.
Board Structure and Oversight Function. Robert A. Lawrence is an interested person and currently serves as Chair. The Trustees have determined that an interested Chair is appropriate and benefits shareholders because an interested Chair has a personal and professional stake in the quality and continuity of services provided to the fund. Independent Trustees exercise their informed business judgment to appoint an individual of their choosing to serve as Chair, regardless of whether the Trustee happens to be independent or a member of management. The Independent Trustees have determined that they can act independently and effectively without having an Independent Trustee serve as Chair and that a key structural component for assuring that they are in a position to do so is for the Independent Trustees to constitute a substantial majority for the Board. The Independent Trustees also regularly meet in executive session. David M. Thomas serves as Lead Independent Trustee and as such (i) acts as a liaison between the Independent Trustees and management with respect to matters important to the Independent Trustees and (ii) with management prepares agendas for Board meetings.
Fidelity® funds are overseen by different Boards of Trustees. The fund's Board oversees Fidelity's high income and certain equity funds, and other Boards oversee Fidelity's alternative investment, investment-grade bond, money market, asset allocation, and other equity funds. The asset allocation funds may invest in Fidelity® funds overseen by the fund's Board. The use of separate Boards, each with its own committee structure, allows the Trustees of each group of Fidelity® funds to focus on the unique issues of the funds they oversee, including common research, investment, and operational issues. On occasion, the separate Boards establish joint committees to address issues of overlapping consequences for the Fidelity® funds overseen by each Board.
The Trustees operate using a system of committees to facilitate the timely and efficient consideration of all matters of importance to the Trustees, the fund, and fund shareholders and to facilitate compliance with legal and regulatory requirements and oversight of the fund's activities and associated risks. The Board, acting through its committees, has charged FMR and its affiliates with (i) identifying events or circumstances the occurrence of which could have demonstrably adverse effects on the fund's business and/or reputation; (ii) implementing processes and controls to lessen the possibility that such events or circumstances occur or to mitigate the effects of such events or circumstances if they do occur; and (iii) creating and maintaining a system designed to evaluate continuously business and market conditions in order to facilitate the identification and implementation processes described in (i) and (ii) above. Because the day-to-day operations and activities of the fund are carried out by or through FMR, its affiliates, and other service providers, the fund's exposure to risks is mitigated but not eliminated by the processes overseen by the Trustees. While each of the Board's committees has responsibility for overseeing different aspects of the fund's activities, oversight is exercised primarily through the Operations, Audit, and Compliance Committees. Appropriate personnel, including but not limited to the fund's Chief Compliance Officer (CCO), FMR's internal auditor, the independent accountants, the fund's Treasurer and portfolio management personnel, make periodic reports to the Board's committees, as appropriate, including an annual review of Fidelity's risk management program for the Fidelity® funds. The responsibilities of each standing committee, including their oversight responsibilities, are described further under "Standing Committees of the Trustees."
Interested Trustees*:
Correspondence intended for a Trustee who is an interested person may be sent to Fidelity Investments, 245 Summer Street, Boston, Massachusetts 02210.
Name, Year of Birth; Principal Occupations and Other Relevant Experience+
Bettina Doulton (1964)
Year of Election or Appointment: 2020
Trustee
Ms. Doulton also serves as Trustee of other Fidelity® funds. Prior to her retirement, Ms. Doulton served in a variety of positions at Fidelity Investments, including as a managing director of research (2006-2007), portfolio manager to certain Fidelity® funds (1993-2005), equity analyst and portfolio assistant (1990-1993), and research assistant (1987-1990). Ms. Doulton currently owns and operates Cellardoor Winery. Previously, Ms. Doulton served as a member of the Board of Brown Capital Management, LLC (2014-2018).
Robert A. Lawrence (1952)
Year of Election or Appointment: 2020
Trustee
Chair of the Board of Trustees
Mr. Lawrence also serves as Trustee of other funds. Previously, Mr. Lawrence served as a Trustee and Member of the Advisory Board of certain funds. Prior to his retirement in 2008, Mr. Lawrence served as Vice President of certain Fidelity® funds (2006-2008), Senior Vice President, Head of High Income Division of Fidelity Management & Research Company (investment adviser firm, 2006-2008), and President of Fidelity Strategic Investments (investment adviser firm, 2002-2005).
* Determined to be an "Interested Trustee" by virtue of, among other things, his or her affiliation with the trust or various entities under common control with FMR.
+ The information includes the Trustee's principal occupation during the last five years and other information relating to the experience, attributes, and skills relevant to the Trustee's qualifications to serve as a Trustee, which led to the conclusion that the Trustee should serve as a Trustee for the fund.
Independent Trustees:
Correspondence intended for an Independent Trustee may be sent to Fidelity Investments, P.O. Box 55235, Boston, Massachusetts 02205-5235.
Name, Year of Birth; Principal Occupations and Other Relevant Experience+
Vijay C. Advani (1960)
Year of Election or Appointment: 2023
Trustee
Mr. Advani also serves as Trustee or Member of the Advisory Board of other funds. Previously, Mr. Advani served as Executive Chairman (2020-2022), Chief Executive Officer (2017-2020) and Chief Operating Officer (2016-2017) of Nuveen (global investment manager). He also served in various capacities at Franklin Resources (global investment manager), including Co-President (2015-2016), Executive Vice President, Global Advisory Services (2008-2015), Head of Global Retail Distribution (2005-2008), Executive Managing Director, International Retail Development (2002-2005), Managing Director, Product Developments, Sales & Marketing, Asia, Eastern Europe and Africa (2000-2002) and President, Templeton Asset Management India (1995-2000). Mr. Advani also served as Senior Investment Officer of International Finance Corporation (private equity and venture capital arm of The World Bank, 1984-1995). Mr. Advani is Chairman Emeritus of the U.S. India Business Council (2018-present), a Director of The Global Impact Investing Network (2019-present), a Director of LOK Capital (Mauritius) (2022-present), a member of the Advisory Council of LOK Capital (2022-present), a Senior Advisor of Neuberger Berman (2021-present), a Senior Advisor of Seviora Holdings Pte. Ltd (Temasek-Singapore) (2021-present), a Director of Seviora Capital (Singapore) (2021-present) and an Advisor of EQUIAM (2021-present). Mr. Advani formerly served as a member of the Board of BowX Acquisition Corp. (special purpose acquisition company, 2020-2021), a member of the Board of Intellecap (advisory arm of The Aavishkaar Group, 2018-2020), a member of the Board of Nuveen Investments, Inc. (2017-2020) and a member of the Board of Docusign (software, 2016-2019).
Thomas P. Bostick (1956)
Year of Election or Appointment: 2021
Trustee
Lieutenant General Bostick also serves as Trustee of other Fidelity® funds. Prior to his retirement, General Bostick (United States Army, Retired) held a variety of positions within the U.S. Army, including Chief of Engineers and Commanding General, U.S. Army Corps of Engineers (2012-2016) and Deputy Chief of Staff and Director of Human Resources, U.S. Army (2009-2012). General Bostick currently serves as a member of the Board and Finance and Governance & Sustainability Committees of CSX Corporation (transportation, 2020-present) and a member of the Board and Corporate Governance and Nominating Committee of Perma-Fix Environmental Services, Inc. (nuclear waste management, 2020-present). General Bostick serves as Chief Executive Officer of Bostick Global Strategies, LLC (consulting, 2016-present), as a member of the Board of HireVue, Inc. (video interview and assessment, 2020-present), as a member of the Board of Allonnia (biotechnology and engineering solutions, 2022-present), on the Advisory Board of Hilco Redevelopment Partners (a real estate investment and redevelopment company, 2021-present), and on the Advisory Board of Solugen, Inc. (specialty bio-based chemicals manufacturer, 2022-present). Previously, General Bostick served as a Member of the Advisory Board of certain Fidelity® funds (2021), President, Intrexon Bioengineering (2018-2020) and Chief Operating Officer (2017-2020) and Senior Vice President of the Environment Sector (2016-2017) of Intrexon Corporation (biopharmaceutical company).
Donald F. Donahue (1950)
Year of Election or Appointment: 2018
Trustee
Mr. Donahue also serves as Trustee of other Fidelity® funds. Mr. Donahue serves as President and Chief Executive Officer of Miranda Partners, LLC (risk consulting for the financial services industry, 2012-present). Previously, Mr. Donahue served as Chief Executive Officer (2006-2012), Chief Operating Officer (2003-2006) and Managing Director, Customer Marketing and Development (1999-2003) of The Depository Trust & Clearing Corporation (financial markets infrastructure). Mr. Donahue currently serves as a member (2007-present) and Co-Chairman (2016-present) of the Board of United Way of New York. Mr. Donahue previously served as a member of the Advisory Board of certain Fidelity® funds (2015-2018) and as a member of the Board of The Leadership Academy (previously NYC Leadership Academy) (2012-2022).
Vicki L. Fuller (1957)
Year of Election or Appointment: 2020
Trustee
Ms. Fuller also serves as Trustee of other Fidelity® funds. Previously, Ms. Fuller served as a member of the Advisory Board of certain Fidelity® funds (2018-2020), Chief Investment Officer of the New York State Common Retirement Fund (2012-2018) and held a variety of positions at AllianceBernstein L.P. (global asset management, 1985-2012), including Managing Director (2006-2012) and Senior Vice President and Senior Portfolio Manager (2001-2006). Ms. Fuller currently serves as a member of the Board, Audit Committee, Compensation Committee and Nominating and Governance Committee of two Blackstone business development companies (2020-present), as a member of the Board of Treliant, LLC (consulting, 2019-present), as a member of the Board of Ariel Alternatives, LLC (private equity, 2022-present) and as a member of the Board and Chair of the Audit Committee of Gusto, Inc. (software, 2021-present). In addition, Ms. Fuller currently serves as a member of the Executive Board of New York University's Stern School of Business. Ms. Fuller previously served as a member of the Board of Roosevelt University (2019-2024) and member of the Board, Audit Committee and Nominating and Governance Committee of The Williams Companies, Inc. (natural gas infrastructure, 2018-2021).
Patricia L. Kampling (1959)
Year of Election or Appointment: 2020
Trustee
Ms. Kampling also serves as Trustee of other Fidelity® funds. Prior to her retirement, Ms. Kampling served as Chairman of the Board and Chief Executive Officer (2012-2019), President and Chief Operating Officer (2011-2012) and Executive Vice President and Chief Financial Officer (2010-2011) of Alliant Energy Corporation. Ms. Kampling currently serves as a member of the Board, Audit Committee and Governance, Compensation and Nominating Committee of Xcel Energy Inc. (utilities company, 2020-present) and as a member of the Board, Audit, Finance and Risk Committee and Safety, Environmental, Technology and Operations Committee and Chair of the Executive Development and Compensation Committee of American Water Works Company, Inc. (utilities company, 2019-present). In addition, Ms. Kampling currently serves as a member of the Board of the Nature Conservancy, Wisconsin Chapter (2019-present). Previously, Ms. Kampling served as a Member of the Advisory Board of certain Fidelity® funds (2020), a member of the Board, Compensation Committee and Executive Committee and Chair of the Audit Committee of Briggs & Stratton Corporation (manufacturing, 2011-2021), a member of the Board of Interstate Power and Light Company (2012-2019) and Wisconsin Power and Light Company (2012-2019) (each a subsidiary of Alliant Energy Corporation) and as a member of the Board and Workforce Development Committee of the Business Roundtable (2018-2019).
Thomas A. Kennedy (1955)
Year of Election or Appointment: 2021
Trustee
Mr. Kennedy also serves as Trustee of other Fidelity® funds. Previously, Mr. Kennedy served as a Member of the Advisory Board of certain Fidelity® funds (2020) and held a variety of positions at Raytheon Company (aerospace and defense, 1983-2020), including Chairman and Chief Executive Officer (2014-2020) and Executive Vice President and Chief Operating Officer (2013-2014). Mr. Kennedy served as Executive Chairman of the Board of Directors of Raytheon Technologies Corporation (aerospace and defense, 2020-2021). Mr. Kennedy serves as a Director of the Board of Directors of Textron Inc. (aerospace and defense, 2023-present).
Oscar Munoz (1959)
Year of Election or Appointment: 2021
Trustee
Mr. Munoz also serves as Trustee of other Fidelity® funds. Prior to his retirement, Mr. Munoz served as Executive Chairman (2020-2021), Chief Executive Officer (2015-2020), President (2015-2016) and a member of the Board (2010-2021) of United Airlines Holdings, Inc. Mr. Munoz currently serves as a member of the Board of CBRE Group, Inc. (commercial real estate, 2020-present), a member of the Board of Univision Communications, Inc. (Hispanic media, 2020-present), a member of the Board of Archer Aviation Inc. (2021-present), a member of the Defense Business Board of the United States Department of Defense (2021-present) and a member of the Board of Salesforce.com, Inc. (cloud-based software, 2022-present). Previously, Mr. Munoz served as a Member of the Advisory Board of certain Fidelity® funds (2021).
David M. Thomas (1949)
Year of Election or Appointment: 2008
Trustee
Lead Independent Trustee
Mr. Thomas also serves as Trustee of other Fidelity® funds. Previously, Mr. Thomas served as Executive Chairman (2005-2006) and Chairman and Chief Executive Officer (2000-2005) of IMS Health, Inc. (pharmaceutical and healthcare information solutions) and as a member of the Board of Fortune Brands Home and Security (home and security products, 2004-2023). Mr. Thomas currently serves as Director (2013-present) and Non-Executive Chairman of the Board (2022-present) of Interpublic Group of Companies, Inc. (marketing communication).
Susan Tomasky (1953)
Year of Election or Appointment: 2020
Trustee
Ms. Tomasky also serves as Trustee of other Fidelity® funds. Prior to her retirement, Ms. Tomasky served in various executive officer positions at American Electric Power Company, Inc. (1998-2011), including most recently as President of AEP Transmission (2007-2011). Ms. Tomasky currently serves as a member of the Board and Sustainability Committee and as Chair of the Audit Committee of Marathon Petroleum Corporation (2018-present) and as a member of the Board, Executive Committee, Corporate Governance Committee and Organization and Compensation Committee and as Lead Director of the Board of Public Service Enterprise Group, Inc. (utilities company, 2012-present) and as a member of the Board of its subsidiary company, Public Service Electric and Gas Co. (2021-present). In addition, Ms. Tomasky currently serves as a member (2009-present) and President (2020-present) of the Board of the Royal Shakespeare Company - America (2009-present) and as a member and Vice Chair of the Board of Kenyon College (2016-present). Previously, Ms. Tomasky served as a Member of the Advisory Board of certain Fidelity® funds (2020), as a member of the Board of the Columbus Association for the Performing Arts (2011-2023), as a member of the Board of the Columbus Regional Airport Authority (2007-2020), as a member of the Board (2011-2018) and Lead Independent Director (2015-2018) of Andeavor Corporation (previously Tesoro Corporation) (independent oil refiner and marketer) and as a member of the Board of Summit Midstream Partners LP (energy, 2012-2018).
Michael E. Wiley (1950)
Year of Election or Appointment: 2018
Trustee
Mr. Wiley also serves as Trustee of other Fidelity® funds. Previously, Mr. Wiley served as a member of the Advisory Board of certain Fidelity® funds (2018-2020), Chairman, President and CEO of Baker Hughes, Inc. (oilfield services, 2000-2004). Mr. Wiley also previously served as a member of the Board of Andeavor Corporation (independent oil refiner and marketer, 2005-2018), a member of the Board of Andeavor Logistics LP (natural resources logistics, 2015-2018) and a member of the Board of High Point Resources (exploration and production, 2005-2020).
+ The information includes the Trustee's principal occupation during the last five years and other information relating to the experience, attributes, and skills relevant to the Trustee's qualifications to serve as a Trustee, which led to the conclusion that the Trustee should serve as a Trustee for the fund.
Advisory Board Members and Officers:
Correspondence intended for a Member of the Advisory Board (if any) may be sent to Fidelity Investments, P.O. Box 55235, Boston, Massachusetts 02205-5235. Correspondence intended for an officer or Peter S. Lynch may be sent to Fidelity Investments, 245 Summer Street, Boston, Massachusetts 02210.
Name, Year of Birth; Principal Occupations+
Peter S. Lynch (1944)
Year of Election or Appointment: 2003
Member of the Advisory Board
Mr. Lynch also serves as a Member of the Advisory Board of other Fidelity® funds. Mr. Lynch is Vice Chairman and a Director of Fidelity Management & Research Company LLC (investment adviser firm). In addition, Mr. Lynch serves as a Trustee of Boston College and as the Chairman of the Inner-City Scholarship Fund. Previously, Mr. Lynch served as Vice Chairman and a Director of FMR Co., Inc. (investment adviser firm) and on the Special Olympics International Board of Directors (1997-2006).
Karen B. Peetz (1955)
Year of Election or Appointment: 2023
Member of the Advisory Board
Ms. Peetz also serves as a Member of the Advisory Board of other funds. Previously, Ms. Peetz served as Chief Administration Officer (2020-2023) of Citigroup Inc. (a diversified financial service company). She also served in various capacities at Bank of New York Mellon Corporation, including President (2013-2016), Vice Chairman, Senior Executive Vice President and Chief Executive Officer of Financial Markets & Treasury Services (2010-2013), Senior Executive Vice President and Chief Executive Officer of Global Corporate Trust (2003-2008), Senior Vice President and Division Manager of Global Payments & Trade Services (2002-2003) and Senior Vice President and Division Manager of Domestic Corporate Trust (1998-2002). Ms. Peetz also served in various capacities at Chase Manhattan Corporation (1982-1998), including Senior Vice President and Manager of Corporate Trust International Business (1996-1998), Managing Director and Manager of Corporate Trust Services (1994-1996) and Managing Director and Group Manager of Financial Institution Sales (1990-1993). Ms. Peetz currently serves as Chair of Amherst Holdings Advisory Council (2018-present), Trustee of Johns Hopkins University (2016-present), Chair of the Carey Business School Advisory Council, Member of the Johns Hopkins Medicine Board and Finance Committee and Chair of the Lyme and Tick Related Disease Institute Advisory Council. Ms. Peetz previously served as a member of the Board of Guardian Life Insurance Company of America (2019-2023), a member of the Board of Trane Technologies (2018-2022), a member of the Board of Wells Fargo Corp. (2017-2019), a member of the Board of SunCoke Energy Inc. (2012-2016), a member of the Board of Private Export Funding Corporation (2010-2016) and as a Trustee of Penn State University (2010-2014) and the United Way of New York City (2008-2010).
Heather Bonner (1977)
Year of Election or Appointment: 2023
Assistant Treasurer
Ms. Bonner also serves as an officer of other funds. Ms. Bonner is a Senior Vice President (2022-present) and is an employee of Fidelity Investments (2022-present). Ms. Bonner serves as Senior Vice President, Vice President, Treasurer, or Director of certain Fidelity entities. Prior to joining Fidelity, Ms. Bonner served as Managing Director at AQR Capital Management (2013-2022) and was the Treasurer and Principal Financial Officer of the AQR Funds (2013-2022).
Craig S. Brown (1977)
Year of Election or Appointment: 2022
Deputy Treasurer
Mr. Brown also serves as an officer of other funds. Mr. Brown is a Vice President (2015-present) and is an employee of Fidelity Investments. Mr. Brown serves as Assistant Treasurer of FIMM, LLC (2021-present). Previously, Mr. Brown served as Assistant Treasurer of certain Fidelity® funds (2019-2022).
John J. Burke III (1964)
Year of Election or Appointment: 2018
Chief Financial Officer
Mr. Burke also serves as Chief Financial Officer of other funds. Mr. Burke is Head of Fidelity Fund and Investment Operations (2018-present) and is an employee of Fidelity Investments. Mr. Burke serves as President, Executive Vice President, or Director of certain Fidelity entities. Previously Mr. Burke served as head of Asset Management Investment Operations (2012-2018).
Margaret Carey (1973)
Year of Election or Appointment: 2023
Secretary and Chief Legal Officer (CLO)
Ms. Carey also serves as an officer of other funds and as CLO of certain Fidelity entities. Ms. Carey is a Senior Vice President, Deputy General Counsel (2019-present) and is an employee of Fidelity Investments.
William C. Coffey (1969)
Year of Election or Appointment: 2019
Assistant Secretary
Mr. Coffey also serves as Assistant Secretary of other funds. Mr. Coffey is a Senior Vice President, Deputy General Counsel (2010-present) and is an employee of Fidelity Investments. Previously, Mr. Coffey served as Secretary and CLO of certain funds (2018-2019); CLO, Secretary, or Senior Vice President of certain Fidelity entities and Assistant Secretary of certain funds (2009-2018).
Timothy M. Cohen (1969)
Year of Election or Appointment: 2018
Vice President
Mr. Cohen also serves as Vice President of other funds. Mr. Cohen is Co-Head of Equity (2018-present) and is an employee of Fidelity Investments. Mr. Cohen serves as President or Director of certain Fidelity entities. Previously, Mr. Cohen served as Executive Vice President of Fidelity SelectCo, LLC (2019) and Head of Global Equity Research (2016-2018).
Jonathan Davis (1968)
Year of Election or Appointment: 2010
Assistant Treasurer
Mr. Davis also serves as an officer of other funds. Mr. Davis is a Vice President (2006-present) and is an employee of Fidelity Investments. Mr. Davis serves as Assistant Treasurer or Director of certain Fidelity entities.
Laura M. Del Prato (1964)
Year of Election or Appointment: 2018
Assistant Treasurer
Ms. Del Prato also serves as an officer of other funds. Ms. Del Prato is a Senior Vice President (2017-present) and is an employee of Fidelity Investments. Ms. Del Prato serves as Senior Vice President, Vice President, Assistant Treasurer, or Director of certain Fidelity entities. Previously, Ms. Del Prato served as President and Treasurer of The North Carolina Capital Management Trust: Cash Portfolio and Term Portfolio (2018-2020).
Colm A. Hogan (1973)
Year of Election or Appointment: 2020
Assistant Treasurer
Mr. Hogan also serves as an officer of other funds. Mr. Hogan is a Vice President (2016-present) and is an employee of Fidelity Investments. Mr. Hogan serves as Assistant Treasurer of certain Fidelity entities. Previously, Mr. Hogan served as Deputy Treasurer of certain Fidelity® funds (2016-2020) and Assistant Treasurer of certain Fidelity® funds (2016-2018).
Pamela R. Holding (1964)
Year of Election or Appointment: 2018
Vice President
Ms. Holding also serves as Vice President of other funds. Ms. Holding is Co-Head of Equity (2018-present) and is an employee of Fidelity Investments. Previously, Ms. Holding served as Executive Vice President of Fidelity SelectCo, LLC (2019) and as Chief Investment Officer of Fidelity Institutional Asset Management (2013-2018).
Chris Maher (1972)
Year of Election or Appointment: 2020
Deputy Treasurer
Mr. Maher also serves as an officer of other funds. Mr. Maher is a Vice President (2008-present) and is an employee of Fidelity Investments. Mr. Maher serves as Assistant Treasurer of certain Fidelity entities. Previously, Mr. Maher served as Assistant Treasurer of certain funds (2013-2020).
Jason P. Pogorelec (1975)
Year of Election or Appointment: 2020
Chief Compliance Officer
Mr. Pogorelec also serves as Chief Compliance Officer of other funds. Mr. Pogorelec is a Senior Vice President of Asset Management Compliance (2020-present) and is an employee of Fidelity Investments. Mr. Pogorelec serves as Compliance Officer of Fidelity Management & Research Company LLC (investment adviser firm, 2023-present) and Ballyrock Investment Advisors LLC (2023-present). Previously, Mr. Pogorelec served as a Vice President, Associate General Counsel for Fidelity Investments (2010-2020) and Assistant Secretary of certain Fidelity® funds (2015-2020).
Brett Segaloff (1972)
Year of Election or Appointment: 2021
Anti-Money Laundering (AML) Officer
Mr. Segaloff also serves as AML Officer of other funds. Mr. Segaloff is a Vice President (2022-present) and is an employee of Fidelity Investments. Mr. Segaloff serves as Anti Money Laundering Compliance Officer or Anti Money Laundering/Bank Secrecy Act Compliance Officer of certain Fidelity entities.
Stacie M. Smith (1974)
Year of Election or Appointment: 2016
President and Treasurer
Ms. Smith also serves as an officer of other funds. Ms. Smith is a Senior Vice President (2016-present) and is an employee of Fidelity Investments. Ms. Smith serves as Assistant Treasurer of certain Fidelity entities and has served in other fund officer roles.
Jim Wegmann (1979)
Year of Election or Appointment: 2019
Assistant Treasurer
Mr. Wegmann also serves as an officer of other funds. Mr. Wegmann is a Vice President (2016-present) and is an employee of Fidelity Investments. Mr. Wegmann serves as Assistant Treasurer of FIMM, LLC (2021-present). Previously, Mr. Wegmann served as Assistant Treasurer of certain Fidelity® funds (2019-2021).
+ The information includes principal occupation during the last five years.
As a shareholder, you incur two types of costs: (1) transaction costs, which may include sales charges (loads) on purchase payments or redemption proceeds, as applicable and (2) ongoing costs, which generally include management fees, distribution and/or service (12b-1) fees and other Fund expenses. This Example is intended to help you understand your ongoing costs (in dollars) of investing in a fund and to compare these costs with the ongoing costs of investing in other mutual funds.
| The Example is based on an investment of $1,000 invested at the beginning of the period and held for the entire period (November 1, 2023 to April 30, 2024). |
Actual Expenses
The first line of the accompanying table provides information about actual account values and actual expenses. You may use the information in this line, together with the amount you invested, to estimate the expenses that you paid over the period. Simply divide your account value by $1,000.00 (for example, an $8,600 account value divided by $1,000.00 = 8.6), then multiply the result by the number in the first line for a class/Fund under the heading entitled "Expenses Paid During Period" to estimate the expenses you paid on your account during this period. If any fund is a shareholder of any underlying mutual funds or exchange-traded funds (ETFs) (the Underlying Funds), such fund indirectly bears its proportional share of the expenses of the Underlying Funds in addition to the direct expenses incurred presented in the table. These fees and expenses are not included in the annualized expense ratio used to calculate the expense estimate in the table below.
Hypothetical Example for Comparison Purposes
The second line of the accompanying table provides information about hypothetical account values and hypothetical expenses based on the actual expense ratio and an assumed rate of return of 5% per year before expenses, which is not the actual return. The hypothetical account values and expenses may not be used to estimate the actual ending account balance or expenses you paid for the period. You may use this information to compare the ongoing costs of investing in the Fund and other funds. To do so, compare this 5% hypothetical example with the 5% hypothetical examples that appear in the shareholder reports of the other funds. If any fund is a shareholder of any Underlying Funds, such fund indirectly bears its proportional share of the expenses of the Underlying Funds in addition to the direct expenses as presented in the table. These fees and expenses are not included in the annualized expense ratio used to calculate the expense estimate in the table below.
Please note that the expenses shown in the table are meant to highlight your ongoing costs only and do not reflect any transaction costs. Therefore, the second line of the table is useful in comparing ongoing costs only, and will not help you determine the relative total costs of owning different funds. In addition, if these transactional costs were included, your costs would have been higher.
| | | | | Annualized Expense Ratio- A | | Beginning Account Value November 1, 2023 | | Ending Account Value April 30, 2024 | | Expenses Paid During Period- C November 1, 2023 to April 30, 2024 |
| Fidelity® Short Duration High Income Fund | | | | | | | | | | |
| Class A | | | | 1.02% | | | | | | |
| Actual | | | | | | $ 1,000 | | $ 1,072.30 | | $ 5.26 |
Hypothetical-B | | | | | | $ 1,000 | | $ 1,019.79 | | $ 5.12 |
| Class M | | | | 1.02% | | | | | | |
| Actual | | | | | | $ 1,000 | | $ 1,071.10 | | $ 5.25 |
Hypothetical-B | | | | | | $ 1,000 | | $ 1,019.79 | | $ 5.12 |
| Class C | | | | 1.77% | | | | | | |
| Actual | | | | | | $ 1,000 | | $ 1,068.40 | | $ 9.10 |
Hypothetical-B | | | | | | $ 1,000 | | $ 1,016.06 | | $ 8.87 |
| Fidelity® Short Duration High Income Fund | | | | .74% | | | | | | |
| Actual | | | | | | $ 1,000 | | $ 1,073.90 | | $ 3.82 |
Hypothetical-B | | | | | | $ 1,000 | | $ 1,021.18 | | $ 3.72 |
Class I ** | | | | .77% | | | | | | |
| Actual | | | | | | $ 1,000 | | $ 1,073.70 | | $ 3.97 |
Hypothetical-B | | | | | | $ 1,000 | | $ 1,021.03 | | $ 3.87 |
| Class Z | | | | .68% | | | | | | |
| Actual | | | | | | $ 1,000 | | $ 1,074.10 | | $ 3.51 |
Hypothetical-B | | | | | | $ 1,000 | | $ 1,021.48 | | $ 3.42 |
| |
A Annualized expense ratio reflects expenses net of applicable fee waivers.
B 5% return per year before expenses
C Expenses are equal to the annualized expense ratio, multiplied by the average account value over the period, multiplied by 182/ 366 (to reflect the one-half year period). The fees and expenses of any Underlying Funds are not included in each annualized expense ratio.
** If fees and changes to the expense contract and/or expense cap, effective March 1, 2024, had been in effect during the entire current period, the restated annualized expense ratio and the expenses paid in the actual and hypothetical examples above would have been as shown in table below:
| | | | | Annualized Expense Ratio- A | | Expenses Paid |
| Fidelity® Short Duration High Income Fund | | | | | | |
| Class I | | | | .73% | | |
| Actual | | | | | | $ 3.76 |
Hypothetical- B | | | | | | $ 3.67 |
| | | | | | | |
| A Annualized expense ratio reflects expenses net of applicable fee waivers. | | | | | | |
| B 5% return per year before expenses | | | | | | |
The dividend and capital gains distributions for the fund(s) are available on Fidelity.com or Institutional.Fidelity.com.
A total of 0.36% of the dividends distributed during the fiscal year was derived from interest on U.S. Government securities which is generally exempt from state income tax.
The fund designates $22,060,954 of distributions paid in the calendar year 2023 as qualifying to be taxed as interest-related dividends for nonresident alien shareholders.
The fund designates $22,490,058 of distributions paid during the fiscal year ended 2024 as qualifying to be taxed as section 163(j) interest dividends.
The fund will notify shareholders in January 2025 of amounts for use in preparing 2024 income tax returns.
Board Approval of Investment Advisory Contracts
Fidelity Short Duration High Income Fund
At its January 2024 meeting, the Board of Trustees, including the Independent Trustees (together, the Board), approved an amended and restated management contract with Fidelity Management & Research Company LLC (FMR) (the Management Contract), and amended and restated sub-advisory agreements (the Sub-Advisory Contracts, and together with the Management Contract, the Advisory Contracts) for the fund, including the fund's sub-advisory agreements with Fidelity Management & Research (Hong Kong) Limited (FMR H.K.) and Fidelity Management & Research (Japan) Limited (FMR Japan). The Advisory Contracts will be effective March 1, 2024. The Board will consider the annual renewal of the fund's Advisory Contracts in May 2024, following its review of additional materials provided by FMR.
Management Contract. The Board approved the Management Contract, which implements a new fee structure combining the management fee, transfer agent fee (TA Fee), and pricing and bookkeeping fee (P&B Fee) of the fund and each class into a single class-level fee based on tiered schedules and subject to a maximum class-level rate (the Unified Fee). In exchange for the Unified Fee, the fund will receive investment advisory, management, administrative, transfer agent, pricing and bookkeeping services under a single agreement - the Management Contract.
In its consideration of the Management Contract over several meetings, the Board received, reviewed and discussed a comprehensive set of analyses regarding the Unified Fee including (i) the legal framework, (ii) design goals for the Unified Fee, (iii) calculation methodology for the Unified Fee and illustrative examples, (iv) annual and cumulative projected impacts under various scenarios, both in the aggregate and at the fund/class level, (v) explanations of schedules, rate levers and maximum rates and (vi) shareholder benefits and projected savings.
The Board considered that the maximum Unified Fee for each class of the fund would be no higher than the sum of (i) the lowest contractual management fee rate under the fund's existing management contract, which is the individual fund fee rate, if any, plus the lowest contractual marginal group fee rate and (ii) the TA and P&B Fee rates, which are fixed fee rates since December 1, 2023 (together, the Unified Fee Cap). The Board noted that Fidelity has represented that, as a result of this Unified Fee Cap, the Unified Fee would be no greater than the fee rates previously authorized to be charged to the fund for the same services. The Board noted that certain expenses such as third-party expenses, Rule 12b-1 fees, and certain other miscellaneous expenses would be outside the scope of the Unified Fee and the calculation of such fees would not change as a result of the Unified Fee. The Board considered that, under the Management Contract, a different management fee rate will be applicable to each class of the fund. The Board noted that Fidelity has represented that the difference in expenses between classes is based on differences in class-specific expenses and not due to any difference in advisory or third-party custodial fees or other expenses related to the management of the fund's assets.
The Board considered Fidelity's representations that implementation of the Unified Fee, which includes the Unified Fee Cap, would cause all funds subject to the Unified Fee, including the fund, to experience an immediate reduction on contractual fee rates for services provided under the current management contracts. The Board considered that some funds would not experience lower net total fees as a result of existing fee caps. The Board further considered that, in addition to the contractual fee savings, the Unified Fee offers funds and their shareholders greater protection from future rate increases for services previously offered under separate agreements that are now covered by the Management Contract because such rate increases would require shareholder approval.
Sub-Advisory Contracts. In connection with the Unified Fee changes, the Board considered the Sub-Advisory Contracts, which simplified the calculation of the fees paid by FMR to the sub-advisers under the agreements. The Board noted that the agreements with FMR H.K. and FMR Japan were amended to provide that FMR will compensate each sub-adviser at a fee rate equal to 110% of the sub-adviser's costs incurred in providing services under the agreement. The Board considered that, under the Sub-Advisory Contracts, FMR, and not the fund, will continue to pay the sub-advisory fees to each applicable sub-adviser.
The Board further considered that the approval of the fund's Advisory Contracts will not result in any changes in the investment process or strategies employed in the management of the fund's assets or the day-to-day management of the fund or the persons primarily responsible for such management. Further, the Board considered that the Management Contract would not change the obligations and services of FMR and its affiliates on behalf of the fund, and, in particular, there would be no change in the nature and level of advisory, management, administration, transfer agent, and pricing and bookkeeping services provided to the fund by FMR, its affiliates, and each applicable sub-adviser.
In connection with its consideration of future renewals of the fund's Advisory Contracts, the Board will consider: (i) the nature, extent and quality of services provided to the funds, including shareholder and administrative services and investment performance; (ii) the competitiveness of the management fee and total expenses for the fund; (iii) the costs of the services and profitability, including the revenues earned and the expenses incurred in conducting the business of developing, marketing, distributing, managing, administering, and servicing the fund and its shareholders, to the extent applicable; and (iv) whether there have been economies of scale in respect of the Fidelity funds, whether the Fidelity funds (including the fund) have appropriately benefited from any such economies of scale, and whether there is the potential for realization of any further economies.
Based on its evaluation of all of the conclusions and representations noted above, and after considering all factors it believed relevant, the Board concluded that the fund's management fee structure is fair and reasonable, and that the fund's Advisory Contracts should be approved.
The Securities and Exchange Commission adopted Rule 22e-4 under the Investment Company Act of 1940 (the Liquidity Rule) to promote effective liquidity risk management throughout the open-end investment company industry, thereby reducing the risk that funds will be unable to meet their redemption obligations and mitigating dilution of the interests of fund shareholders.
The Fund has adopted and implemented a liquidity risk management program (the Program) reasonably designed to assess and manage the Fund's liquidity risk and to comply with the requirements of the Liquidity Rule. The Fund's Board of Trustees (the Board) has designated the Fund's investment adviser as administrator of the Program. The Fidelity advisers have established a Liquidity Risk Management Committee (the LRM Committee) to manage the Program for each of the Fidelity Funds. The LRM Committee monitors the adequacy and effectiveness of implementation of the Program and on a periodic basis assesses each Fund's liquidity risk based on a variety of factors including (1) the Fund's investment strategy, (2) portfolio liquidity and cash flow projections during normal and reasonably foreseeable stressed conditions, (3) shareholder redemptions, (4) borrowings and other funding sources and (5) certain factors specific to ETFs including the effect of the Fund's prices and spreads, market participants, and basket compositions on the overall liquidity of the Fund's portfolio, as applicable.
In accordance with the Program, each of the Fund's portfolio investments is classified into one of four defined liquidity categories based on a determination of a reasonable expectation for how long it would take to convert the investment to cash (or sell or dispose of the investment) without significantly changing its market value.
- Highly liquid investments - cash or convertible to cash within three business days or less
- Moderately liquid investments - convertible to cash in three to seven calendar days
- Less liquid investments - can be sold or disposed of, but not settled, within seven calendar days
- Illiquid investments - cannot be sold or disposed of within seven calendar days
Liquidity classification determinations take into account a variety of factors including various market, trading and investment-specific considerations, as well as market depth, and generally utilize analysis from a third-party liquidity metrics service.
The Liquidity Rule places a 15% limit on a fund's illiquid investments and requires funds that do not primarily hold assets that are highly liquid investments to determine and maintain a minimum percentage of the fund's net assets to be invested in highly liquid investments (highly liquid investment minimum or HLIM). The Program includes provisions reasonably designed to comply with the 15% limit on illiquid investments and for determining, periodically reviewing and complying with the HLIM requirement as applicable.
At a recent meeting of the Fund's Board of Trustees, the LRM Committee provided a written report to the Board pertaining to the operation, adequacy, and effectiveness of the Program for the period December 1, 2022 through November 30, 2023. The report concluded that the Program is operating effectively and is reasonably designed to assess and manage the Fund's liquidity risk.
1.969434.110
SDH-ANN-0624
Fidelity® Global High Income Fund
Annual Report
April 30, 2024
Includes Fidelity and Fidelity Advisor share classes
Contents
To view a fund's proxy voting guidelines and proxy voting record for the 12-month period ended June 30, visit http://www.fidelity.com/proxyvotingresults or visit the Securities and Exchange Commission's (SEC) web site at http://www.sec.gov.
You may also call 1-800-544-8544 if you're an individual investing directly with Fidelity, call 1-800-835-5092 if you're a plan sponsor or participant with Fidelity as your recordkeeper or call 1-877-208-0098 on institutional accounts or if you're an advisor or invest through one to request a free copy of the proxy voting guidelines.
Standard & Poor's, S&P and S&P 500 are registered service marks of The McGraw-Hill Companies, Inc. and have been licensed for use by Fidelity Distributors Corporation.
Other third-party marks appearing herein are the property of their respective owners.
All other marks appearing herein are registered or unregistered trademarks or service marks of FMR LLC or an affiliated company. © 2024 FMR LLC. All rights reserved.
This report and the financial statements contained herein are submitted for the general information of the shareholders of the Fund. This report is not authorized for distribution to prospective investors in the Fund unless preceded or accompanied by an effective prospectus.
A fund files its complete schedule of portfolio holdings with the SEC for the first and third quarters of each fiscal year on Form N-PORT. Forms N-PORT are available on the SEC's web site at http://www.sec.gov. A fund's Forms N-PORT may be reviewed and copied at the SEC's Public Reference Room in Washington, DC. Information regarding the operation of the SEC's Public Reference Room may be obtained by calling 1-800-SEC-0330.
For a complete list of a fund's portfolio holdings, view the most recent holdings listing, semiannual report, or annual report on Fidelity's web site at http://www.fidelity.com, http://www.institutional.fidelity.com, or http://www.401k.com, as applicable.
NOT FDIC INSURED •MAY LOSE VALUE •NO BANK GUARANTEE
Neither the Fund nor Fidelity Distributors Corporation is a bank.
Average annual total return reflects the change in the value of an investment, assuming reinvestment of distributions from dividend income and capital gains (the profits earned upon the sale of securities that have grown in value, if any) and assuming a constant rate of performance each year. The hypothetical investment and the average annual total returns do not reflect the deduction of taxes that a shareholder would pay on fund distributions or the redemption of fund shares. During periods of reimbursement by Fidelity, a fund's total return will be greater than it would be had the reimbursement not occurred. How a fund did yesterday is no guarantee of how it will do tomorrow.
| Average Annual Total Returns |
| | | | |
Periods ended April 30, 2024 | Past 1 year | Past 5 years | Past 10 years |
Class A (incl. 4.00% sales charge) | 3.01% | 1.51% | 2.73% |
Class M (incl. 4.00% sales charge) | 3.01% | 1.51% | 2.73% |
Class C (incl. contingent deferred sales charge) | 5.50% | 1.58% | 2.54% |
| Fidelity® Global High Income Fund | 7.56% | 2.60% | 3.41% |
| Class I | 7.57% | 2.59% | 3.41% |
Class C shares' contingent deferred sales charges included in the past one year, past five years and past ten years total return figures are 1%, 0% and 0%, respectively.
| $10,000 Over 10 Years |
| |
Let's say hypothetically that $10,000 was invested in Fidelity® Global High Income Fund, a class of the fund, on April 30, 2014. The chart shows how the value of your investment would have changed, and also shows how the ICE® BofA® Global High Yield and Emerging Markets Plus Index performed over the same period. |
|
|
Market Recap:
Global high-yield bonds gained 8.09% for the 12 months ending April 30, 2024, as measured by the Fidelity Global High Income Composite IndexSM. The index consists of high-yield bonds representing the U.S. (60%), emerging markets (20%), Europe (15%) and Asia (5%). The index returned -0.84% in the first half of the period amid a stalling pattern in global disinflationary trends and interest rate hikes by the U.S. Federal Reserve. However, it rebounded in the final six months, advancing 9.01%, as the pace of inflation slowed and some central banks began to shift to a more dovish monetary policy, which fueled investors' appetite for riskier assets. Against this dynamic backdrop, the U.S. led the index's reginal components, gaining 8.89%, according to the ICE BofA® US High Yield Constrained Index, as credit spreads tightened. Emerging markets advanced 7.26%, as measured by the J.P. Morgan Corporate Emerging Markets Bond Index Broad Diversified, led by higher-yielding debt markets. Meanwhile, European and Asian high-yield debt rose 6.86% and 5.21%, respectively, according to the ICE BofA® Euro High Yield Constrained Index and the ICE BofA® Asian Dollar High Yield Corporate Constrained Index. In Europe, higher-quality high-yield bond markets lagged, while China (-13%) was a drag on Asian high yield, given the county's worsening property-market rout and subdued economic growth.
Comments from Co-Portfolio Manager Alexandre Karam:
For the fiscal year, the fund's share classes (excluding sales charges, if applicable) gained roughly 7% and 8%, versus 8.09% the Composite index. The fund's allocation of assets modestly detracted versus the Composite index the past 12 months, with an overweight in the underperforming Asian high-yield subportfolio a notable negative. Conversely, security selection contributed to the fund's relative result, particularly in the emerging-markets debt and U.S. high-yield subportfolios. In the emerging-markets debt sleeve, an overweight in Ghana and security selection in Brazil and Chile helped most, while choices in the technology & electronics category boosted the U.S. high-yield sleeve. Security selection in the European high yield subportfolio also contributed to relative performance, albeit to a lesser degree. Conversely, choices in the Asian high-yield debt sleeve weighed on the fund's performance versus the Composite index, due to security selection in China and an underweight in India.
Note to shareholders:
In March 2024, the Board of Trustees approved an Agreement and Plan of Reorganization between Fidelity® Global High Income Fund and Fidelity® High Income Fund. As a result of the proposed Reorganization, shareholders of each class of Fidelity® Global High Income Fund will receive shares of the corresponding class of Fidelity® High Income Fund. A combined information statement and prospectus containing more information with respect to the Reorganization was provided to Fidelity® Global High Income Fund shareholders of record in late May. The tax-free Reorganization, which does not require shareholder approval, is expected to take place on or about September 13, 2024. Effective after the close of business on May 20, 2024, Fidelity® Global High Income Fund was closed to all new investments (other than reinvestment of dividend and capital gain distributions).
The views expressed above reflect those of the portfolio manager(s) only through the end of the period as stated on the cover of this report and do not necessarily represent the views of Fidelity or any other person in the Fidelity organization. Any such views are subject to change at any time based upon market or other conditions and Fidelity disclaims any responsibility to update such views. These views may not be relied on as investment advice and, because investment decisions for a Fidelity fund are based on numerous factors, may not be relied on as an indication of trading intent on behalf of any Fidelity fund.
| Top Bond Issuers (% of Fund's net assets) |
(with maturities greater than one year) |
| German Federal Republic | 1.6 | |
| TransDigm, Inc. | 1.5 | |
| Icahn Enterprises LP/Icahn Enterprises Finance Corp. | 1.2 | |
| Ford Motor Credit Co. LLC | 1.2 | |
| U.S. Treasury Obligations | 1.0 | |
| Tenet Healthcare Corp. | 1.0 | |
| Uber Technologies, Inc. | 0.9 | |
| CCO Holdings LLC/CCO Holdings Capital Corp. | 0.8 | |
| Altice France SA | 0.7 | |
| Tullow Oil PLC | 0.7 | |
| | 10.6 | |
| |
| Market Sectors (% of Fund's net assets) |
| |
| Energy | 14.3 | |
| Telecommunications | 6.8 | |
| Diversified Financial Services | 6.5 | |
| Technology | 5.3 | |
| Banks & Thrifts | 5.2 | |
| |
Quality Diversification (% of Fund's net assets) |
|
| |
| We have used ratings from Moody's Investors Service, Inc. Where Moody's® ratings are not available, we have used S&P® ratings. All ratings are as of the date indicated and do not reflect subsequent changes. |
Asset Allocation (% of Fund's net assets) |
|
|
Geographic Diversification (% of Fund's net assets) |
|
* Includes Short-Term investments and Net Other Assets (Liabilities). Percentages are adjusted for the effect of derivatives, if applicable. |
| |
Showing Percentage of Net Assets
| Corporate Bonds - 81.8% |
| | | Principal Amount (a) | Value ($) |
| Convertible Bonds - 1.2% | | | |
| Air Transportation - 0.1% | | | |
| International Consolidated Airlines Group SA 1.125% 5/18/28 (Reg. S) | EUR | 100,000 | 99,539 |
| Broadcasting - 0.6% | | | |
| DISH Network Corp.: | | | |
| 0% 12/15/25 | | 86,000 | 62,565 |
| 3.375% 8/15/26 | | 646,000 | 394,059 |
| | | | 456,624 |
| Diversified Financial Services - 0.5% | | | |
| New Cotai LLC 5% 2/24/27 (b) | | 158,437 | 353,030 |
| Homebuilders/Real Estate - 0.0% | | | |
| China Aoyuan Group Ltd. 0% 9/30/28 (Reg. S) | | 4,352 | 65 |
TOTAL CONVERTIBLE BONDS | | | 909,258 |
| Nonconvertible Bonds - 80.6% | | | |
| Aerospace - 2.2% | | | |
| ATI, Inc.: | | | |
| 4.875% 10/1/29 | | 35,000 | 32,590 |
| 5.125% 10/1/31 | | 25,000 | 22,778 |
| 5.875% 12/1/27 | | 70,000 | 68,577 |
| Bombardier, Inc.: | | | |
| 6% 2/15/28 (c) | | 45,000 | 43,884 |
| 7.25% 7/1/31 (c) | | 65,000 | 65,160 |
| 7.875% 4/15/27 (c) | | 120,000 | 119,252 |
| 8.75% 11/15/30 (c) | | 50,000 | 53,194 |
| Embraer Netherlands Finance BV: | | | |
| 6.95% 1/17/28 (c) | | 20,000 | 20,413 |
| 7% 7/28/30 (c) | | 50,000 | 51,219 |
| Moog, Inc. 4.25% 12/15/27 (c) | | 20,000 | 18,667 |
| Rolls-Royce PLC 5.75% 10/15/27 (c) | | 55,000 | 54,397 |
| TransDigm, Inc.: | | | |
| 4.875% 5/1/29 | | 200,000 | 183,956 |
| 5.5% 11/15/27 | | 335,000 | 325,369 |
| 6.375% 3/1/29 (c) | | 195,000 | 193,511 |
| 6.625% 3/1/32 (c) | | 75,000 | 74,873 |
| 6.75% 8/15/28 (c) | | 110,000 | 110,688 |
| 6.875% 12/15/30 (c) | | 150,000 | 151,020 |
| Wesco Aircraft Holdings, Inc. 8.5% (c)(d) | | 45,000 | 5,400 |
| | | | 1,594,948 |
| Air Transportation - 0.8% | | | |
| Air Canada 3.875% 8/15/26 (c) | | 65,000 | 61,661 |
| Allegiant Travel Co. 7.25% 8/15/27 (c) | | 40,000 | 38,661 |
| Indira Gandhi International Airport 6.125% 10/31/26 (Reg. S) | | 200,000 | 197,500 |
| Mileage Plus Holdings LLC 6.5% 6/20/27 (c) | | 35,750 | 35,810 |
| Rand Parent LLC 8.5% 2/15/30 (c) | | 165,000 | 163,171 |
| United Airlines, Inc.: | | | |
| 4.375% 4/15/26 (c) | | 80,000 | 76,951 |
| 4.625% 4/15/29 (c) | | 50,000 | 46,081 |
| | | | 619,835 |
| Automotive & Auto Parts - 3.1% | | | |
| Adient Global Holdings Ltd.: | | | |
| 7% 4/15/28 (c) | | 95,000 | 95,974 |
| 8.25% 4/15/31 (c) | | 95,000 | 98,654 |
| Albion Financing 1 SARL 5.25% 10/15/26 (Reg. S) | EUR | 100,000 | 106,636 |
| Aston Martin Capital Holdings Ltd. 10% 3/31/29 (c) | | 200,000 | 194,750 |
| Ford Motor Credit Co. LLC: | | | |
| 2.9% 2/16/28 | | 50,000 | 44,480 |
| 3.625% 6/17/31 | | 600,000 | 506,708 |
| 5.125% 6/16/25 | | 170,000 | 168,204 |
| 6.125% 5/15/28 | EUR | 100,000 | 114,179 |
| IHO Verwaltungs GmbH 3.75% 9/15/26 pay-in-kind(Reg. S) (e) | EUR | 100,000 | 104,692 |
| Jaguar Land Rover Automotive PLC 4.5% 1/15/26 (Reg. S) | EUR | 100,000 | 106,630 |
| LCM Investments Holdings 4.875% 5/1/29 (c) | | 70,000 | 63,933 |
| Macquarie AirFinance Holdings: | | | |
| 6.4% 3/26/29 (c) | | 15,000 | 14,957 |
| 6.5% 3/26/31 (c) | | 25,000 | 25,019 |
| 8.125% 3/30/29 (c) | | 40,000 | 41,828 |
| 8.375% 5/1/28 (c) | | 55,000 | 57,742 |
| McLaren Finance PLC 7.5% 8/1/26 (c) | | 60,000 | 52,110 |
| Nesco Holdings II, Inc. 5.5% 4/15/29 (c) | | 45,000 | 41,886 |
| Schaeffler AG 4.75% 8/14/29 (Reg. S) | EUR | 100,000 | 107,921 |
| Wand NewCo 3, Inc. 7.625% 1/30/32 (c) | | 60,000 | 60,996 |
| ZF Europe Finance BV 4.75% 1/31/29 (Reg. S) | EUR | 100,000 | 106,453 |
| ZF Finance GmbH 5.75% 8/3/26 (Reg. S) | EUR | 200,000 | 219,137 |
| | | | 2,332,889 |
| Banks & Thrifts - 2.4% | | | |
| Access Bank PLC 6.125% 9/21/26 (c) | | 115,000 | 106,411 |
| Ally Financial, Inc.: | | | |
| 8% 11/1/31 | | 155,000 | 167,031 |
| 8% 11/1/31 | | 108,000 | 116,929 |
| Aretec Group, Inc. 10% 8/15/30 (c) | | 145,000 | 157,500 |
| Banca Monte dei Paschi di Siena SpA ISDAFIX 10 AM EURIBOR FIXING 5 + 5.000% 7.708% 1/18/28 (e)(f) | EUR | 100,000 | 111,256 |
| Banco de Credito Social Cooperativo SA: | | | |
| EURIBOR ICE Swap Rate + 4.260% 7.5% 9/14/29 (Reg. S) (e)(f) | EUR | 100,000 | 117,114 |
| 5.25% 11/27/31 (Reg. S) (e) | EUR | 100,000 | 102,584 |
| Bangkok Bank Ltd. PCL 3.733% 9/25/34 (Reg. S) (e) | | 200,000 | 173,486 |
| Bank of East Asia Ltd. 6.75% 3/15/27 (Reg. S) (e) | | 250,000 | 251,125 |
| Commerzbank AG 6.5% 12/6/32 (Reg. S) (e) | EUR | 100,000 | 111,407 |
| Intesa Sanpaolo SpA 2.925% 10/14/30 (Reg. S) | EUR | 100,000 | 96,876 |
| Jane Street Group LLC/JSG Finance, Inc. 7.125% 4/30/31 (c) | | 95,000 | 95,595 |
| Piraeus Bank SA 3.875% 11/3/27 (Reg. S) (e) | EUR | 100,000 | 104,390 |
| VistaJet Malta Finance PLC / XO Management Holding, Inc. 6.375% 2/1/30 (c) | | 130,000 | 100,598 |
| | | | 1,812,302 |
| Broadcasting - 1.8% | | | |
| Clear Channel Outdoor Holdings, Inc.: | | | |
| 7.5% 6/1/29 (c) | | 75,000 | 60,437 |
| 7.75% 4/15/28 (c) | | 35,000 | 29,675 |
| 7.875% 4/1/30 (c) | | 145,000 | 142,167 |
| Diamond Sports Group LLC/Diamond Sports Finance Co. 5.375% (c)(d) | | 70,000 | 1,750 |
| Gray Television, Inc. 5.375% 11/15/31 (c) | | 90,000 | 54,099 |
| Nexstar Media, Inc. 5.625% 7/15/27 (c) | | 75,000 | 70,528 |
| Scripps Escrow II, Inc.: | | | |
| 3.875% 1/15/29 (c) | | 50,000 | 36,935 |
| 5.375% 1/15/31 (c) | | 25,000 | 14,751 |
| Scripps Escrow, Inc. 5.875% 7/15/27 (c) | | 50,000 | 39,347 |
| Sirius XM Radio, Inc.: | | | |
| 4% 7/15/28 (c) | | 315,000 | 280,798 |
| 4.125% 7/1/30 (c) | | 65,000 | 55,124 |
| Summer (BC) Holdco B SARL 5.75% 10/31/26 (Reg. S) | EUR | 100,000 | 104,703 |
| Telecomunicaciones Digitales SA 4.5% 1/30/30 (c) | | 200,000 | 176,200 |
| TV Azteca SA de CV 8.25% (Reg. S) (d) | | 200,000 | 77,322 |
| Univision Communications, Inc.: | | | |
| 4.5% 5/1/29 (c) | | 100,000 | 86,992 |
| 6.625% 6/1/27 (c) | | 110,000 | 106,152 |
| | | | 1,336,980 |
| Building Materials - 1.2% | | | |
| Acproducts Holdings, Inc. 6.375% 5/15/29 (c) | | 100,000 | 69,787 |
| Advanced Drain Systems, Inc. 5% 9/30/27 (c) | | 115,000 | 111,359 |
| CEMEX S.A.B. de CV 5.45% 11/19/29 (c) | | 200,000 | 193,250 |
| EMRLD Borrower LP / Emerald Co. 6.625% 12/15/30 (c) | | 155,000 | 153,611 |
| MITER Brands Acquisition Holdco, Inc. / MIWD Borrower LLC 6.75% 4/1/32 (c) | | 35,000 | 34,759 |
| MIWD Holdco II LLC / MIWD Finance Corp. 5.5% 2/1/30 (c) | | 20,000 | 18,113 |
| SRS Distribution, Inc.: | | | |
| 4.625% 7/1/28 (c) | | 55,000 | 54,795 |
| 6% 12/1/29 (c) | | 55,000 | 55,765 |
| 6.125% 7/1/29 (c) | | 30,000 | 30,446 |
| West China Cement Ltd. 4.95% 7/8/26 (Reg. S) | | 200,000 | 162,500 |
| | | | 884,385 |
| Cable/Satellite TV - 1.6% | | | |
| CCO Holdings LLC/CCO Holdings Capital Corp.: | | | |
| 4.25% 2/1/31 (c) | | 100,000 | 78,264 |
| 4.25% 1/15/34 (c) | | 115,000 | 83,319 |
| 4.5% 8/15/30 (c) | | 195,000 | 158,467 |
| 4.5% 6/1/33 (c) | | 120,000 | 90,239 |
| 5.125% 5/1/27 (c) | | 225,000 | 210,864 |
| CSC Holdings LLC: | | | |
| 4.5% 11/15/31 (c) | | 65,000 | 41,248 |
| 4.625% 12/1/30 (c) | | 75,000 | 32,553 |
| 5% 11/15/31 (c) | | 65,000 | 27,668 |
| 5.75% 1/15/30 (c) | | 100,000 | 43,852 |
| 7.5% 4/1/28 (c) | | 230,000 | 124,439 |
| DISH DBS Corp. 5.75% 12/1/28 (c) | | 45,000 | 30,388 |
| Radiate Holdco LLC/Radiate Financial Service Ltd.: | | | |
| 4.5% 9/15/26 (c) | | 150,000 | 114,560 |
| 6.5% 9/15/28 (c) | | 110,000 | 45,999 |
| Ziggo Bond Co. BV 5.125% 2/28/30 (c) | | 35,000 | 29,041 |
| Ziggo BV 4.875% 1/15/30 (c) | | 50,000 | 43,752 |
| | | | 1,154,653 |
| Capital Goods - 0.2% | | | |
| Benteler International AG 9.375% 5/15/28 (Reg. S) | EUR | 150,000 | 171,040 |
| Chemicals - 4.0% | | | |
| Braskem Idesa SAPI: | | | |
| 6.99% 2/20/32 (c) | | 55,000 | 41,250 |
| 7.45% 11/15/29 (c) | | 30,000 | 23,691 |
| Braskem Netherlands BV 8.5% 1/12/31 (c) | | 75,000 | 76,253 |
| CF Industries Holdings, Inc.: | | | |
| 5.15% 3/15/34 | | 45,000 | 42,478 |
| 5.375% 3/15/44 | | 80,000 | 71,620 |
| Consolidated Energy Finance SA 12% 2/15/31 (c) | | 70,000 | 72,450 |
| CVR Partners LP/CVR Nitrogen Finance Corp. 6.125% 6/15/28 (c) | | 90,000 | 83,970 |
| ENN Clean Energy International Investment Ltd.: | | | |
| 3.375% 5/12/26 (c) | | 200,000 | 189,125 |
| 3.375% 5/12/26 (Reg. S) | | 200,000 | 189,125 |
| Kobe U.S. Midco 2, Inc. 9.25% 11/1/26 pay-in-kind (c)(e) | | 194,250 | 165,598 |
| LSB Industries, Inc. 6.25% 10/15/28 (c) | | 20,000 | 18,959 |
| MEGlobal Canada, Inc. 5% 5/18/25 (c) | | 200,000 | 197,375 |
| NOVA Chemicals Corp.: | | | |
| 4.25% 5/15/29 (c) | | 75,000 | 62,774 |
| 9% 2/15/30 (c) | | 70,000 | 72,128 |
| OCP SA: | | | |
| 3.75% 6/23/31 (c) | | 200,000 | 165,671 |
| 6.875% 4/25/44 (c) | | 150,000 | 137,766 |
| Olympus Water U.S. Holding Corp. 9.75% 11/15/28 (c) | | 200,000 | 212,224 |
| Sasol Financing U.S.A. LLC 4.375% 9/18/26 | | 200,000 | 188,500 |
| SCIH Salt Holdings, Inc.: | | | |
| 4.875% 5/1/28 (c) | | 160,000 | 148,766 |
| 6.625% 5/1/29 (c) | | 45,000 | 41,521 |
| The Chemours Co. LLC: | | | |
| 4.625% 11/15/29 (c) | | 195,000 | 167,090 |
| 5.375% 5/15/27 | | 75,000 | 70,960 |
| 5.75% 11/15/28 (c) | | 230,000 | 211,226 |
| Tronox, Inc. 4.625% 3/15/29 (c) | | 55,000 | 49,065 |
| W.R. Grace Holding LLC: | | | |
| 4.875% 6/15/27 (c) | | 70,000 | 66,439 |
| 5.625% 8/15/29 (c) | | 70,000 | 62,685 |
| 7.375% 3/1/31 (c) | | 120,000 | 121,639 |
| | | | 2,950,348 |
| Consumer Products - 1.5% | | | |
| Central Garden & Pet Co. 4.125% 10/15/30 | | 35,000 | 30,573 |
| Gannett Holdings LLC 6% 11/1/26 (c) | | 45,000 | 41,585 |
| Kernel Holding SA 6.75% 10/27/27 (c) | | 100,000 | 71,500 |
| Mattel, Inc. 3.375% 4/1/26 (c) | | 20,000 | 19,043 |
| Meituan 2.125% 10/28/25 (c) | | 200,000 | 188,915 |
| PetSmart, Inc. / PetSmart Finance Corp. 7.75% 2/15/29 (c) | | 75,000 | 71,286 |
| Prosus NV 4.027% 8/3/50 (c) | | 200,000 | 126,750 |
| Spectrum Brands Holdings, Inc. 4% 10/1/26 | EUR | 100,000 | 105,257 |
| Tempur Sealy International, Inc.: | | | |
| 3.875% 10/15/31 (c) | | 75,000 | 61,748 |
| 4% 4/15/29 (c) | | 60,000 | 53,341 |
| The Scotts Miracle-Gro Co. 4% 4/1/31 | | 40,000 | 33,696 |
| TKC Holdings, Inc.: | | | |
| 6.875% 5/15/28 (c) | | 150,000 | 141,597 |
| 10.5% 5/15/29 (c) | | 130,000 | 124,391 |
| Turkiye Sise ve Cam Fabrikalari A/S 6.95% 3/14/26 (c) | | 75,000 | 75,563 |
| | | | 1,145,245 |
| Containers - 0.3% | | | |
| ARD Finance SA: | | | |
| 5% 6/30/27 pay-in-kind (Reg. S) (e) | EUR | 100,000 | 22,945 |
| 6.5% 6/30/27 pay-in-kind (c)(e) | | 70,000 | 17,264 |
| Ardagh Packaging Finance PLC/Ardagh MP Holdings U.S.A., Inc. 2.125% 8/15/26 (Reg. S) | EUR | 100,000 | 84,305 |
| Berry Global, Inc. 4.875% 7/15/26 (c) | | 40,000 | 39,142 |
| Graham Packaging Co., Inc. 7.125% 8/15/28 (c) | | 30,000 | 27,098 |
| Graphic Packaging International, Inc. 3.75% 2/1/30 (c) | | 35,000 | 30,453 |
| Trident TPI Holdings, Inc. 12.75% 12/31/28 (c) | | 25,000 | 27,054 |
| | | | 248,261 |
| Diversified Financial Services - 4.5% | | | |
| Boost Newco Borrower LLC 7.5% 1/15/31 (c) | | 215,000 | 221,900 |
| Broadstreet Partners, Inc. 5.875% 4/15/29 (c) | | 30,000 | 27,339 |
| Coinbase Global, Inc. 3.625% 10/1/31 (c) | | 185,000 | 144,259 |
| FLY Leasing Ltd. 7% 10/15/24 (c) | | 105,000 | 104,766 |
| Fortress Transportation & Infrastructure Investors LLC 7% 5/1/31 (c) | | 100,000 | 100,558 |
| GGAM Finance Ltd. 6.875% 4/15/29 (c) | | 60,000 | 59,944 |
| Gn Bondco LLC 9.5% 10/15/31 (c) | | 95,000 | 91,231 |
| Hightower Holding LLC 6.75% 4/15/29 (c) | | 25,000 | 23,465 |
| Huarong Finance 2017 Co. Ltd. 4.25% 11/7/27 (Reg. S) | | 210,000 | 190,772 |
| Icahn Enterprises LP/Icahn Enterprises Finance Corp.: | | | |
| 4.375% 2/1/29 | | 165,000 | 138,904 |
| 4.75% 9/15/24 | | 90,000 | 89,468 |
| 5.25% 5/15/27 | | 400,000 | 365,500 |
| 6.375% 12/15/25 | | 295,000 | 289,715 |
| Liberty Costa Rica SR SF 10.875% 1/15/31 (c) | | 200,000 | 206,470 |
| MDGH GMTN RSC Ltd. 5.084% 5/22/53 (c) | | 200,000 | 178,688 |
| OneMain Finance Corp.: | | | |
| 4% 9/15/30 | | 165,000 | 138,781 |
| 7.125% 3/15/26 | | 200,000 | 201,820 |
| Qtel International Finance Ltd. 2.625% 4/8/31 (c) | | 200,000 | 167,688 |
| Shriram Finance Ltd. 6.625% 4/22/27 (Reg. S) | | 200,000 | 197,750 |
| Vedanta Resources Finance II PLC 13.875% 12/9/28 (Reg. S) | | 168,000 | 152,460 |
| Verisure Holding AB 3.875% 7/15/26 (Reg. S) | EUR | 125,000 | 131,899 |
| Vivion Investments SARL 7.9% 8/31/28 pay-in-kind (Reg. S) (e) | EUR | 100,000 | 90,392 |
| Yihua Overseas Investment Ltd. 8.5% (Reg. S) (b)(d) | | 200,000 | 2,754 |
| | | | 3,316,523 |
| Diversified Media - 0.4% | | | |
| Allen Media LLC/Allen Media Co.-Issuer, Inc. 10.5% 2/15/28 (c) | | 220,000 | 104,079 |
| CMG Media Corp. 8.875% 12/15/27 (c) | | 220,000 | 119,688 |
| Lamar Media Corp. 4.875% 1/15/29 | | 45,000 | 42,552 |
| | | | 266,319 |
| Energy - 12.8% | | | |
| Antero Midstream Partners LP/Antero Midstream Finance Corp. 5.75% 3/1/27 (c) | | 140,000 | 137,453 |
| Archrock Partners LP / Archrock Partners Finance Corp. 6.25% 4/1/28 (c) | | 70,000 | 68,576 |
| Atlantica Sustainable Infrastructure PLC 4.125% 6/15/28 (c) | | 200,000 | 181,111 |
| Buffalo Energy Mexico Holdings 7.875% 2/15/39 (c) | | 200,000 | 208,739 |
| Citgo Petroleum Corp.: | | | |
| 6.375% 6/15/26 (c) | | 70,000 | 69,892 |
| 7% 6/15/25 (c) | | 130,000 | 129,867 |
| 8.375% 1/15/29 (c) | | 105,000 | 108,663 |
| CNX Resources Corp.: | | | |
| 6% 1/15/29 (c) | | 25,000 | 24,222 |
| 7.25% 3/1/32 (c) | | 65,000 | 65,179 |
| Comstock Resources, Inc.: | | | |
| 5.875% 1/15/30 (c) | | 50,000 | 45,539 |
| 6.75% 3/1/29 (c) | | 75,000 | 70,568 |
| 6.75% 3/1/29 (c) | | 90,000 | 85,690 |
| CQP Holdco LP / BIP-V Chinook Holdco LLC 5.5% 6/15/31 (c) | | 250,000 | 229,734 |
| CrownRock LP/CrownRock Finance, Inc. 5% 5/1/29 (c) | | 25,000 | 24,630 |
| CVR Energy, Inc. 5.75% 2/15/28 (c) | | 115,000 | 106,860 |
| DCP Midstream Operating LP 8.125% 8/16/30 | | 5,000 | 5,591 |
| Delek Logistics Partners LP/Delek Logistics Finance Corp. 7.125% 6/1/28 (c) | | 45,000 | 43,952 |
| DT Midstream, Inc.: | | | |
| 4.125% 6/15/29 (c) | | 75,000 | 67,978 |
| 4.375% 6/15/31 (c) | | 75,000 | 66,582 |
| Ecopetrol SA 8.875% 1/13/33 | | 40,000 | 40,861 |
| EIG Pearl Holdings SARL 3.545% 8/31/36 (c) | | 80,000 | 66,475 |
| Endeavor Energy Resources LP/EER Finance, Inc. 5.75% 1/30/28 (c) | | 125,000 | 126,615 |
| Energean Israel Finance Ltd. 4.875% 3/30/26 (Reg. S) (c) | | 40,000 | 37,600 |
| Energy Transfer LP 6% 2/1/29 (c) | | 45,000 | 44,939 |
| EnfraGen Energia Sur SA 5.375% 12/30/30 (c) | | 200,000 | 163,063 |
| EnLink Midstream LLC 5.625% 1/15/28 (c) | | 25,000 | 24,564 |
| EQM Midstream Partners LP 6.5% 7/1/27 (c) | | 70,000 | 70,097 |
| EQT Corp. 3.625% 5/15/31 (c) | | 50,000 | 43,250 |
| FEL Energy VI SARL 5.75% 12/1/40 (c) | | 40,710 | 36,484 |
| Galaxy Pipeline Assets BidCo Ltd. 2.625% 3/31/36 (c) | | 85,000 | 66,980 |
| GeoPark Ltd. 5.5% 1/17/27 (c) | | 65,000 | 58,439 |
| Global Partners LP/GLP Finance Corp.: | | | |
| 6.875% 1/15/29 | | 55,000 | 53,825 |
| 8.25% 1/15/32 (c) | | 25,000 | 25,610 |
| Greenko Solar Mauritius Ltd. 5.55% 1/29/25 (Reg. S) | | 200,000 | 197,563 |
| Harvest Midstream I LP 7.5% 9/1/28 (c) | | 135,000 | 135,370 |
| Hess Midstream Operations LP: | | | |
| 4.25% 2/15/30 (c) | | 50,000 | 45,125 |
| 5.125% 6/15/28 (c) | | 80,000 | 76,572 |
| 5.5% 10/15/30 (c) | | 30,000 | 28,684 |
| 5.625% 2/15/26 (c) | | 100,000 | 98,877 |
| HPCL-Mittal Energy Ltd. 5.45% 10/22/26 (Reg. S) | | 200,000 | 193,688 |
| Indika Energy Capital IV Pte Ltd. 8.25% 10/22/25 (Reg. S) | | 250,000 | 251,563 |
| Investment Energy Resources Ltd. 6.25% 4/26/29 (c) | | 200,000 | 190,688 |
| Jonah Energy Parent LLC 12% 11/5/25 (b)(g) | | 80,399 | 85,826 |
| KLX Energy Services Holdings, Inc. 11.5% 11/1/25 (c) | | 95,000 | 95,610 |
| Kosmos Energy Ltd. 7.125% 4/4/26 (c) | | 160,000 | 155,450 |
| Leeward Renewable Energy LLC 4.25% 7/1/29 (c) | | 170,000 | 140,689 |
| Leviathan Bond Ltd. 6.125% 6/30/25 (Reg. S) (c) | | 150,000 | 145,875 |
| MC Brazil Downstream Trading SARL 7.25% 6/30/31 (c) | | 323,256 | 279,212 |
| Medco Oak Tree Pte Ltd.: | | | |
| 7.375% 5/14/26 (c) | | 200,000 | 200,188 |
| 7.375% 5/14/26 (Reg. S) | | 200,000 | 200,188 |
| MEG Energy Corp. 5.875% 2/1/29 (c) | | 110,000 | 106,425 |
| New Fortress Energy, Inc. 6.75% 9/15/25 (c) | | 36,000 | 35,558 |
| Northern Oil & Gas, Inc.: | | | |
| 8.125% 3/1/28 (c) | | 90,000 | 91,049 |
| 8.75% 6/15/31 (c) | | 50,000 | 52,595 |
| Occidental Petroleum Corp.: | | | |
| 5.5% 12/1/25 | | 35,000 | 34,822 |
| 6.375% 9/1/28 | | 70,000 | 71,554 |
| 6.6% 3/15/46 | | 55,000 | 56,630 |
| 6.625% 9/1/30 | | 90,000 | 93,254 |
| 6.95% 7/1/24 | | 31,000 | 31,034 |
| 7.5% 5/1/31 | | 125,000 | 136,108 |
| 8.875% 7/15/30 | | 60,000 | 68,600 |
| Oq Saoc 5.125% 5/6/28 (c) | | 200,000 | 194,000 |
| ORSTED A/S 5.125% 3/14/24 (Reg. S) (e) | EUR | 100,000 | 107,240 |
| PBF Holding Co. LLC/PBF Finance Corp.: | | | |
| 6% 2/15/28 | | 70,000 | 68,270 |
| 7.875% 9/15/30 (c) | | 160,000 | 164,557 |
| Permian Resources Operating LLC 5.875% 7/1/29 (c) | | 80,000 | 77,800 |
| Petroleos Mexicanos: | | | |
| 4.25% 1/15/25 | | 185,000 | 181,011 |
| 6.49% 1/23/27 | | 175,000 | 164,304 |
| 7.69% 1/23/50 | | 75,000 | 52,343 |
| Petrorio Luxembourg SARL 6.125% 6/9/26 (c) | | 100,000 | 97,970 |
| Renew Power Ltd. 5.875% 3/5/27 (Reg. S) | | 200,000 | 191,600 |
| Saudi Arabian Oil Co.: | | | |
| 2.25% 11/24/30 (c) | | 200,000 | 164,625 |
| 3.25% 11/24/50 (c) | | 150,000 | 96,644 |
| 3.5% 4/16/29 (c) | | 125,000 | 114,961 |
| Seadrill Finance Ltd. 8.375% 8/1/30 (c) | | 20,000 | 20,835 |
| SM Energy Co.: | | | |
| 6.5% 7/15/28 | | 25,000 | 24,797 |
| 6.625% 1/15/27 | | 65,000 | 64,666 |
| Southwestern Energy Co.: | | | |
| 4.75% 2/1/32 | | 65,000 | 58,537 |
| 5.375% 2/1/29 | | 50,000 | 47,959 |
| Strathcona Resources Ltd. 6.875% 8/1/26 (c) | | 45,000 | 44,565 |
| Sunoco Logistics Partners, LP 7.25% 5/1/32 (c) | | 50,000 | 50,783 |
| Sunoco LP/Sunoco Finance Corp.: | | | |
| 4.5% 5/15/29 | | 50,000 | 45,648 |
| 6% 4/15/27 | | 175,000 | 172,884 |
| Tallgrass Energy Partners LP / Tallgrass Energy Finance Corp. 6% 12/31/30 (c) | | 55,000 | 51,737 |
| Tengizchevroil Finance Co. International Ltd. 3.25% 8/15/30 (c) | | 100,000 | 79,813 |
| Termocandelaria Power Ltd. 7.875% 1/30/29 (c) | | 140,000 | 138,985 |
| Transocean, Inc.: | | | |
| 8.25% 5/15/29 (c) | | 50,000 | 49,830 |
| 8.5% 5/15/31 (c) | | 50,000 | 49,774 |
| Transportadora de Gas del Sur SA 6.75% 5/2/25 (c) | | 70,000 | 67,725 |
| Tullow Oil PLC: | | | |
| 7% 3/1/25 (c) | | 200,000 | 193,375 |
| 10.25% 5/15/26 (c) | | 358,000 | 345,358 |
| U.S.A. Compression Partners LP/U.S.A. Compression Finance Corp. 7.125% 3/15/29 (c) | | 160,000 | 158,977 |
| Venture Global Calcasieu Pass LLC: | | | |
| 3.875% 8/15/29 (c) | | 70,000 | 61,847 |
| 6.25% 1/15/30 (c) | | 155,000 | 153,251 |
| YPF SA 8.5% 3/23/25 (c) | | 67,750 | 66,852 |
| | | | 9,521,948 |
| Entertainment/Film - 0.1% | | | |
| Live Nation Entertainment, Inc. 4.75% 10/15/27 (c) | | 80,000 | 75,398 |
| Environmental - 0.3% | | | |
| Clean Harbors, Inc. 6.375% 2/1/31 (c) | | 20,000 | 19,814 |
| Covanta Holding Corp. 4.875% 12/1/29 (c) | | 40,000 | 35,064 |
| Madison IAQ LLC: | | | |
| 4.125% 6/30/28 (c) | | 55,000 | 51,021 |
| 5.875% 6/30/29 (c) | | 85,000 | 78,867 |
| Stericycle, Inc. 3.875% 1/15/29 (c) | | 35,000 | 31,099 |
| | | | 215,865 |
| Food & Drug Retail - 0.9% | | | |
| Albertsons Companies LLC/Safeway, Inc./New Albertson's, Inc./Albertson's LLC: | | | |
| 3.5% 3/15/29 (c) | | 35,000 | 30,883 |
| 4.625% 1/15/27 (c) | | 95,000 | 90,771 |
| 4.875% 2/15/30 (c) | | 275,000 | 256,497 |
| Camposol SA 6% 2/3/27 (c) | | 200,000 | 155,375 |
| Emergent BioSolutions, Inc. 3.875% 8/15/28 (c) | | 30,000 | 15,155 |
| Iceland Bondco PLC 3 month EURIBOR EURO INTER + 5.500% 9.401% 12/15/27 (Reg. S) (e)(f) | EUR | 100,000 | 106,667 |
| Murphy Oil U.S.A., Inc. 3.75% 2/15/31 (c) | | 25,000 | 21,462 |
| | | | 676,810 |
| Food/Beverage/Tobacco - 2.3% | | | |
| Adecoagro SA 6% 9/21/27 (c) | | 100,000 | 96,563 |
| BellRing Brands, Inc. 7% 3/15/30 (c) | | 25,000 | 25,298 |
| C&S Group Enterprises LLC 5% 12/15/28 (c) | | 40,000 | 30,668 |
| Central American Bottling Corp. 5.25% 4/27/29 (c) | | 200,000 | 186,058 |
| Chobani LLC/Finance Corp., Inc.: | | | |
| 4.625% 11/15/28 (c) | | 30,000 | 27,767 |
| 7.625% 7/1/29 (c) | | 90,000 | 90,952 |
| Fiesta Purchaser, Inc. 7.875% 3/1/31 (c) | | 40,000 | 40,759 |
| Jbs U.S.A. Holding Lux/ Jbs U.S.A. F 5.5% 1/15/30 | | 120,000 | 115,836 |
| Kraft Heinz Foods Co. 5.5% 6/1/50 | | 25,000 | 23,411 |
| Lamb Weston Holdings, Inc. 4.125% 1/31/30 (c) | | 70,000 | 62,391 |
| MARB BondCo PLC 3.95% 1/29/31 (c) | | 100,000 | 80,125 |
| MHP SA 7.75% 5/10/24 (c) | | 100,000 | 97,620 |
| NBM U.S. Holdings, Inc. 6.625% 8/6/29 (c) | | 65,000 | 63,619 |
| Performance Food Group, Inc.: | | | |
| 4.25% 8/1/29 (c) | | 40,000 | 35,855 |
| 5.5% 10/15/27 (c) | | 100,000 | 96,797 |
| Post Holdings, Inc.: | | | |
| 4.625% 4/15/30 (c) | | 34,000 | 30,706 |
| 6.25% 2/15/32 (c) | | 130,000 | 128,264 |
| TreeHouse Foods, Inc. 4% 9/1/28 | | 20,000 | 17,709 |
| Triton Water Holdings, Inc. 6.25% 4/1/29 (c) | | 145,000 | 130,026 |
| U.S. Foods, Inc.: | | | |
| 4.625% 6/1/30 (c) | | 35,000 | 31,826 |
| 4.75% 2/15/29 (c) | | 80,000 | 74,532 |
| 6.875% 9/15/28 (c) | | 150,000 | 151,277 |
| 7.25% 1/15/32 (c) | | 50,000 | 51,056 |
| | | | 1,689,115 |
| Gaming - 3.6% | | | |
| 888 Acquisitions Ltd. 7.558% 7/15/27 (Reg. S) | EUR | 100,000 | 102,558 |
| Allwyn Entertainment Financing (UK) PLC 7.25% 4/30/30 (Reg. S) | EUR | 100,000 | 110,989 |
| Caesars Entertainment, Inc.: | | | |
| 4.625% 10/15/29 (c) | | 90,000 | 80,310 |
| 6.5% 2/15/32 (c) | | 130,000 | 128,082 |
| Churchill Downs, Inc. 5.75% 4/1/30 (c) | | 135,000 | 128,459 |
| Cirsa Finance International SARL: | | | |
| 7.875% 7/31/28 (Reg. S) | EUR | 100,000 | 112,584 |
| 10.375% 11/30/27 (Reg. S) | EUR | 90,000 | 103,132 |
| Fertitta Entertainment LLC / Fertitta Entertainment Finance Co., Inc.: | | | |
| 4.625% 1/15/29 (c) | | 90,000 | 81,417 |
| 6.75% 1/15/30 (c) | | 45,000 | 39,152 |
| Flutter Treasury Designated Activity Co. 5% 4/29/29 (Reg. S) | EUR | 100,000 | 108,102 |
| GENM Capital Labuan Ltd. 3.882% 4/19/31 (c) | | 200,000 | 169,813 |
| GLP Capital LP/GLP Financing II, Inc.: | | | |
| 5.25% 6/1/25 | | 95,000 | 94,118 |
| 5.375% 4/15/26 | | 30,000 | 29,617 |
| Jacobs Entertainment, Inc. 6.75% 2/15/29 (c) | | 40,000 | 37,944 |
| Light & Wonder International, Inc. 7.5% 9/1/31 (c) | | 35,000 | 35,695 |
| Melco Resorts Finance Ltd. 5.375% 12/4/29 (Reg. S) | | 200,000 | 177,512 |
| MGM China Holdings Ltd. 4.75% 2/1/27 (Reg. S) | | 200,000 | 188,500 |
| Station Casinos LLC: | | | |
| 4.625% 12/1/31 (c) | | 115,000 | 100,802 |
| 6.625% 3/15/32 (c) | | 145,000 | 142,092 |
| Studio City Finance Ltd.: | | | |
| 6.5% 1/15/28 (c) | | 110,000 | 102,850 |
| 6.5% 1/15/28 (Reg. S) | | 200,000 | 187,000 |
| VICI Properties LP / VICI Note Co. 5.75% 2/1/27 (c) | | 70,000 | 69,412 |
| Wynn Macau Ltd. 5.125% 12/15/29 (Reg. S) | | 250,000 | 221,250 |
| Wynn Resorts Finance LLC / Wynn Resorts Capital Corp. 7.125% 2/15/31 (c) | | 150,000 | 152,139 |
| | | | 2,703,529 |
| Healthcare - 4.4% | | | |
| 1375209 BC Ltd. 9% 1/30/28 (c) | | 14,000 | 13,744 |
| AHP Health Partners, Inc. 5.75% 7/15/29 (c) | | 80,000 | 73,300 |
| Auna SA 10% 12/15/29 (c) | | 20,800 | 21,279 |
| Avantor Funding, Inc. 3.875% 11/1/29 (c) | | 70,000 | 61,978 |
| Centene Corp.: | | | |
| 3.375% 2/15/30 | | 160,000 | 139,390 |
| 4.625% 12/15/29 | | 105,000 | 97,778 |
| Charles River Laboratories International, Inc.: | | | |
| 3.75% 3/15/29 (c) | | 20,000 | 17,966 |
| 4% 3/15/31 (c) | | 55,000 | 47,973 |
| Cheplapharm Arzneimittel GmbH 7.5% 5/15/30 | EUR | 100,000 | 111,909 |
| Community Health Systems, Inc.: | | | |
| 4.75% 2/15/31 (c) | | 75,000 | 58,541 |
| 5.25% 5/15/30 (c) | | 155,000 | 126,726 |
| 6% 1/15/29 (c) | | 140,000 | 122,142 |
| 6.125% 4/1/30 (c) | | 170,000 | 120,192 |
| 6.875% 4/15/29 (c) | | 75,000 | 55,755 |
| 8% 3/15/26 (c) | | 47,000 | 46,771 |
| DaVita, Inc.: | | | |
| 3.75% 2/15/31 (c) | | 60,000 | 49,372 |
| 4.625% 6/1/30 (c) | | 80,000 | 70,091 |
| Encompass Health Corp. 5.75% 9/15/25 | | 15,000 | 14,883 |
| Endo Finance Holdings, Inc. 8.5% 4/15/31 (c) | | 70,000 | 71,125 |
| HealthEquity, Inc. 4.5% 10/1/29 (c) | | 30,000 | 27,325 |
| Hologic, Inc. 3.25% 2/15/29 (c) | | 55,000 | 48,574 |
| Jazz Securities DAC 4.375% 1/15/29 (c) | | 55,000 | 50,041 |
| Medline Borrower LP / Medline Co. 6.25% 4/1/29 (c) | | 75,000 | 74,520 |
| Molina Healthcare, Inc.: | | | |
| 3.875% 11/15/30 (c) | | 50,000 | 43,365 |
| 3.875% 5/15/32 (c) | | 100,000 | 83,678 |
| 4.375% 6/15/28 (c) | | 40,000 | 37,098 |
| Nidda Healthcare Holding AG 7.5% 8/21/26 (Reg. S) | EUR | 100,000 | 109,919 |
| Organon & Co. / Organon Foreign Debt Co-Issuer BV: | | | |
| 4.125% 4/30/28 (c) | | 80,000 | 72,861 |
| 5.125% 4/30/31 (c) | | 80,000 | 69,176 |
| Radiology Partners, Inc. 8.5% 1/31/29 pay-in-kind (c)(e) | | 44,820 | 41,346 |
| Surgery Center Holdings, Inc. 7.25% 4/15/32 (c) | | 105,000 | 104,857 |
| Teleflex, Inc. 4.625% 11/15/27 | | 30,000 | 28,565 |
| Tenet Healthcare Corp.: | | | |
| 4.25% 6/1/29 | | 130,000 | 119,078 |
| 4.375% 1/15/30 | | 210,000 | 190,692 |
| 6.125% 10/1/28 | | 210,000 | 207,365 |
| 6.25% 2/1/27 | | 195,000 | 194,213 |
| 6.875% 11/15/31 | | 10,000 | 10,308 |
| Teva Pharmaceutical Finance Netherlands III BV: | | | |
| 1.625% 10/15/28 (Reg. S) | EUR | 100,000 | 92,985 |
| 3.15% 10/1/26 | | 75,000 | 69,481 |
| 4.1% 10/1/46 | | 200,000 | 133,331 |
| 7.875% 9/15/29 | | 100,000 | 105,309 |
| | | | 3,235,002 |
| Homebuilders/Real Estate - 3.4% | | | |
| Add Hero Holdings Ltd.: | | | |
| 8.5% 9/30/29 pay-in-kind (Reg. S) (e) | | 31,943 | 719 |
| 9% 9/30/30 pay-in-kind (Reg. S) (e) | | 24,631 | 308 |
| 9.8% 9/30/31 pay-in-kind (Reg. S) (e) | | 32,142 | 402 |
| Adler Financing SARL 12.5% 6/30/25 pay-in-kind | EUR | 25,000 | 30,649 |
| AGPS BondCo PLC 6% 8/5/25 (Reg. S) (e) | EUR | 100,000 | 41,087 |
| Arcosa, Inc. 4.375% 4/15/29 (c) | | 40,000 | 36,410 |
| Ardonagh Finco Ltd. 7.75% 2/15/31 (c) | | 200,000 | 197,069 |
| Ashton Woods U.S.A. LLC/Ashton Woods Finance Co.: | | | |
| 4.625% 8/1/29 (c) | | 40,000 | 36,177 |
| 6.625% 1/15/28 (c) | | 5,000 | 4,984 |
| Canary Wharf Group Investment Holdings PLC 1.75% 4/7/26 (Reg. S) | EUR | 100,000 | 91,081 |
| China Aoyuan Group Ltd. 5.5% 9/30/31 pay-in-kind (Reg. S) (e) | | 12,509 | 188 |
| CPI Property Group SA: | | | |
| 1.5% 1/27/31 (Reg. S) | EUR | 100,000 | 69,902 |
| 1.625% 4/23/27 (Reg. S) | EUR | 100,000 | 89,693 |
| Franshion Brilliant Ltd. 4.25% 7/23/29 (Reg. S) | | 200,000 | 138,000 |
| GMR Hyderabad International Airport Ltd. 4.75% 2/2/26 (Reg. S) | | 200,000 | 192,770 |
| Greensaif Pipelines Bidco SARL 6.129% 2/23/38 (c) | | 70,000 | 68,863 |
| Greentown China Holdings Ltd. 4.7% 4/29/25 (Reg. S) | | 200,000 | 184,125 |
| Kennedy-Wilson, Inc.: | | | |
| 4.75% 3/1/29 | | 55,000 | 45,489 |
| 5% 3/1/31 | | 55,000 | 42,742 |
| Longfor Properties Co. Ltd. 3.95% 9/16/29 (Reg. S) | | 220,000 | 130,419 |
| Modernland Overseas Pte Ltd.: | | | |
| 5% 4/30/27 pay-in-kind (Reg. S) (b)(e) | | 7,808 | 1,874 |
| 5% 4/30/27 pay-in-kind (e) | | 106,828 | 34,719 |
| MPT Operating Partnership LP/MPT Finance Corp. 3.5% 3/15/31 | | 25,000 | 16,763 |
| Panther Escrow Issuer LLC 7.125% 6/1/31 (c) | | 75,000 | 75,389 |
| Realogy Group LLC/Realogy Co-Issuer Corp. 5.75% 1/15/29 (c) | | 100,000 | 69,125 |
| Realogy Group LLC/Realogy Co.-Issuer Corp. 5.25% 4/15/30 (c) | | 95,000 | 63,768 |
| Starwood Property Trust, Inc. 4.75% 3/15/25 | | 75,000 | 74,079 |
| Taylor Morrison Communities, Inc./Monarch Communities, Inc.: | | | |
| 5.75% 1/15/28 (c) | | 80,000 | 77,785 |
| 5.875% 6/15/27 (c) | | 55,000 | 54,151 |
| TRI Pointe Homes, Inc. 5.7% 6/15/28 | | 15,000 | 14,518 |
| Uniti Group LP/Uniti Group Finance, Inc./CSL Capital LLC: | | | |
| 4.75% 4/15/28 (c) | | 55,000 | 48,238 |
| 6.5% 2/15/29 (c) | | 85,000 | 68,334 |
| 10.5% 2/15/28 (c) | | 110,000 | 114,117 |
| VICI Properties LP / VICI Note Co. 3.75% 2/15/27 (c) | | 205,000 | 192,275 |
| Weekley Homes LLC/Weekley Finance Corp. 4.875% 9/15/28 (c) | | 25,000 | 22,864 |
| Yango Justice International Ltd.: | | | |
| 8.25% (Reg. S) (d) | | 220,000 | 550 |
| 10% (Reg. S) (b)(d) | | 200,000 | 20 |
| Yanlord Land Group Ltd. 5.125% 5/20/26 (Reg. S) | | 200,000 | 161,125 |
| | | | 2,490,771 |
| Hotels - 0.7% | | | |
| Carnival Holdings (Bermuda) Ltd. 10.375% 5/1/28 (c) | | 125,000 | 135,533 |
| Hilton Domestic Operating Co., Inc.: | | | |
| 3.625% 2/15/32 (c) | | 40,000 | 33,613 |
| 3.75% 5/1/29 (c) | | 35,000 | 31,395 |
| 6.125% 4/1/32 (c) | | 45,000 | 44,358 |
| Lindblad Expeditions Holdings 9% 5/15/28 (c) | | 185,000 | 193,514 |
| Lindblad Expeditions LLC 6.75% 2/15/27 (c) | | 65,000 | 64,395 |
| | | | 502,808 |
| Insurance - 1.0% | | | |
| Acrisure LLC / Acrisure Finance, Inc. 10.125% 8/1/26 (c) | | 35,000 | 36,153 |
| Alliant Holdings Intermediate LLC/Alliant Holdings Co.-Issuer: | | | |
| 5.875% 11/1/29 (c) | | 190,000 | 174,466 |
| 6.75% 10/15/27 (c) | | 225,000 | 220,639 |
| AmWINS Group, Inc. 4.875% 6/30/29 (c) | | 40,000 | 36,363 |
| AssuredPartners, Inc.: | | | |
| 5.625% 1/15/29 (c) | | 30,000 | 27,356 |
| 7.5% 2/15/32 (c) | | 155,000 | 150,495 |
| HUB International Ltd. 5.625% 12/1/29 (c) | | 60,000 | 55,223 |
| MGIC Investment Corp. 5.25% 8/15/28 | | 40,000 | 38,395 |
| | | | 739,090 |
| Leisure - 1.1% | | | |
| Amer Sports Co. 6.75% 2/16/31 (c) | | 45,000 | 44,317 |
| Carnival Corp. 5.75% 3/1/27 (c) | | 135,000 | 131,755 |
| NCL Corp. Ltd.: | | | |
| 5.875% 3/15/26 (c) | | 20,000 | 19,596 |
| 7.75% 2/15/29 (c) | | 80,000 | 81,842 |
| NCL Finance Ltd. 6.125% 3/15/28 (c) | | 25,000 | 24,394 |
| Pinnacle Bidco PLC 8.25% 10/11/28 (Reg. S) | EUR | 100,000 | 111,416 |
| Royal Caribbean Cruises Ltd.: | | | |
| 4.25% 7/1/26 (c) | | 130,000 | 124,850 |
| 5.375% 7/15/27 (c) | | 60,000 | 58,390 |
| 5.5% 8/31/26 (c) | | 135,000 | 132,426 |
| 6.25% 3/15/32 (c) | | 60,000 | 59,146 |
| Vail Resorts, Inc. 6.25% 5/15/25 (c) | | 35,000 | 35,019 |
| Viking Cruises Ltd. 9.125% 7/15/31 (c) | | 25,000 | 26,815 |
| | | | 849,966 |
| Metals/Mining - 3.5% | | | |
| Abja Investment Co. Pte Ltd. 5.45% 1/24/28 | | 200,000 | 196,750 |
| Alcoa Nederland Holding BV: | | | |
| 4.125% 3/31/29 (c) | | 70,000 | 63,972 |
| 7.125% 3/15/31 (c) | | 20,000 | 20,230 |
| Alpha Natural Resources, Inc. 9.75% (b)(d) | | 210,000 | 0 |
| Antofagasta PLC 2.375% 10/14/30 (c) | | 200,000 | 159,970 |
| Aris Mining Corp. 6.875% 8/9/26 (c) | | 200,000 | 185,000 |
| Arsenal AIC Parent LLC 8% 10/1/30 (c) | | 30,000 | 31,235 |
| Cleveland-Cliffs, Inc. 7% 3/15/32 (c) | | 160,000 | 156,261 |
| Endeavour Mining PLC 5% 10/14/26 (c) | | 100,000 | 93,875 |
| ERO Copper Corp. 6.5% 2/15/30 (c) | | 365,000 | 343,319 |
| First Quantum Minerals Ltd.: | | | |
| 6.875% 10/15/27 (c) | | 75,000 | 72,000 |
| 9.375% 3/1/29 (c) | | 200,000 | 206,635 |
| FMG Resources Pty Ltd.: | | | |
| 4.375% 4/1/31 (c) | | 40,000 | 35,218 |
| 5.875% 4/15/30 (c) | | 130,000 | 124,958 |
| HudBay Minerals, Inc. 6.125% 4/1/29 (c) | | 105,000 | 102,779 |
| Industrias Penoles SA de CV 4.75% 8/6/50 (c) | | 200,000 | 152,000 |
| Mineral Resources Ltd.: | | | |
| 8% 11/1/27 (c) | | 85,000 | 85,967 |
| 8.5% 5/1/30 (c) | | 20,000 | 20,483 |
| Minsur SA 4.5% 10/28/31 (c) | | 50,000 | 43,344 |
| Novelis Corp. 3.875% 8/15/31 (c) | | 115,000 | 97,384 |
| PT Freeport Indonesia 5.315% 4/14/32 (c) | | 200,000 | 189,250 |
| Samarco Mineracao SA 9% 6/30/31 pay-in-kind (c)(e) | | 51,495 | 46,963 |
| Stillwater Mining Co. 4% 11/16/26 (c) | | 100,000 | 89,406 |
| Volcan Compania Minera SAA 4.375% 2/11/26 (c) | | 95,000 | 64,570 |
| | | | 2,581,569 |
| Paper - 0.5% | | | |
| Ahlstrom Holding 3 OY 4.875% 2/4/28 (c) | | 45,000 | 41,189 |
| Berry Global, Inc. 5.625% 7/15/27 (c) | | 35,000 | 34,134 |
| Clydesdale Acquisition Holdings, Inc.: | | | |
| 6.625% 4/15/29 (c) | | 35,000 | 34,912 |
| 8.75% 4/15/30 (c) | | 200,000 | 193,290 |
| Inversiones CMPC SA 3% 4/6/31 (c) | | 25,000 | 20,711 |
| Suzano Austria GmbH 3.75% 1/15/31 | | 25,000 | 21,545 |
| | | | 345,781 |
| Railroad - 0.2% | | | |
| Genesee & Wyoming, Inc. 6.25% 4/15/32 (c) | | 145,000 | 144,114 |
| Restaurants - 0.9% | | | |
| 1011778 BC Unlimited Liability Co./New Red Finance, Inc. 4% 10/15/30 (c) | | 160,000 | 137,980 |
| Bimbo Bakeries U.S.A., Inc. 6.4% 1/15/34 (c) | | 200,000 | 206,748 |
| CEC Entertainment LLC 6.75% 5/1/26 (c) | | 60,000 | 59,152 |
| Papa John's International, Inc. 3.875% 9/15/29 (c) | | 25,000 | 21,760 |
| Yum! Brands, Inc.: | | | |
| 4.625% 1/31/32 | | 70,000 | 63,017 |
| 4.75% 1/15/30 (c) | | 200,000 | 187,165 |
| | | | 675,822 |
| Services - 3.8% | | | |
| Allied Universal Holdco LLC / Allied Universal Finance Corp. 6% 6/1/29 (c) | | 30,000 | 25,471 |
| Artera Services LLC 8.5% 2/15/31 (c) | | 90,000 | 92,093 |
| ASGN, Inc. 4.625% 5/15/28 (c) | | 160,000 | 149,313 |
| Atlas Luxco 4 SARL / Allied Universal Holdco LLC / Allied Universal Finance Corp. 4.625% 6/1/28 (c) | | 38,000 | 34,087 |
| Avis Budget Car Rental LLC/Avis Budget Finance, Inc. 5.375% 3/1/29 (c) | | 40,000 | 35,579 |
| Booz Allen Hamilton, Inc. 4% 7/1/29 (c) | | 30,000 | 27,460 |
| Brand Industrial Services, Inc. 10.375% 8/1/30 (c) | | 130,000 | 139,503 |
| Camelot Finance SA 4.5% 11/1/26 (c) | | 150,000 | 142,854 |
| CoreCivic, Inc. 8.25% 4/15/29 | | 70,000 | 72,331 |
| CoreLogic, Inc. 4.5% 5/1/28 (c) | | 125,000 | 108,153 |
| GEMS MENASA Cayman Ltd./GEMS Education Delaware LLC 7.125% 7/31/26 (c) | | 520,000 | 516,913 |
| H&E Equipment Services, Inc. 3.875% 12/15/28 (c) | | 90,000 | 79,640 |
| Hertz Corp.: | | | |
| 4.625% 12/1/26 (c) | | 55,000 | 42,602 |
| 5% 12/1/29 (c) | | 70,000 | 48,068 |
| 5.5% (b)(c)(d) | | 65,000 | 2,113 |
| 6% (b)(c)(d) | | 85,000 | 7,650 |
| 6.25% (b)(d) | | 60,000 | 1,950 |
| 7.125% (b)(c)(d) | | 85,000 | 7,650 |
| IPD BV 8% 6/15/28 (Reg. S) | EUR | 100,000 | 112,856 |
| Koc Holding A/S 6.5% 3/11/25 (c) | | 35,000 | 35,058 |
| Legends Hospitality Holding Co. LLC/Legends Hospitality Co-Issuer, Inc. 5% 2/1/26 (c) | | 35,000 | 34,606 |
| Sabre GLBL, Inc. 8.625% 6/1/27 (c) | | 76,000 | 67,251 |
| Service Corp. International 5.125% 6/1/29 | | 35,000 | 33,418 |
| The GEO Group, Inc.: | | | |
| 8.625% 4/15/29 (c) | | 100,000 | 101,236 |
| 10.25% 4/15/31 (c) | | 95,000 | 97,939 |
| Uber Technologies, Inc.: | | | |
| 4.5% 8/15/29 (c) | | 485,000 | 451,825 |
| 6.25% 1/15/28 (c) | | 100,000 | 99,943 |
| 7.5% 9/15/27 (c) | | 90,000 | 91,631 |
| United Rentals North America, Inc. 6.125% 3/15/34 (c) | | 120,000 | 117,166 |
| WASH Multifamily Acquisition, Inc. 5.75% 4/15/26 (c) | | 45,000 | 43,628 |
| | | | 2,819,987 |
| Steel - 1.0% | | | |
| Commercial Metals Co. 3.875% 2/15/31 | | 30,000 | 26,101 |
| CSN Inova Ventures 6.75% 1/28/28 (c) | | 50,000 | 47,453 |
| CSN Resources SA: | | | |
| 5.875% 4/8/32 (c) | | 40,000 | 33,313 |
| 7.625% 4/17/26 (c) | | 15,000 | 14,892 |
| JSW Steel Ltd.: | | | |
| 3.95% 4/5/27 (c) | | 100,000 | 92,418 |
| 5.375% 4/4/25 (Reg. S) | | 200,000 | 197,625 |
| Metinvest BV 5.625% 6/17/25 (Reg. S) | EUR | 100,000 | 94,981 |
| Roller Bearing Co. of America, Inc. 4.375% 10/15/29 (c) | | 20,000 | 18,075 |
| TMK Capital SA 4.3% (Reg. S) (b)(d)(h) | | 200,000 | 30,000 |
| Vallourec SA 7.5% 4/15/32 (c) | | 200,000 | 202,457 |
| | | | 757,315 |
| Super Retail - 1.4% | | | |
| Academy Ltd. 6% 11/15/27 (c) | | 75,000 | 73,317 |
| Asbury Automotive Group, Inc.: | | | |
| 4.5% 3/1/28 | | 21,000 | 19,699 |
| 4.625% 11/15/29 (c) | | 45,000 | 40,690 |
| 4.75% 3/1/30 | | 20,000 | 18,128 |
| 5% 2/15/32 (c) | | 45,000 | 40,005 |
| Bath & Body Works, Inc. 6.625% 10/1/30 (c) | | 110,000 | 109,918 |
| Carvana Co.: | | | |
| 12% 12/1/28 pay-in-kind (c)(e) | | 9,492 | 9,297 |
| 13% 6/1/30 pay-in-kind (c)(e) | | 13,769 | 13,661 |
| 14% 6/1/31 pay-in-kind (c)(e) | | 17,020 | 17,061 |
| EG Global Finance PLC 12% 11/30/28 (c) | | 200,000 | 206,460 |
| Group 1 Automotive, Inc. 4% 8/15/28 (c) | | 200,000 | 181,889 |
| LBM Acquisition LLC 6.25% 1/15/29 (c) | | 80,000 | 73,437 |
| Macy's Retail Holdings LLC 6.125% 3/15/32 (c) | | 35,000 | 33,107 |
| Michaels Companies, Inc.: | | | |
| 5.25% 5/1/28 (c) | | 40,000 | 33,855 |
| 7.875% 5/1/29 (c) | | 40,000 | 29,309 |
| Sally Holdings LLC 6.75% 3/1/32 | | 105,000 | 101,499 |
| | | | 1,001,332 |
| Technology - 4.2% | | | |
| Acuris Finance U.S. 5% 5/1/28 (c) | | 170,000 | 154,222 |
| ams-OSRAM AG 10.5% 3/30/29 (Reg. S) | EUR | 100,000 | 106,720 |
| Athenahealth Group, Inc. 6.5% 2/15/30 (c) | | 175,000 | 157,543 |
| Block, Inc.: | | | |
| 2.75% 6/1/26 | | 75,000 | 70,467 |
| 3.5% 6/1/31 | | 75,000 | 63,357 |
| Boxer Parent Co., Inc. 9.125% 3/1/26 (c) | | 5,000 | 5,030 |
| CA Magnum Holdings 5.375% 10/31/26 (c) | | 400,000 | 378,400 |
| Cloud Software Group, Inc. 9% 9/30/29 (c) | | 185,000 | 178,017 |
| Coherent Corp. 5% 12/15/29 (c) | | 45,000 | 41,515 |
| Crowdstrike Holdings, Inc. 3% 2/15/29 | | 70,000 | 61,498 |
| Diamond II Ltd. 7.95% 7/28/26 (Reg. S) | | 200,000 | 200,500 |
| Elastic NV 4.125% 7/15/29 (c) | | 40,000 | 35,620 |
| HTA Group Ltd. 7% 12/18/25 (c) | | 75,000 | 74,883 |
| Iliad Holding SAS: | | | |
| 5.625% 10/15/28 (Reg. S) | EUR | 100,000 | 105,377 |
| 8.5% 4/15/31 (c)(i) | | 75,000 | 75,656 |
| Iliad SA 5.375% 6/14/27 (Reg. S) | EUR | 200,000 | 217,175 |
| Lenovo Group Ltd. 3.421% 11/2/30 (c) | | 200,000 | 172,640 |
| Match Group Holdings II LLC 4.125% 8/1/30 (c) | | 55,000 | 47,630 |
| MicroStrategy, Inc. 6.125% 6/15/28 (c) | | 120,000 | 111,213 |
| NCR Atleos Corp. 9.5% 4/1/29 (c) | | 100,000 | 106,299 |
| NCR Voyix Corp. 5.125% 4/15/29 (c) | | 45,000 | 41,351 |
| Open Text Holdings, Inc. 4.125% 2/15/30 (c) | | 200,000 | 175,658 |
| Qorvo, Inc. 4.375% 10/15/29 | | 45,000 | 41,525 |
| Rackspace Finance LLC 3.5% 5/15/28 (c) | | 83,500 | 35,070 |
| Roblox Corp. 3.875% 5/1/30 (c) | | 185,000 | 159,997 |
| Seagate HDD Cayman: | | | |
| 8.25% 12/15/29 (c) | | 45,000 | 47,830 |
| 8.5% 7/15/31 (c) | | 40,000 | 42,708 |
| Sensata Technologies BV 4% 4/15/29 (c) | | 65,000 | 58,193 |
| Synaptics, Inc. 4% 6/15/29 (c) | | 30,000 | 26,343 |
| TTM Technologies, Inc. 4% 3/1/29 (c) | | 60,000 | 53,663 |
| UKG, Inc. 6.875% 2/1/31 (c) | | 55,000 | 55,105 |
| | | | 3,101,205 |
| Telecommunications - 6.1% | | | |
| Altice France Holding SA 6% 2/15/28 (c) | | 75,000 | 21,879 |
| Altice France SA: | | | |
| 4.125% 1/15/29 (Reg. S) | EUR | 120,000 | 83,093 |
| 5.125% 1/15/29 (c) | | 50,000 | 32,639 |
| 5.125% 7/15/29 (c) | | 120,000 | 78,164 |
| 5.5% 1/15/28 (c) | | 130,000 | 87,828 |
| AXIAN Telecom 7.375% 2/16/27 (c) | | 200,000 | 194,125 |
| C&W Senior Finance Ltd. 6.875% 9/15/27 (c) | | 330,000 | 312,484 |
| Consolidated Communications, Inc. 5% 10/1/28 (c) | | 135,000 | 112,066 |
| CT Trust 5.125% 2/3/32 (c) | | 200,000 | 173,470 |
| Frontier Communications Holdings LLC: | | | |
| 5% 5/1/28 (c) | | 55,000 | 50,599 |
| 5.875% 10/15/27 (c) | | 50,000 | 47,958 |
| 5.875% 11/1/29 | | 14,771 | 12,333 |
| 6% 1/15/30 (c) | | 95,000 | 79,158 |
| 8.75% 5/15/30 (c) | | 65,000 | 66,178 |
| IHS Netherlands Holdco BV 8% 9/18/27 (c) | | 200,000 | 188,000 |
| Intelsat Jackson Holdings SA 6.5% 3/15/30 (c) | | 135,000 | 129,214 |
| LCPR Senior Secured Financing DAC: | | | |
| 5.125% 7/15/29 (c) | | 400,000 | 333,551 |
| 6.75% 10/15/27 (c) | | 90,000 | 83,279 |
| Level 3 Financing, Inc.: | | | |
| 4% 4/15/31 (c) | | 95,000 | 52,013 |
| 4.5% 4/1/30 (c) | | 75,000 | 42,890 |
| Liquid Telecommunications Financing PLC 5.5% 9/4/26 (c) | | 200,000 | 117,875 |
| Lorca Telecom Bondco SAU 4% 9/18/27 (Reg. S) | EUR | 100,000 | 103,945 |
| Millicom International Cellular SA 4.5% 4/27/31 (c) | | 200,000 | 166,459 |
| Northwest Fiber LLC/Northwest Fiber Finance Sub, Inc. 10.75% 6/1/28 (c) | | 30,000 | 30,881 |
| RCS & RDS SA 2.5% 2/5/25 (Reg. S) | EUR | 100,000 | 104,451 |
| Sable International Finance Ltd. 5.75% 9/7/27 (c) | | 180,000 | 171,066 |
| SBA Communications Corp.: | | | |
| 3.125% 2/1/29 | | 70,000 | 60,960 |
| 3.875% 2/15/27 | | 200,000 | 187,959 |
| Telecom Italia SpA 3% 9/30/25 (Reg. S) | EUR | 300,000 | 313,040 |
| Telefonica Celular del Paraguay SA 5.875% 4/15/27 (c) | | 200,000 | 195,738 |
| Turkcell Iletisim Hizmet A/S 5.8% 4/11/28 (c) | | 200,000 | 191,438 |
| Uniti Group LP/Uniti Fiber Holdings, Inc./CSL Capital LLC 6% 1/15/30 (c) | | 210,000 | 163,315 |
| VTR Comunicaciones SpA 5.125% 1/15/28 (c) | | 176,000 | 139,700 |
| Windstream Escrow LLC 7.75% 8/15/28 (c) | | 200,000 | 192,707 |
| WP/AP Telecom Holdings IV BV 3.75% 1/15/29 (Reg. S) | EUR | 100,000 | 99,783 |
| Zayo Group Holdings, Inc.: | | | |
| 4% 3/1/27 (c) | | 115,000 | 91,536 |
| 6.125% 3/1/28 (c) | | 60,000 | 39,990 |
| | | | 4,551,764 |
| Textiles/Apparel - 0.4% | | | |
| Crocs, Inc.: | | | |
| 4.125% 8/15/31 (c) | | 115,000 | 96,504 |
| 4.25% 3/15/29 (c) | | 55,000 | 49,307 |
| CT Investment GmbH 6.375% 4/15/30 (Reg. S) | EUR | 100,000 | 106,853 |
| Victoria's Secret & Co. 4.625% 7/15/29 (c) | | 50,000 | 39,283 |
| | | | 291,947 |
| Transportation Ex Air/Rail - 0.1% | | | |
| Seaspan Corp. 5.5% 8/1/29 (c) | | 110,000 | 94,603 |
| Utilities - 3.9% | | | |
| Abu Dhabi National Energy Co. PJSC 4.696% 4/24/33 (c) | | 200,000 | 189,813 |
| Aegea Finance SARL 9% 1/20/31 (c) | | 200,000 | 210,060 |
| Clearway Energy Operating LLC 4.75% 3/15/28 (c) | | 40,000 | 37,694 |
| ContourGlobal Power Holdings SA 3.125% 1/1/28 (Reg. S) | EUR | 221,000 | 215,804 |
| DPL, Inc.: | | | |
| 4.125% 7/1/25 | | 180,000 | 174,844 |
| 4.35% 4/15/29 | | 215,000 | 193,842 |
| Energia Group ROI 6.875% 7/31/28 (Reg. S) | EUR | 113,000 | 124,549 |
| Eskom Holdings SOC Ltd. 8.45% 8/10/28 (c) | | 60,000 | 59,025 |
| Mong Duong Finance Holdings BV: | | | |
| 5.125% 5/7/29 (c) | | 92,229 | 87,963 |
| 5.125% 5/7/29 (Reg. S) | | 230,573 | 219,909 |
| NextEra Energy Partners LP 4.25% 9/15/24 (c) | | 4,000 | 3,944 |
| NRG Energy, Inc. 3.875% 2/15/32 (c) | | 5,000 | 4,213 |
| Pacific Gas & Electric Co.: | | | |
| 3.75% 8/15/42 | | 10,000 | 7,123 |
| 3.95% 12/1/47 | | 55,000 | 38,564 |
| 4.55% 7/1/30 | | 130,000 | 120,662 |
| 4.95% 7/1/50 | | 415,000 | 337,529 |
| PG&E Corp. 5% 7/1/28 | | 375,000 | 357,310 |
| Pike Corp. 5.5% 9/1/28 (c) | | 175,000 | 165,854 |
| Solaris Midstream Holdings LLC 7.625% 4/1/26 (c) | | 70,000 | 70,273 |
| Star Energy Geothermal Wayang Windu Ltd. 6.75% 4/24/33 (Reg. S) | | 156,600 | 154,447 |
| Vertiv Group Corp. 4.125% 11/15/28 (c) | | 95,000 | 87,980 |
| Vistra Operations Co. LLC 5.625% 2/15/27 (c) | | 60,000 | 58,377 |
| | | | 2,919,779 |
TOTAL NONCONVERTIBLE BONDS | | | 59,819,248 |
| TOTAL CORPORATE BONDS (Cost $65,768,181) | | | 60,728,506 |
| | | | |
| Government Obligations - 2.6% |
| | | Principal Amount (a) | Value ($) |
| Germany - 1.6% | | | |
| German Federal Republic: | | | |
| 0% 10/18/24 (Reg. S) | EUR | 1,055,000 | 1,107,329 |
| 2.2% 4/13/28(Reg. S) | EUR | 75,000 | 78,623 |
TOTAL GERMANY | | | 1,185,952 |
| United States of America - 1.0% | | | |
| U.S. Treasury Bonds: | | | |
| 2.875% 5/15/52 | | 336,000 | 236,447 |
| 3.625% 2/15/53 | | 428,000 | 349,689 |
| U.S. Treasury Notes 3.875% 8/15/33 | | 189,000 | 177,424 |
TOTAL UNITED STATES OF AMERICA | | | 763,560 |
| TOTAL GOVERNMENT OBLIGATIONS (Cost $2,084,788) | | | 1,949,512 |
| | | | |
| Common Stocks - 2.3% |
| | | Shares | Value ($) |
| Automotive & Auto Parts - 0.0% | | | |
| UC Holdings, Inc. (b)(h) | | 3,510 | 3,510 |
| Energy - 1.4% | | | |
| California Resources Corp. | | 4,138 | 218,735 |
| California Resources Corp. warrants 10/27/24 (h) | | 530 | 9,127 |
| Chesapeake Energy Corp. (j) | | 1,694 | 152,257 |
| EP Energy Corp. (b)(h) | | 7,975 | 14,196 |
| Exxon Mobil Corp. | | 826 | 97,691 |
| Mesquite Energy, Inc. (b)(h) | | 3,453 | 278,574 |
| Noble Corp. PLC: | | | |
| warrants 2/4/28 (h) | | 600 | 15,068 |
| warrants 2/4/28 (h) | | 600 | 13,152 |
| Nostrum Oil & Gas LP warrants (b)(h) | | 6,753 | 0 |
| PureWest Energy (b) | | 105 | 24 |
| PureWest Energy rights (b)(h) | | 63 | 0 |
| Superior Energy Services, Inc. Class A (b) | | 609 | 39,281 |
| Tidewater, Inc. warrants 11/14/42 (h) | | 1,897 | 191,661 |
TOTAL ENERGY | | | 1,029,766 |
| Entertainment/Film - 0.2% | | | |
| New Cotai LLC/New Cotai Capital Corp. (b)(g)(h) | | 125,816 | 96,878 |
| Food & Drug Retail - 0.1% | | | |
| Casino Guichard Perrachon SA (h) | | 32,888 | 1,007 |
| Casino Guichard Perrachon SA warrants 4/27/29 (h) | | 32,888 | 14 |
| Northeast Grocery, Inc. (b)(g)(h) | | 12,754 | 71,677 |
| Southeastern Grocers, Inc. rights (b)(h) | | 7,744 | 8,518 |
TOTAL FOOD & DRUG RETAIL | | | 81,216 |
| Homebuilders/Real Estate - 0.0% | | | |
| China Aoyuan Group Ltd. (h) | | 12,176 | 182 |
| Hotels - 0.0% | | | |
| Travelport Finance Luxembourg SARL (b) | | 7 | 20,232 |
| Telecommunications - 0.0% | | | |
| Digicel Group Ltd. (b) | | 3,198 | 2,868 |
| Textiles/Apparel - 0.1% | | | |
| Intelsat Emergence SA (b) | | 2,308 | 96,728 |
| Utilities - 0.5% | | | |
| PG&E Corp. | | 7,733 | 132,312 |
| Vistra Corp. | | 3,295 | 249,893 |
TOTAL UTILITIES | | | 382,205 |
| TOTAL COMMON STOCKS (Cost $1,247,672) | | | 1,713,585 |
| | | | |
| Bank Loan Obligations - 4.5% |
| | | Principal Amount (a) | Value ($) |
| Aerospace - 0.1% | | | |
| TransDigm, Inc. Tranche I 1LN, term loan CME Term SOFR 1 Month Index + 2.750% 8.0594% 8/24/28 (e)(f)(k) | | 64,554 | 64,864 |
| Air Transportation - 0.6% | | | |
| Echo Global Logistics, Inc.: | | | |
| 1LN, term loan CME Term SOFR 3 Month Index + 4.750% 10.1657% 11/23/28 (b)(e)(f)(k) | | 190,105 | 190,105 |
| 2LN, term loan: | | | |
CME Term SOFR 3 Month Index + 7.000% 12.4157% 11/23/29 (b)(e)(f)(k) | | 30,000 | 30,000 |
CME Term SOFR 3 Month Index + 8.000% 13.4157% 11/23/29 (b)(e)(f)(k) | | 257,000 | 257,000 |
TOTAL AIR TRANSPORTATION | | | 477,105 |
| Banks & Thrifts - 0.0% | | | |
| First Eagle Holdings, Inc. Tranche B 1LN, term loan CME Term SOFR 3 Month Index + 2.500% 7.8019% 2/1/27 (e)(f)(k) | | 16,671 | 16,646 |
| Broadcasting - 0.0% | | | |
| Diamond Sports Group LLC term loan 10% 8/2/27 (k) | | 4,684 | 7,432 |
| Building Materials - 0.1% | | | |
| Hunter Douglas, Inc. Tranche B 1LN, term loan CME Term SOFR 3 Month Index + 3.500% 8.8238% 2/25/29 (e)(f)(k) | | 49,125 | 48,722 |
| Chemicals - 0.2% | | | |
| Consolidated Energy Finance SA Tranche B 1LN, term loan CME Term SOFR 1 Month Index + 4.500% 9.8157% 11/15/30 (e)(f)(k) | | 75,000 | 72,446 |
| Discovery Purchaser Corp. 1LN, term loan CME Term SOFR 3 Month Index + 4.370% 9.6813% 10/4/29 (e)(f)(k) | | 79,004 | 78,856 |
TOTAL CHEMICALS | | | 151,302 |
| Diversified Financial Services - 0.5% | | | |
| BCP Renaissance Parent LLC Tranche B 1LN, term loan CME Term SOFR 1 Month Index + 3.500% 8.8285% 10/31/28 (e)(f)(k) | | 12,777 | 12,822 |
| GTCR W-2 Merger Sub LLC Tranche B 1LN, term loan CME Term SOFR 1 Month Index + 3.000% 8.3094% 1/31/31 (e)(f)(k) | | 125,000 | 125,235 |
| HarbourVest Partners LLC Tranche B 1LN, term loan CME Term SOFR 1 Month Index + 2.500% 7.8432% 4/22/30 (e)(f)(k) | | 14,354 | 14,354 |
| Softbank SVF II Cayman LP 1LN, term loan 3 month U.S. LIBOR + 5.000% 6% 12/31/24 (b)(e)(f)(k) | | 244,821 | 240,537 |
TOTAL DIVERSIFIED FINANCIAL SERVICES | | | 392,948 |
| Diversified Media - 0.2% | | | |
| CMG Media Corp. Tranche B 1LN, term loan CME Term SOFR 3 Month Index + 3.500% 8.9094% 12/17/26 (e)(f)(k) | | 138,568 | 116,685 |
| Energy - 0.0% | | | |
| Mesquite Energy, Inc.: | | | |
| 1LN, term loan 3 month U.S. LIBOR + 8.000% 0% (b)(d)(f)(k) | | 65,772 | 0 |
| term loan 0% (b)(d)(e)(k) | | 28,000 | 0 |
TOTAL ENERGY | | | 0 |
| Food & Drug Retail - 0.0% | | | |
| Northeast Grocery, Inc. Tranche B 1LN, term loan CME Term SOFR 1 Month Index + 7.500% 12.8257% 12/13/28 (e)(f)(k) | | 25,000 | 24,958 |
| Food/Beverage/Tobacco - 0.2% | | | |
| Triton Water Holdings, Inc. Tranche B 1LN, term loan CME Term SOFR 1 Month Index + 4.000% 9.3019% 3/31/28 (e)(f)(k) | | 129,675 | 129,805 |
| Healthcare - 0.0% | | | |
| Electron BidCo, Inc. Tranche B 1LN, term loan CME Term SOFR 1 Month Index + 3.000% 8.4302% 11/1/28 (e)(f)(k) | | 9,800 | 9,814 |
| Insurance - 0.2% | | | |
| Acrisure LLC Tranche B 1LN, term loan CME Term SOFR 1 Month Index + 4.250% 9.6802% 2/15/27 (e)(f)(k) | | 4,888 | 4,894 |
| Alliant Holdings Intermediate LLC Tranche B6 1LN, term loan CME Term SOFR 1 Month Index + 3.500% 8.8189% 11/6/30 (e)(f)(k) | | 31,375 | 31,488 |
| Truist Insurance Holdings LLC 2L, term loan CME Term SOFR 1 Month Index + 4.750% 3/8/32 (f)(k)(l) | | 80,000 | 80,650 |
TOTAL INSURANCE | | | 117,032 |
| Publishing/Printing - 0.2% | | | |
| Clear Channel International BV Tranche B 1LN, term loan 7.5% 8/31/27 (k) | | 120,000 | 118,200 |
| Services - 0.8% | | | |
| Amentum Government Services Holdings LLC Tranche B 1LN, term loan CME Term SOFR 1 Month Index + 4.000% 9.4302% 1/23/27 (e)(f)(k) | | 14,438 | 14,444 |
| Ascend Learning LLC 2LN, term loan CME Term SOFR 1 Month Index + 5.750% 11.1657% 12/10/29 (e)(f)(k) | | 10,000 | 9,792 |
| CoreLogic, Inc. Tranche B 1LN, term loan CME Term SOFR 1 Month Index + 3.500% 8.9302% 6/2/28 (e)(f)(k) | | 157,975 | 152,051 |
| Finastra U.S.A., Inc. term loan CME Term SOFR 1 Month Index + 7.250% 12.4592% 9/13/29 (b)(e)(f)(k) | | 191,556 | 191,556 |
| Spin Holdco, Inc. Tranche B 1LN, term loan CME Term SOFR 3 Month Index + 4.000% 9.5854% 3/4/28 (e)(f)(k) | | 191,828 | 168,718 |
| STS Operating, Inc. 1LN, term loan CME Term SOFR 1 Month Index + 4.000% 9.42% 3/25/31 (e)(f)(k) | | 20,000 | 20,167 |
| Uber Technologies, Inc. Tranche B 1LN, term loan CME Term SOFR 3 Month Index + 3.000% 8.0793% 3/3/30 (e)(f)(k) | | 51,244 | 51,549 |
TOTAL SERVICES | | | 608,277 |
| Super Retail - 0.2% | | | |
| Great Outdoors Group LLC Tranche B 1LN, term loan CME Term SOFR 1 Month Index + 3.750% 9.1802% 3/5/28 (e)(f)(k) | | 154,830 | 154,746 |
| Technology - 0.8% | | | |
| Applied Systems, Inc.: | | | |
| Tranche 2LN, term loan CME Term SOFR 1 Month Index + 5.250% 10.5594% 2/23/32 (e)(f)(k) | | 5,000 | 5,160 |
| Tranche B 1LN, term loan CME Term SOFR 1 Month Index + 3.500% 8.8094% 2/24/31 (e)(f)(k) | | 5,000 | 5,034 |
| Athenahealth Group, Inc. Tranche B 1LN, term loan CME Term SOFR 1 Month Index + 3.500% 8.5657% 2/15/29 (e)(f)(k) | | 87,589 | 87,370 |
| Cotiviti, Inc.: | | | |
| Tranche 1LN, term loan 7.625% 2/24/31 (k) | | 70,000 | 69,358 |
| Tranche B 1LN, term loan CME Term SOFR 1 Month Index + 3.250% 2/21/31 (f)(k)(l) | | 20,000 | 20,017 |
| DH Corp./Societe term loan CME Term SOFR 3 Month Index + 7.250% 12.4592% 9/13/29 (b)(e)(f)(k) | | 4,474 | 4,474 |
| MH Sub I LLC Tranche B 1LN, term loan CME Term SOFR 1 Month Index + 4.250% 9.5657% 5/3/28 (e)(f)(k) | | 158,574 | 157,925 |
| Rackspace Finance LLC Tranche B 1LN, term loan CME Term SOFR 1 Month Index + 6.250% 11.686% 5/15/28 (e)(f)(k) | | 19,398 | 19,326 |
| UKG, Inc. Tranche B 1LN, term loan CME Term SOFR 1 Month Index + 3.500% 8.8143% 2/10/31 (e)(f)(k) | | 219,416 | 220,366 |
TOTAL TECHNOLOGY | | | 589,030 |
| Telecommunications - 0.4% | | | |
| Altice France SA Tranche B14 1LN, term loan CME Term SOFR 1 Month Index + 5.500% 10.8286% 8/15/28 (e)(f)(k) | | 366,300 | 273,696 |
| Crown Subsea Communications Holding, Inc. Tranche B 1LN, term loan CME Term SOFR 1 Month Index + 4.750% 10.0674% 1/30/31 (e)(f)(k) | | 15,000 | 15,094 |
TOTAL TELECOMMUNICATIONS | | | 288,790 |
| TOTAL BANK LOAN OBLIGATIONS (Cost $3,437,014) | | | 3,316,356 |
| | | | |
| Preferred Securities - 5.4% |
| | | Principal Amount (a) | Value ($) |
| Banks & Thrifts - 2.8% | | | |
| Banco de Credito e Inversiones 8.75% (c)(e)(m) | | 200,000 | 208,414 |
| Banco de Sabadell SA 5.75% (Reg. S) (e)(m) | EUR | 200,000 | 209,417 |
| Banco Mercantil del Norte SA 7.625% (c)(e)(m) | | 40,000 | 39,180 |
| Bank of America Corp.: | | | |
| 4.375% (e)(m) | | 100,000 | 91,736 |
| 5.875% (e)(m) | | 190,000 | 183,658 |
| Bank of Communications Co. Ltd. 3.8% (Reg. S) (e)(m) | | 200,000 | 196,926 |
| CaixaBank SA 5.875% (Reg. S) (e)(m) | EUR | 200,000 | 208,591 |
| Citigroup, Inc. 7.625% (e)(m) | | 120,000 | 125,744 |
| Deutsche Bank AG 6.75% (e)(m) | EUR | 200,000 | 202,055 |
| Industrial & Commercial Bank of China Ltd. 3.2% (Reg. S) (e)(m) | | 200,000 | 189,543 |
| Rizal Commercial Banking Corp. 6.5% (Reg. S) (e)(m) | | 200,000 | 197,786 |
| Tinkoff Bank JSC 6% (b)(c)(d)(e)(m) | | 100,000 | 5,000 |
| Woori Bank 4.25% (Reg. S) (e)(m) | | 200,000 | 197,447 |
TOTAL BANKS & THRIFTS | | | 2,055,497 |
| Building Materials - 0.3% | | | |
| CEMEX S.A.B. de CV 5.125% (c)(e)(m) | | 200,000 | 193,414 |
| Diversified Financial Services - 1.0% | | | |
| CAS Capital No 1 Ltd. 4% (Reg. S) (e)(m) | | 200,000 | 183,918 |
| Charles Schwab Corp. 5.375% (e)(m) | | 340,000 | 339,249 |
| Nanyang Commercial Bank Ltd. 6.5% (Reg. S) (e)(m) | | 250,000 | 249,784 |
TOTAL DIVERSIFIED FINANCIAL SERVICES | | | 772,951 |
| Energy - 0.1% | | | |
| Wintershall Dea Finance 2 BV 2.4985% (Reg. S) (e)(m) | EUR | 100,000 | 100,344 |
| Homebuilders/Real Estate - 0.1% | | | |
| China Aoyuan Group Ltd. 0% (Reg. S) (b)(m)(n) | | 48,702 | 731 |
| Heimstaden Bostad AB 3.248% (Reg. S) (e)(m) | EUR | 100,000 | 77,511 |
TOTAL HOMEBUILDERS/REAL ESTATE | | | 78,242 |
| Technology - 0.3% | | | |
| Network i2i Ltd. 5.65% (Reg. S) (e)(m) | | 200,000 | 199,336 |
| Telecommunications - 0.3% | | | |
| Telefonica Europe BV 6.75% (Reg. S) (e)(m) | EUR | 200,000 | 238,056 |
| Utilities - 0.5% | | | |
| Electricite de France SA 7.5% (Reg. S) (e)(m) | EUR | 200,000 | 239,033 |
| TenneT Holding BV 2.374% (Reg. S) (e)(m) | EUR | 100,000 | 104,964 |
TOTAL UTILITIES | | | 343,997 |
| TOTAL PREFERRED SECURITIES (Cost $3,943,848) | | | 3,981,837 |
| | | | |
| Money Market Funds - 2.0% |
| | | Shares | Value ($) |
| Fidelity Cash Central Fund 5.39% (o) | | 1,486,515 | 1,486,812 |
| Fidelity Securities Lending Cash Central Fund 5.39% (o)(p) | | 9,499 | 9,500 |
| TOTAL MONEY MARKET FUNDS (Cost $1,496,220) | | | 1,496,312 |
| | | | |
| TOTAL INVESTMENT IN SECURITIES - 98.6% (Cost $77,977,723) | 73,186,108 |
NET OTHER ASSETS (LIABILITIES) - 1.4% | 1,012,568 |
| NET ASSETS - 100.0% | 74,198,676 |
| | |
Currency Abbreviations
| EUR | - | European Monetary Unit |
Legend
| (a) | Amount is stated in United States dollars unless otherwise noted. |
| (c) | Security exempt from registration under Rule 144A of the Securities Act of 1933. These securities may be resold in transactions exempt from registration, normally to qualified institutional buyers. At the end of the period, the value of these securities amounted to $40,700,348 or 54.9% of net assets. |
| (d) | Non-income producing - Security is in default. |
| (e) | Coupon rates for floating and adjustable rate securities reflect the rates in effect at period end. |
| (f) | Coupon is indexed to a floating interest rate which may be multiplied by a specified factor and/or subject to caps or floors. |
| (g) | Restricted securities (including private placements) - Investment in securities not registered under the Securities Act of 1933 (excluding 144A issues). At the end of the period, the value of restricted securities (excluding 144A issues) amounted to $254,381 or 0.3% of net assets. |
| (i) | Security or a portion of the security purchased on a delayed delivery or when-issued basis. |
| (j) | Security or a portion of the security is on loan at period end. |
| (k) | Remaining maturities of bank loan obligations may be less than the stated maturities shown as a result of contractual or optional prepayments by the borrower. Such prepayments cannot be predicted with certainty. |
| (l) | The coupon rate will be determined upon settlement of the loan after period end. |
| (m) | Security is perpetual in nature with no stated maturity date. |
| (n) | Security initially issued in zero coupon form which converts to coupon form at a specified rate and date. The rate shown is the rate at period end. |
| (o) | Affiliated fund that is generally available only to investment companies and other accounts managed by Fidelity Investments. The rate quoted is the annualized seven-day yield of the fund at period end. A complete unaudited listing of the fund's holdings as of its most recent quarter end is available upon request. In addition, each Fidelity Central Fund's financial statements, which are not covered by the Fund's Report of Independent Registered Public Accounting Firm, are available on the SEC's website or upon request. |
| (p) | Investment made with cash collateral received from securities on loan. |
| Additional information on each restricted holding is as follows: |
| Security | Acquisition Date | Acquisition Cost ($) |
| Jonah Energy Parent LLC 12% 11/5/25 | 5/05/23 | 79,366 |
| | | |
| New Cotai LLC/New Cotai Capital Corp. | 9/11/20 | 623,261 |
| | | |
| Northeast Grocery, Inc. | 11/08/21 | 5,075 |
| | | |
Affiliated Central Funds
Fiscal year to date information regarding the Fund's investments in Fidelity Central Funds, including the ownership percentage, is presented below.
| Affiliate | Value, beginning of period ($) | Purchases ($) | Sales Proceeds ($) | Dividend Income ($) | Realized Gain (loss) ($) | Change in Unrealized appreciation (depreciation) ($) | Value, end of period ($) | % ownership, end of period |
| Fidelity Cash Central Fund 5.39% | 2,730,646 | 31,505,123 | 32,748,943 | 194,081 | (13) | (1) | 1,486,812 | 0.0% |
| Fidelity Securities Lending Cash Central Fund 5.39% | - | 677,671 | 668,171 | 20 | - | - | 9,500 | 0.0% |
| Total | 2,730,646 | 32,182,794 | 33,417,114 | 194,101 | (13) | (1) | 1,496,312 | |
| | | | | | | | | |
Amounts in the dividend income column in the above table include any capital gain distributions from underlying funds, which are presented in the corresponding line item in the Statement of Operations, if applicable.
Amounts in the dividend income column for Fidelity Securities Lending Cash Central Fund represents the income earned on investing cash collateral, less rebates paid to borrowers and any lending agent fees associated with the loan, plus any premium payments received for lending certain types of securities.
Amounts included in the purchases and sales proceeds columns may include in-kind transactions, if applicable.
Investment Valuation
The following is a summary of the inputs used, as of April 30, 2024, involving the Fund's assets and liabilities carried at fair value. The inputs or methodology used for valuing securities may not be an indication of the risk associated with investing in those securities. For more information on valuation inputs, and their aggregation into the levels used below, please refer to the Investment Valuation section in the accompanying Notes to Financial Statements.
| Valuation Inputs at Reporting Date: |
| Description | Total ($) | Level 1 ($) | Level 2 ($) | Level 3 ($) |
Investments in Securities: | | | | |
|
| Equities: | | | | |
Communication Services | 99,596 | - | - | 99,596 |
Consumer Discretionary | 120,620 | - | - | 120,620 |
Consumer Staples | 81,216 | 1,021 | - | 80,195 |
Energy | 1,029,742 | 490,962 | 206,729 | 332,051 |
Real Estate | 182 | - | 182 | - |
Utilities | 382,229 | 382,205 | - | 24 |
|
| Corporate Bonds | 60,728,506 | - | 60,235,639 | 492,867 |
|
| Government Obligations | 1,949,512 | - | 1,949,512 | - |
|
| Bank Loan Obligations | 3,316,356 | - | 2,402,684 | 913,672 |
|
| Preferred Securities | 3,981,837 | - | 3,976,106 | 5,731 |
|
| Money Market Funds | 1,496,312 | 1,496,312 | - | - |
| Total Investments in Securities: | 73,186,108 | 2,370,500 | 68,770,852 | 2,044,756 |
The following is a reconciliation of Investments in Securities for which Level 3 inputs were used in determining value:
| |
| Investments in Securities: | |
| Corporate Bonds | | | |
| Beginning Balance | $ | 1,006,268 | |
| Net Realized Gain (Loss) on Investment Securities | | 261 | |
| Net Unrealized Gain (Loss) on Investment Securities | | (535,246) | |
| Cost of Purchases | | 91,317 | |
| Proceeds of Sales | | (75,521) | |
| Amortization/Accretion | | 1,750 | |
| Transfers into Level 3 | | 4,038 | |
| Transfers out of Level 3 | | - | |
| Ending Balance | $ | 492,867 | |
| The change in unrealized gain (loss) for the period attributable to Level 3 securities held at April 30, 2024 | $ | (104,841) | |
| Bank Loan Obligations | | | |
| Beginning Balance | $ | 1,341,958 | |
| Net Realized Gain (Loss) on Investment Securities | | 12,045 | |
| Net Unrealized Gain (Loss) on Investment Securities | | 23,522 | |
| Cost of Purchases | | 192,109 | |
| Proceeds of Sales | | (660,888) | |
| Amortization/Accretion | | 4,926 | |
| Transfers into Level 3 | | - | |
| Transfers out of Level 3 | | - | |
| Ending Balance | $ | 913,672 | |
| The change in unrealized gain (loss) for the period attributable to Level 3 securities held at April 30, 2024 | $ | 18,370 | |
| Other Investments in Securities | | | |
| Beginning Balance | $ | 1,018,185 | |
| Net Realized Gain (Loss) on Investment Securities | | 300,076 | |
| Net Unrealized Gain (Loss) on Investment Securities | | (305,283) | |
| Cost of Purchases | | 31,987 | |
| Proceeds of Sales | | (406,750) | |
| Amortization/Accretion | | 2 | |
| Transfers into Level 3 | | - | |
| Transfers out of Level 3 | | - | |
| Ending Balance | $ | 638,217 | |
| The change in unrealized gain (loss) for the period attributable to Level 3 securities held at April 30, 2024 | $ | (45,410) | |
| The information used in the above reconciliation represents fiscal year to date activity for any Investments in Securities identified as using Level 3 inputs at either the beginning or the end of the current fiscal period. Cost of purchases and proceeds of sales may include securities received and/or delivered through in-kind transactions, corporate actions or exchanges. Transfers into Level 3 were attributable to a lack of observable market data resulting from decreases in market activity, decreases in liquidity, security restructurings or corporate actions. Transfers out of Level 3 were attributable to observable market data becoming available for those securities. Transfers in or out of Level 3 represent the beginning value of any Security or Instrument where a change in the pricing level occurred from the beginning to the end of the period. Realized and unrealized gains (losses) disclosed in the reconciliation are included in Net Gain (Loss) on the Fund's Statement of Operations. | |
| Statement of Assets and Liabilities |
| | | | April 30, 2024 |
| | | | | |
| Assets | | | | |
| Investment in securities, at value (including securities loaned of $8,988) - See accompanying schedule: | | | | |
Unaffiliated issuers (cost $76,481,503) | $ | 71,689,796 | | |
Fidelity Central Funds (cost $1,496,220) | | 1,496,312 | | |
| | | | | |
| | | | | |
| Total Investment in Securities (cost $77,977,723) | | | $ | 73,186,108 |
| Cash | | | | 22,123 |
| Foreign currency held at value (cost $349,480) | | | | 348,293 |
| Receivable for investments sold | | | | 297,481 |
| Receivable for fund shares sold | | | | 50,892 |
| Dividends receivable | | | | 2,024 |
| Interest receivable | | | | 1,011,503 |
| Distributions receivable from Fidelity Central Funds | | | | 10,164 |
| Prepaid expenses | | | | 26 |
| Receivable from investment adviser for expense reductions | | | | 53,783 |
| Other receivables | | | | 11 |
Total assets | | | | 74,982,408 |
| Liabilities | | | | |
| Payable for investments purchased | | | | |
Regular delivery | $ | 388,377 | | |
Delayed delivery | | 75,000 | | |
| Payable for fund shares redeemed | | 99,348 | | |
| Distributions payable | | 64,387 | | |
| Accrued management fee | | 50,487 | | |
| Distribution and service plan fees payable | | 3,264 | | |
| Audit fee payable | | 85,919 | | |
| Other payables and accrued expenses | | 7,450 | | |
| Collateral on securities loaned | | 9,500 | | |
| Total liabilities | | | | 783,732 |
| Net Assets | | | $ | 74,198,676 |
| Net Assets consist of: | | | | |
| Paid in capital | | | $ | 93,128,042 |
| Total accumulated earnings (loss) | | | | (18,929,366) |
| Net Assets | | | $ | 74,198,676 |
| | | | | |
| Net Asset Value and Maximum Offering Price | | | | |
| Class A : | | | | |
Net Asset Value and redemption price per share ($7,852,196 ÷ 916,250 shares)(a) | | | $ | 8.57 |
| Maximum offering price per share (100/96.00 of $8.57) | | | $ | 8.93 |
| Class M : | | | | |
Net Asset Value and redemption price per share ($2,725,628 ÷ 318,107 shares)(a) | | | $ | 8.57 |
| Maximum offering price per share (100/96.00 of $8.57) | | | $ | 8.93 |
| Class C : | | | | |
Net Asset Value and offering price per share ($1,134,336 ÷ 132,366 shares)(a) | | | $ | 8.57 |
| Global High Income : | | | | |
Net Asset Value, offering price and redemption price per share ($59,729,213 ÷ 6,968,993 shares) | | | $ | 8.57 |
| Class I : | | | | |
Net Asset Value, offering price and redemption price per share ($2,757,303 ÷ 321,729 shares) | | | $ | 8.57 |
(a)Redemption price per share is equal to net asset value less any applicable contingent deferred sales charge. |
| Statement of Operations |
| | | | Year ended April 30, 2024 |
| Investment Income | | | | |
| Dividends | | | $ | 242,578 |
| Interest | | | | 4,634,392 |
| Income from Fidelity Central Funds (including $20 from security lending) | | | | 194,101 |
| Total income | | | | 5,071,071 |
| Expenses | | | | |
| Management fee | $ | 540,077 | | |
| Transfer agent fees | | 100,758 | | |
| Distribution and service plan fees | | 40,177 | | |
| Accounting fees | | 26,106 | | |
| Custodian fees and expenses | | 12,657 | | |
| Independent trustees' fees and expenses | | 381 | | |
| Registration fees | | 102,564 | | |
| Audit | | 102,437 | | |
| Legal | | 8,496 | | |
| Miscellaneous | | 297 | | |
| Total expenses before reductions | | 933,950 | | |
| Expense reductions | | (280,337) | | |
| Total expenses after reductions | | | | 653,613 |
| Net Investment income (loss) | | | | 4,417,458 |
| Realized and Unrealized Gain (Loss) | | | | |
| Net realized gain (loss) on: | | | | |
| Investment Securities: | | | | |
| Unaffiliated issuers | | (3,118,713) | | |
| Fidelity Central Funds | | (13) | | |
| Foreign currency transactions | | (17,011) | | |
| Total net realized gain (loss) | | | | (3,135,737) |
| Change in net unrealized appreciation (depreciation) on: | | | | |
| Investment Securities: | | | | |
| Unaffiliated issuers | | 4,111,893 | | |
| Fidelity Central Funds | | (1) | | |
| Assets and liabilities in foreign currencies | | (5,982) | | |
| Total change in net unrealized appreciation (depreciation) | | | | 4,105,910 |
| Net gain (loss) | | | | 970,173 |
| Net increase (decrease) in net assets resulting from operations | | | $ | 5,387,631 |
| Statement of Changes in Net Assets |
| |
| | Year ended April 30, 2024 | | Year ended April 30, 2023 |
| Increase (Decrease) in Net Assets | | | | |
| Operations | | | | |
| Net investment income (loss) | $ | 4,417,458 | $ | 4,276,750 |
| Net realized gain (loss) | | (3,135,737) | | (6,611,422) |
| Change in net unrealized appreciation (depreciation) | | 4,105,910 | | 2,033,258 |
| Net increase (decrease) in net assets resulting from operations | | 5,387,631 | | (301,414) |
| Distributions to shareholders | | (3,611,064) | | (3,486,392) |
| Distributions to shareholders from tax return of capital | | - | | (291,964) |
| | | | | |
| Total Distributions | | (3,611,064) | | (3,778,356) |
| Share transactions - net increase (decrease) | | (5,907,486) | | (13,836,765) |
| Total increase (decrease) in net assets | | (4,130,919) | | (17,916,535) |
| | | | | |
| Net Assets | | | | |
| Beginning of period | | 78,329,595 | | 96,246,130 |
| End of period | $ | 74,198,676 | $ | 78,329,595 |
| | | | | |
| | | | | |
Financial Highlights
Fidelity Advisor® Global High Income Fund Class A |
| |
| Years ended April 30, | | 2024 | | 2023 | | 2022 | | 2021 | | 2020 |
Selected Per-Share Data | | | | | | | | | | |
| Net asset value, beginning of period | $ | 8.36 | $ | 8.69 | $ | 9.79 | $ | 8.38 | $ | 9.48 |
| Income from Investment Operations | | | | | | | | | | |
Net investment income (loss) A,B | | .474 | | .422 | | .367 | | .391 | | .445 |
| Net realized and unrealized gain (loss) | | .121 | | (.382) | | (1.089) | | 1.394 | | (1.120) |
| Total from investment operations | | .595 | | .040 | | (.722) | | 1.785 | | (.675) |
| Distributions from net investment income | | (.385) | | (.341) | | (.378) | | (.375) | | (.425) |
| Distributions from tax return of capital | | - | | (.029) | | - | | - | | - |
| Total distributions | | (.385) | | (.370) | | (.378) | | (.375) | | (.425) |
| Net asset value, end of period | $ | 8.57 | $ | 8.36 | $ | 8.69 | $ | 9.79 | $ | 8.38 |
Total Return C,D | | | | .64% | | (7.64)% | | 21.59% | | (7.44)% |
Ratios to Average Net Assets B,E,F | | | | | | | | | | |
| Expenses before reductions | | 1.46% | | 1.38% | | 1.37% | | 1.34% | | 1.34% |
| Expenses net of fee waivers, if any | | | | 1.17% | | 1.16% | | 1.25% | | 1.25% |
| Expenses net of all reductions | | 1.06% | | 1.17% | | 1.16% | | 1.25% | | 1.25% |
| Net investment income (loss) | | 5.65% | | 5.13% | | 3.89% | | 4.17% | | 4.77% |
| Supplemental Data | | | | | | | | | | |
| Net assets, end of period (000 omitted) | $ | 7,852 | $ | 7,663 | $ | 15,467 | $ | 8,582 | $ | 5,927 |
Portfolio turnover rate G | | | | 29% | | 45% | | 53% | | 54% |
ACalculated based on average shares outstanding during the period.
BNet investment income (loss) is affected by the timing of the declaration of dividends by any underlying mutual funds or exchange-traded funds (ETFs). Net investment income (loss) of any mutual funds or ETFs is not included in the Fund's net investment income (loss) ratio.
CTotal returns would have been lower if certain expenses had not been reduced during the applicable periods shown.
DTotal returns do not include the effect of the sales charges.
EFees and expenses of any underlying mutual funds or exchange-traded funds (ETFs) are not included in the Fund's expense ratio. The Fund indirectly bears its proportionate share of these expenses. For additional expense information related to investments in Fidelity Central Funds, please refer to the "Investments in Fidelity Central Funds" note found in the Notes to Financial Statements section of the most recent Annual or Semi-Annual report.
FExpense ratios reflect operating expenses of the class. Expenses before reductions do not reflect amounts reimbursed, waived, or reduced through arrangements with the investment adviser, brokerage services, or other offset arrangements, if applicable, and do not represent the amount paid by the class during periods when reimbursements, waivers or reductions occur.
GAmount does not include the portfolio activity of any underlying mutual funds or exchange-traded funds (ETFs).
Fidelity Advisor® Global High Income Fund Class M |
| |
| Years ended April 30, | | 2024 | | 2023 | | 2022 | | 2021 | | 2020 |
Selected Per-Share Data | | | | | | | | | | |
| Net asset value, beginning of period | $ | 8.36 | $ | 8.69 | $ | 9.79 | $ | 8.38 | $ | 9.48 |
| Income from Investment Operations | | | | | | | | | | |
Net investment income (loss) A,B | | .474 | | .421 | | .372 | | .389 | | .445 |
| Net realized and unrealized gain (loss) | | .121 | | (.381) | | (1.094) | | 1.396 | | (1.120) |
| Total from investment operations | | .595 | | .040 | | (.722) | | 1.785 | | (.675) |
| Distributions from net investment income | | (.385) | | (.341) | | (.378) | | (.375) | | (.425) |
| Distributions from tax return of capital | | - | | (.029) | | - | | - | | - |
| Total distributions | | (.385) | | (.370) | | (.378) | | (.375) | | (.425) |
| Net asset value, end of period | $ | 8.57 | $ | 8.36 | $ | 8.69 | $ | 9.79 | $ | 8.38 |
Total Return C,D | | | | .64% | | (7.64)% | | 21.59% | | (7.44)% |
Ratios to Average Net Assets B,E,F | | | | | | | | | | |
| Expenses before reductions | | 1.50% | | 1.45% | | 1.41% | | 1.41% | | 1.41% |
| Expenses net of fee waivers, if any | | | | 1.17% | | 1.16% | | 1.25% | | 1.25% |
| Expenses net of all reductions | | 1.06% | | 1.17% | | 1.16% | | 1.25% | | 1.25% |
| Net investment income (loss) | | 5.65% | | 5.13% | | 3.89% | | 4.16% | | 4.77% |
| Supplemental Data | | | | | | | | | | |
| Net assets, end of period (000 omitted) | $ | 2,726 | $ | 2,634 | $ | 3,118 | $ | 3,164 | $ | 2,928 |
Portfolio turnover rate G | | | | 29% | | 45% | | 53% | | 54% |
ACalculated based on average shares outstanding during the period.
BNet investment income (loss) is affected by the timing of the declaration of dividends by any underlying mutual funds or exchange-traded funds (ETFs). Net investment income (loss) of any mutual funds or ETFs is not included in the Fund's net investment income (loss) ratio.
CTotal returns would have been lower if certain expenses had not been reduced during the applicable periods shown.
DTotal returns do not include the effect of the sales charges.
EFees and expenses of any underlying mutual funds or exchange-traded funds (ETFs) are not included in the Fund's expense ratio. The Fund indirectly bears its proportionate share of these expenses. For additional expense information related to investments in Fidelity Central Funds, please refer to the "Investments in Fidelity Central Funds" note found in the Notes to Financial Statements section of the most recent Annual or Semi-Annual report.
FExpense ratios reflect operating expenses of the class. Expenses before reductions do not reflect amounts reimbursed, waived, or reduced through arrangements with the investment adviser, brokerage services, or other offset arrangements, if applicable, and do not represent the amount paid by the class during periods when reimbursements, waivers or reductions occur.
GAmount does not include the portfolio activity of any underlying mutual funds or exchange-traded funds (ETFs).
Fidelity Advisor® Global High Income Fund Class C |
| |
| Years ended April 30, | | 2024 | | 2023 | | 2022 | | 2021 | | 2020 |
Selected Per-Share Data | | | | | | | | | | |
| Net asset value, beginning of period | $ | 8.36 | $ | 8.69 | $ | 9.79 | $ | 8.38 | $ | 9.48 |
| Income from Investment Operations | | | | | | | | | | |
Net investment income (loss) A,B | | .411 | | .360 | | .301 | | .319 | | .375 |
| Net realized and unrealized gain (loss) | | .121 | | (.381) | | (1.094) | | 1.396 | | (1.119) |
| Total from investment operations | | .532 | | (.021) | | (.793) | | 1.715 | | (.744) |
| Distributions from net investment income | | (.322) | | (.285) | | (.307) | | (.305) | | (.356) |
| Distributions from tax return of capital | | - | | (.024) | | - | | - | | - |
| Total distributions | | (.322) | | (.309) | | (.307) | | (.305) | | (.356) |
| Net asset value, end of period | $ | 8.57 | $ | 8.36 | $ | 8.69 | $ | 9.79 | $ | 8.38 |
Total Return C,D | | | | (.11)% | | (8.33)% | | 20.69% | | (8.13)% |
Ratios to Average Net Assets B,E,F | | | | | | | | | | |
| Expenses before reductions | | 2.25% | | 2.20% | | 2.12% | | 2.14% | | 2.11% |
| Expenses net of fee waivers, if any | | | | 1.92% | | 1.91% | | 2.00% | | 2.00% |
| Expenses net of all reductions | | 1.81% | | 1.92% | | 1.91% | | 2.00% | | 2.00% |
| Net investment income (loss) | | 4.90% | | 4.38% | | 3.14% | | 3.41% | | 4.02% |
| Supplemental Data | | | | | | | | | | |
| Net assets, end of period (000 omitted) | $ | 1,134 | $ | 1,599 | $ | 2,246 | $ | 3,249 | $ | 2,684 |
Portfolio turnover rate G | | | | 29% | | 45% | | 53% | | 54% |
ACalculated based on average shares outstanding during the period.
BNet investment income (loss) is affected by the timing of the declaration of dividends by any underlying mutual funds or exchange-traded funds (ETFs). Net investment income (loss) of any mutual funds or ETFs is not included in the Fund's net investment income (loss) ratio.
CTotal returns would have been lower if certain expenses had not been reduced during the applicable periods shown.
DTotal returns do not include the effect of the contingent deferred sales charge.
EFees and expenses of any underlying mutual funds or exchange-traded funds (ETFs) are not included in the Fund's expense ratio. The Fund indirectly bears its proportionate share of these expenses. For additional expense information related to investments in Fidelity Central Funds, please refer to the "Investments in Fidelity Central Funds" note found in the Notes to Financial Statements section of the most recent Annual or Semi-Annual report.
FExpense ratios reflect operating expenses of the class. Expenses before reductions do not reflect amounts reimbursed, waived, or reduced through arrangements with the investment adviser, brokerage services, or other offset arrangements, if applicable, and do not represent the amount paid by the class during periods when reimbursements, waivers or reductions occur.
GAmount does not include the portfolio activity of any underlying mutual funds or exchange-traded funds (ETFs).
Fidelity® Global High Income Fund |
| |
| Years ended April 30, | | 2024 | | 2023 | | 2022 | | 2021 | | 2020 |
Selected Per-Share Data | | | | | | | | | | |
| Net asset value, beginning of period | $ | 8.36 | $ | 8.69 | $ | 9.79 | $ | 8.38 | $ | 9.48 |
| Income from Investment Operations | | | | | | | | | | |
Net investment income (loss) A,B | | .495 | | .442 | | .397 | | .413 | | .468 |
| Net realized and unrealized gain (loss) | | .121 | | (.381) | | (1.094) | | 1.395 | | (1.119) |
| Total from investment operations | | .616 | | .061 | | (.697) | | 1.808 | | (.651) |
| Distributions from net investment income | | (.406) | | (.361) | | (.403) | | (.398) | | (.449) |
| Distributions from tax return of capital | | - | | (.030) | | - | | - | | - |
| Total distributions | | (.406) | | (.391) | | (.403) | | (.398) | | (.449) |
| Net asset value, end of period | $ | 8.57 | $ | 8.36 | $ | 8.69 | $ | 9.79 | $ | 8.38 |
Total Return C | | | | .89% | | (7.40)% | | 21.89% | | (7.21)% |
Ratios to Average Net Assets B,D,E | | | | | | | | | | |
| Expenses before reductions | | 1.17% | | 1.10% | | 1.04% | | 1.04% | | 1.03% |
| Expenses net of fee waivers, if any | | | | .92% | | .91% | | 1.00% | | 1.00% |
| Expenses net of all reductions | | .81% | | .92% | | .91% | | 1.00% | | 1.00% |
| Net investment income (loss) | | 5.90% | | 5.38% | | 4.15% | | 4.41% | | 5.02% |
| Supplemental Data | | | | | | | | | | |
| Net assets, end of period (000 omitted) | $ | 59,729 | $ | 63,000 | $ | 72,441 | $ | 89,338 | $ | 73,039 |
Portfolio turnover rate F | | | | 29% | | 45% | | 53% | | 54% |
ACalculated based on average shares outstanding during the period.
BNet investment income (loss) is affected by the timing of the declaration of dividends by any underlying mutual funds or exchange-traded funds (ETFs). Net investment income (loss) of any mutual funds or ETFs is not included in the Fund's net investment income (loss) ratio.
CTotal returns would have been lower if certain expenses had not been reduced during the applicable periods shown.
DFees and expenses of any underlying mutual funds or exchange-traded funds (ETFs) are not included in the Fund's expense ratio. The Fund indirectly bears its proportionate share of these expenses. For additional expense information related to investments in Fidelity Central Funds, please refer to the "Investments in Fidelity Central Funds" note found in the Notes to Financial Statements section of the most recent Annual or Semi-Annual report.
EExpense ratios reflect operating expenses of the class. Expenses before reductions do not reflect amounts reimbursed, waived, or reduced through arrangements with the investment adviser, brokerage services, or other offset arrangements, if applicable, and do not represent the amount paid by the class during periods when reimbursements, waivers or reductions occur.
FAmount does not include the portfolio activity of any underlying mutual funds or exchange-traded funds (ETFs).
Fidelity Advisor® Global High Income Fund Class I |
| |
| Years ended April 30, | | 2024 | | 2023 | | 2022 | | 2021 | | 2020 |
Selected Per-Share Data | | | | | | | | | | |
| Net asset value, beginning of period | $ | 8.36 | $ | 8.69 | $ | 9.79 | $ | 8.38 | $ | 9.48 |
| Income from Investment Operations | | | | | | | | | | |
Net investment income (loss) A,B | | .494 | | .442 | | .400 | | .411 | | .473 |
| Net realized and unrealized gain (loss) | | .122 | | (.381) | | (1.097) | | 1.397 | | (1.124) |
| Total from investment operations | | .616 | | .061 | | (.697) | | 1.808 | | (.651) |
| Distributions from net investment income | | (.406) | | (.361) | | (.403) | | (.398) | | (.449) |
| Distributions from tax return of capital | | - | | (.030) | | - | | - | | - |
| Total distributions | | (.406) | | (.391) | | (.403) | | (.398) | | (.449) |
| Net asset value, end of period | $ | 8.57 | $ | 8.36 | $ | 8.69 | $ | 9.79 | $ | 8.38 |
Total Return C | | | | .89% | | (7.40)% | | 21.89% | | (7.21)% |
Ratios to Average Net Assets B,D,E | | | | | | | | | | |
| Expenses before reductions | | 1.21% | | 1.15% | | 1.05% | | 1.05% | | 1.03% |
| Expenses net of fee waivers, if any | | | | .92% | | .91% | | 1.00% | | 1.00% |
| Expenses net of all reductions | | .81% | | .92% | | .91% | | 1.00% | | 1.00% |
| Net investment income (loss) | | 5.90% | | 5.38% | | 4.14% | | 4.42% | | 5.02% |
| Supplemental Data | | | | | | | | | | |
| Net assets, end of period (000 omitted) | $ | 2,757 | $ | 3,433 | $ | 2,975 | $ | 7,844 | $ | 4,350 |
Portfolio turnover rate F | | | | 29% | | 45% | | 53% | | 54% |
ACalculated based on average shares outstanding during the period.
BNet investment income (loss) is affected by the timing of the declaration of dividends by any underlying mutual funds or exchange-traded funds (ETFs). Net investment income (loss) of any mutual funds or ETFs is not included in the Fund's net investment income (loss) ratio.
CTotal returns would have been lower if certain expenses had not been reduced during the applicable periods shown.
DFees and expenses of any underlying mutual funds or exchange-traded funds (ETFs) are not included in the Fund's expense ratio. The Fund indirectly bears its proportionate share of these expenses. For additional expense information related to investments in Fidelity Central Funds, please refer to the "Investments in Fidelity Central Funds" note found in the Notes to Financial Statements section of the most recent Annual or Semi-Annual report.
EExpense ratios reflect operating expenses of the class. Expenses before reductions do not reflect amounts reimbursed, waived, or reduced through arrangements with the investment adviser, brokerage services, or other offset arrangements, if applicable, and do not represent the amount paid by the class during periods when reimbursements, waivers or reductions occur.
FAmount does not include the portfolio activity of any underlying mutual funds or exchange-traded funds (ETFs).
For the period ended April 30, 2024
1. Organization.
Fidelity Global High Income Fund (the Fund) is a fund of Fidelity Summer Street Trust (the Trust) and is authorized to issue an unlimited number of shares. The Trust is registered under the Investment Company Act of 1940, as amended (the 1940 Act), as an open-end management investment company organized as a Massachusetts business trust. The Fund offers Class A, Class M, Class C, Global High Income and Class I shares, each of which has equal rights as to assets and voting privileges. Class A, Class M, Class C and Class I are Fidelity Advisor classes. Each class has exclusive voting rights with respect to matters that affect that class. Class C shares will automatically convert to Class A shares after a holding period of eight years from the initial date of purchase, with certain exceptions. The Fund's investments in emerging markets can be subject to social, economic, regulatory, and political uncertainties and can be extremely volatile.
Effective March 22, 2024, the Fund was closed to new accounts with certain exceptions. Effective May 20, 2024, the Fund was closed to was closed to all new investments (other than reinvestment of dividend and capital gain distributions).
2. Investments in Fidelity Central Funds.
Funds may invest in Fidelity Central Funds, which are open-end investment companies generally available only to other investment companies and accounts managed by the investment adviser and its affiliates. The Schedule of Investments lists any Fidelity Central Funds held as an investment as of period end, but does not include the underlying holdings of each Fidelity Central Fund. An investing fund indirectly bears its proportionate share of the expenses of the underlying Fidelity Central Funds.
Based on its investment objective, each Fidelity Central Fund may invest or participate in various investment vehicles or strategies that are similar to those of the investing fund. These strategies are consistent with the investment objectives of the investing fund and may involve certain economic risks which may cause a decline in value of each of the Fidelity Central Funds and thus a decline in the value of the investing fund.
| Fidelity Central Fund | Investment Manager | Investment Objective | Investment Practices | Expense RatioA |
| Fidelity Money Market Central Funds | Fidelity Management & Research Company LLC (FMR) | Each fund seeks to obtain a high level of current income consistent with the preservation of capital and liquidity. | Short-term Investments | Less than .005% |
A Expenses expressed as a percentage of average net assets and are as of each underlying Central Fund's most recent annual or semi-annual shareholder report.
A complete unaudited list of holdings for each Fidelity Central Fund is available upon request or at the Securities and Exchange Commission website at www.sec.gov. In addition, the financial statements of the Fidelity Central Funds which contain the significant accounting policies (including investment valuation policies) of those funds, and are not covered by the Report of Independent Registered Public Accounting Firm, are available on the Securities and Exchange Commission website or upon request.
3. Significant Accounting Policies.
The Fund is an investment company and applies the accounting and reporting guidance of the Financial Accounting Standards Board (FASB) Accounting Standards Codification Topic 946 Financial Services - Investment Companies. The financial statements have been prepared in conformity with accounting principles generally accepted in the United States of America (GAAP), which require management to make certain estimates and assumptions at the date of the financial statements. Actual results could differ from those estimates. Subsequent events, if any, through the date that the financial statements were issued have been evaluated in the preparation of the financial statements. The Fund's Schedule of Investments lists any underlying mutual funds or exchange-traded funds (ETFs) but does not include the underlying holdings of these funds. The following summarizes the significant accounting policies of the Fund:
Investment Valuation. Investments are valued as of 4:00 p.m. Eastern time on the last calendar day of the period. The Board of Trustees (the Board) has designated the Fund's investment adviser as the valuation designee responsible for the fair valuation function and performing fair value determinations as needed. The investment adviser has established a Fair Value Committee (the Committee) to carry out the day-to-day fair valuation responsibilities and has adopted policies and procedures to govern the fair valuation process and the activities of the Committee. In accordance with these fair valuation policies and procedures, which have been approved by the Board, the Fund attempts to obtain prices from one or more third party pricing services or brokers to value its investments. When current market prices, quotations or currency exchange rates are not readily available or reliable, investments will be fair valued in good faith by the Committee, in accordance with the policies and procedures. Factors used in determining fair value vary by investment type and may include market or investment specific events, transaction data, estimated cash flows, and market observations of comparable investments. The frequency that the fair valuation procedures are used cannot be predicted and they may be utilized to a significant extent. The Committee manages the Fund's fair valuation practices and maintains the fair valuation policies and procedures. The Fund's investment adviser reports to the Board information regarding the fair valuation process and related material matters.
The Fund categorizes the inputs to valuation techniques used to value its investments into a disclosure hierarchy consisting of three levels as shown below:
Level 1 - unadjusted quoted prices in active markets for identical investments
Level 2 - other significant observable inputs (including quoted prices for similar investments, interest rates, prepayment speeds, etc.)
Level 3 - unobservable inputs (including the Fund's own assumptions based on the best information available)
Valuation techniques used to value the Fund's investments by major category are as follows:
Debt securities, including restricted securities, are valued based on evaluated prices received from third party pricing services or from brokers who make markets in such securities. Corporate bonds, bank loan obligations, foreign government and government agency obligations, preferred securities and U.S. government and government agency obligations are valued by pricing services who utilize matrix pricing which considers yield or price of bonds of comparable quality, coupon, maturity and type or by broker-supplied prices. When independent prices are unavailable or unreliable, debt securities may be valued utilizing pricing methodologies which consider similar factors that would be used by third party pricing services. For foreign debt securities, when significant market or security specific events arise, valuations may be determined in good faith in accordance with procedures adopted by the Board. Debt securities are generally categorized as Level 2 in the hierarchy but may be Level 3 depending on the circumstances. The Fund invests a significant portion of its assets in below investment grade securities. The value of these securities can be more volatile due to changes in the credit quality of the issuer and is sensitive to changes in economic, market and regulatory conditions.
Equity securities, including restricted securities, for which market quotations are readily available, are valued at the last reported sale price or official closing price as reported by a third party pricing service on the primary market or exchange on which they are traded and are categorized as Level 1 in the hierarchy. In the event there were no sales during the day or closing prices are not available, securities are valued at the last quoted bid price or may be valued using the last available price and are generally categorized as Level 2 in the hierarchy. For foreign equity securities, when market or security specific events arise, comparisons to the valuation of American Depositary Receipts (ADRs), futures contracts, ETFs and certain indexes as well as quoted prices for similar securities may be used and would be categorized as Level 2 in the hierarchy. For equity securities, including restricted securities, where observable inputs are limited, assumptions about market activity and risk are used and these securities may be categorized as Level 3 in the hierarchy. Securities, including private placements or other restricted securities, for which observable inputs are not available are valued using alternate valuation approaches, including the market approach, the income approach and cost approach, and are categorized as Level 3 in the hierarchy. The market approach considers factors including the price of recent investments in the same or a similar security or financial metrics of comparable securities. The income approach considers factors including expected future cash flows, security specific risks and corresponding discount rates. The cost approach considers factors including the value of the security's underlying assets and liabilities.
Investments in open-end mutual funds, including the Fidelity Central Funds, are valued at their closing net asset value (NAV) each business day and are categorized as Level 1 in the hierarchy.
The following provides information on Level 3 securities held by the Fund that were valued at period end based on unobservable inputs. These amounts exclude valuations provided by a broker.
| Asset Type | Fair Value | Valuation Technique(s) | Unobservable Input | Amount or Range/Weighted Average | Impact to Valuation from an Increase in InputA |
| Equities | $ 632,486 | Market comparable | Enterprise value/Revenue multiple (EV/R) | 0.3 | Increase |
| | | | Enterprise value/EBITDA multiple (EV/EBITDA) | 3.8 - 12.8 / 5.4 | Increase |
| | | Market approach | Parity price | $0.90 | Increase |
| | | Discounted cash flow | Discount rate | 11.1% - 12.5% / 11.2% | Decrease |
| | | Recovery value | Recovery value | $0.00 - $1.10 / $1.10 | Increase |
| | | Black scholes | Discount rate | 4.9% | Increase |
| | | | Term | 2.8 | Increase |
| | | | Volatility | 60.0% | Increase |
| Corporate Bonds | $ 492,867 | Market comparable | Enterprise value/EBITDA multiple (EV/EBITDA) | 5.3 | Increase |
| | | | Daily production multiple ($/Million cubic feet per day) | $3,550.00 | Increase |
| | | Discounted cash flow | Yield | 18.8% | Decrease |
| | | Recovery value | Recovery value | $0.00 | Increase |
| | | Indicative market price | Evaluated bid | $0.01 - $24.00 / $12.03 | Increase |
| | | Black scholes | Discount rate | 4.9% | Increase |
| | | | Term | 2.8 | Increase |
| | | | Volatility | 60.0% | Increase |
| Bank Loan Obligations | $ 913,672 | Discounted cash flow | Yield | 7.2% - 12.2% / 10.0% | Decrease |
| | | Recovery value | Recovery value | $0.00 | Increase |
| Preferred Securities | $ 5,731 | Indicative market price | Evaluated bid | $1.50 - $5.00 / $4.55 | Increase |
A Represents the directional change in the fair value of the Level 3 investments that could have resulted from an increase in the corresponding input as of period end. A decrease to the unobservable input would have had the opposite effect. Significant changes in these inputs may have resulted in a significantly higher or lower fair value measurement at period end.
Changes in valuation techniques may result in transfers in or out of an assigned level within the disclosure hierarchy. The aggregate value of investments by input level as of April 30, 2024, as well as a roll forward of Level 3 investments, is included at the end of the Fund's Schedule of Investments.
Foreign Currency. Certain Funds may use foreign currency contracts to facilitate transactions in foreign-denominated securities. Gains and losses from these transactions may arise from changes in the value of the foreign currency or if the counterparties do not perform under the contracts' terms.
Foreign-denominated assets, including investment securities, and liabilities are translated into U.S. dollars at the exchange rates at period end. Purchases and sales of investment securities, income and dividends received, and expenses denominated in foreign currencies are translated into U.S. dollars at the exchange rate in effect on the transaction date.
The effects of exchange rate fluctuations on investments are included with the net realized and unrealized gain (loss) on investment securities. Other foreign currency transactions resulting in realized and unrealized gain (loss) are disclosed separately.
Investment Transactions and Income. For financial reporting purposes, the Fund's investment holdings and NAV include trades executed through the end of the last business day of the period. The NAV per share for processing shareholder transactions is calculated as of the close of business of the New York Stock Exchange (NYSE), normally 4:00 p.m. Eastern time and includes trades executed through the end of the prior business day. Gains and losses on securities sold are determined on the basis of identified cost and include proceeds received from litigation. Commissions paid to certain brokers with whom the investment adviser, or its affiliates, places trades on behalf of a fund include an amount in addition to trade execution, which may be rebated back to a fund. Any such rebates are included in net realized gain (loss) on investments in the Statement of Operations. Dividend income is recorded on the ex-dividend date, except for certain dividends from foreign securities where the ex-dividend date may have passed, which are recorded as soon as the Fund is informed of the ex-dividend date. Non-cash dividends included in dividend income, if any, are recorded at the fair market value of the securities received. Income and capital gain distributions from Fidelity Central Funds, if any, are recorded on the ex-dividend date. Certain distributions received by the Fund represent a return of capital or capital gain. The Fund determines the components of these distributions subsequent to the ex-dividend date, based upon receipt of tax filings or other correspondence relating to the underlying investment. These distributions are recorded as a reduction of cost of investments and/or as a realized gain. Interest income is accrued as earned and includes coupon interest and amortization of premium and accretion of discount on debt securities as applicable. Paid in Kind (PIK) income is recorded at the fair market value of the securities received. Investment income is recorded net of foreign taxes withheld where recovery of such taxes is uncertain. Debt obligations may be placed on non-accrual status and related interest income may be reduced by ceasing current accruals and writing off interest receivables when the collection of all or a portion of interest has become doubtful based on consistently applied procedures. A debt obligation is removed from non-accrual status when the issuer resumes interest payments or when collectability of interest is reasonably assured. Funds may file withholding tax reclaims in certain jurisdictions to recover a portion of amounts previously withheld. Any withholding tax reclaims income is included in the Statement of Operations in interest. Any receivables for withholding tax reclaims are included in the Statement of Assets and Liabilities in interest receivable.
Class Allocations and Expenses. Investment income, realized and unrealized capital gains and losses, common expenses of a fund, and certain fund-level expense reductions, if any, are allocated daily on a pro-rata basis to each class based on the relative net assets of each class to the total net assets of a fund. Each class differs with respect to transfer agent and distribution and service plan fees incurred, as applicable. Certain expense reductions may also differ by class, if applicable. For the reporting period, the allocated portion of income and expenses to each class as a percent of its average net assets may vary due to the timing of recording these transactions in relation to fluctuating net assets of the classes. Expenses directly attributable to a fund are charged to that fund. Expenses attributable to more than one fund are allocated among the respective funds on the basis of relative net assets or other appropriate methods. Expenses included in the accompanying financial statements reflect the expenses of that fund and do not include any expenses associated with any underlying mutual funds or exchange-traded funds (ETFs). Although not included in a fund's expenses, a fund indirectly bears its proportionate share of these expenses through the net asset value of each underlying mutual fund or exchange-traded fund (ETF). Expense estimates are accrued in the period to which they relate and adjustments are made when actual amounts are known.
Income Tax Information and Distributions to Shareholders. Each year, the Fund intends to qualify as a regulated investment company under Subchapter M of the Internal Revenue Code, including distributing substantially all of its taxable income and realized gains. As a result, no provision for U.S. Federal income taxes is required. As of April 30, 2024, the Fund did not have any unrecognized tax benefits in the financial statements; nor is the Fund aware of any tax positions for which it is reasonably possible that the total amounts of unrecognized tax benefits will significantly change in the next twelve months. The Fund files a U.S. federal tax return, in addition to state and local tax returns as required. The Fund's federal income tax returns are subject to examination by the Internal Revenue Service (IRS) for a period of three fiscal years after they are filed. State and local tax returns may be subject to examination for an additional fiscal year depending on the jurisdiction. Foreign taxes are provided for based on the Fund's understanding of the tax rules and rates that exist in the foreign markets in which it invests.
Distributions are declared and recorded daily and paid monthly from net investment income. Distributions from realized gains, if any, are declared and recorded on the ex-dividend date. Income and capital gain distributions are declared separately for each class. Income and capital gain distributions are determined in accordance with income tax regulations, which may differ from GAAP.
Capital accounts within the financial statements are adjusted for permanent book-tax differences. These adjustments have no impact on net assets or the results of operations. Capital accounts are not adjusted for temporary book-tax differences which will reverse in a subsequent period.
Book-tax differences are primarily due to foreign currency transactions, market discount, partnerships, capital loss carryforwards and losses deferred due to wash sales.
As of period end, the cost and unrealized appreciation (depreciation) in securities, and derivatives if applicable, for federal income tax purposes were as follows:
| Gross unrealized appreciation | $2,573,789 |
| Gross unrealized depreciation | (6,749,806) |
| Net unrealized appreciation (depreciation) | $(4,176,017) |
| Tax Cost | $77,351,263 |
The tax-based components of distributable earnings as of period end were as follows:
| Undistributed ordinary income | $108,236 |
| Capital loss carryforward | $(14,858,761) |
| Net unrealized appreciation (depreciation) on securities and other investments | $(4,178,842) |
Capital loss carryforwards are only available to offset future capital gains of the Fund to the extent provided by regulations and may be limited. The capital loss carryforward information presented below, including any applicable limitation, is estimated as of fiscal period end and is subject to adjustment.
Short-term | $(1,898,217) |
Long-term | (12,960,544) |
| Total capital loss carryforward | $(14,858,761) |
The tax character of distributions paid was as follows:
| | April 30, 2024 | April 30, 2023 |
| Ordinary Income | $3,611,064 | $3,486,392 |
| Tax Return of Capital | - | 291,964 |
| Total | $3,611,064 | $3,778,356 |
Delayed Delivery Transactions and When-Issued Securities. During the period, certain Funds transacted in securities on a delayed delivery or when-issued basis. Payment and delivery may take place after the customary settlement period for that security. The price of the underlying securities and the date when the securities will be delivered and paid for are fixed at the time the transaction is negotiated. Securities purchased on a delayed delivery or when-issued basis are identified as such in the Schedule of Investments. Compensation for interest forgone in the purchase of a delayed delivery or when-issued debt security may be received. With respect to purchase commitments, each applicable Fund identifies securities as segregated in its records with a value at least equal to the amount of the commitment. Payables and receivables associated with the purchases and sales of delayed delivery securities having the same coupon, settlement date and broker are offset. Delayed delivery or when-issued securities that have been purchased from and sold to different brokers are reflected as both payables and receivables in the Statement of Assets and Liabilities under the caption "Delayed delivery", as applicable. Losses may arise due to changes in the value of the underlying securities or if the counterparty does not perform under the contract's terms, or if the issuer does not issue the securities due to political, economic, or other factors.
Restricted Securities (including Private Placements). Funds may invest in securities that are subject to legal or contractual restrictions on resale. These securities generally may be resold in transactions exempt from registration or to the public if the securities are registered. Disposal of these securities may involve time-consuming negotiations and expense, and prompt sale at an acceptable price may be difficult. Information regarding restricted securities held at period end is included at the end of the Schedule of Investments, if applicable.
Loans and Other Direct Debt Instruments. Direct debt instruments are interests in amounts owed to lenders by corporate or other borrowers. These instruments may be in the form of loans, trade claims or other receivables and may include standby financing commitments such as revolving credit facilities that obligate a fund to supply additional cash to the borrower on demand. Loans may be acquired through assignment, participation, or may be made directly to a borrower. Such instruments are presented in the Bank Loan Obligations section in the Schedule of Investments. Certain funds may also invest in unfunded loan commitments, which are contractual obligations for future funding. Information regarding unfunded commitments is included at the end of the Schedule of Investments, if applicable.
4. Purchases and Sales of Investments.
Purchases and sales of securities, other than short-term securities, U.S. government securities and in-kind transactions, as applicable, are noted in the table below.
| | Purchases ($) | Sales ($) |
| Fidelity Global High Income Fund | 25,921,018 | 30,511,078 |
5. Fees and Other Transactions with Affiliates.
Management Fee. Fidelity Management & Research Company LLC (the investment adviser) and its affiliates provide the Fund with investment management related services for which the Fund pays a monthly management fee.
Effective March 1, 2024, the Fund's management contract was amended to incorporate administrative services previously covered under separate services agreements (Transfer Agent and Accounting agreements). The amended contract incorporates a management fee rate that may vary by class. The investment adviser or an affiliate pays certain expenses of managing and operating the Fund out of each class's management fee. Each class of the Fund pays a management fee to the investment adviser. The management fee is calculated and paid to the investment adviser every month. When determining a class's management fee, a mandate rate is calculated based on the monthly average net assets of a group of funds advised by FMR within a designated asset class. A discount rate is subtracted from the mandate rate once the Fund's monthly average net assets reach a certain level. The mandate rate and discount rate may vary by class. The annual management fee rate for a class of shares of the Fund is the lesser of (1) the class's mandate rate reduced by the class's discount rate (if applicable) or (2) the amount set forth in the following table.
| | Maximum Management Fee Rate % |
| Class A | .85 |
| Class M | .85 |
| Class C | .85 |
| Global High Income | .83 |
| Class I | .85 |
One-twelfth of the management fee rate for a class is applied to the average net assets of the class for the month, giving a dollar amount which is the management fee for the class for that month. A different management fee rate may be applicable to each class of the Fund. The difference between classes is the result of separate arrangements for class-level services and/or waivers of certain expenses. It is not the result of any difference in advisory or custodial fees or other expenses related to the management of the Fund's assets, which do not vary by class. For the portion of the reporting period on or after March 1, 2024, the total annualized management fee rates were as follows:
| | Total Management Fee Rate % |
| Class A | .84 |
| Class M | .84 |
| Class C | .84 |
| Global High Income | .80 |
| Class I | .84 |
Prior to March 1, 2024, the management fee was the sum of an individual fund fee rate that was based on an annual rate of .60% of the Fund's average net assets and an annualized group fee rate that averaged .10% during the period. The group fee rate was based upon the monthly average net assets of a group of registered investment companies with which the investment adviser has management contracts. The group fee rate decreased as assets under management increased and increased as assets under management decreased. For the portion of the reporting period prior to March 1, 2024, the total annualized management fee rate was .70%.
Effective March 1, 2024, the Fund's sub-advisory agreements with FMR Investment Management (UK) Limited, Fidelity Management & Research (Hong Kong) Limited, and Fidelity Management & Research (Japan) Limited were amended to provide that the investment adviser pays each sub-adviser monthly fees equal to 110% of the sub-adviser's costs for providing sub-advisory services.
Effective March 1, 2024, the Fund's sub-advisory agreement with FIL Investment Advisors (FIA) was amended to provide that the investment adviser pays FIA monthly fees at an annual rate of 0.30% with respect to the average daily net assets of the Fund managed by FIA. FIA in turn pays FIA(UK).
Distribution and Service Plan Fees. In accordance with Rule 12b-1 of the 1940 Act, the Fund has adopted separate Distribution and Service Plans for each class of shares. Certain classes pay Fidelity Distributors Company LLC (FDC), an affiliate of the investment adviser, separate Distribution and Service Fees, each of which is based on an annual percentage of each class' average net assets. In addition, FDC may pay financial intermediaries for selling shares of the Fund and providing shareholder support services. For the period, the Distribution and Service Fee rates, total fees and amounts retained by FDC were as follows:
| | Distribution Fee | Service Fee | Total Fees ($) | Retained by FDC ($) |
| Class A | - % | .25% | 19,512 | 465 |
| Class M | - % | .25% | 6,685 | 34 |
| Class C | .75% | .25% | 13,980 | 896 |
| | | | 40,177 | 1,395 |
Sales Load. FDC may receive a front-end sales charge of up to 4.00% for selling Class A shares and Class M shares, some of which is paid to financial intermediaries for selling shares of the Fund. Depending on the holding period, FDC may receive contingent deferred sales charges levied on Class A, Class M and Class C redemptions. The deferred sales charges are 1.00% for Class C shares, 1.00% for certain purchases of Class A shares and .25% for certain purchases of Class M shares.
For the period, sales charge amounts retained by FDC were as follows:
| | Retained by FDC ($) |
| Class A | 743 |
| Class M | 361 |
Class C A | 58 |
| | 1,162 |
A When Class C shares are initially sold, FDC pays commissions from its own resources to financial intermediaries through which the sales are made.
Transfer Agent Fees. Fidelity Investments Institutional Operations Company LLC (FIIOC), an affiliate of the investment adviser, is the transfer, dividend disbursing and shareholder servicing agent for each class of the Fund. Effective March 1, 2024, the Fund's management contract was amended to incorporate transfer agent services and associated fees previously covered under a separate services agreement. FIIOC pays for typesetting, printing and mailing of shareholder reports, except proxy statements.
During November 2023, the Board approved a change in the transfer agent fees effective December 1, 2023 to a fixed annual rate of class-level average net assets as follows:
| | % of Class-Level Average Net Assets |
| Class A | .1824 |
| Class M | .2000 |
| Class C | .2000 |
| Global High Income | .1497 |
| Class I | .1928 |
Prior to December 1, 2023, FIIOC received account fees and asset-based fees that varied according to the account size and type of account of the shareholders of the respective classes of the Fund. For the portion of the reporting period prior to March 1, 2024, the fees were equivalent to the following annualized rates:
| | Amount ($) | % of Class-Level Average Net AssetsA |
| Class A | 11,944 | .18 |
| Class M | 5,147 | .23 |
| Class C | 2,816 | .24 |
| Global High Income | 76,332 | .15 |
| Class I | 4,519 | .18 |
| | 100,758 | |
A Annualized.
Accounting Fees. Fidelity Service Company, Inc. (FSC), an affiliate of the investment adviser, maintains the Fund's accounting records. Effective March 1, 2024, the Fund's management contract was amended to incorporate accounting services and associated fees previously covered under a separate services agreement.
During November 2023, the Board approved a change in the accounting fees effective December 1, 2023 to a fixed annual rate of average net assets as follows:
| | % of Average Net Assets |
| Fidelity Global High Income Fund | .0414 |
Prior to December 1, 2023, the accounting fee was based on the level of average net assets for each month. For the portion of the reporting period prior to March 1, 2024, the fees were equivalent to the following annualized rates:
| | % of Average Net Assets |
| Fidelity Global High Income Fund | .04 |
Interfund Trades. Funds may purchase from or sell securities to other Fidelity Funds under procedures adopted by the Board. The procedures have been designed to ensure these interfund trades are executed in accordance with Rule 17a-7 of the 1940 Act. Any interfund trades are included within the respective purchases and sales amounts shown in the Purchases and Sales of Investments note. Interfund trades during the period are noted in the table below.
| | Purchases ($) | Sales ($) | Realized Gain (Loss)($) |
| Fidelity Global High Income Fund | - | 42,258 | 29,462 |
6. Committed Line of Credit.
Certain Funds participate with other funds managed by the investment adviser or an affiliate in a $4.25 billion credit facility (the "line of credit") to be utilized for temporary or emergency purposes to fund shareholder redemptions or for other short-term liquidity purposes. The participating funds have agreed to pay commitment fees on their pro-rata portion of the line of credit, which are reflected in Miscellaneous expenses on the Statement of Operations, and are listed below. During the period, there were no borrowings on this line of credit.
| | Amount ($) |
| Fidelity Global High Income Fund | 133 |
7. Security Lending.
Funds lend portfolio securities from time to time in order to earn additional income. Lending agents are used, including National Financial Services (NFS), an affiliate of the investment adviser. Pursuant to a securities lending agreement, NFS will receive a fee, which is capped at 9.9% of a fund's daily lending revenue, for its services as lending agent. A fund may lend securities to certain qualified borrowers, including NFS. On the settlement date of the loan, a fund receives collateral (in the form of U.S. Treasury obligations, letters of credit and/or cash) against the loaned securities and maintains collateral in an amount not less than 100% of the market value of the loaned securities during the period of the loan. The market value of the loaned securities is determined at the close of business of a fund and any additional required collateral is delivered to a fund on the next business day. A fund or borrower may terminate the loan at any time, and if the borrower defaults on its obligation to return the securities loaned because of insolvency or other reasons, a fund may apply collateral received from the borrower against the obligation. A fund may experience delays and costs in recovering the securities loaned. Any cash collateral received is invested in the Fidelity Securities Lending Cash Central Fund. Any loaned securities are identified as such in the Schedule of Investments, and the value of loaned securities and cash collateral at period end, as applicable, are presented in the Statement of Assets and Liabilities. Security lending income represents the income earned on investing cash collateral, less rebates paid to borrowers and any lending agent fees associated with the loan, plus any premium payments received for lending certain types of securities. Security lending income is presented in the Statement of Operations as a component of income from Fidelity Central Funds. Affiliated security lending activity, if any, was as follows:
| | Total Security Lending Fees Paid to NFS ($) | Security Lending Income From Securities Loaned to NFS ($) | Value of Securities Loaned to NFS at Period End ($) |
| Fidelity Global High Income Fund | 2 | - | - |
8. Expense Reductions.
The investment adviser contractually agreed to reimburse expenses of each class to the extent annual operating expenses exceeded certain levels of class-level average net assets as noted in the table below. This reimbursement will remain in place through August 31, 2025. Some expenses, for example the compensation of the independent Trustees, and certain miscellaneous expenses such as proxy and shareholder meeting expenses, are excluded from this reimbursement.
The following classes were in reimbursement during the period:
| | Expense Limitations | Reimbursement ($) |
| Class A | 1.15%/1.05%A | 30,188 |
| Class M | 1.15%/1.05%A | 11,453 |
| Class C | 1.90%/1.80%A | 6,059 |
| Global High Income | .90%/.80%A | 215,196 |
| Class I | .90%/.80%A | 11,620 |
| | | 274,516 |
A Expense limitation effective June 1, 2023.
Through arrangements with the Fund's custodian and each class' transfer agent, credits realized as a result of certain uninvested cash balances were used to reduce the Fund's expenses. During the period, custodian credits reduced the Fund's expenses by $2,497. During the period, transfer agent credits reduced each class' expenses as noted in the table below.
| | Expense reduction ($) |
| | |
| Class M | 16 |
In addition, during the period the investment adviser or an affiliate reimbursed and/or waived a portion of fund-level operating expenses in the amount of $3,308.
9. Distributions to Shareholders.
Distributions to shareholders of each class were as follows:
| | Year ended April 30, 2024 | Year ended April 30, 2023 |
| Fidelity Global High Income Fund | | |
| Distributions to shareholders | | |
| Class A | $357,744 | $380,555 |
| Class M | 122,765 | 118,501 |
| Class C | 53,282 | 69,010 |
| Global High Income | 2,934,976 | 3,044,980 |
| Class I | 142,297 | 165,310 |
Total | $3,611,064 | $3,778,356 |
10. Share Transactions.
Share transactions for each class were as follows and may contain in-kind transactions, automatic conversions between classes or exchanges between affiliated funds:
| | Shares | Shares | Dollars | Dollars |
| | Year ended April 30, 2024 | Year ended April 30, 2023 | Year ended April 30, 2024 | Year ended April 30, 2023 |
| Fidelity Global High Income Fund | | | | |
| Class A | | | | |
| Shares sold | 126,552 | 117,663 | $1,062,017 | $965,194 |
| Reinvestment of distributions | 41,448 | 45,152 | 348,935 | 370,851 |
| Shares redeemed | (168,522) | (1,026,071) | (1,416,170) | (8,638,977) |
| Net increase (decrease) | (522) | (863,256) | $(5,218) | $(7,302,932) |
| Class M | | | | |
| Shares sold | 51,011 | 29,016 | $435,194 | $241,895 |
| Reinvestment of distributions | 14,407 | 14,213 | 121,338 | 116,461 |
| Shares redeemed | (62,498) | (86,940) | (526,953) | (717,956) |
| Net increase (decrease) | 2,920 | (43,711) | $29,579 | $(359,600) |
| Class C | | | | |
| Shares sold | 13,459 | 14,105 | $112,545 | $115,329 |
| Reinvestment of distributions | 6,285 | 8,356 | 52,853 | 68,433 |
| Shares redeemed | (78,694) | (89,592) | (662,631) | (738,846) |
| Net increase (decrease) | (58,950) | (67,131) | $(497,233) | $(555,084) |
| Global High Income | | | | |
| Shares sold | 1,360,832 | 1,464,734 | $11,502,339 | $12,141,545 |
| Reinvestment of distributions | 268,630 | 287,398 | 2,260,979 | 2,353,838 |
| Shares redeemed | (2,197,018) | (2,551,630) | (18,463,340) | (20,718,743) |
| Net increase (decrease) | (567,556) | (799,498) | $(4,700,022) | $(6,223,360) |
| Class I | | | | |
| Shares sold | 84,464 | 411,632 | $710,197 | $3,447,408 |
| Reinvestment of distributions | 13,724 | 16,694 | 115,366 | 137,183 |
| Shares redeemed | (187,302) | (359,777) | (1,560,155) | (2,980,380) |
| Net increase (decrease) | (89,114) | 68,549 | $(734,592) | $604,211 |
11. Other.
A fund's organizational documents provide former and current trustees and officers with a limited indemnification against liabilities arising in connection with the performance of their duties to the fund. In the normal course of business, a fund may also enter into contracts that provide general indemnifications. A fund's maximum exposure under these arrangements is unknown as this would be dependent on future claims that may be made against a fund. The risk of material loss from such claims is considered remote.
12. Credit Risk.
The Fund's relatively large investment in countries with limited or developing capital markets may involve greater risks than investments in more developed markets and the prices of such investments may be volatile. The yields of emerging market debt obligations reflect, among other things, perceived credit risk. The consequences of political, social or economic changes in these markets may have disruptive effects on the market prices of the Fund's investments and the income they generate, as well as the Fund's ability to repatriate such amounts.
13. Litigation.
The Fund and other entities managed by FMR or its affiliates are involved with proceedings arising out of disputes in the United States Bankruptcy Court for the Southern District of Texas ("Bankruptcy Court"), relating to the In re Sanchez Energy Corporation chapter 11 bankruptcy case (Case No. 19-34508). A Bankruptcy Court-appointed representative of unsecured creditors asserted that eight million shares of Mesquite Energy, Inc. (formerly known as Sanchez Energy Corporation) (the "Company"), held in escrow pursuant to the terms of the Company's confirmed chapter 11 plan, should be awarded to the unsecured creditors instead of the Company's current equity holders, including the Fund, which were providers of debtor-in-possession financing to the Company during its chapter 11 case and holders of secured notes issued by the Company in 2018. The unsecured creditors also asserted that certain additional equity issued by the Company in 2020 in connection with two post-bankruptcy financings, also held by the Fund, is invalid. During August 2023, the Bankruptcy Court issued an opinion awarding a portion of the eight million shares to the unsecured creditors, diluting the value of the Fund's holdings in Mesquite. The Fund will appeal this decision. At this time, Management cannot determine any additional loss or dilution that may be realized. The Fund is also incurring legal costs in defending the disputes and has recovered a portion of these legal costs through an insurance claim.
14. Risk and Uncertainties.
Many factors affect a fund's performance. Developments that disrupt global economies and financial markets, such as pandemics, epidemics, outbreaks of infectious diseases, war, terrorism, and environmental disasters, may significantly affect a fund's investment performance. The effects of these developments to a fund will be impacted by the types of securities in which a fund invests, the financial condition, industry, economic sector, and geographic location of an issuer, and a fund's level of investment in the securities of that issuer. Significant concentrations in security types, issuers, industries, sectors, and geographic locations may magnify the factors that affect a fund's performance.
15. Proposed Reorganization.
The Board of Trustees of the Fund approved an Agreement and Plan of Reorganization (the Agreement) between the Fund and Fidelity High Income Fund. The Agreement provides for the transfer of all the assets and the assumption of all the liabilities of the Fund in exchange for corresponding shares of Fidelity High Income Fund equal in value to the net assets of the Fund on the day the reorganization is effective. The reorganization does not require shareholder approval and is expected to become effective in September 2024. The reorganization is expected to qualify as a tax-free transaction for federal income tax purposes with no gain or loss recognized by the funds or their shareholders.
To the Board of Trustees of Fidelity Summer Street Trust and Shareholders of Fidelity Global High Income Fund
Opinion on the Financial Statements
We have audited the accompanying statement of assets and liabilities, including the schedule of investments, of Fidelity Global High Income Fund (one of the funds constituting Fidelity Summer Street Trust, referred to hereafter as the "Fund") as of April 30, 2024, the related statement of operations for the year ended April 30, 2024, the statement of changes in net assets for each of the two years in the period ended April 30, 2024, including the related notes, and the financial highlights for each of the five years in the period ended April 30, 2024 (collectively referred to as the "financial statements"). In our opinion, the financial statements present fairly, in all material respects, the financial position of the Fund as of April 30, 2024, the results of its operations for the year then ended, the changes in its net assets for each of the two years in the period ended April 30, 2024 and the financial highlights for each of the five years in the period ended April 30, 2024 in conformity with accounting principles generally accepted in the United States of America.
Basis for Opinion
These financial statements are the responsibility of the Fund's management. Our responsibility is to express an opinion on the Fund's financial statements based on our audits. We are a public accounting firm registered with the Public Company Accounting Oversight Board (United States) (PCAOB) and are required to be independent with respect to the Fund in accordance with the U.S. federal securities laws and the applicable rules and regulations of the Securities and Exchange Commission and the PCAOB.
We conducted our audits of these financial statements in accordance with the standards of the PCAOB. Those standards require that we plan and perform the audit to obtain reasonable assurance about whether the financial statements are free of material misstatement, whether due to error or fraud.
Our audits included performing procedures to assess the risks of material misstatement of the financial statements, whether due to error or fraud, and performing procedures that respond to those risks. Such procedures included examining, on a test basis, evidence regarding the amounts and disclosures in the financial statements. Our audits also included evaluating the accounting principles used and significant estimates made by management, as well as evaluating the overall presentation of the financial statements. Our procedures included confirmation of securities owned as of April 30, 2024 by correspondence with the custodian, issuers of privately offered securities, agent banks and brokers; when replies were not received from brokers, we performed other auditing procedures. We believe that our audits provide a reasonable basis for our opinion.
/s/ PricewaterhouseCoopers LLP
Boston, Massachusetts
June 14, 2024
We have served as the auditor of one or more investment companies in the Fidelity group of funds since 1932.
The Trustees, Members of the Advisory Board (if any), and officers of the trust and fund, as applicable, are listed below. The Board of Trustees governs the fund and is responsible for protecting the interests of shareholders. The Trustees are experienced executives who meet periodically throughout the year to oversee the fund's activities, review contractual arrangements with companies that provide services to the fund, oversee management of the risks associated with such activities and contractual arrangements, and review the fund's performance. Except for Vijay Advani, each of the Trustees oversees 323 funds. Mr. Advani oversees 216 funds.
The Trustees hold office without limit in time except that (a) any Trustee may resign; (b) any Trustee may be removed by written instrument, signed by at least two-thirds of the number of Trustees prior to such removal; (c) any Trustee who requests to be retired or who has become incapacitated by illness or injury may be retired by written instrument signed by a majority of the other Trustees; and (d) any Trustee may be removed at any special meeting of shareholders by a two-thirds vote of the outstanding voting securities of the trust. Each Trustee who is not an interested person (as defined in the 1940 Act) of the trust and the fund is referred to herein as an Independent Trustee. Each Independent Trustee shall retire not later than the last day of the calendar year in which his or her 75th birthday occurs. The Independent Trustees may waive this mandatory retirement age policy with respect to individual Trustees. Officers and Advisory Board Members hold office without limit in time, except that any officer or Advisory Board Member may resign or may be removed by a vote of a majority of the Trustees at any regular meeting or any special meeting of the Trustees. Except as indicated, each individual has held the office shown or other offices in the same company for the past five years.
The fund's Statement of Additional Information (SAI) includes more information about the Trustees. To request a free copy, call Fidelity at 1-800-544-8544 if you're an individual investing directly with Fidelity, call 1-800-835-5092 if you're a plan sponsor or participant with Fidelity as your recordkeeper or call 1-877-208-0098 on institutional accounts or if you're an advisor or invest through one.
Experience, Skills, Attributes, and Qualifications of the Trustees. The Governance and Nominating Committee has adopted a statement of policy that describes the experience, qualifications, attributes, and skills that are necessary and desirable for potential Independent Trustee candidates (Statement of Policy). The Board believes that each Trustee satisfied at the time he or she was initially elected or appointed a Trustee, and continues to satisfy, the standards contemplated by the Statement of Policy. The Governance and Nominating Committee also engages professional search firms to help identify potential Independent Trustee candidates who have the experience, qualifications, attributes, and skills consistent with the Statement of Policy. From time to time, additional criteria based on the composition and skills of the current Independent Trustees, as well as experience or skills that may be appropriate in light of future changes to board composition, business conditions, and regulatory or other developments, have also been considered by the professional search firms and the Governance and Nominating Committee. In addition, the Board takes into account the Trustees' commitment and participation in Board and committee meetings, as well as their leadership of standing and ad hoc committees throughout their tenure.
In determining that a particular Trustee was and continues to be qualified to serve as a Trustee, the Board has considered a variety of criteria, none of which, in isolation, was controlling. The Board believes that, collectively, the Trustees have balanced and diverse experience, qualifications, attributes, and skills, which allow the Board to operate effectively in governing the fund and protecting the interests of shareholders. Information about the specific experience, skills, attributes, and qualifications of each Trustee, which in each case led to the Board's conclusion that the Trustee should serve (or continue to serve) as a trustee of the fund, is provided below.
Board Structure and Oversight Function. Robert A. Lawrence is an interested person and currently serves as Chair. The Trustees have determined that an interested Chair is appropriate and benefits shareholders because an interested Chair has a personal and professional stake in the quality and continuity of services provided to the fund. Independent Trustees exercise their informed business judgment to appoint an individual of their choosing to serve as Chair, regardless of whether the Trustee happens to be independent or a member of management. The Independent Trustees have determined that they can act independently and effectively without having an Independent Trustee serve as Chair and that a key structural component for assuring that they are in a position to do so is for the Independent Trustees to constitute a substantial majority for the Board. The Independent Trustees also regularly meet in executive session. David M. Thomas serves as Lead Independent Trustee and as such (i) acts as a liaison between the Independent Trustees and management with respect to matters important to the Independent Trustees and (ii) with management prepares agendas for Board meetings.
Fidelity® funds are overseen by different Boards of Trustees. The fund's Board oversees Fidelity's high income and certain equity funds, and other Boards oversee Fidelity's alternative investment, investment-grade bond, money market, asset allocation, and other equity funds. The asset allocation funds may invest in Fidelity® funds overseen by the fund's Board. The use of separate Boards, each with its own committee structure, allows the Trustees of each group of Fidelity® funds to focus on the unique issues of the funds they oversee, including common research, investment, and operational issues. On occasion, the separate Boards establish joint committees to address issues of overlapping consequences for the Fidelity® funds overseen by each Board.
The Trustees operate using a system of committees to facilitate the timely and efficient consideration of all matters of importance to the Trustees, the fund, and fund shareholders and to facilitate compliance with legal and regulatory requirements and oversight of the fund's activities and associated risks. The Board, acting through its committees, has charged FMR and its affiliates with (i) identifying events or circumstances the occurrence of which could have demonstrably adverse effects on the fund's business and/or reputation; (ii) implementing processes and controls to lessen the possibility that such events or circumstances occur or to mitigate the effects of such events or circumstances if they do occur; and (iii) creating and maintaining a system designed to evaluate continuously business and market conditions in order to facilitate the identification and implementation processes described in (i) and (ii) above. Because the day-to-day operations and activities of the fund are carried out by or through FMR, its affiliates, and other service providers, the fund's exposure to risks is mitigated but not eliminated by the processes overseen by the Trustees. While each of the Board's committees has responsibility for overseeing different aspects of the fund's activities, oversight is exercised primarily through the Operations, Audit, and Compliance Committees. Appropriate personnel, including but not limited to the fund's Chief Compliance Officer (CCO), FMR's internal auditor, the independent accountants, the fund's Treasurer and portfolio management personnel, make periodic reports to the Board's committees, as appropriate, including an annual review of Fidelity's risk management program for the Fidelity® funds. The responsibilities of each standing committee, including their oversight responsibilities, are described further under "Standing Committees of the Trustees."
Interested Trustees*:
Correspondence intended for a Trustee who is an interested person may be sent to Fidelity Investments, 245 Summer Street, Boston, Massachusetts 02210.
Name, Year of Birth; Principal Occupations and Other Relevant Experience+
Bettina Doulton (1964)
Year of Election or Appointment: 2020
Trustee
Ms. Doulton also serves as Trustee of other Fidelity® funds. Prior to her retirement, Ms. Doulton served in a variety of positions at Fidelity Investments, including as a managing director of research (2006-2007), portfolio manager to certain Fidelity® funds (1993-2005), equity analyst and portfolio assistant (1990-1993), and research assistant (1987-1990). Ms. Doulton currently owns and operates Cellardoor Winery. Previously, Ms. Doulton served as a member of the Board of Brown Capital Management, LLC (2014-2018).
Robert A. Lawrence (1952)
Year of Election or Appointment: 2020
Trustee
Chair of the Board of Trustees
Mr. Lawrence also serves as Trustee of other funds. Previously, Mr. Lawrence served as a Trustee and Member of the Advisory Board of certain funds. Prior to his retirement in 2008, Mr. Lawrence served as Vice President of certain Fidelity® funds (2006-2008), Senior Vice President, Head of High Income Division of Fidelity Management & Research Company (investment adviser firm, 2006-2008), and President of Fidelity Strategic Investments (investment adviser firm, 2002-2005).
* Determined to be an "Interested Trustee" by virtue of, among other things, his or her affiliation with the trust or various entities under common control with FMR.
+ The information includes the Trustee's principal occupation during the last five years and other information relating to the experience, attributes, and skills relevant to the Trustee's qualifications to serve as a Trustee, which led to the conclusion that the Trustee should serve as a Trustee for the fund.
Independent Trustees:
Correspondence intended for an Independent Trustee may be sent to Fidelity Investments, P.O. Box 55235, Boston, Massachusetts 02205-5235.
Name, Year of Birth; Principal Occupations and Other Relevant Experience+
Vijay C. Advani (1960)
Year of Election or Appointment: 2023
Trustee
Mr. Advani also serves as Trustee or Member of the Advisory Board of other funds. Previously, Mr. Advani served as Executive Chairman (2020-2022), Chief Executive Officer (2017-2020) and Chief Operating Officer (2016-2017) of Nuveen (global investment manager). He also served in various capacities at Franklin Resources (global investment manager), including Co-President (2015-2016), Executive Vice President, Global Advisory Services (2008-2015), Head of Global Retail Distribution (2005-2008), Executive Managing Director, International Retail Development (2002-2005), Managing Director, Product Developments, Sales & Marketing, Asia, Eastern Europe and Africa (2000-2002) and President, Templeton Asset Management India (1995-2000). Mr. Advani also served as Senior Investment Officer of International Finance Corporation (private equity and venture capital arm of The World Bank, 1984-1995). Mr. Advani is Chairman Emeritus of the U.S. India Business Council (2018-present), a Director of The Global Impact Investing Network (2019-present), a Director of LOK Capital (Mauritius) (2022-present), a member of the Advisory Council of LOK Capital (2022-present), a Senior Advisor of Neuberger Berman (2021-present), a Senior Advisor of Seviora Holdings Pte. Ltd (Temasek-Singapore) (2021-present), a Director of Seviora Capital (Singapore) (2021-present) and an Advisor of EQUIAM (2021-present). Mr. Advani formerly served as a member of the Board of BowX Acquisition Corp. (special purpose acquisition company, 2020-2021), a member of the Board of Intellecap (advisory arm of The Aavishkaar Group, 2018-2020), a member of the Board of Nuveen Investments, Inc. (2017-2020) and a member of the Board of Docusign (software, 2016-2019).
Thomas P. Bostick (1956)
Year of Election or Appointment: 2021
Trustee
Lieutenant General Bostick also serves as Trustee of other Fidelity® funds. Prior to his retirement, General Bostick (United States Army, Retired) held a variety of positions within the U.S. Army, including Chief of Engineers and Commanding General, U.S. Army Corps of Engineers (2012-2016) and Deputy Chief of Staff and Director of Human Resources, U.S. Army (2009-2012). General Bostick currently serves as a member of the Board and Finance and Governance & Sustainability Committees of CSX Corporation (transportation, 2020-present) and a member of the Board and Corporate Governance and Nominating Committee of Perma-Fix Environmental Services, Inc. (nuclear waste management, 2020-present). General Bostick serves as Chief Executive Officer of Bostick Global Strategies, LLC (consulting, 2016-present), as a member of the Board of HireVue, Inc. (video interview and assessment, 2020-present), as a member of the Board of Allonnia (biotechnology and engineering solutions, 2022-present), on the Advisory Board of Hilco Redevelopment Partners (a real estate investment and redevelopment company, 2021-present), and on the Advisory Board of Solugen, Inc. (specialty bio-based chemicals manufacturer, 2022-present). Previously, General Bostick served as a Member of the Advisory Board of certain Fidelity® funds (2021), President, Intrexon Bioengineering (2018-2020) and Chief Operating Officer (2017-2020) and Senior Vice President of the Environment Sector (2016-2017) of Intrexon Corporation (biopharmaceutical company).
Donald F. Donahue (1950)
Year of Election or Appointment: 2018
Trustee
Mr. Donahue also serves as Trustee of other Fidelity® funds. Mr. Donahue serves as President and Chief Executive Officer of Miranda Partners, LLC (risk consulting for the financial services industry, 2012-present). Previously, Mr. Donahue served as Chief Executive Officer (2006-2012), Chief Operating Officer (2003-2006) and Managing Director, Customer Marketing and Development (1999-2003) of The Depository Trust & Clearing Corporation (financial markets infrastructure). Mr. Donahue currently serves as a member (2007-present) and Co-Chairman (2016-present) of the Board of United Way of New York. Mr. Donahue previously served as a member of the Advisory Board of certain Fidelity® funds (2015-2018) and as a member of the Board of The Leadership Academy (previously NYC Leadership Academy) (2012-2022).
Vicki L. Fuller (1957)
Year of Election or Appointment: 2020
Trustee
Ms. Fuller also serves as Trustee of other Fidelity® funds. Previously, Ms. Fuller served as a member of the Advisory Board of certain Fidelity® funds (2018-2020), Chief Investment Officer of the New York State Common Retirement Fund (2012-2018) and held a variety of positions at AllianceBernstein L.P. (global asset management, 1985-2012), including Managing Director (2006-2012) and Senior Vice President and Senior Portfolio Manager (2001-2006). Ms. Fuller currently serves as a member of the Board, Audit Committee, Compensation Committee and Nominating and Governance Committee of two Blackstone business development companies (2020-present), as a member of the Board of Treliant, LLC (consulting, 2019-present), as a member of the Board of Ariel Alternatives, LLC (private equity, 2022-present) and as a member of the Board and Chair of the Audit Committee of Gusto, Inc. (software, 2021-present). In addition, Ms. Fuller currently serves as a member of the Executive Board of New York University's Stern School of Business. Ms. Fuller previously served as a member of the Board of Roosevelt University (2019-2024) and member of the Board, Audit Committee and Nominating and Governance Committee of The Williams Companies, Inc. (natural gas infrastructure, 2018-2021).
Patricia L. Kampling (1959)
Year of Election or Appointment: 2020
Trustee
Ms. Kampling also serves as Trustee of other Fidelity® funds. Prior to her retirement, Ms. Kampling served as Chairman of the Board and Chief Executive Officer (2012-2019), President and Chief Operating Officer (2011-2012) and Executive Vice President and Chief Financial Officer (2010-2011) of Alliant Energy Corporation. Ms. Kampling currently serves as a member of the Board, Audit Committee and Governance, Compensation and Nominating Committee of Xcel Energy Inc. (utilities company, 2020-present) and as a member of the Board, Audit, Finance and Risk Committee and Safety, Environmental, Technology and Operations Committee and Chair of the Executive Development and Compensation Committee of American Water Works Company, Inc. (utilities company, 2019-present). In addition, Ms. Kampling currently serves as a member of the Board of the Nature Conservancy, Wisconsin Chapter (2019-present). Previously, Ms. Kampling served as a Member of the Advisory Board of certain Fidelity® funds (2020), a member of the Board, Compensation Committee and Executive Committee and Chair of the Audit Committee of Briggs & Stratton Corporation (manufacturing, 2011-2021), a member of the Board of Interstate Power and Light Company (2012-2019) and Wisconsin Power and Light Company (2012-2019) (each a subsidiary of Alliant Energy Corporation) and as a member of the Board and Workforce Development Committee of the Business Roundtable (2018-2019).
Thomas A. Kennedy (1955)
Year of Election or Appointment: 2021
Trustee
Mr. Kennedy also serves as Trustee of other Fidelity® funds. Previously, Mr. Kennedy served as a Member of the Advisory Board of certain Fidelity® funds (2020) and held a variety of positions at Raytheon Company (aerospace and defense, 1983-2020), including Chairman and Chief Executive Officer (2014-2020) and Executive Vice President and Chief Operating Officer (2013-2014). Mr. Kennedy served as Executive Chairman of the Board of Directors of Raytheon Technologies Corporation (aerospace and defense, 2020-2021). Mr. Kennedy serves as a Director of the Board of Directors of Textron Inc. (aerospace and defense, 2023-present).
Oscar Munoz (1959)
Year of Election or Appointment: 2021
Trustee
Mr. Munoz also serves as Trustee of other Fidelity® funds. Prior to his retirement, Mr. Munoz served as Executive Chairman (2020-2021), Chief Executive Officer (2015-2020), President (2015-2016) and a member of the Board (2010-2021) of United Airlines Holdings, Inc. Mr. Munoz currently serves as a member of the Board of CBRE Group, Inc. (commercial real estate, 2020-present), a member of the Board of Univision Communications, Inc. (Hispanic media, 2020-present), a member of the Board of Archer Aviation Inc. (2021-present), a member of the Defense Business Board of the United States Department of Defense (2021-present) and a member of the Board of Salesforce.com, Inc. (cloud-based software, 2022-present). Previously, Mr. Munoz served as a Member of the Advisory Board of certain Fidelity® funds (2021).
David M. Thomas (1949)
Year of Election or Appointment: 2008
Trustee
Lead Independent Trustee
Mr. Thomas also serves as Trustee of other Fidelity® funds. Previously, Mr. Thomas served as Executive Chairman (2005-2006) and Chairman and Chief Executive Officer (2000-2005) of IMS Health, Inc. (pharmaceutical and healthcare information solutions) and as a member of the Board of Fortune Brands Home and Security (home and security products, 2004-2023). Mr. Thomas currently serves as Director (2013-present) and Non-Executive Chairman of the Board (2022-present) of Interpublic Group of Companies, Inc. (marketing communication).
Susan Tomasky (1953)
Year of Election or Appointment: 2020
Trustee
Ms. Tomasky also serves as Trustee of other Fidelity® funds. Prior to her retirement, Ms. Tomasky served in various executive officer positions at American Electric Power Company, Inc. (1998-2011), including most recently as President of AEP Transmission (2007-2011). Ms. Tomasky currently serves as a member of the Board and Sustainability Committee and as Chair of the Audit Committee of Marathon Petroleum Corporation (2018-present) and as a member of the Board, Executive Committee, Corporate Governance Committee and Organization and Compensation Committee and as Lead Director of the Board of Public Service Enterprise Group, Inc. (utilities company, 2012-present) and as a member of the Board of its subsidiary company, Public Service Electric and Gas Co. (2021-present). In addition, Ms. Tomasky currently serves as a member (2009-present) and President (2020-present) of the Board of the Royal Shakespeare Company - America (2009-present) and as a member and Vice Chair of the Board of Kenyon College (2016-present). Previously, Ms. Tomasky served as a Member of the Advisory Board of certain Fidelity® funds (2020), as a member of the Board of the Columbus Association for the Performing Arts (2011-2023), as a member of the Board of the Columbus Regional Airport Authority (2007-2020), as a member of the Board (2011-2018) and Lead Independent Director (2015-2018) of Andeavor Corporation (previously Tesoro Corporation) (independent oil refiner and marketer) and as a member of the Board of Summit Midstream Partners LP (energy, 2012-2018).
Michael E. Wiley (1950)
Year of Election or Appointment: 2018
Trustee
Mr. Wiley also serves as Trustee of other Fidelity® funds. Previously, Mr. Wiley served as a member of the Advisory Board of certain Fidelity® funds (2018-2020), Chairman, President and CEO of Baker Hughes, Inc. (oilfield services, 2000-2004). Mr. Wiley also previously served as a member of the Board of Andeavor Corporation (independent oil refiner and marketer, 2005-2018), a member of the Board of Andeavor Logistics LP (natural resources logistics, 2015-2018) and a member of the Board of High Point Resources (exploration and production, 2005-2020).
+ The information includes the Trustee's principal occupation during the last five years and other information relating to the experience, attributes, and skills relevant to the Trustee's qualifications to serve as a Trustee, which led to the conclusion that the Trustee should serve as a Trustee for the fund.
Advisory Board Members and Officers:
Correspondence intended for a Member of the Advisory Board (if any) may be sent to Fidelity Investments, P.O. Box 55235, Boston, Massachusetts 02205-5235. Correspondence intended for an officer or Peter S. Lynch may be sent to Fidelity Investments, 245 Summer Street, Boston, Massachusetts 02210.
Name, Year of Birth; Principal Occupations+
Peter S. Lynch (1944)
Year of Election or Appointment: 2003
Member of the Advisory Board
Mr. Lynch also serves as a Member of the Advisory Board of other Fidelity® funds. Mr. Lynch is Vice Chairman and a Director of Fidelity Management & Research Company LLC (investment adviser firm). In addition, Mr. Lynch serves as a Trustee of Boston College and as the Chairman of the Inner-City Scholarship Fund. Previously, Mr. Lynch served as Vice Chairman and a Director of FMR Co., Inc. (investment adviser firm) and on the Special Olympics International Board of Directors (1997-2006).
Karen B. Peetz (1955)
Year of Election or Appointment: 2023
Member of the Advisory Board
Ms. Peetz also serves as a Member of the Advisory Board of other funds. Previously, Ms. Peetz served as Chief Administration Officer (2020-2023) of Citigroup Inc. (a diversified financial service company). She also served in various capacities at Bank of New York Mellon Corporation, including President (2013-2016), Vice Chairman, Senior Executive Vice President and Chief Executive Officer of Financial Markets & Treasury Services (2010-2013), Senior Executive Vice President and Chief Executive Officer of Global Corporate Trust (2003-2008), Senior Vice President and Division Manager of Global Payments & Trade Services (2002-2003) and Senior Vice President and Division Manager of Domestic Corporate Trust (1998-2002). Ms. Peetz also served in various capacities at Chase Manhattan Corporation (1982-1998), including Senior Vice President and Manager of Corporate Trust International Business (1996-1998), Managing Director and Manager of Corporate Trust Services (1994-1996) and Managing Director and Group Manager of Financial Institution Sales (1990-1993). Ms. Peetz currently serves as Chair of Amherst Holdings Advisory Council (2018-present), Trustee of Johns Hopkins University (2016-present), Chair of the Carey Business School Advisory Council, Member of the Johns Hopkins Medicine Board and Finance Committee and Chair of the Lyme and Tick Related Disease Institute Advisory Council. Ms. Peetz previously served as a member of the Board of Guardian Life Insurance Company of America (2019-2023), a member of the Board of Trane Technologies (2018-2022), a member of the Board of Wells Fargo Corp. (2017-2019), a member of the Board of SunCoke Energy Inc. (2012-2016), a member of the Board of Private Export Funding Corporation (2010-2016) and as a Trustee of Penn State University (2010-2014) and the United Way of New York City (2008-2010).
Heather Bonner (1977)
Year of Election or Appointment: 2023
Assistant Treasurer
Ms. Bonner also serves as an officer of other funds. Ms. Bonner is a Senior Vice President (2022-present) and is an employee of Fidelity Investments (2022-present). Ms. Bonner serves as Senior Vice President, Vice President, Treasurer, or Director of certain Fidelity entities. Prior to joining Fidelity, Ms. Bonner served as Managing Director at AQR Capital Management (2013-2022) and was the Treasurer and Principal Financial Officer of the AQR Funds (2013-2022).
Craig S. Brown (1977)
Year of Election or Appointment: 2022
Deputy Treasurer
Mr. Brown also serves as an officer of other funds. Mr. Brown is a Vice President (2015-present) and is an employee of Fidelity Investments. Mr. Brown serves as Assistant Treasurer of FIMM, LLC (2021-present). Previously, Mr. Brown served as Assistant Treasurer of certain Fidelity® funds (2019-2022).
John J. Burke III (1964)
Year of Election or Appointment: 2018
Chief Financial Officer
Mr. Burke also serves as Chief Financial Officer of other funds. Mr. Burke is Head of Fidelity Fund and Investment Operations (2018-present) and is an employee of Fidelity Investments. Mr. Burke serves as President, Executive Vice President, or Director of certain Fidelity entities. Previously Mr. Burke served as head of Asset Management Investment Operations (2012-2018).
Margaret Carey (1973)
Year of Election or Appointment: 2023
Secretary and Chief Legal Officer (CLO)
Ms. Carey also serves as an officer of other funds and as CLO of certain Fidelity entities. Ms. Carey is a Senior Vice President, Deputy General Counsel (2019-present) and is an employee of Fidelity Investments.
William C. Coffey (1969)
Year of Election or Appointment: 2019
Assistant Secretary
Mr. Coffey also serves as Assistant Secretary of other funds. Mr. Coffey is a Senior Vice President, Deputy General Counsel (2010-present) and is an employee of Fidelity Investments. Previously, Mr. Coffey served as Secretary and CLO of certain funds (2018-2019); CLO, Secretary, or Senior Vice President of certain Fidelity entities and Assistant Secretary of certain funds (2009-2018).
Timothy M. Cohen (1969)
Year of Election or Appointment: 2018
Vice President
Mr. Cohen also serves as Vice President of other funds. Mr. Cohen is Co-Head of Equity (2018-present) and is an employee of Fidelity Investments. Mr. Cohen serves as President or Director of certain Fidelity entities. Previously, Mr. Cohen served as Executive Vice President of Fidelity SelectCo, LLC (2019) and Head of Global Equity Research (2016-2018).
Jonathan Davis (1968)
Year of Election or Appointment: 2010
Assistant Treasurer
Mr. Davis also serves as an officer of other funds. Mr. Davis is a Vice President (2006-present) and is an employee of Fidelity Investments. Mr. Davis serves as Assistant Treasurer or Director of certain Fidelity entities.
Laura M. Del Prato (1964)
Year of Election or Appointment: 2018
Assistant Treasurer
Ms. Del Prato also serves as an officer of other funds. Ms. Del Prato is a Senior Vice President (2017-present) and is an employee of Fidelity Investments. Ms. Del Prato serves as Senior Vice President, Vice President, Assistant Treasurer, or Director of certain Fidelity entities. Previously, Ms. Del Prato served as President and Treasurer of The North Carolina Capital Management Trust: Cash Portfolio and Term Portfolio (2018-2020).
Colm A. Hogan (1973)
Year of Election or Appointment: 2020
Assistant Treasurer
Mr. Hogan also serves as an officer of other funds. Mr. Hogan is a Vice President (2016-present) and is an employee of Fidelity Investments. Mr. Hogan serves as Assistant Treasurer of certain Fidelity entities. Previously, Mr. Hogan served as Deputy Treasurer of certain Fidelity® funds (2016-2020) and Assistant Treasurer of certain Fidelity® funds (2016-2018).
Pamela R. Holding (1964)
Year of Election or Appointment: 2018
Vice President
Ms. Holding also serves as Vice President of other funds. Ms. Holding is Co-Head of Equity (2018-present) and is an employee of Fidelity Investments. Previously, Ms. Holding served as Executive Vice President of Fidelity SelectCo, LLC (2019) and as Chief Investment Officer of Fidelity Institutional Asset Management (2013-2018).
Chris Maher (1972)
Year of Election or Appointment: 2020
Deputy Treasurer
Mr. Maher also serves as an officer of other funds. Mr. Maher is a Vice President (2008-present) and is an employee of Fidelity Investments. Mr. Maher serves as Assistant Treasurer of certain Fidelity entities. Previously, Mr. Maher served as Assistant Treasurer of certain funds (2013-2020).
Jason P. Pogorelec (1975)
Year of Election or Appointment: 2020
Chief Compliance Officer
Mr. Pogorelec also serves as Chief Compliance Officer of other funds. Mr. Pogorelec is a Senior Vice President of Asset Management Compliance (2020-present) and is an employee of Fidelity Investments. Mr. Pogorelec serves as Compliance Officer of Fidelity Management & Research Company LLC (investment adviser firm, 2023-present) and Ballyrock Investment Advisors LLC (2023-present). Previously, Mr. Pogorelec served as a Vice President, Associate General Counsel for Fidelity Investments (2010-2020) and Assistant Secretary of certain Fidelity® funds (2015-2020).
Brett Segaloff (1972)
Year of Election or Appointment: 2021
Anti-Money Laundering (AML) Officer
Mr. Segaloff also serves as AML Officer of other funds. Mr. Segaloff is a Vice President (2022-present) and is an employee of Fidelity Investments. Mr. Segaloff serves as Anti Money Laundering Compliance Officer or Anti Money Laundering/Bank Secrecy Act Compliance Officer of certain Fidelity entities.
Stacie M. Smith (1974)
Year of Election or Appointment: 2016
President and Treasurer
Ms. Smith also serves as an officer of other funds. Ms. Smith is a Senior Vice President (2016-present) and is an employee of Fidelity Investments. Ms. Smith serves as Assistant Treasurer of certain Fidelity entities and has served in other fund officer roles.
Jim Wegmann (1979)
Year of Election or Appointment: 2019
Assistant Treasurer
Mr. Wegmann also serves as an officer of other funds. Mr. Wegmann is a Vice President (2016-present) and is an employee of Fidelity Investments. Mr. Wegmann serves as Assistant Treasurer of FIMM, LLC (2021-present). Previously, Mr. Wegmann served as Assistant Treasurer of certain Fidelity® funds (2019-2021).
+ The information includes principal occupation during the last five years.
As a shareholder, you incur two types of costs: (1) transaction costs, which may include sales charges (loads) on purchase payments or redemption proceeds, as applicable and (2) ongoing costs, which generally include management fees, distribution and/or service (12b-1) fees and other Fund expenses. This Example is intended to help you understand your ongoing costs (in dollars) of investing in a fund and to compare these costs with the ongoing costs of investing in other mutual funds.
| The Example is based on an investment of $1,000 invested at the beginning of the period and held for the entire period (November 1, 2023 to April 30, 2024). |
Actual Expenses
The first line of the accompanying table provides information about actual account values and actual expenses. You may use the information in this line, together with the amount you invested, to estimate the expenses that you paid over the period. Simply divide your account value by $1,000.00 (for example, an $8,600 account value divided by $1,000.00 = 8.6), then multiply the result by the number in the first line for a class/Fund under the heading entitled "Expenses Paid During Period" to estimate the expenses you paid on your account during this period. If any fund is a shareholder of any underlying mutual funds or exchange-traded funds (ETFs) (the Underlying Funds), such fund indirectly bears its proportional share of the expenses of the Underlying Funds in addition to the direct expenses incurred presented in the table. These fees and expenses are not included in the annualized expense ratio used to calculate the expense estimate in the table below.
Hypothetical Example for Comparison Purposes
The second line of the accompanying table provides information about hypothetical account values and hypothetical expenses based on the actual expense ratio and an assumed rate of return of 5% per year before expenses, which is not the actual return. The hypothetical account values and expenses may not be used to estimate the actual ending account balance or expenses you paid for the period. You may use this information to compare the ongoing costs of investing in the Fund and other funds. To do so, compare this 5% hypothetical example with the 5% hypothetical examples that appear in the shareholder reports of the other funds. If any fund is a shareholder of any Underlying Funds, such fund indirectly bears its proportional share of the expenses of the Underlying Funds in addition to the direct expenses as presented in the table. These fees and expenses are not included in the annualized expense ratio used to calculate the expense estimate in the table below.
Please note that the expenses shown in the table are meant to highlight your ongoing costs only and do not reflect any transaction costs. Therefore, the second line of the table is useful in comparing ongoing costs only, and will not help you determine the relative total costs of owning different funds. In addition, if these transactional costs were included, your costs would have been higher.
| | | | | Annualized Expense Ratio- A | | Beginning Account Value November 1, 2023 | | Ending Account Value April 30, 2024 | | Expenses Paid During Period- C November 1, 2023 to April 30, 2024 |
| Fidelity® Global High Income Fund | | | | | | | | | | |
| Class A | | | | 1.05% | | | | | | |
| Actual | | | | | | $ 1,000 | | $ 1,090.00 | | $ 5.46 |
Hypothetical-B | | | | | | $ 1,000 | | $ 1,019.64 | | $ 5.27 |
| Class M | | | | 1.05% | | | | | | |
| Actual | | | | | | $ 1,000 | | $ 1,090.00 | | $ 5.46 |
Hypothetical-B | | | | | | $ 1,000 | | $ 1,019.64 | | $ 5.27 |
| Class C | | | | 1.80% | | | | | | |
| Actual | | | | | | $ 1,000 | | $ 1,086.00 | | $ 9.34 |
Hypothetical-B | | | | | | $ 1,000 | | $ 1,015.91 | | $ 9.02 |
| Fidelity® Global High Income Fund | | | | .80% | | | | | | |
| Actual | | | | | | $ 1,000 | | $ 1,091.40 | | $ 4.16 |
Hypothetical-B | | | | | | $ 1,000 | | $ 1,020.89 | | $ 4.02 |
| Class I | | | | .80% | | | | | | |
| Actual | | | | | | $ 1,000 | | $ 1,091.40 | | $ 4.16 |
Hypothetical-B | | | | | | $ 1,000 | | $ 1,020.89 | | $ 4.02 |
| |
A Annualized expense ratio reflects expenses net of applicable fee waivers.
B 5% return per year before expenses
C Expenses are equal to the annualized expense ratio, multiplied by the average account value over the period, multiplied by 182/ 366 (to reflect the one-half year period). The fees and expenses of any Underlying Funds are not included in each annualized expense ratio.
The dividend and capital gains distributions for the fund(s) are available on Fidelity.com or Institutional.Fidelity.com.
A total of 1.09% of the dividends distributed during the fiscal year was derived from interest on U.S. Government securities which is generally exempt from state income tax.
The fund designates $2,120,054 of distributions paid in the calendar year 2023 as qualifying to be taxed as interest-related dividends for nonresident alien shareholders.
The fund designates $3,611,065 of distributions paid during the fiscal year ended 2024 as qualifying to be taxed as section 163(j) interest dividends.
The fund will notify shareholders in January 2025 of amounts for use in preparing 2024 income tax returns.
Board Approval of Investment Advisory Contracts
Fidelity Global High Income Fund
At its January 2024 meeting, the Board of Trustees, including the Independent Trustees (together, the Board), approved an amended and restated management contract with Fidelity Management & Research Company LLC (FMR) (the Management Contract), and amended and restated sub-advisory agreements (the Sub-Advisory Contracts, and together with the Management Contract, the Advisory Contracts) for the fund, including the fund's sub-advisory agreements with FMR Investment Management (UK) Limited (FMR UK), Fidelity Management & Research (Hong Kong) Limited (FMR H.K.), Fidelity Management & Research (Japan) Limited (FMR Japan), and FIL Investment Advisors (FIL). The Advisory Contracts will be effective March 1, 2024. The Board will consider the annual renewal of the fund's Advisory Contracts in May 2024, following its review of additional materials provided by FMR.
Management Contract. The Board approved the Management Contract, which implements a new fee structure combining the management fee, transfer agent fee (TA Fee), and pricing and bookkeeping fee (P&B Fee) of the fund and each class into a single class-level fee based on tiered schedules and subject to a maximum class-level rate (the Unified Fee). In exchange for the Unified Fee, the fund will receive investment advisory, management, administrative, transfer agent, pricing and bookkeeping services under a single agreement - the Management Contract.
In its consideration of the Management Contract over several meetings, the Board received, reviewed and discussed a comprehensive set of analyses regarding the Unified Fee including (i) the legal framework, (ii) design goals for the Unified Fee, (iii) calculation methodology for the Unified Fee and illustrative examples, (iv) annual and cumulative projected impacts under various scenarios, both in the aggregate and at the fund/class level, (v) explanations of schedules, rate levers and maximum rates and (vi) shareholder benefits and projected savings.
The Board considered that the maximum Unified Fee for each class of the fund would be no higher than the sum of (i) the lowest contractual management fee rate under the fund's existing management contract, which is the individual fund fee rate, if any, plus the lowest contractual marginal group fee rate and (ii) the TA and P&B Fee rates, which are fixed fee rates since December 1, 2023 (together, the Unified Fee Cap). The Board noted that Fidelity has represented that, as a result of this Unified Fee Cap, the Unified Fee would be no greater than the fee rates previously authorized to be charged to the fund for the same services. The Board noted that certain expenses such as third-party expenses, Rule 12b-1 fees, and certain other miscellaneous expenses would be outside the scope of the Unified Fee and the calculation of such fees would not change as a result of the Unified Fee. The Board considered that, under the Management Contract, a different management fee rate will be applicable to each class of the fund. The Board noted that Fidelity has represented that the difference in expenses between classes is based on differences in class-specific expenses and not due to any difference in advisory or third-party custodial fees or other expenses related to the management of the fund's assets.
The Board considered Fidelity's representations that implementation of the Unified Fee, which includes the Unified Fee Cap, would cause all funds subject to the Unified Fee, including the fund, to experience an immediate reduction on contractual fee rates for services provided under the current management contracts. The Board considered that some funds would not experience lower net total fees as a result of existing fee caps. The Board further considered that, in addition to the contractual fee savings, the Unified Fee offers funds and their shareholders greater protection from future rate increases for services previously offered under separate agreements that are now covered by the Management Contract because such rate increases would require shareholder approval.
Sub-Advisory Contracts. In connection with the Unified Fee changes, the Board considered the Sub-Advisory Contracts, which simplified the calculation of the fees paid by FMR to the sub-advisers under the agreements. The Board noted that the agreements with FMR UK, FMR H.K., and FMR Japan were amended to provide that FMR will compensate each sub-adviser at a fee rate equal to 110% of the sub-adviser's costs incurred in providing services under the agreement. The Board further noted that the agreement with FIL was amended to provide that FMR will compensate FIL at a flat fee rate of 0.30% of the net assets sub-advised by it. The Board considered that, under the Sub-Advisory Contracts, FMR, and not the fund, will continue to pay the sub-advisory fees to each applicable sub-adviser.
The Board further considered that the approval of the fund's Advisory Contracts will not result in any changes in the investment process or strategies employed in the management of the fund's assets or the day-to-day management of the fund or the persons primarily responsible for such management. Further, the Board considered that the Management Contract would not change the obligations and services of FMR and its affiliates on behalf of the fund, and, in particular, there would be no change in the nature and level of advisory, management, administration, transfer agent, and pricing and bookkeeping services provided to the fund by FMR, its affiliates, and each applicable sub-adviser.
In connection with its consideration of future renewals of the fund's Advisory Contracts, the Board will consider: (i) the nature, extent and quality of services provided to the funds, including shareholder and administrative services and investment performance; (ii) the competitiveness of the management fee and total expenses for the fund; (iii) the costs of the services and profitability, including the revenues earned and the expenses incurred in conducting the business of developing, marketing, distributing, managing, administering, and servicing the fund and its shareholders, to the extent applicable; and (iv) whether there have been economies of scale in respect of the Fidelity funds, whether the Fidelity funds (including the fund) have appropriately benefited from any such economies of scale, and whether there is the potential for realization of any further economies.
Based on its evaluation of all of the conclusions and representations noted above, and after considering all factors it believed relevant, the Board concluded that the fund's management fee structure is fair and reasonable, and that the fund's Advisory Contracts should be approved.
The Securities and Exchange Commission adopted Rule 22e-4 under the Investment Company Act of 1940 (the Liquidity Rule) to promote effective liquidity risk management throughout the open-end investment company industry, thereby reducing the risk that funds will be unable to meet their redemption obligations and mitigating dilution of the interests of fund shareholders.
The Fund has adopted and implemented a liquidity risk management program (the Program) reasonably designed to assess and manage the Fund's liquidity risk and to comply with the requirements of the Liquidity Rule. The Fund's Board of Trustees (the Board) has designated the Fund's investment adviser as administrator of the Program. The Fidelity advisers have established a Liquidity Risk Management Committee (the LRM Committee) to manage the Program for each of the Fidelity Funds. The LRM Committee monitors the adequacy and effectiveness of implementation of the Program and on a periodic basis assesses each Fund's liquidity risk based on a variety of factors including (1) the Fund's investment strategy, (2) portfolio liquidity and cash flow projections during normal and reasonably foreseeable stressed conditions, (3) shareholder redemptions, (4) borrowings and other funding sources and (5) certain factors specific to ETFs including the effect of the Fund's prices and spreads, market participants, and basket compositions on the overall liquidity of the Fund's portfolio, as applicable.
In accordance with the Program, each of the Fund's portfolio investments is classified into one of four defined liquidity categories based on a determination of a reasonable expectation for how long it would take to convert the investment to cash (or sell or dispose of the investment) without significantly changing its market value.
- Highly liquid investments - cash or convertible to cash within three business days or less
- Moderately liquid investments - convertible to cash in three to seven calendar days
- Less liquid investments - can be sold or disposed of, but not settled, within seven calendar days
- Illiquid investments - cannot be sold or disposed of within seven calendar days
Liquidity classification determinations take into account a variety of factors including various market, trading and investment-specific considerations, as well as market depth, and generally utilize analysis from a third-party liquidity metrics service.
The Liquidity Rule places a 15% limit on a fund's illiquid investments and requires funds that do not primarily hold assets that are highly liquid investments to determine and maintain a minimum percentage of the fund's net assets to be invested in highly liquid investments (highly liquid investment minimum or HLIM). The Program includes provisions reasonably designed to comply with the 15% limit on illiquid investments and for determining, periodically reviewing and complying with the HLIM requirement as applicable.
At a recent meeting of the Fund's Board of Trustees, the LRM Committee provided a written report to the Board pertaining to the operation, adequacy, and effectiveness of the Program for the period December 1, 2022 through November 30, 2023. The report concluded that the Program is operating effectively and is reasonably designed to assess and manage the Fund's liquidity risk.
1.926249.112
GHI-ANN-0624
Fidelity® Healthy Future Fund
Annual Report
April 30, 2024
Includes Fidelity and Fidelity Advisor share classes
Contents
To view a fund's proxy voting guidelines and proxy voting record for the 12-month period ended June 30, visit http://www.fidelity.com/proxyvotingresults or visit the Securities and Exchange Commission's (SEC) web site at http://www.sec.gov.
You may also call 1-800-544-8544 if you're an individual investing directly with Fidelity, call 1-800-835-5092 if you're a plan sponsor or participant with Fidelity as your recordkeeper or call 1-877-208-0098 on institutional accounts or if you're an advisor or invest through one to request a free copy of the proxy voting guidelines.
Standard & Poor's, S&P and S&P 500 are registered service marks of The McGraw-Hill Companies, Inc. and have been licensed for use by Fidelity Distributors Corporation.
Other third-party marks appearing herein are the property of their respective owners.
All other marks appearing herein are registered or unregistered trademarks or service marks of FMR LLC or an affiliated company. © 2024 FMR LLC. All rights reserved.
This report and the financial statements contained herein are submitted for the general information of the shareholders of the Fund. This report is not authorized for distribution to prospective investors in the Fund unless preceded or accompanied by an effective prospectus.
A fund files its complete schedule of portfolio holdings with the SEC for the first and third quarters of each fiscal year on Form N-PORT. Forms N-PORT are available on the SEC's web site at http://www.sec.gov. A fund's Forms N-PORT may be reviewed and copied at the SEC's Public Reference Room in Washington, DC. Information regarding the operation of the SEC's Public Reference Room may be obtained by calling 1-800-SEC-0330.
For a complete list of a fund's portfolio holdings, view the most recent holdings listing, semiannual report, or annual report on Fidelity's web site at http://www.fidelity.com, http://www.institutional.fidelity.com, or http://www.401k.com, as applicable.
NOT FDIC INSURED •MAY LOSE VALUE •NO BANK GUARANTEE
Neither the Fund nor Fidelity Distributors Corporation is a bank.
Average annual total return reflects the change in the value of an investment, assuming reinvestment of distributions from dividend income and capital gains (the profits earned upon the sale of securities that have grown in value, if any) and assuming a constant rate of performance each year. The hypothetical investment and the average annual total returns do not reflect the deduction of taxes that a shareholder would pay on fund distributions or the redemption of fund shares. During periods of reimbursement by Fidelity, a fund's total return will be greater than it would be had the reimbursement not occurred. How a fund did yesterday is no guarantee of how it will do tomorrow.
| Average Annual Total Returns |
| | | | |
Periods ended April 30, 2024 | Past 1 year | Life of Fund A |
Class A (incl. 5.75% sales charge) | 6.29% | 6.19% |
Class M (incl. 3.50% sales charge) | 8.59% | 7.22% |
Class C (incl. contingent deferred sales charge) | 11.01% | 8.68% |
| Fidelity® Healthy Future Fund | 13.12% | 9.77% |
| Class I | 13.12% | 9.77% |
| Class Z | 13.19% | 9.91% |
A From May 24, 2022
Class C shares' contingent deferred sales charges included in the past one year and life of fund total return figures are 1% and 0%, respectively.
| $10,000 Over Life of Fund |
| |
Let's say hypothetically that $10,000 was invested in Fidelity® Healthy Future Fund, a class of the fund, on May 24, 2022, when the fund started. The chart shows how the value of your investment would have changed, and also shows how the MSCI ACWI (All Country World Index) Index performed over the same period. |
|
|
Market Recap:
U.S. equities gained 22.66% for the 12 months ending April 30, 2024, according to the S&P 500® index, driven by resilient corporate profits, a frenzy over generative artificial intelligence and the Federal Reserve's likely pivot to cutting interest rates later this year. Amid this favorable backdrop for higher-risk assets, the S&P 500® continued its late-2023 momentum and ended March at its all-time high before snapping a five-month uptrend in April (-4.08%). Growth stocks led the broad rally, mostly driven by a narrow set of firms in the communication services (+41%) and information technology (+37%) sectors, largely due to excitement for AI. In particular, semiconductor-related stocks (+104%) were a standout. Following the Fed's November 1 meeting, when the central bank hinted it might be done raising rates, the S&P 500® reversed a three-month decline and gained 14.09% in the final two months of 2023 and 10.56% the first quarter. Risk assets were further aided on March 20, when the central bank held steady its benchmark federal funds rate and affirmed its projection to cut in 2024. The index then slipped in April, as inflation remained stickier than expected, spurring doubts of a soft economic landing. For the full 12 months, the financials, industrials and consumer discretionary sectors each gained about 24%. In sharp contrast, real estate and the defensive-oriented utilities sector each roughly broke even. Other notable "laggards" included consumer staples (+3%) and health care (+7%).
Comments from Co-Managers Paul McElroy and Melissa Reilly:
For the fiscal year ending April 30, 2024, the fund gained about 13.12%, versus 12.94% for the MSCI Health and Wellness Custom Index Net MA and 17.87% for the broad-based MSCI All Country World Index (Net MA). From a regional standpoint, an underweight in the U.K. and stock selection in Europe ex the U.K., primarily in Belgium, contributed to the fund's performance versus the MSCI Health and Wellness Custom Index Net MA. By sector, market selection was the primary contributor, led by an overweight in information technology. Stock picking in health care, primarily within the pharmaceuticals, biotechnology & life sciences industry, also helped. Security selection in consumer staples also boosted relative performance. Also lifting the fund's relative result was an overweight in consumer discretionary, primarily within the consumer durables & apparel industry. The top individual relative contributor was an overweight in Nvidia (+213%). Nvidia was the fund's largest holding. The second-largest relative contributor was our non-benchmark stake in Eli Lilly (+99%). Eli Lilly was among the fund's biggest holdings this period. An underweight in Abbott Laboratories (-2%) also contributed. This was a position we established this period. In contrast, from a regional standpoint, underweights in Japan and Europe ex the U.K., primarily in France, detracted from the fund's result versus the MSCI Health and Wellness Custom Index Net MA. By sector, the biggest detractor from performance versus the benchmark was stock selection in consumer discretionary. Also hurting our result were security selection in financials and information technology. The biggest individual relative detractor was our non-benchmark stake in agilon health (-75%). Agilon health was not held at period end. A second notable relative detractor was an underweight in Tesla (+12%). Tesla was one of our largest holdings. This period we increased our investment in Tesla. Another notable relative detractor this period was avoiding Toyota Motor, a benchmark component that gained approximately 74%. Notable changes in positioning include increased exposure to France and a lower allocation to Switzerland.
Application of FMR's environmental, social, and governance (ESG) ratings process and/or its sustainable investing exclusion criteria may affect the Fund's exposure to certain issuers, sectors, regions, and countries and may affect the Fund's performance.
The views expressed above reflect those of the portfolio manager(s) only through the end of the period as stated on the cover of this report and do not necessarily represent the views of Fidelity or any other person in the Fidelity organization. Any such views are subject to change at any time based upon market or other conditions and Fidelity disclaims any responsibility to update such views. These views may not be relied on as investment advice and, because investment decisions for a Fidelity fund are based on numerous factors, may not be relied on as an indication of trading intent on behalf of any Fidelity fund.
Top Holdings (% of Fund's net assets) |
| |
| NVIDIA Corp. | 9.9 | |
| Procter & Gamble Co. | 7.0 | |
| Nestle SA (Reg. S) | 5.0 | |
| Thermo Fisher Scientific, Inc. | 4.7 | |
| Vertex Pharmaceuticals, Inc. | 3.5 | |
| Regeneron Pharmaceuticals, Inc. | 3.4 | |
| UnitedHealth Group, Inc. | 3.1 | |
| L'Oreal SA | 2.9 | |
| Tesla, Inc. | 2.7 | |
| Uber Technologies, Inc. | 2.5 | |
| | 44.7 | |
| |
| Market Sectors (% of Fund's net assets) |
| |
| Health Care | 35.4 | |
| Consumer Staples | 23.2 | |
| Consumer Discretionary | 15.9 | |
| Information Technology | 11.1 | |
| Financials | 7.5 | |
| Industrials | 3.2 | |
| Communication Services | 1.5 | |
| Real Estate | 1.2 | |
| Utilities | 0.9 | |
| |
Asset Allocation (% of Fund's net assets) |
|
|
Geographic Diversification (% of Fund's net assets) |
|
* Includes Short-Term investments and Net Other Assets (Liabilities). Percentages are adjusted for the effect of derivatives, if applicable. |
| |
Showing Percentage of Net Assets
| Common Stocks - 99.9% |
| | | Shares | Value ($) |
| COMMUNICATION SERVICES - 1.5% | | | |
| Entertainment - 1.5% | | | |
| The Walt Disney Co. | | 1,225 | 136,098 |
| CONSUMER DISCRETIONARY - 15.9% | | | |
| Automobile Components - 2.5% | | | |
| Aptiv PLC (a) | | 992 | 70,432 |
| DENSO Corp. | | 9,583 | 163,324 |
| | | | 233,756 |
| Automobiles - 4.8% | | | |
| BYD Co. Ltd. (H Shares) | | 787 | 21,574 |
| General Motors Co. | | 3,502 | 155,944 |
| Rivian Automotive, Inc. (a) | | 1,901 | 16,919 |
| Tesla, Inc. (a) | | 1,387 | 254,209 |
| | | | 448,646 |
| Hotels, Restaurants & Leisure - 3.4% | | | |
| Airbnb, Inc. Class A (a) | | 215 | 34,093 |
| Cava Group, Inc. | | 626 | 45,034 |
| Chipotle Mexican Grill, Inc. (a) | | 44 | 139,022 |
| Hilton Worldwide Holdings, Inc. | | 418 | 82,463 |
| Sweetgreen, Inc. Class A (a) | | 480 | 10,786 |
| | | | 311,398 |
| Specialty Retail - 0.8% | | | |
| TJX Companies, Inc. | | 447 | 42,058 |
| Ulta Beauty, Inc. (a) | | 70 | 28,339 |
| | | | 70,397 |
| Textiles, Apparel & Luxury Goods - 4.4% | | | |
| adidas AG | | 132 | 31,893 |
| Crocs, Inc. (a) | | 282 | 35,072 |
| Deckers Outdoor Corp. (a) | | 202 | 165,331 |
| lululemon athletica, Inc. (a) | | 323 | 116,474 |
| On Holding AG (a) | | 1,901 | 60,357 |
| | | | 409,127 |
TOTAL CONSUMER DISCRETIONARY | | | 1,473,324 |
| CONSUMER STAPLES - 23.2% | | | |
| Consumer Staples Distribution & Retail - 1.1% | | | |
| Costco Wholesale Corp. | | 76 | 54,940 |
| Sprouts Farmers Market LLC (a) | | 698 | 46,089 |
| | | | 101,029 |
| Food Products - 7.1% | | | |
| Danone SA | | 2,545 | 159,285 |
| Freshpet, Inc. (a) | | 338 | 35,852 |
| Nestle SA (Reg. S) | | 4,620 | 463,849 |
| | | | 658,986 |
| Household Products - 9.2% | | | |
| Colgate-Palmolive Co. | | 2,231 | 205,074 |
| Procter & Gamble Co. | | 3,997 | 652,310 |
| | | | 857,384 |
| Personal Care Products - 5.8% | | | |
| elf Beauty, Inc. (a) | | 360 | 58,511 |
| Estee Lauder Companies, Inc. Class A | | 967 | 141,869 |
| Kenvue, Inc. | | 3,517 | 66,190 |
| L'Oreal SA | | 569 | 266,972 |
| | | | 533,542 |
TOTAL CONSUMER STAPLES | | | 2,150,941 |
| FINANCIALS - 7.5% | | | |
| Capital Markets - 1.4% | | | |
| BlackRock, Inc. Class A | | 180 | 135,835 |
| Insurance - 6.1% | | | |
| AIA Group Ltd. | | 23,836 | 174,583 |
| Chubb Ltd. | | 756 | 187,972 |
| Hartford Financial Services Group, Inc. | | 831 | 80,516 |
| Marsh & McLennan Companies, Inc. | | 599 | 119,459 |
| | | | 562,530 |
TOTAL FINANCIALS | | | 698,365 |
| HEALTH CARE - 35.4% | | | |
| Biotechnology - 9.5% | | | |
| Exact Sciences Corp. (a) | | 478 | 28,369 |
| Gilead Sciences, Inc. | | 1,829 | 119,251 |
| Moderna, Inc. (a) | | 849 | 93,653 |
| Regeneron Pharmaceuticals, Inc. (a) | | 356 | 317,075 |
| Vertex Pharmaceuticals, Inc. (a) | | 826 | 324,461 |
| | | | 882,809 |
| Health Care Equipment & Supplies - 5.6% | | | |
| Abbott Laboratories | | 1,681 | 178,136 |
| Boston Scientific Corp. (a) | | 2,139 | 153,730 |
| DexCom, Inc. (a) | | 478 | 60,892 |
| Penumbra, Inc. (a) | | 211 | 41,455 |
| The Cooper Companies, Inc. | | 408 | 36,336 |
| TransMedics Group, Inc. (a) | | 475 | 44,712 |
| | | | 515,261 |
| Health Care Providers & Services - 6.8% | | | |
| Centene Corp. (a) | | 2,523 | 184,330 |
| CVS Health Corp. | | 821 | 55,590 |
| LifeStance Health Group, Inc. (a) | | 10,239 | 63,277 |
| Molina Healthcare, Inc. (a) | | 111 | 37,973 |
| UnitedHealth Group, Inc. | | 602 | 291,187 |
| | | | 632,357 |
| Life Sciences Tools & Services - 7.6% | | | |
| Agilent Technologies, Inc. | | 489 | 67,013 |
| Danaher Corp. | | 816 | 201,242 |
| Thermo Fisher Scientific, Inc. | | 762 | 433,365 |
| | | | 701,620 |
| Pharmaceuticals - 5.9% | | | |
| Eli Lilly & Co. | | 261 | 203,867 |
| Merck & Co., Inc. | | 755 | 97,561 |
| UCB SA | | 1,645 | 218,653 |
| Zoetis, Inc. Class A | | 199 | 31,689 |
| | | | 551,770 |
TOTAL HEALTH CARE | | | 3,283,817 |
| INDUSTRIALS - 3.2% | | | |
| Electrical Equipment - 0.7% | | | |
| Generac Holdings, Inc. (a) | | 444 | 60,366 |
| Ground Transportation - 2.5% | | | |
| Uber Technologies, Inc. (a) | | 3,564 | 236,186 |
TOTAL INDUSTRIALS | | | 296,552 |
| INFORMATION TECHNOLOGY - 11.1% | | | |
| Semiconductors & Semiconductor Equipment - 9.9% | | | |
| NVIDIA Corp. | | 1,067 | 921,909 |
| Technology Hardware, Storage & Peripherals - 1.2% | | | |
| Apple, Inc. | | 525 | 89,423 |
| Samsung Electronics Co. Ltd. GDR (Reg. S) | | 15 | 21,135 |
| | | | 110,558 |
TOTAL INFORMATION TECHNOLOGY | | | 1,032,467 |
| REAL ESTATE - 1.2% | | | |
| Equity Real Estate Investment Trusts (REITs) - 1.2% | | | |
| Welltower, Inc. | | 1,119 | 106,618 |
| UTILITIES - 0.9% | | | |
| Electric Utilities - 0.9% | | | |
| NextEra Energy, Inc. | | 1,191 | 79,761 |
| TOTAL COMMON STOCKS (Cost $8,022,196) | | | 9,257,943 |
| | | | |
| TOTAL INVESTMENT IN SECURITIES - 99.9% (Cost $8,022,196) | 9,257,943 |
NET OTHER ASSETS (LIABILITIES) - 0.1% | 12,416 |
| NET ASSETS - 100.0% | 9,270,359 |
| | |
Legend
Affiliated Central Funds
Fiscal year to date information regarding the Fund's investments in Fidelity Central Funds, including the ownership percentage, is presented below.
| Affiliate | Value, beginning of period ($) | Purchases ($) | Sales Proceeds ($) | Dividend Income ($) | Realized Gain (loss) ($) | Change in Unrealized appreciation (depreciation) ($) | Value, end of period ($) | % ownership, end of period |
| Fidelity Cash Central Fund 5.39% | 25,605 | 5,383,361 | 5,408,966 | 6,611 | - | - | - | 0.0% |
| Total | 25,605 | 5,383,361 | 5,408,966 | 6,611 | - | - | - | |
| | | | | | | | | |
Amounts in the dividend income column in the above table include any capital gain distributions from underlying funds, which are presented in the corresponding line item in the Statement of Operations, if applicable.
Amounts included in the purchases and sales proceeds columns may include in-kind transactions, if applicable.
Investment Valuation
The following is a summary of the inputs used, as of April 30, 2024, involving the Fund's assets and liabilities carried at fair value. The inputs or methodology used for valuing securities may not be an indication of the risk associated with investing in those securities. For more information on valuation inputs, and their aggregation into the levels used below, please refer to the Investment Valuation section in the accompanying Notes to Financial Statements.
| Valuation Inputs at Reporting Date: |
| Description | Total ($) | Level 1 ($) | Level 2 ($) | Level 3 ($) |
Investments in Securities: | | | | |
|
| Equities: | | | | |
Communication Services | 136,098 | 136,098 | - | - |
Consumer Discretionary | 1,473,324 | 1,288,426 | 184,898 | - |
Consumer Staples | 2,150,941 | 1,527,807 | 623,134 | - |
Financials | 698,365 | 523,782 | 174,583 | - |
Health Care | 3,283,817 | 3,283,817 | - | - |
Industrials | 296,552 | 296,552 | - | - |
Information Technology | 1,032,467 | 1,032,467 | - | - |
Real Estate | 106,618 | 106,618 | - | - |
Utilities | 79,761 | 79,761 | - | - |
| | | | | |
| Total Investments in Securities: | 9,257,943 | 8,275,328 | 982,615 | - |
| Statement of Assets and Liabilities |
| | | | April 30, 2024 |
| | | | | |
| Assets | | | | |
Investment in securities, at value - See accompanying schedule Unaffiliated issuers (cost $8,022,196): | | | $ | 9,257,943 |
| Foreign currency held at value (cost $15,010) | | | | 14,964 |
| Receivable for investments sold | | | | 263,576 |
| Receivable for fund shares sold | | | | 6,180 |
| Dividends receivable | | | | 8,972 |
| Reclaims receivable | | | | 5,961 |
| Distributions receivable from Fidelity Central Funds | | | | 530 |
| Prepaid expenses | | | | 2 |
| Receivable from investment adviser for expense reductions | | | | 54,536 |
Total assets | | | | 9,612,664 |
| Liabilities | | | | |
| Payable to custodian bank | $ | 11,564 | | |
| Payable for investments purchased | | 170,341 | | |
| Payable for fund shares redeemed | | 119,019 | | |
| Accrued management fee | | 6,567 | | |
| Distribution and service plan fees payable | | 1,034 | | |
| Audit fee payable | | 32,277 | | |
| Other payables and accrued expenses | | 1,503 | | |
| Total liabilities | | | | 342,305 |
| Net Assets | | | $ | 9,270,359 |
| Net Assets consist of: | | | | |
| Paid in capital | | | $ | 8,226,799 |
| Total accumulated earnings (loss) | | | | 1,043,560 |
| Net Assets | | | $ | 9,270,359 |
| | | | | |
| Net Asset Value and Maximum Offering Price | | | | |
| Class A : | | | | |
Net Asset Value and redemption price per share ($853,693 ÷ 71,634 shares)(a) | | | $ | 11.92 |
| Maximum offering price per share (100/94.25 of $11.92) | | | $ | 12.65 |
| Class M : | | | | |
Net Asset Value and redemption price per share ($1,565,414 ÷ 131,980 shares)(a) | | | $ | 11.86 |
| Maximum offering price per share (100/96.50 of $11.86) | | | $ | 12.29 |
| Class C : | | | | |
Net Asset Value and offering price per share ($261,589 ÷ 22,272 shares)(a) | | | $ | 11.75 |
| Fidelity Healthy Future Fund : | | | | |
Net Asset Value, offering price and redemption price per share ($6,308,666 ÷ 527,211 shares) | | | $ | 11.97 |
| Class I : | | | | |
Net Asset Value, offering price and redemption price per share ($159,464 ÷ 13,327 shares) | | | $ | 11.97 |
| Class Z : | | | | |
Net Asset Value, offering price and redemption price per share ($121,533 ÷ 10,129 shares) | | | $ | 12.00 |
(a)Redemption price per share is equal to net asset value less any applicable contingent deferred sales charge. |
| Statement of Operations |
| | | | Year ended April 30, 2024 |
| Investment Income | | | | |
| Dividends | | | $ | 76,387 |
| Income from Fidelity Central Funds | | | | 6,611 |
| Total income | | | | 82,998 |
| Expenses | | | | |
| Management fee | $ | 47,851 | | |
| Transfer agent fees | | 12,155 | | |
| Distribution and service plan fees | | 6,923 | | |
| Accounting fees and expenses | | 1,831 | | |
| Custodian fees and expenses | | 4,431 | | |
| Independent trustees' fees and expenses | | 30 | | |
| Registration fees | | 77,879 | | |
| Audit | | 44,178 | | |
| Legal | | 486 | | |
| Miscellaneous | | 20 | | |
| Total expenses before reductions | | 195,784 | | |
| Expense reductions | | (119,510) | | |
| Total expenses after reductions | | | | 76,274 |
| Net Investment income (loss) | | | | 6,724 |
| Realized and Unrealized Gain (Loss) | | | | |
| Net realized gain (loss) on: | | | | |
| Investment Securities: | | | | |
| Unaffiliated issuers | | (98,345) | | |
| Foreign currency transactions | | 290 | | |
| Total net realized gain (loss) | | | | (98,055) |
| Change in net unrealized appreciation (depreciation) on: | | | | |
| Investment Securities: | | | | |
| Unaffiliated issuers | | 913,916 | | |
| Assets and liabilities in foreign currencies | | (181) | | |
| Total change in net unrealized appreciation (depreciation) | | | | 913,735 |
| Net gain (loss) | | | | 815,680 |
| Net increase (decrease) in net assets resulting from operations | | | $ | 822,404 |
| Statement of Changes in Net Assets |
| |
| | Year ended April 30, 2024 | | For the period May 24, 2022 (commencement of operations) through April 30, 2023 |
| Increase (Decrease) in Net Assets | | | | |
| Operations | | | | |
| Net investment income (loss) | $ | 6,724 | $ | 2,409 |
| Net realized gain (loss) | | (98,055) | | (100,000) |
| Change in net unrealized appreciation (depreciation) | | 913,735 | | 321,841 |
| Net increase (decrease) in net assets resulting from operations | | 822,404 | | 224,250 |
| Distributions to shareholders | | (3,025) | | - |
| | | | | |
| Share transactions - net increase (decrease) | | 4,382,036 | | 3,844,694 |
| Total increase (decrease) in net assets | | 5,201,415 | | 4,068,944 |
| | | | | |
| Net Assets | | | | |
| Beginning of period | | 4,068,944 | | - |
| End of period | $ | 9,270,359 | $ | 4,068,944 |
| | | | | |
| | | | | |
Financial Highlights
Fidelity Advisor® Healthy Future Fund Class A |
| |
| Years ended April 30, | | 2024 | | 2023 A |
Selected Per-Share Data | | | | |
| Net asset value, beginning of period | $ | 10.57 | $ | 10.00 |
| Income from Investment Operations | | | | |
Net investment income (loss) B,C | | (.01) | | (.01) |
| Net realized and unrealized gain (loss) | | 1.36 | | .58 |
| Total from investment operations | | 1.35 | | .57 |
| Net asset value, end of period | $ | 11.92 | $ | 10.57 |
Total Return D,E,F | | | | 5.70% |
Ratios to Average Net Assets C,G,H | | | | |
| Expenses before reductions | | 3.08% | | 9.78% I,J |
| Expenses net of fee waivers, if any | | | | 1.29% J |
| Expenses net of all reductions | | 1.29% | | 1.29% J |
| Net investment income (loss) | | (.05)% | | (.09)% J |
| Supplemental Data | | | | |
| Net assets, end of period (000 omitted) | $ | 854 | $ | 205 |
Portfolio turnover rate K | | | | 68% J |
AFor the period May 24, 2022 (commencement of operations) through April 30, 2023.
BCalculated based on average shares outstanding during the period.
CNet investment income (loss) is affected by the timing of the declaration of dividends by any underlying mutual funds or exchange-traded funds (ETFs). Net investment income (loss) of any mutual funds or ETFs is not included in the Fund's net investment income (loss) ratio.
DTotal returns for periods of less than one year are not annualized.
ETotal returns would have been lower if certain expenses had not been reduced during the applicable periods shown.
FTotal returns do not include the effect of the sales charges.
GFees and expenses of any underlying mutual funds or exchange-traded funds (ETFs) are not included in the Fund's expense ratio. The Fund indirectly bears its proportionate share of these expenses. For additional expense information related to investments in Fidelity Central Funds, please refer to the "Investments in Fidelity Central Funds" note found in the Notes to Financial Statements section of the most recent Annual or Semi-Annual report.
HExpense ratios reflect operating expenses of the class. Expenses before reductions do not reflect amounts reimbursed, waived, or reduced through arrangements with the investment adviser, brokerage services, or other offset arrangements, if applicable, and do not represent the amount paid by the class during periods when reimbursements, waivers or reductions occur.
IAudit fees are not annualized.
JAnnualized.
KAmount does not include the portfolio activity of any underlying mutual funds or exchange-traded funds (ETFs).
Fidelity Advisor® Healthy Future Fund Class M |
| |
| Years ended April 30, | | 2024 | | 2023 A |
Selected Per-Share Data | | | | |
| Net asset value, beginning of period | $ | 10.54 | $ | 10.00 |
| Income from Investment Operations | | | | |
Net investment income (loss) B,C | | (.03) | | (.03) |
| Net realized and unrealized gain (loss) | | 1.35 | | .57 |
| Total from investment operations | | 1.32 | | .54 |
| Net asset value, end of period | $ | 11.86 | $ | 10.54 |
Total Return D,E,F | | | | 5.40% |
Ratios to Average Net Assets C,G,H | | | | |
| Expenses before reductions | | 3.46% | | 10.17% I,J |
| Expenses net of fee waivers, if any | | | | 1.54% I |
| Expenses net of all reductions | | 1.53% | | 1.54% I |
| Net investment income (loss) | | (.29)% | | (.34)% I |
| Supplemental Data | | | | |
| Net assets, end of period (000 omitted) | $ | 1,565 | $ | 136 |
Portfolio turnover rate K | | | | 68% I |
AFor the period May 24, 2022 (commencement of operations) through April 30, 2023.
BCalculated based on average shares outstanding during the period.
CNet investment income (loss) is affected by the timing of the declaration of dividends by any underlying mutual funds or exchange-traded funds (ETFs). Net investment income (loss) of any mutual funds or ETFs is not included in the Fund's net investment income (loss) ratio.
DTotal returns for periods of less than one year are not annualized.
ETotal returns would have been lower if certain expenses had not been reduced during the applicable periods shown.
FTotal returns do not include the effect of the sales charges.
GFees and expenses of any underlying mutual funds or exchange-traded funds (ETFs) are not included in the Fund's expense ratio. The Fund indirectly bears its proportionate share of these expenses. For additional expense information related to investments in Fidelity Central Funds, please refer to the "Investments in Fidelity Central Funds" note found in the Notes to Financial Statements section of the most recent Annual or Semi-Annual report.
HExpense ratios reflect operating expenses of the class. Expenses before reductions do not reflect amounts reimbursed, waived, or reduced through arrangements with the investment adviser, brokerage services, or other offset arrangements, if applicable, and do not represent the amount paid by the class during periods when reimbursements, waivers or reductions occur.
IAnnualized.
JAudit fees are not annualized.
KAmount does not include the portfolio activity of any underlying mutual funds or exchange-traded funds (ETFs).
Fidelity Advisor® Healthy Future Fund Class C |
| |
| Years ended April 30, | | 2024 | | 2023 A |
Selected Per-Share Data | | | | |
| Net asset value, beginning of period | $ | 10.49 | $ | 10.00 |
| Income from Investment Operations | | | | |
Net investment income (loss) B,C | | (.09) | | (.08) |
| Net realized and unrealized gain (loss) | | 1.35 | | .57 |
| Total from investment operations | | 1.26 | | .49 |
| Net asset value, end of period | $ | 11.75 | $ | 10.49 |
Total Return D,E,F | | | | 4.90% |
Ratios to Average Net Assets C,G,H | | | | |
| Expenses before reductions | | 3.94% | | 10.48% I,J |
| Expenses net of fee waivers, if any | | | | 2.04% J |
| Expenses net of all reductions | | 2.03% | | 2.04% J |
| Net investment income (loss) | | (.80)% | | (.84)% J |
| Supplemental Data | | | | |
| Net assets, end of period (000 omitted) | $ | 262 | $ | 130 |
Portfolio turnover rate K | | | | 68% J |
AFor the period May 24, 2022 (commencement of operations) through April 30, 2023.
BCalculated based on average shares outstanding during the period.
CNet investment income (loss) is affected by the timing of the declaration of dividends by any underlying mutual funds or exchange-traded funds (ETFs). Net investment income (loss) of any mutual funds or ETFs is not included in the Fund's net investment income (loss) ratio.
DTotal returns for periods of less than one year are not annualized.
ETotal returns would have been lower if certain expenses had not been reduced during the applicable periods shown.
FTotal returns do not include the effect of the contingent deferred sales charge.
GFees and expenses of any underlying mutual funds or exchange-traded funds (ETFs) are not included in the Fund's expense ratio. The Fund indirectly bears its proportionate share of these expenses. For additional expense information related to investments in Fidelity Central Funds, please refer to the "Investments in Fidelity Central Funds" note found in the Notes to Financial Statements section of the most recent Annual or Semi-Annual report.
HExpense ratios reflect operating expenses of the class. Expenses before reductions do not reflect amounts reimbursed, waived, or reduced through arrangements with the investment adviser, brokerage services, or other offset arrangements, if applicable, and do not represent the amount paid by the class during periods when reimbursements, waivers or reductions occur.
IAudit fees are not annualized.
JAnnualized.
KAmount does not include the portfolio activity of any underlying mutual funds or exchange-traded funds (ETFs).
Fidelity® Healthy Future Fund |
| |
| Years ended April 30, | | 2024 | | 2023 A |
Selected Per-Share Data | | | | |
| Net asset value, beginning of period | $ | 10.59 | $ | 10.00 |
| Income from Investment Operations | | | | |
Net investment income (loss) B,C | | .02 | | .02 |
| Net realized and unrealized gain (loss) | | 1.37 | | .57 |
| Total from investment operations | | 1.39 | | .59 |
| Distributions from net investment income | | (.01) | | - |
| Total distributions | | (.01) | | - |
| Net asset value, end of period | $ | 11.97 | $ | 10.59 |
Total Return D,E | | | | 5.90% |
Ratios to Average Net Assets C,F,G | | | | |
| Expenses before reductions | | 2.79% | | 9.38% H,I |
| Expenses net of fee waivers, if any | | | | 1.04% I |
| Expenses net of all reductions | | 1.04% | | 1.04% I |
| Net investment income (loss) | | .20% | | .16% I |
| Supplemental Data | | | | |
| Net assets, end of period (000 omitted) | $ | 6,309 | $ | 3,376 |
Portfolio turnover rate J | | | | 68% I |
AFor the period May 24, 2022 (commencement of operations) through April 30, 2023.
BCalculated based on average shares outstanding during the period.
CNet investment income (loss) is affected by the timing of the declaration of dividends by any underlying mutual funds or exchange-traded funds (ETFs). Net investment income (loss) of any mutual funds or ETFs is not included in the Fund's net investment income (loss) ratio.
DTotal returns for periods of less than one year are not annualized.
ETotal returns would have been lower if certain expenses had not been reduced during the applicable periods shown.
FFees and expenses of any underlying mutual funds or exchange-traded funds (ETFs) are not included in the Fund's expense ratio. The Fund indirectly bears its proportionate share of these expenses. For additional expense information related to investments in Fidelity Central Funds, please refer to the "Investments in Fidelity Central Funds" note found in the Notes to Financial Statements section of the most recent Annual or Semi-Annual report.
GExpense ratios reflect operating expenses of the class. Expenses before reductions do not reflect amounts reimbursed, waived, or reduced through arrangements with the investment adviser, brokerage services, or other offset arrangements, if applicable, and do not represent the amount paid by the class during periods when reimbursements, waivers or reductions occur.
HAudit fees are not annualized.
IAnnualized.
JAmount does not include the portfolio activity of any underlying mutual funds or exchange-traded funds (ETFs).
Fidelity Advisor® Healthy Future Fund Class I |
| |
| Years ended April 30, | | 2024 | | 2023 A |
Selected Per-Share Data | | | | |
| Net asset value, beginning of period | $ | 10.59 | $ | 10.00 |
| Income from Investment Operations | | | | |
Net investment income (loss) B,C | | .02 | | .02 |
| Net realized and unrealized gain (loss) | | 1.37 | | .57 |
| Total from investment operations | | 1.39 | | .59 |
| Distributions from net investment income | | (.01) | | - |
| Total distributions | | (.01) | | - |
| Net asset value, end of period | $ | 11.97 | $ | 10.59 |
Total Return D,E | | | | 5.90% |
Ratios to Average Net Assets C,F,G | | | | |
| Expenses before reductions | | 2.82% | | 9.48% H,I |
| Expenses net of fee waivers, if any | | | | 1.05% H |
| Expenses net of all reductions | | 1.04% | | 1.04% H |
| Net investment income (loss) | | .20% | | .16% H |
| Supplemental Data | | | | |
| Net assets, end of period (000 omitted) | $ | 159 | $ | 115 |
Portfolio turnover rate J | | | | 68% H |
AFor the period May 24, 2022 (commencement of operations) through April 30, 2023.
BCalculated based on average shares outstanding during the period.
CNet investment income (loss) is affected by the timing of the declaration of dividends by any underlying mutual funds or exchange-traded funds (ETFs). Net investment income (loss) of any mutual funds or ETFs is not included in the Fund's net investment income (loss) ratio.
DTotal returns would have been lower if certain expenses had not been reduced during the applicable periods shown.
ETotal returns for periods of less than one year are not annualized.
FFees and expenses of any underlying mutual funds or exchange-traded funds (ETFs) are not included in the Fund's expense ratio. The Fund indirectly bears its proportionate share of these expenses. For additional expense information related to investments in Fidelity Central Funds, please refer to the "Investments in Fidelity Central Funds" note found in the Notes to Financial Statements section of the most recent Annual or Semi-Annual report.
GExpense ratios reflect operating expenses of the class. Expenses before reductions do not reflect amounts reimbursed, waived, or reduced through arrangements with the investment adviser, brokerage services, or other offset arrangements, if applicable, and do not represent the amount paid by the class during periods when reimbursements, waivers or reductions occur.
HAnnualized.
IAudit fees are not annualized.
JAmount does not include the portfolio activity of any underlying mutual funds or exchange-traded funds (ETFs).
Fidelity Advisor® Healthy Future Fund Class Z |
| |
| Years ended April 30, | | 2024 | | 2023 A |
Selected Per-Share Data | | | | |
| Net asset value, beginning of period | $ | 10.61 | $ | 10.00 |
| Income from Investment Operations | | | | |
Net investment income (loss) B,C | | .04 | | .03 |
| Net realized and unrealized gain (loss) | | 1.36 | | .58 |
| Total from investment operations | | 1.40 | | .61 |
| Distributions from net investment income | | (.01) | | - |
| Total distributions | | (.01) | | - |
| Net asset value, end of period | $ | 12.00 | $ | 10.61 |
Total Return D,E | | | | 6.10% |
Ratios to Average Net Assets B,F,G | | | | |
| Expenses before reductions | | 2.60% | | 9.34% H,I |
| Expenses net of fee waivers, if any | | | | .90% I |
| Expenses net of all reductions | | .89% | | .89% I |
| Net investment income (loss) | | .35% | | .31% I |
| Supplemental Data | | | | |
| Net assets, end of period (000 omitted) | $ | 122 | $ | 107 |
Portfolio turnover rate J | | | | 68% I |
AFor the period May 24, 2022 (commencement of operations) through April 30, 2023.
BNet investment income (loss) is affected by the timing of the declaration of dividends by any underlying mutual funds or exchange-traded funds (ETFs). Net investment income (loss) of any mutual funds or ETFs is not included in the Fund's net investment income (loss) ratio.
CCalculated based on average shares outstanding during the period.
DTotal returns for periods of less than one year are not annualized.
ETotal returns would have been lower if certain expenses had not been reduced during the applicable periods shown.
FExpense ratios reflect operating expenses of the class. Expenses before reductions do not reflect amounts reimbursed, waived, or reduced through arrangements with the investment adviser, brokerage services, or other offset arrangements, if applicable, and do not represent the amount paid by the class during periods when reimbursements, waivers or reductions occur.
GFees and expenses of any underlying mutual funds or exchange-traded funds (ETFs) are not included in the Fund's expense ratio. The Fund indirectly bears its proportionate share of these expenses. For additional expense information related to investments in Fidelity Central Funds, please refer to the "Investments in Fidelity Central Funds" note found in the Notes to Financial Statements section of the most recent Annual or Semi-Annual report.
HAudit fees are not annualized.
IAnnualized.
JAmount does not include the portfolio activity of any underlying mutual funds or exchange-traded funds (ETFs).
For the period ended April 30, 2024
1. Organization.
Fidelity Healthy Future Fund (the Fund) is a non-diversified fund of Fidelity Summer Street Trust (the Trust) and is authorized to issue an unlimited number of shares. The Trust is registered under the Investment Company Act of 1940, as amended (the 1940 Act), as an open-end management investment company organized as a Massachusetts business trust. The Fund offers Class A, Class M, Class C, Fidelity Healthy Future Fund, Class I and Class Z shares, each of which has equal rights as to assets and voting privileges. Class A, Class M, Class C, Class I and Class Z are Fidelity Advisor classes. Each class has exclusive voting rights with respect to matters that affect that class. Class C shares will automatically convert to Class A shares after a holding period of eight years from the initial date of purchase, with certain exceptions.
2. Investments in Fidelity Central Funds.
Funds may invest in Fidelity Central Funds, which are open-end investment companies generally available only to other investment companies and accounts managed by the investment adviser and its affiliates. The Schedule of Investments lists any Fidelity Central Funds held as an investment as of period end, but does not include the underlying holdings of each Fidelity Central Fund. An investing fund indirectly bears its proportionate share of the expenses of the underlying Fidelity Central Funds.
Based on its investment objective, each Fidelity Central Fund may invest or participate in various investment vehicles or strategies that are similar to those of the investing fund. These strategies are consistent with the investment objectives of the investing fund and may involve certain economic risks which may cause a decline in value of each of the Fidelity Central Funds and thus a decline in the value of the investing fund.
| Fidelity Central Fund | Investment Manager | Investment Objective | Investment Practices | Expense RatioA |
| Fidelity Money Market Central Funds | Fidelity Management & Research Company LLC (FMR) | Each fund seeks to obtain a high level of current income consistent with the preservation of capital and liquidity. | Short-term Investments | Less than .005% |
A Expenses expressed as a percentage of average net assets and are as of each underlying Central Fund's most recent annual or semi-annual shareholder report.
A complete unaudited list of holdings for each Fidelity Central Fund is available upon request or at the Securities and Exchange Commission website at www.sec.gov. In addition, the financial statements of the Fidelity Central Funds which contain the significant accounting policies (including investment valuation policies) of those funds, and are not covered by the Report of Independent Registered Public Accounting Firm, are available on the Securities and Exchange Commission website or upon request.
3. Significant Accounting Policies.
The Fund is an investment company and applies the accounting and reporting guidance of the Financial Accounting Standards Board (FASB) Accounting Standards Codification Topic 946 Financial Services - Investment Companies. The financial statements have been prepared in conformity with accounting principles generally accepted in the United States of America (GAAP), which require management to make certain estimates and assumptions at the date of the financial statements. Actual results could differ from those estimates. Subsequent events, if any, through the date that the financial statements were issued have been evaluated in the preparation of the financial statements. The Fund's Schedule of Investments lists any underlying mutual funds or exchange-traded funds (ETFs) but does not include the underlying holdings of these funds. The following summarizes the significant accounting policies of the Fund:
Investment Valuation. Investments are valued as of 4:00 p.m. Eastern time on the last calendar day of the period. The Board of Trustees (the Board) has designated the Fund's investment adviser as the valuation designee responsible for the fair valuation function and performing fair value determinations as needed. The investment adviser has established a Fair Value Committee (the Committee) to carry out the day-to-day fair valuation responsibilities and has adopted policies and procedures to govern the fair valuation process and the activities of the Committee. In accordance with these fair valuation policies and procedures, which have been approved by the Board, the Fund attempts to obtain prices from one or more third party pricing services or brokers to value its investments. When current market prices, quotations or currency exchange rates are not readily available or reliable, investments will be fair valued in good faith by the Committee, in accordance with the policies and procedures. Factors used in determining fair value vary by investment type and may include market or investment specific events, transaction data, estimated cash flows, and market observations of comparable investments. The frequency that the fair valuation procedures are used cannot be predicted and they may be utilized to a significant extent. The Committee manages the Fund's fair valuation practices and maintains the fair valuation policies and procedures. The Fund's investment adviser reports to the Board information regarding the fair valuation process and related material matters.
The Fund categorizes the inputs to valuation techniques used to value its investments into a disclosure hierarchy consisting of three levels as shown below:
Level 1 - unadjusted quoted prices in active markets for identical investments
Level 2 - other significant observable inputs (including quoted prices for similar investments, interest rates, prepayment speeds, etc.)
Level 3 - unobservable inputs (including the Fund's own assumptions based on the best information available)
Valuation techniques used to value the Fund's investments by major category are as follows:
Equity securities, including restricted securities, for which market quotations are readily available, are valued at the last reported sale price or official closing price as reported by a third party pricing service on the primary market or exchange on which they are traded and are categorized as Level 1 in the hierarchy. In the event there were no sales during the day or closing prices are not available, securities are valued at the last quoted bid price or may be valued using the last available price and are generally categorized as Level 2 in the hierarchy. For foreign equity securities, when market or security specific events arise, comparisons to the valuation of American Depositary Receipts (ADRs), futures contracts, Exchange-Traded Funds (ETFs) and certain indexes as well as quoted prices for similar securities may be used and would be categorized as Level 2 in the hierarchy. For equity securities, including restricted securities, where observable inputs are limited, assumptions about market activity and risk are used and these securities may be categorized as Level 3 in the hierarchy.
Investments in open-end mutual funds, including the Fidelity Central Funds, are valued at their closing net asset value (NAV) each business day and are categorized as Level 1 in the hierarchy.
Changes in valuation techniques may result in transfers in or out of an assigned level within the disclosure hierarchy. The aggregate value of investments by input level as of April 30, 2024 is included at the end of the Fund's Schedule of Investments.
Foreign Currency. Certain Funds may use foreign currency contracts to facilitate transactions in foreign-denominated securities. Gains and losses from these transactions may arise from changes in the value of the foreign currency or if the counterparties do not perform under the contracts' terms.
Foreign-denominated assets, including investment securities, and liabilities are translated into U.S. dollars at the exchange rates at period end. Purchases and sales of investment securities, income and dividends received, and expenses denominated in foreign currencies are translated into U.S. dollars at the exchange rate in effect on the transaction date.
The effects of exchange rate fluctuations on investments are included with the net realized and unrealized gain (loss) on investment securities. Other foreign currency transactions resulting in realized and unrealized gain (loss) are disclosed separately.
Investment Transactions and Income. For financial reporting purposes, the Fund's investment holdings and NAV include trades executed through the end of the last business day of the period. The NAV per share for processing shareholder transactions is calculated as of the close of business of the New York Stock Exchange (NYSE), normally 4:00 p.m. Eastern time and includes trades executed through the end of the prior business day. Gains and losses on securities sold are determined on the basis of identified cost. Commissions paid to certain brokers with whom the investment adviser, or its affiliates, places trades on behalf of a fund include an amount in addition to trade execution, which may be rebated back to a fund. Any such rebates are included in net realized gain (loss) on investments in the Statement of Operations. Dividend income is recorded on the ex-dividend date, except for certain dividends from foreign securities where the ex-dividend date may have passed, which are recorded as soon as the Fund is informed of the ex-dividend date. Non-cash dividends included in dividend income, if any, are recorded at the fair market value of the securities received. Income and capital gain distributions from Fidelity Central Funds, if any, are recorded on the ex-dividend date. Certain distributions received by the Fund represent a return of capital or capital gain. The Fund determines the components of these distributions subsequent to the ex-dividend date, based upon receipt of tax filings or other correspondence relating to the underlying investment. These distributions are recorded as a reduction of cost of investments and/or as a realized gain. Investment income is recorded net of foreign taxes withheld where recovery of such taxes is uncertain. Funds may file withholding tax reclaims in certain jurisdictions to recover a portion of amounts previously withheld. Any withholding tax reclaims income is included in the Statement of Operations in dividends. Any receivables for withholding tax reclaims are included in the Statement of Assets and Liabilities in reclaims receivable.
Class Allocations and Expenses. Investment income, realized and unrealized capital gains and losses, common expenses of a fund, and certain fund-level expense reductions, if any, are allocated daily on a pro-rata basis to each class based on the relative net assets of each class to the total net assets of a fund. Each class differs with respect to transfer agent and distribution and service plan fees incurred, as applicable. Certain expense reductions may also differ by class, if applicable. For the reporting period, the allocated portion of income and expenses to each class as a percent of its average net assets may vary due to the timing of recording these transactions in relation to fluctuating net assets of the classes. Expenses directly attributable to a fund are charged to that fund. Expenses attributable to more than one fund are allocated among the respective funds on the basis of relative net assets or other appropriate methods. Expenses included in the accompanying financial statements reflect the expenses of that fund and do not include any expenses associated with any underlying mutual funds or exchange-traded funds (ETFs). Although not included in a fund's expenses, a fund indirectly bears its proportionate share of these expenses through the net asset value of each underlying mutual fund or exchange-traded fund (ETF). Expense estimates are accrued in the period to which they relate and adjustments are made when actual amounts are known.
Income Tax Information and Distributions to Shareholders. Each year, the Fund intends to qualify as a regulated investment company under Subchapter M of the Internal Revenue Code, including distributing substantially all of its taxable income and realized gains. As a result, no provision for U.S. Federal income taxes is required. As of April 30, 2024, the Fund did not have any unrecognized tax benefits in the financial statements; nor is the Fund aware of any tax positions for which it is reasonably possible that the total amounts of unrecognized tax benefits will significantly change in the next twelve months. The Fund files a U.S. federal tax return, in addition to state and local tax returns as required. The Fund's federal income tax returns are subject to examination by the Internal Revenue Service (IRS) for a period of three fiscal years after they are filed. State and local tax returns may be subject to examination for an additional fiscal year depending on the jurisdiction. Foreign taxes are provided for based on the Fund's understanding of the tax rules and rates that exist in the foreign markets in which it invests.
Distributions are declared and recorded on the ex-dividend date. Income and capital gain distributions are declared separately for each class. Income and capital gain distributions are determined in accordance with income tax regulations, which may differ from GAAP. In addition, the Fund claimed a portion of the payment made to redeeming shareholders as a distribution for income tax purposes.
Capital accounts within the financial statements are adjusted for permanent book-tax differences. These adjustments have no impact on net assets or the results of operations. Capital accounts are not adjusted for temporary book-tax differences which will reverse in a subsequent period.
Book-tax differences are primarily due to foreign currency transactions, capital loss carryforwards and losses deferred due to wash sales.
As of period end, the cost and unrealized appreciation (depreciation) in securities, and derivatives if applicable, for federal income tax purposes were as follows:
| Gross unrealized appreciation | $1,607,200 |
| Gross unrealized depreciation | (411,411) |
| Net unrealized appreciation (depreciation) | $1,195,789 |
| Tax Cost | $8,062,154 |
The tax-based components of distributable earnings as of period end were as follows:
| Undistributed tax-exempt income | $- |
| Undistributed ordinary income | $6,157 |
| Capital loss carryforward | $(158,215) |
| Net unrealized appreciation (depreciation) on securities and other investments | $1,195,618 |
Capital loss carryforwards are only available to offset future capital gains of the Fund to the extent provided by regulations and may be limited. The capital loss carryforward information presented below, including any applicable limitation, is estimated as of fiscal period end and is subject to adjustment.
Short-term | $(158,215) |
Long-term | (-) |
| Total capital loss carryforward | $(158,215) |
The tax character of distributions paid was as follows:
| | April 30, 2024 | April 30, 2023 A |
| Ordinary Income | $3,025 | $- |
| Total | $3,025 | $- |
A For the period May 24, 2022 (commencement of operations) through April 30, 2023.
4. Purchases and Sales of Investments.
Purchases and sales of securities, other than short-term securities and in-kind transactions, as applicable, are noted in the table below.
| | Purchases ($) | Sales ($) |
| Fidelity Healthy Future Fund | 6,933,650 | 2,449,078 |
5. Fees and Other Transactions with Affiliates.
Management Fee. Fidelity Management & Research Company LLC (the investment adviser) and its affiliates provide the Fund with investment management related services for which the Fund pays a monthly management fee.
Effective March 1, 2024, the Fund's management contract was amended to incorporate administrative services previously covered under separate services agreements (Transfer Agent and Accounting agreements). The amended contract incorporates a management fee rate that may vary by class. The investment adviser or an affiliate pays certain expenses of managing and operating the Fund out of each class's management fee. Each class of the Fund pays a management fee to the investment adviser. The management fee is calculated and paid to the investment adviser every month. When determining a class's management fee, a mandate rate is calculated based on the monthly average net assets of a group of funds advised by FMR within a designated asset class. A discount rate is subtracted from the mandate rate once the Fund's monthly average net assets reach a certain level. The mandate rate and discount rate may vary by class. The annual management fee rate for a class of shares of the Fund is the lesser of (1) the class's mandate rate reduced by the class's discount rate (if applicable) or (2) the amount set forth in the following table.
| | Maximum Management Fee Rate % |
| Class A | .87 |
| Class M | .87 |
| Class C | .87 |
| Fidelity Healthy Future Fund | .87 |
| Class I | .85 |
| Class Z | .71 |
One-twelfth of the management fee rate for a class is applied to the average net assets of the class for the month, giving a dollar amount which is the management fee for the class for that month. A different management fee rate may be applicable to each class of the Fund. The difference between classes is the result of separate arrangements for class-level services and/or waivers of certain expenses. It is not the result of any difference in advisory or custodial fees or other expenses related to the management of the Fund's assets, which do not vary by class. For the portion of the reporting period on or after March 1, 2024, the total annualized management fee rates were as follows:
| | Total Management Fee Rate % |
| Class A | .87 |
| Class M | .87 |
| Class C | .87 |
| Fidelity Healthy Future Fund | .83 |
| Class I | .85 |
| Class Z | .71 |
Prior to March 1, 2024, the management fee was the sum of an individual fund fee rate that was based on an annual rate of .45% of the Fund's average net assets and an annualized group fee rate that averaged .22% during the period. The group fee rate was based upon the monthly average net assets of a group of registered investment companies with which the investment adviser has management contracts. The group fee rate decreased as assets under management increased and increased as assets under management decreased. For the portion of the reporting period prior to March 1, 2024, the total annualized management fee rate was .67%.
Effective March 1, 2024, the Fund's sub-advisory agreements with FMR Investment Management (UK) Limited, Fidelity Management & Research (Hong Kong) Limited, and Fidelity Management & Research (Japan) Limited were amended to provide that the investment adviser pays each sub-adviser monthly fees equal to 110% of the sub-adviser's costs for providing sub-advisory services.
Distribution and Service Plan Fees. In accordance with Rule 12b-1 of the 1940 Act, the Fund has adopted separate Distribution and Service Plans for each class of shares. Certain classes pay Fidelity Distributors Company LLC (FDC), an affiliate of the investment adviser, separate Distribution and Service Fees, each of which is based on an annual percentage of each class' average net assets. In addition, FDC may pay financial intermediaries for selling shares of the Fund and providing shareholder support services. For the period, the Distribution and Service Fee rates, total fees and amounts retained by FDC were as follows:
| | Distribution Fee | Service Fee | Total Fees ($) | Retained by FDC ($) |
| Class A | - % | .25% | 1,466 | 1,192 |
| Class M | .25% | .25% | 3,728 | 811 |
| Class C | .75% | .25% | 1,729 | 1,395 |
| | | | 6,923 | 3,398 |
Sales Load. FDC may receive a front-end sales charge of up to 5.75% for selling Class A shares and 3.50% for selling Class M shares, some of which is paid to financial intermediaries for selling shares of the Fund. Depending on the holding period, FDC may receive contingent deferred sales charges levied on Class A, Class M and Class C redemptions. The deferred sales charges are 1.00% for Class C shares, 1.00% for certain purchases of Class A shares and .25% for certain purchases of Class M shares.
For the period, sales charge amounts retained by FDC were as follows:
| | Retained by FDC ($) |
| Class A | 1,539 |
| Class M | 137 |
Class CA | 28 |
| | 1,704 |
A When Class C shares are initially sold, FDC pays commissions from its own resources to financial intermediaries through which the sales are made.
Transfer Agent Fees. Fidelity Investments Institutional Operations Company LLC (FIIOC), an affiliate of the investment adviser, is the transfer, dividend disbursing and shareholder servicing agent for each class of the Fund. Effective March 1, 2024, the Fund's management contract was amended to incorporate transfer agent services and associated fees previously covered under a separate services agreement. FIIOC pays for typesetting, printing and mailing of shareholder reports, except proxy statements.
During November 2023, the Board approved a change in the transfer agent fees effective December 1, 2023 to a fixed annual rate of class-level average net assets as follows:
| | % of Class-Level Average Net Assets |
| Class A | .2000 |
| Class M | .1988 |
| Class C | .2000 |
| Fidelity Healthy Future Fund | .2000 |
| Class I | .1792 |
Prior to December 1, 2023, FIIOC received account fees and asset-based fees that varied according to the account size and type of account of the shareholders of the respective classes of the Fund, except for Class Z. FIIOC received an asset-based fee of Class Z's average net assets. For the portion of the reporting period prior to March 1, 2024, the fees were equivalent to the following annualized rates:
| | Amount ($) | % of Class-Level Average Net Assets |
| Class A | 1,106 | .25 |
| Class M | 961 | .20 |
| Class C | 316 | .24 |
| Fidelity Healthy Future Fund | 9,538 | .24 |
| Class I | 195 | .19 |
| Class Z | 39 | .04 |
| | 12,155 | |
Accounting Fees. Fidelity Service Company, Inc. (FSC), an affiliate of the investment adviser, maintains the Fund's accounting records. Effective March 1, 2024, the Fund's management contract was amended to incorporate accounting services and associated fees previously covered under a separate services agreement.
During November 2023, the Board approved a change in the accounting fees effective December 1, 2023 to a fixed annual rate of average net assets as follows:
| | % of Average Net Assets |
| Fidelity Healthy Future Fund | .0354 |
Prior to December 1, 2023, the accounting fee was based on the level of average net assets for each month. For the portion of the reporting period prior to March 1, 2024, the fees were equivalent to the following annualized rates:
| | % of Average Net Assets |
| Fidelity Healthy Future Fund | .04 |
Brokerage Commissions. A portion of portfolio transactions were placed with brokerage firms which are affiliates of the investment adviser. Brokerage commissions are included in net realized gain (loss) and change in net unrealized appreciation (depreciation) in the Statement of Operations. The commissions paid to these affiliated firms were as follows:
| | Amount ($) |
| Fidelity Healthy Future Fund | 67 |
Interfund Trades. Funds may purchase from or sell securities to other Fidelity Funds under procedures adopted by the Board. The procedures have been designed to ensure these interfund trades are executed in accordance with Rule 17a-7 of the 1940 Act. Any interfund trades are included within the respective purchases and sales amounts shown in the Purchases and Sales of Investments note. Interfund trades during the period are noted in the table below.
| | Purchases ($) | Sales ($) | Realized Gain (Loss)($) |
| Fidelity Healthy Future Fund | 210,813 | 76,525 | (46,689) |
6. Committed Line of Credit.
Certain Funds participate with other funds managed by the investment adviser or an affiliate in a $4.25 billion credit facility (the "line of credit") to be utilized for temporary or emergency purposes to fund shareholder redemptions or for other short-term liquidity purposes. The participating funds have agreed to pay commitment fees on their pro-rata portion of the line of credit, which are reflected in Miscellaneous expenses on the Statement of Operations, and are listed below. During the period, there were no borrowings on this line of credit.
| | Amount ($) |
| Fidelity Healthy Future Fund | 11 |
7. Expense Reductions.
The investment adviser contractually agreed to reimburse expenses of each class to the extent annual operating expenses exceeded certain levels of class-level average net assets as noted in the table below. This reimbursement will remain in place through August 31, 2025. Some expenses, for example the compensation of the independent Trustees, are excluded from this reimbursement.
The following classes were in reimbursement during the period:
| | Expense Limitations | Reimbursement ($) |
| Class A | 1.30% | 10,421 |
| Class M | 1.55% | 14,154 |
| Class C | 2.05% | 3,266 |
| Fidelity Healthy Future Fund | 1.05% | 86,693 |
| Class I | 1.05% | 2,280 |
| Class Z | .90% | 1,917 |
| | | 118,731 |
Through arrangements with the Fund's custodian, credits realized as a result of certain uninvested cash balances were used to reduce the Fund's expenses. During the period, custodian credits reduced the Fund's expenses by $328.
In addition, during the period the investment adviser or an affiliate reimbursed and/or waived a portion of fund-level operating expenses in the amount of $451.
8. Distributions to Shareholders.
Distributions to shareholders of each class were as follows:
| | Year ended April 30, 2024 | Year ended April 30, 2023 A |
| Fidelity Healthy Future Fund | | |
| Distributions to shareholders | | |
| Fidelity Healthy Future Fund | $2,853 | $- |
| Class I | 91 | - |
| Class Z | 81 | - |
Total | $3,025 | $- |
A For the period May 24, 2022 (commencement of operations) through April 30, 2023.
9. Share Transactions.
Share transactions for each class were as follows and may contain in-kind transactions, automatic conversions between classes or exchanges between affiliated funds:
| | Shares | Shares | Dollars | Dollars |
| | Year ended April 30, 2024 | Year ended April 30, 2023 A | Year ended April 30, 2024 | Year ended April 30, 2023 A |
| Fidelity Healthy Future Fund | | | | |
| Class A | | | | |
| Shares sold | 60,658 | 21,624 | $668,918 | $214,288 |
| Shares redeemed | (8,451) | (2,197) | (96,085) | (22,414) |
| Net increase (decrease) | 52,207 | 19,427 | $572,833 | $191,874 |
| Class M | | | | |
| Shares sold | 128,604 | 12,903 | $1,431,236 | $129,961 |
| Shares redeemed | (9,527) | - | (104,174) | - |
| Net increase (decrease) | 119,077 | 12,903 | $1,327,062 | $129,961 |
| Class C | | | | |
| Shares sold | 10,734 | 12,345 | $123,647 | $123,179 |
| Shares redeemed | (807) | - | (8,515) | - |
| Net increase (decrease) | 9,927 | 12,345 | $115,132 | $123,179 |
| Fidelity Healthy Future Fund | | | | |
| Shares sold | 403,281 | 405,307 | $4,519,404 | $4,047,257 |
| Reinvestment of distributions | 215 | - | 2,296 | - |
| Shares redeemed | (195,003) | (86,589) | (2,184,086) | (856,749) |
| Net increase (decrease) | 208,493 | 318,718 | $2,337,614 | $3,190,508 |
| Class I | | | | |
| Shares sold | 4,013 | 10,884 | $47,126 | $108,773 |
| Reinvestment of distributions | 9 | - | 91 | - |
| Shares redeemed | (1,579) | - | (18,393) | - |
| Net increase (decrease) | 2,443 | 10,884 | $28,824 | $108,773 |
| Class Z | | | | |
| Shares sold | 47 | 10,820 | $490 | $107,700 |
| Reinvestment of distributions | 8 | - | 81 | - |
| Shares redeemed | - | (746) | - | (7,301) |
| Net increase (decrease) | 55 | 10,074 | $571 | $100,399 |
A For the period May 24, 2022 (commencement of operations) through April 30, 2023.
10. Other.
A fund's organizational documents provide former and current trustees and officers with a limited indemnification against liabilities arising in connection with the performance of their duties to the fund. In the normal course of business, a fund may also enter into contracts that provide general indemnifications. A fund's maximum exposure under these arrangements is unknown as this would be dependent on future claims that may be made against a fund. The risk of material loss from such claims is considered remote.
At the end of the period, the investment adviser or its affiliates were owners of record of more than 10 of the outstanding shares as follows:
| Fund | Affiliated % |
| Fidelity Healthy Future Fund | 13% |
11. Risk and Uncertainties.
Many factors affect a fund's performance. Developments that disrupt global economies and financial markets, such as pandemics, epidemics, outbreaks of infectious diseases, war, terrorism, and environmental disasters, may significantly affect a fund's investment performance. The effects of these developments to a fund will be impacted by the types of securities in which a fund invests, the financial condition, industry, economic sector, and geographic location of an issuer, and a fund's level of investment in the securities of that issuer. Significant concentrations in security types, issuers, industries, sectors, and geographic locations may magnify the factors that affect a fund's performance.
To the Board of Trustees of Fidelity Summer Street Trust and Shareholders of Fidelity Healthy Future Fund
Opinion on the Financial Statements
We have audited the accompanying statement of assets and liabilities, including the schedule of investments, of Fidelity Healthy Future Fund (one of the funds constituting Fidelity Summer Street Trust, referred to hereafter as the "Fund") as of April 30, 2024, the related statement of operations for the year ended April 30, 2024, and the statement of changes in net assets and the financial highlights for the year ended April 30, 2024 and for the period May 24, 2022 (commencement of operations) through April 30, 2023, including the related notes. In our opinion, the financial statements present fairly, in all material respects, the financial position of the Fund as of April 30, 2024, the results of its operations for the year ended April 30, 2024, and the changes in its net assets and the financial highlights for the year ended April 30, 2024 and for the period May 24, 2022 (commencement of operations) through April 30, 2023 in conformity with accounting principles generally accepted in the United States of America.
Basis for Opinion
These financial statements are the responsibility of the Fund's management. Our responsibility is to express an opinion on the Fund's financial statements based on our audits. We are a public accounting firm registered with the Public Company Accounting Oversight Board (United States) (PCAOB) and are required to be independent with respect to the Fund in accordance with the U.S. federal securities laws and the applicable rules and regulations of the Securities and Exchange Commission and the PCAOB.
We conducted our audits of these financial statements in accordance with the standards of the PCAOB. Those standards require that we plan and perform the audit to obtain reasonable assurance about whether the financial statements are free of material misstatement, whether due to error or fraud.
Our audits included performing procedures to assess the risks of material misstatement of the financial statements, whether due to error or fraud, and performing procedures that respond to those risks. Such procedures included examining, on a test basis, evidence regarding the amounts and disclosures in the financial statements. Our audits also included evaluating the accounting principles used and significant estimates made by management, as well as evaluating the overall presentation of the financial statements. Our procedures included confirmation of securities owned as of April 30, 2024 by correspondence with the custodian and brokers; when replies were not received from brokers, we performed other auditing procedures. We believe that our audits provide a reasonable basis for our opinion.
/s/ PricewaterhouseCoopers LLP
Boston, Massachusetts
June 12, 2024
We have served as the auditor of one or more investment companies in the Fidelity group of funds since 1932.
The Trustees, Members of the Advisory Board (if any), and officers of the trust and fund, as applicable, are listed below. The Board of Trustees governs the fund and is responsible for protecting the interests of shareholders. The Trustees are experienced executives who meet periodically throughout the year to oversee the fund's activities, review contractual arrangements with companies that provide services to the fund, oversee management of the risks associated with such activities and contractual arrangements, and review the fund's performance. Except for Vijay Advani, each of the Trustees oversees 323 funds. Mr. Advani oversees 216 funds.
The Trustees hold office without limit in time except that (a) any Trustee may resign; (b) any Trustee may be removed by written instrument, signed by at least two-thirds of the number of Trustees prior to such removal; (c) any Trustee who requests to be retired or who has become incapacitated by illness or injury may be retired by written instrument signed by a majority of the other Trustees; and (d) any Trustee may be removed at any special meeting of shareholders by a two-thirds vote of the outstanding voting securities of the trust. Each Trustee who is not an interested person (as defined in the 1940 Act) of the trust and the fund is referred to herein as an Independent Trustee. Each Independent Trustee shall retire not later than the last day of the calendar year in which his or her 75th birthday occurs. The Independent Trustees may waive this mandatory retirement age policy with respect to individual Trustees. Officers and Advisory Board Members hold office without limit in time, except that any officer or Advisory Board Member may resign or may be removed by a vote of a majority of the Trustees at any regular meeting or any special meeting of the Trustees. Except as indicated, each individual has held the office shown or other offices in the same company for the past five years.
The fund's Statement of Additional Information (SAI) includes more information about the Trustees. To request a free copy, call Fidelity at 1-800-544-8544 if you're an individual investing directly with Fidelity, call 1-800-835-5092 if you're a plan sponsor or participant with Fidelity as your recordkeeper or call 1-877-208-0098 on institutional accounts or if you're an advisor or invest through one.
Experience, Skills, Attributes, and Qualifications of the Trustees. The Governance and Nominating Committee has adopted a statement of policy that describes the experience, qualifications, attributes, and skills that are necessary and desirable for potential Independent Trustee candidates (Statement of Policy). The Board believes that each Trustee satisfied at the time he or she was initially elected or appointed a Trustee, and continues to satisfy, the standards contemplated by the Statement of Policy. The Governance and Nominating Committee also engages professional search firms to help identify potential Independent Trustee candidates who have the experience, qualifications, attributes, and skills consistent with the Statement of Policy. From time to time, additional criteria based on the composition and skills of the current Independent Trustees, as well as experience or skills that may be appropriate in light of future changes to board composition, business conditions, and regulatory or other developments, have also been considered by the professional search firms and the Governance and Nominating Committee. In addition, the Board takes into account the Trustees' commitment and participation in Board and committee meetings, as well as their leadership of standing and ad hoc committees throughout their tenure.
In determining that a particular Trustee was and continues to be qualified to serve as a Trustee, the Board has considered a variety of criteria, none of which, in isolation, was controlling. The Board believes that, collectively, the Trustees have balanced and diverse experience, qualifications, attributes, and skills, which allow the Board to operate effectively in governing the fund and protecting the interests of shareholders. Information about the specific experience, skills, attributes, and qualifications of each Trustee, which in each case led to the Board's conclusion that the Trustee should serve (or continue to serve) as a trustee of the fund, is provided below.
Board Structure and Oversight Function. Robert A. Lawrence is an interested person and currently serves as Chair. The Trustees have determined that an interested Chair is appropriate and benefits shareholders because an interested Chair has a personal and professional stake in the quality and continuity of services provided to the fund. Independent Trustees exercise their informed business judgment to appoint an individual of their choosing to serve as Chair, regardless of whether the Trustee happens to be independent or a member of management. The Independent Trustees have determined that they can act independently and effectively without having an Independent Trustee serve as Chair and that a key structural component for assuring that they are in a position to do so is for the Independent Trustees to constitute a substantial majority for the Board. The Independent Trustees also regularly meet in executive session. David M. Thomas serves as Lead Independent Trustee and as such (i) acts as a liaison between the Independent Trustees and management with respect to matters important to the Independent Trustees and (ii) with management prepares agendas for Board meetings.
Fidelity® funds are overseen by different Boards of Trustees. The fund's Board oversees Fidelity's high income and certain equity funds, and other Boards oversee Fidelity's alternative investment, investment-grade bond, money market, asset allocation, and other equity funds. The asset allocation funds may invest in Fidelity® funds overseen by the fund's Board. The use of separate Boards, each with its own committee structure, allows the Trustees of each group of Fidelity® funds to focus on the unique issues of the funds they oversee, including common research, investment, and operational issues. On occasion, the separate Boards establish joint committees to address issues of overlapping consequences for the Fidelity® funds overseen by each Board.
The Trustees operate using a system of committees to facilitate the timely and efficient consideration of all matters of importance to the Trustees, the fund, and fund shareholders and to facilitate compliance with legal and regulatory requirements and oversight of the fund's activities and associated risks. The Board, acting through its committees, has charged FMR and its affiliates with (i) identifying events or circumstances the occurrence of which could have demonstrably adverse effects on the fund's business and/or reputation; (ii) implementing processes and controls to lessen the possibility that such events or circumstances occur or to mitigate the effects of such events or circumstances if they do occur; and (iii) creating and maintaining a system designed to evaluate continuously business and market conditions in order to facilitate the identification and implementation processes described in (i) and (ii) above. Because the day-to-day operations and activities of the fund are carried out by or through FMR, its affiliates, and other service providers, the fund's exposure to risks is mitigated but not eliminated by the processes overseen by the Trustees. While each of the Board's committees has responsibility for overseeing different aspects of the fund's activities, oversight is exercised primarily through the Operations, Audit, and Compliance Committees. Appropriate personnel, including but not limited to the fund's Chief Compliance Officer (CCO), FMR's internal auditor, the independent accountants, the fund's Treasurer and portfolio management personnel, make periodic reports to the Board's committees, as appropriate, including an annual review of Fidelity's risk management program for the Fidelity® funds. The responsibilities of each standing committee, including their oversight responsibilities, are described further under "Standing Committees of the Trustees."
Interested Trustees*:
Correspondence intended for a Trustee who is an interested person may be sent to Fidelity Investments, 245 Summer Street, Boston, Massachusetts 02210.
Name, Year of Birth; Principal Occupations and Other Relevant Experience+
Bettina Doulton (1964)
Year of Election or Appointment: 2020
Trustee
Ms. Doulton also serves as Trustee of other Fidelity® funds. Prior to her retirement, Ms. Doulton served in a variety of positions at Fidelity Investments, including as a managing director of research (2006-2007), portfolio manager to certain Fidelity® funds (1993-2005), equity analyst and portfolio assistant (1990-1993), and research assistant (1987-1990). Ms. Doulton currently owns and operates Cellardoor Winery. Previously, Ms. Doulton served as a member of the Board of Brown Capital Management, LLC (2014-2018).
Robert A. Lawrence (1952)
Year of Election or Appointment: 2020
Trustee
Chair of the Board of Trustees
Mr. Lawrence also serves as Trustee of other funds. Previously, Mr. Lawrence served as a Trustee and Member of the Advisory Board of certain funds. Prior to his retirement in 2008, Mr. Lawrence served as Vice President of certain Fidelity® funds (2006-2008), Senior Vice President, Head of High Income Division of Fidelity Management & Research Company (investment adviser firm, 2006-2008), and President of Fidelity Strategic Investments (investment adviser firm, 2002-2005).
* Determined to be an "Interested Trustee" by virtue of, among other things, his or her affiliation with the trust or various entities under common control with FMR.
+ The information includes the Trustee's principal occupation during the last five years and other information relating to the experience, attributes, and skills relevant to the Trustee's qualifications to serve as a Trustee, which led to the conclusion that the Trustee should serve as a Trustee for the fund.
Independent Trustees:
Correspondence intended for an Independent Trustee may be sent to Fidelity Investments, P.O. Box 55235, Boston, Massachusetts 02205-5235.
Name, Year of Birth; Principal Occupations and Other Relevant Experience+
Vijay C. Advani (1960)
Year of Election or Appointment: 2023
Trustee
Mr. Advani also serves as Trustee or Member of the Advisory Board of other funds. Previously, Mr. Advani served as Executive Chairman (2020-2022), Chief Executive Officer (2017-2020) and Chief Operating Officer (2016-2017) of Nuveen (global investment manager). He also served in various capacities at Franklin Resources (global investment manager), including Co-President (2015-2016), Executive Vice President, Global Advisory Services (2008-2015), Head of Global Retail Distribution (2005-2008), Executive Managing Director, International Retail Development (2002-2005), Managing Director, Product Developments, Sales & Marketing, Asia, Eastern Europe and Africa (2000-2002) and President, Templeton Asset Management India (1995-2000). Mr. Advani also served as Senior Investment Officer of International Finance Corporation (private equity and venture capital arm of The World Bank, 1984-1995). Mr. Advani is Chairman Emeritus of the U.S. India Business Council (2018-present), a Director of The Global Impact Investing Network (2019-present), a Director of LOK Capital (Mauritius) (2022-present), a member of the Advisory Council of LOK Capital (2022-present), a Senior Advisor of Neuberger Berman (2021-present), a Senior Advisor of Seviora Holdings Pte. Ltd (Temasek-Singapore) (2021-present), a Director of Seviora Capital (Singapore) (2021-present) and an Advisor of EQUIAM (2021-present). Mr. Advani formerly served as a member of the Board of BowX Acquisition Corp. (special purpose acquisition company, 2020-2021), a member of the Board of Intellecap (advisory arm of The Aavishkaar Group, 2018-2020), a member of the Board of Nuveen Investments, Inc. (2017-2020) and a member of the Board of Docusign (software, 2016-2019).
Thomas P. Bostick (1956)
Year of Election or Appointment: 2021
Trustee
Lieutenant General Bostick also serves as Trustee of other Fidelity® funds. Prior to his retirement, General Bostick (United States Army, Retired) held a variety of positions within the U.S. Army, including Chief of Engineers and Commanding General, U.S. Army Corps of Engineers (2012-2016) and Deputy Chief of Staff and Director of Human Resources, U.S. Army (2009-2012). General Bostick currently serves as a member of the Board and Finance and Governance & Sustainability Committees of CSX Corporation (transportation, 2020-present) and a member of the Board and Corporate Governance and Nominating Committee of Perma-Fix Environmental Services, Inc. (nuclear waste management, 2020-present). General Bostick serves as Chief Executive Officer of Bostick Global Strategies, LLC (consulting, 2016-present), as a member of the Board of HireVue, Inc. (video interview and assessment, 2020-present), as a member of the Board of Allonnia (biotechnology and engineering solutions, 2022-present), on the Advisory Board of Hilco Redevelopment Partners (a real estate investment and redevelopment company, 2021-present), and on the Advisory Board of Solugen, Inc. (specialty bio-based chemicals manufacturer, 2022-present). Previously, General Bostick served as a Member of the Advisory Board of certain Fidelity® funds (2021), President, Intrexon Bioengineering (2018-2020) and Chief Operating Officer (2017-2020) and Senior Vice President of the Environment Sector (2016-2017) of Intrexon Corporation (biopharmaceutical company).
Donald F. Donahue (1950)
Year of Election or Appointment: 2018
Trustee
Mr. Donahue also serves as Trustee of other Fidelity® funds. Mr. Donahue serves as President and Chief Executive Officer of Miranda Partners, LLC (risk consulting for the financial services industry, 2012-present). Previously, Mr. Donahue served as Chief Executive Officer (2006-2012), Chief Operating Officer (2003-2006) and Managing Director, Customer Marketing and Development (1999-2003) of The Depository Trust & Clearing Corporation (financial markets infrastructure). Mr. Donahue currently serves as a member (2007-present) and Co-Chairman (2016-present) of the Board of United Way of New York. Mr. Donahue previously served as a member of the Advisory Board of certain Fidelity® funds (2015-2018) and as a member of the Board of The Leadership Academy (previously NYC Leadership Academy) (2012-2022).
Vicki L. Fuller (1957)
Year of Election or Appointment: 2020
Trustee
Ms. Fuller also serves as Trustee of other Fidelity® funds. Previously, Ms. Fuller served as a member of the Advisory Board of certain Fidelity® funds (2018-2020), Chief Investment Officer of the New York State Common Retirement Fund (2012-2018) and held a variety of positions at AllianceBernstein L.P. (global asset management, 1985-2012), including Managing Director (2006-2012) and Senior Vice President and Senior Portfolio Manager (2001-2006). Ms. Fuller currently serves as a member of the Board, Audit Committee, Compensation Committee and Nominating and Governance Committee of two Blackstone business development companies (2020-present), as a member of the Board of Treliant, LLC (consulting, 2019-present), as a member of the Board of Ariel Alternatives, LLC (private equity, 2022-present) and as a member of the Board and Chair of the Audit Committee of Gusto, Inc. (software, 2021-present). In addition, Ms. Fuller currently serves as a member of the Executive Board of New York University's Stern School of Business. Ms. Fuller previously served as a member of the Board of Roosevelt University (2019-2024) and member of the Board, Audit Committee and Nominating and Governance Committee of The Williams Companies, Inc. (natural gas infrastructure, 2018-2021).
Patricia L. Kampling (1959)
Year of Election or Appointment: 2020
Trustee
Ms. Kampling also serves as Trustee of other Fidelity® funds. Prior to her retirement, Ms. Kampling served as Chairman of the Board and Chief Executive Officer (2012-2019), President and Chief Operating Officer (2011-2012) and Executive Vice President and Chief Financial Officer (2010-2011) of Alliant Energy Corporation. Ms. Kampling currently serves as a member of the Board, Audit Committee and Governance, Compensation and Nominating Committee of Xcel Energy Inc. (utilities company, 2020-present) and as a member of the Board, Audit, Finance and Risk Committee and Safety, Environmental, Technology and Operations Committee and Chair of the Executive Development and Compensation Committee of American Water Works Company, Inc. (utilities company, 2019-present). In addition, Ms. Kampling currently serves as a member of the Board of the Nature Conservancy, Wisconsin Chapter (2019-present). Previously, Ms. Kampling served as a Member of the Advisory Board of certain Fidelity® funds (2020), a member of the Board, Compensation Committee and Executive Committee and Chair of the Audit Committee of Briggs & Stratton Corporation (manufacturing, 2011-2021), a member of the Board of Interstate Power and Light Company (2012-2019) and Wisconsin Power and Light Company (2012-2019) (each a subsidiary of Alliant Energy Corporation) and as a member of the Board and Workforce Development Committee of the Business Roundtable (2018-2019).
Thomas A. Kennedy (1955)
Year of Election or Appointment: 2021
Trustee
Mr. Kennedy also serves as Trustee of other Fidelity® funds. Previously, Mr. Kennedy served as a Member of the Advisory Board of certain Fidelity® funds (2020) and held a variety of positions at Raytheon Company (aerospace and defense, 1983-2020), including Chairman and Chief Executive Officer (2014-2020) and Executive Vice President and Chief Operating Officer (2013-2014). Mr. Kennedy served as Executive Chairman of the Board of Directors of Raytheon Technologies Corporation (aerospace and defense, 2020-2021). Mr. Kennedy serves as a Director of the Board of Directors of Textron Inc. (aerospace and defense, 2023-present).
Oscar Munoz (1959)
Year of Election or Appointment: 2021
Trustee
Mr. Munoz also serves as Trustee of other Fidelity® funds. Prior to his retirement, Mr. Munoz served as Executive Chairman (2020-2021), Chief Executive Officer (2015-2020), President (2015-2016) and a member of the Board (2010-2021) of United Airlines Holdings, Inc. Mr. Munoz currently serves as a member of the Board of CBRE Group, Inc. (commercial real estate, 2020-present), a member of the Board of Univision Communications, Inc. (Hispanic media, 2020-present), a member of the Board of Archer Aviation Inc. (2021-present), a member of the Defense Business Board of the United States Department of Defense (2021-present) and a member of the Board of Salesforce.com, Inc. (cloud-based software, 2022-present). Previously, Mr. Munoz served as a Member of the Advisory Board of certain Fidelity® funds (2021).
David M. Thomas (1949)
Year of Election or Appointment: 2008
Trustee
Lead Independent Trustee
Mr. Thomas also serves as Trustee of other Fidelity® funds. Previously, Mr. Thomas served as Executive Chairman (2005-2006) and Chairman and Chief Executive Officer (2000-2005) of IMS Health, Inc. (pharmaceutical and healthcare information solutions) and as a member of the Board of Fortune Brands Home and Security (home and security products, 2004-2023). Mr. Thomas currently serves as Director (2013-present) and Non-Executive Chairman of the Board (2022-present) of Interpublic Group of Companies, Inc. (marketing communication).
Susan Tomasky (1953)
Year of Election or Appointment: 2020
Trustee
Ms. Tomasky also serves as Trustee of other Fidelity® funds. Prior to her retirement, Ms. Tomasky served in various executive officer positions at American Electric Power Company, Inc. (1998-2011), including most recently as President of AEP Transmission (2007-2011). Ms. Tomasky currently serves as a member of the Board and Sustainability Committee and as Chair of the Audit Committee of Marathon Petroleum Corporation (2018-present) and as a member of the Board, Executive Committee, Corporate Governance Committee and Organization and Compensation Committee and as Lead Director of the Board of Public Service Enterprise Group, Inc. (utilities company, 2012-present) and as a member of the Board of its subsidiary company, Public Service Electric and Gas Co. (2021-present). In addition, Ms. Tomasky currently serves as a member (2009-present) and President (2020-present) of the Board of the Royal Shakespeare Company - America (2009-present) and as a member and Vice Chair of the Board of Kenyon College (2016-present). Previously, Ms. Tomasky served as a Member of the Advisory Board of certain Fidelity® funds (2020), as a member of the Board of the Columbus Association for the Performing Arts (2011-2023), as a member of the Board of the Columbus Regional Airport Authority (2007-2020), as a member of the Board (2011-2018) and Lead Independent Director (2015-2018) of Andeavor Corporation (previously Tesoro Corporation) (independent oil refiner and marketer) and as a member of the Board of Summit Midstream Partners LP (energy, 2012-2018).
Michael E. Wiley (1950)
Year of Election or Appointment: 2018
Trustee
Mr. Wiley also serves as Trustee of other Fidelity® funds. Previously, Mr. Wiley served as a member of the Advisory Board of certain Fidelity® funds (2018-2020), Chairman, President and CEO of Baker Hughes, Inc. (oilfield services, 2000-2004). Mr. Wiley also previously served as a member of the Board of Andeavor Corporation (independent oil refiner and marketer, 2005-2018), a member of the Board of Andeavor Logistics LP (natural resources logistics, 2015-2018) and a member of the Board of High Point Resources (exploration and production, 2005-2020).
+ The information includes the Trustee's principal occupation during the last five years and other information relating to the experience, attributes, and skills relevant to the Trustee's qualifications to serve as a Trustee, which led to the conclusion that the Trustee should serve as a Trustee for the fund.
Advisory Board Members and Officers:
Correspondence intended for a Member of the Advisory Board (if any) may be sent to Fidelity Investments, P.O. Box 55235, Boston, Massachusetts 02205-5235. Correspondence intended for an officer or Peter S. Lynch may be sent to Fidelity Investments, 245 Summer Street, Boston, Massachusetts 02210.
Name, Year of Birth; Principal Occupations+
Peter S. Lynch (1944)
Year of Election or Appointment: 2003
Member of the Advisory Board
Mr. Lynch also serves as a Member of the Advisory Board of other Fidelity® funds. Mr. Lynch is Vice Chairman and a Director of Fidelity Management & Research Company LLC (investment adviser firm). In addition, Mr. Lynch serves as a Trustee of Boston College and as the Chairman of the Inner-City Scholarship Fund. Previously, Mr. Lynch served as Vice Chairman and a Director of FMR Co., Inc. (investment adviser firm) and on the Special Olympics International Board of Directors (1997-2006).
Karen B. Peetz (1955)
Year of Election or Appointment: 2023
Member of the Advisory Board
Ms. Peetz also serves as a Member of the Advisory Board of other funds. Previously, Ms. Peetz served as Chief Administration Officer (2020-2023) of Citigroup Inc. (a diversified financial service company). She also served in various capacities at Bank of New York Mellon Corporation, including President (2013-2016), Vice Chairman, Senior Executive Vice President and Chief Executive Officer of Financial Markets & Treasury Services (2010-2013), Senior Executive Vice President and Chief Executive Officer of Global Corporate Trust (2003-2008), Senior Vice President and Division Manager of Global Payments & Trade Services (2002-2003) and Senior Vice President and Division Manager of Domestic Corporate Trust (1998-2002). Ms. Peetz also served in various capacities at Chase Manhattan Corporation (1982-1998), including Senior Vice President and Manager of Corporate Trust International Business (1996-1998), Managing Director and Manager of Corporate Trust Services (1994-1996) and Managing Director and Group Manager of Financial Institution Sales (1990-1993). Ms. Peetz currently serves as Chair of Amherst Holdings Advisory Council (2018-present), Trustee of Johns Hopkins University (2016-present), Chair of the Carey Business School Advisory Council, Member of the Johns Hopkins Medicine Board and Finance Committee and Chair of the Lyme and Tick Related Disease Institute Advisory Council. Ms. Peetz previously served as a member of the Board of Guardian Life Insurance Company of America (2019-2023), a member of the Board of Trane Technologies (2018-2022), a member of the Board of Wells Fargo Corp. (2017-2019), a member of the Board of SunCoke Energy Inc. (2012-2016), a member of the Board of Private Export Funding Corporation (2010-2016) and as a Trustee of Penn State University (2010-2014) and the United Way of New York City (2008-2010).
Heather Bonner (1977)
Year of Election or Appointment: 2023
Assistant Treasurer
Ms. Bonner also serves as an officer of other funds. Ms. Bonner is a Senior Vice President (2022-present) and is an employee of Fidelity Investments (2022-present). Ms. Bonner serves as Senior Vice President, Vice President, Treasurer, or Director of certain Fidelity entities. Prior to joining Fidelity, Ms. Bonner served as Managing Director at AQR Capital Management (2013-2022) and was the Treasurer and Principal Financial Officer of the AQR Funds (2013-2022).
Craig S. Brown (1977)
Year of Election or Appointment: 2022
Deputy Treasurer
Mr. Brown also serves as an officer of other funds. Mr. Brown is a Vice President (2015-present) and is an employee of Fidelity Investments. Mr. Brown serves as Assistant Treasurer of FIMM, LLC (2021-present). Previously, Mr. Brown served as Assistant Treasurer of certain Fidelity® funds (2019-2022).
John J. Burke III (1964)
Year of Election or Appointment: 2018
Chief Financial Officer
Mr. Burke also serves as Chief Financial Officer of other funds. Mr. Burke is Head of Fidelity Fund and Investment Operations (2018-present) and is an employee of Fidelity Investments. Mr. Burke serves as President, Executive Vice President, or Director of certain Fidelity entities. Previously Mr. Burke served as head of Asset Management Investment Operations (2012-2018).
Margaret Carey (1973)
Year of Election or Appointment: 2023
Secretary and Chief Legal Officer (CLO)
Ms. Carey also serves as an officer of other funds and as CLO of certain Fidelity entities. Ms. Carey is a Senior Vice President, Deputy General Counsel (2019-present) and is an employee of Fidelity Investments.
William C. Coffey (1969)
Year of Election or Appointment: 2019
Assistant Secretary
Mr. Coffey also serves as Assistant Secretary of other funds. Mr. Coffey is a Senior Vice President, Deputy General Counsel (2010-present) and is an employee of Fidelity Investments. Previously, Mr. Coffey served as Secretary and CLO of certain funds (2018-2019); CLO, Secretary, or Senior Vice President of certain Fidelity entities and Assistant Secretary of certain funds (2009-2018).
Timothy M. Cohen (1969)
Year of Election or Appointment: 2018
Vice President
Mr. Cohen also serves as Vice President of other funds. Mr. Cohen is Co-Head of Equity (2018-present) and is an employee of Fidelity Investments. Mr. Cohen serves as President or Director of certain Fidelity entities. Previously, Mr. Cohen served as Executive Vice President of Fidelity SelectCo, LLC (2019) and Head of Global Equity Research (2016-2018).
Jonathan Davis (1968)
Year of Election or Appointment: 2010
Assistant Treasurer
Mr. Davis also serves as an officer of other funds. Mr. Davis is a Vice President (2006-present) and is an employee of Fidelity Investments. Mr. Davis serves as Assistant Treasurer or Director of certain Fidelity entities.
Laura M. Del Prato (1964)
Year of Election or Appointment: 2018
Assistant Treasurer
Ms. Del Prato also serves as an officer of other funds. Ms. Del Prato is a Senior Vice President (2017-present) and is an employee of Fidelity Investments. Ms. Del Prato serves as Senior Vice President, Vice President, Assistant Treasurer, or Director of certain Fidelity entities. Previously, Ms. Del Prato served as President and Treasurer of The North Carolina Capital Management Trust: Cash Portfolio and Term Portfolio (2018-2020).
Colm A. Hogan (1973)
Year of Election or Appointment: 2020
Assistant Treasurer
Mr. Hogan also serves as an officer of other funds. Mr. Hogan is a Vice President (2016-present) and is an employee of Fidelity Investments. Mr. Hogan serves as Assistant Treasurer of certain Fidelity entities. Previously, Mr. Hogan served as Deputy Treasurer of certain Fidelity® funds (2016-2020) and Assistant Treasurer of certain Fidelity® funds (2016-2018).
Pamela R. Holding (1964)
Year of Election or Appointment: 2018
Vice President
Ms. Holding also serves as Vice President of other funds. Ms. Holding is Co-Head of Equity (2018-present) and is an employee of Fidelity Investments. Previously, Ms. Holding served as Executive Vice President of Fidelity SelectCo, LLC (2019) and as Chief Investment Officer of Fidelity Institutional Asset Management (2013-2018).
Chris Maher (1972)
Year of Election or Appointment: 2020
Deputy Treasurer
Mr. Maher also serves as an officer of other funds. Mr. Maher is a Vice President (2008-present) and is an employee of Fidelity Investments. Mr. Maher serves as Assistant Treasurer of certain Fidelity entities. Previously, Mr. Maher served as Assistant Treasurer of certain funds (2013-2020).
Jason P. Pogorelec (1975)
Year of Election or Appointment: 2020
Chief Compliance Officer
Mr. Pogorelec also serves as Chief Compliance Officer of other funds. Mr. Pogorelec is a Senior Vice President of Asset Management Compliance (2020-present) and is an employee of Fidelity Investments. Mr. Pogorelec serves as Compliance Officer of Fidelity Management & Research Company LLC (investment adviser firm, 2023-present) and Ballyrock Investment Advisors LLC (2023-present). Previously, Mr. Pogorelec served as a Vice President, Associate General Counsel for Fidelity Investments (2010-2020) and Assistant Secretary of certain Fidelity® funds (2015-2020).
Brett Segaloff (1972)
Year of Election or Appointment: 2021
Anti-Money Laundering (AML) Officer
Mr. Segaloff also serves as AML Officer of other funds. Mr. Segaloff is a Vice President (2022-present) and is an employee of Fidelity Investments. Mr. Segaloff serves as Anti Money Laundering Compliance Officer or Anti Money Laundering/Bank Secrecy Act Compliance Officer of certain Fidelity entities.
Stacie M. Smith (1974)
Year of Election or Appointment: 2016
President and Treasurer
Ms. Smith also serves as an officer of other funds. Ms. Smith is a Senior Vice President (2016-present) and is an employee of Fidelity Investments. Ms. Smith serves as Assistant Treasurer of certain Fidelity entities and has served in other fund officer roles.
Jim Wegmann (1979)
Year of Election or Appointment: 2019
Assistant Treasurer
Mr. Wegmann also serves as an officer of other funds. Mr. Wegmann is a Vice President (2016-present) and is an employee of Fidelity Investments. Mr. Wegmann serves as Assistant Treasurer of FIMM, LLC (2021-present). Previously, Mr. Wegmann served as Assistant Treasurer of certain Fidelity® funds (2019-2021).
+ The information includes principal occupation during the last five years.
As a shareholder, you incur two types of costs: (1) transaction costs, which may include sales charges (loads) on purchase payments or redemption proceeds, as applicable and (2) ongoing costs, which generally include management fees, distribution and/or service (12b-1) fees and other Fund expenses. This Example is intended to help you understand your ongoing costs (in dollars) of investing in a fund and to compare these costs with the ongoing costs of investing in other mutual funds.
| The Example is based on an investment of $1,000 invested at the beginning of the period and held for the entire period (November 1, 2023 to April 30, 2024). |
Actual Expenses
The first line of the accompanying table provides information about actual account values and actual expenses. You may use the information in this line, together with the amount you invested, to estimate the expenses that you paid over the period. Simply divide your account value by $1,000.00 (for example, an $8,600 account value divided by $1,000.00 = 8.6), then multiply the result by the number in the first line for a class/Fund under the heading entitled "Expenses Paid During Period" to estimate the expenses you paid on your account during this period. If any fund is a shareholder of any underlying mutual funds or exchange-traded funds (ETFs) (the Underlying Funds), such fund indirectly bears its proportional share of the expenses of the Underlying Funds in addition to the direct expenses incurred presented in the table. These fees and expenses are not included in the annualized expense ratio used to calculate the expense estimate in the table below.
Hypothetical Example for Comparison Purposes
The second line of the accompanying table provides information about hypothetical account values and hypothetical expenses based on the actual expense ratio and an assumed rate of return of 5% per year before expenses, which is not the actual return. The hypothetical account values and expenses may not be used to estimate the actual ending account balance or expenses you paid for the period. You may use this information to compare the ongoing costs of investing in the Fund and other funds. To do so, compare this 5% hypothetical example with the 5% hypothetical examples that appear in the shareholder reports of the other funds. If any fund is a shareholder of any Underlying Funds, such fund indirectly bears its proportional share of the expenses of the Underlying Funds in addition to the direct expenses as presented in the table. These fees and expenses are not included in the annualized expense ratio used to calculate the expense estimate in the table below.
Please note that the expenses shown in the table are meant to highlight your ongoing costs only and do not reflect any transaction costs. Therefore, the second line of the table is useful in comparing ongoing costs only, and will not help you determine the relative total costs of owning different funds. In addition, if these transactional costs were included, your costs would have been higher.
| | | | | Annualized Expense Ratio- A | | Beginning Account Value November 1, 2023 | | Ending Account Value April 30, 2024 | | Expenses Paid During Period- C November 1, 2023 to April 30, 2024 |
| Fidelity® Healthy Future Fund | | | | | | | | | | |
| Class A | | | | 1.28% | | | | | | |
| Actual | | | | | | $ 1,000 | | $ 1,184.90 | | $ 6.95 |
Hypothetical-B | | | | | | $ 1,000 | | $ 1,018.50 | | $ 6.42 |
| Class M | | | | 1.52% | | | | | | |
| Actual | | | | | | $ 1,000 | | $ 1,182.50 | | $ 8.25 |
Hypothetical-B | | | | | | $ 1,000 | | $ 1,017.30 | | $ 7.62 |
| Class C | | | | 2.02% | | | | | | |
| Actual | | | | | | $ 1,000 | | $ 1,179.70 | | $ 10.95 |
Hypothetical-B | | | | | | $ 1,000 | | $ 1,014.82 | | $ 10.12 |
| Fidelity® Healthy Future Fund | | | | 1.04% | | | | | | |
| Actual | | | | | | $ 1,000 | | $ 1,186.30 | | $ 5.65 |
Hypothetical-B | | | | | | $ 1,000 | | $ 1,019.69 | | $ 5.22 |
| Class I | | | | 1.03% | | | | | | |
| Actual | | | | | | $ 1,000 | | $ 1,186.30 | | $ 5.60 |
Hypothetical-B | | | | | | $ 1,000 | | $ 1,019.74 | | $ 5.17 |
| Class Z | | | | .89% | | | | | | |
| Actual | | | | | | $ 1,000 | | $ 1,186.90 | | $ 4.84 |
Hypothetical-B | | | | | | $ 1,000 | | $ 1,020.44 | | $ 4.47 |
| |
A Annualized expense ratio reflects expenses net of applicable fee waivers.
B 5% return per year before expenses
C Expenses are equal to the annualized expense ratio, multiplied by the average account value over the period, multiplied by 182/ 366 (to reflect the one-half year period). The fees and expenses of any Underlying Funds are not included in each annualized expense ratio.
The dividend and capital gains distributions for the fund(s) are available on Fidelity.com or Institutional.Fidelity.com.
Fidelity Healthy Future Fund, Class I, and Class Z designate 100% of the dividends distributed during the fiscal year as qualifying for the dividends-received deduction for corporate shareholders.
Fidelity Healthy Future Fund, Class I, and Class Z designate 100% of the dividends distributed during the fiscal year as amounts which may be taken into account as a dividend for purposes of the maximum rate under section 1(h)(11) of the Internal Revenue Code.
The fund will notify shareholders in January 2025 of amounts for use in preparing 2024 income tax returns.
Board Approval of Investment Advisory Contracts
Fidelity Healthy Future Fund
At its January 2024 meeting, the Board of Trustees, including the Independent Trustees (together, the Board), approved an amended and restated management contract with Fidelity Management & Research Company LLC (FMR) (the Management Contract), and amended and restated sub-advisory agreements (the Sub-Advisory Contracts, and together with the Management Contract, the Advisory Contracts) for the fund, including the fund's sub-advisory agreements with FMR Investment Management (UK) Limited (FMR UK), Fidelity Management & Research (Hong Kong) Limited (FMR H.K.), and Fidelity Management & Research (Japan) Limited (FMR Japan). The Advisory Contracts will be effective March 1, 2024. The Board will consider the annual renewal of the fund's Advisory Contracts in May 2024, following its review of additional materials provided by FMR.
Management Contract. The Board approved the Management Contract, which implements a new fee structure combining the management fee, transfer agent fee (TA Fee), and pricing and bookkeeping fee (P&B Fee) of the fund and each class into a single class-level fee based on tiered schedules and subject to a maximum class-level rate (the Unified Fee). In exchange for the Unified Fee, the fund will receive investment advisory, management, administrative, transfer agent, pricing and bookkeeping services under a single agreement - the Management Contract.
In its consideration of the Management Contract over several meetings, the Board received, reviewed and discussed a comprehensive set of analyses regarding the Unified Fee including (i) the legal framework, (ii) design goals for the Unified Fee, (iii) calculation methodology for the Unified Fee and illustrative examples, (iv) annual and cumulative projected impacts under various scenarios, both in the aggregate and at the fund/class level, (v) explanations of schedules, rate levers and maximum rates and (vi) shareholder benefits and projected savings.
The Board considered that the maximum Unified Fee for each class of the fund would be no higher than the sum of (i) the lowest contractual management fee rate under the fund's existing management contract, which is the individual fund fee rate, if any, plus the lowest contractual marginal group fee rate and (ii) the TA and P&B Fee rates, which are fixed fee rates since December 1, 2023 (together, the Unified Fee Cap). The Board noted that Fidelity has represented that, as a result of this Unified Fee Cap, the Unified Fee would be no greater than the fee rates previously authorized to be charged to the fund for the same services. The Board noted that certain expenses such as third-party expenses, Rule 12b-1 fees, and certain other miscellaneous expenses would be outside the scope of the Unified Fee and the calculation of such fees would not change as a result of the Unified Fee. The Board considered that, under the Management Contract, a different management fee rate will be applicable to each class of the fund. The Board noted that Fidelity has represented that the difference in expenses between classes is based on differences in class-specific expenses and not due to any difference in advisory or third-party custodial fees or other expenses related to the management of the fund's assets.
The Board considered Fidelity's representations that implementation of the Unified Fee, which includes the Unified Fee Cap, would cause all funds subject to the Unified Fee, including the fund, to experience an immediate reduction on contractual fee rates for services provided under the current management contracts. The Board considered that some funds would not experience lower net total fees as a result of existing fee caps. The Board further considered that, in addition to the contractual fee savings, the Unified Fee offers funds and their shareholders greater protection from future rate increases for services previously offered under separate agreements that are now covered by the Management Contract because such rate increases would require shareholder approval.
Sub-Advisory Contracts. In connection with the Unified Fee changes, the Board considered the Sub-Advisory Contracts, which simplified the calculation of the fees paid by FMR to the sub-advisers under the agreements. The Board noted that the agreements with FMR UK, FMR H.K., and FMR Japan were amended to provide that FMR will compensate each sub-adviser at a fee rate equal to 110% of the sub-adviser's costs incurred in providing services under the agreement. The Board considered that, under the Sub-Advisory Contracts, FMR, and not the fund, will continue to pay the sub-advisory fees to each applicable sub-adviser.
The Board further considered that the approval of the fund's Advisory Contracts will not result in any changes in the investment process or strategies employed in the management of the fund's assets or the day-to-day management of the fund or the persons primarily responsible for such management. Further, the Board considered that the Management Contract would not change the obligations and services of FMR and its affiliates on behalf of the fund, and, in particular, there would be no change in the nature and level of advisory, management, administration, transfer agent, and pricing and bookkeeping services provided to the fund by FMR, its affiliates, and each applicable sub-adviser.
In connection with its consideration of future renewals of the fund's Advisory Contracts, the Board will consider: (i) the nature, extent and quality of services provided to the funds, including shareholder and administrative services and investment performance; (ii) the competitiveness of the management fee and total expenses for the fund; (iii) the costs of the services and profitability, including the revenues earned and the expenses incurred in conducting the business of developing, marketing, distributing, managing, administering, and servicing the fund and its shareholders, to the extent applicable; and (iv) whether there have been economies of scale in respect of the Fidelity funds, whether the Fidelity funds (including the fund) have appropriately benefited from any such economies of scale, and whether there is the potential for realization of any further economies.
Based on its evaluation of all of the conclusions and representations noted above, and after considering all factors it believed relevant, the Board concluded that the fund's management fee structure is fair and reasonable, and that the fund's Advisory Contracts should be approved.
The Securities and Exchange Commission adopted Rule 22e-4 under the Investment Company Act of 1940 (the Liquidity Rule) to promote effective liquidity risk management throughout the open-end investment company industry, thereby reducing the risk that funds will be unable to meet their redemption obligations and mitigating dilution of the interests of fund shareholders.
The Fund has adopted and implemented a liquidity risk management program (the Program) reasonably designed to assess and manage the Fund's liquidity risk and to comply with the requirements of the Liquidity Rule. The Fund's Board of Trustees (the Board) has designated the Fund's investment adviser as administrator of the Program. The Fidelity advisers have established a Liquidity Risk Management Committee (the LRM Committee) to manage the Program for each of the Fidelity Funds. The LRM Committee monitors the adequacy and effectiveness of implementation of the Program and on a periodic basis assesses each Fund's liquidity risk based on a variety of factors including (1) the Fund's investment strategy, (2) portfolio liquidity and cash flow projections during normal and reasonably foreseeable stressed conditions, (3) shareholder redemptions, (4) borrowings and other funding sources and (5) certain factors specific to ETFs including the effect of the Fund's prices and spreads, market participants, and basket compositions on the overall liquidity of the Fund's portfolio, as applicable.
In accordance with the Program, each of the Fund's portfolio investments is classified into one of four defined liquidity categories based on a determination of a reasonable expectation for how long it would take to convert the investment to cash (or sell or dispose of the investment) without significantly changing its market value.
- Highly liquid investments - cash or convertible to cash within three business days or less
- Moderately liquid investments - convertible to cash in three to seven calendar days
- Less liquid investments - can be sold or disposed of, but not settled, within seven calendar days
- Illiquid investments - cannot be sold or disposed of within seven calendar days
Liquidity classification determinations take into account a variety of factors including various market, trading and investment-specific considerations, as well as market depth, and generally utilize analysis from a third-party liquidity metrics service.
The Liquidity Rule places a 15% limit on a fund's illiquid investments and requires funds that do not primarily hold assets that are highly liquid investments to determine and maintain a minimum percentage of the fund's net assets to be invested in highly liquid investments (highly liquid investment minimum or HLIM). The Program includes provisions reasonably designed to comply with the 15% limit on illiquid investments and for determining, periodically reviewing and complying with the HLIM requirement as applicable.
At a recent meeting of the Fund's Board of Trustees, the LRM Committee provided a written report to the Board pertaining to the operation, adequacy, and effectiveness of the Program for the period December 1, 2022 through November 30, 2023. The report concluded that the Program is operating effectively and is reasonably designed to assess and manage the Fund's liquidity risk.
1.9904957.101
HWF-ANN-0624
Fidelity® Focused High Income Fund
Annual Report
April 30, 2024
Contents
To view a fund's proxy voting guidelines and proxy voting record for the 12-month period ended June 30, visit http://www.fidelity.com/proxyvotingresults or visit the Securities and Exchange Commission's (SEC) web site at http://www.sec.gov.
You may also call 1-800-544-8544 to request a free copy of the proxy voting guidelines.
Standard & Poor's, S&P and S&P 500 are registered service marks of The McGraw-Hill Companies, Inc. and have been licensed for use by Fidelity Distributors Corporation.
Other third-party marks appearing herein are the property of their respective owners.
All other marks appearing herein are registered or unregistered trademarks or service marks of FMR LLC or an affiliated company. © 2024 FMR LLC. All rights reserved.
This report and the financial statements contained herein are submitted for the general information of the shareholders of the Fund. This report is not authorized for distribution to prospective investors in the Fund unless preceded or accompanied by an effective prospectus.
A fund files its complete schedule of portfolio holdings with the SEC for the first and third quarters of each fiscal year on Form N-PORT. Forms N-PORT are available on the SEC's web site at http://www.sec.gov. A fund's Forms N-PORT may be reviewed and copied at the SEC's Public Reference Room in Washington, DC. Information regarding the operation of the SEC's Public Reference Room may be obtained by calling 1-800-SEC-0330.
For a complete list of a fund's portfolio holdings, view the most recent holdings listing, semiannual report, or annual report on Fidelity's web site at http://www.fidelity.com, http://www.institutional.fidelity.com, or http://www.401k.com, as applicable.
NOT FDIC INSURED •MAY LOSE VALUE •NO BANK GUARANTEE
Neither the Fund nor Fidelity Distributors Corporation is a bank.
Average annual total return reflects the change in the value of an investment, assuming reinvestment of distributions from dividend income and capital gains (the profits earned upon the sale of securities that have grown in value, if any) and assuming a constant rate of performance each year. The hypothetical investment and the average annual total returns do not reflect the deduction of taxes that a shareholder would pay on fund distributions or the redemption of fund shares. During periods of reimbursement by Fidelity, a fund's total return will be greater than it would be had the reimbursement not occurred. How a fund did yesterday is no guarantee of how it will do tomorrow.
| Average Annual Total Returns |
| | | | |
Periods ended April 30, 2024 | Past 1 year | Past 5 years | Past 10 years |
| Fidelity® Focused High Income Fund | 6.04% | 2.34% | 3.24% |
| $10,000 Over 10 Years |
| |
Let's say hypothetically that $10,000 was invested in Fidelity® Focused High Income Fund on April 30, 2014. The chart shows how the value of your investment would have changed, and also shows how the ICE® BofA® BB US High Yield Constrained Index performed over the same period. |
|
|
Market Recap:
High-yield bonds gained 8.89% for the 12 months ending April 30, 2024, according to the ICE BofA® US High Yield Constrained Index, driven by resilient corporate profits and the Federal Reserve's likely pivot to cutting interest rates later this year. Amid this favorable backdrop for higher-risk assets, the index advanced fairly steadily for most the period, highlighted by an especially strong final two months of 2023, when the index rose 8.72%. Following the Federal Reserve's November 1 meeting, when the central bank hinted it might be done raising rates, the high-yield index reversed a two-month decline that was due to soaring yields on longer-term government bonds and mixed earnings from some big and influential firms. High yield continued to advance in 2024 but lost some of its momentum, gaining 1.51% through March, as the central bank held steady its benchmark federal funds rate and affirmed its projection to cut in 2024. The index slipped in April (-1%), when inflation remained stickier than expected. For the full 12 months, all 18 industries within the index advanced, with retail (+14%) leading, followed by financial services (+12%) and banking (+11%), which benefited from high interest rates. Energy, the largest segment in the high-yield index this period, gained 10%. Conversely, the telecommunications (+4%) group lagged most, followed by utility, capital goods and transportation (+6% each).
Comments from Co-Managers Jared Beckerman, Benjamin Harrison and Alexandre Karam:
For the fiscal year, the fund gained 6.04%, versus 7.32% for the benchmark ICE BofA BB US High Yield Constrained Index. The fund's core investment in high-yield bonds increased 6.69% and detracted from performance versus the benchmark. By industry, the biggest detractor from performance versus the benchmark was security selection in energy. Also hurting our result were our picks and an overweight in health care and security selection and an underweight in financial services. The biggest individual relative detractor was a non-benchmark stake in Cano Health (-58%). The second-largest relative detractor was an overweight in Occidental Petroleum (+3%), which was among the fund's largest holdings this period. An overweight in Icahn Enterprises (+4%) also detracted. Icahn Enterprises was one of the fund's biggest holdings. In contrast, the biggest contributor to performance versus the benchmark was security selection in leisure. Security selection in capital goods also boosted relative performance. Also lifting the fund's relative result were our picks and an underweight in services. Lastly, the fund's position in cash contributed. The fund's stake in Cable & Wireless Communication gained approximately 17% and was the top individual relative contributor. A non-benchmark stake in Dish Network gained 32% and was a second notable relative contributor. Another notable relative contributor this period was avoiding Spirit Airlines, a benchmark component that returned -23%. Notable changes in positioning include increased exposure to the real estate and technology & electronics industries.
Note to shareholders:
On June 8, 2023, Michael Weaver came off of the fund. On January 1, 2024, Jared Beckerman assumed co-management responsibilities for the fund.
The views expressed above reflect those of the portfolio manager(s) only through the end of the period as stated on the cover of this report and do not necessarily represent the views of Fidelity or any other person in the Fidelity organization. Any such views are subject to change at any time based upon market or other conditions and Fidelity disclaims any responsibility to update such views. These views may not be relied on as investment advice and, because investment decisions for a Fidelity fund are based on numerous factors, may not be relied on as an indication of trading intent on behalf of any Fidelity fund.
| Top Bond Issuers (% of Fund's net assets) |
(with maturities greater than one year) |
| CCO Holdings LLC/CCO Holdings Capital Corp. | 1.8 | |
| VICI Properties LP / VICI Note Co. | 1.7 | |
| Hilton Domestic Operating Company, Inc. | 1.7 | |
| Hess Midstream Operations LP | 1.6 | |
| Sunoco LP/Sunoco Finance Corp. | 1.3 | |
| OneMain Finance Corp. | 1.3 | |
| Icahn Enterprises LP/Icahn Enterprises Finance Corp. | 1.3 | |
| Ford Motor Credit Co. LLC | 1.3 | |
| EQM Midstream Partners LP | 1.3 | |
| PG&E Corp. | 1.3 | |
| | 14.6 | |
| |
| Market Sectors (% of Fund's net assets) |
| |
| Energy | 14.3 | |
| Services | 8.2 | |
| Technology | 6.1 | |
| Diversified Financial Services | 5.6 | |
| Utilities | 5.1 | |
| |
Quality Diversification (% of Fund's net assets) |
|
| |
| We have used ratings from Moody's Investors Service, Inc. Where Moody's® ratings are not available, we have used S&P® ratings. All ratings are as of the date indicated and do not reflect subsequent changes. |
Asset Allocation (% of Fund's net assets) |
|
|
Geographic Diversification (% of Fund's net assets) |
|
* Includes Short-Term investments and Net Other Assets (Liabilities). Percentages are adjusted for the effect of derivatives, if applicable. |
| |
Showing Percentage of Net Assets
| Corporate Bonds - 93.5% |
| | | Principal Amount (a) | Value ($) |
| Convertible Bonds - 0.7% | | | |
| Broadcasting - 0.2% | | | |
| DISH Network Corp. 3.375% 8/15/26 | | 680,000 | 414,799 |
| Homebuilders/Real Estate - 0.2% | | | |
| Realogy Group LLC/Realogy Co-Issuer Corp. 0.25% 6/15/26 | | 443,000 | 361,045 |
| Technology - 0.3% | | | |
| Global Payments, Inc. 1.5% 3/1/31 (b) | | 313,000 | 311,122 |
| Wolfspeed, Inc. 1.875% 12/1/29 | | 370,000 | 212,565 |
| | | | 523,687 |
TOTAL CONVERTIBLE BONDS | | | 1,299,531 |
| Nonconvertible Bonds - 92.8% | | | |
| Aerospace - 3.5% | | | |
| BWX Technologies, Inc. 4.125% 6/30/28 (b) | | 795,000 | 726,232 |
| Howmet Aerospace, Inc.: | | | |
| 5.95% 2/1/37 | | 400,000 | 399,858 |
| 6.75% 1/15/28 | | 665,000 | 686,681 |
| Kaiser Aluminum Corp. 4.625% 3/1/28 (b) | | 800,000 | 744,846 |
| Moog, Inc. 4.25% 12/15/27 (b) | | 1,025,000 | 956,669 |
| Rolls-Royce PLC 5.75% 10/15/27 (b) | | 1,115,000 | 1,102,769 |
| Science Applications International Corp. 4.875% 4/1/28 (b) | | 150,000 | 141,597 |
| TransDigm, Inc. 6.75% 8/15/28 (b) | | 2,190,000 | 2,203,688 |
| | | | 6,962,340 |
| Air Transportation - 1.3% | | | |
| American Airlines, Inc.: | | | |
| 7.25% 2/15/28 (b) | | 175,000 | 175,991 |
| 8.5% 5/15/29 (b) | | 345,000 | 359,377 |
| American Airlines, Inc. / AAdvantage Loyalty IP Ltd. 5.5% 4/20/26 (b) | | 280,000 | 276,752 |
| Rand Parent LLC 8.5% 2/15/30 (b) | | 430,000 | 425,234 |
| United Airlines, Inc. 4.375% 4/15/26 (b) | | 1,440,000 | 1,385,113 |
| | | | 2,622,467 |
| Automotive & Auto Parts - 2.8% | | | |
| Allison Transmission, Inc. 3.75% 1/30/31 (b) | | 1,115,000 | 954,384 |
| Champions Financing, Inc. 8.75% 2/15/29 (b) | | 365,000 | 373,002 |
| Dana, Inc. 4.5% 2/15/32 | | 380,000 | 322,395 |
| Ford Motor Credit Co. LLC: | | | |
| 4.687% 6/9/25 | | 2,140,000 | 2,106,665 |
| 5.125% 6/16/25 | | 530,000 | 524,401 |
| LCM Investments Holdings 4.875% 5/1/29 (b) | | 165,000 | 150,698 |
| Macquarie AirFinance Holdings: | | | |
| 6.4% 3/26/29 (b) | | 65,000 | 64,812 |
| 8.125% 3/30/29 (b) | | 190,000 | 198,684 |
| Phinia, Inc. 6.75% 4/15/29 (b) | | 155,000 | 155,552 |
| Thor Industries, Inc. 4% 10/15/29 (b) | | 500,000 | 432,293 |
| Wand NewCo 3, Inc. 7.625% 1/30/32 (b) | | 270,000 | 274,482 |
| | | | 5,557,368 |
| Banks & Thrifts - 0.3% | | | |
| Jane Street Group LLC/JSG Finance, Inc. 4.5% 11/15/29 (b) | | 210,000 | 191,008 |
| UniCredit SpA: | | | |
| 5.861% 6/19/32 (b)(c) | | 93,000 | 89,922 |
| 7.296% 4/2/34 (b)(c) | | 237,000 | 239,001 |
| Western Alliance Bancorp. 3% 6/15/31 (c) | | 120,000 | 102,056 |
| | | | 621,987 |
| Broadcasting - 2.0% | | | |
| Diamond Sports Group LLC/Diamond Sports Finance Co. 5.375% (b)(d) | | 1,390,000 | 34,750 |
| Nexstar Media, Inc. 5.625% 7/15/27 (b) | | 990,000 | 930,968 |
| Scripps Escrow II, Inc. 3.875% 1/15/29 (b) | | 410,000 | 302,865 |
| Sirius XM Radio, Inc.: | | | |
| 5% 8/1/27 (b) | | 1,700,000 | 1,605,464 |
| 5.5% 7/1/29 (b) | | 625,000 | 580,149 |
| TEGNA, Inc. 5% 9/15/29 | | 210,000 | 185,124 |
| Univision Communications, Inc. 8% 8/15/28 (b) | | 325,000 | 324,617 |
| | | | 3,963,937 |
| Building Materials - 2.0% | | | |
| Advanced Drain Systems, Inc. 5% 9/30/27 (b) | | 1,320,000 | 1,278,212 |
| Beacon Roofing Supply, Inc. 6.5% 8/1/30 (b) | | 230,000 | 229,603 |
| Builders FirstSource, Inc. 4.25% 2/1/32 (b) | | 890,000 | 775,223 |
| Eco Material Technologies, Inc. 7.875% 1/31/27 (b) | | 120,000 | 120,882 |
| Smyrna Ready Mix Concrete LLC 8.875% 11/15/31 (b) | | 375,000 | 394,929 |
| Standard Industries, Inc./New Jersey 4.375% 7/15/30 (b) | | 1,300,000 | 1,151,348 |
| Summit Materials LLC/Summit Materials Finance Corp. 7.25% 1/15/31 (b) | | 160,000 | 164,000 |
| | | | 4,114,197 |
| Cable/Satellite TV - 2.1% | | | |
| CCO Holdings LLC/CCO Holdings Capital Corp.: | | | |
| 4.5% 8/15/30 (b) | | 85,000 | 69,075 |
| 5% 2/1/28 (b) | | 1,780,000 | 1,621,010 |
| 5.125% 5/1/27 (b) | | 2,110,000 | 1,977,434 |
| CSC Holdings LLC: | | | |
| 4.125% 12/1/30 (b) | | 160,000 | 101,635 |
| 5.375% 2/1/28 (b) | | 200,000 | 153,442 |
| Ziggo Bond Co. BV 6% 1/15/27 (b) | | 300,000 | 295,066 |
| | | | 4,217,662 |
| Capital Goods - 0.2% | | | |
| ESAB Corp. 6.25% 4/15/29 (b) | | 370,000 | 368,612 |
| Chemicals - 4.1% | | | |
| Axalta Coating Systems/Dutch Holding BV 4.75% 6/15/27 (b) | | 935,000 | 897,445 |
| Kobe U.S. Midco 2, Inc. 9.25% 11/1/26 pay-in-kind (b)(c) | | 230,000 | 196,075 |
| LSB Industries, Inc. 6.25% 10/15/28 (b) | | 235,000 | 222,771 |
| Methanex Corp.: | | | |
| 5.25% 12/15/29 | | 160,000 | 151,670 |
| 5.65% 12/1/44 | | 991,000 | 837,071 |
| NOVA Chemicals Corp. 5.25% 6/1/27 (b) | | 1,710,000 | 1,608,606 |
| Nufarm Australia Ltd. 5% 1/27/30 (b) | | 865,000 | 789,677 |
| Olympus Water U.S. Holding Corp. 9.75% 11/15/28 (b) | | 245,000 | 259,974 |
| SPCM SA 3.125% 3/15/27 (b) | | 385,000 | 353,516 |
| The Chemours Co. LLC: | | | |
| 4.625% 11/15/29 (b) | | 385,000 | 329,895 |
| 5.375% 5/15/27 | | 1,000,000 | 946,134 |
| 5.75% 11/15/28 (b) | | 505,000 | 463,779 |
| Tronox, Inc. 4.625% 3/15/29 (b) | | 570,000 | 508,490 |
| W.R. Grace Holding LLC: | | | |
| 4.875% 6/15/27 (b) | | 685,000 | 650,151 |
| 7.375% 3/1/31 (b) | | 85,000 | 86,161 |
| | | | 8,301,415 |
| Consumer Products - 1.2% | | | |
| Kohl's Corp. 4.25% 7/17/25 | | 25,000 | 24,369 |
| Mattel, Inc. 6.2% 10/1/40 | | 245,000 | 232,288 |
| Newell Brands, Inc.: | | | |
| 6.625% 9/15/29 | | 875,000 | 845,145 |
| 6.875% 4/1/36 (e) | | 490,000 | 427,755 |
| Prestige Brands, Inc. 3.75% 4/1/31 (b) | | 600,000 | 510,410 |
| Tempur Sealy International, Inc. 3.875% 10/15/31 (b) | | 395,000 | 325,207 |
| | | | 2,365,174 |
| Containers - 1.9% | | | |
| Ball Corp. 3.125% 9/15/31 | | 640,000 | 531,511 |
| Graphic Packaging International, Inc. 3.75% 2/1/30 (b) | | 700,000 | 609,055 |
| Mauser Packaging Solutions Holding Co. 7.875% 4/15/27 (b) | | 430,000 | 438,063 |
| OI European Group BV 4.75% 2/15/30 (b) | | 390,000 | 356,188 |
| Sealed Air Corp.: | | | |
| 5% 4/15/29 (b) | | 950,000 | 893,772 |
| 6.875% 7/15/33 (b) | | 445,000 | 447,950 |
| Sealed Air Corp./Sealed Air Corp. U.S. 7.25% 2/15/31 (b) | | 400,000 | 407,211 |
| Trivium Packaging Finance BV 5.5% 8/15/26 (b) | | 215,000 | 211,017 |
| | | | 3,894,767 |
| Diversified Financial Services - 5.3% | | | |
| Encore Capital Group, Inc. 9.25% 4/1/29 (b) | | 200,000 | 204,329 |
| Fortress Transportation & Infrastructure Investors LLC 7.875% 12/1/30 (b) | | 310,000 | 322,015 |
| GGAM Finance Ltd.: | | | |
| 6.875% 4/15/29 (b) | | 260,000 | 259,756 |
| 7.75% 5/15/26 (b) | | 540,000 | 548,572 |
| 8% 2/15/27 (b) | | 305,000 | 312,585 |
| Gn Bondco LLC 9.5% 10/15/31 (b) | | 425,000 | 408,137 |
| Hightower Holding LLC 6.75% 4/15/29 (b) | | 605,000 | 567,855 |
| Icahn Enterprises LP/Icahn Enterprises Finance Corp.: | | | |
| 5.25% 5/15/27 | | 2,005,000 | 1,832,069 |
| 6.25% 5/15/26 | | 855,000 | 831,544 |
| Ladder Capital Finance Holdings LLLP/Ladder Capital Finance Corp. 4.25% 2/1/27 (b) | | 845,000 | 782,433 |
| LPL Holdings, Inc. 4% 3/15/29 (b) | | 1,520,000 | 1,378,274 |
| Navient Corp. 6.75% 6/15/26 | | 540,000 | 538,198 |
| OneMain Finance Corp.: | | | |
| 3.5% 1/15/27 | | 1,145,000 | 1,053,409 |
| 6.875% 3/15/25 | | 1,105,000 | 1,112,238 |
| 7.125% 3/15/26 | | 500,000 | 504,550 |
| | | | 10,655,964 |
| Diversified Media - 0.4% | | | |
| Lamar Media Corp. 3.625% 1/15/31 | | 915,000 | 782,325 |
| Energy - 14.0% | | | |
| Altus Midstream LP: | | | |
| 5.875% 6/15/30 (b) | | 270,000 | 261,056 |
| 6.625% 12/15/28 (b) | | 405,000 | 406,950 |
| Apache Corp.: | | | |
| 4.25% 1/15/30 | | 215,000 | 197,775 |
| 5.1% 9/1/40 | | 600,000 | 499,394 |
| Baytex Energy Corp. 7.375% 3/15/32 (b) | | 270,000 | 272,295 |
| Cheniere Energy Partners LP 3.25% 1/31/32 | | 865,000 | 722,677 |
| Cheniere Energy, Inc. 4.625% 10/15/28 | | 640,000 | 611,780 |
| CNX Midstream Partners LP 4.75% 4/15/30 (b) | | 160,000 | 141,602 |
| Continental Resources, Inc. 5.75% 1/15/31 (b) | | 1,630,000 | 1,595,752 |
| CVR Energy, Inc.: | | | |
| 5.75% 2/15/28 (b) | | 150,000 | 139,382 |
| 8.5% 1/15/29 (b) | | 420,000 | 421,036 |
| DCP Midstream Operating LP: | | | |
| 5.6% 4/1/44 | | 85,000 | 79,606 |
| 8.125% 8/16/30 | | 25,000 | 27,955 |
| Delek Logistics Partners LP/Delek Logistics Finance Corp. 8.625% 3/15/29 (b) | | 415,000 | 418,140 |
| Endeavor Energy Resources LP/EER Finance, Inc. 5.75% 1/30/28 (b) | | 735,000 | 744,499 |
| EnLink Midstream LLC 5.625% 1/15/28 (b) | | 195,000 | 191,596 |
| EnLink Midstream Partners LP 5.05% 4/1/45 | | 255,000 | 205,081 |
| EQM Midstream Partners LP: | | | |
| 5.5% 7/15/28 | | 800,000 | 779,255 |
| 6.5% 7/1/27 (b) | | 785,000 | 786,090 |
| 6.5% 7/15/48 | | 485,000 | 478,533 |
| 7.5% 6/1/27 (b) | | 555,000 | 565,448 |
| EQT Corp. 3.9% 10/1/27 | | 1,450,000 | 1,367,642 |
| Global Partners LP/GLP Finance Corp. 8.25% 1/15/32 (b) | | 130,000 | 133,174 |
| Harvest Midstream I LP 7.5% 5/15/32 (b) | | 380,000 | 380,471 |
| Hess Midstream Operations LP: | | | |
| 5.125% 6/15/28 (b) | | 1,070,000 | 1,024,150 |
| 5.625% 2/15/26 (b) | | 2,310,000 | 2,284,047 |
| Hilcorp Energy I LP/Hilcorp Finance Co. 6.25% 11/1/28 (b) | | 330,000 | 325,146 |
| Jonah Energy Parent LLC 12% 11/5/25 (f)(g) | | 262,918 | 280,665 |
| Kodiak Gas Services LLC 7.25% 2/15/29 (b) | | 315,000 | 317,272 |
| Matador Resources Co. 6.5% 4/15/32 (b) | | 345,000 | 341,926 |
| New Fortress Energy, Inc. 6.5% 9/30/26 (b) | | 1,040,000 | 994,515 |
| Occidental Petroleum Corp.: | | | |
| 3.5% 8/15/29 | | 810,000 | 725,107 |
| 8.875% 7/15/30 | | 580,000 | 663,131 |
| PBF Holding Co. LLC/PBF Finance Corp. 7.875% 9/15/30 (b) | | 420,000 | 431,963 |
| Permian Resources Operating LLC: | | | |
| 5.875% 7/1/29 (b) | | 200,000 | 194,500 |
| 7% 1/15/32 (b) | | 630,000 | 642,231 |
| Seadrill Finance Ltd. 8.375% 8/1/30 (b) | | 605,000 | 630,271 |
| Sitio Royalties OP / Sitio Finance Corp. 7.875% 11/1/28 (b) | | 387,000 | 397,969 |
| Sunnova Energy Corp. 11.75% 10/1/28 (b) | | 205,000 | 122,393 |
| Sunoco LP/Sunoco Finance Corp.: | | | |
| 4.5% 5/15/29 | | 1,140,000 | 1,040,783 |
| 5.875% 3/15/28 | | 1,695,000 | 1,654,112 |
| 6% 4/15/27 | | 25,000 | 24,698 |
| Superior Plus LP / Superior General Partner, Inc. 4.5% 3/15/29 (b) | | 320,000 | 289,452 |
| Tallgrass Energy Partners LP / Tallgrass Energy Finance Corp.: | | | |
| 5.5% 1/15/28 (b) | | 225,000 | 213,620 |
| 6% 12/31/30 (b) | | 1,190,000 | 1,119,391 |
| Talos Production, Inc. 9% 2/1/29 (b) | | 90,000 | 94,955 |
| Transocean, Inc. 8.25% 5/15/29 (b) | | 400,000 | 398,638 |
| Valaris Ltd. 8.375% 4/30/30 (b) | | 335,000 | 344,519 |
| Venture Global Calcasieu Pass LLC: | | | |
| 3.875% 8/15/29 (b) | | 480,000 | 424,095 |
| 3.875% 11/1/33 (b) | | 380,000 | 311,995 |
| 4.125% 8/15/31 (b) | | 460,000 | 401,475 |
| Venture Global LNG, Inc. 8.125% 6/1/28 (b) | | 320,000 | 327,190 |
| Western Gas Partners LP 4.65% 7/1/26 | | 808,000 | 789,228 |
| | | | 28,236,626 |
| Environmental - 1.4% | | | |
| Darling Ingredients, Inc.: | | | |
| 5.25% 4/15/27 (b) | | 970,000 | 939,825 |
| 6% 6/15/30 (b) | | 170,000 | 165,145 |
| GFL Environmental, Inc. 6.75% 1/15/31 (b) | | 155,000 | 156,253 |
| Madison IAQ LLC 4.125% 6/30/28 (b) | | 1,630,000 | 1,512,070 |
| | | | 2,773,293 |
| Food & Drug Retail - 1.4% | | | |
| Albertsons Companies LLC/Safeway, Inc./New Albertson's, Inc./Albertson's LLC 3.5% 3/15/29 (b) | | 2,810,000 | 2,479,453 |
| Emergent BioSolutions, Inc. 3.875% 8/15/28 (b) | | 375,000 | 189,436 |
| Murphy Oil U.S.A., Inc. 3.75% 2/15/31 (b) | | 190,000 | 163,108 |
| | | | 2,831,997 |
| Food/Beverage/Tobacco - 3.1% | | | |
| BellRing Brands, Inc. 7% 3/15/30 (b) | | 350,000 | 354,175 |
| C&S Group Enterprises LLC 5% 12/15/28 (b) | | 405,000 | 310,512 |
| Chobani LLC/Finance Corp., Inc. 7.625% 7/1/29 (b) | | 245,000 | 247,591 |
| Fiesta Purchaser, Inc. 7.875% 3/1/31 (b) | | 195,000 | 198,698 |
| Jbs U.S.A. Holding Lux/ Jbs U.S.A. F 5.5% 1/15/30 | | 2,525,000 | 2,437,379 |
| KeHE Distributor / Nextwave 9% 2/15/29 (b) | | 315,000 | 318,061 |
| Lamb Weston Holdings, Inc. 4.375% 1/31/32 (b) | | 755,000 | 654,287 |
| Pilgrim's Pride Corp. 4.25% 4/15/31 | | 405,000 | 358,381 |
| Post Holdings, Inc.: | | | |
| 5.5% 12/15/29 (b) | | 590,000 | 559,525 |
| 5.625% 1/15/28 (b) | | 405,000 | 393,034 |
| U.S. Foods, Inc.: | | | |
| 4.625% 6/1/30 (b) | | 180,000 | 163,679 |
| 7.25% 1/15/32 (b) | | 210,000 | 214,435 |
| | | | 6,209,757 |
| Gaming - 4.1% | | | |
| Caesars Entertainment, Inc. 6.5% 2/15/32 (b) | | 605,000 | 596,072 |
| Churchill Downs, Inc. 5.75% 4/1/30 (b) | | 455,000 | 432,954 |
| Melco Resorts Finance Ltd. 4.875% 6/6/25 (b) | | 1,225,000 | 1,192,828 |
| MGM Resorts International 5.75% 6/15/25 | | 866,000 | 861,100 |
| Ontario Gaming Gta LP/Otg Co.-I 8% 8/1/30 (b) | | 115,000 | 116,761 |
| Station Casinos LLC 6.625% 3/15/32 (b) | | 310,000 | 303,783 |
| VICI Properties LP / VICI Note Co.: | | | |
| 4.25% 12/1/26 (b) | | 1,210,000 | 1,154,548 |
| 4.5% 9/1/26 (b) | | 1,300,000 | 1,252,439 |
| 4.625% 6/15/25 (b) | | 245,000 | 241,044 |
| 4.625% 12/1/29 (b) | | 925,000 | 858,142 |
| Wynn Las Vegas LLC/Wynn Las Vegas Capital Corp. 5.25% 5/15/27 (b) | | 870,000 | 840,744 |
| Wynn Resorts Finance LLC / Wynn Resorts Capital Corp. 5.125% 10/1/29 (b) | | 380,000 | 352,593 |
| | | | 8,203,008 |
| Healthcare - 4.6% | | | |
| 180 Medical, Inc. 3.875% 10/15/29 (b) | | 625,000 | 553,378 |
| Avantor Funding, Inc. 4.625% 7/15/28 (b) | | 1,195,000 | 1,110,874 |
| Centene Corp. 2.45% 7/15/28 | | 75,000 | 65,460 |
| Charles River Laboratories International, Inc.: | | | |
| 3.75% 3/15/29 (b) | | 795,000 | 714,139 |
| 4.25% 5/1/28 (b) | | 90,000 | 83,710 |
| DaVita, Inc. 4.625% 6/1/30 (b) | | 365,000 | 319,789 |
| Grifols SA 4.75% 10/15/28 (b) | | 100,000 | 80,764 |
| HealthEquity, Inc. 4.5% 10/1/29 (b) | | 160,000 | 145,732 |
| Hologic, Inc. 4.625% 2/1/28 (b) | | 850,000 | 808,412 |
| IQVIA, Inc. 5% 5/15/27 (b) | | 820,000 | 791,633 |
| Jazz Securities DAC 4.375% 1/15/29 (b) | | 350,000 | 318,440 |
| Medline Borrower LP / Medline Co. 6.25% 4/1/29 (b) | | 205,000 | 203,689 |
| Molina Healthcare, Inc. 3.875% 5/15/32 (b) | | 510,000 | 426,756 |
| Organon & Co. / Organon Foreign Debt Co-Issuer BV 4.125% 4/30/28 (b) | | 840,000 | 765,036 |
| Owens & Minor, Inc. 4.5% 3/31/29 (b) | | 280,000 | 251,009 |
| Surgery Center Holdings, Inc. 7.25% 4/15/32 (b) | | 300,000 | 299,590 |
| Teleflex, Inc. 4.25% 6/1/28 (b) | | 235,000 | 217,157 |
| Tenet Healthcare Corp.: | | | |
| 4.625% 6/15/28 | | 1,810,000 | 1,703,249 |
| 6.125% 6/15/30 | | 465,000 | 455,346 |
| | | | 9,314,163 |
| Homebuilders/Real Estate - 3.8% | | | |
| Century Communities, Inc. 3.875% 8/15/29 (b) | | 460,000 | 401,610 |
| Greystar Real Estate Partners 7.75% 9/1/30 (b) | | 95,000 | 97,848 |
| HAT Holdings I LLC/HAT Holdings II LLC: | | | |
| 3.375% 6/15/26 (b) | | 495,000 | 460,062 |
| 8% 6/15/27 (b) | | 250,000 | 256,287 |
| Howard Hughes Corp. 4.375% 2/1/31 (b) | | 825,000 | 699,554 |
| Kennedy-Wilson, Inc. 4.75% 2/1/30 | | 770,000 | 609,838 |
| LGI Homes, Inc. 8.75% 12/15/28 (b) | | 160,000 | 166,434 |
| MPT Operating Partnership LP/MPT Finance Corp.: | | | |
| 3.5% 3/15/31 | | 2,105,000 | 1,411,465 |
| 5.25% 8/1/26 | | 1,075,000 | 979,133 |
| Panther Escrow Issuer LLC 7.125% 6/1/31 (b) | | 340,000 | 341,763 |
| Ryan Specialty Group LLC 4.375% 2/1/30 (b) | | 540,000 | 495,241 |
| Safehold Operating Partnership LP 2.85% 1/15/32 | | 280,000 | 224,570 |
| Service Properties Trust: | | | |
| 3.95% 1/15/28 | | 75,000 | 63,991 |
| 5.5% 12/15/27 | | 415,000 | 391,585 |
| Taylor Morrison Communities, Inc./Monarch Communities, Inc. 5.75% 1/15/28 (b) | | 450,000 | 437,539 |
| TopBuild Corp. 4.125% 2/15/32 (b) | | 810,000 | 701,259 |
| | | | 7,738,179 |
| Hotels - 2.4% | | | |
| Hilton Domestic Operating Co., Inc.: | | | |
| 3.625% 2/15/32 (b) | | 1,165,000 | 978,974 |
| 4% 5/1/31 (b) | | 2,780,000 | 2,435,942 |
| Hilton Grand Vacations Borrower Escrow LLC 6.625% 1/15/32 (b) | | 420,000 | 414,064 |
| Hilton Worldwide Finance LLC/Hilton Worldwide Finance Corp. 4.875% 4/1/27 | | 445,000 | 432,756 |
| Wyndham Hotels & Resorts, Inc. 4.375% 8/15/28 (b) | | 525,000 | 481,381 |
| | | | 4,743,117 |
| Insurance - 0.5% | | | |
| Alliant Holdings Intermediate LLC/Alliant Holdings Co.-Issuer 4.25% 10/15/27 (b) | | 1,075,000 | 1,002,767 |
| Leisure - 1.6% | | | |
| Amer Sports Co. 6.75% 2/16/31 (b) | | 210,000 | 206,813 |
| Carnival Corp.: | | | |
| 7% 8/15/29 (b) | | 425,000 | 436,294 |
| 7.625% 3/1/26 (b) | | 675,000 | 679,187 |
| NCL Corp. Ltd.: | | | |
| 5.875% 2/15/27 (b) | | 350,000 | 341,904 |
| 8.375% 2/1/28 (b) | | 230,000 | 239,853 |
| Royal Caribbean Cruises Ltd.: | | | |
| 5.5% 4/1/28 (b) | | 1,200,000 | 1,168,040 |
| 6.25% 3/15/32 (b) | | 205,000 | 202,083 |
| | | | 3,274,174 |
| Metals/Mining - 2.0% | | | |
| Alcoa Nederland Holding BV 7.125% 3/15/31 (b) | | 80,000 | 80,921 |
| Arsenal AIC Parent LLC 8% 10/1/30 (b) | | 130,000 | 135,352 |
| Cleveland-Cliffs, Inc. 7% 3/15/32 (b) | | 415,000 | 405,302 |
| ERO Copper Corp. 6.5% 2/15/30 (b) | | 740,000 | 696,044 |
| FMG Resources Pty Ltd. 4.5% 9/15/27 (b) | | 1,140,000 | 1,075,125 |
| HudBay Minerals, Inc. 4.5% 4/1/26 (b) | | 240,000 | 232,115 |
| Mineral Resources Ltd. 8% 11/1/27 (b) | | 1,130,000 | 1,142,859 |
| Novelis Corp. 3.875% 8/15/31 (b) | | 385,000 | 326,023 |
| | | | 4,093,741 |
| Paper - 0.3% | | | |
| Ardagh Metal Packaging Finance U.S.A. LLC/Ardagh Metal Packaging Finance PLC: | | | |
| 3.25% 9/1/28 (b) | | 570,000 | 493,722 |
| 6% 6/15/27 (b) | | 160,000 | 155,097 |
| | | | 648,819 |
| Railroad - 0.2% | | | |
| Genesee & Wyoming, Inc. 6.25% 4/15/32 (b) | | 305,000 | 303,136 |
| Restaurants - 1.2% | | | |
| Garden SpinCo Corp. 8.625% 7/20/30 (b) | | 115,000 | 121,254 |
| Yum! Brands, Inc.: | | | |
| 3.625% 3/15/31 | | 2,615,000 | 2,259,615 |
| 5.35% 11/1/43 | | 110,000 | 102,236 |
| | | | 2,483,105 |
| Services - 7.9% | | | |
| ADT Corp.: | | | |
| 4.125% 8/1/29 (b) | | 385,000 | 348,018 |
| 4.875% 7/15/32 (b) | | 565,000 | 502,905 |
| AECOM 5.125% 3/15/27 | | 1,485,000 | 1,442,685 |
| Allied Universal Holdco LLC 7.875% 2/15/31 (b) | | 310,000 | 310,685 |
| Aramark Services, Inc. 5% 2/1/28 (b) | | 1,685,000 | 1,599,879 |
| Artera Services LLC 8.5% 2/15/31 (b) | | 420,000 | 429,767 |
| ASGN, Inc. 4.625% 5/15/28 (b) | | 965,000 | 900,546 |
| Booz Allen Hamilton, Inc. 4% 7/1/29 (b) | | 155,000 | 141,876 |
| Brand Industrial Services, Inc. 10.375% 8/1/30 (b) | | 320,000 | 343,392 |
| CoreCivic, Inc. 8.25% 4/15/29 | | 205,000 | 211,825 |
| Fair Isaac Corp. 4% 6/15/28 (b) | | 450,000 | 414,480 |
| Gartner, Inc.: | | | |
| 3.625% 6/15/29 (b) | | 220,000 | 196,853 |
| 4.5% 7/1/28 (b) | | 660,000 | 620,662 |
| GEMS MENASA Cayman Ltd./GEMS Education Delaware LLC 7.125% 7/31/26 (b) | | 740,000 | 735,606 |
| Iron Mountain, Inc. 4.875% 9/15/29 (b) | | 2,715,000 | 2,505,311 |
| Prime Securities Services Borrower LLC/Prime Finance, Inc. 3.375% 8/31/27 (b) | | 2,225,000 | 2,026,429 |
| Service Corp. International 5.125% 6/1/29 | | 1,425,000 | 1,360,587 |
| Sotheby's 7.375% 10/15/27 (b) | | 185,000 | 172,406 |
| The GEO Group, Inc. 8.625% 4/15/29 (b) | | 435,000 | 440,376 |
| TriNet Group, Inc. 3.5% 3/1/29 (b) | | 710,000 | 621,657 |
| United Rentals North America, Inc. 6.125% 3/15/34 (b) | | 515,000 | 502,837 |
| | | | 15,828,782 |
| Steel - 0.0% | | | |
| Roller Bearing Co. of America, Inc. 4.375% 10/15/29 (b) | | 110,000 | 99,414 |
| Super Retail - 2.9% | | | |
| Asbury Automotive Group, Inc.: | | | |
| 4.625% 11/15/29 (b) | | 245,000 | 221,532 |
| 5% 2/15/32 (b) | | 260,000 | 231,141 |
| Bath & Body Works, Inc. 6.625% 10/1/30 (b) | | 1,620,000 | 1,618,791 |
| EG Global Finance PLC 12% 11/30/28 (b) | | 615,000 | 634,863 |
| Gap, Inc. 3.875% 10/1/31 (b) | | 385,000 | 312,902 |
| Hanesbrands, Inc. 4.875% 5/15/26 (b) | | 1,115,000 | 1,078,432 |
| Levi Strauss & Co. 3.5% 3/1/31 (b) | | 630,000 | 537,726 |
| Nordstrom, Inc. 4.375% 4/1/30 | | 930,000 | 830,033 |
| The William Carter Co. 5.625% 3/15/27 (b) | | 465,000 | 452,614 |
| | | | 5,918,034 |
| Technology - 5.8% | | | |
| Acuris Finance U.S. 5% 5/1/28 (b) | | 385,000 | 349,268 |
| Block, Inc. 2.75% 6/1/26 | | 380,000 | 357,032 |
| Broadcom, Inc. 2.45% 2/15/31 (b) | | 420,000 | 345,182 |
| Central Parent, Inc./Central Merger Sub, Inc. 7.25% 6/15/29 (b) | | 345,000 | 348,776 |
| CNT PRNT/CDK GLO II/FIN 8% 6/15/29 (b) | | 415,000 | 426,954 |
| Coherent Corp. 5% 12/15/29 (b) | | 1,600,000 | 1,476,094 |
| Crowdstrike Holdings, Inc. 3% 2/15/29 | | 525,000 | 461,238 |
| Elastic NV 4.125% 7/15/29 (b) | | 235,000 | 209,269 |
| Entegris, Inc. 4.375% 4/15/28 (b) | | 730,000 | 680,535 |
| HTA Group Ltd. 7% 12/18/25 (b) | | 435,000 | 434,320 |
| Match Group Holdings II LLC: | | | |
| 3.625% 10/1/31 (b) | | 575,000 | 474,664 |
| 4.125% 8/1/30 (b) | | 265,000 | 229,492 |
| ON Semiconductor Corp. 3.875% 9/1/28 (b) | | 545,000 | 494,572 |
| Open Text Corp.: | | | |
| 3.875% 2/15/28 (b) | | 1,410,000 | 1,287,056 |
| 3.875% 12/1/29 (b) | | 390,000 | 341,330 |
| Open Text Holdings, Inc. 4.125% 2/15/30 (b) | | 130,000 | 114,177 |
| Qorvo, Inc. 4.375% 10/15/29 | | 505,000 | 466,007 |
| Seagate HDD Cayman 8.25% 12/15/29 (b) | | 1,425,000 | 1,514,614 |
| Sensata Technologies, Inc. 3.75% 2/15/31 (b) | | 1,165,000 | 984,515 |
| Twilio, Inc. 3.875% 3/15/31 | | 350,000 | 303,050 |
| VM Consolidated, Inc. 5.5% 4/15/29 (b) | | 345,000 | 324,672 |
| | | | 11,622,817 |
| Telecommunications - 2.9% | | | |
| Altice Financing SA 5% 1/15/28 (b) | | 10,000 | 7,892 |
| Altice France SA 5.125% 7/15/29 (b) | | 390,000 | 254,033 |
| C&W Senior Finance Ltd. 6.875% 9/15/27 (b) | | 1,510,000 | 1,429,849 |
| Cogent Communications Group, Inc. 7% 6/15/27 (b) | | 660,000 | 651,543 |
| Level 3 Financing, Inc.: | | | |
| 4.875% 6/15/29 (b) | | 1,100,000 | 690,524 |
| 11% 11/15/29 (b) | | 133,344 | 136,077 |
| Millicom International Cellular SA: | | | |
| 4.5% 4/27/31 (b) | | 490,000 | 407,825 |
| 5.125% 1/15/28 (b) | | 900,000 | 830,250 |
| SBA Communications Corp. 3.875% 2/15/27 | | 750,000 | 704,848 |
| Virgin Media Finance PLC 5% 7/15/30 (b) | | 105,000 | 86,043 |
| Virgin Media Secured Finance PLC 5.5% 5/15/29 (b) | | 740,000 | 672,854 |
| | | | 5,871,738 |
| Textiles/Apparel - 0.3% | | | |
| Crocs, Inc. 4.125% 8/15/31 (b) | | 405,000 | 339,864 |
| Foot Locker, Inc. 4% 10/1/29 (b) | | 200,000 | 159,638 |
| Kontoor Brands, Inc. 4.125% 11/15/29 (b) | | 130,000 | 115,484 |
| | | | 614,986 |
| Transportation Ex Air/Rail - 0.3% | | | |
| Seaspan Corp. 5.5% 8/1/29 (b) | | 200,000 | 172,006 |
| XPO, Inc.: | | | |
| 6.25% 6/1/28 (b) | | 325,000 | 323,784 |
| 7.125% 2/1/32 (b) | | 105,000 | 105,609 |
| | | | 601,399 |
| Utilities - 5.0% | | | |
| Clearway Energy Operating LLC: | | | |
| 3.75% 2/15/31 (b) | | 1,615,000 | 1,365,347 |
| 4.75% 3/15/28 (b) | | 195,000 | 183,758 |
| FirstEnergy Corp. 2.25% 9/1/30 | | 825,000 | 667,012 |
| NextEra Energy Partners LP: | | | |
| 4.25% 9/15/24 (b) | | 158,000 | 155,804 |
| 7.25% 1/15/29 (b) | | 405,000 | 410,220 |
| NRG Energy, Inc.: | | | |
| 5.25% 6/15/29 (b) | | 625,000 | 591,123 |
| 6.625% 1/15/27 | | 729,000 | 727,492 |
| PG&E Corp. 5% 7/1/28 | | 2,685,000 | 2,558,349 |
| TerraForm Power Operating LLC 4.75% 1/15/30 (b) | | 130,000 | 115,873 |
| Vertiv Group Corp. 4.125% 11/15/28 (b) | | 945,000 | 875,172 |
| Vistra Operations Co. LLC: | | | |
| 5% 7/31/27 (b) | | 2,395,000 | 2,279,387 |
| 7.75% 10/15/31 (b) | | 200,000 | 205,118 |
| | | | 10,134,655 |
TOTAL NONCONVERTIBLE BONDS | | | 186,975,922 |
| TOTAL CORPORATE BONDS (Cost $199,787,886) | | | 188,275,453 |
| | | | |
| Bank Loan Obligations - 0.9% |
| | | Principal Amount (a) | Value ($) |
| Broadcasting - 0.1% | | | |
| Diamond Sports Group LLC: | | | |
| 2LN, term loan CME Term SOFR 1 Month Index + 5.250% 10.6625% (c)(d)(h)(i) | | 206,842 | 4,809 |
| term loan 10% 8/2/27 (i) | | 106,638 | 169,199 |
TOTAL BROADCASTING | | | 174,008 |
| Healthcare - 0.1% | | | |
| Cano Health, Inc.: | | | |
| Tranche B 1LN, term loan CME Term SOFR 1 Month Index + 4.000% 9.4626% (c)(d)(h)(i) | | 455,354 | 114,408 |
| Tranche DD 1LN, term loan CME Term SOFR 1 Month Index + 11.000% 16.3215% 10/7/24 (c)(g)(h)(i) | | 72,410 | 73,859 |
| Tranche DD, term loan CME Term SOFR 1 Month Index + 11.000% 16.3215% 10/7/24 (c)(g)(h)(i) | | 47,239 | 48,184 |
TOTAL HEALTHCARE | | | 236,451 |
| Insurance - 0.2% | | | |
| Alliant Holdings Intermediate LLC Tranche B6 1LN, term loan CME Term SOFR 1 Month Index + 3.500% 8.8189% 11/6/30 (c)(h)(i) | | 283,565 | 284,589 |
| Metals/Mining - 0.1% | | | |
| American Rock Salt Co. LLC 1LN, term loan CME Term SOFR 1 Month Index + 4.000% 9.4302% 6/4/28 (c)(h)(i) | | 244,372 | 216,357 |
| Services - 0.3% | | | |
| ABG Intermediate Holdings 2 LLC Tranche B1 LN, term loan CME Term SOFR 1 Month Index + 3.500% 8.9183% 12/21/28 (c)(h)(i) | | 132,637 | 133,201 |
| Ascend Learning LLC: | | | |
| 2LN, term loan CME Term SOFR 1 Month Index + 5.750% 11.1657% 12/10/29 (c)(h)(i) | | 50,000 | 48,959 |
| Tranche B 1LN, term loan CME Term SOFR 1 Month Index + 3.500% 8.9157% 12/10/28 (c)(h)(i) | | 493,637 | 491,579 |
TOTAL SERVICES | | | 673,739 |
| Utilities - 0.1% | | | |
| Brookfield WEC Holdings, Inc. Tranche B 1LN, term loan CME Term SOFR 1 Month Index + 2.750% 8.0657% 1/20/31 (c)(h)(i) | | 256,750 | 256,858 |
| TOTAL BANK LOAN OBLIGATIONS (Cost $2,179,752) | | | 1,842,002 |
| | | | |
| Preferred Securities - 1.0% |
| | | Principal Amount (a) | Value ($) |
| Banks & Thrifts - 0.4% | | | |
| Ally Financial, Inc.: | | | |
| 4.7% (c)(j) | | 385,000 | 330,655 |
| 4.7% (c)(j) | | 100,000 | 78,377 |
| Wells Fargo & Co. 7.625% (c)(j) | | 320,000 | 337,719 |
TOTAL BANKS & THRIFTS | | | 746,751 |
| Diversified Financial Services - 0.3% | | | |
| Charles Schwab Corp.: | | | |
| 4% (c)(j) | | 465,000 | 381,536 |
| 5.375% (c)(j) | | 225,000 | 224,503 |
TOTAL DIVERSIFIED FINANCIAL SERVICES | | | 606,039 |
| Energy - 0.3% | | | |
| Energy Transfer LP 3 month U.S. LIBOR + 4.020% 9.5966% (c)(h)(j) | | 700,000 | 714,247 |
| TOTAL PREFERRED SECURITIES (Cost $1,841,574) | | | 2,067,037 |
| | | | |
| Money Market Funds - 3.5% |
| | | Shares | Value ($) |
Fidelity Cash Central Fund 5.39% (k) (Cost $6,941,727) | | 6,940,339 | 6,941,727 |
| | | | |
| TOTAL INVESTMENT IN SECURITIES - 98.9% (Cost $210,750,939) | 199,126,219 |
NET OTHER ASSETS (LIABILITIES) - 1.1% | 2,262,272 |
| NET ASSETS - 100.0% | 201,388,491 |
| | |
Legend
| (a) | Amount is stated in United States dollars unless otherwise noted. |
| (b) | Security exempt from registration under Rule 144A of the Securities Act of 1933. These securities may be resold in transactions exempt from registration, normally to qualified institutional buyers. At the end of the period, the value of these securities amounted to $139,715,904 or 69.4% of net assets. |
| (c) | Coupon rates for floating and adjustable rate securities reflect the rates in effect at period end. |
| (d) | Non-income producing - Security is in default. |
| (e) | Security initially issued at one coupon which converts to a higher coupon at a specified date. The rate shown is the rate at period end. |
| (f) | Restricted securities (including private placements) - Investment in securities not registered under the Securities Act of 1933 (excluding 144A issues). At the end of the period, the value of restricted securities (excluding 144A issues) amounted to $280,665 or 0.1% of net assets. |
| (h) | Coupon is indexed to a floating interest rate which may be multiplied by a specified factor and/or subject to caps or floors. |
| (i) | Remaining maturities of bank loan obligations may be less than the stated maturities shown as a result of contractual or optional prepayments by the borrower. Such prepayments cannot be predicted with certainty. |
| (j) | Security is perpetual in nature with no stated maturity date. |
| (k) | Affiliated fund that is generally available only to investment companies and other accounts managed by Fidelity Investments. The rate quoted is the annualized seven-day yield of the fund at period end. A complete unaudited listing of the fund's holdings as of its most recent quarter end is available upon request. In addition, each Fidelity Central Fund's financial statements, which are not covered by the Fund's Report of Independent Registered Public Accounting Firm, are available on the SEC's website or upon request. |
| Additional information on each restricted holding is as follows: |
| Security | Acquisition Date | Acquisition Cost ($) |
| Jonah Energy Parent LLC 12% 11/5/25 | 5/05/23 | 257,660 |
| | | |
Affiliated Central Funds
Fiscal year to date information regarding the Fund's investments in Fidelity Central Funds, including the ownership percentage, is presented below.
| Affiliate | Value, beginning of period ($) | Purchases ($) | Sales Proceeds ($) | Dividend Income ($) | Realized Gain (loss) ($) | Change in Unrealized appreciation (depreciation) ($) | Value, end of period ($) | % ownership, end of period |
| Fidelity Cash Central Fund 5.39% | 22,038,961 | 49,399,647 | 64,496,928 | 686,988 | 47 | - | 6,941,727 | 0.0% |
| Total | 22,038,961 | 49,399,647 | 64,496,928 | 686,988 | 47 | - | 6,941,727 | |
| | | | | | | | | |
Amounts in the dividend income column in the above table include any capital gain distributions from underlying funds, which are presented in the corresponding line item in the Statement of Operations, if applicable.
Amounts included in the purchases and sales proceeds columns may include in-kind transactions, if applicable.
Investment Valuation
The following is a summary of the inputs used, as of April 30, 2024, involving the Fund's assets and liabilities carried at fair value. The inputs or methodology used for valuing securities may not be an indication of the risk associated with investing in those securities. For more information on valuation inputs, and their aggregation into the levels used below, please refer to the Investment Valuation section in the accompanying Notes to Financial Statements.
| Valuation Inputs at Reporting Date: |
| Description | Total ($) | Level 1 ($) | Level 2 ($) | Level 3 ($) |
Investments in Securities: | | | | |
|
| Corporate Bonds | 188,275,453 | - | 187,994,788 | 280,665 |
|
| Bank Loan Obligations | 1,842,002 | - | 1,719,959 | 122,043 |
|
| Preferred Securities | 2,067,037 | - | 2,067,037 | - |
|
| Money Market Funds | 6,941,727 | 6,941,727 | - | - |
| Total Investments in Securities: | 199,126,219 | 6,941,727 | 191,781,784 | 402,708 |
| Statement of Assets and Liabilities |
| | | | April 30, 2024 |
| | | | | |
| Assets | | | | |
| Investment in securities, at value - See accompanying schedule: | | | | |
Unaffiliated issuers (cost $203,809,212) | $ | 192,184,492 | | |
Fidelity Central Funds (cost $6,941,727) | | 6,941,727 | | |
| | | | | |
| | | | | |
| Total Investment in Securities (cost $210,750,939) | | | $ | 199,126,219 |
| Cash | | | | 44,397 |
| Receivable for investments sold | | | | 9 |
| Receivable for fund shares sold | | | | 413,058 |
| Interest receivable | | | | 2,723,677 |
| Distributions receivable from Fidelity Central Funds | | | | 27,898 |
| Prepaid expenses | | | | 73 |
| Receivable from investment adviser for expense reductions | | | | 1,775 |
Total assets | | | | 202,337,106 |
| Liabilities | | | | |
| Payable for investments purchased | $ | 593,090 | | |
| Payable for fund shares redeemed | | 42,963 | | |
| Distributions payable | | 124,979 | | |
| Accrued management fee | | 118,614 | | |
| Other payables and accrued expenses | | 68,969 | | |
| Total liabilities | | | | 948,615 |
| Net Assets | | | $ | 201,388,491 |
| Net Assets consist of: | | | | |
| Paid in capital | | | $ | 237,785,564 |
| Total accumulated earnings (loss) | | | | (36,397,073) |
| Net Assets | | | $ | 201,388,491 |
Net Asset Value, offering price and redemption price per share ($201,388,491 ÷ 25,512,742 shares) | | | $ | 7.89 |
| Statement of Operations |
| | | | Year ended April 30, 2024 |
| Investment Income | | | | |
| Dividends | | | $ | 115,021 |
| Interest | | | | 10,828,578 |
| Income from Fidelity Central Funds | | | | 686,988 |
| Total income | | | | 11,630,587 |
| Expenses | | | | |
| Management fee | $ | 1,191,120 | | |
| Transfer agent fees | | 270,111 | | |
| Accounting fees and expenses | | 72,326 | | |
| Custodian fees and expenses | | 3,354 | | |
| Independent trustees' fees and expenses | | 1,057 | | |
| Registration fees | | 21,621 | | |
| Audit | | 81,088 | | |
| Legal | | 323 | | |
| Miscellaneous | | 836 | | |
| Total expenses before reductions | | 1,641,836 | | |
| Expense reductions | | (87,475) | | |
| Total expenses after reductions | | | | 1,554,361 |
| Net Investment income (loss) | | | | 10,076,226 |
| Realized and Unrealized Gain (Loss) | | | | |
| Net realized gain (loss) on: | | | | |
| Investment Securities: | | | | |
| Unaffiliated issuers | | (4,781,310) | | |
| Fidelity Central Funds | | 47 | | |
| Total net realized gain (loss) | | | | (4,781,263) |
| Change in net unrealized appreciation (depreciation) on: | | | | |
| Investment Securities: | | | | |
| Unaffiliated issuers | | 7,004,957 | | |
| Fidelity Central Funds | | (1) | | |
| Total change in net unrealized appreciation (depreciation) | | | | 7,004,956 |
| Net gain (loss) | | | | 2,223,693 |
| Net increase (decrease) in net assets resulting from operations | | | $ | 12,299,919 |
| Statement of Changes in Net Assets |
| |
| | Year ended April 30, 2024 | | Year ended April 30, 2023 |
| Increase (Decrease) in Net Assets | | | | |
| Operations | | | | |
| Net investment income (loss) | $ | 10,076,226 | $ | 11,061,719 |
| Net realized gain (loss) | | (4,781,263) | | (10,993,496) |
| Change in net unrealized appreciation (depreciation) | | 7,004,956 | | 2,549,482 |
| Net increase (decrease) in net assets resulting from operations | | 12,299,919 | | 2,617,705 |
| Distributions to shareholders | | (9,611,700) | | (10,552,282) |
| | | | | |
| Share transactions | | | | |
| Proceeds from sales of shares | | 19,201,153 | | 14,368,413 |
| Reinvestment of distributions | | 8,015,292 | | 8,853,903 |
| Cost of shares redeemed | | (49,896,043) | | (71,841,155) |
| | | | | |
Net increase (decrease) in net assets resulting from share transactions | | (22,679,598) | | (48,618,839) |
| Total increase (decrease) in net assets | | (19,991,379) | | (56,553,416) |
| | | | | |
| Net Assets | | | | |
| Beginning of period | | 221,379,870 | | 277,933,286 |
| End of period | $ | 201,388,491 | $ | 221,379,870 |
| | | | | |
| Other Information | | | | |
| Shares | | | | |
| Sold | | 2,466,412 | | 1,842,094 |
| Issued in reinvestment of distributions | | 1,028,051 | | 1,150,252 |
| Redeemed | | (6,414,200) | | (9,332,498) |
| Net increase (decrease) | | (2,919,737) | | (6,340,152) |
| | | | | |
Financial Highlights
Fidelity® Focused High Income Fund |
| |
| Years ended April 30, | | 2024 | | 2023 | | 2022 | | 2021 | | 2020 |
Selected Per-Share Data | | | | | | | | | | |
| Net asset value, beginning of period | $ | 7.79 | $ | 7.99 | $ | 8.86 | $ | 8.28 | $ | 8.65 |
| Income from Investment Operations | | | | | | | | | | |
Net investment income (loss) A,B | | .376 | | .357 | | .317 | | .340 | | .374 |
| Net realized and unrealized gain (loss) | | .083 | | (.216) | | (.863) | | .574 | | (.378) |
| Total from investment operations | | .459 | | .141 | | (.546) | | .914 | | (.004) |
| Distributions from net investment income | | (.359) | | (.341) | | (.324) | | (.334) | | (.366) |
| Total distributions | | (.359) | | (.341) | | (.324) | | (.334) | | (.366) |
| Net asset value, end of period | $ | 7.89 | $ | 7.79 | $ | 7.99 | $ | 8.86 | $ | 8.28 |
Total Return C | | | | 1.91% | | (6.41)% | | 11.16% | | (.16)% |
Ratios to Average Net Assets B,D,E | | | | | | | | | | |
| Expenses before reductions | | .79% | | .79% | | .75% | | .75% | | .78% |
| Expenses net of fee waivers, if any | | | | .75% | | .75% | | .75% | | .78% |
| Expenses net of all reductions | | .75% | | .75% | | .75% | | .75% | | .78% |
| Net investment income (loss) | | 4.83% | | 4.62% | | 3.62% | | 3.88% | | 4.31% |
| Supplemental Data | | | | | | | | | | |
| Net assets, end of period (000 omitted) | $ | 201,388 | $ | 221,380 | $ | 277,933 | $ | 384,632 | $ | 347,510 |
Portfolio turnover rate F | | | | 9% | | 20% | | 73% | | 43% |
ACalculated based on average shares outstanding during the period.
BNet investment income (loss) is affected by the timing of the declaration of dividends by any underlying mutual funds or exchange-traded funds (ETFs). Net investment income (loss) of any mutual funds or ETFs is not included in the Fund's net investment income (loss) ratio.
CTotal returns would have been lower if certain expenses had not been reduced during the applicable periods shown.
DFees and expenses of any underlying mutual funds or exchange-traded funds (ETFs) are not included in the Fund's expense ratio. The Fund indirectly bears its proportionate share of these expenses. For additional expense information related to investments in Fidelity Central Funds, please refer to the "Investments in Fidelity Central Funds" note found in the Notes to Financial Statements section of the most recent Annual or Semi-Annual report.
EExpense ratios reflect operating expenses of the class. Expenses before reductions do not reflect amounts reimbursed, waived, or reduced through arrangements with the investment adviser, brokerage services, or other offset arrangements, if applicable, and do not represent the amount paid by the class during periods when reimbursements, waivers or reductions occur.
FAmount does not include the portfolio activity of any underlying mutual funds or exchange-traded funds (ETFs).
For the period ended April 30, 2024
1. Organization.
Fidelity Focused High Income Fund (the Fund) is a fund of Fidelity Summer Street Trust (the Trust) and is authorized to issue an unlimited number of shares. Share transactions on the Statement of Changes in Net Assets may contain exchanges between affiliated funds. The Trust is registered under the Investment Company Act of 1940, as amended (the 1940 Act), as an open-end management investment company organized as a Massachusetts business trust.
2. Investments in Fidelity Central Funds.
Funds may invest in Fidelity Central Funds, which are open-end investment companies generally available only to other investment companies and accounts managed by the investment adviser and its affiliates. The Schedule of Investments lists any Fidelity Central Funds held as an investment as of period end, but does not include the underlying holdings of each Fidelity Central Fund. An investing fund indirectly bears its proportionate share of the expenses of the underlying Fidelity Central Funds.
Based on its investment objective, each Fidelity Central Fund may invest or participate in various investment vehicles or strategies that are similar to those of the investing fund. These strategies are consistent with the investment objectives of the investing fund and may involve certain economic risks which may cause a decline in value of each of the Fidelity Central Funds and thus a decline in the value of the investing fund.
| Fidelity Central Fund | Investment Manager | Investment Objective | Investment Practices | Expense RatioA |
| Fidelity Money Market Central Funds | Fidelity Management & Research Company LLC (FMR) | Each fund seeks to obtain a high level of current income consistent with the preservation of capital and liquidity. | Short-term Investments | Less than .005% |
A Expenses expressed as a percentage of average net assets and are as of each underlying Central Fund's most recent annual or semi-annual shareholder report.
A complete unaudited list of holdings for each Fidelity Central Fund is available upon request or at the Securities and Exchange Commission website at www.sec.gov. In addition, the financial statements of the Fidelity Central Funds which contain the significant accounting policies (including investment valuation policies) of those funds, and are not covered by the Report of Independent Registered Public Accounting Firm, are available on the Securities and Exchange Commission website or upon request.
3. Significant Accounting Policies.
The Fund is an investment company and applies the accounting and reporting guidance of the Financial Accounting Standards Board (FASB) Accounting Standards Codification Topic 946 Financial Services - Investment Companies. The financial statements have been prepared in conformity with accounting principles generally accepted in the United States of America (GAAP), which require management to make certain estimates and assumptions at the date of the financial statements. Actual results could differ from those estimates. Subsequent events, if any, through the date that the financial statements were issued have been evaluated in the preparation of the financial statements. The Fund's Schedule of Investments lists any underlying mutual funds or exchange-traded funds (ETFs) but does not include the underlying holdings of these funds. The following summarizes the significant accounting policies of the Fund:
Investment Valuation. Investments are valued as of 4:00 p.m. Eastern time on the last calendar day of the period. The Board of Trustees (the Board) has designated the Fund's investment adviser as the valuation designee responsible for the fair valuation function and performing fair value determinations as needed. The investment adviser has established a Fair Value Committee (the Committee) to carry out the day-to-day fair valuation responsibilities and has adopted policies and procedures to govern the fair valuation process and the activities of the Committee. In accordance with these fair valuation policies and procedures, which have been approved by the Board, the Fund attempts to obtain prices from one or more third party pricing services or brokers to value its investments. When current market prices, quotations or currency exchange rates are not readily available or reliable, investments will be fair valued in good faith by the Committee, in accordance with the policies and procedures. Factors used in determining fair value vary by investment type and may include market or investment specific events, transaction data, estimated cash flows, and market observations of comparable investments. The frequency that the fair valuation procedures are used cannot be predicted and they may be utilized to a significant extent. The Committee manages the Fund's fair valuation practices and maintains the fair valuation policies and procedures. The Fund's investment adviser reports to the Board information regarding the fair valuation process and related material matters.
The Fund categorizes the inputs to valuation techniques used to value its investments into a disclosure hierarchy consisting of three levels as shown below:
Level 1 - unadjusted quoted prices in active markets for identical investments
Level 2 - other significant observable inputs (including quoted prices for similar investments, interest rates, prepayment speeds, etc.)
Level 3 - unobservable inputs (including the Fund's own assumptions based on the best information available)
Valuation techniques used to value the Fund's investments by major category are as follows:
Debt securities, including restricted securities, are valued based on evaluated prices received from third party pricing services or from brokers who make markets in such securities. Corporate bonds, bank loan obligations and preferred securities are valued by pricing services who utilize matrix pricing which considers yield or price of bonds of comparable quality, coupon, maturity and type or by broker-supplied prices. When independent prices are unavailable or unreliable, debt securities may be valued utilizing pricing methodologies which consider similar factors that would be used by third party pricing services. Debt securities are generally categorized as Level 2 in the hierarchy but may be Level 3 depending on the circumstances. The Fund invests a significant portion of its assets in below investment grade securities. The value of these securities can be more volatile due to changes in the credit quality of the issuer and is sensitive to changes in economic, market and regulatory conditions.
Equity securities, including restricted securities, for which market quotations are readily available, are valued at the last reported sale price or official closing price as reported by a third party pricing service on the primary market or exchange on which they are traded and are categorized as Level 1 in the hierarchy. In the event there were no sales during the day or closing prices are not available, securities are valued at the last quoted bid price or may be valued using the last available price and are generally categorized as Level 2 in the hierarchy. For equity securities, including restricted securities, where observable inputs are limited, assumptions about market activity and risk are used and these securities may be categorized as Level 3 in the hierarchy.
Investments in open-end mutual funds, including the Fidelity Central Funds, are valued at their closing net asset value (NAV) each business day and are categorized as Level 1 in the hierarchy.
Changes in valuation techniques may result in transfers in or out of an assigned level within the disclosure hierarchy. The aggregate value of investments by input level as of April 30, 2024 is included at the end of the Fund's Schedule of Investments.
Investment Transactions and Income. For financial reporting purposes, the Fund's investment holdings and NAV include trades executed through the end of the last business day of the period. The NAV per share for processing shareholder transactions is calculated as of the close of business of the New York Stock Exchange (NYSE), normally 4:00 p.m. Eastern time and includes trades executed through the end of the prior business day. Gains and losses on securities sold are determined on the basis of identified cost and include proceeds received from litigation. Commissions paid to certain brokers with whom the investment adviser, or its affiliates, places trades on behalf of a fund include an amount in addition to trade execution, which may be rebated back to a fund. Any such rebates are included in net realized gain (loss) on investments in the Statement of Operations. Dividend income is recorded on the ex-dividend date, except for certain dividends from foreign securities where the ex-dividend date may have passed, which are recorded as soon as the Fund is informed of the ex-dividend date. Non-cash dividends included in dividend income, if any, are recorded at the fair market value of the securities received. Income and capital gain distributions from Fidelity Central Funds, if any, are recorded on the ex-dividend date. Interest income is accrued as earned and includes coupon interest and amortization of premium and accretion of discount on debt securities as applicable. Paid in Kind (PIK) income is recorded at the fair market value of the securities received. Debt obligations may be placed on non-accrual status and related interest income may be reduced by ceasing current accruals and writing off interest receivables when the collection of all or a portion of interest has become doubtful based on consistently applied procedures. A debt obligation is removed from non-accrual status when the issuer resumes interest payments or when collectability of interest is reasonably assured.
Expenses. Expenses directly attributable to a fund are charged to that fund. Expenses attributable to more than one fund are allocated among the respective funds on the basis of relative net assets or other appropriate methods. Expenses included in the accompanying financial statements reflect the expenses of that fund and do not include any expenses associated with any underlying mutual funds or exchange-traded funds. Although not included in a fund's expenses, a fund indirectly bears its proportionate share of these expenses through the net asset value of each underlying mutual fund or exchange-traded fund. Expense estimates are accrued in the period to which they relate and adjustments are made when actual amounts are known.
Income Tax Information and Distributions to Shareholders. Each year, the Fund intends to qualify as a regulated investment company under Subchapter M of the Internal Revenue Code, including distributing substantially all of its taxable income and realized gains. As a result, no provision for U.S. Federal income taxes is required. As of April 30, 2024, the Fund did not have any unrecognized tax benefits in the financial statements; nor is the Fund aware of any tax positions for which it is reasonably possible that the total amounts of unrecognized tax benefits will significantly change in the next twelve months. The Fund files a U.S. federal tax return, in addition to state and local tax returns as required. The Fund's federal income tax returns are subject to examination by the Internal Revenue Service (IRS) for a period of three fiscal years after they are filed. State and local tax returns may be subject to examination for an additional fiscal year depending on the jurisdiction.
Distributions are declared and recorded daily and paid monthly from net investment income. Distributions from realized gains, if any, are declared and recorded on the ex-dividend date. Income and capital gain distributions are determined in accordance with income tax regulations, which may differ from GAAP.
Capital accounts within the financial statements are adjusted for permanent book-tax differences. These adjustments have no impact on net assets or the results of operations. Capital accounts are not adjusted for temporary book-tax differences which will reverse in a subsequent period.
Book-tax differences are primarily due to market discount, partnerships, prior period premium and discount on debt securities and capital loss carryforwards and losses deferred due to wash sales.
As of period end, the cost and unrealized appreciation (depreciation) in securities, and derivatives if applicable, for federal income tax purposes were as follows:
| Gross unrealized appreciation | $2,439,809 |
| Gross unrealized depreciation | (12,815,501 |
| Net unrealized appreciation (depreciation) | $(10,375,692) |
| Tax Cost | $209,501,911 |
The tax-based components of distributable earnings as of period end were as follows:
| Undistributed tax-exempt income | $- |
| Undistributed ordinary income | $277,104 |
| Capital loss carryforward | $(26,298,484) |
| Net unrealized appreciation (depreciation) on securities and other investments | $(10,375,692) |
Capital loss carryforwards are only available to offset future capital gains of the Fund to the extent provided by regulations and may be limited. The capital loss carryforward information presented below, including any applicable limitation, is estimated as of fiscal period end and is subject to adjustment.
Short-term | $(10,668,361) |
Long-term | (15,630,122) |
| Total capital loss carryforward | $(26,298,484) |
The tax character of distributions paid was as follows:
| | April 30, 2024 | April 30, 2023 |
| Ordinary Income | $9,611,700 | $ 10,552,282 |
Restricted Securities (including Private Placements). Funds may invest in securities that are subject to legal or contractual restrictions on resale. These securities generally may be resold in transactions exempt from registration or to the public if the securities are registered. Disposal of these securities may involve time-consuming negotiations and expense, and prompt sale at an acceptable price may be difficult. Information regarding restricted securities held at period end is included at the end of the Schedule of Investments, if applicable.
Loans and Other Direct Debt Instruments. Direct debt instruments are interests in amounts owed to lenders by corporate or other borrowers. These instruments may be in the form of loans, trade claims or other receivables and may include standby financing commitments such as revolving credit facilities that obligate a fund to supply additional cash to the borrower on demand. Loans may be acquired through assignment, participation, or may be made directly to a borrower. Such instruments are presented in the Bank Loan Obligations section in the Schedule of Investments. Certain funds may also invest in unfunded loan commitments, which are contractual obligations for future funding. Information regarding unfunded commitments is included at the end of the Schedule of Investments, if applicable.
4. Purchases and Sales of Investments.
Purchases and sales of securities, other than short-term securities and in-kind transactions, as applicable, are noted in the table below.
| | Purchases ($) | Sales ($) |
| Fidelity Focused High Income Fund | 50,440,885 | 57,507,490 |
| | | |
5. Fees and Other Transactions with Affiliates.
Management Fee. Fidelity Management & Research Company LLC (the investment adviser) and its affiliates provide the Fund with investment management related services for which the Fund pays a monthly management fee.
Effective March 1, 2024, the Fund's management contract was amended to incorporate administrative services previously covered under separate services agreements (Transfer Agent and Accounting agreements). Any reference to "class" in this note shall mean "the Fund" as the Fund currently offers only one class of shares. The amended contract incorporates a management fee rate that may vary by class. The investment adviser or an affiliate pays certain expenses of managing and operating the Fund out of each class's management fee. Each class of the Fund pays a management fee to the investment adviser. The management fee is calculated and paid to the investment adviser every month. When determining a class's management fee, a mandate rate is calculated based on the monthly average net assets of a group of funds advised by FMR within a designated asset class. A discount rate is subtracted from the mandate rate once the Fund's monthly average net assets reach a certain level. The mandate rate and discount rate may vary by class. The annual management fee rate for a class of shares of the Fund is the lesser of (1) the class's mandate rate reduced by the class's discount rate (if applicable) or (2) the amount set forth in the following table.
| | Maximum Management Fee Rate % |
| Fidelity Focused High Income Fund | .71 |
One-twelfth of the management fee rate for a class is applied to the average net assets of the class for the month, giving a dollar amount which is the management fee for the class for that month. A different management fee rate may be applicable to each class of the Fund. The difference between classes is the result of separate arrangements for class-level services and/or waivers of certain expenses. It is not the result of any difference in advisory or custodial fees or other expenses related to the management of the Fund's assets, which do not vary by class. For the portion of the reporting period on or after March 1, 2024, the total annualized management fee rates were as follows:
| | Total Management Fee Rate % |
| Fidelity Focused High Income Fund | .70 |
Prior to March 1, 2024, the management fee was the sum of an individual fund fee rate that was based on an annual rate of .45% of the Fund's average net assets and an annualized group fee rate that averaged .10% during the period. The group fee rate was based upon the monthly average net assets of a group of registered investment companies with which the investment adviser has management contracts. The group fee rate decreased as assets under management increased and increased as assets under management decreased. For the portion of the reporting period prior to March 1, 2024, the total annualized management fee rate was .55%.
Effective March 1, 2024, the Fund's sub-advisory agreements with FMR Investment Management (UK) Limited, Fidelity Management & Research (Hong Kong) Limited, and Fidelity Management & Research (Japan) Limited were amended to provide that the investment adviser pays each sub-adviser monthly fees equal to 110% of the sub-adviser's costs for providing sub-advisory services.
Transfer Agent Fees. Fidelity Investments Institutional Operations Company LLC (FIIOC), an affiliate of the investment adviser, is the Fund's transfer, dividend disbursing and shareholder servicing agent. Effective March 1, 2024, each Fund's management contract was amended to incorporate transfer agent services and associated fees previously covered under a separate services agreement. FIIOC pays for typesetting, printing and mailing of shareholder reports, except proxy statements.
During November 2023, the Board approved a change in the transfer agent fees effective December 1, 2023 to a fixed annual rate of average net assets of .1541%.
Prior to December 1, 2023, FIIOC received account fees and asset-based fees that varied according to account size and type of account.
For the portion of the reporting period prior to March 1, 2024, the fees were equivalent to the annualized rate of .15% of average net assets.
Accounting Fees. Fidelity Service Company, Inc. (FSC), an affiliate of the investment adviser, maintains the Fund's accounting records. Effective March 1, 2024, the Fund's management contract was amended to incorporate accounting services and associated fees previously covered under a separate services agreement.
During November 2023, the Board approved a change in the accounting fees effective December 1, 2023 to a fixed annual rate of average net assets as follows:
| | % of Average Net Assets |
| Fidelity Focused High Income Fund | .0414 |
Prior to December 1, 2023, the accounting fee was based on the level of average net assets for each month. For the portion of the reporting period prior to March 1, 2024, the fees were equivalent to the following annualized rates:
| | % of Average Net Assets |
| Fidelity Focused High Income Fund | .04 |
Interfund Trades. Funds may purchase from or sell securities to other Fidelity Funds under procedures adopted by the Board. The procedures have been designed to ensure these interfund trades are executed in accordance with Rule 17a-7 of the 1940 Act. Any interfund trades are included within the respective purchases and sales amounts shown in the Purchases and Sales of Investments note. During the period, there were no interfund trades.
6. Committed Line of Credit.
Certain Funds participate with other funds managed by the investment adviser or an affiliate in a $4.25 billion credit facility (the "line of credit") to be utilized for temporary or emergency purposes to fund shareholder redemptions or for other short-term liquidity purposes. The participating funds have agreed to pay commitment fees on their pro-rata portion of the line of credit, which are reflected in Miscellaneous expenses on the Statement of Operations, and are listed below. During the period, there were no borrowings on this line of credit.
| | Amount ($) |
| Fidelity Focused High Income Fund | 368 |
7. Expense Reductions.
The investment adviser contractually agreed to reimburse the Fund to the extent annual operating expenses exceeded .75% of average net assets. This reimbursement will remain in place through August 31, 2025. Some expenses, for example the compensation of the independent Trustees, and certain miscellaneous expenses such as proxy and shareholder meeting expenses, are excluded from this reimbursement. During the period this reimbursement reduced the Fund's expenses by $77,305.
Through arrangements with the Fund's custodian, credits realized as a result of certain uninvested cash balances were used to reduce the Fund's expenses by $995.
In addition, during the period the investment adviser or an affiliate reimbursed and/or waived a portion of operating expenses in the amount of $9,175.
8. Other.
A fund's organizational documents provide former and current trustees and officers with a limited indemnification against liabilities arising in connection with the performance of their duties to the fund. In the normal course of business, a fund may also enter into contracts that provide general indemnifications. A fund's maximum exposure under these arrangements is unknown as this would be dependent on future claims that may be made against a fund. The risk of material loss from such claims is considered remote.
9. Risk and Uncertainties.
Many factors affect a fund's performance. Developments that disrupt global economies and financial markets, such as pandemics, epidemics, outbreaks of infectious diseases, war, terrorism, and environmental disasters, may significantly affect a fund's investment performance. The effects of these developments to a fund will be impacted by the types of securities in which a fund invests, the financial condition, industry, economic sector, and geographic location of an issuer, and a fund's level of investment in the securities of that issuer. Significant concentrations in security types, issuers, industries, sectors, and geographic locations may magnify the factors that affect a fund's performance.
To the Board of Trustees of Fidelity Summer Street Trust and Shareholders of Fidelity Focused High Income Fund
Opinion on the Financial Statements
We have audited the accompanying statement of assets and liabilities, including the schedule of investments, of Fidelity Focused High Income Fund (one of the funds constituting Fidelity Summer Street Trust, referred to hereafter as the "Fund") as of April 30, 2024, the related statement of operations for the year ended April 30, 2024, the statement of changes in net assets for each of the two years in the period ended April 30, 2024, including the related notes, and the financial highlights for each of the five years in the period ended April 30, 2024 (collectively referred to as the "financial statements"). In our opinion, the financial statements present fairly, in all material respects, the financial position of the Fund as of April 30, 2024, the results of its operations for the year then ended, the changes in its net assets for each of the two years in the period ended April 30, 2024 and the financial highlights for each of the five years in the period ended April 30, 2024 in conformity with accounting principles generally accepted in the United States of America.
Basis for Opinion
These financial statements are the responsibility of the Fund's management. Our responsibility is to express an opinion on the Fund's financial statements based on our audits. We are a public accounting firm registered with the Public Company Accounting Oversight Board (United States) (PCAOB) and are required to be independent with respect to the Fund in accordance with the U.S. federal securities laws and the applicable rules and regulations of the Securities and Exchange Commission and the PCAOB.
We conducted our audits of these financial statements in accordance with the standards of the PCAOB. Those standards require that we plan and perform the audit to obtain reasonable assurance about whether the financial statements are free of material misstatement, whether due to error or fraud.
Our audits included performing procedures to assess the risks of material misstatement of the financial statements, whether due to error or fraud, and performing procedures that respond to those risks. Such procedures included examining, on a test basis, evidence regarding the amounts and disclosures in the financial statements. Our audits also included evaluating the accounting principles used and significant estimates made by management, as well as evaluating the overall presentation of the financial statements. Our procedures included confirmation of securities owned as of April 30, 2024 by correspondence with the custodian, agent banks and brokers; when replies were not received from brokers, we performed other auditing procedures. We believe that our audits provide a reasonable basis for our opinion.
/s/ PricewaterhouseCoopers LLP
Boston, Massachusetts
June 12, 2024
We have served as the auditor of one or more investment companies in the Fidelity group of funds since 1932.
The Trustees, Members of the Advisory Board (if any), and officers of the trust and fund, as applicable, are listed below. The Board of Trustees governs the fund and is responsible for protecting the interests of shareholders. The Trustees are experienced executives who meet periodically throughout the year to oversee the fund's activities, review contractual arrangements with companies that provide services to the fund, oversee management of the risks associated with such activities and contractual arrangements, and review the fund's performance. Except for Vijay Advani, each of the Trustees oversees 323 funds. Mr. Advani oversees 216 funds.
The Trustees hold office without limit in time except that (a) any Trustee may resign; (b) any Trustee may be removed by written instrument, signed by at least two-thirds of the number of Trustees prior to such removal; (c) any Trustee who requests to be retired or who has become incapacitated by illness or injury may be retired by written instrument signed by a majority of the other Trustees; and (d) any Trustee may be removed at any special meeting of shareholders by a two-thirds vote of the outstanding voting securities of the trust. Each Trustee who is not an interested person (as defined in the 1940 Act) of the trust and the fund is referred to herein as an Independent Trustee. Each Independent Trustee shall retire not later than the last day of the calendar year in which his or her 75th birthday occurs. The Independent Trustees may waive this mandatory retirement age policy with respect to individual Trustees. Officers and Advisory Board Members hold office without limit in time, except that any officer or Advisory Board Member may resign or may be removed by a vote of a majority of the Trustees at any regular meeting or any special meeting of the Trustees. Except as indicated, each individual has held the office shown or other offices in the same company for the past five years.
The fund's Statement of Additional Information (SAI) includes more information about the Trustees. To request a free copy, call Fidelity at 1-800-544-8544.
Experience, Skills, Attributes, and Qualifications of the Trustees. The Governance and Nominating Committee has adopted a statement of policy that describes the experience, qualifications, attributes, and skills that are necessary and desirable for potential Independent Trustee candidates (Statement of Policy). The Board believes that each Trustee satisfied at the time he or she was initially elected or appointed a Trustee, and continues to satisfy, the standards contemplated by the Statement of Policy. The Governance and Nominating Committee also engages professional search firms to help identify potential Independent Trustee candidates who have the experience, qualifications, attributes, and skills consistent with the Statement of Policy. From time to time, additional criteria based on the composition and skills of the current Independent Trustees, as well as experience or skills that may be appropriate in light of future changes to board composition, business conditions, and regulatory or other developments, have also been considered by the professional search firms and the Governance and Nominating Committee. In addition, the Board takes into account the Trustees' commitment and participation in Board and committee meetings, as well as their leadership of standing and ad hoc committees throughout their tenure.
In determining that a particular Trustee was and continues to be qualified to serve as a Trustee, the Board has considered a variety of criteria, none of which, in isolation, was controlling. The Board believes that, collectively, the Trustees have balanced and diverse experience, qualifications, attributes, and skills, which allow the Board to operate effectively in governing the fund and protecting the interests of shareholders. Information about the specific experience, skills, attributes, and qualifications of each Trustee, which in each case led to the Board's conclusion that the Trustee should serve (or continue to serve) as a trustee of the fund, is provided below.
Board Structure and Oversight Function. Robert A. Lawrence is an interested person and currently serves as Chair. The Trustees have determined that an interested Chair is appropriate and benefits shareholders because an interested Chair has a personal and professional stake in the quality and continuity of services provided to the fund. Independent Trustees exercise their informed business judgment to appoint an individual of their choosing to serve as Chair, regardless of whether the Trustee happens to be independent or a member of management. The Independent Trustees have determined that they can act independently and effectively without having an Independent Trustee serve as Chair and that a key structural component for assuring that they are in a position to do so is for the Independent Trustees to constitute a substantial majority for the Board. The Independent Trustees also regularly meet in executive session. David M. Thomas serves as Lead Independent Trustee and as such (i) acts as a liaison between the Independent Trustees and management with respect to matters important to the Independent Trustees and (ii) with management prepares agendas for Board meetings.
Fidelity® funds are overseen by different Boards of Trustees. The fund's Board oversees Fidelity's high income and certain equity funds, and other Boards oversee Fidelity's alternative investment, investment-grade bond, money market, asset allocation, and other equity funds. The asset allocation funds may invest in Fidelity® funds overseen by the fund's Board. The use of separate Boards, each with its own committee structure, allows the Trustees of each group of Fidelity® funds to focus on the unique issues of the funds they oversee, including common research, investment, and operational issues. On occasion, the separate Boards establish joint committees to address issues of overlapping consequences for the Fidelity® funds overseen by each Board.
The Trustees operate using a system of committees to facilitate the timely and efficient consideration of all matters of importance to the Trustees, the fund, and fund shareholders and to facilitate compliance with legal and regulatory requirements and oversight of the fund's activities and associated risks. The Board, acting through its committees, has charged FMR and its affiliates with (i) identifying events or circumstances the occurrence of which could have demonstrably adverse effects on the fund's business and/or reputation; (ii) implementing processes and controls to lessen the possibility that such events or circumstances occur or to mitigate the effects of such events or circumstances if they do occur; and (iii) creating and maintaining a system designed to evaluate continuously business and market conditions in order to facilitate the identification and implementation processes described in (i) and (ii) above. Because the day-to-day operations and activities of the fund are carried out by or through FMR, its affiliates, and other service providers, the fund's exposure to risks is mitigated but not eliminated by the processes overseen by the Trustees. While each of the Board's committees has responsibility for overseeing different aspects of the fund's activities, oversight is exercised primarily through the Operations, Audit, and Compliance Committees. Appropriate personnel, including but not limited to the fund's Chief Compliance Officer (CCO), FMR's internal auditor, the independent accountants, the fund's Treasurer and portfolio management personnel, make periodic reports to the Board's committees, as appropriate, including an annual review of Fidelity's risk management program for the Fidelity® funds. The responsibilities of each standing committee, including their oversight responsibilities, are described further under "Standing Committees of the Trustees."
Interested Trustees*:
Correspondence intended for a Trustee who is an interested person may be sent to Fidelity Investments, 245 Summer Street, Boston, Massachusetts 02210.
Name, Year of Birth; Principal Occupations and Other Relevant Experience+
Bettina Doulton (1964)
Year of Election or Appointment: 2020
Trustee
Ms. Doulton also serves as Trustee of other Fidelity® funds. Prior to her retirement, Ms. Doulton served in a variety of positions at Fidelity Investments, including as a managing director of research (2006-2007), portfolio manager to certain Fidelity® funds (1993-2005), equity analyst and portfolio assistant (1990-1993), and research assistant (1987-1990). Ms. Doulton currently owns and operates Cellardoor Winery. Previously, Ms. Doulton served as a member of the Board of Brown Capital Management, LLC (2014-2018).
Robert A. Lawrence (1952)
Year of Election or Appointment: 2020
Trustee
Chair of the Board of Trustees
Mr. Lawrence also serves as Trustee of other funds. Previously, Mr. Lawrence served as a Trustee and Member of the Advisory Board of certain funds. Prior to his retirement in 2008, Mr. Lawrence served as Vice President of certain Fidelity® funds (2006-2008), Senior Vice President, Head of High Income Division of Fidelity Management & Research Company (investment adviser firm, 2006-2008), and President of Fidelity Strategic Investments (investment adviser firm, 2002-2005).
* Determined to be an "Interested Trustee" by virtue of, among other things, his or her affiliation with the trust or various entities under common control with FMR.
+ The information includes the Trustee's principal occupation during the last five years and other information relating to the experience, attributes, and skills relevant to the Trustee's qualifications to serve as a Trustee, which led to the conclusion that the Trustee should serve as a Trustee for the fund.
Independent Trustees:
Correspondence intended for an Independent Trustee may be sent to Fidelity Investments, P.O. Box 55235, Boston, Massachusetts 02205-5235.
Name, Year of Birth; Principal Occupations and Other Relevant Experience+
Vijay C. Advani (1960)
Year of Election or Appointment: 2023
Trustee
Mr. Advani also serves as Trustee or Member of the Advisory Board of other funds. Previously, Mr. Advani served as Executive Chairman (2020-2022), Chief Executive Officer (2017-2020) and Chief Operating Officer (2016-2017) of Nuveen (global investment manager). He also served in various capacities at Franklin Resources (global investment manager), including Co-President (2015-2016), Executive Vice President, Global Advisory Services (2008-2015), Head of Global Retail Distribution (2005-2008), Executive Managing Director, International Retail Development (2002-2005), Managing Director, Product Developments, Sales & Marketing, Asia, Eastern Europe and Africa (2000-2002) and President, Templeton Asset Management India (1995-2000). Mr. Advani also served as Senior Investment Officer of International Finance Corporation (private equity and venture capital arm of The World Bank, 1984-1995). Mr. Advani is Chairman Emeritus of the U.S. India Business Council (2018-present), a Director of The Global Impact Investing Network (2019-present), a Director of LOK Capital (Mauritius) (2022-present), a member of the Advisory Council of LOK Capital (2022-present), a Senior Advisor of Neuberger Berman (2021-present), a Senior Advisor of Seviora Holdings Pte. Ltd (Temasek-Singapore) (2021-present), a Director of Seviora Capital (Singapore) (2021-present) and an Advisor of EQUIAM (2021-present). Mr. Advani formerly served as a member of the Board of BowX Acquisition Corp. (special purpose acquisition company, 2020-2021), a member of the Board of Intellecap (advisory arm of The Aavishkaar Group, 2018-2020), a member of the Board of Nuveen Investments, Inc. (2017-2020) and a member of the Board of Docusign (software, 2016-2019).
Thomas P. Bostick (1956)
Year of Election or Appointment: 2021
Trustee
Lieutenant General Bostick also serves as Trustee of other Fidelity® funds. Prior to his retirement, General Bostick (United States Army, Retired) held a variety of positions within the U.S. Army, including Chief of Engineers and Commanding General, U.S. Army Corps of Engineers (2012-2016) and Deputy Chief of Staff and Director of Human Resources, U.S. Army (2009-2012). General Bostick currently serves as a member of the Board and Finance and Governance & Sustainability Committees of CSX Corporation (transportation, 2020-present) and a member of the Board and Corporate Governance and Nominating Committee of Perma-Fix Environmental Services, Inc. (nuclear waste management, 2020-present). General Bostick serves as Chief Executive Officer of Bostick Global Strategies, LLC (consulting, 2016-present), as a member of the Board of HireVue, Inc. (video interview and assessment, 2020-present), as a member of the Board of Allonnia (biotechnology and engineering solutions, 2022-present), on the Advisory Board of Hilco Redevelopment Partners (a real estate investment and redevelopment company, 2021-present), and on the Advisory Board of Solugen, Inc. (specialty bio-based chemicals manufacturer, 2022-present). Previously, General Bostick served as a Member of the Advisory Board of certain Fidelity® funds (2021), President, Intrexon Bioengineering (2018-2020) and Chief Operating Officer (2017-2020) and Senior Vice President of the Environment Sector (2016-2017) of Intrexon Corporation (biopharmaceutical company).
Donald F. Donahue (1950)
Year of Election or Appointment: 2018
Trustee
Mr. Donahue also serves as Trustee of other Fidelity® funds. Mr. Donahue serves as President and Chief Executive Officer of Miranda Partners, LLC (risk consulting for the financial services industry, 2012-present). Previously, Mr. Donahue served as Chief Executive Officer (2006-2012), Chief Operating Officer (2003-2006) and Managing Director, Customer Marketing and Development (1999-2003) of The Depository Trust & Clearing Corporation (financial markets infrastructure). Mr. Donahue currently serves as a member (2007-present) and Co-Chairman (2016-present) of the Board of United Way of New York. Mr. Donahue previously served as a member of the Advisory Board of certain Fidelity® funds (2015-2018) and as a member of the Board of The Leadership Academy (previously NYC Leadership Academy) (2012-2022).
Vicki L. Fuller (1957)
Year of Election or Appointment: 2020
Trustee
Ms. Fuller also serves as Trustee of other Fidelity® funds. Previously, Ms. Fuller served as a member of the Advisory Board of certain Fidelity® funds (2018-2020), Chief Investment Officer of the New York State Common Retirement Fund (2012-2018) and held a variety of positions at AllianceBernstein L.P. (global asset management, 1985-2012), including Managing Director (2006-2012) and Senior Vice President and Senior Portfolio Manager (2001-2006). Ms. Fuller currently serves as a member of the Board, Audit Committee, Compensation Committee and Nominating and Governance Committee of two Blackstone business development companies (2020-present), as a member of the Board of Treliant, LLC (consulting, 2019-present), as a member of the Board of Ariel Alternatives, LLC (private equity, 2022-present) and as a member of the Board and Chair of the Audit Committee of Gusto, Inc. (software, 2021-present). In addition, Ms. Fuller currently serves as a member of the Executive Board of New York University's Stern School of Business. Ms. Fuller previously served as a member of the Board of Roosevelt University (2019-2024) and member of the Board, Audit Committee and Nominating and Governance Committee of The Williams Companies, Inc. (natural gas infrastructure, 2018-2021).
Patricia L. Kampling (1959)
Year of Election or Appointment: 2020
Trustee
Ms. Kampling also serves as Trustee of other Fidelity® funds. Prior to her retirement, Ms. Kampling served as Chairman of the Board and Chief Executive Officer (2012-2019), President and Chief Operating Officer (2011-2012) and Executive Vice President and Chief Financial Officer (2010-2011) of Alliant Energy Corporation. Ms. Kampling currently serves as a member of the Board, Audit Committee and Governance, Compensation and Nominating Committee of Xcel Energy Inc. (utilities company, 2020-present) and as a member of the Board, Audit, Finance and Risk Committee and Safety, Environmental, Technology and Operations Committee and Chair of the Executive Development and Compensation Committee of American Water Works Company, Inc. (utilities company, 2019-present). In addition, Ms. Kampling currently serves as a member of the Board of the Nature Conservancy, Wisconsin Chapter (2019-present). Previously, Ms. Kampling served as a Member of the Advisory Board of certain Fidelity® funds (2020), a member of the Board, Compensation Committee and Executive Committee and Chair of the Audit Committee of Briggs & Stratton Corporation (manufacturing, 2011-2021), a member of the Board of Interstate Power and Light Company (2012-2019) and Wisconsin Power and Light Company (2012-2019) (each a subsidiary of Alliant Energy Corporation) and as a member of the Board and Workforce Development Committee of the Business Roundtable (2018-2019).
Thomas A. Kennedy (1955)
Year of Election or Appointment: 2021
Trustee
Mr. Kennedy also serves as Trustee of other Fidelity® funds. Previously, Mr. Kennedy served as a Member of the Advisory Board of certain Fidelity® funds (2020) and held a variety of positions at Raytheon Company (aerospace and defense, 1983-2020), including Chairman and Chief Executive Officer (2014-2020) and Executive Vice President and Chief Operating Officer (2013-2014). Mr. Kennedy served as Executive Chairman of the Board of Directors of Raytheon Technologies Corporation (aerospace and defense, 2020-2021). Mr. Kennedy serves as a Director of the Board of Directors of Textron Inc. (aerospace and defense, 2023-present).
Oscar Munoz (1959)
Year of Election or Appointment: 2021
Trustee
Mr. Munoz also serves as Trustee of other Fidelity® funds. Prior to his retirement, Mr. Munoz served as Executive Chairman (2020-2021), Chief Executive Officer (2015-2020), President (2015-2016) and a member of the Board (2010-2021) of United Airlines Holdings, Inc. Mr. Munoz currently serves as a member of the Board of CBRE Group, Inc. (commercial real estate, 2020-present), a member of the Board of Univision Communications, Inc. (Hispanic media, 2020-present), a member of the Board of Archer Aviation Inc. (2021-present), a member of the Defense Business Board of the United States Department of Defense (2021-present) and a member of the Board of Salesforce.com, Inc. (cloud-based software, 2022-present). Previously, Mr. Munoz served as a Member of the Advisory Board of certain Fidelity® funds (2021).
David M. Thomas (1949)
Year of Election or Appointment: 2008
Trustee
Lead Independent Trustee
Mr. Thomas also serves as Trustee of other Fidelity® funds. Previously, Mr. Thomas served as Executive Chairman (2005-2006) and Chairman and Chief Executive Officer (2000-2005) of IMS Health, Inc. (pharmaceutical and healthcare information solutions) and as a member of the Board of Fortune Brands Home and Security (home and security products, 2004-2023). Mr. Thomas currently serves as Director (2013-present) and Non-Executive Chairman of the Board (2022-present) of Interpublic Group of Companies, Inc. (marketing communication).
Susan Tomasky (1953)
Year of Election or Appointment: 2020
Trustee
Ms. Tomasky also serves as Trustee of other Fidelity® funds. Prior to her retirement, Ms. Tomasky served in various executive officer positions at American Electric Power Company, Inc. (1998-2011), including most recently as President of AEP Transmission (2007-2011). Ms. Tomasky currently serves as a member of the Board and Sustainability Committee and as Chair of the Audit Committee of Marathon Petroleum Corporation (2018-present) and as a member of the Board, Executive Committee, Corporate Governance Committee and Organization and Compensation Committee and as Lead Director of the Board of Public Service Enterprise Group, Inc. (utilities company, 2012-present) and as a member of the Board of its subsidiary company, Public Service Electric and Gas Co. (2021-present). In addition, Ms. Tomasky currently serves as a member (2009-present) and President (2020-present) of the Board of the Royal Shakespeare Company - America (2009-present) and as a member and Vice Chair of the Board of Kenyon College (2016-present). Previously, Ms. Tomasky served as a Member of the Advisory Board of certain Fidelity® funds (2020), as a member of the Board of the Columbus Association for the Performing Arts (2011-2023), as a member of the Board of the Columbus Regional Airport Authority (2007-2020), as a member of the Board (2011-2018) and Lead Independent Director (2015-2018) of Andeavor Corporation (previously Tesoro Corporation) (independent oil refiner and marketer) and as a member of the Board of Summit Midstream Partners LP (energy, 2012-2018).
Michael E. Wiley (1950)
Year of Election or Appointment: 2018
Trustee
Mr. Wiley also serves as Trustee of other Fidelity® funds. Previously, Mr. Wiley served as a member of the Advisory Board of certain Fidelity® funds (2018-2020), Chairman, President and CEO of Baker Hughes, Inc. (oilfield services, 2000-2004). Mr. Wiley also previously served as a member of the Board of Andeavor Corporation (independent oil refiner and marketer, 2005-2018), a member of the Board of Andeavor Logistics LP (natural resources logistics, 2015-2018) and a member of the Board of High Point Resources (exploration and production, 2005-2020).
+ The information includes the Trustee's principal occupation during the last five years and other information relating to the experience, attributes, and skills relevant to the Trustee's qualifications to serve as a Trustee, which led to the conclusion that the Trustee should serve as a Trustee for the fund.
Advisory Board Members and Officers:
Correspondence intended for a Member of the Advisory Board (if any) may be sent to Fidelity Investments, P.O. Box 55235, Boston, Massachusetts 02205-5235. Correspondence intended for an officer or Peter S. Lynch may be sent to Fidelity Investments, 245 Summer Street, Boston, Massachusetts 02210.
Name, Year of Birth; Principal Occupations+
Peter S. Lynch (1944)
Year of Election or Appointment: 2003
Member of the Advisory Board
Mr. Lynch also serves as a Member of the Advisory Board of other Fidelity® funds. Mr. Lynch is Vice Chairman and a Director of Fidelity Management & Research Company LLC (investment adviser firm). In addition, Mr. Lynch serves as a Trustee of Boston College and as the Chairman of the Inner-City Scholarship Fund. Previously, Mr. Lynch served as Vice Chairman and a Director of FMR Co., Inc. (investment adviser firm) and on the Special Olympics International Board of Directors (1997-2006).
Karen B. Peetz (1955)
Year of Election or Appointment: 2023
Member of the Advisory Board
Ms. Peetz also serves as a Member of the Advisory Board of other funds. Previously, Ms. Peetz served as Chief Administration Officer (2020-2023) of Citigroup Inc. (a diversified financial service company). She also served in various capacities at Bank of New York Mellon Corporation, including President (2013-2016), Vice Chairman, Senior Executive Vice President and Chief Executive Officer of Financial Markets & Treasury Services (2010-2013), Senior Executive Vice President and Chief Executive Officer of Global Corporate Trust (2003-2008), Senior Vice President and Division Manager of Global Payments & Trade Services (2002-2003) and Senior Vice President and Division Manager of Domestic Corporate Trust (1998-2002). Ms. Peetz also served in various capacities at Chase Manhattan Corporation (1982-1998), including Senior Vice President and Manager of Corporate Trust International Business (1996-1998), Managing Director and Manager of Corporate Trust Services (1994-1996) and Managing Director and Group Manager of Financial Institution Sales (1990-1993). Ms. Peetz currently serves as Chair of Amherst Holdings Advisory Council (2018-present), Trustee of Johns Hopkins University (2016-present), Chair of the Carey Business School Advisory Council, Member of the Johns Hopkins Medicine Board and Finance Committee and Chair of the Lyme and Tick Related Disease Institute Advisory Council. Ms. Peetz previously served as a member of the Board of Guardian Life Insurance Company of America (2019-2023), a member of the Board of Trane Technologies (2018-2022), a member of the Board of Wells Fargo Corp. (2017-2019), a member of the Board of SunCoke Energy Inc. (2012-2016), a member of the Board of Private Export Funding Corporation (2010-2016) and as a Trustee of Penn State University (2010-2014) and the United Way of New York City (2008-2010).
Heather Bonner (1977)
Year of Election or Appointment: 2023
Assistant Treasurer
Ms. Bonner also serves as an officer of other funds. Ms. Bonner is a Senior Vice President (2022-present) and is an employee of Fidelity Investments (2022-present). Ms. Bonner serves as Senior Vice President, Vice President, Treasurer, or Director of certain Fidelity entities. Prior to joining Fidelity, Ms. Bonner served as Managing Director at AQR Capital Management (2013-2022) and was the Treasurer and Principal Financial Officer of the AQR Funds (2013-2022).
Craig S. Brown (1977)
Year of Election or Appointment: 2022
Deputy Treasurer
Mr. Brown also serves as an officer of other funds. Mr. Brown is a Vice President (2015-present) and is an employee of Fidelity Investments. Mr. Brown serves as Assistant Treasurer of FIMM, LLC (2021-present). Previously, Mr. Brown served as Assistant Treasurer of certain Fidelity® funds (2019-2022).
John J. Burke III (1964)
Year of Election or Appointment: 2018
Chief Financial Officer
Mr. Burke also serves as Chief Financial Officer of other funds. Mr. Burke is Head of Fidelity Fund and Investment Operations (2018-present) and is an employee of Fidelity Investments. Mr. Burke serves as President, Executive Vice President, or Director of certain Fidelity entities. Previously Mr. Burke served as head of Asset Management Investment Operations (2012-2018).
Margaret Carey (1973)
Year of Election or Appointment: 2023
Secretary and Chief Legal Officer (CLO)
Ms. Carey also serves as an officer of other funds and as CLO of certain Fidelity entities. Ms. Carey is a Senior Vice President, Deputy General Counsel (2019-present) and is an employee of Fidelity Investments.
William C. Coffey (1969)
Year of Election or Appointment: 2019
Assistant Secretary
Mr. Coffey also serves as Assistant Secretary of other funds. Mr. Coffey is a Senior Vice President, Deputy General Counsel (2010-present) and is an employee of Fidelity Investments. Previously, Mr. Coffey served as Secretary and CLO of certain funds (2018-2019); CLO, Secretary, or Senior Vice President of certain Fidelity entities and Assistant Secretary of certain funds (2009-2018).
Timothy M. Cohen (1969)
Year of Election or Appointment: 2018
Vice President
Mr. Cohen also serves as Vice President of other funds. Mr. Cohen is Co-Head of Equity (2018-present) and is an employee of Fidelity Investments. Mr. Cohen serves as President or Director of certain Fidelity entities. Previously, Mr. Cohen served as Executive Vice President of Fidelity SelectCo, LLC (2019) and Head of Global Equity Research (2016-2018).
Jonathan Davis (1968)
Year of Election or Appointment: 2010
Assistant Treasurer
Mr. Davis also serves as an officer of other funds. Mr. Davis is a Vice President (2006-present) and is an employee of Fidelity Investments. Mr. Davis serves as Assistant Treasurer or Director of certain Fidelity entities.
Laura M. Del Prato (1964)
Year of Election or Appointment: 2018
Assistant Treasurer
Ms. Del Prato also serves as an officer of other funds. Ms. Del Prato is a Senior Vice President (2017-present) and is an employee of Fidelity Investments. Ms. Del Prato serves as Senior Vice President, Vice President, Assistant Treasurer, or Director of certain Fidelity entities. Previously, Ms. Del Prato served as President and Treasurer of The North Carolina Capital Management Trust: Cash Portfolio and Term Portfolio (2018-2020).
Colm A. Hogan (1973)
Year of Election or Appointment: 2020
Assistant Treasurer
Mr. Hogan also serves as an officer of other funds. Mr. Hogan is a Vice President (2016-present) and is an employee of Fidelity Investments. Mr. Hogan serves as Assistant Treasurer of certain Fidelity entities. Previously, Mr. Hogan served as Deputy Treasurer of certain Fidelity® funds (2016-2020) and Assistant Treasurer of certain Fidelity® funds (2016-2018).
Pamela R. Holding (1964)
Year of Election or Appointment: 2018
Vice President
Ms. Holding also serves as Vice President of other funds. Ms. Holding is Co-Head of Equity (2018-present) and is an employee of Fidelity Investments. Previously, Ms. Holding served as Executive Vice President of Fidelity SelectCo, LLC (2019) and as Chief Investment Officer of Fidelity Institutional Asset Management (2013-2018).
Chris Maher (1972)
Year of Election or Appointment: 2020
Deputy Treasurer
Mr. Maher also serves as an officer of other funds. Mr. Maher is a Vice President (2008-present) and is an employee of Fidelity Investments. Mr. Maher serves as Assistant Treasurer of certain Fidelity entities. Previously, Mr. Maher served as Assistant Treasurer of certain funds (2013-2020).
Jason P. Pogorelec (1975)
Year of Election or Appointment: 2020
Chief Compliance Officer
Mr. Pogorelec also serves as Chief Compliance Officer of other funds. Mr. Pogorelec is a Senior Vice President of Asset Management Compliance (2020-present) and is an employee of Fidelity Investments. Mr. Pogorelec serves as Compliance Officer of Fidelity Management & Research Company LLC (investment adviser firm, 2023-present) and Ballyrock Investment Advisors LLC (2023-present). Previously, Mr. Pogorelec served as a Vice President, Associate General Counsel for Fidelity Investments (2010-2020) and Assistant Secretary of certain Fidelity® funds (2015-2020).
Brett Segaloff (1972)
Year of Election or Appointment: 2021
Anti-Money Laundering (AML) Officer
Mr. Segaloff also serves as AML Officer of other funds. Mr. Segaloff is a Vice President (2022-present) and is an employee of Fidelity Investments. Mr. Segaloff serves as Anti Money Laundering Compliance Officer or Anti Money Laundering/Bank Secrecy Act Compliance Officer of certain Fidelity entities.
Stacie M. Smith (1974)
Year of Election or Appointment: 2016
President and Treasurer
Ms. Smith also serves as an officer of other funds. Ms. Smith is a Senior Vice President (2016-present) and is an employee of Fidelity Investments. Ms. Smith serves as Assistant Treasurer of certain Fidelity entities and has served in other fund officer roles.
Jim Wegmann (1979)
Year of Election or Appointment: 2019
Assistant Treasurer
Mr. Wegmann also serves as an officer of other funds. Mr. Wegmann is a Vice President (2016-present) and is an employee of Fidelity Investments. Mr. Wegmann serves as Assistant Treasurer of FIMM, LLC (2021-present). Previously, Mr. Wegmann served as Assistant Treasurer of certain Fidelity® funds (2019-2021).
+ The information includes principal occupation during the last five years.
As a shareholder, you incur two types of costs: (1) transaction costs, which may include sales charges (loads) on purchase payments or redemption proceeds, as applicable and (2) ongoing costs, which generally include management fees, distribution and/or service (12b-1) fees and other Fund expenses. This Example is intended to help you understand your ongoing costs (in dollars) of investing in a fund and to compare these costs with the ongoing costs of investing in other mutual funds.
| The Example is based on an investment of $1,000 invested at the beginning of the period and held for the entire period (November 1, 2023 to April 30, 2024). |
Actual Expenses
The first line of the accompanying table provides information about actual account values and actual expenses. You may use the information in this line, together with the amount you invested, to estimate the expenses that you paid over the period. Simply divide your account value by $1,000.00 (for example, an $8,600 account value divided by $1,000.00 = 8.6), then multiply the result by the number in the first line for a class/Fund under the heading entitled "Expenses Paid During Period" to estimate the expenses you paid on your account during this period. If any fund is a shareholder of any underlying mutual funds or exchange-traded funds (ETFs) (the Underlying Funds), such fund indirectly bears its proportional share of the expenses of the Underlying Funds in addition to the direct expenses incurred presented in the table. These fees and expenses are not included in the annualized expense ratio used to calculate the expense estimate in the table below.
Hypothetical Example for Comparison Purposes
The second line of the accompanying table provides information about hypothetical account values and hypothetical expenses based on the actual expense ratio and an assumed rate of return of 5% per year before expenses, which is not the actual return. The hypothetical account values and expenses may not be used to estimate the actual ending account balance or expenses you paid for the period. You may use this information to compare the ongoing costs of investing in the Fund and other funds. To do so, compare this 5% hypothetical example with the 5% hypothetical examples that appear in the shareholder reports of the other funds. If any fund is a shareholder of any Underlying Funds, such fund indirectly bears its proportional share of the expenses of the Underlying Funds in addition to the direct expenses as presented in the table. These fees and expenses are not included in the annualized expense ratio used to calculate the expense estimate in the table below.
Please note that the expenses shown in the table are meant to highlight your ongoing costs only and do not reflect any transaction costs. Therefore, the second line of the table is useful in comparing ongoing costs only, and will not help you determine the relative total costs of owning different funds. In addition, if these transactional costs were included, your costs would have been higher.
| | | | | Annualized Expense Ratio- A | | Beginning Account Value November 1, 2023 | | Ending Account Value April 30, 2024 | | Expenses Paid During Period- C November 1, 2023 to April 30, 2024 |
| | | | | | | | | | |
| Fidelity® Focused High Income Fund | | | | .75% | | | | | | |
| Actual | | | | | | $ 1,000 | | $ 1,078.60 | | $ 3.88 |
Hypothetical-B | | | | | | $ 1,000 | | $ 1,021.13 | | $ 3.77 |
| |
A Annualized expense ratio reflects expenses net of applicable fee waivers.
B 5% return per year before expenses
C Expenses are equal to the annualized expense ratio, multiplied by the average account value over the period, multiplied by 182/ 366 (to reflect the one-half year period). The fees and expenses of any Underlying Funds are not included in each annualized expense ratio.
The dividend and capital gains distributions for the fund(s) are available on Fidelity.com or Institutional.Fidelity.com.
A total of 0.51% of the dividends distributed during the fiscal year was derived from interest on U.S. Government securities which is generally exempt from state income tax.
The fund designates $8,081,150 of distributions paid in the calendar year 2023 as qualifying to be taxed as interest-related dividends for nonresident alien shareholders.
The fund designates $9,611,700 of distributions paid during the fiscal year ended 2024 as qualifying to be taxed as section 163(j) interest dividends.
The fund will notify shareholders in January 2025 of amounts for use in preparing 2024 income tax returns.
Board Approval of Investment Advisory Contracts
Fidelity Focused High Income Fund
At its January 2024 meeting, the Board of Trustees, including the Independent Trustees (together, the Board), approved an amended and restated management contract with Fidelity Management & Research Company LLC (FMR) (the Management Contract), and amended and restated sub-advisory agreements (the Sub-Advisory Contracts, and together with the Management Contract, the Advisory Contracts) for the fund, including the fund's sub-advisory agreements with FMR Investment Management (UK) Limited (FMR UK), Fidelity Management & Research (Hong Kong) Limited (FMR H.K.), and Fidelity Management & Research (Japan) Limited (FMR Japan). The Advisory Contracts will be effective March 1, 2024. The Board will consider the annual renewal of the fund's Advisory Contracts in May 2024, following its review of additional materials provided by FMR.
Management Contract. The Board approved the Management Contract, which implements a new fee structure combining the management fee, transfer agent fee (TA Fee), and pricing and bookkeeping fee (P&B Fee) of the fund into a single fee based on tiered schedules and subject to a maximum rate (the Unified Fee). In exchange for the Unified Fee, the fund will receive investment advisory, management, administrative, transfer agent, pricing and bookkeeping services under a single agreement - the Management Contract.
In its consideration of the Management Contract over several meetings, the Board received, reviewed and discussed a comprehensive set of analyses regarding the Unified Fee including (i) the legal framework, (ii) design goals for the Unified Fee, (iii) calculation methodology for the Unified Fee and illustrative examples, (iv) annual and cumulative projected impacts under various scenarios, both in the aggregate and at the fund/class level, (v) explanations of schedules, rate levers and maximum rates and (vi) shareholder benefits and projected savings.
The Board considered that the maximum Unified Fee for the fund would be no higher than the sum of (i) the lowest contractual management fee rate under the fund's existing management contract, which is the individual fund fee rate, if any, plus the lowest contractual marginal group fee rate and (ii) the TA and P&B Fee rates, which are fixed fee rates since December 1, 2023 (together, the Unified Fee Cap). The Board noted that Fidelity has represented that, as a result of this Unified Fee Cap, the Unified Fee would be no greater than the fee rates previously authorized to be charged to the fund for the same services. The Board noted that certain expenses such as third-party expenses and certain other miscellaneous expenses would be outside the scope of the Unified Fee and the calculation of such fees would not change as a result of the Unified Fee.
The Board considered Fidelity's representations that implementation of the Unified Fee, which includes the Unified Fee Cap, would cause all funds subject to the Unified Fee, including the fund, to experience an immediate reduction on contractual fee rates for services provided under the current management contracts. The Board considered that some funds would not experience lower net total fees as a result of existing fee caps. The Board further considered that, in addition to the contractual fee savings, the Unified Fee offers funds and their shareholders greater protection from future rate increases for services previously offered under separate agreements that are now covered by the Management Contract because such rate increases would require shareholder approval.
Sub-Advisory Contracts. In connection with the Unified Fee changes, the Board considered the Sub-Advisory Contracts, which simplified the calculation of the fees paid by FMR to the sub-advisers under the agreements. The Board noted that the agreements with FMR UK, FMR H.K., and FMR Japan were amended to provide that FMR will compensate each sub-adviser at a fee rate equal to 110% of the sub-adviser's costs incurred in providing services under the agreement. The Board considered that, under the Sub-Advisory Contracts, FMR, and not the fund, will continue to pay the sub-advisory fees to each applicable sub-adviser.
The Board further considered that the approval of the fund's Advisory Contracts will not result in any changes in the investment process or strategies employed in the management of the fund's assets or the day-to-day management of the fund or the persons primarily responsible for such management. Further, the Board considered that the Management Contract would not change the obligations and services of FMR and its affiliates on behalf of the fund, and, in particular, there would be no change in the nature and level of advisory, management, administration, transfer agent, and pricing and bookkeeping services provided to the fund by FMR, its affiliates, and each applicable sub-adviser.
In connection with its consideration of future renewals of the fund's Advisory Contracts, the Board will consider: (i) the nature, extent and quality of services provided to the funds, including shareholder and administrative services and investment performance; (ii) the competitiveness of the management fee and total expenses for the fund; (iii) the costs of the services and profitability, including the revenues earned and the expenses incurred in conducting the business of developing, marketing, distributing, managing, administering, and servicing the fund and its shareholders, to the extent applicable; and (iv) whether there have been economies of scale in respect of the Fidelity funds, whether the Fidelity funds (including the fund) have appropriately benefited from any such economies of scale, and whether there is the potential for realization of any further economies.
Based on its evaluation of all of the conclusions and representations noted above, and after considering all factors it believed relevant, the Board concluded that the fund's management fee structure is fair and reasonable, and that the fund's Advisory Contracts should be approved.
The Securities and Exchange Commission adopted Rule 22e-4 under the Investment Company Act of 1940 (the Liquidity Rule) to promote effective liquidity risk management throughout the open-end investment company industry, thereby reducing the risk that funds will be unable to meet their redemption obligations and mitigating dilution of the interests of fund shareholders.
The Fund has adopted and implemented a liquidity risk management program (the Program) reasonably designed to assess and manage the Fund's liquidity risk and to comply with the requirements of the Liquidity Rule. The Fund's Board of Trustees (the Board) has designated the Fund's investment adviser as administrator of the Program. The Fidelity advisers have established a Liquidity Risk Management Committee (the LRM Committee) to manage the Program for each of the Fidelity Funds. The LRM Committee monitors the adequacy and effectiveness of implementation of the Program and on a periodic basis assesses each Fund's liquidity risk based on a variety of factors including (1) the Fund's investment strategy, (2) portfolio liquidity and cash flow projections during normal and reasonably foreseeable stressed conditions, (3) shareholder redemptions, (4) borrowings and other funding sources and (5) certain factors specific to ETFs including the effect of the Fund's prices and spreads, market participants, and basket compositions on the overall liquidity of the Fund's portfolio, as applicable.
In accordance with the Program, each of the Fund's portfolio investments is classified into one of four defined liquidity categories based on a determination of a reasonable expectation for how long it would take to convert the investment to cash (or sell or dispose of the investment) without significantly changing its market value.
- Highly liquid investments - cash or convertible to cash within three business days or less
- Moderately liquid investments - convertible to cash in three to seven calendar days
- Less liquid investments - can be sold or disposed of, but not settled, within seven calendar days
- Illiquid investments - cannot be sold or disposed of within seven calendar days
Liquidity classification determinations take into account a variety of factors including various market, trading and investment-specific considerations, as well as market depth, and generally utilize analysis from a third-party liquidity metrics service.
The Liquidity Rule places a 15% limit on a fund's illiquid investments and requires funds that do not primarily hold assets that are highly liquid investments to determine and maintain a minimum percentage of the fund's net assets to be invested in highly liquid investments (highly liquid investment minimum or HLIM). The Program includes provisions reasonably designed to comply with the 15% limit on illiquid investments and for determining, periodically reviewing and complying with the HLIM requirement as applicable.
At a recent meeting of the Fund's Board of Trustees, the LRM Committee provided a written report to the Board pertaining to the operation, adequacy, and effectiveness of the Program for the period December 1, 2022 through November 30, 2023. The report concluded that the Program is operating effectively and is reasonably designed to assess and manage the Fund's liquidity risk.
1.801606.119
FFH-ANN-0624
Fidelity® High Income Fund
Annual Report
April 30, 2024
Includes Fidelity and Fidelity Advisor share classes
Contents
To view a fund's proxy voting guidelines and proxy voting record for the 12-month period ended June 30, visit http://www.fidelity.com/proxyvotingresults or visit the Securities and Exchange Commission's (SEC) web site at http://www.sec.gov.
You may also call 1-800-544-8544 if you're an individual investing directly with Fidelity, call 1-800-835-5092 if you're a plan sponsor or participant with Fidelity as your recordkeeper or call 1-877-208-0098 on institutional accounts or if you're an advisor or invest through one to request a free copy of the proxy voting guidelines.
Standard & Poor's, S&P and S&P 500 are registered service marks of The McGraw-Hill Companies, Inc. and have been licensed for use by Fidelity Distributors Corporation.
Other third-party marks appearing herein are the property of their respective owners.
All other marks appearing herein are registered or unregistered trademarks or service marks of FMR LLC or an affiliated company. © 2024 FMR LLC. All rights reserved.
This report and the financial statements contained herein are submitted for the general information of the shareholders of the Fund. This report is not authorized for distribution to prospective investors in the Fund unless preceded or accompanied by an effective prospectus.
A fund files its complete schedule of portfolio holdings with the SEC for the first and third quarters of each fiscal year on Form N-PORT. Forms N-PORT are available on the SEC's web site at http://www.sec.gov. A fund's Forms N-PORT may be reviewed and copied at the SEC's Public Reference Room in Washington, DC. Information regarding the operation of the SEC's Public Reference Room may be obtained by calling 1-800-SEC-0330.
For a complete list of a fund's portfolio holdings, view the most recent holdings listing, semiannual report, or annual report on Fidelity's web site at http://www.fidelity.com, http://www.institutional.fidelity.com, or http://www.401k.com, as applicable.
NOT FDIC INSURED •MAY LOSE VALUE •NO BANK GUARANTEE
Neither the Fund nor Fidelity Distributors Corporation is a bank.
Average annual total return reflects the change in the value of an investment, assuming reinvestment of distributions from dividend income and capital gains (the profits earned upon the sale of securities that have grown in value, if any) and assuming a constant rate of performance each year. The hypothetical investment and the average annual total returns do not reflect the deduction of taxes that a shareholder would pay on fund distributions or the redemption of fund shares. During periods of reimbursement by Fidelity, a fund's total return will be greater than it would be had the reimbursement not occurred. How a fund did yesterday is no guarantee of how it will do tomorrow.
| Average Annual Total Returns |
| | | | |
Periods ended April 30, 2024 | Past 1 year | Past 5 years | Past 10 years |
Class A (incl. 4.00% sales charge) | 3.82% | 1.02% | 2.76% |
Class M (incl. 4.00% sales charge) | 3.82% | 1.01% | 2.76% |
Class C (incl. contingent deferred sales charge) | 6.32% | 1.06% | 2.75% |
| Fidelity® High Income Fund | 8.46% | 2.14% | 3.35% |
| Class I | 8.35% | 2.10% | 3.32% |
| Class Z | 8.53% | 2.21% | 3.38% |
Class C shares' contingent deferred sales charges included in the past one year, past five years and past ten years total return figures are 1%, 0% and 0%, respectively.
Class A shares bear a 0.25% 12b-1 fee. The initial offering of Class A shares took place on December 4, 2018. Returns prior to December 4,
2018, are those of Fidelity® High Income Fund, the original class of the fund, which has no 12b-1 fee. Had Class A's 12b-1 fee been
reflected, returns prior to December 4, 2018, would have been lower.
Class M shares bear a 0.25% 12b-1 fee. The initial offering of Class M shares took place on December 4, 2018. Returns prior to December 4,
2018, are those of of Fidelity® High Income Fund, the original class of the fund, which has no 12b-1 fee. Had Class M's 12b-1 fee been
reflected, returns prior to December 4, 2018, would have been lower.
Class C shares bear a 1.00% 12b-1 fee. The initial offering of Class C shares took place on December 4, 2018. Returns prior to December 4,
2018, are those of Fidelity® High Income Fund, the original class of the fund, which has no 12b-1 fee. Had Class C's 12b-1 fee been
reflected, returns prior to December 4, 2018, would have been lower.
The initial offering of Class I shares took place on December 4, 2018. Returns prior to December 4, 2018 are those of Fidelity® High Income
Fund, the original class of the fund.
The initial offering of Class Z shares took place on December 4, 2018. Returns prior to December 4, 2018 are those of Fidelity® High Income
Fund, the original class of the fund.
| $10,000 Over 10 Years |
| |
Let's say hypothetically that $10,000 was invested in Fidelity® High Income Fund, a class of the fund, on April 30, 2014. The chart shows how the value of your investment would have changed, and also shows how the ICE® BofA® US High Yield Constrained Index performed over the same period. |
|
|
Market Recap:
High-yield bonds gained 8.89% for the 12 months ending April 30, 2024, according to the ICE BofA® US High Yield Constrained Index, driven by resilient corporate profits and the Federal Reserve's likely pivot to cutting interest rates later this year. Amid this favorable backdrop for higher-risk assets, the index advanced fairly steadily for most the period, highlighted by an especially strong final two months of 2023, when the index rose 8.72%. Following the Federal Reserve's November 1 meeting, when the central bank hinted it might be done raising rates, the high-yield index reversed a two-month decline that was due to soaring yields on longer-term government bonds and mixed earnings from some big and influential firms. High yield continued to advance in 2024 but lost some of its momentum, gaining 1.51% through March, as the central bank held steady its benchmark federal funds rate and affirmed its projection to cut in 2024. The index slipped in April (-1%), when inflation remained stickier than expected. For the full 12 months, all 18 industries within the index advanced, with retail (+14%) leading, followed by financial services (+12%) and banking (+11%), which benefited from high interest rates. Energy, the largest segment in the high-yield index this period, gained 10%. Conversely, the telecommunications (+4%) group lagged most, followed by utility, capital goods and transportation (+6% each).
Comments from Co-Managers Jared Beckerman, Benjamin Harrison and Alexandre Karam:
For the fiscal year, the fund's share classes (excluding sales charges, if applicable) gained about 7% to 9%, versus 8.89% for the benchmark ICE BofA US High Yield Constrained Index. The fund's core investment in high-yield bonds increased 9.21% and contributed to performance versus the benchmark. By industry, security selection was the primary contributor, led by technology & electronics. Security selection in telecommunications also helped. Security selection in services and real estate also boosted the fund's relative performance. The top individual relative contributor was an overweight in Communications Sales & Leasing (+31%), which was one of our largest holdings. A second notable relative contributor was an overweight in Dish Network (+23%). Dish Network was among our biggest holdings. Another notable relative contributor was our stake in Rackspace Hosting (+25%). In contrast, the biggest detractor from performance versus the benchmark was security selection in energy. Also hurting our result were our picks in health care and capital goods. The fund's non-benchmark stake in Mesquite Energy returned about -47% and was the largest individual relative detractor. A second notable relative detractor was our stake in Ardagh (-37%). A position in Cano Health returned -68% and notably hurt. Notable changes in positioning include higher allocations to basic industry and financial services.
Note to shareholders:
After 18 years at Fidelity, Michael Weaver retired from the firm on July 5, 2023. On June 8, 2023, Benjamin Harrison and Alexandre Karam assumed full portfolio management responsibilities for the fund. On January 1, 2024, Jared Beckerman assumed co-management responsibilities for the fund.
The views expressed above reflect those of the portfolio manager(s) only through the end of the period as stated on the cover of this report and do not necessarily represent the views of Fidelity or any other person in the Fidelity organization. Any such views are subject to change at any time based upon market or other conditions and Fidelity disclaims any responsibility to update such views. These views may not be relied on as investment advice and, because investment decisions for a Fidelity fund are based on numerous factors, may not be relied on as an indication of trading intent on behalf of any Fidelity fund.
| Top Bond Issuers (% of Fund's net assets) |
(with maturities greater than one year) |
| Community Health Systems, Inc. | 1.7 | |
| TransDigm, Inc. | 1.4 | |
| CCO Holdings LLC/CCO Holdings Capital Corp. | 1.2 | |
| New Fortress Energy, Inc. | 1.1 | |
| Tenet Healthcare Corp. | 1.1 | |
| MPT Operating Partnership LP/MPT Finance Corp. | 1.0 | |
| Tallgrass Energy Partners LP / Tallgrass Energy Finance Corp. | 1.0 | |
| DISH Network Corp. | 1.0 | |
| Icahn Enterprises LP/Icahn Enterprises Finance Corp. | 0.9 | |
| Royal Caribbean Cruises Ltd. | 0.9 | |
| | 11.3 | |
| |
| Market Sectors (% of Fund's net assets) |
| |
| Energy | 14.4 | |
| Healthcare | 7.8 | |
| Services | 7.8 | |
| Technology | 7.1 | |
| Telecommunications | 5.3 | |
| |
Quality Diversification (% of Fund's net assets) |
|
| |
| We have used ratings from Moody's Investors Service, Inc. Where Moody's® ratings are not available, we have used S&P® ratings. All ratings are as of the date indicated and do not reflect subsequent changes. |
Asset Allocation (% of Fund's net assets) |
|
|
Geographic Diversification (% of Fund's net assets) |
|
* Includes Short-Term investments and Net Other Assets (Liabilities). Percentages are adjusted for the effect of derivatives, if applicable. |
| |
Showing Percentage of Net Assets
| Corporate Bonds - 86.3% |
| | | Principal Amount (a) (000s) | Value ($) (000s) |
| Convertible Bonds - 1.4% | | | |
| Broadcasting - 0.7% | | | |
| DISH Network Corp.: | | | |
| 0% 12/15/25 | | 3,198 | 2,327 |
| 3.375% 8/15/26 | | 25,125 | 15,326 |
| | | | 17,653 |
| Diversified Financial Services - 0.1% | | | |
| Rexford Industrial Realty LP: | | | |
| 4.125% 3/15/29 (b) | | 1,626 | 1,567 |
| 4.375% 3/15/27 (b) | | 1,356 | 1,318 |
| | | | 2,885 |
| Energy - 0.1% | | | |
| NextEra Energy Partners LP 2.5% 6/15/26 (b) | | 2,162 | 1,942 |
| Sunnova Energy International, Inc. 0.25% 12/1/26 | | 1,293 | 579 |
| | | | 2,521 |
| Homebuilders/Real Estate - 0.2% | | | |
| Realogy Group LLC/Realogy Co-Issuer Corp. 0.25% 6/15/26 | | 653 | 532 |
| Redfin Corp. 0.5% 4/1/27 | | 7,405 | 3,628 |
| | | | 4,160 |
| Technology - 0.2% | | | |
| Wolfspeed, Inc. 1.875% 12/1/29 | | 10,765 | 6,184 |
| Utilities - 0.1% | | | |
| PG&E Corp. 4.25% 12/1/27 (b) | | 2,633 | 2,637 |
TOTAL CONVERTIBLE BONDS | | | 36,040 |
| Nonconvertible Bonds - 84.9% | | | |
| Aerospace - 2.4% | | | |
| ATI, Inc. 5.875% 12/1/27 | | 3,130 | 3,066 |
| Bombardier, Inc.: | | | |
| 7.25% 7/1/31 (b) | | 3,875 | 3,885 |
| 7.875% 4/15/27 (b) | | 6,866 | 6,823 |
| 8.75% 11/15/30 (b) | | 1,235 | 1,314 |
| BWX Technologies, Inc. 4.125% 6/30/28 (b) | | 7,903 | 7,219 |
| Howmet Aerospace, Inc. 5.95% 2/1/37 (c) | | 551 | 551 |
| Kaiser Aluminum Corp.: | | | |
| 4.5% 6/1/31 (b)(c) | | 360 | 315 |
| 4.625% 3/1/28 (b) | | 1,205 | 1,122 |
| Moog, Inc. 4.25% 12/15/27 (b) | | 410 | 383 |
| Spirit Aerosystems, Inc. 9.75% 11/15/30 (b) | | 1,915 | 2,118 |
| The Boeing Co.: | | | |
| 6.298% 5/1/29 (b) | | 8 | 8 |
| 6.388% 5/1/31 (b) | | 6 | 6 |
| 6.528% 5/1/34 (b) | | 6 | 6 |
| TransDigm, Inc.: | | | |
| 4.625% 1/15/29 | | 5,930 | 5,432 |
| 5.5% 11/15/27 | | 20,742 | 20,146 |
| 6.375% 3/1/29 (b) | | 3,610 | 3,582 |
| 6.75% 8/15/28 (b) | | 4,100 | 4,126 |
| 7.125% 12/1/31 (b) | | 1,560 | 1,590 |
| VistaJet Malta Finance PLC / XO Management Holding, Inc. 9.5% 6/1/28 (b) | | 1,993 | 1,785 |
| | | | 63,477 |
| Air Transportation - 1.1% | | | |
| Air Canada 3.875% 8/15/26 (b) | | 530 | 503 |
| American Airlines, Inc.: | | | |
| 7.25% 2/15/28 (b)(c) | | 1,370 | 1,378 |
| 8.5% 5/15/29 (b) | | 1,920 | 2,000 |
| American Airlines, Inc. / AAdvantage Loyalty IP Ltd. 5.5% 4/20/26 (b) | | 6,137 | 6,065 |
| Hawaiian Brand Intellectual Property Ltd. / HawaiianMiles Loyalty Ltd. 5.75% 1/20/26 (b) | | 2,757 | 2,586 |
| Mileage Plus Holdings LLC 6.5% 6/20/27 (b) | | 897 | 899 |
| Rand Parent LLC 8.5% 2/15/30 (b)(c) | | 14,881 | 14,716 |
| Spirit Loyalty Cayman Ltd. / Spirit IP Cayman Ltd. 8% 9/20/25 (b) | | 2,600 | 2,031 |
| | | | 30,178 |
| Automotive & Auto Parts - 2.3% | | | |
| Adient Global Holdings Ltd. 7% 4/15/28 (b) | | 815 | 823 |
| Aston Martin Capital Holdings Ltd. 10% 3/31/29 (b) | | 2,730 | 2,658 |
| Champions Financing, Inc. 8.75% 2/15/29 (b) | | 6,475 | 6,617 |
| Dana, Inc.: | | | |
| 4.25% 9/1/30 (c) | | 1,115 | 966 |
| 5.375% 11/15/27 (c) | | 745 | 720 |
| Ford Motor Credit Co. LLC: | | | |
| U.S. Secured Overnight Fin. Rate (SOFR) Index + 2.950% 8.2871% 3/6/26 (d)(e) | | 3,910 | 4,039 |
| 3.625% 6/17/31 | | 3,945 | 3,332 |
| 4% 11/13/30 | | 1,415 | 1,233 |
| LCM Investments Holdings 8.25% 8/1/31 (b) | | 1,315 | 1,366 |
| Macquarie AirFinance Holdings: | | | |
| 6.4% 3/26/29 (b) | | 4,160 | 4,148 |
| 6.5% 3/26/31 (b) | | 3,785 | 3,788 |
| 8.125% 3/30/29 (b) | | 3,828 | 4,003 |
| 8.375% 5/1/28 (b) | | 2,865 | 3,008 |
| McLaren Finance PLC 7.5% 8/1/26 (b) | | 3,097 | 2,690 |
| PECF USS Intermediate Holding III Corp. 8% 11/15/29 (b) | | 3,145 | 1,376 |
| Phinia, Inc. 6.75% 4/15/29 (b) | | 1,630 | 1,636 |
| Rivian Holdco & Rivian LLC & Rivian Automotive LLC CME Term SOFR 6 Month Index + 6.020% 11.3101% 10/15/26 (b)(d)(e) | | 3,857 | 3,799 |
| Wand NewCo 3, Inc. 7.625% 1/30/32 (b)(c) | | 3,385 | 3,441 |
| ZF North America Capital, Inc.: | | | |
| 4.75% 4/29/25 (b) | | 3,320 | 3,267 |
| 6.75% 4/23/30 (b) | | 2,125 | 2,133 |
| 6.875% 4/14/28 (b) | | 1,440 | 1,450 |
| 6.875% 4/23/32 (b) | | 2,250 | 2,275 |
| 7.125% 4/14/30 (b) | | 1,440 | 1,472 |
| | | | 60,240 |
| Banks & Thrifts - 1.3% | | | |
| Ally Financial, Inc.: | | | |
| 5.75% 11/20/25 | | 2,073 | 2,056 |
| 6.7% 2/14/33 (c) | | 6,655 | 6,528 |
| Jane Street Group LLC/JSG Finance, Inc.: | | | |
| 4.5% 11/15/29 (b) | | 2,430 | 2,210 |
| 7.125% 4/30/31 (b) | | 3,840 | 3,864 |
| Quicken Loans LLC/Quicken Loans Co.-Issuer, Inc. 4% 10/15/33 (b) | | 1,095 | 894 |
| UniCredit SpA: | | | |
| 5.459% 6/30/35 (b)(d) | | 4,171 | 3,838 |
| 5.861% 6/19/32 (b)(d) | | 1,495 | 1,446 |
| VistaJet Malta Finance PLC / XO Management Holding, Inc.: | | | |
| 6.375% 2/1/30 (b) | | 7,392 | 5,720 |
| 7.875% 5/1/27 (b) | | 2,265 | 2,014 |
| Western Alliance Bancorp. 3% 6/15/31 (d) | | 6,260 | 5,324 |
| | | | 33,894 |
| Broadcasting - 1.6% | | | |
| Clear Channel Outdoor Holdings, Inc.: | | | |
| 5.125% 8/15/27 (b)(c) | | 2,708 | 2,510 |
| 7.5% 6/1/29 (b) | | 2,809 | 2,264 |
| 7.875% 4/1/30 (b) | | 4,570 | 4,481 |
| 9% 9/15/28 (b)(c) | | 4,650 | 4,781 |
| Diamond Sports Group LLC/Diamond Sports Finance Co. 5.375% (b)(f) | | 22,770 | 569 |
| DISH Network Corp. 11.75% 11/15/27 (b) | | 7,125 | 7,182 |
| Sirius XM Radio, Inc.: | | | |
| 4.125% 7/1/30 (b) | | 5,380 | 4,563 |
| 5.5% 7/1/29 (b)(c) | | 6,195 | 5,750 |
| Univision Communications, Inc.: | | | |
| 4.5% 5/1/29 (b) | | 5,615 | 4,885 |
| 6.625% 6/1/27 (b) | | 3,655 | 3,527 |
| 7.375% 6/30/30 (b)(c) | | 790 | 756 |
| 8% 8/15/28 (b) | | 2,185 | 2,182 |
| | | | 43,450 |
| Building Materials - 1.6% | | | |
| Advanced Drain Systems, Inc.: | | | |
| 5% 9/30/27 (b) | | 1,486 | 1,439 |
| 6.375% 6/15/30 (b)(c) | | 1,420 | 1,412 |
| AmeriTex Holdco Intermediate LLC 10.25% 10/15/28 (b)(c) | | 635 | 669 |
| Beacon Roofing Supply, Inc. 6.5% 8/1/30 (b) | | 2,616 | 2,611 |
| Builders FirstSource, Inc.: | | | |
| 4.25% 2/1/32 (b) | | 5,595 | 4,873 |
| 6.375% 3/1/34 (b) | | 1,630 | 1,600 |
| Eco Material Technologies, Inc. 7.875% 1/31/27 (b) | | 6,989 | 7,040 |
| EMRLD Borrower LP / Emerald Co. 6.625% 12/15/30 (b) | | 8,875 | 8,795 |
| MITER Brands Acquisition Holdco, Inc. / MIWD Borrower LLC 6.75% 4/1/32 (b) | | 2,145 | 2,130 |
| Oscar Acquisition Co. LLC / Oscar Finance, Inc. 9.5% 4/15/30 (b) | | 2,950 | 2,838 |
| Smyrna Ready Mix Concrete LLC 8.875% 11/15/31 (b) | | 960 | 1,011 |
| SRS Distribution, Inc.: | | | |
| 4.625% 7/1/28 (b) | | 2,455 | 2,446 |
| 6% 12/1/29 (b) | | 3,095 | 3,138 |
| Summit Materials LLC/Summit Materials Finance Corp. 7.25% 1/15/31 (b) | | 2,030 | 2,081 |
| | | | 42,083 |
| Cable/Satellite TV - 2.3% | | | |
| CCO Holdings LLC/CCO Holdings Capital Corp.: | | | |
| 4.25% 2/1/31 (b) | | 8,354 | 6,538 |
| 4.25% 1/15/34 (b) | | 5,535 | 4,010 |
| 4.5% 8/15/30 (b) | | 4,140 | 3,364 |
| 4.5% 5/1/32 | | 12,236 | 9,395 |
| 4.5% 6/1/33 (b) | | 11,280 | 8,482 |
| 4.75% 3/1/30 (b) | | 80 | 66 |
| CSC Holdings LLC: | | | |
| 3.375% 2/15/31 (b) | | 8,399 | 5,179 |
| 4.125% 12/1/30 (b) | | 2,939 | 1,867 |
| 4.5% 11/15/31 (b) | | 1,430 | 907 |
| 4.625% 12/1/30 (b) | | 9,809 | 4,257 |
| 5.375% 2/1/28 (b) | | 4,235 | 3,249 |
| DIRECTV Financing LLC / DIRECTV Financing Co-Obligor, Inc. 5.875% 8/15/27 (b) | | 1,355 | 1,263 |
| DISH DBS Corp. 5.75% 12/1/28 (b) | | 5,065 | 3,420 |
| Dolya Holdco 18 DAC 5% 7/15/28 (b) | | 1,213 | 1,080 |
| Telenet Finance Luxembourg Notes SARL 5.5% 3/1/28 (b) | | 2,400 | 2,265 |
| Ziggo Bond Co. BV 6% 1/15/27 (b) | | 320 | 315 |
| Ziggo BV 4.875% 1/15/30 (b) | | 5,005 | 4,380 |
| | | | 60,037 |
| Capital Goods - 1.0% | | | |
| ESAB Corp. 6.25% 4/15/29 (b) | | 4,080 | 4,065 |
| Mueller Water Products, Inc. 4% 6/15/29 (b) | | 4,685 | 4,239 |
| Regal Rexnord Corp.: | | | |
| 6.05% 4/15/28 (b) | | 2,765 | 2,760 |
| 6.3% 2/15/30 (b) | | 2,765 | 2,777 |
| TK Elevator U.S. Newco, Inc. 5.25% 7/15/27 (b)(c) | | 9,784 | 9,359 |
| Vertical Holdco GmbH 7.625% 7/15/28 (b) | | 2,480 | 2,431 |
| | | | 25,631 |
| Chemicals - 4.5% | | | |
| Axalta Coating Systems Dutch Holding B BV 7.25% 2/15/31 (b) | | 1,225 | 1,249 |
| Consolidated Energy Finance SA 12% 2/15/31 (b) | | 4,135 | 4,280 |
| CVR Partners LP/CVR Nitrogen Finance Corp. 6.125% 6/15/28 (b) | | 1,775 | 1,656 |
| Element Solutions, Inc. 3.875% 9/1/28 (b) | | 2,554 | 2,299 |
| INEOS Quattro Finance 2 PLC 9.625% 3/15/29 (b) | | 1,185 | 1,252 |
| Kobe U.S. Midco 2, Inc. 9.25% 11/1/26 pay-in-kind (b)(d) | | 4,859 | 4,142 |
| LSB Industries, Inc. 6.25% 10/15/28 (b) | | 2,215 | 2,100 |
| Methanex Corp.: | | | |
| 5.125% 10/15/27 | | 11,101 | 10,677 |
| 5.65% 12/1/44 | | 8,249 | 6,968 |
| NOVA Chemicals Corp.: | | | |
| 4.25% 5/15/29 (b) | | 5,020 | 4,202 |
| 5% 5/1/25 (b) | | 2,270 | 2,228 |
| 5.25% 6/1/27 (b) | | 4,373 | 4,114 |
| 8.5% 11/15/28 (b) | | 1,820 | 1,913 |
| 9% 2/15/30 (b) | | 1,600 | 1,649 |
| Nufarm Australia Ltd. 5% 1/27/30 (b) | | 5,070 | 4,629 |
| Olin Corp. 5% 2/1/30 (c) | | 8,250 | 7,700 |
| Olympus Water U.S. Holding Corp.: | | | |
| 4.25% 10/1/28 (b) | | 5,155 | 4,645 |
| 6.25% 10/1/29 (b) | | 5,435 | 4,898 |
| 9.75% 11/15/28 (b) | | 6,748 | 7,160 |
| SCIH Salt Holdings, Inc.: | | | |
| 4.875% 5/1/28 (b)(c) | | 208 | 193 |
| 6.625% 5/1/29 (b) | | 3,690 | 3,405 |
| SCIL IV LLC / SCIL U.S.A. Holdings LLC 5.375% 11/1/26 (b) | | 3,935 | 3,777 |
| The Chemours Co. LLC: | | | |
| 4.625% 11/15/29 (b) | | 468 | 401 |
| 5.375% 5/15/27 (c) | | 10,144 | 9,598 |
| 5.75% 11/15/28 (b)(c) | | 6,620 | 6,080 |
| TPC Group, Inc. 13% 12/16/27 (b) | | 2,473 | 2,529 |
| Tronox, Inc. 4.625% 3/15/29 (b)(c) | | 7,491 | 6,683 |
| W.R. Grace Holding LLC: | | | |
| 5.625% 8/15/29 (b) | | 9,670 | 8,659 |
| 7.375% 3/1/31 (b) | | 1,105 | 1,120 |
| | | | 120,206 |
| Consumer Products - 0.8% | | | |
| Foundation Building Materials, Inc. 6% 3/1/29 (b) | | 1,610 | 1,419 |
| Kohl's Corp. 4.25% 7/17/25 | | 335 | 327 |
| Mattel, Inc. 5.45% 11/1/41 | | 1,100 | 963 |
| Newell Brands, Inc.: | | | |
| 5.7% 4/1/26 | | 1,380 | 1,358 |
| 6.375% 9/15/27 (c) | | 1,380 | 1,346 |
| 6.625% 9/15/29 (c) | | 1,470 | 1,420 |
| 7% 4/1/46 (g) | | 1,100 | 892 |
| The Scotts Miracle-Gro Co.: | | | |
| 4% 4/1/31 | | 550 | 463 |
| 4.375% 2/1/32 | | 820 | 690 |
| TKC Holdings, Inc.: | | | |
| 6.875% 5/15/28 (b) | | 4,485 | 4,234 |
| 10.5% 5/15/29 (b) | | 4,795 | 4,588 |
| Windsor Holdings III, LLC 8.5% 6/15/30 (b) | | 2,310 | 2,406 |
| | | | 20,106 |
| Containers - 1.1% | | | |
| ARD Finance SA 6.5% 6/30/27 pay-in-kind (b)(d) | | 2,095 | 517 |
| Ardagh Packaging Finance PLC/Ardagh MP Holdings U.S.A., Inc.: | | | |
| 4.125% 8/15/26 (b) | | 1,255 | 1,046 |
| 5.25% 4/30/25 (b) | | 1,458 | 1,444 |
| 5.25% 8/15/27 (b) | | 562 | 287 |
| 5.25% 8/15/27 (b) | | 489 | 249 |
| Ball Corp. 2.875% 8/15/30 | | 1,370 | 1,145 |
| Berry Global, Inc. 4.875% 7/15/26 (b) | | 2,210 | 2,163 |
| Graham Packaging Co., Inc. 7.125% 8/15/28 (b) | | 1,690 | 1,527 |
| Graphic Packaging International, Inc. 3.75% 2/1/30 (b) | | 1,565 | 1,362 |
| LABL, Inc.: | | | |
| 5.875% 11/1/28 (b) | | 800 | 711 |
| 6.75% 7/15/26 (b) | | 1,180 | 1,164 |
| 9.5% 11/1/28 (b) | | 535 | 535 |
| 10.5% 7/15/27 (b) | | 1,328 | 1,304 |
| Mauser Packaging Solutions Holding Co. 7.875% 4/15/27 (b) | | 4,120 | 4,197 |
| Owens-Brockway Glass Container, Inc. 7.25% 5/15/31 (b)(c) | | 1,340 | 1,342 |
| Sealed Air Corp. 5% 4/15/29 (b)(c) | | 5,450 | 5,127 |
| Sealed Air Corp./Sealed Air Corp. U.S.: | | | |
| 6.125% 2/1/28 (b)(c) | | 1,655 | 1,635 |
| 7.25% 2/15/31 (b)(c) | | 2,555 | 2,601 |
| Trivium Packaging Finance BV: | | | |
| 5.5% 8/15/26 (b) | | 737 | 723 |
| 8.5% 8/15/27 (b) | | 646 | 640 |
| | | | 29,719 |
| Diversified Financial Services - 3.8% | | | |
| Aercap Global Aviation Trust 6.5% 6/15/45 (b)(d) | | 2,540 | 2,525 |
| Boost Newco Borrower LLC 7.5% 1/15/31 (b) | | 6,390 | 6,595 |
| Cargo Aircraft Management, Inc. 4.75% 2/1/28 (b)(c) | | 3,075 | 2,768 |
| Coinbase Global, Inc. 3.625% 10/1/31 (b) | | 5,180 | 4,039 |
| Encore Capital Group, Inc. 9.25% 4/1/29 (b) | | 2,000 | 2,043 |
| FLY Leasing Ltd. 7% 10/15/24 (b) | | 915 | 913 |
| Fortress Transportation & Infrastructure Investors LLC 7.875% 12/1/30 (b) | | 3,205 | 3,329 |
| GGAM Finance Ltd.: | | | |
| 6.875% 4/15/29 (b) | | 645 | 644 |
| 7.75% 5/15/26 (b) | | 2,635 | 2,677 |
| 8% 2/15/27 (b) | | 5,110 | 5,237 |
| 8% 6/15/28 (b) | | 7,895 | 8,131 |
| Gn Bondco LLC 9.5% 10/15/31 (b)(c) | | 2,560 | 2,458 |
| Hightower Holding LLC 6.75% 4/15/29 (b) | | 1,997 | 1,874 |
| Icahn Enterprises LP/Icahn Enterprises Finance Corp.: | | | |
| 4.375% 2/1/29 (c) | | 4,810 | 4,049 |
| 5.25% 5/15/27 | | 12,315 | 11,253 |
| 6.25% 5/15/26 | | 9,296 | 9,041 |
| Jefferies Finance LLC/JFIN Co-Issuer Corp. 5% 8/15/28 (b) | | 980 | 882 |
| Ladder Capital Finance Holdings LLLP/Ladder Capital Finance Corp.: | | | |
| 4.75% 6/15/29 (b) | | 3,635 | 3,244 |
| 5.25% 10/1/25 (b) | | 300 | 295 |
| Navient Corp.: | | | |
| 4.875% 3/15/28 | | 639 | 577 |
| 5% 3/15/27 | | 639 | 602 |
| OneMain Finance Corp.: | | | |
| 3.5% 1/15/27 | | 1,745 | 1,605 |
| 3.875% 9/15/28 | | 8,180 | 7,200 |
| 6.875% 3/15/25 | | 2,255 | 2,270 |
| 7.125% 3/15/26 | | 9,445 | 9,531 |
| 9% 1/15/29 (c) | | 335 | 351 |
| Scientific Games Holdings LP/Scientific Games U.S. Finco, Inc. 6.625% 3/1/30 (b) | | 3,118 | 2,950 |
| SLM Corp. 4.2% 10/29/25 | | 1,255 | 1,213 |
| StoneX Group, Inc. 7.875% 3/1/31 (b) | | 1,840 | 1,861 |
| | | | 100,157 |
| Diversified Media - 0.4% | | | |
| Advantage Sales & Marketing, Inc. 6.5% 11/15/28 (b)(c) | | 6,368 | 5,926 |
| Outfront Media Capital LLC / Corp. 7.375% 2/15/31 (b)(c) | | 3,835 | 3,935 |
| | | | 9,861 |
| Energy - 12.2% | | | |
| Altus Midstream LP: | | | |
| 5.875% 6/15/30 (b) | | 3,635 | 3,515 |
| 6.625% 12/15/28 (b) | | 3,825 | 3,843 |
| Antero Midstream Partners LP/Antero Midstream Finance Corp.: | | | |
| 5.75% 3/1/27 (b) | | 1,375 | 1,350 |
| 7.875% 5/15/26 (b) | | 1,375 | 1,400 |
| Atlantica Sustainable Infrastructure PLC 4.125% 6/15/28 (b) | | 7,390 | 6,692 |
| Baytex Energy Corp. 7.375% 3/15/32 (b) | | 2,725 | 2,748 |
| California Resources Corp. 7.125% 2/1/26 (b)(c) | | 1,930 | 1,941 |
| Calumet Specialty Products Partners LP/Calumet Finance Corp. 9.75% 7/15/28 (b) | | 2,005 | 1,922 |
| Canacol Energy Ltd. 5.75% 11/24/28 (b) | | 2,633 | 1,244 |
| CGG SA 8.75% 4/1/27 (b) | | 6,249 | 5,848 |
| Citgo Petroleum Corp.: | | | |
| 6.375% 6/15/26 (b) | | 6,098 | 6,089 |
| 8.375% 1/15/29 (b) | | 1,595 | 1,651 |
| CNX Midstream Partners LP 4.75% 4/15/30 (b) | | 3,199 | 2,831 |
| CNX Resources Corp.: | | | |
| 7.25% 3/1/32 (b)(c) | | 3,720 | 3,730 |
| 7.375% 1/15/31 (b)(c) | | 1,580 | 1,599 |
| Comstock Resources, Inc.: | | | |
| 5.875% 1/15/30 (b) | | 5,030 | 4,581 |
| 6.75% 3/1/29 (b)(c) | | 4,280 | 4,075 |
| CQP Holdco LP / BIP-V Chinook Holdco LLC 7.5% 12/15/33 (b)(c) | | 5,343 | 5,376 |
| CrownRock LP/CrownRock Finance, Inc.: | | | |
| 5% 5/1/29 (b) | | 3,830 | 3,773 |
| 5.625% 10/15/25 (b) | | 560 | 557 |
| CVR Energy, Inc.: | | | |
| 5.75% 2/15/28 (b) | | 5,483 | 5,095 |
| 8.5% 1/15/29 (b) | | 3,995 | 4,005 |
| Delek Logistics Partners LP/Delek Logistics Finance Corp.: | | | |
| 7.125% 6/1/28 (b) | | 7,451 | 7,277 |
| 8.625% 3/15/29 (b) | | 3,345 | 3,370 |
| DT Midstream, Inc.: | | | |
| 4.125% 6/15/29 (b) | | 1,250 | 1,133 |
| 4.375% 6/15/31 (b)(c) | | 740 | 657 |
| Energean PLC 6.5% 4/30/27 (b) | | 2,968 | 2,760 |
| Energy Transfer LP 7.375% 2/1/31 (b) | | 2,760 | 2,846 |
| EnLink Midstream LLC: | | | |
| 5.625% 1/15/28 (b) | | 1,630 | 1,602 |
| 6.5% 9/1/30 (b) | | 5,060 | 5,124 |
| EnLink Midstream Partners LP: | | | |
| 4.15% 6/1/25 | | 385 | 376 |
| 4.85% 7/15/26 (c) | | 2,485 | 2,417 |
| EQM Midstream Partners LP: | | | |
| 4% 8/1/24 (c) | | 2,545 | 2,526 |
| 6% 7/1/25 (b) | | 355 | 354 |
| 6.5% 7/15/48 | | 555 | 548 |
| Global Partners LP/GLP Finance Corp.: | | | |
| 6.875% 1/15/29 | | 1,785 | 1,747 |
| 7% 8/1/27 (c) | | 6,506 | 6,455 |
| 8.25% 1/15/32 (b) | | 535 | 548 |
| Harbour Energy PLC 5.5% 10/15/26 (b) | | 305 | 299 |
| Harvest Midstream I LP: | | | |
| 7.5% 9/1/28 (b) | | 5,420 | 5,435 |
| 7.5% 5/15/32 (b) | | 1,565 | 1,567 |
| Hess Midstream Operations LP: | | | |
| 4.25% 2/15/30 (b) | | 1,880 | 1,697 |
| 5.125% 6/15/28 (b) | | 5,610 | 5,370 |
| 5.5% 10/15/30 (b) | | 1,370 | 1,310 |
| 5.625% 2/15/26 (b)(c) | | 6,625 | 6,551 |
| HF Sinclair Corp. 5% 2/1/28 (b) | | 4,080 | 3,914 |
| Howard Midstream Energy Partners LLC 8.875% 7/15/28 (b) | | 4,687 | 4,909 |
| Independence Energy Finance LLC 7.625% 4/1/32 (b) | | 1,390 | 1,395 |
| Jonah Energy Parent LLC 12% 11/5/25 (h)(i) | | 4,708 | 5,026 |
| Kosmos Energy Ltd.: | | | |
| 7.5% 3/1/28 (b) | | 1,310 | 1,251 |
| 7.75% 5/1/27 (b) | | 655 | 639 |
| Matador Resources Co. 6.5% 4/15/32 (b) | | 3,265 | 3,236 |
| Mesquite Energy, Inc. 7.25% (b)(f)(i) | | 28,768 | 0 |
| Nabors Industries, Inc. 9.125% 1/31/30 (b) | | 640 | 660 |
| New Fortress Energy, Inc.: | | | |
| 6.5% 9/30/26 (b)(c) | | 14,265 | 13,641 |
| 6.75% 9/15/25 (b)(c) | | 6,119 | 6,044 |
| 8.75% 3/15/29 (b)(c) | | 7,510 | 7,324 |
| NGL Energy Operating LLC/NGL Energy Finance Corp.: | | | |
| 8.125% 2/15/29 (b) | | 1,330 | 1,351 |
| 8.375% 2/15/32 (b) | | 1,330 | 1,351 |
| Northern Oil & Gas, Inc.: | | | |
| 8.125% 3/1/28 (b) | | 4,220 | 4,269 |
| 8.75% 6/15/31 (b) | | 1,345 | 1,415 |
| Occidental Petroleum Corp.: | | | |
| 4.2% 3/15/48 | | 1,360 | 1,003 |
| 4.4% 4/15/46 | | 4,100 | 3,167 |
| 4.4% 8/15/49 | | 1,900 | 1,367 |
| 4.5% 7/15/44 | | 3,365 | 2,545 |
| 6.125% 1/1/31 (c) | | 4,795 | 4,855 |
| 6.45% 9/15/36 | | 3,155 | 3,256 |
| 7.95% 6/15/39 | | 685 | 775 |
| PBF Holding Co. LLC/PBF Finance Corp. 7.875% 9/15/30 (b) | | 8,654 | 8,901 |
| Permian Resources Operating LLC: | | | |
| 5.875% 7/1/29 (b) | | 4,725 | 4,595 |
| 7% 1/15/32 (b) | | 640 | 652 |
| 7.75% 2/15/26 (b) | | 660 | 666 |
| Petroleos Mexicanos: | | | |
| 5.35% 2/12/28 | | 1,280 | 1,120 |
| 6.5% 3/13/27 | | 1,920 | 1,801 |
| Prairie Acquiror LP 9% 8/1/29 (b) | | 1,345 | 1,374 |
| Rockies Express Pipeline LLC: | | | |
| 4.8% 5/15/30 (b) | | 1,900 | 1,711 |
| 4.95% 7/15/29 (b) | | 4,294 | 3,948 |
| 6.875% 4/15/40 (b) | | 1,598 | 1,519 |
| Seadrill Finance Ltd. 8.375% 8/1/30 (b) | | 1,240 | 1,292 |
| Sitio Royalties OP / Sitio Finance Corp. 7.875% 11/1/28 (b) | | 1,585 | 1,630 |
| SM Energy Co. 5.625% 6/1/25 | | 3,075 | 3,052 |
| Southwestern Energy Co. 4.75% 2/1/32 | | 3,580 | 3,224 |
| Sunnova Energy Corp.: | | | |
| 5.875% 9/1/26 (b) | | 5,314 | 3,305 |
| 11.75% 10/1/28 (b) | | 320 | 191 |
| Sunoco Logistics Partners, LP: | | | |
| 7% 5/1/29 (b) | | 1,215 | 1,234 |
| 7.25% 5/1/32 (b) | | 1,850 | 1,879 |
| Sunoco LP/Sunoco Finance Corp.: | | | |
| 4.5% 5/15/29 (c) | | 5,094 | 4,651 |
| 5.875% 3/15/28 | | 4,990 | 4,870 |
| Superior Plus LP / Superior General Partner, Inc. 4.5% 3/15/29 (b) | | 1,745 | 1,578 |
| Tallgrass Energy Partners LP / Tallgrass Energy Finance Corp.: | | | |
| 5.5% 1/15/28 (b) | | 9,865 | 9,366 |
| 6% 3/1/27 (b) | | 5,517 | 5,374 |
| 6% 12/31/30 (b) | | 1,620 | 1,524 |
| 6% 9/1/31 (b) | | 9,425 | 8,750 |
| Talos Production, Inc.: | | | |
| 9% 2/1/29 (b)(c) | | 1,145 | 1,208 |
| 9.375% 2/1/31 (b) | | 1,135 | 1,210 |
| Teine Energy Ltd. 6.875% 4/15/29 (b) | | 500 | 486 |
| Transocean Aquila Ltd. 8% 9/30/28 (b) | | 895 | 910 |
| Transocean Poseidon Ltd. 6.875% 2/1/27 (b) | | 1,664 | 1,659 |
| Transocean, Inc.: | | | |
| 8% 2/1/27 (b) | | 6,391 | 6,406 |
| 8.25% 5/15/29 (b) | | 2,265 | 2,257 |
| 8.5% 5/15/31 (b) | | 2,910 | 2,897 |
| 8.75% 2/15/30 (b) | | 3,227 | 3,364 |
| Tullow Oil PLC: | | | |
| 7% 3/1/25 (b) | | 900 | 870 |
| 10.25% 5/15/26 (b) | | 900 | 868 |
| U.S.A. Compression Partners LP/U.S.A. Compression Finance Corp. 7.125% 3/15/29 (b) | | 2,625 | 2,608 |
| Valaris Ltd. 8.375% 4/30/30 (b) | | 4,285 | 4,407 |
| Viper Energy, Inc. 7.375% 11/1/31 (b) | | 960 | 988 |
| Western Gas Partners LP: | | | |
| 5.25% 2/1/50 | | 2,720 | 2,307 |
| 5.3% 3/1/48 | | 1,360 | 1,137 |
| 5.5% 8/15/48 | | 815 | 690 |
| | | | 321,706 |
| Environmental - 0.8% | | | |
| Clean Harbors, Inc. 6.375% 2/1/31 (b)(c) | | 1,305 | 1,293 |
| Covanta Holding Corp. 4.875% 12/1/29 (b) | | 5,220 | 4,576 |
| Darling Ingredients, Inc. 6% 6/15/30 (b) | | 2,155 | 2,093 |
| GFL Environmental, Inc.: | | | |
| 3.75% 8/1/25 (b) | | 2,765 | 2,689 |
| 5.125% 12/15/26 (b) | | 2,765 | 2,693 |
| 6.75% 1/15/31 (b) | | 505 | 509 |
| Stericycle, Inc. 3.875% 1/15/29 (b) | | 7,910 | 7,028 |
| | | | 20,881 |
| Food & Drug Retail - 0.9% | | | |
| Albertsons Companies LLC/Safeway, Inc./New Albertson's, Inc./Albertson's LLC: | | | |
| 3.25% 3/15/26 (b)(c) | | 740 | 703 |
| 3.5% 3/15/29 (b)(c) | | 6,553 | 5,782 |
| 4.875% 2/15/30 (b) | | 2,310 | 2,155 |
| Emergent BioSolutions, Inc. 3.875% 8/15/28 (b) | | 9,414 | 4,756 |
| Murphy Oil U.S.A., Inc. 3.75% 2/15/31 (b) | | 1,690 | 1,451 |
| Parkland Corp.: | | | |
| 4.5% 10/1/29 (b) | | 1,673 | 1,516 |
| 4.625% 5/1/30 (b) | | 8,235 | 7,442 |
| | | | 23,805 |
| Food/Beverage/Tobacco - 2.1% | | | |
| BellRing Brands, Inc. 7% 3/15/30 (b)(c) | | 1,100 | 1,113 |
| C&S Group Enterprises LLC 5% 12/15/28 (b) | | 4,855 | 3,722 |
| Chobani LLC/Finance Corp., Inc. 4.625% 11/15/28 (b) | | 1,100 | 1,018 |
| Fiesta Purchaser, Inc. 7.875% 3/1/31 (b)(c) | | 2,450 | 2,496 |
| KeHE Distributor / Nextwave 9% 2/15/29 (b) | | 5,325 | 5,377 |
| Lamb Weston Holdings, Inc.: | | | |
| 4.125% 1/31/30 (b) | | 7,855 | 7,001 |
| 4.375% 1/31/32 (b) | | 1,370 | 1,187 |
| Performance Food Group, Inc. 5.5% 10/15/27 (b) | | 542 | 525 |
| Pilgrim's Pride Corp.: | | | |
| 3.5% 3/1/32 | | 1,370 | 1,128 |
| 4.25% 4/15/31 | | 1,615 | 1,429 |
| Post Holdings, Inc.: | | | |
| 4.625% 4/15/30 (b) | | 3,666 | 3,311 |
| 5.5% 12/15/29 (b) | | 3,587 | 3,402 |
| 6.25% 2/15/32 (b)(c) | | 3,205 | 3,162 |
| Primo Water Holdings, Inc. 4.375% 4/30/29 (b) | | 2,090 | 1,908 |
| Sigma Holdco BV 7.875% 5/15/26 (b) | | 3,754 | 3,559 |
| Triton Water Holdings, Inc. 6.25% 4/1/29 (b) | | 9,165 | 8,219 |
| U.S. Foods, Inc.: | | | |
| 4.625% 6/1/30 (b) | | 2,045 | 1,860 |
| 4.75% 2/15/29 (b) | | 2,520 | 2,348 |
| 6.875% 9/15/28 (b) | | 1,600 | 1,614 |
| United Natural Foods, Inc. 6.75% 10/15/28 (b) | | 550 | 422 |
| | | | 54,801 |
| Gaming - 1.4% | | | |
| Affinity Interactive 6.875% 12/15/27 (b) | | 2,921 | 2,614 |
| Caesars Entertainment, Inc.: | | | |
| 6.5% 2/15/32 (b) | | 5,320 | 5,241 |
| 7% 2/15/30 (b) | | 1,300 | 1,309 |
| 8.125% 7/1/27 (b) | | 6,319 | 6,404 |
| Fertitta Entertainment LLC / Fertitta Entertainment Finance Co., Inc. 6.75% 1/15/30 (b) | | 6,670 | 5,803 |
| GLP Capital LP/GLP Financing II, Inc. 5.25% 6/1/25 | | 1,310 | 1,298 |
| Jacobs Entertainment, Inc. 6.75% 2/15/29 (b) | | 2,400 | 2,277 |
| Light & Wonder International, Inc. 7.5% 9/1/31 (b) | | 545 | 556 |
| MGM Resorts International 6.5% 4/15/32 (c) | | 2,720 | 2,639 |
| Station Casinos LLC: | | | |
| 4.5% 2/15/28 (b)(c) | | 2,880 | 2,671 |
| 6.625% 3/15/32 (b) | | 2,705 | 2,651 |
| VICI Properties LP / VICI Note Co. 4.125% 8/15/30 (b) | | 2,740 | 2,442 |
| Wynn Resorts Finance LLC / Wynn Resorts Capital Corp. 7.125% 2/15/31 (b) | | 1,365 | 1,384 |
| | | | 37,289 |
| Healthcare - 7.5% | | | |
| 1375209 BC Ltd. 9% 1/30/28 (b) | | 3,606 | 3,540 |
| 180 Medical, Inc. 3.875% 10/15/29 (b) | | 2,575 | 2,280 |
| AdaptHealth LLC 5.125% 3/1/30 (b)(c) | | 5,950 | 5,065 |
| Akumin, Inc. 8% 8/1/28 (b) | | 1,630 | 1,275 |
| AMN Healthcare 4% 4/15/29 (b) | | 1,674 | 1,482 |
| Avantor Funding, Inc.: | | | |
| 3.875% 11/1/29 (b)(c) | | 3,310 | 2,931 |
| 4.625% 7/15/28 (b) | | 2,215 | 2,059 |
| Bausch Health Companies, Inc.: | | | |
| 5.5% 11/1/25 (b) | | 7,903 | 7,361 |
| 9% 12/15/25 (b) | | 640 | 605 |
| Cano Health, Inc. 6.25% (b)(f) | | 2,303 | 3 |
| Catalent Pharma Solutions 3.5% 4/1/30 (b) | | 2,900 | 2,759 |
| Charles River Laboratories International, Inc.: | | | |
| 3.75% 3/15/29 (b) | | 2,975 | 2,672 |
| 4% 3/15/31 (b) | | 2,475 | 2,159 |
| 4.25% 5/1/28 (b) | | 768 | 714 |
| Community Health Systems, Inc.: | | | |
| 4.75% 2/15/31 (b) | | 10,365 | 8,090 |
| 5.25% 5/15/30 (b) | | 19,665 | 16,078 |
| 5.625% 3/15/27 (b) | | 7,515 | 6,881 |
| 6% 1/15/29 (b) | | 4,145 | 3,616 |
| 6.125% 4/1/30 (b) | | 5,811 | 4,108 |
| 6.875% 4/15/29 (b) | | 7,602 | 5,651 |
| 8% 3/15/26 (b) | | 450 | 448 |
| 10.875% 1/15/32 (b) | | 120 | 123 |
| CTR Partnership LP/CareTrust Capital Corp. 3.875% 6/30/28 (b) | | 5,375 | 4,865 |
| DaVita, Inc.: | | | |
| 3.75% 2/15/31 (b) | | 2,170 | 1,786 |
| 4.625% 6/1/30 (b) | | 9,260 | 8,113 |
| Embecta Corp. 5% 2/15/30 (b)(c) | | 2,745 | 2,116 |
| Grifols SA 4.75% 10/15/28 (b) | | 1,552 | 1,253 |
| Hologic, Inc. 3.25% 2/15/29 (b) | | 1,530 | 1,351 |
| IQVIA, Inc. 6.5% 5/15/30 (b)(c) | | 2,670 | 2,682 |
| Jazz Securities DAC 4.375% 1/15/29 (b) | | 4,460 | 4,058 |
| Medline Borrower LP 3.875% 4/1/29 (b) | | 1,375 | 1,232 |
| Medline Borrower LP / Medline Co. 6.25% 4/1/29 (b) | | 9,215 | 9,156 |
| ModivCare Escrow Issuer, Inc. 5% 10/1/29 (b) | | 970 | 674 |
| Modivcare, Inc. 5.875% 11/15/25 (b)(c) | | 6,316 | 6,160 |
| Molina Healthcare, Inc.: | | | |
| 3.875% 11/15/30 (b) | | 3,370 | 2,923 |
| 3.875% 5/15/32 (b) | | 1,465 | 1,226 |
| Omega Healthcare Investors, Inc. 3.25% 4/15/33 | | 6,717 | 5,259 |
| Organon & Co. / Organon Foreign Debt Co-Issuer BV: | | | |
| 4.125% 4/30/28 (b) | | 9,435 | 8,593 |
| 5.125% 4/30/31 (b)(c) | | 2,928 | 2,532 |
| Pediatrix Medical Group, Inc. 5.375% 2/15/30 (b)(c) | | 4,035 | 3,531 |
| Radiology Partners, Inc. 8.5% 1/31/29 pay-in-kind (b)(d) | | 5,378 | 4,962 |
| Regionalcare Hospital Partners 9.75% 12/1/26 (b) | | 2,640 | 2,629 |
| RegionalCare Hospital Partners Holdings, Inc.: | | | |
| 5.375% 1/15/29 (b) | | 2,305 | 1,843 |
| 9.875% 8/15/30 (b) | | 2,080 | 2,166 |
| 11% 10/15/30 (b)(c) | | 320 | 341 |
| Surgery Center Holdings, Inc. 7.25% 4/15/32 (b) | | 4,880 | 4,873 |
| Teleflex, Inc. 4.25% 6/1/28 (b) | | 1,540 | 1,423 |
| Tenet Healthcare Corp.: | | | |
| 4.25% 6/1/29 | | 6,395 | 5,858 |
| 4.375% 1/15/30 (c) | | 4,965 | 4,509 |
| 4.625% 6/15/28 | | 1,728 | 1,626 |
| 6.125% 10/1/28 (c) | | 5,720 | 5,648 |
| 6.125% 6/15/30 (c) | | 6,675 | 6,536 |
| 6.25% 2/1/27 | | 3,134 | 3,121 |
| 6.75% 5/15/31 (b) | | 945 | 947 |
| Teva Pharmaceutical Finance Netherlands III BV: | | | |
| 3.15% 10/1/26 | | 3,265 | 3,025 |
| 7.875% 9/15/29 | | 830 | 874 |
| 8.125% 9/15/31 | | 830 | 896 |
| U.S. Acute Care Solutions 9.75% 5/15/29 (b) | | 625 | 613 |
| | | | 199,300 |
| Homebuilders/Real Estate - 4.0% | | | |
| Anywhere Real Estate Group LLC 7% 4/15/30 (b) | | 2,120 | 1,860 |
| Ashton Woods U.S.A. LLC/Ashton Woods Finance Co. 4.625% 8/1/29 (b) | | 2,515 | 2,275 |
| ATP Tower Holdings LLC/Andean Tower Partners 4.05% 4/27/26 (b) | | 3,054 | 2,840 |
| Beazer Homes U.S.A., Inc. 7.5% 3/15/31 (b) | | 2,160 | 2,135 |
| Greystar Real Estate Partners 7.75% 9/1/30 (b) | | 1,240 | 1,277 |
| HAT Holdings I LLC/HAT Holdings II LLC: | | | |
| 3.375% 6/15/26 (b)(c) | | 2,490 | 2,314 |
| 6% 4/15/25 (b)(c) | | 635 | 632 |
| 8% 6/15/27 (b)(c) | | 530 | 543 |
| Howard Hughes Corp.: | | | |
| 4.125% 2/1/29 (b) | | 2,350 | 2,075 |
| 4.375% 2/1/31 (b) | | 1,765 | 1,497 |
| Kennedy-Wilson, Inc. 4.75% 2/1/30 (c) | | 3,915 | 3,101 |
| Landsea Homes Corp. 8.875% 4/1/29 (b) | | 1,385 | 1,359 |
| LGI Homes, Inc.: | | | |
| 4% 7/15/29 (b) | | 1,585 | 1,359 |
| 8.75% 12/15/28 (b) | | 455 | 473 |
| MPT Operating Partnership LP/MPT Finance Corp.: | | | |
| 3.5% 3/15/31 | | 10,750 | 7,208 |
| 4.625% 8/1/29 | | 6,145 | 4,598 |
| 5% 10/15/27 (c) | | 13,988 | 11,442 |
| 5.25% 8/1/26 (c) | | 2,913 | 2,653 |
| Panther Escrow Issuer LLC 7.125% 6/1/31 (b) | | 4,475 | 4,498 |
| Railworks Holdings LP 8.25% 11/15/28 (b) | | 5,744 | 5,736 |
| Realogy Group LLC/Realogy Co-Issuer Corp. 5.75% 1/15/29 (b) | | 2,611 | 1,805 |
| Realogy Group LLC/Realogy Co.-Issuer Corp. 5.25% 4/15/30 (b) | | 1,411 | 947 |
| Rithm Capital Corp.: | | | |
| 6.25% 10/15/25 (b) | | 468 | 464 |
| 8% 4/1/29 (b) | | 1,300 | 1,271 |
| Safehold Operating Partnership LP: | | | |
| 2.8% 6/15/31 | | 5,785 | 4,734 |
| 2.85% 1/15/32 | | 3,605 | 2,891 |
| Starwood Property Trust, Inc.: | | | |
| 3.75% 12/31/24 (b) | | 1,886 | 1,851 |
| 7.25% 4/1/29 (b)(c) | | 1,625 | 1,603 |
| Taylor Morrison Communities, Inc./Monarch Communities, Inc. 5.125% 8/1/30 (b)(c) | | 1,005 | 936 |
| TopBuild Corp. 4.125% 2/15/32 (b) | | 2,115 | 1,831 |
| TRI Pointe Group, Inc./TRI Pointe Holdings, Inc. 5.875% 6/15/24 | | 70 | 70 |
| TRI Pointe Homes, Inc. 5.7% 6/15/28 | | 545 | 527 |
| Uniti Group LP/Uniti Group Finance, Inc./CSL Capital LLC: | | | |
| 4.75% 4/15/28 (b) | | 13,062 | 11,456 |
| 6.5% 2/15/29 (b) | | 7,350 | 5,909 |
| 10.5% 2/15/28 (b) | | 5,485 | 5,690 |
| VICI Properties LP: | | | |
| 5.75% 4/1/34 | | 338 | 325 |
| 6.125% 4/1/54 | | 2,664 | 2,488 |
| | | | 104,673 |
| Hotels - 0.8% | | | |
| Hilton Domestic Operating Co., Inc.: | | | |
| 3.625% 2/15/32 (b) | | 11,850 | 9,958 |
| 4% 5/1/31 (b) | | 3,495 | 3,062 |
| 5.875% 4/1/29 (b) | | 2,280 | 2,250 |
| 6.125% 4/1/32 (b)(c) | | 2,280 | 2,247 |
| Hilton Grand Vacations Borrower Escrow LLC 6.625% 1/15/32 (b) | | 3,990 | 3,934 |
| Lindblad Expeditions LLC 6.75% 2/15/27 (b) | | 655 | 649 |
| | | | 22,100 |
| Insurance - 1.1% | | | |
| Acrisure LLC / Acrisure Finance, Inc.: | | | |
| 4.25% 2/15/29 (b) | | 1,100 | 985 |
| 8.25% 2/1/29 (b) | | 1,340 | 1,329 |
| Alliant Holdings Intermediate LLC/Alliant Holdings Co.-Issuer: | | | |
| 4.25% 10/15/27 (b) | | 8,485 | 7,915 |
| 6.75% 10/15/27 (b) | | 1,355 | 1,329 |
| 6.75% 4/15/28 (b)(c) | | 1,370 | 1,369 |
| AmWINS Group, Inc.: | | | |
| 4.875% 6/30/29 (b) | | 3,170 | 2,882 |
| 6.375% 2/15/29 (b)(c) | | 2,710 | 2,677 |
| AssuredPartners, Inc.: | | | |
| 5.625% 1/15/29 (b) | | 3,295 | 3,005 |
| 7.5% 2/15/32 (b) | | 3,235 | 3,141 |
| HUB International Ltd. 7.25% 6/15/30 (b) | | 3,345 | 3,394 |
| USI, Inc. 7.5% 1/15/32 (b) | | 800 | 796 |
| | | | 28,822 |
| Leisure - 2.8% | | | |
| Amer Sports Co. 6.75% 2/16/31 (b) | | 5,325 | 5,244 |
| Carnival Corp.: | | | |
| 6% 5/1/29 (b) | | 5,195 | 5,034 |
| 6.65% 1/15/28 | | 750 | 743 |
| 7.625% 3/1/26 (b) | | 11,060 | 11,129 |
| 10.5% 6/1/30 (b) | | 4,995 | 5,425 |
| ClubCorp Holdings, Inc. 8.5% 9/15/25 (b) | | 1,160 | 1,049 |
| MajorDrive Holdings IV LLC 6.375% 6/1/29 (b) | | 5,265 | 4,941 |
| Merlin Entertainments Group 7.375% 2/15/31 (b)(c) | | 1,265 | 1,271 |
| NCL Corp. Ltd.: | | | |
| 3.625% 12/15/24 (b) | | 2,714 | 2,671 |
| 5.875% 3/15/26 (b) | | 2,175 | 2,131 |
| 7.75% 2/15/29 (b) | | 4,840 | 4,951 |
| NCL Finance Ltd. 6.125% 3/15/28 (b) | | 1,660 | 1,620 |
| Royal Caribbean Cruises Ltd.: | | | |
| 4.25% 7/1/26 (b) | | 1,495 | 1,436 |
| 5.5% 8/31/26 (b) | | 10,740 | 10,535 |
| 5.5% 4/1/28 (b) | | 5,955 | 5,796 |
| 6.25% 3/15/32 (b) | | 5,520 | 5,441 |
| Viking Cruises Ltd. 9.125% 7/15/31 (b) | | 905 | 971 |
| Viking Ocean Cruises Ship VII Ltd. 5.625% 2/15/29 (b) | | 1,605 | 1,536 |
| Voc Escrow Ltd. 5% 2/15/28 (b) | | 2,130 | 2,031 |
| | | | 73,955 |
| Metals/Mining - 2.1% | | | |
| Alcoa Nederland Holding BV 7.125% 3/15/31 (b) | | 10,037 | 10,153 |
| Arsenal AIC Parent LLC 8% 10/1/30 (b) | | 1,655 | 1,723 |
| Cleveland-Cliffs, Inc. 7% 3/15/32 (b) | | 655 | 640 |
| Constellium NV 5.875% 2/15/26 (b) | | 1,255 | 1,242 |
| Eldorado Gold Corp. 6.25% 9/1/29 (b) | | 1,505 | 1,420 |
| ERO Copper Corp. 6.5% 2/15/30 (b) | | 8,988 | 8,454 |
| First Quantum Minerals Ltd.: | | | |
| 6.875% 10/15/27 (b) | | 5,740 | 5,510 |
| 8.625% 6/1/31 (b) | | 285 | 277 |
| 9.375% 3/1/29 (b) | | 8,040 | 8,307 |
| FMG Resources Pty Ltd. 4.375% 4/1/31 (b) | | 1,375 | 1,211 |
| HudBay Minerals, Inc. 4.5% 4/1/26 (b) | | 530 | 513 |
| Mineral Resources Ltd.: | | | |
| 8% 11/1/27 (b) | | 3,825 | 3,869 |
| 8.5% 5/1/30 (b) | | 3,355 | 3,436 |
| 9.25% 10/1/28 (b) | | 2,425 | 2,542 |
| Novelis Corp. 3.875% 8/15/31 (b) | | 1,360 | 1,152 |
| PMHC II, Inc. 9% 2/15/30 (b) | | 5,155 | 4,785 |
| | | | 55,234 |
| Paper - 0.8% | | | |
| Ahlstrom Holding 3 OY 4.875% 2/4/28 (b) | | 5,695 | 5,213 |
| Ardagh Metal Packaging Finance U.S.A. LLC/Ardagh Metal Packaging Finance PLC: | | | |
| 4% 9/1/29 (b) | | 5,155 | 4,249 |
| 6% 6/15/27 (b) | | 4,690 | 4,546 |
| Clydesdale Acquisition Holdings, Inc.: | | | |
| 6.625% 4/15/29 (b) | | 1,480 | 1,476 |
| 8.75% 4/15/30 (b) | | 3,995 | 3,861 |
| Mercer International, Inc. 5.125% 2/1/29 (c) | | 908 | 793 |
| | | | 20,138 |
| Publishing/Printing - 0.0% | | | |
| Cimpress PLC 7% 6/15/26 | | 1,120 | 1,111 |
| Railroad - 0.2% | | | |
| Genesee & Wyoming, Inc. 6.25% 4/15/32 (b)(c) | | 6,505 | 6,465 |
| Restaurants - 0.8% | | | |
| 1011778 BC Unlimited Liability Co./New Red Finance, Inc.: | | | |
| 3.875% 1/15/28 (b) | | 2,310 | 2,131 |
| 4% 10/15/30 (b) | | 7,316 | 6,309 |
| 5.75% 4/15/25 (b) | | 1,055 | 1,050 |
| Garden SpinCo Corp. 8.625% 7/20/30 (b) | | 1,415 | 1,492 |
| Yum! Brands, Inc.: | | | |
| 3.625% 3/15/31 | | 1,370 | 1,184 |
| 4.625% 1/31/32 (c) | | 8,980 | 8,084 |
| 5.375% 4/1/32 | | 1,100 | 1,038 |
| | | | 21,288 |
| Services - 6.2% | | | |
| ADT Corp. 4.125% 8/1/29 (b)(c) | | 3,320 | 3,001 |
| AECOM 5.125% 3/15/27 | | 1,845 | 1,792 |
| Allied Universal Holdco LLC 7.875% 2/15/31 (b) | | 3,865 | 3,874 |
| Allied Universal Holdco LLC / Allied Universal Finance Corp.: | | | |
| 6% 6/1/29 (b) | | 4,930 | 4,186 |
| 9.75% 7/15/27 (b) | | 7,745 | 7,716 |
| APX Group, Inc.: | | | |
| 5.75% 7/15/29 (b) | | 3,330 | 3,096 |
| 6.75% 2/15/27 (b) | | 3,020 | 3,000 |
| Artera Services LLC 8.5% 2/15/31 (b) | | 15,843 | 16,211 |
| ASGN, Inc. 4.625% 5/15/28 (b) | | 2,500 | 2,333 |
| Avis Budget Car Rental LLC/Avis Budget Finance, Inc. 5.75% 7/15/27 (b)(c) | | 320 | 304 |
| Brand Industrial Services, Inc. 10.375% 8/1/30 (b) | | 11,100 | 11,911 |
| CoreCivic, Inc.: | | | |
| 4.75% 10/15/27 | | 7,839 | 7,308 |
| 8.25% 4/15/29 | | 8,190 | 8,463 |
| CoreLogic, Inc. 4.5% 5/1/28 (b)(c) | | 3,795 | 3,284 |
| Gartner, Inc.: | | | |
| 3.625% 6/15/29 (b) | | 890 | 796 |
| 4.5% 7/1/28 (b) | | 4,490 | 4,222 |
| GEMS MENASA Cayman Ltd./GEMS Education Delaware LLC 7.125% 7/31/26 (b) | | 12,064 | 11,992 |
| Hertz Corp. 5% 12/1/29 (b) | | 660 | 453 |
| Korn Ferry 4.625% 12/15/27 (b) | | 1,015 | 962 |
| Legends Hospitality Holding Co. LLC/Legends Hospitality Co-Issuer, Inc. 5% 2/1/26 (b) | | 1,790 | 1,770 |
| Life Time, Inc.: | | | |
| 5.75% 1/15/26 (b) | | 3,378 | 3,341 |
| 8% 4/15/26 (b)(c) | | 6,605 | 6,617 |
| Neptune BidCo U.S., Inc. 9.29% 4/15/29 (b) | | 2,787 | 2,627 |
| Service Corp. International: | | | |
| 4% 5/15/31 | | 2,300 | 1,981 |
| 5.125% 6/1/29 | | 1,443 | 1,378 |
| Sotheby's 7.375% 10/15/27 (b) | | 2,745 | 2,558 |
| Staples, Inc.: | | | |
| 7.5% 4/15/26 (b) | | 3,005 | 2,897 |
| 10.75% 4/15/27 (b) | | 3,084 | 2,838 |
| The GEO Group, Inc.: | | | |
| 6% 4/15/26 | | 835 | 834 |
| 8.625% 4/15/29 (b) | | 4,890 | 4,950 |
| 10.25% 4/15/31 (b) | | 4,890 | 5,041 |
| TriNet Group, Inc.: | | | |
| 3.5% 3/1/29 (b) | | 7,560 | 6,619 |
| 7.125% 8/15/31 (b) | | 1,445 | 1,452 |
| Uber Technologies, Inc. 8% 11/1/26 (b) | | 9,595 | 9,690 |
| United Rentals North America, Inc. 6.125% 3/15/34 (b) | | 5,415 | 5,287 |
| WASH Multifamily Acquisition, Inc. 5.75% 4/15/26 (b) | | 9,177 | 8,897 |
| | | | 163,681 |
| Steel - 0.3% | | | |
| ATI, Inc. 7.25% 8/15/30 | | 1,350 | 1,381 |
| Commercial Metals Co.: | | | |
| 3.875% 2/15/31 | | 1,655 | 1,440 |
| 4.125% 1/15/30 | | 2,700 | 2,417 |
| Vallourec SA 7.5% 4/15/32 (b) | | 2,770 | 2,804 |
| | | | 8,042 |
| Super Retail - 1.8% | | | |
| Bath & Body Works, Inc. 6.694% 1/15/27 | | 1,315 | 1,323 |
| Carvana Co.: | | | |
| 4.875% 9/1/29 (b) | | 2,253 | 1,469 |
| 5.5% 4/15/27 (b) | | 2,422 | 1,894 |
| 5.875% 10/1/28 (b) | | 1,267 | 853 |
| 10.25% 5/1/30 (b) | | 357 | 286 |
| 12% 12/1/28 pay-in-kind (b)(d) | | 2,243 | 2,197 |
| 13% 6/1/30 pay-in-kind (b)(d) | | 2,110 | 2,093 |
| 14% 6/1/31 pay-in-kind (b)(d) | | 4,767 | 4,778 |
| EG Global Finance PLC 12% 11/30/28 (b) | | 13,610 | 14,050 |
| Hanesbrands, Inc. 4.875% 5/15/26 (b) | | 558 | 540 |
| LBM Acquisition LLC 6.25% 1/15/29 (b) | | 4,695 | 4,310 |
| Levi Strauss & Co. 3.5% 3/1/31 (b)(c) | | 620 | 529 |
| Michaels Companies, Inc.: | | | |
| 5.25% 5/1/28 (b) | | 3,550 | 3,005 |
| 7.875% 5/1/29 (b) | | 2,730 | 2,000 |
| Nordstrom, Inc.: | | | |
| 4.25% 8/1/31 (c) | | 1,175 | 1,013 |
| 4.375% 4/1/30 (c) | | 870 | 776 |
| Sally Holdings LLC 6.75% 3/1/32 (c) | | 2,705 | 2,615 |
| Wolverine World Wide, Inc. 4% 8/15/29 (b) | | 4,605 | 3,678 |
| | | | 47,409 |
| Technology - 6.4% | | | |
| Acuris Finance U.S. 5% 5/1/28 (b)(c) | | 11,650 | 10,569 |
| Ahead DB Holdings LLC 6.625% 5/1/28 (b) | | 1,290 | 1,173 |
| Block, Inc.: | | | |
| 2.75% 6/1/26 (c) | | 1,375 | 1,292 |
| 3.5% 6/1/31 | | 8,155 | 6,889 |
| Cloud Software Group, Inc.: | | | |
| 6.5% 3/31/29 (b) | | 1,212 | 1,150 |
| 9% 9/30/29 (b) | | 12,200 | 11,740 |
| CNT PRNT/CDK GLO II/FIN 8% 6/15/29 (b) | | 3,270 | 3,364 |
| Coherent Corp. 5% 12/15/29 (b) | | 6,960 | 6,421 |
| CommScope, Inc. 4.75% 9/1/29 (b) | | 3,600 | 2,511 |
| Elastic NV 4.125% 7/15/29 (b) | | 2,410 | 2,146 |
| Entegris, Inc.: | | | |
| 3.625% 5/1/29 (b)(c) | | 2,550 | 2,257 |
| 4.75% 4/15/29 (b) | | 2,000 | 1,886 |
| 5.95% 6/15/30 (b) | | 8,335 | 8,116 |
| Gen Digital, Inc.: | | | |
| 5% 4/15/25 (b) | | 2,715 | 2,682 |
| 7.125% 9/30/30 (b)(c) | | 1,360 | 1,374 |
| Go Daddy Operating Co. LLC / GD Finance Co., Inc.: | | | |
| 3.5% 3/1/29 (b) | | 5,240 | 4,647 |
| 5.25% 12/1/27 (b) | | 945 | 912 |
| GrafTech Global Enterprises, Inc. 9.875% 12/15/28 (b)(c) | | 1,660 | 1,248 |
| Helios Software Holdings, Inc. / ION Corporate Solutions Finance Sarl 8.75% 5/1/29 (b) | | 2,505 | 2,510 |
| HTA Group Ltd. 7% 12/18/25 (b) | | 12,095 | 12,076 |
| Iliad Holding SAS 8.5% 4/15/31 (b)(j) | | 4,275 | 4,312 |
| ION Trading Technologies Ltd. 5.75% 5/15/28 (b) | | 7,345 | 6,709 |
| Match Group Holdings II LLC: | | | |
| 3.625% 10/1/31 (b)(c) | | 820 | 677 |
| 4.125% 8/1/30 (b)(c) | | 1,760 | 1,524 |
| McAfee Corp. 7.375% 2/15/30 (b) | | 2,290 | 2,121 |
| MicroStrategy, Inc. 6.125% 6/15/28 (b) | | 8,160 | 7,562 |
| NCR Atleos Corp. 9.5% 4/1/29 (b) | | 2,875 | 3,056 |
| ON Semiconductor Corp. 3.875% 9/1/28 (b) | | 3,675 | 3,335 |
| Open Text Corp. 3.875% 12/1/29 (b) | | 4,020 | 3,518 |
| Open Text Holdings, Inc.: | | | |
| 4.125% 2/15/30 (b) | | 4,620 | 4,058 |
| 4.125% 12/1/31 (b)(c) | | 4,170 | 3,574 |
| Rackspace Finance LLC 3.5% 5/15/28 (b) | | 6,354 | 2,669 |
| Roblox Corp. 3.875% 5/1/30 (b) | | 4,035 | 3,490 |
| Seagate HDD Cayman: | | | |
| 5.75% 12/1/34 | | 3,695 | 3,499 |
| 8.25% 12/15/29 (b) | | 1,310 | 1,392 |
| 8.5% 7/15/31 (b) | | 1,585 | 1,692 |
| Sensata Technologies BV: | | | |
| 4% 4/15/29 (b) | | 3,440 | 3,080 |
| 5% 10/1/25 (b) | | 550 | 543 |
| Sensata Technologies, Inc. 3.75% 2/15/31 (b) | | 1,370 | 1,158 |
| TTM Technologies, Inc. 4% 3/1/29 (b)(c) | | 13,015 | 11,640 |
| UKG, Inc. 6.875% 2/1/31 (b) | | 3,295 | 3,301 |
| Veritas U.S., Inc./Veritas Bermuda Ltd. 7.5% 9/1/25 (b) | | 1,900 | 1,729 |
| Virtusa Corp. 7.125% 12/15/28 (b) | | 1,345 | 1,212 |
| VM Consolidated, Inc. 5.5% 4/15/29 (b) | | 640 | 602 |
| Western Digital Corp.: | | | |
| 2.85% 2/1/29 | | 5,455 | 4,607 |
| 3.1% 2/1/32 | | 2,295 | 1,794 |
| | | | 167,817 |
| Telecommunications - 4.9% | | | |
| Altice Financing SA 5.75% 8/15/29 (b) | | 13,615 | 10,113 |
| Altice France Holding SA: | | | |
| 6% 2/15/28 (b) | | 10,793 | 3,148 |
| 10.5% 5/15/27 (b) | | 325 | 115 |
| Altice France SA: | | | |
| 5.125% 1/15/29 (b) | | 12,809 | 8,361 |
| 5.125% 7/15/29 (b) | | 5,455 | 3,553 |
| 5.5% 1/15/28 (b) | | 3,940 | 2,662 |
| 5.5% 10/15/29 (b) | | 50 | 33 |
| C&W Senior Finance Ltd. 6.875% 9/15/27 (b) | | 11,832 | 11,204 |
| Cablevision Lightpath LLC: | | | |
| 3.875% 9/15/27 (b) | | 2,199 | 1,940 |
| 5.625% 9/15/28 (b) | | 1,290 | 1,041 |
| Connect Finco SARL / Connect U.S. Finco LLC 6.75% 10/1/26 (b) | | 1,235 | 1,196 |
| Consolidated Communications, Inc. 5% 10/1/28 (b) | | 2,395 | 1,988 |
| Frontier Communications Holdings LLC: | | | |
| 5% 5/1/28 (b) | | 5,510 | 5,069 |
| 5.875% 10/15/27 (b) | | 258 | 247 |
| 5.875% 11/1/29 | | 3,789 | 3,163 |
| 8.75% 5/15/30 (b) | | 4,055 | 4,129 |
| IHS Netherlands Holdco BV 8% 9/18/27 (b) | | 2,080 | 1,955 |
| Intelsat Jackson Holdings SA 6.5% 3/15/30 (b) | | 5,820 | 5,571 |
| LCPR Senior Secured Financing DAC 5.125% 7/15/29 (b) | | 2,555 | 2,131 |
| Level 3 Financing, Inc.: | | | |
| 3.875% 10/15/30 (b) | | 4,179 | 2,297 |
| 4.5% 4/1/30 (b) | | 2,180 | 1,247 |
| 10.5% 5/15/30 (b) | | 7,537 | 7,469 |
| 11% 11/15/29 (b) | | 3,125 | 3,189 |
| Liquid Telecommunications Financing PLC 5.5% 9/4/26 (b) | | 2,285 | 1,347 |
| Millicom International Cellular SA: | | | |
| 4.5% 4/27/31 (b) | | 4,942 | 4,113 |
| 5.125% 1/15/28 (b) | | 3,560 | 3,284 |
| 7.375% 4/2/32 (b) | | 3,240 | 3,166 |
| Sable International Finance Ltd. 5.75% 9/7/27 (b) | | 1,577 | 1,499 |
| Sitios Latinoamerica S.A.B. de CV 5.375% 4/4/32 (b) | | 2,870 | 2,615 |
| Telecom Italia Capital SA: | | | |
| 6% 9/30/34 | | 3,477 | 2,928 |
| 7.2% 7/18/36 | | 3,069 | 2,777 |
| 7.721% 6/4/38 | | 995 | 925 |
| Uniti Group LP/Uniti Fiber Holdings, Inc./CSL Capital LLC 6% 1/15/30 (b) | | 9,475 | 7,369 |
| Virgin Media Secured Finance PLC 4.5% 8/15/30 (b) | | 5,830 | 4,922 |
| VMED O2 UK Financing I PLC: | | | |
| 4.25% 1/31/31 (b) | | 1,079 | 881 |
| 7.75% 4/15/32 (b) | | 1,360 | 1,341 |
| Windstream Escrow LLC 7.75% 8/15/28 (b) | | 4,975 | 4,794 |
| Zayo Group Holdings, Inc. 4% 3/1/27 (b)(c) | | 7,010 | 5,580 |
| | | | 129,362 |
| Textiles/Apparel - 0.2% | | | |
| Crocs, Inc. 4.125% 8/15/31 (b) | | 1,815 | 1,523 |
| Foot Locker, Inc. 4% 10/1/29 (b) | | 1,045 | 834 |
| Kontoor Brands, Inc. 4.125% 11/15/29 (b) | | 1,460 | 1,297 |
| Victoria's Secret & Co. 4.625% 7/15/29 (b) | | 1,945 | 1,528 |
| | | | 5,182 |
| Transportation Ex Air/Rail - 0.7% | | | |
| Golar LNG Ltd. 7% 10/20/25 (b) | | 4,760 | 4,739 |
| Navios South American Logistics, Inc./Navios Logistics Finance U.S., Inc. 10.75% 7/1/25 (b) | | 1,380 | 1,381 |
| Seaspan Corp. 5.5% 8/1/29 (b) | | 6,445 | 5,543 |
| XPO, Inc.: | | | |
| 6.25% 6/1/28 (b) | | 800 | 797 |
| 7.125% 6/1/31 (b) | | 1,330 | 1,337 |
| 7.125% 2/1/32 (b) | | 4,620 | 4,647 |
| | | | 18,444 |
| Utilities - 2.7% | | | |
| Clearway Energy Operating LLC: | | | |
| 3.75% 2/15/31 (b)(c) | | 6,515 | 5,508 |
| 3.75% 1/15/32 (b) | | 670 | 555 |
| 4.75% 3/15/28 (b) | | 1,540 | 1,451 |
| DPL, Inc.: | | | |
| 4.125% 7/1/25 (c) | | 3,760 | 3,652 |
| 4.35% 4/15/29 | | 460 | 415 |
| NextEra Energy Partners LP: | | | |
| 4.5% 9/15/27 (b)(c) | | 1,528 | 1,424 |
| 7.25% 1/15/29 (b)(c) | | 265 | 268 |
| NRG Energy, Inc.: | | | |
| 3.375% 2/15/29 (b) | | 6,240 | 5,472 |
| 3.625% 2/15/31 (b) | | 1,990 | 1,685 |
| 5.25% 6/15/29 (b) | | 5,350 | 5,060 |
| PG&E Corp.: | | | |
| 5% 7/1/28 (c) | | 6,770 | 6,451 |
| 5.25% 7/1/30 (c) | | 14,760 | 13,820 |
| Pike Corp.: | | | |
| 5.5% 9/1/28 (b) | | 1,762 | 1,670 |
| 8.625% 1/31/31 (b) | | 2,070 | 2,168 |
| Vistra Operations Co. LLC: | | | |
| 5% 7/31/27 (b) | | 8,646 | 8,229 |
| 5.5% 9/1/26 (b)(c) | | 2,845 | 2,777 |
| 5.625% 2/15/27 (b)(c) | | 6,375 | 6,203 |
| 6.875% 4/15/32 (b) | | 3,255 | 3,241 |
| 7.75% 10/15/31 (b) | | 2,240 | 2,297 |
| | | | 72,346 |
TOTAL NONCONVERTIBLE BONDS | | | 2,242,890 |
| TOTAL CORPORATE BONDS (Cost $2,447,132) | | | 2,278,930 |
| | | | |
| U.S. Treasury Obligations - 0.5% |
| | | Principal Amount (a) (000s) | Value ($) (000s) |
| U.S. Treasury Notes: | | | |
| 1.5% 8/15/26 | | 3,490 | 3,229 |
| 2.875% 4/30/29 | | 10,465 | 9,605 |
| TOTAL U.S. TREASURY OBLIGATIONS (Cost $12,986) | | | 12,834 |
| | | | |
| Asset-Backed Securities - 0.3% |
| | | Principal Amount (a) (000s) | Value ($) (000s) |
| Carlyle U.S. Clo 2024-2 Ltd. Series 2024-2A Class E, CME Term SOFR 3 Month Index + 6.850% 12.175% 4/25/37 (b)(d)(e) | | 250 | 250 |
| Elmwood CLO Ltd. Series 2021-5A Class E, CME Term SOFR 3 Month Index + 6.610% 11.9362% 1/20/35 (b)(d)(e) | | 896 | 898 |
| Invesco U.S. Clo 2023-2 Ltd. Series 2023-2A Class F, CME Term SOFR 3 Month Index + 7.580% 12.9046% 4/21/36 (b)(d)(e) | | 423 | 421 |
| KKR CLO Ltd. Series 2021-29A Class E, CME Term SOFR 3 Month Index + 7.010% 12.3402% 1/15/32 (b)(d)(e) | | 782 | 782 |
| Midocean Credit Clo Xii Ltd. Series 2024-12A Class ER, CME Term SOFR 3 Month Index + 6.650% 11.9769% 4/18/36 (b)(d)(e) | | 424 | 424 |
| Neuberger Berman Loan Advisers Series 2024-2A Class E, CME Term SOFR 3 Month Index + 7.500% 12.82% 4/20/38 (b)(d)(e)(j) | | 791 | 791 |
| OCP CLO Ltd.: | | | |
| Series 2021-21A Class E, CME Term SOFR 3 Month Index + 6.540% 11.8662% 7/20/34 (b)(d)(e) | | 425 | 413 |
| Series 2024-11A Class ER2, CME Term SOFR 3 Month Index + 6.820% 12.1412% 4/26/36 (b)(d)(e) | | 560 | 556 |
| Palmer Square CLO Ltd. Series 2023-4A Class E, CME Term SOFR 3 Month Index + 6.750% 12.0746% 10/20/33 (b)(d)(e) | | 402 | 404 |
| Regatta XXVII Funding Ltd. Series 2024-1A Class E, CME Term SOFR 3 Month Index + 6.500% 11.7956% 4/26/37 (b)(d)(e) | | 555 | 560 |
| Trestles Clo 2017-1 Ltd. Series 2021-1A Class DR, CME Term SOFR 3 Month Index + 6.510% 11.8352% 4/25/32 (b)(d)(e) | | 1,685 | 1,681 |
| TOTAL ASSET-BACKED SECURITIES (Cost $7,188) | | | 7,180 |
| | | | |
| Commercial Mortgage Securities - 0.4% |
| | | Principal Amount (a) (000s) | Value ($) (000s) |
| BX Commercial Mortgage Trust floater Series 2021-SOAR Class G, CME Term SOFR 1 Month Index + 2.910% 8.2355% 6/15/38 (b)(d)(e) | | 1,891 | 1,883 |
| ELP Commercial Mortgage Trust floater Series 2021-ELP Class F, CME Term SOFR 1 Month Index + 2.780% 8.1025% 11/15/38 (b)(d)(e) | | 2,680 | 2,640 |
| Extended Stay America Trust floater Series 2021-ESH Class F, CME Term SOFR 1 Month Index + 3.810% 9.1355% 7/15/38 (b)(d)(e) | | 1,073 | 1,072 |
| Hilton U.S.A. Trust Series 2016-HHV Class F, 4.3333% 11/5/38 (b)(d) | | 1,700 | 1,558 |
| Merit floater Series 2021-STOR Class F, CME Term SOFR 1 Month Index + 2.310% 7.6355% 7/15/38 (b)(d)(e) | | 3,994 | 3,952 |
| TOTAL COMMERCIAL MORTGAGE SECURITIES (Cost $10,782) | | | 11,105 |
| | | | |
| Common Stocks - 1.9% |
| | | Shares | Value ($) (000s) |
| Automotive & Auto Parts - 0.1% | | | |
| Aptiv PLC (k) | | 31,300 | 2,222 |
| Capital Goods - 0.1% | | | |
| Regal Rexnord Corp. | | 14,900 | 2,404 |
| Energy - 0.8% | | | |
| California Resources Corp. warrants 10/27/24 (k) | | 4,683 | 81 |
| Forbes Energy Services Ltd. (i)(k) | | 47,062 | 0 |
| Mesquite Energy, Inc. (i)(k) | | 213,506 | 17,478 |
| New Fortress Energy, Inc. (c) | | 114,900 | 3,010 |
TOTAL ENERGY | | | 20,569 |
| Food & Drug Retail - 0.0% | | | |
| Southeastern Grocers, Inc. rights (i)(k) | | 1,235,303 | 1,359 |
| Healthcare - 0.1% | | | |
| Bausch + Lomb Corp. (c)(k) | | 34,400 | 500 |
| Bausch Health Cos., Inc. (United States) (k) | | 138,200 | 1,211 |
| Centene Corp. (k) | | 35,200 | 2,572 |
TOTAL HEALTHCARE | | | 4,283 |
| Leisure - 0.1% | | | |
| Topgolf Callaway Brands Corp. (k) | | 174,500 | 2,795 |
| Technology - 0.3% | | | |
| Coherent Corp. (k) | | 60,700 | 3,316 |
| MKS Instruments, Inc. | | 10,700 | 1,273 |
| ON Semiconductor Corp. (k) | | 33,500 | 2,350 |
TOTAL TECHNOLOGY | | | 6,939 |
| Telecommunications - 0.4% | | | |
| CUI Acquisition Corp. Class E (i)(k) | | 1 | 0 |
| GTT Communications, Inc. (i)(k) | | 113,281 | 4,225 |
| Helios Towers PLC (k) | | 4,721,184 | 5,829 |
TOTAL TELECOMMUNICATIONS | | | 10,054 |
| TOTAL COMMON STOCKS (Cost $37,459) | | | 50,625 |
| | | | |
| Bank Loan Obligations - 4.5% |
| | | Principal Amount (a) (000s) | Value ($) (000s) |
| Broadcasting - 0.2% | | | |
| Diamond Sports Group LLC: | | | |
| 1LN, term loan CME Term SOFR 1 Month Index + 8.000% 15.4287% 8/24/26 (d)(e)(l) | | 2,219 | 2,114 |
| 2LN, term loan CME Term SOFR 1 Month Index + 5.250% 10.6625% (d)(e)(f)(l) | | 11,482 | 267 |
| term loan 10% 8/2/27 (l) | | 2,280 | 3,617 |
TOTAL BROADCASTING | | | 5,998 |
| Building Materials - 0.2% | | | |
| Acproducts Holdings, Inc. Tranche B 1LN, term loan CME Term SOFR 3 Month Index + 4.250% 9.8135% 5/17/28 (d)(e)(l) | | 6,327 | 5,478 |
| Chemicals - 0.4% | | | |
| Discovery Purchaser Corp. 1LN, term loan CME Term SOFR 3 Month Index + 4.370% 9.6813% 10/4/29 (d)(e)(l) | | 5,708 | 5,697 |
| Hexion Holdings Corp. 1LN, term loan CME Term SOFR 3 Month Index + 4.500% 9.9757% 3/15/29 (d)(e)(l) | | 5,821 | 5,713 |
TOTAL CHEMICALS | | | 11,410 |
| Consumer Products - 0.1% | | | |
| TKC Holdings, Inc. 1LN, term loan: | | | |
| CME Term SOFR 1 Month Index + 5.500% 10.9302% 5/14/28 (d)(e)(l) | | 325 | 322 |
| 13.5% 2/14/27 (d)(l) | | 1,321 | 1,037 |
TOTAL CONSUMER PRODUCTS | | | 1,359 |
| Energy - 0.3% | | | |
| EG America LLC Tranche BC 1LN, term loan CME Term SOFR 1 Month Index + 5.500% 11.2383% 2/7/28 (d)(e)(l) | | 5,981 | 5,880 |
| Enstall Group BV Tranche B 1LN, term loan CME Term SOFR 3 Month Index + 4.750% 10.571% 8/27/28 (d)(e)(l) | | 2,095 | 2,022 |
| Mesquite Energy, Inc.: | | | |
| 1LN, term loan 3 month U.S. LIBOR + 8.000% 0% (e)(f)(i)(l) | | 3,958 | 0 |
| term loan 0% (d)(f)(i)(l) | | 1,690 | 0 |
TOTAL ENERGY | | | 7,902 |
| Healthcare - 0.1% | | | |
| Cano Health, Inc.: | | | |
| Tranche B 1LN, term loan CME Term SOFR 1 Month Index + 4.000% 9.4626% (d)(e)(f)(l) | | 6,065 | 1,524 |
| Tranche DD 1LN, term loan CME Term SOFR 1 Month Index + 11.000% 16.3215% 10/7/24 (d)(e)(i)(l) | | 964 | 984 |
| Tranche DD, term loan CME Term SOFR 1 Month Index + 11.000% 16.3215% 10/7/24 (d)(e)(i)(l) | | 629 | 642 |
TOTAL HEALTHCARE | | | 3,150 |
| Leisure - 1.0% | | | |
| City Football Group Ltd. Tranche B 1LN, term loan CME Term SOFR 1 Month Index + 3.000% 8.4389% 7/21/28 (d)(e)(l) | | 13,640 | 13,589 |
| ClubCorp Holdings, Inc. Tranche B 1LN, term loan CME Term SOFR 1 Month Index + 5.000% 10.5635% 9/18/26 (d)(e)(l) | | 9,153 | 9,160 |
| United PF Holdings LLC 1LN, term loan CME Term SOFR 1 Month Index + 4.000% 9.5743% 12/30/26 (d)(e)(l) | | 4,893 | 4,252 |
TOTAL LEISURE | | | 27,001 |
| Metals/Mining - 0.0% | | | |
| American Rock Salt Co. LLC 1LN, term loan CME Term SOFR 1 Month Index + 4.000% 9.4302% 6/4/28 (d)(e)(l) | | 977 | 865 |
| Services - 1.4% | | | |
| Artera Services LLC Tranche B 1LN, term loan CME Term SOFR 1 Month Index + 4.500% 9.8094% 2/10/31 (d)(e)(l) | | 1,370 | 1,381 |
| Ascend Learning LLC: | | | |
| 2LN, term loan CME Term SOFR 1 Month Index + 5.750% 11.1657% 12/10/29 (d)(e)(l) | | 1,580 | 1,547 |
| Tranche B 1LN, term loan CME Term SOFR 1 Month Index + 3.500% 8.9157% 12/10/28 (d)(e)(l) | | 5,532 | 5,508 |
| Brand Industrial Services, Inc. Tranche B 1LN, term loan CME Term SOFR 1 Month Index + 4.500% 9.819% 8/1/30 (d)(e)(l) | | 2,917 | 2,925 |
| Brock Holdings Iii LLC Tranche B 1LN, term loan CME Term SOFR 1 Month Index + 6.000% 5/1/30 (e)(l)(m) | | 165 | 165 |
| CoreLogic, Inc. Tranche B 1LN, term loan CME Term SOFR 1 Month Index + 3.500% 8.9302% 6/2/28 (d)(e)(l) | | 6,146 | 5,916 |
| Finastra U.S.A., Inc. term loan CME Term SOFR 1 Month Index + 7.250% 12.4592% 9/13/29 (d)(e)(i)(l) | | 4,749 | 4,749 |
| Galaxy U.S. Opco, Inc. 1LN, term loan CME Term SOFR 1 Month Index + 4.750% 10.0795% 4/29/29 (d)(e)(l) | | 4,933 | 4,415 |
| Spin Holdco, Inc. Tranche B 1LN, term loan CME Term SOFR 3 Month Index + 4.000% 9.5854% 3/4/28 (d)(e)(l) | | 10,356 | 9,108 |
| The GEO Group, Inc. Tranche B 1LN, term loan CME Term SOFR 1 Month Index + 5.250% 10.5689% 4/4/29 (d)(e)(l) | | 650 | 658 |
TOTAL SERVICES | | | 36,372 |
| Super Retail - 0.6% | | | |
| Great Outdoors Group LLC Tranche B 1LN, term loan CME Term SOFR 1 Month Index + 3.750% 9.1802% 3/5/28 (d)(e)(l) | | 1,710 | 1,709 |
| LBM Acquisition LLC Tranche B 1LN, term loan CME Term SOFR 1 Month Index + 3.750% 9.1773% 12/18/27 (d)(e)(l) | | 12,527 | 12,532 |
TOTAL SUPER RETAIL | | | 14,241 |
| Technology - 0.2% | | | |
| Athenahealth Group, Inc. Tranche B 1LN, term loan CME Term SOFR 1 Month Index + 3.500% 8.5657% 2/15/29 (d)(e)(l) | | 3,869 | 3,860 |
| DH Corp./Societe term loan CME Term SOFR 3 Month Index + 7.250% 12.4592% 9/13/29 (d)(e)(i)(l) | | 111 | 111 |
| Rackspace Finance LLC Tranche B 1LN, term loan CME Term SOFR 1 Month Index + 6.250% 11.686% 5/15/28 (d)(e)(l) | | 1,476 | 1,471 |
TOTAL TECHNOLOGY | | | 5,442 |
| TOTAL BANK LOAN OBLIGATIONS (Cost $131,322) | | | 119,218 |
| | | | |
| Preferred Securities - 2.8% |
| | | Principal Amount (a) (000s) | Value ($) (000s) |
| Air Transportation - 0.3% | | | |
| AerCap Holdings NV 5.875% 10/10/79 (d) | | 7,130 | 7,065 |
| Banks & Thrifts - 1.0% | | | |
| Ally Financial, Inc.: | | | |
| 4.7% (d)(n) | | 4,475 | 3,843 |
| 4.7% (d)(n) | | 4,365 | 3,421 |
| Bank of America Corp. 5.875% (d)(n) | | 5,385 | 5,205 |
| Goldman Sachs Group, Inc. 7.5% (d)(n) | | 2,125 | 2,152 |
| JPMorgan Chase & Co.: | | | |
| 4.6% (d)(n) | | 3,885 | 3,866 |
| 6.1% (d)(n) | | 5,400 | 5,439 |
| Wells Fargo & Co. 5.9% (d)(n) | | 2,970 | 3,024 |
TOTAL BANKS & THRIFTS | | | 26,950 |
| Diversified Financial Services - 0.3% | | | |
| Aircastle Ltd. 5.25% (b)(d)(n) | | 5,175 | 4,924 |
| Charles Schwab Corp. 4% (d)(n) | | 3,465 | 2,843 |
TOTAL DIVERSIFIED FINANCIAL SERVICES | | | 7,767 |
| Energy - 1.0% | | | |
| Energy Transfer LP 3 month U.S. LIBOR + 4.020% 9.5966% (d)(e)(n) | | 16,390 | 16,724 |
| EnLink Midstream Partners LP CME Term SOFR 3 Month Index + 4.370% 9.7009% (d)(e)(n) | | 3,586 | 3,580 |
| Plains All American Pipeline LP CME Term SOFR 3 Month Index + 4.110% 9.6786% (d)(e)(n) | | 6,563 | 6,623 |
TOTAL ENERGY | | | 26,927 |
| Services - 0.2% | | | |
| Air Lease Corp. 4.125% (d)(n) | | 5,559 | 4,835 |
| TOTAL PREFERRED SECURITIES (Cost $66,560) | | | 73,544 |
| | | | |
| Other - 1.8% |
| | | Shares | Value ($) (000s) |
| Other - 1.8% | | | |
Fidelity Private Credit Co. LLC (h)(o) (Cost $46,253) | | 4,650,410 | 47,299 |
| | | | |
| Money Market Funds - 4.8% |
| | | Shares | Value ($) (000s) |
| Fidelity Cash Central Fund 5.39% (p) | | 11,043,345 | 11,046 |
| Fidelity Securities Lending Cash Central Fund 5.39% (p)(q) | | 117,099,989 | 117,112 |
| TOTAL MONEY MARKET FUNDS (Cost $128,158) | | | 128,158 |
| | | | |
| TOTAL INVESTMENT IN SECURITIES - 103.3% (Cost $2,887,840) | 2,728,893 |
NET OTHER ASSETS (LIABILITIES) - (3.3)% | (88,018) |
| NET ASSETS - 100.0% | 2,640,875 |
| | |
Any values shown as $0 in the Schedule of Investments may reflect amounts less than $500.
Legend
| (a) | Amount is stated in United States dollars unless otherwise noted. |
| (b) | Security exempt from registration under Rule 144A of the Securities Act of 1933. These securities may be resold in transactions exempt from registration, normally to qualified institutional buyers. At the end of the period, the value of these securities amounted to $1,878,852,000 or 71.1% of net assets. |
| (c) | Security or a portion of the security is on loan at period end. |
| (d) | Coupon rates for floating and adjustable rate securities reflect the rates in effect at period end. |
| (e) | Coupon is indexed to a floating interest rate which may be multiplied by a specified factor and/or subject to caps or floors. |
| (f) | Non-income producing - Security is in default. |
| (g) | Security initially issued at one coupon which converts to a higher coupon at a specified date. The rate shown is the rate at period end. |
| (h) | Restricted securities (including private placements) - Investment in securities not registered under the Securities Act of 1933 (excluding 144A issues). At the end of the period, the value of restricted securities (excluding 144A issues) amounted to $52,325,000 or 2.0% of net assets. |
| (j) | Security or a portion of the security purchased on a delayed delivery or when-issued basis. |
| (l) | Remaining maturities of bank loan obligations may be less than the stated maturities shown as a result of contractual or optional prepayments by the borrower. Such prepayments cannot be predicted with certainty. |
| (m) | The coupon rate will be determined upon settlement of the loan after period end. |
| (n) | Security is perpetual in nature with no stated maturity date. |
| (p) | Affiliated fund that is generally available only to investment companies and other accounts managed by Fidelity Investments. The rate quoted is the annualized seven-day yield of the fund at period end. A complete unaudited listing of the fund's holdings as of its most recent quarter end is available upon request. In addition, each Fidelity Central Fund's financial statements, which are not covered by the Fund's Report of Independent Registered Public Accounting Firm, are available on the SEC's website or upon request. |
| (q) | Investment made with cash collateral received from securities on loan. |
| Additional information on each restricted holding is as follows: |
| Security | Acquisition Date | Acquisition Cost ($) (000s) |
| Fidelity Private Credit Co. LLC | 6/06/22 | 46,253 |
| | | |
| Jonah Energy Parent LLC 12% 11/5/25 | 5/05/23 | 4,614 |
| | | |
Affiliated Central Funds
Fiscal year to date information regarding the Fund's investments in Fidelity Central Funds, including the ownership percentage, is presented below.
| Affiliate (Amounts in thousands) | Value, beginning of period ($) | Purchases ($) | Sales Proceeds ($) | Dividend Income ($) | Realized Gain (loss) ($) | Change in Unrealized appreciation (depreciation) ($) | Value, end of period ($) | % ownership, end of period |
| Fidelity Cash Central Fund 5.39% | 70,215 | 838,688 | 897,859 | 2,062 | 2 | - | 11,046 | 0.0% |
| Fidelity Securities Lending Cash Central Fund 5.39% | 428 | 147,607 | 30,923 | 47 | - | - | 117,112 | 0.4% |
| Total | 70,643 | 986,295 | 928,782 | 2,109 | 2 | - | 128,158 | |
| | | | | | | | | |
Amounts in the dividend income column in the above table include any capital gain distributions from underlying funds, which are presented in the corresponding line item in the Statement of Operations, if applicable.
Amounts in the dividend income column for Fidelity Securities Lending Cash Central Fund represents the income earned on investing cash collateral, less rebates paid to borrowers and any lending agent fees associated with the loan, plus any premium payments received for lending certain types of securities.
Amounts included in the purchases and sales proceeds columns may include in-kind transactions, if applicable.
Affiliated Underlying Funds
Fiscal year to date information regarding the Fund's investments in affiliated Underlying Funds is presented below. Exchanges between classes of the same affiliated Underlying Funds may occur. If an Underlying Funds changes its name, the name presented below is the name in effect at period end.
| Affiliate (Amounts in thousands) | Value, beginning of period ($) | Purchases ($) | Sales Proceeds ($) | Dividend Income ($) | Realized Gain (loss) ($) | Change in Unrealized appreciation (depreciation) ($) | Value, end of period ($) |
| Fidelity Private Credit Co. LLC | 46,120 | - | - | 5,732 | - | 1,179 | 47,299 |
| | 46,120 | - | - | 5,732 | - | 1,179 | 47,299 |
Amounts in the dividend income column in the above table include any capital gain distributions from underlying funds, which are presented in the corresponding line item in the Statement of Operations, if applicable.
Amounts included in the purchases and sales proceeds columns may include in-kind transactions, if applicable.
Investment Valuation
The following is a summary of the inputs used, as of April 30, 2024, involving the Fund's assets and liabilities carried at fair value. The inputs or methodology used for valuing securities may not be an indication of the risk associated with investing in those securities. For more information on valuation inputs, and their aggregation into the levels used below, please refer to the Investment Valuation section in the accompanying Notes to Financial Statements.
| Valuation Inputs at Reporting Date: |
Description (Amounts in thousands) | Total ($) | Level 1 ($) | Level 2 ($) | Level 3 ($) |
Investments in Securities: | | | | |
|
| Equities: | | | | |
Communication Services | 5,829 | 5,829 | - | - |
Consumer Discretionary | 5,017 | 5,017 | - | - |
Consumer Staples | 1,359 | - | - | 1,359 |
Energy | 20,569 | 3,091 | - | 17,478 |
Health Care | 4,283 | 4,283 | - | - |
Industrials | 2,404 | 2,404 | - | - |
Information Technology | 11,164 | 6,939 | - | 4,225 |
|
| Corporate Bonds | 2,278,930 | - | 2,273,904 | 5,026 |
|
| U.S. Government and Government Agency Obligations | 12,834 | - | 12,834 | - |
|
| Asset-Backed Securities | 7,180 | - | 7,180 | - |
|
| Commercial Mortgage Securities | 11,105 | - | 11,105 | - |
|
| Bank Loan Obligations | 119,218 | - | 112,732 | 6,486 |
|
| Preferred Securities | 73,544 | - | 73,544 | - |
|
| Other | 47,299 | - | 47,299 | - |
|
| Money Market Funds | 128,158 | 128,158 | - | - |
| Total Investments in Securities: | 2,728,893 | 155,721 | 2,538,598 | 34,574 |
The following is a reconciliation of Investments in Securities for which Level 3 inputs were used in determining value:
| (Amounts in thousands) | |
| Investments in Securities: | |
| Consumer Staples | | | |
| Beginning Balance | $ | 30,339 | |
| Net Realized Gain (Loss) on Investment Securities | | 23,188 | |
| Net Unrealized Gain (Loss) on Investment Securities | | (21,650) | |
| Cost of Purchases | | 1,359 | |
| Proceeds of Sales | | (31,877) | |
| Amortization/Accretion | | - | |
| Transfers into Level 3 | | - | |
| Transfers out of Level 3 | | - | |
| Ending Balance | $ | 1,359 | |
| The change in unrealized gain (loss) for the period attributable to Level 3 securities held at April 30, 2024 | $ | - | |
| Corporate Bonds | | | |
| Beginning Balance | $ | 30,766 | |
| Net Realized Gain (Loss) on Investment Securities | | - | |
| Net Unrealized Gain (Loss) on Investment Securities | | (25,809) | |
| Cost of Purchases | | 4,614 | |
| Proceeds of Sales | | (4,579) | |
| Amortization/Accretion | | 34 | |
| Transfers into Level 3 | | - | |
| Transfers out of Level 3 | | - | |
| Ending Balance | $ | 5,026 | |
| The change in unrealized gain (loss) for the period attributable to Level 3 securities held at April 30, 2024 | $ | 378 | |
| Other Investments in Securities | | | |
| Beginning Balance | $ | 32,046 | |
| Net Realized Gain (Loss) on Investment Securities | | 6,581 | |
| Net Unrealized Gain (Loss) on Investment Securities | | 560 | |
| Cost of Purchases | | 6,241 | |
| Proceeds of Sales | | (17,303) | |
| Amortization/Accretion | | 64 | |
| Transfers into Level 3 | | - | |
| Transfers out of Level 3 | | - | |
| Ending Balance | $ | 28,189 | |
| The change in unrealized gain (loss) for the period attributable to Level 3 securities held at April 30, 2024 | $ | 7,093 | |
| The information used in the above reconciliation represents fiscal year to date activity for any Investments in Securities identified as using Level 3 inputs at either the beginning or the end of the current fiscal period. Cost of purchases and proceeds of sales may include securities received and/or delivered through in-kind transactions, corporate actions or exchanges. Transfers into Level 3 were attributable to a lack of observable market data resulting from decreases in market activity, decreases in liquidity, security restructurings or corporate actions. Transfers out of Level 3 were attributable to observable market data becoming available for those securities. Transfers in or out of Level 3 represent the beginning value of any Security or Instrument where a change in the pricing level occurred from the beginning to the end of the period. Realized and unrealized gains (losses) disclosed in the reconciliation are included in Net Gain (Loss) on the Fund's Statement of Operations. | |
| Statement of Assets and Liabilities |
| Amounts in thousands (except per-share amounts) | | | | April 30, 2024 |
| | | | | |
| Assets | | | | |
| Investment in securities, at value (including securities loaned of $112,824) - See accompanying schedule: | | | | |
Unaffiliated issuers (cost $2,713,429) | $ | 2,553,436 | | |
Fidelity Central Funds (cost $128,158) | | 128,158 | | |
Other affiliated issuers (cost $46,253) | | 47,299 | | |
| | | | | |
| | | | | |
| Total Investment in Securities (cost $2,887,840) | | | $ | 2,728,893 |
| Cash | | | | 376 |
| Receivable for investments sold | | | | 9,522 |
| Receivable for fund shares sold | | | | 1,059 |
| Interest receivable | | | | 38,452 |
| Distributions receivable from Fidelity Central Funds | | | | 120 |
| Prepaid expenses | | | | 1 |
Total assets | | | | 2,778,423 |
| Liabilities | | | | |
| Payable for investments purchased | | | | |
Regular delivery | $ | 9,304 | | |
Delayed delivery | | 5,066 | | |
| Payable for fund shares redeemed | | 1,893 | | |
| Distributions payable | | 2,579 | | |
| Accrued management fee | | 1,459 | | |
| Distribution and service plan fees payable | | 40 | | |
| Other payables and accrued expenses | | 95 | | |
| Collateral on securities loaned | | 117,112 | | |
| Total liabilities | | | | 137,548 |
| Commitments and contingent liabilities (see Commitments note) | | | | |
| Net Assets | | | $ | 2,640,875 |
| Net Assets consist of: | | | | |
| Paid in capital | | | $ | 3,503,711 |
| Total accumulated earnings (loss) | | | | (862,836) |
| Net Assets | | | $ | 2,640,875 |
| | | | | |
| Net Asset Value and Maximum Offering Price | | | | |
| Class A : | | | | |
Net Asset Value and redemption price per share ($118,358 ÷ 15,561 shares)(a) | | | $ | 7.61 |
| Maximum offering price per share (100/96.00 of $7.61) | | | $ | 7.93 |
| Class M : | | | | |
Net Asset Value and redemption price per share ($30,592 ÷ 4,022 shares)(a) | | | $ | 7.61 |
| Maximum offering price per share (100/96.00 of $7.61) | | | $ | 7.93 |
| Class C : | | | | |
Net Asset Value and offering price per share ($10,073 ÷ 1,324 shares)(a) | | | $ | 7.61 |
| Fidelity High Income Fund : | | | | |
Net Asset Value, offering price and redemption price per share ($2,366,574 ÷ 311,131 shares) | | | $ | 7.61 |
| Class I : | | | | |
Net Asset Value, offering price and redemption price per share ($58,026 ÷ 7,626 shares) | | | $ | 7.61 |
| Class Z : | | | | |
Net Asset Value, offering price and redemption price per share ($57,252 ÷ 7,528 shares) | | | $ | 7.61 |
(a)Redemption price per share is equal to net asset value less any applicable contingent deferred sales charge. |
| Statement of Operations |
| Amounts in thousands | | | | Year ended April 30, 2024 |
| Investment Income | | | | |
| Dividends: | | | | |
| Unaffiliated issuers | | | $ | 3,976 |
| Affiliated issuers | | | | 5,685 |
| Interest | | | | 177,415 |
| Income from Fidelity Central Funds (including $47 from security lending) | | | | 2,109 |
| Total income | | | | 189,185 |
| Expenses | | | | |
| Management fee | $ | 15,288 | | |
| Transfer agent fees | | 2,678 | | |
| Distribution and service plan fees | | 475 | | |
| Accounting fees | | 724 | | |
| Custodian fees and expenses | | 20 | | |
| Independent trustees' fees and expenses | | 14 | | |
| Registration fees | | 114 | | |
| Audit | | 104 | | |
| Legal | | 45 | | |
| Interest | | 2 | | |
| Miscellaneous | | 10 | | |
| Total expenses before reductions | | 19,474 | | |
| Expense reductions | | (381) | | |
| Total expenses after reductions | | | | 19,093 |
| Net Investment income (loss) | | | | 170,092 |
| Realized and Unrealized Gain (Loss) | | | | |
| Net realized gain (loss) on: | | | | |
| Investment Securities: | | | | |
| Unaffiliated issuers | | (136,148) | | |
| Fidelity Central Funds | | 2 | | |
| Foreign currency transactions | | (1) | | |
| Capital gain distributions from underlying funds: | | | | |
| Affiliated issuers | | 47 | | |
| Total net realized gain (loss) | | | | (136,100) |
| Change in net unrealized appreciation (depreciation) on: | | | | |
| Investment Securities: | | | | |
| Unaffiliated issuers | | 178,992 | | |
| Affiliated issuers | | 1,179 | | |
| Total change in net unrealized appreciation (depreciation) | | | | 180,171 |
| Net gain (loss) | | | | 44,071 |
| Net increase (decrease) in net assets resulting from operations | | | $ | 214,163 |
| Statement of Changes in Net Assets |
| |
| Amount in thousands | | Year ended April 30, 2024 | | Year ended April 30, 2023 |
| Increase (Decrease) in Net Assets | | | | |
| Operations | | | | |
| Net investment income (loss) | $ | 170,092 | $ | 167,641 |
| Net realized gain (loss) | | (136,100) | | (210,957) |
| Change in net unrealized appreciation (depreciation) | | 180,171 | | (9,172) |
| Net increase (decrease) in net assets resulting from operations | | 214,163 | | (52,488) |
| Distributions to shareholders | | (154,653) | | (158,804) |
| | | | | |
| Share transactions - net increase (decrease) | | (315,100) | | (471,047) |
| Total increase (decrease) in net assets | | (255,590) | | (682,339) |
| | | | | |
| Net Assets | | | | |
| Beginning of period | | 2,896,465 | | 3,578,804 |
| End of period | $ | 2,640,875 | $ | 2,896,465 |
| | | | | |
| | | | | |
Financial Highlights
Fidelity Advisor® High Income Fund Class A |
| |
| Years ended April 30, | | 2024 | | 2023 | | 2022 | | 2021 | | 2020 |
Selected Per-Share Data | | | | | | | | | | |
| Net asset value, beginning of period | $ | 7.43 | $ | 7.91 | $ | 8.71 | $ | 7.93 | $ | 8.83 |
| Income from Investment Operations | | | | | | | | | | |
Net investment income (loss) A,B | | .449 | | .387 | | .345 | | .368 | | .438 |
| Net realized and unrealized gain (loss) | | .139 | | (.501) | | (.760) | | .772 | | (.908) |
| Total from investment operations | | .588 | | (.114) | | (.415) | | 1.140 | | (.470) |
| Distributions from net investment income | | (.408) | | (.366) | | (.385) | | (.360) | | (.430) |
| Total distributions | | (.408) | | (.366) | | (.385) | | (.360) | | (.430) |
| Net asset value, end of period | $ | 7.61 | $ | 7.43 | $ | 7.91 | $ | 8.71 | $ | 7.93 |
Total Return C,D | | | | (1.33)% | | (5.02)% | | 14.56% | | (5.63)% |
Ratios to Average Net Assets B,E,F | | | | | | | | | | |
| Expenses before reductions | | .99% | | 1.02% | | .99% | | .98% | | .98% |
| Expenses net of fee waivers, if any | | | | 1.02% | | .99% | | .98% | | .98% |
| Expenses net of all reductions | | .98% | | 1.02% | | .99% | | .98% | | .98% |
| Net investment income (loss) | | 6.03% | | 5.19% | | 4.02% | | 4.32% | | 5.04% |
| Supplemental Data | | | | | | | | | | |
| Net assets, end of period (in millions) | $ | 118 | $ | 119 | $ | 132 | $ | 148 | $ | 144 |
Portfolio turnover rate G | | | | 35% | | 54% | | 62% | | 44% H |
ACalculated based on average shares outstanding during the period.
BNet investment income (loss) is affected by the timing of the declaration of dividends by any underlying mutual funds or exchange-traded funds (ETFs). Net investment income (loss) of any mutual funds or ETFs is not included in the Fund's net investment income (loss) ratio.
CTotal returns would have been lower if certain expenses had not been reduced during the applicable periods shown.
DTotal returns do not include the effect of the sales charges.
EFees and expenses of any underlying mutual funds or exchange-traded funds (ETFs) are not included in the Fund's expense ratio. The Fund indirectly bears its proportionate share of these expenses. For additional expense information related to investments in Fidelity Central Funds, please refer to the "Investments in Fidelity Central Funds" note found in the Notes to Financial Statements section of the most recent Annual or Semi-Annual report. For additional expense information related to investments in Fidelity Private Credit Company LLC, please refer to the Investment in Fidelity Private Credit Company LLC note found in the Notes to Financial Statements section of the most recent Annual or Semi-Annual report.
FExpense ratios reflect operating expenses of the class. Expenses before reductions do not reflect amounts reimbursed, waived, or reduced through arrangements with the investment adviser, brokerage services, or other offset arrangements, if applicable, and do not represent the amount paid by the class during periods when reimbursements, waivers or reductions occur.
GAmount does not include the portfolio activity of any underlying mutual funds or exchange-traded funds (ETFs).
HPortfolio turnover rate excludes securities received or delivered in-kind.
Fidelity Advisor® High Income Fund Class M |
| |
| Years ended April 30, | | 2024 | | 2023 | | 2022 | | 2021 | | 2020 |
Selected Per-Share Data | | | | | | | | | | |
| Net asset value, beginning of period | $ | 7.43 | $ | 7.91 | $ | 8.71 | $ | 7.93 | $ | 8.83 |
| Income from Investment Operations | | | | | | | | | | |
Net investment income (loss) A,B | | .449 | | .386 | | .345 | | .367 | | .438 |
| Net realized and unrealized gain (loss) | | .139 | | (.500) | | (.761) | | .772 | | (.909) |
| Total from investment operations | | .588 | | (.114) | | (.416) | | 1.139 | | (.471) |
| Distributions from net investment income | | (.408) | | (.366) | | (.384) | | (.359) | | (.429) |
| Total distributions | | (.408) | | (.366) | | (.384) | | (.359) | | (.429) |
| Net asset value, end of period | $ | 7.61 | $ | 7.43 | $ | 7.91 | $ | 8.71 | $ | 7.93 |
Total Return C,D | | | | (1.34)% | | (5.03)% | | 14.55% | | (5.64)% |
Ratios to Average Net Assets B,E,F | | | | | | | | | | |
| Expenses before reductions | | 1.00% | | 1.03% | | 1.00% | | .99% | | .99% |
| Expenses net of fee waivers, if any | | | | 1.02% | | 1.00% | | .99% | | .99% |
| Expenses net of all reductions | | .98% | | 1.02% | | 1.00% | | .99% | | .99% |
| Net investment income (loss) | | 6.03% | | 5.18% | | 4.01% | | 4.31% | | 5.02% |
| Supplemental Data | | | | | | | | | | |
| Net assets, end of period (in millions) | $ | 31 | $ | 29 | $ | 30 | $ | 36 | $ | 40 |
Portfolio turnover rate G | | | | 35% | | 54% | | 62% | | 44% H |
ACalculated based on average shares outstanding during the period.
BNet investment income (loss) is affected by the timing of the declaration of dividends by any underlying mutual funds or exchange-traded funds (ETFs). Net investment income (loss) of any mutual funds or ETFs is not included in the Fund's net investment income (loss) ratio.
CTotal returns would have been lower if certain expenses had not been reduced during the applicable periods shown.
DTotal returns do not include the effect of the sales charges.
EFees and expenses of any underlying mutual funds or exchange-traded funds (ETFs) are not included in the Fund's expense ratio. The Fund indirectly bears its proportionate share of these expenses. For additional expense information related to investments in Fidelity Central Funds, please refer to the "Investments in Fidelity Central Funds" note found in the Notes to Financial Statements section of the most recent Annual or Semi-Annual report. For additional expense information related to investments in Fidelity Private Credit Company LLC, please refer to the Investment in Fidelity Private Credit Company LLC note found in the Notes to Financial Statements section of the most recent Annual or Semi-Annual report.
FExpense ratios reflect operating expenses of the class. Expenses before reductions do not reflect amounts reimbursed, waived, or reduced through arrangements with the investment adviser, brokerage services, or other offset arrangements, if applicable, and do not represent the amount paid by the class during periods when reimbursements, waivers or reductions occur.
GAmount does not include the portfolio activity of any underlying mutual funds or exchange-traded funds (ETFs).
HPortfolio turnover rate excludes securities received or delivered in-kind.
Fidelity Advisor® High Income Fund Class C |
| |
| Years ended April 30, | | 2024 | | 2023 | | 2022 | | 2021 | | 2020 |
Selected Per-Share Data | | | | | | | | | | |
| Net asset value, beginning of period | $ | 7.43 | $ | 7.91 | $ | 8.71 | $ | 7.93 | $ | 8.83 |
| Income from Investment Operations | | | | | | | | | | |
Net investment income (loss) A,B | | .392 | | .330 | | .281 | | .302 | | .372 |
| Net realized and unrealized gain (loss) | | .138 | | (.501) | | (.763) | | .772 | | (.909) |
| Total from investment operations | | .530 | | (.171) | | (.482) | | 1.074 | | (.537) |
| Distributions from net investment income | | (.350) | | (.309) | | (.318) | | (.294) | | (.363) |
| Total distributions | | (.350) | | (.309) | | (.318) | | (.294) | | (.363) |
| Net asset value, end of period | $ | 7.61 | $ | 7.43 | $ | 7.91 | $ | 8.71 | $ | 7.93 |
Total Return C,D | | | | (2.09)% | | (5.75)% | | 13.68% | | (6.35)% |
Ratios to Average Net Assets B,E,F | | | | | | | | | | |
| Expenses before reductions | | 1.76% | | 1.79% | | 1.76% | | 1.75% | | 1.75% |
| Expenses net of fee waivers, if any | | | | 1.79% | | 1.76% | | 1.75% | | 1.75% |
| Expenses net of all reductions | | 1.75% | | 1.79% | | 1.76% | | 1.75% | | 1.75% |
| Net investment income (loss) | | 5.26% | | 4.42% | | 3.25% | | 3.55% | | 4.27% |
| Supplemental Data | | | | | | | | | | |
| Net assets, end of period (in millions) | $ | 10 | $ | 12 | $ | 17 | $ | 30 | $ | 36 |
Portfolio turnover rate G | | | | 35% | | 54% | | 62% | | 44% H |
ACalculated based on average shares outstanding during the period.
BNet investment income (loss) is affected by the timing of the declaration of dividends by any underlying mutual funds or exchange-traded funds (ETFs). Net investment income (loss) of any mutual funds or ETFs is not included in the Fund's net investment income (loss) ratio.
CTotal returns would have been lower if certain expenses had not been reduced during the applicable periods shown.
DTotal returns do not include the effect of the contingent deferred sales charge.
EFees and expenses of any underlying mutual funds or exchange-traded funds (ETFs) are not included in the Fund's expense ratio. The Fund indirectly bears its proportionate share of these expenses. For additional expense information related to investments in Fidelity Central Funds, please refer to the "Investments in Fidelity Central Funds" note found in the Notes to Financial Statements section of the most recent Annual or Semi-Annual report. For additional expense information related to investments in Fidelity Private Credit Company LLC, please refer to the Investment in Fidelity Private Credit Company LLC note found in the Notes to Financial Statements section of the most recent Annual or Semi-Annual report.
FExpense ratios reflect operating expenses of the class. Expenses before reductions do not reflect amounts reimbursed, waived, or reduced through arrangements with the investment adviser, brokerage services, or other offset arrangements, if applicable, and do not represent the amount paid by the class during periods when reimbursements, waivers or reductions occur.
GAmount does not include the portfolio activity of any underlying mutual funds or exchange-traded funds (ETFs).
HPortfolio turnover rate excludes securities received or delivered in-kind.
Fidelity® High Income Fund |
| |
| Years ended April 30, | | 2024 | | 2023 | | 2022 | | 2021 | | 2020 |
Selected Per-Share Data | | | | | | | | | | |
| Net asset value, beginning of period | $ | 7.43 | $ | 7.91 | $ | 8.71 | $ | 7.93 | $ | 8.83 |
| Income from Investment Operations | | | | | | | | | | |
Net investment income (loss) A,B | | .471 | | .408 | | .371 | | .392 | | .464 |
| Net realized and unrealized gain (loss) | | .138 | | (.500) | | (.761) | | .772 | | (.909) |
| Total from investment operations | | .609 | | (.092) | | (.390) | | 1.164 | | (.445) |
| Distributions from net investment income | | (.429) | | (.388) | | (.410) | | (.384) | | (.455) |
| Total distributions | | (.429) | | (.388) | | (.410) | | (.384) | | (.455) |
| Net asset value, end of period | $ | 7.61 | $ | 7.43 | $ | 7.91 | $ | 8.71 | $ | 7.93 |
Total Return C | | | | (1.04)% | | (4.75)% | | 14.89% | | (5.35)% |
Ratios to Average Net Assets B,D,E | | | | | | | | | | |
| Expenses before reductions | | .70% | | .73% | | .70% | | .69% | | .69% |
| Expenses net of fee waivers, if any | | | | .73% | | .70% | | .69% | | .69% |
| Expenses net of all reductions | | .69% | | .73% | | .70% | | .69% | | .69% |
| Net investment income (loss) | | 6.32% | | 5.48% | | 4.31% | | 4.61% | | 5.33% |
| Supplemental Data | | | | | | | | | | |
| Net assets, end of period (in millions) | $ | 2,367 | $ | 2,567 | $ | 3,181 | $ | 4,139 | $ | 3,871 |
Portfolio turnover rate F | | | | 35% | | 54% | | 62% | | 44% G |
ACalculated based on average shares outstanding during the period.
BNet investment income (loss) is affected by the timing of the declaration of dividends by any underlying mutual funds or exchange-traded funds (ETFs). Net investment income (loss) of any mutual funds or ETFs is not included in the Fund's net investment income (loss) ratio.
CTotal returns would have been lower if certain expenses had not been reduced during the applicable periods shown.
DFees and expenses of any underlying mutual funds or exchange-traded funds (ETFs) are not included in the Fund's expense ratio. The Fund indirectly bears its proportionate share of these expenses. For additional expense information related to investments in Fidelity Central Funds, please refer to the "Investments in Fidelity Central Funds" note found in the Notes to Financial Statements section of the most recent Annual or Semi-Annual report. For additional expense information related to investments in Fidelity Private Credit Company LLC, please refer to the Investment in Fidelity Private Credit Company LLC note found in the Notes to Financial Statements section of the most recent Annual or Semi-Annual report.
EExpense ratios reflect operating expenses of the class. Expenses before reductions do not reflect amounts reimbursed, waived, or reduced through arrangements with the investment adviser, brokerage services, or other offset arrangements, if applicable, and do not represent the amount paid by the class during periods when reimbursements, waivers or reductions occur.
FAmount does not include the portfolio activity of any underlying mutual funds or exchange-traded funds (ETFs).
GPortfolio turnover rate excludes securities received or delivered in-kind.
Fidelity Advisor® High Income Fund Class I |
| |
| Years ended April 30, | | 2024 | | 2023 | | 2022 | | 2021 | | 2020 |
Selected Per-Share Data | | | | | | | | | | |
| Net asset value, beginning of period | $ | 7.43 | $ | 7.91 | $ | 8.71 | $ | 7.93 | $ | 8.83 |
| Income from Investment Operations | | | | | | | | | | |
Net investment income (loss) A,B | | .465 | | .401 | | .390 | | .390 | | .458 |
| Net realized and unrealized gain (loss) | | .137 | | (.499) | | (.774) | | .771 | | (.907) |
| Total from investment operations | | .602 | | (.098) | | (.384) | | 1.161 | | (.449) |
| Distributions from net investment income | | (.422) | | (.382) | | (.416) | | (.381) | | (.451) |
| Total distributions | | (.422) | | (.382) | | (.416) | | (.381) | | (.451) |
| Net asset value, end of period | $ | 7.61 | $ | 7.43 | $ | 7.91 | $ | 8.71 | $ | 7.93 |
Total Return C | | | | (1.12)% | | (4.68)% | | 14.85% | | (5.40)% |
Ratios to Average Net Assets A,D,E | | | | | | | | | | |
| Expenses before reductions | | .81% | | .85% | | .72% | | .73% | | .74% |
| Expenses net of fee waivers, if any | | | | .80% | | .71% | | .73% | | .74% |
| Expenses net of all reductions | | .79% | | .80% | | .71% | | .73% | | .74% |
| Net investment income (loss) | | 6.22% | | 5.41% | | 4.29% | | 4.57% | | 5.28% |
| Supplemental Data | | | | | | | | | | |
| Net assets, end of period (in millions) | $ | 58 | $ | 111 | $ | 85 | $ | 4,010 | $ | 558 |
Portfolio turnover rate F | | | | 35% | | 54% | | 62% | | 44% G |
ANet investment income (loss) is affected by the timing of the declaration of dividends by any underlying mutual funds or exchange-traded funds (ETFs). Net investment income (loss) of any mutual funds or ETFs is not included in the Fund's net investment income (loss) ratio.
BCalculated based on average shares outstanding during the period.
CTotal returns would have been lower if certain expenses had not been reduced during the applicable periods shown.
DFees and expenses of any underlying mutual funds or exchange-traded funds (ETFs) are not included in the Fund's expense ratio. The Fund indirectly bears its proportionate share of these expenses. For additional expense information related to investments in Fidelity Central Funds, please refer to the "Investments in Fidelity Central Funds" note found in the Notes to Financial Statements section of the most recent Annual or Semi-Annual report. For additional expense information related to investments in Fidelity Private Credit Company LLC, please refer to the Investment in Fidelity Private Credit Company LLC note found in the Notes to Financial Statements section of the most recent Annual or Semi-Annual report.
EExpense ratios reflect operating expenses of the class. Expenses before reductions do not reflect amounts reimbursed, waived, or reduced through arrangements with the investment adviser, brokerage services, or other offset arrangements, if applicable, and do not represent the amount paid by the class during periods when reimbursements, waivers or reductions occur.
FAmount does not include the portfolio activity of any underlying mutual funds or exchange-traded funds (ETFs).
GPortfolio turnover rate excludes securities received or delivered in-kind.
Fidelity Advisor® High Income Fund Class Z |
| |
| Years ended April 30, | | 2024 | | 2023 | | 2022 | | 2021 | | 2020 |
Selected Per-Share Data | | | | | | | | | | |
| Net asset value, beginning of period | $ | 7.43 | $ | 7.91 | $ | 8.71 | $ | 7.93 | $ | 8.83 |
| Income from Investment Operations | | | | | | | | | | |
Net investment income (loss) A,B | | .476 | | .415 | | .378 | | .399 | | .464 |
| Net realized and unrealized gain (loss) | | .138 | | (.502) | | (.763) | | .770 | | (.904) |
| Total from investment operations | | .614 | | (.087) | | (.385) | | 1.169 | | (.440) |
| Distributions from net investment income | | (.434) | | (.393) | | (.415) | | (.389) | | (.460) |
| Total distributions | | (.434) | | (.393) | | (.415) | | (.389) | | (.460) |
| Net asset value, end of period | $ | 7.61 | $ | 7.43 | $ | 7.91 | $ | 8.71 | $ | 7.93 |
Total Return C | | | | (.98)% | | (4.68)% | | 14.96% | | (5.30)% |
Ratios to Average Net Assets B,D,E | | | | | | | | | | |
| Expenses before reductions | | .65% | | .66% | | .64% | | .63% | | .63% |
| Expenses net of fee waivers, if any | | | | .66% | | .63% | | .63% | | .63% |
| Expenses net of all reductions | | .64% | | .66% | | .63% | | .62% | | .63% |
| Net investment income (loss) | | 6.37% | | 5.54% | | 4.37% | | 4.67% | | 5.39% |
| Supplemental Data | | | | | | | | | | |
| Net assets, end of period (in millions) | $ | 57 | $ | 58 | $ | 133 | $ | 250 | $ | 61 |
Portfolio turnover rate F | | | | 35% | | 54% | | 62% | | 44% G |
ACalculated based on average shares outstanding during the period.
BNet investment income (loss) is affected by the timing of the declaration of dividends by any underlying mutual funds or exchange-traded funds (ETFs). Net investment income (loss) of any mutual funds or ETFs is not included in the Fund's net investment income (loss) ratio.
CTotal returns would have been lower if certain expenses had not been reduced during the applicable periods shown.
DFees and expenses of any underlying mutual funds or exchange-traded funds (ETFs) are not included in the Fund's expense ratio. The Fund indirectly bears its proportionate share of these expenses. For additional expense information related to investments in Fidelity Central Funds, please refer to the "Investments in Fidelity Central Funds" note found in the Notes to Financial Statements section of the most recent Annual or Semi-Annual report. For additional expense information related to investments in Fidelity Private Credit Company LLC, please refer to the Investment in Fidelity Private Credit Company LLC note found in the Notes to Financial Statements section of the most recent Annual or Semi-Annual report.
EExpense ratios reflect operating expenses of the class. Expenses before reductions do not reflect amounts reimbursed, waived, or reduced through arrangements with the investment adviser, brokerage services, or other offset arrangements, if applicable, and do not represent the amount paid by the class during periods when reimbursements, waivers or reductions occur.
FAmount does not include the portfolio activity of any underlying mutual funds or exchange-traded funds (ETFs).
GPortfolio turnover rate excludes securities received or delivered in-kind.
For the period ended April 30, 2024
(Amounts in thousands except percentages)
1. Organization.
Fidelity High Income Fund (the Fund) is a fund of Fidelity Summer Street Trust (the Trust) and is authorized to issue an unlimited number of shares. The Trust is registered under the Investment Company Act of 1940, as amended (the 1940 Act), as an open-end management investment company organized as a Massachusetts business trust. The Fund offers Class A, Class M, Class C, Fidelity High Income Fund, Class I and Class Z shares, each of which has equal rights as to assets and voting privileges. Class A, Class M, Class C, Class I and Class Z are Fidelity Advisor classes. Each class has exclusive voting rights with respect to matters that affect that class. Class C shares will automatically convert to Class A shares after a holding period of eight years from the initial date of purchase, with certain exceptions.
2. Investments in Fidelity Central Funds.
Funds may invest in Fidelity Central Funds, which are open-end investment companies generally available only to other investment companies and accounts managed by the investment adviser and its affiliates. The Schedule of Investments lists any Fidelity Central Funds held as an investment as of period end, but does not include the underlying holdings of each Fidelity Central Fund. An investing fund indirectly bears its proportionate share of the expenses of the underlying Fidelity Central Funds.
Based on its investment objective, each Fidelity Central Fund may invest or participate in various investment vehicles or strategies that are similar to those of the investing fund. These strategies are consistent with the investment objectives of the investing fund and may involve certain economic risks which may cause a decline in value of each of the Fidelity Central Funds and thus a decline in the value of the investing fund.
| Fidelity Central Fund | Investment Manager | Investment Objective | Investment Practices | Expense RatioA |
| Fidelity Money Market Central Funds | Fidelity Management & Research Company LLC (FMR) | Each fund seeks to obtain a high level of current income consistent with the preservation of capital and liquidity. | Short-term Investments | Less than .005% |
A Expenses expressed as a percentage of average net assets and are as of each underlying Central Fund's most recent annual or semi-annual shareholder report.
A complete unaudited list of holdings for each Fidelity Central Fund is available upon request or at the Securities and Exchange Commission website at www.sec.gov. In addition, the financial statements of the Fidelity Central Funds which contain the significant accounting policies (including investment valuation policies) of those funds, and are not covered by the Report of Independent Registered Public Accounting Firm, are available on the Securities and Exchange Commission website or upon request.
3. Investment in Fidelity Private Credit Company LLC.
The Fund invests in Fidelity Private Credit Company LLC, which is a limited liability company. On June 1, 2023, Fidelity Private Credit Company elected to be regulated as a business development company (BDC). Fidelity Private Credit Company LLC's units are not registered under the Securities Act of 1933 and are subject to substantial restrictions on transfer. The Fund has no redemption rights under Fidelity Private Credit Company LLC's limited liability company agreement. There will be no trading market for the units.
Based on its investment objective, Fidelity Private Credit Company LLC may invest or participate in various investments or strategies that are similar to those in which the Fund may invest or participate. These strategies are consistent with the investment objectives of the Fund and may involve certain economic risks which may cause a decline in value of Fidelity Private Credit Company LLC and thus a decline in the value of the Fund. Fidelity Private Credit Company LLC intends to invest primarily in directly originated loans to private companies but also with liquid credit investments, like broadly syndicated loans, and other select private credit investments.
The Schedule of Investments lists Fidelity Private Credit Company LLC as an investment as of period end, but does not include the underlying holdings of Fidelity Private Credit Company LLC. Fidelity Private Credit Company LLC represented less than 5% of the Fund's net assets at period end. The Fund indirectly bears its proportionate share of the expenses of Fidelity Private Credit Company LLC. The annualized expense ratio for Fidelity Private Credit Company LLC for the three month period ended March 31, 2024 was 11.51%.
4. Significant Accounting Policies.
The Fund is an investment company and applies the accounting and reporting guidance of the Financial Accounting Standards Board (FASB) Accounting Standards Codification Topic 946 Financial Services - Investment Companies. The financial statements have been prepared in conformity with accounting principles generally accepted in the United States of America (GAAP), which require management to make certain estimates and assumptions at the date of the financial statements. Actual results could differ from those estimates. Subsequent events, if any, through the date that the financial statements were issued have been evaluated in the preparation of the financial statements. The Fund's Schedule of Investments lists any underlying mutual funds or exchange-traded funds (ETFs) but does not include the underlying holdings of these funds. The following summarizes the significant accounting policies of the Fund:
Investment Valuation. Investments are valued as of 4:00 p.m. Eastern time on the last calendar day of the period. The Board of Trustees (the Board) has designated the Fund's investment adviser as the valuation designee responsible for the fair valuation function and performing fair value determinations as needed. The investment adviser has established a Fair Value Committee (the Committee) to carry out the day-to-day fair valuation responsibilities and has adopted policies and procedures to govern the fair valuation process and the activities of the Committee. In accordance with these fair valuation policies and procedures, which have been approved by the Board, the Fund attempts to obtain prices from one or more third party pricing services or brokers to value its investments. When current market prices, quotations or currency exchange rates are not readily available or reliable, investments will be fair valued in good faith by the Committee, in accordance with the policies and procedures. Factors used in determining fair value vary by investment type and may include market or investment specific events, transaction data, estimated cash flows, and market observations of comparable investments. The frequency that the fair valuation procedures are used cannot be predicted and they may be utilized to a significant extent. The Committee manages the Fund's fair valuation practices and maintains the fair valuation policies and procedures. The Fund's investment adviser reports to the Board information regarding the fair valuation process and related material matters.
The Fund categorizes the inputs to valuation techniques used to value its investments into a disclosure hierarchy consisting of three levels as shown below:
Level 1 - unadjusted quoted prices in active markets for identical investments
Level 2 - other significant observable inputs (including quoted prices for similar investments, interest rates, prepayment speeds, etc.)
Level 3 - unobservable inputs (including the Fund's own assumptions based on the best information available)
Valuation techniques used to value the Fund's investments by major category are as follows:
Debt securities, including restricted securities, are valued based on evaluated prices received from third party pricing services or from brokers who make markets in such securities. Corporate bonds, bank loan obligations, preferred securities and U.S. government and government agency obligations are valued by pricing services who utilize matrix pricing which considers yield or price of bonds of comparable quality, coupon, maturity and type or by broker-supplied prices. Asset backed securities and commercial mortgage securities are valued by pricing services who utilize matrix pricing which considers prepayment speed assumptions, attributes of the collateral, yield or price of bonds of comparable quality, coupon, maturity and type or by broker-supplied prices. When independent prices are unavailable or unreliable, debt securities may be valued utilizing pricing methodologies which consider similar factors that would be used by third party pricing services. Debt securities are generally categorized as Level 2 in the hierarchy but may be Level 3 depending on the circumstances. The Fund invests a significant portion of its assets in below investment grade securities. The value of these securities can be more volatile due to changes in the credit quality of the issuer and is sensitive to changes in economic, market and regulatory conditions.
Equity securities, including restricted securities, for which market quotations are readily available, are valued at the last reported sale price or official closing price as reported by a third party pricing service on the primary market or exchange on which they are traded and are categorized as Level 1 in the hierarchy. In the event there were no sales during the day or closing prices are not available, securities are valued at the last quoted bid price or may be valued using the last available price and are generally categorized as Level 2 in the hierarchy. For foreign equity securities, when market or security specific events arise, comparisons to the valuation of American Depositary Receipts (ADRs), futures contracts, Exchange-Traded Funds (ETFs) and certain indexes as well as quoted prices for similar securities may be used and would be categorized as Level 2 in the hierarchy. For equity securities, including restricted securities, where observable inputs are limited, assumptions about market activity and risk are used and these securities may be categorized as Level 3 in the hierarchy. Securities, including private placements or other restricted securities, for which observable inputs are not available are valued using alternate valuation approaches, including the market approach, the income approach and cost approach, and are categorized as Level 3 in the hierarchy. The market approach considers factors including the price of recent investments in the same or a similar security or financial metrics of comparable securities. The income approach considers factors including expected future cash flows, security specific risks and corresponding discount rates. The cost approach considers factors including the value of the security's underlying assets and liabilities.
Investments in open-end mutual funds, including the Fidelity Central Funds, are valued at their closing net asset value (NAV) each business day and are categorized as Level 1 in the hierarchy.
Fidelity Private Credit Company LLC is valued at its net asset value (NAV) each month end and is categorized as Level 2 in the hierarchy.
The following provides information on Level 3 securities held by the Fund that were valued at period end based on unobservable inputs. These amounts exclude valuations provided by a broker and valuations using NAV as a practical expedient.
| Asset Type | Fair Value | Valuation Technique(s) | Unobservable Input | Amount or Range/Weighted Average | Impact to Valuation from an Increase in InputA |
| Equities | $23,062 | Market comparable | Enterprise value/EBITDA multiple (EV/EBITDA) | 6.5 | Increase |
| | | Discounted cash flow | Discount rate | 11.1% | Decrease |
| | | Recovery value | Recovery value | $0.00 - $1.10 / $1.10 | Increase |
| Corporate Bonds | $5,026 | Market comparable | Enterprise value/EBITDA multiple (EV/EBITDA) | 5.3 | Increase |
| | | | Daily production multiple ($/Million cubic feet per day) | $3,550.00 | Increase |
| | | Discounted cash flow | Yield | 18.8% | Decrease |
| | | Recovery value | Recovery value | $0.00 | Increase |
| Bank Loan Obligations | $6,486 | Discounted cash flow | Yield | 12.2% | Decrease |
| | | Recovery value | Recovery value | $0.00 | Increase |
| | | Indicative market price | Evaluated bid | $102.00 | Increase |
A Represents the directional change in the fair value of the Level 3 investments that could have resulted from an increase in the corresponding input as of period end. A decrease to the unobservable input would have had the opposite effect. Significant changes in these inputs may have resulted in a significantly higher or lower fair value measurement at period end.
Changes in valuation techniques may result in transfers in or out of an assigned level within the disclosure hierarchy. The aggregate value of investments by input level as of April 30, 2024, as well as a roll forward of Level 3 investments, is included at the end of the Fund's Schedule of Investments.
Foreign Currency. Certain Funds may use foreign currency contracts to facilitate transactions in foreign-denominated securities. Gains and losses from these transactions may arise from changes in the value of the foreign currency or if the counterparties do not perform under the contracts' terms.
Foreign-denominated assets, including investment securities, and liabilities are translated into U.S. dollars at the exchange rates at period end. Purchases and sales of investment securities, income and dividends received, and expenses denominated in foreign currencies are translated into U.S. dollars at the exchange rate in effect on the transaction date.
The effects of exchange rate fluctuations on investments are included with the net realized and unrealized gain (loss) on investment securities. Other foreign currency transactions resulting in realized and unrealized gain (loss) are disclosed separately.
Investment Transactions and Income. For financial reporting purposes, the Fund's investment holdings and NAV include trades executed through the end of the last business day of the period. The NAV per share for processing shareholder transactions is calculated as of the close of business of the New York Stock Exchange (NYSE), normally 4:00 p.m. Eastern time and includes trades executed through the end of the prior business day. Gains and losses on securities sold are determined on the basis of identified cost and include proceeds received from litigation. Commissions paid to certain brokers with whom the investment adviser, or its affiliates, places trades on behalf of a fund include an amount in addition to trade execution, which may be rebated back to a fund. Any such rebates are included in net realized gain (loss) on investments in the Statement of Operations. Dividend income is recorded on the ex-dividend date, except for certain dividends from foreign securities where the ex-dividend date may have passed, which are recorded as soon as the Fund is informed of the ex-dividend date. Non-cash dividends included in dividend income, if any, are recorded at the fair market value of the securities received. Income and capital gain distributions from Fidelity Central Funds, if any, are recorded on the ex-dividend date. Interest income is accrued as earned and includes coupon interest and amortization of premium and accretion of discount on debt securities as applicable. Paid in Kind (PIK) income is recorded at the fair market value of the securities received. Investment income is recorded net of foreign taxes withheld where recovery of such taxes is uncertain. Debt obligations may be placed on non-accrual status and related interest income may be reduced by ceasing current accruals and writing off interest receivables when the collection of all or a portion of interest has become doubtful based on consistently applied procedures. A debt obligation is removed from non-accrual status when the issuer resumes interest payments or when collectability of interest is reasonably assured.
Class Allocations and Expenses. Investment income, realized and unrealized capital gains and losses, common expenses of a fund, and certain fund-level expense reductions, if any, are allocated daily on a pro-rata basis to each class based on the relative net assets of each class to the total net assets of a fund. Each class differs with respect to transfer agent and distribution and service plan fees incurred, as applicable. Certain expense reductions may also differ by class, if applicable. For the reporting period, the allocated portion of income and expenses to each class as a percent of its average net assets may vary due to the timing of recording these transactions in relation to fluctuating net assets of the classes. Expenses directly attributable to a fund are charged to that fund. Expenses attributable to more than one fund are allocated among the respective funds on the basis of relative net assets or other appropriate methods. Expenses included in the accompanying financial statements reflect the expenses of that fund and do not include any expenses associated with any underlying mutual funds or exchange-traded funds (ETFs). Although not included in a fund's expenses, a fund indirectly bears its proportionate share of these expenses through the net asset value of each underlying mutual fund or exchange-traded fund (ETF). Expense estimates are accrued in the period to which they relate and adjustments are made when actual amounts are known.
Income Tax Information and Distributions to Shareholders. Each year, the Fund intends to qualify as a regulated investment company under Subchapter M of the Internal Revenue Code, including distributing substantially all of its taxable income and realized gains. As a result, no provision for U.S. Federal income taxes is required. As of April 30, 2024, the Fund did not have any unrecognized tax benefits in the financial statements; nor is the Fund aware of any tax positions for which it is reasonably possible that the total amounts of unrecognized tax benefits will significantly change in the next twelve months. The Fund files a U.S. federal tax return, in addition to state and local tax returns as required. The Fund's federal income tax returns are subject to examination by the Internal Revenue Service (IRS) for a period of three fiscal years after they are filed. State and local tax returns may be subject to examination for an additional fiscal year depending on the jurisdiction. Foreign taxes are provided for based on the Fund's understanding of the tax rules and rates that exist in the foreign markets in which it invests.
Distributions are declared and recorded daily and paid monthly from net investment income. Distributions from realized gains, if any, are declared and recorded on the ex-dividend date. Income and capital gain distributions are declared separately for each class. Income and capital gain distributions are determined in accordance with income tax regulations, which may differ from GAAP.
Capital accounts within the financial statements are adjusted for permanent book-tax differences. These adjustments have no impact on net assets or the results of operations. Capital accounts are not adjusted for temporary book-tax differences which will reverse in a subsequent period.
Book-tax differences are primarily due to short-term gain distributions from the underlying funds, foreign currency transactions, passive foreign investment companies (PFIC), prior period premium and discount on debt securities, market discount, partnerships, capital loss carryforwards and losses deferred due to wash sales.
As of period end, the cost and unrealized appreciation (depreciation) in securities, and derivatives if applicable, for federal income tax purposes were as follows:
| Gross unrealized appreciation | $71,179 |
| Gross unrealized depreciation | (208,412) |
| Net unrealized appreciation (depreciation) | $(137,233) |
| Tax Cost | $2,866,126 |
The tax-based components of distributable earnings as of period end were as follows:
| Undistributed ordinary income | $5,721 |
| Capital loss carryforward | $(731,324) |
| Net unrealized appreciation (depreciation) on securities and other investments | $(137,233) |
Capital loss carryforwards are only available to offset future capital gains of the Fund to the extent provided by regulations and may be limited. The capital loss carryforward information presented below, including any applicable limitation, is estimated as of fiscal period end and is subject to adjustment.
| Short-term | $(131,937) |
| Long-term | (599,387) |
| Total capital loss carryforward | $(731,324) |
The tax character of distributions paid was as follows:
| | April 30, 2024 | April 30, 2023 |
| Ordinary Income | $154,653 | $ 158,804 |
Delayed Delivery Transactions and When-Issued Securities. During the period, certain Funds transacted in securities on a delayed delivery or when-issued basis. Payment and delivery may take place after the customary settlement period for that security. The price of the underlying securities and the date when the securities will be delivered and paid for are fixed at the time the transaction is negotiated. Securities purchased on a delayed delivery or when-issued basis are identified as such in the Schedule of Investments. Compensation for interest forgone in the purchase of a delayed delivery or when-issued debt security may be received. With respect to purchase commitments, each applicable Fund identifies securities as segregated in its records with a value at least equal to the amount of the commitment. Payables and receivables associated with the purchases and sales of delayed delivery securities having the same coupon, settlement date and broker are offset. Delayed delivery or when-issued securities that have been purchased from and sold to different brokers are reflected as both payables and receivables in the Statement of Assets and Liabilities under the caption "Delayed delivery", as applicable. Losses may arise due to changes in the value of the underlying securities or if the counterparty does not perform under the contract's terms, or if the issuer does not issue the securities due to political, economic, or other factors.
Restricted Securities (including Private Placements). Funds may invest in securities that are subject to legal or contractual restrictions on resale. These securities generally may be resold in transactions exempt from registration or to the public if the securities are registered. Disposal of these securities may involve time-consuming negotiations and expense, and prompt sale at an acceptable price may be difficult. Information regarding restricted securities held at period end is included at the end of the Schedule of Investments, if applicable.
Loans and Other Direct Debt Instruments. Direct debt instruments are interests in amounts owed to lenders by corporate or other borrowers. These instruments may be in the form of loans, trade claims or other receivables and may include standby financing commitments such as revolving credit facilities that obligate a fund to supply additional cash to the borrower on demand. Loans may be acquired through assignment, participation, or may be made directly to a borrower. Such instruments are presented in the Bank Loan Obligations section in the Schedule of Investments. Certain funds may also invest in unfunded loan commitments, which are contractual obligations for future funding. Information regarding unfunded commitments is included at the end of the Schedule of Investments, if applicable.
Commitments. A commitment is an agreement to acquire an investment at a future date (subject to conditions) in connection with a potential public or non-public offering. The amount of commitments outstanding at period end are presented in the table below. These commitments are not included in the net assets of the Fund at period end.
| | Investment to be Acquired | Commitment Amount ($) |
| Fidelity High Income Fund | Fidelity Private Credit Company LLC | 12,276 |
5. Purchases and Sales of Investments.
Purchases and sales of securities, other than short-term securities, U.S. government securities and in-kind transactions, as applicable, are noted in the table below.
| | Purchases ($) | Sales ($) |
| Fidelity High Income Fund | 1,126,326 | 1,391,732 |
6. Fees and Other Transactions with Affiliates.
Management Fee. Fidelity Management & Research Company LLC (the investment adviser) and its affiliates provide the Fund with investment management related services for which the Fund pays a monthly management fee.
Effective March 1, 2024, the Fund's management contract was amended to incorporate administrative services previously covered under separate services agreements (Transfer Agent and Accounting agreements). The amended contract incorporates a management fee rate that may vary by class. The investment adviser or an affiliate pays certain expenses of managing and operating the Fund out of each class's management fee. Each class of the Fund pays a management fee to the investment adviser. The management fee is calculated and paid to the investment adviser every month. When determining a class's management fee, a mandate rate is calculated based on the monthly average net assets of a group of funds advised by FMR within a designated asset class. A discount rate is subtracted from the mandate rate once the Fund's monthly average net assets reach a certain level. The mandate rate and discount rate may vary by class. The annual management fee rate for a class of shares of the Fund is the lesser of (1) the class's mandate rate reduced by the class's discount rate (if applicable) or (2) the amount set forth in the following table.
| | Maximum Management Fee Rate % |
| Class A | .71 |
| Class M | .72 |
| Class C | .74 |
| Fidelity High Income Fund | .67 |
| Class I | .76 |
| Class Z | .61 |
One-twelfth of the management fee rate for a class is applied to the average net assets of the class for the month, giving a dollar amount which is the management fee for the class for that month. A different management fee rate may be applicable to each class of the Fund. The difference between classes is the result of separate arrangements for class-level services and/or waivers of certain expenses. It is not the result of any difference in advisory or custodial fees or other expenses related to the management of the Fund's assets, which do not vary by class. For the portion of the reporting period on or after March 1, 2024, the total annualized management fee rates were as follows:
| | Total Management Fee Rate % |
| Class A | .71 |
| Class M | .71 |
| Class C | .71 |
| Fidelity High Income Fund | .67 |
| Class I | .71 |
| Class Z | .61 |
Prior to March 1, 2024, the management fee was the sum of an individual fund fee rate that was based on an annual rate of .45% of the Fund's average net assets and an annualized group fee rate that averaged .10% during the period. The group fee rate was based upon the monthly average net assets of a group of registered investment companies with which the investment adviser has management contracts. The group fee rate decreased as assets under management increased and increased as assets under management decreased. For the portion of the reporting period prior to March 1, 2024, the total annualized management fee rate was .55%.
Effective March 1, 2024, the Fund's sub-advisory agreements with FMR Investment Management (UK) Limited, Fidelity Management & Research (Hong Kong) Limited, and Fidelity Management & Research (Japan) Limited were amended to provide that the investment adviser pays each sub-adviser monthly fees equal to 110% of the sub-adviser's costs for providing sub-advisory services.
Distribution and Service Plan Fees. In accordance with Rule 12b-1 of the 1940 Act, the Fund has adopted separate Distribution and Service Plans for each class of shares. Certain classes pay Fidelity Distributors Company LLC (FDC), an affiliate of the investment adviser, separate Distribution and Service Fees, each of which is based on an annual percentage of each class' average net assets. In addition, FDC may pay financial intermediaries for selling shares of the Fund and providing shareholder support services. For the period, the Distribution and Service Fee rates, total fees and amounts retained by FDC were as follows:
| | Distribution Fee | Service Fee | Total Fees ($) | Retained by FDC ($) |
| Class A | - % | .25% | 293 | 2 |
| Class M | - % | .25% | 73 | -A |
| Class C | .75% | .25% | 109 | 8 |
| | | | 475 | 10 |
A Amount is less than five-hundred dollars.
Sales Load. FDC may receive a front-end sales charge of up to 4.00% for selling Class A shares and Class M shares, some of which is paid to financial intermediaries for selling shares of the Fund. Depending on the holding period, FDC may receive contingent deferred sales charges levied on Class A, Class M and Class C redemptions. The deferred sales charges are 1.00% for Class C shares, 1.00% for certain purchases of Class A shares and .25% for certain purchases of Class M shares.
For the period, sales charge amounts retained by FDC were as follows:
| | Retained by FDC ($) |
| Class A | 9 |
| Class M | 3 |
Class CB | -A |
| | 12 |
A Amount is less than five-hundred dollars.
B When Class C shares are initially sold, FDC pays commissions from its own resources to financial intermediaries through which the sales are made.
Transfer Agent Fees. Fidelity Investments Institutional Operations Company LLC (FIIOC), an affiliate of the investment adviser, is the transfer, dividend disbursing and shareholder servicing agent for each class of the Fund. Effective March 1, 2024, the Fund's management contract was amended to incorporate transfer agent services and associated fees previously covered under a separate services agreement. FIIOC pays for typesetting, printing and mailing of shareholder reports, except proxy statements.
During November 2023, the Board approved a change in the transfer agent fees effective December 1, 2023 to a fixed annual rate of class-level average net assets as follows:
| | % of Class-Level Average Net Assets |
| Class A | .1544 |
| Class M | .1566 |
| Class C | .1856 |
| Fidelity High Income Fund | .1146 |
| Class I | .2000 |
Prior to December 1, 2023, FIIOC received account fees and asset-based fees that varied according to the account size and type of account of the shareholders of the respective classes of the Fund, except for Class Z. FIIOC received an asset-based fee of Class Z's average net assets. For the portion of the reporting period prior to March 1, 2024, the fees were equivalent to the following annualized rates:
| | Amount ($) | % of Class-Level Average Net Assets |
| Class A | 152 | .16 |
| Class M | 38 | .16 |
| Class C | 17 | .19 |
| Fidelity High Income Fund | 2,317 | .11 |
| Class I | 130 | .23 |
| Class Z | 24 | .05 |
| | 2,678 | |
During the period, the investment adviser or its affiliates waived a portion of these fees.
Accounting Fees. Fidelity Service Company, Inc. (FSC), an affiliate of the investment adviser, maintains the Fund's accounting records. Effective March 1, 2024, the Fund's management contract was amended to incorporate accounting services and associated fees previously covered under a separate services agreement.
During November 2023, the Board approved a change in the accounting fees effective December 1, 2023 to a fixed annual rate of average net assets as follows:
| | % of Average Net Assets |
| Fidelity High Income Fund | .0321% |
Prior to December 1, 2023, the accounting fee was based on the level of average net assets for each month. For the portion of the reporting period prior to March 1, 2024, the fees were equivalent to the following annualized rates:
| | % of Average Net Assets |
| Fidelity High Income Fund | .03 |
Brokerage Commissions. A portion of portfolio transactions were placed with brokerage firms which are affiliates of the investment adviser. Brokerage commissions are included in net realized gain (loss) and change in net unrealized appreciation (depreciation) in the Statement of Operations. The commissions paid to these affiliated firms were as follows:
| | Amount ($) |
| Fidelity High Income Fund | -A |
A Amount is less than five-hundred dollars.
Interfund Lending Program. Pursuant to an Exemptive Order issued by the Securities and Exchange Commission (the SEC), the Fund, along with other registered investment companies having management contracts with Fidelity Management & Research Company LLC (FMR), or other affiliated entities of FMR, may participate in an interfund lending program. This program provides an alternative credit facility allowing the Fund to borrow from, or lend money to, other participating affiliated funds. At period end, there were no interfund loans outstanding. Activity in this program during the period for which loans were outstanding was as follows:
| | Borrower or Lender | Average Loan Balance ($) | Weighted Average Interest Rate | Interest Expense ($) |
| Fidelity High Income Fund | Borrower | 11,434 | 5.57% | 2 |
Interfund Trades. Funds may purchase from or sell securities to other Fidelity Funds under procedures adopted by the Board. The procedures have been designed to ensure these interfund trades are executed in accordance with Rule 17a-7 of the 1940 Act. Any interfund trades are included within the respective purchases and sales amounts shown in the Purchases and Sales of Investments note. Interfund trades during the period are noted in the table below.
| | Purchases ($) | Sales ($) | Realized Gain (Loss)($) |
| Fidelity High Income Fund | - | 43 | 12 |
7. Committed Line of Credit.
Certain Funds participate with other funds managed by the investment adviser or an affiliate in a $4.25 billion credit facility (the "line of credit") to be utilized for temporary or emergency purposes to fund shareholder redemptions or for other short-term liquidity purposes. The participating funds have agreed to pay commitment fees on their pro-rata portion of the line of credit, which are reflected in Miscellaneous expenses on the Statement of Operations, and are listed below. During the period, there were no borrowings on this line of credit.
| | Amount ($) |
| Fidelity High Income Fund | 5 |
8. Security Lending.
Funds lend portfolio securities from time to time in order to earn additional income. Lending agents are used, including National Financial Services (NFS), an affiliate of the investment adviser. Pursuant to a securities lending agreement, NFS will receive a fee, which is capped at 9.9% of a fund's daily lending revenue, for its services as lending agent. A fund may lend securities to certain qualified borrowers, including NFS. On the settlement date of the loan, a fund receives collateral (in the form of U.S. Treasury obligations, letters of credit and/or cash) against the loaned securities and maintains collateral in an amount not less than 100% of the market value of the loaned securities during the period of the loan. The market value of the loaned securities is determined at the close of business of a fund and any additional required collateral is delivered to a fund on the next business day. A fund or borrower may terminate the loan at any time, and if the borrower defaults on its obligation to return the securities loaned because of insolvency or other reasons, a fund may apply collateral received from the borrower against the obligation. A fund may experience delays and costs in recovering the securities loaned. Any cash collateral received is invested in the Fidelity Securities Lending Cash Central Fund. Any loaned securities are identified as such in the Schedule of Investments, and the value of loaned securities and cash collateral at period end, as applicable, are presented in the Statement of Assets and Liabilities. Security lending income represents the income earned on investing cash collateral, less rebates paid to borrowers and any lending agent fees associated with the loan, plus any premium payments received for lending certain types of securities. Security lending income is presented in the Statement of Operations as a component of income from Fidelity Central Funds. Affiliated security lending activity, if any, was as follows:
| | Total Security Lending Fees Paid to NFS ($) | Security Lending Income From Securities Loaned to NFS ($) | Value of Securities Loaned to NFS at Period End ($) |
| Fidelity High Income Fund | 5 | - | - |
9. Expense Reductions.
The investment adviser has contractually agreed to waive the Fund's management fee with respect to the portion of the Fund's assets invested in Fidelity Private Credit Company LLC until August 31, 2025. During the period, this waiver reduced the Fund's management fee by $243.
FIIOC voluntarily agreed to waive Class I transfer agent fees to the extent that they exceeded certain levels of class-level average net assets as noted in the table below. This waiver was discontinued effective July 1, 2023.
| | Transfer Agent Fees Limitation | Waiver ($) |
| Class I | .19% | 6 |
Through arrangements with the Fund's custodian and each class' transfer agent, credits realized as a result of certain uninvested cash balances were used to reduce the Fund's expenses. During the period, custodian credits reduced the Fund's expenses by $14. During the period, transfer agent credits reduced each class' expenses as noted in the table below.
| | Expense reduction ($) |
| Class M | -A |
A Amount is less than five-hundred dollars.
In addition, during the period the investment adviser or an affiliate reimbursed and/or waived a portion of fund-level operating expenses in the amount of $118.
10. Distributions to Shareholders.
Distributions to shareholders of each class were as follows:
| | Year ended April 30, 2024 | Year ended April 30, 2023 |
| Fidelity High Income Fund | | |
| Distributions to shareholders | | |
| Class A | $6,406 | $5,949 |
| Class M | 1,588 | 1,395 |
| Class C | 511 | 576 |
| Fidelity High Income Fund | 138,880 | 143,007 |
| Class I | 3,849 | 4,409 |
| Class Z | 3,419 | 3,468 |
Total | $154,653 | $158,804 |
11. Share Transactions.
Share transactions for each class were as follows and may contain in-kind transactions, automatic conversions between classes or exchanges between affiliated funds:
| | Shares | Shares | Dollars | Dollars |
| | Year ended April 30, 2024 | Year ended April 30, 2023 | Year ended April 30, 2024 | Year ended April 30, 2023 |
| Fidelity High Income Fund | | | | |
| Class A | | | | |
| Shares sold | 1,472 | 1,601 | $11,040 | $12,031 |
| Reinvestment of distributions | 781 | 734 | 5,837 | 5,448 |
| Shares redeemed | (2,774) | (2,939) | (20,682) | (21,937) |
| Net increase (decrease) | (521) | (604) | $(3,805) | $(4,458) |
| Class M | | | | |
| Shares sold | 483 | 482 | $3,664 | $3,625 |
| Reinvestment of distributions | 187 | 165 | 1,397 | 1,223 |
| Shares redeemed | (546) | (573) | (4,097) | (4,281) |
| Net increase (decrease) | 124 | 74 | $964 | $567 |
| Class C | | | | |
| Shares sold | 216 | 199 | $1,615 | $1,483 |
| Reinvestment of distributions | 65 | 73 | 488 | 544 |
| Shares redeemed | (613) | (769) | (4,572) | (5,721) |
| Net increase (decrease) | (332) | (497) | $(2,469) | $(3,694) |
| Fidelity High Income Fund | | | | |
| Shares sold | 32,505 | 36,311 | $243,092 | $272,258 |
| Reinvestment of distributions | 14,572 | 15,389 | 108,893 | 114,248 |
| Shares redeemed | (81,405) | (108,580) | (606,074) | (811,949) |
| Net increase (decrease) | (34,328) | (56,880) | $(254,089) | $(425,443) |
| Class I | | | | |
| Shares sold | 4,511 | 18,269 | $33,389 | $137,197 |
| Reinvestment of distributions | 483 | 555 | 3,617 | 4,118 |
| Shares redeemed | (12,288) | (14,626) | (90,920) | (109,771) |
| Net increase (decrease) | (7,294) | 4,198 | $(53,914) | $31,544 |
| Class Z | | | | |
| Shares sold | 4,381 | 3,793 | $33,183 | $27,871 |
| Reinvestment of distributions | 420 | 416 | 3,141 | 3,101 |
| Shares redeemed | (5,083) | (13,283) | (38,111) | (100,535) |
| Net increase (decrease) | (282) | (9,074) | $(1,787) | $(69,563) |
12. Other.
A fund's organizational documents provide former and current trustees and officers with a limited indemnification against liabilities arising in connection with the performance of their duties to the fund. In the normal course of business, a fund may also enter into contracts that provide general indemnifications. A fund's maximum exposure under these arrangements is unknown as this would be dependent on future claims that may be made against a fund. The risk of material loss from such claims is considered remote.
13. Litigation.
The Fund and other entities managed by FMR or its affiliates are involved with proceedings arising out of disputes in the United States Bankruptcy Court for the Southern District of Texas ("Bankruptcy Court"), relating to the In re Sanchez Energy Corporation chapter 11 bankruptcy case (Case No. 19-34508). A Bankruptcy Court-appointed representative of unsecured creditors asserted that eight million shares of Mesquite Energy, Inc. (formerly known as Sanchez Energy Corporation) (the "Company"), held in escrow pursuant to the terms of the Company's confirmed chapter 11 plan, should be awarded to the unsecured creditors instead of the Company's current equity holders, including the Fund, which were providers of debtor-in-possession financing to the Company during its chapter 11 case and holders of secured notes issued by the Company in 2018. The unsecured creditors also asserted that certain additional equity issued by the Company in 2020 in connection with two post-bankruptcy financings, also held by the Fund, is invalid. During August 2023, the Bankruptcy Court issued an opinion awarding a portion of the eight million shares to the unsecured creditors, diluting the value of the Fund's holdings in Mesquite. The Fund will appeal this decision. At this time, Management cannot determine any additional loss or dilution that may be realized. The Fund is also incurring legal costs in defending the disputes and has recovered a portion of these legal costs through an insurance claim.
14. Risk and Uncertainties.
Many factors affect a fund's performance. Developments that disrupt global economies and financial markets, such as pandemics, epidemics, outbreaks of infectious diseases, war, terrorism, and environmental disasters, may significantly affect a fund's investment performance. The effects of these developments to a fund will be impacted by the types of securities in which a fund invests, the financial condition, industry, economic sector, and geographic location of an issuer, and a fund's level of investment in the securities of that issuer. Significant concentrations in security types, issuers, industries, sectors, and geographic locations may magnify the factors that affect a fund's performance.
15. Proposed Reorganization.
The Board of Trustees of the Fund approved an Agreement and Plan of Reorganization (the Agreement) between the Fund and Fidelity Global High Income Fund. The Agreement provides for the transfer of all the assets and the assumption of all the liabilities of Fidelity Global High Income Fund in exchange for corresponding shares of the Fund equal in value to the net assets of Fidelity Global High Income Fund on the day the reorganization is effective. The reorganization provides shareholders of Fidelity Global High Income Fund access to a larger portfolio with a similar investment objective.
The reorganization does not require Fidelity Global High Income shareholder approval and is expected to become effective in September 2024. The reorganization is expected to qualify as a tax-free transaction for federal income tax purposes with no gain or loss recognized by the funds or their shareholders.
To the Board of Trustees of Fidelity Summer Street Trust and Shareholders of Fidelity High Income Fund
Opinion on the Financial Statements
We have audited the accompanying statement of assets and liabilities, including the schedule of investments, of Fidelity High Income Fund (one of the funds constituting Fidelity Summer Street Trust, referred to hereafter as the "Fund") as of April 30, 2024, the related statement of operations for the year ended April 30, 2024, the statement of changes in net assets for each of the two years in the period ended April 30, 2024, including the related notes, and the financial highlights for each of the five years in the period ended April 30, 2024 (collectively referred to as the "financial statements"). In our opinion, the financial statements present fairly, in all material respects, the financial position of the Fund as of April 30, 2024, the results of its operations for the year then ended, the changes in its net assets for each of the two years in the period ended April 30, 2024 and the financial highlights for each of the five years in the period ended April 30, 2024 in conformity with accounting principles generally accepted in the United States of America.
Basis for Opinion
These financial statements are the responsibility of the Fund's management. Our responsibility is to express an opinion on the Fund's financial statements based on our audits. We are a public accounting firm registered with the Public Company Accounting Oversight Board (United States) (PCAOB) and are required to be independent with respect to the Fund in accordance with the U.S. federal securities laws and the applicable rules and regulations of the Securities and Exchange Commission and the PCAOB.
We conducted our audits of these financial statements in accordance with the standards of the PCAOB. Those standards require that we plan and perform the audit to obtain reasonable assurance about whether the financial statements are free of material misstatement, whether due to error or fraud.
Our audits included performing procedures to assess the risks of material misstatement of the financial statements, whether due to error or fraud, and performing procedures that respond to those risks. Such procedures included examining, on a test basis, evidence regarding the amounts and disclosures in the financial statements. Our audits also included evaluating the accounting principles used and significant estimates made by management, as well as evaluating the overall presentation of the financial statements. Our procedures included confirmation of securities owned as of April 30, 2024 by correspondence with the custodian, issuers of privately offered securities, agent banks and brokers; when replies were not received from brokers, we performed other auditing procedures. We believe that our audits provide a reasonable basis for our opinion.
/s/ PricewaterhouseCoopers LLP
Boston, Massachusetts
June 14, 2024
We have served as the auditor of one or more investment companies in the Fidelity group of funds since 1932.
The Trustees, Members of the Advisory Board (if any), and officers of the trust and fund, as applicable, are listed below. The Board of Trustees governs the fund and is responsible for protecting the interests of shareholders. The Trustees are experienced executives who meet periodically throughout the year to oversee the fund's activities, review contractual arrangements with companies that provide services to the fund, oversee management of the risks associated with such activities and contractual arrangements, and review the fund's performance. Except for Vijay Advani, each of the Trustees oversees 323 funds. Mr. Advani oversees 216 funds.
The Trustees hold office without limit in time except that (a) any Trustee may resign; (b) any Trustee may be removed by written instrument, signed by at least two-thirds of the number of Trustees prior to such removal; (c) any Trustee who requests to be retired or who has become incapacitated by illness or injury may be retired by written instrument signed by a majority of the other Trustees; and (d) any Trustee may be removed at any special meeting of shareholders by a two-thirds vote of the outstanding voting securities of the trust. Each Trustee who is not an interested person (as defined in the 1940 Act) of the trust and the fund is referred to herein as an Independent Trustee. Each Independent Trustee shall retire not later than the last day of the calendar year in which his or her 75th birthday occurs. The Independent Trustees may waive this mandatory retirement age policy with respect to individual Trustees. Officers and Advisory Board Members hold office without limit in time, except that any officer or Advisory Board Member may resign or may be removed by a vote of a majority of the Trustees at any regular meeting or any special meeting of the Trustees. Except as indicated, each individual has held the office shown or other offices in the same company for the past five years.
The fund's Statement of Additional Information (SAI) includes more information about the Trustees. To request a free copy, call Fidelity at 1-800-544-8544 if you're an individual investing directly with Fidelity, call 1-800-835-5092 if you're a plan sponsor or participant with Fidelity as your recordkeeper or call 1-877-208-0098 on institutional accounts or if you're an advisor or invest through one.
Experience, Skills, Attributes, and Qualifications of the Trustees. The Governance and Nominating Committee has adopted a statement of policy that describes the experience, qualifications, attributes, and skills that are necessary and desirable for potential Independent Trustee candidates (Statement of Policy). The Board believes that each Trustee satisfied at the time he or she was initially elected or appointed a Trustee, and continues to satisfy, the standards contemplated by the Statement of Policy. The Governance and Nominating Committee also engages professional search firms to help identify potential Independent Trustee candidates who have the experience, qualifications, attributes, and skills consistent with the Statement of Policy. From time to time, additional criteria based on the composition and skills of the current Independent Trustees, as well as experience or skills that may be appropriate in light of future changes to board composition, business conditions, and regulatory or other developments, have also been considered by the professional search firms and the Governance and Nominating Committee. In addition, the Board takes into account the Trustees' commitment and participation in Board and committee meetings, as well as their leadership of standing and ad hoc committees throughout their tenure.
In determining that a particular Trustee was and continues to be qualified to serve as a Trustee, the Board has considered a variety of criteria, none of which, in isolation, was controlling. The Board believes that, collectively, the Trustees have balanced and diverse experience, qualifications, attributes, and skills, which allow the Board to operate effectively in governing the fund and protecting the interests of shareholders. Information about the specific experience, skills, attributes, and qualifications of each Trustee, which in each case led to the Board's conclusion that the Trustee should serve (or continue to serve) as a trustee of the fund, is provided below.
Board Structure and Oversight Function. Robert A. Lawrence is an interested person and currently serves as Chair. The Trustees have determined that an interested Chair is appropriate and benefits shareholders because an interested Chair has a personal and professional stake in the quality and continuity of services provided to the fund. Independent Trustees exercise their informed business judgment to appoint an individual of their choosing to serve as Chair, regardless of whether the Trustee happens to be independent or a member of management. The Independent Trustees have determined that they can act independently and effectively without having an Independent Trustee serve as Chair and that a key structural component for assuring that they are in a position to do so is for the Independent Trustees to constitute a substantial majority for the Board. The Independent Trustees also regularly meet in executive session. David M. Thomas serves as Lead Independent Trustee and as such (i) acts as a liaison between the Independent Trustees and management with respect to matters important to the Independent Trustees and (ii) with management prepares agendas for Board meetings.
Fidelity® funds are overseen by different Boards of Trustees. The fund's Board oversees Fidelity's high income and certain equity funds, and other Boards oversee Fidelity's alternative investment, investment-grade bond, money market, asset allocation, and other equity funds. The asset allocation funds may invest in Fidelity® funds overseen by the fund's Board. The use of separate Boards, each with its own committee structure, allows the Trustees of each group of Fidelity® funds to focus on the unique issues of the funds they oversee, including common research, investment, and operational issues. On occasion, the separate Boards establish joint committees to address issues of overlapping consequences for the Fidelity® funds overseen by each Board.
The Trustees operate using a system of committees to facilitate the timely and efficient consideration of all matters of importance to the Trustees, the fund, and fund shareholders and to facilitate compliance with legal and regulatory requirements and oversight of the fund's activities and associated risks. The Board, acting through its committees, has charged FMR and its affiliates with (i) identifying events or circumstances the occurrence of which could have demonstrably adverse effects on the fund's business and/or reputation; (ii) implementing processes and controls to lessen the possibility that such events or circumstances occur or to mitigate the effects of such events or circumstances if they do occur; and (iii) creating and maintaining a system designed to evaluate continuously business and market conditions in order to facilitate the identification and implementation processes described in (i) and (ii) above. Because the day-to-day operations and activities of the fund are carried out by or through FMR, its affiliates, and other service providers, the fund's exposure to risks is mitigated but not eliminated by the processes overseen by the Trustees. While each of the Board's committees has responsibility for overseeing different aspects of the fund's activities, oversight is exercised primarily through the Operations, Audit, and Compliance Committees. Appropriate personnel, including but not limited to the fund's Chief Compliance Officer (CCO), FMR's internal auditor, the independent accountants, the fund's Treasurer and portfolio management personnel, make periodic reports to the Board's committees, as appropriate, including an annual review of Fidelity's risk management program for the Fidelity® funds. The responsibilities of each standing committee, including their oversight responsibilities, are described further under "Standing Committees of the Trustees."
Interested Trustees*:
Correspondence intended for a Trustee who is an interested person may be sent to Fidelity Investments, 245 Summer Street, Boston, Massachusetts 02210.
Name, Year of Birth; Principal Occupations and Other Relevant Experience+
Bettina Doulton (1964)
Year of Election or Appointment: 2020
Trustee
Ms. Doulton also serves as Trustee of other Fidelity® funds. Prior to her retirement, Ms. Doulton served in a variety of positions at Fidelity Investments, including as a managing director of research (2006-2007), portfolio manager to certain Fidelity® funds (1993-2005), equity analyst and portfolio assistant (1990-1993), and research assistant (1987-1990). Ms. Doulton currently owns and operates Cellardoor Winery. Previously, Ms. Doulton served as a member of the Board of Brown Capital Management, LLC (2014-2018).
Robert A. Lawrence (1952)
Year of Election or Appointment: 2020
Trustee
Chair of the Board of Trustees
Mr. Lawrence also serves as Trustee of other funds. Previously, Mr. Lawrence served as a Trustee and Member of the Advisory Board of certain funds. Prior to his retirement in 2008, Mr. Lawrence served as Vice President of certain Fidelity® funds (2006-2008), Senior Vice President, Head of High Income Division of Fidelity Management & Research Company (investment adviser firm, 2006-2008), and President of Fidelity Strategic Investments (investment adviser firm, 2002-2005).
* Determined to be an "Interested Trustee" by virtue of, among other things, his or her affiliation with the trust or various entities under common control with FMR.
+ The information includes the Trustee's principal occupation during the last five years and other information relating to the experience, attributes, and skills relevant to the Trustee's qualifications to serve as a Trustee, which led to the conclusion that the Trustee should serve as a Trustee for the fund.
Independent Trustees:
Correspondence intended for an Independent Trustee may be sent to Fidelity Investments, P.O. Box 55235, Boston, Massachusetts 02205-5235.
Name, Year of Birth; Principal Occupations and Other Relevant Experience+
Vijay C. Advani (1960)
Year of Election or Appointment: 2023
Trustee
Mr. Advani also serves as Trustee or Member of the Advisory Board of other funds. Previously, Mr. Advani served as Executive Chairman (2020-2022), Chief Executive Officer (2017-2020) and Chief Operating Officer (2016-2017) of Nuveen (global investment manager). He also served in various capacities at Franklin Resources (global investment manager), including Co-President (2015-2016), Executive Vice President, Global Advisory Services (2008-2015), Head of Global Retail Distribution (2005-2008), Executive Managing Director, International Retail Development (2002-2005), Managing Director, Product Developments, Sales & Marketing, Asia, Eastern Europe and Africa (2000-2002) and President, Templeton Asset Management India (1995-2000). Mr. Advani also served as Senior Investment Officer of International Finance Corporation (private equity and venture capital arm of The World Bank, 1984-1995). Mr. Advani is Chairman Emeritus of the U.S. India Business Council (2018-present), a Director of The Global Impact Investing Network (2019-present), a Director of LOK Capital (Mauritius) (2022-present), a member of the Advisory Council of LOK Capital (2022-present), a Senior Advisor of Neuberger Berman (2021-present), a Senior Advisor of Seviora Holdings Pte. Ltd (Temasek-Singapore) (2021-present), a Director of Seviora Capital (Singapore) (2021-present) and an Advisor of EQUIAM (2021-present). Mr. Advani formerly served as a member of the Board of BowX Acquisition Corp. (special purpose acquisition company, 2020-2021), a member of the Board of Intellecap (advisory arm of The Aavishkaar Group, 2018-2020), a member of the Board of Nuveen Investments, Inc. (2017-2020) and a member of the Board of Docusign (software, 2016-2019).
Thomas P. Bostick (1956)
Year of Election or Appointment: 2021
Trustee
Lieutenant General Bostick also serves as Trustee of other Fidelity® funds. Prior to his retirement, General Bostick (United States Army, Retired) held a variety of positions within the U.S. Army, including Chief of Engineers and Commanding General, U.S. Army Corps of Engineers (2012-2016) and Deputy Chief of Staff and Director of Human Resources, U.S. Army (2009-2012). General Bostick currently serves as a member of the Board and Finance and Governance & Sustainability Committees of CSX Corporation (transportation, 2020-present) and a member of the Board and Corporate Governance and Nominating Committee of Perma-Fix Environmental Services, Inc. (nuclear waste management, 2020-present). General Bostick serves as Chief Executive Officer of Bostick Global Strategies, LLC (consulting, 2016-present), as a member of the Board of HireVue, Inc. (video interview and assessment, 2020-present), as a member of the Board of Allonnia (biotechnology and engineering solutions, 2022-present), on the Advisory Board of Hilco Redevelopment Partners (a real estate investment and redevelopment company, 2021-present), and on the Advisory Board of Solugen, Inc. (specialty bio-based chemicals manufacturer, 2022-present). Previously, General Bostick served as a Member of the Advisory Board of certain Fidelity® funds (2021), President, Intrexon Bioengineering (2018-2020) and Chief Operating Officer (2017-2020) and Senior Vice President of the Environment Sector (2016-2017) of Intrexon Corporation (biopharmaceutical company).
Donald F. Donahue (1950)
Year of Election or Appointment: 2018
Trustee
Mr. Donahue also serves as Trustee of other Fidelity® funds. Mr. Donahue serves as President and Chief Executive Officer of Miranda Partners, LLC (risk consulting for the financial services industry, 2012-present). Previously, Mr. Donahue served as Chief Executive Officer (2006-2012), Chief Operating Officer (2003-2006) and Managing Director, Customer Marketing and Development (1999-2003) of The Depository Trust & Clearing Corporation (financial markets infrastructure). Mr. Donahue currently serves as a member (2007-present) and Co-Chairman (2016-present) of the Board of United Way of New York. Mr. Donahue previously served as a member of the Advisory Board of certain Fidelity® funds (2015-2018) and as a member of the Board of The Leadership Academy (previously NYC Leadership Academy) (2012-2022).
Vicki L. Fuller (1957)
Year of Election or Appointment: 2020
Trustee
Ms. Fuller also serves as Trustee of other Fidelity® funds. Previously, Ms. Fuller served as a member of the Advisory Board of certain Fidelity® funds (2018-2020), Chief Investment Officer of the New York State Common Retirement Fund (2012-2018) and held a variety of positions at AllianceBernstein L.P. (global asset management, 1985-2012), including Managing Director (2006-2012) and Senior Vice President and Senior Portfolio Manager (2001-2006). Ms. Fuller currently serves as a member of the Board, Audit Committee, Compensation Committee and Nominating and Governance Committee of two Blackstone business development companies (2020-present), as a member of the Board of Treliant, LLC (consulting, 2019-present), as a member of the Board of Ariel Alternatives, LLC (private equity, 2022-present) and as a member of the Board and Chair of the Audit Committee of Gusto, Inc. (software, 2021-present). In addition, Ms. Fuller currently serves as a member of the Executive Board of New York University's Stern School of Business. Ms. Fuller previously served as a member of the Board of Roosevelt University (2019-2024) and member of the Board, Audit Committee and Nominating and Governance Committee of The Williams Companies, Inc. (natural gas infrastructure, 2018-2021).
Patricia L. Kampling (1959)
Year of Election or Appointment: 2020
Trustee
Ms. Kampling also serves as Trustee of other Fidelity® funds. Prior to her retirement, Ms. Kampling served as Chairman of the Board and Chief Executive Officer (2012-2019), President and Chief Operating Officer (2011-2012) and Executive Vice President and Chief Financial Officer (2010-2011) of Alliant Energy Corporation. Ms. Kampling currently serves as a member of the Board, Audit Committee and Governance, Compensation and Nominating Committee of Xcel Energy Inc. (utilities company, 2020-present) and as a member of the Board, Audit, Finance and Risk Committee and Safety, Environmental, Technology and Operations Committee and Chair of the Executive Development and Compensation Committee of American Water Works Company, Inc. (utilities company, 2019-present). In addition, Ms. Kampling currently serves as a member of the Board of the Nature Conservancy, Wisconsin Chapter (2019-present). Previously, Ms. Kampling served as a Member of the Advisory Board of certain Fidelity® funds (2020), a member of the Board, Compensation Committee and Executive Committee and Chair of the Audit Committee of Briggs & Stratton Corporation (manufacturing, 2011-2021), a member of the Board of Interstate Power and Light Company (2012-2019) and Wisconsin Power and Light Company (2012-2019) (each a subsidiary of Alliant Energy Corporation) and as a member of the Board and Workforce Development Committee of the Business Roundtable (2018-2019).
Thomas A. Kennedy (1955)
Year of Election or Appointment: 2021
Trustee
Mr. Kennedy also serves as Trustee of other Fidelity® funds. Previously, Mr. Kennedy served as a Member of the Advisory Board of certain Fidelity® funds (2020) and held a variety of positions at Raytheon Company (aerospace and defense, 1983-2020), including Chairman and Chief Executive Officer (2014-2020) and Executive Vice President and Chief Operating Officer (2013-2014). Mr. Kennedy served as Executive Chairman of the Board of Directors of Raytheon Technologies Corporation (aerospace and defense, 2020-2021). Mr. Kennedy serves as a Director of the Board of Directors of Textron Inc. (aerospace and defense, 2023-present).
Oscar Munoz (1959)
Year of Election or Appointment: 2021
Trustee
Mr. Munoz also serves as Trustee of other Fidelity® funds. Prior to his retirement, Mr. Munoz served as Executive Chairman (2020-2021), Chief Executive Officer (2015-2020), President (2015-2016) and a member of the Board (2010-2021) of United Airlines Holdings, Inc. Mr. Munoz currently serves as a member of the Board of CBRE Group, Inc. (commercial real estate, 2020-present), a member of the Board of Univision Communications, Inc. (Hispanic media, 2020-present), a member of the Board of Archer Aviation Inc. (2021-present), a member of the Defense Business Board of the United States Department of Defense (2021-present) and a member of the Board of Salesforce.com, Inc. (cloud-based software, 2022-present). Previously, Mr. Munoz served as a Member of the Advisory Board of certain Fidelity® funds (2021).
David M. Thomas (1949)
Year of Election or Appointment: 2008
Trustee
Lead Independent Trustee
Mr. Thomas also serves as Trustee of other Fidelity® funds. Previously, Mr. Thomas served as Executive Chairman (2005-2006) and Chairman and Chief Executive Officer (2000-2005) of IMS Health, Inc. (pharmaceutical and healthcare information solutions) and as a member of the Board of Fortune Brands Home and Security (home and security products, 2004-2023). Mr. Thomas currently serves as Director (2013-present) and Non-Executive Chairman of the Board (2022-present) of Interpublic Group of Companies, Inc. (marketing communication).
Susan Tomasky (1953)
Year of Election or Appointment: 2020
Trustee
Ms. Tomasky also serves as Trustee of other Fidelity® funds. Prior to her retirement, Ms. Tomasky served in various executive officer positions at American Electric Power Company, Inc. (1998-2011), including most recently as President of AEP Transmission (2007-2011). Ms. Tomasky currently serves as a member of the Board and Sustainability Committee and as Chair of the Audit Committee of Marathon Petroleum Corporation (2018-present) and as a member of the Board, Executive Committee, Corporate Governance Committee and Organization and Compensation Committee and as Lead Director of the Board of Public Service Enterprise Group, Inc. (utilities company, 2012-present) and as a member of the Board of its subsidiary company, Public Service Electric and Gas Co. (2021-present). In addition, Ms. Tomasky currently serves as a member (2009-present) and President (2020-present) of the Board of the Royal Shakespeare Company - America (2009-present) and as a member and Vice Chair of the Board of Kenyon College (2016-present). Previously, Ms. Tomasky served as a Member of the Advisory Board of certain Fidelity® funds (2020), as a member of the Board of the Columbus Association for the Performing Arts (2011-2023), as a member of the Board of the Columbus Regional Airport Authority (2007-2020), as a member of the Board (2011-2018) and Lead Independent Director (2015-2018) of Andeavor Corporation (previously Tesoro Corporation) (independent oil refiner and marketer) and as a member of the Board of Summit Midstream Partners LP (energy, 2012-2018).
Michael E. Wiley (1950)
Year of Election or Appointment: 2018
Trustee
Mr. Wiley also serves as Trustee of other Fidelity® funds. Previously, Mr. Wiley served as a member of the Advisory Board of certain Fidelity® funds (2018-2020), Chairman, President and CEO of Baker Hughes, Inc. (oilfield services, 2000-2004). Mr. Wiley also previously served as a member of the Board of Andeavor Corporation (independent oil refiner and marketer, 2005-2018), a member of the Board of Andeavor Logistics LP (natural resources logistics, 2015-2018) and a member of the Board of High Point Resources (exploration and production, 2005-2020).
+ The information includes the Trustee's principal occupation during the last five years and other information relating to the experience, attributes, and skills relevant to the Trustee's qualifications to serve as a Trustee, which led to the conclusion that the Trustee should serve as a Trustee for the fund.
Advisory Board Members and Officers:
Correspondence intended for a Member of the Advisory Board (if any) may be sent to Fidelity Investments, P.O. Box 55235, Boston, Massachusetts 02205-5235. Correspondence intended for an officer or Peter S. Lynch may be sent to Fidelity Investments, 245 Summer Street, Boston, Massachusetts 02210.
Name, Year of Birth; Principal Occupations+
Peter S. Lynch (1944)
Year of Election or Appointment: 2003
Member of the Advisory Board
Mr. Lynch also serves as a Member of the Advisory Board of other Fidelity® funds. Mr. Lynch is Vice Chairman and a Director of Fidelity Management & Research Company LLC (investment adviser firm). In addition, Mr. Lynch serves as a Trustee of Boston College and as the Chairman of the Inner-City Scholarship Fund. Previously, Mr. Lynch served as Vice Chairman and a Director of FMR Co., Inc. (investment adviser firm) and on the Special Olympics International Board of Directors (1997-2006).
Karen B. Peetz (1955)
Year of Election or Appointment: 2023
Member of the Advisory Board
Ms. Peetz also serves as a Member of the Advisory Board of other funds. Previously, Ms. Peetz served as Chief Administration Officer (2020-2023) of Citigroup Inc. (a diversified financial service company). She also served in various capacities at Bank of New York Mellon Corporation, including President (2013-2016), Vice Chairman, Senior Executive Vice President and Chief Executive Officer of Financial Markets & Treasury Services (2010-2013), Senior Executive Vice President and Chief Executive Officer of Global Corporate Trust (2003-2008), Senior Vice President and Division Manager of Global Payments & Trade Services (2002-2003) and Senior Vice President and Division Manager of Domestic Corporate Trust (1998-2002). Ms. Peetz also served in various capacities at Chase Manhattan Corporation (1982-1998), including Senior Vice President and Manager of Corporate Trust International Business (1996-1998), Managing Director and Manager of Corporate Trust Services (1994-1996) and Managing Director and Group Manager of Financial Institution Sales (1990-1993). Ms. Peetz currently serves as Chair of Amherst Holdings Advisory Council (2018-present), Trustee of Johns Hopkins University (2016-present), Chair of the Carey Business School Advisory Council, Member of the Johns Hopkins Medicine Board and Finance Committee and Chair of the Lyme and Tick Related Disease Institute Advisory Council. Ms. Peetz previously served as a member of the Board of Guardian Life Insurance Company of America (2019-2023), a member of the Board of Trane Technologies (2018-2022), a member of the Board of Wells Fargo Corp. (2017-2019), a member of the Board of SunCoke Energy Inc. (2012-2016), a member of the Board of Private Export Funding Corporation (2010-2016) and as a Trustee of Penn State University (2010-2014) and the United Way of New York City (2008-2010).
Heather Bonner (1977)
Year of Election or Appointment: 2023
Assistant Treasurer
Ms. Bonner also serves as an officer of other funds. Ms. Bonner is a Senior Vice President (2022-present) and is an employee of Fidelity Investments (2022-present). Ms. Bonner serves as Senior Vice President, Vice President, Treasurer, or Director of certain Fidelity entities. Prior to joining Fidelity, Ms. Bonner served as Managing Director at AQR Capital Management (2013-2022) and was the Treasurer and Principal Financial Officer of the AQR Funds (2013-2022).
Craig S. Brown (1977)
Year of Election or Appointment: 2022
Deputy Treasurer
Mr. Brown also serves as an officer of other funds. Mr. Brown is a Vice President (2015-present) and is an employee of Fidelity Investments. Mr. Brown serves as Assistant Treasurer of FIMM, LLC (2021-present). Previously, Mr. Brown served as Assistant Treasurer of certain Fidelity® funds (2019-2022).
John J. Burke III (1964)
Year of Election or Appointment: 2018
Chief Financial Officer
Mr. Burke also serves as Chief Financial Officer of other funds. Mr. Burke is Head of Fidelity Fund and Investment Operations (2018-present) and is an employee of Fidelity Investments. Mr. Burke serves as President, Executive Vice President, or Director of certain Fidelity entities. Previously Mr. Burke served as head of Asset Management Investment Operations (2012-2018).
Margaret Carey (1973)
Year of Election or Appointment: 2023
Secretary and Chief Legal Officer (CLO)
Ms. Carey also serves as an officer of other funds and as CLO of certain Fidelity entities. Ms. Carey is a Senior Vice President, Deputy General Counsel (2019-present) and is an employee of Fidelity Investments.
William C. Coffey (1969)
Year of Election or Appointment: 2019
Assistant Secretary
Mr. Coffey also serves as Assistant Secretary of other funds. Mr. Coffey is a Senior Vice President, Deputy General Counsel (2010-present) and is an employee of Fidelity Investments. Previously, Mr. Coffey served as Secretary and CLO of certain funds (2018-2019); CLO, Secretary, or Senior Vice President of certain Fidelity entities and Assistant Secretary of certain funds (2009-2018).
Timothy M. Cohen (1969)
Year of Election or Appointment: 2018
Vice President
Mr. Cohen also serves as Vice President of other funds. Mr. Cohen is Co-Head of Equity (2018-present) and is an employee of Fidelity Investments. Mr. Cohen serves as President or Director of certain Fidelity entities. Previously, Mr. Cohen served as Executive Vice President of Fidelity SelectCo, LLC (2019) and Head of Global Equity Research (2016-2018).
Jonathan Davis (1968)
Year of Election or Appointment: 2010
Assistant Treasurer
Mr. Davis also serves as an officer of other funds. Mr. Davis is a Vice President (2006-present) and is an employee of Fidelity Investments. Mr. Davis serves as Assistant Treasurer or Director of certain Fidelity entities.
Laura M. Del Prato (1964)
Year of Election or Appointment: 2018
Assistant Treasurer
Ms. Del Prato also serves as an officer of other funds. Ms. Del Prato is a Senior Vice President (2017-present) and is an employee of Fidelity Investments. Ms. Del Prato serves as Senior Vice President, Vice President, Assistant Treasurer, or Director of certain Fidelity entities. Previously, Ms. Del Prato served as President and Treasurer of The North Carolina Capital Management Trust: Cash Portfolio and Term Portfolio (2018-2020).
Colm A. Hogan (1973)
Year of Election or Appointment: 2020
Assistant Treasurer
Mr. Hogan also serves as an officer of other funds. Mr. Hogan is a Vice President (2016-present) and is an employee of Fidelity Investments. Mr. Hogan serves as Assistant Treasurer of certain Fidelity entities. Previously, Mr. Hogan served as Deputy Treasurer of certain Fidelity® funds (2016-2020) and Assistant Treasurer of certain Fidelity® funds (2016-2018).
Pamela R. Holding (1964)
Year of Election or Appointment: 2018
Vice President
Ms. Holding also serves as Vice President of other funds. Ms. Holding is Co-Head of Equity (2018-present) and is an employee of Fidelity Investments. Previously, Ms. Holding served as Executive Vice President of Fidelity SelectCo, LLC (2019) and as Chief Investment Officer of Fidelity Institutional Asset Management (2013-2018).
Chris Maher (1972)
Year of Election or Appointment: 2020
Deputy Treasurer
Mr. Maher also serves as an officer of other funds. Mr. Maher is a Vice President (2008-present) and is an employee of Fidelity Investments. Mr. Maher serves as Assistant Treasurer of certain Fidelity entities. Previously, Mr. Maher served as Assistant Treasurer of certain funds (2013-2020).
Jason P. Pogorelec (1975)
Year of Election or Appointment: 2020
Chief Compliance Officer
Mr. Pogorelec also serves as Chief Compliance Officer of other funds. Mr. Pogorelec is a Senior Vice President of Asset Management Compliance (2020-present) and is an employee of Fidelity Investments. Mr. Pogorelec serves as Compliance Officer of Fidelity Management & Research Company LLC (investment adviser firm, 2023-present) and Ballyrock Investment Advisors LLC (2023-present). Previously, Mr. Pogorelec served as a Vice President, Associate General Counsel for Fidelity Investments (2010-2020) and Assistant Secretary of certain Fidelity® funds (2015-2020).
Brett Segaloff (1972)
Year of Election or Appointment: 2021
Anti-Money Laundering (AML) Officer
Mr. Segaloff also serves as AML Officer of other funds. Mr. Segaloff is a Vice President (2022-present) and is an employee of Fidelity Investments. Mr. Segaloff serves as Anti Money Laundering Compliance Officer or Anti Money Laundering/Bank Secrecy Act Compliance Officer of certain Fidelity entities.
Stacie M. Smith (1974)
Year of Election or Appointment: 2016
President and Treasurer
Ms. Smith also serves as an officer of other funds. Ms. Smith is a Senior Vice President (2016-present) and is an employee of Fidelity Investments. Ms. Smith serves as Assistant Treasurer of certain Fidelity entities and has served in other fund officer roles.
Jim Wegmann (1979)
Year of Election or Appointment: 2019
Assistant Treasurer
Mr. Wegmann also serves as an officer of other funds. Mr. Wegmann is a Vice President (2016-present) and is an employee of Fidelity Investments. Mr. Wegmann serves as Assistant Treasurer of FIMM, LLC (2021-present). Previously, Mr. Wegmann served as Assistant Treasurer of certain Fidelity® funds (2019-2021).
+ The information includes principal occupation during the last five years.
As a shareholder, you incur two types of costs: (1) transaction costs, which may include sales charges (loads) on purchase payments or redemption proceeds, as applicable and (2) ongoing costs, which generally include management fees, distribution and/or service (12b-1) fees and other Fund expenses. This Example is intended to help you understand your ongoing costs (in dollars) of investing in a fund and to compare these costs with the ongoing costs of investing in other mutual funds.
| The Example is based on an investment of $1,000 invested at the beginning of the period and held for the entire period (November 1, 2023 to April 30, 2024). |
Actual Expenses
The first line of the accompanying table provides information about actual account values and actual expenses. You may use the information in this line, together with the amount you invested, to estimate the expenses that you paid over the period. Simply divide your account value by $1,000.00 (for example, an $8,600 account value divided by $1,000.00 = 8.6), then multiply the result by the number in the first line for a class/Fund under the heading entitled "Expenses Paid During Period" to estimate the expenses you paid on your account during this period. If any fund is a shareholder of any underlying mutual funds or exchange-traded funds (ETFs) (the Underlying Funds), such fund indirectly bears its proportional share of the expenses of the Underlying Funds in addition to the direct expenses incurred presented in the table. These fees and expenses are not included in the annualized expense ratio used to calculate the expense estimate in the table below.
Hypothetical Example for Comparison Purposes
The second line of the accompanying table provides information about hypothetical account values and hypothetical expenses based on the actual expense ratio and an assumed rate of return of 5% per year before expenses, which is not the actual return. The hypothetical account values and expenses may not be used to estimate the actual ending account balance or expenses you paid for the period. You may use this information to compare the ongoing costs of investing in the Fund and other funds. To do so, compare this 5% hypothetical example with the 5% hypothetical examples that appear in the shareholder reports of the other funds. If any fund is a shareholder of any Underlying Funds, such fund indirectly bears its proportional share of the expenses of the Underlying Funds in addition to the direct expenses as presented in the table. These fees and expenses are not included in the annualized expense ratio used to calculate the expense estimate in the table below.
Please note that the expenses shown in the table are meant to highlight your ongoing costs only and do not reflect any transaction costs. Therefore, the second line of the table is useful in comparing ongoing costs only, and will not help you determine the relative total costs of owning different funds. In addition, if these transactional costs were included, your costs would have been higher.
| | | | | Annualized Expense Ratio- A | | Beginning Account Value November 1, 2023 | | Ending Account Value April 30, 2024 | | Expenses Paid During Period- C November 1, 2023 to April 30, 2024 |
| Fidelity® High Income Fund | | | | | | | | | | |
Class A ** | | | | 1.03% | | | | | | |
| Actual | | | | | | $ 1,000 | | $ 1,096.30 | | $ 5.37 |
Hypothetical-B | | | | | | $ 1,000 | | $ 1,019.74 | | $ 5.17 |
Class M ** | | | | 1.04% | | | | | | |
| Actual | | | | | | $ 1,000 | | $ 1,096.30 | | $ 5.42 |
Hypothetical-B | | | | | | $ 1,000 | | $ 1,019.69 | | $ 5.22 |
| Class C | | | | 1.80% | | | | | | |
| Actual | | | | | | $ 1,000 | | $ 1,090.60 | | $ 9.36 |
Hypothetical-B | | | | | | $ 1,000 | | $ 1,015.91 | | $ 9.02 |
Fidelity® High Income Fund ** | | | | .74% | | | | | | |
| Actual | | | | | | $ 1,000 | | $ 1,097.80 | | $ 3.86 |
Hypothetical-B | | | | | | $ 1,000 | | $ 1,021.18 | | $ 3.72 |
Class I ** | | | | .82% | | | | | | |
| Actual | | | | | | $ 1,000 | | $ 1,095.90 | | $ 4.27 |
Hypothetical-B | | | | | | $ 1,000 | | $ 1,020.79 | | $ 4.12 |
Class Z ** | | | | .70% | | | | | | |
| Actual | | | | | | $ 1,000 | | $ 1,098.20 | | $ 3.65 |
Hypothetical-B | | | | | | $ 1,000 | | $ 1,021.38 | | $ 3.52 |
| |
A Annualized expense ratio reflects expenses net of applicable fee waivers.
B 5% return per year before expenses
C Expenses are equal to the annualized expense ratio, multiplied by the average account value over the period, multiplied by 182/ 366 (to reflect the one-half year period). The fees and expenses of any Underlying Funds are not included in each annualized expense ratio.
** If fees and changes to the expense contract and/or expense cap, effective March 1, 2024, had been in effect during the entire current period, the restated annualized expense ratio and the expenses paid in the actual and hypothetical examples above would have been as shown in table below:
| | | | | Annualized Expense Ratio- A | | Expenses Paid |
| Fidelity® High Income Fund | | | | | | |
| Class A | | | | .96% | | |
| Actual | | | | | | $ 5.00 |
Hypothetical- B | | | | | | $ 4.82 |
| Class M | | | | .96% | | |
| Actual | | | | | | $ 5.00 |
Hypothetical- B | | | | | | $ 4.82 |
| Fidelity® High Income Fund | | | | .67% | | |
| Actual | | | | | | $ 3.50 |
Hypothetical- B | | | | | | $ 3.37 |
| Class I | | | | .71% | | |
| Actual | | | | | | $ 3.70 |
Hypothetical- B | | | | | | $ 3.57 |
| Class Z | | | | .60% | | |
| Actual | | | | | | $ 3.13 |
Hypothetical- B | | | | | | $ 3.02 |
| | | | | | | |
| A Annualized expense ratio reflects expenses net of applicable fee waivers. | | | | | | |
| B 5% return per year before expenses | | | | | | |
The dividend and capital gains distributions for the fund(s) are available on Fidelity.com or Institutional.Fidelity.com.
A total of 0.13% of the dividends distributed during the fiscal year was derived from interest on U.S. Government securities which is generally exempt from state income tax.
The fund designates $118,491,890 of distributions paid in the calendar year 2023 as qualifying to be taxed as interest-related dividends for nonresident alien shareholders.
The fund designates $154,652,582 of distributions paid during the fiscal year ended 2024 as qualifying to be taxed as section 163(j) interest dividends.
The fund will notify shareholders in January 2025 of amounts for use in preparing 2024 income tax returns.
Board Approval of Investment Advisory Contracts
Fidelity High Income Fund
At its January 2024 meeting, the Board of Trustees, including the Independent Trustees (together, the Board), approved an amended and restated management contract with Fidelity Management & Research Company LLC (FMR) (the Management Contract), and amended and restated sub-advisory agreements (the Sub-Advisory Contracts, and together with the Management Contract, the Advisory Contracts) for the fund, including the fund's sub-advisory agreements with FMR Investment Management (UK) Limited (FMR UK), Fidelity Management & Research (Hong Kong) Limited (FMR H.K.), and Fidelity Management & Research (Japan) Limited (FMR Japan). The Advisory Contracts will be effective March 1, 2024. The Board will consider the annual renewal of the fund's Advisory Contracts in May 2024, following its review of additional materials provided by FMR.
Management Contract. The Board approved the Management Contract, which implements a new fee structure combining the management fee, transfer agent fee (TA Fee), and pricing and bookkeeping fee (P&B Fee) of the fund and each class into a single class-level fee based on tiered schedules and subject to a maximum class-level rate (the Unified Fee). In exchange for the Unified Fee, the fund will receive investment advisory, management, administrative, transfer agent, pricing and bookkeeping services under a single agreement - the Management Contract.
In its consideration of the Management Contract over several meetings, the Board received, reviewed and discussed a comprehensive set of analyses regarding the Unified Fee including (i) the legal framework, (ii) design goals for the Unified Fee, (iii) calculation methodology for the Unified Fee and illustrative examples, (iv) annual and cumulative projected impacts under various scenarios, both in the aggregate and at the fund/class level, (v) explanations of schedules, rate levers and maximum rates and (vi) shareholder benefits and projected savings.
The Board considered that the maximum Unified Fee for each class of the fund would be no higher than the sum of (i) the lowest contractual management fee rate under the fund's existing management contract, which is the individual fund fee rate, if any, plus the lowest contractual marginal group fee rate and (ii) the TA and P&B Fee rates, which are fixed fee rates since December 1, 2023 (together, the Unified Fee Cap). The Board noted that Fidelity has represented that, as a result of this Unified Fee Cap, the Unified Fee would be no greater than the fee rates previously authorized to be charged to the fund for the same services. The Board noted that certain expenses such as third-party expenses, Rule 12b-1 fees, and certain other miscellaneous expenses would be outside the scope of the Unified Fee and the calculation of such fees would not change as a result of the Unified Fee. The Board considered that, under the Management Contract, a different management fee rate will be applicable to each class of the fund. The Board noted that Fidelity has represented that the difference in expenses between classes is based on differences in class-specific expenses and not due to any difference in advisory or third-party custodial fees or other expenses related to the management of the fund's assets.
The Board considered Fidelity's representations that implementation of the Unified Fee, which includes the Unified Fee Cap, would cause all funds subject to the Unified Fee, including the fund, to experience an immediate reduction on contractual fee rates for services provided under the current management contracts. The Board considered that some funds would not experience lower net total fees as a result of existing fee caps. The Board further considered that, in addition to the contractual fee savings, the Unified Fee offers funds and their shareholders greater protection from future rate increases for services previously offered under separate agreements that are now covered by the Management Contract because such rate increases would require shareholder approval.
Sub-Advisory Contracts. In connection with the Unified Fee changes, the Board considered the Sub-Advisory Contracts, which simplified the calculation of the fees paid by FMR to the sub-advisers under the agreements. The Board noted that the agreements with FMR UK, FMR H.K., and FMR Japan were amended to provide that FMR will compensate each sub-adviser at a fee rate equal to 110% of the sub-adviser's costs incurred in providing services under the agreement. The Board considered that, under the Sub-Advisory Contracts, FMR, and not the fund, will continue to pay the sub-advisory fees to each applicable sub-adviser.
The Board further considered that the approval of the fund's Advisory Contracts will not result in any changes in the investment process or strategies employed in the management of the fund's assets or the day-to-day management of the fund or the persons primarily responsible for such management. Further, the Board considered that the Management Contract would not change the obligations and services of FMR and its affiliates on behalf of the fund, and, in particular, there would be no change in the nature and level of advisory, management, administration, transfer agent, and pricing and bookkeeping services provided to the fund by FMR, its affiliates, and each applicable sub-adviser.
In connection with its consideration of future renewals of the fund's Advisory Contracts, the Board will consider: (i) the nature, extent and quality of services provided to the funds, including shareholder and administrative services and investment performance; (ii) the competitiveness of the management fee and total expenses for the fund; (iii) the costs of the services and profitability, including the revenues earned and the expenses incurred in conducting the business of developing, marketing, distributing, managing, administering, and servicing the fund and its shareholders, to the extent applicable; and (iv) whether there have been economies of scale in respect of the Fidelity funds, whether the Fidelity funds (including the fund) have appropriately benefited from any such economies of scale, and whether there is the potential for realization of any further economies.
Based on its evaluation of all of the conclusions and representations noted above, and after considering all factors it believed relevant, the Board concluded that the fund's management fee structure is fair and reasonable, and that the fund's Advisory Contracts should be approved.
The Securities and Exchange Commission adopted Rule 22e-4 under the Investment Company Act of 1940 (the Liquidity Rule) to promote effective liquidity risk management throughout the open-end investment company industry, thereby reducing the risk that funds will be unable to meet their redemption obligations and mitigating dilution of the interests of fund shareholders.
The Fund has adopted and implemented a liquidity risk management program (the Program) reasonably designed to assess and manage the Fund's liquidity risk and to comply with the requirements of the Liquidity Rule. The Fund's Board of Trustees (the Board) has designated the Fund's investment adviser as administrator of the Program. The Fidelity advisers have established a Liquidity Risk Management Committee (the LRM Committee) to manage the Program for each of the Fidelity Funds. The LRM Committee monitors the adequacy and effectiveness of implementation of the Program and on a periodic basis assesses each Fund's liquidity risk based on a variety of factors including (1) the Fund's investment strategy, (2) portfolio liquidity and cash flow projections during normal and reasonably foreseeable stressed conditions, (3) shareholder redemptions, (4) borrowings and other funding sources and (5) certain factors specific to ETFs including the effect of the Fund's prices and spreads, market participants, and basket compositions on the overall liquidity of the Fund's portfolio, as applicable.
In accordance with the Program, each of the Fund's portfolio investments is classified into one of four defined liquidity categories based on a determination of a reasonable expectation for how long it would take to convert the investment to cash (or sell or dispose of the investment) without significantly changing its market value.
- Highly liquid investments - cash or convertible to cash within three business days or less
- Moderately liquid investments - convertible to cash in three to seven calendar days
- Less liquid investments - can be sold or disposed of, but not settled, within seven calendar days
- Illiquid investments - cannot be sold or disposed of within seven calendar days
Liquidity classification determinations take into account a variety of factors including various market, trading and investment-specific considerations, as well as market depth, and generally utilize analysis from a third-party liquidity metrics service.
The Liquidity Rule places a 15% limit on a fund's illiquid investments and requires funds that do not primarily hold assets that are highly liquid investments to determine and maintain a minimum percentage of the fund's net assets to be invested in highly liquid investments (highly liquid investment minimum or HLIM). The Program includes provisions reasonably designed to comply with the 15% limit on illiquid investments and for determining, periodically reviewing and complying with the HLIM requirement as applicable.
At a recent meeting of the Fund's Board of Trustees, the LRM Committee provided a written report to the Board pertaining to the operation, adequacy, and effectiveness of the Program for the period December 1, 2022 through November 30, 2023. The report concluded that the Program is operating effectively and is reasonably designed to assess and manage the Fund's liquidity risk.
1.703464.126
SPH-ANN-0624
Fidelity® Capital & Income Fund
Annual Report
April 30, 2024
Contents
To view a fund's proxy voting guidelines and proxy voting record for the 12-month period ended June 30, visit http://www.fidelity.com/proxyvotingresults or visit the Securities and Exchange Commission's (SEC) web site at http://www.sec.gov.
You may also call 1-800-544-8544 to request a free copy of the proxy voting guidelines.
Standard & Poor's, S&P and S&P 500 are registered service marks of The McGraw-Hill Companies, Inc. and have been licensed for use by Fidelity Distributors Corporation.
Other third-party marks appearing herein are the property of their respective owners.
All other marks appearing herein are registered or unregistered trademarks or service marks of FMR LLC or an affiliated company. © 2024 FMR LLC. All rights reserved.
This report and the financial statements contained herein are submitted for the general information of the shareholders of the Fund. This report is not authorized for distribution to prospective investors in the Fund unless preceded or accompanied by an effective prospectus.
A fund files its complete schedule of portfolio holdings with the SEC for the first and third quarters of each fiscal year on Form N-PORT. Forms N-PORT are available on the SEC's web site at http://www.sec.gov. A fund's Forms N-PORT may be reviewed and copied at the SEC's Public Reference Room in Washington, DC. Information regarding the operation of the SEC's Public Reference Room may be obtained by calling 1-800-SEC-0330.
For a complete list of a fund's portfolio holdings, view the most recent holdings listing, semiannual report, or annual report on Fidelity's web site at http://www.fidelity.com, http://www.institutional.fidelity.com, or http://www.401k.com, as applicable.
NOT FDIC INSURED •MAY LOSE VALUE •NO BANK GUARANTEE
Neither the Fund nor Fidelity Distributors Corporation is a bank.
Average annual total return reflects the change in the value of an investment, assuming reinvestment of distributions from dividend income and capital gains (the profits earned upon the sale of securities that have grown in value, if any) and assuming a constant rate of performance each year. The hypothetical investment and the average annual total returns do not reflect the deduction of taxes that a shareholder would pay on fund distributions or the redemption of fund shares. During periods of reimbursement by Fidelity, a fund's total return will be greater than it would be had the reimbursement not occurred. How a fund did yesterday is no guarantee of how it will do tomorrow.
| Average Annual Total Returns |
| | | | |
Periods ended April 30, 2024 | Past 1 year | Past 5 years | Past 10 years |
| Fidelity® Capital & Income Fund | 10.91% | 6.18% | 6.04% |
| $10,000 Over 10 Years |
| |
Let's say hypothetically that $10,000 was invested in Fidelity® Capital & Income Fund on April 30, 2014. The chart shows how the value of your investment would have changed, and also shows how the ICE® BofA® US High Yield Constrained Index performed over the same period. |
|
|
Market Recap:
High-yield bonds gained 8.89% for the 12 months ending April 30, 2024, according to the ICE BofA® US High Yield Constrained Index, driven by resilient corporate profits and the Federal Reserve's likely pivot to cutting interest rates later this year. Amid this favorable backdrop for higher-risk assets, the index advanced fairly steadily for most the period, highlighted by an especially strong final two months of 2023, when the index rose 8.72%. Following the Federal Reserve's November 1 meeting, when the central bank hinted it might be done raising rates, the high-yield index reversed a two-month decline that was due to soaring yields on longer-term government bonds and mixed earnings from some big and influential firms. High yield continued to advance in 2024 but lost some of its momentum, gaining 1.51% through March, as the central bank held steady its benchmark federal funds rate and affirmed its projection to cut in 2024. The index slipped in April (-1%), when inflation remained stickier than expected. For the full 12 months, all 18 industries within the index advanced, with retail (+14%) leading, followed by financial services (+12%) and banking (+11%), which benefited from high interest rates. Energy, the largest segment in the high-yield index this period, gained 10%. Conversely, the telecommunications (+4%) group lagged most, followed by utility, capital goods and transportation (+6% each).
Comments from Co-Managers Mark Notkin and Brian Chang:
For the fiscal year, the fund gained 10.91%, versus 8.89% for the benchmark ICE BofA US High Yield Constrained Index. The fund's core investment in high-yield bonds increased 8.86% and modestly detracted from performance versus the benchmark. By industry, security selection was the primary relative contributor, led by technology & electronics, capital goods, and energy. Our choices and an underweight in media also helped. The top individual relative contributor was a non-benchmark stake in Nvidia (+185%). This period we increased our stake in Nvidia. The second-largest relative contributor was a non-benchmark stake in Meta Platforms (+78%). An overweight in Vistra Operations (+31%) also helped. Vistra Operations was among the largest holdings at period end. In contrast, the biggest detractors from performance versus the benchmark were our choices in leisure, health care and automotive. The fund's position in cash also hurt. A fund's non-benchmark stake in Mesquite Energy returned roughly -47% and was the biggest individual relative detractor. A second notable relative detractor was an underweight in Carvana (+82%). An overweight in Boyd Gaming (-15%) also hurt. Notable changes in positioning include increased exposure to the technology & electronics industry and a lower allocation to media.
The views expressed above reflect those of the portfolio manager(s) only through the end of the period as stated on the cover of this report and do not necessarily represent the views of Fidelity or any other person in the Fidelity organization. Any such views are subject to change at any time based upon market or other conditions and Fidelity disclaims any responsibility to update such views. These views may not be relied on as investment advice and, because investment decisions for a Fidelity fund are based on numerous factors, may not be relied on as an indication of trading intent on behalf of any Fidelity fund.
| Top Bond Issuers (% of Fund's net assets) |
(with maturities greater than one year) |
| TransDigm, Inc. | 2.3 | |
| Energy Transfer LP | 1.9 | |
| Bank of America Corp. | 1.8 | |
| Ally Financial, Inc. | 1.4 | |
| JPMorgan Chase & Co. | 1.4 | |
| Tenet Healthcare Corp. | 1.2 | |
| Carnival Corp. | 1.1 | |
| Clydesdale Acquisition Holdings, Inc. | 1.0 | |
| Uber Technologies, Inc. | 1.0 | |
| LBM Acquisition LLC | 0.9 | |
| | 14.0 | |
| |
| Market Sectors (% of Fund's net assets) |
| |
| Technology | 15.6 | |
| Energy | 10.7 | |
| Banks & Thrifts | 9.7 | |
| Services | 5.9 | |
| Healthcare | 4.6 | |
| |
Quality Diversification (% of Fund's net assets) |
|
Percentages shown as 0.0% may reflect amounts less than 0.05%. |
| |
| We have used ratings from Moody's Investors Service, Inc. Where Moody's® ratings are not available, we have used S&P® ratings. All ratings are as of the date indicated and do not reflect subsequent changes. |
Asset Allocation (% of Fund's net assets) |
|
|
Showing Percentage of Net Assets
| Corporate Bonds - 55.9% |
| | | Principal Amount (a) (000s) | Value ($) (000s) |
| Convertible Bonds - 1.1% | | | |
| Broadcasting - 0.5% | | | |
| DISH Network Corp.: | | | |
| 0% 12/15/25 | | 37,425 | 27,227 |
| 3.375% 8/15/26 | | 53,665 | 32,736 |
| | | | 59,963 |
| Diversified Financial Services - 0.1% | | | |
| Coinbase Global, Inc. 0.25% 4/1/30 (b) | | 8,566 | 7,736 |
| New Cotai LLC 5% 2/24/27 (c) | | 4,239 | 9,445 |
| | | | 17,181 |
| Technology - 0.5% | | | |
| Wolfspeed, Inc. 1.875% 12/1/29 | | 106,282 | 61,059 |
TOTAL CONVERTIBLE BONDS | | | 138,203 |
| Nonconvertible Bonds - 54.8% | | | |
| Aerospace - 3.1% | | | |
| ATI, Inc.: | | | |
| 4.875% 10/1/29 | | 6,080 | 5,661 |
| 5.125% 10/1/31 | | 5,395 | 4,915 |
| Bombardier, Inc.: | | | |
| 6% 2/15/28 (b) | | 6,075 | 5,924 |
| 7.125% 6/15/26 (b) | | 9,394 | 9,494 |
| 7.25% 7/1/31 (b) | | 6,080 | 6,095 |
| 7.875% 4/15/27 (b) | | 18,970 | 18,852 |
| 8.75% 11/15/30 (b) | | 9,040 | 9,618 |
| Kaiser Aluminum Corp. 4.625% 3/1/28 (b) | | 11,215 | 10,442 |
| Moog, Inc. 4.25% 12/15/27 (b) | | 3,455 | 3,225 |
| Rolls-Royce PLC 5.75% 10/15/27 (b) | | 10,870 | 10,751 |
| TransDigm, Inc.: | | | |
| 4.625% 1/15/29 | | 38,080 | 34,881 |
| 4.875% 5/1/29 | | 25,000 | 22,995 |
| 5.5% 11/15/27 | | 124,228 | 120,656 |
| 6.375% 3/1/29 (b) | | 15,065 | 14,950 |
| 6.625% 3/1/32 (b) | | 6,065 | 6,055 |
| 6.75% 8/15/28 (b) | | 27,225 | 27,395 |
| 6.875% 12/15/30 (b) | | 47,905 | 48,231 |
| 7.125% 12/1/31 (b) | | 12,085 | 12,316 |
| Triumph Group, Inc. 9% 3/15/28 (b) | | 8,013 | 8,297 |
| VistaJet Malta Finance PLC / XO Management Holding, Inc. 9.5% 6/1/28 (b) | | 8,905 | 7,974 |
| | | | 388,727 |
| Air Transportation - 1.4% | | | |
| Air Canada 3.875% 8/15/26 (b) | | 9,105 | 8,637 |
| Allegiant Travel Co. 7.25% 8/15/27 (b) | | 8,870 | 8,573 |
| American Airlines, Inc.: | | | |
| 7.25% 2/15/28 (b) | | 19,595 | 19,706 |
| 8.5% 5/15/29 (b) | | 20,045 | 20,880 |
| American Airlines, Inc. / AAdvantage Loyalty IP Ltd. 5.75% 4/20/29 (b) | | 29,825 | 28,803 |
| Hawaiian Brand Intellectual Property Ltd. / HawaiianMiles Loyalty Ltd. 5.75% 1/20/26 (b) | | 22,205 | 20,826 |
| Rand Parent LLC 8.5% 2/15/30 (b) | | 14,880 | 14,715 |
| Spirit Loyalty Cayman Ltd. / Spirit IP Cayman Ltd.: | | | |
| 8% 9/20/25 (b) | | 2,960 | 2,312 |
| 8% 9/20/25 (b) | | 7,779 | 6,076 |
| United Airlines, Inc.: | | | |
| 4.375% 4/15/26 (b) | | 30,025 | 28,881 |
| 4.625% 4/15/29 (b) | | 18,025 | 16,612 |
| | | | 176,021 |
| Automotive & Auto Parts - 1.2% | | | |
| Adient Global Holdings Ltd. 7% 4/15/28 (b) | | 5,935 | 5,996 |
| Allison Transmission, Inc. 5.875% 6/1/29 (b) | | 7,960 | 7,757 |
| Arko Corp. 5.125% 11/15/29 (b) | | 9,105 | 7,337 |
| Aston Martin Capital Holdings Ltd. 10% 3/31/29 (b) | | 9,125 | 8,885 |
| Clarios Global LP / Clarios U.S. Finance Co. 6.75% 5/15/28 (b) | | 11,885 | 11,909 |
| Dana, Inc.: | | | |
| 4.25% 9/1/30 | | 8,870 | 7,685 |
| 4.5% 2/15/32 | | 9,135 | 7,750 |
| LCM Investments Holdings 8.25% 8/1/31 (b) | | 7,185 | 7,464 |
| Macquarie AirFinance Holdings: | | | |
| 6.4% 3/26/29 (b) | | 4,205 | 4,193 |
| 6.5% 3/26/31 (b) | | 6,430 | 6,435 |
| 8.125% 3/30/29 (b) | | 8,990 | 9,401 |
| McLaren Finance PLC 7.5% 8/1/26 (b) | | 8,290 | 7,200 |
| Nesco Holdings II, Inc. 5.5% 4/15/29 (b) | | 14,525 | 13,520 |
| Rivian Holdco & Rivian LLC & Rivian Automotive LLC CME Term SOFR 6 Month Index + 6.020% 11.3101% 10/15/26 (b)(d)(e) | | 13,055 | 12,859 |
| Tenneco, Inc. 8% 11/17/28 (b) | | 17,960 | 16,781 |
| Wand NewCo 3, Inc. 7.625% 1/30/32 (b) | | 12,115 | 12,316 |
| | | | 147,488 |
| Banks & Thrifts - 1.5% | | | |
| Ally Financial, Inc.: | | | |
| 8% 11/1/31 | | 20,638 | 22,240 |
| 8% 11/1/31 | | 144,500 | 156,446 |
| Jane Street Group LLC/JSG Finance, Inc. 4.5% 11/15/29 (b) | | 8,740 | 7,950 |
| | | | 186,636 |
| Broadcasting - 0.9% | | | |
| DISH Network Corp. 11.75% 11/15/27 (b) | | 41,575 | 41,909 |
| Scripps Escrow II, Inc. 3.875% 1/15/29 (b) | | 2,820 | 2,083 |
| Sirius XM Radio, Inc.: | | | |
| 3.875% 9/1/31 (b) | | 12,130 | 9,755 |
| 4% 7/15/28 (b) | | 10,140 | 9,039 |
| 5% 8/1/27 (b) | | 8,280 | 7,820 |
| Univision Communications, Inc.: | | | |
| 4.5% 5/1/29 (b) | | 12,060 | 10,491 |
| 7.375% 6/30/30 (b) | | 39,140 | 37,480 |
| | | | 118,577 |
| Building Materials - 0.7% | | | |
| Advanced Drain Systems, Inc.: | | | |
| 5% 9/30/27 (b) | | 2,325 | 2,251 |
| 6.375% 6/15/30 (b) | | 6,050 | 6,015 |
| Brundage-Bone Concrete Pumping Holdings, Inc. 6% 2/1/26 (b) | | 6,555 | 6,452 |
| James Hardie International Finance Ltd. 5% 1/15/28 (b) | | 4,136 | 3,976 |
| MITER Brands Acquisition Holdco, Inc. / MIWD Borrower LLC 6.75% 4/1/32 (b) | | 9,120 | 9,057 |
| MIWD Holdco II LLC / MIWD Finance Corp. 5.5% 2/1/30 (b) | | 4,125 | 3,736 |
| Smyrna Ready Mix Concrete LLC 8.875% 11/15/31 (b) | | 24,115 | 25,397 |
| SRS Distribution, Inc.: | | | |
| 4.625% 7/1/28 (b) | | 11,605 | 11,562 |
| 6.125% 7/1/29 (b) | | 4,870 | 4,942 |
| Summit Materials LLC/Summit Materials Finance Corp.: | | | |
| 5.25% 1/15/29 (b) | | 10,525 | 10,113 |
| 7.25% 1/15/31 (b) | | 9,155 | 9,384 |
| | | | 92,885 |
| Cable/Satellite TV - 0.3% | | | |
| CCO Holdings LLC/CCO Holdings Capital Corp. 5.375% 6/1/29 (b) | | 6,650 | 5,857 |
| DISH DBS Corp. 5.75% 12/1/28 (b) | | 15,220 | 10,278 |
| VZ Secured Financing BV 5% 1/15/32 (b) | | 24,310 | 20,477 |
| Ziggo BV 4.875% 1/15/30 (b) | | 7,990 | 6,992 |
| | | | 43,604 |
| Capital Goods - 0.2% | | | |
| ATS Corp. 4.125% 12/15/28 (b) | | 7,895 | 7,098 |
| Chart Industries, Inc. 7.5% 1/1/30 (b) | | 15,680 | 16,038 |
| | | | 23,136 |
| Chemicals - 1.5% | | | |
| Compass Minerals International, Inc. 6.75% 12/1/27 (b) | | 24,600 | 23,070 |
| Consolidated Energy Finance SA 12% 2/15/31 (b) | | 9,700 | 10,040 |
| Ingevity Corp. 3.875% 11/1/28 (b) | | 11,105 | 9,881 |
| LSB Industries, Inc. 6.25% 10/15/28 (b) | | 21,105 | 20,007 |
| NOVA Chemicals Corp. 8.5% 11/15/28 (b) | | 8,160 | 8,577 |
| Olympus Water U.S. Holding Corp.: | | | |
| 4.25% 10/1/28 (b) | | 15,305 | 13,791 |
| 7.125% 10/1/27 (b) | | 7,080 | 7,170 |
| 9.75% 11/15/28 (b) | | 30,040 | 31,876 |
| SCIH Salt Holdings, Inc. 4.875% 5/1/28 (b) | | 7,820 | 7,271 |
| SCIL IV LLC / SCIL U.S.A. Holdings LLC 5.375% 11/1/26 (b) | | 14,015 | 13,451 |
| Tronox, Inc. 4.625% 3/15/29 (b) | | 13,295 | 11,860 |
| W.R. Grace Holding LLC: | | | |
| 5.625% 8/15/29 (b) | | 28,310 | 25,352 |
| 7.375% 3/1/31 (b) | | 5,940 | 6,021 |
| | | | 188,367 |
| Consumer Products - 1.0% | | | |
| Angi Group LLC 3.875% 8/15/28 (b) | | 5,530 | 4,670 |
| Foundation Building Materials, Inc. 6% 3/1/29 (b) | | 5,845 | 5,151 |
| Gannett Holdings LLC 6% 11/1/26 (b) | | 8,785 | 8,118 |
| HFC Prestige Products, Inc./HFC Prestige International U.S. LLC 4.75% 1/15/29 (b) | | 8,760 | 8,166 |
| PetSmart, Inc. / PetSmart Finance Corp.: | | | |
| 4.75% 2/15/28 (b) | | 16,195 | 14,946 |
| 7.75% 2/15/29 (b) | | 17,680 | 16,805 |
| Spectrum Brands Holdings, Inc. 3.875% 3/15/31 (b) | | 8,380 | 7,842 |
| Tempur Sealy International, Inc.: | | | |
| 3.875% 10/15/31 (b) | | 15,965 | 13,144 |
| 4% 4/15/29 (b) | | 15,925 | 14,158 |
| The Scotts Miracle-Gro Co. 4% 4/1/31 | | 11,945 | 10,062 |
| TKC Holdings, Inc. 6.875% 5/15/28 (b) | | 20,025 | 18,903 |
| Windsor Holdings III, LLC 8.5% 6/15/30 (b) | | 5,960 | 6,207 |
| | | | 128,172 |
| Containers - 0.5% | | | |
| Crown Cork & Seal, Inc.: | | | |
| 7.375% 12/15/26 | | 4,845 | 5,000 |
| 7.5% 12/15/96 | | 12,871 | 13,257 |
| Graham Packaging Co., Inc. 7.125% 8/15/28 (b) | | 6,000 | 5,420 |
| Graphic Packaging International, Inc. 3.75% 2/1/30 (b) | | 7,880 | 6,856 |
| Intelligent Packaging Ltd. Finco, Inc. 6% 9/15/28 (b) | | 4,230 | 4,032 |
| Mauser Packaging Solutions Holding Co. 7.875% 4/15/27 (b) | | 11,865 | 12,087 |
| Sealed Air Corp./Sealed Air Corp. U.S. 6.125% 2/1/28 (b) | | 5,935 | 5,863 |
| Trident TPI Holdings, Inc. 12.75% 12/31/28 (b) | | 5,870 | 6,352 |
| | | | 58,867 |
| Diversified Financial Services - 2.2% | | | |
| Broadstreet Partners, Inc. 5.875% 4/15/29 (b) | | 15,505 | 14,130 |
| Coinbase Global, Inc.: | | | |
| 3.375% 10/1/28 (b) | | 29,675 | 24,878 |
| 3.625% 10/1/31 (b) | | 18,050 | 14,075 |
| Compass Group Diversified Holdings LLC: | | | |
| 5% 1/15/32 (b) | | 6,090 | 5,366 |
| 5.25% 4/15/29 (b) | | 17,730 | 16,574 |
| Fortress Transportation & Infrastructure Investors LLC 7.875% 12/1/30 (b) | | 9,065 | 9,416 |
| Hightower Holding LLC 6.75% 4/15/29 (b) | | 5,945 | 5,580 |
| Icahn Enterprises LP/Icahn Enterprises Finance Corp.: | | | |
| 4.375% 2/1/29 | | 11,165 | 9,399 |
| 5.25% 5/15/27 | | 38,210 | 34,914 |
| 6.25% 5/15/26 | | 24,085 | 23,424 |
| 6.375% 12/15/25 | | 8,305 | 8,156 |
| MSCI, Inc. 4% 11/15/29 (b) | | 3,245 | 2,932 |
| OneMain Finance Corp.: | | | |
| 4% 9/15/30 | | 5,610 | 4,719 |
| 5.375% 11/15/29 | | 9,400 | 8,693 |
| 6.625% 1/15/28 | | 7,305 | 7,282 |
| 6.875% 3/15/25 | | 19,480 | 19,608 |
| 7.125% 3/15/26 | | 50,145 | 50,601 |
| 7.875% 3/15/30 | | 6,055 | 6,178 |
| Williams Scotsman, Inc. 7.375% 10/1/31 (b) | | 5,990 | 6,119 |
| | | | 272,044 |
| Energy - 8.0% | | | |
| Altus Midstream LP 5.875% 6/15/30 (b) | | 9,060 | 8,760 |
| Antero Midstream Partners LP/Antero Midstream Finance Corp.: | | | |
| 5.375% 6/15/29 (b) | | 9,060 | 8,621 |
| 5.75% 1/15/28 (b) | | 17,645 | 17,269 |
| Atlantica Sustainable Infrastructure PLC 4.125% 6/15/28 (b) | | 7,820 | 7,081 |
| Borr IHC Ltd. / Borr Finance Ltd.: | | | |
| 10% 11/15/28 (b) | | 9,015 | 9,333 |
| 10.375% 11/15/30 (b) | | 3,005 | 3,106 |
| CGG SA 8.75% 4/1/27 (b) | | 11,985 | 11,215 |
| Chesapeake Energy Corp.: | | | |
| 5.875% 2/1/29 (b) | | 5,840 | 5,726 |
| 6.75% 4/15/29 (b) | | 8,995 | 8,988 |
| 7% (c)(f) | | 6,915 | 0 |
| 8% (c)(f) | | 2,132 | 0 |
| 8% (c)(f) | | 3,385 | 0 |
| Citgo Petroleum Corp.: | | | |
| 6.375% 6/15/26 (b) | | 8,760 | 8,746 |
| 7% 6/15/25 (b) | | 22,045 | 22,022 |
| 8.375% 1/15/29 (b) | | 26,350 | 27,269 |
| Civitas Resources, Inc. 8.625% 11/1/30 (b) | | 12,020 | 12,791 |
| CNX Midstream Partners LP 4.75% 4/15/30 (b) | | 6,435 | 5,695 |
| CNX Resources Corp.: | | | |
| 6% 1/15/29 (b) | | 5,345 | 5,179 |
| 7.375% 1/15/31 (b) | | 5,930 | 6,003 |
| Comstock Resources, Inc.: | | | |
| 5.875% 1/15/30 (b) | | 32,085 | 29,222 |
| 6.75% 3/1/29 (b) | | 20,060 | 19,099 |
| CQP Holdco LP / BIP-V Chinook Holdco LLC: | | | |
| 5.5% 6/15/31 (b) | | 27,225 | 25,018 |
| 7.5% 12/15/33 (b) | | 16,090 | 16,189 |
| CrownRock LP/CrownRock Finance, Inc. 5% 5/1/29 (b) | | 5,055 | 4,980 |
| CVR Energy, Inc.: | | | |
| 5.75% 2/15/28 (b) | | 22,655 | 21,051 |
| 8.5% 1/15/29 (b) | | 42,375 | 42,480 |
| Delek Logistics Partners LP/Delek Logistics Finance Corp. 7.125% 6/1/28 (b) | | 17,655 | 17,244 |
| Diamond Foreign Asset Co. / Diamond Finance, LLC 8.5% 10/1/30 (b) | | 5,990 | 6,265 |
| DT Midstream, Inc.: | | | |
| 4.125% 6/15/29 (b) | | 9,070 | 8,221 |
| 4.375% 6/15/31 (b) | | 9,070 | 8,052 |
| Endeavor Energy Resources LP/EER Finance, Inc. 5.75% 1/30/28 (b) | | 21,251 | 21,526 |
| Energy Transfer LP: | | | |
| 5.5% 6/1/27 | | 16,735 | 16,652 |
| 5.625% 5/1/27 (b) | | 18,015 | 17,838 |
| 5.75% 4/1/25 | | 4,790 | 4,781 |
| 6% 2/1/29 (b) | | 25,785 | 25,750 |
| 7.375% 2/1/31 (b) | | 5,000 | 5,156 |
| EnLink Midstream LLC 6.5% 9/1/30 (b) | | 17,745 | 17,968 |
| Global Partners LP/GLP Finance Corp. 8.25% 1/15/32 (b) | | 7,505 | 7,688 |
| Gran Tierra Energy, Inc. 9.5% 10/15/29 (b) | | 7,555 | 7,090 |
| Hess Midstream Operations LP: | | | |
| 4.25% 2/15/30 (b) | | 9,875 | 8,912 |
| 5.125% 6/15/28 (b) | | 11,235 | 10,754 |
| 5.5% 10/15/30 (b) | | 6,060 | 5,794 |
| 5.625% 2/15/26 (b) | | 15,535 | 15,360 |
| HF Sinclair Corp.: | | | |
| 5% 2/1/28 (b) | | 7,615 | 7,306 |
| 6.375% 4/15/27 (b) | | 6,050 | 6,051 |
| Hilcorp Energy I LP/Hilcorp Finance Co. 6.25% 11/1/28 (b) | | 12,280 | 12,099 |
| Howard Midstream Energy Partners LLC 8.875% 7/15/28 (b) | | 14,895 | 15,601 |
| Jonah Energy Parent LLC 12% 11/5/25 (c)(g) | | 6,742 | 7,198 |
| MEG Energy Corp. 7.125% 2/1/27 (b) | | 6,731 | 6,782 |
| Mesquite Energy, Inc. 7.25% (b)(c)(f) | | 21,977 | 0 |
| Nabors Industries Ltd. 7.5% 1/15/28 (b) | | 9,715 | 9,211 |
| Nabors Industries, Inc. 9.125% 1/31/30 (b) | | 12,085 | 12,462 |
| New Fortress Energy, Inc. 6.75% 9/15/25 (b) | | 5,307 | 5,242 |
| Noble Finance II LLC 8% 4/15/30 (b) | | 5,935 | 6,115 |
| Northern Oil & Gas, Inc.: | | | |
| 8.125% 3/1/28 (b) | | 6,005 | 6,075 |
| 8.75% 6/15/31 (b) | | 11,950 | 12,570 |
| NuStar Logistics LP 6% 6/1/26 | | 12,025 | 11,932 |
| Occidental Petroleum Corp. 7.2% 3/15/29 | | 3,964 | 4,119 |
| PBF Holding Co. LLC/PBF Finance Corp.: | | | |
| 6% 2/15/28 | | 27,530 | 26,850 |
| 7.875% 9/15/30 (b) | | 18,055 | 18,569 |
| Permian Resources Operating LLC 5.875% 7/1/29 (b) | | 8,645 | 8,407 |
| Seadrill Finance Ltd. 8.375% 8/1/30 (b) | | 11,920 | 12,418 |
| Sitio Royalties OP / Sitio Finance Corp. 7.875% 11/1/28 (b) | | 15,045 | 15,471 |
| SM Energy Co.: | | | |
| 5.625% 6/1/25 | | 6,330 | 6,283 |
| 6.625% 1/15/27 | | 21,320 | 21,211 |
| 6.75% 9/15/26 | | 4,550 | 4,549 |
| Southern Natural Gas Co. LLC: | | | |
| 7.35% 2/15/31 | | 23,497 | 24,194 |
| 8% 3/1/32 | | 12,475 | 13,905 |
| Southwestern Energy Co.: | | | |
| 5.375% 3/15/30 | | 12,145 | 11,533 |
| 5.7% 1/23/25 (h) | | 244 | 243 |
| Suburban Propane Partners LP/Suburban Energy Finance Corp. 5% 6/1/31 (b) | | 12,070 | 10,722 |
| Sunnova Energy Corp.: | | | |
| 5.875% 9/1/26 (b) | | 3,020 | 1,878 |
| 11.75% 10/1/28 (b) | | 18,140 | 10,830 |
| Sunoco LP/Sunoco Finance Corp.: | | | |
| 4.5% 5/15/29 | | 10,170 | 9,285 |
| 4.5% 4/30/30 | | 12,185 | 10,965 |
| 7% 9/15/28 (b) | | 5,990 | 6,075 |
| Tallgrass Energy Partners LP / Tallgrass Energy Finance Corp.: | | | |
| 5.5% 1/15/28 (b) | | 595 | 565 |
| 6% 3/1/27 (b) | | 5,935 | 5,781 |
| 6% 9/1/31 (b) | | 11,485 | 10,663 |
| Talos Production, Inc.: | | | |
| 9% 2/1/29 (b) | | 5,340 | 5,634 |
| 9.375% 2/1/31 (b) | | 6,055 | 6,453 |
| Targa Resources Partners LP/Targa Resources Partners Finance Corp. 4.875% 2/1/31 | | 10,360 | 9,696 |
| Teine Energy Ltd. 6.875% 4/15/29 (b) | | 8,990 | 8,734 |
| Transocean Titan Finance Ltd. 8.375% 2/1/28 (b) | | 12,289 | 12,615 |
| Transocean, Inc.: | | | |
| 8% 2/1/27 (b) | | 7,668 | 7,687 |
| 8.25% 5/15/29 (b) | | 4,565 | 4,549 |
| 8.5% 5/15/31 (b) | | 4,565 | 4,544 |
| 8.75% 2/15/30 (b) | | 21,272 | 22,179 |
| Unit Corp. 0% 12/1/29 (c) | | 2,202 | 0 |
| Valaris Ltd. 8.375% 4/30/30 (b) | | 5,985 | 6,155 |
| Venture Global Calcasieu Pass LLC: | | | |
| 3.875% 8/15/29 (b) | | 7,585 | 6,702 |
| 4.125% 8/15/31 (b) | | 7,585 | 6,620 |
| 6.25% 1/15/30 (b) | | 23,810 | 23,541 |
| | | | 1,009,163 |
| Environmental - 0.8% | | | |
| Clean Harbors, Inc. 6.375% 2/1/31 (b) | | 4,960 | 4,914 |
| Covanta Holding Corp.: | | | |
| 4.875% 12/1/29 (b) | | 26,475 | 23,208 |
| 5% 9/1/30 | | 13,761 | 11,874 |
| Darling Ingredients, Inc. 6% 6/15/30 (b) | | 13,885 | 13,488 |
| GFL Environmental, Inc.: | | | |
| 4% 8/1/28 (b) | | 9,105 | 8,253 |
| 4.75% 6/15/29 (b) | | 12,095 | 11,158 |
| 6.75% 1/15/31 (b) | | 8,975 | 9,048 |
| Madison IAQ LLC: | | | |
| 4.125% 6/30/28 (b) | | 11,390 | 10,566 |
| 5.875% 6/30/29 (b) | | 9,085 | 8,429 |
| | | | 100,938 |
| Food & Drug Retail - 1.1% | | | |
| Albertsons Companies LLC/Safeway, Inc./New Albertson's, Inc./Albertson's LLC: | | | |
| 3.5% 3/15/29 (b) | | 36,160 | 31,906 |
| 4.625% 1/15/27 (b) | | 25,300 | 24,174 |
| 4.875% 2/15/30 (b) | | 44,700 | 41,692 |
| Murphy Oil U.S.A., Inc.: | | | |
| 3.75% 2/15/31 (b) | | 5,300 | 4,550 |
| 4.75% 9/15/29 | | 6,860 | 6,387 |
| 5.625% 5/1/27 | | 6,030 | 5,950 |
| Parkland Corp.: | | | |
| 4.5% 10/1/29 (b) | | 8,995 | 8,152 |
| 4.625% 5/1/30 (b) | | 12,175 | 11,003 |
| | | | 133,814 |
| Food/Beverage/Tobacco - 1.6% | | | |
| BellRing Brands, Inc. 7% 3/15/30 (b) | | 14,740 | 14,916 |
| C&S Group Enterprises LLC 5% 12/15/28 (b) | | 8,615 | 6,605 |
| Chobani LLC/Finance Corp., Inc. 4.625% 11/15/28 (b) | | 6,285 | 5,817 |
| Fiesta Purchaser, Inc. 7.875% 3/1/31 (b) | | 11,455 | 11,672 |
| KeHE Distributor / Nextwave 9% 2/15/29 (b) | | 21,910 | 22,123 |
| Lamb Weston Holdings, Inc.: | | | |
| 4.125% 1/31/30 (b) | | 12,150 | 10,829 |
| 4.375% 1/31/32 (b) | | 6,075 | 5,265 |
| Performance Food Group, Inc.: | | | |
| 4.25% 8/1/29 (b) | | 8,495 | 7,615 |
| 5.5% 10/15/27 (b) | | 8,855 | 8,571 |
| Post Holdings, Inc.: | | | |
| 4.5% 9/15/31 (b) | | 47,500 | 41,765 |
| 4.625% 4/15/30 (b) | | 15,630 | 14,116 |
| 5.5% 12/15/29 (b) | | 21,040 | 19,953 |
| Simmons Foods, Inc. 4.625% 3/1/29 (b) | | 8,340 | 7,196 |
| Triton Water Holdings, Inc. 6.25% 4/1/29 (b) | | 6,360 | 5,703 |
| U.S. Foods, Inc.: | | | |
| 4.625% 6/1/30 (b) | | 7,520 | 6,838 |
| 7.25% 1/15/32 (b) | | 5,990 | 6,116 |
| United Natural Foods, Inc. 6.75% 10/15/28 (b) | | 7,750 | 5,948 |
| | | | 201,048 |
| Gaming - 1.7% | | | |
| Affinity Interactive 6.875% 12/15/27 (b) | | 1,310 | 1,173 |
| Boyd Gaming Corp. 4.75% 6/15/31 (b) | | 15,120 | 13,389 |
| Caesars Entertainment, Inc. 7% 2/15/30 (b) | | 17,800 | 17,925 |
| Churchill Downs, Inc.: | | | |
| 5.75% 4/1/30 (b) | | 14,970 | 14,245 |
| 6.75% 5/1/31 (b) | | 11,880 | 11,794 |
| Fertitta Entertainment LLC / Fertitta Entertainment Finance Co., Inc.: | | | |
| 4.625% 1/15/29 (b) | | 25,865 | 23,398 |
| 6.75% 1/15/30 (b) | | 34,295 | 29,838 |
| Jacobs Entertainment, Inc. 6.75% 2/15/29 (b) | | 8,585 | 8,144 |
| Light & Wonder International, Inc. 7.5% 9/1/31 (b) | | 5,990 | 6,109 |
| Melco Resorts Finance Ltd. 5.75% 7/21/28 (b) | | 2,485 | 2,300 |
| MGM Resorts International 4.75% 10/15/28 | | 11,125 | 10,377 |
| Ontario Gaming Gta LP/Otg Co.-I 8% 8/1/30 (b) | | 12,285 | 12,473 |
| Premier Entertainment Sub LLC: | | | |
| 5.625% 9/1/29 (b) | | 13,730 | 10,235 |
| 5.875% 9/1/31 (b) | | 2,100 | 1,508 |
| Station Casinos LLC 4.625% 12/1/31 (b) | | 9,135 | 8,007 |
| Studio City Finance Ltd. 5% 1/15/29 (b) | | 5,700 | 4,888 |
| VICI Properties LP / VICI Note Co.: | | | |
| 3.875% 2/15/29 (b) | | 11,195 | 10,157 |
| 4.25% 12/1/26 (b) | | 21,450 | 20,467 |
| 4.625% 12/1/29 (b) | | 12,240 | 11,355 |
| | | | 217,782 |
| Healthcare - 4.0% | | | |
| 180 Medical, Inc. 3.875% 10/15/29 (b) | | 6,495 | 5,751 |
| Avantor Funding, Inc. 3.875% 11/1/29 (b) | | 6,075 | 5,379 |
| Bausch + Lomb Corp. 8.375% 10/1/28 (b) | | 11,980 | 12,372 |
| Bausch Health Companies, Inc.: | | | |
| 4.875% 6/1/28 (b) | | 17,445 | 11,269 |
| 5.75% 8/15/27 (b) | | 18,030 | 12,441 |
| 6.125% 2/1/27 (b) | | 31,505 | 23,077 |
| 11% 9/30/28 (b) | | 5,140 | 4,012 |
| Cano Health, Inc. 6.25% (b)(f) | | 4,050 | 5 |
| Charles River Laboratories International, Inc.: | | | |
| 3.75% 3/15/29 (b) | | 10,515 | 9,446 |
| 4% 3/15/31 (b) | | 12,085 | 10,541 |
| 4.25% 5/1/28 (b) | | 3,400 | 3,162 |
| Community Health Systems, Inc.: | | | |
| 4.75% 2/15/31 (b) | | 21,790 | 17,008 |
| 5.25% 5/15/30 (b) | | 18,245 | 14,917 |
| 6% 1/15/29 (b) | | 8,490 | 7,407 |
| 6.125% 4/1/30 (b) | | 21,795 | 15,409 |
| 8% 3/15/26 (b) | | 19,026 | 18,933 |
| 10.875% 1/15/32 (b) | | 19,370 | 19,831 |
| DaVita, Inc.: | | | |
| 3.75% 2/15/31 (b) | | 4,180 | 3,440 |
| 4.625% 6/1/30 (b) | | 31,515 | 27,611 |
| Grifols SA 4.75% 10/15/28 (b) | | 6,075 | 4,906 |
| HealthEquity, Inc. 4.5% 10/1/29 (b) | | 6,410 | 5,838 |
| IQVIA, Inc. 5% 5/15/27 (b) | | 12,070 | 11,652 |
| Jazz Securities DAC 4.375% 1/15/29 (b) | | 12,305 | 11,195 |
| ModivCare Escrow Issuer, Inc. 5% 10/1/29 (b) | | 7,010 | 4,870 |
| Modivcare, Inc. 5.875% 11/15/25 (b) | | 8,105 | 7,905 |
| Molina Healthcare, Inc.: | | | |
| 3.875% 11/15/30 (b) | | 10,465 | 9,076 |
| 3.875% 5/15/32 (b) | | 12,160 | 10,175 |
| 4.375% 6/15/28 (b) | | 7,525 | 6,979 |
| Organon & Co. / Organon Foreign Debt Co-Issuer BV: | | | |
| 4.125% 4/30/28 (b) | | 21,010 | 19,135 |
| 5.125% 4/30/31 (b) | | 18,260 | 15,789 |
| Owens & Minor, Inc. 4.5% 3/31/29 (b) | | 8,310 | 7,450 |
| Radiology Partners, Inc. 8.5% 1/31/29 pay-in-kind (b)(d) | | 9,327 | 8,604 |
| Tenet Healthcare Corp.: | | | |
| 4.25% 6/1/29 | | 17,640 | 16,158 |
| 4.375% 1/15/30 | | 43,755 | 39,732 |
| 5.125% 11/1/27 | | 18,070 | 17,481 |
| 6.125% 6/15/30 | | 30,025 | 29,402 |
| 6.25% 2/1/27 | | 35,815 | 35,671 |
| 6.75% 5/15/31 (b) | | 6,005 | 6,017 |
| Teva Pharmaceutical Finance Netherlands III BV: | | | |
| 4.75% 5/9/27 | | 6,085 | 5,834 |
| 5.125% 5/9/29 | | 6,085 | 5,764 |
| 7.875% 9/15/29 | | 5,935 | 6,250 |
| | | | 507,894 |
| Homebuilders/Real Estate - 1.8% | | | |
| Arcosa, Inc. 4.375% 4/15/29 (b) | | 8,410 | 7,655 |
| Ashton Woods U.S.A. LLC/Ashton Woods Finance Co. 4.625% 4/1/30 (b) | | 8,940 | 7,989 |
| Brookfield Residential Properties, Inc./Brookfield Residential U.S. Corp. 4.875% 2/15/30 (b) | | 7,775 | 6,729 |
| Century Communities, Inc. 3.875% 8/15/29 (b) | | 9,110 | 7,954 |
| Greystar Real Estate Partners 7.75% 9/1/30 (b) | | 5,305 | 5,464 |
| LGI Homes, Inc. 8.75% 12/15/28 (b) | | 6,060 | 6,304 |
| MPT Operating Partnership LP/MPT Finance Corp.: | | | |
| 3.5% 3/15/31 | | 11,190 | 7,503 |
| 4.625% 8/1/29 | | 18,080 | 13,529 |
| 5% 10/15/27 | | 38,043 | 31,118 |
| Panther Escrow Issuer LLC 7.125% 6/1/31 (b) | | 21,230 | 21,340 |
| Shea Homes Ltd. Partnership/Corp. 4.75% 4/1/29 | | 8,020 | 7,357 |
| Taylor Morrison Communities, Inc./Monarch Communities, Inc.: | | | |
| 5.125% 8/1/30 (b) | | 10,725 | 9,987 |
| 5.875% 6/15/27 (b) | | 9,260 | 9,117 |
| TopBuild Corp. 3.625% 3/15/29 (b) | | 5,910 | 5,306 |
| TRI Pointe Group, Inc./TRI Pointe Holdings, Inc. 5.875% 6/15/24 | | 16,130 | 16,111 |
| TRI Pointe Homes, Inc. 5.7% 6/15/28 | | 14,380 | 13,918 |
| Uniti Group LP/Uniti Group Finance, Inc./CSL Capital LLC: | | | |
| 4.75% 4/15/28 (b) | | 31,410 | 27,548 |
| 6.5% 2/15/29 (b) | | 14,000 | 11,255 |
| 10.5% 2/15/28 (b) | | 4,785 | 4,964 |
| Weekley Homes LLC/Weekley Finance Corp. 4.875% 9/15/28 (b) | | 5,045 | 4,614 |
| | | | 225,762 |
| Hotels - 0.5% | | | |
| Carnival Holdings (Bermuda) Ltd. 10.375% 5/1/28 (b) | | 17,635 | 19,121 |
| Hilton Domestic Operating Co., Inc.: | | | |
| 3.75% 5/1/29 (b) | | 5,595 | 5,019 |
| 4% 5/1/31 (b) | | 8,395 | 7,356 |
| 4.875% 1/15/30 | | 6,900 | 6,486 |
| 5.875% 4/1/29 (b) | | 8,555 | 8,442 |
| 6.125% 4/1/32 (b) | | 11,955 | 11,785 |
| Hilton Worldwide Finance LLC/Hilton Worldwide Finance Corp. 4.875% 4/1/27 | | 8,435 | 8,203 |
| | | | 66,412 |
| Insurance - 2.2% | | | |
| Acrisure LLC / Acrisure Finance, Inc.: | | | |
| 6% 8/1/29 (b) | | 9,105 | 8,238 |
| 8.25% 2/1/29 (b) | | 28,450 | 28,216 |
| 10.125% 8/1/26 (b) | | 1,800 | 1,859 |
| Alliant Holdings Intermediate LLC/Alliant Holdings Co.-Issuer: | | | |
| 4.25% 10/15/27 (b) | | 11,125 | 10,377 |
| 5.875% 11/1/29 (b) | | 9,115 | 8,370 |
| 6.75% 10/15/27 (b) | | 49,965 | 48,997 |
| 6.75% 4/15/28 (b) | | 35,177 | 35,140 |
| 7% 1/15/31 (b) | | 10,385 | 10,418 |
| AmWINS Group, Inc. 4.875% 6/30/29 (b) | | 8,805 | 8,004 |
| AssuredPartners, Inc.: | | | |
| 5.625% 1/15/29 (b) | | 8,355 | 7,619 |
| 7.5% 2/15/32 (b) | | 6,065 | 5,889 |
| GTCR AP Finance, Inc. 8% 5/15/27 (b) | | 6,010 | 6,012 |
| HUB International Ltd.: | | | |
| 5.625% 12/1/29 (b) | | 36,135 | 33,258 |
| 7.25% 6/15/30 (b) | | 38,895 | 39,466 |
| 7.375% 1/31/32 (b) | | 15,140 | 15,001 |
| MGIC Investment Corp. 5.25% 8/15/28 | | 7,710 | 7,401 |
| USI, Inc. 7.5% 1/15/32 (b) | | 8,005 | 7,962 |
| | | | 282,227 |
| Leisure - 1.9% | | | |
| Boyne U.S.A., Inc. 4.75% 5/15/29 (b) | | 6,360 | 5,787 |
| Carnival Corp.: | | | |
| 4% 8/1/28 (b) | | 56,090 | 51,283 |
| 7% 8/15/29 (b) | | 6,075 | 6,236 |
| 7.625% 3/1/26 (b) | | 19,665 | 19,787 |
| Merlin Entertainments PLC 5.75% 6/15/26 (b) | | 7,725 | 7,633 |
| NCL Corp. Ltd. 5.875% 2/15/27 (b) | | 12,100 | 11,820 |
| Royal Caribbean Cruises Ltd.: | | | |
| 5.375% 7/15/27 (b) | | 9,125 | 8,880 |
| 6.25% 3/15/32 (b) | | 12,110 | 11,938 |
| 7.25% 1/15/30 (b) | | 5,940 | 6,108 |
| 8.25% 1/15/29 (b) | | 32,435 | 34,224 |
| 9.25% 1/15/29 (b) | | 34,425 | 36,764 |
| SeaWorld Parks & Entertainment, Inc. 5.25% 8/15/29 (b) | | 12,145 | 11,199 |
| Vail Resorts, Inc. 6.25% 5/15/25 (b) | | 6,250 | 6,253 |
| Viking Ocean Cruises Ship VII Ltd. 5.625% 2/15/29 (b) | | 4,965 | 4,751 |
| Voc Escrow Ltd. 5% 2/15/28 (b) | | 19,690 | 18,778 |
| | | | 241,441 |
| Metals/Mining - 1.5% | | | |
| Alcoa Nederland Holding BV: | | | |
| 4.125% 3/31/29 (b) | | 15,485 | 14,152 |
| 6.125% 5/15/28 (b) | | 3,565 | 3,540 |
| 7.125% 3/15/31 (b) | | 4,970 | 5,027 |
| Arsenal AIC Parent LLC 8% 10/1/30 (b) | | 7,040 | 7,330 |
| Cleveland-Cliffs, Inc.: | | | |
| 4.625% 3/1/29 (b) | | 23,720 | 21,949 |
| 4.875% 3/1/31 (b) | | 11,440 | 10,022 |
| 6.75% 4/15/30 (b) | | 3,000 | 2,929 |
| Eldorado Gold Corp. 6.25% 9/1/29 (b) | | 13,719 | 12,947 |
| ERO Copper Corp. 6.5% 2/15/30 (b) | | 9,085 | 8,545 |
| First Quantum Minerals Ltd.: | | | |
| 8.625% 6/1/31 (b) | | 21,965 | 21,360 |
| 9.375% 3/1/29 (b) | | 14,250 | 14,723 |
| FMG Resources Pty Ltd.: | | | |
| 4.375% 4/1/31 (b) | | 8,990 | 7,915 |
| 4.5% 9/15/27 (b) | | 9,015 | 8,502 |
| HudBay Minerals, Inc. 4.5% 4/1/26 (b) | | 7,020 | 6,789 |
| Mineral Resources Ltd.: | | | |
| 8% 11/1/27 (b) | | 6,040 | 6,109 |
| 8.125% 5/1/27 (b) | | 18,015 | 18,184 |
| 8.5% 5/1/30 (b) | | 4,475 | 4,583 |
| 9.25% 10/1/28 (b) | | 10,605 | 11,118 |
| Murray Energy Corp.: | | | |
| 11.25% (b)(c)(f) | | 8,915 | 0 |
| 12% pay-in-kind (b)(c)(d)(f) | | 10,343 | 0 |
| | | | 185,724 |
| Paper - 0.7% | | | |
| Ardagh Metal Packaging Finance U.S.A. LLC/Ardagh Metal Packaging Finance PLC: | | | |
| 3.25% 9/1/28 (b) | | 5,915 | 5,123 |
| 4% 9/1/29 (b) | | 11,830 | 9,752 |
| 6% 6/15/27 (b) | | 6,045 | 5,860 |
| Cascades, Inc.: | | | |
| 5.125% 1/15/26 (b) | | 5,600 | 5,423 |
| 5.375% 1/15/28 (b) | | 5,600 | 5,251 |
| Clydesdale Acquisition Holdings, Inc.: | | | |
| 6.625% 4/15/29 (b) | | 7,185 | 7,167 |
| 8.75% 4/15/30 (b) | | 44,650 | 43,152 |
| Mercer International, Inc. 5.125% 2/1/29 | | 15,060 | 13,153 |
| | | | 94,881 |
| Restaurants - 0.6% | | | |
| 1011778 BC Unlimited Liability Co./New Red Finance, Inc.: | | | |
| 3.875% 1/15/28 (b) | | 12,115 | 11,176 |
| 4% 10/15/30 (b) | | 39,005 | 33,637 |
| 4.375% 1/15/28 (b) | | 10,600 | 9,858 |
| Bloomin Brands, Inc. / OSI Restaurant Partners LLC 5.125% 4/15/29 (b) | | 5,565 | 5,121 |
| Garden SpinCo Corp. 8.625% 7/20/30 (b) | | 5,205 | 5,488 |
| Papa John's International, Inc. 3.875% 9/15/29 (b) | | 5,560 | 4,839 |
| Yum! Brands, Inc. 4.625% 1/31/32 | | 11,975 | 10,780 |
| | | | 80,899 |
| Services - 4.0% | | | |
| Adtalem Global Education, Inc. 5.5% 3/1/28 (b) | | 9,010 | 8,537 |
| AECOM 5.125% 3/15/27 | | 11,885 | 11,546 |
| Artera Services LLC 8.5% 2/15/31 (b) | | 25,315 | 25,904 |
| Atlas Luxco 4 SARL / Allied Universal Holdco LLC / Allied Universal Finance Corp.: | | | |
| 4.625% 6/1/28 (b) | | 11,130 | 9,997 |
| 4.625% 6/1/28 (b) | | 7,690 | 6,898 |
| Brand Industrial Services, Inc. 10.375% 8/1/30 (b) | | 44,695 | 47,962 |
| Camelot Finance SA 4.5% 11/1/26 (b) | | 10,590 | 10,085 |
| CoreCivic, Inc. 8.25% 4/15/29 | | 34,400 | 35,545 |
| Fair Isaac Corp. 4% 6/15/28 (b) | | 2,910 | 2,680 |
| GEMS MENASA Cayman Ltd./GEMS Education Delaware LLC 7.125% 7/31/26 (b) | | 8,765 | 8,713 |
| H&E Equipment Services, Inc. 3.875% 12/15/28 (b) | | 16,800 | 14,866 |
| Hertz Corp.: | | | |
| 4.625% 12/1/26 (b) | | 5,180 | 4,012 |
| 5% 12/1/29 (b) | | 10,055 | 6,905 |
| 5.5% (b)(c)(f) | | 10,890 | 354 |
| 6% (b)(c)(f) | | 10,285 | 926 |
| 6.25% (c)(f) | | 11,875 | 386 |
| 7.125% (b)(c)(f) | | 10,285 | 926 |
| Iron Mountain, Inc.: | | | |
| 4.5% 2/15/31 (b) | | 22,025 | 19,426 |
| 4.875% 9/15/29 (b) | | 24,110 | 22,248 |
| Neptune BidCo U.S., Inc. 9.29% 4/15/29 (b) | | 47,450 | 44,722 |
| OpenLane, Inc. 5.125% 6/1/25 (b) | | 10,355 | 10,200 |
| Service Corp. International 4% 5/15/31 | | 12,070 | 10,398 |
| Sotheby's 7.375% 10/15/27 (b) | | 4,960 | 4,622 |
| Sotheby's/Bidfair Holdings, Inc. 5.875% 6/1/29 (b) | | 9,045 | 7,526 |
| The Brink's Co. 4.625% 10/15/27 (b) | | 12,180 | 11,441 |
| The GEO Group, Inc.: | | | |
| 8.625% 4/15/29 (b) | | 21,310 | 21,573 |
| 10.25% 4/15/31 (b) | | 15,225 | 15,696 |
| TriNet Group, Inc. 3.5% 3/1/29 (b) | | 8,865 | 7,762 |
| Uber Technologies, Inc.: | | | |
| 4.5% 8/15/29 (b) | | 27,335 | 25,465 |
| 6.25% 1/15/28 (b) | | 9,175 | 9,170 |
| 7.5% 9/15/27 (b) | | 35,255 | 35,894 |
| 8% 11/1/26 (b) | | 51,060 | 51,567 |
| WASH Multifamily Acquisition, Inc. 5.75% 4/15/26 (b) | | 9,760 | 9,462 |
| | | | 503,414 |
| Steel - 0.2% | | | |
| Algoma Steel SCA 0% 12/31/24 (c) | | 1,982 | 0 |
| ATI, Inc. 7.25% 8/15/30 | | 5,985 | 6,123 |
| Commercial Metals Co. 3.875% 2/15/31 | | 6,135 | 5,338 |
| Roller Bearing Co. of America, Inc. 4.375% 10/15/29 (b) | | 4,375 | 3,954 |
| Vallourec SA 7.5% 4/15/32 (b) | | 12,405 | 12,557 |
| | | | 27,972 |
| Super Retail - 1.4% | | | |
| Asbury Automotive Group, Inc.: | | | |
| 4.5% 3/1/28 | | 3,534 | 3,315 |
| 4.625% 11/15/29 (b) | | 10,005 | 9,047 |
| 4.75% 3/1/30 | | 3,523 | 3,193 |
| 5% 2/15/32 (b) | | 10,800 | 9,601 |
| Bath & Body Works, Inc.: | | | |
| 6.625% 10/1/30 (b) | | 23,165 | 23,148 |
| 6.75% 7/1/36 | | 12,766 | 12,458 |
| 7.5% 6/15/29 | | 8,335 | 8,531 |
| Carvana Co.: | | | |
| 12% 12/1/28 pay-in-kind (b)(d) | | 3,977 | 3,895 |
| 13% 6/1/30 pay-in-kind (b)(d) | | 5,993 | 5,946 |
| 14% 6/1/31 pay-in-kind (b)(d) | | 7,121 | 7,138 |
| EG Global Finance PLC 12% 11/30/28 (b) | | 75,530 | 77,969 |
| LBM Acquisition LLC 6.25% 1/15/29 (b) | | 17,805 | 16,344 |
| | | | 180,585 |
| Technology - 3.4% | | | |
| Acuris Finance U.S. 5% 5/1/28 (b) | | 9,045 | 8,206 |
| Block, Inc. 3.5% 6/1/31 | | 12,070 | 10,196 |
| CA Magnum Holdings 5.375% 10/31/26 (b) | | 4,870 | 4,607 |
| Clarivate Science Holdings Corp.: | | | |
| 3.875% 7/1/28 (b) | | 10,695 | 9,739 |
| 4.875% 7/1/29 (b) | | 10,115 | 9,212 |
| Cloud Software Group, Inc. 6.5% 3/31/29 (b) | | 101,715 | 96,472 |
| Coherent Corp. 5% 12/15/29 (b) | | 9,495 | 8,760 |
| Crowdstrike Holdings, Inc. 3% 2/15/29 | | 8,870 | 7,793 |
| Elastic NV 4.125% 7/15/29 (b) | | 24,245 | 21,590 |
| Gen Digital, Inc. 5% 4/15/25 (b) | | 10,050 | 9,928 |
| Go Daddy Operating Co. LLC / GD Finance Co., Inc.: | | | |
| 3.5% 3/1/29 (b) | | 11,810 | 10,473 |
| 5.25% 12/1/27 (b) | | 9,345 | 9,022 |
| ION Trading Technologies Ltd. 5.75% 5/15/28 (b) | | 12,040 | 10,997 |
| Iron Mountain Information Management Services, Inc. 5% 7/15/32 (b) | | 9,100 | 8,065 |
| MicroStrategy, Inc. 6.125% 6/15/28 (b) | | 23,020 | 21,334 |
| NCR Atleos Corp. 9.5% 4/1/29 (b) | | 8,995 | 9,562 |
| NCR Voyix Corp.: | | | |
| 5% 10/1/28 (b) | | 5,530 | 5,093 |
| 5.125% 4/15/29 (b) | | 8,870 | 8,151 |
| 5.25% 10/1/30 (b) | | 5,530 | 4,924 |
| ON Semiconductor Corp. 3.875% 9/1/28 (b) | | 11,065 | 10,041 |
| Open Text Corp. 6.9% 12/1/27 (b) | | 10,610 | 10,834 |
| Open Text Holdings, Inc.: | | | |
| 4.125% 2/15/30 (b) | | 5,690 | 4,997 |
| 4.125% 12/1/31 (b) | | 5,485 | 4,701 |
| PTC, Inc.: | | | |
| 3.625% 2/15/25 (b) | | 6,650 | 6,513 |
| 4% 2/15/28 (b) | | 6,575 | 6,091 |
| Roblox Corp. 3.875% 5/1/30 (b) | | 9,120 | 7,887 |
| Seagate HDD Cayman: | | | |
| 8.25% 12/15/29 (b) | | 19,590 | 20,822 |
| 8.5% 7/15/31 (b) | | 12,720 | 13,581 |
| Sensata Technologies BV 4% 4/15/29 (b) | | 11,970 | 10,717 |
| Synaptics, Inc. 4% 6/15/29 (b) | | 7,015 | 6,160 |
| TTM Technologies, Inc. 4% 3/1/29 (b) | | 8,870 | 7,933 |
| Twilio, Inc.: | | | |
| 3.625% 3/15/29 | | 9,995 | 8,871 |
| 3.875% 3/15/31 | | 10,460 | 9,057 |
| UKG, Inc. 6.875% 2/1/31 (b) | | 9,090 | 9,107 |
| Unisys Corp. 6.875% 11/1/27 (b) | | 6,095 | 5,256 |
| Veritas U.S., Inc./Veritas Bermuda Ltd. 7.5% 9/1/25 (b) | | 19,670 | 17,895 |
| | | | 434,587 |
| Telecommunications - 2.6% | | | |
| Altice Financing SA: | | | |
| 5% 1/15/28 (b) | | 14,560 | 11,491 |
| 5.75% 8/15/29 (b) | | 25,600 | 19,015 |
| Altice France SA: | | | |
| 5.125% 7/15/29 (b) | | 61,630 | 40,144 |
| 5.5% 1/15/28 (b) | | 1,160 | 784 |
| 5.5% 10/15/29 (b) | | 106,150 | 69,452 |
| C&W Senior Finance Ltd. 6.875% 9/15/27 (b) | | 37,020 | 35,055 |
| Frontier Communications Holdings LLC: | | | |
| 5% 5/1/28 (b) | | 19,575 | 18,009 |
| 5.875% 10/15/27 (b) | | 10,375 | 9,951 |
| Intelsat Jackson Holdings SA 6.5% 3/15/30 (b) | | 25,303 | 24,219 |
| LCPR Senior Secured Financing DAC: | | | |
| 5.125% 7/15/29 (b) | | 14,860 | 12,391 |
| 6.75% 10/15/27 (b) | | 10,157 | 9,398 |
| Millicom International Cellular SA 4.5% 4/27/31 (b) | | 1,725 | 1,436 |
| Qwest Corp. 7.25% 9/15/25 | | 1,480 | 1,466 |
| Sable International Finance Ltd. 5.75% 9/7/27 (b) | | 24,010 | 22,818 |
| SBA Communications Corp.: | | | |
| 3.125% 2/1/29 | | 13,305 | 11,587 |
| 3.875% 2/15/27 | | 17,015 | 15,991 |
| Uniti Group LP/Uniti Fiber Holdings, Inc./CSL Capital LLC 6% 1/15/30 (b) | | 7,365 | 5,728 |
| VMED O2 UK Financing I PLC 4.75% 7/15/31 (b) | | 21,200 | 17,693 |
| | | | 326,628 |
| Textiles/Apparel - 0.1% | | | |
| Crocs, Inc.: | | | |
| 4.125% 8/15/31 (b) | | 6,075 | 5,098 |
| 4.25% 3/15/29 (b) | | 8,675 | 7,777 |
| Kontoor Brands, Inc. 4.125% 11/15/29 (b) | | 5,320 | 4,726 |
| | | | 17,601 |
| Transportation Ex Air/Rail - 0.2% | | | |
| Seaspan Corp. 5.5% 8/1/29 (b) | | 9,095 | 7,822 |
| XPO, Inc.: | | | |
| 6.25% 6/1/28 (b) | | 5,950 | 5,928 |
| 7.125% 2/1/32 (b) | | 9,085 | 9,138 |
| | | | 22,888 |
| Utilities - 2.0% | | | |
| Clearway Energy Operating LLC: | | | |
| 3.75% 2/15/31 (b) | | 13,295 | 11,240 |
| 3.75% 1/15/32 (b) | | 6,075 | 5,030 |
| 4.75% 3/15/28 (b) | | 6,920 | 6,521 |
| NextEra Energy Partners LP 7.25% 1/15/29 (b) | | 6,060 | 6,138 |
| NRG Energy, Inc.: | | | |
| 3.375% 2/15/29 (b) | | 5,145 | 4,512 |
| 3.625% 2/15/31 (b) | | 10,215 | 8,648 |
| 3.875% 2/15/32 (b) | | 1,254 | 1,057 |
| 5.75% 1/15/28 | | 9,000 | 8,858 |
| 6.625% 1/15/27 | | 6,378 | 6,365 |
| Pacific Gas & Electric Co.: | | | |
| 3.45% 7/1/25 | | 2,868 | 2,787 |
| 3.75% 7/1/28 | | 2,868 | 2,642 |
| 3.95% 12/1/47 | | 10,826 | 7,591 |
| 4% 12/1/46 | | 13,774 | 9,745 |
| 4.3% 3/15/45 | | 5,995 | 4,473 |
| PG&E Corp.: | | | |
| 5% 7/1/28 | | 22,000 | 20,962 |
| 5.25% 7/1/30 | | 8,330 | 7,799 |
| Pike Corp.: | | | |
| 5.5% 9/1/28 (b) | | 37,175 | 35,232 |
| 8.625% 1/31/31 (b) | | 15,130 | 15,850 |
| Vistra Operations Co. LLC: | | | |
| 4.375% 5/1/29 (b) | | 23,230 | 21,149 |
| 5% 7/31/27 (b) | | 22,585 | 21,495 |
| 5.5% 9/1/26 (b) | | 3,485 | 3,401 |
| 5.625% 2/15/27 (b) | | 28,195 | 27,432 |
| 7.75% 10/15/31 (b) | | 11,985 | 12,292 |
| | | | 251,219 |
TOTAL NONCONVERTIBLE BONDS | | | 6,937,403 |
| TOTAL CORPORATE BONDS (Cost $7,433,778) | | | 7,075,606 |
| | | | |
| Common Stocks - 19.1% |
| | | Shares | Value ($) (000s) |
| Aerospace - 0.1% | | | |
| TransDigm Group, Inc. | | 13,200 | 16,474 |
| Air Transportation - 0.1% | | | |
| Air Canada (i) | | 23,000 | 339 |
| Delta Air Lines, Inc. | | 146,750 | 7,348 |
TOTAL AIR TRANSPORTATION | | | 7,687 |
| Automotive & Auto Parts - 0.3% | | | |
| BYD Co. Ltd. (H Shares) | | 1,184,500 | 32,470 |
| UC Holdings, Inc. (c)(i) | | 677,217 | 677 |
TOTAL AUTOMOTIVE & AUTO PARTS | | | 33,147 |
| Broadcasting - 0.1% | | | |
| iHeartMedia, Inc. (i) | | 104 | 0 |
| Nexstar Media Group, Inc. Class A | | 53,232 | 8,520 |
TOTAL BROADCASTING | | | 8,520 |
| Building Materials - 1.1% | | | |
| Builders FirstSource, Inc. (i) | | 90,400 | 16,527 |
| Carlisle Companies, Inc. | | 94,400 | 36,651 |
| Eagle Materials, Inc. | | 142,000 | 35,601 |
| EMCOR Group, Inc. | | 57,600 | 20,573 |
| Fortune Brands Innovations, Inc. | | 319,300 | 23,341 |
| Simpson Manufacturing Co. Ltd. | | 63,200 | 10,990 |
TOTAL BUILDING MATERIALS | | | 143,683 |
| Capital Goods - 0.5% | | | |
| Deere & Co. | | 14,600 | 5,715 |
| Parker Hannifin Corp. | | 58,900 | 32,095 |
| Trane Technologies PLC | | 75,800 | 24,054 |
TOTAL CAPITAL GOODS | | | 61,864 |
| Chemicals - 0.4% | | | |
| Olin Corp. | | 342,900 | 17,927 |
| The Chemours Co. LLC | | 857,210 | 22,930 |
| Westlake Corp. | | 51,200 | 7,545 |
TOTAL CHEMICALS | | | 48,402 |
| Consumer Products - 0.1% | | | |
| Tapestry, Inc. | | 344,400 | 13,748 |
| Containers - 0.2% | | | |
| Graphic Packaging Holding Co. | | 973,700 | 25,170 |
| Diversified Financial Services - 1.3% | | | |
| Apollo Global Management, Inc. | | 493,000 | 53,431 |
| Carnelian Point Holdings LP warrants (c)(i) | | 931 | 3 |
| Coinbase Global, Inc. (i) | | 95,100 | 19,394 |
| MasterCard, Inc. Class A | | 92,500 | 41,736 |
| Moody's Corp. | | 33,900 | 12,554 |
| OneMain Holdings, Inc. | | 769,000 | 40,073 |
| PJT Partners, Inc. | | 5,092 | 481 |
TOTAL DIVERSIFIED FINANCIAL SERVICES | | | 167,672 |
| Energy - 1.1% | | | |
| Antero Resources Corp. (i) | | 306,925 | 10,439 |
| California Resources Corp. warrants 10/27/24 (i) | | 57,076 | 983 |
| Canvas Energy, Inc.: | | | |
| Series A warrants 10/1/24 (c)(i) | | 392 | 0 |
| Series B warrants 10/1/25 (c)(i) | | 392 | 0 |
| Cheniere Energy, Inc. | | 205,700 | 32,464 |
| EP Energy Corp. (c)(i) | | 841,775 | 1,498 |
| Forbes Energy Services Ltd. (c)(i) | | 193,218 | 0 |
| Mesquite Energy, Inc. (c)(i) | | 317,026 | 25,952 |
| Permian Resource Corp. Class A | | 3,745,700 | 62,740 |
| PureWest Energy (c) | | 17,812 | 4 |
| PureWest Energy rights (c)(i) | | 10,734 | 0 |
| Superior Energy Services, Inc. Class A (c) | | 110,370 | 7,119 |
| Unit Corp. | | 37,978 | 1,464 |
TOTAL ENERGY | | | 142,663 |
| Entertainment/Film - 0.0% | | | |
| New Cotai LLC/New Cotai Capital Corp. (c)(g)(i) | | 3,366,626 | 2,592 |
| Food & Drug Retail - 0.0% | | | |
| Southeastern Grocers, Inc. rights (c)(i) | | 793,345 | 873 |
| Food/Beverage/Tobacco - 0.4% | | | |
| Celsius Holdings, Inc. (i) | | 238,100 | 16,969 |
| U.S. Foods Holding Corp. (i) | | 632,300 | 31,773 |
TOTAL FOOD/BEVERAGE/TOBACCO | | | 48,742 |
| Gaming - 0.3% | | | |
| Boyd Gaming Corp. | | 453,873 | 24,287 |
| Studio City International Holdings Ltd.: | | | |
| ADR (b)(i) | | 631,958 | 4,702 |
| (NYSE) ADR (i) | | 695,700 | 5,176 |
TOTAL GAMING | | | 34,165 |
| Healthcare - 0.1% | | | |
| Encompass Health Corp. | | 34 | 3 |
| Enhabit Home Health & Hospice (i) | | 17 | 0 |
| Tenet Healthcare Corp. (i) | | 105,498 | 11,846 |
TOTAL HEALTHCARE | | | 11,849 |
| Homebuilders/Real Estate - 1.3% | | | |
| Arthur J. Gallagher & Co. | | 211,900 | 49,731 |
| Comfort Systems U.S.A., Inc. | | 108,500 | 33,571 |
| TopBuild Corp. (i) | | 131,500 | 53,214 |
| Willscot Mobile Mini Holdings (i) | | 610,100 | 22,549 |
TOTAL HOMEBUILDERS/REAL ESTATE | | | 159,065 |
| Metals/Mining - 0.0% | | | |
| Elah Holdings, Inc. (c)(i) | | 906 | 28 |
| Restaurants - 0.1% | | | |
| Domino's Pizza, Inc. | | 30,300 | 16,037 |
| Services - 0.6% | | | |
| Airbnb, Inc. Class A (i) | | 202,100 | 32,047 |
| Penhall Acquisition Co. (c) | | 34,884 | 0 |
| Visa, Inc. Class A | | 178,500 | 47,947 |
TOTAL SERVICES | | | 79,994 |
| Steel - 0.0% | | | |
| Algoma Steel SCA (c)(i) | | 198,162 | 0 |
| Super Retail - 1.0% | | | |
| Amazon.com, Inc. (i) | | 256,900 | 44,958 |
| Arena Brands Holding Corp. Class B (c)(g)(i) | | 659,302 | 9,118 |
| Booking Holdings, Inc. | | 4,600 | 15,879 |
| Dick's Sporting Goods, Inc. | | 140,400 | 28,212 |
| Lowe's Companies, Inc. | | 55,100 | 12,562 |
| Williams-Sonoma, Inc. | | 76,303 | 21,882 |
TOTAL SUPER RETAIL | | | 132,611 |
| Technology - 8.2% | | | |
| Accenture PLC Class A | | 36,900 | 11,104 |
| Adobe, Inc. (i) | | 80,400 | 37,212 |
| Alphabet, Inc. Class A | | 229,200 | 37,309 |
| Arista Networks, Inc. (i) | | 96,000 | 24,630 |
| ASML Holding NV (depository receipt) | | 21,300 | 18,584 |
| Autodesk, Inc. (i) | | 75,700 | 16,113 |
| Block, Inc. Class A (i) | | 285,400 | 20,834 |
| CDW Corp. | | 50,600 | 12,238 |
| Dell Technologies, Inc. | | 97,200 | 12,115 |
| DoubleVerify Holdings, Inc. (i) | | 587,700 | 17,220 |
| Dynatrace, Inc. (i) | | 649,800 | 29,442 |
| Eaton Corp. PLC | | 162,300 | 51,654 |
| Fiserv, Inc. (i) | | 333,000 | 50,839 |
| Gen Digital, Inc. | | 606,400 | 12,213 |
| Intuit, Inc. | | 30,300 | 18,956 |
| KLA Corp. | | 42,500 | 29,295 |
| Lam Research Corp. | | 57,900 | 51,786 |
| Marvell Technology, Inc. | | 273,700 | 18,040 |
| Meta Platforms, Inc. Class A | | 241,300 | 103,800 |
| Microsoft Corp. | | 185,200 | 72,104 |
| Monday.com Ltd. (i) | | 85,300 | 16,150 |
| Nextracker, Inc. Class A (i) | | 876,300 | 37,497 |
| nVent Electric PLC | | 315,900 | 22,767 |
| NVIDIA Corp. | | 134,900 | 116,556 |
| NXP Semiconductors NV | | 43,600 | 11,170 |
| ON Semiconductor Corp. (i) | | 700,403 | 49,140 |
| Oracle Corp. | | 208,200 | 23,683 |
| Salesforce, Inc. | | 111,700 | 30,041 |
| Synopsys, Inc. (i) | | 32,000 | 16,979 |
| UiPath, Inc. Class A (i) | | 1,401,300 | 26,583 |
| Vertiv Holdings Co. | | 414,400 | 38,539 |
TOTAL TECHNOLOGY | | | 1,034,593 |
| Telecommunications - 0.3% | | | |
| EchoStar Corp. Class A (i)(j) | | 769,300 | 12,301 |
| GTT Communications, Inc. (c)(i) | | 85,487 | 3,189 |
| Palo Alto Networks, Inc. (i) | | 54,800 | 15,941 |
TOTAL TELECOMMUNICATIONS | | | 31,431 |
| Textiles/Apparel - 0.3% | | | |
| Crocs, Inc. (i) | | 247,300 | 30,757 |
| LVMH Moet Hennessy Louis Vuitton SE | | 11,800 | 9,693 |
TOTAL TEXTILES/APPAREL | | | 40,450 |
| Transportation Ex Air/Rail - 0.0% | | | |
| Tricer Holdco SCA: | | | |
| Class A1 (c)(g)(i) | | 598,287 | 0 |
| Class A2 (c)(g)(i) | | 598,287 | 0 |
| Class A3 (c)(g)(i) | | 598,287 | 0 |
| Class A4 (c)(g)(i) | | 598,287 | 0 |
| Class A5 (c)(g)(i) | | 598,287 | 0 |
| Class A6 (c)(g)(i) | | 598,287 | 0 |
| Class A7 (c)(g)(i) | | 598,287 | 0 |
| Class A8 (c)(g)(i) | | 598,287 | 0 |
| Class A9 (c)(g)(i) | | 598,287 | 0 |
TOTAL TRANSPORTATION EX AIR/RAIL | | | 0 |
| Utilities - 1.2% | | | |
| Constellation Energy Corp. | | 267,200 | 49,683 |
| Core & Main, Inc. (i) | | 352,800 | 19,923 |
| PG&E Corp. | | 2,097,796 | 35,893 |
| Portland General Electric Co. | | 14,817 | 641 |
| Vistra Corp. | | 636,300 | 48,257 |
TOTAL UTILITIES | | | 154,397 |
| TOTAL COMMON STOCKS (Cost $1,924,923) | | | 2,415,857 |
| | | | |
| Nonconvertible Preferred Stocks - 0.0% |
| | | Shares | Value ($) (000s) |
| Transportation Ex Air/Rail - 0.0% | | | |
Tricer Holdco SCA (c)(g)(i) (Cost $10,250) | | 287,159,690 | 3 |
| | | | |
| Bank Loan Obligations - 9.9% |
| | | Principal Amount (a) (000s) | Value ($) (000s) |
| Air Transportation - 0.0% | | | |
| SkyMiles IP Ltd. Tranche B 1LN, term loan CME Term SOFR 3 Month Index + 3.750% 9.0746% 10/20/27 (d)(e)(k) | | 1,498 | 1,543 |
| United Airlines, Inc. Tranche 1LN, term loan CME Term SOFR 1 Month Index + 2.750% 8.0757% 2/24/31 (d)(e)(k) | | 2,730 | 2,738 |
TOTAL AIR TRANSPORTATION | | | 4,281 |
| Automotive & Auto Parts - 0.0% | | | |
| Clarios Global LP Tranche B 1LN, term loan CME Term SOFR 1 Month Index + 3.250% 8.3157% 5/6/30 (d)(e)(k) | | 2,638 | 2,645 |
| Wand NewCo 3, Inc. Tranche B 1LN, term loan CME Term SOFR 1 Month Index + 3.750% 9.0657% 1/20/31 (d)(e)(k) | | 2,230 | 2,242 |
TOTAL AUTOMOTIVE & AUTO PARTS | | | 4,887 |
| Banks & Thrifts - 0.1% | | | |
| Citadel Securities LP Tranche B 1LN, term loan CME Term SOFR 1 Month Index + 2.250% 7.5657% 7/29/30 (d)(e)(k) | | 9,553 | 9,570 |
| Broadcasting - 0.1% | | | |
| Diamond Sports Group LLC 1LN, term loan CME Term SOFR 1 Month Index + 8.000% 15.4287% 8/24/26 (d)(e)(k) | | 3,007 | 2,864 |
| Univision Communications, Inc.: | | | |
| 1LN, term loan CME Term SOFR 3 Month Index + 4.250% 9.5594% 6/24/29 (d)(e)(k) | | 742 | 742 |
| Tranche B 1LN, term loan CME Term SOFR 1 Month Index + 3.250% 8.6802% 1/31/29 (d)(e)(k) | | 7,350 | 7,326 |
TOTAL BROADCASTING | | | 10,932 |
| Building Materials - 0.2% | | | |
| Hunter Douglas, Inc. Tranche B 1LN, term loan CME Term SOFR 3 Month Index + 3.500% 8.8238% 2/25/29 (d)(e)(k) | | 22,357 | 22,173 |
| Miwd Holdco Ii LLC Tranche B2, term loan CME Term SOFR 1 Month Index + 3.500% 3/20/31 (e)(k)(l) | | 785 | 788 |
| SRS Distribution, Inc. Tranche B 1LN, term loan CME Term SOFR 1 Month Index + 3.500% 8.9302% 6/4/28 (d)(e)(k) | | 6,326 | 6,371 |
TOTAL BUILDING MATERIALS | | | 29,332 |
| Capital Goods - 0.0% | | | |
| Chart Industries, Inc. Tranche B 1LN, term loan CME Term SOFR 1 Month Index + 3.250% 8.6734% 3/17/30 (d)(e)(k) | | 1,563 | 1,567 |
| Chemicals - 0.4% | | | |
| Consolidated Energy Finance SA Tranche B 1LN, term loan CME Term SOFR 1 Month Index + 4.500% 9.8157% 11/15/30 (d)(e)(k) | | 12,125 | 11,712 |
| Discovery Purchaser Corp. 1LN, term loan CME Term SOFR 3 Month Index + 4.370% 9.6813% 10/4/29 (d)(e)(k) | | 17,815 | 17,782 |
| Olympus Water U.S. Holding Corp. Tranche B 1LN, term loan CME Term SOFR 3 Month Index + 3.750% 9.321% 11/9/28 (d)(e)(k) | | 3,622 | 3,627 |
| W.R. Grace Holding LLC Tranche B 1LN, term loan CME Term SOFR 3 Month Index + 3.750% 9.321% 9/22/28 (d)(e)(k) | | 14,681 | 14,681 |
TOTAL CHEMICALS | | | 47,802 |
| Consumer Products - 0.3% | | | |
| Kronos Acquisition Holdings, Inc. Tranche B 1LN, term loan CME Term SOFR 3 Month Index + 3.750% 9.3135% 12/22/26 (d)(e)(k) | | 19,744 | 19,760 |
| TKC Holdings, Inc. 1LN, term loan CME Term SOFR 1 Month Index + 5.500% 10.9302% 5/14/28 (d)(e)(k) | | 19,384 | 19,195 |
TOTAL CONSUMER PRODUCTS | | | 38,955 |
| Containers - 0.0% | | | |
| Kloeckner Pentaplast of America, Inc. Tranche B 1LN, term loan CME Term SOFR 6 Month Index + 4.750% 10.2675% 2/9/26 (d)(e)(k) | | 1,460 | 1,309 |
| Energy - 0.3% | | | |
| EG America LLC Tranche BC 1LN, term loan CME Term SOFR 1 Month Index + 5.500% 11.2383% 2/7/28 (d)(e)(k) | | 35,002 | 34,412 |
| Forbes Energy Services LLC Tranche B, term loan 0% (c)(d)(f)(k) | | 1,810 | 0 |
| Mesquite Energy, Inc.: | | | |
| 1LN, term loan 3 month U.S. LIBOR + 8.000% 0% (c)(e)(f)(k) | | 5,861 | 0 |
| term loan 0% (c)(d)(f)(k) | | 2,528 | 0 |
TOTAL ENERGY | | | 34,412 |
| Environmental - 0.1% | | | |
| Covanta Holding Corp.: | | | |
| Tranche B 1LN, term loan CME Term SOFR 1 Month Index + 2.500% 7.8157% 11/30/28 (d)(e)(k) | | 2,170 | 2,169 |
| Tranche C 1LN, term loan CME Term SOFR 1 Month Index + 2.500% 7.8273% 11/30/28 (d)(e)(k) | | 166 | 166 |
| Madison IAQ LLC Tranche B 1LN, term loan CME Term SOFR 1 Month Index + 3.250% 8.6799% 6/21/28 (d)(e)(k) | | 2,947 | 2,946 |
TOTAL ENVIRONMENTAL | | | 5,281 |
| Food/Beverage/Tobacco - 0.0% | | | |
| Fiesta Purchaser, Inc. Tranche B 1LN, term loan CME Term SOFR 1 Month Index + 4.000% 9.3169% 2/12/31 (d)(e)(k) | | 2,150 | 2,157 |
| Naked Juice LLC 1LN, term loan CME Term SOFR 3 Month Index + 3.250% 8.6594% 1/24/29 (d)(e)(k) | | 2,245 | 2,166 |
TOTAL FOOD/BEVERAGE/TOBACCO | | | 4,323 |
| Gaming - 0.4% | | | |
| Caesars Entertainment, Inc. Tranche B1 1LN, term loan CME Term SOFR 1 Month Index + 2.750% 8.0657% 2/6/31 (d)(e)(k) | | 12,020 | 12,026 |
| Fertitta Entertainment LLC NV Tranche B 1LN, term loan CME Term SOFR 1 Month Index + 4.000% 9.069% 1/27/29 (d)(e)(k) | | 29,447 | 29,500 |
| Light & Wonder International, Inc. Tranche B 1LN, term loan CME Term SOFR 1 Month Index + 2.750% 8.071% 4/16/29 (d)(e)(k) | | 2,349 | 2,351 |
| Ontario Gaming GTA LP Tranche B 1LN, term loan CME Term SOFR 1 Month Index + 4.250% 9.5594% 8/1/30 (d)(e)(k) | | 5,990 | 6,019 |
TOTAL GAMING | | | 49,896 |
| Healthcare - 0.5% | | | |
| Gainwell Acquisition Corp. Tranche B 1LN, term loan CME Term SOFR 3 Month Index + 4.000% 9.4094% 10/1/27 (d)(e)(k) | | 17,318 | 16,490 |
| Jazz Financing Lux SARL Tranche B 1LN, term loan CME Term SOFR 1 Month Index + 3.000% 8.4302% 5/5/28 (d)(e)(k) | | 6,126 | 6,160 |
| Medline Borrower LP Tranche B 1LN, term loan CME Term SOFR 1 Month Index + 2.750% 8.0683% 10/23/28 (d)(e)(k) | | 22,919 | 22,969 |
| Organon & Co. Tranche B 1LN, term loan CME Term SOFR 3 Month Index + 3.000% 8.4334% 6/2/28 (d)(e)(k) | | 14,878 | 14,938 |
| Phoenix Newco, Inc. Tranche B 1LN, term loan CME Term SOFR 1 Month Index + 3.250% 8.6918% 11/15/28 (d)(e)(k) | | 7,051 | 7,070 |
TOTAL HEALTHCARE | | | 67,627 |
| Insurance - 0.6% | | | |
| Acrisure LLC: | | | |
| Tranche B 1LN, term loan: | | | |
CME Term SOFR 1 Month Index + 3.500% 8.9302% 2/15/27 (d)(e)(k) | | 17,851 | 17,814 |
CME Term SOFR 1 Month Index + 4.250% 9.6802% 2/15/27 (d)(e)(k) | | 1,412 | 1,414 |
| Tranche B5 1LN, term loan CME Term SOFR 1 Month Index + 4.500% 9.8157% 11/6/30 (d)(e)(k) | | 3,092 | 3,098 |
| Alliant Holdings Intermediate LLC Tranche B6 1LN, term loan CME Term SOFR 1 Month Index + 3.500% 8.8189% 11/6/30 (d)(e)(k) | | 10,830 | 10,869 |
| HUB International Ltd. Tranche B 1LN, term loan CME Term SOFR 1 Month Index + 3.250% 8.5745% 6/20/30 (d)(e)(k) | | 9,230 | 9,275 |
| Truist Insurance Holdings LLC: | | | |
| 2L, term loan CME Term SOFR 1 Month Index + 4.750% 3/8/32 (e)(k)(l) | | 25,720 | 25,929 |
| Tranche B 1LN, term loan CME Term SOFR 1 Month Index + 3.250% 3/22/31 (e)(k)(l) | | 4,905 | 4,914 |
TOTAL INSURANCE | | | 73,313 |
| Leisure - 0.5% | | | |
| Carnival Corp. Tranche B 1LN, term loan: | | | |
| CME Term SOFR 1 Month Index + 2.750% 8.0669% 8/9/27 (d)(e)(k) | | 27,130 | 27,265 |
| CME Term SOFR 1 Month Index + 2.750% 8.0669% 10/18/28 (d)(e)(k) | | 28,776 | 28,867 |
TOTAL LEISURE | | | 56,132 |
| Metals/Mining - 0.0% | | | |
| Arsenal AIC Parent LLC Tranche B 1LN, term loan CME Term SOFR 1 Month Index + 3.750% 9.0657% 8/19/30 (d)(e)(k) | | 1,632 | 1,642 |
| Paper - 0.6% | | | |
| Clydesdale Acquisition Holdings, Inc. 1LN, term loan CME Term SOFR 1 Month Index + 3.670% 9.0907% 4/13/29 (d)(e)(k) | | 72,864 | 73,137 |
| Services - 1.3% | | | |
| ABG Intermediate Holdings 2 LLC Tranche B1 LN, term loan CME Term SOFR 1 Month Index + 3.500% 8.9183% 12/21/28 (d)(e)(k) | | 17,711 | 17,786 |
| Artera Services LLC Tranche B 1LN, term loan CME Term SOFR 1 Month Index + 4.500% 9.8094% 2/10/31 (d)(e)(k) | | 6,345 | 6,395 |
| Ascend Learning LLC: | | | |
| 2LN, term loan CME Term SOFR 1 Month Index + 5.750% 11.1657% 12/10/29 (d)(e)(k) | | 15,190 | 14,874 |
| Tranche B 1LN, term loan CME Term SOFR 1 Month Index + 3.500% 8.9157% 12/10/28 (d)(e)(k) | | 17,771 | 17,696 |
| Bifm California Buyer, Inc. Tranche 1LN, term loan CME Term SOFR 1 Month Index + 4.250% 9.5657% 5/31/28 (d)(e)(k) | | 1,455 | 1,462 |
| Brand Industrial Services, Inc. Tranche B 1LN, term loan CME Term SOFR 1 Month Index + 4.500% 9.819% 8/1/30 (d)(e)(k) | | 31,375 | 31,460 |
| Galaxy U.S. Opco, Inc. 1LN, term loan CME Term SOFR 1 Month Index + 4.750% 10.0795% 4/29/29 (d)(e)(k) | | 24,159 | 21,622 |
| Neptune BidCo U.S., Inc. Tranche B 1LN, term loan CME Term SOFR 1 Month Index + 5.000% 10.4059% 4/11/29 (d)(e)(k) | | 15,523 | 14,557 |
| Sabert Corp. Tranche B 1LN, term loan CME Term SOFR 1 Month Index + 3.750% 9.1834% 12/16/26 (d)(e)(k) | | 5,009 | 5,024 |
| Sotheby's Tranche B 1LN, term loan CME Term SOFR 1 Month Index + 4.500% 10.0902% 1/15/27 (d)(e)(k) | | 10,753 | 10,469 |
| Spin Holdco, Inc. Tranche B 1LN, term loan CME Term SOFR 3 Month Index + 4.000% 9.5854% 3/4/28 (d)(e)(k) | | 17,739 | 15,602 |
| STS Operating, Inc. 1LN, term loan CME Term SOFR 1 Month Index + 4.000% 9.42% 3/25/31 (d)(e)(k) | | 6,145 | 6,196 |
| The GEO Group, Inc. Tranche B 1LN, term loan CME Term SOFR 1 Month Index + 5.250% 10.5689% 4/4/29 (d)(e)(k) | | 4,725 | 4,780 |
TOTAL SERVICES | | | 167,923 |
| Super Retail - 0.8% | | | |
| Great Outdoors Group LLC Tranche B 1LN, term loan CME Term SOFR 1 Month Index + 3.750% 9.1802% 3/5/28 (d)(e)(k) | | 3,022 | 3,021 |
| LBM Acquisition LLC Tranche B 1LN, term loan CME Term SOFR 1 Month Index + 3.750% 9.1773% 12/18/27 (d)(e)(k) | | 102,107 | 102,150 |
TOTAL SUPER RETAIL | | | 105,171 |
| Technology - 3.5% | | | |
| Acuris Finance U.S., Inc. 1LN, term loan CME Term SOFR 3 Month Index + 4.000% 9.4519% 2/16/28 (d)(e)(k) | | 1,131 | 1,130 |
| Applied Systems, Inc.: | | | |
| Tranche 2LN, term loan CME Term SOFR 1 Month Index + 5.250% 10.5594% 2/23/32 (d)(e)(k) | | 225 | 232 |
| Tranche B 1LN, term loan CME Term SOFR 1 Month Index + 3.500% 8.8094% 2/24/31 (d)(e)(k) | | 11,835 | 11,915 |
| Athenahealth Group, Inc. Tranche B 1LN, term loan CME Term SOFR 1 Month Index + 3.500% 8.5657% 2/15/29 (d)(e)(k) | | 29,114 | 29,042 |
| Boxer Parent Co., Inc. Tranche B 1LN, term loan CME Term SOFR 1 Month Index + 4.250% 9.5802% 12/29/28 (d)(e)(k) | | 31,253 | 31,427 |
| ConnectWise LLC Tranche B 1LN, term loan CME Term SOFR 1 Month Index + 3.500% 9.0635% 9/30/28 (d)(e)(k) | | 18,123 | 18,131 |
| Cotiviti, Inc. Tranche B 1LN, term loan CME Term SOFR 1 Month Index + 3.250% 2/21/31 (e)(k)(l) | | 41,445 | 41,479 |
| DG Investment Intermediate Holdings, Inc. Tranche B 1LN, term loan CME Term SOFR 1 Month Index + 3.750% 9.1802% 3/31/28 (d)(e)(k) | | 1,974 | 1,965 |
| First Advantage Holdings LLC Tranche B 1LN, term loan CME Term SOFR 1 Month Index + 2.750% 8.1918% 1/31/27 (d)(e)(k) | | 3,110 | 3,106 |
| McAfee Corp. Tranche B 1LN, term loan CME Term SOFR 1 Month Index + 3.750% 9.1773% 3/1/29 (d)(e)(k) | | 31,014 | 31,018 |
| MH Sub I LLC Tranche B 1LN, term loan CME Term SOFR 1 Month Index + 4.250% 9.5657% 5/3/28 (d)(e)(k) | | 17,691 | 17,619 |
| Modena Buyer LLC 1LN, term loan CME Term SOFR 1 Month Index + 4.500% 4/21/31 (e)(k)(l) | | 29,405 | 28,762 |
| Polaris Newco LLC Tranche B 1LN, term loan CME Term SOFR 1 Month Index + 4.000% 9.5911% 6/2/28 (d)(e)(k) | | 6,606 | 6,561 |
| Project Alpha Intermediate Holding, Inc. Tranche B 1LN, term loan CME Term SOFR 1 Month Index + 4.750% 10.0627% 10/26/30 (d)(e)(k) | | 12,015 | 12,052 |
| Proofpoint, Inc. Tranche B 1LN, term loan CME Term SOFR 1 Month Index + 3.250% 8.6946% 8/31/28 (d)(e)(k) | | 78,390 | 78,708 |
| RealPage, Inc. Tranche B 1LN, term loan CME Term SOFR 1 Month Index + 3.000% 8.4302% 4/22/28 (d)(e)(k) | | 5,879 | 5,663 |
| UKG, Inc. Tranche B 1LN, term loan CME Term SOFR 1 Month Index + 3.500% 8.8143% 2/10/31 (d)(e)(k) | | 84,057 | 84,421 |
| Veritas U.S., Inc. Tranche B 1LN, term loan CME Term SOFR 1 Month Index + 5.000% 10.4302% 9/1/25 (d)(e)(k) | | 10,023 | 9,197 |
| VS Buyer LLC Tranche B 1LN, term loan CME Term SOFR 1 Month Index + 3.250% 8.569% 4/4/31 (d)(e)(k) | | 35,175 | 35,242 |
TOTAL TECHNOLOGY | | | 447,670 |
| Telecommunications - 0.2% | | | |
| Aventiv Technologies LLC 1LN, term loan: | | | |
| CME Term SOFR 3 Month Index + 5.090% 10.661% 7/31/25 (d)(e)(k) | | 6,964 | 5,136 |
| 13.071% 7/31/25 (d)(e)(k) | | 184 | 185 |
| Connect U.S. Finco LLC Tranche B 1LN, term loan CME Term SOFR 1 Month Index + 4.500% 9.8302% 9/13/29 (d)(e)(k) | | 8,711 | 8,438 |
| GTT Communications, Inc. 1LN, term loan CME Term SOFR 3 Month Index + 9.000% 14.4094% 6/30/28 (d)(e)(k) | | 3,865 | 2,720 |
| Gtt Remainco LLC 1LN, term loan CME Term SOFR 1 Month Index + 7.000% 12.4183% 12/30/27 (d)(e)(k) | | 4,666 | 4,246 |
TOTAL TELECOMMUNICATIONS | | | 20,725 |
| Utilities - 0.0% | | | |
| Talen Energy Supply LLC 1LN, term loan: | | | |
| CME Term SOFR 1 Month Index + 4.500% 9.8257% 5/17/30 (d)(e)(k) | | 556 | 557 |
| CME Term SOFR 1 Month Index + 4.500% 9.8257% 5/17/30 (d)(e)(k) | | 364 | 365 |
TOTAL UTILITIES | | | 922 |
| TOTAL BANK LOAN OBLIGATIONS (Cost $1,257,599) | | | 1,256,809 |
| | | | |
| Preferred Securities - 6.6% |
| | | Principal Amount (a) (000s) | Value ($) (000s) |
| Banks & Thrifts - 5.3% | | | |
| Ally Financial, Inc. 4.7% (d)(m) | | 7,055 | 5,529 |
| Bank of America Corp.: | | | |
| CME Term SOFR 3 Month Index + 3.390% 8.7379% (d)(e)(m) | | 61,440 | 62,572 |
| 5.125% (d)(m) | | 36,030 | 36,626 |
| 5.875% (d)(m) | | 102,630 | 99,204 |
| 6.25% (d)(m) | | 28,555 | 28,739 |
| Citigroup, Inc.: | | | |
| 5% (d)(m) | | 60,300 | 60,139 |
| 6.3% (d)(m) | | 5,610 | 5,771 |
| Citigroup, Inc. 4.7% (d)(m) | | 15,285 | 15,034 |
| Goldman Sachs Group, Inc. CME Term SOFR 3 Month Index + 3.130% 8.437% (d)(e)(m) | | 70,565 | 71,708 |
| JPMorgan Chase & Co.: | | | |
| CME Term SOFR 3 Month Index + 3.560% 8.868% (d)(e)(m) | | 69,385 | 70,923 |
| 4% (d)(m) | | 26,340 | 25,740 |
| 4.6% (d)(m) | | 31,365 | 31,209 |
| 5% (d)(m) | | 30,845 | 31,073 |
| 9.348% (d)(e)(m) | | 8,330 | 8,525 |
| Wells Fargo & Co.: | | | |
| 5.875% (d)(m) | | 50,420 | 51,192 |
| 5.9% (d)(m) | | 63,075 | 64,211 |
TOTAL BANKS & THRIFTS | | | 668,195 |
| Diversified Financial Services - 0.0% | | | |
| OEC Finance Ltd. 7.5% pay-in-kind (b)(m) | | 40 | 3 |
| Energy - 1.3% | | | |
| Energy Transfer LP: | | | |
| 3 month U.S. LIBOR + 4.020% 9.5966% (d)(e)(m) | | 110,889 | 113,146 |
| 6.625% (d)(m) | | 30,505 | 28,443 |
| 7.125% (d)(m) | | 26,105 | 25,922 |
| Summit Midstream Partners LP 3 month U.S. LIBOR + 7.430% 13.0209% (d)(e)(f)(m) | | 2,912 | 3,130 |
TOTAL ENERGY | | | 170,641 |
| TOTAL PREFERRED SECURITIES (Cost $834,783) | | | 838,839 |
| | | | |
| Other - 2.8% |
| | | Shares | Value ($) (000s) |
| Other - 2.8% | | | |
Fidelity Private Credit Co. LLC (g)(n) (Cost $347,180) | | 34,888,952 | 354,826 |
| | | | |
| Money Market Funds - 5.3% |
| | | Shares | Value ($) (000s) |
| Fidelity Cash Central Fund 5.39% (o) | | 662,297,297 | 662,430 |
| Fidelity Securities Lending Cash Central Fund 5.39% (o)(p) | | 1,078,992 | 1,079 |
| TOTAL MONEY MARKET FUNDS (Cost $663,462) | | | 663,509 |
| | | | |
| TOTAL INVESTMENT IN SECURITIES - 99.6% (Cost $12,471,975) | 12,605,449 |
NET OTHER ASSETS (LIABILITIES) - 0.4% | 45,596 |
| NET ASSETS - 100.0% | 12,651,045 |
| | |
Any values shown as $0 in the Schedule of Investments may reflect amounts less than $500.
Legend
| (a) | Amount is stated in United States dollars unless otherwise noted. |
| (b) | Security exempt from registration under Rule 144A of the Securities Act of 1933. These securities may be resold in transactions exempt from registration, normally to qualified institutional buyers. At the end of the period, the value of these securities amounted to $5,622,471,000 or 44.4% of net assets. |
| (d) | Coupon rates for floating and adjustable rate securities reflect the rates in effect at period end. |
| (e) | Coupon is indexed to a floating interest rate which may be multiplied by a specified factor and/or subject to caps or floors. |
| (f) | Non-income producing - Security is in default. |
| (g) | Restricted securities (including private placements) - Investment in securities not registered under the Securities Act of 1933 (excluding 144A issues). At the end of the period, the value of restricted securities (excluding 144A issues) amounted to $373,737,000 or 3.0% of net assets. |
| (h) | Security initially issued at one coupon which converts to a higher coupon at a specified date. The rate shown is the rate at period end. |
| (j) | Security or a portion of the security is on loan at period end. |
| (k) | Remaining maturities of bank loan obligations may be less than the stated maturities shown as a result of contractual or optional prepayments by the borrower. Such prepayments cannot be predicted with certainty. |
| (l) | The coupon rate will be determined upon settlement of the loan after period end. |
| (m) | Security is perpetual in nature with no stated maturity date. |
| (o) | Affiliated fund that is generally available only to investment companies and other accounts managed by Fidelity Investments. The rate quoted is the annualized seven-day yield of the fund at period end. A complete unaudited listing of the fund's holdings as of its most recent quarter end is available upon request. In addition, each Fidelity Central Fund's financial statements, which are not covered by the Fund's Report of Independent Registered Public Accounting Firm, are available on the SEC's website or upon request. |
| (p) | Investment made with cash collateral received from securities on loan. |
| Additional information on each restricted holding is as follows: |
| Security | Acquisition Date | Acquisition Cost ($) (000s) |
| Arena Brands Holding Corp. Class B | 6/18/97 - 1/12/99 | 21,592 |
| | | |
| Fidelity Private Credit Co. LLC | 4/15/22 - 1/02/24 | 347,180 |
| | | |
| Jonah Energy Parent LLC 12% 11/5/25 | 5/05/23 | 6,608 |
| | | |
| New Cotai LLC/New Cotai Capital Corp. | 9/11/20 | 16,677 |
| | | |
| Tricer Holdco SCA | 10/16/09 - 12/30/17 | 10,248 |
| | | |
| Tricer Holdco SCA Class A1 | 10/16/09 - 10/29/09 | 1,653 |
| | | |
| Tricer Holdco SCA Class A2 | 10/16/09 - 10/29/09 | 1,653 |
| | | |
| Tricer Holdco SCA Class A3 | 10/16/09 - 10/29/09 | 1,653 |
| | | |
| Tricer Holdco SCA Class A4 | 10/16/09 - 10/29/09 | 1,653 |
| | | |
| Tricer Holdco SCA Class A5 | 10/16/09 - 10/29/09 | 1,653 |
| | | |
| Tricer Holdco SCA Class A6 | 10/16/09 - 10/29/09 | 1,653 |
| | | |
| Tricer Holdco SCA Class A7 | 10/16/09 - 10/29/09 | 1,653 |
| | | |
| Tricer Holdco SCA Class A8 | 10/16/09 - 10/29/09 | 1,653 |
| | | |
| Tricer Holdco SCA Class A9 | 10/16/09 - 10/29/09 | 1,655 |
| | | |
Affiliated Central Funds
Fiscal year to date information regarding the Fund's investments in Fidelity Central Funds, including the ownership percentage, is presented below.
| Affiliate (Amounts in thousands) | Value, beginning of period ($) | Purchases ($) | Sales Proceeds ($) | Dividend Income ($) | Realized Gain (loss) ($) | Change in Unrealized appreciation (depreciation) ($) | Value, end of period ($) | % ownership, end of period |
| Fidelity Cash Central Fund 5.39% | 597,099 | 2,906,883 | 2,841,553 | 38,549 | 1 | - | 662,430 | 1.3% |
| Fidelity Securities Lending Cash Central Fund 5.39% | - | 99,178 | 98,099 | 5 | - | - | 1,079 | 0.0% |
| Total | 597,099 | 3,006,061 | 2,939,652 | 38,554 | 1 | - | 663,509 | |
| | | | | | | | | |
Amounts in the dividend income column in the above table include any capital gain distributions from underlying funds, which are presented in the corresponding line item in the Statement of Operations, if applicable.
Amounts in the dividend income column for Fidelity Securities Lending Cash Central Fund represents the income earned on investing cash collateral, less rebates paid to borrowers and any lending agent fees associated with the loan, plus any premium payments received for lending certain types of securities.
Amounts included in the purchases and sales proceeds columns may include in-kind transactions, if applicable.
Affiliated Underlying Funds
Fiscal year to date information regarding the Fund's investments in affiliated Underlying Funds is presented below. Exchanges between classes of the same affiliated Underlying Funds may occur. If an Underlying Funds changes its name, the name presented below is the name in effect at period end.
| Affiliate (Amounts in thousands) | Value, beginning of period ($) | Purchases ($) | Sales Proceeds ($) | Dividend Income ($) | Realized Gain (loss) ($) | Change in Unrealized appreciation (depreciation) ($) | Value, end of period ($) |
| Fidelity Private Credit Co. LLC | 324,274 | 22,057 | - | 42,153 | - | 8,495 | 354,826 |
| | 324,274 | 22,057 | - | 42,153 | - | 8,495 | 354,826 |
Amounts in the dividend income column in the above table include any capital gain distributions from underlying funds, which are presented in the corresponding line item in the Statement of Operations, if applicable.
Amounts included in the purchases and sales proceeds columns may include in-kind transactions, if applicable.
Investment Valuation
The following is a summary of the inputs used, as of April 30, 2024, involving the Fund's assets and liabilities carried at fair value. The inputs or methodology used for valuing securities may not be an indication of the risk associated with investing in those securities. For more information on valuation inputs, and their aggregation into the levels used below, please refer to the Investment Valuation section in the accompanying Notes to Financial Statements.
| Valuation Inputs at Reporting Date: |
Description (Amounts in thousands) | Total ($) | Level 1 ($) | Level 2 ($) | Level 3 ($) |
Investments in Securities: | | | | |
|
| Equities: | | | | |
Communication Services | 161,930 | 161,930 | - | - |
Consumer Discretionary | 358,011 | 303,461 | 42,163 | 12,387 |
Consumer Staples | 49,615 | 48,742 | - | 873 |
Energy | 142,659 | 108,090 | - | 34,569 |
Financials | 337,023 | 337,020 | - | 3 |
Health Care | 11,849 | 11,849 | - | - |
Industrials | 420,610 | 420,607 | - | 3 |
Information Technology | 690,484 | 687,295 | - | 3,189 |
Materials | 109,201 | 109,173 | - | 28 |
Utilities | 134,478 | 134,474 | - | 4 |
|
| Corporate Bonds | 7,075,606 | - | 7,056,371 | 19,235 |
|
| Bank Loan Obligations | 1,256,809 | - | 1,256,809 | - |
|
| Preferred Securities | 838,839 | - | 838,839 | - |
|
| Other | 354,826 | - | 354,826 | - |
|
| Money Market Funds | 663,509 | 663,509 | - | - |
| Total Investments in Securities: | 12,605,449 | 2,986,150 | 9,549,008 | 70,291 |
The following is a reconciliation of Investments in Securities for which Level 3 inputs were used in determining value:
| (Amounts in thousands) | |
| Investments in Securities: | |
| Beginning Balance | $ | 163,223 | |
| Net Realized Gain (Loss) on Investment Securities | | 14,091 | |
| Net Unrealized Gain (Loss) on Investment Securities | | (46,137) | |
| Cost of Purchases | | 8,192 | |
| Proceeds of Sales | | (69,346) | |
| Amortization/Accretion | | 215 | |
| Transfers into Level 3 | | 53 | |
| Transfers out of Level 3 | | - | |
| Ending Balance | $ | 70,291 | |
| The change in unrealized gain (loss) for the period attributable to Level 3 securities held at April 30, 2024 | $ | 3,783 | |
| The information used in the above reconciliation represents fiscal year to date activity for any Investments in Securities identified as using Level 3 inputs at either the beginning or the end of the current fiscal period. Cost of purchases and proceeds of sales may include securities received and/or delivered through in-kind transactions, corporate actions or exchanges. Transfers into Level 3 were attributable to a lack of observable market data resulting from decreases in market activity, decreases in liquidity, security restructurings or corporate actions. Transfers out of Level 3 were attributable to observable market data becoming available for those securities. Transfers in or out of Level 3 represent the beginning value of any Security or Instrument where a change in the pricing level occurred from the beginning to the end of the period. Realized and unrealized gains (losses) disclosed in the reconciliation are included in Net Gain (Loss) on the Fund's Statement of Operations. | |
| Statement of Assets and Liabilities |
| Amounts in thousands (except per-share amount) | | | | April 30, 2024 |
| | | | | |
| Assets | | | | |
| Investment in securities, at value (including securities loaned of $1,046) - See accompanying schedule: | | | | |
Unaffiliated issuers (cost $11,461,333) | $ | 11,587,114 | | |
Fidelity Central Funds (cost $663,462) | | 663,509 | | |
Other affiliated issuers (cost $347,180) | | 354,826 | | |
| | | | | |
| | | | | |
| Total Investment in Securities (cost $12,471,975) | | | $ | 12,605,449 |
| Cash | | | | 202 |
| Receivable for investments sold | | | | 52,755 |
| Receivable for fund shares sold | | | | 7,427 |
| Dividends receivable | | | | 768 |
| Interest receivable | | | | 127,768 |
| Distributions receivable from Fidelity Central Funds | | | | 2,494 |
| Prepaid expenses | | | | 4 |
| Other receivables | | | | 491 |
Total assets | | | | 12,797,358 |
| Liabilities | | | | |
| Payable for investments purchased | $ | 123,073 | | |
| Payable for fund shares redeemed | | 8,125 | | |
| Distributions payable | | 6,753 | | |
| Accrued management fee | | 6,682 | | |
| Other payables and accrued expenses | | 601 | | |
| Collateral on securities loaned | | 1,079 | | |
| Total liabilities | | | | 146,313 |
| Commitments and contingent liabilities (see Commitments note) | | | | |
| Net Assets | | | $ | 12,651,045 |
| Net Assets consist of: | | | | |
| Paid in capital | | | $ | 12,608,882 |
| Total accumulated earnings (loss) | | | | 42,163 |
| Net Assets | | | $ | 12,651,045 |
Net Asset Value, offering price and redemption price per share ($12,651,045 ÷ 1,297,185 shares) | | | $ | 9.75 |
| Statement of Operations |
| Amounts in thousands | | | | Year ended April 30, 2024 |
| Investment Income | | | | |
| Dividends: | | | | |
| Unaffiliated issuers | | | $ | 80,348 |
| Affiliated issuers | | | | 41,808 |
| Interest | | | | 586,413 |
| Income from Fidelity Central Funds (including $5 from security lending) | | | | 38,554 |
| Total income | | | | 747,123 |
| Expenses | | | | |
| Management fee | $ | 67,506 | | |
| Transfer agent fees | | 10,864 | | |
| Accounting fees | | 1,224 | | |
| Custodian fees and expenses | | 36 | | |
| Independent trustees' fees and expenses | | 59 | | |
| Registration fees | | 215 | | |
| Audit | | 127 | | |
| Legal | | 85 | | |
| Miscellaneous | | 54 | | |
| Total expenses before reductions | | 80,170 | | |
| Expense reductions | | (2,347) | | |
| Total expenses after reductions | | | | 77,823 |
| Net Investment income (loss) | | | | 669,300 |
| Realized and Unrealized Gain (Loss) | | | | |
| Net realized gain (loss) on: | | | | |
| Investment Securities: | | | | |
| Unaffiliated issuers | | (96,272) | | |
| Fidelity Central Funds | | 1 | | |
| Foreign currency transactions | | (152) | | |
| Capital gain distributions from underlying funds: | | | | |
| Affiliated issuers | | 345 | | |
| Total net realized gain (loss) | | | | (96,078) |
| Change in net unrealized appreciation (depreciation) on: | | | | |
| Investment Securities: | | | | |
| Unaffiliated issuers | | 670,789 | | |
| Affiliated issuers | | 8,495 | | |
| Assets and liabilities in foreign currencies | | 1 | | |
| Total change in net unrealized appreciation (depreciation) | | | | 679,285 |
| Net gain (loss) | | | | 583,207 |
| Net increase (decrease) in net assets resulting from operations | | | $ | 1,252,507 |
| Statement of Changes in Net Assets |
| |
| Amount in thousands | | Year ended April 30, 2024 | | Year ended April 30, 2023 |
| Increase (Decrease) in Net Assets | | | | |
| Operations | | | | |
| Net investment income (loss) | $ | 669,300 | $ | 597,286 |
| Net realized gain (loss) | | (96,078) | | 49,664 |
| Change in net unrealized appreciation (depreciation) | | 679,285 | | (472,925) |
| Net increase (decrease) in net assets resulting from operations | | 1,252,507 | | 174,025 |
| Distributions to shareholders | | (651,200) | | (1,316,424) |
| | | | | |
| Share transactions | | | | |
| Proceeds from sales of shares | | 2,290,716 | | 1,660,390 |
| Reinvestment of distributions | | 567,039 | | 1,172,169 |
| Cost of shares redeemed | | (2,265,878) | | (3,309,299) |
| | | | | |
Net increase (decrease) in net assets resulting from share transactions | | 591,877 | | (476,740) |
| Total increase (decrease) in net assets | | 1,193,184 | | (1,619,139) |
| | | | | |
| Net Assets | | | | |
| Beginning of period | | 11,457,861 | | 13,077,000 |
| End of period | $ | 12,651,045 | $ | 11,457,861 |
| | | | | |
| Other Information | | | | |
| Shares | | | | |
| Sold | | 241,969 | | 177,479 |
| Issued in reinvestment of distributions | | 59,793 | | 125,646 |
| Redeemed | | (239,445) | | (353,587) |
| Net increase (decrease) | | 62,317 | | (50,462) |
| | | | | |
Financial Highlights
Fidelity® Capital & Income Fund |
| |
| Years ended April 30, | | 2024 | | 2023 | | 2022 | | 2021 | | 2020 |
Selected Per-Share Data | | | | | | | | | | |
| Net asset value, beginning of period | $ | 9.28 | $ | 10.17 | $ | 11.24 | $ | 8.92 | $ | 10.08 |
| Income from Investment Operations | | | | | | | | | | |
Net investment income (loss) A,B | | .529 | | .480 | | .387 | | .386 | | .426 |
| Net realized and unrealized gain (loss) | | .456 | | (.308) | | (.714) | | 2.442 | | (1.085) |
| Total from investment operations | | .985 | | .172 | | (.327) | | 2.828 | | (.659) |
| Distributions from net investment income | | (.515) | | (.473) | | (.390) | | (.390) | | (.425) |
| Distributions from net realized gain | | - | | (.589) | | (.353) | | (.118) | | (.076) |
| Total distributions | | (.515) | | (1.062) | | (.743) | | (.508) | | (.501) |
| Net asset value, end of period | $ | 9.75 | $ | 9.28 | $ | 10.17 | $ | 11.24 | $ | 8.92 |
Total Return C | | | | 2.09% | | (3.27)% | | 32.35% | | (6.89)% |
Ratios to Average Net Assets B,D,E | | | | | | | | | | |
| Expenses before reductions | | .67% | | .68% | | .67% | | .68% | | .67% |
| Expenses net of fee waivers, if any | | | | .68% | | .67% | | .68% | | .67% |
| Expenses net of all reductions | | .65% | | .68% | | .67% | | .68% | | .67% |
| Net investment income (loss) | | 5.60% | | 5.16% | | 3.49% | | 3.75% | | 4.32% |
| Supplemental Data | | | | | | | | | | |
| Net assets, end of period (in millions) | $ | 12,651 | $ | 11,458 | $ | 13,077 | $ | 14,674 | $ | 10,228 |
Portfolio turnover rate F | | | | 20% | | 28% | | 37% | | 46% |
ACalculated based on average shares outstanding during the period.
BNet investment income (loss) is affected by the timing of the declaration of dividends by any underlying mutual funds or exchange-traded funds (ETFs). Net investment income (loss) of any mutual funds or ETFs is not included in the Fund's net investment income (loss) ratio.
CTotal returns would have been lower if certain expenses had not been reduced during the applicable periods shown.
DFees and expenses of any underlying mutual funds or exchange-traded funds (ETFs) are not included in the Fund's expense ratio. The Fund indirectly bears its proportionate share of these expenses. For additional expense information related to investments in Fidelity Central Funds, please refer to the "Investments in Fidelity Central Funds" note found in the Notes to Financial Statements section of the most recent Annual or Semi-Annual report. For additional expense information related to investments in Fidelity Private Credit Company LLC, please refer to the Investment in Fidelity Private Credit Company LLC note found in the Notes to Financial Statements section of the most recent Annual or Semi-Annual report.
EExpense ratios reflect operating expenses of the class. Expenses before reductions do not reflect amounts reimbursed, waived, or reduced through arrangements with the investment adviser, brokerage services, or other offset arrangements, if applicable, and do not represent the amount paid by the class during periods when reimbursements, waivers or reductions occur.
FAmount does not include the portfolio activity of any underlying mutual funds or exchange-traded funds (ETFs).
For the period ended April 30, 2024
(Amounts in thousands except percentages)
1. Organization.
Fidelity Capital & Income Fund (the Fund) is a fund of Fidelity Summer Street Trust (the Trust) and is authorized to issue an unlimited number of shares. Share transactions on the Statement of Changes in Net Assets may contain exchanges between affiliated funds. The Trust is registered under the Investment Company Act of 1940, as amended (the 1940 Act), as an open-end management investment company organized as a Massachusetts business trust.
2. Investments in Fidelity Central Funds.
Funds may invest in Fidelity Central Funds, which are open-end investment companies generally available only to other investment companies and accounts managed by the investment adviser and its affiliates. The Schedule of Investments lists any Fidelity Central Funds held as an investment as of period end, but does not include the underlying holdings of each Fidelity Central Fund. An investing fund indirectly bears its proportionate share of the expenses of the underlying Fidelity Central Funds.
Based on its investment objective, each Fidelity Central Fund may invest or participate in various investment vehicles or strategies that are similar to those of the investing fund. These strategies are consistent with the investment objectives of the investing fund and may involve certain economic risks which may cause a decline in value of each of the Fidelity Central Funds and thus a decline in the value of the investing fund.
| Fidelity Central Fund | Investment Manager | Investment Objective | Investment Practices | Expense RatioA |
| Fidelity Money Market Central Funds | Fidelity Management & Research Company LLC (FMR) | Each fund seeks to obtain a high level of current income consistent with the preservation of capital and liquidity. | Short-term Investments | Less than .005% |
A Expenses expressed as a percentage of average net assets and are as of each underlying Central Fund's most recent annual or semi-annual shareholder report.
A complete unaudited list of holdings for each Fidelity Central Fund is available upon request or at the Securities and Exchange Commission website at www.sec.gov. In addition, the financial statements of the Fidelity Central Funds which contain the significant accounting policies (including investment valuation policies) of those funds, and are not covered by the Report of Independent Registered Public Accounting Firm, are available on the Securities and Exchange Commission website or upon request.
3. Investment in Fidelity Private Credit Company LLC.
The Fund invests in Fidelity Private Credit Company LLC, which is a limited liability company. On June 1, 2023, Fidelity Private Credit Company elected to be regulated as a business development company (BDC). Fidelity Private Credit Company LLC's units are not registered under the Securities Act of 1933 and are subject to substantial restrictions on transfer. The Fund has no redemption rights under Fidelity Private Credit Company LLC's limited liability company agreement. There will be no trading market for the units.
Based on its investment objective, Fidelity Private Credit Company LLC may invest or participate in various investments or strategies that are similar to those in which the Fund may invest or participate. These strategies are consistent with the investment objectives of the Fund and may involve certain economic risks which may cause a decline in value of Fidelity Private Credit Company LLC and thus a decline in the value of the Fund. Fidelity Private Credit Company LLC intends to invest primarily in directly originated loans to private companies but also with liquid credit investments, like broadly syndicated loans, and other select private credit investments.
The Schedule of Investments lists Fidelity Private Credit Company LLC as an investment as of period end, but does not include the underlying holdings of Fidelity Private Credit Company LLC. Fidelity Private Credit Company LLC represented less than 5% of the Fund's net assets at period end. The Fund indirectly bears its proportionate share of the expenses of Fidelity Private Credit Company LLC. The annualized expense ratio for Fidelity Private Credit Company LLC for the three month period ended March 31, 2024 was 11.51%.
4. Significant Accounting Policies.
The Fund is an investment company and applies the accounting and reporting guidance of the Financial Accounting Standards Board (FASB) Accounting Standards Codification Topic 946 Financial Services - Investment Companies. The financial statements have been prepared in conformity with accounting principles generally accepted in the United States of America (GAAP), which require management to make certain estimates and assumptions at the date of the financial statements. Actual results could differ from those estimates. Subsequent events, if any, through the date that the financial statements were issued have been evaluated in the preparation of the financial statements. The Fund's Schedule of Investments lists any underlying mutual funds or exchange-traded funds (ETFs) but does not include the underlying holdings of these funds. The following summarizes the significant accounting policies of the Fund:
Investment Valuation. Investments are valued as of 4:00 p.m. Eastern time on the last calendar day of the period. The Board of Trustees (the Board) has designated the Fund's investment adviser as the valuation designee responsible for the fair valuation function and performing fair value determinations as needed. The investment adviser has established a Fair Value Committee (the Committee) to carry out the day-to-day fair valuation responsibilities and has adopted policies and procedures to govern the fair valuation process and the activities of the Committee. In accordance with these fair valuation policies and procedures, which have been approved by the Board, the Fund attempts to obtain prices from one or more third party pricing services or brokers to value its investments. When current market prices, quotations or currency exchange rates are not readily available or reliable, investments will be fair valued in good faith by the Committee, in accordance with the policies and procedures. Factors used in determining fair value vary by investment type and may include market or investment specific events, transaction data, estimated cash flows, and market observations of comparable investments. The frequency that the fair valuation procedures are used cannot be predicted and they may be utilized to a significant extent. The Committee manages the Fund's fair valuation practices and maintains the fair valuation policies and procedures. The Fund's investment adviser reports to the Board information regarding the fair valuation process and related material matters.
The Fund categorizes the inputs to valuation techniques used to value its investments into a disclosure hierarchy consisting of three levels as shown below:
Level 1 - unadjusted quoted prices in active markets for identical investments
Level 2 - other significant observable inputs (including quoted prices for similar investments, interest rates, prepayment speeds, etc.)
Level 3 - unobservable inputs (including the Fund's own assumptions based on the best information available)
Valuation techniques used to value the Fund's investments by major category are as follows:
Debt securities, including restricted securities, are valued based on evaluated prices received from third party pricing services or from brokers who make markets in such securities. Corporate bonds, bank loan obligations and preferred securities are valued by pricing services who utilize matrix pricing which considers yield or price of bonds of comparable quality, coupon, maturity and type or by broker-supplied prices. When independent prices are unavailable or unreliable, debt securities may be valued utilizing pricing methodologies which consider similar factors that would be used by third party pricing services. Debt securities are generally categorized as Level 2 in the hierarchy but may be Level 3 depending on the circumstances. The Fund invests a significant portion of its assets in below investment grade securities. The value of these securities can be more volatile due to changes in the credit quality of the issuer and is sensitive to changes in economic, market and regulatory conditions.
Equity securities, including restricted securities, for which market quotations are readily available, are valued at the last reported sale price or official closing price as reported by a third party pricing service on the primary market or exchange on which they are traded and are categorized as Level 1 in the hierarchy. In the event there were no sales during the day or closing prices are not available, securities are valued at the last quoted bid price or may be valued using the last available price and are generally categorized as Level 2 in the hierarchy. For foreign equity securities, when market or security specific events arise, comparisons to the valuation of American Depositary Receipts (ADRs), futures contracts, Exchange-Traded Funds (ETFs) and certain indexes as well as quoted prices for similar securities may be used and would be categorized as Level 2 in the hierarchy. For equity securities, including restricted securities, where observable inputs are limited, assumptions about market activity and risk are used and these securities may be categorized as Level 3 in the hierarchy.
Investments in open-end mutual funds, including the Fidelity Central Funds, are valued at their closing net asset value (NAV) each business day and are categorized as Level 1 in the hierarchy.
Fidelity Private Credit Company LLC is valued at its net asset value (NAV) each month end and is categorized as Level 2 in the hierarchy.
Changes in valuation techniques may result in transfers in or out of an assigned level within the disclosure hierarchy. The aggregate value of investments by input level as of April 30, 2024, as well as a roll forward of Level 3 investments, is included at the end of the Fund's Schedule of Investments.
Foreign Currency. Certain Funds may use foreign currency contracts to facilitate transactions in foreign-denominated securities. Gains and losses from these transactions may arise from changes in the value of the foreign currency or if the counterparties do not perform under the contracts' terms.
Foreign-denominated assets, including investment securities, and liabilities are translated into U.S. dollars at the exchange rates at period end. Purchases and sales of investment securities, income and dividends received, and expenses denominated in foreign currencies are translated into U.S. dollars at the exchange rate in effect on the transaction date.
The effects of exchange rate fluctuations on investments are included with the net realized and unrealized gain (loss) on investment securities. Other foreign currency transactions resulting in realized and unrealized gain (loss) are disclosed separately.
Investment Transactions and Income. For financial reporting purposes, the Fund's investment holdings and NAV include trades executed through the end of the last business day of the period. The NAV per share for processing shareholder transactions is calculated as of the close of business of the New York Stock Exchange (NYSE), normally 4:00 p.m. Eastern time and includes trades executed through the end of the prior business day. Gains and losses on securities sold are determined on the basis of identified cost and include proceeds received from litigation. Commissions paid to certain brokers with whom the investment adviser, or its affiliates, places trades on behalf of a fund include an amount in addition to trade execution, which may be rebated back to a fund. Any such rebates are included in net realized gain (loss) on investments in the Statement of Operations. Dividend income is recorded on the ex-dividend date, except for certain dividends from foreign securities where the ex-dividend date may have passed, which are recorded as soon as the Fund is informed of the ex-dividend date. Non-cash dividends included in dividend income, if any, are recorded at the fair market value of the securities received. Income and capital gain distributions from Fidelity Central Funds, if any, are recorded on the ex-dividend date. Certain distributions received by the Fund represent a return of capital or capital gain. The Fund determines the components of these distributions subsequent to the ex-dividend date, based upon receipt of tax filings or other correspondence relating to the underlying investment. These distributions are recorded as a reduction of cost of investments and/or as a realized gain. Interest income is accrued as earned and includes coupon interest and amortization of premium and accretion of discount on debt securities as applicable. Paid in Kind (PIK) income is recorded at the fair market value of the securities received. Investment income is recorded net of foreign taxes withheld where recovery of such taxes is uncertain. Debt obligations may be placed on non-accrual status and related interest income may be reduced by ceasing current accruals and writing off interest receivables when the collection of all or a portion of interest has become doubtful based on consistently applied procedures. A debt obligation is removed from non-accrual status when the issuer resumes interest payments or when collectability of interest is reasonably assured. Funds may file withholding tax reclaims in certain jurisdictions to recover a portion of amounts previously withheld. Any withholding tax reclaims income is included in the Statement of Operations in dividends. Any receivables for withholding tax reclaims are included in the Statement of Assets and Liabilities in dividend receivable.
Expenses. Expenses directly attributable to a fund are charged to that fund. Expenses attributable to more than one fund are allocated among the respective funds on the basis of relative net assets or other appropriate methods. Expenses included in the accompanying financial statements reflect the expenses of that fund and do not include any expenses associated with any underlying mutual funds or exchange-traded funds. Although not included in a fund's expenses, a fund indirectly bears its proportionate share of these expenses through the net asset value of each underlying mutual fund or exchange-traded fund. Expense estimates are accrued in the period to which they relate and adjustments are made when actual amounts are known.
Deferred Trustee Compensation. Under a Deferred Compensation Plan (the Plan) for certain Funds, certain independent Trustees have elected to defer receipt of a portion of their annual compensation. Deferred amounts are invested in affiliated mutual funds, are marked-to-market and remain in a fund until distributed in accordance with the Plan. The investment of deferred amounts and the offsetting payable to the Trustees presented below are included in the accompanying Statement of Assets and Liabilities in other receivables and other payables and accrued expenses, as applicable.
| Fidelity Capital & Income Fund | $491 |
Income Tax Information and Distributions to Shareholders. Each year, the Fund intends to qualify as a regulated investment company under Subchapter M of the Internal Revenue Code, including distributing substantially all of its taxable income and realized gains. As a result, no provision for U.S. Federal income taxes is required. As of April 30, 2024, the Fund did not have any unrecognized tax benefits in the financial statements; nor is the Fund aware of any tax positions for which it is reasonably possible that the total amounts of unrecognized tax benefits will significantly change in the next twelve months. The Fund files a U.S. federal tax return, in addition to state and local tax returns as required. The Fund's federal income tax returns are subject to examination by the Internal Revenue Service (IRS) for a period of three fiscal years after they are filed. State and local tax returns may be subject to examination for an additional fiscal year depending on the jurisdiction. Foreign taxes are provided for based on the Fund's understanding of the tax rules and rates that exist in the foreign markets in which it invests.
Distributions are declared and recorded daily and paid monthly from net investment income. Distributions from realized gains, if any, are declared and recorded on the ex-dividend date. Income and capital gain distributions are determined in accordance with income tax regulations, which may differ from GAAP.
Capital accounts within the financial statements are adjusted for permanent book-tax differences. These adjustments have no impact on net assets or the results of operations. Capital accounts are not adjusted for temporary book-tax differences which will reverse in a subsequent period.
Book-tax differences are primarily due to the short-term gain distributions from the underlying mutual funds or exchange-traded funds (ETFs), foreign currency transactions, partnerships, market discount, capital loss carryforwards and losses deferred due to wash sales and excise tax regulations.
As of period end, the cost and unrealized appreciation (depreciation) in securities, and derivatives if applicable, for federal income tax purposes were as follows:
| Gross unrealized appreciation | $832,144 |
| Gross unrealized depreciation | (648,241) |
| Net unrealized appreciation (depreciation) | $183,903 |
| Tax Cost | $12,421,546 |
The tax-based components of distributable earnings as of period end were as follows:
| Undistributed ordinary income | $5,845 |
| Capital loss carryforward | $(147,585) |
| Net unrealized appreciation (depreciation) on securities and other investments | $183,903 |
Capital loss carryforwards are only available to offset future capital gains of the Fund to the extent provided by regulations and may be limited. The capital loss carryforward information presented below, including any applicable limitation, is estimated as of fiscal period end and is subject to adjustment.
| Long-term | $(147,585) |
| Total capital loss carryforward | $(147,585) |
The tax character of distributions paid was as follows:
| | April 30, 2024 | April 30, 2023 |
| Ordinary Income | $651,200 | $587,843 |
| Long-term Capital Gains | - | 728,581 |
| Total | $651,200 | $1,316,424 |
Restricted Securities (including Private Placements). Funds may invest in securities that are subject to legal or contractual restrictions on resale. These securities generally may be resold in transactions exempt from registration or to the public if the securities are registered. Disposal of these securities may involve time-consuming negotiations and expense, and prompt sale at an acceptable price may be difficult. Information regarding restricted securities held at period end is included at the end of the Schedule of Investments, if applicable.
Loans and Other Direct Debt Instruments. Direct debt instruments are interests in amounts owed to lenders by corporate or other borrowers. These instruments may be in the form of loans, trade claims or other receivables and may include standby financing commitments such as revolving credit facilities that obligate a fund to supply additional cash to the borrower on demand. Loans may be acquired through assignment, participation, or may be made directly to a borrower. Such instruments are presented in the Bank Loan Obligations section in the Schedule of Investments. Certain funds may also invest in unfunded loan commitments, which are contractual obligations for future funding. Information regarding unfunded commitments is included at the end of the Schedule of Investments, if applicable.
Commitments. A commitment is an agreement to acquire an investment at a future date (subject to conditions) in connection with a potential public or non-public offering. The amount of commitments outstanding at period end are presented in the table below. These commitments are not included in the net assets of the Fund at period end.
| | Investment to be Acquired | Commitment Amount ($) |
| Fidelity Capital & Income Fund | Fidelity Private Credit Company LLC | 69,908 |
5. Purchases and Sales of Investments.
Purchases and sales of securities, other than short-term securities and in-kind transactions, as applicable, are noted in the table below.
| | Purchases ($) | Sales ($) |
| Fidelity Capital & Income Fund | 4,603,480 | 4,000,769 |
6. Fees and Other Transactions with Affiliates.
Management Fee. Fidelity Management & Research Company LLC (the investment adviser) and its affiliates provide the Fund with investment management related services for which the Fund pays a monthly management fee.
Effective March 1, 2024, the Fund's management contract was amended to incorporate administrative services previously covered under separate services agreements (Transfer Agent and Accounting agreements). Any reference to "class" in this note shall mean "the Fund" as the Fund currently offers only one class of shares. The amended contract incorporates a management fee rate that may vary by class. The investment adviser or an affiliate pays certain expenses of managing and operating the Fund out of each class's management fee. Each class of the Fund pays a management fee to the investment adviser. The management fee is calculated and paid to the investment adviser every month. When determining a class's management fee, a mandate rate is calculated based on the monthly average net assets of a group of funds advised by FMR within a designated asset class. A discount rate is subtracted from the mandate rate once the Fund's monthly average net assets reach a certain level. The mandate rate and discount rate may vary by class. The annual management fee rate for a class of shares of the Fund is the lesser of (1) the class's mandate rate reduced by the class's discount rate (if applicable) or (2) the amount set forth in the following table.
| | Maximum Management Fee Rate % |
| Fidelity Capital & Income Fund | .65 |
One-twelfth of the management fee rate for a class is applied to the average net assets of the class for the month, giving a dollar amount which is the management fee for the class for that month. A different management fee rate may be applicable to each class of the Fund. The difference between classes is the result of separate arrangements for class-level services and/or waivers of certain expenses. It is not the result of any difference in advisory or custodial fees or other expenses related to the management of the Fund's assets, which do not vary by class. For the portion of the reporting period on or after March 1, 2024, the total annualized management fee rates were as follows:
| | Total Management Fee Rate % |
| Fidelity Capital & Income Fund | .65 |
Prior to March 1, 2024, the management fee was the sum of an individual fund fee rate that was based on an annual rate of .45% of the Fund's average net assets and an annualized group fee rate that averaged .10% during the period. The group fee rate was based upon the monthly average net assets of a group of registered investment companies with which the investment adviser has management contracts. The group fee rate decreased as assets under management increased and increased as assets under management decreased. For the portion of the reporting period prior to March 1, 2024, the total annualized management fee rate was .55%.
Effective March 1, 2024, the Fund's sub-advisory agreements with FMR Investment Management (UK) Limited, Fidelity Management & Research (Hong Kong) Limited, and Fidelity Management & Research (Japan) Limited were amended to provide that the investment adviser pays each sub-adviser monthly fees equal to 110% of the sub-adviser's costs for providing sub-advisory services.
Transfer Agent Fees. Fidelity Investments Institutional Operations Company LLC (FIIOC), an affiliate of the investment adviser, is the Fund's transfer, dividend disbursing and shareholder servicing agent. Effective March 1, 2024, each Fund's management contract was amended to incorporate transfer agent services and associated fees previously covered under a separate services agreement. FIIOC pays for typesetting, printing and mailing of shareholder reports, except proxy statements.
During November 2023, the Board approved a change in the transfer agent fees effective December 1, 2023 to a fixed annual rate of average net assets of .1101%
Prior to December 1, 2023, FIIOC received account fees and asset-based fees that varied according to account size and type of account.
For the portion of the reporting period prior to March 1, 2024, the fees were equivalent to the annualized rate of .11% of average net assets.
Accounting Fees. Fidelity Service Company, Inc. (FSC), an affiliate of the investment adviser, maintains the Fund's accounting records. Effective March 1, 2024, the Fund's management contract was amended to incorporate accounting services and associated fees previously covered under a separate services agreement.
During November 2023, the Board approved a change in the accounting fees effective December 1, 2023 to a fixed annual rate of average net assets as follows:
| | % of Average Net Assets |
| Fidelity Capital & Income Fund | .0124 |
Prior to December 1, 2023, the accounting fee was based on the level of average net assets for each month. For the portion of the reporting period prior to March 1, 2024, the fees were equivalent to the following annualized rates:
| | % of Average Net Assets |
| Fidelity Capital & Income Fund | .01 |
Brokerage Commissions. A portion of portfolio transactions were placed with brokerage firms which are affiliates of the investment adviser. Brokerage commissions are included in net realized gain (loss) and change in net unrealized appreciation (depreciation) in the Statement of Operations. The commissions paid to these affiliated firms were as follows:
| | Amount ($) |
| Fidelity Capital & Income Fund | 12 |
Interfund Trades. Funds may purchase from or sell securities to other Fidelity Funds under procedures adopted by the Board. The procedures have been designed to ensure these interfund trades are executed in accordance with Rule 17a-7 of the 1940 Act. Any interfund trades are included within the respective purchases and sales amounts shown in the Purchases and Sales of Investments note. Interfund trades during the period are noted in the table below.
| | Purchases ($) | Sales ($) | Realized Gain (Loss)($) |
| Fidelity Capital & Income Fund | 82,073 | 29,548 | 3,142 |
7. Committed Line of Credit.
Certain Funds participate with other funds managed by the investment adviser or an affiliate in a $4.25 billion credit facility (the "line of credit") to be utilized for temporary or emergency purposes to fund shareholder redemptions or for other short-term liquidity purposes. The participating funds have agreed to pay commitment fees on their pro-rata portion of the line of credit, which are reflected in Miscellaneous expenses on the Statement of Operations, and are listed below. During the period, there were no borrowings on this line of credit.
| | Amount ($) |
| Fidelity Capital & Income Fund | 21 |
8. Security Lending.
Funds lend portfolio securities from time to time in order to earn additional income. Lending agents are used, including National Financial Services (NFS), an affiliate of the investment adviser. Pursuant to a securities lending agreement, NFS will receive a fee, which is capped at 9.9% of a fund's daily lending revenue, for its services as lending agent. A fund may lend securities to certain qualified borrowers, including NFS. On the settlement date of the loan, a fund receives collateral (in the form of U.S. Treasury obligations, letters of credit and/or cash) against the loaned securities and maintains collateral in an amount not less than 100% of the market value of the loaned securities during the period of the loan. The market value of the loaned securities is determined at the close of business of a fund and any additional required collateral is delivered to a fund on the next business day. A fund or borrower may terminate the loan at any time, and if the borrower defaults on its obligation to return the securities loaned because of insolvency or other reasons, a fund may apply collateral received from the borrower against the obligation. A fund may experience delays and costs in recovering the securities loaned. Any cash collateral received is invested in the Fidelity Securities Lending Cash Central Fund. Any loaned securities are identified as such in the Schedule of Investments, and the value of loaned securities and cash collateral at period end, as applicable, are presented in the Statement of Assets and Liabilities. Security lending income represents the income earned on investing cash collateral, less rebates paid to borrowers and any lending agent fees associated with the loan, plus any premium payments received for lending certain types of securities. Security lending income is presented in the Statement of Operations as a component of income from Fidelity Central Funds. Affiliated security lending activity, if any, was as follows:
| | Total Security Lending Fees Paid to NFS ($) | Security Lending Income From Securities Loaned to NFS ($) | Value of Securities Loaned to NFS at Period End ($) |
| Fidelity Capital & Income Fund | 1 | - | - |
9. Expense Reductions.
The investment adviser has contractually agreed to waive the Fund's management fee with respect to the portion of the Fund's assets invested in Fidelity Private Credit Company LLC until August 31, 2025. During the period, this waiver reduced the Fund's management fee by $1,791.
Through arrangements with the Fund's custodian, credits realized as a result of certain uninvested cash balances were used to reduce the Fund's expenses by $33.
In addition, during the period the investment adviser or an affiliate reimbursed and/or waived a portion of operating expenses in the amount of $523.
10. Other.
A fund's organizational documents provide former and current trustees and officers with a limited indemnification against liabilities arising in connection with the performance of their duties to the fund. In the normal course of business, a fund may also enter into contracts that provide general indemnifications. A fund's maximum exposure under these arrangements is unknown as this would be dependent on future claims that may be made against a fund. The risk of material loss from such claims is considered remote.
11. Risk and Uncertainties.
Many factors affect a fund's performance. Developments that disrupt global economies and financial markets, such as pandemics, epidemics, outbreaks of infectious diseases, war, terrorism, and environmental disasters, may significantly affect a fund's investment performance. The effects of these developments to a fund will be impacted by the types of securities in which a fund invests, the financial condition, industry, economic sector, and geographic location of an issuer, and a fund's level of investment in the securities of that issuer. Significant concentrations in security types, issuers, industries, sectors, and geographic locations may magnify the factors that affect a fund's performance.
To the Board of Trustees of Fidelity Summer Street Trust and Shareholders of Fidelity Capital & Income Fund
Opinion on the Financial Statements
We have audited the accompanying statement of assets and liabilities, including the schedule of investments, of Fidelity Capital & Income Fund (one of the funds constituting Fidelity Summer Street Trust, referred to hereafter as the "Fund") as of April 30, 2024, the related statement of operations for the year ended April 30, 2024, the statement of changes in net assets for each of the two years in the period ended April 30, 2024, including the related notes, and the financial highlights for each of the five years in the period ended April 30, 2024 (collectively referred to as the "financial statements"). In our opinion, the financial statements present fairly, in all material respects, the financial position of the Fund as of April 30, 2024, the results of its operations for the year then ended, the changes in its net assets for each of the two years in the period ended April 30, 2024 and the financial highlights for each of the five years in the period ended April 30, 2024 in conformity with accounting principles generally accepted in the United States of America.
Basis for Opinion
These financial statements are the responsibility of the Fund's management. Our responsibility is to express an opinion on the Fund's financial statements based on our audits. We are a public accounting firm registered with the Public Company Accounting Oversight Board (United States) (PCAOB) and are required to be independent with respect to the Fund in accordance with the U.S. federal securities laws and the applicable rules and regulations of the Securities and Exchange Commission and the PCAOB.
We conducted our audits of these financial statements in accordance with the standards of the PCAOB. Those standards require that we plan and perform the audit to obtain reasonable assurance about whether the financial statements are free of material misstatement, whether due to error or fraud.
Our audits included performing procedures to assess the risks of material misstatement of the financial statements, whether due to error or fraud, and performing procedures that respond to those risks. Such procedures included examining, on a test basis, evidence regarding the amounts and disclosures in the financial statements. Our audits also included evaluating the accounting principles used and significant estimates made by management, as well as evaluating the overall presentation of the financial statements. Our procedures included confirmation of securities owned as of April 30, 2024 by correspondence with the custodian, issuers of privately offered securities, agent banks and brokers; when replies were not received from brokers, we performed other auditing procedures. We believe that our audits provide a reasonable basis for our opinion.
/s/ PricewaterhouseCoopers LLP
Boston, Massachusetts
June 14, 2024
We have served as the auditor of one or more investment companies in the Fidelity group of funds since 1932.
The Trustees, Members of the Advisory Board (if any), and officers of the trust and fund, as applicable, are listed below. The Board of Trustees governs the fund and is responsible for protecting the interests of shareholders. The Trustees are experienced executives who meet periodically throughout the year to oversee the fund's activities, review contractual arrangements with companies that provide services to the fund, oversee management of the risks associated with such activities and contractual arrangements, and review the fund's performance. Except for Vijay Advani, each of the Trustees oversees 323 funds. Mr. Advani oversees 216 funds.
The Trustees hold office without limit in time except that (a) any Trustee may resign; (b) any Trustee may be removed by written instrument, signed by at least two-thirds of the number of Trustees prior to such removal; (c) any Trustee who requests to be retired or who has become incapacitated by illness or injury may be retired by written instrument signed by a majority of the other Trustees; and (d) any Trustee may be removed at any special meeting of shareholders by a two-thirds vote of the outstanding voting securities of the trust. Each Trustee who is not an interested person (as defined in the 1940 Act) of the trust and the fund is referred to herein as an Independent Trustee. Each Independent Trustee shall retire not later than the last day of the calendar year in which his or her 75th birthday occurs. The Independent Trustees may waive this mandatory retirement age policy with respect to individual Trustees. Officers and Advisory Board Members hold office without limit in time, except that any officer or Advisory Board Member may resign or may be removed by a vote of a majority of the Trustees at any regular meeting or any special meeting of the Trustees. Except as indicated, each individual has held the office shown or other offices in the same company for the past five years.
The fund's Statement of Additional Information (SAI) includes more information about the Trustees. To request a free copy, call Fidelity at 1-800-544-8544.
Experience, Skills, Attributes, and Qualifications of the Trustees. The Governance and Nominating Committee has adopted a statement of policy that describes the experience, qualifications, attributes, and skills that are necessary and desirable for potential Independent Trustee candidates (Statement of Policy). The Board believes that each Trustee satisfied at the time he or she was initially elected or appointed a Trustee, and continues to satisfy, the standards contemplated by the Statement of Policy. The Governance and Nominating Committee also engages professional search firms to help identify potential Independent Trustee candidates who have the experience, qualifications, attributes, and skills consistent with the Statement of Policy. From time to time, additional criteria based on the composition and skills of the current Independent Trustees, as well as experience or skills that may be appropriate in light of future changes to board composition, business conditions, and regulatory or other developments, have also been considered by the professional search firms and the Governance and Nominating Committee. In addition, the Board takes into account the Trustees' commitment and participation in Board and committee meetings, as well as their leadership of standing and ad hoc committees throughout their tenure.
In determining that a particular Trustee was and continues to be qualified to serve as a Trustee, the Board has considered a variety of criteria, none of which, in isolation, was controlling. The Board believes that, collectively, the Trustees have balanced and diverse experience, qualifications, attributes, and skills, which allow the Board to operate effectively in governing the fund and protecting the interests of shareholders. Information about the specific experience, skills, attributes, and qualifications of each Trustee, which in each case led to the Board's conclusion that the Trustee should serve (or continue to serve) as a trustee of the fund, is provided below.
Board Structure and Oversight Function. Robert A. Lawrence is an interested person and currently serves as Chair. The Trustees have determined that an interested Chair is appropriate and benefits shareholders because an interested Chair has a personal and professional stake in the quality and continuity of services provided to the fund. Independent Trustees exercise their informed business judgment to appoint an individual of their choosing to serve as Chair, regardless of whether the Trustee happens to be independent or a member of management. The Independent Trustees have determined that they can act independently and effectively without having an Independent Trustee serve as Chair and that a key structural component for assuring that they are in a position to do so is for the Independent Trustees to constitute a substantial majority for the Board. The Independent Trustees also regularly meet in executive session. David M. Thomas serves as Lead Independent Trustee and as such (i) acts as a liaison between the Independent Trustees and management with respect to matters important to the Independent Trustees and (ii) with management prepares agendas for Board meetings.
Fidelity® funds are overseen by different Boards of Trustees. The fund's Board oversees Fidelity's high income and certain equity funds, and other Boards oversee Fidelity's alternative investment, investment-grade bond, money market, asset allocation, and other equity funds. The asset allocation funds may invest in Fidelity® funds overseen by the fund's Board. The use of separate Boards, each with its own committee structure, allows the Trustees of each group of Fidelity® funds to focus on the unique issues of the funds they oversee, including common research, investment, and operational issues. On occasion, the separate Boards establish joint committees to address issues of overlapping consequences for the Fidelity® funds overseen by each Board.
The Trustees operate using a system of committees to facilitate the timely and efficient consideration of all matters of importance to the Trustees, the fund, and fund shareholders and to facilitate compliance with legal and regulatory requirements and oversight of the fund's activities and associated risks. The Board, acting through its committees, has charged FMR and its affiliates with (i) identifying events or circumstances the occurrence of which could have demonstrably adverse effects on the fund's business and/or reputation; (ii) implementing processes and controls to lessen the possibility that such events or circumstances occur or to mitigate the effects of such events or circumstances if they do occur; and (iii) creating and maintaining a system designed to evaluate continuously business and market conditions in order to facilitate the identification and implementation processes described in (i) and (ii) above. Because the day-to-day operations and activities of the fund are carried out by or through FMR, its affiliates, and other service providers, the fund's exposure to risks is mitigated but not eliminated by the processes overseen by the Trustees. While each of the Board's committees has responsibility for overseeing different aspects of the fund's activities, oversight is exercised primarily through the Operations, Audit, and Compliance Committees. Appropriate personnel, including but not limited to the fund's Chief Compliance Officer (CCO), FMR's internal auditor, the independent accountants, the fund's Treasurer and portfolio management personnel, make periodic reports to the Board's committees, as appropriate, including an annual review of Fidelity's risk management program for the Fidelity® funds. The responsibilities of each standing committee, including their oversight responsibilities, are described further under "Standing Committees of the Trustees."
Interested Trustees*:
Correspondence intended for a Trustee who is an interested person may be sent to Fidelity Investments, 245 Summer Street, Boston, Massachusetts 02210.
Name, Year of Birth; Principal Occupations and Other Relevant Experience+
Bettina Doulton (1964)
Year of Election or Appointment: 2020
Trustee
Ms. Doulton also serves as Trustee of other Fidelity® funds. Prior to her retirement, Ms. Doulton served in a variety of positions at Fidelity Investments, including as a managing director of research (2006-2007), portfolio manager to certain Fidelity® funds (1993-2005), equity analyst and portfolio assistant (1990-1993), and research assistant (1987-1990). Ms. Doulton currently owns and operates Cellardoor Winery. Previously, Ms. Doulton served as a member of the Board of Brown Capital Management, LLC (2014-2018).
Robert A. Lawrence (1952)
Year of Election or Appointment: 2020
Trustee
Chair of the Board of Trustees
Mr. Lawrence also serves as Trustee of other funds. Previously, Mr. Lawrence served as a Trustee and Member of the Advisory Board of certain funds. Prior to his retirement in 2008, Mr. Lawrence served as Vice President of certain Fidelity® funds (2006-2008), Senior Vice President, Head of High Income Division of Fidelity Management & Research Company (investment adviser firm, 2006-2008), and President of Fidelity Strategic Investments (investment adviser firm, 2002-2005).
* Determined to be an "Interested Trustee" by virtue of, among other things, his or her affiliation with the trust or various entities under common control with FMR.
+ The information includes the Trustee's principal occupation during the last five years and other information relating to the experience, attributes, and skills relevant to the Trustee's qualifications to serve as a Trustee, which led to the conclusion that the Trustee should serve as a Trustee for the fund.
Independent Trustees:
Correspondence intended for an Independent Trustee may be sent to Fidelity Investments, P.O. Box 55235, Boston, Massachusetts 02205-5235.
Name, Year of Birth; Principal Occupations and Other Relevant Experience+
Vijay C. Advani (1960)
Year of Election or Appointment: 2023
Trustee
Mr. Advani also serves as Trustee or Member of the Advisory Board of other funds. Previously, Mr. Advani served as Executive Chairman (2020-2022), Chief Executive Officer (2017-2020) and Chief Operating Officer (2016-2017) of Nuveen (global investment manager). He also served in various capacities at Franklin Resources (global investment manager), including Co-President (2015-2016), Executive Vice President, Global Advisory Services (2008-2015), Head of Global Retail Distribution (2005-2008), Executive Managing Director, International Retail Development (2002-2005), Managing Director, Product Developments, Sales & Marketing, Asia, Eastern Europe and Africa (2000-2002) and President, Templeton Asset Management India (1995-2000). Mr. Advani also served as Senior Investment Officer of International Finance Corporation (private equity and venture capital arm of The World Bank, 1984-1995). Mr. Advani is Chairman Emeritus of the U.S. India Business Council (2018-present), a Director of The Global Impact Investing Network (2019-present), a Director of LOK Capital (Mauritius) (2022-present), a member of the Advisory Council of LOK Capital (2022-present), a Senior Advisor of Neuberger Berman (2021-present), a Senior Advisor of Seviora Holdings Pte. Ltd (Temasek-Singapore) (2021-present), a Director of Seviora Capital (Singapore) (2021-present) and an Advisor of EQUIAM (2021-present). Mr. Advani formerly served as a member of the Board of BowX Acquisition Corp. (special purpose acquisition company, 2020-2021), a member of the Board of Intellecap (advisory arm of The Aavishkaar Group, 2018-2020), a member of the Board of Nuveen Investments, Inc. (2017-2020) and a member of the Board of Docusign (software, 2016-2019).
Thomas P. Bostick (1956)
Year of Election or Appointment: 2021
Trustee
Lieutenant General Bostick also serves as Trustee of other Fidelity® funds. Prior to his retirement, General Bostick (United States Army, Retired) held a variety of positions within the U.S. Army, including Chief of Engineers and Commanding General, U.S. Army Corps of Engineers (2012-2016) and Deputy Chief of Staff and Director of Human Resources, U.S. Army (2009-2012). General Bostick currently serves as a member of the Board and Finance and Governance & Sustainability Committees of CSX Corporation (transportation, 2020-present) and a member of the Board and Corporate Governance and Nominating Committee of Perma-Fix Environmental Services, Inc. (nuclear waste management, 2020-present). General Bostick serves as Chief Executive Officer of Bostick Global Strategies, LLC (consulting, 2016-present), as a member of the Board of HireVue, Inc. (video interview and assessment, 2020-present), as a member of the Board of Allonnia (biotechnology and engineering solutions, 2022-present), on the Advisory Board of Hilco Redevelopment Partners (a real estate investment and redevelopment company, 2021-present), and on the Advisory Board of Solugen, Inc. (specialty bio-based chemicals manufacturer, 2022-present). Previously, General Bostick served as a Member of the Advisory Board of certain Fidelity® funds (2021), President, Intrexon Bioengineering (2018-2020) and Chief Operating Officer (2017-2020) and Senior Vice President of the Environment Sector (2016-2017) of Intrexon Corporation (biopharmaceutical company).
Donald F. Donahue (1950)
Year of Election or Appointment: 2018
Trustee
Mr. Donahue also serves as Trustee of other Fidelity® funds. Mr. Donahue serves as President and Chief Executive Officer of Miranda Partners, LLC (risk consulting for the financial services industry, 2012-present). Previously, Mr. Donahue served as Chief Executive Officer (2006-2012), Chief Operating Officer (2003-2006) and Managing Director, Customer Marketing and Development (1999-2003) of The Depository Trust & Clearing Corporation (financial markets infrastructure). Mr. Donahue currently serves as a member (2007-present) and Co-Chairman (2016-present) of the Board of United Way of New York. Mr. Donahue previously served as a member of the Advisory Board of certain Fidelity® funds (2015-2018) and as a member of the Board of The Leadership Academy (previously NYC Leadership Academy) (2012-2022).
Vicki L. Fuller (1957)
Year of Election or Appointment: 2020
Trustee
Ms. Fuller also serves as Trustee of other Fidelity® funds. Previously, Ms. Fuller served as a member of the Advisory Board of certain Fidelity® funds (2018-2020), Chief Investment Officer of the New York State Common Retirement Fund (2012-2018) and held a variety of positions at AllianceBernstein L.P. (global asset management, 1985-2012), including Managing Director (2006-2012) and Senior Vice President and Senior Portfolio Manager (2001-2006). Ms. Fuller currently serves as a member of the Board, Audit Committee, Compensation Committee and Nominating and Governance Committee of two Blackstone business development companies (2020-present), as a member of the Board of Treliant, LLC (consulting, 2019-present), as a member of the Board of Ariel Alternatives, LLC (private equity, 2022-present) and as a member of the Board and Chair of the Audit Committee of Gusto, Inc. (software, 2021-present). In addition, Ms. Fuller currently serves as a member of the Executive Board of New York University's Stern School of Business. Ms. Fuller previously served as a member of the Board of Roosevelt University (2019-2024) and member of the Board, Audit Committee and Nominating and Governance Committee of The Williams Companies, Inc. (natural gas infrastructure, 2018-2021).
Patricia L. Kampling (1959)
Year of Election or Appointment: 2020
Trustee
Ms. Kampling also serves as Trustee of other Fidelity® funds. Prior to her retirement, Ms. Kampling served as Chairman of the Board and Chief Executive Officer (2012-2019), President and Chief Operating Officer (2011-2012) and Executive Vice President and Chief Financial Officer (2010-2011) of Alliant Energy Corporation. Ms. Kampling currently serves as a member of the Board, Audit Committee and Governance, Compensation and Nominating Committee of Xcel Energy Inc. (utilities company, 2020-present) and as a member of the Board, Audit, Finance and Risk Committee and Safety, Environmental, Technology and Operations Committee and Chair of the Executive Development and Compensation Committee of American Water Works Company, Inc. (utilities company, 2019-present). In addition, Ms. Kampling currently serves as a member of the Board of the Nature Conservancy, Wisconsin Chapter (2019-present). Previously, Ms. Kampling served as a Member of the Advisory Board of certain Fidelity® funds (2020), a member of the Board, Compensation Committee and Executive Committee and Chair of the Audit Committee of Briggs & Stratton Corporation (manufacturing, 2011-2021), a member of the Board of Interstate Power and Light Company (2012-2019) and Wisconsin Power and Light Company (2012-2019) (each a subsidiary of Alliant Energy Corporation) and as a member of the Board and Workforce Development Committee of the Business Roundtable (2018-2019).
Thomas A. Kennedy (1955)
Year of Election or Appointment: 2021
Trustee
Mr. Kennedy also serves as Trustee of other Fidelity® funds. Previously, Mr. Kennedy served as a Member of the Advisory Board of certain Fidelity® funds (2020) and held a variety of positions at Raytheon Company (aerospace and defense, 1983-2020), including Chairman and Chief Executive Officer (2014-2020) and Executive Vice President and Chief Operating Officer (2013-2014). Mr. Kennedy served as Executive Chairman of the Board of Directors of Raytheon Technologies Corporation (aerospace and defense, 2020-2021). Mr. Kennedy serves as a Director of the Board of Directors of Textron Inc. (aerospace and defense, 2023-present).
Oscar Munoz (1959)
Year of Election or Appointment: 2021
Trustee
Mr. Munoz also serves as Trustee of other Fidelity® funds. Prior to his retirement, Mr. Munoz served as Executive Chairman (2020-2021), Chief Executive Officer (2015-2020), President (2015-2016) and a member of the Board (2010-2021) of United Airlines Holdings, Inc. Mr. Munoz currently serves as a member of the Board of CBRE Group, Inc. (commercial real estate, 2020-present), a member of the Board of Univision Communications, Inc. (Hispanic media, 2020-present), a member of the Board of Archer Aviation Inc. (2021-present), a member of the Defense Business Board of the United States Department of Defense (2021-present) and a member of the Board of Salesforce.com, Inc. (cloud-based software, 2022-present). Previously, Mr. Munoz served as a Member of the Advisory Board of certain Fidelity® funds (2021).
David M. Thomas (1949)
Year of Election or Appointment: 2008
Trustee
Lead Independent Trustee
Mr. Thomas also serves as Trustee of other Fidelity® funds. Previously, Mr. Thomas served as Executive Chairman (2005-2006) and Chairman and Chief Executive Officer (2000-2005) of IMS Health, Inc. (pharmaceutical and healthcare information solutions) and as a member of the Board of Fortune Brands Home and Security (home and security products, 2004-2023). Mr. Thomas currently serves as Director (2013-present) and Non-Executive Chairman of the Board (2022-present) of Interpublic Group of Companies, Inc. (marketing communication).
Susan Tomasky (1953)
Year of Election or Appointment: 2020
Trustee
Ms. Tomasky also serves as Trustee of other Fidelity® funds. Prior to her retirement, Ms. Tomasky served in various executive officer positions at American Electric Power Company, Inc. (1998-2011), including most recently as President of AEP Transmission (2007-2011). Ms. Tomasky currently serves as a member of the Board and Sustainability Committee and as Chair of the Audit Committee of Marathon Petroleum Corporation (2018-present) and as a member of the Board, Executive Committee, Corporate Governance Committee and Organization and Compensation Committee and as Lead Director of the Board of Public Service Enterprise Group, Inc. (utilities company, 2012-present) and as a member of the Board of its subsidiary company, Public Service Electric and Gas Co. (2021-present). In addition, Ms. Tomasky currently serves as a member (2009-present) and President (2020-present) of the Board of the Royal Shakespeare Company - America (2009-present) and as a member and Vice Chair of the Board of Kenyon College (2016-present). Previously, Ms. Tomasky served as a Member of the Advisory Board of certain Fidelity® funds (2020), as a member of the Board of the Columbus Association for the Performing Arts (2011-2023), as a member of the Board of the Columbus Regional Airport Authority (2007-2020), as a member of the Board (2011-2018) and Lead Independent Director (2015-2018) of Andeavor Corporation (previously Tesoro Corporation) (independent oil refiner and marketer) and as a member of the Board of Summit Midstream Partners LP (energy, 2012-2018).
Michael E. Wiley (1950)
Year of Election or Appointment: 2018
Trustee
Mr. Wiley also serves as Trustee of other Fidelity® funds. Previously, Mr. Wiley served as a member of the Advisory Board of certain Fidelity® funds (2018-2020), Chairman, President and CEO of Baker Hughes, Inc. (oilfield services, 2000-2004). Mr. Wiley also previously served as a member of the Board of Andeavor Corporation (independent oil refiner and marketer, 2005-2018), a member of the Board of Andeavor Logistics LP (natural resources logistics, 2015-2018) and a member of the Board of High Point Resources (exploration and production, 2005-2020).
+ The information includes the Trustee's principal occupation during the last five years and other information relating to the experience, attributes, and skills relevant to the Trustee's qualifications to serve as a Trustee, which led to the conclusion that the Trustee should serve as a Trustee for the fund.
Advisory Board Members and Officers:
Correspondence intended for a Member of the Advisory Board (if any) may be sent to Fidelity Investments, P.O. Box 55235, Boston, Massachusetts 02205-5235. Correspondence intended for an officer or Peter S. Lynch may be sent to Fidelity Investments, 245 Summer Street, Boston, Massachusetts 02210.
Name, Year of Birth; Principal Occupations+
Peter S. Lynch (1944)
Year of Election or Appointment: 2003
Member of the Advisory Board
Mr. Lynch also serves as a Member of the Advisory Board of other Fidelity® funds. Mr. Lynch is Vice Chairman and a Director of Fidelity Management & Research Company LLC (investment adviser firm). In addition, Mr. Lynch serves as a Trustee of Boston College and as the Chairman of the Inner-City Scholarship Fund. Previously, Mr. Lynch served as Vice Chairman and a Director of FMR Co., Inc. (investment adviser firm) and on the Special Olympics International Board of Directors (1997-2006).
Karen B. Peetz (1955)
Year of Election or Appointment: 2023
Member of the Advisory Board
Ms. Peetz also serves as a Member of the Advisory Board of other funds. Previously, Ms. Peetz served as Chief Administration Officer (2020-2023) of Citigroup Inc. (a diversified financial service company). She also served in various capacities at Bank of New York Mellon Corporation, including President (2013-2016), Vice Chairman, Senior Executive Vice President and Chief Executive Officer of Financial Markets & Treasury Services (2010-2013), Senior Executive Vice President and Chief Executive Officer of Global Corporate Trust (2003-2008), Senior Vice President and Division Manager of Global Payments & Trade Services (2002-2003) and Senior Vice President and Division Manager of Domestic Corporate Trust (1998-2002). Ms. Peetz also served in various capacities at Chase Manhattan Corporation (1982-1998), including Senior Vice President and Manager of Corporate Trust International Business (1996-1998), Managing Director and Manager of Corporate Trust Services (1994-1996) and Managing Director and Group Manager of Financial Institution Sales (1990-1993). Ms. Peetz currently serves as Chair of Amherst Holdings Advisory Council (2018-present), Trustee of Johns Hopkins University (2016-present), Chair of the Carey Business School Advisory Council, Member of the Johns Hopkins Medicine Board and Finance Committee and Chair of the Lyme and Tick Related Disease Institute Advisory Council. Ms. Peetz previously served as a member of the Board of Guardian Life Insurance Company of America (2019-2023), a member of the Board of Trane Technologies (2018-2022), a member of the Board of Wells Fargo Corp. (2017-2019), a member of the Board of SunCoke Energy Inc. (2012-2016), a member of the Board of Private Export Funding Corporation (2010-2016) and as a Trustee of Penn State University (2010-2014) and the United Way of New York City (2008-2010).
Heather Bonner (1977)
Year of Election or Appointment: 2023
Assistant Treasurer
Ms. Bonner also serves as an officer of other funds. Ms. Bonner is a Senior Vice President (2022-present) and is an employee of Fidelity Investments (2022-present). Ms. Bonner serves as Senior Vice President, Vice President, Treasurer, or Director of certain Fidelity entities. Prior to joining Fidelity, Ms. Bonner served as Managing Director at AQR Capital Management (2013-2022) and was the Treasurer and Principal Financial Officer of the AQR Funds (2013-2022).
Craig S. Brown (1977)
Year of Election or Appointment: 2022
Deputy Treasurer
Mr. Brown also serves as an officer of other funds. Mr. Brown is a Vice President (2015-present) and is an employee of Fidelity Investments. Mr. Brown serves as Assistant Treasurer of FIMM, LLC (2021-present). Previously, Mr. Brown served as Assistant Treasurer of certain Fidelity® funds (2019-2022).
John J. Burke III (1964)
Year of Election or Appointment: 2018
Chief Financial Officer
Mr. Burke also serves as Chief Financial Officer of other funds. Mr. Burke is Head of Fidelity Fund and Investment Operations (2018-present) and is an employee of Fidelity Investments. Mr. Burke serves as President, Executive Vice President, or Director of certain Fidelity entities. Previously Mr. Burke served as head of Asset Management Investment Operations (2012-2018).
Margaret Carey (1973)
Year of Election or Appointment: 2023
Secretary and Chief Legal Officer (CLO)
Ms. Carey also serves as an officer of other funds and as CLO of certain Fidelity entities. Ms. Carey is a Senior Vice President, Deputy General Counsel (2019-present) and is an employee of Fidelity Investments.
William C. Coffey (1969)
Year of Election or Appointment: 2019
Assistant Secretary
Mr. Coffey also serves as Assistant Secretary of other funds. Mr. Coffey is a Senior Vice President, Deputy General Counsel (2010-present) and is an employee of Fidelity Investments. Previously, Mr. Coffey served as Secretary and CLO of certain funds (2018-2019); CLO, Secretary, or Senior Vice President of certain Fidelity entities and Assistant Secretary of certain funds (2009-2018).
Timothy M. Cohen (1969)
Year of Election or Appointment: 2018
Vice President
Mr. Cohen also serves as Vice President of other funds. Mr. Cohen is Co-Head of Equity (2018-present) and is an employee of Fidelity Investments. Mr. Cohen serves as President or Director of certain Fidelity entities. Previously, Mr. Cohen served as Executive Vice President of Fidelity SelectCo, LLC (2019) and Head of Global Equity Research (2016-2018).
Jonathan Davis (1968)
Year of Election or Appointment: 2010
Assistant Treasurer
Mr. Davis also serves as an officer of other funds. Mr. Davis is a Vice President (2006-present) and is an employee of Fidelity Investments. Mr. Davis serves as Assistant Treasurer or Director of certain Fidelity entities.
Laura M. Del Prato (1964)
Year of Election or Appointment: 2018
Assistant Treasurer
Ms. Del Prato also serves as an officer of other funds. Ms. Del Prato is a Senior Vice President (2017-present) and is an employee of Fidelity Investments. Ms. Del Prato serves as Senior Vice President, Vice President, Assistant Treasurer, or Director of certain Fidelity entities. Previously, Ms. Del Prato served as President and Treasurer of The North Carolina Capital Management Trust: Cash Portfolio and Term Portfolio (2018-2020).
Colm A. Hogan (1973)
Year of Election or Appointment: 2020
Assistant Treasurer
Mr. Hogan also serves as an officer of other funds. Mr. Hogan is a Vice President (2016-present) and is an employee of Fidelity Investments. Mr. Hogan serves as Assistant Treasurer of certain Fidelity entities. Previously, Mr. Hogan served as Deputy Treasurer of certain Fidelity® funds (2016-2020) and Assistant Treasurer of certain Fidelity® funds (2016-2018).
Pamela R. Holding (1964)
Year of Election or Appointment: 2018
Vice President
Ms. Holding also serves as Vice President of other funds. Ms. Holding is Co-Head of Equity (2018-present) and is an employee of Fidelity Investments. Previously, Ms. Holding served as Executive Vice President of Fidelity SelectCo, LLC (2019) and as Chief Investment Officer of Fidelity Institutional Asset Management (2013-2018).
Chris Maher (1972)
Year of Election or Appointment: 2020
Deputy Treasurer
Mr. Maher also serves as an officer of other funds. Mr. Maher is a Vice President (2008-present) and is an employee of Fidelity Investments. Mr. Maher serves as Assistant Treasurer of certain Fidelity entities. Previously, Mr. Maher served as Assistant Treasurer of certain funds (2013-2020).
Jason P. Pogorelec (1975)
Year of Election or Appointment: 2020
Chief Compliance Officer
Mr. Pogorelec also serves as Chief Compliance Officer of other funds. Mr. Pogorelec is a Senior Vice President of Asset Management Compliance (2020-present) and is an employee of Fidelity Investments. Mr. Pogorelec serves as Compliance Officer of Fidelity Management & Research Company LLC (investment adviser firm, 2023-present) and Ballyrock Investment Advisors LLC (2023-present). Previously, Mr. Pogorelec served as a Vice President, Associate General Counsel for Fidelity Investments (2010-2020) and Assistant Secretary of certain Fidelity® funds (2015-2020).
Brett Segaloff (1972)
Year of Election or Appointment: 2021
Anti-Money Laundering (AML) Officer
Mr. Segaloff also serves as AML Officer of other funds. Mr. Segaloff is a Vice President (2022-present) and is an employee of Fidelity Investments. Mr. Segaloff serves as Anti Money Laundering Compliance Officer or Anti Money Laundering/Bank Secrecy Act Compliance Officer of certain Fidelity entities.
Stacie M. Smith (1974)
Year of Election or Appointment: 2016
President and Treasurer
Ms. Smith also serves as an officer of other funds. Ms. Smith is a Senior Vice President (2016-present) and is an employee of Fidelity Investments. Ms. Smith serves as Assistant Treasurer of certain Fidelity entities and has served in other fund officer roles.
Jim Wegmann (1979)
Year of Election or Appointment: 2019
Assistant Treasurer
Mr. Wegmann also serves as an officer of other funds. Mr. Wegmann is a Vice President (2016-present) and is an employee of Fidelity Investments. Mr. Wegmann serves as Assistant Treasurer of FIMM, LLC (2021-present). Previously, Mr. Wegmann served as Assistant Treasurer of certain Fidelity® funds (2019-2021).
+ The information includes principal occupation during the last five years.
As a shareholder, you incur two types of costs: (1) transaction costs, which may include sales charges (loads) on purchase payments or redemption proceeds, as applicable and (2) ongoing costs, which generally include management fees, distribution and/or service (12b-1) fees and other Fund expenses. This Example is intended to help you understand your ongoing costs (in dollars) of investing in a fund and to compare these costs with the ongoing costs of investing in other mutual funds.
| The Example is based on an investment of $1,000 invested at the beginning of the period and held for the entire period (November 1, 2023 to April 30, 2024). |
Actual Expenses
The first line of the accompanying table provides information about actual account values and actual expenses. You may use the information in this line, together with the amount you invested, to estimate the expenses that you paid over the period. Simply divide your account value by $1,000.00 (for example, an $8,600 account value divided by $1,000.00 = 8.6), then multiply the result by the number in the first line for a class/Fund under the heading entitled "Expenses Paid During Period" to estimate the expenses you paid on your account during this period. If any fund is a shareholder of any underlying mutual funds or exchange-traded funds (ETFs) (the Underlying Funds), such fund indirectly bears its proportional share of the expenses of the Underlying Funds in addition to the direct expenses incurred presented in the table. These fees and expenses are not included in the annualized expense ratio used to calculate the expense estimate in the table below.
Hypothetical Example for Comparison Purposes
The second line of the accompanying table provides information about hypothetical account values and hypothetical expenses based on the actual expense ratio and an assumed rate of return of 5% per year before expenses, which is not the actual return. The hypothetical account values and expenses may not be used to estimate the actual ending account balance or expenses you paid for the period. You may use this information to compare the ongoing costs of investing in the Fund and other funds. To do so, compare this 5% hypothetical example with the 5% hypothetical examples that appear in the shareholder reports of the other funds. If any fund is a shareholder of any Underlying Funds, such fund indirectly bears its proportional share of the expenses of the Underlying Funds in addition to the direct expenses as presented in the table. These fees and expenses are not included in the annualized expense ratio used to calculate the expense estimate in the table below.
Please note that the expenses shown in the table are meant to highlight your ongoing costs only and do not reflect any transaction costs. Therefore, the second line of the table is useful in comparing ongoing costs only, and will not help you determine the relative total costs of owning different funds. In addition, if these transactional costs were included, your costs would have been higher.
| | | | | Annualized Expense Ratio- A | | Beginning Account Value November 1, 2023 | | Ending Account Value April 30, 2024 | | Expenses Paid During Period- C November 1, 2023 to April 30, 2024 |
| | | | | | | | | | |
| Fidelity® Capital & Income Fund | | | | .66% | | | | | | |
| Actual | | | | | | $ 1,000 | | $ 1,109.60 | | $ 3.46 |
Hypothetical-B | | | | | | $ 1,000 | | $ 1,021.58 | | $ 3.32 |
| |
A Annualized expense ratio reflects expenses net of applicable fee waivers.
B 5% return per year before expenses
C Expenses are equal to the annualized expense ratio, multiplied by the average account value over the period, multiplied by 182/ 366 (to reflect the one-half year period). The fees and expenses of any Underlying Funds are not included in each annualized expense ratio.
The dividend and capital gains distributions for the fund(s) are available on Fidelity.com or Institutional.Fidelity.com.
A total of 0.74% of the dividends distributed during the fiscal year was derived from interest on U.S. Government securities which is generally exempt from state income tax.
The fund designates $465,674,036 of distributions paid in the calendar year 2023 as qualifying to be taxed as interest-related dividends for nonresident alien shareholders.
The fund designates $645,274,471 of distributions paid during the fiscal year ended 2024 as qualifying to be taxed as section 163(j) interest dividends.
The fund will notify shareholders in January 2025 of amounts for use in preparing 2024 income tax returns.
Board Approval of Investment Advisory Contracts
Fidelity Capital & Income Fund
At its January 2024 meeting, the Board of Trustees, including the Independent Trustees (together, the Board), approved an amended and restated management contract with Fidelity Management & Research Company LLC (FMR) (the Management Contract), and amended and restated sub-advisory agreements (the Sub-Advisory Contracts, and together with the Management Contract, the Advisory Contracts) for the fund, including the fund's sub-advisory agreements with FMR Investment Management (UK) Limited (FMR UK), Fidelity Management & Research (Hong Kong) Limited (FMR H.K.), and Fidelity Management & Research (Japan) Limited (FMR Japan). The Advisory Contracts will be effective March 1, 2024. The Board will consider the annual renewal of the fund's Advisory Contracts in May 2024, following its review of additional materials provided by FMR.
Management Contract. The Board approved the Management Contract, which implements a new fee structure combining the management fee, transfer agent fee (TA Fee), and pricing and bookkeeping fee (P&B Fee) of the fund into a single fee based on tiered schedules and subject to a maximum rate (the Unified Fee). In exchange for the Unified Fee, the fund will receive investment advisory, management, administrative, transfer agent, pricing and bookkeeping services under a single agreement - the Management Contract.
In its consideration of the Management Contract over several meetings, the Board received, reviewed and discussed a comprehensive set of analyses regarding the Unified Fee including (i) the legal framework, (ii) design goals for the Unified Fee, (iii) calculation methodology for the Unified Fee and illustrative examples, (iv) annual and cumulative projected impacts under various scenarios, both in the aggregate and at the fund/class level, (v) explanations of schedules, rate levers and maximum rates and (vi) shareholder benefits and projected savings.
The Board considered that the maximum Unified Fee for the fund would be no higher than the sum of (i) the lowest contractual management fee rate under the fund's existing management contract, which is the individual fund fee rate, if any, plus the lowest contractual marginal group fee rate and (ii) the TA and P&B Fee rates, which are fixed fee rates since December 1, 2023 (together, the Unified Fee Cap). The Board noted that Fidelity has represented that, as a result of this Unified Fee Cap, the Unified Fee would be no greater than the fee rates previously authorized to be charged to the fund for the same services. The Board noted that certain expenses such as third-party expenses and certain other miscellaneous expenses would be outside the scope of the Unified Fee and the calculation of such fees would not change as a result of the Unified Fee.
The Board considered Fidelity's representations that implementation of the Unified Fee, which includes the Unified Fee Cap, would cause all funds subject to the Unified Fee, including the fund, to experience an immediate reduction on contractual fee rates for services provided under the current management contracts. The Board considered that some funds would not experience lower net total fees as a result of existing fee caps. The Board further considered that, in addition to the contractual fee savings, the Unified Fee offers funds and their shareholders greater protection from future rate increases for services previously offered under separate agreements that are now covered by the Management Contract because such rate increases would require shareholder approval.
Sub-Advisory Contracts. In connection with the Unified Fee changes, the Board considered the Sub-Advisory Contracts, which simplified the calculation of the fees paid by FMR to the sub-advisers under the agreements. The Board noted that the agreements with FMR UK, FMR H.K., and FMR Japan were amended to provide that FMR will compensate each sub-adviser at a fee rate equal to 110% of the sub-adviser's costs incurred in providing services under the agreement. The Board considered that, under the Sub-Advisory Contracts, FMR, and not the fund, will continue to pay the sub-advisory fees to each applicable sub-adviser.
The Board further considered that the approval of the fund's Advisory Contracts will not result in any changes in the investment process or strategies employed in the management of the fund's assets or the day-to-day management of the fund or the persons primarily responsible for such management. Further, the Board considered that the Management Contract would not change the obligations and services of FMR and its affiliates on behalf of the fund, and, in particular, there would be no change in the nature and level of advisory, management, administration, transfer agent, and pricing and bookkeeping services provided to the fund by FMR, its affiliates, and each applicable sub-adviser.
In connection with its consideration of future renewals of the fund's Advisory Contracts, the Board will consider: (i) the nature, extent and quality of services provided to the funds, including shareholder and administrative services and investment performance; (ii) the competitiveness of the management fee and total expenses for the fund; (iii) the costs of the services and profitability, including the revenues earned and the expenses incurred in conducting the business of developing, marketing, distributing, managing, administering, and servicing the fund and its shareholders, to the extent applicable; and (iv) whether there have been economies of scale in respect of the Fidelity funds, whether the Fidelity funds (including the fund) have appropriately benefited from any such economies of scale, and whether there is the potential for realization of any further economies.
Based on its evaluation of all of the conclusions and representations noted above, and after considering all factors it believed relevant, the Board concluded that the fund's management fee structure is fair and reasonable, and that the fund's Advisory Contracts should be approved.
The Securities and Exchange Commission adopted Rule 22e-4 under the Investment Company Act of 1940 (the Liquidity Rule) to promote effective liquidity risk management throughout the open-end investment company industry, thereby reducing the risk that funds will be unable to meet their redemption obligations and mitigating dilution of the interests of fund shareholders.
The Fund has adopted and implemented a liquidity risk management program (the Program) reasonably designed to assess and manage the Fund's liquidity risk and to comply with the requirements of the Liquidity Rule. The Fund's Board of Trustees (the Board) has designated the Fund's investment adviser as administrator of the Program. The Fidelity advisers have established a Liquidity Risk Management Committee (the LRM Committee) to manage the Program for each of the Fidelity Funds. The LRM Committee monitors the adequacy and effectiveness of implementation of the Program and on a periodic basis assesses each Fund's liquidity risk based on a variety of factors including (1) the Fund's investment strategy, (2) portfolio liquidity and cash flow projections during normal and reasonably foreseeable stressed conditions, (3) shareholder redemptions, (4) borrowings and other funding sources and (5) certain factors specific to ETFs including the effect of the Fund's prices and spreads, market participants, and basket compositions on the overall liquidity of the Fund's portfolio, as applicable.
In accordance with the Program, each of the Fund's portfolio investments is classified into one of four defined liquidity categories based on a determination of a reasonable expectation for how long it would take to convert the investment to cash (or sell or dispose of the investment) without significantly changing its market value.
- Highly liquid investments - cash or convertible to cash within three business days or less
- Moderately liquid investments - convertible to cash in three to seven calendar days
- Less liquid investments - can be sold or disposed of, but not settled, within seven calendar days
- Illiquid investments - cannot be sold or disposed of within seven calendar days
Liquidity classification determinations take into account a variety of factors including various market, trading and investment-specific considerations, as well as market depth, and generally utilize analysis from a third-party liquidity metrics service.
The Liquidity Rule places a 15% limit on a fund's illiquid investments and requires funds that do not primarily hold assets that are highly liquid investments to determine and maintain a minimum percentage of the fund's net assets to be invested in highly liquid investments (highly liquid investment minimum or HLIM). The Program includes provisions reasonably designed to comply with the 15% limit on illiquid investments and for determining, periodically reviewing and complying with the HLIM requirement as applicable.
At a recent meeting of the Fund's Board of Trustees, the LRM Committee provided a written report to the Board pertaining to the operation, adequacy, and effectiveness of the Program for the period December 1, 2022 through November 30, 2023. The report concluded that the Program is operating effectively and is reasonably designed to assess and manage the Fund's liquidity risk.
1.703159.126
CAI-ANN-0624
Fidelity® Series High Income Fund
Annual Report
April 30, 2024
Contents
To view a fund's proxy voting guidelines and proxy voting record for the 12-month period ended June 30, visit http://www.fidelity.com/proxyvotingresults or visit the Securities and Exchange Commission's (SEC) web site at http://www.sec.gov.
You may also call 1-800-544-8544 to request a free copy of the proxy voting guidelines.
Standard & Poor's, S&P and S&P 500 are registered service marks of The McGraw-Hill Companies, Inc. and have been licensed for use by Fidelity Distributors Corporation.
Other third-party marks appearing herein are the property of their respective owners.
All other marks appearing herein are registered or unregistered trademarks or service marks of FMR LLC or an affiliated company. © 2024 FMR LLC. All rights reserved.
This report and the financial statements contained herein are submitted for the general information of the shareholders of the Fund. This report is not authorized for distribution to prospective investors in the Fund unless preceded or accompanied by an effective prospectus.
A fund files its complete schedule of portfolio holdings with the SEC for the first and third quarters of each fiscal year on Form N-PORT. Forms N-PORT are available on the SEC's web site at http://www.sec.gov. A fund's Forms N-PORT may be reviewed and copied at the SEC's Public Reference Room in Washington, DC. Information regarding the operation of the SEC's Public Reference Room may be obtained by calling 1-800-SEC-0330.
For a complete list of a fund's portfolio holdings, view the most recent holdings listing, semiannual report, or annual report on Fidelity's web site at http://www.fidelity.com, http://www.institutional.fidelity.com, or http://www.401k.com, as applicable.
NOT FDIC INSURED •MAY LOSE VALUE •NO BANK GUARANTEE
Neither the Fund nor Fidelity Distributors Corporation is a bank.
Average annual total return reflects the change in the value of an investment, assuming reinvestment of distributions from dividend income and capital gains (the profits earned upon the sale of securities that have grown in value, if any) and assuming a constant rate of performance each year. The hypothetical investment and the average annual total returns do not reflect the deduction of taxes that a shareholder would pay on fund distributions or the redemption of fund shares. During periods of reimbursement by Fidelity, a fund's total return will be greater than it would be had the reimbursement not occurred. How a fund did yesterday is no guarantee of how it will do tomorrow.
| Average Annual Total Returns |
| | | | |
Periods ended April 30, 2024 | Past 1 year | Past 5 years | Past 10 years |
| Fidelity® Series High Income Fund | 7.82% | 3.44% | 4.07% |
| $10,000 Over 10 Years |
| |
Let's say hypothetically that $10,000 was invested in Fidelity® Series High Income Fund on April 30, 2014. The chart shows how the value of your investment would have changed, and also shows how the ICE® BofA® US High Yield Constrained Index performed over the same period. |
|
|
Market Recap:
High-yield bonds gained 8.89% for the 12 months ending April 30, 2024, according to the ICE BofA® US High Yield Constrained Index, driven by resilient corporate profits and the Federal Reserve's likely pivot to cutting interest rates later this year. Amid this favorable backdrop for higher-risk assets, the index advanced fairly steadily for most the period, highlighted by an especially strong final two months of 2023, when the index rose 8.72%. Following the Federal Reserve's November 1 meeting, when the central bank hinted it might be done raising rates, the high-yield index reversed a two-month decline that was due to soaring yields on longer-term government bonds and mixed earnings from some big and influential firms. High yield continued to advance in 2024 but lost some of its momentum, gaining 1.51% through March, as the central bank held steady its benchmark federal funds rate and affirmed its projection to cut in 2024. The index slipped in April (-1%), when inflation remained stickier than expected. For the full 12 months, all 18 industries within the index advanced, with retail (+14%) leading, followed by financial services (+12%) and banking (+11%), which benefited from high interest rates. Energy, the largest segment in the high-yield index this period, gained 10%. Conversely, the telecommunications (+4%) group lagged most, followed by utility, capital goods and transportation (+6% each).
Comments from Co-Managers Jared Beckerman, Benjamin Harrison and Alexandre Karam:
For the fiscal year, the fund gained 7.82%, versus 8.89% for the benchmark ICE BofA US High Yield Constrained Index. The fund's core investment in high-yield bonds increased 8.86% and modestly detracted from performance versus the benchmark. By industry, security selection was the primary detractor, especially within energy. Security selection in health care also hurt, as did our picks and an underweight in retail. Also detracting from our result was security selection in capital goods. Lastly, the fund's position in cash detracted. The fund's non-benchmark stake in Mesquite Energy returned about -47% and was the largest individual relative detractor. Mesquite Energy was among the fund's largest holdings this period. A stake in Cano Health returned -65% and was the second-largest relative detractor. Another notable relative detractor was our stake in Ardagh (-41%). In contrast, the biggest contributor to performance versus the benchmark was security selection in technology & electronics. Our choices in telecommunications and real estate also boosted the fund's relative performance. The top individual relative contributor was an overweight in Communications Sales & Leasing (+32%), one of our biggest holdings. A stake in Rackspace Hosting gained approximately 27% and was the second-largest relative contributor. An overweight in Dish Network (+23%) also helped. Dish Network was among our largest holdings. Notable changes in positioning include increased exposure to basic industry and a lower allocation to retail.
Note to shareholders:
On June 8, 2023, Michael Weaver came off of the fund. On January 1, 2024, Jared Beckerman assumed co-management responsibilities for the fund.
The views expressed above reflect those of the portfolio manager(s) only through the end of the period as stated on the cover of this report and do not necessarily represent the views of Fidelity or any other person in the Fidelity organization. Any such views are subject to change at any time based upon market or other conditions and Fidelity disclaims any responsibility to update such views. These views may not be relied on as investment advice and, because investment decisions for a Fidelity fund are based on numerous factors, may not be relied on as an indication of trading intent on behalf of any Fidelity fund.
| Top Bond Issuers (% of Fund's net assets) |
(with maturities greater than one year) |
| Community Health Systems, Inc. | 1.4 | |
| Ford Motor Credit Co. LLC | 1.4 | |
| CCO Holdings LLC/CCO Holdings Capital Corp. | 1.4 | |
| TransDigm, Inc. | 1.4 | |
| Occidental Petroleum Corp. | 1.3 | |
| Fidelity Private Credit Co. LLC | 1.3 | |
| Energy Transfer LP | 1.3 | |
| Tenet Healthcare Corp. | 1.1 | |
| MPT Operating Partnership LP/MPT Finance Corp. | 1.1 | |
| Mesquite Energy, Inc. | 0.9 | |
| | 12.6 | |
| |
| Market Sectors (% of Fund's net assets) |
| |
| Energy | 14.6 | |
| Technology | 7.2 | |
| Healthcare | 7.0 | |
| Services | 6.7 | |
| Telecommunications | 5.1 | |
| |
Quality Diversification (% of Fund's net assets) |
|
| |
| We have used ratings from Moody's Investors Service, Inc. Where Moody's® ratings are not available, we have used S&P® ratings. All ratings are as of the date indicated and do not reflect subsequent changes. |
Asset Allocation (% of Fund's net assets) |
|
|
Geographic Diversification (% of Fund's net assets) |
|
* Includes Short-Term investments and Net Other Assets (Liabilities). Percentages are adjusted for the effect of derivatives, if applicable. |
| |
Showing Percentage of Net Assets
| Corporate Bonds - 84.7% |
| | | Principal Amount (a) | Value ($) |
| Convertible Bonds - 1.4% | | | |
| Broadcasting - 0.6% | | | |
| DISH Network Corp. 3.375% 8/15/26 | | 13,185,000 | 8,042,825 |
| Diversified Financial Services - 0.0% | | | |
| Coinbase Global, Inc. 0.25% 4/1/30 (b) | | 40,000 | 36,126 |
| Energy - 0.0% | | | |
| Sunnova Energy International, Inc. 0.25% 12/1/26 | | 769,000 | 344,315 |
| Homebuilders/Real Estate - 0.3% | | | |
| Realogy Group LLC/Realogy Co-Issuer Corp. 0.25% 6/15/26 | | 2,957,000 | 2,409,955 |
| Redfin Corp. 0.5% 4/1/27 | | 3,576,000 | 1,752,240 |
| | | | 4,162,195 |
| Technology - 0.4% | | | |
| Global Payments, Inc. 1.5% 3/1/31 (b) | | 2,034,000 | 2,021,796 |
| Wolfspeed, Inc. 1.875% 12/1/29 | | 5,485,000 | 3,151,133 |
| | | | 5,172,929 |
| Utilities - 0.1% | | | |
| PG&E Corp. 4.25% 12/1/27 (b) | | 990,000 | 991,485 |
TOTAL CONVERTIBLE BONDS | | | 18,749,875 |
| Nonconvertible Bonds - 83.3% | | | |
| Aerospace - 2.5% | | | |
| ATI, Inc.: | | | |
| 4.875% 10/1/29 | | 1,215,000 | 1,131,341 |
| 5.875% 12/1/27 | | 1,230,000 | 1,204,996 |
| Bombardier, Inc.: | | | |
| 7.25% 7/1/31 (b) | | 1,950,000 | 1,954,800 |
| 7.875% 4/15/27 (b) | | 2,646,000 | 2,629,510 |
| BWX Technologies, Inc. 4.125% 6/30/28 (b) | | 3,247,000 | 2,966,132 |
| Howmet Aerospace, Inc.: | | | |
| 5.9% 2/1/27 | | 545,000 | 547,235 |
| 5.95% 2/1/37 | | 435,000 | 434,846 |
| 6.875% 5/1/25 | | 545,000 | 549,115 |
| Kaiser Aluminum Corp.: | | | |
| 4.5% 6/1/31 (b) | | 830,000 | 726,982 |
| 4.625% 3/1/28 (b) | | 2,375,000 | 2,211,262 |
| Moog, Inc. 4.25% 12/15/27 (b) | | 165,000 | 154,000 |
| Spirit Aerosystems, Inc. 9.75% 11/15/30 (b) | | 965,000 | 1,067,528 |
| TransDigm, Inc.: | | | |
| 4.625% 1/15/29 | | 2,335,000 | 2,138,837 |
| 5.5% 11/15/27 | | 8,055,000 | 7,823,419 |
| 6.375% 3/1/29 (b) | | 6,800,000 | 6,748,071 |
| 6.75% 8/15/28 (b) | | 1,630,000 | 1,640,188 |
| VistaJet Malta Finance PLC / XO Management Holding, Inc. 9.5% 6/1/28 (b) | | 440,000 | 394,014 |
| | | | 34,322,276 |
| Air Transportation - 0.6% | | | |
| Air Canada 3.875% 8/15/26 (b) | | 805,000 | 763,645 |
| American Airlines, Inc.: | | | |
| 7.25% 2/15/28 (b) | | 540,000 | 543,057 |
| 8.5% 5/15/29 (b) | | 2,080,000 | 2,166,678 |
| Mileage Plus Holdings LLC 6.5% 6/20/27 (b) | | 354,250 | 354,848 |
| Rand Parent LLC 8.5% 2/15/30 (b) | | 4,015,000 | 3,970,502 |
| | | | 7,798,730 |
| Automotive & Auto Parts - 3.1% | | | |
| Adient Global Holdings Ltd. 7% 4/15/28 (b) | | 330,000 | 333,383 |
| Aston Martin Capital Holdings Ltd. 10% 3/31/29 (b) | | 1,090,000 | 1,061,388 |
| Champions Financing, Inc. 8.75% 2/15/29 (b) | | 4,770,000 | 4,874,577 |
| Dana, Inc.: | | | |
| 4.25% 9/1/30 | | 440,000 | 381,210 |
| 5.375% 11/15/27 | | 295,000 | 285,060 |
| Ford Motor Co.: | | | |
| 3.25% 2/12/32 | | 1,085,000 | 873,893 |
| 4.75% 1/15/43 | | 545,000 | 429,108 |
| 5.291% 12/8/46 | | 215,000 | 180,784 |
| 6.1% 8/19/32 | | 4,525,000 | 4,438,675 |
| 7.4% 11/1/46 | | 435,000 | 459,703 |
| Ford Motor Credit Co. LLC: | | | |
| U.S. Secured Overnight Fin. Rate (SOFR) Index + 2.950% 8.2871% 3/6/26 (c)(d) | | 1,540,000 | 1,590,965 |
| 2.3% 2/10/25 | | 4,905,000 | 4,766,547 |
| 2.9% 2/10/29 | | 2,715,000 | 2,343,745 |
| 3.375% 11/13/25 | | 545,000 | 523,207 |
| 3.625% 6/17/31 | | 1,540,000 | 1,300,551 |
| 3.815% 11/2/27 | | 1,640,000 | 1,519,446 |
| 4% 11/13/30 | | 550,000 | 479,317 |
| 4.389% 1/8/26 | | 1,090,000 | 1,059,096 |
| 5.125% 6/16/25 | | 545,000 | 539,242 |
| 6.95% 3/6/26 | | 4,385,000 | 4,444,333 |
| IHO Verwaltungs GmbH 4.75% 9/15/26 pay-in-kind (b)(c) | | 215,000 | 207,251 |
| LCM Investments Holdings 8.25% 8/1/31 (b) | | 755,000 | 784,286 |
| Macquarie AirFinance Holdings: | | | |
| 6.4% 3/26/29 (b) | | 450,000 | 448,699 |
| 8.125% 3/30/29 (b) | | 1,115,000 | 1,165,960 |
| 8.375% 5/1/28 (b) | | 1,180,000 | 1,238,823 |
| McLaren Finance PLC 7.5% 8/1/26 (b) | | 405,000 | 351,743 |
| Phinia, Inc. 6.75% 4/15/29 (b) | | 1,045,000 | 1,048,722 |
| Rivian Holdco & Rivian LLC & Rivian Automotive LLC CME Term SOFR 6 Month Index + 6.020% 11.3101% 10/15/26 (b)(c)(d) | | 335,000 | 329,975 |
| Wand NewCo 3, Inc. 7.625% 1/30/32 (b) | | 1,645,000 | 1,672,308 |
| ZF North America Capital, Inc.: | | | |
| 4.75% 4/29/25 (b) | | 1,310,000 | 1,288,994 |
| 6.875% 4/14/28 (b) | | 595,000 | 598,979 |
| 7.125% 4/14/30 (b) | | 595,000 | 608,379 |
| | | | 41,628,349 |
| Banks & Thrifts - 0.9% | | | |
| Ally Financial, Inc.: | | | |
| 5.75% 11/20/25 | | 110,000 | 109,102 |
| 6.7% 2/14/33 | | 2,170,000 | 2,128,737 |
| Jane Street Group LLC/JSG Finance, Inc. 4.5% 11/15/29 (b) | | 970,000 | 882,277 |
| Quicken Loans LLC/Quicken Loans Co.-Issuer, Inc. 4% 10/15/33 (b) | | 435,000 | 355,130 |
| UniCredit SpA: | | | |
| 5.861% 6/19/32 (b)(c) | | 2,542,000 | 2,457,862 |
| 7.296% 4/2/34 (b)(c) | | 1,403,000 | 1,414,844 |
| VistaJet Malta Finance PLC / XO Management Holding, Inc.: | | | |
| 6.375% 2/1/30 (b) | | 3,129,000 | 2,421,325 |
| 7.875% 5/1/27 (b) | | 435,000 | 386,844 |
| Western Alliance Bancorp. 3% 6/15/31 (c) | | 1,910,000 | 1,624,398 |
| | | | 11,780,519 |
| Broadcasting - 1.7% | | | |
| Clear Channel Outdoor Holdings, Inc.: | | | |
| 5.125% 8/15/27 (b) | | 2,900,000 | 2,688,074 |
| 9% 9/15/28 (b) | | 3,050,000 | 3,135,597 |
| Diamond Sports Group LLC/Diamond Sports Finance Co. 5.375% (b)(e) | | 9,005,000 | 225,125 |
| DISH Network Corp. 11.75% 11/15/27 (b) | | 2,760,000 | 2,782,182 |
| Sinclair Television Group, Inc. 5.5% 3/1/30 (b) | | 1,110,000 | 769,474 |
| Sirius XM Radio, Inc.: | | | |
| 4% 7/15/28 (b) | | 2,505,000 | 2,233,010 |
| 4.125% 7/1/30 (b) | | 2,200,000 | 1,865,734 |
| 5.5% 7/1/29 (b) | | 660,000 | 612,637 |
| TEGNA, Inc.: | | | |
| 4.625% 3/15/28 | | 1,895,000 | 1,707,759 |
| 5% 9/15/29 | | 725,000 | 639,119 |
| Univision Communications, Inc.: | | | |
| 4.5% 5/1/29 (b) | | 2,170,000 | 1,887,730 |
| 6.625% 6/1/27 (b) | | 3,080,000 | 2,972,243 |
| 8% 8/15/28 (b) | | 1,975,000 | 1,972,672 |
| | | | 23,491,356 |
| Building Materials - 1.2% | | | |
| Advanced Drain Systems, Inc.: | | | |
| 5% 9/30/27 (b) | | 824,000 | 797,914 |
| 6.375% 6/15/30 (b) | | 490,000 | 487,129 |
| AmeriTex Holdco Intermediate LLC 10.25% 10/15/28 (b) | | 815,000 | 858,506 |
| Beacon Roofing Supply, Inc. 6.5% 8/1/30 (b) | | 1,325,000 | 1,322,712 |
| Builders FirstSource, Inc. 4.25% 2/1/32 (b) | | 2,210,000 | 1,924,993 |
| Eco Material Technologies, Inc. 7.875% 1/31/27 (b) | | 755,000 | 760,548 |
| EMRLD Borrower LP / Emerald Co. 6.625% 12/15/30 (b) | | 4,830,000 | 4,786,721 |
| Smyrna Ready Mix Concrete LLC 8.875% 11/15/31 (b) | | 2,240,000 | 2,359,041 |
| SRS Distribution, Inc.: | | | |
| 4.625% 7/1/28 (b) | | 1,335,000 | 1,330,027 |
| 6% 12/1/29 (b) | | 1,230,000 | 1,247,112 |
| Summit Materials LLC/Summit Materials Finance Corp. 7.25% 1/15/31 (b) | | 950,000 | 973,750 |
| | | | 16,848,453 |
| Cable/Satellite TV - 2.4% | | | |
| CCO Holdings LLC/CCO Holdings Capital Corp.: | | | |
| 4.25% 2/1/31 (b) | | 3,680,000 | 2,880,126 |
| 4.25% 1/15/34 (b) | | 2,145,000 | 1,554,077 |
| 4.5% 8/15/30 (b) | | 675,000 | 548,540 |
| 4.5% 5/1/32 | | 5,635,000 | 4,326,645 |
| 4.75% 3/1/30 (b) | | 4,755,000 | 3,951,145 |
| 4.75% 2/1/32 (b) | | 3,090,000 | 2,430,083 |
| 5% 2/1/28 (b) | | 1,495,000 | 1,361,466 |
| 5.375% 6/1/29 (b) | | 1,705,000 | 1,501,762 |
| CSC Holdings LLC: | | | |
| 4.125% 12/1/30 (b) | | 2,050,000 | 1,302,205 |
| 4.5% 11/15/31 (b) | | 555,000 | 352,197 |
| 4.625% 12/1/30 (b) | | 2,085,000 | 904,959 |
| 5.375% 2/1/28 (b) | | 3,840,000 | 2,946,091 |
| 7.5% 4/1/28 (b) | | 1,530,000 | 827,792 |
| DIRECTV Financing LLC / DIRECTV Financing Co-Obligor, Inc. 5.875% 8/15/27 (b) | | 535,000 | 498,661 |
| DISH DBS Corp. 5.75% 12/1/28 (b) | | 2,740,000 | 1,850,273 |
| Dolya Holdco 18 DAC 5% 7/15/28 (b) | | 1,505,000 | 1,339,782 |
| Radiate Holdco LLC/Radiate Financial Service Ltd. 4.5% 9/15/26 (b) | | 1,630,000 | 1,244,882 |
| Telenet Finance Luxembourg Notes SARL 5.5% 3/1/28 (b) | | 1,000,000 | 943,750 |
| Ziggo BV 4.875% 1/15/30 (b) | | 1,455,000 | 1,273,191 |
| | | | 32,037,627 |
| Capital Goods - 1.1% | | | |
| ESAB Corp. 6.25% 4/15/29 (b) | | 2,470,000 | 2,460,732 |
| Mueller Water Products, Inc. 4% 6/15/29 (b) | | 1,905,000 | 1,723,666 |
| Regal Rexnord Corp.: | | | |
| 6.05% 2/15/26 (b) | | 1,640,000 | 1,640,233 |
| 6.05% 4/15/28 (b) | | 1,090,000 | 1,087,894 |
| 6.3% 2/15/30 (b) | | 1,090,000 | 1,094,661 |
| TK Elevator U.S. Newco, Inc. 5.25% 7/15/27 (b) | | 4,865,000 | 4,653,705 |
| Vertical Holdco GmbH 7.625% 7/15/28 (b) | | 1,645,000 | 1,612,229 |
| | | | 14,273,120 |
| Chemicals - 4.4% | | | |
| Axalta Coating Systems Dutch Holding B BV 7.25% 2/15/31 (b) | | 2,445,000 | 2,493,589 |
| Consolidated Energy Finance SA 12% 2/15/31 (b) | | 2,085,000 | 2,157,985 |
| CVR Partners LP/CVR Nitrogen Finance Corp. 6.125% 6/15/28 (b) | | 1,807,000 | 1,685,929 |
| Element Solutions, Inc. 3.875% 9/1/28 (b) | | 1,044,000 | 939,690 |
| INEOS Quattro Finance 2 PLC 9.625% 3/15/29 (b) | | 2,460,000 | 2,598,835 |
| Kobe U.S. Midco 2, Inc. 9.25% 11/1/26 pay-in-kind (b)(c) | | 3,860,250 | 3,290,863 |
| Kronos Acquisition Holdings, Inc. / KIK Custom Products, Inc. 5% 12/31/26 (b) | | 1,360,000 | 1,314,162 |
| LSB Industries, Inc. 6.25% 10/15/28 (b) | | 880,000 | 834,208 |
| Methanex Corp.: | | | |
| 5.125% 10/15/27 | | 3,800,000 | 3,654,735 |
| 5.65% 12/1/44 | | 3,722,000 | 3,143,873 |
| NOVA Chemicals Corp.: | | | |
| 4.25% 5/15/29 (b) | | 1,900,000 | 1,590,286 |
| 5% 5/1/25 (b) | | 940,000 | 922,437 |
| 5.25% 6/1/27 (b) | | 1,935,000 | 1,820,265 |
| 9% 2/15/30 (b) | | 660,000 | 680,063 |
| Nufarm Australia Ltd. 5% 1/27/30 (b) | | 2,575,000 | 2,350,773 |
| Olin Corp.: | | | |
| 5% 2/1/30 | | 1,110,000 | 1,035,974 |
| 5.125% 9/15/27 | | 2,795,000 | 2,698,313 |
| Olympus Water U.S. Holding Corp.: | | | |
| 4.25% 10/1/28 (b) | | 2,030,000 | 1,829,243 |
| 6.25% 10/1/29 (b) | | 2,255,000 | 2,032,251 |
| 9.75% 11/15/28 (b) | | 2,225,000 | 2,360,989 |
| SCIH Salt Holdings, Inc.: | | | |
| 4.875% 5/1/28 (b) | | 3,750,000 | 3,486,707 |
| 6.625% 5/1/29 (b) | | 1,815,000 | 1,674,672 |
| SCIL IV LLC / SCIL U.S.A. Holdings LLC 5.375% 11/1/26 (b) | | 1,550,000 | 1,487,648 |
| The Chemours Co. LLC: | | | |
| 4.625% 11/15/29 (b) | | 790,000 | 676,928 |
| 5.375% 5/15/27 | | 2,604,000 | 2,463,734 |
| 5.75% 11/15/28 (b) | | 2,625,000 | 2,410,730 |
| Tronox, Inc. 4.625% 3/15/29 (b) | | 3,860,000 | 3,443,459 |
| W.R. Grace Holding LLC: | | | |
| 5.625% 8/15/29 (b) | | 3,750,000 | 3,358,122 |
| 7.375% 3/1/31 (b) | | 440,000 | 446,010 |
| | | | 58,882,473 |
| Consumer Products - 1.0% | | | |
| HFC Prestige Products, Inc./HFC Prestige International U.S. LLC 6.625% 7/15/30 (b) | | 1,850,000 | 1,851,116 |
| Kohl's Corp. 4.25% 7/17/25 | | 150,000 | 146,215 |
| Mattel, Inc.: | | | |
| 3.375% 4/1/26 (b) | | 1,750,000 | 1,666,292 |
| 5.45% 11/1/41 | | 435,000 | 380,722 |
| Newell Brands, Inc.: | | | |
| 5.7% 4/1/26 | | 545,000 | 536,309 |
| 6.375% 9/15/27 | | 3,340,000 | 3,256,939 |
| 6.625% 9/15/29 | | 605,000 | 584,357 |
| 7% 4/1/46 (f) | | 435,000 | 352,918 |
| The Scotts Miracle-Gro Co.: | | | |
| 4% 4/1/31 | | 215,000 | 181,115 |
| 4.375% 2/1/32 | | 330,000 | 277,731 |
| TKC Holdings, Inc.: | | | |
| 6.875% 5/15/28 (b) | | 2,260,000 | 2,133,395 |
| 10.5% 5/15/29 (b) | | 1,895,000 | 1,813,235 |
| | | | 13,180,344 |
| Containers - 1.2% | | | |
| ARD Finance SA 6.5% 6/30/27 pay-in-kind (b)(c) | | 895,000 | 220,727 |
| Ardagh Packaging Finance PLC/Ardagh MP Holdings U.S.A., Inc. 4.125% 8/15/26 (b) | | 2,250,000 | 1,875,053 |
| Ball Corp.: | | | |
| 2.875% 8/15/30 | | 545,000 | 455,460 |
| 6% 6/15/29 | | 710,000 | 706,471 |
| Graham Packaging Co., Inc. 7.125% 8/15/28 (b) | | 545,000 | 492,287 |
| Graphic Packaging International, Inc. 3.75% 2/1/30 (b) | | 610,000 | 530,748 |
| LABL, Inc.: | | | |
| 5.875% 11/1/28 (b) | | 330,000 | 293,487 |
| 6.75% 7/15/26 (b) | | 220,000 | 216,928 |
| 9.5% 11/1/28 (b) | | 220,000 | 220,082 |
| 10.5% 7/15/27 (b) | | 625,000 | 613,879 |
| Mauser Packaging Solutions Holding Co.: | | | |
| 7.875% 4/15/27 (b) | | 1,630,000 | 1,660,563 |
| 9.25% 4/15/27 (b) | | 1,335,000 | 1,308,267 |
| Owens-Brockway Glass Container, Inc. 7.25% 5/15/31 (b) | | 555,000 | 555,849 |
| Sealed Air Corp. 5% 4/15/29 (b) | | 3,300,000 | 3,104,682 |
| Sealed Air Corp./Sealed Air Corp. U.S.: | | | |
| 6.125% 2/1/28 (b) | | 655,000 | 647,020 |
| 7.25% 2/15/31 (b) | | 2,415,000 | 2,458,538 |
| Trivium Packaging Finance BV: | | | |
| 5.5% 8/15/26 (b) | | 494,000 | 484,848 |
| 8.5% 8/15/27 (b) | | 810,000 | 802,112 |
| | | | 16,647,001 |
| Diversified Financial Services - 3.2% | | | |
| Aercap Global Aviation Trust 6.5% 6/15/45 (b)(c) | | 1,090,000 | 1,083,690 |
| Boost Newco Borrower LLC 7.5% 1/15/31 (b) | | 1,525,000 | 1,573,940 |
| Coinbase Global, Inc. 3.375% 10/1/28 (b) | | 900,000 | 754,527 |
| Encore Capital Group, Inc. 9.25% 4/1/29 (b) | | 1,005,000 | 1,026,755 |
| Fortress Transportation & Infrastructure Investors LLC 7.875% 12/1/30 (b) | | 1,860,000 | 1,932,091 |
| GGAM Finance Ltd.: | | | |
| 6.875% 4/15/29 (b) | | 1,715,000 | 1,713,388 |
| 7.75% 5/15/26 (b) | | 1,115,000 | 1,132,700 |
| 8% 2/15/27 (b) | | 2,705,000 | 2,772,269 |
| 8% 6/15/28 (b) | | 1,675,000 | 1,724,975 |
| Gn Bondco LLC 9.5% 10/15/31 (b) | | 2,490,000 | 2,391,200 |
| Hightower Holding LLC 6.75% 4/15/29 (b) | | 1,835,000 | 1,722,336 |
| Icahn Enterprises LP/Icahn Enterprises Finance Corp.: | | | |
| 4.375% 2/1/29 | | 4,560,000 | 3,838,789 |
| 5.25% 5/15/27 | | 3,780,000 | 3,453,975 |
| 6.25% 5/15/26 | | 2,390,000 | 2,324,432 |
| 6.375% 12/15/25 | | 1,225,000 | 1,203,056 |
| Jefferies Finance LLC/JFIN Co-Issuer Corp. 5% 8/15/28 (b) | | 390,000 | 350,887 |
| Jefferson Capital Holding 9.5% 2/15/29 (b) | | 1,050,000 | 1,068,333 |
| Ladder Capital Finance Holdings LLLP/Ladder Capital Finance Corp. 4.75% 6/15/29 (b) | | 1,415,000 | 1,262,821 |
| LPL Holdings, Inc. 4.375% 5/15/31 (b) | | 545,000 | 484,889 |
| OneMain Finance Corp.: | | | |
| 3.5% 1/15/27 | | 3,265,000 | 3,003,825 |
| 3.875% 9/15/28 | | 4,040,000 | 3,556,070 |
| 6.875% 3/15/25 | | 220,000 | 221,441 |
| 7.125% 3/15/26 | | 3,970,000 | 4,006,127 |
| Scientific Games Holdings LP/Scientific Games U.S. Finco, Inc. 6.625% 3/1/30 (b) | | 1,425,000 | 1,348,089 |
| | | | 43,950,605 |
| Diversified Media - 0.4% | | | |
| Advantage Sales & Marketing, Inc. 6.5% 11/15/28 (b) | | 2,875,000 | 2,675,264 |
| CMG Media Corp. 8.875% 12/15/27 (b) | | 5,100,000 | 2,774,591 |
| | | | 5,449,855 |
| Energy - 13.0% | | | |
| Altus Midstream LP: | | | |
| 5.875% 6/15/30 (b) | | 1,535,000 | 1,484,152 |
| 6.625% 12/15/28 (b) | | 4,320,000 | 4,340,796 |
| Antero Midstream Partners LP/Antero Midstream Finance Corp.: | | | |
| 5.75% 3/1/27 (b) | | 545,000 | 535,085 |
| 7.875% 5/15/26 (b) | | 545,000 | 554,905 |
| Apache Corp.: | | | |
| 4.25% 1/15/30 | | 775,000 | 712,908 |
| 5.1% 9/1/40 | | 980,000 | 815,677 |
| Atlantica Sustainable Infrastructure PLC 4.125% 6/15/28 (b) | | 2,540,000 | 2,300,112 |
| Baytex Energy Corp. 7.375% 3/15/32 (b) | | 1,780,000 | 1,795,133 |
| California Resources Corp. 7.125% 2/1/26 (b) | | 765,000 | 769,234 |
| Calumet Specialty Products Partners LP/Calumet Finance Corp. 9.75% 7/15/28 (b) | | 960,000 | 920,464 |
| CGG SA 8.75% 4/1/27 (b) | | 1,310,000 | 1,225,890 |
| Cheniere Energy Partners LP: | | | |
| 3.25% 1/31/32 | | 2,190,000 | 1,829,669 |
| 4% 3/1/31 | | 1,085,000 | 968,100 |
| Citgo Petroleum Corp.: | | | |
| 6.375% 6/15/26 (b) | | 2,380,000 | 2,376,316 |
| 8.375% 1/15/29 (b) | | 1,230,000 | 1,272,913 |
| CNX Resources Corp. 7.375% 1/15/31 (b) | | 625,000 | 632,675 |
| Comstock Resources, Inc.: | | | |
| 5.875% 1/15/30 (b) | | 1,410,000 | 1,284,188 |
| 6.75% 3/1/29 (b) | | 1,535,000 | 1,461,491 |
| CQP Holdco LP / BIP-V Chinook Holdco LLC 7.5% 12/15/33 (b) | | 1,560,000 | 1,569,577 |
| CrownRock LP/CrownRock Finance, Inc.: | | | |
| 5% 5/1/29 (b) | | 1,855,000 | 1,827,567 |
| 5.625% 10/15/25 (b) | | 230,000 | 228,728 |
| CVR Energy, Inc.: | | | |
| 5.75% 2/15/28 (b) | | 2,890,000 | 2,685,435 |
| 8.5% 1/15/29 (b) | | 3,810,000 | 3,819,401 |
| Delek Logistics Partners LP/Delek Logistics Finance Corp.: | | | |
| 7.125% 6/1/28 (b) | | 3,165,000 | 3,091,286 |
| 8.625% 3/15/29 (b) | | 2,440,000 | 2,458,462 |
| DT Midstream, Inc.: | | | |
| 4.125% 6/15/29 (b) | | 1,140,000 | 1,033,260 |
| 4.375% 6/15/31 (b) | | 545,000 | 483,827 |
| Endeavor Energy Resources LP/EER Finance, Inc. 5.75% 1/30/28 (b) | | 1,020,000 | 1,033,182 |
| Energy Transfer LP: | | | |
| 5.625% 5/1/27 (b) | | 9,034,000 | 8,945,100 |
| 5.75% 4/1/25 | | 2,285,000 | 2,280,510 |
| 7.375% 2/1/31 (b) | | 1,090,000 | 1,124,021 |
| EnLink Midstream LLC: | | | |
| 5.625% 1/15/28 (b) | | 5,415,000 | 5,320,483 |
| 6.5% 9/1/30 (b) | | 1,020,000 | 1,032,804 |
| EnLink Midstream Partners LP: | | | |
| 4.15% 6/1/25 | | 545,000 | 531,902 |
| 4.85% 7/15/26 | | 985,000 | 957,992 |
| EQM Midstream Partners LP: | | | |
| 4% 8/1/24 | | 1,005,000 | 997,515 |
| 4.75% 1/15/31 (b) | | 445,000 | 406,611 |
| 6% 7/1/25 (b) | | 140,000 | 139,766 |
| 6.5% 7/1/27 (b) | | 437,000 | 437,607 |
| 6.5% 7/15/48 | | 220,000 | 217,066 |
| Ferrellgas LP/Ferrellgas Finance Corp. 5.375% 4/1/26 (b) | | 295,000 | 289,054 |
| Global Partners LP/GLP Finance Corp.: | | | |
| 6.875% 1/15/29 | | 2,210,000 | 2,162,783 |
| 7% 8/1/27 | | 2,927,000 | 2,903,843 |
| Harvest Midstream I LP: | | | |
| 7.5% 9/1/28 (b) | | 1,110,000 | 1,113,041 |
| 7.5% 5/15/32 (b) | | 2,535,000 | 2,538,144 |
| Hess Midstream Operations LP: | | | |
| 4.25% 2/15/30 (b) | | 1,115,000 | 1,006,281 |
| 5.125% 6/15/28 (b) | | 3,025,000 | 2,895,378 |
| 5.5% 10/15/30 (b) | | 545,000 | 521,094 |
| 5.625% 2/15/26 (b) | | 2,610,000 | 2,580,677 |
| HF Sinclair Corp. 5% 2/1/28 (b) | | 2,280,000 | 2,187,511 |
| Howard Midstream Energy Partners LLC 8.875% 7/15/28 (b) | | 1,170,000 | 1,225,431 |
| Jonah Energy Parent LLC 12% 11/5/25 (g)(h) | | 3,297,992 | 3,520,607 |
| Kodiak Gas Services LLC 7.25% 2/15/29 (b) | | 1,950,000 | 1,964,062 |
| Matador Resources Co. 6.5% 4/15/32 (b) | | 2,310,000 | 2,289,417 |
| Mesquite Energy, Inc. 7.25% (b)(e)(h) | | 10,580,000 | 1 |
| New Fortress Energy, Inc.: | | | |
| 6.5% 9/30/26 (b) | | 5,850,000 | 5,594,144 |
| 8.75% 3/15/29 (b) | | 4,055,000 | 3,954,637 |
| NGL Energy Operating LLC/NGL Energy Finance Corp. 8.125% 2/15/29 (b) | | 1,950,000 | 1,981,044 |
| Northern Oil & Gas, Inc.: | | | |
| 8.125% 3/1/28 (b) | | 1,730,000 | 1,750,159 |
| 8.75% 6/15/31 (b) | | 555,000 | 583,807 |
| Occidental Petroleum Corp.: | | | |
| 4.4% 4/15/46 | | 1,630,000 | 1,259,253 |
| 4.5% 7/15/44 | | 1,335,000 | 1,009,740 |
| 5.5% 12/1/25 | | 2,335,000 | 2,323,115 |
| 5.875% 9/1/25 | | 1,656,000 | 1,656,046 |
| 6.125% 1/1/31 | | 1,895,000 | 1,918,782 |
| 6.625% 9/1/30 | | 3,190,000 | 3,305,319 |
| 7.5% 5/1/31 | | 2,575,000 | 2,803,822 |
| 7.875% 9/15/31 | | 635,000 | 704,907 |
| 7.95% 6/15/39 | | 270,000 | 305,669 |
| 8.875% 7/15/30 | | 2,170,000 | 2,481,026 |
| PBF Holding Co. LLC/PBF Finance Corp. 7.875% 9/15/30 (b) | | 2,660,000 | 2,735,768 |
| Permian Resources Operating LLC: | | | |
| 5.875% 7/1/29 (b) | | 1,573,000 | 1,529,743 |
| 7% 1/15/32 (b) | | 2,785,000 | 2,839,070 |
| Prairie Acquiror LP 9% 8/1/29 (b) | | 1,080,000 | 1,103,123 |
| Rockies Express Pipeline LLC: | | | |
| 4.8% 5/15/30 (b) | | 145,000 | 130,544 |
| 4.95% 7/15/29 (b) | | 1,480,000 | 1,360,614 |
| 6.875% 4/15/40 (b) | | 655,000 | 622,625 |
| Seadrill Finance Ltd. 8.375% 8/1/30 (b) | | 925,000 | 963,638 |
| Sitio Royalties OP / Sitio Finance Corp. 7.875% 11/1/28 (b) | | 2,285,000 | 2,349,765 |
| SM Energy Co. 5.625% 6/1/25 | | 1,200,000 | 1,191,089 |
| Southwestern Energy Co. 4.75% 2/1/32 | | 1,640,000 | 1,476,928 |
| Suburban Propane Partners LP/Suburban Energy Finance Corp. 5.875% 3/1/27 | | 210,000 | 206,896 |
| Sunnova Energy Corp.: | | | |
| 5.875% 9/1/26 (b) | | 880,000 | 547,315 |
| 11.75% 10/1/28 (b) | | 1,210,000 | 722,414 |
| Sunoco LP/Sunoco Finance Corp.: | | | |
| 4.5% 5/15/29 | | 4,570,000 | 4,172,260 |
| 5.875% 3/15/28 | | 875,000 | 853,892 |
| Superior Plus LP / Superior General Partner, Inc. 4.5% 3/15/29 (b) | | 1,155,000 | 1,044,741 |
| Tallgrass Energy Partners LP / Tallgrass Energy Finance Corp.: | | | |
| 5.5% 1/15/28 (b) | | 3,125,000 | 2,966,942 |
| 6% 9/1/31 (b) | | 3,695,000 | 3,430,523 |
| Talos Production, Inc. 9% 2/1/29 (b) | | 560,000 | 590,834 |
| Targa Resources Partners LP/Targa Resources Partners Finance Corp. 4.875% 2/1/31 | | 1,085,000 | 1,015,421 |
| Teine Energy Ltd. 6.875% 4/15/29 (b) | | 295,000 | 286,615 |
| Transocean Poseidon Ltd. 6.875% 2/1/27 (b) | | 681,750 | 679,747 |
| Transocean, Inc.: | | | |
| 8% 2/1/27 (b) | | 4,113,000 | 4,122,945 |
| 8.75% 2/15/30 (b) | | 1,273,500 | 1,327,852 |
| U.S.A. Compression Partners LP/U.S.A. Compression Finance Corp. 7.125% 3/15/29 (b) | | 1,630,000 | 1,619,575 |
| Valaris Ltd. 8.375% 4/30/30 (b) | | 2,135,000 | 2,195,665 |
| Venture Global Calcasieu Pass LLC: | | | |
| 3.875% 8/15/29 (b) | | 2,155,000 | 1,904,012 |
| 4.125% 8/15/31 (b) | | 1,680,000 | 1,466,257 |
| 6.25% 1/15/30 (b) | | 1,445,000 | 1,428,697 |
| Western Gas Partners LP: | | | |
| 3.1% 2/1/25 | | 1,950,000 | 1,906,001 |
| 3.95% 6/1/25 | | 540,000 | 528,988 |
| 5.25% 2/1/50 | | 1,085,000 | 920,247 |
| 5.3% 3/1/48 | | 540,000 | 451,564 |
| 5.5% 8/15/48 | | 325,000 | 275,318 |
| | | | 175,698,232 |
| Environmental - 1.0% | | | |
| Clean Harbors, Inc. 6.375% 2/1/31 (b) | | 515,000 | 510,209 |
| Covanta Holding Corp. 4.875% 12/1/29 (b) | | 1,650,000 | 1,446,399 |
| Darling Ingredients, Inc. 6% 6/15/30 (b) | | 910,000 | 884,012 |
| GFL Environmental, Inc.: | | | |
| 3.75% 8/1/25 (b) | | 1,090,000 | 1,059,969 |
| 5.125% 12/15/26 (b) | | 1,090,000 | 1,061,434 |
| 6.75% 1/15/31 (b) | | 930,000 | 937,518 |
| Madison IAQ LLC: | | | |
| 4.125% 6/30/28 (b) | | 2,375,000 | 2,203,169 |
| 5.875% 6/30/29 (b) | | 2,280,000 | 2,115,485 |
| Stericycle, Inc. 3.875% 1/15/29 (b) | | 3,330,000 | 2,958,851 |
| | | | 13,177,046 |
| Food & Drug Retail - 0.8% | | | |
| Albertsons Companies LLC/Safeway, Inc./New Albertson's, Inc./Albertson's LLC: | | | |
| 3.25% 3/15/26 (b) | | 295,000 | 280,169 |
| 3.5% 3/15/29 (b) | | 2,690,000 | 2,373,569 |
| 4.875% 2/15/30 (b) | | 1,855,000 | 1,730,186 |
| Emergent BioSolutions, Inc. 3.875% 8/15/28 (b) | | 4,325,000 | 2,184,833 |
| Murphy Oil U.S.A., Inc. 3.75% 2/15/31 (b) | | 785,000 | 673,894 |
| Parkland Corp. 4.625% 5/1/30 (b) | | 3,475,000 | 3,140,506 |
| | | | 10,383,157 |
| Food/Beverage/Tobacco - 2.6% | | | |
| BellRing Brands, Inc. 7% 3/15/30 (b) | | 435,000 | 440,189 |
| C&S Group Enterprises LLC 5% 12/15/28 (b) | | 2,380,000 | 1,824,739 |
| Chobani LLC/Finance Corp., Inc.: | | | |
| 4.625% 11/15/28 (b) | | 435,000 | 402,618 |
| 7.625% 7/1/29 (b) | | 1,490,000 | 1,505,758 |
| Fiesta Purchaser, Inc. 7.875% 3/1/31 (b) | | 1,195,000 | 1,217,662 |
| KeHE Distributor / Nextwave 9% 2/15/29 (b) | | 1,935,000 | 1,953,802 |
| Lamb Weston Holdings, Inc.: | | | |
| 4.125% 1/31/30 (b) | | 3,660,000 | 3,262,168 |
| 4.375% 1/31/32 (b) | | 545,000 | 472,300 |
| Performance Food Group, Inc.: | | | |
| 4.25% 8/1/29 (b) | | 2,690,000 | 2,411,258 |
| 5.5% 10/15/27 (b) | | 1,505,000 | 1,456,794 |
| Pilgrim's Pride Corp.: | | | |
| 3.5% 3/1/32 | | 545,000 | 448,770 |
| 4.25% 4/15/31 | | 640,000 | 566,330 |
| Post Holdings, Inc.: | | | |
| 4.625% 4/15/30 (b) | | 1,290,000 | 1,165,025 |
| 5.5% 12/15/29 (b) | | 3,980,000 | 3,774,420 |
| Primo Water Holdings, Inc. 4.375% 4/30/29 (b) | | 2,685,000 | 2,450,755 |
| TreeHouse Foods, Inc. 4% 9/1/28 | | 860,000 | 761,481 |
| Triton Water Holdings, Inc. 6.25% 4/1/29 (b) | | 7,460,000 | 6,689,598 |
| U.S. Foods, Inc.: | | | |
| 4.625% 6/1/30 (b) | | 820,000 | 745,648 |
| 4.75% 2/15/29 (b) | | 2,180,000 | 2,030,998 |
| 7.25% 1/15/32 (b) | | 1,225,000 | 1,250,870 |
| United Natural Foods, Inc. 6.75% 10/15/28 (b) | | 215,000 | 164,999 |
| | | | 34,996,182 |
| Gaming - 2.1% | | | |
| Affinity Interactive 6.875% 12/15/27 (b) | | 1,105,000 | 989,035 |
| Caesars Entertainment, Inc.: | | | |
| 6.5% 2/15/32 (b) | | 3,735,000 | 3,679,884 |
| 7% 2/15/30 (b) | | 1,305,000 | 1,314,165 |
| 8.125% 7/1/27 (b) | | 2,509,000 | 2,542,866 |
| Churchill Downs, Inc. 5.75% 4/1/30 (b) | | 3,965,000 | 3,772,881 |
| Fertitta Entertainment LLC / Fertitta Entertainment Finance Co., Inc.: | | | |
| 4.625% 1/15/29 (b) | | 2,730,000 | 2,469,660 |
| 6.75% 1/15/30 (b) | | 2,125,000 | 1,848,833 |
| Jacobs Entertainment, Inc. 6.75% 2/15/29 (b) | | 975,000 | 924,893 |
| Ontario Gaming Gta LP/Otg Co.-I 8% 8/1/30 (b) | | 660,000 | 670,105 |
| Station Casinos LLC: | | | |
| 4.5% 2/15/28 (b) | | 1,665,000 | 1,544,320 |
| 6.625% 3/15/32 (b) | | 2,735,000 | 2,680,147 |
| VICI Properties LP / VICI Note Co. 4.125% 8/15/30 (b) | | 1,085,000 | 967,079 |
| Wynn Resorts Finance LLC / Wynn Resorts Capital Corp. 7.125% 2/15/31 (b) | | 5,135,000 | 5,208,237 |
| | | | 28,612,105 |
| Healthcare - 6.7% | | | |
| 1375209 BC Ltd. 9% 1/30/28 (b) | | 1,306,000 | 1,282,128 |
| 180 Medical, Inc. 3.875% 10/15/29 (b) | | 1,055,000 | 934,102 |
| Amgen, Inc. 5.6% 3/2/43 | | 1,195,000 | 1,152,345 |
| AMN Healthcare 4% 4/15/29 (b) | | 680,000 | 601,901 |
| Avantor Funding, Inc.: | | | |
| 3.875% 11/1/29 (b) | | 1,345,000 | 1,190,860 |
| 4.625% 7/15/28 (b) | | 885,000 | 822,698 |
| Bausch Health Companies, Inc. 5.5% 11/1/25 (b) | | 2,740,000 | 2,552,171 |
| Cano Health, Inc. 6.25% (b)(e) | | 550,000 | 688 |
| Catalent Pharma Solutions 3.5% 4/1/30 (b) | | 1,320,000 | 1,255,693 |
| Centene Corp. 2.5% 3/1/31 | | 1,470,000 | 1,181,425 |
| Charles River Laboratories International, Inc.: | | | |
| 3.75% 3/15/29 (b) | | 1,150,000 | 1,033,032 |
| 4% 3/15/31 (b) | | 975,000 | 850,437 |
| 4.25% 5/1/28 (b) | | 472,000 | 439,014 |
| Community Health Systems, Inc.: | | | |
| 4.75% 2/15/31 (b) | | 4,055,000 | 3,165,090 |
| 5.25% 5/15/30 (b) | | 7,690,000 | 6,287,229 |
| 5.625% 3/15/27 (b) | | 4,905,000 | 4,491,221 |
| 6% 1/15/29 (b) | | 2,290,000 | 1,997,889 |
| 6.125% 4/1/30 (b) | | 2,340,000 | 1,654,409 |
| 6.875% 4/15/29 (b) | | 1,490,000 | 1,107,663 |
| 8% 3/15/26 (b) | | 531,000 | 528,415 |
| 10.875% 1/15/32 (b) | | 1,015,000 | 1,039,132 |
| CTR Partnership LP/CareTrust Capital Corp. 3.875% 6/30/28 (b) | | 2,070,000 | 1,873,665 |
| DaVita, Inc.: | | | |
| 3.75% 2/15/31 (b) | | 855,000 | 703,556 |
| 4.625% 6/1/30 (b) | | 4,560,000 | 3,995,170 |
| Embecta Corp. 5% 2/15/30 (b) | | 860,000 | 663,018 |
| Grifols SA 4.75% 10/15/28 (b) | | 660,000 | 533,042 |
| HCA Holdings, Inc. 5.5% 6/15/47 | | 1,085,000 | 975,393 |
| HealthEquity, Inc. 4.5% 10/1/29 (b) | | 1,865,000 | 1,698,687 |
| Hologic, Inc. 3.25% 2/15/29 (b) | | 840,000 | 741,850 |
| Humana, Inc. 5.875% 3/1/33 | | 1,085,000 | 1,084,105 |
| IQVIA, Inc. 6.5% 5/15/30 (b) | | 1,110,000 | 1,115,036 |
| Jazz Securities DAC 4.375% 1/15/29 (b) | | 1,850,000 | 1,683,181 |
| Medline Borrower LP 3.875% 4/1/29 (b) | | 6,955,000 | 6,230,505 |
| Medline Borrower LP / Medline Co. 6.25% 4/1/29 (b) | | 1,365,000 | 1,356,269 |
| ModivCare Escrow Issuer, Inc. 5% 10/1/29 (b) | | 785,000 | 545,337 |
| Modivcare, Inc. 5.875% 11/15/25 (b) | | 1,490,000 | 1,453,207 |
| Molina Healthcare, Inc. 3.875% 11/15/30 (b) | | 1,465,000 | 1,270,583 |
| Option Care Health, Inc. 4.375% 10/31/29 (b) | | 255,000 | 228,374 |
| Organon & Co. / Organon Foreign Debt Co-Issuer BV: | | | |
| 4.125% 4/30/28 (b) | | 3,935,000 | 3,583,828 |
| 5.125% 4/30/31 (b) | | 1,050,000 | 907,937 |
| Owens & Minor, Inc. 4.5% 3/31/29 (b) | | 1,010,000 | 905,427 |
| Pediatrix Medical Group, Inc. 5.375% 2/15/30 (b) | | 2,895,000 | 2,533,096 |
| Radiology Partners, Inc. 8.5% 1/31/29 pay-in-kind (b)(c) | | 1,380,479 | 1,273,492 |
| Surgery Center Holdings, Inc. 7.25% 4/15/32 (b) | | 1,995,000 | 1,992,276 |
| Teleflex, Inc. 4.25% 6/1/28 (b) | | 930,000 | 859,387 |
| Tenet Healthcare Corp.: | | | |
| 4.25% 6/1/29 | | 2,790,000 | 2,555,587 |
| 4.375% 1/15/30 | | 1,990,000 | 1,807,035 |
| 4.625% 6/15/28 | | 2,545,000 | 2,394,899 |
| 6.125% 10/1/28 | | 3,035,000 | 2,996,920 |
| 6.125% 6/15/30 | | 2,820,000 | 2,761,452 |
| 6.25% 2/1/27 | | 2,741,000 | 2,729,942 |
| 6.75% 5/15/31 (b) | | 390,000 | 390,773 |
| Teva Pharmaceutical Finance Netherlands III BV: | | | |
| 3.15% 10/1/26 | | 1,310,000 | 1,213,609 |
| 7.875% 9/15/29 | | 330,000 | 347,519 |
| 8.125% 9/15/31 | | 330,000 | 356,122 |
| U.S. Acute Care Solutions 9.75% 5/15/29 (b) | | 585,000 | 573,671 |
| | | | 89,901,492 |
| Homebuilders/Real Estate - 3.3% | | | |
| Anywhere Real Estate Group LLC 7% 4/15/30 (b) | | 874,400 | 767,238 |
| Ashton Woods U.S.A. LLC/Ashton Woods Finance Co. 4.625% 8/1/29 (b) | | 985,000 | 890,851 |
| Beazer Homes U.S.A., Inc. 7.5% 3/15/31 (b) | | 1,085,000 | 1,072,443 |
| Greystar Real Estate Partners 7.75% 9/1/30 (b) | | 555,000 | 571,640 |
| HAT Holdings I LLC/HAT Holdings II LLC 8% 6/15/27 (b) | | 1,520,000 | 1,558,226 |
| Howard Hughes Corp.: | | | |
| 4.125% 2/1/29 (b) | | 945,000 | 834,499 |
| 4.375% 2/1/31 (b) | | 775,000 | 657,157 |
| Kennedy-Wilson, Inc. 4.75% 2/1/30 | | 1,605,000 | 1,271,156 |
| Landsea Homes Corp. 8.875% 4/1/29 (b) | | 1,330,000 | 1,305,063 |
| LGI Homes, Inc. 8.75% 12/15/28 (b) | | 960,000 | 998,607 |
| MPT Operating Partnership LP/MPT Finance Corp.: | | | |
| 3.5% 3/15/31 | | 5,035,000 | 3,376,118 |
| 4.625% 8/1/29 | | 2,850,000 | 2,132,673 |
| 5% 10/15/27 | | 9,335,000 | 7,635,657 |
| 5.25% 8/1/26 | | 1,085,000 | 988,241 |
| Panther Escrow Issuer LLC 7.125% 6/1/31 (b) | | 2,255,000 | 2,266,695 |
| Railworks Holdings LP 8.25% 11/15/28 (b) | | 1,990,000 | 1,987,383 |
| Realogy Group LLC/Realogy Co-Issuer Corp. 5.75% 1/15/29 (b) | | 32,000 | 22,120 |
| Realogy Group LLC/Realogy Co.-Issuer Corp. 5.25% 4/15/30 (b) | | 25,000 | 16,781 |
| Rithm Capital Corp. 8% 4/1/29 (b) | | 830,000 | 811,627 |
| Safehold Operating Partnership LP 2.85% 1/15/32 | | 1,635,000 | 1,311,328 |
| Taylor Morrison Communities, Inc./Monarch Communities, Inc. 5.125% 8/1/30 (b) | | 395,000 | 367,813 |
| TopBuild Corp. 4.125% 2/15/32 (b) | | 1,185,000 | 1,025,915 |
| TRI Pointe Group, Inc./TRI Pointe Holdings, Inc. 5.875% 6/15/24 | | 30,000 | 29,965 |
| TRI Pointe Homes, Inc. 5.7% 6/15/28 | | 220,000 | 212,931 |
| Uniti Group LP/Uniti Group Finance, Inc./CSL Capital LLC: | | | |
| 4.75% 4/15/28 (b) | | 6,395,000 | 5,608,737 |
| 6.5% 2/15/29 (b) | | 4,996,000 | 4,016,417 |
| 10.5% 2/15/28 (b) | | 2,175,000 | 2,256,410 |
| | | | 43,993,691 |
| Hotels - 0.8% | | | |
| Hilton Domestic Operating Co., Inc.: | | | |
| 3.625% 2/15/32 (b) | | 4,715,000 | 3,962,114 |
| 3.75% 5/1/29 (b) | | 495,000 | 444,021 |
| 4% 5/1/31 (b) | | 2,420,000 | 2,120,497 |
| 5.875% 4/1/29 (b) | | 685,000 | 675,927 |
| Hilton Grand Vacations Borrower Escrow LLC 6.625% 1/15/32 (b) | | 2,585,000 | 2,548,467 |
| Wyndham Hotels & Resorts, Inc. 4.375% 8/15/28 (b) | | 1,785,000 | 1,636,696 |
| | | | 11,387,722 |
| Insurance - 1.7% | | | |
| Acrisure LLC / Acrisure Finance, Inc.: | | | |
| 4.25% 2/15/29 (b) | | 435,000 | 389,699 |
| 8.25% 2/1/29 (b) | | 1,485,000 | 1,472,802 |
| Alliant Holdings Intermediate LLC/Alliant Holdings Co.-Issuer: | | | |
| 4.25% 10/15/27 (b) | | 3,740,000 | 3,488,697 |
| 5.875% 11/1/29 (b) | | 1,365,000 | 1,253,402 |
| 6.75% 10/15/27 (b) | | 6,945,000 | 6,810,393 |
| 6.75% 4/15/28 (b) | | 540,000 | 539,430 |
| AmWINS Group, Inc. 4.875% 6/30/29 (b) | | 1,660,000 | 1,509,075 |
| AssuredPartners, Inc.: | | | |
| 5.625% 1/15/29 (b) | | 1,355,000 | 1,235,597 |
| 7.5% 2/15/32 (b) | | 2,145,000 | 2,082,656 |
| HUB International Ltd. 7.25% 6/15/30 (b) | | 3,595,000 | 3,647,735 |
| USI, Inc. 7.5% 1/15/32 (b) | | 840,000 | 835,531 |
| | | | 23,265,017 |
| Leisure - 2.3% | | | |
| Amer Sports Co. 6.75% 2/16/31 (b) | | 1,375,000 | 1,354,136 |
| Carnival Corp.: | | | |
| 5.75% 3/1/27 (b) | | 3,414,000 | 3,331,932 |
| 6% 5/1/29 (b) | | 2,235,000 | 2,165,812 |
| 6.65% 1/15/28 | | 300,000 | 297,304 |
| 7% 8/15/29 (b) | | 2,465,000 | 2,530,502 |
| 10.5% 6/1/30 (b) | | 1,985,000 | 2,155,726 |
| ClubCorp Holdings, Inc. 8.5% 9/15/25 (b) | | 315,000 | 284,800 |
| MajorDrive Holdings IV LLC 6.375% 6/1/29 (b) | | 1,705,000 | 1,599,995 |
| NCL Corp. Ltd.: | | | |
| 5.875% 3/15/26 (b) | | 890,000 | 872,040 |
| 7.75% 2/15/29 (b) | | 3,300,000 | 3,375,989 |
| NCL Finance Ltd. 6.125% 3/15/28 (b) | | 3,490,000 | 3,405,468 |
| Royal Caribbean Cruises Ltd.: | | | |
| 5.375% 7/15/27 (b) | | 1,535,000 | 1,493,808 |
| 5.5% 4/1/28 (b) | | 2,745,000 | 2,671,892 |
| 6.25% 3/15/32 (b) | | 1,730,000 | 1,705,386 |
| 7.25% 1/15/30 (b) | | 540,000 | 555,316 |
| Viking Cruises Ltd. 9.125% 7/15/31 (b) | | 1,195,000 | 1,281,768 |
| Viking Ocean Cruises Ship VII Ltd. 5.625% 2/15/29 (b) | | 630,000 | 602,878 |
| Voc Escrow Ltd. 5% 2/15/28 (b) | | 865,000 | 824,930 |
| | | | 30,509,682 |
| Metals/Mining - 1.8% | | | |
| Alcoa Nederland Holding BV 7.125% 3/15/31 (b) | | 530,000 | 536,099 |
| Arsenal AIC Parent LLC 8% 10/1/30 (b) | | 740,000 | 770,463 |
| Cleveland-Cliffs, Inc.: | | | |
| 4.875% 3/1/31 (b) | | 215,000 | 188,344 |
| 7% 3/15/32 (b) | | 2,045,000 | 1,997,213 |
| Constellium NV 5.875% 2/15/26 (b) | | 797,000 | 788,791 |
| Eldorado Gold Corp. 6.25% 9/1/29 (b) | | 1,005,000 | 948,419 |
| ERO Copper Corp. 6.5% 2/15/30 (b) | | 5,665,000 | 5,328,499 |
| First Quantum Minerals Ltd.: | | | |
| 6.875% 10/15/27 (b) | | 2,360,000 | 2,265,600 |
| 8.625% 6/1/31 (b) | | 1,180,000 | 1,147,491 |
| 9.375% 3/1/29 (b) | | 3,380,000 | 3,492,132 |
| FMG Resources Pty Ltd.: | | | |
| 4.375% 4/1/31 (b) | | 545,000 | 479,842 |
| 4.5% 9/15/27 (b) | | 630,000 | 594,148 |
| Mineral Resources Ltd.: | | | |
| 8.5% 5/1/30 (b) | | 1,400,000 | 1,433,842 |
| 9.25% 10/1/28 (b) | | 1,105,000 | 1,158,411 |
| Novelis Corp.: | | | |
| 3.25% 11/15/26 (b) | | 330,000 | 308,538 |
| 3.875% 8/15/31 (b) | | 545,000 | 461,514 |
| PMHC II, Inc. 9% 2/15/30 (b) | | 2,130,000 | 1,977,106 |
| | | | 23,876,452 |
| Paper - 0.8% | | | |
| Ahlstrom Holding 3 OY 4.875% 2/4/28 (b) | | 2,205,000 | 2,018,237 |
| Ardagh Metal Packaging Finance U.S.A. LLC/Ardagh Metal Packaging Finance PLC: | | | |
| 4% 9/1/29 (b) | | 1,145,000 | 943,846 |
| 6% 6/15/27 (b) | | 1,985,000 | 1,924,174 |
| Clydesdale Acquisition Holdings, Inc.: | | | |
| 6.625% 4/15/29 (b) | | 3,325,000 | 3,316,649 |
| 8.75% 4/15/30 (b) | | 2,330,000 | 2,251,830 |
| Mercer International, Inc. 5.125% 2/1/29 | | 710,000 | 620,115 |
| | | | 11,074,851 |
| Publishing/Printing - 0.1% | | | |
| News Corp. 5.125% 2/15/32 (b) | | 1,685,000 | 1,543,933 |
| Railroad - 0.2% | | | |
| First Student Bidco, Inc./First Transit Parent, Inc. 4% 7/31/29 (b) | | 1,045,000 | 913,419 |
| Genesee & Wyoming, Inc. 6.25% 4/15/32 (b) | | 2,040,000 | 2,027,535 |
| | | | 2,940,954 |
| Restaurants - 0.8% | | | |
| 1011778 BC Unlimited Liability Co./New Red Finance, Inc.: | | | |
| 3.875% 1/15/28 (b) | | 930,000 | 857,937 |
| 4% 10/15/30 (b) | | 5,530,000 | 4,768,928 |
| 5.75% 4/15/25 (b) | | 425,000 | 423,025 |
| Garden SpinCo Corp. 8.625% 7/20/30 (b) | | 550,000 | 579,911 |
| Yum! Brands, Inc.: | | | |
| 3.625% 3/15/31 | | 545,000 | 470,933 |
| 4.625% 1/31/32 | | 3,225,000 | 2,903,270 |
| 5.375% 4/1/32 | | 435,000 | 410,328 |
| | | | 10,414,332 |
| Services - 5.8% | | | |
| AECOM 5.125% 3/15/27 | | 730,000 | 709,199 |
| Allied Universal Holdco LLC 7.875% 2/15/31 (b) | | 2,020,000 | 2,024,461 |
| Allied Universal Holdco LLC / Allied Universal Finance Corp.: | | | |
| 6% 6/1/29 (b) | | 2,040,000 | 1,731,997 |
| 9.75% 7/15/27 (b) | | 1,455,000 | 1,449,491 |
| APX Group, Inc.: | | | |
| 5.75% 7/15/29 (b) | | 1,390,000 | 1,292,469 |
| 6.75% 2/15/27 (b) | | 1,280,000 | 1,271,510 |
| Aramark Services, Inc. 5% 2/1/28 (b) | | 1,560,000 | 1,481,194 |
| Artera Services LLC 8.5% 2/15/31 (b) | | 5,195,000 | 5,315,805 |
| ASGN, Inc. 4.625% 5/15/28 (b) | | 1,025,000 | 956,538 |
| Atlas Luxco 4 SARL / Allied Universal Holdco LLC / Allied Universal Finance Corp. 4.625% 6/1/28 (b) | | 2,190,000 | 1,964,491 |
| Booz Allen Hamilton, Inc. 3.875% 9/1/28 (b) | | 3,975,000 | 3,676,269 |
| Brand Industrial Services, Inc. 10.375% 8/1/30 (b) | | 5,400,000 | 5,794,735 |
| CoreCivic, Inc.: | | | |
| 4.75% 10/15/27 | | 3,661,000 | 3,412,932 |
| 8.25% 4/15/29 | | 1,365,000 | 1,410,448 |
| CoreLogic, Inc. 4.5% 5/1/28 (b) | | 1,535,000 | 1,328,123 |
| Gartner, Inc.: | | | |
| 3.625% 6/15/29 (b) | | 345,000 | 308,702 |
| 3.75% 10/1/30 (b) | | 555,000 | 483,001 |
| 4.5% 7/1/28 (b) | | 2,505,000 | 2,355,696 |
| GEMS MENASA Cayman Ltd./GEMS Education Delaware LLC 7.125% 7/31/26 (b) | | 5,221,000 | 5,190,000 |
| Iron Mountain, Inc. 4.5% 2/15/31 (b) | | 545,000 | 480,700 |
| Korn Ferry 4.625% 12/15/27 (b) | | 400,000 | 379,307 |
| Life Time, Inc. 8% 4/15/26 (b) | | 1,655,000 | 1,657,903 |
| Neptune BidCo U.S., Inc. 9.29% 4/15/29 (b) | | 2,925,000 | 2,756,813 |
| Prime Securities Services Borrower LLC/Prime Finance, Inc. 5.75% 4/15/26 (b) | | 1,090,000 | 1,076,290 |
| Service Corp. International: | | | |
| 4% 5/15/31 | | 945,000 | 814,083 |
| 5.125% 6/1/29 | | 597,000 | 570,015 |
| Sotheby's 7.375% 10/15/27 (b) | | 1,270,000 | 1,183,542 |
| Staples, Inc. 7.5% 4/15/26 (b) | | 2,690,000 | 2,593,475 |
| The GEO Group, Inc.: | | | |
| 8.625% 4/15/29 (b) | | 2,885,000 | 2,920,657 |
| 10.25% 4/15/31 (b) | | 2,710,000 | 2,793,848 |
| TriNet Group, Inc. 3.5% 3/1/29 (b) | | 3,950,000 | 3,458,514 |
| Uber Technologies, Inc.: | | | |
| 4.5% 8/15/29 (b) | | 6,630,000 | 6,176,491 |
| 8% 11/1/26 (b) | | 3,275,000 | 3,307,494 |
| United Rentals North America, Inc.: | | | |
| 6% 12/15/29 (b) | | 545,000 | 539,319 |
| 6.125% 3/15/34 (b) | | 3,415,000 | 3,334,347 |
| WASH Multifamily Acquisition, Inc. 5.75% 4/15/26 (b) | | 2,762,000 | 2,677,789 |
| | | | 78,877,648 |
| Steel - 0.2% | | | |
| Commercial Metals Co.: | | | |
| 3.875% 2/15/31 | | 655,000 | 569,880 |
| 4.125% 1/15/30 | | 1,140,000 | 1,020,631 |
| Roller Bearing Co. of America, Inc. 4.375% 10/15/29 (b) | | 1,475,000 | 1,333,052 |
| | | | 2,923,563 |
| Super Retail - 1.6% | | | |
| Bath & Body Works, Inc. 6.694% 1/15/27 | | 625,000 | 628,879 |
| Carvana Co.: | | | |
| 4.875% 9/1/29 (b) | | 1,855,000 | 1,209,815 |
| 5.5% 4/15/27 (b) | | 1,025,000 | 801,758 |
| 5.875% 10/1/28 (b) | | 507,000 | 341,239 |
| 10.25% 5/1/30 (b) | | 150,000 | 120,036 |
| 12% 12/1/28 pay-in-kind (b)(c) | | 606,433 | 593,978 |
| 13% 6/1/30 pay-in-kind (b)(c) | | 915,167 | 907,986 |
| 14% 6/1/31 pay-in-kind (b)(c) | | 1,086,116 | 1,088,733 |
| EG Global Finance PLC 12% 11/30/28 (b) | | 5,560,000 | 5,739,576 |
| Hanesbrands, Inc. 4.875% 5/15/26 (b) | | 295,000 | 285,325 |
| LBM Acquisition LLC 6.25% 1/15/29 (b) | | 2,315,000 | 2,125,088 |
| Levi Strauss & Co. 3.5% 3/1/31 (b) | | 700,000 | 597,473 |
| Michaels Companies, Inc.: | | | |
| 5.25% 5/1/28 (b) | | 1,425,000 | 1,206,087 |
| 7.875% 5/1/29 (b) | | 1,100,000 | 805,985 |
| Nordstrom, Inc.: | | | |
| 4.25% 8/1/31 | | 1,630,000 | 1,405,901 |
| 4.375% 4/1/30 | | 1,090,000 | 972,834 |
| Wolverine World Wide, Inc. 4% 8/15/29 (b) | | 3,250,000 | 2,595,854 |
| | | | 21,426,547 |
| Technology - 6.0% | | | |
| Acuris Finance U.S. 5% 5/1/28 (b) | | 4,495,000 | 4,077,815 |
| Athenahealth Group, Inc. 6.5% 2/15/30 (b) | | 760,000 | 684,188 |
| Black Knight InfoServ LLC 3.625% 9/1/28 (b) | | 3,485,000 | 3,236,694 |
| Block, Inc. 3.5% 6/1/31 | | 3,117,000 | 2,633,099 |
| Broadcom, Inc.: | | | |
| 2.45% 2/15/31 (b) | | 2,035,000 | 1,672,490 |
| 2.6% 2/15/33 (b) | | 1,570,000 | 1,237,542 |
| Clarivate Science Holdings Corp.: | | | |
| 3.875% 7/1/28 (b) | | 710,000 | 646,529 |
| 4.875% 7/1/29 (b) | | 720,000 | 655,702 |
| Cloud Software Group, Inc.: | | | |
| 6.5% 3/31/29 (b) | | 2,710,000 | 2,570,309 |
| 9% 9/30/29 (b) | | 5,045,000 | 4,854,578 |
| CNT PRNT/CDK GLO II/FIN 8% 6/15/29 (b) | | 2,415,000 | 2,484,566 |
| Coherent Corp. 5% 12/15/29 (b) | | 2,885,000 | 2,661,582 |
| CommScope, Inc.: | | | |
| 4.75% 9/1/29 (b) | | 1,415,000 | 986,963 |
| 6% 3/1/26 (b) | | 1,260,000 | 1,126,125 |
| Elastic NV 4.125% 7/15/29 (b) | | 1,715,000 | 1,527,217 |
| Entegris, Inc.: | | | |
| 3.625% 5/1/29 (b) | | 990,000 | 876,150 |
| 4.75% 4/15/29 (b) | | 3,475,000 | 3,277,576 |
| 5.95% 6/15/30 (b) | | 3,270,000 | 3,184,142 |
| Gen Digital, Inc.: | | | |
| 5% 4/15/25 (b) | | 1,090,000 | 1,076,793 |
| 7.125% 9/30/30 (b) | | 545,000 | 550,623 |
| Go Daddy Operating Co. LLC / GD Finance Co., Inc.: | | | |
| 3.5% 3/1/29 (b) | | 2,070,000 | 1,835,574 |
| 5.25% 12/1/27 (b) | | 625,000 | 603,409 |
| GrafTech Global Enterprises, Inc. 9.875% 12/15/28 (b) | | 1,090,000 | 819,472 |
| HTA Group Ltd. 7% 12/18/25 (b) | | 3,830,000 | 3,824,016 |
| ION Trading Technologies Ltd. 5.75% 5/15/28 (b) | | 4,095,000 | 3,740,409 |
| Match Group Holdings II LLC: | | | |
| 3.625% 10/1/31 (b) | | 325,000 | 268,289 |
| 4.125% 8/1/30 (b) | | 695,000 | 601,874 |
| MicroStrategy, Inc. 6.125% 6/15/28 (b) | | 3,355,000 | 3,109,321 |
| ON Semiconductor Corp. 3.875% 9/1/28 (b) | | 1,875,000 | 1,701,509 |
| Open Text Corp.: | | | |
| 3.875% 2/15/28 (b) | | 1,310,000 | 1,195,775 |
| 3.875% 12/1/29 (b) | | 1,655,000 | 1,448,464 |
| Open Text Holdings, Inc.: | | | |
| 4.125% 2/15/30 (b) | | 1,840,000 | 1,616,050 |
| 4.125% 12/1/31 (b) | | 875,000 | 749,940 |
| Rackspace Finance LLC 3.5% 5/15/28 (b) | | 2,262,850 | 950,397 |
| Roblox Corp. 3.875% 5/1/30 (b) | | 3,450,000 | 2,983,720 |
| Seagate HDD Cayman: | | | |
| 5.75% 12/1/34 | | 1,210,000 | 1,145,795 |
| 8.25% 12/15/29 (b) | | 555,000 | 589,902 |
| 8.5% 7/15/31 (b) | | 670,000 | 715,362 |
| Sensata Technologies BV: | | | |
| 4% 4/15/29 (b) | | 3,430,000 | 3,070,816 |
| 5% 10/1/25 (b) | | 215,000 | 212,237 |
| Sensata Technologies, Inc. 3.75% 2/15/31 (b) | | 545,000 | 460,567 |
| SS&C Technologies, Inc. 5.5% 9/30/27 (b) | | 440,000 | 427,688 |
| TTM Technologies, Inc. 4% 3/1/29 (b) | | 4,905,000 | 4,386,933 |
| UKG, Inc. 6.875% 2/1/31 (b) | | 1,605,000 | 1,608,059 |
| Veritas U.S., Inc./Veritas Bermuda Ltd. 7.5% 9/1/25 (b) | | 1,760,000 | 1,601,193 |
| VM Consolidated, Inc. 5.5% 4/15/29 (b) | | 2,020,000 | 1,900,977 |
| | | | 81,588,431 |
| Telecommunications - 4.5% | | | |
| Altice Financing SA: | | | |
| 5% 1/15/28 (b) | | 1,570,000 | 1,239,055 |
| 5.75% 8/15/29 (b) | | 6,145,000 | 4,564,349 |
| Altice France Holding SA 6% 2/15/28 (b) | | 2,945,000 | 859,100 |
| Altice France SA: | | | |
| 5.125% 1/15/29 (b) | | 2,620,000 | 1,710,277 |
| 5.125% 7/15/29 (b) | | 3,475,000 | 2,263,495 |
| 5.5% 1/15/28 (b) | | 4,455,000 | 3,009,797 |
| 5.5% 10/15/29 (b) | | 20,000 | 13,086 |
| C&W Senior Finance Ltd. 6.875% 9/15/27 (b) | | 6,814,000 | 6,452,313 |
| Cablevision Lightpath LLC: | | | |
| 3.875% 9/15/27 (b) | | 765,000 | 675,001 |
| 5.625% 9/15/28 (b) | | 605,000 | 488,221 |
| Consolidated Communications, Inc. 5% 10/1/28 (b) | | 930,000 | 772,010 |
| Frontier Communications Holdings LLC: | | | |
| 5% 5/1/28 (b) | | 430,000 | 395,595 |
| 5.875% 10/15/27 (b) | | 1,685,000 | 1,616,182 |
| 5.875% 11/1/29 | | 2,485,000 | 2,074,793 |
| 8.75% 5/15/30 (b) | | 1,675,000 | 1,705,368 |
| IHS Netherlands Holdco BV 8% 9/18/27 (b) | | 680,000 | 639,200 |
| Intelsat Jackson Holdings SA 6.5% 3/15/30 (b) | | 3,100,000 | 2,967,144 |
| LCPR Senior Secured Financing DAC 5.125% 7/15/29 (b) | | 1,010,000 | 842,217 |
| Level 3 Financing, Inc.: | | | |
| 3.875% 10/15/30 (b) | | 565,000 | 310,593 |
| 4.5% 4/1/30 (b) | | 2,100,000 | 1,200,933 |
| 10.5% 5/15/30 (b) | | 2,909,000 | 2,882,591 |
| 11% 11/15/29 (b) | | 1,014,402 | 1,035,196 |
| Millicom International Cellular SA: | | | |
| 4.5% 4/27/31 (b) | | 3,880,000 | 3,229,305 |
| 5.125% 1/15/28 (b) | | 211,500 | 195,109 |
| Sable International Finance Ltd. 5.75% 9/7/27 (b) | | 748,000 | 710,873 |
| SBA Communications Corp. 3.125% 2/1/29 | | 550,000 | 478,972 |
| Telecom Italia Capital SA: | | | |
| 6% 9/30/34 | | 3,032,000 | 2,553,022 |
| 7.2% 7/18/36 | | 1,449,000 | 1,311,029 |
| 7.721% 6/4/38 | | 400,000 | 371,901 |
| Uniti Group LP/Uniti Fiber Holdings, Inc./CSL Capital LLC 6% 1/15/30 (b) | | 3,690,000 | 2,869,680 |
| Virgin Media Secured Finance PLC 4.5% 8/15/30 (b) | | 2,980,000 | 2,515,648 |
| VMED O2 UK Financing I PLC 4.25% 1/31/31 (b) | | 3,745,000 | 3,059,495 |
| Windstream Escrow LLC 7.75% 8/15/28 (b) | | 2,220,000 | 2,139,053 |
| Zayo Group Holdings, Inc.: | | | |
| 4% 3/1/27 (b) | | 2,600,000 | 2,069,503 |
| 6.125% 3/1/28 (b) | | 1,755,000 | 1,169,711 |
| | | | 60,389,817 |
| Textiles/Apparel - 0.2% | | | |
| Crocs, Inc. 4.125% 8/15/31 (b) | | 720,000 | 604,202 |
| Foot Locker, Inc. 4% 10/1/29 (b) | | 715,000 | 570,706 |
| Kontoor Brands, Inc. 4.125% 11/15/29 (b) | | 580,000 | 515,237 |
| Victoria's Secret & Co. 4.625% 7/15/29 (b) | | 810,000 | 636,389 |
| | | | 2,326,534 |
| Transportation Ex Air/Rail - 0.6% | | | |
| Golar LNG Ltd. 7% 10/20/25 (b) | | 1,690,000 | 1,682,513 |
| Great Lakes Dredge & Dock Corp. 5.25% 6/1/29 (b) | | 1,020,000 | 856,038 |
| Seaspan Corp. 5.5% 8/1/29 (b) | | 3,000,000 | 2,580,089 |
| XPO, Inc.: | | | |
| 6.25% 6/1/28 (b) | | 335,000 | 333,747 |
| 7.125% 6/1/31 (b) | | 550,000 | 552,835 |
| 7.125% 2/1/32 (b) | | 1,650,000 | 1,659,574 |
| | | | 7,664,796 |
| Utilities - 2.7% | | | |
| Clearway Energy Operating LLC: | | | |
| 3.75% 2/15/31 (b) | | 2,580,000 | 2,181,173 |
| 3.75% 1/15/32 (b) | | 280,000 | 231,844 |
| DPL, Inc.: | | | |
| 4.125% 7/1/25 | | 1,370,000 | 1,330,759 |
| 4.35% 4/15/29 | | 185,000 | 166,794 |
| FirstEnergy Corp. 3.4% 3/1/50 | | 2,175,000 | 1,395,694 |
| NextEra Energy Partners LP 7.25% 1/15/29 (b) | | 2,495,000 | 2,527,156 |
| NRG Energy, Inc.: | | | |
| 3.375% 2/15/29 (b) | | 2,360,000 | 2,069,615 |
| 3.625% 2/15/31 (b) | | 790,000 | 668,788 |
| 5.25% 6/15/29 (b) | | 2,565,000 | 2,425,968 |
| PG&E Corp.: | | | |
| 5% 7/1/28 | | 4,420,000 | 4,211,499 |
| 5.25% 7/1/30 | | 5,970,000 | 5,589,671 |
| Pike Corp.: | | | |
| 5.5% 9/1/28 (b) | | 4,027,000 | 3,816,529 |
| 8.625% 1/31/31 (b) | | 1,425,000 | 1,492,786 |
| Vistra Operations Co. LLC: | | | |
| 5% 7/31/27 (b) | | 2,849,000 | 2,711,471 |
| 5.5% 9/1/26 (b) | | 1,130,000 | 1,102,799 |
| 5.625% 2/15/27 (b) | | 1,965,000 | 1,911,846 |
| 7.75% 10/15/31 (b) | | 2,445,000 | 2,507,572 |
| | | | 36,341,964 |
TOTAL NONCONVERTIBLE BONDS | | | 1,123,604,856 |
| TOTAL CORPORATE BONDS (Cost $1,220,853,677) | | | 1,142,354,731 |
| | | | |
| Commercial Mortgage Securities - 0.4% |
| | | Principal Amount (a) | Value ($) |
| BX Commercial Mortgage Trust floater Series 2021-SOAR Class G, CME Term SOFR 1 Month Index + 2.910% 8.2355% 6/15/38 (b)(c)(d) | | 843,903 | 840,335 |
| ELP Commercial Mortgage Trust floater Series 2021-ELP Class F, CME Term SOFR 1 Month Index + 2.780% 8.1025% 11/15/38 (b)(c)(d) | | 1,196,607 | 1,178,658 |
| Extended Stay America Trust floater Series 2021-ESH Class F, CME Term SOFR 1 Month Index + 3.810% 9.1355% 7/15/38 (b)(c)(d) | | 490,955 | 490,342 |
| Hilton U.S.A. Trust Series 2016-HHV Class F, 4.3333% 11/5/38 (b)(c) | | 772,000 | 707,332 |
| Merit floater Series 2021-STOR Class F, CME Term SOFR 1 Month Index + 2.310% 7.6355% 7/15/38 (b)(c)(d) | | 1,791,000 | 1,771,971 |
| TOTAL COMMERCIAL MORTGAGE SECURITIES (Cost $4,844,523) | | | 4,988,638 |
| | | | |
| Common Stocks - 2.3% |
| | | Shares | Value ($) |
| Automotive & Auto Parts - 0.1% | | | |
| Aptiv PLC (i) | | 12,300 | 873,300 |
| Capital Goods - 0.2% | | | |
| Chart Industries, Inc. (i) | | 10,900 | 1,570,254 |
| Regal Rexnord Corp. | | 9,000 | 1,452,330 |
TOTAL CAPITAL GOODS | | | 3,022,584 |
| Energy - 1.1% | | | |
| California Resources Corp. | | 25,500 | 1,347,930 |
| California Resources Corp. warrants 10/27/24 (i) | | 2,871 | 49,439 |
| Mesquite Energy, Inc. (h)(i) | | 149,356 | 12,226,305 |
| New Fortress Energy, Inc. (j) | | 59,400 | 1,556,280 |
TOTAL ENERGY | | | 15,179,954 |
| Food & Drug Retail - 0.1% | | | |
| Southeastern Grocers, Inc. rights (h)(i) | | 963,443 | 1,059,787 |
| Healthcare - 0.1% | | | |
| Centene Corp. (i) | | 24,000 | 1,753,440 |
| Metals/Mining - 0.0% | | | |
| Elah Holdings, Inc. (h)(i) | | 333 | 10,252 |
| Technology - 0.3% | | | |
| Coherent Corp. (i) | | 31,700 | 1,731,771 |
| MKS Instruments, Inc. | | 5,900 | 701,982 |
| ON Semiconductor Corp. (i) | | 17,500 | 1,227,800 |
TOTAL TECHNOLOGY | | | 3,661,553 |
| Telecommunications - 0.4% | | | |
| GTT Communications, Inc. (h)(i) | | 40,978 | 1,528,479 |
| Helios Towers PLC (i) | | 2,493,500 | 3,078,364 |
| SBA Communications Corp. Class A | | 5,600 | 1,042,272 |
TOTAL TELECOMMUNICATIONS | | | 5,649,115 |
| TOTAL COMMON STOCKS (Cost $20,566,842) | | | 31,209,985 |
| | | | |
| Bank Loan Obligations - 4.5% |
| | | Principal Amount (a) | Value ($) |
| Broadcasting - 0.2% | | | |
| Diamond Sports Group LLC: | | | |
| 1LN, term loan CME Term SOFR 1 Month Index + 8.000% 15.4287% 8/24/26 (c)(d)(k) | | 871,768 | 830,359 |
| 2LN, term loan CME Term SOFR 1 Month Index + 5.250% 10.6625% (c)(d)(e)(k) | | 4,452,028 | 103,510 |
| term loan 10% 8/2/27 (k) | | 895,675 | 1,421,141 |
TOTAL BROADCASTING | | | 2,355,010 |
| Building Materials - 0.1% | | | |
| Acproducts Holdings, Inc. Tranche B 1LN, term loan CME Term SOFR 3 Month Index + 4.250% 9.8135% 5/17/28 (c)(d)(k) | | 2,259,213 | 1,955,913 |
| Chemicals - 0.7% | | | |
| Consolidated Energy Finance SA Tranche B 1LN, term loan CME Term SOFR 1 Month Index + 4.500% 9.8157% 11/15/30 (c)(d)(k) | | 2,845,000 | 2,748,099 |
| Discovery Purchaser Corp. 1LN, term loan CME Term SOFR 3 Month Index + 4.370% 9.6813% 10/4/29 (c)(d)(k) | | 1,896,084 | 1,892,538 |
| Hexion Holdings Corp. 1LN, term loan CME Term SOFR 3 Month Index + 4.500% 9.9757% 3/15/29 (c)(d)(k) | | 3,590,863 | 3,524,109 |
| Olympus Water U.S. Holding Corp. Tranche B 1LN, term loan CME Term SOFR 3 Month Index + 3.750% 9.321% 11/9/28 (c)(d)(k) | | 1,416,378 | 1,418,346 |
TOTAL CHEMICALS | | | 9,583,092 |
| Consumer Products - 0.1% | | | |
| Mattress Firm, Inc. Tranche B 1LN, term loan CME Term SOFR 3 Month Index + 4.250% 9.8135% 9/24/28 (c)(d)(k) | | 1,687,042 | 1,690,214 |
| Energy - 0.2% | | | |
| EG America LLC Tranche BC 1LN, term loan CME Term SOFR 1 Month Index + 5.500% 11.2383% 2/7/28 (c)(d)(k) | | 2,346,333 | 2,306,751 |
| Mesquite Energy, Inc.: | | | |
| 1LN, term loan 3 month U.S. LIBOR + 8.000% 0% (d)(e)(h)(k) | | 2,735,146 | 0 |
| term loan 0% (c)(e)(h)(k) | | 1,217,000 | 0 |
TOTAL ENERGY | | | 2,306,751 |
| Healthcare - 0.2% | | | |
| Cano Health, Inc.: | | | |
| Tranche B 1LN, term loan CME Term SOFR 1 Month Index + 4.000% 9.4626% (c)(d)(e)(k) | | 2,379,043 | 597,735 |
| Tranche DD 1LN, term loan CME Term SOFR 1 Month Index + 11.000% 16.3215% 10/7/24 (c)(d)(h)(k) | | 378,316 | 385,882 |
| Tranche DD, term loan CME Term SOFR 1 Month Index + 11.000% 16.3215% 10/7/24 (c)(d)(h)(k) | | 246,806 | 251,742 |
| Gainwell Acquisition Corp. Tranche B 1LN, term loan CME Term SOFR 3 Month Index + 4.000% 9.4094% 10/1/27 (c)(d)(k) | | 789,796 | 752,036 |
| WCG Intermediate Corp. Tranche B 1LN, term loan CME Term SOFR 1 Month Index + 4.000% 9.4418% 1/8/27 (c)(d)(k) | | 126,709 | 127,027 |
TOTAL HEALTHCARE | | | 2,114,422 |
| Insurance - 0.0% | | | |
| Alliant Holdings Intermediate LLC Tranche B6 1LN, term loan CME Term SOFR 1 Month Index + 3.500% 8.8189% 11/6/30 (c)(d)(k) | | 160,022 | 160,600 |
| Leisure - 0.6% | | | |
| City Football Group Ltd. Tranche B 1LN, term loan CME Term SOFR 1 Month Index + 3.000% 8.4389% 7/21/28 (c)(d)(k) | | 5,705,427 | 5,684,032 |
| ClubCorp Holdings, Inc. Tranche B 1LN, term loan CME Term SOFR 1 Month Index + 5.000% 10.5635% 9/18/26 (c)(d)(k) | | 2,400,662 | 2,402,462 |
TOTAL LEISURE | | | 8,086,494 |
| Metals/Mining - 0.1% | | | |
| American Rock Salt Co. LLC 1LN, term loan CME Term SOFR 1 Month Index + 4.000% 9.4302% 6/4/28 (c)(d)(k) | | 1,625,821 | 1,439,436 |
| Paper - 0.0% | | | |
| Clydesdale Acquisition Holdings, Inc. 1LN, term loan CME Term SOFR 1 Month Index + 3.670% 9.0907% 4/13/29 (c)(d)(k) | | 345,356 | 346,651 |
| Services - 0.9% | | | |
| ABG Intermediate Holdings 2 LLC Tranche B1 LN, term loan CME Term SOFR 1 Month Index + 3.500% 8.9183% 12/21/28 (c)(d)(k) | | 637,537 | 640,247 |
| Ascend Learning LLC: | | | |
| 2LN, term loan CME Term SOFR 1 Month Index + 5.750% 11.1657% 12/10/29 (c)(d)(k) | | 225,000 | 220,313 |
| Tranche B 1LN, term loan CME Term SOFR 1 Month Index + 3.500% 8.9157% 12/10/28 (c)(d)(k) | | 2,218,925 | 2,209,672 |
| Brand Industrial Services, Inc. Tranche B 1LN, term loan CME Term SOFR 1 Month Index + 4.500% 9.819% 8/1/30 (c)(d)(k) | | 631,825 | 633,537 |
| CoreLogic, Inc. Tranche B 1LN, term loan CME Term SOFR 1 Month Index + 3.500% 8.9302% 6/2/28 (c)(d)(k) | | 2,488,101 | 2,394,797 |
| Finastra U.S.A., Inc. term loan CME Term SOFR 1 Month Index + 7.250% 12.4592% 9/13/29 (c)(d)(h)(k) | | 3,268,662 | 3,268,662 |
| Spin Holdco, Inc. Tranche B 1LN, term loan CME Term SOFR 3 Month Index + 4.000% 9.5854% 3/4/28 (c)(d)(k) | | 3,317,252 | 2,917,623 |
TOTAL SERVICES | | | 12,284,851 |
| Super Retail - 0.6% | | | |
| Great Outdoors Group LLC Tranche B 1LN, term loan CME Term SOFR 1 Month Index + 3.750% 9.1802% 3/5/28 (c)(d)(k) | | 2,743,719 | 2,742,237 |
| LBM Acquisition LLC Tranche B 1LN, term loan CME Term SOFR 1 Month Index + 3.750% 9.1773% 12/18/27 (c)(d)(k) | | 5,396,948 | 5,399,215 |
TOTAL SUPER RETAIL | | | 8,141,452 |
| Technology - 0.5% | | | |
| Applied Systems, Inc. Tranche 2LN, term loan CME Term SOFR 1 Month Index + 5.250% 10.5594% 2/23/32 (c)(d)(k) | | 25,000 | 25,802 |
| Athenahealth Group, Inc. Tranche B 1LN, term loan CME Term SOFR 1 Month Index + 3.500% 8.5657% 2/15/29 (c)(d)(k) | | 1,575,458 | 1,571,519 |
| DH Corp./Societe term loan CME Term SOFR 3 Month Index + 7.250% 12.4592% 9/13/29 (c)(d)(h)(k) | | 76,338 | 76,338 |
| Rackspace Finance LLC Tranche B 1LN, term loan CME Term SOFR 1 Month Index + 6.250% 11.686% 5/15/28 (c)(d)(k) | | 525,696 | 523,725 |
| Sophia LP Tranche B 1LN, term loan CME Term SOFR 1 Month Index + 3.500% 8.9157% 10/7/29 (c)(d)(k) | | 614,951 | 616,599 |
| UKG, Inc. Tranche B 1LN, term loan CME Term SOFR 1 Month Index + 3.500% 8.8143% 2/10/31 (c)(d)(k) | | 2,462,981 | 2,473,646 |
| Verscend Holding Corp. Tranche B 1LN, term loan CME Term SOFR 1 Month Index + 4.000% 9.4446% 8/27/25 (c)(d)(k) | | 814,898 | 815,101 |
TOTAL TECHNOLOGY | | | 6,102,730 |
| Telecommunications - 0.2% | | | |
| GTT Communications, Inc. 1LN, term loan CME Term SOFR 3 Month Index + 9.000% 14.4094% 6/30/28 (c)(d)(k) | | 1,852,691 | 1,303,831 |
| Gtt Remainco LLC 1LN, term loan CME Term SOFR 1 Month Index + 7.000% 12.4183% 12/30/27 (c)(d)(k) | | 2,236,765 | 2,035,456 |
TOTAL TELECOMMUNICATIONS | | | 3,339,287 |
| Textiles/Apparel - 0.1% | | | |
| Tory Burch LLC Tranche B 1LN, term loan CME Term SOFR 1 Month Index + 3.500% 8.6918% 4/16/28 (c)(d)(k) | | 729,375 | 729,069 |
| TOTAL BANK LOAN OBLIGATIONS (Cost $66,874,855) | | | 60,635,972 |
| | | | |
| Preferred Securities - 1.3% |
| | | Principal Amount (a) | Value ($) |
| Air Transportation - 0.1% | | | |
| AerCap Holdings NV 5.875% 10/10/79 (c) | | 1,225,000 | 1,213,812 |
| Banks & Thrifts - 0.8% | | | |
| Ally Financial, Inc.: | | | |
| 4.7% (c)(l) | | 1,785,000 | 1,399,021 |
| 4.7% (c)(l) | | 1,820,000 | 1,563,095 |
| Bank of America Corp. 5.875% (c)(l) | | 2,195,000 | 2,121,730 |
| JPMorgan Chase & Co.: | | | |
| 4.6% (c)(l) | | 1,580,000 | 1,572,142 |
| 6.1% (c)(l) | | 2,190,000 | 2,205,740 |
| Wells Fargo & Co.: | | | |
| 5.9% (c)(l) | | 1,205,000 | 1,226,708 |
| 7.625% (c)(l) | | 615,000 | 649,053 |
TOTAL BANKS & THRIFTS | | | 10,737,489 |
| Diversified Financial Services - 0.1% | | | |
| Aircastle Ltd. 5.25% (b)(c)(l) | | 225,000 | 214,095 |
| Charles Schwab Corp. 4% (c)(l) | | 1,405,000 | 1,152,812 |
TOTAL DIVERSIFIED FINANCIAL SERVICES | | | 1,366,907 |
| Energy - 0.3% | | | |
| Energy Transfer LP 3 month U.S. LIBOR + 4.020% 9.5966% (c)(d)(l) | | 4,070,000 | 4,152,835 |
| TOTAL PREFERRED SECURITIES (Cost $15,714,972) | | | 17,471,043 |
| | | | |
| Fixed-Income Funds - 0.5% |
| | | Shares | Value ($) |
iShares Broad USD High Yield Corporate Bond ETF (j) (Cost $6,511,488) | | 179,600 | 6,454,824 |
| | | | |
| Other - 1.3% |
| | | Shares | Value ($) |
| Other - 1.3% | | | |
Fidelity Private Credit Co. LLC (g)(m) (Cost $16,931,688) | | 1,699,797 | 17,286,920 |
| | | | |
| Money Market Funds - 4.6% |
| | | Shares | Value ($) |
| Fidelity Cash Central Fund 5.39% (n) | | 54,791,432 | 54,802,390 |
| Fidelity Securities Lending Cash Central Fund 5.39% (n)(o) | | 8,171,533 | 8,172,350 |
| TOTAL MONEY MARKET FUNDS (Cost $62,974,740) | | | 62,974,740 |
| | | | |
| TOTAL INVESTMENT IN SECURITIES - 99.6% (Cost $1,415,272,785) | 1,343,376,853 |
NET OTHER ASSETS (LIABILITIES) - 0.4% | 5,821,722 |
| NET ASSETS - 100.0% | 1,349,198,575 |
| | |
Security Type Abbreviations
Legend
| (a) | Amount is stated in United States dollars unless otherwise noted. |
| (b) | Security exempt from registration under Rule 144A of the Securities Act of 1933. These securities may be resold in transactions exempt from registration, normally to qualified institutional buyers. At the end of the period, the value of these securities amounted to $911,958,346 or 67.6% of net assets. |
| (c) | Coupon rates for floating and adjustable rate securities reflect the rates in effect at period end. |
| (d) | Coupon is indexed to a floating interest rate which may be multiplied by a specified factor and/or subject to caps or floors. |
| (e) | Non-income producing - Security is in default. |
| (f) | Security initially issued at one coupon which converts to a higher coupon at a specified date. The rate shown is the rate at period end. |
| (g) | Restricted securities (including private placements) - Investment in securities not registered under the Securities Act of 1933 (excluding 144A issues). At the end of the period, the value of restricted securities (excluding 144A issues) amounted to $20,807,527 or 1.5% of net assets. |
| (j) | Security or a portion of the security is on loan at period end. |
| (k) | Remaining maturities of bank loan obligations may be less than the stated maturities shown as a result of contractual or optional prepayments by the borrower. Such prepayments cannot be predicted with certainty. |
| (l) | Security is perpetual in nature with no stated maturity date. |
| (n) | Affiliated fund that is generally available only to investment companies and other accounts managed by Fidelity Investments. The rate quoted is the annualized seven-day yield of the fund at period end. A complete unaudited listing of the fund's holdings as of its most recent quarter end is available upon request. In addition, each Fidelity Central Fund's financial statements, which are not covered by the Fund's Report of Independent Registered Public Accounting Firm, are available on the SEC's website or upon request. |
| (o) | Investment made with cash collateral received from securities on loan. |
| Additional information on each restricted holding is as follows: |
| Security | Acquisition Date | Acquisition Cost ($) |
| Fidelity Private Credit Co. LLC | 4/15/22 - 4/08/24 | 16,931,688 |
| | | |
| Jonah Energy Parent LLC 12% 11/5/25 | 5/05/23 | 3,255,619 |
| | | |
Affiliated Central Funds
Fiscal year to date information regarding the Fund's investments in Fidelity Central Funds, including the ownership percentage, is presented below.
| Affiliate | Value, beginning of period ($) | Purchases ($) | Sales Proceeds ($) | Dividend Income ($) | Realized Gain (loss) ($) | Change in Unrealized appreciation (depreciation) ($) | Value, end of period ($) | % ownership, end of period |
| Fidelity Cash Central Fund 5.39% | 50,252,241 | 355,281,606 | 350,731,463 | 3,140,255 | 6 | - | 54,802,390 | 0.1% |
| Fidelity Securities Lending Cash Central Fund 5.39% | 1,171,350 | 45,398,478 | 38,397,478 | 1,761 | - | - | 8,172,350 | 0.0% |
| Total | 51,423,591 | 400,680,084 | 389,128,941 | 3,142,016 | 6 | - | 62,974,740 | |
| | | | | | | | | |
Amounts in the dividend income column in the above table include any capital gain distributions from underlying funds, which are presented in the corresponding line item in the Statement of Operations, if applicable.
Amounts in the dividend income column for Fidelity Securities Lending Cash Central Fund represents the income earned on investing cash collateral, less rebates paid to borrowers and any lending agent fees associated with the loan, plus any premium payments received for lending certain types of securities.
Amounts included in the purchases and sales proceeds columns may include in-kind transactions, if applicable.
Affiliated Underlying Funds
Fiscal year to date information regarding the Fund's investments in affiliated Underlying Funds is presented below. Exchanges between classes of the same affiliated Underlying Funds may occur. If an Underlying Funds changes its name, the name presented below is the name in effect at period end.
| Affiliate | Value, beginning of period ($) | Purchases ($) | Sales Proceeds ($) | Dividend Income ($) | Realized Gain (loss) ($) | Change in Unrealized appreciation (depreciation) ($) | Value, end of period ($) |
| Fidelity Private Credit Co. LLC | 14,258,260 | 2,636,192 | - | 1,928,763 | - | 392,468 | 17,286,920 |
| | 14,258,260 | 2,636,192 | - | 1,928,763 | - | 392,468 | 17,286,920 |
Amounts in the dividend income column in the above table include any capital gain distributions from underlying funds, which are presented in the corresponding line item in the Statement of Operations, if applicable.
Amounts included in the purchases and sales proceeds columns may include in-kind transactions, if applicable.
Investment Valuation
The following is a summary of the inputs used, as of April 30, 2024, involving the Fund's assets and liabilities carried at fair value. The inputs or methodology used for valuing securities may not be an indication of the risk associated with investing in those securities. For more information on valuation inputs, and their aggregation into the levels used below, please refer to the Investment Valuation section in the accompanying Notes to Financial Statements.
| Valuation Inputs at Reporting Date: |
| Description | Total ($) | Level 1 ($) | Level 2 ($) | Level 3 ($) |
Investments in Securities: | | | | |
|
| Equities: | | | | |
Communication Services | 3,078,364 | 3,078,364 | - | - |
Consumer Discretionary | 873,300 | 873,300 | - | - |
Consumer Staples | 1,059,787 | - | - | 1,059,787 |
Energy | 15,179,954 | 2,953,649 | - | 12,226,305 |
Health Care | 1,753,440 | 1,753,440 | - | - |
Industrials | 3,022,584 | 3,022,584 | - | - |
Information Technology | 5,190,032 | 3,661,553 | - | 1,528,479 |
Materials | 10,252 | - | - | 10,252 |
Real Estate | 1,042,272 | 1,042,272 | - | - |
|
| Corporate Bonds | 1,142,354,731 | - | 1,138,834,123 | 3,520,608 |
|
| Commercial Mortgage Securities | 4,988,638 | - | 4,988,638 | - |
|
| Bank Loan Obligations | 60,635,972 | - | 56,653,348 | 3,982,624 |
|
| Preferred Securities | 17,471,043 | - | 17,471,043 | - |
|
| Fixed-Income Funds | 6,454,824 | 6,454,824 | - | - |
|
| Other | 17,286,920 | - | 17,286,920 | - |
|
| Money Market Funds | 62,974,740 | 62,974,740 | - | - |
| Total Investments in Securities: | 1,343,376,853 | 85,814,726 | 1,235,234,072 | 22,328,055 |
The following is a reconciliation of Investments in Securities for which Level 3 inputs were used in determining value:
| |
| Investments in Securities: | |
| Consumer Staples | | | |
| Beginning Balance | $ | 23,662,145 | |
| Net Realized Gain (Loss) on Investment Securities | | 18,085,211 | |
| Net Unrealized Gain (Loss) on Investment Securities | | (16,885,325) | |
| Cost of Purchases | | 1,059,787 | |
| Proceeds of Sales | | (24,862,031) | |
| Amortization/Accretion | | - | |
| Transfers into Level 3 | | - | |
| Transfers out of Level 3 | | - | |
| Ending Balance | $ | 1,059,787 | |
| The change in unrealized gain (loss) for the period attributable to Level 3 securities held at April 30, 2024 | $ | - | |
| Energy | | | |
| Beginning Balance | $ | 16,085,086 | |
| Net Realized Gain (Loss) on Investment Securities | | 4,654,055 | |
| Net Unrealized Gain (Loss) on Investment Securities | | (1,810,351) | |
| Cost of Purchases | | - | |
| Proceeds of Sales | | (6,702,485) | |
| Amortization/Accretion | | - | |
| Transfers into Level 3 | | - | |
| Transfers out of Level 3 | | - | |
| Ending Balance | $ | 12,226,305 | |
| The change in unrealized gain (loss) for the period attributable to Level 3 securities held at April 30, 2024 | $ | 2,843,744 | |
| Corporate Bonds | | | |
| Beginning Balance | $ | 21,528,391 | |
| Net Realized Gain (Loss) on Investment Securities | | - | |
| Net Unrealized Gain (Loss) on Investment Securities | | (18,059,247) | |
| Cost of Purchases | | 3,232,032 | |
| Proceeds of Sales | | (3,204,154) | |
| Amortization/Accretion | | 23,586 | |
| Transfers into Level 3 | | - | |
| Transfers out of Level 3 | | - | |
| Ending Balance | $ | 3,520,608 | |
| The change in unrealized gain (loss) for the period attributable to Level 3 securities held at April 30, 2024 | $ | 264,988 | |
| Other Investments in Securities | | | |
| Beginning Balance | $ | 3,501,820 | |
| Net Realized Gain (Loss) on Investment Securities | | (23,136) | |
| Net Unrealized Gain (Loss) on Investment Securities | | 1,161,022 | |
| Cost of Purchases | | 3,857,891 | |
| Proceeds of Sales | | (3,023,095) | |
| Amortization/Accretion | | 27,273 | |
| Transfers into Level 3 | | 19,580 | |
| Transfers out of Level 3 | | - | |
| Ending Balance | $ | 5,521,355 | |
| The change in unrealized gain (loss) for the period attributable to Level 3 securities held at April 30, 2024 | $ | 1,119,247 | |
| The information used in the above reconciliation represents fiscal year to date activity for any Investments in Securities identified as using Level 3 inputs at either the beginning or the end of the current fiscal period. Cost of purchases and proceeds of sales may include securities received and/or delivered through in-kind transactions, corporate actions or exchanges. Transfers into Level 3 were attributable to a lack of observable market data resulting from decreases in market activity, decreases in liquidity, security restructurings or corporate actions. Transfers out of Level 3 were attributable to observable market data becoming available for those securities. Transfers in or out of Level 3 represent the beginning value of any Security or Instrument where a change in the pricing level occurred from the beginning to the end of the period. Realized and unrealized gains (losses) disclosed in the reconciliation are included in Net Gain (Loss) on the Fund's Statement of Operations. | |
| Statement of Assets and Liabilities |
| | | | April 30, 2024 |
| | | | | |
| Assets | | | | |
| Investment in securities, at value (including securities loaned of $7,907,852) - See accompanying schedule: | | | | |
Unaffiliated issuers (cost $1,335,366,357) | $ | 1,263,115,193 | | |
Fidelity Central Funds (cost $62,974,740) | | 62,974,740 | | |
Other affiliated issuers (cost $16,931,688) | | 17,286,920 | | |
| | | | | |
| | | | | |
| Total Investment in Securities (cost $1,415,272,785) | | | $ | 1,343,376,853 |
| Cash | | | | 117,158 |
| Receivable for investments sold | | | | 90,500 |
| Receivable for fund shares sold | | | | 580,843 |
| Interest receivable | | | | 18,773,105 |
| Distributions receivable from Fidelity Central Funds | | | | 211,516 |
| Receivable from investment adviser for expense reductions | | | | 11,469 |
Total assets | | | | 1,363,161,444 |
| Liabilities | | | | |
| Payable for investments purchased | $ | 4,893,144 | | |
| Payable for fund shares redeemed | | 890,483 | | |
| Other payables and accrued expenses | | 6,892 | | |
| Collateral on securities loaned | | 8,172,350 | | |
| Total liabilities | | | | 13,962,869 |
| Commitments and contingent liabilities (see Commitments note) | | | | |
| Net Assets | | | $ | 1,349,198,575 |
| Net Assets consist of: | | | | |
| Paid in capital | | | $ | 1,820,309,982 |
| Total accumulated earnings (loss) | | | | (471,111,407) |
| Net Assets | | | $ | 1,349,198,575 |
Net Asset Value, offering price and redemption price per share ($1,349,198,575 ÷ 161,905,363 shares) | | | $ | 8.33 |
| Statement of Operations |
| | | | Year ended April 30, 2024 |
| Investment Income | | | | |
| Dividends: | | | | |
| Unaffiliated issuers | | | $ | 1,190,330 |
| Affiliated issuers | | | | 1,912,891 |
| Interest | | | | 79,021,182 |
| Income from Fidelity Central Funds (including $1,761 from security lending) | | | | 3,142,016 |
| Other income | | | $ | 644,922 |
| Payment from investment adviser | | | | 82,981 |
| Total income | | | | 85,994,322 |
| Expenses | | | | |
| Custodian fees and expenses | $ | 11,876 | | |
| Independent trustees' fees and expenses | | 6,192 | | |
| Legal | | 26,733 | | |
| Total expenses before reductions | | 44,801 | | |
| Expense reductions | | (10,290) | | |
| Total expenses after reductions | | | | 34,511 |
| Net Investment income (loss) | | | | 85,959,811 |
| Realized and Unrealized Gain (Loss) | | | | |
| Net realized gain (loss) on: | | | | |
| Investment Securities: | | | | |
| Unaffiliated issuers | | (23,263,891) | | |
| Fidelity Central Funds | | 6 | | |
| Foreign currency transactions | | 390 | | |
| Capital gain distributions from underlying funds: | | | | |
| Affiliated issuers | | 15,872 | | |
| Total net realized gain (loss) | | | | (23,247,623) |
| Change in net unrealized appreciation (depreciation) on: | | | | |
| Investment Securities: | | | | |
| Unaffiliated issuers | | 33,638,327 | | |
| Affiliated issuers | | 392,468 | | |
| Total change in net unrealized appreciation (depreciation) | | | | 34,030,795 |
| Net gain (loss) | | | | 10,783,172 |
| Net increase (decrease) in net assets resulting from operations | | | $ | 96,742,983 |
| Statement of Changes in Net Assets |
| |
| | Year ended April 30, 2024 | | Year ended April 30, 2023 |
| Increase (Decrease) in Net Assets | | | | |
| Operations | | | | |
| Net investment income (loss) | $ | 85,959,811 | $ | 79,437,342 |
| Net realized gain (loss) | | (23,247,623) | | (75,164,666) |
| Change in net unrealized appreciation (depreciation) | | 34,030,795 | | (8,053,810) |
| Net increase (decrease) in net assets resulting from operations | | 96,742,983 | | (3,781,134) |
| Distributions to shareholders | | (81,389,502) | | (76,803,551) |
| | | | | |
| Share transactions | | | | |
| Proceeds from sales of shares | | 228,600,645 | | 114,999,411 |
| Reinvestment of distributions | | 81,389,526 | | 76,697,542 |
| Cost of shares redeemed | | (176,213,871) | | (385,925,272) |
| | | | | |
Net increase (decrease) in net assets resulting from share transactions | | 133,776,300 | | (194,228,319) |
| Total increase (decrease) in net assets | | 149,129,781 | | (274,813,004) |
| | | | | |
| Net Assets | | | | |
| Beginning of period | | 1,200,068,794 | | 1,474,881,798 |
| End of period | $ | 1,349,198,575 | $ | 1,200,068,794 |
| | | | | |
| Other Information | | | | |
| Shares | | | | |
| Sold | | 27,698,132 | | 13,920,010 |
| Issued in reinvestment of distributions | | 9,876,597 | | 9,311,777 |
| Redeemed | | (21,371,348) | | (46,319,197) |
| Net increase (decrease) | | 16,203,381 | | (23,087,410) |
| | | | | |
Financial Highlights
Fidelity® Series High Income Fund |
| |
| Years ended April 30, | | 2024 | | 2023 | | 2022 | | 2021 | | 2020 |
Selected Per-Share Data | | | | | | | | | | |
| Net asset value, beginning of period | $ | 8.24 | $ | 8.74 | $ | 9.44 | $ | 8.54 | $ | 9.50 |
| Income from Investment Operations | | | | | | | | | | |
Net investment income (loss) A,B | | .562 | | .536 | | .510 | | .513 | | .577 |
| Net realized and unrealized gain (loss) | | .060 | | (.516) | | (.699) | | .890 | | (.935) |
| Total from investment operations | | .622 | | .020 | | (.189) | | 1.403 | | (.358) |
| Distributions from net investment income | | (.532) | | (.520) | | (.511) | | (.503) | | (.598) |
| Distributions from net realized gain | | - | | - | | - | | - | | (.004) |
| Total distributions | | (.532) | | (.520) | | (.511) | | (.503) | | (.602) |
| Net asset value, end of period | $ | 8.33 | $ | 8.24 | $ | 8.74 | $ | 9.44 | $ | 8.54 |
Total Return C | | | | .41% | | (2.24)% | | 16.72% | | (4.11)% |
Ratios to Average Net Assets B,D,E | | | | | | | | | | |
| Expenses before reductions | | -% F | | .04% | | .02% | | -% F | | -% F |
| Expenses net of fee waivers, if any | | | | -% F | | -% F | | -% F | | -% F |
| Expenses net of all reductions | | -% F | | -% F | | -% F | | -% F | | -% F |
| Net investment income (loss) | | 6.83% | | 6.49% | | 5.42% | | 5.58% | | 6.20% |
| Supplemental Data | | | | | | | | | | |
| Net assets, end of period (000 omitted) | $ | 1,349,199 | $ | 1,200,069 | $ | 1,474,882 | $ | 1,702,161 | $ | 1,491,532 |
Portfolio turnover rate G | | | | 34% | | 49% | | 68% | | 41% H |
ACalculated based on average shares outstanding during the period.
BNet investment income (loss) is affected by the timing of the declaration of dividends by any underlying mutual funds or exchange-traded funds (ETFs). Net investment income (loss) of any mutual funds or ETFs is not included in the Fund's net investment income (loss) ratio.
CTotal returns would have been lower if certain expenses had not been reduced during the applicable periods shown.
DFees and expenses of any underlying mutual funds or exchange-traded funds (ETFs) are not included in the Fund's expense ratio. The Fund indirectly bears its proportionate share of these expenses. For additional expense information related to investments in Fidelity Central Funds, please refer to the "Investments in Fidelity Central Funds" note found in the Notes to Financial Statements section of the most recent Annual or Semi-Annual report. For additional expense information related to investments in Fidelity Private Credit Company LLC, please refer to the Investment in Fidelity Private Credit Company LLC note found in the Notes to Financial Statements section of the most recent Annual or Semi-Annual report.
EExpense ratios reflect operating expenses of the class. Expenses before reductions do not reflect amounts reimbursed, waived, or reduced through arrangements with the investment adviser, brokerage services, or other offset arrangements, if applicable, and do not represent the amount paid by the class during periods when reimbursements, waivers or reductions occur.
FAmount represents less than .005%.
GAmount does not include the portfolio activity of any underlying mutual funds or exchange-traded funds (ETFs).
HPortfolio turnover rate excludes securities received or delivered in-kind.
For the period ended April 30, 2024
1. Organization.
Fidelity Series High Income Fund (the Fund) is a fund of Fidelity Summer Street Trust (the Trust) and is authorized to issue an unlimited number of shares. Shares are offered only to certain other Fidelity funds, Fidelity managed 529 plans, and Fidelity managed collective investment trusts. The Trust is registered under the Investment Company Act of 1940, as amended (the 1940 Act), as an open-end management investment company organized as a Massachusetts business trust.
2. Investments in Fidelity Central Funds.
Funds may invest in Fidelity Central Funds, which are open-end investment companies generally available only to other investment companies and accounts managed by the investment adviser and its affiliates. The Schedule of Investments lists any Fidelity Central Funds held as an investment as of period end, but does not include the underlying holdings of each Fidelity Central Fund. An investing fund indirectly bears its proportionate share of the expenses of the underlying Fidelity Central Funds.
Based on its investment objective, each Fidelity Central Fund may invest or participate in various investment vehicles or strategies that are similar to those of the investing fund. These strategies are consistent with the investment objectives of the investing fund and may involve certain economic risks which may cause a decline in value of each of the Fidelity Central Funds and thus a decline in the value of the investing fund.
| Fidelity Central Fund | Investment Manager | Investment Objective | Investment Practices | Expense RatioA |
| Fidelity Money Market Central Funds | Fidelity Management & Research Company LLC (FMR) | Each fund seeks to obtain a high level of current income consistent with the preservation of capital and liquidity. | Short-term Investments | Less than .005% |
A Expenses expressed as a percentage of average net assets and are as of each underlying Central Fund's most recent annual or semi-annual shareholder report.
A complete unaudited list of holdings for each Fidelity Central Fund is available upon request or at the Securities and Exchange Commission website at www.sec.gov. In addition, the financial statements of the Fidelity Central Funds which contain the significant accounting policies (including investment valuation policies) of those funds, and are not covered by the Report of Independent Registered Public Accounting Firm, are available on the Securities and Exchange Commission website or upon request.
3. Investment in Fidelity Private Credit Company LLC.
The Fund invests in Fidelity Private Credit Company LLC, which is a limited liability company. On June 1, 2023, Fidelity Private Credit Company LLC elected to be regulated as a business development company (BDC). Fidelity Private Credit Company LLC's units are not registered under the Securities Act of 1933 and are subject to substantial restrictions on transfer. The Fund has no redemption rights under Fidelity Private Credit Company LLC's limited liability company agreement. There will be no trading market for the units.
Based on its investment objective, Fidelity Private Credit Company LLC may invest or participate in various investments or strategies that are similar to those in which the Fund may invest or participate. These strategies are consistent with the investment objectives of the Fund and may involve certain economic risks which may cause a decline in value of Fidelity Private Credit Company LLC and thus a decline in the value of the Fund. Fidelity Private Credit Company LLC intends to invest primarily in directly originated loans to private companies but also with liquid credit investments, like broadly syndicated loans, and other select private credit investments.
The Schedule of Investments lists Fidelity Private Credit Company LLC as an investment as of period end, but does not include the underlying holdings of Fidelity Private Credit Company LLC. Fidelity Private Credit Company LLC represented less than 5% of the Fund's net assets at period end. The Fund indirectly bears its proportionate share of the expenses of Fidelity Private Credit Company LLC. The annualized expense ratio for Fidelity Private Credit Company LLC for the three month period ended March 31, 2024 was 11.51%.
4. Significant Accounting Policies.
The Fund is an investment company and applies the accounting and reporting guidance of the Financial Accounting Standards Board (FASB) Accounting Standards Codification Topic 946 Financial Services - Investment Companies. The financial statements have been prepared in conformity with accounting principles generally accepted in the United States of America (GAAP), which require management to make certain estimates and assumptions at the date of the financial statements. Actual results could differ from those estimates. Subsequent events, if any, through the date that the financial statements were issued have been evaluated in the preparation of the financial statements. The Fund's Schedule of Investments lists any underlying mutual funds or exchange-traded funds (ETFs) but does not include the underlying holdings of these funds. The following summarizes the significant accounting policies of the Fund:
Investment Valuation. Investments are valued as of 4:00 p.m. Eastern time on the last calendar day of the period. The Board of Trustees (the Board) has designated the Fund's investment adviser as the valuation designee responsible for the fair valuation function and performing fair value determinations as needed. The investment adviser has established a Fair Value Committee (the Committee) to carry out the day-to-day fair valuation responsibilities and has adopted policies and procedures to govern the fair valuation process and the activities of the Committee. In accordance with these fair valuation policies and procedures, which have been approved by the Board, the Fund attempts to obtain prices from one or more third party pricing services or brokers to value its investments. When current market prices, quotations or currency exchange rates are not readily available or reliable, investments will be fair valued in good faith by the Committee, in accordance with the policies and procedures. Factors used in determining fair value vary by investment type and may include market or investment specific events, transaction data, estimated cash flows, and market observations of comparable investments. The frequency that the fair valuation procedures are used cannot be predicted and they may be utilized to a significant extent. The Committee manages the Fund's fair valuation practices and maintains the fair valuation policies and procedures. The Fund's investment adviser reports to the Board information regarding the fair valuation process and related material matters.
The Fund categorizes the inputs to valuation techniques used to value its investments into a disclosure hierarchy consisting of three levels as shown below:
Level 1 - unadjusted quoted prices in active markets for identical investments
Level 2 - other significant observable inputs (including quoted prices for similar investments, interest rates, prepayment speeds, etc.)
Level 3 - unobservable inputs (including the Fund's own assumptions based on the best information available)
Valuation techniques used to value the Fund's investments by major category are as follows:
Debt securities, including restricted securities, are valued based on evaluated prices received from third party pricing services or from brokers who make markets in such securities. Corporate bonds, bank loan obligations and preferred securities are valued by pricing services who utilize matrix pricing which considers yield or price of bonds of comparable quality, coupon, maturity and type or by broker-supplied prices. Commercial mortgage securities are valued by pricing services who utilize matrix pricing which considers prepayment speed assumptions, attributes of the collateral, yield or price of bonds of comparable quality, coupon, maturity and type or by broker-supplied prices. When independent prices are unavailable or unreliable, debt securities may be valued utilizing pricing methodologies which consider similar factors that would be used by third party pricing services. Debt securities are generally categorized as Level 2 in the hierarchy but may be Level 3 depending on the circumstances. The Fund invests a significant portion of its assets in below investment grade securities. The value of these securities can be more volatile due to changes in the credit quality of the issuer and is sensitive to changes in economic, market and regulatory conditions.
Equity securities, including restricted securities, for which market quotations are readily available, are valued at the last reported sale price or official closing price as reported by a third party pricing service on the primary market or exchange on which they are traded and are categorized as Level 1 in the hierarchy. In the event there were no sales during the day or closing prices are not available, securities are valued at the last quoted bid price or may be valued using the last available price and are generally categorized as Level 2 in the hierarchy. For foreign equity securities, when market or security specific events arise, comparisons to the valuation of American Depositary Receipts (ADRs), futures contracts, ETFs and certain indexes as well as quoted prices for similar securities may be used and would be categorized as Level 2 in the hierarchy. For equity securities, including restricted securities, where observable inputs are limited, assumptions about market activity and risk are used and these securities may be categorized as Level 3 in the hierarchy. Securities, including private placements or other restricted securities, for which observable inputs are not available are valued using alternate valuation approaches, including the market approach, the income approach and cost approach, and are categorized as Level 3 in the hierarchy. The market approach considers factors including the price of recent investments in the same or a similar security or financial metrics of comparable securities. The income approach considers factors including expected future cash flows, security specific risks and corresponding discount rates. The cost approach considers factors including the value of the security's underlying assets and liabilities.
ETFs are valued at their last sale price or official closing price as reported by a third party pricing service on the primary market or exchange on which they are traded and are categorized as Level 1 in the hierarchy. In the event there were no sales during the day but the exchange reports a closing bid level, ETFs are valued at the closing bid and would be categorized as Level 1 in the hierarchy. In the event there was no closing bid, ETFs may be valued by another method that the Board believes reflects fair value in accordance with the Board's fair value pricing policies and may be categorized as Level 2 in the hierarchy.
Investments in open-end mutual funds, including the Fidelity Central Funds, are valued at their closing net asset value (NAV) each business day and are categorized as Level 1 in the hierarchy.
Fidelity Private Credit Company LLC is valued at its net asset value (NAV) each month end and is categorized as Level 2 in the hierarchy.
The following provides information on Level 3 securities held by the Fund that were valued at period end based on unobservable inputs. These amounts exclude valuations provided by a broker and valuations using NAV as a practical expedient.
| Asset Type | Fair Value | Valuation Technique(s) | Unobservable Input | Amount or Range/Weighted Average | Impact to Valuation from an Increase in InputA |
| Equities | $14,814,571 | Market comparable | Enterprise value/EBITDA multiple (EV/EBITDA) | 6.5 | Increase |
| | | Discounted cash flow | Discount rate | 11.1% | Decrease |
| | | Recovery value | Recovery value | $1.10 | Increase |
| Corporate Bonds | $3,520,608 | Market comparable | Enterprise value/EBITDA multiple (EV/EBITDA) | 5.3 | Increase |
| | | | Daily production multiple ($/Million cubic feet per day) | $3,550.00 | Increase |
| | | Discounted cash flow | Yield | 18.8% | Decrease |
| | | Recovery value | Recovery value | $0.00 | Increase |
| Bank Loan Obligations | $3,982,624 | Discounted cash flow | Yield | 12.2% | Decrease |
| | | Recovery value | Recovery value | $0.00 | Increase |
| | | Indicative market price | Evaluated bid | $102.00 | Increase |
A Represents the directional change in the fair value of the Level 3 investments that could have resulted from an increase in the corresponding input as of period end. A decrease to the unobservable input would have had the opposite effect. Significant changes in these inputs may have resulted in a significantly higher or lower fair value measurement at period end.
Changes in valuation techniques may result in transfers in or out of an assigned level within the disclosure hierarchy. The aggregate value of investments by input level as of April 30, 2024, as well as a roll forward of Level 3 investments, is included at the end of the Fund's Schedule of Investments.
Foreign Currency. Certain Funds may use foreign currency contracts to facilitate transactions in foreign-denominated securities. Gains and losses from these transactions may arise from changes in the value of the foreign currency or if the counterparties do not perform under the contracts' terms.
Foreign-denominated assets, including investment securities, and liabilities are translated into U.S. dollars at the exchange rates at period end. Purchases and sales of investment securities, income and dividends received, and expenses denominated in foreign currencies are translated into U.S. dollars at the exchange rate in effect on the transaction date.
The effects of exchange rate fluctuations on investments are included with the net realized and unrealized gain (loss) on investment securities. Other foreign currency transactions resulting in realized and unrealized gain (loss) are disclosed separately.
Investment Transactions and Income. For financial reporting purposes, the Fund's investment holdings and NAV include trades executed through the end of the last business day of the period. The NAV per share for processing shareholder transactions is calculated as of the close of business of the New York Stock Exchange (NYSE), normally 4:00 p.m. Eastern time and includes trades executed through the end of the prior business day. Gains and losses on securities sold are determined on the basis of identified cost and include proceeds received from litigation. Commissions paid to certain brokers with whom the investment adviser, or its affiliates, places trades on behalf of a fund include an amount in addition to trade execution, which may be rebated back to a fund. Any such rebates are included in net realized gain (loss) on investments in the Statement of Operations. Dividend income is recorded on the ex-dividend date, except for certain dividends from foreign securities where the ex-dividend date may have passed, which are recorded as soon as the Fund is informed of the ex-dividend date. Non-cash dividends included in dividend income, if any, are recorded at the fair market value of the securities received. Income and capital gain distributions from Fidelity Central Funds, if any, are recorded on the ex-dividend date. Interest income is accrued as earned and includes coupon interest and amortization of premium and accretion of discount on debt securities as applicable. Paid in Kind (PIK) income is recorded at the fair market value of the securities received. Investment income is recorded net of foreign taxes withheld where recovery of such taxes is uncertain. Debt obligations may be placed on non-accrual status and related interest income may be reduced by ceasing current accruals and writing off interest receivables when the collection of all or a portion of interest has become doubtful based on consistently applied procedures. A debt obligation is removed from non-accrual status when the issuer resumes interest payments or when collectability of interest is reasonably assured. The investment adviser has contractually agreed to reimburse the Fund with respect to the portion of the Fund's assets invested in Fidelity Private Credit Company LLC until August 31, 2025 as presented in the Statement of Operations in payment from investment adviser.
Expenses. Expenses directly attributable to a fund are charged to that fund. Expenses attributable to more than one fund are allocated among the respective funds on the basis of relative net assets or other appropriate methods. Expenses included in the accompanying financial statements reflect the expenses of that fund and do not include any expenses associated with any underlying mutual funds or exchange-traded funds. Although not included in a fund's expenses, a fund indirectly bears its proportionate share of these expenses through the net asset value of each underlying mutual fund or exchange-traded fund. Expense estimates are accrued in the period to which they relate and adjustments are made when actual amounts are known.
Income Tax Information and Distributions to Shareholders. Each year, the Fund intends to qualify as a regulated investment company under Subchapter M of the Internal Revenue Code, including distributing substantially all of its taxable income and realized gains. As a result, no provision for U.S. Federal income taxes is required. As of April 30, 2024, the Fund did not have any unrecognized tax benefits in the financial statements; nor is the Fund aware of any tax positions for which it is reasonably possible that the total amounts of unrecognized tax benefits will significantly change in the next twelve months. The Fund files a U.S. federal tax return, in addition to state and local tax returns as required. The Fund's federal income tax returns are subject to examination by the Internal Revenue Service (IRS) for a period of three fiscal years after they are filed. State and local tax returns may be subject to examination for an additional fiscal year depending on the jurisdiction. Foreign taxes are provided for based on the Fund's understanding of the tax rules and rates that exist in the foreign markets in which it invests.
Distributions are declared and recorded daily and paid monthly from net investment income. Distributions from realized gains, if any, are declared and recorded on the ex-dividend date. Income and capital gain distributions are determined in accordance with income tax regulations, which may differ from GAAP.
Capital accounts within the financial statements are adjusted for permanent book-tax differences. These adjustments have no impact on net assets or the results of operations. Capital accounts are not adjusted for temporary book-tax differences which will reverse in a subsequent period.
Book-tax differences are primarily due to short-term gain distributions from the underlying funds, foreign currency transactions, passive foreign investment companies (PFIC), prior period premium and discount on debt securities, market discount, partnerships, capital loss carryforwards and losses deferred due to wash sales.
As of period end, the cost and unrealized appreciation (depreciation) in securities, and derivatives if applicable, for federal income tax purposes were as follows:
| Gross unrealized appreciation | $37,369,705 |
| Gross unrealized depreciation | (97,317,909) |
| Net unrealized appreciation (depreciation) | $(59,948,204) |
| Tax Cost | $1,403,325,057 |
The tax-based components of distributable earnings as of period end were as follows:
| Undistributed ordinary income | $1,016,952 |
| Capital loss carryforward | $(412,180,155) |
| Net unrealized appreciation (depreciation) on securities and other investments | $(59,948,204) |
Capital loss carryforwards are only available to offset future capital gains of the Fund to the extent provided by regulations and may be limited. The capital loss carryforward information presented below, including any applicable limitation, is estimated as of fiscal period end and is subject to adjustment.
Short-term | $(49,453,366) |
Long-term | (362,726,789) |
| Total capital loss carryforward | $(412,180,155) |
The tax character of distributions paid was as follows:
| | April 30, 2024 | April 30, 2023 |
| Ordinary Income | $81,389,502 | $76,803,551 |
Restricted Securities (including Private Placements). Funds may invest in securities that are subject to legal or contractual restrictions on resale. These securities generally may be resold in transactions exempt from registration or to the public if the securities are registered. Disposal of these securities may involve time-consuming negotiations and expense, and prompt sale at an acceptable price may be difficult. Information regarding restricted securities held at period end is included at the end of the Schedule of Investments, if applicable.
Loans and Other Direct Debt Instruments. Direct debt instruments are interests in amounts owed to lenders by corporate or other borrowers. These instruments may be in the form of loans, trade claims or other receivables and may include standby financing commitments such as revolving credit facilities that obligate a fund to supply additional cash to the borrower on demand. Loans may be acquired through assignment, participation, or may be made directly to a borrower. Such instruments are presented in the Bank Loan Obligations section in the Schedule of Investments. Certain funds may also invest in unfunded loan commitments, which are contractual obligations for future funding. Information regarding unfunded commitments is included at the end of the Schedule of Investments, if applicable.
Commitments. A commitment is an agreement to acquire an investment at a future date (subject to conditions) in connection with a potential public or non-public offering. The amount of commitments outstanding at period end are presented in the table below. These commitments are not included in the net assets of the Fund at period end.
| | Investment to be Acquired | Commitment Amount ($) |
| Fidelity Series High Income Fund | Fidelity Private Credit Company LLC | 3,086,009 |
5. Purchases and Sales of Investments.
Purchases and sales of securities, other than short-term securities and in-kind transactions, as applicable, are noted in the table below.
| | Purchases ($) | Sales ($) |
| Fidelity Series High Income Fund | 464,474,239 | 334,937,185 |
6. Fees and Other Transactions with Affiliates.
Management Fee. Fidelity Management & Research Company LLC (the investment adviser) and its affiliates provide the Fund with investment management related services for which the Fund does not pay a management fee. Under the management contract, the investment adviser or an affiliate pays all ordinary operating expenses of the Fund, except custody fees, fees and expenses of the independent Trustees, and certain miscellaneous expenses such as proxy and shareholder meeting expenses.
Brokerage Commissions. A portion of portfolio transactions were placed with brokerage firms which are affiliates of the investment adviser. Brokerage commissions are included in net realized gain (loss) and change in net unrealized appreciation (depreciation) in the Statement of Operations. The commissions paid to these affiliated firms were as follows:
| | Amount ($) |
| Fidelity Series High Income Fund | 98 |
Interfund Trades. Funds may purchase from or sell securities to other Fidelity Funds under procedures adopted by the Board. The procedures have been designed to ensure these interfund trades are executed in accordance with Rule 17a-7 of the 1940 Act. Any interfund trades are included within the respective purchases and sales amounts shown in the Purchases and Sales of Investments note. Interfund trades during the period are noted in the table below.
| | Purchases ($) | Sales ($) | Realized Gain (Loss) ($) |
| Fidelity Series High Income Fund | 263,299 | 142,956 | 26,288 |
Sub-Advisory Arrangements . Effective March 1, 2024, the Fund's sub-advisory agreements with FMR Investment Management (UK) Limited, Fidelity Management & Research (Hong Kong) Limited, and Fidelity Management & Research (Japan) Limited were amended to provide that the investment adviser pays each sub-adviser monthly fees equal to 110% of the sub-adviser's costs for providing sub-advisory services
Other. During the period, the investment adviser reimbursed the Fund for certain losses as follows:
| | Amount ($) |
| Fidelity Series High Income Fund | 83,190 |
7. Committed Line of Credit.
Certain Funds participate with other funds managed by the investment adviser or an affiliate in a $4.25 billion credit facility (the "line of credit") to be utilized for temporary or emergency purposes to fund shareholder redemptions or for other short-term liquidity purposes. The commitment fees on the pro-rata portion of the line of credit are borne by the investment adviser. During the period, there were no borrowings on this line of credit.
8. Security Lending.
Funds lend portfolio securities from time to time in order to earn additional income. Lending agents are used, including National Financial Services (NFS), an affiliate of the investment adviser. Pursuant to a securities lending agreement, NFS will receive a fee, which is capped at 9.9% of a fund's daily lending revenue, for its services as lending agent. A fund may lend securities to certain qualified borrowers, including NFS. On the settlement date of the loan, a fund receives collateral (in the form of U.S. Treasury obligations, letters of credit and/or cash) against the loaned securities and maintains collateral in an amount not less than 100% of the market value of the loaned securities during the period of the loan. The market value of the loaned securities is determined at the close of business of a fund and any additional required collateral is delivered to a fund on the next business day. A fund or borrower may terminate the loan at any time, and if the borrower defaults on its obligation to return the securities loaned because of insolvency or other reasons, a fund may apply collateral received from the borrower against the obligation. A fund may experience delays and costs in recovering the securities loaned. Any cash collateral received is invested in the Fidelity Securities Lending Cash Central Fund. Any loaned securities are identified as such in the Schedule of Investments, and the value of loaned securities and cash collateral at period end, as applicable, are presented in the Statement of Assets and Liabilities. Security lending income represents the income earned on investing cash collateral, less rebates paid to borrowers and any lending agent fees associated with the loan, plus any premium payments received for lending certain types of securities. Security lending income is presented in the Statement of Operations as a component of income from Fidelity Central Funds. Affiliated security lending activity, if any, was as follows:
| | Total Security Lending Fees Paid to NFS ($) | Security Lending Income From Securities Loaned to NFS ($) | Value of Securities Loaned to NFS at Period End ($) |
| Fidelity Series High Income Fund | 183 | - | - |
9. Expense Reductions.
The investment adviser contractually agreed to reimburse the Fund to the extent annual operating expenses exceeded .003% of average net assets. This reimbursement will remain in place through August 31, 2027. Some expenses, for example the compensation of the independent Trustees, and certain other expenses such as interest expense, are excluded from this reimbursement. During the period this reimbursement reduced the Fund's expenses by $868.
Through arrangements with the Fund's custodian, credits realized as a result of certain uninvested cash balances were used to reduce the Fund's expenses by $9,422.
10. Other.
A fund's organizational documents provide former and current trustees and officers with a limited indemnification against liabilities arising in connection with the performance of their duties to the fund. In the normal course of business, a fund may also enter into contracts that provide general indemnifications. A fund's maximum exposure under these arrangements is unknown as this would be dependent on future claims that may be made against a fund. The risk of material loss from such claims is considered remote.
At the end of the period, mutual funds and accounts managed by the investment adviser or its affiliates were the owners of record of all of the outstanding shares of the Fund.
11. Litigation.
The Fund and other entities managed by FMR or its affiliates are involved with proceedings arising out of disputes in the United States Bankruptcy Court for the Southern District of Texas ("Bankruptcy Court"), relating to the In re Sanchez Energy Corporation chapter 11 bankruptcy case (Case No. 19-34508). A Bankruptcy Court-appointed representative of unsecured creditors asserted that eight million shares of Mesquite Energy, Inc. (formerly known as Sanchez Energy Corporation) (the "Company"), held in escrow pursuant to the terms of the Company's confirmed chapter 11 plan, should be awarded to the unsecured creditors instead of the Company's current equity holders, including the Fund, which were providers of debtor-in-possession financing to the Company during its chapter 11 case and holders of secured notes issued by the Company in 2018. The unsecured creditors also asserted that certain additional equity issued by the Company in 2020 in connection with two post-bankruptcy financings, also held by the Fund, is invalid. During August 2023, the Bankruptcy Court issued an opinion awarding a portion of the eight million shares to the unsecured creditors, diluting the value of the Fund's holdings in Mesquite. The Fund will appeal this decision. At this time, Management cannot determine any additional loss or dilution that may be realized. The Fund is also incurring legal costs in defending the disputes and has recovered a portion of these legal costs through an insurance claim that is presented as other income in the Statement of Operations.
12. Risk and Uncertainties.
Many factors affect a fund's performance. Developments that disrupt global economies and financial markets, such as pandemics, epidemics, outbreaks of infectious diseases, war, terrorism, and environmental disasters, may significantly affect a fund's investment performance. The effects of these developments to a fund will be impacted by the types of securities in which a fund invests, the financial condition, industry, economic sector, and geographic location of an issuer, and a fund's level of investment in the securities of that issuer. Significant concentrations in security types, issuers, industries, sectors, and geographic locations may magnify the factors that affect a fund's performance.
To the Board of Trustees of Fidelity Summer Street Trust and the Shareholders of Fidelity Series High Income Fund:
Opinion on the Financial Statements and Financial Highlights
We have audited the accompanying statement of assets and liabilities of Fidelity Series High Income Fund (the "Fund"), a fund of Fidelity Summer Street Trust, including the schedule of investments, as of April 30, 2024, the related statement of operations for the year then ended, the statement of changes in net assets for each of the two years in the period then ended, the financial highlights for each of the five years in the period then ended, and the related notes. In our opinion, the financial statements and financial highlights present fairly, in all material respects, the financial position of the Fund as of April 30, 2024, and the results of its operations for the year then ended, the changes in its net assets for each of the two years in the period then ended, and the financial highlights for each of the five years in the period then ended in conformity with accounting principles generally accepted in the United States of America.
Basis for Opinion
These financial statements and financial highlights are the responsibility of the Fund's management. Our responsibility is to express an opinion on the Fund's financial statements and financial highlights based on our audits. We are a public accounting firm registered with the Public Company Accounting Oversight Board (United States) (PCAOB) and are required to be independent with respect to the Fund in accordance with the U.S. federal securities laws and the applicable rules and regulations of the Securities and Exchange Commission and the PCAOB.
We conducted our audits in accordance with the standards of the PCAOB. Those standards require that we plan and perform the audit to obtain reasonable assurance about whether the financial statements and financial highlights are free of material misstatement, whether due to error or fraud. The Fund is not required to have, nor were we engaged to perform, an audit of its internal control over financial reporting. As part of our audits, we are required to obtain an understanding of internal control over financial reporting but not for the purpose of expressing an opinion on the effectiveness of the Fund's internal control over financial reporting. Accordingly, we express no such opinion.
Our audits included performing procedures to assess the risks of material misstatement of the financial statements and financial highlights, whether due to error or fraud, and performing procedures that respond to those risks. Such procedures included examining, on a test basis, evidence regarding the amounts and disclosures in the financial statements and financial highlights. Our audits also included evaluating the accounting principles used and significant estimates made by management, as well as evaluating the overall presentation of the financial statements and financial highlights. Our procedures included confirmation of securities owned as of April 30, 2024, by correspondence with the custodian, brokers, and agent banks; when replies were not received from brokers or agent banks, we performed other auditing procedures. We believe that our audits provide a reasonable basis for our opinion.
/s/ Deloitte & Touche LLP
Boston, Massachusetts
June 14, 2024
We have served as the auditor of one or more of the Fidelity investment companies since 1999.
The Trustees, Members of the Advisory Board (if any), and officers of the trust and fund, as applicable, are listed below. The Board of Trustees governs the fund and is responsible for protecting the interests of shareholders. The Trustees are experienced executives who meet periodically throughout the year to oversee the fund's activities, review contractual arrangements with companies that provide services to the fund, oversee management of the risks associated with such activities and contractual arrangements, and review the fund's performance. Except for Vijay Advani, each of the Trustees oversees 323 funds. Mr. Advani oversees 216 funds.
The Trustees hold office without limit in time except that (a) any Trustee may resign; (b) any Trustee may be removed by written instrument, signed by at least two-thirds of the number of Trustees prior to such removal; (c) any Trustee who requests to be retired or who has become incapacitated by illness or injury may be retired by written instrument signed by a majority of the other Trustees; and (d) any Trustee may be removed at any special meeting of shareholders by a two-thirds vote of the outstanding voting securities of the trust. Each Trustee who is not an interested person (as defined in the 1940 Act) of the trust and the fund is referred to herein as an Independent Trustee. Each Independent Trustee shall retire not later than the last day of the calendar year in which his or her 75th birthday occurs. The Independent Trustees may waive this mandatory retirement age policy with respect to individual Trustees. Officers and Advisory Board Members hold office without limit in time, except that any officer or Advisory Board Member may resign or may be removed by a vote of a majority of the Trustees at any regular meeting or any special meeting of the Trustees. Except as indicated, each individual has held the office shown or other offices in the same company for the past five years.
The fund's Statement of Additional Information (SAI) includes more information about the Trustees. To request a free copy, call Fidelity at 1-800-544-8544.
Experience, Skills, Attributes, and Qualifications of the Trustees. The Governance and Nominating Committee has adopted a statement of policy that describes the experience, qualifications, attributes, and skills that are necessary and desirable for potential Independent Trustee candidates (Statement of Policy). The Board believes that each Trustee satisfied at the time he or she was initially elected or appointed a Trustee, and continues to satisfy, the standards contemplated by the Statement of Policy. The Governance and Nominating Committee also engages professional search firms to help identify potential Independent Trustee candidates who have the experience, qualifications, attributes, and skills consistent with the Statement of Policy. From time to time, additional criteria based on the composition and skills of the current Independent Trustees, as well as experience or skills that may be appropriate in light of future changes to board composition, business conditions, and regulatory or other developments, have also been considered by the professional search firms and the Governance and Nominating Committee. In addition, the Board takes into account the Trustees' commitment and participation in Board and committee meetings, as well as their leadership of standing and ad hoc committees throughout their tenure.
In determining that a particular Trustee was and continues to be qualified to serve as a Trustee, the Board has considered a variety of criteria, none of which, in isolation, was controlling. The Board believes that, collectively, the Trustees have balanced and diverse experience, qualifications, attributes, and skills, which allow the Board to operate effectively in governing the fund and protecting the interests of shareholders. Information about the specific experience, skills, attributes, and qualifications of each Trustee, which in each case led to the Board's conclusion that the Trustee should serve (or continue to serve) as a trustee of the fund, is provided below.
Board Structure and Oversight Function. Robert A. Lawrence is an interested person and currently serves as Chair. The Trustees have determined that an interested Chair is appropriate and benefits shareholders because an interested Chair has a personal and professional stake in the quality and continuity of services provided to the fund. Independent Trustees exercise their informed business judgment to appoint an individual of their choosing to serve as Chair, regardless of whether the Trustee happens to be independent or a member of management. The Independent Trustees have determined that they can act independently and effectively without having an Independent Trustee serve as Chair and that a key structural component for assuring that they are in a position to do so is for the Independent Trustees to constitute a substantial majority for the Board. The Independent Trustees also regularly meet in executive session. David M. Thomas serves as Lead Independent Trustee and as such (i) acts as a liaison between the Independent Trustees and management with respect to matters important to the Independent Trustees and (ii) with management prepares agendas for Board meetings.
Fidelity® funds are overseen by different Boards of Trustees. The fund's Board oversees Fidelity's high income and certain equity funds, and other Boards oversee Fidelity's alternative investment, investment-grade bond, money market, asset allocation, and other equity funds. The asset allocation funds may invest in Fidelity® funds overseen by the fund's Board. The use of separate Boards, each with its own committee structure, allows the Trustees of each group of Fidelity® funds to focus on the unique issues of the funds they oversee, including common research, investment, and operational issues. On occasion, the separate Boards establish joint committees to address issues of overlapping consequences for the Fidelity® funds overseen by each Board.
The Trustees operate using a system of committees to facilitate the timely and efficient consideration of all matters of importance to the Trustees, the fund, and fund shareholders and to facilitate compliance with legal and regulatory requirements and oversight of the fund's activities and associated risks. The Board, acting through its committees, has charged FMR and its affiliates with (i) identifying events or circumstances the occurrence of which could have demonstrably adverse effects on the fund's business and/or reputation; (ii) implementing processes and controls to lessen the possibility that such events or circumstances occur or to mitigate the effects of such events or circumstances if they do occur; and (iii) creating and maintaining a system designed to evaluate continuously business and market conditions in order to facilitate the identification and implementation processes described in (i) and (ii) above. Because the day-to-day operations and activities of the fund are carried out by or through FMR, its affiliates, and other service providers, the fund's exposure to risks is mitigated but not eliminated by the processes overseen by the Trustees. While each of the Board's committees has responsibility for overseeing different aspects of the fund's activities, oversight is exercised primarily through the Operations, Audit, and Compliance Committees. Appropriate personnel, including but not limited to the fund's Chief Compliance Officer (CCO), FMR's internal auditor, the independent accountants, the fund's Treasurer and portfolio management personnel, make periodic reports to the Board's committees, as appropriate, including an annual review of Fidelity's risk management program for the Fidelity® funds. The responsibilities of each standing committee, including their oversight responsibilities, are described further under "Standing Committees of the Trustees."
Interested Trustees*:
Correspondence intended for a Trustee who is an interested person may be sent to Fidelity Investments, 245 Summer Street, Boston, Massachusetts 02210.
Name, Year of Birth; Principal Occupations and Other Relevant Experience+
Bettina Doulton (1964)
Year of Election or Appointment: 2020
Trustee
Ms. Doulton also serves as Trustee of other Fidelity® funds. Prior to her retirement, Ms. Doulton served in a variety of positions at Fidelity Investments, including as a managing director of research (2006-2007), portfolio manager to certain Fidelity® funds (1993-2005), equity analyst and portfolio assistant (1990-1993), and research assistant (1987-1990). Ms. Doulton currently owns and operates Cellardoor Winery. Previously, Ms. Doulton served as a member of the Board of Brown Capital Management, LLC (2014-2018).
Robert A. Lawrence (1952)
Year of Election or Appointment: 2020
Trustee
Chair of the Board of Trustees
Mr. Lawrence also serves as Trustee of other funds. Previously, Mr. Lawrence served as a Trustee and Member of the Advisory Board of certain funds. Prior to his retirement in 2008, Mr. Lawrence served as Vice President of certain Fidelity® funds (2006-2008), Senior Vice President, Head of High Income Division of Fidelity Management & Research Company (investment adviser firm, 2006-2008), and President of Fidelity Strategic Investments (investment adviser firm, 2002-2005).
* Determined to be an "Interested Trustee" by virtue of, among other things, his or her affiliation with the trust or various entities under common control with FMR.
+ The information includes the Trustee's principal occupation during the last five years and other information relating to the experience, attributes, and skills relevant to the Trustee's qualifications to serve as a Trustee, which led to the conclusion that the Trustee should serve as a Trustee for the fund.
Independent Trustees:
Correspondence intended for an Independent Trustee may be sent to Fidelity Investments, P.O. Box 55235, Boston, Massachusetts 02205-5235.
Name, Year of Birth; Principal Occupations and Other Relevant Experience+
Vijay C. Advani (1960)
Year of Election or Appointment: 2023
Trustee
Mr. Advani also serves as Trustee or Member of the Advisory Board of other funds. Previously, Mr. Advani served as Executive Chairman (2020-2022), Chief Executive Officer (2017-2020) and Chief Operating Officer (2016-2017) of Nuveen (global investment manager). He also served in various capacities at Franklin Resources (global investment manager), including Co-President (2015-2016), Executive Vice President, Global Advisory Services (2008-2015), Head of Global Retail Distribution (2005-2008), Executive Managing Director, International Retail Development (2002-2005), Managing Director, Product Developments, Sales & Marketing, Asia, Eastern Europe and Africa (2000-2002) and President, Templeton Asset Management India (1995-2000). Mr. Advani also served as Senior Investment Officer of International Finance Corporation (private equity and venture capital arm of The World Bank, 1984-1995). Mr. Advani is Chairman Emeritus of the U.S. India Business Council (2018-present), a Director of The Global Impact Investing Network (2019-present), a Director of LOK Capital (Mauritius) (2022-present), a member of the Advisory Council of LOK Capital (2022-present), a Senior Advisor of Neuberger Berman (2021-present), a Senior Advisor of Seviora Holdings Pte. Ltd (Temasek-Singapore) (2021-present), a Director of Seviora Capital (Singapore) (2021-present) and an Advisor of EQUIAM (2021-present). Mr. Advani formerly served as a member of the Board of BowX Acquisition Corp. (special purpose acquisition company, 2020-2021), a member of the Board of Intellecap (advisory arm of The Aavishkaar Group, 2018-2020), a member of the Board of Nuveen Investments, Inc. (2017-2020) and a member of the Board of Docusign (software, 2016-2019).
Thomas P. Bostick (1956)
Year of Election or Appointment: 2021
Trustee
Lieutenant General Bostick also serves as Trustee of other Fidelity® funds. Prior to his retirement, General Bostick (United States Army, Retired) held a variety of positions within the U.S. Army, including Chief of Engineers and Commanding General, U.S. Army Corps of Engineers (2012-2016) and Deputy Chief of Staff and Director of Human Resources, U.S. Army (2009-2012). General Bostick currently serves as a member of the Board and Finance and Governance & Sustainability Committees of CSX Corporation (transportation, 2020-present) and a member of the Board and Corporate Governance and Nominating Committee of Perma-Fix Environmental Services, Inc. (nuclear waste management, 2020-present). General Bostick serves as Chief Executive Officer of Bostick Global Strategies, LLC (consulting, 2016-present), as a member of the Board of HireVue, Inc. (video interview and assessment, 2020-present), as a member of the Board of Allonnia (biotechnology and engineering solutions, 2022-present), on the Advisory Board of Hilco Redevelopment Partners (a real estate investment and redevelopment company, 2021-present), and on the Advisory Board of Solugen, Inc. (specialty bio-based chemicals manufacturer, 2022-present). Previously, General Bostick served as a Member of the Advisory Board of certain Fidelity® funds (2021), President, Intrexon Bioengineering (2018-2020) and Chief Operating Officer (2017-2020) and Senior Vice President of the Environment Sector (2016-2017) of Intrexon Corporation (biopharmaceutical company).
Donald F. Donahue (1950)
Year of Election or Appointment: 2018
Trustee
Mr. Donahue also serves as Trustee of other Fidelity® funds. Mr. Donahue serves as President and Chief Executive Officer of Miranda Partners, LLC (risk consulting for the financial services industry, 2012-present). Previously, Mr. Donahue served as Chief Executive Officer (2006-2012), Chief Operating Officer (2003-2006) and Managing Director, Customer Marketing and Development (1999-2003) of The Depository Trust & Clearing Corporation (financial markets infrastructure). Mr. Donahue currently serves as a member (2007-present) and Co-Chairman (2016-present) of the Board of United Way of New York. Mr. Donahue previously served as a member of the Advisory Board of certain Fidelity® funds (2015-2018) and as a member of the Board of The Leadership Academy (previously NYC Leadership Academy) (2012-2022).
Vicki L. Fuller (1957)
Year of Election or Appointment: 2020
Trustee
Ms. Fuller also serves as Trustee of other Fidelity® funds. Previously, Ms. Fuller served as a member of the Advisory Board of certain Fidelity® funds (2018-2020), Chief Investment Officer of the New York State Common Retirement Fund (2012-2018) and held a variety of positions at AllianceBernstein L.P. (global asset management, 1985-2012), including Managing Director (2006-2012) and Senior Vice President and Senior Portfolio Manager (2001-2006). Ms. Fuller currently serves as a member of the Board, Audit Committee, Compensation Committee and Nominating and Governance Committee of two Blackstone business development companies (2020-present), as a member of the Board of Treliant, LLC (consulting, 2019-present), as a member of the Board of Ariel Alternatives, LLC (private equity, 2022-present) and as a member of the Board and Chair of the Audit Committee of Gusto, Inc. (software, 2021-present). In addition, Ms. Fuller currently serves as a member of the Executive Board of New York University's Stern School of Business. Ms. Fuller previously served as a member of the Board of Roosevelt University (2019-2024) and member of the Board, Audit Committee and Nominating and Governance Committee of The Williams Companies, Inc. (natural gas infrastructure, 2018-2021).
Patricia L. Kampling (1959)
Year of Election or Appointment: 2020
Trustee
Ms. Kampling also serves as Trustee of other Fidelity® funds. Prior to her retirement, Ms. Kampling served as Chairman of the Board and Chief Executive Officer (2012-2019), President and Chief Operating Officer (2011-2012) and Executive Vice President and Chief Financial Officer (2010-2011) of Alliant Energy Corporation. Ms. Kampling currently serves as a member of the Board, Audit Committee and Governance, Compensation and Nominating Committee of Xcel Energy Inc. (utilities company, 2020-present) and as a member of the Board, Audit, Finance and Risk Committee and Safety, Environmental, Technology and Operations Committee and Chair of the Executive Development and Compensation Committee of American Water Works Company, Inc. (utilities company, 2019-present). In addition, Ms. Kampling currently serves as a member of the Board of the Nature Conservancy, Wisconsin Chapter (2019-present). Previously, Ms. Kampling served as a Member of the Advisory Board of certain Fidelity® funds (2020), a member of the Board, Compensation Committee and Executive Committee and Chair of the Audit Committee of Briggs & Stratton Corporation (manufacturing, 2011-2021), a member of the Board of Interstate Power and Light Company (2012-2019) and Wisconsin Power and Light Company (2012-2019) (each a subsidiary of Alliant Energy Corporation) and as a member of the Board and Workforce Development Committee of the Business Roundtable (2018-2019).
Thomas A. Kennedy (1955)
Year of Election or Appointment: 2021
Trustee
Mr. Kennedy also serves as Trustee of other Fidelity® funds. Previously, Mr. Kennedy served as a Member of the Advisory Board of certain Fidelity® funds (2020) and held a variety of positions at Raytheon Company (aerospace and defense, 1983-2020), including Chairman and Chief Executive Officer (2014-2020) and Executive Vice President and Chief Operating Officer (2013-2014). Mr. Kennedy served as Executive Chairman of the Board of Directors of Raytheon Technologies Corporation (aerospace and defense, 2020-2021). Mr. Kennedy serves as a Director of the Board of Directors of Textron Inc. (aerospace and defense, 2023-present).
Oscar Munoz (1959)
Year of Election or Appointment: 2021
Trustee
Mr. Munoz also serves as Trustee of other Fidelity® funds. Prior to his retirement, Mr. Munoz served as Executive Chairman (2020-2021), Chief Executive Officer (2015-2020), President (2015-2016) and a member of the Board (2010-2021) of United Airlines Holdings, Inc. Mr. Munoz currently serves as a member of the Board of CBRE Group, Inc. (commercial real estate, 2020-present), a member of the Board of Univision Communications, Inc. (Hispanic media, 2020-present), a member of the Board of Archer Aviation Inc. (2021-present), a member of the Defense Business Board of the United States Department of Defense (2021-present) and a member of the Board of Salesforce.com, Inc. (cloud-based software, 2022-present). Previously, Mr. Munoz served as a Member of the Advisory Board of certain Fidelity® funds (2021).
David M. Thomas (1949)
Year of Election or Appointment: 2008
Trustee
Lead Independent Trustee
Mr. Thomas also serves as Trustee of other Fidelity® funds. Previously, Mr. Thomas served as Executive Chairman (2005-2006) and Chairman and Chief Executive Officer (2000-2005) of IMS Health, Inc. (pharmaceutical and healthcare information solutions) and as a member of the Board of Fortune Brands Home and Security (home and security products, 2004-2023). Mr. Thomas currently serves as Director (2013-present) and Non-Executive Chairman of the Board (2022-present) of Interpublic Group of Companies, Inc. (marketing communication).
Susan Tomasky (1953)
Year of Election or Appointment: 2020
Trustee
Ms. Tomasky also serves as Trustee of other Fidelity® funds. Prior to her retirement, Ms. Tomasky served in various executive officer positions at American Electric Power Company, Inc. (1998-2011), including most recently as President of AEP Transmission (2007-2011). Ms. Tomasky currently serves as a member of the Board and Sustainability Committee and as Chair of the Audit Committee of Marathon Petroleum Corporation (2018-present) and as a member of the Board, Executive Committee, Corporate Governance Committee and Organization and Compensation Committee and as Lead Director of the Board of Public Service Enterprise Group, Inc. (utilities company, 2012-present) and as a member of the Board of its subsidiary company, Public Service Electric and Gas Co. (2021-present). In addition, Ms. Tomasky currently serves as a member (2009-present) and President (2020-present) of the Board of the Royal Shakespeare Company - America (2009-present) and as a member and Vice Chair of the Board of Kenyon College (2016-present). Previously, Ms. Tomasky served as a Member of the Advisory Board of certain Fidelity® funds (2020), as a member of the Board of the Columbus Association for the Performing Arts (2011-2023), as a member of the Board of the Columbus Regional Airport Authority (2007-2020), as a member of the Board (2011-2018) and Lead Independent Director (2015-2018) of Andeavor Corporation (previously Tesoro Corporation) (independent oil refiner and marketer) and as a member of the Board of Summit Midstream Partners LP (energy, 2012-2018).
Michael E. Wiley (1950)
Year of Election or Appointment: 2018
Trustee
Mr. Wiley also serves as Trustee of other Fidelity® funds. Previously, Mr. Wiley served as a member of the Advisory Board of certain Fidelity® funds (2018-2020), Chairman, President and CEO of Baker Hughes, Inc. (oilfield services, 2000-2004). Mr. Wiley also previously served as a member of the Board of Andeavor Corporation (independent oil refiner and marketer, 2005-2018), a member of the Board of Andeavor Logistics LP (natural resources logistics, 2015-2018) and a member of the Board of High Point Resources (exploration and production, 2005-2020).
+ The information includes the Trustee's principal occupation during the last five years and other information relating to the experience, attributes, and skills relevant to the Trustee's qualifications to serve as a Trustee, which led to the conclusion that the Trustee should serve as a Trustee for the fund.
Advisory Board Members and Officers:
Correspondence intended for a Member of the Advisory Board (if any) may be sent to Fidelity Investments, P.O. Box 55235, Boston, Massachusetts 02205-5235. Correspondence intended for an officer or Peter S. Lynch may be sent to Fidelity Investments, 245 Summer Street, Boston, Massachusetts 02210.
Name, Year of Birth; Principal Occupations+
Peter S. Lynch (1944)
Year of Election or Appointment: 2003
Member of the Advisory Board
Mr. Lynch also serves as a Member of the Advisory Board of other Fidelity® funds. Mr. Lynch is Vice Chairman and a Director of Fidelity Management & Research Company LLC (investment adviser firm). In addition, Mr. Lynch serves as a Trustee of Boston College and as the Chairman of the Inner-City Scholarship Fund. Previously, Mr. Lynch served as Vice Chairman and a Director of FMR Co., Inc. (investment adviser firm) and on the Special Olympics International Board of Directors (1997-2006).
Karen B. Peetz (1955)
Year of Election or Appointment: 2023
Member of the Advisory Board
Ms. Peetz also serves as a Member of the Advisory Board of other funds. Previously, Ms. Peetz served as Chief Administration Officer (2020-2023) of Citigroup Inc. (a diversified financial service company). She also served in various capacities at Bank of New York Mellon Corporation, including President (2013-2016), Vice Chairman, Senior Executive Vice President and Chief Executive Officer of Financial Markets & Treasury Services (2010-2013), Senior Executive Vice President and Chief Executive Officer of Global Corporate Trust (2003-2008), Senior Vice President and Division Manager of Global Payments & Trade Services (2002-2003) and Senior Vice President and Division Manager of Domestic Corporate Trust (1998-2002). Ms. Peetz also served in various capacities at Chase Manhattan Corporation (1982-1998), including Senior Vice President and Manager of Corporate Trust International Business (1996-1998), Managing Director and Manager of Corporate Trust Services (1994-1996) and Managing Director and Group Manager of Financial Institution Sales (1990-1993). Ms. Peetz currently serves as Chair of Amherst Holdings Advisory Council (2018-present), Trustee of Johns Hopkins University (2016-present), Chair of the Carey Business School Advisory Council, Member of the Johns Hopkins Medicine Board and Finance Committee and Chair of the Lyme and Tick Related Disease Institute Advisory Council. Ms. Peetz previously served as a member of the Board of Guardian Life Insurance Company of America (2019-2023), a member of the Board of Trane Technologies (2018-2022), a member of the Board of Wells Fargo Corp. (2017-2019), a member of the Board of SunCoke Energy Inc. (2012-2016), a member of the Board of Private Export Funding Corporation (2010-2016) and as a Trustee of Penn State University (2010-2014) and the United Way of New York City (2008-2010).
Heather Bonner (1977)
Year of Election or Appointment: 2023
Assistant Treasurer
Ms. Bonner also serves as an officer of other funds. Ms. Bonner is a Senior Vice President (2022-present) and is an employee of Fidelity Investments (2022-present). Ms. Bonner serves as Senior Vice President, Vice President, Treasurer, or Director of certain Fidelity entities. Prior to joining Fidelity, Ms. Bonner served as Managing Director at AQR Capital Management (2013-2022) and was the Treasurer and Principal Financial Officer of the AQR Funds (2013-2022).
Craig S. Brown (1977)
Year of Election or Appointment: 2022
Deputy Treasurer
Mr. Brown also serves as an officer of other funds. Mr. Brown is a Vice President (2015-present) and is an employee of Fidelity Investments. Mr. Brown serves as Assistant Treasurer of FIMM, LLC (2021-present). Previously, Mr. Brown served as Assistant Treasurer of certain Fidelity® funds (2019-2022).
John J. Burke III (1964)
Year of Election or Appointment: 2018
Chief Financial Officer
Mr. Burke also serves as Chief Financial Officer of other funds. Mr. Burke is Head of Fidelity Fund and Investment Operations (2018-present) and is an employee of Fidelity Investments. Mr. Burke serves as President, Executive Vice President, or Director of certain Fidelity entities. Previously Mr. Burke served as head of Asset Management Investment Operations (2012-2018).
Margaret Carey (1973)
Year of Election or Appointment: 2023
Secretary and Chief Legal Officer (CLO)
Ms. Carey also serves as an officer of other funds and as CLO of certain Fidelity entities. Ms. Carey is a Senior Vice President, Deputy General Counsel (2019-present) and is an employee of Fidelity Investments.
William C. Coffey (1969)
Year of Election or Appointment: 2019
Assistant Secretary
Mr. Coffey also serves as Assistant Secretary of other funds. Mr. Coffey is a Senior Vice President, Deputy General Counsel (2010-present) and is an employee of Fidelity Investments. Previously, Mr. Coffey served as Secretary and CLO of certain funds (2018-2019); CLO, Secretary, or Senior Vice President of certain Fidelity entities and Assistant Secretary of certain funds (2009-2018).
Timothy M. Cohen (1969)
Year of Election or Appointment: 2018
Vice President
Mr. Cohen also serves as Vice President of other funds. Mr. Cohen is Co-Head of Equity (2018-present) and is an employee of Fidelity Investments. Mr. Cohen serves as President or Director of certain Fidelity entities. Previously, Mr. Cohen served as Executive Vice President of Fidelity SelectCo, LLC (2019) and Head of Global Equity Research (2016-2018).
Jonathan Davis (1968)
Year of Election or Appointment: 2010
Assistant Treasurer
Mr. Davis also serves as an officer of other funds. Mr. Davis is a Vice President (2006-present) and is an employee of Fidelity Investments. Mr. Davis serves as Assistant Treasurer or Director of certain Fidelity entities.
Laura M. Del Prato (1964)
Year of Election or Appointment: 2018
Assistant Treasurer
Ms. Del Prato also serves as an officer of other funds. Ms. Del Prato is a Senior Vice President (2017-present) and is an employee of Fidelity Investments. Ms. Del Prato serves as Senior Vice President, Vice President, Assistant Treasurer, or Director of certain Fidelity entities. Previously, Ms. Del Prato served as President and Treasurer of The North Carolina Capital Management Trust: Cash Portfolio and Term Portfolio (2018-2020).
Colm A. Hogan (1973)
Year of Election or Appointment: 2020
Assistant Treasurer
Mr. Hogan also serves as an officer of other funds. Mr. Hogan is a Vice President (2016-present) and is an employee of Fidelity Investments. Mr. Hogan serves as Assistant Treasurer of certain Fidelity entities. Previously, Mr. Hogan served as Deputy Treasurer of certain Fidelity® funds (2016-2020) and Assistant Treasurer of certain Fidelity® funds (2016-2018).
Pamela R. Holding (1964)
Year of Election or Appointment: 2018
Vice President
Ms. Holding also serves as Vice President of other funds. Ms. Holding is Co-Head of Equity (2018-present) and is an employee of Fidelity Investments. Previously, Ms. Holding served as Executive Vice President of Fidelity SelectCo, LLC (2019) and as Chief Investment Officer of Fidelity Institutional Asset Management (2013-2018).
Chris Maher (1972)
Year of Election or Appointment: 2020
Deputy Treasurer
Mr. Maher also serves as an officer of other funds. Mr. Maher is a Vice President (2008-present) and is an employee of Fidelity Investments. Mr. Maher serves as Assistant Treasurer of certain Fidelity entities. Previously, Mr. Maher served as Assistant Treasurer of certain funds (2013-2020).
Jason P. Pogorelec (1975)
Year of Election or Appointment: 2020
Chief Compliance Officer
Mr. Pogorelec also serves as Chief Compliance Officer of other funds. Mr. Pogorelec is a Senior Vice President of Asset Management Compliance (2020-present) and is an employee of Fidelity Investments. Mr. Pogorelec serves as Compliance Officer of Fidelity Management & Research Company LLC (investment adviser firm, 2023-present) and Ballyrock Investment Advisors LLC (2023-present). Previously, Mr. Pogorelec served as a Vice President, Associate General Counsel for Fidelity Investments (2010-2020) and Assistant Secretary of certain Fidelity® funds (2015-2020).
Brett Segaloff (1972)
Year of Election or Appointment: 2021
Anti-Money Laundering (AML) Officer
Mr. Segaloff also serves as AML Officer of other funds. Mr. Segaloff is a Vice President (2022-present) and is an employee of Fidelity Investments. Mr. Segaloff serves as Anti Money Laundering Compliance Officer or Anti Money Laundering/Bank Secrecy Act Compliance Officer of certain Fidelity entities.
Stacie M. Smith (1974)
Year of Election or Appointment: 2016
President and Treasurer
Ms. Smith also serves as an officer of other funds. Ms. Smith is a Senior Vice President (2016-present) and is an employee of Fidelity Investments. Ms. Smith serves as Assistant Treasurer of certain Fidelity entities and has served in other fund officer roles.
Jim Wegmann (1979)
Year of Election or Appointment: 2019
Assistant Treasurer
Mr. Wegmann also serves as an officer of other funds. Mr. Wegmann is a Vice President (2016-present) and is an employee of Fidelity Investments. Mr. Wegmann serves as Assistant Treasurer of FIMM, LLC (2021-present). Previously, Mr. Wegmann served as Assistant Treasurer of certain Fidelity® funds (2019-2021).
+ The information includes principal occupation during the last five years.
As a shareholder, you incur two types of costs: (1) transaction costs, which may include sales charges (loads) on purchase payments or redemption proceeds, as applicable and (2) ongoing costs, which generally include management fees, distribution and/or service (12b-1) fees and other Fund expenses. This Example is intended to help you understand your ongoing costs (in dollars) of investing in a fund and to compare these costs with the ongoing costs of investing in other mutual funds.
| The Example is based on an investment of $1,000 invested at the beginning of the period and held for the entire period (November 1, 2023 to April 30, 2024). |
Actual Expenses
The first line of the accompanying table provides information about actual account values and actual expenses. You may use the information in this line, together with the amount you invested, to estimate the expenses that you paid over the period. Simply divide your account value by $1,000.00 (for example, an $8,600 account value divided by $1,000.00 = 8.6), then multiply the result by the number in the first line for a class/Fund under the heading entitled "Expenses Paid During Period" to estimate the expenses you paid on your account during this period. If any fund is a shareholder of any underlying mutual funds or exchange-traded funds (ETFs) (the Underlying Funds), such fund indirectly bears its proportional share of the expenses of the Underlying Funds in addition to the direct expenses incurred presented in the table. These fees and expenses are not included in the annualized expense ratio used to calculate the expense estimate in the table below.
Hypothetical Example for Comparison Purposes
The second line of the accompanying table provides information about hypothetical account values and hypothetical expenses based on the actual expense ratio and an assumed rate of return of 5% per year before expenses, which is not the actual return. The hypothetical account values and expenses may not be used to estimate the actual ending account balance or expenses you paid for the period. You may use this information to compare the ongoing costs of investing in the Fund and other funds. To do so, compare this 5% hypothetical example with the 5% hypothetical examples that appear in the shareholder reports of the other funds. If any fund is a shareholder of any Underlying Funds, such fund indirectly bears its proportional share of the expenses of the Underlying Funds in addition to the direct expenses as presented in the table. These fees and expenses are not included in the annualized expense ratio used to calculate the expense estimate in the table below.
Please note that the expenses shown in the table are meant to highlight your ongoing costs only and do not reflect any transaction costs. Therefore, the second line of the table is useful in comparing ongoing costs only, and will not help you determine the relative total costs of owning different funds. In addition, if these transactional costs were included, your costs would have been higher.
| | | | | Annualized Expense Ratio- A | | Beginning Account Value November 1, 2023 | | Ending Account Value April 30, 2024 | | Expenses Paid During Period- C November 1, 2023 to April 30, 2024 |
| | | | | | | | | | |
| Fidelity® Series High Income Fund | | | | -%-D | | | | | | |
| Actual | | | | | | $ 1,000 | | $ 1,090.40 | | $-E |
Hypothetical-B | | | | | | $ 1,000 | | $ 1,024.86 | | $-E |
| |
A Annualized expense ratio reflects expenses net of applicable fee waivers.
B 5% return per year before expenses
C Expenses are equal to the annualized expense ratio, multiplied by the average account value over the period, multiplied by 182/ 366 (to reflect the one-half year period). The fees and expenses of any Underlying Funds are not included in each annualized expense ratio.
D Amount represents less than .005%.
E Amount represents less than $.005.
The dividend and capital gains distributions for the fund(s) are available on Fidelity.com or Institutional.Fidelity.com.
A total of 0.48% of the dividends distributed during the fiscal year was derived from interest on U.S. Government securities which is generally exempt from state income tax.
The fund designates $81,389,501 of distributions paid during the fiscal year ended 2024 as qualifying to be taxed as section 163(j) interest dividends.
The fund will notify shareholders in January 2025 of amounts for use in preparing 2024 income tax returns.
Board Approval of Investment Advisory Contracts
Fidelity Series High Income Fund
At its January 2024 meeting, the Board of Trustees, including the Independent Trustees (together, the Board), approved amended and restated sub-advisory agreements (the Sub-Advisory Contracts) for the fund, including the fund's sub-advisory agreements with FMR Investment Management (UK) Limited (FMR UK), Fidelity Management & Research (Hong Kong) Limited (FMR H.K.), and Fidelity Management & Research (Japan) Limited (FMR Japan). The Sub-Advisory Contracts will be effective March 1, 2024. The Board will consider the annual renewal of the fund's Sub-Advisory Contracts in May 2024, following its review of additional materials provided by FMR.
The Board considered the Sub-Advisory Contracts, which simplified the calculation of the fees paid by FMR to the sub-advisers under the agreements. The Board noted that the agreements with FMR UK, FMR H.K., and FMR Japan were amended to provide that FMR will compensate each sub-adviser at a fee rate equal to 110% of the sub-adviser's costs incurred in providing services under the agreement. The Board considered that, under the Sub-Advisory Contracts, FMR, and not the fund, will continue to pay the sub-advisory fees to each applicable sub-adviser, and that the management fee paid by the fund under the management contract with FMR will remain unchanged.
The Board further considered that the approval of the fund's Sub-Advisory Contracts will not result in any changes in the investment process or strategies employed in the management of the fund's assets or the day-to-day management of the fund or the persons primarily responsible for such management. Further, the Board considered that the Sub-Advisory Contracts would not change the obligations and services of FMR and its affiliates on behalf of the fund, and, in particular, there would be no change in the nature and level of services provided to the fund by FMR and its affiliates.
In connection with its consideration of future renewals of the fund's advisory contracts, the Board will consider: (i) the nature, extent and quality of services provided to the funds, including shareholder and administrative services and investment performance; (ii) the competitiveness of the management fee and total expenses for the fund; (iii) the costs of the services and profitability, including the revenues earned and the expenses incurred in conducting the business of developing, marketing, distributing, managing, administering, and servicing the fund and its shareholders, to the extent applicable; and (iv) whether there have been economies of scale in respect of the Fidelity funds, whether the Fidelity funds (including the fund) have appropriately benefited from any such economies of scale, and whether there is the potential for realization of any further economies.
Based on its evaluation of all of the conclusions noted above, and after considering all factors it believed relevant, the Board concluded that the fund's management fee structure is fair and reasonable, and that the fund's Sub-Advisory Contracts should be approved.
The Securities and Exchange Commission adopted Rule 22e-4 under the Investment Company Act of 1940 (the Liquidity Rule) to promote effective liquidity risk management throughout the open-end investment company industry, thereby reducing the risk that funds will be unable to meet their redemption obligations and mitigating dilution of the interests of fund shareholders.
The Fund has adopted and implemented a liquidity risk management program (the Program) reasonably designed to assess and manage the Fund's liquidity risk and to comply with the requirements of the Liquidity Rule. The Fund's Board of Trustees (the Board) has designated the Fund's investment adviser as administrator of the Program. The Fidelity advisers have established a Liquidity Risk Management Committee (the LRM Committee) to manage the Program for each of the Fidelity Funds. The LRM Committee monitors the adequacy and effectiveness of implementation of the Program and on a periodic basis assesses each Fund's liquidity risk based on a variety of factors including (1) the Fund's investment strategy, (2) portfolio liquidity and cash flow projections during normal and reasonably foreseeable stressed conditions, (3) shareholder redemptions, (4) borrowings and other funding sources and (5) certain factors specific to ETFs including the effect of the Fund's prices and spreads, market participants, and basket compositions on the overall liquidity of the Fund's portfolio, as applicable.
In accordance with the Program, each of the Fund's portfolio investments is classified into one of four defined liquidity categories based on a determination of a reasonable expectation for how long it would take to convert the investment to cash (or sell or dispose of the investment) without significantly changing its market value.
- Highly liquid investments - cash or convertible to cash within three business days or less
- Moderately liquid investments - convertible to cash in three to seven calendar days
- Less liquid investments - can be sold or disposed of, but not settled, within seven calendar days
- Illiquid investments - cannot be sold or disposed of within seven calendar days
Liquidity classification determinations take into account a variety of factors including various market, trading and investment-specific considerations, as well as market depth, and generally utilize analysis from a third-party liquidity metrics service.
The Liquidity Rule places a 15% limit on a fund's illiquid investments and requires funds that do not primarily hold assets that are highly liquid investments to determine and maintain a minimum percentage of the fund's net assets to be invested in highly liquid investments (highly liquid investment minimum or HLIM). The Program includes provisions reasonably designed to comply with the 15% limit on illiquid investments and for determining, periodically reviewing and complying with the HLIM requirement as applicable.
At a recent meeting of the Fund's Board of Trustees, the LRM Committee provided a written report to the Board pertaining to the operation, adequacy, and effectiveness of the Program for the period December 1, 2022 through November 30, 2023. The report concluded that the Program is operating effectively and is reasonably designed to assess and manage the Fund's liquidity risk.
1.924270.113
FSH-ANN-0624
Fidelity® U.S. Low Volatility Equity Fund
Annual Report
April 30, 2024
Contents
To view a fund's proxy voting guidelines and proxy voting record for the 12-month period ended June 30, visit http://www.fidelity.com/proxyvotingresults or visit the Securities and Exchange Commission's (SEC) web site at http://www.sec.gov.
You may also call 1-800-544-8544 to request a free copy of the proxy voting guidelines.
Standard & Poor's, S&P and S&P 500 are registered service marks of The McGraw-Hill Companies, Inc. and have been licensed for use by Fidelity Distributors Corporation.
Other third-party marks appearing herein are the property of their respective owners.
All other marks appearing herein are registered or unregistered trademarks or service marks of FMR LLC or an affiliated company. © 2024 FMR LLC. All rights reserved.
This report and the financial statements contained herein are submitted for the general information of the shareholders of the Fund. This report is not authorized for distribution to prospective investors in the Fund unless preceded or accompanied by an effective prospectus.
A fund files its complete schedule of portfolio holdings with the SEC for the first and third quarters of each fiscal year on Form N-PORT. Forms N-PORT are available on the SEC's web site at http://www.sec.gov. A fund's Forms N-PORT may be reviewed and copied at the SEC's Public Reference Room in Washington, DC. Information regarding the operation of the SEC's Public Reference Room may be obtained by calling 1-800-SEC-0330.
For a complete list of a fund's portfolio holdings, view the most recent holdings listing, semiannual report, or annual report on Fidelity's web site at http://www.fidelity.com, http://www.institutional.fidelity.com, or http://www.401k.com, as applicable.
NOT FDIC INSURED •MAY LOSE VALUE •NO BANK GUARANTEE
Neither the Fund nor Fidelity Distributors Corporation is a bank.
Average annual total return reflects the change in the value of an investment, assuming reinvestment of distributions from dividend income and capital gains (the profits earned upon the sale of securities that have grown in value, if any) and assuming a constant rate of performance each year. The hypothetical investment and the average annual total returns do not reflect the deduction of taxes that a shareholder would pay on fund distributions or the redemption of fund shares. During periods of reimbursement by Fidelity, a fund's total return will be greater than it would be had the reimbursement not occurred. How a fund did yesterday is no guarantee of how it will do tomorrow.
| Average Annual Total Returns |
| | | | |
Periods ended April 30, 2024 | Past 1 year | Life of Fund A |
| Fidelity® U.S. Low Volatility Equity Fund | 10.05% | 5.56% |
A From November 5, 2019
| $10,000 Over Life of Fund |
| |
Let's say hypothetically that $10,000 was invested in Fidelity® U.S. Low Volatility Equity Fund, on November 5, 2019, when the fund started. The chart shows how the value of your investment would have changed, and also shows how the Russell 3000® Index performed over the same period. |
|
|
Market Recap:
U.S. equities gained 22.66% for the 12 months ending April 30, 2024, according to the S&P 500® index, driven by resilient corporate profits, a frenzy over generative artificial intelligence and the Federal Reserve's likely pivot to cutting interest rates later this year. Amid this favorable backdrop for higher-risk assets, the S&P 500® continued its late-2023 momentum and ended March at its all-time high before snapping a five-month uptrend in April (-4.08%). Growth stocks led the broad rally, mostly driven by a narrow set of firms in the communication services (+41%) and information technology (+37%) sectors, largely due to excitement for AI. In particular, semiconductor-related stocks (+104%) were a standout. Following the Fed's November 1 meeting, when the central bank hinted it might be done raising rates, the S&P 500® reversed a three-month decline and gained 14.09% in the final two months of 2023 and 10.56% the first quarter. Risk assets were further aided on March 20, when the central bank held steady its benchmark federal funds rate and affirmed its projection to cut in 2024. The index then slipped in April, as inflation remained stickier than expected, spurring doubts of a soft economic landing. For the full 12 months, the financials, industrials and consumer discretionary sectors each gained about 24%. In sharp contrast, real estate and the defensive-oriented utilities sector each roughly broke even. Other notable "laggards" included consumer staples (+3%) and health care (+7%).
Comments from Portfolio Manager Zach Dewhirst:
For the fiscal year ending April 30, 2024, the fund gained 10.05%, versus 22.30% for the benchmark Russell 3000 Index. The biggest detractors from performance versus the benchmark were stock selection and an underweight in information technology, and picks and an overweight in consumer staples, primarily within the food, beverage & tobacco industry. Positioning in communication services and health care also hurt our relative result. The largest individual relative detractor this period was avoiding Nvidia, a benchmark component that gained about 211%. Not owning Amazon.com and Alphabet, benchmark components that gained 66% and 52%, respectively, also notably detracted. In contrast, the biggest contributor to performance versus the benchmark was avoiding the underperforming real estate sector, especially the equity real estate investment trusts (REITs) industry. Stock picks and an underweight in energy also boosted relative performance. Further lifting the fund's relative result was an overweight in financials, primarily within the insurance industry. The top individual relative contributors were a significant underweight in Apple (+1%), a stock that was not held in the portfolio at period end, and an overweight in Sprouts Farmers Market (+93%), a position we established this period. An overweight in Emcor (+62%), another stake we established this period, also helped. Notable changes in positioning include increased exposure to energy and a lower allocation to utilities.
Note to shareholders:
Following Board approval in May 2024, Fidelity added the MSCI USA Minimum Volatility Index as a supplemental benchmark for the fund, effective June 1, 2024, to provide a better performance comparison. This change does not impact how the fund is managed.
The views expressed above reflect those of the portfolio manager(s) only through the end of the period as stated on the cover of this report and do not necessarily represent the views of Fidelity or any other person in the Fidelity organization. Any such views are subject to change at any time based upon market or other conditions and Fidelity disclaims any responsibility to update such views. These views may not be relied on as investment advice and, because investment decisions for a Fidelity fund are based on numerous factors, may not be relied on as an indication of trading intent on behalf of any Fidelity fund.
Top Holdings (% of Fund's net assets) |
| |
| Republic Services, Inc. | 1.2 | |
| Linde PLC | 1.1 | |
| Microsoft Corp. | 1.1 | |
| T-Mobile U.S., Inc. | 1.1 | |
| Marsh & McLennan Companies, Inc. | 1.1 | |
| Progressive Corp. | 1.1 | |
| Cboe Global Markets, Inc. | 1.1 | |
| Cigna Group | 1.1 | |
| Eli Lilly & Co. | 1.1 | |
| Merck & Co., Inc. | 1.1 | |
| | 11.1 | |
| |
| Market Sectors (% of Fund's net assets) |
| |
| Health Care | 19.4 | |
| Information Technology | 17.6 | |
| Financials | 16.0 | |
| Consumer Staples | 14.7 | |
| Industrials | 10.7 | |
| Consumer Discretionary | 5.5 | |
| Energy | 5.5 | |
| Communication Services | 4.3 | |
| Utilities | 2.9 | |
| Materials | 2.7 | |
| |
Asset Allocation (% of Fund's net assets) |
|
|
Showing Percentage of Net Assets
| Common Stocks - 99.3% |
| | | Shares | Value ($) |
| COMMUNICATION SERVICES - 4.3% | | | |
| Diversified Telecommunication Services - 1.4% | | | |
| AT&T, Inc. | | 12,263 | 207,122 |
| Verizon Communications, Inc. | | 6,066 | 239,546 |
| | | | 446,668 |
| Entertainment - 1.5% | | | |
| IMAX Corp. (a)(b) | | 14,781 | 236,644 |
| The Walt Disney Co. | | 1,950 | 216,645 |
| | | | 453,289 |
| Media - 0.3% | | | |
| Comcast Corp. Class A | | 2,246 | 85,595 |
| Wireless Telecommunication Services - 1.1% | | | |
| T-Mobile U.S., Inc. | | 2,119 | 347,876 |
TOTAL COMMUNICATION SERVICES | | | 1,333,428 |
| CONSUMER DISCRETIONARY - 5.5% | | | |
| Diversified Consumer Services - 0.8% | | | |
| Grand Canyon Education, Inc. (a) | | 1,967 | 255,749 |
| Hotels, Restaurants & Leisure - 2.2% | | | |
| Chipotle Mexican Grill, Inc. (a) | | 60 | 189,576 |
| McDonald's Corp. | | 929 | 253,654 |
| Yum! Brands, Inc. | | 1,792 | 253,120 |
| | | | 696,350 |
| Specialty Retail - 2.5% | | | |
| Murphy U.S.A., Inc. | | 579 | 239,602 |
| O'Reilly Automotive, Inc. (a) | | 240 | 243,182 |
| TJX Companies, Inc. | | 2,964 | 278,883 |
| | | | 761,667 |
TOTAL CONSUMER DISCRETIONARY | | | 1,713,766 |
| CONSUMER STAPLES - 14.7% | | | |
| Beverages - 3.3% | | | |
| Coca-Cola Consolidated, Inc. | | 200 | 165,200 |
| Constellation Brands, Inc. Class A (sub. vtg.) | | 423 | 107,214 |
| Keurig Dr. Pepper, Inc. | | 6,707 | 226,026 |
| Monster Beverage Corp. (a) | | 5,182 | 276,978 |
| The Coca-Cola Co. | | 3,975 | 245,536 |
| | | | 1,020,954 |
| Consumer Staples Distribution & Retail - 3.1% | | | |
| Albertsons Companies, Inc. | | 5,600 | 114,240 |
| BJ's Wholesale Club Holdings, Inc. (a) | | 3,135 | 234,122 |
| Costco Wholesale Corp. | | 318 | 229,882 |
| Sprouts Farmers Market LLC (a) | | 1,284 | 84,783 |
| Walmart, Inc. | | 5,156 | 306,009 |
| | | | 969,036 |
| Food Products - 3.9% | | | |
| Bunge Global SA | | 2,240 | 227,942 |
| Lamb Weston Holdings, Inc. | | 2,220 | 185,015 |
| Lancaster Colony Corp. | | 400 | 76,324 |
| The J.M. Smucker Co. | | 1,933 | 222,005 |
| The Simply Good Foods Co. (a) | | 6,928 | 252,526 |
| Tyson Foods, Inc. Class A | | 4,079 | 247,391 |
| | | | 1,211,203 |
| Household Products - 3.5% | | | |
| Colgate-Palmolive Co. | | 3,046 | 279,988 |
| Procter & Gamble Co. | | 1,774 | 289,517 |
| Reynolds Consumer Products, Inc. | | 9,165 | 262,394 |
| The Clorox Co. | | 1,782 | 263,504 |
| | | | 1,095,403 |
| Tobacco - 0.9% | | | |
| Philip Morris International, Inc. | | 2,767 | 262,699 |
TOTAL CONSUMER STAPLES | | | 4,559,295 |
| ENERGY - 5.5% | | | |
| Oil, Gas & Consumable Fuels - 5.5% | | | |
| Cheniere Energy, Inc. | | 1,500 | 236,730 |
| ConocoPhillips Co. | | 2,027 | 254,632 |
| Diamondback Energy, Inc. | | 1,412 | 283,996 |
| Exxon Mobil Corp. | | 2,507 | 296,503 |
| International Seaways, Inc. | | 2,699 | 149,228 |
| Phillips 66 Co. | | 1,798 | 257,492 |
| Pioneer Natural Resources Co. | | 830 | 223,536 |
| | | | 1,702,117 |
| FINANCIALS - 16.0% | | | |
| Capital Markets - 1.7% | | | |
| Cboe Global Markets, Inc. | | 1,865 | 337,845 |
| Intercontinental Exchange, Inc. | | 1,363 | 175,500 |
| | | | 513,345 |
| Financial Services - 2.7% | | | |
| Fiserv, Inc. (a) | | 1,500 | 229,005 |
| MasterCard, Inc. Class A | | 693 | 312,682 |
| Visa, Inc. Class A | | 1,121 | 301,112 |
| | | | 842,799 |
| Insurance - 11.6% | | | |
| American Financial Group, Inc. | | 1,645 | 210,149 |
| Arch Capital Group Ltd. (a) | | 2,723 | 254,709 |
| Arthur J. Gallagher & Co. | | 1,192 | 279,750 |
| Brown & Brown, Inc. | | 3,393 | 276,665 |
| Chubb Ltd. | | 1,179 | 293,147 |
| Everest Re Group Ltd. | | 624 | 228,640 |
| Hanover Insurance Group, Inc. | | 1,816 | 235,753 |
| Hartford Financial Services Group, Inc. | | 2,860 | 277,105 |
| Marsh & McLennan Companies, Inc. | | 1,721 | 343,219 |
| Progressive Corp. | | 1,636 | 340,697 |
| Reinsurance Group of America, Inc. | | 1,359 | 254,119 |
| Selective Insurance Group, Inc. | | 2,600 | 264,290 |
| The Travelers Companies, Inc. | | 1,521 | 322,695 |
| | | | 3,580,938 |
TOTAL FINANCIALS | | | 4,937,082 |
| HEALTH CARE - 19.4% | | | |
| Biotechnology - 4.4% | | | |
| AbbVie, Inc. | | 1,527 | 248,351 |
| Biogen, Inc. (a) | | 309 | 66,379 |
| Exelixis, Inc. (a) | | 11,842 | 277,813 |
| Gilead Sciences, Inc. | | 3,557 | 231,916 |
| Incyte Corp. (a) | | 4,254 | 221,421 |
| Regeneron Pharmaceuticals, Inc. (a) | | 359 | 319,747 |
| | | | 1,365,627 |
| Health Care Equipment & Supplies - 2.6% | | | |
| Abbott Laboratories | | 2,051 | 217,344 |
| Boston Scientific Corp. (a) | | 4,075 | 292,870 |
| Hologic, Inc. (a) | | 1,100 | 83,347 |
| Stryker Corp. | | 649 | 218,389 |
| | | | 811,950 |
| Health Care Providers & Services - 7.4% | | | |
| Cencora, Inc. | | 1,362 | 325,586 |
| Centene Corp. (a) | | 2,972 | 217,134 |
| Chemed Corp. | | 414 | 235,152 |
| Cigna Group | | 938 | 334,904 |
| CVS Health Corp. | | 3,095 | 209,562 |
| Elevance Health, Inc. | | 473 | 250,018 |
| Molina Healthcare, Inc. (a) | | 633 | 216,549 |
| Quest Diagnostics, Inc. | | 1,609 | 222,332 |
| UnitedHealth Group, Inc. | | 564 | 272,807 |
| | | | 2,284,044 |
| Life Sciences Tools & Services - 1.4% | | | |
| Danaher Corp. | | 718 | 177,073 |
| Thermo Fisher Scientific, Inc. | | 438 | 249,099 |
| | | | 426,172 |
| Pharmaceuticals - 3.6% | | | |
| AstraZeneca PLC (United Kingdom) | | 1,950 | 294,935 |
| Eli Lilly & Co. | | 424 | 331,186 |
| Merck & Co., Inc. | | 2,551 | 329,640 |
| Roche Holding AG (participation certificate) | | 621 | 148,800 |
| | | | 1,104,561 |
TOTAL HEALTH CARE | | | 5,992,354 |
| INDUSTRIALS - 10.7% | | | |
| Aerospace & Defense - 3.4% | | | |
| General Dynamics Corp. | | 866 | 248,620 |
| General Electric Co. | | 1,693 | 273,961 |
| Lockheed Martin Corp. | | 538 | 250,132 |
| Northrop Grumman Corp. | | 586 | 284,228 |
| | | | 1,056,941 |
| Commercial Services & Supplies - 2.2% | | | |
| Republic Services, Inc. | | 1,958 | 375,350 |
| Waste Connections, Inc. (United States) | | 1,821 | 295,166 |
| | | | 670,516 |
| Construction & Engineering - 0.8% | | | |
| EMCOR Group, Inc. | | 727 | 259,663 |
| Electrical Equipment - 0.3% | | | |
| GE Vernova LLC | | 498 | 76,548 |
| Ground Transportation - 1.7% | | | |
| CSX Corp. | | 3,200 | 106,304 |
| Landstar System, Inc. | | 1,486 | 259,173 |
| Union Pacific Corp. | | 700 | 166,012 |
| | | | 531,489 |
| Professional Services - 2.3% | | | |
| CACI International, Inc. Class A (a) | | 763 | 306,901 |
| Leidos Holdings, Inc. | | 1,835 | 257,304 |
| Science Applications International Corp. | | 1,133 | 145,817 |
| | | | 710,022 |
TOTAL INDUSTRIALS | | | 3,305,179 |
| INFORMATION TECHNOLOGY - 17.6% | | | |
| Communications Equipment - 1.6% | | | |
| Cisco Systems, Inc. | | 5,018 | 235,746 |
| Motorola Solutions, Inc. | | 783 | 265,554 |
| | | | 501,300 |
| Electronic Equipment, Instruments & Components - 4.0% | | | |
| Amphenol Corp. Class A | | 1,924 | 232,361 |
| CDW Corp. | | 981 | 237,265 |
| Insight Enterprises, Inc. (a) | | 1,715 | 313,108 |
| Keyence Corp. | | 542 | 241,732 |
| TD SYNNEX Corp. | | 1,931 | 227,549 |
| | | | 1,252,015 |
| IT Services - 2.1% | | | |
| Accenture PLC Class A | | 827 | 248,853 |
| Amdocs Ltd. | | 2,812 | 236,180 |
| IBM Corp. | | 900 | 149,580 |
| | | | 634,613 |
| Semiconductors & Semiconductor Equipment - 0.4% | | | |
| Analog Devices, Inc. | | 633 | 126,986 |
| Software - 9.0% | | | |
| Blackbaud, Inc. (a) | | 1,512 | 117,815 |
| CCC Intelligent Solutions Holdings, Inc. Class A (a) | | 20,677 | 231,996 |
| CommVault Systems, Inc. (a) | | 3,210 | 328,929 |
| Manhattan Associates, Inc. (a) | | 1,196 | 246,448 |
| Microsoft Corp. | | 898 | 349,618 |
| PTC, Inc. (a) | | 1,814 | 321,876 |
| Roper Technologies, Inc. | | 616 | 315,059 |
| Salesforce, Inc. | | 1,047 | 281,580 |
| SAP SE sponsored ADR | | 1,146 | 207,667 |
| ServiceNow, Inc. (a) | | 306 | 212,159 |
| Workday, Inc. Class A (a) | | 768 | 187,953 |
| | | | 2,801,100 |
| Technology Hardware, Storage & Peripherals - 0.5% | | | |
| FUJIFILM Holdings Corp. ADR (b) | | 13,752 | 146,046 |
TOTAL INFORMATION TECHNOLOGY | | | 5,462,060 |
| MATERIALS - 2.7% | | | |
| Chemicals - 1.9% | | | |
| Ecolab, Inc. | | 1,030 | 232,935 |
| Linde PLC | | 794 | 350,122 |
| | | | 583,057 |
| Containers & Packaging - 0.8% | | | |
| Aptargroup, Inc. | | 1,750 | 252,665 |
TOTAL MATERIALS | | | 835,722 |
| UTILITIES - 2.9% | | | |
| Electric Utilities - 2.4% | | | |
| Allete, Inc. | | 3,628 | 214,850 |
| Duke Energy Corp. | | 1,100 | 108,086 |
| PPL Corp. | | 4,868 | 133,675 |
| Southern Co. | | 3,963 | 291,281 |
| | | | 747,892 |
| Multi-Utilities - 0.5% | | | |
| Public Service Enterprise Group, Inc. | | 2,000 | 138,160 |
TOTAL UTILITIES | | | 886,052 |
| TOTAL COMMON STOCKS (Cost $25,641,983) | | | 30,727,055 |
| | | | |
| Money Market Funds - 0.7% |
| | | Shares | Value ($) |
Fidelity Securities Lending Cash Central Fund 5.39% (c)(d) (Cost $213,750) | | 213,729 | 213,750 |
| | | | |
| Equity Funds - 0.2% |
| | | Shares | Value ($) |
| Domestic Equity Funds - 0.2% | | | |
iShares MSCI USA Minimum Volatility ETF (Cost $73,775) | | 900 | 72,405 |
| | | | |
| TOTAL INVESTMENT IN SECURITIES - 100.2% (Cost $25,929,508) | 31,013,210 |
NET OTHER ASSETS (LIABILITIES) - (0.2)% | (50,099) |
| NET ASSETS - 100.0% | 30,963,111 |
| | |
Security Type Abbreviations
Legend
| (b) | Security or a portion of the security is on loan at period end. |
| (c) | Affiliated fund that is generally available only to investment companies and other accounts managed by Fidelity Investments. The rate quoted is the annualized seven-day yield of the fund at period end. A complete unaudited listing of the fund's holdings as of its most recent quarter end is available upon request. In addition, each Fidelity Central Fund's financial statements, which are not covered by the Fund's Report of Independent Registered Public Accounting Firm, are available on the SEC's website or upon request. |
| (d) | Investment made with cash collateral received from securities on loan. |
Affiliated Central Funds
Fiscal year to date information regarding the Fund's investments in Fidelity Central Funds, including the ownership percentage, is presented below.
| Affiliate | Value, beginning of period ($) | Purchases ($) | Sales Proceeds ($) | Dividend Income ($) | Realized Gain (loss) ($) | Change in Unrealized appreciation (depreciation) ($) | Value, end of period ($) | % ownership, end of period |
| Fidelity Cash Central Fund 5.39% | 255,294 | 21,023,280 | 21,278,575 | 19,089 | 1 | - | - | 0.0% |
| Fidelity Securities Lending Cash Central Fund 5.39% | 1,701,129 | 16,330,539 | 17,817,918 | 11,353 | - | - | 213,750 | 0.0% |
| Total | 1,956,423 | 37,353,819 | 39,096,493 | 30,442 | 1 | - | 213,750 | |
| | | | | | | | | |
Amounts in the dividend income column in the above table include any capital gain distributions from underlying funds, which are presented in the corresponding line item in the Statement of Operations, if applicable.
Amounts in the dividend income column for Fidelity Securities Lending Cash Central Fund represents the income earned on investing cash collateral, less rebates paid to borrowers and any lending agent fees associated with the loan, plus any premium payments received for lending certain types of securities.
Amounts included in the purchases and sales proceeds columns may include in-kind transactions, if applicable.
Investment Valuation
The following is a summary of the inputs used, as of April 30, 2024, involving the Fund's assets and liabilities carried at fair value. The inputs or methodology used for valuing securities may not be an indication of the risk associated with investing in those securities. For more information on valuation inputs, and their aggregation into the levels used below, please refer to the Investment Valuation section in the accompanying Notes to Financial Statements.
| Valuation Inputs at Reporting Date: |
| Description | Total ($) | Level 1 ($) | Level 2 ($) | Level 3 ($) |
Investments in Securities: | | | | |
|
| Equities: | | | | |
Communication Services | 1,333,428 | 1,333,428 | - | - |
Consumer Discretionary | 1,713,766 | 1,713,766 | - | - |
Consumer Staples | 4,559,295 | 4,559,295 | - | - |
Energy | 1,702,117 | 1,702,117 | - | - |
Financials | 4,937,082 | 4,937,082 | - | - |
Health Care | 5,992,354 | 5,548,619 | 443,735 | - |
Industrials | 3,305,179 | 3,305,179 | - | - |
Information Technology | 5,462,060 | 5,462,060 | - | - |
Materials | 835,722 | 835,722 | - | - |
Utilities | 886,052 | 886,052 | - | - |
|
| Money Market Funds | 213,750 | 213,750 | - | - |
|
| Equity Funds | 72,405 | 72,405 | - | - |
| Total Investments in Securities: | 31,013,210 | 30,569,475 | 443,735 | - |
| Statement of Assets and Liabilities |
| | | | April 30, 2024 |
| | | | | |
| Assets | | | | |
| Investment in securities, at value (including securities loaned of $201,673) - See accompanying schedule: | | | | |
Unaffiliated issuers (cost $25,715,758) | $ | 30,799,460 | | |
Fidelity Central Funds (cost $213,750) | | 213,750 | | |
| | | | | |
| | | | | |
| Total Investment in Securities (cost $25,929,508) | | | $ | 31,013,210 |
| Receivable for investments sold | | | | 618,997 |
| Receivable for fund shares sold | | | | 3,224 |
| Dividends receivable | | | | 23,704 |
| Reclaims receivable | | | | 77,655 |
| Distributions receivable from Fidelity Central Funds | | | | 1,218 |
| Prepaid expenses | | | | 70 |
| Receivable from investment adviser for expense reductions | | | | 2,236 |
Total assets | | | | 31,740,314 |
| Liabilities | | | | |
| Payable to custodian bank | $ | 75,445 | | |
| Payable for investments purchased | | 429,429 | | |
| Payable for fund shares redeemed | | 5,895 | | |
| Accrued management fee | | 14,836 | | |
| Other payables and accrued expenses | | 37,848 | | |
| Collateral on securities loaned | | 213,750 | | |
| Total liabilities | | | | 777,203 |
| Net Assets | | | $ | 30,963,111 |
| Net Assets consist of: | | | | |
| Paid in capital | | | $ | 25,915,982 |
| Total accumulated earnings (loss) | | | | 5,047,129 |
| Net Assets | | | $ | 30,963,111 |
Net Asset Value, offering price and redemption price per share ($30,963,111 ÷ 2,765,295 shares) | | | $ | 11.20 |
| Statement of Operations |
| | | | Year ended April 30, 2024 |
| Investment Income | | | | |
| Dividends | | | $ | 2,690,831 |
| Income from Fidelity Central Funds (including $11,353 from security lending) | | | | 30,442 |
| Total income | | | | 2,721,273 |
| Expenses | | | | |
| Management fee | $ | 653,653 | | |
| Transfer agent fees | | 253,217 | | |
| Accounting fees | | 51,752 | | |
| Custodian fees and expenses | | 15,914 | | |
| Independent trustees' fees and expenses | | 892 | | |
| Registration fees | | 25,836 | | |
| Audit | | 43,793 | | |
| Legal | | 439 | | |
| Miscellaneous | | 763 | | |
| Total expenses before reductions | | 1,046,259 | | |
| Expense reductions | | (15,829) | | |
| Total expenses after reductions | | | | 1,030,430 |
| Net Investment income (loss) | | | | 1,690,843 |
| Realized and Unrealized Gain (Loss) | | | | |
| Net realized gain (loss) on: | | | | |
| Investment Securities: | | | | |
| Unaffiliated issuers | | 6,626,439 | | |
| Redemptions in-kind | | 24,654,864 | | |
| Fidelity Central Funds | | 1 | | |
| Foreign currency transactions | | (853) | | |
| Total net realized gain (loss) | | | | 31,280,451 |
| Change in net unrealized appreciation (depreciation) on: | | | | |
| Investment Securities: | | | | |
| Unaffiliated issuers | | (19,648,357) | | |
| Assets and liabilities in foreign currencies | | (2,112) | | |
| Total change in net unrealized appreciation (depreciation) | | | | (19,650,469) |
| Net gain (loss) | | | | 11,629,982 |
| Net increase (decrease) in net assets resulting from operations | | | $ | 13,320,825 |
| Statement of Changes in Net Assets |
| |
| | Year ended April 30, 2024 | | Year ended April 30, 2023 |
| Increase (Decrease) in Net Assets | | | | |
| Operations | | | | |
| Net investment income (loss) | $ | 1,690,843 | $ | 3,848,130 |
| Net realized gain (loss) | | 31,280,451 | | (2,220,656) |
| Change in net unrealized appreciation (depreciation) | | (19,650,469) | | (8,987,256) |
| Net increase (decrease) in net assets resulting from operations | | 13,320,825 | | (7,359,782) |
| Distributions to shareholders | | (2,899,631) | | (16,179,737) |
| | | | | |
| Share transactions | | | | |
| Proceeds from sales of shares | | 14,238,685 | | 86,979,419 |
| Reinvestment of distributions | | 2,864,385 | | 16,070,098 |
| Cost of shares redeemed | | (203,454,396) | | (229,448,009) |
| | | | | |
Net increase (decrease) in net assets resulting from share transactions | | (186,351,326) | | (126,398,492) |
| Total increase (decrease) in net assets | | (175,930,132) | | (149,938,011) |
| | | | | |
| Net Assets | | | | |
| Beginning of period | | 206,893,243 | | 356,831,254 |
| End of period | $ | 30,963,111 | $ | 206,893,243 |
| | | | | |
| Other Information | | | | |
| Shares | | | | |
| Sold | | 1,355,755 | | 8,496,394 |
| Issued in reinvestment of distributions | | 275,401 | | 1,595,671 |
| Redeemed | | (18,859,577) | | (22,844,639) |
| Net increase (decrease) | | (17,228,421) | | (12,752,574) |
| | | | | |
Financial Highlights
Fidelity® U.S. Low Volatility Equity Fund |
| |
| Years ended April 30, | | 2024 | | 2023 | | 2022 | | 2021 | | 2020 A |
Selected Per-Share Data | | | | | | | | | | |
| Net asset value, beginning of period | $ | 10.35 | $ | 10.90 | $ | 11.49 | $ | 9.23 | $ | 10.00 |
| Income from Investment Operations | | | | | | | | | | |
Net investment income (loss) B,C | | .12 | | .13 | | .08 | | .08 | | .05 |
| Net realized and unrealized gain (loss) | | .91 | | (.17) | | (.03) | | 2.25 | | (.79) |
| Total from investment operations | | 1.03 | | (.04) | | .05 | | 2.33 | | (.74) |
| Distributions from net investment income | | (.12) | | (.13) | | (.08) | | (.07) | | (.03) |
| Distributions from net realized gain | | (.06) | | (.38) | | (.56) | | - | | - |
| Total distributions | | (.18) | | (.51) | | (.64) | | (.07) | | (.03) |
| Net asset value, end of period | $ | 11.20 | $ | 10.35 | $ | 10.90 | $ | 11.49 | $ | 9.23 |
Total Return D,E | | | | (.22)% | | .12% | | 25.27% | | (7.44)% |
Ratios to Average Net Assets C,F,G | | | | | | | | | | |
| Expenses before reductions | | .68% | | .66% | | .73% | | .77% | | 2.28% H |
| Expenses net of fee waivers, if any | | | | .66% | | .72% | | .77% | | .95% H |
| Expenses net of all reductions | | .67% | | .66% | | .72% | | .77% | | .95% H |
| Net investment income (loss) | | 1.11% | | 1.28% | | .71% | | .79% | | 1.46% H |
| Supplemental Data | | | | | | | | | | |
| Net assets, end of period (000 omitted) | $ | 30,963 | $ | 206,893 | $ | 356,831 | $ | 361,699 | $ | 294,690 |
Portfolio turnover rate I | | | | 69% | | 46% | | 39% | | 101% J,K |
AFor the period November 5, 2019 (commencement of operations) through April 30, 2020.
BCalculated based on average shares outstanding during the period.
CNet investment income (loss) is affected by the timing of the declaration of dividends by any underlying mutual funds or exchange-traded funds (ETFs). Net investment income (loss) of any mutual funds or ETFs is not included in the Fund's net investment income (loss) ratio.
DTotal returns for periods of less than one year are not annualized.
ETotal returns would have been lower if certain expenses had not been reduced during the applicable periods shown.
FFees and expenses of any underlying mutual funds or exchange-traded funds (ETFs) are not included in the Fund's expense ratio. The Fund indirectly bears its proportionate share of these expenses. For additional expense information related to investments in Fidelity Central Funds, please refer to the "Investments in Fidelity Central Funds" note found in the Notes to Financial Statements section of the most recent Annual or Semi-Annual report.
GExpense ratios reflect operating expenses of the class. Expenses before reductions do not reflect amounts reimbursed, waived, or reduced through arrangements with the investment adviser, brokerage services, or other offset arrangements, if applicable, and do not represent the amount paid by the class during periods when reimbursements, waivers or reductions occur.
HAnnualized.
IAmount does not include the portfolio activity of any underlying mutual funds or exchange-traded funds (ETFs).
JPortfolio turnover rate excludes securities received or delivered in-kind.
KAmount not annualized.
For the period ended April 30, 2024
1. Organization.
Fidelity U.S. Low Volatility Equity Fund (the Fund) is a fund of Fidelity Summer Street Trust (the Trust) and is authorized to issue an unlimited number of shares. Share transactions on the Statement of Changes in Net Assets may contain exchanges between affiliated funds. The Trust is registered under the Investment Company Act of 1940, as amended (the 1940 Act), as an open-end management investment company organized as a Massachusetts business trust.
2. Investments in Fidelity Central Funds.
Funds may invest in Fidelity Central Funds, which are open-end investment companies generally available only to other investment companies and accounts managed by the investment adviser and its affiliates. The Schedule of Investments lists any Fidelity Central Funds held as an investment as of period end, but does not include the underlying holdings of each Fidelity Central Fund. An investing fund indirectly bears its proportionate share of the expenses of the underlying Fidelity Central Funds.
Based on its investment objective, each Fidelity Central Fund may invest or participate in various investment vehicles or strategies that are similar to those of the investing fund. These strategies are consistent with the investment objectives of the investing fund and may involve certain economic risks which may cause a decline in value of each of the Fidelity Central Funds and thus a decline in the value of the investing fund.
| Fidelity Central Fund | Investment Manager | Investment Objective | Investment Practices | Expense RatioA |
| Fidelity Money Market Central Funds | Fidelity Management & Research Company LLC (FMR) | Each fund seeks to obtain a high level of current income consistent with the preservation of capital and liquidity. | Short-term Investments | Less than .005% |
A Expenses expressed as a percentage of average net assets and are as of each underlying Central Fund's most recent annual or semi-annual shareholder report.
A complete unaudited list of holdings for each Fidelity Central Fund is available upon request or at the Securities and Exchange Commission website at www.sec.gov. In addition, the financial statements of the Fidelity Central Funds which contain the significant accounting policies (including investment valuation policies) of those funds, and are not covered by the Report of Independent Registered Public Accounting Firm, are available on the Securities and Exchange Commission website or upon request.
3. Significant Accounting Policies.
The Fund is an investment company and applies the accounting and reporting guidance of the Financial Accounting Standards Board (FASB) Accounting Standards Codification Topic 946 Financial Services - Investment Companies. The financial statements have been prepared in conformity with accounting principles generally accepted in the United States of America (GAAP), which require management to make certain estimates and assumptions at the date of the financial statements. Actual results could differ from those estimates. Subsequent events, if any, through the date that the financial statements were issued have been evaluated in the preparation of the financial statements. The Fund's Schedule of Investments lists any underlying mutual funds or exchange-traded funds (ETFs) but does not include the underlying holdings of these funds. The following summarizes the significant accounting policies of the Fund:
Investment Valuation. Investments are valued as of 4:00 p.m. Eastern time on the last calendar day of the period. The Board of Trustees (the Board) has designated the Fund's investment adviser as the valuation designee responsible for the fair valuation function and performing fair value determinations as needed. The investment adviser has established a Fair Value Committee (the Committee) to carry out the day-to-day fair valuation responsibilities and has adopted policies and procedures to govern the fair valuation process and the activities of the Committee. In accordance with these fair valuation policies and procedures, which have been approved by the Board, the Fund attempts to obtain prices from one or more third party pricing services or brokers to value its investments. When current market prices, quotations or currency exchange rates are not readily available or reliable, investments will be fair valued in good faith by the Committee, in accordance with the policies and procedures. Factors used in determining fair value vary by investment type and may include market or investment specific events, transaction data, estimated cash flows, and market observations of comparable investments. The frequency that the fair valuation procedures are used cannot be predicted and they may be utilized to a significant extent. The Committee manages the Fund's fair valuation practices and maintains the fair valuation policies and procedures. The Fund's investment adviser reports to the Board information regarding the fair valuation process and related material matters.
The Fund categorizes the inputs to valuation techniques used to value its investments into a disclosure hierarchy consisting of three levels as shown below:
Level 1 - unadjusted quoted prices in active markets for identical investments
Level 2 - other significant observable inputs (including quoted prices for similar investments, interest rates, prepayment speeds, etc.)
Level 3 - unobservable inputs (including the Fund's own assumptions based on the best information available)
Valuation techniques used to value the Fund's investments by major category are as follows:
Equity securities, including restricted securities, for which market quotations are readily available, are valued at the last reported sale price or official closing price as reported by a third party pricing service on the primary market or exchange on which they are traded and are categorized as Level 1 in the hierarchy. In the event there were no sales during the day or closing prices are not available, securities are valued at the last quoted bid price or may be valued using the last available price and are generally categorized as Level 2 in the hierarchy. For foreign equity securities, when market or security specific events arise, comparisons to the valuation of American Depositary Receipts (ADRs), futures contracts, Exchange-Traded Funds (ETFs) and certain indexes as well as quoted prices for similar securities may be used and would be categorized as Level 2 in the hierarchy. For equity securities, including restricted securities, where observable inputs are limited, assumptions about market activity and risk are used and these securities may be categorized as Level 3 in the hierarchy.
Exchange-Traded Funds (ETFs) are valued at their last sale price or official closing price as reported by a third party pricing service on the primary market or exchange on which they are traded and are categorized as Level 1 in the hierarchy. In the event there were no sales during the day but the exchange reports a closing bid level, ETFs are valued at the closing bid and would be categorized as Level 1 in the hierarchy. In the event there was no closing bid, ETFs may be valued by another method that the Board believes reflects fair value in accordance with the Board's fair value pricing policies and may be categorized as Level 2 in the hierarchy.
Investments in open-end mutual funds, including the Fidelity Central Funds, are valued at their closing net asset value (NAV) each business day and are categorized as Level 1 in the hierarchy.
Changes in valuation techniques may result in transfers in or out of an assigned level within the disclosure hierarchy. The aggregate value of investments by input level as of April 30, 2024 is included at the end of the Fund's Schedule of Investments.
Foreign Currency. Certain Funds may use foreign currency contracts to facilitate transactions in foreign-denominated securities. Gains and losses from these transactions may arise from changes in the value of the foreign currency or if the counterparties do not perform under the contracts' terms.
Foreign-denominated assets, including investment securities, and liabilities are translated into U.S. dollars at the exchange rates at period end. Purchases and sales of investment securities, income and dividends received, and expenses denominated in foreign currencies are translated into U.S. dollars at the exchange rate in effect on the transaction date.
The effects of exchange rate fluctuations on investments are included with the net realized and unrealized gain (loss) on investment securities. Other foreign currency transactions resulting in realized and unrealized gain (loss) are disclosed separately.
Investment Transactions and Income. For financial reporting purposes, the Fund's investment holdings and NAV include trades executed through the end of the last business day of the period. The NAV per share for processing shareholder transactions is calculated as of the close of business of the New York Stock Exchange (NYSE), normally 4:00 p.m. Eastern time and includes trades executed through the end of the prior business day. Gains and losses on securities sold are determined on the basis of identified cost. Commissions paid to certain brokers with whom the investment adviser, or its affiliates, places trades on behalf of a fund include an amount in addition to trade execution, which may be rebated back to a fund. Any such rebates are included in net realized gain (loss) on investments in the Statement of Operations. Dividend income is recorded on the ex-dividend date, except for certain dividends from foreign securities where the ex-dividend date may have passed, which are recorded as soon as the Fund is informed of the ex-dividend date. Non-cash dividends included in dividend income, if any, are recorded at the fair market value of the securities received. Income and capital gain distributions from Fidelity Central Funds, if any, are recorded on the ex-dividend date. Certain distributions received by the Fund represent a return of capital or capital gain. The Fund determines the components of these distributions subsequent to the ex-dividend date, based upon receipt of tax filings or other correspondence relating to the underlying investment. These distributions are recorded as a reduction of cost of investments and/or as a realized gain. Investment income is recorded net of foreign taxes withheld where recovery of such taxes is uncertain. Funds may file withholding tax reclaims in certain jurisdictions to recover a portion of amounts previously withheld. Any withholding tax reclaims income is included in the Statement of Operations in dividends. Any receivables for withholding tax reclaims are included in the Statement of Assets and Liabilities in reclaims receivable.
Expenses. Expenses directly attributable to a fund are charged to that fund. Expenses attributable to more than one fund are allocated among the respective funds on the basis of relative net assets or other appropriate methods. Expenses included in the accompanying financial statements reflect the expenses of that fund and do not include any expenses associated with any underlying mutual funds or exchange-traded funds. Although not included in a fund's expenses, a fund indirectly bears its proportionate share of these expenses through the net asset value of each underlying mutual fund or exchange-traded fund. Expense estimates are accrued in the period to which they relate and adjustments are made when actual amounts are known.
Income Tax Information and Distributions to Shareholders. Each year, the Fund intends to qualify as a regulated investment company under Subchapter M of the Internal Revenue Code, including distributing substantially all of its taxable income and realized gains. As a result, no provision for U.S. Federal income taxes is required. As of April 30, 2024, the Fund did not have any unrecognized tax benefits in the financial statements; nor is the Fund aware of any tax positions for which it is reasonably possible that the total amounts of unrecognized tax benefits will significantly change in the next twelve months. The Fund files a U.S. federal tax return, in addition to state and local tax returns as required. The Fund's federal income tax returns are subject to examination by the Internal Revenue Service (IRS) for a period of three fiscal years after they are filed. State and local tax returns may be subject to examination for an additional fiscal year depending on the jurisdiction. Foreign taxes are provided for based on the Fund's understanding of the tax rules and rates that exist in the foreign markets in which it invests.
Distributions are declared and recorded on the ex-dividend date. Income and capital gain distributions are determined in accordance with income tax regulations, which may differ from GAAP. In addition, the Fund claimed a portion of the payment made to redeeming shareholders as a distribution for income tax purposes.
Capital accounts within the financial statements are adjusted for permanent book-tax differences. These adjustments have no impact on net assets or the results of operations. Capital accounts are not adjusted for temporary book-tax differences which will reverse in a subsequent period.
Book-tax differences are primarily due to foreign currency transactions, redemptions in-kind and losses deferred due to wash sales.
As of period end, the cost and unrealized appreciation (depreciation) in securities, and derivatives if applicable, for federal income tax purposes were as follows:
| Gross unrealized appreciation | $5,985,348 |
| Gross unrealized depreciation | (936,182) |
| Net unrealized appreciation (depreciation) | $5,049,166 |
| Tax Cost | $25,964,044 |
The tax-based components of distributable earnings as of period end were as follows:
| Undistributed tax-exempt income | $- |
| Undistributed ordinary income | $- |
| Net unrealized appreciation (depreciation) on securities and other investments | $5,048,782 |
The tax character of distributions paid was as follows:
| | April 30, 2024 | April 30, 2023 |
| Ordinary Income | $1,962,214 | $3,896,000 |
| Long-term Capital Gains | 937,417 | 12,283,737 |
| Total | $2,899,631 | $16,179,737 |
4. Purchases and Sales of Investments.
Purchases and sales of securities, other than short-term securities and in-kind transactions, as applicable, are noted in the table below.
| | Purchases ($) | Sales ($) |
| Fidelity U.S. Low Volatility Equity Fund | 72,635,961 | 116,560,517 |
5. Fees and Other Transactions with Affiliates.
Management Fee. Fidelity Management & Research Company LLC (the investment adviser) and its affiliates provide the Fund with investment management related services for which the Fund pays a monthly management fee.
Effective March 1, 2024, the Fund's management contract was amended to incorporate administrative services previously covered under separate services agreements (Transfer Agent and Accounting agreements). Any reference to "class" in this note shall mean "the Fund" as the Fund currently offers only one class of shares. The amended contract incorporates a management fee rate that may vary by class. The investment adviser or an affiliate pays certain expenses of managing and operating the Fund out of each class's management fee. Each class of the Fund pays a management fee to the investment adviser. The management fee is calculated and paid to the investment adviser every month. When determining a class's management fee, a mandate rate is calculated based on the monthly average net assets of a group of funds advised by FMR within a designated asset class. A discount rate is subtracted from the mandate rate once the Fund's monthly average net assets reach a certain level. The mandate rate and discount rate may vary by class. The annual management fee rate for a class of shares of the Fund is the lesser of (1) the class's mandate rate reduced by the class's discount rate (if applicable) or (2) the amount set forth in the following table.
| | Maximum Management Fee Rate % |
| Fidelity U.S. Low Volatility Equity Fund | .59 |
One-twelfth of the management fee rate for a class is applied to the average net assets of the class for the month, giving a dollar amount which is the management fee for the class for that month. A different management fee rate may be applicable to each class of the Fund. The difference between classes is the result of separate arrangements for class-level services and/or waivers of certain expenses. It is not the result of any difference in advisory or custodial fees or other expenses related to the management of the Fund's assets, which do not vary by class. For the portion of the reporting period on or after March 1, 2024, the total annualized management fee rates were as follows:
| | Total Management Fee Rate % |
| Fidelity U.S. Low Volatility Equity Fund | .58 |
Prior to March 1, 2024, the management fee was the sum of an individual fund fee rate that was based on an annual rate of .20% of the Fund's average net assets and an annualized group fee rate that averaged .22% during the period. The group fee rate was based upon the monthly average net assets of a group of registered investment companies with which the investment adviser has management contracts. The group fee rate decreased as assets under management increased and increased as assets under management decreased. For the portion of the reporting period prior to March 1, 2024, the total annualized management fee rate was .42%.
Effective March 1, 2024, the Fund's sub-advisory agreements with FMR Investment Management (UK) Limited, Fidelity Management & Research (Hong Kong) Limited, and Fidelity Management & Research (Japan) Limited were amended to provide that the investment adviser pays each sub-adviser monthly fees equal to 110% of the sub-adviser's costs for providing sub-advisory services.
Transfer Agent Fees. Fidelity Investments Institutional Operations Company LLC (FIIOC), an affiliate of the investment adviser, is the Fund's transfer, dividend disbursing and shareholder servicing agent. Effective March 1, 2024, each Fund's management contract was amended to incorporate transfer agent services and associated fees previously covered under a separate services agreement. FIIOC pays for typesetting, printing and mailing of shareholder reports, except proxy statements.
During November 2023, the Board approved a change in the transfer agent fees effective December 1, 2023 to a fixed annual rate of average net assets of .1737%.
Prior to December 1, 2023, FIIOC received account fees and asset-based fees that varied according to account size and type of account.
For the portion of the reporting period prior to March 1, 2024, the fees were equivalent to the annualized rate of .17% of average net assets.
Accounting Fees. Fidelity Service Company, Inc. (FSC), an affiliate of the investment adviser, maintains the Fund's accounting records. Effective March 1, 2024, the Fund's management contract was amended to incorporate accounting services and associated fees previously covered under a separate services agreement.
During November 2023, the Board approved a change in the accounting fees effective December 1, 2023 to a fixed annual rate of average net assets as follows:
| | % of Average Net Assets |
| Fidelity U.S. Low Volatility Equity Fund | .0353 |
Prior to December 1, 2023, the accounting fee was based on the level of average net assets for each month. For the portion of the reporting period prior to March 1, 2024, the fees were equivalent to the following annualized rates:
| | % of Average Net Assets |
| Fidelity U.S. Low Volatility Equity Fund | .04 |
Brokerage Commissions. A portion of portfolio transactions were placed with brokerage firms which are affiliates of the investment adviser. Brokerage commissions are included in net realized gain (loss) and change in net unrealized appreciation (depreciation) in the Statement of Operations. The commissions paid to these affiliated firms were as follows:
| | Amount ($) |
| Fidelity U.S. Low Volatility Equity Fund | 1,055 |
Interfund Trades. Funds may purchase from or sell securities to other Fidelity Funds under procedures adopted by the Board. The procedures have been designed to ensure these interfund trades are executed in accordance with Rule 17a-7 of the 1940 Act. Any interfund trades are included within the respective purchases and sales amounts shown in the Purchases and Sales of Investments note. Interfund trades during the period are noted in the table below.
| | Purchases ($) | Sales ($) | Realized Gain (Loss)($) |
| Fidelity U.S. Low Volatility Equity Fund | 849,852 | 2,685,272 | 778,867 |
Affiliated Redemptions In-Kind. Shares that were redeemed in-kind for investments, including accrued interest and cash, if any, are shown in the table below. The net realized gain or loss on investments delivered through in-kind redemptions is included in the "Net realized gain (loss) on: Redemptions in-kind" line in the accompanying Statement of Operations. The amount of the in-kind redemptions is included in share transactions in the accompanying Statement of Changes in Net Assets. There was no gain or loss for federal income tax purposes.
| | Shares | Total net realized gain or loss ($) | Total Proceeds ($) |
| Fidelity U.S. Low Volatility Equity Fund | 12,998,678 | 24,654,864 | 141,738,370 |
6. Committed Line of Credit.
Certain Funds participate with other funds managed by the investment adviser or an affiliate in a $4.25 billion credit facility (the "line of credit") to be utilized for temporary or emergency purposes to fund shareholder redemptions or for other short-term liquidity purposes. The participating funds have agreed to pay commitment fees on their pro-rata portion of the line of credit, which are reflected in Miscellaneous expenses on the Statement of Operations, and are listed below. During the period, there were no borrowings on this line of credit.
| | Amount ($) |
| Fidelity U.S. Low Volatility Equity Fund | 280 |
7. Security Lending.
Funds lend portfolio securities from time to time in order to earn additional income. Lending agents are used, including National Financial Services (NFS), an affiliate of the investment adviser. Pursuant to a securities lending agreement, NFS will receive a fee, which is capped at 9.9% of a fund's daily lending revenue, for its services as lending agent. A fund may lend securities to certain qualified borrowers, including NFS. On the settlement date of the loan, a fund receives collateral (in the form of U.S. Treasury obligations, letters of credit and/or cash) against the loaned securities and maintains collateral in an amount not less than 100% of the market value of the loaned securities during the period of the loan. The market value of the loaned securities is determined at the close of business of a fund and any additional required collateral is delivered to a fund on the next business day. A fund or borrower may terminate the loan at any time, and if the borrower defaults on its obligation to return the securities loaned because of insolvency or other reasons, a fund may apply collateral received from the borrower against the obligation. A fund may experience delays and costs in recovering the securities loaned. Any cash collateral received is invested in the Fidelity Securities Lending Cash Central Fund. Any loaned securities are identified as such in the Schedule of Investments, and the value of loaned securities and cash collateral at period end, as applicable, are presented in the Statement of Assets and Liabilities. Security lending income represents the income earned on investing cash collateral, less rebates paid to borrowers and any lending agent fees associated with the loan, plus any premium payments received for lending certain types of securities. Security lending income is presented in the Statement of Operations as a component of income from Fidelity Central Funds. Affiliated security lending activity, if any, was as follows:
| | Total Security Lending Fees Paid to NFS ($) | Security Lending Income From Securities Loaned to NFS ($) | Value of Securities Loaned to NFS at Period End ($) |
| Fidelity U.S. Low Volatility Equity Fund | 1,171 | - | - |
8. Expense Reductions.
The investment adviser voluntarily agreed to reimburse the Fund to the extent annual operating expenses exceeded .70% of average net assets. This reimbursement will remain in place through August 31, 2025. Some expenses, for example the compensation of the independent Trustees, and certain miscellaneous expenses such as proxy and shareholder meeting expenses, are excluded from this reimbursement. During the period this reimbursement reduced the Fund's expenses by $2,236.
In addition, during the period the investment adviser or an affiliate reimbursed and/or waived a portion of operating expenses in the amount of $13,593.
9. Other.
A fund's organizational documents provide former and current trustees and officers with a limited indemnification against liabilities arising in connection with the performance of their duties to the fund. In the normal course of business, a fund may also enter into contracts that provide general indemnifications. A fund's maximum exposure under these arrangements is unknown as this would be dependent on future claims that may be made against a fund. The risk of material loss from such claims is considered remote.
10. Risk and Uncertainties.
Many factors affect a fund's performance. Developments that disrupt global economies and financial markets, such as pandemics, epidemics, outbreaks of infectious diseases, war, terrorism, and environmental disasters, may significantly affect a fund's investment performance. The effects of these developments to a fund will be impacted by the types of securities in which a fund invests, the financial condition, industry, economic sector, and geographic location of an issuer, and a fund's level of investment in the securities of that issuer. Significant concentrations in security types, issuers, industries, sectors, and geographic locations may magnify the factors that affect a fund's performance.
To the Board of Trustees of Fidelity Summer Street Trust and Shareholders of Fidelity U.S. Low Volatility Equity Fund
Opinion on the Financial Statements
We have audited the accompanying statement of assets and liabilities, including the schedule of investments, of Fidelity U.S. Low Volatility Equity Fund (one of the funds constituting Fidelity Summer Street Trust, referred to hereafter as the "Fund") as of April 30, 2024, the related statement of operations for the year ended April 30, 2024, the statement of changes in net assets for each of the two years in the period ended April 30, 2024, including the related notes, and the financial highlights for each of the four years in the period ended April 30, 2024 and for the period November 5, 2019 (commencement of operations) through April 30, 2020 (collectively referred to as the "financial statements"). In our opinion, the financial statements present fairly, in all material respects, the financial position of the Fund as of April 30, 2024, the results of its operations for the year then ended, the changes in its net assets for each of the two years in the period ended April 30, 2024 and the financial highlights for each of the four years in the period ended April 30, 2024 and for the period November 5, 2019 (commencement of operations) through April 30, 2020 in conformity with accounting principles generally accepted in the United States of America.
Basis for Opinion
These financial statements are the responsibility of the Fund's management. Our responsibility is to express an opinion on the Fund's financial statements based on our audits. We are a public accounting firm registered with the Public Company Accounting Oversight Board (United States) (PCAOB) and are required to be independent with respect to the Fund in accordance with the U.S. federal securities laws and the applicable rules and regulations of the Securities and Exchange Commission and the PCAOB.
We conducted our audits of these financial statements in accordance with the standards of the PCAOB. Those standards require that we plan and perform the audit to obtain reasonable assurance about whether the financial statements are free of material misstatement, whether due to error or fraud.
Our audits included performing procedures to assess the risks of material misstatement of the financial statements, whether due to error or fraud, and performing procedures that respond to those risks. Such procedures included examining, on a test basis, evidence regarding the amounts and disclosures in the financial statements. Our audits also included evaluating the accounting principles used and significant estimates made by management, as well as evaluating the overall presentation of the financial statements. Our procedures included confirmation of securities owned as of April 30, 2024 by correspondence with the custodian and brokers; when replies were not received from brokers, we performed other auditing procedures. We believe that our audits provide a reasonable basis for our opinion.
/s/ PricewaterhouseCoopers LLP
Boston, Massachusetts
June 12, 2024
We have served as the auditor of one or more investment companies in the Fidelity group of funds since 1932.
The Trustees, Members of the Advisory Board (if any), and officers of the trust and fund, as applicable, are listed below. The Board of Trustees governs the fund and is responsible for protecting the interests of shareholders. The Trustees are experienced executives who meet periodically throughout the year to oversee the fund's activities, review contractual arrangements with companies that provide services to the fund, oversee management of the risks associated with such activities and contractual arrangements, and review the fund's performance. Except for Vijay Advani, each of the Trustees oversees 323 funds. Mr. Advani oversees 216 funds.
The Trustees hold office without limit in time except that (a) any Trustee may resign; (b) any Trustee may be removed by written instrument, signed by at least two-thirds of the number of Trustees prior to such removal; (c) any Trustee who requests to be retired or who has become incapacitated by illness or injury may be retired by written instrument signed by a majority of the other Trustees; and (d) any Trustee may be removed at any special meeting of shareholders by a two-thirds vote of the outstanding voting securities of the trust. Each Trustee who is not an interested person (as defined in the 1940 Act) of the trust and the fund is referred to herein as an Independent Trustee. Each Independent Trustee shall retire not later than the last day of the calendar year in which his or her 75th birthday occurs. The Independent Trustees may waive this mandatory retirement age policy with respect to individual Trustees. Officers and Advisory Board Members hold office without limit in time, except that any officer or Advisory Board Member may resign or may be removed by a vote of a majority of the Trustees at any regular meeting or any special meeting of the Trustees. Except as indicated, each individual has held the office shown or other offices in the same company for the past five years.
The fund's Statement of Additional Information (SAI) includes more information about the Trustees. To request a free copy, call Fidelity at 1-800-544-8544.
Experience, Skills, Attributes, and Qualifications of the Trustees. The Governance and Nominating Committee has adopted a statement of policy that describes the experience, qualifications, attributes, and skills that are necessary and desirable for potential Independent Trustee candidates (Statement of Policy). The Board believes that each Trustee satisfied at the time he or she was initially elected or appointed a Trustee, and continues to satisfy, the standards contemplated by the Statement of Policy. The Governance and Nominating Committee also engages professional search firms to help identify potential Independent Trustee candidates who have the experience, qualifications, attributes, and skills consistent with the Statement of Policy. From time to time, additional criteria based on the composition and skills of the current Independent Trustees, as well as experience or skills that may be appropriate in light of future changes to board composition, business conditions, and regulatory or other developments, have also been considered by the professional search firms and the Governance and Nominating Committee. In addition, the Board takes into account the Trustees' commitment and participation in Board and committee meetings, as well as their leadership of standing and ad hoc committees throughout their tenure.
In determining that a particular Trustee was and continues to be qualified to serve as a Trustee, the Board has considered a variety of criteria, none of which, in isolation, was controlling. The Board believes that, collectively, the Trustees have balanced and diverse experience, qualifications, attributes, and skills, which allow the Board to operate effectively in governing the fund and protecting the interests of shareholders. Information about the specific experience, skills, attributes, and qualifications of each Trustee, which in each case led to the Board's conclusion that the Trustee should serve (or continue to serve) as a trustee of the fund, is provided below.
Board Structure and Oversight Function. Robert A. Lawrence is an interested person and currently serves as Chair. The Trustees have determined that an interested Chair is appropriate and benefits shareholders because an interested Chair has a personal and professional stake in the quality and continuity of services provided to the fund. Independent Trustees exercise their informed business judgment to appoint an individual of their choosing to serve as Chair, regardless of whether the Trustee happens to be independent or a member of management. The Independent Trustees have determined that they can act independently and effectively without having an Independent Trustee serve as Chair and that a key structural component for assuring that they are in a position to do so is for the Independent Trustees to constitute a substantial majority for the Board. The Independent Trustees also regularly meet in executive session. David M. Thomas serves as Lead Independent Trustee and as such (i) acts as a liaison between the Independent Trustees and management with respect to matters important to the Independent Trustees and (ii) with management prepares agendas for Board meetings.
Fidelity® funds are overseen by different Boards of Trustees. The fund's Board oversees Fidelity's high income and certain equity funds, and other Boards oversee Fidelity's alternative investment, investment-grade bond, money market, asset allocation, and other equity funds. The asset allocation funds may invest in Fidelity® funds overseen by the fund's Board. The use of separate Boards, each with its own committee structure, allows the Trustees of each group of Fidelity® funds to focus on the unique issues of the funds they oversee, including common research, investment, and operational issues. On occasion, the separate Boards establish joint committees to address issues of overlapping consequences for the Fidelity® funds overseen by each Board.
The Trustees operate using a system of committees to facilitate the timely and efficient consideration of all matters of importance to the Trustees, the fund, and fund shareholders and to facilitate compliance with legal and regulatory requirements and oversight of the fund's activities and associated risks. The Board, acting through its committees, has charged FMR and its affiliates with (i) identifying events or circumstances the occurrence of which could have demonstrably adverse effects on the fund's business and/or reputation; (ii) implementing processes and controls to lessen the possibility that such events or circumstances occur or to mitigate the effects of such events or circumstances if they do occur; and (iii) creating and maintaining a system designed to evaluate continuously business and market conditions in order to facilitate the identification and implementation processes described in (i) and (ii) above. Because the day-to-day operations and activities of the fund are carried out by or through FMR, its affiliates, and other service providers, the fund's exposure to risks is mitigated but not eliminated by the processes overseen by the Trustees. While each of the Board's committees has responsibility for overseeing different aspects of the fund's activities, oversight is exercised primarily through the Operations, Audit, and Compliance Committees. Appropriate personnel, including but not limited to the fund's Chief Compliance Officer (CCO), FMR's internal auditor, the independent accountants, the fund's Treasurer and portfolio management personnel, make periodic reports to the Board's committees, as appropriate, including an annual review of Fidelity's risk management program for the Fidelity® funds. The responsibilities of each standing committee, including their oversight responsibilities, are described further under "Standing Committees of the Trustees."
Interested Trustees*:
Correspondence intended for a Trustee who is an interested person may be sent to Fidelity Investments, 245 Summer Street, Boston, Massachusetts 02210.
Name, Year of Birth; Principal Occupations and Other Relevant Experience+
Bettina Doulton (1964)
Year of Election or Appointment: 2020
Trustee
Ms. Doulton also serves as Trustee of other Fidelity® funds. Prior to her retirement, Ms. Doulton served in a variety of positions at Fidelity Investments, including as a managing director of research (2006-2007), portfolio manager to certain Fidelity® funds (1993-2005), equity analyst and portfolio assistant (1990-1993), and research assistant (1987-1990). Ms. Doulton currently owns and operates Cellardoor Winery. Previously, Ms. Doulton served as a member of the Board of Brown Capital Management, LLC (2014-2018).
Robert A. Lawrence (1952)
Year of Election or Appointment: 2020
Trustee
Chair of the Board of Trustees
Mr. Lawrence also serves as Trustee of other funds. Previously, Mr. Lawrence served as a Trustee and Member of the Advisory Board of certain funds. Prior to his retirement in 2008, Mr. Lawrence served as Vice President of certain Fidelity® funds (2006-2008), Senior Vice President, Head of High Income Division of Fidelity Management & Research Company (investment adviser firm, 2006-2008), and President of Fidelity Strategic Investments (investment adviser firm, 2002-2005).
* Determined to be an "Interested Trustee" by virtue of, among other things, his or her affiliation with the trust or various entities under common control with FMR.
+ The information includes the Trustee's principal occupation during the last five years and other information relating to the experience, attributes, and skills relevant to the Trustee's qualifications to serve as a Trustee, which led to the conclusion that the Trustee should serve as a Trustee for the fund.
Independent Trustees:
Correspondence intended for an Independent Trustee may be sent to Fidelity Investments, P.O. Box 55235, Boston, Massachusetts 02205-5235.
Name, Year of Birth; Principal Occupations and Other Relevant Experience+
Vijay C. Advani (1960)
Year of Election or Appointment: 2023
Trustee
Mr. Advani also serves as Trustee or Member of the Advisory Board of other funds. Previously, Mr. Advani served as Executive Chairman (2020-2022), Chief Executive Officer (2017-2020) and Chief Operating Officer (2016-2017) of Nuveen (global investment manager). He also served in various capacities at Franklin Resources (global investment manager), including Co-President (2015-2016), Executive Vice President, Global Advisory Services (2008-2015), Head of Global Retail Distribution (2005-2008), Executive Managing Director, International Retail Development (2002-2005), Managing Director, Product Developments, Sales & Marketing, Asia, Eastern Europe and Africa (2000-2002) and President, Templeton Asset Management India (1995-2000). Mr. Advani also served as Senior Investment Officer of International Finance Corporation (private equity and venture capital arm of The World Bank, 1984-1995). Mr. Advani is Chairman Emeritus of the U.S. India Business Council (2018-present), a Director of The Global Impact Investing Network (2019-present), a Director of LOK Capital (Mauritius) (2022-present), a member of the Advisory Council of LOK Capital (2022-present), a Senior Advisor of Neuberger Berman (2021-present), a Senior Advisor of Seviora Holdings Pte. Ltd (Temasek-Singapore) (2021-present), a Director of Seviora Capital (Singapore) (2021-present) and an Advisor of EQUIAM (2021-present). Mr. Advani formerly served as a member of the Board of BowX Acquisition Corp. (special purpose acquisition company, 2020-2021), a member of the Board of Intellecap (advisory arm of The Aavishkaar Group, 2018-2020), a member of the Board of Nuveen Investments, Inc. (2017-2020) and a member of the Board of Docusign (software, 2016-2019).
Thomas P. Bostick (1956)
Year of Election or Appointment: 2021
Trustee
Lieutenant General Bostick also serves as Trustee of other Fidelity® funds. Prior to his retirement, General Bostick (United States Army, Retired) held a variety of positions within the U.S. Army, including Chief of Engineers and Commanding General, U.S. Army Corps of Engineers (2012-2016) and Deputy Chief of Staff and Director of Human Resources, U.S. Army (2009-2012). General Bostick currently serves as a member of the Board and Finance and Governance & Sustainability Committees of CSX Corporation (transportation, 2020-present) and a member of the Board and Corporate Governance and Nominating Committee of Perma-Fix Environmental Services, Inc. (nuclear waste management, 2020-present). General Bostick serves as Chief Executive Officer of Bostick Global Strategies, LLC (consulting, 2016-present), as a member of the Board of HireVue, Inc. (video interview and assessment, 2020-present), as a member of the Board of Allonnia (biotechnology and engineering solutions, 2022-present), on the Advisory Board of Hilco Redevelopment Partners (a real estate investment and redevelopment company, 2021-present), and on the Advisory Board of Solugen, Inc. (specialty bio-based chemicals manufacturer, 2022-present). Previously, General Bostick served as a Member of the Advisory Board of certain Fidelity® funds (2021), President, Intrexon Bioengineering (2018-2020) and Chief Operating Officer (2017-2020) and Senior Vice President of the Environment Sector (2016-2017) of Intrexon Corporation (biopharmaceutical company).
Donald F. Donahue (1950)
Year of Election or Appointment: 2018
Trustee
Mr. Donahue also serves as Trustee of other Fidelity® funds. Mr. Donahue serves as President and Chief Executive Officer of Miranda Partners, LLC (risk consulting for the financial services industry, 2012-present). Previously, Mr. Donahue served as Chief Executive Officer (2006-2012), Chief Operating Officer (2003-2006) and Managing Director, Customer Marketing and Development (1999-2003) of The Depository Trust & Clearing Corporation (financial markets infrastructure). Mr. Donahue currently serves as a member (2007-present) and Co-Chairman (2016-present) of the Board of United Way of New York. Mr. Donahue previously served as a member of the Advisory Board of certain Fidelity® funds (2015-2018) and as a member of the Board of The Leadership Academy (previously NYC Leadership Academy) (2012-2022).
Vicki L. Fuller (1957)
Year of Election or Appointment: 2020
Trustee
Ms. Fuller also serves as Trustee of other Fidelity® funds. Previously, Ms. Fuller served as a member of the Advisory Board of certain Fidelity® funds (2018-2020), Chief Investment Officer of the New York State Common Retirement Fund (2012-2018) and held a variety of positions at AllianceBernstein L.P. (global asset management, 1985-2012), including Managing Director (2006-2012) and Senior Vice President and Senior Portfolio Manager (2001-2006). Ms. Fuller currently serves as a member of the Board, Audit Committee, Compensation Committee and Nominating and Governance Committee of two Blackstone business development companies (2020-present), as a member of the Board of Treliant, LLC (consulting, 2019-present), as a member of the Board of Ariel Alternatives, LLC (private equity, 2022-present) and as a member of the Board and Chair of the Audit Committee of Gusto, Inc. (software, 2021-present). In addition, Ms. Fuller currently serves as a member of the Executive Board of New York University's Stern School of Business. Ms. Fuller previously served as a member of the Board of Roosevelt University (2019-2024) and member of the Board, Audit Committee and Nominating and Governance Committee of The Williams Companies, Inc. (natural gas infrastructure, 2018-2021).
Patricia L. Kampling (1959)
Year of Election or Appointment: 2020
Trustee
Ms. Kampling also serves as Trustee of other Fidelity® funds. Prior to her retirement, Ms. Kampling served as Chairman of the Board and Chief Executive Officer (2012-2019), President and Chief Operating Officer (2011-2012) and Executive Vice President and Chief Financial Officer (2010-2011) of Alliant Energy Corporation. Ms. Kampling currently serves as a member of the Board, Audit Committee and Governance, Compensation and Nominating Committee of Xcel Energy Inc. (utilities company, 2020-present) and as a member of the Board, Audit, Finance and Risk Committee and Safety, Environmental, Technology and Operations Committee and Chair of the Executive Development and Compensation Committee of American Water Works Company, Inc. (utilities company, 2019-present). In addition, Ms. Kampling currently serves as a member of the Board of the Nature Conservancy, Wisconsin Chapter (2019-present). Previously, Ms. Kampling served as a Member of the Advisory Board of certain Fidelity® funds (2020), a member of the Board, Compensation Committee and Executive Committee and Chair of the Audit Committee of Briggs & Stratton Corporation (manufacturing, 2011-2021), a member of the Board of Interstate Power and Light Company (2012-2019) and Wisconsin Power and Light Company (2012-2019) (each a subsidiary of Alliant Energy Corporation) and as a member of the Board and Workforce Development Committee of the Business Roundtable (2018-2019).
Thomas A. Kennedy (1955)
Year of Election or Appointment: 2021
Trustee
Mr. Kennedy also serves as Trustee of other Fidelity® funds. Previously, Mr. Kennedy served as a Member of the Advisory Board of certain Fidelity® funds (2020) and held a variety of positions at Raytheon Company (aerospace and defense, 1983-2020), including Chairman and Chief Executive Officer (2014-2020) and Executive Vice President and Chief Operating Officer (2013-2014). Mr. Kennedy served as Executive Chairman of the Board of Directors of Raytheon Technologies Corporation (aerospace and defense, 2020-2021). Mr. Kennedy serves as a Director of the Board of Directors of Textron Inc. (aerospace and defense, 2023-present).
Oscar Munoz (1959)
Year of Election or Appointment: 2021
Trustee
Mr. Munoz also serves as Trustee of other Fidelity® funds. Prior to his retirement, Mr. Munoz served as Executive Chairman (2020-2021), Chief Executive Officer (2015-2020), President (2015-2016) and a member of the Board (2010-2021) of United Airlines Holdings, Inc. Mr. Munoz currently serves as a member of the Board of CBRE Group, Inc. (commercial real estate, 2020-present), a member of the Board of Univision Communications, Inc. (Hispanic media, 2020-present), a member of the Board of Archer Aviation Inc. (2021-present), a member of the Defense Business Board of the United States Department of Defense (2021-present) and a member of the Board of Salesforce.com, Inc. (cloud-based software, 2022-present). Previously, Mr. Munoz served as a Member of the Advisory Board of certain Fidelity® funds (2021).
David M. Thomas (1949)
Year of Election or Appointment: 2008
Trustee
Lead Independent Trustee
Mr. Thomas also serves as Trustee of other Fidelity® funds. Previously, Mr. Thomas served as Executive Chairman (2005-2006) and Chairman and Chief Executive Officer (2000-2005) of IMS Health, Inc. (pharmaceutical and healthcare information solutions) and as a member of the Board of Fortune Brands Home and Security (home and security products, 2004-2023). Mr. Thomas currently serves as Director (2013-present) and Non-Executive Chairman of the Board (2022-present) of Interpublic Group of Companies, Inc. (marketing communication).
Susan Tomasky (1953)
Year of Election or Appointment: 2020
Trustee
Ms. Tomasky also serves as Trustee of other Fidelity® funds. Prior to her retirement, Ms. Tomasky served in various executive officer positions at American Electric Power Company, Inc. (1998-2011), including most recently as President of AEP Transmission (2007-2011). Ms. Tomasky currently serves as a member of the Board and Sustainability Committee and as Chair of the Audit Committee of Marathon Petroleum Corporation (2018-present) and as a member of the Board, Executive Committee, Corporate Governance Committee and Organization and Compensation Committee and as Lead Director of the Board of Public Service Enterprise Group, Inc. (utilities company, 2012-present) and as a member of the Board of its subsidiary company, Public Service Electric and Gas Co. (2021-present). In addition, Ms. Tomasky currently serves as a member (2009-present) and President (2020-present) of the Board of the Royal Shakespeare Company - America (2009-present) and as a member and Vice Chair of the Board of Kenyon College (2016-present). Previously, Ms. Tomasky served as a Member of the Advisory Board of certain Fidelity® funds (2020), as a member of the Board of the Columbus Association for the Performing Arts (2011-2023), as a member of the Board of the Columbus Regional Airport Authority (2007-2020), as a member of the Board (2011-2018) and Lead Independent Director (2015-2018) of Andeavor Corporation (previously Tesoro Corporation) (independent oil refiner and marketer) and as a member of the Board of Summit Midstream Partners LP (energy, 2012-2018).
Michael E. Wiley (1950)
Year of Election or Appointment: 2018
Trustee
Mr. Wiley also serves as Trustee of other Fidelity® funds. Previously, Mr. Wiley served as a member of the Advisory Board of certain Fidelity® funds (2018-2020), Chairman, President and CEO of Baker Hughes, Inc. (oilfield services, 2000-2004). Mr. Wiley also previously served as a member of the Board of Andeavor Corporation (independent oil refiner and marketer, 2005-2018), a member of the Board of Andeavor Logistics LP (natural resources logistics, 2015-2018) and a member of the Board of High Point Resources (exploration and production, 2005-2020).
+ The information includes the Trustee's principal occupation during the last five years and other information relating to the experience, attributes, and skills relevant to the Trustee's qualifications to serve as a Trustee, which led to the conclusion that the Trustee should serve as a Trustee for the fund.
Advisory Board Members and Officers:
Correspondence intended for a Member of the Advisory Board (if any) may be sent to Fidelity Investments, P.O. Box 55235, Boston, Massachusetts 02205-5235. Correspondence intended for an officer or Peter S. Lynch may be sent to Fidelity Investments, 245 Summer Street, Boston, Massachusetts 02210.
Name, Year of Birth; Principal Occupations+
Peter S. Lynch (1944)
Year of Election or Appointment: 2003
Member of the Advisory Board
Mr. Lynch also serves as a Member of the Advisory Board of other Fidelity® funds. Mr. Lynch is Vice Chairman and a Director of Fidelity Management & Research Company LLC (investment adviser firm). In addition, Mr. Lynch serves as a Trustee of Boston College and as the Chairman of the Inner-City Scholarship Fund. Previously, Mr. Lynch served as Vice Chairman and a Director of FMR Co., Inc. (investment adviser firm) and on the Special Olympics International Board of Directors (1997-2006).
Karen B. Peetz (1955)
Year of Election or Appointment: 2023
Member of the Advisory Board
Ms. Peetz also serves as a Member of the Advisory Board of other funds. Previously, Ms. Peetz served as Chief Administration Officer (2020-2023) of Citigroup Inc. (a diversified financial service company). She also served in various capacities at Bank of New York Mellon Corporation, including President (2013-2016), Vice Chairman, Senior Executive Vice President and Chief Executive Officer of Financial Markets & Treasury Services (2010-2013), Senior Executive Vice President and Chief Executive Officer of Global Corporate Trust (2003-2008), Senior Vice President and Division Manager of Global Payments & Trade Services (2002-2003) and Senior Vice President and Division Manager of Domestic Corporate Trust (1998-2002). Ms. Peetz also served in various capacities at Chase Manhattan Corporation (1982-1998), including Senior Vice President and Manager of Corporate Trust International Business (1996-1998), Managing Director and Manager of Corporate Trust Services (1994-1996) and Managing Director and Group Manager of Financial Institution Sales (1990-1993). Ms. Peetz currently serves as Chair of Amherst Holdings Advisory Council (2018-present), Trustee of Johns Hopkins University (2016-present), Chair of the Carey Business School Advisory Council, Member of the Johns Hopkins Medicine Board and Finance Committee and Chair of the Lyme and Tick Related Disease Institute Advisory Council. Ms. Peetz previously served as a member of the Board of Guardian Life Insurance Company of America (2019-2023), a member of the Board of Trane Technologies (2018-2022), a member of the Board of Wells Fargo Corp. (2017-2019), a member of the Board of SunCoke Energy Inc. (2012-2016), a member of the Board of Private Export Funding Corporation (2010-2016) and as a Trustee of Penn State University (2010-2014) and the United Way of New York City (2008-2010).
Heather Bonner (1977)
Year of Election or Appointment: 2023
Assistant Treasurer
Ms. Bonner also serves as an officer of other funds. Ms. Bonner is a Senior Vice President (2022-present) and is an employee of Fidelity Investments (2022-present). Ms. Bonner serves as Senior Vice President, Vice President, Treasurer, or Director of certain Fidelity entities. Prior to joining Fidelity, Ms. Bonner served as Managing Director at AQR Capital Management (2013-2022) and was the Treasurer and Principal Financial Officer of the AQR Funds (2013-2022).
Craig S. Brown (1977)
Year of Election or Appointment: 2022
Deputy Treasurer
Mr. Brown also serves as an officer of other funds. Mr. Brown is a Vice President (2015-present) and is an employee of Fidelity Investments. Mr. Brown serves as Assistant Treasurer of FIMM, LLC (2021-present). Previously, Mr. Brown served as Assistant Treasurer of certain Fidelity® funds (2019-2022).
John J. Burke III (1964)
Year of Election or Appointment: 2018
Chief Financial Officer
Mr. Burke also serves as Chief Financial Officer of other funds. Mr. Burke is Head of Fidelity Fund and Investment Operations (2018-present) and is an employee of Fidelity Investments. Mr. Burke serves as President, Executive Vice President, or Director of certain Fidelity entities. Previously Mr. Burke served as head of Asset Management Investment Operations (2012-2018).
Margaret Carey (1973)
Year of Election or Appointment: 2023
Secretary and Chief Legal Officer (CLO)
Ms. Carey also serves as an officer of other funds and as CLO of certain Fidelity entities. Ms. Carey is a Senior Vice President, Deputy General Counsel (2019-present) and is an employee of Fidelity Investments.
William C. Coffey (1969)
Year of Election or Appointment: 2019
Assistant Secretary
Mr. Coffey also serves as Assistant Secretary of other funds. Mr. Coffey is a Senior Vice President, Deputy General Counsel (2010-present) and is an employee of Fidelity Investments. Previously, Mr. Coffey served as Secretary and CLO of certain funds (2018-2019); CLO, Secretary, or Senior Vice President of certain Fidelity entities and Assistant Secretary of certain funds (2009-2018).
Timothy M. Cohen (1969)
Year of Election or Appointment: 2018
Vice President
Mr. Cohen also serves as Vice President of other funds. Mr. Cohen is Co-Head of Equity (2018-present) and is an employee of Fidelity Investments. Mr. Cohen serves as President or Director of certain Fidelity entities. Previously, Mr. Cohen served as Executive Vice President of Fidelity SelectCo, LLC (2019) and Head of Global Equity Research (2016-2018).
Jonathan Davis (1968)
Year of Election or Appointment: 2010
Assistant Treasurer
Mr. Davis also serves as an officer of other funds. Mr. Davis is a Vice President (2006-present) and is an employee of Fidelity Investments. Mr. Davis serves as Assistant Treasurer or Director of certain Fidelity entities.
Laura M. Del Prato (1964)
Year of Election or Appointment: 2018
Assistant Treasurer
Ms. Del Prato also serves as an officer of other funds. Ms. Del Prato is a Senior Vice President (2017-present) and is an employee of Fidelity Investments. Ms. Del Prato serves as Senior Vice President, Vice President, Assistant Treasurer, or Director of certain Fidelity entities. Previously, Ms. Del Prato served as President and Treasurer of The North Carolina Capital Management Trust: Cash Portfolio and Term Portfolio (2018-2020).
Colm A. Hogan (1973)
Year of Election or Appointment: 2020
Assistant Treasurer
Mr. Hogan also serves as an officer of other funds. Mr. Hogan is a Vice President (2016-present) and is an employee of Fidelity Investments. Mr. Hogan serves as Assistant Treasurer of certain Fidelity entities. Previously, Mr. Hogan served as Deputy Treasurer of certain Fidelity® funds (2016-2020) and Assistant Treasurer of certain Fidelity® funds (2016-2018).
Pamela R. Holding (1964)
Year of Election or Appointment: 2018
Vice President
Ms. Holding also serves as Vice President of other funds. Ms. Holding is Co-Head of Equity (2018-present) and is an employee of Fidelity Investments. Previously, Ms. Holding served as Executive Vice President of Fidelity SelectCo, LLC (2019) and as Chief Investment Officer of Fidelity Institutional Asset Management (2013-2018).
Chris Maher (1972)
Year of Election or Appointment: 2020
Deputy Treasurer
Mr. Maher also serves as an officer of other funds. Mr. Maher is a Vice President (2008-present) and is an employee of Fidelity Investments. Mr. Maher serves as Assistant Treasurer of certain Fidelity entities. Previously, Mr. Maher served as Assistant Treasurer of certain funds (2013-2020).
Jason P. Pogorelec (1975)
Year of Election or Appointment: 2020
Chief Compliance Officer
Mr. Pogorelec also serves as Chief Compliance Officer of other funds. Mr. Pogorelec is a Senior Vice President of Asset Management Compliance (2020-present) and is an employee of Fidelity Investments. Mr. Pogorelec serves as Compliance Officer of Fidelity Management & Research Company LLC (investment adviser firm, 2023-present) and Ballyrock Investment Advisors LLC (2023-present). Previously, Mr. Pogorelec served as a Vice President, Associate General Counsel for Fidelity Investments (2010-2020) and Assistant Secretary of certain Fidelity® funds (2015-2020).
Brett Segaloff (1972)
Year of Election or Appointment: 2021
Anti-Money Laundering (AML) Officer
Mr. Segaloff also serves as AML Officer of other funds. Mr. Segaloff is a Vice President (2022-present) and is an employee of Fidelity Investments. Mr. Segaloff serves as Anti Money Laundering Compliance Officer or Anti Money Laundering/Bank Secrecy Act Compliance Officer of certain Fidelity entities.
Stacie M. Smith (1974)
Year of Election or Appointment: 2016
President and Treasurer
Ms. Smith also serves as an officer of other funds. Ms. Smith is a Senior Vice President (2016-present) and is an employee of Fidelity Investments. Ms. Smith serves as Assistant Treasurer of certain Fidelity entities and has served in other fund officer roles.
Jim Wegmann (1979)
Year of Election or Appointment: 2019
Assistant Treasurer
Mr. Wegmann also serves as an officer of other funds. Mr. Wegmann is a Vice President (2016-present) and is an employee of Fidelity Investments. Mr. Wegmann serves as Assistant Treasurer of FIMM, LLC (2021-present). Previously, Mr. Wegmann served as Assistant Treasurer of certain Fidelity® funds (2019-2021).
+ The information includes principal occupation during the last five years.
As a shareholder, you incur two types of costs: (1) transaction costs, which may include sales charges (loads) on purchase payments or redemption proceeds, as applicable and (2) ongoing costs, which generally include management fees, distribution and/or service (12b-1) fees and other Fund expenses. This Example is intended to help you understand your ongoing costs (in dollars) of investing in a fund and to compare these costs with the ongoing costs of investing in other mutual funds.
| The Example is based on an investment of $1,000 invested at the beginning of the period and held for the entire period (November 1, 2023 to April 30, 2024). |
Actual Expenses
The first line of the accompanying table provides information about actual account values and actual expenses. You may use the information in this line, together with the amount you invested, to estimate the expenses that you paid over the period. Simply divide your account value by $1,000.00 (for example, an $8,600 account value divided by $1,000.00 = 8.6), then multiply the result by the number in the first line for a class/Fund under the heading entitled "Expenses Paid During Period" to estimate the expenses you paid on your account during this period. If any fund is a shareholder of any underlying mutual funds or exchange-traded funds (ETFs) (the Underlying Funds), such fund indirectly bears its proportional share of the expenses of the Underlying Funds in addition to the direct expenses incurred presented in the table. These fees and expenses are not included in the annualized expense ratio used to calculate the expense estimate in the table below.
Hypothetical Example for Comparison Purposes
The second line of the accompanying table provides information about hypothetical account values and hypothetical expenses based on the actual expense ratio and an assumed rate of return of 5% per year before expenses, which is not the actual return. The hypothetical account values and expenses may not be used to estimate the actual ending account balance or expenses you paid for the period. You may use this information to compare the ongoing costs of investing in the Fund and other funds. To do so, compare this 5% hypothetical example with the 5% hypothetical examples that appear in the shareholder reports of the other funds. If any fund is a shareholder of any Underlying Funds, such fund indirectly bears its proportional share of the expenses of the Underlying Funds in addition to the direct expenses as presented in the table. These fees and expenses are not included in the annualized expense ratio used to calculate the expense estimate in the table below.
Please note that the expenses shown in the table are meant to highlight your ongoing costs only and do not reflect any transaction costs. Therefore, the second line of the table is useful in comparing ongoing costs only, and will not help you determine the relative total costs of owning different funds. In addition, if these transactional costs were included, your costs would have been higher.
| | | | | Annualized Expense Ratio- A | | Beginning Account Value November 1, 2023 | | Ending Account Value April 30, 2024 | | Expenses Paid During Period- C November 1, 2023 to April 30, 2024 |
| | | | | | | | | | |
Fidelity® U.S. Low Volatility Equity Fund ** | | | | .69% | | | | | | |
| Actual | | | | | | $ 1,000 | | $ 1,132.70 | | $ 3.66 |
Hypothetical-B | | | | | | $ 1,000 | | $ 1,021.43 | | $ 3.47 |
| |
A Annualized expense ratio reflects expenses net of applicable fee waivers.
B 5% return per year before expenses
C Expenses are equal to the annualized expense ratio, multiplied by the average account value over the period, multiplied by 182/ 366 (to reflect the one-half year period). The fees and expenses of any Underlying Funds are not included in each annualized expense ratio.
** If fees and changes to the expense contract and/or expense cap, effective March 1, 2024, had been in effect during the entire current period, the restated annualized expense ratio and the expenses paid in the actual and hypothetical examples above would have been as shown in table below:
| | | | | Annualized Expense Ratio- A | | Expenses Paid |
| | | | | | |
| Fidelity® U.S. Low Volatility Equity Fund | | | | .63% | | |
| Actual | | | | | | $ 3.34 |
Hypothetical- B | | | | | | $ 3.17 |
| | | | | | | |
| A Annualized expense ratio reflects expenses net of applicable fee waivers. | | | | | | |
| B 5% return per year before expenses | | | | | | |
The dividend and capital gains distributions for the fund(s) are available on Fidelity.com or Institutional.Fidelity.com.
The fund hereby designates as a capital gain dividend with respect to the taxable year ended April 30, 2024, $4,068,622, or, if subsequently determined to be different, the net capital gain of such year.
The fund designates 100% of the dividends distributed during the fiscal year as qualifying for the dividends-received deduction for corporate shareholders.
The fund designates 100% of the dividends distributed during the fiscal year as amounts which may be taken into account as a dividend for the purposes of the maximum rate under section 1(h)(11) of the Internal Revenue Code.
The fund will notify shareholders in January 2025 of amounts for use in preparing 2024 income tax returns.
Board Approval of Investment Advisory Contracts
Fidelity U.S. Low Volatility Equity Fund
At its January 2024 meeting, the Board of Trustees, including the Independent Trustees (together, the Board), approved an amended and restated management contract with Fidelity Management & Research Company LLC (FMR) (the Management Contract), and amended and restated sub-advisory agreements (the Sub-Advisory Contracts, and together with the Management Contract, the Advisory Contracts) for the fund, including the fund's sub-advisory agreements with FMR Investment Management (UK) Limited (FMR UK), Fidelity Management & Research (Hong Kong) Limited (FMR H.K.), and Fidelity Management & Research (Japan) Limited (FMR Japan). The Advisory Contracts will be effective March 1, 2024. The Board will consider the annual renewal of the fund's Advisory Contracts in May 2024, following its review of additional materials provided by FMR.
Management Contract. The Board approved the Management Contract, which implements a new fee structure combining the management fee, transfer agent fee (TA Fee), and pricing and bookkeeping fee (P&B Fee) of the fund into a single fee based on tiered schedules and subject to a maximum rate (the Unified Fee). In exchange for the Unified Fee, the fund will receive investment advisory, management, administrative, transfer agent, pricing and bookkeeping services under a single agreement - the Management Contract.
In its consideration of the Management Contract over several meetings, the Board received, reviewed and discussed a comprehensive set of analyses regarding the Unified Fee including (i) the legal framework, (ii) design goals for the Unified Fee, (iii) calculation methodology for the Unified Fee and illustrative examples, (iv) annual and cumulative projected impacts under various scenarios, both in the aggregate and at the fund/class level, (v) explanations of schedules, rate levers and maximum rates and (vi) shareholder benefits and projected savings.
The Board considered that the maximum Unified Fee for the fund would be no higher than the sum of (i) the lowest contractual management fee rate under the fund's existing management contract, which is the individual fund fee rate, if any, plus the lowest contractual marginal group fee rate and (ii) the TA and P&B Fee rates, which are fixed fee rates since December 1, 2023 (together, the Unified Fee Cap). The Board noted that Fidelity has represented that, as a result of this Unified Fee Cap, the Unified Fee would be no greater than the fee rates previously authorized to be charged to the fund for the same services. The Board noted that certain expenses such as third-party expenses and certain other miscellaneous expenses would be outside the scope of the Unified Fee and the calculation of such fees would not change as a result of the Unified Fee.
The Board considered Fidelity's representations that implementation of the Unified Fee, which includes the Unified Fee Cap, would cause all funds subject to the Unified Fee, including the fund, to experience an immediate reduction on contractual fee rates for services provided under the current management contracts. The Board considered that some funds would not experience lower net total fees as a result of existing fee caps. The Board further considered that, in addition to the contractual fee savings, the Unified Fee offers funds and their shareholders greater protection from future rate increases for services previously offered under separate agreements that are now covered by the Management Contract because such rate increases would require shareholder approval.
Sub-Advisory Contracts. In connection with the Unified Fee changes, the Board considered the Sub-Advisory Contracts, which simplified the calculation of the fees paid by FMR to the sub-advisers under the agreements. The Board noted that the agreements with FMR UK, FMR H.K., and FMR Japan were amended to provide that FMR will compensate each sub-adviser at a fee rate equal to 110% of the sub-adviser's costs incurred in providing services under the agreement. The Board considered that, under the Sub-Advisory Contracts, FMR, and not the fund, will continue to pay the sub-advisory fees to each applicable sub-adviser.
The Board further considered that the approval of the fund's Advisory Contracts will not result in any changes in the investment process or strategies employed in the management of the fund's assets or the day-to-day management of the fund or the persons primarily responsible for such management. Further, the Board considered that the Management Contract would not change the obligations and services of FMR and its affiliates on behalf of the fund, and, in particular, there would be no change in the nature and level of advisory, management, administration, transfer agent, and pricing and bookkeeping services provided to the fund by FMR, its affiliates, and each applicable sub-adviser.
In connection with its consideration of future renewals of the fund's Advisory Contracts, the Board will consider: (i) the nature, extent and quality of services provided to the funds, including shareholder and administrative services and investment performance; (ii) the competitiveness of the management fee and total expenses for the fund; (iii) the costs of the services and profitability, including the revenues earned and the expenses incurred in conducting the business of developing, marketing, distributing, managing, administering, and servicing the fund and its shareholders, to the extent applicable; and (iv) whether there have been economies of scale in respect of the Fidelity funds, whether the Fidelity funds (including the fund) have appropriately benefited from any such economies of scale, and whether there is the potential for realization of any further economies.
Based on its evaluation of all of the conclusions and representations noted above, and after considering all factors it believed relevant, the Board concluded that the fund's management fee structure is fair and reasonable, and that the fund's Advisory Contracts should be approved.
The Securities and Exchange Commission adopted Rule 22e-4 under the Investment Company Act of 1940 (the Liquidity Rule) to promote effective liquidity risk management throughout the open-end investment company industry, thereby reducing the risk that funds will be unable to meet their redemption obligations and mitigating dilution of the interests of fund shareholders.
The Fund has adopted and implemented a liquidity risk management program (the Program) reasonably designed to assess and manage the Fund's liquidity risk and to comply with the requirements of the Liquidity Rule. The Fund's Board of Trustees (the Board) has designated the Fund's investment adviser as administrator of the Program. The Fidelity advisers have established a Liquidity Risk Management Committee (the LRM Committee) to manage the Program for each of the Fidelity Funds. The LRM Committee monitors the adequacy and effectiveness of implementation of the Program and on a periodic basis assesses each Fund's liquidity risk based on a variety of factors including (1) the Fund's investment strategy, (2) portfolio liquidity and cash flow projections during normal and reasonably foreseeable stressed conditions, (3) shareholder redemptions, (4) borrowings and other funding sources and (5) certain factors specific to ETFs including the effect of the Fund's prices and spreads, market participants, and basket compositions on the overall liquidity of the Fund's portfolio, as applicable.
In accordance with the Program, each of the Fund's portfolio investments is classified into one of four defined liquidity categories based on a determination of a reasonable expectation for how long it would take to convert the investment to cash (or sell or dispose of the investment) without significantly changing its market value.
- Highly liquid investments - cash or convertible to cash within three business days or less
- Moderately liquid investments - convertible to cash in three to seven calendar days
- Less liquid investments - can be sold or disposed of, but not settled, within seven calendar days
- Illiquid investments - cannot be sold or disposed of within seven calendar days
Liquidity classification determinations take into account a variety of factors including various market, trading and investment-specific considerations, as well as market depth, and generally utilize analysis from a third-party liquidity metrics service.
The Liquidity Rule places a 15% limit on a fund's illiquid investments and requires funds that do not primarily hold assets that are highly liquid investments to determine and maintain a minimum percentage of the fund's net assets to be invested in highly liquid investments (highly liquid investment minimum or HLIM). The Program includes provisions reasonably designed to comply with the 15% limit on illiquid investments and for determining, periodically reviewing and complying with the HLIM requirement as applicable.
At a recent meeting of the Fund's Board of Trustees, the LRM Committee provided a written report to the Board pertaining to the operation, adequacy, and effectiveness of the Program for the period December 1, 2022 through November 30, 2023. The report concluded that the Program is operating effectively and is reasonably designed to assess and manage the Fund's liquidity risk.
1.9896228.104
USL-ANN-0624
Fidelity® SAI High Income Fund
Annual Report
April 30, 2024
Offered exclusively to certain clients of the Adviser, or its affiliates, including Strategic Advisers LLC (Strategic Advisers) - not available for sale to the general public. Fidelity® SAI is a product name of Fidelity® funds dedicated to certain programs affiliated with Strategic Advisers.
Contents
To view a fund's proxy voting guidelines and proxy voting record for the 12-month period ended June 30, visit http://www.fidelity.com/proxyvotingresults or visit the Securities and Exchange Commission's (SEC) web site at http://www.sec.gov.
You may also call 1-800-544-3455 to request a free copy of the proxy voting guidelines.
Standard & Poor's, S&P and S&P 500 are registered service marks of The McGraw-Hill Companies, Inc. and have been licensed for use by Fidelity Distributors Corporation.
Other third-party marks appearing herein are the property of their respective owners.
All other marks appearing herein are registered or unregistered trademarks or service marks of FMR LLC or an affiliated company. © 2024 FMR LLC. All rights reserved.
This report and the financial statements contained herein are submitted for the general information of the shareholders of the Fund. This report is not authorized for distribution to prospective investors in the Fund unless preceded or accompanied by an effective prospectus.
A fund files its complete schedule of portfolio holdings with the SEC for the first and third quarters of each fiscal year on Form N-PORT. Forms N-PORT are available on the SEC's web site at http://www.sec.gov. A fund's Forms N-PORT may be reviewed and copied at the SEC's Public Reference Room in Washington, DC. Information regarding the operation of the SEC's Public Reference Room may be obtained by calling 1-800-SEC-0330.
For a complete list of a fund's portfolio holdings, view the most recent holdings listing, semiannual report, or annual report on Fidelity's web site at http://www.fidelity.com, http://www.institutional.fidelity.com, or http://www.401k.com, as applicable.
NOT FDIC INSURED •MAY LOSE VALUE •NO BANK GUARANTEE
Neither the Fund nor Fidelity Distributors Corporation is a bank.
Average annual total return reflects the change in the value of an investment, assuming reinvestment of distributions from dividend income and capital gains (the profits earned upon the sale of securities that have grown in value, if any) and assuming a constant rate of performance each year. The hypothetical investment and the average annual total returns do not reflect the deduction of taxes that a shareholder would pay on fund distributions or the redemption of fund shares. During periods of reimbursement by Fidelity, a fund's total return will be greater than it would be had the reimbursement not occurred. How a fund did yesterday is no guarantee of how it will do tomorrow.
| Average Annual Total Returns |
| | | | |
Periods ended April 30, 2024 | Past 1 year | Life of Fund A |
| Fidelity® SAI High Income Fund | 8.05% | 0.83% |
A From May 13, 2021
| $10,000 Over Life of Fund |
| |
Let's say hypothetically that $10,000 was invested in Fidelity® SAI High Income Fund, on May 13, 2021, when the fund started. The chart shows how the value of your investment would have changed, and also shows how the ICE® BofA® US High Yield Constrained Index performed over the same period. |
|
|
Market Recap:
High-yield bonds gained 8.89% for the 12 months ending April 30, 2024, according to the ICE BofA® US High Yield Constrained Index, driven by resilient corporate profits and the Federal Reserve's likely pivot to cutting interest rates later this year. Amid this favorable backdrop for higher-risk assets, the index advanced fairly steadily for most the period, highlighted by an especially strong final two months of 2023, when the index rose 8.72%. Following the Federal Reserve's November 1 meeting, when the central bank hinted it might be done raising rates, the high-yield index reversed a two-month decline that was due to soaring yields on longer-term government bonds and mixed earnings from some big and influential firms. High yield continued to advance in 2024 but lost some of its momentum, gaining 1.51% through March, as the central bank held steady its benchmark federal funds rate and affirmed its projection to cut in 2024. The index slipped in April (-1%), when inflation remained stickier than expected. For the full 12 months, all 18 industries within the index advanced, with retail (+14%) leading, followed by financial services (+12%) and banking (+11%), which benefited from high interest rates. Energy, the largest segment in the high-yield index this period, gained 10%. Conversely, the telecommunications (+4%) group lagged most, followed by utility, capital goods and transportation (+6% each).
Comments from Co-Managers Jared Beckerman, Benjamin Harrison and Alexandre Karam:
For the fiscal year, the fund gained 8.05%, versus 8.89% for the benchmark ICE BofA US High Yield Constrained Index. The fund's core investment in high-yield bonds rose 9.37% and contributed to performance versus the benchmark. By industry, security selection was the primary detractor, especially within energy. Security selection in health care also hurt, as did our picks and an underweight in retail. Also detracting from our result was security selection in capital goods. The biggest individual relative detractor was a non-benchmark stake in Mesquite Energy (-47%), which was among the fund's largest holdings. A second notable relative detractor was a stake in Ardagh (-36%). Another notable relative detractor was our stake in Cano Health (-68%). In contrast, the biggest contributor to performance versus the benchmark was security selection in technology & electronics. Security selection in telecommunications also boosted relative performance. Also contributing to our result were our choices and an overweight in basic industry. Lastly, the fund's position in cash contributed. The top individual relative contributor was an overweight in Communications Sales & Leasing (+32%), which was one of our biggest holdings. A non-benchmark stake in GTT Communications gained 70% and was the second-largest relative contributor. Another notable relative contributor was a stake in Rackspace Hosting (+33%). Notable changes in positioning include higher allocations to basic industry and financial services.
Note to shareholders:
On June 8, 2023, Michael Weaver came off of the fund. On January 1, 2024, Jared Beckerman assumed co-management responsibilities for the fund.
The views expressed above reflect those of the portfolio manager(s) only through the end of the period as stated on the cover of this report and do not necessarily represent the views of Fidelity or any other person in the Fidelity organization. Any such views are subject to change at any time based upon market or other conditions and Fidelity disclaims any responsibility to update such views. These views may not be relied on as investment advice and, because investment decisions for a Fidelity fund are based on numerous factors, may not be relied on as an indication of trading intent on behalf of any Fidelity fund.
| Top Bond Issuers (% of Fund's net assets) |
(with maturities greater than one year) |
| Community Health Systems, Inc. | 1.8 | |
| Fidelity Private Credit Co. LLC | 1.3 | |
| New Fortress Energy, Inc. | 1.1 | |
| TransDigm, Inc. | 1.1 | |
| CCO Holdings LLC/CCO Holdings Capital Corp. | 1.1 | |
| Mesquite Energy, Inc. | 1.1 | |
| MPT Operating Partnership LP/MPT Finance Corp. | 1.0 | |
| Tenet Healthcare Corp. | 1.0 | |
| Uniti Group LP/Uniti Group Finance, Inc./CSL Capital LLC | 1.0 | |
| Tallgrass Energy Partners LP / Tallgrass Energy Finance Corp. | 1.0 | |
| | 11.5 | |
| |
| Market Sectors (% of Fund's net assets) |
| |
| Energy | 15.4 | |
| Healthcare | 7.8 | |
| Services | 7.7 | |
| Technology | 6.7 | |
| Telecommunications | 5.7 | |
| |
Quality Diversification (% of Fund's net assets) |
|
| |
| We have used ratings from Moody's Investors Service, Inc. Where Moody's® ratings are not available, we have used S&P® ratings. All ratings are as of the date indicated and do not reflect subsequent changes. |
Asset Allocation (% of Fund's net assets) |
|
|
Geographic Diversification (% of Fund's net assets) |
|
* Includes Short-Term investments and Net Other Assets (Liabilities). Percentages are adjusted for the effect of derivatives, if applicable. |
| |
Showing Percentage of Net Assets
| Corporate Bonds - 86.2% |
| | | Principal Amount (a) | Value ($) |
| Convertible Bonds - 1.4% | | | |
| Broadcasting - 0.7% | | | |
| DISH Network Corp.: | | | |
| 0% 12/15/25 | | 1,986,000 | 1,444,795 |
| 3.375% 8/15/26 | | 14,390,000 | 8,777,873 |
| | | | 10,222,668 |
| Diversified Financial Services - 0.1% | | | |
| Rexford Industrial Realty LP: | | | |
| 4.125% 3/15/29 (b) | | 947,000 | 912,888 |
| 4.375% 3/15/27 (b) | | 789,000 | 766,960 |
| | | | 1,679,848 |
| Energy - 0.1% | | | |
| NextEra Energy Partners LP 2.5% 6/15/26 (b) | | 1,294,000 | 1,162,614 |
| Sunnova Energy International, Inc. 0.25% 12/1/26 | | 757,000 | 338,942 |
| | | | 1,501,556 |
| Homebuilders/Real Estate - 0.2% | | | |
| Realogy Group LLC/Realogy Co-Issuer Corp. 0.25% 6/15/26 | | 379,000 | 308,885 |
| Redfin Corp. 0.5% 4/1/27 | | 4,622,000 | 2,264,780 |
| | | | 2,573,665 |
| Technology - 0.2% | | | |
| Wolfspeed, Inc. 1.875% 12/1/29 | | 6,448,000 | 3,704,376 |
| Utilities - 0.1% | | | |
| PG&E Corp. 4.25% 12/1/27 (b) | | 1,502,000 | 1,504,253 |
TOTAL CONVERTIBLE BONDS | | | 21,186,366 |
| Nonconvertible Bonds - 84.8% | | | |
| Aerospace - 2.1% | | | |
| Bombardier, Inc.: | | | |
| 7.25% 7/1/31 (b) | | 2,255,000 | 2,260,550 |
| 7.875% 4/15/27 (b) | | 3,574,000 | 3,551,726 |
| 8.75% 11/15/30 (b) | | 1,250,000 | 1,329,860 |
| BWX Technologies, Inc. 4.125% 6/30/28 (b) | | 4,425,000 | 4,042,234 |
| Howmet Aerospace, Inc. 5.95% 2/1/37 (c) | | 295,000 | 294,895 |
| Kaiser Aluminum Corp.: | | | |
| 4.5% 6/1/31 (b)(c) | | 280,000 | 245,247 |
| 4.625% 3/1/28 (b) | | 820,000 | 763,467 |
| Moog, Inc. 4.25% 12/15/27 (b) | | 220,000 | 205,334 |
| Spirit Aerosystems, Inc. 9.75% 11/15/30 (b) | | 1,145,000 | 1,266,652 |
| TransDigm, Inc.: | | | |
| 4.625% 1/15/29 | | 4,090,000 | 3,746,399 |
| 5.5% 11/15/27 | | 4,405,000 | 4,278,356 |
| 6.375% 3/1/29 (b) | | 2,690,000 | 2,669,457 |
| 6.75% 8/15/28 (b) | | 2,050,000 | 2,062,813 |
| 6.875% 12/15/30 (b) | | 3,840,000 | 3,866,110 |
| 7.125% 12/1/31 (b) | | 885,000 | 901,881 |
| VistaJet Malta Finance PLC / XO Management Holding, Inc. 9.5% 6/1/28 (b) | | 1,145,000 | 1,025,331 |
| | | | 32,510,312 |
| Air Transportation - 1.2% | | | |
| Air Canada 3.875% 8/15/26 (b) | | 1,075,000 | 1,019,774 |
| American Airlines, Inc.: | | | |
| 7.25% 2/15/28 (b)(c) | | 685,000 | 688,878 |
| 8.5% 5/15/29 (b) | | 1,465,000 | 1,526,049 |
| American Airlines, Inc. / AAdvantage Loyalty IP Ltd. 5.5% 4/20/26 (b) | | 3,017,500 | 2,982,495 |
| Hawaiian Brand Intellectual Property Ltd. / HawaiianMiles Loyalty Ltd. 5.75% 1/20/26 (b) | | 1,650,000 | 1,547,518 |
| Mileage Plus Holdings LLC 6.5% 6/20/27 (b) | | 474,500 | 475,301 |
| Rand Parent LLC 8.5% 2/15/30 (b)(c) | | 8,638,000 | 8,542,266 |
| Spirit Loyalty Cayman Ltd. / Spirit IP Cayman Ltd. 8% 9/20/25 (b) | | 1,720,000 | 1,343,384 |
| | | | 18,125,665 |
| Automotive & Auto Parts - 2.1% | | | |
| Adient Global Holdings Ltd. 7% 4/15/28 (b) | | 445,000 | 449,562 |
| Aston Martin Capital Holdings Ltd. 10% 3/31/29 (b) | | 1,585,000 | 1,543,394 |
| Champions Financing, Inc. 8.75% 2/15/29 (b) | | 3,805,000 | 3,888,421 |
| Dana, Inc.: | | | |
| 4.25% 9/1/30 (c) | | 590,000 | 511,168 |
| 5.375% 11/15/27 (c) | | 395,000 | 381,691 |
| Ford Motor Credit Co. LLC: | | | |
| 3.625% 6/17/31 | | 1,665,000 | 1,406,115 |
| 4% 11/13/30 | | 725,000 | 631,827 |
| LCM Investments Holdings 8.25% 8/1/31 (b) | | 785,000 | 815,450 |
| Macquarie AirFinance Holdings: | | | |
| 6.4% 3/26/29 (b) | | 2,415,000 | 2,408,015 |
| 6.5% 3/26/31 (b) | | 2,205,000 | 2,206,647 |
| 8.125% 3/30/29 (b) | | 2,535,000 | 2,650,860 |
| 8.375% 5/1/28 (b) | | 1,605,000 | 1,685,009 |
| McLaren Finance PLC 7.5% 8/1/26 (b) | | 1,800,000 | 1,563,300 |
| PECF USS Intermediate Holding III Corp. 8% 11/15/29 (b) | | 1,965,000 | 859,688 |
| Phinia, Inc. 6.75% 4/15/29 (b) | | 950,000 | 953,384 |
| Rivian Holdco & Rivian LLC & Rivian Automotive LLC CME Term SOFR 6 Month Index + 6.020% 11.3101% 10/15/26 (b)(d)(e) | | 2,270,000 | 2,235,949 |
| Wand NewCo 3, Inc. 7.625% 1/30/32 (b)(c) | | 2,070,000 | 2,104,363 |
| ZF North America Capital, Inc.: | | | |
| 4.75% 4/29/25 (b) | | 1,750,000 | 1,721,938 |
| 6.75% 4/23/30 (b) | | 2,175,000 | 2,183,163 |
| 6.875% 4/14/28 (b) | | 810,000 | 815,417 |
| 6.875% 4/23/32 (b) | | 1,320,000 | 1,334,783 |
| 7.125% 4/14/30 (b) | | 810,000 | 828,214 |
| | | | 33,178,358 |
| Banks & Thrifts - 1.3% | | | |
| Ally Financial, Inc.: | | | |
| 5.75% 11/20/25 | | 1,514,000 | 1,501,645 |
| 6.7% 2/14/33 (c) | | 3,380,000 | 3,315,729 |
| Jane Street Group LLC/JSG Finance, Inc.: | | | |
| 4.5% 11/15/29 (b) | | 2,015,000 | 1,832,772 |
| 7.125% 4/30/31 (b) | | 2,265,000 | 2,279,187 |
| Quicken Loans LLC/Quicken Loans Co.-Issuer, Inc. 4% 10/15/33 (b) | | 585,000 | 477,588 |
| UniCredit SpA: | | | |
| 5.459% 6/30/35 (b)(d) | | 2,591,000 | 2,384,032 |
| 5.861% 6/19/32 (b)(d) | | 945,000 | 913,721 |
| VistaJet Malta Finance PLC / XO Management Holding, Inc.: | | | |
| 6.375% 2/1/30 (b) | | 4,579,000 | 3,543,383 |
| 7.875% 5/1/27 (b) | | 1,284,000 | 1,141,858 |
| Western Alliance Bancorp. 3% 6/15/31 (d) | | 3,700,000 | 3,146,739 |
| | | | 20,536,654 |
| Broadcasting - 1.5% | | | |
| Clear Channel Outdoor Holdings, Inc.: | | | |
| 5.125% 8/15/27 (b)(c) | | 1,885,000 | 1,747,248 |
| 7.5% 6/1/29 (b) | | 1,570,000 | 1,265,147 |
| 7.875% 4/1/30 (b) | | 2,665,000 | 2,612,925 |
| 9% 9/15/28 (b)(c) | | 2,690,000 | 2,765,494 |
| Diamond Sports Group LLC/Diamond Sports Finance Co. 5.375% (b)(f) | | 12,645,000 | 316,125 |
| DISH Network Corp. 11.75% 11/15/27 (b) | | 2,765,000 | 2,787,222 |
| Sirius XM Radio, Inc.: | | | |
| 4.125% 7/1/30 (b)(c) | | 4,645,000 | 3,939,242 |
| 5.5% 7/1/29 (b)(c) | | 1,135,000 | 1,053,550 |
| Univision Communications, Inc.: | | | |
| 4.5% 5/1/29 (b) | | 130,000 | 113,090 |
| 6.625% 6/1/27 (b) | | 2,985,000 | 2,880,567 |
| 7.375% 6/30/30 (b)(c) | | 2,750,000 | 2,633,347 |
| 8% 8/15/28 (b) | | 1,215,000 | 1,213,568 |
| | | | 23,327,525 |
| Building Materials - 1.6% | | | |
| Advanced Drain Systems, Inc.: | | | |
| 5% 9/30/27 (b) | | 350,000 | 338,920 |
| 6.375% 6/15/30 (b)(c) | | 1,330,000 | 1,322,208 |
| AmeriTex Holdco Intermediate LLC 10.25% 10/15/28 (b) | | 395,000 | 416,086 |
| Beacon Roofing Supply, Inc. 6.5% 8/1/30 (b) | | 1,565,000 | 1,562,298 |
| Builders FirstSource, Inc.: | | | |
| 4.25% 2/1/32 (b) | | 3,750,000 | 3,266,391 |
| 6.375% 3/1/34 (b) | | 945,000 | 927,463 |
| Eco Material Technologies, Inc. 7.875% 1/31/27 (b) | | 4,215,000 | 4,245,972 |
| EMRLD Borrower LP / Emerald Co. 6.625% 12/15/30 (b) | | 5,285,000 | 5,237,644 |
| MITER Brands Acquisition Holdco, Inc. / MIWD Borrower LLC 6.75% 4/1/32 (b) | | 1,245,000 | 1,236,443 |
| Oscar Acquisition Co. LLC / Oscar Finance, Inc. 9.5% 4/15/30 (b) | | 1,765,000 | 1,698,221 |
| Smyrna Ready Mix Concrete LLC 8.875% 11/15/31 (b) | | 575,000 | 605,557 |
| SRS Distribution, Inc. 6% 12/1/29 (b) | | 2,595,000 | 2,631,102 |
| Summit Materials LLC/Summit Materials Finance Corp. 7.25% 1/15/31 (b) | | 1,235,000 | 1,265,875 |
| | | | 24,754,180 |
| Cable/Satellite TV - 2.0% | | | |
| CCO Holdings LLC/CCO Holdings Capital Corp.: | | | |
| 4.25% 2/1/31 (b) | | 5,510,000 | 4,312,362 |
| 4.25% 1/15/34 (b) | | 2,840,000 | 2,057,612 |
| 4.5% 8/15/30 (b) | | 2,435,000 | 1,978,806 |
| 4.5% 5/1/32 | | 5,889,000 | 4,521,671 |
| 4.5% 6/1/33 (b) | | 5,460,000 | 4,105,884 |
| 4.75% 2/1/32 (b) | | 390,000 | 306,710 |
| CSC Holdings LLC: | | | |
| 3.375% 2/15/31 (b) | | 1,395,000 | 860,110 |
| 4.125% 12/1/30 (b) | | 3,145,000 | 1,997,773 |
| 4.5% 11/15/31 (b) | | 745,000 | 472,769 |
| 4.625% 12/1/30 (b) | | 5,700,000 | 2,473,990 |
| 5.375% 2/1/28 (b) | | 2,550,000 | 1,956,389 |
| DIRECTV Financing LLC / DIRECTV Financing Co-Obligor, Inc. 5.875% 8/15/27 (b) | | 720,000 | 671,095 |
| DISH DBS Corp. 5.75% 12/1/28 (b) | | 2,730,000 | 1,843,520 |
| Dolya Holdco 18 DAC 5% 7/15/28 (b) | | 720,000 | 640,959 |
| Telenet Finance Luxembourg Notes SARL 5.5% 3/1/28 (b) | | 1,400,000 | 1,321,250 |
| Ziggo Bond Co. BV 6% 1/15/27 (b) | | 185,000 | 181,958 |
| Ziggo BV 4.875% 1/15/30 (b) | | 1,730,000 | 1,513,828 |
| | | | 31,216,686 |
| Capital Goods - 1.0% | | | |
| ESAB Corp. 6.25% 4/15/29 (b) | | 2,375,000 | 2,366,088 |
| Mueller Water Products, Inc. 4% 6/15/29 (b) | | 2,785,000 | 2,519,901 |
| Regal Rexnord Corp.: | | | |
| 6.05% 2/15/26 (b) | | 1,940,000 | 1,940,275 |
| 6.3% 2/15/30 (b) | | 1,310,000 | 1,315,601 |
| TK Elevator U.S. Newco, Inc. 5.25% 7/15/27 (b) | | 4,880,000 | 4,668,054 |
| Vertical Holdco GmbH 7.625% 7/15/28 (b) | | 2,560,000 | 2,509,001 |
| | | | 15,318,920 |
| Chemicals - 4.8% | | | |
| Axalta Coating Systems Dutch Holding B BV 7.25% 2/15/31 (b) | | 730,000 | 744,507 |
| Consolidated Energy Finance SA 12% 2/15/31 (b) | | 2,430,000 | 2,515,062 |
| CVR Partners LP/CVR Nitrogen Finance Corp. 6.125% 6/15/28 (b) | | 3,015,000 | 2,812,992 |
| Element Solutions, Inc. 3.875% 9/1/28 (b) | | 1,420,000 | 1,278,122 |
| INEOS Quattro Finance 2 PLC 9.625% 3/15/29 (b) | | 705,000 | 744,788 |
| Kobe U.S. Midco 2, Inc. 9.25% 11/1/26 pay-in-kind (b)(d) | | 2,701,250 | 2,302,816 |
| LSB Industries, Inc. 6.25% 10/15/28 (b) | | 1,210,000 | 1,147,035 |
| Methanex Corp.: | | | |
| 5.125% 10/15/27 | | 4,425,000 | 4,255,842 |
| 5.25% 12/15/29 | | 1,430,000 | 1,355,553 |
| 5.65% 12/1/44 | | 4,210,000 | 3,556,074 |
| NOVA Chemicals Corp.: | | | |
| 4.25% 5/15/29 (b) | | 4,555,000 | 3,812,500 |
| 5% 5/1/25 (b) | | 200,000 | 196,263 |
| 5.25% 6/1/27 (b) | | 4,340,000 | 4,082,661 |
| 8.5% 11/15/28 (b) | | 990,000 | 1,040,568 |
| 9% 2/15/30 (b) | | 955,000 | 984,030 |
| Nufarm Australia Ltd. 5% 1/27/30 (b) | | 4,168,000 | 3,805,057 |
| Olin Corp. 5% 2/1/30 (c) | | 5,195,000 | 4,848,545 |
| Olympus Water U.S. Holding Corp.: | | | |
| 4.25% 10/1/28 (b) | | 3,270,000 | 2,946,614 |
| 6.25% 10/1/29 (b) | | 3,140,000 | 2,829,830 |
| 9.75% 11/15/28 (b) | | 6,305,000 | 6,690,353 |
| SCIH Salt Holdings, Inc.: | | | |
| 4.875% 5/1/28 (b)(c) | | 690,000 | 641,554 |
| 6.625% 5/1/29 (b) | | 2,144,000 | 1,978,235 |
| SCIL IV LLC / SCIL U.S.A. Holdings LLC 5.375% 11/1/26 (b) | | 3,235,000 | 3,104,864 |
| The Chemours Co. LLC: | | | |
| 4.625% 11/15/29 (b) | | 3,145,000 | 2,694,858 |
| 5.375% 5/15/27 | | 710,000 | 671,755 |
| 5.75% 11/15/28 (b)(c) | | 3,530,000 | 3,241,858 |
| TPC Group, Inc. 13% 12/16/27 (b) | | 1,458,918 | 1,491,926 |
| Tronox, Inc. 4.625% 3/15/29 (b)(c) | | 4,550,000 | 4,059,000 |
| W.R. Grace Holding LLC: | | | |
| 5.625% 8/15/29 (b) | | 5,025,000 | 4,499,883 |
| 7.375% 3/1/31 (b) | | 595,000 | 603,128 |
| | | | 74,936,273 |
| Consumer Products - 0.8% | | | |
| Foundation Building Materials, Inc. 6% 3/1/29 (b) | | 938,000 | 826,652 |
| Kohl's Corp. 4.25% 7/17/25 | | 190,000 | 185,206 |
| Mattel, Inc. 5.45% 11/1/41 | | 585,000 | 512,005 |
| Newell Brands, Inc.: | | | |
| 5.7% 4/1/26 | | 730,000 | 718,359 |
| 6.375% 9/15/27 (c) | | 730,000 | 711,846 |
| 6.625% 9/15/29 (c) | | 820,000 | 792,022 |
| 7% 4/1/46 (g) | | 585,000 | 474,614 |
| The Scotts Miracle-Gro Co.: | | | |
| 4% 4/1/31 | | 295,000 | 248,507 |
| 4.375% 2/1/32 | | 435,000 | 366,100 |
| TKC Holdings, Inc.: | | | |
| 6.875% 5/15/28 (b) | | 2,760,000 | 2,605,386 |
| 10.5% 5/15/29 (b) | | 2,928,000 | 2,801,663 |
| Windsor Holdings III, LLC 8.5% 6/15/30 (b) | | 1,825,000 | 1,900,782 |
| | | | 12,143,142 |
| Containers - 1.1% | | | |
| ARD Finance SA 6.5% 6/30/27 pay-in-kind (b)(d) | | 1,187,000 | 292,740 |
| Ardagh Packaging Finance PLC/Ardagh MP Holdings U.S.A., Inc.: | | | |
| 4.125% 8/15/26 (b) | | 730,000 | 608,350 |
| 5.25% 4/30/25 (b) | | 955,000 | 945,637 |
| 5.25% 8/15/27 (b) | | 308,000 | 157,080 |
| 5.25% 8/15/27 (b) | | 311,000 | 158,610 |
| Ball Corp.: | | | |
| 2.875% 8/15/30 | | 730,000 | 610,066 |
| 6% 6/15/29 | | 975,000 | 970,153 |
| Berry Global, Inc. 4.875% 7/15/26 (b) | | 1,170,000 | 1,144,889 |
| Graham Packaging Co., Inc. 7.125% 8/15/28 (b) | | 940,000 | 849,082 |
| Graphic Packaging International, Inc. 3.75% 2/1/30 (b) | | 960,000 | 835,275 |
| LABL, Inc.: | | | |
| 5.875% 11/1/28 (b) | | 450,000 | 400,209 |
| 6.75% 7/15/26 (b) | | 680,000 | 670,506 |
| 9.5% 11/1/28 (b) | | 300,000 | 300,112 |
| 10.5% 7/15/27 (b) | | 964,000 | 946,848 |
| Mauser Packaging Solutions Holding Co. 7.875% 4/15/27 (b) | | 2,190,000 | 2,231,063 |
| Owens-Brockway Glass Container, Inc. 7.25% 5/15/31 (b)(c) | | 765,000 | 766,170 |
| Sealed Air Corp. 5% 4/15/29 (b) | | 3,690,000 | 3,471,598 |
| Sealed Air Corp./Sealed Air Corp. U.S.: | | | |
| 6.125% 2/1/28 (b) | | 825,000 | 814,948 |
| 7.25% 2/15/31 (b)(c) | | 1,425,000 | 1,450,690 |
| Trivium Packaging Finance BV: | | | |
| 5.5% 8/15/26 (b) | | 180,000 | 176,665 |
| 8.5% 8/15/27 (b) | | 265,000 | 262,420 |
| | | | 18,063,111 |
| Diversified Financial Services - 3.8% | | | |
| Aercap Global Aviation Trust 6.5% 6/15/45 (b)(d) | | 1,500,000 | 1,491,317 |
| Boost Newco Borrower LLC 7.5% 1/15/31 (b) | | 3,255,000 | 3,359,459 |
| Cargo Aircraft Management, Inc. 4.75% 2/1/28 (b) | | 1,785,000 | 1,606,500 |
| Coinbase Global, Inc.: | | | |
| 3.375% 10/1/28 (b) | | 280,000 | 234,742 |
| 3.625% 10/1/31 (b) | | 2,610,000 | 2,035,222 |
| Encore Capital Group, Inc. 9.25% 4/1/29 (b) | | 1,160,000 | 1,185,110 |
| FLY Leasing Ltd. 7% 10/15/24 (b) | | 573,000 | 571,722 |
| Fortress Transportation & Infrastructure Investors LLC 7.875% 12/1/30 (b)(c) | | 1,910,000 | 1,984,029 |
| GGAM Finance Ltd.: | | | |
| 6.875% 4/15/29 (b) | | 375,000 | 374,648 |
| 7.75% 5/15/26 (b) | | 1,385,000 | 1,406,985 |
| 8% 2/15/27 (b) | | 3,565,000 | 3,653,656 |
| 8% 6/15/28 (b) | | 4,200,000 | 4,325,311 |
| Gn Bondco LLC 9.5% 10/15/31 (b)(c) | | 1,660,000 | 1,594,133 |
| Hightower Holding LLC 6.75% 4/15/29 (b) | | 1,150,000 | 1,079,393 |
| Icahn Enterprises LP/Icahn Enterprises Finance Corp.: | | | |
| 4.375% 2/1/29 | | 3,245,000 | 2,731,770 |
| 5.25% 5/15/27 | | 7,915,000 | 7,232,331 |
| 6.25% 5/15/26 | | 4,110,000 | 3,997,245 |
| Jefferies Finance LLC/JFIN Co-Issuer Corp. 5% 8/15/28 (b) | | 520,000 | 467,850 |
| Ladder Capital Finance Holdings LLLP/Ladder Capital Finance Corp.: | | | |
| 4.75% 6/15/29 (b)(c) | | 2,550,000 | 2,275,755 |
| 5.25% 10/1/25 (b) | | 175,000 | 172,146 |
| Navient Corp.: | | | |
| 4.875% 3/15/28 | | 375,000 | 338,815 |
| 5% 3/15/27 | | 375,000 | 353,532 |
| OneMain Finance Corp.: | | | |
| 3.5% 1/15/27 | | 5,105,000 | 4,696,640 |
| 3.875% 9/15/28 | | 5,843,000 | 5,143,099 |
| 7.125% 3/15/26 | | 3,225,000 | 3,254,347 |
| 9% 1/15/29 (c) | | 330,000 | 345,962 |
| Scientific Games Holdings LP/Scientific Games U.S. Finco, Inc. 6.625% 3/1/30 (b) | | 1,880,000 | 1,778,531 |
| SLM Corp. 4.2% 10/29/25 | | 765,000 | 739,541 |
| StoneX Group, Inc. 7.875% 3/1/31 (b) | | 1,080,000 | 1,092,193 |
| | | | 59,521,984 |
| Diversified Media - 0.4% | | | |
| Advantage Sales & Marketing, Inc. 6.5% 11/15/28 (b) | | 3,705,000 | 3,447,601 |
| Outfront Media Capital LLC / Corp. 7.375% 2/15/31 (b) | | 2,295,000 | 2,355,131 |
| | | | 5,802,732 |
| Energy - 12.7% | | | |
| Altus Midstream LP: | | | |
| 5.875% 6/15/30 (b) | | 2,270,000 | 2,194,805 |
| 6.625% 12/15/28 (b) | | 2,335,000 | 2,346,241 |
| Antero Midstream Partners LP/Antero Midstream Finance Corp.: | | | |
| 5.75% 3/1/27 (b) | | 730,000 | 716,720 |
| 7.875% 5/15/26 (b) | | 730,000 | 743,268 |
| Atlantica Sustainable Infrastructure PLC 4.125% 6/15/28 (b) | | 4,505,000 | 4,079,530 |
| Baytex Energy Corp. 7.375% 3/15/32 (b) | | 1,585,000 | 1,598,475 |
| California Resources Corp. 7.125% 2/1/26 (b) | | 1,020,000 | 1,025,646 |
| Calumet Specialty Products Partners LP/Calumet Finance Corp. 9.75% 7/15/28 (b) | | 1,180,000 | 1,131,404 |
| Canacol Energy Ltd. 5.75% 11/24/28 (b) | | 1,530,000 | 722,925 |
| CGG SA 8.75% 4/1/27 (b) | | 3,940,000 | 3,687,027 |
| Citgo Petroleum Corp.: | | | |
| 6.375% 6/15/26 (b) | | 3,110,000 | 3,105,185 |
| 8.375% 1/15/29 (b) | | 1,000,000 | 1,034,889 |
| CNX Midstream Partners LP 4.75% 4/15/30 (b) | | 2,835,000 | 2,509,018 |
| CNX Resources Corp.: | | | |
| 7.25% 3/1/32 (b)(c) | | 2,185,000 | 2,191,031 |
| 7.375% 1/15/31 (b)(c) | | 855,000 | 865,499 |
| Comstock Resources, Inc.: | | | |
| 5.875% 1/15/30 (b) | | 3,350,000 | 3,051,084 |
| 6.75% 3/1/29 (b)(c) | | 2,280,000 | 2,170,815 |
| CQP Holdco LP / BIP-V Chinook Holdco LLC 7.5% 12/15/33 (b) | | 3,192,000 | 3,211,597 |
| CrownRock LP/CrownRock Finance, Inc.: | | | |
| 5% 5/1/29 (b) | | 3,265,000 | 3,216,715 |
| 5.625% 10/15/25 (b) | | 395,000 | 392,816 |
| CVR Energy, Inc.: | | | |
| 5.75% 2/15/28 (b) | | 4,910,000 | 4,562,451 |
| 8.5% 1/15/29 (b) | | 3,230,000 | 3,237,970 |
| Delek Logistics Partners LP/Delek Logistics Finance Corp.: | | | |
| 7.125% 6/1/28 (b) | | 4,740,000 | 4,629,604 |
| 8.625% 3/15/29 (b) | | 1,945,000 | 1,959,717 |
| DT Midstream, Inc.: | | | |
| 4.125% 6/15/29 (b) | | 575,000 | 521,162 |
| 4.375% 6/15/31 (b) | | 195,000 | 173,112 |
| Energean PLC 6.5% 4/30/27 (b) | | 1,795,000 | 1,669,350 |
| Energy Transfer LP: | | | |
| 6% 2/1/29 (b) | | 995,000 | 993,644 |
| 7.375% 2/1/31 (b) | | 1,355,000 | 1,397,292 |
| EnLink Midstream LLC: | | | |
| 5.625% 1/15/28 (b) | | 1,265,000 | 1,242,920 |
| 6.5% 9/1/30 (b) | | 4,430,000 | 4,485,610 |
| EnLink Midstream Partners LP: | | | |
| 4.15% 6/1/25 | | 685,000 | 668,537 |
| 4.85% 7/15/26 | | 1,210,000 | 1,176,822 |
| EQM Midstream Partners LP: | | | |
| 4.75% 1/15/31 (b) | | 600,000 | 548,240 |
| 6% 7/1/25 (b) | | 185,000 | 184,691 |
| 6.5% 7/1/27 (b)(c) | | 610,000 | 610,847 |
| 6.5% 7/15/48 | | 300,000 | 296,000 |
| Global Partners LP/GLP Finance Corp.: | | | |
| 6.875% 1/15/29 | | 3,538,000 | 3,462,410 |
| 7% 8/1/27 | | 2,975,000 | 2,951,463 |
| 8.25% 1/15/32 (b) | | 450,000 | 460,988 |
| Harbour Energy PLC 5.5% 10/15/26 (b) | | 190,000 | 186,258 |
| Harvest Midstream I LP: | | | |
| 7.5% 9/1/28 (b) | | 3,565,000 | 3,574,768 |
| 7.5% 5/15/32 (b) | | 925,000 | 926,147 |
| Hess Midstream Operations LP: | | | |
| 4.25% 2/15/30 (b) | | 1,030,000 | 929,569 |
| 5.125% 6/15/28 (b) | | 1,650,000 | 1,579,297 |
| 5.5% 10/15/30 (b) | | 580,000 | 554,558 |
| 5.625% 2/15/26 (b) | | 3,510,000 | 3,470,565 |
| HF Sinclair Corp. 5% 2/1/28 (b) | | 3,270,000 | 3,137,351 |
| Howard Midstream Energy Partners LLC 8.875% 7/15/28 (b) | | 2,800,000 | 2,932,656 |
| Independence Energy Finance LLC 7.625% 4/1/32 (b) | | 808,000 | 811,014 |
| Jonah Energy Parent LLC 12% 11/5/25 (h)(i) | | 4,515,379 | 4,820,167 |
| Kosmos Energy Ltd.: | | | |
| 7.5% 3/1/28 (b)(c) | | 760,000 | 725,800 |
| 7.75% 5/1/27 (b) | | 380,000 | 370,619 |
| Matador Resources Co. 6.5% 4/15/32 (b) | | 1,900,000 | 1,883,070 |
| Nabors Industries, Inc. 9.125% 1/31/30 (b) | | 380,000 | 391,850 |
| New Fortress Energy, Inc.: | | | |
| 6.5% 9/30/26 (b)(c) | | 8,410,000 | 8,042,180 |
| 6.75% 9/15/25 (b)(c) | | 3,838,000 | 3,790,841 |
| 8.75% 3/15/29 (b)(c) | | 4,379,000 | 4,270,618 |
| NGL Energy Operating LLC/NGL Energy Finance Corp.: | | | |
| 8.125% 2/15/29 (b) | | 790,000 | 802,577 |
| 8.375% 2/15/32 (b) | | 790,000 | 802,760 |
| Northern Oil & Gas, Inc.: | | | |
| 8.125% 3/1/28 (b) | | 2,370,000 | 2,397,617 |
| 8.75% 6/15/31 (b) | | 760,000 | 799,447 |
| Occidental Petroleum Corp.: | | | |
| 4.2% 3/15/48 | | 735,000 | 541,967 |
| 4.4% 4/15/46 | | 2,055,000 | 1,587,585 |
| 4.4% 8/15/49 | | 980,000 | 705,241 |
| 4.5% 7/15/44 | | 1,705,000 | 1,289,593 |
| 6.45% 9/15/36 | | 1,685,000 | 1,738,907 |
| 7.95% 6/15/39 | | 365,000 | 413,220 |
| PBF Holding Co. LLC/PBF Finance Corp. 7.875% 9/15/30 (b) | | 5,325,000 | 5,476,679 |
| Permian Resources Operating LLC: | | | |
| 5.875% 7/1/29 (b) | | 2,150,000 | 2,090,875 |
| 7% 1/15/32 (b) | | 530,000 | 540,290 |
| 7.75% 2/15/26 (b) | | 1,150,000 | 1,160,268 |
| Petroleos Mexicanos: | | | |
| 5.35% 2/12/28 | | 750,000 | 656,175 |
| 6.5% 3/13/27 | | 1,130,000 | 1,059,997 |
| Prairie Acquiror LP 9% 8/1/29 (b) | | 790,000 | 806,914 |
| Rockies Express Pipeline LLC: | | | |
| 4.8% 5/15/30 (b) | | 2,185,000 | 1,967,170 |
| 4.95% 7/15/29 (b) | | 3,370,000 | 3,098,155 |
| 6.875% 4/15/40 (b) | | 330,000 | 313,689 |
| Seadrill Finance Ltd. 8.375% 8/1/30 (b) | | 740,000 | 770,911 |
| Sitio Royalties OP / Sitio Finance Corp. 7.875% 11/1/28 (b) | | 1,000,000 | 1,028,344 |
| SM Energy Co. 5.625% 6/1/25 | | 1,915,000 | 1,900,780 |
| Southwestern Energy Co. 4.75% 2/1/32 | | 3,505,000 | 3,156,482 |
| Sunnova Energy Corp.: | | | |
| 5.875% 9/1/26 (b) | | 2,815,000 | 1,750,786 |
| 11.75% 10/1/28 (b) | | 500,000 | 298,518 |
| Sunoco Logistics Partners, LP: | | | |
| 7% 5/1/29 (b) | | 710,000 | 721,066 |
| 7.25% 5/1/32 (b) | | 1,085,000 | 1,101,988 |
| Sunoco LP/Sunoco Finance Corp.: | | | |
| 4.5% 5/15/29 | | 2,585,000 | 2,360,020 |
| 5.875% 3/15/28 | | 2,780,000 | 2,712,938 |
| Superior Plus LP / Superior General Partner, Inc. 4.5% 3/15/29 (b) | | 1,455,000 | 1,316,102 |
| Tallgrass Energy Partners LP / Tallgrass Energy Finance Corp.: | | | |
| 5.5% 1/15/28 (b) | | 4,530,000 | 4,300,879 |
| 6% 3/1/27 (b) | | 1,626,000 | 1,583,839 |
| 6% 12/31/30 (b) | | 5,570,000 | 5,239,501 |
| 6% 9/1/31 (b) | | 4,265,000 | 3,959,725 |
| Talos Production, Inc.: | | | |
| 9% 2/1/29 (b)(c) | | 680,000 | 717,441 |
| 9.375% 2/1/31 (b)(c) | | 950,000 | 1,012,414 |
| Teine Energy Ltd. 6.875% 4/15/29 (b) | | 395,000 | 383,773 |
| Transocean Aquila Ltd. 8% 9/30/28 (b) | | 510,000 | 518,718 |
| Transocean Poseidon Ltd. 6.875% 2/1/27 (b) | | 924,750 | 922,033 |
| Transocean, Inc.: | | | |
| 8% 2/1/27 (b) | | 4,096,000 | 4,105,904 |
| 8.25% 5/15/29 (b) | | 1,315,000 | 1,310,521 |
| 8.5% 5/15/31 (b) | | 1,695,000 | 1,687,337 |
| 8.75% 2/15/30 (b) | | 1,615,500 | 1,684,448 |
| Tullow Oil PLC: | | | |
| 7% 3/1/25 (b) | | 525,000 | 507,609 |
| 10.25% 5/15/26 (b) | | 525,000 | 506,461 |
| U.S.A. Compression Partners LP/U.S.A. Compression Finance Corp. 7.125% 3/15/29 (b) | | 1,530,000 | 1,520,215 |
| Valaris Ltd. 8.375% 4/30/30 (b) | | 3,400,000 | 3,496,610 |
| Viper Energy, Inc. 7.375% 11/1/31 (b) | | 570,000 | 586,895 |
| Western Gas Partners LP: | | | |
| 5.25% 2/1/50 | | 1,470,000 | 1,246,786 |
| 5.3% 3/1/48 | | 735,000 | 614,629 |
| 5.5% 8/15/48 | | 440,000 | 372,738 |
| | | | 199,270,385 |
| Environmental - 1.1% | | | |
| Clean Harbors, Inc. 6.375% 2/1/31 (b) | | 950,000 | 941,162 |
| Covanta Holding Corp. 4.875% 12/1/29 (b) | | 2,860,000 | 2,507,092 |
| Darling Ingredients, Inc. 6% 6/15/30 (b) | | 1,345,000 | 1,306,589 |
| GFL Environmental, Inc.: | | | |
| 3.75% 8/1/25 (b) | | 1,460,000 | 1,419,775 |
| 5.125% 12/15/26 (b) | | 1,460,000 | 1,421,738 |
| 6.75% 1/15/31 (b) | | 305,000 | 307,466 |
| Madison IAQ LLC: | | | |
| 4.125% 6/30/28 (b) | | 2,935,000 | 2,722,653 |
| 5.875% 6/30/29 (b) | | 2,180,000 | 2,022,701 |
| Stericycle, Inc. 3.875% 1/15/29 (b) | | 5,170,000 | 4,593,771 |
| | | | 17,242,947 |
| Food & Drug Retail - 1.0% | | | |
| Albertsons Companies LLC/Safeway, Inc./New Albertson's, Inc./Albertson's LLC: | | | |
| 3.25% 3/15/26 (b) | | 395,000 | 375,141 |
| 3.5% 3/15/29 (b) | | 3,410,000 | 3,008,874 |
| 4.875% 2/15/30 (b) | | 3,585,000 | 3,343,782 |
| Emergent BioSolutions, Inc. 3.875% 8/15/28 (b) | | 5,715,000 | 2,887,011 |
| Murphy Oil U.S.A., Inc. 3.75% 2/15/31 (b) | | 1,315,000 | 1,128,879 |
| Parkland Corp.: | | | |
| 4.5% 10/1/29 (b) | | 980,000 | 888,159 |
| 4.625% 5/1/30 (b) | | 4,735,000 | 4,279,222 |
| | | | 15,911,068 |
| Food/Beverage/Tobacco - 2.2% | | | |
| BellRing Brands, Inc. 7% 3/15/30 (b)(c) | | 585,000 | 591,978 |
| C&S Group Enterprises LLC 5% 12/15/28 (b) | | 3,320,000 | 2,545,434 |
| Chobani LLC/Finance Corp., Inc. 4.625% 11/15/28 (b) | | 585,000 | 541,452 |
| Fiesta Purchaser, Inc. 7.875% 3/1/31 (b)(c) | | 1,455,000 | 1,482,593 |
| KeHE Distributor / Nextwave 9% 2/15/29 (b) | | 3,150,000 | 3,180,609 |
| Lamb Weston Holdings, Inc.: | | | |
| 4.125% 1/31/30 (b) | | 4,645,000 | 4,140,101 |
| 4.375% 1/31/32 (b) | | 735,000 | 636,955 |
| Performance Food Group, Inc. 5.5% 10/15/27 (b) | | 335,000 | 324,270 |
| Pilgrim's Pride Corp.: | | | |
| 3.5% 3/1/32 | | 730,000 | 601,105 |
| 4.25% 4/15/31 | | 865,000 | 765,430 |
| Post Holdings, Inc.: | | | |
| 4.625% 4/15/30 (b) | | 2,035,000 | 1,837,849 |
| 5.5% 12/15/29 (b) | | 2,055,000 | 1,948,853 |
| 6.25% 2/15/32 (b) | | 1,905,000 | 1,879,564 |
| Primo Water Holdings, Inc. 4.375% 4/30/29 (b) | | 1,815,000 | 1,656,655 |
| Sigma Holdco BV 7.875% 5/15/26 (b) | | 2,215,000 | 2,099,820 |
| TreeHouse Foods, Inc. 4% 9/1/28 (c) | | 1,265,000 | 1,120,086 |
| Triton Water Holdings, Inc. 6.25% 4/1/29 (b) | | 5,540,000 | 4,967,879 |
| U.S. Foods, Inc.: | | | |
| 4.625% 6/1/30 (b) | | 1,725,000 | 1,568,589 |
| 4.75% 2/15/29 (b) | | 1,695,000 | 1,579,148 |
| 6.875% 9/15/28 (b) | | 1,000,000 | 1,008,511 |
| United Natural Foods, Inc. 6.75% 10/15/28 (b) | | 295,000 | 226,393 |
| | | | 34,703,274 |
| Gaming - 1.3% | | | |
| Affinity Interactive 6.875% 12/15/27 (b) | | 1,400,000 | 1,253,076 |
| Caesars Entertainment, Inc.: | | | |
| 6.5% 2/15/32 (b) | | 3,155,000 | 3,108,442 |
| 8.125% 7/1/27 (b) | | 3,309,000 | 3,353,664 |
| Fertitta Entertainment LLC / Fertitta Entertainment Finance Co., Inc. 6.75% 1/15/30 (b) | | 3,882,000 | 3,377,491 |
| GLP Capital LP/GLP Financing II, Inc. 5.25% 6/1/25 | | 795,000 | 787,621 |
| Jacobs Entertainment, Inc. 6.75% 2/15/29 (b) | | 1,690,000 | 1,603,148 |
| Light & Wonder International, Inc. 7.5% 9/1/31 (b) | | 1,200,000 | 1,223,824 |
| MGM Resorts International 6.5% 4/15/32 | | 1,585,000 | 1,537,797 |
| Station Casinos LLC: | | | |
| 4.5% 2/15/28 (b) | | 390,000 | 361,733 |
| 6.625% 3/15/32 (b) | | 1,580,000 | 1,548,312 |
| VICI Properties LP / VICI Note Co. 4.125% 8/15/30 (b) | | 1,465,000 | 1,305,780 |
| Wynn Resorts Finance LLC / Wynn Resorts Capital Corp. 7.125% 2/15/31 (b) | | 735,000 | 745,483 |
| | | | 20,206,371 |
| Healthcare - 7.5% | | | |
| 1375209 BC Ltd. 9% 1/30/28 (b) | | 2,883,000 | 2,830,302 |
| 180 Medical, Inc. 3.875% 10/15/29 (b) | | 1,435,000 | 1,270,556 |
| AdaptHealth LLC 5.125% 3/1/30 (b)(c) | | 3,948,000 | 3,360,621 |
| Akumin, Inc. 8% 8/1/28 (b) | | 950,000 | 743,375 |
| AMN Healthcare 4% 4/15/29 (b) | | 925,000 | 818,763 |
| Avantor Funding, Inc.: | | | |
| 3.875% 11/1/29 (b) | | 1,830,000 | 1,620,278 |
| 4.625% 7/15/28 (b) | | 280,000 | 260,289 |
| Bausch Health Companies, Inc.: | | | |
| 5.5% 11/1/25 (b) | | 4,458,000 | 4,152,401 |
| 9% 12/15/25 (b) | | 400,000 | 377,928 |
| Cano Health, Inc. 6.25% (b)(f) | | 1,350,000 | 1,688 |
| Catalent Pharma Solutions 3.5% 4/1/30 (b) | | 1,295,000 | 1,231,911 |
| Charles River Laboratories International, Inc.: | | | |
| 3.75% 3/15/29 (b) | | 1,300,000 | 1,167,775 |
| 4% 3/15/31 (b) | | 1,310,000 | 1,142,639 |
| 4.25% 5/1/28 (b) | | 385,000 | 358,094 |
| Community Health Systems, Inc.: | | | |
| 4.75% 2/15/31 (b) | | 5,555,000 | 4,335,900 |
| 5.25% 5/15/30 (b) | | 13,300,000 | 10,873,881 |
| 5.625% 3/15/27 (b) | | 2,695,000 | 2,467,654 |
| 6% 1/15/29 (b) | | 2,470,000 | 2,154,929 |
| 6.125% 4/1/30 (b) | | 3,564,000 | 2,519,793 |
| 6.875% 4/15/29 (b) | | 5,995,000 | 4,456,671 |
| 8% 3/15/26 (b) | | 190,000 | 189,075 |
| CTR Partnership LP/CareTrust Capital Corp. 3.875% 6/30/28 (b) | | 3,610,000 | 3,267,599 |
| DaVita, Inc.: | | | |
| 3.75% 2/15/31 (b) | | 1,180,000 | 970,990 |
| 4.625% 6/1/30 (b) | | 5,865,000 | 5,138,525 |
| Embecta Corp. 5% 2/15/30 (b)(c) | | 1,180,000 | 909,722 |
| Grifols SA 4.75% 10/15/28 (b) | | 1,255,000 | 1,013,588 |
| HealthEquity, Inc. 4.5% 10/1/29 (b) | | 1,595,000 | 1,452,765 |
| Hologic, Inc. 3.25% 2/15/29 (b) | | 765,000 | 675,614 |
| IQVIA, Inc.: | | | |
| 5% 10/15/26 (b)(c) | | 295,000 | 288,522 |
| 6.5% 5/15/30 (b) | | 1,525,000 | 1,531,919 |
| Jazz Securities DAC 4.375% 1/15/29 (b) | | 2,600,000 | 2,365,552 |
| Medline Borrower LP 3.875% 4/1/29 (b) | | 730,000 | 653,957 |
| Medline Borrower LP / Medline Co. 6.25% 4/1/29 (b) | | 5,360,000 | 5,325,715 |
| ModivCare Escrow Issuer, Inc. 5% 10/1/29 (b) | | 626,000 | 434,881 |
| Modivcare, Inc. 5.875% 11/15/25 (b)(c) | | 4,092,000 | 3,990,954 |
| Molina Healthcare, Inc.: | | | |
| 3.875% 11/15/30 (b) | | 1,385,000 | 1,201,200 |
| 3.875% 5/15/32 (b) | | 785,000 | 656,870 |
| Omega Healthcare Investors, Inc. 3.25% 4/15/33 | | 3,934,000 | 3,080,236 |
| Organon & Co. / Organon Foreign Debt Co-Issuer BV: | | | |
| 4.125% 4/30/28 (b) | | 4,990,000 | 4,544,676 |
| 5.125% 4/30/31 (b)(c) | | 2,370,000 | 2,049,343 |
| Pediatrix Medical Group, Inc. 5.375% 2/15/30 (b)(c) | | 2,468,000 | 2,159,475 |
| Radiology Partners, Inc. 8.5% 1/31/29 pay-in-kind (b)(d) | | 3,177,792 | 2,931,513 |
| Regionalcare Hospital Partners 9.75% 12/1/26 (b) | | 1,560,000 | 1,553,245 |
| RegionalCare Hospital Partners Holdings, Inc.: | | | |
| 5.375% 1/15/29 (b) | | 1,375,000 | 1,099,360 |
| 9.875% 8/15/30 (b) | | 1,255,000 | 1,306,829 |
| 11% 10/15/30 (b)(c) | | 190,000 | 202,235 |
| Surgery Center Holdings, Inc. 7.25% 4/15/32 (b) | | 2,965,000 | 2,960,952 |
| Teleflex, Inc. 4.25% 6/1/28 (b) | | 1,275,000 | 1,178,192 |
| Tenet Healthcare Corp.: | | | |
| 4.25% 6/1/29 | | 3,575,000 | 3,274,632 |
| 4.375% 1/15/30 | | 3,385,000 | 3,073,776 |
| 6.125% 10/1/28 (c) | | 3,245,000 | 3,204,286 |
| 6.125% 6/15/30 | | 4,165,000 | 4,078,528 |
| 6.25% 2/1/27 | | 1,255,000 | 1,249,937 |
| 6.75% 5/15/31 (b) | | 480,000 | 480,952 |
| Teva Pharmaceutical Finance Netherlands III BV: | | | |
| 3.15% 10/1/26 | | 1,775,000 | 1,644,394 |
| 7.875% 9/15/29 | | 250,000 | 263,272 |
| 8.125% 9/15/31 | | 450,000 | 485,621 |
| U.S. Acute Care Solutions 9.75% 5/15/29 (b) | | 365,000 | 357,932 |
| | | | 117,392,282 |
| Homebuilders/Real Estate - 4.2% | | | |
| Anywhere Real Estate Group LLC 7% 4/15/30 (b) | | 1,194,400 | 1,048,021 |
| Ashton Woods U.S.A. LLC/Ashton Woods Finance Co. 4.625% 8/1/29 (b) | | 2,060,000 | 1,863,099 |
| ATP Tower Holdings LLC/Andean Tower Partners 4.05% 4/27/26 (b) | | 2,170,000 | 2,018,157 |
| Beazer Homes U.S.A., Inc. 7.5% 3/15/31 (b) | | 1,255,000 | 1,240,476 |
| Greystar Real Estate Partners 7.75% 9/1/30 (b) | | 750,000 | 772,487 |
| HAT Holdings I LLC/HAT Holdings II LLC: | | | |
| 3.375% 6/15/26 (b)(c) | | 1,550,000 | 1,440,598 |
| 6% 4/15/25 (b) | | 660,000 | 656,483 |
| 8% 6/15/27 (b)(c) | | 695,000 | 712,479 |
| Howard Hughes Corp.: | | | |
| 4.125% 2/1/29 (b) | | 1,830,000 | 1,616,014 |
| 4.375% 2/1/31 (b) | | 995,000 | 843,705 |
| Kennedy-Wilson, Inc. 4.75% 2/1/30 (c) | | 2,080,000 | 1,647,355 |
| Landsea Homes Corp. 8.875% 4/1/29 (b) | | 805,000 | 789,906 |
| LGI Homes, Inc.: | | | |
| 4% 7/15/29 (b) | | 965,000 | 827,560 |
| 8.75% 12/15/28 (b) | | 275,000 | 286,059 |
| MPT Operating Partnership LP/MPT Finance Corp.: | | | |
| 3.5% 3/15/31 | | 8,090,000 | 5,424,586 |
| 4.625% 8/1/29 | | 2,525,000 | 1,889,474 |
| 5% 10/15/27 (c) | | 7,225,000 | 5,909,761 |
| 5.25% 8/1/26 (c) | | 2,435,000 | 2,217,851 |
| Panther Escrow Issuer LLC 7.125% 6/1/31 (b) | | 2,605,000 | 2,618,510 |
| Railworks Holdings LP 8.25% 11/15/28 (b) | | 3,585,000 | 3,580,286 |
| Realogy Group LLC/Realogy Co-Issuer Corp. 5.75% 1/15/29 (b) | | 1,675,000 | 1,157,844 |
| Realogy Group LLC/Realogy Co.-Issuer Corp. 5.25% 4/15/30 (b) | | 824,000 | 553,102 |
| Rithm Capital Corp.: | | | |
| 6.25% 10/15/25 (b) | | 368,000 | 364,483 |
| 8% 4/1/29 (b) | | 760,000 | 743,176 |
| Safehold Operating Partnership LP: | | | |
| 2.8% 6/15/31 | | 3,516,000 | 2,877,197 |
| 2.85% 1/15/32 | | 2,255,000 | 1,808,590 |
| Starwood Property Trust, Inc.: | | | |
| 3.75% 12/31/24 (b) | | 1,150,000 | 1,128,955 |
| 7.25% 4/1/29 (b)(c) | | 940,000 | 927,307 |
| Taylor Morrison Communities, Inc./Monarch Communities, Inc. 5.125% 8/1/30 (b) | | 535,000 | 498,177 |
| TopBuild Corp. 4.125% 2/15/32 (b) | | 1,320,000 | 1,142,792 |
| TRI Pointe Group, Inc./TRI Pointe Holdings, Inc. 5.875% 6/15/24 | | 40,000 | 39,954 |
| TRI Pointe Homes, Inc. 5.7% 6/15/28 | | 295,000 | 285,522 |
| Uniti Group LP/Uniti Group Finance, Inc./CSL Capital LLC: | | | |
| 4.75% 4/15/28 (b) | | 8,270,000 | 7,253,206 |
| 6.5% 2/15/29 (b) | | 6,155,000 | 4,948,168 |
| 10.5% 2/15/28 (b) | | 2,930,000 | 3,039,669 |
| VICI Properties LP: | | | |
| 5.75% 4/1/34 | | 197,000 | 189,572 |
| 6.125% 4/1/54 | | 1,555,000 | 1,452,437 |
| | | | 65,813,018 |
| Hotels - 0.7% | | | |
| Hilton Domestic Operating Co., Inc.: | | | |
| 3.625% 2/15/32 (b) | | 4,305,000 | 3,617,583 |
| 4% 5/1/31 (b) | | 2,055,000 | 1,800,670 |
| 5.875% 4/1/29 (b) | | 1,325,000 | 1,307,451 |
| 6.125% 4/1/32 (b) | | 1,325,000 | 1,306,104 |
| Hilton Grand Vacations Borrower Escrow LLC 6.625% 1/15/32 (b)(c) | | 3,305,000 | 3,258,291 |
| Lindblad Expeditions LLC 6.75% 2/15/27 (b) | | 395,000 | 391,324 |
| | | | 11,681,423 |
| Insurance - 0.9% | | | |
| Acrisure LLC / Acrisure Finance, Inc.: | | | |
| 4.25% 2/15/29 (b) | | 585,000 | 524,077 |
| 8.25% 2/1/29 (b) | | 830,000 | 823,182 |
| Alliant Holdings Intermediate LLC/Alliant Holdings Co.-Issuer: | | | |
| 6.75% 10/15/27 (b) | | 740,000 | 725,657 |
| 6.75% 4/15/28 (b) | | 735,000 | 734,224 |
| AmWINS Group, Inc.: | | | |
| 4.875% 6/30/29 (b) | | 1,910,000 | 1,736,345 |
| 6.375% 2/15/29 (b) | | 1,590,000 | 1,570,749 |
| AssuredPartners, Inc.: | | | |
| 5.625% 1/15/29 (b) | | 2,915,000 | 2,658,130 |
| 7.5% 2/15/32 (b) | | 1,900,000 | 1,844,777 |
| HUB International Ltd. 7.25% 6/15/30 (b) | | 1,965,000 | 1,993,825 |
| USI, Inc. 7.5% 1/15/32 (b) | | 945,000 | 939,972 |
| | | | 13,550,938 |
| Leisure - 2.8% | | | |
| Amer Sports Co. 6.75% 2/16/31 (b) | | 3,115,000 | 3,067,733 |
| Carnival Corp.: | | | |
| 5.75% 3/1/27 (b) | | 900,000 | 878,365 |
| 6% 5/1/29 (b) | | 3,000,000 | 2,907,130 |
| 6.65% 1/15/28 | | 670,000 | 663,979 |
| 7.625% 3/1/26 (b) | | 5,230,000 | 5,262,440 |
| 10.5% 6/1/30 (b) | | 3,840,000 | 4,170,271 |
| ClubCorp Holdings, Inc. 8.5% 9/15/25 (b) | | 645,000 | 583,163 |
| MajorDrive Holdings IV LLC 6.375% 6/1/29 (b) | | 3,065,000 | 2,876,238 |
| Merlin Entertainments Group 7.375% 2/15/31 (b)(c) | | 750,000 | 753,515 |
| NCL Corp. Ltd.: | | | |
| 3.625% 12/15/24 (b) | | 3,090,000 | 3,041,189 |
| 5.875% 3/15/26 (b) | | 1,435,000 | 1,406,043 |
| 7.75% 2/15/29 (b) | | 3,690,000 | 3,774,970 |
| NCL Finance Ltd. 6.125% 3/15/28 (b) | | 1,290,000 | 1,258,755 |
| Royal Caribbean Cruises Ltd.: | | | |
| 5.5% 8/31/26 (b) | | 4,420,000 | 4,335,721 |
| 5.5% 4/1/28 (b) | | 3,035,000 | 2,954,168 |
| 6.25% 3/15/32 (b) | | 3,225,000 | 3,179,116 |
| Viking Cruises Ltd. 9.125% 7/15/31 (b) | | 535,000 | 573,846 |
| Viking Ocean Cruises Ship VII Ltd. 5.625% 2/15/29 (b) | | 1,545,000 | 1,478,488 |
| Voc Escrow Ltd. 5% 2/15/28 (b) | | 1,420,000 | 1,354,221 |
| | | | 44,519,351 |
| Metals/Mining - 2.3% | | | |
| Alcoa Nederland Holding BV 7.125% 3/15/31 (b) | | 6,344,000 | 6,417,007 |
| Arsenal AIC Parent LLC 8% 10/1/30 (b) | | 995,000 | 1,035,960 |
| Cleveland-Cliffs, Inc. 7% 3/15/32 (b) | | 380,000 | 371,120 |
| Constellium NV 5.875% 2/15/26 (b) | | 823,000 | 814,524 |
| Eldorado Gold Corp. 6.25% 9/1/29 (b) | | 1,130,000 | 1,066,381 |
| ERO Copper Corp. 6.5% 2/15/30 (b) | | 5,490,000 | 5,163,894 |
| First Quantum Minerals Ltd.: | | | |
| 6.875% 10/15/27 (b) | | 2,985,000 | 2,865,600 |
| 8.625% 6/1/31 (b) | | 1,625,000 | 1,580,231 |
| 9.375% 3/1/29 (b) | | 4,705,000 | 4,861,088 |
| FMG Resources Pty Ltd. 4.375% 4/1/31 (b) | | 730,000 | 642,724 |
| HudBay Minerals, Inc. 4.5% 4/1/26 (b) | | 1,485,000 | 1,436,210 |
| Mineral Resources Ltd.: | | | |
| 8% 11/1/27 (b) | | 1,980,000 | 2,002,532 |
| 8.5% 5/1/30 (b) | | 2,110,000 | 2,161,005 |
| 9.25% 10/1/28 (b) | | 1,360,000 | 1,425,737 |
| Novelis Corp. 3.875% 8/15/31 (b) | | 740,000 | 626,642 |
| PMHC II, Inc. 9% 2/15/30 (b) | | 3,135,000 | 2,909,966 |
| | | | 35,380,621 |
| Paper - 0.8% | | | |
| Ahlstrom Holding 3 OY 4.875% 2/4/28 (b) | | 2,875,000 | 2,631,488 |
| Ardagh Metal Packaging Finance U.S.A. LLC/Ardagh Metal Packaging Finance PLC: | | | |
| 4% 9/1/29 (b) | | 3,000,000 | 2,472,958 |
| 6% 6/15/27 (b) | | 2,930,000 | 2,840,217 |
| Clydesdale Acquisition Holdings, Inc.: | | | |
| 6.625% 4/15/29 (b) | | 1,405,000 | 1,401,471 |
| 8.75% 4/15/30 (b) | | 2,250,000 | 2,174,514 |
| Mercer International, Inc. 5.125% 2/1/29 (c) | | 950,000 | 829,732 |
| | | | 12,350,380 |
| Publishing/Printing - 0.0% | | | |
| Cimpress PLC 7% 6/15/26 | | 660,000 | 654,892 |
| Railroad - 0.2% | | | |
| Genesee & Wyoming, Inc. 6.25% 4/15/32 (b) | | 3,825,000 | 3,801,629 |
| Restaurants - 0.6% | | | |
| 1011778 BC Unlimited Liability Co./New Red Finance, Inc.: | | | |
| 3.875% 1/15/28 (b) | | 1,265,000 | 1,166,979 |
| 4% 10/15/30 (b) | | 3,170,000 | 2,733,725 |
| Garden SpinCo Corp. 8.625% 7/20/30 (b) | | 740,000 | 780,244 |
| Yum! Brands, Inc.: | | | |
| 3.625% 3/15/31 | | 735,000 | 635,112 |
| 4.625% 1/31/32 (c) | | 3,255,000 | 2,930,278 |
| 5.375% 4/1/32 (c) | | 585,000 | 551,820 |
| | | | 8,798,158 |
| Services - 6.0% | | | |
| ADT Corp. 4.125% 8/1/29 (b)(c) | | 1,715,000 | 1,550,263 |
| AECOM 5.125% 3/15/27 | | 1,240,000 | 1,204,666 |
| Allied Universal Holdco LLC 7.875% 2/15/31 (b) | | 2,265,000 | 2,270,002 |
| Allied Universal Holdco LLC / Allied Universal Finance Corp.: | | | |
| 6% 6/1/29 (b) | | 2,635,000 | 2,237,163 |
| 9.75% 7/15/27 (b) | | 4,932,000 | 4,913,325 |
| APX Group, Inc.: | | | |
| 5.75% 7/15/29 (b) | | 1,525,000 | 1,417,997 |
| 6.75% 2/15/27 (b) | | 2,835,000 | 2,816,195 |
| Aramark Services, Inc. 5% 2/1/28 (b) | | 760,000 | 721,607 |
| Artera Services LLC 8.5% 2/15/31 (b) | | 9,604,000 | 9,827,331 |
| ASGN, Inc. 4.625% 5/15/28 (b) | | 1,395,000 | 1,301,825 |
| Avis Budget Car Rental LLC/Avis Budget Finance, Inc. 5.75% 7/15/27 (b) | | 185,000 | 175,773 |
| Brand Industrial Services, Inc. 10.375% 8/1/30 (b) | | 6,275,000 | 6,733,696 |
| CoreCivic, Inc.: | | | |
| 4.75% 10/15/27 | | 3,675,000 | 3,425,983 |
| 8.25% 4/15/29 (c) | | 4,775,000 | 4,933,984 |
| CoreLogic, Inc. 4.5% 5/1/28 (b)(c) | | 2,080,000 | 1,799,672 |
| Gartner, Inc.: | | | |
| 3.625% 6/15/29 (b) | | 575,000 | 514,503 |
| 4.5% 7/1/28 (b) | | 750,000 | 705,298 |
| GEMS MENASA Cayman Ltd./GEMS Education Delaware LLC 7.125% 7/31/26 (b) | | 6,364,000 | 6,326,214 |
| Hertz Corp. 5% 12/1/29 (b) | | 395,000 | 271,243 |
| Iron Mountain, Inc. 4.5% 2/15/31 (b) | | 730,000 | 643,874 |
| Korn Ferry 4.625% 12/15/27 (b) | | 540,000 | 512,065 |
| Legends Hospitality Holding Co. LLC/Legends Hospitality Co-Issuer, Inc. 5% 2/1/26 (b) | | 1,074,000 | 1,061,918 |
| Life Time, Inc.: | | | |
| 5.75% 1/15/26 (b) | | 2,651,000 | 2,622,172 |
| 8% 4/15/26 (b)(c) | | 3,980,000 | 3,986,980 |
| Neptune BidCo U.S., Inc. 9.29% 4/15/29 (b) | | 1,673,000 | 1,576,803 |
| Service Corp. International: | | | |
| 4% 5/15/31 | | 1,285,000 | 1,106,981 |
| 5.125% 6/1/29 | | 810,000 | 773,387 |
| Sotheby's 7.375% 10/15/27 (b) | | 1,700,000 | 1,584,269 |
| Staples, Inc.: | | | |
| 7.5% 4/15/26 (b) | | 1,755,000 | 1,692,026 |
| 10.75% 4/15/27 (b) | | 1,800,000 | 1,656,473 |
| The GEO Group, Inc.: | | | |
| 6% 4/15/26 | | 490,000 | 489,657 |
| 8.625% 4/15/29 (b) | | 2,855,000 | 2,890,286 |
| 10.25% 4/15/31 (b) | | 2,855,000 | 2,943,335 |
| TriNet Group, Inc.: | | | |
| 3.5% 3/1/29 (b) | | 4,635,000 | 4,058,282 |
| 7.125% 8/15/31 (b) | | 875,000 | 879,413 |
| Uber Technologies, Inc.: | | | |
| 4.5% 8/15/29 (b)(c) | | 345,000 | 321,401 |
| 8% 11/1/26 (b) | | 4,365,000 | 4,408,309 |
| United Rentals North America, Inc. 6.125% 3/15/34 (b) | | 3,160,000 | 3,085,369 |
| WASH Multifamily Acquisition, Inc. 5.75% 4/15/26 (b) | | 3,885,000 | 3,766,550 |
| | | | 93,206,290 |
| Steel - 0.3% | | | |
| ATI, Inc. 7.25% 8/15/30 | | 820,000 | 838,842 |
| Commercial Metals Co.: | | | |
| 3.875% 2/15/31 | | 880,000 | 765,641 |
| 4.125% 1/15/30 | | 2,025,000 | 1,812,964 |
| Vallourec SA 7.5% 4/15/32 (b) | | 1,715,000 | 1,736,067 |
| | | | 5,153,514 |
| Super Retail - 1.7% | | | |
| Bath & Body Works, Inc. 6.694% 1/15/27 | | 1,123,000 | 1,129,970 |
| Carvana Co.: | | | |
| 4.875% 9/1/29 (b) | | 1,322,000 | 862,197 |
| 5.5% 4/15/27 (b) | | 1,312,000 | 1,026,250 |
| 5.875% 10/1/28 (b) | | 764,000 | 514,214 |
| 12% 12/1/28 pay-in-kind (b)(d) | | 1,709,613 | 1,674,500 |
| 13% 6/1/30 pay-in-kind (b)(d) | | 1,103,709 | 1,095,049 |
| 14% 6/1/31 pay-in-kind (b)(d) | | 2,914,777 | 2,921,800 |
| EG Global Finance PLC 12% 11/30/28 (b) | | 5,300,000 | 5,471,178 |
| Hanesbrands, Inc. 4.875% 5/15/26 (b) | | 580,000 | 560,978 |
| LBM Acquisition LLC 6.25% 1/15/29 (b) | | 2,255,000 | 2,070,010 |
| Levi Strauss & Co. 3.5% 3/1/31 (b)(c) | | 310,000 | 264,595 |
| Michaels Companies, Inc.: | | | |
| 5.25% 5/1/28 (b) | | 2,095,000 | 1,773,160 |
| 7.875% 5/1/29 (b) | | 1,315,000 | 963,518 |
| Nordstrom, Inc.: | | | |
| 4.25% 8/1/31 (c) | | 685,000 | 590,823 |
| 4.375% 4/1/30 (c) | | 435,000 | 388,241 |
| Sally Holdings LLC 6.75% 3/1/32 (c) | | 1,590,000 | 1,536,987 |
| Wolverine World Wide, Inc. 4% 8/15/29 (b) | | 4,356,000 | 3,479,243 |
| | | | 26,322,713 |
| Technology - 6.1% | | | |
| Acuris Finance U.S. 5% 5/1/28 (b) | | 5,535,000 | 5,021,292 |
| Ahead DB Holdings LLC 6.625% 5/1/28 (b) | | 755,000 | 686,257 |
| Block, Inc.: | | | |
| 2.75% 6/1/26 (c) | | 730,000 | 685,878 |
| 3.5% 6/1/31 | | 4,995,000 | 4,219,547 |
| Cloud Software Group, Inc.: | | | |
| 6.5% 3/31/29 (b) | | 775,000 | 735,051 |
| 9% 9/30/29 (b) | | 7,098,000 | 6,830,088 |
| CNT PRNT/CDK GLO II/FIN 8% 6/15/29 (b) | | 1,975,000 | 2,031,892 |
| Coherent Corp. 5% 12/15/29 (b) | | 3,765,000 | 3,473,434 |
| CommScope, Inc.: | | | |
| 4.75% 9/1/29 (b) | | 2,985,000 | 2,082,038 |
| 6% 3/1/26 (b) | | 445,000 | 397,719 |
| Elastic NV 4.125% 7/15/29 (b) | | 2,363,000 | 2,104,265 |
| Entegris, Inc.: | | | |
| 3.625% 5/1/29 (b)(c) | | 1,200,000 | 1,062,000 |
| 4.75% 4/15/29 (b) | | 500,000 | 471,594 |
| 5.95% 6/15/30 (b) | | 4,125,000 | 4,016,692 |
| Gen Digital, Inc.: | | | |
| 5% 4/15/25 (b) | | 1,480,000 | 1,462,068 |
| 7.125% 9/30/30 (b)(c) | | 740,000 | 747,635 |
| Go Daddy Operating Co. LLC / GD Finance Co., Inc.: | | | |
| 3.5% 3/1/29 (b) | | 4,760,000 | 4,220,932 |
| 5.25% 12/1/27 (b) | | 855,000 | 825,463 |
| GrafTech Global Enterprises, Inc. 9.875% 12/15/28 (b)(c) | | 980,000 | 736,773 |
| Helios Software Holdings, Inc. / ION Corporate Solutions Finance Sarl 8.75% 5/1/29 (b) | | 1,480,000 | 1,482,929 |
| HTA Group Ltd. 7% 12/18/25 (b) | | 7,267,000 | 7,255,645 |
| Iliad Holding SAS 8.5% 4/15/31 (b)(j) | | 2,530,000 | 2,552,138 |
| ION Trading Technologies Ltd. 5.75% 5/15/28 (b) | | 5,045,000 | 4,608,147 |
| Match Group Holdings II LLC: | | | |
| 3.625% 10/1/31 (b)(c) | | 440,000 | 363,222 |
| 4.125% 8/1/30 (b) | | 930,000 | 805,385 |
| McAfee Corp. 7.375% 2/15/30 (b) | | 1,380,000 | 1,278,253 |
| MicroStrategy, Inc. 6.125% 6/15/28 (b) | | 3,765,000 | 3,489,298 |
| NCR Atleos Corp. 9.5% 4/1/29 (b) | | 1,800,000 | 1,913,388 |
| ON Semiconductor Corp. 3.875% 9/1/28 (b) | | 305,000 | 276,779 |
| Open Text Corp.: | | | |
| 3.875% 2/15/28 (b) | | 1,590,000 | 1,451,361 |
| 3.875% 12/1/29 (b) | | 905,000 | 792,060 |
| Open Text Holdings, Inc.: | | | |
| 4.125% 2/15/30 (b) | | 3,045,000 | 2,674,388 |
| 4.125% 12/1/31 (b) | | 3,020,000 | 2,588,364 |
| Rackspace Finance LLC 3.5% 5/15/28 (b) | | 2,033,225 | 853,955 |
| Roblox Corp. 3.875% 5/1/30 (b) | | 3,335,000 | 2,884,263 |
| Seagate HDD Cayman: | | | |
| 5.75% 12/1/34 | | 1,955,000 | 1,851,264 |
| 8.25% 12/15/29 (b) | | 715,000 | 759,964 |
| 8.5% 7/15/31 (b) | | 875,000 | 934,242 |
| Sensata Technologies BV: | | | |
| 4% 4/15/29 (b) | | 2,060,000 | 1,844,280 |
| 5% 10/1/25 (b) | | 295,000 | 291,209 |
| Sensata Technologies, Inc. 3.75% 2/15/31 (b) | | 735,000 | 621,132 |
| TTM Technologies, Inc. 4% 3/1/29 (b) | | 4,365,000 | 3,903,968 |
| UKG, Inc. 6.875% 2/1/31 (b) | | 1,955,000 | 1,958,726 |
| Veritas U.S., Inc./Veritas Bermuda Ltd. 7.5% 9/1/25 (b) | | 1,197,000 | 1,088,993 |
| Virtusa Corp. 7.125% 12/15/28 (b) | | 795,000 | 716,375 |
| VM Consolidated, Inc. 5.5% 4/15/29 (b) | | 400,000 | 376,431 |
| Western Digital Corp.: | | | |
| 2.85% 2/1/29 | | 3,130,000 | 2,643,606 |
| 3.1% 2/1/32 | | 1,300,000 | 1,016,081 |
| | | | 95,086,464 |
| Telecommunications - 5.3% | | | |
| Altice Financing SA 5.75% 8/15/29 (b) | | 9,837,000 | 7,306,672 |
| Altice France Holding SA: | | | |
| 6% 2/15/28 (b) | | 5,700,000 | 1,662,774 |
| 10.5% 5/15/27 (b) | | 190,000 | 67,448 |
| Altice France SA: | | | |
| 5.125% 1/15/29 (b) | | 6,685,000 | 4,363,816 |
| 5.125% 7/15/29 (b) | | 7,257,000 | 4,726,959 |
| 5.5% 1/15/28 (b) | | 1,790,000 | 1,209,324 |
| 5.5% 10/15/29 (b) | | 30,000 | 19,629 |
| C&W Senior Finance Ltd. 6.875% 9/15/27 (b) | | 6,817,000 | 6,455,154 |
| Cablevision Lightpath LLC: | | | |
| 3.875% 9/15/27 (b) | | 2,405,000 | 2,122,062 |
| 5.625% 9/15/28 (b) | | 2,530,000 | 2,041,652 |
| Connect Finco SARL / Connect U.S. Finco LLC 6.75% 10/1/26 (b) | | 730,000 | 707,059 |
| Consolidated Communications, Inc. 5% 10/1/28 (b) | | 2,005,000 | 1,664,387 |
| Frontier Communications Holdings LLC: | | | |
| 5% 5/1/28 (b) | | 1,495,000 | 1,375,383 |
| 5.875% 10/15/27 (b) | | 1,760,000 | 1,688,119 |
| 5.875% 11/1/29 | | 2,365,000 | 1,974,601 |
| 8.75% 5/15/30 (b) | | 2,675,000 | 2,723,498 |
| IHS Netherlands Holdco BV 8% 9/18/27 (b) | | 1,214,000 | 1,141,160 |
| Intelsat Jackson Holdings SA 6.5% 3/15/30 (b) | | 2,815,000 | 2,694,358 |
| LCPR Senior Secured Financing DAC 5.125% 7/15/29 (b) | | 1,355,000 | 1,129,906 |
| Level 3 Financing, Inc.: | | | |
| 3.875% 10/15/30 (b) | | 4,705,000 | 2,586,446 |
| 4.5% 4/1/30 (b) | | 1,950,000 | 1,115,152 |
| 10.5% 5/15/30 (b) | | 3,258,000 | 3,228,423 |
| 11% 11/15/29 (b) | | 1,581,023 | 1,613,432 |
| Liquid Telecommunications Financing PLC 5.5% 9/4/26 (b) | | 1,330,000 | 783,869 |
| Millicom International Cellular SA: | | | |
| 4.5% 4/27/31 (b) | | 2,230,000 | 1,856,018 |
| 5.125% 1/15/28 (b) | | 1,885,500 | 1,739,374 |
| 7.375% 4/2/32 (b) | | 1,885,000 | 1,841,815 |
| Sable International Finance Ltd. 5.75% 9/7/27 (b) | | 130,000 | 123,547 |
| Sitios Latinoamerica S.A.B. de CV 5.375% 4/4/32 (b) | | 1,715,000 | 1,562,682 |
| Telecom Italia Capital SA: | | | |
| 6% 9/30/34 | | 2,740,000 | 2,307,150 |
| 7.2% 7/18/36 | | 1,625,000 | 1,470,270 |
| 7.721% 6/4/38 | | 850,000 | 790,290 |
| Uniti Group LP/Uniti Fiber Holdings, Inc./CSL Capital LLC 6% 1/15/30 (b) | | 4,842,000 | 3,765,580 |
| Virgin Media Secured Finance PLC 4.5% 8/15/30 (b) | | 4,685,000 | 3,954,970 |
| VMED O2 UK Financing I PLC 4.25% 1/31/31 (b) | | 4,045,000 | 3,304,582 |
| Windstream Escrow LLC 7.75% 8/15/28 (b) | | 2,960,000 | 2,852,070 |
| Zayo Group Holdings, Inc. 4% 3/1/27 (b) | | 4,275,000 | 3,402,741 |
| | | | 83,372,372 |
| Textiles/Apparel - 0.2% | | | |
| Crocs, Inc. 4.125% 8/15/31 (b) | | 970,000 | 813,994 |
| Foot Locker, Inc. 4% 10/1/29 (b) | | 585,000 | 466,942 |
| Kontoor Brands, Inc. 4.125% 11/15/29 (b) | | 1,230,000 | 1,092,657 |
| Victoria's Secret & Co. 4.625% 7/15/29 (b) | | 1,110,000 | 872,089 |
| | | | 3,245,682 |
| Transportation Ex Air/Rail - 0.7% | | | |
| Golar LNG Ltd. 7% 10/20/25 (b) | | 3,344,000 | 3,329,186 |
| Navios South American Logistics, Inc./Navios Logistics Finance U.S., Inc. 10.75% 7/1/25 (b) | | 810,000 | 810,486 |
| Seaspan Corp. 5.5% 8/1/29 (b) | | 3,398,000 | 2,922,381 |
| XPO, Inc.: | | | |
| 6.25% 6/1/28 (b) | | 460,000 | 458,279 |
| 7.125% 6/1/31 (b) | | 760,000 | 763,917 |
| 7.125% 2/1/32 (b) | | 2,815,000 | 2,831,334 |
| | | | 11,115,583 |
| Utilities - 2.5% | | | |
| Clearway Energy Operating LLC: | | | |
| 3.75% 2/15/31 (b) | | 3,795,000 | 3,208,353 |
| 3.75% 1/15/32 (b) | | 385,000 | 318,785 |
| 4.75% 3/15/28 (b) | | 1,280,000 | 1,206,208 |
| DPL, Inc.: | | | |
| 4.125% 7/1/25 | | 2,005,000 | 1,947,570 |
| 4.35% 4/15/29 | | 245,000 | 220,889 |
| NextEra Energy Partners LP: | | | |
| 4.5% 9/15/27 (b)(c) | | 905,000 | 843,248 |
| 7.25% 1/15/29 (b)(c) | | 490,000 | 496,315 |
| NRG Energy, Inc.: | | | |
| 3.375% 2/15/29 (b) | | 2,565,000 | 2,249,390 |
| 3.625% 2/15/31 (b) | | 930,000 | 787,307 |
| 5.25% 6/15/29 (b) | | 2,640,000 | 2,496,903 |
| PG&E Corp. 5.25% 7/1/30 (c) | | 12,220,000 | 11,441,505 |
| Pike Corp.: | | | |
| 5.5% 9/1/28 (b) | | 757,000 | 717,435 |
| 8.625% 1/31/31 (b) | | 3,042,000 | 3,186,705 |
| Vistra Operations Co. LLC: | | | |
| 5% 7/31/27 (b) | | 2,395,000 | 2,279,387 |
| 5.5% 9/1/26 (b) | | 1,420,000 | 1,385,818 |
| 5.625% 2/15/27 (b) | | 2,700,000 | 2,626,963 |
| 6.875% 4/15/32 (b) | | 1,895,000 | 1,887,064 |
| 7.75% 10/15/31 (b) | | 2,065,000 | 2,117,847 |
| | | | 39,417,692 |
TOTAL NONCONVERTIBLE BONDS | | | 1,327,632,589 |
| TOTAL CORPORATE BONDS (Cost $1,423,780,895) | | | 1,348,818,955 |
| | | | |
| U.S. Treasury Obligations - 0.3% |
| | | Principal Amount (a) | Value ($) |
| U.S. Treasury Notes: | | | |
| 1.5% 8/15/26 | | 1,620,000 | 1,498,753 |
| 2.875% 4/30/29 | | 3,465,000 | 3,180,220 |
| TOTAL U.S. TREASURY OBLIGATIONS (Cost $4,731,096) | | | 4,678,973 |
| | | | |
| Commercial Mortgage Securities - 0.4% |
| | | Principal Amount (a) | Value ($) |
| BX Commercial Mortgage Trust floater Series 2021-SOAR Class G, CME Term SOFR 1 Month Index + 2.910% 8.2355% 6/15/38 (b)(d)(e) | | 1,140,505 | 1,135,683 |
| ELP Commercial Mortgage Trust floater Series 2021-ELP Class F, CME Term SOFR 1 Month Index + 2.780% 8.1025% 11/15/38 (b)(d)(e) | | 1,617,118 | 1,592,861 |
| Extended Stay America Trust floater Series 2021-ESH Class F, CME Term SOFR 1 Month Index + 3.810% 9.1355% 7/15/38 (b)(d)(e) | | 633,579 | 632,787 |
| Hilton U.S.A. Trust Series 2016-HHV Class F, 4.3333% 11/5/38 (b)(d) | | 1,066,000 | 976,704 |
| Merit floater Series 2021-STOR Class F, CME Term SOFR 1 Month Index + 2.310% 7.6355% 7/15/38 (b)(d)(e) | | 2,435,000 | 2,409,128 |
| TOTAL COMMERCIAL MORTGAGE SECURITIES (Cost $6,552,289) | | | 6,747,163 |
| | | | |
| Common Stocks - 2.4% |
| | | Shares | Value ($) |
| Automotive & Auto Parts - 0.1% | | | |
| Aptiv PLC (k) | | 16,200 | 1,150,200 |
| Capital Goods - 0.1% | | | |
| Regal Rexnord Corp. | | 8,700 | 1,403,919 |
| Energy - 1.2% | | | |
| California Resources Corp. warrants 10/27/24 (k) | | 4,491 | 77,335 |
| Mesquite Energy, Inc. (i)(k) | | 204,784 | 16,763,618 |
| New Fortress Energy, Inc. (c) | | 66,900 | 1,752,780 |
TOTAL ENERGY | | | 18,593,733 |
| Food & Drug Retail - 0.1% | | | |
| Southeastern Grocers, Inc. rights (i)(k) | | 1,184,833 | 1,303,316 |
| Healthcare - 0.2% | | | |
| Bausch + Lomb Corp. (c)(k) | | 20,000 | 290,800 |
| Bausch Health Cos., Inc. (United States) (k) | | 80,400 | 704,304 |
| Centene Corp. (k) | | 20,500 | 1,497,730 |
TOTAL HEALTHCARE | | | 2,492,834 |
| Leisure - 0.1% | | | |
| Topgolf Callaway Brands Corp. (k) | | 101,600 | 1,627,632 |
| Technology - 0.2% | | | |
| Coherent Corp. (k) | | 35,400 | 1,933,902 |
| MKS Instruments, Inc. | | 6,200 | 737,676 |
| ON Semiconductor Corp. (k) | | 19,700 | 1,382,152 |
TOTAL TECHNOLOGY | | | 4,053,730 |
| Telecommunications - 0.4% | | | |
| GTT Communications, Inc. (i)(k) | | 89,354 | 3,332,904 |
| Helios Towers PLC (k) | | 2,752,362 | 3,397,943 |
TOTAL TELECOMMUNICATIONS | | | 6,730,847 |
| TOTAL COMMON STOCKS (Cost $26,221,835) | | | 37,356,211 |
| | | | |
| Bank Loan Obligations - 4.8% |
| | | Principal Amount (a) | Value ($) |
| Broadcasting - 0.2% | | | |
| Diamond Sports Group LLC: | | | |
| 1LN, term loan CME Term SOFR 1 Month Index + 8.000% 15.4287% 8/24/26 (d)(e)(l) | | 1,034,114 | 984,993 |
| 2LN, term loan CME Term SOFR 1 Month Index + 5.250% 10.6625% (d)(e)(f)(l) | | 7,322,814 | 170,255 |
| term loan 10% 8/2/27 (l) | | 1,328,229 | 2,107,462 |
TOTAL BROADCASTING | | | 3,262,710 |
| Building Materials - 0.2% | | | |
| Acproducts Holdings, Inc. Tranche B 1LN, term loan CME Term SOFR 3 Month Index + 4.250% 9.8135% 5/17/28 (d)(e)(l) | | 4,380,888 | 3,792,753 |
| Chemicals - 0.5% | | | |
| Discovery Purchaser Corp. 1LN, term loan CME Term SOFR 3 Month Index + 4.370% 9.6813% 10/4/29 (d)(e)(l) | | 3,614,199 | 3,607,441 |
| Hexion Holdings Corp. 1LN, term loan CME Term SOFR 3 Month Index + 4.500% 9.9757% 3/15/29 (d)(e)(l) | | 3,561,383 | 3,495,177 |
TOTAL CHEMICALS | | | 7,102,618 |
| Consumer Products - 0.1% | | | |
| TKC Holdings, Inc. 1LN, term loan: | | | |
| CME Term SOFR 1 Month Index + 5.500% 10.9302% 5/14/28 (d)(e)(l) | | 190,000 | 188,148 |
| 13.5% 2/14/27 (d)(l) | | 772,825 | 606,668 |
TOTAL CONSUMER PRODUCTS | | | 794,816 |
| Energy - 0.4% | | | |
| EG America LLC Tranche BC 1LN, term loan CME Term SOFR 1 Month Index + 5.500% 11.2383% 2/7/28 (d)(e)(l) | | 5,394,457 | 5,303,453 |
| Enstall Group BV Tranche B 1LN, term loan CME Term SOFR 3 Month Index + 4.750% 10.571% 8/27/28 (d)(e)(l) | | 1,218,292 | 1,175,652 |
| Mesquite Energy, Inc.: | | | |
| 1LN, term loan 3 month U.S. LIBOR + 8.000% 0% (e)(f)(i)(l) | | 3,800,000 | 0 |
| term loan 0% (d)(f)(i)(l) | | 1,620,000 | 0 |
TOTAL ENERGY | | | 6,479,105 |
| Healthcare - 0.1% | | | |
| Cano Health, Inc.: | | | |
| Tranche B 1LN, term loan CME Term SOFR 1 Month Index + 4.000% 9.4626% (d)(e)(f)(l) | | 3,427,072 | 861,052 |
| Tranche DD 1LN, term loan CME Term SOFR 1 Month Index + 11.000% 16.3215% 10/7/24 (d)(e)(i)(l) | | 544,973 | 555,873 |
| Tranche DD, term loan CME Term SOFR 1 Month Index + 11.000% 16.3215% 10/7/24 (d)(e)(i)(l) | | 355,530 | 362,641 |
TOTAL HEALTHCARE | | | 1,779,566 |
| Leisure - 1.1% | | | |
| City Football Group Ltd. Tranche B 1LN, term loan CME Term SOFR 1 Month Index + 3.000% 8.4389% 7/21/28 (d)(e)(l) | | 8,848,261 | 8,815,080 |
| ClubCorp Holdings, Inc. Tranche B 1LN, term loan CME Term SOFR 1 Month Index + 5.000% 10.5635% 9/18/26 (d)(e)(l) | | 6,528,775 | 6,533,672 |
| United PF Holdings LLC 1LN, term loan CME Term SOFR 1 Month Index + 4.000% 9.5743% 12/30/26 (d)(e)(l) | | 2,886,664 | 2,508,511 |
TOTAL LEISURE | | | 17,857,263 |
| Metals/Mining - 0.0% | | | |
| American Rock Salt Co. LLC 1LN, term loan CME Term SOFR 1 Month Index + 4.000% 9.4302% 6/4/28 (d)(e)(l) | | 568,538 | 503,361 |
| Services - 1.5% | | | |
| Artera Services LLC Tranche B 1LN, term loan CME Term SOFR 1 Month Index + 4.500% 9.8094% 2/10/31 (d)(e)(l) | | 805,000 | 811,376 |
| Ascend Learning LLC: | | | |
| 2LN, term loan CME Term SOFR 1 Month Index + 5.750% 11.1657% 12/10/29 (d)(e)(l) | | 1,000,000 | 979,170 |
| Tranche B 1LN, term loan CME Term SOFR 1 Month Index + 3.500% 8.9157% 12/10/28 (d)(e)(l) | | 4,654,039 | 4,634,632 |
| Brand Industrial Services, Inc. Tranche B 1LN, term loan CME Term SOFR 1 Month Index + 4.500% 9.819% 8/1/30 (d)(e)(l) | | 2,197,581 | 2,203,536 |
| Brock Holdings Iii LLC Tranche B 1LN, term loan CME Term SOFR 1 Month Index + 6.000% 5/1/30 (e)(l)(m) | | 95,000 | 94,763 |
| CoreLogic, Inc. Tranche B 1LN, term loan CME Term SOFR 1 Month Index + 3.500% 8.9302% 6/2/28 (d)(e)(l) | | 3,381,646 | 3,254,834 |
| Finastra U.S.A., Inc. term loan CME Term SOFR 1 Month Index + 7.250% 12.4592% 9/13/29 (d)(e)(i)(l) | | 2,911,992 | 2,911,992 |
| Galaxy U.S. Opco, Inc. 1LN, term loan CME Term SOFR 1 Month Index + 4.750% 10.0795% 4/29/29 (d)(e)(l) | | 2,868,203 | 2,567,041 |
| Spin Holdco, Inc. Tranche B 1LN, term loan CME Term SOFR 3 Month Index + 4.000% 9.5854% 3/4/28 (d)(e)(l) | | 6,079,306 | 5,346,932 |
| The GEO Group, Inc. Tranche B 1LN, term loan CME Term SOFR 1 Month Index + 5.250% 10.5689% 4/4/29 (d)(e)(l) | | 380,000 | 384,435 |
TOTAL SERVICES | | | 23,188,711 |
| Super Retail - 0.5% | | | |
| Great Outdoors Group LLC Tranche B 1LN, term loan CME Term SOFR 1 Month Index + 3.750% 9.1802% 3/5/28 (d)(e)(l) | | 1,572,150 | 1,571,301 |
| LBM Acquisition LLC Tranche B 1LN, term loan CME Term SOFR 1 Month Index + 3.750% 9.1773% 12/18/27 (d)(e)(l) | | 5,883,930 | 5,886,402 |
TOTAL SUPER RETAIL | | | 7,457,703 |
| Technology - 0.2% | | | |
| Athenahealth Group, Inc. Tranche B 1LN, term loan CME Term SOFR 1 Month Index + 3.500% 8.5657% 2/15/29 (d)(e)(l) | | 1,978,343 | 1,973,397 |
| DH Corp./Societe term loan CME Term SOFR 3 Month Index + 7.250% 12.4592% 9/13/29 (d)(e)(i)(l) | | 68,008 | 68,008 |
| Rackspace Finance LLC Tranche B 1LN, term loan CME Term SOFR 1 Month Index + 6.250% 11.686% 5/15/28 (d)(e)(l) | | 472,350 | 470,579 |
TOTAL TECHNOLOGY | | | 2,511,984 |
| TOTAL BANK LOAN OBLIGATIONS (Cost $79,562,654) | | | 74,730,590 |
| | | | |
| Preferred Securities - 2.8% |
| | | Principal Amount (a) | Value ($) |
| Air Transportation - 0.3% | | | |
| AerCap Holdings NV 5.875% 10/10/79 (d) | | 4,540,000 | 4,498,536 |
| Banks & Thrifts - 1.0% | | | |
| Ally Financial, Inc.: | | | |
| 4.7% (d)(n) | | 2,270,000 | 1,949,574 |
| 4.7% (d)(n) | | 2,715,000 | 2,127,923 |
| Bank of America Corp. 5.875% (d)(n) | | 2,985,000 | 2,885,359 |
| Goldman Sachs Group, Inc. 7.5% (d)(n) | | 2,170,000 | 2,197,160 |
| JPMorgan Chase & Co.: | | | |
| 4.6% (d)(n) | | 2,155,000 | 2,144,282 |
| 6.1% (d)(n) | | 2,980,000 | 3,001,417 |
| Wells Fargo & Co. 5.9% (d)(n) | | 1,640,000 | 1,669,544 |
TOTAL BANKS & THRIFTS | | | 15,975,259 |
| Diversified Financial Services - 0.3% | | | |
| Aircastle Ltd. 5.25% (b)(d)(n) | | 3,160,000 | 3,006,851 |
| Charles Schwab Corp. 4% (d)(n) | | 1,910,000 | 1,567,168 |
TOTAL DIVERSIFIED FINANCIAL SERVICES | | | 4,574,019 |
| Energy - 1.0% | | | |
| Energy Transfer LP 3 month U.S. LIBOR + 4.020% 9.5966% (d)(e)(n) | | 9,595,000 | 9,790,283 |
| EnLink Midstream Partners LP CME Term SOFR 3 Month Index + 4.370% 9.7009% (d)(e)(n) | | 1,630,000 | 1,627,092 |
| Plains All American Pipeline LP CME Term SOFR 3 Month Index + 4.110% 9.6786% (d)(e)(n) | | 3,950,000 | 3,986,063 |
TOTAL ENERGY | | | 15,403,438 |
| Services - 0.2% | | | |
| Air Lease Corp. 4.125% (d)(n) | | 3,435,000 | 2,987,853 |
| TOTAL PREFERRED SECURITIES (Cost $39,454,505) | | | 43,439,105 |
| | | | |
| Other - 1.3% |
| | | Shares | Value ($) |
| Other - 1.3% | | | |
Fidelity Private Credit Co. LLC (h)(o) (Cost $19,918,584) | | 1,999,635 | 20,336,289 |
| | | | |
| Money Market Funds - 5.0% |
| | | Shares | Value ($) |
| Fidelity Cash Central Fund 5.39% (p) | | 11,722,623 | 11,724,968 |
| Fidelity Securities Lending Cash Central Fund 5.39% (p)(q) | | 66,840,927 | 66,847,611 |
| TOTAL MONEY MARKET FUNDS (Cost $78,572,579) | | | 78,572,579 |
| | | | |
| TOTAL INVESTMENT IN SECURITIES - 103.2% (Cost $1,678,794,437) | 1,614,679,865 |
NET OTHER ASSETS (LIABILITIES) - (3.2)% | (49,782,068) |
| NET ASSETS - 100.0% | 1,564,897,797 |
| | |
Legend
| (a) | Amount is stated in United States dollars unless otherwise noted. |
| (b) | Security exempt from registration under Rule 144A of the Securities Act of 1933. These securities may be resold in transactions exempt from registration, normally to qualified institutional buyers. At the end of the period, the value of these securities amounted to $1,130,413,087 or 72.2% of net assets. |
| (c) | Security or a portion of the security is on loan at period end. |
| (d) | Coupon rates for floating and adjustable rate securities reflect the rates in effect at period end. |
| (e) | Coupon is indexed to a floating interest rate which may be multiplied by a specified factor and/or subject to caps or floors. |
| (f) | Non-income producing - Security is in default. |
| (g) | Security initially issued at one coupon which converts to a higher coupon at a specified date. The rate shown is the rate at period end. |
| (h) | Restricted securities (including private placements) - Investment in securities not registered under the Securities Act of 1933 (excluding 144A issues). At the end of the period, the value of restricted securities (excluding 144A issues) amounted to $25,156,456 or 1.6% of net assets. |
| (j) | Security or a portion of the security purchased on a delayed delivery or when-issued basis. |
| (l) | Remaining maturities of bank loan obligations may be less than the stated maturities shown as a result of contractual or optional prepayments by the borrower. Such prepayments cannot be predicted with certainty. |
| (m) | The coupon rate will be determined upon settlement of the loan after period end. |
| (n) | Security is perpetual in nature with no stated maturity date. |
| (p) | Affiliated fund that is generally available only to investment companies and other accounts managed by Fidelity Investments. The rate quoted is the annualized seven-day yield of the fund at period end. A complete unaudited listing of the fund's holdings as of its most recent quarter end is available upon request. In addition, each Fidelity Central Fund's financial statements, which are not covered by the Fund's Report of Independent Registered Public Accounting Firm, are available on the SEC's website or upon request. |
| (q) | Investment made with cash collateral received from securities on loan. |
| Additional information on each restricted holding is as follows: |
| Security | Acquisition Date | Acquisition Cost ($) |
| Fidelity Private Credit Co. LLC | 4/15/22 - 4/08/24 | 19,918,584 |
| | | |
| Jonah Energy Parent LLC 12% 11/5/25 | 5/05/23 | 4,425,071 |
| | | |
Affiliated Central Funds
Fiscal year to date information regarding the Fund's investments in Fidelity Central Funds, including the ownership percentage, is presented below.
| Affiliate | Value, beginning of period ($) | Purchases ($) | Sales Proceeds ($) | Dividend Income ($) | Realized Gain (loss) ($) | Change in Unrealized appreciation (depreciation) ($) | Value, end of period ($) | % ownership, end of period |
| Fidelity Cash Central Fund 5.39% | 80,986,531 | 474,000,928 | 543,263,353 | 2,228,492 | 862 | - | 11,724,968 | 0.0% |
| Fidelity Securities Lending Cash Central Fund 5.39% | 246,600 | 96,962,532 | 30,361,521 | 26,905 | - | - | 66,847,611 | 0.2% |
| Total | 81,233,131 | 570,963,460 | 573,624,874 | 2,255,397 | 862 | - | 78,572,579 | |
| | | | | | | | | |
Amounts in the dividend income column in the above table include any capital gain distributions from underlying funds, which are presented in the corresponding line item in the Statement of Operations, if applicable.
Amounts in the dividend income column for Fidelity Securities Lending Cash Central Fund represents the income earned on investing cash collateral, less rebates paid to borrowers and any lending agent fees associated with the loan, plus any premium payments received for lending certain types of securities.
Amounts included in the purchases and sales proceeds columns may include in-kind transactions, if applicable.
Affiliated Underlying Funds
Fiscal year to date information regarding the Fund's investments in affiliated Underlying Funds is presented below. Exchanges between classes of the same affiliated Underlying Funds may occur. If an Underlying Funds changes its name, the name presented below is the name in effect at period end.
| Affiliate | Value, beginning of period ($) | Purchases ($) | Sales Proceeds ($) | Dividend Income ($) | Realized Gain (loss) ($) | Change in Unrealized appreciation (depreciation) ($) | Value, end of period ($) |
| Fidelity Private Credit Co. LLC | 16,775,367 | 3,099,197 | - | 2,269,045 | - | 461,725 | 20,336,289 |
| | 16,775,367 | 3,099,197 | - | 2,269,045 | - | 461,725 | 20,336,289 |
Amounts in the dividend income column in the above table include any capital gain distributions from underlying funds, which are presented in the corresponding line item in the Statement of Operations, if applicable.
Amounts included in the purchases and sales proceeds columns may include in-kind transactions, if applicable.
Investment Valuation
The following is a summary of the inputs used, as of April 30, 2024, involving the Fund's assets and liabilities carried at fair value. The inputs or methodology used for valuing securities may not be an indication of the risk associated with investing in those securities. For more information on valuation inputs, and their aggregation into the levels used below, please refer to the Investment Valuation section in the accompanying Notes to Financial Statements.
| Valuation Inputs at Reporting Date: |
| Description | Total ($) | Level 1 ($) | Level 2 ($) | Level 3 ($) |
Investments in Securities: | | | | |
|
| Equities: | | | | |
Communication Services | 3,397,943 | 3,397,943 | - | - |
Consumer Discretionary | 2,777,832 | 2,777,832 | - | - |
Consumer Staples | 1,303,316 | - | - | 1,303,316 |
Energy | 18,593,733 | 1,830,115 | - | 16,763,618 |
Health Care | 2,492,834 | 2,492,834 | - | - |
Industrials | 1,403,919 | 1,403,919 | - | - |
Information Technology | 7,386,634 | 4,053,730 | - | 3,332,904 |
|
| Corporate Bonds | 1,348,818,955 | - | 1,343,998,788 | 4,820,167 |
|
| U.S. Government and Government Agency Obligations | 4,678,973 | - | 4,678,973 | - |
|
| Commercial Mortgage Securities | 6,747,163 | - | 6,747,163 | - |
|
| Bank Loan Obligations | 74,730,590 | - | 70,832,076 | 3,898,514 |
|
| Preferred Securities | 43,439,105 | - | 43,439,105 | - |
|
| Other | 20,336,289 | - | 20,336,289 | - |
|
| Money Market Funds | 78,572,579 | 78,572,579 | - | - |
| Total Investments in Securities: | 1,614,679,865 | 94,528,952 | 1,490,032,394 | 30,118,519 |
The following is a reconciliation of Investments in Securities for which Level 3 inputs were used in determining value:
| |
| Investments in Securities: | |
| Consumer Staples | | | |
| Beginning Balance | $ | 29,099,479 | |
| Net Realized Gain (Loss) on Investment Securities | | 8,034,543 | |
| Net Unrealized Gain (Loss) on Investment Securities | | (6,558,933) | |
| Cost of Purchases | | 1,303,316 | |
| Proceeds of Sales | | (30,575,089) | |
| Amortization/Accretion | | - | |
| Transfers into Level 3 | | - | |
| Transfers out of Level 3 | | - | |
| Ending Balance | $ | 1,303,316 | |
| The change in unrealized gain (loss) for the period attributable to Level 3 securities held at April 30, 2024 | $ | - | |
| Energy | | | |
| Beginning Balance | $ | 22,041,156 | |
| Net Realized Gain (Loss) on Investment Securities | | (521,070) | |
| Net Unrealized Gain (Loss) on Investment Securities | | 4,420,117 | |
| Cost of Purchases | | - | |
| Proceeds of Sales | | (9,176,585) | |
| Amortization/Accretion | | - | |
| Transfers into Level 3 | | - | |
| Transfers out of Level 3 | | - | |
| Ending Balance | $ | 16,763,618 | |
| The change in unrealized gain (loss) for the period attributable to Level 3 securities held at April 30, 2024 | $ | 3,899,087 | |
| Corporate Bonds | | | |
| Beginning Balance | $ | 29,527,322 | |
| Net Realized Gain (Loss) on Investment Securities | | (11,627,292) | |
| Net Unrealized Gain (Loss) on Investment Securities | | (13,142,561) | |
| Cost of Purchases | | 4,425,071 | |
| Proceeds of Sales | | (4,394,666) | |
| Amortization/Accretion | | 32,293 | |
| Transfers into Level 3 | | - | |
| Transfers out of Level 3 | | - | |
| Ending Balance | $ | 4,820,167 | |
| The change in unrealized gain (loss) for the period attributable to Level 3 securities held at April 30, 2024 | $ | 362,803 | |
| Other Investments in Securities | | | |
| Beginning Balance | $ | 6,750,048 | |
| Net Realized Gain (Loss) on Investment Securities | | (47,709) | |
| Net Unrealized Gain (Loss) on Investment Securities | | 2,417,067 | |
| Cost of Purchases | | 3,755,603 | |
| Proceeds of Sales | | (5,684,027) | |
| Amortization/Accretion | | 40,436 | |
| Transfers into Level 3 | | - | |
| Transfers out of Level 3 | | - | |
| Ending Balance | $ | 7,231,418 | |
| The change in unrealized gain (loss) for the period attributable to Level 3 securities held at April 30, 2024 | $ | 2,348,122 | |
| The information used in the above reconciliation represents fiscal year to date activity for any Investments in Securities identified as using Level 3 inputs at either the beginning or the end of the current fiscal period. Cost of purchases and proceeds of sales may include securities received and/or delivered through in-kind transactions, corporate actions or exchanges. Transfers into Level 3 were attributable to a lack of observable market data resulting from decreases in market activity, decreases in liquidity, security restructurings or corporate actions. Transfers out of Level 3 were attributable to observable market data becoming available for those securities. Transfers in or out of Level 3 represent the beginning value of any Security or Instrument where a change in the pricing level occurred from the beginning to the end of the period. Realized and unrealized gains (losses) disclosed in the reconciliation are included in Net Gain (Loss) on the Fund's Statement of Operations. | |
| Statement of Assets and Liabilities |
| | | | April 30, 2024 |
| | | | | |
| Assets | | | | |
| Investment in securities, at value (including securities loaned of $64,380,476) - See accompanying schedule: | | | | |
Unaffiliated issuers (cost $1,580,303,274) | $ | 1,515,770,997 | | |
Fidelity Central Funds (cost $78,572,579) | | 78,572,579 | | |
Other affiliated issuers (cost $19,918,584) | | 20,336,289 | | |
| | | | | |
| | | | | |
| Total Investment in Securities (cost $1,678,794,437) | | | $ | 1,614,679,865 |
| Cash | | | | 273,602 |
| Receivable for investments sold | | | | 3,363,549 |
| Receivable for fund shares sold | | | | 1,391,966 |
| Interest receivable | | | | 22,653,972 |
| Distributions receivable from Fidelity Central Funds | | | | 82,388 |
| Receivable for daily variation margin on centrally cleared swaps | | | | 50 |
| Prepaid expenses | | | | 565 |
Total assets | | | | 1,642,445,957 |
| Liabilities | | | | |
| Payable for investments purchased | | | | |
Regular delivery | $ | 5,466,461 | | |
Delayed delivery | | 2,530,000 | | |
| Payable for fund shares redeemed | | 1,909,678 | | |
| Distributions payable | | 19,448 | | |
| Accrued management fee | | 684,730 | | |
| Other payables and accrued expenses | | 90,232 | | |
| Collateral on securities loaned | | 66,847,611 | | |
| Total liabilities | | | | 77,548,160 |
| Commitments and contingent liabilities (see Commitments note) | | | | |
| Net Assets | | | $ | 1,564,897,797 |
| Net Assets consist of: | | | | |
| Paid in capital | | | $ | 1,926,355,036 |
| Total accumulated earnings (loss) | | | | (361,457,239) |
| Net Assets | | | $ | 1,564,897,797 |
Net Asset Value, offering price and redemption price per share ($1,564,897,797 ÷ 176,987,619 shares) | | | $ | 8.84 |
| Statement of Operations |
| | | | Year ended April 30, 2024 |
| Investment Income | | | | |
| Dividends: | | | | |
| Unaffiliated issuers | | | $ | 2,303,390 |
| Affiliated issuers | | | | 2,250,373 |
| Interest | | | | 104,693,952 |
| Income from Fidelity Central Funds (including $26,905 from security lending) | | | | 2,255,397 |
| Other income | | | $ | 884,260 |
| Total income | | | | 112,387,372 |
| Expenses | | | | |
| Management fee | $ | 8,759,812 | | |
| Custodian fees and expenses | | 16,296 | | |
| Independent trustees' fees and expenses | | 8,114 | | |
| Registration fees | | 47,965 | | |
| Audit | | 97,346 | | |
| Legal | | 38,757 | | |
| Interest | | 7,438 | | |
| Miscellaneous | | 7,699 | | |
| Total expenses before reductions | | 8,983,427 | | |
| Expense reductions | | (173,296) | | |
| Total expenses after reductions | | | | 8,810,131 |
| Net Investment income (loss) | | | | 103,577,241 |
| Realized and Unrealized Gain (Loss) | | | | |
| Net realized gain (loss) on: | | | | |
| Investment Securities: | | | | |
| Unaffiliated issuers | | (88,782,553) | | |
| Fidelity Central Funds | | 862 | | |
| Foreign currency transactions | | (699) | | |
| Swaps | | 87 | | |
| Capital gain distributions from underlying funds: | | | | |
| Affiliated issuers | | 18,672 | | |
| Total net realized gain (loss) | | | | (88,763,631) |
| Change in net unrealized appreciation (depreciation) on: | | | | |
| Investment Securities: | | | | |
| Unaffiliated issuers | | 109,408,591 | | |
| Affiliated issuers | | 461,725 | | |
| Assets and liabilities in foreign currencies | | 1 | | |
| Total change in net unrealized appreciation (depreciation) | | | | 109,870,317 |
| Net gain (loss) | | | | 21,106,686 |
| Net increase (decrease) in net assets resulting from operations | | | $ | 124,683,927 |
| Statement of Changes in Net Assets |
| |
| | Year ended April 30, 2024 | | Year ended April 30, 2023 |
| Increase (Decrease) in Net Assets | | | | |
| Operations | | | | |
| Net investment income (loss) | $ | 103,577,241 | $ | 95,180,197 |
| Net realized gain (loss) | | (88,763,631) | | (166,579,134) |
| Change in net unrealized appreciation (depreciation) | | 109,870,317 | | 36,966,638 |
| Net increase (decrease) in net assets resulting from operations | | 124,683,927 | | (34,432,299) |
| Distributions to shareholders | | (93,914,132) | | (88,720,097) |
| | | | | |
| Share transactions | | | | |
| Proceeds from sales of shares | | 436,578,762 | | 342,593,298 |
| Reinvestment of distributions | | 93,610,032 | | 88,547,414 |
| Cost of shares redeemed | | (636,365,834) | | (1,149,048,683) |
| | | | | |
Net increase (decrease) in net assets resulting from share transactions | | (106,177,040) | | (717,907,971) |
| Total increase (decrease) in net assets | | (75,407,245) | | (841,060,367) |
| | | | | |
| Net Assets | | | | |
| Beginning of period | | 1,640,305,042 | | 2,481,365,409 |
| End of period | $ | 1,564,897,797 | $ | 1,640,305,042 |
| | | | | |
| Other Information | | | | |
| Shares | | | | |
| Sold | | 50,252,095 | | 39,423,955 |
| Issued in reinvestment of distributions | | 10,770,620 | | 10,242,638 |
| Redeemed | | (73,289,474) | | (131,491,444) |
| Net increase (decrease) | | (12,266,759) | | (81,824,851) |
| | | | | |
Financial Highlights
Fidelity® SAI High Income Fund |
| |
| Years ended April 30, | | 2024 | | 2023 | | 2022 A |
Selected Per-Share Data | | | | | | |
| Net asset value, beginning of period | $ | 8.67 | $ | 9.15 | $ | 10.00 |
| Income from Investment Operations | | | | | | |
Net investment income (loss) B,C | | .557 | | .491 | | .388 |
| Net realized and unrealized gain (loss) | | .118 | | (.510) | | (.879) |
| Total from investment operations | | .675 | | (.019) | | (.491) |
| Distributions from net investment income | | (.505) | | (.461) | | (.345) |
| Distributions from net realized gain | | - | | - | | (.014) |
| Total distributions | | (.505) | | (.461) | | (.359) |
| Net asset value, end of period | $ | 8.84 | $ | 8.67 | $ | 9.15 |
Total Return D,E | | | | (.07)% | | (5.10)% |
Ratios to Average Net Assets C,F,G | | | | | | |
| Expenses before reductions | | .56% | | .60% | | .60% H |
| Expenses net of fee waivers, if any | | | | .60% | | .60% H |
| Expenses net of all reductions | | .55% | | .60% | | .60% H |
| Net investment income (loss) | | 6.43% | | 5.65% | | 4.06% H |
| Supplemental Data | | | | | | |
| Net assets, end of period (000 omitted) | $ | 1,564,898 | $ | 1,640,305 | $ | 2,481,365 |
Portfolio turnover rate I | | | | 32% | | 59% H,J |
AFor the period May 13, 2021 (commencement of operations) through April 30, 2022.
BCalculated based on average shares outstanding during the period.
CNet investment income (loss) is affected by the timing of the declaration of dividends by any underlying mutual funds or exchange-traded funds (ETFs). Net investment income (loss) of any mutual funds or ETFs is not included in the Fund's net investment income (loss) ratio.
DTotal returns for periods of less than one year are not annualized.
ETotal returns would have been lower if certain expenses had not been reduced during the applicable periods shown.
FFees and expenses of any underlying mutual funds or exchange-traded funds (ETFs) are not included in the Fund's expense ratio. The Fund indirectly bears its proportionate share of these expenses. For additional expense information related to investments in Fidelity Central Funds, please refer to the "Investments in Fidelity Central Funds" note found in the Notes to Financial Statements section of the most recent Annual or Semi-Annual report. For additional expense information related to investments in Fidelity Private Credit Company LLC, please refer to the Investment in Fidelity Private Credit Company LLC note found in the Notes to Financial Statements section of the most recent Annual or Semi-Annual report.
GExpense ratios reflect operating expenses of the class. Expenses before reductions do not reflect amounts reimbursed, waived, or reduced through arrangements with the investment adviser, brokerage services, or other offset arrangements, if applicable, and do not represent the amount paid by the class during periods when reimbursements, waivers or reductions occur.
HAnnualized.
IAmount does not include the portfolio activity of any underlying mutual funds or exchange-traded funds (ETFs).
JPortfolio turnover rate excludes securities received or delivered in-kind.
For the period ended April 30, 2024
1. Organization.
Fidelity SAI High Income Fund (the Fund) is a fund of Fidelity Summer Street Trust (the Trust) and is authorized to issue an unlimited number of shares. Shares are offered exclusively to certain clients of Fidelity Management & Research Company LLC (FMR) or its affiliates. The Trust is registered under the Investment Company Act of 1940, as amended (the 1940 Act), as an open-end management investment company organized as a Massachusetts business trust.
2. Investments in Fidelity Central Funds.
Funds may invest in Fidelity Central Funds, which are open-end investment companies generally available only to other investment companies and accounts managed by the investment adviser and its affiliates. The Schedule of Investments lists any Fidelity Central Funds held as an investment as of period end, but does not include the underlying holdings of each Fidelity Central Fund. An investing fund indirectly bears its proportionate share of the expenses of the underlying Fidelity Central Funds.
Based on its investment objective, each Fidelity Central Fund may invest or participate in various investment vehicles or strategies that are similar to those of the investing fund. These strategies are consistent with the investment objectives of the investing fund and may involve certain economic risks which may cause a decline in value of each of the Fidelity Central Funds and thus a decline in the value of the investing fund.
| Fidelity Central Fund | Investment Manager | Investment Objective | Investment Practices | Expense RatioA |
| Fidelity Money Market Central Funds | Fidelity Management & Research Company LLC (FMR) | Each fund seeks to obtain a high level of current income consistent with the preservation of capital and liquidity. | Short-term Investments | Less than .005% |
A Expenses expressed as a percentage of average net assets and are as of each underlying Central Fund's most recent annual or semi-annual shareholder report.
A complete unaudited list of holdings for each Fidelity Central Fund is available upon request or at the Securities and Exchange Commission website at www.sec.gov. In addition, the financial statements of the Fidelity Central Funds which contain the significant accounting policies (including investment valuation policies) of those funds, and are not covered by the Report of Independent Registered Public Accounting Firm, are available on the Securities and Exchange Commission website or upon request.
3.Investment in Fidelity Private Credit Company LLC.
The Fund invests in Fidelity Private Credit Company LLC, which is a limited liability company. On June 1, 2023, Fidelity Private Credit Company elected to be regulated as a business development company (BDC). Fidelity Private Credit Company LLC's units are not registered under the Securities Act of 1933 and are subject to substantial restrictions on transfer. The Fund has no redemption rights under Fidelity Private Credit Company LLC's limited liability company agreement. There will be no trading market for the units.
Based on its investment objective, Fidelity Private Credit Company LLC may invest or participate in various investments or strategies that are similar to those in which the Fund may invest or participate. These strategies are consistent with the investment objectives of the Fund and may involve certain economic risks which may cause a decline in value of Fidelity Private Credit Company LLC and thus a decline in the value of the Fund. Fidelity Private Credit Company LLC intends to invest primarily in directly originated loans to private companies but also with liquid credit investments, like broadly syndicated loans, and other select private credit investments.
The Schedule of Investments lists Fidelity Private Credit Company LLC as an investment as of period end, but does not include the underlying holdings of Fidelity Private Credit Company LLC. Fidelity Private Credit Company LLC represented less than 5% of the Fund's net assets at period end. The Fund indirectly bears its proportionate share of the expenses of Fidelity Private Credit Company LLC. The annualized expense ratio for Fidelity Private Credit Company LLC for the three month period ended March 31, 2024 was 11.51%.
4. Significant Accounting Policies.
The Fund is an investment company and applies the accounting and reporting guidance of the Financial Accounting Standards Board (FASB) Accounting Standards Codification Topic 946 Financial Services - Investment Companies. The financial statements have been prepared in conformity with accounting principles generally accepted in the United States of America (GAAP), which require management to make certain estimates and assumptions at the date of the financial statements. Actual results could differ from those estimates. Subsequent events, if any, through the date that the financial statements were issued have been evaluated in the preparation of the financial statements. The Fund's Schedule of Investments lists any underlying mutual funds or ETFs but does not include the underlying holdings of these funds. The following summarizes the significant accounting policies of the Fund:
Investment Valuation. Investments are valued as of 4:00 p.m. Eastern time on the last calendar day of the period. The Board of Trustees (the Board) has designated the Fund's investment adviser as the valuation designee responsible for the fair valuation function and performing fair value determinations as needed. The investment adviser has established a Fair Value Committee (the Committee) to carry out the day-to-day fair valuation responsibilities and has adopted policies and procedures to govern the fair valuation process and the activities of the Committee. In accordance with these fair valuation policies and procedures, which have been approved by the Board, the Fund attempts to obtain prices from one or more third party pricing services or brokers to value its investments. When current market prices, quotations or currency exchange rates are not readily available or reliable, investments will be fair valued in good faith by the Committee, in accordance with the policies and procedures. Factors used in determining fair value vary by investment type and may include market or investment specific events, transaction data, estimated cash flows, and market observations of comparable investments. The frequency that the fair valuation procedures are used cannot be predicted and they may be utilized to a significant extent. The Committee manages the Fund's fair valuation practices and maintains the fair valuation policies and procedures. The Fund's investment adviser reports to the Board information regarding the fair valuation process and related material matters.
The Fund categorizes the inputs to valuation techniques used to value its investments into a disclosure hierarchy consisting of three levels as shown below:
Level 1 - unadjusted quoted prices in active markets for identical investments
Level 2 - other significant observable inputs (including quoted prices for similar investments, interest rates, prepayment speeds, etc.)
Level 3 - unobservable inputs (including the Fund's own assumptions based on the best information available)
Valuation techniques used to value the Fund's investments by major category are as follows:
Debt securities, including restricted securities, are valued based on evaluated prices received from third party pricing services or from brokers who make markets in such securities. Corporate bonds, bank loan obligations, U.S. government and government agency ogligations and preferred securities are valued by pricing services who utilize matrix pricing which considers yield or price of bonds of comparable quality, coupon, maturity and type or by broker-supplied prices. Commercial mortgage securities are valued by pricing services who utilize matrix pricing which considers prepayment speed assumptions, attributes of the collateral, yield or price of bonds of comparable quality, coupon, maturity and type or by broker-supplied prices. When independent prices are unavailable or unreliable, debt securities may be valued utilizing pricing methodologies which consider similar factors that would be used by third party pricing services. Debt securities are generally categorized as Level 2 in the hierarchy but may be Level 3 depending on the circumstances. The Fund invests a significant portion of its assets in below investment grade securities. The value of these securities can be more volatile due to changes in the credit quality of the issuer and is sensitive to changes in economic, market and regulatory conditions.
Equity securities, including restricted securities, for which market quotations are readily available, are valued at the last reported sale price or official closing price as reported by a third party pricing service on the primary market or exchange on which they are traded and are categorized as Level 1 in the hierarchy. In the event there were no sales during the day or closing prices are not available, securities are valued at the last quoted bid price or may be valued using the last available price and are generally categorized as Level 2 in the hierarchy. For foreign equity securities, when market or security specific events arise, comparisons to the valuation of American Depositary Receipts (ADRs), futures contracts, ETFs and certain indexes as well as quoted prices for similar securities may be used and would be categorized as Level 2 in the hierarchy. For equity securities, including restricted securities, where observable inputs are limited, assumptions about market activity and risk are used and these securities may be categorized as Level 3 in the hierarchy. Securities, including private placements or other restricted securities, for which observable inputs are not available are valued using alternate valuation approaches, including the market approach, the income approach and cost approach, and are categorized as Level 3 in the hierarchy. The market approach considers factors including the price of recent investments in the same or a similar security or financial metrics of comparable securities. The income approach considers factors including expected future cash flows, security specific risks and corresponding discount rates. The cost approach considers factors including the value of the security's underlying assets and liabilities.
Investments in open-end mutual funds, including the Fidelity Central Funds, are valued at their closing net asset value (NAV) each business day and are categorized as Level 1 in the hierarchy.
Fidelity Private Credit Company LLC is valued at its net asset value (NAV) each month end and is categorized as Level 2 in the hierarchy.
The following provides information on Level 3 securities held by the Fund that were valued at period end based on unobservable inputs. These amounts exclude valuations provided by a broker and valuations using NAV as a practical expedient.
| Asset Type | Fair Value | Valuation Technique(s) | Unobservable Input | Amount or Range/Weighted Average | Impact to Valuation from an Increase in InputA |
| Equities | $21,399,838 | Market comparable | Enterprise value/EBITDA multiple (EV/EBITDA) | 6.5 | Increase |
| | | Discounted cash flow | Discount rate | 11.1% | Decrease |
| | | Recovery value | Recovery value | $1.10 | Increase |
| Corporate Bonds | $4,820,167 | Market comparable | Enterprise value/EBITDA multiple (EV/EBITDA) | 5.3 | Increase |
| | | | Daily production multiple ($/Million cubic feet per day) | $3,550.00 | Increase |
| | | Discounted cash flow | Yield | 18.8% | Decrease |
| Bank Loan Obligations | $3,898,514 | Discounted cash flow | Yield | 12.2% | Decrease |
| | | Recovery value | Recovery value | $0.00 | Increase |
| | | Indicative market price | Evaluated bid | $102.00 | Increase |
A Represents the directional change in the fair value of the Level 3 investments that could have resulted from an increase in the corresponding input as of period end. A decrease to the unobservable input would have had the opposite effect. Significant changes in these inputs may have resulted in a significantly higher or lower fair value measurement at period end.
Changes in valuation techniques may result in transfers in or out of an assigned level within the disclosure hierarchy. The aggregate value of investments by input level as of April 30, 2024, as well as a roll forward of Level 3 investments, is included at the end of the Fund's Schedule of Investments.
Foreign Currency. Certain Funds may use foreign currency contracts to facilitate transactions in foreign-denominated securities. Gains and losses from these transactions may arise from changes in the value of the foreign currency or if the counterparties do not perform under the contracts' terms.
Foreign-denominated assets, including investment securities, and liabilities are translated into U.S. dollars at the exchange rates at period end. Purchases and sales of investment securities, income and dividends received, and expenses denominated in foreign currencies are translated into U.S. dollars at the exchange rate in effect on the transaction date.
The effects of exchange rate fluctuations on investments are included with the net realized and unrealized gain (loss) on investment securities. Other foreign currency transactions resulting in realized and unrealized gain (loss) are disclosed separately.
Investment Transactions and Income. For financial reporting purposes, the Fund's investment holdings and NAV include trades executed through the end of the last business day of the period. The NAV per share for processing shareholder transactions is calculated as of the close of business of the New York Stock Exchange (NYSE), normally 4:00 p.m. Eastern time and includes trades executed through the end of the prior business day. Gains and losses on securities sold are determined on the basis of identified cost. Commissions paid to certain brokers with whom the investment adviser, or its affiliates, places trades on behalf of a fund include an amount in addition to trade execution, which may be rebated back to a fund. Any such rebates are included in net realized gain (loss) on investments in the Statement of Operations. Dividend income is recorded on the ex-dividend date, except for certain dividends from foreign securities where the ex-dividend date may have passed, which are recorded as soon as the Fund is informed of the ex-dividend date. Non-cash dividends included in dividend income, if any, are recorded at the fair market value of the securities received. Income and capital gain distributions from Fidelity Central Funds, if any, are recorded on the ex-dividend date. Interest income is accrued as earned and includes coupon interest and amortization of premium and accretion of discount on debt securities as applicable. Paid in Kind (PIK) income is recorded at the fair market value of the securities received. Investment income is recorded net of foreign taxes withheld where recovery of such taxes is uncertain. Debt obligations may be placed on non-accrual status and related interest income may be reduced by ceasing current accruals and writing off interest receivables when the collection of all or a portion of interest has become doubtful based on consistently applied procedures. A debt obligation is removed from non-accrual status when the issuer resumes interest payments or when collectability of interest is reasonably assured.
Expenses. Expenses directly attributable to a fund are charged to that fund. Expenses attributable to more than one fund are allocated among the respective funds on the basis of relative net assets or other appropriate methods. Expenses included in the accompanying financial statements reflect the expenses of that fund and do not include any expenses associated with any underlying mutual funds or exchange-traded funds. Although not included in a fund's expenses, a fund indirectly bears its proportionate share of these expenses through the net asset value of each underlying mutual fund or exchange-traded fund. Expense estimates are accrued in the period to which they relate and adjustments are made when actual amounts are known.
Income Tax Information and Distributions to Shareholders. Each year, the Fund intends to qualify as a regulated investment company under Subchapter M of the Internal Revenue Code, including distributing substantially all of its taxable income and realized gains. As a result, no provision for U.S. Federal income taxes is required. As of April 30, 2024, the Fund did not have any unrecognized tax benefits in the financial statements; nor is the Fund aware of any tax positions for which it is reasonably possible that the total amounts of unrecognized tax benefits will significantly change in the next twelve months. The Fund files a U.S. federal tax return, in addition to state and local tax returns as required. The Fund's federal income tax returns are subject to examination by the Internal Revenue Service (IRS) for a period of three fiscal years after they are filed. State and local tax returns may be subject to examination for an additional fiscal year depending on the jurisdiction. Foreign taxes are provided for based on the Fund's understanding of the tax rules and rates that exist in the foreign markets in which it invests.
Distributions are declared and recorded daily and paid monthly from net investment income. Distributions from realized gains, if any, are declared and recorded on the ex-dividend date. Income and capital gain distributions are determined in accordance with income tax regulations, which may differ from GAAP.
Capital accounts within the financial statements are adjusted for permanent book-tax differences. These adjustments have no impact on net assets or the results of operations. Capital accounts are not adjusted for temporary book-tax differences which will reverse in a subsequent period.
Book-tax differences are primarily due to short-term gain distributions from the underlying funds, swaps, foreign currency transactions, passive foreign investment companies (PFIC), prior period premium and discount on debt securities, market discount, capital loss carryforwards, partnerships, and losses deferred due to wash sales.
As of period end, the cost and unrealized appreciation (depreciation) in securities, and derivatives if applicable, for federal income tax purposes were as follows:
| Gross unrealized appreciation | $44,828,194 |
| Gross unrealized depreciation | (95,730,008) |
| Net unrealized appreciation (depreciation) | $(50,901,814) |
| Tax Cost | $1,665,581,679 |
The tax-based components of distributable earnings as of period end were as follows:
| Undistributed ordinary income | $2,491,790 |
| Capital loss carryforward | $(313,047,214) |
| Net unrealized appreciation (depreciation) on securities and other investments | $(50,901,814) |
Capital loss carryforwards are only available to offset future capital gains of the Fund to the extent provided by regulations and may be limited. The capital loss carryforward information presented below, including any applicable limitation, is estimated as of fiscal period end and is subject to adjustment.
Short-term | $(157,920,898) |
Long-term | (155,126,316) |
| Total capital loss carryforward | $(313,047,214) |
The tax character of distributions paid was as follows:
| | April 30, 2024 | April 30, 2023 |
| Ordinary Income | $93,914,132 | $ 88,720,097 |
Delayed Delivery Transactions and When-Issued Securities. During the period, certain Funds transacted in securities on a delayed delivery or when-issued basis. Payment and delivery may take place after the customary settlement period for that security. The price of the underlying securities and the date when the securities will be delivered and paid for are fixed at the time the transaction is negotiated. Securities purchased on a delayed delivery or when-issued basis are identified as such in the Schedule of Investments. Compensation for interest forgone in the purchase of a delayed delivery or when-issued debt security may be received. With respect to purchase commitments, each applicable Fund identifies securities as segregated in its records with a value at least equal to the amount of the commitment. Payables and receivables associated with the purchases and sales of delayed delivery securities having the same coupon, settlement date and broker are offset. Delayed delivery or when-issued securities that have been purchased from and sold to different brokers are reflected as both payables and receivables in the Statement of Assets and Liabilities under the caption "Delayed delivery", as applicable. Losses may arise due to changes in the value of the underlying securities or if the counterparty does not perform under the contract's terms, or if the issuer does not issue the securities due to political, economic, or other factors.
Restricted Securities (including Private Placements). Funds may invest in securities that are subject to legal or contractual restrictions on resale. These securities generally may be resold in transactions exempt from registration or to the public if the securities are registered. Disposal of these securities may involve time-consuming negotiations and expense, and prompt sale at an acceptable price may be difficult. Information regarding restricted securities held at period end is included at the end of the Schedule of Investments, if applicable.
Loans and Other Direct Debt Instruments. Direct debt instruments are interests in amounts owed to lenders by corporate or other borrowers. These instruments may be in the form of loans, trade claims or other receivables and may include standby financing commitments such as revolving credit facilities that obligate a fund to supply additional cash to the borrower on demand. Loans may be acquired through assignment, participation, or may be made directly to a borrower. Such instruments are presented in the Bank Loan Obligations section in the Schedule of Investments. Certain funds may also invest in unfunded loan commitments, which are contractual obligations for future funding. Information regarding unfunded commitments is included at the end of the Schedule of Investments, if applicable.
Commitments. A commitment is an agreement to acquire an investment at a future date (subject to conditions) in connection with a potential public or non-public offering. The amount of commitments outstanding at period end are presented in the table below. These commitments are not included in the net assets of the Fund at period end.
| | Investment to be Acquired | Commitment Amount ($) |
| Fidelity SAI High Income Fund | Fidelity Private Credit Central Fund LLC | 3,632,000 |
5. Derivative Instruments.
Risk Exposures and the Use of Derivative Instruments. The Fund's investment objectives allow for various types of derivative instruments, including swaps. Derivatives are investments whose value is primarily derived from underlying assets, indices or reference rates and may be transacted on an exchange or over-the-counter (OTC). Derivatives may involve a future commitment to buy or sell a specified asset based on specified terms, to exchange future cash flows at periodic intervals based on a notional principal amount, or for one party to make one or more payments upon the occurrence of specified events in exchange for periodic payments from the other party.
Derivatives were used to increase returns, to gain exposure to certain types of assets and to manage exposure to certain risks as defined below. The success of any strategy involving derivatives depends on analysis of numerous economic factors, and if the strategies for investment do not work as intended, the objectives may not be achieved.
Derivatives were used to increase or decrease exposure to the following risk(s):
| | |
| Credit Risk | Credit risk relates to the ability of the issuer of a financial instrument to make further principal or interest payments on an obligation or commitment that it has to a fund. |
Funds are also exposed to additional risks from investing in derivatives, such as liquidity risk and counterparty credit risk. Liquidity risk is the risk that a fund will be unable to close out the derivative in the open market in a timely manner. Counterparty credit risk is the risk that the counterparty will not be able to fulfill its obligation to a fund. Counterparty credit risk related to centrally cleared swaps may be mitigated by the protection provided by the clearinghouse.
Investing in derivatives may involve greater risks than investing in the underlying assets directly and, to varying degrees, may involve risk of loss in excess of any initial investment and collateral received and amounts recognized in the Statement of Assets and Liabilities. In addition, there may be the risk that the change in value of the derivative contract does not correspond to the change in value of the underlying instrument.
Swaps. A swap is a contract between two parties to exchange future cash flows at periodic intervals based on a notional principal amount. A centrally cleared swap is a transaction executed between a fund and a dealer counterparty, then cleared by a futures commission merchant (FCM) through a clearinghouse. Once cleared, the clearinghouse serves as a central counterparty, with whom a fund exchanges cash flows for the life of the transaction, similar to transactions in futures contracts.
Centrally cleared swaps require a fund to deposit either cash or securities (initial margin) with the FCM, at the instruction of and for the benefit of the clearinghouse. Any securities deposited to meet initial margin requirements are identified in the Schedule of Investments. Any cash deposited to meet initial margin requirements is presented in segregated cash with brokers for derivative instruments in the Statement of Assets and Liabilities. Centrally cleared swaps are marked-to-market daily and subsequent payments (variation margin) are made or received depending on the daily fluctuations in the value of the swaps and are recorded as unrealized appreciation or (depreciation). These daily payments, if any, are included in receivable or payable for daily variation margin on centrally cleared swaps in the Statement of Assets and Liabilities. Any premiums for centrally cleared swaps are recorded periodically throughout the term of the swap to variation margin and included in total accumulated earnings (loss) in the Statement of Assets and Liabilities. Any premiums are recognized as realized gain (loss) upon termination or maturity of the swap.
Payments are exchanged at specified intervals, accrued daily commencing with the effective date of the contract and recorded as realized gain or (loss). Some swaps may be terminated prior to the effective date and realize a gain or loss upon termination. The net realized gain (loss) and change in net unrealized appreciation (depreciation) on swaps during the period is presented in the Statement of Operations.
Any open swaps at period end are included in the Schedule of Investments under the caption "Swaps", and are representative of volume of activity during the period unless an average notional amount is presented.
Credit Default Swaps. Credit default swaps enable a fund to buy or sell protection against specified credit events on a single-name issuer or a traded credit index. Under the terms of a credit default swap the buyer of protection (buyer) receives credit protection in exchange for making periodic payments to the seller of protection (seller) based on a fixed percentage applied to a notional principal amount. In return for these payments, the seller will be required to make a payment upon the occurrence of one or more specified credit events. A fund enters into credit default swaps as a seller to gain credit exposure to an issuer and/or as a buyer to obtain a measure of protection against defaults of an issuer. Periodic payments are made over the life of the contract by the buyer provided that no credit event occurs.
For credit default swaps on most corporate and sovereign issuers, credit events include bankruptcy, failure to pay or repudiation/moratorium. For credit default swaps on corporate or sovereign issuers, the obligation that may be put to the seller is not limited to the specific reference obligation described in the Schedule of Investments. For credit default swaps on asset-backed securities, a credit event may be triggered by events such as failure to pay principal, maturity extension, rating downgrade or write-down. For credit default swaps on asset-backed securities, the reference obligation described represents the security that may be put to the seller. For credit default swaps on a traded credit index, a specified credit event may affect all or individual underlying securities included in the index.
As a seller, if an underlying credit event occurs, a fund will pay a net settlement amount of cash equal to the notional amount of the swap less the recovery value of the reference obligation or underlying securities comprising an index. Only in the event of the industry's inability to value the underlying asset will a fund be required to take delivery of the reference obligation or underlying securities comprising an index and pay an amount equal to the notional amount of the swap.
As a buyer, if an underlying credit event occurs, a fund will receive a net settlement amount of cash equal to the notional amount of the swap less the recovery value of the reference obligation or underlying securities comprising an index. Only in the event of the industry's inability to value the underlying asset will a fund be required to deliver the reference obligation or underlying securities comprising an index in exchange for payment of an amount equal to the notional amount of the swap.
Typically, the value of each credit default swap and credit rating disclosed for each reference obligation in the Schedule of Investments, where a fund is the seller, can be used as measures of the current payment/performance risk of the swap. As the value of the swap changes as a positive or negative percentage of the total notional amount, the payment/performance risk may decrease or increase, respectively. In addition to these measures, the investment adviser monitors a variety of factors including cash flow assumptions, market activity and market sentiment as part of its ongoing process of assessing payment/performance risk.
6. Purchases and Sales of Investments.
Purchases and sales of securities, other than short-term securities, U.S. government securities and in-kind transactions, as applicable, are noted in the table below.
| | Purchases ($) | Sales ($) |
| Fidelity SAI High Income Fund | 735,690,756 | 775,190,985 |
7. Fees and Other Transactions with Affiliates.
Management Fee. Fidelity Management & Research Company LLC (the investment adviser) and its affiliates provide the Fund with investment management related services for which the Fund pays a monthly management fee. Effective March 1, 2024, the Fund pays a monthly management fee that is based on an annual rate of .532% of the Fund's average net assets.
Prior to March 1, 2024, the management fee was the sum of an individual fund fee rate that was based on an annual rate of .45% of the Fund's average net assets and an annualized group fee rate that averaged .10% during the period. The group fee rate was based upon the monthly average net assets of a group of registered investment companies with which the investment adviser has management contracts. The group fee rate decreased as assets under management increased and increased as assets under management decreased.
For the reporting period, the total annual management fee rate was .54% of the Fund's average net assets.
Brokerage Commissions. A portion of portfolio transactions were placed with brokerage firms which are affiliates of the investment adviser. Brokerage commissions are included in net realized gain (loss) and change in net unrealized appreciation (depreciation) in the Statement of Operations. The commissions paid to these affiliated firms were as follows:
| | Amount ($) |
| Fidelity SAI High Income Fund | 236 |
Interfund Lending Program. Pursuant to an Exemptive Order issued by the Securities and Exchange Commission (the SEC), the Fund, along with other registered investment companies having management contracts with Fidelity Management & Research Company LLC (FMR), or other affiliated entities of FMR, may participate in an interfund lending program. This program provides an alternative credit facility allowing the Fund to borrow from, or lend money to, other participating affiliated funds. At period end, there were no interfund loans outstanding. Activity in this program during the period for which loans were outstanding was as follows:
| | Borrower or Lender | Average Loan Balance ($) | Weighted Average Interest Rate | Interest Expense ($) |
| Fidelity SAI High Income Fund | Borrower | 16,025,000 | 5.57% | 7,438 |
Interfund Trades. Funds may purchase from or sell securities to other Fidelity Funds under procedures adopted by the Board. The procedures have been designed to ensure these interfund trades are executed in accordance with Rule 17a-7 of the 1940 Act. Any interfund trades are included within the respective purchases and sales amounts shown in the Purchases and Sales of Investments note. Interfund trades during the period are noted in the table below.
| | Purchases ($) | Sales ($) | Realized Gain (Loss)($) |
| Fidelity SAI High Income Fund | - | 29,847 | 7,804 |
Other. During the period, the investment adviser reimbursed the Fund for certain losses as follows:
| | Amount ($) |
| Fidelity SAI High Income Fund | 199,373 |
Sub-Advisory Arrangements. Effective March 1, 2024, the Fund's sub-advisory agreements with FMR Investment Management (UK) Limited, Fidelity Management & Research (Hong Kong) Limited, and Fidelity Management & Research (Japan) Limited were amended to provide that the investment adviser pays each sub-adviser monthly fees equal to 110% of the sub-adviser's costs for providing sub-advisory services.
8. Committed Line of Credit.
Certain Funds participate with other funds managed by the investment adviser or an affiliate in a $4.25 billion credit facility (the "line of credit") to be utilized for temporary or emergency purposes to fund shareholder redemptions or for other short-term liquidity purposes. The participating funds have agreed to pay commitment fees on their pro-rata portion of the line of credit, which are reflected in Miscellaneous expenses on the Statement of Operations, and are listed below. During the period, there were no borrowings on this line of credit.
| | Amount ($) |
| Fidelity SAI High Income Fund | 2,825 |
9. Security Lending.
Funds lend portfolio securities from time to time in order to earn additional income. Lending agents are used, including National Financial Services (NFS), an affiliate of the investment adviser. Pursuant to a securities lending agreement, NFS will receive a fee, which is capped at 9.9% of a fund's daily lending revenue, for its services as lending agent. A fund may lend securities to certain qualified borrowers, including NFS. On the settlement date of the loan, a fund receives collateral (in the form of U.S. Treasury obligations, letters of credit and/or cash) against the loaned securities and maintains collateral in an amount not less than 100% of the market value of the loaned securities during the period of the loan. The market value of the loaned securities is determined at the close of business of a fund and any additional required collateral is delivered to a fund on the next business day. A fund or borrower may terminate the loan at any time, and if the borrower defaults on its obligation to return the securities loaned because of insolvency or other reasons, a fund may apply collateral received from the borrower against the obligation. A fund may experience delays and costs in recovering the securities loaned. Any cash collateral received is invested in the Fidelity Securities Lending Cash Central Fund. Any loaned securities are identified as such in the Schedule of Investments, and the value of loaned securities and cash collateral at period end, as applicable, are presented in the Statement of Assets and Liabilities. Security lending income represents the income earned on investing cash collateral, less rebates paid to borrowers and any lending agent fees associated with the loan, plus any premium payments received for lending certain types of securities. Security lending income is presented in the Statement of Operations as a component of income from Fidelity Central Funds. Affiliated security lending activity, if any, was as follows:
| | Total Security Lending Fees Paid to NFS ($) | Security Lending Income From Securities Loaned to NFS ($) | Value of Securities Loaned to NFS at Period End ($) |
| Fidelity SAI High Income Fund | 2,900 | - | - |
10. Expense Reductions.
The investment adviser has contractually agreed to waive the Fund's management fee with respect to the portion of the Fund's assets invested in Fidelity Private Credit Company LLC until August 31, 2025. During the period, this waiver reduced the Fund's management fee by $90,921.
Through arrangements with the Fund's custodian, credits realized as a result of certain uninvested cash balances were used to reduce the Fund's expenses by $11,144.
In addition, during the period the investment adviser or an affiliate reimbursed and/or waived a portion of operating expenses in the amount of $71,231.
11. Other.
A fund's organizational documents provide former and current trustees and officers with a limited indemnification against liabilities arising in connection with the performance of their duties to the fund. In the normal course of business, a fund may also enter into contracts that provide general indemnifications. A fund's maximum exposure under these arrangements is unknown as this would be dependent on future claims that may be made against a fund. The risk of material loss from such claims is considered remote.
In addition, at the end of the period, the following mutual funds managed by the investment adviser or its affiliates were the owners of record of 10% or more of the total outstanding shares.
| | Strategic Advisers Fidelity Core Income Fund |
| Fidelity SAI High Income Fund | 14% |
12. Litigation.
The Fund and other entities managed by FMR or its affiliates are involved with proceedings arising out of disputes in the United States Bankruptcy Court for the Southern District of Texas ("Bankruptcy Court"), relating to the In re Sanchez Energy Corporation chapter 11 bankruptcy case (Case No. 19-34508). A Bankruptcy Court-appointed representative of unsecured creditors asserted that eight million shares of Mesquite Energy, Inc. (formerly known as Sanchez Energy Corporation) (the "Company"), held in escrow pursuant to the terms of the Company's confirmed chapter 11 plan, should be awarded to the unsecured creditors instead of the Company's current equity holders, including the Fund, which were providers of debtor-in-possession financing to the Company during its chapter 11 case and holders of secured notes issued by the Company in 2018. The unsecured creditors also asserted that certain additional equity issued by the Company in 2020 in connection with two post-bankruptcy financings, also held by the Fund, is invalid. During August 2023, the Bankruptcy Court issued an opinion awarding a portion of the eight million shares to the unsecured creditors, diluting the value of the Fund's holdings in Mesquite. The Fund will appeal this decision. At this time, Management cannot determine any additional loss or dilution that may be realized. The Fund is also incurring legal costs in defending the disputes and has recovered a portion of these legal costs through an insurance claim that is presented as other income in the Statement of Operations.
13. Risk and Uncertainties.
Many factors affect a fund's performance. Developments that disrupt global economies and financial markets, such as pandemics, epidemics, outbreaks of infectious diseases, war, terrorism, and environmental disasters, may significantly affect a fund's investment performance. The effects of these developments to a fund will be impacted by the types of securities in which a fund invests, the financial condition, industry, economic sector, and geographic location of an issuer, and a fund's level of investment in the securities of that issuer. Significant concentrations in security types, issuers, industries, sectors, and geographic locations may magnify the factors that affect a fund's performance.
To the Board of Trustees of Fidelity Summer Street Trust and Shareholders of Fidelity SAI High Income Fund
Opinion on the Financial Statements
We have audited the accompanying statement of assets and liabilities, including the schedule of investments, of Fidelity SAI High Income Fund (one of the funds constituting Fidelity Summer Street Trust, referred to hereafter as the "Fund") as of April 30, 2024, the related statement of operations for the year ended April 30, 2024, the statement of changes in net assets for each of the two years in the period ended April 30, 2024, including the related notes, and the financial highlights for each of the two years in the period ended April 30, 2024 and for the period May 13, 2021 (commencement of operations) through April 30, 2022 (collectively referred to as the "financial statements"). In our opinion, the financial statements present fairly, in all material respects, the financial position of the Fund as of April 30, 2024, the results of its operations for the year then ended, the changes in its net assets for each of the two years in the period ended April 30, 2024 and the financial highlights for each of the two years in the period ended April 30, 2024 and for the period May 13, 2021 (commencement of operations) through April 30, 2022 in conformity with accounting principles generally accepted in the United States of America.
Basis for Opinion
These financial statements are the responsibility of the Fund's management. Our responsibility is to express an opinion on the Fund's financial statements based on our audits. We are a public accounting firm registered with the Public Company Accounting Oversight Board (United States) (PCAOB) and are required to be independent with respect to the Fund in accordance with the U.S. federal securities laws and the applicable rules and regulations of the Securities and Exchange Commission and the PCAOB.
We conducted our audits of these financial statements in accordance with the standards of the PCAOB. Those standards require that we plan and perform the audit to obtain reasonable assurance about whether the financial statements are free of material misstatement, whether due to error or fraud.
Our audits included performing procedures to assess the risks of material misstatement of the financial statements, whether due to error or fraud, and performing procedures that respond to those risks. Such procedures included examining, on a test basis, evidence regarding the amounts and disclosures in the financial statements. Our audits also included evaluating the accounting principles used and significant estimates made by management, as well as evaluating the overall presentation of the financial statements. Our procedures included confirmation of securities owned as of April 30, 2024 by correspondence with the custodian, issuers of privately offered securities, agent banks and brokers; when replies were not received from brokers, we performed other auditing procedures. We believe that our audits provide a reasonable basis for our opinion.
/s/ PricewaterhouseCoopers LLP
Boston, Massachusetts
June 14, 2024
We have served as the auditor of one or more investment companies in the Fidelity group of funds since 1932.
The Trustees, Members of the Advisory Board (if any), and officers of the trust and fund, as applicable, are listed below. The Board of Trustees governs the fund and is responsible for protecting the interests of shareholders. The Trustees are experienced executives who meet periodically throughout the year to oversee the fund's activities, review contractual arrangements with companies that provide services to the fund, oversee management of the risks associated with such activities and contractual arrangements, and review the fund's performance. Except for Vijay Advani, each of the Trustees oversees 323 funds. Mr. Advani oversees 216 funds.
The Trustees hold office without limit in time except that (a) any Trustee may resign; (b) any Trustee may be removed by written instrument, signed by at least two-thirds of the number of Trustees prior to such removal; (c) any Trustee who requests to be retired or who has become incapacitated by illness or injury may be retired by written instrument signed by a majority of the other Trustees; and (d) any Trustee may be removed at any special meeting of shareholders by a two-thirds vote of the outstanding voting securities of the trust. Each Trustee who is not an interested person (as defined in the 1940 Act) of the trust and the fund is referred to herein as an Independent Trustee. Each Independent Trustee shall retire not later than the last day of the calendar year in which his or her 75th birthday occurs. The Independent Trustees may waive this mandatory retirement age policy with respect to individual Trustees. Officers and Advisory Board Members hold office without limit in time, except that any officer or Advisory Board Member may resign or may be removed by a vote of a majority of the Trustees at any regular meeting or any special meeting of the Trustees. Except as indicated, each individual has held the office shown or other offices in the same company for the past five years.
The fund's Statement of Additional Information (SAI) includes more information about the Trustees. To request a free copy, call Fidelity at 1-800-544-3455.
Experience, Skills, Attributes, and Qualifications of the Trustees. The Governance and Nominating Committee has adopted a statement of policy that describes the experience, qualifications, attributes, and skills that are necessary and desirable for potential Independent Trustee candidates (Statement of Policy). The Board believes that each Trustee satisfied at the time he or she was initially elected or appointed a Trustee, and continues to satisfy, the standards contemplated by the Statement of Policy. The Governance and Nominating Committee also engages professional search firms to help identify potential Independent Trustee candidates who have the experience, qualifications, attributes, and skills consistent with the Statement of Policy. From time to time, additional criteria based on the composition and skills of the current Independent Trustees, as well as experience or skills that may be appropriate in light of future changes to board composition, business conditions, and regulatory or other developments, have also been considered by the professional search firms and the Governance and Nominating Committee. In addition, the Board takes into account the Trustees' commitment and participation in Board and committee meetings, as well as their leadership of standing and ad hoc committees throughout their tenure.
In determining that a particular Trustee was and continues to be qualified to serve as a Trustee, the Board has considered a variety of criteria, none of which, in isolation, was controlling. The Board believes that, collectively, the Trustees have balanced and diverse experience, qualifications, attributes, and skills, which allow the Board to operate effectively in governing the fund and protecting the interests of shareholders. Information about the specific experience, skills, attributes, and qualifications of each Trustee, which in each case led to the Board's conclusion that the Trustee should serve (or continue to serve) as a trustee of the fund, is provided below.
Board Structure and Oversight Function. Robert A. Lawrence is an interested person and currently serves as Chair. The Trustees have determined that an interested Chair is appropriate and benefits shareholders because an interested Chair has a personal and professional stake in the quality and continuity of services provided to the fund. Independent Trustees exercise their informed business judgment to appoint an individual of their choosing to serve as Chair, regardless of whether the Trustee happens to be independent or a member of management. The Independent Trustees have determined that they can act independently and effectively without having an Independent Trustee serve as Chair and that a key structural component for assuring that they are in a position to do so is for the Independent Trustees to constitute a substantial majority for the Board. The Independent Trustees also regularly meet in executive session. David M. Thomas serves as Lead Independent Trustee and as such (i) acts as a liaison between the Independent Trustees and management with respect to matters important to the Independent Trustees and (ii) with management prepares agendas for Board meetings.
Fidelity® funds are overseen by different Boards of Trustees. The fund's Board oversees Fidelity's high income and certain equity funds, and other Boards oversee Fidelity's alternative investment, investment-grade bond, money market, asset allocation, and other equity funds. The asset allocation funds may invest in Fidelity® funds overseen by the fund's Board. The use of separate Boards, each with its own committee structure, allows the Trustees of each group of Fidelity® funds to focus on the unique issues of the funds they oversee, including common research, investment, and operational issues. On occasion, the separate Boards establish joint committees to address issues of overlapping consequences for the Fidelity® funds overseen by each Board.
The Trustees operate using a system of committees to facilitate the timely and efficient consideration of all matters of importance to the Trustees, the fund, and fund shareholders and to facilitate compliance with legal and regulatory requirements and oversight of the fund's activities and associated risks. The Board, acting through its committees, has charged FMR and its affiliates with (i) identifying events or circumstances the occurrence of which could have demonstrably adverse effects on the fund's business and/or reputation; (ii) implementing processes and controls to lessen the possibility that such events or circumstances occur or to mitigate the effects of such events or circumstances if they do occur; and (iii) creating and maintaining a system designed to evaluate continuously business and market conditions in order to facilitate the identification and implementation processes described in (i) and (ii) above. Because the day-to-day operations and activities of the fund are carried out by or through FMR, its affiliates, and other service providers, the fund's exposure to risks is mitigated but not eliminated by the processes overseen by the Trustees. While each of the Board's committees has responsibility for overseeing different aspects of the fund's activities, oversight is exercised primarily through the Operations, Audit, and Compliance Committees. Appropriate personnel, including but not limited to the fund's Chief Compliance Officer (CCO), FMR's internal auditor, the independent accountants, the fund's Treasurer and portfolio management personnel, make periodic reports to the Board's committees, as appropriate, including an annual review of Fidelity's risk management program for the Fidelity® funds. The responsibilities of each standing committee, including their oversight responsibilities, are described further under "Standing Committees of the Trustees."
Interested Trustees*:
Correspondence intended for a Trustee who is an interested person may be sent to Fidelity Investments, 245 Summer Street, Boston, Massachusetts 02210.
Name, Year of Birth; Principal Occupations and Other Relevant Experience+
Bettina Doulton (1964)
Year of Election or Appointment: 2020
Trustee
Ms. Doulton also serves as Trustee of other Fidelity® funds. Prior to her retirement, Ms. Doulton served in a variety of positions at Fidelity Investments, including as a managing director of research (2006-2007), portfolio manager to certain Fidelity® funds (1993-2005), equity analyst and portfolio assistant (1990-1993), and research assistant (1987-1990). Ms. Doulton currently owns and operates Cellardoor Winery. Previously, Ms. Doulton served as a member of the Board of Brown Capital Management, LLC (2014-2018).
Robert A. Lawrence (1952)
Year of Election or Appointment: 2020
Trustee
Chair of the Board of Trustees
Mr. Lawrence also serves as Trustee of other funds. Previously, Mr. Lawrence served as a Trustee and Member of the Advisory Board of certain funds. Prior to his retirement in 2008, Mr. Lawrence served as Vice President of certain Fidelity® funds (2006-2008), Senior Vice President, Head of High Income Division of Fidelity Management & Research Company (investment adviser firm, 2006-2008), and President of Fidelity Strategic Investments (investment adviser firm, 2002-2005).
* Determined to be an "Interested Trustee" by virtue of, among other things, his or her affiliation with the trust or various entities under common control with FMR.
+ The information includes the Trustee's principal occupation during the last five years and other information relating to the experience, attributes, and skills relevant to the Trustee's qualifications to serve as a Trustee, which led to the conclusion that the Trustee should serve as a Trustee for the fund.
Independent Trustees:
Correspondence intended for an Independent Trustee may be sent to Fidelity Investments, P.O. Box 55235, Boston, Massachusetts 02205-5235.
Name, Year of Birth; Principal Occupations and Other Relevant Experience+
Vijay C. Advani (1960)
Year of Election or Appointment: 2023
Trustee
Mr. Advani also serves as Trustee or Member of the Advisory Board of other funds. Previously, Mr. Advani served as Executive Chairman (2020-2022), Chief Executive Officer (2017-2020) and Chief Operating Officer (2016-2017) of Nuveen (global investment manager). He also served in various capacities at Franklin Resources (global investment manager), including Co-President (2015-2016), Executive Vice President, Global Advisory Services (2008-2015), Head of Global Retail Distribution (2005-2008), Executive Managing Director, International Retail Development (2002-2005), Managing Director, Product Developments, Sales & Marketing, Asia, Eastern Europe and Africa (2000-2002) and President, Templeton Asset Management India (1995-2000). Mr. Advani also served as Senior Investment Officer of International Finance Corporation (private equity and venture capital arm of The World Bank, 1984-1995). Mr. Advani is Chairman Emeritus of the U.S. India Business Council (2018-present), a Director of The Global Impact Investing Network (2019-present), a Director of LOK Capital (Mauritius) (2022-present), a member of the Advisory Council of LOK Capital (2022-present), a Senior Advisor of Neuberger Berman (2021-present), a Senior Advisor of Seviora Holdings Pte. Ltd (Temasek-Singapore) (2021-present), a Director of Seviora Capital (Singapore) (2021-present) and an Advisor of EQUIAM (2021-present). Mr. Advani formerly served as a member of the Board of BowX Acquisition Corp. (special purpose acquisition company, 2020-2021), a member of the Board of Intellecap (advisory arm of The Aavishkaar Group, 2018-2020), a member of the Board of Nuveen Investments, Inc. (2017-2020) and a member of the Board of Docusign (software, 2016-2019).
Thomas P. Bostick (1956)
Year of Election or Appointment: 2021
Trustee
Lieutenant General Bostick also serves as Trustee of other Fidelity® funds. Prior to his retirement, General Bostick (United States Army, Retired) held a variety of positions within the U.S. Army, including Chief of Engineers and Commanding General, U.S. Army Corps of Engineers (2012-2016) and Deputy Chief of Staff and Director of Human Resources, U.S. Army (2009-2012). General Bostick currently serves as a member of the Board and Finance and Governance & Sustainability Committees of CSX Corporation (transportation, 2020-present) and a member of the Board and Corporate Governance and Nominating Committee of Perma-Fix Environmental Services, Inc. (nuclear waste management, 2020-present). General Bostick serves as Chief Executive Officer of Bostick Global Strategies, LLC (consulting, 2016-present), as a member of the Board of HireVue, Inc. (video interview and assessment, 2020-present), as a member of the Board of Allonnia (biotechnology and engineering solutions, 2022-present), on the Advisory Board of Hilco Redevelopment Partners (a real estate investment and redevelopment company, 2021-present), and on the Advisory Board of Solugen, Inc. (specialty bio-based chemicals manufacturer, 2022-present). Previously, General Bostick served as a Member of the Advisory Board of certain Fidelity® funds (2021), President, Intrexon Bioengineering (2018-2020) and Chief Operating Officer (2017-2020) and Senior Vice President of the Environment Sector (2016-2017) of Intrexon Corporation (biopharmaceutical company).
Donald F. Donahue (1950)
Year of Election or Appointment: 2018
Trustee
Mr. Donahue also serves as Trustee of other Fidelity® funds. Mr. Donahue serves as President and Chief Executive Officer of Miranda Partners, LLC (risk consulting for the financial services industry, 2012-present). Previously, Mr. Donahue served as Chief Executive Officer (2006-2012), Chief Operating Officer (2003-2006) and Managing Director, Customer Marketing and Development (1999-2003) of The Depository Trust & Clearing Corporation (financial markets infrastructure). Mr. Donahue currently serves as a member (2007-present) and Co-Chairman (2016-present) of the Board of United Way of New York. Mr. Donahue previously served as a member of the Advisory Board of certain Fidelity® funds (2015-2018) and as a member of the Board of The Leadership Academy (previously NYC Leadership Academy) (2012-2022).
Vicki L. Fuller (1957)
Year of Election or Appointment: 2020
Trustee
Ms. Fuller also serves as Trustee of other Fidelity® funds. Previously, Ms. Fuller served as a member of the Advisory Board of certain Fidelity® funds (2018-2020), Chief Investment Officer of the New York State Common Retirement Fund (2012-2018) and held a variety of positions at AllianceBernstein L.P. (global asset management, 1985-2012), including Managing Director (2006-2012) and Senior Vice President and Senior Portfolio Manager (2001-2006). Ms. Fuller currently serves as a member of the Board, Audit Committee, Compensation Committee and Nominating and Governance Committee of two Blackstone business development companies (2020-present), as a member of the Board of Treliant, LLC (consulting, 2019-present), as a member of the Board of Ariel Alternatives, LLC (private equity, 2022-present) and as a member of the Board and Chair of the Audit Committee of Gusto, Inc. (software, 2021-present). In addition, Ms. Fuller currently serves as a member of the Executive Board of New York University's Stern School of Business. Ms. Fuller previously served as a member of the Board of Roosevelt University (2019-2024) and member of the Board, Audit Committee and Nominating and Governance Committee of The Williams Companies, Inc. (natural gas infrastructure, 2018-2021).
Patricia L. Kampling (1959)
Year of Election or Appointment: 2020
Trustee
Ms. Kampling also serves as Trustee of other Fidelity® funds. Prior to her retirement, Ms. Kampling served as Chairman of the Board and Chief Executive Officer (2012-2019), President and Chief Operating Officer (2011-2012) and Executive Vice President and Chief Financial Officer (2010-2011) of Alliant Energy Corporation. Ms. Kampling currently serves as a member of the Board, Audit Committee and Governance, Compensation and Nominating Committee of Xcel Energy Inc. (utilities company, 2020-present) and as a member of the Board, Audit, Finance and Risk Committee and Safety, Environmental, Technology and Operations Committee and Chair of the Executive Development and Compensation Committee of American Water Works Company, Inc. (utilities company, 2019-present). In addition, Ms. Kampling currently serves as a member of the Board of the Nature Conservancy, Wisconsin Chapter (2019-present). Previously, Ms. Kampling served as a Member of the Advisory Board of certain Fidelity® funds (2020), a member of the Board, Compensation Committee and Executive Committee and Chair of the Audit Committee of Briggs & Stratton Corporation (manufacturing, 2011-2021), a member of the Board of Interstate Power and Light Company (2012-2019) and Wisconsin Power and Light Company (2012-2019) (each a subsidiary of Alliant Energy Corporation) and as a member of the Board and Workforce Development Committee of the Business Roundtable (2018-2019).
Thomas A. Kennedy (1955)
Year of Election or Appointment: 2021
Trustee
Mr. Kennedy also serves as Trustee of other Fidelity® funds. Previously, Mr. Kennedy served as a Member of the Advisory Board of certain Fidelity® funds (2020) and held a variety of positions at Raytheon Company (aerospace and defense, 1983-2020), including Chairman and Chief Executive Officer (2014-2020) and Executive Vice President and Chief Operating Officer (2013-2014). Mr. Kennedy served as Executive Chairman of the Board of Directors of Raytheon Technologies Corporation (aerospace and defense, 2020-2021). Mr. Kennedy serves as a Director of the Board of Directors of Textron Inc. (aerospace and defense, 2023-present).
Oscar Munoz (1959)
Year of Election or Appointment: 2021
Trustee
Mr. Munoz also serves as Trustee of other Fidelity® funds. Prior to his retirement, Mr. Munoz served as Executive Chairman (2020-2021), Chief Executive Officer (2015-2020), President (2015-2016) and a member of the Board (2010-2021) of United Airlines Holdings, Inc. Mr. Munoz currently serves as a member of the Board of CBRE Group, Inc. (commercial real estate, 2020-present), a member of the Board of Univision Communications, Inc. (Hispanic media, 2020-present), a member of the Board of Archer Aviation Inc. (2021-present), a member of the Defense Business Board of the United States Department of Defense (2021-present) and a member of the Board of Salesforce.com, Inc. (cloud-based software, 2022-present). Previously, Mr. Munoz served as a Member of the Advisory Board of certain Fidelity® funds (2021).
David M. Thomas (1949)
Year of Election or Appointment: 2008
Trustee
Lead Independent Trustee
Mr. Thomas also serves as Trustee of other Fidelity® funds. Previously, Mr. Thomas served as Executive Chairman (2005-2006) and Chairman and Chief Executive Officer (2000-2005) of IMS Health, Inc. (pharmaceutical and healthcare information solutions) and as a member of the Board of Fortune Brands Home and Security (home and security products, 2004-2023). Mr. Thomas currently serves as Director (2013-present) and Non-Executive Chairman of the Board (2022-present) of Interpublic Group of Companies, Inc. (marketing communication).
Susan Tomasky (1953)
Year of Election or Appointment: 2020
Trustee
Ms. Tomasky also serves as Trustee of other Fidelity® funds. Prior to her retirement, Ms. Tomasky served in various executive officer positions at American Electric Power Company, Inc. (1998-2011), including most recently as President of AEP Transmission (2007-2011). Ms. Tomasky currently serves as a member of the Board and Sustainability Committee and as Chair of the Audit Committee of Marathon Petroleum Corporation (2018-present) and as a member of the Board, Executive Committee, Corporate Governance Committee and Organization and Compensation Committee and as Lead Director of the Board of Public Service Enterprise Group, Inc. (utilities company, 2012-present) and as a member of the Board of its subsidiary company, Public Service Electric and Gas Co. (2021-present). In addition, Ms. Tomasky currently serves as a member (2009-present) and President (2020-present) of the Board of the Royal Shakespeare Company - America (2009-present) and as a member and Vice Chair of the Board of Kenyon College (2016-present). Previously, Ms. Tomasky served as a Member of the Advisory Board of certain Fidelity® funds (2020), as a member of the Board of the Columbus Association for the Performing Arts (2011-2023), as a member of the Board of the Columbus Regional Airport Authority (2007-2020), as a member of the Board (2011-2018) and Lead Independent Director (2015-2018) of Andeavor Corporation (previously Tesoro Corporation) (independent oil refiner and marketer) and as a member of the Board of Summit Midstream Partners LP (energy, 2012-2018).
Michael E. Wiley (1950)
Year of Election or Appointment: 2018
Trustee
Mr. Wiley also serves as Trustee of other Fidelity® funds. Previously, Mr. Wiley served as a member of the Advisory Board of certain Fidelity® funds (2018-2020), Chairman, President and CEO of Baker Hughes, Inc. (oilfield services, 2000-2004). Mr. Wiley also previously served as a member of the Board of Andeavor Corporation (independent oil refiner and marketer, 2005-2018), a member of the Board of Andeavor Logistics LP (natural resources logistics, 2015-2018) and a member of the Board of High Point Resources (exploration and production, 2005-2020).
+ The information includes the Trustee's principal occupation during the last five years and other information relating to the experience, attributes, and skills relevant to the Trustee's qualifications to serve as a Trustee, which led to the conclusion that the Trustee should serve as a Trustee for the fund.
Advisory Board Members and Officers:
Correspondence intended for a Member of the Advisory Board (if any) may be sent to Fidelity Investments, P.O. Box 55235, Boston, Massachusetts 02205-5235. Correspondence intended for an officer or Peter S. Lynch may be sent to Fidelity Investments, 245 Summer Street, Boston, Massachusetts 02210.
Name, Year of Birth; Principal Occupations+
Peter S. Lynch (1944)
Year of Election or Appointment: 2003
Member of the Advisory Board
Mr. Lynch also serves as a Member of the Advisory Board of other Fidelity® funds. Mr. Lynch is Vice Chairman and a Director of Fidelity Management & Research Company LLC (investment adviser firm). In addition, Mr. Lynch serves as a Trustee of Boston College and as the Chairman of the Inner-City Scholarship Fund. Previously, Mr. Lynch served as Vice Chairman and a Director of FMR Co., Inc. (investment adviser firm) and on the Special Olympics International Board of Directors (1997-2006).
Karen B. Peetz (1955)
Year of Election or Appointment: 2023
Member of the Advisory Board
Ms. Peetz also serves as a Member of the Advisory Board of other funds. Previously, Ms. Peetz served as Chief Administration Officer (2020-2023) of Citigroup Inc. (a diversified financial service company). She also served in various capacities at Bank of New York Mellon Corporation, including President (2013-2016), Vice Chairman, Senior Executive Vice President and Chief Executive Officer of Financial Markets & Treasury Services (2010-2013), Senior Executive Vice President and Chief Executive Officer of Global Corporate Trust (2003-2008), Senior Vice President and Division Manager of Global Payments & Trade Services (2002-2003) and Senior Vice President and Division Manager of Domestic Corporate Trust (1998-2002). Ms. Peetz also served in various capacities at Chase Manhattan Corporation (1982-1998), including Senior Vice President and Manager of Corporate Trust International Business (1996-1998), Managing Director and Manager of Corporate Trust Services (1994-1996) and Managing Director and Group Manager of Financial Institution Sales (1990-1993). Ms. Peetz currently serves as Chair of Amherst Holdings Advisory Council (2018-present), Trustee of Johns Hopkins University (2016-present), Chair of the Carey Business School Advisory Council, Member of the Johns Hopkins Medicine Board and Finance Committee and Chair of the Lyme and Tick Related Disease Institute Advisory Council. Ms. Peetz previously served as a member of the Board of Guardian Life Insurance Company of America (2019-2023), a member of the Board of Trane Technologies (2018-2022), a member of the Board of Wells Fargo Corp. (2017-2019), a member of the Board of SunCoke Energy Inc. (2012-2016), a member of the Board of Private Export Funding Corporation (2010-2016) and as a Trustee of Penn State University (2010-2014) and the United Way of New York City (2008-2010).
Heather Bonner (1977)
Year of Election or Appointment: 2023
Assistant Treasurer
Ms. Bonner also serves as an officer of other funds. Ms. Bonner is a Senior Vice President (2022-present) and is an employee of Fidelity Investments (2022-present). Ms. Bonner serves as Senior Vice President, Vice President, Treasurer, or Director of certain Fidelity entities. Prior to joining Fidelity, Ms. Bonner served as Managing Director at AQR Capital Management (2013-2022) and was the Treasurer and Principal Financial Officer of the AQR Funds (2013-2022).
Craig S. Brown (1977)
Year of Election or Appointment: 2022
Deputy Treasurer
Mr. Brown also serves as an officer of other funds. Mr. Brown is a Vice President (2015-present) and is an employee of Fidelity Investments. Mr. Brown serves as Assistant Treasurer of FIMM, LLC (2021-present). Previously, Mr. Brown served as Assistant Treasurer of certain Fidelity® funds (2019-2022).
John J. Burke III (1964)
Year of Election or Appointment: 2018
Chief Financial Officer
Mr. Burke also serves as Chief Financial Officer of other funds. Mr. Burke is Head of Fidelity Fund and Investment Operations (2018-present) and is an employee of Fidelity Investments. Mr. Burke serves as President, Executive Vice President, or Director of certain Fidelity entities. Previously Mr. Burke served as head of Asset Management Investment Operations (2012-2018).
Margaret Carey (1973)
Year of Election or Appointment: 2023
Secretary and Chief Legal Officer (CLO)
Ms. Carey also serves as an officer of other funds and as CLO of certain Fidelity entities. Ms. Carey is a Senior Vice President, Deputy General Counsel (2019-present) and is an employee of Fidelity Investments.
William C. Coffey (1969)
Year of Election or Appointment: 2019
Assistant Secretary
Mr. Coffey also serves as Assistant Secretary of other funds. Mr. Coffey is a Senior Vice President, Deputy General Counsel (2010-present) and is an employee of Fidelity Investments. Previously, Mr. Coffey served as Secretary and CLO of certain funds (2018-2019); CLO, Secretary, or Senior Vice President of certain Fidelity entities and Assistant Secretary of certain funds (2009-2018).
Timothy M. Cohen (1969)
Year of Election or Appointment: 2018
Vice President
Mr. Cohen also serves as Vice President of other funds. Mr. Cohen is Co-Head of Equity (2018-present) and is an employee of Fidelity Investments. Mr. Cohen serves as President or Director of certain Fidelity entities. Previously, Mr. Cohen served as Executive Vice President of Fidelity SelectCo, LLC (2019) and Head of Global Equity Research (2016-2018).
Jonathan Davis (1968)
Year of Election or Appointment: 2010
Assistant Treasurer
Mr. Davis also serves as an officer of other funds. Mr. Davis is a Vice President (2006-present) and is an employee of Fidelity Investments. Mr. Davis serves as Assistant Treasurer or Director of certain Fidelity entities.
Laura M. Del Prato (1964)
Year of Election or Appointment: 2018
Assistant Treasurer
Ms. Del Prato also serves as an officer of other funds. Ms. Del Prato is a Senior Vice President (2017-present) and is an employee of Fidelity Investments. Ms. Del Prato serves as Senior Vice President, Vice President, Assistant Treasurer, or Director of certain Fidelity entities. Previously, Ms. Del Prato served as President and Treasurer of The North Carolina Capital Management Trust: Cash Portfolio and Term Portfolio (2018-2020).
Colm A. Hogan (1973)
Year of Election or Appointment: 2020
Assistant Treasurer
Mr. Hogan also serves as an officer of other funds. Mr. Hogan is a Vice President (2016-present) and is an employee of Fidelity Investments. Mr. Hogan serves as Assistant Treasurer of certain Fidelity entities. Previously, Mr. Hogan served as Deputy Treasurer of certain Fidelity® funds (2016-2020) and Assistant Treasurer of certain Fidelity® funds (2016-2018).
Pamela R. Holding (1964)
Year of Election or Appointment: 2018
Vice President
Ms. Holding also serves as Vice President of other funds. Ms. Holding is Co-Head of Equity (2018-present) and is an employee of Fidelity Investments. Previously, Ms. Holding served as Executive Vice President of Fidelity SelectCo, LLC (2019) and as Chief Investment Officer of Fidelity Institutional Asset Management (2013-2018).
Chris Maher (1972)
Year of Election or Appointment: 2020
Deputy Treasurer
Mr. Maher also serves as an officer of other funds. Mr. Maher is a Vice President (2008-present) and is an employee of Fidelity Investments. Mr. Maher serves as Assistant Treasurer of certain Fidelity entities. Previously, Mr. Maher served as Assistant Treasurer of certain funds (2013-2020).
Jason P. Pogorelec (1975)
Year of Election or Appointment: 2020
Chief Compliance Officer
Mr. Pogorelec also serves as Chief Compliance Officer of other funds. Mr. Pogorelec is a Senior Vice President of Asset Management Compliance (2020-present) and is an employee of Fidelity Investments. Mr. Pogorelec serves as Compliance Officer of Fidelity Management & Research Company LLC (investment adviser firm, 2023-present) and Ballyrock Investment Advisors LLC (2023-present). Previously, Mr. Pogorelec served as a Vice President, Associate General Counsel for Fidelity Investments (2010-2020) and Assistant Secretary of certain Fidelity® funds (2015-2020).
Brett Segaloff (1972)
Year of Election or Appointment: 2021
Anti-Money Laundering (AML) Officer
Mr. Segaloff also serves as AML Officer of other funds. Mr. Segaloff is a Vice President (2022-present) and is an employee of Fidelity Investments. Mr. Segaloff serves as Anti Money Laundering Compliance Officer or Anti Money Laundering/Bank Secrecy Act Compliance Officer of certain Fidelity entities.
Stacie M. Smith (1974)
Year of Election or Appointment: 2016
President and Treasurer
Ms. Smith also serves as an officer of other funds. Ms. Smith is a Senior Vice President (2016-present) and is an employee of Fidelity Investments. Ms. Smith serves as Assistant Treasurer of certain Fidelity entities and has served in other fund officer roles.
Jim Wegmann (1979)
Year of Election or Appointment: 2019
Assistant Treasurer
Mr. Wegmann also serves as an officer of other funds. Mr. Wegmann is a Vice President (2016-present) and is an employee of Fidelity Investments. Mr. Wegmann serves as Assistant Treasurer of FIMM, LLC (2021-present). Previously, Mr. Wegmann served as Assistant Treasurer of certain Fidelity® funds (2019-2021).
+ The information includes principal occupation during the last five years.
As a shareholder, you incur two types of costs: (1) transaction costs, which may include sales charges (loads) on purchase payments or redemption proceeds, as applicable and (2) ongoing costs, which generally include management fees, distribution and/or service (12b-1) fees and other Fund expenses. This Example is intended to help you understand your ongoing costs (in dollars) of investing in a fund and to compare these costs with the ongoing costs of investing in other mutual funds.
| The Example is based on an investment of $1,000 invested at the beginning of the period and held for the entire period (November 1, 2023 to April 30, 2024). |
Actual Expenses
The first line of the accompanying table provides information about actual account values and actual expenses. You may use the information in this line, together with the amount you invested, to estimate the expenses that you paid over the period. Simply divide your account value by $1,000.00 (for example, an $8,600 account value divided by $1,000.00 = 8.6), then multiply the result by the number in the first line for a class/Fund under the heading entitled "Expenses Paid During Period" to estimate the expenses you paid on your account during this period. If any fund is a shareholder of any underlying mutual funds or exchange-traded funds (ETFs) (the Underlying Funds), such fund indirectly bears its proportional share of the expenses of the Underlying Funds in addition to the direct expenses incurred presented in the table. These fees and expenses are not included in the annualized expense ratio used to calculate the expense estimate in the table below.
Hypothetical Example for Comparison Purposes
The second line of the accompanying table provides information about hypothetical account values and hypothetical expenses based on the actual expense ratio and an assumed rate of return of 5% per year before expenses, which is not the actual return. The hypothetical account values and expenses may not be used to estimate the actual ending account balance or expenses you paid for the period. You may use this information to compare the ongoing costs of investing in the Fund and other funds. To do so, compare this 5% hypothetical example with the 5% hypothetical examples that appear in the shareholder reports of the other funds. If any fund is a shareholder of any Underlying Funds, such fund indirectly bears its proportional share of the expenses of the Underlying Funds in addition to the direct expenses as presented in the table. These fees and expenses are not included in the annualized expense ratio used to calculate the expense estimate in the table below.
Please note that the expenses shown in the table are meant to highlight your ongoing costs only and do not reflect any transaction costs. Therefore, the second line of the table is useful in comparing ongoing costs only, and will not help you determine the relative total costs of owning different funds. In addition, if these transactional costs were included, your costs would have been higher.
| | | | | Annualized Expense Ratio- A | | Beginning Account Value November 1, 2023 | | Ending Account Value April 30, 2024 | | Expenses Paid During Period- C November 1, 2023 to April 30, 2024 |
| | | | | | | | | | |
| Fidelity® SAI High Income Fund | | | | .52% | | | | | | |
| Actual | | | | | | $ 1,000 | | $ 1,097.40 | | $ 2.71 |
Hypothetical-B | | | | | | $ 1,000 | | $ 1,022.28 | | $ 2.61 |
| |
A Annualized expense ratio reflects expenses net of applicable fee waivers.
B 5% return per year before expenses
C Expenses are equal to the annualized expense ratio, multiplied by the average account value over the period, multiplied by 182/ 366 (to reflect the one-half year period). The fees and expenses of any Underlying Funds are not included in each annualized expense ratio.
The dividend and capital gains distributions for the fund(s) are available on Fidelity.com or Institutional.Fidelity.com.
A total of 0.16% of the dividends distributed during the fiscal year was derived from interest on U.S. Government securities which is generally exempt from state income tax.
The fund designates $93,914,249 of distributions paid during the fiscal year ended 2024 as qualifying to be taxed as section 163(j) interest dividends.
The fund will notify shareholders in January 2025 of amounts for use in preparing 2024 income tax returns.
Board Approval of Investment Advisory Contracts
Fidelity SAI High Income Fund
At its January 2024 meeting, the Board of Trustees, including the Independent Trustees (together, the Board), approved an amended and restated management contract with Fidelity Management & Research Company LLC (FMR) (the Management Contract), and amended and restated sub-advisory agreements (the Sub-Advisory Contracts, and together with the Management Contract, the Advisory Contracts) for the fund, including the fund's sub-advisory agreements with FMR Investment Management (UK) Limited (FMR UK), Fidelity Management & Research (Hong Kong) Limited (FMR H.K.), and Fidelity Management & Research (Japan) Limited (FMR Japan). The Advisory Contracts will be effective March 1, 2024. The Board will consider the annual renewal of the fund's Advisory Contracts in May 2024, following its review of additional materials provided by FMR.
Management Contract. The Board approved the Management Contract, which implements a new fee structure that eliminates the existing group fee schedule and fixes the management fee rate at the sum of the individual fee rate and the lowest marginal contractual group fee rate under the current management contract. The Board noted that shareholders in the affected funds are not currently impacted by changes in the group fee rates due to other arrangements such as fund expense caps or managed account fee crediting. The Board considered Fidelity's representations that the Management Contract would result in the same or lower fees for the fund.
Sub-Advisory Contracts. In connection with the Management Contract changes, the Board considered the Sub-Advisory Contracts, which simplified the calculation of the fees paid by FMR to the sub-advisers under the agreements. The Board noted that the agreements with FMR UK, FMR H.K., and FMR Japan were amended to provide that FMR will compensate each sub-adviser at a fee rate equal to 110% of the sub-adviser's costs incurred in providing services under the agreement. The Board considered that, under the Sub-Advisory Contracts, FMR, and not the fund, will continue to pay the sub-advisory fees to each applicable sub-adviser.
The Board considered that the approval of the fund's Advisory Contracts will not result in any changes in the investment process or strategies employed in the management of the fund's assets or the day-to-day management of the fund or the persons primarily responsible for such management. Further, the Board considered that the Management Contract would not change the obligations and services of FMR and its affiliates on behalf of the fund, and, in particular, there would be no change in the nature and level of advisory, management, administration, transfer agent, and pricing and bookkeeping services provided to the fund by FMR, its affiliates, and each applicable sub-adviser.
In connection with its consideration of future renewals of the fund's Advisory Contracts, the Board will consider: (i) the nature, extent and quality of services provided to the funds, including shareholder and administrative services and investment performance; (ii) the competitiveness of the management fee and total expenses for the fund; (iii) the costs of the services and profitability, including the revenues earned and the expenses incurred in conducting the business of developing, marketing, distributing, managing, administering, and servicing the fund and its shareholders, to the extent applicable; and (iv) whether there have been economies of scale in respect of the Fidelity funds, whether the Fidelity funds (including the fund) have appropriately benefited from any such economies of scale, and whether there is the potential for realization of any further economies.
Based on its evaluation of all of the conclusions noted above, and after considering all factors it believed relevant, the Board concluded that the fund's management fee structure is fair and reasonable, and that the fund's Advisory Contracts should be approved.
The Securities and Exchange Commission adopted Rule 22e-4 under the Investment Company Act of 1940 (the Liquidity Rule) to promote effective liquidity risk management throughout the open-end investment company industry, thereby reducing the risk that funds will be unable to meet their redemption obligations and mitigating dilution of the interests of fund shareholders.
The Fund has adopted and implemented a liquidity risk management program (the Program) reasonably designed to assess and manage the Fund's liquidity risk and to comply with the requirements of the Liquidity Rule. The Fund's Board of Trustees (the Board) has designated the Fund's investment adviser as administrator of the Program. The Fidelity advisers have established a Liquidity Risk Management Committee (the LRM Committee) to manage the Program for each of the Fidelity Funds. The LRM Committee monitors the adequacy and effectiveness of implementation of the Program and on a periodic basis assesses each Fund's liquidity risk based on a variety of factors including (1) the Fund's investment strategy, (2) portfolio liquidity and cash flow projections during normal and reasonably foreseeable stressed conditions, (3) shareholder redemptions, (4) borrowings and other funding sources and (5) certain factors specific to ETFs including the effect of the Fund's prices and spreads, market participants, and basket compositions on the overall liquidity of the Fund's portfolio, as applicable.
In accordance with the Program, each of the Fund's portfolio investments is classified into one of four defined liquidity categories based on a determination of a reasonable expectation for how long it would take to convert the investment to cash (or sell or dispose of the investment) without significantly changing its market value.
- Highly liquid investments - cash or convertible to cash within three business days or less
- Moderately liquid investments - convertible to cash in three to seven calendar days
- Less liquid investments - can be sold or disposed of, but not settled, within seven calendar days
- Illiquid investments - cannot be sold or disposed of within seven calendar days
Liquidity classification determinations take into account a variety of factors including various market, trading and investment-specific considerations, as well as market depth, and generally utilize analysis from a third-party liquidity metrics service.
The Liquidity Rule places a 15% limit on a fund's illiquid investments and requires funds that do not primarily hold assets that are highly liquid investments to determine and maintain a minimum percentage of the fund's net assets to be invested in highly liquid investments (highly liquid investment minimum or HLIM). The Program includes provisions reasonably designed to comply with the 15% limit on illiquid investments and for determining, periodically reviewing and complying with the HLIM requirement as applicable.
At a recent meeting of the Fund's Board of Trustees, the LRM Committee provided a written report to the Board pertaining to the operation, adequacy, and effectiveness of the Program for the period December 1, 2022 through November 30, 2023. The report concluded that the Program is operating effectively and is reasonably designed to assess and manage the Fund's liquidity risk.
1.9901441.102
SAH-ANN-0624
Item 2.
Code of Ethics
As of the end of the period, April 30, 2024, Fidelity Summer Street Trust (the trust) has adopted a code of ethics, as defined in Item 2 of Form N-CSR, that applies to its President and Treasurer and its Chief Financial Officer. A copy of the code of ethics is filed as an exhibit to this Form N-CSR.
Item 3.
Audit Committee Financial Expert
The Board of Trustees of the trust has determined that Donald F. Donahue is an audit committee financial expert, as defined in Item 3 of Form N-CSR. Mr. Donahue is independent for purposes of Item 3 of Form N-CSR.
Item 4.
Principal Accountant Fees and Services
Fees and Services
The following table presents fees billed by Deloitte & Touche LLP, the member firms of Deloitte Touche Tohmatsu, and their respective affiliates (collectively, “Deloitte Entities”) in each of the last two fiscal years for services rendered to Fidelity Series High Income Fund, Fidelity Short Duration High Income Fund and Fidelity Women’s Leadership Fund (the “Funds”):
Services Billed by Deloitte Entities
April 30, 2024 FeesA
| | | | |
| Audit Fees | Audit-Related Fees | Tax Fees | All Other Fees |
Fidelity Series High Income Fund | $52,400 | $- | $9,700 | $1,300 |
Fidelity Short Duration High Income Fund | $55,100 | $- | $9,700 | $1,400 |
Fidelity Women’s Leadership Fund | $39,400 | $- | $7,600 | $1,000 |
| | | | |
| Audit Fees | Audit-Related Fees | Tax Fees | All Other Fees |
Fidelity Series High Income Fund | $52,600 | $- | $9,700 | $1,300 |
Fidelity Short Duration High Income Fund | $55,300 | $- | $9,700 | $1,300 |
Fidelity Women’s Leadership Fund | $39,600 | $- | $7,400 | $1,000 |
A Amounts may reflect rounding.
The following table presents fees billed by PricewaterhouseCoopers LLP (“PwC”) in each of the last two fiscal years for services rendered to Fidelity Capital & Income Fund, Fidelity Focused High Income Fund, Fidelity Global High Income Fund, Fidelity Healthy Future Fund, Fidelity High Income Fund, Fidelity SAI High Income Fund and Fidelity U.S. Low Volatility Equity Fund (the “Funds”):
Services Billed by PwC
April 30, 2024 FeesA
| | | | |
| Audit Fees | Audit-Related Fees | Tax Fees | All Other Fees |
Fidelity Capital & Income Fund | $100,300 | $8,600 | $11,900 | $2,900 |
Fidelity Focused High Income Fund | $63,000 | $5,500 | $8,800 | $1,800 |
Fidelity Global High Income Fund | $80,700 | $7,000 | $10,100 | $2,300 |
Fidelity Healthy Future Fund | $32,000 | $2,600 | $7,700 | $900 |
Fidelity High Income Fund | $79,400 | $7,100 | $12,300 | $2,400 |
Fidelity SAI High Income Fund | $73,700 | $6,700 | $12,200 | $2,200 |
Fidelity U.S. Low Volatility Equity Fund | $28,500 | $2,700 | $9,800 | $900 |
| | | | |
| Audit Fees | Audit-Related Fees | Tax Fees | All Other Fees |
Fidelity Capital & Income Fund | $101,000 | $8,100 | $12,200 | $2,800 |
Fidelity Focused High Income Fund | $63,200 | $5,200 | $8,800 | $1,800 |
Fidelity Global High Income Fund | $81,800 | $6,600 | $9,500 | $2,300 |
Fidelity Healthy Future Fund | $25,100 | $2,200 | $7,700 | $700 |
Fidelity High Income Fund | $85,400 | $6,700 | $14,800 | $2,300 |
Fidelity SAI High Income Fund | $79,600 | $5,900 | $15,000 | $2,000 |
Fidelity U.S. Low Volatility Equity Fund | $25,500 | $2,500 | $12,000 | $900 |
A Amounts may reflect rounding.
B Fidelity Healthy Future Fund commenced operations on May 24, 2022.
The following table(s) present(s) fees billed by Deloitte Entities and PwC that were required to be approved by the Audit Committee for services that relate directly to the operations and financial reporting of the Fund(s) and that are rendered on behalf of Fidelity Management & Research Company LLC ("FMR") and entities controlling, controlled by, or under common control with FMR (not including any sub-adviser whose role is primarily portfolio management and is subcontracted with or overseen by another investment adviser) that provide ongoing services to the Fund(s) (“Fund Service Providers”):
Services Billed by Deloitte Entities
| | |
| April 30, 2024A | April 30, 2023A
|
Audit-Related Fees | $75,000 | $80,000 |
Tax Fees | $- | $- |
All Other Fees | $935,000 | $- |
A Amounts may reflect rounding.
Services Billed by PwC
| | |
| April 30, 2024A | April 30, 2023A,B |
Audit-Related Fees | $9,367,800 | $8,604,200 |
Tax Fees | $61,000 | $1,000 |
All Other Fees | $- | $- |
A Amounts may reflect rounding.
B May include amounts billed prior to the Fidelity Healthy Future Fund’s commencement of operations.
“Audit-Related Fees” represent fees billed for assurance and related services that are reasonably related to the performance of the fund audit or the review of the fund's financial statements and that are not reported under Audit Fees.
“Tax Fees” represent fees billed for tax compliance, tax advice or tax planning that relate directly to the operations and financial reporting of the fund.
“All Other Fees” represent fees billed for services provided to the fund or Fund Service Provider, a significant portion of which are assurance related, that relate directly to the operations and financial reporting of the fund, excluding those services that are reported under Audit Fees, Audit-Related Fees or Tax Fees.
Assurance services must be performed by an independent public accountant.
* * *
The aggregate non-audit fees billed by Deloitte Entities and PwC for services rendered to the Fund(s), FMR (not including any sub-adviser whose role is primarily portfolio management and is subcontracted with or overseen by another investment adviser), and any Fund Service Provider for each of the last two fiscal years of the Fund(s) are as follows:
| | |
Billed By | April 30, 2024A | April 30, 2023A,B |
Deloitte Entities | $5,065,200 | $2,078,400 |
PwC | $15,039,900 | $14,387,800 |
|
|
|
A Amounts may reflect rounding.
B May include amounts billed prior to the Fidelity Healthy Future Fund’s commencement of operations
The trust's Audit Committee has considered non-audit services that were not pre-approved that were provided by Deloitte Entities and PwC to Fund Service Providers to be compatible with maintaining the independence of Deloitte Entities and PwC in its(their) audit of the Fund(s), taking into account representations from Deloitte Entities and PwC, in accordance with Public Company Accounting Oversight Board rules, regarding its independence from the Fund(s) and its(their) related entities and FMR’s review of the appropriateness and permissibility under applicable law of such non-audit services prior to their provision to the Fund(s) Service Providers.
Audit Committee Pre-Approval Policies and Procedures
The trust’s Audit Committee must pre-approve all audit and non-audit services provided by a fund’s independent registered public accounting firm relating to the operations or financial reporting of the fund. Prior to the commencement of any audit or non-audit services to a fund, the Audit Committee reviews the services to determine whether they are appropriate and permissible under applicable law.
The Audit Committee has adopted policies and procedures to, among other purposes, provide a framework for the Committee’s consideration of non-audit services by the audit firms that audit the Fidelity funds. The policies and procedures require that any non-audit service provided by a fund audit firm to a Fidelity fund and any non-audit service provided by a fund auditor to a Fund Service Provider that relates directly to the operations and financial reporting of a Fidelity fund (“Covered Service”) are subject to approval by the Audit Committee before such service is provided.
All Covered Services must be approved in advance of provision of the service either: (i) by formal resolution of the Audit Committee, or (ii) by oral or written approval of the service by the Chair of the Audit Committee (or if the Chair is unavailable, such other member of the Audit Committee as may be designated by the Chair to act in the Chair’s absence). The approval contemplated by (ii) above is permitted where the Treasurer determines that action on such an engagement is necessary before the next meeting of the Audit Committee.
Non-audit services provided by a fund audit firm to a Fund Service Provider that do not relate directly to the operations and financial reporting of a Fidelity fund are reported to the Audit Committee periodically.
Non-Audit Services Approved Pursuant to Rule 2-01(c)(7)(i)(C) and (ii) of Regulation S-X (“De Minimis Exception”)
There were no non-audit services approved or required to be approved by the Audit Committee pursuant to the De Minimis Exception during the Fund’s(s’) last two fiscal years relating to services provided to (i) the Fund(s) or (ii) any Fund Service Provider that relate directly to the operations and financial reporting of the Fund(s).
The Registrant has not retained, for the preparation of the audit report on the financial statements included in the Form N-CSR, a registered public accounting firm that has a branch or office that is located in a foreign jurisdiction and that the Public Company Accounting Oversight Board (the “PCAOB”) has determined that the PCAOB is unable to inspect or investigate completely because of a position taken by an authority in the foreign jurisdiction.
The Registrant is not a “foreign issuer,” as defined in 17 CFR 240.3b-4.
Item 5.
Audit Committee of Listed Registrants
Not applicable.
Item 6.
Investments
(a)
Not applicable.
(b)
Not applicable.
Item 7.
Disclosure of Proxy Voting Policies and Procedures for Closed-End Management Investment Companies
Not applicable.
Item 8.
Portfolio Managers of Closed-End Management Investment Companies
Not applicable.
Item 9.
Purchase of Equity Securities by Closed-End Management Investment Company and Affiliated Purchasers
Not applicable.
Item 10.
Submission of Matters to a Vote of Security Holders
There were no material changes to the procedures by which shareholders may recommend nominees to the trust’s Board of Trustees.
Item 11.
Controls and Procedures
(a)(i) The President and Treasurer and the Chief Financial Officer have concluded that the trust’s disclosure controls and procedures (as defined in Rule 30a-3(c) under the Investment Company Act) provide reasonable assurances that material information relating to the trust is made known to them by the appropriate persons, based on their evaluation of these controls and procedures as of a date within 90 days of the filing date of this report.
(a)(ii) There was no change in the trust’s internal control over financial reporting (as defined in Rule 30a-3(d) under the Investment Company Act) that occurred during the period covered by this report that has materially affected, or is reasonably likely to materially affect, the trust’s internal control over financial reporting.
Item 12.
Disclosure of Securities Lending Activities for Closed-End Management
Investment Companies
Not applicable.
Item 18.
Recovery of Erroneously Awarded Compensation
(a)
Not applicable.
(b)
Not applicable.
Item 19.
Exhibits
SIGNATURES
Pursuant to the requirements of the Securities Exchange Act of 1934 and the Investment Company Act of 1940, the registrant has duly caused this report to be signed on its behalf by the undersigned, thereunto duly authorized.
Fidelity Summer Street Trust
| |
By: | /s/Stacie M. Smith |
| Stacie M. Smith |
| President and Treasurer (Principal Executive Officer) |
|
|
Date: | June 21, 2024 |
Pursuant to the requirements of the Securities Exchange Act of 1934 and the Investment Company Act of 1940, this report has been signed below by the following persons on behalf of the registrant and in the capacities and on the dates indicated.
| |
By: | /s/Stacie M. Smith |
| Stacie M. Smith |
| President and Treasurer (Principal Executive Officer) |
|
|
Date: | June 21, 2024 |
| |
By: | /s/John J. Burke III |
| John J. Burke III |
| Chief Financial Officer (Principal Financial Officer) |
|
|
Date: | June 21, 2024 |