UNITED STATES
SECURITIES AND EXCHANGE COMMISSION
Washington, D.C. 20549
FORM N-CSR
CERTIFIED SHAREHOLDER REPORT OF REGISTERED
MANAGEMENT INVESTMENT COMPANIES
Investment Company Act file number 811-2737
Fidelity Summer Street Trust
(Exact name of registrant as specified in charter)
245 Summer St., Boston, MA 02210
(Address of principal executive offices) (Zip code)
Marc Bryant, Secretary
245 Summer St.
Boston, Massachusetts 02210
(Name and address of agent for service)
Registrant's telephone number, including area code:
617-563-7000
Date of fiscal year end: | April 30 |
Date of reporting period: | October 31, 2017 |
Item 1.
Reports to Stockholders
Fidelity® Capital & Income Fund Semi-Annual Report October 31, 2017 |
 |
Contents
Board Approval of Investment Advisory Contracts and Management Fees |
To view a fund's proxy voting guidelines and proxy voting record for the 12-month period ended June 30, visit http://www.fidelity.com/proxyvotingresults or visit the Securities and Exchange Commission's (SEC) web site at http://www.sec.gov.
You may also call 1-800-544-8544 to request a free copy of the proxy voting guidelines.
Standard & Poor's, S&P and S&P 500 are registered service marks of The McGraw-Hill Companies, Inc. and have been licensed for use by Fidelity Distributors Corporation.
Other third-party marks appearing herein are the property of their respective owners.
All other marks appearing herein are registered or unregistered trademarks or service marks of FMR LLC or an affiliated company. © 2017 FMR LLC. All rights reserved.
This report and the financial statements contained herein are submitted for the general information of the shareholders of the Fund. This report is not authorized for distribution to prospective investors in the Fund unless preceded or accompanied by an effective prospectus.
A fund files its complete schedule of portfolio holdings with the SEC for the first and third quarters of each fiscal year on Form N-Q. Forms N-Q are available on the SEC’s web site at http://www.sec.gov. A fund's Forms N-Q may be reviewed and copied at the SEC’s Public Reference Room in Washington, DC. Information regarding the operation of the SEC's Public Reference Room may be obtained by calling 1-800-SEC-0330.
For a complete list of a fund's portfolio holdings, view the most recent holdings listing, semiannual report, or annual report on Fidelity's web site at http://www.fidelity.com, http://www.institutional.fidelity.com, or http://www.401k.com, as applicable.
NOT FDIC INSURED •MAY LOSE VALUE •NO BANK GUARANTEE
Neither the Fund nor Fidelity Distributors Corporation is a bank.
Investment Summary (Unaudited)
Top Five Holdings as of October 31, 2017
| (by issuer, excluding cash equivalents) | % of fund's net assets | % of fund's net assets 6 months ago |
| Ally Financial, Inc. | 3.7 | 3.2 |
| Energy Future Intermediate Holding Co. LLC/Energy Future Intermediate Holding Finance, Inc. | 2.0 | 1.8 |
| CCO Holdings LLC/CCO Holdings Capital Corp. | 1.7 | 1.6 |
| Citigroup, Inc. | 1.5 | 1.6 |
| SFR Group SA | 1.4 | 2.6 |
| 10.3 |
Top Five Market Sectors as of October 31, 2017
| % of fund's net assets | % of fund's net assets 6 months ago | |
| Technology | 11.0 | 11.1 |
| Energy | 10.7 | 10.3 |
| Banks & Thrifts | 10.2 | 9.3 |
| Telecommunications | 10.2 | 13.0 |
| Healthcare | 5.2 | 6.3 |
Quality Diversification (% of fund's net assets)
| As of October 31, 2017 | ||
| AAA,AA,A | 0.1% | |
| BBB | 3.9% | |
| BB | 20.9% | |
| B | 28.8% | |
| CCC,CC,C | 11.2% | |
| Not Rated | 3.6% | |
| Equities | 22.2% | |
| Short-Term Investments and Net Other Assets | 9.3% | |
| As of April 30, 2017 | ||
| AAA,AA,A | 0.1% | |
| BBB | 3.6% | |
| BB | 21.9% | |
| B | 28.7% | |
| CCC,CC,C | 13.6% | |
| Not Rated | 2.6% | |
| Equities | 21.6% | |
| Short-Term Investments and Net Other Assets | 7.9% | |
We have used ratings from Moody's Investors Service, Inc. Where Moody's® ratings are not available, we have used S&P® ratings. All ratings are as of the date indicated and do not reflect subsequent changes.
Asset Allocation (% of fund's net assets)
| As of October 31, 2017* | ||
| Nonconvertible Bonds | 59.7% | |
| Common Stocks | 22.2% | |
| Bank Loan Obligations | 2.6% | |
| Other Investments | 6.2% | |
| Short-Term Investments and Net Other Assets (Liabilities) | 9.3% | |

* Foreign investments - 19.1%
| As of April 30, 2017* | ||
| Nonconvertible Bonds | 63.1% | |
| Convertible Bonds, Preferred Stocks | 0.1% | |
| Common Stocks | 21.5% | |
| Bank Loan Obligations | 1.8% | |
| Other Investments | 5.6% | |
| Short-Term Investments and Net Other Assets (Liabilities) | 7.9% | |

* Foreign investments - 18.3%
Investments October 31, 2017
Showing Percentage of Net Assets
| Corporate Bonds - 59.7% | |||
| Principal Amount (000s) | Value (000s) | ||
| Convertible Bonds - 0.0% | |||
| Automotive & Auto Parts - 0.0% | |||
| Exide Technologies 7% 4/30/25 pay-in-kind (a) | $2,599 | $1,572 | |
| Nonconvertible Bonds - 59.7% | |||
| Aerospace - 0.7% | |||
| DAE Funding LLC: | |||
| 4% 8/1/20 (b) | 6,960 | 7,064 | |
| 4.5% 8/1/22 (b) | 8,695 | 8,815 | |
| 5% 8/1/24 (b) | 11,980 | 12,235 | |
| Huntington Ingalls Industries, Inc. 5% 11/15/25 (b) | 10,820 | 11,720 | |
| KLX, Inc. 5.875% 12/1/22 (b) | 27,955 | 29,248 | |
| TransDigm, Inc. 6.375% 6/15/26 | 10,825 | 11,014 | |
| 80,096 | |||
| Air Transportation - 0.4% | |||
| Air Canada 2013-1 Pass Through 5.375% 11/15/22 (b) | 2,519 | 2,650 | |
| Allegiant Travel Co. 5.5% 7/15/19 | 3,350 | 3,459 | |
| Continental Airlines, Inc. pass-thru trust certificates 6.903% 4/19/22 | 979 | 1,036 | |
| Delta Air Lines, Inc. pass-thru trust certificates 8.021% 2/10/24 | 6,887 | 7,851 | |
| Hawaiian Airlines pass-thru certificates Series 2013-1 Class B, 4.95% 7/15/23 | 4,010 | 4,110 | |
| Northwest Airlines, Inc. pass-thru trust certificates 8.028% 11/1/17 | 1,524 | 1,525 | |
| U.S. Airways pass-thru certificates: | |||
| Series 2011-1 Class A, 7.125% 10/22/23 | 8,715 | 10,075 | |
| Series 2012-2 Class B, 6.75% 6/3/21 | 2,879 | 3,161 | |
| Series 2013-1 Class B, 5.375% 11/15/21 | 3,875 | 4,112 | |
| XPO Logistics, Inc. 6.125% 9/1/23 (b) | 8,900 | 9,367 | |
| 47,346 | |||
| Automotive & Auto Parts - 0.7% | |||
| Allison Transmission, Inc. 5% 10/1/24 (b) | 11,405 | 11,890 | |
| American Tire Distributors, Inc. 10.25% 3/1/22 (b) | 5,465 | 5,704 | |
| Delphi Jersey Holdings PLC 5% 10/1/25 (b) | 13,220 | 13,319 | |
| Exide Technologies 11% 4/30/22 pay-in-kind (a)(b)(c) | 2,541 | 2,160 | |
| LKQ Corp. 4.75% 5/15/23 | 2,190 | 2,250 | |
| Penske Automotive Group, Inc. 5.5% 5/15/26 | 8,565 | 8,822 | |
| Tenneco, Inc. 5% 7/15/26 | 8,345 | 8,572 | |
| Tesla, Inc. 5.3% 8/15/25 (b) | 30,260 | 29,201 | |
| 81,918 | |||
| Banks & Thrifts - 3.7% | |||
| Ally Financial, Inc.: | |||
| 4.125% 2/13/22 | 22,220 | 23,109 | |
| 4.625% 3/30/25 | 37,190 | 39,561 | |
| 5.125% 9/30/24 | 85,095 | 93,179 | |
| 8% 11/1/31 | 20,638 | 27,242 | |
| 8% 11/1/31 | 198,609 | 262,658 | |
| 445,749 | |||
| Broadcasting - 1.1% | |||
| AMC Networks, Inc.: | |||
| 4.75% 12/15/22 | 5,930 | 6,086 | |
| 4.75% 8/1/25 | 12,105 | 12,090 | |
| CBS Radio, Inc. 7.25% 11/1/24 (b) | 7,525 | 7,873 | |
| Clear Channel Communications, Inc.: | |||
| 9% 3/1/21 | 4,490 | 3,227 | |
| 11.25% 3/1/21 | 34,705 | 24,901 | |
| 14% 2/1/21 pay-in-kind (a) | 12,143 | 1,214 | |
| iHeartCommunications, Inc.: | |||
| 10.625% 3/15/23 | 29,269 | 21,001 | |
| 11.25% 3/1/21 (b) | 11,660 | 8,279 | |
| Sirius XM Radio, Inc.: | |||
| 4.625% 5/15/23 (b) | 4,925 | 5,048 | |
| 5% 8/1/27 (b) | 12,085 | 12,191 | |
| 5.375% 4/15/25 (b) | 12,000 | 12,645 | |
| 5.375% 7/15/26 (b) | 11,315 | 11,923 | |
| Tegna, Inc. 5.5% 9/15/24 (b) | 8,440 | 8,841 | |
| 135,319 | |||
| Building Materials - 0.1% | |||
| American Builders & Contractors Supply Co., Inc. 5.625% 4/15/21 (b) | 1,205 | 1,237 | |
| Summit Materials LLC/Summit Materials Finance Corp. 5.125% 6/1/25 (b) | 5,095 | 5,159 | |
| U.S. Concrete, Inc. 6.375% 6/1/24 | 5,535 | 5,950 | |
| USG Corp. 4.875% 6/1/27 (b) | 3,170 | 3,289 | |
| 15,635 | |||
| Cable/Satellite TV - 2.6% | |||
| Altice SA 7.625% 2/15/25 (b) | 30,480 | 33,071 | |
| Altice U.S. Finance SA 5.5% 5/15/26 (b) | 11,375 | 11,830 | |
| CCO Holdings LLC/CCO Holdings Capital Corp.: | |||
| 5% 2/1/28 (b) | 30,300 | 30,073 | |
| 5.125% 2/15/23 | 30,665 | 31,662 | |
| 5.125% 5/1/23 (b) | 14,050 | 14,647 | |
| 5.125% 5/1/27 (b) | 50,315 | 50,818 | |
| 5.375% 5/1/25 (b) | 14,050 | 14,577 | |
| 5.5% 5/1/26 (b) | 17,605 | 18,045 | |
| 5.75% 9/1/23 | 9,495 | 9,839 | |
| 5.75% 1/15/24 | 11,275 | 11,712 | |
| 5.75% 2/15/26 (b) | 20,340 | 21,265 | |
| Lynx II Corp. 6.375% 4/15/23 (b) | 3,545 | 3,696 | |
| Videotron Ltd. 5.125% 4/15/27 (b) | 12,060 | 12,678 | |
| Virgin Media Finance PLC 4.875% 2/15/22 | 10,880 | 10,608 | |
| Wave Holdco LLC/Wave Holdco Corp. 8.25% 7/15/19 pay-in-kind (a)(b) | 2,757 | 2,757 | |
| Ziggo Bond Finance BV: | |||
| 5.875% 1/15/25 (b) | 1,175 | 1,209 | |
| 6% 1/15/27 (b) | 11,435 | 11,635 | |
| Ziggo Secured Finance BV 5.5% 1/15/27 (b) | 22,875 | 23,333 | |
| 313,455 | |||
| Capital Goods - 0.2% | |||
| AECOM 5.125% 3/15/27 | 11,885 | 12,227 | |
| BCD Acquisition, Inc. 9.625% 9/15/23 (b) | 17,085 | 18,665 | |
| 30,892 | |||
| Chemicals - 2.1% | |||
| CF Industries Holdings, Inc.: | |||
| 4.95% 6/1/43 | 12,120 | 11,120 | |
| 5.15% 3/15/34 | 12,120 | 12,090 | |
| 5.375% 3/15/44 | 12,110 | 11,626 | |
| Hexion, Inc. 10.375% 2/1/22 (b) | 4,420 | 4,166 | |
| Kraton Polymers LLC/Kraton Polymers Capital Corp. 10.5% 4/15/23 (b) | 7,250 | 8,229 | |
| Momentive Performance Materials, Inc.: | |||
| 3.88% 10/24/21 | 85,120 | 88,525 | |
| 4.69% 4/24/22 | 28,622 | 29,481 | |
| 10% 10/15/20 (c)(d) | 28,622 | 0 | |
| MPM Escrow LLC/MPM Finance Escrow Corp. 8.875% 10/15/20 (c)(d) | 85,120 | 0 | |
| NOVA Chemicals Corp.: | |||
| 4.875% 6/1/24 (b) | 15,135 | 15,419 | |
| 5.25% 6/1/27 (b) | 12,980 | 13,240 | |
| Nufarm Australia Ltd. 6.375% 10/15/19 (b) | 4,160 | 4,233 | |
| Platform Specialty Products Corp.: | |||
| 6.5% 2/1/22 (b) | 10,570 | 10,953 | |
| 10.375% 5/1/21 (b) | 3,490 | 3,787 | |
| The Chemours Co. LLC 5.375% 5/15/27 | 5,000 | 5,338 | |
| TPC Group, Inc. 8.75% 12/15/20 (b) | 14,165 | 13,846 | |
| Tronox Finance PLC 5.75% 10/1/25 (b) | 5,510 | 5,751 | |
| Valvoline Finco Two LLC 5.5% 7/15/24 (b) | 4,170 | 4,420 | |
| Versum Materials, Inc. 5.5% 9/30/24 (b) | 5,910 | 6,294 | |
| 248,518 | |||
| Consumer Products - 0.5% | |||
| Edgewell Personal Care Co. 5.5% 6/15/25 (b) | 7,330 | 7,697 | |
| First Quality Finance Co., Inc. 5% 7/1/25 (b) | 9,675 | 9,948 | |
| Kronos Acquisition Holdings, Inc. 9% 8/15/23 (b) | 1,955 | 1,879 | |
| Revlon Consumer Products Corp. 5.75% 2/15/21 (a) | 29,740 | 25,502 | |
| Spectrum Brands Holdings, Inc. 5.75% 7/15/25 | 11,680 | 12,406 | |
| 57,432 | |||
| Containers - 1.0% | |||
| Ardagh Packaging Finance PLC/Ardagh MP Holdings U.S.A., Inc.: | |||
| 4.625% 5/15/23 (b) | 11,410 | 11,724 | |
| 6% 6/30/21 (b) | 7,260 | 7,469 | |
| 6% 2/15/25 (b) | 19,450 | 20,641 | |
| 7.25% 5/15/24 (b) | 20,265 | 22,266 | |
| Crown Cork & Seal, Inc.: | |||
| 7.375% 12/15/26 | 4,845 | 5,693 | |
| 7.5% 12/15/96 | 12,871 | 13,354 | |
| Plastipak Holdings, Inc. 6.25% 10/15/25 (b) | 3,540 | 3,610 | |
| Reynolds Group Issuer, Inc./Reynolds Group Issuer LLC/Reynolds Group Issuer (Luxembourg) SA: | |||
| 5.125% 7/15/23 (b) | 22,890 | 23,831 | |
| 7% 7/15/24 (b) | 6,635 | 7,083 | |
| Sealed Air Corp. 5.25% 4/1/23 (b) | 5,010 | 5,386 | |
| 121,057 | |||
| Diversified Financial Services - 4.1% | |||
| Adient Global Holdings Ltd. 4.875% 8/15/26 (b) | 11,400 | 11,728 | |
| Aircastle Ltd.: | |||
| 5% 4/1/23 | 6,445 | 6,816 | |
| 5.5% 2/15/22 | 10,600 | 11,395 | |
| Ascend Learning LLC 6.875% 8/1/25 (b) | 4,115 | 4,310 | |
| AssuredPartners, Inc. 7% 8/15/25 (b) | 4,865 | 5,072 | |
| CIT Group, Inc.: | |||
| 5% 8/15/22 | 14,266 | 15,336 | |
| 5.375% 5/15/20 | 1,403 | 1,505 | |
| Eagle Holding Co. II LLC 7.625% 5/15/22 pay-in-kind (a)(b) | 5,525 | 5,698 | |
| FLY Leasing Ltd. 5.25% 10/15/24 | 9,470 | 9,511 | |
| Grinding Media, Inc./MC Grinding Media Canada, Inc. 7.375% 12/15/23 (b) | 7,120 | 7,743 | |
| Icahn Enterprises LP/Icahn Enterprises Finance Corp.: | |||
| 5.875% 2/1/22 | 70,330 | 72,660 | |
| 6% 8/1/20 | 20,090 | 20,718 | |
| 6.25% 2/1/22 | 8,385 | 8,762 | |
| 6.75% 2/1/24 | 10,075 | 10,667 | |
| MSCI, Inc.: | |||
| 5.25% 11/15/24 (b) | 6,725 | 7,112 | |
| 5.75% 8/15/25 (b) | 7,185 | 7,760 | |
| Navient Corp.: | |||
| 5.875% 10/25/24 | 28,294 | 28,718 | |
| 6.5% 6/15/22 | 27,055 | 28,712 | |
| 7.25% 9/25/23 | 5,688 | 6,161 | |
| Prime Securities Services Borrower LLC/Prime Finance, Inc. 9.25% 5/15/23 (b) | 61,805 | 68,492 | |
| Radiate Holdco LLC/Radiate Financial Service Ltd. 6.625% 2/15/25 (b) | 10,425 | 10,243 | |
| SLM Corp.: | |||
| 5.5% 1/25/23 | 44,765 | 45,325 | |
| 6.125% 3/25/24 | 15,595 | 16,004 | |
| 7.25% 1/25/22 | 27,370 | 29,696 | |
| Springleaf Financial Corp.: | |||
| 6.125% 5/15/22 | 9,080 | 9,579 | |
| 7.75% 10/1/21 | 1,715 | 1,927 | |
| 8.25% 12/15/20 | 8,550 | 9,640 | |
| Venator Finance SARL/Venator Capital Management Ltd. 5.75% 7/15/25 (b) | 10,265 | 10,855 | |
| Vertiv Inter Holding Corp. 12% 2/15/22 pay-in-kind (a)(b) | 17,485 | 19,102 | |
| 491,247 | |||
| Diversified Media - 0.5% | |||
| Block Communications, Inc. 6.875% 2/15/25 (b) | 9,080 | 9,806 | |
| Liberty Media Corp.: | |||
| 8.25% 2/1/30 | 12,298 | 13,528 | |
| 8.5% 7/15/29 | 7,900 | 8,809 | |
| Nielsen Finance LLC/Nielsen Finance Co. 5% 4/15/22 (b) | 6,170 | 6,355 | |
| Quebecor Media, Inc. 5.75% 1/15/23 | 15,820 | 17,165 | |
| WMG Acquisition Corp. 5.625% 4/15/22 (b) | 2,152 | 2,233 | |
| 57,896 | |||
| Energy - 8.5% | |||
| Access Midstream Partners LP/ACMP Finance Corp. 4.875% 3/15/24 | 6,625 | 6,948 | |
| American Energy-Permian Basin LLC/AEPB Finance Corp. 13% 11/30/20 (b) | 18,325 | 21,257 | |
| Antero Midstream Partners LP/Antero Midstream Finance Corp. 5.375% 9/15/24 | 4,420 | 4,597 | |
| Antero Resources Corp.: | |||
| 5.125% 12/1/22 | 840 | 863 | |
| 5.625% 6/1/23 (Reg. S) | 10,850 | 11,365 | |
| Antero Resources Finance Corp. 5.375% 11/1/21 | 5,830 | 5,983 | |
| Callon Petroleum Co. 6.125% 10/1/24 | 4,090 | 4,254 | |
| Carrizo Oil & Gas, Inc. 6.25% 4/15/23 | 7,400 | 7,530 | |
| Cheniere Corpus Christi Holdings LLC: | |||
| 5.125% 6/30/27 (b) | 12,490 | 12,880 | |
| 5.875% 3/31/25 | 14,620 | 15,826 | |
| 7% 6/30/24 | 13,100 | 14,950 | |
| Chesapeake Energy Corp.: | |||
| 8% 12/15/22 (b) | 16,717 | 17,986 | |
| 8% 1/15/25 (b) | 6,650 | 6,567 | |
| Citgo Holding, Inc. 10.75% 2/15/20 (b) | 50,085 | 54,092 | |
| Compressco Partners LP/Compressco Finance, Inc. 7.25% 8/15/22 | 4,465 | 4,041 | |
| Concho Resources, Inc. 4.375% 1/15/25 | 11,660 | 12,303 | |
| Consolidated Energy Finance SA: | |||
| 3 month U.S. LIBOR + 3.750% 5.07% 6/15/22 (a)(b)(e) | 3,025 | 3,018 | |
| 6.875% 6/15/25 (b) | 6,050 | 6,398 | |
| Crestwood Midstream Partners LP/Crestwood Midstream Finance Corp.: | |||
| 5.75% 4/1/25 | 8,985 | 9,221 | |
| 6.25% 4/1/23 | 9,260 | 9,630 | |
| CVR Refining LLC/Coffeyville Finance, Inc. 6.5% 11/1/22 | 20,970 | 21,547 | |
| Denbury Resources, Inc.: | |||
| 4.625% 7/15/23 | 11,210 | 6,362 | |
| 5.5% 5/1/22 | 18,370 | 11,527 | |
| 6.375% 8/15/21 | 15,820 | 10,837 | |
| 9% 5/15/21 (b) | 12,180 | 11,906 | |
| Diamondback Energy, Inc.: | |||
| 4.75% 11/1/24 | 9,930 | 10,104 | |
| 5.375% 5/31/25 | 5,155 | 5,355 | |
| Eagle Rock Energy Partners LP/Eagle Rock Energy Finance Corp. 8.375% 6/1/19 (c)(d) | 14,075 | 0 | |
| Endeavor Energy Resources LP/EER Finance, Inc. 7% 8/15/21 (b) | 10,660 | 11,046 | |
| Energy Transfer Equity LP 5.5% 6/1/27 | 16,735 | 17,739 | |
| Ensco PLC: | |||
| 4.5% 10/1/24 | 12,210 | 10,012 | |
| 5.2% 3/15/25 | 7,540 | 6,352 | |
| 5.75% 10/1/44 | 10,983 | 7,496 | |
| EP Energy LLC/Everest Acquisition Finance, Inc. 8% 11/29/24 (b) | 6,315 | 6,441 | |
| EV Energy Partners LP/EV Energy Finance Corp. 8% 4/15/19 | 9,210 | 3,868 | |
| Exterran Energy Solutions LP 8.125% 5/1/25 (b) | 11,280 | 11,872 | |
| Exterran Partners LP/EXLP Finance Corp. 6% 10/1/22 | 8,075 | 8,025 | |
| Extraction Oil & Gas, Inc. 7.375% 5/15/24 (b) | 7,165 | 7,631 | |
| Forum Energy Technologies, Inc. 6.25% 10/1/21 | 13,870 | 13,835 | |
| Genesis Energy LP/Genesis Energy Finance Corp. 5.75% 2/15/21 | 4,655 | 4,727 | |
| Hilcorp Energy I LP/Hilcorp Finance Co.: | |||
| 5% 12/1/24 (b) | 9,920 | 9,870 | |
| 5.75% 10/1/25 (b) | 11,285 | 11,553 | |
| Holly Energy Partners LP/Holly Finance Corp. 6% 8/1/24 (b) | 7,145 | 7,484 | |
| Hornbeck Offshore Services, Inc. 5.875% 4/1/20 | 8,093 | 5,341 | |
| Jonah Energy LLC 7.25% 10/15/25 (b) | 12,095 | 12,095 | |
| Jupiter Resources, Inc. 8.5% 10/1/22 (b) | 7,195 | 5,126 | |
| Laredo Petroleum, Inc. 7.375% 5/1/22 (Reg. S) | 9,390 | 9,777 | |
| Murphy Oil U.S.A., Inc. 5.625% 5/1/27 | 6,030 | 6,392 | |
| Newfield Exploration Co.: | |||
| 5.375% 1/1/26 | 9,245 | 9,823 | |
| 5.625% 7/1/24 | 1,550 | 1,676 | |
| NextEra Energy Partners LP: | |||
| 4.25% 9/15/24 (b) | 8,025 | 8,105 | |
| 4.5% 9/15/27 (b) | 5,580 | 5,615 | |
| NGL Energy Partners LP/NGL Energy Finance Corp. 6.125% 3/1/25 | 11,920 | 11,294 | |
| NGPL PipeCo LLC: | |||
| 4.375% 8/15/22 (b) | 2,995 | 3,081 | |
| 4.875% 8/15/27 (b) | 3,000 | 3,105 | |
| Noble Holding International Ltd.: | |||
| 4.625% 3/1/21 | 1,124 | 1,040 | |
| 6.2% 8/1/40 | 4,305 | 2,906 | |
| 7.7% 4/1/25 (a) | 9,635 | 8,382 | |
| 8.7% 4/1/45 (a) | 2,130 | 1,704 | |
| Parsley Energy LLC/Parsley: | |||
| 5.25% 8/15/25 (b) | 7,215 | 7,287 | |
| 5.625% 10/15/27 (b) | 5,885 | 6,073 | |
| 6.25% 6/1/24 (b) | 8,115 | 8,602 | |
| PBF Holding Co. LLC/PBF Finance Corp.: | |||
| 7% 11/15/23 | 32,600 | 33,904 | |
| 7.25% 6/15/25 (b) | 12,115 | 12,524 | |
| PBF Logistics LP/PBF Logistics Finance, Inc. 6.875% 5/15/23 | 8,455 | 8,751 | |
| PDC Energy, Inc. 6.125% 9/15/24 | 3,555 | 3,711 | |
| Peabody Securities Finance Corp.: | |||
| 6% 3/31/22 (b) | 9,600 | 9,888 | |
| 6.375% 3/31/25 (b) | 10,460 | 10,787 | |
| QEP Resources, Inc. 5.25% 5/1/23 | 12,370 | 12,215 | |
| Range Resources Corp. 5% 3/15/23 | 18,145 | 17,963 | |
| RSP Permian, Inc.: | |||
| 5.25% 1/15/25 (b) | 4,360 | 4,436 | |
| 6.625% 10/1/22 | 4,715 | 4,957 | |
| Sabine Pass Liquefaction LLC: | |||
| 5% 3/15/27 | 17,145 | 18,445 | |
| 5.875% 6/30/26 | 17,145 | 19,395 | |
| SemGroup Corp.: | |||
| 6.375% 3/15/25 (b) | 5,990 | 5,900 | |
| 7.25% 3/15/26 (b) | 11,220 | 11,416 | |
| SESI LLC 7.75% 9/15/24 (b) | 7,245 | 7,499 | |
| SM Energy Co.: | |||
| 5.625% 6/1/25 | 5,480 | 5,329 | |
| 6.75% 9/15/26 | 4,550 | 4,669 | |
| Southern Natural Gas Co.: | |||
| 7.35% 2/15/31 | 23,497 | 30,189 | |
| 8% 3/1/32 | 12,475 | 17,005 | |
| Southern Star Central Corp. 5.125% 7/15/22 (b) | 6,750 | 7,037 | |
| Southwestern Energy Co.: | |||
| 4.1% 3/15/22 | 17,110 | 16,811 | |
| 7.5% 4/1/26 | 9,070 | 9,410 | |
| 7.75% 10/1/27 | 8,135 | 8,460 | |
| Summit Midstream Holdings LLC 5.75% 4/15/25 | 8,365 | 8,532 | |
| Sunoco LP/Sunoco Finance Corp.: | |||
| 6.25% 4/15/21 | 16,355 | 17,132 | |
| 6.375% 4/1/23 | 7,815 | 8,303 | |
| Targa Resources Partners LP/Targa Resources Partners Finance Corp.: | |||
| 5% 1/15/28 (b) | 12,180 | 12,210 | |
| 5.125% 2/1/25 | 5,750 | 5,923 | |
| 5.375% 2/1/27 | 5,750 | 5,973 | |
| Teine Energy Ltd. 6.875% 9/30/22 (b) | 11,950 | 12,219 | |
| Tennessee Gas Pipeline Co. 7.625% 4/1/37 | 5,445 | 6,908 | |
| TerraForm Power Operating LLC: | |||
| 6.375% 2/1/23 (a)(b) | 30,835 | 32,300 | |
| 6.625% 6/15/25 (a)(b) | 7,915 | 8,588 | |
| Tesoro Logistics LP/Tesoro Logistics Finance Corp.: | |||
| 6.125% 10/15/21 | 2,890 | 2,984 | |
| 6.375% 5/1/24 | 4,570 | 5,004 | |
| Trinidad Drilling Ltd. 6.625% 2/15/25 (b) | 4,720 | 4,590 | |
| Ultra Resources, Inc.: | |||
| 6.875% 4/15/22 (b) | 9,060 | 9,151 | |
| 7.125% 4/15/25 (b) | 6,040 | 6,025 | |
| Unit Corp. 6.625% 5/15/21 | 2,202 | 2,210 | |
| WPX Energy, Inc.: | |||
| 5.25% 9/15/24 | 8,725 | 8,758 | |
| 6% 1/15/22 | 21,830 | 22,730 | |
| 1,022,963 | |||
| Entertainment/Film - 0.3% | |||
| CBS Outdoor Americas Capital LLC/CBS Outdoor Americas Capital Corp.: | |||
| 5.25% 2/15/22 | 2,380 | 2,457 | |
| 5.625% 2/15/24 | 2,570 | 2,705 | |
| Lions Gate Entertainment Corp. 5.875% 11/1/24 (b) | 3,865 | 4,097 | |
| New Cotai LLC/New Cotai Capital Corp. 10.625% 5/1/19 pay-in-kind (a)(b) | 23,247 | 23,247 | |
| 32,506 | |||
| Environmental - 0.3% | |||
| ADS Waste Holdings, Inc. 5.625% 11/15/24 (b) | 10,140 | 10,546 | |
| CD&R Waterworks Merger Sub LLC 6.125% 8/15/25 (b) | 4,700 | 4,759 | |
| Covanta Holding Corp.: | |||
| 5.875% 3/1/24 | 7,775 | 7,794 | |
| 5.875% 7/1/25 | 3,205 | 3,173 | |
| Kissner Holdings LP/Kissner Milling Co. Ltd./BSC Holding, Inc./Kissner U.S.A. 8.375% 12/1/22 (b) | 9,525 | 9,620 | |
| 35,892 | |||
| Food & Drug Retail - 0.4% | |||
| BI-LO LLC/BI-LO Finance Corp.: | |||
| 9.25% 2/15/19 (b) | 24,122 | 22,011 | |
| 9.375% 9/15/18 pay-in-kind (a)(b) | 15,975 | 4,473 | |
| FAGE International SA/FAGE U.S.A. Dairy Industry, Inc. 5.625% 8/15/26 (b) | 16,350 | 16,795 | |
| 43,279 | |||
| Food/Beverage/Tobacco - 1.7% | |||
| B&G Foods, Inc. 4.625% 6/1/21 | 10,575 | 10,787 | |
| ESAL GmbH 6.25% 2/5/23 (b) | 28,980 | 27,893 | |
| Hearthside Group Holdings LLC/Hearthside Finance, Inc. 6.5% 5/1/22 (b) | 3,220 | 3,292 | |
| JBS Investments GmbH 7.25% 4/3/24 (b) | 37,820 | 37,347 | |
| JBS U.S.A. LLC/JBS U.S.A. Finance, Inc.: | |||
| 5.75% 6/15/25 (b) | 20,055 | 19,453 | |
| 5.875% 7/15/24 (b) | 6,030 | 5,924 | |
| 7.25% 6/1/21 (b) | 7,350 | 7,493 | |
| 8.25% 2/1/20 (b) | 7,110 | 7,172 | |
| Lamb Weston Holdings, Inc.: | |||
| 4.625% 11/1/24 (b) | 7,660 | 8,005 | |
| 4.875% 11/1/26 (b) | 7,740 | 8,137 | |
| Pilgrim's Pride Corp.: | |||
| 5.75% 3/15/25 (b) | 17,930 | 18,983 | |
| 5.875% 9/30/27 (b) | 7,010 | 7,290 | |
| Post Holdings, Inc.: | |||
| 5% 8/15/26 (b) | 17,030 | 17,115 | |
| 5.5% 3/1/25 (b) | 10,085 | 10,514 | |
| 5.75% 3/1/27 (b) | 7,710 | 8,009 | |
| TreeHouse Foods, Inc. 4.875% 3/15/22 | 4,150 | 4,280 | |
| 201,694 | |||
| Gaming - 1.0% | |||
| Eldorado Resorts, Inc. 6% 4/1/25 | 12,270 | 12,945 | |
| Jacobs Entertainment, Inc. 7.875% 2/1/24 (b) | 2,820 | 3,046 | |
| MCE Finance Ltd. 4.875% 6/6/25 (b) | 4,695 | 4,738 | |
| MGM Growth Properties Operating Partnership LP 5.625% 5/1/24 | 6,770 | 7,312 | |
| Penn National Gaming, Inc. 5.625% 1/15/27 (b) | 2,295 | 2,375 | |
| Scientific Games Corp.: | |||
| 5% 10/15/25 (b) | 3,490 | 3,542 | |
| 10% 12/1/22 | 22,999 | 25,441 | |
| Station Casinos LLC 5% 10/1/25 (b) | 12,105 | 12,120 | |
| Wynn Las Vegas LLC/Wynn Las Vegas Capital Corp. 5.25% 5/15/27 (b) | 27,670 | 28,258 | |
| Wynn Macau Ltd.: | |||
| 4.875% 10/1/24 (b) | 8,815 | 8,959 | |
| 5.5% 10/1/27 (b) | 9,080 | 9,200 | |
| 117,936 | |||
| Healthcare - 4.7% | |||
| AMAG Pharmaceuticals, Inc. 7.875% 9/1/23 (b) | 6,045 | 6,151 | |
| AmSurg Corp. 5.625% 7/15/22 | 6,995 | 7,117 | |
| Catalent Pharma Solutions 4.875% 1/15/26 (b) | 4,000 | 4,060 | |
| Community Health Systems, Inc.: | |||
| 6.25% 3/31/23 | 26,630 | 25,631 | |
| 6.875% 2/1/22 | 70,615 | 51,108 | |
| 7.125% 7/15/20 | 14,580 | 12,648 | |
| Double Eagle Acquisition Sub, Inc. 7.5% 10/1/24 (b) | 4,033 | 4,446 | |
| Envision Healthcare Corp. 6.25% 12/1/24 (b) | 11,515 | 11,961 | |
| HCA Holdings, Inc.: | |||
| 4.75% 5/1/23 | 12,395 | 12,968 | |
| 5.25% 6/15/26 | 14,055 | 14,951 | |
| 5.375% 2/1/25 | 22,530 | 23,234 | |
| 5.875% 5/1/23 | 33,560 | 35,951 | |
| 5.875% 2/15/26 | 29,610 | 31,128 | |
| 7.5% 2/15/22 | 10,725 | 12,173 | |
| HealthSouth Corp.: | |||
| 5.125% 3/15/23 | 6,440 | 6,569 | |
| 5.75% 11/1/24 | 22,135 | 22,661 | |
| Hill-Rom Holdings, Inc. 5.75% 9/1/23 (b) | 5,715 | 6,015 | |
| Hologic, Inc. 5.25% 7/15/22 (b) | 12,345 | 12,885 | |
| Jaguar Holding Co. II/Pharmaceutical Product Development LLC 6.375% 8/1/23 (b) | 11,285 | 11,779 | |
| MPH Acquisition Holdings LLC 7.125% 6/1/24 (b) | 6,095 | 6,560 | |
| MPT Operating Partnership LP/MPT Finance Corp.: | |||
| 5% 10/15/27 | 13,310 | 13,676 | |
| 5.25% 8/1/26 | 4,030 | 4,196 | |
| Quintiles Transnational Corp. 4.875% 5/15/23 (b) | 8,705 | 9,053 | |
| RegionalCare Hospital Partners Holdings, Inc. 8.25% 5/1/23 (b) | 12,857 | 13,500 | |
| Sabra Health Care LP/Sabra Capital Corp. 5.375% 6/1/23 | 4,945 | 5,106 | |
| Tenet Healthcare Corp.: | |||
| 4.625% 7/15/24 (b) | 6,055 | 5,957 | |
| 6.75% 6/15/23 | 13,245 | 12,434 | |
| 6.875% 11/15/31 | 23,140 | 19,553 | |
| 7.5% 1/1/22 (b) | 6,590 | 6,936 | |
| 8.125% 4/1/22 | 14,975 | 15,050 | |
| Tennessee Merger Sub, Inc. 6.375% 2/1/25 (b) | 17,340 | 15,953 | |
| THC Escrow Corp. III: | |||
| 5.125% 5/1/25 (b) | 6,055 | 5,896 | |
| 7% 8/1/25 (b) | 12,115 | 11,100 | |
| Valeant Pharmaceuticals International, Inc.: | |||
| 5.5% 11/1/25 (b) | 11,285 | 11,539 | |
| 5.875% 5/15/23 (b) | 42,000 | 35,490 | |
| 6.5% 3/15/22 (b) | 11,985 | 12,704 | |
| 6.75% 8/15/21 (b) | 2,029 | 1,966 | |
| 7% 3/15/24 (b) | 17,980 | 19,463 | |
| Vizient, Inc. 10.375% 3/1/24 (b) | 12,515 | 14,267 | |
| Wellcare Health Plans, Inc. 5.25% 4/1/25 | 9,245 | 9,730 | |
| 563,565 | |||
| Homebuilders/Real Estate - 1.2% | |||
| Brookfield Residential Properties, Inc./Brookfield Residential U.S. Corp. 6.125% 7/1/22 (b) | 6,475 | 6,758 | |
| Brookfield Residential Properties, Inc. 6.5% 12/15/20 (b) | 5,010 | 5,116 | |
| Howard Hughes Corp. 5.375% 3/15/25 (b) | 12,730 | 13,080 | |
| Mattamy Group Corp. 6.875% 12/15/23 (b) | 8,755 | 9,193 | |
| Odebrecht Finance Ltd.: | |||
| 4.375% 4/25/25 (b) | 12,020 | 4,568 | |
| 5.25% 6/27/29 (b) | 10,987 | 4,065 | |
| 7.125% 6/26/42 (b) | 5,370 | 2,027 | |
| Shea Homes Ltd. Partnership/Corp.: | |||
| 5.875% 4/1/23 (b) | 3,545 | 3,678 | |
| 6.125% 4/1/25 (b) | 3,545 | 3,687 | |
| Taylor Morrison Communities, Inc./Monarch Communities, Inc.: | |||
| 5.25% 4/15/21 (b) | 14,750 | 15,063 | |
| 5.875% 4/15/23 (b) | 8,405 | 8,999 | |
| Toll Brothers Finance Corp.: | |||
| 4.375% 4/15/23 | 24,055 | 25,137 | |
| 5.625% 1/15/24 | 3,075 | 3,371 | |
| TRI Pointe Homes, Inc.: | |||
| 4.375% 6/15/19 | 6,675 | 6,850 | |
| 5.875% 6/15/24 | 16,130 | 17,461 | |
| West Street Merger Sub, Inc. 6.375% 9/1/25 (b) | 6,060 | 6,143 | |
| William Lyon Homes, Inc. 5.875% 1/31/25 | 7,125 | 7,268 | |
| 142,464 | |||
| Hotels - 0.4% | |||
| Choice Hotels International, Inc. 5.75% 7/1/22 | 3,035 | 3,361 | |
| FelCor Lodging LP 6% 6/1/25 | 10,935 | 11,782 | |
| Hilton Worldwide Finance LLC/Hilton Worldwide Finance Corp.: | |||
| 4.625% 4/1/25 | 17,975 | 18,537 | |
| 4.875% 4/1/27 | 8,435 | 8,857 | |
| Playa Resorts Holding BV 8% 8/15/20 (b) | 8,279 | 8,569 | |
| 51,106 | |||
| Insurance - 0.5% | |||
| Alliant Holdings Co.-Issuer, Inc./Wayne Merger Sub LLC 8.25% 8/1/23 (b) | 28,500 | 30,353 | |
| Hockey Merger Sub 2, Inc. 7.875% 10/1/21 (b) | 22,620 | 23,544 | |
| USIS Merger Sub, Inc. 6.875% 5/1/25 (b) | 12,080 | 12,533 | |
| 66,430 | |||
| Leisure - 0.8% | |||
| 24 Hour Holdings III LLC 8% 6/1/22 (b) | 4,530 | 4,190 | |
| Carlson Travel, Inc. 6.75% 12/15/23 (b) | 4,355 | 4,311 | |
| Cedar Fair LP/Magnum Management Corp. 5.375% 4/15/27 (b) | 6,830 | 7,214 | |
| LTF Merger Sub, Inc. 8.5% 6/15/23 (b) | 7,365 | 7,862 | |
| Silversea Cruises 7.25% 2/1/25 (b) | 4,765 | 5,110 | |
| Six Flags Entertainment Corp.: | |||
| 4.875% 7/31/24 (b) | 14,040 | 14,444 | |
| 5.5% 4/15/27 (b) | 7,460 | 7,786 | |
| Studio City Co. Ltd.: | |||
| 5.875% 11/30/19 (b) | 7,565 | 7,934 | |
| 7.25% 11/30/21 (b) | 19,685 | 21,065 | |
| Viking Cruises Ltd. 5.875% 9/15/27 (b) | 11,595 | 11,682 | |
| 91,598 | |||
| Metals/Mining - 1.7% | |||
| Alcoa Nederland Holding BV: | |||
| 6.75% 9/30/24 (b) | 7,705 | 8,564 | |
| 7% 9/30/26 (b) | 6,385 | 7,279 | |
| Aleris International, Inc. 6% 6/1/20 (b)(c) | 151 | 151 | |
| Bluescope Steel Ltd./Bluescope Steel Finance 6.5% 5/15/21 (b) | 3,500 | 3,658 | |
| First Quantum Minerals Ltd.: | |||
| 7% 2/15/21 (b) | 13,590 | 14,100 | |
| 7.25% 5/15/22 (b) | 7,715 | 8,062 | |
| 7.25% 4/1/23 (b) | 11,390 | 12,045 | |
| 7.5% 4/1/25 (b) | 15,025 | 15,908 | |
| FMG Resources (August 2006) Pty Ltd.: | |||
| 4.75% 5/15/22 (b) | 7,950 | 8,109 | |
| 5.125% 5/15/24 (b) | 9,780 | 10,061 | |
| Freeport-McMoRan, Inc.: | |||
| 3.55% 3/1/22 | 5,690 | 5,633 | |
| 3.875% 3/15/23 | 17,075 | 16,798 | |
| 5.4% 11/14/34 | 5,430 | 5,294 | |
| 5.45% 3/15/43 | 35,380 | 33,257 | |
| 6.75% 2/1/22 | 16,510 | 17,170 | |
| Joseph T Ryerson & Son, Inc. 11% 5/15/22 (b) | 6,445 | 7,283 | |
| Lundin Mining Corp.: | |||
| 7.5% 11/1/20 (b) | 3,930 | 4,088 | |
| 7.875% 11/1/22 (b) | 570 | 617 | |
| Mirabela Nickel Ltd. 1% 9/10/44 pay-in-kind (b)(c)(d) | 41 | 0 | |
| Murray Energy Corp. 11.25% 4/15/21 (b) | 14,540 | 7,997 | |
| Prince Mineral Holding Corp. 11.5% 12/15/19 (a)(b) | 3,255 | 3,361 | |
| SunCoke Energy Partners LP/SunCoke Energy Partners Finance Corp. 7.5% 6/15/25 (b) | 9,795 | 10,260 | |
| 199,695 | |||
| Paper - 0.2% | |||
| Boise Cascade Co. 5.625% 9/1/24 (b) | 4,105 | 4,269 | |
| Flex Acquisition Co., Inc. 6.875% 1/15/25 (b) | 5,230 | 5,407 | |
| NewPage Corp.: | |||
| 3 month U.S. LIBOR + 6.250% 0% 5/1/12 (a)(c)(d)(e) | 6,337 | 0 | |
| 11.375% 12/31/2114 (c)(d) | 12,558 | 0 | |
| Xerium Technologies, Inc. 9.5% 8/15/21 | 17,025 | 17,488 | |
| 27,164 | |||
| Publishing/Printing - 0.4% | |||
| Cengage Learning, Inc. 9.5% 6/15/24 (b) | 25,970 | 23,405 | |
| Harland Clarke Holdings Corp. 8.375% 8/15/22 (b) | 20,025 | 21,026 | |
| 44,431 | |||
| Restaurants - 1.0% | |||
| 1011778 BC Unlimited Liability Co./New Red Finance, Inc.: | |||
| 5% 10/15/25 (b) | 18,305 | 18,648 | |
| 5% 10/15/25 (b) | 22,485 | 22,907 | |
| Golden Nugget, Inc.: | |||
| 6.75% 10/15/24 (b) | 21,290 | 21,663 | |
| 8.75% 10/1/25 (b) | 24,245 | 24,912 | |
| KFC Holding Co./Pizza Hut Holding LLC: | |||
| 4.75% 6/1/27 (b) | 9,215 | 9,457 | |
| 5% 6/1/24 (b) | 8,800 | 9,284 | |
| 5.25% 6/1/26 (b) | 8,800 | 9,351 | |
| 116,222 | |||
| Services - 1.6% | |||
| APX Group, Inc.: | |||
| 7.625% 9/1/23 | 16,950 | 17,840 | |
| 7.875% 12/1/22 | 26,730 | 28,835 | |
| 8.75% 12/1/20 | 19,025 | 19,501 | |
| Avantor, Inc. 6% 10/1/24 (b) | 12,090 | 12,332 | |
| Blueline Rental Finance Corp./Blueline Rental LLC 9.25% 3/15/24 (b) | 22,945 | 24,895 | |
| Everi Payments, Inc. 10% 1/15/22 | 11,085 | 12,055 | |
| IHS Markit Ltd. 4.75% 2/15/25 (b) | 9,190 | 9,718 | |
| KAR Auction Services, Inc. 5.125% 6/1/25 (b) | 10,355 | 10,717 | |
| Laureate Education, Inc. 8.25% 5/1/25 (b) | 33,595 | 36,157 | |
| Ritchie Brothers Auctioneers, Inc. 5.375% 1/15/25 (b) | 3,510 | 3,694 | |
| The Brink's Co. 4.625% 10/15/27 (b) | 12,180 | 12,120 | |
| United Rentals North America, Inc. 5.5% 5/15/27 | 7,325 | 7,838 | |
| 195,702 | |||
| Steel - 0.5% | |||
| Big River Steel LLC/BRS Finance Corp. 7.25% 9/1/25 (b) | 9,390 | 10,071 | |
| Cliffs Natural Resources, Inc. 5.75% 3/1/25 (b) | 12,105 | 11,727 | |
| JMC Steel Group, Inc. 9.875% 6/15/23 (b) | 7,500 | 8,475 | |
| United States Steel Corp. 8.375% 7/1/21 (b) | 24,580 | 26,823 | |
| 57,096 | |||
| Super Retail - 1.0% | |||
| Hanesbrands, Inc.: | |||
| 4.625% 5/15/24 (b) | 5,710 | 5,867 | |
| 4.875% 5/15/26 (b) | 5,710 | 5,874 | |
| L Brands, Inc. 6.875% 11/1/35 | 13,095 | 12,997 | |
| Netflix, Inc.: | |||
| 4.375% 11/15/26 (b) | 11,520 | 11,297 | |
| 4.875% 4/15/28 (b) | 24,355 | 24,208 | |
| 5.375% 2/1/21 (b) | 7,725 | 8,246 | |
| 5.75% 3/1/24 | 12,225 | 13,096 | |
| 5.875% 2/15/25 | 27,663 | 29,865 | |
| Sonic Automotive, Inc.: | |||
| 5% 5/15/23 | 1,610 | 1,578 | |
| 6.125% 3/15/27 | 5,990 | 6,185 | |
| Springs Industries, Inc. 6.25% 6/1/21 | 2,990 | 3,080 | |
| 122,293 | |||
| Technology - 3.3% | |||
| Balboa Merger Sub, Inc. 11.375% 12/1/21 (b) | 23,415 | 25,581 | |
| Brocade Communications Systems, Inc. 4.625% 1/15/23 | 6,460 | 6,613 | |
| Camelot Finance SA 7.875% 10/15/24 (b) | 5,065 | 5,445 | |
| CDW LLC/CDW Finance Corp.: | |||
| 5% 9/1/23 | 10,930 | 11,408 | |
| 5% 9/1/25 | 6,380 | 6,691 | |
| Ceridian HCM Holding, Inc. 11% 3/15/21 (b) | 4,675 | 4,938 | |
| Conduent Finance, Inc./Xerox Business Service LLC 10.5% 12/15/24 (b) | 26,160 | 30,803 | |
| Ensemble S Merger Sub, Inc. 9% 9/30/23 (b) | 19,115 | 19,832 | |
| Entegris, Inc. 6% 4/1/22 (b) | 3,215 | 3,360 | |
| Gartner, Inc. 5.125% 4/1/25 (b) | 6,010 | 6,356 | |
| Greeneden U.S. Holdings II LLC 10% 11/30/24 (b) | 12,465 | 14,070 | |
| Inception Merger Sub, Inc./Rackspace Hosting, Inc. 8.625% 11/15/24 (b) | 9,220 | 9,710 | |
| j2 Cloud Services LLC/j2 Global Communications, Inc. 6% 7/15/25 (b) | 8,065 | 8,488 | |
| JDA Escrow LLC/JDA Bond Finance, Inc. 7.375% 10/15/24 (b) | 4,060 | 4,222 | |
| Micron Technology, Inc.: | |||
| 5.25% 8/1/23 (b) | 4,485 | 4,694 | |
| 7.5% 9/15/23 | 10,485 | 11,612 | |
| Microsemi Corp. 9.125% 4/15/23 (b) | 2,383 | 2,711 | |
| NXP BV/NXP Funding LLC: | |||
| 4.625% 6/15/22 (b) | 14,060 | 15,062 | |
| 4.625% 6/1/23 (b) | 10,735 | 11,567 | |
| 5.75% 3/15/23 (b) | 15,325 | 15,938 | |
| Open Text Corp. 5.875% 6/1/26 (b) | 8,535 | 9,250 | |
| Parametric Technology Corp. 6% 5/15/24 | 3,490 | 3,786 | |
| Qorvo, Inc.: | |||
| 6.75% 12/1/23 | 8,570 | 9,277 | |
| 7% 12/1/25 | 25,960 | 29,570 | |
| Sensata Technologies BV 5% 10/1/25 (b) | 11,210 | 11,883 | |
| Sensata Technologies UK Financing Co. PLC 6.25% 2/15/26 (b) | 11,535 | 12,631 | |
| Solera LLC/Solera Finance, Inc. 10.5% 3/1/24 (b) | 29,985 | 34,183 | |
| SS&C Technologies Holdings, Inc. 5.875% 7/15/23 | 8,960 | 9,464 | |
| Symantec Corp. 5% 4/15/25 (b) | 10,050 | 10,502 | |
| TTM Technologies, Inc. 5.625% 10/1/25 (b) | 4,060 | 4,141 | |
| Veritas U.S., Inc./Veritas Bermuda Ltd.: | |||
| 7.5% 2/1/23 (b) | 14,610 | 15,523 | |
| 10.5% 2/1/24 (b) | 29,365 | 31,274 | |
| 400,585 | |||
| Telecommunications - 8.7% | |||
| Altice Financing SA: | |||
| 6.5% 1/15/22 (b) | 26,701 | 27,636 | |
| 6.625% 2/15/23 (b) | 20,740 | 21,862 | |
| 7.5% 5/15/26 (b) | 21,660 | 23,745 | |
| Altice Finco SA 8.125% 1/15/24 (b) | 21,880 | 23,578 | |
| Citizens Communications Co.: | |||
| 7.875% 1/15/27 | 9,275 | 6,678 | |
| 9% 8/15/31 | 13,178 | 10,246 | |
| CommScope Technologies Finance LLC 5% 3/15/27 (b) | 12,745 | 12,410 | |
| CyrusOne LP/CyrusOne Finance Corp.: | |||
| 5% 3/15/24 (b) | 3,190 | 3,346 | |
| 5.375% 3/15/27 (b) | 2,735 | 2,923 | |
| Digicel Group Ltd.: | |||
| 6% 4/15/21 (b) | 2,020 | 1,987 | |
| 6.75% 3/1/23 (b) | 1,900 | 1,875 | |
| 7.125% 4/1/22 (b) | 42,670 | 40,216 | |
| 8.25% 9/30/20 (b) | 21,044 | 20,807 | |
| Equinix, Inc. 5.375% 5/15/27 | 9,265 | 9,925 | |
| GCI, Inc. 6.875% 4/15/25 | 10,905 | 11,805 | |
| GTT Communications, Inc. 7.875% 12/31/24 (b) | 5,565 | 5,934 | |
| Intelsat Jackson Holdings SA: | |||
| 5.5% 8/1/23 | 55,360 | 47,194 | |
| 7.25% 10/15/20 | 39,625 | 38,127 | |
| 7.5% 4/1/21 | 21,110 | 20,002 | |
| 9.75% 7/15/25 (b) | 15,175 | 15,270 | |
| Level 3 Financing, Inc.: | |||
| 5.125% 5/1/23 | 11,240 | 11,507 | |
| 5.375% 5/1/25 | 11,240 | 11,746 | |
| Millicom International Cellular SA 6% 3/15/25 (b) | 10,745 | 11,339 | |
| Neptune Finco Corp.: | |||
| 10.125% 1/15/23 (b) | 11,460 | 13,122 | |
| 10.875% 10/15/25 (b) | 18,570 | 22,748 | |
| Sable International Finance Ltd. 6.875% 8/1/22 (b) | 47,295 | 50,724 | |
| SFR Group SA: | |||
| 6.25% 5/15/24 (b) | 63,925 | 66,961 | |
| 7.375% 5/1/26 (b) | 87,735 | 94,315 | |
| Sprint Capital Corp.: | |||
| 6.875% 11/15/28 | 11,304 | 12,060 | |
| 8.75% 3/15/32 | 8,446 | 10,241 | |
| Sprint Communications, Inc. 6% 11/15/22 | 28,255 | 29,668 | |
| Sprint Corp.: | |||
| 7.125% 6/15/24 | 56,633 | 61,217 | |
| 7.625% 2/15/25 | 32,350 | 35,464 | |
| 7.875% 9/15/23 | 29,545 | 33,017 | |
| T-Mobile U.S.A., Inc.: | |||
| 6% 4/15/24 | 17,090 | 18,286 | |
| 6.375% 3/1/25 | 76,286 | 82,389 | |
| 6.5% 1/15/24 | 37,110 | 39,615 | |
| Telesat Canada/Telesat LLC 8.875% 11/15/24 (b) | 9,010 | 10,091 | |
| U.S. West Communications: | |||
| 7.25% 9/15/25 | 1,480 | 1,650 | |
| 7.25% 10/15/35 | 5,745 | 5,782 | |
| UPCB Finance IV Ltd. 5.375% 1/15/25 (b) | 11,930 | 12,198 | |
| Wind Tre SpA 5% 1/20/26 (b) | 20,535 | 20,668 | |
| Zayo Group LLC/Zayo Capital, Inc.: | |||
| 5.75% 1/15/27 (b) | 28,150 | 29,663 | |
| 6% 4/1/23 | 11,035 | 11,601 | |
| 1,041,638 | |||
| Transportation Ex Air/Rail - 0.3% | |||
| Navios Maritime Acquisition Corp./Navios Acquisition Finance U.S., Inc. 8.125% 11/15/21 (b) | 2,850 | 2,508 | |
| Navios South American Logistics, Inc./Navios Logistics Finance U.S., Inc. 7.25% 5/1/22 (b) | 10,180 | 9,976 | |
| Teekay Corp. 8.5% 1/15/20 | 21,637 | 21,880 | |
| 34,364 | |||
| Utilities - 3.5% | |||
| Dynegy, Inc.: | |||
| 7.375% 11/1/22 | 36,240 | 38,913 | |
| 7.625% 11/1/24 | 41,495 | 45,333 | |
| 8% 1/15/25 (b) | 20,435 | 22,325 | |
| 8.125% 1/30/26 (b) | 24,235 | 26,901 | |
| Energy Future Intermediate Holding Co. LLC/Energy Future Intermediate Holding Finance, Inc.: | |||
| 11% 10/1/21 (d) | 74,350 | 105,949 | |
| 12.25% 3/1/22 (a)(b)(d) | 83,211 | 127,104 | |
| EnLink Midstream Partners LP: | |||
| 4.15% 6/1/25 | 8,545 | 8,671 | |
| 4.4% 4/1/24 | 8,560 | 8,875 | |
| Global Partners LP/GLP Finance Corp.: | |||
| 6.25% 7/15/22 | 2,720 | 2,781 | |
| 7% 6/15/23 | 11,295 | 11,464 | |
| InterGen NV 7% 6/30/23 (b) | 4,475 | 4,341 | |
| Pattern Energy Group, Inc. 5.875% 2/1/24 (b) | 5,475 | 5,817 | |
| PPL Energy Supply LLC 6.5% 6/1/25 | 8,945 | 7,782 | |
| RJS Power Holdings LLC 4.625% 7/15/19 (a)(b) | 1,995 | 2,020 | |
| 418,276 | |||
| TOTAL NONCONVERTIBLE BONDS | 7,153,459 | ||
| TOTAL CORPORATE BONDS | |||
| (Cost $6,699,615) | 7,155,031 | ||
| Shares | Value (000s) | ||
| Common Stocks - 22.2% | |||
| Air Transportation - 0.8% | |||
| Air Canada (f) | 3,438,100 | 68,117 | |
| Delta Air Lines, Inc. | 422,100 | 21,118 | |
| TOTAL AIR TRANSPORTATION | 89,235 | ||
| Automotive & Auto Parts - 1.2% | |||
| Allison Transmission Holdings, Inc. | 289,700 | 12,309 | |
| Chassix Holdings, Inc. (c)(f) | 677,217 | 24,603 | |
| Chassix Holdings, Inc. warrants 7/29/20 (c)(f) | 37,382 | 443 | |
| Delphi Automotive PLC | 304,000 | 30,212 | |
| Exide Technologies (c)(f) | 9,824 | 0 | |
| Exide Technologies (f) | 32,746 | 23 | |
| Fiat Chrysler Automobiles NV (f) | 1,287,000 | 22,329 | |
| Lear Corp. | 221,700 | 38,928 | |
| Tenneco, Inc. | 320,700 | 18,636 | |
| TOTAL AUTOMOTIVE & AUTO PARTS | 147,483 | ||
| Banks & Thrifts - 0.3% | |||
| Bank of America Corp. | 661,200 | 18,110 | |
| Citigroup, Inc. | 275,500 | 20,249 | |
| TOTAL BANKS & THRIFTS | 38,359 | ||
| Broadcasting - 0.6% | |||
| Nexstar Broadcasting Group, Inc. Class A | 454,029 | 28,967 | |
| Sinclair Broadcast Group, Inc. Class A (g) | 1,263,600 | 40,056 | |
| TOTAL BROADCASTING | 69,023 | ||
| Building Materials - 0.0% | |||
| Ply Gem Holdings, Inc. (f) | 41,200 | 696 | |
| Cable/Satellite TV - 1.0% | |||
| Altice NV Class A (f) | 700,831 | 13,221 | |
| Liberty Global PLC Class A (f) | 1,124,300 | 34,685 | |
| Naspers Ltd. Class N | 290,300 | 70,734 | |
| TOTAL CABLE/SATELLITE TV | 118,640 | ||
| Chemicals - 1.2% | |||
| DowDuPont, Inc. | 358,300 | 25,909 | |
| LyondellBasell Industries NV Class A | 638,945 | 66,150 | |
| Platform Specialty Products Corp. (f) | 2,414,600 | 25,836 | |
| The Chemours Co. LLC | 447,500 | 25,333 | |
| TOTAL CHEMICALS | 143,228 | ||
| Consumer Products - 0.1% | |||
| Newell Brands, Inc. | 412,639 | 16,827 | |
| Reddy Ice Holdings, Inc. (c)(f) | 496,439 | 228 | |
| TOTAL CONSUMER PRODUCTS | 17,055 | ||
| Containers - 0.2% | |||
| Graphic Packaging Holding Co. | 1,489,400 | 23,071 | |
| Diversified Financial Services - 0.6% | |||
| AerCap Holdings NV (f) | 480,900 | 25,315 | |
| OneMain Holdings, Inc. (f) | 1,446,000 | 45,939 | |
| Penson Worldwide, Inc. Class A (c)(f) | 10,322,034 | 0 | |
| PJT Partners, Inc. | 5,092 | 197 | |
| Qudian, Inc. ADR | 27,000 | 672 | |
| TOTAL DIVERSIFIED FINANCIAL SERVICES | 72,123 | ||
| Energy - 1.1% | |||
| Chaparral Energy, Inc.: | |||
| Class A | 120,910 | 2,896 | |
| Class B | 25,896 | 620 | |
| Cheniere Energy, Inc. (f) | 517,600 | 24,193 | |
| Crestwood Equity Partners LP | 151,525 | 3,788 | |
| Diamondback Energy, Inc. (f) | 215,400 | 23,082 | |
| Forbes Energy Services Ltd. | 193,218 | 2,531 | |
| Goodrich Petroleum Corp. | 129,527 | 1,271 | |
| Pioneer Natural Resources Co. | 127,200 | 19,038 | |
| Rice Energy, Inc. (f) | 1,041,000 | 29,512 | |
| Southwestern Energy Co. (f) | 2,230,100 | 12,377 | |
| VNR Finance Corp. | 118,582 | 2,354 | |
| VNR Finance Corp. (b) | 577,714 | 10,894 | |
| TOTAL ENERGY | 132,556 | ||
| Food/Beverage/Tobacco - 0.2% | |||
| JBS SA | 9,116,500 | 21,013 | |
| Gaming - 1.7% | |||
| Boyd Gaming Corp. | 891,200 | 26,050 | |
| Melco Crown Entertainment Ltd. sponsored ADR | 1,184,400 | 29,942 | |
| MGM Mirage, Inc. | 910,700 | 28,550 | |
| Red Rock Resorts, Inc. | 3,656,651 | 90,063 | |
| Wynn Resorts Ltd. | 207,300 | 30,575 | |
| TOTAL GAMING | 205,180 | ||
| Healthcare - 0.5% | |||
| Allergan PLC | 106,710 | 18,912 | |
| HCA Holdings, Inc. (f) | 304,500 | 23,035 | |
| HealthSouth Corp. | 34 | 2 | |
| Jazz Pharmaceuticals PLC (f) | 154,600 | 21,881 | |
| Rotech Healthcare, Inc. (c)(f) | 185,710 | 297 | |
| TOTAL HEALTHCARE | 64,127 | ||
| Homebuilders/Real Estate - 0.6% | |||
| American Tower Corp. | 11,612 | 1,668 | |
| CalAtlantic Group, Inc. | 400,000 | 19,736 | |
| PulteGroup, Inc. | 820,000 | 24,789 | |
| Realogy Holdings Corp. | 51,500 | 1,665 | |
| Toll Brothers, Inc. | 458,000 | 21,086 | |
| TOTAL HOMEBUILDERS/REAL ESTATE | 68,944 | ||
| Hotels - 0.3% | |||
| Extended Stay America, Inc. unit | 1,653,549 | 32,773 | |
| Leisure - 0.2% | |||
| Royal Caribbean Cruises Ltd. | 197,700 | 24,469 | |
| Metals/Mining - 0.2% | |||
| Aleris Corp. (c)(f) | 127,520 | 893 | |
| Freeport-McMoRan, Inc. (f) | 1,385,000 | 19,362 | |
| TOTAL METALS/MINING | 20,255 | ||
| Publishing/Printing - 0.0% | |||
| Houghton Mifflin Harcourt Co. warrants 6/22/19 (f)(h) | 127,577 | 20 | |
| Services - 2.2% | |||
| Air Lease Corp. Class A | 549,800 | 23,889 | |
| Expedia, Inc. | 187,000 | 23,311 | |
| HD Supply Holdings, Inc. (f) | 1,088,200 | 38,511 | |
| MasterCard, Inc. Class A | 412,300 | 61,338 | |
| Novus Holdings Ltd. | 100,408 | 50 | |
| Penhall Acquisition Co.: | |||
| Class A (c)(f) | 26,163 | 2,047 | |
| Class B (c)(f) | 8,721 | 682 | |
| United Rentals, Inc. (f) | 524,794 | 74,248 | |
| Visa, Inc. Class A | 360,800 | 39,681 | |
| WP Rocket Holdings, Inc. (c)(f)(h) | 25,255,077 | 253 | |
| TOTAL SERVICES | 264,010 | ||
| Super Retail - 0.3% | |||
| Arena Brands Holding Corp. Class B (c)(f)(h) | 659,302 | 778 | |
| Priceline Group, Inc. (f) | 19,300 | 36,901 | |
| TOTAL SUPER RETAIL | 37,679 | ||
| Technology - 7.1% | |||
| Adobe Systems, Inc. (f) | 256,400 | 44,911 | |
| Alphabet, Inc. Class A (f) | 107,300 | 110,845 | |
| Broadcom Ltd. | 292,000 | 77,062 | |
| CDW Corp. | 491,300 | 34,391 | |
| Cypress Semiconductor Corp. | 24,992 | 396 | |
| Electronic Arts, Inc. (f) | 310,300 | 37,112 | |
| EPAM Systems, Inc. (f) | 261,900 | 23,872 | |
| Facebook, Inc. Class A (f) | 618,500 | 111,367 | |
| First Data Corp. Class A (f) | 1,594,089 | 28,391 | |
| Global Payments, Inc. | 293,124 | 30,470 | |
| MagnaChip Semiconductor Corp. (f)(g) | 219,804 | 2,275 | |
| Micron Technology, Inc. (f) | 883,800 | 39,161 | |
| Microsemi Corp. (f) | 733,000 | 39,120 | |
| Nuance Communications, Inc. (f) | 1,484,700 | 21,884 | |
| ON Semiconductor Corp. (f) | 2,335,138 | 49,785 | |
| PayPal Holdings, Inc. (f) | 630,400 | 45,742 | |
| Qorvo, Inc. (f) | 358,297 | 27,162 | |
| Semtech Corp. (f) | 375,700 | 15,422 | |
| Skyworks Solutions, Inc. | 987,934 | 112,486 | |
| TOTAL TECHNOLOGY | 851,854 | ||
| Telecommunications - 1.5% | |||
| Alibaba Group Holding Ltd. sponsored ADR (f) | 643,800 | 119,032 | |
| T-Mobile U.S., Inc. (f) | 978,600 | 58,491 | |
| TOTAL TELECOMMUNICATIONS | 177,523 | ||
| Transportation Ex Air/Rail - 0.0% | |||
| Tricer Holdco SCA (c)(h) | 598,287 | 2,878 | |
| U.S. Shipping Partners Corp. (c)(f) | 51,736 | 0 | |
| U.S. Shipping Partners Corp. warrants 12/31/29 (c)(f) | 484,379 | 0 | |
| TOTAL TRANSPORTATION EX AIR/RAIL | 2,878 | ||
| Utilities - 0.3% | |||
| Portland General Electric Co. | 14,817 | 707 | |
| The AES Corp. | 2,957,700 | 31,440 | |
| TOTAL UTILITIES | 32,147 | ||
| TOTAL COMMON STOCKS | |||
| (Cost $1,913,706) | 2,654,341 | ||
| Preferred Stocks - 0.0% | |||
| Convertible Preferred Stocks - 0.0% | |||
| Consumer Products - 0.0% | |||
| Reddy Ice Holdings, Inc. 7.00% pay-in-kind (c)(f) | 199,717 | 1,857 | |
| Nonconvertible Preferred Stocks - 0.0% | |||
| Transportation Ex Air/Rail - 0.0% | |||
| Tricer Holdco SCA (c)(h) | 265,905,500 | 2,659 | |
| TOTAL PREFERRED STOCKS | |||
| (Cost $11,035) | 4,516 | ||
| Principal Amount (000s) | Value (000s) | ||
| Bank Loan Obligations - 2.6% | |||
| Automotive & Auto Parts - 0.0% | |||
| Chassix, Inc. term loan 12% 7/29/19 (c) | 3,297 | 3,288 | |
| Building Materials - 0.0% | |||
| Traverse Midstream Partners Ll Tranche B, term loan 3 month U.S. LIBOR + 4.000% 5.33% 9/27/24 (a)(e) | 2,980 | 3,018 | |
| Consumer Services - 0.0% | |||
| Optiv Security, Inc. Tranche 2LN, term loan 3 month U.S. LIBOR + 7.250% 8.5625% 2/1/25 (a)(e) | 350 | 322 | |
| Diversified Financial Services - 0.0% | |||
| Bcp Renaissance Parent LLC Tranche B, term loan 3 month U.S. LIBOR + 4.000% 5.3801% 10/31/24 (a)(e) | 2,895 | 2,927 | |
| Energy - 1.1% | |||
| Alon U.S.A. Partners LP term loan 3 month U.S. LIBOR + 8.000% 9.25% 11/26/18 (a)(e) | 6,183 | 6,230 | |
| Bcp Raptor LLC Tranche B, term loan 3 month U.S. LIBOR + 4.250% 5.5222% 6/22/24 (a)(e) | 9,027 | 9,120 | |
| California Resources Corp. Tranche 1LN, term loan 3 month U.S. LIBOR + 10.375% 11.6117% 12/31/21 (a)(e) | 64,095 | 68,635 | |
| Chesapeake Energy Corp. Tranche 1LN, term loan 3 month U.S. LIBOR + 7.500% 8.8144% 8/23/21 (a)(e) | 14,200 | 15,218 | |
| Forbes Energy Services LLC Tranche B, term loan 12% 4/13/21 (a)(c) | 1,902 | 1,917 | |
| Seadrill Operating LP Tranche B, term loan 3 month U.S. LIBOR + 3.000% 4.3328% 2/21/21 (a)(e) | 31,047 | 23,551 | |
| Vanguard Natural Gas LLC Tranche B, term loan 3 month U.S. LIBOR + 7.500% 8.74% 5/1/21 (a)(e) | 1,452 | 1,425 | |
| TOTAL ENERGY | 126,096 | ||
| Metals/Mining - 0.2% | |||
| Murray Energy Corp. Tranche B 2LN, term loan 3 month U.S. LIBOR + 7.250% 8.5828% 4/16/20 (a)(e) | 22,957 | 20,407 | |
| Paper - 0.0% | |||
| Caraustar Industries, Inc. Tranche B, term loan 3 month U.S. LIBOR + 5.500% 6.8328% 3/14/22 (a)(e) | 1,677 | 1,688 | |
| Publishing/Printing - 0.1% | |||
| Harland Clarke Holdings Corp. Tranche B 7LN, term loan 3 month U.S. LIBOR + 4.750% 11/3/23 (e)(i) | 3,765 | 3,777 | |
| Services - 0.2% | |||
| Almonde, Inc.: | |||
| Tranche 2LN, term loan 3 month U.S. LIBOR + 7.250% 8.5669% 6/13/25 (a)(e) | 1,230 | 1,218 | |
| Tranche B 1LN, term loan 3 month U.S. LIBOR + 3.500% 4.8169% 6/13/24 (a)(e) | 5,710 | 5,687 | |
| KUEHG Corp.: | |||
| Tranche B 1LN, term loan 3 month U.S. LIBOR + 3.750% 5.0828% 8/13/22 (a)(e) | 12,869 | 12,925 | |
| Tranche B, term loan 3 month U.S. LIBOR + 8.250% 9.5828% 8/22/25 (a)(e) | 6,055 | 6,040 | |
| TOTAL SERVICES | 25,870 | ||
| Steel - 0.0% | |||
| Essar Steel Algoma, Inc. Tranche B, term loan 3 month U.S. LIBOR + 6.500% 0% 8/16/19 (d)(e) | 5,183 | 2,889 | |
| Super Retail - 0.1% | |||
| Sears Roebuck Acceptance Corp. Tranche B, term loan 3 month U.S. LIBOR + 7.500% 8.7378% 7/20/20 (a)(e) | 8,680 | 8,718 | |
| Technology - 0.6% | |||
| Digicert Holdings, Inc. Tranche B, term loan: | |||
| 3 month U.S. LIBOR + 4.750% 6.1301% 10/31/24 (a)(e) | 3,885 | 3,927 | |
| 3 month U.S. LIBOR + 8.000% 9.3801% 10/31/25 (a)(e) | 4,840 | 4,864 | |
| Kronos, Inc. term loan 3 month U.S. LIBOR + 8.250% 9.5606% 11/1/24 (a)(e) | 19,695 | 20,252 | |
| Landesk Group, Inc. term loan: | |||
| 3 month U.S. LIBOR + 4.250% 5.5% 1/20/24 (a)(e) | 3,145 | 3,066 | |
| 3 month U.S. LIBOR + 9.000% 10.25% 1/20/25 (a)(e) | 10,270 | 9,943 | |
| Mcafee LLC Tranche B, term loan: | |||
| 3 month U.S. LIBOR + 4.500% 5.8328% 9/29/24 (a)(e) | 4,745 | 4,774 | |
| 3 month U.S. LIBOR + 8.500% 9.8328% 9/29/25 (a)(e) | 25,135 | 25,512 | |
| TOTAL TECHNOLOGY | 72,338 | ||
| Utilities - 0.3% | |||
| Energy Future Holdings Corp. Tranche B, term loan 3 month U.S. LIBOR + 3.000% 4.2422% 6/30/18 (a)(e) | 36,260 | 36,487 | |
| TOTAL BANK LOAN OBLIGATIONS | |||
| (Cost $303,287) | 307,825 | ||
| Preferred Securities - 6.2% | |||
| Banks & Thrifts - 6.2% | |||
| Bank of America Corp.: | |||
| 5.125% (a)(j) | 28,140 | 29,348 | |
| 5.2% (a)(j) | 61,440 | 65,387 | |
| 6.25% (a)(j) | 28,555 | 32,084 | |
| Barclays Bank PLC 7.625% 11/21/22 | 22,355 | 26,440 | |
| Citigroup, Inc.: | |||
| 5.8% (a)(j) | 41,925 | 44,987 | |
| 5.9% (a)(j) | 27,015 | 29,314 | |
| 5.95% (a)(j) | 51,015 | 56,420 | |
| 6.25% (a)(j) | 17,065 | 19,659 | |
| 6.3% (a)(j) | 5,610 | 6,262 | |
| Goldman Sachs Group, Inc.: | |||
| 5% (a)(j)(k) | 30,455 | 30,493 | |
| 5.375% (a)(j) | 31,615 | 33,609 | |
| 5.7% (a)(j) | 35,166 | 37,262 | |
| JPMorgan Chase & Co.: | |||
| 5% (a)(j) | 33,640 | 35,244 | |
| 5.3% (a)(j) | 16,855 | 18,168 | |
| 6% (a)(j) | 69,385 | 77,538 | |
| 6.125% (a)(j) | 17,585 | 19,525 | |
| 6.75% (a)(j) | 8,330 | 9,689 | |
| Royal Bank of Scotland Group PLC 8.625% (a)(j) | 41,759 | 47,605 | |
| Wells Fargo & Co.: | |||
| 5.875% (a)(j) | 50,420 | 57,495 | |
| 5.9% (a)(j) | 63,075 | 70,578 | |
| TOTAL BANKS & THRIFTS | 747,107 | ||
| Homebuilders/Real Estate - 0.0% | |||
| Odebrecht Finance Ltd. 7.5% (b)(j) | 2,940 | 1,114 | |
| TOTAL PREFERRED SECURITIES | |||
| (Cost $696,958) | 748,221 | ||
| Shares | Value (000s) | ||
| Money Market Funds - 8.9% | |||
| Fidelity Cash Central Fund, 1.10% (l) | 1,044,963,754 | 1,045,173 | |
| Fidelity Securities Lending Cash Central Fund 1.11% (l)(m) | 17,356,321 | 17,358 | |
| TOTAL MONEY MARKET FUNDS | |||
| (Cost $1,062,487) | 1,062,531 | ||
| TOTAL INVESTMENT IN SECURITIES - 99.6% | |||
| (Cost $10,687,088) | 11,932,465 | ||
| NET OTHER ASSETS (LIABILITIES) - 0.4% | 42,579 | ||
| NET ASSETS - 100% | $11,975,044 |
Values shown as $0 may reflect amounts less than $500.
Legend
(a) Coupon rates for floating and adjustable rate securities reflect the rates in effect at period end.
(b) Security exempt from registration under Rule 144A of the Securities Act of 1933. These securities may be resold in transactions exempt from registration, normally to qualified institutional buyers. At the end of the period, the value of these securities amounted to $3,693,941,000 or 30.8% of net assets.
(c) Level 3 security
(d) Non-income producing - Security is in default.
(e) Coupon is indexed to a floating interest rate which may be multiplied by a specified factor and/or subject to caps or floors.
(f) Non-income producing
(g) Security or a portion of the security is on loan at period end.
(h) Restricted securities - Investment in securities not registered under the Securities Act of 1933 (excluding 144A issues). At the end of the period, the value of restricted securities (excluding 144A issues) amounted to $6,588,000 or 0.1% of net assets.
(i) The coupon rate will be determined upon settlement of the loan after period end.
(j) Security is perpetual in nature with no stated maturity date.
(k) Security or a portion of the security purchased on a delayed delivery or when-issued basis.
(l) Affiliated fund that is generally available only to investment companies and other accounts managed by Fidelity Investments. The rate quoted is the annualized seven-day yield of the fund at period end. A complete unaudited listing of the fund's holdings as of its most recent quarter end is available upon request. In addition, each Fidelity Central Fund's financial statements, which are not covered by the Fund's Report of Independent Registered Public Accounting Firm, are available on the SEC's website or upon request.
(m) Investment made with cash collateral received from securities on loan.
Additional information on each restricted holding is as follows:
| Security | Acquisition Date | Acquisition Cost (000s) |
| Arena Brands Holding Corp. Class B | 6/18/97 - 1/12/99 | $21,592 |
| Houghton Mifflin Harcourt Co. warrants 6/22/19 | 6/22/12 | $246 |
| Tricer Holdco SCA | 12/19/16 | $14,875 |
| Tricer Holdco SCA | 12/19/16 | $9,607 |
| WP Rocket Holdings, Inc. | 6/24/11 - 2/2/15 | $13,154 |
Affiliated Central Funds
Information regarding fiscal year to date income earned by the Fund from investments in Fidelity Central Funds is as follows:
| Fund | Income earned |
| (Amounts in thousands) | |
| Fidelity Cash Central Fund | $4,671 |
| Fidelity Securities Lending Cash Central Fund | 20 |
| Total | $4,691 |
Investment Valuation
The following is a summary of the inputs used, as of October 31, 2017, involving the Fund's assets and liabilities carried at fair value. The inputs or methodology used for valuing securities may not be an indication of the risk associated with investing in those securities. For more information on valuation inputs, and their aggregation into the levels used below, please refer to the Investment Valuation section in the accompanying Notes to Financial Statements.
| Valuation Inputs at Reporting Date: | ||||
| Description | Total | Level 1 | Level 2 | Level 3 |
| (Amounts in thousands) | ||||
| Investments in Securities: | ||||
| Equities: | ||||
| Consumer Discretionary | $728,707 | $702,863 | $20 | $25,824 |
| Consumer Staples | 23,098 | 21,013 | -- | 2,085 |
| Energy | 132,556 | 121,662 | 10,894 | -- |
| Financials | 84,495 | 84,495 | -- | -- |
| Health Care | 64,127 | 63,830 | -- | 297 |
| Industrials | 272,772 | 264,253 | -- | 8,519 |
| Information Technology | 1,072,577 | 1,072,577 | -- | -- |
| Materials | 186,554 | 185,661 | -- | 893 |
| Real Estate | 3,333 | 3,333 | -- | -- |
| Telecommunication Services | 58,491 | 58,491 | -- | -- |
| Utilities | 32,147 | 32,147 | -- | -- |
| Corporate Bonds | 7,155,031 | -- | 7,152,720 | 2,311 |
| Bank Loan Obligations | 307,825 | -- | 302,620 | 5,205 |
| Preferred Securities | 748,221 | -- | 748,221 | -- |
| Money Market Funds | 1,062,531 | 1,062,531 | -- | -- |
| Total Investments in Securities: | $11,932,465 | $3,672,856 | $8,214,475 | $45,134 |
Other Information
Distribution of investments by country or territory of incorporation, as a percentage of Total Net Assets, is as follows (Unaudited):
| United States of America | 80.9% |
| Canada | 3.1% |
| Luxembourg | 2.5% |
| Cayman Islands | 2.1% |
| Netherlands | 2.1% |
| United Kingdom | 1.5% |
| France | 1.4% |
| Bermuda | 1.0% |
| Others (Individually Less Than 1%) | 5.4% |
| 100.0% |
See accompanying notes which are an integral part of the financial statements.
Financial Statements
Statement of Assets and Liabilities
| Amounts in thousands (except per-share amount) | October 31, 2017 | |
| Assets | ||
| Investment in securities, at value (including securities loaned of $17,147) — See accompanying schedule: Unaffiliated issuers (cost $9,624,601) | $10,869,934 | |
| Fidelity Central Funds (cost $1,062,487) | 1,062,531 | |
| Total Investment in Securities (cost $10,687,088) | $11,932,465 | |
| Cash | 14,944 | |
| Receivable for investments sold | 12,588 | |
| Receivable for fund shares sold | 9,629 | |
| Dividends receivable | 452 | |
| Interest receivable | 122,548 | |
| Distributions receivable from Fidelity Central Funds | 926 | |
| Prepaid expenses | 26 | |
| Other receivables | 1,918 | |
| Total assets | 12,095,496 | |
| Liabilities | ||
| Payable for investments purchased | ||
| Regular delivery | $54,891 | |
| Delayed delivery | 30,455 | |
| Payable for fund shares redeemed | 6,217 | |
| Distributions payable | 4,035 | |
| Accrued management fee | 5,525 | |
| Other affiliated payables | 1,256 | |
| Other payables and accrued expenses | 714 | |
| Collateral on securities loaned | 17,359 | |
| Total liabilities | 120,452 | |
| Net Assets | $11,975,044 | |
| Net Assets consist of: | ||
| Paid in capital | $10,738,394 | |
| Undistributed net investment income | 82,633 | |
| Accumulated undistributed net realized gain (loss) on investments and foreign currency transactions | (91,360) | |
| Net unrealized appreciation (depreciation) on investments and assets and liabilities in foreign currencies | 1,245,377 | |
| Net Assets, for 1,158,563 shares outstanding | $11,975,044 | |
| Net Asset Value, offering price and redemption price per share ($11,975,044 ÷ 1,158,563 shares) | $10.34 |
See accompanying notes which are an integral part of the financial statements.
Statement of Operations
| Amounts in thousands | Six months ended October 31, 2017 | |
| Investment Income | ||
| Dividends | $29,796 | |
| Interest | 247,648 | |
| Income from Fidelity Central Funds | 4,691 | |
| Total income | 282,135 | |
| Expenses | ||
| Management fee | $32,202 | |
| Transfer agent fees | 6,688 | |
| Accounting and security lending fees | 721 | |
| Custodian fees and expenses | 77 | |
| Independent trustees' fees and expenses | 22 | |
| Registration fees | 112 | |
| Audit | 112 | |
| Legal | (165) | |
| Miscellaneous | 49 | |
| Total expenses before reductions | 39,818 | |
| Expense reductions | (128) | 39,690 |
| Net investment income (loss) | 242,445 | |
| Realized and Unrealized Gain (Loss) | ||
| Net realized gain (loss) on: | ||
| Investment securities: | ||
| Unaffiliated issuers | (85,157) | |
| Fidelity Central Funds | (1) | |
| Foreign currency transactions | (29) | |
| Total net realized gain (loss) | (85,187) | |
| Change in net unrealized appreciation (depreciation) on: | ||
| Investment securities: | ||
| Unaffiliated issuers | 466,835 | |
| Total change in net unrealized appreciation (depreciation) | 466,835 | |
| Net gain (loss) | 381,648 | |
| Net increase (decrease) in net assets resulting from operations | $624,093 |
See accompanying notes which are an integral part of the financial statements.
Statement of Changes in Net Assets
| Amounts in thousands�� | Six months ended October 31, 2017 | Year ended April 30, 2017 |
| Increase (Decrease) in Net Assets | ||
| Operations | ||
| Net investment income (loss) | $242,445 | $469,037 |
| Net realized gain (loss) | (85,187) | 203,756 |
| Change in net unrealized appreciation (depreciation) | 466,835 | 686,024 |
| Net increase (decrease) in net assets resulting from operations | 624,093 | 1,358,817 |
| Distributions to shareholders from net investment income | (217,613) | (441,674) |
| Distributions to shareholders from net realized gain | (119,664) | – |
| Total distributions | (337,277) | (441,674) |
| Share transactions | ||
| Proceeds from sales of shares | 1,171,004 | 1,958,022 |
| Reinvestment of distributions | 302,448 | 395,486 |
| Cost of shares redeemed | (1,015,887) | (2,229,289) |
| Net increase (decrease) in net assets resulting from share transactions | 457,565 | 124,219 |
| Redemption fees | 248 | 595 |
| Total increase (decrease) in net assets | 744,629 | 1,041,957 |
| Net Assets | ||
| Beginning of period | 11,230,415 | 10,188,458 |
| End of period | $11,975,044 | $11,230,415 |
| Other Information | ||
| Undistributed net investment income end of period | $82,633 | $57,801 |
| Shares | ||
| Sold | 115,295 | 201,303 |
| Issued in reinvestment of distributions | 29,831 | 40,821 |
| Redeemed | (100,010) | (230,785) |
| Net increase (decrease) | 45,116 | 11,339 |
See accompanying notes which are an integral part of the financial statements.
Financial Highlights
Fidelity Capital & Income Fund
| Six months endedOctober 31, | Years ended April 30, | |||||
| 2017 | 2017 | 2016 | 2015 | 2014 | 2013 | |
| Selected Per–Share Data | ||||||
| Net asset value, beginning of period | $10.09 | $9.24 | $9.99 | $10.07 | $9.86 | $9.23 |
| Income from Investment Operations | ||||||
| Net investment income (loss)A | .213 | .430 | .404 | .416 | .472 | .547 |
| Net realized and unrealized gain (loss) | .335 | .824 | (.710) | .276 | .258 | .631 |
| Total from investment operations | .548 | 1.254 | (.306) | .692 | .730 | 1.178 |
| Distributions from net investment income | (.191) | (.405) | (.387) | (.411) | (.458) | (.501) |
| Distributions from net realized gain | (.107) | – | (.058) | (.362) | (.063) | (.048) |
| Total distributions | (.298) | (.405) | (.445) | (.773) | (.521) | (.549) |
| Redemption fees added to paid in capitalA | –B | .001 | .001 | .001 | .001 | .001 |
| Net asset value, end of period | $10.34 | $10.09 | $9.24 | $9.99 | $10.07 | $9.86 |
| Total ReturnC,D | 5.53% | 13.85% | (3.05)% | 7.17% | 7.71% | 13.23% |
| Ratios to Average Net AssetsE,F | ||||||
| Expenses before reductions | .68%G | .73% | .75% | .72% | .71% | .73% |
| Expenses net of fee waivers, if any | .68%G | .73% | .75% | .72% | .71% | .73% |
| Expenses net of all reductions | .68%G | .73% | .74% | .72% | .71% | .73% |
| Net investment income (loss) | 4.17%G | 4.45% | 4.30% | 4.16% | 4.82% | 5.83% |
| Supplemental Data | ||||||
| Net assets, end of period (in millions) | $11,975 | $11,230 | $10,188 | $11,160 | $10,382 | $10,205 |
| Portfolio turnover rateH | 34%G | 39% | 35% | 41% | 47% | 60% |
A Calculated based on average shares outstanding during the period.
B Amount represents less than $.0005 per share.
C Total returns for periods of less than one year are not annualized.
D Total returns would have been lower if certain expenses had not been reduced during the applicable periods shown.
E Fees and expenses of any underlying Fidelity Central Funds are not included in the Fund's expense ratio. The Fund indirectly bears its proportionate share of the expenses of any underlying Fidelity Central Funds.
F Expense ratios reflect operating expenses of the Fund. Expenses before reductions do not reflect amounts reimbursed by the investment adviser or reductions from brokerage service arrangements or reductions from other expense offset arrangements and do not represent the amount paid by the Fund during periods when reimbursements or reductions occur. Expenses net of fee waivers reflect expenses after reimbursement by the investment adviser but prior to reductions from brokerage service arrangements or other expense offset arrangements. Expenses net of all reductions represent the net expenses paid by the Fund.
G Annualized
H Amount does not include the portfolio activity of any underlying Fidelity Central Funds.
See accompanying notes which are an integral part of the financial statements.
Notes to Financial Statements
For the period ended October 31, 2017
(Amounts in thousands except percentages)
1. Organization.
Fidelity Capital & Income Fund (the Fund) is a fund of Fidelity Summer Street Trust (the Trust) and is authorized to issue an unlimited number of shares. Share transactions on the Statement of Changes in Net Assets may contain exchanges between affiliated funds. The Trust is registered under the Investment Company Act of 1940, as amended (the 1940 Act), as an open-end management investment company organized as a Massachusetts business trust.
2. Investments in Fidelity Central Funds.
The Fund invests in Fidelity Central Funds, which are open-end investment companies generally available only to other investment companies and accounts managed by the investment adviser and its affiliates. The Fund's Schedule of Investments lists each of the Fidelity Central Funds held as of period end, if any, as an investment of the Fund, but does not include the underlying holdings of each Fidelity Central Fund. As an Investing Fund, the Fund indirectly bears its proportionate share of the expenses of the underlying Fidelity Central Funds.
The Money Market Central Funds seek preservation of capital and current income and are managed by Fidelity Investments Money Management, Inc. (FIMM), an affiliate of the investment adviser. Annualized expenses of the Money Market Central Funds as of their most recent shareholder report date are less than .005%.
A complete unaudited list of holdings for each Fidelity Central Fund is available upon request or at the Securities and Exchange Commission (the SEC) website at www.sec.gov. In addition, the financial statements of the Fidelity Central Funds, which are not covered by the Fund's Report of Independent Registered Public Accounting Firm, are available on the SEC website or upon request.
3. Significant Accounting Policies.
The Fund is an investment company and applies the accounting and reporting guidance of the Financial Accounting Standards Board (FASB) Accounting Standards Codification Topic 946 Financial Services – Investments Companies. The financial statements have been prepared in conformity with accounting principles generally accepted in the United States of America (GAAP), which require management to make certain estimates and assumptions at the date of the financial statements. Actual results could differ from those estimates. Subsequent events, if any, through the date that the financial statements were issued have been evaluated in the preparation of the financial statements. The following summarizes the significant accounting policies of the Fund:
Investment Valuation. Investments are valued as of 4:00 p.m. Eastern time on the last calendar day of the period. The Board of Trustees (the Board) has delegated the day to day responsibility for the valuation of the Fund's investments to the Fair Value Committee (the Committee) established by the Fund's investment adviser. In accordance with valuation policies and procedures approved by the Board, the Fund attempts to obtain prices from one or more third party pricing vendors or brokers to value its investments. When current market prices, quotations or currency exchange rates are not readily available or reliable, investments will be fair valued in good faith by the Committee, in accordance with procedures adopted by the Board. Factors used in determining fair value vary by investment type and may include market or investment specific events, changes in interest rates and credit quality. The frequency with which these procedures are used cannot be predicted and they may be utilized to a significant extent. The Committee oversees the Fund's valuation policies and procedures and reports to the Board on the Committee's activities and fair value determinations. The Board monitors the appropriateness of the procedures used in valuing the Fund's investments and ratifies the fair value determinations of the Committee.
The Fund categorizes the inputs to valuation techniques used to value its investments into a disclosure hierarchy consisting of three levels as shown below:
- Level 1 – quoted prices in active markets for identical investments
- Level 2 – other significant observable inputs (including quoted prices for similar investments, interest rates, prepayment speeds, etc.)
- Level 3 – unobservable inputs (including the Fund's own assumptions based on the best information available)
Valuation techniques used to value the Fund's investments by major category are as follows:
Debt securities, including restricted securities, are valued based on evaluated prices received from third party pricing vendors or from brokers who make markets in such securities. Corporate bonds, bank loan obligations and preferred securities are valued by pricing vendors who utilize matrix pricing which considers yield or price of bonds of comparable quality, coupon, maturity and type or by broker-supplied prices. When independent prices are unavailable or unreliable, debt securities be valued utilizing pricing methodologies which consider similar factors that would be used by third party pricing vendors. Debt securities are generally categorized as Level 2 in the hierarchy but may be Level 3 depending on the circumstances.
Equity securities, including restricted securities, for which market quotations are readily available, are valued at the last reported sale price or official closing price as reported by a third party pricing vendor on the primary market or exchange on which they are traded and are categorized as Level 1 in the hierarchy. In the event there were no sales during the day or closing prices are not available, securities are valued at the last quoted bid price or may be valued using the last available price and are generally categorized as Level 2 in the hierarchy. For foreign equity securities, when market or security specific events arise, comparisons to the valuation of American Depositary Receipts (ADRs), futures contracts, Exchange-Traded Funds (ETFs) and certain indexes as well as quoted prices for similar securities may be used and would be categorized as Level 2 in the hierarchy. Utilizing these techniques may result in transfers between Level 1 and Level 2. For equity securities, including restricted securities, where observable inputs are limited, assumptions about market activity and risk are used and these securities may be categorized as Level 3 in the hierarchy.
Investments in open-end mutual funds, including the Fidelity Central Funds, are valued at their closing net asset value (NAV) each business day and are categorized as Level 1 in the hierarchy.
Changes in valuation techniques may result in transfers in or out of an assigned level within the disclosure hierarchy. The aggregate value of investments by input level as of October 31, 2017 is included at the end of the Fund's Schedule of Investments.
Foreign Currency. The Fund may use foreign currency contracts to facilitate transactions in foreign-denominated securities. Gains and losses from these transactions may arise from changes in the value of the foreign currency or if the counterparties do not perform under the contracts' terms.
Foreign-denominated assets, including investment securities, and liabilities are translated into U.S. dollars at the exchange rates at period end. Purchases and sales of investment securities, income and dividends received and expenses denominated in foreign currencies are translated into U.S. dollars at the exchange rate in effect on the transaction date.
The effects of exchange rate fluctuations on investments are included with the net realized and unrealized gain (loss) on investment securities. Other foreign currency transactions resulting in realized and unrealized gain (loss) are disclosed separately.
Investment Transactions and Income. For financial reporting purposes, the Fund's investment holdings and NAV include trades executed through the end of the last business day of the period. The NAV per share for processing shareholder transactions is calculated as of the close of business of the New York Stock Exchange (NYSE), normally 4:00 p.m. Eastern time and includes trades executed through the end of the prior business day. Gains and losses on securities sold are determined on the basis of identified cost and includes proceeds received from litigation. Dividend income is recorded on the ex-dividend date, except for certain dividends from foreign securities where the ex-dividend date may have passed, which are recorded as soon as the Fund is informed of the ex-dividend date. Non-cash dividends included in dividend income, if any, are recorded at the fair market value of the securities received. Income and capital gain distributions from Fidelity Central Funds, if any, are recorded on the ex-dividend date. Certain distributions received by the Fund represent a return of capital or capital gain. The Fund determines the components of these distributions subsequent to the ex-dividend date, based upon receipt of tax filings or other correspondence relating to the underlying investment. These distributions are recorded as a reduction of cost of investments and/or as a realized gain. Interest income is accrued as earned and includes coupon interest and amortization of premium and accretion of discount on debt securities as applicable. Paid in Kind (PIK) income is recorded at the fair market value of the securities received. Investment income is recorded net of foreign taxes withheld where recovery of such taxes is uncertain. Debt obligations may be placed on non-accrual status and related interest income may be reduced by ceasing current accruals and writing off interest receivables when the collection of all or a portion of interest has become doubtful based on consistently applied procedures. A debt obligation is removed from non-accrual status when the issuer resumes interest payments or when collectability of interest is reasonably assured.
Expenses. Expenses directly attributable to a fund are charged to that fund. Expenses attributable to more than one fund are allocated among the respective funds on the basis of relative net assets or other appropriate methods. Expense estimates are accrued in the period to which they relate and adjustments are made when actual amounts are known.
Deferred Trustee Compensation. Under a Deferred Compensation Plan (the Plan), independent Trustees may elect to defer receipt of a portion of their annual compensation. Deferred amounts are invested in a cross-section of Fidelity funds, are marked-to-market and remain in the Fund until distributed in accordance with the Plan. The investment of deferred amounts and the offsetting payable to the Trustees are included in the accompanying Statement of Assets and Liabilities.
Income Tax Information and Distributions to Shareholders. Each year, the Fund intends to qualify as a regulated investment company under Subchapter M of the Internal Revenue Code, including distributing substantially all of its taxable income and realized gains. As a result, no provision for U.S. Federal income taxes is required. The Fund files a U.S. federal tax return, in addition to state and local tax returns as required. The Fund's federal income tax returns are subject to examination by the Internal Revenue Service (IRS) for a period of three fiscal years after they are filed. State and local tax returns may be subject to examination for an additional fiscal year depending on the jurisdiction. Foreign taxes are provided for based on the Fund's understanding of the tax rules and rates that exist in the foreign markets in which it invests.
Dividends are declared and recorded daily and paid monthly from net investment income. Distributions from realized gains, if any, are declared and recorded on the ex-dividend date. Income and capital gain distributions are determined in accordance with income tax regulations, which may differ from GAAP.
Capital accounts within the financial statements are adjusted for permanent book-tax differences. These adjustments have no impact on net assets or the results of operations. Capital accounts are not adjusted for temporary book-tax differences which will reverse in a subsequent period.
Book-tax differences are primarily due to partnerships, foreign currency transactions, market discount, deferred trustees compensation, capital loss carryforwards and losses deferred due to wash sales.
As of period end, the cost and unrealized appreciation (depreciation) in securities, and derivatives if applicable, for federal income tax purposes were as follows:
| Gross unrealized appreciation | $1,541,454 |
| Gross unrealized depreciation | (267,527) |
| Net unrealized appreciation (depreciation) | $1,273,927 |
| Tax cost | $10,658,538 |
Short-Term Trading (Redemption) Fees. Shares held by investors in the Fund less than 90 days may have been subject to a redemption fee equal to 1.00% of the NAV of shares redeemed. All redemption fees, which reduce the proceeds of the shareholder redemption, are retained by the Fund and accounted for as an addition to paid in capital. In November 2017, the Board of Trustees approved the elimination of those redemption fees effective December 18, 2017.
Delayed Delivery Transactions and When-Issued Securities. During the period, the Fund transacted in securities on a delayed delivery or when-issued basis. Payment and delivery may take place after the customary settlement period for that security. The price of the underlying securities and the date when the securities will be delivered and paid for are fixed at the time the transaction is negotiated. The securities purchased on a delayed delivery or when-issued basis are identified as such in the Fund's Schedule of Investments. The Fund may receive compensation for interest forgone in the purchase of a delayed delivery or when-issued security. With respect to purchase commitments, the Fund identifies securities as segregated in its records with a value at least equal to the amount of the commitment. Losses may arise due to changes in the value of the underlying securities or if the counterparty does not perform under the contract's terms, or if the issuer does not issue the securities due to political, economic, or other factors.
Restricted Securities. The Fund may invest in securities that are subject to legal or contractual restrictions on resale. These securities generally may be resold in transactions exempt from registration or to the public if the securities are registered. Disposal of these securities may involve time-consuming negotiations and expense, and prompt sale at an acceptable price may be difficult. Information regarding restricted securities is included at the end of the Fund's Schedule of Investments.
Loans and Other Direct Debt Instruments. The Fund invests in direct debt instruments which are interests in amounts owed to lenders by corporate or other borrowers. These instruments may be in the form of loans, trade claims or other receivables and may include standby financing commitments such as revolving credit facilities that obligate the Fund to supply additional cash to the borrower on demand. Loans may be acquired through assignment or participation. The Fund did not have any unfunded loan commitments, which are contractual obligations for future funding, at period end.
New Accounting Pronouncement. In March 2017, the Financial Accounting Standards Board (FASB) issued an Accounting Standards Update (ASU), ASU 2017-08, which amends the amortization period for certain callable debt securities that are held at a premium. The amendment requires the premium to be amortized to the earliest call date. The amendments do not require an accounting change for securities held at a discount. The ASU is effective for annual periods beginning after December 15, 2018. Management is currently evaluating the potential impact of these changes to the financial statements.
4. Purchases and Sales of Investments.
Purchases and sales of securities, other than short-term securities, aggregated $1,978,708 and $1,844,459, respectively.
5. Fees and Other Transactions with Affiliates.
Management Fee. Fidelity Management & Research Company (the investment adviser) and its affiliates provide the Fund with investment management related services for which the Fund pays a monthly management fee. The management fee is the sum of an individual fund fee rate that is based on an annual rate of .45% of the Fund's average net assets and an annualized group fee rate that averaged .11% during the period. The group fee rate is based upon the average net assets of all the mutual funds advised by the investment adviser, including any mutual funds previously advised by the investment adviser that are currently advised by Fidelity SelectCo, LLC, an affiliate of the investment adviser. The group fee rate decreases as assets under management increase and increases as assets under management decrease. For the reporting period, the total annualized management fee rate was .56% of the Fund's average net assets.
Transfer Agent Fees. Fidelity Investments Institutional Operations Company, Inc. (FIIOC), an affiliate of the investment adviser, is the Fund's transfer, dividend disbursing and shareholder servicing agent. FIIOC receives account fees and asset-based fees that vary according to account size and type of account. FIIOC pays for typesetting, printing and mailing of shareholder reports, except proxy statements. For the period, the transfer agent fees were equivalent to an annualized rate of .11% of average net assets.
Accounting and Security Lending Fees. Fidelity Service Company, Inc. (FSC), an affiliate of the investment adviser, maintains the Fund's accounting records. The accounting fee is based on the level of average net assets for each month. Under a separate contract, FSC administers the security lending program. The security lending fee is based on the number and duration of lending transactions.
Brokerage Commissions. The Fund placed a portion of its portfolio transactions with brokerage firms which are affiliates of the investment adviser. Brokerage commissions are included in net realized gain (loss) and change in net unrealized appreciation (depreciation) in the Statement of Operations. The commissions paid to these affiliated firms were $31 for the period.
Interfund Trades. The Fund may purchase from or sell securities to other Fidelity Funds under procedures adopted by the Board. The procedures have been designed to ensure these interfund trades are executed in accordance with Rule 17a-7 of the 1940 Act. Interfund trades are included within the respective purchases and sales amounts shown in the Purchases and Sales of Investments note.
6. Committed Line of Credit.
The Fund participates with other funds managed by the investment adviser or an affiliate in a $4.25 billion credit facility (the "line of credit") to be utilized for temporary or emergency purposes to fund shareholder redemptions or for other short-term liquidity purposes. The Fund has agreed to pay commitment fees on its pro-rata portion of the line of credit, which amounted to $17 and is reflected in Miscellaneous expenses on the Statement of Operations. During the period, the Fund did not borrow on this line of credit.
7. Security Lending.
The Fund lends portfolio securities through a lending agent from time to time in order to earn additional income. For equity securities, a lending agent is used and may loan securities to certain qualified borrowers, including Fidelity Capital Markets (FCM), a broker-dealer affiliated with the Fund. On the settlement date of the loan, the Fund receives collateral (in the form of U.S. Treasury obligations, letters of credit and/or cash) against the loaned securities and maintains collateral in an amount not less than 100% of the market value of the loaned securities during the period of the loan. The market value of the loaned securities is determined at the close of business of the Fund and any additional required collateral is delivered to the Fund on the next business day. The Fund or borrower may terminate the loan at any time, and if the borrower defaults on its obligation to return the securities loaned because of insolvency or other reasons, the Fund may apply collateral received from the borrower against the obligation. The Fund may experience delays and costs in recovering the securities loaned. Any cash collateral received is invested in the Fidelity Securities Lending Cash Central Fund. The value of loaned securities and cash collateral at period end are disclosed on the Fund's Statement of Assets and Liabilities. The value of securities loaned to FCM at period end was $1,369. Security lending income represents the income earned on investing cash collateral, less rebates paid to borrowers and any lending agent fees associated with the loan, plus any premium payments received for lending certain types of securities. Security lending income is presented in the Statement of Operations as a component of income from Fidelity Central Funds. Total security lending income during the period amounted to $20, including $7 from securities loaned to FCM.
8. Expense Reductions.
Commissions paid to certain brokers with whom the investment adviser, or its affiliates, places trades on behalf of the Fund include an amount in addition to trade execution, which may be rebated back to the Fund to offset certain expenses. This amount totaled $86 for the period. Through arrangements with the Fund's custodian, credits realized as a result of certain uninvested cash balances were used to reduce the Fund's expenses. During the period, these credits reduced the Fund's custody expenses by $11.
In addition, during the period the investment adviser reimbursed and/or waived a portion of operating expenses in the amount of $31.
9. Other.
The Fund's organizational documents provide former and current trustees and officers with a limited indemnification against liabilities arising in connection with the performance of their duties to the Fund. In the normal course of business, the Fund may also enter into contracts that provide general indemnifications. The Fund's maximum exposure under these arrangements is unknown as this would be dependent on future claims that may be made against the Fund. The risk of material loss from such claims is considered remote.
10. Litigation.
The Fund, and other entities managed by FMR or its affiliates were named as defendants in a lawsuit filed in the United States Bankruptcy Court for the Southern District of New York in 2009. The lawsuit was brought by creditors of Motors Liquidation Company (f/k/a General Motors), which went through Chapter 11 bankruptcy proceedings in 2009, and is captioned Official Committee of Unsecured Creditors of Motors Liquidation Company v. JPMorgan Chase Bank, N.A., et al., Adversary No. 09-00504 (REG). The plaintiffs are seeking an order that the Fund and other defendants return proceeds received in 2009 in full payment of the principal and interest on General Motors secured debt. The plaintiffs contend that the Fund and the other defendants were not secured creditors at the time of the 2009 payments and, thus, were not entitled to payment in full. In January 2015, the Court of Appeals ruled that JPMorgan, as administrative agent for all of the debtholders, released the security interest on certain collateral securing the debt prior to the 2009 payments. In September 2017, an opinion was issued in a trial intended to help determine the value of any remaining, unreleased collateral. Management is evaluating the impact of this ruling and the parties have agreed to mediation. At this time, Management cannot determine the amount of loss that may be realized, but expects the amount to be less than the $100,876 received in 2009. The Fund is also incurring legal costs in defending the case.
Report of Independent Registered Public Accounting Firm
To the Trustees of Fidelity Summer Street Trust and Shareholders of Fidelity Capital & Income Fund:
In our opinion, the accompanying statement of assets and liabilities, including the schedule of investments, and the related statements of operations and of changes in net assets and the financial highlights present fairly, in all material respects, the financial position of Fidelity Capital & Income Fund (a fund of Fidelity Summer Street Trust) as of October 31, 2017, and the results of its operations, the changes in its net assets and the financial highlights for each of the periods indicated, in conformity with accounting principles generally accepted in the United States of America. These financial statements and financial highlights (hereafter referred to as “financial statements”) are the responsibility of the Fidelity Capital & Income Fund’s management. Our responsibility is to express an opinion on these financial statements based on our audits. We conducted our audits of these financial statements in accordance with the standards of the Public Company Accounting Oversight Board (United States). Those standards require that we plan and perform the audit to obtain reasonable assurance about whether the financial statements are free of material misstatement. An audit includes examining, on a test basis, evidence supporting the amounts and disclosures in the financial statements, assessing the accounting principles used and significant estimates made by management, and evaluating the overall financial statement presentation. Our procedures included confirmation of securities owned as of October 31, 2017 by correspondence with the custodian and brokers; when replies were not received from brokers, we performed other auditing procedures. We believe that our audits provide a reasonable basis for our opinion.
PricewaterhouseCoopers LLP
Boston, Massachusetts
December 15, 2017
Shareholder Expense Example
As a shareholder of a Fund, you incur two types of costs: (1) transaction costs, including redemption fees and (2) ongoing costs, including management fees and other Fund expenses. This Example is intended to help you understand your ongoing costs (in dollars) of investing in the Funds and to compare these costs with the ongoing costs of investing in other mutual funds.
The Example is based on an investment of $1,000 invested at the beginning of the period and held for the entire period (May 1, 2017 to October 31, 2017).
Actual Expenses
The first line of the accompanying table provides information about actual account values and actual expenses. You may use the information in this line, together with the amount you invested, to estimate the expenses that you paid over the period. Simply divide your account value by $1,000.00 (for example, an $8,600 account value divided by $1,000.00 = 8.6), then multiply the result by the number in the first line under the heading entitled "Expenses Paid During Period" to estimate the expenses you paid on your account during this period. A small balance maintenance fee of $12.00 that is charged once a year may apply for certain accounts with a value of less than $2,000. This fee is not included in the table below. If it was, the estimate of expenses you paid during the period would be higher, and your ending account value lower, by this amount. In addition, the Fund, as a shareholder in the underlying Fidelity Central Funds, will indirectly bear its pro-rata share of the fees and expenses incurred by the underlying Fidelity Central Funds. These fees and expenses are not included in the Fund's annualized expense ratio used to calculate the expense estimate in the table below.
Hypothetical Example for Comparison Purposes
The second line of the accompanying table provides information about hypothetical account values and hypothetical expenses based on the Fund's actual expense ratio and an assumed rate of return of 5% per year before expenses, which is not the Fund's actual return. The hypothetical account values and expenses may not be used to estimate the actual ending account balance or expenses you paid for the period. You may use this information to compare the ongoing costs of investing in the Fund and other funds. To do so, compare this 5% hypothetical example with the 5% hypothetical examples that appear in the shareholder reports of the other funds. A small balance maintenance fee of $12.00 that is charged once a year may apply for certain accounts with a value of less than $2,000. This fee is not included in the table below. If it was, the estimate of expenses you paid during the period would be higher, and your ending account value lower, by this amount. In addition, the Fund, as a shareholder in the underlying Fidelity Central Funds, will indirectly bear its pro-rata share of the fees and expenses incurred by the underlying Fidelity Central Funds. These fees and expenses are not included in the Fund's annualized expense ratio used to calculate the expense estimate in the table below.
Please note that the expenses shown in the table are meant to highlight your ongoing costs only and do not reflect any transaction costs. Therefore, the second line of the table is useful in comparing ongoing costs only, and will not help you determine the relative total costs of owning different funds. In addition, if these transactional costs were included, your costs would have been higher.
| Annualized Expense Ratio-A | Beginning Account Value May 1, 2017 | Ending Account Value October 31, 2017 | Expenses Paid During Period-B May 1, 2017 to October 31, 2017 | |
| Actual | .68% | $1,000.00 | $1,055.30 | $3.52 |
| Hypothetical-C | $1,000.00 | $1,021.78 | $3.47 |
A Annualized expense ratio reflects expenses net of applicable fee waivers.
B Expenses are equal to the Fund's annualized expense ratio, multiplied by the average account value over the period, multiplied by 184/365 (to reflect the one-half year period).
C 5% return per year before expenses
Board Approval of Investment Advisory Contracts and Management Fees
Fidelity Capital & Income Fund
Each year, the Board of Trustees, including the Independent Trustees (together, the Board), votes on the renewal of the management contract with Fidelity Management & Research Company (FMR) and the sub-advisory agreements (together, the Advisory Contracts) for the fund. FMR and the sub-advisers are referred to herein as the Investment Advisers. The Board, assisted by the advice of fund counsel and Independent Trustees' counsel, requests and considers a broad range of information relevant to the renewal of the Advisory Contracts throughout the year.
The Board meets regularly and, at each of its meetings, covers an extensive agenda of topics and materials and considers factors that are relevant to its annual consideration of the renewal of the fund's Advisory Contracts, including the services and support provided to the fund and its shareholders. The Board has established various standing committees (Committees), each composed of and chaired by Independent Trustees with varying backgrounds, to which the Board has assigned specific subject matter responsibilities in order to enhance effective decision-making by the Board. The Board, acting directly and through its Committees, requests and receives information concerning the annual consideration of the renewal of the fund's Advisory Contracts. The Board also meets as needed to review matters specifically related to the Board's annual consideration of the renewal of the Advisory Contracts. Members of the Board may also meet with trustees of other Fidelity funds through ad hoc joint committees to discuss certain matters relevant to all of the Fidelity funds.
At its July 2017 meeting, the Board unanimously determined to renew the fund's Advisory Contracts. In reaching its determination, the Board considered all factors it believed relevant, including (i) the nature, extent, and quality of the services to be provided to the fund and its shareholders (including the investment performance of the fund); (ii) the competitiveness of the fund's management fee and total expense ratio relative to peer funds; (iii) the total costs of the services to be provided by and the profits to be realized by Fidelity from its relationships with the fund; and (iv) the extent to which, if any, economies of scale exist and would be realized as the fund grows, and whether any economies of scale are appropriately shared with fund shareholders.
In considering whether to renew the Advisory Contracts for the fund, the Board reached a determination, with the assistance of fund counsel and Independent Trustees' counsel and through the exercise of its business judgment, that the renewal of the Advisory Contracts was in the best interests of the fund and its shareholders and that the compensation payable under the Advisory Contracts was fair and reasonable. The Board's decision to renew the Advisory Contracts was not based on any single factor, but rather was based on a comprehensive consideration of all the information provided to the Board at its meetings throughout the year. The Board, in reaching its determination to renew the Advisory Contracts, was aware that shareholders of the fund have a broad range of investment choices available to them, including a wide choice among funds offered by Fidelity's competitors, and that the fund's shareholders, who have the opportunity to review and weigh the disclosure provided by the fund in its prospectus and other public disclosures, have chosen to invest in this fund, which is part of the Fidelity family of funds.
Amendment to Group Fee Rate. The Board also approved an amendment to the management contract for the fund to add an additional breakpoint to the group fee schedule, effective October 1, 2017. The Board noted that the additional breakpoint would result in lower management fee rates as Fidelity's assets under management increase.
Nature, Extent, and Quality of Services Provided. The Board considered Fidelity's staffing as it relates to the fund, including the backgrounds of investment personnel of Fidelity, and also considered the fund's investment objective, strategies, and related investment philosophy. The Independent Trustees also had discussions with senior management of Fidelity's investment operations and investment groups. The Board considered the structure of the investment personnel compensation program and whether this structure provides appropriate incentives to act in the best interests of the fund. Additionally, the Board considered the portfolio managers' investments, if any, in the funds that they manage.Resources Dedicated to Investment Management and Support Services. The Board and the Fund Oversight and Research Committees reviewed the general qualifications and capabilities of Fidelity's investment staff, including its size, education, experience, and resources, as well as Fidelity's approach to recruiting, training, managing, and compensating investment personnel. The Board noted that Fidelity has continued to increase the resources devoted to non-U.S. offices, including expansion of Fidelity's global investment organization. The Board also noted that Fidelity's analysts have extensive resources, tools and capabilities that allow them to conduct sophisticated quantitative and fundamental analysis, as well as credit analysis of issuers, counterparties and guarantors. Further, the Board considered that Fidelity's investment professionals have sufficient access to global information and data so as to provide competitive investment results over time, and that those professionals also have access to sophisticated tools that permit them to assess portfolio construction and risk and performance attribution characteristics continuously, as well as to transmit new information and research conclusions rapidly around the world. Additionally, in its deliberations, the Board considered Fidelity's trading, risk management, compliance, and technology and operations capabilities and resources, which are integral parts of the investment management process.Shareholder and Administrative Services. The Board considered (i) the nature, extent, quality, and cost of advisory, administrative, and shareholder services performed by the Investment Advisers and their affiliates under the Advisory Contracts and under separate agreements covering transfer agency, pricing and bookkeeping, and securities lending services for the fund; (ii) the nature and extent of the supervision of third party service providers, principally custodians, subcustodians, and pricing vendors; and (iii) the resources devoted to, and the record of compliance with, the fund's compliance policies and procedures. The Board also reviewed the allocation of fund brokerage, including allocations to brokers affiliated with the Investment Advisers, the use of brokerage commissions to pay fund expenses, and the use of "soft" commission dollars to pay for research services.The Board noted that the growth of fund assets over time across the complex allows Fidelity to reinvest in the development of services designed to enhance the value or convenience of the Fidelity funds as investment vehicles. These services include 24-hour access to account information and market information through telephone representatives and over the Internet, investor education materials and asset allocation tools, and the expanded availability of Fidelity Investor Centers.In 2014, the Board formed an ad hoc Committee on Transfer Agency Fees to review the variety of transfer agency fee structures throughout the industry and Fidelity's competitive positioning with respect to industry participants.Investment in a Large Fund Family. The Board considered the benefits to shareholders of investing in a Fidelity fund, including the benefits of investing in a fund that is part of a large family of funds offering a variety of investment disciplines and providing a large variety of mutual fund investor services. The Board noted that Fidelity had taken, or had made recommendations that resulted in the Fidelity funds taking, a number of actions over the previous year that benefited particular funds, including: (i) continuing to dedicate additional resources to Fidelity's investment research process, and to the support of the senior management team that oversees asset management; (ii) continuing efforts to enhance Fidelity's global research capabilities; (iii) launching new funds and making other enhancements to meet client needs; (iv) launching new share classes of existing funds; (v) eliminating purchase minimums and broadening eligibility requirements for certain lower-priced share classes; (vi) reducing management fees and total expenses for certain growth equity funds and index funds; (vii) lowering expense caps for certain existing funds and classes to reduce expenses borne by shareholders; (viii) eliminating short-term redemption fees for certain funds; (ix) introducing a new pricing structure for certain funds of funds that is expected to reduce overall expenses paid by shareholders; (x) rationalizing product lines and gaining increased efficiencies through proposals for fund mergers and share class consolidations; (xi) continuing to develop, acquire and implement systems and technology to improve services to the funds and shareholders, strengthen information security, and increase efficiency; and (xii) implementing enhancements to further strengthen Fidelity's product line to increase investors' probability of success in achieving their investment goals, including retirement income goals.Investment Performance. The Board considered whether the fund has operated in accordance with its investment objective, as well as its record of compliance with its investment restrictions and its performance history.The Board took into account discussions with representatives of the Investment Advisers about fund investment performance that occur at Board meetings throughout the year. In this regard the Board noted that as part of regularly scheduled fund reviews and other reports to the Board on fund performance, the Board considers annualized return information for the fund for different time periods, measured against a securities market index ("benchmark index") and a peer group of funds with similar objectives ("peer group"), if any. In its evaluation of fund investment performance, the Board gave particular attention to information indicating changes in performance of certain Fidelity funds for specific time periods and discussed with the Investment Advisers the reasons for any overperformance or underperformance.In addition to reviewing absolute and relative fund performance, the Independent Trustees periodically consider the appropriateness of fund performance metrics in evaluating the results achieved. In general, the Independent Trustees believe that fund performance should be evaluated based on net performance (after fees and expenses) of both the highest performing and lowest performing fund share classes, where applicable, compared to appropriate benchmark indices, over appropriate time periods that may include full market cycles, and compared to peer groups, as applicable, over the same periods, taking into account relevant factors including the following: general market conditions; issuer-specific information; and fund cash flows and other factors.The Independent Trustees recognize that shareholders evaluate performance on a net basis over their own holding periods, for which one-, three-, and five-year periods are often used as a proxy. For this reason, the performance information reviewed by the Board also included net cumulative calendar year total return information for the fund and an appropriate benchmark index and peer group for the most recent one-, three-, and five-year periods, as shown below. Returns are shown compared to the 25th percentile (top of box, 75% beaten) and 75th percentile (bottom of box, 25% beaten) of the peer universe.Fidelity Capital & Income Fund
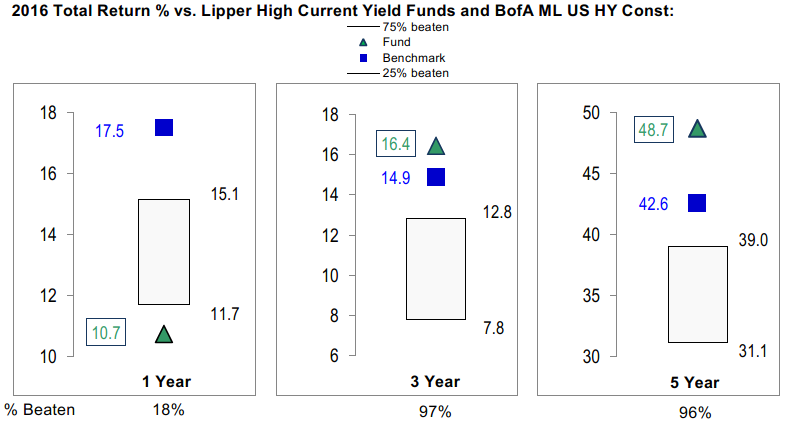
Fidelity Capital & Income Fund
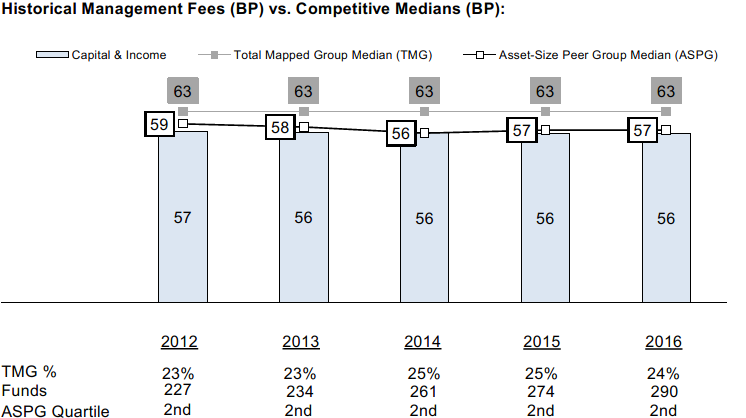
![]()
Corporate Headquarters
245 Summer St.
Boston, MA 02210
www.fidelity.com
CAI-SANN-1217
1.538653.120
Fidelity® Focused High Income Fund Semi-Annual Report October 31, 2017 |
|
Contents
Board Approval of Investment Advisory Contracts and Management Fees |
To view a fund's proxy voting guidelines and proxy voting record for the 12-month period ended June 30, visit http://www.fidelity.com/proxyvotingresults or visit the Securities and Exchange Commission's (SEC) web site at http://www.sec.gov.
You may also call 1-800-544-8544 to request a free copy of the proxy voting guidelines.
Standard & Poor's, S&P and S&P 500 are registered service marks of The McGraw-Hill Companies, Inc. and have been licensed for use by Fidelity Distributors Corporation.
Other third-party marks appearing herein are the property of their respective owners.
All other marks appearing herein are registered or unregistered trademarks or service marks of FMR LLC or an affiliated company. © 2017 FMR LLC. All rights reserved.
This report and the financial statements contained herein are submitted for the general information of the shareholders of the Fund. This report is not authorized for distribution to prospective investors in the Fund unless preceded or accompanied by an effective prospectus.
A fund files its complete schedule of portfolio holdings with the SEC for the first and third quarters of each fiscal year on Form N-Q. Forms N-Q are available on the SEC’s web site at http://www.sec.gov. A fund's Forms N-Q may be reviewed and copied at the SEC’s Public Reference Room in Washington, DC. Information regarding the operation of the SEC's Public Reference Room may be obtained by calling 1-800-SEC-0330.
For a complete list of a fund's portfolio holdings, view the most recent holdings listing, semiannual report, or annual report on Fidelity's web site at http://www.fidelity.com, http://www.institutional.fidelity.com, or http://www.401k.com, as applicable.
NOT FDIC INSURED •MAY LOSE VALUE •NO BANK GUARANTEE
Neither the Fund nor Fidelity Distributors Corporation is a bank.
Investment Summary (Unaudited)
Top Five Holdings as of October 31, 2017
| (by issuer, excluding cash equivalents) | % of fund's net assets | % of fund's net assets 6 months ago |
| Icahn Enterprises LP/Icahn Enterprises Finance Corp. | 4.6 | 3.9 |
| CCO Holdings LLC/CCO Holdings Capital Corp. | 3.1 | 2.0 |
| Citigroup, Inc. | 2.8 | 2.2 |
| T-Mobile U.S.A., Inc. | 2.5 | 3.3 |
| NSG Holdings II LLC/NSG Holdings, Inc. | 2.3 | 2.0 |
| 15.3 |
Top Five Market Sectors as of October 31, 2017
| % of fund's net assets | % of fund's net assets 6 months ago | |
| Energy | 15.0 | 10.7 |
| Banks & Thrifts | 9.3 | 9.7 |
| Technology | 7.9 | 6.3 |
| Diversified Financial Services | 7.3 | 8.0 |
| Cable/Satellite TV | 7.1 | 6.0 |
Quality Diversification (% of fund's net assets)
| As of October 31, 2017 | ||
| BBB | 2.5% | |
| BB | 75.4% | |
| B | 19.1% | |
| Short-Term Investments and Net Other Assets | 3.0% | |

| As of April 30, 2017 | ||
| BBB | 2.5% | |
| BB | 75.2% | |
| B | 18.8% | |
| Short-Term Investments and Net Other Assets | 3.5% | |
We have used ratings from Moody's Investors Service, Inc. Where Moody's® ratings are not available, we have used S&P® ratings. All ratings are as of the date indicated and do not reflect subsequent changes.
Asset Allocation (% of fund's net assets)
| As of October 31, 2017* | ||
| Nonconvertible Bonds | 80.9% | |
| Bank Loan Obligations | 7.7% | |
| Other Investments | 8.4% | |
| Short-Term Investments and Net Other Assets (Liabilities) | 3.0% | |

* Foreign investments - 23.3%
| As of April 30, 2017* | ||
| Nonconvertible Bonds | 81.1% | |
| Bank Loan Obligations | 7.0% | |
| Other Investments | 8.4% | |
| Short-Term Investments and Net Other Assets (Liabilities) | 3.5% | |

* Foreign investments - 32.3%
Investments October 31, 2017 (Unaudited)
Showing Percentage of Net Assets
| Nonconvertible Bonds - 80.9% | |||
| Principal Amount | Value | ||
| Aerospace - 2.2% | |||
| DAE Funding LLC: | |||
| 4% 8/1/20 (a) | $325,000 | $329,875 | |
| 4.5% 8/1/22 (a) | 405,000 | 410,569 | |
| 5% 8/1/24 (a) | 9,095,000 | 9,288,269 | |
| TOTAL AEROSPACE | 10,028,713 | ||
| Air Transportation - 2.0% | |||
| Air Canada Trust Series 2015-1 equipment trust certificate Class C, 5% 3/15/20 (a) | 1,335,000 | 1,365,038 | |
| Allegiant Travel Co. 5.5% 7/15/19 | 2,095,000 | 2,163,088 | |
| Continental Airlines, Inc.: | |||
| pass-thru trust certificates 9.798% 4/1/21 | 60,135 | 65,998 | |
| 5.5% 10/29/20 | 1,292,936 | 1,354,350 | |
| 6.25% 4/11/20 | 1,289,073 | 1,364,806 | |
| Delta Air Lines, Inc. pass-thru trust certificates 8.021% 2/10/24 | 738,922 | 842,371 | |
| United Air Lines, Inc. pass-thru trust certificates Class B, 7.336% 7/2/19 | 82,393 | 87,337 | |
| United Continental Holdings, Inc. 4.25% 10/1/22 | 2,095,000 | 2,105,475 | |
| TOTAL AIR TRANSPORTATION | 9,348,463 | ||
| Automotive & Auto Parts - 0.1% | |||
| Delphi Jersey Holdings PLC 5% 10/1/25 (a) | 605,000 | 609,538 | |
| Banks & Thrifts - 0.9% | |||
| Royal Bank of Scotland Group PLC 5.125% 5/28/24 | 4,100,000 | 4,386,846 | |
| Broadcasting - 1.5% | |||
| AMC Networks, Inc.: | |||
| 4.75% 12/15/22 | 505,000 | 518,256 | |
| 4.75% 8/1/25 | 1,045,000 | 1,043,694 | |
| 5% 4/1/24 | 1,990,000 | 2,027,313 | |
| Sirius XM Radio, Inc.: | |||
| 3.875% 8/1/22 (a) | 1,695,000 | 1,726,781 | |
| 5% 8/1/27 (a) | 1,590,000 | 1,603,913 | |
| TOTAL BROADCASTING | 6,919,957 | ||
| Building Materials - 0.2% | |||
| Eagle Materials, Inc. 4.5% 8/1/26 | 955,000 | 995,588 | |
| Cable/Satellite TV - 6.4% | |||
| Altice U.S. Finance SA 5.375% 7/15/23 (a) | 6,745,000 | 7,031,663 | |
| CCO Holdings LLC/CCO Holdings Capital Corp.: | |||
| 4% 3/1/23 (a) | 1,710,000 | 1,734,590 | |
| 5% 2/1/28 (a) | 3,150,000 | 3,126,375 | |
| 5.125% 5/1/23 (a) | 1,105,000 | 1,151,963 | |
| 5.125% 5/1/27 (a) | 1,760,000 | 1,777,600 | |
| 5.5% 5/1/26 (a) | 4,450,000 | 4,561,250 | |
| 5.875% 5/1/27 (a) | 1,630,000 | 1,706,936 | |
| CSC Holdings, Inc. 5.5% 4/15/27 (a) | 1,320,000 | 1,359,600 | |
| Virgin Media Secured Finance PLC: | |||
| 5.5% 1/15/25 (a) | 590,000 | 619,500 | |
| 5.5% 8/15/26 (a) | 1,460,000 | 1,527,525 | |
| Ziggo Secured Finance BV 5.5% 1/15/27 (a) | 4,765,000 | 4,860,300 | |
| TOTAL CABLE/SATELLITE TV | 29,457,302 | ||
| Chemicals - 1.9% | |||
| CF Industries Holdings, Inc.: | |||
| 3.4% 12/1/21 (a) | 620,000 | 629,573 | |
| 3.45% 6/1/23 | 1,855,000 | 1,831,813 | |
| 4.5% 12/1/26 (a) | 445,000 | 468,458 | |
| 5.15% 3/15/34 | 80,000 | 79,800 | |
| NOVA Chemicals Corp.: | |||
| 4.875% 6/1/24 (a) | 1,065,000 | 1,084,969 | |
| 5.25% 6/1/27 (a) | 970,000 | 989,400 | |
| Olin Corp. 5.125% 9/15/27 | 1,695,000 | 1,781,869 | |
| Valvoline, Inc. 4.375% 8/15/25 (a) | 1,065,000 | 1,075,650 | |
| Versum Materials, Inc. 5.5% 9/30/24 (a) | 865,000 | 921,225 | |
| TOTAL CHEMICALS | 8,862,757 | ||
| Consumer Products - 0.3% | |||
| Edgewell Personal Care Co. 5.5% 6/15/25 (a) | 1,140,000 | 1,197,000 | |
| Containers - 1.4% | |||
| Ardagh Packaging Finance PLC/Ardagh MP Holdings U.S.A., Inc.: | |||
| 4.25% 9/15/22 (a) | 925,000 | 952,750 | |
| 4.625% 5/15/23 (a) | 1,520,000 | 1,561,800 | |
| Crown Americas LLC/Crown Americas Capital Corp. V 4.25% 9/30/26 | 2,500,000 | 2,500,000 | |
| Owens-Brockway Glass Container, Inc. 5.375% 1/15/25 (a) | 460,000 | 491,050 | |
| Silgan Holdings, Inc. 4.75% 3/15/25 (a) | 810,000 | 832,275 | |
| TOTAL CONTAINERS | 6,337,875 | ||
| Diversified Financial Services - 7.3% | |||
| FLY Leasing Ltd.: | |||
| 5.25% 10/15/24 | 435,000 | 436,905 | |
| 6.375% 10/15/21 | 1,970,000 | 2,056,188 | |
| 6.75% 12/15/20 | 1,770,000 | 1,838,676 | |
| Icahn Enterprises LP/Icahn Enterprises Finance Corp.: | |||
| 4.875% 3/15/19 | 2,379,000 | 2,390,895 | |
| 5.875% 2/1/22 | 10,785,000 | 11,142,307 | |
| 6% 8/1/20 | 6,315,000 | 6,512,344 | |
| 6.25% 2/1/22 | 755,000 | 788,975 | |
| 6.75% 2/1/24 | 580,000 | 614,075 | |
| ILFC E-Capital Trust I 3 month U.S. LIBOR + 1.550% 4.36% 12/21/65 (a)(b)(c) | 580,000 | 559,700 | |
| ILFC E-Capital Trust II 3 month U.S. LIBOR + 1.800% 4.61% 12/21/65 (a)(b)(c) | 2,430,000 | 2,357,100 | |
| MSCI, Inc. 4.75% 8/1/26 (a) | 3,350,000 | 3,488,188 | |
| SLM Corp. 5.5% 1/25/23 | 1,455,000 | 1,473,188 | |
| TOTAL DIVERSIFIED FINANCIAL SERVICES | 33,658,541 | ||
| Diversified Media - 0.5% | |||
| Nielsen Finance LLC/Nielsen Finance Co. 5% 4/15/22 (a) | 2,165,000 | 2,229,950 | |
| Energy - 15.0% | |||
| Antero Resources Corp.: | |||
| 5% 3/1/25 | 3,330,000 | 3,379,950 | |
| 5.625% 6/1/23 (Reg. S) | 5,015,000 | 5,253,213 | |
| Antero Resources Finance Corp. 5.375% 11/1/21 | 1,490,000 | 1,529,113 | |
| Cheniere Corpus Christi Holdings LLC: | |||
| 5.125% 6/30/27 (a) | 605,000 | 623,906 | |
| 5.875% 3/31/25 | 1,590,000 | 1,721,175 | |
| 7% 6/30/24 | 1,000,000 | 1,141,250 | |
| Consolidated Energy Finance SA 3 month U.S. LIBOR + 3.750% 5.07% 6/15/22 (a)(b)(c) | 3,290,000 | 3,282,492 | |
| Continental Resources, Inc.: | |||
| 3.8% 6/1/24 | 1,150,000 | 1,116,938 | |
| 4.5% 4/15/23 | 3,690,000 | 3,736,125 | |
| 4.9% 6/1/44 | 1,730,000 | 1,611,063 | |
| Crestwood Midstream Partners LP/Crestwood Midstream Finance Corp. 5.75% 4/1/25 | 2,195,000 | 2,252,619 | |
| CVR Refining LLC/Coffeyville Finance, Inc. 6.5% 11/1/22 | 2,630,000 | 2,702,325 | |
| Diamond Offshore Drilling, Inc. 7.875% 8/15/25 | 805,000 | 861,350 | |
| Energy Transfer Equity LP 4.25% 3/15/23 | 1,055,000 | 1,073,473 | |
| Ensco PLC: | |||
| 4.5% 10/1/24 | 550,000 | 451,000 | |
| 5.2% 3/15/25 | 3,000,000 | 2,527,500 | |
| 8% 1/31/24 | 1,314,000 | 1,300,860 | |
| Hilcorp Energy I LP/Hilcorp Finance Co.: | |||
| 5% 12/1/24 (a) | 2,755,000 | 2,741,225 | |
| 5.75% 10/1/25 (a) | 1,294,000 | 1,324,733 | |
| Jonah Energy LLC 7.25% 10/15/25 (a) | 750,000 | 750,000 | |
| Nabors Industries, Inc. 5.5% 1/15/23 | 4,485,000 | 4,277,569 | |
| Newfield Exploration Co. 5.375% 1/1/26 | 4,360,000 | 4,632,500 | |
| NextEra Energy Partners LP: | |||
| 4.25% 9/15/24 (a) | 365,000 | 368,650 | |
| 4.5% 9/15/27 (a) | 255,000 | 256,594 | |
| NGL Energy Partners LP/NGL Energy Finance Corp. 6.125% 3/1/25 | 755,000 | 715,363 | |
| NGPL PipeCo LLC: | |||
| 4.375% 8/15/22 (a) | 140,000 | 144,025 | |
| 4.875% 8/15/27 (a) | 140,000 | 144,900 | |
| Noble Holding International Ltd.: | |||
| 4.625% 3/1/21 | 1,130,000 | 1,045,250 | |
| 5.25% 3/15/42 | 575,000 | 365,125 | |
| 7.7% 4/1/25 (b) | 835,000 | 726,450 | |
| 7.75% 1/15/24 | 2,355,000 | 2,107,725 | |
| PBF Holding Co. LLC/PBF Finance Corp. 7% 11/15/23 | 395,000 | 410,800 | |
| Precision Drilling Corp.: | |||
| 5.25% 11/15/24 | 360,000 | 333,900 | |
| 6.5% 12/15/21 | 345,000 | 348,450 | |
| 7.75% 12/15/23 | 830,000 | 850,750 | |
| Range Resources Corp.: | |||
| 4.875% 5/15/25 | 850,000 | 820,250 | |
| 5% 8/15/22 | 1,625,000 | 1,604,688 | |
| 5% 3/15/23 | 890,000 | 881,082 | |
| Targa Resources Partners LP/Targa Resources Partners Finance Corp.: | |||
| 4.125% 11/15/19 | 2,120,000 | 2,141,200 | |
| 5% 1/15/28 (a) | 1,390,000 | 1,393,475 | |
| 5.125% 2/1/25 | 390,000 | 401,700 | |
| 5.375% 2/1/27 | 390,000 | 405,113 | |
| The Williams Companies, Inc.: | |||
| 3.7% 1/15/23 | 2,635,000 | 2,658,056 | |
| 4.55% 6/24/24 | 1,970,000 | 2,058,650 | |
| Whiting Petroleum Corp.: | |||
| 5.75% 3/15/21 | 385,000 | 387,888 | |
| 6.25% 4/1/23 | 200,000 | 199,500 | |
| TOTAL ENERGY | 69,059,963 | ||
| Entertainment/Film - 0.1% | |||
| CBS Outdoor Americas Capital LLC/CBS Outdoor Americas Capital Corp.: | |||
| 5.625% 2/15/24 | 345,000 | 363,113 | |
| 5.875% 3/15/25 | 155,000 | 164,203 | |
| TOTAL ENTERTAINMENT/FILM | 527,316 | ||
| Food & Drug Retail - 0.0% | |||
| FAGE International SA/FAGE U.S.A. Dairy Industry, Inc. 5.625% 8/15/26 (a) | 260,000 | 267,069 | |
| Food/Beverage/Tobacco - 2.8% | |||
| C&S Group Enterprises LLC 5.375% 7/15/22 (a) | 920,000 | 892,400 | |
| Darling International, Inc. 5.375% 1/15/22 | 1,492,000 | 1,542,355 | |
| ESAL GmbH 6.25% 2/5/23 (a) | 1,560,000 | 1,501,500 | |
| JBS Investments GmbH 7.75% 10/28/20 (a) | 630,000 | 642,915 | |
| Lamb Weston Holdings, Inc.: | |||
| 4.625% 11/1/24 (a) | 1,375,000 | 1,436,875 | |
| 4.875% 11/1/26 (a) | 1,065,000 | 1,119,581 | |
| Minerva Luxembourg SA 6.5% 9/20/26 (a) | 3,290,000 | 3,411,730 | |
| Vector Group Ltd. 6.125% 2/1/25 (a) | 2,205,000 | 2,287,688 | |
| TOTAL FOOD/BEVERAGE/TOBACCO | 12,835,044 | ||
| Gaming - 3.3% | |||
| GLP Capital LP/GLP Financing II, Inc. 5.375% 4/15/26 | 330,000 | 357,225 | |
| MCE Finance Ltd. 4.875% 6/6/25 (a) | 3,225,000 | 3,254,381 | |
| MGM Growth Properties Operating Partnership LP: | |||
| 4.5% 9/1/26 | 6,595,000 | 6,619,731 | |
| 4.5% 1/15/28 (a) | 1,030,000 | 1,027,425 | |
| Scientific Games Corp.: | |||
| 5% 10/15/25 (a) | 160,000 | 162,400 | |
| 7% 1/1/22 (a) | 1,460,000 | 1,543,950 | |
| Wynn Las Vegas LLC/Wynn Las Vegas Capital Corp. 5.25% 5/15/27 (a) | 710,000 | 725,088 | |
| Wynn Macau Ltd.: | |||
| 4.875% 10/1/24 (a) | 405,000 | 411,602 | |
| 5.5% 10/1/27 (a) | 1,210,000 | 1,225,996 | |
| TOTAL GAMING | 15,327,798 | ||
| Healthcare - 4.8% | |||
| AMAG Pharmaceuticals, Inc. 7.875% 9/1/23 (a) | 190,000 | 193,325 | |
| Community Health Systems, Inc.: | |||
| 5.125% 8/1/21 | 1,080,000 | 1,050,300 | |
| 6.25% 3/31/23 | 2,155,000 | 2,074,188 | |
| CTR Partnership LP/CareTrust Capital Corp. 5.25% 6/1/25 | 1,195,000 | 1,227,863 | |
| HCA Holdings, Inc.: | |||
| 5% 3/15/24 | 1,055,000 | 1,111,706 | |
| 5.25% 6/15/26 | 1,545,000 | 1,643,494 | |
| MPT Operating Partnership LP/MPT Finance Corp.: | |||
| 5% 10/15/27 | 610,000 | 626,775 | |
| 5.25% 8/1/26 | 1,455,000 | 1,514,917 | |
| 6.375% 3/1/24 | 880,000 | 951,500 | |
| Sabra Health Care LP/Sabra Capital Corp. 5.375% 6/1/23 | 995,000 | 1,027,338 | |
| Teleflex, Inc. 4.875% 6/1/26 | 5,830,000 | 6,121,500 | |
| Tenet Healthcare Corp.: | |||
| 4.375% 10/1/21 | 1,100,000 | 1,096,150 | |
| 4.625% 7/15/24 (a) | 715,000 | 703,381 | |
| Valeant Pharmaceuticals International, Inc.: | |||
| 5.5% 11/1/25 (a) | 515,000 | 526,588 | |
| 6.5% 3/15/22 (a) | 695,000 | 736,700 | |
| 7% 3/15/24 (a) | 1,340,000 | 1,450,550 | |
| TOTAL HEALTHCARE | 22,056,275 | ||
| Homebuilders/Real Estate - 1.9% | |||
| CalAtlantic Group, Inc. 5.25% 6/1/26 | 1,765,000 | 1,879,725 | |
| Howard Hughes Corp. 5.375% 3/15/25 (a) | 1,045,000 | 1,073,738 | |
| M.D.C. Holdings, Inc. 6% 1/15/43 | 345,000 | 330,148 | |
| M/I Homes, Inc. 5.625% 8/1/25 | 295,000 | 299,794 | |
| Mattamy Group Corp.: | |||
| 6.5% 10/1/25 (a) | 480,000 | 500,400 | |
| 6.875% 12/15/23 (a) | 245,000 | 257,250 | |
| PulteGroup, Inc. 5% 1/15/27 | 895,000 | 939,750 | |
| Toll Brothers Finance Corp. 4.875% 3/15/27 | 1,898,000 | 1,988,155 | |
| VEREIT Operating Partnership LP: | |||
| 4.125% 6/1/21 | 650,000 | 679,064 | |
| 4.875% 6/1/26 | 650,000 | 694,253 | |
| TOTAL HOMEBUILDERS/REAL ESTATE | 8,642,277 | ||
| Hotels - 0.8% | |||
| Hilton Escrow Issuer LLC 4.25% 9/1/24 | 2,345,000 | 2,394,831 | |
| Hilton Worldwide Finance LLC/Hilton Worldwide Finance Corp.: | |||
| 4.625% 4/1/25 | 750,000 | 773,438 | |
| 4.875% 4/1/27 | 445,000 | 467,250 | |
| TOTAL HOTELS | 3,635,519 | ||
| Leisure - 0.2% | |||
| Hilton Grand Vacations Borrower LLC/Hilton Grand Vacations Borrower, Inc. 6.125% 12/1/24 (a) | 415,000 | 455,463 | |
| Silversea Cruises 7.25% 2/1/25 (a) | 400,000 | 429,000 | |
| TOTAL LEISURE | 884,463 | ||
| Metals/Mining - 2.9% | |||
| ArcelorMittal SA 6.125% 6/1/25 | 1,015,000 | 1,170,772 | |
| FMG Resources (August 2006) Pty Ltd.: | |||
| 4.75% 5/15/22 (a) | 900,000 | 918,000 | |
| 5.125% 5/15/24 (a) | 1,085,000 | 1,116,194 | |
| Freeport-McMoRan, Inc.: | |||
| 3.55% 3/1/22 | 5,505,000 | 5,449,950 | |
| 3.875% 3/15/23 | 370,000 | 363,988 | |
| 4.55% 11/14/24 | 2,340,000 | 2,335,343 | |
| SunCoke Energy Partners LP/SunCoke Energy Partners Finance Corp. 7.5% 6/15/25 (a) | 1,950,000 | 2,042,625 | |
| TOTAL METALS/MINING | 13,396,872 | ||
| Restaurants - 0.8% | |||
| 1011778 BC Unlimited Liability Co./New Red Finance, Inc. 4.25% 5/15/24 (a) | 2,440,000 | 2,457,568 | |
| KFC Holding Co./Pizza Hut Holding LLC: | |||
| 4.75% 6/1/27 (a) | 440,000 | 451,550 | |
| 5.25% 6/1/26 (a) | 670,000 | 711,976 | |
| TOTAL RESTAURANTS | 3,621,094 | ||
| Services - 1.0% | |||
| Aramark Services, Inc. 4.75% 6/1/26 | 2,460,000 | 2,573,111 | |
| Ashtead Capital, Inc.: | |||
| 4.125% 8/15/25 (a) | 415,000 | 418,113 | |
| 4.375% 8/15/27 (a) | 435,000 | 440,438 | |
| CDK Global, Inc. 4.875% 6/1/27 (a) | 505,000 | 526,463 | |
| Corrections Corp. of America 5% 10/15/22 | 105,000 | 109,594 | |
| Prime Security One MS, Inc. 4.875% 7/15/32 (a) | 695,000 | 657,644 | |
| TOTAL SERVICES | 4,725,363 | ||
| Steel - 2.7% | |||
| Commercial Metals Co. 5.375% 7/15/27 | 1,785,000 | 1,843,013 | |
| Steel Dynamics, Inc.: | |||
| 4.125% 9/15/25 (a) | 1,150,000 | 1,152,875 | |
| 5% 12/15/26 | 1,500,000 | 1,590,000 | |
| 5.125% 10/1/21 | 6,445,000 | 6,614,181 | |
| 5.25% 4/15/23 | 1,045,000 | 1,078,963 | |
| TOTAL STEEL | 12,279,032 | ||
| Technology - 7.3% | |||
| EMC Corp. 2.65% 6/1/20 | 1,880,000 | 1,857,503 | |
| Gartner, Inc. 5.125% 4/1/25 (a) | 390,000 | 412,425 | |
| j2 Cloud Services LLC/j2 Global Communications, Inc. 6% 7/15/25 (a) | 385,000 | 405,213 | |
| Micron Technology, Inc.: | |||
| 5.25% 8/1/23 (a) | 1,760,000 | 1,842,016 | |
| 5.25% 1/15/24 (a) | 580,000 | 609,725 | |
| 5.5% 2/1/25 | 615,000 | 653,438 | |
| 5.625% 1/15/26 (a) | 2,825,000 | 3,001,563 | |
| Nuance Communications, Inc.: | |||
| 5.375% 8/15/20 (a) | 2,280,000 | 2,310,780 | |
| 5.625% 12/15/26 (a) | 1,495,000 | 1,588,438 | |
| NXP BV/NXP Funding LLC: | |||
| 3.875% 9/1/22 (a) | 3,470,000 | 3,604,463 | |
| 4.125% 6/1/21 (a) | 2,490,000 | 2,602,050 | |
| 4.625% 6/15/22 (a) | 1,560,000 | 1,671,150 | |
| 4.625% 6/1/23 (a) | 1,705,000 | 1,837,138 | |
| Open Text Corp. 5.875% 6/1/26 (a) | 5,015,000 | 5,435,006 | |
| Qorvo, Inc. 7% 12/1/25 | 1,371,000 | 1,561,638 | |
| Sensata Technologies BV 5% 10/1/25 (a) | 1,915,000 | 2,029,900 | |
| Sensata Technologies UK Financing Co. PLC 6.25% 2/15/26 (a) | 435,000 | 476,325 | |
| Symantec Corp. 5% 4/15/25 (a) | 1,295,000 | 1,353,275 | |
| TTM Technologies, Inc. 5.625% 10/1/25 (a) | 185,000 | 188,700 | |
| TOTAL TECHNOLOGY | 33,440,746 | ||
| Telecommunications - 6.7% | |||
| Altice Financing SA: | |||
| 6.5% 1/15/22 (a) | 3,575,000 | 3,700,125 | |
| 6.625% 2/15/23 (a) | 4,860,000 | 5,122,926 | |
| 7.5% 5/15/26 (a) | 433,000 | 474,676 | |
| Equinix, Inc. 5.375% 5/15/27 | 485,000 | 519,556 | |
| Inmarsat Finance PLC 4.875% 5/15/22 (a) | 600,000 | 612,120 | |
| Level 3 Financing, Inc. 5.25% 3/15/26 | 1,186,000 | 1,225,672 | |
| T-Mobile U.S.A., Inc.: | |||
| 4% 4/15/22 | 1,470,000 | 1,520,531 | |
| 6% 3/1/23 | 3,765,000 | 3,967,369 | |
| 6.375% 3/1/25 | 2,980,000 | 3,218,400 | |
| 6.5% 1/15/24 | 2,535,000 | 2,706,113 | |
| 6.625% 4/1/23 | 70,000 | 73,500 | |
| Telecom Italia Capital SA: | |||
| 6% 9/30/34 | 1,125,000 | 1,260,371 | |
| 6.375% 11/15/33 | 1,885,000 | 2,186,600 | |
| Telecom Italia SpA 5.303% 5/30/24 (a) | 515,000 | 554,913 | |
| Wind Acquisition Finance SA 4.75% 7/15/20 (a) | 2,585,000 | 2,615,762 | |
| Wind Tre SpA 5% 1/20/26 (a) | 895,000 | 900,807 | |
| TOTAL TELECOMMUNICATIONS | 30,659,441 | ||
| Utilities - 5.9% | |||
| Dolphin Subsidiary II, Inc. 7.25% 10/15/21 | 3,140,000 | 3,466,560 | |
| DPL, Inc. 6.75% 10/1/19 | 3,790,000 | 3,988,975 | |
| NRG Energy, Inc.: | |||
| 6.25% 5/1/24 | 360,000 | 382,500 | |
| 6.625% 1/15/27 | 1,390,000 | 1,480,350 | |
| NRG Yield Operating LLC 5% 9/15/26 | 1,340,000 | 1,380,200 | |
| NSG Holdings II LLC/NSG Holdings, Inc. 7.75% 12/15/25 (a) | 9,967,089 | 10,826,750 | |
| The AES Corp.: | |||
| 4.875% 5/15/23 | 3,105,000 | 3,174,863 | |
| 5.125% 9/1/27 | 440,000 | 451,660 | |
| 6% 5/15/26 | 1,880,000 | 2,025,700 | |
| TOTAL UTILITIES | 27,177,558 | ||
| TOTAL NONCONVERTIBLE BONDS | |||
| (Cost $358,770,396) | 372,568,360 | ||
| Bank Loan Obligations - 7.7% | |||
| Aerospace - 1.2% | |||
| TransDigm, Inc.: | |||
| Tranche D, term loan 3 month U.S. LIBOR + 3.000% 4.3273% 6/4/21 (b)(c) | 1,483,630 | 1,492,442 | |
| Tranche F, term loan 3 month U.S. LIBOR + 3.000% 4.274% 6/9/23 (b)(c) | 2,807,226 | 2,818,118 | |
| Tranche G, term loan 3 month U.S. LIBOR + 3.000% 4.2623% 8/22/24 (b)(c) | 1,042,388 | 1,047,110 | |
| TOTAL AEROSPACE | 5,357,670 | ||
| Air Transportation - 1.4% | |||
| American Airlines, Inc.: | |||
| Tranche B, term loan 3 month U.S. LIBOR + 2.000% 3.2378% 10/10/21 (b)(c) | 3,903,466 | 3,909,438 | |
| Tranche B, term loan 3 month U.S. LIBOR + 2.500% 3.7389% 12/14/23 (b)(c) | 1,300,000 | 1,303,068 | |
| United Air Lines, Inc. Tranche B, term loan 3 month U.S. LIBOR + 2.250% 3.5611% 4/1/24 (b)(c) | 1,184,050 | 1,189,082 | |
| TOTAL AIR TRANSPORTATION | 6,401,588 | ||
| Broadcasting - 0.3% | |||
| Nielsen Finance LLC Tranche B 4LN, term loan 3 month U.S. LIBOR + 2.000% 3.2378% 10/4/23 (b)(c) | 1,600,905 | 1,605,660 | |
| Cable/Satellite TV - 0.7% | |||
| Unitymedia Finance LLC Tranche B, term loan 3 month U.S. LIBOR + 2.250% 3.4889% 9/30/25 (b)(c) | 1,155,000 | 1,154,018 | |
| Zayo Group LLC term loan 3 month U.S. LIBOR + 2.000% 3.2389% 1/19/21 (b)(c) | 567,150 | 568,301 | |
| Ziggo Secured Finance Partnership Tranche E, term loan 3 month U.S. LIBOR + 2.500% 3.7389% 4/15/25 (b)(c) | 1,335,000 | 1,337,924 | |
| TOTAL CABLE/SATELLITE TV | 3,060,243 | ||
| Chemicals - 0.0% | |||
| Tronox Blocked Borrower LLC Tranche B, term loan 3 month U.S. LIBOR + 3.000% 4.3231% 9/22/24 (b)(c) | 65,000 | 65,515 | |
| Tronox Finance LLC Tranche B, term loan 3 month U.S. LIBOR + 3.000% 4.3283% 9/22/24 (b)(c) | 150,000 | 151,188 | |
| TOTAL CHEMICALS | 216,703 | ||
| Entertainment/Film - 0.2% | |||
| AMC Entertainment, Inc. Tranche B, term loan 3 month U.S. LIBOR + 2.250% 3.4889% 12/15/22 (b)(c) | 827,888 | 827,698 | |
| Food & Drug Retail - 0.5% | |||
| Albertson's LLC Tranche B, term loan 3 month U.S. LIBOR + 3.000% 4.3172% 6/22/23 (b)(c) | 295,659 | 286,174 | |
| JBS U.S.A. Lux SA Tranche B, term loan 3 month U.S. LIBOR + 2.500% 3.7389% 10/30/22(b)(c) | 1,218,875 | 1,192,218 | |
| Pizza Hut Holdings LLC Tranche B, term loan 3 month U.S. LIBOR + 2.000% 3.2367% 6/16/23 (b)(c) | 955,200 | 960,931 | |
| TOTAL FOOD & DRUG RETAIL | 2,439,323 | ||
| Food/Beverage/Tobacco - 0.1% | |||
| Post Holdings, Inc. Tranche B, term loan 3 month U.S. LIBOR + 2.250% 3.4923% 5/24/24 (b)(c) | 239,400 | 240,554 | |
| Gaming - 0.3% | |||
| CityCenter Holdings LLC Tranche B, term loan 3 month U.S. LIBOR + 2.500% 3.7423% 4/18/24 (b)(c) | 937,650 | 941,522 | |
| Scientific Games Corp. Tranche B, term loan 3 month U.S. LIBOR + 3.250% 4.5159% 8/14/24 (b)(c) | 380,000 | 384,222 | |
| TOTAL GAMING | 1,325,744 | ||
| Healthcare - 0.3% | |||
| Valeant Pharmaceuticals International, Inc. Tranche B, term loan 3 month U.S. LIBOR + 4.750% 5.99% 4/1/22 (b)(c) | 1,502,463 | 1,535,336 | |
| Restaurants - 0.3% | |||
| Burger King Worldwide, Inc. Tranche B, term loan 3 month U.S. LIBOR + 2.250% 3.5276% 2/17/24 (b)(c) | 1,400,099 | 1,401,499 | |
| Super Retail - 0.3% | |||
| PetSmart, Inc. term loan 3 month U.S. LIBOR + 3.000% 4.24% 3/11/22 (b)(c) | 1,450,405 | 1,236,963 | |
| Technology - 0.6% | |||
| Go Daddy Operating Co. LLC Tranche B, term loan 3 month U.S. LIBOR + 2.500% 3.7423% 2/15/24 (b)(c) | 1,574,354 | 1,582,226 | |
| Rackspace Hosting, Inc. Tranche B, term loan 3 month U.S. LIBOR + 3.000% 4.3106% 11/3/23 (b)(c) | 1,101,402 | 1,100,719 | |
| TOTAL TECHNOLOGY | 2,682,945 | ||
| Telecommunications - 0.4% | |||
| Level 3 Financing, Inc. Tranche B, term loan 3 month U.S. LIBOR + 2.250% 3.4889% 2/22/24 (b)(c) | 1,200,000 | 1,204,068 | |
| Sable International Finance Ltd. Tranche B, term loan 3 month U.S. LIBOR + 3.500% 4.7423% 1/31/25 (b)(c) | 135,000 | 135,485 | |
| Sprint Communications, Inc. Tranche B, term loan 3 month U.S. LIBOR + 2.500% 3.75% 2/3/24 (b)(c) | 437,800 | 439,258 | |
| Telesat LLC Tranche B 4LN, term loan 3 month U.S. LIBOR + 3.000% 4.32% 11/17/23 (b)(c) | 39,700 | 39,911 | |
| TOTAL TELECOMMUNICATIONS | 1,818,722 | ||
| Utilities - 1.1% | |||
| Calpine Construction Finance Co. LP Tranche B 1LN, term loan 3 month U.S. LIBOR + 2.250% 3.49% 5/3/20 (b)(c) | 3,983,359 | 3,983,359 | |
| Calpine Corp. Tranche B, term loan 3 month U.S. LIBOR + 1.750% 3% 11/30/17 (b)(c) | 130,227 | 130,227 | |
| The AES Corp. Tranche B, term loan 3 month U.S. LIBOR + 2.000% 3.3172% 5/24/22 (b)(c) | 1,154,200 | 1,156,128 | |
| TOTAL UTILITIES | 5,269,714 | ||
| TOTAL BANK LOAN OBLIGATIONS | |||
| (Cost $35,402,000) | 35,420,362 | ||
| Preferred Securities - 8.4% | |||
| Banks & Thrifts - 8.4% | |||
| Bank of America Corp.: | |||
| 6.1% (b)(d) | 2,835,000 | 3,186,066 | |
| 6.25% (b)(d) | 3,180,000 | 3,573,020 | |
| 6.5% (b)(d) | 3,150,000 | 3,607,876 | |
| Barclays Bank PLC 7.625% 11/21/22 | 6,180,000 | 7,309,289 | |
| Barclays PLC 6.625% (b)(d) | 935,000 | 985,073 | |
| Citigroup, Inc.: | |||
| 5.95% (b)(d) | 10,630,000 | 11,922,544 | |
| 5.95% (b)(d) | 1,070,000 | 1,142,537 | |
| Credit Agricole SA 6.625% (a)(b)(d) | 3,293,000 | 3,485,140 | |
| Goldman Sachs Group, Inc. 5% (b)(d)(e) | 1,520,000 | 1,521,900 | |
| JPMorgan Chase & Co.: | |||
| 5.3% (b)(d) | 485,000 | 522,782 | |
| 6.1% (b)(d) | 985,000 | 1,103,392 | |
| Royal Bank of Scotland Group PLC 7.5% (b)(d) | 425,000 | 458,190 | |
| TOTAL PREFERRED SECURITIES | |||
| (Cost $35,109,733) | 38,817,809 | ||
| Shares | Value | ||
| Money Market Funds - 1.4% | |||
| Fidelity Cash Central Fund, 1.10%(f) | |||
| (Cost $6,275,945) | 6,274,744 | 6,275,999 | |
| TOTAL INVESTMENT IN SECURITIES - 98.4% | |||
| (Cost $435,558,074) | 453,082,530 | ||
| NET OTHER ASSETS (LIABILITIES) - 1.6% | 7,383,933 | ||
| NET ASSETS - 100% | $460,466,463 |
Legend
(a) Security exempt from registration under Rule 144A of the Securities Act of 1933. These securities may be resold in transactions exempt from registration, normally to qualified institutional buyers. At the end of the period, the value of these securities amounted to $169,452,200 or 36.8% of net assets.
(b) Coupon rates for floating and adjustable rate securities reflect the rates in effect at period end.
(c) Coupon is indexed to a floating interest rate which may be multiplied by a specified factor and/or subject to caps or floors.
(d) Security is perpetual in nature with no stated maturity date.
(e) Security or a portion of the security purchased on a delayed delivery or when-issued basis.
(f) Affiliated fund that is generally available only to investment companies and other accounts managed by Fidelity Investments. The rate quoted is the annualized seven-day yield of the fund at period end. A complete unaudited listing of the fund's holdings as of its most recent quarter end is available upon request. In addition, each Fidelity Central Fund's financial statements are available on the SEC's website or upon request.
Affiliated Central Funds
Information regarding fiscal year to date income earned by the Fund from investments in Fidelity Central Funds is as follows:
| Fund | Income earned |
| Fidelity Cash Central Fund | $94,697 |
| Total | $94,697 |
Investment Valuation
The following is a summary of the inputs used, as of October 31, 2017, involving the Fund's assets and liabilities carried at fair value. The inputs or methodology used for valuing securities may not be an indication of the risk associated with investing in those securities. For more information on valuation inputs, and their aggregation into the levels used below, please refer to the Investment Valuation section in the accompanying Notes to Financial Statements.
| Valuation Inputs at Reporting Date: | ||||
| Description | Total | Level 1 | Level 2 | Level 3 |
| Investments in Securities: | ||||
| Corporate Bonds | $372,568,360 | $-- | $372,568,360 | $-- |
| Bank Loan Obligations | 35,420,362 | -- | 35,420,362 | -- |
| Preferred Securities | 38,817,809 | -- | 38,817,809 | -- |
| Money Market Funds | 6,275,999 | 6,275,999 | -- | -- |
| Total Investments in Securities: | $453,082,530 | $6,275,999 | $446,806,531 | $-- |
Other Information
Distribution of investments by country or territory of incorporation, as a percentage of Total Net Assets, is as follows (Unaudited):
| United States of America | 76.7% |
| Luxembourg | 5.4% |
| United Kingdom | 4.3% |
| Netherlands | 4.0% |
| Canada | 3.9% |
| Cayman Islands | 2.1% |
| Bermuda | 1.0% |
| Others (Individually Less Than 1%) | 2.6% |
| 100.0% |
See accompanying notes which are an integral part of the financial statements.
Financial Statements
Statement of Assets and Liabilities
| October 31, 2017 (Unaudited) | ||
| Assets | ||
| Investment in securities, at value — See accompanying schedule: Unaffiliated issuers (cost $429,282,129) | $446,806,531 | |
| Fidelity Central Funds (cost $6,275,945) | 6,275,999 | |
| Total Investment in Securities (cost $435,558,074) | $453,082,530 | |
| Cash | 150,956 | |
| Receivable for investments sold | 6,465,976 | |
| Receivable for fund shares sold | 316,181 | |
| Interest receivable | 5,263,426 | |
| Distributions receivable from Fidelity Central Funds | 13,465 | |
| Prepaid expenses | 1,226 | |
| Total assets | 465,293,760 | |
| Liabilities | ||
| Payable for investments purchased | ||
| Regular delivery | $2,219,050 | |
| Delayed delivery | 1,520,000 | |
| Payable for fund shares redeemed | 336,703 | |
| Distributions payable | 371,228 | |
| Accrued management fee | 240,118 | |
| Other affiliated payables | 97,860 | |
| Other payables and accrued expenses | 42,338 | |
| Total liabilities | 4,827,297 | |
| Net Assets | $460,466,463 | |
| Net Assets consist of: | ||
| Paid in capital | $456,103,559 | |
| Undistributed net investment income | 1,092,892 | |
| Accumulated undistributed net realized gain (loss) on investments | (14,254,444) | |
| Net unrealized appreciation (depreciation) on investments | 17,524,456 | |
| Net Assets, for 52,481,530 shares outstanding | $460,466,463 | |
| Net Asset Value, offering price and redemption price per share ($460,466,463 ÷ 52,481,530 shares) | $8.77 |
See accompanying notes which are an integral part of the financial statements.
Statement of Operations
| Six months ended October 31, 2017 (Unaudited) | ||
| Investment Income | ||
| Dividends | $1,348,290 | |
| Interest | 12,519,905 | |
| Income from Fidelity Central Funds | 94,697 | |
| Total income | 13,962,892 | |
| Expenses | ||
| Management fee | $1,494,223 | |
| Transfer agent fees | 471,366 | |
| Accounting fees and expenses | 109,133 | |
| Custodian fees and expenses | 4,464 | |
| Independent trustees' fees and expenses | 1,056 | |
| Registration fees | 27,922 | |
| Audit | 42,534 | |
| Legal | 518 | |
| Miscellaneous | 2,896 | |
| Total expenses before reductions | 2,154,112 | |
| Expense reductions | (4,144) | 2,149,968 |
| Net investment income (loss) | 11,812,924 | |
| Realized and Unrealized Gain (Loss) | ||
| Net realized gain (loss) on: | ||
| Investment securities: | ||
| Unaffiliated issuers | 8,217,902 | |
| Fidelity Central Funds | 187 | |
| Total net realized gain (loss) | 8,218,089 | |
| Change in net unrealized appreciation (depreciation) on: | ||
| Investment securities: | ||
| Unaffiliated issuers | (2,714,121) | |
| Fidelity Central Funds | (186) | |
| Total change in net unrealized appreciation (depreciation) | (2,714,307) | |
| Net gain (loss) | 5,503,782 | |
| Net increase (decrease) in net assets resulting from operations | $17,316,706 |
See accompanying notes which are an integral part of the financial statements.
Statement of Changes in Net Assets
| Six months ended October 31, 2017 (Unaudited) | Year ended April 30, 2017 | |
| Increase (Decrease) in Net Assets | ||
| Operations | ||
| Net investment income (loss) | $11,812,924 | $30,859,253 |
| Net realized gain (loss) | 8,218,089 | 9,824,846 |
| Change in net unrealized appreciation (depreciation) | (2,714,307) | 22,570,230 |
| Net increase (decrease) in net assets resulting from operations | 17,316,706 | 63,254,329 |
| Distributions to shareholders from net investment income | (11,127,910) | (29,056,213) |
| Share transactions | ||
| Proceeds from sales of shares | 54,332,403 | 192,306,765 |
| Reinvestment of distributions | 8,757,251 | 22,232,204 |
| Cost of shares redeemed | (157,801,595) | (469,747,532) |
| Net increase (decrease) in net assets resulting from share transactions | (94,711,941) | (255,208,563) |
| Redemption fees | 19,071 | 249,211 |
| Total increase (decrease) in net assets | (88,504,074) | (220,761,236) |
| Net Assets | ||
| Beginning of period | 548,970,537 | 769,731,773 |
| End of period | $460,466,463 | $548,970,537 |
| Other Information | ||
| Undistributed net investment income end of period | $1,092,892 | $407,878 |
| Shares | ||
| Sold | 6,233,703 | 22,868,386 |
| Issued in reinvestment of distributions | 1,004,208 | 2,626,415 |
| Redeemed | (18,061,050) | (55,820,827) |
| Net increase (decrease) | (10,823,139) | (30,326,026) |
See accompanying notes which are an integral part of the financial statements.
Financial Highlights
Fidelity Focused High Income Fund
| Six months ended (Unaudited) October 31, | Years ended April 30, | |||||
| 2017 | 2017 | 2016 | 2015 | 2014 | 2013 | |
| Selected Per–Share Data | ||||||
| Net asset value, beginning of period | $8.67 | $8.22 | $8.73 | $9.12 | $9.55 | $9.23 |
| Income from Investment Operations | ||||||
| Net investment income (loss)A | .192 | .397 | .396 | .390 | .444 | .489 |
| Net realized and unrealized gain (loss) | .089 | .423 | (.519) | (.116) | (.102) | .402 |
| Total from investment operations | .281 | .820 | (.123) | .274 | .342 | .891 |
| Distributions from net investment income | (.181) | (.373) | (.389) | (.388) | (.438) | (.468) |
| Distributions from net realized gain | – | – | – | (.278) | (.335) | (.104) |
| Total distributions | (.181) | (.373) | (.389) | (.666) | (.773) | (.572) |
| Redemption fees added to paid in capitalA | –B | .003 | .002 | .002 | .001 | .001 |
| Net asset value, end of period | $8.77 | $8.67 | $8.22 | $8.73 | $9.12 | $9.55 |
| Total ReturnC,D | 3.27% | 10.22% | (1.30)% | 3.20% | 3.92% | 9.99% |
| Ratios to Average Net AssetsE,F | ||||||
| Expenses before reductions | .80%G | .83% | .85% | .85% | .83% | .81% |
| Expenses net of fee waivers, if any | .80%G | .83% | .85% | .85% | .83% | .81% |
| Expenses net of all reductions | .80%G | .82% | .85% | .85% | .83% | .81% |
| Net investment income (loss) | 4.38%G | 4.70% | 4.80% | 4.40% | 4.86% | 5.23% |
| Supplemental Data | ||||||
| Net assets, end of period (000 omitted) | $460,466 | $548,971 | $769,732 | $625,413 | $754,153 | $902,605 |
| Portfolio turnover rateH | 50%G | 51% | 47% | 62% | 77% | 47% |
A Calculated based on average shares outstanding during the period.
B Amount represents less than $.0005 per share.
C Total returns for periods of less than one year are not annualized.
D Total returns would have been lower if certain expenses had not been reduced during the applicable periods shown.
E Fees and expenses of any underlying Fidelity Central Funds are not included in the Fund's expense ratio. The Fund indirectly bears its proportionate share of the expenses of any underlying Fidelity Central Funds.
F Expense ratios reflect operating expenses of the Fund. Expenses before reductions do not reflect amounts reimbursed by the investment adviser or reductions from expense offset arrangements and do not represent the amount paid by the Fund during periods when reimbursements or reductions occur. Expenses net of fee waivers reflect expenses after reimbursement by the investment adviser but prior to reductions from expense offset arrangements. Expenses net of all reductions represent the net expenses paid by the Fund.
G Annualized
H Amount does not include the portfolio activity of any underlying Fidelity Central Funds.
See accompanying notes which are an integral part of the financial statements.
Notes to Financial Statements (Unaudited)
For the period ended October 31, 2017
1. Organization.
Fidelity Focused High Income Fund (the Fund) is a fund of Fidelity Summer Street Trust (the Trust) and is authorized to issue an unlimited number of shares. Share transactions on the Statement of Changes in Net Assets may contain exchanges between affiliated funds. The Trust is registered under the Investment Company Act of 1940, as amended (the 1940 Act), as an open-end management investment company organized as a Massachusetts business trust.
2. Investments in Fidelity Central Funds.
The Fund invests in Fidelity Central Funds, which are open-end investment companies generally available only to other investment companies and accounts managed by the investment adviser and its affiliates. The Fund's Schedule of Investments lists each of the Fidelity Central Funds held as of period end, if any, as an investment of the Fund, but does not include the underlying holdings of each Fidelity Central Fund. As an Investing Fund, the Fund indirectly bears its proportionate share of the expenses of the underlying Fidelity Central Funds.
The Money Market Central Funds seek preservation of capital and current income and are managed by Fidelity Investments Money Management, Inc. (FIMM), an affiliate of the investment adviser. Annualized expenses of the Money Market Central Funds as of their most recent shareholder report date are less than .005%.
A complete unaudited list of holdings for each Fidelity Central Fund is available upon request or at the Securities and Exchange Commission (the SEC) website at www.sec.gov. In addition, the financial statements of the Fidelity Central Funds are available on the SEC website or upon request.
3. Significant Accounting Policies.
The Fund is an investment company and applies the accounting and reporting guidance of the Financial Accounting Standards Board (FASB) Accounting Standards Codification Topic 946 Financial Services – Investments Companies. The financial statements have been prepared in conformity with accounting principles generally accepted in the United States of America (GAAP), which require management to make certain estimates and assumptions at the date of the financial statements. Actual results could differ from those estimates. Subsequent events, if any, through the date that the financial statements were issued have been evaluated in the preparation of the financial statements. The following summarizes the significant accounting policies of the Fund:
Investment Valuation. Investments are valued as of 4:00 p.m. Eastern time on the last calendar day of the period. The Board of Trustees (the Board) has delegated the day to day responsibility for the valuation of the Fund's investments to the Fair Value Committee (the Committee) established by the Fund's investment adviser. In accordance with valuation policies and procedures approved by the Board, the Fund attempts to obtain prices from one or more third party pricing vendors or brokers to value its investments. When current market prices, quotations or currency exchange rates are not readily available or reliable, investments will be fair valued in good faith by the Committee, in accordance with procedures adopted by the Board. Factors used in determining fair value vary by investment type and may include market or investment specific events, changes in interest rates and credit quality. The frequency with which these procedures are used cannot be predicted and they may be utilized to a significant extent. The Committee oversees the Fund's valuation policies and procedures and reports to the Board on the Committee's activities and fair value determinations. The Board monitors the appropriateness of the procedures used in valuing the Fund's investments and ratifies the fair value determinations of the Committee.
The Fund categorizes the inputs to valuation techniques used to value its investments into a disclosure hierarchy consisting of three levels as shown below:
- Level 1 – quoted prices in active markets for identical investments
- Level 2 – other significant observable inputs (including quoted prices for similar investments, interest rates, prepayment speeds, etc.)
- Level 3 – unobservable inputs (including the Fund's own assumptions based on the best information available)
Valuation techniques used to value the Fund's investments by major category are as follows:
Debt securities, including restricted securities, are valued based on evaluated prices received from third party pricing vendors or from brokers who make markets in such securities. Corporate bonds, bank loan obligations and preferred securities are valued by pricing vendors who utilize matrix pricing which considers yield or price of bonds of comparable quality, coupon, maturity and type or by broker-supplied prices. When independent prices are unavailable or unreliable, debt securities may be valued utilizing pricing methodologies which consider similar factors that would be used by third party pricing vendors. Debt securities are generally categorized as Level 2 in the hierarchy but may be Level 3 depending on the circumstances. The Fund invests a significant portion of its assets in below investment grade securities. The value of these securities can be more volatile due to changes in the credit quality of the issuer and is sensitive to changes in economic, market and regulatory conditions.
Investments in open-end mutual funds, including the Fidelity Central Funds, are valued at their closing net asset value (NAV) each business day and are categorized as Level 1 in the hierarchy.
Changes in valuation techniques may result in transfers in or out of an assigned level within the disclosure hierarchy. The aggregate value of investments by input level as of October 31, 2017 is included at the end of the Fund's Schedule of Investments.
Investment Transactions and Income. For financial reporting purposes, the Fund's investment holdings and NAV include trades executed through the end of the last business day of the period. The NAV per share for processing shareholder transactions is calculated as of the close of business of the New York Stock Exchange (NYSE), normally 4:00 p.m. Eastern time and includes trades executed through the end of the prior business day. Gains and losses on securities sold are determined on the basis of identified cost. Dividend income is recorded on the ex-dividend date. Income and capital gain distributions from Fidelity Central Funds, if any, are recorded on the ex-dividend date. Interest income is accrued as earned and includes coupon interest and amortization of premium and accretion of discount on debt securities as applicable. Debt obligations may be placed on non-accrual status and related interest income may be reduced by ceasing current accruals and writing off interest receivables when the collection of all or a portion of interest has become doubtful based on consistently applied procedures. A debt obligation is removed from non-accrual status when the issuer resumes interest payments or when collectability of interest is reasonably assured.
Expenses. Expenses directly attributable to a fund are charged to that fund. Expenses attributable to more than one fund are allocated among the respective funds on the basis of relative net assets or other appropriate methods. Expense estimates are accrued in the period to which they relate and adjustments are made when actual amounts are known.
Income Tax Information and Distributions to Shareholders. Each year, the Fund intends to qualify as a regulated investment company under Subchapter M of the Internal Revenue Code, including distributing substantially all of its taxable income and realized gains. As a result, no provision for U.S. Federal income taxes is required. The Fund files a U.S. federal tax return, in addition to state and local tax returns as required. The Fund's federal income tax returns are subject to examination by the Internal Revenue Service (IRS) for a period of three fiscal years after they are filed. State and local tax returns may be subject to examination for an additional fiscal year depending on the jurisdiction.
Dividends are declared and recorded daily and paid monthly from net investment income. Distributions from realized gains, if any, are declared and recorded on the ex-dividend date. Income and capital gain distributions are determined in accordance with income tax regulations, which may differ from GAAP.
Capital accounts within the financial statements are adjusted for permanent book-tax differences. These adjustments have no impact on net assets or the results of operations. Capital accounts are not adjusted for temporary book-tax differences which will reverse in a subsequent period.
Book-tax differences are primarily due to market discount, capital loss carryforwards and losses deferred due to wash sales.
As of period end, the cost and unrealized appreciation (depreciation) in securities, and derivatives if applicable, for federal income tax purposes were as follows:
| Gross unrealized appreciation | $19,614,323 |
| Gross unrealized depreciation | (1,076,637) |
| Net unrealized appreciation (depreciation) | $18,537,686 |
| Tax cost | $434,544,844 |
Capital loss carryforwards are only available to offset future capital gains of the Fund to the extent provided by regulations and may be limited. Under the Regulated Investment Company Modernization Act of 2010 (the Act), the Fund is permitted to carry forward capital losses incurred in taxable years beginning after December 22, 2010 for an unlimited period and such capital losses are required to be used prior to any losses that expire. The capital loss carryforward information presented below, including any applicable limitation, is estimated as of prior fiscal period end and is subject to adjustment.
| No expiration | |
| Short-term | $(11,779,142) |
| Long-term | (10,559,985) |
| Total capital loss carryforward | $(22,339,127) |
Short-Term Trading (Redemption) Fees. Shares held by investors in the Fund less than 90 days may have been subject to a redemption fee equal to 1.00% of the NAV of shares redeemed. All redemption fees, which reduce the proceeds of the shareholder redemption, are retained by the Fund and accounted for as an addition to paid in capital. In November 2017, the Board of Trustees approved the elimination of these redemption fees effective December 18, 2017.
Delayed Delivery Transactions and When-Issued Securities. During the period, the Fund transacted in securities on a delayed delivery or when-issued basis. Payment and delivery may take place after the customary settlement period for that security. The price of the underlying securities and the date when the securities will be delivered and paid for are fixed at the time the transaction is negotiated. The securities purchased on a delayed delivery or when-issued basis are identified as such in the Fund's Schedule of Investments. The Fund may receive compensation for interest forgone in the purchase of a delayed delivery or when-issued security. With respect to purchase commitments, the Fund identifies securities as segregated in its records with a value at least equal to the amount of the commitment. Losses may arise due to changes in the value of the underlying securities or if the counterparty does not perform under the contract's terms, or if the issuer does not issue the securities due to political, economic, or other factors.
Restricted Securities. The Fund may invest in securities that are subject to legal or contractual restrictions on resale. These securities generally may be resold in transactions exempt from registration or to the public if the securities are registered. Disposal of these securities may involve time-consuming negotiations and expense, and prompt sale at an acceptable price may be difficult. Information regarding restricted securities is included at the end of the Fund's Schedule of Investments.
Loans and Other Direct Debt Instruments. The Fund invests in direct debt instruments which are interests in amounts owed to lenders by corporate or other borrowers. These instruments may be in the form of loans, trade claims or other receivables and may include standby financing commitments such as revolving credit facilities that obligate the Fund to supply additional cash to the borrower on demand. Loans may be acquired through assignment or participation. The Fund did not have any unfunded loan commitments, which are contractual obligations for future funding, at period end.
New Accounting Pronouncement. In March 2017, the Financial Accounting Standards Board (FASB) issued an Accounting Standards Update (ASU), ASU 2017-08, which amends the amortization period for certain callable debt securities that are held at a premium. The amendment requires the premium to be amortized to the earliest call date. The amendments do not require an accounting change for securities held at a discount. The ASU is effective for annual periods beginning after December 15, 2018. Management is currently evaluating the potential impact of these changes to the financial statements.
4. Purchases and Sales of Investments.
Purchases and sales of securities, other than short-term securities, aggregated $128,178,545 and $216,721,116, respectively.
5. Fees and Other Transactions with Affiliates.
Management Fee. Fidelity Management & Research Company (the investment adviser) and its affiliates provide the Fund with investment management related services for which the Fund pays a monthly management fee. The management fee is the sum of an individual fund fee rate that is based on an annual rate of .45% of the Fund's average net assets and an annualized group fee rate that averaged .11% during the period. The group fee rate is based upon the average net assets of all the mutual funds advised by the investment adviser, including any mutual funds previously advised by the investment adviser that are currently advised by Fidelity SelectCo, LLC, an affiliate of the investment adviser. The group fee rate decreases as assets under management increase and increases as assets under management decrease. For the reporting period, the total annualized management fee rate was .56% of the Fund's average net assets.
Transfer Agent Fees. Fidelity Investments Institutional Operations Company, Inc. (FIIOC), an affiliate of the investment adviser, is the Fund's transfer, dividend disbursing and shareholder servicing agent. FIIOC receives account fees and asset-based fees that vary according to account size and type of account. FIIOC pays for typesetting, printing and mailing of shareholder reports, except proxy statements. For the period, the transfer agent fees were equivalent to an annualized rate of .17% of average net assets.
Accounting Fees. Fidelity Service Company, Inc. (FSC), an affiliate of the investment adviser, maintains the Fund's accounting records. The fee is based on the level of average net assets for each month.
Interfund Trades. The Fund may purchase from or sell securities to other Fidelity Funds under procedures adopted by the Board. The procedures have been designed to ensure these interfund trades are executed in accordance with Rule 17a-7 of the 1940 Act. Interfund trades are included within the respective purchases and sales amounts shown in the Purchases and Sales of Investments note.
6. Committed Line of Credit.
The Fund participates with other funds managed by the investment adviser or an affiliate in a $4.25 billion credit facility (the "line of credit") to be utilized for temporary or emergency purposes to fund shareholder redemptions or for other short-term liquidity purposes. The Fund has agreed to pay commitment fees on its pro-rata portion of the line of credit, which amounted to $817 and is reflected in Miscellaneous expenses on the Statement of Operations. During the period, the Fund did not borrow on this line of credit.
7. Expense Reductions.
Through arrangements with the Fund's custodian, credits realized as a result of certain uninvested cash balances were used to reduce the Fund's expenses. During the period, these credits reduced the Fund's custody expenses by $2,297.
In addition, during the period the investment adviser reimbursed and/or waived a portion of operating expenses in the amount of $1,847.
8. Other.
The Fund's organizational documents provide former and current trustees and officers with a limited indemnification against liabilities arising in connection with the performance of their duties to the Fund. In the normal course of business, the Fund may also enter into contracts that provide general indemnifications. The Fund's maximum exposure under these arrangements is unknown as this would be dependent on future claims that may be made against the Fund. The risk of material loss from such claims is considered remote.
Shareholder Expense Example
As a shareholder of a Fund, you incur two types of costs: (1) transaction costs, including redemption fees and (2) ongoing costs, including management fees and other Fund expenses. This Example is intended to help you understand your ongoing costs (in dollars) of investing in the Funds and to compare these costs with the ongoing costs of investing in other mutual funds.
The Example is based on an investment of $1,000 invested at the beginning of the period and held for the entire period (May 1, 2017 to October 31, 2017).
Actual Expenses
The first line of the accompanying table provides information about actual account values and actual expenses. You may use the information in this line, together with the amount you invested, to estimate the expenses that you paid over the period. Simply divide your account value by $1,000.00 (for example, an $8,600 account value divided by $1,000.00 = 8.6), then multiply the result by the number in the first line under the heading entitled "Expenses Paid During Period" to estimate the expenses you paid on your account during this period. A small balance maintenance fee of $12.00 that is charged once a year may apply for certain accounts with a value of less than $2,000. This fee is not included in the table below. If it was, the estimate of expenses you paid during the period would be higher, and your ending account value lower, by this amount. In addition, the Fund, as a shareholder in the underlying Fidelity Central Funds, will indirectly bear its pro-rata share of the fees and expenses incurred by the underlying Fidelity Central Funds. These fees and expenses are not included in the Fund's annualized expense ratio used to calculate the expense estimate in the table below.
Hypothetical Example for Comparison Purposes
The second line of the accompanying table provides information about hypothetical account values and hypothetical expenses based on the Fund's actual expense ratio and an assumed rate of return of 5% per year before expenses, which is not the Fund's actual return. The hypothetical account values and expenses may not be used to estimate the actual ending account balance or expenses you paid for the period. You may use this information to compare the ongoing costs of investing in the Fund and other funds. To do so, compare this 5% hypothetical example with the 5% hypothetical examples that appear in the shareholder reports of the other funds. A small balance maintenance fee of $12.00 that is charged once a year may apply for certain accounts with a value of less than $2,000. This fee is not included in the table below. If it was, the estimate of expenses you paid during the period would be higher, and your ending account value lower, by this amount. In addition, the Fund, as a shareholder in the underlying Fidelity Central Funds, will indirectly bear its pro-rata share of the fees and expenses incurred by the underlying Fidelity Central Funds. These fees and expenses are not included in the Fund's annualized expense ratio used to calculate the expense estimate in the table below.
Please note that the expenses shown in the table are meant to highlight your ongoing costs only and do not reflect any transaction costs. Therefore, the second line of the table is useful in comparing ongoing costs only, and will not help you determine the relative total costs of owning different funds. In addition, if these transactional costs were included, your costs would have been higher.
| Annualized Expense Ratio-A | Beginning Account Value May 1, 2017 | Ending Account Value October 31, 2017 | Expenses Paid During Period-B May 1, 2017 to October 31, 2017 | |
| Actual | .80% | $1,000.00 | $1,032.70 | $4.10 |
| Hypothetical-C | $1,000.00 | $1,021.17 | $4.08 |
A Annualized expense ratio reflects expenses net of applicable fee waivers.
B Expenses are equal to the Fund's annualized expense ratio, multiplied by the average account value over the period, multiplied by 184/365 (to reflect the one-half year period).
C 5% return per year before expenses
Board Approval of Investment Advisory Contracts and Management Fees
Fidelity Focused High Income Fund
Each year, the Board of Trustees, including the Independent Trustees (together, the Board), votes on the renewal of the management contract with Fidelity Management & Research Company (FMR) and the sub-advisory agreements (together, the Advisory Contracts) for the fund. FMR and the sub-advisers are referred to herein as the Investment Advisers. The Board, assisted by the advice of fund counsel and Independent Trustees' counsel, requests and considers a broad range of information relevant to the renewal of the Advisory Contracts throughout the year.
The Board meets regularly and, at each of its meetings, covers an extensive agenda of topics and materials and considers factors that are relevant to its annual consideration of the renewal of the fund's Advisory Contracts, including the services and support provided to the fund and its shareholders. The Board has established various standing committees (Committees), each composed of and chaired by Independent Trustees with varying backgrounds, to which the Board has assigned specific subject matter responsibilities in order to enhance effective decision-making by the Board. The Board, acting directly and through its Committees, requests and receives information concerning the annual consideration of the renewal of the fund's Advisory Contracts. The Board also meets as needed to review matters specifically related to the Board's annual consideration of the renewal of the Advisory Contracts. Members of the Board may also meet with trustees of other Fidelity funds through ad hoc joint committees to discuss certain matters relevant to all of the Fidelity funds.
At its July 2017 meeting, the Board unanimously determined to renew the fund's Advisory Contracts. In reaching its determination, the Board considered all factors it believed relevant, including (i) the nature, extent, and quality of the services to be provided to the fund and its shareholders (including the investment performance of the fund); (ii) the competitiveness of the fund's management fee and total expense ratio relative to peer funds; (iii) the total costs of the services to be provided by and the profits to be realized by Fidelity from its relationships with the fund; and (iv) the extent to which, if any, economies of scale exist and would be realized as the fund grows, and whether any economies of scale are appropriately shared with fund shareholders.
In considering whether to renew the Advisory Contracts for the fund, the Board reached a determination, with the assistance of fund counsel and Independent Trustees' counsel and through the exercise of its business judgment, that the renewal of the Advisory Contracts was in the best interests of the fund and its shareholders and that the compensation payable under the Advisory Contracts was fair and reasonable. The Board's decision to renew the Advisory Contracts was not based on any single factor, but rather was based on a comprehensive consideration of all the information provided to the Board at its meetings throughout the year. The Board, in reaching its determination to renew the Advisory Contracts, was aware that shareholders of the fund have a broad range of investment choices available to them, including a wide choice among funds offered by Fidelity's competitors, and that the fund's shareholders, who have the opportunity to review and weigh the disclosure provided by the fund in its prospectus and other public disclosures, have chosen to invest in this fund, which is part of the Fidelity family of funds.
Amendment to Group Fee Rate. The Board also approved an amendment to the management contract for the fund to add an additional breakpoint to the group fee schedule, effective October 1, 2017. The Board noted that the additional breakpoint would result in lower management fee rates as Fidelity's assets under management increase.
Nature, Extent, and Quality of Services Provided. The Board considered Fidelity's staffing as it relates to the fund, including the backgrounds of investment personnel of Fidelity, and also considered the fund's investment objective, strategies, and related investment philosophy. The Independent Trustees also had discussions with senior management of Fidelity's investment operations and investment groups. The Board considered the structure of the investment personnel compensation program and whether this structure provides appropriate incentives to act in the best interests of the fund. Additionally, the Board considered the portfolio managers' investments, if any, in the funds that they manage.Resources Dedicated to Investment Management and Support Services. The Board and the Fund Oversight and Research Committees reviewed the general qualifications and capabilities of Fidelity's investment staff, including its size, education, experience, and resources, as well as Fidelity's approach to recruiting, training, managing, and compensating investment personnel. The Board noted that Fidelity has continued to increase the resources devoted to non-U.S. offices, including expansion of Fidelity's global investment organization. The Board also noted that Fidelity's analysts have extensive resources, tools and capabilities that allow them to conduct sophisticated quantitative and fundamental analysis, as well as credit analysis of issuers, counterparties and guarantors. Further, the Board considered that Fidelity's investment professionals have sufficient access to global information and data so as to provide competitive investment results over time, and that those professionals also have access to sophisticated tools that permit them to assess portfolio construction and risk and performance attribution characteristics continuously, as well as to transmit new information and research conclusions rapidly around the world. Additionally, in its deliberations, the Board considered Fidelity's trading, risk management, compliance, and technology and operations capabilities and resources, which are integral parts of the investment management process.Shareholder and Administrative Services. The Board considered (i) the nature, extent, quality, and cost of advisory, administrative, and shareholder services performed by the Investment Advisers and their affiliates under the Advisory Contracts and under separate agreements covering transfer agency, pricing and bookkeeping, and securities lending services for the fund; (ii) the nature and extent of the supervision of third party service providers, principally custodians, subcustodians, and pricing vendors; and (iii) the resources devoted to, and the record of compliance with, the fund's compliance policies and procedures. The Board also reviewed the allocation of fund brokerage, including allocations to brokers affiliated with the Investment Advisers, the use of brokerage commissions to pay fund expenses, and the use of "soft" commission dollars to pay for research services.The Board noted that the growth of fund assets over time across the complex allows Fidelity to reinvest in the development of services designed to enhance the value or convenience of the Fidelity funds as investment vehicles. These services include 24-hour access to account information and market information through telephone representatives and over the Internet, investor education materials and asset allocation tools, and the expanded availability of Fidelity Investor Centers.In 2014, the Board formed an ad hoc Committee on Transfer Agency Fees to review the variety of transfer agency fee structures throughout the industry and Fidelity's competitive positioning with respect to industry participants.Investment in a Large Fund Family. The Board considered the benefits to shareholders of investing in a Fidelity fund, including the benefits of investing in a fund that is part of a large family of funds offering a variety of investment disciplines and providing a large variety of mutual fund investor services. The Board noted that Fidelity had taken, or had made recommendations that resulted in the Fidelity funds taking, a number of actions over the previous year that benefited particular funds, including: (i) continuing to dedicate additional resources to Fidelity's investment research process, and to the support of the senior management team that oversees asset management; (ii) continuing efforts to enhance Fidelity's global research capabilities; (iii) launching new funds and making other enhancements to meet client needs; (iv) launching new share classes of existing funds; (v) eliminating purchase minimums and broadening eligibility requirements for certain lower-priced share classes; (vi) reducing management fees and total expenses for certain growth equity funds and index funds; (vii) lowering expense caps for certain existing funds and classes to reduce expenses borne by shareholders; (viii) eliminating short-term redemption fees for certain funds; (ix) introducing a new pricing structure for certain funds of funds that is expected to reduce overall expenses paid by shareholders; (x) rationalizing product lines and gaining increased efficiencies through proposals for fund mergers and share class consolidations; (xi) continuing to develop, acquire and implement systems and technology to improve services to the funds and shareholders, strengthen information security, and increase efficiency; and (xii) implementing enhancements to further strengthen Fidelity's product line to increase investors' probability of success in achieving their investment goals, including retirement income goals.Investment Performance. The Board considered whether the fund has operated in accordance with its investment objective, as well as its record of compliance with its investment restrictions and its performance history.The Board took into account discussions with representatives of the Investment Advisers about fund investment performance that occur at Board meetings throughout the year. In this regard the Board noted that as part of regularly scheduled fund reviews and other reports to the Board on fund performance, the Board considers annualized return information for the fund for different time periods, measured against a securities market index ("benchmark index") and a peer group of funds with similar objectives ("peer group"), if any. In its evaluation of fund investment performance, the Board gave particular attention to information indicating changes in performance of certain Fidelity funds for specific time periods and discussed with the Investment Advisers the reasons for any overperformance or underperformance.In addition to reviewing absolute and relative fund performance, the Independent Trustees periodically consider the appropriateness of fund performance metrics in evaluating the results achieved. In general, the Independent Trustees believe that fund performance should be evaluated based on net performance (after fees and expenses) of both the highest performing and lowest performing fund share classes, where applicable, compared to appropriate benchmark indices, over appropriate time periods that may include full market cycles, and compared to peer groups, as applicable, over the same periods, taking into account relevant factors including the following: general market conditions; issuer-specific information; and fund cash flows and other factors.The Independent Trustees recognize that shareholders evaluate performance on a net basis over their own holding periods, for which one-, three-, and five-year periods are often used as a proxy. For this reason, the performance information reviewed by the Board also included net cumulative calendar year total return information for the fund and an appropriate benchmark index and peer group for the most recent one-, three-, and five-year periods, as shown below. Returns are shown compared to the 25th percentile (top of box, 75% beaten) and 75th percentile (bottom of box, 25% beaten) of the peer universe.Fidelity Focused High Income Fund
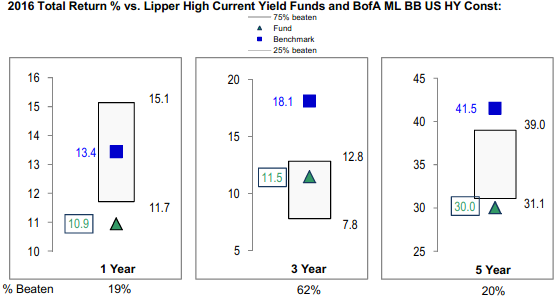
Fidelity Focused High Income Fund
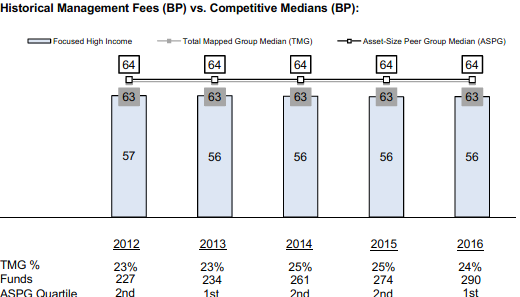
![]()
Corporate Headquarters
245 Summer St.
Boston, MA 02210
www.fidelity.com
FFH-SANN-1217
1.801609.114
Fidelity Advisor® Global High Income Fund - Semi-Annual Report October 31, 2017 Class A, Class M, Class C and Class I are classes of Fidelity® Global High Income Fund |
|
Contents
Board Approval of Investment Advisory Contracts and Management Fees |
To view a fund's proxy voting guidelines and proxy voting record for the 12-month period ended June 30, visit http://www.fidelity.com/proxyvotingresults or visit the Securities and Exchange Commission's (SEC) web site at http://www.sec.gov.
You may also call 1-877-208-0098 to request a free copy of the proxy voting guidelines.
Standard & Poor's, S&P and S&P 500 are registered service marks of The McGraw-Hill Companies, Inc. and have been licensed for use by Fidelity Distributors Corporation.
Other third-party marks appearing herein are the property of their respective owners.
All other marks appearing herein are registered or unregistered trademarks or service marks of FMR LLC or an affiliated company. © 2017 FMR LLC. All rights reserved.
This report and the financial statements contained herein are submitted for the general information of the shareholders of the Fund. This report is not authorized for distribution to prospective investors in the Fund unless preceded or accompanied by an effective prospectus.
A fund files its complete schedule of portfolio holdings with the SEC for the first and third quarters of each fiscal year on Form N-Q. Forms N-Q are available on the SEC’s web site at http://www.sec.gov. A fund's Forms N-Q may be reviewed and copied at the SEC’s Public Reference Room in Washington, DC. Information regarding the operation of the SEC's Public Reference Room may be obtained by calling 1-800-SEC-0330.
For a complete list of a fund's portfolio holdings, view the most recent holdings listing, semiannual report, or annual report on Fidelity's web site at http://www.fidelity.com, http://www.institutional.fidelity.com, or http://www.401k.com, as applicable.
NOT FDIC INSURED •MAY LOSE VALUE •NO BANK GUARANTEE
Neither the Fund nor Fidelity Distributors Corporation is a bank.
Investment Summary (Unaudited)
Top Five Holdings as of October 31, 2017
| (by issuer, excluding cash equivalents) | % of fund's net assets | % of fund's net assets 6 months ago |
| Ally Financial, Inc. | 2.5 | 2.0 |
| APX Group, Inc. | 1.4 | 1.6 |
| TerraForm Power Operating LLC | 1.4 | 0.7 |
| Valeant Pharmaceuticals International, Inc. | 1.3 | 1.2 |
| Chesapeake Energy Corp. | 1.0 | 1.2 |
| 7.6 |
Top Five Countries as of October 31, 2017
| (excluding cash equivalents) | % of fund's net assets | % of fund's net assets 6 months ago |
| United States of America | 40.7 | 45.0 |
| Luxembourg | 8.7 | 8.1 |
| Netherlands | 6.1 | 6.4 |
| Cayman Islands | 5.7 | 4.5 |
| Canada | 3.6 | 3.5 |
Top Five Market Sectors as of October 31, 2017
| % of fund's net assets | % of fund's net assets 6 months ago | |
| Energy | 14.3 | 12.2 |
| Banks & Thrifts | 10.0 | 11.0 |
| Telecommunications | 9.0 | 11.1 |
| Healthcare | 6.0 | 5.9 |
| Cable/Satellite TV | 5.4 | 5.7 |
Quality Diversification (% of fund's net assets)
| As of October 31, 2017 | ||
| AAA,AA,A | 0.3% | |
| BBB | 2.6% | |
| BB | 37.4% | |
| B | 33.9% | |
| CCC,CC,C | 12.6% | |
| Not Rated | 4.9% | |
| Equities | 1.6% | |
| Short-Term Investments and Net Other Assets | 6.7% | |
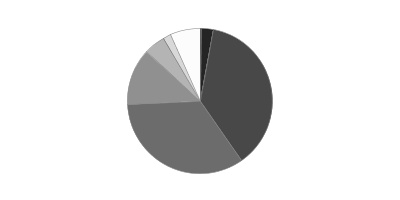
| As of April 30, 2017 | ||
| AAA,AA,A | 0.1% | |
| BBB | 2.5% | |
| BB | 35.7% | |
| B | 31.7% | |
| CCC,CC,C | 16.9% | |
| Not Rated | 4.5% | |
| Equities | 2.1% | |
| Short-Term Investments and Net Other Assets | 6.5% | |
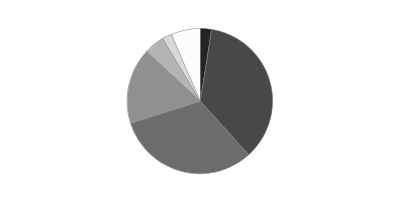
We have used ratings from Moody's Investors Service, Inc. Where Moody's® ratings are not available, we have used S&P® ratings. All ratings are as of the date indicated and do not reflect subsequent changes.
Asset Allocation (% of fund's net assets)
| As of October 31, 2017* | ||
| Corporate Bonds | 80.4% | |
| Stocks | 1.6% | |
| Preferred Securities | 7.4% | |
| Other Investments | 3.9% | |
| Short-Term Investments and Net Other Assets (Liabilities) | 6.7% | |

* Foreign investments - 52.6%
| As of April 30, 2017* | ||
| Corporate Bonds | 81.1% | |
| Stocks | 2.1% | |
| Preferred Securities | 7.4% | |
| Other Investments | 2.9% | |
| Short-Term Investments and Net Other Assets (Liabilities) | 6.5% | |

* Foreign investments - 48.5%
Investments October 31, 2017 (Unaudited)
Showing Percentage of Net Assets
| Nonconvertible Bonds - 80.4% | |||
| Principal Amount(a) | Value | ||
| Aerospace - 0.4% | |||
| DAE Funding LLC: | |||
| 4.5% 8/1/22 (b) | $50,000 | $50,688 | |
| 5% 8/1/24 (b) | 65,000 | 66,381 | |
| Leonardo SpA: | |||
| 1.5% 6/7/24 (Reg. S) | EUR | 200,000 | 238,534 |
| 4.875% 3/24/25 | EUR | 100,000 | 144,946 |
| TOTAL AEROSPACE | 500,549 | ||
| Air Transportation - 1.0% | |||
| Aeropuertos Argentina 2000 SA 6.875% 2/1/27 (b) | 350,000 | 377,125 | |
| Azul Investments LLP 5.875% 10/26/24 (b) | 200,000 | 199,300 | |
| Continental Airlines, Inc. 6.125% 4/29/18 | 55,000 | 55,809 | |
| Rumo Luxembourg Sarl 7.375% 2/9/24 (b) | 300,000 | 326,850 | |
| United Continental Holdings, Inc.: | |||
| 4.25% 10/1/22 | 300,000 | 301,500 | |
| 6.375% 6/1/18 | 45,000 | 46,013 | |
| TOTAL AIR TRANSPORTATION | 1,306,597 | ||
| Automotive - 0.4% | |||
| Schaeffler Finance BV 3.5% 5/15/22 (Reg. S) | EUR | 200,000 | 237,629 |
| Tenedora Nemak SA de CV 5.5% 2/28/23 (b) | 300,000 | 307,890 | |
| TOTAL AUTOMOTIVE | 545,519 | ||
| Automotive & Auto Parts - 1.9% | |||
| Allison Transmission, Inc. 4.75% 10/1/27 (b) | 300,000 | 303,000 | |
| American Tire Distributors, Inc. 10.25% 3/1/22 (b) | 170,000 | 177,438 | |
| Delphi Jersey Holdings PLC 5% 10/1/25 (b) | 80,000 | 80,600 | |
| Faurecia SA 3.625% 6/15/23 (Reg. S) | EUR | 100,000 | 123,202 |
| Fiat Finance & Trade Ltd. SA 7.375% 7/9/18 | EUR | 200,000 | 244,273 |
| IHO Verwaltungs GmbH 3.75% 9/15/26 pay-in-kind(Reg. S) (c) | EUR | 300,000 | 373,917 |
| Jaguar Land Rover PLC 4.5% 10/1/27 (b) | 230,000 | 227,705 | |
| Lithia Motors, Inc. 5.25% 8/1/25 (b) | 40,000 | 41,950 | |
| Metalsa SA de CV 4.9% 4/24/23 (b) | 200,000 | 203,000 | |
| Tesla, Inc. 5.3% 8/15/25 (b) | 220,000 | 212,300 | |
| Volkswagen International Finance NV 0.5% 3/30/21 (Reg. S) | EUR | 100,000 | 117,804 |
| ZF North America Capital, Inc.: | |||
| 2.25% 4/26/19 (Reg. S) | EUR | 100,000 | 120,178 |
| 2.75% 4/27/23 (Reg. S) | EUR | 100,000 | 125,949 |
| TOTAL AUTOMOTIVE & AUTO PARTS | 2,351,316 | ||
| Banks & Thrifts - 6.4% | |||
| Access Bank PLC 10.5% 10/19/21 (b) | 25,000 | 28,256 | |
| Akbank TAS/Ak Finansal Kiralama A/S 7.2% 3/16/27 (b)(c) | 200,000 | 206,560 | |
| Ally Financial, Inc.: | |||
| 5.75% 11/20/25 | 945,000 | 1,043,044 | |
| 8% 12/31/18 | 225,000 | 238,781 | |
| 8% 11/1/31 | 257,000 | 339,240 | |
| 8% 11/1/31 | 1,115,000 | 1,474,540 | |
| Banco de Bogota SA 6.25% 5/12/26 (b) | 200,000 | 217,000 | |
| Banco de Sabadell SA 5.625% 5/6/26 (Reg. S) | EUR | 100,000 | 135,628 |
| Banco Do Brasil SA 4.625% 1/15/25 (b) | 300,000 | 299,400 | |
| Banco Internacional del Peru SAA 6.625% 3/19/29 (b)(c) | 200,000 | 226,500 | |
| Banco Macro SA 6.75% 11/4/26 (b)(c) | 150,000 | 157,800 | |
| Bankia SA 3.375% 3/15/27 (Reg. S) (c) | EUR | 100,000 | 122,413 |
| HOIST Kredit AB 1.125% 10/4/21 (Reg. S) | EUR | 200,000 | 233,154 |
| Industrial Senior Trust 5.5% 11/1/22 (b) | 200,000 | 203,700 | |
| Itau Unibanco Holding SA 6.2% 12/21/21 (b) | 350,000 | 379,750 | |
| JSC BGEO Group 6% 7/26/23 (b) | 450,000 | 462,447 | |
| Mercury Bondco PLC 7.125% 5/30/21 pay-in-kind(Reg. S) (c) | EUR | 200,000 | 242,811 |
| Royal Bank of Scotland Group PLC: | |||
| 3.625% 3/25/24 (Reg. S) (c) | EUR | 100,000 | 120,568 |
| 5.125% 5/28/24 | 317,000 | 339,178 | |
| SB Capital SA 5.5% 2/26/24 (b)(c) | 200,000 | 204,537 | |
| Times Property Holdings Ltd. 6.25% 1/23/20 (Reg. S) | 200,000 | 205,728 | |
| Turkiye Garanti Bankasi A/S 6.125% 5/24/27 (b)(c) | 200,000 | 197,500 | |
| Turkiye Halk Bankasi A/S 3.875% 2/5/20 (b) | 200,000 | 192,708 | |
| Turkiye Is Bankasi A/S 5.5% 4/21/22 (b) | 200,000 | 199,300 | |
| Turkiye Vakiflar Bankasi TAO 3.5% 6/17/19 (Reg. S) | EUR | 100,000 | 119,046 |
| UniCredit SpA 6.95% 10/31/22 (Reg. S) | EUR | 100,000 | 145,234 |
| Zenith Bank PLC: | |||
| 6.25% 4/22/19 (b) | 200,000 | 204,980 | |
| 7.375% 5/30/22 (b) | 200,000 | 207,476 | |
| TOTAL BANKS & THRIFTS | 8,147,279 | ||
| Broadcasting - 0.6% | |||
| AMC Networks, Inc.: | |||
| 4.75% 12/15/22 | 100,000 | 102,625 | |
| 4.75% 8/1/25 | 125,000 | 124,844 | |
| Sirius XM Radio, Inc.: | |||
| 3.875% 8/1/22 (b) | 20,000 | 20,375 | |
| 5% 8/1/27 (b) | 125,000 | 126,094 | |
| TV Azteca SA de CV 8.25% 8/9/24 (Reg. S) | 400,000 | 422,000 | |
| TOTAL BROADCASTING | 795,938 | ||
| Building Materials - 1.6% | |||
| Builders FirstSource, Inc. 5.625% 9/1/24 (b) | 115,000 | 121,469 | |
| CEMEX Finance LLC: | |||
| 4.625% 6/15/24 | EUR | 100,000 | 127,046 |
| 6% 4/1/24 (Reg. S) | 250,000 | 264,375 | |
| Elementia S.A.B. de CV 5.5% 1/15/25 (b) | 200,000 | 206,000 | |
| GCP Applied Technologies, Inc. 9.5% 2/1/23 (b) | 70,000 | 78,400 | |
| Grupo Cementos de Chihuahua S.A.B. de CV 5.25% 6/23/24 (b) | 200,000 | 205,500 | |
| HD Supply, Inc. 5.75% 4/15/24 (b) | 30,000 | 32,363 | |
| HeidelbergCement Finance Luxembourg SA 3.25% 10/21/21 (Reg. S) | EUR | 300,000 | 392,249 |
| HMAN Finance Sub Corp. 6.375% 7/15/22 (b) | 100,000 | 99,250 | |
| Petrobras Global Finance BV 6.25% 3/17/24 | 200,000 | 214,470 | |
| Union Andina de Cementos SAA 5.875% 10/30/21 (Reg. S) | 300,000 | 315,300 | |
| USG Corp. 4.875% 6/1/27 (b) | 15,000 | 15,563 | |
| TOTAL BUILDING MATERIALS | 2,071,985 | ||
| Cable/Satellite TV - 5.0% | |||
| Altice SA: | |||
| 7.625% 2/15/25 (b) | 700,000 | 759,500 | |
| 7.75% 5/15/22 (b) | 235,000 | 248,806 | |
| Altice U.S. Finance SA 7.75% 7/15/25 (b) | 210,000 | 229,425 | |
| Cable One, Inc. 5.75% 6/15/22 (b) | 55,000 | 57,475 | |
| Cablevision SA 6.5% 6/15/21 (b) | 200,000 | 214,040 | |
| CCO Holdings LLC/CCO Holdings Capital Corp.: | |||
| 5.125% 5/1/27 (b) | 545,000 | 550,450 | |
| 5.5% 5/1/26 (b) | 110,000 | 112,750 | |
| 5.75% 1/15/24 | 615,000 | 638,831 | |
| 5.75% 2/15/26 (b) | 65,000 | 67,958 | |
| Cequel Communications Holdings I LLC/Cequel Capital Corp. 5.125% 12/15/21 (b) | 255,000 | 259,463 | |
| CSC Holdings, Inc. 5.5% 4/15/27 (b) | 345,000 | 355,350 | |
| DISH DBS Corp. 5% 3/15/23 | 470,000 | 454,725 | |
| Myriad International Holding BV 5.5% 7/21/25 (b) | 200,000 | 216,706 | |
| Telenet Finance VI Luxembourg SCA 4.875% 7/15/27 (Reg. S) | EUR | 100,000 | 128,746 |
| Unitymedia Hessen GmbH & Co. KG 5.75% 1/15/23 (Reg. S) | EUR | 145,800 | 176,462 |
| Unitymedia Hessen GmbH & Co. KG/Unitymedia NRW GmbH: | |||
| 3.5% 1/15/27 (Reg. S) | EUR | 100,000 | 122,552 |
| 5.5% 1/15/23 (b) | 180,000 | 184,950 | |
| UPCB Finance VII Ltd. 3.625% 6/15/29 (Reg. S) | EUR | 400,000 | 468,124 |
| Virgin Media Finance PLC 4.5% 1/15/25 (Reg. S) | EUR | 100,000 | 123,125 |
| VTR Finance BV 6.875% 1/15/24 (b) | 600,000 | 636,150 | |
| Ziggo Bond Finance BV 6% 1/15/27 (b) | 160,000 | 162,800 | |
| Ziggo Secured Finance BV 4.25% 1/15/27 (Reg. S) | EUR | 100,000 | 124,613 |
| TOTAL CABLE/SATELLITE TV | 6,293,001 | ||
| Chemicals - 2.2% | |||
| Bayer AG 3% 7/1/75 (Reg S.) (c) | EUR | 100,000 | 122,600 |
| CF Industries Holdings, Inc.: | |||
| 4.95% 6/1/43 | 170,000 | 155,975 | |
| 5.15% 3/15/34 | 100,000 | 99,750 | |
| 5.375% 3/15/44 | 65,000 | 62,400 | |
| Evolution Escrow Issuer LLC 7.5% 3/15/22 (b) | 175,000 | 183,531 | |
| INEOS Finance PLC 2.125% 11/15/25 (Reg. S) | EUR | 100,000 | 116,631 |
| Momentive Performance Materials, Inc. 3.88% 10/24/21 | 200,000 | 208,000 | |
| MPM Escrow LLC/MPM Finance Escrow Corp. 8.875% 10/15/20 (d)(e) | 140,000 | 0 | |
| NOVA Chemicals Corp.: | |||
| 4.875% 6/1/24 (b) | 70,000 | 71,313 | |
| 5.25% 6/1/27 (b) | 70,000 | 71,400 | |
| OCP SA 5.625% 4/25/24 (b) | 200,000 | 214,748 | |
| Platform Specialty Products Corp. 6.5% 2/1/22 (b) | 200,000 | 207,250 | |
| The Chemours Co. LLC 5.375% 5/15/27 | 25,000 | 26,688 | |
| TPC Group, Inc. 8.75% 12/15/20 (b) | 290,000 | 283,475 | |
| Trinseo Materials Operating SCA/Trinseo Materials Finance, Inc. 5.375% 9/1/25 (b) | 300,000 | 315,750 | |
| Tronox Finance PLC 5.75% 10/1/25 (b) | 35,000 | 36,531 | |
| Valvoline, Inc. 4.375% 8/15/25 (b) | 400,000 | 404,000 | |
| Yingde Gases Investment Ltd. 7.25% 2/28/20 (Reg. S) | 200,000 | 205,798 | |
| TOTAL CHEMICALS | 2,785,840 | ||
| Containers - 1.8% | |||
| ARD Finance SA: | |||
| 6.625% 9/15/23 (Reg. S) pay-in-kind (c) | EUR | 100,000 | 125,176 |
| 7.125% 9/15/23 pay-in-kind (c) | 200,000 | 213,000 | |
| Ardagh Packaging Finance PLC/Ardagh MP Holdings U.S.A., Inc.: | |||
| 2.75% 3/15/24 (Reg. S) | EUR | 100,000 | 119,980 |
| 6% 2/15/25 (b) | 200,000 | 212,250 | |
| 6.75% 5/15/24 (Reg. S) | EUR | 100,000 | 130,305 |
| 7.25% 5/15/24 (b) | 200,000 | 219,750 | |
| Ball Corp. 4.375% 12/15/23 | EUR | 200,000 | 267,275 |
| Kleopatra Holdings 1 SCA 8.5% 6/30/23 pay-in-kind(Reg. S) (c) | EUR | 200,000 | 234,610 |
| OI European Group BV 6.75% 9/15/20 (Reg. S) | EUR | 150,000 | 206,720 |
| Plastipak Holdings, Inc. 6.25% 10/15/25 (b) | 20,000 | 20,396 | |
| Reynolds Group Issuer, Inc./Reynolds Group Issuer LLC/Reynolds Group Issuer (Luxembourg) SA 5.75% 10/15/20 | 285,000 | 289,990 | |
| Silgan Holdings, Inc.: | |||
| 3.25% 3/15/25 (b) | EUR | 100,000 | 121,016 |
| 3.25% 3/15/25 (Reg. S) | EUR | 100,000 | 121,016 |
| TOTAL CONTAINERS | 2,281,484 | ||
| Diversified Financial Services - 4.0% | |||
| Arena Lux Finance Sarl 2.875% 11/1/24 (Reg. S) | EUR | 100,000 | 118,240 |
| Arrow Global Finance PLC 3 month EURIBOR + 2.875% 2.875% 4/1/25 (Reg. S) (c)(f) | EUR | 100,000 | 116,485 |
| Ascend Learning LLC 6.875% 8/1/25 (b) | 85,000 | 89,038 | |
| Cabot Financial SA (Luxembourg) 3 month EURIBOR + 5.875% 5.875% 11/15/21 (Reg. S) (c)(f) | EUR | 150,000 | 182,957 |
| Chobani LLC/Finance Corp., Inc. 7.5% 4/15/25 (b) | 195,000 | 211,819 | |
| Comcel Trust 6.875% 2/6/24 (b) | 200,000 | 211,000 | |
| Eagle Holding Co. II LLC 7.625% 5/15/22 pay-in-kind (b)(c) | 30,000 | 30,938 | |
| Exela International LLC/Exela Financial, Inc. 10% 7/15/23 (b) | 70,000 | 67,025 | |
| FLY Leasing Ltd. 5.25% 10/15/24 | 60,000 | 60,263 | |
| Garfunkelux Holdco 3 SA 7.5% 8/1/22 (Reg. S) | EUR | 200,000 | 250,031 |
| Gemdale Ever Prosperity Investment Ltd. 4.95% 7/26/22 (Reg. S) | 300,000 | 304,751 | |
| Grinding Media, Inc./MC Grinding Media Canada, Inc. 7.375% 12/15/23 (b) | 90,000 | 97,875 | |
| Icahn Enterprises LP/Icahn Enterprises Finance Corp.: | |||
| 5.875% 2/1/22 | 305,000 | 315,105 | |
| 6.25% 2/1/22 | 30,000 | 31,350 | |
| 6.75% 2/1/24 | 55,000 | 58,231 | |
| International Lease Finance Corp. 5.875% 8/15/22 | 175,000 | 196,708 | |
| International Personal Finance PLC 5.75% 4/7/21 (Reg S.) | EUR | 100,000 | 108,937 |
| LHC3 PLC 4.125% 8/15/24 pay-in-kind (Reg. S) (c) | EUR | 200,000 | 240,709 |
| MSCI, Inc. 5.75% 8/15/25 (b) | 50,000 | 54,000 | |
| Navient Corp.: | |||
| 5% 10/26/20 | 54,000 | 55,620 | |
| 6.5% 6/15/22 | 65,000 | 68,981 | |
| 7.25% 9/25/23 | 55,000 | 59,572 | |
| Orchestra Borrower LLC/Orchestra Co.-Issuer, Inc. 6.75% 6/15/22 (b) | 40,000 | 41,592 | |
| Pontis IV Ltd. 5.125% 3/31/27 (b) | 200,000 | 203,750 | |
| Prime Securities Services Borrower LLC/Prime Finance, Inc. 9.25% 5/15/23 (b) | 660,000 | 731,412 | |
| Radiate Holdco LLC/Radiate Financial Service Ltd. 6.625% 2/15/25 (b) | 25,000 | 24,563 | |
| SLM Corp.: | |||
| 5.5% 1/25/23 | 475,000 | 480,938 | |
| 6.125% 3/25/24 | 205,000 | 210,381 | |
| 8% 3/25/20 | 190,000 | 209,475 | |
| Verisure Holding AB 6% 11/1/22 (Reg. S) | EUR | 234,000 | 293,808 |
| TOTAL DIVERSIFIED FINANCIAL SERVICES | 5,125,554 | ||
| Diversified Media - 0.2% | |||
| E.W. Scripps Co. 5.125% 5/15/25 (b) | 15,000 | 15,413 | |
| MDC Partners, Inc. 6.5% 5/1/24 (b) | 205,000 | 209,100 | |
| TOTAL DIVERSIFIED MEDIA | 224,513 | ||
| Energy - 13.0% | |||
| Afren PLC 10.25% 4/8/19 (b)(d)(e) | 285,920 | 51 | |
| Antero Resources Corp.: | |||
| 5.125% 12/1/22 | 215,000 | 220,913 | |
| 5.625% 6/1/23 (Reg. S) | 80,000 | 83,800 | |
| Areva SA 4.875% 9/23/24 | EUR | 300,000 | 393,661 |
| Borets Finance DAC 6.5% 4/7/22 (b) | 200,000 | 213,118 | |
| Bulgarian Energy Holding EAD 4.875% 8/2/21 | EUR | 100,000 | 126,976 |
| Calfrac Holdings LP 7.5% 12/1/20 (b) | 155,000 | 151,900 | |
| California Resources Corp. 8% 12/15/22 (b) | 350,000 | 231,000 | |
| Callon Petroleum Co. 6.125% 10/1/24 | 25,000 | 26,000 | |
| Carrizo Oil & Gas, Inc. 6.25% 4/15/23 | 20,000 | 20,350 | |
| Cheniere Corpus Christi Holdings LLC: | |||
| 5.125% 6/30/27 (b) | 70,000 | 72,188 | |
| 5.875% 3/31/25 | 80,000 | 86,600 | |
| Chesapeake Energy Corp.: | |||
| 3 month U.S. LIBOR + 3.250% 4.6092% 4/15/19 (c)(f) | 70,000 | 69,300 | |
| 4.875% 4/15/22 | 180,000 | 166,500 | |
| 5.75% 3/15/23 | 65,000 | 59,313 | |
| 8% 12/15/22 (b) | 168,000 | 180,758 | |
| 8% 1/15/25 (b) | 305,000 | 305,000 | |
| 8% 6/15/27 (b) | 560,000 | 540,050 | |
| China Jinjiang Environment Holding Co. Ltd. 6% 7/27/20 (Reg. S) | 200,000 | 201,066 | |
| Citgo Holding, Inc. 10.75% 2/15/20 (b) | 155,000 | 167,400 | |
| Consolidated Energy Finance SA: | |||
| 3 month U.S. LIBOR + 3.750% 5.07% 6/15/22 (b)(c)(f) | 470,000 | 468,927 | |
| 6.875% 6/15/25 (b) | 275,000 | 290,813 | |
| Covey Park Energy LLC 7.5% 5/15/25 (b) | 50,000 | 51,875 | |
| Diamond Offshore Drilling, Inc. 7.875% 8/15/25 | 95,000 | 101,650 | |
| EDC Finance Ltd. 4.875% 4/17/20 (b) | 200,000 | 204,500 | |
| Ensco PLC: | |||
| 4.5% 10/1/24 | 140,000 | 114,800 | |
| 5.2% 3/15/25 | 30,000 | 25,275 | |
| EP Energy LLC/Everest Acquisition Finance, Inc. 8% 11/29/24 (b) | 35,000 | 35,700 | |
| Exterran Partners LP/EXLP Finance Corp.: | |||
| 6% 4/1/21 | 15,000 | 14,925 | |
| 6% 10/1/22 | 300,000 | 298,125 | |
| Extraction Oil & Gas, Inc. 7.375% 5/15/24 (b) | 40,000 | 42,600 | |
| FTS International, Inc. 6.25% 5/1/22 | 160,000 | 155,200 | |
| Gaz Capital SA: | |||
| 3.389% 3/20/20 (Reg. S) | EUR | 100,000 | 122,892 |
| 3.6% 2/26/21 (Reg. S) | EUR | 300,000 | 375,863 |
| Geo Coal International Pte Ltd. 8% 10/4/22 (Reg. S) | 200,000 | 203,095 | |
| Gulfmark Offshore, Inc. 6.375% 3/15/22 (d) | 330,000 | 69,300 | |
| Hilcorp Energy I LP/Hilcorp Finance Co.: | |||
| 5% 12/1/24 (b) | 320,000 | 318,400 | |
| 5.75% 10/1/25 (b) | 200,000 | 204,750 | |
| Hilong Holding Ltd. 7.25% 6/22/20 (Reg. S) | 200,000 | 199,743 | |
| Indika Energy Capital II Pte. Ltd. 6.875% 4/10/22 (Reg. S) | 200,000 | 208,485 | |
| Jonah Energy LLC 7.25% 10/15/25 (b) | 105,000 | 105,000 | |
| Kosmos Energy Ltd. 7.875% 8/1/21 (b) | 200,000 | 207,000 | |
| Medco Strait Services Pte. Ltd. 8.5% 8/17/22 | 200,000 | 212,841 | |
| NextEra Energy Partners LP: | |||
| 4.25% 9/15/24 (b) | 50,000 | 50,500 | |
| 4.5% 9/15/27 (b) | 35,000 | 35,219 | |
| NGPL PipeCo LLC: | |||
| 4.375% 8/15/22 (b) | 15,000 | 15,431 | |
| 4.875% 8/15/27 (b) | 15,000 | 15,525 | |
| Noble Holding International Ltd.: | |||
| 3.95% 3/15/22 | 90,000 | 75,600 | |
| 4.625% 3/1/21 | 8,000 | 7,400 | |
| 6.05% 3/1/41 | 5,000 | 3,313 | |
| 6.2% 8/1/40 | 85,000 | 57,375 | |
| 7.75% 1/15/24 | 225,000 | 201,375 | |
| Nostrum Oil & Gas Finance BV 8% 7/25/22 (b) | 400,000 | 416,200 | |
| NuStar Logistics LP 5.625% 4/28/27 | 30,000 | 31,650 | |
| Oasis Petroleum, Inc. 6.875% 3/15/22 | 45,000 | 46,125 | |
| Pacific Drilling V Ltd. 7.25% 12/1/17 (b) | 380,000 | 167,200 | |
| Pacific Exploration and Production Corp. 10% 11/2/21 pay-in-kind (c) | 88,000 | 100,100 | |
| Pan American Energy LLC 7.875% 5/7/21 (b) | 400,000 | 433,840 | |
| Parsley Energy LLC/Parsley: | |||
| 5.625% 10/15/27 (b) | 35,000 | 36,116 | |
| 6.25% 6/1/24 (b) | 10,000 | 10,600 | |
| PBF Holding Co. LLC/PBF Finance Corp.: | |||
| 7% 11/15/23 | 130,000 | 135,200 | |
| 7.25% 6/15/25 (b) | 70,000 | 72,363 | |
| PBF Logistics LP/PBF Logistics Finance, Inc. 6.875% 5/15/23 (b) | 130,000 | 134,550 | |
| Peabody Securities Finance Corp.: | |||
| 6% 3/31/22 (b) | 20,000 | 20,600 | |
| 6.375% 3/31/25 (b) | 25,000 | 25,781 | |
| Petrobras Energia SA 7.375% 7/21/23 (Reg. S) | 200,000 | 218,700 | |
| Pride International, Inc. 7.875% 8/15/40 | 95,000 | 79,325 | |
| Puma International Financing SA: | |||
| 5.125% 10/6/24 (Reg. S) | 200,000 | 204,540 | |
| 6.75% 2/1/21 (Reg. S) | 200,000 | 204,768 | |
| Range Resources Corp. 4.875% 5/15/25 | 60,000 | 57,900 | |
| Repsol International Finance BV 4.5% 3/25/75 (Reg. S) (c) | EUR | 200,000 | 259,736 |
| Rose Rock Midstream LP/Rose Rock Finance Corp. 5.625% 7/15/22 | 125,000 | 123,125 | |
| Sabine Pass Liquefaction LLC 5.625% 3/1/25 | 15,000 | 16,664 | |
| SemGroup Corp. 7.25% 3/15/26 (b) | 70,000 | 71,225 | |
| SESI LLC 7.75% 9/15/24 (b) | 40,000 | 41,400 | |
| Sibur Securities Dac 4.125% 10/5/23 (b) | 200,000 | 199,250 | |
| SM Energy Co.: | |||
| 5% 1/15/24 | 65,000 | 62,075 | |
| 5.625% 6/1/25 | 110,000 | 106,975 | |
| 6.125% 11/15/22 | 150,000 | 150,750 | |
| 6.5% 11/15/21 | 30,000 | 30,300 | |
| 6.5% 1/1/23 | 15,000 | 15,263 | |
| 6.75% 9/15/26 | 25,000 | 25,656 | |
| Southwestern Energy Co.: | |||
| 7.5% 4/1/26 | 65,000 | 67,438 | |
| 7.75% 10/1/27 | 50,000 | 52,000 | |
| Summit Midstream Holdings LLC 5.75% 4/15/25 | 45,000 | 45,900 | |
| Sunoco LP/Sunoco Finance Corp.: | |||
| 6.25% 4/15/21 | 110,000 | 115,225 | |
| 6.375% 4/1/23 | 60,000 | 63,750 | |
| Targa Resources Partners LP/Targa Resources Partners Finance Corp.: | |||
| 5.125% 2/1/25 | 35,000 | 36,050 | |
| 5.375% 2/1/27 | 35,000 | 36,356 | |
| Teine Energy Ltd. 6.875% 9/30/22 (b) | 85,000 | 86,913 | |
| TerraForm Power Operating LLC: | |||
| 6.375% 2/1/23 (b)(c) | 445,000 | 466,138 | |
| 6.625% 6/15/25 (b)(c) | 1,210,000 | 1,312,850 | |
| Tesoro Logistics LP/Tesoro Logistics Finance Corp.: | |||
| 6.125% 10/15/21 | 20,000 | 20,650 | |
| 6.375% 5/1/24 | 45,000 | 49,275 | |
| The Oil and Gas Holding Co. 7.5% 10/25/27 (b) | 200,000 | 207,508 | |
| Transocean, Inc. 7.5% 1/15/26 (b) | 130,000 | 133,900 | |
| Transportadora de Gas del Sur SA 9.625% 5/14/20 (b) | 431,097 | 467,270 | |
| Trinidad Drilling Ltd. 6.625% 2/15/25 (b) | 25,000 | 24,313 | |
| Tupras Turkiye Petrol Rafinerileri A/S 4.5% 10/18/24 (b) | 200,000 | 195,649 | |
| Ultra Resources, Inc.: | |||
| 6.875% 4/15/22 (b) | 55,000 | 55,550 | |
| 7.125% 4/15/25 (b) | 40,000 | 39,900 | |
| Ultrapar Participacoes SA 5.25% 10/6/26 (b) | 200,000 | 205,000 | |
| Weatherford International Ltd. 9.875% 2/15/24 | 115,000 | 123,050 | |
| WPX Energy, Inc.: | |||
| 5.25% 9/15/24 | 105,000 | 105,394 | |
| 6% 1/15/22 | 149,000 | 155,146 | |
| 7.5% 8/1/20 | 44,000 | 47,740 | |
| 8.25% 8/1/23 | 100,000 | 112,625 | |
| YPF SA: | |||
| 8.5% 3/23/21 (b) | 275,000 | 311,388 | |
| 8.5% 7/28/25 (b) | 400,000 | 465,200 | |
| Ziggo Secured Finance BV 3.75% 1/15/25 (Reg. S) | EUR | 100,000 | 122,506 |
| TOTAL ENERGY | 16,432,102 | ||
| Entertainment/Film - 1.3% | |||
| AMC Entertainment Holdings, Inc. 6.125% 5/15/27 | 45,000 | 44,550 | |
| CBS Outdoor Americas Capital LLC/CBS Outdoor Americas Capital Corp. 5.625% 2/15/24 | 565,000 | 594,663 | |
| NAI Entertainment Holdings LLC/NAI Entertainment Finance Corp. 5% 8/1/18 (b) | 170,000 | 170,170 | |
| New Cotai LLC/New Cotai Capital Corp. 10.625% 5/1/19 pay-in-kind (b)(c) | 868,830 | 868,830 | |
| TOTAL ENTERTAINMENT/FILM | 1,678,213 | ||
| Environmental - 0.6% | |||
| CD&R Waterworks Merger Sub LLC 6.125% 8/15/25 (b) | 25,000 | 25,313 | |
| Covanta Holding Corp.: | |||
| 5.875% 3/1/24 | 110,000 | 110,275 | |
| 5.875% 7/1/25 | 15,000 | 14,850 | |
| 6.375% 10/1/22 | 95,000 | 98,088 | |
| LBC Tank Terminals Holding Netherlands BV 6.875% 5/15/23 (b) | 445,000 | 465,581 | |
| TOTAL ENVIRONMENTAL | 714,107 | ||
| Food & Drug Retail - 1.1% | |||
| Albertsons Companies LLC/Safeway, Inc./New Albertson's, Inc./Albertson's LLC: | |||
| 5.75% 3/15/25 | 80,000 | 70,400 | |
| 6.625% 6/15/24 | 35,000 | 32,900 | |
| Albertsons, Inc.: | |||
| 6.625% 6/1/28 | 75,000 | 57,563 | |
| 7.45% 8/1/29 | 5,000 | 4,138 | |
| BI-LO LLC/BI-LO Finance Corp.: | |||
| 9.25% 2/15/19 (b) | 90,000 | 82,125 | |
| 9.375% 9/15/18 pay-in-kind (b)(c) | 88,984 | 24,916 | |
| Casino Guichard Perrachon SA 5.976% 5/26/21 (c) | EUR | 100,000 | 137,154 |
| Cumberland Farms, Inc. 6.75% 5/1/25 (b) | 25,000 | 26,563 | |
| Darling Global Finance BV 4.75% 5/30/22 (Reg. S) | EUR | 100,000 | 121,727 |
| FAGE International SA/FAGE U.S.A. Dairy Industry, Inc. 5.625% 8/15/26 (b) | 200,000 | 205,438 | |
| Rite Aid Corp. 6.875% 12/15/28 (b)(c) | 505,000 | 388,850 | |
| Tesco PLC 5.125% 4/10/47 | EUR | 100,000 | 144,813 |
| Tops Holding LLC/Tops Markets II Corp. 8% 6/15/22 (b) | 165,000 | 99,000 | |
| TOTAL FOOD & DRUG RETAIL | 1,395,587 | ||
| Food/Beverage/Tobacco - 2.4% | |||
| Central American Bottling Corp. 5.75% 1/31/27 (b) | 200,000 | 211,168 | |
| ESAL GmbH 6.25% 2/5/23 (b) | 105,000 | 101,063 | |
| Gruma S.A.B. de CV 4.875% 12/1/24 (b) | 300,000 | 323,250 | |
| JBS Investments GmbH: | |||
| 7.25% 4/3/24 (b) | 383,000 | 378,213 | |
| 7.75% 10/28/20 (b) | 170,000 | 173,485 | |
| JBS U.S.A. LLC/JBS U.S.A. Finance, Inc.: | |||
| 5.75% 6/15/25 (b) | 415,000 | 402,550 | |
| 5.875% 7/15/24 (b) | 10,000 | 9,825 | |
| Lamb Weston Holdings, Inc.: | |||
| 4.625% 11/1/24 (b) | 45,000 | 47,025 | |
| 4.875% 11/1/26 (b) | 45,000 | 47,306 | |
| MHP SA 8.25% 4/2/20 (b) | 200,000 | 216,000 | |
| Minerva Luxembourg SA: | |||
| 6.5% 9/20/26 (b) | 400,000 | 414,800 | |
| 7.75% 1/31/23 (Reg. S) | 200,000 | 209,250 | |
| Pilgrim's Pride Corp.: | |||
| 5.75% 3/15/25 (b) | 25,000 | 26,469 | |
| 5.875% 9/30/27 (b) | 45,000 | 46,800 | |
| Post Holdings, Inc.: | |||
| 5.5% 3/1/25 (b) | 75,000 | 78,188 | |
| 5.75% 3/1/27 (b) | 160,000 | 166,200 | |
| U.S. Foods, Inc. 5.875% 6/15/24 (b) | 70,000 | 73,938 | |
| Vector Group Ltd. 6.125% 2/1/25 (b) | 150,000 | 155,625 | |
| TOTAL FOOD/BEVERAGE/TOBACCO | 3,081,155 | ||
| Gaming - 2.5% | |||
| Caesars Growth Properties Holdings LLC/Caesars Growth Properties Finance, Inc. 9.375% 5/1/22 | 405,000 | 435,578 | |
| Cleopatra Finance Ltd.: | |||
| 4.125% 2/15/20 | EUR | 100,000 | 124,895 |
| 4.75% 2/15/23 (Reg. S) | EUR | 200,000 | 262,674 |
| Codere Finance (Luxembourg) SA 6.75% 11/1/21 (Reg. S) | EUR | 200,000 | 243,463 |
| CRC Escrow Issuer LLC/CRC Finance LLC 5.25% 10/15/25 (b) | 220,000 | 221,441 | |
| Eldorado Resorts, Inc. 6% 4/1/25 | 70,000 | 73,850 | |
| GLP Capital LP/GLP Financing II, Inc. 5.375% 4/15/26 | 30,000 | 32,475 | |
| Jacobs Entertainment, Inc. 7.875% 2/1/24 (b) | 15,000 | 16,200 | |
| MGM Growth Properties Operating Partnership LP 4.5% 1/15/28 (b) | 50,000 | 49,875 | |
| MGM Mirage, Inc. 8.625% 2/1/19 | 115,000 | 123,194 | |
| Paris Las Vegas Holding LLC/Harrah's Las Vegas LLC/Flamingo Las Vegas Holdings, Inc. 11% 10/1/21 (c) | 305,000 | 323,300 | |
| Penn National Gaming, Inc. 5.625% 1/15/27 (b) | 15,000 | 15,525 | |
| Scientific Games Corp.: | |||
| 5% 10/15/25 (b) | 20,000 | 20,300 | |
| 7% 1/1/22 (b) | 45,000 | 47,588 | |
| 10% 12/1/22 | 270,000 | 298,669 | |
| Station Casinos LLC 5% 10/1/25 (b) | 90,000 | 90,113 | |
| Studio City Finance Ltd. 8.5% 12/1/20 (b) | 200,000 | 205,500 | |
| Sugarhouse HSP Gaming Prop Mezz LP/Sugarhouse HSP Gaming Finance Corp. 5.875% 5/15/25 (b) | 45,000 | 43,875 | |
| Wynn Las Vegas LLC/Wynn Las Vegas Capital Corp. 5.25% 5/15/27 (b) | 85,000 | 86,806 | |
| Wynn Macau Ltd.: | |||
| 4.875% 10/1/24 (b) | 200,000 | 203,260 | |
| 5.5% 10/1/27 (b) | 200,000 | 202,644 | |
| TOTAL GAMING | 3,121,225 | ||
| Healthcare - 5.4% | |||
| Catalent Pharma Solutions 4.875% 1/15/26 (b) | 25,000 | 25,375 | |
| Community Health Systems, Inc.: | |||
| 6.25% 3/31/23 | 145,000 | 139,563 | |
| 6.875% 2/1/22 | 280,000 | 202,650 | |
| CTR Partnership LP/CareTrust Capital Corp. 5.25% 6/1/25 | 100,000 | 102,750 | |
| Ephios Bondco PLC 6.25% 7/1/22 | EUR | 100,000 | 124,125 |
| Eurofins Scientific SA 2.125% 7/25/24 (Reg. S) | EUR | 100,000 | 119,803 |
| FMC Finance VII SA 5.25% 2/15/21 | EUR | 250,000 | 337,818 |
| HCA Holdings, Inc.: | |||
| 4.5% 2/15/27 | 500,000 | 504,375 | |
| 5.875% 3/15/22 | 274,000 | 300,030 | |
| 5.875% 2/15/26 | 85,000 | 89,356 | |
| 7.5% 2/15/22 | 180,000 | 204,300 | |
| HealthSouth Corp.: | |||
| 5.75% 11/1/24 | 150,000 | 153,563 | |
| 5.75% 9/15/25 | 15,000 | 15,469 | |
| Hologic, Inc. 4.375% 10/15/25 (b) | 35,000 | 35,560 | |
| IMS Health, Inc.: | |||
| 3.25% 3/15/25 (Reg. S) | EUR | 300,000 | 361,738 |
| 5% 10/15/26 (b) | 200,000 | 212,500 | |
| MPT Operating Partnership LP/MPT Finance Corp. 5% 10/15/27 | 75,000 | 77,063 | |
| Nidda Healthcare Holding AG 3.5% 9/30/24 (Reg. S) | EUR | 100,000 | 119,234 |
| Ortho-Clinical Diagnostics, Inc. 6.625% 5/15/22 (b) | 205,000 | 205,256 | |
| Sabra Health Care LP/Sabra Capital Corp.: | |||
| 5.375% 6/1/23 | 155,000 | 160,038 | |
| 5.5% 2/1/21 | 120,000 | 123,750 | |
| Tenet Healthcare Corp.: | |||
| 4.625% 7/15/24 (b) | 165,000 | 162,319 | |
| 6.75% 6/15/23 | 470,000 | 441,213 | |
| 7.5% 1/1/22 (b) | 40,000 | 42,100 | |
| 8.125% 4/1/22 | 515,000 | 517,575 | |
| THC Escrow Corp. III 5.125% 5/1/25 (b) | 210,000 | 204,488 | |
| Valeant Pharmaceuticals International, Inc.: | |||
| 5.375% 3/15/20 (b) | 475,000 | 467,281 | |
| 5.5% 3/1/23 (b) | 115,000 | 96,600 | |
| 5.5% 11/1/25 (b) | 70,000 | 71,575 | |
| 5.875% 5/15/23 (b) | 625,000 | 528,125 | |
| 6.125% 4/15/25 (b) | 5,000 | 4,200 | |
| 6.5% 3/15/22 (b) | 80,000 | 84,800 | |
| 6.75% 8/15/21 (b) | 30,000 | 29,063 | |
| 7% 3/15/24 (b) | 160,000 | 173,200 | |
| 7.25% 7/15/22 (b) | 25,000 | 23,938 | |
| 7.5% 7/15/21 (b) | 273,000 | 268,564 | |
| Vizient, Inc. 10.375% 3/1/24 (b) | 80,000 | 91,200 | |
| Wellcare Health Plans, Inc. 5.25% 4/1/25 | 50,000 | 52,625 | |
| TOTAL HEALTHCARE | 6,873,182 | ||
| Homebuilders/Real Estate - 1.9% | |||
| Ashton Woods U.S.A. LLC/Ashton Woods Finance Co. 6.875% 2/15/21 (b) | 241,000 | 247,326 | |
| Brookfield Residential Properties, Inc./Brookfield Residential U.S. Corp. 6.125% 7/1/22 (b) | 5,000 | 5,219 | |
| Brookfield Residential Properties, Inc.: | |||
| 6.375% 5/15/25 (b) | 15,000 | 15,713 | |
| 6.5% 12/15/20 (b) | 115,000 | 117,444 | |
| Cementos Progreso Trust 7.125% 11/6/23 (b) | 200,000 | 213,000 | |
| Central China Real Estate Ltd. 8.75% 1/23/21 (Reg. S) | 200,000 | 215,500 | |
| Fantasia Holdings Group Co. Ltd. 7.375% 10/4/21 (Reg. S) | 200,000 | 199,621 | |
| Howard Hughes Corp. 5.375% 3/15/25 (b) | 110,000 | 113,025 | |
| IRSA Propiedades Comerciales SA 8.75% 3/23/23 (b) | 150,000 | 169,397 | |
| Jingrui Holdings Ltd. 7.75% 4/12/20 | 200,000 | 193,993 | |
| Lodha Developers International Ltd. 12% 3/13/20 (Reg. S) | 200,000 | 210,500 | |
| Marquee Land Pte. Ltd. 9.75% 8/5/19 (Reg. S) | 37,000 | 38,931 | |
| Mattamy Group Corp. 6.875% 12/15/23 (b) | 25,000 | 26,250 | |
| Oceanwide Holdings International 2015 Co., Ltd. 9.625% 8/11/20 (Reg. S) | 200,000 | 205,562 | |
| Ryland Group, Inc. 5.375% 10/1/22 | 55,000 | 59,950 | |
| Shea Homes Ltd. Partnership/Corp.: | |||
| 5.875% 4/1/23 (b) | 30,000 | 31,125 | |
| 6.125% 4/1/25 (b) | 30,000 | 31,200 | |
| Weekley Homes LLC/Weekley Finance Corp. 6% 2/1/23 | 90,000 | 88,200 | |
| William Lyon Homes, Inc. 5.875% 1/31/25 | 40,000 | 40,800 | |
| Yida China Holdings 6.95% 4/19/20 (Reg. S) | 200,000 | 190,057 | |
| TOTAL HOMEBUILDERS/REAL ESTATE | 2,412,813 | ||
| Hotels - 0.1% | |||
| Hilton Worldwide Finance LLC/Hilton Worldwide Finance Corp.: | |||
| 4.625% 4/1/25 | 70,000 | 72,188 | |
| 4.875% 4/1/27 | 40,000 | 42,000 | |
| TOTAL HOTELS | 114,188 | ||
| Insurance - 0.7% | |||
| Alliant Holdings Co.-Issuer, Inc./Wayne Merger Sub LLC 8.25% 8/1/23 (b) | 120,000 | 127,800 | |
| Assicurazioni Generali SpA 7.75% 12/12/42 (c) | EUR | 100,000 | 150,645 |
| Hockey Merger Sub 2, Inc. 7.875% 10/1/21 (b) | 140,000 | 145,716 | |
| Intrum Justitia AB 2.75% 7/15/22 (Reg. S) | EUR | 150,000 | 179,011 |
| Sumitomo Life Insurance Co. 4% 9/14/77 (Reg. S) (c) | 200,000 | 196,912 | |
| USIS Merger Sub, Inc. 6.875% 5/1/25 (b) | 75,000 | 77,813 | |
| TOTAL INSURANCE | 877,897 | ||
| Leisure - 0.1% | |||
| Cedar Fair LP/Magnum Management Corp. 5.375% 4/15/27 (b) | 35,000 | 36,969 | |
| Silversea Cruises 7.25% 2/1/25 (b) | 25,000 | 26,813 | |
| Viking Cruises Ltd. 5.875% 9/15/27 (b) | 70,000 | 70,525 | |
| TOTAL LEISURE | 134,307 | ||
| Metals/Mining - 3.3% | |||
| Alpha Natural Resources, Inc. 9.75% 4/15/18 (d)(e) | 210,000 | 0 | |
| Anglo American Capital PLC 1.75% 4/3/18 (Reg. S) | EUR | 100,000 | 117,337 |
| ArcelorMittal SA: | |||
| 3% 3/25/19 (Reg. S) | EUR | 100,000 | 121,266 |
| 3.125% 1/14/22 (Reg. S) | EUR | 100,000 | 128,721 |
| Bluescope Steel Ltd./Bluescope Steel Finance 6.5% 5/15/21 (b) | 25,000 | 26,125 | |
| First Quantum Minerals Ltd.: | |||
| 7% 2/15/21 (b) | 85,000 | 88,188 | |
| 7.25% 5/15/22 (b) | 220,000 | 229,900 | |
| 7.25% 4/1/23 (b) | 400,000 | 423,000 | |
| 7.5% 4/1/25 (b) | 200,000 | 211,750 | |
| FMG Resources (August 2006) Pty Ltd. 4.75% 5/15/22 (b) | 45,000 | 45,900 | |
| Freeport-McMoRan, Inc.: | |||
| 6.5% 11/15/20 | 15,000 | 15,281 | |
| 6.75% 2/1/22 | 50,000 | 52,000 | |
| 6.875% 2/15/23 | 215,000 | 235,182 | |
| Gold Fields Orogen Holding BVI Ltd. 4.875% 10/7/20 (b) | 200,000 | 205,000 | |
| Joseph T Ryerson & Son, Inc. 11% 5/15/22 (b) | 40,000 | 45,200 | |
| Minsur SA 6.25% 2/7/24 (Reg. S) | 200,000 | 222,000 | |
| Murray Energy Corp. 11.25% 4/15/21 (b) | 150,000 | 82,500 | |
| New Gold, Inc. 6.375% 5/15/25 (b) | 105,000 | 111,563 | |
| Novelis Corp. 5.875% 9/30/26 (b) | 70,000 | 72,143 | |
| Polyus Finance PLC 5.25% 2/7/23 (b) | 200,000 | 209,620 | |
| PT Bukit Makmur Mandiri Utama 7.75% 2/13/22 (b) | 200,000 | 216,508 | |
| Qinghai Provincial Investment Group Co. Ltd. 6.3% 9/26/18 (Reg. S) | 200,000 | 202,300 | |
| Southern Copper Corp. 7.5% 7/27/35 | 150,000 | 197,983 | |
| Stillwater Mining Co. 6.125% 6/27/22 (b) | 200,000 | 203,800 | |
| Vedanta Resources PLC: | |||
| 6.125% 8/9/24 | 200,000 | 204,050 | |
| 6.375% 7/30/22 (b) | 300,000 | 313,860 | |
| VM Holding SA 5.375% 5/4/27 (b) | 200,000 | 211,240 | |
| Walter Energy, Inc. 9.5% 10/15/19 (b)(d)(e) | 155,000 | 0 | |
| TOTAL METALS/MINING | 4,192,417 | ||
| Paper - 0.2% | |||
| Flex Acquisition Co., Inc. 6.875% 1/15/25 (b) | 30,000 | 31,013 | |
| Smurfit Kappa Acquisitions 3.25% 6/1/21 (Reg. S) | EUR | 200,000 | 253,099 |
| TOTAL PAPER | 284,112 | ||
| Publishing/Printing - 0.7% | |||
| Cenveo Corp. 6% 8/1/19 (b) | 145,000 | 100,050 | |
| Clear Channel International BV 8.75% 12/15/20 (b) | 20,000 | 21,000 | |
| Harland Clarke Holdings Corp. 8.375% 8/15/22 (b) | 45,000 | 47,250 | |
| McGraw-Hill Global Education Holdings LLC/McGraw-Hill Global Education Finance 7.875% 5/15/24 (b) | 250,000 | 251,563 | |
| MHGE Parent LLC/MHGE Parent Finance, Inc. 8.5% 8/1/19 pay-in-kind (b)(c) | 410,000 | 409,488 | |
| TOTAL PUBLISHING/PRINTING | 829,351 | ||
| Railroad - 0.2% | |||
| RZD Capital Ltd. 3.3744% 5/20/21 (Reg. S) | EUR | 200,000 | 250,046 |
| Restaurants - 0.9% | |||
| 1011778 BC Unlimited Liability Co./New Red Finance, Inc.: | |||
| 4.25% 5/15/24 (b) | 160,000 | 161,152 | |
| 4.625% 1/15/22 (b) | 70,000 | 71,631 | |
| 5% 10/15/25 (b) | 140,000 | 142,625 | |
| Arcos Dorados Holdings, Inc. 5.875% 4/4/27 (b) | 200,000 | 212,046 | |
| Golden Nugget, Inc.: | |||
| 6.75% 10/15/24 (b) | 120,000 | 122,100 | |
| 8.75% 10/1/25 (b) | 65,000 | 66,788 | |
| KFC Holding Co./Pizza Hut Holding LLC: | |||
| 4.75% 6/1/27 (b) | 50,000 | 51,313 | |
| 5% 6/1/24 (b) | 195,000 | 205,725 | |
| 5.25% 6/1/26 (b) | 100,000 | 106,265 | |
| TOTAL RESTAURANTS | 1,139,645 | ||
| Services - 3.0% | |||
| APX Group, Inc.: | |||
| 7.625% 9/1/23 | 250,000 | 263,125 | |
| 7.875% 12/1/22 | 515,000 | 555,556 | |
| 8.75% 12/1/20 | 1,000,000 | 1,025,000 | |
| Ashtead Capital, Inc.: | |||
| 4.125% 8/15/25 (b) | 200,000 | 201,500 | |
| 4.375% 8/15/27 (b) | 200,000 | 202,500 | |
| Avantor, Inc. 6% 10/1/24 (b) | 110,000 | 112,200 | |
| Blueline Rental Finance Corp./Blueline Rental LLC 9.25% 3/15/24 (b) | 45,000 | 48,825 | |
| CDK Global, Inc. 4.875% 6/1/27 (b) | 105,000 | 109,463 | |
| Ephios Holdco II PLC 8.25% 7/1/23 (Reg. S) | EUR | 100,000 | 127,910 |
| FTI Consulting, Inc. 6% 11/15/22 | 175,000 | 180,705 | |
| H&E Equipment Services, Inc. 5.625% 9/1/25 (b) | 80,000 | 84,500 | |
| Herc Rentals, Inc.: | |||
| 7.5% 6/1/22 (b) | 36,000 | 38,963 | |
| 7.75% 6/1/24 (b) | 36,000 | 39,510 | |
| IHS Markit Ltd. 4.75% 2/15/25 (b) | 65,000 | 68,738 | |
| IPD BV 4.5% 7/15/22 (Reg. S) | EUR | 100,000 | 122,659 |
| Jurassic Holdings III, Inc. 6.875% 2/15/21 (Reg. S) (b) | 220,000 | 196,900 | |
| Laureate Education, Inc. 8.25% 5/1/25 (b) | 180,000 | 193,725 | |
| Prime Security One MS, Inc. 4.875% 7/15/32 (b) | 176,000 | 166,540 | |
| United Rentals North America, Inc. 5.5% 5/15/27 | 45,000 | 48,150 | |
| TOTAL SERVICES | 3,786,469 | ||
| Steel - 0.8% | |||
| Big River Steel LLC/BRS Finance Corp. 7.25% 9/1/25 (b) | 55,000 | 58,988 | |
| Cliffs Natural Resources, Inc. 5.75% 3/1/25 (b) | 165,000 | 159,844 | |
| EVRAZ Group SA 5.375% 3/20/23 (b) | 200,000 | 206,560 | |
| Metinvest BV 9.3725% 12/31/21 pay-in-kind (c) | 132,008 | 137,288 | |
| Thyssenkrupp AG 3.125% 10/25/19 (Reg. S) | EUR | 180,000 | 220,786 |
| Zhongrong International Resour 7.25% 10/26/20 (Reg. S) | 200,000 | 199,600 | |
| TOTAL STEEL | 983,066 | ||
| Super Retail - 0.3% | |||
| InRetail Shopping Malls 6.5% 7/9/21 (b) | 200,000 | 211,300 | |
| Netflix, Inc.: | |||
| 4.375% 11/15/26 (b) | 110,000 | 107,869 | |
| 4.875% 4/15/28 (b) | 85,000 | 84,486 | |
| TOTAL SUPER RETAIL | 403,655 | ||
| Technology - 3.0% | |||
| Balboa Merger Sub, Inc. 11.375% 12/1/21 (b) | 360,000 | 393,300 | |
| Brocade Communications Systems, Inc. 4.625% 1/15/23 | 140,000 | 143,325 | |
| CDW LLC/CDW Finance Corp. 5% 9/1/25 | 35,000 | 36,706 | |
| Ceridian HCM Holding, Inc. 11% 3/15/21 (b) | 155,000 | 163,719 | |
| Diamond 1 Finance Corp./Diamond 2 Finance Corp.: | |||
| 5.875% 6/15/21 (b) | 65,000 | 68,073 | |
| 7.125% 6/15/24 (b) | 65,000 | 71,744 | |
| Ensemble S Merger Sub, Inc. 9% 9/30/23 (b) | 320,000 | 332,000 | |
| Greeneden U.S. Holdings II LLC 10% 11/30/24 (b) | 150,000 | 169,313 | |
| HT Global IT Solutions Holdings Ltd. 7% 7/14/21 (Reg. S) | 200,000 | 211,985 | |
| Inception Merger Sub, Inc./Rackspace Hosting, Inc. 8.625% 11/15/24 (b) | 80,000 | 84,250 | |
| j2 Cloud Services LLC/j2 Global Communications, Inc. 6% 7/15/25 (b) | 45,000 | 47,363 | |
| Jain International Trading BV 7.125% 2/1/22 (Reg. S) | 200,000 | 201,410 | |
| Micron Technology, Inc.: | |||
| 5.25% 1/15/24 (b) | 60,000 | 63,075 | |
| 5.5% 2/1/25 | 85,000 | 90,313 | |
| NXP BV/NXP Funding LLC 4.625% 6/1/23 (b) | 200,000 | 215,500 | |
| Parametric Technology Corp. 6% 5/15/24 | 20,000 | 21,699 | |
| Sabre GLBL, Inc. 5.25% 11/15/23 (b) | 85,000 | 89,038 | |
| Sensata Technologies BV 4.875% 10/15/23 (b) | 120,000 | 126,000 | |
| Solera LLC/Solera Finance, Inc. 10.5% 3/1/24 (b) | 410,000 | 467,400 | |
| STATS ChipPAC Ltd. 8.5% 11/24/20 (Reg. S) | 200,000 | 215,000 | |
| TTM Technologies, Inc. 5.625% 10/1/25 (b) | 25,000 | 25,500 | |
| Veritas U.S., Inc./Veritas Bermuda Ltd. 10.5% 2/1/24 (b) | 455,000 | 484,575 | |
| Western Digital Corp. 10.5% 4/1/24 | 110,000 | 129,085 | |
| TOTAL TECHNOLOGY | 3,850,373 | ||
| Telecommunications - 7.7% | |||
| Altice Financing SA 5.25% 2/15/23 (Reg. S) | EUR | 100,000 | 122,309 |
| Altice Finco SA: | |||
| 4.75% 1/15/28 | EUR | 150,000 | 176,082 |
| 7.625% 2/15/25 (b) | 400,000 | 428,560 | |
| 8.125% 1/15/24 (b) | 200,000 | 215,524 | |
| Banglalink Digital Communications Ltd.: | |||
| 8.625% 5/6/19 (b) | 200,000 | 208,380 | |
| 8.625% 5/6/19 (Reg. S) | 200,000 | 208,380 | |
| C&W Senior Financing Designated Activity Co. 6.875% 9/15/27 (b) | 200,000 | 209,000 | |
| Cellnex Telecom Sau 2.375% 1/16/24 (Reg. S) | EUR | 200,000 | 242,942 |
| CyrusOne LP/CyrusOne Finance Corp.: | |||
| 5% 3/15/24 (b) | 15,000 | 15,731 | |
| 5.375% 3/15/27 (b) | 15,000 | 16,031 | |
| Digicel Group Ltd. 6% 4/15/21 (Reg. S) | 200,000 | 196,732 | |
| Equinix, Inc. 5.375% 5/15/27 | 50,000 | 53,563 | |
| GCI, Inc. 6.875% 4/15/25 | 85,000 | 92,013 | |
| Globo Comunicacao e Participacoes SA 4.875% 4/11/22 (Reg. S) | 250,000 | 261,250 | |
| GTH Finance BV 7.25% 4/26/23 (b) | 200,000 | 226,468 | |
| GTT Communications, Inc. 7.875% 12/31/24 (b) | 300,000 | 319,875 | |
| Intelsat Jackson Holdings SA: | |||
| 8% 2/15/24 (b) | 260,000 | 275,600 | |
| 9.75% 7/15/25 (b) | 80,000 | 80,500 | |
| Intelsat Luxembourg SA 8.125% 6/1/23 | 100,000 | 60,688 | |
| Millicom International Cellular SA 5.125% 1/15/28 (b) | 200,000 | 201,020 | |
| MTN (Mauritius) Investments Ltd. 6.5% 10/13/26 (b) | 200,000 | 216,000 | |
| MTS International Funding Ltd. 5% 5/30/23 (b) | 350,000 | 363,125 | |
| Neptune Finco Corp.: | |||
| 10.125% 1/15/23 (b) | 350,000 | 400,750 | |
| 10.875% 10/15/25 (b) | 200,000 | 245,000 | |
| Nokia Corp.: | |||
| 3.375% 6/12/22 | 35,000 | 34,869 | |
| 4.375% 6/12/27 | 45,000 | 45,000 | |
| Sable International Finance Ltd. 6.875% 8/1/22 (b) | 445,000 | 477,263 | |
| SFR Group SA 7.375% 5/1/26 (b) | 55,000 | 59,125 | |
| Sprint Capital Corp.: | |||
| 6.9% 5/1/19 | 615,000 | 648,825 | |
| 8.75% 3/15/32 | 240,000 | 291,000 | |
| Sprint Communications, Inc. 6% 11/15/22 | 40,000 | 42,000 | |
| Sprint Corp.: | |||
| 7.125% 6/15/24 | 200,000 | 216,188 | |
| 7.25% 9/15/21 | 10,000 | 10,900 | |
| 7.875% 9/15/23 | 540,000 | 603,450 | |
| T-Mobile U.S.A., Inc. 6.836% 4/28/23 | 285,000 | 300,675 | |
| TBG Global Pte. Ltd. 5.25% 2/10/22 (Reg. S) | 200,000 | 205,605 | |
| Telecom Italia SpA: | |||
| 3.625% 5/25/26 (Reg. S) | EUR | 200,000 | 266,823 |
| 4.875% 9/25/20 (Reg. S) | EUR | 100,000 | 132,366 |
| 5.25% 3/17/55 | EUR | 100,000 | 143,345 |
| Telefonica Celular del Paraguay SA 6.75% 12/13/22 (b) | 200,000 | 205,612 | |
| VimpelCom Holdings BV 4.95% 6/16/24 (b) | 200,000 | 204,652 | |
| Wind Acquisition Finance SA 4% 7/15/20 (Reg. S) | EUR | 350,000 | 411,774 |
| Wind Tre SpA: | |||
| 3.125% 1/20/25 (Reg. S) | EUR | 200,000 | 233,669 |
| 5% 1/20/26 (b) | 200,000 | 201,298 | |
| Zayo Group LLC/Zayo Capital, Inc. 5.75% 1/15/27 (b) | 135,000 | 142,256 | |
| TOTAL TELECOMMUNICATIONS | 9,712,218 | ||
| Textiles/Apparel - 0.4% | |||
| Novalis Sas 3% 4/30/22 (Reg. S) | EUR | 200,000 | 238,969 |
| Prime Bloom Holdings Ltd. 7.5% 12/19/19 (Reg. S) | 200,000 | 202,534 | |
| TOTAL TEXTILES/APPAREL | 441,503 | ||
| Transportation Ex Air/Rail - 0.4% | |||
| eHi Car Service Co. Ltd. 5.875% 8/14/22 | 200,000 | 207,288 | |
| Navios Maritime Acquisition Corp./Navios Acquisition Finance U.S., Inc. 8.125% 11/15/21 (b) | 155,000 | 136,400 | |
| Teekay Corp. 8.5% 1/15/20 | 145,000 | 146,631 | |
| TOTAL TRANSPORTATION EX AIR/RAIL | 490,319 | ||
| Utilities - 4.9% | |||
| ContourGlobal Power Holdings SA 5.125% 6/15/21 (Reg. S) | EUR | 200,000 | 244,868 |
| DPL, Inc. 6.75% 10/1/19 | 1,000,000 | 1,052,500 | |
| Dynegy, Inc.: | |||
| 5.875% 6/1/23 | 70,000 | 72,275 | |
| 7.375% 11/1/22 | 105,000 | 112,744 | |
| 7.625% 11/1/24 | 245,000 | 267,663 | |
| 8% 1/15/25 (b) | 45,000 | 49,163 | |
| 8.125% 1/30/26 (b) | 245,000 | 271,950 | |
| Enel SpA 5% 1/15/75 (c) | EUR | 300,000 | 380,906 |
| Energy Future Intermediate Holding Co. LLC/Energy Future Intermediate Holding Finance, Inc.: | |||
| 11% 10/1/21 (d) | 31,737 | 45,225 | |
| 12.25% 3/1/22 (b)(c)(d) | 650,609 | 993,806 | |
| Greenko Investment Co. 4.875% 8/16/23 (Reg. S) | 200,000 | 199,050 | |
| InterGen NV 7% 6/30/23 (b) | 645,000 | 625,650 | |
| Listrindo Capital BV 4.95% 9/14/26 (b) | 200,000 | 202,500 | |
| NRG Energy, Inc. 6.625% 3/15/23 | 310,000 | 320,850 | |
| NSG Holdings II LLC/NSG Holdings, Inc. 7.75% 12/15/25 (b) | 316,375 | 343,663 | |
| Pattern Energy Group, Inc. 5.875% 2/1/24 (b) | 30,000 | 31,875 | |
| Petrobras Global Finance BV: | |||
| 4.75% 1/14/25 | EUR | 200,000 | 257,435 |
| 7.375% 1/17/27 | 300,000 | 333,150 | |
| PPL Energy Supply LLC 6.5% 6/1/25 | 50,000 | 43,500 | |
| RJS Power Holdings LLC 4.625% 7/15/19 (b)(c) | 73,000 | 73,913 | |
| RWE AG 3.5% 4/21/75 (Reg. S) (c) | EUR | 150,000 | 183,639 |
| The AES Corp. 5.125% 9/1/27 | 55,000 | 56,458 | |
| TOTAL UTILITIES | 6,162,783 | ||
| TOTAL NONCONVERTIBLE BONDS | |||
| (Cost $98,085,885) | 101,790,308 | ||
| Shares | Value | ||
| Common Stocks - 1.3% | |||
| Automotive & Auto Parts - 0.2% | |||
| Chassix Holdings, Inc. (e)(g) | 3,510 | 127,518 | |
| General Motors Co. | 3,168 | 136,161 | |
| TOTAL AUTOMOTIVE & AUTO PARTS | 263,679 | ||
| Chemicals - 0.2% | |||
| LyondellBasell Industries NV Class A | 2,100 | 217,413 | |
| Energy - 0.2% | |||
| Contura Energy, Inc. | 25 | 1,478 | |
| Contura Energy, Inc. warrants 7/26/23 (g) | 41 | 943 | |
| Extraction Oil & Gas, Inc. | 1,041 | 16,604 | |
| LINN Energy, Inc. | 491 | 18,928 | |
| Pacific Exploration and Production Corp. | 3,454 | 103,077 | |
| Southwestern Energy Co. (g) | 1,927 | 10,695 | |
| The Williams Companies, Inc. | 1,900 | 54,150 | |
| TOTAL ENERGY | 205,875 | ||
| Food/Beverage/Tobacco - 0.1% | |||
| U.S. Foods Holding Corp. (g) | 6,800 | 185,504 | |
| Gaming - 0.1% | |||
| Penn National Gaming, Inc. (g) | 4,600 | 120,014 | |
| Healthcare - 0.2% | |||
| HCA Holdings, Inc. (g) | 2,600 | 196,690 | |
| Legend Acquisition, Inc. (e)(g) | 2,128 | 50,540 | |
| TOTAL HEALTHCARE | 247,230 | ||
| Homebuilders/Real Estate - 0.0% | |||
| Keane Group, Inc. | 1,100 | 16,984 | |
| Hotels - 0.1% | |||
| Extended Stay America, Inc. unit | 7,700 | 152,614 | |
| Metals/Mining - 0.0% | |||
| Alpha Natural Resources Holdings, Inc. | 363 | 1,452 | |
| Warrior Metropolitan Coal, Inc. | 1,129 | 29,377 | |
| TOTAL METALS/MINING | 30,829 | ||
| Services - 0.2% | |||
| United Rentals, Inc. (g) | 1,300 | 183,924 | |
| WP Rocket Holdings, Inc. (e)(g)(h) | 356,213 | 3,562 | |
| TOTAL SERVICES | 187,486 | ||
| Steel - 0.0% | |||
| ANR, Inc. | 363 | 7,623 | |
| ANR, Inc. rights 3/31/23 (g) | 216,142 | 1,729 | |
| TOTAL STEEL | 9,352 | ||
| TOTAL COMMON STOCKS | |||
| (Cost $2,245,246) | 1,636,980 | ||
| Convertible Preferred Stocks - 0.3% | |||
| Energy - 0.0% | |||
| Southwestern Energy Co. Series B 6.25% | 5,200 | 66,138 | |
| Healthcare - 0.2% | |||
| Allergan PLC 5.50% | 300 | 192,375 | |
| Teva Pharmaceutical Industries Ltd. 7% | 250 | 71,050 | |
| TOTAL HEALTHCARE | 263,425 | ||
| Utilities - 0.1% | |||
| Dynegy, Inc. 7.00% | 1,600 | 131,040 | |
| TOTAL CONVERTIBLE PREFERRED STOCKS | |||
| (Cost $798,774) | 460,603 | ||
| Principal Amount(a) | Value | ||
| Bank Loan Obligations - 3.9% | |||
| Aerospace - 0.1% | |||
| TransDigm, Inc. Tranche G, term loan 3 month U.S. LIBOR + 3.000% 4.2623% 8/22/24 (c)(f) | 129,675 | 130,262 | |
| Automotive & Auto Parts - 0.0% | |||
| Chassix, Inc. term loan 12% 7/29/19 (e) | 17,397 | 17,353 | |
| Cable/Satellite TV - 0.3% | |||
| Numericable LLC Tranche B 12LN, term loan 3 month U.S. LIBOR + 3.000% 4.3491% 1/1/26 (c)(f) | 190,000 | 190,044 | |
| WideOpenWest Finance LLC Tranche B, term loan 3 month U.S. LIBOR + 3.250% 4.4867% 8/19/23 (c)(f) | 210,000 | 210,263 | |
| TOTAL CABLE/SATELLITE TV | 400,307 | ||
| Chemicals - 0.0% | |||
| Oxea Corp. Tranche B, term loan 3 month U.S. LIBOR + 3.500% 4.875% 10/12/24 (c)(f) | 10,000 | 10,016 | |
| Tronox Blocked Borrower LLC Tranche B, term loan 3 month U.S. LIBOR + 3.000% 4.3231% 9/22/24 (c)(f) | 9,070 | 9,142 | |
| Tronox Finance LLC Tranche B, term loan 3 month U.S. LIBOR + 3.000% 4.3283% 9/22/24 (c)(f) | 20,930 | 21,096 | |
| TOTAL CHEMICALS | 40,254 | ||
| Diversified Financial Services - 0.1% | |||
| Bcp Renaissance Parent LLC Tranche B, term loan 3 month U.S. LIBOR + 4.500% 5.3801% 9/20/24 (c)(f) | 15,000 | 15,164 | |
| Cypress Intermediate Holdings, Inc. Tranche B 1LN, term loan 3 month U.S. LIBOR + 3.000% 4.24% 4/27/24 (c)(f) | 124,688 | 125,155 | |
| TOTAL DIVERSIFIED FINANCIAL SERVICES | 140,319 | ||
| Energy - 0.8% | |||
| Arctic LNG Carriers Ltd. Tranche B 1LN, term loan 3 month U.S. LIBOR + 4.500% 5.7423% 5/18/23 (c)(f) | 224,438 | 226,401 | |
| Bcp Raptor LLC Tranche B, term loan 3 month U.S. LIBOR + 4.250% 5.5222% 6/22/24 (c)(f) | 49,875 | 50,389 | |
| California Resources Corp. Tranche 1LN, term loan 3 month U.S. LIBOR + 10.375% 11.6117% 12/31/21 (c)(f) | 230,000 | 246,291 | |
| Chesapeake Energy Corp. Tranche 1LN, term loan 3 month U.S. LIBOR + 7.500% 8.8144% 8/23/21 (c)(f) | 119,000 | 127,529 | |
| Chief Exploration & Development, LLC. Tranche 2LN, term loan 3 month U.S. LIBOR + 6.500% 7.9586% 5/16/21 (c)(f) | 255,000 | 249,051 | |
| FTS International, Inc. Tranche B, term loan 3 month U.S. LIBOR + 4.750% 5.9923% 4/16/21 (c)(f) | 15,000 | 14,618 | |
| Pacific Drilling SA Tranche B, term loan 3 month U.S. LIBOR + 3.500% 4.875% 6/3/18 (c)(f) | 47,875 | 15,611 | |
| Seadrill Operating LP Tranche B, term loan 3 month U.S. LIBOR + 3.000% 4.3328% 2/21/21 (c)(f) | 99,074 | 75,154 | |
| TOTAL ENERGY | 1,005,044 | ||
| Gaming - 0.0% | |||
| Caesars Growth Properties Holdings LLC Tranche 1LN, term loan 3 month U.S. LIBOR + 3.000% 4.2423% 5/8/21 (c)(f) | 4,975 | 4,976 | |
| Healthcare - 0.1% | |||
| U.S. Renal Care, Inc. Tranche 2LN, term loan 3 month U.S. LIBOR + 8.000% 9.3328% 12/31/23 (c)(f) | 110,000 | 106,700 | |
| Homebuilders/Real Estate - 0.0% | |||
| DTZ U.S. Borrower LLC Tranche 2LN, term loan 3 month U.S. LIBOR + 8.250% 9.6301% 11/4/22 (c)(f) | 4,681 | 4,751 | |
| Insurance - 0.0% | |||
| Alliant Holdings Intermediate LLC Tranche B, term loan 3 month U.S. LIBOR + 3.250% 4.4896% 8/14/22 (c)(f) | 4,975 | 5,008 | |
| USI, Inc. Tranche B, term loan 3 month U.S. LIBOR + 3.000% 4.3142% 5/16/24 (c)(f) | 15,000 | 15,031 | |
| TOTAL INSURANCE | 20,039 | ||
| Leisure - 0.0% | |||
| Intrawest Resorts Holdings, Inc. Tranche B 1LN, term loan 3 month U.S. LIBOR + 3.250% 4.4923% 7/31/24 (c)(f) | 5,000 | 5,050 | |
| Metals/Mining - 0.0% | |||
| Murray Energy Corp. Tranche B 2LN, term loan 3 month U.S. LIBOR + 7.250% 8.5828% 4/16/20 (c)(f) | 39,454 | 35,071 | |
| Paper - 0.0% | |||
| Caraustar Industries, Inc. Tranche B, term loan 3 month U.S. LIBOR + 5.500% 6.8328% 3/14/22 (c)(f) | 9,950 | 10,020 | |
| Publishing/Printing - 0.1% | |||
| Harland Clarke Holdings Corp. Tranche B 6LN, term loan 3 month U.S. LIBOR + 5.500% 6.8328% 2/9/22 (c)(f) | 88,931 | 88,915 | |
| Restaurants - 0.3% | |||
| Burger King Worldwide, Inc. Tranche B, term loan 3 month U.S. LIBOR + 2.250% 3.5276% 2/17/24 (c)(f) | 302,851 | 303,154 | |
| Services - 0.9% | |||
| Brand Energy & Infrastructure Services, Inc. Tranche B, term loan 3 month U.S. LIBOR + 4.250% 5.6149% 6/21/24 (c)(f) | 204,488 | 205,737 | |
| KUEHG Corp.: | |||
| Tranche B 1LN, term loan 3 month U.S. LIBOR + 3.750% 5.0828% 8/13/22 (c)(f) | 765,727 | 769,081 | |
| Tranche B, term loan 3 month U.S. LIBOR + 8.250% 9.5828% 8/22/25 (c)(f) | 95,000 | 94,763 | |
| TOTAL SERVICES | 1,069,581 | ||
| Technology - 0.3% | |||
| Digicert Holdings, Inc. Tranche B, term loan 3 month U.S. LIBOR + 4.750% 6.1301% 9/19/24 (c)(f) | 25,000 | 25,271 | |
| First Data Corp. Tranche B 1LN, term loan 3 month U.S. LIBOR + 2.500% 3.7379% 4/26/24 (c)(f) | 36,917 | 37,062 | |
| Kronos, Inc. term loan 3 month U.S. LIBOR + 8.250% 9.5606% 11/1/24 (c)(f) | 115,000 | 118,252 | |
| Mcafee LLC Tranche B, term loan 3 month U.S. LIBOR + 8.500% 9.8328% 9/29/25 (c)(f) | 75,000 | 76,125 | |
| Renaissance Learning, Inc.: | |||
| Tranche 1LN, term loan 3 month U.S. LIBOR + 3.750% 5.0828% 4/9/21 (c)(f) | 61,700 | 62,060 | |
| Tranche 2LN, term loan 3 month U.S. LIBOR + 7.000% 8.3328% 4/9/22 (c)(f) | 95,000 | 95,950 | |
| TOTAL TECHNOLOGY | 414,720 | ||
| Telecommunications - 0.6% | |||
| Intelsat Jackson Holdings SA Tranche B 2LN, term loan 3 month U.S. LIBOR + 2.750% 4.0711% 6/30/19 (c)(f) | 245,000 | 244,147 | |
| Sable International Finance Ltd. Tranche B, term loan 3 month U.S. LIBOR + 3.500% 4.7423% 1/31/25 (c)(f) | 490,000 | 491,759 | |
| TOTAL TELECOMMUNICATIONS | 735,906 | ||
| Utilities - 0.3% | |||
| Energy Future Holdings Corp. Tranche B, term loan 3 month U.S. LIBOR + 3.000% 4.2422% 6/30/18 (c)(f) | 400,000 | 402,500 | |
| TOTAL BANK LOAN OBLIGATIONS | |||
| (Cost $4,822,529) | 4,934,922 | ||
| Preferred Securities - 7.4% | |||
| Automotive & Auto Parts - 0.2% | |||
| Baoxin Auto Finance I Ltd. 5.625% (c)(i) | 200,000 | 200,156 | |
| Banks & Thrifts - 3.6% | |||
| Alfa Bond Issuance PLC 8% (Reg. S) (c)(i) | 200,000 | 216,879 | |
| Banco Do Brasil SA 9% (b)(c)(i) | 200,000 | 226,189 | |
| Banco Mercantil del Norte SA 7.625% (b)(c)(i) | 400,000 | 436,655 | |
| Bank of East Asia Ltd. 5.5% (Reg. S) (c)(i) | 200,000 | 211,135 | |
| Barclays Bank PLC 7.625% 11/21/22 | 420,000 | 496,747 | |
| China CITIC Bank International Ltd. 4.25% (Reg. S) (c)(i) | 200,000 | 197,969 | |
| Chong Hing Bank Ltd. 6.5% (c)(i) | 200,000 | 209,495 | |
| Citigroup, Inc. 5.35% (c)(i) | 550,000 | 589,031 | |
| Credit Agricole SA: | |||
| 6.5%(Reg. S) (c)(i) | EUR | 200,000 | 270,771 |
| 6.625% (b)(c)(i) | 315,000 | 333,380 | |
| 7.875% (b)(c)(i) | 200,000 | 229,438 | |
| 8.125% (b)(c)(i) | 200,000 | 242,476 | |
| Intesa Sanpaolo SpA 8.047% (c)(i) | EUR | 350,000 | 438,598 |
| Royal Bank of Scotland Group PLC 8.625% (c)(i) | 200,000 | 227,996 | |
| Standard Chartered PLC 7.5% (b)(c)(i) | 200,000 | 220,626 | |
| TOTAL BANKS & THRIFTS | 4,547,385 | ||
| Building Materials - 0.2% | |||
| Wisdom Glory Group Ltd. 5.25% (Reg. S) (c)(i) | 200,000 | 204,384 | |
| Cable/Satellite TV - 0.1% | |||
| SES SA 4.625%/VAR (Reg. S) unit (i) | 100,000 | 130,567 | |
| Chemicals - 0.1% | |||
| Solvay SA 5.869% (c)(i) | EUR | 100,000 | 143,484 |
| Consumer Products - 0.5% | |||
| Cosan Overseas Ltd. 8.25% (i) | 600,000 | 624,737 | |
| Containers - 0.1% | |||
| Colombia Telecomunicacines Sa 8.5% (b)(c)(i) | 100,000 | 107,501 | |
| Diversified Financial Services - 0.5% | |||
| China Cinda Asset Management Co. Ltd. 4.45% (Reg. S) (c)(i) | 200,000 | 199,522 | |
| Hutchison Whampoa Europe Finance, Ltd. 3.75% (Reg. S) (c)(i) | EUR | 150,000 | 180,731 |
| Magnesita Finance Ltd. 8.625% (b)(i) | 30,000 | 30,085 | |
| Nanyang Commercial Bank Ltd. 5% (Reg. S) (c)(i) | 200,000 | 205,748 | |
| TOTAL DIVERSIFIED FINANCIAL SERVICES | 616,086 | ||
| Energy - 0.3% | |||
| Gas Natural Fenosa Finance BV 4.125% (Reg. S) (c)(i) | EUR | 300,000 | 393,738 |
| Healthcare - 0.1% | |||
| Fullerton Healthcare Corp. Ltd. 7% (Reg. S) (c)(i) | 200,000 | 199,250 | |
| Homebuilders/Real Estate - 1.0% | |||
| CIFI Holdings Group Co. Ltd. 5.375% (Reg. S) (c)(i) | 200,000 | 201,440 | |
| Grand City Properties SA 3.75% (c)(i) | EUR | 200,000 | 257,973 |
| Moon Wise Global Ltd. 9% (Reg. S) (c)(i) | 200,000 | 216,090 | |
| RKI Overseas Finance 2017 (A) 7% (Reg. S) (i) | 200,000 | 201,853 | |
| Sino-Ocean Land Treasure Finan 4.9% (Reg. S) (c)(i) | 200,000 | 201,497 | |
| Yuzhou Properties Co. 5.375% (Reg. S) (c)(i) | 200,000 | 199,274 | |
| TOTAL HOMEBUILDERS/REAL ESTATE | 1,278,127 | ||
| Telecommunications - 0.7% | |||
| Koninklijke KPN NV 6.125% (Reg. S) (c)(i) | EUR | 200,000 | 245,913 |
| Telefonica Europe BV: | |||
| 5% (Reg. S) (c)(i) | EUR | 300,000 | 390,324 |
| 6.5% (Reg. S) (c)(i) | EUR | 200,000 | 246,677 |
| TOTAL TELECOMMUNICATIONS | 882,914 | ||
| TOTAL PREFERRED SECURITIES | |||
| (Cost $8,878,344) | 9,328,329 | ||
| Shares | Value | ||
| Money Market Funds - 5.7% | |||
| Fidelity Cash Central Fund, 1.10% (j) | |||
| (Cost $7,239,557) | 7,238,612 | 7,240,060 | |
| TOTAL INVESTMENT IN SECURITIES - 99.0% | |||
| (Cost $122,070,335) | 125,391,202 | ||
| NET OTHER ASSETS (LIABILITIES) - 1.0% | 1,256,420 | ||
| NET ASSETS - 100% | $126,647,622 |
Currency Abbreviations
EUR – European Monetary Unit
Legend
(a) Amount is stated in United States dollars unless otherwise noted.
(b) Security exempt from registration under Rule 144A of the Securities Act of 1933. These securities may be resold in transactions exempt from registration, normally to qualified institutional buyers. At the end of the period, the value of these securities amounted to $54,450,226 or 43.0% of net assets.
(c) Coupon rates for floating and adjustable rate securities reflect the rates in effect at period end.
(d) Non-income producing - Security is in default.
(e) Level 3 security
(f) Coupon is indexed to a floating interest rate which may be multiplied by a specified factor and/or subject to caps or floors.
(g) Non-income producing
(h) Restricted securities - Investment in securities not registered under the Securities Act of 1933 (excluding 144A issues). At the end of the period, the value of restricted securities (excluding 144A issues) amounted to $3,562 or 0.0% of net assets.
(i) Security is perpetual in nature with no stated maturity date.
(j) Affiliated fund that is generally available only to investment companies and other accounts managed by Fidelity Investments. The rate quoted is the annualized seven-day yield of the fund at period end. A complete unaudited listing of the fund's holdings as of its most recent quarter end is available upon request. In addition, each Fidelity Central Fund's financial statements are available on the SEC's website or upon request.
Additional information on each restricted holding is as follows:
| Security | Acquisition Date | Acquisition Cost |
| WP Rocket Holdings, Inc. | 6/24/11 - 2/2/15 | $184,731 |
Affiliated Central Funds
Information regarding fiscal year to date income earned by the Fund from investments in Fidelity Central Funds is as follows:
| Fund | Income earned |
| Fidelity Cash Central Fund | $41,517 |
| Fidelity Securities Lending Cash Central Fund | 35 |
| Total | $41,552 |
Investment Valuation
The following is a summary of the inputs used, as of October 31, 2017, involving the Fund's assets and liabilities carried at fair value. The inputs or methodology used for valuing securities may not be an indication of the risk associated with investing in those securities. For more information on valuation inputs, and their aggregation into the levels used below, please refer to the Investment Valuation section in the accompanying Notes to Financial Statements.
| Valuation Inputs at Reporting Date: | ||||
| Description | Total | Level 1 | Level 2 | Level 3 |
| Investments in Securities: | ||||
| Equities: | ||||
| Consumer Discretionary | $721,811 | $594,293 | $-- | $127,518 |
| Energy | 312,194 | 246,056 | 66,138 | -- |
| Health Care | 510,655 | 196,690 | 263,425 | 50,540 |
| Industrials | 204,470 | 200,908 | -- | 3,562 |
| Materials | 217,413 | 217,413 | -- | -- |
| Utilities | 131,040 | -- | 131,040 | -- |
| Corporate Bonds | 101,790,308 | -- | 101,790,257 | 51 |
| Bank Loan Obligations | 4,934,922 | -- | 4,917,569 | 17,353 |
| Preferred Securities | 9,328,329 | -- | 9,328,329 | -- |
| Money Market Funds | 7,240,060 | 7,240,060 | -- | -- |
| Total Investments in Securities: | $125,391,202 | $8,695,420 | $116,496,758 | $199,024 |
Other Information
Distribution of investments by country or territory of incorporation, as a percentage of Total Net Assets, is as follows (Unaudited):
| United States of America | 47.4% |
| Luxembourg | 8.7% |
| Netherlands | 6.1% |
| Cayman Islands | 5.7% |
| Canada | 3.6% |
| United Kingdom | 3.2% |
| British Virgin Islands | 2.5% |
| Ireland | 2.4% |
| Argentina | 2.2% |
| Italy | 1.9% |
| Mexico | 1.7% |
| France | 1.5% |
| Germany | 1.1% |
| Multi-National | 1.1% |
| Singapore | 1.0% |
| Others (Individually Less Than 1%) | 9.9% |
| 100.0% |
See accompanying notes which are an integral part of the financial statements.
Financial Statements
Statement of Assets and Liabilities
| October 31, 2017 (Unaudited) | ||
| Assets | ||
| Investment in securities, at value — See accompanying schedule: Unaffiliated issuers (cost $114,830,778) | $118,151,142 | |
| Fidelity Central Funds (cost $7,239,557) | 7,240,060 | |
| Total Investment in Securities (cost $122,070,335) | $125,391,202 | |
| Cash | 731,674 | |
| Foreign currency held at value (cost $136,587) | 136,272 | |
| Receivable for investments sold | 240,774 | |
| Receivable for fund shares sold | 321,040 | |
| Dividends receivable | 14,758 | |
| Interest receivable | 1,851,771 | |
| Distributions receivable from Fidelity Central Funds | 7,194 | |
| Prepaid expenses | 246 | |
| Receivable from investment adviser for expense reductions | 3,010 | |
| Total assets | 128,697,941 | |
| Liabilities | ||
| Payable for investments purchased | $1,727,007 | |
| Payable for fund shares redeemed | 115,866 | |
| Distributions payable | 64,912 | |
| Accrued management fee | 73,711 | |
| Distribution and service plan fees payable | 5,743 | |
| Other affiliated payables | 19,289 | |
| Other payables and accrued expenses | 43,791 | |
| Total liabilities | 2,050,319 | |
| Net Assets | $126,647,622 | |
| Net Assets consist of: | ||
| Paid in capital | $126,487,820 | |
| Undistributed net investment income | 325,468 | |
| Accumulated undistributed net realized gain (loss) on investments and foreign currency transactions | (3,488,179) | |
| Net unrealized appreciation (depreciation) on investments and assets and liabilities in foreign currencies | 3,322,513 | |
| Net Assets | $126,647,622 | |
| Calculation of Maximum Offering Price | ||
| Class A: | ||
| Net Asset Value and redemption price per share ($7,552,373 ÷ 770,591 shares) | $9.80 | |
| Maximum offering price per share (100/96.00 of $9.80) | $10.21 | |
| Class M: | ||
| Net Asset Value and redemption price per share ($3,907,003 ÷ 398,684 shares) | $9.80 | |
| Maximum offering price per share (100/96.00 of $9.80) | $10.21 | |
| Class C: | ||
| Net Asset Value and offering price per share ($4,212,856 ÷ 429,836 shares)(a) | $9.80 | |
| Global High Income: | ||
| Net Asset Value, offering price and redemption price per share ($107,722,592 ÷ 10,990,516 shares) | $9.80 | |
| Class I: | ||
| Net Asset Value, offering price and redemption price per share ($3,252,798 ÷ 331,874 shares) | $9.80 |
(a) Redemption price per share is equal to net asset value less any applicable contingent deferred sales charge.
See accompanying notes which are an integral part of the financial statements.
Statement of Operations
| Six months ended October 31, 2017 (Unaudited) | ||
| Investment Income | ||
| Dividends | $259,995 | |
| Interest | 2,940,557 | |
| Income from Fidelity Central Funds | 41,552 | |
| Total income | 3,242,104 | |
| Expenses | ||
| Management fee | $396,639 | |
| Transfer agent fees | 84,826 | |
| Distribution and service plan fees | 32,465 | |
| Accounting and security lending fees | 23,258 | |
| Custodian fees and expenses | 8,393 | |
| Independent trustees' fees and expenses | 208 | |
| Registration fees | 33,018 | |
| Audit | 39,817 | |
| Legal | 6,424 | |
| Miscellaneous | 487 | |
| Total expenses before reductions | 625,535 | |
| Expense reductions | (27,173) | 598,362 |
| Net investment income (loss) | 2,643,742 | |
| Realized and Unrealized Gain (Loss) | ||
| Net realized gain (loss) on: | ||
| Investment securities: | ||
| Unaffiliated issuers | (1,149,140) | |
| Foreign currency transactions | 4,000 | |
| Total net realized gain (loss) | (1,145,140) | |
| Change in net unrealized appreciation (depreciation) on: | ||
| Investment securities: | ||
| Unaffiliated issuers | 3,841,370 | |
| Assets and liabilities in foreign currencies | (1,297) | |
| Total change in net unrealized appreciation (depreciation) | 3,840,073 | |
| Net gain (loss) | 2,694,933 | |
| Net increase (decrease) in net assets resulting from operations | $5,338,675 |
See accompanying notes which are an integral part of the financial statements.
Statement of Changes in Net Assets
| Six months ended October 31, 2017 (Unaudited) | Year ended April 30, 2017 | |
| Increase (Decrease) in Net Assets | ||
| Operations | ||
| Net investment income (loss) | $2,643,742 | $5,224,215 |
| Net realized gain (loss) | (1,145,140) | (46,333) |
| Change in net unrealized appreciation (depreciation) | 3,840,073 | 4,535,843 |
| Net increase (decrease) in net assets resulting from operations | 5,338,675 | 9,713,725 |
| Distributions to shareholders from net investment income | (2,422,495) | (4,739,795) |
| Share transactions - net increase (decrease) | 21,812,996 | (9,314,472) |
| Redemption fees | 6,781 | 30,815 |
| Total increase (decrease) in net assets | 24,735,957 | (4,309,727) |
| Net Assets | ||
| Beginning of period | 101,911,665 | 106,221,392 |
| End of period | $126,647,622 | $101,911,665 |
| Other Information | ||
| Undistributed net investment income end of period | $325,468 | $104,221 |
See accompanying notes which are an integral part of the financial statements.
Financial Highlights
Fidelity Global High Income Fund Class A
| Six months ended (Unaudited) October 31, | Years ended April 30, | |||||
| 2017 | 2017 | 2016 | 2015 | 2014 | 2013 | |
| Selected Per–Share Data | ||||||
| Net asset value, beginning of period | $9.54 | $9.07 | $9.60 | $10.21 | $10.46 | $9.74 |
| Income from Investment Operations | ||||||
| Net investment income (loss)A | .220 | .463 | .462 | .476 | .506 | .526 |
| Net realized and unrealized gain (loss) | .240 | .422 | (.541) | (.293)B | (.036) | .714 |
| Total from investment operations | .460 | .885 | (.079) | .183 | .470 | 1.240 |
| Distributions from net investment income | (.201) | (.418) | (.454) | (.486) | (.483) | (.477) |
| Distributions from net realized gain | – | – | – | (.310) | (.239) | (.046) |
| Total distributions | (.201) | (.418) | (.454) | (.796) | (.722) | (.523) |
| Redemption fees added to paid in capitalA | .001 | .003 | .003 | .003 | .002 | .003 |
| Net asset value, end of period | $9.80 | $9.54 | $9.07 | $9.60 | $10.21 | $10.46 |
| Total ReturnC,D,E | 4.86% | 10.00% | (.65)% | 1.97%B | 4.86% | 13.13% |
| Ratios to Average Net AssetsF,G | ||||||
| Expenses before reductions | 1.33%H | 1.36% | 1.38% | 1.28% | 1.23% | 1.24% |
| Expenses net of fee waivers, if any | 1.25%H | 1.25% | 1.25% | 1.25% | 1.23% | 1.24% |
| Expenses net of all reductions | 1.25%H | 1.25% | 1.25% | 1.25% | 1.23% | 1.24% |
| Net investment income (loss) | 4.49%H | 4.98% | 5.11% | 4.82% | 5.03% | 5.25% |
| Supplemental Data | ||||||
| Net assets, end of period (000 omitted) | $7,552 | $7,102 | $6,187 | $7,036 | $8,000 | $6,419 |
| Portfolio turnover rateI | 48%H | 48% | 41% | 44% | 72% | 55% |
A Calculated based on average shares outstanding during the period.
B Amount includes a reimbursement from the investment adviser for an operational error which amounted to less than $.01 per share. Excluding this reimbursement, the total return would have been 1.93%.
C Total returns for periods of less than one year are not annualized.
D Total returns would have been lower if certain expenses had not been reduced during the applicable periods shown.
E Total returns do not include the effect of the sales charges.
F Fees and expenses of any underlying Fidelity Central Funds are not included in the Fund's expense ratio. The Fund indirectly bears its proportionate share of the expenses of any underlying Fidelity Central Funds.
G Expense ratios reflect operating expenses of the class. Expenses before reductions do not reflect amounts reimbursed by the investment adviser or reductions from brokerage service arrangements or reductions from other expense offset arrangements and do not represent the amount paid by the class during periods when reimbursements or reductions occur. Expenses net of fee waivers reflect expenses after reimbursement by the investment adviser but prior to reductions from brokerage service arrangements or other expense offset arrangements. Expenses net of all reductions represent the net expenses paid by the class.
H Annualized
I Amount does not include the portfolio activity of any underlying Fidelity Central Funds.
See accompanying notes which are an integral part of the financial statements.
Fidelity Global High Income Fund Class M
| Six months ended (Unaudited) October 31, | Years ended April 30, | |||||
| 2017 | 2017 | 2016 | 2015 | 2014 | 2013 | |
| Selected Per–Share Data | ||||||
| Net asset value, beginning of period | $9.54 | $9.07 | $9.60 | $10.21 | $10.46 | $9.74 |
| Income from Investment Operations | ||||||
| Net investment income (loss)A | .219 | .464 | .462 | .474 | .504 | .523 |
| Net realized and unrealized gain (loss) | .241 | .421 | (.541) | (.291)B | (.036) | .712 |
| Total from investment operations | .460 | .885 | (.079) | .183 | .468 | 1.235 |
| Distributions from net investment income | (.201) | (.418) | (.454) | (.486) | (.481) | (.472) |
| Distributions from net realized gain | – | – | – | (.310) | (.239) | (.046) |
| Total distributions | (.201) | (.418) | (.454) | (.796) | (.720) | (.518) |
| Redemption fees added to paid in capitalA | .001 | .003 | .003 | .003 | .002 | .003 |
| Net asset value, end of period | $9.80 | $9.54 | $9.07 | $9.60 | $10.21 | $10.46 |
| Total ReturnC,D,E | 4.87% | 10.00% | (.65)% | 1.98%B | 4.84% | 13.08% |
| Ratios to Average Net AssetsF,G | ||||||
| Expenses before reductions | 1.42%H | 1.50% | 1.48% | 1.40% | 1.35% | 1.25% |
| Expenses net of fee waivers, if any | 1.25%H | 1.25% | 1.25% | 1.25% | 1.25% | 1.25% |
| Expenses net of all reductions | 1.25%H | 1.25% | 1.25% | 1.25% | 1.25% | 1.25% |
| Net investment income (loss) | 4.49%H | 4.98% | 5.11% | 4.82% | 5.01% | 5.24% |
| Supplemental Data | ||||||
| Net assets, end of period (000 omitted) | $3,907 | $3,029 | $1,436 | $1,745 | $1,595 | $1,349 |
| Portfolio turnover rateI | 48%H | 48% | 41% | 44% | 72% | 55% |
A Calculated based on average shares outstanding during the period.
B Amount includes a reimbursement from the investment adviser for an operational error which amounted to less than $.01 per share. Excluding this reimbursement, the total return would have been 1.94%.
C Total returns for periods of less than one year are not annualized.
D Total returns would have been lower if certain expenses had not been reduced during the applicable periods shown.
E Total returns do not include the effect of the sales charges.
F Fees and expenses of any underlying Fidelity Central Funds are not included in the Fund's expense ratio. The Fund indirectly bears its proportionate share of the expenses of any underlying Fidelity Central Funds.
G Expense ratios reflect operating expenses of the class. Expenses before reductions do not reflect amounts reimbursed by the investment adviser or reductions from brokerage service arrangements or reductions from other expense offset arrangements and do not represent the amount paid by the class during periods when reimbursements or reductions occur. Expenses net of fee waivers reflect expenses after reimbursement by the investment adviser but prior to reductions from brokerage service arrangements or other expense offset arrangements. Expenses net of all reductions represent the net expenses paid by the class.
H Annualized
I Amount does not include the portfolio activity of any underlying Fidelity Central Funds.
See accompanying notes which are an integral part of the financial statements.
Fidelity Global High Income Fund Class C
| Six months ended (Unaudited) October 31, | Years ended April 30, | |||||
| 2017 | 2017 | 2016 | 2015 | 2014 | 2013 | |
| Selected Per–Share Data | ||||||
| Net asset value, beginning of period | $9.54 | $9.07 | $9.60 | $10.21 | $10.46 | $9.74 |
| Income from Investment Operations | ||||||
| Net investment income (loss)A | .183 | .394 | .394 | .401 | .428 | .448 |
| Net realized and unrealized gain (loss) | .240 | .422 | (.540) | (.292)B | (.035) | .712 |
| Total from investment operations | .423 | .816 | (.146) | .109 | .393 | 1.160 |
| Distributions from net investment income | (.164) | (.349) | (.387) | (.412) | (.406) | (.397) |
| Distributions from net realized gain | – | – | – | (.310) | (.239) | (.046) |
| Total distributions | (.164) | (.349) | (.387) | (.722) | (.645) | (.443) |
| Redemption fees added to paid in capitalA | .001 | .003 | .003 | .003 | .002 | .003 |
| Net asset value, end of period | $9.80 | $9.54 | $9.07 | $9.60 | $10.21 | $10.46 |
| Total ReturnC,D,E | 4.47% | 9.19% | (1.39)% | 1.22%B | 4.05% | 12.23% |
| Ratios to Average Net AssetsF,G | ||||||
| Expenses before reductions | 2.10%H | 2.18% | 2.20% | 2.12% | 2.05% | 2.01% |
| Expenses net of fee waivers, if any | 2.00%H | 2.00% | 2.00% | 2.00% | 2.00% | 2.00% |
| Expenses net of all reductions | 2.00%H | 2.00% | 2.00% | 2.00% | 2.00% | 2.00% |
| Net investment income (loss) | 3.74%H | 4.23% | 4.36% | 4.07% | 4.26% | 4.49% |
| Supplemental Data | ||||||
| Net assets, end of period (000 omitted) | $4,213 | $3,775 | $3,437 | $3,811 | $3,720 | $2,941 |
| Portfolio turnover rateI | 48%H | 48% | 41% | 44% | 72% | 55% |
A Calculated based on average shares outstanding during the period.
B Amount includes a reimbursement from the investment adviser for an operational error which amounted to less than $.01 per share. Excluding this reimbursement, the total return would have been 1.18%.
C Total returns for periods of less than one year are not annualized.
D Total returns would have been lower if certain expenses had not been reduced during the applicable periods shown.
E Total returns do not include the effect of the contingent deferred sales charge.
F Fees and expenses of any underlying Fidelity Central Funds are not included in the Fund's expense ratio. The Fund indirectly bears its proportionate share of the expenses of any underlying Fidelity Central Funds.
G Expense ratios reflect operating expenses of the class. Expenses before reductions do not reflect amounts reimbursed by the investment adviser or reductions from brokerage service arrangements or reductions from other expense offset arrangements and do not represent the amount paid by the class during periods when reimbursements or reductions occur. Expenses net of fee waivers reflect expenses after reimbursement by the investment adviser but prior to reductions from brokerage service arrangements or other expense offset arrangements. Expenses net of all reductions represent the net expenses paid by the class.
H Annualized
I Amount does not include the portfolio activity of any underlying Fidelity Central Funds.
See accompanying notes which are an integral part of the financial statements.
Fidelity Global High Income Fund
| Six months ended (Unaudited) October 31, | Years ended April 30, | |||||
| 2017 | 2017 | 2016 | 2015 | 2014 | 2013 | |
| Selected Per–Share Data | ||||||
| Net asset value, beginning of period | $9.54 | $9.07 | $9.60 | $10.21 | $10.47 | $9.74 |
| Income from Investment Operations | ||||||
| Net investment income (loss)A | .232 | .486 | .486 | .508 | .534 | .555 |
| Net realized and unrealized gain (loss) | .240 | .423 | (.542) | (.301)B | (.046) | .724 |
| Total from investment operations | .472 | .909 | (.056) | .207 | .488 | 1.279 |
| Distributions from net investment income | (.213) | (.442) | (.477) | (.510) | (.511) | (.506) |
| Distributions from net realized gain | – | – | – | (.310) | (.239) | (.046) |
| Total distributions | (.213) | (.442) | (.477) | (.820) | (.750) | (.552) |
| Redemption fees added to paid in capitalA | .001 | .003 | .003 | .003 | .002 | .003 |
| Net asset value, end of period | $9.80 | $9.54 | $9.07 | $9.60 | $10.21 | $10.47 |
| Total ReturnC,D | 4.99% | 10.28% | (.40)% | 2.23%B | 5.05% | 13.56% |
| Ratios to Average Net AssetsE,F | ||||||
| Expenses before reductions | 1.04%G | 1.14% | 1.20% | 1.05% | .95% | .96% |
| Expenses net of fee waivers, if any | 1.00%G | 1.00% | 1.00% | 1.00% | .95% | .96% |
| Expenses net of all reductions | 1.00%G | 1.00% | 1.00% | 1.00% | .95% | .96% |
| Net investment income (loss) | 4.74%G | 5.23% | 5.35% | 5.07% | 5.30% | 5.53% |
| Supplemental Data | ||||||
| Net assets, end of period (000 omitted) | $107,723 | $85,188 | $93,256 | $119,712 | $344,206 | $345,210 |
| Portfolio turnover rateH | 48%G | 48% | 41% | 44% | 72% | 55% |
A Calculated based on average shares outstanding during the period.
B Amount includes a reimbursement from the investment adviser for an operational error which amounted to less than $.01 per share. Excluding this reimbursement, the total return would have been 2.19%.
C Total returns for periods of less than one year are not annualized.
D Total returns would have been lower if certain expenses had not been reduced during the applicable periods shown.
E Fees and expenses of any underlying Fidelity Central Funds are not included in the Fund's expense ratio. The Fund indirectly bears its proportionate share of the expenses of any underlying Fidelity Central Funds.
F Expense ratios reflect operating expenses of the class. Expenses before reductions do not reflect amounts reimbursed by the investment adviser or reductions from brokerage service arrangements or reductions from other expense offset arrangements and do not represent the amount paid by the class during periods when reimbursements or reductions occur. Expenses net of fee waivers reflect expenses after reimbursement by the investment adviser but prior to reductions from brokerage service arrangements or other expense offset arrangements. Expenses net of all reductions represent the net expenses paid by the class.
G Annualized
H Amount does not include the portfolio activity of any underlying Fidelity Central Funds.
See accompanying notes which are an integral part of the financial statements.
Fidelity Global High Income Fund Class I
| Six months ended (Unaudited) October 31, | Years ended April 30, | |||||
| 2017 | 2017 | 2016 | 2015 | 2014 | 2013 | |
| Selected Per–Share Data | ||||||
| Net asset value, beginning of period | $9.54 | $9.07 | $9.60 | $10.21 | $10.47 | $9.74 |
| Income from Investment Operations | ||||||
| Net investment income (loss)A | .232 | .486 | .483 | .501 | .532 | .549 |
| Net realized and unrealized gain (loss) | .240 | .423 | (.539) | (.293)B | (.046) | .728 |
| Total from investment operations | .472 | .909 | (.056) | .208 | .486 | 1.277 |
| Distributions from net investment income | (.213) | (.442) | (.477) | (.511) | (.509) | (.504) |
| Distributions from net realized gain | – | – | – | (.310) | (.239) | (.046) |
| Total distributions | (.213) | (.442) | (.477) | (.821) | (.748) | (.550) |
| Redemption fees added to paid in capitalA | .001 | .003 | .003 | .003 | .002 | .003 |
| Net asset value, end of period | $9.80 | $9.54 | $9.07 | $9.60 | $10.21 | $10.47 |
| Total ReturnC,D | 5.00% | 10.28% | (.40)% | 2.23%B | 5.03% | 13.54% |
| Ratios to Average Net AssetsE,F | ||||||
| Expenses before reductions | 1.06%G | 1.16% | 1.10% | 1.02% | .97% | .98% |
| Expenses net of fee waivers, if any | 1.00%G | 1.00% | 1.00% | 1.00% | .97% | .98% |
| Expenses net of all reductions | 1.00%G | 1.00% | 1.00% | 1.00% | .97% | .98% |
| Net investment income (loss) | 4.75%G | 5.23% | 5.35% | 5.07% | 5.28% | 5.51% |
| Supplemental Data | ||||||
| Net assets, end of period (000 omitted) | $3,253 | $2,817 | $1,905 | $2,481 | $5,344 | $6,049 |
| Portfolio turnover rateH | 48%G | 48% | 41% | 44% | 72% | 55% |
A Calculated based on average shares outstanding during the period.
B Amount includes a reimbursement from the investment adviser for an operational error which amounted to less than $.01 per share. Excluding this reimbursement, the total return would have been 2.19%.
C Total returns for periods of less than one year are not annualized.
D Total returns would have been lower if certain expenses had not been reduced during the applicable periods shown.
E Fees and expenses of any underlying Fidelity Central Funds are not included in the Fund's expense ratio. The Fund indirectly bears its proportionate share of the expenses of any underlying Fidelity Central Funds.
F Expense ratios reflect operating expenses of the class. Expenses before reductions do not reflect amounts reimbursed by the investment adviser or reductions from brokerage service arrangements or reductions from other expense offset arrangements and do not represent the amount paid by the class during periods when reimbursements or reductions occur. Expenses net of fee waivers reflect expenses after reimbursement by the investment adviser but prior to reductions from brokerage service arrangements or other expense offset arrangements. Expenses net of all reductions represent the net expenses paid by the class.
G Annualized
H Amount does not include the portfolio activity of any underlying Fidelity Central Funds.
See accompanying notes which are an integral part of the financial statements.
Notes to Financial Statements (Unaudited)
For the period ended October 31, 2017
1. Organization.
Fidelity Global High Income Fund (the Fund) is a fund of Fidelity Summer Street Trust (the Trust) and is authorized to issue an unlimited number of shares. The Trust is registered under the Investment Company Act of 1940, as amended (the 1940 Act), as an open-end management investment company organized as a Massachusetts business trust. The Fund offers Class A, Class M, Class C, Global High Income and Class I shares, each of which has equal rights as to assets and voting privileges. Each class has exclusive voting rights with respect to matters that affect that class. The Fund's investments in emerging markets can be subject to social, economic, regulatory, and political uncertainties and can be extremely volatile.
2. Investments in Fidelity Central Funds.
The Fund invests in Fidelity Central Funds, which are open-end investment companies generally available only to other investment companies and accounts managed by the investment adviser and its affiliates. The Fund's Schedule of Investments lists each of the Fidelity Central Funds held as of period end, if any, as an investment of the Fund, but does not include the underlying holdings of each Fidelity Central Fund. As an Investing Fund, the Fund indirectly bears its proportionate share of the expenses of the underlying Fidelity Central Funds.
The Money Market Central Funds seek preservation of capital and current income and are managed by Fidelity Investments Money Management, Inc. (FIMM), an affiliate of the investment adviser. Annualized expenses of the Money Market Central Funds as of their most recent shareholder report date are less than .005%.
A complete unaudited list of holdings for each Fidelity Central Fund is available upon request or at the Securities and Exchange Commission (the SEC) website at www.sec.gov. In addition, the financial statements of the Fidelity Central Funds are available on the SEC website or upon request.
3. Significant Accounting Policies.
The Fund is an investment company and applies the accounting and reporting guidance of the Financial Accounting Standards Board (FASB) Accounting Standards Codification Topic 946 Financial Services – Investments Companies. The financial statements have been prepared in conformity with accounting principles generally accepted in the United States of America (GAAP), which require management to make certain estimates and assumptions at the date of the financial statements. Actual results could differ from those estimates. Subsequent events, if any, through the date that the financial statements were issued have been evaluated in the preparation of the financial statements. The following summarizes the significant accounting policies of the Fund:
Investment Valuation. Investments are valued as of 4:00 p.m. Eastern time on the last calendar day of the period. The Board of Trustees (the Board) has delegated the day to day responsibility for the valuation of the Fund's investments to the Fair Value Committee (the Committee) established by the Fund's investment adviser. In accordance with valuation policies and procedures approved by the Board, the Fund attempts to obtain prices from one or more third party pricing vendors or brokers to value its investments. When current market prices, quotations or currency exchange rates are not readily available or reliable, investments will be fair valued in good faith by the Committee, in accordance with procedures adopted by the Board. Factors used in determining fair value vary by investment type and may include market or investment specific events, changes in interest rates and credit quality. The frequency with which these procedures are used cannot be predicted and they may be utilized to a significant extent. The Committee oversees the Fund's valuation policies and procedures and reports to the Board on the Committee's activities and fair value determinations. The Board monitors the appropriateness of the procedures used in valuing the Fund's investments and ratifies the fair value determinations of the Committee.
The Fund categorizes the inputs to valuation techniques used to value its investments into a disclosure hierarchy consisting of three levels as shown below:
- Level 1 – quoted prices in active markets for identical investments
- Level 2 – other significant observable inputs (including quoted prices for similar investments, interest rates, prepayment speeds, etc.)
- Level 3 – unobservable inputs (including the Fund's own assumptions based on the best information available)
Valuation techniques used to value the Fund's investments by major category are as follows:
Debt securities, including restricted securities, are valued based on evaluated prices received from third party pricing vendors or from brokers who make markets in such securities. Corporate bonds, bank loan obligations, and preferred securities are valued by pricing vendors who utilize matrix pricing which considers yield or price of bonds of comparable quality, coupon, maturity and type or by broker-supplied prices. When independent prices are unavailable or unreliable, debt securities may be valued utilizing pricing methodologies which consider similar factors that would be used by third party pricing vendors. For foreign debt securities, when significant market or security specific events arise, valuations may be determined in good faith in accordance with procedures adopted by the Board. Debt securities are generally categorized as Level 2 in the hierarchy but may be Level 3 depending on the circumstances. The Fund invests a significant portion of its assets in below investment grade securities. The value of these securities can be more volatile due to changes in the credit quality of the issuer and is sensitive to changes in economic, market and regulatory conditions.
Equity securities, including restricted securities, for which market quotations are readily available, are valued at the last reported sale price or official closing price as reported by a third party pricing vendor on the primary market or exchange on which they are traded and are categorized as Level 1 in the hierarchy. In the event there were no sales during the day or closing prices are not available, securities are valued at the last quoted bid price or may be valued using the last available price and are generally categorized as Level 2 in the hierarchy. For foreign equity securities, when market or security specific events arise, comparisons to the valuation of American Depositary Receipts (ADRs), futures contracts, Exchange-Traded Funds (ETFs) and certain indexes as well as quoted prices for similar securities may be used and would be categorized as Level 2 in the hierarchy. Utilizing these techniques may result in transfers between Level 1 and Level 2. For equity securities, including restricted securities, where observable inputs are limited, assumptions about market activity and risk are used and these securities may be categorized as Level 3 in the hierarchy.
Investments in open-end mutual funds, including the Fidelity Central Funds, are valued at their closing net asset value (NAV) each business day and are categorized as Level 1 in the hierarchy.
Changes in valuation techniques may result in transfers in or out of an assigned level within the disclosure hierarchy. The aggregate value of investments by input level as of October 31, 2017 is included at the end of the Fund's Schedule of Investments.
Foreign Currency. The Fund may use foreign currency contracts to facilitate transactions in foreign-denominated securities. Gains and losses from these transactions may arise from changes in the value of the foreign currency or if the counterparties do not perform under the contracts' terms.
Foreign-denominated assets, including investment securities, and liabilities are translated into U.S. dollars at the exchange rates at period end. Purchases and sales of investment securities, income and dividends received and expenses denominated in foreign currencies are translated into U.S. dollars at the exchange rate in effect on the transaction date.
The effects of exchange rate fluctuations on investments are included with the net realized and unrealized gain (loss) on investment securities. Other foreign currency transactions resulting in realized and unrealized gain (loss) are disclosed separately.
Investment Transactions and Income. For financial reporting purposes, the Fund's investment holdings and NAV include trades executed through the end of the last business day of the period. The NAV per share for processing shareholder transactions is calculated as of the close of business of the New York Stock Exchange (NYSE), normally 4:00 p.m. Eastern time and includes trades executed through the end of the prior business day. Gains and losses on securities sold are determined on the basis of identified cost. Dividend income is recorded on the ex-dividend date, except for certain dividends from foreign securities where the ex-dividend date may have passed, which are recorded as soon as the Fund is informed of the ex-dividend date. Non-cash dividends included in dividend income, if any, are recorded at the fair market value of the securities received. Income and capital gain distributions from Fidelity Central Funds, if any, are recorded on the ex-dividend date. Certain distributions received by the Fund represent a return of capital or capital gain. The Fund determines the components of these distributions subsequent to the ex-dividend date, based upon receipt of tax filings or other correspondence relating to the underlying investment. These distributions are recorded as a reduction of cost of investments and/or as a realized gain. Interest income is accrued as earned and includes coupon interest and amortization of premium and accretion of discount on debt securities as applicable. Paid in Kind (PIK) income is recorded at the fair market value of the securities received. Investment income is recorded net of foreign taxes withheld where recovery of such taxes is uncertain. Debt obligations may be placed on non-accrual status and related interest income may be reduced by ceasing current accruals and writing off interest receivables when the collection of all or a portion of interest has become doubtful based on consistently applied procedures. A debt obligation is removed from non-accrual status when the issuer resumes interest payments or when collectability of interest is reasonably assured.
Class Allocations and Expenses. Investment income, realized and unrealized capital gains and losses, common expenses of the Fund, and certain fund-level expense reductions, if any, are allocated daily on a pro-rata basis to each class based on the relative net assets of each class to the total net assets of the Fund. Each class differs with respect to transfer agent and distribution and service plan fees incurred. Certain expense reductions may also differ by class. For the reporting period, the allocated portion of income and expenses to each class as a percent of its average net assets may vary due to the timing of recording these transactions in relation to fluctuating net assets of the classes. Expenses directly attributable to a fund are charged to that fund. Expenses attributable to more than one fund are allocated among the respective funds on the basis of relative net assets or other appropriate methods. Expense estimates are accrued in the period to which they relate and adjustments are made when actual amounts are known.
Income Tax Information and Distributions to Shareholders. Each year, the Fund intends to qualify as a regulated investment company under Subchapter M of the Internal Revenue Code, including distributing substantially all of its taxable income and realized gains. As a result, no provision for U.S. Federal income taxes is required. The Fund files a U.S. federal tax return, in addition to state and local tax returns as required. The Fund's federal income tax returns are subject to examination by the Internal Revenue Service (IRS) for a period of three fiscal years after they are filed. State and local tax returns may be subject to examination for an additional fiscal year depending on the jurisdiction. Foreign taxes are provided for based on the Fund's understanding of the tax rules and rates that exist in the foreign markets in which it invests.
Dividends are declared and recorded daily and paid monthly from net investment income. Distributions from realized gains, if any, are declared and recorded on the ex-dividend date. Income dividends and capital gain distributions are declared separately for each class. Income and capital gain distributions are determined in accordance with income tax regulations, which may differ from GAAP.
Capital accounts within the financial statements are adjusted for permanent book-tax differences. These adjustments have no impact on net assets or the results of operations. Capital accounts are not adjusted for temporary book-tax differences which will reverse in a subsequent period.
Book-tax differences are primarily due to foreign currency transactions, defaulted bonds, market discount, equity-debt classifications, partnerships, capital loss carryforwards, and losses deferred due to wash sales and excise tax regulations.
As of period end, the cost and unrealized appreciation (depreciation) in securities, and derivatives if applicable, for federal income tax purposes were as follows:
| Gross unrealized appreciation | $6,839,376 |
| Gross unrealized depreciation | (3,056,766) |
| Net unrealized appreciation (depreciation) | $3,782,610 |
| Tax cost | $121,608,592 |
Capital loss carryforwards are only available to offset future capital gains of the Fund to the extent provided by regulations and may be limited. Under the Regulated Investment Company Modernization Act of 2010 (the Act), the Fund is permitted to carry forward capital losses incurred in taxable years beginning after December 22, 2010 for an unlimited period and such capital losses are required to be used prior to any losses that expire. The capital loss carryforward information presented below, including any applicable limitation, is estimated as of prior fiscal period end and is subject to adjustment.
| No expiration | |
| Short-term | $(710,939) |
| Long-term | (1,619,042) |
| Total capital loss carryforward | $(2,329,981) |
The Fund elected to defer to its next fiscal year approximately $70,554 of ordinary losses recognized during the period January 1, 2017 to April 30, 2017.
Short-Term Trading (Redemption) Fees. Shares held by investors in the Fund less than 90 days may have been subject to a redemption fee equal to 1.00% of the NAV of shares redeemed. All redemption fees, which reduce the proceeds of the shareholder redemption, are retained by the Fund and accounted for as an addition to paid in capital. In November 2017, the Board of Trustees approved the elimination of these redemption fees effective December 18, 2017.
Restricted Securities. The Fund may invest in securities that are subject to legal or contractual restrictions on resale. These securities generally may be resold in transactions exempt from registration or to the public if the securities are registered. Disposal of these securities may involve time-consuming negotiations and expense, and prompt sale at an acceptable price may be difficult. Information regarding restricted securities is included at the end of the Fund's Schedule of Investments.
Loans and Other Direct Debt Instruments. The Fund invests in direct debt instruments which are interests in amounts owed to lenders by corporate or other borrowers. These instruments may be in the form of loans, trade claims or other receivables and may include standby financing commitments such as revolving credit facilities that obligate the Fund to supply additional cash to the borrower on demand. Loans may be acquired through assignment or participation. The Fund did not have any unfunded loan commitments, which are contractual obligations for future funding, at period end.
New Accounting Pronouncement. In March 2017, the Financial Accounting Standards Board (FASB) issued an Accounting Standards Update (ASU), ASU 2017-08, which amends the amortization period for certain callable debt securities that are held at a premium. The amendment requires the premium to be amortized to the earliest call date. The amendments do not require an accounting change for securities held at a discount. The ASU is effective for annual periods beginning after December 15, 2018. Management is currently evaluating the potential impact of these changes to the financial statements.
4. Purchases and Sales of Investments.
Purchases and sales of securities, other than short-term securities, aggregated $44,858,660 and $25,204,201, respectively.
5. Fees and Other Transactions with Affiliates.
Management Fee. Fidelity Management & Research Company (the investment adviser) and its affiliates provide the Fund with investment management related services for which the Fund pays a monthly management fee. The management fee is the sum of an individual fund fee rate that is based on an annual rate of .60% of the Fund's average net assets and an annualized group fee rate that averaged .11% during the period. The group fee rate is based upon the average net assets of all the mutual funds advised by the investment adviser, including any mutual funds previously advised by the investment adviser that are currently advised by Fidelity SelectCo, LLC, an affiliate of the investment adviser. The group fee rate decreases as assets under management increase and increases as assets under management decrease. For the reporting period, the total annualized management fee rate was .71% of the Fund's average net assets.
Distribution and Service Plan Fees. In accordance with Rule 12b-1 of the 1940 Act, the Fund has adopted separate Distribution and Service Plans for each class of shares. Certain classes pay Fidelity Distributors Corporation (FDC), an affiliate of the investment adviser, separate Distribution and Service Fees, each of which is based on an annual percentage of each class' average net assets. In addition, FDC may pay financial intermediaries for selling shares of the Fund and providing shareholder support services. For the period, the Distribution and Service Fee rates, total fees and amounts retained by FDC were as follows:
| Distribution Fee | Service Fee | Total Fees | Retained by FDC | |
| Class A | -% | .25% | $8,992 | $208 |
| Class M | -% | .25% | 4,426 | – |
| Class C | .75% | .25% | 19,047 | 3,333 |
| $32,465 | $3,541 |
Sales Load. FDC may receive a front-end sales charge of up to 4.00% for selling Class A shares and Class M shares, some of which is paid to financial intermediaries for selling shares of the Fund. Depending on the holding period, FDC may receive contingent deferred sales charges levied on Class A, Class M and Class C redemptions. The deferred sales charges are 1.00% for Class C shares, 1.00% for certain purchases of Class A shares and .25% for certain purchases of Class M shares.
For the period, sales charge amounts retained by FDC were as follows:
| Retained by FDC | |
| Class A | $765 |
| Class M | 1,086 |
| Class C(a) | 112 |
| $1,963 |
(a) When Class C shares are initially sold, FDC pays commissions from its own resources to financial intermediaries through which the sales are made.
Transfer Agent Fees. Fidelity Investments Institutional Operations Company, Inc., (FIIOC), an affiliate of the investment adviser, is the transfer, dividend disbursing and shareholder servicing agent for each class of the Fund. FIIOC receives account fees and asset-based fees that vary according to the account size and type of account of the shareholders of the respective classes of the Fund. FIIOC pays for typesetting, printing and mailing of shareholder reports, except proxy statements.
For the period, transfer agent fees for each class were as follows:
| Amount | % of Class-Level Average Net Assets(a) | |
| Class A | $6,412 | .18 |
| Class M | 4,809 | .27 |
| Class C | 4,030 | .21 |
| Global High Income | 67,351 | .14 |
| Class I | 2,224 | .16 |
| $84,826 |
(a) Annualized
Accounting and Security Lending Fees. Fidelity Service Company, Inc. (FSC), an affiliate of the investment adviser, maintains the Fund's accounting records. The accounting fee is based on the level of average net assets for each month. Under a separate contract, FSC administers the security lending program. The security lending fee is based on the number and duration of lending transactions.
Brokerage Commissions. The Fund placed a portion of its portfolio transactions with brokerage firms which are affiliates of the investment adviser. Brokerage commissions are included in net realized gain (loss) and change in net unrealized appreciation (depreciation) in the Statement of Operations. The commissions paid to these affiliated firms were $2 for the period.
Interfund Trades. The Fund may purchase from or sell securities to other Fidelity Funds under procedures adopted by the Board. The procedures have been designed to ensure these interfund trades are executed in accordance with Rule 17a-7 of the 1940 Act. Interfund trades are included within the respective purchases and sales amounts shown in the Purchases and Sales of Investments note.
6. Committed Line of Credit.
The Fund participates with other funds managed by the investment adviser or an affiliate in a $4.25 billion credit facility (the "line of credit") to be utilized for temporary or emergency purposes to fund shareholder redemptions or for other short-term liquidity purposes. The Fund has agreed to pay commitment fees on its pro-rata portion of the line of credit, which amounted to $160 and is reflected in Miscellaneous expenses on the Statement of Operations. During the period, the Fund did not borrow on this line of credit.
7. Security Lending.
The Fund lends portfolio securities through a lending agent from time to time in order to earn additional income. For equity securities, a lending agent is used and may loan securities to certain qualified borrowers, including Fidelity Capital Markets (FCM), a broker-dealer affiliated with the Fund. On the settlement date of the loan, the Fund receives collateral (in the form of U.S. Treasury obligations, letters of credit and/or cash) against the loaned securities and maintains collateral in an amount not less than 100% of the market value of the loaned securities during the period of the loan. The market value of the loaned securities is determined at the close of business of the Fund and any additional required collateral is delivered to the Fund on the next business day. The Fund or borrower may terminate the loan at any time, and if the borrower defaults on its obligation to return the securities loaned because of insolvency or other reasons, the Fund may apply collateral received from the borrower against the obligation. The Fund may experience delays and costs in recovering the securities loaned. Any cash collateral received is invested in the Fidelity Securities Lending Cash Central Fund. At period end, there were no security loans outstanding. Security lending income represents the income earned on investing cash collateral, less rebates paid to borrowers and any lending agent fees associated with the loan, plus any premium payments received for lending certain types of securities. Security lending income is presented in the Statement of Operations as a component of income from Fidelity Central Funds. Total security lending income during the period amounted to $35. During the period, there were no securities loaned to FCM.
8. Expense Reductions.
The investment adviser voluntarily agreed to reimburse each class to the extent annual operating expenses exceeded certain levels of average net assets as noted in the table below. Some expenses, for example the compensation of the independent Trustees, and certain miscellaneous expenses such as proxy and shareholder meeting expenses, are excluded from this reimbursement.
The following classes were in reimbursement during the period:
| Expense Limitations | Reimbursement | |
| Class A | 1.25% | $2,708 |
| Class M | 1.25% | 2,921 |
| Class C | 2.00% | 1,954 |
| Global High Income | 1.00% | 18,110 |
| Class I | 1.00% | 908 |
| $26,601 |
Commissions paid to certain brokers with whom the investment adviser, or its affiliates, places trades on behalf of the Fund include an amount in addition to trade execution, which may be rebated back to the Fund to offset certain expenses. This amount totaled $10 for the period. In addition, through arrangements with the Fund's custodian, credits realized as a result of certain uninvested cash balances were used to reduce the Fund's expenses. During the period, these credits reduced the Fund's custody expenses by $265.
In addition, during the period the investment adviser reimbursed and/or waived a portion of fund-level operating expenses in the amount of $297.
9. Distributions to Shareholders.
Distributions to shareholders of each class were as follows:
| Six months ended October 31, 2017 | Year ended April 30, 2017 | |
| From net investment income | ||
| Class A | $148,565 | $322,665 |
| Class M | 73,319 | 85,695 |
| Class C | 64,437 | 134,767 |
| Global High Income | 2,076,623 | 4,092,807 |
| Class I | 59,551 | 103,861 |
| Total | $2,422,495 | $4,739,795 |
10. Share Transactions.
Share transactions for each class were as follows and may contain automatic conversions between classes or exchanges between affiliated funds:
| Shares | Shares | Dollars | Dollars | |
| Six months ended October 31, 2017 | Year ended April 30, 2017 | Six months ended October 31, 2017 | Year ended April 30, 2017 | |
| Class A | ||||
| Shares sold | 96,038 | 290,886 | $936,197 | $2,707,041 |
| Reinvestment of distributions | 14,578 | 32,498 | 141,860 | 302,941 |
| Shares redeemed | (84,501) | (260,720) | (819,422) | (2,436,346) |
| Net increase (decrease) | 26,115 | 62,664 | $258,635 | $573,636 |
| Class M | ||||
| Shares sold | 119,153 | 218,520 | $1,153,021 | $2,050,318 |
| Reinvestment of distributions | 7,305 | 8,661 | 71,096 | 80,890 |
| Shares redeemed | (45,273) | (67,976) | (438,540) | (634,029) |
| Net increase (decrease) | 81,185 | 159,205 | $785,577 | $1,497,179 |
| Class C | ||||
| Shares sold | 73,972 | 109,325 | $721,306 | $1,017,340 |
| Reinvestment of distributions | 6,345 | 12,879 | 61,766 | 120,047 |
| Shares redeemed | (46,207) | (105,252) | (447,109) | (975,560) |
| Net increase (decrease) | 34,110 | 16,952 | $335,963 | $161,827 |
| Global High Income | ||||
| Shares sold | 3,186,464 | 2,895,819 | $30,977,097 | $26,886,491 |
| Reinvestment of distributions | 179,293 | 364,798 | 1,746,203 | 3,396,619 |
| Shares redeemed | (1,304,213) | (4,608,362) | (12,653,529) | (42,638,341) |
| Net increase (decrease) | 2,061,544 | (1,347,745) | $20,069,771 | $(12,355,231) |
| Class I | ||||
| Shares sold | 211,402 | 194,425 | $2,064,658 | $1,826,275 |
| Reinvestment of distributions | 4,760 | 6,271 | 46,273 | 58,709 |
| Shares redeemed | (179,555) | (115,409) | (1,747,881) | (1,076,867) |
| Net increase (decrease) | 36,607 | 85,287 | $363,050 | $808,117 |
11. Other.
The Fund's organizational documents provide former and current trustees and officers with a limited indemnification against liabilities arising in connection with the performance of their duties to the Fund. In the normal course of business, the Fund may also enter into contracts that provide general indemnifications. The Fund's maximum exposure under these arrangements is unknown as this would be dependent on future claims that may be made against the Fund. The risk of material loss from such claims is considered remote.
12. Credit Risk.
The Fund's relatively large investment in countries with limited or developing capital markets may involve greater risks than investments in more developed markets and the prices of such investments may be volatile. The yields of emerging market debt obligations reflect, among other things, perceived credit risk. The consequences of political, social or economic changes in these markets may have disruptive effects on the market prices of the Fund's investments and the income they generate, as well as the Fund's ability to repatriate such amounts.
Shareholder Expense Example
As a shareholder of the Fund, you incur two types of costs: (1) transaction costs, including sales charges (loads) on purchase payments or redemption proceeds, redemption fees and (2) ongoing costs, including management fees, distribution and/or service (12b-1) fees and other Fund expenses. This Example is intended to help you understand your ongoing costs (in dollars) of investing in the Fund and to compare these costs with the ongoing costs of investing in other mutual funds.
The Example is based on an investment of $1,000 invested at the beginning of the period and held for the entire period (May 1, 2017 to October 31, 2017).
Actual Expenses
The first line of the accompanying table for each class of the Fund provides information about actual account values and actual expenses. You may use the information in this line, together with the amount you invested, to estimate the expenses that you paid over the period. Simply divide your account value by $1,000.00 (for example, an $8,600 account value divided by $1,000.00 = 8.6), then multiply the result by the number in the first line for a class of the Fund under the heading entitled "Expenses Paid During Period" to estimate the expenses you paid on your account during this period. A small balance maintenance fee of $12.00 that is charged once a year may apply for certain accounts with a value of less than $2,000. This fee is not included in the table below. If it was, the estimate of expenses you paid during the period would be higher, and your ending account value lower, by this amount. In addition, the Fund, as a shareholder in the underlying Fidelity Central Funds, will indirectly bear its pro-rata share of the fees and expenses incurred by the underlying Fidelity Central Funds. These fees and expenses are not included in the Fund's annualized expense ratio used to calculate the expense estimate in the table below.
Hypothetical Example for Comparison Purposes
The second line of the accompanying table for each class of the Fund provides information about hypothetical account values and hypothetical expenses based on a Class' actual expense ratio and an assumed rate of return of 5% per year before expenses, which is not the Class' actual return. The hypothetical account values and expenses may not be used to estimate the actual ending account balance or expenses you paid for the period. You may use this information to compare the ongoing costs of investing in the Fund and other funds. To do so, compare this 5% hypothetical example with the 5% hypothetical examples that appear in the shareholder reports of the other funds. A small balance maintenance fee of $12.00 that is charged once a year may apply for certain accounts with a value of less than $2,000. This fee is not included in the table below. If it was, the estimate of expenses you paid during the period would be higher, and your ending account value lower, by this amount. In addition, the Fund, as a shareholder in the underlying Fidelity Central Funds, will indirectly bear its pro-rata share of the fees and expenses incurred by the underlying Fidelity Central Funds. These fees and expenses are not included in the Fund's annualized expense ratio used to calculate the expense estimate in the table below.
Please note that the expenses shown in the table are meant to highlight your ongoing costs only and do not reflect any transaction costs. Therefore, the second line of the table is useful in comparing ongoing costs only, and will not help you determine the relative total costs of owning different funds. In addition, if these transactional costs were included, your costs would have been higher.
| Annualized Expense Ratio-A | Beginning Account Value May 1, 2017 | Ending Account Value October 31, 2017 | Expenses Paid During Period-B May 1, 2017 to October 31, 2017 | |
| Class A | 1.25% | |||
| Actual | $1,000.00 | $1,048.60 | $6.45 | |
| Hypothetical-C | $1,000.00 | $1,018.90 | $6.36 | |
| Class M | 1.25% | |||
| Actual | $1,000.00 | $1,048.70 | $6.45 | |
| Hypothetical-C | $1,000.00 | $1,018.90 | $6.36 | |
| Class C | 2.00% | |||
| Actual | $1,000.00 | $1,044.70 | $10.31 | |
| Hypothetical-C | $1,000.00 | $1,015.12 | $10.16 | |
| Global High Income | 1.00% | |||
| Actual | $1,000.00 | $1,049.90 | $5.17 | |
| Hypothetical-C | $1,000.00 | $1,020.16 | $5.09 | |
| Class I | 1.00% | |||
| Actual | $1,000.00 | $1,050.00 | $5.17 | |
| Hypothetical-C | $1,000.00 | $1,020.16 | $5.09 |
A Annualized expense ratio reflects expenses net of applicable fee waivers.
B Expenses are equal to each Class' annualized expense ratio, multiplied by the average account value over the period, multiplied by 184/365 (to reflect the one-half year period).
C 5% return per year before expenses
Board Approval of Investment Advisory Contracts and Management Fees
Fidelity Global High Income Fund
Each year, the Board of Trustees, including the Independent Trustees (together, the Board), votes on the renewal of the management contract with Fidelity Management & Research Company (FMR) and the sub-advisory agreements (together, the Advisory Contracts) for the fund. FMR and the sub-advisers are referred to herein as the Investment Advisers. The Board, assisted by the advice of fund counsel and Independent Trustees' counsel, requests and considers a broad range of information relevant to the renewal of the Advisory Contracts throughout the year.
The Board meets regularly and, at each of its meetings, covers an extensive agenda of topics and materials and considers factors that are relevant to its annual consideration of the renewal of the fund's Advisory Contracts, including the services and support provided to the fund and its shareholders. The Board has established various standing committees (Committees), each composed of and chaired by Independent Trustees with varying backgrounds, to which the Board has assigned specific subject matter responsibilities in order to enhance effective decision-making by the Board. The Board, acting directly and through its Committees, requests and receives information concerning the annual consideration of the renewal of the fund's Advisory Contracts. The Board also meets as needed to review matters specifically related to the Board's annual consideration of the renewal of the Advisory Contracts. Members of the Board may also meet with trustees of other Fidelity funds through ad hoc joint committees to discuss certain matters relevant to all of the Fidelity funds.
At its July 2017 meeting, the Board unanimously determined to renew the fund's Advisory Contracts. In reaching its determination, the Board considered all factors it believed relevant, including (i) the nature, extent, and quality of the services to be provided to the fund and its shareholders (including the investment performance of the fund); (ii) the competitiveness of the fund's management fee and total expense ratio relative to peer funds; (iii) the total costs of the services to be provided by and the profits to be realized by Fidelity from its relationships with the fund; and (iv) the extent to which, if any, economies of scale exist and would be realized as the fund grows, and whether any economies of scale are appropriately shared with fund shareholders.
In considering whether to renew the Advisory Contracts for the fund, the Board reached a determination, with the assistance of fund counsel and Independent Trustees' counsel and through the exercise of its business judgment, that the renewal of the Advisory Contracts was in the best interests of the fund and its shareholders and that the compensation payable under the Advisory Contracts was fair and reasonable. The Board's decision to renew the Advisory Contracts was not based on any single factor, but rather was based on a comprehensive consideration of all the information provided to the Board at its meetings throughout the year. The Board, in reaching its determination to renew the Advisory Contracts, was aware that shareholders of the fund have a broad range of investment choices available to them, including a wide choice among funds offered by Fidelity's competitors, and that the fund's shareholders, who have the opportunity to review and weigh the disclosure provided by the fund in its prospectus and other public disclosures, have chosen to invest in this fund, which is part of the Fidelity family of funds.
Amendment to Group Fee Rate. The Board also approved an amendment to the management contract for the fund to add an additional breakpoint to the group fee schedule, effective October 1, 2017. The Board noted that the additional breakpoint would result in lower management fee rates as Fidelity's assets under management increase.
Nature, Extent, and Quality of Services Provided. The Board considered Fidelity's staffing as it relates to the fund, including the backgrounds of investment personnel of Fidelity, and also considered the fund's investment objective, strategies, and related investment philosophy. The Independent Trustees also had discussions with senior management of Fidelity's investment operations and investment groups. The Board considered the structure of the investment personnel compensation program and whether this structure provides appropriate incentives to act in the best interests of the fund. Additionally, the Board considered the portfolio managers' investments, if any, in the funds that they manage.Resources Dedicated to Investment Management and Support Services. The Board and the Fund Oversight and Research Committees reviewed the general qualifications and capabilities of Fidelity's investment staff, including its size, education, experience, and resources, as well as Fidelity's approach to recruiting, training, managing, and compensating investment personnel. The Board noted that Fidelity has continued to increase the resources devoted to non-U.S. offices, including expansion of Fidelity's global investment organization. The Board also noted that Fidelity's analysts have extensive resources, tools and capabilities that allow them to conduct sophisticated quantitative and fundamental analysis, as well as credit analysis of issuers, counterparties and guarantors. Further, the Board considered that Fidelity's investment professionals have sufficient access to global information and data so as to provide competitive investment results over time, and that those professionals also have access to sophisticated tools that permit them to assess portfolio construction and risk and performance attribution characteristics continuously, as well as to transmit new information and research conclusions rapidly around the world. Additionally, in its deliberations, the Board considered Fidelity's trading, risk management, compliance, and technology and operations capabilities and resources, which are integral parts of the investment management process.Shareholder and Administrative Services. The Board considered (i) the nature, extent, quality, and cost of advisory, administrative, and shareholder services performed by the Investment Advisers and their affiliates under the Advisory Contracts and under separate agreements covering transfer agency, pricing and bookkeeping, and securities lending services for the fund; (ii) the nature and extent of the supervision of third party service providers, principally custodians, subcustodians, and pricing vendors; and (iii) the resources devoted to, and the record of compliance with, the fund's compliance policies and procedures. The Board also reviewed the allocation of fund brokerage, including allocations to brokers affiliated with the Investment Advisers, the use of brokerage commissions to pay fund expenses, and the use of "soft" commission dollars to pay for research services.The Board noted that the growth of fund assets over time across the complex allows Fidelity to reinvest in the development of services designed to enhance the value or convenience of the Fidelity funds as investment vehicles. These services include 24-hour access to account information and market information through telephone representatives and over the Internet, investor education materials and asset allocation tools, and the expanded availability of Fidelity Investor Centers.In 2014, the Board formed an ad hoc Committee on Transfer Agency Fees to review the variety of transfer agency fee structures throughout the industry and Fidelity's competitive positioning with respect to industry participants.Investment in a Large Fund Family. The Board considered the benefits to shareholders of investing in a Fidelity fund, including the benefits of investing in a fund that is part of a large family of funds offering a variety of investment disciplines and providing a large variety of mutual fund investor services. The Board noted that Fidelity had taken, or had made recommendations that resulted in the Fidelity funds taking, a number of actions over the previous year that benefited particular funds, including: (i) continuing to dedicate additional resources to Fidelity's investment research process, and to the support of the senior management team that oversees asset management; (ii) continuing efforts to enhance Fidelity's global research capabilities; (iii) launching new funds and making other enhancements to meet client needs; (iv) launching new share classes of existing funds; (v) eliminating purchase minimums and broadening eligibility requirements for certain lower-priced share classes; (vi) reducing management fees and total expenses for certain growth equity funds and index funds; (vii) lowering expense caps for certain existing funds and classes to reduce expenses borne by shareholders; (viii) eliminating short-term redemption fees for certain funds; (ix) introducing a new pricing structure for certain funds of funds that is expected to reduce overall expenses paid by shareholders; (x) rationalizing product lines and gaining increased efficiencies through proposals for fund mergers and share class consolidations; (xi) continuing to develop, acquire and implement systems and technology to improve services to the funds and shareholders, strengthen information security, and increase efficiency; and (xii) implementing enhancements to further strengthen Fidelity's product line to increase investors' probability of success in achieving their investment goals, including retirement income goals.Investment Performance. The Board considered whether the fund has operated in accordance with its investment objective, as well as its record of compliance with its investment restrictions and its performance history.The Board took into account discussions with representatives of the Investment Advisers about fund investment performance that occur at Board meetings throughout the year. In this regard the Board noted that as part of regularly scheduled fund reviews and other reports to the Board on fund performance, the Board considers annualized return information for the fund for different time periods, measured against a securities market index ("benchmark index") and a peer group of funds with similar objectives ("peer group"), if any. In its evaluation of fund investment performance, the Board gave particular attention to information indicating changes in performance of certain Fidelity funds for specific time periods and discussed with the Investment Advisers the reasons for any overperformance or underperformance.In addition to reviewing absolute and relative fund performance, the Independent Trustees periodically consider the appropriateness of fund performance metrics in evaluating the results achieved. In general, the Independent Trustees believe that fund performance should be evaluated based on net performance (after fees and expenses) of both the highest performing and lowest performing fund share classes, where applicable, compared to appropriate benchmark indices, over appropriate time periods that may include full market cycles, and compared to peer groups, as applicable, over the same periods, taking into account relevant factors including the following: general market conditions; issuer-specific information; and fund cash flows and other factors.The Independent Trustees recognize that shareholders evaluate performance on a net basis over their own holding periods, for which one-, three-, and five-year periods are often used as a proxy. For this reason, the performance information reviewed by the Board also included net cumulative calendar year total return information for the fund and an appropriate benchmark index for the most recent one-, three-, and five-year periods, as shown below. A peer group is not shown below because the fund does not generally utilize a peer group for performance comparison purposes.Fidelity Global High Income Fund
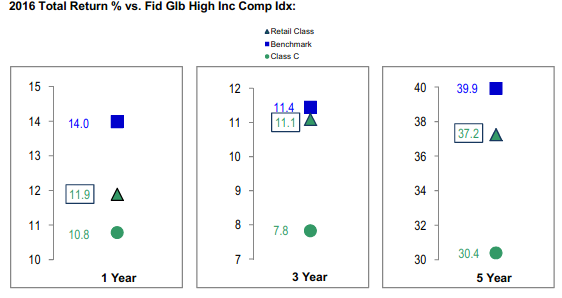
Fidelity Global High Income Fund
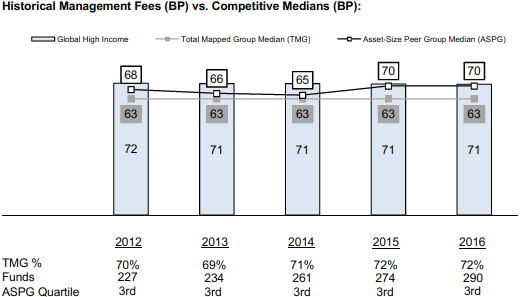
![]()
AGHI-SANN-1217
1.926292.106
Fidelity® Global High Income Fund Semi-Annual Report October 31, 2017 |
|
Contents
Board Approval of Investment Advisory Contracts and Management Fees |
To view a fund's proxy voting guidelines and proxy voting record for the 12-month period ended June 30, visit http://www.fidelity.com/proxyvotingresults or visit the Securities and Exchange Commission's (SEC) web site at http://www.sec.gov.
You may also call 1-800-544-8544 to request a free copy of the proxy voting guidelines.
Standard & Poor's, S&P and S&P 500 are registered service marks of The McGraw-Hill Companies, Inc. and have been licensed for use by Fidelity Distributors Corporation.
Other third-party marks appearing herein are the property of their respective owners.
All other marks appearing herein are registered or unregistered trademarks or service marks of FMR LLC or an affiliated company. © 2017 FMR LLC. All rights reserved.
This report and the financial statements contained herein are submitted for the general information of the shareholders of the Fund. This report is not authorized for distribution to prospective investors in the Fund unless preceded or accompanied by an effective prospectus.
A fund files its complete schedule of portfolio holdings with the SEC for the first and third quarters of each fiscal year on Form N-Q. Forms N-Q are available on the SEC’s web site at http://www.sec.gov. A fund's Forms N-Q may be reviewed and copied at the SEC’s Public Reference Room in Washington, DC. Information regarding the operation of the SEC's Public Reference Room may be obtained by calling 1-800-SEC-0330.
For a complete list of a fund's portfolio holdings, view the most recent holdings listing, semiannual report, or annual report on Fidelity's web site at http://www.fidelity.com, http://www.institutional.fidelity.com, or http://www.401k.com, as applicable.
NOT FDIC INSURED •MAY LOSE VALUE •NO BANK GUARANTEE
Neither the Fund nor Fidelity Distributors Corporation is a bank.
Investment Summary (Unaudited)
Top Five Holdings as of October 31, 2017
| (by issuer, excluding cash equivalents) | % of fund's net assets | % of fund's net assets 6 months ago |
| Ally Financial, Inc. | 2.5 | 2.0 |
| APX Group, Inc. | 1.4 | 1.6 |
| TerraForm Power Operating LLC | 1.4 | 0.7 |
| Valeant Pharmaceuticals International, Inc. | 1.3 | 1.2 |
| Chesapeake Energy Corp. | 1.0 | 1.2 |
| 7.6 |
Top Five Countries as of October 31, 2017
| (excluding cash equivalents) | % of fund's net assets | % of fund's net assets 6 months ago |
| United States of America | 40.7 | 45.0 |
| Luxembourg | 8.7 | 8.1 |
| Netherlands | 6.1 | 6.4 |
| Cayman Islands | 5.7 | 4.5 |
| Canada | 3.6 | 3.5 |
Top Five Market Sectors as of October 31, 2017
| % of fund's net assets | % of fund's net assets 6 months ago | |
| Energy | 14.3 | 12.2 |
| Banks & Thrifts | 10.0 | 11.0 |
| Telecommunications | 9.0 | 11.1 |
| Healthcare | 6.0 | 5.9 |
| Cable/Satellite TV | 5.4 | 5.7 |
Quality Diversification (% of fund's net assets)
| As of October 31, 2017 | ||
| AAA,AA,A | 0.3% | |
| BBB | 2.6% | |
| BB | 37.4% | |
| B | 33.9% | |
| CCC,CC,C | 12.6% | |
| Not Rated | 4.9% | |
| Equities | 1.6% | |
| Short-Term Investments and Net Other Assets | 6.7% | |

| As of April 30, 2017 | ||
| AAA,AA,A | 0.1% | |
| BBB | 2.5% | |
| BB | 35.7% | |
| B | 31.7% | |
| CCC,CC,C | 16.9% | |
| Not Rated | 4.5% | |
| Equities | 2.1% | |
| Short-Term Investments and Net Other Assets | 6.5% | |

We have used ratings from Moody's Investors Service, Inc. Where Moody's® ratings are not available, we have used S&P® ratings. All ratings are as of the date indicated and do not reflect subsequent changes.
Asset Allocation (% of fund's net assets)
| As of October 31, 2017* | ||
| Corporate Bonds | 80.4% | |
| Stocks | 1.6% | |
| Preferred Securities | 7.4% | |
| Other Investments | 3.9% | |
| Short-Term Investments and Net Other Assets (Liabilities) | 6.7% | |

* Foreign investments - 52.6%
| As of April 30, 2017* | ||
| Corporate Bonds | 81.1% | |
| Stocks | 2.1% | |
| Preferred Securities | 7.4% | |
| Other Investments | 2.9% | |
| Short-Term Investments and Net Other Assets (Liabilities) | 6.5% | |

* Foreign investments - 48.5%
Investments October 31, 2017 (Unaudited)
Showing Percentage of Net Assets
| Nonconvertible Bonds - 80.4% | |||
| Principal Amount(a) | Value | ||
| Aerospace - 0.4% | |||
| DAE Funding LLC: | |||
| 4.5% 8/1/22 (b) | $50,000 | $50,688 | |
| 5% 8/1/24 (b) | 65,000 | 66,381 | |
| Leonardo SpA: | |||
| 1.5% 6/7/24 (Reg. S) | EUR | 200,000 | 238,534 |
| 4.875% 3/24/25 | EUR | 100,000 | 144,946 |
| TOTAL AEROSPACE | 500,549 | ||
| Air Transportation - 1.0% | |||
| Aeropuertos Argentina 2000 SA 6.875% 2/1/27 (b) | 350,000 | 377,125 | |
| Azul Investments LLP 5.875% 10/26/24 (b) | 200,000 | 199,300 | |
| Continental Airlines, Inc. 6.125% 4/29/18 | 55,000 | 55,809 | |
| Rumo Luxembourg Sarl 7.375% 2/9/24 (b) | 300,000 | 326,850 | |
| United Continental Holdings, Inc.: | |||
| 4.25% 10/1/22 | 300,000 | 301,500 | |
| 6.375% 6/1/18 | 45,000 | 46,013 | |
| TOTAL AIR TRANSPORTATION | 1,306,597 | ||
| Automotive - 0.4% | |||
| Schaeffler Finance BV 3.5% 5/15/22 (Reg. S) | EUR | 200,000 | 237,629 |
| Tenedora Nemak SA de CV 5.5% 2/28/23 (b) | 300,000 | 307,890 | |
| TOTAL AUTOMOTIVE | 545,519 | ||
| Automotive & Auto Parts - 1.9% | |||
| Allison Transmission, Inc. 4.75% 10/1/27 (b) | 300,000 | 303,000 | |
| American Tire Distributors, Inc. 10.25% 3/1/22 (b) | 170,000 | 177,438 | |
| Delphi Jersey Holdings PLC 5% 10/1/25 (b) | 80,000 | 80,600 | |
| Faurecia SA 3.625% 6/15/23 (Reg. S) | EUR | 100,000 | 123,202 |
| Fiat Finance & Trade Ltd. SA 7.375% 7/9/18 | EUR | 200,000 | 244,273 |
| IHO Verwaltungs GmbH 3.75% 9/15/26 pay-in-kind(Reg. S) (c) | EUR | 300,000 | 373,917 |
| Jaguar Land Rover PLC 4.5% 10/1/27 (b) | 230,000 | 227,705 | |
| Lithia Motors, Inc. 5.25% 8/1/25 (b) | 40,000 | 41,950 | |
| Metalsa SA de CV 4.9% 4/24/23 (b) | 200,000 | 203,000 | |
| Tesla, Inc. 5.3% 8/15/25 (b) | 220,000 | 212,300 | |
| Volkswagen International Finance NV 0.5% 3/30/21 (Reg. S) | EUR | 100,000 | 117,804 |
| ZF North America Capital, Inc.: | |||
| 2.25% 4/26/19 (Reg. S) | EUR | 100,000 | 120,178 |
| 2.75% 4/27/23 (Reg. S) | EUR | 100,000 | 125,949 |
| TOTAL AUTOMOTIVE & AUTO PARTS | 2,351,316 | ||
| Banks & Thrifts - 6.4% | |||
| Access Bank PLC 10.5% 10/19/21 (b) | 25,000 | 28,256 | |
| Akbank TAS/Ak Finansal Kiralama A/S 7.2% 3/16/27 (b)(c) | 200,000 | 206,560 | |
| Ally Financial, Inc.: | |||
| 5.75% 11/20/25 | 945,000 | 1,043,044 | |
| 8% 12/31/18 | 225,000 | 238,781 | |
| 8% 11/1/31 | 257,000 | 339,240 | |
| 8% 11/1/31 | 1,115,000 | 1,474,540 | |
| Banco de Bogota SA 6.25% 5/12/26 (b) | 200,000 | 217,000 | |
| Banco de Sabadell SA 5.625% 5/6/26 (Reg. S) | EUR | 100,000 | 135,628 |
| Banco Do Brasil SA 4.625% 1/15/25 (b) | 300,000 | 299,400 | |
| Banco Internacional del Peru SAA 6.625% 3/19/29 (b)(c) | 200,000 | 226,500 | |
| Banco Macro SA 6.75% 11/4/26 (b)(c) | 150,000 | 157,800 | |
| Bankia SA 3.375% 3/15/27 (Reg. S) (c) | EUR | 100,000 | 122,413 |
| HOIST Kredit AB 1.125% 10/4/21 (Reg. S) | EUR | 200,000 | 233,154 |
| Industrial Senior Trust 5.5% 11/1/22 (b) | 200,000 | 203,700 | |
| Itau Unibanco Holding SA 6.2% 12/21/21 (b) | 350,000 | 379,750 | |
| JSC BGEO Group 6% 7/26/23 (b) | 450,000 | 462,447 | |
| Mercury Bondco PLC 7.125% 5/30/21 pay-in-kind(Reg. S) (c) | EUR | 200,000 | 242,811 |
| Royal Bank of Scotland Group PLC: | |||
| 3.625% 3/25/24 (Reg. S) (c) | EUR | 100,000 | 120,568 |
| 5.125% 5/28/24 | 317,000 | 339,178 | |
| SB Capital SA 5.5% 2/26/24 (b)(c) | 200,000 | 204,537 | |
| Times Property Holdings Ltd. 6.25% 1/23/20 (Reg. S) | 200,000 | 205,728 | |
| Turkiye Garanti Bankasi A/S 6.125% 5/24/27 (b)(c) | 200,000 | 197,500 | |
| Turkiye Halk Bankasi A/S 3.875% 2/5/20 (b) | 200,000 | 192,708 | |
| Turkiye Is Bankasi A/S 5.5% 4/21/22 (b) | 200,000 | 199,300 | |
| Turkiye Vakiflar Bankasi TAO 3.5% 6/17/19 (Reg. S) | EUR | 100,000 | 119,046 |
| UniCredit SpA 6.95% 10/31/22 (Reg. S) | EUR | 100,000 | 145,234 |
| Zenith Bank PLC: | |||
| 6.25% 4/22/19 (b) | 200,000 | 204,980 | |
| 7.375% 5/30/22 (b) | 200,000 | 207,476 | |
| TOTAL BANKS & THRIFTS | 8,147,279 | ||
| Broadcasting - 0.6% | |||
| AMC Networks, Inc.: | |||
| 4.75% 12/15/22 | 100,000 | 102,625 | |
| 4.75% 8/1/25 | 125,000 | 124,844 | |
| Sirius XM Radio, Inc.: | |||
| 3.875% 8/1/22 (b) | 20,000 | 20,375 | |
| 5% 8/1/27 (b) | 125,000 | 126,094 | |
| TV Azteca SA de CV 8.25% 8/9/24 (Reg. S) | 400,000 | 422,000 | |
| TOTAL BROADCASTING | 795,938 | ||
| Building Materials - 1.6% | |||
| Builders FirstSource, Inc. 5.625% 9/1/24 (b) | 115,000 | 121,469 | |
| CEMEX Finance LLC: | |||
| 4.625% 6/15/24 | EUR | 100,000 | 127,046 |
| 6% 4/1/24 (Reg. S) | 250,000 | 264,375 | |
| Elementia S.A.B. de CV 5.5% 1/15/25 (b) | 200,000 | 206,000 | |
| GCP Applied Technologies, Inc. 9.5% 2/1/23 (b) | 70,000 | 78,400 | |
| Grupo Cementos de Chihuahua S.A.B. de CV 5.25% 6/23/24 (b) | 200,000 | 205,500 | |
| HD Supply, Inc. 5.75% 4/15/24 (b) | 30,000 | 32,363 | |
| HeidelbergCement Finance Luxembourg SA 3.25% 10/21/21 (Reg. S) | EUR | 300,000 | 392,249 |
| HMAN Finance Sub Corp. 6.375% 7/15/22 (b) | 100,000 | 99,250 | |
| Petrobras Global Finance BV 6.25% 3/17/24 | 200,000 | 214,470 | |
| Union Andina de Cementos SAA 5.875% 10/30/21 (Reg. S) | 300,000 | 315,300 | |
| USG Corp. 4.875% 6/1/27 (b) | 15,000 | 15,563 | |
| TOTAL BUILDING MATERIALS | 2,071,985 | ||
| Cable/Satellite TV - 5.0% | |||
| Altice SA: | |||
| 7.625% 2/15/25 (b) | 700,000 | 759,500 | |
| 7.75% 5/15/22 (b) | 235,000 | 248,806 | |
| Altice U.S. Finance SA 7.75% 7/15/25 (b) | 210,000 | 229,425 | |
| Cable One, Inc. 5.75% 6/15/22 (b) | 55,000 | 57,475 | |
| Cablevision SA 6.5% 6/15/21 (b) | 200,000 | 214,040 | |
| CCO Holdings LLC/CCO Holdings Capital Corp.: | |||
| 5.125% 5/1/27 (b) | 545,000 | 550,450 | |
| 5.5% 5/1/26 (b) | 110,000 | 112,750 | |
| 5.75% 1/15/24 | 615,000 | 638,831 | |
| 5.75% 2/15/26 (b) | 65,000 | 67,958 | |
| Cequel Communications Holdings I LLC/Cequel Capital Corp. 5.125% 12/15/21 (b) | 255,000 | 259,463 | |
| CSC Holdings, Inc. 5.5% 4/15/27 (b) | 345,000 | 355,350 | |
| DISH DBS Corp. 5% 3/15/23 | 470,000 | 454,725 | |
| Myriad International Holding BV 5.5% 7/21/25 (b) | 200,000 | 216,706 | |
| Telenet Finance VI Luxembourg SCA 4.875% 7/15/27 (Reg. S) | EUR | 100,000 | 128,746 |
| Unitymedia Hessen GmbH & Co. KG 5.75% 1/15/23 (Reg. S) | EUR | 145,800 | 176,462 |
| Unitymedia Hessen GmbH & Co. KG/Unitymedia NRW GmbH: | |||
| 3.5% 1/15/27 (Reg. S) | EUR | 100,000 | 122,552 |
| 5.5% 1/15/23 (b) | 180,000 | 184,950 | |
| UPCB Finance VII Ltd. 3.625% 6/15/29 (Reg. S) | EUR | 400,000 | 468,124 |
| Virgin Media Finance PLC 4.5% 1/15/25 (Reg. S) | EUR | 100,000 | 123,125 |
| VTR Finance BV 6.875% 1/15/24 (b) | 600,000 | 636,150 | |
| Ziggo Bond Finance BV 6% 1/15/27 (b) | 160,000 | 162,800 | |
| Ziggo Secured Finance BV 4.25% 1/15/27 (Reg. S) | EUR | 100,000 | 124,613 |
| TOTAL CABLE/SATELLITE TV | 6,293,001 | ||
| Chemicals - 2.2% | |||
| Bayer AG 3% 7/1/75 (Reg S.) (c) | EUR | 100,000 | 122,600 |
| CF Industries Holdings, Inc.: | |||
| 4.95% 6/1/43 | 170,000 | 155,975 | |
| 5.15% 3/15/34 | 100,000 | 99,750 | |
| 5.375% 3/15/44 | 65,000 | 62,400 | |
| Evolution Escrow Issuer LLC 7.5% 3/15/22 (b) | 175,000 | 183,531 | |
| INEOS Finance PLC 2.125% 11/15/25 (Reg. S) | EUR | 100,000 | 116,631 |
| Momentive Performance Materials, Inc. 3.88% 10/24/21 | 200,000 | 208,000 | |
| MPM Escrow LLC/MPM Finance Escrow Corp. 8.875% 10/15/20 (d)(e) | 140,000 | 0 | |
| NOVA Chemicals Corp.: | |||
| 4.875% 6/1/24 (b) | 70,000 | 71,313 | |
| 5.25% 6/1/27 (b) | 70,000 | 71,400 | |
| OCP SA 5.625% 4/25/24 (b) | 200,000 | 214,748 | |
| Platform Specialty Products Corp. 6.5% 2/1/22 (b) | 200,000 | 207,250 | |
| The Chemours Co. LLC 5.375% 5/15/27 | 25,000 | 26,688 | |
| TPC Group, Inc. 8.75% 12/15/20 (b) | 290,000 | 283,475 | |
| Trinseo Materials Operating SCA/Trinseo Materials Finance, Inc. 5.375% 9/1/25 (b) | 300,000 | 315,750 | |
| Tronox Finance PLC 5.75% 10/1/25 (b) | 35,000 | 36,531 | |
| Valvoline, Inc. 4.375% 8/15/25 (b) | 400,000 | 404,000 | |
| Yingde Gases Investment Ltd. 7.25% 2/28/20 (Reg. S) | 200,000 | 205,798 | |
| TOTAL CHEMICALS | 2,785,840 | ||
| Containers - 1.8% | |||
| ARD Finance SA: | |||
| 6.625% 9/15/23 (Reg. S) pay-in-kind (c) | EUR | 100,000 | 125,176 |
| 7.125% 9/15/23 pay-in-kind (c) | 200,000 | 213,000 | |
| Ardagh Packaging Finance PLC/Ardagh MP Holdings U.S.A., Inc.: | |||
| 2.75% 3/15/24 (Reg. S) | EUR | 100,000 | 119,980 |
| 6% 2/15/25 (b) | 200,000 | 212,250 | |
| 6.75% 5/15/24 (Reg. S) | EUR | 100,000 | 130,305 |
| 7.25% 5/15/24 (b) | 200,000 | 219,750 | |
| Ball Corp. 4.375% 12/15/23 | EUR | 200,000 | 267,275 |
| Kleopatra Holdings 1 SCA 8.5% 6/30/23 pay-in-kind(Reg. S) (c) | EUR | 200,000 | 234,610 |
| OI European Group BV 6.75% 9/15/20 (Reg. S) | EUR | 150,000 | 206,720 |
| Plastipak Holdings, Inc. 6.25% 10/15/25 (b) | 20,000 | 20,396 | |
| Reynolds Group Issuer, Inc./Reynolds Group Issuer LLC/Reynolds Group Issuer (Luxembourg) SA 5.75% 10/15/20 | 285,000 | 289,990 | |
| Silgan Holdings, Inc.: | |||
| 3.25% 3/15/25 (b) | EUR | 100,000 | 121,016 |
| 3.25% 3/15/25 (Reg. S) | EUR | 100,000 | 121,016 |
| TOTAL CONTAINERS | 2,281,484 | ||
| Diversified Financial Services - 4.0% | |||
| Arena Lux Finance Sarl 2.875% 11/1/24 (Reg. S) | EUR | 100,000 | 118,240 |
| Arrow Global Finance PLC 3 month EURIBOR + 2.875% 2.875% 4/1/25 (Reg. S) (c)(f) | EUR | 100,000 | 116,485 |
| Ascend Learning LLC 6.875% 8/1/25 (b) | 85,000 | 89,038 | |
| Cabot Financial SA (Luxembourg) 3 month EURIBOR + 5.875% 5.875% 11/15/21 (Reg. S) (c)(f) | EUR | 150,000 | 182,957 |
| Chobani LLC/Finance Corp., Inc. 7.5% 4/15/25 (b) | 195,000 | 211,819 | |
| Comcel Trust 6.875% 2/6/24 (b) | 200,000 | 211,000 | |
| Eagle Holding Co. II LLC 7.625% 5/15/22 pay-in-kind (b)(c) | 30,000 | 30,938 | |
| Exela International LLC/Exela Financial, Inc. 10% 7/15/23 (b) | 70,000 | 67,025 | |
| FLY Leasing Ltd. 5.25% 10/15/24 | 60,000 | 60,263 | |
| Garfunkelux Holdco 3 SA 7.5% 8/1/22 (Reg. S) | EUR | 200,000 | 250,031 |
| Gemdale Ever Prosperity Investment Ltd. 4.95% 7/26/22 (Reg. S) | 300,000 | 304,751 | |
| Grinding Media, Inc./MC Grinding Media Canada, Inc. 7.375% 12/15/23 (b) | 90,000 | 97,875 | |
| Icahn Enterprises LP/Icahn Enterprises Finance Corp.: | |||
| 5.875% 2/1/22 | 305,000 | 315,105 | |
| 6.25% 2/1/22 | 30,000 | 31,350 | |
| 6.75% 2/1/24 | 55,000 | 58,231 | |
| International Lease Finance Corp. 5.875% 8/15/22 | 175,000 | 196,708 | |
| International Personal Finance PLC 5.75% 4/7/21 (Reg S.) | EUR | 100,000 | 108,937 |
| LHC3 PLC 4.125% 8/15/24 pay-in-kind (Reg. S) (c) | EUR | 200,000 | 240,709 |
| MSCI, Inc. 5.75% 8/15/25 (b) | 50,000 | 54,000 | |
| Navient Corp.: | |||
| 5% 10/26/20 | 54,000 | 55,620 | |
| 6.5% 6/15/22 | 65,000 | 68,981 | |
| 7.25% 9/25/23 | 55,000 | 59,572 | |
| Orchestra Borrower LLC/Orchestra Co.-Issuer, Inc. 6.75% 6/15/22 (b) | 40,000 | 41,592 | |
| Pontis IV Ltd. 5.125% 3/31/27 (b) | 200,000 | 203,750 | |
| Prime Securities Services Borrower LLC/Prime Finance, Inc. 9.25% 5/15/23 (b) | 660,000 | 731,412 | |
| Radiate Holdco LLC/Radiate Financial Service Ltd. 6.625% 2/15/25 (b) | 25,000 | 24,563 | |
| SLM Corp.: | |||
| 5.5% 1/25/23 | 475,000 | 480,938 | |
| 6.125% 3/25/24 | 205,000 | 210,381 | |
| 8% 3/25/20 | 190,000 | 209,475 | |
| Verisure Holding AB 6% 11/1/22 (Reg. S) | EUR | 234,000 | 293,808 |
| TOTAL DIVERSIFIED FINANCIAL SERVICES | 5,125,554 | ||
| Diversified Media - 0.2% | |||
| E.W. Scripps Co. 5.125% 5/15/25 (b) | 15,000 | 15,413 | |
| MDC Partners, Inc. 6.5% 5/1/24 (b) | 205,000 | 209,100 | |
| TOTAL DIVERSIFIED MEDIA | 224,513 | ||
| Energy - 13.0% | |||
| Afren PLC 10.25% 4/8/19 (b)(d)(e) | 285,920 | 51 | |
| Antero Resources Corp.: | |||
| 5.125% 12/1/22 | 215,000 | 220,913 | |
| 5.625% 6/1/23 (Reg. S) | 80,000 | 83,800 | |
| Areva SA 4.875% 9/23/24 | EUR | 300,000 | 393,661 |
| Borets Finance DAC 6.5% 4/7/22 (b) | 200,000 | 213,118 | |
| Bulgarian Energy Holding EAD 4.875% 8/2/21 | EUR | 100,000 | 126,976 |
| Calfrac Holdings LP 7.5% 12/1/20 (b) | 155,000 | 151,900 | |
| California Resources Corp. 8% 12/15/22 (b) | 350,000 | 231,000 | |
| Callon Petroleum Co. 6.125% 10/1/24 | 25,000 | 26,000 | |
| Carrizo Oil & Gas, Inc. 6.25% 4/15/23 | 20,000 | 20,350 | |
| Cheniere Corpus Christi Holdings LLC: | |||
| 5.125% 6/30/27 (b) | 70,000 | 72,188 | |
| 5.875% 3/31/25 | 80,000 | 86,600 | |
| Chesapeake Energy Corp.: | |||
| 3 month U.S. LIBOR + 3.250% 4.6092% 4/15/19 (c)(f) | 70,000 | 69,300 | |
| 4.875% 4/15/22 | 180,000 | 166,500 | |
| 5.75% 3/15/23 | 65,000 | 59,313 | |
| 8% 12/15/22 (b) | 168,000 | 180,758 | |
| 8% 1/15/25 (b) | 305,000 | 305,000 | |
| 8% 6/15/27 (b) | 560,000 | 540,050 | |
| China Jinjiang Environment Holding Co. Ltd. 6% 7/27/20 (Reg. S) | 200,000 | 201,066 | |
| Citgo Holding, Inc. 10.75% 2/15/20 (b) | 155,000 | 167,400 | |
| Consolidated Energy Finance SA: | |||
| 3 month U.S. LIBOR + 3.750% 5.07% 6/15/22 (b)(c)(f) | 470,000 | 468,927 | |
| 6.875% 6/15/25 (b) | 275,000 | 290,813 | |
| Covey Park Energy LLC 7.5% 5/15/25 (b) | 50,000 | 51,875 | |
| Diamond Offshore Drilling, Inc. 7.875% 8/15/25 | 95,000 | 101,650 | |
| EDC Finance Ltd. 4.875% 4/17/20 (b) | 200,000 | 204,500 | |
| Ensco PLC: | |||
| 4.5% 10/1/24 | 140,000 | 114,800 | |
| 5.2% 3/15/25 | 30,000 | 25,275 | |
| EP Energy LLC/Everest Acquisition Finance, Inc. 8% 11/29/24 (b) | 35,000 | 35,700 | |
| Exterran Partners LP/EXLP Finance Corp.: | |||
| 6% 4/1/21 | 15,000 | 14,925 | |
| 6% 10/1/22 | 300,000 | 298,125 | |
| Extraction Oil & Gas, Inc. 7.375% 5/15/24 (b) | 40,000 | 42,600 | |
| FTS International, Inc. 6.25% 5/1/22 | 160,000 | 155,200 | |
| Gaz Capital SA: | |||
| 3.389% 3/20/20 (Reg. S) | EUR | 100,000 | 122,892 |
| 3.6% 2/26/21 (Reg. S) | EUR | 300,000 | 375,863 |
| Geo Coal International Pte Ltd. 8% 10/4/22 (Reg. S) | 200,000 | 203,095 | |
| Gulfmark Offshore, Inc. 6.375% 3/15/22 (d) | 330,000 | 69,300 | |
| Hilcorp Energy I LP/Hilcorp Finance Co.: | |||
| 5% 12/1/24 (b) | 320,000 | 318,400 | |
| 5.75% 10/1/25 (b) | 200,000 | 204,750 | |
| Hilong Holding Ltd. 7.25% 6/22/20 (Reg. S) | 200,000 | 199,743 | |
| Indika Energy Capital II Pte. Ltd. 6.875% 4/10/22 (Reg. S) | 200,000 | 208,485 | |
| Jonah Energy LLC 7.25% 10/15/25 (b) | 105,000 | 105,000 | |
| Kosmos Energy Ltd. 7.875% 8/1/21 (b) | 200,000 | 207,000 | |
| Medco Strait Services Pte. Ltd. 8.5% 8/17/22 | 200,000 | 212,841 | |
| NextEra Energy Partners LP: | |||
| 4.25% 9/15/24 (b) | 50,000 | 50,500 | |
| 4.5% 9/15/27 (b) | 35,000 | 35,219 | |
| NGPL PipeCo LLC: | |||
| 4.375% 8/15/22 (b) | 15,000 | 15,431 | |
| 4.875% 8/15/27 (b) | 15,000 | 15,525 | |
| Noble Holding International Ltd.: | |||
| 3.95% 3/15/22 | 90,000 | 75,600 | |
| 4.625% 3/1/21 | 8,000 | 7,400 | |
| 6.05% 3/1/41 | 5,000 | 3,313 | |
| 6.2% 8/1/40 | 85,000 | 57,375 | |
| 7.75% 1/15/24 | 225,000 | 201,375 | |
| Nostrum Oil & Gas Finance BV 8% 7/25/22 (b) | 400,000 | 416,200 | |
| NuStar Logistics LP 5.625% 4/28/27 | 30,000 | 31,650 | |
| Oasis Petroleum, Inc. 6.875% 3/15/22 | 45,000 | 46,125 | |
| Pacific Drilling V Ltd. 7.25% 12/1/17 (b) | 380,000 | 167,200 | |
| Pacific Exploration and Production Corp. 10% 11/2/21 pay-in-kind (c) | 88,000 | 100,100 | |
| Pan American Energy LLC 7.875% 5/7/21 (b) | 400,000 | 433,840 | |
| Parsley Energy LLC/Parsley: | |||
| 5.625% 10/15/27 (b) | 35,000 | 36,116 | |
| 6.25% 6/1/24 (b) | 10,000 | 10,600 | |
| PBF Holding Co. LLC/PBF Finance Corp.: | |||
| 7% 11/15/23 | 130,000 | 135,200 | |
| 7.25% 6/15/25 (b) | 70,000 | 72,363 | |
| PBF Logistics LP/PBF Logistics Finance, Inc. 6.875% 5/15/23 (b) | 130,000 | 134,550 | |
| Peabody Securities Finance Corp.: | |||
| 6% 3/31/22 (b) | 20,000 | 20,600 | |
| 6.375% 3/31/25 (b) | 25,000 | 25,781 | |
| Petrobras Energia SA 7.375% 7/21/23 (Reg. S) | 200,000 | 218,700 | |
| Pride International, Inc. 7.875% 8/15/40 | 95,000 | 79,325 | |
| Puma International Financing SA: | |||
| 5.125% 10/6/24 (Reg. S) | 200,000 | 204,540 | |
| 6.75% 2/1/21 (Reg. S) | 200,000 | 204,768 | |
| Range Resources Corp. 4.875% 5/15/25 | 60,000 | 57,900 | |
| Repsol International Finance BV 4.5% 3/25/75 (Reg. S) (c) | EUR | 200,000 | 259,736 |
| Rose Rock Midstream LP/Rose Rock Finance Corp. 5.625% 7/15/22 | 125,000 | 123,125 | |
| Sabine Pass Liquefaction LLC 5.625% 3/1/25 | 15,000 | 16,664 | |
| SemGroup Corp. 7.25% 3/15/26 (b) | 70,000 | 71,225 | |
| SESI LLC 7.75% 9/15/24 (b) | 40,000 | 41,400 | |
| Sibur Securities Dac 4.125% 10/5/23 (b) | 200,000 | 199,250 | |
| SM Energy Co.: | |||
| 5% 1/15/24 | 65,000 | 62,075 | |
| 5.625% 6/1/25 | 110,000 | 106,975 | |
| 6.125% 11/15/22 | 150,000 | 150,750 | |
| 6.5% 11/15/21 | 30,000 | 30,300 | |
| 6.5% 1/1/23 | 15,000 | 15,263 | |
| 6.75% 9/15/26 | 25,000 | 25,656 | |
| Southwestern Energy Co.: | |||
| 7.5% 4/1/26 | 65,000 | 67,438 | |
| 7.75% 10/1/27 | 50,000 | 52,000 | |
| Summit Midstream Holdings LLC 5.75% 4/15/25 | 45,000 | 45,900 | |
| Sunoco LP/Sunoco Finance Corp.: | |||
| 6.25% 4/15/21 | 110,000 | 115,225 | |
| 6.375% 4/1/23 | 60,000 | 63,750 | |
| Targa Resources Partners LP/Targa Resources Partners Finance Corp.: | |||
| 5.125% 2/1/25 | 35,000 | 36,050 | |
| 5.375% 2/1/27 | 35,000 | 36,356 | |
| Teine Energy Ltd. 6.875% 9/30/22 (b) | 85,000 | 86,913 | |
| TerraForm Power Operating LLC: | |||
| 6.375% 2/1/23 (b)(c) | 445,000 | 466,138 | |
| 6.625% 6/15/25 (b)(c) | 1,210,000 | 1,312,850 | |
| Tesoro Logistics LP/Tesoro Logistics Finance Corp.: | |||
| 6.125% 10/15/21 | 20,000 | 20,650 | |
| 6.375% 5/1/24 | 45,000 | 49,275 | |
| The Oil and Gas Holding Co. 7.5% 10/25/27 (b) | 200,000 | 207,508 | |
| Transocean, Inc. 7.5% 1/15/26 (b) | 130,000 | 133,900 | |
| Transportadora de Gas del Sur SA 9.625% 5/14/20 (b) | 431,097 | 467,270 | |
| Trinidad Drilling Ltd. 6.625% 2/15/25 (b) | 25,000 | 24,313 | |
| Tupras Turkiye Petrol Rafinerileri A/S 4.5% 10/18/24 (b) | 200,000 | 195,649 | |
| Ultra Resources, Inc.: | |||
| 6.875% 4/15/22 (b) | 55,000 | 55,550 | |
| 7.125% 4/15/25 (b) | 40,000 | 39,900 | |
| Ultrapar Participacoes SA 5.25% 10/6/26 (b) | 200,000 | 205,000 | |
| Weatherford International Ltd. 9.875% 2/15/24 | 115,000 | 123,050 | |
| WPX Energy, Inc.: | |||
| 5.25% 9/15/24 | 105,000 | 105,394 | |
| 6% 1/15/22 | 149,000 | 155,146 | |
| 7.5% 8/1/20 | 44,000 | 47,740 | |
| 8.25% 8/1/23 | 100,000 | 112,625 | |
| YPF SA: | |||
| 8.5% 3/23/21 (b) | 275,000 | 311,388 | |
| 8.5% 7/28/25 (b) | 400,000 | 465,200 | |
| Ziggo Secured Finance BV 3.75% 1/15/25 (Reg. S) | EUR | 100,000 | 122,506 |
| TOTAL ENERGY | 16,432,102 | ||
| Entertainment/Film - 1.3% | |||
| AMC Entertainment Holdings, Inc. 6.125% 5/15/27 | 45,000 | 44,550 | |
| CBS Outdoor Americas Capital LLC/CBS Outdoor Americas Capital Corp. 5.625% 2/15/24 | 565,000 | 594,663 | |
| NAI Entertainment Holdings LLC/NAI Entertainment Finance Corp. 5% 8/1/18 (b) | 170,000 | 170,170 | |
| New Cotai LLC/New Cotai Capital Corp. 10.625% 5/1/19 pay-in-kind (b)(c) | 868,830 | 868,830 | |
| TOTAL ENTERTAINMENT/FILM | 1,678,213 | ||
| Environmental - 0.6% | |||
| CD&R Waterworks Merger Sub LLC 6.125% 8/15/25 (b) | 25,000 | 25,313 | |
| Covanta Holding Corp.: | |||
| 5.875% 3/1/24 | 110,000 | 110,275 | |
| 5.875% 7/1/25 | 15,000 | 14,850 | |
| 6.375% 10/1/22 | 95,000 | 98,088 | |
| LBC Tank Terminals Holding Netherlands BV 6.875% 5/15/23 (b) | 445,000 | 465,581 | |
| TOTAL ENVIRONMENTAL | 714,107 | ||
| Food & Drug Retail - 1.1% | |||
| Albertsons Companies LLC/Safeway, Inc./New Albertson's, Inc./Albertson's LLC: | |||
| 5.75% 3/15/25 | 80,000 | 70,400 | |
| 6.625% 6/15/24 | 35,000 | 32,900 | |
| Albertsons, Inc.: | |||
| 6.625% 6/1/28 | 75,000 | 57,563 | |
| 7.45% 8/1/29 | 5,000 | 4,138 | |
| BI-LO LLC/BI-LO Finance Corp.: | |||
| 9.25% 2/15/19 (b) | 90,000 | 82,125 | |
| 9.375% 9/15/18 pay-in-kind (b)(c) | 88,984 | 24,916 | |
| Casino Guichard Perrachon SA 5.976% 5/26/21 (c) | EUR | 100,000 | 137,154 |
| Cumberland Farms, Inc. 6.75% 5/1/25 (b) | 25,000 | 26,563 | |
| Darling Global Finance BV 4.75% 5/30/22 (Reg. S) | EUR | 100,000 | 121,727 |
| FAGE International SA/FAGE U.S.A. Dairy Industry, Inc. 5.625% 8/15/26 (b) | 200,000 | 205,438 | |
| Rite Aid Corp. 6.875% 12/15/28 (b)(c) | 505,000 | 388,850 | |
| Tesco PLC 5.125% 4/10/47 | EUR | 100,000 | 144,813 |
| Tops Holding LLC/Tops Markets II Corp. 8% 6/15/22 (b) | 165,000 | 99,000 | |
| TOTAL FOOD & DRUG RETAIL | 1,395,587 | ||
| Food/Beverage/Tobacco - 2.4% | |||
| Central American Bottling Corp. 5.75% 1/31/27 (b) | 200,000 | 211,168 | |
| ESAL GmbH 6.25% 2/5/23 (b) | 105,000 | 101,063 | |
| Gruma S.A.B. de CV 4.875% 12/1/24 (b) | 300,000 | 323,250 | |
| JBS Investments GmbH: | |||
| 7.25% 4/3/24 (b) | 383,000 | 378,213 | |
| 7.75% 10/28/20 (b) | 170,000 | 173,485 | |
| JBS U.S.A. LLC/JBS U.S.A. Finance, Inc.: | |||
| 5.75% 6/15/25 (b) | 415,000 | 402,550 | |
| 5.875% 7/15/24 (b) | 10,000 | 9,825 | |
| Lamb Weston Holdings, Inc.: | |||
| 4.625% 11/1/24 (b) | 45,000 | 47,025 | |
| 4.875% 11/1/26 (b) | 45,000 | 47,306 | |
| MHP SA 8.25% 4/2/20 (b) | 200,000 | 216,000 | |
| Minerva Luxembourg SA: | |||
| 6.5% 9/20/26 (b) | 400,000 | 414,800 | |
| 7.75% 1/31/23 (Reg. S) | 200,000 | 209,250 | |
| Pilgrim's Pride Corp.: | |||
| 5.75% 3/15/25 (b) | 25,000 | 26,469 | |
| 5.875% 9/30/27 (b) | 45,000 | 46,800 | |
| Post Holdings, Inc.: | |||
| 5.5% 3/1/25 (b) | 75,000 | 78,188 | |
| 5.75% 3/1/27 (b) | 160,000 | 166,200 | |
| U.S. Foods, Inc. 5.875% 6/15/24 (b) | 70,000 | 73,938 | |
| Vector Group Ltd. 6.125% 2/1/25 (b) | 150,000 | 155,625 | |
| TOTAL FOOD/BEVERAGE/TOBACCO | 3,081,155 | ||
| Gaming - 2.5% | |||
| Caesars Growth Properties Holdings LLC/Caesars Growth Properties Finance, Inc. 9.375% 5/1/22 | 405,000 | 435,578 | |
| Cleopatra Finance Ltd.: | |||
| 4.125% 2/15/20 | EUR | 100,000 | 124,895 |
| 4.75% 2/15/23 (Reg. S) | EUR | 200,000 | 262,674 |
| Codere Finance (Luxembourg) SA 6.75% 11/1/21 (Reg. S) | EUR | 200,000 | 243,463 |
| CRC Escrow Issuer LLC/CRC Finance LLC 5.25% 10/15/25 (b) | 220,000 | 221,441 | |
| Eldorado Resorts, Inc. 6% 4/1/25 | 70,000 | 73,850 | |
| GLP Capital LP/GLP Financing II, Inc. 5.375% 4/15/26 | 30,000 | 32,475 | |
| Jacobs Entertainment, Inc. 7.875% 2/1/24 (b) | 15,000 | 16,200 | |
| MGM Growth Properties Operating Partnership LP 4.5% 1/15/28 (b) | 50,000 | 49,875 | |
| MGM Mirage, Inc. 8.625% 2/1/19 | 115,000 | 123,194 | |
| Paris Las Vegas Holding LLC/Harrah's Las Vegas LLC/Flamingo Las Vegas Holdings, Inc. 11% 10/1/21 (c) | 305,000 | 323,300 | |
| Penn National Gaming, Inc. 5.625% 1/15/27 (b) | 15,000 | 15,525 | |
| Scientific Games Corp.: | |||
| 5% 10/15/25 (b) | 20,000 | 20,300 | |
| 7% 1/1/22 (b) | 45,000 | 47,588 | |
| 10% 12/1/22 | 270,000 | 298,669 | |
| Station Casinos LLC 5% 10/1/25 (b) | 90,000 | 90,113 | |
| Studio City Finance Ltd. 8.5% 12/1/20 (b) | 200,000 | 205,500 | |
| Sugarhouse HSP Gaming Prop Mezz LP/Sugarhouse HSP Gaming Finance Corp. 5.875% 5/15/25 (b) | 45,000 | 43,875 | |
| Wynn Las Vegas LLC/Wynn Las Vegas Capital Corp. 5.25% 5/15/27 (b) | 85,000 | 86,806 | |
| Wynn Macau Ltd.: | |||
| 4.875% 10/1/24 (b) | 200,000 | 203,260 | |
| 5.5% 10/1/27 (b) | 200,000 | 202,644 | |
| TOTAL GAMING | 3,121,225 | ||
| Healthcare - 5.4% | |||
| Catalent Pharma Solutions 4.875% 1/15/26 (b) | 25,000 | 25,375 | |
| Community Health Systems, Inc.: | |||
| 6.25% 3/31/23 | 145,000 | 139,563 | |
| 6.875% 2/1/22 | 280,000 | 202,650 | |
| CTR Partnership LP/CareTrust Capital Corp. 5.25% 6/1/25 | 100,000 | 102,750 | |
| Ephios Bondco PLC 6.25% 7/1/22 | EUR | 100,000 | 124,125 |
| Eurofins Scientific SA 2.125% 7/25/24 (Reg. S) | EUR | 100,000 | 119,803 |
| FMC Finance VII SA 5.25% 2/15/21 | EUR | 250,000 | 337,818 |
| HCA Holdings, Inc.: | |||
| 4.5% 2/15/27 | 500,000 | 504,375 | |
| 5.875% 3/15/22 | 274,000 | 300,030 | |
| 5.875% 2/15/26 | 85,000 | 89,356 | |
| 7.5% 2/15/22 | 180,000 | 204,300 | |
| HealthSouth Corp.: | |||
| 5.75% 11/1/24 | 150,000 | 153,563 | |
| 5.75% 9/15/25 | 15,000 | 15,469 | |
| Hologic, Inc. 4.375% 10/15/25 (b) | 35,000 | 35,560 | |
| IMS Health, Inc.: | |||
| 3.25% 3/15/25 (Reg. S) | EUR | 300,000 | 361,738 |
| 5% 10/15/26 (b) | 200,000 | 212,500 | |
| MPT Operating Partnership LP/MPT Finance Corp. 5% 10/15/27 | 75,000 | 77,063 | |
| Nidda Healthcare Holding AG 3.5% 9/30/24 (Reg. S) | EUR | 100,000 | 119,234 |
| Ortho-Clinical Diagnostics, Inc. 6.625% 5/15/22 (b) | 205,000 | 205,256 | |
| Sabra Health Care LP/Sabra Capital Corp.: | |||
| 5.375% 6/1/23 | 155,000 | 160,038 | |
| 5.5% 2/1/21 | 120,000 | 123,750 | |
| Tenet Healthcare Corp.: | |||
| 4.625% 7/15/24 (b) | 165,000 | 162,319 | |
| 6.75% 6/15/23 | 470,000 | 441,213 | |
| 7.5% 1/1/22 (b) | 40,000 | 42,100 | |
| 8.125% 4/1/22 | 515,000 | 517,575 | |
| THC Escrow Corp. III 5.125% 5/1/25 (b) | 210,000 | 204,488 | |
| Valeant Pharmaceuticals International, Inc.: | |||
| 5.375% 3/15/20 (b) | 475,000 | 467,281 | |
| 5.5% 3/1/23 (b) | 115,000 | 96,600 | |
| 5.5% 11/1/25 (b) | 70,000 | 71,575 | |
| 5.875% 5/15/23 (b) | 625,000 | 528,125 | |
| 6.125% 4/15/25 (b) | 5,000 | 4,200 | |
| 6.5% 3/15/22 (b) | 80,000 | 84,800 | |
| 6.75% 8/15/21 (b) | 30,000 | 29,063 | |
| 7% 3/15/24 (b) | 160,000 | 173,200 | |
| 7.25% 7/15/22 (b) | 25,000 | 23,938 | |
| 7.5% 7/15/21 (b) | 273,000 | 268,564 | |
| Vizient, Inc. 10.375% 3/1/24 (b) | 80,000 | 91,200 | |
| Wellcare Health Plans, Inc. 5.25% 4/1/25 | 50,000 | 52,625 | |
| TOTAL HEALTHCARE | 6,873,182 | ||
| Homebuilders/Real Estate - 1.9% | |||
| Ashton Woods U.S.A. LLC/Ashton Woods Finance Co. 6.875% 2/15/21 (b) | 241,000 | 247,326 | |
| Brookfield Residential Properties, Inc./Brookfield Residential U.S. Corp. 6.125% 7/1/22 (b) | 5,000 | 5,219 | |
| Brookfield Residential Properties, Inc.: | |||
| 6.375% 5/15/25 (b) | 15,000 | 15,713 | |
| 6.5% 12/15/20 (b) | 115,000 | 117,444 | |
| Cementos Progreso Trust 7.125% 11/6/23 (b) | 200,000 | 213,000 | |
| Central China Real Estate Ltd. 8.75% 1/23/21 (Reg. S) | 200,000 | 215,500 | |
| Fantasia Holdings Group Co. Ltd. 7.375% 10/4/21 (Reg. S) | 200,000 | 199,621 | |
| Howard Hughes Corp. 5.375% 3/15/25 (b) | 110,000 | 113,025 | |
| IRSA Propiedades Comerciales SA 8.75% 3/23/23 (b) | 150,000 | 169,397 | |
| Jingrui Holdings Ltd. 7.75% 4/12/20 | 200,000 | 193,993 | |
| Lodha Developers International Ltd. 12% 3/13/20 (Reg. S) | 200,000 | 210,500 | |
| Marquee Land Pte. Ltd. 9.75% 8/5/19 (Reg. S) | 37,000 | 38,931 | |
| Mattamy Group Corp. 6.875% 12/15/23 (b) | 25,000 | 26,250 | |
| Oceanwide Holdings International 2015 Co., Ltd. 9.625% 8/11/20 (Reg. S) | 200,000 | 205,562 | |
| Ryland Group, Inc. 5.375% 10/1/22 | 55,000 | 59,950 | |
| Shea Homes Ltd. Partnership/Corp.: | |||
| 5.875% 4/1/23 (b) | 30,000 | 31,125 | |
| 6.125% 4/1/25 (b) | 30,000 | 31,200 | |
| Weekley Homes LLC/Weekley Finance Corp. 6% 2/1/23 | 90,000 | 88,200 | |
| William Lyon Homes, Inc. 5.875% 1/31/25 | 40,000 | 40,800 | |
| Yida China Holdings 6.95% 4/19/20 (Reg. S) | 200,000 | 190,057 | |
| TOTAL HOMEBUILDERS/REAL ESTATE | 2,412,813 | ||
| Hotels - 0.1% | |||
| Hilton Worldwide Finance LLC/Hilton Worldwide Finance Corp.: | |||
| 4.625% 4/1/25 | 70,000 | 72,188 | |
| 4.875% 4/1/27 | 40,000 | 42,000 | |
| TOTAL HOTELS | 114,188 | ||
| Insurance - 0.7% | |||
| Alliant Holdings Co.-Issuer, Inc./Wayne Merger Sub LLC 8.25% 8/1/23 (b) | 120,000 | 127,800 | |
| Assicurazioni Generali SpA 7.75% 12/12/42 (c) | EUR | 100,000 | 150,645 |
| Hockey Merger Sub 2, Inc. 7.875% 10/1/21 (b) | 140,000 | 145,716 | |
| Intrum Justitia AB 2.75% 7/15/22 (Reg. S) | EUR | 150,000 | 179,011 |
| Sumitomo Life Insurance Co. 4% 9/14/77 (Reg. S) (c) | 200,000 | 196,912 | |
| USIS Merger Sub, Inc. 6.875% 5/1/25 (b) | 75,000 | 77,813 | |
| TOTAL INSURANCE | 877,897 | ||
| Leisure - 0.1% | |||
| Cedar Fair LP/Magnum Management Corp. 5.375% 4/15/27 (b) | 35,000 | 36,969 | |
| Silversea Cruises 7.25% 2/1/25 (b) | 25,000 | 26,813 | |
| Viking Cruises Ltd. 5.875% 9/15/27 (b) | 70,000 | 70,525 | |
| TOTAL LEISURE | 134,307 | ||
| Metals/Mining - 3.3% | |||
| Alpha Natural Resources, Inc. 9.75% 4/15/18 (d)(e) | 210,000 | 0 | |
| Anglo American Capital PLC 1.75% 4/3/18 (Reg. S) | EUR | 100,000 | 117,337 |
| ArcelorMittal SA: | |||
| 3% 3/25/19 (Reg. S) | EUR | 100,000 | 121,266 |
| 3.125% 1/14/22 (Reg. S) | EUR | 100,000 | 128,721 |
| Bluescope Steel Ltd./Bluescope Steel Finance 6.5% 5/15/21 (b) | 25,000 | 26,125 | |
| First Quantum Minerals Ltd.: | |||
| 7% 2/15/21 (b) | 85,000 | 88,188 | |
| 7.25% 5/15/22 (b) | 220,000 | 229,900 | |
| 7.25% 4/1/23 (b) | 400,000 | 423,000 | |
| 7.5% 4/1/25 (b) | 200,000 | 211,750 | |
| FMG Resources (August 2006) Pty Ltd. 4.75% 5/15/22 (b) | 45,000 | 45,900 | |
| Freeport-McMoRan, Inc.: | |||
| 6.5% 11/15/20 | 15,000 | 15,281 | |
| 6.75% 2/1/22 | 50,000 | 52,000 | |
| 6.875% 2/15/23 | 215,000 | 235,182 | |
| Gold Fields Orogen Holding BVI Ltd. 4.875% 10/7/20 (b) | 200,000 | 205,000 | |
| Joseph T Ryerson & Son, Inc. 11% 5/15/22 (b) | 40,000 | 45,200 | |
| Minsur SA 6.25% 2/7/24 (Reg. S) | 200,000 | 222,000 | |
| Murray Energy Corp. 11.25% 4/15/21 (b) | 150,000 | 82,500 | |
| New Gold, Inc. 6.375% 5/15/25 (b) | 105,000 | 111,563 | |
| Novelis Corp. 5.875% 9/30/26 (b) | 70,000 | 72,143 | |
| Polyus Finance PLC 5.25% 2/7/23 (b) | 200,000 | 209,620 | |
| PT Bukit Makmur Mandiri Utama 7.75% 2/13/22 (b) | 200,000 | 216,508 | |
| Qinghai Provincial Investment Group Co. Ltd. 6.3% 9/26/18 (Reg. S) | 200,000 | 202,300 | |
| Southern Copper Corp. 7.5% 7/27/35 | 150,000 | 197,983 | |
| Stillwater Mining Co. 6.125% 6/27/22 (b) | 200,000 | 203,800 | |
| Vedanta Resources PLC: | |||
| 6.125% 8/9/24 | 200,000 | 204,050 | |
| 6.375% 7/30/22 (b) | 300,000 | 313,860 | |
| VM Holding SA 5.375% 5/4/27 (b) | 200,000 | 211,240 | |
| Walter Energy, Inc. 9.5% 10/15/19 (b)(d)(e) | 155,000 | 0 | |
| TOTAL METALS/MINING | 4,192,417 | ||
| Paper - 0.2% | |||
| Flex Acquisition Co., Inc. 6.875% 1/15/25 (b) | 30,000 | 31,013 | |
| Smurfit Kappa Acquisitions 3.25% 6/1/21 (Reg. S) | EUR | 200,000 | 253,099 |
| TOTAL PAPER | 284,112 | ||
| Publishing/Printing - 0.7% | |||
| Cenveo Corp. 6% 8/1/19 (b) | 145,000 | 100,050 | |
| Clear Channel International BV 8.75% 12/15/20 (b) | 20,000 | 21,000 | |
| Harland Clarke Holdings Corp. 8.375% 8/15/22 (b) | 45,000 | 47,250 | |
| McGraw-Hill Global Education Holdings LLC/McGraw-Hill Global Education Finance 7.875% 5/15/24 (b) | 250,000 | 251,563 | |
| MHGE Parent LLC/MHGE Parent Finance, Inc. 8.5% 8/1/19 pay-in-kind (b)(c) | 410,000 | 409,488 | |
| TOTAL PUBLISHING/PRINTING | 829,351 | ||
| Railroad - 0.2% | |||
| RZD Capital Ltd. 3.3744% 5/20/21 (Reg. S) | EUR | 200,000 | 250,046 |
| Restaurants - 0.9% | |||
| 1011778 BC Unlimited Liability Co./New Red Finance, Inc.: | |||
| 4.25% 5/15/24 (b) | 160,000 | 161,152 | |
| 4.625% 1/15/22 (b) | 70,000 | 71,631 | |
| 5% 10/15/25 (b) | 140,000 | 142,625 | |
| Arcos Dorados Holdings, Inc. 5.875% 4/4/27 (b) | 200,000 | 212,046 | |
| Golden Nugget, Inc.: | |||
| 6.75% 10/15/24 (b) | 120,000 | 122,100 | |
| 8.75% 10/1/25 (b) | 65,000 | 66,788 | |
| KFC Holding Co./Pizza Hut Holding LLC: | |||
| 4.75% 6/1/27 (b) | 50,000 | 51,313 | |
| 5% 6/1/24 (b) | 195,000 | 205,725 | |
| 5.25% 6/1/26 (b) | 100,000 | 106,265 | |
| TOTAL RESTAURANTS | 1,139,645 | ||
| Services - 3.0% | |||
| APX Group, Inc.: | |||
| 7.625% 9/1/23 | 250,000 | 263,125 | |
| 7.875% 12/1/22 | 515,000 | 555,556 | |
| 8.75% 12/1/20 | 1,000,000 | 1,025,000 | |
| Ashtead Capital, Inc.: | |||
| 4.125% 8/15/25 (b) | 200,000 | 201,500 | |
| 4.375% 8/15/27 (b) | 200,000 | 202,500 | |
| Avantor, Inc. 6% 10/1/24 (b) | 110,000 | 112,200 | |
| Blueline Rental Finance Corp./Blueline Rental LLC 9.25% 3/15/24 (b) | 45,000 | 48,825 | |
| CDK Global, Inc. 4.875% 6/1/27 (b) | 105,000 | 109,463 | |
| Ephios Holdco II PLC 8.25% 7/1/23 (Reg. S) | EUR | 100,000 | 127,910 |
| FTI Consulting, Inc. 6% 11/15/22 | 175,000 | 180,705 | |
| H&E Equipment Services, Inc. 5.625% 9/1/25 (b) | 80,000 | 84,500 | |
| Herc Rentals, Inc.: | |||
| 7.5% 6/1/22 (b) | 36,000 | 38,963 | |
| 7.75% 6/1/24 (b) | 36,000 | 39,510 | |
| IHS Markit Ltd. 4.75% 2/15/25 (b) | 65,000 | 68,738 | |
| IPD BV 4.5% 7/15/22 (Reg. S) | EUR | 100,000 | 122,659 |
| Jurassic Holdings III, Inc. 6.875% 2/15/21 (Reg. S) (b) | 220,000 | 196,900 | |
| Laureate Education, Inc. 8.25% 5/1/25 (b) | 180,000 | 193,725 | |
| Prime Security One MS, Inc. 4.875% 7/15/32 (b) | 176,000 | 166,540 | |
| United Rentals North America, Inc. 5.5% 5/15/27 | 45,000 | 48,150 | |
| TOTAL SERVICES | 3,786,469 | ||
| Steel - 0.8% | |||
| Big River Steel LLC/BRS Finance Corp. 7.25% 9/1/25 (b) | 55,000 | 58,988 | |
| Cliffs Natural Resources, Inc. 5.75% 3/1/25 (b) | 165,000 | 159,844 | |
| EVRAZ Group SA 5.375% 3/20/23 (b) | 200,000 | 206,560 | |
| Metinvest BV 9.3725% 12/31/21 pay-in-kind (c) | 132,008 | 137,288 | |
| Thyssenkrupp AG 3.125% 10/25/19 (Reg. S) | EUR | 180,000 | 220,786 |
| Zhongrong International Resour 7.25% 10/26/20 (Reg. S) | 200,000 | 199,600 | |
| TOTAL STEEL | 983,066 | ||
| Super Retail - 0.3% | |||
| InRetail Shopping Malls 6.5% 7/9/21 (b) | 200,000 | 211,300 | |
| Netflix, Inc.: | |||
| 4.375% 11/15/26 (b) | 110,000 | 107,869 | |
| 4.875% 4/15/28 (b) | 85,000 | 84,486 | |
| TOTAL SUPER RETAIL | 403,655 | ||
| Technology - 3.0% | |||
| Balboa Merger Sub, Inc. 11.375% 12/1/21 (b) | 360,000 | 393,300 | |
| Brocade Communications Systems, Inc. 4.625% 1/15/23 | 140,000 | 143,325 | |
| CDW LLC/CDW Finance Corp. 5% 9/1/25 | 35,000 | 36,706 | |
| Ceridian HCM Holding, Inc. 11% 3/15/21 (b) | 155,000 | 163,719 | |
| Diamond 1 Finance Corp./Diamond 2 Finance Corp.: | |||
| 5.875% 6/15/21 (b) | 65,000 | 68,073 | |
| 7.125% 6/15/24 (b) | 65,000 | 71,744 | |
| Ensemble S Merger Sub, Inc. 9% 9/30/23 (b) | 320,000 | 332,000 | |
| Greeneden U.S. Holdings II LLC 10% 11/30/24 (b) | 150,000 | 169,313 | |
| HT Global IT Solutions Holdings Ltd. 7% 7/14/21 (Reg. S) | 200,000 | 211,985 | |
| Inception Merger Sub, Inc./Rackspace Hosting, Inc. 8.625% 11/15/24 (b) | 80,000 | 84,250 | |
| j2 Cloud Services LLC/j2 Global Communications, Inc. 6% 7/15/25 (b) | 45,000 | 47,363 | |
| Jain International Trading BV 7.125% 2/1/22 (Reg. S) | 200,000 | 201,410 | |
| Micron Technology, Inc.: | |||
| 5.25% 1/15/24 (b) | 60,000 | 63,075 | |
| 5.5% 2/1/25 | 85,000 | 90,313 | |
| NXP BV/NXP Funding LLC 4.625% 6/1/23 (b) | 200,000 | 215,500 | |
| Parametric Technology Corp. 6% 5/15/24 | 20,000 | 21,699 | |
| Sabre GLBL, Inc. 5.25% 11/15/23 (b) | 85,000 | 89,038 | |
| Sensata Technologies BV 4.875% 10/15/23 (b) | 120,000 | 126,000 | |
| Solera LLC/Solera Finance, Inc. 10.5% 3/1/24 (b) | 410,000 | 467,400 | |
| STATS ChipPAC Ltd. 8.5% 11/24/20 (Reg. S) | 200,000 | 215,000 | |
| TTM Technologies, Inc. 5.625% 10/1/25 (b) | 25,000 | 25,500 | |
| Veritas U.S., Inc./Veritas Bermuda Ltd. 10.5% 2/1/24 (b) | 455,000 | 484,575 | |
| Western Digital Corp. 10.5% 4/1/24 | 110,000 | 129,085 | |
| TOTAL TECHNOLOGY | 3,850,373 | ||
| Telecommunications - 7.7% | |||
| Altice Financing SA 5.25% 2/15/23 (Reg. S) | EUR | 100,000 | 122,309 |
| Altice Finco SA: | |||
| 4.75% 1/15/28 | EUR | 150,000 | 176,082 |
| 7.625% 2/15/25 (b) | 400,000 | 428,560 | |
| 8.125% 1/15/24 (b) | 200,000 | 215,524 | |
| Banglalink Digital Communications Ltd.: | |||
| 8.625% 5/6/19 (b) | 200,000 | 208,380 | |
| 8.625% 5/6/19 (Reg. S) | 200,000 | 208,380 | |
| C&W Senior Financing Designated Activity Co. 6.875% 9/15/27 (b) | 200,000 | 209,000 | |
| Cellnex Telecom Sau 2.375% 1/16/24 (Reg. S) | EUR | 200,000 | 242,942 |
| CyrusOne LP/CyrusOne Finance Corp.: | |||
| 5% 3/15/24 (b) | 15,000 | 15,731 | |
| 5.375% 3/15/27 (b) | 15,000 | 16,031 | |
| Digicel Group Ltd. 6% 4/15/21 (Reg. S) | 200,000 | 196,732 | |
| Equinix, Inc. 5.375% 5/15/27 | 50,000 | 53,563 | |
| GCI, Inc. 6.875% 4/15/25 | 85,000 | 92,013 | |
| Globo Comunicacao e Participacoes SA 4.875% 4/11/22 (Reg. S) | 250,000 | 261,250 | |
| GTH Finance BV 7.25% 4/26/23 (b) | 200,000 | 226,468 | |
| GTT Communications, Inc. 7.875% 12/31/24 (b) | 300,000 | 319,875 | |
| Intelsat Jackson Holdings SA: | |||
| 8% 2/15/24 (b) | 260,000 | 275,600 | |
| 9.75% 7/15/25 (b) | 80,000 | 80,500 | |
| Intelsat Luxembourg SA 8.125% 6/1/23 | 100,000 | 60,688 | |
| Millicom International Cellular SA 5.125% 1/15/28 (b) | 200,000 | 201,020 | |
| MTN (Mauritius) Investments Ltd. 6.5% 10/13/26 (b) | 200,000 | 216,000 | |
| MTS International Funding Ltd. 5% 5/30/23 (b) | 350,000 | 363,125 | |
| Neptune Finco Corp.: | |||
| 10.125% 1/15/23 (b) | 350,000 | 400,750 | |
| 10.875% 10/15/25 (b) | 200,000 | 245,000 | |
| Nokia Corp.: | |||
| 3.375% 6/12/22 | 35,000 | 34,869 | |
| 4.375% 6/12/27 | 45,000 | 45,000 | |
| Sable International Finance Ltd. 6.875% 8/1/22 (b) | 445,000 | 477,263 | |
| SFR Group SA 7.375% 5/1/26 (b) | 55,000 | 59,125 | |
| Sprint Capital Corp.: | |||
| 6.9% 5/1/19 | 615,000 | 648,825 | |
| 8.75% 3/15/32 | 240,000 | 291,000 | |
| Sprint Communications, Inc. 6% 11/15/22 | 40,000 | 42,000 | |
| Sprint Corp.: | |||
| 7.125% 6/15/24 | 200,000 | 216,188 | |
| 7.25% 9/15/21 | 10,000 | 10,900 | |
| 7.875% 9/15/23 | 540,000 | 603,450 | |
| T-Mobile U.S.A., Inc. 6.836% 4/28/23 | 285,000 | 300,675 | |
| TBG Global Pte. Ltd. 5.25% 2/10/22 (Reg. S) | 200,000 | 205,605 | |
| Telecom Italia SpA: | |||
| 3.625% 5/25/26 (Reg. S) | EUR | 200,000 | 266,823 |
| 4.875% 9/25/20 (Reg. S) | EUR | 100,000 | 132,366 |
| 5.25% 3/17/55 | EUR | 100,000 | 143,345 |
| Telefonica Celular del Paraguay SA 6.75% 12/13/22 (b) | 200,000 | 205,612 | |
| VimpelCom Holdings BV 4.95% 6/16/24 (b) | 200,000 | 204,652 | |
| Wind Acquisition Finance SA 4% 7/15/20 (Reg. S) | EUR | 350,000 | 411,774 |
| Wind Tre SpA: | |||
| 3.125% 1/20/25 (Reg. S) | EUR | 200,000 | 233,669 |
| 5% 1/20/26 (b) | 200,000 | 201,298 | |
| Zayo Group LLC/Zayo Capital, Inc. 5.75% 1/15/27 (b) | 135,000 | 142,256 | |
| TOTAL TELECOMMUNICATIONS | 9,712,218 | ||
| Textiles/Apparel - 0.4% | |||
| Novalis Sas 3% 4/30/22 (Reg. S) | EUR | 200,000 | 238,969 |
| Prime Bloom Holdings Ltd. 7.5% 12/19/19 (Reg. S) | 200,000 | 202,534 | |
| TOTAL TEXTILES/APPAREL | 441,503 | ||
| Transportation Ex Air/Rail - 0.4% | |||
| eHi Car Service Co. Ltd. 5.875% 8/14/22 | 200,000 | 207,288 | |
| Navios Maritime Acquisition Corp./Navios Acquisition Finance U.S., Inc. 8.125% 11/15/21 (b) | 155,000 | 136,400 | |
| Teekay Corp. 8.5% 1/15/20 | 145,000 | 146,631 | |
| TOTAL TRANSPORTATION EX AIR/RAIL | 490,319 | ||
| Utilities - 4.9% | |||
| ContourGlobal Power Holdings SA 5.125% 6/15/21 (Reg. S) | EUR | 200,000 | 244,868 |
| DPL, Inc. 6.75% 10/1/19 | 1,000,000 | 1,052,500 | |
| Dynegy, Inc.: | |||
| 5.875% 6/1/23 | 70,000 | 72,275 | |
| 7.375% 11/1/22 | 105,000 | 112,744 | |
| 7.625% 11/1/24 | 245,000 | 267,663 | |
| 8% 1/15/25 (b) | 45,000 | 49,163 | |
| 8.125% 1/30/26 (b) | 245,000 | 271,950 | |
| Enel SpA 5% 1/15/75 (c) | EUR | 300,000 | 380,906 |
| Energy Future Intermediate Holding Co. LLC/Energy Future Intermediate Holding Finance, Inc.: | |||
| 11% 10/1/21 (d) | 31,737 | 45,225 | |
| 12.25% 3/1/22 (b)(c)(d) | 650,609 | 993,806 | |
| Greenko Investment Co. 4.875% 8/16/23 (Reg. S) | 200,000 | 199,050 | |
| InterGen NV 7% 6/30/23 (b) | 645,000 | 625,650 | |
| Listrindo Capital BV 4.95% 9/14/26 (b) | 200,000 | 202,500 | |
| NRG Energy, Inc. 6.625% 3/15/23 | 310,000 | 320,850 | |
| NSG Holdings II LLC/NSG Holdings, Inc. 7.75% 12/15/25 (b) | 316,375 | 343,663 | |
| Pattern Energy Group, Inc. 5.875% 2/1/24 (b) | 30,000 | 31,875 | |
| Petrobras Global Finance BV: | |||
| 4.75% 1/14/25 | EUR | 200,000 | 257,435 |
| 7.375% 1/17/27 | 300,000 | 333,150 | |
| PPL Energy Supply LLC 6.5% 6/1/25 | 50,000 | 43,500 | |
| RJS Power Holdings LLC 4.625% 7/15/19 (b)(c) | 73,000 | 73,913 | |
| RWE AG 3.5% 4/21/75 (Reg. S) (c) | EUR | 150,000 | 183,639 |
| The AES Corp. 5.125% 9/1/27 | 55,000 | 56,458 | |
| TOTAL UTILITIES | 6,162,783 | ||
| TOTAL NONCONVERTIBLE BONDS | |||
| (Cost $98,085,885) | 101,790,308 | ||
| Shares | Value | ||
| Common Stocks - 1.3% | |||
| Automotive & Auto Parts - 0.2% | |||
| Chassix Holdings, Inc. (e)(g) | 3,510 | 127,518 | |
| General Motors Co. | 3,168 | 136,161 | |
| TOTAL AUTOMOTIVE & AUTO PARTS | 263,679 | ||
| Chemicals - 0.2% | |||
| LyondellBasell Industries NV Class A | 2,100 | 217,413 | |
| Energy - 0.2% | |||
| Contura Energy, Inc. | 25 | 1,478 | |
| Contura Energy, Inc. warrants 7/26/23 (g) | 41 | 943 | |
| Extraction Oil & Gas, Inc. | 1,041 | 16,604 | |
| LINN Energy, Inc. | 491 | 18,928 | |
| Pacific Exploration and Production Corp. | 3,454 | 103,077 | |
| Southwestern Energy Co. (g) | 1,927 | 10,695 | |
| The Williams Companies, Inc. | 1,900 | 54,150 | |
| TOTAL ENERGY | 205,875 | ||
| Food/Beverage/Tobacco - 0.1% | |||
| U.S. Foods Holding Corp. (g) | 6,800 | 185,504 | |
| Gaming - 0.1% | |||
| Penn National Gaming, Inc. (g) | 4,600 | 120,014 | |
| Healthcare - 0.2% | |||
| HCA Holdings, Inc. (g) | 2,600 | 196,690 | |
| Legend Acquisition, Inc. (e)(g) | 2,128 | 50,540 | |
| TOTAL HEALTHCARE | 247,230 | ||
| Homebuilders/Real Estate - 0.0% | |||
| Keane Group, Inc. | 1,100 | 16,984 | |
| Hotels - 0.1% | |||
| Extended Stay America, Inc. unit | 7,700 | 152,614 | |
| Metals/Mining - 0.0% | |||
| Alpha Natural Resources Holdings, Inc. | 363 | 1,452 | |
| Warrior Metropolitan Coal, Inc. | 1,129 | 29,377 | |
| TOTAL METALS/MINING | 30,829 | ||
| Services - 0.2% | |||
| United Rentals, Inc. (g) | 1,300 | 183,924 | |
| WP Rocket Holdings, Inc. (e)(g)(h) | 356,213 | 3,562 | |
| TOTAL SERVICES | 187,486 | ||
| Steel - 0.0% | |||
| ANR, Inc. | 363 | 7,623 | |
| ANR, Inc. rights 3/31/23 (g) | 216,142 | 1,729 | |
| TOTAL STEEL | 9,352 | ||
| TOTAL COMMON STOCKS | |||
| (Cost $2,245,246) | 1,636,980 | ||
| Convertible Preferred Stocks - 0.3% | |||
| Energy - 0.0% | |||
| Southwestern Energy Co. Series B 6.25% | 5,200 | 66,138 | |
| Healthcare - 0.2% | |||
| Allergan PLC 5.50% | 300 | 192,375 | |
| Teva Pharmaceutical Industries Ltd. 7% | 250 | 71,050 | |
| TOTAL HEALTHCARE | 263,425 | ||
| Utilities - 0.1% | |||
| Dynegy, Inc. 7.00% | 1,600 | 131,040 | |
| TOTAL CONVERTIBLE PREFERRED STOCKS | |||
| (Cost $798,774) | 460,603 | ||
| Principal Amount(a) | Value | ||
| Bank Loan Obligations - 3.9% | |||
| Aerospace - 0.1% | |||
| TransDigm, Inc. Tranche G, term loan 3 month U.S. LIBOR + 3.000% 4.2623% 8/22/24 (c)(f) | 129,675 | 130,262 | |
| Automotive & Auto Parts - 0.0% | |||
| Chassix, Inc. term loan 12% 7/29/19 (e) | 17,397 | 17,353 | |
| Cable/Satellite TV - 0.3% | |||
| Numericable LLC Tranche B 12LN, term loan 3 month U.S. LIBOR + 3.000% 4.3491% 1/1/26 (c)(f) | 190,000 | 190,044 | |
| WideOpenWest Finance LLC Tranche B, term loan 3 month U.S. LIBOR + 3.250% 4.4867% 8/19/23 (c)(f) | 210,000 | 210,263 | |
| TOTAL CABLE/SATELLITE TV | 400,307 | ||
| Chemicals - 0.0% | |||
| Oxea Corp. Tranche B, term loan 3 month U.S. LIBOR + 3.500% 4.875% 10/12/24 (c)(f) | 10,000 | 10,016 | |
| Tronox Blocked Borrower LLC Tranche B, term loan 3 month U.S. LIBOR + 3.000% 4.3231% 9/22/24 (c)(f) | 9,070 | 9,142 | |
| Tronox Finance LLC Tranche B, term loan 3 month U.S. LIBOR + 3.000% 4.3283% 9/22/24 (c)(f) | 20,930 | 21,096 | |
| TOTAL CHEMICALS | 40,254 | ||
| Diversified Financial Services - 0.1% | |||
| Bcp Renaissance Parent LLC Tranche B, term loan 3 month U.S. LIBOR + 4.500% 5.3801% 9/20/24 (c)(f) | 15,000 | 15,164 | |
| Cypress Intermediate Holdings, Inc. Tranche B 1LN, term loan 3 month U.S. LIBOR + 3.000% 4.24% 4/27/24 (c)(f) | 124,688 | 125,155 | |
| TOTAL DIVERSIFIED FINANCIAL SERVICES | 140,319 | ||
| Energy - 0.8% | |||
| Arctic LNG Carriers Ltd. Tranche B 1LN, term loan 3 month U.S. LIBOR + 4.500% 5.7423% 5/18/23 (c)(f) | 224,438 | 226,401 | |
| Bcp Raptor LLC Tranche B, term loan 3 month U.S. LIBOR + 4.250% 5.5222% 6/22/24 (c)(f) | 49,875 | 50,389 | |
| California Resources Corp. Tranche 1LN, term loan 3 month U.S. LIBOR + 10.375% 11.6117% 12/31/21 (c)(f) | 230,000 | 246,291 | |
| Chesapeake Energy Corp. Tranche 1LN, term loan 3 month U.S. LIBOR + 7.500% 8.8144% 8/23/21 (c)(f) | 119,000 | 127,529 | |
| Chief Exploration & Development, LLC. Tranche 2LN, term loan 3 month U.S. LIBOR + 6.500% 7.9586% 5/16/21 (c)(f) | 255,000 | 249,051 | |
| FTS International, Inc. Tranche B, term loan 3 month U.S. LIBOR + 4.750% 5.9923% 4/16/21 (c)(f) | 15,000 | 14,618 | |
| Pacific Drilling SA Tranche B, term loan 3 month U.S. LIBOR + 3.500% 4.875% 6/3/18 (c)(f) | 47,875 | 15,611 | |
| Seadrill Operating LP Tranche B, term loan 3 month U.S. LIBOR + 3.000% 4.3328% 2/21/21 (c)(f) | 99,074 | 75,154 | |
| TOTAL ENERGY | 1,005,044 | ||
| Gaming - 0.0% | |||
| Caesars Growth Properties Holdings LLC Tranche 1LN, term loan 3 month U.S. LIBOR + 3.000% 4.2423% 5/8/21 (c)(f) | 4,975 | 4,976 | |
| Healthcare - 0.1% | |||
| U.S. Renal Care, Inc. Tranche 2LN, term loan 3 month U.S. LIBOR + 8.000% 9.3328% 12/31/23 (c)(f) | 110,000 | 106,700 | |
| Homebuilders/Real Estate - 0.0% | |||
| DTZ U.S. Borrower LLC Tranche 2LN, term loan 3 month U.S. LIBOR + 8.250% 9.6301% 11/4/22 (c)(f) | 4,681 | 4,751 | |
| Insurance - 0.0% | |||
| Alliant Holdings Intermediate LLC Tranche B, term loan 3 month U.S. LIBOR + 3.250% 4.4896% 8/14/22 (c)(f) | 4,975 | 5,008 | |
| USI, Inc. Tranche B, term loan 3 month U.S. LIBOR + 3.000% 4.3142% 5/16/24 (c)(f) | 15,000 | 15,031 | |
| TOTAL INSURANCE | 20,039 | ||
| Leisure - 0.0% | |||
| Intrawest Resorts Holdings, Inc. Tranche B 1LN, term loan 3 month U.S. LIBOR + 3.250% 4.4923% 7/31/24 (c)(f) | 5,000 | 5,050 | |
| Metals/Mining - 0.0% | |||
| Murray Energy Corp. Tranche B 2LN, term loan 3 month U.S. LIBOR + 7.250% 8.5828% 4/16/20 (c)(f) | 39,454 | 35,071 | |
| Paper - 0.0% | |||
| Caraustar Industries, Inc. Tranche B, term loan 3 month U.S. LIBOR + 5.500% 6.8328% 3/14/22 (c)(f) | 9,950 | 10,020 | |
| Publishing/Printing - 0.1% | |||
| Harland Clarke Holdings Corp. Tranche B 6LN, term loan 3 month U.S. LIBOR + 5.500% 6.8328% 2/9/22 (c)(f) | 88,931 | 88,915 | |
| Restaurants - 0.3% | |||
| Burger King Worldwide, Inc. Tranche B, term loan 3 month U.S. LIBOR + 2.250% 3.5276% 2/17/24 (c)(f) | 302,851 | 303,154 | |
| Services - 0.9% | |||
| Brand Energy & Infrastructure Services, Inc. Tranche B, term loan 3 month U.S. LIBOR + 4.250% 5.6149% 6/21/24 (c)(f) | 204,488 | 205,737 | |
| KUEHG Corp.: | |||
| Tranche B 1LN, term loan 3 month U.S. LIBOR + 3.750% 5.0828% 8/13/22 (c)(f) | 765,727 | 769,081 | |
| Tranche B, term loan 3 month U.S. LIBOR + 8.250% 9.5828% 8/22/25 (c)(f) | 95,000 | 94,763 | |
| TOTAL SERVICES | 1,069,581 | ||
| Technology - 0.3% | |||
| Digicert Holdings, Inc. Tranche B, term loan 3 month U.S. LIBOR + 4.750% 6.1301% 9/19/24 (c)(f) | 25,000 | 25,271 | |
| First Data Corp. Tranche B 1LN, term loan 3 month U.S. LIBOR + 2.500% 3.7379% 4/26/24 (c)(f) | 36,917 | 37,062 | |
| Kronos, Inc. term loan 3 month U.S. LIBOR + 8.250% 9.5606% 11/1/24 (c)(f) | 115,000 | 118,252 | |
| Mcafee LLC Tranche B, term loan 3 month U.S. LIBOR + 8.500% 9.8328% 9/29/25 (c)(f) | 75,000 | 76,125 | |
| Renaissance Learning, Inc.: | |||
| Tranche 1LN, term loan 3 month U.S. LIBOR + 3.750% 5.0828% 4/9/21 (c)(f) | 61,700 | 62,060 | |
| Tranche 2LN, term loan 3 month U.S. LIBOR + 7.000% 8.3328% 4/9/22 (c)(f) | 95,000 | 95,950 | |
| TOTAL TECHNOLOGY | 414,720 | ||
| Telecommunications - 0.6% | |||
| Intelsat Jackson Holdings SA Tranche B 2LN, term loan 3 month U.S. LIBOR + 2.750% 4.0711% 6/30/19 (c)(f) | 245,000 | 244,147 | |
| Sable International Finance Ltd. Tranche B, term loan 3 month U.S. LIBOR + 3.500% 4.7423% 1/31/25 (c)(f) | 490,000 | 491,759 | |
| TOTAL TELECOMMUNICATIONS | 735,906 | ||
| Utilities - 0.3% | |||
| Energy Future Holdings Corp. Tranche B, term loan 3 month U.S. LIBOR + 3.000% 4.2422% 6/30/18 (c)(f) | 400,000 | 402,500 | |
| TOTAL BANK LOAN OBLIGATIONS | |||
| (Cost $4,822,529) | 4,934,922 | ||
| Preferred Securities - 7.4% | |||
| Automotive & Auto Parts - 0.2% | |||
| Baoxin Auto Finance I Ltd. 5.625% (c)(i) | 200,000 | 200,156 | |
| Banks & Thrifts - 3.6% | |||
| Alfa Bond Issuance PLC 8% (Reg. S) (c)(i) | 200,000 | 216,879 | |
| Banco Do Brasil SA 9% (b)(c)(i) | 200,000 | 226,189 | |
| Banco Mercantil del Norte SA 7.625% (b)(c)(i) | 400,000 | 436,655 | |
| Bank of East Asia Ltd. 5.5% (Reg. S) (c)(i) | 200,000 | 211,135 | |
| Barclays Bank PLC 7.625% 11/21/22 | 420,000 | 496,747 | |
| China CITIC Bank International Ltd. 4.25% (Reg. S) (c)(i) | 200,000 | 197,969 | |
| Chong Hing Bank Ltd. 6.5% (c)(i) | 200,000 | 209,495 | |
| Citigroup, Inc. 5.35% (c)(i) | 550,000 | 589,031 | |
| Credit Agricole SA: | |||
| 6.5%(Reg. S) (c)(i) | EUR | 200,000 | 270,771 |
| 6.625% (b)(c)(i) | 315,000 | 333,380 | |
| 7.875% (b)(c)(i) | 200,000 | 229,438 | |
| 8.125% (b)(c)(i) | 200,000 | 242,476 | |
| Intesa Sanpaolo SpA 8.047% (c)(i) | EUR | 350,000 | 438,598 |
| Royal Bank of Scotland Group PLC 8.625% (c)(i) | 200,000 | 227,996 | |
| Standard Chartered PLC 7.5% (b)(c)(i) | 200,000 | 220,626 | |
| TOTAL BANKS & THRIFTS | 4,547,385 | ||
| Building Materials - 0.2% | |||
| Wisdom Glory Group Ltd. 5.25% (Reg. S) (c)(i) | 200,000 | 204,384 | |
| Cable/Satellite TV - 0.1% | |||
| SES SA 4.625%/VAR (Reg. S) unit (i) | 100,000 | 130,567 | |
| Chemicals - 0.1% | |||
| Solvay SA 5.869% (c)(i) | EUR | 100,000 | 143,484 |
| Consumer Products - 0.5% | |||
| Cosan Overseas Ltd. 8.25% (i) | 600,000 | 624,737 | |
| Containers - 0.1% | |||
| Colombia Telecomunicacines Sa 8.5% (b)(c)(i) | 100,000 | 107,501 | |
| Diversified Financial Services - 0.5% | |||
| China Cinda Asset Management Co. Ltd. 4.45% (Reg. S) (c)(i) | 200,000 | 199,522 | |
| Hutchison Whampoa Europe Finance, Ltd. 3.75% (Reg. S) (c)(i) | EUR | 150,000 | 180,731 |
| Magnesita Finance Ltd. 8.625% (b)(i) | 30,000 | 30,085 | |
| Nanyang Commercial Bank Ltd. 5% (Reg. S) (c)(i) | 200,000 | 205,748 | |
| TOTAL DIVERSIFIED FINANCIAL SERVICES | 616,086 | ||
| Energy - 0.3% | |||
| Gas Natural Fenosa Finance BV 4.125% (Reg. S) (c)(i) | EUR | 300,000 | 393,738 |
| Healthcare - 0.1% | |||
| Fullerton Healthcare Corp. Ltd. 7% (Reg. S) (c)(i) | 200,000 | 199,250 | |
| Homebuilders/Real Estate - 1.0% | |||
| CIFI Holdings Group Co. Ltd. 5.375% (Reg. S) (c)(i) | 200,000 | 201,440 | |
| Grand City Properties SA 3.75% (c)(i) | EUR | 200,000 | 257,973 |
| Moon Wise Global Ltd. 9% (Reg. S) (c)(i) | 200,000 | 216,090 | |
| RKI Overseas Finance 2017 (A) 7% (Reg. S) (i) | 200,000 | 201,853 | |
| Sino-Ocean Land Treasure Finan 4.9% (Reg. S) (c)(i) | 200,000 | 201,497 | |
| Yuzhou Properties Co. 5.375% (Reg. S) (c)(i) | 200,000 | 199,274 | |
| TOTAL HOMEBUILDERS/REAL ESTATE | 1,278,127 | ||
| Telecommunications - 0.7% | |||
| Koninklijke KPN NV 6.125% (Reg. S) (c)(i) | EUR | 200,000 | 245,913 |
| Telefonica Europe BV: | |||
| 5% (Reg. S) (c)(i) | EUR | 300,000 | 390,324 |
| 6.5% (Reg. S) (c)(i) | EUR | 200,000 | 246,677 |
| TOTAL TELECOMMUNICATIONS | 882,914 | ||
| TOTAL PREFERRED SECURITIES | |||
| (Cost $8,878,344) | 9,328,329 | ||
| Shares | Value | ||
| Money Market Funds - 5.7% | |||
| Fidelity Cash Central Fund, 1.10% (j) | |||
| (Cost $7,239,557) | 7,238,612 | 7,240,060 | |
| TOTAL INVESTMENT IN SECURITIES - 99.0% | |||
| (Cost $122,070,335) | 125,391,202 | ||
| NET OTHER ASSETS (LIABILITIES) - 1.0% | 1,256,420 | ||
| NET ASSETS - 100% | $126,647,622 |
Currency Abbreviations
EUR – European Monetary Unit
Legend
(a) Amount is stated in United States dollars unless otherwise noted.
(b) Security exempt from registration under Rule 144A of the Securities Act of 1933. These securities may be resold in transactions exempt from registration, normally to qualified institutional buyers. At the end of the period, the value of these securities amounted to $54,450,226 or 43.0% of net assets.
(c) Coupon rates for floating and adjustable rate securities reflect the rates in effect at period end.
(d) Non-income producing - Security is in default.
(e) Level 3 security
(f) Coupon is indexed to a floating interest rate which may be multiplied by a specified factor and/or subject to caps or floors.
(g) Non-income producing
(h) Restricted securities - Investment in securities not registered under the Securities Act of 1933 (excluding 144A issues). At the end of the period, the value of restricted securities (excluding 144A issues) amounted to $3,562 or 0.0% of net assets.
(i) Security is perpetual in nature with no stated maturity date.
(j) Affiliated fund that is generally available only to investment companies and other accounts managed by Fidelity Investments. The rate quoted is the annualized seven-day yield of the fund at period end. A complete unaudited listing of the fund's holdings as of its most recent quarter end is available upon request. In addition, each Fidelity Central Fund's financial statements are available on the SEC's website or upon request.
Additional information on each restricted holding is as follows:
| Security | Acquisition Date | Acquisition Cost |
| WP Rocket Holdings, Inc. | 6/24/11 - 2/2/15 | $184,731 |
Affiliated Central Funds
Information regarding fiscal year to date income earned by the Fund from investments in Fidelity Central Funds is as follows:
| Fund | Income earned |
| Fidelity Cash Central Fund | $41,517 |
| Fidelity Securities Lending Cash Central Fund | 35 |
| Total | $41,552 |
Investment Valuation
The following is a summary of the inputs used, as of October 31, 2017, involving the Fund's assets and liabilities carried at fair value. The inputs or methodology used for valuing securities may not be an indication of the risk associated with investing in those securities. For more information on valuation inputs, and their aggregation into the levels used below, please refer to the Investment Valuation section in the accompanying Notes to Financial Statements.
| Valuation Inputs at Reporting Date: | ||||
| Description | Total | Level 1 | Level 2 | Level 3 |
| Investments in Securities: | ||||
| Equities: | ||||
| Consumer Discretionary | $721,811 | $594,293 | $-- | $127,518 |
| Energy | 312,194 | 246,056 | 66,138 | -- |
| Health Care | 510,655 | 196,690 | 263,425 | 50,540 |
| Industrials | 204,470 | 200,908 | -- | 3,562 |
| Materials | 217,413 | 217,413 | -- | -- |
| Utilities | 131,040 | -- | 131,040 | -- |
| Corporate Bonds | 101,790,308 | -- | 101,790,257 | 51 |
| Bank Loan Obligations | 4,934,922 | -- | 4,917,569 | 17,353 |
| Preferred Securities | 9,328,329 | -- | 9,328,329 | -- |
| Money Market Funds | 7,240,060 | 7,240,060 | -- | -- |
| Total Investments in Securities: | $125,391,202 | $8,695,420 | $116,496,758 | $199,024 |
Other Information
Distribution of investments by country or territory of incorporation, as a percentage of Total Net Assets, is as follows (Unaudited):
| United States of America | 47.4% |
| Luxembourg | 8.7% |
| Netherlands | 6.1% |
| Cayman Islands | 5.7% |
| Canada | 3.6% |
| United Kingdom | 3.2% |
| British Virgin Islands | 2.5% |
| Ireland | 2.4% |
| Argentina | 2.2% |
| Italy | 1.9% |
| Mexico | 1.7% |
| France | 1.5% |
| Germany | 1.1% |
| Multi-National | 1.1% |
| Singapore | 1.0% |
| Others (Individually Less Than 1%) | 9.9% |
| 100.0% |
See accompanying notes which are an integral part of the financial statements.
Financial Statements
Statement of Assets and Liabilities
| October 31, 2017 (Unaudited) | ||
| Assets | ||
| Investment in securities, at value — See accompanying schedule: Unaffiliated issuers (cost $114,830,778) | $118,151,142 | |
| Fidelity Central Funds (cost $7,239,557) | 7,240,060 | |
| Total Investment in Securities (cost $122,070,335) | $125,391,202 | |
| Cash | 731,674 | |
| Foreign currency held at value (cost $136,587) | 136,272 | |
| Receivable for investments sold | 240,774 | |
| Receivable for fund shares sold | 321,040 | |
| Dividends receivable | 14,758 | |
| Interest receivable | 1,851,771 | |
| Distributions receivable from Fidelity Central Funds | 7,194 | |
| Prepaid expenses | 246 | |
| Receivable from investment adviser for expense reductions | 3,010 | |
| Total assets | 128,697,941 | |
| Liabilities | ||
| Payable for investments purchased | $1,727,007 | |
| Payable for fund shares redeemed | 115,866 | |
| Distributions payable | 64,912 | |
| Accrued management fee | 73,711 | |
| Distribution and service plan fees payable | 5,743 | |
| Other affiliated payables | 19,289 | |
| Other payables and accrued expenses | 43,791 | |
| Total liabilities | 2,050,319 | |
| Net Assets | $126,647,622 | |
| Net Assets consist of: | ||
| Paid in capital | $126,487,820 | |
| Undistributed net investment income | 325,468 | |
| Accumulated undistributed net realized gain (loss) on investments and foreign currency transactions | (3,488,179) | |
| Net unrealized appreciation (depreciation) on investments and assets and liabilities in foreign currencies | 3,322,513 | |
| Net Assets | $126,647,622 | |
| Calculation of Maximum Offering Price | ||
| Class A: | ||
| Net Asset Value and redemption price per share ($7,552,373 ÷ 770,591 shares) | $9.80 | |
| Maximum offering price per share (100/96.00 of $9.80) | $10.21 | |
| Class M: | ||
| Net Asset Value and redemption price per share ($3,907,003 ÷ 398,684 shares) | $9.80 | |
| Maximum offering price per share (100/96.00 of $9.80) | $10.21 | |
| Class C: | ||
| Net Asset Value and offering price per share ($4,212,856 ÷ 429,836 shares)(a) | $9.80 | |
| Global High Income: | ||
| Net Asset Value, offering price and redemption price per share ($107,722,592 ÷ 10,990,516 shares) | $9.80 | |
| Class I: | ||
| Net Asset Value, offering price and redemption price per share ($3,252,798 ÷ 331,874 shares) | $9.80 |
(a) Redemption price per share is equal to net asset value less any applicable contingent deferred sales charge.
See accompanying notes which are an integral part of the financial statements.
Statement of Operations
| Six months ended October 31, 2017 (Unaudited) | ||
| Investment Income | ||
| Dividends | $259,995 | |
| Interest | 2,940,557 | |
| Income from Fidelity Central Funds | 41,552 | |
| Total income | 3,242,104 | |
| Expenses | ||
| Management fee | $396,639 | |
| Transfer agent fees | 84,826 | |
| Distribution and service plan fees | 32,465 | |
| Accounting and security lending fees | 23,258 | |
| Custodian fees and expenses | 8,393 | |
| Independent trustees' fees and expenses | 208 | |
| Registration fees | 33,018 | |
| Audit | 39,817 | |
| Legal | 6,424 | |
| Miscellaneous | 487 | |
| Total expenses before reductions | 625,535 | |
| Expense reductions | (27,173) | 598,362 |
| Net investment income (loss) | 2,643,742 | |
| Realized and Unrealized Gain (Loss) | ||
| Net realized gain (loss) on: | ||
| Investment securities: | ||
| Unaffiliated issuers | (1,149,140) | |
| Foreign currency transactions | 4,000 | |
| Total net realized gain (loss) | (1,145,140) | |
| Change in net unrealized appreciation (depreciation) on: | ||
| Investment securities: | ||
| Unaffiliated issuers | 3,841,370 | |
| Assets and liabilities in foreign currencies | (1,297) | |
| Total change in net unrealized appreciation (depreciation) | 3,840,073 | |
| Net gain (loss) | 2,694,933 | |
| Net increase (decrease) in net assets resulting from operations | $5,338,675 |
See accompanying notes which are an integral part of the financial statements.
Statement of Changes in Net Assets
| Six months ended October 31, 2017 (Unaudited) | Year ended April 30, 2017 | |
| Increase (Decrease) in Net Assets | ||
| Operations | ||
| Net investment income (loss) | $2,643,742 | $5,224,215 |
| Net realized gain (loss) | (1,145,140) | (46,333) |
| Change in net unrealized appreciation (depreciation) | 3,840,073 | 4,535,843 |
| Net increase (decrease) in net assets resulting from operations | 5,338,675 | 9,713,725 |
| Distributions to shareholders from net investment income | (2,422,495) | (4,739,795) |
| Share transactions - net increase (decrease) | 21,812,996 | (9,314,472) |
| Redemption fees | 6,781 | 30,815 |
| Total increase (decrease) in net assets | 24,735,957 | (4,309,727) |
| Net Assets | ||
| Beginning of period | 101,911,665 | 106,221,392 |
| End of period | $126,647,622 | $101,911,665 |
| Other Information | ||
| Undistributed net investment income end of period | $325,468 | $104,221 |
See accompanying notes which are an integral part of the financial statements.
Financial Highlights
Fidelity Global High Income Fund Class A
| Six months ended (Unaudited) October 31, | Years ended April 30, | |||||
| 2017 | 2017 | 2016 | 2015 | 2014 | 2013 | |
| Selected Per–Share Data | ||||||
| Net asset value, beginning of period | $9.54 | $9.07 | $9.60 | $10.21 | $10.46 | $9.74 |
| Income from Investment Operations | ||||||
| Net investment income (loss)A | .220 | .463 | .462 | .476 | .506 | .526 |
| Net realized and unrealized gain (loss) | .240 | .422 | (.541) | (.293)B | (.036) | .714 |
| Total from investment operations | .460 | .885 | (.079) | .183 | .470 | 1.240 |
| Distributions from net investment income | (.201) | (.418) | (.454) | (.486) | (.483) | (.477) |
| Distributions from net realized gain | – | – | – | (.310) | (.239) | (.046) |
| Total distributions | (.201) | (.418) | (.454) | (.796) | (.722) | (.523) |
| Redemption fees added to paid in capitalA | .001 | .003 | .003 | .003 | .002 | .003 |
| Net asset value, end of period | $9.80 | $9.54 | $9.07 | $9.60 | $10.21 | $10.46 |
| Total ReturnC,D,E | 4.86% | 10.00% | (.65)% | 1.97%B | 4.86% | 13.13% |
| Ratios to Average Net AssetsF,G | ||||||
| Expenses before reductions | 1.33%H | 1.36% | 1.38% | 1.28% | 1.23% | 1.24% |
| Expenses net of fee waivers, if any | 1.25%H | 1.25% | 1.25% | 1.25% | 1.23% | 1.24% |
| Expenses net of all reductions | 1.25%H | 1.25% | 1.25% | 1.25% | 1.23% | 1.24% |
| Net investment income (loss) | 4.49%H | 4.98% | 5.11% | 4.82% | 5.03% | 5.25% |
| Supplemental Data | ||||||
| Net assets, end of period (000 omitted) | $7,552 | $7,102 | $6,187 | $7,036 | $8,000 | $6,419 |
| Portfolio turnover rateI | 48%H | 48% | 41% | 44% | 72% | 55% |
A Calculated based on average shares outstanding during the period.
B Amount includes a reimbursement from the investment adviser for an operational error which amounted to less than $.01 per share. Excluding this reimbursement, the total return would have been 1.93%.
C Total returns for periods of less than one year are not annualized.
D Total returns would have been lower if certain expenses had not been reduced during the applicable periods shown.
E Total returns do not include the effect of the sales charges.
F Fees and expenses of any underlying Fidelity Central Funds are not included in the Fund's expense ratio. The Fund indirectly bears its proportionate share of the expenses of any underlying Fidelity Central Funds.
G Expense ratios reflect operating expenses of the class. Expenses before reductions do not reflect amounts reimbursed by the investment adviser or reductions from brokerage service arrangements or reductions from other expense offset arrangements and do not represent the amount paid by the class during periods when reimbursements or reductions occur. Expenses net of fee waivers reflect expenses after reimbursement by the investment adviser but prior to reductions from brokerage service arrangements or other expense offset arrangements. Expenses net of all reductions represent the net expenses paid by the class.
H Annualized
I Amount does not include the portfolio activity of any underlying Fidelity Central Funds.
See accompanying notes which are an integral part of the financial statements.
Fidelity Global High Income Fund Class M
| Six months ended (Unaudited) October 31, | Years ended April 30, | |||||
| 2017 | 2017 | 2016 | 2015 | 2014 | 2013 | |
| Selected Per–Share Data | ||||||
| Net asset value, beginning of period | $9.54 | $9.07 | $9.60 | $10.21 | $10.46 | $9.74 |
| Income from Investment Operations | ||||||
| Net investment income (loss)A | .219 | .464 | .462 | .474 | .504 | .523 |
| Net realized and unrealized gain (loss) | .241 | .421 | (.541) | (.291)B | (.036) | .712 |
| Total from investment operations | .460 | .885 | (.079) | .183 | .468 | 1.235 |
| Distributions from net investment income | (.201) | (.418) | (.454) | (.486) | (.481) | (.472) |
| Distributions from net realized gain | – | – | – | (.310) | (.239) | (.046) |
| Total distributions | (.201) | (.418) | (.454) | (.796) | (.720) | (.518) |
| Redemption fees added to paid in capitalA | .001 | .003 | .003 | .003 | .002 | .003 |
| Net asset value, end of period | $9.80 | $9.54 | $9.07 | $9.60 | $10.21 | $10.46 |
| Total ReturnC,D,E | 4.87% | 10.00% | (.65)% | 1.98%B | 4.84% | 13.08% |
| Ratios to Average Net AssetsF,G | ||||||
| Expenses before reductions | 1.42%H | 1.50% | 1.48% | 1.40% | 1.35% | 1.25% |
| Expenses net of fee waivers, if any | 1.25%H | 1.25% | 1.25% | 1.25% | 1.25% | 1.25% |
| Expenses net of all reductions | 1.25%H | 1.25% | 1.25% | 1.25% | 1.25% | 1.25% |
| Net investment income (loss) | 4.49%H | 4.98% | 5.11% | 4.82% | 5.01% | 5.24% |
| Supplemental Data | ||||||
| Net assets, end of period (000 omitted) | $3,907 | $3,029 | $1,436 | $1,745 | $1,595 | $1,349 |
| Portfolio turnover rateI | 48%H | 48% | 41% | 44% | 72% | 55% |
A Calculated based on average shares outstanding during the period.
B Amount includes a reimbursement from the investment adviser for an operational error which amounted to less than $.01 per share. Excluding this reimbursement, the total return would have been 1.94%.
C Total returns for periods of less than one year are not annualized.
D Total returns would have been lower if certain expenses had not been reduced during the applicable periods shown.
E Total returns do not include the effect of the sales charges.
F Fees and expenses of any underlying Fidelity Central Funds are not included in the Fund's expense ratio. The Fund indirectly bears its proportionate share of the expenses of any underlying Fidelity Central Funds.
G Expense ratios reflect operating expenses of the class. Expenses before reductions do not reflect amounts reimbursed by the investment adviser or reductions from brokerage service arrangements or reductions from other expense offset arrangements and do not represent the amount paid by the class during periods when reimbursements or reductions occur. Expenses net of fee waivers reflect expenses after reimbursement by the investment adviser but prior to reductions from brokerage service arrangements or other expense offset arrangements. Expenses net of all reductions represent the net expenses paid by the class.
H Annualized
I Amount does not include the portfolio activity of any underlying Fidelity Central Funds.
See accompanying notes which are an integral part of the financial statements.
Fidelity Global High Income Fund Class C
| Six months ended (Unaudited) October 31, | Years ended April 30, | |||||
| 2017 | 2017 | 2016 | 2015 | 2014 | 2013 | |
| Selected Per–Share Data | ||||||
| Net asset value, beginning of period | $9.54 | $9.07 | $9.60 | $10.21 | $10.46 | $9.74 |
| Income from Investment Operations | ||||||
| Net investment income (loss)A | .183 | .394 | .394 | .401 | .428 | .448 |
| Net realized and unrealized gain (loss) | .240 | .422 | (.540) | (.292)B | (.035) | .712 |
| Total from investment operations | .423 | .816 | (.146) | .109 | .393 | 1.160 |
| Distributions from net investment income | (.164) | (.349) | (.387) | (.412) | (.406) | (.397) |
| Distributions from net realized gain | – | – | – | (.310) | (.239) | (.046) |
| Total distributions | (.164) | (.349) | (.387) | (.722) | (.645) | (.443) |
| Redemption fees added to paid in capitalA | .001 | .003 | .003 | .003 | .002 | .003 |
| Net asset value, end of period | $9.80 | $9.54 | $9.07 | $9.60 | $10.21 | $10.46 |
| Total ReturnC,D,E | 4.47% | 9.19% | (1.39)% | 1.22%B | 4.05% | 12.23% |
| Ratios to Average Net AssetsF,G | ||||||
| Expenses before reductions | 2.10%H | 2.18% | 2.20% | 2.12% | 2.05% | 2.01% |
| Expenses net of fee waivers, if any | 2.00%H | 2.00% | 2.00% | 2.00% | 2.00% | 2.00% |
| Expenses net of all reductions | 2.00%H | 2.00% | 2.00% | 2.00% | 2.00% | 2.00% |
| Net investment income (loss) | 3.74%H | 4.23% | 4.36% | 4.07% | 4.26% | 4.49% |
| Supplemental Data | ||||||
| Net assets, end of period (000 omitted) | $4,213 | $3,775 | $3,437 | $3,811 | $3,720 | $2,941 |
| Portfolio turnover rateI | 48%H | 48% | 41% | 44% | 72% | 55% |
A Calculated based on average shares outstanding during the period.
B Amount includes a reimbursement from the investment adviser for an operational error which amounted to less than $.01 per share. Excluding this reimbursement, the total return would have been 1.18%.
C Total returns for periods of less than one year are not annualized.
D Total returns would have been lower if certain expenses had not been reduced during the applicable periods shown.
E Total returns do not include the effect of the contingent deferred sales charge.
F Fees and expenses of any underlying Fidelity Central Funds are not included in the Fund's expense ratio. The Fund indirectly bears its proportionate share of the expenses of any underlying Fidelity Central Funds.
G Expense ratios reflect operating expenses of the class. Expenses before reductions do not reflect amounts reimbursed by the investment adviser or reductions from brokerage service arrangements or reductions from other expense offset arrangements and do not represent the amount paid by the class during periods when reimbursements or reductions occur. Expenses net of fee waivers reflect expenses after reimbursement by the investment adviser but prior to reductions from brokerage service arrangements or other expense offset arrangements. Expenses net of all reductions represent the net expenses paid by the class.
H Annualized
I Amount does not include the portfolio activity of any underlying Fidelity Central Funds.
See accompanying notes which are an integral part of the financial statements.
Fidelity Global High Income Fund
| Six months ended (Unaudited) October 31, | Years ended April 30, | |||||
| 2017 | 2017 | 2016 | 2015 | 2014 | 2013 | |
| Selected Per–Share Data | ||||||
| Net asset value, beginning of period | $9.54 | $9.07 | $9.60 | $10.21 | $10.47 | $9.74 |
| Income from Investment Operations | ||||||
| Net investment income (loss)A | .232 | .486 | .486 | .508 | .534 | .555 |
| Net realized and unrealized gain (loss) | .240 | .423 | (.542) | (.301)B | (.046) | .724 |
| Total from investment operations | .472 | .909 | (.056) | .207 | .488 | 1.279 |
| Distributions from net investment income | (.213) | (.442) | (.477) | (.510) | (.511) | (.506) |
| Distributions from net realized gain | – | – | – | (.310) | (.239) | (.046) |
| Total distributions | (.213) | (.442) | (.477) | (.820) | (.750) | (.552) |
| Redemption fees added to paid in capitalA | .001 | .003 | .003 | .003 | .002 | .003 |
| Net asset value, end of period | $9.80 | $9.54 | $9.07 | $9.60 | $10.21 | $10.47 |
| Total ReturnC,D | 4.99% | 10.28% | (.40)% | 2.23%B | 5.05% | 13.56% |
| Ratios to Average Net AssetsE,F | ||||||
| Expenses before reductions | 1.04%G | 1.14% | 1.20% | 1.05% | .95% | .96% |
| Expenses net of fee waivers, if any | 1.00%G | 1.00% | 1.00% | 1.00% | .95% | .96% |
| Expenses net of all reductions | 1.00%G | 1.00% | 1.00% | 1.00% | .95% | .96% |
| Net investment income (loss) | 4.74%G | 5.23% | 5.35% | 5.07% | 5.30% | 5.53% |
| Supplemental Data | ||||||
| Net assets, end of period (000 omitted) | $107,723 | $85,188 | $93,256 | $119,712 | $344,206 | $345,210 |
| Portfolio turnover rateH | 48%G | 48% | 41% | 44% | 72% | 55% |
A Calculated based on average shares outstanding during the period.
B Amount includes a reimbursement from the investment adviser for an operational error which amounted to less than $.01 per share. Excluding this reimbursement, the total return would have been 2.19%.
C Total returns for periods of less than one year are not annualized.
D Total returns would have been lower if certain expenses had not been reduced during the applicable periods shown.
E Fees and expenses of any underlying Fidelity Central Funds are not included in the Fund's expense ratio. The Fund indirectly bears its proportionate share of the expenses of any underlying Fidelity Central Funds.
F Expense ratios reflect operating expenses of the class. Expenses before reductions do not reflect amounts reimbursed by the investment adviser or reductions from brokerage service arrangements or reductions from other expense offset arrangements and do not represent the amount paid by the class during periods when reimbursements or reductions occur. Expenses net of fee waivers reflect expenses after reimbursement by the investment adviser but prior to reductions from brokerage service arrangements or other expense offset arrangements. Expenses net of all reductions represent the net expenses paid by the class.
G Annualized
H Amount does not include the portfolio activity of any underlying Fidelity Central Funds.
See accompanying notes which are an integral part of the financial statements.
Fidelity Global High Income Fund Class I
| Six months ended (Unaudited) October 31, | Years ended April 30, | |||||
| 2017 | 2017 | 2016 | 2015 | 2014 | 2013 | |
| Selected Per–Share Data | ||||||
| Net asset value, beginning of period | $9.54 | $9.07 | $9.60 | $10.21 | $10.47 | $9.74 |
| Income from Investment Operations | ||||||
| Net investment income (loss)A | .232 | .486 | .483 | .501 | .532 | .549 |
| Net realized and unrealized gain (loss) | .240 | .423 | (.539) | (.293)B | (.046) | .728 |
| Total from investment operations | .472 | .909 | (.056) | .208 | .486 | 1.277 |
| Distributions from net investment income | (.213) | (.442) | (.477) | (.511) | (.509) | (.504) |
| Distributions from net realized gain | – | – | – | (.310) | (.239) | (.046) |
| Total distributions | (.213) | (.442) | (.477) | (.821) | (.748) | (.550) |
| Redemption fees added to paid in capitalA | .001 | .003 | .003 | .003 | .002 | .003 |
| Net asset value, end of period | $9.80 | $9.54 | $9.07 | $9.60 | $10.21 | $10.47 |
| Total ReturnC,D | 5.00% | 10.28% | (.40)% | 2.23%B | 5.03% | 13.54% |
| Ratios to Average Net AssetsE,F | ||||||
| Expenses before reductions | 1.06%G | 1.16% | 1.10% | 1.02% | .97% | .98% |
| Expenses net of fee waivers, if any | 1.00%G | 1.00% | 1.00% | 1.00% | .97% | .98% |
| Expenses net of all reductions | 1.00%G | 1.00% | 1.00% | 1.00% | .97% | .98% |
| Net investment income (loss) | 4.75%G | 5.23% | 5.35% | 5.07% | 5.28% | 5.51% |
| Supplemental Data | ||||||
| Net assets, end of period (000 omitted) | $3,253 | $2,817 | $1,905 | $2,481 | $5,344 | $6,049 |
| Portfolio turnover rateH | 48%G | 48% | 41% | 44% | 72% | 55% |
A Calculated based on average shares outstanding during the period.
B Amount includes a reimbursement from the investment adviser for an operational error which amounted to less than $.01 per share. Excluding this reimbursement, the total return would have been 2.19%.
C Total returns for periods of less than one year are not annualized.
D Total returns would have been lower if certain expenses had not been reduced during the applicable periods shown.
E Fees and expenses of any underlying Fidelity Central Funds are not included in the Fund's expense ratio. The Fund indirectly bears its proportionate share of the expenses of any underlying Fidelity Central Funds.
F Expense ratios reflect operating expenses of the class. Expenses before reductions do not reflect amounts reimbursed by the investment adviser or reductions from brokerage service arrangements or reductions from other expense offset arrangements and do not represent the amount paid by the class during periods when reimbursements or reductions occur. Expenses net of fee waivers reflect expenses after reimbursement by the investment adviser but prior to reductions from brokerage service arrangements or other expense offset arrangements. Expenses net of all reductions represent the net expenses paid by the class.
G Annualized
H Amount does not include the portfolio activity of any underlying Fidelity Central Funds.
See accompanying notes which are an integral part of the financial statements.
Notes to Financial Statements (Unaudited)
For the period ended October 31, 2017
1. Organization.
Fidelity Global High Income Fund (the Fund) is a fund of Fidelity Summer Street Trust (the Trust) and is authorized to issue an unlimited number of shares. The Trust is registered under the Investment Company Act of 1940, as amended (the 1940 Act), as an open-end management investment company organized as a Massachusetts business trust. The Fund offers Class A, Class M, Class C, Global High Income and Class I shares, each of which has equal rights as to assets and voting privileges. Each class has exclusive voting rights with respect to matters that affect that class. The Fund's investments in emerging markets can be subject to social, economic, regulatory, and political uncertainties and can be extremely volatile.
2. Investments in Fidelity Central Funds.
The Fund invests in Fidelity Central Funds, which are open-end investment companies generally available only to other investment companies and accounts managed by the investment adviser and its affiliates. The Fund's Schedule of Investments lists each of the Fidelity Central Funds held as of period end, if any, as an investment of the Fund, but does not include the underlying holdings of each Fidelity Central Fund. As an Investing Fund, the Fund indirectly bears its proportionate share of the expenses of the underlying Fidelity Central Funds.
The Money Market Central Funds seek preservation of capital and current income and are managed by Fidelity Investments Money Management, Inc. (FIMM), an affiliate of the investment adviser. Annualized expenses of the Money Market Central Funds as of their most recent shareholder report date are less than .005%.
A complete unaudited list of holdings for each Fidelity Central Fund is available upon request or at the Securities and Exchange Commission (the SEC) website at www.sec.gov. In addition, the financial statements of the Fidelity Central Funds are available on the SEC website or upon request.
3. Significant Accounting Policies.
The Fund is an investment company and applies the accounting and reporting guidance of the Financial Accounting Standards Board (FASB) Accounting Standards Codification Topic 946 Financial Services – Investments Companies. The financial statements have been prepared in conformity with accounting principles generally accepted in the United States of America (GAAP), which require management to make certain estimates and assumptions at the date of the financial statements. Actual results could differ from those estimates. Subsequent events, if any, through the date that the financial statements were issued have been evaluated in the preparation of the financial statements. The following summarizes the significant accounting policies of the Fund:
Investment Valuation. Investments are valued as of 4:00 p.m. Eastern time on the last calendar day of the period. The Board of Trustees (the Board) has delegated the day to day responsibility for the valuation of the Fund's investments to the Fair Value Committee (the Committee) established by the Fund's investment adviser. In accordance with valuation policies and procedures approved by the Board, the Fund attempts to obtain prices from one or more third party pricing vendors or brokers to value its investments. When current market prices, quotations or currency exchange rates are not readily available or reliable, investments will be fair valued in good faith by the Committee, in accordance with procedures adopted by the Board. Factors used in determining fair value vary by investment type and may include market or investment specific events, changes in interest rates and credit quality. The frequency with which these procedures are used cannot be predicted and they may be utilized to a significant extent. The Committee oversees the Fund's valuation policies and procedures and reports to the Board on the Committee's activities and fair value determinations. The Board monitors the appropriateness of the procedures used in valuing the Fund's investments and ratifies the fair value determinations of the Committee.
The Fund categorizes the inputs to valuation techniques used to value its investments into a disclosure hierarchy consisting of three levels as shown below:
- Level 1 – quoted prices in active markets for identical investments
- Level 2 – other significant observable inputs (including quoted prices for similar investments, interest rates, prepayment speeds, etc.)
- Level 3 – unobservable inputs (including the Fund's own assumptions based on the best information available)
Valuation techniques used to value the Fund's investments by major category are as follows:
Debt securities, including restricted securities, are valued based on evaluated prices received from third party pricing vendors or from brokers who make markets in such securities. Corporate bonds, bank loan obligations, and preferred securities are valued by pricing vendors who utilize matrix pricing which considers yield or price of bonds of comparable quality, coupon, maturity and type or by broker-supplied prices. When independent prices are unavailable or unreliable, debt securities may be valued utilizing pricing methodologies which consider similar factors that would be used by third party pricing vendors. For foreign debt securities, when significant market or security specific events arise, valuations may be determined in good faith in accordance with procedures adopted by the Board. Debt securities are generally categorized as Level 2 in the hierarchy but may be Level 3 depending on the circumstances. The Fund invests a significant portion of its assets in below investment grade securities. The value of these securities can be more volatile due to changes in the credit quality of the issuer and is sensitive to changes in economic, market and regulatory conditions.
Equity securities, including restricted securities, for which market quotations are readily available, are valued at the last reported sale price or official closing price as reported by a third party pricing vendor on the primary market or exchange on which they are traded and are categorized as Level 1 in the hierarchy. In the event there were no sales during the day or closing prices are not available, securities are valued at the last quoted bid price or may be valued using the last available price and are generally categorized as Level 2 in the hierarchy. For foreign equity securities, when market or security specific events arise, comparisons to the valuation of American Depositary Receipts (ADRs), futures contracts, Exchange-Traded Funds (ETFs) and certain indexes as well as quoted prices for similar securities may be used and would be categorized as Level 2 in the hierarchy. Utilizing these techniques may result in transfers between Level 1 and Level 2. For equity securities, including restricted securities, where observable inputs are limited, assumptions about market activity and risk are used and these securities may be categorized as Level 3 in the hierarchy.
Investments in open-end mutual funds, including the Fidelity Central Funds, are valued at their closing net asset value (NAV) each business day and are categorized as Level 1 in the hierarchy.
Changes in valuation techniques may result in transfers in or out of an assigned level within the disclosure hierarchy. The aggregate value of investments by input level as of October 31, 2017 is included at the end of the Fund's Schedule of Investments.
Foreign Currency. The Fund may use foreign currency contracts to facilitate transactions in foreign-denominated securities. Gains and losses from these transactions may arise from changes in the value of the foreign currency or if the counterparties do not perform under the contracts' terms.
Foreign-denominated assets, including investment securities, and liabilities are translated into U.S. dollars at the exchange rates at period end. Purchases and sales of investment securities, income and dividends received and expenses denominated in foreign currencies are translated into U.S. dollars at the exchange rate in effect on the transaction date.
The effects of exchange rate fluctuations on investments are included with the net realized and unrealized gain (loss) on investment securities. Other foreign currency transactions resulting in realized and unrealized gain (loss) are disclosed separately.
Investment Transactions and Income. For financial reporting purposes, the Fund's investment holdings and NAV include trades executed through the end of the last business day of the period. The NAV per share for processing shareholder transactions is calculated as of the close of business of the New York Stock Exchange (NYSE), normally 4:00 p.m. Eastern time and includes trades executed through the end of the prior business day. Gains and losses on securities sold are determined on the basis of identified cost. Dividend income is recorded on the ex-dividend date, except for certain dividends from foreign securities where the ex-dividend date may have passed, which are recorded as soon as the Fund is informed of the ex-dividend date. Non-cash dividends included in dividend income, if any, are recorded at the fair market value of the securities received. Income and capital gain distributions from Fidelity Central Funds, if any, are recorded on the ex-dividend date. Certain distributions received by the Fund represent a return of capital or capital gain. The Fund determines the components of these distributions subsequent to the ex-dividend date, based upon receipt of tax filings or other correspondence relating to the underlying investment. These distributions are recorded as a reduction of cost of investments and/or as a realized gain. Interest income is accrued as earned and includes coupon interest and amortization of premium and accretion of discount on debt securities as applicable. Paid in Kind (PIK) income is recorded at the fair market value of the securities received. Investment income is recorded net of foreign taxes withheld where recovery of such taxes is uncertain. Debt obligations may be placed on non-accrual status and related interest income may be reduced by ceasing current accruals and writing off interest receivables when the collection of all or a portion of interest has become doubtful based on consistently applied procedures. A debt obligation is removed from non-accrual status when the issuer resumes interest payments or when collectability of interest is reasonably assured.
Class Allocations and Expenses. Investment income, realized and unrealized capital gains and losses, common expenses of the Fund, and certain fund-level expense reductions, if any, are allocated daily on a pro-rata basis to each class based on the relative net assets of each class to the total net assets of the Fund. Each class differs with respect to transfer agent and distribution and service plan fees incurred. Certain expense reductions may also differ by class. For the reporting period, the allocated portion of income and expenses to each class as a percent of its average net assets may vary due to the timing of recording these transactions in relation to fluctuating net assets of the classes. Expenses directly attributable to a fund are charged to that fund. Expenses attributable to more than one fund are allocated among the respective funds on the basis of relative net assets or other appropriate methods. Expense estimates are accrued in the period to which they relate and adjustments are made when actual amounts are known.
Income Tax Information and Distributions to Shareholders. Each year, the Fund intends to qualify as a regulated investment company under Subchapter M of the Internal Revenue Code, including distributing substantially all of its taxable income and realized gains. As a result, no provision for U.S. Federal income taxes is required. The Fund files a U.S. federal tax return, in addition to state and local tax returns as required. The Fund's federal income tax returns are subject to examination by the Internal Revenue Service (IRS) for a period of three fiscal years after they are filed. State and local tax returns may be subject to examination for an additional fiscal year depending on the jurisdiction. Foreign taxes are provided for based on the Fund's understanding of the tax rules and rates that exist in the foreign markets in which it invests.
Dividends are declared and recorded daily and paid monthly from net investment income. Distributions from realized gains, if any, are declared and recorded on the ex-dividend date. Income dividends and capital gain distributions are declared separately for each class. Income and capital gain distributions are determined in accordance with income tax regulations, which may differ from GAAP.
Capital accounts within the financial statements are adjusted for permanent book-tax differences. These adjustments have no impact on net assets or the results of operations. Capital accounts are not adjusted for temporary book-tax differences which will reverse in a subsequent period.
Book-tax differences are primarily due to foreign currency transactions, defaulted bonds, market discount, equity-debt classifications, partnerships, capital loss carryforwards, and losses deferred due to wash sales and excise tax regulations.
As of period end, the cost and unrealized appreciation (depreciation) in securities, and derivatives if applicable, for federal income tax purposes were as follows:
| Gross unrealized appreciation | $6,839,376 |
| Gross unrealized depreciation | (3,056,766) |
| Net unrealized appreciation (depreciation) | $3,782,610 |
| Tax cost | $121,608,592 |
Capital loss carryforwards are only available to offset future capital gains of the Fund to the extent provided by regulations and may be limited. Under the Regulated Investment Company Modernization Act of 2010 (the Act), the Fund is permitted to carry forward capital losses incurred in taxable years beginning after December 22, 2010 for an unlimited period and such capital losses are required to be used prior to any losses that expire. The capital loss carryforward information presented below, including any applicable limitation, is estimated as of prior fiscal period end and is subject to adjustment.
| No expiration | |
| Short-term | $(710,939) |
| Long-term | (1,619,042) |
| Total capital loss carryforward | $(2,329,981) |
The Fund elected to defer to its next fiscal year approximately $70,554 of ordinary losses recognized during the period January 1, 2017 to April 30, 2017.
Short-Term Trading (Redemption) Fees. Shares held by investors in the Fund less than 90 days may have been subject to a redemption fee equal to 1.00% of the NAV of shares redeemed. All redemption fees, which reduce the proceeds of the shareholder redemption, are retained by the Fund and accounted for as an addition to paid in capital. In November 2017, the Board of Trustees approved the elimination of these redemption fees effective December 18, 2017.
Restricted Securities. The Fund may invest in securities that are subject to legal or contractual restrictions on resale. These securities generally may be resold in transactions exempt from registration or to the public if the securities are registered. Disposal of these securities may involve time-consuming negotiations and expense, and prompt sale at an acceptable price may be difficult. Information regarding restricted securities is included at the end of the Fund's Schedule of Investments.
Loans and Other Direct Debt Instruments. The Fund invests in direct debt instruments which are interests in amounts owed to lenders by corporate or other borrowers. These instruments may be in the form of loans, trade claims or other receivables and may include standby financing commitments such as revolving credit facilities that obligate the Fund to supply additional cash to the borrower on demand. Loans may be acquired through assignment or participation. The Fund did not have any unfunded loan commitments, which are contractual obligations for future funding, at period end.
New Accounting Pronouncement. In March 2017, the Financial Accounting Standards Board (FASB) issued an Accounting Standards Update (ASU), ASU 2017-08, which amends the amortization period for certain callable debt securities that are held at a premium. The amendment requires the premium to be amortized to the earliest call date. The amendments do not require an accounting change for securities held at a discount. The ASU is effective for annual periods beginning after December 15, 2018. Management is currently evaluating the potential impact of these changes to the financial statements.
4. Purchases and Sales of Investments.
Purchases and sales of securities, other than short-term securities, aggregated $44,858,660 and $25,204,201, respectively.
5. Fees and Other Transactions with Affiliates.
Management Fee. Fidelity Management & Research Company (the investment adviser) and its affiliates provide the Fund with investment management related services for which the Fund pays a monthly management fee. The management fee is the sum of an individual fund fee rate that is based on an annual rate of .60% of the Fund's average net assets and an annualized group fee rate that averaged .11% during the period. The group fee rate is based upon the average net assets of all the mutual funds advised by the investment adviser, including any mutual funds previously advised by the investment adviser that are currently advised by Fidelity SelectCo, LLC, an affiliate of the investment adviser. The group fee rate decreases as assets under management increase and increases as assets under management decrease. For the reporting period, the total annualized management fee rate was .71% of the Fund's average net assets.
Distribution and Service Plan Fees. In accordance with Rule 12b-1 of the 1940 Act, the Fund has adopted separate Distribution and Service Plans for each class of shares. Certain classes pay Fidelity Distributors Corporation (FDC), an affiliate of the investment adviser, separate Distribution and Service Fees, each of which is based on an annual percentage of each class' average net assets. In addition, FDC may pay financial intermediaries for selling shares of the Fund and providing shareholder support services. For the period, the Distribution and Service Fee rates, total fees and amounts retained by FDC were as follows:
| Distribution Fee | Service Fee | Total Fees | Retained by FDC | |
| Class A | -% | .25% | $8,992 | $208 |
| Class M | -% | .25% | 4,426 | – |
| Class C | .75% | .25% | 19,047 | 3,333 |
| $32,465 | $3,541 |
Sales Load. FDC may receive a front-end sales charge of up to 4.00% for selling Class A shares and Class M shares, some of which is paid to financial intermediaries for selling shares of the Fund. Depending on the holding period, FDC may receive contingent deferred sales charges levied on Class A, Class M and Class C redemptions. The deferred sales charges are 1.00% for Class C shares, 1.00% for certain purchases of Class A shares and .25% for certain purchases of Class M shares.
For the period, sales charge amounts retained by FDC were as follows:
| Retained by FDC | |
| Class A | $765 |
| Class M | 1,086 |
| Class C(a) | 112 |
| $1,963 |
(a) When Class C shares are initially sold, FDC pays commissions from its own resources to financial intermediaries through which the sales are made.
Transfer Agent Fees. Fidelity Investments Institutional Operations Company, Inc., (FIIOC), an affiliate of the investment adviser, is the transfer, dividend disbursing and shareholder servicing agent for each class of the Fund. FIIOC receives account fees and asset-based fees that vary according to the account size and type of account of the shareholders of the respective classes of the Fund. FIIOC pays for typesetting, printing and mailing of shareholder reports, except proxy statements.
For the period, transfer agent fees for each class were as follows:
| Amount | % of Class-Level Average Net Assets(a) | |
| Class A | $6,412 | .18 |
| Class M | 4,809 | .27 |
| Class C | 4,030 | .21 |
| Global High Income | 67,351 | .14 |
| Class I | 2,224 | .16 |
| $84,826 |
(a) Annualized
Accounting and Security Lending Fees. Fidelity Service Company, Inc. (FSC), an affiliate of the investment adviser, maintains the Fund's accounting records. The accounting fee is based on the level of average net assets for each month. Under a separate contract, FSC administers the security lending program. The security lending fee is based on the number and duration of lending transactions.
Brokerage Commissions. The Fund placed a portion of its portfolio transactions with brokerage firms which are affiliates of the investment adviser. Brokerage commissions are included in net realized gain (loss) and change in net unrealized appreciation (depreciation) in the Statement of Operations. The commissions paid to these affiliated firms were $2 for the period.
Interfund Trades. The Fund may purchase from or sell securities to other Fidelity Funds under procedures adopted by the Board. The procedures have been designed to ensure these interfund trades are executed in accordance with Rule 17a-7 of the 1940 Act. Interfund trades are included within the respective purchases and sales amounts shown in the Purchases and Sales of Investments note.
6. Committed Line of Credit.
The Fund participates with other funds managed by the investment adviser or an affiliate in a $4.25 billion credit facility (the "line of credit") to be utilized for temporary or emergency purposes to fund shareholder redemptions or for other short-term liquidity purposes. The Fund has agreed to pay commitment fees on its pro-rata portion of the line of credit, which amounted to $160 and is reflected in Miscellaneous expenses on the Statement of Operations. During the period, the Fund did not borrow on this line of credit.
7. Security Lending.
The Fund lends portfolio securities through a lending agent from time to time in order to earn additional income. For equity securities, a lending agent is used and may loan securities to certain qualified borrowers, including Fidelity Capital Markets (FCM), a broker-dealer affiliated with the Fund. On the settlement date of the loan, the Fund receives collateral (in the form of U.S. Treasury obligations, letters of credit and/or cash) against the loaned securities and maintains collateral in an amount not less than 100% of the market value of the loaned securities during the period of the loan. The market value of the loaned securities is determined at the close of business of the Fund and any additional required collateral is delivered to the Fund on the next business day. The Fund or borrower may terminate the loan at any time, and if the borrower defaults on its obligation to return the securities loaned because of insolvency or other reasons, the Fund may apply collateral received from the borrower against the obligation. The Fund may experience delays and costs in recovering the securities loaned. Any cash collateral received is invested in the Fidelity Securities Lending Cash Central Fund. At period end, there were no security loans outstanding. Security lending income represents the income earned on investing cash collateral, less rebates paid to borrowers and any lending agent fees associated with the loan, plus any premium payments received for lending certain types of securities. Security lending income is presented in the Statement of Operations as a component of income from Fidelity Central Funds. Total security lending income during the period amounted to $35. During the period, there were no securities loaned to FCM.
8. Expense Reductions.
The investment adviser voluntarily agreed to reimburse each class to the extent annual operating expenses exceeded certain levels of average net assets as noted in the table below. Some expenses, for example the compensation of the independent Trustees, and certain miscellaneous expenses such as proxy and shareholder meeting expenses, are excluded from this reimbursement.
The following classes were in reimbursement during the period:
| Expense Limitations | Reimbursement | |
| Class A | 1.25% | $2,708 |
| Class M | 1.25% | 2,921 |
| Class C | 2.00% | 1,954 |
| Global High Income | 1.00% | 18,110 |
| Class I | 1.00% | 908 |
| $26,601 |
Commissions paid to certain brokers with whom the investment adviser, or its affiliates, places trades on behalf of the Fund include an amount in addition to trade execution, which may be rebated back to the Fund to offset certain expenses. This amount totaled $10 for the period. In addition, through arrangements with the Fund's custodian, credits realized as a result of certain uninvested cash balances were used to reduce the Fund's expenses. During the period, these credits reduced the Fund's custody expenses by $265.
In addition, during the period the investment adviser reimbursed and/or waived a portion of fund-level operating expenses in the amount of $297.
9. Distributions to Shareholders.
Distributions to shareholders of each class were as follows:
| Six months ended October 31, 2017 | Year ended April 30, 2017 | |
| From net investment income | ||
| Class A | $148,565 | $322,665 |
| Class M | 73,319 | 85,695 |
| Class C | 64,437 | 134,767 |
| Global High Income | 2,076,623 | 4,092,807 |
| Class I | 59,551 | 103,861 |
| Total | $2,422,495 | $4,739,795 |
10. Share Transactions.
Share transactions for each class were as follows and may contain automatic conversions between classes or exchanges between affiliated funds:
| Shares | Shares | Dollars | Dollars | |
| Six months ended October 31, 2017 | Year ended April 30, 2017 | Six months ended October 31, 2017 | Year ended April 30, 2017 | |
| Class A | ||||
| Shares sold | 96,038 | 290,886 | $936,197 | $2,707,041 |
| Reinvestment of distributions | 14,578 | 32,498 | 141,860 | 302,941 |
| Shares redeemed | (84,501) | (260,720) | (819,422) | (2,436,346) |
| Net increase (decrease) | 26,115 | 62,664 | $258,635 | $573,636 |
| Class M | ||||
| Shares sold | 119,153 | 218,520 | $1,153,021 | $2,050,318 |
| Reinvestment of distributions | 7,305 | 8,661 | 71,096 | 80,890 |
| Shares redeemed | (45,273) | (67,976) | (438,540) | (634,029) |
| Net increase (decrease) | 81,185 | 159,205 | $785,577 | $1,497,179 |
| Class C | ||||
| Shares sold | 73,972 | 109,325 | $721,306 | $1,017,340 |
| Reinvestment of distributions | 6,345 | 12,879 | 61,766 | 120,047 |
| Shares redeemed | (46,207) | (105,252) | (447,109) | (975,560) |
| Net increase (decrease) | 34,110 | 16,952 | $335,963 | $161,827 |
| Global High Income | ||||
| Shares sold | 3,186,464 | 2,895,819 | $30,977,097 | $26,886,491 |
| Reinvestment of distributions | 179,293 | 364,798 | 1,746,203 | 3,396,619 |
| Shares redeemed | (1,304,213) | (4,608,362) | (12,653,529) | (42,638,341) |
| Net increase (decrease) | 2,061,544 | (1,347,745) | $20,069,771 | $(12,355,231) |
| Class I | ||||
| Shares sold | 211,402 | 194,425 | $2,064,658 | $1,826,275 |
| Reinvestment of distributions | 4,760 | 6,271 | 46,273 | 58,709 |
| Shares redeemed | (179,555) | (115,409) | (1,747,881) | (1,076,867) |
| Net increase (decrease) | 36,607 | 85,287 | $363,050 | $808,117 |
11. Other.
The Fund's organizational documents provide former and current trustees and officers with a limited indemnification against liabilities arising in connection with the performance of their duties to the Fund. In the normal course of business, the Fund may also enter into contracts that provide general indemnifications. The Fund's maximum exposure under these arrangements is unknown as this would be dependent on future claims that may be made against the Fund. The risk of material loss from such claims is considered remote.
12. Credit Risk.
The Fund's relatively large investment in countries with limited or developing capital markets may involve greater risks than investments in more developed markets and the prices of such investments may be volatile. The yields of emerging market debt obligations reflect, among other things, perceived credit risk. The consequences of political, social or economic changes in these markets may have disruptive effects on the market prices of the Fund's investments and the income they generate, as well as the Fund's ability to repatriate such amounts.
Shareholder Expense Example
As a shareholder of the Fund, you incur two types of costs: (1) transaction costs, including sales charges (loads) on purchase payments or redemption proceeds, redemption fees and (2) ongoing costs, including management fees, distribution and/or service (12b-1) fees and other Fund expenses. This Example is intended to help you understand your ongoing costs (in dollars) of investing in the Fund and to compare these costs with the ongoing costs of investing in other mutual funds.
The Example is based on an investment of $1,000 invested at the beginning of the period and held for the entire period (May 1, 2017 to October 31, 2017).
Actual Expenses
The first line of the accompanying table for each class of the Fund provides information about actual account values and actual expenses. You may use the information in this line, together with the amount you invested, to estimate the expenses that you paid over the period. Simply divide your account value by $1,000.00 (for example, an $8,600 account value divided by $1,000.00 = 8.6), then multiply the result by the number in the first line for a class of the Fund under the heading entitled "Expenses Paid During Period" to estimate the expenses you paid on your account during this period. A small balance maintenance fee of $12.00 that is charged once a year may apply for certain accounts with a value of less than $2,000. This fee is not included in the table below. If it was, the estimate of expenses you paid during the period would be higher, and your ending account value lower, by this amount. In addition, the Fund, as a shareholder in the underlying Fidelity Central Funds, will indirectly bear its pro-rata share of the fees and expenses incurred by the underlying Fidelity Central Funds. These fees and expenses are not included in the Fund's annualized expense ratio used to calculate the expense estimate in the table below.
Hypothetical Example for Comparison Purposes
The second line of the accompanying table for each class of the Fund provides information about hypothetical account values and hypothetical expenses based on a Class' actual expense ratio and an assumed rate of return of 5% per year before expenses, which is not the Class' actual return. The hypothetical account values and expenses may not be used to estimate the actual ending account balance or expenses you paid for the period. You may use this information to compare the ongoing costs of investing in the Fund and other funds. To do so, compare this 5% hypothetical example with the 5% hypothetical examples that appear in the shareholder reports of the other funds. A small balance maintenance fee of $12.00 that is charged once a year may apply for certain accounts with a value of less than $2,000. This fee is not included in the table below. If it was, the estimate of expenses you paid during the period would be higher, and your ending account value lower, by this amount. In addition, the Fund, as a shareholder in the underlying Fidelity Central Funds, will indirectly bear its pro-rata share of the fees and expenses incurred by the underlying Fidelity Central Funds. These fees and expenses are not included in the Fund's annualized expense ratio used to calculate the expense estimate in the table below.
Please note that the expenses shown in the table are meant to highlight your ongoing costs only and do not reflect any transaction costs. Therefore, the second line of the table is useful in comparing ongoing costs only, and will not help you determine the relative total costs of owning different funds. In addition, if these transactional costs were included, your costs would have been higher.
| Annualized Expense Ratio-A | Beginning Account Value May 1, 2017 | Ending Account Value October 31, 2017 | Expenses Paid During Period-B May 1, 2017 to October 31, 2017 | |
| Class A | 1.25% | |||
| Actual | $1,000.00 | $1,048.60 | $6.45 | |
| Hypothetical-C | $1,000.00 | $1,018.90 | $6.36 | |
| Class M | 1.25% | |||
| Actual | $1,000.00 | $1,048.70 | $6.45 | |
| Hypothetical-C | $1,000.00 | $1,018.90 | $6.36 | |
| Class C | 2.00% | |||
| Actual | $1,000.00 | $1,044.70 | $10.31 | |
| Hypothetical-C | $1,000.00 | $1,015.12 | $10.16 | |
| Global High Income | 1.00% | |||
| Actual | $1,000.00 | $1,049.90 | $5.17 | |
| Hypothetical-C | $1,000.00 | $1,020.16 | $5.09 | |
| Class I | 1.00% | |||
| Actual | $1,000.00 | $1,050.00 | $5.17 | |
| Hypothetical-C | $1,000.00 | $1,020.16 | $5.09 |
A Annualized expense ratio reflects expenses net of applicable fee waivers.
B Expenses are equal to each Class' annualized expense ratio, multiplied by the average account value over the period, multiplied by 184/365 (to reflect the one-half year period).
C 5% return per year before expenses
Board Approval of Investment Advisory Contracts and Management Fees
Fidelity Global High Income Fund
Each year, the Board of Trustees, including the Independent Trustees (together, the Board), votes on the renewal of the management contract with Fidelity Management & Research Company (FMR) and the sub-advisory agreements (together, the Advisory Contracts) for the fund. FMR and the sub-advisers are referred to herein as the Investment Advisers. The Board, assisted by the advice of fund counsel and Independent Trustees' counsel, requests and considers a broad range of information relevant to the renewal of the Advisory Contracts throughout the year.
The Board meets regularly and, at each of its meetings, covers an extensive agenda of topics and materials and considers factors that are relevant to its annual consideration of the renewal of the fund's Advisory Contracts, including the services and support provided to the fund and its shareholders. The Board has established various standing committees (Committees), each composed of and chaired by Independent Trustees with varying backgrounds, to which the Board has assigned specific subject matter responsibilities in order to enhance effective decision-making by the Board. The Board, acting directly and through its Committees, requests and receives information concerning the annual consideration of the renewal of the fund's Advisory Contracts. The Board also meets as needed to review matters specifically related to the Board's annual consideration of the renewal of the Advisory Contracts. Members of the Board may also meet with trustees of other Fidelity funds through ad hoc joint committees to discuss certain matters relevant to all of the Fidelity funds.
At its July 2017 meeting, the Board unanimously determined to renew the fund's Advisory Contracts. In reaching its determination, the Board considered all factors it believed relevant, including (i) the nature, extent, and quality of the services to be provided to the fund and its shareholders (including the investment performance of the fund); (ii) the competitiveness of the fund's management fee and total expense ratio relative to peer funds; (iii) the total costs of the services to be provided by and the profits to be realized by Fidelity from its relationships with the fund; and (iv) the extent to which, if any, economies of scale exist and would be realized as the fund grows, and whether any economies of scale are appropriately shared with fund shareholders.
In considering whether to renew the Advisory Contracts for the fund, the Board reached a determination, with the assistance of fund counsel and Independent Trustees' counsel and through the exercise of its business judgment, that the renewal of the Advisory Contracts was in the best interests of the fund and its shareholders and that the compensation payable under the Advisory Contracts was fair and reasonable. The Board's decision to renew the Advisory Contracts was not based on any single factor, but rather was based on a comprehensive consideration of all the information provided to the Board at its meetings throughout the year. The Board, in reaching its determination to renew the Advisory Contracts, was aware that shareholders of the fund have a broad range of investment choices available to them, including a wide choice among funds offered by Fidelity's competitors, and that the fund's shareholders, who have the opportunity to review and weigh the disclosure provided by the fund in its prospectus and other public disclosures, have chosen to invest in this fund, which is part of the Fidelity family of funds.
Amendment to Group Fee Rate. The Board also approved an amendment to the management contract for the fund to add an additional breakpoint to the group fee schedule, effective October 1, 2017. The Board noted that the additional breakpoint would result in lower management fee rates as Fidelity's assets under management increase.
Nature, Extent, and Quality of Services Provided. The Board considered Fidelity's staffing as it relates to the fund, including the backgrounds of investment personnel of Fidelity, and also considered the fund's investment objective, strategies, and related investment philosophy. The Independent Trustees also had discussions with senior management of Fidelity's investment operations and investment groups. The Board considered the structure of the investment personnel compensation program and whether this structure provides appropriate incentives to act in the best interests of the fund. Additionally, the Board considered the portfolio managers' investments, if any, in the funds that they manage.Resources Dedicated to Investment Management and Support Services. The Board and the Fund Oversight and Research Committees reviewed the general qualifications and capabilities of Fidelity's investment staff, including its size, education, experience, and resources, as well as Fidelity's approach to recruiting, training, managing, and compensating investment personnel. The Board noted that Fidelity has continued to increase the resources devoted to non-U.S. offices, including expansion of Fidelity's global investment organization. The Board also noted that Fidelity's analysts have extensive resources, tools and capabilities that allow them to conduct sophisticated quantitative and fundamental analysis, as well as credit analysis of issuers, counterparties and guarantors. Further, the Board considered that Fidelity's investment professionals have sufficient access to global information and data so as to provide competitive investment results over time, and that those professionals also have access to sophisticated tools that permit them to assess portfolio construction and risk and performance attribution characteristics continuously, as well as to transmit new information and research conclusions rapidly around the world. Additionally, in its deliberations, the Board considered Fidelity's trading, risk management, compliance, and technology and operations capabilities and resources, which are integral parts of the investment management process.Shareholder and Administrative Services. The Board considered (i) the nature, extent, quality, and cost of advisory, administrative, and shareholder services performed by the Investment Advisers and their affiliates under the Advisory Contracts and under separate agreements covering transfer agency, pricing and bookkeeping, and securities lending services for the fund; (ii) the nature and extent of the supervision of third party service providers, principally custodians, subcustodians, and pricing vendors; and (iii) the resources devoted to, and the record of compliance with, the fund's compliance policies and procedures. The Board also reviewed the allocation of fund brokerage, including allocations to brokers affiliated with the Investment Advisers, the use of brokerage commissions to pay fund expenses, and the use of "soft" commission dollars to pay for research services.The Board noted that the growth of fund assets over time across the complex allows Fidelity to reinvest in the development of services designed to enhance the value or convenience of the Fidelity funds as investment vehicles. These services include 24-hour access to account information and market information through telephone representatives and over the Internet, investor education materials and asset allocation tools, and the expanded availability of Fidelity Investor Centers.In 2014, the Board formed an ad hoc Committee on Transfer Agency Fees to review the variety of transfer agency fee structures throughout the industry and Fidelity's competitive positioning with respect to industry participants.Investment in a Large Fund Family. The Board considered the benefits to shareholders of investing in a Fidelity fund, including the benefits of investing in a fund that is part of a large family of funds offering a variety of investment disciplines and providing a large variety of mutual fund investor services. The Board noted that Fidelity had taken, or had made recommendations that resulted in the Fidelity funds taking, a number of actions over the previous year that benefited particular funds, including: (i) continuing to dedicate additional resources to Fidelity's investment research process, and to the support of the senior management team that oversees asset management; (ii) continuing efforts to enhance Fidelity's global research capabilities; (iii) launching new funds and making other enhancements to meet client needs; (iv) launching new share classes of existing funds; (v) eliminating purchase minimums and broadening eligibility requirements for certain lower-priced share classes; (vi) reducing management fees and total expenses for certain growth equity funds and index funds; (vii) lowering expense caps for certain existing funds and classes to reduce expenses borne by shareholders; (viii) eliminating short-term redemption fees for certain funds; (ix) introducing a new pricing structure for certain funds of funds that is expected to reduce overall expenses paid by shareholders; (x) rationalizing product lines and gaining increased efficiencies through proposals for fund mergers and share class consolidations; (xi) continuing to develop, acquire and implement systems and technology to improve services to the funds and shareholders, strengthen information security, and increase efficiency; and (xii) implementing enhancements to further strengthen Fidelity's product line to increase investors' probability of success in achieving their investment goals, including retirement income goals.Investment Performance. The Board considered whether the fund has operated in accordance with its investment objective, as well as its record of compliance with its investment restrictions and its performance history.The Board took into account discussions with representatives of the Investment Advisers about fund investment performance that occur at Board meetings throughout the year. In this regard the Board noted that as part of regularly scheduled fund reviews and other reports to the Board on fund performance, the Board considers annualized return information for the fund for different time periods, measured against a securities market index ("benchmark index") and a peer group of funds with similar objectives ("peer group"), if any. In its evaluation of fund investment performance, the Board gave particular attention to information indicating changes in performance of certain Fidelity funds for specific time periods and discussed with the Investment Advisers the reasons for any overperformance or underperformance.In addition to reviewing absolute and relative fund performance, the Independent Trustees periodically consider the appropriateness of fund performance metrics in evaluating the results achieved. In general, the Independent Trustees believe that fund performance should be evaluated based on net performance (after fees and expenses) of both the highest performing and lowest performing fund share classes, where applicable, compared to appropriate benchmark indices, over appropriate time periods that may include full market cycles, and compared to peer groups, as applicable, over the same periods, taking into account relevant factors including the following: general market conditions; issuer-specific information; and fund cash flows and other factors.The Independent Trustees recognize that shareholders evaluate performance on a net basis over their own holding periods, for which one-, three-, and five-year periods are often used as a proxy. For this reason, the performance information reviewed by the Board also included net cumulative calendar year total return information for the fund and an appropriate benchmark index for the most recent one-, three-, and five-year periods, as shown below. A peer group is not shown below because the fund does not generally utilize a peer group for performance comparison purposes.Fidelity Global High Income Fund
Fidelity Global High Income Fund
![]()
Corporate Headquarters
245 Summer St.
Boston, MA 02210
www.fidelity.com
GHI-SANN-1217
1.926252.106
Fidelity® High Income Fund Semi-Annual Report October 31, 2017 |
|
Contents
Board Approval of Investment Advisory Contracts and Management Fees |
To view a fund's proxy voting guidelines and proxy voting record for the 12-month period ended June 30, visit http://www.fidelity.com/proxyvotingresults or visit the Securities and Exchange Commission's (SEC) web site at http://www.sec.gov.
You may also call 1-800-544-8544 to request a free copy of the proxy voting guidelines.
Standard & Poor's, S&P and S&P 500 are registered service marks of The McGraw-Hill Companies, Inc. and have been licensed for use by Fidelity Distributors Corporation.
Other third-party marks appearing herein are the property of their respective owners.
All other marks appearing herein are registered or unregistered trademarks or service marks of FMR LLC or an affiliated company. © 2017 FMR LLC. All rights reserved.
This report and the financial statements contained herein are submitted for the general information of the shareholders of the Fund. This report is not authorized for distribution to prospective investors in the Fund unless preceded or accompanied by an effective prospectus.
A fund files its complete schedule of portfolio holdings with the SEC for the first and third quarters of each fiscal year on Form N-Q. Forms N-Q are available on the SEC’s web site at http://www.sec.gov. A fund's Forms N-Q may be reviewed and copied at the SEC’s Public Reference Room in Washington, DC. Information regarding the operation of the SEC's Public Reference Room may be obtained by calling 1-800-SEC-0330.
For a complete list of a fund's portfolio holdings, view the most recent holdings listing, semiannual report, or annual report on Fidelity's web site at http://www.fidelity.com, http://www.institutional.fidelity.com, or http://www.401k.com, as applicable.
NOT FDIC INSURED •MAY LOSE VALUE •NO BANK GUARANTEE
Neither the Fund nor Fidelity Distributors Corporation is a bank.
Investment Summary (Unaudited)
Top Five Holdings as of October 31, 2017
| (by issuer, excluding cash equivalents) | % of fund's net assets | % of fund's net assets 6 months ago |
| Community Health Systems, Inc. | 2.4 | 2.4 |
| Valeant Pharmaceuticals International, Inc. | 2.0 | 1.5 |
| Ortho-Clinical Diagnostics, Inc. | 1.8 | 1.2 |
| CCO Holdings LLC/CCO Holdings Capital Corp. | 1.5 | 1.2 |
| Sprint Corp. | 1.3 | 1.4 |
| 9.0 |
Top Five Market Sectors as of October 31, 2017
| % of fund's net assets | % of fund's net assets 6 months ago | |
| Energy | 12.9 | 12.3 |
| Healthcare | 11.7 | 11.4 |
| Telecommunications | 8.6 | 9.1 |
| Cable/Satellite TV | 5.4 | 5.8 |
| Banks & Thrifts | 4.9 | 6.8 |
Quality Diversification (% of fund's net assets)
| As of October 31, 2017 | ||
| BBB | 0.2% | |
| BB | 28.7% | |
| B | 43.6% | |
| CCC,CC,C | 13.3% | |
| Not Rated | 1.2% | |
| Equities | 1.3% | |
| Short-Term Investments and Net Other Assets | 11.7% | |
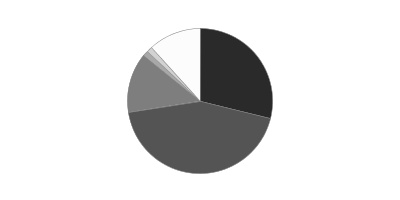
| As of April 30, 2017 | ||
| BBB | 0.5% | |
| BB | 31.8% | |
| B | 44.4% | |
| CCC,CC,C | 14.6% | |
| Not Rated | 0.6% | |
| Equities | 1.2% | |
| Short-Term Investments and Net Other Assets | 6.9% | |
We have used ratings from Moody's Investors Service, Inc. Where Moody's® ratings are not available, we have used S&P® ratings. All ratings are as of the date indicated and do not reflect subsequent changes.
Asset Allocation (% of fund's net assets)
| As of October 31, 2017* | ||
| Nonconvertible Bonds | 77.5% | |
| Convertible Bonds, Preferred Stocks | 1.4% | |
| Common Stocks | 0.1% | |
| Bank Loan Obligations | 5.5% | |
| Other Investments | 3.8% | |
| Short-Term Investments and Net Other Assets (Liabilities) | 11.7% | |

* Foreign investments - 22.2%
| As of April 30, 2017* | ||
| Nonconvertible Bonds | 81.0% | |
| Convertible Bonds, Preferred Stocks | 1.1% | |
| Common Stocks | 0.2% | |
| Bank Loan Obligations | 5.5% | |
| Other Investments | 5.3% | |
| Short-Term Investments and Net Other Assets (Liabilities) | 6.9% | |

* Foreign investments - 23.9%
Investments October 31, 2017 (Unaudited)
Showing Percentage of Net Assets
| Corporate Bonds - 77.7% | |||
| Principal Amount (000s) | Value (000s) | ||
| Convertible Bonds - 0.2% | |||
| Capital Goods - 0.1% | |||
| General Cable Corp. 4.5% 11/15/29 (a) | $5,136 | $4,934 | |
| Energy - 0.1% | |||
| Ensco Jersey Finance Ltd. 3% 1/31/24 (b) | 7,690 | 6,498 | |
| TOTAL CONVERTIBLE BONDS | 11,432 | ||
| Nonconvertible Bonds - 77.5% | |||
| Aerospace - 0.2% | |||
| DAE Funding LLC: | |||
| 4% 8/1/20 (b) | 2,645 | 2,685 | |
| 4.5% 8/1/22 (b) | 3,305 | 3,350 | |
| 5% 8/1/24 (b) | 4,550 | 4,647 | |
| 10,682 | |||
| Air Transportation - 0.1% | |||
| United Continental Holdings, Inc. 6.375% 6/1/18 | 1,270 | 1,299 | |
| XPO Logistics, Inc. 6.125% 9/1/23 (b) | 4,030 | 4,242 | |
| 5,541 | |||
| Automotive & Auto Parts - 0.8% | |||
| Allison Transmission, Inc. 5% 10/1/24 (b) | 6,465 | 6,740 | |
| Delphi Jersey Holdings PLC 5% 10/1/25 (b) | 4,955 | 4,992 | |
| Lithia Motors, Inc. 5.25% 8/1/25 (b) | 2,905 | 3,047 | |
| Tesla, Inc. 5.3% 8/15/25 (b) | 15,925 | 15,368 | |
| The Goodyear Tire & Rubber Co. 5% 5/31/26 | 4,545 | 4,659 | |
| 34,806 | |||
| Banks & Thrifts - 1.1% | |||
| Ally Financial, Inc.: | |||
| 4.25% 4/15/21 | 2,395 | 2,491 | |
| 5.75% 11/20/25 | 32,090 | 35,419 | |
| Royal Bank of Scotland Group PLC 5.125% 5/28/24 | 9,465 | 10,127 | |
| 48,037 | |||
| Broadcasting - 0.9% | |||
| AMC Networks, Inc.: | |||
| 4.75% 8/1/25 | 5,315 | 5,308 | |
| 5% 4/1/24 | 940 | 958 | |
| CBS Radio, Inc. 7.25% 11/1/24 (b) | 3,410 | 3,568 | |
| iHeartCommunications, Inc.: | |||
| 9% 9/15/22 | 4,320 | 3,121 | |
| 10.625% 3/15/23 | 6,665 | 4,782 | |
| 11.25% 3/1/21 (b) | 5,040 | 3,578 | |
| Sinclair Television Group, Inc. 5.125% 2/15/27 (b) | 1,595 | 1,517 | |
| Sirius XM Radio, Inc.: | |||
| 3.875% 8/1/22 (b) | 4,075 | 4,151 | |
| 5% 8/1/27 (b) | 6,735 | 6,794 | |
| 5.375% 7/15/26 (b) | 6,655 | 7,013 | |
| 40,790 | |||
| Building Materials - 0.7% | |||
| Beacon Roofing Supply, Inc. 4.875% 11/1/25 (b) | 5,310 | 5,375 | |
| Builders FirstSource, Inc. 5.625% 9/1/24 (b) | 6,490 | 6,855 | |
| Building Materials Corp. of America: | |||
| 5.5% 2/15/23 (b) | 6,160 | 6,499 | |
| 6% 10/15/25 (b) | 6,360 | 6,877 | |
| Summit Materials LLC/Summit Materials Finance Corp. 5.125% 6/1/25 (b) | 1,995 | 2,020 | |
| U.S. Concrete, Inc. 6.375% 6/1/24 | 2,360 | 2,537 | |
| USG Corp. 5.5% 3/1/25 (b) | 2,150 | 2,306 | |
| 32,469 | |||
| Cable/Satellite TV - 4.9% | |||
| Altice SA 7.75% 5/15/22 (b) | 33,630 | 35,606 | |
| Altice U.S. Finance SA: | |||
| 5.375% 7/15/23 (b) | 12,165 | 12,682 | |
| 5.5% 5/15/26 (b) | 16,930 | 17,607 | |
| CCO Holdings LLC/CCO Holdings Capital Corp.: | |||
| 4% 3/1/23 (b) | 5,310 | 5,386 | |
| 5% 2/1/28 (b) | 7,965 | 7,905 | |
| 5.125% 2/15/23 | 4,795 | 4,951 | |
| 5.125% 5/1/23 (b) | 1,000 | 1,043 | |
| 5.125% 5/1/27 (b) | 17,585 | 17,761 | |
| 5.5% 5/1/26 (b) | 14,635 | 15,001 | |
| 5.75% 9/1/23 | 6,260 | 6,487 | |
| 5.875% 4/1/24 (b) | 12,305 | 13,105 | |
| Cequel Communications Holdings I LLC/Cequel Capital Corp.: | |||
| 5.125% 12/15/21 (b) | 4,795 | 4,879 | |
| 5.125% 12/15/21 (b) | 2,210 | 2,249 | |
| CSC Holdings, Inc. 5.5% 4/15/27 (b) | 11,570 | 11,917 | |
| DISH DBS Corp.: | |||
| 5% 3/15/23 | 5,810 | 5,621 | |
| 5.875% 7/15/22 | 3,210 | 3,228 | |
| 6.75% 6/1/21 | 5,543 | 5,820 | |
| 7.75% 7/1/26 | 2,150 | 2,352 | |
| Virgin Media Finance PLC 4.875% 2/15/22 | 7,525 | 7,337 | |
| Virgin Media Secured Finance PLC 5.5% 8/15/26 (b) | 8,690 | 9,092 | |
| VTR Finance BV 6.875% 1/15/24 (b) | 5,835 | 6,187 | |
| Ziggo Bond Finance BV 6% 1/15/27 (b) | 3,310 | 3,368 | |
| Ziggo Secured Finance BV 5.5% 1/15/27 (b) | 16,785 | 17,121 | |
| 216,705 | |||
| Capital Goods - 1.1% | |||
| Belden, Inc. 5.25% 7/15/24 (b) | 8,579 | 8,922 | |
| General Cable Corp. 5.75% 10/1/22 (c) | 35,960 | 36,859 | |
| SPX Flow, Inc.: | |||
| 5.625% 8/15/24 (b) | 2,150 | 2,274 | |
| 5.875% 8/15/26 (b) | 2,150 | 2,284 | |
| 50,339 | |||
| Chemicals - 3.6% | |||
| A. Schulman, Inc. 6.875% 6/1/23 | 7,175 | 7,561 | |
| Blue Cube Spinco, Inc.: | |||
| 9.75% 10/15/23 | 4,075 | 4,839 | |
| 10% 10/15/25 | 5,930 | 7,220 | |
| CF Industries Holdings, Inc.: | |||
| 3.45% 6/1/23 | 8,165 | 8,063 | |
| 5.15% 3/15/34 | 20,715 | 20,663 | |
| 5.375% 3/15/44 | 14,645 | 14,059 | |
| Evolution Escrow Issuer LLC 7.5% 3/15/22 (b) | 9,210 | 9,659 | |
| Momentive Performance Materials, Inc. 3.88% 10/24/21 | 22,866 | 23,781 | |
| MPM Escrow LLC/MPM Finance Escrow Corp. 8.875% 10/15/20 (d)(e) | 19,122 | 0 | |
| NOVA Chemicals Corp.: | |||
| 4.875% 6/1/24 (b) | 6,405 | 6,525 | |
| 5.25% 6/1/27 (b) | 5,585 | 5,697 | |
| The Chemours Co. LLC: | |||
| 5.375% 5/15/27 | 1,970 | 2,103 | |
| 6.625% 5/15/23 | 10,825 | 11,475 | |
| 7% 5/15/25 | 11,310 | 12,611 | |
| TPC Group, Inc. 8.75% 12/15/20 (b) | 7,975 | 7,796 | |
| Trinseo Materials Operating SCA/Trinseo Materials Finance, Inc. 5.375% 9/1/25 (b) | 5,305 | 5,584 | |
| Tronox Finance PLC 5.75% 10/1/25 (b) | 2,065 | 2,155 | |
| Valvoline Finco Two LLC 5.5% 7/15/24 (b) | 1,890 | 2,003 | |
| Valvoline, Inc. 4.375% 8/15/25 (b) | 1,751 | 1,769 | |
| Versum Materials, Inc. 5.5% 9/30/24 (b) | 2,685 | 2,860 | |
| W. R. Grace & Co.-Conn.: | |||
| 5.125% 10/1/21 (b) | 1,855 | 1,994 | |
| 5.625% 10/1/24 (b) | 1,800 | 1,969 | |
| 160,386 | |||
| Consumer Products - 0.2% | |||
| Edgewell Personal Care Co. 5.5% 6/15/25 (b) | 235 | 247 | |
| First Quality Finance Co., Inc. 5% 7/1/25 (b) | 3,715 | 3,820 | |
| Tempur Sealy International, Inc. 5.5% 6/15/26 | 6,420 | 6,613 | |
| 10,680 | |||
| Containers - 1.2% | |||
| Ardagh Packaging Finance PLC/Ardagh MP Holdings U.S.A., Inc.: | |||
| 4.625% 5/15/23 (b) | 21,095 | 21,675 | |
| 6% 2/15/25 (b) | 5,485 | 5,821 | |
| Crown Americas LLC/Crown Americas Capital Corp. IV 4.5% 1/15/23 | 1,975 | 2,056 | |
| Crown Americas LLC/Crown Americas Capital Corp. V 4.25% 9/30/26 | 860 | 860 | |
| Owens-Brockway Glass Container, Inc.: | |||
| 5% 1/15/22 (b) | 6,190 | 6,546 | |
| 5.375% 1/15/25 (b) | 4,130 | 4,409 | |
| Plastipak Holdings, Inc. 6.25% 10/15/25 (b) | 1,320 | 1,346 | |
| Reynolds Group Issuer, Inc./Reynolds Group Issuer LLC/Reynolds Group Issuer (Luxembourg) SA 5.125% 7/15/23 (b) | 8,975 | 9,344 | |
| 52,057 | |||
| Diversified Financial Services - 3.1% | |||
| Adient Global Holdings Ltd. 4.875% 8/15/26 (b) | 4,265 | 4,388 | |
| Aircastle Ltd. 5.125% 3/15/21 | 6,085 | 6,458 | |
| AssuredPartners, Inc. 7% 8/15/25 (b) | 1,845 | 1,923 | |
| CIT Group, Inc.: | |||
| 5% 8/15/22 | 2,820 | 3,032 | |
| 5.375% 5/15/20 | 768 | 824 | |
| FLY Leasing Ltd. 6.375% 10/15/21 | 15,728 | 16,416 | |
| Grinding Media, Inc./MC Grinding Media Canada, Inc. 7.375% 12/15/23 (b) | 3,245 | 3,529 | |
| Icahn Enterprises LP/Icahn Enterprises Finance Corp.: | |||
| 4.875% 3/15/19 | 5,395 | 5,422 | |
| 6% 8/1/20 | 3,610 | 3,723 | |
| 6.25% 2/1/22 | 2,435 | 2,545 | |
| ILFC E-Capital Trust I 3 month U.S. LIBOR + 1.550% 4.36% 12/21/65 (b)(c)(f) | 7,105 | 6,856 | |
| ILFC E-Capital Trust II 3 month U.S. LIBOR + 1.800% 4.61% 12/21/65 (b)(c)(f) | 9,720 | 9,428 | |
| Intelsat Connect Finance SA 12.5% 4/1/22 (b) | 1,937 | 1,835 | |
| MSCI, Inc.: | |||
| 4.75% 8/1/26 (b) | 2,740 | 2,853 | |
| 5.75% 8/15/25 (b) | 3,285 | 3,548 | |
| Navient Corp.: | |||
| 5% 10/26/20 | 2,165 | 2,230 | |
| 6.625% 7/26/21 | 3,750 | 4,017 | |
| 6.75% 6/25/25 | 10,695 | 11,176 | |
| 7.25% 9/25/23 | 1,095 | 1,186 | |
| SLM Corp.: | |||
| 4.875% 6/17/19 | 10,145 | 10,437 | |
| 6.125% 3/25/24 | 2,655 | 2,725 | |
| 7.25% 1/25/22 | 5,390 | 5,848 | |
| 8% 3/25/20 | 9,007 | 9,930 | |
| Springleaf Financial Corp.: | |||
| 6.125% 5/15/22 | 5,360 | 5,655 | |
| 8.25% 12/15/20 | 6,395 | 7,210 | |
| Venator Finance SARL/Venator Capital Management Ltd. 5.75% 7/15/25 (b) | 3,930 | 4,156 | |
| 137,350 | |||
| Diversified Media - 1.8% | |||
| Clear Channel Worldwide Holdings, Inc.: | |||
| Series A: | |||
| 6.5% 11/15/22 | 10,245 | 10,578 | |
| 7.625% 3/15/20 | 21,395 | 21,288 | |
| 7.625% 3/15/20 | 4,720 | 4,714 | |
| E.W. Scripps Co. 5.125% 5/15/25 (b) | 1,260 | 1,295 | |
| MDC Partners, Inc. 6.5% 5/1/24 (b) | 17,671 | 18,024 | |
| Nielsen Co. S.a.r.l. (Luxembourg) 5% 2/1/25 (b) | 2,960 | 3,064 | |
| Nielsen Finance LLC/Nielsen Finance Co. 5% 4/15/22 (b) | 18,410 | 18,962 | |
| 77,925 | |||
| Energy - 11.9% | |||
| AmeriGas Partners LP/AmeriGas Finance Corp. 5.5% 5/20/25 | 4,695 | 4,801 | |
| Antero Resources Corp.: | |||
| 5.125% 12/1/22 | 2,440 | 2,507 | |
| 5.625% 6/1/23 (Reg. S) | 3,960 | 4,148 | |
| Antero Resources Finance Corp. 5.375% 11/1/21 | 4,735 | 4,859 | |
| Baytex Energy Corp.: | |||
| 5.125% 6/1/21 (b) | 3,070 | 2,909 | |
| 5.625% 6/1/24 (b) | 3,655 | 3,399 | |
| Calfrac Holdings LP 7.5% 12/1/20 (b) | 7,460 | 7,311 | |
| California Resources Corp. 8% 12/15/22 (b) | 29,715 | 19,612 | |
| Callon Petroleum Co. 6.125% 10/1/24 | 1,865 | 1,940 | |
| Cheniere Corpus Christi Holdings LLC 5.125% 6/30/27 (b) | 4,890 | 5,043 | |
| Chesapeake Energy Corp.: | |||
| 4.875% 4/15/22 | 1,957 | 1,810 | |
| 5.375% 6/15/21 | 10,395 | 10,005 | |
| 5.75% 3/15/23 | 3,500 | 3,194 | |
| 8% 1/15/25 (b) | 5,265 | 5,265 | |
| 8% 6/15/27 (b) | 5,730 | 5,526 | |
| Citgo Petroleum Corp. 6.25% 8/15/22 (b) | 24,190 | 24,855 | |
| Compressco Partners LP/Compressco Finance, Inc. 7.25% 8/15/22 | 2,620 | 2,371 | |
| Consolidated Energy Finance SA: | |||
| 3 month U.S. LIBOR + 3.750% 5.07% 6/15/22 (b)(c)(f) | 3,995 | 3,986 | |
| 6.875% 6/15/25 (b) | 4,850 | 5,129 | |
| Continental Resources, Inc.: | |||
| 4.5% 4/15/23 | 4,270 | 4,323 | |
| 5% 9/15/22 | 18,015 | 18,218 | |
| Covey Park Energy LLC 7.5% 5/15/25 (b) | 3,670 | 3,808 | |
| Crestwood Midstream Partners LP/Crestwood Midstream Finance Corp. 6.25% 4/1/23 | 2,070 | 2,153 | |
| CVR Refining LLC/Coffeyville Finance, Inc. 6.5% 11/1/22 | 9,618 | 9,882 | |
| Denbury Resources, Inc.: | |||
| 4.625% 7/15/23 | 14,555 | 8,260 | |
| 5.5% 5/1/22 | 11,825 | 7,420 | |
| 9% 5/15/21 (b) | 5,315 | 5,195 | |
| Diamond Offshore Drilling, Inc. 7.875% 8/15/25 | 2,655 | 2,841 | |
| Ensco PLC: | |||
| 4.5% 10/1/24 | 4,355 | 3,571 | |
| 5.2% 3/15/25 | 2,345 | 1,976 | |
| 5.75% 10/1/44 | 6,460 | 4,409 | |
| EP Energy LLC/Everest Acquisition Finance, Inc. 8% 11/29/24 (b) | 6,105 | 6,227 | |
| Exterran Energy Solutions LP 8.125% 5/1/25 (b) | 4,660 | 4,905 | |
| Exterran Partners LP/EXLP Finance Corp. 6% 4/1/21 | 2,360 | 2,348 | |
| FTS International, Inc. 6.25% 5/1/22 | 9,715 | 9,424 | |
| Hilcorp Energy I LP/Hilcorp Finance Co.: | |||
| 5% 12/1/24 (b) | 12,190 | 12,129 | |
| 5.75% 10/1/25 (b) | 5,380 | 5,508 | |
| Holly Energy Partners LP/Holly Finance Corp. 6% 8/1/24 (b) | 3,230 | 3,383 | |
| Jonah Energy LLC 7.25% 10/15/25 (b) | 6,170 | 6,170 | |
| NextEra Energy Partners LP 4.25% 9/15/24 (b) | 3,015 | 3,045 | |
| NGL Energy Partners LP/NGL Energy Finance Corp.: | |||
| 5.125% 7/15/19 | 3,230 | 3,230 | |
| 6.125% 3/1/25 | 5,455 | 5,169 | |
| 7.5% 11/1/23 | 12,475 | 12,444 | |
| NGPL PipeCo LLC 4.375% 8/15/22 (b) | 1,135 | 1,168 | |
| Noble Holding International Ltd.: | |||
| 4.625% 3/1/21 | 2,536 | 2,346 | |
| 5.25% 3/15/42 | 3,445 | 2,188 | |
| 6.05% 3/1/41 | 4,160 | 2,756 | |
| 7.7% 4/1/25 (c) | 5,680 | 4,942 | |
| 7.75% 1/15/24 | 24,745 | 22,147 | |
| NuStar Logistics LP 5.625% 4/28/27 | 2,430 | 2,564 | |
| Pacific Drilling SA 5.375% 6/1/20 (b) | 1,700 | 598 | |
| Parsley Energy LLC/Parsley: | |||
| 5.25% 8/15/25 (b) | 3,100 | 3,131 | |
| 5.625% 10/15/27 (b) | 2,200 | 2,270 | |
| 6.25% 6/1/24 (b) | 925 | 981 | |
| PBF Holding Co. LLC/PBF Finance Corp.: | |||
| 7% 11/15/23 | 16,415 | 17,072 | |
| 7.25% 6/15/25 (b) | 11,755 | 12,152 | |
| PBF Logistics LP/PBF Logistics Finance, Inc.: | |||
| 6.875% 5/15/23 | 820 | 849 | |
| 6.875% 5/15/23 (b) | 2,655 | 2,748 | |
| PDC Energy, Inc. 6.125% 9/15/24 | 1,625 | 1,696 | |
| Range Resources Corp. 5% 3/15/23 | 7,605 | 7,529 | |
| Rose Rock Midstream LP/Rose Rock Finance Corp.: | |||
| 5.625% 7/15/22 | 4,315 | 4,250 | |
| 5.625% 11/15/23 | 5,320 | 5,200 | |
| SemGroup Corp.: | |||
| 6.375% 3/15/25 (b) | 6,235 | 6,141 | |
| 7.25% 3/15/26 (b) | 4,215 | 4,289 | |
| SM Energy Co.: | |||
| 5% 1/15/24 | 7,235 | 6,909 | |
| 5.625% 6/1/25 | 6,395 | 6,219 | |
| 6.125% 11/15/22 | 12,935 | 13,000 | |
| 6.5% 11/15/21 | 3,615 | 3,651 | |
| 6.5% 1/1/23 | 9,245 | 9,407 | |
| 6.75% 9/15/26 | 2,875 | 2,950 | |
| Southwestern Energy Co.: | |||
| 4.1% 3/15/22 | 23,927 | 23,508 | |
| 7.5% 4/1/26 | 6,780 | 7,034 | |
| 7.75% 10/1/27 | 3,060 | 3,182 | |
| Summit Midstream Holdings LLC 5.75% 4/15/25 | 3,595 | 3,667 | |
| Sunoco LP/Sunoco Finance Corp. 6.375% 4/1/23 | 8,570 | 9,106 | |
| Targa Resources Partners LP/Targa Resources Partners Finance Corp.: | |||
| 4.25% 11/15/23 | 6,115 | 6,084 | |
| 5.125% 2/1/25 | 2,610 | 2,688 | |
| 5.25% 5/1/23 | 2,920 | 3,004 | |
| 5.375% 2/1/27 | 2,610 | 2,711 | |
| 6.75% 3/15/24 | 1,230 | 1,325 | |
| Teine Energy Ltd. 6.875% 9/30/22 (b) | 410 | 419 | |
| Tervita Escrow Corp. 7.625% 12/1/21 (b) | 17,690 | 17,911 | |
| Tesoro Logistics LP/Tesoro Logistics Finance Corp. 6.125% 10/15/21 | 4,935 | 5,095 | |
| Transocean, Inc. 9% 7/15/23 (b) | 4,330 | 4,698 | |
| Weatherford International Ltd.: | |||
| 6.5% 8/1/36 | 3,015 | 2,510 | |
| 7% 3/15/38 | 5,375 | 4,515 | |
| Weatherford International, Inc. 6.8% 6/15/37 | 4,355 | 3,702 | |
| Whiting Petroleum Corp.: | |||
| 5.75% 3/15/21 | 2,495 | 2,514 | |
| 6.25% 4/1/23 | 1,265 | 1,262 | |
| WPX Energy, Inc.: | |||
| 5.25% 9/15/24 | 2,605 | 2,615 | |
| 6% 1/15/22 | 3,563 | 3,710 | |
| 8.25% 8/1/23 | 3,575 | 4,026 | |
| 529,147 | |||
| Entertainment/Film - 1.2% | |||
| AMC Entertainment Holdings, Inc.: | |||
| 5.875% 11/15/26 | 13,315 | 12,999 | |
| 6.125% 5/15/27 | 14,445 | 14,301 | |
| AMC Entertainment, Inc. 5.75% 6/15/25 | 5,320 | 5,174 | |
| CBS Outdoor Americas Capital LLC/CBS Outdoor Americas Capital Corp.: | |||
| 5.625% 2/15/24 | 2,800 | 2,947 | |
| 5.875% 3/15/25 | 10,155 | 10,758 | |
| New Cotai LLC/New Cotai Capital Corp. 10.625% 5/1/19 pay-in-kind (b)(c) | 6,377 | 6,377 | |
| 52,556 | |||
| Environmental - 1.3% | |||
| Covanta Holding Corp.: | |||
| 5.875% 3/1/24 | 9,255 | 9,278 | |
| 5.875% 7/1/25 | 13,229 | 13,097 | |
| 6.375% 10/1/22 | 6,490 | 6,701 | |
| LBC Tank Terminals Holding Netherlands BV 6.875% 5/15/23 (b) | 18,820 | 19,690 | |
| Wrangler Buyer Corp. 6% 10/1/25 (b) | 6,370 | 6,513 | |
| 55,279 | |||
| Food & Drug Retail - 2.0% | |||
| Albertsons Companies LLC/Safeway, Inc./New Albertson's, Inc./Albertson's LLC: | |||
| 5.75% 3/15/25 | 10,270 | 9,038 | |
| 6.625% 6/15/24 | 6,890 | 6,477 | |
| BI-LO LLC/BI-LO Finance Corp.: | |||
| 9.25% 2/15/19 (b) | 36,335 | 33,156 | |
| 9.375% 9/15/18 pay-in-kind (b)(c) | 48,725 | 13,643 | |
| Performance Food Group, Inc. 5.5% 6/1/24 (b) | 2,765 | 2,896 | |
| Rite Aid Corp. 7.7% 2/15/27 | 3,030 | 2,576 | |
| Tops Holding LLC/Tops Markets II Corp. 8% 6/15/22 (b) | 33,220 | 19,932 | |
| 87,718 | |||
| Food/Beverage/Tobacco - 3.8% | |||
| B&G Foods, Inc. 5.25% 4/1/25 | 5,480 | 5,596 | |
| C&S Group Enterprises LLC 5.375% 7/15/22 (b) | 31,277 | 30,339 | |
| Cott Beverages, Inc. 5.375% 7/1/22 | 370 | 385 | |
| Cott Holdings, Inc. 5.5% 4/1/25 (b) | 8,265 | 8,523 | |
| ESAL GmbH 6.25% 2/5/23 (b) | 22,645 | 21,796 | |
| JBS Investments GmbH: | |||
| 7.25% 4/3/24 (b) | 14,005 | 13,830 | |
| 7.75% 10/28/20 (b) | 12,800 | 13,062 | |
| JBS U.S.A. LLC/JBS U.S.A. Finance, Inc.: | |||
| 5.75% 6/15/25 (b) | 2,625 | 2,546 | |
| 7.25% 6/1/21 (b) | 5,070 | 5,169 | |
| 7.25% 6/1/21 (b) | 9,250 | 9,430 | |
| Lamb Weston Holdings, Inc.: | |||
| 4.625% 11/1/24 (b) | 3,230 | 3,375 | |
| 4.875% 11/1/26 (b) | 2,515 | 2,644 | |
| Minerva Luxembourg SA 6.5% 9/20/26 (b) | 12,565 | 13,030 | |
| Pilgrim's Pride Corp. 5.875% 9/30/27 (b) | 2,645 | 2,751 | |
| Post Holdings, Inc.: | |||
| 5% 8/15/26 (b) | 6,895 | 6,929 | |
| 5.5% 3/1/25 (b) | 6,025 | 6,281 | |
| 5.75% 3/1/27 (b) | 6,915 | 7,183 | |
| U.S. Foods, Inc. 5.875% 6/15/24 (b) | 4,305 | 4,547 | |
| Vector Group Ltd. 6.125% 2/1/25 (b) | 9,390 | 9,742 | |
| 167,158 | |||
| Gaming - 1.3% | |||
| Boyd Gaming Corp. 6.375% 4/1/26 | 2,050 | 2,250 | |
| CRC Escrow Issuer LLC/CRC Finance LLC 5.25% 10/15/25 (b) | 26,425 | 26,598 | |
| Eldorado Resorts, Inc. 6% 4/1/25 | 1,260 | 1,329 | |
| GLP Capital LP/GLP Financing II, Inc. 5.375% 4/15/26 | 1,020 | 1,104 | |
| Jacobs Entertainment, Inc. 7.875% 2/1/24 (b) | 1,215 | 1,312 | |
| MCE Finance Ltd. 4.875% 6/6/25 (b) | 1,795 | 1,811 | |
| MGM Growth Properties Operating Partnership LP 4.5% 9/1/26 | 4,120 | 4,135 | |
| Scientific Games Corp.: | |||
| 5% 10/15/25 (b) | 1,310 | 1,330 | |
| 7% 1/1/22 (b) | 9,325 | 9,861 | |
| Seminole Hard Rock Entertainment, Inc. 5.875% 5/15/21 (b) | 3,705 | 3,761 | |
| Sugarhouse HSP Gaming Prop Mezz LP/Sugarhouse HSP Gaming Finance Corp. 5.875% 5/15/25 (b) | 3,500 | 3,413 | |
| Wynn Macau Ltd. 4.875% 10/1/24 (b) | 2,605 | 2,647 | |
| 59,551 | |||
| Healthcare - 10.7% | |||
| Acadia Healthcare Co., Inc. 5.625% 2/15/23 | 2,315 | 2,378 | |
| AMAG Pharmaceuticals, Inc. 7.875% 9/1/23 (b) | 8,825 | 8,979 | |
| AmSurg Corp. 5.625% 7/15/22 | 5,345 | 5,439 | |
| Catalent Pharma Solutions 4.875% 1/15/26 (b) | 1,490 | 1,512 | |
| Community Health Systems, Inc.: | |||
| 5.125% 8/1/21 | 33,240 | 32,326 | |
| 6.25% 3/31/23 | 10,965 | 10,554 | |
| 6.875% 2/1/22 | 85,380 | 61,783 | |
| CTR Partnership LP/CareTrust Capital Corp. 5.25% 6/1/25 | 7,105 | 7,300 | |
| DaVita HealthCare Partners, Inc.: | |||
| 5% 5/1/25 | 7,445 | 7,333 | |
| 5.125% 7/15/24 | 11,170 | 11,198 | |
| HCA Holdings, Inc.: | |||
| 4.5% 2/15/27 | 4,300 | 4,338 | |
| 5.25% 6/15/26 | 5,705 | 6,069 | |
| 5.875% 5/1/23 | 12,595 | 13,492 | |
| 6.25% 2/15/21 | 7,735 | 8,325 | |
| HealthSouth Corp. 5.75% 9/15/25 | 5,215 | 5,378 | |
| Hologic, Inc. 4.375% 10/15/25 (b) | 2,155 | 2,189 | |
| IMS Health, Inc. 5% 10/15/26 (b) | 3,785 | 4,022 | |
| Kindred Healthcare, Inc.: | |||
| 8% 1/15/20 | 27,095 | 27,366 | |
| 8.75% 1/15/23 | 22,675 | 22,108 | |
| Mallinckrodt International Finance SA/Mallinckrodt CB LLC: | |||
| 5.625% 10/15/23 (b) | 2,805 | 2,619 | |
| 5.75% 8/1/22 (b) | 4,305 | 4,214 | |
| MPT Operating Partnership LP/MPT Finance Corp.: | |||
| 5% 10/15/27 | 5,000 | 5,138 | |
| 5.25% 8/1/26 | 2,735 | 2,848 | |
| 5.5% 5/1/24 | 3,770 | 3,991 | |
| 6.375% 3/1/24 | 3,810 | 4,120 | |
| Ortho-Clinical Diagnostics, Inc. 6.625% 5/15/22 (b) | 46,883 | 46,942 | |
| Sabra Health Care LP/Sabra Capital Corp.: | |||
| 5.375% 6/1/23 | 15,645 | 16,153 | |
| 5.5% 2/1/21 | 13,650 | 14,077 | |
| SP Finco LLC 6.75% 7/1/25 (b) | 3,295 | 3,007 | |
| Teleflex, Inc. 4.875% 6/1/26 | 7,435 | 7,807 | |
| Tenet Healthcare Corp.: | |||
| 4.375% 10/1/21 | 21,045 | 20,971 | |
| 4.5% 4/1/21 | 780 | 788 | |
| 6% 10/1/20 | 2,530 | 2,657 | |
| THC Escrow Corp. III 5.125% 5/1/25 (b) | 10,645 | 10,366 | |
| Valeant Pharmaceuticals International, Inc.: | |||
| 5.375% 3/15/20 (b) | 13,685 | 13,463 | |
| 5.5% 3/1/23 (b) | 3,190 | 2,680 | |
| 5.5% 11/1/25 (b) | 4,230 | 4,325 | |
| 5.625% 12/1/21 (b) | 3,595 | 3,276 | |
| 5.875% 5/15/23 (b) | 24,895 | 21,036 | |
| 6.125% 4/15/25 (b) | 16,550 | 13,902 | |
| 6.75% 8/15/21 (b) | 9,748 | 9,443 | |
| 7.25% 7/15/22 (b) | 14,385 | 13,774 | |
| 7.5% 7/15/21 (b) | 5,200 | 5,116 | |
| VPI Escrow Corp. 6.375% 10/15/20 (b) | 2,772 | 2,755 | |
| 477,557 | |||
| Homebuilders/Real Estate - 2.2% | |||
| Ashton Woods U.S.A. LLC/Ashton Woods Finance Co. 6.75% 8/1/25 (b) | 2,655 | 2,628 | |
| AV Homes, Inc. 6.625% 5/15/22 | 3,960 | 4,112 | |
| Beazer Homes U.S.A., Inc.: | |||
| 5.875% 10/15/27 (b) | 8,065 | 8,055 | |
| 6.75% 3/15/25 | 5,520 | 5,839 | |
| Brookfield Residential Properties, Inc./Brookfield Residential U.S. Corp. 6.125% 7/1/22 (b) | 1,825 | 1,905 | |
| Brookfield Residential Properties, Inc. 6.375% 5/15/25 (b) | 2,426 | 2,541 | |
| CalAtlantic Group, Inc.: | |||
| 5% 6/15/27 | 5,320 | 5,593 | |
| 5.25% 6/1/26 | 2,010 | 2,141 | |
| 5.875% 11/15/24 | 2,735 | 3,044 | |
| Howard Hughes Corp. 5.375% 3/15/25 (b) | 5,340 | 5,487 | |
| Kennedy-Wilson, Inc. 5.875% 4/1/24 | 4,295 | 4,456 | |
| M/I Homes, Inc. 5.625% 8/1/25 | 2,380 | 2,419 | |
| Mattamy Group Corp.: | |||
| 6.5% 10/1/25 (b) | 3,960 | 4,128 | |
| 6.875% 12/15/23 (b) | 1,840 | 1,932 | |
| Meritage Homes Corp. 5.125% 6/6/27 | 5,345 | 5,405 | |
| Shea Homes Ltd. Partnership/Corp. 6.125% 4/1/25 (b) | 3,275 | 3,406 | |
| Starwood Property Trust, Inc. 5% 12/15/21 | 4,690 | 4,913 | |
| Taylor Morrison Communities, Inc./Monarch Communities, Inc. 5.625% 3/1/24 (b) | 11,417 | 11,916 | |
| TRI Pointe Homes, Inc.: | |||
| 5.25% 6/1/27 | 6,390 | 6,534 | |
| 5.875% 6/15/24 | 2,260 | 2,446 | |
| William Lyon Homes, Inc.: | |||
| 5.75% 4/15/19 | 2,530 | 2,562 | |
| 5.875% 1/31/25 | 3,095 | 3,157 | |
| 7% 8/15/22 | 3,905 | 4,051 | |
| 98,670 | |||
| Hotels - 0.5% | |||
| ESH Hospitality, Inc. 5.25% 5/1/25 (b) | 14,775 | 15,274 | |
| Hilton Escrow Issuer LLC 4.25% 9/1/24 | 8,425 | 8,604 | |
| 23,878 | |||
| Leisure - 0.4% | |||
| Carlson Travel, Inc. 9.5% 12/15/24 (b) | 2,165 | 2,030 | |
| Silversea Cruises 7.25% 2/1/25 (b) | 2,075 | 2,225 | |
| Six Flags Entertainment Corp.: | |||
| 4.875% 7/31/24 (b) | 2,735 | 2,814 | |
| 5.5% 4/15/27 (b) | 2,735 | 2,855 | |
| Studio City Co. Ltd.: | |||
| 5.875% 11/30/19 (b) | 1,345 | 1,411 | |
| 7.25% 11/30/21 (b) | 7,035 | 7,528 | |
| 18,863 | |||
| Metals/Mining - 2.5% | |||
| Eldorado Gold Corp. 6.125% 12/15/20 (b) | 3,800 | 3,781 | |
| First Quantum Minerals Ltd.: | |||
| 7% 2/15/21 (b) | 2,470 | 2,563 | |
| 7.25% 5/15/22 (b) | 1,975 | 2,064 | |
| 7.25% 4/1/23 (b) | 8,520 | 9,010 | |
| 7.5% 4/1/25 (b) | 20,780 | 22,001 | |
| FMG Resources (August 2006) Pty Ltd.: | |||
| 4.75% 5/15/22 (b) | 3,140 | 3,203 | |
| 5.125% 5/15/24 (b) | 3,860 | 3,971 | |
| Freeport-McMoRan, Inc.: | |||
| 3.55% 3/1/22 | 8,355 | 8,271 | |
| 3.875% 3/15/23 | 10,420 | 10,251 | |
| 4.55% 11/14/24 | 19,750 | 19,711 | |
| 5.4% 11/14/34 | 8,590 | 8,375 | |
| 6.75% 2/1/22 | 4,480 | 4,659 | |
| 6.875% 2/15/23 | 4,275 | 4,676 | |
| Novelis Corp. 5.875% 9/30/26 (b) | 4,300 | 4,432 | |
| SunCoke Energy Partners LP/SunCoke Energy Partners Finance Corp. 7.5% 6/15/25 (b) | 5,440 | 5,698 | |
| Walter Energy, Inc. 9.5% 10/15/19 (b)(d)(e) | 5,823 | 0 | |
| 112,666 | |||
| Paper - 0.1% | |||
| Boise Cascade Co. 5.625% 9/1/24 (b) | 1,855 | 1,929 | |
| Louisiana-Pacific Corp. 4.875% 9/15/24 | 2,150 | 2,217 | |
| NewPage Corp. 11.375% 12/31/2114 (d)(e) | 30,662 | 0 | |
| 4,146 | |||
| Publishing/Printing - 0.0% | |||
| Clear Channel International BV 8.75% 12/15/20 (b) | 1,195 | 1,255 | |
| Restaurants - 0.7% | |||
| 1011778 BC Unlimited Liability Co./New Red Finance, Inc.: | |||
| 4.25% 5/15/24 (b) | 5,375 | 5,414 | |
| 5% 10/15/25 (b) | 5,310 | 5,410 | |
| Golden Nugget, Inc.: | |||
| 6.75% 10/15/24 (b) | 7,965 | 8,104 | |
| 8.75% 10/1/25 (b) | 2,655 | 2,728 | |
| KFC Holding Co./Pizza Hut Holding LLC: | |||
| 4.75% 6/1/27 (b) | 2,660 | 2,730 | |
| 5% 6/1/24 (b) | 6,290 | 6,636 | |
| 31,022 | |||
| Services - 2.7% | |||
| Anna Merger Sub, Inc. 7.75% 10/1/22 (b) | 6,880 | 4,816 | |
| APX Group, Inc.: | |||
| 7.625% 9/1/23 | 6,420 | 6,757 | |
| 7.875% 12/1/22 | 12,845 | 13,857 | |
| Aramark Services, Inc.: | |||
| 4.75% 6/1/26 | 4,275 | 4,472 | |
| 5% 4/1/25 (b) | 5,505 | 5,883 | |
| 5.125% 1/15/24 | 3,350 | 3,543 | |
| Avantor, Inc.: | |||
| 6% 10/1/24 (b) | 6,545 | 6,676 | |
| 9% 10/1/25 (b) | 13,275 | 13,409 | |
| Blueline Rental Finance Corp./Blueline Rental LLC 9.25% 3/15/24 (b) | 11,450 | 12,423 | |
| Brand Energy & Infrastructure Services, Inc. 8.5% 7/15/25 (b) | 2,655 | 2,808 | |
| Corrections Corp. of America: | |||
| 4.75% 10/15/27 | 1,855 | 1,860 | |
| 5% 10/15/22 | 4,758 | 4,966 | |
| H&E Equipment Services, Inc. 5.625% 9/1/25 (b) | 3,715 | 3,924 | |
| Hertz Corp. 6.25% 10/15/22 | 4,400 | 4,213 | |
| IHS Markit Ltd.: | |||
| 4.75% 2/15/25 (b) | 4,720 | 4,991 | |
| 5% 11/1/22 (b) | 1,360 | 1,462 | |
| KAR Auction Services, Inc. 5.125% 6/1/25 (b) | 4,050 | 4,192 | |
| Prime Security One MS, Inc. 4.875% 7/15/32 (b) | 2,655 | 2,512 | |
| Ritchie Brothers Auctioneers, Inc. 5.375% 1/15/25 (b) | 1,545 | 1,626 | |
| The GEO Group, Inc. 6% 4/15/26 | 1,840 | 1,923 | |
| United Rentals North America, Inc.: | |||
| 4.625% 10/15/25 | 4,250 | 4,348 | |
| 5.5% 5/15/27 | 2,330 | 2,493 | |
| 5.875% 9/15/26 | 4,405 | 4,801 | |
| 117,955 | |||
| Steel - 0.3% | |||
| Big River Steel LLC/BRS Finance Corp. 7.25% 9/1/25 (b) | 3,545 | 3,802 | |
| Cliffs Natural Resources, Inc. 5.75% 3/1/25 (b) | 10,620 | 10,288 | |
| 14,090 | |||
| Super Retail - 0.5% | |||
| Asbury Automotive Group, Inc. 6% 12/15/24 | 6,190 | 6,530 | |
| DBP Holding Corp. 7.75% 10/15/20 (b) | 5,075 | 2,715 | |
| JC Penney Corp., Inc.: | |||
| 6.375% 10/15/36 | 1,725 | 1,013 | |
| 7.4% 4/1/37 | 923 | 563 | |
| Netflix, Inc. 4.375% 11/15/26 (b) | 2,350 | 2,304 | |
| PetSmart, Inc.: | |||
| 5.875% 6/1/25 (b) | 2,675 | 2,334 | |
| 8.875% 6/1/25 (b) | 2,675 | 2,107 | |
| Sonic Automotive, Inc. 6.125% 3/15/27 | 3,380 | 3,490 | |
| 21,056 | |||
| Technology - 1.9% | |||
| CDW LLC/CDW Finance Corp. 5.5% 12/1/24 | 3,295 | 3,649 | |
| Compiler Finance Sub, Inc. 7% 5/1/21 (b) | 7,620 | 7,715 | |
| Conduent Finance, Inc./Xerox Business Service LLC 10.5% 12/15/24 (b) | 4,950 | 5,829 | |
| Diamond 1 Finance Corp./Diamond 2 Finance Corp. 7.125% 6/15/24 (b) | 1,290 | 1,424 | |
| Inception Merger Sub, Inc./Rackspace Hosting, Inc. 8.625% 11/15/24 (b) | 18,530 | 19,514 | |
| j2 Cloud Services LLC/j2 Global Communications, Inc. 6% 7/15/25 (b) | 3,095 | 3,257 | |
| Micron Technology, Inc. 5.25% 1/15/24 (b) | 13,155 | 13,829 | |
| Nuance Communications, Inc. 5.625% 12/15/26 (b) | 11,255 | 11,958 | |
| Open Text Corp. 5.875% 6/1/26 (b) | 4,285 | 4,644 | |
| Qorvo, Inc. 6.75% 12/1/23 | 3,555 | 3,848 | |
| Sabre GLBL, Inc. 5.25% 11/15/23 (b) | 4,250 | 4,452 | |
| TTM Technologies, Inc. 5.625% 10/1/25 (b) | 1,525 | 1,556 | |
| VeriSign, Inc. 4.75% 7/15/27 | 2,800 | 2,884 | |
| 84,559 | |||
| Telecommunications - 7.8% | |||
| Altice Financing SA: | |||
| 6.5% 1/15/22 (b) | 6,214 | 6,431 | |
| 7.5% 5/15/26 (b) | 17,345 | 19,014 | |
| Altice Finco SA: | |||
| 7.625% 2/15/25 (b) | 10,375 | 11,116 | |
| 8.125% 1/15/24 (b) | 19,990 | 21,542 | |
| Cincinnati Bell, Inc. 7% 7/15/24 (b) | 6,185 | 6,170 | |
| CommScope Technologies Finance LLC: | |||
| 5% 3/15/27 (b) | 5,325 | 5,185 | |
| 6% 6/15/25 (b) | 1,620 | 1,711 | |
| CyrusOne LP/CyrusOne Finance Corp. 5% 3/15/24 (b) | 1,335 | 1,400 | |
| Frontier Communications Corp. 11% 9/15/25 | 19,390 | 16,457 | |
| GCI, Inc. 6.875% 4/15/25 | 6,590 | 7,134 | |
| Gogo Intermediate Holdings LLC/Gogo Finance Co., Inc. 12.5% 7/1/22 (b) | 3,825 | 4,337 | |
| Inmarsat Finance PLC 4.875% 5/15/22 (b) | 2,245 | 2,290 | |
| Intelsat Jackson Holdings SA: | |||
| 5.5% 8/1/23 | 12,430 | 10,597 | |
| 7.5% 4/1/21 | 1,445 | 1,369 | |
| 8% 2/15/24 (b) | 5,705 | 6,047 | |
| Level 3 Financing, Inc.: | |||
| 5.125% 5/1/23 | 6,560 | 6,716 | |
| 5.375% 1/15/24 | 5,570 | 5,786 | |
| Neptune Finco Corp.: | |||
| 6.625% 10/15/25 (b) | 7,010 | 7,683 | |
| 10.125% 1/15/23 (b) | 4,490 | 5,141 | |
| 10.875% 10/15/25 (b) | 2,345 | 2,873 | |
| Sable International Finance Ltd. 6.875% 8/1/22 (b) | 10,360 | 11,111 | |
| SFR Group SA: | |||
| 6% 5/15/22 (b) | 10,880 | 11,342 | |
| 6.25% 5/15/24 (b) | 4,450 | 4,661 | |
| 7.375% 5/1/26 (b) | 10,355 | 11,132 | |
| Sprint Capital Corp. 6.875% 11/15/28 | 8,180 | 8,727 | |
| Sprint Communications, Inc. 6% 11/15/22 | 17,465 | 18,338 | |
| Sprint Corp.: | |||
| 7.125% 6/15/24 | 20,630 | 22,300 | |
| 7.25% 9/15/21 | 13,030 | 14,203 | |
| 7.875% 9/15/23 | 20,045 | 22,400 | |
| T-Mobile U.S.A., Inc.: | |||
| 6% 3/1/23 | 3,700 | 3,899 | |
| 6% 4/15/24 | 10,590 | 11,331 | |
| 6.625% 4/1/23 | 16,025 | 16,826 | |
| Telecom Italia Capital SA 6.375% 11/15/33 | 4,080 | 4,733 | |
| Telesat Canada/Telesat LLC 8.875% 11/15/24 (b) | 4,015 | 4,497 | |
| ViaSat, Inc. 5.625% 9/15/25 (b) | 5,310 | 5,370 | |
| Wind Acquisition Finance SA 4.75% 7/15/20 (b) | 12,545 | 12,694 | |
| Wind Tre SpA 5% 1/20/26 (b) | 7,655 | 7,705 | |
| Zayo Group LLC/Zayo Capital, Inc. 5.75% 1/15/27 (b) | 6,575 | 6,928 | |
| 347,196 | |||
| Transportation Ex Air/Rail - 1.9% | |||
| Navios Maritime Acquisition Corp./Navios Acquisition Finance U.S., Inc. 8.125% 11/15/21 (b) | 12,930 | 11,378 | |
| Navios Maritime Holdings, Inc.: | |||
| 7.375% 1/15/22 (b) | 35,720 | 29,290 | |
| 8.125% 2/15/19 | 16,681 | 16,431 | |
| Navios South American Logistics, Inc./Navios Logistics Finance U.S., Inc. 7.25% 5/1/22 (b) | 1,575 | 1,544 | |
| Teekay Corp. 8.5% 1/15/20 | 24,793 | 25,072 | |
| 83,715 | |||
| Utilities - 4.1% | |||
| Calpine Corp. 5.75% 1/15/25 | 10,695 | 10,160 | |
| Cortes NP Acquisition Corp. 9.25% 10/15/24 (b) | 8,515 | 9,324 | |
| Dolphin Subsidiary II, Inc. 7.25% 10/15/21 | 10,390 | 11,471 | |
| Dynegy, Inc.: | |||
| 7.375% 11/1/22 | 1,648 | 1,770 | |
| 7.625% 11/1/24 | 42,875 | 46,841 | |
| 8% 1/15/25 (b) | 6,290 | 6,872 | |
| 8.125% 1/30/26 (b) | 2,655 | 2,947 | |
| Global Partners LP/GLP Finance Corp.: | |||
| 6.25% 7/15/22 | 5,950 | 6,084 | |
| 7% 6/15/23 | 16,745 | 16,996 | |
| InterGen NV 7% 6/30/23 (b) | 38,674 | 37,514 | |
| NRG Energy, Inc. 7.25% 5/15/26 | 1,000 | 1,084 | |
| NRG Yield Operating LLC 5% 9/15/26 | 2,685 | 2,766 | |
| NSG Holdings II LLC/NSG Holdings, Inc. 7.75% 12/15/25 (b) | 7,218 | 7,840 | |
| Pattern Energy Group, Inc. 5.875% 2/1/24 (b) | 2,370 | 2,518 | |
| PPL Energy Supply LLC 6.5% 6/1/25 | 5,125 | 4,459 | |
| RJS Power Holdings LLC 4.625% 7/15/19 (b)(c) | 1,314 | 1,330 | |
| The AES Corp.: | |||
| 5.125% 9/1/27 | 2,655 | 2,725 | |
| 6% 5/15/26 | 8,415 | 9,067 | |
| 181,768 | |||
| TOTAL NONCONVERTIBLE BONDS | 3,447,572 | ||
| TOTAL CORPORATE BONDS | |||
| (Cost $3,392,554) | 3,459,004 | ||
| Shares | Value (000s) | ||
| Common Stocks - 0.1% | |||
| Automotive & Auto Parts - 0.1% | |||
| Chassix Holdings, Inc. (e)(g) | 103,457 | 3,759 | |
| Chassix Holdings, Inc. warrants 7/29/20 (e)(g) | 27,176 | 322 | |
| TOTAL AUTOMOTIVE & AUTO PARTS | 4,081 | ||
| Banks & Thrifts - 0.0% | |||
| CIT Group, Inc. | 6,724 | 313 | |
| Chemicals - 0.0% | |||
| LyondellBasell Industries NV Class A | 306 | 32 | |
| Environmental - 0.0% | |||
| Tervita Corp. Class A (e) | 79,321 | 507 | |
| Healthcare - 0.0% | |||
| HealthSouth Corp. | 22 | 1 | |
| TOTAL COMMON STOCKS | |||
| (Cost $13,557) | 4,934 | ||
| Preferred Stocks - 1.2% | |||
| Convertible Preferred Stocks - 0.7% | |||
| Energy - 0.4% | |||
| Chesapeake Energy Corp. Series A 5.75% | 32,900 | 18,321 | |
| Telecommunications - 0.3% | |||
| Crown Castle International Corp. Series A 6.875% | 9,600 | 10,529 | |
| TOTAL CONVERTIBLE PREFERRED STOCKS | 28,850 | ||
| Nonconvertible Preferred Stocks - 0.5% | |||
| Environmental - 0.5% | |||
| Tervita Corp. Series A (e) | 3,612,430 | 23,101 | |
| TOTAL PREFERRED STOCKS | |||
| (Cost $52,855) | 51,951 | ||
| Principal Amount (000s) | Value (000s) | ||
| Bank Loan Obligations - 5.5% | |||
| Automotive & Auto Parts - 0.0% | |||
| Chassix, Inc. term loan 12% 7/29/19 (e) | 470 | 469 | |
| Broadcasting - 0.2% | |||
| CBS Radio, Inc.: | |||
| term loan 3 month U.S. LIBOR + 3.500% 4.7379% 10/17/23 (c)(f) | 7,743 | 7,789 | |
| Tranche B 1LN, term loan 3 month U.S. LIBOR + 2.750% 3/2/24 (f)(h) | 905 | 907 | |
| TOTAL BROADCASTING | 8,696 | ||
| Building Materials - 0.1% | |||
| Beacon Roofing Supply, Inc. Tranche B, term loan 3 month U.S. LIBOR + 2.250% 1/2/25 (f)(h) | 5,975 | 6,012 | |
| Cable/Satellite TV - 0.5% | |||
| Charter Communication Operating LLC term loan: | |||
| 3 month U.S. LIBOR + 2.000% 3.25% 7/1/20 (c)(f) | 4,454 | 4,474 | |
| 3 month U.S. LIBOR + 2.000% 3.25% 1/3/21 (c)(f) | 6,375 | 6,400 | |
| Virgin Media Bristol LLC Tranche 1LN, term loan 3 month U.S. LIBOR + 2.750% 3.9889% 1/31/25 (c)(f) | 7,170 | 7,197 | |
| WideOpenWest Finance LLC Tranche B, term loan 3 month U.S. LIBOR + 3.250% 4.4867% 8/19/23 (c)(f) | 2,715 | 2,718 | |
| TOTAL CABLE/SATELLITE TV | 20,789 | ||
| Chemicals - 0.0% | |||
| Tronox Blocked Borrower LLC Tranche B, term loan 3 month U.S. LIBOR + 3.000% 4.3231% 9/22/24 (c)(f) | 531 | 535 | |
| Tronox Finance LLC Tranche B, term loan 3 month U.S. LIBOR + 3.000% 4.3283% 9/22/24 (c)(f) | 1,224 | 1,234 | |
| Venator Materials LLC Tranche B, term loan 3 month U.S. LIBOR + 3.000% 4.3801% 8/8/24 (c)(f) | 400 | 405 | |
| TOTAL CHEMICALS | 2,174 | ||
| Containers - 0.0% | |||
| Plastipak Packaging, Inc. Tranche B, term loan 3 month U.S. LIBOR + 2.750% 3.99% 10/14/24 (c)(f) | 260 | 262 | |
| Diversified Financial Services - 0.0% | |||
| Bcp Renaissance Parent LLC Tranche B, term loan 3 month U.S. LIBOR + 4.500% 5.3801% 9/20/24 (c)(f) | 1,085 | 1,097 | |
| Diversified Media - 0.1% | |||
| Outfront Media Capital LLC / Corp. Tranche B, term loan 3 month U.S. LIBOR + 2.250% 3.4889% 3/16/24 (c)(f) | 3,160 | 3,182 | |
| Energy - 0.5% | |||
| California Resources Corp. Tranche 1LN, term loan 3 month U.S. LIBOR + 10.375% 11.6117% 12/31/21 (c)(f) | 4,570 | 4,894 | |
| FTS International, Inc. Tranche B, term loan 3 month U.S. LIBOR + 4.750% 5.9923% 4/16/21 (c)(f) | 16,275 | 15,860 | |
| TOTAL ENERGY | 20,754 | ||
| Environmental - 0.1% | |||
| Hd Supply Waterworks Ltd. Tranche B, term loan 3 month U.S. LIBOR + 3.000% 4.455% 8/1/24 (c)(f) | 3,495 | 3,517 | |
| Wrangler Buyer Corp. Tranche B, term loan 3 month U.S. LIBOR + 3.000% 4.2344% 9/28/24 (c)(f) | 455 | 459 | |
| TOTAL ENVIRONMENTAL | 3,976 | ||
| Gaming - 0.9% | |||
| Caesars Growth Properties Holdings LLC Tranche 1LN, term loan 3 month U.S. LIBOR + 3.000% 4.2423% 5/8/21 (c)(f) | 10,627 | 10,629 | |
| Caesars Resort Collection LLC Tranche B 1LN, term loan 3 month U.S. LIBOR + 2.750% 9/28/24 (f)(h) | 13,575 | 13,657 | |
| CityCenter Holdings LLC Tranche B, term loan 3 month U.S. LIBOR + 2.500% 3.7423% 4/18/24 (c)(f) | 7,641 | 7,672 | |
| Golden Nugget, Inc. Tranche B 1LN, term loan 3 month U.S. LIBOR + 3.250% 4.5264% 10/4/23 (c)(f) | 2,843 | 2,871 | |
| Scientific Games Corp. Tranche B, term loan 3 month U.S. LIBOR + 3.250% 4.5159% 8/14/24 (c)(f) | 3,070 | 3,104 | |
| TOTAL GAMING | 37,933 | ||
| Healthcare - 1.0% | |||
| Community Health Systems, Inc. Tranche H, term loan 3 month U.S. LIBOR + 3.000% 4.3169% 1/27/21 (c)(f) | 4,028 | 3,893 | |
| Kindred Healthcare, Inc. Tranche B, term loan 3 month U.S. LIBOR + 3.500% 4.875% 4/9/21 (c)(f) | 6,306 | 6,322 | |
| Ortho-Clinical Diagnostics, Inc. Tranche B, term loan 3 month U.S. LIBOR + 3.750% 5.0828% 6/30/21 (c)(f) | 33,849 | 34,005 | |
| U.S. Renal Care, Inc. Tranche B 1LN, term loan 3 month U.S. LIBOR + 4.250% 5.5828% 12/31/22 (c)(f) | 1,895 | 1,829 | |
| TOTAL HEALTHCARE | 46,049 | ||
| Insurance - 0.0% | |||
| Asurion LLC Tranche B, term loan 3 month U.S. LIBOR + 6.000% 7.235% 8/4/25 (c)(f) | 1,245 | 1,285 | |
| Paper - 0.1% | |||
| Caraustar Industries, Inc. Tranche B, term loan 3 month U.S. LIBOR + 5.500% 6.8328% 3/14/22 (c)(f) | 6,311 | 6,356 | |
| Publishing/Printing - 0.0% | |||
| Springer Science+Business Media Deutschland GmbH Tranche B 13LN, term loan 3 month U.S. LIBOR + 3.500% 8/15/22 (f)(h) | 170 | 170 | |
| Restaurants - 0.1% | |||
| Burger King Worldwide, Inc. Tranche B, term loan 3 month U.S. LIBOR + 2.250% 3.5276% 2/17/24 (c)(f) | 3,120 | 3,123 | |
| Services - 0.4% | |||
| Almonde, Inc. Tranche B 1LN, term loan 3 month U.S. LIBOR + 3.500% 4.8169% 6/13/24 (c)(f) | 2,285 | 2,276 | |
| Avantor, Inc. Tranche B, term loan 3 month U.S. LIBOR + 4.000% 9/20/24 (f)(h) | 5,425 | 5,453 | |
| Laureate Education, Inc. Tranche B 1LN, term loan 3 month U.S. LIBOR + 4.500% 5.7423% 4/26/24 (c)(f) | 7,965 | 8,000 | |
| TOTAL SERVICES | 15,729 | ||
| Steel - 0.2% | |||
| Big River Steel LLC Tranche B, term loan 3 month U.S. LIBOR + 5.000% 6.3328% 8/23/23 (c)(f) | 7,050 | 7,173 | |
| Super Retail - 0.1% | |||
| Sears Holdings Corp. Tranche ABL, term loan 3 month U.S. LIBOR + 4.500% 5.7417% 6/30/18 (c)(f) | 5,999 | 5,919 | |
| Technology - 0.4% | |||
| First Data Corp. Tranche B 1LN, term loan 3 month U.S. LIBOR + 2.500% 3.7379% 4/26/24 (c)(f) | 2,690 | 2,701 | |
| Information Resources, Inc. Tranche B 1LN, term loan 3 month U.S. LIBOR + 4.250% 5.6174% 1/18/24 (c)(f) | 1,000 | 1,010 | |
| Kronos, Inc. Tranche B 1LN, term loan 3 month U.S. LIBOR + 3.500% 4.8114% 11/1/23 (c)(f) | 9,493 | 9,557 | |
| Veritas U.S., Inc. Tranche B, term loan 3 month U.S. LIBOR + 4.500% 5.8328% 1/27/23 (c)(f) | 5,482 | 5,523 | |
| TOTAL TECHNOLOGY | 18,791 | ||
| Telecommunications - 0.5% | |||
| Altice Financing SA Tranche B, term loan 3 month U.S. LIBOR + 2.750% 1/5/26 (f)(h) | 7,855 | 7,855 | |
| Radiate Holdco LLC Tranche B, term loan 3 month U.S. LIBOR + 3.000% 4.2423% 2/1/24 (c)(f) | 10,900 | 10,775 | |
| Sprint Communications, Inc. Tranche B, term loan 3 month U.S. LIBOR + 2.500% 3.75% 2/3/24 (c)(f) | 3,284 | 3,294 | |
| TOTAL TELECOMMUNICATIONS | 21,924 | ||
| Transportation Ex Air/Rail - 0.1% | |||
| International Seaways Operating Corp. Tranche B, term loan 3 month U.S. LIBOR + 5.500% 6.74% 6/22/22 (c)(f) | 3,369 | 3,386 | |
| Utilities - 0.2% | |||
| Cortes NP Acquisition Corp. Tranche B, term loan 3 month U.S. LIBOR + 4.000% 5.235% 11/30/23 (c)(f) | 6,353 | 6,396 | |
| Vistra Operations Co. LLC Tranche B 2LN, term loan 3 month U.S. LIBOR + 2.750% 4.0104% 12/14/23 (c)(f) | 1,930 | 1,944 | |
| TOTAL UTILITIES | 8,340 | ||
| TOTAL BANK LOAN OBLIGATIONS | |||
| (Cost $240,281) | 243,589 | ||
| Preferred Securities - 3.8% | |||
| Banks & Thrifts - 3.8% | |||
| Bank of America Corp.: | |||
| 6.1% (c)(i) | 7,150 | 8,035 | |
| 6.25% (c)(i) | 6,240 | 7,011 | |
| Barclays Bank PLC 7.625% 11/21/22 | 18,275 | 21,614 | |
| Barclays PLC: | |||
| 6.625% (c)(i) | 19,280 | 20,313 | |
| 8.25% (c)(i) | 13,960 | 14,987 | |
| Citigroup, Inc.: | |||
| 5.875% (c)(i) | 10,105 | 10,636 | |
| 6.3% (c)(i) | 5,630 | 6,284 | |
| Credit Agricole SA: | |||
| 6.625% (b)(c)(i) | 8,755 | 9,266 | |
| 7.875% (b)(c)(i) | 11,570 | 13,273 | |
| Credit Suisse Group AG: | |||
| 6.25% (b)(c)(i) | 2,730 | 3,049 | |
| 7.5% (b)(c)(i) | 2,165 | 2,580 | |
| JPMorgan Chase & Co.: | |||
| 6.125% (c)(i) | 3,445 | 3,825 | |
| 6.75% (c)(i) | 4,255 | 4,949 | |
| Lloyds Banking Group PLC 7.5% (c)(i) | 14,060 | 16,147 | |
| Royal Bank of Scotland Group PLC: | |||
| 7.5% (c)(i) | 13,855 | 14,937 | |
| 8% (c)(i) | 3,715 | 4,273 | |
| 8.625% (c)(i) | 8,860 | 10,100 | |
| TOTAL PREFERRED SECURITIES | |||
| (Cost $155,582) | 171,279 | ||
| Shares | Value (000s) | ||
| Money Market Funds - 11.0% | |||
| Fidelity Cash Central Fund, 1.10% (j) | |||
| (Cost $488,312) | 488,252,770 | 488,350 | |
| TOTAL INVESTMENT IN SECURITIES - 99.3% | |||
| (Cost $4,343,141) | 4,419,107 | ||
| NET OTHER ASSETS (LIABILITIES) - 0.7% | 31,712 | ||
| NET ASSETS - 100% | $4,450,819 |
Values shown as $0 may reflect amounts less than $500.
Legend
(a) Security initially issued at one coupon which converts to a higher coupon at a specified date. The rate shown is the rate at period end.
(b) Security exempt from registration under Rule 144A of the Securities Act of 1933. These securities may be resold in transactions exempt from registration, normally to qualified institutional buyers. At the end of the period, the value of these securities amounted to $1,805,858,000 or 40.6% of net assets.
(c) Coupon rates for floating and adjustable rate securities reflect the rates in effect at period end.
(d) Non-income producing - Security is in default.
(e) Level 3 security
(f) Coupon is indexed to a floating interest rate which may be multiplied by a specified factor and/or subject to caps or floors.
(g) Non-income producing
(h) The coupon rate will be determined upon settlement of the loan after period end.
(i) Security is perpetual in nature with no stated maturity date.
(j) Affiliated fund that is generally available only to investment companies and other accounts managed by Fidelity Investments. The rate quoted is the annualized seven-day yield of the fund at period end. A complete unaudited listing of the fund's holdings as of its most recent quarter end is available upon request. In addition, each Fidelity Central Fund's financial statements are available on the SEC's website or upon request.
Affiliated Central Funds
Information regarding fiscal year to date income earned by the Fund from investments in Fidelity Central Funds is as follows:
| Fund | Income earned |
| (Amounts in thousands) | |
| Fidelity Cash Central Fund | $1,998 |
| Total | $1,998 |
Other Affiliated Issuers
An affiliated company is a company in which the Fund has ownership of at least 5% of the voting securities. Fiscal year to date transactions with companies which are or were affiliates are as follows:
| Affiliate (Amounts in thousands) | Value, beginning of period | Purchases | Sales Proceeds | Dividend Income | Realized Gain (loss) | Change in Unrealized appreciation (depreciation) | Value, end of period |
| Broadview Networks Holdings, Inc. | $3,705 | $-- | $4,253 | $-- | $(7,093) | $7,641 | $-- |
| Total | $3,705 | $-- | $4,253 | $-- | $(7,093) | $7,641 | $-- |
Investment Valuation
The following is a summary of the inputs used, as of October 31, 2017, involving the Fund's assets and liabilities carried at fair value. The inputs or methodology used for valuing securities may not be an indication of the risk associated with investing in those securities. For more information on valuation inputs, and their aggregation into the levels used below, please refer to the Investment Valuation section in the accompanying Notes to Financial Statements.
| Valuation Inputs at Reporting Date: | ||||
| Description | Total | Level 1 | Level 2 | Level 3 |
| (Amounts in thousands) | ||||
| Investments in Securities: | ||||
| Equities: | ||||
| Consumer Discretionary | $4,081 | $-- | $-- | $4,081 |
| Energy | 18,321 | -- | 18,321 | -- |
| Financials | 313 | 313 | -- | -- |
| Health Care | 1 | 1 | -- | -- |
| Industrials | 23,608 | -- | -- | 23,608 |
| Materials | 32 | 32 | -- | -- |
| Real Estate | 10,529 | -- | 10,529 | -- |
| Corporate Bonds | 3,459,004 | -- | 3,459,004 | -- |
| Bank Loan Obligations | 243,589 | -- | 243,120 | 469 |
| Preferred Securities | 171,279 | -- | 171,279 | -- |
| Money Market Funds | 488,350 | 488,350 | -- | -- |
| Total Investments in Securities: | $4,419,107 | $488,696 | $3,902,253 | $28,158 |
Other Information
Distribution of investments by country or territory of incorporation, as a percentage of Total Net Assets, is as follows (Unaudited):
| United States of America | 77.8% |
| Canada | 4.8% |
| Luxembourg | 3.8% |
| United Kingdom | 3.2% |
| Netherlands | 1.8% |
| Marshall Islands | 1.8% |
| France | 1.2% |
| Cayman Islands | 1.1% |
| Austria | 1.1% |
| Others (Individually Less Than 1%) | 3.4% |
| 100.0% |
See accompanying notes which are an integral part of the financial statements.
Financial Statements
Statement of Assets and Liabilities
| Amounts in thousands (except per-share amount) | October 31, 2017 (Unaudited) | |
| Assets | ||
| Investment in securities, at value — See accompanying schedule: Unaffiliated issuers (cost $3,854,829) | $3,930,757 | |
| Fidelity Central Funds (cost $488,312) | 488,350 | |
| Total Investment in Securities (cost $4,343,141) | $4,419,107 | |
| Cash | 2,054 | |
| Receivable for investments sold | 41,621 | |
| Receivable for fund shares sold | 7,840 | |
| Dividends receivable | 647 | |
| Interest receivable | 62,133 | |
| Distributions receivable from Fidelity Central Funds | 344 | |
| Prepaid expenses | 10 | |
| Other receivables | 640 | |
| Total assets | 4,534,396 | |
| Liabilities | ||
| Payable for investments purchased | $66,576 | |
| Payable for fund shares redeemed | 10,898 | |
| Distributions payable | 3,465 | |
| Accrued management fee | 2,060 | |
| Other affiliated payables | 511 | |
| Other payables and accrued expenses | 67 | |
| Total liabilities | 83,577 | |
| Net Assets | $4,450,819 | |
| Net Assets consist of: | ||
| Paid in capital | $4,498,108 | |
| Undistributed net investment income | 43,151 | |
| Accumulated undistributed net realized gain (loss) on investments | (166,406) | |
| Net unrealized appreciation (depreciation) on investments | 75,966 | |
| Net Assets, for 492,679 shares outstanding | $4,450,819 | |
| Net Asset Value, offering price and redemption price per share ($4,450,819 ÷ 492,679 shares) | $9.03 |
See accompanying notes which are an integral part of the financial statements.
Statement of Operations
| Amounts in thousands | Six months ended October 31, 2017 (Unaudited) | |
| Investment Income | ||
| Dividends | $6,155 | |
| Interest | 131,396 | |
| Income from Fidelity Central Funds | 1,998 | |
| Total income | 139,549 | |
| Expenses | ||
| Management fee | $12,252 | |
| Transfer agent fees | 2,482 | |
| Accounting fees and expenses | 574 | |
| Custodian fees and expenses | 24 | |
| Independent trustees' fees and expenses | 9 | |
| Registration fees | 58 | |
| Audit | 57 | |
| Legal | (23) | |
| Miscellaneous | 21 | |
| Total expenses before reductions | 15,454 | |
| Expense reductions | (26) | 15,428 |
| Net investment income (loss) | 124,121 | |
| Realized and Unrealized Gain (Loss) | ||
| Net realized gain (loss) on: | ||
| Investment securities: | ||
| Unaffiliated issuers | 45,956 | |
| Fidelity Central Funds | 2 | |
| Other affiliated issuers | (7,093) | |
| Total net realized gain (loss) | 38,865 | |
| Change in net unrealized appreciation (depreciation) on: | ||
| Investment securities: | ||
| Unaffiliated issuers | (16,102) | |
| Fidelity Central Funds | (1) | |
| Other affiliated issuers | 7,642 | |
| Total change in net unrealized appreciation (depreciation) | (8,461) | |
| Net gain (loss) | 30,404 | |
| Net increase (decrease) in net assets resulting from operations | $154,525 |
See accompanying notes which are an integral part of the financial statements.
Statement of Changes in Net Assets
| Amounts in thousands | Six months ended October 31, 2017 (Unaudited) | Year ended April 30, 2017 |
| Increase (Decrease) in Net Assets | ||
| Operations | ||
| Net investment income (loss) | $124,121 | $269,263 |
| Net realized gain (loss) | 38,865 | (64,197) |
| Change in net unrealized appreciation (depreciation) | (8,461) | 388,354 |
| Net increase (decrease) in net assets resulting from operations | 154,525 | 593,420 |
| Distributions to shareholders from net investment income | (109,414) | (252,069) |
| Share transactions | ||
| Proceeds from sales of shares | 372,027 | 1,064,869 |
| Reinvestment of distributions | 88,968 | 206,922 |
| Cost of shares redeemed | (547,299) | (1,555,712) |
| Net increase (decrease) in net assets resulting from share transactions | (86,304) | (283,921) |
| Redemption fees | 90 | 321 |
| Total increase (decrease) in net assets | (41,103) | 57,751 |
| Net Assets | ||
| Beginning of period | 4,491,922 | 4,434,171 |
| End of period | $4,450,819 | $4,491,922 |
| Other Information | ||
| Undistributed net investment income end of period | $43,151 | $28,444 |
| Shares | ||
| Sold | 41,458 | 123,618 |
| Issued in reinvestment of distributions | 9,900 | 23,922 |
| Redeemed | (61,029) | (178,909) |
| Net increase (decrease) | (9,671) | (31,369) |
See accompanying notes which are an integral part of the financial statements.
Financial Highlights
Fidelity High Income Fund
| Six months ended (Unaudited) October 31, | Years ended April 30, | |||||
| 2017 | 2017 | 2016 | 2015 | 2014 | 2013 | |
| Selected Per–Share Data | ||||||
| Net asset value, beginning of period | $8.94 | $8.31 | $9.04 | $9.45 | $9.59 | $9.05 |
| Income from Investment Operations | ||||||
| Net investment income (loss)A | .253 | .501 | .503 | .495 | .523 | .551 |
| Net realized and unrealized gain (loss) | .060 | .597 | (.741) | (.291) | (.091) | .538 |
| Total from investment operations | .313 | 1.098 | (.238) | .204 | .432 | 1.089 |
| Distributions from net investment income | (.223) | (.469) | (.493) | (.486) | (.509) | (.504) |
| Distributions from net realized gain | – | – | – | (.129) | (.064) | (.046) |
| Total distributions | (.223) | (.469) | (.493) | (.615) | (.573) | (.550) |
| Redemption fees added to paid in capitalA | –B | .001 | .001 | .001 | .001 | .001 |
| Net asset value, end of period | $9.03 | $8.94 | $8.31 | $9.04 | $9.45 | $9.59 |
| Total ReturnC,D | 3.54% | 13.56% | (2.47)% | 2.29% | 4.74% | 12.44% |
| Ratios to Average Net AssetsE,F | ||||||
| Expenses before reductions | .70%G | .72% | .73% | .72% | .72% | .72% |
| Expenses net of fee waivers, if any | .70%G | .72% | .73% | .72% | .72% | .72% |
| Expenses net of all reductions | .70%G | .72% | .73% | .72% | .72% | .72% |
| Net investment income (loss) | 5.60%G | 5.81% | 6.00% | 5.38% | 5.58% | 5.96% |
| Supplemental Data | ||||||
| Net assets, end of period (in millions) | $4,451 | $4,492 | $4,434 | $5,347 | $6,372 | $6,678 |
| Portfolio turnover rateH | 45%G | 52% | 33% | 37% | 56% | 44% |
A Calculated based on average shares outstanding during the period.
B Amount represents less than $.0005 per share.
C Total returns for periods of less than one year are not annualized.
D Total returns would have been lower if certain expenses had not been reduced during the applicable periods shown.
E Fees and expenses of any underlying Fidelity Central Funds are not included in the Fund's expense ratio. The Fund indirectly bears its proportionate share of the expenses of any underlying Fidelity Central Funds.
F Expense ratios reflect operating expenses of the Fund. Expenses before reductions do not reflect amounts reimbursed by the investment adviser or reductions from brokerage service arrangements or reductions from other expense offset arrangements and do not represent the amount paid by the Fund during periods when reimbursements or reductions occur. Expenses net of fee waivers reflect expenses after reimbursement by the investment adviser but prior to reductions from brokerage service arrangements or other expense offset arrangements. Expenses net of all reductions represent the net expenses paid by the Fund.
G Annualized
H Amount does not include the portfolio activity of any underlying Fidelity Central Funds.
See accompanying notes which are an integral part of the financial statements.
Notes to Financial Statements (Unaudited)
For the period ended October 31, 2017
(Amounts in thousands except percentages)
1. Organization.
Fidelity High Income Fund (the Fund) is a fund of Fidelity Summer Street Trust (the Trust) and is authorized to issue an unlimited number of shares. Share transactions on the Statement of Changes in Net Assets may contain exchanges between affiliated funds. The Trust is registered under the Investment Company Act of 1940, as amended (the 1940 Act), as an open-end management investment company organized as a Massachusetts business trust.
2. Investments in Fidelity Central Funds.
The Fund invests in Fidelity Central Funds, which are open-end investment companies generally available only to other investment companies and accounts managed by the investment adviser and its affiliates. The Fund's Schedule of Investments lists each of the Fidelity Central Funds held as of period end, if any, as an investment of the Fund, but does not include the underlying holdings of each Fidelity Central Fund. As an Investing Fund, the Fund indirectly bears its proportionate share of the expenses of the underlying Fidelity Central Funds.
The Money Market Central Funds seek preservation of capital and current income and are managed by Fidelity Investments Money Management, Inc. (FIMM), an affiliate of the investment adviser. Annualized expenses of the Money Market Central Funds as of their most recent shareholder report date are less than .005%.
A complete unaudited list of holdings for each Fidelity Central Fund is available upon request or at the Securities and Exchange Commission (the SEC) website at www.sec.gov. In addition, the financial statements of the Fidelity Central Funds are available on the SEC website or upon request.
3. Significant Accounting Policies.
The Fund is an investment company and applies the accounting and reporting guidance of the Financial Accounting Standards Board (FASB) Accounting Standards Codification Topic 946 Financial Services – Investments Companies. The financial statements have been prepared in conformity with accounting principles generally accepted in the United States of America (GAAP), which require management to make certain estimates and assumptions at the date of the financial statements. Actual results could differ from those estimates. Subsequent events, if any, through the date that the financial statements were issued have been evaluated in the preparation of the financial statements. The following summarizes the significant accounting policies of the Fund:
Investment Valuation. Investments are valued as of 4:00 p.m. Eastern time on the last calendar day of the period. The Board of Trustees (the Board) has delegated the day to day responsibility for the valuation of the Fund's investments to the Fair Value Committee (the Committee) established by the Fund's investment adviser. In accordance with valuation policies and procedures approved by the Board, the Fund attempts to obtain prices from one or more third party pricing vendors or brokers to value its investments. When current market prices, quotations or currency exchange rates are not readily available or reliable, investments will be fair valued in good faith by the Committee, in accordance with procedures adopted by the Board. Factors used in determining fair value vary by investment type and may include market or investment specific events, changes in interest rates and credit quality. The frequency with which these procedures are used cannot be predicted and they may be utilized to a significant extent. The Committee oversees the Fund's valuation policies and procedures and reports to the Board on the Committee's activities and fair value determinations. The Board monitors the appropriateness of the procedures used in valuing the Fund's investments and ratifies the fair value determinations of the Committee.
The Fund categorizes the inputs to valuation techniques used to value its investments into a disclosure hierarchy consisting of three levels as shown below:
- Level 1 – quoted prices in active markets for identical investments
- Level 2 – other significant observable inputs (including quoted prices for similar investments, interest rates, prepayment speeds, etc.)
- Level 3 – unobservable inputs (including the Fund's own assumptions based on the best information available)
Valuation techniques used to value the Fund's investments by major category are as follows:
Debt securities, including restricted securities, are valued based on evaluated prices received from third party pricing vendors or from brokers who make markets in such securities. Corporate bonds, bank loan obligations and preferred securities are valued by pricing vendors who utilize matrix pricing which considers yield or price of bonds of comparable quality, coupon, maturity and type or by broker-supplied prices. When independent prices are unavailable or unreliable, debt securities may be valued utilizing pricing methodologies which consider similar factors that would be used by third party pricing vendors. The Fund invests a significant portion of its assets in below investment grade securities. The value of these securities can be more volatile due to changes in the credit quality of the issuer and is sensitive to changes in economic, market and regulatory conditions.
Equity securities, including restricted securities, for which market quotations are readily available, are valued at the last reported sale price or official closing price as reported by a third party pricing vendor on the primary market or exchange on which they are traded and are categorized as Level 1 in the hierarchy. In the event there were no sales during the day or closing prices are not available, securities are valued at the last quoted bid price or may be valued using the last available price and are generally categorized as Level 2 in the hierarchy. For foreign equity securities, when market or security specific events arise, comparisons to the valuation of American Depositary Receipts (ADRs), futures contracts, Exchange-Traded Funds (ETFs) and certain indexes as well as quoted prices for similar securities may be used and would be categorized as Level 2 in the hierarchy. Utilizing these techniques may result in transfers between Level 1 and Level 2. For equity securities, including restricted securities, where observable inputs are limited, assumptions about market activity and risk are used and these securities may be categorized as Level 3 in the hierarchy.
Investments in open-end mutual funds, including the Fidelity Central Funds, are valued at their closing net asset value (NAV) each business day and are categorized as Level 1 in the hierarchy.
Changes in valuation techniques may result in transfers in or out of an assigned level within the disclosure hierarchy. The aggregate value of investments by input level as of October 31, 2017 is included at the end of the Fund's Schedule of Investments.
Investment Transactions and Income. For financial reporting purposes, the Fund's investment holdings and NAV include trades executed through the end of the last business day of the period. The NAV per share for processing shareholder transactions is calculated as of the close of business of the New York Stock Exchange (NYSE), normally 4:00 p.m. Eastern time and includes trades executed through the end of the prior business day. Gains and losses on securities sold are determined on the basis of identified cost and includes proceeds received from litigation. Dividend income is recorded on the ex-dividend date, except for certain dividends from foreign securities where the ex-dividend date may have passed, which are recorded as soon as the Fund is informed of the ex-dividend date. Non-cash dividends included in dividend income, if any, are recorded at the fair market value of the securities received. Income and capital gain distributions from Fidelity Central Funds, if any, are recorded on the ex-dividend date. Certain distributions received by the Fund represent a return of capital or capital gain. The Fund determines the components of these distributions subsequent to the ex-dividend date, based upon receipt of tax filings or other correspondence relating to the underlying investment. These distributions are recorded as a reduction of cost of investments and/or as a realized gain. Interest income is accrued as earned and includes coupon interest and amortization of premium and accretion of discount on debt securities as applicable. Paid in Kind (PIK) income is recorded at the fair market value of the securities received. Debt obligations may be placed on non-accrual status and related interest income may be reduced by ceasing current accruals and writing off interest receivables when the collection of all or a portion of interest has become doubtful based on consistently applied procedures. A debt obligation is removed from non-accrual status when the issuer resumes interest payments or when collectability of interest is reasonably assured.
Expenses. Expenses directly attributable to a fund are charged to that fund. Expenses attributable to more than one fund are allocated among the respective funds on the basis of relative net assets or other appropriate methods. Expense estimates are accrued in the period to which they relate and adjustments are made when actual amounts are known.
Income Tax Information and Distributions to Shareholders. Each year, the Fund intends to qualify as a regulated investment company under Subchapter M of the Internal Revenue Code, including distributing substantially all of its taxable income and realized gains. As a result, no provision for U.S. Federal income taxes is required. The Fund files a U.S. federal tax return, in addition to state and local tax returns as required. The Fund's federal income tax returns are subject to examination by the Internal Revenue Service (IRS) for a period of three fiscal years after they are filed. State and local tax returns may be subject to examination for an additional fiscal year depending on the jurisdiction.
Dividends are declared and recorded daily and paid monthly from net investment income. Distributions from realized gains, if any, are declared and recorded on the ex-dividend date. Income and capital gain distributions are determined in accordance with income tax regulations, which may differ from GAAP.
Capital accounts within the financial statements are adjusted for permanent book-tax differences. These adjustments have no impact on net assets or the results of operations. Capital accounts are not adjusted for temporary book-tax differences which will reverse in a subsequent period.
Book-tax differences are primarily due to foreign currency transactions, market discount, contingent interest, deferred trustees compensation, certain conversion ratio adjustments, capital loss carryforwards and losses deferred due to wash sales.
As of period end, the cost and unrealized appreciation (depreciation) in securities, and derivatives if applicable, for federal income tax purposes as follows:
| Gross unrealized appreciation | $209,153 |
| Gross unrealized depreciation | (107,409) |
| Net unrealized appreciation (depreciation) | $101,744 |
| Tax cost | $4,317,363 |
Capital loss carryforwards are only available to offset future capital gains of the Fund to the extent provided by regulations and may be limited. Under the Regulated Investment Company Modernization Act of 2010 (the Act), the Fund is permitted to carry forward capital losses incurred in taxable years beginning after December 22, 2010 for an unlimited period and such capital losses are required to be used prior to any losses that expire. The capital loss carryforward information presented below, including any applicable limitation, is estimated as of prior fiscal period end and is subject to adjustment.
| No expiration | |
| Short-term | $(29,322) |
| Long-term | (174,065) |
| Total no expiration | $(203,387) |
Short-Term Trading (Redemption) Fees. Shares held by investors in the Fund less than 90 days may have been subject to a redemption fee equal to 1.00% of the NAV of shares redeemed. All redemption fees, which reduce the proceeds of the shareholder redemption, are retained by the Fund and accounted for as an addition to paid in capital. In November 2017, the Board of Trustees approved the elimination of these redemption fees effective December 18, 2017.
Restricted Securities. The Fund may invest in securities that are subject to legal or contractual restrictions on resale. These securities generally may be resold in transactions exempt from registration or to the public if the securities are registered. Disposal of these securities may involve time-consuming negotiations and expense, and prompt sale at an acceptable price may be difficult. Information regarding restricted securities is included at the end of the Fund's Schedule of Investments.
Loans and Other Direct Debt Instruments. The Fund invests in direct debt instruments which are interests in amounts owed to lenders by corporate or other borrowers. These instruments may be in the form of loans, trade claims or other receivables and may include standby financing commitments such as revolving credit facilities that obligate the Fund to supply additional cash to the borrower on demand. Loans may be acquired through assignment or participation. The Fund did not have any unfunded loan commitments, which are contractual obligations for future funding, at period end.
New Accounting Pronouncement. In March 2017, the Financial Accounting Standards Board (FASB) issued an Accounting Standards Update (ASU), ASU 2017-08, which amends the amortization period for certain callable debt securities that are held at a premium. The amendment requires the premium to be amortized to the earliest call date. The amendments do not require an accounting change for securities held at a discount. The ASU is effective for annual periods beginning after December 15, 2018. Management is currently evaluating the potential impact of these changes to the financial statements.
4. Purchases and Sales of Investments.
Purchases and sales of securities, other than short-term securities, aggregated $910,801 and $1,203,982, respectively.
5. Fees and Other Transactions with Affiliates.
Management Fee. Fidelity Management & Research Company (the investment adviser) and its affiliates provide the Fund with investment management related services for which the Fund pays a monthly management fee. The management fee is the sum of an individual fund fee rate that is based on an annual rate of .45% of the Fund's average net assets and an annualized group fee rate that averaged .11% during the period. The group fee rate is based upon the average net assets of all the mutual funds advised by the investment adviser, including any mutual funds previously advised by the investment adviser that are currently advised by Fidelity SelectCo, LLC, an affiliate of the investment adviser. The group fee rate decreases as assets under management increase and increases as assets under management decrease. For the reporting period, the total annualized management fee rate was .56% of the Fund's average net assets.
Transfer Agent Fees. Fidelity Investments Institutional Operations Company, Inc. (FIIOC), an affiliate of the investment adviser, is the Fund's transfer, dividend disbursing and shareholder servicing agent. FIIOC receives account fees and asset-based fees that vary according to account size and type of account. FIIOC pays for typesetting, printing and mailing of shareholder reports, except proxy statements. For the period, the transfer agent fees were equivalent to an annualized rate of .11% of average net assets.
Accounting Fees. Fidelity Service Company, Inc. (FSC), an affiliate of the investment adviser, maintains the Fund's accounting records. The fee is based on the level of average net assets for each month.
Interfund Trades. The Fund may purchase from or sell securities to other Fidelity Funds under procedures adopted by the Board. The procedures have been designed to ensure these interfund trades are executed in accordance with Rule 17a-7 of the 1940 Act. Interfund trades are included within the respective purchases and sales amounts shown in the Purchases and Sales of Investments note.
6. Committed Line of Credit.
The Fund participates with other funds managed by the investment adviser or an affiliate in a $4.25 billion credit facility (the "line of credit") to be utilized for temporary or emergency purposes to fund shareholder redemptions or for other short-term liquidity purposes. The Fund has agreed to pay commitment fees on its pro-rata portion of the line of credit, which amounted to $7 and is reflected in Miscellaneous expenses on the Statement of Operations. During the period, the Fund did not borrow on this line of credit.
7. Expense Reductions.
Through arrangements with the Fund's custodian, credits realized as a result of certain uninvested cash balances were used to reduce the Fund's expenses. During the period, these credits reduced the Fund's custody expenses by $12.
In addition, during the period the investment adviser reimbursed and/or waived a portion of operating expenses in the amount of $14.
8. Other.
The Fund's organizational documents provide former and current trustees and officers with a limited indemnification against liabilities arising in connection with the performance of their duties to the Fund. In the normal course of business, the Fund may also enter into contracts that provide general indemnifications. The Fund's maximum exposure under these arrangements is unknown as this would be dependent on future claims that may be made against the Fund. The risk of material loss from such claims is considered remote.
9. Litigation.
The Fund, and other entities managed by FMR or its affiliates were named as defendants in a lawsuit filed in the United States Bankruptcy Court for the Southern District of New York in 2009. The lawsuit was brought by creditors of Motors Liquidation Company (f/k/a General Motors), which went through Chapter 11 bankruptcy proceedings in 2009, and is captioned Official Committee of Unsecured Creditors of Motors Liquidation Company v. JPMorgan Chase Bank, N.A., et al., Adversary No. 09-00504 (REG). The plaintiffs are seeking an order that the Fund and other defendants return proceeds received in 2009 in full payment of the principal and interest on General Motors secured debt. The plaintiffs contend that the Fund and the other defendants were not secured creditors at the time of the 2009 payments and, thus, were not entitled to payment in full. In January 2015, the Court of Appeals ruled that JPMorgan, as administrative agent for all of the debtholders, released the security interest on certain collateral securing the debt prior to the 2009 payments. In September 2017, an opinion was issued in a trial intended to help determine the value of any remaining, unreleased collateral. Management is evaluating the impact of this ruling and the parties have agreed to mediation. At this time, Management cannot determine the amount of loss that may be realized, but expects the amount to be less than the $13,206 received in 2009. The Fund is also incurring legal costs in defending the case.
Shareholder Expense Example
As a shareholder of a Fund, you incur two types of costs: (1) transaction costs, including redemption fees and (2) ongoing costs, including management fees and other Fund expenses. This Example is intended to help you understand your ongoing costs (in dollars) of investing in the Funds and to compare these costs with the ongoing costs of investing in other mutual funds.
The Example is based on an investment of $1,000 invested at the beginning of the period and held for the entire period (May 1, 2017 to October 31, 2017).
Actual Expenses
The first line of the accompanying table provides information about actual account values and actual expenses. You may use the information in this line, together with the amount you invested, to estimate the expenses that you paid over the period. Simply divide your account value by $1,000.00 (for example, an $8,600 account value divided by $1,000.00 = 8.6), then multiply the result by the number in the first line under the heading entitled "Expenses Paid During Period" to estimate the expenses you paid on your account during this period. A small balance maintenance fee of $12.00 that is charged once a year may apply for certain accounts with a value of less than $2,000. This fee is not included in the table below. If it was, the estimate of expenses you paid during the period would be higher, and your ending account value lower, by this amount. In addition, the Fund, as a shareholder in the underlying Fidelity Central Funds, will indirectly bear its pro-rata share of the fees and expenses incurred by the underlying Fidelity Central Funds. These fees and expenses are not included in the Fund's annualized expense ratio used to calculate the expense estimate in the table below.
Hypothetical Example for Comparison Purposes
The second line of the accompanying table provides information about hypothetical account values and hypothetical expenses based on the Fund's actual expense ratio and an assumed rate of return of 5% per year before expenses, which is not the Fund's actual return. The hypothetical account values and expenses may not be used to estimate the actual ending account balance or expenses you paid for the period. You may use this information to compare the ongoing costs of investing in the Fund and other funds. To do so, compare this 5% hypothetical example with the 5% hypothetical examples that appear in the shareholder reports of the other funds. A small balance maintenance fee of $12.00 that is charged once a year may apply for certain accounts with a value of less than $2,000. This fee is not included in the table below. If it was, the estimate of expenses you paid during the period would be higher, and your ending account value lower, by this amount. In addition, the Fund, as a shareholder in the underlying Fidelity Central Funds, will indirectly bear its pro-rata share of the fees and expenses incurred by the underlying Fidelity Central Funds. These fees and expenses are not included in the Fund's annualized expense ratio used to calculate the expense estimate in the table below.
Please note that the expenses shown in the table are meant to highlight your ongoing costs only and do not reflect any transaction costs. Therefore, the second line of the table is useful in comparing ongoing costs only, and will not help you determine the relative total costs of owning different funds. In addition, if these transactional costs were included, your costs would have been higher.
| Annualized Expense Ratio-A | Beginning Account Value May 1, 2017 | Ending Account Value October 31, 2017 | Expenses Paid During Period-B May 1, 2017 to October 31, 2017 | |
| Actual | .70% | $1,000.00 | $1,035.40 | $3.59 |
| Hypothetical-C | $1,000.00 | $1,021.68 | $3.57 |
A Annualized expense ratio reflects expenses net of applicable fee waivers.
B Expenses are equal to the Fund's annualized expense ratio, multiplied by the average account value over the period, multiplied by 184/365 (to reflect the one-half year period).
C 5% return per year before expenses
Board Approval of Investment Advisory Contracts and Management Fees
Fidelity High Income Fund
Each year, the Board of Trustees, including the Independent Trustees (together, the Board), votes on the renewal of the management contract with Fidelity Management & Research Company (FMR) and the sub-advisory agreements (together, the Advisory Contracts) for the fund. FMR and the sub-advisers are referred to herein as the Investment Advisers. The Board, assisted by the advice of fund counsel and Independent Trustees' counsel, requests and considers a broad range of information relevant to the renewal of the Advisory Contracts throughout the year.
The Board meets regularly and, at each of its meetings, covers an extensive agenda of topics and materials and considers factors that are relevant to its annual consideration of the renewal of the fund's Advisory Contracts, including the services and support provided to the fund and its shareholders. The Board has established various standing committees (Committees), each composed of and chaired by Independent Trustees with varying backgrounds, to which the Board has assigned specific subject matter responsibilities in order to enhance effective decision-making by the Board. The Board, acting directly and through its Committees, requests and receives information concerning the annual consideration of the renewal of the fund's Advisory Contracts. The Board also meets as needed to review matters specifically related to the Board's annual consideration of the renewal of the Advisory Contracts. Members of the Board may also meet with trustees of other Fidelity funds through ad hoc joint committees to discuss certain matters relevant to all of the Fidelity funds.
At its July 2017 meeting, the Board unanimously determined to renew the fund's Advisory Contracts. In reaching its determination, the Board considered all factors it believed relevant, including (i) the nature, extent, and quality of the services to be provided to the fund and its shareholders (including the investment performance of the fund); (ii) the competitiveness of the fund's management fee and total expense ratio relative to peer funds; (iii) the total costs of the services to be provided by and the profits to be realized by Fidelity from its relationships with the fund; and (iv) the extent to which, if any, economies of scale exist and would be realized as the fund grows, and whether any economies of scale are appropriately shared with fund shareholders.
In considering whether to renew the Advisory Contracts for the fund, the Board reached a determination, with the assistance of fund counsel and Independent Trustees' counsel and through the exercise of its business judgment, that the renewal of the Advisory Contracts was in the best interests of the fund and its shareholders and that the compensation payable under the Advisory Contracts was fair and reasonable. The Board's decision to renew the Advisory Contracts was not based on any single factor, but rather was based on a comprehensive consideration of all the information provided to the Board at its meetings throughout the year. The Board, in reaching its determination to renew the Advisory Contracts, was aware that shareholders of the fund have a broad range of investment choices available to them, including a wide choice among funds offered by Fidelity's competitors, and that the fund's shareholders, who have the opportunity to review and weigh the disclosure provided by the fund in its prospectus and other public disclosures, have chosen to invest in this fund, which is part of the Fidelity family of funds.
Amendment to Group Fee Rate. The Board also approved an amendment to the management contract for the fund to add an additional breakpoint to the group fee schedule, effective October 1, 2017. The Board noted that the additional breakpoint would result in lower management fee rates as Fidelity's assets under management increase.
Nature, Extent, and Quality of Services Provided. The Board considered Fidelity's staffing as it relates to the fund, including the backgrounds of investment personnel of Fidelity, and also considered the fund's investment objective, strategies, and related investment philosophy. The Independent Trustees also had discussions with senior management of Fidelity's investment operations and investment groups. The Board considered the structure of the investment personnel compensation program and whether this structure provides appropriate incentives to act in the best interests of the fund. Additionally, the Board considered the portfolio managers' investments, if any, in the funds that they manage.Resources Dedicated to Investment Management and Support Services. The Board and the Fund Oversight and Research Committees reviewed the general qualifications and capabilities of Fidelity's investment staff, including its size, education, experience, and resources, as well as Fidelity's approach to recruiting, training, managing, and compensating investment personnel. The Board noted that Fidelity has continued to increase the resources devoted to non-U.S. offices, including expansion of Fidelity's global investment organization. The Board also noted that Fidelity's analysts have extensive resources, tools and capabilities that allow them to conduct sophisticated quantitative and fundamental analysis, as well as credit analysis of issuers, counterparties and guarantors. Further, the Board considered that Fidelity's investment professionals have sufficient access to global information and data so as to provide competitive investment results over time, and that those professionals also have access to sophisticated tools that permit them to assess portfolio construction and risk and performance attribution characteristics continuously, as well as to transmit new information and research conclusions rapidly around the world. Additionally, in its deliberations, the Board considered Fidelity's trading, risk management, compliance, and technology and operations capabilities and resources, which are integral parts of the investment management process.Shareholder and Administrative Services. The Board considered (i) the nature, extent, quality, and cost of advisory, administrative, and shareholder services performed by the Investment Advisers and their affiliates under the Advisory Contracts and under separate agreements covering transfer agency, pricing and bookkeeping, and securities lending services for the fund; (ii) the nature and extent of the supervision of third party service providers, principally custodians, subcustodians, and pricing vendors; and (iii) the resources devoted to, and the record of compliance with, the fund's compliance policies and procedures. The Board also reviewed the allocation of fund brokerage, including allocations to brokers affiliated with the Investment Advisers, the use of brokerage commissions to pay fund expenses, and the use of "soft" commission dollars to pay for research services.The Board noted that the growth of fund assets over time across the complex allows Fidelity to reinvest in the development of services designed to enhance the value or convenience of the Fidelity funds as investment vehicles. These services include 24-hour access to account information and market information through telephone representatives and over the Internet, investor education materials and asset allocation tools, and the expanded availability of Fidelity Investor Centers.In 2014, the Board formed an ad hoc Committee on Transfer Agency Fees to review the variety of transfer agency fee structures throughout the industry and Fidelity's competitive positioning with respect to industry participants.Investment in a Large Fund Family. The Board considered the benefits to shareholders of investing in a Fidelity fund, including the benefits of investing in a fund that is part of a large family of funds offering a variety of investment disciplines and providing a large variety of mutual fund investor services. The Board noted that Fidelity had taken, or had made recommendations that resulted in the Fidelity funds taking, a number of actions over the previous year that benefited particular funds, including: (i) continuing to dedicate additional resources to Fidelity's investment research process, and to the support of the senior management team that oversees asset management; (ii) continuing efforts to enhance Fidelity's global research capabilities; (iii) launching new funds and making other enhancements to meet client needs; (iv) launching new share classes of existing funds; (v) eliminating purchase minimums and broadening eligibility requirements for certain lower-priced share classes; (vi) reducing management fees and total expenses for certain growth equity funds and index funds; (vii) lowering expense caps for certain existing funds and classes to reduce expenses borne by shareholders; (viii) eliminating short-term redemption fees for certain funds; (ix) introducing a new pricing structure for certain funds of funds that is expected to reduce overall expenses paid by shareholders; (x) rationalizing product lines and gaining increased efficiencies through proposals for fund mergers and share class consolidations; (xi) continuing to develop, acquire and implement systems and technology to improve services to the funds and shareholders, strengthen information security, and increase efficiency; and (xii) implementing enhancements to further strengthen Fidelity's product line to increase investors' probability of success in achieving their investment goals, including retirement income goals.Investment Performance. The Board considered whether the fund has operated in accordance with its investment objective, as well as its record of compliance with its investment restrictions and its performance history.The Board took into account discussions with representatives of the Investment Advisers about fund investment performance that occur at Board meetings throughout the year. In this regard the Board noted that as part of regularly scheduled fund reviews and other reports to the Board on fund performance, the Board considers annualized return information for the fund for different time periods, measured against a securities market index ("benchmark index") and a peer group of funds with similar objectives ("peer group"), if any. In its evaluation of fund investment performance, the Board gave particular attention to information indicating changes in performance of certain Fidelity funds for specific time periods and discussed with the Investment Advisers the reasons for any overperformance or underperformance.In addition to reviewing absolute and relative fund performance, the Independent Trustees periodically consider the appropriateness of fund performance metrics in evaluating the results achieved. In general, the Independent Trustees believe that fund performance should be evaluated based on net performance (after fees and expenses) of both the highest performing and lowest performing fund share classes, where applicable, compared to appropriate benchmark indices, over appropriate time periods that may include full market cycles, and compared to peer groups, as applicable, over the same periods, taking into account relevant factors including the following: general market conditions; issuer-specific information; and fund cash flows and other factors.The Independent Trustees recognize that shareholders evaluate performance on a net basis over their own holding periods, for which one-, three-, and five-year periods are often used as a proxy. For this reason, the performance information reviewed by the Board also included net cumulative calendar year total return information for the fund and an appropriate benchmark index and peer group for the most recent one-, three-, and five-year periods, as shown below. Returns are shown compared to the 25th percentile (top of box, 75% beaten) and 75th percentile (bottom of box, 25% beaten) of the peer universe.Fidelity High Income Fund

Fidelity High Income Fund
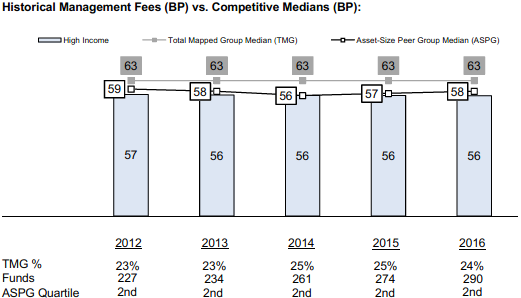
![]()
Corporate Headquarters
245 Summer St.
Boston, MA 02210
www.fidelity.com
SPH-SANN-1217
1.538299.120
Fidelity® Series High Income Fund Semi-Annual Report October 31, 2017 |
|
Contents
Board Approval of Investment Advisory Contracts and Management Fees |
To view a fund's proxy voting guidelines and proxy voting record for the 12-month period ended June 30, visit http://www.fidelity.com/proxyvotingresults or visit the Securities and Exchange Commission's (SEC) web site at http://www.sec.gov.
You may also call 1-800-544-8544 to request a free copy of the proxy voting guidelines.
Standard & Poor's, S&P and S&P 500 are registered service marks of The McGraw-Hill Companies, Inc. and have been licensed for use by Fidelity Distributors Corporation.
Other third-party marks appearing herein are the property of their respective owners.
All other marks appearing herein are registered or unregistered trademarks or service marks of FMR LLC or an affiliated company. © 2017 FMR LLC. All rights reserved.
This report and the financial statements contained herein are submitted for the general information of the shareholders of the Fund. This report is not authorized for distribution to prospective investors in the Fund unless preceded or accompanied by an effective prospectus.
A fund files its complete schedule of portfolio holdings with the SEC for the first and third quarters of each fiscal year on Form N-Q. Forms N-Q are available on the SEC’s web site at http://www.sec.gov. A fund's Forms N-Q may be reviewed and copied at the SEC’s Public Reference Room in Washington, DC. Information regarding the operation of the SEC's Public Reference Room may be obtained by calling 1-800-SEC-0330.
For a complete list of a fund's portfolio holdings, view the most recent holdings listing, semiannual report, or annual report on Fidelity's web site at http://www.fidelity.com, http://www.institutional.fidelity.com, or http://www.401k.com, as applicable.
NOT FDIC INSURED •MAY LOSE VALUE •NO BANK GUARANTEE
Neither the Fund nor Fidelity Distributors Corporation is a bank.
Investment Summary (Unaudited)
Top Five Holdings as of October 31, 2017
| (by issuer, excluding cash equivalents) | % of fund's net assets | % of fund's net assets 6 months ago |
| Community Health Systems, Inc. | 2.5 | 2.7 |
| Valeant Pharmaceuticals International, Inc. | 1.9 | 1.4 |
| CCO Holdings LLC/CCO Holdings Capital Corp. | 1.9 | 1.6 |
| Ortho-Clinical Diagnostics, Inc. | 1.8 | 1.1 |
| Freeport-McMoRan, Inc. | 1.4 | 1.5 |
| 9.5 |
Top Five Market Sectors as of October 31, 2017
| % of fund's net assets | % of fund's net assets 6 months ago | |
| Energy | 13.0 | 11.7 |
| Healthcare | 12.1 | 11.5 |
| Telecommunications | 8.5 | 9.1 |
| Cable/Satellite TV | 5.4 | 5.9 |
| Banks & Thrifts | 5.0 | 6.3 |
Quality Diversification (% of fund's net assets)
| As of October 31, 2017 | ||
| BBB | 0.2% | |
| BB | 28.5% | |
| B | 44.0% | |
| CCC,CC,C | 13.5% | |
| Not Rated | 1.1% | |
| Equities | 2.2% | |
| Short-Term Investments and Net Other Assets | 10.5% | |

| As of April 30, 2017 | ||
| BBB | 0.4% | |
| BB | 28.9% | |
| B | 43.1% | |
| CCC,CC,C | 15.0% | |
| Not Rated | 0.7% | |
| Equities | 2.2% | |
| Short-Term Investments and Net Other Assets | 9.7% | |

We have used ratings from Moody's Investors Service, Inc. Where Moody's® ratings are not available, we have used S&P® ratings. All ratings are as of the date indicated and do not reflect subsequent changes.
Asset Allocation (% of fund's net assets)
| As of October 31, 2017* | ||
| Nonconvertible Bonds | 78.3% | |
| Convertible Bonds, Preferred Stocks | 2.1% | |
| Common Stocks | 0.4% | |
| Bank Loan Obligations | 4.8% | |
| Other Investments | 3.9% | |
| Short-Term Investments and Net Other Assets (Liabilities) | 10.5% | |

* Foreign investments - 23.4%
| As of April 30, 2017* | ||
| Nonconvertible Bonds | 78.9% | |
| Convertible Bonds, Preferred Stocks | 1.8% | |
| Common Stocks | 0.5% | |
| Bank Loan Obligations | 4.4% | |
| Other Investments | 4.7% | |
| Short-Term Investments and Net Other Assets (Liabilities) | 9.7% | |

* Foreign investments - 24.4%
Investments October 31, 2017 (Unaudited)
Showing Percentage of Net Assets
| Corporate Bonds - 78.6% | |||
| Principal Amount | Value | ||
| Convertible Bonds - 0.3% | |||
| Capital Goods - 0.1% | |||
| General Cable Corp. 4.5% 11/15/29 (a) | $2,824,000 | $2,712,805 | |
| Energy - 0.2% | |||
| Ensco Jersey Finance Ltd. 3% 1/31/24 (b) | 5,510,000 | 4,655,950 | |
| TOTAL CONVERTIBLE BONDS | 7,368,755 | ||
| Nonconvertible Bonds - 78.3% | |||
| Aerospace - 0.2% | |||
| DAE Funding LLC: | |||
| 4% 8/1/20 (b) | 1,685,000 | 1,710,275 | |
| 4.5% 8/1/22 (b) | 2,110,000 | 2,139,013 | |
| 5% 8/1/24 (b) | 2,905,000 | 2,966,731 | |
| 6,816,019 | |||
| Automotive & Auto Parts - 0.7% | |||
| Allison Transmission, Inc. 5% 10/1/24 (b) | 3,155,000 | 3,289,088 | |
| Delphi Jersey Holdings PLC 5% 10/1/25 (b) | 3,175,000 | 3,198,813 | |
| Lithia Motors, Inc. 5.25% 8/1/25 (b) | 1,855,000 | 1,945,431 | |
| Tesla, Inc. 5.3% 8/15/25 (b) | 10,205,000 | 9,847,825 | |
| The Goodyear Tire & Rubber Co. 5% 5/31/26 | 2,730,000 | 2,798,250 | |
| 21,079,407 | |||
| Banks & Thrifts - 1.1% | |||
| Ally Financial, Inc.: | |||
| 4.25% 4/15/21 | 1,210,000 | 1,258,400 | |
| 5.75% 11/20/25 | 22,265,000 | 24,574,994 | |
| Royal Bank of Scotland Group PLC 5.125% 5/28/24 | 6,150,000 | 6,580,268 | |
| 32,413,662 | |||
| Broadcasting - 1.0% | |||
| AMC Networks, Inc.: | |||
| 4.75% 8/1/25 | 3,395,000 | 3,390,756 | |
| 5% 4/1/24 | 855,000 | 871,031 | |
| CBS Radio, Inc. 7.25% 11/1/24 (b) | 3,765,000 | 3,939,131 | |
| iHeartCommunications, Inc.: | |||
| 9% 9/15/22 | 3,755,000 | 2,712,988 | |
| 10.625% 3/15/23 | 4,900,000 | 3,515,750 | |
| 11.25% 3/1/21 (b) | 4,625,000 | 3,283,750 | |
| Sinclair Television Group, Inc. 5.125% 2/15/27 (b) | 1,020,000 | 972,825 | |
| Sirius XM Radio, Inc.: | |||
| 3.875% 8/1/22 (b) | 2,610,000 | 2,658,938 | |
| 5% 8/1/27 (b) | 4,315,000 | 4,352,756 | |
| 5.375% 7/15/26 (b) | 3,680,000 | 3,877,800 | |
| 29,575,725 | |||
| Building Materials - 0.7% | |||
| Beacon Roofing Supply, Inc. 4.875% 11/1/25 (b) | 3,405,000 | 3,446,541 | |
| Builders FirstSource, Inc. 5.625% 9/1/24 (b) | 2,735,000 | 2,888,844 | |
| Building Materials Corp. of America: | |||
| 5.5% 2/15/23 (b) | 4,430,000 | 4,673,650 | |
| 6% 10/15/25 (b) | 4,195,000 | 4,535,844 | |
| Summit Materials LLC/Summit Materials Finance Corp. 5.125% 6/1/25(b) | 1,255,000 | 1,270,688 | |
| U.S. Concrete, Inc. 6.375% 6/1/24 | 1,350,000 | 1,451,250 | |
| USG Corp. 5.5% 3/1/25 (b) | 2,770,000 | 2,970,825 | |
| 21,237,642 | |||
| Cable/Satellite TV - 5.2% | |||
| Altice SA 7.75% 5/15/22 (b) | 26,595,000 | 28,157,456 | |
| Altice U.S. Finance SA: | |||
| 5.375% 7/15/23 (b) | 5,690,000 | 5,931,825 | |
| 5.5% 5/15/26 (b) | 12,000,000 | 12,480,000 | |
| CCO Holdings LLC/CCO Holdings Capital Corp.: | |||
| 4% 3/1/23 (b) | 3,405,000 | 3,453,964 | |
| 5% 2/1/28 (b) | 5,105,000 | 5,066,713 | |
| 5.125% 2/15/23 | 4,450,000 | 4,594,625 | |
| 5.125% 5/1/27 (b) | 13,450,000 | 13,584,500 | |
| 5.5% 5/1/26 (b) | 7,285,000 | 7,467,125 | |
| 5.75% 9/1/23 | 7,640,000 | 7,916,950 | |
| 5.875% 4/1/24 (b) | 9,080,000 | 9,670,200 | |
| Cequel Communications Holdings I LLC/Cequel Capital Corp. 5.125% 12/15/21 (b) | 4,245,000 | 4,319,288 | |
| CSC Holdings, Inc. 5.5% 4/15/27 (b) | 5,810,000 | 5,984,300 | |
| DISH DBS Corp.: | |||
| 5.875% 7/15/22 | 4,135,000 | 4,158,280 | |
| 6.75% 6/1/21 | 4,995,000 | 5,244,750 | |
| 7.75% 7/1/26 | 2,390,000 | 2,614,063 | |
| Virgin Media Finance PLC 4.875% 2/15/22 | 8,880,000 | 8,658,000 | |
| Virgin Media Secured Finance PLC 5.5% 8/15/26 (b) | 2,895,000 | 3,028,894 | |
| VTR Finance BV 6.875% 1/15/24 (b) | 2,000,000 | 2,120,500 | |
| Ziggo Secured Finance BV 5.5% 1/15/27 (b) | 12,310,000 | 12,556,200 | |
| 147,007,633 | |||
| Capital Goods - 1.0% | |||
| Belden, Inc. 5.25% 7/15/24 (b) | 5,435,000 | 5,652,400 | |
| General Cable Corp. 5.75% 10/1/22 (c) | 22,406,000 | 22,966,150 | |
| 28,618,550 | |||
| Chemicals - 3.7% | |||
| A. Schulman, Inc. 6.875% 6/1/23 | 5,155,000 | 5,432,081 | |
| Blue Cube Spinco, Inc. 10% 10/15/25 | 6,250,000 | 7,609,375 | |
| CF Industries Holdings, Inc.: | |||
| 3.45% 6/1/23 | 4,970,000 | 4,907,875 | |
| 5.15% 3/15/34 | 12,430,000 | 12,398,925 | |
| 5.375% 3/15/44 | 7,085,000 | 6,801,600 | |
| Evolution Escrow Issuer LLC 7.5% 3/15/22 (b) | 4,285,000 | 4,493,894 | |
| Momentive Performance Materials, Inc. 3.88% 10/24/21 | 18,676,000 | 19,423,040 | |
| MPM Escrow LLC/MPM Finance Escrow Corp. 8.875% 10/15/20 (d)(e) | 27,576,000 | 3 | |
| NOVA Chemicals Corp.: | |||
| 4.875% 6/1/24 (b) | 4,050,000 | 4,125,938 | |
| 5.25% 6/1/27 (b) | 3,545,000 | 3,615,900 | |
| The Chemours Co. LLC: | |||
| 5.375% 5/15/27 | 1,235,000 | 1,318,363 | |
| 6.625% 5/15/23 | 6,805,000 | 7,213,300 | |
| 7% 5/15/25 | 7,030,000 | 7,838,450 | |
| TPC Group, Inc. 8.75% 12/15/20 (b) | 5,085,000 | 4,970,588 | |
| Trinseo Materials Operating SCA/Trinseo Materials Finance, Inc. 5.375% 9/1/25 (b) | 3,405,000 | 3,583,763 | |
| Tronox Finance PLC 5.75% 10/1/25 (b) | 1,325,000 | 1,382,969 | |
| Valvoline Finco Two LLC 5.5% 7/15/24 (b) | 2,075,000 | 2,199,500 | |
| Valvoline, Inc. 4.375% 8/15/25 (b) | 1,125,000 | 1,136,250 | |
| Versum Materials, Inc. 5.5% 9/30/24 (b) | 2,965,000 | 3,157,725 | |
| W. R. Grace & Co.-Conn.: | |||
| 5.125% 10/1/21 (b) | 1,155,000 | 1,241,625 | |
| 5.625% 10/1/24 (b) | 2,475,000 | 2,707,031 | |
| 105,558,195 | |||
| Consumer Products - 0.1% | |||
| Edgewell Personal Care Co. 5.5% 6/15/25 (b) | 210,000 | 220,500 | |
| First Quality Finance Co., Inc. 5% 7/1/25 (b) | 2,380,000 | 2,447,092 | |
| 2,667,592 | |||
| Containers - 0.9% | |||
| Ardagh Packaging Finance PLC/Ardagh MP Holdings U.S.A., Inc.: | |||
| 4.625% 5/15/23 (b) | 12,285,000 | 12,622,838 | |
| 6% 2/15/25 (b) | 3,267,000 | 3,467,104 | |
| Crown Americas LLC/Crown Americas Capital Corp. V 4.25% 9/30/26 | 955,000 | 955,000 | |
| Owens-Brockway Glass Container, Inc. 5.375% 1/15/25 (b) | 4,140,000 | 4,419,450 | |
| Plastipak Holdings, Inc. 6.25% 10/15/25 (b) | 845,000 | 861,731 | |
| Reynolds Group Issuer, Inc./Reynolds Group Issuer LLC/Reynolds Group Issuer (Luxembourg) SA 5.125% 7/15/23 (b) | 3,950,000 | 4,112,345 | |
| 26,438,468 | |||
| Diversified Financial Services - 3.6% | |||
| Aircastle Ltd.: | |||
| 5% 4/1/23 | 4,435,000 | 4,690,013 | |
| 5.125% 3/15/21 | 4,795,000 | 5,088,694 | |
| AssuredPartners, Inc. 7% 8/15/25 (b) | 1,180,000 | 1,230,150 | |
| CIT Group, Inc. 5% 8/15/22 | 4,850,000 | 5,213,750 | |
| FLY Leasing Ltd.: | |||
| 6.375% 10/15/21 | 9,522,000 | 9,938,588 | |
| 6.75% 12/15/20 | 3,975,000 | 4,129,230 | |
| Grinding Media, Inc./MC Grinding Media Canada, Inc. 7.375% 12/15/23 (b) | 2,070,000 | 2,251,125 | |
| Icahn Enterprises LP/Icahn Enterprises Finance Corp.: | |||
| 4.875% 3/15/19 | 3,385,000 | 3,401,925 | |
| 6.25% 2/1/22 | 2,180,000 | 2,278,100 | |
| ILFC E-Capital Trust I 3 month U.S. LIBOR + 1.550% 4.36% 12/21/65 (b)(c)(f) | 8,630,000 | 8,327,950 | |
| ILFC E-Capital Trust II 3 month U.S. LIBOR + 1.800% 4.61% 12/21/65 (b)(c)(f) | 9,553,000 | 9,266,410 | |
| Intelsat Connect Finance SA 12.5% 4/1/22 (b) | 1,698,000 | 1,608,855 | |
| MSCI, Inc.: | |||
| 4.75% 8/1/26 (b) | 3,040,000 | 3,165,400 | |
| 5.75% 8/15/25 (b) | 1,635,000 | 1,765,800 | |
| Navient Corp.: | |||
| 5% 10/26/20 | 2,425,000 | 2,497,750 | |
| 6.75% 6/25/25 | 6,740,000 | 7,043,300 | |
| 7.25% 9/25/23 | 655,000 | 709,447 | |
| SLM Corp.: | |||
| 4.875% 6/17/19 | 6,680,000 | 6,872,050 | |
| 6.125% 3/25/24 | 3,215,000 | 3,299,394 | |
| 7.25% 1/25/22 | 2,925,000 | 3,173,625 | |
| 8% 3/25/20 | 6,038,000 | 6,656,895 | |
| Springleaf Financial Corp.: | |||
| 6.125% 5/15/22 | 3,365,000 | 3,550,075 | |
| 8.25% 12/15/20 | 3,180,000 | 3,585,450 | |
| Venator Finance SARL/Venator Capital Management Ltd. 5.75% 7/15/25 (b) | 2,520,000 | 2,664,900 | |
| 102,408,876 | |||
| Diversified Media - 1.7% | |||
| Clear Channel Worldwide Holdings, Inc.: | |||
| Series A: | |||
| 6.5% 11/15/22 | 6,115,000 | 6,313,738 | |
| 7.625% 3/15/20 | 13,045,000 | 12,979,775 | |
| 7.625% 3/15/20 | 3,380,000 | 3,375,775 | |
| E.W. Scripps Co. 5.125% 5/15/25 (b) | 750,000 | 770,625 | |
| MDC Partners, Inc. 6.5% 5/1/24 (b) | 10,793,000 | 11,008,860 | |
| Nielsen Co. S.a.r.l. (Luxembourg) 5% 2/1/25 (b) | 1,420,000 | 1,469,700 | |
| Nielsen Finance LLC/Nielsen Finance Co. 5% 4/15/22 (b) | 12,945,000 | 13,333,350 | |
| 49,251,823 | |||
| Energy - 12.1% | |||
| AmeriGas Partners LP/AmeriGas Finance Corp. 5.5% 5/20/25 | 4,270,000 | 4,366,075 | |
| Antero Resources Corp. 5.625% 6/1/23 (Reg. S) | 6,440,000 | 6,745,900 | |
| Baytex Energy Corp. 5.125% 6/1/21 (b) | 3,495,000 | 3,311,513 | |
| Calfrac Holdings LP 7.5% 12/1/20 (b) | 5,875,000 | 5,757,500 | |
| California Resources Corp. 8% 12/15/22 (b) | 18,850,000 | 12,441,000 | |
| Cheniere Corpus Christi Holdings LLC 5.125% 6/30/27 (b) | 3,075,000 | 3,171,094 | |
| Chesapeake Energy Corp.: | |||
| 4.875% 4/15/22 | 1,470,000 | 1,359,750 | |
| 5.375% 6/15/21 | 6,041,000 | 5,814,463 | |
| 8% 1/15/25 (b) | 1,555,000 | 1,555,000 | |
| 8% 6/15/27 (b) | 3,630,000 | 3,500,681 | |
| Citgo Petroleum Corp. 6.25% 8/15/22 (b) | 16,028,000 | 16,468,770 | |
| Consolidated Energy Finance SA: | |||
| 3 month U.S. LIBOR + 3.750% 5.07% 6/15/22 (b)(c)(f) | 2,560,000 | 2,554,158 | |
| 6.875% 6/15/25 (b) | 3,085,000 | 3,262,388 | |
| Continental Resources, Inc.: | |||
| 4.5% 4/15/23 | 4,815,000 | 4,875,188 | |
| 5% 9/15/22 | 11,710,000 | 11,841,738 | |
| Covey Park Energy LLC 7.5% 5/15/25 (b) | 2,260,000 | 2,344,750 | |
| Crestwood Midstream Partners LP/Crestwood Midstream Finance Corp. 6.25% 4/1/23 | 2,590,000 | 2,693,600 | |
| CVR Refining LLC/Coffeyville Finance, Inc. 6.5% 11/1/22 | 5,900,000 | 6,062,250 | |
| Denbury Resources, Inc.: | |||
| 4.625% 7/15/23 | 10,949,000 | 6,213,558 | |
| 5.5% 5/1/22 | 6,110,000 | 3,834,025 | |
| 9% 5/15/21 (b) | 3,395,000 | 3,318,613 | |
| Diamond Offshore Drilling, Inc. 7.875% 8/15/25 | 1,700,000 | 1,819,000 | |
| Ensco PLC: | |||
| 5.2% 3/15/25 | 2,605,000 | 2,194,713 | |
| 5.75% 10/1/44 | 5,160,000 | 3,521,700 | |
| EP Energy LLC/Everest Acquisition Finance, Inc. 8% 11/29/24 (b) | 3,915,000 | 3,993,300 | |
| Exterran Energy Solutions LP 8.125% 5/1/25 (b) | 2,790,000 | 2,936,475 | |
| Exterran Partners LP/EXLP Finance Corp. 6% 4/1/21 | 2,120,000 | 2,109,400 | |
| FTS International, Inc. 6.25% 5/1/22 | 8,000,000 | 7,760,000 | |
| Hilcorp Energy I LP/Hilcorp Finance Co.: | |||
| 5% 12/1/24 (b) | 5,160,000 | 5,134,200 | |
| 5.75% 10/1/25 (b) | 3,650,000 | 3,736,688 | |
| Jonah Energy LLC 7.25% 10/15/25 (b) | 3,950,000 | 3,950,000 | |
| NextEra Energy Partners LP 4.25% 9/15/24 (b) | 1,930,000 | 1,949,300 | |
| NGL Energy Partners LP/NGL Energy Finance Corp.: | |||
| 5.125% 7/15/19 | 3,205,000 | 3,205,000 | |
| 6.125% 3/1/25 | 4,750,000 | 4,500,625 | |
| 7.5% 11/1/23 | 4,075,000 | 4,064,813 | |
| NGPL PipeCo LLC 4.375% 8/15/22 (b) | 725,000 | 745,844 | |
| Noble Holding International Ltd.: | |||
| 5.25% 3/15/42 | 3,815,000 | 2,422,525 | |
| 6.05% 3/1/41 | 3,935,000 | 2,606,938 | |
| 7.7% 4/1/25 (c) | 3,075,000 | 2,675,250 | |
| 7.75% 1/15/24 | 15,275,000 | 13,671,125 | |
| NuStar Logistics LP 5.625% 4/28/27 | 1,445,000 | 1,524,475 | |
| Parsley Energy LLC/Parsley: | |||
| 5.625% 10/15/27 (b) | 1,410,000 | 1,454,951 | |
| 6.25% 6/1/24 (b) | 1,030,000 | 1,091,800 | |
| PBF Holding Co. LLC/PBF Finance Corp.: | |||
| 7% 11/15/23 | 9,290,000 | 9,661,600 | |
| 7.25% 6/15/25 (b) | 8,420,000 | 8,704,175 | |
| PBF Logistics LP/PBF Logistics Finance, Inc.: | |||
| 6.875% 5/15/23 | 995,000 | 1,029,825 | |
| 6.875% 5/15/23 (b) | 1,700,000 | 1,759,500 | |
| PDC Energy, Inc. 6.125% 9/15/24 | 1,795,000 | 1,873,531 | |
| Range Resources Corp. 5% 3/15/23 | 3,405,000 | 3,370,882 | |
| Rose Rock Midstream LP/Rose Rock Finance Corp.: | |||
| 5.625% 7/15/22 | 4,540,000 | 4,471,900 | |
| 5.625% 11/15/23 | 2,665,000 | 2,605,038 | |
| SemGroup Corp.: | |||
| 6.375% 3/15/25 (b) | 3,685,000 | 3,629,725 | |
| 7.25% 3/15/26 (b) | 2,705,000 | 2,752,338 | |
| SM Energy Co.: | |||
| 5% 1/15/24 | 8,500,000 | 8,117,500 | |
| 5.625% 6/1/25 | 4,185,000 | 4,069,913 | |
| 6.125% 11/15/22 | 8,320,000 | 8,361,600 | |
| 6.5% 1/1/23 | 7,270,000 | 7,397,225 | |
| 6.75% 9/15/26 | 2,280,000 | 2,339,850 | |
| Southwestern Energy Co.: | |||
| 4.1% 3/15/22 | 17,615,000 | 17,306,738 | |
| 7.5% 4/1/26 | 4,345,000 | 4,507,938 | |
| 7.75% 10/1/27 | 1,965,000 | 2,043,600 | |
| Sunoco LP/Sunoco Finance Corp. 6.375% 4/1/23 | 6,335,000 | 6,730,938 | |
| Targa Resources Partners LP/Targa Resources Partners Finance Corp.: | |||
| 4.25% 11/15/23 | 4,185,000 | 4,164,075 | |
| 5% 1/15/28 (b) | 3,000,000 | 3,007,500 | |
| 5.125% 2/1/25 | 2,885,000 | 2,971,550 | |
| 6.75% 3/15/24 | 1,490,000 | 1,605,475 | |
| Teine Energy Ltd. 6.875% 9/30/22 (b) | 525,000 | 536,813 | |
| Tervita Escrow Corp. 7.625% 12/1/21 (b) | 13,130,000 | 13,294,125 | |
| Tesoro Logistics LP/Tesoro Logistics Finance Corp.: | |||
| 5.875% 10/1/20 | 3,828,000 | 3,894,990 | |
| 6.125% 10/15/21 | 2,620,000 | 2,705,150 | |
| Transocean, Inc. 9% 7/15/23 (b) | 3,755,000 | 4,074,175 | |
| Weatherford International Ltd.: | |||
| 6.5% 8/1/36 | 3,345,000 | 2,784,713 | |
| 7% 3/15/38 | 3,465,000 | 2,910,600 | |
| Weatherford International, Inc. 6.8% 6/15/37 | 1,720,000 | 1,462,000 | |
| Whiting Petroleum Corp.: | |||
| 5.75% 3/15/21 | 2,365,000 | 2,382,738 | |
| 6.25% 4/1/23 | 1,455,000 | 1,451,363 | |
| WPX Energy, Inc.: | |||
| 5.25% 9/15/24 | 1,665,000 | 1,671,244 | |
| 6% 1/15/22 | 1,955,000 | 2,035,644 | |
| 8.25% 8/1/23 | 2,555,000 | 2,877,569 | |
| 343,123,676 | |||
| Entertainment/Film - 1.2% | |||
| AMC Entertainment Holdings, Inc.: | |||
| 5.875% 11/15/26 | 7,775,000 | 7,590,344 | |
| 6.125% 5/15/27 | 9,105,000 | 9,013,950 | |
| AMC Entertainment, Inc. 5.75% 6/15/25 | 3,400,000 | 3,306,500 | |
| CBS Outdoor Americas Capital LLC/CBS Outdoor Americas Capital Corp.: | |||
| 5.625% 2/15/24 | 4,285,000 | 4,509,963 | |
| 5.875% 3/15/25 | 3,515,000 | 3,723,703 | |
| New Cotai LLC/New Cotai Capital Corp. 10.625% 5/1/19 pay-in-kind (b)(c) | 4,980,720 | 4,980,720 | |
| 33,125,180 | |||
| Environmental - 1.3% | |||
| Covanta Holding Corp.: | |||
| 5.875% 3/1/24 | 6,910,000 | 6,927,275 | |
| 5.875% 7/1/25 | 7,330,000 | 7,256,700 | |
| 6.375% 10/1/22 | 4,804,000 | 4,960,130 | |
| LBC Tank Terminals Holding Netherlands BV 6.875% 5/15/23 (b) | 13,015,000 | 13,616,944 | |
| Wrangler Buyer Corp. 6% 10/1/25 (b) | 4,085,000 | 4,176,913 | |
| 36,937,962 | |||
| Food & Drug Retail - 2.5% | |||
| Albertsons Companies LLC/Safeway, Inc./New Albertson's, Inc./Albertson's LLC: | |||
| 5.75% 3/15/25 | 6,985,000 | 6,146,800 | |
| 6.625% 6/15/24 | 5,935,000 | 5,578,900 | |
| BI-LO LLC/BI-LO Finance Corp.: | |||
| 9.25% 2/15/19 (b) | 30,150,000 | 27,511,875 | |
| 9.375% 9/15/18 pay-in-kind (b)(c) | 38,022,500 | 10,646,300 | |
| Performance Food Group, Inc. 5.5% 6/1/24 (b) | 3,110,000 | 3,257,725 | |
| Rite Aid Corp. 7.7% 2/15/27 | 4,550,000 | 3,867,500 | |
| Tops Holding LLC/Tops Markets II Corp. 8% 6/15/22 (b) | 23,460,000 | 14,076,000 | |
| 71,085,100 | |||
| Food/Beverage/Tobacco - 3.5% | |||
| B&G Foods, Inc. 5.25% 4/1/25 | 3,275,000 | 3,344,594 | |
| C&S Group Enterprises LLC 5.375% 7/15/22 (b) | 20,440,000 | 19,826,800 | |
| Cott Beverages, Inc. 5.375% 7/1/22 | 445,000 | 463,634 | |
| Cott Holdings, Inc. 5.5% 4/1/25 (b) | 4,875,000 | 5,027,344 | |
| ESAL GmbH 6.25% 2/5/23 (b) | 18,850,000 | 18,143,125 | |
| JBS Investments GmbH: | |||
| 7.25% 4/3/24 (b) | 3,010,000 | 2,972,375 | |
| 7.75% 10/28/20 (b) | 10,220,000 | 10,429,510 | |
| JBS U.S.A. LLC/JBS U.S.A. Finance, Inc.: | |||
| 5.75% 6/15/25 (b) | 2,990,000 | 2,900,300 | |
| 7.25% 6/1/21 (b) | 7,415,000 | 7,559,444 | |
| Lamb Weston Holdings, Inc.: | |||
| 4.625% 11/1/24 (b) | 2,380,000 | 2,487,100 | |
| 4.875% 11/1/26 (b) | 2,280,000 | 2,396,850 | |
| Minerva Luxembourg SA 6.5% 9/20/26 (b) | 6,060,000 | 6,284,220 | |
| Pilgrim's Pride Corp. 5.875% 9/30/27 (b) | 1,695,000 | 1,762,800 | |
| Post Holdings, Inc.: | |||
| 5% 8/15/26 (b) | 3,555,000 | 3,572,775 | |
| 5.75% 3/1/27 (b) | 3,720,000 | 3,864,150 | |
| Vector Group Ltd. 6.125% 2/1/25 (b) | 8,515,000 | 8,834,313 | |
| 99,869,334 | |||
| Gaming - 1.1% | |||
| CRC Escrow Issuer LLC/CRC Finance LLC 5.25% 10/15/25 (b) | 16,925,000 | 17,035,859 | |
| Eldorado Resorts, Inc. 6% 4/1/25 | 750,000 | 791,250 | |
| GLP Capital LP/GLP Financing II, Inc. 5.375% 4/15/26 | 1,200,000 | 1,299,000 | |
| Jacobs Entertainment, Inc. 7.875% 2/1/24 (b) | 1,100,000 | 1,188,000 | |
| MCE Finance Ltd. 4.875% 6/6/25 (b) | 1,150,000 | 1,160,477 | |
| Scientific Games Corp.: | |||
| 5% 10/15/25 (b) | 840,000 | 852,600 | |
| 7% 1/1/22 (b) | 6,035,000 | 6,382,013 | |
| Sugarhouse HSP Gaming Prop Mezz LP/Sugarhouse HSP Gaming Finance Corp. 5.875% 5/15/25 (b) | 2,165,000 | 2,110,875 | |
| Wynn Macau Ltd. 4.875% 10/1/24 (b) | 1,670,000 | 1,697,221 | |
| 32,517,295 | |||
| Healthcare - 11.0% | |||
| AMAG Pharmaceuticals, Inc. 7.875% 9/1/23 (b) | 5,077,000 | 5,165,848 | |
| AmSurg Corp. 5.625% 7/15/22 | 2,570,000 | 2,614,975 | |
| Catalent Pharma Solutions 4.875% 1/15/26 (b) | 955,000 | 969,325 | |
| Community Health Systems, Inc.: | |||
| 5.125% 8/1/21 | 20,955,000 | 20,378,738 | |
| 6.25% 3/31/23 | 6,700,000 | 6,448,750 | |
| 6.875% 2/1/22 | 57,479,000 | 41,600,378 | |
| CTR Partnership LP/CareTrust Capital Corp. 5.25% 6/1/25 | 4,465,000 | 4,587,788 | |
| DaVita HealthCare Partners, Inc.: | |||
| 5% 5/1/25 | 1,450,000 | 1,428,250 | |
| 5.125% 7/15/24 | 10,995,000 | 11,022,488 | |
| HCA Holdings, Inc.: | |||
| 4.5% 2/15/27 | 4,780,000 | 4,821,825 | |
| 5.25% 6/15/26 | 4,930,000 | 5,244,288 | |
| 5.875% 5/1/23 | 9,350,000 | 10,016,188 | |
| 6.25% 2/15/21 | 5,100,000 | 5,488,875 | |
| HealthSouth Corp. 5.75% 9/15/25 | 3,890,000 | 4,011,563 | |
| Hologic, Inc. 4.375% 10/15/25 (b) | 1,375,000 | 1,397,000 | |
| IMS Health, Inc. 5% 10/15/26 (b) | 4,190,000 | 4,451,875 | |
| Kindred Healthcare, Inc.: | |||
| 8% 1/15/20 | 17,580,000 | 17,755,800 | |
| 8.75% 1/15/23 | 14,110,000 | 13,757,250 | |
| Mallinckrodt International Finance SA/Mallinckrodt CB LLC 5.625% 10/15/23 (b) | 1,655,000 | 1,545,356 | |
| MPT Operating Partnership LP/MPT Finance Corp.: | |||
| 5% 10/15/27 | 3,205,000 | 3,293,138 | |
| 5.5% 5/1/24 | 3,365,000 | 3,562,694 | |
| 6.375% 3/1/24 | 4,595,000 | 4,968,344 | |
| Ortho-Clinical Diagnostics, Inc. 6.625% 5/15/22 (b) | 29,677,000 | 29,714,096 | |
| Sabra Health Care LP/Sabra Capital Corp.: | |||
| 5.375% 6/1/23 | 12,260,000 | 12,658,450 | |
| 5.5% 2/1/21 | 8,330,000 | 8,590,313 | |
| SP Finco LLC 6.75% 7/1/25 (b) | 2,110,000 | 1,925,375 | |
| Teleflex, Inc. 4.875% 6/1/26 | 4,340,000 | 4,557,000 | |
| Tenet Healthcare Corp.: | |||
| 4.375% 10/1/21 | 16,240,000 | 16,183,160 | |
| 6% 10/1/20 | 1,980,000 | 2,079,000 | |
| THC Escrow Corp. III 5.125% 5/1/25 (b) | 6,775,000 | 6,597,156 | |
| Valeant Pharmaceuticals International, Inc.: | |||
| 5.375% 3/15/20 (b) | 8,970,000 | 8,824,238 | |
| 5.5% 3/1/23 (b) | 2,450,000 | 2,058,000 | |
| 5.5% 11/1/25 (b) | 2,710,000 | 2,770,975 | |
| 5.625% 12/1/21 (b) | 3,495,000 | 3,184,819 | |
| 5.875% 5/15/23 (b) | 16,195,000 | 13,684,775 | |
| 6.125% 4/15/25 (b) | 10,785,000 | 9,059,400 | |
| 6.75% 8/15/21 (b) | 5,101,000 | 4,941,594 | |
| 7.25% 7/15/22 (b) | 7,851,000 | 7,517,333 | |
| 7.5% 7/15/21 (b) | 1,425,000 | 1,401,844 | |
| VPI Escrow Corp. 6.375% 10/15/20 (b) | 3,142,000 | 3,122,363 | |
| 313,400,627 | |||
| Homebuilders/Real Estate - 2.0% | |||
| Ashton Woods U.S.A. LLC/Ashton Woods Finance Co. 6.75% 8/1/25 (b) | 1,700,000 | 1,683,000 | |
| AV Homes, Inc. 6.625% 5/15/22 | 2,475,000 | 2,570,164 | |
| Beazer Homes U.S.A., Inc.: | |||
| 5.875% 10/15/27 (b) | 5,170,000 | 5,163,538 | |
| 6.75% 3/15/25 | 3,255,000 | 3,443,139 | |
| Brookfield Residential Properties, Inc. 6.375% 5/15/25 (b) | 2,935,000 | 3,074,413 | |
| CalAtlantic Group, Inc.: | |||
| 5% 6/15/27 | 3,390,000 | 3,563,738 | |
| 5.25% 6/1/26 | 1,205,000 | 1,283,325 | |
| 5.875% 11/15/24 | 1,640,000 | 1,825,525 | |
| Howard Hughes Corp. 5.375% 3/15/25 (b) | 3,145,000 | 3,231,488 | |
| M/I Homes, Inc. 5.625% 8/1/25 | 1,525,000 | 1,549,781 | |
| Mattamy Group Corp.: | |||
| 6.5% 10/1/25 (b) | 2,535,000 | 2,642,738 | |
| 6.875% 12/15/23 (b) | 1,680,000 | 1,764,000 | |
| Meritage Homes Corp. 5.125% 6/6/27 | 3,370,000 | 3,407,913 | |
| Shea Homes Ltd. Partnership/Corp. 6.125% 4/1/25 (b) | 3,025,000 | 3,146,000 | |
| Taylor Morrison Communities, Inc./Monarch Communities, Inc. 5.625% 3/1/24 (b) | 7,164,000 | 7,477,425 | |
| TRI Pointe Homes, Inc. 5.25% 6/1/27 | 4,065,000 | 4,156,463 | |
| William Lyon Homes, Inc.: | |||
| 5.875% 1/31/25 | 2,820,000 | 2,876,400 | |
| 7% 8/15/22 | 3,175,000 | 3,294,063 | |
| 56,153,113 | |||
| Hotels - 0.4% | |||
| ESH Hospitality, Inc. 5.25% 5/1/25 (b) | 8,059,000 | 8,330,991 | |
| Hilton Escrow Issuer LLC 4.25% 9/1/24 | 2,000,000 | 2,042,500 | |
| 10,373,491 | |||
| Leisure - 0.5% | |||
| Carlson Travel, Inc. 9.5% 12/15/24 (b) | 1,975,000 | 1,851,563 | |
| Silversea Cruises 7.25% 2/1/25 (b) | 1,885,000 | 2,021,663 | |
| Six Flags Entertainment Corp.: | |||
| 4.875% 7/31/24 (b) | 1,640,000 | 1,687,150 | |
| 5.5% 4/15/27 (b) | 1,640,000 | 1,711,750 | |
| Studio City Co. Ltd.: | |||
| 5.875% 11/30/19 (b) | 3,055,000 | 3,203,931 | |
| 7.25% 11/30/21 (b) | 4,420,000 | 4,729,842 | |
| 15,205,899 | |||
| Metals/Mining - 2.5% | |||
| First Quantum Minerals Ltd.: | |||
| 7.25% 5/15/22 (b) | 2,480,000 | 2,591,600 | |
| 7.25% 4/1/23 (b) | 5,070,000 | 5,361,525 | |
| 7.5% 4/1/25 (b) | 13,800,000 | 14,610,750 | |
| FMG Resources (August 2006) Pty Ltd.: | |||
| 4.75% 5/15/22 (b) | 1,965,000 | 2,004,300 | |
| 5.125% 5/15/24 (b) | 2,420,000 | 2,489,575 | |
| Freeport-McMoRan, Inc.: | |||
| 3.55% 3/1/22 | 5,555,000 | 5,499,450 | |
| 3.875% 3/15/23 | 1,835,000 | 1,805,181 | |
| 4.55% 11/14/24 | 15,340,000 | 15,309,473 | |
| 5.4% 11/14/34 | 6,570,000 | 6,405,750 | |
| 6.75% 2/1/22 | 4,825,000 | 5,018,000 | |
| 6.875% 2/15/23 | 4,810,000 | 5,261,515 | |
| SunCoke Energy Partners LP/SunCoke Energy Partners Finance Corp. 7.5% 6/15/25 (b) | 3,435,000 | 3,598,163 | |
| Walter Energy, Inc. 9.5% 10/15/19 (b)(d)(e) | 7,630,000 | 1 | |
| 69,955,283 | |||
| Paper - 0.1% | |||
| Louisiana-Pacific Corp. 4.875% 9/15/24 | 2,390,000 | 2,464,688 | |
| NewPage Corp. 11.375% 12/31/2114 (d)(e) | 56,349,036 | 6 | |
| 2,464,694 | |||
| Publishing/Printing - 0.0% | |||
| Clear Channel International BV 8.75% 12/15/20 (b) | 765,000 | 803,250 | |
| Restaurants - 0.7% | |||
| 1011778 BC Unlimited Liability Co./New Red Finance, Inc.: | |||
| 4.25% 5/15/24 (b) | 3,350,000 | 3,374,120 | |
| 5% 10/15/25 (b) | 3,405,000 | 3,468,844 | |
| Golden Nugget, Inc.: | |||
| 6.75% 10/15/24 (b) | 5,105,000 | 5,194,338 | |
| 8.75% 10/1/25 (b) | 1,700,000 | 1,746,750 | |
| KFC Holding Co./Pizza Hut Holding LLC: | |||
| 4.75% 6/1/27 (b) | 1,700,000 | 1,744,625 | |
| 5% 6/1/24 (b) | 3,515,000 | 3,708,325 | |
| 19,237,002 | |||
| Services - 2.8% | |||
| Anna Merger Sub, Inc. 7.75% 10/1/22 (b) | 4,435,000 | 3,104,500 | |
| APX Group, Inc.: | |||
| 6.375% 12/1/19 | 3,558,000 | 3,620,265 | |
| 7.625% 9/1/23 | 4,105,000 | 4,320,513 | |
| 7.875% 12/1/22 | 8,405,000 | 9,066,894 | |
| 8.75% 12/1/20 | 2,690,000 | 2,757,250 | |
| Aramark Services, Inc.: | |||
| 4.75% 6/1/26 | 2,810,000 | 2,939,204 | |
| 5% 4/1/25 (b) | 3,250,000 | 3,473,438 | |
| 5.125% 1/15/24 | 2,405,000 | 2,543,288 | |
| Avantor, Inc.: | |||
| 6% 10/1/24 (b) | 4,195,000 | 4,278,900 | |
| 9% 10/1/25 (b) | 8,510,000 | 8,595,781 | |
| Blueline Rental Finance Corp./Blueline Rental LLC 9.25% 3/15/24 (b) | 6,930,000 | 7,519,050 | |
| Brand Energy & Infrastructure Services, Inc. 8.5% 7/15/25 (b) | 1,700,000 | 1,797,750 | |
| Corrections Corp. of America: | |||
| 4.75% 10/15/27 | 1,195,000 | 1,197,988 | |
| 5% 10/15/22 | 1,695,000 | 1,769,156 | |
| H&E Equipment Services, Inc. 5.625% 9/1/25 (b) | 2,385,000 | 2,519,156 | |
| IHS Markit Ltd.: | |||
| 4.75% 2/15/25 (b) | 3,010,000 | 3,183,075 | |
| 5% 11/1/22 (b) | 1,370,000 | 1,472,750 | |
| KAR Auction Services, Inc. 5.125% 6/1/25 (b) | 2,555,000 | 2,644,425 | |
| Prime Security One MS, Inc. 4.875% 7/15/32 (b) | 1,700,000 | 1,608,625 | |
| Ritchie Brothers Auctioneers, Inc. 5.375% 1/15/25 (b) | 1,410,000 | 1,484,025 | |
| United Rentals North America, Inc.: | |||
| 4.625% 10/15/25 | 2,725,000 | 2,788,084 | |
| 5.5% 5/15/27 | 2,115,000 | 2,263,050 | |
| 5.875% 9/15/26 | 3,081,000 | 3,358,290 | |
| 78,305,457 | |||
| Steel - 0.3% | |||
| Big River Steel LLC/BRS Finance Corp. 7.25% 9/1/25 (b) | 2,275,000 | 2,439,938 | |
| Cliffs Natural Resources, Inc. 5.75% 3/1/25 (b) | 6,795,000 | 6,582,656 | |
| 9,022,594 | |||
| Super Retail - 0.4% | |||
| Asbury Automotive Group, Inc. 6% 12/15/24 | 3,975,000 | 4,193,625 | |
| DBP Holding Corp. 7.75% 10/15/20 (b) | 3,415,000 | 1,827,025 | |
| JC Penney Corp., Inc.: | |||
| 6.375% 10/15/36 | 645,000 | 378,938 | |
| 7.4% 4/1/37 | 1,130,000 | 689,300 | |
| PetSmart, Inc.: | |||
| 5.875% 6/1/25 (b) | 1,685,000 | 1,470,163 | |
| 8.875% 6/1/25 (b) | 1,685,000 | 1,326,938 | |
| Sonic Automotive, Inc. 6.125% 3/15/27 | 1,990,000 | 2,054,675 | |
| 11,940,664 | |||
| Technology - 2.2% | |||
| Compiler Finance Sub, Inc. 7% 5/1/21 (b) | 10,715,000 | 10,848,938 | |
| Conduent Finance, Inc./Xerox Business Service LLC 10.5% 12/15/24 (b) | 4,520,000 | 5,322,300 | |
| Diamond 1 Finance Corp./Diamond 2 Finance Corp.: | |||
| 5.875% 6/15/21 (b) | 3,920,000 | 4,105,329 | |
| 7.125% 6/15/24 (b) | 1,435,000 | 1,583,881 | |
| Inception Merger Sub, Inc./Rackspace Hosting, Inc. 8.625% 11/15/24 (b) | 12,705,000 | 13,379,953 | |
| j2 Cloud Services LLC/j2 Global Communications, Inc. 6% 7/15/25 (b) | 1,980,000 | 2,083,950 | |
| Micron Technology, Inc. 5.25% 1/15/24 (b) | 9,815,000 | 10,318,019 | |
| Nuance Communications, Inc. 5.625% 12/15/26 (b) | 6,270,000 | 6,661,875 | |
| Open Text Corp. 5.875% 6/1/26 (b) | 2,800,000 | 3,034,500 | |
| Qorvo, Inc. 6.75% 12/1/23 | 2,780,000 | 3,009,350 | |
| TTM Technologies, Inc. 5.625% 10/1/25 (b) | 975,000 | 994,500 | |
| VeriSign, Inc. 4.75% 7/15/27 | 1,790,000 | 1,843,700 | |
| 63,186,295 | |||
| Telecommunications - 7.8% | |||
| Altice Financing SA: | |||
| 6.5% 1/15/22 (b) | 510,000 | 527,850 | |
| 7.5% 5/15/26 (b) | 13,090,000 | 14,349,913 | |
| Altice Finco SA: | |||
| 7.625% 2/15/25 (b) | 7,170,000 | 7,681,938 | |
| 8.125% 1/15/24 (b) | 14,870,000 | 16,024,209 | |
| Cincinnati Bell, Inc. 7% 7/15/24 (b) | 3,465,000 | 3,456,338 | |
| CommScope Technologies Finance LLC: | |||
| 5% 3/15/27 (b) | 3,155,000 | 3,072,181 | |
| 6% 6/15/25 (b) | 2,890,000 | 3,052,563 | |
| CyrusOne LP/CyrusOne Finance Corp. 5% 3/15/24 (b) | 790,000 | 828,513 | |
| Frontier Communications Corp. 11% 9/15/25 | 11,595,000 | 9,841,256 | |
| GCI, Inc. 6.875% 4/15/25 | 3,450,000 | 3,734,625 | |
| Gogo Intermediate Holdings LLC/Gogo Finance Co., Inc. 12.5% 7/1/22 (b) | 2,450,000 | 2,777,688 | |
| Intelsat Jackson Holdings SA: | |||
| 5.5% 8/1/23 | 6,020,000 | 5,132,050 | |
| 7.5% 4/1/21 | 1,235,000 | 1,170,163 | |
| 8% 2/15/24 (b) | 4,960,000 | 5,257,600 | |
| Level 3 Financing, Inc.: | |||
| 5.125% 5/1/23 | 2,220,000 | 2,272,725 | |
| 5.375% 1/15/24 | 4,325,000 | 4,492,594 | |
| Neptune Finco Corp.: | |||
| 6.625% 10/15/25 (b) | 4,865,000 | 5,332,040 | |
| 10.125% 1/15/23 (b) | 3,750,000 | 4,293,750 | |
| 10.875% 10/15/25 (b) | 1,615,000 | 1,978,375 | |
| Sable International Finance Ltd. 6.875% 8/1/22 (b) | 6,015,000 | 6,451,088 | |
| SFR Group SA: | |||
| 6% 5/15/22 (b) | 6,155,000 | 6,416,588 | |
| 7.375% 5/1/26 (b) | 6,300,000 | 6,772,500 | |
| Sprint Capital Corp. 6.875% 11/15/28 | 4,894,000 | 5,221,286 | |
| Sprint Communications, Inc. 6% 11/15/22 | 11,860,000 | 12,453,000 | |
| Sprint Corp.: | |||
| 7.125% 6/15/24 | 10,795,000 | 11,668,747 | |
| 7.25% 9/15/21 | 7,535,000 | 8,213,150 | |
| 7.875% 9/15/23 | 15,630,000 | 17,466,525 | |
| T-Mobile U.S.A., Inc.: | |||
| 6% 4/15/24 | 12,105,000 | 12,952,350 | |
| 6.625% 4/1/23 | 11,270,000 | 11,833,500 | |
| Telesat Canada/Telesat LLC 8.875% 11/15/24 (b) | 3,650,000 | 4,088,000 | |
| ViaSat, Inc. 5.625% 9/15/25 (b) | 3,405,000 | 3,443,306 | |
| Wind Acquisition Finance SA 4.75% 7/15/20 (b) | 8,135,000 | 8,231,807 | |
| Wind Tre SpA 5% 1/20/26 (b) | 4,890,000 | 4,921,726 | |
| Zayo Group LLC/Zayo Capital, Inc. 5.75% 1/15/27 (b) | 5,070,000 | 5,342,513 | |
| 220,752,457 | |||
| Transportation Ex Air/Rail - 1.9% | |||
| Navios Maritime Acquisition Corp./Navios Acquisition Finance U.S., Inc. 8.125% 11/15/21 (b) | 8,370,000 | 7,365,600 | |
| Navios Maritime Holdings, Inc.: | |||
| 7.375% 1/15/22 (b) | 23,750,000 | 19,475,000 | |
| 8.125% 2/15/19 | 9,951,000 | 9,801,735 | |
| Navios South American Logistics, Inc./Navios Logistics Finance U.S., Inc. 7.25% 5/1/22 (b) | 1,175,000 | 1,151,500 | |
| Teekay Corp. 8.5% 1/15/20 | 16,760,000 | 16,948,550 | |
| 54,742,385 | |||
| Utilities - 4.1% | |||
| Calpine Corp. 5.75% 1/15/25 | 6,750,000 | 6,412,500 | |
| Cortes NP Acquisition Corp. 9.25% 10/15/24 (b) | 5,645,000 | 6,181,275 | |
| Dolphin Subsidiary II, Inc. 7.25% 10/15/21 | 7,605,000 | 8,395,920 | |
| Dynegy, Inc.: | |||
| 7.375% 11/1/22 | 987,000 | 1,059,791 | |
| 7.625% 11/1/24 | 27,015,000 | 29,513,888 | |
| 8% 1/15/25 (b) | 4,715,000 | 5,151,138 | |
| 8.125% 1/30/26 (b) | 2,425,000 | 2,691,750 | |
| Global Partners LP/GLP Finance Corp.: | |||
| 6.25% 7/15/22 | 4,700,000 | 4,805,750 | |
| 7% 6/15/23 | 9,200,000 | 9,338,000 | |
| InterGen NV 7% 6/30/23 (b) | 25,532,000 | 24,766,040 | |
| NRG Yield Operating LLC 5% 9/15/26 | 1,735,000 | 1,787,050 | |
| NSG Holdings II LLC/NSG Holdings, Inc. 7.75% 12/15/25 (b) | 4,236,055 | 4,601,415 | |
| Pattern Energy Group, Inc. 5.875% 2/1/24 (b) | 2,150,000 | 2,284,375 | |
| PPL Energy Supply LLC 6.5% 6/1/25 | 2,640,000 | 2,296,800 | |
| RJS Power Holdings LLC 4.625% 7/15/19 (b)(c) | 728,000 | 737,100 | |
| The AES Corp.: | |||
| 5.125% 9/1/27 | 1,700,000 | 1,745,050 | |
| 6% 5/15/26 | 3,475,000 | 3,744,313 | |
| 115,512,155 | |||
| TOTAL NONCONVERTIBLE BONDS | 2,230,787,505 | ||
| TOTAL CORPORATE BONDS | |||
| (Cost $2,190,495,264) | 2,238,156,260 | ||
| Shares | Value | ||
| Common Stocks - 0.4% | |||
| Automotive & Auto Parts - 0.3% | |||
| Chassix Holdings, Inc. (e)(g) | 180,386 | 6,553,423 | |
| Chassix Holdings, Inc. warrants 7/29/20 (e)(g) | 48,708 | 577,677 | |
| Motors Liquidation Co. GUC Trust (g) | 49,155 | 479,753 | |
| TOTAL AUTOMOTIVE & AUTO PARTS | 7,610,853 | ||
| Environmental - 0.0% | |||
| Tervita Corp. Class A (e) | 116,052 | 742,135 | |
| Metals/Mining - 0.0% | |||
| Aleris Corp. (e)(g) | 46,900 | 328,300 | |
| Transportation Ex Air/Rail - 0.1% | |||
| Navios Maritime Holdings, Inc. (g)(h) | 771,100 | 1,403,402 | |
| Tricer Holdco SCA (e)(i) | 220,288 | 1,059,585 | |
| TOTAL TRANSPORTATION EX AIR/RAIL | 2,462,987 | ||
| TOTAL COMMON STOCKS | |||
| (Cost $29,581,327) | 11,144,275 | ||
| Preferred Stocks - 1.8% | |||
| Convertible Preferred Stocks - 0.7% | |||
| Energy - 0.5% | |||
| Chesapeake Energy Corp. Series A 5.75% | 24,700 | 13,754,813 | |
| Telecommunications - 0.2% | |||
| Crown Castle International Corp. Series A 6.875% | 6,100 | 6,690,480 | |
| TOTAL CONVERTIBLE PREFERRED STOCKS | 20,445,293 | ||
| Nonconvertible Preferred Stocks - 1.1% | |||
| Environmental - 1.1% | |||
| Tervita Corp. Series A (e) | 4,769,117 | 30,497,803 | |
| Transportation Ex Air/Rail - 0.0% | |||
| Tricer Holdco SCA (e)(i) | 97,905,800 | 979,058 | |
| TOTAL NONCONVERTIBLE PREFERRED STOCKS | 31,476,861 | ||
| TOTAL PREFERRED STOCKS | |||
| (Cost $53,228,127) | 51,922,154 | ||
| Principal Amount | Value | ||
| Bank Loan Obligations - 4.8% | |||
| Automotive & Auto Parts - 0.0% | |||
| Chassix, Inc. term loan 12% 7/29/19 (e) | 818,141 | 816,095 | |
| Broadcasting - 0.0% | |||
| CBS Radio, Inc. Tranche B 1LN, term loan 3 month U.S. LIBOR + 2.750% 3/2/24 (f)(j) | 535,000 | 536,338 | |
| Building Materials - 0.1% | |||
| Beacon Roofing Supply, Inc. Tranche B, term loan 3 month U.S. LIBOR + 2.250% 1/2/25 (f)(j) | 3,825,000 | 3,848,906 | |
| Cable/Satellite TV - 0.2% | |||
| Charter Communication Operating LLC term loan 3 month U.S. LIBOR + 2.000% 3.25% 7/1/20 (c)(f) | 4,599,806 | 4,620,229 | |
| WideOpenWest Finance LLC Tranche B, term loan 3 month U.S. LIBOR + 3.250% 4.4867% 8/19/23 (c)(f) | 1,740,000 | 1,742,175 | |
| TOTAL CABLE/SATELLITE TV | 6,362,404 | ||
| Chemicals - 0.1% | |||
| Tronox Blocked Borrower LLC Tranche B, term loan 3 month U.S. LIBOR + 3.000% 4.3231% 9/22/24 (c)(f) | 340,116 | 342,810 | |
| Tronox Finance LLC Tranche B, term loan 3 month U.S. LIBOR + 3.000% 4.3283% 9/22/24 (c)(f) | 784,884 | 791,100 | |
| Venator Materials LLC Tranche B, term loan 3 month U.S. LIBOR + 3.000% 4.3801% 8/8/24 (c)(f) | 255,000 | 257,869 | |
| TOTAL CHEMICALS | 1,391,779 | ||
| Containers - 0.2% | |||
| Plastipak Packaging, Inc. Tranche B, term loan 3 month U.S. LIBOR + 2.750% 3.99% 10/14/24 (c)(f) | 170,000 | 171,190 | |
| Reynolds Group Holdings, Inc. Tranche B, term loan 3 month U.S. LIBOR + 2.750% 3.985% 2/5/23 (c)(f) | 4,210,049 | 4,233,709 | |
| TOTAL CONTAINERS | 4,404,899 | ||
| Diversified Financial Services - 0.0% | |||
| Bcp Renaissance Parent LLC Tranche B, term loan 3 month U.S. LIBOR + 4.500% 5.3801% 9/20/24 (c)(f) | 695,000 | 702,603 | |
| Diversified Media - 0.1% | |||
| Outfront Media Capital LLC / Corp. Tranche B, term loan 3 month U.S. LIBOR + 2.250% 3.4889% 3/16/24 (c)(f) | 3,922,875 | 3,950,335 | |
| Energy - 0.2% | |||
| FTS International, Inc. Tranche B, term loan 3 month U.S. LIBOR + 4.750% 5.9923% 4/16/21 (c)(f) | 5,785,000�� | 5,637,483 | |
| Environmental - 0.1% | |||
| Hd Supply Waterworks Ltd. Tranche B, term loan 3 month U.S. LIBOR + 3.000% 4.455% 8/1/24 (c)(f) | 2,230,000 | 2,243,938 | |
| Wrangler Buyer Corp. Tranche B, term loan 3 month U.S. LIBOR + 3.000% 4.2344% 9/28/24 (c)(f) | 290,000 | 292,433 | |
| TOTAL ENVIRONMENTAL | 2,536,371 | ||
| Gaming - 0.6% | |||
| Caesars Growth Properties Holdings LLC Tranche 1LN, term loan 3 month U.S. LIBOR + 3.000% 4.2423% 5/8/21 (f) | 263,675 | 263,730 | |
| Caesars Resort Collection LLC Tranche B 1LN, term loan 3 month U.S. LIBOR + 2.750% 9/28/24 (f)(j) | 8,690,000 | 8,742,748 | |
| CityCenter Holdings LLC Tranche B, term loan 3 month U.S. LIBOR + 2.500% 3.7423% 4/18/24 (c)(f) | 4,543,613 | 4,562,378 | |
| Golden Nugget, Inc. Tranche B 1LN, term loan 3 month U.S. LIBOR + 3.250% 4.5264% 10/4/23 (c)(f) | 1,825,387 | 1,843,185 | |
| Scientific Games Corp. Tranche B, term loan 3 month U.S. LIBOR + 3.250% 4.5159% 8/14/24 (c)(f) | 1,965,000 | 1,986,831 | |
| TOTAL GAMING | 17,398,872 | ||
| Healthcare - 1.1% | |||
| Community Health Systems, Inc. Tranche H, term loan 3 month U.S. LIBOR + 3.000% 4.3169% 1/27/21 (c)(f) | 2,291,115 | 2,214,316 | |
| Kindred Healthcare, Inc. Tranche B, term loan 3 month U.S. LIBOR + 3.500% 4.875% 4/9/21 (c)(f) | 4,308,679 | 4,319,451 | |
| Ortho-Clinical Diagnostics, Inc. Tranche B, term loan 3 month U.S. LIBOR + 3.750% 5.0828% 6/30/21 (c)(f) | 21,933,894 | 22,034,570 | |
| U.S. Renal Care, Inc. Tranche B 1LN, term loan 3 month U.S. LIBOR + 4.250% 5.5828% 12/31/22 (c)(f) | 1,211,916 | 1,169,717 | |
| TOTAL HEALTHCARE | 29,738,054 | ||
| Insurance - 0.0% | |||
| Asurion LLC Tranche B, term loan 3 month U.S. LIBOR + 6.000% 7.235% 8/4/25 (c)(f) | 795,000 | 820,345 | |
| Paper - 0.2% | |||
| Caraustar Industries, Inc. Tranche B, term loan 3 month U.S. LIBOR + 5.500% 6.8328% 3/14/22 (c)(f) | 4,008,890 | 4,037,273 | |
| Publishing/Printing - 0.0% | |||
| Springer Science+Business Media Deutschland GmbH Tranche B 13LN, term loan 3 month U.S. LIBOR + 3.500% 8/15/22 (f)(j) | 108,303 | 108,574 | |
| Restaurants - 0.1% | |||
| Burger King Worldwide, Inc. Tranche B, term loan 3 month U.S. LIBOR + 2.250% 3.5276% 2/17/24 (c)(f) | 1,916,122 | 1,918,038 | |
| Services - 0.3% | |||
| Almonde, Inc. Tranche B 1LN, term loan 3 month U.S. LIBOR + 3.500% 4.8169% 6/13/24 (c)(f) | 1,405,000 | 1,399,324 | |
| Avantor, Inc. Tranche B, term loan 3 month U.S. LIBOR + 4.000% 9/20/24 (f)(j) | 3,480,000 | 3,498,026 | |
| Laureate Education, Inc. Tranche B 1LN, term loan 3 month U.S. LIBOR + 4.500% 5.7423% 4/26/24 (c)(f) | 4,736,200 | 4,756,945 | |
| TOTAL SERVICES | 9,654,295 | ||
| Steel - 0.2% | |||
| Big River Steel LLC Tranche B, term loan 3 month U.S. LIBOR + 5.000% 6.3328% 8/23/23 (c)(f) | 4,525,000 | 4,604,188 | |
| Super Retail - 0.1% | |||
| Sears Holdings Corp. Tranche ABL, term loan 3 month U.S. LIBOR + 4.500% 5.7417% 6/30/18 (c)(f) | 3,564,971 | 3,517,450 | |
| Technology - 0.4% | |||
| First Data Corp. Tranche B 1LN, term loan 3 month U.S. LIBOR + 2.500% 3.7379% 4/26/24 (c)(f) | 1,601,285 | 1,607,578 | |
| Information Resources, Inc. Tranche B 1LN, term loan 3 month U.S. LIBOR + 4.250% 5.6174% 1/18/24 (c)(f) | 905,450 | 914,885 | |
| Kronos, Inc. Tranche B 1LN, term loan 3 month U.S. LIBOR + 3.500% 4.8114% 11/1/23 (c)(f) | 4,649,921 | 4,680,983 | |
| Veritas U.S., Inc. Tranche B, term loan 3 month U.S. LIBOR + 4.500% 5.8328% 1/27/23 (c)(f) | 3,392,950 | 3,417,786 | |
| TOTAL TECHNOLOGY | 10,621,232 | ||
| Telecommunications - 0.5% | |||
| Altice Financing SA Tranche B, term loan 3 month U.S. LIBOR + 2.750% 1/5/26 (f)(j) | 5,025,000 | 5,025,000 | |
| Radiate Holdco LLC Tranche B, term loan 3 month U.S. LIBOR + 3.000% 4.2423% 2/1/24 (c)(f) | 6,920,225 | 6,840,435 | |
| Sprint Communications, Inc. Tranche B, term loan 3 month U.S. LIBOR + 2.500% 3.75% 2/3/24 (c)(f) | 2,970,075 | 2,979,965 | |
| TOTAL TELECOMMUNICATIONS | 14,845,400 | ||
| Transportation Ex Air/Rail - 0.1% | |||
| International Seaways Operating Corp. Tranche B, term loan 3 month U.S. LIBOR + 5.500% 6.74% 6/22/22 (c)(f) | 2,156,438 | 2,167,220 | |
| Utilities - 0.2% | |||
| Cortes NP Acquisition Corp. Tranche B, term loan 3 month U.S. LIBOR + 4.000% 5.235% 11/30/23 (c)(f) | 4,117,446 | 4,145,774 | |
| Vistra Operations Co. LLC Tranche B 2LN, term loan 3 month U.S. LIBOR + 2.750% 4.0104% 12/14/23 (c)(f) | 1,756,725 | 1,768,917 | |
| TOTAL UTILITIES | 5,914,691 | ||
| TOTAL BANK LOAN OBLIGATIONS | |||
| (Cost $133,717,565) | 135,532,845 | ||
| Preferred Securities - 3.9% | |||
| Banks & Thrifts - 3.9% | |||
| Bank of America Corp.: | |||
| 6.1% (c)(k) | 5,230,000 | 5,877,646 | |
| 6.25% (c)(k) | 3,190,000 | 3,584,256 | |
| Barclays Bank PLC 7.625% 11/21/22 | 12,860,000 | 15,209,920 | |
| Barclays PLC: | |||
| 6.625% (c)(k) | 12,490,000 | 13,158,893 | |
| 8.25% (c)(k) | 7,517,000 | 8,070,044 | |
| Citigroup, Inc.: | |||
| 5.875% (c)(k) | 6,840,000 | 7,199,649 | |
| 6.3% (c)(k) | 5,300,000 | 5,915,559 | |
| Credit Agricole SA: | |||
| 6.625% (b)(c)(k) | 5,565,000 | 5,889,708 | |
| 7.875% (b)(c)(k) | 8,001,000 | 9,178,647 | |
| Credit Suisse Group AG 6.25% (b)(c)(k) | 3,080,000 | 3,440,280 | |
| JPMorgan Chase & Co. 6.125% (c)(k) | 3,995,000 | 4,435,794 | |
| Lloyds Banking Group PLC 7.5% (c)(k) | 8,540,000 | 9,807,862 | |
| Royal Bank of Scotland Group PLC: | |||
| 7.5% (c)(k) | 8,765,000 | 9,449,489 | |
| 8% (c)(k) | 2,100,000 | 2,415,489 | |
| 8.625% (c)(k) | 7,285,000 | 8,304,772 | |
| TOTAL PREFERRED SECURITIES | |||
| (Cost $100,597,313) | 111,938,008 | ||
| Shares | Value | ||
| Money Market Funds - 9.7% | |||
| Fidelity Cash Central Fund, 1.10% (l) | 273,371,622 | 273,426,297 | |
| Fidelity Securities Lending Cash Central Fund 1.11% (l)(m) | 1,149,903 | 1,150,018 | |
| TOTAL MONEY MARKET FUNDS | |||
| (Cost $274,566,437) | 274,576,315 | ||
| TOTAL INVESTMENT IN SECURITIES - 99.2% | |||
| (Cost $2,782,186,033) | 2,823,269,857 | ||
| NET OTHER ASSETS (LIABILITIES) - 0.8% | 24,043,151 | ||
| NET ASSETS - 100% | $2,847,313,008 |
Legend
(a) Security initially issued at one coupon which converts to a higher coupon at a specified date. The rate shown is the rate at period end.
(b) Security exempt from registration under Rule 144A of the Securities Act of 1933. These securities may be resold in transactions exempt from registration, normally to qualified institutional buyers. At the end of the period, the value of these securities amounted to $1,162,541,239 or 40.8% of net assets.
(c) Coupon rates for floating and adjustable rate securities reflect the rates in effect at period end.
(d) Non-income producing - Security is in default.
(e) Level 3 security
(f) Coupon is indexed to a floating interest rate which may be multiplied by a specified factor and/or subject to caps or floors.
(g) Non-income producing
(h) Security or a portion of the security is on loan at period end.
(i) Restricted securities - Investment in securities not registered under the Securities Act of 1933 (excluding 144A issues). At the end of the period, the value of restricted securities (excluding 144A issues) amounted to $2,038,643 or 0.1% of net assets.
(j) The coupon rate will be determined upon settlement of the loan after period end.
(k) Security is perpetual in nature with no stated maturity date.
(l) Affiliated fund that is generally available only to investment companies and other accounts managed by Fidelity Investments. The rate quoted is the annualized seven-day yield of the fund at period end. A complete unaudited listing of the fund's holdings as of its most recent quarter end is available upon request. In addition, each Fidelity Central Fund's financial statements are available on the SEC's website or upon request.
(m) Investment made with cash collateral received from securities on loan.
Additional information on each restricted holding is as follows:
| Security | Acquisition Date | Acquisition Cost |
| Tricer Holdco SCA�� | 12/19/16 | $4,423,093 |
| Tricer Holdco SCA | 12/19/16 | $2,857,323 |
Affiliated Central Funds
Information regarding fiscal year to date income earned by the Fund from investments in Fidelity Central Funds is as follows:
| Fund | Income earned |
| Fidelity Cash Central Fund | $1,386,754 |
| Fidelity Securities Lending Cash Central Fund | 13,452 |
| Total | $1,400,206 |
Other Affiliated Issuers
An affiliated company is a company in which the Fund has ownership of at least 5% of the voting securities. Fiscal year to date transactions with companies which are or were affiliates are as follows:
| Affiliate | Value, beginning of period | Purchases | Sales Proceeds | Dividend Income | Realized Gain (loss) | Change in Unrealized appreciation (depreciation) | Value, end of period |
| Broadview Networks Holdings, Inc. | $3,161,995 | $-- | $3,630,053 | $-- | $(6,155,142) | $6,623,200 | $-- |
| Total | $3,161,995 | $-- | $3,630,053 | $-- | $(6,155,142) | $6,623,200 | $-- |
Investment Valuation
The following is a summary of the inputs used, as of October 31, 2017, involving the Fund's assets and liabilities carried at fair value. The inputs or methodology used for valuing securities may not be an indication of the risk associated with investing in those securities. For more information on valuation inputs, and their aggregation into the levels used below, please refer to the Investment Valuation section in the accompanying Notes to Financial Statements.
| Valuation Inputs at Reporting Date: | ||||
| Description | Total | Level 1 | Level 2 | Level 3 |
| Investments in Securities: | ||||
| Equities: | ||||
| Consumer Discretionary | $7,131,100 | $-- | $-- | $7,131,100 |
| Energy | 13,754,813 | -- | 13,754,813 | -- |
| Financials | 479,753 | 479,753 | -- | -- |
| Industrials | 34,681,983 | 1,403,402 | -- | 33,278,581 |
| Materials | 328,300 | -- | -- | 328,300 |
| Real Estate | 6,690,480 | -- | 6,690,480 | -- |
| Corporate Bonds | 2,238,156,260 | -- | 2,238,156,250 | 10 |
| Bank Loan Obligations | 135,532,845 | -- | 134,716,750 | 816,095 |
| Preferred Securities | 111,938,008 | -- | 111,938,008 | -- |
| Money Market Funds | 274,576,315 | 274,576,315 | -- | -- |
| Total Investments in Securities: | $2,823,269,857 | $276,459,470 | $2,505,256,301 | $41,554,086 |
The following is a reconciliation of Investments in Securities and Derivative Instruments for which Level 3 inputs were used in determining value:
| Investments in Securities: | |
| Equities - Industrials | |
| Beginning Balance | $32,699,267 |
| Net Realized Gain (Loss) on Investment Securities | 237 |
| Net Unrealized Gain (Loss) on Investment Securities | 579,077 |
| Cost of Purchases | -- |
| Proceeds of Sales | -- |
| Amortization/Accretion | -- |
| Transfers into Level 3 | -- |
| Transfers out of Level 3 | -- |
| Ending Balance | $33,278,581 |
| The change in unrealized gain (loss) for the period attributable to Level 3 securities held at October 31, 2017 | $579,077 |
| Other Investments in Securities | |
| Beginning Balance | $8,120,958 |
| Net Realized Gain (Loss) on Investment Securities | 111,756 |
| Net Unrealized Gain (Loss) on Investment Securities | 1,210,025 |
| Cost of Purchases | -- |
| Proceeds of Sales | (1,167,774) |
| Amortization/Accretion | 540 |
| Transfers into Level 3 | -- |
| Transfers out of Level 3 | -- |
| Ending Balance | $8,275,505 |
| The change in unrealized gain (loss) for the period attributable to Level 3 securities held at October 31, 2017 | $1,210,025 |
The information used in the above reconciliations represents fiscal year to date activity for any Investments in Securities identified as using Level 3 inputs at either the beginning or the end of the current fiscal period. Transfers in or out of Level 3 represent the beginning value of any Security or Instrument where a change in the pricing level occurred from the beginning to the end of the period. The cost of purchases and the proceeds of sales may include securities received or delivered through corporate actions or exchanges. Realized and unrealized gains(losses) disclosed in the reconciliation are included in Net Gain (Loss) on the Fund’s Statement of Operations.
Other Information
Distribution of investments by country or territory of incorporation, as a percentage of Total Net Assets, is as follows (Unaudited):
| United States of America | 76.6% |
| Canada | 5.4% |
| Luxembourg | 4.0% |
| United Kingdom | 3.2% |
| Netherlands | 1.9% |
| Marshall Islands | 1.8% |
| Cayman Islands | 1.2% |
| Bermuda | 1.2% |
| Austria | 1.1% |
| Multi-National | 1.0% |
| Others (Individually Less Than 1%) | 2.6% |
| 100.0% |
See accompanying notes which are an integral part of the financial statements.
Financial Statements
Statement of Assets and Liabilities
| October 31, 2017 (Unaudited) | ||
| Assets | ||
| Investment in securities, at value (including securities loaned of $1,046,500) — See accompanying schedule: Unaffiliated issuers (cost $2,507,619,596) | $2,548,693,542 | |
| Fidelity Central Funds (cost $274,566,437) | 274,576,315 | |
| Total Investment in Securities (cost $2,782,186,033) | $2,823,269,857 | |
| Cash | 1,320,470 | |
| Receivable for investments sold | 25,387,991 | |
| Receivable for fund shares sold | 329,829 | |
| Dividends receivable | 465,731 | |
| Interest receivable | 40,329,353 | |
| Distributions receivable from Fidelity Central Funds | 212,545 | |
| Other receivables | 423,375 | |
| Total assets | 2,891,739,151 | |
| Liabilities | ||
| Payable for investments purchased | $42,566,040 | |
| Payable for fund shares redeemed | 693,378 | |
| Distributions payable | 6 | |
| Other payables and accrued expenses | 16,719 | |
| Collateral on securities loaned | 1,150,000 | |
| Total liabilities | 44,426,143 | |
| Net Assets | $2,847,313,008 | |
| Net Assets consist of: | ||
| Paid in capital | $3,030,180,222 | |
| Undistributed net investment income | 34,866,646 | |
| Accumulated undistributed net realized gain (loss) on investments | (258,817,684) | |
| Net unrealized appreciation (depreciation) on investments | 41,083,824 | |
| Net Assets | $2,847,313,008 | |
| Series High Income: | ||
| Net Asset Value, offering price and redemption price per share ($2,847,313,008 ÷ 291,420,274 shares) | $9.77 |
See accompanying notes which are an integral part of the financial statements.
Statement of Operations
| Six months ended October 31, 2017 (Unaudited) | ||
| Investment Income | ||
| Dividends | $3,770,441 | |
| Interest | 84,306,236 | |
| Income from Fidelity Central Funds | 1,400,206 | |
| Total income | 89,476,883 | |
| Expenses | ||
| Management fee | $1,295,818 | |
| Transfer agent fees | 108,560 | |
| Accounting and security lending fees | 74,619 | |
| Custodian fees and expenses | 12,217 | |
| Independent trustees' fees and expenses | 5,421 | |
| Audit | 287 | |
| Legal | 3,938 | |
| Miscellaneous | 12,091 | |
| Total expenses before reductions | 1,512,951 | |
| Expense reductions | (22,433) | 1,490,518 |
| Net investment income (loss) | 87,986,365 | |
| Realized and Unrealized Gain (Loss) | ||
| Net realized gain (loss) on: | ||
| Investment securities: | ||
| Unaffiliated issuers | 21,088,531 | |
| Fidelity Central Funds | 48 | |
| Other affiliated issuers | (6,155,142) | |
| Total net realized gain (loss) | 14,933,437 | |
| Change in net unrealized appreciation (depreciation) on: | ||
| Investment securities: | ||
| Unaffiliated issuers | (4,154,165) | |
| Fidelity Central Funds | (30) | |
| Other affiliated issuers | 6,623,200 | |
| Total change in net unrealized appreciation (depreciation) | 2,469,005 | |
| Net gain (loss) | 17,402,442 | |
| Net increase (decrease) in net assets resulting from operations | $105,388,807 |
See accompanying notes which are an integral part of the financial statements.
Statement of Changes in Net Assets
| Six months ended October 31, 2017 (Unaudited) | Year ended April 30, 2017 | |
| Increase (Decrease) in Net Assets | ||
| Operations | ||
| Net investment income (loss) | $87,986,365 | $262,953,138 |
| Net realized gain (loss) | 14,933,437 | (78,543,200) |
| Change in net unrealized appreciation (depreciation) | 2,469,005 | 417,966,470 |
| Net increase (decrease) in net assets resulting from operations | 105,388,807 | 602,376,408 |
| Distributions to shareholders from net investment income | (78,649,424) | (247,339,463) |
| Share transactions - net increase (decrease) | 41,110,056 | (2,678,415,045) |
| Total increase (decrease) in net assets | 67,849,439 | (2,323,378,100) |
| Net Assets | ||
| Beginning of period | 2,779,463,569 | 5,102,841,669 |
| End of period | $2,847,313,008 | $2,779,463,569 |
| Other Information | ||
| Undistributed net investment income end of period | $34,866,646 | $25,529,705 |
See accompanying notes which are an integral part of the financial statements.
Financial Highlights
Fidelity Series High Income Fund Series High Income
| Six months ended (Unaudited) October 31, | Years ended April 30, | |||||
| 2017 | 2017 | 2016 | 2015 | 2014 | 2013 | |
| Selected Per–Share Data | ||||||
| Net asset value, beginning of period | $9.68 | $8.96 | $9.87 | $10.58 | $10.63 | $9.96 |
| Income from Investment Operations | ||||||
| Net investment income (loss)A | .302 | .557 | .550 | .565 | .566 | .587 |
| Net realized and unrealized gain (loss) | .060 | .687 | (.867) | (.382) | (.033) | .655 |
| Total from investment operations | .362 | 1.244 | (.317) | .183 | .533 | 1.242 |
| Distributions from net investment income | (.272) | (.524) | (.546) | (.552) | (.554) | (.550) |
| Distributions from net realized gain | – | – | (.047) | (.341) | (.029) | (.022) |
| Total distributions | (.272) | (.524) | (.593) | (.893) | (.583) | (.572) |
| Net asset value, end of period | $9.77 | $9.68 | $8.96 | $9.87 | $10.58 | $10.63 |
| Total ReturnB,C | 3.78% | 14.25% | (3.08)% | 1.86% | 5.23% | 12.85% |
| Ratios to Average Net AssetsD,E | ||||||
| Expenses before reductions | .11%F | .69% | .69% | .69% | .70% | .71% |
| Expenses net of fee waivers, if any | .11%F | .69% | .69% | .69% | .70% | .71% |
| Expenses net of all reductions | .11%F | .69% | .69% | .69% | .69% | .71% |
| Net investment income (loss) | 6.22%F | 6.00% | 6.07% | 5.51% | 5.42% | 5.74% |
| Supplemental Data | ||||||
| Net assets, end of period (000 omitted) | $2,847,313 | $1,285,072 | $2,417,317 | $2,835,891 | $5,367,464 | $5,381,081 |
| Portfolio turnover rateG | 46%F | 44% | 34% | 31% | 54% | 45% |
A Calculated based on average shares outstanding during the period.
B Total returns for periods of less than one year are not annualized.
C Total returns would have been lower if certain expenses had not been reduced during the applicable periods shown.
D Fees and expenses of any underlying Fidelity Central Funds are not included in the Fund's expense ratio. The Fund indirectly bears its proportionate share of the expenses of any underlying Fidelity Central Funds.
E Expense ratios reflect operating expenses of the class. Expenses before reductions do not reflect amounts reimbursed by the investment adviser or reductions from brokerage service arrangements or reductions from other expense offset arrangements and do not represent the amount paid by the class during periods when reimbursements or reductions occur. Expenses net of fee waivers reflect expenses after reimbursement by the investment adviser but prior to reductions from brokerage service arrangements or other expense offset arrangements. Expenses net of all reductions represent the net expenses paid by the class.
F Annualized
G Amount does not include the portfolio activity of any underlying Fidelity Central Funds.
See accompanying notes which are an integral part of the financial statements.
Notes to Financial Statements (Unaudited)
For the period ended October 31, 2017
1. Organization.
Fidelity Series High Income Fund (the Fund) is a fund of Fidelity Summer Street Trust (the Trust) and is authorized to issue an unlimited number of shares. The Trust is registered under the Investment Company Act of 1940, as amended (the 1940 Act), as an open-end management investment company organized as a Massachusetts business trust. Effective August 28, 2017, the Fund no longer offered Class F shares, and all outstanding shares of Class F were exchanged for shares of Series High Income.
2. Investments in Fidelity Central Funds.
The Fund invests in Fidelity Central Funds, which are open-end investment companies generally available only to other investment companies and accounts managed by the investment adviser and its affiliates. The Fund's Schedule of Investments lists each of the Fidelity Central Funds held as of period end, if any, as an investment of the Fund, but does not include the underlying holdings of each Fidelity Central Fund. As an Investing Fund, the Fund indirectly bears its proportionate share of the expenses of the underlying Fidelity Central Funds.
The Money Market Central Funds seek preservation of capital and current income and are managed by Fidelity Investments Money Management, Inc. (FIMM), an affiliate of the investment adviser. Annualized expenses of the Money Market Central Funds as of their most recent shareholder report date are less than .005%.
A complete unaudited list of holdings for each Fidelity Central Fund is available upon request or at the Securities and Exchange Commission (the SEC) website at www.sec.gov. In addition, the financial statements of the Fidelity Central Funds are available on the SEC website or upon request.
3. Significant Accounting Policies.
The Fund is an investment company and applies the accounting and reporting guidance of the Financial Accounting Standards Board (FASB) Accounting Standards Codification Topic 946 Financial Services – Investments Companies. The financial statements have been prepared in conformity with accounting principles generally accepted in the United States of America (GAAP), which require management to make certain estimates and assumptions at the date of the financial statements. Actual results could differ from those estimates. Subsequent events, if any, through the date that the financial statements were issued have been evaluated in the preparation of the financial statements. The following summarizes the significant accounting policies of the Fund:
Investment Valuation. Investments are valued as of 4:00 p.m. Eastern time on the last calendar day of the period. The Board of Trustees (the Board) has delegated the day to day responsibility for the valuation of the Fund's investments to the Fair Value Committee (the Committee) established by the Fund's investment adviser. In accordance with valuation policies and procedures approved by the Board, the Fund attempts to obtain prices from one or more third party pricing vendors or brokers to value its investments. When current market prices, quotations or currency exchange rates are not readily available or reliable, investments will be fair valued in good faith by the Committee, in accordance with procedures adopted by the Board. Factors used in determining fair value vary by investment type and may include market or investment specific events, changes in interest rates and credit quality. The frequency with which these procedures are used cannot be predicted and they may be utilized to a significant extent. The Committee oversees the Fund's valuation policies and procedures and reports to the Board on the Committee's activities and fair value determinations. The Board monitors the appropriateness of the procedures used in valuing the Fund's investments and ratifies the fair value determinations of the Committee.
The Fund categorizes the inputs to valuation techniques used to value its investments into a disclosure hierarchy consisting of three levels as shown below:
- Level 1 – quoted prices in active markets for identical investments
- Level 2 – other significant observable inputs (including quoted prices for similar investments, interest rates, prepayment speeds, etc.)
- Level 3 – unobservable inputs (including the Fund's own assumptions based on the best information available)
Valuation techniques used to value the Fund's investments by major category are as follows:
Debt securities, including restricted securities, are valued based on evaluated prices received from third party pricing vendors or from brokers who make markets in such securities. Corporate bonds, bank loan obligations and preferred securities are valued by pricing vendors who utilize matrix pricing which considers yield or price of bonds of comparable quality, coupon, maturity and type or by broker-supplied prices. When independent prices are unavailable or unreliable, debt securities may be valued utilizing pricing methodologies which consider similar factors that would be used by third party pricing vendors. Debt securities are generally categorized as Level 2 in the hierarchy but may be Level 3 depending on the circumstances. The Fund invests a significant portion of its assets in below investment grade securities. The value of these securities can be more volatile due to changes in the credit quality of the issuer and is sensitive to changes in economic, market and regulatory conditions.
Equity securities, including restricted securities, for which market quotations are readily available, are valued at the last reported sale price or official closing price as reported by a third party pricing vendor on the primary market or exchange on which they are traded and are categorized as Level 1 in the hierarchy. In the event there were no sales during the day or closing prices are not available, securities are valued at the last quoted bid price or may be valued using the last available price and are generally categorized as Level 2 in the hierarchy. For foreign equity securities, when market or security specific events arise, comparisons to the valuation of American Depositary Receipts (ADRs), futures contracts, Exchange-Traded Funds (ETFs) and certain indexes as well as quoted prices for similar securities may be used and would be categorized as Level 2 in the hierarchy. Utilizing these techniques may result in transfers between Level 1 and Level 2. For equity securities, including restricted securities, where observable inputs are limited, assumptions about market activity and risk are used and these securities may be categorized as Level 3 in the hierarchy. Equity securities, including restricted securities, for which observable inputs are not available are valued using alternate valuation approaches, including the market approach and the income approach and are categorized as Level 3 in the hierarchy. The market approach generally consists of using comparable market transactions while the income approach generally consists of using the net present value of estimated future cash flows, adjusted as appropriate for liquidity, credit, market and/or other risk factors.
Investments in open-end mutual funds, including the Fidelity Central Funds, are valued at their closing net asset value (NAV) each business day and are categorized as Level 1 in the hierarchy.
The following provides information on Level 3 securities held by the Fund that were valued at period end based on unobservable inputs. These amounts exclude valuations provided by a broker.
| Asset Type | Fair Value | Valuation Technique (s) | Unobservable Input | Amount or Range/Weighted Average | Impact to Valuation from an Increase in Input(a) |
| Corp- orate Bonds | $10 | Recovery value | Recovery value | 0.0% | Increase |
| Equities | $40,737,981 | Market approach | Transaction price | $0.01 | Increase |
| Market comparable | Discount rate | 15.0% | Decrease | ||
| Enterprise value/EBITDA multiple (EV/EBITDA) | 4.5 - 8.4 / 7.7 | Increase | |||
| Discount for lack of marketability | 10.0% - 15.0% / 10.1% | Decrease | |||
| Book Value | Book value multiple | 1.0 | Increase |
(a) Represents the expected directional change in the fair value of the Level 3 investments that would result from an increase in the corresponding input. A decrease to the unobservable input would have the opposite effect. Significant changes in these inputs could result in significantly higher or lower fair value measurements.
Changes in valuation techniques may result in transfers in or out of an assigned level within the disclosure hierarchy. The aggregate value of investments by input level as of October 31, 2017, as well as a roll forward of Level 3 investments, is included at the end of the Fund's Schedule of Investments.
Investment Transactions and Income. For financial reporting purposes, the Fund's investment holdings and NAV include trades executed through the end of the last business day of the period. The NAV per share for processing shareholder transactions is calculated as of the close of business of the New York Stock Exchange (NYSE), normally 4:00 p.m. Eastern time and includes trades executed through the end of the prior business day. Gains and losses on securities sold are determined on the basis of identified cost. Dividend income is recorded on the ex-dividend date, except for certain dividends from foreign securities where the ex-dividend date may have passed, which are recorded as soon as the Fund is informed of the ex-dividend date. Non-cash dividends included in dividend income, if any, are recorded at the fair market value of the securities received. Income and capital gain distributions from Fidelity Central Funds, if any, are recorded on the ex-dividend date. Certain distributions received by the Fund represent a return of capital or capital gain. The Fund determines the components of these distributions subsequent to the ex-dividend date, based upon receipt of tax filings or other correspondence relating to the underlying investment. These distributions are recorded as a reduction of cost of investments and/or as a realized gain. Interest income is accrued as earned and includes coupon interest and amortization of premium and accretion of discount on debt securities as applicable. Paid in Kind (PIK) income is recorded at the fair market value of the securities received. Debt obligations may be placed on non-accrual status and related interest income may be reduced by ceasing current accruals and writing off interest receivables when the collection of all or a portion of interest has become doubtful based on consistently applied procedures. A debt obligation is removed from non-accrual status when the issuer resumes interest payments or when collectability of interest is reasonably assured.
Class Allocations and Expenses. Investment income, realized and unrealized capital gains and losses, common expenses of the Fund, and certain fund-level expense reductions, if any, are allocated daily on a pro-rata basis to each class based on the relative net assets of each class to the total net assets of the Fund. Each class differs with respect to transfer agent fees incurred. Certain expense reductions may also differ by class. For the reporting period, the allocated portion of income and expenses to each class as a percent of its average net assets may vary due to the timing of recording these transactions in relation to fluctuating net assets of the classes. Expenses directly attributable to a fund are charged to that fund. Expenses attributable to more than one fund are allocated among the respective funds on the basis of relative net assets or other appropriate methods. Expense estimates are accrued in the period to which they relate and adjustments are made when actual amounts are known.
Income Tax Information and Distributions to Shareholders. Each year, the Fund intends to qualify as a regulated investment company under Subchapter M of the Internal Revenue Code, including distributing substantially all of its taxable income and realized gains. As a result, no provision for U.S. Federal income taxes is required. The Fund files a U.S. federal tax return, in addition to state and local tax returns as required. The Fund's federal income tax returns are subject to examination by the Internal Revenue Service (IRS) for a period of three fiscal years after they are filed. State and local tax returns may be subject to examination for an additional fiscal year depending on the jurisdiction.
Dividends are declared and recorded daily and paid monthly from net investment income. Distributions from realized gains, if any, are declared and recorded on the ex-dividend date. Income dividends and capital gain distributions are declared separately for each class. Income and capital gain distributions are determined in accordance with income tax regulations, which may differ from GAAP.
Capital accounts within the financial statements are adjusted for permanent book-tax differences. These adjustments have no impact on net assets or the results of operations. Capital accounts are not adjusted for temporary book-tax differences which will reverse in a subsequent period.
Book-tax differences are primarily due to foreign currency transactions, market discount, contingent interest, certain conversion ratio adjustments, capital loss carryforwards and losses deferred due to wash sales.
As of period end, the cost and unrealized appreciation (depreciation) in securities, and derivatives if applicable, for federal income tax purposes were as follows:
| Gross unrealized appreciation | $155,106,254 |
| Gross unrealized depreciation | (94,492,073) |
| Net unrealized appreciation (depreciation) | $60,614,181 |
| Tax cost | $2,762,655,676 |
Capital loss carryforwards are only available to offset future capital gains of the Fund to the extent provided by regulations and may be limited. Under the Regulated Investment Company Modernization Act of 2010 (the Act), the Fund is permitted to carry forward capital losses incurred in taxable years beginning after December 22, 2010 for an unlimited period and such capital losses are required to be used prior to any losses that expire. The capital loss carryforward information presented below, including any applicable limitation, is estimated as of fiscal period end and is subject to adjustment.
| No expiration | |
| Short-term | $(2,934,456) |
| Long-Term | (266,860,709) |
| Total capital loss carryforward | $(269,795,165) |
Restricted Securities. The Fund may invest in securities that are subject to legal or contractual restrictions on resale. These securities generally may be resold in transactions exempt from registration or to the public if the securities are registered. Disposal of these securities may involve time-consuming negotiations and expense, and prompt sale at an acceptable price may be difficult. Information regarding restricted securities is included at the end of the Fund's Schedule of Investments.
Loans and Other Direct Debt Instruments. The Fund invests in direct debt instruments which are interests in amounts owed to lenders by corporate or other borrowers. These instruments may be in the form of loans, trade claims or other receivables and may include standby financing commitments such as revolving credit facilities that obligate the Fund to supply additional cash to the borrower on demand. Loans may be acquired through assignment or participation. The Fund did not have any unfunded loan commitments, which are contractual obligations for future funding, at period end.
New Accounting Pronouncement. In March 2017, the Financial Accounting Standards Board (FASB) issued an Accounting Standards Update (ASU), ASU 2017-08, which amends the amortization period for certain callable debt securities that are held at a premium. The amendment requires the premium to be amortized to the earliest call date. The amendments do not require an accounting change for securities held at a discount. The ASU is effective for annual periods beginning after December 15, 2018. Management is currently evaluating the potential impact of these changes to the financial statements.
4. Purchases and Sales of Investments.
Purchases and sales of securities, other than short-term securities, aggregated $597,205,918 and $583,160,833, respectively.
5. Fees and Other Transactions with Affiliates.
Management Fee. Effective June 1, 2017, under the management contract approved by the Board and shareholders, Fidelity Management & Research Company (the investment adviser) and its affiliates provide the Fund with investment management related services for which the Fund does not pay a management fee. In addition, the investment adviser pays all ordinary operating expenses of the Fund, except custody fees, fees and expenses of the independent Trustees, and certain miscellaneous expenses such as proxy and shareholder meeting expenses.
Prior to June 1, 2017, the investment adviser and its affiliates provided the Fund with investment management related services for which the Fund paid a monthly management fee. The management fee was the sum of an individual fund fee rate that was based on an annual rate of .45% of the Fund's average net assets and an annualized group fee rate that averaged .11% during the period. The group fee rate was based upon the average net assets of all the mutual funds advised by the investment adviser, including any mutual funds previously advised by the investment adviser that are currently advised by Fidelity SelectCo, LLC, an affiliate of the investment adviser. The group fee rate decreased as assets under management increased and increased as assets under management decreased.
Transfer Agent Fees. Fidelity Investments Institutional Operations Company, Inc., (FIIOC), an affiliate of the investment adviser, is the transfer, dividend disbursing and shareholder servicing agent for each class of the Fund. Effective June 1, 2017, fees for these services are no longer charged to the classes. Prior to June 1, 2017, FIIOC received account fees and asset-based fees that varied according to the account size and type of account of the shareholders of Series High Income. FIIOC received no fees for providing transfer agency services to Class F. FIIOC pays for typesetting, printing and mailing of shareholder reports, except proxy statements.
For the period, transfer agent fees for each applicable class were as follows:
| Amount | % of Class-Level Average Net Assets(a) | |
| Series High Income | $108,560 | .01 |
(a) Annualized
Accounting and Security Lending Fees. Fidelity Service Company, Inc. (FSC), an affiliate of the investment adviser, maintains the Fund's accounting records. The accounting fee is based on the level of average net assets for each month. Under a separate contract, FSC administers the security lending program. The security lending fee is based on the number and duration of lending transactions. Effective June 1, 2017, these fees are paid by the investment adviser or an affiliate.
Interfund Trades. The Fund may purchase from or sell securities to other Fidelity Funds under procedures adopted by the Board. The procedures have been designed to ensure these interfund trades are executed in accordance with Rule 17a-7 of the 1940 Act. Interfund trades are included within the respective purchases and sales amounts shown in the Purchases and Sales of Investments note.
6. Committed Line of Credit.
The Fund participates with other funds managed by the investment adviser or an affiliate in a $4.25 billion credit facility (the "line of credit") to be utilized for temporary or emergency purposes to fund shareholder redemptions or for other short-term liquidity purposes. The Fund has agreed to pay commitment fees on its pro-rata portion of the line of credit, which amounted to $4,193 and is reflected in Miscellaneous expenses on the Statement of Operations. During the period, the Fund did not borrow on this line of credit.
7. Security Lending.
The Fund lends portfolio securities through a lending agent from time to time in order to earn additional income. For equity securities, a lending agent is used and may loan securities to certain qualified borrowers, including Fidelity Capital Markets (FCM), a broker-dealer affiliated with the Fund. On the settlement date of the loan, the Fund receives collateral (in the form of U.S. Treasury obligations, letters of credit and/or cash) against the loaned securities and maintains collateral in an amount not less than 100% of the market value of the loaned securities during the period of the loan. The market value of the loaned securities is determined at the close of business of the Fund and any additional required collateral is delivered to the Fund on the next business day. The Fund or borrower may terminate the loan at any time, and if the borrower defaults on its obligation to return the securities loaned because of insolvency or other reasons, the Fund may apply collateral received from the borrower against the obligation. The Fund may experience delays and costs in recovering the securities loaned. Any cash collateral received is invested in the Fidelity Securities Lending Cash Central Fund. The value of loaned securities and cash collateral at period end are disclosed on the Fund's Statement of Assets and Liabilities. Security lending income represents the income earned on investing cash collateral, less rebates paid to borrowers and any lending agent fees associated with the loan, plus any premium payments received for lending certain types of securities. Security lending income is presented in the Statement of Operations as a component of income from Fidelity Central Funds. Total security lending income during the period amounted to $13,452. During the period, there were no securities loaned to FCM.
8. Expense Reductions.
Commissions paid to certain brokers with whom the investment adviser, or its affiliates, places trades on behalf of the Fund include an amount in addition to trade execution, which may be rebated back to the Fund to offset certain expenses. This amount totaled $52 for the period. Through arrangements with the Fund's custodian, credits realized as a result of certain uninvested cash balances were used to reduce the Fund's expenses. During the period, these credits reduced the Fund's custody expenses by $9,733.
In addition, during the period the investment adviser reimbursed and/or waived a portion of fund-level operating expenses in the amount of $12,648.
9. Distributions to Shareholders.
Distributions to shareholders of each class were as follows:
| Six months ended October 31, 2017 | Year ended April 30, 2017 | |
| From net investment income | ||
| Series High Income | $51,685,750 | $114,652,474 |
| Class F | 26,963,674 | 132,686,989 |
| Total | $78,649,424 | $247,339,463 |
10. Share Transactions.
Transactions for each class of shares were as follows:
| Shares | Shares | Dollars | Dollars | |
| Six months ended October 31, 2017 | Year ended April 30, 2017 | Six months ended October 31, 2017 | Year ended April 30, 2017 | |
| Series High Income | ||||
| Shares sold | 167,472,768 | 2,082,318 | $1,618,425,306 | $19,724,061 |
| Reinvestment of distributions | 4,981,965 | 12,324,155 | 48,476,861 | 114,652,474 |
| Shares redeemed | (13,826,415) | (151,455,603) | (134,175,027) | (1,433,263,448) |
| Net increase (decrease) | 158,628,318 | (137,049,130) | $1,532,727,140 | $(1,298,886,913) |
| Class F | ||||
| Shares sold | 4,069,818 | 4,059,163 | $39,433,422 | $38,467,624 |
| Reinvestment of distributions | 2,131,566 | 14,258,185 | 20,689,896 | 132,686,989 |
| Shares redeemed | (160,622,473) | (163,677,622) | (1,551,740,402) | (1,550,682,745) |
| Net increase (decrease) | (154,421,089) | (145,360,274) | $(1,491,617,084) | $(1,379,528,132) |
11. Other.
The Fund's organizational documents provide former and current trustees and officers with a limited indemnification against liabilities arising in connection with the performance of their duties to the Fund. In the normal course of business, the Fund may also enter into contracts that provide general indemnifications. The Fund's maximum exposure under these arrangements is unknown as this would be dependent on future claims that may be made against the Fund. The risk of material loss from such claims is considered remote.
At the end of the period, mutual funds managed by the investment adviser or its affiliates were the owners of record of all of the outstanding shares of the Fund.
Shareholder Expense Example
As a shareholder of the Fund, you incur two types of costs: (1) transaction costs, and (2) ongoing costs, including management fees and other Fund expenses. This Example is intended to help you understand your ongoing costs (in dollars) of investing in the Fund and to compare these costs with the ongoing costs of investing in other mutual funds.
The Example is based on an investment of $1,000 invested at the beginning of the period and held for the entire period (May 1, 2017 to October 31, 2017).
Actual Expenses
The first line of the accompanying table provides information about actual account values and actual expenses. You may use the information in this line, together with the amount you invested, to estimate the expenses that you paid over the period. Simply divide your account value by $1,000.00 (for example, an $8,600 account value divided by $1,000.00 = 8.6), then multiply the result by the number in the first line under the heading entitled "Expenses Paid During Period" to estimate the expenses you paid on your account during this period. In addition, the Fund, as a shareholder in the underlying Fidelity Central Funds, will indirectly bear its pro-rata share of the fees and expenses incurred by the underlying Fidelity Central Funds. These fees and expenses are not included in the Fund's annualized expense ratio used to calculate the expense estimate in the table below.
Hypothetical Example for Comparison Purposes
The second line of the accompanying table provides information about hypothetical account values and hypothetical expenses based on the Fund's actual expense ratio and an assumed rate of return of 5% per year before expenses, which is not the Fund's actual return. The hypothetical account values and expenses may not be used to estimate the actual ending account balance or expenses you paid for the period. You may use this information to compare the ongoing costs of investing in the Fund and other funds. To do so, compare this 5% hypothetical example with the 5% hypothetical examples that appear in the shareholder reports of the other funds. In addition, the Fund, as a shareholder in the underlying Fidelity Central Funds, will indirectly bear its pro-rata share of the fees and expenses incurred by the underlying Fidelity Central Funds. These fees and expenses are not included in the Fund's annualized expense ratio used to calculate the expense estimate in the table below.
Please note that the expenses shown in the table are meant to highlight your ongoing costs only and do not reflect any transaction costs. Therefore, the second line of the table is useful in comparing ongoing costs only, and will not help you determine the relative total costs of owning different funds.
| Annualized Expense Ratio-A | Beginning Account Value May 1, 2017 | Ending Account Value October 31, 2017 | Expenses Paid During Period-B May 1, 2017 to October 31, 2017 | |
| Series High Income | .11% | |||
| Actual | $1,000.00 | $1,037.80 | $.57** | |
| Hypothetical-C | $1,000.00 | $1,024.65 | $.56** |
A Annualized expense ratio reflects expenses net of applicable fee waivers.
B Expenses are equal to the Fund's annualized expense ratio, multiplied by the average account value over the period, multiplied by 184/365 (to reflect the one-half year period).
C 5% return per year before expenses
** If fees and changes to the Fund's expense contract and/or expense cap, effective June 1, 2017, had been in effect during the entire period, the restated annualized expense ratio would have been .00% and the expenses paid in the actual and hypothetical examples above would have been $.00 and $.00, respectively.
Board Approval of Investment Advisory Contracts and Management Fees
Fidelity Series High Income Fund
Each year, the Board of Trustees, including the Independent Trustees (together, the Board), votes on the renewal of the management contract with Fidelity Management & Research Company (FMR) and the sub-advisory agreements (together, the Advisory Contracts) for the fund. FMR and the sub-advisers are referred to herein as the Investment Advisers. The Board, assisted by the advice of fund counsel and Independent Trustees' counsel, requests and considers a broad range of information relevant to the renewal of the Advisory Contracts throughout the year.
The Board meets regularly and, at each of its meetings, covers an extensive agenda of topics and materials and considers factors that are relevant to its annual consideration of the renewal of the fund's Advisory Contracts, including the services and support provided to the fund and its shareholders. The Board has established various standing committees (Committees), each composed of and chaired by Independent Trustees with varying backgrounds, to which the Board has assigned specific subject matter responsibilities in order to enhance effective decision-making by the Board. The Board, acting directly and through its Committees, requests and receives information concerning the annual consideration of the renewal of the fund's Advisory Contracts. The Board also meets as needed to review matters specifically related to the Board's annual consideration of the renewal of the Advisory Contracts. Members of the Board may also meet with trustees of other Fidelity funds through ad hoc joint committees to discuss certain matters relevant to all of the Fidelity funds.
At its July 2017 meeting, the Board unanimously determined to renew the fund's Advisory Contracts. In reaching its determination, the Board considered that the Advisory Contracts currently in place had become effective on June 1, 2017 in connection with shareholders of certain other Fidelity funds that invest in the fund (referred to herein as Freedom Funds) voting to approve new management contracts for the Freedom Funds. The Board noted the Advisory Contracts implemented a new fee structure pursuant to which the fund does not pay a management fee to FMR. The Board also approved certain amendments to the sub-advisory agreements for the fund to ensure consistency in the sub-advisory fees paid under the new fee structure compared to the sub-advisory fees paid under the prior fee structure. The Board noted that the amendments will not result in any changes to the nature, extent, and quality of services provided to the fund.
In considering whether to renew the Advisory Contracts for the fund, the Board considered all factors it believed relevant and reached a determination, with the assistance of fund counsel and Independent Trustees' counsel and through the exercise of its business judgment, that the renewal of the Advisory Contracts was in the best interests of the fund and its shareholders and the fact that no fee is payable under the management contract was fair and reasonable.
Nature, Extent, and Quality of Services Provided. The Board considered Fidelity's staffing as it relates to the fund, including the backgrounds of investment personnel of Fidelity, and also considered the fund's investment objective, strategies, and related investment philosophy. The Independent Trustees also had discussions with senior management of Fidelity's investment operations and investment groups. The Board considered the structure of the investment personnel compensation program and whether this structure provides appropriate incentives to act in the best interests of the fund.Resources Dedicated to Investment Management and Support Services. The Board and the Fund Oversight and Research Committees reviewed the general qualifications and capabilities of Fidelity's investment staff, including its size, education, experience, and resources, as well as Fidelity's approach to recruiting, training, managing, and compensating investment personnel. The Board noted that Fidelity has continued to increase the resources devoted to non-U.S. offices, including expansion of Fidelity's global investment organization. The Board also noted that Fidelity's analysts have extensive resources, tools and capabilities that allow them to conduct sophisticated quantitative and fundamental analysis, as well as credit analysis of issuers, counterparties and guarantors. Further, the Board considered that Fidelity's investment professionals have sufficient access to global information and data so as to provide competitive investment results over time, and that those professionals also have access to sophisticated tools that permit them to assess portfolio construction and risk and performance attribution characteristics continuously, as well as to transmit new information and research conclusions rapidly around the world. Additionally, in its deliberations, the Board considered Fidelity's trading, risk management, compliance, and technology and operations capabilities and resources, which are integral parts of the investment management process.Administrative Services. The Board considered (i) the nature, extent, quality, and cost of advisory and administrative services performed by the Investment Advisers and their affiliates under the Advisory Contracts and under separate agreements covering transfer agency, pricing and bookkeeping, and securities lending services for the fund; (ii) the nature and extent of the supervision of third party service providers, principally custodians, subcustodians, and pricing vendors; and (iii) the resources devoted to, and the record of compliance with, the fund's compliance policies and procedures. The Board also reviewed the allocation of fund brokerage, including allocations to brokers affiliated with the Investment Advisers, the use of brokerage commissions to pay fund expenses, and the use of "soft" commission dollars to pay for research services.Investment Performance. The Board considered whether the fund has operated in accordance with its investment objective, as well as its record of compliance with its investment restrictions. The Board reviewed the fund's absolute investment performance, as well as the fund's relative investment performance, but did not consider performance to be a material factor in its decision to renew the fund's Advisory Contracts, as the fund is not publicly offered as a stand-alone investment product. In this regard, the Board noted that the fund is designed to offer an investment option for other investment companies managed by Fidelity and ultimately to enhance the performance of those investment companies.Based on its review, the Board concluded that the nature, extent, and quality of services provided to the fund under the Advisory Contracts should continue to benefit the shareholders of the fund.Competitiveness of Management Fee and Total Expense Ratio. The Board considered that the fund does not pay FMR a management fee for investment advisory services. The Board also noted that FMR or an affiliate undertakes to pay all operating expenses of the fund, except transfer agent fees, 12b-1 fees, Independent Trustee fees and expenses, custodian fees and expenses, proxy and shareholder meeting expenses, interest, taxes, brokerage expenses, and extraordinary expenses (such as litigation expenses).The Board further considered that, effective June 1, 2017, FMR has contractually agreed to reimburse the fund to the extent that total operating expenses (excluding interest, certain taxes, certain securities lending costs, brokerage commissions, fees and expenses of the Independent Trustees, proxy and shareholder meeting expenses, extraordinary expenses, and acquired fund fees and expenses, if any), as a percentage of its average net assets, exceed 0.014% through June 30, 2020.Based on its review, the Board considered that the fund does not pay a management fee and concluded that the total expense ratio of each class of the fund was reasonable in light of the services that the fund and its shareholders receive and the other factors considered.Costs of the Services and Profitability. The Board considered the level of Fidelity's profits in respect of all the Fidelity funds.PricewaterhouseCoopers LLP (PwC), independent registered public accounting firm and auditor to Fidelity and certain Fidelity funds, has been engaged annually by the Board as part of the Board's assessment of Fidelity's profitability analysis. PwC's engagement includes the review and assessment of the methodologies used by Fidelity in determining the revenues and expenses attributable to Fidelity's mutual fund business, and completion of agreed-upon procedures in respect of the mathematical accuracy of the fund profitability information and its conformity to established allocation methodologies. After considering PwC's reports issued under the engagement and information provided by Fidelity, the Board concluded that while other allocation methods may also be reasonable, Fidelity's profitability methodologies are reasonable in all material respects.The Board also reviewed Fidelity's non-fund businesses and potential fall-out benefits related to the mutual fund business as well as cases where Fidelity's affiliates may benefit from or be related to the fund's business.The Board concluded that the costs of the services provided by and the profits realized by Fidelity in connection with the operation of the fund were not relevant to the renewal of the Advisory Contracts because the fund pays no advisory fees and FMR or an affiliate bears all expenses of the fund, with limited exceptions.Economies of Scale. The Board concluded that because the fund pays no advisory fees and FMR or an affiliate bears all expenses of the fund, with limited exceptions, economies of scale cannot be realized by the fund.Additional Information Requested by the Board. In order to develop fully the factual basis for consideration of the Fidelity funds' advisory contracts, the Board requested and received additional information on certain topics, including: (i) fund performance trends, in particular the underperformance of certain funds, and Fidelity's long-term strategies for certain funds; (ii) Fidelity's fund profitability methodology, profitability trends for certain funds, and the impact of certain factors on fund profitability results, including the impact of market trends on actively managed funds; (iii) the use of performance fees and the calculation of performance adjustments, including the impact of underperformance and fund outflows on performance adjustments; (iv) metrics for evaluating index fund performance; (v) Fidelity's group fee structure, including the group fee breakpoint schedules; (vi) the terms of Fidelity's contractual and voluntary expense cap arrangements with the funds; (vii) the methodology with respect to evaluating competitive fund data and peer group classifications and fee comparisons; (viii) the expense structures for different funds and classes; (ix) Fidelity's arrangements with affiliated sub-advisers on behalf of the funds; (x) information regarding other accounts managed by Fidelity, including institutional accounts and collective investment trusts; (xi) recent changes to the fee structure for certain funds of funds; and (xii) the impact of the Department of Labor's new fiduciary rule on the funds' comparative expense information.Based on its evaluation of all of the conclusions noted above, and after considering all factors it believed relevant, the Board concluded that the advisory fee structures are fair and reasonable, and that the fund's Advisory Contracts should be renewed.![]()
Corporate Headquarters
245 Summer St.
Boston, MA 02210
www.fidelity.com
FSH-SANN-1217
1.924273.106
Fidelity Advisor® Short Duration High Income Fund - Semi-Annual Report October 31, 2017 Class A, Class M, Class C and Class I are classes of Fidelity® Short Duration High Income Fund |
|
Contents
Board Approval of Investment Advisory Contracts and Management Fees | |
To view a fund's proxy voting guidelines and proxy voting record for the 12-month period ended June 30, visit http://www.fidelity.com/proxyvotingresults or visit the Securities and Exchange Commission's (SEC) web site at http://www.sec.gov.
You may also call 1-877-208-0098 to request a free copy of the proxy voting guidelines.
Standard & Poor's, S&P and S&P 500 are registered service marks of The McGraw-Hill Companies, Inc. and have been licensed for use by Fidelity Distributors Corporation.
Other third-party marks appearing herein are the property of their respective owners.
All other marks appearing herein are registered or unregistered trademarks or service marks of FMR LLC or an affiliated company. © 2017 FMR LLC. All rights reserved.
This report and the financial statements contained herein are submitted for the general information of the shareholders of the Fund. This report is not authorized for distribution to prospective investors in the Fund unless preceded or accompanied by an effective prospectus.
A fund files its complete schedule of portfolio holdings with the SEC for the first and third quarters of each fiscal year on Form N-Q. Forms N-Q are available on the SEC’s web site at http://www.sec.gov. A fund's Forms N-Q may be reviewed and copied at the SEC’s Public Reference Room in Washington, DC. Information regarding the operation of the SEC's Public Reference Room may be obtained by calling 1-800-SEC-0330.
For a complete list of a fund's portfolio holdings, view the most recent holdings listing, semiannual report, or annual report on Fidelity's web site at http://www.fidelity.com, http://www.institutional.fidelity.com, or http://www.401k.com, as applicable.
NOT FDIC INSURED •MAY LOSE VALUE •NO BANK GUARANTEE
Neither the Fund nor Fidelity Distributors Corporation is a bank.
Investment Summary (Unaudited)
Top Five Holdings as of October 31, 2017
| (by issuer, excluding cash equivalents) | % of fund's net assets | % of fund's net assets 6 months ago |
| DAE Funding LLC | 3.0 | 0.0 |
| Icahn Enterprises LP/Icahn Enterprises Finance Corp. | 3.0 | 1.6 |
| TransDigm, Inc. | 3.0 | 2.5 |
| FMG Resources (August 2006) Pty Ltd. | 2.6 | 0.0 |
| Sprint Communications, Inc. | 2.6 | 1.9 |
| 14.2 |
Top Five Market Sectors as of October 31, 2017
| % of fund's net assets | % of fund's net assets 6 months ago | |
| Energy | 16.3 | 14.9 |
| Healthcare | 9.0 | 9.1 |
| Telecommunications | 8.1 | 9.1 |
| Utilities | 6.9 | 6.0 |
| Metals/Mining | 6.2 | 3.5 |
Quality Diversification (% of fund's net assets)
| As of October 31, 2017 | ||
| AAA,AA,A | 0.8% | |
| BBB | 7.4% | |
| BB | 38.8% | |
| B | 40.0% | |
| CCC,CC,C | 7.1% | |
| Not Rated | 2.0% | |
| Equities | 0.1% | |
| Short-Term Investments and Net Other Assets | 3.8% | |

| As of April 30, 2017 | ||
| AAA,AA,A | 0.8% | |
| BBB | 8.5% | |
| BB | 33.1% | |
| B | 44.3% | |
| CCC,CC,C | 7.3% | |
| Not Rated | 1.1% | |
| Equities | 0.3% | |
| Short-Term Investments and Net Other Assets | 4.6% | |

We have used ratings from Moody's Investors Service, Inc. Where Moody's® ratings are not available, we have used S&P® ratings. All ratings are as of the date indicated and do not reflect subsequent changes.
Asset Allocation (% of fund's net assets)
| As of October 31, 2017* | ||
| Nonconvertible Bonds | 82.1% | |
| Common Stocks | 0.1% | |
| Bank Loan Obligations | 12.8% | |
| Other Investments | 1.2% | |
| Short-Term Investments and Net Other Assets (Liabilities) | 3.8% | |

* Foreign investments - 22.1%
| As of April 30, 2017* | ||
| Nonconvertible Bonds | 79.4% | |
| Convertible Bonds, Preferred Stocks | 0.1% | |
| Common Stocks | 0.2% | |
| Bank Loan Obligations | 14.4% | |
| Other Investments | 1.3% | |
| Short-Term Investments and Net Other Assets (Liabilities) | 4.6% | |

* Foreign investments - 27.2%
Percentages shown as 0.0% may reflect amounts less than 0.05%.
Investments October 31, 2017 (Unaudited)
Showing Percentage of Net Assets
| Nonconvertible Bonds - 82.1% | |||
| Principal Amount | Value | ||
| Aerospace - 5.1% | |||
| DAE Funding LLC: | |||
| 4% 8/1/20 (a) | $550,000 | $558,250 | |
| 4.5% 8/1/22 (a) | 3,265,000 | 3,309,877 | |
| TransDigm, Inc. 6% 7/15/22 | 2,510,000 | 2,604,125 | |
| TOTAL AEROSPACE | 6,472,252 | ||
| Air Transportation - 3.4% | |||
| Air Canada 7.75% 4/15/21 (a) | 840,000 | 959,700 | |
| Air Canada Trust Series 2015-1 equipment trust certificate Class C, 5% 3/15/20 (a) | 75,000 | 76,688 | |
| Allegiant Travel Co. 5.5% 7/15/19 | 785,000 | 810,513 | |
| American Airlines Group, Inc. 5.5% 10/1/19 (a) | 485,000 | 504,400 | |
| U.S. Airways Group, Inc. 6.125% 6/1/18 | 1,030,000 | 1,050,600 | |
| United Continental Holdings, Inc.: | |||
| 4.25% 10/1/22 | 345,000 | 346,725 | |
| 6% 12/1/20 | 45,000 | 48,825 | |
| 6.375% 6/1/18 | 500,000 | 511,250 | |
| TOTAL AIR TRANSPORTATION | 4,308,701 | ||
| Automotive - 0.2% | |||
| Ford Motor Credit Co. LLC 2.875% 10/1/18 | 200,000 | 201,722 | |
| Automotive & Auto Parts - 0.2% | |||
| American Tire Distributors, Inc. 10.25% 3/1/22 (a) | 80,000 | 83,500 | |
| General Motors Financial Co., Inc. 2.35% 10/4/19 | 100,000 | 100,363 | |
| TOTAL AUTOMOTIVE & AUTO PARTS | 183,863 | ||
| Banks & Thrifts - 1.9% | |||
| Bank of America Corp. 2.625% 4/19/21 | 250,000 | 251,177 | |
| Citigroup, Inc. 2.9% 12/8/21 | 200,000 | 202,212 | |
| Citizens Bank NA 2.25% 3/2/20 | 250,000 | 250,250 | |
| Credit Suisse Group Funding Guernsey Ltd. 3.45% 4/16/21 | 250,000 | 256,945 | |
| Deutsche Bank AG 2.7% 7/13/20 | 250,000 | 250,829 | |
| Goldman Sachs Group, Inc.: | |||
| 2.625% 4/25/21 | 100,000 | 100,432 | |
| 2.876% 10/31/22 (b) | 250,000 | 250,383 | |
| JPMorgan Chase & Co. 2.55% 3/1/21 | 200,000 | 201,239 | |
| SunTrust Banks, Inc. 2.7% 1/27/22 | 200,000 | 201,168 | |
| Synchrony Bank 3% 6/15/22 | 250,000 | 249,901 | |
| Synovus Financial Corp. 3.125% 11/1/22 | 17,000 | 16,993 | |
| UniCredit SpA 3.75% 4/12/22 (a) | 200,000 | 204,727 | |
| TOTAL BANKS & THRIFTS | 2,436,256 | ||
| Broadcasting - 0.6% | |||
| AMC Networks, Inc. 4.75% 12/15/22 | 496,000 | 509,020 | |
| Sirius XM Radio, Inc. 3.875% 8/1/22 (a) | 265,000 | 269,969 | |
| TOTAL BROADCASTING | 778,989 | ||
| Building Materials - 0.6% | |||
| Building Materials Corp. of America 5.125% 2/15/21 (a) | 120,000 | 123,750 | |
| CEMEX S.A.B. de CV 6.5% 12/10/19 (a) | 637,000 | 658,340 | |
| TOTAL BUILDING MATERIALS | 782,090 | ||
| Cable/Satellite TV - 2.7% | |||
| Altice U.S. Finance SA 5.375% 7/15/23 (a) | 500,000 | 521,250 | |
| CCO Holdings LLC/CCO Holdings Capital Corp.: | |||
| 4% 3/1/23 (a) | 305,000 | 309,386 | |
| 5.125% 2/15/23 | 1,800,000 | 1,858,500 | |
| 5.125% 5/1/23 (a) | 720,000 | 750,600 | |
| TOTAL CABLE/SATELLITE TV | 3,439,736 | ||
| Capital Goods - 0.2% | |||
| Roper Technologies, Inc. 2.8% 12/15/21 | 213,000 | 215,026 | |
| Chemicals - 2.0% | |||
| CF Industries Holdings, Inc.: | |||
| 3.4% 12/1/21 (a) | 60,000 | 60,926 | |
| 3.45% 6/1/23 | 805,000 | 794,938 | |
| Evolution Escrow Issuer LLC 7.5% 3/15/22 (a) | 430,000 | 450,963 | |
| Nufarm Australia Ltd. 6.375% 10/15/19 (a) | 510,000 | 518,925 | |
| Platform Specialty Products Corp. 6.5% 2/1/22 (a) | 500,000 | 518,125 | |
| TPC Group, Inc. 8.75% 12/15/20 (a) | 165,000 | 161,288 | |
| TOTAL CHEMICALS | 2,505,165 | ||
| Containers - 0.5% | |||
| Ardagh Packaging Finance PLC/Ardagh MP Holdings U.S.A., Inc.: | |||
| 4.25% 9/15/22 (a) | 200,000 | 206,000 | |
| 4.625% 5/15/23 (a) | 400,000 | 411,000 | |
| Reynolds Group Issuer, Inc./Reynolds Group Issuer LLC/Reynolds Group Issuer (Luxembourg) SA 3 month U.S. LIBOR + 3.500% 4.8592% 7/15/21 (a)(b)(c) | 50,000 | 51,000 | |
| TOTAL CONTAINERS | 668,000 | ||
| Diversified Financial Services - 4.5% | |||
| AerCap Ireland Capital Ltd./AerCap Global Aviation Trust 3.95% 2/1/22 | 300,000 | 312,778 | |
| Capital One Financial Corp. 2.5% 5/12/20 | 200,000 | 200,688 | |
| FLY Leasing Ltd. 6.75% 12/15/20 | 65,000 | 67,522 | |
| Hyundai Capital America 2.55% 2/6/19 (a) | 100,000 | 100,172 | |
| Icahn Enterprises LP/Icahn Enterprises Finance Corp.: | |||
| 5.875% 2/1/22 | 770,000 | 795,510 | |
| 6% 8/1/20 | 320,000 | 330,000 | |
| 6.25% 2/1/22 | 2,555,000 | 2,669,975 | |
| ILFC E-Capital Trust I 3 month U.S. LIBOR + 1.550% 4.36% 12/21/65 (a)(b)(c) | 605,000 | 583,825 | |
| ILFC E-Capital Trust II 3 month U.S. LIBOR + 1.800% 4.61% 12/21/65 (a)(b)(c) | 150,000 | 145,500 | |
| Moody's Corp. 5.5% 9/1/20 | 200,000 | 217,386 | |
| Morgan Stanley 2.5% 4/21/21 | 250,000 | 250,436 | |
| TOTAL DIVERSIFIED FINANCIAL SERVICES | 5,673,792 | ||
| Diversified Media - 2.1% | |||
| 21st Century Fox America, Inc. 4.5% 2/15/21 | 200,000 | 213,146 | |
| Nielsen Finance LLC/Nielsen Finance Co. 5% 4/15/22 (a) | 2,350,000 | 2,420,500 | |
| TOTAL DIVERSIFIED MEDIA | 2,633,646 | ||
| Energy - 15.8% | |||
| Anadarko Petroleum Corp. 4.85% 3/15/21 | 200,000 | 212,354 | |
| Antero Resources Corp.: | |||
| 5.125% 12/1/22 | 370,000 | 380,175 | |
| 5.625% 6/1/23 (Reg. S) | 235,000 | 246,163 | |
| Antero Resources Finance Corp. 5.375% 11/1/21 | 60,000 | 61,575 | |
| Calfrac Holdings LP 7.5% 12/1/20 (a) | 145,000 | 142,100 | |
| California Resources Corp. 8% 12/15/22 (a) | 505,000 | 333,300 | |
| Cenovus Energy, Inc. 3% 8/15/22 | 250,000 | 247,385 | |
| Chesapeake Energy Corp.: | |||
| 4.875% 4/15/22 | 850,000 | 786,250 | |
| 5.75% 3/15/23 | 160,000 | 146,000 | |
| 6.125% 2/15/21 | 43,000 | 43,430 | |
| 8% 12/15/22 (a) | 806,000 | 867,208 | |
| Consolidated Energy Finance SA 3 month U.S. LIBOR + 3.750% 5.07% 6/15/22 (a)(b)(c) | 220,000 | 219,498 | |
| Continental Resources, Inc. 4.5% 4/15/23 | 500,000 | 506,250 | |
| CVR Refining LLC/Coffeyville Finance, Inc. 6.5% 11/1/22 | 940,000 | 965,850 | |
| Denbury Resources, Inc. 9% 5/15/21 (a) | 490,000 | 478,975 | |
| Ensco PLC 8% 1/31/24 | 1,132,000 | 1,120,680 | |
| EP Energy LLC/Everest Acquisition Finance, Inc. 8% 11/29/24 (a) | 160,000 | 163,200 | |
| Exterran Partners LP/EXLP Finance Corp. 6% 4/1/21 | 740,000 | 736,300 | |
| Forum Energy Technologies, Inc. 6.25% 10/1/21 | 30,000 | 29,925 | |
| FTS International, Inc.: | |||
| 3 month U.S. LIBOR + 7.500% 8.82% 6/15/20 (a)(b)(c) | 60,000 | 61,275 | |
| 6.25% 5/1/22 | 265,000 | 257,050 | |
| Nabors Industries, Inc. 5.5% 1/15/23 | 428,000 | 408,205 | |
| NGPL PipeCo LLC 4.375% 8/15/22 (a) | 20,000 | 20,575 | |
| Noble Holding International Ltd.: | |||
| 4.625% 3/1/21 | 626,000 | 579,050 | |
| 7.75% 1/15/24 | 50,000 | 44,750 | |
| Parsley Energy LLC/Parsley 5.25% 8/15/25 (a) | 30,000 | 30,300 | |
| PBF Holding Co. LLC/PBF Finance Corp. 7% 11/15/23 | 495,000 | 514,800 | |
| PBF Logistics LP/PBF Logistics Finance, Inc. 6.875% 5/15/23 (a) | 150,000 | 155,250 | |
| Plains All American Pipeline LP/PAA Finance Corp.: | |||
| 2.6% 12/15/19 | 100,000 | 99,896 | |
| 3.65% 6/1/22 | 18,000 | 18,195 | |
| Precision Drilling Corp.: | |||
| 6.5% 12/15/21 | 500,000 | 505,000 | |
| 7.75% 12/15/23 | 235,000 | 240,875 | |
| Range Resources Corp.: | |||
| 5% 8/15/22 | 840,000 | 829,500 | |
| 5% 3/15/23 | 1,715,000 | 1,697,816 | |
| Southwestern Energy Co. 4.1% 3/15/22 | 185,000 | 181,763 | |
| Sunoco LP/Sunoco Finance Corp.: | |||
| 5.5% 8/1/20 | 1,060,000 | 1,089,150 | |
| 6.375% 4/1/23 | 135,000 | 143,438 | |
| Targa Resources Partners LP/Targa Resources Partners Finance Corp. 4.125% 11/15/19 | 207,000 | 209,070 | |
| TerraForm Power Operating LLC 6.375% 2/1/23 (a)(b) | 50,000 | 52,375 | |
| Tesoro Logistics LP/Tesoro Logistics Finance Corp.: | |||
| 5.5% 10/15/19 | 755,000 | 794,638 | |
| 5.875% 10/1/20 | 210,000 | 213,675 | |
| 6.125% 10/15/21 | 10,000 | 10,325 | |
| 6.25% 10/15/22 | 365,000 | 388,725 | |
| The Williams Companies, Inc. 3.7% 1/15/23 | 1,505,000 | 1,518,169 | |
| TransCanada PipeLines Ltd. 2.5% 8/1/22 | 9,000 | 9,004 | |
| Western Gas Partners LP 2.6% 8/15/18 | 200,000 | 200,830 | |
| Whiting Petroleum Corp.: | |||
| 5% 3/15/19 | 500,000 | 504,375 | |
| 5.75% 3/15/21 | 165,000 | 166,238 | |
| 6.25% 4/1/23 | 40,000 | 39,900 | |
| WPX Energy, Inc. 6% 1/15/22 | 1,220,000 | 1,270,325 | |
| TOTAL ENERGY | 19,941,155 | ||
| Entertainment/Film - 0.5% | |||
| AMC Entertainment, Inc. 5.875% 2/15/22 | 200,000 | 201,680 | |
| CBS Outdoor Americas Capital LLC/CBS Outdoor Americas Capital Corp. 5.625% 2/15/24 | 60,000 | 63,150 | |
| New Cotai LLC/New Cotai Capital Corp. 10.625% 5/1/19 pay-in-kind (a)(b) | 291,996 | 291,996 | |
| TOTAL ENTERTAINMENT/FILM | 556,826 | ||
| Environmental - 0.4% | |||
| LBC Tank Terminals Holding Netherlands BV 6.875% 5/15/23 (a) | 500,000 | 523,125 | |
| Food & Drug Retail - 0.1% | |||
| Tops Holding LLC/Tops Markets II Corp. 8% 6/15/22 (a) | 200,000 | 120,000 | |
| Food/Beverage/Tobacco - 1.6% | |||
| Anheuser-Busch InBev Finance, Inc. 2.65% 2/1/21 | 200,000 | 202,443 | |
| Bat Capital Corp. 2.764% 8/15/22 (a) | 250,000 | 250,192 | |
| C&S Group Enterprises LLC 5.375% 7/15/22 (a) | 565,000 | 548,050 | |
| Darling International, Inc. 5.375% 1/15/22 | 415,000 | 429,006 | |
| Imperial Tobacco Finance PLC 2.95% 7/21/20 (a) | 200,000 | 202,725 | |
| JBS Investments GmbH 7.75% 10/28/20 (a) | 345,000 | 352,073 | |
| TOTAL FOOD/BEVERAGE/TOBACCO | 1,984,489 | ||
| Gaming - 1.9% | |||
| GLP Capital LP/GLP Financing II, Inc. 4.375% 4/15/21 | 60,000 | 62,700 | |
| MGM Mirage, Inc. 6% 3/15/23 | 500,000 | 548,200 | |
| Scientific Games Corp.: | |||
| 6.625% 5/15/21 | 735,000 | 759,806 | |
| 7% 1/1/22 (a) | 5,000 | 5,288 | |
| 10% 12/1/22 | 500,000 | 553,090 | |
| Wynn Macau Ltd. 4.875% 10/1/24 (a) | 500,000 | 508,150 | |
| TOTAL GAMING | 2,437,234 | ||
| Healthcare - 8.9% | |||
| Abbott Laboratories 5.125% 4/1/19 | 200,000 | 208,795 | |
| AMAG Pharmaceuticals, Inc. 7.875% 9/1/23 (a) | 25,000 | 25,438 | |
| Becton, Dickinson & Co. 2.894% 6/6/22 | 200,000 | 200,393 | |
| Community Health Systems, Inc.: | |||
| 5.125% 8/1/21 | 320,000 | 311,200 | |
| 6.25% 3/31/23 | 1,155,000 | 1,111,688 | |
| 6.875% 2/1/22 | 1,065,000 | 770,794 | |
| Forest Laboratories, Inc. 5% 12/15/21 (a) | 200,000 | 217,076 | |
| HCA Holdings, Inc.: | |||
| 4.75% 5/1/23 | 300,000 | 313,875 | |
| 6.25% 2/15/21 | 800,000 | 861,000 | |
| HealthSouth Corp. 5.125% 3/15/23 | 255,000 | 260,100 | |
| Kindred Healthcare, Inc.: | |||
| 8% 1/15/20 | 900,000 | 909,000 | |
| 8.75% 1/15/23 | 70,000 | 68,250 | |
| Mylan N.V. 3.15% 6/15/21 | 200,000 | 202,247 | |
| Ortho-Clinical Diagnostics, Inc. 6.625% 5/15/22 (a) | 65,000 | 65,081 | |
| Sabra Health Care LP/Sabra Capital Corp. 5.375% 6/1/23 | 60,000 | 61,950 | |
| Shire Acquisitions Investments Ireland DAC 2.4% 9/23/21 | 200,000 | 198,627 | |
| Tenet Healthcare Corp.: | |||
| 4.375% 10/1/21 | 1,365,000 | 1,360,223 | |
| 4.75% 6/1/20 | 200,000 | 205,000 | |
| 8.125% 4/1/22 | 485,000 | 487,425 | |
| Teva Pharmaceutical Finance Netherlands III BV 2.2% 7/21/21 | 250,000 | 235,110 | |
| Valeant Pharmaceuticals International, Inc.: | |||
| 5.375% 3/15/20 (a) | 655,000 | 644,356 | |
| 5.625% 12/1/21 (a) | 1,500,000 | 1,366,875 | |
| 5.875% 5/15/23 (a) | 105,000 | 88,725 | |
| 6.5% 3/15/22 (a) | 835,000 | 885,100 | |
| VPI Escrow Corp. 6.375% 10/15/20 (a) | 138,000 | 137,138 | |
| TOTAL HEALTHCARE | 11,195,466 | ||
| Homebuilders/Real Estate - 2.9% | |||
| Brandywine Operating Partnership LP 4.95% 4/15/18 | 150,000 | 151,801 | |
| Brookfield Residential Properties, Inc. 6.5% 12/15/20 (a) | 300,000 | 306,375 | |
| DDR Corp. 4.625% 7/15/22 | 200,000 | 211,137 | |
| Healthcare Trust of America Holdings LP 2.95% 7/1/22 | 216,000 | 217,248 | |
| Lennar Corp. 4.125% 1/15/22 | 110,000 | 113,850 | |
| M/I Homes, Inc. 6.75% 1/15/21 | 140,000 | 145,600 | |
| Mack-Cali Realty LP 2.5% 12/15/17 | 150,000 | 150,031 | |
| Mattamy Group Corp. 6.875% 12/15/23 (a) | 150,000 | 157,500 | |
| Rialto Holdings LLC/Rialto Corp. 7% 12/1/18 (a) | 85,000 | 85,213 | |
| Taylor Morrison Communities, Inc./Monarch Communities, Inc. 5.25% 4/15/21 (a) | 75,000 | 76,593 | |
| Ventas Realty LP/Ventas Capital Corp. 4.75% 6/1/21 | 200,000 | 213,697 | |
| William Lyon Homes, Inc. 5.75% 4/15/19 | 1,835,000 | 1,857,938 | |
| TOTAL HOMEBUILDERS/REAL ESTATE | 3,686,983 | ||
| Insurance - 0.2% | |||
| American International Group, Inc. 3.3% 3/1/21 | 200,000 | 205,872 | |
| ING U.S., Inc. 2.9% 2/15/18 (b) | 59,000 | 59,164 | |
| TOTAL INSURANCE | 265,036 | ||
| Leisure - 1.1% | |||
| Hilton Grand Vacations Borrower LLC/Hilton Grand Vacations Borrower, Inc. 6.125% 12/1/24 (a) | 45,000 | 49,388 | |
| Studio City Co. Ltd.: | |||
| 5.875% 11/30/19 (a) | 200,000 | 209,750 | |
| 7.25% 11/30/21 (a) | 1,000,000 | 1,070,100 | |
| TOTAL LEISURE | 1,329,238 | ||
| Metals/Mining - 6.2% | |||
| First Quantum Minerals Ltd.: | |||
| 7.25% 5/15/22 (a) | 1,110,000 | 1,159,950 | |
| 7.25% 4/1/23 (a) | 835,000 | 883,013 | |
| FMG Resources (August 2006) Pty Ltd. 4.75% 5/15/22 (a) | 3,235,000 | 3,299,700 | |
| Freeport-McMoRan, Inc.: | |||
| 2.375% 3/15/18 | 200,000 | 200,000 | |
| 3.55% 3/1/22 | 2,340,000 | 2,316,600 | |
| TOTAL METALS/MINING | 7,859,263 | ||
| Restaurants - 1.0% | |||
| Yum! Brands, Inc. 3.875% 11/1/23 | 1,225,000 | 1,231,125 | |
| Services - 0.8% | |||
| Air Lease Corp. 2.125% 1/15/20 | 200,000 | 199,746 | |
| APX Group, Inc.: | |||
| 6.375% 12/1/19 | 625,000 | 635,938 | |
| 8.75% 12/1/20 | 190,000 | 194,750 | |
| Corrections Corp. of America 5% 10/15/22 | 25,000 | 26,094 | |
| TOTAL SERVICES | 1,056,528 | ||
| Super Retail - 0.2% | |||
| AutoZone, Inc. 2.5% 4/15/21 | 145,000 | 144,755 | |
| JC Penney Corp., Inc. 5.65% 6/1/20 | 109,000 | 95,648 | |
| TOTAL SUPER RETAIL | 240,403 | ||
| Technology - 2.9% | |||
| Ceridian HCM Holding, Inc. 11% 3/15/21 (a) | 20,000 | 21,125 | |
| Diamond 1 Finance Corp./Diamond 2 Finance Corp. 4.42% 6/15/21 (a) | 200,000 | 210,273 | |
| EMC Corp. 2.65% 6/1/20 | 640,000 | 632,341 | |
| Micron Technology, Inc.: | |||
| 5.25% 8/1/23 (a) | 700,000 | 732,620 | |
| 5.25% 1/15/24 (a) | 450,000 | 473,063 | |
| Nuance Communications, Inc. 5.375% 8/15/20 (a) | 321,000 | 325,334 | |
| NXP BV/NXP Funding LLC: | |||
| 3.875% 9/1/22 (a) | 700,000 | 727,125 | |
| 4.125% 6/1/21 (a) | 400,000 | 418,000 | |
| Sensata Technologies BV 4.875% 10/15/23 (a) | 155,000 | 162,750 | |
| TOTAL TECHNOLOGY | 3,702,631 | ||
| Telecommunications - 6.4% | |||
| Altice Financing SA: | |||
| 6.5% 1/15/22 (a) | 600,000 | 621,000 | |
| 6.625% 2/15/23 (a) | 500,000 | 527,050 | |
| AT&T, Inc. 2.8% 2/17/21 | 200,000 | 202,846 | |
| Equinix, Inc. 5.375% 4/1/23 | 500,000 | 516,250 | |
| Gogo Intermediate Holdings LLC/Gogo Finance Co., Inc. 12.5% 7/1/22 (a) | 505,000 | 572,544 | |
| Inmarsat Finance PLC 4.875% 5/15/22 (a) | 275,000 | 280,555 | |
| SFR Group SA 6% 5/15/22 (a) | 800,000 | 834,000 | |
| Sprint Communications, Inc.: | |||
| 6% 11/15/22 | 2,880,000 | 3,024,000 | |
| 9% 11/15/18 (a) | 115,000 | 122,044 | |
| T-Mobile U.S.A., Inc. 4% 4/15/22 | 225,000 | 232,734 | |
| Wind Acquisition Finance SA: | |||
| 4.75% 7/15/20 (a) | 680,000 | 688,092 | |
| 7.375% 4/23/21 (a) | 400,000 | 415,520 | |
| TOTAL TELECOMMUNICATIONS | 8,036,635 | ||
| Transportation Ex Air/Rail - 0.8% | |||
| Navios Maritime Acquisition Corp./Navios Acquisition Finance U.S., Inc. 8.125% 11/15/21 (a) | 875,000 | 770,000 | |
| Navios Maritime Holdings, Inc. 7.375% 1/15/22 (a) | 265,000 | 217,300 | |
| TOTAL TRANSPORTATION EX AIR/RAIL | 987,300 | ||
| Utilities - 6.4% | |||
| Calpine Corp. 6% 1/15/22 (a) | 1,800,000 | 1,858,500 | |
| DCP Midstream Operating LP 2.5% 12/1/17 | 100,000 | 100,000 | |
| Dolphin Subsidiary II, Inc. 7.25% 10/15/21 | 558,000 | 616,032 | |
| Dominion Resources, Inc. 4.104% 4/1/21 | 250,000 | 259,209 | |
| DPL, Inc. 6.75% 10/1/19 | 1,046,000 | 1,100,915 | |
| Dynegy, Inc. 5.875% 6/1/23 | 1,300,000 | 1,342,250 | |
| EQT Corp. 2.5% 10/1/20 | 9,000 | 8,994 | |
| Exelon Corp. 3.497% 6/1/22 (b) | 250,000 | 257,256 | |
| Global Partners LP/GLP Finance Corp. 6.25% 7/15/22 | 635,000 | 649,288 | |
| InterGen NV 7% 6/30/23 (a) | 170,000 | 164,900 | |
| NRG Energy, Inc. 6.625% 1/15/27 | 75,000 | 79,875 | |
| The AES Corp. 4.875% 5/15/23 | 1,315,000 | 1,344,588 | |
| Williams Partners LP 5.25% 3/15/20 | 200,000 | 213,826 | |
| TOTAL UTILITIES | 7,995,633 | ||
| TOTAL NONCONVERTIBLE BONDS | |||
| (Cost $102,200,573) | 103,448,308 | ||
| Shares | Value | ||
| Common Stocks - 0.1% | |||
| Energy - 0.1% | |||
| Forbes Energy Services Ltd. | 6,468 | 84,731 | |
| Southwestern Energy Co. (d) | 2,708 | 15,029 | |
| TOTAL COMMON STOCKS | |||
| (Cost $324,331) | 99,760 | ||
| Convertible Preferred Stocks - 0.0% | |||
| Energy - 0.0% | |||
| Southwestern Energy Co. Series B 6.25% | |||
| (Cost $111,697) | 6,300 | 80,128 | |
| Principal Amount | Value | ||
| Bank Loan Obligations - 12.8% | |||
| Aerospace - 0.9% | |||
| TransDigm, Inc.: | |||
| Tranche D, term loan 3 month U.S. LIBOR + 3.000% 4.3273% 6/4/21 (b)(c) | 288,379 | 290,092 | |
| Tranche F, term loan 3 month U.S. LIBOR + 3.000% 4.274% 6/9/23 (b)(c) | 500,111 | 502,052 | |
| Tranche G, term loan 3 month U.S. LIBOR + 3.000% 4.2623% 8/22/24 (b)(c) | 339,150 | 340,686 | |
| TOTAL AEROSPACE | 1,132,830 | ||
| Air Transportation - 0.8% | |||
| American Airlines, Inc.: | |||
| Tranche B, term loan 3 month U.S. LIBOR + 2.000% 3.2378% 10/10/21 (b)(c) | 346,212 | 346,741 | |
| Tranche B, term loan 3 month U.S. LIBOR + 2.500% 3.7389% 12/14/23 (b)(c) | 300,000 | 300,708 | |
| United Air Lines, Inc. Tranche B, term loan 3 month U.S. LIBOR + 2.250% 3.5611% 4/1/24 (b)(c) | 363,175 | 364,718 | |
| TOTAL AIR TRANSPORTATION | 1,012,167 | ||
| Broadcasting - 0.1% | |||
| ION Media Networks, Inc. Tranche B, term loan 3 month U.S. LIBOR + 3.000% 4.25% 12/18/20 (b)(c) | 175,000 | 176,094 | |
| Building Materials - 0.2% | |||
| HD Supply, Inc. Tranche B 4LN, term loan 3 month U.S. LIBOR + 2.500% 3.8328% 10/17/23 (b)(c) | 277,900 | 280,854 | |
| Cable/Satellite TV - 1.5% | |||
| Numericable LLC Tranche B 12LN, term loan 3 month U.S. LIBOR + 3.000% 4.3491% 1/1/26 (b)(c) | 305,000 | 305,070 | |
| Unitymedia Finance LLC Tranche B, term loan 3 month U.S. LIBOR + 2.250% 3.4889% 9/30/25 (b)(c) | 365,000 | 364,690 | |
| WideOpenWest Finance LLC Tranche B, term loan 3 month U.S. LIBOR + 3.250% 4.4867% 8/19/23 (b)(c) | 495,000 | 495,619 | |
| Zayo Group LLC term loan 3 month U.S. LIBOR + 2.000% 3.2389% 1/19/21 (b)(c) | 144,275 | 144,568 | |
| Ziggo Secured Finance Partnership Tranche E, term loan 3 month U.S. LIBOR + 2.500% 3.7389% 4/15/25 (b)(c) | 530,000 | 531,161 | |
| TOTAL CABLE/SATELLITE TV | 1,841,108 | ||
| Chemicals - 0.1% | |||
| Tronox Blocked Borrower LLC Tranche B, term loan 3 month U.S. LIBOR + 3.000% 4.3231% 9/22/24 (b)(c) | 21,163 | 21,330 | |
| Tronox Finance LLC Tranche B, term loan 3 month U.S. LIBOR + 3.000% 4.3283% 9/22/24 (b)(c) | 48,837 | 49,224 | |
| TOTAL CHEMICALS | 70,554 | ||
| Containers - 0.2% | |||
| Reynolds Group Holdings, Inc. Tranche B, term loan 3 month U.S. LIBOR + 2.750% 3.985% 2/5/23 (b)(c) | 306,906 | 308,631 | |
| Diversified Financial Services - 0.1% | |||
| Bcp Renaissance Parent LLC Tranche B, term loan 3 month U.S. LIBOR + 4.000% 5.3801% 10/31/24 (b)(c) | 45,000 | 45,492 | |
| IBC Capital U.S. LLC: | |||
| Tranche 2LN, term loan 3 month U.S. LIBOR + 7.000% 8.3172% 9/11/22 (b)(c) | 100,000 | 94,500 | |
| Tranche B 1LN, term loan 3 month U.S. LIBOR + 3.750% 5.0672% 9/11/21 (b)(c) | 24,375 | 24,375 | |
| TOTAL DIVERSIFIED FINANCIAL SERVICES | 164,367 | ||
| Energy - 0.4% | |||
| California Resources Corp. Tranche 1LN, term loan 3 month U.S. LIBOR + 10.375% 11.6117% 12/31/21 (b)(c) | 100,000 | 107,083 | |
| Chesapeake Energy Corp. Tranche 1LN, term loan 3 month U.S. LIBOR + 7.500% 8.8144% 8/23/21 (b)(c) | 200,000 | 214,334 | |
| Forbes Energy Services LLC Tranche B, term loan 12% 4/13/21 (b)(e) | 63,685 | 64,162 | |
| Gavilan Resources LLC Tranche 2LN, term loan 3 month U.S. LIBOR + 6.000% 7.2378% 3/1/24 (b)(c) | 100,000 | 96,750 | |
| TOTAL ENERGY | 482,329 | ||
| Entertainment/Film - 0.2% | |||
| AMC Entertainment, Inc. Tranche B, term loan 3 month U.S. LIBOR + 2.250% 3.4889% 12/15/22 (b)(c) | 279,288 | 279,223 | |
| Environmental - 0.1% | |||
| Hd Supply Waterworks Ltd. Tranche B, term loan 3 month U.S. LIBOR + 3.000% 4.455% 8/1/24 (b)(c) | 145,000 | 145,906 | |
| Food & Drug Retail - 0.4% | |||
| Albertson's LLC Tranche B, term loan 3 month U.S. LIBOR + 3.000% 4.3172% 6/22/23 (b)(c) | 217,905 | 210,915 | |
| JBS U.S.A. Lux SA Tranche B, term loan 3 month U.S. LIBOR + 2.500% 3.7389% 10/30/22 (b)(c) | 313,425 | 306,570 | |
| TOTAL FOOD & DRUG RETAIL | 517,485 | ||
| Food/Beverage/Tobacco - 0.1% | |||
| Chobani LLC Tranche B, term loan 3 month U.S. LIBOR + 3.500% 4.7378% 10/7/23 (b)(c) | 20,000 | 20,233 | |
| Post Holdings, Inc. Tranche B, term loan 3 month U.S. LIBOR + 2.250% 3.4923% 5/24/24 (b)(c) | 74,813 | 75,173 | |
| TOTAL FOOD/BEVERAGE/TOBACCO | 95,406 | ||
| Gaming - 0.8% | |||
| CityCenter Holdings LLC Tranche B, term loan 3 month U.S. LIBOR + 2.500% 3.7423% 4/18/24 (b)(c) | 284,288 | 285,462 | |
| Golden Entertainment, Inc. Tranche B, term loan: | |||
| 3 month U.S. LIBOR + 3.000% 4.24% 10/20/24 (b)(c) | 460,000 | 460,193 | |
| 3 month U.S. LIBOR + 7.000% 10/20/25 (c)(f) | 155,000 | 156,163 | |
| Scientific Games Corp. Tranche B, term loan 3 month U.S. LIBOR + 3.250% 4.5159% 8/14/24 (b)(c) | 130,000 | 131,444 | |
| TOTAL GAMING | 1,033,262 | ||
| Healthcare - 0.1% | |||
| Valeant Pharmaceuticals International, Inc. Tranche B, term loan 3 month U.S. LIBOR + 4.750% 5.99% 4/1/22 (b)(c) | 64,621 | 66,035 | |
| Insurance - 0.3% | |||
| USI, Inc. Tranche B, term loan: | |||
| 3 month U.S. LIBOR + 3.000% 5/16/24 (c)(f) | 305,000 | 304,619 | |
| 3 month U.S. LIBOR + 3.000% 4.3142% 5/16/24 (b)(c) | 50,000 | 50,104 | |
| TOTAL INSURANCE | 354,723 | ||
| Publishing/Printing - 0.2% | |||
| Springer Science+Business Media Deutschland GmbH: | |||
| Tranche B 13LN, term loan 3 month U.S. LIBOR + 3.500% 8/15/22 (c)(f) | 5,000 | 5,013 | |
| Tranche B 9LN, term loan 3 month U.S. LIBOR + 3.500% 4.7423% 8/14/20 (b)(c) | 190,426 | 191,100 | |
| TOTAL PUBLISHING/PRINTING | 196,113 | ||
| Restaurants - 0.3% | |||
| Burger King Worldwide, Inc. Tranche B, term loan 3 month U.S. LIBOR + 2.250% 3.5276% 2/17/24 (b)(c) | 392,224 | 392,616 | |
| Services - 0.8% | |||
| Almonde, Inc.: | |||
| Tranche 2LN, term loan 3 month U.S. LIBOR + 7.250% 8.5669% 6/13/25 (b)(c) | 20,000 | 19,806 | |
| Tranche B 1LN, term loan 3 month U.S. LIBOR + 3.500% 4.8169% 6/13/24 (b)(c) | 85,000 | 84,657 | |
| Brand Energy & Infrastructure Services, Inc. Tranche B, term loan 3 month U.S. LIBOR + 4.250% 5.6149% 6/21/24 (b)(c) | 493,763 | 496,779 | |
| Lineage Logistics Holdings, LLC. Tranche B, term loan 3 month U.S. LIBOR + 3.500% 4.7423% 4/7/21 (b)(c) | 364,220 | 365,243 | |
| TOTAL SERVICES | 966,485 | ||
| Super Retail - 0.7% | |||
| PetSmart, Inc. term loan 3 month U.S. LIBOR + 3.000% 4.24% 3/11/22 (b)(c) | 376,222 | 320,857 | |
| Red Ventures LLC: | |||
| Tranche 2LN, term loan 3 month U.S. LIBOR + 8.000% 10/18/25 (c)(f) | 155,000 | 154,613 | |
| Tranche B 1LN, term loan 3 month U.S. LIBOR + 4.000% 10/18/24 (c)(f) | 460,000 | 456,932 | |
| TOTAL SUPER RETAIL | 932,402 | ||
| Technology - 2.2% | |||
| Ceridian HCM Holding, Inc. Tranche B 2LN, term loan 3 month U.S. LIBOR + 3.500% 4.7389% 9/15/20 (b)(c) | 413,699 | 413,699 | |
| EIG Investors Corp. Tranche B, term loan 3 month U.S. LIBOR + 4.000% 5.3178% 2/9/23 (b)(c) | 354,279 | 357,971 | |
| Epicor Software Corp. Tranche B, term loan 3 month U.S. LIBOR + 3.750% 5% 6/1/22 (b)(c) | 141,131 | 141,866 | |
| Go Daddy Operating Co. LLC Tranche B, term loan 3 month U.S. LIBOR + 2.500% 3.7423% 2/15/24 (b)(c) | 433,445 | 435,613 | |
| Kronos, Inc. Tranche B 1LN, term loan 3 month U.S. LIBOR + 3.500% 4.8114% 11/1/23 (b)(c) | 392,042 | 394,661 | |
| Landesk Group, Inc. term loan: | |||
| 3 month U.S. LIBOR + 4.250% 5.5% 1/20/24 (b)(c) | 184,421 | 179,810 | |
| 3 month U.S. LIBOR + 9.000% 10.25% 1/20/25 (b)(c) | 105,000 | 101,654 | |
| Rackspace Hosting, Inc. Tranche B, term loan 3 month U.S. LIBOR + 3.000% 4.3106% 11/3/23 (b)(c) | 299,113 | 298,927 | |
| Uber Technologies, Inc. Tranche B, term loan 3 month U.S. LIBOR + 4.000% 5.2379% 7/13/23 (b)(c) | 445,500 | 448,284 | |
| TOTAL TECHNOLOGY | 2,772,485 | ||
| Telecommunications - 1.7% | |||
| Altice Financing SA Tranche B, term loan 3 month U.S. LIBOR + 2.750% 4.1092% 7/15/25 (b)(c) | 149,250 | 149,187 | |
| Level 3 Financing, Inc. Tranche B, term loan 3 month U.S. LIBOR + 2.250% 3.4889% 2/22/24 (b)(c) | 335,000 | 336,136 | |
| LTS Buyer LLC Tranche B 1LN, term loan 3 month U.S. LIBOR + 3.250% 6.5% 4/11/20 (b)(c) | 14,440 | 14,467 | |
| Radiate Holdco LLC Tranche B, term loan 3 month U.S. LIBOR + 3.000% 4.2423% 2/1/24 (b)(c) | 373,125 | 368,823 | |
| Sable International Finance Ltd. Tranche B, term loan 3 month U.S. LIBOR + 3.500% 4.7423% 1/31/25 (b)(c) | 45,000 | 45,162 | |
| Securus Technologies, Inc. Tranche B, term loan: | |||
| 3 month U.S. LIBOR + 4.500% 5.7421% 6/15/24 (b)(c) | 495,000 | 500,777 | |
| 3 month U.S. LIBOR + 8.250% 6/15/25 (c)(f) | 165,000 | 166,101 | |
| SFR Group SA Tranche B 11LN, term loan 3 month U.S. LIBOR + 2.750% 4.1301% 7/31/25 (b)(c) | 452,725 | 451,756 | |
| Sprint Communications, Inc. Tranche B, term loan 3 month U.S. LIBOR + 2.500% 3.75% 2/3/24 (b)(c) | 114,425 | 114,806 | |
| Telesat LLC Tranche B 4LN, term loan 3 month U.S. LIBOR + 3.000% 4.32% 11/17/23 (b)(c) | 9,925 | 9,978 | |
| TOTAL TELECOMMUNICATIONS | 2,157,193 | ||
| Transportation Ex Air/Rail - 0.1% | |||
| International Seaways Operating Corp. Tranche B, term loan 3 month U.S. LIBOR + 5.500% 6.74% 6/22/22 (b)(c) | 74,969 | 75,344 | |
| Utilities - 0.5% | |||
| Calpine Construction Finance Co. LP Tranche B 1LN, term loan 3 month U.S. LIBOR + 2.250% 3.49% 5/3/20 (b)(c) | 257,290 | 257,290 | |
| Calpine Corp. Tranche B, term loan 3 month U.S. LIBOR + 1.750% 3% 11/30/17 (b)(c) | 24,545 | 24,545 | |
| The AES Corp. Tranche B, term loan 3 month U.S. LIBOR + 2.000% 3.3172% 5/24/22 (b)(c) | 363,175 | 363,782 | |
| TOTAL UTILITIES | 645,617 | ||
| TOTAL BANK LOAN OBLIGATIONS | |||
| (Cost $16,071,038) | 16,099,229 | ||
| Bank Notes - 0.4% | |||
| Compass Bank 2.875% 6/29/22 | 250,000 | 248,194 | |
| Regions Bank 7.5% 5/15/18 | 250,000 | 257,299 | |
| TOTAL BANK NOTES | |||
| (Cost $506,076) | 505,493 | ||
| Preferred Securities - 0.8% | |||
| Banks & Thrifts - 0.8% | |||
| Citigroup, Inc.: | |||
| 5.95% (b)(g) | $100,000 | $112,160 | |
| 5.95% (b)(g) | 10,000 | 10,678 | |
| Royal Bank of Scotland Group PLC 7.5% (b)(g) | 800,000 | 862,475 | |
| TOTAL PREFERRED SECURITIES | |||
| (Cost $895,947) | 985,313 | ||
| Shares | Value | ||
| Money Market Funds - 6.3% | |||
| Fidelity Cash Central Fund, 1.10%(h) | |||
| (Cost $7,904,930) | 7,903,558 | 7,905,139 | |
| TOTAL INVESTMENT IN SECURITIES - 102.5% | |||
| (Cost $128,014,592) | 129,123,370 | ||
| NET OTHER ASSETS (LIABILITIES) - (2.5)% | (3,204,212) | ||
| NET ASSETS - 100% | $125,919,158 |
Legend
(a) Security exempt from registration under Rule 144A of the Securities Act of 1933. These securities may be resold in transactions exempt from registration, normally to qualified institutional buyers. At the end of the period, the value of these securities amounted to $40,153,482 or 31.9% of net assets.
(b) Coupon rates for floating and adjustable rate securities reflect the rates in effect at period end.
(c) Coupon is indexed to a floating interest rate which may be multiplied by a specified factor and/or subject to caps or floors.
(d) Non-income producing
(e) Level 3 security
(f) The coupon rate will be determined upon settlement of the loan after period end.
(g) Security is perpetual in nature with no stated maturity date.
(h) Affiliated fund that is generally available only to investment companies and other accounts managed by Fidelity Investments. The rate quoted is the annualized seven-day yield of the fund at period end. A complete unaudited listing of the fund's holdings as of its most recent quarter end is available upon request. In addition, each Fidelity Central Fund's financial statements are available on the SEC's website or upon request.
Affiliated Central Funds
Information regarding fiscal year to date income earned by the Fund from investments in Fidelity Central Funds is as follows:
| Fund | Income earned |
| Fidelity Cash Central Fund | $33,298 |
| Total | $33,298 |
Investment Valuation
The following is a summary of the inputs used, as of October 31, 2017, involving the Fund's assets and liabilities carried at fair value. The inputs or methodology used for valuing securities may not be an indication of the risk associated with investing in those securities. For more information on valuation inputs, and their aggregation into the levels used below, please refer to the Investment Valuation section in the accompanying Notes to Financial Statements.
| Valuation Inputs at Reporting Date: | ||||
| Description | Total | Level 1 | Level 2 | Level 3 |
| Investments in Securities: | ||||
| Equities: | ||||
| Energy | $179,888 | $99,760 | $80,128 | $-- |
| Corporate Bonds | 103,448,308 | -- | 103,448,308 | -- |
| Bank Loan Obligations | 16,099,229 | -- | 16,035,067 | 64,162 |
| Bank Notes | 505,493 | -- | 505,493 | -- |
| Preferred Securities | 985,313 | -- | 985,313 | -- |
| Money Market Funds | 7,905,139 | 7,905,139 | -- | -- |
| Total Investments in Securities: | $129,123,370 | $8,004,899 | $121,054,309 | $64,162 |
Other Information
Distribution of investments by country or territory of incorporation, as a percentage of Total Net Assets, is as follows (Unaudited):
| United States of America | 77.9% |
| Canada | 6.3% |
| Australia | 3.0% |
| Luxembourg | 2.2% |
| United Kingdom | 2.0% |
| Netherlands | 1.9% |
| France | 1.1% |
| British Virgin Islands | 1.1% |
| Others (Individually Less Than 1%) | 4.5% |
| 100.0% |
See accompanying notes which are an integral part of the financial statements.
Financial Statements
Statement of Assets and Liabilities
| October 31, 2017 (Unaudited) | ||
| Assets | ||
| Investment in securities, at value — See accompanying schedule: Unaffiliated issuers (cost $120,109,662) | $121,218,231 | |
| Fidelity Central Funds (cost $7,904,930) | 7,905,139 | |
| Total Investment in Securities (cost $128,014,592) | $129,123,370 | |
| Cash | 1,145 | |
| Receivable for investments sold | 904,497 | |
| Receivable for fund shares sold | 161,947 | |
| Interest receivable | 1,572,320 | |
| Distributions receivable from Fidelity Central Funds | 6,434 | |
| Prepaid expenses | 262 | |
| Receivable from investment adviser for expense reductions | 41,525 | |
| Other receivables | 4 | |
| Total assets | 131,811,504 | |
| Liabilities | ||
| Payable for investments purchased | $5,586,039 | |
| Payable for fund shares redeemed | 98,804 | |
| Distributions payable | 86,332 | |
| Accrued management fee | 57,516 | |
| Distribution and service plan fees payable | 7,636 | |
| Other affiliated payables | 15,434 | |
| Other payables and accrued expenses | 40,585 | |
| Total liabilities | 5,892,346 | |
| Net Assets | $125,919,158 | |
| Net Assets consist of: | ||
| Paid in capital | $128,370,848 | |
| Undistributed net investment income | 532,049 | |
| Accumulated undistributed net realized gain (loss) on investments | (4,092,517) | |
| Net unrealized appreciation (depreciation) on investments | 1,108,778 | |
| Net Assets | $125,919,158 | |
| Calculation of Maximum Offering Price | ||
| Class A: | ||
| Net Asset Value and redemption price per share ($11,843,617 ÷ 1,233,921 shares) | $9.60 | |
| Maximum offering price per share (100/96.00 of $9.60) | $10.00 | |
| Class M: | ||
| Net Asset Value and redemption price per share ($2,493,161 ÷ 259,796 shares) | $9.60 | |
| Maximum offering price per share (100/96.00 of $9.60) | $10.00 | |
| Class C: | ||
| Net Asset Value and offering price per share ($5,634,390 ÷ 586,967 shares)(a) | $9.60 | |
| Short Duration High Income: | ||
| Net Asset Value, offering price and redemption price per share ($93,391,837 ÷ 9,729,679 shares) | $9.60 | |
| Class I: | ||
| Net Asset Value, offering price and redemption price per share ($12,556,153 ÷ 1,308,144 shares) | $9.60 |
(a) Redemption price per share is equal to net asset value less any applicable contingent deferred sales charge.
See accompanying notes which are an integral part of the financial statements.
Statement of Operations
| Six months ended October 31, 2017 (Unaudited) | ||
| Investment Income | ||
| Dividends | $43,604 | |
| Interest | 2,788,339 | |
| Income from Fidelity Central Funds | 33,298 | |
| Total income | 2,865,241 | |
| Expenses | ||
| Management fee | $318,467 | |
| Transfer agent fees | 65,253 | |
| Distribution and service plan fees | 45,650 | |
| Accounting fees and expenses | 23,695 | |
| Custodian fees and expenses | 9,731 | |
| Independent trustees' fees and expenses | 216 | |
| Registration fees | 86,334 | |
| Audit | 35,969 | |
| Legal | 103 | |
| Miscellaneous | 465 | |
| Total expenses before reductions | 585,883 | |
| Expense reductions | (79,640) | 506,243 |
| Net investment income (loss) | 2,358,998 | |
| Realized and Unrealized Gain (Loss) | ||
| Net realized gain (loss) on: | ||
| Investment securities: | ||
| Unaffiliated issuers | 263,716 | |
| Total net realized gain (loss) | 263,716 | |
| Change in net unrealized appreciation (depreciation) on investment securities | (84,624) | |
| Net gain (loss) | 179,092 | |
| Net increase (decrease) in net assets resulting from operations | $2,538,090 |
See accompanying notes which are an integral part of the financial statements.
Statement of Changes in Net Assets
| Six months ended October 31, 2017 (Unaudited) | Year ended April 30, 2017 | |
| Increase (Decrease) in Net Assets | ||
| Operations | ||
| Net investment income (loss) | $2,358,998 | $3,742,238 |
| Net realized gain (loss) | 263,716 | 928,524 |
| Change in net unrealized appreciation (depreciation) | (84,624) | 2,281,335 |
| Net increase (decrease) in net assets resulting from operations | 2,538,090 | 6,952,097 |
| Distributions to shareholders from net investment income | (2,170,632) | (3,434,018) |
| Share transactions - net increase (decrease) | 29,382,697 | 29,153,621 |
| Redemption fees | 7,953 | 26,578 |
| Total increase (decrease) in net assets | 29,758,108 | 32,698,278 |
| Net Assets | ||
| Beginning of period | 96,161,050 | 63,462,772 |
| End of period | $125,919,158 | $96,161,050 |
| Other Information | ||
| Undistributed net investment income end of period | $532,049 | $343,683 |
See accompanying notes which are an integral part of the financial statements.
Financial Highlights
Fidelity Short Duration High Income Fund Class A
| Six months ended (Unaudited) October 31, | Years ended April 30, | ||||
| 2017 | 2017 | 2016 | 2015 | 2014 A | |
| Selected Per–Share Data | |||||
| Net asset value, beginning of period | $9.57 | $9.14 | $9.86 | $10.10 | $10.00 |
| Income from Investment Operations | |||||
| Net investment income (loss)B | .189 | .395 | .429 | .358 | .132 |
| Net realized and unrealized gain (loss) | .014 | .397 | (.737) | (.246) | .091 |
| Total from investment operations | .203 | .792 | (.308) | .112 | .223 |
| Distributions from net investment income | (.174) | (.365) | (.413) | (.358) | (.124) |
| Distributions from net realized gain | – | – | (.002) | – | – |
| Total distributions | (.174) | (.365) | (.415) | (.358) | (.124) |
| Redemption fees added to paid in capitalB | .001 | .003 | .003 | .006 | .001 |
| Net asset value, end of period | $9.60 | $9.57 | $9.14 | $9.86 | $10.10 |
| Total ReturnC,D,E | 2.14% | 8.84% | (3.06)% | 1.22% | 2.25% |
| Ratios to Average Net AssetsF,G | |||||
| Expenses before reductions | 1.22%H | 1.22% | 1.24% | 1.29% | 1.61%H |
| Expenses net of fee waivers, if any | 1.05%H | 1.05% | 1.05% | 1.05% | 1.05%H |
| Expenses net of all reductions | 1.05%H | 1.05% | 1.05% | 1.05% | 1.05%H |
| Net investment income (loss) | 3.92%H | 4.21% | 4.65% | 3.63% | 2.72%H |
| Supplemental Data | |||||
| Net assets, end of period (000 omitted) | $11,844 | $9,304 | $6,823 | $4,398 | $3,043 |
| Portfolio turnover rateI | 49%H | 105% | 56% | 84% | 20%J |
A For the period November 5, 2013 (commencement of operations) to April 30, 2014.
B Calculated based on average shares outstanding during the period.
C Total returns for periods of less than one year are not annualized.
D Total returns would have been lower if certain expenses had not been reduced during the applicable periods shown.
E Total returns do not include the effect of the sales charges.
F Fees and expenses of any underlying Fidelity Central Funds are not included in the Fund's expense ratio. The Fund indirectly bears its proportionate share of the expenses of any underlying Fidelity Central Funds.
G Expense ratios reflect operating expenses of the class. Expenses before reductions do not reflect amounts reimbursed by the investment adviser or reductions from expense offset arrangements and do not represent the amount paid by the class during periods when reimbursements or reductions occur. Expense ratios before reductions for start-up periods may not be representative of longer-term operating periods. Expenses net of fee waivers reflect expenses after reimbursement by the investment adviser but prior to reductions from expense offset arrangements. Expenses net of all reductions represent the net expenses paid by the class.
H Annualized
I Amount does not include the portfolio activity of any underlying Fidelity Central Funds.
J Amount not annualized.
See accompanying notes which are an integral part of the financial statements.
Fidelity Short Duration High Income Fund Class M
| Six months ended (Unaudited) October 31, | Years ended April 30, | ||||
| 2017 | 2017 | 2016 | 2015 | 2014 A | |
| Selected Per–Share Data | |||||
| Net asset value, beginning of period | $9.57 | $9.14 | $9.86 | $10.10 | $10.00 |
| Income from Investment Operations | |||||
| Net investment income (loss)B | .189 | .395 | .433 | .360 | .132 |
| Net realized and unrealized gain (loss) | .014 | .397 | (.741) | (.247) | .091 |
| Total from investment operations | .203 | .792 | (.308) | .113 | .223 |
| Distributions from net investment income | (.174) | (.365) | (.413) | (.359) | (.124) |
| Distributions from net realized gain | – | – | (.002) | – | – |
| Total distributions | (.174) | (.365) | (.415) | (.359) | (.124) |
| Redemption fees added to paid in capitalB | .001 | .003 | .003 | .006 | .001 |
| Net asset value, end of period | $9.60 | $9.57 | $9.14 | $9.86 | $10.10 |
| Total ReturnC,D,E | 2.15% | 8.84% | (3.06)% | 1.23% | 2.25% |
| Ratios to Average Net AssetsF,G | |||||
| Expenses before reductions | 1.21%H | 1.22% | 1.25% | 1.31% | 1.61%H |
| Expenses net of fee waivers, if any | 1.05%H | 1.05% | 1.05% | 1.05% | 1.05%H |
| Expenses net of all reductions | 1.05%H | 1.05% | 1.05% | 1.05% | 1.05%H |
| Net investment income (loss) | 3.92%H | 4.21% | 4.65% | 3.63% | 2.72%H |
| Supplemental Data | |||||
| Net assets, end of period (000 omitted) | $2,493 | $2,703 | $2,426 | $2,930 | $2,946 |
| Portfolio turnover rateI | 49%H | 105% | 56% | 84% | 20%J |
A For the period November 5, 2013 (commencement of operations) to April 30, 2014.
B Calculated based on average shares outstanding during the period.
C Total returns for periods of less than one year are not annualized.
D Total returns would have been lower if certain expenses had not been reduced during the applicable periods shown.
E Total returns do not include the effect of the sales charges.
F Fees and expenses of any underlying Fidelity Central Funds are not included in the Fund's expense ratio. The Fund indirectly bears its proportionate share of the expenses of any underlying Fidelity Central Funds.
G Expense ratios reflect operating expenses of the class. Expenses before reductions do not reflect amounts reimbursed by the investment adviser or reductions from expense offset arrangements and do not represent the amount paid by the class during periods when reimbursements or reductions occur. Expense ratios before reductions for start-up periods may not be representative of longer-term operating periods. Expenses net of fee waivers reflect expenses after reimbursement by the investment adviser but prior to reductions from expense offset arrangements. Expenses net of all reductions represent the net expenses paid by the class.
H Annualized
I Amount does not include the portfolio activity of any underlying Fidelity Central Funds.
J Amount not annualized.
See accompanying notes which are an integral part of the financial statements.
Fidelity Short Duration High Income Fund Class C
| Six months ended (Unaudited) October 31, | Years ended April 30, | ||||
| 2017 | 2017 | 2016 | 2015 | 2014 A | |
| Selected Per–Share Data | |||||
| Net asset value, beginning of period | $9.57 | $9.15 | $9.86 | $10.10 | $10.00 |
| Income from Investment Operations | |||||
| Net investment income (loss)B | .153 | .325 | .360 | .285 | .096 |
| Net realized and unrealized gain (loss) | .013 | .386 | (.728) | (.247) | .090 |
| Total from investment operations | .166 | .711 | (.368) | .038 | .186 |
| Distributions from net investment income | (.137) | (.294) | (.343) | (.284) | (.087) |
| Distributions from net realized gain | – | – | (.002) | – | – |
| Total distributions | (.137) | (.294) | (.345) | (.284) | (.087) |
| Redemption fees added to paid in capitalB | .001 | .003 | .003 | .006 | .001 |
| Net asset value, end of period | $9.60 | $9.57 | $9.15 | $9.86 | $10.10 |
| Total ReturnC,D,E | 1.76% | 7.92% | (3.68)% | .47% | 1.88% |
| Ratios to Average Net AssetsF,G | |||||
| Expenses before reductions | 1.98%H | 2.00% | 2.00% | 2.08% | 2.37%H |
| Expenses net of fee waivers, if any | 1.80%H | 1.80% | 1.80% | 1.80% | 1.80%H |
| Expenses net of all reductions | 1.80%H | 1.80% | 1.80% | 1.80% | 1.80%H |
| Net investment income (loss) | 3.17%H | 3.46% | 3.90% | 2.88% | 1.97%H |
| Supplemental Data | |||||
| Net assets, end of period (000 omitted) | $5,634 | $5,387 | $3,827 | $3,465 | $3,114 |
| Portfolio turnover rateI | 49%H | 105% | 56% | 84% | 20%J |
A For the period November 5, 2013 (commencement of operations) to April 30, 2014.
B Calculated based on average shares outstanding during the period.
C Total returns for periods of less than one year are not annualized.
D Total returns would have been lower if certain expenses had not been reduced during the applicable periods shown.
E Total returns do not include the effect of the contingent deferred sales charge.
F Fees and expenses of any underlying Fidelity Central Funds are not included in the Fund's expense ratio. The Fund indirectly bears its proportionate share of the expenses of any underlying Fidelity Central Funds.
G Expense ratios reflect operating expenses of the class. Expenses before reductions do not reflect amounts reimbursed by the investment adviser or reductions from expense offset arrangements and do not represent the amount paid by the class during periods when reimbursements or reductions occur. Expense ratios before reductions for start-up periods may not be representative of longer-term operating periods. Expenses net of fee waivers reflect expenses after reimbursement by the investment adviser but prior to reductions from expense offset arrangements. Expenses net of all reductions represent the net expenses paid by the class.
H Annualized
I Amount does not include the portfolio activity of any underlying Fidelity Central Funds.
J Amount not annualized.
See accompanying notes which are an integral part of the financial statements.
Fidelity Short Duration High Income Fund
| Six months ended (Unaudited) October 31, | Years ended April 30, | ||||
| 2017 | 2017 | 2016 | 2015 | 2014 A | |
| Selected Per–Share Data | |||||
| Net asset value, beginning of period | $9.57 | $9.15 | $9.86 | $10.10 | $10.00 |
| Income from Investment Operations | |||||
| Net investment income (loss)B | .201 | .420 | .455 | .385 | .142 |
| Net realized and unrealized gain (loss) | .014 | .385 | (.730) | (.248) | .093 |
| Total from investment operations | .215 | .805 | (.275) | .137 | .235 |
| Distributions from net investment income | (.186) | (.388) | (.436) | (.383) | (.136) |
| Distributions from net realized gain | – | – | (.002) | – | – |
| Total distributions | (.186) | (.388) | (.438) | (.383) | (.136) |
| Redemption fees added to paid in capitalB | .001 | .003 | .003 | .006 | .001 |
| Net asset value, end of period | $9.60 | $9.57 | $9.15 | $9.86 | $10.10 |
| Total ReturnC,D | 2.27% | 9.00% | (2.71)% | 1.48% | 2.37% |
| Ratios to Average Net AssetsE,F | |||||
| Expenses before reductions | .93%G | .93% | .96% | 1.00% | 1.24%G |
| Expenses net of fee waivers, if any | .80%G | .80% | .80% | .80% | .80%G |
| Expenses net of all reductions | .80%G | .80% | .80% | .80% | .80%G |
| Net investment income (loss) | 4.17%G | 4.46% | 4.90% | 3.88% | 2.96%G |
| Supplemental Data | |||||
| Net assets, end of period (000 omitted) | $93,392 | $68,646 | $47,531 | $45,109 | $54,547 |
| Portfolio turnover rateH | 49%G | 105% | 56% | 84% | 20%I |
A For the period November 5, 2013 (commencement of operations) to April 30, 2014.
B Calculated based on average shares outstanding during the period.
C Total returns for periods of less than one year are not annualized.
D Total returns would have been lower if certain expenses had not been reduced during the applicable periods shown.
E Fees and expenses of any underlying Fidelity Central Funds are not included in the Fund's expense ratio. The Fund indirectly bears its proportionate share of the expenses of any underlying Fidelity Central Funds.
F Expense ratios reflect operating expenses of the class. Expenses before reductions do not reflect amounts reimbursed by the investment adviser or reductions from expense offset arrangements and do not represent the amount paid by the class during periods when reimbursements or reductions occur. Expense ratios before reductions for start-up periods may not be representative of longer-term operating periods. Expenses net of fee waivers reflect expenses after reimbursement by the investment adviser but prior to reductions from expense offset arrangements. Expenses net of all reductions represent the net expenses paid by the class.
G Annualized
H Amount does not include the portfolio activity of any underlying Fidelity Central Funds.
I Amount not annualized.
See accompanying notes which are an integral part of the financial statements.
Fidelity Short Duration High Income Fund Class I
| Six months ended (Unaudited) October 31, | Years ended April 30, | ||||
| 2017 | 2017 | 2016 | 2015 | 2014 A | |
| Selected Per–Share Data | |||||
| Net asset value, beginning of period | $9.57 | $9.15 | $9.86 | $10.10 | $10.00 |
| Income from Investment Operations | |||||
| Net investment income (loss)B | .201 | .420 | .460 | .383 | .143 |
| Net realized and unrealized gain (loss) | .014 | .385 | (.735) | (.246) | .091 |
| Total from investment operations | .215 | .805 | (.275) | .137 | .234 |
| Distributions from net investment income | (.186) | (.388) | (.436) | (.383) | (.135) |
| Distributions from net realized gain | – | – | (.002) | – | – |
| Total distributions | (.186) | (.388) | (.438) | (.383) | (.135) |
| Redemption fees added to paid in capitalB | .001 | .003 | .003 | .006 | .001 |
| Net asset value, end of period | $9.60 | $9.57 | $9.15 | $9.86 | $10.10 |
| Total ReturnC,D | 2.27% | 8.99% | (2.71)% | 1.48% | 2.37% |
| Ratios to Average Net AssetsE,F | |||||
| Expenses before reductions | .96%G | .96% | .99% | 1.04% | 1.34%G |
| Expenses net of fee waivers, if any | .80%G | .80% | .80% | .80% | .80%G |
| Expenses net of all reductions | .80%G | .80% | .80% | .80% | .80%G |
| Net investment income (loss) | 4.17%G | 4.46% | 4.90% | 3.88% | 2.97%G |
| Supplemental Data | |||||
| Net assets, end of period (000 omitted) | $12,556 | $10,122 | $2,856 | $5,932 | $4,419 |
| Portfolio turnover rateH | 49%G | 105% | 56% | 84% | 20%I |
A For the period November 5, 2013 (commencement of operations) to April 30, 2014.
B Calculated based on average shares outstanding during the period.
C Total returns for periods of less than one year are not annualized.
D Total returns would have been lower if certain expenses had not been reduced during the applicable periods shown.
E Fees and expenses of any underlying Fidelity Central Funds are not included in the Fund's expense ratio. The Fund indirectly bears its proportionate share of the expenses of any underlying Fidelity Central Funds.
F Expense ratios reflect operating expenses of the class. Expenses before reductions do not reflect amounts reimbursed by the investment adviser or reductions from expense offset arrangements and do not represent the amount paid by the class during periods when reimbursements or reductions occur. Expense ratios before reductions for start-up periods may not be representative of longer-term operating periods. Expenses net of fee waivers reflect expenses after reimbursement by the investment adviser but prior to reductions from expense offset arrangements. Expenses net of all reductions represent the net expenses paid by the class.
G Annualized
H Amount does not include the portfolio activity of any underlying Fidelity Central Funds.
I Amount not annualized.
See accompanying notes which are an integral part of the financial statements.
Notes to Financial Statements (Unaudited)
For the period ended October 31, 2017
1. Organization.
Fidelity Short Duration High Income Fund (the Fund) is a fund of Fidelity Summer Street Trust (the Trust) and is authorized to issue an unlimited number of shares. The Trust is registered under the Investment Company Act of 1940, as amended (the 1940 Act), as an open-end management investment company organized as a Massachusetts business trust. The Fund offers Class A, Class M, Class C, Short Duration High Income and Class I shares, each of which has equal rights as to assets and voting privileges. Each class has exclusive voting rights with respect to matters that affect that class.
2. Investments in Fidelity Central Funds.
The Fund invests in Fidelity Central Funds, which are open-end investment companies generally available only to other investment companies and accounts managed by the investment adviser and its affiliates. The Fund's Schedule of Investments lists each of the Fidelity Central Funds held as of period end, if any, as an investment of the Fund, but does not include the underlying holdings of each Fidelity Central Fund. As an Investing Fund, the Fund indirectly bears its proportionate share of the expenses of the underlying Fidelity Central Funds.
The Money Market Central Funds seek preservation of capital and current income and are managed by Fidelity Investments Money Management, Inc. (FIMM), an affiliate of the investment adviser. Annualized expenses of the Money Market Central Funds as of their most recent shareholder report date are less than .005%.
A complete unaudited list of holdings for each Fidelity Central Fund is available upon request or at the Securities and Exchange Commission (the SEC) website at www.sec.gov. In addition, the financial statements of the Fidelity Central Funds are available on the SEC website or upon request.
3. Significant Accounting Policies.
The Fund is an investment company and applies the accounting and reporting guidance of the Financial Accounting Standards Board (FASB) Accounting Standards Codification Topic 946 Financial Services – Investments Companies. The financial statements have been prepared in conformity with accounting principles generally accepted in the United States of America (GAAP), which require management to make certain estimates and assumptions at the date of the financial statements. Actual results could differ from those estimates. Subsequent events, if any, through the date that the financial statements were issued have been evaluated in the preparation of the financial statements. The following summarizes the significant accounting policies of the Fund:
Investment Valuation. Investments are valued as of 4:00 p.m. Eastern time on the last calendar day of the period. The Board of Trustees (the Board) has delegated the day to day responsibility for the valuation of the Fund's investments to the Fair Value Committee (the Committee) established by the Fund's investment adviser. In accordance with valuation policies and procedures approved by the Board, the Fund attempts to obtain prices from one or more third party pricing vendors or brokers to value its investments. When current market prices, quotations or currency exchange rates are not readily available or reliable, investments will be fair valued in good faith by the Committee, in accordance with procedures adopted by the Board. Factors used in determining fair value vary by investment type and may include market or investment specific events, changes in interest rates and credit quality. The frequency with which these procedures are used cannot be predicted and they may be utilized to a significant extent. The Committee oversees the Fund's valuation policies and procedures and reports to the Board on the Committee's activities and fair value determinations. The Board monitors the appropriateness of the procedures used in valuing the Fund's investments and ratifies the fair value determinations of the Committee.
The Fund categorizes the inputs to valuation techniques used to value its investments into a disclosure hierarchy consisting of three levels as shown below:
- Level 1 – quoted prices in active markets for identical investments
- Level 2 – other significant observable inputs (including quoted prices for similar investments, interest rates, prepayment speeds, etc.)
- Level 3 – unobservable inputs (including the Fund's own assumptions based on the best information available)
Valuation techniques used to value the Fund's investments by major category are as follows:
Debt securities, including restricted securities, are valued based on evaluated prices received from third party pricing vendors or from brokers who make markets in such securities. Corporate bonds, bank notes, bank loan obligations and preferred securities are valued by pricing vendors who utilize matrix pricing which considers yield or price of bonds of comparable quality, coupon, maturity and type or by broker-supplied prices. When independent prices are unavailable or unreliable, debt securities may be valued utilizing pricing methodologies which consider similar factors that would be used by third party pricing vendors. Debt securities are generally categorized as Level 2 in the hierarchy but may be Level 3 depending on the circumstances. The Fund invests a significant portion of its assets in below investment grade securities. The value of these securities can be more volatile due to changes in the credit quality of the issuer and is sensitive to changes in economic, market and regulatory conditions.
Equity securities, including restricted securities, for which market quotations are readily available, are valued at the last reported sale price or official closing price as reported by a third party pricing vendor on the primary market or exchange on which they are traded and are categorized as Level 1 in the hierarchy. In the event there were no sales during the day or closing prices are not available, securities are valued at the last quoted bid price or may be valued using the last available price and are generally categorized as Level 2 in the hierarchy. Utilizing these techniques may result in transfers between Level 1 and Level 2. For equity securities, including restricted securities, where observable inputs are limited, assumptions about market activity and risk are used and these securities may be categorized as Level 3 in the hierarchy.
Investments in open-end mutual funds, including the Fidelity Central Funds, are valued at their closing net asset value (NAV) each business day and are categorized as Level 1 in the hierarchy.
Changes in valuation techniques may result in transfers in or out of an assigned level within the disclosure hierarchy. The aggregate value of investments by input level as of October 31, 2017 is included at the end of the Fund's Schedule of Investments.
Investment Transactions and Income. For financial reporting purposes, the Fund's investment holdings and NAV include trades executed through the end of the last business day of the period. The NAV per share for processing shareholder transactions is calculated as of the close of business of the New York Stock Exchange (NYSE), normally 4:00 p.m. Eastern time and includes trades executed through the end of the prior business day. Gains and losses on securities sold are determined on the basis of identified cost. Dividend income is recorded on the ex-dividend date, except for certain dividends from foreign securities where the ex-dividend date may have passed, which are recorded as soon as the Fund is informed of the ex-dividend date. Non-cash dividends included in dividend income, if any, are recorded at the fair market value of the securities received. Income and capital gain distributions from Fidelity Central Funds, if any, are recorded on the ex-dividend date. Interest income is accrued as earned and includes coupon interest and amortization of premium and accretion of discount on debt securities as applicable. Paid in Kind (PIK) income is recorded at the fair market value of the securities received. Debt obligations may be placed on non-accrual status and related interest income may be reduced by ceasing current accruals and writing off interest receivables when the collection of all or a portion of interest has become doubtful based on consistently applied procedures. A debt obligation is removed from non-accrual status when the issuer resumes interest payments or when collectability of interest is reasonably assured.
Class Allocations and Expenses. Investment income, realized and unrealized capital gains and losses, common expenses of the Fund, and certain fund-level expense reductions, if any, are allocated daily on a pro-rata basis to each class based on the relative net assets of each class to the total net assets of the Fund. Each class differs with respect to transfer agent and distribution and service plan fees incurred. Certain expense reductions may also differ by class. For the reporting period, the allocated portion of income and expenses to each class as a percent of its average net assets may vary due to the timing of recording these transactions in relation to fluctuating net assets of the classes. Expenses directly attributable to a fund are charged to that fund. Expenses attributable to more than one fund are allocated among the respective funds on the basis of relative net assets or other appropriate methods. Expense estimates are accrued in the period to which they relate and adjustments are made when actual amounts are known.
Income Tax Information and Distributions to Shareholders. Each year, the Fund intends to qualify as a regulated investment company under Subchapter M of the Internal Revenue Code, including distributing substantially all of its taxable income and realized gains. As a result, no provision for U.S. Federal income taxes is required. The Fund files a U.S. federal tax return, in addition to state and local tax returns as required. The Fund's federal income tax returns are subject to examination by the Internal Revenue Service (IRS) for a period of three fiscal years after they are filed. State and local tax returns may be subject to examination for an additional fiscal year depending on the jurisdiction.
Dividends are declared and recorded daily and paid monthly from net investment income. Distributions from realized gains, if any, are declared and recorded on the ex-dividend date. Income dividends and capital gain distributions are declared separately for each class. Income and capital gain distributions are determined in accordance with income tax regulations, which may differ from GAAP.
Capital accounts within the financial statements are adjusted for permanent book-tax differences. These adjustments have no impact on net assets or the results of operations. Capital accounts are not adjusted for temporary book-tax differences which will reverse in a subsequent period.
Book-tax differences are primarily due to market discount, capital loss carryforwards and losses deferred due to wash sales.
As of period end, the cost and unrealized appreciation (depreciation) in securities, and derivatives if applicable, for federal income tax purposes were as follows:
| Gross unrealized appreciation | $2,339,443 |
| Gross unrealized depreciation | (976,674) |
| Net unrealized appreciation (depreciation) | $1,362,769 |
| Tax cost | $127,760,601 |
Capital loss carryforwards are only available to offset future capital gains of the Fund to the extent provided by regulations and may be limited. Under the Regulated Investment Company Modernization Act of 2010 (the Act), the Fund is permitted to carry forward capital losses incurred in taxable years beginning after December 22, 2010 for an unlimited period and such capital losses are required to be used prior to any losses that expire. The capital loss carryforward information presented below, including any applicable limitation, is estimated as of prior fiscal period end and is subject to adjustment.
| No expiration | |
| Short-term | $(2,307,910) |
| Long-term | (2,039,116) |
| Total capital loss carryforward | $(4,347,026) |
Short-Term Trading (Redemption) Fees. Shares held by investors in the Fund less than 90 days may have been subject to a redemption fee equal to 1.00% of the NAV of shares redeemed. All redemption fees, which reduce the proceeds of the shareholder redemption, are retained by the Fund and accounted for as an addition to paid in capital. In November 2017, the Board of Trustees approved the elimination of these redemption fees effective December 18, 2017.
Restricted Securities. The Fund may invest in securities that are subject to legal or contractual restrictions on resale. These securities generally may be resold in transactions exempt from registration or to the public if the securities are registered. Disposal of these securities may involve time-consuming negotiations and expense, and prompt sale at an acceptable price may be difficult. Information regarding restricted securities is included at the end of the Fund's Schedule of Investments.
Loans and Other Direct Debt Instruments. The Fund invests in direct debt instruments which are interests in amounts owed to lenders by corporate or other borrowers. These instruments may be in the form of loans, trade claims or other receivables and may include standby financing commitments such as revolving credit facilities that obligate the Fund to supply additional cash to the borrower on demand. Loans may be acquired through assignment or participation. The Fund did not have any unfunded loan commitments, which are contractual obligations for future funding, at period end.
New Accounting Pronouncement. In March 2017, the Financial Accounting Standards Board (FASB) issued an Accounting Standards Update (ASU), ASU 2017-08, which amends the amortization period for certain callable debt securities that are held at a premium. The amendment requires the premium to be amortized to the earliest call date. The amendments do not require an accounting change for securities held at a discount. The ASU is effective for annual periods beginning after December 15, 2018. Management is currently evaluating the potential impact of these changes to the financial statements.
4. Purchases and Sales of Investments.
Purchases and sales of securities, other than short-term securities, aggregated $56,002,749 and $26,596,177, respectively.
5. Fees and Other Transactions with Affiliates.
Management Fee. Fidelity Management & Research Company (the investment adviser) and its affiliates provide the Fund with investment management related services for which the Fund pays a monthly management fee. The management fee is the sum of an individual fund fee rate that is based on an annual rate of .45% of the Fund's average net assets and an annualized group fee rate that averaged .11% during the period. The group fee rate is based upon the average net assets of all the mutual funds advised by the investment adviser, including any mutual funds previously advised by the investment adviser that are currently advised by Fidelity SelectCo, LLC, an affiliate of the investment adviser. The group fee rate decreases as assets under management increase and increases as assets under management decrease. For the reporting period, the total annualized management fee rate was .56% of the Fund's average net assets.
Distribution and Service Plan Fees. In accordance with Rule 12b-1 of the 1940 Act, the Fund has adopted separate Distribution and Service Plans for each class of shares. Certain classes pay Fidelity Distributors Corporation (FDC), an affiliate of the investment adviser, separate Distribution and Service Fees, each of which is based on an annual percentage of each class' average net assets. In addition, FDC may pay financial intermediaries for selling shares of the Fund and providing shareholder support services. For the period, the Distribution and Service Fee rates, total fees and amounts retained by FDC were as follows:
| Distribution Fee | Service Fee | Total Fees | Retained by FDC | |
| Class A | -% | .25% | $13,544 | $1,304 |
| Class M | -% | .25% | 3,198 | – |
| Class C | .75% | .25% | 28,908 | 8,982 |
| $45,650 | $10,286 |
Sales Load. FDC may receive a front-end sales charge of up to 4.00% for selling Class A shares and Class M shares, some of which is paid to financial intermediaries for selling shares of the Fund. Depending on the holding period, FDC may receive contingent deferred sales charges levied on Class A, Class M and Class C redemptions. The deferred sales charges are 1.00% for Class C shares, 1.00% for certain purchases of Class A shares and .25% for certain purchases of Class M shares.
For the period, sales charge amounts retained by FDC were as follows:
| Retained by FDC | |
| Class A | $2,115 |
| Class C(a) | 151 |
| $2,266 |
(a) When Class C shares are initially sold, FDC pays commissions from its own resources to financial intermediaries through which the sales are made.
Transfer Agent Fees. Fidelity Investments Institutional Operations Company, Inc., (FIIOC), an affiliate of the investment adviser, is the transfer, dividend disbursing and shareholder servicing agent for each class of the Fund. FIIOC receives account fees and asset-based fees that vary according to the account size and type of account of the shareholders of the respective classes of the Fund. FIIOC pays for typesetting, printing and mailing of shareholder reports, except proxy statements.
For the period, transfer agent fees for each class were as follows:
| Amount | % of Class-Level Average Net Assets(a) | |
| Class A | $8,099 | .15 |
| Class M | 1,826 | .14 |
| Class C | 4,918 | .17 |
| Short Duration High Income | 42,233 | .10 |
| Class I | 8,177 | .13 |
| $65,253 |
(a) Annualized
Accounting Fees. Fidelity Service Company, Inc. (FSC), an affiliate of the investment adviser, maintains the Fund's accounting records. The fee is based on the level of average net assets for each month.
Interfund Trades. The Fund may purchase from or sell securities to other Fidelity Funds under procedures adopted by the Board. The procedures have been designed to ensure these interfund trades are executed in accordance with Rule 17a-7 of the 1940 Act. Interfund trades are included within the respective purchases and sales amounts shown in the Purchases and Sales of Investments note.
6. Committed Line of Credit.
The Fund participates with other funds managed by the investment adviser or an affiliate in a $4.25 billion credit facility (the "line of credit") to be utilized for temporary or emergency purposes to fund shareholder redemptions or for other short-term liquidity purposes. The Fund has agreed to pay commitment fees on its pro-rata portion of the line of credit, which amounted to $167 and is reflected in Miscellaneous expenses on the Statement of Operations. During the period, the Fund did not borrow on this line of credit.
7. Expense Reductions.
The investment adviser contractually agreed to reimburse each class to the extent annual operating expenses exceeded certain levels of average net assets as noted in the table below. This reimbursement will remain in place through June 30, 2018. Some expenses, for example interest expense, including commitment fees, are excluded from this reimbursement.
The following classes were in reimbursement during the period:
| Expense Limitations | Reimbursement | |
| Class A | 1.05% | $9,224 |
| Class M | 1.05% | 2,041 |
| Class C | 1.80% | 5,260 |
| Short Duration High Income | .80% | 52,700 |
| Class I | .80% | 9,378 |
| $78,603 |
In addition, through arrangements with the Fund's custodian, credits realized as a result of certain uninvested cash balances were used to reduce the Fund's expenses. During the period, these credits reduced the Fund's custody expenses by $738.
In addition, during the period the investment adviser reimbursed and/or waived a portion of fund-level operating expenses in the amount of $299.
8. Distributions to Shareholders.
Distributions to shareholders of each class were as follows:
| Six months ended October 31, 2017 | Year ended April 30, 2017 | |
| From net investment income | ||
| Class A | $195,783 | $317,363 |
| Class M | 46,445 | 103,289 |
| Class C | 83,039 | 140,651 |
| Short Duration High Income | 1,611,332 | 2,611,325 |
| Class I | 234,033 | 261,390 |
| Total | $2,170,632 | $3,434,018 |
9. Share Transactions.
Share transactions for each class were as follows and may contain automatic conversions between classes or exchanges between affiliated funds:
| Shares | Shares | Dollars | Dollars | |
| Six months ended October 31, 2017 | Year ended April 30, 2017 | Six months ended October 31, 2017 | Year ended April 30, 2017 | |
| Class A | ||||
| Shares sold | 351,404 | 645,427 | $3,360,399 | $6,074,019 |
| Reinvestment of distributions | 19,585 | 29,495 | 187,662 | 277,499 |
| Shares redeemed | (109,321) | (448,823) | (1,046,993) | (4,232,209) |
| Net increase (decrease) | 261,668 | 226,099 | $2,501,068 | $2,119,309 |
| Class M | ||||
| Shares sold | 15,066 | 194,670 | $144,305 | $1,826,606 |
| Reinvestment of distributions | 4,683 | 10,007 | 44,871 | 94,026 |
| Shares redeemed | (42,404) | (187,509) | (406,415) | (1,761,626) |
| Net increase (decrease) | (22,655) | 17,168 | $(217,239) | $159,006 |
| Class C | ||||
| Shares sold | 112,148 | 388,650 | $1,073,253 | $3,652,222 |
| Reinvestment of distributions | 8,649 | 14,192 | 82,868 | 133,454 |
| Shares redeemed | (96,690) | (258,472) | (926,637) | (2,424,502) |
| Net increase (decrease) | 24,107 | 144,370 | $229,484 | $1,361,174 |
| Short Duration High Income | ||||
| Shares sold | 3,600,448 | 7,522,788 | $34,466,791 | $70,771,297 |
| Reinvestment of distributions | 134,678 | 236,168 | 1,290,386 | 2,225,048 |
| Shares redeemed | (1,178,339) | (5,783,381) | (11,271,676) | (54,506,631) |
| Net increase (decrease) | 2,556,787 | 1,975,575 | $24,485,501 | $18,489,714 |
| Class I | ||||
| Shares sold | 601,398 | 1,132,152 | $5,745,496 | $10,676,049 |
| Reinvestment of distributions | 19,246 | 17,955 | 184,406 | 169,457 |
| Shares redeemed | (370,139) | (404,716) | (3,546,019) | (3,821,088) |
| Net increase (decrease) | 250,505 | 745,391 | $2,383,883 | $7,024,418 |
10. Other.
The Fund's organizational documents provide former and current trustees and officers with a limited indemnification against liabilities arising in connection with the performance of their duties to the Fund. In the normal course of business, the Fund may also enter into contracts that provide general indemnifications. The Fund's maximum exposure under these arrangements is unknown as this would be dependent on future claims that may be made against the Fund. The risk of material loss from such claims is considered remote.
Board Approval of Investment Advisory Contracts and Management Fees
Fidelity Short Duration High Income Fund
Each year, the Board of Trustees, including the Independent Trustees (together, the Board), votes on the renewal of the management contract with Fidelity Management & Research Company (FMR) and the sub-advisory agreements (together, the Advisory Contracts) for the fund. FMR and the sub-advisers are referred to herein as the Investment Advisers. The Board, assisted by the advice of fund counsel and Independent Trustees' counsel, requests and considers a broad range of information relevant to the renewal of the Advisory Contracts throughout the year.
The Board meets regularly and, at each of its meetings, covers an extensive agenda of topics and materials and considers factors that are relevant to its annual consideration of the renewal of the fund's Advisory Contracts, including the services and support provided to the fund and its shareholders. The Board has established various standing committees (Committees), each composed of and chaired by Independent Trustees with varying backgrounds, to which the Board has assigned specific subject matter responsibilities in order to enhance effective decision-making by the Board. The Board, acting directly and through its Committees, requests and receives information concerning the annual consideration of the renewal of the fund's Advisory Contracts. The Board also meets as needed to review matters specifically related to the Board's annual consideration of the renewal of the Advisory Contracts. Members of the Board may also meet with trustees of other Fidelity funds through ad hoc joint committees to discuss certain matters relevant to all of the Fidelity funds.
At its July 2017 meeting, the Board unanimously determined to renew the fund's Advisory Contracts. In reaching its determination, the Board considered all factors it believed relevant, including (i) the nature, extent, and quality of the services to be provided to the fund and its shareholders (including the investment performance of the fund); (ii) the competitiveness of the fund's management fee and total expense ratio relative to peer funds; (iii) the total costs of the services to be provided by and the profits to be realized by Fidelity from its relationships with the fund; and (iv) the extent to which, if any, economies of scale exist and would be realized as the fund grows, and whether any economies of scale are appropriately shared with fund shareholders.
In considering whether to renew the Advisory Contracts for the fund, the Board reached a determination, with the assistance of fund counsel and Independent Trustees' counsel and through the exercise of its business judgment, that the renewal of the Advisory Contracts was in the best interests of the fund and its shareholders and that the compensation payable under the Advisory Contracts was fair and reasonable. The Board's decision to renew the Advisory Contracts was not based on any single factor, but rather was based on a comprehensive consideration of all the information provided to the Board at its meetings throughout the year. The Board, in reaching its determination to renew the Advisory Contracts, was aware that shareholders of the fund have a broad range of investment choices available to them, including a wide choice among funds offered by Fidelity's competitors, and that the fund's shareholders, who have the opportunity to review and weigh the disclosure provided by the fund in its prospectus and other public disclosures, have chosen to invest in this fund, which is part of the Fidelity family of funds.
Amendment to Group Fee Rate. The Board also approved an amendment to the management contract for the fund to add an additional breakpoint to the group fee schedule, effective October 1, 2017. The Board noted that the additional breakpoint would result in lower management fee rates as Fidelity's assets under management increase.
Nature, Extent, and Quality of Services Provided. The Board considered Fidelity's staffing as it relates to the fund, including the backgrounds of investment personnel of Fidelity, and also considered the fund's investment objective, strategies, and related investment philosophy. The Independent Trustees also had discussions with senior management of Fidelity's investment operations and investment groups. The Board considered the structure of the investment personnel compensation program and whether this structure provides appropriate incentives to act in the best interests of the fund. Additionally, the Board considered the portfolio managers' investments, if any, in the funds that they manage.Resources Dedicated to Investment Management and Support Services. The Board and the Fund Oversight and Research Committees reviewed the general qualifications and capabilities of Fidelity's investment staff, including its size, education, experience, and resources, as well as Fidelity's approach to recruiting, training, managing, and compensating investment personnel. The Board noted that Fidelity has continued to increase the resources devoted to non-U.S. offices, including expansion of Fidelity's global investment organization. The Board also noted that Fidelity's analysts have extensive resources, tools and capabilities that allow them to conduct sophisticated quantitative and fundamental analysis, as well as credit analysis of issuers, counterparties and guarantors. Further, the Board considered that Fidelity's investment professionals have sufficient access to global information and data so as to provide competitive investment results over time, and that those professionals also have access to sophisticated tools that permit them to assess portfolio construction and risk and performance attribution characteristics continuously, as well as to transmit new information and research conclusions rapidly around the world. Additionally, in its deliberations, the Board considered Fidelity's trading, risk management, compliance, and technology and operations capabilities and resources, which are integral parts of the investment management process.Shareholder and Administrative Services. The Board considered (i) the nature, extent, quality, and cost of advisory, administrative, and shareholder services performed by the Investment Advisers and their affiliates under the Advisory Contracts and under separate agreements covering transfer agency, pricing and bookkeeping, and securities lending services for the fund; (ii) the nature and extent of the supervision of third party service providers, principally custodians, subcustodians, and pricing vendors; and (iii) the resources devoted to, and the record of compliance with, the fund's compliance policies and procedures. The Board also reviewed the allocation of fund brokerage, including allocations to brokers affiliated with the Investment Advisers, the use of brokerage commissions to pay fund expenses, and the use of "soft" commission dollars to pay for research services.The Board noted that the growth of fund assets over time across the complex allows Fidelity to reinvest in the development of services designed to enhance the value or convenience of the Fidelity funds as investment vehicles. These services include 24-hour access to account information and market information through telephone representatives and over the Internet, investor education materials and asset allocation tools, and the expanded availability of Fidelity Investor Centers.In 2014, the Board formed an ad hoc Committee on Transfer Agency Fees to review the variety of transfer agency fee structures throughout the industry and Fidelity's competitive positioning with respect to industry participants.Investment in a Large Fund Family. The Board considered the benefits to shareholders of investing in a Fidelity fund, including the benefits of investing in a fund that is part of a large family of funds offering a variety of investment disciplines and providing a large variety of mutual fund investor services. The Board noted that Fidelity had taken, or had made recommendations that resulted in the Fidelity funds taking, a number of actions over the previous year that benefited particular funds, including: (i) continuing to dedicate additional resources to Fidelity's investment research process, and to the support of the senior management team that oversees asset management; (ii) continuing efforts to enhance Fidelity's global research capabilities; (iii) launching new funds and making other enhancements to meet client needs; (iv) launching new share classes of existing funds; (v) eliminating purchase minimums and broadening eligibility requirements for certain lower-priced share classes; (vi) reducing management fees and total expenses for certain growth equity funds and index funds; (vii) lowering expense caps for certain existing funds and classes to reduce expenses borne by shareholders; (viii) eliminating short-term redemption fees for certain funds; (ix) introducing a new pricing structure for certain funds of funds that is expected to reduce overall expenses paid by shareholders; (x) rationalizing product lines and gaining increased efficiencies through proposals for fund mergers and share class consolidations; (xi) continuing to develop, acquire and implement systems and technology to improve services to the funds and shareholders, strengthen information security, and increase efficiency; and (xii) implementing enhancements to further strengthen Fidelity's product line to increase investors' probability of success in achieving their investment goals, including retirement income goals.Investment Performance. The Board considered whether the fund has operated in accordance with its investment objective, as well as its record of compliance with its investment restrictions and its performance history.The Board took into account discussions with representatives of the Investment Advisers about fund investment performance that occur at Board meetings throughout the year. In this regard the Board noted that as part of regularly scheduled fund reviews and other reports to the Board on fund performance, the Board considers annualized return information for the fund for different time periods, measured against a securities market index ("benchmark index") and a peer group of funds with similar objectives ("peer group"), if any. In its evaluation of fund investment performance, the Board gave particular attention to information indicating changes in performance of certain Fidelity funds for specific time periods and discussed with the Investment Advisers the reasons for any overperformance or underperformance.In addition to reviewing absolute and relative fund performance, the Independent Trustees periodically consider the appropriateness of fund performance metrics in evaluating the results achieved. In general, the Independent Trustees believe that fund performance should be evaluated based on net performance (after fees and expenses) of both the highest performing and lowest performing fund share classes, where applicable, compared to appropriate benchmark indices, over appropriate time periods that may include full market cycles, and compared to peer groups, as applicable, over the same periods, taking into account relevant factors including the following: general market conditions; issuer-specific information; and fund cash flows and other factors.The Independent Trustees recognize that shareholders evaluate performance on a net basis over their own holding periods, for which one-, three-, and five-year periods are often used as a proxy. For this reason, the performance information reviewed by the Board also included net cumulative calendar year total return information for the fund and an appropriate benchmark index for the most recent one- and three-year periods, as shown below. A peer group is not shown below because the fund does not generally utilize a peer group for performance comparison purposes.Fidelity Short Duration High Income Fund
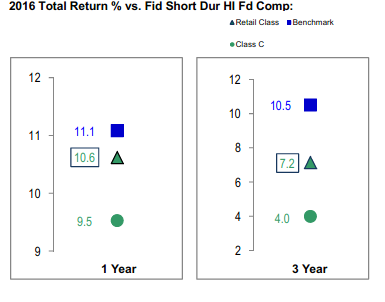
Fidelity Short Duration High Income Fund
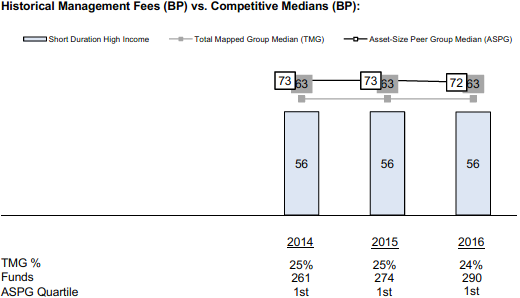
Shareholder Expense Example
As a shareholder of the Fund, you incur two types of costs: (1) transaction costs, including sales charges (loads) on purchase payments or redemption proceeds, redemption fees and (2) ongoing costs, including management fees, distribution and/or service (12b-1) fees and other Fund expenses. This Example is intended to help you understand your ongoing costs (in dollars) of investing in the Fund and to compare these costs with the ongoing costs of investing in other mutual funds.
The Example is based on an investment of $1,000 invested at the beginning of the period and held for the entire period (May 1, 2017 to October 31, 2017).
Actual Expenses
The first line of the accompanying table for each class of the Fund provides information about actual account values and actual expenses. You may use the information in this line, together with the amount you invested, to estimate the expenses that you paid over the period. Simply divide your account value by $1,000.00 (for example, an $8,600 account value divided by $1,000.00 = 8.6), then multiply the result by the number in the first line for a class of the Fund under the heading entitled "Expenses Paid During Period" to estimate the expenses you paid on your account during this period. A small balance maintenance fee of $12.00 that is charged once a year may apply for certain accounts with a value of less than $2,000. This fee is not included in the table below. If it was, the estimate of expenses you paid during the period would be higher, and your ending account value lower, by this amount. In addition, the Fund, as a shareholder in the underlying Fidelity Central Funds, will indirectly bear its pro-rata share of the fees and expenses incurred by the underlying Fidelity Central Funds. These fees and expenses are not included in the Fund's annualized expense ratio used to calculate the expense estimate in the table below.
Hypothetical Example for Comparison Purposes
The second line of the accompanying table for each class of the Fund provides information about hypothetical account values and hypothetical expenses based on a Class' actual expense ratio and an assumed rate of return of 5% per year before expenses, which is not the Class' actual return. The hypothetical account values and expenses may not be used to estimate the actual ending account balance or expenses you paid for the period. You may use this information to compare the ongoing costs of investing in the Fund and other funds. To do so, compare this 5% hypothetical example with the 5% hypothetical examples that appear in the shareholder reports of the other funds. A small balance maintenance fee of $12.00 that is charged once a year may apply for certain accounts with a value of less than $2,000. This fee is not included in the table below. If it was, the estimate of expenses you paid during the period would be higher, and your ending account value lower, by this amount. In addition, the Fund, as a shareholder in the underlying Fidelity Central Funds, will indirectly bear its pro-rata share of the fees and expenses incurred by the underlying Fidelity Central Funds. These fees and expenses are not included in the Fund's annualized expense ratio used to calculate the expense estimate in the table below.
Please note that the expenses shown in the table are meant to highlight your ongoing costs only and do not reflect any transaction costs. Therefore, the second line of the table is useful in comparing ongoing costs only, and will not help you determine the relative total costs of owning different funds. In addition, if these transactional costs were included, your costs would have been higher.
| Annualized Expense Ratio-A | Beginning Account Value May 1, 2017 | Ending Account Value October 31, 2017 | Expenses Paid During Period-B May 1, 2017 to October 31, 2017 | |
| Class A | 1.05% | |||
| Actual | $1,000.00 | $1,021.40 | $5.35 | |
| Hypothetical-C | $1,000.00 | $1,019.91 | $5.35 | |
| Class M | 1.05% | |||
| Actual | $1,000.00 | $1,021.50 | $5.35 | |
| Hypothetical-C | $1,000.00 | $1,019.91 | $5.35 | |
| Class C | 1.80% | |||
| Actual | $1,000.00 | $1,017.60 | $9.15 | |
| Hypothetical-C | $1,000.00 | $1,016.13 | $9.15 | |
| Short Duration High Income | .80% | |||
| Actual | $1,000.00 | $1,022.70 | $4.08 | |
| Hypothetical-C | $1,000.00 | $1,021.17 | $4.08 | |
| Class I | .80% | |||
| Actual | $1,000.00 | $1,022.70 | $4.08 | |
| Hypothetical-C | $1,000.00 | $1,021.17 | $4.08 |
A Annualized expense ratio reflects expenses net of applicable fee waivers.
B Expenses are equal to each Class' annualized expense ratio, multiplied by the average account value over the period, multiplied by 184/365 (to reflect the one-half year period).
C 5% return per year before expenses
![]()
ASDH-SANN-1217
1.969458.103
Fidelity® Short Duration High Income Fund Semi-Annual Report October 31, 2017 |
|
Contents
Board Approval of Investment Advisory Contracts and Management Fees |
To view a fund's proxy voting guidelines and proxy voting record for the 12-month period ended June 30, visit http://www.fidelity.com/proxyvotingresults or visit the Securities and Exchange Commission's (SEC) web site at http://www.sec.gov.
You may also call 1-800-544-8544 to request a free copy of the proxy voting guidelines.
Standard & Poor's, S&P and S&P 500 are registered service marks of The McGraw-Hill Companies, Inc. and have been licensed for use by Fidelity Distributors Corporation.
Other third-party marks appearing herein are the property of their respective owners.
All other marks appearing herein are registered or unregistered trademarks or service marks of FMR LLC or an affiliated company. © 2017 FMR LLC. All rights reserved.
This report and the financial statements contained herein are submitted for the general information of the shareholders of the Fund. This report is not authorized for distribution to prospective investors in the Fund unless preceded or accompanied by an effective prospectus.
A fund files its complete schedule of portfolio holdings with the SEC for the first and third quarters of each fiscal year on Form N-Q. Forms N-Q are available on the SEC’s web site at http://www.sec.gov. A fund's Forms N-Q may be reviewed and copied at the SEC’s Public Reference Room in Washington, DC. Information regarding the operation of the SEC's Public Reference Room may be obtained by calling 1-800-SEC-0330.
For a complete list of a fund's portfolio holdings, view the most recent holdings listing, semiannual report, or annual report on Fidelity's web site at http://www.fidelity.com, http://www.institutional.fidelity.com, or http://www.401k.com, as applicable.
NOT FDIC INSURED •MAY LOSE VALUE •NO BANK GUARANTEE
Neither the Fund nor Fidelity Distributors Corporation is a bank.
Investment Summary (Unaudited)
Top Five Holdings as of October 31, 2017
| (by issuer, excluding cash equivalents) | % of fund's net assets | % of fund's net assets 6 months ago |
| DAE Funding LLC | 3.0 | 0.0 |
| Icahn Enterprises LP/Icahn Enterprises Finance Corp. | 3.0 | 1.6 |
| TransDigm, Inc. | 3.0 | 2.5 |
| FMG Resources (August 2006) Pty Ltd. | 2.6 | 0.0 |
| Sprint Communications, Inc. | 2.6 | 1.9 |
| 14.2 |
Top Five Market Sectors as of October 31, 2017
| % of fund's net assets | % of fund's net assets 6 months ago | |
| Energy | 16.3 | 14.9 |
| Healthcare | 9.0 | 9.1 |
| Telecommunications | 8.1 | 9.1 |
| Utilities | 6.9 | 6.0 |
| Metals/Mining | 6.2 | 3.5 |
Quality Diversification (% of fund's net assets)
| As of October 31, 2017 | ||
| AAA,AA,A | 0.8% | |
| BBB | 7.4% | |
| BB | 38.8% | |
| B | 40.0% | |
| CCC,CC,C | 7.1% | |
| Not Rated | 2.0% | |
| Equities | 0.1% | |
| Short-Term Investments and Net Other Assets | 3.8% | |
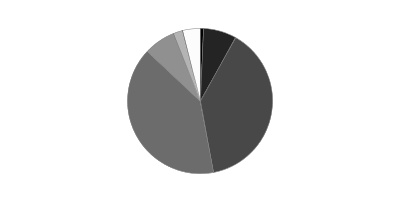
| As of April 30, 2017 | ||
| AAA,AA,A | 0.8% | |
| BBB | 8.5% | |
| BB | 33.1% | |
| B | 44.3% | |
| CCC,CC,C | 7.3% | |
| Not Rated | 1.1% | |
| Equities | 0.3% | |
| Short-Term Investments and Net Other Assets | 4.6% | |

We have used ratings from Moody's Investors Service, Inc. Where Moody's® ratings are not available, we have used S&P® ratings. All ratings are as of the date indicated and do not reflect subsequent changes.
Asset Allocation (% of fund's net assets)
| As of October 31, 2017* | ||
| Nonconvertible Bonds | 82.1% | |
| Common Stocks | 0.1% | |
| Bank Loan Obligations | 12.8% | |
| Other Investments | 1.2% | |
| Short-Term Investments and Net Other Assets (Liabilities) | 3.8% | |

* Foreign investments - 22.1%
| As of April 30, 2017* | ||
| Nonconvertible Bonds | 79.4% | |
| Convertible Bonds, Preferred Stocks | 0.1% | |
| Common Stocks | 0.2% | |
| Bank Loan Obligations | 14.4% | |
| Other Investments | 1.3% | |
| Short-Term Investments and Net Other Assets (Liabilities) | 4.6% | |

* Foreign investments - 27.2%
Percentages shown as 0.0% may reflect amounts less than 0.05%.
Investments October 31, 2017 (Unaudited)
Showing Percentage of Net Assets
| Nonconvertible Bonds - 82.1% | |||
| Principal Amount | Value | ||
| Aerospace - 5.1% | |||
| DAE Funding LLC: | |||
| 4% 8/1/20 (a) | $550,000 | $558,250 | |
| 4.5% 8/1/22 (a) | 3,265,000 | 3,309,877 | |
| TransDigm, Inc. 6% 7/15/22 | 2,510,000 | 2,604,125 | |
| TOTAL AEROSPACE | 6,472,252 | ||
| Air Transportation - 3.4% | |||
| Air Canada 7.75% 4/15/21 (a) | 840,000 | 959,700 | |
| Air Canada Trust Series 2015-1 equipment trust certificate Class C, 5% 3/15/20 (a) | 75,000 | 76,688 | |
| Allegiant Travel Co. 5.5% 7/15/19 | 785,000 | 810,513 | |
| American Airlines Group, Inc. 5.5% 10/1/19 (a) | 485,000 | 504,400 | |
| U.S. Airways Group, Inc. 6.125% 6/1/18 | 1,030,000 | 1,050,600 | |
| United Continental Holdings, Inc.: | |||
| 4.25% 10/1/22 | 345,000 | 346,725 | |
| 6% 12/1/20 | 45,000 | 48,825 | |
| 6.375% 6/1/18 | 500,000 | 511,250 | |
| TOTAL AIR TRANSPORTATION | 4,308,701 | ||
| Automotive - 0.2% | |||
| Ford Motor Credit Co. LLC 2.875% 10/1/18 | 200,000 | 201,722 | |
| Automotive & Auto Parts - 0.2% | |||
| American Tire Distributors, Inc. 10.25% 3/1/22 (a) | 80,000 | 83,500 | |
| General Motors Financial Co., Inc. 2.35% 10/4/19 | 100,000 | 100,363 | |
| TOTAL AUTOMOTIVE & AUTO PARTS | 183,863 | ||
| Banks & Thrifts - 1.9% | |||
| Bank of America Corp. 2.625% 4/19/21 | 250,000 | 251,177 | |
| Citigroup, Inc. 2.9% 12/8/21 | 200,000 | 202,212 | |
| Citizens Bank NA 2.25% 3/2/20 | 250,000 | 250,250 | |
| Credit Suisse Group Funding Guernsey Ltd. 3.45% 4/16/21 | 250,000 | 256,945 | |
| Deutsche Bank AG 2.7% 7/13/20 | 250,000 | 250,829 | |
| Goldman Sachs Group, Inc.: | |||
| 2.625% 4/25/21 | 100,000 | 100,432 | |
| 2.876% 10/31/22 (b) | 250,000 | 250,383 | |
| JPMorgan Chase & Co. 2.55% 3/1/21 | 200,000 | 201,239 | |
| SunTrust Banks, Inc. 2.7% 1/27/22 | 200,000 | 201,168 | |
| Synchrony Bank 3% 6/15/22 | 250,000 | 249,901 | |
| Synovus Financial Corp. 3.125% 11/1/22 | 17,000 | 16,993 | |
| UniCredit SpA 3.75% 4/12/22 (a) | 200,000 | 204,727 | |
| TOTAL BANKS & THRIFTS | 2,436,256 | ||
| Broadcasting - 0.6% | |||
| AMC Networks, Inc. 4.75% 12/15/22 | 496,000 | 509,020 | |
| Sirius XM Radio, Inc. 3.875% 8/1/22 (a) | 265,000 | 269,969 | |
| TOTAL BROADCASTING | 778,989 | ||
| Building Materials - 0.6% | |||
| Building Materials Corp. of America 5.125% 2/15/21 (a) | 120,000 | 123,750 | |
| CEMEX S.A.B. de CV 6.5% 12/10/19 (a) | 637,000 | 658,340 | |
| TOTAL BUILDING MATERIALS | 782,090 | ||
| Cable/Satellite TV - 2.7% | |||
| Altice U.S. Finance SA 5.375% 7/15/23 (a) | 500,000 | 521,250 | |
| CCO Holdings LLC/CCO Holdings Capital Corp.: | |||
| 4% 3/1/23 (a) | 305,000 | 309,386 | |
| 5.125% 2/15/23 | 1,800,000 | 1,858,500 | |
| 5.125% 5/1/23 (a) | 720,000 | 750,600 | |
| TOTAL CABLE/SATELLITE TV | 3,439,736 | ||
| Capital Goods - 0.2% | |||
| Roper Technologies, Inc. 2.8% 12/15/21 | 213,000 | 215,026 | |
| Chemicals - 2.0% | |||
| CF Industries Holdings, Inc.: | |||
| 3.4% 12/1/21 (a) | 60,000 | 60,926 | |
| 3.45% 6/1/23 | 805,000 | 794,938 | |
| Evolution Escrow Issuer LLC 7.5% 3/15/22 (a) | 430,000 | 450,963 | |
| Nufarm Australia Ltd. 6.375% 10/15/19 (a) | 510,000 | 518,925 | |
| Platform Specialty Products Corp. 6.5% 2/1/22 (a) | 500,000 | 518,125 | |
| TPC Group, Inc. 8.75% 12/15/20 (a) | 165,000 | 161,288 | |
| TOTAL CHEMICALS | 2,505,165 | ||
| Containers - 0.5% | |||
| Ardagh Packaging Finance PLC/Ardagh MP Holdings U.S.A., Inc.: | |||
| 4.25% 9/15/22 (a) | 200,000 | 206,000 | |
| 4.625% 5/15/23 (a) | 400,000 | 411,000 | |
| Reynolds Group Issuer, Inc./Reynolds Group Issuer LLC/Reynolds Group Issuer (Luxembourg) SA 3 month U.S. LIBOR + 3.500% 4.8592% 7/15/21 (a)(b)(c) | 50,000 | 51,000 | |
| TOTAL CONTAINERS | 668,000 | ||
| Diversified Financial Services - 4.5% | |||
| AerCap Ireland Capital Ltd./AerCap Global Aviation Trust 3.95% 2/1/22 | 300,000 | 312,778 | |
| Capital One Financial Corp. 2.5% 5/12/20 | 200,000 | 200,688 | |
| FLY Leasing Ltd. 6.75% 12/15/20 | 65,000 | 67,522 | |
| Hyundai Capital America 2.55% 2/6/19 (a) | 100,000 | 100,172 | |
| Icahn Enterprises LP/Icahn Enterprises Finance Corp.: | |||
| 5.875% 2/1/22 | 770,000 | 795,510 | |
| 6% 8/1/20 | 320,000 | 330,000 | |
| 6.25% 2/1/22 | 2,555,000 | 2,669,975 | |
| ILFC E-Capital Trust I 3 month U.S. LIBOR + 1.550% 4.36% 12/21/65 (a)(b)(c) | 605,000 | 583,825 | |
| ILFC E-Capital Trust II 3 month U.S. LIBOR + 1.800% 4.61% 12/21/65 (a)(b)(c) | 150,000 | 145,500 | |
| Moody's Corp. 5.5% 9/1/20 | 200,000 | 217,386 | |
| Morgan Stanley 2.5% 4/21/21 | 250,000 | 250,436 | |
| TOTAL DIVERSIFIED FINANCIAL SERVICES | 5,673,792 | ||
| Diversified Media - 2.1% | |||
| 21st Century Fox America, Inc. 4.5% 2/15/21 | 200,000 | 213,146 | |
| Nielsen Finance LLC/Nielsen Finance Co. 5% 4/15/22 (a) | 2,350,000 | 2,420,500 | |
| TOTAL DIVERSIFIED MEDIA | 2,633,646 | ||
| Energy - 15.8% | |||
| Anadarko Petroleum Corp. 4.85% 3/15/21 | 200,000 | 212,354 | |
| Antero Resources Corp.: | |||
| 5.125% 12/1/22 | 370,000 | 380,175 | |
| 5.625% 6/1/23 (Reg. S) | 235,000 | 246,163 | |
| Antero Resources Finance Corp. 5.375% 11/1/21 | 60,000 | 61,575 | |
| Calfrac Holdings LP 7.5% 12/1/20 (a) | 145,000 | 142,100 | |
| California Resources Corp. 8% 12/15/22 (a) | 505,000 | 333,300 | |
| Cenovus Energy, Inc. 3% 8/15/22 | 250,000 | 247,385 | |
| Chesapeake Energy Corp.: | |||
| 4.875% 4/15/22 | 850,000 | 786,250 | |
| 5.75% 3/15/23 | 160,000 | 146,000 | |
| 6.125% 2/15/21 | 43,000 | 43,430 | |
| 8% 12/15/22 (a) | 806,000 | 867,208 | |
| Consolidated Energy Finance SA 3 month U.S. LIBOR + 3.750% 5.07% 6/15/22 (a)(b)(c) | 220,000 | 219,498 | |
| Continental Resources, Inc. 4.5% 4/15/23 | 500,000 | 506,250 | |
| CVR Refining LLC/Coffeyville Finance, Inc. 6.5% 11/1/22 | 940,000 | 965,850 | |
| Denbury Resources, Inc. 9% 5/15/21 (a) | 490,000 | 478,975 | |
| Ensco PLC 8% 1/31/24 | 1,132,000 | 1,120,680 | |
| EP Energy LLC/Everest Acquisition Finance, Inc. 8% 11/29/24 (a) | 160,000 | 163,200 | |
| Exterran Partners LP/EXLP Finance Corp. 6% 4/1/21 | 740,000 | 736,300 | |
| Forum Energy Technologies, Inc. 6.25% 10/1/21 | 30,000 | 29,925 | |
| FTS International, Inc.: | |||
| 3 month U.S. LIBOR + 7.500% 8.82% 6/15/20 (a)(b)(c) | 60,000 | 61,275 | |
| 6.25% 5/1/22 | 265,000 | 257,050 | |
| Nabors Industries, Inc. 5.5% 1/15/23 | 428,000 | 408,205 | |
| NGPL PipeCo LLC 4.375% 8/15/22 (a) | 20,000 | 20,575 | |
| Noble Holding International Ltd.: | |||
| 4.625% 3/1/21 | 626,000 | 579,050 | |
| 7.75% 1/15/24 | 50,000 | 44,750 | |
| Parsley Energy LLC/Parsley 5.25% 8/15/25 (a) | 30,000 | 30,300 | |
| PBF Holding Co. LLC/PBF Finance Corp. 7% 11/15/23 | 495,000 | 514,800 | |
| PBF Logistics LP/PBF Logistics Finance, Inc. 6.875% 5/15/23 (a) | 150,000 | 155,250 | |
| Plains All American Pipeline LP/PAA Finance Corp.: | |||
| 2.6% 12/15/19 | 100,000 | 99,896 | |
| 3.65% 6/1/22 | 18,000 | 18,195 | |
| Precision Drilling Corp.: | |||
| 6.5% 12/15/21 | 500,000 | 505,000 | |
| 7.75% 12/15/23 | 235,000 | 240,875 | |
| Range Resources Corp.: | |||
| 5% 8/15/22 | 840,000 | 829,500 | |
| 5% 3/15/23 | 1,715,000 | 1,697,816 | |
| Southwestern Energy Co. 4.1% 3/15/22 | 185,000 | 181,763 | |
| Sunoco LP/Sunoco Finance Corp.: | |||
| 5.5% 8/1/20 | 1,060,000 | 1,089,150 | |
| 6.375% 4/1/23 | 135,000 | 143,438 | |
| Targa Resources Partners LP/Targa Resources Partners Finance Corp. 4.125% 11/15/19 | 207,000 | 209,070 | |
| TerraForm Power Operating LLC 6.375% 2/1/23 (a)(b) | 50,000 | 52,375 | |
| Tesoro Logistics LP/Tesoro Logistics Finance Corp.: | |||
| 5.5% 10/15/19 | 755,000 | 794,638 | |
| 5.875% 10/1/20 | 210,000 | 213,675 | |
| 6.125% 10/15/21 | 10,000 | 10,325 | |
| 6.25% 10/15/22 | 365,000 | 388,725 | |
| The Williams Companies, Inc. 3.7% 1/15/23 | 1,505,000 | 1,518,169 | |
| TransCanada PipeLines Ltd. 2.5% 8/1/22 | 9,000 | 9,004 | |
| Western Gas Partners LP 2.6% 8/15/18 | 200,000 | 200,830 | |
| Whiting Petroleum Corp.: | |||
| 5% 3/15/19 | 500,000 | 504,375 | |
| 5.75% 3/15/21 | 165,000 | 166,238 | |
| 6.25% 4/1/23 | 40,000 | 39,900 | |
| WPX Energy, Inc. 6% 1/15/22 | 1,220,000 | 1,270,325 | |
| TOTAL ENERGY | 19,941,155 | ||
| Entertainment/Film - 0.5% | |||
| AMC Entertainment, Inc. 5.875% 2/15/22 | 200,000 | 201,680 | |
| CBS Outdoor Americas Capital LLC/CBS Outdoor Americas Capital Corp. 5.625% 2/15/24 | 60,000 | 63,150 | |
| New Cotai LLC/New Cotai Capital Corp. 10.625% 5/1/19 pay-in-kind (a)(b) | 291,996 | 291,996 | |
| TOTAL ENTERTAINMENT/FILM | 556,826 | ||
| Environmental - 0.4% | |||
| LBC Tank Terminals Holding Netherlands BV 6.875% 5/15/23 (a) | 500,000 | 523,125 | |
| Food & Drug Retail - 0.1% | |||
| Tops Holding LLC/Tops Markets II Corp. 8% 6/15/22 (a) | 200,000 | 120,000 | |
| Food/Beverage/Tobacco - 1.6% | |||
| Anheuser-Busch InBev Finance, Inc. 2.65% 2/1/21 | 200,000 | 202,443 | |
| Bat Capital Corp. 2.764% 8/15/22 (a) | 250,000 | 250,192 | |
| C&S Group Enterprises LLC 5.375% 7/15/22 (a) | 565,000 | 548,050 | |
| Darling International, Inc. 5.375% 1/15/22 | 415,000 | 429,006 | |
| Imperial Tobacco Finance PLC 2.95% 7/21/20 (a) | 200,000 | 202,725 | |
| JBS Investments GmbH 7.75% 10/28/20 (a) | 345,000 | 352,073 | |
| TOTAL FOOD/BEVERAGE/TOBACCO | 1,984,489 | ||
| Gaming - 1.9% | |||
| GLP Capital LP/GLP Financing II, Inc. 4.375% 4/15/21 | 60,000 | 62,700 | |
| MGM Mirage, Inc. 6% 3/15/23 | 500,000 | 548,200 | |
| Scientific Games Corp.: | |||
| 6.625% 5/15/21 | 735,000 | 759,806 | |
| 7% 1/1/22 (a) | 5,000 | 5,288 | |
| 10% 12/1/22 | 500,000 | 553,090 | |
| Wynn Macau Ltd. 4.875% 10/1/24 (a) | 500,000 | 508,150 | |
| TOTAL GAMING | 2,437,234 | ||
| Healthcare - 8.9% | |||
| Abbott Laboratories 5.125% 4/1/19 | 200,000 | 208,795 | |
| AMAG Pharmaceuticals, Inc. 7.875% 9/1/23 (a) | 25,000 | 25,438 | |
| Becton, Dickinson & Co. 2.894% 6/6/22 | 200,000 | 200,393 | |
| Community Health Systems, Inc.: | |||
| 5.125% 8/1/21 | 320,000 | 311,200 | |
| 6.25% 3/31/23 | 1,155,000 | 1,111,688 | |
| 6.875% 2/1/22 | 1,065,000 | 770,794 | |
| Forest Laboratories, Inc. 5% 12/15/21 (a) | 200,000 | 217,076 | |
| HCA Holdings, Inc.: | |||
| 4.75% 5/1/23 | 300,000 | 313,875 | |
| 6.25% 2/15/21 | 800,000 | 861,000 | |
| HealthSouth Corp. 5.125% 3/15/23 | 255,000 | 260,100 | |
| Kindred Healthcare, Inc.: | |||
| 8% 1/15/20 | 900,000 | 909,000 | |
| 8.75% 1/15/23 | 70,000 | 68,250 | |
| Mylan N.V. 3.15% 6/15/21 | 200,000 | 202,247 | |
| Ortho-Clinical Diagnostics, Inc. 6.625% 5/15/22 (a) | 65,000 | 65,081 | |
| Sabra Health Care LP/Sabra Capital Corp. 5.375% 6/1/23 | 60,000 | 61,950 | |
| Shire Acquisitions Investments Ireland DAC 2.4% 9/23/21 | 200,000 | 198,627 | |
| Tenet Healthcare Corp.: | |||
| 4.375% 10/1/21 | 1,365,000 | 1,360,223 | |
| 4.75% 6/1/20 | 200,000 | 205,000 | |
| 8.125% 4/1/22 | 485,000 | 487,425 | |
| Teva Pharmaceutical Finance Netherlands III BV 2.2% 7/21/21 | 250,000 | 235,110 | |
| Valeant Pharmaceuticals International, Inc.: | |||
| 5.375% 3/15/20 (a) | 655,000 | 644,356 | |
| 5.625% 12/1/21 (a) | 1,500,000 | 1,366,875 | |
| 5.875% 5/15/23 (a) | 105,000 | 88,725 | |
| 6.5% 3/15/22 (a) | 835,000 | 885,100 | |
| VPI Escrow Corp. 6.375% 10/15/20 (a) | 138,000 | 137,138 | |
| TOTAL HEALTHCARE | 11,195,466 | ||
| Homebuilders/Real Estate - 2.9% | |||
| Brandywine Operating Partnership LP 4.95% 4/15/18 | 150,000 | 151,801 | |
| Brookfield Residential Properties, Inc. 6.5% 12/15/20 (a) | 300,000 | 306,375 | |
| DDR Corp. 4.625% 7/15/22 | 200,000 | 211,137 | |
| Healthcare Trust of America Holdings LP 2.95% 7/1/22 | 216,000 | 217,248 | |
| Lennar Corp. 4.125% 1/15/22 | 110,000 | 113,850 | |
| M/I Homes, Inc. 6.75% 1/15/21 | 140,000 | 145,600 | |
| Mack-Cali Realty LP 2.5% 12/15/17 | 150,000 | 150,031 | |
| Mattamy Group Corp. 6.875% 12/15/23 (a) | 150,000 | 157,500 | |
| Rialto Holdings LLC/Rialto Corp. 7% 12/1/18 (a) | 85,000 | 85,213 | |
| Taylor Morrison Communities, Inc./Monarch Communities, Inc. 5.25% 4/15/21 (a) | 75,000 | 76,593 | |
| Ventas Realty LP/Ventas Capital Corp. 4.75% 6/1/21 | 200,000 | 213,697 | |
| William Lyon Homes, Inc. 5.75% 4/15/19 | 1,835,000 | 1,857,938 | |
| TOTAL HOMEBUILDERS/REAL ESTATE | 3,686,983 | ||
| Insurance - 0.2% | |||
| American International Group, Inc. 3.3% 3/1/21 | 200,000 | 205,872 | |
| ING U.S., Inc. 2.9% 2/15/18 (b) | 59,000 | 59,164 | |
| TOTAL INSURANCE | 265,036 | ||
| Leisure - 1.1% | |||
| Hilton Grand Vacations Borrower LLC/Hilton Grand Vacations Borrower, Inc. 6.125% 12/1/24 (a) | 45,000 | 49,388 | |
| Studio City Co. Ltd.: | |||
| 5.875% 11/30/19 (a) | 200,000 | 209,750 | |
| 7.25% 11/30/21 (a) | 1,000,000 | 1,070,100 | |
| TOTAL LEISURE | 1,329,238 | ||
| Metals/Mining - 6.2% | |||
| First Quantum Minerals Ltd.: | |||
| 7.25% 5/15/22 (a) | 1,110,000 | 1,159,950 | |
| 7.25% 4/1/23 (a) | 835,000 | 883,013 | |
| FMG Resources (August 2006) Pty Ltd. 4.75% 5/15/22 (a) | 3,235,000 | 3,299,700 | |
| Freeport-McMoRan, Inc.: | |||
| 2.375% 3/15/18 | 200,000 | 200,000 | |
| 3.55% 3/1/22 | 2,340,000 | 2,316,600 | |
| TOTAL METALS/MINING | 7,859,263 | ||
| Restaurants - 1.0% | |||
| Yum! Brands, Inc. 3.875% 11/1/23 | 1,225,000 | 1,231,125 | |
| Services - 0.8% | |||
| Air Lease Corp. 2.125% 1/15/20 | 200,000 | 199,746 | |
| APX Group, Inc.: | |||
| 6.375% 12/1/19 | 625,000 | 635,938 | |
| 8.75% 12/1/20 | 190,000 | 194,750 | |
| Corrections Corp. of America 5% 10/15/22 | 25,000 | 26,094 | |
| TOTAL SERVICES | 1,056,528 | ||
| Super Retail - 0.2% | |||
| AutoZone, Inc. 2.5% 4/15/21 | 145,000 | 144,755 | |
| JC Penney Corp., Inc. 5.65% 6/1/20 | 109,000 | 95,648 | |
| TOTAL SUPER RETAIL | 240,403 | ||
| Technology - 2.9% | |||
| Ceridian HCM Holding, Inc. 11% 3/15/21 (a) | 20,000 | 21,125 | |
| Diamond 1 Finance Corp./Diamond 2 Finance Corp. 4.42% 6/15/21 (a) | 200,000 | 210,273 | |
| EMC Corp. 2.65% 6/1/20 | 640,000 | 632,341 | |
| Micron Technology, Inc.: | |||
| 5.25% 8/1/23 (a) | 700,000 | 732,620 | |
| 5.25% 1/15/24 (a) | 450,000 | 473,063 | |
| Nuance Communications, Inc. 5.375% 8/15/20 (a) | 321,000 | 325,334 | |
| NXP BV/NXP Funding LLC: | |||
| 3.875% 9/1/22 (a) | 700,000 | 727,125 | |
| 4.125% 6/1/21 (a) | 400,000 | 418,000 | |
| Sensata Technologies BV 4.875% 10/15/23 (a) | 155,000 | 162,750 | |
| TOTAL TECHNOLOGY | 3,702,631 | ||
| Telecommunications - 6.4% | |||
| Altice Financing SA: | |||
| 6.5% 1/15/22 (a) | 600,000 | 621,000 | |
| 6.625% 2/15/23 (a) | 500,000 | 527,050 | |
| AT&T, Inc. 2.8% 2/17/21 | 200,000 | 202,846 | |
| Equinix, Inc. 5.375% 4/1/23 | 500,000 | 516,250 | |
| Gogo Intermediate Holdings LLC/Gogo Finance Co., Inc. 12.5% 7/1/22 (a) | 505,000 | 572,544 | |
| Inmarsat Finance PLC 4.875% 5/15/22 (a) | 275,000 | 280,555 | |
| SFR Group SA 6% 5/15/22 (a) | 800,000 | 834,000 | |
| Sprint Communications, Inc.: | |||
| 6% 11/15/22 | 2,880,000 | 3,024,000 | |
| 9% 11/15/18 (a) | 115,000 | 122,044 | |
| T-Mobile U.S.A., Inc. 4% 4/15/22 | 225,000 | 232,734 | |
| Wind Acquisition Finance SA: | |||
| 4.75% 7/15/20 (a) | 680,000 | 688,092 | |
| 7.375% 4/23/21 (a) | 400,000 | 415,520 | |
| TOTAL TELECOMMUNICATIONS | 8,036,635 | ||
| Transportation Ex Air/Rail - 0.8% | |||
| Navios Maritime Acquisition Corp./Navios Acquisition Finance U.S., Inc. 8.125% 11/15/21 (a) | 875,000 | 770,000 | |
| Navios Maritime Holdings, Inc. 7.375% 1/15/22 (a) | 265,000 | 217,300 | |
| TOTAL TRANSPORTATION EX AIR/RAIL | 987,300 | ||
| Utilities - 6.4% | |||
| Calpine Corp. 6% 1/15/22 (a) | 1,800,000 | 1,858,500 | |
| DCP Midstream Operating LP 2.5% 12/1/17 | 100,000 | 100,000 | |
| Dolphin Subsidiary II, Inc. 7.25% 10/15/21 | 558,000 | 616,032 | |
| Dominion Resources, Inc. 4.104% 4/1/21 | 250,000 | 259,209 | |
| DPL, Inc. 6.75% 10/1/19 | 1,046,000 | 1,100,915 | |
| Dynegy, Inc. 5.875% 6/1/23 | 1,300,000 | 1,342,250 | |
| EQT Corp. 2.5% 10/1/20 | 9,000 | 8,994 | |
| Exelon Corp. 3.497% 6/1/22 (b) | 250,000 | 257,256 | |
| Global Partners LP/GLP Finance Corp. 6.25% 7/15/22 | 635,000 | 649,288 | |
| InterGen NV 7% 6/30/23 (a) | 170,000 | 164,900 | |
| NRG Energy, Inc. 6.625% 1/15/27 | 75,000 | 79,875 | |
| The AES Corp. 4.875% 5/15/23 | 1,315,000 | 1,344,588 | |
| Williams Partners LP 5.25% 3/15/20 | 200,000 | 213,826 | |
| TOTAL UTILITIES | 7,995,633 | ||
| TOTAL NONCONVERTIBLE BONDS | |||
| (Cost $102,200,573) | 103,448,308 | ||
| Shares | Value | ||
| Common Stocks - 0.1% | |||
| Energy - 0.1% | |||
| Forbes Energy Services Ltd. | 6,468 | 84,731 | |
| Southwestern Energy Co. (d) | 2,708 | 15,029 | |
| TOTAL COMMON STOCKS | |||
| (Cost $324,331) | 99,760 | ||
| Convertible Preferred Stocks - 0.0% | |||
| Energy - 0.0% | |||
| Southwestern Energy Co. Series B 6.25% | |||
| (Cost $111,697) | 6,300 | 80,128 | |
| Principal Amount | Value | ||
| Bank Loan Obligations - 12.8% | |||
| Aerospace - 0.9% | |||
| TransDigm, Inc.: | |||
| Tranche D, term loan 3 month U.S. LIBOR + 3.000% 4.3273% 6/4/21 (b)(c) | 288,379 | 290,092 | |
| Tranche F, term loan 3 month U.S. LIBOR + 3.000% 4.274% 6/9/23 (b)(c) | 500,111 | 502,052 | |
| Tranche G, term loan 3 month U.S. LIBOR + 3.000% 4.2623% 8/22/24 (b)(c) | 339,150 | 340,686 | |
| TOTAL AEROSPACE | 1,132,830 | ||
| Air Transportation - 0.8% | |||
| American Airlines, Inc.: | |||
| Tranche B, term loan 3 month U.S. LIBOR + 2.000% 3.2378% 10/10/21 (b)(c) | 346,212 | 346,741 | |
| Tranche B, term loan 3 month U.S. LIBOR + 2.500% 3.7389% 12/14/23 (b)(c) | 300,000 | 300,708 | |
| United Air Lines, Inc. Tranche B, term loan 3 month U.S. LIBOR + 2.250% 3.5611% 4/1/24 (b)(c) | 363,175 | 364,718 | |
| TOTAL AIR TRANSPORTATION | 1,012,167 | ||
| Broadcasting - 0.1% | |||
| ION Media Networks, Inc. Tranche B, term loan 3 month U.S. LIBOR + 3.000% 4.25% 12/18/20 (b)(c) | 175,000 | 176,094 | |
| Building Materials - 0.2% | |||
| HD Supply, Inc. Tranche B 4LN, term loan 3 month U.S. LIBOR + 2.500% 3.8328% 10/17/23 (b)(c) | 277,900 | 280,854 | |
| Cable/Satellite TV - 1.5% | |||
| Numericable LLC Tranche B 12LN, term loan 3 month U.S. LIBOR + 3.000% 4.3491% 1/1/26 (b)(c) | 305,000 | 305,070 | |
| Unitymedia Finance LLC Tranche B, term loan 3 month U.S. LIBOR + 2.250% 3.4889% 9/30/25 (b)(c) | 365,000 | 364,690 | |
| WideOpenWest Finance LLC Tranche B, term loan 3 month U.S. LIBOR + 3.250% 4.4867% 8/19/23 (b)(c) | 495,000 | 495,619 | |
| Zayo Group LLC term loan 3 month U.S. LIBOR + 2.000% 3.2389% 1/19/21 (b)(c) | 144,275 | 144,568 | |
| Ziggo Secured Finance Partnership Tranche E, term loan 3 month U.S. LIBOR + 2.500% 3.7389% 4/15/25 (b)(c) | 530,000 | 531,161 | |
| TOTAL CABLE/SATELLITE TV | 1,841,108 | ||
| Chemicals - 0.1% | |||
| Tronox Blocked Borrower LLC Tranche B, term loan 3 month U.S. LIBOR + 3.000% 4.3231% 9/22/24 (b)(c) | 21,163 | 21,330 | |
| Tronox Finance LLC Tranche B, term loan 3 month U.S. LIBOR + 3.000% 4.3283% 9/22/24 (b)(c) | 48,837 | 49,224 | |
| TOTAL CHEMICALS | 70,554 | ||
| Containers - 0.2% | |||
| Reynolds Group Holdings, Inc. Tranche B, term loan 3 month U.S. LIBOR + 2.750% 3.985% 2/5/23 (b)(c) | 306,906 | 308,631 | |
| Diversified Financial Services - 0.1% | |||
| Bcp Renaissance Parent LLC Tranche B, term loan 3 month U.S. LIBOR + 4.000% 5.3801% 10/31/24 (b)(c) | 45,000 | 45,492 | |
| IBC Capital U.S. LLC: | |||
| Tranche 2LN, term loan 3 month U.S. LIBOR + 7.000% 8.3172% 9/11/22 (b)(c) | 100,000 | 94,500 | |
| Tranche B 1LN, term loan 3 month U.S. LIBOR + 3.750% 5.0672% 9/11/21 (b)(c) | 24,375 | 24,375 | |
| TOTAL DIVERSIFIED FINANCIAL SERVICES | 164,367 | ||
| Energy - 0.4% | |||
| California Resources Corp. Tranche 1LN, term loan 3 month U.S. LIBOR + 10.375% 11.6117% 12/31/21 (b)(c) | 100,000 | 107,083 | |
| Chesapeake Energy Corp. Tranche 1LN, term loan 3 month U.S. LIBOR + 7.500% 8.8144% 8/23/21 (b)(c) | 200,000 | 214,334 | |
| Forbes Energy Services LLC Tranche B, term loan 12% 4/13/21 (b)(e) | 63,685 | 64,162 | |
| Gavilan Resources LLC Tranche 2LN, term loan 3 month U.S. LIBOR + 6.000% 7.2378% 3/1/24 (b)(c) | 100,000 | 96,750 | |
| TOTAL ENERGY | 482,329 | ||
| Entertainment/Film - 0.2% | |||
| AMC Entertainment, Inc. Tranche B, term loan 3 month U.S. LIBOR + 2.250% 3.4889% 12/15/22 (b)(c) | 279,288 | 279,223 | |
| Environmental - 0.1% | |||
| Hd Supply Waterworks Ltd. Tranche B, term loan 3 month U.S. LIBOR + 3.000% 4.455% 8/1/24 (b)(c) | 145,000 | 145,906 | |
| Food & Drug Retail - 0.4% | |||
| Albertson's LLC Tranche B, term loan 3 month U.S. LIBOR + 3.000% 4.3172% 6/22/23 (b)(c) | 217,905 | 210,915 | |
| JBS U.S.A. Lux SA Tranche B, term loan 3 month U.S. LIBOR + 2.500% 3.7389% 10/30/22 (b)(c) | 313,425 | 306,570 | |
| TOTAL FOOD & DRUG RETAIL | 517,485 | ||
| Food/Beverage/Tobacco - 0.1% | |||
| Chobani LLC Tranche B, term loan 3 month U.S. LIBOR + 3.500% 4.7378% 10/7/23 (b)(c) | 20,000 | 20,233 | |
| Post Holdings, Inc. Tranche B, term loan 3 month U.S. LIBOR + 2.250% 3.4923% 5/24/24 (b)(c) | 74,813 | 75,173 | |
| TOTAL FOOD/BEVERAGE/TOBACCO | 95,406 | ||
| Gaming - 0.8% | |||
| CityCenter Holdings LLC Tranche B, term loan 3 month U.S. LIBOR + 2.500% 3.7423% 4/18/24 (b)(c) | 284,288 | 285,462 | |
| Golden Entertainment, Inc. Tranche B, term loan: | |||
| 3 month U.S. LIBOR + 3.000% 4.24% 10/20/24 (b)(c) | 460,000 | 460,193 | |
| 3 month U.S. LIBOR + 7.000% 10/20/25 (c)(f) | 155,000 | 156,163 | |
| Scientific Games Corp. Tranche B, term loan 3 month U.S. LIBOR + 3.250% 4.5159% 8/14/24 (b)(c) | 130,000 | 131,444 | |
| TOTAL GAMING | 1,033,262 | ||
| Healthcare - 0.1% | |||
| Valeant Pharmaceuticals International, Inc. Tranche B, term loan 3 month U.S. LIBOR + 4.750% 5.99% 4/1/22 (b)(c) | 64,621 | 66,035 | |
| Insurance - 0.3% | |||
| USI, Inc. Tranche B, term loan: | |||
| 3 month U.S. LIBOR + 3.000% 5/16/24 (c)(f) | 305,000 | 304,619 | |
| 3 month U.S. LIBOR + 3.000% 4.3142% 5/16/24 (b)(c) | 50,000 | 50,104 | |
| TOTAL INSURANCE | 354,723 | ||
| Publishing/Printing - 0.2% | |||
| Springer Science+Business Media Deutschland GmbH: | |||
| Tranche B 13LN, term loan 3 month U.S. LIBOR + 3.500% 8/15/22 (c)(f) | 5,000 | 5,013 | |
| Tranche B 9LN, term loan 3 month U.S. LIBOR + 3.500% 4.7423% 8/14/20 (b)(c) | 190,426 | 191,100 | |
| TOTAL PUBLISHING/PRINTING | 196,113 | ||
| Restaurants - 0.3% | |||
| Burger King Worldwide, Inc. Tranche B, term loan 3 month U.S. LIBOR + 2.250% 3.5276% 2/17/24 (b)(c) | 392,224 | 392,616 | |
| Services - 0.8% | |||
| Almonde, Inc.: | |||
| Tranche 2LN, term loan 3 month U.S. LIBOR + 7.250% 8.5669% 6/13/25 (b)(c) | 20,000 | 19,806 | |
| Tranche B 1LN, term loan 3 month U.S. LIBOR + 3.500% 4.8169% 6/13/24 (b)(c) | 85,000 | 84,657 | |
| Brand Energy & Infrastructure Services, Inc. Tranche B, term loan 3 month U.S. LIBOR + 4.250% 5.6149% 6/21/24 (b)(c) | 493,763 | 496,779 | |
| Lineage Logistics Holdings, LLC. Tranche B, term loan 3 month U.S. LIBOR + 3.500% 4.7423% 4/7/21 (b)(c) | 364,220 | 365,243 | |
| TOTAL SERVICES | 966,485 | ||
| Super Retail - 0.7% | |||
| PetSmart, Inc. term loan 3 month U.S. LIBOR + 3.000% 4.24% 3/11/22 (b)(c) | 376,222 | 320,857 | |
| Red Ventures LLC: | |||
| Tranche 2LN, term loan 3 month U.S. LIBOR + 8.000% 10/18/25 (c)(f) | 155,000 | 154,613 | |
| Tranche B 1LN, term loan 3 month U.S. LIBOR + 4.000% 10/18/24 (c)(f) | 460,000 | 456,932 | |
| TOTAL SUPER RETAIL | 932,402 | ||
| Technology - 2.2% | |||
| Ceridian HCM Holding, Inc. Tranche B 2LN, term loan 3 month U.S. LIBOR + 3.500% 4.7389% 9/15/20 (b)(c) | 413,699 | 413,699 | |
| EIG Investors Corp. Tranche B, term loan 3 month U.S. LIBOR + 4.000% 5.3178% 2/9/23 (b)(c) | 354,279 | 357,971 | |
| Epicor Software Corp. Tranche B, term loan 3 month U.S. LIBOR + 3.750% 5% 6/1/22 (b)(c) | 141,131 | 141,866 | |
| Go Daddy Operating Co. LLC Tranche B, term loan 3 month U.S. LIBOR + 2.500% 3.7423% 2/15/24 (b)(c) | 433,445 | 435,613 | |
| Kronos, Inc. Tranche B 1LN, term loan 3 month U.S. LIBOR + 3.500% 4.8114% 11/1/23 (b)(c) | 392,042 | 394,661 | |
| Landesk Group, Inc. term loan: | |||
| 3 month U.S. LIBOR + 4.250% 5.5% 1/20/24 (b)(c) | 184,421 | 179,810 | |
| 3 month U.S. LIBOR + 9.000% 10.25% 1/20/25 (b)(c) | 105,000 | 101,654 | |
| Rackspace Hosting, Inc. Tranche B, term loan 3 month U.S. LIBOR + 3.000% 4.3106% 11/3/23 (b)(c) | 299,113 | 298,927 | |
| Uber Technologies, Inc. Tranche B, term loan 3 month U.S. LIBOR + 4.000% 5.2379% 7/13/23 (b)(c) | 445,500 | 448,284 | |
| TOTAL TECHNOLOGY | 2,772,485 | ||
| Telecommunications - 1.7% | |||
| Altice Financing SA Tranche B, term loan 3 month U.S. LIBOR + 2.750% 4.1092% 7/15/25 (b)(c) | 149,250 | 149,187 | |
| Level 3 Financing, Inc. Tranche B, term loan 3 month U.S. LIBOR + 2.250% 3.4889% 2/22/24 (b)(c) | 335,000 | 336,136 | |
| LTS Buyer LLC Tranche B 1LN, term loan 3 month U.S. LIBOR + 3.250% 6.5% 4/11/20 (b)(c) | 14,440 | 14,467 | |
| Radiate Holdco LLC Tranche B, term loan 3 month U.S. LIBOR + 3.000% 4.2423% 2/1/24 (b)(c) | 373,125 | 368,823 | |
| Sable International Finance Ltd. Tranche B, term loan 3 month U.S. LIBOR + 3.500% 4.7423% 1/31/25 (b)(c) | 45,000 | 45,162 | |
| Securus Technologies, Inc. Tranche B, term loan: | |||
| 3 month U.S. LIBOR + 4.500% 5.7421% 6/15/24 (b)(c) | 495,000 | 500,777 | |
| 3 month U.S. LIBOR + 8.250% 6/15/25 (c)(f) | 165,000 | 166,101 | |
| SFR Group SA Tranche B 11LN, term loan 3 month U.S. LIBOR + 2.750% 4.1301% 7/31/25 (b)(c) | 452,725 | 451,756 | |
| Sprint Communications, Inc. Tranche B, term loan 3 month U.S. LIBOR + 2.500% 3.75% 2/3/24 (b)(c) | 114,425 | 114,806 | |
| Telesat LLC Tranche B 4LN, term loan 3 month U.S. LIBOR + 3.000% 4.32% 11/17/23 (b)(c) | 9,925 | 9,978 | |
| TOTAL TELECOMMUNICATIONS | 2,157,193 | ||
| Transportation Ex Air/Rail - 0.1% | |||
| International Seaways Operating Corp. Tranche B, term loan 3 month U.S. LIBOR + 5.500% 6.74% 6/22/22 (b)(c) | 74,969 | 75,344 | |
| Utilities - 0.5% | |||
| Calpine Construction Finance Co. LP Tranche B 1LN, term loan 3 month U.S. LIBOR + 2.250% 3.49% 5/3/20 (b)(c) | 257,290 | 257,290 | |
| Calpine Corp. Tranche B, term loan 3 month U.S. LIBOR + 1.750% 3% 11/30/17 (b)(c) | 24,545 | 24,545 | |
| The AES Corp. Tranche B, term loan 3 month U.S. LIBOR + 2.000% 3.3172% 5/24/22 (b)(c) | 363,175 | 363,782 | |
| TOTAL UTILITIES | 645,617 | ||
| TOTAL BANK LOAN OBLIGATIONS | |||
| (Cost $16,071,038) | 16,099,229 | ||
| Bank Notes - 0.4% | |||
| Compass Bank 2.875% 6/29/22 | 250,000 | 248,194 | |
| Regions Bank 7.5% 5/15/18 | 250,000 | 257,299 | |
| TOTAL BANK NOTES | |||
| (Cost $506,076) | 505,493 | ||
| Preferred Securities - 0.8% | |||
| Banks & Thrifts - 0.8% | |||
| Citigroup, Inc.: | |||
| 5.95% (b)(g) | $100,000 | $112,160 | |
| 5.95% (b)(g) | 10,000 | 10,678 | |
| Royal Bank of Scotland Group PLC 7.5% (b)(g) | 800,000 | 862,475 | |
| TOTAL PREFERRED SECURITIES | |||
| (Cost $895,947) | 985,313 | ||
| Shares | Value | ||
| Money Market Funds - 6.3% | |||
| Fidelity Cash Central Fund, 1.10%(h) | |||
| (Cost $7,904,930) | 7,903,558 | 7,905,139 | |
| TOTAL INVESTMENT IN SECURITIES - 102.5% | |||
| (Cost $128,014,592) | 129,123,370 | ||
| NET OTHER ASSETS (LIABILITIES) - (2.5)% | (3,204,212) | ||
| NET ASSETS - 100% | $125,919,158 |
Legend
(a) Security exempt from registration under Rule 144A of the Securities Act of 1933. These securities may be resold in transactions exempt from registration, normally to qualified institutional buyers. At the end of the period, the value of these securities amounted to $40,153,482 or 31.9% of net assets.
(b) Coupon rates for floating and adjustable rate securities reflect the rates in effect at period end.
(c) Coupon is indexed to a floating interest rate which may be multiplied by a specified factor and/or subject to caps or floors.
(d) Non-income producing
(e) Level 3 security
(f) The coupon rate will be determined upon settlement of the loan after period end.
(g) Security is perpetual in nature with no stated maturity date.
(h) Affiliated fund that is generally available only to investment companies and other accounts managed by Fidelity Investments. The rate quoted is the annualized seven-day yield of the fund at period end. A complete unaudited listing of the fund's holdings as of its most recent quarter end is available upon request. In addition, each Fidelity Central Fund's financial statements are available on the SEC's website or upon request.
Affiliated Central Funds
Information regarding fiscal year to date income earned by the Fund from investments in Fidelity Central Funds is as follows:
| Fund | Income earned |
| Fidelity Cash Central Fund | $33,298 |
| Total | $33,298 |
Investment Valuation
The following is a summary of the inputs used, as of October 31, 2017, involving the Fund's assets and liabilities carried at fair value. The inputs or methodology used for valuing securities may not be an indication of the risk associated with investing in those securities. For more information on valuation inputs, and their aggregation into the levels used below, please refer to the Investment Valuation section in the accompanying Notes to Financial Statements.
| Valuation Inputs at Reporting Date: | ||||
| Description | Total | Level 1 | Level 2 | Level 3 |
| Investments in Securities: | ||||
| Equities: | ||||
| Energy | $179,888 | $99,760 | $80,128 | $-- |
| Corporate Bonds | 103,448,308 | -- | 103,448,308 | -- |
| Bank Loan Obligations | 16,099,229 | -- | 16,035,067 | 64,162 |
| Bank Notes | 505,493 | -- | 505,493 | -- |
| Preferred Securities | 985,313 | -- | 985,313 | -- |
| Money Market Funds | 7,905,139 | 7,905,139 | -- | -- |
| Total Investments in Securities: | $129,123,370 | $8,004,899 | $121,054,309 | $64,162 |
Other Information
Distribution of investments by country or territory of incorporation, as a percentage of Total Net Assets, is as follows (Unaudited):
| United States of America | 77.9% |
| Canada | 6.3% |
| Australia | 3.0% |
| Luxembourg | 2.2% |
| United Kingdom | 2.0% |
| Netherlands | 1.9% |
| France | 1.1% |
| British Virgin Islands | 1.1% |
| Others (Individually Less Than 1%) | 4.5% |
| 100.0% |
See accompanying notes which are an integral part of the financial statements.
Financial Statements
Statement of Assets and Liabilities
| October 31, 2017 (Unaudited) | ||
| Assets | ||
| Investment in securities, at value — See accompanying schedule: Unaffiliated issuers (cost $120,109,662) | $121,218,231 | |
| Fidelity Central Funds (cost $7,904,930) | 7,905,139 | |
| Total Investment in Securities (cost $128,014,592) | $129,123,370 | |
| Cash | 1,145 | |
| Receivable for investments sold | 904,497 | |
| Receivable for fund shares sold | 161,947 | |
| Interest receivable | 1,572,320 | |
| Distributions receivable from Fidelity Central Funds | 6,434 | |
| Prepaid expenses | 262 | |
| Receivable from investment adviser for expense reductions | 41,525 | |
| Other receivables | 4 | |
| Total assets | 131,811,504 | |
| Liabilities | ||
| Payable for investments purchased | $5,586,039 | |
| Payable for fund shares redeemed | 98,804 | |
| Distributions payable | 86,332 | |
| Accrued management fee | 57,516 | |
| Distribution and service plan fees payable | 7,636 | |
| Other affiliated payables | 15,434 | |
| Other payables and accrued expenses | 40,585 | |
| Total liabilities | 5,892,346 | |
| Net Assets | $125,919,158 | |
| Net Assets consist of: | ||
| Paid in capital | $128,370,848 | |
| Undistributed net investment income | 532,049 | |
| Accumulated undistributed net realized gain (loss) on investments | (4,092,517) | |
| Net unrealized appreciation (depreciation) on investments | 1,108,778 | |
| Net Assets | $125,919,158 | |
| Calculation of Maximum Offering Price | ||
| Class A: | ||
| Net Asset Value and redemption price per share ($11,843,617 ÷ 1,233,921 shares) | $9.60 | |
| Maximum offering price per share (100/96.00 of $9.60) | $10.00 | |
| Class M: | ||
| Net Asset Value and redemption price per share ($2,493,161 ÷ 259,796 shares) | $9.60 | |
| Maximum offering price per share (100/96.00 of $9.60) | $10.00 | |
| Class C: | ||
| Net Asset Value and offering price per share ($5,634,390 ÷ 586,967 shares)(a) | $9.60 | |
| Short Duration High Income: | ||
| Net Asset Value, offering price and redemption price per share ($93,391,837 ÷ 9,729,679 shares) | $9.60 | |
| Class I: | ||
| Net Asset Value, offering price and redemption price per share ($12,556,153 ÷ 1,308,144 shares) | $9.60 |
(a) Redemption price per share is equal to net asset value less any applicable contingent deferred sales charge.
See accompanying notes which are an integral part of the financial statements.
Statement of Operations
| Six months ended October 31, 2017 (Unaudited) | ||
| Investment Income | ||
| Dividends | $43,604 | |
| Interest | 2,788,339 | |
| Income from Fidelity Central Funds | 33,298 | |
| Total income | 2,865,241 | |
| Expenses | ||
| Management fee | $318,467 | |
| Transfer agent fees | 65,253 | |
| Distribution and service plan fees | 45,650 | |
| Accounting fees and expenses | 23,695 | |
| Custodian fees and expenses | 9,731 | |
| Independent trustees' fees and expenses | 216 | |
| Registration fees | 86,334 | |
| Audit | 35,969 | |
| Legal | 103 | |
| Miscellaneous | 465 | |
| Total expenses before reductions | 585,883 | |
| Expense reductions | (79,640) | 506,243 |
| Net investment income (loss) | 2,358,998 | |
| Realized and Unrealized Gain (Loss) | ||
| Net realized gain (loss) on: | ||
| Investment securities: | ||
| Unaffiliated issuers | 263,716 | |
| Total net realized gain (loss) | 263,716 | |
| Change in net unrealized appreciation (depreciation) on investment securities | (84,624) | |
| Net gain (loss) | 179,092 | |
| Net increase (decrease) in net assets resulting from operations | $2,538,090 |
See accompanying notes which are an integral part of the financial statements.
Statement of Changes in Net Assets
| Six months ended October 31, 2017 (Unaudited) | Year ended April 30, 2017 | |
| Increase (Decrease) in Net Assets | ||
| Operations | ||
| Net investment income (loss) | $2,358,998 | $3,742,238 |
| Net realized gain (loss) | 263,716 | 928,524 |
| Change in net unrealized appreciation (depreciation) | (84,624) | 2,281,335 |
| Net increase (decrease) in net assets resulting from operations | 2,538,090 | 6,952,097 |
| Distributions to shareholders from net investment income | (2,170,632) | (3,434,018) |
| Share transactions - net increase (decrease) | 29,382,697 | 29,153,621 |
| Redemption fees | 7,953 | 26,578 |
| Total increase (decrease) in net assets | 29,758,108 | 32,698,278 |
| Net Assets | ||
| Beginning of period | 96,161,050 | 63,462,772 |
| End of period | $125,919,158 | $96,161,050 |
| Other Information | ||
| Undistributed net investment income end of period | $532,049 | $343,683 |
See accompanying notes which are an integral part of the financial statements.
Financial Highlights
Fidelity Short Duration High Income Fund Class A
| Six months ended (Unaudited) October 31, | Years ended April 30, | ||||
| 2017 | 2017 | 2016 | 2015 | 2014 A | |
| Selected Per–Share Data | |||||
| Net asset value, beginning of period | $9.57 | $9.14 | $9.86 | $10.10 | $10.00 |
| Income from Investment Operations | |||||
| Net investment income (loss)B | .189 | .395 | .429 | .358 | .132 |
| Net realized and unrealized gain (loss) | .014 | .397 | (.737) | (.246) | .091 |
| Total from investment operations | .203 | .792 | (.308) | .112 | .223 |
| Distributions from net investment income | (.174) | (.365) | (.413) | (.358) | (.124) |
| Distributions from net realized gain | – | – | (.002) | – | – |
| Total distributions | (.174) | (.365) | (.415) | (.358) | (.124) |
| Redemption fees added to paid in capitalB | .001 | .003 | .003 | .006 | .001 |
| Net asset value, end of period | $9.60 | $9.57 | $9.14 | $9.86 | $10.10 |
| Total ReturnC,D,E | 2.14% | 8.84% | (3.06)% | 1.22% | 2.25% |
| Ratios to Average Net AssetsF,G | |||||
| Expenses before reductions | 1.22%H | 1.22% | 1.24% | 1.29% | 1.61%H |
| Expenses net of fee waivers, if any | 1.05%H | 1.05% | 1.05% | 1.05% | 1.05%H |
| Expenses net of all reductions | 1.05%H | 1.05% | 1.05% | 1.05% | 1.05%H |
| Net investment income (loss) | 3.92%H | 4.21% | 4.65% | 3.63% | 2.72%H |
| Supplemental Data | |||||
| Net assets, end of period (000 omitted) | $11,844 | $9,304 | $6,823 | $4,398 | $3,043 |
| Portfolio turnover rateI | 49%H | 105% | 56% | 84% | 20%J |
A For the period November 5, 2013 (commencement of operations) to April 30, 2014.
B Calculated based on average shares outstanding during the period.
C Total returns for periods of less than one year are not annualized.
D Total returns would have been lower if certain expenses had not been reduced during the applicable periods shown.
E Total returns do not include the effect of the sales charges.
F Fees and expenses of any underlying Fidelity Central Funds are not included in the Fund's expense ratio. The Fund indirectly bears its proportionate share of the expenses of any underlying Fidelity Central Funds.
G Expense ratios reflect operating expenses of the class. Expenses before reductions do not reflect amounts reimbursed by the investment adviser or reductions from expense offset arrangements and do not represent the amount paid by the class during periods when reimbursements or reductions occur. Expense ratios before reductions for start-up periods may not be representative of longer-term operating periods. Expenses net of fee waivers reflect expenses after reimbursement by the investment adviser but prior to reductions from expense offset arrangements. Expenses net of all reductions represent the net expenses paid by the class.
H Annualized
I Amount does not include the portfolio activity of any underlying Fidelity Central Funds.
J Amount not annualized.
See accompanying notes which are an integral part of the financial statements.
Fidelity Short Duration High Income Fund Class M
| Six months ended (Unaudited) October 31, | Years ended April 30, | ||||
| 2017 | 2017 | 2016 | 2015 | 2014 A | |
| Selected Per–Share Data | |||||
| Net asset value, beginning of period | $9.57 | $9.14 | $9.86 | $10.10 | $10.00 |
| Income from Investment Operations | |||||
| Net investment income (loss)B | .189 | .395 | .433 | .360 | .132 |
| Net realized and unrealized gain (loss) | .014 | .397 | (.741) | (.247) | .091 |
| Total from investment operations | .203 | .792 | (.308) | .113 | .223 |
| Distributions from net investment income | (.174) | (.365) | (.413) | (.359) | (.124) |
| Distributions from net realized gain | – | – | (.002) | – | – |
| Total distributions | (.174) | (.365) | (.415) | (.359) | (.124) |
| Redemption fees added to paid in capitalB | .001 | .003 | .003 | .006 | .001 |
| Net asset value, end of period | $9.60 | $9.57 | $9.14 | $9.86 | $10.10 |
| Total ReturnC,D,E | 2.15% | 8.84% | (3.06)% | 1.23% | 2.25% |
| Ratios to Average Net AssetsF,G | |||||
| Expenses before reductions | 1.21%H | 1.22% | 1.25% | 1.31% | 1.61%H |
| Expenses net of fee waivers, if any | 1.05%H | 1.05% | 1.05% | 1.05% | 1.05%H |
| Expenses net of all reductions | 1.05%H | 1.05% | 1.05% | 1.05% | 1.05%H |
| Net investment income (loss) | 3.92%H | 4.21% | 4.65% | 3.63% | 2.72%H |
| Supplemental Data | |||||
| Net assets, end of period (000 omitted) | $2,493 | $2,703 | $2,426 | $2,930 | $2,946 |
| Portfolio turnover rateI | 49%H | 105% | 56% | 84% | 20%J |
A For the period November 5, 2013 (commencement of operations) to April 30, 2014.
B Calculated based on average shares outstanding during the period.
C Total returns for periods of less than one year are not annualized.
D Total returns would have been lower if certain expenses had not been reduced during the applicable periods shown.
E Total returns do not include the effect of the sales charges.
F Fees and expenses of any underlying Fidelity Central Funds are not included in the Fund's expense ratio. The Fund indirectly bears its proportionate share of the expenses of any underlying Fidelity Central Funds.
G Expense ratios reflect operating expenses of the class. Expenses before reductions do not reflect amounts reimbursed by the investment adviser or reductions from expense offset arrangements and do not represent the amount paid by the class during periods when reimbursements or reductions occur. Expense ratios before reductions for start-up periods may not be representative of longer-term operating periods. Expenses net of fee waivers reflect expenses after reimbursement by the investment adviser but prior to reductions from expense offset arrangements. Expenses net of all reductions represent the net expenses paid by the class.
H Annualized
I Amount does not include the portfolio activity of any underlying Fidelity Central Funds.
J Amount not annualized.
See accompanying notes which are an integral part of the financial statements.
Fidelity Short Duration High Income Fund Class C
| Six months ended (Unaudited) October 31, | Years ended April 30, | ||||
| 2017 | 2017 | 2016 | 2015 | 2014 A | |
| Selected Per–Share Data | |||||
| Net asset value, beginning of period | $9.57 | $9.15 | $9.86 | $10.10 | $10.00 |
| Income from Investment Operations | |||||
| Net investment income (loss)B | .153 | .325 | .360 | .285 | .096 |
| Net realized and unrealized gain (loss) | .013 | .386 | (.728) | (.247) | .090 |
| Total from investment operations | .166 | .711 | (.368) | .038 | .186 |
| Distributions from net investment income | (.137) | (.294) | (.343) | (.284) | (.087) |
| Distributions from net realized gain | – | – | (.002) | – | – |
| Total distributions | (.137) | (.294) | (.345) | (.284) | (.087) |
| Redemption fees added to paid in capitalB | .001 | .003 | .003 | .006 | .001 |
| Net asset value, end of period | $9.60 | $9.57 | $9.15 | $9.86 | $10.10 |
| Total ReturnC,D,E | 1.76% | 7.92% | (3.68)% | .47% | 1.88% |
| Ratios to Average Net AssetsF,G | |||||
| Expenses before reductions | 1.98%H | 2.00% | 2.00% | 2.08% | 2.37%H |
| Expenses net of fee waivers, if any | 1.80%H | 1.80% | 1.80% | 1.80% | 1.80%H |
| Expenses net of all reductions | 1.80%H | 1.80% | 1.80% | 1.80% | 1.80%H |
| Net investment income (loss) | 3.17%H | 3.46% | 3.90% | 2.88% | 1.97%H |
| Supplemental Data | |||||
| Net assets, end of period (000 omitted) | $5,634 | $5,387 | $3,827 | $3,465 | $3,114 |
| Portfolio turnover rateI | 49%H | 105% | 56% | 84% | 20%J |
A For the period November 5, 2013 (commencement of operations) to April 30, 2014.
B Calculated based on average shares outstanding during the period.
C Total returns for periods of less than one year are not annualized.
D Total returns would have been lower if certain expenses had not been reduced during the applicable periods shown.
E Total returns do not include the effect of the contingent deferred sales charge.
F Fees and expenses of any underlying Fidelity Central Funds are not included in the Fund's expense ratio. The Fund indirectly bears its proportionate share of the expenses of any underlying Fidelity Central Funds.
G Expense ratios reflect operating expenses of the class. Expenses before reductions do not reflect amounts reimbursed by the investment adviser or reductions from expense offset arrangements and do not represent the amount paid by the class during periods when reimbursements or reductions occur. Expense ratios before reductions for start-up periods may not be representative of longer-term operating periods. Expenses net of fee waivers reflect expenses after reimbursement by the investment adviser but prior to reductions from expense offset arrangements. Expenses net of all reductions represent the net expenses paid by the class.
H Annualized
I Amount does not include the portfolio activity of any underlying Fidelity Central Funds.
J Amount not annualized.
See accompanying notes which are an integral part of the financial statements.
Fidelity Short Duration High Income Fund
| Six months ended (Unaudited) October 31, | Years ended April 30, | ||||
| 2017 | 2017 | 2016 | 2015 | 2014 A | |
| Selected Per–Share Data | |||||
| Net asset value, beginning of period | $9.57 | $9.15 | $9.86 | $10.10 | $10.00 |
| Income from Investment Operations | |||||
| Net investment income (loss)B | .201 | .420 | .455 | .385 | .142 |
| Net realized and unrealized gain (loss) | .014 | .385 | (.730) | (.248) | .093 |
| Total from investment operations | .215 | .805 | (.275) | .137 | .235 |
| Distributions from net investment income | (.186) | (.388) | (.436) | (.383) | (.136) |
| Distributions from net realized gain | – | – | (.002) | – | – |
| Total distributions | (.186) | (.388) | (.438) | (.383) | (.136) |
| Redemption fees added to paid in capitalB | .001 | .003 | .003 | .006 | .001 |
| Net asset value, end of period | $9.60 | $9.57 | $9.15 | $9.86 | $10.10 |
| Total ReturnC,D | 2.27% | 9.00% | (2.71)% | 1.48% | 2.37% |
| Ratios to Average Net AssetsE,F | |||||
| Expenses before reductions | .93%G | .93% | .96% | 1.00% | 1.24%G |
| Expenses net of fee waivers, if any | .80%G | .80% | .80% | .80% | .80%G |
| Expenses net of all reductions | .80%G | .80% | .80% | .80% | .80%G |
| Net investment income (loss) | 4.17%G | 4.46% | 4.90% | 3.88% | 2.96%G |
| Supplemental Data | |||||
| Net assets, end of period (000 omitted) | $93,392 | $68,646 | $47,531 | $45,109 | $54,547 |
| Portfolio turnover rateH | 49%G | 105% | 56% | 84% | 20%I |
A For the period November 5, 2013 (commencement of operations) to April 30, 2014.
B Calculated based on average shares outstanding during the period.
C Total returns for periods of less than one year are not annualized.
D Total returns would have been lower if certain expenses had not been reduced during the applicable periods shown.
E Fees and expenses of any underlying Fidelity Central Funds are not included in the Fund's expense ratio. The Fund indirectly bears its proportionate share of the expenses of any underlying Fidelity Central Funds.
F Expense ratios reflect operating expenses of the class. Expenses before reductions do not reflect amounts reimbursed by the investment adviser or reductions from expense offset arrangements and do not represent the amount paid by the class during periods when reimbursements or reductions occur. Expense ratios before reductions for start-up periods may not be representative of longer-term operating periods. Expenses net of fee waivers reflect expenses after reimbursement by the investment adviser but prior to reductions from expense offset arrangements. Expenses net of all reductions represent the net expenses paid by the class.
G Annualized
H Amount does not include the portfolio activity of any underlying Fidelity Central Funds.
I Amount not annualized.
See accompanying notes which are an integral part of the financial statements.
Fidelity Short Duration High Income Fund Class I
| Six months ended (Unaudited) October 31, | Years ended April 30, | ||||
| 2017 | 2017 | 2016 | 2015 | 2014 A | |
| Selected Per–Share Data | |||||
| Net asset value, beginning of period | $9.57 | $9.15 | $9.86 | $10.10 | $10.00 |
| Income from Investment Operations | |||||
| Net investment income (loss)B | .201 | .420 | .460 | .383 | .143 |
| Net realized and unrealized gain (loss) | .014 | .385 | (.735) | (.246) | .091 |
| Total from investment operations | .215 | .805 | (.275) | .137 | .234 |
| Distributions from net investment income | (.186) | (.388) | (.436) | (.383) | (.135) |
| Distributions from net realized gain | – | – | (.002) | – | – |
| Total distributions | (.186) | (.388) | (.438) | (.383) | (.135) |
| Redemption fees added to paid in capitalB | .001 | .003 | .003 | .006 | .001 |
| Net asset value, end of period | $9.60 | $9.57 | $9.15 | $9.86 | $10.10 |
| Total ReturnC,D | 2.27% | 8.99% | (2.71)% | 1.48% | 2.37% |
| Ratios to Average Net AssetsE,F | |||||
| Expenses before reductions | .96%G | .96% | .99% | 1.04% | 1.34%G |
| Expenses net of fee waivers, if any | .80%G | .80% | .80% | .80% | .80%G |
| Expenses net of all reductions | .80%G | .80% | .80% | .80% | .80%G |
| Net investment income (loss) | 4.17%G | 4.46% | 4.90% | 3.88% | 2.97%G |
| Supplemental Data | |||||
| Net assets, end of period (000 omitted) | $12,556 | $10,122 | $2,856 | $5,932 | $4,419 |
| Portfolio turnover rateH | 49%G | 105% | 56% | 84% | 20%I |
A For the period November 5, 2013 (commencement of operations) to April 30, 2014.
B Calculated based on average shares outstanding during the period.
C Total returns for periods of less than one year are not annualized.
D Total returns would have been lower if certain expenses had not been reduced during the applicable periods shown.
E Fees and expenses of any underlying Fidelity Central Funds are not included in the Fund's expense ratio. The Fund indirectly bears its proportionate share of the expenses of any underlying Fidelity Central Funds.
F Expense ratios reflect operating expenses of the class. Expenses before reductions do not reflect amounts reimbursed by the investment adviser or reductions from expense offset arrangements and do not represent the amount paid by the class during periods when reimbursements or reductions occur. Expense ratios before reductions for start-up periods may not be representative of longer-term operating periods. Expenses net of fee waivers reflect expenses after reimbursement by the investment adviser but prior to reductions from expense offset arrangements. Expenses net of all reductions represent the net expenses paid by the class.
G Annualized
H Amount does not include the portfolio activity of any underlying Fidelity Central Funds.
I Amount not annualized.
See accompanying notes which are an integral part of the financial statements.
Notes to Financial Statements (Unaudited)
For the period ended October 31, 2017
1. Organization.
Fidelity Short Duration High Income Fund (the Fund) is a fund of Fidelity Summer Street Trust (the Trust) and is authorized to issue an unlimited number of shares. The Trust is registered under the Investment Company Act of 1940, as amended (the 1940 Act), as an open-end management investment company organized as a Massachusetts business trust. The Fund offers Class A, Class M, Class C, Short Duration High Income and Class I shares, each of which has equal rights as to assets and voting privileges. Each class has exclusive voting rights with respect to matters that affect that class.
2. Investments in Fidelity Central Funds.
The Fund invests in Fidelity Central Funds, which are open-end investment companies generally available only to other investment companies and accounts managed by the investment adviser and its affiliates. The Fund's Schedule of Investments lists each of the Fidelity Central Funds held as of period end, if any, as an investment of the Fund, but does not include the underlying holdings of each Fidelity Central Fund. As an Investing Fund, the Fund indirectly bears its proportionate share of the expenses of the underlying Fidelity Central Funds.
The Money Market Central Funds seek preservation of capital and current income and are managed by Fidelity Investments Money Management, Inc. (FIMM), an affiliate of the investment adviser. Annualized expenses of the Money Market Central Funds as of their most recent shareholder report date are less than .005%.
A complete unaudited list of holdings for each Fidelity Central Fund is available upon request or at the Securities and Exchange Commission (the SEC) website at www.sec.gov. In addition, the financial statements of the Fidelity Central Funds are available on the SEC website or upon request.
3. Significant Accounting Policies.
The Fund is an investment company and applies the accounting and reporting guidance of the Financial Accounting Standards Board (FASB) Accounting Standards Codification Topic 946 Financial Services – Investments Companies. The financial statements have been prepared in conformity with accounting principles generally accepted in the United States of America (GAAP), which require management to make certain estimates and assumptions at the date of the financial statements. Actual results could differ from those estimates. Subsequent events, if any, through the date that the financial statements were issued have been evaluated in the preparation of the financial statements. The following summarizes the significant accounting policies of the Fund:
Investment Valuation. Investments are valued as of 4:00 p.m. Eastern time on the last calendar day of the period. The Board of Trustees (the Board) has delegated the day to day responsibility for the valuation of the Fund's investments to the Fair Value Committee (the Committee) established by the Fund's investment adviser. In accordance with valuation policies and procedures approved by the Board, the Fund attempts to obtain prices from one or more third party pricing vendors or brokers to value its investments. When current market prices, quotations or currency exchange rates are not readily available or reliable, investments will be fair valued in good faith by the Committee, in accordance with procedures adopted by the Board. Factors used in determining fair value vary by investment type and may include market or investment specific events, changes in interest rates and credit quality. The frequency with which these procedures are used cannot be predicted and they may be utilized to a significant extent. The Committee oversees the Fund's valuation policies and procedures and reports to the Board on the Committee's activities and fair value determinations. The Board monitors the appropriateness of the procedures used in valuing the Fund's investments and ratifies the fair value determinations of the Committee.
The Fund categorizes the inputs to valuation techniques used to value its investments into a disclosure hierarchy consisting of three levels as shown below:
- Level 1 – quoted prices in active markets for identical investments
- Level 2 – other significant observable inputs (including quoted prices for similar investments, interest rates, prepayment speeds, etc.)
- Level 3 – unobservable inputs (including the Fund's own assumptions based on the best information available)
Valuation techniques used to value the Fund's investments by major category are as follows:
Debt securities, including restricted securities, are valued based on evaluated prices received from third party pricing vendors or from brokers who make markets in such securities. Corporate bonds, bank notes, bank loan obligations and preferred securities are valued by pricing vendors who utilize matrix pricing which considers yield or price of bonds of comparable quality, coupon, maturity and type or by broker-supplied prices. When independent prices are unavailable or unreliable, debt securities may be valued utilizing pricing methodologies which consider similar factors that would be used by third party pricing vendors. Debt securities are generally categorized as Level 2 in the hierarchy but may be Level 3 depending on the circumstances. The Fund invests a significant portion of its assets in below investment grade securities. The value of these securities can be more volatile due to changes in the credit quality of the issuer and is sensitive to changes in economic, market and regulatory conditions.
Equity securities, including restricted securities, for which market quotations are readily available, are valued at the last reported sale price or official closing price as reported by a third party pricing vendor on the primary market or exchange on which they are traded and are categorized as Level 1 in the hierarchy. In the event there were no sales during the day or closing prices are not available, securities are valued at the last quoted bid price or may be valued using the last available price and are generally categorized as Level 2 in the hierarchy. Utilizing these techniques may result in transfers between Level 1 and Level 2. For equity securities, including restricted securities, where observable inputs are limited, assumptions about market activity and risk are used and these securities may be categorized as Level 3 in the hierarchy.
Investments in open-end mutual funds, including the Fidelity Central Funds, are valued at their closing net asset value (NAV) each business day and are categorized as Level 1 in the hierarchy.
Changes in valuation techniques may result in transfers in or out of an assigned level within the disclosure hierarchy. The aggregate value of investments by input level as of October 31, 2017 is included at the end of the Fund's Schedule of Investments.
Investment Transactions and Income. For financial reporting purposes, the Fund's investment holdings and NAV include trades executed through the end of the last business day of the period. The NAV per share for processing shareholder transactions is calculated as of the close of business of the New York Stock Exchange (NYSE), normally 4:00 p.m. Eastern time and includes trades executed through the end of the prior business day. Gains and losses on securities sold are determined on the basis of identified cost. Dividend income is recorded on the ex-dividend date, except for certain dividends from foreign securities where the ex-dividend date may have passed, which are recorded as soon as the Fund is informed of the ex-dividend date. Non-cash dividends included in dividend income, if any, are recorded at the fair market value of the securities received. Income and capital gain distributions from Fidelity Central Funds, if any, are recorded on the ex-dividend date. Interest income is accrued as earned and includes coupon interest and amortization of premium and accretion of discount on debt securities as applicable. Paid in Kind (PIK) income is recorded at the fair market value of the securities received. Debt obligations may be placed on non-accrual status and related interest income may be reduced by ceasing current accruals and writing off interest receivables when the collection of all or a portion of interest has become doubtful based on consistently applied procedures. A debt obligation is removed from non-accrual status when the issuer resumes interest payments or when collectability of interest is reasonably assured.
Class Allocations and Expenses. Investment income, realized and unrealized capital gains and losses, common expenses of the Fund, and certain fund-level expense reductions, if any, are allocated daily on a pro-rata basis to each class based on the relative net assets of each class to the total net assets of the Fund. Each class differs with respect to transfer agent and distribution and service plan fees incurred. Certain expense reductions may also differ by class. For the reporting period, the allocated portion of income and expenses to each class as a percent of its average net assets may vary due to the timing of recording these transactions in relation to fluctuating net assets of the classes. Expenses directly attributable to a fund are charged to that fund. Expenses attributable to more than one fund are allocated among the respective funds on the basis of relative net assets or other appropriate methods. Expense estimates are accrued in the period to which they relate and adjustments are made when actual amounts are known.
Income Tax Information and Distributions to Shareholders. Each year, the Fund intends to qualify as a regulated investment company under Subchapter M of the Internal Revenue Code, including distributing substantially all of its taxable income and realized gains. As a result, no provision for U.S. Federal income taxes is required. The Fund files a U.S. federal tax return, in addition to state and local tax returns as required. The Fund's federal income tax returns are subject to examination by the Internal Revenue Service (IRS) for a period of three fiscal years after they are filed. State and local tax returns may be subject to examination for an additional fiscal year depending on the jurisdiction.
Dividends are declared and recorded daily and paid monthly from net investment income. Distributions from realized gains, if any, are declared and recorded on the ex-dividend date. Income dividends and capital gain distributions are declared separately for each class. Income and capital gain distributions are determined in accordance with income tax regulations, which may differ from GAAP.
Capital accounts within the financial statements are adjusted for permanent book-tax differences. These adjustments have no impact on net assets or the results of operations. Capital accounts are not adjusted for temporary book-tax differences which will reverse in a subsequent period.
Book-tax differences are primarily due to market discount, capital loss carryforwards and losses deferred due to wash sales.
As of period end, the cost and unrealized appreciation (depreciation) in securities, and derivatives if applicable, for federal income tax purposes were as follows:
| Gross unrealized appreciation | $2,339,443 |
| Gross unrealized depreciation | (976,674) |
| Net unrealized appreciation (depreciation) | $1,362,769 |
| Tax cost | $127,760,601 |
Capital loss carryforwards are only available to offset future capital gains of the Fund to the extent provided by regulations and may be limited. Under the Regulated Investment Company Modernization Act of 2010 (the Act), the Fund is permitted to carry forward capital losses incurred in taxable years beginning after December 22, 2010 for an unlimited period and such capital losses are required to be used prior to any losses that expire. The capital loss carryforward information presented below, including any applicable limitation, is estimated as of prior fiscal period end and is subject to adjustment.
| No expiration | |
| Short-term | $(2,307,910) |
| Long-term | (2,039,116) |
| Total capital loss carryforward | $(4,347,026) |
Short-Term Trading (Redemption) Fees. Shares held by investors in the Fund less than 90 days may have been subject to a redemption fee equal to 1.00% of the NAV of shares redeemed. All redemption fees, which reduce the proceeds of the shareholder redemption, are retained by the Fund and accounted for as an addition to paid in capital. In November 2017, the Board of Trustees approved the elimination of these redemption fees effective December 18, 2017.
Restricted Securities. The Fund may invest in securities that are subject to legal or contractual restrictions on resale. These securities generally may be resold in transactions exempt from registration or to the public if the securities are registered. Disposal of these securities may involve time-consuming negotiations and expense, and prompt sale at an acceptable price may be difficult. Information regarding restricted securities is included at the end of the Fund's Schedule of Investments.
Loans and Other Direct Debt Instruments. The Fund invests in direct debt instruments which are interests in amounts owed to lenders by corporate or other borrowers. These instruments may be in the form of loans, trade claims or other receivables and may include standby financing commitments such as revolving credit facilities that obligate the Fund to supply additional cash to the borrower on demand. Loans may be acquired through assignment or participation. The Fund did not have any unfunded loan commitments, which are contractual obligations for future funding, at period end.
New Accounting Pronouncement. In March 2017, the Financial Accounting Standards Board (FASB) issued an Accounting Standards Update (ASU), ASU 2017-08, which amends the amortization period for certain callable debt securities that are held at a premium. The amendment requires the premium to be amortized to the earliest call date. The amendments do not require an accounting change for securities held at a discount. The ASU is effective for annual periods beginning after December 15, 2018. Management is currently evaluating the potential impact of these changes to the financial statements.
4. Purchases and Sales of Investments.
Purchases and sales of securities, other than short-term securities, aggregated $56,002,749 and $26,596,177, respectively.
5. Fees and Other Transactions with Affiliates.
Management Fee. Fidelity Management & Research Company (the investment adviser) and its affiliates provide the Fund with investment management related services for which the Fund pays a monthly management fee. The management fee is the sum of an individual fund fee rate that is based on an annual rate of .45% of the Fund's average net assets and an annualized group fee rate that averaged .11% during the period. The group fee rate is based upon the average net assets of all the mutual funds advised by the investment adviser, including any mutual funds previously advised by the investment adviser that are currently advised by Fidelity SelectCo, LLC, an affiliate of the investment adviser. The group fee rate decreases as assets under management increase and increases as assets under management decrease. For the reporting period, the total annualized management fee rate was .56% of the Fund's average net assets.
Distribution and Service Plan Fees. In accordance with Rule 12b-1 of the 1940 Act, the Fund has adopted separate Distribution and Service Plans for each class of shares. Certain classes pay Fidelity Distributors Corporation (FDC), an affiliate of the investment adviser, separate Distribution and Service Fees, each of which is based on an annual percentage of each class' average net assets. In addition, FDC may pay financial intermediaries for selling shares of the Fund and providing shareholder support services. For the period, the Distribution and Service Fee rates, total fees and amounts retained by FDC were as follows:
| Distribution Fee | Service Fee | Total Fees | Retained by FDC | |
| Class A | -% | .25% | $13,544 | $1,304 |
| Class M | -% | .25% | 3,198 | – |
| Class C | .75% | .25% | 28,908 | 8,982 |
| $45,650 | $10,286 |
Sales Load. FDC may receive a front-end sales charge of up to 4.00% for selling Class A shares and Class M shares, some of which is paid to financial intermediaries for selling shares of the Fund. Depending on the holding period, FDC may receive contingent deferred sales charges levied on Class A, Class M and Class C redemptions. The deferred sales charges are 1.00% for Class C shares, 1.00% for certain purchases of Class A shares and .25% for certain purchases of Class M shares.
For the period, sales charge amounts retained by FDC were as follows:
| Retained by FDC | |
| Class A | $2,115 |
| Class C(a) | 151 |
| $2,266 |
(a) When Class C shares are initially sold, FDC pays commissions from its own resources to financial intermediaries through which the sales are made.
Transfer Agent Fees. Fidelity Investments Institutional Operations Company, Inc., (FIIOC), an affiliate of the investment adviser, is the transfer, dividend disbursing and shareholder servicing agent for each class of the Fund. FIIOC receives account fees and asset-based fees that vary according to the account size and type of account of the shareholders of the respective classes of the Fund. FIIOC pays for typesetting, printing and mailing of shareholder reports, except proxy statements.
For the period, transfer agent fees for each class were as follows:
| Amount | % of Class-Level Average Net Assets(a) | |
| Class A | $8,099 | .15 |
| Class M | 1,826 | .14 |
| Class C | 4,918 | .17 |
| Short Duration High Income | 42,233 | .10 |
| Class I | 8,177 | .13 |
| $65,253 |
(a) Annualized
Accounting Fees. Fidelity Service Company, Inc. (FSC), an affiliate of the investment adviser, maintains the Fund's accounting records. The fee is based on the level of average net assets for each month.
Interfund Trades. The Fund may purchase from or sell securities to other Fidelity Funds under procedures adopted by the Board. The procedures have been designed to ensure these interfund trades are executed in accordance with Rule 17a-7 of the 1940 Act. Interfund trades are included within the respective purchases and sales amounts shown in the Purchases and Sales of Investments note.
6. Committed Line of Credit.
The Fund participates with other funds managed by the investment adviser or an affiliate in a $4.25 billion credit facility (the "line of credit") to be utilized for temporary or emergency purposes to fund shareholder redemptions or for other short-term liquidity purposes. The Fund has agreed to pay commitment fees on its pro-rata portion of the line of credit, which amounted to $167 and is reflected in Miscellaneous expenses on the Statement of Operations. During the period, the Fund did not borrow on this line of credit.
7. Expense Reductions.
The investment adviser contractually agreed to reimburse each class to the extent annual operating expenses exceeded certain levels of average net assets as noted in the table below. This reimbursement will remain in place through June 30, 2018. Some expenses, for example interest expense, including commitment fees, are excluded from this reimbursement.
The following classes were in reimbursement during the period:
| Expense Limitations | Reimbursement | |
| Class A | 1.05% | $9,224 |
| Class M | 1.05% | 2,041 |
| Class C | 1.80% | 5,260 |
| Short Duration High Income | .80% | 52,700 |
| Class I | .80% | 9,378 |
| $78,603 |
In addition, through arrangements with the Fund's custodian, credits realized as a result of certain uninvested cash balances were used to reduce the Fund's expenses. During the period, these credits reduced the Fund's custody expenses by $738.
In addition, during the period the investment adviser reimbursed and/or waived a portion of fund-level operating expenses in the amount of $299.
8. Distributions to Shareholders.
Distributions to shareholders of each class were as follows:
| Six months ended October 31, 2017 | Year ended April 30, 2017 | |
| From net investment income | ||
| Class A | $195,783 | $317,363 |
| Class M | 46,445 | 103,289 |
| Class C | 83,039 | 140,651 |
| Short Duration High Income | 1,611,332 | 2,611,325 |
| Class I | 234,033 | 261,390 |
| Total | $2,170,632 | $3,434,018 |
9. Share Transactions.
Share transactions for each class were as follows and may contain automatic conversions between classes or exchanges between affiliated funds:
| Shares | Shares | Dollars | Dollars | |
| Six months ended October 31, 2017 | Year ended April 30, 2017 | Six months ended October 31, 2017 | Year ended April 30, 2017 | |
| Class A | ||||
| Shares sold | 351,404 | 645,427 | $3,360,399 | $6,074,019 |
| Reinvestment of distributions | 19,585 | 29,495 | 187,662 | 277,499 |
| Shares redeemed | (109,321) | (448,823) | (1,046,993) | (4,232,209) |
| Net increase (decrease) | 261,668 | 226,099 | $2,501,068 | $2,119,309 |
| Class M | ||||
| Shares sold | 15,066 | 194,670 | $144,305 | $1,826,606 |
| Reinvestment of distributions | 4,683 | 10,007 | 44,871 | 94,026 |
| Shares redeemed | (42,404) | (187,509) | (406,415) | (1,761,626) |
| Net increase (decrease) | (22,655) | 17,168 | $(217,239) | $159,006 |
| Class C | ||||
| Shares sold | 112,148 | 388,650 | $1,073,253 | $3,652,222 |
| Reinvestment of distributions | 8,649 | 14,192 | 82,868 | 133,454 |
| Shares redeemed | (96,690) | (258,472) | (926,637) | (2,424,502) |
| Net increase (decrease) | 24,107 | 144,370 | $229,484 | $1,361,174 |
| Short Duration High Income | ||||
| Shares sold | 3,600,448 | 7,522,788 | $34,466,791 | $70,771,297 |
| Reinvestment of distributions | 134,678 | 236,168 | 1,290,386 | 2,225,048 |
| Shares redeemed | (1,178,339) | (5,783,381) | (11,271,676) | (54,506,631) |
| Net increase (decrease) | 2,556,787 | 1,975,575 | $24,485,501 | $18,489,714 |
| Class I | ||||
| Shares sold | 601,398 | 1,132,152 | $5,745,496 | $10,676,049 |
| Reinvestment of distributions | 19,246 | 17,955 | 184,406 | 169,457 |
| Shares redeemed | (370,139) | (404,716) | (3,546,019) | (3,821,088) |
| Net increase (decrease) | 250,505 | 745,391 | $2,383,883 | $7,024,418 |
10. Other.
The Fund's organizational documents provide former and current trustees and officers with a limited indemnification against liabilities arising in connection with the performance of their duties to the Fund. In the normal course of business, the Fund may also enter into contracts that provide general indemnifications. The Fund's maximum exposure under these arrangements is unknown as this would be dependent on future claims that may be made against the Fund. The risk of material loss from such claims is considered remote.
Shareholder Expense Example
As a shareholder of the Fund, you incur two types of costs: (1) transaction costs, including sales charges (loads) on purchase payments or redemption proceeds, redemption fees and (2) ongoing costs, including management fees, distribution and/or service (12b-1) fees and other Fund expenses. This Example is intended to help you understand your ongoing costs (in dollars) of investing in the Fund and to compare these costs with the ongoing costs of investing in other mutual funds.
The Example is based on an investment of $1,000 invested at the beginning of the period and held for the entire period (May 1, 2017 to October 31, 2017).
Actual Expenses
The first line of the accompanying table for each class of the Fund provides information about actual account values and actual expenses. You may use the information in this line, together with the amount you invested, to estimate the expenses that you paid over the period. Simply divide your account value by $1,000.00 (for example, an $8,600 account value divided by $1,000.00 = 8.6), then multiply the result by the number in the first line for a class of the Fund under the heading entitled "Expenses Paid During Period" to estimate the expenses you paid on your account during this period. A small balance maintenance fee of $12.00 that is charged once a year may apply for certain accounts with a value of less than $2,000. This fee is not included in the table below. If it was, the estimate of expenses you paid during the period would be higher, and your ending account value lower, by this amount. In addition, the Fund, as a shareholder in the underlying Fidelity Central Funds, will indirectly bear its pro-rata share of the fees and expenses incurred by the underlying Fidelity Central Funds. These fees and expenses are not included in the Fund's annualized expense ratio used to calculate the expense estimate in the table below.
Hypothetical Example for Comparison Purposes
The second line of the accompanying table for each class of the Fund provides information about hypothetical account values and hypothetical expenses based on a Class' actual expense ratio and an assumed rate of return of 5% per year before expenses, which is not the Class' actual return. The hypothetical account values and expenses may not be used to estimate the actual ending account balance or expenses you paid for the period. You may use this information to compare the ongoing costs of investing in the Fund and other funds. To do so, compare this 5% hypothetical example with the 5% hypothetical examples that appear in the shareholder reports of the other funds. A small balance maintenance fee of $12.00 that is charged once a year may apply for certain accounts with a value of less than $2,000. This fee is not included in the table below. If it was, the estimate of expenses you paid during the period would be higher, and your ending account value lower, by this amount. In addition, the Fund, as a shareholder in the underlying Fidelity Central Funds, will indirectly bear its pro-rata share of the fees and expenses incurred by the underlying Fidelity Central Funds. These fees and expenses are not included in the Fund's annualized expense ratio used to calculate the expense estimate in the table below.
Please note that the expenses shown in the table are meant to highlight your ongoing costs only and do not reflect any transaction costs. Therefore, the second line of the table is useful in comparing ongoing costs only, and will not help you determine the relative total costs of owning different funds. In addition, if these transactional costs were included, your costs would have been higher.
| Annualized Expense Ratio-A | Beginning Account Value May 1, 2017 | Ending Account Value October 31, 2017 | Expenses Paid During Period-B May 1, 2017 to October 31, 2017 | |
| Class A | 1.05% | |||
| Actual | $1,000.00 | $1,021.40 | $5.35 | |
| Hypothetical-C | $1,000.00 | $1,019.91 | $5.35 | |
| Class M | 1.05% | |||
| Actual | $1,000.00 | $1,021.50 | $5.35 | |
| Hypothetical-C | $1,000.00 | $1,019.91 | $5.35 | |
| Class C | 1.80% | |||
| Actual | $1,000.00 | $1,017.60 | $9.15 | |
| Hypothetical-C | $1,000.00 | $1,016.13 | $9.15 | |
| Short Duration High Income | .80% | |||
| Actual | $1,000.00 | $1,022.70 | $4.08 | |
| Hypothetical-C | $1,000.00 | $1,021.17 | $4.08 | |
| Class I | .80% | |||
| Actual | $1,000.00 | $1,022.70 | $4.08 | |
| Hypothetical-C | $1,000.00 | $1,021.17 | $4.08 |
A Annualized expense ratio reflects expenses net of applicable fee waivers.
B Expenses are equal to each Class' annualized expense ratio, multiplied by the average account value over the period, multiplied by 184/365 (to reflect the one-half year period).
C 5% return per year before expenses
Board Approval of Investment Advisory Contracts and Management Fees
Fidelity Short Duration High Income Fund
Each year, the Board of Trustees, including the Independent Trustees (together, the Board), votes on the renewal of the management contract with Fidelity Management & Research Company (FMR) and the sub-advisory agreements (together, the Advisory Contracts) for the fund. FMR and the sub-advisers are referred to herein as the Investment Advisers. The Board, assisted by the advice of fund counsel and Independent Trustees' counsel, requests and considers a broad range of information relevant to the renewal of the Advisory Contracts throughout the year.
The Board meets regularly and, at each of its meetings, covers an extensive agenda of topics and materials and considers factors that are relevant to its annual consideration of the renewal of the fund's Advisory Contracts, including the services and support provided to the fund and its shareholders. The Board has established various standing committees (Committees), each composed of and chaired by Independent Trustees with varying backgrounds, to which the Board has assigned specific subject matter responsibilities in order to enhance effective decision-making by the Board. The Board, acting directly and through its Committees, requests and receives information concerning the annual consideration of the renewal of the fund's Advisory Contracts. The Board also meets as needed to review matters specifically related to the Board's annual consideration of the renewal of the Advisory Contracts. Members of the Board may also meet with trustees of other Fidelity funds through ad hoc joint committees to discuss certain matters relevant to all of the Fidelity funds.
At its July 2017 meeting, the Board unanimously determined to renew the fund's Advisory Contracts. In reaching its determination, the Board considered all factors it believed relevant, including (i) the nature, extent, and quality of the services to be provided to the fund and its shareholders (including the investment performance of the fund); (ii) the competitiveness of the fund's management fee and total expense ratio relative to peer funds; (iii) the total costs of the services to be provided by and the profits to be realized by Fidelity from its relationships with the fund; and (iv) the extent to which, if any, economies of scale exist and would be realized as the fund grows, and whether any economies of scale are appropriately shared with fund shareholders.
In considering whether to renew the Advisory Contracts for the fund, the Board reached a determination, with the assistance of fund counsel and Independent Trustees' counsel and through the exercise of its business judgment, that the renewal of the Advisory Contracts was in the best interests of the fund and its shareholders and that the compensation payable under the Advisory Contracts was fair and reasonable. The Board's decision to renew the Advisory Contracts was not based on any single factor, but rather was based on a comprehensive consideration of all the information provided to the Board at its meetings throughout the year. The Board, in reaching its determination to renew the Advisory Contracts, was aware that shareholders of the fund have a broad range of investment choices available to them, including a wide choice among funds offered by Fidelity's competitors, and that the fund's shareholders, who have the opportunity to review and weigh the disclosure provided by the fund in its prospectus and other public disclosures, have chosen to invest in this fund, which is part of the Fidelity family of funds.
Amendment to Group Fee Rate. The Board also approved an amendment to the management contract for the fund to add an additional breakpoint to the group fee schedule, effective October 1, 2017. The Board noted that the additional breakpoint would result in lower management fee rates as Fidelity's assets under management increase.
Nature, Extent, and Quality of Services Provided. The Board considered Fidelity's staffing as it relates to the fund, including the backgrounds of investment personnel of Fidelity, and also considered the fund's investment objective, strategies, and related investment philosophy. The Independent Trustees also had discussions with senior management of Fidelity's investment operations and investment groups. The Board considered the structure of the investment personnel compensation program and whether this structure provides appropriate incentives to act in the best interests of the fund. Additionally, the Board considered the portfolio managers' investments, if any, in the funds that they manage.Resources Dedicated to Investment Management and Support Services. The Board and the Fund Oversight and Research Committees reviewed the general qualifications and capabilities of Fidelity's investment staff, including its size, education, experience, and resources, as well as Fidelity's approach to recruiting, training, managing, and compensating investment personnel. The Board noted that Fidelity has continued to increase the resources devoted to non-U.S. offices, including expansion of Fidelity's global investment organization. The Board also noted that Fidelity's analysts have extensive resources, tools and capabilities that allow them to conduct sophisticated quantitative and fundamental analysis, as well as credit analysis of issuers, counterparties and guarantors. Further, the Board considered that Fidelity's investment professionals have sufficient access to global information and data so as to provide competitive investment results over time, and that those professionals also have access to sophisticated tools that permit them to assess portfolio construction and risk and performance attribution characteristics continuously, as well as to transmit new information and research conclusions rapidly around the world. Additionally, in its deliberations, the Board considered Fidelity's trading, risk management, compliance, and technology and operations capabilities and resources, which are integral parts of the investment management process.Shareholder and Administrative Services. The Board considered (i) the nature, extent, quality, and cost of advisory, administrative, and shareholder services performed by the Investment Advisers and their affiliates under the Advisory Contracts and under separate agreements covering transfer agency, pricing and bookkeeping, and securities lending services for the fund; (ii) the nature and extent of the supervision of third party service providers, principally custodians, subcustodians, and pricing vendors; and (iii) the resources devoted to, and the record of compliance with, the fund's compliance policies and procedures. The Board also reviewed the allocation of fund brokerage, including allocations to brokers affiliated with the Investment Advisers, the use of brokerage commissions to pay fund expenses, and the use of "soft" commission dollars to pay for research services.The Board noted that the growth of fund assets over time across the complex allows Fidelity to reinvest in the development of services designed to enhance the value or convenience of the Fidelity funds as investment vehicles. These services include 24-hour access to account information and market information through telephone representatives and over the Internet, investor education materials and asset allocation tools, and the expanded availability of Fidelity Investor Centers.In 2014, the Board formed an ad hoc Committee on Transfer Agency Fees to review the variety of transfer agency fee structures throughout the industry and Fidelity's competitive positioning with respect to industry participants.Investment in a Large Fund Family. The Board considered the benefits to shareholders of investing in a Fidelity fund, including the benefits of investing in a fund that is part of a large family of funds offering a variety of investment disciplines and providing a large variety of mutual fund investor services. The Board noted that Fidelity had taken, or had made recommendations that resulted in the Fidelity funds taking, a number of actions over the previous year that benefited particular funds, including: (i) continuing to dedicate additional resources to Fidelity's investment research process, and to the support of the senior management team that oversees asset management; (ii) continuing efforts to enhance Fidelity's global research capabilities; (iii) launching new funds and making other enhancements to meet client needs; (iv) launching new share classes of existing funds; (v) eliminating purchase minimums and broadening eligibility requirements for certain lower-priced share classes; (vi) reducing management fees and total expenses for certain growth equity funds and index funds; (vii) lowering expense caps for certain existing funds and classes to reduce expenses borne by shareholders; (viii) eliminating short-term redemption fees for certain funds; (ix) introducing a new pricing structure for certain funds of funds that is expected to reduce overall expenses paid by shareholders; (x) rationalizing product lines and gaining increased efficiencies through proposals for fund mergers and share class consolidations; (xi) continuing to develop, acquire and implement systems and technology to improve services to the funds and shareholders, strengthen information security, and increase efficiency; and (xii) implementing enhancements to further strengthen Fidelity's product line to increase investors' probability of success in achieving their investment goals, including retirement income goals.Investment Performance. The Board considered whether the fund has operated in accordance with its investment objective, as well as its record of compliance with its investment restrictions and its performance history.The Board took into account discussions with representatives of the Investment Advisers about fund investment performance that occur at Board meetings throughout the year. In this regard the Board noted that as part of regularly scheduled fund reviews and other reports to the Board on fund performance, the Board considers annualized return information for the fund for different time periods, measured against a securities market index ("benchmark index") and a peer group of funds with similar objectives ("peer group"), if any. In its evaluation of fund investment performance, the Board gave particular attention to information indicating changes in performance of certain Fidelity funds for specific time periods and discussed with the Investment Advisers the reasons for any overperformance or underperformance.In addition to reviewing absolute and relative fund performance, the Independent Trustees periodically consider the appropriateness of fund performance metrics in evaluating the results achieved. In general, the Independent Trustees believe that fund performance should be evaluated based on net performance (after fees and expenses) of both the highest performing and lowest performing fund share classes, where applicable, compared to appropriate benchmark indices, over appropriate time periods that may include full market cycles, and compared to peer groups, as applicable, over the same periods, taking into account relevant factors including the following: general market conditions; issuer-specific information; and fund cash flows and other factors.The Independent Trustees recognize that shareholders evaluate performance on a net basis over their own holding periods, for which one-, three-, and five-year periods are often used as a proxy. For this reason, the performance information reviewed by the Board also included net cumulative calendar year total return information for the fund and an appropriate benchmark index for the most recent one- and three-year periods, as shown below. A peer group is not shown below because the fund does not generally utilize a peer group for performance comparison purposes.Fidelity Short Duration High Income Fund
Fidelity Short Duration High Income Fund
![]()
Corporate Headquarters
245 Summer St.
Boston, MA 02210
www.fidelity.com
SDH-SANN-1217
1.969437.103
Item 2.
Code of Ethics
Not applicable.
Item 3.
Audit Committee Financial Expert
Not applicable.
Item 4.
Principal Accountant Fees and Services
Not applicable.
Item 5.
Audit Committee of Listed Registrants
Not applicable.
Item 6.
Investments
(a)
Not applicable.
(b)
Not applicable
Item 7.
Disclosure of Proxy Voting Policies and Procedures for Closed-End Management Investment Companies
Not applicable.
Item 8.
Portfolio Managers of Closed-End Management Investment Companies
Not applicable.
Item 9.
Purchase of Equity Securities by Closed-End Management Investment Company and Affiliated Purchasers
Not applicable.
Item 10.
Submission of Matters to a Vote of Security Holders
There were no material changes to the procedures by which shareholders may recommend nominees to the Fidelity Summer Street Trust’s Board of Trustees.
Item 11.
Controls and Procedures
(a)(i) The President and Treasurer and the Chief Financial Officer have concluded that the Fidelity Summer Street Trust’s (the “Trust”) disclosure controls and procedures (as defined in Rule 30a-3(c) under the Investment Company Act) provide reasonable
assurances that material information relating to the Trust is made known to them by the appropriate persons, based on their evaluation of these controls and procedures as of a date within 90 days of the filing date of this report.
(a)(ii) There was no change in the Trust’s internal control over financial reporting (as defined in Rule 30a-3(d) under the Investment Company Act) that occurred during the second fiscal quarter of the period covered by this report that has materially affected, or is reasonably likely to materially affect, the Trust’s internal control over financial reporting.
Item 12.
Exhibits
(a) | (1) | Not applicable. |
(a) | (2) | Certification pursuant to Rule 30a-2(a) under the Investment Company Act of 1940 (17 CFR 270.30a-2(a)) is filed and attached hereto as Exhibit 99.CERT. |
(a) | (3) | Not applicable. |
(b) | Certification pursuant to Rule 30a-2(b) under the Investment Company Act of 1940 (17 CFR 270.30a-2(b)) is furnished and attached hereto as Exhibit 99.906CERT. |
SIGNATURES
Pursuant to the requirements of the Securities Exchange Act of 1934 and the Investment Company Act of 1940, the registrant has duly caused this report to be signed on its behalf by the undersigned, thereunto duly authorized.
Fidelity Summer Street Trust
By: | /s/Stacie M. Smith |
Stacie M. Smith | |
President and Treasurer | |
Date: | December 26, 2017 |
Pursuant to the requirements of the Securities Exchange Act of 1934 and the Investment Company Act of 1940, this report has been signed below by the following persons on behalf of the registrant and in the capacities and on the dates indicated.
By: | /s/Stacie M. Smith |
Stacie M. Smith | |
President and Treasurer | |
Date: | December 26, 2017 |
By: | /s/Howard J. Galligan III |
Howard J. Galligan III | |
Chief Financial Officer | |
Date: | December 26, 2017 |