UNITED STATES
SECURITIES AND EXCHANGE COMMISSION
Washington, D.C. 20549
FORM N-CSR
CERTIFIED SHAREHOLDER REPORT OF REGISTERED
MANAGEMENT INVESTMENT COMPANIES
Investment Company Act file number 811-2737
Fidelity Summer Street Trust
(Exact name of registrant as specified in charter)
245 Summer St., Boston, MA 02210
(Address of principal executive offices) (Zip code)
William C. Coffey, Secretary
245 Summer St.
Boston, Massachusetts 02210
(Name and address of agent for service)
Registrant's telephone number, including area code:
617-563-7000
Date of fiscal year end: | September 30 |
Date of reporting period: | March 31, 2019 |
Item 1.
Reports to Stockholders
Fidelity® Series Floating Rate High Income Fund Semi-Annual Report March 31, 2019 |
 |
Beginning on January 1, 2021, as permitted by regulations adopted by the Securities and Exchange Commission, paper copies of a fund’s shareholder reports will no longer be sent by mail, unless you specifically request paper copies of the reports from the fund or from your financial intermediary, such as a financial advisor, broker-dealer or bank. Instead, the reports will be made available on a website, and you will be notified by mail each time a report is posted and provided with a website link to access the report.
If you already elected to receive shareholder reports electronically, you will not be affected by this change and you need not take any action. You may elect to receive shareholder reports and other communications from a fund electronically, by contacting your financial intermediary. For Fidelity customers, visit Fidelity's web site or call Fidelity using the contact information listed below.
You may elect to receive all future reports in paper free of charge. If you wish to continue receiving paper copies of your shareholder reports, you may contact your financial intermediary or, if you are a Fidelity customer, visit Fidelity’s website, or call Fidelity at the applicable toll-free number listed below. Your election to receive reports in paper will apply to all funds held with the fund complex/your financial intermediary.
| Account Type | Website | Phone Number |
| Brokerage, Mutual Fund, or Annuity Contracts: | fidelity.com/mailpreferences | 1-800-343-3548 |
| Employer Provided Retirement Accounts: | netbenefits.fidelity.com/preferences (choose 'no' under Required Disclosures to continue to print) | 1-800-343-0860 |
| Advisor Sold Accounts Serviced Through Your Financial Intermediary: | Contact Your Financial Intermediary | Your Financial Intermediary's phone number |
| Advisor Sold Accounts Serviced by Fidelity: | institutional.fidelity.com | 1-877-208-0098 |
Contents
Board Approval of Investment Advisory Contracts and Management Fees |
To view a fund's proxy voting guidelines and proxy voting record for the 12-month period ended June 30, visit http://www.fidelity.com/proxyvotingresults or visit the Securities and Exchange Commission's (SEC) web site at http://www.sec.gov.
You may also call 1-800-544-8544 to request a free copy of the proxy voting guidelines.
Standard & Poor's, S&P and S&P 500 are registered service marks of The McGraw-Hill Companies, Inc. and have been licensed for use by Fidelity Distributors Corporation.
Other third-party marks appearing herein are the property of their respective owners.
All other marks appearing herein are registered or unregistered trademarks or service marks of FMR LLC or an affiliated company. © 2019 FMR LLC. All rights reserved.
This report and the financial statements contained herein are submitted for the general information of the shareholders of the Fund. This report is not authorized for distribution to prospective investors in the Fund unless preceded or accompanied by an effective prospectus.
A fund files its complete schedule of portfolio holdings with the SEC for the first and third quarters of each fiscal year on Form N-PORT. Forms N-PORT are available on the SEC’s web site at http://www.sec.gov. A fund's Forms N-PORT may be reviewed and copied at the SEC’s Public Reference Room in Washington, DC. Information regarding the operation of the SEC's Public Reference Room may be obtained by calling 1-800-SEC-0330.
For a complete list of a fund's portfolio holdings, view the most recent holdings listing, semiannual report, or annual report on Fidelity's web site at http://www.fidelity.com, http://www.institutional.fidelity.com, or http://www.401k.com, as applicable.
NOT FDIC INSURED •MAY LOSE VALUE •NO BANK GUARANTEE
Neither the Fund nor Fidelity Distributors Corporation is a bank.
Investment Summary (Unaudited)
Top Five Holdings as of March 31, 2019
| (by issuer, excluding cash equivalents) | % of fund's net assets |
| Bass Pro Shops LLC. | 2.4 |
| Intelsat Jackson Holdings SA | 2.0 |
| Asurion LLC | 1.6 |
| Caesars Resort Collection LLC | 1.3 |
| Valeant Pharmaceuticals International, Inc. | 1.2 |
| 8.5 |
Top Five Market Sectors as of March 31, 2019
| % of fund's net assets | |
| Technology | 15.5 |
| Telecommunications | 7.9 |
| Gaming | 6.9 |
| Energy | 6.8 |
| Healthcare | 6.5 |
Quality Diversification (% of fund's net assets)
| As of March 31, 2019 | ||
| BBB | 2.6% | |
| BB | 29.2% | |
| B | 51.7% | |
| CCC,CC,C | 7.4% | |
| Not Rated | 2.4% | |
| Equities | 1.7% | |
| Short-Term Investments and Net Other Assets | 5.0% | |
We have used ratings from Moody's Investors Service, Inc. Where Moody's® ratings are not available, we have used S&P® ratings. All ratings are as of the date indicated and do not reflect subsequent changes.
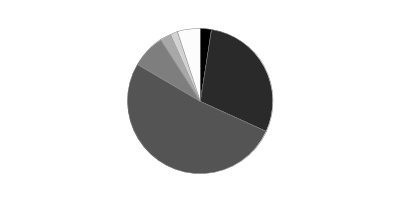
Asset Allocation (% of fund's net assets)
| As of March 31, 2019* | ||
| Bank Loan Obligations | 87.8% | |
| Nonconvertible Bonds | 5.5% | |
| Common Stocks | 1.7% | |
| Short-Term Investments and Net Other Assets (Liabilities) | 5.0% | |

* Foreign investments - 12.0%
Schedule of Investments March 31, 2019 (Unaudited)
Showing Percentage of Net Assets
| Bank Loan Obligations - 87.8%(a) | |||
| Principal Amount | Value | ||
| Aerospace - 1.2% | |||
| DAE Aviation Holdings, Inc. Tranche B, term loan 3 month U.S. LIBOR + 3.750% 6.24% 7/7/22 (b)(c) | $651,915 | $652,326 | |
| TransDigm, Inc.: | |||
| Tranche E, term loan 3 month U.S. LIBOR + 2.500% 4.9986% 5/30/25 (b)(c) | 920,700 | 895,381 | |
| Tranche G, term loan 3 month U.S. LIBOR + 2.500% 4.9986% 8/22/24 (b)(c) | 982,563 | 956,525 | |
| Wesco Aircraft Hardware Corp. Tranche B, term loan 3 month U.S. LIBOR + 2.500% 5% 2/28/21 (b)(c) | 405,000 | 398,925 | |
| WP CPP Holdings LLC Tranche B 2LN, term loan 3 month U.S. LIBOR + 7.750% 10.51% 4/30/26 (b)(c) | 235,000 | 232,258 | |
| TOTAL AEROSPACE | 3,135,415 | ||
| Air Transportation - 0.5% | |||
| Dynasty Acquisition Co., Inc.: | |||
| Tranche B 1LN, term loan 3 month U.S. LIBOR + 4.000% 1/24/26 (c)(d) | 494,266 | 494,127 | |
| Tranche B 2LN, term loan 3 month U.S. LIBOR + 4.000% 1/24/26 (c)(d) | 265,734 | 265,660 | |
| XPO Logistics, Inc. Tranche B, term loan 3 month U.S. LIBOR + 2.000% 4.493% 2/23/25 (b)(c) | 460,000 | 451,780 | |
| TOTAL AIR TRANSPORTATION | 1,211,567 | ||
| Automotive & Auto Parts - 0.9% | |||
| Hertz Corp. Tranche B 1LN, term loan 3 month U.S. LIBOR + 2.750% 5.25% 6/30/23 (b)(c) | 265,640 | 260,412 | |
| North American Lifting Holdings, Inc.: | |||
| Tranche 1LN, term loan 3 month U.S. LIBOR + 4.500% 7.303% 11/27/20 (b)(c) | 802,973 | 749,439 | |
| Tranche 2LN, term loan 3 month U.S. LIBOR + 9.000% 11.803% 11/27/21 (b)(c) | 845,000 | 695,013 | |
| The Gates Corp. Tranche B 1LN, term loan 3 month U.S. LIBOR + 2.750% 5.2486% 3/31/24 (b)(c) | 339,363 | 334,636 | |
| UOS LLC Tranche B 1LN, term loan 3 month U.S. LIBOR + 5.500% 7.9975% 4/18/23 (b)(c) | 287,796 | 287,796 | |
| TOTAL AUTOMOTIVE & AUTO PARTS | 2,327,296 | ||
| Banks & Thrifts - 0.2% | |||
| Citadel Securities LP Tranche B, term loan 3 month U.S. LIBOR + 3.500% 5.9986% 2/22/26 (b)(c)(e) | 500,000 | 499,375 | |
| Deerfield Dakota Holding LLC Tranche B 1LN, term loan 3 month U.S. LIBOR + 4.000% 6.4892% 2/13/25 (b)(c) | 110,000 | 109,725 | |
| TOTAL BANKS & THRIFTS | 609,100 | ||
| Broadcasting - 0.8% | |||
| AppLovin Corp. Tranche B, term loan 3 month U.S. LIBOR + 3.750% 6.2486% 8/15/25 (b)(c) | 503,738 | 501,219 | |
| CBS Radio, Inc. Tranche B 1LN, term loan 3 month U.S. LIBOR + 2.750% 5.243% 11/18/24 (b)(c) | 718,984 | 698,133 | |
| ION Media Networks, Inc. Tranche B, term loan 3 month U.S. LIBOR + 2.750% 5.25% 12/18/20 (b)(c) | 408,365 | 406,834 | |
| NEP/NCP Holdco, Inc.: | |||
| Tranche B 1LN, term loan 3 month U.S. LIBOR + 3.250% 5.7486% 10/19/25 (b)(c) | 269,325 | 266,699 | |
| Tranche B 2LN, term loan 3 month U.S. LIBOR + 7.000% 9.4955% 10/19/26 (b)(c) | 250,000 | 245,000 | |
| TOTAL BROADCASTING | 2,117,885 | ||
| Building Materials - 0.8% | |||
| ACProducts, Inc. Tranche B 1LN, term loan 3 month U.S. LIBOR + 5.500% 7.9986% 2/14/24 (b)(c)(e) | 250,000 | 237,500 | |
| HD Supply, Inc. Tranche B 5LN, term loan 3 month U.S. LIBOR + 1.750% 4.2486% 10/17/23 (b)(c) | 248,750 | 245,516 | |
| Traverse Midstream Partners Ll Tranche B, term loan 3 month U.S. LIBOR + 4.000% 6.5% 9/27/24 (b)(c) | 855,700 | 853,561 | |
| Ventia Deco LLC Tranche B, term loan 3 month U.S. LIBOR + 3.500% 6.303% 5/21/22 (b)(c) | 640,295 | 638,695 | |
| TOTAL BUILDING MATERIALS | 1,975,272 | ||
| Cable/Satellite TV - 2.3% | |||
| Cable One, Inc. Tranche B, term loan 3 month U.S. LIBOR + 1.750% 4.25% 5/1/24 (b)(c) | 329,138 | 327,699 | |
| Charter Communication Operating LLC Tranche B, term loan 3 month U.S. LIBOR + 2.000% 4.5% 4/30/25 (b)(c) | 2,945,101 | 2,923,012 | |
| CSC Holdings LLC: | |||
| Tranche B, term loan 3 month U.S. LIBOR + 2.500% 4.9838% 1/25/26 (b)(c) | 419,793 | 410,696 | |
| Tranche B3 1LN, term loan 3 month U.S. LIBOR + 2.250% 4.7338% 1/15/26 (b)(c) | 500,000 | 484,875 | |
| MCC Iowa LLC Tranche M, term loan 3 month U.S. LIBOR + 2.000% 4.41% 1/15/25 (b)(c) | 261,025 | 258,253 | |
| Virgin Media Bristol LLC Tranche B, term loan 3 month U.S. LIBOR + 2.500% 4.9838% 1/15/26 (b)(c) | 499,000 | 493,296 | |
| WideOpenWest Finance LLC Tranche B, term loan 3 month U.S. LIBOR + 3.250% 5.7406% 8/19/23 (b)(c) | 1,030,076 | 990,160 | |
| TOTAL CABLE/SATELLITE TV | 5,887,991 | ||
| Capital Goods - 0.5% | |||
| Altra Industrial Motion Corp. Tranche B 1LN, term loan 3 month U.S. LIBOR + 2.000% 4.4986% 10/1/25 (b)(c) | 310,668 | 304,843 | |
| Apergy Corp. Tranche B, term loan 3 month U.S. LIBOR + 2.500% 5.029% 5/9/25 (b)(c) | 311,747 | 309,019 | |
| CPM Holdings, Inc.: | |||
| 2LN, term loan 3 month U.S. LIBOR + 8.250% 10.7486% 11/15/26 (b)(c) | 135,000 | 132,525 | |
| Tranche B 1LN, term loan 3 month U.S. LIBOR + 3.750% 6.2486% 11/15/25 (b)(c) | 438,900 | 434,511 | |
| TOTAL CAPITAL GOODS | 1,180,898 | ||
| Chemicals - 2.4% | |||
| Invictus U.S. Newco LLC: | |||
| Tranche 1LN, term loan 3 month U.S. LIBOR + 3.000% 5.5791% 3/28/25 (b)(c) | 420,750 | 416,282 | |
| Tranche 2LN, term loan 3 month U.S. LIBOR + 6.750% 9.3291% 3/28/26 (b)(c) | 250,000 | 247,500 | |
| MacDermid, Inc. Tranche B, term loan 3 month U.S. LIBOR + 2.250% 4.7486% 1/31/26 (b)(c) | 374,063 | 370,558 | |
| Messer Industries U.S.A., Inc. Tranche B 1LN, term loan 3 month U.S. LIBOR + 2.500% 9/28/25 (c)(d) | 750,000 | 733,598 | |
| Oxea Corp. Tranche B2, term loan 3 month U.S. LIBOR + 3.500% 6% 10/11/24 (b)(c) | 539,131 | 536,435 | |
| PQ Corp. Tranche B, term loan 3 month U.S. LIBOR + 2.500% 5.2444% 2/8/25 (b)(c) | 274,072 | 270,646 | |
| Starfruit U.S. Holdco LLC Tranche B, term loan 3 month U.S. LIBOR + 3.250% 5.7404% 10/1/25 (b)(c) | 1,245,000 | 1,225,553 | |
| The Chemours Co. LLC Tranche B 1LN, term loan 3 month U.S. LIBOR + 1.750% 4.25% 4/3/25 (b)(c) | 402,240 | 397,337 | |
| Trinseo Materials Operating SCA/Trinseo Materials Finance, Inc. term loan 3 month U.S. LIBOR + 2.000% 4.4989% 9/6/24 (b)(c) | 738,750 | 726,561 | |
| Tronox Blocked Borrower LLC Tranche B, term loan 3 month U.S. LIBOR + 3.000% 5.4986% 9/22/24 (b)(c) | 233,295 | 232,056 | |
| Tronox Finance LLC Tranche B, term loan 3 month U.S. LIBOR + 3.000% 5.4986% 9/22/24 (b)(c) | 503,844 | 501,169 | |
| W. R. Grace & Co.-Conn.: | |||
| Tranche B 1LN, term loan 3 month U.S. LIBOR + 1.750% 4.351% 4/3/25 (b)(c) | 230,945 | 227,384 | |
| Tranche B 2LN, term loan 3 month U.S. LIBOR + 1.750% 4.351% 4/3/25 (b)(c) | 395,905 | 389,800 | |
| TOTAL CHEMICALS | 6,274,879 | ||
| Consumer Products - 1.2% | |||
| Coty, Inc. Tranche B 1LN, term loan 3 month U.S. LIBOR + 2.250% 4.7418% 4/5/25 (b)(c) | 542,268 | 523,967 | |
| CSM Bakery Supplies Tranche B 1LN, term loan 3 month U.S. LIBOR + 4.000% 6.8% 7/3/20 (b)(c) | 368,379 | 350,727 | |
| Owens & Minor Distribution, Inc. Tranche B, term loan 3 month U.S. LIBOR + 4.500% 6.9892% 4/30/25 (b)(c) | 995,000 | 746,250 | |
| Prestige Brands, Inc. term loan 3 month U.S. LIBOR + 2.000% 4.4986% 1/26/24 (b)(c) | 377,301 | 372,762 | |
| Rodan & Fields LLC Tranche B, term loan 3 month U.S. LIBOR + 4.000% 6.4888% 6/15/25 (b)(c) | 372,188 | 321,942 | |
| Weight Watchers International, Inc. Tranche B, term loan 3 month U.S. LIBOR + 4.750% 7.56% 11/29/24 (b)(c) | 889,529 | 844,501 | |
| TOTAL CONSUMER PRODUCTS | 3,160,149 | ||
| Containers - 2.2% | |||
| Berlin Packaging, LLC Tranche B 1LN, term loan 3 month U.S. LIBOR + 3.000% 5.4951% 11/7/25 (b)(c) | 883,810 | 854,644 | |
| Berry Global, Inc.: | |||
| Tranche Q, term loan 3 month U.S. LIBOR + 2.000% 4.6101% 10/1/22 (b)(c) | 495,797 | 492,078 | |
| Tranche T, term loan 3 month U.S. LIBOR + 1.750% 4.2428% 1/6/21 (b)(c) | 1,213,791 | 1,208,487 | |
| BWAY Holding Co. Tranche B, term loan 3 month U.S. LIBOR + 3.250% 6.0325% 4/3/24 (b)(c) | 245,625 | 239,300 | |
| Charter Nex U.S., Inc. Tranche B 1LN, term loan 3 month U.S. LIBOR + 2.750% 5.2455% 5/16/24 (b)(c) | 397,913 | 385,892 | |
| Consolidated Container Co. Tranche B 1LN, term loan 3 month U.S. LIBOR + 2.750% 5.2486% 5/22/24 (b)(c) | 236,367 | 232,280 | |
| Crown Americas LLC Tranche B 1LN, term loan 3 month U.S. LIBOR + 2.000% 4.4838% 4/3/25 (b)(c) | 397,107 | 397,674 | |
| Hostess Brands LLC Tranche B, term loan 3 month U.S. LIBOR + 2.250% 4.8945% 8/3/22 (b)(c) | 98,699 | 95,787 | |
| Reynolds Group Holdings, Inc. Tranche B, term loan 3 month U.S. LIBOR + 2.750% 5.243% 2/5/23 (b)(c) | 1,685,172 | 1,664,107 | |
| Tank Holding Corp. Tranche B 1LN, term loan 3 month U.S. LIBOR + 4.000% 3/25/26 (c)(d) | 200,000 | 200,126 | |
| TOTAL CONTAINERS | 5,770,375 | ||
| Diversified Financial Services - 4.0% | |||
| Avolon TLB Borrower 1 (U.S.) LLC Tranche B3 1LN, term loan 3 month U.S. LIBOR + 2.000% 4.4878% 1/15/25 (b)(c) | 858,106 | 850,289 | |
| BCP Renaissance Parent LLC Tranche B, term loan 3 month U.S. LIBOR + 3.500% 6.2444% 10/31/24 (b)(c) | 600,214 | 597,213 | |
| Cypress Intermediate Holdings, Inc. Tranche B 1LN, term loan 3 month U.S. LIBOR + 3.000% 5.5% 4/27/24 (b)(c) | 1,252,688 | 1,228,423 | |
| Delos Finance SARL Tranche B, term loan 3 month U.S. LIBOR + 1.750% 4.553% 10/6/23 (b)(c) | 856,000 | 854,502 | |
| Financial & Risk U.S. Holdings, Inc. Tranche B, term loan 3 month U.S. LIBOR + 3.750% 6.243% 10/1/25 (b)(c) | 1,232,910 | 1,196,145 | |
| Fly Funding II SARL Tranche B, term loan 3 month U.S. LIBOR + 2.000% 4.7% 2/9/23 (b)(c) | 793,163 | 780,671 | |
| Focus Financial Partners LLC Tranche B 1LN, term loan 3 month U.S. LIBOR + 2.500% 4.993% 7/3/24 (b)(c) | 447,413 | 445,176 | |
| Greensky Holdings LLC Tranche B, term loan 3 month U.S. LIBOR + 3.250% 5.75% 3/29/25 (b)(c) | 425,700 | 421,711 | |
| HarbourVest Partners LLC Tranche B 1LN, term loan 3 month U.S. LIBOR + 2.250% 4.8489% 3/1/25 (b)(c) | 969,019 | 957,710 | |
| NAB Holdings LLC Tranche B, term loan 3 month U.S. LIBOR + 3.000% 5.601% 6/30/24 (b)(c) | 561,478 | 543,230 | |
| Ocwen Loan Servicing LLC Tranche B, term loan 3 month U.S. LIBOR + 5.000% 7.4855% 12/5/20 (b)(c) | 508,052 | 505,512 | |
| Recess Holdings, Inc. Tranche B, term loan 3 month U.S. LIBOR + 3.750% 6.398% 9/29/24 (b)(c) | 213,618 | 208,100 | |
| SAI Global GP Tranche B, term loan 3 month U.S. LIBOR + 4.500% 6.993% 12/8/23 (b)(c) | 733,125 | 619,491 | |
| TransUnion LLC: | |||
| Tranche B 4LN, term loan 3 month U.S. LIBOR + 2.000% 4.493% 6/19/25 (b)(c) | 744,375 | 733,522 | |
| Tranche B, term loan 3 month U.S. LIBOR + 2.000% 4.493% 4/9/23 (b)(c) | 408,131 | 403,976 | |
| TOTAL DIVERSIFIED FINANCIAL SERVICES | 10,345,671 | ||
| Energy - 5.0% | |||
| Arctic LNG Carriers Ltd. Tranche B 1LN, term loan 3 month U.S. LIBOR + 4.500% 6.9986% 5/18/23 (b)(c) | 698,584 | 675,880 | |
| BCP Raptor II LLC Tranche B, term loan 3 month U.S. LIBOR + 4.750% 7.3651% 11/3/25 (b)(c) | 496,000 | 467,728 | |
| BCP Raptor LLC Tranche B, term loan 3 month U.S. LIBOR + 4.250% 6.8789% 6/22/24 (b)(c) | 651,388 | 610,273 | |
| Brazos Delaware II LLC Tranche B, term loan 3 month U.S. LIBOR + 4.000% 6.4868% 5/21/25 (b)(c) | 516,100 | 488,747 | |
| California Resources Corp.: | |||
| Tranche 1LN, term loan 3 month U.S. LIBOR + 10.375% 12.8705% 12/31/21 (b)(c) | 1,507,000 | 1,587,067 | |
| Tranche B, term loan 3 month U.S. LIBOR + 4.750% 7.2455% 12/31/22 (b)(c) | 1,038,000 | 1,019,191 | |
| Citgo Petroleum Corp.: | |||
| Tranche B 1LN, term loan 3 month U.S. LIBOR + 5.000% 3/27/24 (c)(d) | 1,250,000 | 1,243,750 | |
| Tranche B, term loan 3 month U.S. LIBOR + 3.500% 8% 7/29/21 (b)(c) | 852,082 | 848,247 | |
| Delek U.S. Holdings, Inc. Tranche B 1LN, term loan 3 month U.S. LIBOR + 2.250% 4.75% 3/13/25 (b)(c) | 386,100 | 381,274 | |
| EG America LLC Tranche B 1LN, term loan 3 month U.S. LIBOR + 4.000% 6.8134% 2/6/25 (b)(c) | 139,297 | 135,884 | |
| Epic Crude Services LP Tranche B 1LN, term loan 3 month U.S. LIBOR + 5.000% 7.49% 3/1/26 (b)(c) | 750,000 | 740,393 | |
| Equitrans Midstream Corp. Tranche B, term loan 3 month U.S. LIBOR + 4.500% 7% 1/31/24 (b)(c) | 364,088 | 364,390 | |
| FTS International, Inc. Tranche B, term loan 3 month U.S. LIBOR + 4.750% 7.2486% 4/16/21 (b)(c) | 120,866 | 120,526 | |
| Gavilan Resources LLC Tranche 2LN, term loan 3 month U.S. LIBOR + 6.000% 8.4855% 3/1/24 (b)(c) | 745,000 | 578,120 | |
| GIP III Stetson I LP Tranche B, term loan 3 month U.S. LIBOR + 4.250% 6.7318% 7/18/25 (b)(c) | 1,212,579 | 1,200,453 | |
| Gulf Finance LLC Tranche B 1LN, term loan 3 month U.S. LIBOR + 5.250% 7.8666% 8/25/23 (b)(c) | 640,844 | 508,670 | |
| Natgasoline LLC Tranche B, term loan 3 month U.S. LIBOR + 3.500% 6.125% 11/14/25 (b)(c) | 862,838 | 862,838 | |
| Oregon Clean Energy LLC Tranche B 1LN, term loan 3 month U.S. LIBOR + 3.750% 6.2486% 3/1/26 (b)(c) | 185,000 | 185,000 | |
| Terra-Gen Finance Co. LLC Tranche B, term loan 3 month U.S. LIBOR + 4.250% 6.7486% 12/9/21 (b)(c) | 701,850 | 628,155 | |
| TerraForm Power Operating LLC Tranche B, term loan 3 month U.S. LIBOR + 2.000% 4.4986% 11/8/22 (b)(c) | 256,750 | 250,010 | |
| TOTAL ENERGY | 12,896,596 | ||
| Entertainment/Film - 0.8% | |||
| AMC Entertainment Holdings, Inc.: | |||
| Tranche B 1LN, term loan 3 month U.S. LIBOR + 3.000% 3/14/26 (c)(d) | 500,000 | 496,000 | |
| Tranche B, term loan 3 month U.S. LIBOR + 2.250% 4.7338% 12/15/23 (b)(c) | 352,800 | 352,447 | |
| CDS U.S. Intermediate Holdings, Inc.: | |||
| Tranche B 1LN, term loan 3 month U.S. LIBOR + 3.750% 6.2958% 7/8/22 (b)(c) | 1,025,984 | 939,627 | |
| Tranche B 2LN, term loan 3 month U.S. LIBOR + 8.250% 10.8073% 7/8/23 (b)(c) | 215,000 | 191,081 | |
| SMG U.S. Midco 2, Inc. Tranche B 1LN, term loan 3 month U.S. LIBOR + 3.000% 5.4986% 1/23/25 (b)(c) | 202,950 | 200,074 | |
| TOTAL ENTERTAINMENT/FILM | 2,179,229 | ||
| Environmental - 0.1% | |||
| Tunnel Hill Partners LP Tranche B 1LN, term loan 3 month U.S. LIBOR + 3.500% 5.9986% 2/8/26 (b)(c) | 250,000 | 247,813 | |
| Food & Drug Retail - 3.4% | |||
| Agro Merchants Intermediate Ho Tranche B, term loan 3 month U.S. LIBOR + 3.750% 6.351% 12/6/24 (b)(c) | 493,924 | 487,443 | |
| Albertson's LLC: | |||
| Tranche B 7LN, term loan 3 month U.S. LIBOR + 3.000% 5.4986% 10/29/25 (b)(c) | 249,375 | 245,993 | |
| Tranche B, term loan 3 month U.S. LIBOR + 3.000% 5.6088% 12/21/22 (b)(c) | 1,088,789 | 1,079,414 | |
| BI-LO LLC Tranche B, term loan 3 month U.S. LIBOR + 8.000% 10.7108% 5/31/24 (b)(c) | 2,476,902 | 2,388,972 | |
| GOBP Holdings, Inc. Tranche B 1LN, term loan 3 month U.S. LIBOR + 3.750% 6.553% 10/22/25 (b)(c) | 743,138 | 733,663 | |
| JBS USA Lux SA Tranche B, term loan 3 month U.S. LIBOR + 2.500% 4.9834% 10/30/22 (b)(c) | 1,472,710 | 1,461,120 | |
| JP Intermediate B LLC Tranche B, term loan 3 month U.S. LIBOR + 5.500% 8.2444% 11/20/25 (b)(c) | 370,313 | 346,861 | |
| Lannett Co., Inc.: | |||
| Tranche B, term loan 3 month U.S. LIBOR + 5.000% 7.493% 11/25/20 (b)(c) | 65,795 | 63,493 | |
| Tranche B, term loan 3 month U.S. LIBOR + 5.375% 7.868% 11/25/22 (b)(c) | 1,046,219 | 969,500 | |
| RPI Finance Trust Tranche B 6LN, term loan 3 month U.S. LIBOR + 2.000% 4.493% 3/27/23 (b)(c) | 452,154 | 449,328 | |
| Smart & Final, Inc. Tranche B, term loan 3 month U.S. LIBOR + 3.500% 6.1289% 11/15/22 (b)(c) | 572,715 | 544,555 | |
| TOTAL FOOD & DRUG RETAIL | 8,770,342 | ||
| Food/Beverage/Tobacco - 1.5% | |||
| 8th Avenue Food & Provisions, Inc.: | |||
| 2LN, term loan 3 month U.S. LIBOR + 7.750% 10.2404% 10/1/26 (b)(c) | 80,000 | 79,700 | |
| Tranche B 1LN, term loan 3 month U.S. LIBOR + 3.750% 6.2404% 10/1/25 (b)(c) | 239,400 | 239,161 | |
| Chobani LLC Tranche B, term loan 3 month U.S. LIBOR + 3.500% 5.9986% 10/7/23 (b)(c) | 991,910 | 948,514 | |
| Eg Finco Ltd. Tranche B, term loan 3 month U.S. LIBOR + 4.000% 6.601% 2/6/25(b)(c) | 311,850 | 304,210 | |
| Post Holdings, Inc. Tranche B, term loan 3 month U.S. LIBOR + 2.000% 4.49% 5/24/24 (b)(c) | 650,765 | 644,361 | |
| Shearer's Foods, Inc.: | |||
| Tranche 2LN, term loan 3 month U.S. LIBOR + 6.750% 9.243% 6/30/22 (b)(c) | 555,938 | 535,090 | |
| Tranche B 1LN, term loan 3 month U.S. LIBOR + 4.250% 6.743% 6/30/21 (b)(c) | 244,886 | 240,676 | |
| U.S. Foods, Inc. Tranche B, term loan 3 month U.S. LIBOR + 2.000% 4.4986% 6/27/23 (b)(c) | 717,188 | 705,533 | |
| U.S. Salt LLC Tranche B 1LN, term loan 3 month U.S. LIBOR + 4.750% 7.2318% 1/16/26 (b)(c)(e) | 165,000 | 164,588 | |
| TOTAL FOOD/BEVERAGE/TOBACCO | 3,861,833 | ||
| Gaming - 6.6% | |||
| Affinity Gaming LLC Tranche B, term loan 3 month U.S. LIBOR + 3.250% 5.7486% 7/1/23 (b)(c) | 467,637 | 446,126 | |
| AP Gaming I LLC Tranche B, term loan 3 month U.S. LIBOR + 3.500% 5.9986% 2/15/24 (b)(c) | 575,341 | 572,321 | |
| Aristocrat Technologies, Inc. Tranche B 3LN, term loan 3 month U.S. LIBOR + 1.750% 4.5257% 10/19/24 (b)(c) | 556,206 | 545,238 | |
| Boyd Gaming Corp. Tranche B 1LN, term loan 3 month U.S. LIBOR + 2.250% 4.6576% 9/15/23 (b)(c) | 681,802 | 675,202 | |
| Caesars Resort Collection LLC Tranche B 1LN, term loan 3 month U.S. LIBOR + 2.750% 5.2486% 12/22/24 (b)(c) | 3,413,952 | 3,365,166 | |
| CityCenter Holdings LLC Tranche B, term loan 3 month U.S. LIBOR + 2.250% 4.743% 4/18/24 (b)(c) | 425,668 | 417,618 | |
| Eldorado Resorts, Inc. Tranche B, term loan 3 month U.S. LIBOR + 2.000% 4.875% 4/17/24 (b)(c) | 1,049,126 | 1,038,635 | |
| Golden Entertainment, Inc. Tranche B, term loan: | |||
| 3 month U.S. LIBOR + 3.000% 5.5% 10/20/24 (b)(c) | 980,038 | 970,237 | |
| 3 month U.S. LIBOR + 7.000% 9.5% 10/20/25 (b)(c) | 500,000 | 487,500 | |
| Golden Nugget, Inc. Tranche B 1LN, term loan 3 month U.S. LIBOR + 2.750% 5.2389% 10/4/23 (b)(c) | 2,220,402 | 2,196,466 | |
| Greektown Holdings LLC Tranche B, term loan 3 month U.S. LIBOR + 2.750% 5.243% 4/25/24(b)(c) | 342,188 | 341,616 | |
| Las Vegas Sands LLC Tranche B, term loan 3 month U.S. LIBOR + 1.750% 4.2486% 3/27/25 (b)(c) | 735,784 | 722,062 | |
| Mohegan Tribal Gaming Authority Tranche B, term loan 3 month U.S. LIBOR + 4.000% 6.493% 10/14/23 (b)(c) | 336,994 | 318,460 | |
| Penn National Gaming, Inc. Tranche B, term loan 3 month U.S. LIBOR + 2.250% 4.7486% 10/15/25 (b)(c) | 499,748 | 494,125 | |
| Scientific Games Corp. Tranche B 5LN, term loan 3 month U.S. LIBOR + 2.750% 5.3123% 8/14/24 (b)(c) | 1,847,359 | 1,797,222 | |
| Stars Group Holdings BV Tranche B, term loan 3 month U.S. LIBOR + 3.500% 6.303% 7/10/25 (b)(c) | 1,448,363 | 1,444,409 | |
| Station Casinos LLC Tranche B, term loan 3 month U.S. LIBOR + 2.500% 5% 6/8/23 (b)(c) | 688,827 | 680,995 | |
| Wynn America LLC Tranche A 1LN, term loan 3 month U.S. LIBOR + 1.750% 4.25% 12/31/21 (b)(c) | 308,000 | 297,990 | |
| Wynn Resorts Ltd. Tranche B, term loan 3 month U.S. LIBOR + 2.250% 4.75% 10/30/24 (b)(c) | 250,000 | 244,493 | |
| TOTAL GAMING | 17,055,881 | ||
| Healthcare - 5.3% | |||
| Accelerated Health Systems LLC Tranche B, term loan 3 month U.S. LIBOR + 3.500% 5.9904% 11/1/25 (b)(c) | 498,750 | 496,880 | |
| American Renal Holdings, Inc. Tranche B, term loan 3 month U.S. LIBOR + 3.250% 5.7486% 6/22/24 (b)(c) | 751,613 | 713,092 | |
| CVS Holdings I LP: | |||
| Tranche 2LN, term loan 3 month U.S. LIBOR + 6.750% 9.25% 2/6/26 (b)(c) | 250,000 | 244,375 | |
| Tranche B 1LN, term loan 3 month U.S. LIBOR + 2.750% 5.25% 2/6/25 (b)(c) | 376,200 | 362,563 | |
| HCA Holdings, Inc.: | |||
| Tranche B 10LN, term loan 3 month U.S. LIBOR + 2.000% 4.4986% 3/13/25 (b)(c) | 990,000 | 988,456 | |
| Tranche B 11LN, term loan 3 month U.S. LIBOR + 1.750% 4.2486% 3/18/23 (b)(c) | 836,790 | 835,610 | |
| Innoviva, Inc. Tranche B, term loan 3 month U.S. LIBOR + 4.500% 7.1413% 8/18/22 (b)(c) | 45,375 | 44,468 | |
| Ortho-Clinical Diagnostics, Inc. Tranche B 1LN, term loan 3 month U.S. LIBOR + 3.250% 5.7486% 6/30/25 (b)(c) | 884,457 | 850,919 | |
| PAREXEL International Corp. Tranche B, term loan 3 month U.S. LIBOR + 2.750% 5.2486% 9/27/24 (b)(c) | 892,809 | 859,329 | |
| Press Ganey Holdings, Inc. Tranche 1LN, term loan 3 month U.S. LIBOR + 2.750% 5.2486% 10/21/23 (b)(c) | 305,159 | 298,293 | |
| Prospect Medical Holdings, Inc. Tranche 1LN, term loan 3 month U.S. LIBOR + 5.500% 8% 2/22/24 (b)(c) | 655,050 | 594,458 | |
| RegionalCare Hospital Partners Holdings, Inc. Tranche B, term loan 3 month U.S. LIBOR + 4.500% 6.9818% 11/16/25 (b)(c) | 748,125 | 739,125 | |
| Tivity Health, Inc. Tranche B 1LN, term loan 3 month U.S. LIBOR + 5.250% 7.7486% 3/7/26 (b)(c) | 243,229 | 237,958 | |
| U.S. Anesthesia Partners, Inc. Tranche B, term loan 3 month U.S. LIBOR + 3.000% 5.4986% 6/23/24 (b)(c) | 649,240 | 641,611 | |
| U.S. Renal Care, Inc. Tranche B 1LN, term loan 3 month U.S. LIBOR + 4.250% 6.851% 12/31/22 (b)(c) | 699,481 | 698,026 | |
| Valeant Pharmaceuticals International, Inc.: | |||
| Tranche B 2LN, term loan 3 month U.S. LIBOR + 2.750% 5.2309% 11/27/25 (b)(c) | 1,187,500 | 1,172,846 | |
| Tranche B, term loan 3 month U.S. LIBOR + 3.000% 5.4809% 6/1/25 (b)(c) | 1,397,481 | 1,387,503 | |
| VVC Holding Corp. Tranche B 1LN, term loan 3 month U.S. LIBOR + 4.500% 7.197% 2/5/26 (b)(c) | 1,750,000 | 1,723,750 | |
| Wink Holdco, Inc. Tranche B, term loan 3 month U.S. LIBOR + 3.000% 5.4986% 12/1/24 (b)(c) | 740,625 | 715,940 | |
| TOTAL HEALTHCARE | 13,605,202 | ||
| Homebuilders/Real Estate - 1.7% | |||
| DTZ U.S. Borrower LLC Tranche B, term loan 3 month U.S. LIBOR + 3.250% 5.7486% 8/21/25 (b)(c) | 994,005 | 984,065 | |
| Forest City Enterprises LP Tranche B, term loan 3 month U.S. LIBOR + 4.000% 6.4809% 12/7/25 (b)(c) | 563,588 | 564,996 | |
| Lightstone Holdco LLC: | |||
| Tranche B 1LN, term loan 3 month U.S. LIBOR + 3.750% 6.243% 1/30/24 (b)(c) | 678,660 | 655,049 | |
| Tranche C 1LN, term loan 3 month U.S. LIBOR + 3.750% 6.243% 1/30/24 (b)(c) | 38,277 | 36,946 | |
| MGM Growth Properties Operating Partner LP Tranche B, term loan 3 month U.S. LIBOR + 2.000% 4.493% 3/23/25 (b)(c) | 380,915 | 375,338 | |
| Realogy Group LLC Tranche B, term loan 3 month U.S. LIBOR + 2.250% 4.7318% 2/8/25 (b)(c) | 467,440 | 453,029 | |
| VICI Properties, LLC Tranche B 1LN, term loan 3 month U.S. LIBOR + 2.000% 4.4906% 12/22/24 (b)(c) | 1,358,636 | 1,333,162 | |
| TOTAL HOMEBUILDERS/REAL ESTATE | 4,402,585 | ||
| Hotels - 1.2% | |||
| Aimbridge Acquisition Co., Inc. Tranche B 1LN, term loan 3 month U.S. LIBOR + 3.750% 6.2392% 2/1/26 (b)(c) | 250,000 | 249,375 | |
| ESH Hospitality, Inc. Tranche B, term loan 3 month U.S. LIBOR + 2.000% 4.493% 8/30/23 (b)(c) | 436,058 | 432,787 | |
| Four Seasons Holdings, Inc. Tranche B, term loan 3 month U.S. LIBOR + 2.000% 4.4986% 11/30/23 (b)(c) | 1,290,415 | 1,278,853 | |
| Hilton Worldwide Finance LLC Tranche B 2LN, term loan 3 month U.S. LIBOR + 1.750% 4.2355% 10/25/23 (b)(c) | 126,445 | 126,129 | |
| Marriott Ownership Resorts, Inc. Tranche B, term loan 3 month U.S. LIBOR + 2.250% 4.743% 8/31/25 (b)(c) | 204,488 | 203,209 | |
| Travelport Finance Luxembourg SARL: | |||
| 1LN, term loan 3 month U.S. LIBOR + 5.000% 3/18/26 (c)(d) | 500,000 | 485,625 | |
| Tranche B 2LN, term loan 3 month U.S. LIBOR + 9.000% 3/18/27 (c)(d)(e) | 250,000 | 242,500 | |
| TOTAL HOTELS | 3,018,478 | ||
| Insurance - 3.2% | |||
| Acrisure LLC Tranche B, term loan 3 month U.S. LIBOR + 4.250% 6.8789% 11/22/23 (b)(c) | 685,534 | 680,249 | |
| Alliant Holdings Intermediate LLC Tranche B, term loan 3 month U.S. LIBOR + 2.750% 5.2318% 5/10/25 (b)(c) | 682,602 | 654,875 | |
| AmWINS Group, Inc. Tranche B 1LN, term loan 3 month U.S. LIBOR + 2.750% 5.2473% 1/25/24 (b)(c) | 487,487 | 480,175 | |
| Asurion LLC: | |||
| Tranche B 6LN, term loan 3 month U.S. LIBOR + 3.000% 5.4986% 11/3/23 (b)(c) | 2,280,475 | 2,267,658 | |
| Tranche B 7LN, term loan 3 month U.S. LIBOR + 3.000% 5.4986% 11/3/24 (b)(c) | 496,250 | 492,260 | |
| Tranche B, term loan 3 month U.S. LIBOR + 6.500% 8.9986% 8/4/25 (b)(c) | 1,363,000 | 1,379,465 | |
| HUB International Ltd. Tranche B, term loan 3 month U.S. LIBOR + 2.750% 5.5144% 4/25/25 (b)(c) | 1,530,434 | 1,478,139 | |
| USI, Inc. Tranche B, term loan 3 month U.S. LIBOR + 3.000% 5.601% 5/16/24 (b)(c) | 821,331 | 795,319 | |
| TOTAL INSURANCE | 8,228,140 | ||
| Leisure - 2.7% | |||
| Alterra Mountain Co. Tranche B 1LN, term loan 3 month U.S. LIBOR + 3.000% 5.493% 7/31/24 (b)(c) | 623,331 | 619,242 | |
| Callaway Golf Co. Tranche B, term loan 3 month U.S. LIBOR + 4.500% 6.9904% 12/14/25 (b)(c) | 408,975 | 411,703 | |
| Crown Finance U.S., Inc. Tranche B 1LN, term loan 3 month U.S. LIBOR + 2.500% 4.9986% 2/28/25 (b)(c) | 1,030,116 | 1,004,961 | |
| Delta 2 SARL Tranche B, term loan 3 month U.S. LIBOR + 2.500% 4.993% 2/1/24 (b)(c) | 1,290,956 | 1,241,577 | |
| Equinox Holdings, Inc.: | |||
| Tranche 2LN, term loan 3 month U.S. LIBOR + 7.000% 9.4986% 9/8/24 (b)(c) | 250,000 | 250,625 | |
| Tranche B-1, term loan 3 month U.S. LIBOR + 3.000% 5.493% 3/8/24 (b)(c) | 735,056 | 729,911 | |
| LTF Merger Sub, Inc. Tranche B, term loan 3 month U.S. LIBOR + 2.750% 5.3785% 6/10/22 (b)(c) | 945,953 | 933,618 | |
| NVA Holdings, Inc. Tranche B 3LN, term loan 3 month U.S. LIBOR + 2.750% 5.2486% 2/2/25 (b)(c) | 485,584 | 468,287 | |
| SeaWorld Parks & Entertainment, Inc. Tranche B 5LN, term loan 3 month U.S. LIBOR + 3.000% 5.493% 3/31/24 (b)(c) | 343,249 | 339,511 | |
| Seminole Tribe of Florida Tranche B, term loan 3 month U.S. LIBOR + 1.750% 4.243% 7/6/24 (b)(c) | 488,520 | 486,688 | |
| SP PF Buyer LLC Tranche B 1LN, term loan 3 month U.S. LIBOR + 4.500% 7.0581% 12/21/25 (b)(c) | 375,000 | 370,781 | |
| TOTAL LEISURE | 6,856,904 | ||
| Metals/Mining - 0.6% | |||
| American Rock Salt Co. LLC Tranche B, term loan 3 month U.S. LIBOR + 3.750% 6.2486% 3/21/25 (b)(c) | 688,050 | 684,610 | |
| Murray Energy Corp. Tranche B 2LN, term loan 3 month U.S. LIBOR + 7.250% 9.8789% 10/17/22 (b)(c) | 1,126,076 | 925,263 | |
| TOTAL METALS/MINING | 1,609,873 | ||
| Paper - 0.4% | |||
| Flex Acquisition Co., Inc.: | |||
| Tranche B 1LN, term loan 3 month U.S. LIBOR + 3.000% 5.6258% 12/29/23 (b)(c) | 384,871 | 372,201 | |
| Tranche B 1LN, term loan 3 month U.S. LIBOR + 3.250% 5.8758% 6/29/25 (b)(c) | 746,250 | 721,997 | |
| TOTAL PAPER | 1,094,198 | ||
| Publishing/Printing - 2.0% | |||
| Cengage Learning, Inc. Tranche B, term loan 3 month U.S. LIBOR + 4.250% 6.7355% 6/7/23 (b)(c) | 1,150,141 | 1,032,252 | |
| Getty Images, Inc. Tranche B 1LN, term loan 3 month U.S. LIBOR + 4.500% 7.0625% 2/12/26 (b)(c) | 249,375 | 247,193 | |
| Harland Clarke Holdings Corp. Tranche B 7LN, term loan 3 month U.S. LIBOR + 4.750% 7.351% 11/3/23 (b)(c) | 671,952 | 601,397 | |
| Houghton Mifflin Harcourt Publishing, Inc. Tranche B, term loan 3 month U.S. LIBOR + 3.000% 5.4986% 5/29/21 (b)(c) | 628,983 | 593,602 | |
| Learning Care Group (U.S.) No 2 Tranche B 1LN, term loan 3 month U.S. LIBOR + 3.250% 5.8157% 3/13/25 (b)(c) | 683,100 | 667,730 | |
| McGraw-Hill Global Education Holdings, LLC term loan 3 month U.S. LIBOR + 4.000% 6.493% 5/4/22 (b)(c) | 547,613 | 502,435 | |
| Merrill Communications LLC Tranche B, term loan 3 month U.S. LIBOR + 5.250% 7.9944% 6/1/22 (b)(c) | 328,527 | 329,348 | |
| Proquest LLC Tranche B, term loan 3 month U.S. LIBOR + 3.250% 5.851% 10/24/21 (b)(c) | 402,277 | 399,932 | |
| Springer Science+Business Media Deutschland GmbH Tranche B 13LN, term loan 3 month U.S. LIBOR + 3.500% 5.993% 8/24/22 (b)(c) | 733,449 | 729,019 | |
| TOTAL PUBLISHING/PRINTING | 5,102,908 | ||
| Restaurants - 1.1% | |||
| Burger King Worldwide, Inc. Tranche B, term loan 3 month U.S. LIBOR + 2.250% 4.7486% 2/17/24 (b)(c) | 741,703 | 729,338 | |
| CEC Entertainment, Inc. Tranche B, term loan 3 month U.S. LIBOR + 3.250% 5.7486% 2/14/21 (b)(c) | 375,994 | 363,681 | |
| K-Mac Holdings Corp. Tranche B 1LN, term loan 3 month U.S. LIBOR + 3.250% 5.7355% 3/16/25 (b)(c) | 174,928 | 171,954 | |
| PFC Acquisition Corp. Tranche B 1LN, term loan 3 month U.S. LIBOR + 6.500% 8.9892% 3/1/26 (b)(c) | 375,000 | 369,375 | |
| Red Lobster Hospitality LLC Tranche B, term loan 3 month U.S. LIBOR + 5.250% 7.7486% 7/28/21 (b)(c) | 478,196 | 472,219 | |
| Restaurant Technologies, Inc. 1LN, term loan 3 month U.S. LIBOR + 3.250% 5.7486% 10/1/25 (b)(c) | 239,400 | 238,354 | |
| Tacala Investment Corp. term loan 3 month U.S. LIBOR + 3.250% 5.7486% 2/1/25 (b)(c) | 524,700 | 516,992 | |
| TOTAL RESTAURANTS | 2,861,913 | ||
| Services - 5.1% | |||
| Almonde, Inc.: | |||
| Tranche 2LN, term loan 3 month U.S. LIBOR + 7.250% 9.851% 6/13/25 (b)(c) | 1,195,000 | 1,148,945 | |
| Tranche B 1LN, term loan 3 month U.S. LIBOR + 3.500% 6.303% 6/13/24 (b)(c) | 1,061,470 | 1,022,333 | |
| Ancestry.Com Operations, Inc. Tranche B 1LN, term loan 3 month U.S. LIBOR + 3.250% 5.75% 10/19/23 (b)(c) | 714,576 | 709,517 | |
| Aramark Services, Inc. Tranche B 3LN, term loan 3 month U.S. LIBOR + 1.750% 4.2486% 3/11/25 (b)(c) | 614,325 | 608,950 | |
| Brand Energy & Infrastructure Services, Inc. Tranche B, term loan 3 month U.S. LIBOR + 4.250% 6.9563% 6/21/24 (b)(c) | 484,907 | 463,557 | |
| Bright Horizons Family Solutions Tranche B, term loan 3 month U.S. LIBOR + 1.750% 4.2537% 11/7/23 (b)(c) | 460,132 | 456,970 | |
| Cast & Crew Payroll LLC Tranche B 1LN, term loan 3 month U.S. LIBOR + 4.000% 6.5% 2/7/26 (b)(c) | 265,000 | 265,795 | |
| Filtration Group Corp. Tranche B, term loan 3 month U.S. LIBOR + 3.000% 5.493% 3/29/25 (b)(c) | 485,100 | 481,564 | |
| Ion Trading Finance Ltd. Tranche B 1LN, term loan 3 month U.S. LIBOR + 4.000% 6.6336% 11/21/24 (b)(c) | 729,209 | 706,158 | |
| KUEHG Corp. Tranche B, term loan 3 month U.S. LIBOR + 3.750% 6.553% 2/21/25 (b)(c) | 709,917 | 700,006 | |
| Laureate Education, Inc. Tranche B 1LN, term loan 3 month U.S. LIBOR + 3.500% 5.9986% 4/26/24 (b)(c) | 2,135,760 | 2,132,300 | |
| Lineage Logistics Holdings, LLC. Tranche B, term loan 3 month U.S. LIBOR + 3.000% 5.493% 2/27/25 (b)(c) | 1,634,854 | 1,584,795 | |
| Qlik Technologies, Inc. Tranche B 1LN, term loan 3 month U.S. LIBOR + 4.250% 4/26/24 (c)(d) | 250,000 | 248,125 | |
| Spin Holdco, Inc. Tranche B, term loan 3 month U.S. LIBOR + 3.250% 6.0289% 11/14/22 (b)(c) | 858,783 | 833,664 | |
| SSH Group Holdings, Inc. Tranche B 1LN, term loan 3 month U.S. LIBOR + 4.250% 6.7486% 7/30/25 (b)(c) | 249,373 | 246,463 | |
| Thomson Reuters IP&S Tranche B, term loan 3 month U.S. LIBOR + 3.250% 5.7468% 10/3/23 (b)(c) | 475,196 | 472,226 | |
| TMK Hawk Parent Corp. Tranche B, term loan 3 month U.S. LIBOR + 3.500% 5.9986% 9/26/24 (b)(c) | 413,745 | 364,613 | |
| WASH Multifamily Acquisition, Inc.: | |||
| Tranche B 1LN, term loan 3 month U.S. LIBOR + 3.250% 5.7486% 5/14/22 (b)(c) | 496,908 | 478,274 | |
| Tranche B 2LN, term loan 3 month U.S. LIBOR + 7.000% 9.4986% 5/14/23 (b)(c) | 195,000 | 187,200 | |
| TOTAL SERVICES | 13,111,455 | ||
| Steel - 0.3% | |||
| JMC Steel Group, Inc. Tranche B, term loan 3 month U.S. LIBOR + 2.250% 4.74% 6/14/21 (b)(c) | 671,609 | 664,557 | |
| Super Retail - 4.2% | |||
| Academy Ltd. Tranche B, term loan 3 month U.S. LIBOR + 4.000% 6.4896% 7/2/22 (b)(c) | 691,846 | 496,053 | |
| Bass Pro Shops LLC. Tranche B, term loan 3 month U.S. LIBOR + 5.000% 7.4986% 9/25/24 (b)(c) | 6,503,005 | 6,346,919 | |
| BJ's Wholesale Club, Inc. Tranche B 1LN, term loan 3 month U.S. LIBOR + 3.000% 5.4989% 2/3/24 (b)(c) | 1,474,080 | 1,468,891 | |
| Burlington Coat Factory Warehouse Corp. Tranche B, term loan 3 month U.S. LIBOR + 2.000% 4.5% 11/17/24 (b)(c) | 360,712 | 357,256 | |
| David's Bridal, Inc. term loan: | |||
| 3 month U.S. LIBOR + 7.500% 10.29% 7/18/23 (b)(c) | 13,485 | 13,620 | |
| 3 month U.S. LIBOR + 8.000% 10.79% 1/18/24 (b)(c) | 53,940 | 46,635 | |
| Harbor Freight Tools U.S.A., Inc. Tranche B, term loan 3 month U.S. LIBOR + 2.500% 4.993% 8/19/23(b)(c) | 581,640 | 567,099 | |
| Party City Holdings, Inc. term loan 3 month U.S. LIBOR + 2.500% 4.9998% 8/19/22 (b)(c) | 428,405 | 424,717 | |
| PETCO Animal Supplies, Inc. Tranche B 1LN, term loan 3 month U.S. LIBOR + 3.250% 5.9944% 1/26/23 (b)(c) | 599,770 | 454,626 | |
| PetSmart, Inc. term loan 3 month U.S. LIBOR + 3.000% 5.49% 3/11/22 (b)(c) | 256,837 | 230,031 | |
| Sports Authority, Inc. Tranche B, term loan 3 month U.S. LIBOR + 6.000% 0% 11/16/17 (c)(e)(f) | 1,202,543 | 1,203 | |
| The Hillman Group, Inc. Tranche B, term loan 3 month U.S. LIBOR + 4.000% 6.4986% 5/31/25 (b)(c) | 467,644 | 445,431 | |
| TOTAL SUPER RETAIL | 10,852,481 | ||
| Technology - 15.3% | |||
| Anastasia Parent LLC Tranche B, term loan 3 month U.S. LIBOR + 3.750% 6.2486% 8/10/25 (b)(c) | 655,705 | 608,166 | |
| Aptean, Inc.: | |||
| 1LN, term loan 3 month U.S. LIBOR + 4.250% 3/29/26 (c)(d) | 250,000 | 249,688 | |
| Tranche 2LN, term loan 3 month U.S. LIBOR + 9.500% 12.11% 12/20/23 (b)(c) | 210,000 | 209,672 | |
| Tranche B 1LN, term loan 3 month U.S. LIBOR + 4.250% 6.86% 12/20/22 (b)(c) | 459,442 | 459,061 | |
| ATS Consolidated, Inc. Tranche B 1LN, term loan 3 month U.S. LIBOR + 3.750% 6.2486% 2/28/25 (b)(c) | 490,050 | 489,589 | |
| Boxer Parent Co., Inc. Tranche B, term loan 3 month U.S. LIBOR + 4.250% 6.851% 10/2/25 (b)(c) | 498,750 | 487,862 | |
| Bracket Intermediate Holding Corp. 1LN, term loan 3 month U.S. LIBOR + 4.250% 6.7319% 9/5/25 (b)(c) | 497,500 | 494,391 | |
| Brave Parent Holdings, Inc. Tranche B 1LN, term loan 3 month U.S. LIBOR + 4.000% 6.4986% 4/19/25 (b)(c) | 248,747 | 245,431 | |
| Ceridian HCM Holding, Inc. Tranche B, term loan 3 month U.S. LIBOR + 3.250% 5.743% 4/30/25 (b)(c) | 995,000 | 991,269 | |
| CommScope, Inc. Tranche B 1LN, term loan 3 month U.S. LIBOR + 3.250% 2/7/26 (c)(d) | 1,335,000 | 1,332,771 | |
| Compuware Corp. 1LN, term loan 3 month U.S. LIBOR + 3.500% 5.9986% 8/23/25 (b)(c) | 458,850 | 458,566 | |
| Cvent, Inc. Tranche B, term loan 3 month U.S. LIBOR + 3.750% 6.243% 11/29/24 (b)(c) | 246,008 | 240,472 | |
| Datto, Inc. 1LN, term loan 3 month U.S. LIBOR + 4.250% 3/29/26 (c)(d) | 250,000 | 250,000 | |
| Dell International LLC Tranche B, term loan 3 month U.S. LIBOR + 2.000% 4.5% 9/7/23 (b)(c) | 347,812 | 343,600 | |
| DG Investment Intermediate Holdings, Inc.: | |||
| Tranche B 1LN, term loan 3 month U.S. LIBOR + 3.000% 5.4986% 2/1/25 (b)(c) | 351,597 | 339,730 | |
| Tranche B 2LN, term loan 3 month U.S. LIBOR + 6.750% 9.2486% 2/1/26 (b)(c) | 135,000 | 129,600 | |
| Digicert Holdings, Inc. Tranche B, term loan: | |||
| 3 month U.S. LIBOR + 4.000% 6.4986% 10/31/24 (b)(c) | 951,009 | 931,988 | |
| 3 month U.S. LIBOR + 8.000% 10.4986% 10/31/25 (b)(c) | 372,000 | 362,235 | |
| Dynatrace LLC: | |||
| 2LN, term loan 3 month U.S. LIBOR + 7.000% 9.493% 8/23/26 (b)(c) | 68,382 | 67,913 | |
| Tranche B 1LN, term loan 3 month U.S. LIBOR + 3.250% 5.7486% 8/23/25 (b)(c) | 327,180 | 325,544 | |
| EagleView Technology Corp. Tranche B 1LN, term loan 3 month U.S. LIBOR + 3.500% 5.9818% 8/14/25 (b)(c) | 593,513 | 576,200 | |
| EIG Investors Corp. Tranche B, term loan 3 month U.S. LIBOR + 3.750% 6.3886% 2/9/23 (b)(c) | 290,351 | 288,536 | |
| Electro Rent Corp. Tranche B 1LN, term loan 3 month U.S. LIBOR + 5.000% 7.7792% 1/31/24 (b)(c) | 192,347 | 192,506 | |
| Epicor Software Corp. Tranche B, term loan 3 month U.S. LIBOR + 3.250% 5.75% 6/1/22 (b)(c) | 668,149 | 659,691 | |
| EPV Merger Sub, Inc.: | |||
| Tranche 2LN, term loan 3 month U.S. LIBOR + 7.250% 9.743% 3/8/26 (b)(c) | 110,000 | 106,150 | |
| Tranche B 1LN, term loan 3 month U.S. LIBOR + 3.250% 5.743% 3/8/25 (b)(c) | 377,150 | 358,176 | |
| EXC Holdings III Corp. Tranche B, term loan: | |||
| 3 month U.S. LIBOR + 3.500% 6.101% 12/2/24 (b)(c) | 633,241 | 629,283 | |
| 3 month U.S. LIBOR + 7.500% 10.3076% 12/1/25 (b)(c) | 250,000 | 249,375 | |
| First Data Corp. Tranche B, term loan 3 month U.S. LIBOR + 2.000% 4.4855% 7/10/22 (b)(c) | 1,807,078 | 1,802,524 | |
| Global Payments, Inc. Tranche B 3LN, term loan 3 month U.S. LIBOR + 1.750% 4.243% 4/22/23 (b)(c) | 379,580 | 375,310 | |
| Go Daddy Operating Co. LLC Tranche B, term loan 3 month U.S. LIBOR + 2.250% 4.743% 2/15/24 (b)(c) | 1,089,183 | 1,080,263 | |
| Hyland Software, Inc.: | |||
| Tranche 2LN, term loan 3 month U.S. LIBOR + 7.000% 9.493% 7/7/25 (b)(c) | 60,000 | 59,675 | |
| Tranche B 1LN, term loan 3 month U.S. LIBOR + 3.500% 5.9986% 7/1/24 (b)(c) | 432,314 | 431,142 | |
| Infor U.S., Inc. Tranche B 6LN, term loan 3 month U.S. LIBOR + 2.750% 5.243% 2/1/22 (b)(c) | 1,217,809 | 1,211,148 | |
| Kronos, Inc.: | |||
| 2LN, term loan 3 month U.S. LIBOR + 8.250% 10.9863% 11/1/24 (b)(c) | 662,000 | 670,692 | |
| Tranche B 1LN, term loan 3 month U.S. LIBOR + 3.000% 5.7363% 11/1/23 (b)(c) | 1,453,319 | 1,438,379 | |
| Landesk Group, Inc. term loan: | |||
| 3 month U.S. LIBOR + 4.250% 6.75% 1/20/24 (b)(c) | 587,390 | 582,620 | |
| 3 month U.S. LIBOR + 9.000% 11.5% 1/20/25 (b)(c) | 500,000 | 480,625 | |
| MA FinanceCo. LLC: | |||
| Tranche B 2LN, term loan 3 month U.S. LIBOR + 2.250% 4.743% 11/20/21 (b)(c) | 148,500 | 144,788 | |
| Tranche B 3LN, term loan: | |||
| 3 month U.S. LIBOR + 2.500% 4.993% 6/21/24 (b)(c) | 1,374,427 | 1,337,318 | |
| 3 month U.S. LIBOR + 2.500% 4.993% 6/21/24 (b)(c) | 195,503 | 190,225 | |
| McAfee LLC Tranche B, term loan: | |||
| 3 month U.S. LIBOR + 3.750% 6.243% 9/29/24 (b)(c) | 970,281 | 968,660 | |
| 3 month U.S. LIBOR + 8.500% 10.993% 9/29/25 (b)(c) | 155,000 | 155,930 | |
| Microchip Technology, Inc. Tranche B, term loan 3 month U.S. LIBOR + 2.000% 4.5% 5/29/25 (b)(c) | 425,498 | 420,286 | |
| NAVEX TopCo, Inc.: | |||
| 2LN, term loan 3 month U.S. LIBOR + 7.000% 9.5% 9/4/26 (b)(c) | 85,000 | 83,088 | |
| Tranche B 1LN, term loan 3 month U.S. LIBOR + 3.250% 5.75% 9/4/25 (b)(c) | 343,275 | 334,587 | |
| Renaissance Holding Corp.: | |||
| Tranche B 1LN, term loan 3 month U.S. LIBOR + 3.250% 5.743% 5/31/25 (b)(c) | 992,500 | 949,574 | |
| Tranche B 2LN, term loan 3 month U.S. LIBOR + 7.000% 9.493% 5/31/26 (b)(c) | 440,000 | 401,865 | |
| Severin Acquisition LLC Tranche B 1LN, term loan 3 month U.S. LIBOR + 3.250% 5.9885% 8/1/25 (b)(c) | 713,213 | 690,925 | |
| Solera LLC Tranche B, term loan 3 month U.S. LIBOR + 2.750% 5.2486% 3/3/23 (b)(c) | 574,978 | 569,590 | |
| Sophia L.P. term loan 3 month U.S. LIBOR + 3.250% 6.053% 9/30/22 (b)(c) | 1,223,541 | 1,214,107 | |
| SS&C Technologies, Inc.: | |||
| Tranche B 1LN, term loan 3 month U.S. LIBOR + 2.250% 4.743% 7/8/22 (b)(c) | 553,198 | 548,015 | |
| Tranche B 3LN, term loan 3 month U.S. LIBOR + 2.250% 4.7486% 4/16/25 (b)(c) | 253,514 | 251,171 | |
| Tranche B 4LN, term loan 3 month U.S. LIBOR + 2.250% 4.7486% 4/16/25 (b)(c) | 182,276 | 180,592 | |
| Tranche B 5LN, term loan 3 month U.S. LIBOR + 2.250% 4.7486% 4/16/25 (b)(c) | 1,691,361 | 1,675,361 | |
| Syniverse Holdings, Inc. Tranche B, term loan 3 month U.S. LIBOR + 5.000% 7.4838% 3/9/23 (b)(c) | 742,003 | 679,674 | |
| Tempo Acquisition LLC Tranche B, term loan 3 month U.S. LIBOR + 3.000% 5.4986% 5/1/24 (b)(c) | 973,172 | 963,197 | |
| TIBCO Software, Inc. Tranche B, term loan 3 month U.S. LIBOR + 3.500% 6% 12/4/20 (b)(c) | 250,219 | 248,968 | |
| TTM Technologies, Inc. Tranche B, term loan 3 month U.S. LIBOR + 2.500% 4.9893% 9/28/24 (b)(c) | 812,607 | 805,497 | |
| Uber Technologies, Inc. Tranche B, term loan: | |||
| 3 month U.S. LIBOR + 3.500% 5.9818% 7/13/23 (b)(c) | 513,683 | 509,404 | |
| 3 month U.S. LIBOR + 4.000% 6.4928% 4/4/25 (b)(c) | 492,768 | 492,644 | |
| Vantiv LLC Tranche B 4LN, term loan 3 month U.S. LIBOR + 1.750% 4.208% 8/9/24 (b)(c) | 739,018 | 736,993 | |
| Veritas U.S., Inc. Tranche B, term loan 3 month U.S. LIBOR + 4.500% 7.0211% 1/27/23 (b)(c) | 214,453 | 198,000 | |
| Verscend Holding Corp. Tranche B, term loan 3 month U.S. LIBOR + 4.500% 6.9986% 8/27/25 (b)(c) | 638,790 | 633,201 | |
| Vertafore, Inc.: | |||
| Tranche B 1LN, term loan 3 month U.S. LIBOR + 3.250% 6.053% 7/2/25 (b)(c) | 1,162,088 | 1,139,671 | |
| Tranche B 2LN, term loan 3 month U.S. LIBOR + 7.250% 9.7486% 7/2/26 (b)(c) | 750,000 | 738,750 | |
| VFH Parent LLC Tranche B 1LN, term loan 3 month U.S. LIBOR + 3.500% 6.1261% 3/1/26 (b)(c) | 870,000 | 871,088 | |
| Web.com Group, Inc.: | |||
| 2LN, term loan 3 month U.S. LIBOR + 7.750% 10.2428% 10/11/26 (b)(c) | 389,714 | 382,894 | |
| Tranche B 1LN, term loan 3 month U.S. LIBOR + 3.750% 6.2428% 10/11/25 (b)(c) | 444,342 | 437,957 | |
| WEX, Inc. Tranche B, term loan 3 month U.S. LIBOR + 2.250% 4.7486% 7/1/23 (b)(c) | 406,468 | 402,115 | |
| TOTAL TECHNOLOGY | 39,565,978 | ||
| Telecommunications - 6.8% | |||
| Altice Financing SA Tranche B, term loan: | |||
| 3 month U.S. LIBOR + 2.750% 5.2338% 7/15/25 (b)(c) | 491,250 | 467,302 | |
| 3 month U.S. LIBOR + 2.750% 5.2406% 1/31/26 (b)(c) | 493,750 | 469,803 | |
| Evo Payments International LLC Tranche B, term loan 3 month U.S. LIBOR + 3.250% 5.75% 12/22/23 (b)(c) | 490,050 | 488,825 | |
| Frontier Communications Corp. Tranche B 1LN, term loan 3 month U.S. LIBOR + 3.750% 6.25% 6/15/24 (b)(c) | 2,326,627 | 2,268,461 | |
| GTT Communications, Inc. Tranche B, term loan 3 month U.S. LIBOR + 2.750% 5.24% 5/31/25 (b)(c) | 992,500 | 933,198 | |
| Intelsat Jackson Holdings SA: | |||
| Tranche B, term loan 3 month U.S. LIBOR + 3.750% 6.2398% 11/27/23 (b)(c) | 2,675,000 | 2,632,361 | |
| Tranche B-4, term loan 3 month U.S. LIBOR + 4.500% 6.9898% 1/2/24 (b)(c) | 1,000,000 | 1,000,750 | |
| Tranche B-5, term loan 6.625% 1/2/24 | 1,525,000 | 1,522,331 | |
| Level 3 Financing, Inc. Tranche B, term loan 3 month U.S. LIBOR + 2.250% 4.7355% 2/22/24 (b)(c) | 916,000 | 904,358 | |
| Neptune Finco Corp. Tranche B, term loan 3 month U.S. LIBOR + 2.250% 4.7338% 7/17/25 (b)(c) | 949,341 | 921,031 | |
| Onvoy LLC Tranche B 1LN, term loan 3 month U.S. LIBOR + 4.500% 7.101% 2/10/24 (b)(c) | 735,000 | 652,313 | |
| Radiate Holdco LLC Tranche B, term loan 3 month U.S. LIBOR + 3.000% 5.493% 2/1/24 (b)(c) | 776,757 | 758,317 | |
| Sable International Finance Ltd. Tranche B 4LN, term loan 3 month U.S. LIBOR + 3.250% 5.7486% 2/2/26 (b)(c) | 1,249,000 | 1,243,542 | |
| Securus Technologies, Inc. Tranche B, term loan: | |||
| 3 month U.S. LIBOR + 4.500% 6.993% 11/1/24 (b)(c) | 489,148 | 485,480 | |
| 3 month U.S. LIBOR + 8.250% 10.743% 11/1/25 (b)(c) | 500,000 | 489,165 | |
| SFR Group SA: | |||
| Tranche B 11LN, term loan 3 month U.S. LIBOR + 2.750% 5.243% 7/31/25 (b)(c) | 24,383 | 22,645 | |
| Tranche B 13LN, term loan 3 month U.S. LIBOR + 4.000% 6.4838% 8/14/26 (b)(c) | 1,246,875 | 1,192,013 | |
| Sprint Communications, Inc.: | |||
| Tranche B 2LN, term loan 3 month U.S. LIBOR + 3.000% 5.5% 2/2/24 (b)(c) | 498,750 | 490,645 | |
| Tranche B, term loan 3 month U.S. LIBOR + 2.500% 5% 2/3/24 (b)(c) | 525,975 | 511,510 | |
| Windstream Services LLC 1LN, term loan 3 month U.S. LIBOR + 2.500% 2/26/21 (c)(d) | 250,000 | 249,298 | |
| TOTAL TELECOMMUNICATIONS | 17,703,348 | ||
| Textiles/Apparel - 0.1% | |||
| ABB Optical Group LLC Tranche B, term loan 3 month U.S. LIBOR + 5.000% 7.4863% 6/15/23 (b)(c) | 409,500 | 386,978 | |
| Transportation Ex Air/Rail - 0.6% | |||
| IBC Capital Ltd.: | |||
| 2LN, term loan 3 month U.S. LIBOR + 7.000% 9.6146% 9/11/24 (b)(c) | 135,000 | 122,850 | |
| Tranche B 1LN, term loan 3 month U.S. LIBOR + 3.750% 6.3646% 9/11/23 (b)(c) | 491,518 | 475,853 | |
| International Seaways Operating Corp. Tranche B, term loan 3 month U.S. LIBOR + 5.500% 8.5% 6/22/22 (b)(c) | 547,416 | 551,522 | |
| Navios Maritime Partners LP Tranche B, term loan 3 month U.S. LIBOR + 5.000% 7.6% 9/14/20 (b)(c) | 502,542 | 498,356 | |
| TOTAL TRANSPORTATION EX AIR/RAIL | 1,648,581 | ||
| Utilities - 2.8% | |||
| Brookfield WEC Holdings, Inc.: | |||
| 2LN, term loan 3 month U.S. LIBOR + 6.750% 9.2486% 8/1/26 (b)(c) | 685,000 | 684,315 | |
| Tranche B 1LN, term loan 3 month U.S. LIBOR + 3.750% 6.2486% 8/1/25 (b)(c) | 1,005,480 | 1,002,273 | |
| Green Energy Partners/Stonewall LLC Tranche B 1LN, term loan 3 month U.S. LIBOR + 5.500% 8.101% 11/13/21 (b)(c) | 852,025 | 841,375 | |
| Houston Fuel Oil Terminal Co. Tranche B 1LN, term loan 3 month U.S. LIBOR + 2.750% 5.25% 6/26/25 (b)(c) | 495,753 | 492,654 | |
| Limetree Bay Terminals LLC term loan 3 month U.S. LIBOR + 4.000% 6.493% 2/15/24 (b)(c) | 370,611 | 357,021 | |
| LMBE-MC HoldCo II LLC Tranche B, term loan 3 month U.S. LIBOR + 4.000% 6.61% 12/3/25 (b)(c) | 249,375 | 248,128 | |
| Moxie Patriot LLC Tranche B, term loan 3 month U.S. LIBOR + 5.750% 8.351% 12/19/20 (b)(c) | 1,082,844 | 1,021,934 | |
| Vertiv Group Corp. Tranche B, term loan 3 month U.S. LIBOR + 4.000% 6.6289% 11/30/23 (b)(c) | 495,510 | 464,541 | |
| Vistra Operations Co. LLC: | |||
| Tranche B 2LN, term loan 3 month U.S. LIBOR + 2.250% 4.7486% 12/14/23 (b)(c) | 733,125 | 726,915 | |
| Tranche B 3LN, term loan 3 month U.S. LIBOR + 2.000% 4.4862% 12/31/25 (b)(c) | 1,553,884 | 1,529,022 | |
| TOTAL UTILITIES | 7,368,178 | ||
| TOTAL BANK LOAN OBLIGATIONS | |||
| (Cost $232,421,266) | 227,089,949 | ||
| Nonconvertible Bonds - 5.5% | |||
| Aerospace - 0.2% | |||
| TransDigm, Inc. 6.25% 3/15/26 (g) | 500,000 | 518,750 | |
| Chemicals - 0.1% | |||
| TPC Group, Inc. 8.75% 12/15/20 (g) | 250,000 | 246,250 | |
| Containers - 0.2% | |||
| Reynolds Group Issuer, Inc./Reynolds Group Issuer LLC/Reynolds Group Issuer (Luxembourg) SA 3 month U.S. LIBOR + 3.500% 6.2873% 7/15/21 (b)(c)(g) | 520,000 | 521,950 | |
| Diversified Financial Services - 0.1% | |||
| Transocean Poseidon Ltd. 6.875% 2/1/27 (g) | 140,000 | 145,600 | |
| Diversified Media - 0.1% | |||
| Clear Channel Worldwide Holdings, Inc. 9.25% 2/15/24 (g) | 300,000 | 318,000 | |
| Energy - 1.2% | |||
| Cheniere Corpus Christi Holdings LLC: | |||
| 5.125% 6/30/27 | 475,000 | 498,156 | |
| 7% 6/30/24 | 500,000 | 564,400 | |
| Consolidated Energy Finance SA: | |||
| 3 month U.S. LIBOR + 3.750% 6.3609% 6/15/22 (b)(c)(g) | 1,000,000 | 996,578 | |
| 6.875% 6/15/25 (g) | 420,000 | 423,150 | |
| Denbury Resources, Inc.: | |||
| 9% 5/15/21 (g) | 150,000 | 145,875 | |
| 9.25% 3/31/22 (g) | 300,000 | 289,500 | |
| EP Energy LLC/Everest Acquisition Finance, Inc. 7.75% 5/15/26 (g) | 290,000 | 236,350 | |
| TOTAL ENERGY | 3,154,009 | ||
| Environmental - 0.0% | |||
| Tervita Escrow Corp. 7.625% 12/1/21 (g) | 80,000 | 79,400 | |
| Gaming - 0.3% | |||
| Stars Group Holdings BV 7% 7/15/26 (g) | 495,000 | 516,038 | |
| Sugarhouse HSP Gaming Prop Mezz LP/Sugarhouse HSP Gaming Finance Corp. 5.875% 5/15/25 (g) | 300,000 | 296,438 | |
| TOTAL GAMING | 812,476 | ||
| Healthcare - 1.2% | |||
| Community Health Systems, Inc. 6.25% 3/31/23 | 465,000 | 436,519 | |
| Tenet Healthcare Corp.: | |||
| 4.625% 7/15/24 | 1,500,000 | 1,503,750 | |
| 5.125% 5/1/25 | 500,000 | 502,525 | |
| Valeant Pharmaceuticals International, Inc.: | |||
| 5.5% 11/1/25 (g) | 235,000 | 239,994 | |
| 9% 12/15/25 (g) | 315,000 | 342,185 | |
| TOTAL HEALTHCARE | 3,024,973 | ||
| Leisure - 0.3% | |||
| Studio City Co. Ltd.: | |||
| 5.875% 11/30/19 (g) | 325,000 | 329,063 | |
| 7.25% 11/30/21 (g) | 500,000 | 517,245 | |
| TOTAL LEISURE | 846,308 | ||
| Paper - 0.1% | |||
| CommScope Finance LLC: | |||
| 5.5% 3/1/24 (g) | 150,000 | 153,419 | |
| 6% 3/1/26 (g) | 150,000 | 155,156 | |
| TOTAL PAPER | 308,575 | ||
| Services - 0.1% | |||
| Brand Energy & Infrastructure Services, Inc. 8.5% 7/15/25 (g) | 250,000 | 224,375 | |
| Technology - 0.2% | |||
| Uber Technologies, Inc. 7.5% 11/1/23 (g) | 500,000 | 521,250 | |
| Telecommunications - 1.1% | |||
| Altice Financing SA 7.5% 5/15/26 (g) | 900,000 | 888,300 | |
| Frontier Communications Corp. 8% 4/1/27 (g) | 675,000 | 696,938 | |
| SFR Group SA: | |||
| 6.25% 5/15/24 (g) | 515,000 | 518,863 | |
| 7.375% 5/1/26 (g) | 855,000 | 837,900 | |
| TOTAL TELECOMMUNICATIONS | 2,942,001 | ||
| Textiles/Apparel - 0.1% | |||
| Eagle Intermediate Global Holding BV 7.5% 5/1/25 (g) | 175,000 | 171,588 | |
| Transportation Ex Air/Rail - 0.2% | |||
| Avolon Holdings Funding Ltd. 5.125% 10/1/23 (g) | 455,000 | 462,963 | |
| TOTAL NONCONVERTIBLE BONDS | |||
| (Cost $14,190,455) | 14,298,468 | ||
| Shares | Value | ||
| Common Stocks - 1.7% | |||
| Chemicals - 0.6% | |||
| LyondellBasell Industries NV Class A | 18,200 | 1,530,256 | |
| Energy - 0.6% | |||
| Expro Holdings U.S., Inc. (e)(h) | 62,178 | 1,119,204 | |
| Expro Holdings U.S., Inc. (e)(g)(h) | 22,818 | 410,724 | |
| TOTAL ENERGY | 1,529,928 | ||
| Publishing/Printing - 0.1% | |||
| Cenveo Corp. (e) | 7,037 | 205,199 | |
| Super Retail - 0.0% | |||
| David's Bridal, Inc. (e) | 1,031 | 536 | |
| Utilities - 0.4% | |||
| TexGen Power LLC (e) | 25,327 | 995,351 | |
| TOTAL COMMON STOCKS | |||
| (Cost $4,504,068) | 4,261,270 | ||
| Other - 0.0% | |||
| Other - 0.0% | |||
| Tribune Co. Claim (e)(h) | |||
| (Cost $29,756) | 30,115 | 30,115 | |
| Money Market Funds - 6.6% | |||
| Fidelity Cash Central Fund, 2.48% (i) | |||
| (Cost $17,035,936) | 17,034,592 | 17,037,999 | |
| TOTAL INVESTMENT IN SECURITIES - 101.6% | |||
| (Cost $268,181,481) | 262,717,801 | ||
| NET OTHER ASSETS (LIABILITIES) - (1.6)% | (4,202,287) | ||
| NET ASSETS - 100% | $258,515,514 |
Legend
(a) Remaining maturities of bank loan obligations may be less than the stated maturities shown as a result of contractual or optional prepayments by the borrower. Such prepayments cannot be predicted with certainty.
(b) Coupon rates for floating and adjustable rate securities reflect the rates in effect at period end.
(c) Coupon is indexed to a floating interest rate which may be multiplied by a specified factor and/or subject to caps or floors.
(d) The coupon rate will be determined upon settlement of the loan after period end.
(e) Level 3 security
(f) Non-income producing - Security is in default.
(g) Security exempt from registration under Rule 144A of the Securities Act of 1933. These securities may be resold in transactions exempt from registration, normally to qualified institutional buyers. At the end of the period, the value of these securities amounted to $11,203,842 or 4.3% of net assets.
(h) Non-income producing
(i) Affiliated fund that is generally available only to investment companies and other accounts managed by Fidelity Investments. The rate quoted is the annualized seven-day yield of the fund at period end. A complete unaudited listing of the fund's holdings as of its most recent quarter end is available upon request. In addition, each Fidelity Central Fund's financial statements are available on the SEC's website or upon request.
Affiliated Central Funds
Information regarding fiscal year to date income earned by the Fund from investments in Fidelity Central Funds is as follows:
| Fund | Income earned |
| Fidelity Cash Central Fund | $231,333 |
| Total | $231,333 |
Amounts in the income column in the above table include any capital gain distributions from underlying funds, which are presented in the corresponding line-item in the Statement of Operations, if applicable.
Investment Valuation
The following is a summary of the inputs used, as of March 31, 2019, involving the Fund's assets and liabilities carried at fair value. The inputs or methodology used for valuing securities may not be an indication of the risk associated with investing in those securities. For more information on valuation inputs, and their aggregation into the levels used below, please refer to the Investment Valuation section in the accompanying Notes to Financial Statements.
| Valuation Inputs at Reporting Date: | ||||
| Description | Total | Level 1 | Level 2 | Level 3 |
| Investments in Securities: | ||||
| Equities: | ||||
| Consumer Discretionary | $536 | $-- | $-- | $536 |
| Energy | 1,529,928 | -- | -- | 1,529,928 |
| Industrials | 205,199 | -- | -- | 205,199 |
| Materials | 1,530,256 | 1,530,256 | -- | -- |
| Utilities | 995,351 | -- | -- | 995,351 |
| Bank Loan Obligations | 227,089,949 | -- | 225,944,783 | 1,145,166 |
| Corporate Bonds | 14,298,468 | -- | 14,298,468 | -- |
| Other | 30,115 | -- | -- | 30,115 |
| Money Market Funds | 17,037,999 | 17,037,999 | -- | -- |
| Total Investments in Securities: | $262,717,801 | $18,568,255 | $240,243,251 | $3,906,295 |
The following is a reconciliation of Investments in Securities and Derivative Instruments for which Level 3 inputs were used in determining value:
| Investments in Securities: | |
| Beginning Balance | $3,498,554 |
| Net Realized Gain (Loss) on Investment Securities | 286 |
| Net Unrealized Gain (Loss) on Investment Securities | (395,707) |
| Cost of Purchases | 1,141,386 |
| Proceeds of Sales | (40,707) |
| Amortization/Accretion | 140 |
| Transfers into Level 3 | 1,243 |
| Transfers out of Level 3 | (298,900) |
| Ending Balance | $3,906,295 |
| The change in unrealized gain (loss) for the period attributable to Level 3 securities held at March 31, 2019 | $(395,707) |
The information used in the above reconciliation represents fiscal year to date activity for any Investments in Securities identified as using Level 3 inputs at either the beginning or the end of the current fiscal period. Transfers in or out of Level 3 represent the beginning value of any Security or Instrument where a change in the pricing level occurred from the beginning to the end of the period. The cost of purchases and the proceeds of sales may include securities received or delivered through corporate actions or exchanges. Realized and unrealized gains (losses) disclosed in the reconciliation are included in Net Gain (Loss) on the Fund's Statement of Operations.
Other Information
Distribution of investments by country or territory of incorporation, as a percentage of Total Net Assets, is as follows (Unaudited):
| United States of America | 88.0% |
| Luxembourg | 5.6% |
| Netherlands | 1.3% |
| Cayman Islands | 1.2% |
| Canada | 1.0% |
| France | 1.0% |
| Others (Individually Less Than 1%) | 1.9% |
| 100.0% |
See accompanying notes which are an integral part of the financial statements.
Financial Statements
Statement of Assets and Liabilities
| March 31, 2019 (Unaudited) | ||
| Assets | ||
| Investment in securities, at value — See accompanying schedule: Unaffiliated issuers (cost $251,145,545) | $245,679,802 | |
| Fidelity Central Funds (cost $17,035,936) | 17,037,999 | |
| Total Investment in Securities (cost $268,181,481) | $262,717,801 | |
| Receivable for investments sold | 2,262,257 | |
| Receivable for fund shares sold | 56,492 | |
| Interest receivable | 1,728,571 | |
| Distributions receivable from Fidelity Central Funds | 33,615 | |
| Total assets | 266,798,736 | |
| Liabilities | ||
| Payable for investments purchased | $7,925,360 | |
| Payable for fund shares redeemed | 351,718 | |
| Other payables and accrued expenses | 6,144 | |
| Total liabilities | 8,283,222 | |
| Net Assets | $258,515,514 | |
| Net Assets consist of: | ||
| Paid in capital | $286,727,211 | |
| Total distributable earnings (loss) | (28,211,697) | |
| Net Assets, for 27,887,086 shares outstanding | $258,515,514 | |
| Net Asset Value, offering price and redemption price per share ($258,515,514 ÷ 27,887,086 shares) | $9.27 |
See accompanying notes which are an integral part of the financial statements.
Statement of Operations
| Six months ended March 31, 2019 (Unaudited) | ||
| Investment Income | ||
| Dividends | $135,433 | |
| Interest | 8,685,081 | |
| Income from Fidelity Central Funds | 231,333 | |
| Total income | 9,051,847 | |
| Expenses | ||
| Custodian fees and expenses | $8,153 | |
| Independent trustees' fees and expenses | 1,085 | |
| Commitment fees | 712 | |
| Total expenses before reductions | 9,950 | |
| Expense reductions | (8,641) | |
| Total expenses after reductions | 1,309 | |
| Net investment income (loss) | 9,050,538 | |
| Realized and Unrealized Gain (Loss) | ||
| Net realized gain (loss) on: | ||
| Investment securities: | ||
| Unaffiliated issuers | (3,245,350) | |
| Fidelity Central Funds | 1,051 | |
| Total net realized gain (loss) | (3,244,299) | |
| Change in net unrealized appreciation (depreciation) on: | ||
| Investment securities: | ||
| Unaffiliated issuers | (3,147,468) | |
| Fidelity Central Funds | (1,052) | |
| Total change in net unrealized appreciation (depreciation) | (3,148,520) | |
| Net gain (loss) | (6,392,819) | |
| Net increase (decrease) in net assets resulting from operations | $2,657,719 |
See accompanying notes which are an integral part of the financial statements.
Statement of Changes in Net Assets
| Six months ended March 31, 2019 (Unaudited) | Year ended September 30, 2018 | |
| Increase (Decrease) in Net Assets | ||
| Operations | ||
| Net investment income (loss) | $9,050,538 | $25,915,481 |
| Net realized gain (loss) | (3,244,299) | (3,298,132) |
| Change in net unrealized appreciation (depreciation) | (3,148,520) | 3,190,802 |
| Net increase (decrease) in net assets resulting from operations | 2,657,719 | 25,808,151 |
| Distributions to shareholders | (11,707,415) | – |
| Distributions to shareholders from net investment income | – | (24,422,695) |
| Total distributions | (11,707,415) | (24,422,695) |
| Share transactions | ||
| Proceeds from sales of shares | 9,663,033 | 28,880,712 |
| Reinvestment of distributions | 11,707,412 | 24,422,002 |
| Cost of shares redeemed | (215,008,116) | (42,421,637) |
| Net increase (decrease) in net assets resulting from share transactions | (193,637,671) | 10,881,077 |
| Total increase (decrease) in net assets | (202,687,367) | 12,266,533 |
| Net Assets | ||
| Beginning of period | 461,202,881 | 448,936,348 |
| End of period | $258,515,514 | $461,202,881 |
| Other Information | ||
| Undistributed net investment income end of period | $3,453,216 | |
| Shares | ||
| Sold | 1,037,487 | 3,037,422 |
| Issued in reinvestment of distributions | 1,265,476 | 2,569,288 |
| Redeemed | (22,854,614) | (4,465,093) |
| Net increase (decrease) | (20,551,651) | 1,141,617 |
See accompanying notes which are an integral part of the financial statements.
Financial Highlights
Fidelity Series Floating Rate High Income Fund
| Six months ended (Unaudited) March 31, | Years endedSeptember 30, | |||||
| 2019 | 2018 | 2017 | 2016 | 2015 | 2014 | |
| Selected Per–Share Data | ||||||
| Net asset value, beginning of period | $9.52 | $9.49 | $9.42 | $9.46 | $10.33 | $10.58 |
| Income from Investment Operations | ||||||
| Net investment income (loss)A | .269 | .540 | .445 | .438 | .457 | .468 |
| Net realized and unrealized gain (loss) | (.148) | (.001) | .053 | (.028) | (.534) | .002 |
| Total from investment operations | .121 | .539 | .498 | .410 | (.077) | .470 |
| Distributions from net investment income | (.371) | (.509) | (.428) | (.450) | (.434) | (.439) |
| Distributions from net realized gain | – | – | – | – | (.359) | (.281) |
| Total distributions | (.371) | (.509) | (.428) | (.450) | (.793) | (.720) |
| Net asset value, end of period | $9.27 | $9.52 | $9.49 | $9.42 | $9.46 | $10.33 |
| Total ReturnB,C | 1.35% | 5.82% | 5.38% | 4.59% | (.80)% | 4.58% |
| Ratios to Average Net AssetsD,E | ||||||
| Expenses before reductions | .01%F | .01% | .49% | .75% | .72% | .72% |
| Expenses net of fee waivers, if any | .01%F | .01% | .49% | .75% | .72% | .72% |
| Expenses net of all reductions | - %F,G | - %G | .48% | .75% | .72% | .72% |
| Net investment income (loss) | 5.80%F | 5.68% | 4.71% | 4.78% | 4.61% | 4.46% |
| Supplemental Data | ||||||
| Net assets, end of period (000 omitted) | $258,516 | $461,203 | $448,936 | $203,368 | $205,782 | $430,191 |
| Portfolio turnover rateH | 32%F | 52% | 75% | 46% | 42% | 61% |
A Calculated based on average shares outstanding during the period.
B Total returns for periods of less than one year are not annualized.
C Total returns would have been lower if certain expenses had not been reduced during the applicable periods shown.
D Fees and expenses of any underlying Fidelity Central Funds are not included in the Fund's expense ratio. The Fund indirectly bears its proportionate share of the expenses of any underlying Fidelity Central Funds.
E Expense ratios reflect operating expenses of the Fund. Expenses before reductions do not reflect amounts reimbursed by the investment adviser or reductions from brokerage service arrangements or reductions from other expense offset arrangements and do not represent the amount paid by the Fund during periods when reimbursements or reductions occur. Expenses net of fee waivers reflect expenses after reimbursement by the investment adviser but prior to reductions from brokerage service arrangements or other expense offset arrangements. Expenses net of all reductions represent the net expenses paid by the Fund.
F Annualized
G Amount represents less than .005%.
H Amount does not include the portfolio activity of any underlying Fidelity Central Funds.
See accompanying notes which are an integral part of the financial statements.
Notes to Financial Statements (Unaudited)
For the period ended March 31, 2019
1. Organization.
Fidelity Series Floating Rate High Income Fund (the Fund) is a fund of Fidelity Summer Street Trust (the Trust) and is authorized to issue an unlimited number of shares. Shares of the Fund are only available for purchase by mutual funds for which Fidelity Management & Research Company (FMR) or an affiliate serves as an investment manager. The Trust is registered under the Investment Company Act of 1940, as amended (the 1940 Act), as an open-end management investment company organized as a Massachusetts business trust.
2. Investments in Fidelity Central Funds.
The Fund invests in Fidelity Central Funds, which are open-end investment companies generally available only to other investment companies and accounts managed by the investment adviser and its affiliates. The Fund's Schedule of Investments lists each of the Fidelity Central Funds held as of period end, if any, as an investment of the Fund, but does not include the underlying holdings of each Fidelity Central Fund. As an Investing Fund, the Fund indirectly bears its proportionate share of the expenses of the underlying Fidelity Central Funds.
The Money Market Central Funds seek preservation of capital and current income and are managed by Fidelity Investments Money Management, Inc. (FIMM), an affiliate of the investment adviser. Annualized expenses of the Money Market Central Funds as of their most recent shareholder report date are less than .005%.
A complete unaudited list of holdings for each Fidelity Central Fund is available upon request or at the Securities and Exchange Commission (the SEC) website at www.sec.gov. In addition, the financial statements of the Fidelity Central Funds are available on the SEC website or upon request.
3. Significant Accounting Policies.
The Fund is an investment company and applies the accounting and reporting guidance of the Financial Accounting Standards Board (FASB) Accounting Standards Codification Topic 946 Financial Services – Investments Companies. The financial statements have been prepared in conformity with accounting principles generally accepted in the United States of America (GAAP), which require management to make certain estimates and assumptions at the date of the financial statements. Actual results could differ from those estimates. Subsequent events, if any, through the date that the financial statements were issued have been evaluated in the preparation of the financial statements. The following summarizes the significant accounting policies of the Fund:
Investment Valuation. Investments are valued as of 4:00 p.m. Eastern time on the last calendar day of the period. The Board of Trustees (the Board) has delegated the day to day responsibility for the valuation of the Fund's investments to the Fair Value Committee (the Committee) established by the Fund's investment adviser. In accordance with valuation policies and procedures approved by the Board, the Fund attempts to obtain prices from one or more third party pricing vendors or brokers to value its investments. When current market prices, quotations or currency exchange rates are not readily available or reliable, investments will be fair valued in good faith by the Committee, in accordance with procedures adopted by the Board. Factors used in determining fair value vary by investment type and may include market or investment specific events, changes in interest rates and credit quality. The frequency with which these procedures are used cannot be predicted and they may be utilized to a significant extent. The Committee oversees the Fund's valuation policies and procedures and reports to the Board on the Committee's activities and fair value determinations. The Board monitors the appropriateness of the procedures used in valuing the Fund's investments and ratifies the fair value determinations of the Committee.
The Fund categorizes the inputs to valuation techniques used to value its investments into a disclosure hierarchy consisting of three levels as shown below:
- Level 1 – quoted prices in active markets for identical investments
- Level 2 – other significant observable inputs (including quoted prices for similar investments, interest rates, prepayment speeds, etc.)
- Level 3 – unobservable inputs (including the Fund's own assumptions based on the best information available)
Valuation techniques used to value the Fund's investments by major category are as follows:
Debt securities, including restricted securities, are valued based on evaluated prices received from third party pricing vendors or from brokers who make markets in such securities. Corporate bonds and bank loan obligations are valued by pricing vendors who utilize matrix pricing which considers yield or price of bonds of comparable quality, coupon, maturity and type or by broker-supplied prices. When independent prices are unavailable or unreliable, debt securities may be valued utilizing pricing methodologies which consider similar factors that would be used by third party pricing vendors. Debt securities are generally categorized as Level 2 in the hierarchy but may be Level 3 depending on the circumstances. The Fund invests a significant portion of its assets in below investment grade securities. The value of these securities can be more volatile due to changes in the credit quality of the issuer and is sensitive to changes in economic, market and regulatory conditions.
Equity securities, including restricted securities, for which market quotations are readily available, are valued at the last reported sale price or official closing price as reported by a third party pricing vendor on the primary market or exchange on which they are traded and are categorized as Level 1 in the hierarchy. In the event there were no sales during the day or closing prices are not available, securities are valued at the last quoted bid price or may be valued using the last available price and are generally categorized as Level 2 in the hierarchy. For foreign equity securities, when market or security specific events arise, comparisons to the valuation of American Depositary Receipts (ADRs), futures contracts, Exchange-Traded Funds (ETFs) and certain indexes as well as quoted prices for similar securities may be used and would be categorized as Level 2 in the hierarchy. For equity securities, including restricted securities, where observable inputs are limited, assumptions about market activity and risk are used and these securities may be categorized as Level 3 in the hierarchy.
Investments in open-end mutual funds, including the Fidelity Central Funds, are valued at their closing net asset value (NAV) each business day and are categorized as Level 1 in the hierarchy.
The following provides information on Level 3 securities held by the Fund that were valued at period end based on unobservable inputs. These amounts exclude valuations provided by a broker.
| Asset Type | Fair Value | Valuation Technique(s) | Unobservable Input | Amount or Range/Weighted Average | Impact to Valuation from an Increase in Input(a) |
| Equities | $2,731,014 | Market Comparable | Book value multiple | 1.0 | Increase |
| Enterprise value/EBITDA multiple (EV/EBITDA) | 7.2% | Increase | |||
| Discount rate | 10.0% | Decrease | |||
| Market approach | Parity price | $0.52 - $29.16 / $29.09 | Increase | ||
| Broker quoted | Bid price | $18.00 | Increase | ||
| Bank Loan Obligations | $736,876 | Broker quoted | Evaluated bid | $95.00 - $99.88 / $98.30 | Increase |
| Other | $30,115 | Recovery value | Recovery Value | 1.0% | Increase |
(a) Represents the directional change in the fair value of the Level 3 investments that could have resulted from an increase in the corresponding input as of period end. A decrease to the unobservable input would have had the opposite effect. Significant changes in these inputs may have resulted in a significantly higher or lower fair value measurement at period end.
Changes in valuation techniques may result in transfers in or out of an assigned level within the disclosure hierarchy. The aggregate value of investments by input level as of March 31, 2019, as well as a roll forward of Level 3 investments, is included at the end of the Fund's Schedule of Investments.
Investment Transactions and Income. For financial reporting purposes, the Fund's investment holdings and NAV include trades executed through the end of the last business day of the period. The NAV per share for processing shareholder transactions is calculated as of the close of business of the New York Stock Exchange (NYSE), normally 4:00 p.m. Eastern time and includes trades executed through the end of the prior business day. Gains and losses on securities sold are determined on the basis of identified cost. Dividend income is recorded on the ex-dividend date, except for certain dividends from foreign securities where the ex-dividend date may have passed, which are recorded as soon as the Fund is informed of the ex-dividend date. Non-cash dividends included in dividend income, if any, are recorded at the fair market value of the securities received. Income and capital gain distributions from Fidelity Central Funds, if any, are recorded on the ex-dividend date. Certain distributions received by the Fund represent a return of capital or capital gain. The Fund determines the components of these distributions subsequent to the ex-dividend date, based upon receipt of tax filings or other correspondence relating to the underlying investment. These distributions are recorded as a reduction of cost of investments and/or as a realized gain. Interest income is accrued as earned and includes coupon interest and amortization of premium and accretion of discount on debt securities as applicable. Debt obligations may be placed on non-accrual status and related interest income may be reduced by ceasing current accruals and writing off interest receivables when the collection of all or a portion of interest has become doubtful based on consistently applied procedures. A debt obligation is removed from non-accrual status when the issuer resumes interest payments or when collectability of interest is reasonably assured. The Fund earns certain fees in connection with its floating rate loan purchasing activities. These fees are in addition to interest payments earned and may include amendment fees, consent fees and prepayment fees. These fees are recorded as Interest in the accompanying financial statements.
Expenses. Expenses directly attributable to a fund are charged to that fund. Expenses attributable to more than one fund are allocated among the respective funds on the basis of relative net assets or other appropriate methods. Expense estimates are accrued in the period to which they relate and adjustments are made when actual amounts are known.
Income Tax Information and Distributions to Shareholders. Each year, the Fund intends to qualify as a regulated investment company under Subchapter M of the Internal Revenue Code, including distributing substantially all of its taxable income and realized gains. As a result, no provision for U.S. Federal income taxes is required. The Fund files a U.S. federal tax return, in addition to state and local tax returns as required. The Fund's federal income tax returns are subject to examination by the Internal Revenue Service (IRS) for a period of three fiscal years after they are filed. State and local tax returns may be subject to examination for an additional fiscal year depending on the jurisdiction.
Distributions are declared and recorded daily and paid monthly from net investment income. Distributions from realized gains, if any, are declared and recorded on the ex-dividend date. Income and capital gain distributions are determined in accordance with income tax regulations, which may differ from GAAP.
Capital accounts within the financial statements are adjusted for permanent book-tax differences. These adjustments have no impact on net assets or the results of operations. Capital accounts are not adjusted for temporary book-tax differences which will reverse in a subsequent period.
Book-tax differences are primarily due to market discount, capital loss carryforwards and losses deferred due to wash sales.
As of period end, the cost and unrealized appreciation (depreciation) in securities, and derivatives if applicable, for federal income tax purposes were as follows:
| Gross unrealized appreciation | $2,639,420 |
| Gross unrealized depreciation | (7,192,824) |
| Net unrealized appreciation (depreciation) | $(4,553,404) |
| Tax cost | $267,271,205 |
Capital loss carryforwards are only available to offset future capital gains of the Fund to the extent provided by regulations and may be limited. Under the Regulated Investment Company Modernization Act of 2010 (the Act), the Fund is permitted to carry forward capital losses incurred in taxable years beginning after December 22, 2010 for an unlimited period and such capital losses are required to be used prior to any losses that expire. The capital loss carryforward information presented below, including any applicable limitation, is estimated as of prior fiscal period end and is subject to adjustment.
| No expiration | |
| Short-term | $(850,068) |
| Long-term | (19,421,174) |
| Total capital loss carryforward | $(20,271,242) |
Restricted Securities. The Fund may invest in securities that are subject to legal or contractual restrictions on resale. These securities generally may be resold in transactions exempt from registration or to the public if the securities are registered. Disposal of these securities may involve time-consuming negotiations and expense, and prompt sale at an acceptable price may be difficult. Information regarding restricted securities is included at the end of the Fund's Schedule of Investments.
Loans and Other Direct Debt Instruments. The Fund invests in direct debt instruments which are interests in amounts owed to lenders by corporate or other borrowers. These instruments may be in the form of loans, trade claims or other receivables and may include standby financing commitments such as revolving credit facilities that obligate the Fund to supply additional cash to the borrower on demand. Loans may be acquired through assignment or participation. The fund did not have any unfunded loan commitments, which are contractual obligations for future funding, at period end.
New Rule Issuance. During August 2018, the U.S. Securities and Exchange Commission issued Final Rule Release No. 33-10532, Disclosure Update and Simplification. This Final Rule includes amendments specific to registered investment companies that are intended to eliminate overlap in disclosure requirements between Regulation S-X and GAAP. In accordance with these amendments, certain line-items in the Fund's financial statements have been combined or removed for the current period as outlined in the table below.
| Financial Statement | Current Line-Item Presentation (As Applicable) | Prior Line-Item Presentation (As Applicable) |
| Statement of Assets and Liabilities | Total distributable earnings (loss) | Undistributed/Distributions in excess of/Accumulated net investment income (loss) Accumulated/Undistributed net realized gain (loss) Net unrealized appreciation (depreciation) |
| Statement of Changes in Net Assets | N/A - removed | Undistributed/Distributions in excess of/Accumulated net investment income (loss) end of period |
| Statement of Changes in Net Assets | Distributions to shareholders | Distributions to shareholders from net investment income Distributions to shareholders from net realized gain |
4. Purchase and Sales of Investments.
Purchases and sales of securities (including principal repayments of bank loan obligations), other than short-term securities, aggregated $47,903,174 and $240,170,865, respectively.
5. Fees and Other Transactions with Affiliates.
Management Fee. Fidelity Management & Research Company (the investment adviser) and its affiliates provide the Fund with investment management related services for which the Fund does not pay a management fee. Under the management contract, the investment adviser or an affiliate pays all ordinary operating expenses of the Fund, except custody fees, fees and expenses of the independent Trustees, and certain miscellaneous expenses such as proxy and shareholder meeting expenses.
Interfund Trades. The Fund may purchase from or sell securities to other Fidelity Funds under procedures adopted by the Board. The procedures have been designed to ensure these interfund trades are executed in accordance with Rule 17a-7 of the 1940 Act. Interfund trades are included within the respective purchases and sales amounts shown in the Purchases and Sales of Investments note.
6. Committed Line of Credit.
The Fund participates with other funds managed by the investment adviser or an affiliate in a $4.25 billion credit facility (the "line of credit") to be utilized for temporary or emergency purposes to fund shareholder redemptions or for other short-term liquidity purposes. The Fund has agreed to pay commitment fees on its pro-rata portion of the line of credit, which amounted to $712 and is reflected in Commitment fees on the Statement of Operations. During the period, the Fund did not borrow on this line of credit.
7. Expense Reductions.
Through arrangements with the Fund's custodian, credits realized as a result of certain uninvested cash balances were used to reduce the Fund's expenses. During the period, these credits reduced the Fund's expenses by $8,641.
8. Other.
The Fund's organizational documents provide former and current trustees and officers with a limited indemnification against liabilities arising in connection with the performance of their duties to the Fund. In the normal course of business, the Fund may also enter into contracts that provide general indemnifications. The Fund's maximum exposure under these arrangements is unknown as this would be dependent on future claims that may be made against the Fund. The risk of material loss from such claims is considered remote.
At the end of the period, mutual funds managed by the investment adviser or its affiliates were the owners of record of all of the outstanding shares of the Fund.
Shareholder Expense Example
As a shareholder of the Fund, you incur two types of costs: (1) transaction costs and (2) ongoing costs, including other Fund expenses. This Example is intended to help you understand your ongoing costs (in dollars) of investing in the Fund and to compare these costs with the ongoing costs of investing in other mutual funds.
The Example is based on an investment of $1,000 invested at the beginning of the period and held for the entire period (October 1, 2018 to March 31, 2019).
Actual Expenses
The first line of the accompanying table provides information about actual account values and actual expenses. You may use the information in this line, together with the amount you invested, to estimate the expenses that you paid over the period. Simply divide your account value by $1,000.00 (for example, an $8,600 account value divided by $1,000.00 = 8.6), then multiply the result by the number in the first line under the heading entitled "Expenses Paid During Period" to estimate the expenses you paid on your account during this period. In addition, the Fund, as a shareholder in the underlying Fidelity Central Funds, will indirectly bear its pro-rata share of the fees and expenses incurred by the underlying Fidelity Central Funds. These fees and expenses are not included in the Fund's annualized expense ratio used to calculate the expense estimate in the table below.
Hypothetical Example for Comparison Purposes
The second line of the accompanying table provides information about hypothetical account values and hypothetical expenses based on the Fund's actual expense ratio and an assumed rate of return of 5% per year before expenses, which is not the Fund's actual return. The hypothetical account values and expenses may not be used to estimate the actual ending account balance or expenses you paid for the period. You may use this information to compare the ongoing costs of investing in the Fund and other funds. To do so, compare this 5% hypothetical example with the 5% hypothetical examples that appear in the shareholder reports of the other funds. In addition, the Fund, as a shareholder in the underlying Fidelity Central Funds, will indirectly bear its pro-rata share of the fees and expenses incurred by the underlying Fidelity Central Funds. These fees and expenses are not included in the Fund's annualized expense ratio used to calculate the expense estimate in the table below.
Please note that the expenses shown in the table are meant to highlight your ongoing costs only and do not reflect any transaction costs. Therefore, the second line of the table is useful in comparing ongoing costs only, and will not help you determine the relative total costs of owning different funds.
| Annualized Expense Ratio-A | Beginning Account Value October 1, 2018 | Ending Account Value March 31, 2019 | Expenses Paid During Period-B October 1, 2018 to March 31, 2019 | |
| Actual | .01% | $1,000.00 | $1,013.50 | $.05 |
| Hypothetical-C | $1,000.00 | $1,024.88 | $.05 |
A Annualized expense ratio reflects expenses net of applicable fee waivers.
B Expenses are equal to the Fund's annualized expense ratio, multiplied by the average account value over the period, multiplied by 182/365 (to reflect the one-half year period).
C 5% return per year before expenses
Board Approval of Investment Advisory Contracts and Management Fees
Fidelity Series Floating Rate High Income Fund
Each year, the Board of Trustees, including the Independent Trustees (together, the Board), votes on the renewal of the management contract with Fidelity Management & Research Company (FMR) and the sub-advisory agreements (together, the Advisory Contracts) for the fund. FMR and the sub-advisers are referred to herein as the Investment Advisers. The Board, assisted by the advice of fund counsel and Independent Trustees' counsel, requests and considers a broad range of information relevant to the renewal of the Advisory Contracts throughout the year.
The Board meets regularly and, at each of its meetings, covers an extensive agenda of topics and materials and considers factors that are relevant to its annual consideration of the renewal of the fund's Advisory Contracts, including the services and support provided to the fund and its shareholders. The Board has established various standing committees (Committees), each composed of and chaired by Independent Trustees with varying backgrounds, to which the Board has assigned specific subject matter responsibilities in order to enhance effective decision-making by the Board. The Board, acting directly and through its Committees, requests and receives information concerning the annual consideration of the renewal of the fund's Advisory Contracts. The Board also meets as needed to review matters specifically related to the Board's annual consideration of the renewal of the Advisory Contracts. Members of the Board may also meet with trustees of other Fidelity funds through joint ad hoc committees to discuss certain matters relevant to all of the Fidelity funds.
At its January 2019 meeting, the Board unanimously determined to renew the fund's Advisory Contracts. In considering whether to renew the Advisory Contracts for the fund, the Board considered all factors it believed relevant and reached a determination, with the assistance of fund counsel and Independent Trustees' counsel and through the exercise of its business judgment, that the renewal of the Advisory Contracts was in the best interests of the fund and its shareholders and the fact that no fee is payable under the management contract was fair and reasonable.
Nature, Extent, and Quality of Services Provided. The Board considered Fidelity's staffing as it relates to the fund, including the backgrounds of investment personnel of Fidelity, and also considered the fund's investment objective, strategies, and related investment philosophy. The Independent Trustees also had discussions with senior management of Fidelity's investment operations and investment groups. The Board considered the structure of the investment personnel compensation program and whether this structure provides appropriate incentives to act in the best interests of the fund.Resources Dedicated to Investment Management and Support Services. The Board and the Fund Oversight and Research Committees reviewed the general qualifications and capabilities of Fidelity's investment staff, including its size, education, experience, and resources, as well as Fidelity's approach to recruiting, training, managing, and compensating investment personnel. The Board noted that Fidelity has continued to increase the resources devoted to non-U.S. offices, including expansion of Fidelity's global investment organization. The Board also noted that Fidelity's analysts have extensive resources, tools and capabilities that allow them to conduct sophisticated quantitative and fundamental analysis, as well as credit analysis of issuers, counterparties and guarantors. Further, the Board considered that Fidelity's investment professionals have sufficient access to global information and data so as to provide competitive investment results over time, and that those professionals also have access to sophisticated tools that permit them to assess portfolio construction and risk and performance attribution characteristics continuously, as well as to transmit new information and research conclusions rapidly around the world. Additionally, in its deliberations, the Board considered Fidelity's trading, risk management, compliance, and technology and operations capabilities and resources, which are integral parts of the investment management process.Administrative Services. The Board considered (i) the nature, extent, quality, and cost of advisory and administrative services performed by the Investment Advisers and their affiliates under the Advisory Contracts and under separate agreements covering transfer agency, pricing and bookkeeping, and securities lending services for the fund; (ii) the nature and extent of the supervision of third party service providers, principally custodians, subcustodians, and pricing vendors; and (iii) the resources devoted to, and the record of compliance with, the fund's compliance policies and procedures. The Board also reviewed the allocation of fund brokerage, including allocations to brokers affiliated with the Investment Advisers, the use of brokerage commissions to pay fund expenses, and the use of "soft" commission dollars to pay for research services.Investment Performance. The Board considered whether the fund has operated in accordance with its investment objective, as well as its record of compliance with its investment restrictions. The Board reviewed the fund's absolute investment performance, as well as the fund's relative investment performance, but did not consider performance to be a material factor in its decision to renew the fund's Advisory Contracts, as the fund is not publicly offered as a stand-alone investment product. In this regard, the Board noted that the fund is designed to offer an investment option for other investment companies managed by Fidelity and ultimately to enhance the performance of those investment companies.Based on its review, the Board concluded that the nature, extent, and quality of services provided to the fund under the Advisory Contracts should continue to benefit the shareholders of the fund.Competitiveness of Management Fee and Total Expense Ratio. The Board considered that the fund does not pay FMR a management fee for investment advisory services. The Board also noted that FMR or an affiliate undertakes to pay all operating expenses of the fund with certain exceptions.In connection with the renewal of the Advisory Contracts, the Board also approved amendments to the management contract for the fund to clarify that the fund pays its non-operating expenses, including brokerage commissions and fees and expenses associated with the fund's securities lending program. The Board considered that the amendments would not change the services provided to the fund or the party responsible for making such payments under the current management contract.The Board further considered that FMR has contractually agreed to reimburse the fund to the extent that total operating expenses, with certain exceptions, as a percentage of its average net assets, exceed 0.014% through November 30, 2020.Based on its review, the Board considered that the fund does not pay a management fee and concluded that the total expense ratio of each class of the fund was reasonable in light of the services that the fund and its shareholders receive and the other factors considered.Costs of the Services and Profitability. The Board considered the level of Fidelity's profits in respect of all the Fidelity funds.PricewaterhouseCoopers LLP (PwC), auditor to Fidelity and certain Fidelity funds, has been engaged annually by the Board as part of the Board's assessment of Fidelity's profitability analysis. PwC's engagement includes the review and assessment of the methodologies used by Fidelity in determining the revenues and expenses attributable to Fidelity's mutual fund business, and completion of agreed-upon procedures in respect of the mathematical accuracy of the fund profitability information and its conformity to established allocation methodologies. After considering PwC's reports issued under the engagement and information provided by Fidelity, the Board concluded that while other allocation methods may also be reasonable, Fidelity's profitability methodologies are reasonable in all material respects.The Board also reviewed Fidelity's non-fund businesses and potential indirect benefits such businesses may have received as a result of their association with Fidelity's mutual fund business (i.e., fall-out benefits) as well as cases where Fidelity's affiliates may benefit from the fund's business. The Board noted that changes to fall-out benefits year-over-year reflect business developments at Fidelity's various businesses.The Board concluded that the costs of the services provided by and the profits realized by Fidelity in connection with the operation of the fund were not relevant to the renewal of the Advisory Contracts because the fund pays no advisory fees and FMR or an affiliate bears all expenses of the fund with certain exceptions.Economies of Scale. The Board concluded that because the fund pays no advisory fees and FMR or an affiliate bears all expenses of the fund with certain exceptions, the realization of economies of scale was not a material factor in the Board's decision to renew the fund's Advisory Contracts.Additional Information Requested by the Board. In order to develop fully the factual basis for consideration of the Fidelity funds' advisory contracts, the Board requested and received additional information on certain topics, including: (i) fund performance trends, in particular the underperformance of certain funds, and Fidelity's long-term strategies for certain funds; (ii) Fidelity's fund profitability methodology, profitability trends for certain funds, and the impact of certain factors on fund profitability results; (iii) metrics for evaluating index fund and ETF performance and information about ETF trading characteristics; (iv) the methodology with respect to the evaluation of competitive fund data and peer group classifications and fee comparisons; (v) the expense structures for different funds and classes; (vi) information regarding other accounts managed by Fidelity, including collective investment trusts; and (vii) Fidelity's philosophies and strategies for evaluating funds and classes with lower or declining asset levels.Based on its evaluation of all of the conclusions noted above, and after considering all factors it believed relevant, the Board concluded that the advisory fee arrangements are fair and reasonable, and that the fund's Advisory Contracts should be renewed.![]()
SFR-SANN-0519
1.924293.107
Item 2.
Code of Ethics
Not applicable.
Item 3.
Audit Committee Financial Expert
Not applicable.
Item 4.
Principal Accountant Fees and Services
Not applicable.
Item 5.
Audit Committee of Listed Registrants
Not applicable.
Item 6.
Investments
(a)
Not applicable.
(b)
Not applicable
Item 7.
Disclosure of Proxy Voting Policies and Procedures for Closed-End Management Investment Companies
Not applicable.
Item 8.
Portfolio Managers of Closed-End Management Investment Companies
Not applicable.
Item 9.
Purchase of Equity Securities by Closed-End Management Investment Company and Affiliated Purchasers
Not applicable.
Item 10.
Submission of Matters to a Vote of Security Holders
There were no material changes to the procedures by which shareholders may recommend nominees to the Fidelity Summer Street Trust’s Board of Trustees.
Item 11.
Controls and Procedures
(a)(i) The President and Treasurer and the Chief Financial Officer have concluded that the Fidelity Summer Street Trust’s (the “Trust”) disclosure controls and procedures (as defined in Rule 30a-3(c) under the Investment Company Act) provide reasonable
assurances that material information relating to the Trust is made known to them by the appropriate persons, based on their evaluation of these controls and procedures as of a date within 90 days of the filing date of this report.
(a)(ii) There was no change in the Trust’s internal control over financial reporting (as defined in Rule 30a-3(d) under the Investment Company Act) that occurred during the period covered by this report that has materially affected, or is reasonably likely to materially affect, the Trust’s internal control over financial reporting.
Item 12.
Disclosure of Securities Lending Activities for Closed-End Management
Investment Companies
Not applicable.
Item 13.
Exhibits
(a) | (1) | Not applicable. |
(a) | (2) | Certification pursuant to Rule 30a-2(a) under the Investment Company Act of 1940 (17 CFR 270.30a-2(a)) is filed and attached hereto as Exhibit 99.CERT. |
(a) | (3) | Not applicable. |
(b) | Certification pursuant to Rule 30a-2(b) under the Investment Company Act of 1940 (17 CFR 270.30a-2(b)) is furnished and attached hereto as Exhibit 99.906CERT. |
SIGNATURES
Pursuant to the requirements of the Securities Exchange Act of 1934 and the Investment Company Act of 1940, the registrant has duly caused this report to be signed on its behalf by the undersigned, thereunto duly authorized.
Fidelity Summer Street Trust
By: | /s/Stacie M. Smith |
Stacie M. Smith | |
President and Treasurer | |
Date: | May 24, 2019 |
Pursuant to the requirements of the Securities Exchange Act of 1934 and the Investment Company Act of 1940, this report has been signed below by the following persons on behalf of the registrant and in the capacities and on the dates indicated.
By: | /s/Stacie M. Smith |
Stacie M. Smith | |
President and Treasurer | |
Date: | May 24, 2019 |
By: | /s/John J. Burke III |
John J. Burke III | |
Chief Financial Officer | |
Date: | May 24, 2019 |