UNITED STATES
SECURITIES AND EXCHANGE COMMISSION
Washington, D.C. 20549
FORM N-CSR
CERTIFIED SHAREHOLDER REPORT OF REGISTERED
MANAGEMENT INVESTMENT COMPANIES
Investment Company Act file number 811-02737
Fidelity Summer Street Trust
(Exact name of registrant as specified in charter)
245 Summer St., Boston, Massachusetts 02210
(Address of principal executive offices) (Zip code)
Cynthia Lo Bessette, Secretary
245 Summer St.
Boston, Massachusetts 02210
(Name and address of agent for service)
Registrant's telephone number, including area code:
617-563-7000
Date of fiscal year end: | April 30 |
Date of reporting period: | April 30, 2020 |
Item 1.
Reports to Stockholders
Fidelity® Capital & Income Fund
April 30, 2020

See the inside front cover for important information about access to your fund’s shareholder reports.
Beginning on January 1, 2021, as permitted by regulations adopted by the Securities and Exchange Commission, paper copies of a fund’s shareholder reports will no longer be sent by mail, unless you specifically request paper copies of the reports from the fund or from your financial intermediary, such as a financial advisor, broker-dealer or bank. Instead, the reports will be made available on a website, and you will be notified by mail each time a report is posted and provided with a website link to access the report.
If you already elected to receive shareholder reports electronically, you will not be affected by this change and you need not take any action. You may elect to receive shareholder reports and other communications from a fund electronically, by contacting your financial intermediary. For Fidelity customers, visit Fidelity's web site or call Fidelity using the contact information listed below.
You may elect to receive all future reports in paper free of charge. If you wish to continue receiving paper copies of your shareholder reports, you may contact your financial intermediary or, if you are a Fidelity customer, visit Fidelity’s website, or call Fidelity at the applicable toll-free number listed below. Your election to receive reports in paper will apply to all funds held with the fund complex/your financial intermediary.
| Account Type | Website | Phone Number |
| Brokerage, Mutual Fund, or Annuity Contracts: | fidelity.com/mailpreferences | 1-800-343-3548 |
| Employer Provided Retirement Accounts: | netbenefits.fidelity.com/preferences (choose 'no' under Required Disclosures to continue to print) | 1-800-343-0860 |
| Advisor Sold Accounts Serviced Through Your Financial Intermediary: | Contact Your Financial Intermediary | Your Financial Intermediary's phone number |
| Advisor Sold Accounts Serviced by Fidelity: | institutional.fidelity.com | 1-877-208-0098 |
Contents
Board Approval of Investment Advisory Contracts and Management Fees | |
To view a fund's proxy voting guidelines and proxy voting record for the 12-month period ended June 30, visit http://www.fidelity.com/proxyvotingresults or visit the Securities and Exchange Commission's (SEC) web site at http://www.sec.gov.
You may also call 1-800-544-8544 to request a free copy of the proxy voting guidelines.
Standard & Poor's, S&P and S&P 500 are registered service marks of The McGraw-Hill Companies, Inc. and have been licensed for use by Fidelity Distributors Corporation.
Other third-party marks appearing herein are the property of their respective owners.
All other marks appearing herein are registered or unregistered trademarks or service marks of FMR LLC or an affiliated company. © 2020 FMR LLC. All rights reserved.
This report and the financial statements contained herein are submitted for the general information of the shareholders of the Fund. This report is not authorized for distribution to prospective investors in the Fund unless preceded or accompanied by an effective prospectus.
A fund files its complete schedule of portfolio holdings with the SEC for the first and third quarters of each fiscal year on Form N-PORT. Forms N-PORT are available on the SEC’s web site at http://www.sec.gov. A fund's Forms N-PORT may be reviewed and copied at the SEC’s Public Reference Room in Washington, DC. Information regarding the operation of the SEC's Public Reference Room may be obtained by calling 1-800-SEC-0330.
For a complete list of a fund's portfolio holdings, view the most recent holdings listing, semiannual report, or annual report on Fidelity's web site at http://www.fidelity.com, http://www.institutional.fidelity.com, or http://www.401k.com, as applicable.
NOT FDIC INSURED •MAY LOSE VALUE •NO BANK GUARANTEE
Neither the Fund nor Fidelity Distributors Corporation is a bank.
Note to Shareholders:
Early in 2020, the outbreak and spread of a new coronavirus emerged as a public health emergency that had a major influence on financial markets, primarily based on its impact on the global economy and the outlook for corporate earnings. The virus causes a respiratory disease known as COVID-19. On March 11, the World Health Organization declared the COVID-19 outbreak a pandemic, citing sustained risk of further global spread.
In the weeks following, as the crisis worsened, we witnessed an escalating human tragedy with wide-scale social and economic consequences from coronavirus-containment measures. The outbreak of COVID-19 prompted a number of measures to limit the spread, including travel and border restrictions, quarantines, and restrictions on large gatherings. In turn, these resulted in lower consumer activity, diminished demand for a wide range of products and services, disruption in manufacturing and supply chains, and – given the wide variability in outcomes regarding the outbreak – significant market uncertainty and volatility. Amid the turmoil, the U.S. government took unprecedented action – in concert with the U.S. Federal Reserve and central banks around the world – to help support consumers, businesses, and the broader economy, and to limit disruption to the financial system.
The situation continues to unfold, and the extent and duration of its impact on financial markets and the economy remain highly uncertain. Extreme events such as the coronavirus crisis are “exogenous shocks” that can have significant adverse effects on mutual funds and their investments. Although multiple asset classes may be affected by market disruption, the duration and impact may not be the same for all types of assets.
Fidelity is committed to helping you stay informed amid news about COVID-19 and during increased market volatility, and we’re taking extra steps to be responsive to customer needs. We encourage you to visit our websites, where we offer ongoing updates, commentary, and analysis on the markets and our funds.
Performance: The Bottom Line
Average annual total return reflects the change in the value of an investment, assuming reinvestment of distributions from dividend income and capital gains (the profits earned upon the sale of securities that have grown in value, if any) and assuming a constant rate of performance each year. The hypothetical investment and the average annual total returns do not reflect the deduction of taxes that a shareholder would pay on fund distributions or the redemption of fund shares. During periods of reimbursement by Fidelity, a fund’s total return will be greater than it would be had the reimbursement not occurred. How a fund did yesterday is no guarantee of how it will do tomorrow.
Average Annual Total Returns
| For the periods ended April 30, 2020 | Past 1 year | Past 5 years | Past 10 years |
| Fidelity® Capital & Income Fund | (6.89)% | 2.97% | 5.74% |
$10,000 Over 10 Years
Let's say hypothetically that $10,000 was invested in Fidelity® Capital & Income Fund on April 30, 2010.
The chart shows how the value of your investment would have changed, and also shows how the ICE® BofA® US High Yield Constrained Index performed over the same period.

| Period Ending Values | ||
| $17,468 | Fidelity® Capital & Income Fund | |
| $17,322 | ICE® BofA® US High Yield Constrained Index | |
Management's Discussion of Fund Performance
Market Recap: U.S. high-yield bonds rode a supportive backdrop into 2020 before giving way amid the early-year global outbreak and spread of the coronavirus. The ICE BofA® US High Yield Constrained Index returned -5.27% for the 12 months ending April 30. Declared a pandemic on March 11, the crisis and containment efforts caused broad contraction in economic activity, plunging oil prices and extreme uncertainty, volatility, and dislocation in financial markets. Following a flat January, high yield returned -1.55% in February, after a surge in COVID-19 cases outside China. The downtrend steepened in March, with the market enduring its fastest sell-off on record and credit spreads widening sharply. The index finished the month down 11.77%, capping its worst quarter since 2008, despite an uptrend in the final week. A historically rapid and expansive U.S. monetary/fiscal-policy response provided a partial offset to the economic disruption. This was evident in April, when the index rose 3.80% on improved coronavirus trends, plans for reopening the economy and progress on potential treatments. Investor sentiment for risk assets waned this period, with fairly wide performance variance based on quality. Among major credit tiers, higher-rated (BB) bonds gained 0.32%, while lower-quality (CCC-C) issues returned -20.79%. By industry, the biggest laggards included energy (-33%) and air transportation (-17%), whereas defensive-oriented groups such as food & drug retail (+11%) and cable/satellite TV (+7%) enjoyed some ballast.Comments from Co-Portfolio Managers Mark Notkin and Brian Chang: For the fiscal year, the fund returned -6.89, lagging its benchmark, the ICE BofA® US High Yield Constrained Index. The primary detractor versus the benchmark the past 12 months was a non-benchmark position in equities, representing roughly 21% of assets. Security selection was the issue here, as the fund’s stocks returned -9.13%, well behind the 0.86% gain of the S&P 500® index. A much smaller non-benchmark stake in floating-rate bank loans returned -37%, also hurting our relative result. Conversely, an allocation to high-yield bonds – the fund's primary area of focus – topped the benchmark and contributed to relative performance. The past 12 months, we added exposure to high yield, ending the period with an allocation of 71% of fund assets. The fund's position in cash helped in a down market, especially later in the period. Energy was a particular area of weakness for the fund, including our three largest relative detractors: a sizable stake in California Resources (-83%), followed by Denbury (-76%) and EP Energy (-87%). Our top contributor stemmed from our decision to avoid energy firm and benchmark component Valaris (-84%), an offshore drilling contractor based in the United Kingdom. An out-of-benchmark equity position in software maker Microsoft gained 39% and helped relative performance.The views expressed above reflect those of the portfolio manager(s) only through the end of the period as stated on the cover of this report and do not necessarily represent the views of Fidelity or any other person in the Fidelity organization. Any such views are subject to change at any time based upon market or other conditions and Fidelity disclaims any responsibility to update such views. These views may not be relied on as investment advice and, because investment decisions for a Fidelity fund are based on numerous factors, may not be relied on as an indication of trading intent on behalf of any Fidelity fund.
Note to shareholders: On October 1, 2019, Brian Chang assumed co-management responsibilities, joining Mark Notkin.Investment Summary (Unaudited)
Top Five Holdings as of April 30, 2020
| (by issuer, excluding cash equivalents) | % of fund's net assets |
| CCO Holdings LLC/CCO Holdings Capital Corp. | 3.2 |
| Ally Financial, Inc. | 2.7 |
| JPMorgan Chase & Co. | 2.6 |
| Bank of America Corp. | 2.4 |
| Pacific Gas & Electric Co. | 2.3 |
| 13.2 |
Top Five Market Sectors as of April 30, 2020
| % of fund's net assets | |
| Banks & Thrifts | 11.7 |
| Technology | 11.0 |
| Energy | 10.1 |
| Healthcare | 8.5 |
| Telecommunications | 7.1 |
Quality Diversification (% of fund's net assets)
| As of April 30, 2020 | ||
| AAA,AA,A | 0.1% | |
| BBB | 7.8% | |
| BB | 28.1% | |
| B | 26.0% | |
| CCC,CC,C | 9.4% | |
| D | 0.5% | |
| Not Rated | 3.0% | |
| Equities | 21.0% | |
| Short-Term Investments and Net Other Assets | 4.1% | |

We have used ratings from Moody's Investors Service, Inc. Where Moody's® ratings are not available, we have used S&P® ratings. All ratings are as of the date indicated and do not reflect subsequent changes.
Asset Allocation (% of fund's net assets)
| As of April 30, 2020* | ||
| Nonconvertible Bonds | 61.1% | |
| Convertible Bonds, Preferred Stocks | 0.1% | |
| Common Stocks | 21.0% | |
| Bank Loan Obligations | 3.9% | |
| Other Investments | 9.8% | |
| Short-Term Investments and Net Other Assets (Liabilities) | 4.1% | |

* Foreign investments – 14.8%
Schedule of Investments April 30, 2020
Showing Percentage of Net Assets
| Corporate Bonds - 61.2% | |||
| Principal Amount (000s) | Value (000s) | ||
| Convertible Bonds - 0.1% | |||
| Energy - 0.1% | |||
| Denbury Resources, Inc. 6.375% 12/31/24 (a) | $37,706 | $4,960 | |
| Nonconvertible Bonds - 61.1% | |||
| Aerospace - 3.1% | |||
| Arconic Rolled Products Corp.: | |||
| 6% 5/15/25 (a)(b) | 6,630 | 6,705 | |
| 6.125% 2/15/28 (a) | 7,830 | 7,451 | |
| BBA U.S. Holdings, Inc. 5.375% 5/1/26 (a) | 4,405 | 4,064 | |
| Bombardier, Inc.: | |||
| 7.5% 12/1/24 (a) | 2,990 | 1,986 | |
| 7.5% 3/15/25 (a) | 4,350 | 2,814 | |
| 7.875% 4/15/27 (a) | 29,780 | 19,283 | |
| BWX Technologies, Inc. 5.375% 7/15/26 (a) | 8,510 | 8,691 | |
| DAE Funding LLC 4% 8/1/20 (a) | 5,145 | 5,073 | |
| Moog, Inc. 4.25% 12/15/27 (a) | 3,455 | 3,239 | |
| Spirit Aerosystems, Inc. 7.5% 4/15/25 (a) | 15,000 | 14,775 | |
| TransDigm UK Holdings PLC 6.875% 5/15/26 | 35,725 | 30,545 | |
| TransDigm, Inc.: | |||
| 5.5% 11/15/27 (a) | 96,325 | 81,395 | |
| 6.25% 3/15/26 (a) | 17,925 | 17,544 | |
| 6.375% 6/15/26 | 61,985 | 53,047 | |
| 6.5% 5/15/25 | 16,505 | 14,772 | |
| 7.5% 3/15/27 | 18,012 | 16,396 | |
| Wolverine Escrow LLC: | |||
| 8.5% 11/15/24 (a) | 21,705 | 15,248 | |
| 9% 11/15/26 (a) | 22,920 | 15,890 | |
| 318,918 | |||
| Air Transportation - 0.5% | |||
| Air Canada 2013-1 Pass Through Trust 5.375% 11/15/22 (a) | 1,857 | 1,798 | |
| Cargo Aircraft Management, Inc. 4.75% 2/1/28 (a) | 6,915 | 6,457 | |
| Continental Airlines, Inc. pass-thru certificates 6.903% 10/19/23 | 290 | 270 | |
| Delta Air Lines, Inc. 7% 5/1/25 (a) | 27,280 | 27,959 | |
| Delta Air Lines, Inc. pass-thru trust certificates 8.021% 2/10/24 | 4,319 | 4,097 | |
| Hawaiian Airlines pass-thru certificates Series 2013-1 Class B, 4.95% 7/15/23 | 3,347 | 2,988 | |
| U.S. Airways pass-thru certificates: | |||
| Series 2011-1 Class A, 7.125% 4/22/25 | 6,442 | 6,420 | |
| Series 2012-2 Class B, 6.75% 12/3/22 | 2,434 | 2,183 | |
| Series 2013-1 Class B, 5.375% 5/15/23 | 3,314 | 2,890 | |
| 55,062 | |||
| Automotive & Auto Parts - 0.4% | |||
| Allison Transmission, Inc.: | |||
| 5% 10/1/24 (a) | 11,405 | 10,949 | |
| 5.875% 6/1/29 (a) | 7,960 | 7,717 | |
| Exide Technologies: | |||
| 10.75% 10/31/21 pay-in-kind (a)(c)(d) | 858 | 798 | |
| 11% 10/31/24 pay-in-kind (a)(c)(d) | 2,145 | 1,394 | |
| 11% 10/31/24 pay-in-kind (a)(c)(d) | 891 | 401 | |
| IAA Spinco, Inc. 5.5% 6/15/27 (a) | 4,680 | 4,670 | |
| Lithia Motors, Inc. 4.625% 12/15/27 (a) | 3,525 | 3,331 | |
| Penske Automotive Group, Inc. 5.5% 5/15/26 | 8,565 | 7,916 | |
| 37,176 | |||
| Banks & Thrifts - 2.7% | |||
| Ally Financial, Inc.: | |||
| 8% 11/1/31 | 20,638 | 23,837 | |
| 8% 11/1/31 | 206,609 | 251,360 | |
| 275,197 | |||
| Broadcasting - 1.9% | |||
| iHeartCommunications, Inc.: | |||
| 4.75% 1/15/28 (a) | 8,405 | 7,270 | |
| 11.25% 3/1/21 (d) | 11,660 | 0 | |
| Netflix, Inc.: | |||
| 4.875% 4/15/28 | 23,755 | 25,262 | |
| 5.375% 11/15/29 (a) | 11,075 | 12,164 | |
| 5.875% 11/15/28 | 64,825 | 73,307 | |
| Nexstar Escrow, Inc. 5.625% 7/15/27 (a) | 23,735 | 22,667 | |
| Sirius XM Radio, Inc.: | |||
| 4.625% 5/15/23 (a) | 4,925 | 4,956 | |
| 5% 8/1/27 (a) | 14,525 | 14,855 | |
| 5.375% 4/15/25 (a) | 12,000 | 12,375 | |
| 5.375% 7/15/26 (a) | 11,315 | 11,739 | |
| Tegna, Inc. 5% 9/15/29 (a) | 12,060 | 10,781 | |
| 195,376 | |||
| Building Materials - 0.1% | |||
| Advanced Drain Systems, Inc. 5% 9/30/27 (a) | 2,325 | 2,284 | |
| Summit Materials LLC/Summit Materials Finance Corp. 5.125% 6/1/25 (a) | 5,095 | 4,929 | |
| U.S. Concrete, Inc. 6.375% 6/1/24 | 5,535 | 5,226 | |
| 12,439 | |||
| Cable/Satellite TV - 6.3% | |||
| CCO Holdings LLC/CCO Holdings Capital Corp.: | |||
| 4.5% 8/15/30 (a) | 21,660 | 21,768 | |
| 4.75% 3/1/30 (a) | 63,365 | 64,632 | |
| 5% 2/1/28 (a) | 91,490 | 94,235 | |
| 5.125% 5/1/27 (a) | 69,885 | 72,565 | |
| 5.375% 6/1/29 (a) | 18,080 | 19,075 | |
| 5.5% 5/1/26 (a) | 17,605 | 18,311 | |
| 5.75% 2/15/26 (a) | 20,340 | 21,206 | |
| 5.875% 5/1/27 (a) | 17,965 | 18,709 | |
| CSC Holdings LLC: | |||
| 5.375% 2/1/28 (a) | 23,655 | 24,697 | |
| 5.5% 5/15/26 (a) | 50,968 | 52,874 | |
| 5.75% 1/15/30 (a) | 102,845 | 106,927 | |
| 6.5% 2/1/29 (a) | 24,795 | 27,086 | |
| 7.5% 4/1/28 (a) | 14,375 | 15,797 | |
| LCPR Senior Secured Financing DAC 6.75% 10/15/27 (a) | 11,285 | 11,732 | |
| Videotron Ltd. 5.125% 4/15/27 (a) | 12,060 | 12,603 | |
| Virgin Media Finance PLC 4.875% 2/15/22 | 10,880 | 10,880 | |
| Ziggo Bond Co. BV: | |||
| 5.125% 2/28/30 (a) | 6,000 | 5,910 | |
| 6% 1/15/27 (a) | 11,435 | 11,492 | |
| Ziggo BV: | |||
| 4.875% 1/15/30 (a) | 7,990 | 7,897 | |
| 5.5% 1/15/27 (a) | 20,588 | 20,942 | |
| 639,338 | |||
| Capital Goods - 0.2% | |||
| AECOM 5.125% 3/15/27 | 11,885 | 12,093 | |
| Stevens Holding Co., Inc. 6.125% 10/1/26 (a) | 3,245 | 3,252 | |
| 15,345 | |||
| Chemicals - 2.7% | |||
| CF Industries Holdings, Inc.: | |||
| 4.95% 6/1/43 | 59,882 | 61,192 | |
| 5.15% 3/15/34 | 26,868 | 27,943 | |
| 5.375% 3/15/44 | 53,336 | 55,203 | |
| Element Solutions, Inc. 5.875% 12/1/25 (a) | 18,605 | 18,465 | |
| LSB Industries, Inc. 9.625% 5/1/23 (a) | 6,090 | 5,664 | |
| Neon Holdings, Inc. 10.125% 4/1/26 (a) | 12,060 | 10,854 | |
| NOVA Chemicals Corp.: | |||
| 4.875% 6/1/24 (a) | 15,135 | 13,584 | |
| 5.25% 6/1/27 (a) | 12,980 | 10,384 | |
| OCI NV: | |||
| 5.25% 11/1/24 (a) | 16,670 | 16,423 | |
| 6.625% 4/15/23 (a) | 5,370 | 5,371 | |
| Starfruit Finco BV / Starfruit U.S. Holdco LLC 8% 10/1/26 (a) | 11,315 | 10,596 | |
| The Chemours Co. LLC 5.375% 5/15/27 | 32,330 | 27,157 | |
| Tronox, Inc. 6.5% 5/1/25 (a) | 8,760 | 8,815 | |
| Valvoline, Inc. 4.25% 2/15/30 (a) | 8,315 | 8,086 | |
| 279,737 | |||
| Consumer Products - 0.3% | |||
| Terrier Media Buyer, Inc. 8.875% 12/15/27 (a) | 39,000 | 32,175 | |
| Containers - 0.9% | |||
| ARD Finance SA 6.5% 6/30/27 pay-in-kind (a)(c) | 11,200 | 10,396 | |
| Cascades, Inc.: | |||
| 5.125% 1/15/26 (a) | 5,600 | 5,600 | |
| 5.375% 1/15/28 (a) | 5,600 | 5,625 | |
| Crown Cork & Seal, Inc.: | |||
| 7.375% 12/15/26 | 4,845 | 5,305 | |
| 7.5% 12/15/96 | 12,871 | 13,000 | |
| Labl Escrow Issuer LLC: | |||
| 6.75% 7/15/26 (a) | 18,015 | 18,615 | |
| 10.5% 7/15/27 (a) | 12,010 | 11,908 | |
| Trivium Packaging Finance BV: | |||
| 5.5% 8/15/26 (a) | 6,930 | 7,103 | |
| 8.5% 8/15/27 (a) | 12,005 | 12,545 | |
| 90,097 | |||
| Diversified Financial Services - 2.8% | |||
| AssuredPartners, Inc. 7% 8/15/25 (a) | 4,865 | 4,531 | |
| Enviva Partners LP / Enviva Partners Finance Corp. 6.5% 1/15/26 (a) | 11,230 | 11,763 | |
| FLY Leasing Ltd. 5.25% 10/15/24 | 9,470 | 7,576 | |
| Icahn Enterprises LP/Icahn Enterprises Finance Corp.: | |||
| 5.25% 5/15/27 | 29,665 | 28,182 | |
| 6.25% 5/15/26 | 24,085 | 23,666 | |
| 6.375% 12/15/25 | 54,810 | 54,536 | |
| 6.75% 2/1/24 | 10,075 | 10,086 | |
| James Hardie International Finance Ltd.: | |||
| 4.75% 1/15/25 (a) | 8,815 | 8,598 | |
| 5% 1/15/28 (a) | 8,900 | 8,433 | |
| MSCI, Inc.: | |||
| 4% 11/15/29 (a) | 6,385 | 6,629 | |
| 5.75% 8/15/25 (a) | 7,185 | 7,505 | |
| Park Aerospace Holdings Ltd.: | |||
| 4.5% 3/15/23 (a) | 4,315 | 3,817 | |
| 5.25% 8/15/22 (a) | 9,140 | 8,427 | |
| 5.5% 2/15/24 (a) | 790 | 696 | |
| Springleaf Finance Corp.: | �� | ||
| 5.375% 11/15/29 | 9,400 | 7,804 | |
| 6.625% 1/15/28 | 7,305 | 6,447 | |
| 6.875% 3/15/25 | 51,610 | 48,808 | |
| 7.125% 3/15/26 | 38,380 | 36,173 | |
| 283,677 | |||
| Diversified Media - 0.3% | |||
| Block Communications, Inc. 4.875% 3/1/28 (a) | 7,830 | 7,791 | |
| Outfront Media Capital LLC / Corp. 4.625% 3/15/30 (a) | 11,205 | 10,225 | |
| Quebecor Media, Inc. 5.75% 1/15/23 | 15,820 | 16,673 | |
| 34,689 | |||
| Energy - 8.0% | |||
| Antero Midstream Partners LP/Antero Midstream Finance Corp. 5.75% 1/15/28 (a) | 17,645 | 12,969 | |
| Antero Resources Corp. 5.625% 6/1/23 (Reg. S) | 2,240 | 1,316 | |
| Antero Resources Finance Corp. 5.375% 11/1/21 | 2,795 | 2,500 | |
| Callon Petroleum Co. 6.125% 10/1/24 | 4,090 | 787 | |
| Carrizo Oil & Gas, Inc. 6.25% 4/15/23 | 7,400 | 1,536 | |
| Chesapeake Energy Corp.: | |||
| 7% 10/1/24 | 6,915 | 138 | |
| 8% 1/15/25 | 3,385 | 68 | |
| 8% 6/15/27 | 2,132 | 43 | |
| 11.5% 1/1/25 (a) | 24,640 | 678 | |
| Citgo Holding, Inc. 9.25% 8/1/24 (a) | 27,185 | 24,467 | |
| CNX Midstream Partners LP 6.5% 3/15/26 (a) | 6,675 | 5,496 | |
| Comstock Escrow Corp. 9.75% 8/15/26 | 61,450 | 53,155 | |
| Consolidated Energy Finance SA: | |||
| 3 month U.S. LIBOR + 3.750% 4.4905% 6/15/22 (a)(c)(e) | 3,025 | 2,512 | |
| 6.5% 5/15/26 (a) | 53,531 | 41,620 | |
| 6.875% 6/15/25 (a) | 10,765 | 8,289 | |
| Continental Resources, Inc.: | |||
| 3.8% 6/1/24 | 4,425 | 3,617 | |
| 4.375% 1/15/28 | 1,825 | 1,405 | |
| 4.5% 4/15/23 | 2,660 | 2,352 | |
| 4.9% 6/1/44 | 2,750 | 1,911 | |
| Covey Park Energy LLC 7.5% 5/15/25 (a) | 10,865 | 9,018 | |
| Crestwood Midstream Partners LP/Crestwood Midstream Finance Corp.: | |||
| 5.625% 5/1/27 (a) | 18,015 | 11,710 | |
| 5.75% 4/1/25 | 4,790 | 3,449 | |
| 6.25% 4/1/23 | 1,600 | 1,168 | |
| CVR Energy, Inc.: | |||
| 5.25% 2/15/25 (a) | 16,990 | 13,932 | |
| 5.75% 2/15/28 (a) | 22,655 | 19,155 | |
| DCP Midstream LLC 5.85% 5/21/43 (a)(c) | 18,335 | 8,434 | |
| Denbury Resources, Inc.: | |||
| 7.75% 2/15/24 (a) | 43,134 | 7,764 | |
| 9% 5/15/21 (a) | 47,050 | 8,469 | |
| 9.25% 3/31/22 (a) | 7,030 | 1,265 | |
| Diamond Offshore Drilling, Inc.: | |||
| 4.875% 11/1/43 (f) | 550 | 59 | |
| 5.7% 10/15/39 (f) | 2,813 | 302 | |
| EG Global Finance PLC 8.5% 10/30/25 (a) | 16,085 | 15,683 | |
| Endeavor Energy Resources LP/EER Finance, Inc.: | |||
| 5.5% 1/30/26 (a) | 9,698 | 8,583 | |
| 5.75% 1/30/28 (a) | 16,811 | 14,626 | |
| Energy Transfer Equity LP 5.5% 6/1/27 | 16,735 | 17,113 | |
| EP Energy LLC/Everest Acquisition Finance, Inc. 7.75% 5/15/26 (a)(f) | 76,525 | 8,418 | |
| EQT Corp. 3.9% 10/1/27 | 27,454 | 23,061 | |
| Exterran Energy Solutions LP 8.125% 5/1/25 | 11,280 | 6,768 | |
| Extraction Oil & Gas, Inc. 7.375% 5/15/24 (a) | 7,165 | 1,126 | |
| Forum Energy Technologies, Inc. 6.25% 10/1/21 | 13,870 | 4,438 | |
| Genesis Energy LP/Genesis Energy Finance Corp. 6.25% 5/15/26 | 9,130 | 7,624 | |
| Hess Infrastructure Partners LP 5.625% 2/15/26 (a) | 15,535 | 14,448 | |
| Hess Midstream Partners LP 5.125% 6/15/28 (a) | 11,235 | 9,844 | |
| Hilcorp Energy I LP/Hilcorp Finance Co.: | |||
| 5% 12/1/24 (a) | 9,920 | 5,605 | |
| 5.75% 10/1/25 (a) | 11,285 | 6,291 | |
| 6.25% 11/1/28 (a) | 12,280 | 6,355 | |
| Holly Energy Partners LP/Holly Finance Corp. 5% 2/1/28 (a) | 7,615 | 6,927 | |
| Indigo Natural Resources LLC 6.875% 2/15/26 (a) | 22,135 | 20,586 | |
| Jonah Energy LLC 7.25% 10/15/25 (a) | 18,030 | 316 | |
| Laredo Petroleum, Inc.: | |||
| 9.5% 1/15/25 | 11,330 | 4,815 | |
| 10.125% 1/15/28 | 8,495 | 3,461 | |
| MEG Energy Corp. 7.125% 2/1/27 (a) | 11,335 | 7,821 | |
| MPLX LP 6.375% 5/1/24 (a) | 4,570 | 4,664 | |
| Murphy Oil U.S.A., Inc.: | |||
| 4.75% 9/15/29 | 6,860 | 7,064 | |
| 5.625% 5/1/27 | 6,030 | 6,208 | |
| Nabors Industries Ltd.: | |||
| 7.25% 1/15/26 (a) | 11,260 | 4,279 | |
| 7.5% 1/15/28 (a) | 9,715 | 3,886 | |
| Nabors Industries, Inc. 5.75% 2/1/25 | 19,210 | 4,370 | |
| NextEra Energy Partners LP 4.25% 7/15/24 (a) | 12,015 | 12,229 | |
| NGL Energy Partners LP/NGL Energy Finance Corp. 6.125% 3/1/25 | 11,920 | 7,748 | |
| NGPL PipeCo LLC: | |||
| 4.375% 8/15/22 (a) | 2,995 | 3,004 | |
| 4.875% 8/15/27 (a) | 3,000 | 3,054 | |
| Nine Energy Service, Inc. 8.75% 11/1/23 (a) | 6,245 | 1,194 | |
| NuStar Logistics LP 6% 6/1/26 | 12,025 | 10,988 | |
| Occidental Petroleum Corp.: | |||
| 4.4% 4/15/46 | 9,300 | 5,836 | |
| 4.4% 8/15/49 | 23,525 | 14,203 | |
| 4.625% 6/15/45 | 7,660 | 4,692 | |
| 6.45% 9/15/36 | 9,300 | 6,789 | |
| 6.6% 3/15/46 | 8,755 | 6,479 | |
| Parsley Energy LLC/Parsley Finance Corp.: | |||
| 5.375% 1/15/25 (a) | 1,100 | 987 | |
| 5.625% 10/15/27 (a) | 2,545 | 2,176 | |
| PBF Holding Co. LLC/PBF Finance Corp.: | |||
| 6% 2/15/28 (a) | 27,530 | 19,599 | |
| 7.25% 6/15/25 | 22,875 | 17,557 | |
| PBF Logistics LP/PBF Logistics Finance, Inc. 6.875% 5/15/23 | 8,455 | 6,510 | |
| PDC Energy, Inc. 6.125% 9/15/24 | 3,555 | 2,791 | |
| Range Resources Corp.: | |||
| 4.875% 5/15/25 | 8,965 | 6,948 | |
| 5% 3/15/23 | 33,270 | 29,278 | |
| Sanchez Energy Corp. 7.25% 2/15/23 (a)(f) | 21,977 | 220 | |
| SESI LLC 7.75% 9/15/24 | 7,245 | 1,501 | |
| SM Energy Co.: | |||
| 5.625% 6/1/25 | 7,285 | 2,040 | |
| 6.625% 1/15/27 | 21,320 | 5,616 | |
| 6.75% 9/15/26 | 4,550 | 1,240 | |
| Southern Natural Gas Co.: | |||
| 7.35% 2/15/31 | 23,497 | 28,133 | |
| 8% 3/1/32 | 12,475 | 16,228 | |
| Southern Star Central Corp. 5.125% 7/15/22 (a) | 6,750 | 6,435 | |
| Southwestern Energy Co.: | |||
| 6.2% 1/23/25 (c) | 1,805 | 1,597 | |
| 7.5% 4/1/26 | 20,490 | 18,348 | |
| 7.75% 10/1/27 | 12,945 | 11,265 | |
| SRC Energy, Inc. 6.25% 12/1/25 | 7,435 | 4,610 | |
| Summit Midstream Holdings LLC 5.75% 4/15/25 | 5,390 | 1,079 | |
| Sunoco LP/Sunoco Finance Corp.: | |||
| 4.875% 1/15/23 | 9,145 | 8,894 | |
| 5.5% 2/15/26 | 11,640 | 11,233 | |
| Teine Energy Ltd. 6.875% 9/30/22 (a) | 11,950 | 11,472 | |
| Tennessee Gas Pipeline Co. 7.625% 4/1/37 | 5,445 | 6,576 | |
| TerraForm Power Operating LLC: | |||
| 4.25% 1/31/23 (a) | 6,270 | 6,424 | |
| 4.75% 1/15/30 (a) | 11,110 | 11,360 | |
| 5% 1/31/28 (a) | 6,295 | 6,604 | |
| Transocean, Inc. 7.5% 1/15/26 (a) | 12,910 | 4,906 | |
| Ultra Resources, Inc. 11% 7/12/24 pay-in-kind | 10,734 | 644 | |
| Unit Corp. 6.625% 5/15/21 | 2,202 | 129 | |
| W&T Offshore, Inc. 9.75% 11/1/23 (a) | 41,795 | 13,792 | |
| Whiting Petroleum Corp. 6.625% 1/15/26 (f) | 8,380 | 838 | |
| 817,210 | |||
| Entertainment/Film - 0.2% | |||
| Allen Media LLC 10.5% 2/15/28 (a) | 11,405 | 8,468 | |
| Lions Gate Entertainment Corp. 5.875% 11/1/24 (a) | 3,865 | 3,519 | |
| New Cotai LLC/New Cotai Capital Corp. 10.625% 5/1/19 pay-in-kind (a)(c)(f) | 28,594 | 12,867 | |
| 24,854 | |||
| Environmental - 0.3% | |||
| ADS Waste Holdings, Inc. 5.625% 11/15/24 (a) | 10,140 | 10,495 | |
| Covanta Holding Corp.: | |||
| 5.875% 3/1/24 | 7,775 | 7,639 | |
| 5.875% 7/1/25 | 3,205 | 3,101 | |
| 6% 1/1/27 | 12,335 | 11,842 | |
| 33,077 | |||
| Food & Drug Retail - 0.6% | |||
| Albertsons Companies LLC/Safeway, Inc./New Albertson's, Inc./Albertson's LLC: | |||
| 4.625% 1/15/27 (a) | 16,495 | 16,577 | |
| 4.875% 2/15/30 (a) | 33,425 | 33,885 | |
| Performance Food Group, Inc. 5.5% 10/15/27 (a) | 12,635 | 12,004 | |
| 62,466 | |||
| Food/Beverage/Tobacco - 2.1% | |||
| JBS Investments II GmbH: | |||
| 5.75% 1/15/28 (a) | 10,705 | 10,437 | |
| 7% 1/15/26 (a) | 11,630 | 12,065 | |
| JBS U.S.A. LLC/JBS U.S.A. Finance, Inc.: | |||
| 5.75% 6/15/25 (a) | 24,630 | 24,938 | |
| 6.75% 2/15/28 (a) | 18,350 | 19,652 | |
| JBS U.S.A. Lux SA / JBS Food Co.: | |||
| 5.5% 1/15/30 (a) | 20,180 | 20,432 | |
| 6.5% 4/15/29 (a) | 29,320 | 31,006 | |
| KeHE Distributors LLC / KeHE Finance Corp. 8.625% 10/15/26 (a) | 9,735 | 10,295 | |
| Lamb Weston Holdings, Inc.: | |||
| 4.625% 11/1/24 (a) | 7,660 | 7,809 | |
| 4.875% 11/1/26 (a) | 7,740 | 7,779 | |
| Pilgrim's Pride Corp. 5.75% 3/15/25 (a) | 17,930 | 18,112 | |
| Post Holdings, Inc.: | |||
| 4.625% 4/15/30 (a) | 11,405 | 11,177 | |
| 5% 8/15/26 (a) | 17,030 | 16,966 | |
| 5.5% 12/15/29 (a) | 14,975 | 15,050 | |
| 5.75% 3/1/27 (a) | 7,710 | 7,893 | |
| 213,611 | |||
| Gaming - 0.8% | |||
| MCE Finance Ltd.: | |||
| 4.875% 6/6/25 (a) | 30,275 | 29,214 | |
| 5.25% 4/26/26 (a) | 12,015 | 11,715 | |
| 5.375% 12/4/29 (a) | 8,160 | 7,622 | |
| Scientific Games Corp.: | |||
| 7% 5/15/28 (a) | 8,405 | 6,052 | |
| 7.25% 11/15/29 (a) | 8,405 | 5,989 | |
| Transocean, Inc. 7.25% 11/1/25 (a) | 12,270 | 4,663 | |
| Wynn Macau Ltd. 5.125% 12/15/29 (a) | 16,800 | 16,212 | |
| 81,467 | |||
| Healthcare - 5.3% | |||
| BCPE Cycle Merger Sub II, Inc. 10.625% 7/15/27 (a) | 31,235 | 31,118 | |
| Catalent Pharma Solutions: | |||
| 4.875% 1/15/26 (a) | 4,000 | 4,060 | |
| 5% 7/15/27 (a) | 3,765 | 3,840 | |
| Centene Corp.: | |||
| 4.25% 12/15/27 (a) | 11,560 | 12,095 | |
| 4.625% 12/15/29 (a) | 40,420 | 44,260 | |
| 4.75% 1/15/25 (a) | 7,440 | 7,614 | |
| 5.25% 4/1/25 (a) | 3,260 | 3,399 | |
| 5.375% 6/1/26 (a) | 30,420 | 32,233 | |
| 5.375% 8/15/26 (a) | 7,920 | 8,436 | |
| Charles River Laboratories International, Inc. 4.25% 5/1/28 (a) | 3,400 | 3,430 | |
| Community Health Systems, Inc.: | |||
| 6.625% 2/15/25 (a) | 13,150 | 12,065 | |
| 8% 3/15/26 (a) | 61,410 | 58,866 | |
| 8.125% 6/30/24 (a) | 41,763 | 27,877 | |
| 9.875% 6/30/23 (a) | 36,023 | 26,495 | |
| Encompass Health Corp.: | |||
| 5.125% 3/15/23 | 6,440 | 6,408 | |
| 5.75% 11/1/24 | 12,913 | 12,978 | |
| Hologic, Inc.: | |||
| 4.375% 10/15/25 (a) | 6,295 | 6,324 | |
| 4.625% 2/1/28 (a) | 4,255 | 4,319 | |
| Horizon Pharma U.S.A., Inc. 5.5% 8/1/27 (a) | 12,050 | 12,532 | |
| IMS Health, Inc. 5% 5/15/27 (a) | 12,070 | 12,398 | |
| MPH Acquisition Holdings LLC 7.125% 6/1/24 (a) | 6,095 | 5,432 | |
| MPT Operating Partnership LP/MPT Finance Corp.: | |||
| 4.625% 8/1/29 | 18,080 | 17,978 | |
| 5% 10/15/27 | 25,968 | 26,487 | |
| Ortho-Clinical Diagnostics, Inc. 7.25% 2/1/28 (a) | 16,205 | 14,544 | |
| Radiology Partners, Inc. 9.25% 2/1/28 (a) | 20,865 | 19,874 | |
| Service Corp. International 5.125% 6/1/29 | 5,665 | 5,892 | |
| Teleflex, Inc. 4.625% 11/15/27 | 4,975 | 5,099 | |
| Tenet Healthcare Corp.: | |||
| 4.625% 7/15/24 | 6,055 | 5,975 | |
| 4.625% 9/1/24 (a) | 12,045 | 11,804 | |
| 4.875% 1/1/26 (a) | 30,115 | 29,823 | |
| 5.125% 5/1/25 | 6,055 | 5,661 | |
| 5.125% 11/1/27 (a) | 18,070 | 17,844 | |
| 6.25% 2/1/27 (a) | 17,930 | 17,654 | |
| Valeant Pharmaceuticals International, Inc.: | |||
| 5.5% 11/1/25 (a) | 20,817 | 21,639 | |
| 5.75% 8/15/27 (a) | 3,120 | 3,290 | |
| Vizient, Inc. 6.25% 5/15/27 (a) | 2,760 | 2,900 | |
| 542,643 | |||
| Homebuilders/Real Estate - 1.4% | |||
| Alliant Holdings Intermediate LLC 6.75% 10/15/27 (a) | 5,555 | 5,542 | |
| Brookfield Residential Properties, Inc./Brookfield Residential U.S. Corp. 4.875% 2/15/30 (a) | 7,775 | 6,385 | |
| Howard Hughes Corp. 5.375% 3/15/25 (a) | 12,730 | 12,340 | |
| Lennar Corp. 4.75% 11/29/27 | 12,205 | 12,519 | |
| LGI Homes, Inc. 6.875% 7/15/26 (a) | 12,190 | 11,352 | |
| Odebrecht Finance Ltd.: | |||
| 4.375% 4/25/25 (a)(f) | 12,020 | 398 | |
| 5.25% 6/27/29 (a)(f) | 10,987 | 441 | |
| 7.125% 6/26/42 (a)(f) | 5,370 | 269 | |
| Starwood Property Trust, Inc. 4.75% 3/15/25 | 11,625 | 9,823 | |
| Taylor Morrison Communities, Inc./Monarch Communities, Inc.: | |||
| 5.625% 3/1/24 (a) | 1,312 | 1,233 | |
| 5.875% 1/31/25 (a) | 7,125 | 6,698 | |
| 5.875% 6/15/27 (a) | 9,260 | 8,519 | |
| 6% 9/1/23 (a) | 7,430 | 7,179 | |
| TRI Pointe Homes, Inc. 5.875% 6/15/24 | 16,130 | 15,648 | |
| Uniti Group, Inc. 7.875% 2/15/25 (a) | 17,650 | 16,988 | |
| VICI Properties, Inc.: | |||
| 4.25% 12/1/26 (a) | 21,450 | 20,047 | |
| 4.625% 12/1/29 (a) | 12,240 | 11,307 | |
| 146,688 | |||
| Hotels - 0.7% | |||
| Choice Hotels International, Inc. 5.75% 7/1/22 | 3,035 | 3,021 | |
| FelCor Lodging LP 6% 6/1/25 | 10,935 | 10,447 | |
| Hilton Domestic Operating Co., Inc.: | |||
| 4.875% 1/15/30 | 6,900 | 6,607 | |
| 5.125% 5/1/26 | 18,255 | 18,023 | |
| Hilton Worldwide Finance LLC/Hilton Worldwide Finance Corp.: | |||
| 4.625% 4/1/25 | 17,975 | 17,750 | |
| 4.875% 4/1/27 | 8,435 | 8,179 | |
| Marriott Ownership Resorts, Inc. 6.5% 9/15/26 | 9,495 | 8,997 | |
| 73,024 | |||
| Insurance - 0.6% | |||
| Acrisure LLC / Acrisure Finance, Inc.: | |||
| 7% 11/15/25 (a) | 34,880 | 30,869 | |
| 8.125% 2/15/24 (a) | 12,845 | 13,230 | |
| HUB International Ltd. 7% 5/1/26 (a) | 11,770 | 11,611 | |
| 55,710 | |||
| Leisure - 0.7% | |||
| Carnival Corp. 11.5% 4/1/23 (a) | 32,585 | 34,046 | |
| Merlin Entertainments PLC 5.75% 6/15/26 (a) | 7,725 | 7,300 | |
| Studio City Co. Ltd. 7.25% 11/30/21 (a) | 6,220 | 6,138 | |
| Vail Resorts, Inc. 6.25% 5/15/25 (a) | 6,250 | 6,453 | |
| Viking Cruises Ltd. 5.875% 9/15/27 (a) | 11,595 | 7,892 | |
| Voc Escrow Ltd. 5% 2/15/28 (a) | 10,755 | 8,450 | |
| 70,279 | |||
| Metals/Mining - 1.8% | |||
| Alcoa Nederland Holding BV: | |||
| 6.125% 5/15/28 (a) | 3,565 | 3,449 | |
| 6.75% 9/30/24 (a) | 7,705 | 7,626 | |
| 7% 9/30/26 (a) | 6,385 | 6,321 | |
| Aleris International, Inc. 6% 6/1/20 (a)(d) | 151 | 151 | |
| Compass Minerals International, Inc. 6.75% 12/1/27 (a) | 24,600 | 24,354 | |
| First Quantum Minerals Ltd.: | |||
| 6.5% 3/1/24 (a) | 8,210 | 7,143 | |
| 6.875% 3/1/26 (a) | 23,905 | 20,678 | |
| 7.25% 4/1/23 (a) | 3,465 | 3,110 | |
| 7.5% 4/1/25 (a) | 18,935 | 16,503 | |
| FMG Resources (August 2006) Pty Ltd.: | |||
| 4.5% 9/15/27 (a) | 9,015 | 8,808 | |
| 4.75% 5/15/22 (a) | 7,950 | 7,986 | |
| 5.125% 3/15/23 (a) | 12,860 | 12,981 | |
| 5.125% 5/15/24 (a) | 9,780 | 9,924 | |
| Freeport-McMoRan, Inc. 5.45% 3/15/43 | 5,135 | 4,726 | |
| Howmet Aerospace, Inc. 6.875% 5/1/25 | 10,860 | 11,075 | |
| Joseph T Ryerson & Son, Inc. 11% 5/15/22 (a) | 6,445 | 6,187 | |
| Kaiser Aluminum Corp. 4.625% 3/1/28 (a) | 11,215 | 10,441 | |
| Mineral Resources Ltd. 8.125% 5/1/27 (a) | 18,015 | 18,533 | |
| Murray Energy Corp.: | |||
| 11.25% 4/15/21 (a)(f) | 8,915 | 0 | |
| 12% 4/15/24 pay-in-kind (a)(c)(f) | 10,343 | 0 | |
| SunCoke Energy Partners LP/SunCoke Energy Partners Finance Corp. 7.5% 6/15/25 (a) | 9,795 | 7,469 | |
| 187,465 | |||
| Paper - 0.0% | |||
| Boise Cascade Co. 5.625% 9/1/24 (a) | 4,105 | 4,084 | |
| Publishing/Printing - 0.2% | |||
| Getty Images, Inc. 9.75% 3/1/27 (a) | 20,665 | 15,344 | |
| Restaurants - 1.6% | |||
| 1011778 BC Unlimited Liability Co./New Red Finance, Inc.: | |||
| 3.875% 1/15/28 (a) | 9,165 | 8,889 | |
| 4.375% 1/15/28 (a) | 12,815 | 12,391 | |
| 5% 10/15/25 (a) | 65,605 | 65,933 | |
| Golden Nugget, Inc.: | |||
| 6.75% 10/15/24 (a) | 22,555 | 17,593 | |
| 8.75% 10/1/25 (a) | 24,245 | 13,577 | |
| KFC Holding Co./Pizza Hut Holding LLC: | |||
| 4.75% 6/1/27 (a) | 9,215 | 9,512 | |
| 5% 6/1/24 (a) | 8,800 | 9,067 | |
| 5.25% 6/1/26 (a) | 8,800 | 8,998 | |
| Yum! Brands, Inc.: | |||
| 4.75% 1/15/30 (a) | 10,355 | 10,562 | |
| 7.75% 4/1/25 (a) | 3,735 | 4,072 | |
| 160,594 | |||
| Services - 1.2% | |||
| ASGN, Inc. 4.625% 5/15/28 (a) | 9,590 | 8,844 | |
| Avantor, Inc. 6% 10/1/24 (a) | 12,090 | 12,743 | |
| CDK Global, Inc. 5.875% 6/15/26 | 4,545 | 4,761 | |
| GEMS MENASA Cayman Ltd. 7.125% 7/31/26 (a) | 8,765 | 8,045 | |
| Iron Mountain, Inc. 4.875% 9/15/29 (a) | 24,110 | 23,085 | |
| KAR Auction Services, Inc. 5.125% 6/1/25 (a) | 10,355 | 8,931 | |
| Ritchie Bros. Auctioneers, Inc. 5.375% 1/15/25 (a) | 3,510 | 3,545 | |
| Tempo Acquisition LLC 6.75% 6/1/25 (a) | 8,815 | 8,551 | |
| The Brink's Co. 4.625% 10/15/27 (a) | 12,180 | 11,388 | |
| The GEO Group, Inc.: | |||
| 5.125% 4/1/23 | 9,625 | 8,061 | |
| 5.875% 10/15/24 | 6,200 | 4,898 | |
| 6% 4/15/26 | 9,655 | 7,314 | |
| United Rentals North America, Inc.: | |||
| 3.875% 11/15/27 | 5,560 | 5,435 | |
| 5.5% 5/15/27 | 7,325 | 7,398 | |
| 122,999 | |||
| Steel - 0.5% | |||
| Algoma Steel SCA 0% 12/31/23 (d) | 1,982 | 1,506 | |
| Cleveland-Cliffs, Inc.: | |||
| 4.875% 1/15/24 (a) | 12,165 | 10,406 | |
| 5.75% 3/1/25 | 3,141 | 2,246 | |
| 5.875% 6/1/27 | 18,030 | 11,269 | |
| Commercial Metals Co. 5.75% 4/15/26 | 9,135 | 9,044 | |
| Infrabuild Australia Pty Ltd. 12% 10/1/24 (a) | 9,055 | 7,697 | |
| JMC Steel Group, Inc. 9.875% 6/15/23 (a) | 3,000 | 3,004 | |
| United States Steel Corp. 6.25% 3/15/26 | 12,205 | 7,760 | |
| 52,932 | |||
| Super Retail - 0.1% | |||
| Asbury Automotive Group, Inc.: | |||
| 4.5% 3/1/28 (a) | 3,534 | 2,967 | |
| 4.75% 3/1/30 (a) | 3,523 | 2,952 | |
| Burlington Coat Factory Warehouse Corp. 6.25% 4/15/25 (a) | 3,270 | 3,327 | |
| 9,246 | |||
| Technology - 2.9% | |||
| Ascend Learning LLC: | |||
| 6.875% 8/1/25 (a) | 4,115 | 4,074 | |
| 6.875% 8/1/25 (a) | 11,865 | 11,746 | |
| Banff Merger Sub, Inc. 9.75% 9/1/26 (a) | 24,658 | 22,131 | |
| Camelot Finance SA 4.5% 11/1/26 (a) | 10,590 | 10,669 | |
| CDW LLC/CDW Finance Corp. 5% 9/1/25 | 6,380 | 6,571 | |
| Ensemble S Merger Sub, Inc. 9% 9/30/23 (a) | 19,115 | 19,147 | |
| Fair Isaac Corp. 4% 6/15/28 (a) | 10,910 | 10,828 | |
| Go Daddy Operating Co. LLC / GD Finance Co., Inc. 5.25% 12/1/27 (a) | 9,345 | 9,602 | |
| j2 Cloud Services LLC/j2 Global Communications, Inc. 6% 7/15/25 (a) | 8,065 | 8,146 | |
| JDA Escrow LLC/JDA Bond Finance, Inc. 7.375% 10/15/24 (a) | 4,060 | 3,989 | |
| MTS Systems Corp. 5.75% 8/15/27 (a) | 3,140 | 2,912 | |
| NCR Corp.: | |||
| 5.75% 9/1/27 (a) | 9,035 | 9,058 | |
| 6.125% 9/1/29 (a) | 9,035 | 8,967 | |
| 8.125% 4/15/25 (a) | 4,675 | 4,956 | |
| Nortonlifelock, Inc. 5% 4/15/25 (a) | 10,050 | 10,113 | |
| Open Text Corp.: | |||
| 3.875% 2/15/28 (a) | 5,690 | 5,548 | |
| 5.875% 6/1/26 (a) | 8,535 | 8,962 | |
| Open Text Holdings, Inc. 4.125% 2/15/30 (a) | 5,690 | 5,535 | |
| Parametric Technology Corp.: | |||
| 3.625% 2/15/25 (a) | 6,650 | 6,547 | |
| 4% 2/15/28 (a) | 6,575 | 6,444 | |
| 6% 5/15/24 | 3,490 | 3,596 | |
| Qorvo, Inc. 5.5% 7/15/26 | 6,085 | 6,389 | |
| Sensata Technologies BV 5% 10/1/25 (a) | 11,210 | 11,149 | |
| Sensata Technologies UK Financing Co. PLC 6.25% 2/15/26 (a) | 11,535 | 11,881 | |
| Uber Technologies, Inc.: | |||
| 7.5% 9/15/27 (a) | 29,590 | 30,185 | |
| 8% 11/1/26 (a) | 28,140 | 28,844 | |
| Veritas U.S., Inc./Veritas Bermuda Ltd.: | |||
| 7.5% 2/1/23 (a) | 16,225 | 15,763 | |
| 10.5% 2/1/24 (a) | 14,323 | 12,783 | |
| 296,535 | |||
| Telecommunications - 5.9% | |||
| Altice Financing SA 5% 1/15/28 (a) | 11,280 | 10,998 | |
| C&W Senior Financing Designated Activity Co. 6.875% 9/15/27 (a) | 22,740 | 22,456 | |
| Front Range BidCo, Inc. 4% 3/1/27 (a) | 17,180 | 16,662 | |
| Frontier Communications Corp. 8.5% 4/1/26 (a)(f) | 42,840 | 39,627 | |
| GCI, Inc. 6.875% 4/15/25 | 10,905 | 11,259 | |
| GTT Communications, Inc. 7.875% 12/31/24 (a) | 1,110 | 663 | |
| Intelsat Jackson Holdings SA: | |||
| 5.5% 8/1/23 | 31,470 | 17,092 | |
| 8% 2/15/24 (a) | 20,755 | 21,311 | |
| 8.5% 10/15/24 (a) | 21,405 | 12,415 | |
| 9.75% 7/15/25 (a) | 36,315 | 20,518 | |
| NGL Energy Partners LP/NGL Energy Finance Corp. 7.5% 4/15/26 | 12,005 | 7,803 | |
| Sable International Finance Ltd. 5.75% 9/7/27 (a) | 20,710 | 20,710 | |
| Sabre GLBL, Inc. 9.25% 4/15/25 (a) | 8,180 | 8,640 | |
| SBA Communications Corp. 3.875% 2/15/27 (a) | 17,015 | 17,377 | |
| SFR Group SA: | |||
| 5.5% 1/15/28 (a) | 22,110 | 22,267 | |
| 7.375% 5/1/26 (a) | 125,670 | 131,325 | |
| 8.125% 2/1/27 (a) | 7,635 | 8,227 | |
| Sprint Capital Corp.: | |||
| 6.875% 11/15/28 | 76,454 | 92,077 | |
| 8.75% 3/15/32 | 66,716 | 93,736 | |
| Sprint Corp. 7.625% 3/1/26 | 10,895 | 12,879 | |
| Telenet Finance Luxembourg Notes SARL 5.5% 3/1/28 (a) | 15,200 | 15,504 | |
| U.S. West Communications 7.25% 9/15/25 | 1,480 | 1,586 | |
| 605,132 | |||
| Transportation Ex Air/Rail - 0.3% | |||
| Avolon Holdings Funding Ltd.: | |||
| 5.125% 10/1/23 (a) | 3,310 | 2,961 | |
| 5.25% 5/15/24 (a) | 17,970 | 15,582 | |
| 5.5% 1/15/23 (a) | 5,305 | 4,874 | |
| Navios South American Logistics, Inc./Navios Logistics Finance U.S., Inc. 7.25% 5/1/22 (a) | 10,180 | 9,124 | |
| 32,541 | |||
| Utilities - 3.7% | |||
| Clearway Energy Operating LLC 4.75% 3/15/28 (a) | 6,920 | 7,041 | |
| Global Partners LP/GLP Finance Corp. 7% 6/15/23 | 11,295 | 9,827 | |
| NextEra Energy Partners LP: | |||
| 4.25% 9/15/24 (a) | 8,025 | 8,145 | |
| 4.5% 9/15/27 (a) | 5,580 | 5,726 | |
| NRG Energy, Inc.: | |||
| 5.75% 1/15/28 | 9,410 | 10,116 | |
| 6.625% 1/15/27 | 26,747 | 28,552 | |
| Pacific Gas & Electric Co.: | |||
| 3.5% 10/1/20 (f) | 5,735 | 5,864 | |
| 3.75% 8/15/42 (f) | 10,400 | 10,166 | |
| 3.95% 12/1/47 (f) | 53,930 | 52,717 | |
| 4% 12/1/46 (f) | 24,380 | 24,307 | |
| 4.25% 3/15/46 (f) | 2,400 | 2,478 | |
| 4.3% 3/15/45 (f) | 5,995 | 6,250 | |
| 5.8% 3/1/37 (f) | 41,190 | 46,133 | |
| 6.05% 3/1/34 (f) | 80,450 | 90,506 | |
| Pattern Energy Group, Inc. 5.875% 2/1/24 (a) | 5,475 | 5,530 | |
| The AES Corp. 4.5% 3/15/23 | 5,175 | 5,163 | |
| Vistra Operations Co. LLC: | |||
| 5% 7/31/27 (a) | 22,585 | 23,034 | |
| 5.5% 9/1/26 (a) | 3,485 | 3,588 | |
| 5.625% 2/15/27 (a) | 28,195 | 29,675 | |
| 374,818 | |||
| TOTAL NONCONVERTIBLE BONDS | 6,251,945 | ||
| TOTAL CORPORATE BONDS | |||
| (Cost $6,855,265) | 6,256,905 | ||
| Shares | Value (000s) | ||
| Common Stocks - 21.0% | |||
| Air Transportation - 0.5% | |||
| Air Canada (g) | 3,438,100 | 49,993 | |
| Automotive & Auto Parts - 0.6% | |||
| Allison Transmission Holdings, Inc. | 285,200 | 10,364 | |
| Chassix Holdings, Inc. warrants 7/29/20 (d)(g) | 37,382 | 381 | |
| Exide Technologies (d)(g) | 9,824 | 10 | |
| Exide Technologies (d)(g) | 580,031 | 0 | |
| Motors Liquidation Co. GUC Trust (g) | 11,464 | 121 | |
| Tesla, Inc. (g) | 39,100 | 30,572 | |
| UC Holdings, Inc. (d)(g) | 677,217 | 16,869 | |
| TOTAL AUTOMOTIVE & AUTO PARTS | 58,317 | ||
| Banks & Thrifts - 0.4% | |||
| Bank of America Corp. | 747,115 | 17,968 | |
| JPMorgan Chase & Co. | 250,380 | 23,976 | |
| TOTAL BANKS & THRIFTS | 41,944 | ||
| Broadcasting - 0.3% | |||
| iHeartMedia, Inc. warrants 5/1/39 (g) | 104 | 1 | |
| Nexstar Broadcasting Group, Inc. Class A | 376,429 | 26,365 | |
| TOTAL BROADCASTING | 26,366 | ||
| Building Materials - 0.2% | |||
| Carrier Global Corp. (g) | 1,120,800 | 19,849 | |
| Cable/Satellite TV - 0.5% | |||
| Altice U.S.A., Inc. Class A (g) | 1,930,500 | 50,135 | |
| Capital Goods - 1.2% | |||
| Fortive Corp. | 396,900 | 25,402 | |
| Thermo Fisher Scientific, Inc. | 112,300 | 37,585 | |
| Zebra Technologies Corp. Class A (g) | 268,300 | 61,618 | |
| TOTAL CAPITAL GOODS | 124,605 | ||
| Chemicals - 0.3% | |||
| CF Industries Holdings, Inc. | 695,500 | 19,126 | |
| The Chemours Co. LLC | 781,940 | 9,172 | |
| TOTAL CHEMICALS | 28,298 | ||
| Consumer Products - 0.1% | |||
| Reddy Ice Holdings, Inc. (d) | 199,717 | 21 | |
| Reddy Ice Holdings, Inc. (d)(g) | 496,439 | 0 | |
| Tempur Sealy International, Inc. (g) | 295,200 | 15,867 | |
| TOTAL CONSUMER PRODUCTS | 15,888 | ||
| Containers - 0.1% | |||
| Berry Global Group, Inc. (g) | 390,700 | 15,546 | |
| Diversified Financial Services - 1.0% | |||
| American Express Co. | 270,700 | 24,701 | |
| MasterCard, Inc. Class A | 194,400 | 53,454 | |
| OneMain Holdings, Inc. | 876,600 | 21,222 | |
| Penson Worldwide, Inc. Class A (d)(g) | 10,322,034 | 0 | |
| PJT Partners, Inc. | 5,092 | 248 | |
| TOTAL DIVERSIFIED FINANCIAL SERVICES | 99,625 | ||
| Energy - 0.1% | |||
| Chaparral Energy, Inc. Class A (g)(h) | 146,806 | 72 | |
| Forbes Energy Services Ltd. (g) | 193,218 | 17 | |
| Goodrich Petroleum Corp. (g) | 129,527 | 1,102 | |
| Harvest Oil & Gas Corp. | 254,828 | 624 | |
| MEG Energy Corp. (g) | 2,376,100 | 5,309 | |
| Ultra Petroleum Corp. warrants 7/14/25 (g) | 211,400 | 0 | |
| VNR Finance Corp. (d)(g) | 119,961 | 0 | |
| VNR Finance Corp. (a)(d)(g) | 577,714 | 0 | |
| TOTAL ENERGY | 7,124 | ||
| Food & Drug Retail - 0.1% | |||
| Southeastern Grocers, Inc. (d)(g) | 183,263 | 7,431 | |
| Food/Beverage/Tobacco - 0.8% | |||
| Darling International, Inc. (g) | 1,038,617 | 21,385 | |
| JBS SA | 14,101,600 | 61,822 | |
| TOTAL FOOD/BEVERAGE/TOBACCO | 83,207 | ||
| Gaming - 1.0% | |||
| Boyd Gaming Corp. | 1,243,300 | 20,751 | |
| Eldorado Resorts, Inc. (g) | 1,155,536 | 24,775 | |
| MGM Mirage, Inc. | 603,800 | 10,162 | |
| Penn National Gaming, Inc. (g) | 1,786,500 | 31,835 | |
| Studio City International Holdings Ltd. ADR (g) | 695,700 | 12,105 | |
| TOTAL GAMING | 99,628 | ||
| Healthcare - 2.8% | |||
| Alexion Pharmaceuticals, Inc. (g) | 182,800 | 19,646 | |
| Bausch Health Cos., Inc. (Canada) (g) | 653,700 | 11,811 | |
| Bristol-Myers Squibb Co. | 313,200 | 19,046 | |
| Charles River Laboratories International, Inc. (g) | 185,000 | 26,764 | |
| Cigna Corp. | 158,700 | 31,070 | |
| Encompass Health Corp. | 34 | 2 | |
| HCA Holdings, Inc. | 176,200 | 19,361 | |
| Humana, Inc. | 105,400 | 40,244 | |
| IQVIA Holdings, Inc. (g) | 393,500 | 56,109 | |
| Jazz Pharmaceuticals PLC (g) | 141,800 | 15,633 | |
| Rotech Healthcare, Inc. (d)(g) | 185,710 | 1,933 | |
| UnitedHealth Group, Inc. | 144,600 | 42,291 | |
| TOTAL HEALTHCARE | 283,910 | ||
| Homebuilders/Real Estate - 0.0% | |||
| American Tower Corp. | 11,612 | 2,764 | |
| Leisure - 0.0% | |||
| Royal Caribbean Cruises Ltd. (h) | 115,100 | 5,383 | |
| Metals/Mining - 0.1% | |||
| Aleris Corp. (d)(g) | 127,520 | 0 | |
| Elah Holdings, Inc. (g) | 906 | 47 | |
| First Quantum Minerals Ltd. | 1,764,200 | 10,773 | |
| TOTAL METALS/MINING | 10,820 | ||
| Restaurants - 0.2% | |||
| Restaurant Brands International, Inc. | 446,100 | 21,761 | |
| Services - 1.5% | |||
| ASGN, Inc. (g) | 258,700 | 12,017 | |
| HD Supply Holdings, Inc. (g) | 909,800 | 27,003 | |
| Novus Holdings Ltd. | 100,408 | 8 | |
| Penhall Acquisition Co.: | |||
| Class A (d)(g) | 26,163 | 1,717 | |
| Class B (d)(g) | 8,721 | 572 | |
| United Rentals, Inc. (g) | 524,794 | 67,436 | |
| Visa, Inc. Class A | 255,040 | 45,581 | |
| TOTAL SERVICES | 154,334 | ||
| Steel - 0.0% | |||
| Algoma Steel GP (d)(g) | 198,162 | 4 | |
| Algoma Steel SCA (d)(g) | 198,162 | 36 | |
| TOTAL STEEL | 40 | ||
| Super Retail - 0.2% | |||
| Amazon.com, Inc. (g) | 7,400 | 18,308 | |
| Arena Brands Holding Corp. Class B (d)(g)(i) | 659,302 | 1,549 | |
| TOTAL SUPER RETAIL | 19,857 | ||
| Technology - 6.9% | |||
| Adobe, Inc. (g) | 256,400 | 90,673 | |
| Alphabet, Inc. Class A (g) | 49,800 | 67,066 | |
| Broadcom, Inc. | 58,300 | 15,835 | |
| CDW Corp. | 247,000 | 27,368 | |
| EPAM Systems, Inc. (g) | 217,400 | 48,021 | |
| Facebook, Inc. Class A (g) | 257,000 | 52,610 | |
| Fiserv, Inc. (g) | 316,513 | 32,620 | |
| Global Payments, Inc. | 352,024 | 58,443 | |
| GoDaddy, Inc. (g) | 281,500 | 19,545 | |
| Lam Research Corp. | 153,700 | 39,237 | |
| Microchip Technology, Inc. (h) | 511,900 | 44,909 | |
| Microsoft Corp. | 428,400 | 76,774 | |
| ON Semiconductor Corp. (g) | 1,315,038 | 21,100 | |
| PayPal Holdings, Inc. (g) | 335,400 | 41,254 | |
| Salesforce.com, Inc. (g) | 63,300 | 10,251 | |
| Skyworks Solutions, Inc. | 182,400 | 18,948 | |
| SS&C Technologies Holdings, Inc. | 486,982 | 26,862 | |
| VMware, Inc. Class A (g)(h) | 113,600 | 14,941 | |
| TOTAL TECHNOLOGY | 706,457 | ||
| Telecommunications - 1.0% | |||
| Palo Alto Networks, Inc. (g) | 118,300 | 23,247 | |
| T-Mobile U.S., Inc. (g) | 906,500 | 79,591 | |
| TOTAL TELECOMMUNICATIONS | 102,838 | ||
| Transportation Ex Air/Rail - 0.0% | |||
| Tricer Holdco SCA: | |||
| Class A1 (d)(g)(i) | 598,287 | 1 | |
| Class A2 (d)(g)(i) | 598,287 | 1 | |
| Class A3 (d)(g)(i) | 598,287 | 1 | |
| Class A4 (d)(g)(i) | 598,287 | 1 | |
| Class A5 (d)(g)(i) | 598,287 | 1 | |
| Class A6 (d)(g)(i) | 598,287 | 1 | |
| Class A7 (d)(g)(i) | 598,287 | 1 | |
| Class A8 (d)(g)(i) | 598,287 | 1 | |
| Class A9 (d)(g)(i) | 598,287 | 1 | |
| U.S. Shipping Partners Corp. (d)(g) | 51,736 | 0 | |
| U.S. Shipping Partners Corp. warrants 12/31/29 (d)(g) | 484,379 | 0 | |
| TOTAL TRANSPORTATION EX AIR/RAIL | 9 | ||
| Utilities - 1.1% | |||
| NRG Energy, Inc. | 986,100 | 33,064 | |
| PG&E Corp. (g) | 1,657,700 | 17,638 | |
| Portland General Electric Co. | 14,817 | 693 | |
| Vistra Energy Corp. | 3,018,900 | 58,989 | |
| TOTAL UTILITIES | 110,384 | ||
| TOTAL COMMON STOCKS | |||
| (Cost $1,834,050) | 2,146,513 | ||
| Nonconvertible Preferred Stocks - 0.0% | |||
| Transportation Ex Air/Rail - 0.0% | |||
| Tricer Holdco SCA (d)(g)(i) | |||
| (Cost $10,250) | 287,159,690 | 97 | |
| Principal Amount (000s) | Value (000s) | ||
| Bank Loan Obligations - 3.9% | |||
| Aerospace - 0.0% | |||
| Arconic Rolled Products Corp. Tranche B 1LN, term loan 3 month U.S. LIBOR + 2.750% 3.24% 3/25/27 (c)(e)(j) | 1,455 | 1,440 | |
| Air Transportation - 0.0% | |||
| Dynasty Acquisition Co., Inc.: | |||
| Tranche B 1LN, term loan 3 month U.S. LIBOR + 3.500% 4.9501% 4/8/26 (c)(e)(j) | 2,631 | 2,295 | |
| Tranche B2 1LN, term loan 3 month U.S. LIBOR + 3.500% 4.9501% 4/8/26 (c)(e)(j) | 1,414 | 1,234 | |
| TOTAL AIR TRANSPORTATION | 3,529 | ||
| Automotive & Auto Parts - 0.2% | |||
| Wand NewCo 3, Inc. Tranche B 1LN, term loan 3 month U.S. LIBOR + 3.000% 4.072% 2/5/26 (c)(e)(j) | 18,354 | 16,267 | |
| Banks & Thrifts - 0.0% | |||
| Citadel Securities LP Tranche B 1LN, term loan 3 month U.S. LIBOR + 2.750% 3.1536% 2/27/26 (c)(e)(j) | 3,643 | 3,479 | |
| Broadcasting - 0.1% | |||
| Nexstar Broadcasting, Inc. Tranche B, term loan 3 month U.S. LIBOR + 2.750% 3.7345% 9/19/26 (c)(e)(j) | 4,270 | 3,998 | |
| Building Materials - 0.1% | |||
| ACProducts, Inc. 1LN, term loan 3 month U.S. LIBOR + 6.500% 8.1916% 8/13/25 (c)(e)(j) | 4,730 | 4,204 | |
| Traverse Midstream Partners Ll Tranche B, term loan 3 month U.S. LIBOR + 4.000% 5% 9/27/24 (c)(e)(j) | 2,935 | 2,183 | |
| TOTAL BUILDING MATERIALS | 6,387 | ||
| Cable/Satellite TV - 0.0% | |||
| LCPR Loan Financing LLC Tranche B 1LN, term loan 3 month U.S. LIBOR + 5.000% 5.814% 10/22/26 (c)(e)(j) | 2,140 | 2,092 | |
| Diversified Financial Services - 0.2% | |||
| RPI 2019 Intermediate Finance Trust Tranche B 1LN, term loan 3 month U.S. LIBOR + 1.750% 2.1536% 2/11/27 (c)(e)(j) | 8,374 | 8,116 | |
| RPI Intermediate Finance Trust Tranche B 1LN, term loan 3 month U.S. LIBOR + 1.750% 2.1536% 2/11/27 (c)(e)(j) | 6,004 | 5,826 | |
| TOTAL DIVERSIFIED FINANCIAL SERVICES | 13,942 | ||
| Energy - 0.9% | |||
| BCP Raptor II LLC Tranche B, term loan 3 month U.S. LIBOR + 4.750% 5.1536% 11/3/25 (c)(e)(j) | 6,024 | 2,809 | |
| BCP Raptor LLC Tranche B, term loan 3 month U.S. LIBOR + 4.250% 5.25% 6/24/24 (c)(e)(j) | 8,801 | 4,093 | |
| California Resources Corp.: | |||
| Tranche 1LN, term loan 3 month U.S. LIBOR + 10.375% 11.9883% 12/31/21 (c)(e)(j) | 98,780 | 3,520 | |
| Tranche B, term loan 3 month U.S. LIBOR + 4.750% 6.3633% 12/31/22 (c)(e)(j) | 119,795 | 26,288 | |
| Chesapeake Energy Corp. term loan 3 month U.S. LIBOR + 8.000% 9% 6/9/24 (c)(e)(j) | 56,390 | 19,924 | |
| Citgo Holding, Inc. Tranche B 1LN, term loan 3 month U.S. LIBOR + 7.000% 8% 8/1/23 (c)(e)(j) | 1,398 | 1,153 | |
| EG America LLC 2LN, term loan 3 month U.S. LIBOR + 8.000% 9.072% 3/23/26 (c)(e)(j) | 5,815 | 4,332 | |
| Epic Crude Services LP Tranche B 1LN, term loan 3 month U.S. LIBOR + 5.000% 6.62% 3/1/26 (c)(e)(j) | 35,950 | 21,462 | |
| Forbes Energy Services LLC Tranche B, term loan 18% 4/13/21 (c)(d)(j) | 1,985 | 2,000 | |
| Sanchez Energy Corp.: | |||
| 1LN, term loan 3 month U.S. LIBOR + 8.000% 0% 12/31/49 (d)(e)(f)(j) | 5,861 | 4,689 | |
| term loan 7.25% 12/31/49 (c)(d)(f)(j) | 2,528 | 2,022 | |
| TOTAL ENERGY | 92,292 | ||
| Entertainment/Film - 0.1% | |||
| Allen Media LLC Tranche B 1LN, term loan 3 month U.S. LIBOR + 5.500% 7.2309% 2/10/27 (c)(e)(j) | 8,555 | 7,700 | |
| Healthcare - 0.4% | |||
| U.S. Renal Care, Inc. Tranche B 1LN, term loan 3 month U.S. LIBOR + 5.000% 5.4375% 6/13/26 (c)(e)(j) | 43,462 | 40,976 | |
| Valeant Pharmaceuticals International, Inc. Tranche B, term loan 3 month U.S. LIBOR + 3.000% 3.7183% 6/1/25 (c)(e)(j) | 1,918 | 1,853 | |
| TOTAL HEALTHCARE | 42,829 | ||
| Hotels - 0.0% | |||
| Travelport Finance Luxembourg SARL Tranche B 2LN, term loan 3 month U.S. LIBOR + 9.000% 10.072% 5/28/27 (c)(e)(j) | 12,390 | 3,655 | |
| Metals/Mining - 0.0% | |||
| Murray Energy Corp.: | |||
| term loan 3 month U.S. LIBOR + 11.000% 13% 7/31/20 (c)(e)(j) | 4,624 | 3,006 | |
| Tranche B 2LN, term loan 3 month U.S. LIBOR + 7.250% 0% 10/17/22 (e)(f)(j) | 22,488 | 169 | |
| TOTAL METALS/MINING | 3,175 | ||
| Services - 0.2% | |||
| KUEHG Corp. Tranche B 2LN, term loan 3 month U.S. LIBOR + 8.250% 9.7001% 8/22/25 (c)(e)(j) | 6,055 | 4,541 | |
| Maverick Purchaser Sub LLC Tranche B 1LN, term loan 3 month U.S. LIBOR + 4.000% 4.4036% 1/23/27 (c)(e)(j) | 2,230 | 2,124 | |
| Sabert Corp. Tranche B 1LN, term loan 3 month U.S. LIBOR + 4.500% 5.5% 12/10/26 (c)(e)(j) | 8,249 | 7,796 | |
| Sotheby's 1LN, term loan 3 month U.S. LIBOR + 5.500% 6.5% 1/3/27 (c)(e)(j) | 11,203 | 9,579 | |
| TOTAL SERVICES | 24,040 | ||
| Technology - 1.2% | |||
| Boxer Parent Co., Inc. Tranche B, term loan 3 month U.S. LIBOR + 4.250% 4.6536% 10/2/25 (c)(e)(j) | 36,552 | 31,435 | |
| Camelot Finance SA Tranche B, term loan 3 month U.S. LIBOR + 3.250% 3.6536% 10/31/26 (c)(e)(j) | 1,147 | 1,096 | |
| Curie Merger Sub LLC 1LN, term loan 3 month U.S. LIBOR + 4.250% 5.7001% 11/4/26 (c)(e)(j) | 600 | 574 | |
| Kronos, Inc. 2LN, term loan 3 month U.S. LIBOR + 8.250% 10.0133% 11/1/24 (c)(e)(j) | 19,695 | 18,809 | |
| Landesk Group, Inc. term loan: | |||
| 3 month U.S. LIBOR + 4.250% 5.25% 1/20/24 (c)(e)(j) | 3,070 | 2,776 | |
| 3 month U.S. LIBOR + 9.000% 10% 1/20/25 (c)(e)(j) | 10,270 | 8,909 | |
| McAfee LLC Tranche B, term loan: | |||
| 3 month U.S. LIBOR + 3.750% 4.1876% 9/29/24 (c)(e)(j) | 4,575 | 4,367 | |
| 3 month U.S. LIBOR + 8.500% 9.5% 9/29/25 (c)(e)(j) | 24,662 | 23,830 | |
| ON Semiconductor Corp. Tranche B 1LN, term loan 3 month U.S. LIBOR + 2.000% 2.4036% 9/19/26 (c)(e)(j) | 7,806 | 7,517 | |
| VS Buyer LLC Tranche B 1LN, term loan 3 month U.S. LIBOR + 3.250% 4.8633% 2/19/27 (c)(e)(j) | 2,355 | 2,214 | |
| Web.com Group, Inc.: | |||
| 2LN, term loan 3 month U.S. LIBOR + 7.750% 8.9451% 10/11/26 (c)(e)(j) | 10,089 | 8,021 | |
| Tranche B 1LN, term loan 3 month U.S. LIBOR + 3.750% 4.9451% 10/11/25 (c)(e)(j) | 11,054 | 9,829 | |
| TOTAL TECHNOLOGY | 119,377 | ||
| Telecommunications - 0.2% | |||
| Connect Finco Sarl Tranche B 1LN, term loan 3 month U.S. LIBOR + 4.500% 5.5% 12/11/26 (c)(e)(j) | 9,050 | 8,251 | |
| GTT Communications, Inc. Tranche B, term loan 3 month U.S. LIBOR + 2.750% 3.74% 5/31/25 (c)(e)(j) | 9,387 | 6,779 | |
| Zayo Group Holdings, Inc. 1LN, term loan 3 month U.S. LIBOR + 3.000% 3.4036% 3/9/27 (c)(e)(j) | 8,780 | 8,229 | |
| TOTAL TELECOMMUNICATIONS | 23,259 | ||
| Utilities - 0.3% | |||
| Vertiv Group Corp. Tranche B 1LN, term loan 3 month U.S. LIBOR + 3.000% 3.9929% 3/2/27 (c)(e)(j) | 34,225 | 32,086 | |
| TOTAL BANK LOAN OBLIGATIONS | |||
| (Cost $692,061) | 399,547 | ||
| Preferred Securities - 9.8% | |||
| Banks & Thrifts - 8.6% | |||
| Bank of America Corp.: | |||
| 5.125% (c)(k) | 36,030 | 36,071 | |
| 5.2% (c)(k) | 61,440 | 61,017 | |
| 5.875% (c)(k) | 102,630 | 105,454 | |
| 6.25% (c)(k) | 28,555 | 30,037 | |
| Citigroup, Inc.: | |||
| 4.7% (c)(k) | 15,285 | 13,493 | |
| 5% (c)(k) | 60,300 | 55,241 | |
| 5.9% (c)(k) | 27,015 | 27,638 | |
| 5.95% (c)(k) | 51,015 | 51,544 | |
| 6.3% (c)(k) | 5,610 | 5,703 | |
| Goldman Sachs Group, Inc.: | |||
| 4.4% (c)(k) | 8,035 | 7,221 | |
| 4.95% (c)(k) | 13,335 | 12,705 | |
| 5% (c)(k) | 84,915 | 78,866 | |
| 5.375% (c)(k) | 31,615 | 30,170 | |
| Huntington Bancshares, Inc. 5.7% (c)(k) | 12,990 | 11,464 | |
| JPMorgan Chase & Co.: | |||
| 3 month U.S. LIBOR + 3.320% 4.7534% (c)(e)(k) | 43,545 | 38,338 | |
| 4% (c)(k) | 34,340 | 30,128 | |
| 4.6% (c)(k) | 23,365 | 21,249 | |
| 5% (c)(k) | 30,845 | 29,071 | |
| 5.3% (c)(k) | 16,855 | 16,448 | |
| 6% (c)(k) | 69,385 | 71,108 | |
| 6.125% (c)(k) | 17,585 | 17,984 | |
| 6.75% (c)(k) | 8,330 | 9,082 | |
| Wells Fargo & Co.: | |||
| 5.875% (c)(k) | 50,420 | 54,940 | |
| 5.9% (c)(k) | 63,075 | 65,424 | |
| TOTAL BANKS & THRIFTS | 880,396 | ||
| Diversified Financial Services - 0.2% | |||
| AerCap Holdings NV 5.875% 10/10/79 (c) | 33,325 | 22,357 | |
| Energy - 1.0% | |||
| DCP Midstream Partners LP 7.375% (c)(k) | 15,260 | 6,261 | |
| Energy Transfer Partners LP: | |||
| 6.25% (c)(k) | 70,123 | 50,001 | |
| 6.625% (c)(k) | 27,290 | 19,926 | |
| MPLX LP 6.875% (c)(k) | 30,450 | 22,331 | |
| Summit Midstream Partners LP 9.5% (c)(k) | 15,260 | 2,073 | |
| TOTAL ENERGY | 100,592 | ||
| Homebuilders/Real Estate - 0.0% | |||
| Odebrecht Finance Ltd. 7.5% (a)(f)(k) | 2,940 | 118 | |
| TOTAL PREFERRED SECURITIES | |||
| (Cost $1,093,033) | 1,003,463 | ||
| Shares | Value (000s) | ||
| Money Market Funds - 3.2% | |||
| Fidelity Cash Central Fund 0.16% (l) | 321,821,000 | 321,918 | |
| Fidelity Securities Lending Cash Central Fund 0.11% (l)(m) | 9,321,519 | 9,322 | |
| TOTAL MONEY MARKET FUNDS | |||
| (Cost $331,161) | 331,240 | ||
| TOTAL INVESTMENT IN SECURITIES - 99.1% | |||
| (Cost $10,815,820) | 10,137,765 | ||
| NET OTHER ASSETS (LIABILITIES) - 0.9% | 90,603 | ||
| NET ASSETS - 100% | $10,228,368 |
Values shown as $0 in the Schedule of Investments may reflect amounts less than $500.
Legend
(a) Security exempt from registration under Rule 144A of the Securities Act of 1933. These securities may be resold in transactions exempt from registration, normally to qualified institutional buyers. At the end of the period, the value of these securities amounted to $4,034,631,000 or 39.4% of net assets.
(b) Security or a portion of the security purchased on a delayed delivery or when-issued basis.
(c) Coupon rates for floating and adjustable rate securities reflect the rates in effect at period end.
(d) Level 3 security
(e) Coupon is indexed to a floating interest rate which may be multiplied by a specified factor and/or subject to caps or floors.
(f) Non-income producing - Security is in default.
(g) Non-income producing
(h) Security or a portion of the security is on loan at period end.
(i) Restricted securities (including private placements) - Investment in securities not registered under the Securities Act of 1933 (excluding 144A issues). At the end of the period, the value of restricted securities (excluding 144A issues) amounted to $1,655,000 or 0.0% of net assets.
(j) Remaining maturities of bank loan obligations may be less than the stated maturities shown as a result of contractual or optional prepayments by the borrower. Such prepayments cannot be predicted with certainty.
(k) Security is perpetual in nature with no stated maturity date.
(l) Affiliated fund that is generally available only to investment companies and other accounts managed by Fidelity Investments. The rate quoted is the annualized seven-day yield of the fund at period end. A complete unaudited listing of the fund's holdings as of its most recent quarter end is available upon request. In addition, each Fidelity Central Fund's financial statements, which are not covered by the Fund's Report of Independent Registered Public Accounting Firm, are available on the SEC's website or upon request.
(m) Investment made with cash collateral received from securities on loan.
Additional information on each restricted holding is as follows:
| Security | Acquisition Date | Acquisition Cost (000s) |
| Arena Brands Holding Corp. Class B | 6/18/97 - 1/12/99 | $21,592 |
| Tricer Holdco SCA | 10/16/09 - 12/30/17 | $10,248 |
| Tricer Holdco SCA Class A1 | 10/16/09 - 10/29/09 | $1,653 |
| Tricer Holdco SCA Class A2 | 10/16/09 - 10/29/09 | $1,653 |
| Tricer Holdco SCA Class A3 | 10/16/09 - 10/29/09 | $1,653 |
| Tricer Holdco SCA Class A4 | 10/16/09 - 10/29/09 | $1,653 |
| Tricer Holdco SCA Class A5 | 10/16/09 - 10/29/09 | $1,653 |
| Tricer Holdco SCA Class A6 | 10/16/09 - 10/29/09 | $1,653 |
| Tricer Holdco SCA Class A7 | 10/16/09 - 10/29/09 | $1,653 |
| Tricer Holdco SCA Class A8 | 10/16/09 - 10/29/09 | $1,653 |
| Tricer Holdco SCA Class A9 | 10/16/09 - 10/29/09 | $1,654 |
Affiliated Central Funds
Information regarding fiscal year to date income earned by the Fund from investments in Fidelity Central Funds is as follows:
| Fund | Income earned |
| (Amounts in thousands) | |
| Fidelity Cash Central Fund | $17,097 |
| Fidelity Securities Lending Cash Central Fund | 148 |
| Total | $17,245 |
Amounts in the income column in the above table include any capital gain distributions from underlying funds, which are presented in the corresponding line-item in the Statement of Operations, if applicable. Amount for Fidelity Securities Lending Cash Central Fund represents the income earned on investing cash collateral, less rebates paid to borrowers and any lending agent fees associated with the loan, plus any premium payments received for lending certain types of securities.
Investment Valuation
The following is a summary of the inputs used, as of April 30, 2020, involving the Fund's assets and liabilities carried at fair value. The inputs or methodology used for valuing securities may not be an indication of the risk associated with investing in those securities. For more information on valuation inputs, and their aggregation into the levels used below, please refer to the Investment Valuation section in the accompanying Notes to Financial Statements.
| Valuation Inputs at Reporting Date: | ||||
| Description | Total | Level 1 | Level 2 | Level 3 |
| (Amounts in thousands) | ||||
| Investments in Securities: | ||||
| Equities: | ||||
| Communication Services | $275,768 | $275,767 | $1 | $-- |
| Consumer Discretionary | 210,328 | 191,519 | -- | 18,809 |
| Consumer Staples | 90,659 | 83,207 | -- | 7,452 |
| Energy | 7,124 | 7,124 | -- | -- |
| Financials | 88,236 | 88,236 | -- | -- |
| Health Care | 321,495 | 319,562 | -- | 1,933 |
| Industrials | 214,467 | 212,064 | 8 | 2,395 |
| Information Technology | 770,681 | 770,681 | -- | -- |
| Materials | 54,704 | 54,664 | -- | 40 |
| Real Estate | 2,764 | 2,764 | -- | -- |
| Utilities | 110,384 | 110,384 | -- | -- |
| Corporate Bonds | 6,256,905 | -- | 6,252,655 | 4,250 |
| Bank Loan Obligations | 399,547 | -- | 390,836 | 8,711 |
| Preferred Securities | 1,003,463 | -- | 1,003,463 | -- |
| Money Market Funds | 331,240 | 331,240 | -- | -- |
| Total Investments in Securities: | $10,137,765 | $2,447,212 | $7,646,963 | $43,590 |
Other Information
Distribution of investments by country or territory of incorporation, as a percentage of Total Net Assets, is as follows (Unaudited):
| United States of America | 85.2% |
| Canada | 3.7% |
| Luxembourg | 1.7% |
| France | 1.6% |
| Netherlands | 1.4% |
| Cayman Islands | 1.3% |
| Multi-National | 1.3% |
| Others (Individually Less Than 1%) | 3.8% |
| 100.0% |
See accompanying notes which are an integral part of the financial statements.
Financial Statements
Statement of Assets and Liabilities
| Amounts in thousands (except per-share amount) | April 30, 2020 | |
| Assets | ||
| Investment in securities, at value (including securities loaned of $8,746) — See accompanying schedule: Unaffiliated issuers (cost $10,484,659) | $9,806,525 | |
| Fidelity Central Funds (cost $331,161) | 331,240 | |
| Total Investment in Securities (cost $10,815,820) | $10,137,765 | |
| Cash | 238 | |
| Receivable for investments sold | 19,684 | |
| Receivable for fund shares sold | 6,848 | |
| Dividends receivable | 2,087 | |
| Interest receivable | 130,082 | |
| Distributions receivable from Fidelity Central Funds | 63 | |
| Prepaid expenses | 5 | |
| Other receivables | 528 | |
| Total assets | 10,297,300 | |
| Liabilities | ||
| Payable for investments purchased | ||
| Regular delivery | $22,617 | |
| Delayed delivery | 6,630 | |
| Payable for fund shares redeemed | 19,656 | |
| Distributions payable | 4,250 | |
| Accrued management fee | 4,560 | |
| Other affiliated payables | 1,097 | |
| Other payables and accrued expenses | 804 | |
| Collateral on securities loaned | 9,318 | |
| Total liabilities | 68,932 | |
| Net Assets | $10,228,368 | |
| Net Assets consist of: | ||
| Paid in capital | $10,827,373 | |
| Total accumulated earnings (loss) | (599,005) | |
| Net Assets | $10,228,368 | |
| Net Asset Value, offering price and redemption price per share ($10,228,368 ÷ 1,146,238 shares) | $8.92 |
See accompanying notes which are an integral part of the financial statements.
Statement of Operations
| Amounts in thousands | Year ended April 30, 2020 | |
| Investment Income | ||
| Dividends | $85,158 | |
| Interest | 479,552 | |
| Income from Fidelity Central Funds (including $148 from security lending) | 17,245 | |
| Total income | 581,955 | |
| Expenses | ||
| Management fee | $64,407 | |
| Transfer agent fees | 12,848 | |
| Accounting fees | 1,445 | |
| Custodian fees and expenses | 130 | |
| Independent trustees' fees and expenses | 69 | |
| Registration fees | 266 | |
| Audit | 128 | |
| Legal | (1,745) | |
| Miscellaneous | 219 | |
| Total expenses before reductions | 77,767 | |
| Expense reductions | (85) | |
| Total expenses after reductions | 77,682 | |
| Net investment income (loss) | 504,273 | |
| Realized and Unrealized Gain (Loss) | ||
| Net realized gain (loss) on: | ||
| Investment securities: | ||
| Unaffiliated issuers | 80,982 | |
| Fidelity Central Funds | 71 | |
| Foreign currency transactions | (108) | |
| Total net realized gain (loss) | 80,945 | |
| Change in net unrealized appreciation (depreciation) on: | ||
| Investment securities: | ||
| Unaffiliated issuers | (1,461,144) | |
| Fidelity Central Funds | 33 | |
| Assets and liabilities in foreign currencies | (20) | |
| Total change in net unrealized appreciation (depreciation) | (1,461,131) | |
| Net gain (loss) | (1,380,186) | |
| Net increase (decrease) in net assets resulting from operations | $(875,913) |
See accompanying notes which are an integral part of the financial statements.
Statement of Changes in Net Assets
| Amounts in thousands | Year ended April 30, 2020 | Year ended April 30, 2019 |
| Increase (Decrease) in Net Assets | ||
| Operations | ||
| Net investment income (loss) | $504,273 | $514,624 |
| Net realized gain (loss) | 80,945 | 78,620 |
| Change in net unrealized appreciation (depreciation) | (1,461,131) | 114,337 |
| Net increase (decrease) in net assets resulting from operations | (875,913) | 707,581 |
| Distributions to shareholders | (594,227) | (807,791) |
| Share transactions | ||
| Proceeds from sales of shares | 3,247,199 | 2,212,313 |
| Reinvestment of distributions | 527,109 | 721,792 |
| Cost of shares redeemed | (3,706,922) | (3,255,515) |
| Net increase (decrease) in net assets resulting from share transactions | 67,386 | (321,410) |
| Total increase (decrease) in net assets | (1,402,754) | (421,620) |
| Net Assets | ||
| Beginning of period | 11,631,122 | 12,052,742 |
| End of period | $10,228,368 | $11,631,122 |
| Other Information | ||
| Shares | ||
| Sold | 335,944 | 223,038 |
| Issued in reinvestment of distributions | 53,598 | 73,721 |
| Redeemed | (397,075) | (333,577) |
| Net increase (decrease) | (7,533) | (36,818) |
See accompanying notes which are an integral part of the financial statements.
Financial Highlights
Fidelity Capital & Income Fund
| Years ended April 30, | 2020 | 2019 | 2018 | 2017 | 2016 |
| Selected Per–Share Data | |||||
| Net asset value, beginning of period | $10.08 | $10.12 | $10.09 | $9.24 | $9.99 |
| Income from Investment Operations | |||||
| Net investment income (loss)A | .426 | .432 | .482 | .430 | .404 |
| Net realized and unrealized gain (loss) | (1.085) | .207 | .065 | .824 | (.710) |
| Total from investment operations | (.659) | .639 | .547 | 1.254 | (.306) |
| Distributions from net investment income | (.425) | (.487) | (.410) | (.405) | (.387) |
| Distributions from net realized gain | (.076) | (.192) | (.107) | – | (.058) |
| Total distributions | (.501) | (.679) | (.517) | (.405) | (.445) |
| Redemption fees added to paid in capitalA | – | – | –B | .001 | .001 |
| Net asset value, end of period | $8.92 | $10.08 | $10.12 | $10.09 | $9.24 |
| Total ReturnC | (6.89)% | 6.74% | 5.51% | 13.85% | (3.05)% |
| Ratios to Average Net AssetsD,E | |||||
| Expenses before reductions | .67% | .69% | .67% | .73% | .75% |
| Expenses net of fee waivers, if any | .67% | .69% | .67% | .73% | .75% |
| Expenses net of all reductions | .67% | .69% | .67% | .73% | .74% |
| Net investment income (loss) | 4.32% | 4.37% | 4.71% | 4.45% | 4.30% |
| Supplemental Data | |||||
| Net assets, end of period (in millions) | $10,228 | $11,631 | $12,053 | $11,230 | $10,188 |
| Portfolio turnover rateF | 46% | 43% | 39% | 39% | 35% |
A Calculated based on average shares outstanding during the period.
B Amount represents less than $.0005 per share.
C Total returns would have been lower if certain expenses had not been reduced during the applicable periods shown.
D Fees and expenses of any underlying Fidelity Central Funds are not included in the Fund's expense ratio. The Fund indirectly bears its proportionate share of the expenses of any underlying Fidelity Central Funds.
E Expense ratios reflect operating expenses of the Fund. Expenses before reductions do not reflect amounts reimbursed by the investment adviser or reductions from brokerage service arrangements or reductions from other expense offset arrangements and do not represent the amount paid by the Fund during periods when reimbursements or reductions occur. Expenses net of fee waivers reflect expenses after reimbursement by the investment adviser but prior to reductions from brokerage service arrangements or other expense offset arrangements. Expenses net of all reductions represent the net expenses paid by the Fund.
F Amount does not include the portfolio activity of any underlying Fidelity Central Funds.
See accompanying notes which are an integral part of the financial statements.
Notes to Financial Statements
For the period ended April 30, 2020
(Amounts in thousands except percentages)
1. Organization.
Fidelity Capital & Income Fund (the Fund) is a fund of Fidelity Summer Street Trust (the Trust) and is authorized to issue an unlimited number of shares. Share transactions on the Statement of Changes in Net Assets may contain exchanges between affiliated funds. The Trust is registered under the Investment Company Act of 1940, as amended (the 1940 Act), as an open-end management investment company organized as a Massachusetts business trust.
Effective January 1, 2020:
Investment advisers Fidelity Investments Money Management, Inc., FMR Co., Inc., and Fidelity SelectCo, LLC, merged with and into Fidelity Management & Research Company. In connection with the merger transactions, the resulting, merged investment adviser was then redomiciled from Massachusetts to Delaware, changed its corporate structure from a corporation to a limited liability company, and changed its name to "Fidelity Management & Research Company LLC".
Fidelity Investments Institutional Operations Company, Inc. converted from a Massachusetts corporation to a Massachusetts LLC, and changed its name to "Fidelity Investments Institutional Operations Company LLC".
2. Investments in Fidelity Central Funds.
The Fund invests in Fidelity Central Funds, which are open-end investment companies generally available only to other investment companies and accounts managed by the investment adviser and its affiliates. The Fund's Schedule of Investments lists each of the Fidelity Central Funds held as of period end, if any, as an investment of the Fund, but does not include the underlying holdings of each Fidelity Central Fund. As an Investing Fund, the Fund indirectly bears its proportionate share of the expenses of the underlying Fidelity Central Funds.
The Money Market Central Funds seek preservation of capital and current income and are managed by the investment adviser. Annualized expenses of the Money Market Central Funds as of their most recent shareholder report date ranged from less than .005% to .01%.
A complete unaudited list of holdings for each Fidelity Central Fund is available upon request or at the Securities and Exchange Commission (the SEC) website at www.sec.gov. In addition, the financial statements of the Fidelity Central Funds, which are not covered by the Fund's Report of Independent Registered Public Accounting Firm, are available on the SEC website or upon request.
3. Significant Accounting Policies.
The Fund is an investment company and applies the accounting and reporting guidance of the Financial Accounting Standards Board (FASB) Accounting Standards Codification Topic 946 Financial Services – Investments Companies. The financial statements have been prepared in conformity with accounting principles generally accepted in the United States of America (GAAP), which require management to make certain estimates and assumptions at the date of the financial statements. Actual results could differ from those estimates. Subsequent events, if any, through the date that the financial statements were issued have been evaluated in the preparation of the financial statements. The following summarizes the significant accounting policies of the Fund:
Investment Valuation. Investments are valued as of 4:00 p.m. Eastern time on the last calendar day of the period. The Board of Trustees (the Board) has delegated the day to day responsibility for the valuation of the Fund's investments to the Fair Value Committee (the Committee) established by the Fund's investment adviser. In accordance with valuation policies and procedures approved by the Board, the Fund attempts to obtain prices from one or more third party pricing vendors or brokers to value its investments. When current market prices, quotations or currency exchange rates are not readily available or reliable, investments will be fair valued in good faith by the Committee, in accordance with procedures adopted by the Board. Factors used in determining fair value vary by investment type and may include market or investment specific events, changes in interest rates and credit quality. The frequency with which these procedures are used cannot be predicted and they may be utilized to a significant extent. The Committee oversees the Fund's valuation policies and procedures and reports to the Board on the Committee's activities and fair value determinations. The Board monitors the appropriateness of the procedures used in valuing the Fund's investments and ratifies the fair value determinations of the Committee.
The Fund categorizes the inputs to valuation techniques used to value its investments into a disclosure hierarchy consisting of three levels as shown below:
- Level 1 – quoted prices in active markets for identical investments
- Level 2 – other significant observable inputs (including quoted prices for similar investments, interest rates, prepayment speeds, etc.)
- Level 3 – unobservable inputs (including the Fund's own assumptions based on the best information available)
Valuation techniques used to value the Fund's investments by major category are as follows:
Debt securities, including restricted securities, are valued based on evaluated prices received from third party pricing vendors or from brokers who make markets in such securities. Corporate bonds, bank loan obligations and preferred securities are valued by pricing vendors who utilize matrix pricing which considers yield or price of bonds of comparable quality, coupon, maturity and type or by broker-supplied prices. When independent prices are unavailable or unreliable, debt securities may be valued utilizing pricing methodologies which consider similar factors that would be used by third party pricing vendors. Debt securities are generally categorized as Level 2 in the hierarchy but may be Level 3 depending on the circumstances. The Fund invests a significant portion of its assets in below investment grade securities. The value of these securities can be more volatile due to changes in the credit quality of the issuer and is sensitive to changes in economic, market and regulatory conditions.
Equity securities, including restricted securities, for which market quotations are readily available, are valued at the last reported sale price or official closing price as reported by a third party pricing vendor on the primary market or exchange on which they are traded and are categorized as Level 1 in the hierarchy. In the event there were no sales during the day or closing prices are not available, securities are valued at the last quoted bid price or may be valued using the last available price and are generally categorized as Level 2 in the hierarchy. For foreign equity securities, when market or security specific events arise, comparisons to the valuation of American Depositary Receipts (ADRs), futures contracts, Exchange-Traded Funds (ETFs) and certain indexes as well as quoted prices for similar securities may be used and would be categorized as Level 2 in the hierarchy. For equity securities, including restricted securities, where observable inputs are limited, assumptions about market activity and risk are used and these securities may be categorized as Level 3 in the hierarchy.
Investments in open-end mutual funds, including the Fidelity Central Funds, are valued at their closing net asset value (NAV) each business day and are categorized as Level 1 in the hierarchy.
Changes in valuation techniques may result in transfers in or out of an assigned level within the disclosure hierarchy. The aggregate value of investments by input level as of April 30, 2020 is included at the end of the Fund's Schedule of Investments.
Foreign Currency. The Fund may use foreign currency contracts to facilitate transactions in foreign-denominated securities. Gains and losses from these transactions may arise from changes in the value of the foreign currency or if the counterparties do not perform under the contracts' terms.
Foreign-denominated assets, including investment securities, and liabilities are translated into U.S. dollars at the exchange rates at period end. Purchases and sales of investment securities, income and dividends received and expenses denominated in foreign currencies are translated into U.S. dollars at the exchange rate in effect on the transaction date.
The effects of exchange rate fluctuations on investments are included with the net realized and unrealized gain (loss) on investment securities. Other foreign currency transactions resulting in realized and unrealized gain (loss) are disclosed separately.
Investment Transactions and Income. For financial reporting purposes, the Fund's investment holdings and NAV include trades executed through the end of the last business day of the period. The NAV per share for processing shareholder transactions is calculated as of the close of business of the New York Stock Exchange (NYSE), normally 4:00 p.m. Eastern time and includes trades executed through the end of the prior business day. Gains and losses on securities sold are determined on the basis of identified cost and include proceeds received from litigation. Dividend income is recorded on the ex-dividend date, except for certain dividends from foreign securities where the ex-dividend date may have passed, which are recorded as soon as the Fund is informed of the ex-dividend date. Non-cash dividends included in dividend income, if any, are recorded at the fair market value of the securities received. Income and capital gain distributions from Fidelity Central Funds, if any, are recorded on the ex-dividend date. Certain distributions received by the Fund represent a return of capital or capital gain. The Fund determines the components of these distributions subsequent to the ex-dividend date, based upon receipt of tax filings or other correspondence relating to the underlying investment. These distributions are recorded as a reduction of cost of investments and/or as a realized gain. Interest income is accrued as earned and includes coupon interest and amortization of premium and accretion of discount on debt securities as applicable. Paid in Kind (PIK) income is recorded at the fair market value of the securities received. Investment income is recorded net of foreign taxes withheld where recovery of such taxes is uncertain. Debt obligations may be placed on non-accrual status and related interest income may be reduced by ceasing current accruals and writing off interest receivables when the collection of all or a portion of interest has become doubtful based on consistently applied procedures. A debt obligation is removed from non-accrual status when the issuer resumes interest payments or when collectability of interest is reasonably assured.
Expenses. Expenses directly attributable to a fund are charged to that fund. Expenses attributable to more than one fund are allocated among the respective funds on the basis of relative net assets or other appropriate methods. Expense estimates are accrued in the period to which they relate and adjustments are made when actual amounts are known.
Deferred Trustee Compensation. Under a Deferred Compensation Plan (the Plan) for the Fund, certain independent Trustees have elected to defer receipt of a portion of their annual compensation. Deferred amounts are invested in a cross-section of Fidelity funds, are marked-to-market and remain in the Fund until distributed in accordance with the Plan. The investment of deferred amounts and the offsetting payable to the Trustees of $505 are included in the accompanying Statement of Assets and Liabilities in other receivables and other payables and accrued expenses, respectively.
Income Tax Information and Distributions to Shareholders. Each year, the Fund intends to qualify as a regulated investment company under Subchapter M of the Internal Revenue Code, including distributing substantially all of its taxable income and realized gains. As a result, no provision for U.S. Federal income taxes is required. As of April 30, 2020, the Fund did not have any unrecognized tax benefits in the financial statements; nor is the Fund aware of any tax positions for which it is reasonably possible that the total amounts of unrecognized tax benefits will significantly change in the next twelve months. The Fund files a U.S. federal tax return, in addition to state and local tax returns as required. The Fund's federal income tax returns are subject to examination by the Internal Revenue Service (IRS) for a period of three fiscal years after they are filed. State and local tax returns may be subject to examination for an additional fiscal year depending on the jurisdiction. Foreign taxes are provided for based on the Fund's understanding of the tax rules and rates that exist in the foreign markets in which it invests.
Distributions are declared and recorded daily and paid monthly from net investment income. Distributions from realized gains, if any, are declared and recorded on the ex-dividend date. Income and capital gain distributions are determined in accordance with income tax regulations, which may differ from GAAP. In addition, the Fund claimed a portion of the payment made to redeeming shareholders as a distribution for income tax purposes.
Capital accounts within the financial statements are adjusted for permanent book-tax differences. These adjustments have no impact on net assets or the results of operations. Capital accounts are not adjusted for temporary book-tax differences which will reverse in a subsequent period.
Book-tax differences are primarily due to foreign currency transactions, defaulted bonds, market discount, partnerships, deferred trustees compensation and losses deferred due to wash sales.
As of period end, the cost and unrealized appreciation (depreciation) in securities, and derivatives if applicable, for federal income tax purposes were as follows:
| Gross unrealized appreciation | $847,742 |
| Gross unrealized depreciation | (1,485,649) |
| Net unrealized appreciation (depreciation) | $(637,907) |
| Tax Cost | $10,775,672 |
The tax-based components of distributable earnings as of period end were as follows:
| Undistributed ordinary income | $12,529 |
| Undistributed long-term capital gain | $26,847 |
| Net unrealized appreciation (depreciation) on securities and other investments | $(637,932) |
The tax character of distributions paid was as follows:
| April 30, 2020 | April 30, 2019 | |
| Ordinary Income | $505,526 | $ 578,310 |
| Long-term Capital Gains | 88,701 | 229,481 |
| Total | $594,227 | $ 807,791 |
Delayed Delivery Transactions and When-Issued Securities. During the period, the Fund transacted in securities on a delayed delivery or when-issued basis. Payment and delivery may take place after the customary settlement period for that security. The price of the underlying securities and the date when the securities will be delivered and paid for are fixed at the time the transaction is negotiated. The securities purchased on a delayed delivery or when-issued basis are identified as such in the Fund's Schedule of Investments. The Fund may receive compensation for interest forgone in the purchase of a delayed delivery or when-issued security. With respect to purchase commitments, the Fund identifies securities as segregated in its records with a value at least equal to the amount of the commitment. Losses may arise due to changes in the value of the underlying securities or if the counterparty does not perform under the contract's terms, or if the issuer does not issue the securities due to political, economic, or other factors.
Restricted Securities (including Private Placements). The Fund may invest in securities that are subject to legal or contractual restrictions on resale. These securities generally may be resold in transactions exempt from registration or to the public if the securities are registered. Disposal of these securities may involve time-consuming negotiations and expense, and prompt sale at an acceptable price may be difficult. Information regarding restricted securities is included at the end of the Fund's Schedule of Investments.
Loans and Other Direct Debt Instruments. The Fund invests in direct debt instruments which are interests in amounts owed to lenders by corporate or other borrowers. These instruments may be in the form of loans, trade claims or other receivables and may include standby financing commitments such as revolving credit facilities that obligate the Fund to supply additional cash to the borrower on demand. Loans may be acquired through assignment or participation. The Fund did not have any unfunded loan commitments, which are contractual obligations for future funding, at period end.
4. Purchases and Sales of Investments.
Purchases and sales of securities, other than short-term securities, are noted in the table below.
| Purchases ($) | Sales ($) | |
| Fidelity Capital & Income Fund | 5,292,481 | 4,902,639 |
5. Fees and Other Transactions with Affiliates.
Management Fee. Fidelity Management & Research Company LLC (the investment adviser) and its affiliates provide the Fund with investment management related services for which the Fund pays a monthly management fee. The management fee is the sum of an individual fund fee rate that is based on an annual rate of .45% of the Fund's average net assets and an annualized group fee rate that averaged .10% during the period. The group fee rate is based upon the monthly average net assets of a group of registered investment companies with which the investment adviser has management contracts. The group fee rate decreases as assets under management increase and increases as assets under management decrease. For the reporting period, the total annual management fee rate was .55% of the Fund's average net assets.
Transfer Agent Fees. Fidelity Investments Institutional Operations Company LLC (FIIOC), an affiliate of the investment adviser, is the Fund's transfer, dividend disbursing and shareholder servicing agent. FIIOC receives account fees and asset-based fees that vary according to account size and type of account. FIIOC pays for typesetting, printing and mailing of shareholder reports, except proxy statements. For the period, the transfer agent fees were equivalent to an annual rate of .11% of average net assets.
Accounting Fees. Fidelity Service Company, Inc. (FSC), an affiliate of the investment adviser, maintains the Fund's accounting records. The accounting fee is based on the level of average net assets for each month. For the period, the fees were equivalent to the following annual rates:
| % of Average Net Assets | |
| Fidelity Capital & Income Fund | .01 |
Brokerage Commissions. A portion of portfolio transactions were placed with brokerage firms which are affiliates of the investment adviser. Brokerage commissions are included in net realized gain (loss) and change in net unrealized appreciation (depreciation) in the Statement of Operations. The commissions paid to these affiliated firms were as follows:
| Amount | |
| Fidelity Capital & Income Fund | $38 |
Interfund Trades. Funds may purchase from or sell securities to other Fidelity Funds under procedures adopted by the Board. The procedures have been designed to ensure these interfund trades are executed in accordance with Rule 17a-7 of the 1940 Act. Interfund trades are included within the respective purchases and sales amounts shown in the Purchases and Sales of Investments note.
6. Committed Line of Credit.
Certain Funds participate with other funds managed by the investment adviser or an affiliate in a $4.25 billion credit facility (the "line of credit") to be utilized for temporary or emergency purposes to fund shareholder redemptions or for other short-term liquidity purposes. The participating funds have agreed to pay commitment fees on their pro-rata portion of the line of credit, which are reflected in Miscellaneous expenses on the Statement of Operations, and are as follows:
| Amount | |
| Fidelity Capital & Income Fund | $29 |
During the period, there were no borrowings on this line of credit.
7. Security Lending.
The Fund lends portfolio securities from time to time in order to earn additional income. For equity securities, lending agents are used, including National Financial Services (NFS), an affiliate of the Fund. Pursuant to a securities lending agreement, NFS will receive a fee, which is capped at 9.9% of daily lending revenue, for its services as lending agent. The Fund may lend securities to certain qualified borrowers, including NFS. On the settlement date of the loan, the Fund receives collateral (in the form of U.S. Treasury obligations, letters of credit and/or cash) against the loaned securities and maintains collateral in an amount not less than 100% of the market value of the loaned securities during the period of the loan. The market value of the loaned securities is determined at the close of business of the Fund and any additional required collateral is delivered to the Fund on the next business day. The Fund or borrower may terminate the loan at any time, and if the borrower defaults on its obligation to return the securities loaned because of insolvency or other reasons, the Fund may apply collateral received from the borrower against the obligation. The Fund may experience delays and costs in recovering the securities loaned. Any cash collateral received is invested in the Fidelity Securities Lending Cash Central Fund. The value of loaned securities and cash collateral at period end are disclosed on the Fund's Statement of Assets and Liabilities. At period end, there were no security loans outstanding with NFS, as affiliated borrower. Total fees paid by the Fund to NFS, as lending agent, amounted to $7. Security lending income represents the income earned on investing cash collateral, less rebates paid to borrowers and any lending agent fees associated with the loan, plus any premium payments received for lending certain types of securities. Security lending income is presented in the Statement of Operations as a component of income from Fidelity Central Funds, and includes $3 from securities loaned to NFS, as affiliated borrower.
8. Expense Reductions.
Commissions paid to certain brokers with whom the investment adviser, or its affiliates, places trades on behalf of the Fund include an amount in addition to trade execution, which may be rebated back to the Fund to offset certain expenses. This amount totaled $5 for the period. In addition, through arrangements with the Fund's custodian, credits realized as a result of certain uninvested cash balances were used to reduce the Fund's expenses by $40.
In addition, during the period the investment adviser or an affiliate reimbursed and/or waived a portion of operating expenses in the amount of $40.
9. Other.
The Fund's organizational documents provide former and current trustees and officers with a limited indemnification against liabilities arising in connection with the performance of their duties to the Fund. In the normal course of business, the Fund may also enter into contracts that provide general indemnifications. The Fund's maximum exposure under these arrangements is unknown as this would be dependent on future claims that may be made against the Fund. The risk of material loss from such claims is considered remote.
10. Litigation.
The Fund and other entities managed by FMR or its affiliates were named as defendants in a lawsuit filed in the United States Bankruptcy Court for the Southern District of New York in 2009. The lawsuit was brought by creditors of Motors Liquidation Company (f/k/a General Motors), which went through Chapter 11 bankruptcy proceedings in 2009, and is captioned Official Committee of Unsecured Creditors of Motors Liquidation Company v. JPMorgan Chase Bank, N.A., et al., Adversary No. 09-00504 (REG). The plaintiffs sought an order that the Fund and other defendants return proceeds received in 2009 in full payment of the principal and interest on General Motors secured debt. The plaintiffs contended that the Fund and the other defendants were not secured creditors at the time of the 2009 payments and, thus, were not entitled to payment in full. In May 2019, the parties reached a settlement that has been approved by the Bankruptcy Court. Under the terms of the settlement, the Fund will not be required to return any of the proceeds received in 2009, and will be entitled to recover a portion of the legal costs incurred in defending the case.
11. Coronavirus (COVID-19) Pandemic.
An outbreak of COVID-19 first detected in China during December 2019 has since spread globally and was declared a pandemic by the World Health Organization during March 2020. Developments that disrupt global economies and financial markets, such as the COVID-19 pandemic, may magnify factors that affect the Fund's performance.
Report of Independent Registered Public Accounting Firm
To the Board of Trustees of Fidelity Summer Street Trust and Shareholders of Fidelity Capital & Income Fund
Opinion on the Financial Statements
We have audited the accompanying statement of assets and liabilities, including the schedule of investments, of Fidelity Capital & Income Fund (one of the funds constituting Fidelity Summer Street Trust, referred to hereafter as the “Fund”) as of April 30, 2020, the related statement of operations for the year ended April 30, 2020, the statement of changes in net assets for each of the two years in the period ended April 30, 2020, including the related notes, and the financial highlights for each of the five years in the period ended April 30, 2020 (collectively referred to as the “financial statements”). In our opinion, the financial statements present fairly, in all material respects, the financial position of the Fund as of April 30, 2020, the results of its operations for the year then ended, the changes in its net assets for each of the two years in the period ended April 30, 2020 and the financial highlights for each of the five years in the period ended April 30, 2020 in conformity with accounting principles generally accepted in the United States of America.
Basis for Opinion
These financial statements are the responsibility of the Fund’s management. Our responsibility is to express an opinion on the Fund’s financial statements based on our audits. We are a public accounting firm registered with the Public Company Accounting Oversight Board (United States) (PCAOB) and are required to be independent with respect to the Fund in accordance with the U.S. federal securities laws and the applicable rules and regulations of the Securities and Exchange Commission and the PCAOB.
We conducted our audits of these financial statements in accordance with the standards of the PCAOB. Those standards require that we plan and perform the audit to obtain reasonable assurance about whether the financial statements are free of material misstatement, whether due to error or fraud.
Our audits included performing procedures to assess the risks of material misstatement of the financial statements, whether due to error or fraud, and performing procedures that respond to those risks. Such procedures included examining, on a test basis, evidence regarding the amounts and disclosures in the financial statements. Our audits also included evaluating the accounting principles used and significant estimates made by management, as well as evaluating the overall presentation of the financial statements. Our procedures included confirmation of securities owned as of April 30, 2020 by correspondence with the custodian, issuers of privately offered securities, agent banks and brokers; when replies were not received from brokers, we performed other auditing procedures. We believe that our audits provide a reasonable basis for our opinion.
PricewaterhouseCoopers LLP
Boston, Massachusetts
June 10, 2020
We have served as the auditor of one or more investment companies in the Fidelity group of funds since 1932.
Trustees and Officers
The Trustees, Members of the Advisory Board (if any), and officers of the trust and fund, as applicable, are listed below. The Board of Trustees governs the fund and is responsible for protecting the interests of shareholders. The Trustees are experienced executives who meet periodically throughout the year to oversee the fund's activities, review contractual arrangements with companies that provide services to the fund, oversee management of the risks associated with such activities and contractual arrangements, and review the fund's performance. Except for Bettina Doulton, each of the Trustees oversees 312 funds. Ms. Doulton oversees 210 funds.
The Trustees hold office without limit in time except that (a) any Trustee may resign; (b) any Trustee may be removed by written instrument, signed by at least two-thirds of the number of Trustees prior to such removal; (c) any Trustee who requests to be retired or who has become incapacitated by illness or injury may be retired by written instrument signed by a majority of the other Trustees; and (d) any Trustee may be removed at any special meeting of shareholders by a two-thirds vote of the outstanding voting securities of the trust. Each Trustee who is not an interested person (as defined in the 1940 Act) of the trust and the fund is referred to herein as an Independent Trustee. Each Independent Trustee shall retire not later than the last day of the calendar year in which his or her 75th birthday occurs. The Independent Trustees may waive this mandatory retirement age policy with respect to individual Trustees. Officers and Advisory Board Members hold office without limit in time, except that any officer or Advisory Board Member may resign or may be removed by a vote of a majority of the Trustees at any regular meeting or any special meeting of the Trustees. Except as indicated, each individual has held the office shown or other offices in the same company for the past five years.
The fund’s Statement of Additional Information (SAI) includes more information about the Trustees. To request a free copy, call Fidelity at 1-800-544-8544.
Experience, Skills, Attributes, and Qualifications of the Trustees. The Governance and Nominating Committee has adopted a statement of policy that describes the experience, qualifications, attributes, and skills that are necessary and desirable for potential Independent Trustee candidates (Statement of Policy). The Board believes that each Trustee satisfied at the time he or she was initially elected or appointed a Trustee, and continues to satisfy, the standards contemplated by the Statement of Policy. The Governance and Nominating Committee also engages professional search firms to help identify potential Independent Trustee candidates who have the experience, qualifications, attributes, and skills consistent with the Statement of Policy. From time to time, additional criteria based on the composition and skills of the current Independent Trustees, as well as experience or skills that may be appropriate in light of future changes to board composition, business conditions, and regulatory or other developments, have also been considered by the professional search firms and the Governance and Nominating Committee. In addition, the Board takes into account the Trustees' commitment and participation in Board and committee meetings, as well as their leadership of standing and ad hoc committees throughout their tenure.
In determining that a particular Trustee was and continues to be qualified to serve as a Trustee, the Board has considered a variety of criteria, none of which, in isolation, was controlling. The Board believes that, collectively, the Trustees have balanced and diverse experience, qualifications, attributes, and skills, which allow the Board to operate effectively in governing the fund and protecting the interests of shareholders. Information about the specific experience, skills, attributes, and qualifications of each Trustee, which in each case led to the Board's conclusion that the Trustee should serve (or continue to serve) as a trustee of the fund, is provided below.
Board Structure and Oversight Function. Robert A. Lawrence is an interested person and currently serves as Acting Chairman. The Trustees have determined that an interested Chairman is appropriate and benefits shareholders because an interested Chairman has a personal and professional stake in the quality and continuity of services provided to the fund. Independent Trustees exercise their informed business judgment to appoint an individual of their choosing to serve as Chairman, regardless of whether the Trustee happens to be independent or a member of management. The Independent Trustees have determined that they can act independently and effectively without having an Independent Trustee serve as Chairman and that a key structural component for assuring that they are in a position to do so is for the Independent Trustees to constitute a substantial majority for the Board. The Independent Trustees also regularly meet in executive session. Ned C. Lautenbach and David M. Thomas serve as Co-Lead Independent Trustees and as such each (i) acts as a liaison between the Independent Trustees and management with respect to matters important to the Independent Trustees and (ii) with management prepares agendas for Board meetings.
Fidelity® funds are overseen by different Boards of Trustees. The fund's Board oversees Fidelity's high income and certain equity funds, and other Boards oversee Fidelity's investment-grade bond, money market, asset allocation, and other equity funds. The asset allocation funds may invest in Fidelity® funds overseen by the fund's Board. The use of separate Boards, each with its own committee structure, allows the Trustees of each group of Fidelity® funds to focus on the unique issues of the funds they oversee, including common research, investment, and operational issues. On occasion, the separate Boards establish joint committees to address issues of overlapping consequences for the Fidelity® funds overseen by each Board.
The Trustees operate using a system of committees to facilitate the timely and efficient consideration of all matters of importance to the Trustees, the fund, and fund shareholders and to facilitate compliance with legal and regulatory requirements and oversight of the fund's activities and associated risks. The Board, acting through its committees, has charged FMR and its affiliates with (i) identifying events or circumstances the occurrence of which could have demonstrably adverse effects on the fund's business and/or reputation; (ii) implementing processes and controls to lessen the possibility that such events or circumstances occur or to mitigate the effects of such events or circumstances if they do occur; and (iii) creating and maintaining a system designed to evaluate continuously business and market conditions in order to facilitate the identification and implementation processes described in (i) and (ii) above. Because the day-to-day operations and activities of the fund are carried out by or through FMR, its affiliates, and other service providers, the fund's exposure to risks is mitigated but not eliminated by the processes overseen by the Trustees. While each of the Board's committees has responsibility for overseeing different aspects of the fund's activities, oversight is exercised primarily through the Operations, Audit, and Compliance Committees. Appropriate personnel, including but not limited to the fund's Chief Compliance Officer (CCO), FMR's internal auditor, the independent accountants, the fund's Treasurer and portfolio management personnel, make periodic reports to the Board's committees, as appropriate, including an annual review of Fidelity's risk management program for the Fidelity® funds. The responsibilities of each standing committee, including their oversight responsibilities, are described further under "Standing Committees of the Trustees."
Interested Trustees*:
Correspondence intended for a Trustee who is an interested person may be sent to Fidelity Investments, 245 Summer Street, Boston, Massachusetts 02210.
Name, Year of Birth; Principal Occupations and Other Relevant Experience+
Bettina Doulton (1964)
Year of Election or Appointment: 2020
Trustee
Ms. Doulton also serves as Trustee of other Fidelity® funds. Prior to her retirement, Ms. Doulton served in a variety of positions at Fidelity Investments, including as a managing director of research (2006-2007), portfolio manager to certain Fidelity® funds (1993-2005), equity analyst and portfolio assistant (1990-1993), and research assistant (1987-1990). Ms. Doulton currently owns and operates Phi Builders + Architects and Cellardoor Winery. Previously, Ms. Doulton served as a member of the Board of Brown Capital Management, LLC (2013-2018).
Robert A. Lawrence (1952)
Year of Election or Appointment: 2020
Trustee
Acting Chairman of the Board of Trustees
Mr. Lawrence also serves as Trustee of other funds. Previously, Mr. Lawrence served as a Member of the Advisory Board of certain funds. Prior to his retirement in 2008, Mr. Lawrence served as Vice President of certain Fidelity® funds (2006-2008), Senior Vice President, Head of High Income Division of Fidelity Management & Research Company (investment adviser firm, 2006-2008), and President of Fidelity Strategic Investments (investment adviser firm, 2002-2005).
* Determined to be an “Interested Trustee” by virtue of, among other things, his or her affiliation with the trust or various entities under common control with FMR.
+ The information includes the Trustee's principal occupation during the last five years and other information relating to the experience, attributes, and skills relevant to the Trustee's qualifications to serve as a Trustee, which led to the conclusion that the Trustee should serve as a Trustee for the fund.
Independent Trustees:
Correspondence intended for an Independent Trustee may be sent to Fidelity Investments, P.O. Box 55235, Boston, Massachusetts 02205-5235.
Name, Year of Birth; Principal Occupations and Other Relevant Experience+
Dennis J. Dirks (1948)
Year of Election or Appointment: 2005
Trustee
Mr. Dirks also serves as Trustee of other Fidelity® funds. Prior to his retirement in May 2003, Mr. Dirks served as Chief Operating Officer and as a member of the Board of The Depository Trust & Clearing Corporation (financial markets infrastructure), President, Chief Operating Officer and a member of the Board of The Depository Trust Company (DTC), President and a member of the Board of the National Securities Clearing Corporation (NSCC), Chief Executive Officer and a member of the Board of the Government Securities Clearing Corporation and Chief Executive Officer and a member of the Board of the Mortgage-Backed Securities Clearing Corporation. Mr. Dirks currently serves as a member of the Finance Committee (2016-present) and Board (2017-present) and is Treasurer (2018-present) of the Asolo Repertory Theatre.
Donald F. Donahue (1950)
Year of Election or Appointment: 2018
Trustee
Mr. Donahue also serves as Trustee of other Fidelity® funds. Mr. Donahue serves as President and Chief Executive Officer of Miranda Partners, LLC (risk consulting for the financial services industry, 2012-present). Previously, Mr. Donahue served as Chief Executive Officer (2006-2012), Chief Operating Officer (2003-2006) and Managing Director, Customer Marketing and Development (1999-2003) of The Depository Trust & Clearing Corporation (financial markets infrastructure). Mr. Donahue currently serves as a member (2007-present) and Co-Chairman (2016-present) of the Board of United Way of New York, a member of the Board of NYC Leadership Academy (2012-present) and a member of the Board of Advisors of Ripple Labs, Inc. (financial services, 2015-present). Mr. Donahue previously served as a member of the Advisory Board of certain Fidelity® funds (2015-2018).
Vicki L. Fuller (1957)
Year of Election or Appointment: 2020
Trustee
Ms. Fuller also serves as Trustee of other Fidelity® funds. Previously, Ms. Fuller served as a member of the Advisory Board of certain Fidelity® funds (2018-2020), Chief Investment Officer of the New York State Common Retirement Fund (2012-2018) and held a variety of positions at AllianceBernstein L.P. (global asset management, 1985-2012), including Managing Director (2006-2012) and Senior Vice President and Senior Portfolio Manager (2001-2006). Ms. Fuller currently serves as a member of the Board, Audit Committee and Nominating and Governance Committee of The Williams Companies, Inc. (natural gas infrastructure, 2018-present) and as a member of the Board of Treliant, LLC (consulting, 2019-present).
Patricia L. Kampling (1959)
Year of Election or Appointment: 2020
Trustee
Ms. Kampling also serves as Trustee of other Fidelity® funds. Prior to her retirement, Ms. Kampling served as Chairman of the Board and Chief Executive Officer (2012-2019), President and Chief Operating Officer (2011-2012) and Executive Vice President and Chief Financial Officer (2010-2011) of Alliant Energy Corporation. Ms. Kampling currently serves as a member of the Board, Compensation Committee and Executive Committee and as Chair of the Audit Committee of Briggs & Stratton Corporation (manufacturing, 2011-present) and as a member of the Board, Audit, Finance and Risk Committee and Safety, Environmental, Technology and Operations Committee of American Water Works Company, Inc. (utilities company, 2019-present). In addition, Ms. Kampling currently serves as a member of the Board of the Nature Conservancy, Wisconsin Chapter (2019-present). Previously, Ms. Kampling served as a Member of the Advisory Board of certain Fidelity® funds (2020), a member of the Board of Interstate Power and Light Company (2012-2019) and Wisconsin Power and Light Company (2012-2019) (each a subsidiary of Alliant Energy Corporation) and as a member of the Board and Workforce Development Committee of the Business Roundtable (2018-2019).
Alan J. Lacy (1953)
Year of Election or Appointment: 2008
Trustee
Mr. Lacy also serves as Trustee of other Fidelity® funds. Previously, Mr. Lacy served as Senior Adviser (2007-2014) of Oak Hill Capital Partners, L.P. (private equity), Chief Executive Officer (2005) and Vice Chairman (2005-2006) of Sears Holdings Corporation (retail), Chief Executive Officer and Chairman of the Board of Sears, Roebuck and Co. (retail, 2000-2005), Chairman (2014-2017) and a member of the Board (2010-2017) of Dave & Buster’s Entertainment, Inc. (restaurant and entertainment complexes) and a member of the Board of Bristol-Myers Squibb Company (global pharmaceuticals, 2008-2020). Mr. Lacy currently serves as a Trustee of the California Chapter of The Nature Conservancy (2015-present) and a member of the Board of the Center for Advanced Study in the Behavioral Sciences at Stanford University (2015-present).
Ned C. Lautenbach (1944)
Year of Election or Appointment: 2000
Trustee
Co-Lead Independent Trustee
Mr. Lautenbach also serves as Trustee of other Fidelity® funds. Mr. Lautenbach currently serves as Chair of the Board of Governors, State University System of Florida (2013-present) and is a member of the Council on Foreign Relations (1994-present). He is also a member and has in the past served as Chairman of the Board of Directors of Artis-Naples (2012-present). Previously, Mr. Lautenbach served as a member and then Lead Director of the Board of Directors of Eaton Corporation (diversified industrial, 1997-2016). He was also a Partner at Clayton, Dubilier & Rice, LLC (private equity investment, 1998-2010); as well as Director of Sony Corporation (2006-2007). In addition, Mr. Lautenbach had a 30-year career with IBM (technology company), during which time he served as Senior Vice President and as a member of the Corporate Executive Committee (1968-1998).
Joseph Mauriello (1944)
Year of Election or Appointment: 2008
Trustee
Mr. Mauriello also serves as Trustee of other Fidelity® funds. Prior to his retirement in January 2006, Mr. Mauriello served in numerous senior management positions including Deputy Chairman and Chief Operating Officer (2004-2005), and Vice Chairman of Financial Services (2002-2004) of KPMG LLP US (professional services, 1965-2005). Mr. Mauriello currently serves as a member of the Independent Directors Council Governing Council (2015-present). Previously, Mr. Mauriello served as a member of the Board of XL Group plc. (global insurance and re-insurance, 2006-2018).
Cornelia M. Small (1944)
Year of Election or Appointment: 2005
Trustee
Ms. Small also serves as Trustee of other Fidelity® funds. Previously, Ms. Small served as Chief Investment Officer, Director of Global Equity Investments and a member of Scudder, Stevens & Clark and Scudder Kemper Investments. Ms. Small previously served as a member of the Board (2009-2019) and Chair of the Investment Committee (2010-2019) of the Teagle Foundation and a member of the Investment Committee of the Berkshire Taconic Community Foundation (2008-2019).
Garnett A. Smith (1947)
Year of Election or Appointment: 2018
Trustee
Mr. Smith also serves as Trustee of other Fidelity® funds. Prior to his retirement, Mr. Smith served as Chairman and Chief Executive Officer (1990-1997) and President (1986-1990) of Inbrand Corp. (manufacturer of personal absorbent products). Prior to his employment with Inbrand Corp., he was employed by a retail fabric chain and North Carolina National Bank (now Bank of America). Mr. Smith previously served as a member of the Advisory Board of certain Fidelity® funds (2012-2013).
David M. Thomas (1949)
Year of Election or Appointment: 2008
Trustee
Co-Lead Independent Trustee
Mr. Thomas also serves as Trustee of other Fidelity® funds. Previously, Mr. Thomas served as Executive Chairman (2005-2006) and Chairman and Chief Executive Officer (2000-2005) of IMS Health, Inc. (pharmaceutical and healthcare information solutions). Mr. Thomas currently serves as Non-Executive Chairman of the Board of Fortune Brands Home and Security (home and security products, 2011-present), and a member of the Board (2004-present) and Presiding Director (2013-present) of Interpublic Group of Companies, Inc. (marketing communication).
Susan Tomasky (1953)
Year of Election or Appointment: 2020
Trustee
Ms. Tomasky also serves as Trustee of other Fidelity® funds. Prior to her retirement, Ms. Tomasky served in various executive officer positions at American Electric Power Company, Inc. (1998-2011), including most recently as President of AEP Transmission (2007-2011). Ms. Tomasky currently serves as a member of the Board and Sustainability Committee and as Chair of the Audit Committee of Marathon Petroleum Corporation (2018-present) and as a member of the Board, Corporate Governance Committee and Organization and Compensation Committee and as Chair of the Audit Committee of Public Service Enterprise Group, Inc. (utilities company, 2012-present). In addition, Ms. Tomasky currently serves as a member of the Board of the Columbus Regional Airport Authority (2007-present), as a member of the Board of the Royal Shakespeare Company – America (2009-present), as a member of the Board of the Columbus Association for the Performing Arts (2011-present) and as a member of the Board of Kenyon College (2016-present). Previously, Ms. Tomasky served as a Member of the Advisory Board of certain Fidelity® funds (2020), a member of the Board (2011-2019) and as Lead Independent Director (2015-2018) of Andeavor Corporation (previously Tesoro Corporation) (independent oil refiner and marketer) and as a member of the Board of Summit Midstream Partners LP (energy, 2012-2018).
Michael E. Wiley (1950)
Year of Election or Appointment: 2018
Trustee
Mr. Wiley also serves as Trustee of other Fidelity® funds. Previously, Mr. Wiley served as a member of the Advisory Board of certain Fidelity® funds (2018-2020), Chairman, President and CEO of Baker Hughes, Inc. (oilfield services, 2000-2004). Mr. Wiley also previously served as a member of the Board of Andeavor Corporation (independent oil refiner and marketer, 2005-2018), a member of the Board of Andeavor Logistics LP (natural resources logistics, 2015-2018) and a member of the Board of High Point Resources (exploration and production, 2005-2020).
+ The information includes the Trustee's principal occupation during the last five years and other information relating to the experience, attributes, and skills relevant to the Trustee's qualifications to serve as a Trustee, which led to the conclusion that the Trustee should serve as a Trustee for the fund.
Advisory Board Members and Officers:
Correspondence intended for a Member of the Advisory Board (if any) may be sent to Fidelity Investments, P.O. Box 55235, Boston, Massachusetts 02205-5235. Correspondence intended for an officer or Peter S. Lynch may be sent to Fidelity Investments, 245 Summer Street, Boston, Massachusetts 02210. Officers appear below in alphabetical order.
Name, Year of Birth; Principal Occupation
Peter S. Lynch (1944)
Year of Election or Appointment: 2003
Member of the Advisory Board
Mr. Lynch also serves as a Member of the Advisory Board of other Fidelity® funds. Mr. Lynch is Vice Chairman and a Director of Fidelity Management & Research Company LLC (investment adviser firm). In addition, Mr. Lynch serves as a Trustee of Boston College and as the Chairman of the Inner-City Scholarship Fund. Previously, Mr. Lynch served as Vice Chairman and a Director of FMR Co., Inc. (investment adviser firm) and on the Special Olympics International Board of Directors (1997-2006).
Elizabeth Paige Baumann (1968)
Year of Election or Appointment: 2017
Anti-Money Laundering (AML) Officer
Ms. Baumann also serves as AML Officer of other funds. She is Chief AML Officer (2012-present) and Senior Vice President (2014-present) of FMR LLC (diversified financial services company) and is an employee of Fidelity Investments. Previously, Ms. Baumann served as AML Officer of certain funds (2017-2019), as AML Officer of the funds (2012-2016), and Vice President (2007-2014) and Deputy Anti-Money Laundering Officer (2007-2012) of FMR LLC.
Craig S. Brown (1977)
Year of Election or Appointment: 2019
Assistant Treasurer
Mr. Brown also serves as Assistant Treasurer of other funds. Mr. Brown is an employee of Fidelity Investments (2013-present).
John J. Burke III (1964)
Year of Election or Appointment: 2018
Chief Financial Officer
Mr. Burke also serves as Chief Financial Officer of other funds. Mr. Burke serves as Head of Investment Operations for Fidelity Fund and Investment Operations (2018-present) and is an employee of Fidelity Investments (1998-present). Previously Mr. Burke served as head of Asset Management Investment Operations (2012-2018).
William C. Coffey (1969)
Year of Election or Appointment: 2019
Assistant Secretary
Mr. Coffey also serves as Assistant Secretary of other funds. He is Senior Vice President and Deputy General Counsel of FMR LLC (diversified financial services company, 2010-present), and is an employee of Fidelity Investments. Previously, Mr. Coffey served as Secretary and CLO of certain funds (2018-2019); CLO, Secretary, and Senior Vice President of Fidelity Management & Research Company and FMR Co., Inc. (investment adviser firms, 2018-2019); Secretary of Fidelity SelectCo, LLC and Fidelity Investments Money Management, Inc. (investment adviser firms, 2018-2019); CLO of Fidelity Management & Research (Hong Kong) Limited, FMR Investment Management (UK) Limited, and Fidelity Management & Research (Japan) Limited (investment adviser firms, 2018-2019); and Assistant Secretary of certain funds (2009-2018).
Timothy M. Cohen (1969)
Year of Election or Appointment: 2018
Vice President
Mr. Cohen also serves as Vice President of other funds. Mr. Cohen serves as Co-Head of Equity (2018-present), a Director of Fidelity Management & Research (Japan) Limited (investment adviser firm, 2016-present), and is an employee of Fidelity Investments. Previously, Mr. Cohen served as Executive Vice President of Fidelity SelectCo, LLC (2019), Head of Global Equity Research (2016-2018), Chief Investment Officer - Equity and a Director of Fidelity Management & Research (U.K.) Inc. (investment adviser firm, 2013-2015) and as a Director of Fidelity Management & Research (Hong Kong) Limited (investment adviser firm, 2017).
Jonathan Davis (1968)
Year of Election or Appointment: 2010
Assistant Treasurer
Mr. Davis also serves as Assistant Treasurer of other funds. Mr. Davis serves as Assistant Treasurer of FMR Capital, Inc. (2017-present) and is an employee of Fidelity Investments. Previously, Mr. Davis served as Vice President and Associate General Counsel of FMR LLC (diversified financial services company, 2003-2010).
Laura M. Del Prato (1964)
Year of Election or Appointment: 2018
Assistant Treasurer
Ms. Del Prato also serves as an officer of other funds. Ms. Del Prato is an employee of Fidelity Investments (2017-present). Prior to joining Fidelity Investments, Ms. Del Prato served as a Managing Director and Treasurer of the JPMorgan Mutual Funds (2014-2017). Prior to JPMorgan, Ms. Del Prato served as a partner at Cohen Fund Audit Services (accounting firm, 2012-2013) and KPMG LLP (accounting firm, 2004-2012).
Colm A. Hogan (1973)
Year of Election or Appointment: 2020
Assistant Treasurer
Mr. Hogan also serves as an officer of other funds. Mr. Hogan serves as Assistant Treasurer of FMR Capital, Inc. (2017-present) and is an employee of Fidelity Investments (2005-present). Previously, Mr. Hogan served as Deputy Treasurer of certain Fidelity® funds (2016-2020) and Assistant Treasurer of certain Fidelity® funds (2016-2018).
Pamela R. Holding (1964)
Year of Election or Appointment: 2018
Vice President
Ms. Holding also serves as Vice President of other funds. Ms. Holding serves as Co-Head of Equity (2018-present) and is an employee of Fidelity Investments (2013-present). Previously, Ms. Holding served as Executive Vice President of Fidelity SelectCo, LLC (2019) and as Chief Investment Officer of Fidelity Institutional Asset Management (2013-2018).
Cynthia Lo Bessette (1969)
Year of Election or Appointment: 2019
Secretary and Chief Legal Officer (CLO)
Ms. Lo Bessette also serves as an officer of other funds. Ms. Lo Bessette serves as CLO, Secretary, and Senior Vice President of Fidelity Management & Research Company LLC (investment adviser firm, 2019-present); and CLO of Fidelity Management & Research (Hong Kong) Limited, FMR Investment Management (UK) Limited, and Fidelity Management & Research (Japan) Limited (investment adviser firms, 2019-present). She is a Senior Vice President and Deputy General Counsel of FMR LLC (diversified financial services company, 2019-present), and is an employee of Fidelity Investments. Previously, Ms. Lo Bessette served as CLO, Secretary, and Senior Vice President of FMR Co., Inc. (investment adviser firm, 2019); Secretary of Fidelity SelectCo, LLC and Fidelity Investments Money Management, Inc. (investment adviser firms, 2019). Prior to joining Fidelity Investments, Ms. Lo Bessette was Executive Vice President, General Counsel (2016-2019) and Senior Vice President, Deputy General Counsel (2015-2016) of OppenheimerFunds (investment management company) and Deputy Chief Legal Officer (2013-2015) of Jennison Associates LLC (investment adviser firm).
Chris Maher (1972)
Year of Election or Appointment: 2020
Deputy Treasurer
Mr. Maher also serves as an officer of other funds. Mr. Maher serves as Assistant Treasurer of FMR Capital, Inc. (2017-present), and is an employee of Fidelity Investments (2008-present). Previously, Mr. Maher served as Assistant Treasurer of certain funds (2013-2020); Vice President of Asset Management Compliance (2013), Vice President of the Program Management Group of FMR (investment adviser firm, 2010-2013), and Vice President of Valuation Oversight (2008-2010).
Jason P. Pogorelec (1975)
Year of Election or Appointment: 2020
Chief Compliance Officer
Mr. Pogorelec also serves as an officer of other funds. Mr. Pogorelec serves as Vice President, Associate General Counsel (2010-present) and is an employee of Fidelity Investments (2006-present). Previously, Mr. Pogorelec served as Assistant Secretary of certain Fidelity funds (2015-2020).
Stacie M. Smith (1974)
Year of Election or Appointment: 2016
President and Treasurer
Ms. Smith also serves as an officer of other funds. Ms. Smith serves as Assistant Treasurer of FMR Capital, Inc. (2017-present), is an employee of Fidelity Investments (2009-present), and has served in other fund officer roles. Prior to joining Fidelity Investments, Ms. Smith served as Senior Audit Manager of Ernst & Young LLP (accounting firm, 1996-2009). Previously, Ms. Smith served as Assistant Treasurer (2013-2019) and Deputy Treasurer (2013-2016) of certain Fidelity® funds.
Marc L. Spector (1972)
Year of Election or Appointment: 2016
Assistant Treasurer
Mr. Spector also serves as an officer of other funds. Mr. Spector serves as Assistant Treasurer of FMR Capital, Inc. (2017-present) and is an employee of Fidelity Investments (2016-present). Prior to joining Fidelity Investments, Mr. Spector served as Director at the Siegfried Group (accounting firm, 2013-2016), and prior to Siegfried Group as audit senior manager at Deloitte & Touche LLP (accounting firm, 2005-2013).
Jim Wegmann (1979)
Year of Election or Appointment: 2019
Assistant Treasurer
Mr. Wegmann also serves as Assistant Treasurer of other funds. Mr. Wegmann is an employee of Fidelity Investments (2011-present).
Shareholder Expense Example
As a shareholder of the Fund, you incur two types of costs: (1) transaction costs and (2) ongoing costs, including management fees and other Fund expenses. This Example is intended to help you understand your ongoing costs (in dollars) of investing in the Fund and to compare these costs with the ongoing costs of investing in other mutual funds.
The Example is based on an investment of $1,000 invested at the beginning of the period and held for the entire period (November 1, 2019 to April 30, 2020).
Actual Expenses
The first line of the accompanying table provides information about actual account values and actual expenses. You may use the information in this line, together with the amount you invested, to estimate the expenses that you paid over the period. Simply divide your account value by $1,000.00 (for example, an $8,600 account value divided by $1,000.00 = 8.6), then multiply the result by the number in the first line under the heading entitled "Expenses Paid During Period" to estimate the expenses you paid on your account during this period. In addition, the Fund, as a shareholder in the underlying Fidelity Central Funds, will indirectly bear its pro-rata share of the fees and expenses incurred by the underlying Fidelity Central Funds. These fees and expenses are not included in the Fund's annualized expense ratio used to calculate the expense estimate in the table below.
Hypothetical Example for Comparison Purposes
The second line of the accompanying table provides information about hypothetical account values and hypothetical expenses based on the Fund's actual expense ratio and an assumed rate of return of 5% per year before expenses, which is not the Fund's actual return. The hypothetical account values and expenses may not be used to estimate the actual ending account balance or expenses you paid for the period. You may use this information to compare the ongoing costs of investing in the Fund and other funds. To do so, compare this 5% hypothetical example with the 5% hypothetical examples that appear in the shareholder reports of the other funds. In addition, the Fund, as a shareholder in the underlying Fidelity Central Funds, will indirectly bear its pro-rata share of the fees and expenses incurred by the underlying Fidelity Central Funds. These fees and expenses are not included in the Fund's annualized expense ratio used to calculate the expense estimate in the table below.
Please note that the expenses shown in the table are meant to highlight your ongoing costs only and do not reflect any transaction costs. Therefore, the second line of the table is useful in comparing ongoing costs only, and will not help you determine the relative total costs of owning different funds.
| Annualized Expense Ratio-A | Beginning Account Value November 1, 2019 | Ending Account Value April 30, 2020 | Expenses Paid During Period-B November 1, 2019 to April 30, 2020 | |
| Actual | .65% | $1,000.00 | $914.30 | $3.09 |
| Hypothetical-C | $1,000.00 | $1,021.63 | $3.27 |
A Annualized expense ratio reflects expenses net of applicable fee waivers.
B Expenses are equal to the Fund's annualized expense ratio, multiplied by the average account value over the period, multiplied by 182/366 (to reflect the one-half year period).
C 5% return per year before expenses
Distributions (Unaudited)
The Board of Trustees of Fidelity Capital & Income Fund voted to pay on June 8, 2020 to shareholders of record at the opening of business on June 5, 2020, a distribution of $0.025 per share derived from capital gains realized from sales of portfolio securities.
The fund hereby designates as a capital gain dividend with respect to the taxable year ended April 30, 2020, $85,043,103, or, if subsequently determined to be different, the net capital gain of such year.
A total of 0.61% of the dividends distributed during the fiscal year was derived from interest on U.S. Government securities which is generally exempt from state income tax.
The fund designates $142,176,984 of distributions paid during the period January 1, 2020 to April 30, 2020 as qualifying to be taxed as interest-related dividends for nonresident alien shareholders.
The fund will notify shareholders in January 2021 of amounts for use in preparing 2020 income tax returns.
Board Approval of Investment Advisory Contracts and Management Fees
Fidelity Capital & Income Fund
Each year, the Board of Trustees, including the Independent Trustees (together, the Board), votes on the renewal of the management contract with Fidelity Management & Research Company LLC (FMR) and the sub-advisory agreements (together, the Advisory Contracts) for the fund. FMR and the sub-advisers are referred to herein as the Investment Advisers. The Board, assisted by the advice of fund counsel and Independent Trustees' counsel, requests and considers a broad range of information relevant to the renewal of the Advisory Contracts throughout the year.Approval of Amended and Restated Advisory Contracts. At its November 2019 meeting, the Board unanimously determined to approve an amended and restated management contract and sub-advisory agreements (Amended and Restated Contracts) for a stub period of January 1, 2020 through January 31, 2020 in connection with a consolidation of certain of Fidelity's advisory businesses. The Board considered that, on or about January 1, 2020, FMR Co., Inc. (FMRC) expected to merge with and into FMR and, after the merger, FMR expected to redomicile as a Delaware limited liability company. The Board also approved the termination of the sub-advisory agreement with FMRC upon the completion of the merger. The Board noted that references to FMR in the Amended and Restated Contracts would be updated to reflect FMR's new form of organization and domicile and considered that the definition of "group assets" for purposes of the fund's group fee would be modified to avoid double-counting assets once the reorganization is complete. The Board also noted Fidelity's assurance that neither the planned consolidation nor the Amended and Restated Contracts will change the investment processes, the level or nature of services provided, the resources and personnel allocated, trading and compliance operations, or any fees paid by the fund.The Board meets regularly and, at each of its meetings, covers an extensive agenda of topics and materials and considers factors that are relevant to its annual consideration of the renewal of the fund's Advisory Contracts, including the services and support provided to the fund and its shareholders. The Board has established various standing committees (Committees), each composed of and chaired by Independent Trustees with varying backgrounds, to which the Board has assigned specific subject matter responsibilities in order to enhance effective decision-making by the Board. The Board, acting directly and through its Committees, requests and receives information concerning the annual consideration of the renewal of the fund's Advisory Contracts. The Board also meets as needed to review matters specifically related to the Board's annual consideration of the renewal of the Advisory Contracts. Members of the Board may also meet with trustees of other Fidelity funds through joint ad hoc committees to discuss certain matters relevant to all of the Fidelity funds.At its January 2020 meeting, the Board unanimously determined to renew the fund's Advisory Contracts. In reaching its determination, the Board considered all factors it believed relevant, including (i) the nature, extent, and quality of the services provided to the fund and its shareholders (including the investment performance of the fund); (ii) the competitiveness of the fund's management fee and total expense ratio relative to peer funds; (iii) the total costs of the services provided by and the profits realized by Fidelity from its relationships with the fund; and (iv) the extent to which, if any, economies of scale exist and are realized as the fund grows, and whether any economies of scale are appropriately shared with fund shareholders.In considering whether to renew the Advisory Contracts for the fund, the Board reached a determination, with the assistance of fund counsel and Independent Trustees' counsel and through the exercise of its business judgment, that the renewal of the Advisory Contracts was in the best interests of the fund and its shareholders and that the compensation payable under the Advisory Contracts was fair and reasonable. The Board's decision to renew the Advisory Contracts was not based on any single factor, but rather was based on a comprehensive consideration of all the information provided to the Board at its meetings throughout the year. The Board, in reaching its determination to renew the Advisory Contracts, was aware that shareholders of the fund have a broad range of investment choices available to them, including a wide choice among funds offered by Fidelity's competitors, and that the fund's shareholders, who have the opportunity to review and weigh the disclosure provided by the fund in its prospectus and other public disclosures, have chosen to invest in this fund, which is part of the Fidelity family of funds.Nature, Extent, and Quality of Services Provided. The Board considered Fidelity's staffing as it relates to the fund, including the backgrounds of investment personnel of Fidelity, and also considered the fund's investment objective, strategies, and related investment philosophy. The Independent Trustees also had discussions with senior management of Fidelity's investment operations and investment groups. The Board considered the structure of the investment personnel compensation program and whether this structure provides appropriate incentives to act in the best interests of the fund. Additionally, the Board considered the portfolio managers' investments, if any, in the funds that they manage.Resources Dedicated to Investment Management and Support Services. The Board and the Fund Oversight and Research Committees reviewed the general qualifications and capabilities of Fidelity's investment staff, including its size, education, experience, and resources, as well as Fidelity's approach to recruiting, training, managing, and compensating investment personnel. The Board noted that Fidelity has continued to increase the resources devoted to non-U.S. offices, including expansion of Fidelity's global investment organization. The Board also noted that Fidelity's analysts have extensive resources, tools and capabilities that allow them to conduct sophisticated quantitative and fundamental analysis, as well as credit analysis of issuers, counterparties and guarantors. Further, the Board considered that Fidelity's investment professionals have sufficient access to global information and data so as to provide competitive investment results over time, and that those professionals also have access to sophisticated tools that permit them to assess portfolio construction and risk and performance attribution characteristics continuously, as well as to transmit new information and research conclusions rapidly around the world. Additionally, in its deliberations, the Board considered Fidelity's trading, risk management, compliance, and technology and operations capabilities and resources, which are integral parts of the investment management process.Shareholder and Administrative Services. The Board considered (i) the nature, extent, quality, and cost of advisory, administrative, and shareholder services performed by the Investment Advisers and their affiliates under the Advisory Contracts and under separate agreements covering transfer agency, pricing and bookkeeping, and securities lending services for the fund; (ii) the nature and extent of the supervision of third party service providers, principally custodians, subcustodians, and pricing vendors; and (iii) the resources devoted to, and the record of compliance with, the fund's compliance policies and procedures. The Board also reviewed the allocation of fund brokerage, including allocations to brokers affiliated with the Investment Advisers, the use of brokerage commissions to pay fund expenses, and the use of "soft" commission dollars to pay for research services.The Board noted that the growth of fund assets over time across the complex allows Fidelity to reinvest in the development of services designed to enhance the value and convenience of the Fidelity funds as investment vehicles. These services include 24-hour access to account information and market information over the Internet and through telephone representatives, investor education materials and asset allocation tools, and the expanded availability of Fidelity Investor Centers.The Board noted that it and the boards of certain other Fidelity funds had formed an ad hoc Committee on Transfer Agency Fees to review the variety of transfer agency fee structures throughout the industry and Fidelity's competitive positioning with respect to industry participants.Investment in a Large Fund Family. The Board considered the benefits to shareholders of investing in a Fidelity fund, including the benefits of investing in a fund that is part of a large family of funds offering a variety of investment disciplines and providing a large variety of mutual fund investor services. The Board noted that Fidelity had taken, or had made recommendations that resulted in the Fidelity funds taking, a number of actions over the previous year that benefited particular funds, including: (i) continuing to dedicate additional resources to Fidelity's investment research process, which includes meetings with management of issuers of securities in which the funds invest, and to the support of the senior management team that oversees asset management; (ii) continuing efforts to enhance Fidelity's global research capabilities; (iii) launching new funds and ETFs with innovative structures, strategies and pricing and making other enhancements to meet client needs; (iv) launching new share classes of existing funds; (v) eliminating purchase minimums and broadening eligibility requirements for certain funds and share classes; (vi) reducing management fees and total expenses for certain target date funds and index funds; (vii) lowering expense caps for certain existing funds and classes, and converting certain voluntary expense caps to contractual caps, to reduce expenses borne by shareholders; (viii) rationalizing product lines and gaining increased efficiencies from fund mergers, liquidations, and share class consolidations; (ix) continuing to develop, acquire and implement systems and technology to improve services to the funds and shareholders, strengthen information security, and increase efficiency; and (x) continuing to implement enhancements to further strengthen Fidelity's product line to increase investors' probability of success in achieving their investment goals, including retirement income goals.Investment Performance. The Board considered whether the fund has operated in accordance with its investment objective, as well as its record of compliance with its investment restrictions and its performance history. The Board noted that there was a portfolio management change for the fund in October 2019. The Board will continue to monitor closely the fund's performance, taking into account the portfolio management change.The Board took into account discussions that occur at Board meetings throughout the year with representatives of the Investment Advisers about fund investment performance. In this regard the Board noted that as part of regularly scheduled fund reviews and other reports to the Board on fund performance, the Board considers annualized return information for the fund for different time periods, measured against an appropriate securities market index (benchmark index) and a peer group of funds with similar objectives (peer group), if any. In its evaluation of fund investment performance, the Board gave particular attention to information indicating changes in performance of certain Fidelity funds for specific time periods and discussed with the Investment Advisers the reasons for any overperformance or underperformance.In addition to reviewing absolute and relative fund performance, the Independent Trustees periodically consider the appropriateness of fund performance metrics in evaluating the results achieved. In general, the Independent Trustees believe that fund performance should be evaluated based on net performance (after fees and expenses) of both the highest performing and lowest performing fund share classes, where applicable, compared to appropriate benchmark indices, over appropriate time periods that may include full market cycles, and compared to peer groups, as applicable, over the same periods, taking into account relevant factors including the following: general market conditions; issuer-specific information; and fund cash flows and other factors.The Independent Trustees recognize that shareholders evaluate performance on a net basis over their own holding periods, for which one-, three-, and five-year periods are often used as a proxy. For this reason, the performance information reviewed by the Board also included net cumulative total return information for the fund and an appropriate benchmark index and peer group for the most recent one-, three-, and five-year periods ended June 30, 2019, as shown below. Returns are shown compared to the 25th percentile (top of box, 75% beaten) and 75th percentile (bottom of box, 25% beaten) of the peer universe.Fidelity Capital & Income Fund
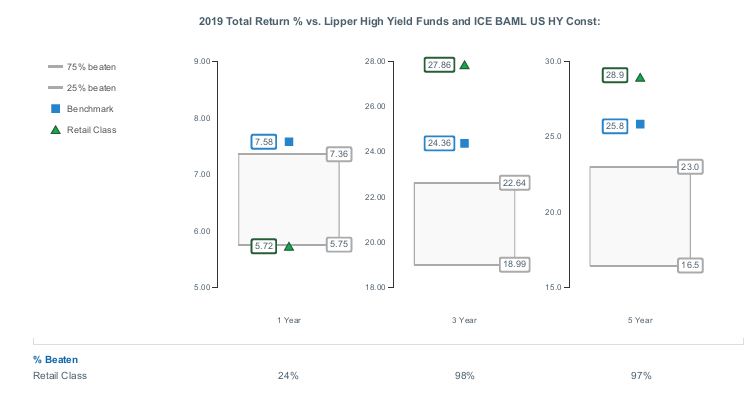
Fidelity Capital & Income Fund
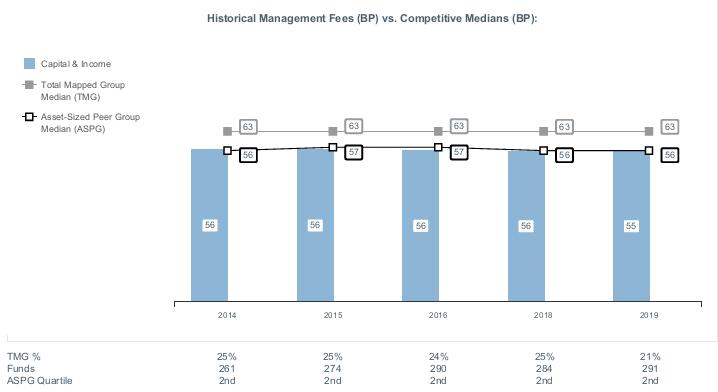
Liquidity Risk Management Program
The Securities and Exchange Commission adopted Rule 22e-4 under the Investment Company Act of 1940 (the Liquidity Rule) to promote effective liquidity risk management throughout the open-end investment company industry, thereby reducing the risk that funds will be unable to meet their redemption obligations and mitigating dilution of the interests of fund shareholders.
The Fund has adopted and implemented a liquidity risk management program pursuant to the Liquidity Rule (the Program) effective December 1, 2018. The Program is reasonably designed to assess and manage the Fund’s liquidity risk and to comply with the requirements of the Liquidity Rule. The Fund’s Board of Trustees (the Board) has designated the Fund’s investment adviser as administrator of the Program. The Fidelity advisers have established a Liquidity Risk Management Committee (the LRM Committee) to manage the Program for each of the Fidelity Funds. The LRM Committee monitors the adequacy and effectiveness of implementation of the Program and on a periodic basis assesses each Fund’s liquidity risk based on a variety of factors including (1) the Fund’s investment strategy, (2) portfolio liquidity and cash flow projections during normal and reasonably foreseeable stressed conditions, (3) shareholder redemptions, (4) borrowings and other funding sources and (5) in the case of exchange-traded funds, certain additional factors including the effect of the Fund’s prices and spreads, market participants, and basket compositions on the overall liquidity of the Fund’s portfolio, as applicable.
In accordance with the Program, each of the Fund’s portfolio investments is classified into one of four liquidity categories described below based on a determination of a reasonable expectation for how long it would take to convert the investment to cash (or sell or dispose of the investment) without significantly changing its market value.
- Highly liquid investments – cash or convertible to cash within three business days or less
- Moderately liquid investments – convertible to cash in three to seven calendar days
- Less liquid investments – can be sold or disposed of, but not settled, within seven calendar days
- Illiquid investments – cannot be sold or disposed of within seven calendar days
Liquidity classification determinations take into account a variety of factors including various market, trading and investment-specific considerations, as well as market depth, and generally utilize analysis from a third-party liquidity metrics service.
The Liquidity Rule places a 15% limit on a fund’s illiquid investments and requires funds that do not primarily hold assets that are highly liquid investments to determine and maintain a minimum percentage of the fund’s net assets to be invested in highly liquid investments (highly liquid investment minimum or HLIM). The Program includes provisions reasonably designed to comply with the 15% limit on illiquid investments and for determining, periodically reviewing and complying with the HLIM requirement as applicable.
At a recent meeting of the Fund’s Board of Trustees, the LRM Committee provided a written report to the Board pertaining to the operation, adequacy, and effectiveness of implementation of the Program for the annual period from December 1, 2018 through November 30, 2019. The report concluded that the Program has been implemented and is operating effectively and is reasonably designed to assess and manage the Fund’s liquidity risk.
![]()
CAI-ANN-0620
1.703159.122
Fidelity® High Income Fund
April 30, 2020
Includes Fidelity and Fidelity Advisor share classes
See the inside front cover for important information about access to your fund’s shareholder reports.
Beginning on January 1, 2021, as permitted by regulations adopted by the Securities and Exchange Commission, paper copies of a fund’s shareholder reports will no longer be sent by mail, unless you specifically request paper copies of the reports from the fund or from your financial intermediary, such as a financial advisor, broker-dealer or bank. Instead, the reports will be made available on a website, and you will be notified by mail each time a report is posted and provided with a website link to access the report.
If you already elected to receive shareholder reports electronically, you will not be affected by this change and you need not take any action. You may elect to receive shareholder reports and other communications from a fund electronically, by contacting your financial intermediary. For Fidelity customers, visit Fidelity's web site or call Fidelity using the contact information listed below.
You may elect to receive all future reports in paper free of charge. If you wish to continue receiving paper copies of your shareholder reports, you may contact your financial intermediary or, if you are a Fidelity customer, visit Fidelity’s website, or call Fidelity at the applicable toll-free number listed below. Your election to receive reports in paper will apply to all funds held with the fund complex/your financial intermediary.
| Account Type | Website | Phone Number |
| Brokerage, Mutual Fund, or Annuity Contracts: | fidelity.com/mailpreferences | 1-800-343-3548 |
| Employer Provided Retirement Accounts: | netbenefits.fidelity.com/preferences (choose 'no' under Required Disclosures to continue to print) | 1-800-343-0860 |
| Advisor Sold Accounts Serviced Through Your Financial Intermediary: | Contact Your Financial Intermediary | Your Financial Intermediary's phone number |
| Advisor Sold Accounts Serviced by Fidelity: | institutional.fidelity.com | 1-877-208-0098 |
Contents
Board Approval of Investment Advisory Contracts and Management Fees | |
To view a fund's proxy voting guidelines and proxy voting record for the 12-month period ended June 30, visit http://www.fidelity.com/proxyvotingresults or visit the Securities and Exchange Commission's (SEC) web site at http://www.sec.gov.
You may also call 1-800-544-8544 if you’re an individual investing directly with Fidelity, call 1-800-835-5092 if you’re a plan sponsor or participant with Fidelity as your recordkeeper or call 1-877-208-0098 on institutional accounts or if you’re an advisor or invest through one to request a free copy of the proxy voting guidelines.
Standard & Poor's, S&P and S&P 500 are registered service marks of The McGraw-Hill Companies, Inc. and have been licensed for use by Fidelity Distributors Corporation.
Other third-party marks appearing herein are the property of their respective owners.
All other marks appearing herein are registered or unregistered trademarks or service marks of FMR LLC or an affiliated company. © 2020 FMR LLC. All rights reserved.
This report and the financial statements contained herein are submitted for the general information of the shareholders of the Fund. This report is not authorized for distribution to prospective investors in the Fund unless preceded or accompanied by an effective prospectus.
A fund files its complete schedule of portfolio holdings with the SEC for the first and third quarters of each fiscal year on Form N-PORT. Forms N-PORT are available on the SEC’s web site at http://www.sec.gov. A fund's Forms N-PORT may be reviewed and copied at the SEC’s Public Reference Room in Washington, DC. Information regarding the operation of the SEC's Public Reference Room may be obtained by calling 1-800-SEC-0330.
For a complete list of a fund's portfolio holdings, view the most recent holdings listing, semiannual report, or annual report on Fidelity's web site at http://www.fidelity.com, http://www.institutional.fidelity.com, or http://www.401k.com, as applicable.
NOT FDIC INSURED •MAY LOSE VALUE •NO BANK GUARANTEE
Neither the Fund nor Fidelity Distributors Corporation is a bank.
Note to Shareholders:
Early in 2020, the outbreak and spread of a new coronavirus emerged as a public health emergency that had a major influence on financial markets, primarily based on its impact on the global economy and the outlook for corporate earnings. The virus causes a respiratory disease known as COVID-19. On March 11, the World Health Organization declared the COVID-19 outbreak a pandemic, citing sustained risk of further global spread.
In the weeks following, as the crisis worsened, we witnessed an escalating human tragedy with wide-scale social and economic consequences from coronavirus-containment measures. The outbreak of COVID-19 prompted a number of measures to limit the spread, including travel and border restrictions, quarantines, and restrictions on large gatherings. In turn, these resulted in lower consumer activity, diminished demand for a wide range of products and services, disruption in manufacturing and supply chains, and – given the wide variability in outcomes regarding the outbreak – significant market uncertainty and volatility. Amid the turmoil, the U.S. government took unprecedented action – in concert with the U.S. Federal Reserve and central banks around the world – to help support consumers, businesses, and the broader economy, and to limit disruption to the financial system.
The situation continues to unfold, and the extent and duration of its impact on financial markets and the economy remain highly uncertain. Extreme events such as the coronavirus crisis are “exogenous shocks” that can have significant adverse effects on mutual funds and their investments. Although multiple asset classes may be affected by market disruption, the duration and impact may not be the same for all types of assets.
Fidelity is committed to helping you stay informed amid news about COVID-19 and during increased market volatility, and we’re taking extra steps to be responsive to customer needs. We encourage you to visit our websites, where we offer ongoing updates, commentary, and analysis on the markets and our funds.
Performance: The Bottom Line
Average annual total return reflects the change in the value of an investment, assuming reinvestment of distributions from dividend income and capital gains (the profits earned upon the sale of securities that have grown in value, if any) and assuming a constant rate of performance each year. The hypothetical investment and the average annual total returns do not reflect the deduction of taxes that a shareholder would pay on fund distributions or the redemption of fund shares. During periods of reimbursement by Fidelity, a fund’s total return will be greater than it would be had the reimbursement not occurred. How a fund did yesterday is no guarantee of how it will do tomorrow.
Average Annual Total Returns
| For the periods ended April 30, 2020 | Past 1 year | Past 5 years | Past 10 years |
| Class A (incl. 4.00% sales charge) | (9.40)% | 2.03% | 4.61% |
| Class M (incl. 4.00% sales charge) | (9.41)% | 2.03% | 4.61% |
| Class C (incl. contingent deferred sales charge) | (7.25)% | 2.64% | 4.93% |
| Fidelity® High Income Fund | (5.35)% | 2.96% | 5.09% |
| Class I | (5.40)% | 2.93% | 5.08% |
| Class Z | (5.30)% | 2.97% | 5.09% |
Class A shares bear a 0.25% 12b-1 fee. The initial offering of Class A shares took place on December 4, 2018. Returns prior to December 4, 2018, are those of Fidelity® High Income Fund, the original class of the fund, which has no 12b-1 fee. Had Class A's 12b-1 fee been reflected, returns prior to December 4, 2018, would have been lower.
Class M shares bear a 0.25% 12b-1 fee. The initial offering of Class M shares took place on December 4, 2018. Returns prior to December 4, 2018, are those of Fidelity® High Income Fund, the original class of the fund, which has no 12b-1 fee. Had Class M's 12b-1 fee been reflected, returns prior to December 4, 2018, would have been lower.
Class C shares bear a 1.00% 12b-1 fee. The initial offering of Class C shares took place on December 4, 2018. Returns prior to December 4, 2018, are those of Fidelity® High Income Fund, the original class of the fund, which has no 12b-1 fee. Had Class C's 12b-1 fee been reflected, returns prior to December 4, 2018, would have been lower.
Class C shares' contingent deferred sales charges included in the past one year, past five years and past ten years total return figures are 1%, 0% and 0%, respectively.
The initial offering of Class I shares took place on December 4, 2018. Returns prior to December 4, 2018 are those of Fidelity® High Income Fund, the original class of the fund.
The initial offering of Class Z shares took place on December 4, 2018. Returns prior to December 4, 2108, are those of Fidelity® High Income Fund, the original class of the fund.
$10,000 Over 10 Years
Let's say hypothetically that $10,000 was invested in Fidelity® High Income Fund, a class of the fund, on April 30, 2010.
The chart shows how the value of your investment would have changed, and also shows how the ICE® BofA® US High Yield Constrained Index performed over the same period.

| Period Ending Values | ||
| $16,427 | Fidelity® High Income Fund | |
| $17,322 | ICE® BofA® US High Yield Constrained Index | |
Management's Discussion of Fund Performance
Market Recap: U.S. high-yield bonds rode a supportive backdrop into 2020 before giving way amid the early-year global outbreak and spread of the coronavirus. The ICE BofA® US High Yield Constrained Index returned -5.27% for the 12 months ending April 30. Declared a pandemic on March 11, the crisis and containment efforts caused broad contraction in economic activity, plunging oil prices and extreme uncertainty, volatility, and dislocation in financial markets. Following a flat January, high yield returned -1.55% in February, after a surge in COVID-19 cases outside China. The downtrend steepened in March, with the market enduring its fastest sell-off on record and credit spreads widening sharply. The index finished the month down 11.77%, capping its worst quarter since 2008, despite an uptrend in the final week. A historically rapid and expansive U.S. monetary/fiscal-policy response provided a partial offset to the economic disruption. This was evident in April, when the index rose 3.80% on improved coronavirus trends, plans for reopening the economy and progress on potential treatments. Investor sentiment for risk assets waned this period, with fairly wide performance variance based on quality. Among major credit tiers, higher-rated (BB) bonds gained 0.32%, while lower-quality (CCC-C) issues returned -20.79%. By industry, the biggest laggards included energy (-33%) and air transportation (-17%), whereas defensive-oriented groups such as food & drug retail (+11%) and cable/satellite TV (+7%) enjoyed some ballast.Comments from Co-Portfolio Managers Michael Weaver and Alexandre Karam: For the fiscal year, the fund’s share classes (excluding sales charges, if applicable) returned about about -5% to -6%, versus -5.27% for the benchmark, the ICE BofA® US High Yield Constrained Index. The fund’s core high-yield bond subportfolio outpaced the benchmark and modestly contributed to our relative result. The fund's stake in cash, which averaged roughly 4% of assets this period, also boosted relative performance. In contrast, our small non-benchmark allocation to floating-rate bank loans significantly trailed high yield, and therefore hurt relative performance. By industry, security selection in telecommunications, services and broadcasting contributed, as did our overweighting in cable/satellite TV. Conversely, our picks and an overweighting in energy detracted most by a wide margin, with security selection and an overweighting in air transportation hurting to a lesser degree. Our top individual contributor was an outsized stake in JBS (+5%), a major processor of beef, pork and prepared foods. In the telecommunications group, we added value by overweighting Altice Financial (+9%), a sizable fund holding. Turning to notable detractors versus the benchmark, overweightings in several underperforming energy names hurt most, including California Resources (-91%), Chesapeake Energy (-91%), Denbury (-76%) and Sanchez Energy (-67%).The views expressed above reflect those of the portfolio manager(s) only through the end of the period as stated on the cover of this report and do not necessarily represent the views of Fidelity or any other person in the Fidelity organization. Any such views are subject to change at any time based upon market or other conditions and Fidelity disclaims any responsibility to update such views. These views may not be relied on as investment advice and, because investment decisions for a Fidelity fund are based on numerous factors, may not be relied on as an indication of trading intent on behalf of any Fidelity fund.
Investment Summary (Unaudited)
Top Five Holdings as of April 30, 2020
| (by issuer, excluding cash equivalents) | % of fund's net assets |
| Tenet Healthcare Corp. | 3.1 |
| CCO Holdings LLC/CCO Holdings Capital Corp. | 3.1 |
| TransDigm, Inc. | 2.4 |
| C&W Senior Financing Designated Activity Co. | 1.9 |
| SFR Group SA | 1.8 |
| 12.3 |
Top Five Market Sectors as of April 30, 2020
| % of fund's net assets | |
| Telecommunications | 15.0 |
| Healthcare | 9.2 |
| Energy | 8.5 |
| Cable/Satellite TV | 6.4 |
| Technology | 5.8 |
Quality Diversification (% of fund's net assets)
| As of April 30, 2020 | ||
| BBB | 2.5% | |
| BB | 36.7% | |
| B | 37.1% | |
| CCC,CC,C | 17.1% | |
| D | 0.9% | |
| Not Rated | 0.2% | |
| Equities | 0.6% | |
| Short-Term Investments and Net Other Assets | 4.9% | |

We have used ratings from Moody's Investors Service, Inc. Where Moody's® ratings are not available, we have used S&P® ratings. All ratings are as of the date indicated and do not reflect subsequent changes.
Asset Allocation (% of fund's net assets)
| As of April 30, 2020 * | ||
| Nonconvertible Bonds | 90.7% | |
| Convertible Bonds, Preferred Stocks | 0.8% | |
| Common Stocks | 0.5% | |
| Bank Loan Obligations | 1.7% | |
| Other Investments | 1.4% | |
| Short-Term Investments and Net Other Assets (Liabilities) | 4.9% | |

* Foreign investments - 23.5%
Schedule of Investments April 30, 2020
Showing Percentage of Net Assets
| Corporate Bonds - 91.4% | |||
| Principal Amount (000s) | Value (000s) | ||
| Convertible Bonds - 0.7% | |||
| Broadcasting - 0.7% | |||
| DISH Network Corp.: | |||
| 2.375% 3/15/24 | $17,054 | $14,339 | |
| 3.375% 8/15/26 | 26,345 | 21,355 | |
| 35,694 | |||
| Nonconvertible Bonds - 90.7% | |||
| Aerospace - 3.9% | |||
| BBA U.S. Holdings, Inc. 5.375% 5/1/26 (a) | 22,816 | 21,048 | |
| Bombardier, Inc.: | |||
| 6.125% 1/15/23 (a) | 4,738 | 3,388 | |
| 7.5% 12/1/24 (a) | 1,569 | 1,042 | |
| 7.5% 3/15/25 (a) | 26,233 | 16,969 | |
| 7.875% 4/15/27 (a) | 6,392 | 4,139 | |
| BWX Technologies, Inc. 5.375% 7/15/26 (a) | 17,280 | 17,647 | |
| Moog, Inc. 4.25% 12/15/27 (a) | 1,505 | 1,411 | |
| TransDigm UK Holdings PLC 6.875% 5/15/26 | 5,135 | 4,390 | |
| TransDigm, Inc.: | |||
| 5.5% 11/15/27 (a) | 51,115 | 43,192 | |
| 6.25% 3/15/26 (a) | 24,414 | 23,895 | |
| 6.5% 5/15/25 | 5,589 | 5,002 | |
| 7.5% 3/15/27 | 4,474 | 4,073 | |
| 8% 12/15/25 (a) | 35,940 | 37,378 | |
| 183,574 | |||
| Air Transportation - 0.9% | |||
| Aercap Global Aviation Trust 6.5% 6/15/45 (a)(b) | 39,758 | 29,023 | |
| XPO Logistics, Inc. 6.25% 5/1/25 (a) | 11,140 | 11,279 | |
| 40,302 | |||
| Banks & Thrifts - 1.2% | |||
| Ally Financial, Inc.: | |||
| 5.75% 11/20/25 | 45,705 | 46,848 | |
| 8% 11/1/31 | 7,348 | 8,940 | |
| 55,788 | |||
| Broadcasting - 2.2% | |||
| Netflix, Inc.: | |||
| 4.875% 4/15/28 | 7,325 | 7,790 | |
| 5.375% 11/15/29 (a) | 2,760 | 3,031 | |
| 5.875% 11/15/28 | 9,485 | 10,726 | |
| 6.375% 5/15/29 | 17,940 | 21,033 | |
| Sirius XM Radio, Inc.: | |||
| 5% 8/1/27 (a) | 20,227 | 20,687 | |
| 5.375% 4/15/25 (a) | 21,979 | 22,666 | |
| 5.375% 7/15/26 (a) | 18,249 | 18,933 | |
| 104,866 | |||
| Building Materials - 0.4% | |||
| Advanced Drain Systems, Inc. 5% 9/30/27 (a) | 18,966 | 18,634 | |
| Cable/Satellite TV - 6.0% | |||
| CCO Holdings LLC/CCO Holdings Capital Corp.: | |||
| 4% 3/1/23 (a) | 5,601 | 5,641 | |
| 4.5% 8/15/30 (a) | 9,175 | 9,221 | |
| 4.75% 3/1/30 (a) | 2,385 | 2,433 | |
| 5% 2/1/28 (a) | 22,338 | 23,008 | |
| 5.125% 5/1/23 (a) | 5,390 | 5,459 | |
| 5.125% 5/1/27 (a) | 18,817 | 19,539 | |
| 5.5% 5/1/26 (a) | 26,948 | 28,029 | |
| 5.75% 2/15/26 (a) | 26,531 | 27,661 | |
| 5.875% 5/1/27 (a) | 21,160 | 22,037 | |
| CSC Holdings LLC: | |||
| 5.25% 6/1/24 | 1,517 | 1,578 | |
| 5.375% 2/1/28 (a) | 10,000 | 10,441 | |
| 5.5% 5/15/26 (a) | 32,797 | 34,024 | |
| 5.5% 4/15/27 (a) | 12,869 | 13,380 | |
| 7.5% 4/1/28 (a) | 4,650 | 5,110 | |
| 7.75% 7/15/25 (a) | 9,015 | 9,402 | |
| DISH DBS Corp.: | |||
| 5.875% 11/15/24 | 3,152 | 3,032 | |
| 7.75% 7/1/26 | 15,777 | 15,540 | |
| Virgin Media Secured Finance PLC 5.5% 8/15/26 (a) | 12,703 | 13,111 | |
| Ziggo Bond Co. BV: | |||
| 5.125% 2/28/30 (a) | 11,465 | 11,293 | |
| 6% 1/15/27 (a) | 2,185 | 2,196 | |
| Ziggo BV 5.5% 1/15/27 (a) | 20,772 | 21,129 | |
| 283,264 | |||
| Capital Goods - 0.9% | |||
| AECOM: | |||
| 5.125% 3/15/27 | 26,360 | 26,821 | |
| 5.875% 10/15/24 | 14,724 | 15,578 | |
| 42,399 | |||
| Chemicals - 1.7% | |||
| Blue Cube Spinco, Inc.: | |||
| 9.75% 10/15/23 | 3,990 | 4,160 | |
| 10% 10/15/25 | 5,806 | 6,153 | |
| Element Solutions, Inc. 5.875% 12/1/25 (a) | 11,697 | 11,609 | |
| Olin Corp.: | |||
| 5% 2/1/30 | 5,080 | 4,436 | |
| 5.125% 9/15/27 | 2,193 | 2,003 | |
| 5.625% 8/1/29 | 12,315 | 11,130 | |
| The Chemours Co. LLC: | |||
| 5.375% 5/15/27 | 8,302 | 6,974 | |
| 6.625% 5/15/23 | 5,481 | 5,125 | |
| 7% 5/15/25 | 14,582 | 13,703 | |
| Valvoline, Inc.: | |||
| 4.25% 2/15/30 (a) | 8,500 | 8,266 | |
| 4.375% 8/15/25 | 1,483 | 1,487 | |
| W. R. Grace & Co.-Conn.: | |||
| 5.125% 10/1/21 (a) | 1,816 | 1,825 | |
| 5.625% 10/1/24 (a) | 1,762 | 1,766 | |
| 78,637 | |||
| Consumer Products - 0.0% | |||
| Prestige Brands, Inc. 6.375% 3/1/24 (a) | 671 | 689 | |
| Containers - 1.9% | |||
| Ardagh Packaging Finance PLC/Ardagh MP Holdings U.S.A., Inc. 6% 2/15/25 (a) | 31,069 | 31,096 | |
| Crown Americas LLC/Crown Americas Capital Corp. IV 4.5% 1/15/23 | 1,934 | 1,983 | |
| OI European Group BV 4% 3/15/23 (a) | 3,094 | 2,986 | |
| Owens-Brockway Glass Container, Inc.: | |||
| 5% 1/15/22 (a) | 6,060 | 6,121 | |
| 5.375% 1/15/25 (a) | 7,524 | 7,336 | |
| Reynolds Group Issuer, Inc./Reynolds Group Issuer LLC/Reynolds Group Issuer (Luxembourg) SA: | |||
| 5.125% 7/15/23 (a) | 9,149 | 9,195 | |
| 7% 7/15/24 (a) | 9,359 | 9,394 | |
| Silgan Holdings, Inc. 4.75% 3/15/25 | 1,062 | 1,078 | |
| Trivium Packaging Finance BV: | |||
| 5.5% 8/15/26 (a) | 17,966 | 18,415 | |
| 8.5% 8/15/27 (a) | 3,065 | 3,203 | |
| 90,807 | |||
| Diversified Financial Services - 4.3% | |||
| Chobani LLC/Finance Corp., Inc. 7.5% 4/15/25 (a) | 1,018 | 1,014 | |
| Crown Americas LLC/Crown Americas Capital Corp. IV 4.75% 2/1/26 | 9,680 | 9,946 | |
| FLY Leasing Ltd.: | |||
| 5.25% 10/15/24 | 27,627 | 22,102 | |
| 6.375% 10/15/21 | 9,325 | 8,579 | |
| Icahn Enterprises LP/Icahn Enterprises Finance Corp.: | |||
| 4.75% 9/15/24 | 15,905 | 14,959 | |
| 6.25% 5/15/26 | 11,621 | 11,419 | |
| 6.375% 12/15/25 | 19,248 | 19,152 | |
| Navient Corp.: | |||
| 6.5% 6/15/22 | 10,436 | 10,097 | |
| 7.25% 1/25/22 | 6,603 | 6,471 | |
| 7.25% 9/25/23 | 8,735 | 8,363 | |
| Park Aerospace Holdings Ltd. 5.5% 2/15/24 (a) | 8,000 | 7,044 | |
| Radiate Holdco LLC/Radiate Financial Service Ltd.: | |||
| 6.625% 2/15/25 (a) | 18,601 | 18,415 | |
| 6.875% 2/15/23 (a) | 19,527 | 19,136 | |
| Springleaf Finance Corp.: | |||
| 6.875% 3/15/25 | 8,214 | 7,768 | |
| 7.125% 3/15/26 | 15,263 | 14,385 | |
| Ypso Finance BIS SA 6% 2/15/28 (a) | 26,885 | 24,460 | |
| 203,310 | |||
| Diversified Media - 1.1% | |||
| Nielsen Co. SARL (Luxembourg) 5% 2/1/25 (a) | 33,772 | 32,590 | |
| Nielsen Finance LLC/Nielsen Finance Co. 5% 4/15/22 (a) | 19,531 | 19,240 | |
| 51,830 | |||
| Energy - 8.1% | |||
| Cheniere Energy Partners LP: | |||
| 5.25% 10/1/25 | 54,158 | 51,699 | |
| 5.625% 10/1/26 | 8,657 | 8,273 | |
| Chesapeake Energy Corp.: | |||
| 7% 10/1/24 | 4,505 | 90 | |
| 8% 1/15/25 | 22,210 | 444 | |
| 8% 6/15/27 | 21,465 | 429 | |
| Citgo Petroleum Corp. 6.25% 8/15/22 (a) | 19,057 | 18,247 | |
| Comstock Escrow Corp. 9.75% 8/15/26 | 17,898 | 15,482 | |
| Consolidated Energy Finance SA 3 month U.S. LIBOR + 3.750% 4.4905% 6/15/22 (a)(b)(c) | 8,456 | 7,022 | |
| Crestwood Midstream Partners LP/Crestwood Midstream Finance Corp.: | |||
| 5.625% 5/1/27 (a) | 12,985 | 8,440 | |
| 5.75% 4/1/25 | 11,117 | 8,004 | |
| 6.25% 4/1/23 | 13,789 | 10,066 | |
| CVR Energy, Inc.: | |||
| 5.25% 2/15/25 (a) | 16,895 | 13,854 | |
| 5.75% 2/15/28 (a) | 2,074 | 1,754 | |
| DCP Midstream Operating LP 5.375% 7/15/25 | 16,932 | 13,715 | |
| Denbury Resources, Inc.: | |||
| 7.75% 2/15/24 (a) | 24,563 | 4,421 | |
| 9% 5/15/21 (a) | 2,173 | 391 | |
| 9.25% 3/31/22 (a) | 17,284 | 3,111 | |
| EG Global Finance PLC: | |||
| 6.75% 2/7/25 (a) | 11,335 | 10,315 | |
| 8.5% 10/30/25 (a) | 19,353 | 18,869 | |
| Hess Infrastructure Partners LP 5.625% 2/15/26 (a) | 24,335 | 22,632 | |
| Hess Midstream Partners LP 5.125% 6/15/28 (a) | 9,415 | 8,249 | |
| Hilcorp Energy I LP/Hilcorp Finance Co. 5% 12/1/24 (a) | 11,492 | 6,493 | |
| Holly Energy Partners LP/Holly Finance Corp. 5% 2/1/28 (a) | 14,960 | 13,609 | |
| Jonah Energy LLC 7.25% 10/15/25 (a) | 23,715 | 415 | |
| MEG Energy Corp.: | |||
| 7% 3/31/24 (a) | 5,288 | 3,754 | |
| 7.125% 2/1/27 (a) | 12,723 | 8,779 | |
| PBF Holding Co. LLC/PBF Finance Corp. 7.25% 6/15/25 | 959 | 736 | |
| PBF Logistics LP/PBF Logistics Finance, Inc. 6.875% 5/15/23 | 4,650 | 3,581 | |
| Sanchez Energy Corp. 7.25% 2/15/23 (a)(d) | 28,768 | 288 | |
| Summit Midstream Holdings LLC 5.75% 4/15/25 | 29,701 | 5,946 | |
| Sunoco LP/Sunoco Finance Corp.: | |||
| 4.875% 1/15/23 | 7,093 | 6,898 | |
| 5.5% 2/15/26 | 7,447 | 7,186 | |
| 5.875% 3/15/28 | 2,670 | 2,537 | |
| 6% 4/15/27 | 350 | 341 | |
| Targa Resources Partners LP/Targa Resources Partners Finance Corp.: | |||
| 4.25% 11/15/23 | 5,987 | 5,403 | |
| 5% 1/15/28 | 2,000 | 1,702 | |
| 5.125% 2/1/25 | 460 | 414 | |
| 5.375% 2/1/27 | 460 | 391 | |
| 5.5% 3/1/30 (a) | 1,500 | 1,279 | |
| 5.875% 4/15/26 | 15,924 | 14,133 | |
| 6.5% 7/15/27 | 4,800 | 4,320 | |
| 6.75% 3/15/24 | 11,467 | 10,836 | |
| TerraForm Power Operating LLC: | |||
| 4.25% 1/31/23 (a) | 7,171 | 7,347 | |
| 5% 1/31/28 (a) | 2,805 | 2,943 | |
| U.S.A. Compression Partners LP: | |||
| 6.875% 4/1/26 | 11,701 | 9,419 | |
| 6.875% 9/1/27 | 3,813 | 3,127 | |
| Viper Energy Partners LP 5.375% 11/1/27 (a) | 20,983 | 18,780 | |
| Weatherford International Ltd. 11% 12/1/24 (a) | 9,627 | 7,124 | |
| Western Gas Partners LP: | |||
| 4% 7/1/22 | 2,540 | 2,457 | |
| 4.65% 7/1/26 | 975 | 863 | |
| 5.25% 2/1/50 | 434 | 342 | |
| 5.3% 3/1/48 | 4,850 | 3,650 | |
| 380,600 | |||
| Entertainment/Film - 0.4% | |||
| Altice Finco SA 7.625% 2/15/25 (a) | 19,610 | 19,757 | |
| Environmental - 0.4% | |||
| LBC Tank Terminals Holding Netherlands BV 6.875% 5/15/23 (a) | 21,248 | 20,717 | |
| Food & Drug Retail - 0.3% | |||
| Performance Food Group, Inc. 6.875% 5/1/25 (a) | 13,300 | 13,533 | |
| Food/Beverage/Tobacco - 4.3% | |||
| Cott Holdings, Inc. 5.5% 4/1/25 (a) | 8,092 | 8,132 | |
| Darling International, Inc. 5.25% 4/15/27 (a) | 2,315 | 2,333 | |
| ESAL GmbH 6.25% 2/5/23 (a) | 10,664 | 10,571 | |
| JBS U.S.A. LLC/JBS U.S.A. Finance, Inc.: | |||
| 5.75% 6/15/25 (a) | 24,735 | 25,044 | |
| 5.875% 7/15/24 (a) | 10,985 | 11,205 | |
| 6.75% 2/15/28 (a) | 35,558 | 38,080 | |
| JBS U.S.A. Lux SA / JBS Food Co.: | |||
| 5.5% 1/15/30 (a) | 14,010 | 14,185 | |
| 6.5% 4/15/29 (a) | 46,469 | 49,141 | |
| Post Holdings, Inc.: | |||
| 4.625% 4/15/30 (a) | 6,840 | 6,703 | |
| 5% 8/15/26 (a) | 9,853 | 9,816 | |
| 5.5% 12/15/29 (a) | 5,000 | 5,025 | |
| 5.625% 1/15/28 (a) | 10,000 | 10,175 | |
| U.S. Foods, Inc.: | |||
| 5.875% 6/15/24 (a) | 4,215 | 4,015 | |
| 6.25% 4/15/25 (a) | 8,795 | 8,993 | |
| 203,418 | |||
| Gaming - 5.4% | |||
| Boyd Gaming Corp.: | |||
| 4.75% 12/1/27 (a) | 5,860 | 5,048 | |
| 6% 8/15/26 | 8,224 | 7,443 | |
| 6.375% 4/1/26 | 14,929 | 13,447 | |
| Caesars Resort Collection LLC 5.25% 10/15/25 (a) | 45,745 | 35,924 | |
| Eldorado Resorts, Inc.: | |||
| 6% 4/1/25 | 12,600 | 12,096 | |
| 6% 9/15/26 | 2,330 | 2,341 | |
| GLP Capital LP/GLP Financing II, Inc.: | |||
| 5.25% 6/1/25 | 12,203 | 11,869 | |
| 5.375% 4/15/26 | 999 | 995 | |
| Golden Entertainment, Inc. 7.625% 4/15/26 (a) | 25,220 | 19,041 | |
| MCE Finance Ltd. 4.875% 6/6/25 (a) | 7,170 | 6,919 | |
| MGM Growth Properties Operating Partnership LP: | |||
| 4.5% 9/1/26 | 22,885 | 22,141 | |
| 4.5% 1/15/28 | 1,429 | 1,343 | |
| 5.625% 5/1/24 | 12,713 | 12,906 | |
| 5.75% 2/1/27 | 4,396 | 4,451 | |
| MGM Mirage, Inc. 5.75% 6/15/25 | 5,090 | 4,886 | |
| Scientific Games Corp. 5% 10/15/25 (a) | 12,639 | 11,038 | |
| Stars Group Holdings BV 7% 7/15/26 (a) | 15,357 | 15,787 | |
| Station Casinos LLC 5% 10/1/25 (a) | 3,785 | 3,156 | |
| Sugarhouse HSP Gaming Prop Mezz LP/Sugarhouse HSP Gaming Finance Corp. 5.875% 5/15/25 (a) | 12,732 | 10,834 | |
| Twin River Worldwide Holdings, Inc. 6.75% 6/1/27 (a) | 10,537 | 8,377 | |
| Wynn Las Vegas LLC/Wynn Las Vegas Capital Corp. 5.25% 5/15/27 (a) | 19,781 | 16,900 | |
| Wynn Macau Ltd.: | |||
| 4.875% 10/1/24 (a) | 21,553 | 20,745 | |
| 5.5% 10/1/27 (a) | 8,533 | 8,274 | |
| 255,961 | |||
| Healthcare - 9.2% | |||
| BCPE Cycle Merger Sub II, Inc. 10.625% 7/15/27 (a) | 3,090 | 3,078 | |
| Catalent Pharma Solutions 4.875% 1/15/26 (a) | 2,448 | 2,485 | |
| Centene Corp.: | |||
| 4.25% 12/15/27 (a) | 7,145 | 7,475 | |
| 5.25% 4/1/25 (a) | 12,742 | 13,284 | |
| 5.375% 6/1/26 (a) | 4,580 | 4,853 | |
| 5.375% 8/15/26 (a) | 16,100 | 17,148 | |
| Charles River Laboratories International, Inc.: | |||
| 4.25% 5/1/28 (a) | 1,503 | 1,516 | |
| 5.5% 4/1/26 (a) | 6,755 | 6,947 | |
| Community Health Systems, Inc.: | |||
| 6.25% 3/31/23 | 4,297 | 3,996 | |
| 8% 3/15/26 (a) | 51,306 | 49,181 | |
| 8.625% 1/15/24 (a) | 14,103 | 13,750 | |
| CTR Partnership LP/CareTrust Capital Corp. 5.25% 6/1/25 | 8,669 | 8,658 | |
| HCA Holdings, Inc. 5.875% 5/1/23 | 12,331 | 13,268 | |
| Hologic, Inc.: | |||
| 4.375% 10/15/25 (a) | 5,698 | 5,724 | |
| 4.625% 2/1/28 (a) | 259 | 263 | |
| IMS Health, Inc. 5% 10/15/26 (a) | 3,785 | 3,902 | |
| MPH Acquisition Holdings LLC 7.125% 6/1/24 (a) | 19,781 | 17,629 | |
| MPT Operating Partnership LP/MPT Finance Corp.: | |||
| 5.25% 8/1/26 | 8,245 | 8,327 | |
| 5.5% 5/1/24 | 9,237 | 9,191 | |
| 6.375% 3/1/24 | 4,606 | 4,757 | |
| Service Corp. International 5.125% 6/1/29 | 12,173 | 12,660 | |
| Teleflex, Inc. 4.875% 6/1/26 | 11,052 | 11,218 | |
| Tenet Healthcare Corp.: | |||
| 4.625% 7/15/24 | 994 | 981 | |
| 4.875% 1/1/26 (a) | 8,160 | 8,081 | |
| 5.125% 5/1/25 | 11,738 | 10,975 | |
| 6.25% 2/1/27 (a) | 13,954 | 13,739 | |
| 6.75% 6/15/23 | 19,086 | 19,067 | |
| 7% 8/1/25 | 26,420 | 24,560 | |
| 7.5% 4/1/25 (a) | 12,190 | 13,110 | |
| 8.125% 4/1/22 | 58,100 | 58,553 | |
| Valeant Pharmaceuticals International, Inc.: | |||
| 5.5% 11/1/25 (a) | 12,649 | 13,149 | |
| 5.875% 5/15/23 (a) | 580 | 576 | |
| 6.125% 4/15/25 (a) | 22,023 | 22,257 | |
| 7% 3/15/24 (a) | 6,700 | 6,953 | |
| 8.5% 1/31/27 (a) | 4,269 | 4,706 | |
| 9% 12/15/25 (a) | 6,339 | 6,913 | |
| 9.25% 4/1/26 (a) | 10,250 | 11,275 | |
| Vizient, Inc. 6.25% 5/15/27 (a) | 1,190 | 1,250 | |
| 435,455 | |||
| Homebuilders/Real Estate - 2.1% | |||
| Alliant Holdings Intermediate LLC 6.75% 10/15/27 (a) | 37,975 | 37,884 | |
| Howard Hughes Corp. 5.375% 3/15/25 (a) | 20,858 | 20,218 | |
| Starwood Property Trust, Inc.: | |||
| 4.75% 3/15/25 | 10,069 | 8,508 | |
| 5% 12/15/21 | 4,592 | 4,294 | |
| VICI Properties, Inc.: | |||
| 3.5% 2/15/25 (a) | 6,530 | 6,122 | |
| 4.25% 12/1/26 (a) | 9,370 | 8,757 | |
| 4.625% 12/1/29 (a) | 12,665 | 11,699 | |
| 97,482 | |||
| Hotels - 0.6% | |||
| Hilton Domestic Operating Co., Inc.: | |||
| 4.25% 9/1/24 | 11,034 | 10,710 | |
| 5.125% 5/1/26 | 13,631 | 13,458 | |
| Hilton Worldwide Finance LLC/Hilton Worldwide Finance Corp. 4.875% 4/1/27 | 573 | 556 | |
| Wyndham Hotels & Resorts, Inc. 5.375% 4/15/26 (a) | 1,797 | 1,644 | |
| 26,368 | |||
| Insurance - 1.2% | |||
| AmWINS Group, Inc. 7.75% 7/1/26 (a) | 26,303 | 27,092 | |
| USIS Merger Sub, Inc. 6.875% 5/1/25 (a) | 27,221 | 27,289 | |
| 54,381 | |||
| Leisure - 0.5% | |||
| Mattel, Inc.: | |||
| 5.875% 12/15/27 (a) | 3,125 | 3,055 | |
| 6.75% 12/31/25 (a) | 20,022 | 20,322 | |
| 23,377 | |||
| Metals/Mining - 1.2% | |||
| First Quantum Minerals Ltd.: | |||
| 6.5% 3/1/24 (a) | 13,569 | 11,805 | |
| 7.25% 5/15/22 (a) | 2,784 | 2,580 | |
| 7.25% 4/1/23 (a) | 12,815 | 11,501 | |
| FMG Resources (August 2006) Pty Ltd. 4.5% 9/15/27 (a) | 195 | 191 | |
| Freeport-McMoRan, Inc.: | |||
| 3.55% 3/1/22 | 736 | 742 | |
| 3.875% 3/15/23 | 10,764 | 10,737 | |
| Nufarm Australia Ltd. 5.75% 4/30/26 (a) | 18,583 | 17,468 | |
| 55,024 | |||
| Paper - 0.8% | |||
| Berry Global Escrow Corp. 4.875% 7/15/26 (a) | 10,529 | 10,755 | |
| Flex Acquisition Co., Inc.: | |||
| 6.875% 1/15/25 (a) | 18,096 | 17,525 | |
| 7.875% 7/15/26 (a) | 10,748 | 10,318 | |
| 38,598 | |||
| Restaurants - 1.6% | |||
| 1011778 BC Unlimited Liability Co./New Red Finance, Inc.: | |||
| 4.25% 5/15/24 (a) | 12,673 | 12,669 | |
| 5% 10/15/25 (a) | 4,631 | 4,654 | |
| 5.75% 4/15/25 (a) | 3,930 | 4,146 | |
| Golden Nugget, Inc. 6.75% 10/15/24 (a) | 24,311 | 18,963 | |
| KFC Holding Co./Pizza Hut Holding LLC 5% 6/1/24 (a) | 14,553 | 14,995 | |
| Yum! Brands, Inc. 7.75% 4/1/25 (a) | 17,445 | 19,017 | |
| 74,444 | |||
| Services - 4.4% | |||
| Aramark Services, Inc.: | |||
| 4.75% 6/1/26 | 10,745 | 10,261 | |
| 5% 4/1/25 (a) | 6,344 | 6,170 | |
| 5% 2/1/28 (a) | 20,380 | 19,452 | |
| 6.375% 5/1/25 (a) | 18,660 | 19,406 | |
| ASGN, Inc. 4.625% 5/15/28 (a) | 5,440 | 5,017 | |
| Avantor, Inc. 6% 10/1/24 (a) | 11,543 | 12,166 | |
| Brand Energy & Infrastructure Services, Inc. 8.5% 7/15/25 (a) | 12,463 | 9,223 | |
| CDK Global, Inc.: | |||
| 4.875% 6/1/27 | 700 | 698 | |
| 5.25% 5/15/29 (a) | 2,315 | 2,361 | |
| 5.875% 6/15/26 | 8,821 | 9,240 | |
| CoreCivic, Inc.: | |||
| 4.625% 5/1/23 | 2,448 | 2,313 | |
| 5% 10/15/22 | 11,751 | 11,292 | |
| Frontdoor, Inc. 6.75% 8/15/26 (a) | 4,078 | 4,231 | |
| GEMS MENASA Cayman Ltd. 7.125% 7/31/26 (a) | 26,499 | 24,321 | |
| Laureate Education, Inc. 8.25% 5/1/25 (a) | 19,600 | 20,021 | |
| Tempo Acquisition LLC: | |||
| 5.75% 6/1/25 (a) | 7,405 | 7,516 | |
| 6.75% 6/1/25 (a) | 30,747 | 29,825 | |
| The GEO Group, Inc.: | |||
| 5.875% 10/15/24 | 3,649 | 2,883 | |
| 6% 4/15/26 | 13,385 | 10,139 | |
| 206,535 | |||
| Steel - 0.4% | |||
| Allegheny Technologies, Inc. 5.875% 12/1/27 | 24,105 | 19,887 | |
| Super Retail - 0.2% | |||
| The William Carter Co. 5.625% 3/15/27 (a) | 7,749 | 7,856 | |
| Technology - 5.8% | |||
| Ascend Learning LLC: | |||
| 6.875% 8/1/25 (a) | 12,221 | 12,099 | |
| 6.875% 8/1/25 (a) | 4,930 | 4,881 | |
| Banff Merger Sub, Inc. 9.75% 9/1/26 (a) | 31,080 | 27,894 | |
| Camelot Finance SA 4.5% 11/1/26 (a) | 12,670 | 12,765 | |
| Ensemble S Merger Sub, Inc. 9% 9/30/23 (a) | 25,039 | 25,080 | |
| Entegris, Inc. 4.375% 4/15/28 (a) | 9,725 | 9,737 | |
| Fair Isaac Corp. 5.25% 5/15/26 (a) | 4,224 | 4,361 | |
| Financial & Risk U.S. Holdings, Inc. 8.25% 11/15/26 (a) | 5,980 | 6,488 | |
| Gartner, Inc. 5.125% 4/1/25 (a) | 514 | 530 | |
| Match Group, Inc. 4.125% 8/1/30 (a) | 3,610 | 3,502 | |
| Nortonlifelock, Inc. 5% 4/15/25 (a) | 30,251 | 30,440 | |
| Nuance Communications, Inc. 5.625% 12/15/26 | 14,955 | 15,676 | |
| Qorvo, Inc. 5.5% 7/15/26 | 15,067 | 15,820 | |
| Rackspace Hosting, Inc. 8.625% 11/15/24 (a) | 42,424 | 41,793 | |
| Sensata Technologies BV 5% 10/1/25 (a) | 2,966 | 2,950 | |
| Solera LLC/Solera Finance, Inc. 10.5% 3/1/24 (a) | 13,557 | 13,489 | |
| SS&C Technologies, Inc. 5.5% 9/30/27 (a) | 17,716 | 18,159 | |
| TTM Technologies, Inc. 5.625% 10/1/25 (a) | 26,531 | 25,370 | |
| 271,034 | |||
| Telecommunications - 14.5% | |||
| Altice Financing SA: | |||
| 5% 1/15/28 (a) | 4,855 | 4,734 | |
| 7.5% 5/15/26 (a) | 37,330 | 38,917 | |
| C&W Senior Financing Designated Activity Co.: | |||
| 6.875% 9/15/27 (a) | 63,377 | 62,579 | |
| 7.5% 10/15/26 (a) | 29,062 | 29,068 | |
| Century Telephone Enterprises, Inc. 6.875% 1/15/28 | 845 | 875 | |
| CenturyLink, Inc.: | |||
| 5.125% 12/15/26 (a) | 25,475 | 24,138 | |
| 5.625% 4/1/25 | 8,905 | 8,905 | |
| Cogent Communications Group, Inc. 5.375% 3/1/22 (a) | 3,779 | 3,830 | |
| Front Range BidCo, Inc.: | |||
| 4% 3/1/27 (a) | 8,315 | 8,064 | |
| 6.125% 3/1/28 (a) | 9,560 | 9,010 | |
| Frontier Communications Corp. 8% 4/1/27 (a)(d) | 43,405 | 44,260 | |
| Intelsat Jackson Holdings SA: | |||
| 8% 2/15/24 (a) | 21,215 | 21,784 | |
| 8.5% 10/15/24 (a) | 18,102 | 10,499 | |
| Level 3 Financing, Inc.: | |||
| 4.625% 9/15/27 (a) | 11,675 | 11,568 | |
| 5.125% 5/1/23 | 6,326 | 6,310 | |
| 5.375% 1/15/24 | 22,126 | 22,292 | |
| 5.375% 5/1/25 | 4,619 | 4,688 | |
| Millicom International Cellular SA: | |||
| 5.125% 1/15/28 (a) | 10,000 | 9,231 | |
| 6% 3/15/25 (a) | 6,230 | 6,244 | |
| 6.625% 10/15/26 (a) | 34,393 | 35,081 | |
| Neptune Finco Corp.: | |||
| 6.625% 10/15/25 (a) | 23,208 | 24,272 | |
| 10.875% 10/15/25 (a) | 1,075 | 1,162 | |
| Sable International Finance Ltd. 5.75% 9/7/27 (a) | 5,058 | 5,058 | |
| SFR Group SA: | |||
| 7.375% 5/1/26 (a) | 38,741 | 40,484 | |
| 8.125% 2/1/27 (a) | 38,278 | 41,245 | |
| Sprint Capital Corp. 6.875% 11/15/28 | 16,575 | 19,962 | |
| Sprint Communications, Inc. 6% 11/15/22 | 36,119 | 38,200 | |
| Sprint Corp.: | |||
| 7.125% 6/15/24 | 12,655 | 14,205 | |
| 7.875% 9/15/23 | 49,855 | 56,077 | |
| T-Mobile U.S.A., Inc.: | |||
| 3.75% 4/15/27 (a) | 12,185 | 13,063 | |
| 3.875% 4/15/30 (a) | 12,185 | 13,329 | |
| 4.5% 2/1/26 | 1,493 | 1,538 | |
| 5.375% 4/15/27 | 3,000 | 3,195 | |
| 6.375% 3/1/25 | 13,350 | 13,700 | |
| Telecom Italia Capital SA: | |||
| 6% 9/30/34 | 4,978 | 5,157 | |
| 6.375% 11/15/33 | 2,795 | 3,012 | |
| Telecom Italia SpA 5.303% 5/30/24 (a) | 12,228 | 12,717 | |
| Telenet Finance Luxembourg Notes SARL 5.5% 3/1/28 (a) | 15,200 | 15,504 | |
| 683,957 | |||
| Transportation Ex Air/Rail - 0.2% | |||
| Avolon Holdings Funding Ltd. 5.5% 1/15/23 (a) | 11,545 | 10,607 | |
| Utilities - 4.6% | |||
| Clearway Energy Operating LLC: | |||
| 4.75% 3/15/28 (a) | 3,020 | 3,073 | |
| 5.75% 10/15/25 | 1,180 | 1,215 | |
| DCP Midstream Operating LP 5.125% 5/15/29 | 23,706 | 17,654 | |
| Dynegy, Inc. 5.875% 6/1/23 | 1,287 | 1,300 | |
| Global Partners LP/GLP Finance Corp.: | |||
| 7% 6/15/23 | 15,111 | 13,147 | |
| 7% 8/1/27 | 11,357 | 9,140 | |
| InterGen NV 7% 6/30/23 (a) | 42,782 | 37,969 | |
| NextEra Energy Partners LP: | |||
| 4.25% 9/15/24 (a) | 13,775 | 13,982 | |
| 4.5% 9/15/27 (a) | 357 | 366 | |
| NRG Energy, Inc.: | |||
| 5.25% 6/15/29 (a) | 10,490 | 11,237 | |
| 5.75% 1/15/28 | 8,281 | 8,902 | |
| 6.625% 1/15/27 | 1,757 | 1,876 | |
| 7.25% 5/15/26 | 979 | 1,052 | |
| NRG Yield Operating LLC 5% 9/15/26 | 3,515 | 3,533 | |
| NSG Holdings II LLC/NSG Holdings, Inc. 7.75% 12/15/25 (a) | 18,670 | 18,810 | |
| Talen Energy Supply LLC 10.5% 1/15/26 (a) | 5,816 | 4,799 | |
| The AES Corp.: | |||
| 4.5% 3/15/23 | 1,018 | 1,016 | |
| 4.875% 5/15/23 | 2,181 | 2,197 | |
| 5.125% 9/1/27 | 2,599 | 2,709 | |
| 6% 5/15/26 | 9,707 | 10,151 | |
| Vistra Operations Co. LLC: | |||
| 5% 7/31/27 (a) | 19,806 | 20,200 | |
| 5.5% 9/1/26 (a) | 21,678 | 22,318 | |
| 5.625% 2/15/27 (a) | 11,440 | 12,041 | |
| 218,687 | |||
| TOTAL NONCONVERTIBLE BONDS | 4,271,778 | ||
| TOTAL CORPORATE BONDS | |||
| (Cost $4,622,920) | 4,307,472 | ||
| Shares | Value (000s) | ||
| Common Stocks - 0.5% | |||
| Automotive & Auto Parts - 0.0% | |||
| Motors Liquidation Co. GUC Trust (e) | 1,502 | 16 | |
| Energy - 0.0% | |||
| Forbes Energy Services Ltd. (e) | 47,062 | 4 | |
| Weatherford International PLC (e) | 72,884 | 328 | |
| TOTAL ENERGY | 332 | ||
| Food & Drug Retail - 0.5% | |||
| Southeastern Grocers, Inc. (e)(f) | 559,052 | 22,670 | |
| Telecommunications - 0.0% | |||
| CUI Acquisition Corp. Class E (e)(f) | 1 | 24 | |
| TOTAL COMMON STOCKS | |||
| (Cost $21,849) | 23,042 | ||
| Convertible Preferred Stocks - 0.1% | |||
| Telecommunications - 0.1% | |||
| Crown Castle International Corp. Series A, 6.875% | |||
| (Cost $2,170) | 2,170 | 3,057 | |
| Principal Amount (000s) | Value (000s) | ||
| Bank Loan Obligations - 1.7% | |||
| Cable/Satellite TV - 0.4% | |||
| WideOpenWest Finance LLC Tranche B, term loan 3 month U.S. LIBOR + 3.250% 4.25% 8/19/23 (b)(c)(g) | 20,177 | 18,682 | |
| Energy - 0.4% | |||
| California Resources Corp.: | |||
| Tranche 1LN, term loan 3 month U.S. LIBOR + 10.375% 11.9883% 12/31/21 (b)(c)(g) | 20,649 | 736 | |
| Tranche B, term loan 3 month U.S. LIBOR + 4.750% 6.3633% 12/31/22 (b)(c)(g) | 20,716 | 4,546 | |
| Gavilan Resources LLC Tranche 2LN, term loan 3 month U.S. LIBOR + 6.000% 6.9894% 3/1/24 (b)(c)(g) | 25,259 | 2,147 | |
| Sanchez Energy Corp.: | |||
| 1LN, term loan 3 month U.S. LIBOR + 8.000% 0% 12/31/49 (c)(d)(f)(g) | 7,758 | 6,207 | |
| term loan 7.25% 12/31/49 (b)(d)(f)(g) | 3,310 | 2,648 | |
| TOTAL ENERGY | 16,284 | ||
| Gaming - 0.0% | |||
| Golden Entertainment, Inc. Tranche B, term loan 3 month U.S. LIBOR + 3.000% 3.75% 10/20/24 (b)(c)(g) | 1,935 | 1,577 | |
| Insurance - 0.2% | |||
| HUB International Ltd. Tranche B, term loan 3 month U.S. LIBOR + 2.750% 4.5435% 4/25/25 (b)(c)(g) | 10,763 | 10,061 | |
| Services - 0.3% | |||
| Almonde, Inc.: | |||
| Tranche 2LN, term loan 3 month U.S. LIBOR + 7.250% 8.25% 6/13/25 (b)(c)(g) | 85 | 72 | |
| Tranche B 1LN, term loan 3 month U.S. LIBOR + 3.500% 4.5% 6/13/24 (b)(c)(g) | 16,251 | 14,052 | |
| Brand Energy & Infrastructure Services, Inc. Tranche B, term loan 3 month U.S. LIBOR + 4.250% 5.4549% 6/21/24 (b)(c)(g) | 2,154 | 1,815 | |
| TOTAL SERVICES | 15,939 | ||
| Telecommunications - 0.4% | |||
| Intelsat Jackson Holdings SA: | |||
| Tranche B, term loan 3 month U.S. LIBOR + 3.750% 5.682% 11/27/23 (b)(c)(g) | 16,730 | 16,386 | |
| Tranche B-4, term loan 3 month U.S. LIBOR + 4.500% 6.432% 1/2/24 (b)(c)(g) | 1,485 | 1,464 | |
| TOTAL TELECOMMUNICATIONS | 17,850 | ||
| TOTAL BANK LOAN OBLIGATIONS | |||
| (Cost $125,341) | 80,393 | ||
| Preferred Securities - 1.4% | |||
| Banks & Thrifts - 1.0% | |||
| Bank of America Corp.: | |||
| 5.2% (b)(h) | 13,456 | 13,363 | |
| 5.875% (b)(h) | 1,278 | 1,313 | |
| 6.5% (b)(h) | 622 | 663 | |
| Citigroup, Inc. 4.7% (b)(h) | 11,200 | 9,887 | |
| JPMorgan Chase & Co. 4.6% (b)(h) | 10,215 | 9,290 | |
| Wells Fargo & Co. 5.9% (b)(h) | 12,648 | 13,119 | |
| TOTAL BANKS & THRIFTS | 47,635 | ||
| Diversified Financial Services - 0.4% | |||
| AerCap Holdings NV 5.875% 10/10/79 (b) | 26,096 | 17,507 | |
| Energy - 0.0% | |||
| MPLX LP 6.875% (b)(h) | 1,899 | 1,393 | |
| Summit Midstream Partners LP 9.5% (b)(h) | 5,208 | 707 | |
| TOTAL ENERGY | 2,100 | ||
| TOTAL PREFERRED SECURITIES | |||
| (Cost $83,202) | 67,242 | ||
| Shares | Value (000s) | ||
| Money Market Funds - 4.4% | |||
| Fidelity Cash Central Fund 0.16% (i) | |||
| (Cost $205,718) | 205,686,492 | 205,748 | |
| TOTAL INVESTMENT IN SECURITIES - 99.5% | |||
| (Cost $5,061,200) | 4,686,954 | ||
| NET OTHER ASSETS (LIABILITIES) - 0.5% | 23,644 | ||
| NET ASSETS - 100% | $4,710,598 |
Legend
(a) Security exempt from registration under Rule 144A of the Securities Act of 1933. These securities may be resold in transactions exempt from registration, normally to qualified institutional buyers. At the end of the period, the value of these securities amounted to $3,017,119,000 or 64.0% of net assets.
(b) Coupon rates for floating and adjustable rate securities reflect the rates in effect at period end.
(c) Coupon is indexed to a floating interest rate which may be multiplied by a specified factor and/or subject to caps or floors.
(d) Non-income producing - Security is in default.
(e) Non-income producing
(f) Level 3 security
(g) Remaining maturities of bank loan obligations may be less than the stated maturities shown as a result of contractual or optional prepayments by the borrower. Such prepayments cannot be predicted with certainty.
(h) Security is perpetual in nature with no stated maturity date.
(i) Affiliated fund that is generally available only to investment companies and other accounts managed by Fidelity Investments. The rate quoted is the annualized seven-day yield of the fund at period end. A complete unaudited listing of the fund's holdings as of its most recent quarter end is available upon request. In addition, each Fidelity Central Fund's financial statements, which are not covered by the Fund's Report of Independent Registered Public Accounting Firm, are available on the SEC's website or upon request.
Affiliated Central Funds
Information regarding fiscal year to date income earned by the Fund from investments in Fidelity Central Funds is as follows:
| Fund | Income earned |
| (Amounts in thousands) | |
| Fidelity Cash Central Fund | $4,279 |
| Total | $4,279 |
Amounts in the income column in the above table include any capital gain distributions from underlying funds, which are presented in the corresponding line-item in the Statement of Operations, if applicable.
Investment Valuation
The following is a summary of the inputs used, as of April 30, 2020, involving the Fund's assets and liabilities carried at fair value. The inputs or methodology used for valuing securities may not be an indication of the risk associated with investing in those securities. For more information on valuation inputs, and their aggregation into the levels used below, please refer to the Investment Valuation section in the accompanying Notes to Financial Statements.
| Valuation Inputs at Reporting Date: | ||||
| Description | Total | Level 1 | Level 2 | Level 3 |
| (Amounts in thousands) | ||||
| Investments in Securities: | ||||
| Equities: | ||||
| Communication Services | $24 | $-- | $-- | $24 |
| Consumer Staples | 22,670 | -- | -- | 22,670 |
| Energy | 332 | 332 | -- | -- |
| Financials | 16 | 16 | -- | -- |
| Real Estate | 3,057 | -- | 3,057 | -- |
| Corporate Bonds | 4,307,472 | -- | 4,307,472 | -- |
| Bank Loan Obligations | 80,393 | -- | 71,538 | 8,855 |
| Preferred Securities | 67,242 | -- | 67,242 | -- |
| Money Market Funds | 205,748 | 205,748 | -- | -- |
| Total Investments in Securities: | $4,686,954 | $206,096 | $4,449,309 | $31,549 |
Other Information
Distribution of investments by country or territory of incorporation, as a percentage of Total Net Assets, is as follows (Unaudited):
| United States of America | 76.5% |
| Luxembourg | 5.5% |
| Multi-National | 3.6% |
| Netherlands | 3.3% |
| Canada | 3.0% |
| Ireland | 1.9% |
| France | 1.8% |
| Cayman Islands | 1.7% |
| United Kingdom | 1.0% |
| Others (Individually Less Than 1%) | 1.7% |
| 100.0% |
See accompanying notes which are an integral part of the financial statements.
Financial Statements
Statement of Assets and Liabilities
| Amounts in thousands (except per-share amounts) | April 30, 2020 | |
| Assets | ||
| Investment in securities, at value — See accompanying schedule: Unaffiliated issuers (cost $4,855,482) | $4,481,206 | |
| Fidelity Central Funds (cost $205,718) | 205,748 | |
| Total Investment in Securities (cost $5,061,200) | $4,686,954 | |
| Receivable for investments sold | 7,224 | |
| Receivable for fund shares sold | 5,567 | |
| Dividends receivable | 37 | |
| Interest receivable | 70,253 | |
| Distributions receivable from Fidelity Central Funds | 34 | |
| Prepaid expenses | 2 | |
| Other receivables | 29 | |
| Total assets | 4,770,100 | |
| Liabilities | ||
| Payable for investments purchased | $46,458 | |
| Payable for fund shares redeemed | 6,879 | |
| Distributions payable | 3,282 | |
| Accrued management fee | 2,080 | |
| Distribution and service plan fees payable | 68 | |
| Other affiliated payables | 538 | |
| Other payables and accrued expenses | 197 | |
| Total liabilities | 59,502 | |
| Net Assets | $4,710,598 | |
| Net Assets consist of: | ||
| Paid in capital | $5,435,765 | |
| Total accumulated earnings (loss) | (725,167) | |
| Net Assets | $4,710,598 | |
| Net Asset Value and Maximum Offering Price | ||
| Class A: | ||
| Net Asset Value and redemption price per share ($143,778 ÷ 18,141 shares)(a) | $7.93 | |
| Maximum offering price per share (100/96.00 of $7.93) | $8.26 | |
| Class M: | ||
| Net Asset Value and redemption price per share ($40,435 ÷ 5,102 shares)(a) | $7.93 | |
| Maximum offering price per share (100/96.00 of $7.93) | $8.26 | |
| Class C: | ||
| Net Asset Value and offering price per share ($36,203 ÷ 4,566 shares)(a) | $7.93 | |
| Fidelity High Income Fund: | ||
| Net Asset Value, offering price and redemption price per share ($3,871,123 ÷ 488,387 shares) | $7.93 | |
| Class I: | ||
| Net Asset Value, offering price and redemption price per share ($557,994 ÷ 70,407 shares) | $7.93 | |
| Class Z: | ||
| Net Asset Value, offering price and redemption price per share ($61,065 ÷ 7,705 shares) | $7.93 |
(a) Redemption price per share is equal to net asset value less any applicable contingent deferred sales charge.
See accompanying notes which are an integral part of the financial statements.
Statement of Operations
| Amounts in thousands | Year ended April 30, 2020 | |
| Investment Income | ||
| Dividends | $7,793 | |
| Interest | 296,408 | |
| Income from Fidelity Central Funds | 4,279 | |
| Total income | 308,480 | |
| Expenses | ||
| Management fee | $28,303 | |
| Transfer agent fees | 5,903 | |
| Distribution and service plan fees | 995 | |
| Accounting fees and expenses | 1,177 | |
| Custodian fees and expenses | 44 | |
| Independent trustees' fees and expenses | 30 | |
| Registration fees | 200 | |
| Audit | 125 | |
| Legal | (230) | |
| Miscellaneous | 126 | |
| Total expenses before reductions | 36,673 | |
| Expense reductions | (38) | |
| Total expenses after reductions | 36,635 | |
| Net investment income (loss) | 271,845 | |
| Realized and Unrealized Gain (Loss) | ||
| Net realized gain (loss) on: | ||
| Investment securities: | ||
| Unaffiliated issuers | (106,987) | |
| Redemptions in-kind with affiliated entities | 4,389 | |
| Fidelity Central Funds | 27 | |
| Total net realized gain (loss) | (102,571) | |
| Change in net unrealized appreciation (depreciation) on: | ||
| Investment securities: | ||
| Unaffiliated issuers | (437,497) | |
| Fidelity Central Funds | 9 | |
| Total change in net unrealized appreciation (depreciation) | (437,488) | |
| Net gain (loss) | (540,059) | |
| Net increase (decrease) in net assets resulting from operations | $(268,214) |
See accompanying notes which are an integral part of the financial statements.
Statement of Changes in Net Assets
| Amounts in thousands | Year ended April 30, 2020 | Year ended April 30, 2019 |
| Increase (Decrease) in Net Assets | ||
| Operations | ||
| Net investment income (loss) | $271,845 | $256,659 |
| Net realized gain (loss) | (102,571) | (105,222) |
| Change in net unrealized appreciation (depreciation) | (437,488) | 124,490 |
| Net increase (decrease) in net assets resulting from operations | (268,214) | 275,927 |
| Distributions to shareholders | (266,971) | (256,881) |
| Share transactions - net increase (decrease) | 121,991 | 780,403 |
| Total increase (decrease) in net assets | (413,194) | 799,449 |
| Net Assets | ||
| Beginning of period | 5,123,792 | 4,324,343 |
| End of period | $4,710,598 | $5,123,792 |
See accompanying notes which are an integral part of the financial statements.
Financial Highlights
Fidelity High Income Fund Class A
| Years ended April 30, | 2020 | 2019 A |
| Selected Per–Share Data | ||
| Net asset value, beginning of period | $8.83 | $8.56 |
| Income from Investment Operations | ||
| Net investment income (loss)B | .438 | .192 |
| Net realized and unrealized gain (loss) | (.908) | .286 |
| Total from investment operations | (.470) | .478 |
| Distributions from net investment income | (.430) | (.208) |
| Total distributions | (.430) | (.208) |
| Net asset value, end of period | $7.93 | $8.83 |
| Total ReturnC,D,E | (5.63)% | 5.68% |
| Ratios to Average Net AssetsF,G | ||
| Expenses before reductions | .98% | .99%H |
| Expenses net of fee waivers, if any | .98% | .99%H |
| Expenses net of all reductions | .98% | .99%H |
| Net investment income (loss) | 5.04% | 5.60%H |
| Supplemental Data | ||
| Net assets, end of period (in millions) | $144 | $170 |
| Portfolio turnover rateI | 44%J | 62%K |
A For the period December 4, 2018 (commencement of sale of shares) to April 30, 2019.
B Calculated based on average shares outstanding during the period.
C Total returns for periods of less than one year are not annualized.
D Total returns would have been lower if certain expenses had not been reduced during the applicable periods shown.
E Total returns do not include the effect of the sales charges.
F Fees and expenses of any underlying Fidelity Central Funds are not included in the Fund's expense ratio. The Fund indirectly bears its proportionate share of the expenses of any underlying Fidelity Central Funds.
G Expense ratios reflect operating expenses of the class. Expenses before reductions do not reflect amounts reimbursed by the investment adviser or reductions from brokerage service arrangements or reductions from other expense offset arrangements and do not represent the amount paid by the class during periods when reimbursements or reductions occur. Expense ratios before reductions for start-up periods may not be representative of longer-term operating periods. Expenses net of fee waivers reflect expenses after reimbursement by the investment adviser but prior to reductions from brokerage service arrangements or other expense offset arrangements. Expenses net of all reductions represent the net expenses paid by the class.
H Annualized
I Amount does not include the portfolio activity of any underlying Fidelity Central Funds.
J Portfolio turnover rate excludes securities received or delivered in-kind.
K The portfolio turnover rate does not include the assets acquired in the merger.
See accompanying notes which are an integral part of the financial statements.
Fidelity High Income Fund Class M
| Years ended April 30, | 2020 | 2019 A |
| Selected Per–Share Data | ||
| Net asset value, beginning of period | $8.83 | $8.56 |
| Income from Investment Operations | ||
| Net investment income (loss)B | .438 | .191 |
| Net realized and unrealized gain (loss) | (.909) | .286 |
| Total from investment operations | (.471) | .477 |
| Distributions from net investment income | (.429) | (.207) |
| Total distributions | (.429) | (.207) |
| Net asset value, end of period | $7.93 | $8.83 |
| Total ReturnC,D,E | (5.64)% | 5.68% |
| Ratios to Average Net AssetsF,G | ||
| Expenses before reductions | .99% | 1.01%H |
| Expenses net of fee waivers, if any | .99% | 1.01%H |
| Expenses net of all reductions | .99% | 1.01%H |
| Net investment income (loss) | 5.02% | 5.59%H |
| Supplemental Data | ||
| Net assets, end of period (in millions) | $40 | $50 |
| Portfolio turnover rateI | 44%J | 62%K |
A For the period December 4, 2018 (commencement of sale of shares) to April 30, 2019.
B Calculated based on average shares outstanding during the period.
C Total returns for periods of less than one year are not annualized.
D Total returns would have been lower if certain expenses had not been reduced during the applicable periods shown.
E Total returns do not include the effect of the sales charges.
F Fees and expenses of any underlying Fidelity Central Funds are not included in the Fund's expense ratio. The Fund indirectly bears its proportionate share of the expenses of any underlying Fidelity Central Funds.
G Expense ratios reflect operating expenses of the class. Expenses before reductions do not reflect amounts reimbursed by the investment adviser or reductions from brokerage service arrangements or reductions from other expense offset arrangements and do not represent the amount paid by the class during periods when reimbursements or reductions occur. Expense ratios before reductions for start-up periods may not be representative of longer-term operating periods. Expenses net of fee waivers reflect expenses after reimbursement by the investment adviser but prior to reductions from brokerage service arrangements or other expense offset arrangements. Expenses net of all reductions represent the net expenses paid by the class.
H Annualized
I Amount does not include the portfolio activity of any underlying Fidelity Central Funds.
J Portfolio turnover rate excludes securities received or delivered in-kind.
K The portfolio turnover rate does not include the assets acquired in the merger.
See accompanying notes which are an integral part of the financial statements.
Fidelity High Income Fund Class C
| Years ended April 30, | 2020 | 2019 A |
| Selected Per–Share Data | ||
| Net asset value, beginning of period | $8.83 | $8.56 |
| Income from Investment Operations | ||
| Net investment income (loss)B | .372 | .166 |
| Net realized and unrealized gain (loss) | (.909) | .285 |
| Total from investment operations | (.537) | .451 |
| Distributions from net investment income | (.363) | (.181) |
| Total distributions | (.363) | (.181) |
| Net asset value, end of period | $7.93 | $8.83 |
| Total ReturnC,D,E | (6.35)% | 5.36% |
| Ratios to Average Net AssetsF,G | ||
| Expenses before reductions | 1.75% | 1.77%H |
| Expenses net of fee waivers, if any | 1.75% | 1.77%H |
| Expenses net of all reductions | 1.75% | 1.77%H |
| Net investment income (loss) | 4.27% | 4.84%H |
| Supplemental Data | ||
| Net assets, end of period (in millions) | $36 | $52 |
| Portfolio turnover rateI | 44%J | 62%K |
A For the period December 4, 2018 (commencement of sale of shares) to April 30, 2019.
B Calculated based on average shares outstanding during the period.
C Total returns for periods of less than one year are not annualized.
D Total returns would have been lower if certain expenses had not been reduced during the applicable periods shown.
E Total returns do not include the effect of the contingent deferred sales charge.
F Fees and expenses of any underlying Fidelity Central Funds are not included in the Fund's expense ratio. The Fund indirectly bears its proportionate share of the expenses of any underlying Fidelity Central Funds.
G Expense ratios reflect operating expenses of the class. Expenses before reductions do not reflect amounts reimbursed by the investment adviser or reductions from brokerage service arrangements or reductions from other expense offset arrangements and do not represent the amount paid by the class during periods when reimbursements or reductions occur. Expense ratios before reductions for start-up periods may not be representative of longer-term operating periods. Expenses net of fee waivers reflect expenses after reimbursement by the investment adviser but prior to reductions from brokerage service arrangements or other expense offset arrangements. Expenses net of all reductions represent the net expenses paid by the class.
H Annualized
I Amount does not include the portfolio activity of any underlying Fidelity Central Funds.
J Portfolio turnover rate excludes securities received or delivered in-kind.
K The portfolio turnover rate does not include the assets acquired in the merger.
See accompanying notes which are an integral part of the financial statements.
Fidelity High Income Fund
| Years ended April 30, | 2020 | 2019 | 2018 | 2017 | 2016 |
| Selected Per–Share Data | |||||
| Net asset value, beginning of period | $8.83 | $8.83 | $8.94 | $8.31 | $9.04 |
| Income from Investment Operations | |||||
| Net investment income (loss)A | .464 | .493 | .513 | .501 | .503 |
| Net realized and unrealized gain (loss) | (.909) | –B | (.137) | .597 | (.741) |
| Total from investment operations | (.445) | .493 | .376 | 1.098 | (.238) |
| Distributions from net investment income | (.455) | (.493) | (.486) | (.469) | (.493) |
| Total distributions | (.455) | (.493) | (.486) | (.469) | (.493) |
| Redemption fees added to paid in capitalA | – | – | –B | .001 | .001 |
| Net asset value, end of period | $7.93 | $8.83 | $8.83 | $8.94 | $8.31 |
| Total ReturnC | (5.35)% | 5.83% | 4.27% | 13.56% | (2.47)% |
| Ratios to Average Net AssetsD,E | |||||
| Expenses before reductions | .69% | .70% | .70% | .72% | .73% |
| Expenses net of fee waivers, if any | .69% | .70% | .70% | .72% | .73% |
| Expenses net of all reductions | .69% | .70% | .70% | .72% | .73% |
| Net investment income (loss) | 5.33% | 5.66% | 5.73% | 5.81% | 6.00% |
| Supplemental Data | |||||
| Net assets, end of period (in millions) | $3,871 | $4,392 | $4,324 | $4,492 | $4,434 |
| Portfolio turnover rateF | 44%G | 62%H | 51% | 52% | 33% |
A Calculated based on average shares outstanding during the period.
B Amount represents less than $.0005 per share.
C Total returns would have been lower if certain expenses had not been reduced during the applicable periods shown.
D Fees and expenses of any underlying Fidelity Central Funds are not included in the Fund's expense ratio. The Fund indirectly bears its proportionate share of the expenses of any underlying Fidelity Central Funds.
E Expense ratios reflect operating expenses of the class. Expenses before reductions do not reflect amounts reimbursed by the investment adviser or reductions from brokerage service arrangements or reductions from other expense offset arrangements and do not represent the amount paid by the class during periods when reimbursements or reductions occur. Expenses net of fee waivers reflect expenses after reimbursement by the investment adviser but prior to reductions from brokerage service arrangements or other expense offset arrangements. Expenses net of all reductions represent the net expenses paid by the class.
F Amount does not include the portfolio activity of any underlying Fidelity Central Funds.
G Portfolio turnover rate excludes securities received or delivered in-kind.
H The portfolio turnover rate does not include the assets acquired in the merger.
See accompanying notes which are an integral part of the financial statements.
Fidelity High Income Fund Class I
| Years ended April 30, | 2020 | 2019 A |
| Selected Per–Share Data | ||
| Net asset value, beginning of period | $8.83 | $8.56 |
| Income from Investment Operations | ||
| Net investment income (loss)B | .458 | .199 |
| Net realized and unrealized gain (loss) | (.907) | .286 |
| Total from investment operations | (.449) | .485 |
| Distributions from net investment income | (.451) | (.215) |
| Total distributions | (.451) | (.215) |
| Net asset value, end of period | $7.93 | $8.83 |
| Total ReturnC,D | (5.40)% | 5.77% |
| Ratios to Average Net AssetsE,F | ||
| Expenses before reductions | .74% | .78%G |
| Expenses net of fee waivers, if any | .74% | .78%G |
| Expenses net of all reductions | .74% | .78%G |
| Net investment income (loss) | 5.28% | 5.81%G |
| Supplemental Data | ||
| Net assets, end of period (in millions) | $558 | $448 |
| Portfolio turnover rateH | 44%I | 62%J |
A For the period December 4, 2018 (commencement of sale of shares) to April 30, 2019.
B Calculated based on average shares outstanding during the period.
C Total returns for periods of less than one year are not annualized.
D Total returns would have been lower if certain expenses had not been reduced during the applicable periods shown.
E Fees and expenses of any underlying Fidelity Central Funds are not included in the Fund's expense ratio. The Fund indirectly bears its proportionate share of the expenses of any underlying Fidelity Central Funds.
F Expense ratios reflect operating expenses of the class. Expenses before reductions do not reflect amounts reimbursed by the investment adviser or reductions from brokerage service arrangements or reductions from other expense offset arrangements and do not represent the amount paid by the class during periods when reimbursements or reductions occur. Expense ratios before reductions for start-up periods may not be representative of longer-term operating periods. Expenses net of fee waivers reflect expenses after reimbursement by the investment adviser but prior to reductions from brokerage service arrangements or other expense offset arrangements. Expenses net of all reductions represent the net expenses paid by the class.
G Annualized
H Amount does not include the portfolio activity of any underlying Fidelity Central Funds.
I Portfolio turnover rate excludes securities received or delivered in-kind.
J The portfolio turnover rate does not include the assets acquired in the merger.
See accompanying notes which are an integral part of the financial statements.
Fidelity High Income Fund Class Z
| Years ended April 30, | 2020 | 2019 A |
| Selected Per–Share Data | ||
| Net asset value, beginning of period | $8.83 | $8.56 |
| Income from Investment Operations | ||
| Net investment income (loss)B | .464 | .201 |
| Net realized and unrealized gain (loss) | (.904) | .289 |
| Total from investment operations | (.440) | .490 |
| Distributions from net investment income | (.460) | (.220) |
| Total distributions | (.460) | (.220) |
| Net asset value, end of period | $7.93 | $8.83 |
| Total ReturnC,D | (5.30)% | 5.83% |
| Ratios to Average Net AssetsE,F | ||
| Expenses before reductions | .63% | .64%G |
| Expenses net of fee waivers, if any | .63% | .64%G |
| Expenses net of all reductions | .63% | .63%G |
| Net investment income (loss) | 5.39% | 5.85%G |
| Supplemental Data | ||
| Net assets, end of period (in millions) | $61 | $13 |
| Portfolio turnover rateH | 44%I | 62%J |
A For the period December 4, 2018 (commencement of sale of shares) to April 30, 2019.
B Calculated based on average shares outstanding during the period.
C Total returns for periods of less than one year are not annualized.
D Total returns would have been lower if certain expenses had not been reduced during the applicable periods shown.
E Fees and expenses of any underlying Fidelity Central Funds are not included in the Fund's expense ratio. The Fund indirectly bears its proportionate share of the expenses of any underlying Fidelity Central Funds.
F Expense ratios reflect operating expenses of the class. Expenses before reductions do not reflect amounts reimbursed by the investment adviser or reductions from brokerage service arrangements or reductions from other expense offset arrangements and do not represent the amount paid by the class during periods when reimbursements or reductions occur. Expense ratios before reductions for start-up periods may not be representative of longer-term operating periods. Expenses net of fee waivers reflect expenses after reimbursement by the investment adviser but prior to reductions from brokerage service arrangements or other expense offset arrangements. Expenses net of all reductions represent the net expenses paid by the class.
G Annualized
H Amount does not include the portfolio activity of any underlying Fidelity Central Funds.
I Portfolio turnover rate excludes securities received or delivered in-kind.
J The portfolio turnover rate does not include the assets acquired in the merger.
See accompanying notes which are an integral part of the financial statements.
Notes to Financial Statements
For the period ended April 30, 2020
(Amounts in thousands except percentages)
1. Organization.
Fidelity High Income Fund (the Fund) is a fund of Fidelity Summer Street Trust (the Trust) and is authorized to issue an unlimited number of shares. The Trust is registered under the Investment Company Act of 1940, as amended (the 1940 Act), as an open-end management investment company organized as a Massachusetts business trust. The Fund offers Class A, Class M, Class C, Fidelity High Income Fund, Class I and Class Z shares, each of which has equal rights as to assets and voting privileges. Each class has exclusive voting rights with respect to matters that affect that class. Class C shares will automatically convert to Class A shares after a holding period of ten years from the initial date of purchase, with certain exceptions.
Effective January 1, 2020:
Investment advisers Fidelity Investments Money Management, Inc., FMR Co., Inc., and Fidelity SelectCo, LLC, merged with and into Fidelity Management & Research Company. In connection with the merger transactions, the resulting, merged investment adviser was then redomiciled from Massachusetts to Delaware, changed its corporate structure from a corporation to a limited liability company, and changed its name to "Fidelity Management & Research Company LLC".
Broker-dealer Fidelity Distributors Corporation merged with and into Fidelity Investments Institutional Services Company, Inc. ("FIISC"). FIISC was then redomiciled from Massachusetts to Delaware, changed its corporate structure from a corporation to a limited liability company, and changed its name to "Fidelity Distributors Company LLC".
Fidelity Investments Institutional Operations Company, Inc. converted from a Massachusetts corporation to a Massachusetts LLC, and changed its name to "Fidelity Investments Institutional Operations Company LLC".
2. Investments in Fidelity Central Funds.
The Fund invests in Fidelity Central Funds, which are open-end investment companies generally available only to other investment companies and accounts managed by the investment adviser and its affiliates. The Fund's Schedule of Investments lists each of the Fidelity Central Funds held as of period end, if any, as an investment of the Fund, but does not include the underlying holdings of each Fidelity Central Fund. As an Investing Fund, the Fund indirectly bears its proportionate share of the expenses of the underlying Fidelity Central Funds.
The Money Market Central Funds seek preservation of capital and current income and are managed by the investment adviser. Annualized expenses of the Money Market Central Funds as of their most recent shareholder report date ranged from less than .005% to .01%.
A complete unaudited list of holdings for each Fidelity Central Fund is available upon request or at the Securities and Exchange Commission (the SEC) website at www.sec.gov. In addition, the financial statements of the Fidelity Central Funds, which are not covered by the Fund's Report of Independent Registered Public Accounting Firm, are available on the SEC website or upon request.
3. Significant Accounting Policies.
The Fund is an investment company and applies the accounting and reporting guidance of the Financial Accounting Standards Board (FASB) Accounting Standards Codification Topic 946 Financial Services – Investments Companies. The financial statements have been prepared in conformity with accounting principles generally accepted in the United States of America (GAAP), which require management to make certain estimates and assumptions at the date of the financial statements. Actual results could differ from those estimates. Subsequent events, if any, through the date that the financial statements were issued have been evaluated in the preparation of the financial statements. The following summarizes the significant accounting policies of the Fund:
Investment Valuation. Investments are valued as of 4:00 p.m. Eastern time on the last calendar day of the period. The Board of Trustees (the Board) has delegated the day to day responsibility for the valuation of the Fund's investments to the Fair Value Committee (the Committee) established by the Fund's investment adviser. In accordance with valuation policies and procedures approved by the Board, the Fund attempts to obtain prices from one or more third party pricing vendors or brokers to value its investments. When current market prices, quotations or currency exchange rates are not readily available or reliable, investments will be fair valued in good faith by the Committee, in accordance with procedures adopted by the Board. Factors used in determining fair value vary by investment type and may include market or investment specific events, changes in interest rates and credit quality. The frequency with which these procedures are used cannot be predicted and they may be utilized to a significant extent. The Committee oversees the Fund's valuation policies and procedures and reports to the Board on the Committee's activities and fair value determinations. The Board monitors the appropriateness of the procedures used in valuing the Fund's investments and ratifies the fair value determinations of the Committee.
The Fund categorizes the inputs to valuation techniques used to value its investments into a disclosure hierarchy consisting of three levels as shown below:
- Level 1 – quoted prices in active markets for identical investments
- Level 2 – other significant observable inputs (including quoted prices for similar investments, interest rates, prepayment speeds, etc.)
- Level 3 – unobservable inputs (including the Fund's own assumptions based on the best information available)
Valuation techniques used to value the Fund's investments by major category are as follows:
Debt securities, including restricted securities, are valued based on evaluated prices received from third party pricing vendors or from brokers who make markets in such securities. Corporate bonds, bank loan obligations and preferred securities are valued by pricing vendors who utilize matrix pricing which considers yield or price of bonds of comparable quality, coupon, maturity and type or by broker-supplied prices. When independent prices are unavailable or unreliable, debt securities may be valued utilizing pricing methodologies which consider similar factors that would be used by third party pricing vendors. Debt securities are generally categorized as Level 2 in the hierarchy but may be Level 3 depending on the circumstances. The Fund invests a significant portion of its assets in below investment grade securities. The value of these securities can be more volatile due to changes in the credit quality of the issuer and is sensitive to changes in economic, market and regulatory conditions.
Equity securities, including restricted securities, for which market quotations are readily available, are valued at the last reported sale price or official closing price as reported by a third party pricing vendor on the primary market or exchange on which they are traded and are categorized as Level 1 in the hierarchy. In the event there were no sales during the day or closing prices are not available, securities are valued at the last quoted bid price or may be valued using the last available price and are generally categorized as Level 2 in the hierarchy. For foreign equity securities, when market or security specific events arise, comparisons to the valuation of American Depositary Receipts (ADRs), futures contracts, Exchange-Traded Funds (ETFs) and certain indexes as well as quoted prices for similar securities may be used and would be categorized as Level 2 in the hierarchy. For equity securities, including restricted securities, where observable inputs are limited, assumptions about market activity and risk are used and these securities may be categorized as Level 3 in the hierarchy.
Investments in open-end mutual funds, including the Fidelity Central Funds, are valued at their closing net asset value (NAV) each business day and are categorized as Level 1 in the hierarchy.
Changes in valuation techniques may result in transfers in or out of an assigned level within the disclosure hierarchy. The aggregate value of investments by input level as of April 30, 2020 is included at the end of the Fund's Schedule of Investments.
Investment Transactions and Income. For financial reporting purposes, the Fund's investment holdings and NAV include trades executed through the end of the last business day of the period. The NAV per share for processing shareholder transactions is calculated as of the close of business of the New York Stock Exchange (NYSE), normally 4:00 p.m. Eastern time and includes trades executed through the end of the prior business day. Gains and losses on securities sold are determined on the basis of identified cost and include proceeds received from litigation. Dividend income is recorded on the ex-dividend date, except for certain dividends from foreign securities where the ex-dividend date may have passed, which are recorded as soon as the Fund is informed of the ex-dividend date. Non-cash dividends included in dividend income, if any, are recorded at the fair market value of the securities received. Income and capital gain distributions from Fidelity Central Funds, if any, are recorded on the ex-dividend date. Certain distributions received by the Fund represent a return of capital or capital gain. The Fund determines the components of these distributions subsequent to the ex-dividend date, based upon receipt of tax filings or other correspondence relating to the underlying investment. These distributions are recorded as a reduction of cost of investments and/or as a realized gain. Interest income is accrued as earned and includes coupon interest and amortization of premium and accretion of discount on debt securities as applicable. Paid in Kind (PIK) income is recorded at the fair market value of the securities received. Debt obligations may be placed on non-accrual status and related interest income may be reduced by ceasing current accruals and writing off interest receivables when the collection of all or a portion of interest has become doubtful based on consistently applied procedures. A debt obligation is removed from non-accrual status when the issuer resumes interest payments or when collectability of interest is reasonably assured.
Class Allocations and Expenses. Investment income, realized and unrealized capital gains and losses, common expenses of the Fund, and certain fund-level expense reductions, if any, are allocated daily on a pro-rata basis to each class based on the relative net assets of each class to the total net assets of the Fund. Each class differs with respect to transfer agent and distribution and service plan fees incurred. Certain expense reductions may also differ by class. For the reporting period, the allocated portion of income and expenses to each class as a percent of its average net assets may vary due to the timing of recording these transactions in relation to fluctuating net assets of the classes. Expenses directly attributable to a fund are charged to that fund. Expenses attributable to more than one fund are allocated among the respective funds on the basis of relative net assets or other appropriate methods. Expense estimates are accrued in the period to which they relate and adjustments are made when actual amounts are known.
Income Tax Information and Distributions to Shareholders. Each year, the Fund intends to qualify as a regulated investment company under Subchapter M of the Internal Revenue Code, including distributing substantially all of its taxable income and realized gains. As a result, no provision for U.S. Federal income taxes is required. As of April 30, 2020, the Fund did not have any unrecognized tax benefits in the financial statements; nor is the Fund aware of any tax positions for which it is reasonably possible that the total amounts of unrecognized tax benefits will significantly change in the next twelve months. The Fund files a U.S. federal tax return, in addition to state and local tax returns as required. The Fund's federal income tax returns are subject to examination by the Internal Revenue Service (IRS) for a period of three fiscal years after they are filed. State and local tax returns may be subject to examination for an additional fiscal year depending on the jurisdiction.
Distributions are declared and recorded daily and paid monthly from net investment income. Distributions from realized gains, if any, are declared and recorded on the ex-dividend date. Income and capital gain distributions are declared separately for each class. Income and capital gain distributions are determined in accordance with income tax regulations, which may differ from GAAP.
Capital accounts within the financial statements are adjusted for permanent book-tax differences. These adjustments have no impact on net assets or the results of operations. Capital accounts are not adjusted for temporary book-tax differences which will reverse in a subsequent period.
Book-tax differences are primarily due to defaulted bonds, market discount, equity-debt classifications, certain conversion ratio adjustments, redemptions in kind, partnerships, capital loss carryforwards and losses deferred due to wash sales.
As of period end, the cost and unrealized appreciation (depreciation) in securities, and derivatives if applicable, for federal income tax purposes were as follows:
| Gross unrealized appreciation | $91,021 |
| Gross unrealized depreciation | (450,185) |
| Net unrealized appreciation (depreciation) | $(359,164) |
| Tax Cost | $5,046,118 |
The tax-based components of distributable earnings as of period end were as follows:
| Undistributed ordinary income | $6,420 |
| Capital loss carryforward | $(372,424) |
| Net unrealized appreciation (depreciation) on securities and other investments | $(359,164) |
Capital loss carryforwards are only available to offset future capital gains of the Fund to the extent provided by regulations and may be limited. The capital loss carryforward information presented below, including any applicable limitation, is estimated as of fiscal period end and is subject to adjustment.
| No expiration | |
| Short-term | $(99,966) |
| Long-term | (272,458) |
| Total capital loss carryforward | $(372,424) |
Approximately $15,947 of the Fund's realized capital losses and $16,510 of the Fund's unrealized capital losses are subject to limitation. Due to this limitation, the Fund will only be permitted to use approximately $17,403 of those capital losses per year to offset capital gains. These realized and unrealized losses were acquired from Fidelity Advisor High Income Fund when it merged into the Fund in a prior period.
The tax character of distributions paid was as follows:
| April 30, 2020 | April 30, 2019 | |
| Ordinary Income | $266,971 | $ 256,881 |
Restricted Securities (including Private Placements). The Fund may invest in securities that are subject to legal or contractual restrictions on resale. These securities generally may be resold in transactions exempt from registration or to the public if the securities are registered. Disposal of these securities may involve time-consuming negotiations and expense, and prompt sale at an acceptable price may be difficult. Information regarding restricted securities is included at the end of the Fund's Schedule of Investments.
Loans and Other Direct Debt Instruments. The Fund invests in direct debt instruments which are interests in amounts owed to lenders by corporate or other borrowers. These instruments may be in the form of loans, trade claims or other receivables and may include standby financing commitments such as revolving credit facilities that obligate the Fund to supply additional cash to the borrower on demand. Loans may be acquired through assignment or participation. The Fund did not have any unfunded loan commitments, which are contractual obligations for future funding, at period end.
4. Purchases and Sales of Investments.
Purchases and sales of securities, other than short-term securities and in-kind transactions are noted in the table below.
| Purchases ($) | Sales ($) | |
| Fidelity High Income Fund | 2,388,967 | 2,126,064 |
5. Fees and Other Transactions with Affiliates.
Management Fee. Fidelity Management & Research Company LLC (the investment adviser) and its affiliates provide the Fund with investment management related services for which the Fund pays a monthly management fee. The management fee is the sum of an individual fund fee rate that is based on an annual rate of .45% of the Fund's average net assets and an annualized group fee rate that averaged .10% during the period. The group fee rate is based upon the monthly average net assets of a group of registered investment companies with which the investment adviser has management contracts. The group fee rate decreases as assets under management increase and increases as assets under management decrease. For the reporting period, the total annual management fee rate was .55% of the Fund's average net assets.
Distribution and Service Plan Fees. In accordance with Rule 12b-1 of the 1940 Act, the Fund has adopted separate Distribution and Service Plans for each class of shares. Certain classes pay Fidelity Distributors Company LLC (FDC), an affiliate of the investment adviser, separate Distribution and Service Fees, each of which is based on an annual percentage of each class' average net assets. In addition, FDC may pay financial intermediaries for selling shares of the Fund and providing shareholder support services. For the period, the Distribution and Service Fee rates, total fees and amounts retained by FDC were as follows:
| Distribution Fee | Service Fee | Total Fees | Retained by FDC | |
| Class A | -% | .25% | $412 | $9 |
| Class M | -% | .25% | 126 | – |
| Class C | .75% | .25% | 457 | 26 |
| $995 | $35 |
Sales Load. FDC may receive a front-end sales charge of up to 4.00% for selling Class A shares and Class M shares, some of which is paid to financial intermediaries for selling shares of the Fund. Depending on the holding period, FDC may receive contingent deferred sales charges levied on Class A, Class M and Class C redemptions. The deferred sales charges are 1.00% for Class C shares, 1.00% for certain purchases of Class A shares and .25% for certain purchases of Class M shares.
For the period, sales charge amounts retained by FDC were as follows:
| Retained by FDC | |
| Class A | $29 |
| Class M | 6 |
| Class C(a) | 2 |
| $37 |
(a) When Class C shares are initially sold, FDC pays commissions from its own resources to financial intermediaries through which the sales are made.
Transfer Agent Fees. Fidelity Investments Institutional Operations Company LLC (FIIOC), an affiliate of the investment adviser, is the transfer, dividend disbursing and shareholder servicing agent for each class of the Fund. FIIOC receives account fees and asset-based fees that vary according to the account size and type of account of the shareholders of the respective classes of the Fund, except for Class Z. FIIOC receives an asset-based fee of Class Z's average net assets. FIIOC pays for typesetting, printing and mailing of shareholder reports, except proxy statements.
For the period, transfer agent fees for each class were as follows:
| Amount | % of Class-Level Average Net Assets | |
| Class A | $250 | .15 |
| Class M | 82 | .16 |
| Class C | 79 | .17 |
| Fidelity High Income Fund | 4,651 | .11 |
| Class I | 817 | .16 |
| Class Z | 24 | .05 |
| $5,903 |
Accounting Fees. Fidelity Service Company, Inc. (FSC), an affiliate of the investment adviser, maintains the Fund's accounting records. The accounting fee is based on the level of average net assets for each month. For the period, the fees were equivalent to the following annual rates:
| % of Average Net Assets | |
| Fidelity High Income Fund | .02 |
Brokerage Commissions. A portion of portfolio transactions were placed with brokerage firms which are affiliates of the investment adviser. Brokerage commissions are included in net realized gain (loss) and change in net unrealized appreciation (depreciation) in the Statement of Operations. The commissions paid to these affiliated firms were as follows:
| Amount | |
| Fidelity High Income Fund | $ -(a) |
(a) Amount represents less than five hundred dollars.
Interfund Trades. Funds may purchase from or sell securities to other Fidelity Funds under procedures adopted by the Board. The procedures have been designed to ensure these interfund trades are executed in accordance with Rule 17a-7 of the 1940 Act. Interfund trades are included within the respective purchases and sales amounts shown in the Purchases and Sales of Investments note.
Affiliated Redemptions In-Kind. During the period, 12,631 shares of the Fund were redeemed in-kind for investments, including accrued interest, and cash with a value of $112,257. The net realized gain of $4,389 on investments delivered through in-kind redemptions is included in the accompanying Statement of Operations. The amount of the in-kind redemptions is included in share transactions in the accompanying Statement of Changes in Net Assets as well as the Notes to Financial Statements. The Fund recognized no gain or loss for federal income tax purposes.
6. Committed Line of Credit.
Certain Funds participate with other funds managed by the investment adviser or an affiliate in a $4.25 billion credit facility (the "line of credit") to be utilized for temporary or emergency purposes to fund shareholder redemptions or for other short-term liquidity purposes. The participating funds have agreed to pay commitment fees on their pro-rata portion of the line of credit, which are reflected in Miscellaneous expenses on the Statement of Operations, and are as follows:
| Amount | |
| Fidelity High Income Fund | $13 |
During the period, there were no borrowings on this line of credit.
7. Expense Reductions.
Through arrangements with the Fund's custodian, credits realized as a result of certain uninvested cash balances were used to reduce the Fund's expenses. During the period, custodian credits reduced the Fund's expenses by $21.
In addition, during the period the investment adviser or an affiliate reimbursed and/or waived a portion of fund-level operating expenses in the amount of $17.
8. Distributions to Shareholders.
Distributions to shareholders of each class were as follows:
| Year ended April 30, 2020 | Year ended April 30, 2019(a) | |
| Distributions to shareholders | ||
| Class A | $8,150 | $3,743 |
| Class M | 2,479 | 1,162 |
| Class C | 1,908 | 1,257 |
| Fidelity High Income Fund | 225,692 | 240,114 |
| Class I | 26,243 | 10,446 |
| Class Z | 2,499 | 159 |
| Total | $266,971 | $256,881 |
(a) Distributions for Class A, Class M, Class C, Class I and Class Z are for the period December 4, 2018 (commencement of sale of shares) to April 30, 2019.
9. Share Transactions.
Share transactions for each class were as follows and may contain automatic conversions between classes or exchanges between affiliated funds:
| Shares | Shares | Dollars | Dollars | |
| Year ended April 30, 2020 | Year ended April 30, 2019(a) | Year ended April 30, 2020 | Year ended April 30, 2019(a) | |
| Class A | ||||
| Shares sold | 2,794 | 2,457 | $24,364 | $21,373 |
| Issued in exchange for the shares of Fidelity Advisor High Income Fund | – | 18,670 | – | 159,252 |
| Reinvestment of distributions | 830 | 383 | 7,189 | 3,281 |
| Shares redeemed | (4,721) | (2,272) | (40,339) | (19,430) |
| Net increase (decrease) | (1,097) | 19,238 | $(8,786) | $164,476 |
| Class M | ||||
| Shares sold | 929 | 259 | $8,069 | $2,238 |
| Issued in exchange for the shares of Fidelity Advisor High Income Fund | – | 5,803 | – | 49,500 |
| Reinvestment of distributions | 265 | 126 | 2,295 | 1,076 |
| Shares redeemed | (1,745) | (535) | (14,688) | (4,599) |
| Net increase (decrease) | (551) | 5,653 | $(4,324) | $48,215 |
| Class C | ||||
| Shares sold | 495 | 275 | $4,250 | $2,378 |
| Issued in exchange for the shares of Fidelity Advisor High Income Fund | – | 7,719 | – | 65,765 |
| Reinvestment of distributions | 201 | 137 | 1,741 | 1,174 |
| Shares redeemed | (2,003) | (2,258) | (17,129) | (19,621) |
| Net increase (decrease) | (1,307) | 5,873 | $(11,138) | $49,696 |
| Fidelity High Income Fund | ||||
| Shares sold | 164,477 | 126,441 | $1,383,939 | $1,102,580 |
| Reinvestment of distributions | 20,940 | 22,383 | 181,398 | 194,157 |
| Shares redeemed | (194,580)(b) | (140,878) | (1,639,874)(b) | (1,223,927) |
| Net increase (decrease) | (9,163) | 7,946 | $(74,537) | $72,810 |
| Class I | ||||
| Shares sold | 45,132 | 7,919 | $386,113 | $68,533 |
| Issued in exchange for the shares of Fidelity Advisor High Income Fund | – | 48,879 | – | 416,933 |
| Reinvestment of distributions | 2,710 | 1,170 | 23,418 | 10,028 |
| Shares redeemed | (28,148)(b) | (7,255) | (243,683)(b) | (62,518) |
| Net increase (decrease) | 19,694 | 50,713 | $165,848 | $432,976 |
| Class Z | ||||
| Shares sold | 8,794 | 1,483 | $75,919 | $12,847 |
| Issued in exchange for the shares of Fidelity Advisor High Income Fund | – | 222 | – | 1,895 |
| Reinvestment of distributions | 237 | 10 | 2,038 | 87 |
| Shares redeemed | (2,742) | (299) | (23,029) | (2,599) |
| Net increase (decrease) | 6,289 | 1,416 | $54,928 | $12,230 |
(a) Share transactions for Class A, Class M, Class C, Class I and Class Z are for the period December 4, 2018 (commencement of sale of shares) to April 30, 2019
(b) Amount includes in-kind redemptions (see the Affiliated Redemptions In-Kind notes for additional details).
10. Other.
The Fund's organizational documents provide former and current trustees and officers with a limited indemnification against liabilities arising in connection with the performance of their duties to the Fund. In the normal course of business, the Fund may also enter into contracts that provide general indemnifications. The Fund's maximum exposure under these arrangements is unknown as this would be dependent on future claims that may be made against the Fund. The risk of material loss from such claims is considered remote.
11. Prior Fiscal Year Merger Information.
On December 7, 2018, the Fund acquired all of the assets and assumed all of the liabilities of Fidelity Advisor High Income Fund ("Target Fund") pursuant to an Agreement and Plan of Reorganization approved by the Board of Trustees ("The Board"). In addition, the Board approved the creation of additional classes of shares that commenced sale of shares on December 4, 2018. The acquisition was accomplished by an exchange of each class of the Fund for corresponding shares then outstanding of the Target Fund at their respective net asset value on the acquisition date. The reorganization provides shareholders of the Target Fund access to a larger portfolio with a similar investment objective and lower expenses. The reorganization qualified as a tax-free reorganization for federal income tax purposes with no gain or loss recognized to the funds or their shareholders. The Target Fund's net assets of $693,345, including securities of $686,303 and unrealized depreciation of $28,031, was combined with the Fund's net assets of $4,115,643 for total net assets after the acquisition of $4,808,988.
Pro forma results of operations of the combined entity for the entire period ended April 30, 2019, as though the acquisition had occurred as of the beginning of the year (rather than on the actual acquisition date), are as follows:
| Net investment income (loss) | $279,393 |
| Total net realized gain (loss) | (107,293) |
| Total change in net unrealized appreciation (depreciation) | 99,966 |
| Net increase (decrease) in net assets resulting from operations | $272,066 |
Because the combined investment portfolios have been managed as a single portfolio since the acquisition was completed, it is not practicable to separate the amounts of revenue and earnings of the acquired fund that has been included in the Fund's Statement of Operations since December 7, 2018.
12. Litigation.
The Fund and other entities managed by FMR or its affiliates were named as defendants in a lawsuit filed in the United States Bankruptcy Court for the Southern District of New York in 2009. The lawsuit was brought by creditors of Motors Liquidation Company (f/k/a General Motors), which went through Chapter 11 bankruptcy proceedings in 2009, and is captioned Official Committee of Unsecured Creditors of Motors Liquidation Company v. JPMorgan Chase Bank, N.A., et al., Adversary No. 09-00504 (REG). The plaintiffs sought an order that the Fund and other defendants return proceeds received in 2009 in full payment of the principal and interest on General Motors secured debt. The plaintiffs contended that the Fund and the other defendants were not secured creditors at the time of the 2009 payments and, thus, were not entitled to payment in full. In May 2019, the parties reached a settlement that has been approved by the Bankruptcy Court. Under the terms of the settlement, the Fund will not be required to return any of the proceeds received in 2009, and will be entitled to recover a portion of the legal costs incurred in defending the case.
13. Coronavirus (COVID-19) Pandemic.
An outbreak of COVID-19 first detected in China during December 2019 has since spread globally and was declared a pandemic by the World Health Organization during March 2020. Developments that disrupt global economies and financial markets, such as the COVID-19 pandemic, may magnify factors that affect the Fund's performance.
Report of Independent Registered Public Accounting Firm
To the Board of Trustees of Fidelity Summer Street Trust and Shareholders of Fidelity High Income Fund
Opinion on the Financial Statements
We have audited the accompanying statement of assets and liabilities, including the schedule of investments, of Fidelity High Income Fund (one of the funds constituting Fidelity Summer Street Trust, referred to hereafter as the “Fund”) as of April 30, 2020, the related statement of operations for the year ended April 30, 2020, the statement of changes in net assets for each of the two years in the period ended April 30, 2020, including the related notes, and the financial highlights for each of the periods indicated therein (collectively referred to as the “financial statements”). In our opinion, the financial statements present fairly, in all material respects, the financial position of the Fund as of April 30, 2020, the results of its operations for the year then ended, the changes in its net assets for each of the two years in the period ended April 30, 2020 and the financial highlights for each of the periods indicated therein in conformity with accounting principles generally accepted in the United States of America.
Basis for Opinion
These financial statements are the responsibility of the Fund’s management. Our responsibility is to express an opinion on the Fund’s financial statements based on our audits. We are a public accounting firm registered with the Public Company Accounting Oversight Board (United States) (PCAOB) and are required to be independent with respect to the Fund in accordance with the U.S. federal securities laws and the applicable rules and regulations of the Securities and Exchange Commission and the PCAOB.
We conducted our audits of these financial statements in accordance with the standards of the PCAOB. Those standards require that we plan and perform the audit to obtain reasonable assurance about whether the financial statements are free of material misstatement, whether due to error or fraud.
Our audits included performing procedures to assess the risks of material misstatement of the financial statements, whether due to error or fraud, and performing procedures that respond to those risks. Such procedures included examining, on a test basis, evidence regarding the amounts and disclosures in the financial statements. Our audits also included evaluating the accounting principles used and significant estimates made by management, as well as evaluating the overall presentation of the financial statements. Our procedures included confirmation of securities owned as of April 30, 2020 by correspondence with the custodian, issuers of privately offered securities, agent banks and brokers; when replies were not received from brokers, we performed other auditing procedures. We believe that our audits provide a reasonable basis for our opinion.
PricewaterhouseCoopers LLP
Boston, Massachusetts
June 10, 2020
We have served as the auditor of one or more investment companies in the Fidelity group of funds since 1932.
Trustees and Officers
The Trustees, Members of the Advisory Board (if any), and officers of the trust and fund, as applicable, are listed below. The Board of Trustees governs the fund and is responsible for protecting the interests of shareholders. The Trustees are experienced executives who meet periodically throughout the year to oversee the fund's activities, review contractual arrangements with companies that provide services to the fund, oversee management of the risks associated with such activities and contractual arrangements, and review the fund's performance. Except for Bettina Doulton, each of the Trustees oversees 312 funds. Ms. Doulton oversees 210 funds.
The Trustees hold office without limit in time except that (a) any Trustee may resign; (b) any Trustee may be removed by written instrument, signed by at least two-thirds of the number of Trustees prior to such removal; (c) any Trustee who requests to be retired or who has become incapacitated by illness or injury may be retired by written instrument signed by a majority of the other Trustees; and (d) any Trustee may be removed at any special meeting of shareholders by a two-thirds vote of the outstanding voting securities of the trust. Each Trustee who is not an interested person (as defined in the 1940 Act) of the trust and the fund is referred to herein as an Independent Trustee. Each Independent Trustee shall retire not later than the last day of the calendar year in which his or her 75th birthday occurs. The Independent Trustees may waive this mandatory retirement age policy with respect to individual Trustees. Officers and Advisory Board Members hold office without limit in time, except that any officer or Advisory Board Member may resign or may be removed by a vote of a majority of the Trustees at any regular meeting or any special meeting of the Trustees. Except as indicated, each individual has held the office shown or other offices in the same company for the past five years.
The fund's Statement of Additional Information (SAI) includes more information about the Trustees. To request a free copy, call Fidelity at 1-800-544-8544 if you’re an individual investing directly with Fidelity, call 1-800-835-5092 if you’re a plan sponsor or participant with Fidelity as your recordkeeper or call 1-877-208-0098 on institutional accounts or if you’re an advisor or invest through one.
Experience, Skills, Attributes, and Qualifications of the Trustees. The Governance and Nominating Committee has adopted a statement of policy that describes the experience, qualifications, attributes, and skills that are necessary and desirable for potential Independent Trustee candidates (Statement of Policy). The Board believes that each Trustee satisfied at the time he or she was initially elected or appointed a Trustee, and continues to satisfy, the standards contemplated by the Statement of Policy. The Governance and Nominating Committee also engages professional search firms to help identify potential Independent Trustee candidates who have the experience, qualifications, attributes, and skills consistent with the Statement of Policy. From time to time, additional criteria based on the composition and skills of the current Independent Trustees, as well as experience or skills that may be appropriate in light of future changes to board composition, business conditions, and regulatory or other developments, have also been considered by the professional search firms and the Governance and Nominating Committee. In addition, the Board takes into account the Trustees' commitment and participation in Board and committee meetings, as well as their leadership of standing and ad hoc committees throughout their tenure.
In determining that a particular Trustee was and continues to be qualified to serve as a Trustee, the Board has considered a variety of criteria, none of which, in isolation, was controlling. The Board believes that, collectively, the Trustees have balanced and diverse experience, qualifications, attributes, and skills, which allow the Board to operate effectively in governing the fund and protecting the interests of shareholders. Information about the specific experience, skills, attributes, and qualifications of each Trustee, which in each case led to the Board's conclusion that the Trustee should serve (or continue to serve) as a trustee of the fund, is provided below.
Board Structure and Oversight Function. Robert A. Lawrence is an interested person and currently serves as Acting Chairman. The Trustees have determined that an interested Chairman is appropriate and benefits shareholders because an interested Chairman has a personal and professional stake in the quality and continuity of services provided to the fund. Independent Trustees exercise their informed business judgment to appoint an individual of their choosing to serve as Chairman, regardless of whether the Trustee happens to be independent or a member of management. The Independent Trustees have determined that they can act independently and effectively without having an Independent Trustee serve as Chairman and that a key structural component for assuring that they are in a position to do so is for the Independent Trustees to constitute a substantial majority for the Board. The Independent Trustees also regularly meet in executive session. Ned C. Lautenbach and David M. Thomas serve as Co-Lead Independent Trustees and as such each (i) acts as a liaison between the Independent Trustees and management with respect to matters important to the Independent Trustees and (ii) with management prepares agendas for Board meetings.
Fidelity® funds are overseen by different Boards of Trustees. The fund's Board oversees Fidelity's high income and certain equity funds, and other Boards oversee Fidelity's investment-grade bond, money market, asset allocation, and other equity funds. The asset allocation funds may invest in Fidelity® funds overseen by the fund's Board. The use of separate Boards, each with its own committee structure, allows the Trustees of each group of Fidelity® funds to focus on the unique issues of the funds they oversee, including common research, investment, and operational issues. On occasion, the separate Boards establish joint committees to address issues of overlapping consequences for the Fidelity® funds overseen by each Board.
The Trustees operate using a system of committees to facilitate the timely and efficient consideration of all matters of importance to the Trustees, the fund, and fund shareholders and to facilitate compliance with legal and regulatory requirements and oversight of the fund's activities and associated risks. The Board, acting through its committees, has charged FMR and its affiliates with (i) identifying events or circumstances the occurrence of which could have demonstrably adverse effects on the fund's business and/or reputation; (ii) implementing processes and controls to lessen the possibility that such events or circumstances occur or to mitigate the effects of such events or circumstances if they do occur; and (iii) creating and maintaining a system designed to evaluate continuously business and market conditions in order to facilitate the identification and implementation processes described in (i) and (ii) above. Because the day-to-day operations and activities of the fund are carried out by or through FMR, its affiliates, and other service providers, the fund's exposure to risks is mitigated but not eliminated by the processes overseen by the Trustees. While each of the Board's committees has responsibility for overseeing different aspects of the fund's activities, oversight is exercised primarily through the Operations, Audit, and Compliance Committees. Appropriate personnel, including but not limited to the fund's Chief Compliance Officer (CCO), FMR's internal auditor, the independent accountants, the fund's Treasurer and portfolio management personnel, make periodic reports to the Board's committees, as appropriate, including an annual review of Fidelity's risk management program for the Fidelity® funds. The responsibilities of each standing committee, including their oversight responsibilities, are described further under "Standing Committees of the Trustees."
Interested Trustees*:
Correspondence intended for a Trustee who is an interested person may be sent to Fidelity Investments, 245 Summer Street, Boston, Massachusetts 02210.
Name, Year of Birth; Principal Occupations and Other Relevant Experience+
Bettina Doulton (1964)
Year of Election or Appointment: 2020
Trustee
Ms. Doulton also serves as Trustee of other Fidelity® funds. Prior to her retirement, Ms. Doulton served in a variety of positions at Fidelity Investments, including as a managing director of research (2006-2007), portfolio manager to certain Fidelity® funds (1993-2005), equity analyst and portfolio assistant (1990-1993), and research assistant (1987-1990). Ms. Doulton currently owns and operates Phi Builders + Architects and Cellardoor Winery. Previously, Ms. Doulton served as a member of the Board of Brown Capital Management, LLC (2013-2018).
Robert A. Lawrence (1952)
Year of Election or Appointment: 2020
Trustee
Acting Chairman of the Board of Trustees
Mr. Lawrence also serves as Trustee of other funds. Previously, Mr. Lawrence served as a Member of the Advisory Board of certain funds. Prior to his retirement in 2008, Mr. Lawrence served as Vice President of certain Fidelity® funds (2006-2008), Senior Vice President, Head of High Income Division of Fidelity Management & Research Company (investment adviser firm, 2006-2008), and President of Fidelity Strategic Investments (investment adviser firm, 2002-2005).
* Determined to be an “Interested Trustee” by virtue of, among other things, his or her affiliation with the trust or various entities under common control with FMR.
+ The information includes the Trustee's principal occupation during the last five years and other information relating to the experience, attributes, and skills relevant to the Trustee's qualifications to serve as a Trustee, which led to the conclusion that the Trustee should serve as a Trustee for the fund.
Independent Trustees:
Correspondence intended for an Independent Trustee may be sent to Fidelity Investments, P.O. Box 55235, Boston, Massachusetts 02205-5235.
Name, Year of Birth; Principal Occupations and Other Relevant Experience+
Dennis J. Dirks (1948)
Year of Election or Appointment: 2005
Trustee
Mr. Dirks also serves as Trustee of other Fidelity® funds. Prior to his retirement in May 2003, Mr. Dirks served as Chief Operating Officer and as a member of the Board of The Depository Trust & Clearing Corporation (financial markets infrastructure), President, Chief Operating Officer and a member of the Board of The Depository Trust Company (DTC), President and a member of the Board of the National Securities Clearing Corporation (NSCC), Chief Executive Officer and a member of the Board of the Government Securities Clearing Corporation and Chief Executive Officer and a member of the Board of the Mortgage-Backed Securities Clearing Corporation. Mr. Dirks currently serves as a member of the Finance Committee (2016-present) and Board (2017-present) and is Treasurer (2018-present) of the Asolo Repertory Theatre.
Donald F. Donahue (1950)
Year of Election or Appointment: 2018
Trustee
Mr. Donahue also serves as Trustee of other Fidelity® funds. Mr. Donahue serves as President and Chief Executive Officer of Miranda Partners, LLC (risk consulting for the financial services industry, 2012-present). Previously, Mr. Donahue served as Chief Executive Officer (2006-2012), Chief Operating Officer (2003-2006) and Managing Director, Customer Marketing and Development (1999-2003) of The Depository Trust & Clearing Corporation (financial markets infrastructure). Mr. Donahue currently serves as a member (2007-present) and Co-Chairman (2016-present) of the Board of United Way of New York, a member of the Board of NYC Leadership Academy (2012-present) and a member of the Board of Advisors of Ripple Labs, Inc. (financial services, 2015-present). Mr. Donahue previously served as a member of the Advisory Board of certain Fidelity® funds (2015-2018).
Vicki L. Fuller (1957)
Year of Election or Appointment: 2020
Trustee
Ms. Fuller also serves as Trustee of other Fidelity® funds. Previously, Ms. Fuller served as a member of the Advisory Board of certain Fidelity® funds (2018-2020), Chief Investment Officer of the New York State Common Retirement Fund (2012-2018) and held a variety of positions at AllianceBernstein L.P. (global asset management, 1985-2012), including Managing Director (2006-2012) and Senior Vice President and Senior Portfolio Manager (2001-2006). Ms. Fuller currently serves as a member of the Board, Audit Committee and Nominating and Governance Committee of The Williams Companies, Inc. (natural gas infrastructure, 2018-present) and as a member of the Board of Treliant, LLC (consulting, 2019-present).
Patricia L. Kampling (1959)
Year of Election or Appointment: 2020
Trustee
Ms. Kampling also serves as Trustee of other Fidelity® funds. Prior to her retirement, Ms. Kampling served as Chairman of the Board and Chief Executive Officer (2012-2019), President and Chief Operating Officer (2011-2012) and Executive Vice President and Chief Financial Officer (2010-2011) of Alliant Energy Corporation. Ms. Kampling currently serves as a member of the Board, Compensation Committee and Executive Committee and as Chair of the Audit Committee of Briggs & Stratton Corporation (manufacturing, 2011-present) and as a member of the Board, Audit, Finance and Risk Committee and Safety, Environmental, Technology and Operations Committee of American Water Works Company, Inc. (utilities company, 2019-present). In addition, Ms. Kampling currently serves as a member of the Board of the Nature Conservancy, Wisconsin Chapter (2019-present). Previously, Ms. Kampling served as a Member of the Advisory Board of certain Fidelity® funds (2020), a member of the Board of Interstate Power and Light Company (2012-2019) and Wisconsin Power and Light Company (2012-2019) (each a subsidiary of Alliant Energy Corporation) and as a member of the Board and Workforce Development Committee of the Business Roundtable (2018-2019).
Alan J. Lacy (1953)
Year of Election or Appointment: 2008
Trustee
Mr. Lacy also serves as Trustee of other Fidelity® funds. Previously, Mr. Lacy served as Senior Adviser (2007-2014) of Oak Hill Capital Partners, L.P. (private equity), Chief Executive Officer (2005) and Vice Chairman (2005-2006) of Sears Holdings Corporation (retail), Chief Executive Officer and Chairman of the Board of Sears, Roebuck and Co. (retail, 2000-2005), Chairman (2014-2017) and a member of the Board (2010-2017) of Dave & Buster’s Entertainment, Inc. (restaurant and entertainment complexes) and a member of the Board of Bristol-Myers Squibb Company (global pharmaceuticals, 2008-2020). Mr. Lacy currently serves as a Trustee of the California Chapter of The Nature Conservancy (2015-present) and a member of the Board of the Center for Advanced Study in the Behavioral Sciences at Stanford University (2015-present).
Ned C. Lautenbach (1944)
Year of Election or Appointment: 2000
Trustee
Co-Lead Independent Trustee
Mr. Lautenbach also serves as Trustee of other Fidelity® funds. Mr. Lautenbach currently serves as Chair of the Board of Governors, State University System of Florida (2013-present) and is a member of the Council on Foreign Relations (1994-present). He is also a member and has in the past served as Chairman of the Board of Directors of Artis-Naples (2012-present). Previously, Mr. Lautenbach served as a member and then Lead Director of the Board of Directors of Eaton Corporation (diversified industrial, 1997-2016). He was also a Partner at Clayton, Dubilier & Rice, LLC (private equity investment, 1998-2010); as well as Director of Sony Corporation (2006-2007). In addition, Mr. Lautenbach had a 30-year career with IBM (technology company), during which time he served as Senior Vice President and as a member of the Corporate Executive Committee (1968-1998).
Joseph Mauriello (1944)
Year of Election or Appointment: 2008
Trustee
Mr. Mauriello also serves as Trustee of other Fidelity® funds. Prior to his retirement in January 2006, Mr. Mauriello served in numerous senior management positions including Deputy Chairman and Chief Operating Officer (2004-2005), and Vice Chairman of Financial Services (2002-2004) of KPMG LLP US (professional services, 1965-2005). Mr. Mauriello currently serves as a member of the Independent Directors Council Governing Council (2015-present). Previously, Mr. Mauriello served as a member of the Board of XL Group plc. (global insurance and re-insurance, 2006-2018).
Cornelia M. Small (1944)
Year of Election or Appointment: 2005
Trustee
Ms. Small also serves as Trustee of other Fidelity® funds. Previously, Ms. Small served as Chief Investment Officer, Director of Global Equity Investments and a member of Scudder, Stevens & Clark and Scudder Kemper Investments. Ms. Small previously served as a member of the Board (2009-2019) and Chair of the Investment Committee (2010-2019) of the Teagle Foundation and a member of the Investment Committee of the Berkshire Taconic Community Foundation (2008-2019).
Garnett A. Smith (1947)
Year of Election or Appointment: 2018
Trustee
Mr. Smith also serves as Trustee of other Fidelity® funds. Prior to his retirement, Mr. Smith served as Chairman and Chief Executive Officer (1990-1997) and President (1986-1990) of Inbrand Corp. (manufacturer of personal absorbent products). Prior to his employment with Inbrand Corp., he was employed by a retail fabric chain and North Carolina National Bank (now Bank of America). Mr. Smith previously served as a member of the Advisory Board of certain Fidelity® funds (2012-2013).
David M. Thomas (1949)
Year of Election or Appointment: 2008
Trustee
Co-Lead Independent Trustee
Mr. Thomas also serves as Trustee of other Fidelity® funds. Previously, Mr. Thomas served as Executive Chairman (2005-2006) and Chairman and Chief Executive Officer (2000-2005) of IMS Health, Inc. (pharmaceutical and healthcare information solutions). Mr. Thomas currently serves as Non-Executive Chairman of the Board of Fortune Brands Home and Security (home and security products, 2011-present), and a member of the Board (2004-present) and Presiding Director (2013-present) of Interpublic Group of Companies, Inc. (marketing communication).
Susan Tomasky (1953)
Year of Election or Appointment: 2020
Trustee
Ms. Tomasky also serves as Trustee of other Fidelity® funds. Prior to her retirement, Ms. Tomasky served in various executive officer positions at American Electric Power Company, Inc. (1998-2011), including most recently as President of AEP Transmission (2007-2011). Ms. Tomasky currently serves as a member of the Board and Sustainability Committee and as Chair of the Audit Committee of Marathon Petroleum Corporation (2018-present) and as a member of the Board, Corporate Governance Committee and Organization and Compensation Committee and as Chair of the Audit Committee of Public Service Enterprise Group, Inc. (utilities company, 2012-present). In addition, Ms. Tomasky currently serves as a member of the Board of the Columbus Regional Airport Authority (2007-present), as a member of the Board of the Royal Shakespeare Company – America (2009-present), as a member of the Board of the Columbus Association for the Performing Arts (2011-present) and as a member of the Board of Kenyon College (2016-present). Previously, Ms. Tomasky served as a Member of the Advisory Board of certain Fidelity® funds (2020), a member of the Board (2011-2019) and as Lead Independent Director (2015-2018) of Andeavor Corporation (previously Tesoro Corporation) (independent oil refiner and marketer) and as a member of the Board of Summit Midstream Partners LP (energy, 2012-2018).
Michael E. Wiley (1950)
Year of Election or Appointment: 2018
Trustee
Mr. Wiley also serves as Trustee of other Fidelity® funds. Previously, Mr. Wiley served as a member of the Advisory Board of certain Fidelity® funds (2018-2020), Chairman, President and CEO of Baker Hughes, Inc. (oilfield services, 2000-2004). Mr. Wiley also previously served as a member of the Board of Andeavor Corporation (independent oil refiner and marketer, 2005-2018), a member of the Board of Andeavor Logistics LP (natural resources logistics, 2015-2018) and a member of the Board of High Point Resources (exploration and production, 2005-2020).
+ The information includes the Trustee's principal occupation during the last five years and other information relating to the experience, attributes, and skills relevant to the Trustee's qualifications to serve as a Trustee, which led to the conclusion that the Trustee should serve as a Trustee for the fund.
Advisory Board Members and Officers:
Correspondence intended for a Member of the Advisory Board (if any) may be sent to Fidelity Investments, P.O. Box 55235, Boston, Massachusetts 02205-5235. Correspondence intended for an officer or Peter S. Lynch may be sent to Fidelity Investments, 245 Summer Street, Boston, Massachusetts 02210. Officers appear below in alphabetical order.
Name, Year of Birth; Principal Occupation
Peter S. Lynch (1944)
Year of Election or Appointment: 2003
Member of the Advisory Board
Mr. Lynch also serves as a Member of the Advisory Board of other Fidelity® funds. Mr. Lynch is Vice Chairman and a Director of Fidelity Management & Research Company LLC (investment adviser firm). In addition, Mr. Lynch serves as a Trustee of Boston College and as the Chairman of the Inner-City Scholarship Fund. Previously, Mr. Lynch served as Vice Chairman and a Director of FMR Co., Inc. (investment adviser firm) and on the Special Olympics International Board of Directors (1997-2006).
Elizabeth Paige Baumann (1968)
Year of Election or Appointment: 2017
Anti-Money Laundering (AML) Officer
Ms. Baumann also serves as AML Officer of other funds. She is Chief AML Officer (2012-present) and Senior Vice President (2014-present) of FMR LLC (diversified financial services company) and is an employee of Fidelity Investments. Previously, Ms. Baumann served as AML Officer of certain funds (2017-2019), as AML Officer of the funds (2012-2016), and Vice President (2007-2014) and Deputy Anti-Money Laundering Officer (2007-2012) of FMR LLC.
Craig S. Brown (1977)
Year of Election or Appointment: 2019
Assistant Treasurer
Mr. Brown also serves as Assistant Treasurer of other funds. Mr. Brown is an employee of Fidelity Investments (2013-present).
John J. Burke III (1964)
Year of Election or Appointment: 2018
Chief Financial Officer
Mr. Burke also serves as Chief Financial Officer of other funds. Mr. Burke serves as Head of Investment Operations for Fidelity Fund and Investment Operations (2018-present) and is an employee of Fidelity Investments (1998-present). Previously Mr. Burke served as head of Asset Management Investment Operations (2012-2018).
William C. Coffey (1969)
Year of Election or Appointment: 2019
Assistant Secretary
Mr. Coffey also serves as Assistant Secretary of other funds. He is Senior Vice President and Deputy General Counsel of FMR LLC (diversified financial services company, 2010-present), and is an employee of Fidelity Investments. Previously, Mr. Coffey served as Secretary and CLO of certain funds (2018-2019); CLO, Secretary, and Senior Vice President of Fidelity Management & Research Company and FMR Co., Inc. (investment adviser firms, 2018-2019); Secretary of Fidelity SelectCo, LLC and Fidelity Investments Money Management, Inc. (investment adviser firms, 2018-2019); CLO of Fidelity Management & Research (Hong Kong) Limited, FMR Investment Management (UK) Limited, and Fidelity Management & Research (Japan) Limited (investment adviser firms, 2018-2019); and Assistant Secretary of certain funds (2009-2018).
Timothy M. Cohen (1969)
Year of Election or Appointment: 2018
Vice President
Mr. Cohen also serves as Vice President of other funds. Mr. Cohen serves as Co-Head of Equity (2018-present), a Director of Fidelity Management & Research (Japan) Limited (investment adviser firm, 2016-present), and is an employee of Fidelity Investments. Previously, Mr. Cohen served as Executive Vice President of Fidelity SelectCo, LLC (2019), Head of Global Equity Research (2016-2018), Chief Investment Officer - Equity and a Director of Fidelity Management & Research (U.K.) Inc. (investment adviser firm, 2013-2015) and as a Director of Fidelity Management & Research (Hong Kong) Limited (investment adviser firm, 2017).
Jonathan Davis (1968)
Year of Election or Appointment: 2010
Assistant Treasurer
Mr. Davis also serves as Assistant Treasurer of other funds. Mr. Davis serves as Assistant Treasurer of FMR Capital, Inc. (2017-present) and is an employee of Fidelity Investments. Previously, Mr. Davis served as Vice President and Associate General Counsel of FMR LLC (diversified financial services company, 2003-2010).
Laura M. Del Prato (1964)
Year of Election or Appointment: 2018
Assistant Treasurer
Ms. Del Prato also serves as an officer of other funds. Ms. Del Prato is an employee of Fidelity Investments (2017-present). Prior to joining Fidelity Investments, Ms. Del Prato served as a Managing Director and Treasurer of the JPMorgan Mutual Funds (2014-2017). Prior to JPMorgan, Ms. Del Prato served as a partner at Cohen Fund Audit Services (accounting firm, 2012-2013) and KPMG LLP (accounting firm, 2004-2012).
Colm A. Hogan (1973)
Year of Election or Appointment: 2020
Assistant Treasurer
Mr. Hogan also serves as an officer of other funds. Mr. Hogan serves as Assistant Treasurer of FMR Capital, Inc. (2017-present) and is an employee of Fidelity Investments (2005-present). Previously, Mr. Hogan served as Deputy Treasurer of certain Fidelity® funds (2016-2020) and Assistant Treasurer of certain Fidelity® funds (2016-2018).
Pamela R. Holding (1964)
Year of Election or Appointment: 2018
Vice President
Ms. Holding also serves as Vice President of other funds. Ms. Holding serves as Co-Head of Equity (2018-present) and is an employee of Fidelity Investments (2013-present). Previously, Ms. Holding served as Executive Vice President of Fidelity SelectCo, LLC (2019) and as Chief Investment Officer of Fidelity Institutional Asset Management (2013-2018).
Cynthia Lo Bessette (1969)
Year of Election or Appointment: 2019
Secretary and Chief Legal Officer (CLO)
Ms. Lo Bessette also serves as an officer of other funds. Ms. Lo Bessette serves as CLO, Secretary, and Senior Vice President of Fidelity Management & Research Company LLC (investment adviser firm, 2019-present); and CLO of Fidelity Management & Research (Hong Kong) Limited, FMR Investment Management (UK) Limited, and Fidelity Management & Research (Japan) Limited (investment adviser firms, 2019-present). She is a Senior Vice President and Deputy General Counsel of FMR LLC (diversified financial services company, 2019-present), and is an employee of Fidelity Investments. Previously, Ms. Lo Bessette served as CLO, Secretary, and Senior Vice President of FMR Co., Inc. (investment adviser firm, 2019); Secretary of Fidelity SelectCo, LLC and Fidelity Investments Money Management, Inc. (investment adviser firms, 2019). Prior to joining Fidelity Investments, Ms. Lo Bessette was Executive Vice President, General Counsel (2016-2019) and Senior Vice President, Deputy General Counsel (2015-2016) of OppenheimerFunds (investment management company) and Deputy Chief Legal Officer (2013-2015) of Jennison Associates LLC (investment adviser firm).
Chris Maher (1972)
Year of Election or Appointment: 2020
Deputy Treasurer
Mr. Maher also serves as an officer of other funds. Mr. Maher serves as Assistant Treasurer of FMR Capital, Inc. (2017-present), and is an employee of Fidelity Investments (2008-present). Previously, Mr. Maher served as Assistant Treasurer of certain funds (2013-2020); Vice President of Asset Management Compliance (2013), Vice President of the Program Management Group of FMR (investment adviser firm, 2010-2013), and Vice President of Valuation Oversight (2008-2010).
Jason P. Pogorelec (1975)
Year of Election or Appointment: 2020
Chief Compliance Officer
Mr. Pogorelec also serves as an officer of other funds. Mr. Pogorelec serves as Vice President, Associate General Counsel (2010-present) and is an employee of Fidelity Investments (2006-present). Previously, Mr. Pogorelec served as Assistant Secretary of certain Fidelity funds (2015-2020).
Stacie M. Smith (1974)
Year of Election or Appointment: 2016
President and Treasurer
Ms. Smith also serves as an officer of other funds. Ms. Smith serves as Assistant Treasurer of FMR Capital, Inc. (2017-present), is an employee of Fidelity Investments (2009-present), and has served in other fund officer roles. Prior to joining Fidelity Investments, Ms. Smith served as Senior Audit Manager of Ernst & Young LLP (accounting firm, 1996-2009). Previously, Ms. Smith served as Assistant Treasurer (2013-2019) and Deputy Treasurer (2013-2016) of certain Fidelity® funds.
Marc L. Spector (1972)
Year of Election or Appointment: 2016
Assistant Treasurer
Mr. Spector also serves as an officer of other funds. Mr. Spector serves as Assistant Treasurer of FMR Capital, Inc. (2017-present) and is an employee of Fidelity Investments (2016-present). Prior to joining Fidelity Investments, Mr. Spector served as Director at the Siegfried Group (accounting firm, 2013-2016), and prior to Siegfried Group as audit senior manager at Deloitte & Touche LLP (accounting firm, 2005-2013).
Jim Wegmann (1979)
Year of Election or Appointment: 2019
Assistant Treasurer
Mr. Wegmann also serves as Assistant Treasurer of other funds. Mr. Wegmann is an employee of Fidelity Investments (2011-present).
Shareholder Expense Example
As a shareholder of the Fund, you incur two types of costs: (1) transaction costs, including sales charges (loads) on purchase payments or redemption proceeds, and (2) ongoing costs, including management fees, distribution and/or service (12b-1) fees and other Fund expenses. This Example is intended to help you understand your ongoing costs (in dollars) of investing in the Fund and to compare these costs with the ongoing costs of investing in other mutual funds.
The Example is based on an investment of $1,000 invested at the beginning of the period and held for the entire period (November 1, 2019 to April 30, 2020).
Actual Expenses
The first line of the accompanying table for each class of the Fund provides information about actual account values and actual expenses. You may use the information in this line, together with the amount you invested, to estimate the expenses that you paid over the period. Simply divide your account value by $1,000.00 (for example, an $8,600 account value divided by $1,000.00 = 8.6), then multiply the result by the number in the first line for a class of the Fund under the heading entitled "Expenses Paid During Period" to estimate the expenses you paid on your account during this period. In addition, the Fund, as a shareholder in the underlying Fidelity Central Funds, will indirectly bear its pro-rata share of the fees and expenses incurred by the underlying Fidelity Central Funds. These fees and expenses are not included in the Fund's annualized expense ratio used to calculate the expense estimate in the table below.
Hypothetical Example for Comparison Purposes
The second line of the accompanying table for each class of the Fund provides information about hypothetical account values and hypothetical expenses based on a Class' actual expense ratio and an assumed rate of return of 5% per year before expenses, which is not the Class' actual return. The hypothetical account values and expenses may not be used to estimate the actual ending account balance or expenses you paid for the period. You may use this information to compare the ongoing costs of investing in the Fund and other funds. To do so, compare this 5% hypothetical example with the 5% hypothetical examples that appear in the shareholder reports of the other funds. In addition, the Fund, as a shareholder in the underlying Fidelity Central Funds, will indirectly bear its pro-rata share of the fees and expenses incurred by the underlying Fidelity Central Funds. These fees and expenses are not included in the Fund's annualized expense ratio used to calculate the expense estimate in the table below.
Please note that the expenses shown in the table are meant to highlight your ongoing costs only and do not reflect any transaction costs. Therefore, the second line of the table is useful in comparing ongoing costs only, and will not help you determine the relative total costs of owning different funds. In addition, if these transactional costs were included, your costs would have been higher.
| Annualized Expense Ratio-A | Beginning Account Value November 1, 2019 | Ending Account Value April 30, 2020 | Expenses Paid During Period-B November 1, 2019 to April 30, 2020 | |
| Class A | .98% | |||
| Actual | $1,000.00 | $919.40 | $4.68 | |
| Hypothetical-C | $1,000.00 | $1,019.99 | $4.92 | |
| Class M | 1.00% | |||
| Actual | $1,000.00 | $919.40 | $4.77 | |
| Hypothetical-C | $1,000.00 | $1,019.89 | $5.02 | |
| Class C | 1.76% | |||
| Actual | $1,000.00 | $915.90 | $8.38 | |
| Hypothetical-C | $1,000.00 | $1,016.11 | $8.82 | |
| Fidelity High Income Fund | .69% | |||
| Actual | $1,000.00 | $920.80 | $3.30 | |
| Hypothetical-C | $1,000.00 | $1,021.43 | $3.47 | |
| Class I | .74% | |||
| Actual | $1,000.00 | $920.50 | $3.53 | |
| Hypothetical-C | $1,000.00 | $1,021.18 | $3.72 | |
| Class Z | .63% | |||
| Actual | $1,000.00 | $921.00 | $3.01 | |
| Hypothetical-C | $1,000.00 | $1,021.73 | $3.17 |
A Annualized expense ratio reflects expenses net of applicable fee waivers.
B Expenses are equal to each Class' annualized expense ratio, multiplied by the average account value over the period, multiplied by 182/366 (to reflect the one-half year period).
C 5% return per year before expenses
Distributions (Unaudited)
A total of 0.30% of the dividends distributed during the fiscal year was derived from interest on U.S. Government securities which is generally exempt from state income tax.
The fund designates $68,658,977 of distributions paid during the period January 1, 2020 to April 30, 2020 as qualifying to be taxed as interest-related dividends for nonresident alien shareholders.
The fund will notify shareholders in January 2021 of amounts for use in preparing 2020 income tax returns.
Board Approval of Investment Advisory Contracts and Management Fees
Fidelity High Income Fund
Each year, the Board of Trustees, including the Independent Trustees (together, the Board), votes on the renewal of the management contract with Fidelity Management & Research Company LLC (FMR) and the sub-advisory agreements (together, the Advisory Contracts) for the fund. FMR and the sub-advisers are referred to herein as the Investment Advisers. The Board, assisted by the advice of fund counsel and Independent Trustees' counsel, requests and considers a broad range of information relevant to the renewal of the Advisory Contracts throughout the year.Approval of Amended and Restated Advisory Contracts. At its November 2019 meeting, the Board unanimously determined to approve an amended and restated management contract and sub-advisory agreements (Amended and Restated Contracts) for a stub period of January 1, 2020 through January 31, 2020 in connection with a consolidation of certain of Fidelity's advisory businesses. The Board considered that, on or about January 1, 2020, FMR Co., Inc. (FMRC) expected to merge with and into FMR and, after the merger, FMR expected to redomicile as a Delaware limited liability company. The Board also approved the termination of the sub-advisory agreement with FMRC upon the completion of the merger. The Board noted that references to FMR in the Amended and Restated Contracts would be updated to reflect FMR's new form of organization and domicile and considered that the definition of "group assets" for purposes of the fund's group fee would be modified to avoid double-counting assets once the reorganization is complete. The Board also noted Fidelity's assurance that neither the planned consolidation nor the Amended and Restated Contracts will change the investment processes, the level or nature of services provided, the resources and personnel allocated, trading and compliance operations, or any fees paid by the fund.The Board meets regularly and, at each of its meetings, covers an extensive agenda of topics and materials and considers factors that are relevant to its annual consideration of the renewal of the fund's Advisory Contracts, including the services and support provided to the fund and its shareholders. The Board has established various standing committees (Committees), each composed of and chaired by Independent Trustees with varying backgrounds, to which the Board has assigned specific subject matter responsibilities in order to enhance effective decision-making by the Board. The Board, acting directly and through its Committees, requests and receives information concerning the annual consideration of the renewal of the fund's Advisory Contracts. The Board also meets as needed to review matters specifically related to the Board's annual consideration of the renewal of the Advisory Contracts. Members of the Board may also meet with trustees of other Fidelity funds through joint ad hoc committees to discuss certain matters relevant to all of the Fidelity funds.At its January 2020 meeting, the Board unanimously determined to renew the fund's Advisory Contracts. In reaching its determination, the Board considered all factors it believed relevant, including (i) the nature, extent, and quality of the services provided to the fund and its shareholders (including the investment performance of the fund); (ii) the competitiveness of the fund's management fee and total expense ratio relative to peer funds; (iii) the total costs of the services provided by and the profits realized by Fidelity from its relationships with the fund; and (iv) the extent to which, if any, economies of scale exist and are realized as the fund grows, and whether any economies of scale are appropriately shared with fund shareholders.In considering whether to renew the Advisory Contracts for the fund, the Board reached a determination, with the assistance of fund counsel and Independent Trustees' counsel and through the exercise of its business judgment, that the renewal of the Advisory Contracts was in the best interests of the fund and its shareholders and that the compensation payable under the Advisory Contracts was fair and reasonable. The Board's decision to renew the Advisory Contracts was not based on any single factor, but rather was based on a comprehensive consideration of all the information provided to the Board at its meetings throughout the year. The Board, in reaching its determination to renew the Advisory Contracts, was aware that shareholders of the fund have a broad range of investment choices available to them, including a wide choice among funds offered by Fidelity's competitors, and that the fund's shareholders, who have the opportunity to review and weigh the disclosure provided by the fund in its prospectus and other public disclosures, have chosen to invest in this fund, which is part of the Fidelity family of funds.Nature, Extent, and Quality of Services Provided. The Board considered Fidelity's staffing as it relates to the fund, including the backgrounds of investment personnel of Fidelity, and also considered the fund's investment objective, strategies, and related investment philosophy. The Independent Trustees also had discussions with senior management of Fidelity's investment operations and investment groups. The Board considered the structure of the investment personnel compensation program and whether this structure provides appropriate incentives to act in the best interests of the fund. Additionally, the Board considered the portfolio managers' investments, if any, in the funds that they manage.Resources Dedicated to Investment Management and Support Services. The Board and the Fund Oversight and Research Committees reviewed the general qualifications and capabilities of Fidelity's investment staff, including its size, education, experience, and resources, as well as Fidelity's approach to recruiting, training, managing, and compensating investment personnel. The Board noted that Fidelity has continued to increase the resources devoted to non-U.S. offices, including expansion of Fidelity's global investment organization. The Board also noted that Fidelity's analysts have extensive resources, tools and capabilities that allow them to conduct sophisticated quantitative and fundamental analysis, as well as credit analysis of issuers, counterparties and guarantors. Further, the Board considered that Fidelity's investment professionals have sufficient access to global information and data so as to provide competitive investment results over time, and that those professionals also have access to sophisticated tools that permit them to assess portfolio construction and risk and performance attribution characteristics continuously, as well as to transmit new information and research conclusions rapidly around the world. Additionally, in its deliberations, the Board considered Fidelity's trading, risk management, compliance, and technology and operations capabilities and resources, which are integral parts of the investment management process.Shareholder and Administrative Services. The Board considered (i) the nature, extent, quality, and cost of advisory, administrative, and shareholder services performed by the Investment Advisers and their affiliates under the Advisory Contracts and under separate agreements covering transfer agency, pricing and bookkeeping, and securities lending services for the fund; (ii) the nature and extent of the supervision of third party service providers, principally custodians, subcustodians, and pricing vendors; and (iii) the resources devoted to, and the record of compliance with, the fund's compliance policies and procedures. The Board also reviewed the allocation of fund brokerage, including allocations to brokers affiliated with the Investment Advisers, the use of brokerage commissions to pay fund expenses, and the use of "soft" commission dollars to pay for research services.The Board noted that the growth of fund assets over time across the complex allows Fidelity to reinvest in the development of services designed to enhance the value and convenience of the Fidelity funds as investment vehicles. These services include 24-hour access to account information and market information over the Internet and through telephone representatives, investor education materials and asset allocation tools, and the expanded availability of Fidelity Investor Centers.The Board noted that it and the boards of certain other Fidelity funds had formed an ad hoc Committee on Transfer Agency Fees to review the variety of transfer agency fee structures throughout the industry and Fidelity's competitive positioning with respect to industry participants.Investment in a Large Fund Family. The Board considered the benefits to shareholders of investing in a Fidelity fund, including the benefits of investing in a fund that is part of a large family of funds offering a variety of investment disciplines and providing a large variety of mutual fund investor services. The Board noted that Fidelity had taken, or had made recommendations that resulted in the Fidelity funds taking, a number of actions over the previous year that benefited particular funds, including: (i) continuing to dedicate additional resources to Fidelity's investment research process, which includes meetings with management of issuers of securities in which the funds invest, and to the support of the senior management team that oversees asset management; (ii) continuing efforts to enhance Fidelity's global research capabilities; (iii) launching new funds and ETFs with innovative structures, strategies and pricing and making other enhancements to meet client needs; (iv) launching new share classes of existing funds; (v) eliminating purchase minimums and broadening eligibility requirements for certain funds and share classes; (vi) reducing management fees and total expenses for certain target date funds and index funds; (vii) lowering expense caps for certain existing funds and classes, and converting certain voluntary expense caps to contractual caps, to reduce expenses borne by shareholders; (viii) rationalizing product lines and gaining increased efficiencies from fund mergers, liquidations, and share class consolidations; (ix) continuing to develop, acquire and implement systems and technology to improve services to the funds and shareholders, strengthen information security, and increase efficiency; and (x) continuing to implement enhancements to further strengthen Fidelity's product line to increase investors' probability of success in achieving their investment goals, including retirement income goals.Investment Performance. The Board considered whether the fund has operated in accordance with its investment objective, as well as its record of compliance with its investment restrictions and its performance history. The Board noted that there were portfolio management changes for the fund in September 2018 and November 2018. The Board will continue to monitor closely the fund's performance, taking into account the portfolio management changes.The Board took into account discussions that occur at Board meetings throughout the year with representatives of the Investment Advisers about fund investment performance. In this regard the Board noted that as part of regularly scheduled fund reviews and other reports to the Board on fund performance, the Board considers annualized return information for the fund for different time periods, measured against an appropriate securities market index (benchmark index) and a peer group of funds with similar objectives (peer group), if any. In its evaluation of fund investment performance, the Board gave particular attention to information indicating changes in performance of certain Fidelity funds for specific time periods and discussed with the Investment Advisers the reasons for any overperformance or underperformance.In addition to reviewing absolute and relative fund performance, the Independent Trustees periodically consider the appropriateness of fund performance metrics in evaluating the results achieved. In general, the Independent Trustees believe that fund performance should be evaluated based on net performance (after fees and expenses) of both the highest performing and lowest performing fund share classes, where applicable, compared to appropriate benchmark indices, over appropriate time periods that may include full market cycles, and compared to peer groups, as applicable, over the same periods, taking into account relevant factors including the following: general market conditions; issuer-specific information; and fund cash flows and other factors.The Independent Trustees recognize that shareholders evaluate performance on a net basis over their own holding periods, for which one-, three-, and five-year periods are often used as a proxy. For this reason, the performance information reviewed by the Board also included net cumulative total return information for the fund and an appropriate benchmark index and peer group for the most recent one-, three-, and five-year periods ended June 30, 2019, as shown below. Returns are shown compared to the 25th percentile (top of box, 75% beaten) and 75th percentile (bottom of box, 25% beaten) of the peer universe.Fidelity High Income Fund
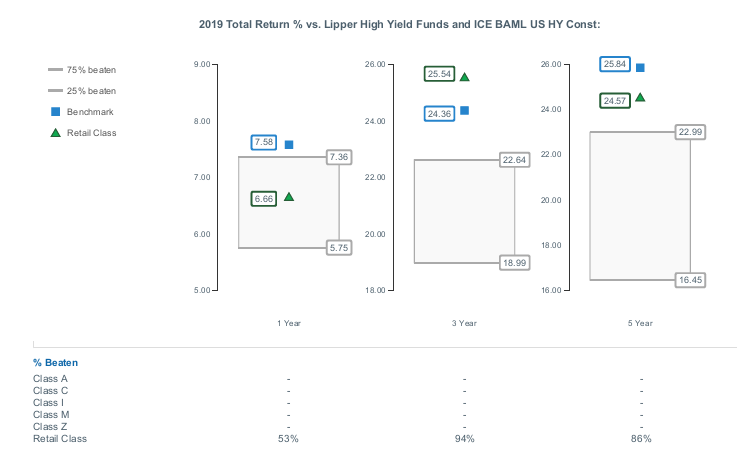
Fidelity High Income Fund
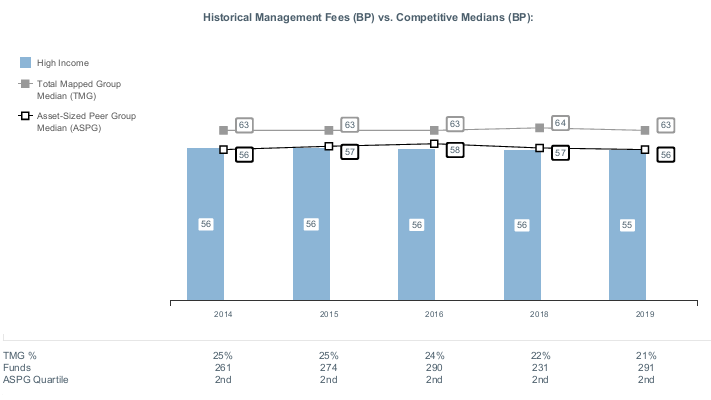
Liquidity Risk Management Program
The Securities and Exchange Commission adopted Rule 22e-4 under the Investment Company Act of 1940 (the Liquidity Rule) to promote effective liquidity risk management throughout the open-end investment company industry, thereby reducing the risk that funds will be unable to meet their redemption obligations and mitigating dilution of the interests of fund shareholders.
The Fund has adopted and implemented a liquidity risk management program pursuant to the Liquidity Rule (the Program) effective December 1, 2018. The Program is reasonably designed to assess and manage the Fund’s liquidity risk and to comply with the requirements of the Liquidity Rule. The Fund’s Board of Trustees (the Board) has designated the Fund’s investment adviser as administrator of the Program. The Fidelity advisers have established a Liquidity Risk Management Committee (the LRM Committee) to manage the Program for each of the Fidelity Funds. The LRM Committee monitors the adequacy and effectiveness of implementation of the Program and on a periodic basis assesses each Fund’s liquidity risk based on a variety of factors including (1) the Fund’s investment strategy, (2) portfolio liquidity and cash flow projections during normal and reasonably foreseeable stressed conditions, (3) shareholder redemptions, (4) borrowings and other funding sources and (5) in the case of exchange-traded funds, certain additional factors including the effect of the Fund’s prices and spreads, market participants, and basket compositions on the overall liquidity of the Fund’s portfolio, as applicable.
In accordance with the Program, each of the Fund’s portfolio investments is classified into one of four liquidity categories described below based on a determination of a reasonable expectation for how long it would take to convert the investment to cash (or sell or dispose of the investment) without significantly changing its market value.
- Highly liquid investments – cash or convertible to cash within three business days or less
- Moderately liquid investments – convertible to cash in three to seven calendar days
- Less liquid investments – can be sold or disposed of, but not settled, within seven calendar days
- Illiquid investments – cannot be sold or disposed of within seven calendar days
Liquidity classification determinations take into account a variety of factors including various market, trading and investment-specific considerations, as well as market depth, and generally utilize analysis from a third-party liquidity metrics service.
The Liquidity Rule places a 15% limit on a fund’s illiquid investments and requires funds that do not primarily hold assets that are highly liquid investments to determine and maintain a minimum percentage of the fund’s net assets to be invested in highly liquid investments (highly liquid investment minimum or HLIM). The Program includes provisions reasonably designed to comply with the 15% limit on illiquid investments and for determining, periodically reviewing and complying with the HLIM requirement as applicable.
At a recent meeting of the Fund’s Board of Trustees, the LRM Committee provided a written report to the Board pertaining to the operation, adequacy, and effectiveness of implementation of the Program for the annual period from December 1, 2018 through November 30, 2019. The report concluded that the Program has been implemented and is operating effectively and is reasonably designed to assess and manage the Fund’s liquidity risk.
![]()
SPH-ANN-0620
1.703464.122
Fidelity® Focused High Income Fund
April 30, 2020
See the inside front cover for important information about access to your fund’s shareholder reports.
Beginning on January 1, 2021, as permitted by regulations adopted by the Securities and Exchange Commission, paper copies of a fund’s shareholder reports will no longer be sent by mail, unless you specifically request paper copies of the reports from the fund or from your financial intermediary, such as a financial advisor, broker-dealer or bank. Instead, the reports will be made available on a website, and you will be notified by mail each time a report is posted and provided with a website link to access the report.
If you already elected to receive shareholder reports electronically, you will not be affected by this change and you need not take any action. You may elect to receive shareholder reports and other communications from a fund electronically, by contacting your financial intermediary. For Fidelity customers, visit Fidelity's web site or call Fidelity using the contact information listed below.
You may elect to receive all future reports in paper free of charge. If you wish to continue receiving paper copies of your shareholder reports, you may contact your financial intermediary or, if you are a Fidelity customer, visit Fidelity’s website, or call Fidelity at the applicable toll-free number listed below. Your election to receive reports in paper will apply to all funds held with the fund complex/your financial intermediary.
| Account Type | Website | Phone Number |
| Brokerage, Mutual Fund, or Annuity Contracts: | fidelity.com/mailpreferences | 1-800-343-3548 |
| Employer Provided Retirement Accounts: | netbenefits.fidelity.com/preferences (choose 'no' under Required Disclosures to continue to print) | 1-800-343-0860 |
| Advisor Sold Accounts Serviced Through Your Financial Intermediary: | Contact Your Financial Intermediary | Your Financial Intermediary's phone number |
| Advisor Sold Accounts Serviced by Fidelity: | institutional.fidelity.com | 1-877-208-0098 |
Contents
Board Approval of Investment Advisory Contracts and Management Fees | |
To view a fund's proxy voting guidelines and proxy voting record for the 12-month period ended June 30, visit http://www.fidelity.com/proxyvotingresults or visit the Securities and Exchange Commission's (SEC) web site at http://www.sec.gov.
You may also call 1-800-544-8544 to request a free copy of the proxy voting guidelines.
Standard & Poor's, S&P and S&P 500 are registered service marks of The McGraw-Hill Companies, Inc. and have been licensed for use by Fidelity Distributors Corporation.
Other third-party marks appearing herein are the property of their respective owners.
All other marks appearing herein are registered or unregistered trademarks or service marks of FMR LLC or an affiliated company. © 2020 FMR LLC. All rights reserved.
This report and the financial statements contained herein are submitted for the general information of the shareholders of the Fund. This report is not authorized for distribution to prospective investors in the Fund unless preceded or accompanied by an effective prospectus.
A fund files its complete schedule of portfolio holdings with the SEC for the first and third quarters of each fiscal year on Form N-PORT. Forms N-PORT are available on the SEC’s web site at http://www.sec.gov. A fund's Forms N-PORT may be reviewed and copied at the SEC’s Public Reference Room in Washington, DC. Information regarding the operation of the SEC's Public Reference Room may be obtained by calling 1-800-SEC-0330.
For a complete list of a fund's portfolio holdings, view the most recent holdings listing, semiannual report, or annual report on Fidelity's web site at http://www.fidelity.com, http://www.institutional.fidelity.com, or http://www.401k.com, as applicable.
NOT FDIC INSURED •MAY LOSE VALUE •NO BANK GUARANTEE
Neither the Fund nor Fidelity Distributors Corporation is a bank.
Note to Shareholders:
Early in 2020, the outbreak and spread of a new coronavirus emerged as a public health emergency that had a major influence on financial markets, primarily based on its impact on the global economy and the outlook for corporate earnings. The virus causes a respiratory disease known as COVID-19. On March 11, the World Health Organization declared the COVID-19 outbreak a pandemic, citing sustained risk of further global spread.
In the weeks following, as the crisis worsened, we witnessed an escalating human tragedy with wide-scale social and economic consequences from coronavirus-containment measures. The outbreak of COVID-19 prompted a number of measures to limit the spread, including travel and border restrictions, quarantines, and restrictions on large gatherings. In turn, these resulted in lower consumer activity, diminished demand for a wide range of products and services, disruption in manufacturing and supply chains, and – given the wide variability in outcomes regarding the outbreak – significant market uncertainty and volatility. Amid the turmoil, the U.S. government took unprecedented action – in concert with the U.S. Federal Reserve and central banks around the world – to help support consumers, businesses, and the broader economy, and to limit disruption to the financial system.
The situation continues to unfold, and the extent and duration of its impact on financial markets and the economy remain highly uncertain. Extreme events such as the coronavirus crisis are “exogenous shocks” that can have significant adverse effects on mutual funds and their investments. Although multiple asset classes may be affected by market disruption, the duration and impact may not be the same for all types of assets.
Fidelity is committed to helping you stay informed amid news about COVID-19 and during increased market volatility, and we’re taking extra steps to be responsive to customer needs. We encourage you to visit our websites, where we offer ongoing updates, commentary, and analysis on the markets and our funds.
Performance: The Bottom Line
Average annual total return reflects the change in the value of an investment, assuming reinvestment of distributions from dividend income and capital gains (the profits earned upon the sale of securities that have grown in value, if any) and assuming a constant rate of performance each year. The hypothetical investment and the average annual total returns do not reflect the deduction of taxes that a shareholder would pay on fund distributions or the redemption of fund shares. During periods of reimbursement by Fidelity, a fund’s total return will be greater than it would be had the reimbursement not occurred. How a fund did yesterday is no guarantee of how it will do tomorrow.
Average Annual Total Returns
| For the periods ended April 30, 2020 | Past 1 year | Past 5 years | Past 10 years |
| Fidelity® Focused High Income Fund | (0.16)% | 3.47% | 5.18% |
$10,000 Over 10 Years
Let's say hypothetically that $10,000 was invested in Fidelity® Focused High Income Fund on April 30, 2010.
The chart shows how the value of your investment would have changed, and also shows how the ICE® BofA® BB US High Yield Constrained Index performed over the same period.

| Period Ending Values | ||
| $16,570 | Fidelity® Focused High Income Fund | |
| $18,267 | ICE® BofA® BB US High Yield Constrained Index | |
Management's Discussion of Fund Performance
Market Recap: U.S. high-yield bonds rode a supportive backdrop into 2020 before giving way amid the early-year global outbreak and spread of the coronavirus. The ICE BofA® US High Yield Constrained Index returned -5.27% for the 12 months ending April 30. Declared a pandemic on March 11, the crisis and containment efforts caused broad contraction in economic activity, plunging oil prices and extreme uncertainty, volatility, and dislocation in financial markets. Following a flat January, high yield returned -1.55% in February, after a surge in COVID-19 cases outside China. The downtrend steepened in March, with the market enduring its fastest sell-off on record and credit spreads widening sharply. The index finished the month down 11.77%, capping its worst quarter since 2008, despite an uptrend in the final week. A historically rapid and expansive U.S. monetary/fiscal-policy response provided a partial offset to the economic disruption. This was evident in April, when the index rose 3.80% on improved coronavirus trends, plans for reopening the economy and progress on potential treatments. Investor sentiment for risk assets waned this period, with fairly wide performance variance based on quality. Among major credit tiers, higher-rated (BB) bonds gained 0.32%, while lower-quality (CCC-C) issues returned -20.79%. By industry, the biggest laggards included energy (-33%) and air transportation (-17%), whereas defensive-oriented groups such as food & drug retail (+11%) and cable/satellite TV (+7%) enjoyed some ballast.Comments from Co-Portfolio Managers Michael Weaver and Alexandre Karam: For the fiscal year, the fund returned -0.16%, roughly in line with the -0.06% result of the benchmark, the ICE BofA® BB US High Yield Constrained Index. The fund’s core high-yield bond subportfolio outpaced the benchmark and contributed to our relative result. The fund's stake in cash, representing about 5% of assets this period, also boosted relative performance. In contrast, a modest non-benchmark allocation to floating-rate bank loans widely trailed the benchmark and therefore slightly hurt relative performance. By industry, security selection in utilities contributed most, followed by overweightings and security selection in diversified financial services and cable/satellite TV. Conversely, our picks in banks & thfifts, air transportation, and energy detracted most. On an individual security basis, it helped that we avoided energy companies and benchmark components Enlink Midstream (-41%) and QEP Resources (-59%). Among fund holdings, our top individual contributor was an outsized stake in JBS (+4%), a major processor of beef, pork and prepared foods. In the cable/satellite TV category, we added value by overweighting Charter Communications (+7%). Turning to notable detractors versus the benchmark, overweighting aircraft-leasing company AerCap (-24%) hurt most, followed by non-benchmark exposure to two underperforming energy names, Crestwood Midstream (-24%) and Summit Midstream (-47%).The views expressed above reflect those of the portfolio manager(s) only through the end of the period as stated on the cover of this report and do not necessarily represent the views of Fidelity or any other person in the Fidelity organization. Any such views are subject to change at any time based upon market or other conditions and Fidelity disclaims any responsibility to update such views. These views may not be relied on as investment advice and, because investment decisions for a Fidelity fund are based on numerous factors, may not be relied on as an indication of trading intent on behalf of any Fidelity fund.
Investment Summary (Unaudited)
Top Five Holdings as of April 30, 2020
| (by issuer, excluding cash equivalents) | % of fund's net assets |
| CCO Holdings LLC/CCO Holdings Capital Corp. | 3.5 |
| Centene Corp. | 3.5 |
| JBS U.S.A. LLC/JBS U.S.A. Finance, Inc. | 2.4 |
| CSC Holdings LLC | 2.3 |
| Icahn Enterprises LP/Icahn Enterprises Finance Corp. | 2.2 |
| 13.9 |
Top Five Market Sectors as of April 30, 2020
| % of fund's net assets | |
| Telecommunications | 13.7 |
| Healthcare | 10.7 |
| Energy | 8.1 |
| Cable/Satellite TV | 7.6 |
| Utilities | 6.9 |
Quality Diversification (% of fund's net assets)
| As of April 30, 2020 | ||
| BBB | 5.3% | |
| BB | 61.1% | |
| B | 25.4% | |
| CCC,CC,C | 0.6% | |
| Not Rated | 0.4% | |
| Short-Term Investments and Net Other Assets | 7.2% | |

We have used ratings from Moody's Investors Service, Inc. Where Moody's® ratings are not available, we have used S&P® ratings. All ratings are as of the date indicated and do not reflect subsequent changes.
Asset Allocation (% of fund's net assets)
| As of April 30, 2020 * | ||
| Nonconvertible Bonds | 88.3% | |
| Convertible Bonds, Preferred Stocks | 0.4% | |
| Bank Loan Obligations | 0.4% | |
| Other Investments | 3.7% | |
| Short-Term Investments and Net Other Assets (Liabilities) | 7.2% | |

* Foreign investments - 21.1%
Schedule of Investments April 30, 2020
Showing Percentage of Net Assets
| Corporate Bonds - 88.7% | |||
| Principal Amount | Value | ||
| Convertible Bonds - 0.4% | |||
| Broadcasting - 0.4% | |||
| DISH Network Corp.: | |||
| 2.375% 3/15/24 | $1,230,000 | $1,034,148 | |
| 3.375% 8/15/26 | 680,000 | 551,208 | |
| 1,585,356 | |||
| Nonconvertible Bonds - 88.3% | |||
| Aerospace - 3.0% | |||
| BBA U.S. Holdings, Inc.: | |||
| 4% 3/1/28 (a) | 1,500,000 | 1,275,000 | |
| 5.375% 5/1/26 (a) | 1,620,000 | 1,494,450 | |
| BWX Technologies, Inc. 5.375% 7/15/26 (a) | 3,000,000 | 3,063,750 | |
| Moog, Inc. 4.25% 12/15/27 (a) | 95,000 | 89,063 | |
| TransDigm, Inc.: | |||
| 6.25% 3/15/26 (a) | 2,815,000 | 2,755,181 | |
| 6.5% 5/15/25 | 165,000 | 147,675 | |
| 7.5% 3/15/27 | 145,000 | 131,994 | |
| 8% 12/15/25 (a) | 1,505,000 | 1,565,200 | |
| 10,522,313 | |||
| Air Transportation - 1.0% | |||
| Aercap Global Aviation Trust 6.5% 6/15/45 (a)(b) | 3,450,000 | 2,518,500 | |
| XPO Logistics, Inc. 6.25% 5/1/25 (a) | 820,000 | 830,250 | |
| 3,348,750 | |||
| Banks & Thrifts - 1.8% | |||
| Ally Financial, Inc.: | |||
| 5.125% 9/30/24 | 770,000 | 796,719 | |
| 5.75% 11/20/25 | 4,735,000 | 4,853,375 | |
| 8% 11/1/31 | 450,000 | 547,506 | |
| 6,197,600 | |||
| Broadcasting - 4.1% | |||
| Netflix, Inc.: | |||
| 3.625% 6/15/25 (a) | 740,000 | 748,325 | |
| 4.375% 11/15/26 | 610,000 | 640,927 | |
| 4.875% 4/15/28 | 535,000 | 568,935 | |
| 5.375% 11/15/29 (a) | 205,000 | 225,152 | |
| 5.875% 11/15/28 | 695,000 | 785,941 | |
| 6.375% 5/15/29 | 3,215,000 | 3,769,266 | |
| Sirius XM Radio, Inc.: | |||
| 4.625% 7/15/24 (a) | 430,000 | 438,428 | |
| 5% 8/1/27 (a) | 2,285,000 | 2,336,984 | |
| 5.375% 7/15/26 (a) | 1,400,000 | 1,452,500 | |
| 5.5% 7/1/29 (a) | 3,000,000 | 3,163,800 | |
| 14,130,258 | |||
| Building Materials - 0.4% | |||
| Advanced Drain Systems, Inc. 5% 9/30/27 (a) | 1,320,000 | 1,296,900 | |
| Cable/Satellite TV - 7.6% | |||
| CCO Holdings LLC/CCO Holdings Capital Corp.: | |||
| 4.5% 8/15/30 (a) | 675,000 | 678,375 | |
| 5% 2/1/28 (a) | 3,055,000 | 3,146,650 | |
| 5.125% 5/1/23 (a) | 1,105,000 | 1,119,155 | |
| 5.125% 5/1/27 (a) | 2,110,000 | 2,190,919 | |
| 5.375% 5/1/25 (a) | 1,000,000 | 1,025,438 | |
| 5.5% 5/1/26 (a) | 2,290,000 | 2,381,852 | |
| 5.875% 5/1/27 (a) | 1,630,000 | 1,697,543 | |
| CSC Holdings LLC: | |||
| 5.375% 7/15/23 (a) | 3,745,000 | 3,787,131 | |
| 5.375% 2/1/28 (a) | 1,500,000 | 1,566,075 | |
| 5.5% 5/15/26 (a) | 1,200,000 | 1,244,880 | |
| 5.5% 4/15/27 (a) | 1,320,000 | 1,372,388 | |
| DISH DBS Corp. 5.875% 11/15/24 | 1,330,000 | 1,279,247 | |
| Virgin Media Secured Finance PLC 5.5% 8/15/26 (a) | 1,460,000 | 1,506,939 | |
| Ziggo Bond Co. BV 6% 1/15/27 (a) | 300,000 | 301,500 | |
| Ziggo BV 5.5% 1/15/27 (a) | 3,010,000 | 3,061,772 | |
| 26,359,864 | |||
| Capital Goods - 1.2% | |||
| AECOM: | |||
| 5.125% 3/15/27 | 2,000,000 | 2,035,000 | |
| 5.875% 10/15/24 | 2,155,000 | 2,279,990 | |
| 4,314,990 | |||
| Chemicals - 2.0% | |||
| Olin Corp.: | |||
| 5% 2/1/30 | 360,000 | 314,352 | |
| 5.125% 9/15/27 | 1,695,000 | 1,548,213 | |
| The Chemours Co. LLC: | |||
| 5.375% 5/15/27 | 1,000,000 | 840,000�� | |
| 7% 5/15/25 | 1,205,000 | 1,132,339 | |
| Valvoline, Inc.: | |||
| 4.25% 2/15/30 (a) | 255,000 | 247,988 | |
| 4.375% 8/15/25 | 1,565,000 | 1,568,913 | |
| W. R. Grace & Co.-Conn. 5.625% 10/1/24 (a) | 1,200,000 | 1,203,000 | |
| 6,854,805 | |||
| Containers - 1.2% | |||
| Ardagh Packaging Finance PLC/Ardagh MP Holdings U.S.A., Inc. 6% 2/15/25 (a) | 850,000 | 850,740 | |
| OI European Group BV 4% 3/15/23 (a) | 1,230,000 | 1,186,950 | |
| Owens-Brockway Glass Container, Inc. 5.375% 1/15/25 (a) | 460,000 | 448,500 | |
| Reynolds Group Issuer, Inc./Reynolds Group Issuer LLC/Reynolds Group Issuer (Luxembourg) SA 5.125% 7/15/23 (a) | 890,000 | 894,450 | |
| Silgan Holdings, Inc. 4.75% 3/15/25 | 810,000 | 822,150 | |
| 4,202,790 | |||
| Diversified Financial Services - 4.3% | |||
| FLY Leasing Ltd. 5.25% 10/15/24 | 3,085,000 | 2,468,000 | |
| Icahn Enterprises LP/Icahn Enterprises Finance Corp.: | |||
| 4.75% 9/15/24 | 3,610,000 | 3,395,277 | |
| 5.25% 5/15/27 | 3,500,000 | 3,325,035 | |
| 6.25% 5/15/26 | 700,000 | 687,834 | |
| Navient Corp.: | |||
| 5.5% 1/25/23 | 835,000 | 774,463 | |
| 6.5% 6/15/22 | 460,000 | 445,050 | |
| 7.25% 1/25/22 | 605,000 | 592,900 | |
| 7.25% 9/25/23 | 1,765,000 | 1,689,988 | |
| Springleaf Finance Corp.: | |||
| 6.875% 3/15/25 | 1,105,000 | 1,044,999 | |
| 7.125% 3/15/26 | 500,000 | 471,250 | |
| 14,894,796 | |||
| Diversified Media - 1.2% | |||
| Nielsen Co. SARL (Luxembourg) 5% 2/1/25 (a) | 2,130,000 | 2,055,450 | |
| Nielsen Finance LLC/Nielsen Finance Co. 5% 4/15/22 (a) | 2,300,000 | 2,265,753 | |
| 4,321,203 | |||
| Energy - 7.6% | |||
| Cheniere Energy Partners LP: | |||
| 5.25% 10/1/25 | 3,165,000 | 3,021,309 | |
| 5.625% 10/1/26 | 1,155,000 | 1,103,718 | |
| Consolidated Energy Finance SA 3 month U.S. LIBOR + 3.750% 4.4905% 6/15/22 (a)(b)(c) | 1,270,000 | 1,054,648 | |
| Crestwood Midstream Partners LP/Crestwood Midstream Finance Corp.: | |||
| 5.75% 4/1/25 | 3,645,000 | 2,624,400 | |
| 6.25% 4/1/23 | 845,000 | 616,850 | |
| CVR Energy, Inc.: | |||
| 5.25% 2/15/25 (a) | 1,200,000 | 984,000 | |
| 5.75% 2/15/28 (a) | 150,000 | 126,827 | |
| DCP Midstream Operating LP 5.375% 7/15/25 | 2,410,000 | 1,952,100 | |
| Denbury Resources, Inc.: | |||
| 7.75% 2/15/24 (a) | 980,000 | 176,400 | |
| 9.25% 3/31/22 (a) | 95,000 | 17,100 | |
| Hess Infrastructure Partners LP 5.625% 2/15/26 (a) | 2,310,000 | 2,148,300 | |
| Hess Midstream Partners LP 5.125% 6/15/28 (a) | 1,070,000 | 937,534 | |
| Hilcorp Energy I LP/Hilcorp Finance Co. 5% 12/1/24 (a) | 695,000 | 392,675 | |
| Holly Energy Partners LP/Holly Finance Corp. 5% 2/1/28 (a) | 1,360,000 | 1,237,192 | |
| Jonah Energy LLC 7.25% 10/15/25 (a) | 750,000 | 13,125 | |
| Sunoco LP/Sunoco Finance Corp.: | |||
| 4.875% 1/15/23 | 50,000 | 48,625 | |
| 5.5% 2/15/26 | 1,010,000 | 974,650 | |
| 5.875% 3/15/28 | 195,000 | 185,250 | |
| 6% 4/15/27 | 25,000 | 24,375 | |
| Targa Resources Partners LP/Targa Resources Partners Finance Corp.: | |||
| 4.25% 11/15/23 | 335,000 | 302,338 | |
| 5.125% 2/1/25 | 780,000 | 702,000 | |
| 5.375% 2/1/27 | 2,245,000 | 1,908,250 | |
| 5.875% 4/15/26 | 1,840,000 | 1,633,000 | |
| 6.75% 3/15/24 | 565,000 | 533,925 | |
| TerraForm Power Operating LLC: | |||
| 4.25% 1/31/23 (a) | 1,205,000 | 1,234,523 | |
| 5% 1/31/28 (a) | 385,000 | 403,880 | |
| Viper Energy Partners LP 5.375% 11/1/27 (a) | 1,500,000 | 1,342,500 | |
| Western Gas Partners LP: | |||
| 4% 7/1/22 | 185,000 | 178,988 | |
| 4.65% 7/1/26 | 70,000 | 61,950 | |
| 5.25% 2/1/50 | 30,000 | 23,625 | |
| 5.3% 3/1/48 | 360,000 | 270,900 | |
| 26,234,957 | |||
| Environmental - 0.3% | |||
| LBC Tank Terminals Holding Netherlands BV 6.875% 5/15/23 (a) | 900,000 | 877,500 | |
| Food/Beverage/Tobacco - 4.3% | |||
| Darling International, Inc. 5.25% 4/15/27 (a) | 170,000 | 171,292 | |
| ESAL GmbH 6.25% 2/5/23 (a) | 415,000 | 411,373 | |
| JBS U.S.A. LLC/JBS U.S.A. Finance, Inc.: | |||
| 5.75% 6/15/25 (a) | 4,315,000 | 4,368,981 | |
| 5.875% 7/15/24 (a) | 2,340,000 | 2,386,800 | |
| 6.75% 2/15/28 (a) | 1,245,000 | 1,333,320 | |
| JBS U.S.A. Lux SA / JBS Food Co.: | |||
| 5.5% 1/15/30 (a) | 825,000 | 835,313 | |
| 6.5% 4/15/29 (a) | 3,890,000 | 4,113,714 | |
| Post Holdings, Inc.: | |||
| 4.625% 4/15/30 (a) | 135,000 | 132,299 | |
| 5% 8/15/26 (a) | 135,000 | 134,494 | |
| 5.625% 1/15/28 (a) | 405,000 | 412,088 | |
| U.S. Foods, Inc. 6.25% 4/15/25 (a) | 650,000 | 664,625 | |
| 14,964,299 | |||
| Gaming - 4.2% | |||
| GLP Capital LP/GLP Financing II, Inc. 5.25% 6/1/25 | 995,000 | 967,737 | |
| MCE Finance Ltd. 4.875% 6/6/25 (a) | 1,225,000 | 1,182,083 | |
| MGM Growth Properties Operating Partnership LP: | |||
| 4.5% 9/1/26 | 3,300,000 | 3,192,750 | |
| 4.5% 1/15/28 | 1,525,000 | 1,433,500 | |
| 5.75% 2/1/27 | 270,000 | 273,375 | |
| MGM Mirage, Inc. 5.75% 6/15/25 | 866,000 | 831,369 | |
| Scientific Games Corp. 5% 10/15/25 (a) | 790,000 | 689,907 | |
| Twin River Worldwide Holdings, Inc. 6.75% 6/1/27 (a) | 900,000 | 715,500 | |
| Wynn Las Vegas LLC/Wynn Las Vegas Capital Corp.: | |||
| 5.25% 5/15/27 (a) | 2,405,000 | 2,054,772 | |
| 5.5% 3/1/25 (a) | 900,000 | 801,000 | |
| Wynn Macau Ltd. 4.875% 10/1/24 (a) | 2,115,000 | 2,035,688 | |
| Wynn Resorts Ltd. 5.125% 10/1/29 (a) | 380,000 | 356,250 | |
| 14,533,931 | |||
| Healthcare - 10.7% | |||
| Centene Corp.: | |||
| 4.25% 12/15/27 (a) | 3,635,000 | 3,803,119 | |
| 5.25% 4/1/25 (a) | 500,000 | 521,250 | |
| 5.375% 6/1/26 (a) | 1,820,000 | 1,928,490 | |
| 5.375% 8/15/26 (a) | 5,205,000 | 5,543,826 | |
| Charles River Laboratories International, Inc.: | |||
| 4.25% 5/1/28 (a) | 90,000 | 90,788 | |
| 5.5% 4/1/26 (a) | 1,675,000 | 1,722,570 | |
| CTR Partnership LP/CareTrust Capital Corp. 5.25% 6/1/25 | 1,195,000 | 1,193,506 | |
| HCA Holdings, Inc. 5.875% 2/15/26 | 1,600,000 | 1,780,000 | |
| Hologic, Inc.: | |||
| 4.375% 10/15/25 (a) | 1,530,000 | 1,537,038 | |
| 4.625% 2/1/28 (a) | 150,000 | 152,250 | |
| IMS Health, Inc.: | |||
| 5% 10/15/26 (a) | 2,250,000 | 2,319,300 | |
| 5% 5/15/27 (a) | 820,000 | 842,296 | |
| MPT Operating Partnership LP/MPT Finance Corp.: | |||
| 5.25% 8/1/26 | 1,455,000 | 1,469,550 | |
| 6.375% 3/1/24 | 880,000 | 908,767 | |
| Service Corp. International 5.125% 6/1/29 | 1,425,000 | 1,482,000 | |
| Teleflex, Inc. 4.875% 6/1/26 | 1,955,000 | 1,984,325 | |
| Tenet Healthcare Corp.: | |||
| 4.625% 7/15/24 | 2,520,000 | 2,486,736 | |
| 4.875% 1/1/26 (a) | 595,000 | 589,229 | |
| 5.125% 5/1/25 | 1,200,000 | 1,122,000 | |
| 6.25% 2/1/27 (a) | 925,000 | 910,755 | |
| 7.5% 4/1/25 (a) | 1,605,000 | 1,726,178 | |
| Valeant Pharmaceuticals International, Inc. 7% 3/15/24 (a) | 3,040,000 | 3,154,578 | |
| 37,268,551 | |||
| Homebuilders/Real Estate - 1.5% | |||
| Howard Hughes Corp. 5.375% 3/15/25 (a) | 1,345,000 | 1,303,762 | |
| Starwood Property Trust, Inc. 4.75% 3/15/25 | 440,000 | 371,800 | |
| VICI Properties, Inc.: | |||
| 3.5% 2/15/25 (a) | 470,000 | 440,625 | |
| 4.25% 12/1/26 (a) | 2,210,000 | 2,065,444 | |
| 4.625% 12/1/29 (a) | 925,000 | 854,469 | |
| 5,036,100 | |||
| Hotels - 0.9% | |||
| Hilton Domestic Operating Co., Inc. 4.25% 9/1/24 | 945,000 | 917,241 | |
| Hilton Worldwide Finance LLC/Hilton Worldwide Finance Corp.: | |||
| 4.625% 4/1/25 | 750,000 | 740,625 | |
| 4.875% 4/1/27 | 445,000 | 431,472 | |
| Wyndham Hotels & Resorts, Inc. 5.375% 4/15/26 (a) | 1,020,000 | 933,300 | |
| 3,022,638 | |||
| Leisure - 0.1% | |||
| Mattel, Inc. 6.75% 12/31/25 (a) | 375,000 | 380,625 | |
| Metals/Mining - 0.8% | |||
| FMG Resources (August 2006) Pty Ltd. 4.5% 9/15/27 (a) | 15,000 | 14,655 | |
| Freeport-McMoRan, Inc.: | |||
| 3.55% 3/1/22 | 248,000 | 249,910 | |
| 4.55% 11/14/24 | 340,000 | 340,850 | |
| Nufarm Australia Ltd. 5.75% 4/30/26 (a) | 2,460,000 | 2,312,400 | |
| 2,917,815 | |||
| Paper - 0.2% | |||
| Berry Global Escrow Corp. 4.875% 7/15/26 (a) | 635,000 | 648,613 | |
| Restaurants - 1.1% | |||
| 1011778 BC Unlimited Liability Co./New Red Finance, Inc.: | |||
| 4.25% 5/15/24 (a) | 1,325,000 | 1,324,589 | |
| 4.375% 1/15/28 (a) | 1,035,000 | 1,000,793 | |
| 5.75% 4/15/25 (a) | 285,000 | 300,675 | |
| KFC Holding Co./Pizza Hut Holding LLC 5% 6/1/24 (a) | 1,300,000 | 1,339,494 | |
| 3,965,551 | |||
| Services - 3.0% | |||
| Aramark Services, Inc.: | |||
| 4.75% 6/1/26 | 2,570,000 | 2,454,350 | |
| 5% 2/1/28 (a) | 1,685,000 | 1,608,248 | |
| 6.375% 5/1/25 (a) | 1,715,000 | 1,783,600 | |
| ASGN, Inc. 4.625% 5/15/28 (a) | 400,000 | 368,880 | |
| CDK Global, Inc.: | |||
| 4.875% 6/1/27 | 2,505,000 | 2,498,738 | |
| 5.25% 5/15/29 (a) | 140,000 | 142,800 | |
| CoreCivic, Inc.: | |||
| 4.625% 5/1/23 | 145,000 | 137,025 | |
| 5% 10/15/22 | 530,000 | 509,277 | |
| GEMS MENASA Cayman Ltd. 7.125% 7/31/26 (a) | 1,030,000 | 945,347 | |
| 10,448,265 | |||
| Super Retail - 0.1% | |||
| The William Carter Co. 5.625% 3/15/27 (a) | 465,000 | 471,398 | |
| Technology - 5.4% | |||
| Entegris, Inc.: | |||
| 4.375% 4/15/28 (a) | 715,000 | 715,894 | |
| 4.625% 2/10/26 (a) | 1,400,000 | 1,403,500 | |
| Fair Isaac Corp. 5.25% 5/15/26 (a) | 1,305,000 | 1,347,413 | |
| Gartner, Inc. 5.125% 4/1/25 (a) | 390,000 | 402,188 | |
| Match Group, Inc. 4.125% 8/1/30 (a) | 265,000 | 257,050 | |
| Nortonlifelock, Inc. 5% 4/15/25 (a) | 4,335,000 | 4,362,094 | |
| Nuance Communications, Inc. 5.625% 12/15/26 | 1,495,000 | 1,567,059 | |
| Open Text Corp. 3.875% 2/15/28 (a) | 655,000 | 638,625 | |
| Qorvo, Inc.: | |||
| 4.375% 10/15/29 (a) | 500,000 | 498,125 | |
| 5.5% 7/15/26 | 1,330,000 | 1,396,500 | |
| Sensata Technologies BV 5% 10/1/25 (a) | 915,000 | 910,059 | |
| SoftBank Group Corp. 5.375% 7/30/22 (Reg. S) | 1,000,000 | 995,200 | |
| SS&C Technologies, Inc. 5.5% 9/30/27 (a) | 2,020,000 | 2,070,500 | |
| TTM Technologies, Inc. 5.625% 10/1/25 (a) | 2,265,000 | 2,165,906 | |
| 18,730,113 | |||
| Telecommunications - 13.4% | |||
| Altice Financing SA: | |||
| 5% 1/15/28 (a) | 340,000 | 331,500 | |
| 7.5% 5/15/26 (a) | 433,000 | 451,403 | |
| C&W Senior Financing Designated Activity Co.: | |||
| 6.875% 9/15/27 (a) | 1,510,000 | 1,491,125 | |
| 7.5% 10/15/26 (a) | 3,575,000 | 3,575,787 | |
| Century Telephone Enterprises, Inc. 6.875% 1/15/28 | 60,000 | 62,100 | |
| CenturyLink, Inc.: | |||
| 5.125% 12/15/26 (a) | 1,725,000 | 1,634,438 | |
| 5.625% 4/1/25 | 640,000 | 640,000 | |
| Equinix, Inc. 5.875% 1/15/26 | 1,625,000 | 1,687,725 | |
| Intelsat Jackson Holdings SA 8% 2/15/24 (a) | 1,470,000 | 1,509,396 | |
| Level 3 Financing, Inc.: | |||
| 4.625% 9/15/27 (a) | 2,900,000 | 2,873,320 | |
| 5.25% 3/15/26 | 1,186,000 | 1,215,650 | |
| 5.375% 5/1/25 | 900,000 | 913,500 | |
| Millicom International Cellular SA: | |||
| 5.125% 1/15/28 (a) | 1,000,000 | 923,125 | |
| 6% 3/15/25 (a) | 1,950,000 | 1,954,290 | |
| 6.625% 10/15/26 (a) | 3,125,000 | 3,187,500 | |
| Neptune Finco Corp.: | |||
| 6.625% 10/15/25 (a) | 1,600,000 | 1,673,360 | |
| 10.875% 10/15/25 (a) | 80,000 | 86,476 | |
| Sable International Finance Ltd. 5.75% 9/7/27 (a) | 2,905,000 | 2,905,000 | |
| SBA Communications Corp. 4.875% 9/1/24 | 1,500,000 | 1,551,810 | |
| SFR Group SA 7.375% 5/1/26 (a) | 1,800,000 | 1,881,000 | |
| Sprint Communications, Inc. 6% 11/15/22 | 1,800,000 | 1,903,698 | |
| T-Mobile U.S.A., Inc.: | |||
| 3.75% 4/15/27 (a) | 2,560,000 | 2,744,397 | |
| 3.875% 4/15/30 (a) | 1,938,000 | 2,119,881 | |
| 4.5% 2/1/26 | 845,000 | 870,604 | |
| 6.375% 3/1/25 | 985,000 | 1,010,856 | |
| Telecom Italia Capital SA: | |||
| 6% 9/30/34 | 295,000 | 305,591 | |
| 6.375% 11/15/33 | 1,165,000 | 1,255,404 | |
| Telecom Italia SpA 5.303% 5/30/24 (a) | 2,540,000 | 2,641,575 | |
| Telenet Finance Luxembourg Notes SARL 5.5% 3/1/28 (a) | 3,200,000 | 3,264,000 | |
| 46,664,511 | |||
| Utilities - 6.9% | |||
| Clearway Energy Operating LLC: | |||
| 4.75% 3/15/28 (a) | 195,000 | 198,413 | |
| 5.75% 10/15/25 | 525,000 | 540,698 | |
| DCP Midstream Operating LP 5.125% 5/15/29 | 1,000,000 | 744,700 | |
| Global Partners LP/GLP Finance Corp. 7% 8/1/27 | 900,000 | 724,320 | |
| InterGen NV 7% 6/30/23 (a) | 1,635,000 | 1,451,063 | |
| NextEra Energy Partners LP: | |||
| 4.25% 9/15/24 (a) | 1,760,000 | 1,786,400 | |
| 4.5% 9/15/27 (a) | 255,000 | 261,694 | |
| NRG Energy, Inc.: | |||
| 5.25% 6/15/29 (a) | 625,000 | 669,531 | |
| 5.75% 1/15/28 | 865,000 | 929,875 | |
| 6.625% 1/15/27 | 2,390,000 | 2,551,325 | |
| NRG Yield Operating LLC 5% 9/15/26 | 1,600,000 | 1,608,000 | |
| NSG Holdings II LLC/NSG Holdings, Inc. 7.75% 12/15/25 (a) | 2,576,945 | 2,596,273 | |
| The AES Corp.: | |||
| 5.5% 4/15/25 | 1,365,000 | 1,399,125 | |
| 6% 5/15/26 | 1,880,000 | 1,965,916 | |
| Vistra Operations Co. LLC: | |||
| 5% 7/31/27 (a) | 3,175,000 | 3,238,183 | |
| 5.5% 9/1/26 (a) | 2,520,000 | 2,594,340 | |
| 5.625% 2/15/27 (a) | 830,000 | 873,575 | |
| 24,133,431 | |||
| TOTAL NONCONVERTIBLE BONDS | 306,742,567 | ||
| TOTAL CORPORATE BONDS | |||
| (Cost $318,228,528) | 308,327,923 | ||
| Bank Loan Obligations - 0.4% | |||
| Energy - 0.1% | |||
| California Resources Corp. Tranche B, term loan 3 month U.S. LIBOR + 4.750% 6.3633% 12/31/22 (b)(c)(d) | 1,290,000 | 283,078 | |
| Telecommunications - 0.3% | |||
| Intelsat Jackson Holdings SA: | |||
| Tranche B, term loan 3 month U.S. LIBOR + 3.750% 5.682% 11/27/23 (b)(c)(d) | 1,175,000 | 1,150,842 | |
| Tranche B-4, term loan 3 month U.S. LIBOR + 4.500% 6.432% 1/2/24 (b)(c)(d) | 100,000 | 98,611 | |
| TOTAL TELECOMMUNICATIONS | 1,249,453 | ||
| TOTAL BANK LOAN OBLIGATIONS | |||
| (Cost $2,394,564) | 1,532,531 | ||
| Preferred Securities - 3.7% | |||
| Banks & Thrifts - 2.6% | |||
| Bank of America Corp.: | |||
| 5.2% (b)(e) | 1,850,000 | 1,837,264 | |
| 6.1% (b)(e) | 1,335,000 | 1,423,189 | |
| 6.5% (b)(e) | 450,000 | 479,889 | |
| Barclays PLC 7.875% (Reg. S) (b)(e) | 890,000 | 889,860 | |
| Citigroup, Inc. 4.7% (b)(e) | 805,000 | 710,645 | |
| JPMorgan Chase & Co. 4.6% (b)(e) | 1,820,000 | 1,655,201 | |
| Wells Fargo & Co. 5.9% (b)(e) | 2,000,000 | 2,074,492 | |
| TOTAL BANKS & THRIFTS | 9,070,540 | ||
| Diversified Financial Services - 0.7% | |||
| AerCap Holdings NV 5.875% 10/10/79 (b) | 3,520,000 | 2,361,468 | |
| Energy - 0.4% | |||
| MPLX LP 6.875% (b)(e) | 1,700,000 | 1,246,739 | |
| TOTAL PREFERRED SECURITIES | |||
| (Cost $14,681,024) | 12,678,747 | ||
| Shares | Value | ||
| Money Market Funds - 6.7% | |||
| Fidelity Cash Central Fund 0.16% (f) | |||
| (Cost $23,269,052) | 23,263,357 | 23,270,336 | |
| TOTAL INVESTMENT IN SECURITIES - 99.5% | |||
| (Cost $358,573,168) | 345,809,537 | ||
| NET OTHER ASSETS (LIABILITIES) - 0.5% | 1,700,088 | ||
| NET ASSETS - 100% | $347,509,625 |
Legend
(a) Security exempt from registration under Rule 144A of the Securities Act of 1933. These securities may be resold in transactions exempt from registration, normally to qualified institutional buyers. At the end of the period, the value of these securities amounted to $198,002,417 or 57.0% of net assets.
(b) Coupon rates for floating and adjustable rate securities reflect the rates in effect at period end.
(c) Coupon is indexed to a floating interest rate which may be multiplied by a specified factor and/or subject to caps or floors.
(d) Remaining maturities of bank loan obligations may be less than the stated maturities shown as a result of contractual or optional prepayments by the borrower. Such prepayments cannot be predicted with certainty.
(e) Security is perpetual in nature with no stated maturity date.
(f) Affiliated fund that is generally available only to investment companies and other accounts managed by Fidelity Investments. The rate quoted is the annualized seven-day yield of the fund at period end. A complete unaudited listing of the fund's holdings as of its most recent quarter end is available upon request. In addition, each Fidelity Central Fund's financial statements, which are not covered by the Fund's Report of Independent Registered Public Accounting Firm, are available on the SEC's website or upon request.
Affiliated Central Funds
Information regarding fiscal year to date income earned by the Fund from investments in Fidelity Central Funds is as follows:
| Fund | Income earned |
| Fidelity Cash Central Fund | $304,843 |
| Total | $304,843 |
Amounts in the income column in the above table include any capital gain distributions from underlying funds, which are presented in the corresponding line-item in the Statement of Operations, if applicable.
Investment Valuation
The following is a summary of the inputs used, as of April 30, 2020, involving the Fund's assets and liabilities carried at fair value. The inputs or methodology used for valuing securities may not be an indication of the risk associated with investing in those securities. For more information on valuation inputs, and their aggregation into the levels used below, please refer to the Investment Valuation section in the accompanying Notes to Financial Statements.
| Valuation Inputs at Reporting Date: | ||||
| Description | Total | Level 1 | Level 2 | Level 3 |
| Investments in Securities: | ||||
| Corporate Bonds | $308,327,923 | $-- | $308,327,923 | $-- |
| Bank Loan Obligations | 1,532,531 | -- | 1,532,531 | -- |
| Preferred Securities | 12,678,747 | -- | 12,678,747 | -- |
| Money Market Funds | 23,270,336 | 23,270,336 | -- | -- |
| Total Investments in Securities: | $345,809,537 | $23,270,336 | $322,539,201 | $-- |
Other Information
Distribution of investments by country or territory of incorporation, as a percentage of Total Net Assets, is as follows (Unaudited):
| United States of America | 78.9% |
| Luxembourg | 5.0% |
| Multi-National | 4.1% |
| Netherlands | 3.0% |
| Cayman Islands | 2.1% |
| Canada | 1.8% |
| Ireland | 1.4% |
| Others (Individually Less Than 1%) | 3.7% |
| 100.0% |
See accompanying notes which are an integral part of the financial statements.
Financial Statements
Statement of Assets and Liabilities
| April 30, 2020 | ||
| Assets | ||
| Investment in securities, at value — See accompanying schedule: Unaffiliated issuers (cost $335,304,116) | $322,539,201 | |
| Fidelity Central Funds (cost $23,269,052) | 23,270,336 | |
| Total Investment in Securities (cost $358,573,168) | $345,809,537 | |
| Cash | 360,973 | |
| Receivable for investments sold | 38,400 | |
| Receivable for fund shares sold | 1,140,601 | |
| Interest receivable | 4,201,095 | |
| Distributions receivable from Fidelity Central Funds | 2,456 | |
| Prepaid expenses | 138 | |
| Other receivables | 100 | |
| Total assets | 351,553,300 | |
| Liabilities | ||
| Payable for investments purchased | $3,456,992 | |
| Payable for fund shares redeemed | 164,388 | |
| Distributions payable | 148,692 | |
| Accrued management fee | 149,006 | |
| Other affiliated payables | 49,542 | |
| Other payables and accrued expenses | 75,055 | |
| Total liabilities | 4,043,675 | |
| Net Assets | $347,509,625 | |
| Net Assets consist of: | ||
| Paid in capital | $372,270,844 | |
| Total accumulated earnings (loss) | (24,761,219) | |
| Net Assets | $347,509,625 | |
| Net Asset Value, offering price and redemption price per share ($347,509,625 ÷ 41,987,374 shares) | $8.28 |
See accompanying notes which are an integral part of the financial statements.
Statement of Operations
| Year ended April 30, 2020 | ||
| Investment Income | ||
| Dividends | $806,641 | |
| Interest | 15,697,996 | |
| Income from Fidelity Central Funds | 304,843 | |
| Total income | 16,809,480 | |
| Expenses | ||
| Management fee | $1,826,966 | |
| Transfer agent fees | 469,177 | |
| Accounting fees and expenses | 137,275 | |
| Custodian fees and expenses | 6,703 | |
| Independent trustees' fees and expenses | 1,907 | |
| Registration fees | 41,439 | |
| Audit | 82,132 | |
| Legal | 399 | |
| Miscellaneous | 6,143 | |
| Total expenses before reductions | 2,572,141 | |
| Expense reductions | (1,925) | |
| Total expenses after reductions | 2,570,216 | |
| Net investment income (loss) | 14,239,264 | |
| Realized and Unrealized Gain (Loss) | ||
| Net realized gain (loss) on: | ||
| Investment securities: | ||
| Unaffiliated issuers | (1,074,054) | |
| Fidelity Central Funds | 161 | |
| Total net realized gain (loss) | (1,073,893) | |
| Change in net unrealized appreciation (depreciation) on: | ||
| Investment securities: | ||
| Unaffiliated issuers | (18,781,702) | |
| Fidelity Central Funds | 1,284 | |
| Total change in net unrealized appreciation (depreciation) | (18,780,418) | |
| Net gain (loss) | (19,854,311) | |
| Net increase (decrease) in net assets resulting from operations | $(5,615,047) |
See accompanying notes which are an integral part of the financial statements.
Statement of Changes in Net Assets
| Year ended April 30, 2020 | Year ended April 30, 2019 | |
| Increase (Decrease) in Net Assets | ||
| Operations | ||
| Net investment income (loss) | $14,239,264 | $15,002,290 |
| Net realized gain (loss) | (1,073,893) | 28,481 |
| Change in net unrealized appreciation (depreciation) | (18,780,418) | 5,646,422 |
| Net increase (decrease) in net assets resulting from operations | (5,615,047) | 20,677,193 |
| Distributions to shareholders | (13,902,230) | (15,270,755) |
| Share transactions | ||
| Proceeds from sales of shares | 215,542,959 | 41,191,306 |
| Reinvestment of distributions | 11,724,346 | 11,912,459 |
| Cost of shares redeemed | (163,021,665) | (153,578,554) |
| Net increase (decrease) in net assets resulting from share transactions | 64,245,640 | (100,474,789) |
| Total increase (decrease) in net assets | 44,728,363 | (95,068,351) |
| Net Assets | ||
| Beginning of period | 302,781,262 | 397,849,613 |
| End of period | $347,509,625 | $302,781,262 |
| Other Information | ||
| Shares | ||
| Sold | 24,818,287 | 4,881,029 |
| Issued in reinvestment of distributions | 1,351,795 | 1,418,128 |
| Redeemed | (19,197,228) | (18,271,518) |
| Net increase (decrease) | 6,972,854 | (11,972,361) |
See accompanying notes which are an integral part of the financial statements.
Financial Highlights
Fidelity Focused High Income Fund
| Years ended April 30, | 2020 | 2019 | 2018 | 2017 | 2016 |
| Selected Per–Share Data | |||||
| Net asset value, beginning of period | $8.65 | $8.47 | $8.67 | $8.22 | $8.73 |
| Income from Investment Operations | |||||
| Net investment income (loss)A | .374 | .399 | .380 | .397 | .396 |
| Net realized and unrealized gain (loss) | (.378) | .190 | (.219) | .423 | (.519) |
| Total from investment operations | (.004) | .589 | .161 | .820 | (.123) |
| Distributions from net investment income | (.366) | (.409) | (.362) | (.373) | (.389) |
| Total distributions | (.366) | (.409) | (.362) | (.373) | (.389) |
| Redemption fees added to paid in capitalA | – | – | .001 | .003 | .002 |
| Net asset value, end of period | $8.28 | $8.65 | $8.47 | $8.67 | $8.22 |
| Total ReturnB | (.16)% | 7.21% | 1.86% | 10.22% | (1.30)% |
| Ratios to Average Net AssetsC,D | |||||
| Expenses before reductions | .78% | .79% | .80% | .83% | .85% |
| Expenses net of fee waivers, if any | .78% | .79% | .80% | .83% | .85% |
| Expenses net of all reductions | .78% | .78% | .79% | .82% | .85% |
| Net investment income (loss) | 4.31% | 4.73% | 4.38% | 4.70% | 4.80% |
| Supplemental Data | |||||
| Net assets, end of period (000 omitted) | $347,510 | $302,781 | $397,850 | $548,971 | $769,732 |
| Portfolio turnover rateE | 43% | 49% | 47% | 51% | 47% |
A Calculated based on average shares outstanding during the period.
B Total returns would have been lower if certain expenses had not been reduced during the applicable periods shown.
C Fees and expenses of any underlying Fidelity Central Funds are not included in the Fund's expense ratio. The Fund indirectly bears its proportionate share of the expenses of any underlying Fidelity Central Funds.
D Expense ratios reflect operating expenses of the Fund. Expenses before reductions do not reflect amounts reimbursed by the investment adviser or reductions from expense offset arrangements and do not represent the amount paid by the Fund during periods when reimbursements or reductions occur. Expenses net of fee waivers reflect expenses after reimbursement by the investment adviser but prior to reductions from expense offset arrangements. Expenses net of all reductions represent the net expenses paid by the Fund.
E Amount does not include the portfolio activity of any underlying Fidelity Central Funds.
See accompanying notes which are an integral part of the financial statements.
Notes to Financial Statements
For the period ended April 30, 2020
1. Organization.
Fidelity Focused High Income Fund (the Fund) is a fund of Fidelity Summer Street Trust (the Trust) and is authorized to issue an unlimited number of shares. Share transactions on the Statement of Changes in Net Assets may contain exchanges between affiliated funds. The Trust is registered under the Investment Company Act of 1940, as amended (the 1940 Act), as an open-end management investment company organized as a Massachusetts business trust.
Effective January 1, 2020:
Investment advisers Fidelity Investments Money Management, Inc., FMR Co., Inc., and Fidelity SelectCo, LLC, merged with and into Fidelity Management & Research Company. In connection with the merger transactions, the resulting, merged investment adviser was then redomiciled from Massachusetts to Delaware, changed its corporate structure from a corporation to a limited liability company, and changed its name to "Fidelity Management & Research Company LLC".
Fidelity Investments Institutional Operations Company, Inc. converted from a Massachusetts corporation to a Massachusetts LLC, and changed its name to "Fidelity Investments Institutional Operations Company LLC".
2. Investments in Fidelity Central Funds.
The Fund invests in Fidelity Central Funds, which are open-end investment companies generally available only to other investment companies and accounts managed by the investment adviser and its affiliates. The Fund's Schedule of Investments lists each of the Fidelity Central Funds held as of period end, if any, as an investment of the Fund, but does not include the underlying holdings of each Fidelity Central Fund. As an Investing Fund, the Fund indirectly bears its proportionate share of the expenses of the underlying Fidelity Central Funds.
The Money Market Central Funds seek preservation of capital and current income and are managed by the investment adviser. Annualized expenses of the Money Market Central Funds as of their most recent shareholder report date ranged from less than .005% to .01%.
A complete unaudited list of holdings for each Fidelity Central Fund is available upon request or at the Securities and Exchange Commission (the SEC) website at www.sec.gov. In addition, the financial statements of the Fidelity Central Funds, which are not covered by the Fund's Report of Independent Registered Public Accounting Firm, are available on the SEC website or upon request.
3. Significant Accounting Policies.
The Fund is an investment company and applies the accounting and reporting guidance of the Financial Accounting Standards Board (FASB) Accounting Standards Codification Topic 946 Financial Services – Investments Companies. The financial statements have been prepared in conformity with accounting principles generally accepted in the United States of America (GAAP), which require management to make certain estimates and assumptions at the date of the financial statements. Actual results could differ from those estimates. Subsequent events, if any, through the date that the financial statements were issued have been evaluated in the preparation of the financial statements. The following summarizes the significant accounting policies of the Fund:
Investment Valuation. Investments are valued as of 4:00 p.m. Eastern time on the last calendar day of the period. The Board of Trustees (the Board) has delegated the day to day responsibility for the valuation of the Fund's investments to the Fair Value Committee (the Committee) established by the Fund's investment adviser. In accordance with valuation policies and procedures approved by the Board, the Fund attempts to obtain prices from one or more third party pricing vendors or brokers to value its investments. When current market prices, quotations or currency exchange rates are not readily available or reliable, investments will be fair valued in good faith by the Committee, in accordance with procedures adopted by the Board. Factors used in determining fair value vary by investment type and may include market or investment specific events, changes in interest rates and credit quality. The frequency with which these procedures are used cannot be predicted and they may be utilized to a significant extent. The Committee oversees the Fund's valuation policies and procedures and reports to the Board on the Committee's activities and fair value determinations. The Board monitors the appropriateness of the procedures used in valuing the Fund's investments and ratifies the fair value determinations of the Committee.
The Fund categorizes the inputs to valuation techniques used to value its investments into a disclosure hierarchy consisting of three levels as shown below:
- Level 1 – quoted prices in active markets for identical investments
- Level 2 – other significant observable inputs (including quoted prices for similar investments, interest rates, prepayment speeds, etc.)
- Level 3 – unobservable inputs (including the Fund's own assumptions based on the best information available)
Valuation techniques used to value the Fund's investments by major category are as follows:
Debt securities, including restricted securities, are valued based on evaluated prices received from third party pricing vendors or from brokers who make markets in such securities. Corporate bonds, bank loan obligations and preferred securities are valued by pricing vendors who utilize matrix pricing which considers yield or price of bonds of comparable quality, coupon, maturity and type or by broker-supplied prices. When independent prices are unavailable or unreliable, debt securities may be valued utilizing pricing methodologies which consider similar factors that would be used by third party pricing vendors. Debt securities are generally categorized as Level 2 in the hierarchy but may be Level 3 depending on the circumstances. The Fund invests a significant portion of its assets in below investment grade securities. The value of these securities can be more volatile due to changes in the credit quality of the issuer and is sensitive to changes in economic, market and regulatory conditions.
Investments in open-end mutual funds, including the Fidelity Central Funds, are valued at their closing net asset value (NAV) each business day and are categorized as Level 1 in the hierarchy.
Changes in valuation techniques may result in transfers in or out of an assigned level within the disclosure hierarchy. The aggregate value of investments by input level as of April 30, 2020 is included at the end of the Fund's Schedule of Investments.
Investment Transactions and Income. For financial reporting purposes, the Fund's investment holdings and NAV include trades executed through the end of the last business day of the period. The NAV per share for processing shareholder transactions is calculated as of the close of business of the New York Stock Exchange (NYSE), normally 4:00 p.m. Eastern time and includes trades executed through the end of the prior business day. Gains and losses on securities sold are determined on the basis of identified cost and include proceeds received from litigation. Dividend income is recorded on the ex-dividend date. Income and capital gain distributions from Fidelity Central Funds, if any, are recorded on the ex-dividend date. Interest income is accrued as earned and includes coupon interest and amortization of premium and accretion of discount on debt securities as applicable. Debt obligations may be placed on non-accrual status and related interest income may be reduced by ceasing current accruals and writing off interest receivables when the collection of all or a portion of interest has become doubtful based on consistently applied procedures. A debt obligation is removed from non-accrual status when the issuer resumes interest payments or when collectability of interest is reasonably assured.
Expenses. Expenses directly attributable to a fund are charged to that fund. Expenses attributable to more than one fund are allocated among the respective funds on the basis of relative net assets or other appropriate methods. Expense estimates are accrued in the period to which they relate and adjustments are made when actual amounts are known.
Income Tax Information and Distributions to Shareholders. Each year, the Fund intends to qualify as a regulated investment company under Subchapter M of the Internal Revenue Code, including distributing substantially all of its taxable income and realized gains. As a result, no provision for U.S. Federal income taxes is required. As of April 30, 2020, the Fund did not have any unrecognized tax benefits in the financial statements; nor is the Fund aware of any tax positions for which it is reasonably possible that the total amounts of unrecognized tax benefits will significantly change in the next twelve months. The Fund files a U.S. federal tax return, in addition to state and local tax returns as required. The Fund's federal income tax returns are subject to examination by the Internal Revenue Service (IRS) for a period of three fiscal years after they are filed. State and local tax returns may be subject to examination for an additional fiscal year depending on the jurisdiction.
Distributions are declared and recorded daily and paid monthly from net investment income. Distributions from realized gains, if any, are declared and recorded on the ex-dividend date. Income and capital gain distributions are determined in accordance with income tax regulations, which may differ from GAAP.
Capital accounts within the financial statements are adjusted for permanent book-tax differences. These adjustments have no impact on net assets or the results of operations. Capital accounts are not adjusted for temporary book-tax differences which will reverse in a subsequent period.
Book-tax differences are primarily due to market discount, partnerships, capital loss carryforwards and losses deferred due to wash sales.
As of period end, the cost and unrealized appreciation (depreciation) in securities, and derivatives if applicable, for federal income tax purposes were as follows:
| Gross unrealized appreciation | $4,822,499 |
| Gross unrealized depreciation | (17,036,909) |
| Net unrealized appreciation (depreciation) | $(12,214,410) |
| Tax Cost | $358,023,947 |
The tax-based components of distributable earnings as of period end were as follows:
| Undistributed ordinary income | $375,778 |
| Capital loss carryforward | $(12,922,587) |
| Net unrealized appreciation (depreciation) on securities and other investments | $(12,214,410) |
Capital loss carryforwards are only available to offset future capital gains of the Fund to the extent provided by regulations and may be limited. The capital loss carryforward information presented below, including any applicable limitation, is estimated as of fiscal period end and is subject to adjustment.
| No expiration | |
| Short-term | $(12,922,587) |
The tax character of distributions paid was as follows:
| April 30, 2020 | April 30, 2019 | |
| Ordinary Income | $13,902,230 | $ 15,270,755 |
Restricted Securities (including Private Placements). The Fund may invest in securities that are subject to legal or contractual restrictions on resale. These securities generally may be resold in transactions exempt from registration or to the public if the securities are registered. Disposal of these securities may involve time-consuming negotiations and expense, and prompt sale at an acceptable price may be difficult. Information regarding restricted securities is included at the end of the Fund's Schedule of Investments.
Loans and Other Direct Debt Instruments. The Fund invests in direct debt instruments which are interests in amounts owed to lenders by corporate or other borrowers. These instruments may be in the form of loans, trade claims or other receivables and may include standby financing commitments such as revolving credit facilities that obligate the Fund to supply additional cash to the borrower on demand. Loans may be acquired through assignment or participation. The Fund did not have any unfunded loan commitments, which are contractual obligations for future funding, at period end
4. Purchases and Sales of Investments.
Purchases and sales of securities, other than short-term securities, are noted in the table below.
| Purchases ($) | Sales ($) | |
| Fidelity Focused High Income Fund | 193,775,655 | 134,764,683 |
5. Fees and Other Transactions with Affiliates.
Management Fee. Fidelity Management & Research Company LLC (the investment adviser) and its affiliates provide the Fund with investment management related services for which the Fund pays a monthly management fee. The management fee is the sum of an individual fund fee rate that is based on an annual rate of .45% of the Fund's average net assets and an annualized group fee rate that averaged .10% during the period. The group fee rate is based upon the monthly average net assets of a group of registered investment companies with which the investment adviser has management contracts. The group fee rate decreases as assets under management increase and increases as assets under management decrease. For the reporting period, the total annual management fee rate was .55% of the Fund's average net assets.
Transfer Agent Fees. Fidelity Investments Institutional Operations Company LLC (FIIOC), an affiliate of the investment adviser, is the Fund's transfer, dividend disbursing and shareholder servicing agent. FIIOC receives account fees and asset-based fees that vary according to account size and type of account. FIIOC pays for typesetting, printing and mailing of shareholder reports, except proxy statements. For the period, the transfer agent fees were equivalent to an annual rate of .14% of average net assets.
Accounting Fees. Fidelity Service Company, Inc. (FSC), an affiliate of the investment adviser, maintains the Fund's accounting records. The accounting fee is based on the level of average net assets for each month. For the period, the fees were equivalent to the following annual rates:
| % of Average Net Assets | |
| Fidelity Focused High Income Fund | .04 |
Interfund Trades. Funds may purchase from or sell securities to other Fidelity Funds under procedures adopted by the Board. The procedures have been designed to ensure these interfund trades are executed in accordance with Rule 17a-7 of the 1940 Act. Interfund trades are included within the respective purchases and sales amounts shown in the Purchases and Sales of Investments note.
6. Committed Line of Credit.
Certain Funds participate with other funds managed by the investment adviser or an affiliate in a $4.25 billion credit facility (the "line of credit") to be utilized for temporary or emergency purposes to fund shareholder redemptions or for other short-term liquidity purposes. The participating funds have agreed to pay commitment fees on their pro-rata portion of the line of credit, which are reflected in Miscellaneous expenses on the Statement of Operations, and are as follows:
| Amount | |
| Fidelity Focused High Income Fund | $810 |
During the period, there were no borrowings on this line of credit.
7. Expense Reductions.
Through arrangements with the Fund's custodian, credits realized as a result of certain uninvested cash balances were used to reduce the Fund's expenses by $847.
In addition, during the period the investment adviser or an affiliate reimbursed and/or waived a portion of operating expenses in the amount of $1,078.
8. Other.
The Fund's organizational documents provide former and current trustees and officers with a limited indemnification against liabilities arising in connection with the performance of their duties to the Fund. In the normal course of business, the Fund may also enter into contracts that provide general indemnifications. The Fund's maximum exposure under these arrangements is unknown as this would be dependent on future claims that may be made against the Fund. The risk of material loss from such claims is considered remote.
9. Coronavirus (COVID-19) Pandemic.
An outbreak of COVID-19 first detected in China during December 2019 has since spread globally and was declared a pandemic by the World Health Organization during March 2020. Developments that disrupt global economies and financial markets, such as the COVID-19 pandemic, may magnify factors that affect the Fund's performance.
Report of Independent Registered Public Accounting Firm
To the Board of Trustees of Fidelity Summer Street Trust and Shareholders of Fidelity Focused High Income Fund
Opinion on the Financial Statements
We have audited the accompanying statement of assets and liabilities, including the schedule of investments, of Fidelity Focused High Income Fund (one of the funds constituting Fidelity Summer Street Trust, referred to hereafter as the “Fund”) as of April 30, 2020, the related statement of operations for the year ended April 30, 2020, the statement of changes in net assets for each of the two years in the period ended April 30, 2020, including the related notes, and the financial highlights for each of the five years in the period ended April 30, 2020 (collectively referred to as the “financial statements”). In our opinion, the financial statements present fairly, in all material respects, the financial position of the Fund as of April 30, 2020, the results of its operations for the year then ended, the changes in its net assets for each of the two years in the period ended April 30, 2020 and the financial highlights for each of the five years in the period ended April 30, 2020 in conformity with accounting principles generally accepted in the United States of America.
Basis for Opinion
These financial statements are the responsibility of the Fund’s management. Our responsibility is to express an opinion on the Fund’s financial statements based on our audits. We are a public accounting firm registered with the Public Company Accounting Oversight Board (United States) (PCAOB) and are required to be independent with respect to the Fund in accordance with the U.S. federal securities laws and the applicable rules and regulations of the Securities and Exchange Commission and the PCAOB.
We conducted our audits of these financial statements in accordance with the standards of the PCAOB. Those standards require that we plan and perform the audit to obtain reasonable assurance about whether the financial statements are free of material misstatement, whether due to error or fraud.
Our audits included performing procedures to assess the risks of material misstatement of the financial statements, whether due to error or fraud, and performing procedures that respond to those risks. Such procedures included examining, on a test basis, evidence regarding the amounts and disclosures in the financial statements. Our audits also included evaluating the accounting principles used and significant estimates made by management, as well as evaluating the overall presentation of the financial statements. Our procedures included confirmation of securities owned as of April 30, 2020 by correspondence with the custodian and brokers; when replies were not received from brokers, we performed other auditing procedures. We believe that our audits provide a reasonable basis for our opinion.
PricewaterhouseCoopers LLP
Boston, Massachusetts
June 10, 2020
We have served as the auditor of one or more investment companies in the Fidelity group of funds since 1932.
Trustees and Officers
The Trustees, Members of the Advisory Board (if any), and officers of the trust and fund, as applicable, are listed below. The Board of Trustees governs the fund and is responsible for protecting the interests of shareholders. The Trustees are experienced executives who meet periodically throughout the year to oversee the fund's activities, review contractual arrangements with companies that provide services to the fund, oversee management of the risks associated with such activities and contractual arrangements, and review the fund's performance. Except for Bettina Doulton, each of the Trustees oversees 312 funds. Ms. Doulton oversees 210 funds.
The Trustees hold office without limit in time except that (a) any Trustee may resign; (b) any Trustee may be removed by written instrument, signed by at least two-thirds of the number of Trustees prior to such removal; (c) any Trustee who requests to be retired or who has become incapacitated by illness or injury may be retired by written instrument signed by a majority of the other Trustees; and (d) any Trustee may be removed at any special meeting of shareholders by a two-thirds vote of the outstanding voting securities of the trust. Each Trustee who is not an interested person (as defined in the 1940 Act) of the trust and the fund is referred to herein as an Independent Trustee. Each Independent Trustee shall retire not later than the last day of the calendar year in which his or her 75th birthday occurs. The Independent Trustees may waive this mandatory retirement age policy with respect to individual Trustees. Officers and Advisory Board Members hold office without limit in time, except that any officer or Advisory Board Member may resign or may be removed by a vote of a majority of the Trustees at any regular meeting or any special meeting of the Trustees. Except as indicated, each individual has held the office shown or other offices in the same company for the past five years.
The fund’s Statement of Additional Information (SAI) includes more information about the Trustees. To request a free copy, call Fidelity at 1-800-544-8544.
Experience, Skills, Attributes, and Qualifications of the Trustees. The Governance and Nominating Committee has adopted a statement of policy that describes the experience, qualifications, attributes, and skills that are necessary and desirable for potential Independent Trustee candidates (Statement of Policy). The Board believes that each Trustee satisfied at the time he or she was initially elected or appointed a Trustee, and continues to satisfy, the standards contemplated by the Statement of Policy. The Governance and Nominating Committee also engages professional search firms to help identify potential Independent Trustee candidates who have the experience, qualifications, attributes, and skills consistent with the Statement of Policy. From time to time, additional criteria based on the composition and skills of the current Independent Trustees, as well as experience or skills that may be appropriate in light of future changes to board composition, business conditions, and regulatory or other developments, have also been considered by the professional search firms and the Governance and Nominating Committee. In addition, the Board takes into account the Trustees' commitment and participation in Board and committee meetings, as well as their leadership of standing and ad hoc committees throughout their tenure.
In determining that a particular Trustee was and continues to be qualified to serve as a Trustee, the Board has considered a variety of criteria, none of which, in isolation, was controlling. The Board believes that, collectively, the Trustees have balanced and diverse experience, qualifications, attributes, and skills, which allow the Board to operate effectively in governing the fund and protecting the interests of shareholders. Information about the specific experience, skills, attributes, and qualifications of each Trustee, which in each case led to the Board's conclusion that the Trustee should serve (or continue to serve) as a trustee of the fund, is provided below.
Board Structure and Oversight Function. Robert A. Lawrence is an interested person and currently serves as Acting Chairman. The Trustees have determined that an interested Chairman is appropriate and benefits shareholders because an interested Chairman has a personal and professional stake in the quality and continuity of services provided to the fund. Independent Trustees exercise their informed business judgment to appoint an individual of their choosing to serve as Chairman, regardless of whether the Trustee happens to be independent or a member of management. The Independent Trustees have determined that they can act independently and effectively without having an Independent Trustee serve as Chairman and that a key structural component for assuring that they are in a position to do so is for the Independent Trustees to constitute a substantial majority for the Board. The Independent Trustees also regularly meet in executive session. Ned C. Lautenbach and David M. Thomas serve as Co-Lead Independent Trustees and as such each (i) acts as a liaison between the Independent Trustees and management with respect to matters important to the Independent Trustees and (ii) with management prepares agendas for Board meetings.
Fidelity® funds are overseen by different Boards of Trustees. The fund's Board oversees Fidelity's high income and certain equity funds, and other Boards oversee Fidelity's investment-grade bond, money market, asset allocation, and other equity funds. The asset allocation funds may invest in Fidelity® funds overseen by the fund's Board. The use of separate Boards, each with its own committee structure, allows the Trustees of each group of Fidelity® funds to focus on the unique issues of the funds they oversee, including common research, investment, and operational issues. On occasion, the separate Boards establish joint committees to address issues of overlapping consequences for the Fidelity® funds overseen by each Board.
The Trustees operate using a system of committees to facilitate the timely and efficient consideration of all matters of importance to the Trustees, the fund, and fund shareholders and to facilitate compliance with legal and regulatory requirements and oversight of the fund's activities and associated risks. The Board, acting through its committees, has charged FMR and its affiliates with (i) identifying events or circumstances the occurrence of which could have demonstrably adverse effects on the fund's business and/or reputation; (ii) implementing processes and controls to lessen the possibility that such events or circumstances occur or to mitigate the effects of such events or circumstances if they do occur; and (iii) creating and maintaining a system designed to evaluate continuously business and market conditions in order to facilitate the identification and implementation processes described in (i) and (ii) above. Because the day-to-day operations and activities of the fund are carried out by or through FMR, its affiliates, and other service providers, the fund's exposure to risks is mitigated but not eliminated by the processes overseen by the Trustees. While each of the Board's committees has responsibility for overseeing different aspects of the fund's activities, oversight is exercised primarily through the Operations, Audit, and Compliance Committees. Appropriate personnel, including but not limited to the fund's Chief Compliance Officer (CCO), FMR's internal auditor, the independent accountants, the fund's Treasurer and portfolio management personnel, make periodic reports to the Board's committees, as appropriate, including an annual review of Fidelity's risk management program for the Fidelity® funds. The responsibilities of each standing committee, including their oversight responsibilities, are described further under "Standing Committees of the Trustees."
Interested Trustees*:
Correspondence intended for a Trustee who is an interested person may be sent to Fidelity Investments, 245 Summer Street, Boston, Massachusetts 02210.
Name, Year of Birth; Principal Occupations and Other Relevant Experience+
Bettina Doulton (1964)
Year of Election or Appointment: 2020
Trustee
Ms. Doulton also serves as Trustee of other Fidelity® funds. Prior to her retirement, Ms. Doulton served in a variety of positions at Fidelity Investments, including as a managing director of research (2006-2007), portfolio manager to certain Fidelity® funds (1993-2005), equity analyst and portfolio assistant (1990-1993), and research assistant (1987-1990). Ms. Doulton currently owns and operates Phi Builders + Architects and Cellardoor Winery. Previously, Ms. Doulton served as a member of the Board of Brown Capital Management, LLC (2013-2018).
Robert A. Lawrence (1952)
Year of Election or Appointment: 2020
Trustee
Acting Chairman of the Board of Trustees
Mr. Lawrence also serves as Trustee of other funds. Previously, Mr. Lawrence served as a Member of the Advisory Board of certain funds. Prior to his retirement in 2008, Mr. Lawrence served as Vice President of certain Fidelity® funds (2006-2008), Senior Vice President, Head of High Income Division of Fidelity Management & Research Company (investment adviser firm, 2006-2008), and President of Fidelity Strategic Investments (investment adviser firm, 2002-2005).
* Determined to be an “Interested Trustee” by virtue of, among other things, his or her affiliation with the trust or various entities under common control with FMR.
+ The information includes the Trustee's principal occupation during the last five years and other information relating to the experience, attributes, and skills relevant to the Trustee's qualifications to serve as a Trustee, which led to the conclusion that the Trustee should serve as a Trustee for the fund.
Independent Trustees:
Correspondence intended for an Independent Trustee may be sent to Fidelity Investments, P.O. Box 55235, Boston, Massachusetts 02205-5235.
Name, Year of Birth; Principal Occupations and Other Relevant Experience+
Dennis J. Dirks (1948)
Year of Election or Appointment: 2005
Trustee
Mr. Dirks also serves as Trustee of other Fidelity® funds. Prior to his retirement in May 2003, Mr. Dirks served as Chief Operating Officer and as a member of the Board of The Depository Trust & Clearing Corporation (financial markets infrastructure), President, Chief Operating Officer and a member of the Board of The Depository Trust Company (DTC), President and a member of the Board of the National Securities Clearing Corporation (NSCC), Chief Executive Officer and a member of the Board of the Government Securities Clearing Corporation and Chief Executive Officer and a member of the Board of the Mortgage-Backed Securities Clearing Corporation. Mr. Dirks currently serves as a member of the Finance Committee (2016-present) and Board (2017-present) and is Treasurer (2018-present) of the Asolo Repertory Theatre.
Donald F. Donahue (1950)
Year of Election or Appointment: 2018
Trustee
Mr. Donahue also serves as Trustee of other Fidelity® funds. Mr. Donahue serves as President and Chief Executive Officer of Miranda Partners, LLC (risk consulting for the financial services industry, 2012-present). Previously, Mr. Donahue served as Chief Executive Officer (2006-2012), Chief Operating Officer (2003-2006) and Managing Director, Customer Marketing and Development (1999-2003) of The Depository Trust & Clearing Corporation (financial markets infrastructure). Mr. Donahue currently serves as a member (2007-present) and Co-Chairman (2016-present) of the Board of United Way of New York, a member of the Board of NYC Leadership Academy (2012-present) and a member of the Board of Advisors of Ripple Labs, Inc. (financial services, 2015-present). Mr. Donahue previously served as a member of the Advisory Board of certain Fidelity® funds (2015-2018).
Vicki L. Fuller (1957)
Year of Election or Appointment: 2020
Trustee
Ms. Fuller also serves as Trustee of other Fidelity® funds. Previously, Ms. Fuller served as a member of the Advisory Board of certain Fidelity® funds (2018-2020), Chief Investment Officer of the New York State Common Retirement Fund (2012-2018) and held a variety of positions at AllianceBernstein L.P. (global asset management, 1985-2012), including Managing Director (2006-2012) and Senior Vice President and Senior Portfolio Manager (2001-2006). Ms. Fuller currently serves as a member of the Board, Audit Committee and Nominating and Governance Committee of The Williams Companies, Inc. (natural gas infrastructure, 2018-present) and as a member of the Board of Treliant, LLC (consulting, 2019-present).
Patricia L. Kampling (1959)
Year of Election or Appointment: 2020
Trustee
Ms. Kampling also serves as Trustee of other Fidelity® funds. Prior to her retirement, Ms. Kampling served as Chairman of the Board and Chief Executive Officer (2012-2019), President and Chief Operating Officer (2011-2012) and Executive Vice President and Chief Financial Officer (2010-2011) of Alliant Energy Corporation. Ms. Kampling currently serves as a member of the Board, Compensation Committee and Executive Committee and as Chair of the Audit Committee of Briggs & Stratton Corporation (manufacturing, 2011-present) and as a member of the Board, Audit, Finance and Risk Committee and Safety, Environmental, Technology and Operations Committee of American Water Works Company, Inc. (utilities company, 2019-present). In addition, Ms. Kampling currently serves as a member of the Board of the Nature Conservancy, Wisconsin Chapter (2019-present). Previously, Ms. Kampling served as a Member of the Advisory Board of certain Fidelity® funds (2020), a member of the Board of Interstate Power and Light Company (2012-2019) and Wisconsin Power and Light Company (2012-2019) (each a subsidiary of Alliant Energy Corporation) and as a member of the Board and Workforce Development Committee of the Business Roundtable (2018-2019).
Alan J. Lacy (1953)
Year of Election or Appointment: 2008
Trustee
Mr. Lacy also serves as Trustee of other Fidelity® funds. Previously, Mr. Lacy served as Senior Adviser (2007-2014) of Oak Hill Capital Partners, L.P. (private equity), Chief Executive Officer (2005) and Vice Chairman (2005-2006) of Sears Holdings Corporation (retail), Chief Executive Officer and Chairman of the Board of Sears, Roebuck and Co. (retail, 2000-2005), Chairman (2014-2017) and a member of the Board (2010-2017) of Dave & Buster’s Entertainment, Inc. (restaurant and entertainment complexes) and a member of the Board of Bristol-Myers Squibb Company (global pharmaceuticals, 2008-2020). Mr. Lacy currently serves as a Trustee of the California Chapter of The Nature Conservancy (2015-present) and a member of the Board of the Center for Advanced Study in the Behavioral Sciences at Stanford University (2015-present).
Ned C. Lautenbach (1944)
Year of Election or Appointment: 2000
Trustee
Co-Lead Independent Trustee
Mr. Lautenbach also serves as Trustee of other Fidelity® funds. Mr. Lautenbach currently serves as Chair of the Board of Governors, State University System of Florida (2013-present) and is a member of the Council on Foreign Relations (1994-present). He is also a member and has in the past served as Chairman of the Board of Directors of Artis-Naples (2012-present). Previously, Mr. Lautenbach served as a member and then Lead Director of the Board of Directors of Eaton Corporation (diversified industrial, 1997-2016). He was also a Partner at Clayton, Dubilier & Rice, LLC (private equity investment, 1998-2010); as well as Director of Sony Corporation (2006-2007). In addition, Mr. Lautenbach had a 30-year career with IBM (technology company), during which time he served as Senior Vice President and as a member of the Corporate Executive Committee (1968-1998).
Joseph Mauriello (1944)
Year of Election or Appointment: 2008
Trustee
Mr. Mauriello also serves as Trustee of other Fidelity® funds. Prior to his retirement in January 2006, Mr. Mauriello served in numerous senior management positions including Deputy Chairman and Chief Operating Officer (2004-2005), and Vice Chairman of Financial Services (2002-2004) of KPMG LLP US (professional services, 1965-2005). Mr. Mauriello currently serves as a member of the Independent Directors Council Governing Council (2015-present). Previously, Mr. Mauriello served as a member of the Board of XL Group plc. (global insurance and re-insurance, 2006-2018).
Cornelia M. Small (1944)
Year of Election or Appointment: 2005
Trustee
Ms. Small also serves as Trustee of other Fidelity® funds. Previously, Ms. Small served as Chief Investment Officer, Director of Global Equity Investments and a member of Scudder, Stevens & Clark and Scudder Kemper Investments. Ms. Small previously served as a member of the Board (2009-2019) and Chair of the Investment Committee (2010-2019) of the Teagle Foundation and a member of the Investment Committee of the Berkshire Taconic Community Foundation (2008-2019).
Garnett A. Smith (1947)
Year of Election or Appointment: 2018
Trustee
Mr. Smith also serves as Trustee of other Fidelity® funds. Prior to his retirement, Mr. Smith served as Chairman and Chief Executive Officer (1990-1997) and President (1986-1990) of Inbrand Corp. (manufacturer of personal absorbent products). Prior to his employment with Inbrand Corp., he was employed by a retail fabric chain and North Carolina National Bank (now Bank of America). Mr. Smith previously served as a member of the Advisory Board of certain Fidelity® funds (2012-2013).
David M. Thomas (1949)
Year of Election or Appointment: 2008
Trustee
Co-Lead Independent Trustee
Mr. Thomas also serves as Trustee of other Fidelity® funds. Previously, Mr. Thomas served as Executive Chairman (2005-2006) and Chairman and Chief Executive Officer (2000-2005) of IMS Health, Inc. (pharmaceutical and healthcare information solutions). Mr. Thomas currently serves as Non-Executive Chairman of the Board of Fortune Brands Home and Security (home and security products, 2011-present), and a member of the Board (2004-present) and Presiding Director (2013-present) of Interpublic Group of Companies, Inc. (marketing communication).
Susan Tomasky (1953)
Year of Election or Appointment: 2020
Trustee
Ms. Tomasky also serves as Trustee of other Fidelity® funds. Prior to her retirement, Ms. Tomasky served in various executive officer positions at American Electric Power Company, Inc. (1998-2011), including most recently as President of AEP Transmission (2007-2011). Ms. Tomasky currently serves as a member of the Board and Sustainability Committee and as Chair of the Audit Committee of Marathon Petroleum Corporation (2018-present) and as a member of the Board, Corporate Governance Committee and Organization and Compensation Committee and as Chair of the Audit Committee of Public Service Enterprise Group, Inc. (utilities company, 2012-present). In addition, Ms. Tomasky currently serves as a member of the Board of the Columbus Regional Airport Authority (2007-present), as a member of the Board of the Royal Shakespeare Company – America (2009-present), as a member of the Board of the Columbus Association for the Performing Arts (2011-present) and as a member of the Board of Kenyon College (2016-present). Previously, Ms. Tomasky served as a Member of the Advisory Board of certain Fidelity® funds (2020), a member of the Board (2011-2019) and as Lead Independent Director (2015-2018) of Andeavor Corporation (previously Tesoro Corporation) (independent oil refiner and marketer) and as a member of the Board of Summit Midstream Partners LP (energy, 2012-2018).
Michael E. Wiley (1950)
Year of Election or Appointment: 2018
Trustee
Mr. Wiley also serves as Trustee of other Fidelity® funds. Previously, Mr. Wiley served as a member of the Advisory Board of certain Fidelity® funds (2018-2020), Chairman, President and CEO of Baker Hughes, Inc. (oilfield services, 2000-2004). Mr. Wiley also previously served as a member of the Board of Andeavor Corporation (independent oil refiner and marketer, 2005-2018), a member of the Board of Andeavor Logistics LP (natural resources logistics, 2015-2018) and a member of the Board of High Point Resources (exploration and production, 2005-2020).
+ The information includes the Trustee's principal occupation during the last five years and other information relating to the experience, attributes, and skills relevant to the Trustee's qualifications to serve as a Trustee, which led to the conclusion that the Trustee should serve as a Trustee for the fund.
Advisory Board Members and Officers:
Correspondence intended for a Member of the Advisory Board (if any) may be sent to Fidelity Investments, P.O. Box 55235, Boston, Massachusetts 02205-5235. Correspondence intended for an officer or Peter S. Lynch may be sent to Fidelity Investments, 245 Summer Street, Boston, Massachusetts 02210. Officers appear below in alphabetical order.
Name, Year of Birth; Principal Occupation
Peter S. Lynch (1944)
Year of Election or Appointment: 2003
Member of the Advisory Board
Mr. Lynch also serves as a Member of the Advisory Board of other Fidelity® funds. Mr. Lynch is Vice Chairman and a Director of Fidelity Management & Research Company LLC (investment adviser firm). In addition, Mr. Lynch serves as a Trustee of Boston College and as the Chairman of the Inner-City Scholarship Fund. Previously, Mr. Lynch served as Vice Chairman and a Director of FMR Co., Inc. (investment adviser firm) and on the Special Olympics International Board of Directors (1997-2006).
Elizabeth Paige Baumann (1968)
Year of Election or Appointment: 2017
Anti-Money Laundering (AML) Officer
Ms. Baumann also serves as AML Officer of other funds. She is Chief AML Officer (2012-present) and Senior Vice President (2014-present) of FMR LLC (diversified financial services company) and is an employee of Fidelity Investments. Previously, Ms. Baumann served as AML Officer of certain funds (2017-2019), as AML Officer of the funds (2012-2016), and Vice President (2007-2014) and Deputy Anti-Money Laundering Officer (2007-2012) of FMR LLC.
Craig S. Brown (1977)
Year of Election or Appointment: 2019
Assistant Treasurer
Mr. Brown also serves as Assistant Treasurer of other funds. Mr. Brown is an employee of Fidelity Investments (2013-present).
John J. Burke III (1964)
Year of Election or Appointment: 2018
Chief Financial Officer
Mr. Burke also serves as Chief Financial Officer of other funds. Mr. Burke serves as Head of Investment Operations for Fidelity Fund and Investment Operations (2018-present) and is an employee of Fidelity Investments (1998-present). Previously Mr. Burke served as head of Asset Management Investment Operations (2012-2018).
William C. Coffey (1969)
Year of Election or Appointment: 2019
Assistant Secretary
Mr. Coffey also serves as Assistant Secretary of other funds. He is Senior Vice President and Deputy General Counsel of FMR LLC (diversified financial services company, 2010-present), and is an employee of Fidelity Investments. Previously, Mr. Coffey served as Secretary and CLO of certain funds (2018-2019); CLO, Secretary, and Senior Vice President of Fidelity Management & Research Company and FMR Co., Inc. (investment adviser firms, 2018-2019); Secretary of Fidelity SelectCo, LLC and Fidelity Investments Money Management, Inc. (investment adviser firms, 2018-2019); CLO of Fidelity Management & Research (Hong Kong) Limited, FMR Investment Management (UK) Limited, and Fidelity Management & Research (Japan) Limited (investment adviser firms, 2018-2019); and Assistant Secretary of certain funds (2009-2018).
Timothy M. Cohen (1969)
Year of Election or Appointment: 2018
Vice President
Mr. Cohen also serves as Vice President of other funds. Mr. Cohen serves as Co-Head of Equity (2018-present), a Director of Fidelity Management & Research (Japan) Limited (investment adviser firm, 2016-present), and is an employee of Fidelity Investments. Previously, Mr. Cohen served as Executive Vice President of Fidelity SelectCo, LLC (2019), Head of Global Equity Research (2016-2018), Chief Investment Officer - Equity and a Director of Fidelity Management & Research (U.K.) Inc. (investment adviser firm, 2013-2015) and as a Director of Fidelity Management & Research (Hong Kong) Limited (investment adviser firm, 2017).
Jonathan Davis (1968)
Year of Election or Appointment: 2010
Assistant Treasurer
Mr. Davis also serves as Assistant Treasurer of other funds. Mr. Davis serves as Assistant Treasurer of FMR Capital, Inc. (2017-present) and is an employee of Fidelity Investments. Previously, Mr. Davis served as Vice President and Associate General Counsel of FMR LLC (diversified financial services company, 2003-2010).
Laura M. Del Prato (1964)
Year of Election or Appointment: 2018
Assistant Treasurer
Ms. Del Prato also serves as an officer of other funds. Ms. Del Prato is an employee of Fidelity Investments (2017-present). Prior to joining Fidelity Investments, Ms. Del Prato served as a Managing Director and Treasurer of the JPMorgan Mutual Funds (2014-2017). Prior to JPMorgan, Ms. Del Prato served as a partner at Cohen Fund Audit Services (accounting firm, 2012-2013) and KPMG LLP (accounting firm, 2004-2012).
Colm A. Hogan (1973)
Year of Election or Appointment: 2020
Assistant Treasurer
Mr. Hogan also serves as an officer of other funds. Mr. Hogan serves as Assistant Treasurer of FMR Capital, Inc. (2017-present) and is an employee of Fidelity Investments (2005-present). Previously, Mr. Hogan served as Deputy Treasurer of certain Fidelity® funds (2016-2020) and Assistant Treasurer of certain Fidelity® funds (2016-2018).
Pamela R. Holding (1964)
Year of Election or Appointment: 2018
Vice President
Ms. Holding also serves as Vice President of other funds. Ms. Holding serves as Co-Head of Equity (2018-present) and is an employee of Fidelity Investments (2013-present). Previously, Ms. Holding served as Executive Vice President of Fidelity SelectCo, LLC (2019) and as Chief Investment Officer of Fidelity Institutional Asset Management (2013-2018).
Cynthia Lo Bessette (1969)
Year of Election or Appointment: 2019
Secretary and Chief Legal Officer (CLO)
Ms. Lo Bessette also serves as an officer of other funds. Ms. Lo Bessette serves as CLO, Secretary, and Senior Vice President of Fidelity Management & Research Company LLC (investment adviser firm, 2019-present); and CLO of Fidelity Management & Research (Hong Kong) Limited, FMR Investment Management (UK) Limited, and Fidelity Management & Research (Japan) Limited (investment adviser firms, 2019-present). She is a Senior Vice President and Deputy General Counsel of FMR LLC (diversified financial services company, 2019-present), and is an employee of Fidelity Investments. Previously, Ms. Lo Bessette served as CLO, Secretary, and Senior Vice President of FMR Co., Inc. (investment adviser firm, 2019); Secretary of Fidelity SelectCo, LLC and Fidelity Investments Money Management, Inc. (investment adviser firms, 2019). Prior to joining Fidelity Investments, Ms. Lo Bessette was Executive Vice President, General Counsel (2016-2019) and Senior Vice President, Deputy General Counsel (2015-2016) of OppenheimerFunds (investment management company) and Deputy Chief Legal Officer (2013-2015) of Jennison Associates LLC (investment adviser firm).
Chris Maher (1972)
Year of Election or Appointment: 2020
Deputy Treasurer
Mr. Maher also serves as an officer of other funds. Mr. Maher serves as Assistant Treasurer of FMR Capital, Inc. (2017-present), and is an employee of Fidelity Investments (2008-present). Previously, Mr. Maher served as Assistant Treasurer of certain funds (2013-2020); Vice President of Asset Management Compliance (2013), Vice President of the Program Management Group of FMR (investment adviser firm, 2010-2013), and Vice President of Valuation Oversight (2008-2010).
Jason P. Pogorelec (1975)
Year of Election or Appointment: 2020
Chief Compliance Officer
Mr. Pogorelec also serves as an officer of other funds. Mr. Pogorelec serves as Vice President, Associate General Counsel (2010-present) and is an employee of Fidelity Investments (2006-present). Previously, Mr. Pogorelec served as Assistant Secretary of certain Fidelity funds (2015-2020).
Stacie M. Smith (1974)
Year of Election or Appointment: 2016
President and Treasurer
Ms. Smith also serves as an officer of other funds. Ms. Smith serves as Assistant Treasurer of FMR Capital, Inc. (2017-present), is an employee of Fidelity Investments (2009-present), and has served in other fund officer roles. Prior to joining Fidelity Investments, Ms. Smith served as Senior Audit Manager of Ernst & Young LLP (accounting firm, 1996-2009). Previously, Ms. Smith served as Assistant Treasurer (2013-2019) and Deputy Treasurer (2013-2016) of certain Fidelity® funds.
Marc L. Spector (1972)
Year of Election or Appointment: 2016
Assistant Treasurer
Mr. Spector also serves as an officer of other funds. Mr. Spector serves as Assistant Treasurer of FMR Capital, Inc. (2017-present) and is an employee of Fidelity Investments (2016-present). Prior to joining Fidelity Investments, Mr. Spector served as Director at the Siegfried Group (accounting firm, 2013-2016), and prior to Siegfried Group as audit senior manager at Deloitte & Touche LLP (accounting firm, 2005-2013).
Jim Wegmann (1979)
Year of Election or Appointment: 2019
Assistant Treasurer
Mr. Wegmann also serves as Assistant Treasurer of other funds. Mr. Wegmann is an employee of Fidelity Investments (2011-present).
Shareholder Expense Example
As a shareholder of the Fund, you incur two types of costs: (1) transaction costs and (2) ongoing costs, including management fees and other Fund expenses. This Example is intended to help you understand your ongoing costs (in dollars) of investing in the Fund and to compare these costs with the ongoing costs of investing in other mutual funds.
The Example is based on an investment of $1,000 invested at the beginning of the period and held for the entire period (November 1, 2019 to April 30, 2020).
Actual Expenses
The first line of the accompanying table provides information about actual account values and actual expenses. You may use the information in this line, together with the amount you invested, to estimate the expenses that you paid over the period. Simply divide your account value by $1,000.00 (for example, an $8,600 account value divided by $1,000.00 = 8.6), then multiply the result by the number in the first line under the heading entitled "Expenses Paid During Period" to estimate the expenses you paid on your account during this period. In addition, the Fund, as a shareholder in the underlying Fidelity Central Funds, will indirectly bear its pro-rata share of the fees and expenses incurred by the underlying Fidelity Central Funds. These fees and expenses are not included in the Fund's annualized expense ratio used to calculate the expense estimate in the table below.
Hypothetical Example for Comparison Purposes
The second line of the accompanying table provides information about hypothetical account values and hypothetical expenses based on the Fund's actual expense ratio and an assumed rate of return of 5% per year before expenses, which is not the Fund's actual return. The hypothetical account values and expenses may not be used to estimate the actual ending account balance or expenses you paid for the period. You may use this information to compare the ongoing costs of investing in the Fund and other funds. To do so, compare this 5% hypothetical example with the 5% hypothetical examples that appear in the shareholder reports of the other funds. In addition, the Fund, as a shareholder in the underlying Fidelity Central Funds, will indirectly bear its pro-rata share of the fees and expenses incurred by the underlying Fidelity Central Funds. These fees and expenses are not included in the Fund's annualized expense ratio used to calculate the expense estimate in the table below.
Please note that the expenses shown in the table are meant to highlight your ongoing costs only and do not reflect any transaction costs. Therefore, the second line of the table is useful in comparing ongoing costs only, and will not help you determine the relative total costs of owning different funds.
| Annualized Expense Ratio-A | Beginning Account Value November 1, 2019 | Ending Account Value April 30, 2020 | Expenses Paid During Period-B November 1, 2019 to April 30, 2020 | |
| Actual | .77% | $1,000.00 | $955.10 | $3.74 |
| Hypothetical-C | $1,000.00 | $1,021.03 | $3.87 |
A Annualized expense ratio reflects expenses net of applicable fee waivers.
B Expenses are equal to the Fund's annualized expense ratio, multiplied by the average account value over the period, multiplied by 182/366 (to reflect the one-half year period).
C 5% return per year before expenses
Distributions (Unaudited)
A total of 0.40% of the dividends distributed during the fiscal year was derived from interest on U.S. Government securities which is generally exempt from state income tax.
The fund designates $4,146,499 of distributions paid during the period January 1, 2020 to April 30, 2020 as qualifying to be taxed as interest-related dividends for nonresident alien shareholders.
The fund will notify shareholders in January 2021 of amounts for use in preparing 2020 income tax returns.
Board Approval of Investment Advisory Contracts and Management Fees
Fidelity Focused High Income Fund
Each year, the Board of Trustees, including the Independent Trustees (together, the Board), votes on the renewal of the management contract with Fidelity Management & Research Company LLC (FMR) and the sub-advisory agreements (together, the Advisory Contracts) for the fund. FMR and the sub-advisers are referred to herein as the Investment Advisers. The Board, assisted by the advice of fund counsel and Independent Trustees' counsel, requests and considers a broad range of information relevant to the renewal of the Advisory Contracts throughout the year.Approval of Amended and Restated Advisory Contracts. At its November 2019 meeting, the Board unanimously determined to approve an amended and restated management contract and sub-advisory agreements (Amended and Restated Contracts) for a stub period of January 1, 2020 through January 31, 2020 in connection with a consolidation of certain of Fidelity's advisory businesses. The Board considered that, on or about January 1, 2020, FMR Co., Inc. (FMRC) expected to merge with and into FMR and, after the merger, FMR expected to redomicile as a Delaware limited liability company. The Board also approved the termination of the sub-advisory agreement with FMRC upon the completion of the merger. The Board noted that references to FMR in the Amended and Restated Contracts would be updated to reflect FMR's new form of organization and domicile and considered that the definition of "group assets" for purposes of the fund's group fee would be modified to avoid double-counting assets once the reorganization is complete. The Board also noted Fidelity's assurance that neither the planned consolidation nor the Amended and Restated Contracts will change the investment processes, the level or nature of services provided, the resources and personnel allocated, trading and compliance operations, or any fees paid by the fund.The Board meets regularly and, at each of its meetings, covers an extensive agenda of topics and materials and considers factors that are relevant to its annual consideration of the renewal of the fund's Advisory Contracts, including the services and support provided to the fund and its shareholders. The Board has established various standing committees (Committees), each composed of and chaired by Independent Trustees with varying backgrounds, to which the Board has assigned specific subject matter responsibilities in order to enhance effective decision-making by the Board. The Board, acting directly and through its Committees, requests and receives information concerning the annual consideration of the renewal of the fund's Advisory Contracts. The Board also meets as needed to review matters specifically related to the Board's annual consideration of the renewal of the Advisory Contracts. Members of the Board may also meet with trustees of other Fidelity funds through joint ad hoc committees to discuss certain matters relevant to all of the Fidelity funds.At its January 2020 meeting, the Board unanimously determined to renew the fund's Advisory Contracts. In reaching its determination, the Board considered all factors it believed relevant, including (i) the nature, extent, and quality of the services provided to the fund and its shareholders (including the investment performance of the fund); (ii) the competitiveness of the fund's management fee and total expense ratio relative to peer funds; (iii) the total costs of the services provided by and the profits realized by Fidelity from its relationships with the fund; and (iv) the extent to which, if any, economies of scale exist and are realized as the fund grows, and whether any economies of scale are appropriately shared with fund shareholders.In considering whether to renew the Advisory Contracts for the fund, the Board reached a determination, with the assistance of fund counsel and Independent Trustees' counsel and through the exercise of its business judgment, that the renewal of the Advisory Contracts was in the best interests of the fund and its shareholders and that the compensation payable under the Advisory Contracts was fair and reasonable. The Board's decision to renew the Advisory Contracts was not based on any single factor, but rather was based on a comprehensive consideration of all the information provided to the Board at its meetings throughout the year. The Board, in reaching its determination to renew the Advisory Contracts, was aware that shareholders of the fund have a broad range of investment choices available to them, including a wide choice among funds offered by Fidelity's competitors, and that the fund's shareholders, who have the opportunity to review and weigh the disclosure provided by the fund in its prospectus and other public disclosures, have chosen to invest in this fund, which is part of the Fidelity family of funds.Nature, Extent, and Quality of Services Provided. The Board considered Fidelity's staffing as it relates to the fund, including the backgrounds of investment personnel of Fidelity, and also considered the fund's investment objective, strategies, and related investment philosophy. The Independent Trustees also had discussions with senior management of Fidelity's investment operations and investment groups. The Board considered the structure of the investment personnel compensation program and whether this structure provides appropriate incentives to act in the best interests of the fund. Additionally, the Board considered the portfolio managers' investments, if any, in the funds that they manage.Resources Dedicated to Investment Management and Support Services. The Board and the Fund Oversight and Research Committees reviewed the general qualifications and capabilities of Fidelity's investment staff, including its size, education, experience, and resources, as well as Fidelity's approach to recruiting, training, managing, and compensating investment personnel. The Board noted that Fidelity has continued to increase the resources devoted to non-U.S. offices, including expansion of Fidelity's global investment organization. The Board also noted that Fidelity's analysts have extensive resources, tools and capabilities that allow them to conduct sophisticated quantitative and fundamental analysis, as well as credit analysis of issuers, counterparties and guarantors. Further, the Board considered that Fidelity's investment professionals have sufficient access to global information and data so as to provide competitive investment results over time, and that those professionals also have access to sophisticated tools that permit them to assess portfolio construction and risk and performance attribution characteristics continuously, as well as to transmit new information and research conclusions rapidly around the world. Additionally, in its deliberations, the Board considered Fidelity's trading, risk management, compliance, and technology and operations capabilities and resources, which are integral parts of the investment management process.Shareholder and Administrative Services. The Board considered (i) the nature, extent, quality, and cost of advisory, administrative, and shareholder services performed by the Investment Advisers and their affiliates under the Advisory Contracts and under separate agreements covering transfer agency, pricing and bookkeeping, and securities lending services for the fund; (ii) the nature and extent of the supervision of third party service providers, principally custodians, subcustodians, and pricing vendors; and (iii) the resources devoted to, and the record of compliance with, the fund's compliance policies and procedures. The Board also reviewed the allocation of fund brokerage, including allocations to brokers affiliated with the Investment Advisers, the use of brokerage commissions to pay fund expenses, and the use of "soft" commission dollars to pay for research services.The Board noted that the growth of fund assets over time across the complex allows Fidelity to reinvest in the development of services designed to enhance the value and convenience of the Fidelity funds as investment vehicles. These services include 24-hour access to account information and market information over the Internet and through telephone representatives, investor education materials and asset allocation tools, and the expanded availability of Fidelity Investor Centers.The Board noted that it and the boards of certain other Fidelity funds had formed an ad hoc Committee on Transfer Agency Fees to review the variety of transfer agency fee structures throughout the industry and Fidelity's competitive positioning with respect to industry participants.Investment in a Large Fund Family. The Board considered the benefits to shareholders of investing in a Fidelity fund, including the benefits of investing in a fund that is part of a large family of funds offering a variety of investment disciplines and providing a large variety of mutual fund investor services. The Board noted that Fidelity had taken, or had made recommendations that resulted in the Fidelity funds taking, a number of actions over the previous year that benefited particular funds, including: (i) continuing to dedicate additional resources to Fidelity's investment research process, which includes meetings with management of issuers of securities in which the funds invest, and to the support of the senior management team that oversees asset management; (ii) continuing efforts to enhance Fidelity's global research capabilities; (iii) launching new funds and ETFs with innovative structures, strategies and pricing and making other enhancements to meet client needs; (iv) launching new share classes of existing funds; (v) eliminating purchase minimums and broadening eligibility requirements for certain funds and share classes; (vi) reducing management fees and total expenses for certain target date funds and index funds; (vii) lowering expense caps for certain existing funds and classes, and converting certain voluntary expense caps to contractual caps, to reduce expenses borne by shareholders; (viii) rationalizing product lines and gaining increased efficiencies from fund mergers, liquidations, and share class consolidations; (ix) continuing to develop, acquire and implement systems and technology to improve services to the funds and shareholders, strengthen information security, and increase efficiency; and (x) continuing to implement enhancements to further strengthen Fidelity's product line to increase investors' probability of success in achieving their investment goals, including retirement income goals.Investment Performance. The Board considered whether the fund has operated in accordance with its investment objective, as well as its record of compliance with its investment restrictions and its performance history. The Board noted that there were portfolio management changes for the fund in June 2018, November 2018, and December 2018. The Board will continue to monitor closely the fund's performance, taking into account the portfolio management changes.The Board took into account discussions that occur at Board meetings throughout the year with representatives of the Investment Advisers about fund investment performance. In this regard the Board noted that as part of regularly scheduled fund reviews and other reports to the Board on fund performance, the Board considers annualized return information for the fund for different time periods, measured against an appropriate securities market index (benchmark index) and a peer group of funds with similar objectives (peer group), if any. In its evaluation of fund investment performance, the Board gave particular attention to information indicating changes in performance of certain Fidelity funds for specific time periods and discussed with the Investment Advisers the reasons for any overperformance or underperformance.In addition to reviewing absolute and relative fund performance, the Independent Trustees periodically consider the appropriateness of fund performance metrics in evaluating the results achieved. In general, the Independent Trustees believe that fund performance should be evaluated based on net performance (after fees and expenses) of both the highest performing and lowest performing fund share classes, where applicable, compared to appropriate benchmark indices, over appropriate time periods that may include full market cycles, and compared to peer groups, as applicable, over the same periods, taking into account relevant factors including the following: general market conditions; issuer-specific information; and fund cash flows and other factors.The Independent Trustees recognize that shareholders evaluate performance on a net basis over their own holding periods, for which one-, three-, and five-year periods are often used as a proxy. For this reason, the performance information reviewed by the Board also included net cumulative total return information for the fund and an appropriate benchmark index and peer group for the most recent one-, three-, and five-year periods ended June 30, 2019, as shown below. Returns are shown compared to the 25th percentile (top of box, 75% beaten) and 75th percentile (bottom of box, 25% beaten) of the peer universe.Fidelity Focused High Income Fund

Fidelity Focused High Income Fund
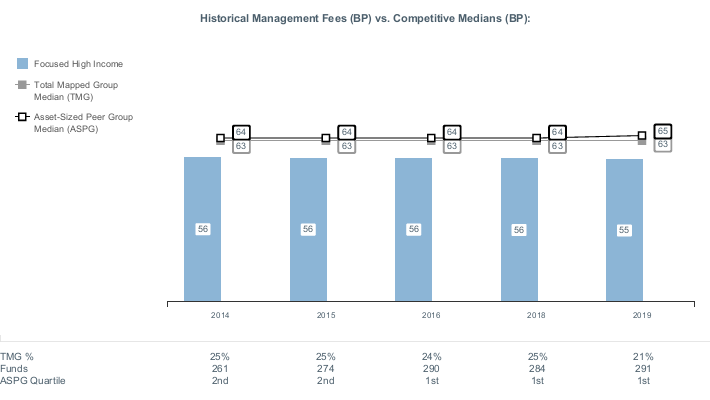
Liquidity Risk Management Program
The Securities and Exchange Commission adopted Rule 22e-4 under the Investment Company Act of 1940 (the Liquidity Rule) to promote effective liquidity risk management throughout the open-end investment company industry, thereby reducing the risk that funds will be unable to meet their redemption obligations and mitigating dilution of the interests of fund shareholders.
The Fund has adopted and implemented a liquidity risk management program pursuant to the Liquidity Rule (the Program) effective December 1, 2018. The Program is reasonably designed to assess and manage the Fund’s liquidity risk and to comply with the requirements of the Liquidity Rule. The Fund’s Board of Trustees (the Board) has designated the Fund’s investment adviser as administrator of the Program. The Fidelity advisers have established a Liquidity Risk Management Committee (the LRM Committee) to manage the Program for each of the Fidelity Funds. The LRM Committee monitors the adequacy and effectiveness of implementation of the Program and on a periodic basis assesses each Fund’s liquidity risk based on a variety of factors including (1) the Fund’s investment strategy, (2) portfolio liquidity and cash flow projections during normal and reasonably foreseeable stressed conditions, (3) shareholder redemptions, (4) borrowings and other funding sources and (5) in the case of exchange-traded funds, certain additional factors including the effect of the Fund’s prices and spreads, market participants, and basket compositions on the overall liquidity of the Fund’s portfolio, as applicable.
In accordance with the Program, each of the Fund’s portfolio investments is classified into one of four liquidity categories described below based on a determination of a reasonable expectation for how long it would take to convert the investment to cash (or sell or dispose of the investment) without significantly changing its market value.
- Highly liquid investments – cash or convertible to cash within three business days or less
- Moderately liquid investments – convertible to cash in three to seven calendar days
- Less liquid investments – can be sold or disposed of, but not settled, within seven calendar days
- Illiquid investments – cannot be sold or disposed of within seven calendar days
Liquidity classification determinations take into account a variety of factors including various market, trading and investment-specific considerations, as well as market depth, and generally utilize analysis from a third-party liquidity metrics service.
The Liquidity Rule places a 15% limit on a fund’s illiquid investments and requires funds that do not primarily hold assets that are highly liquid investments to determine and maintain a minimum percentage of the fund’s net assets to be invested in highly liquid investments (highly liquid investment minimum or HLIM). The Program includes provisions reasonably designed to comply with the 15% limit on illiquid investments and for determining, periodically reviewing and complying with the HLIM requirement as applicable.
At a recent meeting of the Fund’s Board of Trustees, the LRM Committee provided a written report to the Board pertaining to the operation, adequacy, and effectiveness of implementation of the Program for the annual period from December 1, 2018 through November 30, 2019. The report concluded that the Program has been implemented and is operating effectively and is reasonably designed to assess and manage the Fund’s liquidity risk.
![]()
FFH-ANN-0620
1.801606.115
Fidelity® Series High Income Fund
April 30, 2020
See the inside front cover for important information about access to your fund’s shareholder reports.
Beginning on January 1, 2021, as permitted by regulations adopted by the Securities and Exchange Commission, paper copies of a fund’s shareholder reports will no longer be sent by mail, unless you specifically request paper copies of the reports from the fund or from your financial intermediary, such as a financial advisor, broker-dealer or bank. Instead, the reports will be made available on a website, and you will be notified by mail each time a report is posted and provided with a website link to access the report.
If you already elected to receive shareholder reports electronically, you will not be affected by this change and you need not take any action. You may elect to receive shareholder reports and other communications from a fund electronically, by contacting your financial intermediary. For Fidelity customers, visit Fidelity's web site or call Fidelity using the contact information listed below.
You may elect to receive all future reports in paper free of charge. If you wish to continue receiving paper copies of your shareholder reports, you may contact your financial intermediary or, if you are a Fidelity customer, visit Fidelity’s website, or call Fidelity at the applicable toll-free number listed below. Your election to receive reports in paper will apply to all funds held with the fund complex/your financial intermediary.
| Account Type | Website | Phone Number |
| Brokerage, Mutual Fund, or Annuity Contracts: | fidelity.com/mailpreferences | 1-800-343-3548 |
| Employer Provided Retirement Accounts: | netbenefits.fidelity.com/preferences (choose 'no' under Required Disclosures to continue to print) | 1-800-343-0860 |
| Advisor Sold Accounts Serviced Through Your Financial Intermediary: | Contact Your Financial Intermediary | Your Financial Intermediary's phone number |
| Advisor Sold Accounts Serviced by Fidelity: | institutional.fidelity.com | 1-877-208-0098 |
Contents
Board Approval of Investment Advisory Contracts and Management Fees | |
To view a fund's proxy voting guidelines and proxy voting record for the 12-month period ended June 30, visit http://www.fidelity.com/proxyvotingresults or visit the Securities and Exchange Commission's (SEC) web site at http://www.sec.gov.
You may also call 1-800-544-8544 to request a free copy of the proxy voting guidelines.
Standard & Poor's, S&P and S&P 500 are registered service marks of The McGraw-Hill Companies, Inc. and have been licensed for use by Fidelity Distributors Corporation.
Other third-party marks appearing herein are the property of their respective owners.
All other marks appearing herein are registered or unregistered trademarks or service marks of FMR LLC or an affiliated company. © 2020 FMR LLC. All rights reserved.
This report and the financial statements contained herein are submitted for the general information of the shareholders of the Fund. This report is not authorized for distribution to prospective investors in the Fund unless preceded or accompanied by an effective prospectus.
A fund files its complete schedule of portfolio holdings with the SEC for the first and third quarters of each fiscal year on Form N-PORT. Forms N-PORT are available on the SEC’s web site at http://www.sec.gov. A fund's Forms N-PORT may be reviewed and copied at the SEC’s Public Reference Room in Washington, DC. Information regarding the operation of the SEC's Public Reference Room may be obtained by calling 1-800-SEC-0330.
For a complete list of a fund's portfolio holdings, view the most recent holdings listing, semiannual report, or annual report on Fidelity's web site at http://www.fidelity.com, http://www.institutional.fidelity.com, or http://www.401k.com, as applicable.
NOT FDIC INSURED •MAY LOSE VALUE •NO BANK GUARANTEE
Neither the Fund nor Fidelity Distributors Corporation is a bank.
Note to Shareholders:
Early in 2020, the outbreak and spread of a new coronavirus emerged as a public health emergency that had a major influence on financial markets, primarily based on its impact on the global economy and the outlook for corporate earnings. The virus causes a respiratory disease known as COVID-19. On March 11, the World Health Organization declared the COVID-19 outbreak a pandemic, citing sustained risk of further global spread.
In the weeks following, as the crisis worsened, we witnessed an escalating human tragedy with wide-scale social and economic consequences from coronavirus-containment measures. The outbreak of COVID-19 prompted a number of measures to limit the spread, including travel and border restrictions, quarantines, and restrictions on large gatherings. In turn, these resulted in lower consumer activity, diminished demand for a wide range of products and services, disruption in manufacturing and supply chains, and – given the wide variability in outcomes regarding the outbreak – significant market uncertainty and volatility. Amid the turmoil, the U.S. government took unprecedented action – in concert with the U.S. Federal Reserve and central banks around the world – to help support consumers, businesses, and the broader economy, and to limit disruption to the financial system.
The situation continues to unfold, and the extent and duration of its impact on financial markets and the economy remain highly uncertain. Extreme events such as the coronavirus crisis are “exogenous shocks” that can have significant adverse effects on mutual funds and their investments. Although multiple asset classes may be affected by market disruption, the duration and impact may not be the same for all types of assets.
Fidelity is committed to helping you stay informed amid news about COVID-19 and during increased market volatility, and we’re taking extra steps to be responsive to customer needs. We encourage you to visit our websites, where we offer ongoing updates, commentary, and analysis on the markets and our funds.
Performance: The Bottom Line
Average annual total return reflects the change in the value of an investment, assuming reinvestment of distributions from dividend income and capital gains (the profits earned upon the sale of securities that have grown in value, if any) and assuming a constant rate of performance each year. The hypothetical investment and the average annual total returns do not reflect the deduction of taxes that a shareholder would pay on fund distributions or the redemption of fund shares. During periods of reimbursement by Fidelity, a fund’s total return will be greater than it would be had the reimbursement not occurred. How a fund did yesterday is no guarantee of how it will do tomorrow.
Average Annual Total Returns
| For the periods ended April 30, 2020 | Past 1 year | Past 5 years | Life of fundA |
| Fidelity® Series High Income Fund | (4.11)% | 3.43% | 4.74% |
A From March 10, 2011
$10,000 Over Life of Fund
Let's say hypothetically that $10,000 was invested in Fidelity® Series High Income Fund on March 10, 2011, when the fund started.
The chart shows how the value of your investment would have changed, and also shows how the ICE® BofA® US High Yield Constrained Index performed over the same period.
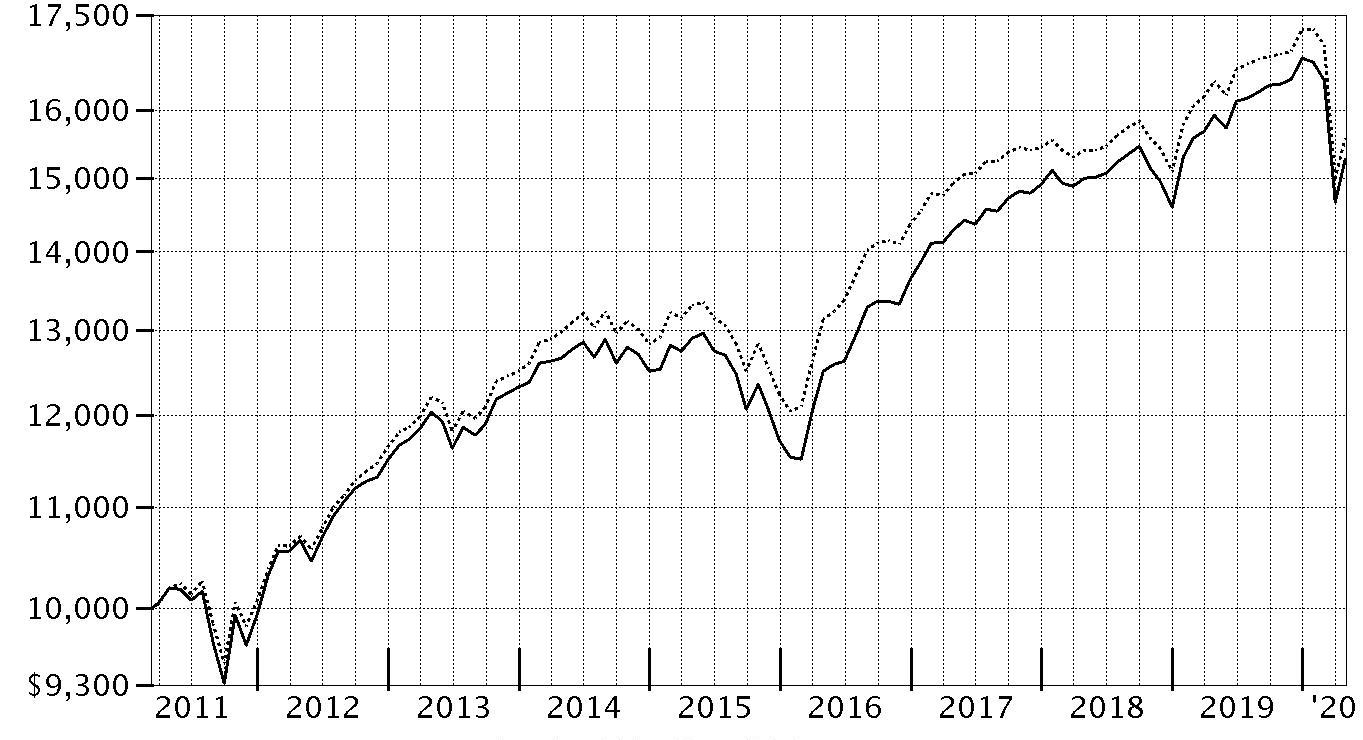
| Period Ending Values | ||
| $15,269 | Fidelity® Series High Income Fund | |
| $15,572 | ICE® BofA® US High Yield Constrained Index | |
Management's Discussion of Fund Performance
Market Recap: U.S. high-yield bonds rode a supportive backdrop into 2020 before giving way amid the early-year global outbreak and spread of the coronavirus. The ICE BofA® US High Yield Constrained Index returned -5.27% for the 12 months ending April 30. Declared a pandemic on March 11, the crisis and containment efforts caused broad contraction in economic activity, plunging oil prices and extreme uncertainty, volatility, and dislocation in financial markets. Following a flat January, high yield returned -1.55% in February, after a surge in COVID-19 cases outside China. The downtrend steepened in March, with the market enduring its fastest sell-off on record and credit spreads widening sharply. The index finished the month down 11.77%, capping its worst quarter since 2008, despite an uptrend in the final week. A historically rapid and expansive U.S. monetary/fiscal-policy response provided a partial offset to the economic disruption. This was evident in April, when the index rose 3.80% on improved coronavirus trends, plans for reopening the economy and progress on potential treatments. Investor sentiment for risk assets waned this period, with fairly wide performance variance based on quality. Among major credit tiers, higher-rated (BB) bonds gained 0.32%, while lower-quality (CCC-C) issues returned -20.79%. By industry, the biggest laggards included energy (-33%) and air transportation (-17%), whereas defensive-oriented groups such as food & drug retail (+11%) and cable/satellite TV (+7%) enjoyed some ballast.Comments from Co-Portfolio Managers Michael Weaver and Alexandre Karam: For the fiscal year, the fund returned -4.11%, outperforming the benchmark, the ICE BofA® US High Yield Constrained Index. The fund’s core high-yield bond subportfolio outpaced the benchmark by a sizable margin and notably contributed to our relative result. The fund's stake in cash, which averaged 3% of assets this period, also boosted relative performance. In contrast, our small non-benchmark allocation to floating-rate bank loans significantly trailed high yield, and therefore hurt relative performance. By industry, security selection in telecommunications and food/beverage/tobacco contributed, as did our overweightings in cable/satellite TV and banks & thrifts. Conversely, our picks and an overweighting in energy detracted most by a wide margin, with security selection and an overweighting in air transportation hurting to a lesser degree. Our top individual contributor was an outsized stake in JBS (+6%), a major processor of beef, pork and prepared foods. In the telecommunications group, we added value by overweighting Altice Financial (+10%), a sizable fund holding. Turning to notable detractors versus the benchmark, overweightings in several underperforming energy names hurt most, including California Resources (-90%), Chesapeake Energy (-91%), Sanchez Energy (-67%) and Denbury (-77%).The views expressed above reflect those of the portfolio manager(s) only through the end of the period as stated on the cover of this report and do not necessarily represent the views of Fidelity or any other person in the Fidelity organization. Any such views are subject to change at any time based upon market or other conditions and Fidelity disclaims any responsibility to update such views. These views may not be relied on as investment advice and, because investment decisions for a Fidelity fund are based on numerous factors, may not be relied on as an indication of trading intent on behalf of any Fidelity fund.
Investment Summary (Unaudited)
Top Five Holdings as of April 30, 2020
| (by issuer, excluding cash equivalents) | % of fund's net assets |
| Tenet Healthcare Corp. | 3.2 |
| CCO Holdings LLC/CCO Holdings Capital Corp. | 2.7 |
| TransDigm, Inc. | 2.5 |
| JBS U.S.A. LLC/JBS U.S.A. Finance, Inc. | 2.1 |
| C&W Senior Financing Designated Activity Co. | 2.0 |
| 12.5 |
Top Five Market Sectors as of April 30, 2020
| % of fund's net assets | |
| Telecommunications | 16.0 |
| Healthcare | 10.0 |
| Energy | 8.9 |
| Technology | 6.0 |
| Cable/Satellite TV | 5.4 |
Quality Diversification (% of fund's net assets)
| As of April 30, 2020 | ||
| BBB | 3.1% | |
| BB | 38.1% | |
| B | 35.9% | |
| CCC,CC,C | 16.2% | |
| D | 0.9% | |
| Not Rated | 0.3% | |
| Equities | 1.4% | |
| Short-Term Investments and Net Other Assets | 4.1% | |

We have used ratings from Moody's Investors Service, Inc. Where Moody's® ratings are not available, we have used S&P® ratings. All ratings are as of the date indicated and do not reflect subsequent changes.
Asset Allocation (% of fund's net assets)
| As of April 30, 2020* | ||
| Nonconvertible Bonds | 89.9% | |
| Convertible Bonds, Preferred Stocks | 1.0% | |
| Common Stocks | 1.2% | |
| Bank Loan Obligations | 1.2% | |
| Other Investments | 2.6% | |
| Short-Term Investments and Net Other Assets (Liabilities) | 4.1% | |

* Foreign investments - 23.8%
Schedule of Investments April 30, 2020
Showing Percentage of Net Assets
| Corporate Bonds - 90.7% | |||
| Principal Amount | Value | ||
| Convertible Bonds - 0.8% | |||
| Broadcasting - 0.8% | |||
| DISH Network Corp.: | |||
| 2.375% 3/15/24 | $5,404,000 | $4,543,527 | |
| 3.375% 8/15/26 | 9,285,000 | 7,526,421 | |
| 12,069,948 | |||
| Nonconvertible Bonds - 89.9% | |||
| Aerospace - 4.0% | |||
| BBA U.S. Holdings, Inc. 5.375% 5/1/26 (a) | 7,334,000 | 6,765,615 | |
| Bombardier, Inc.: | |||
| 6.125% 1/15/23 (a) | 102,000 | 72,930 | |
| 7.5% 12/1/24 (a) | 581,000 | 386,002 | |
| 7.5% 3/15/25 (a) | 10,102,000 | 6,534,731 | |
| 7.875% 4/15/27 (a) | 2,013,000 | 1,303,418 | |
| BWX Technologies, Inc. 5.375% 7/15/26 (a) | 5,995,000 | 6,122,394 | |
| Moog, Inc. 4.25% 12/15/27 (a) | 475,000 | 445,313 | |
| TransDigm UK Holdings PLC 6.875% 5/15/26 | 1,610,000 | 1,376,550 | |
| TransDigm, Inc.: | |||
| 5.5% 11/15/27 (a) | 16,920,000 | 14,297,400 | |
| 6.25% 3/15/26 (a) | 12,871,000 | 12,597,491 | |
| 6.5% 5/15/25 | 801,000 | 716,895 | |
| 7.5% 3/15/27 | 1,455,000 | 1,324,487 | |
| 8% 12/15/25 (a) | 7,155,000 | 7,441,200 | |
| 59,384,426 | |||
| Air Transportation - 0.9% | |||
| Aercap Global Aviation Trust 6.5% 6/15/45 (a)(b) | 13,053,000 | 9,528,690 | |
| XPO Logistics, Inc. 6.25% 5/1/25 (a) | 3,560,000 | 3,604,500 | |
| 13,133,190 | |||
| Banks & Thrifts - 1.3% | |||
| Ally Financial, Inc.: | |||
| 3.875% 5/21/24 | 2,576,000 | 2,530,920 | |
| 5.75% 11/20/25 | 14,300,000 | 14,657,500 | |
| 8% 11/1/31 | 2,332,000 | 2,837,298 | |
| 20,025,718 | |||
| Broadcasting - 2.1% | |||
| Netflix, Inc.: | |||
| 4.875% 4/15/28 | 2,305,000 | 2,451,206 | |
| 5.375% 11/15/29 (a) | 865,000 | 950,030 | |
| 5.875% 11/15/28 | 2,985,000 | 3,375,587 | |
| 6.375% 5/15/29 | 925,000 | 1,084,470 | |
| Sirius XM Radio, Inc.: | |||
| 3.875% 8/1/22 (a) | 2,746,000 | 2,763,163 | |
| 4.625% 7/15/24 (a) | 2,298,000 | 2,343,041 | |
| 5% 8/1/27 (a) | 4,558,000 | 4,661,695 | |
| 5.375% 4/15/25 (a) | 6,694,960 | 6,904,178 | |
| 5.375% 7/15/26 (a) | 6,784,000 | 7,038,400 | |
| 31,571,770 | |||
| Building Materials - 0.4% | |||
| Advanced Drain Systems, Inc. 5% 9/30/27 (a) | 6,029,000 | 5,923,493 | |
| Cable/Satellite TV - 5.4% | |||
| Cablevision Systems Corp. 5.875% 9/15/22 | 25,000 | 26,031 | |
| CCO Holdings LLC/CCO Holdings Capital Corp.: | |||
| 4% 3/1/23 (a) | 164,000 | 165,164 | |
| 4.5% 8/15/30 (a) | 2,885,000 | 2,899,425 | |
| 4.75% 3/1/30 (a) | 4,755,000 | 4,850,100 | |
| 5% 2/1/28 (a) | 5,417,000 | 5,579,510 | |
| 5.125% 5/1/23 (a) | 115,000 | 116,473 | |
| 5.125% 5/1/27 (a) | 5,123,000 | 5,319,467 | |
| 5.5% 5/1/26 (a) | 4,657,000 | 4,843,792 | |
| 5.75% 2/15/26 (a) | 7,889,000 | 8,225,071 | |
| 5.875% 5/1/27 (a) | 8,528,000 | 8,881,379 | |
| CSC Holdings LLC: | |||
| 5.25% 6/1/24 | 33,000 | 34,317 | |
| 5.375% 7/15/23 (a) | 329,000 | 332,701 | |
| 5.5% 5/15/26 (a) | 10,888,000 | 11,295,211 | |
| 5.5% 4/15/27 (a) | 4,086,000 | 4,248,163 | |
| 5.75% 1/15/30 (a) | 2,685,000 | 2,791,561 | |
| 7.5% 4/1/28 (a) | 1,885,000 | 2,071,497 | |
| 7.75% 7/15/25 (a) | 3,770,000 | 3,931,658 | |
| DISH DBS Corp. 5.875% 11/15/24 | 68,000 | 65,405 | |
| Virgin Media Secured Finance PLC 5.5% 8/15/26 (a) | 2,947,000 | 3,041,746 | |
| Ziggo Bond Co. BV 5.125% 2/28/30 (a) | 3,605,000 | 3,550,925 | |
| Ziggo BV 5.5% 1/15/27 (a) | 8,404,000 | 8,548,549 | |
| 80,818,145 | |||
| Capital Goods - 0.5% | |||
| AECOM: | |||
| 5.125% 3/15/27 | 2,960,000 | 3,011,800 | |
| 5.875% 10/15/24 | 4,321,000 | 4,571,618 | |
| 7,583,418 | |||
| Chemicals - 1.7% | |||
| Blue Cube Spinco, Inc.: | |||
| 9.75% 10/15/23 | 85,000 | 88,613 | |
| 10% 10/15/25 | 124,000 | 131,403 | |
| CF Industries Holdings, Inc.: | |||
| 5.15% 3/15/34 | 7,790,000 | 8,101,600 | |
| 5.375% 3/15/44 | 246,000 | 254,610 | |
| Element Solutions, Inc. 5.875% 12/1/25 (a) | 4,248,000 | 4,216,140 | |
| Olin Corp. 5.125% 9/15/27 | 47,000 | 42,930 | |
| The Chemours Co. LLC: | |||
| 5.375% 5/15/27 | 1,038,000 | 871,920 | |
| 6.625% 5/15/23 | 3,636,000 | 3,399,660 | |
| 7% 5/15/25 | 4,953,000 | 4,654,334 | |
| Valvoline, Inc.: | |||
| 4.25% 2/15/30 (a) | 1,100,000 | 1,069,750 | |
| 4.375% 8/15/25 | 32,000 | 32,080 | |
| W. R. Grace & Co.-Conn.: | |||
| 5.125% 10/1/21 (a) | 1,194,000 | 1,199,970 | |
| 5.625% 10/1/24 (a) | 1,513,000 | 1,516,783 | |
| 25,579,793 | |||
| Consumer Products - 0.0% | |||
| Prestige Brands, Inc. 6.375% 3/1/24 (a) | 14,000 | 14,385 | |
| Containers - 1.5% | |||
| Ardagh Packaging Finance PLC/Ardagh MP Holdings U.S.A., Inc. 6% 2/15/25 (a) | 9,378,000 | 9,386,159 | |
| Crown Americas LLC/Crown Americas Capital Corp. IV 4.5% 1/15/23 | 41,000 | 42,033 | |
| OI European Group BV 4% 3/15/23 (a) | 66,000 | 63,690 | |
| Owens-Brockway Glass Container, Inc.: | |||
| 5% 1/15/22 (a) | 130,000 | 131,300 | |
| 5.375% 1/15/25 (a) | 161,000 | 156,975 | |
| Reynolds Group Issuer, Inc./Reynolds Group Issuer LLC/Reynolds Group Issuer (Luxembourg) SA: | |||
| 5.125% 7/15/23 (a) | 2,706,000 | 2,719,530 | |
| 7% 7/15/24 (a) | 3,186,000 | 3,197,788 | |
| Silgan Holdings, Inc. 4.75% 3/15/25 | 23,000 | 23,345 | |
| Trivium Packaging Finance BV: | |||
| 5.5% 8/15/26 (a) | 5,719,000 | 5,861,975 | |
| 8.5% 8/15/27 (a) | 890,000 | 930,050 | |
| 22,512,845 | |||
| Diversified Financial Services - 4.1% | |||
| Chobani LLC/Finance Corp., Inc. 7.5% 4/15/25 (a) | 22,000 | 21,908 | |
| Crown Americas LLC/Crown Americas Capital Corp. IV 4.75% 2/1/26 | 924,000 | 949,410 | |
| FLY Leasing Ltd.: | |||
| 5.25% 10/15/24 | 6,572,000 | 5,257,600 | |
| 6.375% 10/15/21 | 5,167,000 | 4,753,640 | |
| Icahn Enterprises LP/Icahn Enterprises Finance Corp.: | |||
| 4.75% 9/15/24 | 4,960,000 | 4,664,979 | |
| 6.375% 12/15/25 | 6,562,000 | 6,529,190 | |
| MSCI, Inc.: | |||
| 4.75% 8/1/26 (a) | 33,000 | 34,494 | |
| 5.375% 5/15/27 (a) | 110,000 | 118,525 | |
| 5.75% 8/15/25 (a) | 1,704,000 | 1,779,998 | |
| Navient Corp.: | |||
| 6.5% 6/15/22 | 5,254,000 | 5,083,245 | |
| 6.625% 7/26/21 | 79,000 | 78,605 | |
| 7.25% 1/25/22 | 1,067,000 | 1,045,660 | |
| 7.25% 9/25/23 | 3,232,000 | 3,094,640 | |
| Quicken Loans, Inc. 5.25% 1/15/28 (a) | 4,724,000 | 4,586,059 | |
| Radiate Holdco LLC/Radiate Financial Service Ltd.: | |||
| 6.625% 2/15/25 (a) | 2,694,000 | 2,667,060 | |
| 6.875% 2/15/23 (a) | 4,903,000 | 4,804,940 | |
| Springleaf Finance Corp.: | |||
| 6.875% 3/15/25 | 1,911,000 | 1,807,233 | |
| 7.125% 3/15/26 | 5,792,000 | 5,458,960 | |
| Ypso Finance BIS SA 6% 2/15/28 (a) | 8,585,000 | 7,810,633 | |
| 60,546,779 | |||
| Diversified Media - 0.7% | |||
| Nielsen Co. SARL (Luxembourg) 5% 2/1/25 (a) | 3,963,000 | 3,824,295 | |
| Nielsen Finance LLC/Nielsen Finance Co. 5% 4/15/22 (a) | 7,364,000 | 7,254,350 | |
| 11,078,645 | |||
| Energy - 8.5% | |||
| Cheniere Energy Partners LP: | |||
| 5.25% 10/1/25 | 25,422,000 | 24,267,825 | |
| 5.625% 10/1/26 | 2,413,000 | 2,305,863 | |
| Chesapeake Energy Corp.: | |||
| 7% 10/1/24 | 1,425,000 | 28,500 | |
| 8% 1/15/25 | 7,240,000 | 144,800 | |
| 8% 6/15/27 | 6,796,000 | 135,920 | |
| Citgo Petroleum Corp. 6.25% 8/15/22 (a) | 6,536,000 | 6,258,220 | |
| Comstock Escrow Corp. 9.75% 8/15/26 | 6,212,000 | 5,373,442 | |
| Consolidated Energy Finance SA 3 month U.S. LIBOR + 3.750% 4.4905% 6/15/22 (a)(b)(c) | 179,000 | 148,647 | |
| Crestwood Midstream Partners LP/Crestwood Midstream Finance Corp.: | |||
| 5.625% 5/1/27 (a) | 4,035,000 | 2,622,750 | |
| 5.75% 4/1/25 | 238,000 | 171,360 | |
| 6.25% 4/1/23 | 7,651,000 | 5,585,230 | |
| CVR Energy, Inc.: | |||
| 5.25% 2/15/25 (a) | 5,320,000 | 4,362,400 | |
| 5.75% 2/15/28 (a) | 680,000 | 574,947 | |
| DCP Midstream Operating LP 5.375% 7/15/25 | 5,258,000 | 4,258,980 | |
| Denbury Resources, Inc.: | |||
| 7.75% 2/15/24 (a) | 10,746,000 | 1,934,280 | |
| 9% 5/15/21 (a) | 47,000 | 8,460 | |
| 9.25% 3/31/22 (a) | 4,577,000 | 823,860 | |
| EG Global Finance PLC: | |||
| 6.75% 2/7/25 (a) | 3,560,000 | 3,239,600 | |
| 8.5% 10/30/25 (a) | 6,085,000 | 5,932,875 | |
| Hess Infrastructure Partners LP 5.625% 2/15/26 (a) | 6,665,000 | 6,198,450 | |
| Hess Midstream Partners LP 5.125% 6/15/28 (a) | 3,025,000 | 2,650,505 | |
| Hilcorp Energy I LP/Hilcorp Finance Co. 5% 12/1/24 (a) | 3,570,000 | 2,017,050 | |
| Holly Energy Partners LP/Holly Finance Corp.(a) | 4,665,000 | 4,243,751 | |
| Jonah Energy LLC 7.25% 10/15/25 (a) | 9,408,000 | 164,640 | |
| MEG Energy Corp.: | |||
| 7% 3/31/24 (a) | 1,671,000 | 1,186,410 | |
| 7.125% 2/1/27 (a) | 4,005,000 | 2,763,450 | |
| PBF Holding Co. LLC/PBF Finance Corp. 7.25% 6/15/25 | 721,000 | 553,368 | |
| PBF Logistics LP/PBF Logistics Finance, Inc. 6.875% 5/15/23 | 100,000 | 77,000 | |
| Sanchez Energy Corp. 7.25% 2/15/23 (a)(d) | 10,580,000 | 105,800 | |
| Summit Midstream Holdings LLC 5.75% 4/15/25 | 6,458,000 | 1,292,892 | |
| Sunoco LP/Sunoco Finance Corp.: | |||
| 4.875% 1/15/23 | 2,757,000 | 2,681,183 | |
| 5.5% 2/15/26 | 2,308,000 | 2,227,220 | |
| 5.875% 3/15/28 | 875,000 | 831,250 | |
| 6% 4/15/27 | 115,000 | 112,125 | |
| Targa Resources Partners LP/Targa Resources Partners Finance Corp.: | |||
| 4.25% 11/15/23 | 4,313,000 | 3,892,483 | |
| 5.125% 2/1/25 | 10,000 | 9,000 | |
| 5.375% 2/1/27 | 10,000 | 8,500 | |
| 5.875% 4/15/26 | 9,481,000 | 8,414,388 | |
| 6.75% 3/15/24 | 1,558,000 | 1,472,310 | |
| TerraForm Power Operating LLC: | |||
| 4.25% 1/31/23 (a) | 2,904,000 | 2,975,148 | |
| 5% 1/31/28 (a) | 1,355,000 | 1,421,449 | |
| U.S.A. Compression Partners LP: | |||
| 6.875% 4/1/26 | 3,811,000 | 3,067,855 | |
| 6.875% 9/1/27 | 2,097,000 | 1,719,540 | |
| Viper Energy Partners LP 5.375% 11/1/27 (a) | 4,037,000 | 3,613,115 | |
| Weatherford International Ltd. 11% 12/1/24 (a) | 3,224,000 | 2,385,760 | |
| Western Gas Partners LP: | |||
| 4% 7/1/22 | 790,000 | 764,325 | |
| 4.65% 7/1/26 | 305,000 | 269,925 | |
| 5.25% 2/1/50 | 135,000 | 106,313 | |
| 5.3% 3/1/48 | 1,535,000 | 1,155,088 | |
| 126,558,252 | |||
| Entertainment/Film - 0.5% | |||
| Altice Finco SA 7.625% 2/15/25 (a) | 7,680,000 | 7,737,600 | |
| Environmental - 0.9% | |||
| LBC Tank Terminals Holding Netherlands BV 6.875% 5/15/23 (a) | 13,470,000 | 13,133,250 | |
| Food & Drug Retail - 0.3% | |||
| Performance Food Group, Inc. 6.875% 5/1/25 (a) | 4,250,000 | 4,324,375 | |
| Food/Beverage/Tobacco - 4.2% | |||
| Cott Holdings, Inc. 5.5% 4/1/25 (a) | 3,048,000 | 3,063,240 | |
| Darling International, Inc. 5.25% 4/15/27 (a) | 730,000 | 735,548 | |
| ESAL GmbH 6.25% 2/5/23 (a) | 1,835,000 | 1,818,962 | |
| JBS U.S.A. LLC/JBS U.S.A. Finance, Inc.: | |||
| 5.75% 6/15/25 (a) | 15,105,000 | 15,293,964 | |
| 5.875% 7/15/24 (a) | 2,890,000 | 2,947,800 | |
| 6.75% 2/15/28 (a) | 11,672,000 | 12,500,012 | |
| JBS U.S.A. Lux SA / JBS Food Co.: | |||
| 5.5% 1/15/30 (a) | 4,490,000 | 4,546,125 | |
| 6.5% 4/15/29 (a) | 9,811,000 | 10,375,231 | |
| Post Holdings, Inc.: | |||
| 4.625% 4/15/30 (a) | 570,000 | 558,594 | |
| 5% 8/15/26 (a) | 2,617,000 | 2,607,186 | |
| 5.5% 12/15/29 (a) | 2,815,000 | 2,829,075 | |
| 5.625% 1/15/28 (a) | 1,750,000 | 1,780,625 | |
| U.S. Foods, Inc.: | |||
| 5.875% 6/15/24 (a) | 90,000 | 85,725 | |
| 6.25% 4/15/25 (a) | 2,810,000 | 2,873,225 | |
| 62,015,312 | |||
| Gaming - 5.2% | |||
| Boyd Gaming Corp.: | |||
| 4.75% 12/1/27 (a) | 1,933,000 | 1,665,280 | |
| 6% 8/15/26 | 3,636,000 | 3,290,580 | |
| 6.375% 4/1/26 | 3,693,000 | 3,326,285 | |
| Caesars Resort Collection LLC 5.25% 10/15/25 (a) | 10,030,000 | 7,876,559 | |
| Eldorado Resorts, Inc.: | |||
| 6% 4/1/25 | 4,020,000 | 3,859,200 | |
| 6% 9/15/26 | 1,340,000 | 1,346,298 | |
| GLP Capital LP/GLP Financing II, Inc.: | |||
| 5.25% 6/1/25 | 3,642,000 | 3,542,209 | |
| 5.375% 4/15/26 | 1,221,000 | 1,216,421 | |
| Golden Entertainment, Inc. 7.625% 4/15/26 (a) | 7,980,000 | 6,024,900 | |
| MCE Finance Ltd. 4.875% 6/6/25 (a) | 2,855,000 | 2,754,977 | |
| MGM Growth Properties Operating Partnership LP: | |||
| 4.5% 9/1/26 | 5,335,000 | 5,161,613 | |
| 4.5% 1/15/28 | 31,000 | 29,140 | |
| 5.625% 5/1/24 | 7,742,000 | 7,859,756 | |
| 5.75% 2/1/27 | 1,434,000 | 1,451,925 | |
| MGM Mirage, Inc. 5.75% 6/15/25 | 2,163,000 | 2,076,502 | |
| Scientific Games Corp. 5% 10/15/25 (a) | 4,006,000 | 3,498,440 | |
| Stars Group Holdings BV 7% 7/15/26 (a) | 3,833,000 | 3,940,324 | |
| Station Casinos LLC 5% 10/1/25 (a) | 720,000 | 600,264 | |
| Sugarhouse HSP Gaming Prop Mezz LP/Sugarhouse HSP Gaming Finance Corp. 5.875% 5/15/25 (a) | 273,000 | 232,309 | |
| Twin River Worldwide Holdings, Inc. 6.75% 6/1/27 (a) | 3,361,000 | 2,671,995 | |
| Wynn Las Vegas LLC/Wynn Las Vegas Capital Corp. 5.25% 5/15/27 (a) | 6,899,000 | 5,894,333 | |
| Wynn Macau Ltd.: | |||
| 4.875% 10/1/24 (a) | 6,917,000 | 6,657,613 | |
| 5.5% 10/1/27 (a) | 2,575,000 | 2,496,945 | |
| 77,473,868 | |||
| Healthcare - 10.0% | |||
| BCPE Cycle Merger Sub II, Inc. 10.625% 7/15/27 (a) | 1,010,000 | 1,006,213 | |
| Catalent Pharma Solutions 4.875% 1/15/26 (a) | 1,007,000 | 1,022,105 | |
| Centene Corp.: | |||
| 4.25% 12/15/27 (a) | 1,595,000 | 1,668,769 | |
| 5.25% 4/1/25 (a) | 4,278,000 | 4,459,815 | |
| 5.375% 8/15/26 (a) | 5,965,000 | 6,353,322 | |
| Charles River Laboratories International, Inc.: | |||
| 4.25% 5/1/28 (a) | 472,000 | 476,130 | |
| 5.5% 4/1/26 (a) | 2,695,000 | 2,771,538 | |
| Community Health Systems, Inc.: | |||
| 6.25% 3/31/23 | 523,000 | 486,390 | |
| 8% 3/15/26 (a) | 10,019,000 | 9,604,013 | |
| 8.625% 1/15/24 (a) | 8,242,000 | 8,035,950 | |
| CTR Partnership LP/CareTrust Capital Corp. 5.25% 6/1/25 | 4,651,000 | 4,645,186 | |
| HCA Holdings, Inc.: | |||
| 4.5% 2/15/27 | 55,000 | 59,451 | |
| 5% 3/15/24 | 40,000 | 43,678 | |
| 5.25% 6/15/26 | 2,980,000 | 3,320,637 | |
| 5.375% 2/1/25 | 265,000 | 284,912 | |
| 5.375% 9/1/26 | 3,032,000 | 3,282,140 | |
| 5.875% 5/1/23 | 7,614,000 | 8,192,359 | |
| Hologic, Inc.: | |||
| 4.375% 10/15/25 (a) | 2,967,000 | 2,980,648 | |
| 4.625% 2/1/28 (a) | 6,000 | 6,090 | |
| IMS Health, Inc. 5% 5/15/27 (a) | 4,387,000 | 4,506,283 | |
| MPH Acquisition Holdings LLC 7.125% 6/1/24 (a) | 6,234,000 | 5,555,865 | |
| MPT Operating Partnership LP/MPT Finance Corp.: | |||
| 5.25% 8/1/26 | 2,072,000 | 2,092,720 | |
| 5.5% 5/1/24 | 1,713,000 | 1,704,435 | |
| 6.375% 3/1/24 | 2,694,000 | 2,782,067 | |
| Service Corp. International 5.125% 6/1/29 | 2,272,000 | 2,362,880 | |
| Teleflex, Inc. 4.875% 6/1/26 | 3,382,000 | 3,432,730 | |
| Tenet Healthcare Corp.: | |||
| 4.625% 7/15/24 | 21,000 | 20,723 | |
| 4.875% 1/1/26 (a) | 2,570,000 | 2,545,071 | |
| 5.125% 5/1/25 | 2,027,000 | 1,895,245 | |
| 6.25% 2/1/27 (a) | 6,226,000 | 6,130,120 | |
| 6.75% 6/15/23 | 10,414,000 | 10,403,586 | |
| 7% 8/1/25 | 9,720,000 | 9,035,712 | |
| 7.5% 4/1/25 (a) | 4,165,000 | 4,479,458 | |
| 8.125% 4/1/22 | 12,590,000 | 12,688,202 | |
| Valeant Pharmaceuticals International, Inc.: | |||
| 5.5% 11/1/25 (a) | 3,916,000 | 4,070,682 | |
| 5.875% 5/15/23 (a) | 189,000 | 187,583 | |
| 7% 3/15/24 (a) | 3,285,000 | 3,408,812 | |
| 8.5% 1/31/27 (a) | 2,946,000 | 3,247,670 | |
| 9% 12/15/25 (a) | 4,871,000 | 5,311,826 | |
| 9.25% 4/1/26 (a) | 4,165,000 | 4,581,500 | |
| Vizient, Inc. 6.25% 5/15/27 (a) | 385,000 | 404,520 | |
| 149,547,036 | |||
| Homebuilders/Real Estate - 2.0% | |||
| Alliant Holdings Intermediate LLC 6.75% 10/15/27 (a) | 12,190,000 | 12,160,744 | |
| Howard Hughes Corp. 5.375% 3/15/25 (a) | 5,982,000 | 5,798,592 | |
| Starwood Property Trust, Inc.: | |||
| 4.75% 3/15/25 | 3,421,000 | 2,890,745 | |
| 5% 12/15/21 | 98,000 | 91,630 | |
| VICI Properties, Inc.: | |||
| 3.5% 2/15/25 (a) | 2,030,000 | 1,903,125 | |
| 4.25% 12/1/26 (a) | 2,955,000 | 2,761,713 | |
| 4.625% 12/1/29 (a) | 3,990,000 | 3,685,763 | |
| 29,292,312 | |||
| Hotels - 0.5% | |||
| Hilton Domestic Operating Co., Inc.: | |||
| 4.25% 9/1/24 | 2,236,000 | 2,170,318 | |
| 5.125% 5/1/26 | 5,924,000 | 5,848,765 | |
| Hilton Worldwide Finance LLC/Hilton Worldwide Finance Corp. 4.875% 4/1/27 | 12,000 | 11,635 | |
| Wyndham Hotels & Resorts, Inc. 5.375% 4/15/26 (a) | 38,000 | 34,770 | |
| 8,065,488 | |||
| Insurance - 1.2% | |||
| AmWINS Group, Inc. 7.75% 7/1/26 (a) | 8,587,000 | 8,844,610 | |
| USIS Merger Sub, Inc. 6.875% 5/1/25 (a) | 9,449,000 | 9,472,623 | |
| 18,317,233 | |||
| Leisure - 0.5% | |||
| Mattel, Inc.: | |||
| 5.875% 12/15/27 (a) | 155,000 | 151,513 | |
| 6.75% 12/31/25 (a) | 7,323,000 | 7,432,845 | |
| 7,584,358 | |||
| Metals/Mining - 0.9% | |||
| First Quantum Minerals Ltd.: | |||
| 6.5% 3/1/24 (a) | 2,641,000 | 2,297,670 | |
| 7.25% 4/1/23 (a) | 3,410,000 | 3,060,475 | |
| FMG Resources (August 2006) Pty Ltd. 4.5% 9/15/27 (a) | 65,000 | 63,505 | |
| Freeport-McMoRan, Inc.: | |||
| 3.55% 3/1/22 | 16,000 | 16,123 | |
| 3.875% 3/15/23 | 2,066,000 | 2,060,835 | |
| Nufarm Australia Ltd. 5.75% 4/30/26 (a) | 5,812,000 | 5,463,280 | |
| 12,961,888 | |||
| Paper - 0.9% | |||
| Berry Global Escrow Corp. 4.875% 7/15/26 (a) | 3,396,000 | 3,468,802 | |
| Flex Acquisition Co., Inc.: | |||
| 6.875% 1/15/25 (a) | 7,499,000 | 7,262,407 | |
| 7.875% 7/15/26 (a) | 3,388,000 | 3,252,480 | |
| 13,983,689 | |||
| Restaurants - 1.3% | |||
| 1011778 BC Unlimited Liability Co./New Red Finance, Inc.: | |||
| 4.25% 5/15/24 (a) | 4,770,000 | 4,768,521 | |
| 5% 10/15/25 (a) | 1,804,000 | 1,813,020 | |
| 5.75% 4/15/25 (a) | 1,340,000 | 1,413,700 | |
| Golden Nugget, Inc. 6.75% 10/15/24 (a) | 7,388,000 | 5,762,640 | |
| KFC Holding Co./Pizza Hut Holding LLC 5% 6/1/24 (a) | 312,000 | 321,479 | |
| Yum! Brands, Inc. 7.75% 4/1/25 (a) | 5,105,000 | 5,565,088 | |
| 19,644,448 | |||
| Services - 4.1% | |||
| Aramark Services, Inc.: | |||
| 4.75% 6/1/26 | 265,000 | 253,075 | |
| 5% 4/1/25 (a) | 3,171,000 | 3,083,798 | |
| 5% 2/1/28 (a) | 7,765,000 | 7,411,304 | |
| 6.375% 5/1/25 (a) | 5,940,000 | 6,177,600 | |
| ASGN, Inc. 4.625% 5/15/28 (a) | 1,770,000 | 1,632,294 | |
| Avantor, Inc. 6% 10/1/24 (a) | 247,000 | 260,338 | |
| Brand Energy & Infrastructure Services, Inc. 8.5% 7/15/25 (a) | 4,052,000 | 2,998,480 | |
| CDK Global, Inc.: | |||
| 4.875% 6/1/27 | 15,000 | 14,963 | |
| 5.25% 5/15/29 (a) | 745,000 | 759,900 | |
| 5.875% 6/15/26 | 2,899,000 | 3,036,703 | |
| CoreCivic, Inc.: | |||
| 4.625% 5/1/23 | 1,337,000 | 1,263,465 | |
| 5% 10/15/22 | 5,682,000 | 5,459,834 | |
| Frontdoor, Inc. 6.75% 8/15/26 (a) | 1,942,000 | 2,014,825 | |
| GEMS MENASA Cayman Ltd. 7.125% 7/31/26 (a) | 7,846,000 | 7,201,157 | |
| Laureate Education, Inc. 8.25% 5/1/25 (a) | 5,945,000 | 6,072,818 | |
| Tempo Acquisition LLC: | |||
| 5.75% 6/1/25 (a) | 2,340,000 | 2,375,100 | |
| 6.75% 6/1/25 (a) | 7,683,000 | 7,452,510 | |
| The GEO Group, Inc.: | |||
| 5.875% 10/15/24 | 1,116,000 | 881,640 | |
| 6% 4/15/26 | 4,190,000 | 3,173,925 | |
| 61,523,729 | |||
| Steel - 0.4% | |||
| Allegheny Technologies, Inc. 5.875% 12/1/27 | 6,400,000 | 5,280,000 | |
| Super Retail - 0.3% | |||
| The William Carter Co. 5.625% 3/15/27 (a) | 4,251,000 | 4,309,494 | |
| Technology - 6.0% | |||
| Ascend Learning LLC: | |||
| 6.875% 8/1/25 (a) | 793,000 | 785,070 | |
| 6.875% 8/1/25 (a) | 5,259,000 | 5,206,410 | |
| Banff Merger Sub, Inc. 9.75% 9/1/26 (a) | 9,900,000 | 8,885,250 | |
| Camelot Finance SA 4.5% 11/1/26 (a) | 3,870,000 | 3,899,025 | |
| Ensemble S Merger Sub, Inc. 9% 9/30/23 (a) | 7,006,000 | 7,017,560 | |
| Entegris, Inc. 4.375% 4/15/28 (a) | 3,105,000 | 3,108,881 | |
| Fair Isaac Corp. 5.25% 5/15/26 (a) | 1,581,000 | 1,632,383 | |
| Financial & Risk U.S. Holdings, Inc. 8.25% 11/15/26 (a) | 2,064,000 | 2,239,440 | |
| Gartner, Inc. 5.125% 4/1/25 (a) | 11,000 | 11,344 | |
| Match Group, Inc. 4.125% 8/1/30 (a) | 1,135,000 | 1,100,950 | |
| Nortonlifelock, Inc.: | |||
| 4.2% 9/15/20 | 2,212,000 | 2,214,765 | |
| 5% 4/15/25 (a) | 5,043,000 | 5,074,519 | |
| Nuance Communications, Inc. 5.625% 12/15/26 | 4,915,000 | 5,151,903 | |
| Open Text Corp. 3.875% 2/15/28 (a) | 2,815,000 | 2,744,625 | |
| Qorvo, Inc. 5.5% 7/15/26 | 4,473,000 | 4,696,650 | |
| Rackspace Hosting, Inc. 8.625% 11/15/24 (a) | 13,486,000 | 13,285,328 | |
| Sensata Technologies BV 5% 10/1/25 (a) | 64,000 | 63,654 | |
| Solera LLC/Solera Finance, Inc. 10.5% 3/1/24 (a) | 4,708,000 | 4,684,460 | |
| SS&C Technologies, Inc. 5.5% 9/30/27 (a) | 7,899,000 | 8,096,475 | |
| TTM Technologies, Inc. 5.625% 10/1/25 (a) | 9,454,000 | 9,040,388 | |
| 88,939,080 | |||
| Telecommunications - 15.2% | |||
| Altice Financing SA 7.5% 5/15/26 (a) | 12,375,000 | 12,900,938 | |
| C&W Senior Financing Designated Activity Co.: | |||
| 6.875% 9/15/27 (a) | 18,330,000 | 18,100,875 | |
| 7.5% 10/15/26 (a) | 12,342,000 | 12,344,715 | |
| Century Telephone Enterprises, Inc. 6.875% 1/15/28 | 260,000 | 269,100 | |
| CenturyLink, Inc.: | |||
| 5.125% 12/15/26 (a) | 8,125,000 | 7,698,438 | |
| 5.625% 4/1/25 | 2,775,000 | 2,775,000 | |
| Cogent Communications Group, Inc. 5.375% 3/1/22 (a) | 2,531,000 | 2,564,915 | |
| Front Range BidCo, Inc.: | |||
| 4% 3/1/27 (a) | 2,600,000 | 2,521,558 | |
| 6.125% 3/1/28 (a) | 3,040,000 | 2,865,261 | |
| Frontier Communications Corp. 8% 4/1/27 (a)(d) | 13,860,000 | 14,133,042 | |
| Intelsat Jackson Holdings SA: | |||
| 8% 2/15/24 (a) | 6,820,000 | 7,002,776 | |
| 8.5% 10/15/24 (a) | 4,778,000 | 2,771,240 | |
| Level 3 Financing, Inc.: | |||
| 5.125% 5/1/23 | 564,000 | 562,590 | |
| 5.375% 1/15/24 | 14,984,000 | 15,096,380 | |
| 5.375% 5/1/25 | 201,000 | 204,015 | |
| Millicom International Cellular SA: | |||
| 5.125% 1/15/28 (a) | 4,000,000 | 3,692,500 | |
| 6% 3/15/25 (a) | 2,565,000 | 2,570,643 | |
| 6.625% 10/15/26 (a) | 7,662,000 | 7,815,240 | |
| Neptune Finco Corp.: | |||
| 6.625% 10/15/25 (a) | 7,107,000 | 7,432,856 | |
| 10.875% 10/15/25 (a) | 355,000 | 383,737 | |
| Sable International Finance Ltd. 5.75% 9/7/27 (a) | 830,000 | 830,000 | |
| SFR Group SA: | |||
| 7.375% 5/1/26 (a) | 15,724,000 | 16,431,580 | |
| 8.125% 2/1/27 (a) | 7,717,000 | 8,315,068 | |
| Sprint Capital Corp. 6.875% 11/15/28 | 5,220,000 | 6,286,707 | |
| Sprint Communications, Inc. 6% 11/15/22 | 12,281,000 | 12,988,508 | |
| Sprint Corp.: | |||
| 7.125% 6/15/24 | 3,935,000 | 4,417,038 | |
| 7.875% 9/15/23 | 15,515,000 | 17,451,272 | |
| T-Mobile U.S.A., Inc.: | |||
| 3.75% 4/15/27 (a) | 4,165,000 | 4,465,005 | |
| 3.875% 4/15/30 (a) | 4,165,000 | 4,555,885 | |
| 4.5% 2/1/26 | 32,000 | 32,970 | |
| 6.375% 3/1/25 | 10,725,000 | 11,006,531 | |
| Telecom Italia Capital SA: | |||
| 6% 9/30/34 | 2,727,000 | 2,824,899 | |
| 6.375% 11/15/33 | 1,530,000 | 1,648,728 | |
| Telecom Italia SpA 5.303% 5/30/24 (a) | 5,517,000 | 5,737,625 | |
| Telenet Finance Luxembourg Notes SARL 5.5% 3/1/28 (a) | 5,400,000 | 5,508,000 | |
| 226,205,635 | |||
| Utilities - 4.4% | |||
| Clearway Energy Operating LLC: | |||
| 4.75% 3/15/28 (a) | 955,000 | 971,713 | |
| 5.75% 10/15/25 | 25,000 | 25,748 | |
| DCP Midstream Operating LP 5.125% 5/15/29 | 6,994,000 | 5,208,432 | |
| Dynegy, Inc. 5.875% 6/1/23 | 28,000 | 28,280 | |
| Global Partners LP/GLP Finance Corp.: | |||
| 7% 6/15/23 | 3,429,000 | 2,983,230 | |
| 7% 8/1/27 | 3,643,000 | 2,931,886 | |
| InterGen NV 7% 6/30/23 (a) | 15,134,000 | 13,431,425 | |
| NextEra Energy Partners LP: | |||
| 4.25% 9/15/24 (a) | 4,580,000 | 4,648,700 | |
| 4.5% 9/15/27 (a) | 8,000 | 8,210 | |
| NRG Energy, Inc.: | |||
| 5.25% 6/15/29 (a) | 3,365,000 | 3,604,756 | |
| 5.75% 1/15/28 | 4,384,000 | 4,712,800 | |
| 6.625% 1/15/27 | 38,000 | 40,565 | |
| 7.25% 5/15/26 | 21,000 | 22,575 | |
| NRG Yield Operating LLC 5% 9/15/26 | 1,810,000 | 1,819,050 | |
| NSG Holdings II LLC/NSG Holdings, Inc. 7.75% 12/15/25 (a) | 2,866,125 | 2,887,621 | |
| Talen Energy Supply LLC 10.5% 1/15/26 (a) | 1,831,000 | 1,510,703 | |
| The AES Corp.: | |||
| 4.5% 3/15/23 | 22,000 | 21,950 | |
| 4.875% 5/15/23 | 47,000 | 47,343 | |
| 5.125% 9/1/27 | 1,756,000 | 1,830,630 | |
| 6% 5/15/26 | 208,000 | 217,506 | |
| Vistra Operations Co. LLC: | |||
| 5% 7/31/27 (a) | 6,324,000 | 6,449,848 | |
| 5.5% 9/1/26 (a) | 8,542,000 | 8,793,989 | |
| 5.625% 2/15/27 (a) | 3,595,000 | 3,783,738 | |
| 65,980,698 | |||
| TOTAL NONCONVERTIBLE BONDS | 1,341,050,352 | ||
| TOTAL CORPORATE BONDS | |||
| (Cost $1,445,395,707) | 1,353,120,300 | ||
| Shares | Value | ||
| Common Stocks - 1.2% | |||
| Energy - 0.0% | |||
| Weatherford International PLC (e) | 24,110 | 108,495 | |
| Food & Drug Retail - 1.2% | |||
| Southeastern Grocers, Inc. (e)(f) | 436,231 | 17,689,167 | |
| Metals/Mining - 0.0% | |||
| Aleris Corp. (e)(f) | 46,900 | 0 | |
| Elah Holdings, Inc. (e) | 333 | 17,316 | |
| TOTAL METALS/MINING | 17,316 | ||
| TOTAL COMMON STOCKS | |||
| (Cost $16,720,786) | 17,814,978 | ||
| Convertible Preferred Stocks - 0.2% | |||
| Telecommunications - 0.2% | |||
| Crown Castle International Corp. Series A, 6.875% | |||
| (Cost $1,463,147) | 1,450 | 2,042,905 | |
| Principal Amount | Value | ||
| Bank Loan Obligations - 1.2% | |||
| Cable/Satellite TV - 0.0% | |||
| WideOpenWest Finance LLC Tranche B, term loan 3 month U.S. LIBOR + 3.250% 4.25% 8/19/23(b)(c)(g) | 432,781 | 400,729 | |
| Energy - 0.4% | |||
| California Resources Corp.: | |||
| Tranche 1LN, term loan 3 month U.S. LIBOR + 10.375% 11.9883% 12/31/21 (b)(c)(g) | 6,466,000 | 230,384 | |
| Tranche B, term loan 3 month U.S. LIBOR + 4.750% 6.3633% 12/31/22 (b)(c)(g) | 6,484,000 | 1,422,849 | |
| Gavilan Resources LLC Tranche 2LN, term loan 3 month U.S. LIBOR + 6.000% 6.9894% 3/1/24 (b)(c)(g) | 7,786,000 | 661,810 | |
| Sanchez Energy Corp.: | |||
| 1LN, term loan 3 month U.S. LIBOR + 8.000% 0% 5/11/20(c)(d)(f)(g) | 2,735,146 | 2,188,117 | |
| term loan 7.25% 12/31/49 (b)(d)(f)(g) | 1,217,000 | 973,600 | |
| TOTAL ENERGY | 5,476,760 | ||
| Insurance - 0.2% | |||
| HUB International Ltd. Tranche B, term loan 3 month U.S. LIBOR + 2.750% 4.5435% 4/25/25 (b)(c)(g) | 3,809,131 | 3,560,662 | |
| Services - 0.0% | |||
| Almonde, Inc. Tranche B 1LN, term loan 3 month U.S. LIBOR + 3.500% 4.5% 6/13/24 (b)(c)(g) | 348,120 | 301,027 | |
| Telecommunications - 0.6% | |||
| Intelsat Jackson Holdings SA: | |||
| Tranche B, term loan 3 month U.S. LIBOR + 3.750% 5.682% 11/27/23 (b)(c)(g) | 5,360,000 | 5,249,798 | |
| Tranche B-4, term loan 3 month U.S. LIBOR + 4.500% 6.432% 1/2/24 (b)(c)(g) | 475,000 | 468,402 | |
| Radiate Holdco LLC Tranche B, term loan 3 month U.S. LIBOR + 3.000% 3.75% 2/1/24 (b)(c)(g) | 2,441,234 | 2,330,988 | |
| TOTAL TELECOMMUNICATIONS | 8,049,188 | ||
| TOTAL BANK LOAN OBLIGATIONS | |||
| (Cost $30,506,821) | 17,788,366 | ||
| Preferred Securities - 2.6% | |||
| Banks & Thrifts - 2.2% | |||
| Bank of America Corp.: | |||
| 5.2% (b)(h) | 549,000 | 545,220 | |
| 5.875% (b)(h) | 27,000 | 27,743 | |
| 6.25% (b)(h) | 10,521,000 | 11,066,873 | |
| 6.5% (b)(h) | 13,000 | 13,863 | |
| Barclays PLC 7.875% (Reg. S) (b)(h) | 4,681,000 | 4,680,257 | |
| Citigroup, Inc. 4.7% (b)(h) | 3,485,000 | 3,076,517 | |
| JPMorgan Chase & Co. 4.6% (b)(h) | 7,870,000 | 7,157,382 | |
| Royal Bank of Scotland Group PLC 7.5% (b)(h) | 3,239,000 | 3,112,361 | |
| Wells Fargo & Co. 5.9% (b)(h) | 3,392,000 | 3,518,338 | |
| TOTAL BANKS & THRIFTS | 33,198,554 | ||
| Diversified Financial Services - 0.4% | |||
| AerCap Holdings NV 5.875% 10/10/79 (b) | 8,354,000 | 5,604,461 | |
| Energy - 0.0% | |||
| MPLX LP 6.875% (b)(h) | 41,000 | 30,068 | |
| Summit Midstream Partners LP 9.5% (b)(h) | 3,512,000 | 476,987 | |
| TOTAL ENERGY | 507,055 | ||
| TOTAL PREFERRED SECURITIES | |||
| (Cost $46,748,464) | 39,310,070 | ||
| Shares | Value | ||
| Money Market Funds - 3.1% | |||
| Fidelity Cash Central Fund 0.16% (i) | |||
| (Cost $46,592,862) | 46,582,916 | 46,596,891 | |
| TOTAL INVESTMENT IN SECURITIES - 99.0% | |||
| (Cost $1,587,427,787) | 1,476,673,510 | ||
| NET OTHER ASSETS (LIABILITIES) - 1.0% | 14,858,952 | ||
| NET ASSETS - 100% | $1,491,532,462 |
Legend
(a) Security exempt from registration under Rule 144A of the Securities Act of 1933. These securities may be resold in transactions exempt from registration, normally to qualified institutional buyers. At the end of the period, the value of these securities amounted to $935,830,204 or 62.7% of net assets.
(b) Coupon rates for floating and adjustable rate securities reflect the rates in effect at period end.
(c) Coupon is indexed to a floating interest rate which may be multiplied by a specified factor and/or subject to caps or floors.
(d) Non-income producing - Security is in default.
(e) Non-income producing
(f) Level 3 security
(g) Remaining maturities of bank loan obligations may be less than the stated maturities shown as a result of contractual or optional prepayments by the borrower. Such prepayments cannot be predicted with certainty.
(h) Security is perpetual in nature with no stated maturity date.
(i) Affiliated fund that is generally available only to investment companies and other accounts managed by Fidelity Investments. The rate quoted is the annualized seven-day yield of the fund at period end. A complete unaudited listing of the fund's holdings as of its most recent quarter end is available upon request. In addition, each Fidelity Central Fund's financial statements, which are not covered by the Fund's Report of Independent Registered Public Accounting Firm, are available on the SEC's website or upon request.
Affiliated Central Funds
Information regarding fiscal year to date income earned by the Fund from investments in Fidelity Central Funds is as follows:
| Fund | Income earned |
| Fidelity Cash Central Fund | $798,840 |
| Fidelity Securities Lending Cash Central Fund | 280 |
| Total | $799,120 |
Amounts in the income column in the above table include any capital gain distributions from underlying funds, which are presented in the corresponding line-item in the Statement of Operations, if applicable. Amount for Fidelity Securities Lending Cash Central Fund represents the income earned on investing cash collateral, less rebates paid to borrowers and any lending agent fees associated with the loan, plus any premium payments received for lending certain types of securities.
Investment Valuation
The following is a summary of the inputs used, as of April 30, 2020, involving the Fund's assets and liabilities carried at fair value. The inputs or methodology used for valuing securities may not be an indication of the risk associated with investing in those securities. For more information on valuation inputs, and their aggregation into the levels used below, please refer to the Investment Valuation section in the accompanying Notes to Financial Statements.
| Valuation Inputs at Reporting Date: | ||||
| Description | Total | Level 1 | Level 2 | Level 3 |
| Investments in Securities: | ||||
| Equities: | ||||
| Consumer Staples | $17,689,167 | $-- | $-- | $17,689,167 |
| Energy | 108,495 | 108,495 | -- | -- |
| Materials | 17,316 | 17,316 | -- | -- |
| Real Estate | 2,042,905 | -- | 2,042,905 | -- |
| Corporate Bonds | 1,353,120,300 | -- | 1,353,120,300 | -- |
| Bank Loan Obligations | 17,788,366 | -- | 14,626,649 | 3,161,717 |
| Preferred Securities | 39,310,070 | -- | 39,310,070 | -- |
| Money Market Funds | 46,596,891 | 46,596,891 | -- | -- |
| Total Investments in Securities: | $1,476,673,510 | $46,722,702 | $1,409,099,924 | $20,850,884 |
The following is a reconciliation of Investments in Securities for which Level 3 inputs were used in determining value:
| Investments in Securities: | |
| Equities - Consumer Staples | |
| Beginning Balance | $15,302,983 |
| Net Realized Gain (Loss) on Investment Securities | -- |
| Net Unrealized Gain (Loss) on Investment Securities | 2,386,184 |
| Cost of Purchases | -- |
| Proceeds of Sales | -- |
| Amortization/Accretion | -- |
| Transfers into Level 3 | -- |
| Transfers out of Level 3 | -- |
| Ending Balance | $17,689,167 |
| The change in unrealized gain (loss) for the period attributable to Level 3 securities held at April 30, 2020 | $2,386,184 |
| Equities - Other Investments in Securities | |
| Beginning Balance | $631,808 |
| Net Realized Gain (Loss) on Investment Securities | 145,491 |
| Net Unrealized Gain (Loss) on Investment Securities | (1,402,871) |
| Cost of Purchases | 5,860,093 |
| Proceeds of Sales | (2,217,570) |
| Amortization/Accretion | 166,744 |
| Transfers into Level 3 | -- |
| Transfers out of Level 3 | (21,978) |
| Ending Balance | $3,161,717 |
| The change in unrealized gain (loss) for the period attributable to Level 3 securities held at April 30, 2020 | $(793,041) |
The information used in the above reconciliations represents fiscal year to date activity for any Investments in Securities identified as using Level 3 inputs at either the beginning or the end of the current fiscal period, and includes securities received through affiliated in-kind transactions. See Note 5 of the Notes to Financial Statements. Transfers in or out of Level 3 represent the beginning value of any Security or Instrument where a change in the pricing level occurred from the beginning to the end of the period. The cost of purchases and the proceeds of sales may include securities received or delivered through corporate actions or exchanges. Realized and unrealized gains (losses) disclosed in the reconciliations are included in Net Gain (Loss) on the Fund's Statement of Operations.
Other Information
Distribution of investments by country or territory of incorporation, as a percentage of Total Net Assets, is as follows (Unaudited):
| United States of America | 76.2% |
| Luxembourg | 5.1% |
| Netherlands | 3.8% |
| Multi-National | 3.7% |
| Canada | 2.8% |
| Ireland | 2.0% |
| France | 1.7% |
| Cayman Islands | 1.5% |
| United Kingdom | 1.4% |
| Others (Individually Less Than 1%) | 1.8% |
| 100.0% |
See accompanying notes which are an integral part of the financial statements.
Financial Statements
Statement of Assets and Liabilities
| April 30, 2020 | ||
| Assets | ||
| Investment in securities, at value — See accompanying schedule: Unaffiliated issuers (cost $1,540,834,925) | $1,430,076,619 | |
| Fidelity Central Funds (cost $46,592,862) | 46,596,891 | |
| Total Investment in Securities (cost $1,587,427,787) | $1,476,673,510 | |
| Receivable for investments sold | 8,850,712 | |
| Receivable for fund shares sold | 515,528 | |
| Dividends receivable | 24,923 | |
| Interest receivable | 22,341,517 | |
| Distributions receivable from Fidelity Central Funds | 4,169 | |
| Total assets | 1,508,410,359 | |
| Liabilities | ||
| Payable for investments purchased | $15,078,361 | |
| Payable for fund shares redeemed | 1,787,563 | |
| Other payables and accrued expenses | 11,973 | |
| Total liabilities | 16,877,897 | |
| Net Assets | $1,491,532,462 | |
| Net Assets consist of: | ||
| Paid in capital | $1,933,178,151 | |
| Total accumulated earnings (loss) | (441,645,689) | |
| Net Assets | $1,491,532,462 | |
| Net Asset Value, offering price and redemption price per share ($1,491,532,462 ÷ 174,749,730 shares) | $8.54 |
See accompanying notes which are an integral part of the financial statements.
Statement of Operations
| Year ended April 30, 2020 | ||
| Investment Income | ||
| Dividends | $2,499,553 | |
| Interest | 93,587,059 | |
| Income from Fidelity Central Funds (including $280 from security lending) | 799,120 | |
| Total income | 96,885,732 | |
| Expenses | ||
| Custodian fees and expenses | $16,369 | |
| Independent trustees' fees and expenses | 9,500 | |
| Miscellaneous | 4,645 | |
| Total expenses before reductions | 30,514 | |
| Expense reductions | (13,974) | |
| Total expenses after reductions | 16,540 | |
| Net investment income (loss) | 96,869,192 | |
| Realized and Unrealized Gain (Loss) | ||
| Net realized gain (loss) on: | ||
| Investment securities: | ||
| Unaffiliated issuers | (30,162,277) | |
| Fidelity Central Funds | 5,153 | |
| Total net realized gain (loss) | (30,157,124) | |
| Change in net unrealized appreciation (depreciation) on: | ||
| Investment securities: | ||
| Unaffiliated issuers | (135,779,107) | |
| Fidelity Central Funds | 1,090 | |
| Total change in net unrealized appreciation (depreciation) | (135,778,017) | |
| Net gain (loss) | (165,935,141) | |
| Net increase (decrease) in net assets resulting from operations | $(69,065,949) |
See accompanying notes which are an integral part of the financial statements.
Statement of Changes in Net Assets
| Year ended April 30, 2020 | Year ended April 30, 2019 | |
| Increase (Decrease) in Net Assets | ||
| Operations | ||
| Net investment income (loss) | $96,869,192 | $164,663,192 |
| Net realized gain (loss) | (30,157,124) | (76,864,585) |
| Change in net unrealized appreciation (depreciation) | (135,778,017) | 54,057,179 |
| Net increase (decrease) in net assets resulting from operations | (69,065,949) | 141,855,786 |
| Distributions to shareholders | (100,751,571) | (167,180,454) |
| Share transactions | ||
| Proceeds from sales of shares | 238,271,398 | 156,636,382 |
| Reinvestment of distributions | 100,586,768 | 167,180,454 |
| Cost of shares redeemed | (188,249,664) | (1,671,555,581) |
| Net increase (decrease) in net assets resulting from share transactions | 150,608,502 | (1,347,738,745) |
| Total increase (decrease) in net assets | (19,209,018) | (1,373,063,413) |
| Net Assets | ||
| Beginning of period | 1,510,741,480 | 2,883,804,893 |
| End of period | $1,491,532,462 | $1,510,741,480 |
| Other Information | ||
| Shares | ||
| Sold | 25,321,877 | 16,663,280 |
| Issued in reinvestment of distributions | 10,832,064 | 17,863,731 |
| Redeemed | (20,475,888) | (177,266,032) |
| Net increase (decrease) | 15,678,053 | (142,739,021) |
See accompanying notes which are an integral part of the financial statements.
Financial Highlights
Fidelity Series High Income Fund
| Years ended April 30, | 2020 | 2019 | 2018 | 2017 | 2016 |
| Selected Per–Share Data | |||||
| Net asset value, beginning of period | $9.50 | $9.56 | $9.68 | $8.96 | $9.87 |
| Income from Investment Operations | |||||
| Net investment income (loss)A | .577 | .607 | .623 | .557 | .550 |
| Net realized and unrealized gain (loss) | (.935) | (.051) | (.141) | .687 | (.867) |
| Total from investment operations | (.358) | .556 | .482 | 1.244 | (.317) |
| Distributions from net investment income | (.598) | (.616) | (.602) | (.524) | (.546) |
| Distributions from net realized gain | (.004) | – | – | – | (.047) |
| Total distributions | (.602) | (.616) | (.602) | (.524) | (.593) |
| Net asset value, end of period | $8.54 | $9.50 | $9.56 | $9.68 | $8.96 |
| Total ReturnB | (4.11)% | 6.12% | 5.08% | 14.25% | (3.08)% |
| Ratios to Average Net AssetsC,D | |||||
| Expenses before reductions | - %E | - %E | .06% | .69% | .69% |
| Expenses net of fee waivers, if any | - %E | - %E | .05% | .69% | .69% |
| Expenses net of all reductions | - %E | - %E | .05% | .69% | .69% |
| Net investment income (loss) | 6.20% | 6.44% | 6.44% | 6.00% | 6.07% |
| Supplemental Data | |||||
| Net assets, end of period (000 omitted) | $1,491,532 | $1,510,741 | $2,883,805 | $1,285,072 | $2,417,317 |
| Portfolio turnover rateF | 41%G | 69% | 49% | 44% | 34% |
A Calculated based on average shares outstanding during the period.
B Total returns would have been lower if certain expenses had not been reduced during the applicable periods shown.
C Fees and expenses of any underlying Fidelity Central Funds are not included in the Fund's expense ratio. The Fund indirectly bears its proportionate share of the expenses of any underlying Fidelity Central Funds.
D Expense ratios reflect operating expenses of the Fund. Expenses before reductions do not reflect amounts reimbursed by the investment adviser or reductions from brokerage service arrangements or reductions from other expense offset arrangements and do not represent the amount paid by the Fund during periods when reimbursements or reductions occur. Expenses net of fee waivers reflect expenses after reimbursement by the investment adviser but prior to reductions from brokerage service arrangements or other expense offset arrangements. Expenses net of all reductions represent the net expenses paid by the Fund.
E Amount represents less than .005%.
F Amount does not include the portfolio activity of any underlying Fidelity Central Funds.
G Portfolio turnover rate excludes securities received or delivered in-kind.
See accompanying notes which are an integral part of the financial statements.
Notes to Financial Statements
For the period ended April 30, 2020
1. Organization.
Fidelity Series High Income Fund (the Fund) is a fund of Fidelity Summer Street Trust (the Trust) and is authorized to issue an unlimited number of shares. Shares are offered only to certain other Fidelity funds and Fidelity managed 529 plans. The Trust is registered under the Investment Company Act of 1940, as amended (the 1940 Act), as an open-end management investment company organized as a Massachusetts business trust.
Effective January 1, 2020:
Investment advisers Fidelity Investments Money Management, Inc., FMR Co., Inc., and Fidelity SelectCo, LLC, merged with and into Fidelity Management & Research Company. In connection with the merger transactions, the resulting, merged investment adviser was then redomiciled from Massachusetts to Delaware, changed its corporate structure from a corporation to a limited liability company, and changed its name to "Fidelity Management & Research Company LLC".
2. Investments in Fidelity Central Funds.
The Fund invest in Fidelity Central Funds, which are open-end investment companies generally available only to other investment companies and accounts managed by the investment adviser and its affiliates. The Fund's Schedule of Investments lists each of the Fidelity Central Funds held as of period end, if any, as an investment of the Fund, but does not include the underlying holdings of each Fidelity Central Fund. As an Investing Fund, the Fund indirectly bears its proportionate share of the expenses of the underlying Fidelity Central Funds.
The Money Market Central Funds seek preservation of capital and current income and are managed by the investment adviser. Annualized expenses of the Money Market Central Funds as of their most recent shareholder report date ranged from less than .005% to .01%.
A complete unaudited list of holdings for each Fidelity Central Fund is available upon request or at the Securities and Exchange Commission (the SEC) website at www.sec.gov. In addition, the financial statements of the Fidelity Central Funds, which are not covered by the Fund's Report of Independent Registered Public Accounting Firm, are available on the SEC website or upon request.
3. Significant Accounting Policies.
The Fund is an investment company and applies the accounting and reporting guidance of the Financial Accounting Standards Board (FASB) Accounting Standards Codification Topic 946 Financial Services – Investments Companies. The financial statements have been prepared in conformity with accounting principles generally accepted in the United States of America (GAAP), which require management to make certain estimates and assumptions at the date of the financial statements. Actual results could differ from those estimates. Subsequent events, if any, through the date that the financial statements were issued have been evaluated in the preparation of the financial statements. The following summarizes the significant accounting policies of the Fund:
Investment Valuation. Investments are valued as of 4:00 p.m. Eastern time on the last calendar day of the period. The Board of Trustees (the Board) has delegated the day to day responsibility for the valuation of the Fund's investments to the Fair Value Committee (the Committee) established by the Fund's investment adviser. In accordance with valuation policies and procedures approved by the Board, the Fund attempts to obtain prices from one or more third party pricing vendors or brokers to value its investments. When current market prices, quotations or currency exchange rates are not readily available or reliable, investments will be fair valued in good faith by the Committee, in accordance with procedures adopted by the Board. Factors used in determining fair value vary by investment type and may include market or investment specific events, changes in interest rates and credit quality. The frequency with which these procedures are used cannot be predicted and they may be utilized to a significant extent. The Committee oversees the Fund's valuation policies and procedures and reports to the Board on the Committee's activities and fair value determinations. The Board monitors the appropriateness of the procedures used in valuing the Fund's investments and ratifies the fair value determinations of the Committee.
The Fund categorizes the inputs to valuation techniques used to value its investments into a disclosure hierarchy consisting of three levels as shown below:
- Level 1 – quoted prices in active markets for identical investments
- Level 2 – other significant observable inputs (including quoted prices for similar investments, interest rates, prepayment speeds, etc.)
- Level 3 – unobservable inputs (including the Fund's own assumptions based on the best information available)
Valuation techniques used to value the Fund's investments by major category are as follows:
Debt securities, including restricted securities, are valued based on evaluated prices received from third party pricing vendors or from brokers who make markets in such securities. Corporate bonds, bank loan obligations and preferred securities are valued by pricing vendors who utilize matrix pricing which considers yield or price of bonds of comparable quality, coupon, maturity and type or by broker-supplied prices. When independent prices are unavailable or unreliable, debt securities may be valued utilizing pricing methodologies which consider similar factors that would be used by third party pricing vendors. Debt securities are generally categorized as Level 2 in the hierarchy but may be Level 3 depending on the circumstances. The Fund invests a significant portion of its assets in below investment grade securities. The value of these securities can be more volatile due to changes in the credit quality of the issuer and is sensitive to changes in economic, market and regulatory conditions.
Equity securities, including restricted securities, for which market quotations are readily available, are valued at the last reported sale price or official closing price as reported by a third party pricing vendor on the primary market or exchange on which they are traded and are categorized as Level 1 in the hierarchy. In the event there were no sales during the day or closing prices are not available, securities are valued at the last quoted bid price or may be valued using the last available price and are generally categorized as Level 2 in the hierarchy. For foreign equity securities, when market or security specific events arise, comparisons to the valuation of American Depositary Receipts (ADRs), futures contracts, Exchange-Traded Funds (ETFs) and certain indexes as well as quoted prices for similar securities may be used and would be categorized as Level 2 in the hierarchy. For equity securities, including restricted securities, where observable inputs are limited, assumptions about market activity and risk are used and these securities may be categorized as Level 3 in the hierarchy. Securities, including private placements or other restricted securities, for which observable inputs are not available are valued using alternate valuation approaches, including the market approach, the income approach and cost approach, and are categorized as Level 3 in the hierarchy. The market approach considers factors including the price of recent investments in the same or a similar security or financial metrics of comparable securities. The income approach considers factors including expected future cash flows, security specific risks and corresponding discount rates. The cost approach considers factors including the value of the security's underlying assets and liabilities.
Investments in open-end mutual funds, including the Fidelity Central Funds, are valued at their closing net asset value (NAV) each business day and are categorized as Level 1 in the hierarchy.
The following provides information on Level 3 securities held by the Fund that were valued at period end based on unobservable inputs. These amounts exclude valuations provided by a broker.
| Asset Type | Fair Value | Valuation Technique (s) | Unobservable Input | Amount or Range / Weighted Average | Impact to Valuation from an Increase in Input(a) |
| Equities | $17,689,167 | Discounted cash flow | Weighted average cost of capital (WACC) | 9.3% | Decrease |
| Discount for lack of marketability | 10.0% | Decrease | |||
| Growth rate | 1.0% | Increase | |||
| Book value | Book value multiple | 0.0 | Increase | ||
| Bank Loan Obligations | $3,161,717 | Market approach | Discount rate | 20.0% | Decrease |
(a) Represents the directional change in the fair value of the Level 3 investments that could have resulted from an increase in the corresponding input as of period end. A decrease to the unobservable input would have had the opposite effect. Significant changes in these inputs may have resulted in a significantly higher or lower fair value measurement at period end.
Changes in valuation techniques may result in transfers in or out of an assigned level within the disclosure hierarchy. The aggregate value of investments by input level as of April 30, 2020, as well as a roll forward of Level 3 investments, is included at the end of the Fund's Schedule of Investments.
Investment Transactions and Income. For financial reporting purposes, the Fund's investment holdings and NAV include trades executed through the end of the last business day of the period. The NAV per share for processing shareholder transactions is calculated as of the close of business of the New York Stock Exchange (NYSE), normally 4:00 p.m. Eastern time and includes trades executed through the end of the prior business day. Gains and losses on securities sold are determined on the basis of identified cost and include proceeds received from litigation. Dividend income is recorded on the ex-dividend date, except for certain dividends from foreign securities where the ex-dividend date may have passed, which are recorded as soon as the Fund is informed of the ex-dividend date. Non-cash dividends included in dividend income, if any, are recorded at the fair market value of the securities received. Income and capital gain distributions from Fidelity Central Funds, if any, are recorded on the ex-dividend date. Certain distributions received by the Fund represent a return of capital or capital gain. The Fund determines the components of these distributions subsequent to the ex-dividend date, based upon receipt of tax filings or other correspondence relating to the underlying investment. These distributions are recorded as a reduction of cost of investments and/or as a realized gain. Interest income is accrued as earned and includes coupon interest and amortization of premium and accretion of discount on debt securities as applicable. Paid in Kind (PIK) income is recorded at the fair market value of the securities received. Debt obligations may be placed on non-accrual status and related interest income may be reduced by ceasing current accruals and writing off interest receivables when the collection of all or a portion of interest has become doubtful based on consistently applied procedures. A debt obligation is removed from non-accrual status when the issuer resumes interest payments or when collectability of interest is reasonably assured.
Expenses. Expenses directly attributable to a fund are charged to that fund. Expenses attributable to more than one fund are allocated among the respective funds on the basis of relative net assets or other appropriate methods. Expense estimates are accrued in the period to which they relate and adjustments are made when actual amounts are known.
Income Tax Information and Distributions to Shareholders. Each year, the Fund intends to qualify as a regulated investment company under Subchapter M of the Internal Revenue Code, including distributing substantially all of its taxable income and realized gains. As a result, no provision for U.S. Federal income taxes is required. As of April 30, 2020, the Fund did not have any unrecognized tax benefits in the financial statements; nor is the Fund aware of any tax positions for which it is reasonably possible that the total amounts of unrecognized tax benefits will significantly change in the next twelve months. The Fund files a U.S. federal tax return, in addition to state and local tax returns as required. The Fund's federal income tax returns are subject to examination by the Internal Revenue Service (IRS) for a period of three fiscal years after they are filed. State and local tax returns may be subject to examination for an additional fiscal year depending on the jurisdiction.
Distributions are declared and recorded daily and paid monthly from net investment income. Distributions from realized gains, if any, are declared and recorded on the ex-dividend date. Income and capital gain distributions are determined in accordance with income tax regulations, which may differ from GAAP.
Capital accounts within the financial statements are adjusted for permanent book-tax differences. These adjustments have no impact on net assets or the results of operations. Capital accounts are not adjusted for temporary book-tax differences which will reverse in a subsequent period.
Book-tax differences are primarily due to defaulted bonds, market discount, certain conversion ratio adjustments, equity-debt classifications, partnerships, capital loss carryforwards and losses deferred due to wash sales.
As of period end, the cost and unrealized appreciation (depreciation) in securities, and derivatives if applicable, for federal income tax purposes were as follows:
| Gross unrealized appreciation | $35,396,991 |
| Gross unrealized depreciation | (140,581,505) |
| Net unrealized appreciation (depreciation) | $(105,184,514) |
| Tax Cost | $1,581,858,024 |
The tax-based components of distributable earnings as of period end were as follows:
| Undistributed ordinary income | $1,654,297 |
| Capital loss carryforward | $(338,115,474) |
| Net unrealized appreciation (depreciation) on securities and other investments | $(105,184,514) |
Capital loss carryforwards are only available to offset future capital gains of the Fund to the extent provided by regulations and may be limited. The capital loss carryforward information presented below, including any applicable limitation, is estimated as of fiscal period end and is subject to adjustment.
| No expiration | |
| Short-term | $(26,835,436) |
| Long-term | (311,280,038) |
| Total capital loss carryforward | $(338,115,474) |
The tax character of distributions paid was as follows:
| April 30, 2020 | April 30, 2019 | |
| Ordinary Income | $100,751,571 | $ 167,180,454 |
Restricted Securities (including Private Placements). The Fund may invest in securities that are subject to legal or contractual restrictions on resale. These securities generally may be resold in transactions exempt from registration or to the public if the securities are registered. Disposal of these securities may involve time-consuming negotiations and expense, and prompt sale at an acceptable price may be difficult. Information regarding restricted securities is included at the end of the Fund's Schedule of Investments.
Loans and Other Direct Debt Instruments. The Fund invests in direct debt instruments which are interests in amounts owed to lenders by corporate or other borrowers. These instruments may be in the form of loans, trade claims or other receivables and may include standby financing commitments such as revolving credit facilities that obligate the Fund to supply additional cash to the borrower on demand. Loans may be acquired through assignment or participation. The Fund did not have any unfunded loan commitments, which are contractual obligations for future funding, at period end.
4. Purchases and Sales of Investments.
Purchases and sales of securities, other than short-term securities and in-kind transactions, are noted in the table below.
| Purchases ($) | Sales ($) | |
| Fidelity Series High Income Fund | 653,098,236 | 619,413,609 |
5. Fees and Other Transactions with Affiliates.
Management Fee. Fidelity Management & Research Company LLC (the investment adviser) and its affiliates provide the Fund with investment management related services for which the Fund does not pay a management fee. Under the management contract, the investment adviser or an affiliate pays all ordinary operating expenses of the Fund, except custody fees, fees and expenses of the independent Trustees, and certain miscellaneous expenses such as proxy and shareholder meeting expenses.
Brokerage Commissions. A portion of portfolio transactions were placed with brokerage firms which are affiliates of the investment adviser. Brokerage commissions are included in net realized gain (loss) and change in net unrealized appreciation (depreciation) in the Statement of Operations. The commissions paid to these affiliated firms were as follows:
| Amount | |
| Fidelity Series High Income Fund | $5 |
Interfund Trades. Funds may purchase from or sell securities to other Fidelity Funds under procedures adopted by the Board. The procedures have been designed to ensure these interfund trades are executed in accordance with Rule 17a-7 of the 1940 Act. Interfund trades are included within the respective purchases and sales amounts shown in the Purchases and Sales of Investments note.
Affiliated Exchanges In-Kind. During the period, the Fund received investments, including accrued interest, and cash valued at $112,256,713 in exchange for 11,804,071 shares of the Fund. The amount of in-kind exchanges is included in share transactions in the accompanying Statement of Changes in Net Assets.
6. Committed Line of Credit.
Certain Funds participate with other funds managed by the investment adviser or an affiliate in a $4.25 billion credit facility (the "line of credit") to be utilized for temporary or emergency purposes to fund shareholder redemptions or for other short-term liquidity purposes. The participating funds have agreed to pay commitment fees on their pro-rata portion of the line of credit, which are reflected in Miscellaneous expenses on the Statement of Operations, and are as follows:
| Amount | |
| Fidelity Series High Income Fund | $3,858 |
During the period, there were no borrowings on this line of credit.
7. Security Lending.
The Fund lends portfolio securities from time to time in order to earn additional income. For equity securities, lending agents are used, including National Financial Services (NFS), an affiliate of the Fund. Pursuant to a securities lending agreement, NFS will receive a fee, which is capped at 9.9% of daily lending revenue, for its services as lending agent. The Fund may lend securities to certain qualified borrowers, including NFS. On the settlement date of the loan, the Fund receives collateral (in the form of U.S. Treasury obligations, letters of credit and/or cash) against the loaned securities and maintains collateral in an amount not less than 100% of the market value of the loaned securities during the period of the loan. The market value of the loaned securities is determined at the close of business of the Fund and any additional required collateral is delivered to the Fund on the next business day. The Fund or borrower may terminate the loan at any time, and if the borrower defaults on its obligation to return the securities loaned because of insolvency or other reasons, the Fund may apply collateral received from the borrower against the obligation. The Fund may experience delays and costs in recovering the securities loaned. Any cash collateral received is invested in the Fidelity Securities Lending Cash Central Fund. At period end, there were no security loans outstanding. Total fees paid by the Fund to NFS, as lending agent, amounted to $26. Security lending income represents the income earned on investing cash collateral, less rebates paid to borrowers and any lending agent fees associated with the loan, plus any premium payments received for lending certain types of securities. Security lending income is presented in the Statement of Operations as a component of income from Fidelity Central Funds. During the period, there were no securities loaned to NFS.
8. Expense Reductions.
Through arrangements with the Fund's custodian, credits realized as a result of certain uninvested cash balances were used to reduce the Fund's expenses by $13,974.
9. Other.
The Fund's organizational documents provide former and current trustees and officers with a limited indemnification against liabilities arising in connection with the performance of their duties to the Fund. In the normal course of business, the Fund may also enter into contracts that provide general indemnifications. The Fund's maximum exposure under these arrangements is unknown as this would be dependent on future claims that may be made against the Fund. The risk of material loss from such claims is considered remote.
At the end of the period, mutual funds and accounts managed by the investment adviser or its affiliates were the owners of record of all of the outstanding shares of the Fund.
10. Coronavirus (COVID-19) Pandemic.
An outbreak of COVID-19 first detected in China during December 2019 has since spread globally and was declared a pandemic by the World Health Organization during March 2020. Developments that disrupt global economies and financial markets, such as the COVID-19 pandemic, may magnify factors that affect the Fund's performance.
Report of Independent Registered Public Accounting Firm
To the Board of Trustees of Fidelity Summer Street Trust and Shareholders of Fidelity Series High Income Fund
Opinion on the Financial Statements and Financial Highlights
We have audited the accompanying statement of assets and liabilities of Fidelity Series High Income Fund (the "Fund"), a fund of Fidelity Summer Street Trust, including the schedule of investments, as of April 30, 2020, the related statement of operations for the year then ended, the statement of changes in net assets for each of the two years in the period then ended, the financial highlights for each of the five years in the period then ended, and the related notes. In our opinion, the financial statements and financial highlights present fairly, in all material respects, the financial position of the Fund as of April 30, 2020, and the results of its operations for the year then ended, the changes in its net assets for each of the two years in the period then ended, and the financial highlights for each of the five years in the period then ended in conformity with accounting principles generally accepted in the United States of America.
Basis for Opinion
These financial statements and financial highlights are the responsibility of the Fund's management. Our responsibility is to express an opinion on the Fund's financial statements and financial highlights based on our audits. We are a public accounting firm registered with the Public Company Accounting Oversight Board (United States) (PCAOB) and are required to be independent with respect to the Fund in accordance with the U.S. federal securities laws and the applicable rules and regulations of the Securities and Exchange Commission and the PCAOB.
We conducted our audits in accordance with the standards of the PCAOB. Those standards require that we plan and perform the audit to obtain reasonable assurance about whether the financial statements and financial highlights are free of material misstatement, whether due to error or fraud. The Fund is not required to have, nor were we engaged to perform, an audit of its internal control over financial reporting. As part of our audits we are required to obtain an understanding of internal control over financial reporting but not for the purpose of expressing an opinion on the effectiveness of the Fund’s internal control over financial reporting. Accordingly, we express no such opinion.
Our audits included performing procedures to assess the risks of material misstatement of the financial statements and financial highlights, whether due to error or fraud, and performing procedures that respond to those risks. Such procedures included examining, on a test basis, evidence regarding the amounts and disclosures in the financial statements and financial highlights. Our audits also included evaluating the accounting principles used and significant estimates made by management, as well as evaluating the overall presentation of the financial statements and financial highlights. Our procedures included confirmation of securities owned as of April 30, 2020, by correspondence with the custodian and brokers; when replies were not received from brokers, we performed other auditing procedures. We believe that our audits provide a reasonable basis for our opinion.
/s/ Deloitte & Touche LLP
Boston, Massachusetts
June 15, 2020
We have served as the auditor of one or more of the Fidelity investment companies since 1999.
Trustees and Officers
The Trustees, Members of the Advisory Board (if any), and officers of the trust and fund, as applicable, are listed below. The Board of Trustees governs the fund and is responsible for protecting the interests of shareholders. The Trustees are experienced executives who meet periodically throughout the year to oversee the fund's activities, review contractual arrangements with companies that provide services to the fund, oversee management of the risks associated with such activities and contractual arrangements, and review the fund's performance. Except for Bettina Doulton, each of the Trustees oversees 312 funds. Ms. Doulton oversees 210 funds.
The Trustees hold office without limit in time except that (a) any Trustee may resign; (b) any Trustee may be removed by written instrument, signed by at least two-thirds of the number of Trustees prior to such removal; (c) any Trustee who requests to be retired or who has become incapacitated by illness or injury may be retired by written instrument signed by a majority of the other Trustees; and (d) any Trustee may be removed at any special meeting of shareholders by a two-thirds vote of the outstanding voting securities of the trust. Each Trustee who is not an interested person (as defined in the 1940 Act) of the trust and the fund is referred to herein as an Independent Trustee. Each Independent Trustee shall retire not later than the last day of the calendar year in which his or her 75th birthday occurs. The Independent Trustees may waive this mandatory retirement age policy with respect to individual Trustees. Officers and Advisory Board Members hold office without limit in time, except that any officer or Advisory Board Member may resign or may be removed by a vote of a majority of the Trustees at any regular meeting or any special meeting of the Trustees. Except as indicated, each individual has held the office shown or other offices in the same company for the past five years.
The fund’s Statement of Additional Information (SAI) includes more information about the Trustees. To request a free copy, call Fidelity at 1-800-544-8544.
Experience, Skills, Attributes, and Qualifications of the Trustees. The Governance and Nominating Committee has adopted a statement of policy that describes the experience, qualifications, attributes, and skills that are necessary and desirable for potential Independent Trustee candidates (Statement of Policy). The Board believes that each Trustee satisfied at the time he or she was initially elected or appointed a Trustee, and continues to satisfy, the standards contemplated by the Statement of Policy. The Governance and Nominating Committee also engages professional search firms to help identify potential Independent Trustee candidates who have the experience, qualifications, attributes, and skills consistent with the Statement of Policy. From time to time, additional criteria based on the composition and skills of the current Independent Trustees, as well as experience or skills that may be appropriate in light of future changes to board composition, business conditions, and regulatory or other developments, have also been considered by the professional search firms and the Governance and Nominating Committee. In addition, the Board takes into account the Trustees' commitment and participation in Board and committee meetings, as well as their leadership of standing and ad hoc committees throughout their tenure.
In determining that a particular Trustee was and continues to be qualified to serve as a Trustee, the Board has considered a variety of criteria, none of which, in isolation, was controlling. The Board believes that, collectively, the Trustees have balanced and diverse experience, qualifications, attributes, and skills, which allow the Board to operate effectively in governing the fund and protecting the interests of shareholders. Information about the specific experience, skills, attributes, and qualifications of each Trustee, which in each case led to the Board's conclusion that the Trustee should serve (or continue to serve) as a trustee of the fund, is provided below.
Board Structure and Oversight Function. Robert A. Lawrence is an interested person and currently serves as Acting Chairman. The Trustees have determined that an interested Chairman is appropriate and benefits shareholders because an interested Chairman has a personal and professional stake in the quality and continuity of services provided to the fund. Independent Trustees exercise their informed business judgment to appoint an individual of their choosing to serve as Chairman, regardless of whether the Trustee happens to be independent or a member of management. The Independent Trustees have determined that they can act independently and effectively without having an Independent Trustee serve as Chairman and that a key structural component for assuring that they are in a position to do so is for the Independent Trustees to constitute a substantial majority for the Board. The Independent Trustees also regularly meet in executive session. Ned C. Lautenbach and David M. Thomas serve as Co-Lead Independent Trustees and as such each (i) acts as a liaison between the Independent Trustees and management with respect to matters important to the Independent Trustees and (ii) with management prepares agendas for Board meetings.
Fidelity® funds are overseen by different Boards of Trustees. The fund's Board oversees Fidelity's high income and certain equity funds, and other Boards oversee Fidelity's investment-grade bond, money market, asset allocation, and other equity funds. The asset allocation funds may invest in Fidelity® funds overseen by the fund's Board. The use of separate Boards, each with its own committee structure, allows the Trustees of each group of Fidelity® funds to focus on the unique issues of the funds they oversee, including common research, investment, and operational issues. On occasion, the separate Boards establish joint committees to address issues of overlapping consequences for the Fidelity® funds overseen by each Board.
The Trustees operate using a system of committees to facilitate the timely and efficient consideration of all matters of importance to the Trustees, the fund, and fund shareholders and to facilitate compliance with legal and regulatory requirements and oversight of the fund's activities and associated risks. The Board, acting through its committees, has charged FMR and its affiliates with (i) identifying events or circumstances the occurrence of which could have demonstrably adverse effects on the fund's business and/or reputation; (ii) implementing processes and controls to lessen the possibility that such events or circumstances occur or to mitigate the effects of such events or circumstances if they do occur; and (iii) creating and maintaining a system designed to evaluate continuously business and market conditions in order to facilitate the identification and implementation processes described in (i) and (ii) above. Because the day-to-day operations and activities of the fund are carried out by or through FMR, its affiliates, and other service providers, the fund's exposure to risks is mitigated but not eliminated by the processes overseen by the Trustees. While each of the Board's committees has responsibility for overseeing different aspects of the fund's activities, oversight is exercised primarily through the Operations, Audit, and Compliance Committees. Appropriate personnel, including but not limited to the fund's Chief Compliance Officer (CCO), FMR's internal auditor, the independent accountants, the fund's Treasurer and portfolio management personnel, make periodic reports to the Board's committees, as appropriate, including an annual review of Fidelity's risk management program for the Fidelity® funds. The responsibilities of each standing committee, including their oversight responsibilities, are described further under "Standing Committees of the Trustees."
Interested Trustees*:
Correspondence intended for a Trustee who is an interested person may be sent to Fidelity Investments, 245 Summer Street, Boston, Massachusetts 02210.
Name, Year of Birth; Principal Occupations and Other Relevant Experience+
Bettina Doulton (1964)
Year of Election or Appointment: 2020
Trustee
Ms. Doulton also serves as Trustee of other Fidelity® funds. Prior to her retirement, Ms. Doulton served in a variety of positions at Fidelity Investments, including as a managing director of research (2006-2007), portfolio manager to certain Fidelity® funds (1993-2005), equity analyst and portfolio assistant (1990-1993), and research assistant (1987-1990). Ms. Doulton currently owns and operates Phi Builders + Architects and Cellardoor Winery. Previously, Ms. Doulton served as a member of the Board of Brown Capital Management, LLC (2013-2018).
Robert A. Lawrence (1952)
Year of Election or Appointment: 2020
Trustee
Acting Chairman of the Board of Trustees
Mr. Lawrence also serves as Trustee of other funds. Previously, Mr. Lawrence served as a Member of the Advisory Board of certain funds. Prior to his retirement in 2008, Mr. Lawrence served as Vice President of certain Fidelity® funds (2006-2008), Senior Vice President, Head of High Income Division of Fidelity Management & Research Company (investment adviser firm, 2006-2008), and President of Fidelity Strategic Investments (investment adviser firm, 2002-2005).
* Determined to be an “Interested Trustee” by virtue of, among other things, his or her affiliation with the trust or various entities under common control with FMR.
+ The information includes the Trustee's principal occupation during the last five years and other information relating to the experience, attributes, and skills relevant to the Trustee's qualifications to serve as a Trustee, which led to the conclusion that the Trustee should serve as a Trustee for the fund.
Independent Trustees:
Correspondence intended for an Independent Trustee may be sent to Fidelity Investments, P.O. Box 55235, Boston, Massachusetts 02205-5235.
Name, Year of Birth; Principal Occupations and Other Relevant Experience+
Dennis J. Dirks (1948)
Year of Election or Appointment: 2005
Trustee
Mr. Dirks also serves as Trustee of other Fidelity® funds. Prior to his retirement in May 2003, Mr. Dirks served as Chief Operating Officer and as a member of the Board of The Depository Trust & Clearing Corporation (financial markets infrastructure), President, Chief Operating Officer and a member of the Board of The Depository Trust Company (DTC), President and a member of the Board of the National Securities Clearing Corporation (NSCC), Chief Executive Officer and a member of the Board of the Government Securities Clearing Corporation and Chief Executive Officer and a member of the Board of the Mortgage-Backed Securities Clearing Corporation. Mr. Dirks currently serves as a member of the Finance Committee (2016-present) and Board (2017-present) and is Treasurer (2018-present) of the Asolo Repertory Theatre.
Donald F. Donahue (1950)
Year of Election or Appointment: 2018
Trustee
Mr. Donahue also serves as Trustee of other Fidelity® funds. Mr. Donahue serves as President and Chief Executive Officer of Miranda Partners, LLC (risk consulting for the financial services industry, 2012-present). Previously, Mr. Donahue served as Chief Executive Officer (2006-2012), Chief Operating Officer (2003-2006) and Managing Director, Customer Marketing and Development (1999-2003) of The Depository Trust & Clearing Corporation (financial markets infrastructure). Mr. Donahue currently serves as a member (2007-present) and Co-Chairman (2016-present) of the Board of United Way of New York, a member of the Board of NYC Leadership Academy (2012-present) and a member of the Board of Advisors of Ripple Labs, Inc. (financial services, 2015-present). Mr. Donahue previously served as a member of the Advisory Board of certain Fidelity® funds (2015-2018).
Vicki L. Fuller (1957)
Year of Election or Appointment: 2020
Trustee
Ms. Fuller also serves as Trustee of other Fidelity® funds. Previously, Ms. Fuller served as a member of the Advisory Board of certain Fidelity® funds (2018-2020), Chief Investment Officer of the New York State Common Retirement Fund (2012-2018) and held a variety of positions at AllianceBernstein L.P. (global asset management, 1985-2012), including Managing Director (2006-2012) and Senior Vice President and Senior Portfolio Manager (2001-2006). Ms. Fuller currently serves as a member of the Board, Audit Committee and Nominating and Governance Committee of The Williams Companies, Inc. (natural gas infrastructure, 2018-present) and as a member of the Board of Treliant, LLC (consulting, 2019-present).
Patricia L. Kampling (1959)
Year of Election or Appointment: 2020
Trustee
Ms. Kampling also serves as Trustee of other Fidelity® funds. Prior to her retirement, Ms. Kampling served as Chairman of the Board and Chief Executive Officer (2012-2019), President and Chief Operating Officer (2011-2012) and Executive Vice President and Chief Financial Officer (2010-2011) of Alliant Energy Corporation. Ms. Kampling currently serves as a member of the Board, Compensation Committee and Executive Committee and as Chair of the Audit Committee of Briggs & Stratton Corporation (manufacturing, 2011-present) and as a member of the Board, Audit, Finance and Risk Committee and Safety, Environmental, Technology and Operations Committee of American Water Works Company, Inc. (utilities company, 2019-present). In addition, Ms. Kampling currently serves as a member of the Board of the Nature Conservancy, Wisconsin Chapter (2019-present). Previously, Ms. Kampling served as a Member of the Advisory Board of certain Fidelity® funds (2020), a member of the Board of Interstate Power and Light Company (2012-2019) and Wisconsin Power and Light Company (2012-2019) (each a subsidiary of Alliant Energy Corporation) and as a member of the Board and Workforce Development Committee of the Business Roundtable (2018-2019).
Alan J. Lacy (1953)
Year of Election or Appointment: 2008
Trustee
Mr. Lacy also serves as Trustee of other Fidelity® funds. Previously, Mr. Lacy served as Senior Adviser (2007-2014) of Oak Hill Capital Partners, L.P. (private equity), Chief Executive Officer (2005) and Vice Chairman (2005-2006) of Sears Holdings Corporation (retail), Chief Executive Officer and Chairman of the Board of Sears, Roebuck and Co. (retail, 2000-2005), Chairman (2014-2017) and a member of the Board (2010-2017) of Dave & Buster’s Entertainment, Inc. (restaurant and entertainment complexes) and a member of the Board of Bristol-Myers Squibb Company (global pharmaceuticals, 2008-2020). Mr. Lacy currently serves as a Trustee of the California Chapter of The Nature Conservancy (2015-present) and a member of the Board of the Center for Advanced Study in the Behavioral Sciences at Stanford University (2015-present).
Ned C. Lautenbach (1944)
Year of Election or Appointment: 2000
Trustee
Co-Lead Independent Trustee
Mr. Lautenbach also serves as Trustee of other Fidelity® funds. Mr. Lautenbach currently serves as Chair of the Board of Governors, State University System of Florida (2013-present) and is a member of the Council on Foreign Relations (1994-present). He is also a member and has in the past served as Chairman of the Board of Directors of Artis-Naples (2012-present). Previously, Mr. Lautenbach served as a member and then Lead Director of the Board of Directors of Eaton Corporation (diversified industrial, 1997-2016). He was also a Partner at Clayton, Dubilier & Rice, LLC (private equity investment, 1998-2010); as well as Director of Sony Corporation (2006-2007). In addition, Mr. Lautenbach had a 30-year career with IBM (technology company), during which time he served as Senior Vice President and as a member of the Corporate Executive Committee (1968-1998).
Joseph Mauriello (1944)
Year of Election or Appointment: 2008
Trustee
Mr. Mauriello also serves as Trustee of other Fidelity® funds. Prior to his retirement in January 2006, Mr. Mauriello served in numerous senior management positions including Deputy Chairman and Chief Operating Officer (2004-2005), and Vice Chairman of Financial Services (2002-2004) of KPMG LLP US (professional services, 1965-2005). Mr. Mauriello currently serves as a member of the Independent Directors Council Governing Council (2015-present). Previously, Mr. Mauriello served as a member of the Board of XL Group plc. (global insurance and re-insurance, 2006-2018).
Cornelia M. Small (1944)
Year of Election or Appointment: 2005
Trustee
Ms. Small also serves as Trustee of other Fidelity® funds. Previously, Ms. Small served as Chief Investment Officer, Director of Global Equity Investments and a member of Scudder, Stevens & Clark and Scudder Kemper Investments. Ms. Small previously served as a member of the Board (2009-2019) and Chair of the Investment Committee (2010-2019) of the Teagle Foundation and a member of the Investment Committee of the Berkshire Taconic Community Foundation (2008-2019).
Garnett A. Smith (1947)
Year of Election or Appointment: 2018
Trustee
Mr. Smith also serves as Trustee of other Fidelity® funds. Prior to his retirement, Mr. Smith served as Chairman and Chief Executive Officer (1990-1997) and President (1986-1990) of Inbrand Corp. (manufacturer of personal absorbent products). Prior to his employment with Inbrand Corp., he was employed by a retail fabric chain and North Carolina National Bank (now Bank of America). Mr. Smith previously served as a member of the Advisory Board of certain Fidelity® funds (2012-2013).
David M. Thomas (1949)
Year of Election or Appointment: 2008
Trustee
Co-Lead Independent Trustee
Mr. Thomas also serves as Trustee of other Fidelity® funds. Previously, Mr. Thomas served as Executive Chairman (2005-2006) and Chairman and Chief Executive Officer (2000-2005) of IMS Health, Inc. (pharmaceutical and healthcare information solutions). Mr. Thomas currently serves as Non-Executive Chairman of the Board of Fortune Brands Home and Security (home and security products, 2011-present), and a member of the Board (2004-present) and Presiding Director (2013-present) of Interpublic Group of Companies, Inc. (marketing communication).
Susan Tomasky (1953)
Year of Election or Appointment: 2020
Trustee
Ms. Tomasky also serves as Trustee of other Fidelity® funds. Prior to her retirement, Ms. Tomasky served in various executive officer positions at American Electric Power Company, Inc. (1998-2011), including most recently as President of AEP Transmission (2007-2011). Ms. Tomasky currently serves as a member of the Board and Sustainability Committee and as Chair of the Audit Committee of Marathon Petroleum Corporation (2018-present) and as a member of the Board, Corporate Governance Committee and Organization and Compensation Committee and as Chair of the Audit Committee of Public Service Enterprise Group, Inc. (utilities company, 2012-present). In addition, Ms. Tomasky currently serves as a member of the Board of the Columbus Regional Airport Authority (2007-present), as a member of the Board of the Royal Shakespeare Company – America (2009-present), as a member of the Board of the Columbus Association for the Performing Arts (2011-present) and as a member of the Board of Kenyon College (2016-present). Previously, Ms. Tomasky served as a Member of the Advisory Board of certain Fidelity® funds (2020), a member of the Board (2011-2019) and as Lead Independent Director (2015-2018) of Andeavor Corporation (previously Tesoro Corporation) (independent oil refiner and marketer) and as a member of the Board of Summit Midstream Partners LP (energy, 2012-2018).
Michael E. Wiley (1950)
Year of Election or Appointment: 2018
Trustee
Mr. Wiley also serves as Trustee of other Fidelity® funds. Previously, Mr. Wiley served as a member of the Advisory Board of certain Fidelity® funds (2018-2020), Chairman, President and CEO of Baker Hughes, Inc. (oilfield services, 2000-2004). Mr. Wiley also previously served as a member of the Board of Andeavor Corporation (independent oil refiner and marketer, 2005-2018), a member of the Board of Andeavor Logistics LP (natural resources logistics, 2015-2018) and a member of the Board of High Point Resources (exploration and production, 2005-2020).
+ The information includes the Trustee's principal occupation during the last five years and other information relating to the experience, attributes, and skills relevant to the Trustee's qualifications to serve as a Trustee, which led to the conclusion that the Trustee should serve as a Trustee for the fund.
Advisory Board Members and Officers:
Correspondence intended for a Member of the Advisory Board (if any) may be sent to Fidelity Investments, P.O. Box 55235, Boston, Massachusetts 02205-5235. Correspondence intended for an officer or Peter S. Lynch may be sent to Fidelity Investments, 245 Summer Street, Boston, Massachusetts 02210. Officers appear below in alphabetical order.
Name, Year of Birth; Principal Occupation
Peter S. Lynch (1944)
Year of Election or Appointment: 2003
Member of the Advisory Board
Mr. Lynch also serves as a Member of the Advisory Board of other Fidelity® funds. Mr. Lynch is Vice Chairman and a Director of Fidelity Management & Research Company LLC (investment adviser firm). In addition, Mr. Lynch serves as a Trustee of Boston College and as the Chairman of the Inner-City Scholarship Fund. Previously, Mr. Lynch served as Vice Chairman and a Director of FMR Co., Inc. (investment adviser firm) and on the Special Olympics International Board of Directors (1997-2006).
Elizabeth Paige Baumann (1968)
Year of Election or Appointment: 2017
Anti-Money Laundering (AML) Officer
Ms. Baumann also serves as AML Officer of other funds. She is Chief AML Officer (2012-present) and Senior Vice President (2014-present) of FMR LLC (diversified financial services company) and is an employee of Fidelity Investments. Previously, Ms. Baumann served as AML Officer of certain funds (2017-2019), as AML Officer of the funds (2012-2016), and Vice President (2007-2014) and Deputy Anti-Money Laundering Officer (2007-2012) of FMR LLC.
Craig S. Brown (1977)
Year of Election or Appointment: 2019
Assistant Treasurer
Mr. Brown also serves as Assistant Treasurer of other funds. Mr. Brown is an employee of Fidelity Investments (2013-present).
John J. Burke III (1964)
Year of Election or Appointment: 2018
Chief Financial Officer
Mr. Burke also serves as Chief Financial Officer of other funds. Mr. Burke serves as Head of Investment Operations for Fidelity Fund and Investment Operations (2018-present) and is an employee of Fidelity Investments (1998-present). Previously Mr. Burke served as head of Asset Management Investment Operations (2012-2018).
William C. Coffey (1969)
Year of Election or Appointment: 2019
Assistant Secretary
Mr. Coffey also serves as Assistant Secretary of other funds. He is Senior Vice President and Deputy General Counsel of FMR LLC (diversified financial services company, 2010-present), and is an employee of Fidelity Investments. Previously, Mr. Coffey served as Secretary and CLO of certain funds (2018-2019); CLO, Secretary, and Senior Vice President of Fidelity Management & Research Company and FMR Co., Inc. (investment adviser firms, 2018-2019); Secretary of Fidelity SelectCo, LLC and Fidelity Investments Money Management, Inc. (investment adviser firms, 2018-2019); CLO of Fidelity Management & Research (Hong Kong) Limited, FMR Investment Management (UK) Limited, and Fidelity Management & Research (Japan) Limited (investment adviser firms, 2018-2019); and Assistant Secretary of certain funds (2009-2018).
Timothy M. Cohen (1969)
Year of Election or Appointment: 2018
Vice President
Mr. Cohen also serves as Vice President of other funds. Mr. Cohen serves as Co-Head of Equity (2018-present), a Director of Fidelity Management & Research (Japan) Limited (investment adviser firm, 2016-present), and is an employee of Fidelity Investments. Previously, Mr. Cohen served as Executive Vice President of Fidelity SelectCo, LLC (2019), Head of Global Equity Research (2016-2018), Chief Investment Officer - Equity and a Director of Fidelity Management & Research (U.K.) Inc. (investment adviser firm, 2013-2015) and as a Director of Fidelity Management & Research (Hong Kong) Limited (investment adviser firm, 2017).
Jonathan Davis (1968)
Year of Election or Appointment: 2010
Assistant Treasurer
Mr. Davis also serves as Assistant Treasurer of other funds. Mr. Davis serves as Assistant Treasurer of FMR Capital, Inc. (2017-present) and is an employee of Fidelity Investments. Previously, Mr. Davis served as Vice President and Associate General Counsel of FMR LLC (diversified financial services company, 2003-2010).
Laura M. Del Prato (1964)
Year of Election or Appointment: 2018
Assistant Treasurer
Ms. Del Prato also serves as an officer of other funds. Ms. Del Prato is an employee of Fidelity Investments (2017-present). Prior to joining Fidelity Investments, Ms. Del Prato served as a Managing Director and Treasurer of the JPMorgan Mutual Funds (2014-2017). Prior to JPMorgan, Ms. Del Prato served as a partner at Cohen Fund Audit Services (accounting firm, 2012-2013) and KPMG LLP (accounting firm, 2004-2012).
Colm A. Hogan (1973)
Year of Election or Appointment: 2020
Assistant Treasurer
Mr. Hogan also serves as an officer of other funds. Mr. Hogan serves as Assistant Treasurer of FMR Capital, Inc. (2017-present) and is an employee of Fidelity Investments (2005-present). Previously, Mr. Hogan served as Deputy Treasurer of certain Fidelity® funds (2016-2020) and Assistant Treasurer of certain Fidelity® funds (2016-2018).
Pamela R. Holding (1964)
Year of Election or Appointment: 2018
Vice President
Ms. Holding also serves as Vice President of other funds. Ms. Holding serves as Co-Head of Equity (2018-present) and is an employee of Fidelity Investments (2013-present). Previously, Ms. Holding served as Executive Vice President of Fidelity SelectCo, LLC (2019) and as Chief Investment Officer of Fidelity Institutional Asset Management (2013-2018).
Cynthia Lo Bessette (1969)
Year of Election or Appointment: 2019
Secretary and Chief Legal Officer (CLO)
Ms. Lo Bessette also serves as an officer of other funds. Ms. Lo Bessette serves as CLO, Secretary, and Senior Vice President of Fidelity Management & Research Company LLC (investment adviser firm, 2019-present); and CLO of Fidelity Management & Research (Hong Kong) Limited, FMR Investment Management (UK) Limited, and Fidelity Management & Research (Japan) Limited (investment adviser firms, 2019-present). She is a Senior Vice President and Deputy General Counsel of FMR LLC (diversified financial services company, 2019-present), and is an employee of Fidelity Investments. Previously, Ms. Lo Bessette served as CLO, Secretary, and Senior Vice President of FMR Co., Inc. (investment adviser firm, 2019); Secretary of Fidelity SelectCo, LLC and Fidelity Investments Money Management, Inc. (investment adviser firms, 2019). Prior to joining Fidelity Investments, Ms. Lo Bessette was Executive Vice President, General Counsel (2016-2019) and Senior Vice President, Deputy General Counsel (2015-2016) of OppenheimerFunds (investment management company) and Deputy Chief Legal Officer (2013-2015) of Jennison Associates LLC (investment adviser firm).
Chris Maher (1972)
Year of Election or Appointment: 2020
Deputy Treasurer
Mr. Maher also serves as an officer of other funds. Mr. Maher serves as Assistant Treasurer of FMR Capital, Inc. (2017-present), and is an employee of Fidelity Investments (2008-present). Previously, Mr. Maher served as Assistant Treasurer of certain funds (2013-2020); Vice President of Asset Management Compliance (2013), Vice President of the Program Management Group of FMR (investment adviser firm, 2010-2013), and Vice President of Valuation Oversight (2008-2010).
Jason P. Pogorelec (1975)
Year of Election or Appointment: 2020
Chief Compliance Officer
Mr. Pogorelec also serves as an officer of other funds. Mr. Pogorelec serves as Vice President, Associate General Counsel (2010-present) and is an employee of Fidelity Investments (2006-present). Previously, Mr. Pogorelec served as Assistant Secretary of certain Fidelity funds (2015-2020).
Stacie M. Smith (1974)
Year of Election or Appointment: 2016
President and Treasurer
Ms. Smith also serves as an officer of other funds. Ms. Smith serves as Assistant Treasurer of FMR Capital, Inc. (2017-present), is an employee of Fidelity Investments (2009-present), and has served in other fund officer roles. Prior to joining Fidelity Investments, Ms. Smith served as Senior Audit Manager of Ernst & Young LLP (accounting firm, 1996-2009). Previously, Ms. Smith served as Assistant Treasurer (2013-2019) and Deputy Treasurer (2013-2016) of certain Fidelity® funds.
Marc L. Spector (1972)
Year of Election or Appointment: 2016
Assistant Treasurer
Mr. Spector also serves as an officer of other funds. Mr. Spector serves as Assistant Treasurer of FMR Capital, Inc. (2017-present) and is an employee of Fidelity Investments (2016-present). Prior to joining Fidelity Investments, Mr. Spector served as Director at the Siegfried Group (accounting firm, 2013-2016), and prior to Siegfried Group as audit senior manager at Deloitte & Touche LLP (accounting firm, 2005-2013).
Jim Wegmann (1979)
Year of Election or Appointment: 2019
Assistant Treasurer
Mr. Wegmann also serves as Assistant Treasurer of other funds. Mr. Wegmann is an employee of Fidelity Investments (2011-present).
Shareholder Expense Example
As a shareholder of the Fund, you incur two types of costs: (1) transaction costs and (2) ongoing costs, including other Fund expenses. This Example is intended to help you understand your ongoing costs (in dollars) of investing in the Fund and to compare these costs with the ongoing costs of investing in other mutual funds.
The Example is based on an investment of $1,000 invested at the beginning of the period and held for the entire period (November 1, 2019 to April 30, 2020).
Actual Expenses
The first line of the accompanying table provides information about actual account values and actual expenses. You may use the information in this line, together with the amount you invested, to estimate the expenses that you paid over the period. Simply divide your account value by $1,000.00 (for example, an $8,600 account value divided by $1,000.00 = 8.6), then multiply the result by the number in the first line under the heading entitled "Expenses Paid During Period" to estimate the expenses you paid on your account during this period. In addition, the Fund, as a shareholder in the underlying Fidelity Central Funds, will indirectly bear its pro-rata share of the fees and expenses incurred by the underlying Fidelity Central Funds. These fees and expenses are not included in the Fund's annualized expense ratio used to calculate the expense estimate in the table below.
Hypothetical Example for Comparison Purposes
The second line of the accompanying table provides information about hypothetical account values and hypothetical expenses based on the Fund's actual expense ratio and an assumed rate of return of 5% per year before expenses, which is not the Fund's actual return. The hypothetical account values and expenses may not be used to estimate the actual ending account balance or expenses you paid for the period. You may use this information to compare the ongoing costs of investing in the Fund and other funds. To do so, compare this 5% hypothetical example with the 5% hypothetical examples that appear in the shareholder reports of the other funds. In addition, the Fund, as a shareholder in the underlying Fidelity Central Funds, will indirectly bear its pro-rata share of the fees and expenses incurred by the underlying Fidelity Central Funds. These fees and expenses are not included in the Fund's annualized expense ratio used to calculate the expense estimate in the table below.
Please note that the expenses shown in the table are meant to highlight your ongoing costs only and do not reflect any transaction costs. Therefore, the second line of the table is useful in comparing ongoing costs only, and will not help you determine the relative total costs of owning different funds.
| Annualized Expense Ratio-A | Beginning Account Value November 1, 2019 | Ending Account Value April 30, 2020 | Expenses Paid During Period-B November 1, 2019 to April 30, 2020 | |
| Actual | - %-C | $1,000.00 | $931.10 | $--D |
| Hypothetical-E | $1,000.00 | $1,024.86 | $--D |
A Annualized expense ratio reflects expenses net of applicable fee waivers.
B Expenses are equal to the Fund's annualized expense ratio, multiplied by the average account value over the period, multiplied by 182/366 (to reflect the one-half year period).
C Amount represents less than .005%.
D Amount represents less than $.005.
E 5% return per year before expenses
Distributions (Unaudited)
A total of 0.19% of the dividends distributed during the fiscal year was derived from interest on U.S. Government securities which is generally exempt from state income tax.
The fund will notify shareholders in January 2021 of amounts for use in preparing 2020 income tax returns.
Board Approval of Investment Advisory Contracts and Management Fees
Fidelity Series High Income Fund
Each year, the Board of Trustees, including the Independent Trustees (together, the Board), votes on the renewal of the management contract with Fidelity Management & Research Company LLC (FMR) and the sub-advisory agreements (together, the Advisory Contracts) for the fund. FMR and the sub-advisers are referred to herein as the Investment Advisers. The Board, assisted by the advice of fund counsel and Independent Trustees' counsel, requests and considers a broad range of information relevant to the renewal of the Advisory Contracts throughout the year.Approval of Amended and Restated Advisory Contracts. At its November 2019 meeting, the Board unanimously determined to approve an amended and restated management contract and sub-advisory agreements (Amended and Restated Contracts) for a stub period of January 1, 2020 through January 31, 2020 in connection with a consolidation of certain of Fidelity's advisory businesses. The Board considered that, on or about January 1, 2020, FMR Co., Inc. (FMRC) expected to merge with and into FMR and, after the merger, FMR expected to redomicile as a Delaware limited liability company. The Board also approved the termination of the sub-advisory agreement with FMRC upon the completion of the merger. The Board noted that references to FMR in the Amended and Restated Contracts would be updated to reflect FMR's new form of organization and domicile. The Board also noted Fidelity's assurance that neither the planned consolidation nor the Amended and Restated Contracts will change the investment processes, the level or nature of services provided, the resources and personnel allocated, trading and compliance operations, or any fees paid by the fund.The Board meets regularly and, at each of its meetings, covers an extensive agenda of topics and materials and considers factors that are relevant to its annual consideration of the renewal of the fund's Advisory Contracts, including the services and support provided to the fund and its shareholders. The Board has established various standing committees (Committees), each composed of and chaired by Independent Trustees with varying backgrounds, to which the Board has assigned specific subject matter responsibilities in order to enhance effective decision-making by the Board. The Board, acting directly and through its Committees, requests and receives information concerning the annual consideration of the renewal of the fund's Advisory Contracts. The Board also meets as needed to review matters specifically related to the Board's annual consideration of the renewal of the Advisory Contracts. Members of the Board may also meet with trustees of other Fidelity funds through joint ad hoc committees to discuss certain matters relevant to all of the Fidelity funds.At its January 2020 meeting, the Board unanimously determined to renew the fund's Advisory Contracts. In considering whether to renew the Advisory Contracts for the fund, the Board considered all factors it believed relevant and reached a determination, with the assistance of fund counsel and Independent Trustees' counsel and through the exercise of its business judgment, that the renewal of the Advisory Contracts was in the best interests of the fund and its shareholders and the fact that no fee is payable under the management contract was fair and reasonable.Nature, Extent, and Quality of Services Provided. The Board considered Fidelity's staffing as it relates to the fund, including the backgrounds of investment personnel of Fidelity, and also considered the fund's investment objective, strategies, and related investment philosophy. The Independent Trustees also had discussions with senior management of Fidelity's investment operations and investment groups. The Board considered the structure of the investment personnel compensation program and whether this structure provides appropriate incentives to act in the best interests of the fund.Resources Dedicated to Investment Management and Support Services. The Board and the Fund Oversight and Research Committees reviewed the general qualifications and capabilities of Fidelity's investment staff, including its size, education, experience, and resources, as well as Fidelity's approach to recruiting, training, managing, and compensating investment personnel. The Board noted that Fidelity has continued to increase the resources devoted to non-U.S. offices, including expansion of Fidelity's global investment organization. The Board also noted that Fidelity's analysts have extensive resources, tools and capabilities that allow them to conduct sophisticated quantitative and fundamental analysis, as well as credit analysis of issuers, counterparties and guarantors. Further, the Board considered that Fidelity's investment professionals have sufficient access to global information and data so as to provide competitive investment results over time, and that those professionals also have access to sophisticated tools that permit them to assess portfolio construction and risk and performance attribution characteristics continuously, as well as to transmit new information and research conclusions rapidly around the world. Additionally, in its deliberations, the Board considered Fidelity's trading, risk management, compliance, and technology and operations capabilities and resources, which are integral parts of the investment management process.Administrative Services. The Board considered (i) the nature, extent, quality, and cost of advisory and administrative services performed by the Investment Advisers and their affiliates under the Advisory Contracts and under separate agreements covering transfer agency, pricing and bookkeeping, and securities lending services for the fund; (ii) the nature and extent of the supervision of third party service providers, principally custodians, subcustodians, and pricing vendors; and (iii) the resources devoted to, and the record of compliance with, the fund's compliance policies and procedures. The Board also reviewed the allocation of fund brokerage, including allocations to brokers affiliated with the Investment Advisers, the use of brokerage commissions to pay fund expenses, and the use of "soft" commission dollars to pay for research services.Investment Performance. The Board considered whether the fund has operated in accordance with its investment objective, as well as its record of compliance with its investment restrictions. The Board reviewed the fund's absolute investment performance, as well as the fund's relative investment performance, but did not consider performance to be a material factor in its decision to renew the fund's Advisory Contracts, as the fund is not publicly offered as a stand-alone investment product. In this regard, the Board noted that the fund is designed to offer an investment option for other investment companies managed by Fidelity and ultimately to enhance the performance of those investment companies.Based on its review, the Board concluded that the nature, extent, and quality of services provided to the fund under the Advisory Contracts should continue to benefit the shareholders of the fund.Competitiveness of Management Fee and Total Expense Ratio. The Board considered that the fund does not pay FMR a management fee for investment advisory services. The Board also noted that FMR undertakes to pay all operating expenses of the fund with certain exceptions.In connection with the renewal of the Advisory Contracts, the Board also approved amendments to the management contract for the fund to clarify that the fund pays its non-operating expenses, including brokerage commissions and fees and expenses associated with the fund's securities lending program. The Board considered that the amendments would not change the services provided to the fund or the party responsible for making such payments under the current management contract.The Board further considered that FMR has contractually agreed to reimburse the fund to the extent that total operating expenses, with certain exceptions, as a percentage of its average net assets, exceed 0.014% through August 31, 2022.Based on its review, the Board considered that the fund does not pay a management fee and concluded that the total expense ratio of each class of the fund was reasonable in light of the services that the fund and its shareholders receive and the other factors considered.Costs of the Services and Profitability. The Board considered the level of Fidelity's profits in respect of all the Fidelity funds.PricewaterhouseCoopers LLP (PwC), auditor to Fidelity and certain Fidelity funds, has been engaged annually by the Board as part of the Board's assessment of Fidelity's profitability analysis. PwC's engagement includes the review and assessment of the methodologies used by Fidelity in determining the revenues and expenses attributable to Fidelity's mutual fund business, and completion of agreed-upon procedures in respect of the mathematical accuracy of the fund profitability information and its conformity to established allocation methodologies. After considering PwC's reports issued under the engagement and information provided by Fidelity, the Board concluded that while other allocation methods may also be reasonable, Fidelity's profitability methodologies are reasonable in all material respects.The Board also reviewed Fidelity's non-fund businesses and potential indirect benefits such businesses may have received as a result of their association with Fidelity's mutual fund business (i.e., fall-out benefits) as well as cases where Fidelity's affiliates may benefit from the funds' business. The Board noted that changes to fall-out benefits year-over-year reflect business developments at Fidelity's various businesses. The Board considered that a joint ad hoc committee created by it and the boards of other Fidelity funds had recently been established, and met periodically, to evaluate potential fall-out benefits (PFOB Committee). The Board noted that the PFOB Committee, among other things: (i) discussed the legal framework surrounding potential fall-out benefits; (ii) reviewed the Board's responsibilities and approach to potential fall-out benefits; and (iii) reviewed practices employed by competitor funds regarding the review of potential fall-out benefits.The Board concluded that the costs of the services provided by and the profits realized by Fidelity in connection with the operation of the fund were not relevant to the renewal of the Advisory Contracts because the fund pays no advisory fees and FMR bears all expenses of the fund with certain exceptions.Economies of Scale. The Board concluded that because the fund pays no advisory fees and FMR bears all expenses of the fund with certain exceptions, the realization of economies of scale was not a material factor in the Board's decision to renew the fund's Advisory Contracts.Additional Information Requested by the Board. In order to develop fully the factual basis for consideration of the Fidelity funds' advisory contracts, the Board requested and received additional information on certain topics, including: (i) fund flow and performance trends, in particular the underperformance of certain funds and strategies, and Fidelity's long-term strategies for certain funds; (ii) consideration of performance fees for additional funds; (iii) changes in Fidelity's non-fund businesses and the impact of such changes on the funds; (iv) metrics for evaluating index fund and ETF performance and information about ETF trading characteristics; (v) the methodology with respect to evaluating competitive fund data and peer group classifications and fee comparisons; (vi) the expense structures for different funds and classes; (vii) information regarding other accounts managed by Fidelity, including collective investment trusts and separately managed accounts; and (viii) Fidelity's philosophies and strategies for evaluating funds and classes with lower or declining asset levels.Based on its evaluation of all of the conclusions noted above, and after considering all factors it believed relevant, the Board concluded that the advisory fee arrangements are fair and reasonable, and that the fund's Amended and Restated Contracts should be approved and the fund's Advisory Contracts should be renewed.Liquidity Risk Management Program
The Securities and Exchange Commission adopted Rule 22e-4 under the Investment Company Act of 1940 (the Liquidity Rule) to promote effective liquidity risk management throughout the open-end investment company industry, thereby reducing the risk that funds will be unable to meet their redemption obligations and mitigating dilution of the interests of fund shareholders.
The Fund has adopted and implemented a liquidity risk management program pursuant to the Liquidity Rule (the Program) effective December 1, 2018. The Program is reasonably designed to assess and manage the Fund’s liquidity risk and to comply with the requirements of the Liquidity Rule. The Fund’s Board of Trustees (the Board) has designated the Fund’s investment adviser as administrator of the Program. The Fidelity advisers have established a Liquidity Risk Management Committee (the LRM Committee) to manage the Program for each of the Fidelity Funds. The LRM Committee monitors the adequacy and effectiveness of implementation of the Program and on a periodic basis assesses each Fund’s liquidity risk based on a variety of factors including (1) the Fund’s investment strategy, (2) portfolio liquidity and cash flow projections during normal and reasonably foreseeable stressed conditions, (3) shareholder redemptions, (4) borrowings and other funding sources and (5) in the case of exchange-traded funds, certain additional factors including the effect of the Fund’s prices and spreads, market participants, and basket compositions on the overall liquidity of the Fund’s portfolio, as applicable.
In accordance with the Program, each of the Fund’s portfolio investments is classified into one of four liquidity categories described below based on a determination of a reasonable expectation for how long it would take to convert the investment to cash (or sell or dispose of the investment) without significantly changing its market value.
- Highly liquid investments – cash or convertible to cash within three business days or less
- Moderately liquid investments – convertible to cash in three to seven calendar days
- Less liquid investments – can be sold or disposed of, but not settled, within seven calendar days
- Illiquid investments – cannot be sold or disposed of within seven calendar days
Liquidity classification determinations take into account a variety of factors including various market, trading and investment-specific considerations, as well as market depth, and generally utilize analysis from a third-party liquidity metrics service.
The Liquidity Rule places a 15% limit on a fund’s illiquid investments and requires funds that do not primarily hold assets that are highly liquid investments to determine and maintain a minimum percentage of the fund’s net assets to be invested in highly liquid investments (highly liquid investment minimum or HLIM). The Program includes provisions reasonably designed to comply with the 15% limit on illiquid investments and for determining, periodically reviewing and complying with the HLIM requirement as applicable.
At a recent meeting of the Fund’s Board of Trustees, the LRM Committee provided a written report to the Board pertaining to the operation, adequacy, and effectiveness of implementation of the Program for the annual period from December 1, 2018 through November 30, 2019. The report concluded that the Program has been implemented and is operating effectively and is reasonably designed to assess and manage the Fund’s liquidity risk.
![]()
FSH-ANN-0620
1.924270.109
Fidelity® Global High Income Fund
April 30, 2020
Includes Fidelity and Fidelity Advisor share classes
See the inside front cover for important information about access to your fund’s shareholder reports.
Beginning on January 1, 2021, as permitted by regulations adopted by the Securities and Exchange Commission, paper copies of a fund’s shareholder reports will no longer be sent by mail, unless you specifically request paper copies of the reports from the fund or from your financial intermediary, such as a financial advisor, broker-dealer or bank. Instead, the reports will be made available on a website, and you will be notified by mail each time a report is posted and provided with a website link to access the report.
If you already elected to receive shareholder reports electronically, you will not be affected by this change and you need not take any action. You may elect to receive shareholder reports and other communications from a fund electronically, by contacting your financial intermediary. For Fidelity customers, visit Fidelity's web site or call Fidelity using the contact information listed below.
You may elect to receive all future reports in paper free of charge. If you wish to continue receiving paper copies of your shareholder reports, you may contact your financial intermediary or, if you are a Fidelity customer, visit Fidelity’s website, or call Fidelity at the applicable toll-free number listed below. Your election to receive reports in paper will apply to all funds held with the fund complex/your financial intermediary.
| Account Type | Website | Phone Number |
| Brokerage, Mutual Fund, or Annuity Contracts: | fidelity.com/mailpreferences | 1-800-343-3548 |
| Employer Provided Retirement Accounts: | netbenefits.fidelity.com/preferences (choose 'no' under Required Disclosures to continue to print) | 1-800-343-0860 |
| Advisor Sold Accounts Serviced Through Your Financial Intermediary: | Contact Your Financial Intermediary | Your Financial Intermediary's phone number |
| Advisor Sold Accounts Serviced by Fidelity: | institutional.fidelity.com | 1-877-208-0098 |
Contents
Board Approval of Investment Advisory Contracts and Management Fees | |
To view a fund's proxy voting guidelines and proxy voting record for the 12-month period ended June 30, visit http://www.fidelity.com/proxyvotingresults or visit the Securities and Exchange Commission's (SEC) web site at http://www.sec.gov.
You may also call 1-800-544-8544 if you’re an individual investing directly with Fidelity, call 1-800-835-5092 if you’re a plan sponsor or participant with Fidelity as your recordkeeper or call 1-877-208-0098 on institutional accounts or if you’re an advisor or invest through one to request a free copy of the proxy voting guidelines.
Standard & Poor's, S&P and S&P 500 are registered service marks of The McGraw-Hill Companies, Inc. and have been licensed for use by Fidelity Distributors Corporation.
Other third-party marks appearing herein are the property of their respective owners.
All other marks appearing herein are registered or unregistered trademarks or service marks of FMR LLC or an affiliated company. © 2020 FMR LLC. All rights reserved.
This report and the financial statements contained herein are submitted for the general information of the shareholders of the Fund. This report is not authorized for distribution to prospective investors in the Fund unless preceded or accompanied by an effective prospectus.
A fund files its complete schedule of portfolio holdings with the SEC for the first and third quarters of each fiscal year on Form N-PORT. Forms N-PORT are available on the SEC’s web site at http://www.sec.gov. A fund's Forms N-PORT may be reviewed and copied at the SEC’s Public Reference Room in Washington, DC. Information regarding the operation of the SEC's Public Reference Room may be obtained by calling 1-800-SEC-0330.
For a complete list of a fund's portfolio holdings, view the most recent holdings listing, semiannual report, or annual report on Fidelity's web site at http://www.fidelity.com, http://www.institutional.fidelity.com, or http://www.401k.com, as applicable.
NOT FDIC INSURED •MAY LOSE VALUE •NO BANK GUARANTEE
Neither the Fund nor Fidelity Distributors Corporation is a bank.
Note to Shareholders:
Early in 2020, the outbreak and spread of a new coronavirus emerged as a public health emergency that had a major influence on financial markets, primarily based on its impact on the global economy and the outlook for corporate earnings. The virus causes a respiratory disease known as COVID-19. On March 11, the World Health Organization declared the COVID-19 outbreak a pandemic, citing sustained risk of further global spread.
In the weeks following, as the crisis worsened, we witnessed an escalating human tragedy with wide-scale social and economic consequences from coronavirus-containment measures. The outbreak of COVID-19 prompted a number of measures to limit the spread, including travel and border restrictions, quarantines, and restrictions on large gatherings. In turn, these resulted in lower consumer activity, diminished demand for a wide range of products and services, disruption in manufacturing and supply chains, and – given the wide variability in outcomes regarding the outbreak – significant market uncertainty and volatility. Amid the turmoil, the U.S. government took unprecedented action – in concert with the U.S. Federal Reserve and central banks around the world – to help support consumers, businesses, and the broader economy, and to limit disruption to the financial system.
The situation continues to unfold, and the extent and duration of its impact on financial markets and the economy remain highly uncertain. Extreme events such as the coronavirus crisis are “exogenous shocks” that can have significant adverse effects on mutual funds and their investments. Although multiple asset classes may be affected by market disruption, the duration and impact may not be the same for all types of assets.
Fidelity is committed to helping you stay informed amid news about COVID-19 and during increased market volatility, and we’re taking extra steps to be responsive to customer needs. We encourage you to visit our websites, where we offer ongoing updates, commentary, and analysis on the markets and our funds.
Performance: The Bottom Line
Average annual total return reflects the change in the value of an investment, assuming reinvestment of distributions from dividend income and capital gains (the profits earned upon the sale of securities that have grown in value, if any) and assuming a constant rate of performance each year. The hypothetical investment and the average annual total returns do not reflect the deduction of taxes that a shareholder would pay on fund distributions or the redemption of fund shares. During periods of reimbursement by Fidelity, a fund’s total return will be greater than it would be had the reimbursement not occurred. How a fund did yesterday is no guarantee of how it will do tomorrow.
Average Annual Total Returns
| For the periods ended April 30, 2020 | Past 1 year | Past 5 years | Life of fundA |
| Class A (incl. 4.00% sales charge) | (11.14)% | 1.14% | 3.00% |
| Class M (incl. 4.00% sales charge) | (11.14)% | 1.15% | 2.99% |
| Class C (incl. contingent deferred sales charge) | (9.02)% | 1.21% | 2.69% |
| Fidelity® Global High Income Fund | (7.21)% | 2.23% | 3.73% |
| Class I | (7.21)% | 2.23% | 3.73% |
A From May 11, 2011
Class C shares' contingent deferred sales charges included in the past one year, past five years, and life of fund total return figures are 1%, 0%, and 0%, respectively.
$10,000 Over Life of Fund
Let's say hypothetically that $10,000 was invested in Fidelity® Global High Income Fund - Fidelity® Global High Income Fund on May 11, 2011, when the fund started, and the current % sales charge was paid.
The chart shows how the value of your investment would have changed, and also shows how the ICE® BofA® Global High Yield and Emerging Markets Plus Index performed over the same period.
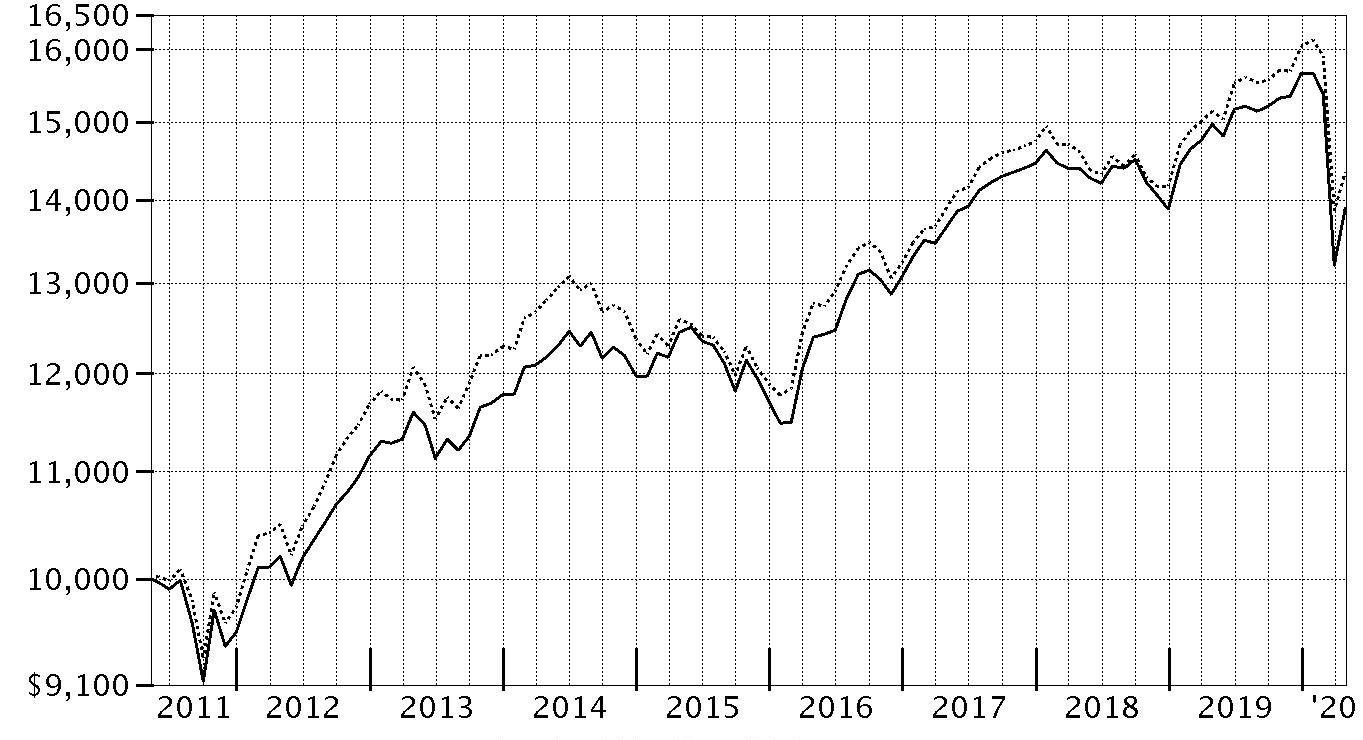
| Period Ending Values | ||
| $13,896 | Fidelity® Global High Income Fund | |
| $14,348 | ICE® BofA® Global High Yield and Emerging Markets Plus Index | |
Management's Discussion of Fund Performance
Market Recap: Global high-yield bonds returned -4.54% for the 12 months ending April 30, 2020, as measured by the Fidelity Global High Income Composite Index℠. The early-2020 outbreak and spread of the coronavirus hampered global economic growth and trade. Declared a pandemic on March 11, the crisis and containment efforts caused broad contraction in economic activity, along with extreme uncertainty, volatility and dislocation in financial markets. After gaining 13.39% in 2019, global high yield opened the new year with a flattish January. The asset class began to slide in late February (-1.32%), however, after a surge in COVID-19 cases outside China. The downtrend was considerably steep in March (-12.09%), but reversed in April (+4.31%) amid improving coronavirus trends, plans for reopening some economies, progress on potential treatments and historic monetary/fiscal-policy responses. By region, Europe declined the most, returning -7.94%, according to the ICE BofA® Euro High Yield Constrained Index. Headwinds included challenging macro/political conditions, negative interest rates and a resurgent dollar. U.S. high-yield bonds (-5.27%) also underperformed, as measured by the ICE BofA® US High Yield Constrained Index. Asian high-yield debt returned -2.82%, according to the ICE BofA® Asian Dollar High Yield Corporate Constrained Index, while emerging-markets corporate debt fared best, with the J.P. Morgan Corporate Emerging Markets Bond Index Broad Diversified returning -0.21%.Comments from Co-Portfolio Manager Harley Lank: For the fiscal year, the fund’s shares classes (excluding sales charges, if applicable) returned about -7% to -8%, trailing the -4.54% result of the Fidelity Global High Income Composite IndexSM. The fund trailed the Composite index the past 12 months, as security selection within three of the fund’s four regional subportfolios detracted, especially among emerging markets. In particular, security selection in Mexico and an overweighting in Argentina weighed on the emerging-markets debt subportfolio. Meanwhile, both the Asian and U.S. high-yield debt sleeves were hurt by positioning in the energy segment, which declined this period on lower oil prices. Conversely, relative performance benefited from security selection in European high yield, where several holdings across a number of countries and sectors were helpful. From an asset allocation perspective, positioning contributed to the fund’s performance versus the Composite index. In particular, it helped most to underweight European high yield and overweight Asian high yield.The views expressed above reflect those of the portfolio manager(s) only through the end of the period as stated on the cover of this report and do not necessarily represent the views of Fidelity or any other person in the Fidelity organization. Any such views are subject to change at any time based upon market or other conditions and Fidelity disclaims any responsibility to update such views. These views may not be relied on as investment advice and, because investment decisions for a Fidelity fund are based on numerous factors, may not be relied on as an indication of trading intent on behalf of any Fidelity fund.
Note to shareholders: On June 29, 2019, Timothy Gill and Jonathan Kelly assumed co-management responsibilities for the fund. John Carlson and Lisa Roche are no longer co-managers for the fund. On October 1, 2019, Alexandre Karam assumed co-management responsibilities for the fund's U.S. high-yield subportfolio, joining Co-Manager Harley Lank.Investment Summary (Unaudited)
Top Five Holdings as of April 30, 2020
| (by issuer, excluding cash equivalents) | % of fund's net assets |
| CCO Holdings LLC/CCO Holdings Capital Corp. | 1.7 |
| Ally Financial, Inc. | 1.7 |
| Citigroup, Inc. | 1.6 |
| Pacific Gas & Electric Co. | 1.4 |
| Tenet Healthcare Corp. | 1.3 |
| 7.7 |
Top Five Countries as of April 30, 2020
| (excluding cash equivalents) | % of fund's net assets |
| United States of America | 48.6 |
| Cayman Islands | 7.6 |
| Netherlands | 5.9 |
| Luxembourg | 5.1 |
| Canada | 2.4 |
Top Five Market Sectors as of April 30, 2020
| % of fund's net assets | |
| Energy | 11.2 |
| Telecommunications | 9.0 |
| Banks & Thrifts | 8.6 |
| Healthcare | 7.4 |
| Homebuilders/Real Estate | 7.1 |
Quality Diversification (% of fund's net assets)
| As of April 30, 2020 | ||
| AAA,AA,A | 0.4% | |
| BBB | 3.9% | |
| BB | 40.6% | |
| B | 32.6% | |
| CCC,CC,C | 12.1% | |
| D | 0.6% | |
| Not Rated | 4.6% | |
| Equities | 1.0% | |
| Short-Term Investments and Net Other Assets | 4.2% | |

We have used ratings from Moody's Investors Service, Inc. Where Moody's® ratings are not available, we have used S&P® ratings. All ratings are as of the date indicated and do not reflect subsequent changes.
Asset Allocation (% of fund's net assets)
| As of April 30, 2020* | ||
| Corporate Bonds | 81.7% | |
| Government Obligations | 0.6% | |
| Stocks | 1.0% | |
| Preferred Securities | 7.5% | |
| Other Investments | 5.0% | |
| Short-Term Investments and Net Other Assets (Liabilities) | 4.2% | |

* Foreign investments – 47.2%
Schedule of Investments April 30, 2020
Showing Percentage of Net Assets
| Corporate Bonds - 81.7% | |||
| Principal Amount(a) | Value | ||
| Convertible Bonds - 0.6% | |||
| Broadcasting - 0.5% | |||
| DISH Network Corp.: | |||
| 2.375% 3/15/24 | $120,000 | $100,893 | |
| 3.375% 8/15/26 | 392,000 | 317,755 | |
| 418,648 | |||
| Diversified Financial Services - 0.1% | |||
| Nexi SpA 1.75% 4/24/27 (Reg. S) | EUR | 100,000 | 110,407 |
| Energy - 0.0% | |||
| Denbury Resources, Inc. 6.375% 12/31/24 (b) | 89,000 | 11,707 | |
| Steel - 0.0% | |||
| Vallourec SA 4.125% 10/4/22 | EUR | 8,632 | 31,595 |
| TOTAL CONVERTIBLE BONDS | 572,357 | ||
| Nonconvertible Bonds - 81.1% | |||
| Aerospace - 1.9% | |||
| BBA U.S. Holdings, Inc.: | |||
| 4% 3/1/28 (b) | 70,000 | 59,500 | |
| 5.375% 5/1/26 (b) | 30,000 | 27,675 | |
| Bombardier, Inc.: | |||
| 7.5% 12/1/24 (b) | 96,000 | 63,780 | |
| 7.875% 4/15/27 (b) | 260,000 | 168,350 | |
| BWX Technologies, Inc. 5.375% 7/15/26 (b) | 65,000 | 66,381 | |
| DAE Funding LLC 4.5% 8/1/22 (b) | 50,000 | 45,563 | |
| Moog, Inc. 4.25% 12/15/27 (b) | 20,000 | 18,750 | |
| The Boeing Co.: | |||
| 4.5% 5/1/27 | 130,000 | 130,000 | |
| 4.6% 5/1/30 | 130,000 | 130,000 | |
| 4.875% 5/1/25 | 130,000 | 130,000 | |
| TransDigm UK Holdings PLC 6.875% 5/15/26 | 200,000 | 171,000 | |
| TransDigm, Inc.: | |||
| 5.5% 11/15/27 (b) | 455,000 | 384,475 | |
| 6.25% 3/15/26 (b) | 25,000 | 24,469 | |
| 7.5% 3/15/27 | 285,000 | 259,436 | |
| Wolverine Escrow LLC 8.5% 11/15/24 (b) | 45,000 | 31,613 | |
| 1,710,992 | |||
| Air Transportation - 0.7% | |||
| Aerovias de Mexico SA de CV 7% 2/5/25 (b) | 200,000 | 72,375 | |
| Azul Investments LLP 5.875% 10/26/24 (b) | 365,000 | 188,888 | |
| Rumo Luxembourg Sarl 7.375% 2/9/24 (b) | 300,000 | 307,875 | |
| 569,138 | |||
| Automotive & Auto Parts - 1.2% | |||
| Ford Motor Co.: | |||
| 9% 4/22/25 | 120,000 | 116,850 | |
| 9.625% 4/22/30 | 40,000 | 39,851 | |
| Ford Motor Credit Co. LLC: | |||
| 3.087% 1/9/23 | 200,000 | 181,000 | |
| 5.875% 8/2/21 | 115,000 | 113,850 | |
| IAA Spinco, Inc. 5.5% 6/15/27 (b) | 30,000 | 29,934 | |
| Jaguar Land Rover PLC 2.2% 1/15/24 (Reg. S) | EUR | 100,000 | 77,250 |
| Lithia Motors, Inc. 4.625% 12/15/27 (b) | 30,000 | 28,350 | |
| LKQ European Holdings BV 3.625% 4/1/26 | EUR | 100,000 | 107,941 |
| Metalsa SA de CV 4.9% 4/24/23 (b) | 150,000 | 138,525 | |
| Novem Group GmbH 3 month EURIBOR + 5.250% 5.25% 5/15/24 (Reg. S) (c)(d) | EUR | 100,000 | 85,977 |
| Volvo Car AB 2.125% 4/2/24 (Reg. S) | EUR | 100,000 | 104,084 |
| 1,023,612 | |||
| Banks & Thrifts - 4.5% | |||
| Alfa Bond Issuance PLC 5.95% 4/15/30 (b)(c) | 200,000 | 192,500 | |
| Ally Financial, Inc.: | |||
| 5.75% 11/20/25 | 250,000 | 256,250 | |
| 8% 11/1/31 | 155,000 | 179,025 | |
| 8% 11/1/31 | 868,000 | 1,056,034 | |
| Banca Monte dei Paschi di Siena SpA 5.375% 1/18/28 (c) | EUR | 100,000 | 65,038 |
| Banco de Reservas de La Republica Dominicana 7% 2/1/23 (b) | 150,000 | 142,125 | |
| Bankia SA 3.375% 3/15/27 (Reg. S) (c) | EUR | 200,000 | 216,145 |
| Biz Finance PLC 9.625% 4/27/22 (b) | 50,000 | 49,125 | |
| CBOM Finance PLC 4.7% 1/29/25 (b) | 200,000 | 190,250 | |
| Development Bank of the Republic of Belarus 6.75% 5/2/24 (b) | 200,000 | 184,000 | |
| Georgia Bank Joint Stock Co. 6% 7/26/23 (b) | 400,000 | 380,000 | |
| Industrial Senior Trust 5.5% 11/1/22 (b) | 200,000 | 199,494 | |
| Intesa Sanpaolo SpA 3.928% 9/15/26 (Reg. S) | EUR | 200,000 | 230,530 |
| Pearl Holding III Ltd. 9.5% 12/11/22 | 200,000 | 62,000 | |
| TBC Bank JSC 5.75% 6/19/24 (b) | 200,000 | 180,000 | |
| Turkiye Is Bankasi A/S 5.5% 4/21/22 (b) | 200,000 | 199,000 | |
| Turkiye Sinai Kalkinma Bankasi A/S 6% 1/23/25 (b) | 200,000 | 184,375 | |
| 3,965,891 | |||
| Broadcasting - 1.7% | |||
| AMC Networks, Inc.: | |||
| 4.75% 12/15/22 | 66,000 | 65,340 | |
| 4.75% 8/1/25 | 125,000 | 114,169 | |
| Cable Onda SA 4.5% 1/30/30 (b) | 200,000 | 190,000 | |
| Entercom Media Corp. 6.5% 5/1/27 (b) | 40,000 | 29,500 | |
| Netflix, Inc.: | |||
| 3.625% 6/15/30 (Reg. S) | EUR | 100,000 | 110,435 |
| 3.875% 11/15/29 (Reg. S) | EUR | 200,000 | 224,649 |
| 4.875% 4/15/28 | 85,000 | 90,392 | |
| 5.875% 11/15/28 | 140,000 | 158,319 | |
| Nexstar Escrow, Inc. 5.625% 7/15/27 (b) | 75,000 | 71,625 | |
| Scripps Escrow, Inc. 5.875% 7/15/27 (b) | 60,000 | 50,700 | |
| Sirius XM Radio, Inc.: | |||
| 4.625% 7/15/24 (b) | 100,000 | 101,960 | |
| 5% 8/1/27 (b) | 65,000 | 66,479 | |
| Tegna, Inc. 5% 9/15/29 (b) | 85,000 | 75,985 | |
| TV Azteca SA de CV 8.25% 8/9/24 (Reg. S) | 200,000 | 115,188 | |
| 1,464,741 | |||
| Building Materials - 1.3% | |||
| Advanced Drain Systems, Inc. 5% 9/30/27 (b) | 315,000 | 309,488 | |
| CEMEX Finance LLC 6% 4/1/24 (b) | 137,000 | 124,410 | |
| CEMEX S.A.B. de CV 5.45% 11/19/29 (b) | 200,000 | 164,000 | |
| Elementia S.A.B. de CV 5.5% 1/15/25 (b) | 200,000 | 147,906 | |
| HD Supply, Inc. 5.375% 10/15/26 (b) | 120,000 | 122,388 | |
| HMAN Finance Sub Corp. 6.375% 7/15/22 (b) | 100,000 | 75,500 | |
| Loxam SAS 3.25% 1/14/25 (Reg. S) | EUR | 100,000 | 98,079 |
| Titan Global Finance PLC 2.375% 11/16/24 (Reg. S) | EUR | 100,000 | 102,736 |
| 1,144,507 | |||
| Cable/Satellite TV - 5.2% | |||
| Altice France Holding SA 8% 5/15/27 (b) | EUR | 175,000 | 194,567 |
| CCO Holdings LLC/CCO Holdings Capital Corp.: | |||
| 4.5% 8/15/30 (b) | 95,000 | 95,475 | |
| 4.75% 3/1/30 (b) | 140,000 | 142,800 | |
| 5.125% 5/1/27 (b) | 890,000 | 924,132 | |
| 5.5% 5/1/26(b) | 260,000 | 270,429 | |
| 5.75% 2/15/26 (b) | 65,000 | 67,769 | |
| CSC Holdings LLC: | |||
| 5.375% 2/1/28 (b) | 165,000 | 172,268 | |
| 5.5% 4/15/27 (b) | 115,000 | 119,564 | |
| 5.75% 1/15/30 (b) | 100,000 | 103,969 | |
| 6.5% 2/1/29 (b) | 165,000 | 180,246 | |
| 7.5% 4/1/28 (b) | 230,000 | 252,756 | |
| DISH DBS Corp.: | |||
| 5% 3/15/23 | 250,000 | 238,125 | |
| 5.875% 11/15/24 | 55,000 | 52,901 | |
| 7.75% 7/1/26 | 185,000 | 182,225 | |
| LCPR Senior Secured Financing DAC 6.75% 10/15/27 (b) | 200,000 | 207,920 | |
| UPC Holding BV 3.875% 6/15/29 (Reg. S) | EUR | 100,000 | 106,256 |
| Virgin Media Finance PLC 4.5% 1/15/25 (Reg. S) | EUR | 100,000 | 110,681 |
| Virgin Media Secured Finance PLC 5.5% 5/15/29 (b) | 320,000 | 332,224 | |
| VTR Finance BV 6.875% 1/15/24 (b) | 539,000 | 535,178 | |
| Ziggo Bond Co. BV: | |||
| 5.125% 2/28/30 (b) | 35,000 | 34,475 | |
| 6% 1/15/27 (b) | 160,000 | 160,800 | |
| Ziggo BV: | |||
| 4.25% 1/15/27 (Reg. S) | EUR | 90,000 | 101,092 |
| 4.875% 1/15/30 (b) | 50,000 | 49,415 | |
| 4,635,267 | |||
| Chemicals - 2.0% | |||
| Braskem Idesa SAPI 7.45% 11/15/29 (b) | 250,000 | 182,875 | |
| Braskem Netherlands BV 4.5% 1/31/30 (b) | 200,000 | 162,000 | |
| CF Industries Holdings, Inc.: | |||
| 4.95% 6/1/43 | 175,000 | 178,827 | |
| 5.15% 3/15/34 | 145,000 | 150,800 | |
| 5.375% 3/15/44 | 225,000 | 232,875 | |
| CTC BondCo GmbH 5.25% 12/15/25 | EUR | 200,000 | 190,897 |
| OCI NV: | |||
| 5.25% 11/1/24 (b) | 110,000 | 108,367 | |
| 6.625% 4/15/23 (b) | 80,000 | 80,012 | |
| Starfruit Finco BV / Starfruit U.S. Holdco LLC 8% 10/1/26 (b) | 150,000 | 140,475 | |
| The Chemours Co. LLC: | |||
| 5.375% 5/15/27 | 60,000 | 50,400 | |
| 6.625% 5/15/23 | 60,000 | 56,100 | |
| 7% 5/15/25 | 95,000 | 89,272 | |
| Tronox, Inc. 6.5% 5/1/25 (b) | 135,000 | 135,844 | |
| Valvoline, Inc. 4.25% 2/15/30 (b) | 45,000 | 43,763 | |
| 1,802,507 | |||
| Consumer Products - 0.7% | |||
| Bonitron Designated Activity Co. 8.75% 10/30/22 (b) | 170,000 | 164,103 | |
| International Design Group SpA 6.5% 11/15/25 (Reg. S) | EUR | 100,000 | 93,038 |
| Terrier Media Buyer, Inc. 8.875% 12/15/27 (b) | 90,000 | 74,250 | |
| Turk Sise ve Cam Fabrikalari A/S 4.25% 5/9/20 (b) | 200,000 | 199,625 | |
| Walnut Bidco PLC 6.75% 8/1/24 (Reg. S) | EUR | 100,000 | 89,805 |
| 620,821 | |||
| Containers - 1.2% | |||
| ARD Finance SA 6.5% 6/30/27 pay-in-kind (b)(c) | 70,000 | 64,974 | |
| Ardagh Packaging Finance PLC/Ardagh MP Holdings U.S.A., Inc. 6% 2/15/25 (b) | 180,000 | 180,157 | |
| Ball Corp.: | |||
| 4.375% 12/15/23 | EUR | 300,000 | 353,175 |
| 4.875% 3/15/26 | 205,000 | 220,375 | |
| Berry Global, Inc. 4.5% 2/15/26 (b) | 200,000 | 197,420 | |
| Plastipak Holdings, Inc. 6.25% 10/15/25 (b) | 20,000 | 17,856 | |
| Trivium Packaging Finance BV 5.5% 8/15/26 (b) | 40,000 | 41,000 | |
| 1,074,957 | |||
| Diversified Financial Services - 4.6% | |||
| Chobani LLC/Finance Corp., Inc. 7.5% 4/15/25 (b) | 15,000 | 14,937 | |
| Comcel Trust 6.875% 2/6/24 (b) | 220,000 | 220,000 | |
| Credito Real S.A.B. de CV 9.5% 2/7/26 (b) | 200,000 | 180,000 | |
| Diamond Sports Group LLC/Diamond Sports Finance Co. 5.375% 8/15/26 (b) | 70,000 | 53,200 | |
| Enviva Partners LP / Enviva Partners Finance Corp. 6.5% 1/15/26 (b) | 90,000 | 94,275 | |
| FLY Leasing Ltd. 5.25% 10/15/24 | 60,000 | 48,000 | |
| Ford Credit Europe PLC 1.615% 5/11/23 (Reg. S) | EUR | 200,000 | 195,679 |
| Fortune Star (BVI) Ltd. 6.75% 7/2/23 (Reg. S) | 200,000 | 194,125 | |
| Garfunkelux Holdco 3 SA: | |||
| 3 month EURIBOR + 3.500% 3.5% 9/1/23 (Reg. S) (c)(d) | EUR | 100,000 | 85,191 |
| 7.5% 8/1/22 (Reg. S) | EUR | 100,000 | 88,764 |
| Icahn Enterprises LP/Icahn Enterprises Finance Corp.: | |||
| 4.75% 9/15/24 | 90,000 | 84,647 | |
| 5.25% 5/15/27 | 90,000 | 85,501 | |
| 6.25% 5/15/26 | 260,000 | 255,481 | |
| 6.375% 12/15/25 | 215,000 | 213,925 | |
| Lincoln Financing SARL 3.625% 4/1/24 (Reg. S) | EUR | 225,000 | 209,425 |
| MSCI, Inc.: | |||
| 5.375% 5/15/27 (b) | 500,000 | 538,750 | |
| 5.75% 8/15/25 (b) | 50,000 | 52,230 | |
| Navient Corp.: | |||
| 5.875% 10/25/24 | 190,000 | 172,900 | |
| 7.25% 9/25/23 | 55,000 | 52,663 | |
| Park Aerospace Holdings Ltd.: | |||
| 4.5% 3/15/23 (b) | 20,000 | 17,690 | |
| 5.5% 2/15/24 (b) | 322,000 | 283,504 | |
| Radiate Holdco LLC/Radiate Financial Service Ltd.: | |||
| 6.625% 2/15/25 (b) | 285,000 | 282,150 | |
| 6.875% 2/15/23 (b) | 85,000 | 83,300 | |
| Springleaf Finance Corp. 6.875% 3/15/25 | 75,000 | 70,928 | |
| Vivion Investments SARL 3.5% 11/1/25 (Reg. S) | EUR | 100,000 | 97,706 |
| Yihua Overseas Investment Ltd. 8.5% 10/23/20 (Reg. S) | 200,000 | 112,250 | |
| Ypso Finance BIS SA: | |||
| 4% 2/15/28 (Reg. S) | EUR | 100,000 | 93,969 |
| 6% 2/15/28 (b) | 75,000 | 68,235 | |
| 10.5% 5/15/27 (b) | 130,000 | 140,427 | |
| �� | 4,089,852 | ||
| Diversified Media - 0.2% | |||
| E.W. Scripps Co. 5.125% 5/15/25 (b) | 30,000 | 25,296 | |
| Viacom, Inc.: | |||
| 5.875% 2/28/57 (c) | 75,000 | 68,295 | |
| 6.25% 2/28/57 (c) | 90,000 | 88,200 | |
| 181,791 | |||
| Energy - 10.2% | |||
| Antero Midstream Partners LP/Antero Midstream Finance Corp.: | |||
| 5.75% 3/1/27 (b) | 140,000 | 103,600 | |
| 5.75% 1/15/28 (b) | 60,000 | 44,100 | |
| Archrock Partners LP / Archrock Partners Finance Corp. 6.25% 4/1/28 (b) | 70,000 | 52,150 | |
| California Resources Corp. 8% 12/15/22 (b) | 555,000 | 19,425 | |
| Cheniere Corpus Christi Holdings LLC 5.125% 6/30/27 | 135,000 | 134,604 | |
| Cheniere Energy Partners LP 5.625% 10/1/26 | 90,000 | 86,004 | |
| Chesapeake Energy Corp.: | |||
| 5.75% 3/15/23 | 135,000 | 2,869 | |
| 6.625% 8/15/20 | 91,000 | 5,460 | |
| 11.5% 1/1/25 (b) | 36,000 | 990 | |
| Citgo Holding, Inc. 9.25% 8/1/24 (b) | 185,000 | 166,500 | |
| Citgo Petroleum Corp. 6.25% 8/15/22 (b) | 85,000 | 81,388 | |
| Comstock Escrow Corp. 9.75% 8/15/26 | 140,000 | 121,101 | |
| Consolidated Energy Finance SA: | |||
| 3 month U.S. LIBOR + 3.750% 4.4905% 6/15/22 (b)(c)(d) | 320,000 | 265,738 | |
| 6.5% 5/15/26 (b) | 185,000 | 143,838 | |
| 6.875% 6/15/25 (b) | 200,000 | 154,000 | |
| Continental Resources, Inc. 4.5% 4/15/23 | 10,000 | 8,844 | |
| Covey Park Energy LLC 7.5% 5/15/25 (b) | 210,000 | 174,300 | |
| CVR Energy, Inc.: | |||
| 5.25% 2/15/25 (b) | 140,000 | 114,800 | |
| 5.75% 2/15/28 (b) | 140,000 | 118,371 | |
| DCP Midstream LLC 5.85% 5/21/43 (b)(c) | 60,000 | 27,600 | |
| DCP Midstream Operating LP 5.375% 7/15/25 | 135,000 | 109,350 | |
| Denbury Resources, Inc.: | |||
| 7.75% 2/15/24 (b) | 421,000 | 75,780 | |
| 9.25% 3/31/22 (b) | 45,000 | 8,100 | |
| Duke Energy Field Services 8.125% 8/16/30 | 5,000 | 3,900 | |
| Ecopetrol SA: | |||
| 5.375% 6/26/26 | 100,000 | 98,156 | |
| 5.875% 5/28/45 | 100,000 | 88,023 | |
| EG Global Finance PLC: | |||
| 6.25% 10/30/25 (Reg. S) | EUR | 100,000 | 98,627 |
| 6.75% 2/7/25 (b) | 335,000 | 304,850 | |
| 8.5% 10/30/25 (b) | 75,000 | 73,125 | |
| Endeavor Energy Resources LP/EER Finance, Inc. 5.75% 1/30/28 (b) | 125,000 | 108,750 | |
| EP Energy LLC/Everest Acquisition Finance, Inc. 7.75% 5/15/26 (b)(e) | 725,000 | 79,750 | |
| GeoPark Ltd.: | |||
| 5.5% 1/17/27 (b) | 200,000 | 125,375 | |
| 6.5% 9/21/24 (b) | 200,000 | 142,320 | |
| Greenko Dutch BV 5.25% 7/24/24 | 200,000 | 176,250 | |
| Hess Infrastructure Partners LP 5.625% 2/15/26 (b) | 100,000 | 93,000 | |
| Hess Midstream Partners LP 5.125% 6/15/28 (b) | 80,000 | 70,096 | |
| Hilcorp Energy I LP/Hilcorp Finance Co. 5% 12/1/24 (b) | 145,000 | 81,925 | |
| Indika Energy Capital III Pte. Ltd. 5.875% 11/9/24 (b) | 200,000 | 167,750 | |
| Jonah Energy LLC 7.25% 10/15/25 (b) | 215,000 | 3,763 | |
| KLX Energy Services Holdings, Inc. 11.5% 11/1/25 (b) | 95,000 | 34,794 | |
| Kosmos Energy Ltd. 7.125% 4/4/26 (b) | 285,000 | 174,741 | |
| Magnolia Oil & Gas Operating LLC 6% 8/1/26 (b) | 85,000 | 69,700 | |
| Medco Bell Pte Ltd.: | |||
| 6.375% 1/30/27 (b) | 200,000 | 119,000 | |
| 6.375% 1/30/27 (Reg. S) | 200,000 | 119,000 | |
| Medco Oak Tree Pte Ltd. 7.375% 5/14/26 (b) | 200,000 | 122,000 | |
| MEG Energy Corp.: | |||
| 7% 3/31/24 (b) | 216,000 | 153,360 | |
| 7.125% 2/1/27 (b) | 140,000 | 96,600 | |
| Mongolian Mining Corp. / Energy Resources LLC 9.25% 4/15/24 (Reg. S) | 200,000 | 120,250 | |
| MPLX LP 6.375% 5/1/24 (b) | 45,000 | 45,929 | |
| Murphy Oil Corp. 5.875% 12/1/27 | 90,000 | 61,083 | |
| Nabors Industries, Inc. 5.75% 2/1/25 | 105,000 | 23,888 | |
| Neerg Energy Ltd. 6% 2/13/22 (Reg. S) | 200,000 | 180,500 | |
| Noble Holding International Ltd.: | |||
| 6.05% 3/1/41 | 5,000 | 31 | |
| 6.2% 8/1/40 | 85,000 | 531 | |
| 7.75% 1/15/24 | 48,000 | 2,640 | |
| 7.95% 4/1/25 (c) | 55,000 | 344 | |
| Nostrum Oil & Gas Finance BV 8% 7/25/22 (b) | 400,000 | 68,000 | |
| Oasis Petroleum, Inc. 6.875% 3/15/22 | 43,000 | 6,396 | |
| Pacific Drilling SA 12% 4/1/24 pay-in-kind (b)(c) | 9,642 | 289 | |
| Parsley Energy LLC/Parsley Finance Corp. 5.625% 10/15/27 (b) | 435,000 | 371,925 | |
| PBF Holding Co. LLC/PBF Finance Corp.: | |||
| 6% 2/15/28 (b) | 160,000 | 113,904 | |
| 7.25% 6/15/25 | 70,000 | 53,725 | |
| PBF Logistics LP/PBF Logistics Finance, Inc. 6.875% 5/15/23 | 130,000 | 100,100 | |
| Petrobras Global Finance BV: | |||
| 5.093% 1/15/30 (b) | 88,000 | 80,300 | |
| 6.9% 3/19/49 | 135,000 | 129,594 | |
| Petroleos Mexicanos: | |||
| 6.49% 1/23/27 (b) | 175,000 | 141,470 | |
| 7.69% 1/23/50 (b) | 75,000 | 55,125 | |
| Pride International, Inc. 7.875% 8/15/40 | 95,000 | 7,719 | |
| Puma International Financing SA 5.125% 10/6/24 (Reg. S) | 200,000 | 134,824 | |
| Repsol International Finance BV 4.5% 3/25/75 (Reg. S) (c) | EUR | 200,000 | 216,871 |
| Sanchez Energy Corp. 7.25% 2/15/23 (b)(e) | 172,000 | 1,720 | |
| Saudi Arabian Oil Co. 3.5% 4/16/29 (b) | 200,000 | 201,250 | |
| SESI LLC 7.75% 9/15/24 | 40,000 | 8,285 | |
| SM Energy Co.: | |||
| 5% 1/15/24 | 65,000 | 20,501 | |
| 5.625% 6/1/25 | 100,000 | 28,000 | |
| 6.625% 1/15/27 | 65,000 | 17,121 | |
| 6.75% 9/15/26 | 25,000 | 6,813 | |
| Sunoco LP/Sunoco Finance Corp.: | |||
| 4.875% 1/15/23 | 90,000 | 87,525 | |
| 5.5% 2/15/26 | 75,000 | 72,375 | |
| 6% 4/15/27 | 175,000 | 170,625 | |
| Targa Resources Partners LP/Targa Resources Partners Finance Corp.: | |||
| 5.125% 2/1/25 | 35,000 | 31,500 | |
| 5.375% 2/1/27 | 35,000 | 29,750 | |
| 5.5% 3/1/30 (b) | 70,000 | 59,675 | |
| 5.875% 4/15/26 | 70,000 | 62,125 | |
| 6.5% 7/15/27 | 40,000 | 36,000 | |
| 6.875% 1/15/29 | 70,000 | 64,197 | |
| Teine Energy Ltd. 6.875% 9/30/22 (b) | 85,000 | 81,600 | |
| Termocandelaria Power Ltd. 7.875% 1/30/29 (b) | 200,000 | 193,000 | |
| TerraForm Power Operating LLC: | |||
| 4.25% 1/31/23 (b) | 150,000 | 153,675 | |
| 4.75% 1/15/30 (b) | 225,000 | 230,063 | |
| 5% 1/31/28 (b) | 50,000 | 52,452 | |
| Transocean Sentry Ltd. 5.375% 5/15/23 (b) | 85,000 | 64,600 | |
| Transportadora de Gas del Sur SA 6.75% 5/2/25 (b) | 300,000 | 218,250 | |
| Tullow Oil PLC: | |||
| 6.25% 4/15/22 (b) | 200,000 | 107,250 | |
| 7% 3/1/25 (b) | 200,000 | 100,375 | |
| U.S.A. Compression Partners LP 6.875% 4/1/26 | 35,000 | 28,175 | |
| Ultra Resources, Inc. 11% 7/12/24 pay-in-kind | 63,329 | 3,800 | |
| Valaris PLC: | |||
| 5.2% 3/15/25 | 30,000 | 2,400 | |
| 7.75% 2/1/26 | 85,000 | 6,800 | |
| Viper Energy Partners LP 5.375% 11/1/27 (b) | 30,000 | 26,850 | |
| W&T Offshore, Inc. 9.75% 11/1/23 (b) | 75,000 | 24,750 | |
| Weatherford International Ltd. 11% 12/1/24 (b) | 95,000 | 70,300 | |
| YPF SA: | |||
| 8.5% 3/23/21 (b) | 275,000 | 171,392 | |
| 8.5% 7/28/25 (b) | 275,000 | 131,141 | |
| 9,103,540 | |||
| Entertainment/Film - 1.0% | |||
| Allen Media LLC 10.5% 2/15/28 (b) | 70,000 | 51,975 | |
| Altice Finco SA 7.625% 2/15/25 (b) | 210,000 | 211,575 | |
| Live Nation Entertainment, Inc. 4.75% 10/15/27 (b) | 80,000 | 68,399 | |
| New Cotai LLC/New Cotai Capital Corp. 10.625% 5/1/19 pay-in-kind (b)(c)(e) | 1,068,694 | 480,912 | |
| Petroleos Mexicanos 3.625% 11/24/25 (Reg. S) | EUR | 100,000 | 86,401 |
| 899,262 | |||
| Environmental - 0.6% | |||
| LBC Tank Terminals Holding Netherlands BV 6.875% 5/15/23 (b) | 465,000 | 453,375 | |
| Paprec Holding 3 month EURIBOR + 3.500% 3.5% 3/31/25 (c)(d) | EUR | 100,000 | 87,120 |
| 540,495 | |||
| Food & Drug Retail - 0.7% | |||
| Albertsons Companies LLC/Safeway, Inc./New Albertson's, Inc./Albertson's LLC: | |||
| 4.625% 1/15/27 (b) | 95,000 | 95,475 | |
| 4.875% 2/15/30 (b) | 95,000 | 96,306 | |
| Camposol SA 6% 2/3/27 (b) | 200,000 | 186,750 | |
| Sigma Holdco BV 5.75% 5/15/26 (Reg. S) | EUR | 110,000 | 115,119 |
| Tereos Finance Group I 4.125% 6/16/23 (Reg. S) | EUR | 100,000 | 77,257 |
| Tops Markets LLC 13% 11/19/24 pay-in-kind (c) | 33,712 | 32,701 | |
| 603,608 | |||
| Food/Beverage/Tobacco - 2.2% | |||
| Central American Bottling Corp. 5.75% 1/31/27 (b) | 200,000 | 195,750 | |
| ESAL GmbH 6.25% 2/5/23 (b) | 21,000 | 20,816 | |
| JBS Investments II GmbH: | |||
| 5.75% 1/15/28 (b) | 200,000 | 195,000 | |
| 7% 1/15/26 (b) | 500,000 | 518,700 | |
| JBS U.S.A. LLC/JBS U.S.A. Finance, Inc.: | |||
| 5.75% 6/15/25 (b) | 30,000 | 30,375 | |
| 5.875% 7/15/24 (b) | 40,000 | 40,800 | |
| 6.75% 2/15/28 (b) | 185,000 | 198,124 | |
| JBS U.S.A. Lux SA / JBS Food Co.: | |||
| 5.5% 1/15/30 (b) | 120,000 | 121,500 | |
| 6.5% 4/15/29 (b) | 80,000 | 84,601 | |
| KeHE Distributors LLC / KeHE Finance Corp. 8.625% 10/15/26 (b) | 60,000 | 63,450 | |
| Lamb Weston Holdings, Inc.: | |||
| 4.625% 11/1/24 (b) | 45,000 | 45,878 | |
| 4.875% 11/1/26 (b) | 45,000 | 45,225 | |
| MHP SA 7.75% 5/10/24 (b) | 200,000 | 194,438 | |
| Post Holdings, Inc.: | |||
| 4.625% 4/15/30 (b) | 45,000 | 44,100 | |
| 5.625% 1/15/28 (b) | 110,000 | 111,925 | |
| Vector Group Ltd. 6.125% 2/1/25 (b) | 75,000 | 72,750 | |
| 1,983,432 | |||
| Gaming - 1.8% | |||
| Boyd Gaming Corp. 4.75% 12/1/27 (b) | 115,000 | 99,073 | |
| Caesars Resort Collection LLC 5.25% 10/15/25 (b) | 300,000 | 235,590 | |
| GLP Capital LP/GLP Financing II, Inc.: | |||
| 5.25% 6/1/25 | 95,000 | 92,397 | |
| 5.375% 4/15/26 | 30,000 | 29,888 | |
| International Game Technology PLC 6.25% 1/15/27 (b) | 50,000 | 48,610 | |
| MCE Finance Ltd.: | |||
| 5.25% 4/26/26 (b) | 180,000 | 175,507 | |
| 5.375% 12/4/29 (Reg. S) | 200,000 | 186,817 | |
| MGM Growth Properties Operating Partnership LP: | |||
| 4.5% 1/15/28 | 350,000 | 329,000 | |
| 5.75% 2/1/27 | 70,000 | 70,875 | |
| MGM Mirage, Inc. 6.75% 5/1/25 (f) | 130,000 | 127,416 | |
| Station Casinos LLC 5% 10/1/25 (b) | 155,000 | 129,224 | |
| Transocean, Inc. 7.25% 11/1/25 (b) | 160,000 | 60,800 | |
| Twin River Worldwide Holdings, Inc. 6.75% 6/1/27 (b) | 40,000 | 31,800 | |
| 1,616,997 | |||
| Healthcare - 6.9% | |||
| BCPE Cycle Merger Sub II, Inc. 10.625% 7/15/27 (b) | 110,000 | 109,588 | |
| Catalent Pharma Solutions 5% 7/15/27 (b) | 20,000 | 20,400 | |
| Centene Corp.: | |||
| 3.375% 2/15/30 (b) | 60,000 | 60,522 | |
| 4.25% 12/15/27 (b) | 70,000 | 73,238 | |
| 4.625% 12/15/29 (b) | 105,000 | 114,975 | |
| 5.25% 4/1/25 (b) | 50,000 | 52,125 | |
| 5.375% 6/1/26 (b) | 245,000 | 259,604 | |
| 5.375% 8/15/26 (b) | 55,000 | 58,581 | |
| Charles River Laboratories International, Inc.: | |||
| 4.25% 5/1/28 (b) | 20,000 | 20,175 | |
| 5.5% 4/1/26 (b) | 65,000 | 66,846 | |
| Community Health Systems, Inc.: | |||
| 6.25% 3/31/23 | 265,000 | 246,450 | |
| 8% 3/15/26 (b) | 440,000 | 421,775 | |
| 8.125% 6/30/24 (b) | 55,000 | 36,713 | |
| CTR Partnership LP/CareTrust Capital Corp. 5.25% 6/1/25 | 100,000 | 99,875 | |
| Encompass Health Corp. 5.75% 9/15/25 | 15,000 | 15,225 | |
| Eurofins Scientific SA 2.125% 7/25/24 (Reg. S) | EUR | 100,000 | 106,891 |
| HCA Holdings, Inc.: | |||
| 5.375% 9/1/26 | 85,000 | 92,013 | |
| 5.625% 9/1/28 | 150,000 | 166,212 | |
| 5.875% 2/15/26 | 85,000 | 94,563 | |
| 5.875% 2/1/29 | 45,000 | 51,561 | |
| Hologic, Inc. 4.375% 10/15/25 (b) | 55,000 | 55,253 | |
| IMS Health, Inc.: | |||
| 3.25% 3/15/25 (Reg. S) | EUR | 200,000 | 220,367 |
| 5% 10/15/26 (b) | 120,000 | 123,696 | |
| InRetail Pharma SA 5.375% 5/2/23 (b) | 200,000 | 201,313 | |
| MPT Operating Partnership LP/MPT Finance Corp.: | |||
| 5% 10/15/27 | 330,000 | 336,600 | |
| 5.25% 8/1/26 | 100,000 | 101,000 | |
| Ortho-Clinical Diagnostics, Inc. 7.25% 2/1/28 (b) | 30,000 | 26,925 | |
| Polaris Intermediate Corp. 8.5% 12/1/22 pay-in-kind (b)(c) | 145,000 | 121,438 | |
| Radiology Partners, Inc. 9.25% 2/1/28 (b) | 140,000 | 133,350 | |
| Sabra Health Care LP/Sabra Capital Corp. 3.9% 10/15/29 | 72,000 | 64,620 | |
| Service Corp. International 5.125% 6/1/29 | 35,000 | 36,400 | |
| Teleflex, Inc. 4.625% 11/15/27 | 30,000 | 30,750 | |
| Tenet Healthcare Corp.: | |||
| 4.625% 7/15/24 | 160,000 | 157,888 | |
| 5.125% 5/1/25 | 210,000 | 196,350 | |
| 6.25% 2/1/27 (b) | 195,000 | 191,997 | |
| 6.75% 6/15/23 | 300,000 | 299,700 | |
| 8.125% 4/1/22 | 395,000 | 398,081 | |
| Teva Pharmaceutical Finance Netherlands III BV: | |||
| 1.125% 10/15/24 | EUR | 200,000 | 188,677 |
| 3.15% 10/1/26 | 75,000 | 65,250 | |
| 4.1% 10/1/46 | 200,000 | 155,000 | |
| Valeant Pharmaceuticals International, Inc.: | |||
| 5% 1/30/28 (b) | 110,000 | 105,303 | |
| 5.25% 1/30/30 (b) | 55,000 | 54,450 | |
| 5.5% 3/1/23 (b) | 18,000 | 17,820 | |
| 5.5% 11/1/25 (b) | 260,000 | 270,270 | |
| 5.75% 8/15/27 (b) | 20,000 | 21,092 | |
| 5.875% 5/15/23 (b) | 9,000 | 8,933 | |
| 6.5% 3/15/22 (b) | 80,000 | 81,584 | |
| 8.5% 1/31/27 (b) | 60,000 | 66,144 | |
| 9.25% 4/1/26 (b) | 230,000 | 253,000 | |
| Vizient, Inc. 6.25% 5/15/27 (b) | 15,000 | 15,761 | |
| 6,166,344 | |||
| Homebuilders/Real Estate - 5.6% | |||
| ADLER Real Estate AG 3% 4/27/26 (Reg. S) | EUR | 100,000 | 103,694 |
| Alliant Holdings Intermediate LLC 6.75% 10/15/27 (b) | 190,000 | 189,544 | |
| China SCE Property Holdings Ltd.: | |||
| 7.25% 4/19/23 (Reg. S) | 200,000 | 190,000 | |
| 7.375% 4/9/24 (Reg. S) | 200,000 | 187,688 | |
| China South City Holdings Ltd. 11.5% 2/12/22 (Reg. S) | 200,000 | 154,000 | |
| Easy Tactic Ltd. 5.875% 2/13/23 (Reg. S) | 200,000 | 171,270 | |
| Evergrande Real Estate Group Ltd.: | |||
| 8.25% 3/23/22 (Reg. S) | 200,000 | 177,250 | |
| 8.75% 6/28/25 (Reg. S) | 200,000 | 156,750 | |
| Jababeka International BV 6.5% 10/5/23 (Reg. S) | 200,000 | 130,500 | |
| Kaisa Group Holdings Ltd.: | |||
| 8.5% 6/30/22 (Reg. S) | 200,000 | 185,063 | |
| 11.5% 1/30/23 (Reg. S) | 200,000 | 191,500 | |
| KWG Property Holding Ltd. 5.2% 9/21/22 (Reg. S) | 200,000 | 189,722 | |
| Lennar Corp. 5.375% 10/1/22 | 55,000 | 56,425 | |
| Modernland Overseas Pte Ltd. 6.95% 4/13/24 | 200,000 | 126,594 | |
| New Metro Global Ltd. 6.8% 8/5/23 (Reg. S) | 200,000 | 193,250 | |
| Redsun Properties Group Ltd. 9.7% 4/16/23 (Reg. S) | 220,000 | 182,600 | |
| Ronshine China Holdings Ltd.: | |||
| 8.1% 6/9/23 (Reg. S) | 200,000 | 194,750 | |
| 11.25% 8/22/21 (Reg. S) | 200,000 | 207,000 | |
| Scenery Journey Ltd. 11% 11/6/20 (Reg. S) | 200,000 | 200,000 | |
| Starwood Property Trust, Inc. 4.75% 3/15/25 | 75,000 | 63,375 | |
| Taylor Morrison Communities, Inc./Monarch Communities, Inc.: | |||
| 5.75% 1/15/28 (b) | 80,000 | 72,400 | |
| 5.875% 6/15/27 (b) | 55,000 | 50,600 | |
| Theta Capital Pte Ltd. 6.75% 10/31/26 (Reg. S) | 250,000 | 170,549 | |
| Times China Holdings Ltd. 6.6% 3/2/23 (Reg. S) | 200,000 | 196,688 | |
| VICI Properties, Inc.: | |||
| 3.75% 2/15/27 (b) | 55,000 | 51,150 | |
| 4.125% 8/15/30 (b) | 70,000 | 63,700 | |
| Wanda Properties Overseas Ltd. 6.875% 7/23/23 (Reg. S) | 200,000 | 176,750 | |
| Yango Justice International Ltd.: | |||
| 8.25% 11/25/23 (Reg. S) | 220,000 | 192,225 | |
| 10% 2/12/23 (Reg. S) | 200,000 | 198,188 | |
| Yuzhou Properties Co.: | |||
| 7.375% 1/13/26 (Reg. S) | 200,000 | 162,500 | |
| 8.3% 5/27/25 (Reg. S) | 200,000 | 174,000 | |
| Zhenro Properties Group Ltd. 8.7% 8/3/22 (Reg. S) | 200,000 | 196,000 | |
| 4,955,725 | |||
| Hotels - 0.3% | |||
| Hilton Domestic Operating Co., Inc.: | |||
| 4.875% 1/15/30 | 120,000 | 114,900 | |
| 5.125% 5/1/26 | 135,000 | 133,286 | |
| Hilton Worldwide Finance LLC/Hilton Worldwide Finance Corp. 4.875% 4/1/27 | 40,000 | 38,784 | |
| 286,970 | |||
| Insurance - 0.7% | |||
| Acrisure LLC / Acrisure Finance, Inc.: | |||
| 7% 11/15/25 (b) | 115,000 | 101,775 | |
| 8.125% 2/15/24 (b) | 55,000 | 56,650 | |
| HUB International Ltd. 7% 5/1/26 (b) | 190,000 | 187,426 | |
| USIS Merger Sub, Inc. 6.875% 5/1/25 (b) | 275,000 | 275,688 | |
| 621,539 | |||
| Leisure - 0.1% | |||
| Vail Resorts, Inc. 6.25% 5/15/25 (b) | 35,000 | 36,138 | |
| Voc Escrow Ltd. 5% 2/15/28 (b) | 70,000 | 54,999 | |
| 91,137 | |||
| Metals/Mining - 2.5% | |||
| Abja Investment Co. Pte Ltd. 5.45% 1/24/28 | 300,000 | 240,723 | |
| Alpha Natural Resources, Inc. 9.75% 4/15/18 (e)(g) | 210,000 | 0 | |
| Compass Minerals International, Inc. 6.75% 12/1/27 (b) | 140,000 | 138,600 | |
| Constellium NV 5.875% 2/15/26 (b) | 250,000 | 230,625 | |
| First Quantum Minerals Ltd.: | |||
| 6.5% 3/1/24 (b) | 200,000 | 174,000 | |
| 6.875% 3/1/26 (b) | 200,000 | 173,000 | |
| 7.25% 4/1/23 (b) | 325,000 | 291,688 | |
| 7.5% 4/1/25 (b) | 230,000 | 200,459 | |
| FMG Resources (August 2006) Pty Ltd.: | |||
| 4.75% 5/15/22 (b) | 45,000 | 45,203 | |
| 5.125% 3/15/23 (b) | 95,000 | 95,893 | |
| Freeport-McMoRan, Inc. 5.4% 11/14/34 | 30,000 | 28,200 | |
| Howmet Aerospace, Inc. 5.95% 2/1/37 | 45,000 | 41,850 | |
| Minsur SA 6.25% 2/7/24 (Reg. S) | 200,000 | 208,263 | |
| Stillwater Mining Co. 6.125% 6/27/22 (b) | 200,000 | 198,000 | |
| Vedanta Resources PLC 6.375% 7/30/22 (Reg. S) | 400,000 | 146,250 | |
| 2,212,754 | |||
| Paper - 0.1% | |||
| Berry Global Escrow Corp.: | |||
| 4.875% 7/15/26 (b) | 40,000 | 40,858 | |
| 5.625% 7/15/27 (b) | 35,000 | 36,138 | |
| 76,996 | |||
| Restaurants - 0.5% | |||
| 1011778 BC Unlimited Liability Co./New Red Finance, Inc. 5% 10/15/25 (b) | 140,000 | 140,700 | |
| Golden Nugget, Inc.: | |||
| 6.75% 10/15/24 (b) | 130,000 | 101,400 | |
| 8.75% 10/1/25 (b) | 60,000 | 33,600 | |
| KFC Holding Co./Pizza Hut Holding LLC: | |||
| 4.75% 6/1/27 (b) | 50,000 | 51,610 | |
| 5.25% 6/1/26 (b) | 100,000 | 102,250 | |
| Yum! Brands, Inc. 7.75% 4/1/25 (b) | 20,000 | 21,803 | |
| 451,363 | |||
| Services - 2.9% | |||
| Algeco Scotsman Global Finance PLC 3 month EURIBOR + 6.250% 6.25% 2/15/23 (c)(d) | EUR | 100,000 | 95,935 |
| ASGN, Inc. 4.625% 5/15/28 (b) | 160,000 | 147,552 | |
| Brand Energy & Infrastructure Services, Inc. 8.5% 7/15/25 (b) | 250,000 | 185,000 | |
| CDK Global, Inc.: | |||
| 4.875% 6/1/27 | 105,000 | 104,738 | |
| 5.25% 5/15/29 (b) | 35,000 | 35,700 | |
| 5.875% 6/15/26 | 35,000 | 36,663 | |
| Expedia, Inc.: | |||
| 6.25% 5/1/25 (b)(f) | 100,000 | 101,931 | |
| 7% 5/1/25 (b)(f) | 75,000 | 76,277 | |
| GEMS MENASA Cayman Ltd. 7.125% 7/31/26 (b) | 400,000 | 367,125 | |
| Global A&T Electronics Ltd. 8.5% 1/12/23 | 200,000 | 163,990 | |
| H&E Equipment Services, Inc. 5.625% 9/1/25 | 180,000 | 171,468 | |
| IHS Markit Ltd.: | |||
| 4% 3/1/26 (b) | 35,000 | 37,100 | |
| 4.75% 2/15/25 (b) | 65,000 | 70,355 | |
| Intrum Justitia AB: | |||
| 2.75% 7/15/22 (Reg. S) | EUR | 50,000 | 47,839 |
| 3% 9/15/27 (Reg. S) | EUR | 233,000 | 187,840 |
| 3.5% 7/15/26 (Reg. S) | EUR | 100,000 | 83,285 |
| Laureate Education, Inc. 8.25% 5/1/25 (b) | 195,000 | 199,193 | |
| Sotheby's 7.375% 10/15/27 (b) | 80,000 | 67,350 | |
| Techem Verwaltungsgesellschaft 2% 7/15/25 (Reg. S) | EUR | 126,000 | 130,214 |
| Tempo Acquisition LLC 6.75% 6/1/25 (b) | 55,000 | 53,350 | |
| The GEO Group, Inc.: | |||
| 5.125% 4/1/23 | 50,000 | 41,875 | |
| 5.875% 10/15/24 | 15,000 | 11,850 | |
| 6% 4/15/26 | 170,000 | 128,775 | |
| 2,545,405 | |||
| Steel - 1.0% | |||
| Allegheny Technologies, Inc. 5.875% 12/1/27 | 70,000 | 57,750 | |
| CSN Resources SA 7.625% 4/17/26 (b) | 200,000 | 142,000 | |
| Infrabuild Australia Pty Ltd. 12% 10/1/24 (b) | 60,000 | 51,000 | |
| JSW Steel Ltd. 5.375% 4/4/25 (Reg. S) | 200,000 | 159,125 | |
| Metinvest BV 7.75% 4/23/23 (b) | 300,000 | 207,000 | |
| Usiminas International SARL 5.875% 7/18/26 (b) | 200,000 | 176,313 | |
| Vallourec SA: | |||
| 2.25% 9/30/24 (Reg. S) | EUR | 100,000 | 52,601 |
| 6.625% 10/15/22 (Reg. S) | EUR | 100,000 | 57,116 |
| 902,905 | |||
| Super Retail - 0.0% | |||
| Asbury Automotive Group, Inc.: | |||
| 4.5% 3/1/28 (b) | 21,000 | 17,634 | |
| 4.75% 3/1/30 (b) | 19,000 | 15,919 | |
| 33,553 | |||
| Technology - 3.6% | |||
| Banff Merger Sub, Inc. 9.75% 9/1/26 (b) | 330,000 | 296,175 | |
| Camelot Finance SA 4.5% 11/1/26 (b) | 265,000 | 266,988 | |
| CDW LLC/CDW Finance Corp. 4.25% 4/1/28 | 80,000 | 80,368 | |
| Energizer Gamma Acquistion BV 4.625% 7/15/26 (Reg. S) | EUR | 100,000 | 108,243 |
| Ensemble S Merger Sub, Inc. 9% 9/30/23 (b) | 267,000 | 267,441 | |
| Entegris, Inc. 4.625% 2/10/26 (b) | 85,000 | 85,213 | |
| Fair Isaac Corp. 5.25% 5/15/26 (b) | 50,000 | 51,625 | |
| Go Daddy Operating Co. LLC / GD Finance Co., Inc. 5.25% 12/1/27 (b) | 205,000 | 210,638 | |
| Itron, Inc. 5% 1/15/26 (b) | 30,000 | 30,150 | |
| j2 Cloud Services LLC/j2 Global Communications, Inc. 6% 7/15/25 (b) | 45,000 | 45,450 | |
| Jain International Trading BV 7.125% 2/1/22 (Reg. S) | 200,000 | 61,750 | |
| Match Group, Inc.: | |||
| 4.125% 8/1/30 (b) | 70,000 | 67,900 | |
| 5% 12/15/27 (b) | 60,000 | 62,820 | |
| 5.625% 2/15/29 (b) | 65,000 | 68,088 | |
| Open Text Holdings, Inc. 4.125% 2/15/30 (b) | 95,000 | 92,407 | |
| Orano SA 3.375% 4/23/26 (Reg. S) | EUR | 100,000 | 107,284 |
| Qorvo, Inc. 4.375% 10/15/29 (b) | 45,000 | 44,831 | |
| Rackspace Hosting, Inc. 8.625% 11/15/24 (b) | 130,000 | 128,066 | |
| SoftBank Group Corp.: | |||
| 3.125% 9/19/25 | EUR | 100,000 | 101,366 |
| 4% 9/19/29 (Reg. S) | EUR | 300,000 | 296,077 |
| Solera LLC/Solera Finance, Inc. 10.5% 3/1/24 (b) | 360,000 | 358,200 | |
| TTM Technologies, Inc. 5.625% 10/1/25 (b) | 125,000 | 119,531 | |
| Vedanta Resources Finance II PLC 9.25% 4/23/26 (b) | 200,000 | 78,750 | |
| Veritas U.S., Inc./Veritas Bermuda Ltd. 10.5% 2/1/24 (b) | 225,000 | 200,813 | |
| 3,230,174 | |||
| Telecommunications - 8.3% | |||
| Altice Financing SA 5% 1/15/28 (b) | 200,000 | 195,000 | |
| Axtel S.A.B. de CV 6.375% 11/14/24 (b) | 300,000 | 277,875 | |
| C&W Senior Financing Designated Activity Co.: | |||
| 6.875% 9/15/27 (b) | 340,000 | 335,750 | |
| 7.5% 10/15/26 (b) | 100,000 | 100,022 | |
| Cellnex Telecom SA 2.375% 1/16/24 (Reg. S) | EUR | 100,000 | 113,077 |
| CenturyLink, Inc.: | |||
| 4% 2/15/27 (b) | 115,000 | 111,550 | |
| 5.125% 12/15/26 (b) | 150,000 | 142,125 | |
| Colombia Telecomunicaciones SA 5.375% 9/27/22 (b) | 225,000 | 221,695 | |
| Digicel Group Ltd. 6.75% 3/1/23 (b) | 150,000 | 60,938 | |
| Equinix, Inc. 5.375% 5/15/27 | 50,000 | 54,000 | |
| Front Range BidCo, Inc.: | |||
| 4% 3/1/27 (b) | 115,000 | 111,530 | |
| 6.125% 3/1/28 (b) | 60,000 | 56,551 | |
| Frontier Communications Corp.: | |||
| 8% 4/1/27 (b)(e) | 115,000 | 117,266 | |
| 8.5% 4/1/26 (b)(e) | 225,000 | 208,125 | |
| 11% 9/15/25 (e) | 215,000 | 66,586 | |
| GTT Communications, Inc. 7.875% 12/31/24 (b) | 180,000 | 107,550 | |
| IHS Netherlands Holdco BV 8% 9/18/27 (b) | 200,000 | 179,250 | |
| Intelsat Jackson Holdings SA: | |||
| 5.5% 8/1/23 | 315,000 | 171,084 | |
| 8.5% 10/15/24 (b) | 45,000 | 26,100 | |
| Intelsat Luxembourg SA 8.125% 6/1/23 | 106,000 | 8,501 | |
| Level 3 Financing, Inc. 5.375% 1/15/24 | 400,000 | 403,000 | |
| Millicom International Cellular SA 5.125% 1/15/28 (b) | 250,000 | 230,781 | |
| RCS & RDS SA: | |||
| 2.5% 2/5/25 (Reg. S) | EUR | 100,000 | 105,818 |
| 3.25% 2/5/28 (Reg. S) | EUR | 100,000 | 102,496 |
| Sable International Finance Ltd. 5.75% 9/7/27 (b) | 325,000 | 325,000 | |
| Sabre GLBL, Inc. 9.25% 4/15/25 (b) | 45,000 | 47,531 | |
| SBA Communications Corp. 3.875% 2/15/27 (b) | 140,000 | 142,975 | |
| SFR Group SA: | |||
| 5.5% 1/15/28 (b) | 130,000 | 130,923 | |
| 7.375% 5/1/26 (b) | 150,000 | 156,750 | |
| 8.125% 2/1/27 (b) | 245,000 | 263,988 | |
| Sprint Capital Corp.: | |||
| 6.875% 11/15/28 | 165,000 | 198,718 | |
| 8.75% 3/15/32 | 530,000 | 744,650 | |
| Sprint Corp.: | |||
| 7.125% 6/15/24 | 200,000 | 224,500 | |
| 7.625% 3/1/26 | 70,000 | 82,747 | |
| TBG Global Pte. Ltd. 5.25% 2/10/22 (Reg. S) | 400,000 | 387,576 | |
| Telecom Italia SpA 2.75% 4/15/25 (Reg. S) | EUR | 100,000 | 109,037 |
| Telefonica Celular del Paraguay SA 5.875% 4/15/27 (b) | 200,000 | 192,488 | |
| Telenet Finance Luxembourg Notes SARL 3.5% 3/1/28 (Reg. S) | EUR | 200,000 | 224,320 |
| Telesat Canada/Telesat LLC 6.5% 10/15/27 (b) | 45,000 | 42,413 | |
| Turk Telekomunikasyon A/S 6.875% 2/28/25 (b) | 200,000 | 198,938 | |
| Turkcell Iletisim Hizmet A/S 5.8% 4/11/28 (b) | 200,000 | 187,813 | |
| VFU Funding PLC (VF Ukraine) 6.2% 2/11/25 (b) | 200,000 | 183,000 | |
| 7,350,037 | |||
| Textiles/Apparel - 0.1% | |||
| CBR Fashion Finance BV 5.125% 10/1/22 (Reg. S) | EUR | 100,000 | 89,257 |
| Transportation Ex Air/Rail - 1.5% | |||
| Abertis Infraestructuras SA: | |||
| 1.875% 3/26/32 (Reg. S) | EUR | 100,000 | 97,316 |
| 3% 3/27/31 (Reg. S) | EUR | 100,000 | 109,007 |
| Atlantia SpA 1.625% 2/3/25 (Reg. S) | EUR | 100,000 | 98,988 |
| Autostrade per L'italia SpA: | |||
| 1.625% 6/12/23 | EUR | 215,000 | 223,262 |
| 1.875% 9/26/29 (Reg. S) | EUR | 100,000 | 96,858 |
| Avolon Holdings Funding Ltd.: | |||
| 5.25% 5/15/24 (b) | 135,000 | 117,060 | |
| 5.5% 1/15/23 (b) | 95,000 | 87,284 | |
| Mersin Uluslararasi Liman Isletmeciligi A/S 5.375% 11/15/24 (b) | 200,000 | 197,063 | |
| Navios Maritime Acquisition Corp./Navios Acquisition Finance U.S., Inc. 8.125% 11/15/21 (b) | 235,000 | 152,750 | |
| Navios Maritime Holdings, Inc.: | |||
| 7.375% 1/15/22 (b) | 90,000 | 36,000 | |
| 11.25% 8/15/22 (b) | 135,000 | 72,225 | |
| Teekay Corp. 9.25% 11/15/22 (b) | 60,000 | 58,800 | |
| 1,346,613 | |||
| Utilities - 5.3% | |||
| Clearway Energy Operating LLC 4.75% 3/15/28 (b) | 40,000 | 40,700 | |
| DCP Midstream Operating LP 5.125% 5/15/29 | 105,000 | 78,194 | |
| DPL, Inc. 4.35% 4/15/29 | 265,000 | 257,694 | |
| Dynegy, Inc. 5.875% 6/1/23 | 70,000 | 70,700 | |
| Energias de Portugal SA 4.496% 4/30/79 (Reg. S) (c) | EUR | 100,000 | 113,530 |
| Eskom Holdings SOC Ltd. 5.75% 1/26/21 (b) | 200,000 | 178,500 | |
| Greenko Investment Co. 4.875% 8/16/23 (Reg. S) | 200,000 | 178,500 | |
| InterGen NV 7% 6/30/23 (b) | 845,000 | 749,938 | |
| NextEra Energy Partners LP: | |||
| 4.25% 9/15/24 (b) | 50,000 | 50,750 | |
| 4.5% 9/15/27 (b) | 35,000 | 35,919 | |
| NRG Energy, Inc.: | |||
| 5.25% 6/15/29 (b) | 60,000 | 64,275 | |
| 5.75% 1/15/28 | 615,000 | 661,125 | |
| NSG Holdings II LLC/NSG Holdings, Inc. 7.75% 12/15/25 (b) | 224,993 | 226,680 | |
| Pacific Gas & Electric Co.: | |||
| 3.75% 8/15/42 (e) | 10,000 | 9,775 | |
| 3.95% 12/1/47 (e) | 80,000 | 78,200 | |
| 5.4% 1/15/40 (e) | 50,000 | 56,125 | |
| 5.8% 3/1/37 (e) | 175,000 | 196,000 | |
| 6.05% 3/1/34 (e) | 790,000 | 888,750 | |
| Pattern Energy Group, Inc. 5.875% 2/1/24 (b) | 30,000 | 30,300 | |
| Teollisuuden Voima Oyj 2.125% 2/4/25 (Reg. S) | EUR | 100,000 | 106,495 |
| TerraForm Global, Inc. 6.125% 3/1/26 (b) | 310,000 | 306,900 | |
| The AES Corp. 4% 3/15/21 | 195,000 | 195,000 | |
| Vistra Operations Co. LLC: | |||
| 5.5% 9/1/26 (b) | 45,000 | 46,328 | |
| 5.625% 2/15/27 (b) | 60,000 | 63,150 | |
| 4,683,528 | |||
| TOTAL NONCONVERTIBLE BONDS | 72,075,710 | ||
| TOTAL CORPORATE BONDS | |||
| (Cost $83,644,287) | 72,648,067 | ||
| Government Obligations - 0.6% | |||
| Germany - 0.2% | |||
| German Federal Republic 2% 8/15/23 | EUR | 200,000 | 239,462 |
| Sri Lanka - 0.4% | |||
| Democratic Socialist Republic of Sri Lanka: | |||
| 6.2% 5/11/27 (Reg. S) | 200,000 | 113,500 | |
| 7.55% 3/28/30 (Reg. S) | 200,000 | 112,750 | |
| 7.85% 3/14/29(Reg. S) | 200,000 | 112,482 | |
| TOTAL SRI LANKA | 338,732 | ||
| TOTAL GOVERNMENT OBLIGATIONS | |||
| (Cost $847,143) | 578,194 | ||
| Shares | Value | ||
| Common Stocks - 1.0% | |||
| Automotive & Auto Parts - 0.1% | |||
| UC Holdings, Inc. (g)(h) | 3,510 | 87,434 | |
| Broadcasting - 0.0% | |||
| DISH Network Corp. Class A (h) | 314 | 7,855 | |
| Energy - 0.1% | |||
| Pacific Drilling SA (h)(i) | 19,106 | 12,243 | |
| Tidewater, Inc.: | |||
| warrants 11/14/42 (h) | 5,448 | 34,595 | |
| warrants 11/14/42 (h) | 1,897 | 12,046 | |
| Ultra Petroleum Corp. warrants 7/14/25 (h) | 1,260 | 0 | |
| TOTAL ENERGY | 58,884 | ||
| Food & Drug Retail - 0.1% | |||
| Southeastern Grocers, Inc. (g)(h) | 1,789 | 72,544 | |
| Tops Markets Corp. (g)(h) | 165 | 58,007 | |
| Tops Markets Corp. (Escrow) (g)(h)(j) | 165,000 | 2 | |
| TOTAL FOOD & DRUG RETAIL | 130,553 | ||
| Gaming - 0.2% | |||
| Boyd Gaming Corp. | 4,800 | 80,112 | |
| Penn National Gaming, Inc. (h) | 4,600 | 81,972 | |
| TOTAL GAMING | 162,084 | ||
| Healthcare - 0.1% | |||
| HCA Holdings, Inc. | 400 | 43,952 | |
| Metals/Mining - 0.0% | |||
| Warrior Metropolitan Coal, Inc. | 69 | 866 | |
| Services - 0.1% | |||
| United Rentals, Inc. (h) | 1,000 | 128,500 | |
| Utilities - 0.3% | |||
| NRG Energy, Inc. | 3,200 | 107,296 | |
| Vistra Energy Corp. | 9,795 | 191,394 | |
| TOTAL UTILITIES | 298,690 | ||
| TOTAL COMMON STOCKS | |||
| (Cost $1,656,426) | 918,818 | ||
| Principal Amount(a) | Value | ||
| Bank Loan Obligations - 5.0% | |||
| Aerospace - 0.4% | |||
| TransDigm, Inc.: | |||
| Tranche E 1LN, term loan 3 month U.S. LIBOR + 2.250% 2.6536% 5/30/25 (c)(d)(k) | 158,457 | 138,373 | |
| Tranche F 1LN, term loan 3 month U.S. LIBOR + 2.250% 2.6536% 12/9/25 (c)(d)(k) | 78,011 | 68,102 | |
| Tranche G 1LN, term loan 3 month U.S. LIBOR + 2.250% 2.6536% 8/22/24 (c)(d)(k) | 215,539 | 188,207 | |
| TOTAL AEROSPACE | 394,682 | ||
| Banks & Thrifts - 0.0% | |||
| First Eagle Holdings, Inc. Tranche B 1LN, term loan 3 month U.S. LIBOR + 2.500% 3.9501% 2/1/27 (c)(d)(k) | 29,925 | 27,687 | |
| Building Materials - 0.0% | |||
| ACProducts, Inc. 1LN, term loan 3 month U.S. LIBOR + 6.500% 8.1916% 8/13/25 (c)(d)(k) | 25,000 | 22,219 | |
| Cable/Satellite TV - 0.6% | |||
| LCPR Loan Financing LLC Tranche B 1LN, term loan 3 month U.S. LIBOR + 5.000% 5.814% 10/22/26 (c)(d)(k) | 15,000 | 14,663 | |
| WideOpenWest Finance LLC Tranche B, term loan 3 month U.S. LIBOR + 3.250% 4.25% 8/19/23 (c)(d)(k) | 549,682 | 508,973 | |
| TOTAL CABLE/SATELLITE TV | 523,636 | ||
| Chemicals - 0.0% | |||
| Starfruit U.S. Holdco LLC Tranche B, term loan 3 month U.S. LIBOR + 3.000% 3.8635% 10/1/25 (c)(d)(k) | 43,409 | 39,286 | |
| Diversified Financial Services - 0.0% | |||
| BCP Renaissance Parent LLC Tranche B, term loan 3 month U.S. LIBOR + 3.500% 4.9501% 10/31/24 (c)(d)(k) | 14,738 | 11,274 | |
| HarbourVest Partners LLC Tranche B 1LN, term loan 3 month U.S. LIBOR + 2.250% 3.064% 3/1/25 (c)(d)(k) | 16,137 | 15,330 | |
| TOTAL DIVERSIFIED FINANCIAL SERVICES | 26,604 | ||
| Energy - 0.6% | |||
| BCP Raptor LLC Tranche B, term loan 3 month U.S. LIBOR + 4.250% 5.25% 6/24/24 (c)(d)(k) | 48,625 | 22,611 | |
| California Resources Corp.: | |||
| Tranche 1LN, term loan 3 month U.S. LIBOR + 10.375% 11.9883% 12/31/21 (c)(d)(k) | 365,000 | 13,005 | |
| Tranche B, term loan 3 month U.S. LIBOR + 4.750% 6.3633% 12/31/22 (c)(d)(k) | 185,000 | 40,596 | |
| Chesapeake Energy Corp. term loan 3 month U.S. LIBOR + 8.000% 9% 6/9/24 (c)(d)(k) | 265,000 | 93,632 | |
| Citgo Holding, Inc. Tranche B 1LN, term loan 3 month U.S. LIBOR + 7.000% 8% 8/1/23 (c)(d)(k) | 9,950 | 8,209 | |
| Citgo Petroleum Corp. Tranche B 1LN, term loan 3 month U.S. LIBOR + 5.000% 6% 3/28/24 (c)(d)(k) | 153,450 | 135,036 | |
| Epic Crude Services LP Tranche B 1LN, term loan 3 month U.S. LIBOR + 5.000% 6.62% 3/1/26 (c)(d)(k) | 270,000 | 161,190 | |
| Sanchez Energy Corp.: | |||
| 1LN, term loan 3 month U.S. LIBOR + 8.000% 0% 5/11/20(d)(e)(g)(k) | 65,772 | 52,618 | |
| term loan 7.25% 5/11/20(c)(e)(g)(k) | 28,000 | 22,400 | |
| TOTAL ENERGY | 549,297 | ||
| Food & Drug Retail - 0.8% | |||
| BI-LO LLC Tranche B, term loan 3 month U.S. LIBOR + 8.000% 9.377% 5/31/24 (c)(d)(k) | 687,750 | 648,204 | |
| Tops Markets LLC 1LN, term loan 3 month U.S. LIBOR + 8.500% 10% 11/19/23 (c)(d)(g)(k) | 66,199 | 66,530 | |
| TOTAL FOOD & DRUG RETAIL | 714,734 | ||
| Healthcare - 0.4% | |||
| U.S. Renal Care, Inc. Tranche B 1LN, term loan 3 month U.S. LIBOR + 5.000% 5.4375% 6/13/26 (c)(d)(k) | 333,325 | 314,262 | |
| Hotels - 0.1% | |||
| Travelport Finance Luxembourg SARL 1LN, term loan 3 month U.S. LIBOR + 5.000% 6.072% 5/29/26 (c)(d)(k) | 69,463 | 42,112 | |
| Insurance - 0.1% | |||
| Alliant Holdings Intermediate LLC: | |||
| Tranche B, term loan 3 month U.S. LIBOR + 3.000% 3.9894% 5/10/25 (c)(d)(k) | 4,863 | 4,532 | |
| Tranche B-2 1LN, term loan 3 month U.S. LIBOR + 3.250% 3.9683% 5/9/25 (c)(d)(k) | 64,513 | 60,432 | |
| TOTAL INSURANCE | 64,964 | ||
| Leisure - 0.2% | |||
| Alterra Mountain Co. Tranche B 1LN, term loan 3 month U.S. LIBOR + 2.750% 3.1536% 7/31/24 (c)(d)(k) | 4,888 | 4,503 | |
| Crown Finance U.S., Inc. Tranche B 1LN, term loan 3 month U.S. LIBOR + 2.250% 3.322% 2/28/25 (c)(d)(k) | 228,084 | 142,934 | |
| TOTAL LEISURE | 147,437 | ||
| Services - 0.6% | |||
| Airbnb, Inc. Tranche B 1LN, term loan 3 month U.S. LIBOR + 7.500% 4/17/25 (d)(k)(l) | 30,000 | 30,338 | |
| Almonde, Inc. Tranche 2LN, term loan 3 month U.S. LIBOR + 7.250% 8.25% 6/13/25 (c)(d)(k) | 220,000 | 186,340 | |
| CoreCivic, Inc. Tranche B 1LN, term loan 3 month U.S. LIBOR + 4.500% 5.5% 12/18/24 (c)(d)(k) | 59,250 | 55,103 | |
| IRI Holdings, Inc. Tranche B 1LN, term loan 3 month U.S. LIBOR + 4.250% 5.8633% 11/30/25 (c)(d)(k) | 97,579 | 81,966 | |
| KUEHG Corp. Tranche B 2LN, term loan 3 month U.S. LIBOR + 8.250% 9.7001% 8/22/25 (c)(d)(k) | 95,000 | 71,250 | |
| Maverick Purchaser Sub LLC Tranche B 1LN, term loan 3 month U.S. LIBOR + 4.000% 4.4036% 1/23/27 (c)(d)(k) | 15,000 | 14,288 | |
| Sotheby's 1LN, term loan 3 month U.S. LIBOR + 5.500% 6.5% 1/3/27 (c)(d)(k) | 111,428 | 95,271 | |
| TOTAL SERVICES | 534,556 | ||
| Technology - 0.8% | |||
| Financial & Risk U.S. Holdings, Inc. Tranche B, term loan 3 month U.S. LIBOR + 3.250% 3.6536% 10/1/25 (c)(d)(k) | 386,090 | 377,284 | |
| Kronos, Inc.: | |||
| 2LN, term loan 3 month U.S. LIBOR + 8.250% 10.0133% 11/1/24 (c)(d)(k) | 115,000 | 109,825 | |
| Tranche B 1LN, term loan 3 month U.S. LIBOR + 3.000% 4.7633% 11/1/23 (c)(d)(k) | 89,743 | 86,546 | |
| Ultimate Software Group, Inc. 1LN, term loan 3 month U.S. LIBOR + 3.750% 4.1536% 5/4/26 (c)(d)(k) | 19,900 | 18,946 | |
| Vertafore, Inc. Tranche B 2LN, term loan 3 month U.S. LIBOR + 7.250% 7.6536% 7/2/26 (c)(d)(k) | 65,000 | 60,978 | |
| VM Consolidated, Inc. Tranche B L1N, term loan 3 month U.S. LIBOR + 3.250% 3.6536% 2/28/25 (c)(d)(k) | 9,584 | 8,625 | |
| VS Buyer LLC Tranche B 1LN, term loan 3 month U.S. LIBOR + 3.250% 4.8633% 2/19/27 (c)(d)(k) | 15,000 | 14,100 | |
| TOTAL TECHNOLOGY | 676,304 | ||
| Telecommunications - 0.4% | |||
| SFR Group SA Tranche B 12LN, term loan 3 month U.S. LIBOR + 3.680% 4.5015% 1/31/26 (c)(d)(k) | 380,739 | 350,607 | |
| Utilities - 0.0% | |||
| Pike Corp. Tranche B 1LN, term loan 3 month U.S. LIBOR + 3.250% 4.25% 7/24/26 (c)(d)(k) | 14,368 | 13,784 | |
| TOTAL BANK LOAN OBLIGATIONS | |||
| (Cost $5,607,360) | 4,442,171 | ||
| Preferred Securities - 7.5% | |||
| Banks & Thrifts - 4.1% | |||
| AIB Group PLC 5.25% (Reg. S) (c)(m) | EUR | 200,000 | 190,947 |
| Alfa Bond Issuance PLC 8% (Reg. S) (c)(m) | 200,000 | 199,411 | |
| Banco Do Brasil SA 9% (b)(c)(m) | 200,000 | 197,839 | |
| Banco Mercantil del Norte SA 7.625% (b)(c)(m) | 360,000 | 297,085 | |
| Bank of America Corp.: | |||
| 4.3% (c)(m) | 160,000 | 145,453 | |
| 5.875% (c)(m) | 355,000 | 364,767 | |
| Citigroup, Inc.: | |||
| 4.7% (c)(m) | 90,000 | 79,451 | |
| 5% (c)(m) | 180,000 | 164,898 | |
| 5.35% (c)(m) | 550,000 | 516,831 | |
| 5.95% (c)(m) | 575,000 | 580,962 | |
| Intesa Sanpaolo SpA 7% (Reg. S) (c)(m) | EUR | 200,000 | 216,900 |
| Itau Unibanco Holding SA 6.125% (b)(c)(m) | 200,000 | 190,219 | |
| JPMorgan Chase & Co.: | |||
| 4.6% (c)(m) | 135,000 | 122,776 | |
| 5% (c)(m) | 185,000 | 174,362 | |
| UniCredit SpA 9.25% (Reg. S) (c)(m) | EUR | 200,000 | 228,597 |
| TOTAL BANKS & THRIFTS | 3,670,498 | ||
| Consumer Products - 0.3% | |||
| Cosan Overseas Ltd. 8.25% (m) | 285,000 | 280,829 | |
| Diversified Financial Services - 0.3% | |||
| AerCap Holdings NV 5.875% 10/10/79 (c) | 115,000 | 77,150 | |
| LeasePlan Corp. NV 7.375% (Reg. S) (c)(m) | EUR | 200,000 | 176,911 |
| TOTAL DIVERSIFIED FINANCIAL SERVICES | 254,061 | ||
| Energy - 0.3% | |||
| Gas Natural Fenosa Finance BV 4.125% (Reg. S) (c)(m) | EUR | 100,000 | 113,272 |
| SMC Global Power Holdings Corp. 5.7% (Reg. S) (c)(m) | 200,000 | 172,913 | |
| TOTAL ENERGY | 286,185 | ||
| Homebuilders/Real Estate - 1.5% | |||
| Agile Property Holdings Ltd.: | |||
| 6.875% (Reg. S) (c)(m) | 200,000 | 183,543 | |
| 7.875% (Reg. S) (c)(m) | 200,000 | 186,438 | |
| CIFI Holdings Group Co. Ltd. 5.375% (Reg. S) (c)(m) | 200,000 | 173,229 | |
| Grand City Properties SA 3.75% (c)(m) | EUR | 100,000 | 109,922 |
| RKI Overseas Finance 2017 (A) 7% (Reg. S) (m) | 200,000 | 155,910 | |
| TLG Finance SARL 3.375% (Reg. S) (c)(m) | EUR | 200,000 | 207,011 |
| Yuzhou Properties Co. 5.375% (Reg. S) (c)(m) | 200,000 | 152,935 | |
| Zhenro Properties Group Ltd. 10.25% (Reg. S) (c)(m) | 200,000 | 183,463 | |
| TOTAL HOMEBUILDERS/REAL ESTATE | 1,352,451 | ||
| Telecommunications - 0.3% | |||
| Telefonica Europe BV 3.875% (Reg. S) (c)(m) | EUR | 200,000 | 220,557 |
| Utilities - 0.7% | |||
| EDF SA: | |||
| 4% (Reg. S) (c)(m) | EUR | 100,000 | 111,819 |
| 5% (Reg. S) (c)(m) | EUR | 100,000 | 114,063 |
| 5.375% 12/31/99 (c) | EUR | 200,000 | 230,716 |
| RWE AG 3.5% 4/21/75 (Reg. S) (c) | EUR | 100,000 | 111,987 |
| TOTAL UTILITIES | 568,585 | ||
| TOTAL PREFERRED SECURITIES | |||
| (Cost $7,271,779) | 6,633,166 | ||
| Shares | Value | ||
| Money Market Funds - 3.4% | |||
| Fidelity Cash Central Fund 0.16% (n) | 2,977,454 | 2,978,347 | |
| Fidelity Securities Lending Cash Central Fund 0.11% (n)(o) | 19,098 | 19,100 | |
| TOTAL MONEY MARKET FUNDS | |||
| (Cost $2,997,146) | 2,997,447 | ||
| TOTAL INVESTMENT IN SECURITIES - 99.2% | |||
| (Cost $102,024,141) | 88,217,863 | ||
| NET OTHER ASSETS (LIABILITIES) - 0.8% | 710,360 | ||
| NET ASSETS - 100% | $88,928,223 |
Currency Abbreviations
EUR – European Monetary Unit
Legend
(a) Amount is stated in United States dollars unless otherwise noted.
(b) Security exempt from registration under Rule 144A of the Securities Act of 1933. These securities may be resold in transactions exempt from registration, normally to qualified institutional buyers. At the end of the period, the value of these securities amounted to $41,773,734 or 47.0% of net assets.
(c) Coupon rates for floating and adjustable rate securities reflect the rates in effect at period end.
(d) Coupon is indexed to a floating interest rate which may be multiplied by a specified factor and/or subject to caps or floors.
(e) Non-income producing - Security is in default.
(f) Security or a portion of the security purchased on a delayed delivery or when-issued basis.
(g) Level 3 security
(h) Non-income producing
(i) Security or a portion of the security is on loan at period end.
(j) Restricted securities (including private placements) - Investment in securities not registered under the Securities Act of 1933 (excluding 144A issues). At the end of the period, the value of restricted securities (excluding 144A issues) amounted to $2 or 0.0% of net assets.
(k) Remaining maturities of bank loan obligations may be less than the stated maturities shown as a result of contractual or optional prepayments by the borrower. Such prepayments cannot be predicted with certainty.
(l) The coupon rate will be determined upon settlement of the loan after period end.
(m) Security is perpetual in nature with no stated maturity date.
(n) Affiliated fund that is generally available only to investment companies and other accounts managed by Fidelity Investments. The rate quoted is the annualized seven-day yield of the fund at period end. A complete unaudited listing of the fund's holdings as of its most recent quarter end is available upon request. In addition, each Fidelity Central Fund's financial statements, which are not covered by the Fund's Report of Independent Registered Public Accounting Firm, are available on the SEC's website or upon request.
(o) Investment made with cash collateral received from securities on loan.
Additional information on each restricted holding is as follows:
| Security | Acquisition Date | Acquisition Cost |
| Tops Markets Corp. (Escrow) | 11/16/18 | $0 |
Affiliated Central Funds
Information regarding fiscal year to date income earned by the Fund from investments in Fidelity Central Funds is as follows:
| Fund | Income earned |
| Fidelity Cash Central Fund | $111,803 |
| Fidelity Securities Lending Cash Central Fund | 17 |
| Total | $111,820 |
Amounts in the income column in the above table include any capital gain distributions from underlying funds, which are presented in the corresponding line-item in the Statement of Operations, if applicable. Amount for Fidelity Securities Lending Cash Central Fund represents the income earned on investing cash collateral, less rebates paid to borrowers and any lending agent fees associated with the loan, plus any premium payments received for lending certain types of securities.
Investment Valuation
The following is a summary of the inputs used, as of April 30, 2020, involving the Fund's assets and liabilities carried at fair value. The inputs or methodology used for valuing securities may not be an indication of the risk associated with investing in those securities. For more information on valuation inputs, and their aggregation into the levels used below, please refer to the Investment Valuation section in the accompanying Notes to Financial Statements.
| Valuation Inputs at Reporting Date: | ||||
| Description | Total | Level 1 | Level 2 | Level 3 |
| Investments in Securities: | ||||
| Equities: | ||||
| Communication Services | $7,855 | $7,855 | $-- | $-- |
| Consumer Discretionary | 249,518 | 162,084 | -- | 87,434 |
| Consumer Staples | 130,553 | -- | -- | 130,553 |
| Energy | 58,884 | 58,884 | -- | -- |
| Health Care | 43,952 | 43,952 | -- | -- |
| Industrials | 128,500 | 128,500 | -- | -- |
| Materials | 866 | 866 | -- | -- |
| Utilities | 298,690 | 298,690 | -- | -- |
| Corporate Bonds | 72,648,067 | -- | 72,648,067 | -- |
| Government Obligations | 578,194 | -- | 578,194 | -- |
| Bank Loan Obligations | 4,442,171 | -- | 4,300,623 | 141,548 |
| Preferred Securities | 6,633,166 | -- | 6,633,166 | -- |
| Money Market Funds | 2,997,447 | 2,997,447 | -- | -- |
| Total Investments in Securities: | $88,217,863 | $3,698,278 | $84,160,050 | $359,535 |
Other Information
Distribution of investments by country or territory of incorporation, as a percentage of Total Net Assets, is as follows (Unaudited):
| United States of America | 52.8% |
| Cayman Islands | 7.6% |
| Netherlands | 5.9% |
| Luxembourg | 5.1% |
| Canada | 2.4% |
| United Kingdom | 2.4% |
| France | 2.4% |
| Mexico | 1.9% |
| Multi-National | 1.7% |
| Ireland | 1.7% |
| Italy | 1.7% |
| Singapore | 1.5% |
| British Virgin Islands | 1.5% |
| Turkey | 1.2% |
| Others (Individually Less Than 1%) | 10.2% |
| 100.0% |
See accompanying notes which are an integral part of the financial statements.
Financial Statements
Statement of Assets and Liabilities
| April 30, 2020 | ||
| Assets | ||
| Investment in securities, at value (including securities loaned of $12,239) — See accompanying schedule: Unaffiliated issuers (cost $99,026,995) | $85,220,416 | |
| Fidelity Central Funds (cost $2,997,146) | 2,997,447 | |
| Total Investment in Securities (cost $102,024,141) | $88,217,863 | |
| Cash | 360,643 | |
| Receivable for investments sold | 596,601 | |
| Receivable for fund shares sold | 13,749 | |
| Dividends receivable | 18,277 | |
| Interest receivable | 1,384,144 | |
| Distributions receivable from Fidelity Central Funds | 457 | |
| Prepaid expenses | 54 | |
| Receivable from investment adviser for expense reductions | 34,526 | |
| Other receivables | 112 | |
| Total assets | 90,626,426 | |
| Liabilities | ||
| Payable for investments purchased | ||
| Regular delivery | $881,494 | |
| Delayed delivery | 305,000 | |
| Payable for fund shares redeemed | 289,127 | |
| Distributions payable | 55,027 | |
| Accrued management fee | 51,914 | |
| Distribution and service plan fees payable | 4,105 | |
| Payable to custodian bank | 3,268 | |
| Other affiliated payables | 15,037 | |
| Other payables and accrued expenses | 74,131 | |
| Collateral on securities loaned | 19,100 | |
| Total liabilities | 1,698,203 | |
| Net Assets | $88,928,223 | |
| Net Assets consist of: | ||
| Paid in capital | $107,814,856 | |
| Total accumulated earnings (loss) | (18,886,633) | |
| Net Assets | $88,928,223 | |
| Net Asset Value and Maximum Offering Price | ||
| Class A: | ||
| Net Asset Value and redemption price per share ($5,927,092 ÷ 707,189 shares)(a) | $8.38 | |
| Maximum offering price per share (100/96.00 of $8.38) | $8.73 | |
| Class M: | ||
| Net Asset Value and redemption price per share ($2,927,974 ÷ 349,387 shares)(a) | $8.38 | |
| Maximum offering price per share (100/96.00 of $8.38) | $8.73 | |
| Class C: | ||
| Net Asset Value and offering price per share ($2,684,060 ÷ 320,244 shares)(a) | $8.38 | |
| Global High Income: | ||
| Net Asset Value, offering price and redemption price per share ($73,038,784 ÷ 8,713,562 shares) | $8.38 | |
| Class I: | ||
| Net Asset Value, offering price and redemption price per share ($4,350,313 ÷ 519,006 shares) | $8.38 |
(a) Redemption price per share is equal to net asset value less any applicable contingent deferred sales charge.
See accompanying notes which are an integral part of the financial statements.
Statement of Operations
| Year ended April 30, 2020 | ||
| Investment Income | ||
| Dividends | $450,565 | |
| Interest | 6,377,897 | |
| Income from Fidelity Central Funds (including $17 from security lending) | 111,820 | |
| Total income | 6,940,282 | |
| Expenses | ||
| Management fee | $808,926 | |
| Transfer agent fees | 165,409 | |
| Distribution and service plan fees | 61,980 | |
| Accounting fees | 47,796 | |
| Custodian fees and expenses | 20,827 | |
| Independent trustees' fees and expenses | 688 | |
| Registration fees | 75,154 | |
| Audit | 77,879 | |
| Legal | 735 | |
| Miscellaneous | 2,731 | |
| Total expenses before reductions | 1,262,125 | |
| Expense reductions | (47,266) | |
| Total expenses after reductions | 1,214,859 | |
| Net investment income (loss) | 5,725,423 | |
| Realized and Unrealized Gain (Loss) | ||
| Net realized gain (loss) on: | ||
| Investment securities: | ||
| Unaffiliated issuers | (1,475,941) | |
| Fidelity Central Funds | 256 | |
| Foreign currency transactions | (12,114) | |
| Total net realized gain (loss) | (1,487,799) | |
| Change in net unrealized appreciation (depreciation) on: | ||
| Investment securities: | ||
| Unaffiliated issuers | (12,445,970) | |
| Fidelity Central Funds | 116 | |
| Assets and liabilities in foreign currencies | 1,335 | |
| Total change in net unrealized appreciation (depreciation) | (12,444,519) | |
| Net gain (loss) | (13,932,318) | |
| Net increase (decrease) in net assets resulting from operations | $(8,206,895) |
See accompanying notes which are an integral part of the financial statements.
Statement of Changes in Net Assets
| Year ended April 30, 2020 | Year ended April 30, 2019 | |
| Increase (Decrease) in Net Assets | ||
| Operations | ||
| Net investment income (loss) | $5,725,423 | $6,690,427 |
| Net realized gain (loss) | (1,487,799) | (1,440,603) |
| Change in net unrealized appreciation (depreciation) | (12,444,519) | (726,200) |
| Net increase (decrease) in net assets resulting from operations | (8,206,895) | 4,523,624 |
| Distributions to shareholders | (5,486,858) | (6,909,437) |
| Share transactions - net increase (decrease) | (17,407,596) | (30,207,682) |
| Total increase (decrease) in net assets | (31,101,349) | (32,593,495) |
| Net Assets | ||
| Beginning of period | 120,029,572 | 152,623,067 |
| End of period | $88,928,223 | $120,029,572 |
See accompanying notes which are an integral part of the financial statements.
Financial Highlights
Fidelity Global High Income Fund Class A
| Years ended April 30, | 2020 | 2019 | 2018 | 2017 | 2016 |
| Selected Per–Share Data | |||||
| Net asset value, beginning of period | $9.48 | $9.61 | $9.54 | $9.07 | $9.60 |
| Income from Investment Operations | |||||
| Net investment income (loss)A | .445 | .468 | .462 | .463 | .462 |
| Net realized and unrealized gain (loss) | (1.120) | (.115) | .006 | .422 | (.541) |
| Total from investment operations | (.675) | .353 | .468 | .885 | (.079) |
| Distributions from net investment income | (.425) | (.457) | (.399) | (.418) | (.454) |
| Distributions from net realized gain | – | (.026) | – | – | – |
| Total distributions | (.425) | (.483) | (.399) | (.418) | (.454) |
| Redemption fees added to paid in capitalA | – | – | .001 | .003 | .003 |
| Net asset value, end of period | $8.38 | $9.48 | $9.61 | $9.54 | $9.07 |
| Total ReturnB,C | (7.44)% | 3.88% | 4.94% | 10.00% | (.65)% |
| Ratios to Average Net AssetsD,E | |||||
| Expenses before reductions | 1.34% | 1.32% | 1.31% | 1.36% | 1.38% |
| Expenses net of fee waivers, if any | 1.25% | 1.25% | 1.25% | 1.25% | 1.25% |
| Expenses net of all reductions | 1.25% | 1.25% | 1.25% | 1.25% | 1.25% |
| Net investment income (loss) | 4.77% | 5.00% | 4.75% | 4.98% | 5.11% |
| Supplemental Data | |||||
| Net assets, end of period (000 omitted) | $5,927 | $7,365 | $8,712 | $7,102 | $6,187 |
| Portfolio turnover rateF | 54% | 44% | 48% | 48% | 41% |
A Calculated based on average shares outstanding during the period.
B Total returns would have been lower if certain expenses had not been reduced during the applicable periods shown.
C Total returns do not include the effect of the sales charges.
D Fees and expenses of any underlying Fidelity Central Funds are not included in the Fund's expense ratio. The Fund indirectly bears its proportionate share of the expenses of any underlying Fidelity Central Funds.
E Expense ratios reflect operating expenses of the class. Expenses before reductions do not reflect amounts reimbursed by the investment adviser or reductions from brokerage service arrangements or reductions from other expense offset arrangements and do not represent the amount paid by the class during periods when reimbursements or reductions occur. Expenses net of fee waivers reflect expenses after reimbursement by the investment adviser but prior to reductions from brokerage service arrangements or other expense offset arrangements. Expenses net of all reductions represent the net expenses paid by the class.
F Amount does not include the portfolio activity of any underlying Fidelity Central Funds.
See accompanying notes which are an integral part of the financial statements.
Fidelity Global High Income Fund Class M
| Years ended April 30, | 2020 | 2019 | 2018 | 2017 | 2016 |
| Selected Per–Share Data | |||||
| Net asset value, beginning of period | $9.48 | $9.61 | $9.54 | $9.07 | $9.60 |
| Income from Investment Operations | |||||
| Net investment income (loss)A | .445 | .467 | .462 | .464 | .462 |
| Net realized and unrealized gain (loss) | (1.120) | (.114) | .006 | .421 | (.541) |
| Total from investment operations | (.675) | .353 | .468 | .885 | (.079) |
| Distributions from net investment income | (.425) | (.457) | (.399) | (.418) | (.454) |
| Distributions from net realized gain | – | (.026) | – | – | – |
| Total distributions | (.425) | (.483) | (.399) | (.418) | (.454) |
| Redemption fees added to paid in capitalA | – | – | .001 | .003 | .003 |
| Net asset value, end of period | $8.38 | $9.48 | $9.61 | $9.54 | $9.07 |
| Total ReturnB,C | (7.44)% | 3.88% | 4.94% | 10.00% | (.65)% |
| Ratios to Average Net AssetsD,E | |||||
| Expenses before reductions | 1.41% | 1.40% | 1.40% | 1.50% | 1.48% |
| Expenses net of fee waivers, if any | 1.25% | 1.25% | 1.25% | 1.25% | 1.25% |
| Expenses net of all reductions | 1.25% | 1.25% | 1.25% | 1.25% | 1.25% |
| Net investment income (loss) | 4.77% | 5.00% | 4.75% | 4.98% | 5.11% |
| Supplemental Data | |||||
| Net assets, end of period (000 omitted) | $2,928 | $3,971 | $4,301 | $3,029 | $1,436 |
| Portfolio turnover rateF | 54% | 44% | 48% | 48% | 41% |
A Calculated based on average shares outstanding during the period.
B Total returns would have been lower if certain expenses had not been reduced during the applicable periods shown.
C Total returns do not include the effect of the sales charges.
D Fees and expenses of any underlying Fidelity Central Funds are not included in the Fund's expense ratio. The Fund indirectly bears its proportionate share of the expenses of any underlying Fidelity Central Funds.
E Expense ratios reflect operating expenses of the class. Expenses before reductions do not reflect amounts reimbursed by the investment adviser or reductions from brokerage service arrangements or reductions from other expense offset arrangements and do not represent the amount paid by the class during periods when reimbursements or reductions occur. Expenses net of fee waivers reflect expenses after reimbursement by the investment adviser but prior to reductions from brokerage service arrangements or other expense offset arrangements. Expenses net of all reductions represent the net expenses paid by the class.
F Amount does not include the portfolio activity of any underlying Fidelity Central Funds.
See accompanying notes which are an integral part of the financial statements.
Fidelity Global High Income Fund Class C
| Years ended April 30, | 2020 | 2019 | 2018 | 2017 | 2016 |
| Selected Per–Share Data | |||||
| Net asset value, beginning of period | $9.48 | $9.61 | $9.54 | $9.07 | $9.60 |
| Income from Investment Operations | |||||
| Net investment income (loss)A | .375 | .398 | .390 | .394 | .394 |
| Net realized and unrealized gain (loss) | (1.119) | (.115) | .005 | .422 | (.540) |
| Total from investment operations | (.744) | .283 | .395 | .816 | (.146) |
| Distributions from net investment income | (.356) | (.387) | (.326) | (.349) | (.387) |
| Distributions from net realized gain | – | (.026) | – | – | – |
| Total distributions | (.356) | (.413) | (.326) | (.349) | (.387) |
| Redemption fees added to paid in capitalA | – | – | .001 | .003 | .003 |
| Net asset value, end of period | $8.38 | $9.48 | $9.61 | $9.54 | $9.07 |
| Total ReturnB,C | (8.13)% | 3.10% | 4.16% | 9.19% | (1.39)% |
| Ratios to Average Net AssetsD,E | |||||
| Expenses before reductions | 2.11% | 2.08% | 2.08% | 2.18% | 2.20% |
| Expenses net of fee waivers, if any | 2.00% | 2.00% | 2.00% | 2.00% | 2.00% |
| Expenses net of all reductions | 2.00% | 2.00% | 2.00% | 2.00% | 2.00% |
| Net investment income (loss) | 4.02% | 4.25% | 4.00% | 4.23% | 4.36% |
| Supplemental Data | |||||
| Net assets, end of period (000 omitted) | $2,684 | $3,723 | $4,420 | $3,775 | $3,437 |
| Portfolio turnover rateF | 54% | 44% | 48% | 48% | 41% |
A Calculated based on average shares outstanding during the period.
B Total returns would have been lower if certain expenses had not been reduced during the applicable periods shown.
C Total returns do not include the effect of the contingent deferred sales charge.
D Fees and expenses of any underlying Fidelity Central Funds are not included in the Fund's expense ratio. The Fund indirectly bears its proportionate share of the expenses of any underlying Fidelity Central Funds.
E Expense ratios reflect operating expenses of the class. Expenses before reductions do not reflect amounts reimbursed by the investment adviser or reductions from brokerage service arrangements or reductions from other expense offset arrangements and do not represent the amount paid by the class during periods when reimbursements or reductions occur. Expenses net of fee waivers reflect expenses after reimbursement by the investment adviser but prior to reductions from brokerage service arrangements or other expense offset arrangements. Expenses net of all reductions represent the net expenses paid by the class.
F Amount does not include the portfolio activity of any underlying Fidelity Central Funds.
See accompanying notes which are an integral part of the financial statements.
Fidelity Global High Income Fund
| Years ended April 30, | 2020 | 2019 | 2018 | 2017 | 2016 |
| Selected Per–Share Data | |||||
| Net asset value, beginning of period | $9.48 | $9.62 | $9.54 | $9.07 | $9.60 |
| Income from Investment Operations | |||||
| Net investment income (loss)A | .468 | .491 | .487 | .486 | .486 |
| Net realized and unrealized gain (loss) | (1.119) | (.125) | .015 | .423 | (.542) |
| Total from investment operations | (.651) | .366 | .502 | .909 | (.056) |
| Distributions from net investment income | (.449) | (.480) | (.423) | (.442) | (.477) |
| Distributions from net realized gain | – | (.026) | – | – | – |
| Total distributions | (.449) | (.506) | (.423) | (.442) | (.477) |
| Redemption fees added to paid in capitalA | – | – | .001 | .003 | .003 |
| Net asset value, end of period | $8.38 | $9.48 | $9.62 | $9.54 | $9.07 |
| Total ReturnB,C | (7.21)% | 4.03% | 5.31% | 10.28% | (.40)% |
| Ratios to Average Net AssetsD,E | |||||
| Expenses before reductions | 1.03% | 1.01% | 1.02% | 1.14% | 1.20% |
| Expenses net of fee waivers, if any | 1.00% | 1.00% | 1.00% | 1.00% | 1.00% |
| Expenses net of all reductions | 1.00% | 1.00% | 1.00% | 1.00% | 1.00% |
| Net investment income (loss) | 5.02% | 5.25% | 5.00% | 5.23% | 5.35% |
| Supplemental Data | |||||
| Net assets, end of period (000 omitted) | $73,039 | $97,619 | $125,192 | $85,188 | $93,256 |
| Portfolio turnover rateF | 54% | 44% | 48% | 48% | 41% |
A Calculated based on average shares outstanding during the period.
B Total returns for periods of less than one year are not annualized.
C Total returns would have been lower if certain expenses had not been reduced during the applicable periods shown.
D Fees and expenses of any underlying Fidelity Central Funds are not included in the Fund's expense ratio. The Fund indirectly bears its proportionate share of the expenses of any underlying Fidelity Central Funds.
E Expense ratios reflect operating expenses of the class. Expenses before reductions do not reflect amounts reimbursed by the investment adviser or reductions from brokerage service arrangements or reductions from other expense offset arrangements and do not represent the amount paid by the class during periods when reimbursements or reductions occur. Expenses net of fee waivers reflect expenses after reimbursement by the investment adviser but prior to reductions from brokerage service arrangements or other expense offset arrangements. Expenses net of all reductions represent the net expenses paid by the class.
F Amount does not include the portfolio activity of any underlying Fidelity Central Funds.
See accompanying notes which are an integral part of the financial statements.
Fidelity Global High Income Fund Class I
| Years ended April 30, | 2020 | 2019 | 2018 | 2017 | 2016 |
| Selected Per–Share Data | |||||
| Net asset value, beginning of period | $9.48 | $9.62 | $9.54 | $9.07 | $9.60 |
| Income from Investment Operations | |||||
| Net investment income (loss)A | .473 | .491 | .485 | .486 | .483 |
| Net realized and unrealized gain (loss) | (1.124) | (.125) | .017 | .423 | (.539) |
| Total from investment operations | (.651) | .366 | .502 | .909 | (.056) |
| Distributions from net investment income | (.449) | (.480) | (.423) | (.442) | (.477) |
| Distributions from net realized gain | – | (.026) | – | – | – |
| Total distributions | (.449) | (.506) | (.423) | (.442) | (.477) |
| Redemption fees added to paid in capitalA | – | – | .001 | .003 | .003 |
| Net asset value, end of period | $8.38 | $9.48 | $9.62 | $9.54 | $9.07 |
| Total ReturnB | (7.21)% | 4.03% | 5.31% | 10.28% | (.40)% |
| Ratios to Average Net AssetsC,D | |||||
| Expenses before reductions | 1.03% | 1.05% | 1.03% | 1.16% | 1.10% |
| Expenses net of fee waivers, if any | 1.00% | 1.00% | 1.00% | 1.00% | 1.00% |
| Expenses net of all reductions | 1.00% | 1.00% | 1.00% | 1.00% | 1.00% |
| Net investment income (loss) | 5.02% | 5.25% | 5.00% | 5.23% | 5.35% |
| Supplemental Data | |||||
| Net assets, end of period (000 omitted) | $4,350 | $7,352 | $9,999 | $2,817 | $1,905 |
| Portfolio turnover rateE | 54% | 44% | 48% | 48% | 41% |
A Calculated based on average shares outstanding during the period.
B Total returns would have been lower if certain expenses had not been reduced during the applicable periods shown.
C Fees and expenses of any underlying Fidelity Central Funds are not included in the Fund's expense ratio. The Fund indirectly bears its proportionate share of the expenses of any underlying Fidelity Central Funds.
D Expense ratios reflect operating expenses of the class. Expenses before reductions do not reflect amounts reimbursed by the investment adviser or reductions from brokerage service arrangements or reductions from other expense offset arrangements and do not represent the amount paid by the class during periods when reimbursements or reductions occur. Expenses net of fee waivers reflect expenses after reimbursement by the investment adviser but prior to reductions from brokerage service arrangements or other expense offset arrangements. Expenses net of all reductions represent the net expenses paid by the class.
E Amount does not include the portfolio activity of any underlying Fidelity Central Funds.
See accompanying notes which are an integral part of the financial statements.
Notes to Financial Statements
For the period ended April 30, 2020
1. Organization.
Fidelity Global High Income Fund (the Fund) is a fund of Fidelity Summer Street Trust (the Trust) and is authorized to issue an unlimited number of shares. The Trust is registered under the Investment Company Act of 1940, as amended (the 1940 Act), as an open-end management investment company organized as a Massachusetts business trust. The Fund offers Class A, Class M, Class C, Global High Income and Class I shares, each of which has equal rights as to assets and voting privileges. Each class has exclusive voting rights with respect to matters that affect that class. Class C shares will automatically convert to Class A shares after a holding period of ten years from the initial date of purchase, with certain exceptions. The Fund's investments in emerging markets can be subject to social, economic, regulatory, and political uncertainties and can be extremely volatile.
Effective January 1, 2020:
Investment advisers Fidelity Investments Money Management, Inc., FMR Co., Inc., and Fidelity SelectCo, LLC, merged with and into Fidelity Management & Research Company. In connection with the merger transactions, the resulting, merged investment adviser was then redomiciled from Massachusetts to Delaware, changed its corporate structure from a corporation to a limited liability company, and changed its name to "Fidelity Management & Research Company LLC".
Broker-dealer Fidelity Distributors Corporation merged with and into Fidelity Investments Institutional Services Company, Inc. ("FIISC"). FIISC was then redomiciled from Massachusetts to Delaware, changed its corporate structure from a corporation to a limited liability company, and changed its name to "Fidelity Distributors Company LLC".
Fidelity Investments Institutional Operations Company, Inc. converted from a Massachusetts corporation to a Massachusetts LLC, and changed its name to "Fidelity Investments Institutional Operations Company LLC".
2. Investments in Fidelity Central Funds.
The Fund invests in Fidelity Central Funds, which are open-end investment companies generally available only to other investment companies and accounts managed by the investment adviser and its affiliates. The Fund's Schedule of Investments lists each of the Fidelity Central Funds held as of period end, if any, as an investment of the Fund, but does not include the underlying holdings of each Fidelity Central Fund. As an Investing Fund, the Fund indirectly bears its proportionate share of the expenses of the underlying Fidelity Central Funds.
The Money Market Central Funds seek preservation of capital and current income and are managed by the investment adviser. Annualized expenses of the Money Market Central Funds as of their most recent shareholder report date ranged from less than .005% to .01%.
A complete unaudited list of holdings for each Fidelity Central Fund is available upon request or at the Securities and Exchange Commission (the SEC) website at www.sec.gov. In addition, the financial statements of the Fidelity Central Funds, which are not covered by the Fund's Report of Independent Registered Public Accounting Firm, are available on the SEC website or upon request.
3. Significant Accounting Policies.
The Fund is an investment company and applies the accounting and reporting guidance of the Financial Accounting Standards Board (FASB) Accounting Standards Codification Topic 946 Financial Services – Investments Companies. The financial statements have been prepared in conformity with accounting principles generally accepted in the United States of America (GAAP), which require management to make certain estimates and assumptions at the date of the financial statements. Actual results could differ from those estimates. Subsequent events, if any, through the date that the financial statements were issued have been evaluated in the preparation of the financial statements. The following summarizes the significant accounting policies of the Fund:
Investment Valuation. Investments are valued as of 4:00 p.m. Eastern time on the last calendar day of the period. The Board of Trustees (the Board) has delegated the day to day responsibility for the valuation of the Fund's investments to the Fair Value Committee (the Committee) established by the Fund's investment adviser. In accordance with valuation policies and procedures approved by the Board, the Fund attempts to obtain prices from one or more third party pricing vendors or brokers to value its investments. When current market prices, quotations or currency exchange rates are not readily available or reliable, investments will be fair valued in good faith by the Committee, in accordance with procedures adopted by the Board. Factors used in determining fair value vary by investment type and may include market or investment specific events, changes in interest rates and credit quality. The frequency with which these procedures are used cannot be predicted and they may be utilized to a significant extent. The Committee oversees the Fund's valuation policies and procedures and reports to the Board on the Committee's activities and fair value determinations. The Board monitors the appropriateness of the procedures used in valuing the Fund's investments and ratifies the fair value determinations of the Committee.
The Fund categorizes the inputs to valuation techniques used to value its investments into a disclosure hierarchy consisting of three levels as shown below:
- Level 1 – quoted prices in active markets for identical investments
- Level 2 – other significant observable inputs (including quoted prices for similar investments, interest rates, prepayment speeds, etc.)
- Level 3 – unobservable inputs (including the Fund's own assumptions based on the best information available)
Valuation techniques used to value the Fund's investments by major category are as follows:
Debt securities, including restricted securities, are valued based on evaluated prices received from third party pricing vendors or from brokers who make markets in such securities. Corporate bonds, bank loan obligations, foreign government and government agency obligations and preferred securities are valued by pricing vendors who utilize matrix pricing which considers yield or price of bonds of comparable quality, coupon, maturity and type or by broker-supplied prices. When independent prices are unavailable or unreliable, debt securities may be valued utilizing pricing methodologies which consider similar factors that would be used by third party pricing vendors. For foreign debt securities, when significant market or security specific events arise, valuations may be determined in good faith in accordance with procedures adopted by the Board. Debt securities are generally categorized as Level 2 in the hierarchy but may be Level 3 depending on the circumstances. The Fund invests a significant portion of its assets in below investment grade securities. The value of these securities can be more volatile due to changes in the credit quality of the issuer and is sensitive to changes in economic, market and regulatory conditions.
Equity securities, including restricted securities, for which market quotations are readily available, are valued at the last reported sale price or official closing price as reported by a third party pricing vendor on the primary market or exchange on which they are traded and are categorized as Level 1 in the hierarchy. In the event there were no sales during the day or closing prices are not available, securities are valued at the last quoted bid price or may be valued using the last available price and are generally categorized as Level 2 in the hierarchy. For equity securities, including restricted securities, where observable inputs are limited, assumptions about market activity and risk are used and these securities may be categorized as Level 3 in the hierarchy.
Investments in open-end mutual funds, including the Fidelity Central Funds, are valued at their closing net asset value (NAV) each business day and are categorized as Level 1 in the hierarchy.
Changes in valuation techniques may result in transfers in or out of an assigned level within the disclosure hierarchy. The aggregate value of investments by input level as of April 30, 2020 is included at the end of the Fund's Schedule of Investments.
Foreign Currency. The Fund may use foreign currency contracts to facilitate transactions in foreign-denominated securities. Gains and losses from these transactions may arise from changes in the value of the foreign currency or if the counterparties do not perform under the contracts' terms.
Foreign-denominated assets, including investment securities, and liabilities are translated into U.S. dollars at the exchange rates at period end. Purchases and sales of investment securities, income and dividends received and expenses denominated in foreign currencies are translated into U.S. dollars at the exchange rate in effect on the transaction date.
The effects of exchange rate fluctuations on investments are included with the net realized and unrealized gain (loss) on investment securities. Other foreign currency transactions resulting in realized and unrealized gain (loss) are disclosed separately.
Investment Transactions and Income. For financial reporting purposes, the Fund's investment holdings and NAV include trades executed through the end of the last business day of the period. The NAV per share for processing shareholder transactions is calculated as of the close of business of the New York Stock Exchange (NYSE), normally 4:00 p.m. Eastern time and includes trades executed through the end of the prior business day. Gains and losses on securities sold are determined on the basis of identified cost and include proceeds received from litigation. Dividend income is recorded on the ex-dividend date, except for certain dividends from foreign securities where the ex-dividend date may have passed, which are recorded as soon as the Fund is informed of the ex-dividend date. Non-cash dividends included in dividend income, if any, are recorded at the fair market value of the securities received. Income and capital gain distributions from Fidelity Central Funds, if any, are recorded on the ex-dividend date. Certain distributions received by the Fund represent a return of capital or capital gain. The Fund determines the components of these distributions subsequent to the ex-dividend date, based upon receipt of tax filings or other correspondence relating to the underlying investment. These distributions are recorded as a reduction of cost of investments and/or as a realized gain. Interest income is accrued as earned and includes coupon interest and amortization of premium and accretion of discount on debt securities as applicable. Paid in Kind (PIK) income is recorded at the fair market value of the securities received. Investment income is recorded net of foreign taxes withheld where recovery of such taxes is uncertain. Debt obligations may be placed on non-accrual status and related interest income may be reduced by ceasing current accruals and writing off interest receivables when the collection of all or a portion of interest has become doubtful based on consistently applied procedures. A debt obligation is removed from non-accrual status when the issuer resumes interest payments or when collectability of interest is reasonably assured.
Class Allocations and Expenses. Investment income, realized and unrealized capital gains and losses, common expenses of the Fund, and certain fund-level expense reductions, if any, are allocated daily on a pro-rata basis to each class based on the relative net assets of each class to the total net assets of the Fund. Each class differs with respect to transfer agent and distribution and service plan fees incurred. Certain expense reductions may also differ by class. For the reporting period, the allocated portion of income and expenses to each class as a percent of its average net assets may vary due to the timing of recording these transactions in relation to fluctuating net assets of the classes. Expenses directly attributable to a fund are charged to that fund. Expenses attributable to more than one fund are allocated among the respective funds on the basis of relative net assets or other appropriate methods. Expense estimates are accrued in the period to which they relate and adjustments are made when actual amounts are known.
Income Tax Information and Distributions to Shareholders. Each year, the Fund intends to qualify as a regulated investment company under Subchapter M of the Internal Revenue Code, including distributing substantially all of its taxable income and realized gains. As a result, no provision for U.S. Federal income taxes is required. As of April 30, 2020, the Fund did not have any unrecognized tax benefits in the financial statements; nor is the Fund aware of any tax positions for which it is reasonably possible that the total amounts of unrecognized tax benefits will significantly change in the next twelve months. The Fund files a U.S. federal tax return, in addition to state and local tax returns as required. The Fund's federal income tax returns are subject to examination by the Internal Revenue Service (IRS) for a period of three fiscal years after they are filed. State and local tax returns may be subject to examination for an additional fiscal year depending on the jurisdiction. Foreign taxes are provided for based on the Fund's understanding of the tax rules and rates that exist in the foreign markets in which it invests.
Distributions are declared and recorded daily and paid monthly from net investment income. Distributions from realized gains, if any, are declared and recorded on the ex-dividend date. Income and capital gain distributions are declared separately for each class. Income and capital gain distributions are determined in accordance with income tax regulations, which may differ from GAAP.
Capital accounts within the financial statements are adjusted for permanent book-tax differences. These adjustments have no impact on net assets or the results of operations. Capital accounts are not adjusted for temporary book-tax differences which will reverse in a subsequent period.
Book-tax differences are primarily due to foreign currency transactions, defaulted bonds, market discount, equity-debt classifications, capital loss carryforwards and losses deferred due to wash sales.
As of period end, the cost and unrealized appreciation (depreciation) in securities, and derivatives if applicable, for federal income tax purposes were as follows:
| Gross unrealized appreciation | $1,299,568 |
| Gross unrealized depreciation | (14,398,021) |
| Net unrealized appreciation (depreciation) | $(13,098,453) |
| Tax Cost | $101,316,316 |
The tax-based components of distributable earnings as of period end were as follows:
| Capital loss carryforward | $(5,650,989) |
| Net unrealized appreciation (depreciation) on securities and other investments | $(13,100,392) |
Capital loss carryforwards are only available to offset future capital gains of the Fund to the extent provided by regulations and may be limited. The capital loss carryforward information presented below, including any applicable limitation, is estimated as of fiscal period end and is subject to adjustment.
| No expiration | |
| Short-term | $(1,322,101) |
| Long-term | (4,328,888) |
| Total capital loss carryforward | $(5,650,989) |
The tax character of distributions paid was as follows:
| April 30, 2020 | April 30, 2019 | |
| Ordinary Income | $5,486,858 | $ 6,909,437 |
Delayed Delivery Transactions and When-Issued Securities. During the period, the Fund transacted in securities on a delayed delivery or when-issued basis. Payment and delivery may take place after the customary settlement period for that security. The price of the underlying securities and the date when the securities will be delivered and paid for are fixed at the time the transaction is negotiated. The securities purchased on a delayed delivery or when-issued basis are identified as such in the Fund's Schedule of Investments. With respect to purchase commitments, the Fund identifies securities as segregated in its records with a value at least equal to the amount of the commitment. Losses may arise due to changes in the value of the underlying securities or if the counterparty does not perform under the contract's terms, or if the issuer does not issue the securities due to political, economic, or other factors.
Restricted Securities (including Private Placements). The Fund may invest in securities that are subject to legal or contractual restrictions on resale. These securities generally may be resold in transactions exempt from registration or to the public if the securities are registered. Disposal of these securities may involve time-consuming negotiations and expense, and prompt sale at an acceptable price may be difficult. Information regarding restricted securities is included at the end of the Fund's Schedule of Investments.
Loans and Other Direct Debt Instruments. The Fund invests in direct debt instruments which are interests in amounts owed to lenders by corporate or other borrowers. These instruments may be in the form of loans, trade claims or other receivables and may include standby financing commitments such as revolving credit facilities that obligate the Fund to supply additional cash to the borrower on demand. Loans may be acquired through assignment or participation. The Fund did not have any unfunded loan commitments, which are contractual obligations for future funding, at period end.
4. Purchases and Sales of Investments.
Purchases and sales of securities, other than short-term securities, are noted in the table below.
| Purchases ($) | Sales ($) | |
| Fidelity Global High Income Fund | 58,234,911 | 71,509,924 |
5. Fees and Other Transactions with Affiliates.
Management Fee. Fidelity Management & Research Company LLC (the investment adviser) and its affiliates provide the Fund with investment management related services for which the Fund pays a monthly management fee. The management fee is the sum of an individual fund fee rate that is based on an annual rate of .60% of the Fund's average net assets and an annualized group fee rate that averaged .10% during the period. The group fee rate is based upon the monthly average net assets of a group of registered investment companies with which the investment adviser has management contracts. The group fee rate decreases as assets under management increase and increases as assets under management decrease. For the reporting period, the total annual management fee rate was .70% of the Fund's average net assets.
Distribution and Service Plan Fees. In accordance with Rule 12b-1 of the 1940 Act, the Fund has adopted separate Distribution and Service Plans for each class of shares. Certain classes pay Fidelity Distributors Company LLC (FDC), an affiliate of the investment adviser, separate Distribution and Service Fees, each of which is based on an annual percentage of each class' average net assets. In addition, FDC may pay financial intermediaries for selling shares of the Fund and providing shareholder support services. For the period, the Distribution and Service Fee rates, total fees and amounts retained by FDC were as follows:
| Distribution Fee | Service Fee | Total Fees | Retained by FDC | |
| Class A | -% | .25% | $17,461 | $827 |
| Class M | -% | .25% | 9,600 | 16 |
| Class C | .75% | .25% | 34,919 | 3,043 |
| $61,980 | $3,886 |
Sales Load. FDC may receive a front-end sales charge of up to 4.00% for selling Class A shares and Class M shares, some of which is paid to financial intermediaries for selling shares of the Fund. Depending on the holding period, FDC may receive contingent deferred sales charges levied on Class A, Class M and Class C redemptions. The deferred sales charges are 1.00% for Class C shares, 1.00% for certain purchases of Class A shares and .25% for certain purchases of Class M shares.
For the period, sales charge amounts retained by FDC were as follows:
| Retained by FDC | |
| Class A | $1,533 |
| Class M | 433 |
| Class C(a) | 173 |
| $2,139 |
(a) When Class C shares are initially sold, FDC pays commissions from its own resources to financial intermediaries through which the sales are made.
Transfer Agent Fees. Fidelity Investments Institutional Operations Company LLC (FIIOC), an affiliate of the investment adviser, is the transfer, dividend disbursing and shareholder servicing agent for each class of the Fund. FIIOC receives account fees and asset-based fees that vary according to the account size and type of account of the shareholders of the respective classes of the Fund. FIIOC pays for typesetting, printing and mailing of shareholder reports, except proxy statements.
For the period, transfer agent fees for each class were as follows:
| Amount | % of Class-Level Average Net Assets | |
| Class A | $13,134 | .19 |
| Class M | 9,998 | .26 |
| Class C | 7,523 | .22 |
| Global High Income | 123,881 | .13 |
| Class I | 10,873 | .15 |
| $165,409 |
Accounting Fees. Fidelity Service Company, Inc. (FSC), an affiliate of the investment adviser, maintains the Fund's accounting records. The accounting fee is based on the level of average net assets for each month. For the period, the fees were equivalent to the following annual rates:
| % of Average Net Assets | |
| Fidelity Global High Income Fund | .04 |
Interfund Trades. Funds may purchase from or sell securities to other Fidelity Funds under procedures adopted by the Board. The procedures have been designed to ensure these interfund trades are executed in accordance with Rule 17a-7 of the 1940 Act. Interfund trades are included within the respective purchases and sales amounts shown in the Purchases and Sales of Investments note.
6. Committed Line of Credit.
Certain Funds participate with other funds managed by the investment adviser or an affiliate in a $4.25 billion credit facility (the "line of credit") to be utilized for temporary or emergency purposes to fund shareholder redemptions or for other short-term liquidity purposes. The participating funds have agreed to pay commitment fees on their pro-rata portion of the line of credit, which are reflected in Miscellaneous expenses on the Statement of Operations, and are as follows:
| Amount | |
| Fidelity Global High Income Fund | $289 |
During the period, there were no borrowings on this line of credit.
7. Security Lending.
The Fund lends portfolio securities from time to time in order to earn additional income. For equity securities, lending agents are used, including National Financial Services (NFS), an affiliate of the Fund. Pursuant to a securities lending agreement, NFS will receive a fee, which is capped at 9.9% of daily lending revenue, for its services as lending agent. The Fund may lend securities to certain qualified borrowers, including NFS. On the settlement date of the loan, the Fund receives collateral (in the form of U.S. Treasury obligations, letters of credit and/or cash) against the loaned securities and maintains collateral in an amount not less than 100% of the market value of the loaned securities during the period of the loan. The market value of the loaned securities is determined at the close of business of the Fund and any additional required collateral is delivered to the Fund on the next business day. The Fund or borrower may terminate the loan at any time, and if the borrower defaults on its obligation to return the securities loaned because of insolvency or other reasons, the Fund may apply collateral received from the borrower against the obligation. The Fund may experience delays and costs in recovering the securities loaned. Any cash collateral received is invested in the Fidelity Securities Lending Cash Central Fund. The value of loaned securities and cash collateral at period end are disclosed on the Fund's Statement of Assets and Liabilities. Total fees paid by the Fund to NFS, as lending agent, amounted to $2. Security lending income represents the income earned on investing cash collateral, less rebates paid to borrowers and any lending agent fees associated with the loan, plus any premium payments received for lending certain types of securities. Security lending income is presented in the Statement of Operations as a component of income from Fidelity Central Funds. During the period, there were no securities loaned to NFS.
8. Expense Reductions.
The investment adviser contractually agreed to reimburse expenses of each class to the extent annual operating expenses exceeded certain levels of class-level average net assets as noted in the table below. This reimbursement will remain in place through August 31, 2021. Some expenses, for example the compensation of the independent Trustees, and certain miscellaneous expenses such as proxy and shareholder meeting expenses, are excluded from this reimbursement.
The following classes were in reimbursement during the period:
| Expense Limitations | Reimbursement | |
| Class A | 1.25% | $6,031 |
| Class M | 1.25% | 5,954 |
| Class C | 2.00% | 3,859 |
| Global High Income | 1.00% | 26,720 |
| Class I | 1.00% | 2,084 |
| $44,648 |
Commissions paid to certain brokers with whom the investment adviser, or its affiliates, places trades on behalf of the Fund include an amount in addition to trade execution, which may be rebated back to the Fund to offset certain expenses. This amount totaled $10 for the period. In addition, through arrangements with the Fund's custodian, credits realized as a result of certain uninvested cash balances were used to reduce the Fund's expenses. During the period, custodian credits reduced the Fund's expenses by $1,690.
In addition, during the period the investment adviser or an affiliate reimbursed and/or waived a portion of fund-level operating expenses in the amount of $418.
In addition, during the period, the investment adviser or an affiliate reimbursed the Fund $500 for an operational error which is included in the accompanying Statement of Operations.
9. Distributions to Shareholders.
Distributions to shareholders of each class were as follows:
| Year ended April 30, 2020 | Year ended April 30, 2019 | |
| Distributions to shareholders | ||
| Class A | $319,152 | $391,427 |
| Class M | 175,538 | 205,532 |
| Class C | 133,488 | 180,304 |
| Global High Income | 4,505,816 | 5,783,573 |
| Class I | 352,864 | 348,601 |
| Total | $5,486,858 | $6,909,437 |
10. Share Transactions.
Share transactions for each class were as follows and may contain automatic conversions between classes or exchanges between affiliated funds:
| Shares | Shares | Dollars | Dollars | |
| Year ended April 30, 2020 | Year ended April 30, 2019 | Year ended April 30, 2020 | Year ended April 30, 2019 | |
| Class A | ||||
| Shares sold | 197,034 | 161,804 | $1,858,939 | $1,505,999 |
| Reinvestment of distributions | 33,059 | 40,182 | 305,262 | 374,959 |
| Shares redeemed | (299,995) | (331,036) | (2,770,187) | (3,106,435) |
| Net increase (decrease) | (69,902) | (129,050) | $(605,986) | $(1,225,477) |
| Class M | ||||
| Shares sold | 77,844 | 61,952 | $706,114 | $578,414 |
| Reinvestment of distributions | 18,336 | 21,579 | 169,732 | 201,288 |
| Shares redeemed | (165,796) | (111,896) | (1,461,219) | (1,039,339) |
| Net increase (decrease) | (69,616) | (28,365) | $(585,373) | $(259,637) |
| Class C | ||||
| Shares sold | 41,564 | 68,330 | $394,093 | $639,377 |
| Reinvestment of distributions | 14,119 | 18,636 | 130,433 | 173,728 |
| Shares redeemed | (128,235) | (153,859) | (1,134,831) | (1,442,196) |
| Net increase (decrease) | (72,552) | (66,893) | $(610,305) | $(629,091) |
| Global High Income | ||||
| Shares sold | 2,579,185 | 3,114,879 | $24,201,126 | $29,075,801 |
| Reinvestment of distributions | 399,861 | 527,744 | 3,695,269 | 4,924,322 |
| Shares redeemed | (4,564,449) | (6,363,830) | (41,279,073) | (59,508,602) |
| Net increase (decrease) | (1,585,403) | (2,721,207) | $(13,382,678) | $(25,508,479) |
| Class I | ||||
| Shares sold | 747,752 | 485,713 | $7,064,718 | $4,504,729 |
| Reinvestment of distributions | 32,909 | 29,106 | 305,644 | 271,715 |
| Shares redeemed | (1,037,268) | (779,082) | (9,593,616) | (7,361,442) |
| Net increase (decrease) | (256,607) | (264,263) | $(2,223,254) | $(2,584,998) |
11. Other.
The Fund's organizational documents provide former and current trustees and officers with a limited indemnification against liabilities arising in connection with the performance of their duties to the Fund. In the normal course of business, the Fund may also enter into contracts that provide general indemnifications. The Fund's maximum exposure under these arrangements is unknown as this would be dependent on future claims that may be made against the Fund. The risk of material loss from such claims is considered remote.
12. Credit Risk.
The Fund's relatively large investment in countries with limited or developing capital markets may involve greater risks than investments in more developed markets and the prices of such investments may be volatile. The yields of emerging market debt obligations reflect, among other things, perceived credit risk. The consequences of political, social or economic changes in these markets may have disruptive effects on the market prices of the Fund's investments and the income they generate, as well as the Fund's ability to repatriate such amounts.
13. Coronavirus (COVID-19) Pandemic.
An outbreak of COVID-19 first detected in China during December 2019 has since spread globally and was declared a pandemic by the World Health Organization during March 2020. Developments that disrupt global economies and financial markets, such as the COVID-19 pandemic, may magnify factors that affect the Fund's performance.
Report of Independent Registered Public Accounting Firm
To the Board of Trustees of Fidelity Summer Street Trust and Shareholders of Fidelity Global High Income Fund
Opinion on the Financial Statements
We have audited the accompanying statement of assets and liabilities, including the schedule of investments, of Fidelity Global High Income Fund (one of the funds constituting Fidelity Summer Street Trust, referred to hereafter as the “Fund”) as of April 30, 2020, the related statement of operations for the year ended April 30, 2020, the statement of changes in net assets for each of the two years in the period ended April 30, 2020, including the related notes, and the financial highlights for each of the five years in the period ended April 30, 2020 (collectively referred to as the “financial statements”). In our opinion, the financial statements present fairly, in all material respects, the financial position of the Fund as of April 30, 2020, the results of its operations for the year then ended, the changes in its net assets for each of the two years in the period ended April 30, 2020 and the financial highlights for each of the five years in the period ended April 30, 2020 in conformity with accounting principles generally accepted in the United States of America.
Basis for Opinion
These financial statements are the responsibility of the Fund’s management. Our responsibility is to express an opinion on the Fund’s financial statements based on our audits. We are a public accounting firm registered with the Public Company Accounting Oversight Board (United States) (PCAOB) and are required to be independent with respect to the Fund in accordance with the U.S. federal securities laws and the applicable rules and regulations of the Securities and Exchange Commission and the PCAOB.
We conducted our audits of these financial statements in accordance with the standards of the PCAOB. Those standards require that we plan and perform the audit to obtain reasonable assurance about whether the financial statements are free of material misstatement, whether due to error or fraud.
Our audits included performing procedures to assess the risks of material misstatement of the financial statements, whether due to error or fraud, and performing procedures that respond to those risks. Such procedures included examining, on a test basis, evidence regarding the amounts and disclosures in the financial statements. Our audits also included evaluating the accounting principles used and significant estimates made by management, as well as evaluating the overall presentation of the financial statements. Our procedures included confirmation of securities owned as of April 30, 2020 by correspondence with the custodian, issuers of privately offered securities, agent banks and brokers; when replies were not received from brokers, we performed other auditing procedures. We believe that our audits provide a reasonable basis for our opinion.
PricewaterhouseCoopers LLP
Boston, Massachusetts
June 16, 2020
We have served as the auditor of one or more investment companies in the Fidelity group of funds since 1932.
Trustees and Officers
The Trustees, Members of the Advisory Board (if any), and officers of the trust and fund, as applicable, are listed below. The Board of Trustees governs the fund and is responsible for protecting the interests of shareholders. The Trustees are experienced executives who meet periodically throughout the year to oversee the fund's activities, review contractual arrangements with companies that provide services to the fund, oversee management of the risks associated with such activities and contractual arrangements, and review the fund's performance. Except for Bettina Doulton, each of the Trustees oversees 312 funds. Ms. Doulton oversees 210 funds.
The Trustees hold office without limit in time except that (a) any Trustee may resign; (b) any Trustee may be removed by written instrument, signed by at least two-thirds of the number of Trustees prior to such removal; (c) any Trustee who requests to be retired or who has become incapacitated by illness or injury may be retired by written instrument signed by a majority of the other Trustees; and (d) any Trustee may be removed at any special meeting of shareholders by a two-thirds vote of the outstanding voting securities of the trust. Each Trustee who is not an interested person (as defined in the 1940 Act) of the trust and the fund is referred to herein as an Independent Trustee. Each Independent Trustee shall retire not later than the last day of the calendar year in which his or her 75th birthday occurs. The Independent Trustees may waive this mandatory retirement age policy with respect to individual Trustees. Officers and Advisory Board Members hold office without limit in time, except that any officer or Advisory Board Member may resign or may be removed by a vote of a majority of the Trustees at any regular meeting or any special meeting of the Trustees. Except as indicated, each individual has held the office shown or other offices in the same company for the past five years.
The fund's Statement of Additional Information (SAI) includes more information about the Trustees. To request a free copy, call Fidelity at 1-800-544-8544 if you’re an individual investing directly with Fidelity, call 1-800-835-5092 if you’re a plan sponsor or participant with Fidelity as your recordkeeper or call 1-877-208-0098 on institutional accounts or if you’re an advisor or invest through one.
Experience, Skills, Attributes, and Qualifications of the Trustees. The Governance and Nominating Committee has adopted a statement of policy that describes the experience, qualifications, attributes, and skills that are necessary and desirable for potential Independent Trustee candidates (Statement of Policy). The Board believes that each Trustee satisfied at the time he or she was initially elected or appointed a Trustee, and continues to satisfy, the standards contemplated by the Statement of Policy. The Governance and Nominating Committee also engages professional search firms to help identify potential Independent Trustee candidates who have the experience, qualifications, attributes, and skills consistent with the Statement of Policy. From time to time, additional criteria based on the composition and skills of the current Independent Trustees, as well as experience or skills that may be appropriate in light of future changes to board composition, business conditions, and regulatory or other developments, have also been considered by the professional search firms and the Governance and Nominating Committee. In addition, the Board takes into account the Trustees' commitment and participation in Board and committee meetings, as well as their leadership of standing and ad hoc committees throughout their tenure.
In determining that a particular Trustee was and continues to be qualified to serve as a Trustee, the Board has considered a variety of criteria, none of which, in isolation, was controlling. The Board believes that, collectively, the Trustees have balanced and diverse experience, qualifications, attributes, and skills, which allow the Board to operate effectively in governing the fund and protecting the interests of shareholders. Information about the specific experience, skills, attributes, and qualifications of each Trustee, which in each case led to the Board's conclusion that the Trustee should serve (or continue to serve) as a trustee of the fund, is provided below.
Board Structure and Oversight Function. Robert A. Lawrence is an interested person and currently serves as Acting Chairman. The Trustees have determined that an interested Chairman is appropriate and benefits shareholders because an interested Chairman has a personal and professional stake in the quality and continuity of services provided to the fund. Independent Trustees exercise their informed business judgment to appoint an individual of their choosing to serve as Chairman, regardless of whether the Trustee happens to be independent or a member of management. The Independent Trustees have determined that they can act independently and effectively without having an Independent Trustee serve as Chairman and that a key structural component for assuring that they are in a position to do so is for the Independent Trustees to constitute a substantial majority for the Board. The Independent Trustees also regularly meet in executive session. Ned C. Lautenbach and David M. Thomas serve as Co-Lead Independent Trustees and as such each (i) acts as a liaison between the Independent Trustees and management with respect to matters important to the Independent Trustees and (ii) with management prepares agendas for Board meetings.
Fidelity® funds are overseen by different Boards of Trustees. The fund's Board oversees Fidelity's high income and certain equity funds, and other Boards oversee Fidelity's investment-grade bond, money market, asset allocation, and other equity funds. The asset allocation funds may invest in Fidelity® funds overseen by the fund's Board. The use of separate Boards, each with its own committee structure, allows the Trustees of each group of Fidelity® funds to focus on the unique issues of the funds they oversee, including common research, investment, and operational issues. On occasion, the separate Boards establish joint committees to address issues of overlapping consequences for the Fidelity® funds overseen by each Board.
The Trustees operate using a system of committees to facilitate the timely and efficient consideration of all matters of importance to the Trustees, the fund, and fund shareholders and to facilitate compliance with legal and regulatory requirements and oversight of the fund's activities and associated risks. The Board, acting through its committees, has charged FMR and its affiliates with (i) identifying events or circumstances the occurrence of which could have demonstrably adverse effects on the fund's business and/or reputation; (ii) implementing processes and controls to lessen the possibility that such events or circumstances occur or to mitigate the effects of such events or circumstances if they do occur; and (iii) creating and maintaining a system designed to evaluate continuously business and market conditions in order to facilitate the identification and implementation processes described in (i) and (ii) above. Because the day-to-day operations and activities of the fund are carried out by or through FMR, its affiliates, and other service providers, the fund's exposure to risks is mitigated but not eliminated by the processes overseen by the Trustees. While each of the Board's committees has responsibility for overseeing different aspects of the fund's activities, oversight is exercised primarily through the Operations, Audit, and Compliance Committees. Appropriate personnel, including but not limited to the fund's Chief Compliance Officer (CCO), FMR's internal auditor, the independent accountants, the fund's Treasurer and portfolio management personnel, make periodic reports to the Board's committees, as appropriate, including an annual review of Fidelity's risk management program for the Fidelity® funds. The responsibilities of each standing committee, including their oversight responsibilities, are described further under "Standing Committees of the Trustees."
Interested Trustees*:
Correspondence intended for a Trustee who is an interested person may be sent to Fidelity Investments, 245 Summer Street, Boston, Massachusetts 02210.
Name, Year of Birth; Principal Occupations and Other Relevant Experience+
Bettina Doulton (1964)
Year of Election or Appointment: 2020
Trustee
Ms. Doulton also serves as Trustee of other Fidelity® funds. Prior to her retirement, Ms. Doulton served in a variety of positions at Fidelity Investments, including as a managing director of research (2006-2007), portfolio manager to certain Fidelity® funds (1993-2005), equity analyst and portfolio assistant (1990-1993), and research assistant (1987-1990). Ms. Doulton currently owns and operates Phi Builders + Architects and Cellardoor Winery. Previously, Ms. Doulton served as a member of the Board of Brown Capital Management, LLC (2013-2018).
Robert A. Lawrence (1952)
Year of Election or Appointment: 2020
Trustee
Acting Chairman of the Board of Trustees
Mr. Lawrence also serves as Trustee of other funds. Previously, Mr. Lawrence served as a Member of the Advisory Board of certain funds. Prior to his retirement in 2008, Mr. Lawrence served as Vice President of certain Fidelity® funds (2006-2008), Senior Vice President, Head of High Income Division of Fidelity Management & Research Company (investment adviser firm, 2006-2008), and President of Fidelity Strategic Investments (investment adviser firm, 2002-2005).
* Determined to be an “Interested Trustee” by virtue of, among other things, his or her affiliation with the trust or various entities under common control with FMR.
+ The information includes the Trustee's principal occupation during the last five years and other information relating to the experience, attributes, and skills relevant to the Trustee's qualifications to serve as a Trustee, which led to the conclusion that the Trustee should serve as a Trustee for the fund.
Independent Trustees:
Correspondence intended for an Independent Trustee may be sent to Fidelity Investments, P.O. Box 55235, Boston, Massachusetts 02205-5235.
Name, Year of Birth; Principal Occupations and Other Relevant Experience+
Dennis J. Dirks (1948)
Year of Election or Appointment: 2005
Trustee
Mr. Dirks also serves as Trustee of other Fidelity® funds. Prior to his retirement in May 2003, Mr. Dirks served as Chief Operating Officer and as a member of the Board of The Depository Trust & Clearing Corporation (financial markets infrastructure), President, Chief Operating Officer and a member of the Board of The Depository Trust Company (DTC), President and a member of the Board of the National Securities Clearing Corporation (NSCC), Chief Executive Officer and a member of the Board of the Government Securities Clearing Corporation and Chief Executive Officer and a member of the Board of the Mortgage-Backed Securities Clearing Corporation. Mr. Dirks currently serves as a member of the Finance Committee (2016-present) and Board (2017-present) and is Treasurer (2018-present) of the Asolo Repertory Theatre.
Donald F. Donahue (1950)
Year of Election or Appointment: 2018
Trustee
Mr. Donahue also serves as Trustee of other Fidelity® funds. Mr. Donahue serves as President and Chief Executive Officer of Miranda Partners, LLC (risk consulting for the financial services industry, 2012-present). Previously, Mr. Donahue served as Chief Executive Officer (2006-2012), Chief Operating Officer (2003-2006) and Managing Director, Customer Marketing and Development (1999-2003) of The Depository Trust & Clearing Corporation (financial markets infrastructure). Mr. Donahue currently serves as a member (2007-present) and Co-Chairman (2016-present) of the Board of United Way of New York, a member of the Board of NYC Leadership Academy (2012-present) and a member of the Board of Advisors of Ripple Labs, Inc. (financial services, 2015-present). Mr. Donahue previously served as a member of the Advisory Board of certain Fidelity® funds (2015-2018).
Vicki L. Fuller (1957)
Year of Election or Appointment: 2020
Trustee
Ms. Fuller also serves as Trustee of other Fidelity® funds. Previously, Ms. Fuller served as a member of the Advisory Board of certain Fidelity® funds (2018-2020), Chief Investment Officer of the New York State Common Retirement Fund (2012-2018) and held a variety of positions at AllianceBernstein L.P. (global asset management, 1985-2012), including Managing Director (2006-2012) and Senior Vice President and Senior Portfolio Manager (2001-2006). Ms. Fuller currently serves as a member of the Board, Audit Committee and Nominating and Governance Committee of The Williams Companies, Inc. (natural gas infrastructure, 2018-present) and as a member of the Board of Treliant, LLC (consulting, 2019-present).
Patricia L. Kampling (1959)
Year of Election or Appointment: 2020
Trustee
Ms. Kampling also serves as Trustee of other Fidelity® funds. Prior to her retirement, Ms. Kampling served as Chairman of the Board and Chief Executive Officer (2012-2019), President and Chief Operating Officer (2011-2012) and Executive Vice President and Chief Financial Officer (2010-2011) of Alliant Energy Corporation. Ms. Kampling currently serves as a member of the Board, Compensation Committee and Executive Committee and as Chair of the Audit Committee of Briggs & Stratton Corporation (manufacturing, 2011-present) and as a member of the Board, Audit, Finance and Risk Committee and Safety, Environmental, Technology and Operations Committee of American Water Works Company, Inc. (utilities company, 2019-present). In addition, Ms. Kampling currently serves as a member of the Board of the Nature Conservancy, Wisconsin Chapter (2019-present). Previously, Ms. Kampling served as a Member of the Advisory Board of certain Fidelity® funds (2020), a member of the Board of Interstate Power and Light Company (2012-2019) and Wisconsin Power and Light Company (2012-2019) (each a subsidiary of Alliant Energy Corporation) and as a member of the Board and Workforce Development Committee of the Business Roundtable (2018-2019).
Alan J. Lacy (1953)
Year of Election or Appointment: 2008
Trustee
Mr. Lacy also serves as Trustee of other Fidelity® funds. Previously, Mr. Lacy served as Senior Adviser (2007-2014) of Oak Hill Capital Partners, L.P. (private equity), Chief Executive Officer (2005) and Vice Chairman (2005-2006) of Sears Holdings Corporation (retail), Chief Executive Officer and Chairman of the Board of Sears, Roebuck and Co. (retail, 2000-2005), Chairman (2014-2017) and a member of the Board (2010-2017) of Dave & Buster’s Entertainment, Inc. (restaurant and entertainment complexes) and a member of the Board of Bristol-Myers Squibb Company (global pharmaceuticals, 2008-2020). Mr. Lacy currently serves as a Trustee of the California Chapter of The Nature Conservancy (2015-present) and a member of the Board of the Center for Advanced Study in the Behavioral Sciences at Stanford University (2015-present).
Ned C. Lautenbach (1944)
Year of Election or Appointment: 2000
Trustee
Co-Lead Independent Trustee
Mr. Lautenbach also serves as Trustee of other Fidelity® funds. Mr. Lautenbach currently serves as Chair of the Board of Governors, State University System of Florida (2013-present) and is a member of the Council on Foreign Relations (1994-present). He is also a member and has in the past served as Chairman of the Board of Directors of Artis-Naples (2012-present). Previously, Mr. Lautenbach served as a member and then Lead Director of the Board of Directors of Eaton Corporation (diversified industrial, 1997-2016). He was also a Partner at Clayton, Dubilier & Rice, LLC (private equity investment, 1998-2010); as well as Director of Sony Corporation (2006-2007). In addition, Mr. Lautenbach had a 30-year career with IBM (technology company), during which time he served as Senior Vice President and as a member of the Corporate Executive Committee (1968-1998).
Joseph Mauriello (1944)
Year of Election or Appointment: 2008
Trustee
Mr. Mauriello also serves as Trustee of other Fidelity® funds. Prior to his retirement in January 2006, Mr. Mauriello served in numerous senior management positions including Deputy Chairman and Chief Operating Officer (2004-2005), and Vice Chairman of Financial Services (2002-2004) of KPMG LLP US (professional services, 1965-2005). Mr. Mauriello currently serves as a member of the Independent Directors Council Governing Council (2015-present). Previously, Mr. Mauriello served as a member of the Board of XL Group plc. (global insurance and re-insurance, 2006-2018).
Cornelia M. Small (1944)
Year of Election or Appointment: 2005
Trustee
Ms. Small also serves as Trustee of other Fidelity® funds. Previously, Ms. Small served as Chief Investment Officer, Director of Global Equity Investments and a member of Scudder, Stevens & Clark and Scudder Kemper Investments. Ms. Small previously served as a member of the Board (2009-2019) and Chair of the Investment Committee (2010-2019) of the Teagle Foundation and a member of the Investment Committee of the Berkshire Taconic Community Foundation (2008-2019).
Garnett A. Smith (1947)
Year of Election or Appointment: 2018
Trustee
Mr. Smith also serves as Trustee of other Fidelity® funds. Prior to his retirement, Mr. Smith served as Chairman and Chief Executive Officer (1990-1997) and President (1986-1990) of Inbrand Corp. (manufacturer of personal absorbent products). Prior to his employment with Inbrand Corp., he was employed by a retail fabric chain and North Carolina National Bank (now Bank of America). Mr. Smith previously served as a member of the Advisory Board of certain Fidelity® funds (2012-2013).
David M. Thomas (1949)
Year of Election or Appointment: 2008
Trustee
Co-Lead Independent Trustee
Mr. Thomas also serves as Trustee of other Fidelity® funds. Previously, Mr. Thomas served as Executive Chairman (2005-2006) and Chairman and Chief Executive Officer (2000-2005) of IMS Health, Inc. (pharmaceutical and healthcare information solutions). Mr. Thomas currently serves as Non-Executive Chairman of the Board of Fortune Brands Home and Security (home and security products, 2011-present), and a member of the Board (2004-present) and Presiding Director (2013-present) of Interpublic Group of Companies, Inc. (marketing communication).
Susan Tomasky (1953)
Year of Election or Appointment: 2020
Trustee
Ms. Tomasky also serves as Trustee of other Fidelity® funds. Prior to her retirement, Ms. Tomasky served in various executive officer positions at American Electric Power Company, Inc. (1998-2011), including most recently as President of AEP Transmission (2007-2011). Ms. Tomasky currently serves as a member of the Board and Sustainability Committee and as Chair of the Audit Committee of Marathon Petroleum Corporation (2018-present) and as a member of the Board, Corporate Governance Committee and Organization and Compensation Committee and as Chair of the Audit Committee of Public Service Enterprise Group, Inc. (utilities company, 2012-present). In addition, Ms. Tomasky currently serves as a member of the Board of the Columbus Regional Airport Authority (2007-present), as a member of the Board of the Royal Shakespeare Company – America (2009-present), as a member of the Board of the Columbus Association for the Performing Arts (2011-present) and as a member of the Board of Kenyon College (2016-present). Previously, Ms. Tomasky served as a Member of the Advisory Board of certain Fidelity® funds (2020), a member of the Board (2011-2019) and as Lead Independent Director (2015-2018) of Andeavor Corporation (previously Tesoro Corporation) (independent oil refiner and marketer) and as a member of the Board of Summit Midstream Partners LP (energy, 2012-2018).
Michael E. Wiley (1950)
Year of Election or Appointment: 2018
Trustee
Mr. Wiley also serves as Trustee of other Fidelity® funds. Previously, Mr. Wiley served as a member of the Advisory Board of certain Fidelity® funds (2018-2020), Chairman, President and CEO of Baker Hughes, Inc. (oilfield services, 2000-2004). Mr. Wiley also previously served as a member of the Board of Andeavor Corporation (independent oil refiner and marketer, 2005-2018), a member of the Board of Andeavor Logistics LP (natural resources logistics, 2015-2018) and a member of the Board of High Point Resources (exploration and production, 2005-2020).
+ The information includes the Trustee's principal occupation during the last five years and other information relating to the experience, attributes, and skills relevant to the Trustee's qualifications to serve as a Trustee, which led to the conclusion that the Trustee should serve as a Trustee for the fund.
Advisory Board Members and Officers:
Correspondence intended for a Member of the Advisory Board (if any) may be sent to Fidelity Investments, P.O. Box 55235, Boston, Massachusetts 02205-5235. Correspondence intended for an officer or Peter S. Lynch may be sent to Fidelity Investments, 245 Summer Street, Boston, Massachusetts 02210. Officers appear below in alphabetical order.
Name, Year of Birth; Principal Occupation
Peter S. Lynch (1944)
Year of Election or Appointment: 2003
Member of the Advisory Board
Mr. Lynch also serves as a Member of the Advisory Board of other Fidelity® funds. Mr. Lynch is Vice Chairman and a Director of Fidelity Management & Research Company LLC (investment adviser firm). In addition, Mr. Lynch serves as a Trustee of Boston College and as the Chairman of the Inner-City Scholarship Fund. Previously, Mr. Lynch served as Vice Chairman and a Director of FMR Co., Inc. (investment adviser firm) and on the Special Olympics International Board of Directors (1997-2006).
Elizabeth Paige Baumann (1968)
Year of Election or Appointment: 2017
Anti-Money Laundering (AML) Officer
Ms. Baumann also serves as AML Officer of other funds. She is Chief AML Officer (2012-present) and Senior Vice President (2014-present) of FMR LLC (diversified financial services company) and is an employee of Fidelity Investments. Previously, Ms. Baumann served as AML Officer of certain funds (2017-2019), as AML Officer of the funds (2012-2016), and Vice President (2007-2014) and Deputy Anti-Money Laundering Officer (2007-2012) of FMR LLC.
Craig S. Brown (1977)
Year of Election or Appointment: 2019
Assistant Treasurer
Mr. Brown also serves as Assistant Treasurer of other funds. Mr. Brown is an employee of Fidelity Investments (2013-present).
John J. Burke III (1964)
Year of Election or Appointment: 2018
Chief Financial Officer
Mr. Burke also serves as Chief Financial Officer of other funds. Mr. Burke serves as Head of Investment Operations for Fidelity Fund and Investment Operations (2018-present) and is an employee of Fidelity Investments (1998-present). Previously Mr. Burke served as head of Asset Management Investment Operations (2012-2018).
William C. Coffey (1969)
Year of Election or Appointment: 2019
Assistant Secretary
Mr. Coffey also serves as Assistant Secretary of other funds. He is Senior Vice President and Deputy General Counsel of FMR LLC (diversified financial services company, 2010-present), and is an employee of Fidelity Investments. Previously, Mr. Coffey served as Secretary and CLO of certain funds (2018-2019); CLO, Secretary, and Senior Vice President of Fidelity Management & Research Company and FMR Co., Inc. (investment adviser firms, 2018-2019); Secretary of Fidelity SelectCo, LLC and Fidelity Investments Money Management, Inc. (investment adviser firms, 2018-2019); CLO of Fidelity Management & Research (Hong Kong) Limited, FMR Investment Management (UK) Limited, and Fidelity Management & Research (Japan) Limited (investment adviser firms, 2018-2019); and Assistant Secretary of certain funds (2009-2018).
Timothy M. Cohen (1969)
Year of Election or Appointment: 2018
Vice President
Mr. Cohen also serves as Vice President of other funds. Mr. Cohen serves as Co-Head of Equity (2018-present), a Director of Fidelity Management & Research (Japan) Limited (investment adviser firm, 2016-present), and is an employee of Fidelity Investments. Previously, Mr. Cohen served as Executive Vice President of Fidelity SelectCo, LLC (2019), Head of Global Equity Research (2016-2018), Chief Investment Officer - Equity and a Director of Fidelity Management & Research (U.K.) Inc. (investment adviser firm, 2013-2015) and as a Director of Fidelity Management & Research (Hong Kong) Limited (investment adviser firm, 2017).
Jonathan Davis (1968)
Year of Election or Appointment: 2010
Assistant Treasurer
Mr. Davis also serves as Assistant Treasurer of other funds. Mr. Davis serves as Assistant Treasurer of FMR Capital, Inc. (2017-present) and is an employee of Fidelity Investments. Previously, Mr. Davis served as Vice President and Associate General Counsel of FMR LLC (diversified financial services company, 2003-2010).
Laura M. Del Prato (1964)
Year of Election or Appointment: 2018
Assistant Treasurer
Ms. Del Prato also serves as an officer of other funds. Ms. Del Prato is an employee of Fidelity Investments (2017-present). Prior to joining Fidelity Investments, Ms. Del Prato served as a Managing Director and Treasurer of the JPMorgan Mutual Funds (2014-2017). Prior to JPMorgan, Ms. Del Prato served as a partner at Cohen Fund Audit Services (accounting firm, 2012-2013) and KPMG LLP (accounting firm, 2004-2012).
Colm A. Hogan (1973)
Year of Election or Appointment: 2020
Assistant Treasurer
Mr. Hogan also serves as an officer of other funds. Mr. Hogan serves as Assistant Treasurer of FMR Capital, Inc. (2017-present) and is an employee of Fidelity Investments (2005-present). Previously, Mr. Hogan served as Deputy Treasurer of certain Fidelity® funds (2016-2020) and Assistant Treasurer of certain Fidelity® funds (2016-2018).
Pamela R. Holding (1964)
Year of Election or Appointment: 2018
Vice President
Ms. Holding also serves as Vice President of other funds. Ms. Holding serves as Co-Head of Equity (2018-present) and is an employee of Fidelity Investments (2013-present). Previously, Ms. Holding served as Executive Vice President of Fidelity SelectCo, LLC (2019) and as Chief Investment Officer of Fidelity Institutional Asset Management (2013-2018).
Cynthia Lo Bessette (1969)
Year of Election or Appointment: 2019
Secretary and Chief Legal Officer (CLO)
Ms. Lo Bessette also serves as an officer of other funds. Ms. Lo Bessette serves as CLO, Secretary, and Senior Vice President of Fidelity Management & Research Company LLC (investment adviser firm, 2019-present); and CLO of Fidelity Management & Research (Hong Kong) Limited, FMR Investment Management (UK) Limited, and Fidelity Management & Research (Japan) Limited (investment adviser firms, 2019-present). She is a Senior Vice President and Deputy General Counsel of FMR LLC (diversified financial services company, 2019-present), and is an employee of Fidelity Investments. Previously, Ms. Lo Bessette served as CLO, Secretary, and Senior Vice President of FMR Co., Inc. (investment adviser firm, 2019); Secretary of Fidelity SelectCo, LLC and Fidelity Investments Money Management, Inc. (investment adviser firms, 2019). Prior to joining Fidelity Investments, Ms. Lo Bessette was Executive Vice President, General Counsel (2016-2019) and Senior Vice President, Deputy General Counsel (2015-2016) of OppenheimerFunds (investment management company) and Deputy Chief Legal Officer (2013-2015) of Jennison Associates LLC (investment adviser firm).
Chris Maher (1972)
Year of Election or Appointment: 2020
Deputy Treasurer
Mr. Maher also serves as an officer of other funds. Mr. Maher serves as Assistant Treasurer of FMR Capital, Inc. (2017-present), and is an employee of Fidelity Investments (2008-present). Previously, Mr. Maher served as Assistant Treasurer of certain funds (2013-2020); Vice President of Asset Management Compliance (2013), Vice President of the Program Management Group of FMR (investment adviser firm, 2010-2013), and Vice President of Valuation Oversight (2008-2010).
Jason P. Pogorelec (1975)
Year of Election or Appointment: 2020
Chief Compliance Officer
Mr. Pogorelec also serves as an officer of other funds. Mr. Pogorelec serves as Vice President, Associate General Counsel (2010-present) and is an employee of Fidelity Investments (2006-present). Previously, Mr. Pogorelec served as Assistant Secretary of certain Fidelity funds (2015-2020).
Stacie M. Smith (1974)
Year of Election or Appointment: 2016
President and Treasurer
Ms. Smith also serves as an officer of other funds. Ms. Smith serves as Assistant Treasurer of FMR Capital, Inc. (2017-present), is an employee of Fidelity Investments (2009-present), and has served in other fund officer roles. Prior to joining Fidelity Investments, Ms. Smith served as Senior Audit Manager of Ernst & Young LLP (accounting firm, 1996-2009). Previously, Ms. Smith served as Assistant Treasurer (2013-2019) and Deputy Treasurer (2013-2016) of certain Fidelity® funds.
Marc L. Spector (1972)
Year of Election or Appointment: 2016
Assistant Treasurer
Mr. Spector also serves as an officer of other funds. Mr. Spector serves as Assistant Treasurer of FMR Capital, Inc. (2017-present) and is an employee of Fidelity Investments (2016-present). Prior to joining Fidelity Investments, Mr. Spector served as Director at the Siegfried Group (accounting firm, 2013-2016), and prior to Siegfried Group as audit senior manager at Deloitte & Touche LLP (accounting firm, 2005-2013).
Jim Wegmann (1979)
Year of Election or Appointment: 2019
Assistant Treasurer
Mr. Wegmann also serves as Assistant Treasurer of other funds. Mr. Wegmann is an employee of Fidelity Investments (2011-present).
Shareholder Expense Example
As a shareholder of the Fund, you incur two types of costs: (1) transaction costs, including sales charges (loads) on purchase payments or redemption proceeds, and (2) ongoing costs, including management fees, distribution and/or service (12b-1) fees and other Fund expenses. This Example is intended to help you understand your ongoing costs (in dollars) of investing in the Fund and to compare these costs with the ongoing costs of investing in other mutual funds.
The Example is based on an investment of $1,000 invested at the beginning of the period and held for the entire period (November 1, 2019 to April 30, 2020).
Actual Expenses
The first line of the accompanying table for each class of the Fund provides information about actual account values and actual expenses. You may use the information in this line, together with the amount you invested, to estimate the expenses that you paid over the period. Simply divide your account value by $1,000.00 (for example, an $8,600 account value divided by $1,000.00 = 8.6), then multiply the result by the number in the first line for a class of the Fund under the heading entitled "Expenses Paid During Period" to estimate the expenses you paid on your account during this period. In addition, the Fund, as a shareholder in the underlying Fidelity Central Funds, will indirectly bear its pro-rata share of the fees and expenses incurred by the underlying Fidelity Central Funds. These fees and expenses are not included in the Fund's annualized expense ratio used to calculate the expense estimate in the table below.
Hypothetical Example for Comparison Purposes
The second line of the accompanying table for each class of the Fund provides information about hypothetical account values and hypothetical expenses based on a Class' actual expense ratio and an assumed rate of return of 5% per year before expenses, which is not the Class' actual return. The hypothetical account values and expenses may not be used to estimate the actual ending account balance or expenses you paid for the period. You may use this information to compare the ongoing costs of investing in the Fund and other funds. To do so, compare this 5% hypothetical example with the 5% hypothetical examples that appear in the shareholder reports of the other funds. In addition, the Fund, as a shareholder in the underlying Fidelity Central Funds, will indirectly bear its pro-rata share of the fees and expenses incurred by the underlying Fidelity Central Funds. These fees and expenses are not included in the Fund's annualized expense ratio used to calculate the expense estimate in the table below.
Please note that the expenses shown in the table are meant to highlight your ongoing costs only and do not reflect any transaction costs. Therefore, the second line of the table is useful in comparing ongoing costs only, and will not help you determine the relative total costs of owning different funds. In addition, if these transactional costs were included, your costs would have been higher.
| Annualized Expense Ratio-A | Beginning Account Value November 1, 2019 | Ending Account Value April 30, 2020 | Expenses Paid During Period-B November 1, 2019 to April 30, 2020 | |
| Class A | 1.25% | |||
| Actual | $1,000.00 | $905.60 | $5.92 | |
| Hypothetical-C | $1,000.00 | $1,018.65 | $6.27 | |
| Class M | 1.25% | |||
| Actual | $1,000.00 | $905.60 | $5.92 | |
| Hypothetical-C | $1,000.00 | $1,018.65 | $6.27 | |
| Class C | 2.00% | |||
| Actual | $1,000.00 | $902.30 | $9.46 | |
| Hypothetical-C | $1,000.00 | $1,014.92 | $10.02 | |
| Global High Income | 1.00% | |||
| Actual | $1,000.00 | $906.80 | $4.74 | |
| Hypothetical-C | $1,000.00 | $1,019.89 | $5.02 | |
| Class I | 1.00% | |||
| Actual | $1,000.00 | $906.80 | $4.74 | |
| Hypothetical-C | $1,000.00 | $1,019.89 | $5.02 |
A Annualized expense ratio reflects expenses net of applicable fee waivers.
B Expenses are equal to each Class' annualized expense ratio, multiplied by the average account value over the period, multiplied by 182/366 (to reflect the one-half year period).
C 5% return per year before expenses
Distributions (Unaudited)
A total of 0.34% of the dividends distributed during the fiscal year was derived from interest on U.S. Government securities which is generally exempt from state income tax.
The fund designates $931,145 of distributions paid during the period January 1, 2020 to April 30, 2020 as qualifying to be taxed as interest-related dividends for nonresident alien shareholders.
The fund will notify shareholders in January 2021 of amounts for use in preparing 2020 income tax returns.
Board Approval of Investment Advisory Contracts and Management Fees
Fidelity Global High Income Fund
Each year, the Board of Trustees, including the Independent Trustees (together, the Board), votes on the renewal of the management contract with Fidelity Management & Research Company LLC (FMR) and the sub-advisory agreements (together, the Advisory Contracts) for the fund. FMR and the sub-advisers are referred to herein as the Investment Advisers. The Board, assisted by the advice of fund counsel and Independent Trustees' counsel, requests and considers a broad range of information relevant to the renewal of the Advisory Contracts throughout the year.Approval of Amended and Restated Advisory Contracts. At its November 2019 meeting, the Board unanimously determined to approve an amended and restated management contract and sub-advisory agreements (Amended and Restated Contracts) for a stub period of January 1, 2020 through January 31, 2020 in connection with a consolidation of certain of Fidelity's advisory businesses. The Board considered that, on or about January 1, 2020, FMR Co., Inc. (FMRC) expected to merge with and into FMR and, after the merger, FMR expected to redomicile as a Delaware limited liability company. The Board also approved the termination of the sub-advisory agreement with FMRC upon the completion of the merger. The Board noted that references to FMR in the Amended and Restated Contracts would be updated to reflect FMR's new form of organization and domicile and considered that the definition of "group assets" for purposes of the fund's group fee would be modified to avoid double-counting assets once the reorganization is complete. The Board also noted Fidelity's assurance that neither the planned consolidation nor the Amended and Restated Contracts will change the investment processes, the level or nature of services provided, the resources and personnel allocated, trading and compliance operations, or any fees paid by the fund.The Board meets regularly and, at each of its meetings, covers an extensive agenda of topics and materials and considers factors that are relevant to its annual consideration of the renewal of the fund's Advisory Contracts, including the services and support provided to the fund and its shareholders. The Board has established various standing committees (Committees), each composed of and chaired by Independent Trustees with varying backgrounds, to which the Board has assigned specific subject matter responsibilities in order to enhance effective decision-making by the Board. The Board, acting directly and through its Committees, requests and receives information concerning the annual consideration of the renewal of the fund's Advisory Contracts. The Board also meets as needed to review matters specifically related to the Board's annual consideration of the renewal of the Advisory Contracts. Members of the Board may also meet with trustees of other Fidelity funds through joint ad hoc committees to discuss certain matters relevant to all of the Fidelity funds.At its January 2020 meeting, the Board unanimously determined to renew the fund's Advisory Contracts. In reaching its determination, the Board considered all factors it believed relevant, including (i) the nature, extent, and quality of the services provided to the fund and its shareholders (including the investment performance of the fund); (ii) the competitiveness of the fund's management fee and total expense ratio relative to peer funds; (iii) the total costs of the services provided by and the profits realized by Fidelity from its relationships with the fund; and (iv) the extent to which, if any, economies of scale exist and are realized as the fund grows, and whether any economies of scale are appropriately shared with fund shareholders.In considering whether to renew the Advisory Contracts for the fund, the Board reached a determination, with the assistance of fund counsel and Independent Trustees' counsel and through the exercise of its business judgment, that the renewal of the Advisory Contracts was in the best interests of the fund and its shareholders and that the compensation payable under the Advisory Contracts was fair and reasonable. The Board's decision to renew the Advisory Contracts was not based on any single factor, but rather was based on a comprehensive consideration of all the information provided to the Board at its meetings throughout the year. The Board, in reaching its determination to renew the Advisory Contracts, was aware that shareholders of the fund have a broad range of investment choices available to them, including a wide choice among funds offered by Fidelity's competitors, and that the fund's shareholders, who have the opportunity to review and weigh the disclosure provided by the fund in its prospectus and other public disclosures, have chosen to invest in this fund, which is part of the Fidelity family of funds.Nature, Extent, and Quality of Services Provided. The Board considered Fidelity's staffing as it relates to the fund, including the backgrounds of investment personnel of Fidelity, and also considered the fund's investment objective, strategies, and related investment philosophy. The Independent Trustees also had discussions with senior management of Fidelity's investment operations and investment groups. The Board considered the structure of the investment personnel compensation program and whether this structure provides appropriate incentives to act in the best interests of the fund. Additionally, the Board considered the portfolio managers' investments, if any, in the funds that they manage.Resources Dedicated to Investment Management and Support Services. The Board and the Fund Oversight and Research Committees reviewed the general qualifications and capabilities of Fidelity's investment staff, including its size, education, experience, and resources, as well as Fidelity's approach to recruiting, training, managing, and compensating investment personnel. The Board noted that Fidelity has continued to increase the resources devoted to non-U.S. offices, including expansion of Fidelity's global investment organization. The Board also noted that Fidelity's analysts have extensive resources, tools and capabilities that allow them to conduct sophisticated quantitative and fundamental analysis, as well as credit analysis of issuers, counterparties and guarantors. Further, the Board considered that Fidelity's investment professionals have sufficient access to global information and data so as to provide competitive investment results over time, and that those professionals also have access to sophisticated tools that permit them to assess portfolio construction and risk and performance attribution characteristics continuously, as well as to transmit new information and research conclusions rapidly around the world. Additionally, in its deliberations, the Board considered Fidelity's trading, risk management, compliance, and technology and operations capabilities and resources, which are integral parts of the investment management process.Shareholder and Administrative Services. The Board considered (i) the nature, extent, quality, and cost of advisory, administrative, and shareholder services performed by the Investment Advisers and their affiliates under the Advisory Contracts and under separate agreements covering transfer agency, pricing and bookkeeping, and securities lending services for the fund; (ii) the nature and extent of the supervision of third party service providers, principally custodians, subcustodians, and pricing vendors; and (iii) the resources devoted to, and the record of compliance with, the fund's compliance policies and procedures. The Board also reviewed the allocation of fund brokerage, including allocations to brokers affiliated with the Investment Advisers, the use of brokerage commissions to pay fund expenses, and the use of "soft" commission dollars to pay for research services.The Board noted that the growth of fund assets over time across the complex allows Fidelity to reinvest in the development of services designed to enhance the value and convenience of the Fidelity funds as investment vehicles. These services include 24-hour access to account information and market information over the Internet and through telephone representatives, investor education materials and asset allocation tools, and the expanded availability of Fidelity Investor Centers.The Board noted that it and the boards of certain other Fidelity funds had formed an ad hoc Committee on Transfer Agency Fees to review the variety of transfer agency fee structures throughout the industry and Fidelity's competitive positioning with respect to industry participants.Investment in a Large Fund Family. The Board considered the benefits to shareholders of investing in a Fidelity fund, including the benefits of investing in a fund that is part of a large family of funds offering a variety of investment disciplines and providing a large variety of mutual fund investor services. The Board noted that Fidelity had taken, or had made recommendations that resulted in the Fidelity funds taking, a number of actions over the previous year that benefited particular funds, including: (i) continuing to dedicate additional resources to Fidelity's investment research process, which includes meetings with management of issuers of securities in which the funds invest, and to the support of the senior management team that oversees asset management; (ii) continuing efforts to enhance Fidelity's global research capabilities; (iii) launching new funds and ETFs with innovative structures, strategies and pricing and making other enhancements to meet client needs; (iv) launching new share classes of existing funds; (v) eliminating purchase minimums and broadening eligibility requirements for certain funds and share classes; (vi) reducing management fees and total expenses for certain target date funds and index funds; (vii) lowering expense caps for certain existing funds and classes, and converting certain voluntary expense caps to contractual caps, to reduce expenses borne by shareholders; (viii) rationalizing product lines and gaining increased efficiencies from fund mergers, liquidations, and share class consolidations; (ix) continuing to develop, acquire and implement systems and technology to improve services to the funds and shareholders, strengthen information security, and increase efficiency; and (x) continuing to implement enhancements to further strengthen Fidelity's product line to increase investors' probability of success in achieving their investment goals, including retirement income goals.Investment Performance. The Board considered whether the fund has operated in accordance with its investment objective, as well as its record of compliance with its investment restrictions and its performance history. The Board noted that there were portfolio management changes for the fund in December 2018, June 2019, and October 2019. The Board will continue to monitor closely the fund's performance as the new portfolio manager(s) establishes a track record.The Board took into account discussions that occur at Board meetings throughout the year with representatives of the Investment Advisers about fund investment performance. In this regard the Board noted that as part of regularly scheduled fund reviews and other reports to the Board on fund performance, the Board considers annualized return information for the fund for different time periods, measured against an appropriate securities market index (benchmark index) and a peer group of funds with similar objectives (peer group), if any. In its evaluation of fund investment performance, the Board gave particular attention to information indicating changes in performance of certain Fidelity funds for specific time periods and discussed with the Investment Advisers the reasons for any overperformance or underperformance.In addition to reviewing absolute and relative fund performance, the Independent Trustees periodically consider the appropriateness of fund performance metrics in evaluating the results achieved. In general, the Independent Trustees believe that fund performance should be evaluated based on net performance (after fees and expenses) of both the highest performing and lowest performing fund share classes, where applicable, compared to appropriate benchmark indices, over appropriate time periods that may include full market cycles, and compared to peer groups, as applicable, over the same periods, taking into account relevant factors including the following: general market conditions; issuer-specific information; and fund cash flows and other factors.The Independent Trustees recognize that shareholders evaluate performance on a net basis over their own holding periods, for which one-, three-, and five-year periods are often used as a proxy. For this reason, the performance information reviewed by the Board also included net cumulative total return information for the fund and an appropriate benchmark index for the most recent one-, three-, and five-year periods ended June 30, 2019, as shown below. A peer group is not shown below because the fund does not generally utilize a peer group for performance comparison purposes.Fidelity Global High Income Fund

Fidelity Global High Income Fund
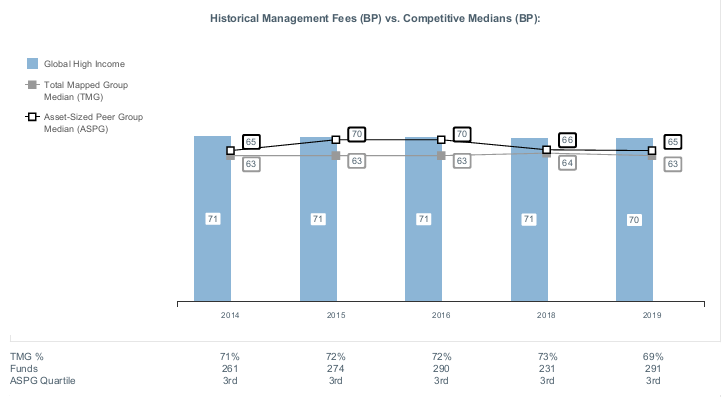
Liquidity Risk Management Program
The Securities and Exchange Commission adopted Rule 22e-4 under the Investment Company Act of 1940 (the Liquidity Rule) to promote effective liquidity risk management throughout the open-end investment company industry, thereby reducing the risk that funds will be unable to meet their redemption obligations and mitigating dilution of the interests of fund shareholders.
The Fund has adopted and implemented a liquidity risk management program pursuant to the Liquidity Rule (the Program) effective December 1, 2018. The Program is reasonably designed to assess and manage the Fund’s liquidity risk and to comply with the requirements of the Liquidity Rule. The Fund’s Board of Trustees (the Board) has designated the Fund’s investment adviser as administrator of the Program. The Fidelity advisers have established a Liquidity Risk Management Committee (the LRM Committee) to manage the Program for each of the Fidelity Funds. The LRM Committee monitors the adequacy and effectiveness of implementation of the Program and on a periodic basis assesses each Fund’s liquidity risk based on a variety of factors including (1) the Fund’s investment strategy, (2) portfolio liquidity and cash flow projections during normal and reasonably foreseeable stressed conditions, (3) shareholder redemptions, (4) borrowings and other funding sources and (5) in the case of exchange-traded funds, certain additional factors including the effect of the Fund’s prices and spreads, market participants, and basket compositions on the overall liquidity of the Fund’s portfolio, as applicable.
In accordance with the Program, each of the Fund’s portfolio investments is classified into one of four liquidity categories described below based on a determination of a reasonable expectation for how long it would take to convert the investment to cash (or sell or dispose of the investment) without significantly changing its market value.
- Highly liquid investments – cash or convertible to cash within three business days or less
- Moderately liquid investments – convertible to cash in three to seven calendar days
- Less liquid investments – can be sold or disposed of, but not settled, within seven calendar days
- Illiquid investments – cannot be sold or disposed of within seven calendar days
Liquidity classification determinations take into account a variety of factors including various market, trading and investment-specific considerations, as well as market depth, and generally utilize analysis from a third-party liquidity metrics service.
The Liquidity Rule places a 15% limit on a fund’s illiquid investments and requires funds that do not primarily hold assets that are highly liquid investments to determine and maintain a minimum percentage of the fund’s net assets to be invested in highly liquid investments (highly liquid investment minimum or HLIM). The Program includes provisions reasonably designed to comply with the 15% limit on illiquid investments and for determining, periodically reviewing and complying with the HLIM requirement as applicable.
At a recent meeting of the Fund’s Board of Trustees, the LRM Committee provided a written report to the Board pertaining to the operation, adequacy, and effectiveness of implementation of the Program for the annual period from December 1, 2018 through November 30, 2019. The report concluded that the Program has been implemented and is operating effectively and is reasonably designed to assess and manage the Fund’s liquidity risk.
![]()
GHI-ANN-0620
1.926249.108
Fidelity® Short Duration High Income Fund
April 30, 2020
Includes Fidelity and Fidelity Advisor share classes
See the inside front cover for important information about access to your fund’s shareholder reports.
Beginning on January 1, 2021, as permitted by regulations adopted by the Securities and Exchange Commission, paper copies of a fund’s shareholder reports will no longer be sent by mail, unless you specifically request paper copies of the reports from the fund or from your financial intermediary, such as a financial advisor, broker-dealer or bank. Instead, the reports will be made available on a website, and you will be notified by mail each time a report is posted and provided with a website link to access the report.
If you already elected to receive shareholder reports electronically, you will not be affected by this change and you need not take any action. You may elect to receive shareholder reports and other communications from a fund electronically, by contacting your financial intermediary. For Fidelity customers, visit Fidelity's web site or call Fidelity using the contact information listed below.
You may elect to receive all future reports in paper free of charge. If you wish to continue receiving paper copies of your shareholder reports, you may contact your financial intermediary or, if you are a Fidelity customer, visit Fidelity’s website, or call Fidelity at the applicable toll-free number listed below. Your election to receive reports in paper will apply to all funds held with the fund complex/your financial intermediary.
| Account Type | Website | Phone Number |
| Brokerage, Mutual Fund, or Annuity Contracts: | fidelity.com/mailpreferences | 1-800-343-3548 |
| Employer Provided Retirement Accounts: | netbenefits.fidelity.com/preferences (choose 'no' under Required Disclosures to continue to print) | 1-800-343-0860 |
| Advisor Sold Accounts Serviced Through Your Financial Intermediary: | Contact Your Financial Intermediary | Your Financial Intermediary's phone number |
| Advisor Sold Accounts Serviced by Fidelity: | institutional.fidelity.com | 1-877-208-0098 |
Contents
Board Approval of Investment Advisory Contracts and Management Fees | |
To view a fund's proxy voting guidelines and proxy voting record for the 12-month period ended June 30, visit http://www.fidelity.com/proxyvotingresults or visit the Securities and Exchange Commission's (SEC) web site at http://www.sec.gov.
You may also call 1-800-544-8544 if you’re an individual investing directly with Fidelity, call 1-800-835-5092 if you’re a plan sponsor or participant with Fidelity as your recordkeeper or call 1-877-208-0098 on institutional accounts or if you’re an advisor or invest through one to request a free copy of the proxy voting guidelines.
Standard & Poor's, S&P and S&P 500 are registered service marks of The McGraw-Hill Companies, Inc. and have been licensed for use by Fidelity Distributors Corporation.
Other third-party marks appearing herein are the property of their respective owners.
All other marks appearing herein are registered or unregistered trademarks or service marks of FMR LLC or an affiliated company. © 2020 FMR LLC. All rights reserved.
This report and the financial statements contained herein are submitted for the general information of the shareholders of the Fund. This report is not authorized for distribution to prospective investors in the Fund unless preceded or accompanied by an effective prospectus.
A fund files its complete schedule of portfolio holdings with the SEC for the first and third quarters of each fiscal year on Form N-PORT. Forms N-PORT are available on the SEC’s web site at http://www.sec.gov. A fund's Forms N-PORT may be reviewed and copied at the SEC’s Public Reference Room in Washington, DC. Information regarding the operation of the SEC's Public Reference Room may be obtained by calling 1-800-SEC-0330.
For a complete list of a fund's portfolio holdings, view the most recent holdings listing, semiannual report, or annual report on Fidelity's web site at http://www.fidelity.com, http://www.institutional.fidelity.com, or http://www.401k.com, as applicable.
NOT FDIC INSURED •MAY LOSE VALUE •NO BANK GUARANTEE
Neither the Fund nor Fidelity Distributors Corporation is a bank.
Note to Shareholders:
Early in 2020, the outbreak and spread of a new coronavirus emerged as a public health emergency that had a major influence on financial markets, primarily based on its impact on the global economy and the outlook for corporate earnings. The virus causes a respiratory disease known as COVID-19. On March 11, the World Health Organization declared the COVID-19 outbreak a pandemic, citing sustained risk of further global spread.
In the weeks following, as the crisis worsened, we witnessed an escalating human tragedy with wide-scale social and economic consequences from coronavirus-containment measures. The outbreak of COVID-19 prompted a number of measures to limit the spread, including travel and border restrictions, quarantines, and restrictions on large gatherings. In turn, these resulted in lower consumer activity, diminished demand for a wide range of products and services, disruption in manufacturing and supply chains, and – given the wide variability in outcomes regarding the outbreak – significant market uncertainty and volatility. Amid the turmoil, the U.S. government took unprecedented action – in concert with the U.S. Federal Reserve and central banks around the world – to help support consumers, businesses, and the broader economy, and to limit disruption to the financial system.
The situation continues to unfold, and the extent and duration of its impact on financial markets and the economy remain highly uncertain. Extreme events such as the coronavirus crisis are “exogenous shocks” that can have significant adverse effects on mutual funds and their investments. Although multiple asset classes may be affected by market disruption, the duration and impact may not be the same for all types of assets.
Fidelity is committed to helping you stay informed amid news about COVID-19 and during increased market volatility, and we’re taking extra steps to be responsive to customer needs. We encourage you to visit our websites, where we offer ongoing updates, commentary, and analysis on the markets and our funds.
Performance: The Bottom Line
Average annual total return reflects the change in the value of an investment, assuming reinvestment of distributions from dividend income and capital gains (the profits earned upon the sale of securities that have grown in value, if any) and assuming a constant rate of performance each year. The hypothetical investment and the average annual total returns do not reflect the deduction of taxes that a shareholder would pay on fund distributions or the redemption of fund shares. During periods of reimbursement by Fidelity, a fund’s total return will be greater than it would be had the reimbursement not occurred. How a fund did yesterday is no guarantee of how it will do tomorrow.
Average Annual Total Returns
| For the periods ended April 30, 2020 | Past 1 year | Past 5 years | Life of fundA |
| Class A (incl. 4.00% sales charge) | (6.37)% | 1.11% | 1.39% |
| Class M (incl. 4.00% sales charge) | (6.48)% | 1.09% | 1.38% |
| Class C (incl. contingent deferred sales charge) | (4.14)% | 1.18% | 1.27% |
| Fidelity® Short Duration High Income Fund | (2.23)% | 2.20% | 2.29% |
| Class I | (2.23)% | 2.20% | 2.29% |
| Class Z | (2.24)% | 2.22% | 2.31% |
A From November 5, 2013
Class C shares' contingent deferred sales charges included in the past one year, past five years, and life of fund total return figures are 1%, 0%, and 0%, respectively.
The initial offering of Class Z shares took place on October 2, 2018. Returns prior to October 2, 2018, are those of Class I.
$10,000 Over Life of Fund
Let's say hypothetically that $10,000 was invested in Fidelity® Short Duration High Income Fund, a class of the fund, on November 5, 2013, when the fund started.
The chart shows how the value of your investment would have changed, and also shows how the ICE® BofA® 1-5 Year BB-B US Cash Pay High Yield Constrained Index performed over the same period.
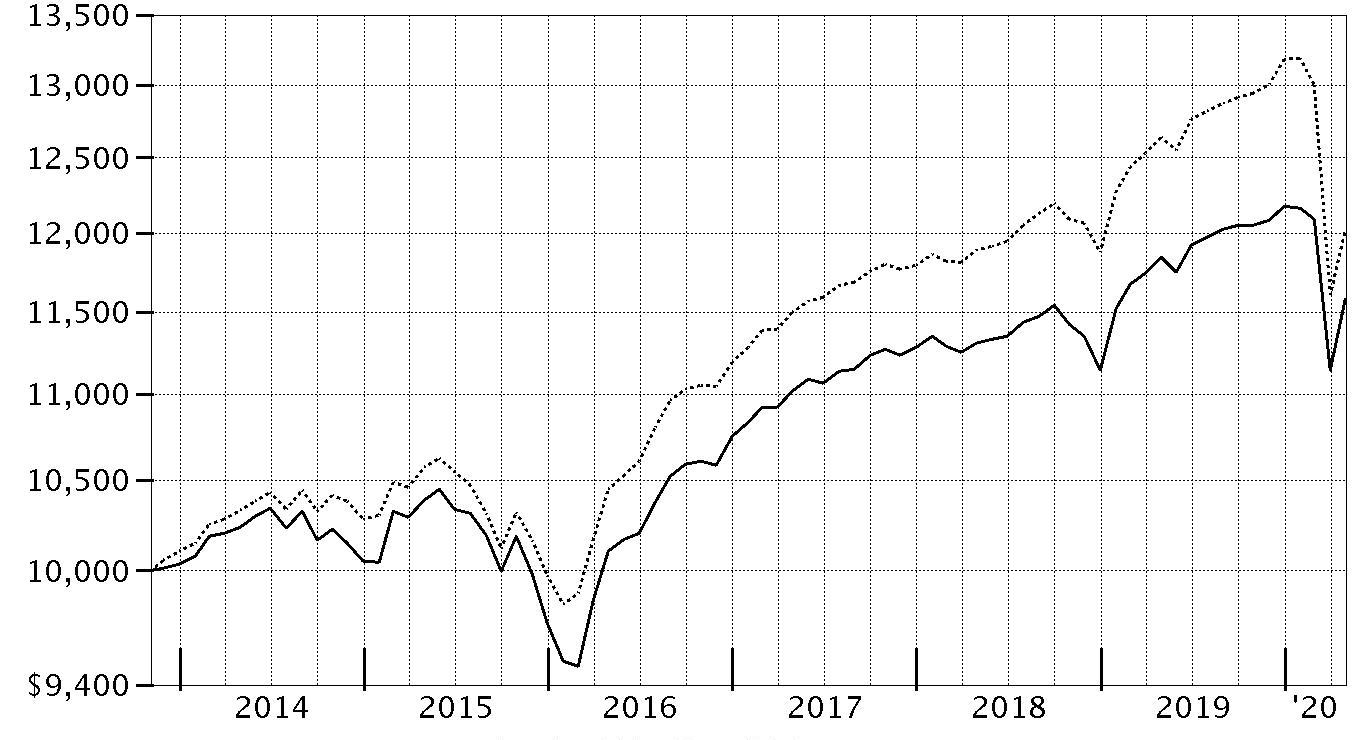
| Period Ending Values | ||
| $11,581 | Fidelity® Short Duration High Income Fund | |
| $12,015 | ICE® BofA® 1-5 Year BB-B US Cash Pay High Yield Constrained Index | |
Management's Discussion of Fund Performance
Market Recap: U.S. high-yield bonds rode a supportive backdrop into 2020 before giving way amid the early-year global outbreak and spread of the coronavirus. The ICE BofA® US High Yield Constrained Index returned -5.27% for the 12 months ending April 30. Declared a pandemic on March 11, the crisis and containment efforts caused broad contraction in economic activity, plunging oil prices and extreme uncertainty, volatility, and dislocation in financial markets. Following a flat January, high yield returned -1.55% in February, after a surge in COVID-19 cases outside China. The downtrend steepened in March, with the market enduring its fastest sell-off on record and credit spreads widening sharply. The index finished the month down 11.77%, capping its worst quarter since 2008, despite an uptrend in the final week. A historically rapid and expansive U.S. monetary/fiscal-policy response provided a partial offset to the economic disruption. This was evident in April, when the index rose 3.80% on improved coronavirus trends, plans for reopening the economy and progress on potential treatments. Investor sentiment for risk assets waned this period, with fairly wide performance variance based on quality. Among major credit tiers, higher-rated (BB) bonds gained 0.32%, while lower-quality (CCC-C) issues returned -20.79%. By industry, the biggest laggards included energy (-33%) and air transportation (-17%), whereas defensive-oriented groups such as food & drug retail (+11%) and cable/satellite TV (+7%) enjoyed some ballast.Comments from Co-Portfolio Managers Michael Weaver and Alexandre Karam: For the fiscal year, the fund’s share classes (excluding sales charges, if applicable) returned roughly -2% to-3%, topping the -4.18% result of the Fidelity Short Duration High Income Composite Index℠. The fund’s core high-yield bond subportfolio outpaced its benchmark by a sizable margin and notably contributed to our result versus the Composite index, bolstered by favorable security selection and, to a lesser degree, industry allocation. The fund's stake in cash, representing about 6% of assets this period, also boosted relative performance. In contrast, our small non-index allocation to floating-rate bank loans significantly trailed high yield, and therefore hurt relative performance. By industry, security selection in energy and food/beverage/tobacco contributed, as did our overweightings in telecommunications, food/beverage/tobacco, and cable/satellite TV. Conversely, our picks and an overweighting in gaming detracted most, with security selection and an underweighting in insurance hurting to a lesser degree. Our top individual contributor was an outsized stake in JBS (+6%), a major processor of beef, pork and prepared foods. We also benefited from avoiding Hertz, a component of the Composite index that returned -71%. Turning to notable detractors, exposure to several underperforming energy names hurt most, including California Resources (-96%) and Weatherford International (-62%). California Resources was a non-index holding.The views expressed above reflect those of the portfolio manager(s) only through the end of the period as stated on the cover of this report and do not necessarily represent the views of Fidelity or any other person in the Fidelity organization. Any such views are subject to change at any time based upon market or other conditions and Fidelity disclaims any responsibility to update such views. These views may not be relied on as investment advice and, because investment decisions for a Fidelity fund are based on numerous factors, may not be relied on as an indication of trading intent on behalf of any Fidelity fund.
Notes to shareholders: On May 20, 2020, following the end of the reporting period, the Board of Trustees approved a proposal to remove the policy of investing in investment-grade corporate bonds from the fund's principal investment strategies and, accordingly, adjust its multi-asset composite benchmark. Specifically, beginning on July 1, 2020, the fund will no longer include investing in investment-grade corporate bonds as part of its principal investment strategy. With this change, the investment-grade component of the composite benchmark will be eliminated and the neutral allocation will increase from 80% to 85% for High Yield, and from 10% to 15% for floating-rate leveraged loans.On June 29, 2019, Michael Weaver, Eric Mollenhauer and Alexandre Karam assumed co-management responsibilities for the fund.Investment Summary (Unaudited)
Top Five Holdings as of April 30, 2020
| (by issuer, excluding cash equivalents) | % of fund's net assets |
| JBS U.S.A. LLC/JBS U.S.A. Finance, Inc. | 4.3 |
| Sprint Corp. | 3.5 |
| CCO Holdings LLC/CCO Holdings Capital Corp. | 2.9 |
| Nielsen Finance LLC/Nielsen Finance Co. | 2.7 |
| Cablevision Systems Corp. | 2.5 |
| 15.9 |
Top Five Market Sectors as of April 30, 2020
| % of fund's net assets | |
| Telecommunications | 13.4 |
| Energy | 10.7 |
| Healthcare | 9.8 |
| Cable/Satellite TV | 8.3 |
| Gaming | 5.2 |
Quality Diversification (% of fund's net assets)
| As of April 30, 2020 | ||
| BBB | 10.1% | |
| BB | 41.3% | |
| B | 37.8% | |
| CCC,CC,C | 7.3% | |
| D | 0.3% | |
| Not Rated | 0.2% | |
| Short-Term Investments and Net Other Assets | 3.0% | |

We have used ratings from Moody's Investors Service, Inc. Where Moody's® ratings are not available, we have used S&P® ratings. All ratings are as of the date indicated and do not reflect subsequent changes.
Asset Allocation (% of fund's net assets)
| As of April 30, 2020 * | ||
| Nonconvertible Bonds | 95.6% | |
| Convertible Bonds, Preferred Stocks | 0.5% | |
| Bank Loan Obligations | 0.2% | |
| Other Investments | 0.7% | |
| Short-Term Investments and Net Other Assets (Liabilities) | 3.0% | |

* Foreign investments - 22.8%
Schedule of Investments April 30, 2020
Showing Percentage of Net Assets
| Corporate Bonds - 96.1% | |||
| Principal Amount | Value | ||
| Convertible Bonds - 0.5% | |||
| Broadcasting - 0.5% | |||
| DISH Network Corp. 2.375% 3/15/24 | $510,000 | $428,793 | |
| Nonconvertible Bonds - 95.6% | |||
| Aerospace - 0.8% | |||
| TransDigm, Inc.: | |||
| 5.5% 11/15/27 (a) | 535,000 | 452,075 | |
| 6.25% 3/15/26 (a) | 215,000 | 210,431 | |
| 7.5% 3/15/27 | 25,000 | 22,758 | |
| 685,264 | |||
| Banks & Thrifts - 3.0% | |||
| Ally Financial, Inc.: | |||
| 3.875% 5/21/24 | 970,000 | 953,025 | |
| 4.125% 2/13/22 | 1,200,000 | 1,215,888 | |
| Bank of America Corp. 4.2% 8/26/24 | 250,000 | 270,339 | |
| Deutsche Bank AG New York Branch 2.7% 7/13/20 | 250,000 | 249,730 | |
| 2,688,982 | |||
| Broadcasting - 2.3% | |||
| Netflix, Inc. 4.375% 11/15/26 | 185,000 | 194,380 | |
| Sirius XM Radio, Inc. 3.875% 8/1/22 (a) | 1,830,000 | 1,841,438 | |
| 2,035,818 | |||
| Building Materials - 0.3% | |||
| Advanced Drain Systems, Inc. 5% 9/30/27 (a) | 245,000 | 240,713 | |
| Cable/Satellite TV - 8.3% | |||
| Cablevision Systems Corp. 5.875% 9/15/22 | 2,145,000 | 2,233,481 | |
| CCO Holdings LLC/CCO Holdings Capital Corp.: | |||
| 4% 3/1/23 (a) | 1,315,000 | 1,324,337 | |
| 5.125% 5/1/23 (a) | 1,220,000 | 1,235,628 | |
| CSC Holdings LLC 5.375% 7/15/23 (a) | 750,000 | 758,438 | |
| DISH DBS Corp.: | |||
| 5.125% 5/1/20 | 45,000 | 45,000 | |
| 5.875% 7/15/22 | 1,260,000 | 1,271,655 | |
| 6.75% 6/1/21 | 430,000 | 428,280 | |
| 7,296,819 | |||
| Capital Goods - 2.4% | |||
| AECOM 5.875% 10/15/24 | 2,000,000 | 2,116,000 | |
| Chemicals - 3.7% | |||
| Blue Cube Spinco, Inc. 9.75% 10/15/23 | 1,000,000 | 1,042,500 | |
| CF Industries Holdings, Inc.: | |||
| 3.4% 12/1/21 (a) | 30,000 | 29,979 | |
| 3.45% 6/1/23 | 805,000 | 815,063 | |
| NOVA Chemicals Corp. 5.25% 8/1/23 (a) | 500,000 | 471,250 | |
| The Chemours Co. LLC 6.625% 5/15/23 | 950,000 | 888,250 | |
| 3,247,042 | |||
| Containers - 5.0% | |||
| Ardagh Packaging Finance PLC/Ardagh MP Holdings U.S.A., Inc. 4.25% 9/15/22 (a) | 1,100,000 | 1,105,830 | |
| Ball Corp.: | |||
| 4% 11/15/23 | 300,000 | 309,000 | |
| 5% 3/15/22 | 800,000 | 838,000 | |
| Berry Global, Inc. 5.125% 7/15/23 | 700,000 | 704,375 | |
| OI European Group BV 4% 3/15/23 (a) | 950,000 | 916,750 | |
| Reynolds Group Issuer, Inc./Reynolds Group Issuer LLC/Reynolds Group Issuer (Luxembourg) SA 3 month U.S. LIBOR + 3.500% 4.7189% 7/15/21 (a)(b)(c) | 310,000 | 305,350 | |
| Trivium Packaging Finance BV: | |||
| 5.5% 8/15/26 (a) | 220,000 | 225,500 | |
| 8.5% 8/15/27 (a) | 55,000 | 57,475 | |
| 4,462,280 | |||
| Diversified Financial Services - 2.1% | |||
| Aircastle Ltd. 4.125% 5/1/24 | 80,000 | 70,127 | |
| Capital One Financial Corp. 3.2% 1/30/23 | 200,000 | 203,693 | |
| Financial & Risk U.S. Holdings, Inc. 6.25% 5/15/26 (a) | 170,000 | 181,195 | |
| FLY Leasing Ltd.: | |||
| 5.25% 10/15/24 | 790,000 | 632,000 | |
| 6.375% 10/15/21 | 250,000 | 230,000 | |
| Morgan Stanley 4.1% 5/22/23 | 200,000 | 211,165 | |
| Park Aerospace Holdings Ltd.: | |||
| 4.5% 3/15/23 (a) | 251,000 | 222,010 | |
| 5.25% 8/15/22 (a) | 105,000 | 96,810 | |
| 1,847,000 | |||
| Diversified Media - 2.7% | |||
| Nielsen Finance LLC/Nielsen Finance Co. 5% 4/15/22 (a) | 2,395,000 | 2,359,338 | |
| Energy - 10.6% | |||
| Citgo Petroleum Corp. 6.25% 8/15/22 (a) | 650,000 | 622,375 | |
| Consolidated Energy Finance SA 3 month U.S. LIBOR + 3.750% 4.4905% 6/15/22 (a)(b)(c) | 520,000 | 431,824 | |
| Crestwood Midstream Partners LP/Crestwood Midstream Finance Corp. 6.25% 4/1/23 | 1,500,000 | 1,095,000 | |
| CVR Energy, Inc.: | |||
| 5.25% 2/15/25 (a) | 65,000 | 53,300 | |
| 5.75% 2/15/28 (a) | 50,000 | 42,276 | |
| DCP Midstream Operating LP 5.375% 7/15/25 | 1,400,000 | 1,134,000 | |
| Denbury Resources, Inc.: | |||
| 7.75% 2/15/24 (a) | 477,000 | 85,860 | |
| 9.25% 3/31/22 (a) | 465,000 | 83,700 | |
| EG Global Finance PLC 6.75% 2/7/25 (a) | 700,000 | 637,000 | |
| Energy Transfer Partners LP 4.25% 3/15/23 | 475,000 | 470,677 | |
| MEG Energy Corp. 7.125% 2/1/27 (a) | 280,000 | 193,200 | |
| MPLX LP 6.25% 10/15/22 (a) | 135,000 | 134,875 | |
| PBF Logistics LP/PBF Logistics Finance, Inc. 6.875% 5/15/23 | 650,000 | 500,500 | |
| Precision Drilling Corp.: | |||
| 6.5% 12/15/21 | 90,584 | 68,844 | |
| 7.75% 12/15/23 | 235,000 | 103,400 | |
| Sanchez Energy Corp. 7.25% 2/15/23 (a)(d) | 135,000 | 1,350 | |
| Summit Midstream Holdings LLC 5.5% 8/15/22 | 425,000 | 102,000 | |
| Sunoco LP/Sunoco Finance Corp.: | |||
| 4.875% 1/15/23 | 615,000 | 598,088 | |
| 5.5% 2/15/26 | 70,000 | 67,550 | |
| 5.875% 3/15/28 | 60,000 | 57,000 | |
| 6% 4/15/27 | 10,000 | 9,750 | |
| Targa Resources Partners LP/Targa Resources Partners Finance Corp.: | |||
| 4.25% 11/15/23 | 625,000 | 564,063 | |
| 5.125% 2/1/25 | 1,000,000 | 900,000 | |
| TerraForm Power Operating LLC 4.25% 1/31/23 (a) | 1,350,000 | 1,383,075 | |
| 9,339,707 | |||
| Environmental - 1.3% | |||
| LBC Tank Terminals Holding Netherlands BV 6.875% 5/15/23 (a) | 1,150,000 | 1,121,250 | |
| Food/Beverage/Tobacco - 4.9% | |||
| ESAL GmbH 6.25% 2/5/23 (a) | 130,000 | 128,864 | |
| Imperial Tobacco Finance PLC 2.95% 7/21/20 (a) | 200,000 | 200,372 | |
| JBS U.S.A. LLC/JBS U.S.A. Finance, Inc.: | |||
| 5.75% 6/15/25 (a) | 3,750,000 | 3,796,900 | |
| 5.875% 7/15/24 (a) | 35,000 | 35,700 | |
| Post Holdings, Inc.: | |||
| 4.625% 4/15/30 (a) | 40,000 | 39,200 | |
| 5% 8/15/26 (a) | 40,000 | 39,850 | |
| 5.625% 1/15/28 (a) | 125,000 | 127,188 | |
| 4,368,074 | |||
| Gaming - 5.2% | |||
| Golden Entertainment, Inc. 7.625% 4/15/26 (a) | 1,555,000 | 1,174,025 | |
| MGM China Holdings Ltd. 5.375% 5/15/24 (a) | 500,000 | 487,500 | |
| MGM Mirage, Inc. 6% 3/15/23 | 1,000,000 | 972,500 | |
| Scientific Games Corp. 5% 10/15/25 (a) | 115,000 | 100,430 | |
| Station Casinos LLC 5% 10/1/25 (a) | 1,100,000 | 917,070 | |
| Wynn Las Vegas LLC/Wynn Las Vegas Capital Corp. 4.25% 5/30/23 (a) | 500,000 | 466,250 | |
| Wynn Macau Ltd. 4.875% 10/1/24 (a) | 500,000 | 481,250 | |
| 4,599,025 | |||
| Healthcare - 9.8% | |||
| Bayer U.S. Finance II LLC 3.875% 12/15/23 (a) | 200,000 | 212,271 | |
| Centene Corp. 5.375% 8/15/26 (a) | 1,100,000 | 1,171,610 | |
| Cigna Corp. 3.5% 6/15/24 (a) | 200,000 | 213,587 | |
| Community Health Systems, Inc. 6.25% 3/31/23 | 405,000 | 376,650 | |
| DaVita HealthCare Partners, Inc. 5.125% 7/15/24 | 500,000 | 507,500 | |
| Encompass Health Corp. 5.125% 3/15/23 | 255,000 | 253,725 | |
| HCA Holdings, Inc.: | |||
| 4.75% 5/1/23 | 700,000 | 745,951 | |
| 5% 3/15/24 | 300,000 | 327,587 | |
| Hologic, Inc. 4.375% 10/15/25 (a) | 500,000 | 502,300 | |
| Mylan NV 3.15% 6/15/21 | 200,000 | 201,192 | |
| Tenet Healthcare Corp.: | |||
| 6.75% 6/15/23 | 1,165,000 | 1,163,835 | |
| 8.125% 4/1/22 | 985,000 | 992,683 | |
| Teva Pharmaceutical Finance Netherlands III BV 2.2% 7/21/21 | 65,000 | 63,294 | |
| Valeant Pharmaceuticals International, Inc.: | |||
| 5.875% 5/15/23 (a) | 53,000 | 52,603 | |
| 6.5% 3/15/22 (a) | 785,000 | 800,543 | |
| 9.25% 4/1/26 (a) | 1,000,000 | 1,100,000 | |
| Vizient, Inc. 6.25% 5/15/27 (a) | 20,000 | 21,014 | |
| 8,706,345 | |||
| Homebuilders/Real Estate - 1.4% | |||
| VICI Properties, Inc.: | |||
| 3.5% 2/15/25 (a) | 1,000,000 | 937,500 | |
| 4.625% 12/1/29 (a) | 285,000 | 263,269 | |
| 1,200,769 | |||
| Leisure - 0.8% | |||
| Mattel, Inc.: | |||
| 5.875% 12/15/27 (a) | 10,000 | 9,775 | |
| 6.75% 12/31/25 (a) | 165,000 | 167,475 | |
| Studio City Co. Ltd. 7.25% 11/30/21 (a) | 500,000 | 493,438 | |
| 670,688 | |||
| Metals/Mining - 0.4% | |||
| First Quantum Minerals Ltd. 7.25% 4/1/23 (a) | 375,000 | 336,563 | |
| Freeport-McMoRan, Inc. 3.55% 3/1/22 | 40,000 | 40,308 | |
| 376,871 | |||
| Paper - 0.4% | |||
| Berry Global Escrow Corp. 4.875% 7/15/26 (a) | 175,000 | 178,752 | |
| CommScope Finance LLC: | |||
| 5.5% 3/1/24 (a) | 100,000 | 100,000 | |
| 6% 3/1/26 (a) | 100,000 | 99,995 | |
| 378,747 | |||
| Restaurants - 3.4% | |||
| 1011778 BC Unlimited Liability Co./New Red Finance, Inc. 5% 10/15/25 (a) | 1,100,000 | 1,105,500 | |
| Golden Nugget, Inc. 6.75% 10/15/24 (a) | 800,000 | 624,000 | |
| Yum! Brands, Inc. 3.875% 11/1/23 | 1,225,000 | 1,243,008 | |
| 2,972,508 | |||
| Services - 2.6% | |||
| CoreCivic, Inc. 5% 10/15/22 | 1,225,000 | 1,177,103 | |
| Laureate Education, Inc. 8.25% 5/1/25 (a) | 1,075,000 | 1,098,113 | |
| 2,275,216 | |||
| Super Retail - 1.2% | |||
| Netflix, Inc. 5.75% 3/1/24 | 1,000,000 | 1,087,400 | |
| Technology - 3.8% | |||
| Ensemble S Merger Sub, Inc. 9% 9/30/23 (a) | 260,000 | 260,429 | |
| Financial & Risk U.S. Holdings, Inc. 8.25% 11/15/26 (a) | 120,000 | 130,200 | |
| Nortonlifelock, Inc. 4.2% 9/15/20 | 1,900,000 | 1,902,375 | |
| NXP BV/NXP Funding LLC: | |||
| 3.875% 9/1/22 (a) | 415,000 | 429,991 | |
| 4.125% 6/1/21 (a) | 175,000 | 178,774 | |
| Sensata Technologies BV 4.875% 10/15/23 (a) | 155,000 | 155,775 | |
| Solera LLC/Solera Finance, Inc. 10.5% 3/1/24 (a) | 285,000 | 283,575 | |
| 3,341,119 | |||
| Telecommunications - 13.4% | |||
| C&W Senior Financing Designated Activity Co.: | |||
| 6.875% 9/15/27 (a) | 25,000 | 24,688 | |
| 7.5% 10/15/26 (a) | 30,000 | 30,007 | |
| CenturyLink, Inc. 6.75% 12/1/23 | 600,000 | 626,760 | |
| Cogent Communications Group, Inc. 5.375% 3/1/22 (a) | 1,375,000 | 1,393,425 | |
| Frontier Communications Corp. 8% 4/1/27 (a)(d) | 290,000 | 295,713 | |
| Intelsat Jackson Holdings SA: | |||
| 8% 2/15/24 (a) | 390,000 | 400,452 | |
| 9.5% 9/30/22 (a) | 1,200,000 | 1,333,284 | |
| Level 3 Financing, Inc. 5.625% 2/1/23 | 300,000 | 300,456 | |
| Millicom International Cellular SA 6% 3/15/25 (a) | 105,000 | 105,231 | |
| Neptune Finco Corp. 10.875% 10/15/25 (a) | 25,000 | 27,024 | |
| Qwest Corp. 6.75% 12/1/21 | 700,000 | 732,264 | |
| SBA Communications Corp.: | |||
| 4% 10/1/22 | 500,000 | 502,650 | |
| 4.875% 9/1/24 | 500,000 | 517,270 | |
| SFR Group SA: | |||
| 7.375% 5/1/26 (a) | 125,000 | 130,625 | |
| 8.125% 2/1/27 (a) | 160,000 | 172,400 | |
| Sprint Communications, Inc. 6% 11/15/22 | 885,000 | 935,985 | |
| Sprint Corp.: | |||
| 7.25% 9/15/21 | 500,000 | 524,375 | |
| 7.875% 9/15/23 | 2,280,000 | 2,564,544 | |
| T-Mobile U.S.A., Inc. 6.375% 3/1/25 | 230,000 | 236,038 | |
| Telecom Italia SpA 5.303% 5/30/24 (a) | 1,000,000 | 1,039,990 | |
| 11,893,181 | |||
| Transportation Ex Air/Rail - 0.9% | |||
| Avolon Holdings Funding Ltd.: | |||
| 5.125% 10/1/23 (a) | 580,000 | 518,831 | |
| 5.25% 5/15/24 (a) | 155,000 | 134,402 | |
| 5.5% 1/15/23 (a) | 165,000 | 151,598 | |
| 804,831 | |||
| Utilities - 4.9% | |||
| Dynegy, Inc. 5.875% 6/1/23 | 1,300,000 | 1,313,000 | |
| NextEra Energy Partners LP 4.25% 9/15/24 (a) | 455,000 | 461,825 | |
| NRG Yield Operating LLC 5% 9/15/26 | 245,000 | 246,225 | |
| The AES Corp.: | |||
| 4% 3/15/21 | 185,000 | 185,000 | |
| 4.5% 3/15/23 | 120,000 | 119,726 | |
| 4.875% 5/15/23 | 1,389,000 | 1,399,140 | |
| Vistra Operations Co. LLC: | |||
| 5% 7/31/27 (a) | 225,000 | 229,478 | |
| 5.625% 2/15/27 (a) | 255,000 | 268,388 | |
| Williams Partners LP 3.35% 8/15/22 | 150,000 | 150,452 | |
| 4,373,234 | |||
| TOTAL NONCONVERTIBLE BONDS | 84,488,221 | ||
| TOTAL CORPORATE BONDS | |||
| (Cost $89,355,744) | 84,917,014 | ||
| Shares | Value | ||
| Common Stocks - 0.0% | |||
| Energy - 0.0% | |||
| Forbes Energy Services Ltd. (e) | |||
| (Cost $301,607) | 6,468 | 582 | |
| Principal Amount | Value | ||
| Bank Loan Obligations - 0.2% | |||
| Energy - 0.1% | |||
| California Resources Corp. Tranche 1LN, term loan 3 month U.S. LIBOR + 10.375% 11.9883% 12/31/21 (b)(c)(f) | 5,000 | 178 | |
| Forbes Energy Services LLC Tranche B, term loan 18% 4/13/21 (b)(f)(g) | 66,466 | 66,965 | |
| Sanchez Energy Corp.: | |||
| 1LN, term loan 3 month U.S. LIBOR + 8.000% 0% 05/11/20(c)(d)(f)(g) | 35,876 | 28,700 | |
| term loan 7.25% 5/11/20(b)(d)(f)(g) | 15,000 | 12,000 | |
| TOTAL ENERGY | 107,843 | ||
| Food & Drug Retail - 0.1% | |||
| Tops Markets LLC 1LN, term loan 3 month U.S. LIBOR + 8.500% 10% 11/19/23 (b)(c)(f)(g) | 80,241 | 80,642 | |
| TOTAL BANK LOAN OBLIGATIONS | |||
| (Cost $199,564) | 188,485 | ||
| Preferred Securities - 0.7% | |||
| Banks & Thrifts - 0.7% | |||
| Bank of America Corp. 5.2% (b)(h) | 300,000 | 297,935 | |
| Citigroup, Inc.: | |||
| 5.95% (b)(h) | 10,000 | 9,338 | |
| 5.95% (b)(h) | 100,000 | 103,507 | |
| Royal Bank of Scotland Group PLC 7.5% (b)(h) | 225,000 | 216,203 | |
| TOTAL PREFERRED SECURITIES | |||
| (Cost $618,694) | 626,983 | ||
| Shares | Value | ||
| Money Market Funds - 2.5% | |||
| Fidelity Cash Central Fund 0.16% (i) | |||
| (Cost $2,237,554) | 2,237,062 | 2,237,734 | |
| TOTAL INVESTMENT IN SECURITIES - 99.5% | |||
| (Cost $92,713,163) | 87,970,798 | ||
| NET OTHER ASSETS (LIABILITIES) - 0.5% | 439,935 | ||
| NET ASSETS - 100% | $88,410,733 |
Legend
(a) Security exempt from registration under Rule 144A of the Securities Act of 1933. These securities may be resold in transactions exempt from registration, normally to qualified institutional buyers. At the end of the period, the value of these securities amounted to $42,463,644 or 48.0% of net assets.
(b) Coupon rates for floating and adjustable rate securities reflect the rates in effect at period end.
(c) Coupon is indexed to a floating interest rate which may be multiplied by a specified factor and/or subject to caps or floors.
(d) Non-income producing - Security is in default.
(e) Non-income producing
(f) Remaining maturities of bank loan obligations may be less than the stated maturities shown as a result of contractual or optional prepayments by the borrower. Such prepayments cannot be predicted with certainty.
(g) Level 3 security
(h) Security is perpetual in nature with no stated maturity date.
(i) Affiliated fund that is generally available only to investment companies and other accounts managed by Fidelity Investments. The rate quoted is the annualized seven-day yield of the fund at period end. A complete unaudited listing of the fund's holdings as of its most recent quarter end is available upon request. In addition, each Fidelity Central Fund's financial statements, which are not covered by the Fund's Report of Independent Registered Public Accounting Firm, are available on the SEC's website or upon request.
Affiliated Central Funds
Information regarding fiscal year to date income earned by the Fund from investments in Fidelity Central Funds is as follows:
| Fund | Income earned |
| Fidelity Cash Central Fund | $126,237 |
| Total | $126,237 |
Amounts in the income column in the above table include any capital gain distributions from underlying funds, which are presented in the corresponding line-item in the Statement of Operations, if applicable.
Investment Valuation
The following is a summary of the inputs used, as of April 30, 2020, involving the Fund's assets and liabilities carried at fair value. The inputs or methodology used for valuing securities may not be an indication of the risk associated with investing in those securities. For more information on valuation inputs, and their aggregation into the levels used below, please refer to the Investment Valuation section in the accompanying Notes to Financial Statements.
| Valuation Inputs at Reporting Date: | ||||
| Description | Total | Level 1 | Level 2 | Level 3 |
| Investments in Securities: | ||||
| Equities: | ||||
| Energy | $582 | $582 | $-- | $-- |
| Corporate Bonds | 84,917,014 | -- | 84,917,014 | -- |
| Bank Loan Obligations | 188,485 | -- | 178 | 188,307 |
| Preferred Securities | 626,983 | -- | 626,983 | -- |
| Money Market Funds | 2,237,734 | 2,237,734 | -- | -- |
| Total Investments in Securities: | $87,970,798 | $2,238,316 | $85,544,175 | $188,307 |
Other Information
Distribution of investments by country or territory of incorporation, as a percentage of Total Net Assets, is as follows (Unaudited):
| United States of America | 77.2% |
| Multi-National | 5.6% |
| Netherlands | 3.9% |
| Canada | 3.6% |
| Luxembourg | 2.6% |
| Cayman Islands | 2.5% |
| United Kingdom | 1.2% |
| Italy | 1.2% |
| Bermuda | 1.1% |
| Others (Individually Less Than 1%) | 1.1% |
| 100.0% |
See accompanying notes which are an integral part of the financial statements.
Financial Statements
Statement of Assets and Liabilities
| April 30, 2020 | ||
| Assets | ||
| Investment in securities, at value — See accompanying schedule: Unaffiliated issuers (cost $90,475,609) | $85,733,064 | |
| Fidelity Central Funds (cost $2,237,554) | 2,237,734 | |
| Total Investment in Securities (cost $92,713,163) | $87,970,798 | |
| Receivable for fund shares sold | 143,120 | |
| Interest receivable | 1,130,263 | |
| Distributions receivable from Fidelity Central Funds | 388 | |
| Prepaid expenses | 52 | |
| Receivable from investment adviser for expense reductions | 7,110 | |
| Total assets | 89,251,731 | |
| Liabilities | ||
| Payable to custodian bank | $394,847 | |
| Payable for investments purchased | 62,080 | |
| Payable for fund shares redeemed | 225,380 | |
| Distributions payable | 39,668 | |
| Accrued management fee | 40,729 | |
| Audit fee payable | 53,735 | |
| Distribution and service plan fees payable | 6,308 | |
| Other affiliated payables | 12,789 | |
| Other payables and accrued expenses | 5,462 | |
| Total liabilities | 840,998 | |
| Net Assets | $88,410,733 | |
| Net Assets consist of: | ||
| Paid in capital | $101,311,133 | |
| Total accumulated earnings (loss) | (12,900,400) | |
| Net Assets | $88,410,733 | |
| Net Asset Value and Maximum Offering Price | ||
| Class A: | ||
| Net Asset Value and redemption price per share ($12,603,089 ÷ 1,421,568 shares)(a) | $8.87 | |
| Maximum offering price per share (100/96.00 of $8.87) | $9.24 | |
| Class M: | ||
| Net Asset Value and redemption price per share ($2,105,937 ÷ 237,561 shares)(a) | $8.86 | |
| Maximum offering price per share (100/96.00 of $8.86) | $9.23 | |
| Class C: | ||
| Net Asset Value and offering price per share ($4,017,418 ÷ 453,095 shares)(a) | $8.87 | |
| Short Duration High Income: | ||
| Net Asset Value, offering price and redemption price per share ($63,703,432 ÷ 7,185,085 shares) | $8.87 | |
| Class I: | ||
| Net Asset Value, offering price and redemption price per share ($3,949,894 ÷ 445,507 shares) | $8.87 | |
| Class Z: | ||
| Net Asset Value, offering price and redemption price per share ($2,030,963 ÷ 228,996 shares) | $8.87 |
(a) Redemption price per share is equal to net asset value less any applicable contingent deferred sales charge.
See accompanying notes which are an integral part of the financial statements.
Statement of Operations
| Year ended April 30, 2020 | ||
| Investment Income | ||
| Dividends | $58,083 | |
| Interest | 5,295,382 | |
| Income from Fidelity Central Funds | 126,237 | |
| Total income | 5,479,702 | |
| Expenses | ||
| Management fee | $631,643 | |
| Transfer agent fees | 140,095 | |
| Distribution and service plan fees | 87,145 | |
| Accounting fees and expenses | 47,456 | |
| Custodian fees and expenses | 15,588 | |
| Independent trustees' fees and expenses | 679 | |
| Registration fees | 85,866 | |
| Audit | 72,098 | |
| Legal | 141 | |
| Miscellaneous | 2,362 | |
| Total expenses before reductions | 1,083,073 | |
| Expense reductions | (80,374) | |
| Total expenses after reductions | 1,002,699 | |
| Net investment income (loss) | 4,477,003 | |
| Realized and Unrealized Gain (Loss) | ||
| Net realized gain (loss) on: | ||
| Investment securities: | ||
| Unaffiliated issuers | (4,197,639) | |
| Fidelity Central Funds | 539 | |
| Total net realized gain (loss) | (4,197,100) | |
| Change in net unrealized appreciation (depreciation) on: | ||
| Investment securities: | ||
| Unaffiliated issuers | (4,145,692) | |
| Fidelity Central Funds | 63 | |
| Total change in net unrealized appreciation (depreciation) | (4,145,629) | |
| Net gain (loss) | (8,342,729) | |
| Net increase (decrease) in net assets resulting from operations | $(3,865,726) |
See accompanying notes which are an integral part of the financial statements.
Statement of Changes in Net Assets
| Year ended April 30, 2020 | Year ended April 30, 2019 | |
| Increase (Decrease) in Net Assets | ||
| Operations | ||
| Net investment income (loss) | $4,477,003 | $5,175,031 |
| Net realized gain (loss) | (4,197,100) | (210,272) |
| Change in net unrealized appreciation (depreciation) | (4,145,629) | 158,060 |
| Net increase (decrease) in net assets resulting from operations | (3,865,726) | 5,122,819 |
| Distributions to shareholders | (4,465,978) | (5,003,921) |
| Share transactions - net increase (decrease) | (18,299,860) | 7,008,413 |
| Total increase (decrease) in net assets | (26,631,564) | 7,127,311 |
| Net Assets | ||
| Beginning of period | 115,042,297 | 107,914,986 |
| End of period | $88,410,733 | $115,042,297 |
See accompanying notes which are an integral part of the financial statements.
Financial Highlights
Fidelity Short Duration High Income Fund Class A
| Years ended April 30, | 2020 | 2019 | 2018 | 2017 | 2016 |
| Selected Per–Share Data | |||||
| Net asset value, beginning of period | $9.44 | $9.42 | $9.57 | $9.14 | $9.86 |
| Income from Investment Operations | |||||
| Net investment income (loss)A | .348 | .409 | .381 | .395 | .429 |
| Net realized and unrealized gain (loss) | (.571) | .004B | (.159) | .397 | (.737) |
| Total from investment operations | (.223) | .413 | .222 | .792 | (.308) |
| Distributions from net investment income | (.347) | (.393) | (.373) | (.365) | (.413) |
| Distributions from net realized gain | – | – | – | – | (.002) |
| Total distributions | (.347) | (.393) | (.373) | (.365) | (.415) |
| Redemption fees added to paid in capitalA | – | – | .001 | .003 | .003 |
| Net asset value, end of period | $8.87 | $9.44 | $9.42 | $9.57 | $9.14 |
| Total ReturnC,D | (2.47)% | 4.52% | 2.36% | 8.84% | (3.06)% |
| Ratios to Average Net AssetsE,F | |||||
| Expenses before reductions | 1.15% | 1.15% | 1.16% | 1.22% | 1.24% |
| Expenses net of fee waivers, if any | 1.05% | 1.05% | 1.05% | 1.05% | 1.05% |
| Expenses net of all reductions | 1.05% | 1.05% | 1.05% | 1.05% | 1.05% |
| Net investment income (loss) | 3.74% | 4.37% | 4.00% | 4.21% | 4.65% |
| Supplemental Data | |||||
| Net assets, end of period (000 omitted) | $12,603 | $15,050 | $12,351 | $9,304 | $6,823 |
| Portfolio turnover rateG | 77% | 33% | 65% | 105% | 56% |
A Calculated based on average shares outstanding during the period.
B The amount shown for a share outstanding does not correspond with the aggregate net gain (loss) on investments for the period due to the timing of sales and repurchases of shares in relation to fluctuating market values of the investments of the Fund.
C Total returns would have been lower if certain expenses had not been reduced during the applicable periods shown.
D Total returns do not include the effect of the sales charges.
E Fees and expenses of any underlying Fidelity Central Funds are not included in the Fund's expense ratio. The Fund indirectly bears its proportionate share of the expenses of any underlying Fidelity Central Funds.
F Expense ratios reflect operating expenses of the class. Expenses before reductions do not reflect amounts reimbursed by the investment adviser or reductions from brokerage service arrangements or reductions from other expense offset arrangements and do not represent the amount paid by the class during periods when reimbursements or reductions occur. Expenses net of fee waivers reflect expenses after reimbursement by the investment adviser but prior to reductions from brokerage service arrangements or other expense offset arrangements. Expenses net of all reductions represent the net expenses paid by the class.
G Amount does not include the portfolio activity of any underlying Fidelity Central Funds.
See accompanying notes which are an integral part of the financial statements.
Fidelity Short Duration High Income Fund Class M
| Years ended April 30, | 2020 | 2019 | 2018 | 2017 | 2016 |
| Selected Per–Share Data | |||||
| Net asset value, beginning of period | $9.44 | $9.42 | $9.57 | $9.14 | $9.86 |
| Income from Investment Operations | |||||
| Net investment income (loss)A | .348 | .408 | .382 | .395 | .433 |
| Net realized and unrealized gain (loss) | (.581) | .005B | (.160) | .397 | (.741) |
| Total from investment operations | (.233) | .413 | .222 | .792 | (.308) |
| Distributions from net investment income | (.347) | (.393) | (.373) | (.365) | (.413) |
| Distributions from net realized gain | – | – | – | – | (.002) |
| Total distributions | (.347) | (.393) | (.373) | (.365) | (.415) |
| Redemption fees added to paid in capitalA | – | – | .001 | .003 | .003 |
| Net asset value, end of period | $8.86 | $9.44 | $9.42 | $9.57 | $9.14 |
| Total ReturnC,D | (2.58)% | 4.52% | 2.36% | 8.84% | (3.06)% |
| Ratios to Average Net AssetsE,F | |||||
| Expenses before reductions | 1.16% | 1.16% | 1.16% | 1.22% | 1.25% |
| Expenses net of fee waivers, if any | 1.05% | 1.05% | 1.05% | 1.05% | 1.05% |
| Expenses net of all reductions | 1.05% | 1.05% | 1.05% | 1.05% | 1.05% |
| Net investment income (loss) | 3.74% | 4.37% | 4.00% | 4.21% | 4.65% |
| Supplemental Data | |||||
| Net assets, end of period (000 omitted) | $2,106 | $2,537 | $2,081 | $2,703 | $2,426 |
| Portfolio turnover rateG | 77% | 33% | 65% | 105% | 56% |
A Calculated based on average shares outstanding during the period.
B The amount shown for a share outstanding does not correspond with the aggregate net gain (loss) on investments for the period due to the timing of sales and repurchases of shares in relation to fluctuating market values of the investments of the Fund.
C Total returns would have been lower if certain expenses had not been reduced during the applicable periods shown.
D Total returns do not include the effect of the sales charges.
E Fees and expenses of any underlying Fidelity Central Funds are not included in the Fund's expense ratio. The Fund indirectly bears its proportionate share of the expenses of any underlying Fidelity Central Funds.
F Expense ratios reflect operating expenses of the class. Expenses before reductions do not reflect amounts reimbursed by the investment adviser or reductions from brokerage service arrangements or reductions from other expense offset arrangements and do not represent the amount paid by the class during periods when reimbursements or reductions occur. Expenses net of fee waivers reflect expenses after reimbursement by the investment adviser but prior to reductions from brokerage service arrangements or other expense offset arrangements. Expenses net of all reductions represent the net expenses paid by the class.
G Amount does not include the portfolio activity of any underlying Fidelity Central Funds.
See accompanying notes which are an integral part of the financial statements.
Fidelity Short Duration High Income Fund Class C
| Years ended April 30, | 2020 | 2019 | 2018 | 2017 | 2016 |
| Selected Per–Share Data | |||||
| Net asset value, beginning of period | $9.44 | $9.42 | $9.57 | $9.15 | $9.86 |
| Income from Investment Operations | |||||
| Net investment income (loss)A | .278 | .338 | .310 | .325 | .360 |
| Net realized and unrealized gain (loss) | (.571) | .005B | (.159) | .386 | (.728) |
| Total from investment operations | (.293) | .343 | .151 | .711 | (.368) |
| Distributions from net investment income | (.277) | (.323) | (.302) | (.294) | (.343) |
| Distributions from net realized gain | – | – | – | – | (.002) |
| Total distributions | (.277) | (.323) | (.302) | (.294) | (.345) |
| Redemption fees added to paid in capitalA | – | – | .001 | .003 | .003 |
| Net asset value, end of period | $8.87 | $9.44 | $9.42 | $9.57 | $9.15 |
| Total ReturnC,D | (3.20)% | 3.74% | 1.59% | 7.92% | (3.68)% |
| Ratios to Average Net AssetsE,F | |||||
| Expenses before reductions | 1.93% | 1.92% | 1.93% | 2.00% | 2.00% |
| Expenses net of fee waivers, if any | 1.80% | 1.80% | 1.80% | 1.80% | 1.80% |
| Expenses net of all reductions | 1.80% | 1.80% | 1.80% | 1.80% | 1.80% |
| Net investment income (loss) | 2.99% | 3.61% | 3.25% | 3.46% | 3.90% |
| Supplemental Data | �� | ||||
| Net assets, end of period (000 omitted) | $4,017 | $4,541 | $5,146 | $5,387 | $3,827 |
| Portfolio turnover rateG | 77% | 33% | 65% | 105% | 56% |
A Calculated based on average shares outstanding during the period.
B The amount shown for a share outstanding does not correspond with the aggregate net gain (loss) on investments for the period due to the timing of sales and repurchases of shares in relation to fluctuating market values of the investments of the Fund.
C Total returns would have been lower if certain expenses had not been reduced during the applicable periods shown.
D Total returns do not include the effect of the contingent deferred sales charge.
E Fees and expenses of any underlying Fidelity Central Funds are not included in the Fund's expense ratio. The Fund indirectly bears its proportionate share of the expenses of any underlying Fidelity Central Funds.
F Expense ratios reflect operating expenses of the class. Expenses before reductions do not reflect amounts reimbursed by the investment adviser or reductions from brokerage service arrangements or reductions from other expense offset arrangements and do not represent the amount paid by the class during periods when reimbursements or reductions occur. Expenses net of fee waivers reflect expenses after reimbursement by the investment adviser but prior to reductions from brokerage service arrangements or other expense offset arrangements. Expenses net of all reductions represent the net expenses paid by the class.
G Amount does not include the portfolio activity of any underlying Fidelity Central Funds.
See accompanying notes which are an integral part of the financial statements.
Fidelity Short Duration High Income Fund
| Years ended April 30, | 2020 | 2019 | 2018 | 2017 | 2016 |
| Selected Per–Share Data | |||||
| Net asset value, beginning of period | $9.44 | $9.42 | $9.57 | $9.15 | $9.86 |
| Income from Investment Operations | |||||
| Net investment income (loss)A | .372 | .431 | .405 | .420 | .455 |
| Net realized and unrealized gain (loss) | (.572) | .006B | (.159) | .385 | (.730) |
| Total from investment operations | (.200) | .437 | .246 | .805 | (.275) |
| Distributions from net investment income | (.370) | (.417) | (.397) | (.388) | (.436) |
| Distributions from net realized gain | – | – | – | – | (.002) |
| Total distributions | (.370) | (.417) | (.397) | (.388) | (.438) |
| Redemption fees added to paid in capitalA | – | – | .001 | .003 | .003 |
| Net asset value, end of period | $8.87 | $9.44 | $9.42 | $9.57 | $9.15 |
| Total ReturnC | (2.23)% | 4.78% | 2.61% | 9.00% | (2.71)% |
| Ratios to Average Net AssetsD,E | |||||
| Expenses before reductions | .86% | .86% | .86% | .93% | .96% |
| Expenses net of fee waivers, if any | .80% | .80% | .80% | .80% | .80% |
| Expenses net of all reductions | .80% | .80% | .80% | .80% | .80% |
| Net investment income (loss) | 3.99% | 4.61% | 4.25% | 4.46% | 4.90% |
| Supplemental Data | |||||
| Net assets, end of period (000 omitted) | $63,703 | $88,429 | $83,652 | $68,646 | $47,531 |
| Portfolio turnover rateF | 77% | 33% | 65% | 105% | 56% |
A Calculated based on average shares outstanding during the period.
B The amount shown for a share outstanding does not correspond with the aggregate net gain (loss) on investments for the period due to the timing of sales and repurchases of shares in relation to fluctuating market values of the investments of the Fund.
C Total returns would have been lower if certain expenses had not been reduced during the applicable periods shown.
D Fees and expenses of any underlying Fidelity Central Funds are not included in the Fund's expense ratio. The Fund indirectly bears its proportionate share of the expenses of any underlying Fidelity Central Funds.
E Expense ratios reflect operating expenses of the class. Expenses before reductions do not reflect amounts reimbursed by the investment adviser or reductions from brokerage service arrangements or reductions from other expense offset arrangements and do not represent the amount paid by the class during periods when reimbursements or reductions occur. Expenses net of fee waivers reflect expenses after reimbursement by the investment adviser but prior to reductions from brokerage service arrangements or other expense offset arrangements. Expenses net of all reductions represent the net expenses paid by the class.
F Amount does not include the portfolio activity of any underlying Fidelity Central Funds.
See accompanying notes which are an integral part of the financial statements.
Fidelity Short Duration High Income Fund Class I
| Years ended April 30, | 2020 | 2019 | 2018 | 2017 | 2016 |
| Selected Per–Share Data | |||||
| Net asset value, beginning of period | $9.44 | $9.42 | $9.57 | $9.15 | $9.86 |
| Income from Investment Operations | |||||
| Net investment income (loss)A | .372 | .430 | .406 | .420 | .460 |
| Net realized and unrealized gain (loss) | (.572) | .007B | (.160) | .385 | (.735) |
| Total from investment operations | (.200) | .437 | .246 | .805 | (.275) |
| Distributions from net investment income | (.370) | (.417) | (.397) | (.388) | (.436) |
| Distributions from net realized gain | – | – | – | – | (.002) |
| Total distributions | (.370) | (.417) | (.397) | (.388) | (.438) |
| Redemption fees added to paid in capitalA | – | – | .001 | .003 | .003 |
| Net asset value, end of period | $8.87 | $9.44 | $9.42 | $9.57 | $9.15 |
| Total ReturnC | (2.23)% | 4.78% | 2.61% | 8.99% | (2.71)% |
| Ratios to Average Net AssetsD,E | |||||
| Expenses before reductions | .89% | .89% | .91% | .96% | .99% |
| Expenses net of fee waivers, if any | .80% | .80% | .80% | .80% | .80% |
| Expenses net of all reductions | .80% | .80% | .80% | .80% | .80% |
| Net investment income (loss) | 3.99% | 4.60% | 4.25% | 4.46% | 4.90% |
| Supplemental Data | |||||
| Net assets, end of period (000 omitted) | $3,950 | $4,060 | $4,686 | $10,122 | $2,856 |
| Portfolio turnover rateF | 77% | 33% | 65% | 105% | 56% |
A Calculated based on average shares outstanding during the period.
B The amount shown for a share outstanding does not correspond with the aggregate net gain (loss) on investments for the period due to the timing of sales and repurchases of shares in relation to fluctuating market values of the investments of the Fund.
C Total returns would have been lower if certain expenses had not been reduced during the applicable periods shown.
D Fees and expenses of any underlying Fidelity Central Funds are not included in the Fund's expense ratio. The Fund indirectly bears its proportionate share of the expenses of any underlying Fidelity Central Funds.
E Expense ratios reflect operating expenses of the class. Expenses before reductions do not reflect amounts reimbursed by the investment adviser or reductions from brokerage service arrangements or reductions from other expense offset arrangements and do not represent the amount paid by the class during periods when reimbursements or reductions occur. Expenses net of fee waivers reflect expenses after reimbursement by the investment adviser but prior to reductions from brokerage service arrangements or other expense offset arrangements. Expenses net of all reductions represent the net expenses paid by the class.
F Amount does not include the portfolio activity of any underlying Fidelity Central Funds.
See accompanying notes which are an integral part of the financial statements.
Fidelity Short Duration High Income Fund Class Z
| Years ended April 30, | 2020 | 2019 A |
| Selected Per–Share Data | ||
| Net asset value, beginning of period | $9.45 | $9.46 |
| Income from Investment Operations | ||
| Net investment income (loss)B | .378 | .261 |
| Net realized and unrealized gain (loss) | (.579) | (.016) |
| Total from investment operations | (.201) | .245 |
| Distributions from net investment income | (.379) | (.255) |
| Distributions from net realized gain | – | – |
| Total distributions | (.379) | (.255) |
| Net asset value, end of period | $8.87 | $9.45 |
| Total ReturnC,D | (2.24)% | 2.67% |
| Ratios to Average Net AssetsE,F | ||
| Expenses before reductions | .80% | .82%G |
| Expenses net of fee waivers, if any | .71% | .71%G |
| Expenses net of all reductions | .71% | .71%G |
| Net investment income (loss) | 4.08% | 4.86%G |
| Supplemental Data | ||
| Net assets, end of period (000 omitted) | $2,031 | $425 |
| Portfolio turnover rateH | 77% | 33% |
A For the period October 2, 2018 (commencement of sale of shares) to April 30, 2019.
B Calculated based on average shares outstanding during the period.
C Total returns for periods of less than one year are not annualized.
D Total returns would have been lower if certain expenses had not been reduced during the applicable periods shown.
E Fees and expenses of any underlying Fidelity Central Funds are not included in the Fund's expense ratio. The Fund indirectly bears its proportionate share of the expenses of any underlying Fidelity Central Funds.
F Expense ratios reflect operating expenses of the class. Expenses before reductions do not reflect amounts reimbursed by the investment adviser or reductions from brokerage service arrangements or reductions from other expense offset arrangements and do not represent the amount paid by the class during periods when reimbursements or reductions occur. Expense ratios before reductions for start-up periods may not be representative of longer-term operating periods. Expenses net of fee waivers reflect expenses after reimbursement by the investment adviser but prior to reductions from brokerage service arrangements or other expense offset arrangements. Expenses net of all reductions represent the net expenses paid by the class.
G Annualized
H Amount does not include the portfolio activity of any underlying Fidelity Central Funds.
See accompanying notes which are an integral part of the financial statements.
Notes to Financial Statements
For the period ended April 30, 2020
1. Organization.
Fidelity Short Duration High Income Fund (the Fund) is a fund of Fidelity Summer Street Trust (the Trust) and is authorized to issue an unlimited number of shares. The Trust is registered under the Investment Company Act of 1940, as amended (the 1940 Act), as an open-end management investment company organized as a Massachusetts business trust. The Fund offers Class A, Class M, Class C, Short Duration High Income, Class I and Class Z shares, each of which has equal rights as to assets and voting privileges. Each class has exclusive voting rights with respect to matters that affect that class. Class C shares will automatically convert to Class A shares after a holding period of ten years from the initial date of purchase, with certain exceptions.
Effective January 1, 2020:
Investment advisers Fidelity Investments Money Management, Inc., FMR Co., Inc., and Fidelity SelectCo, LLC, merged with and into Fidelity Management & Research Company. In connection with the merger transactions, the resulting, merged investment adviser was then redomiciled from Massachusetts to Delaware, changed its corporate structure from a corporation to a limited liability company, and changed its name to "Fidelity Management & Research Company LLC".
Broker-dealer Fidelity Distributors Corporation merged with and into Fidelity Investments Institutional Services Company, Inc. ("FIISC"). FIISC was then redomiciled from Massachusetts to Delaware, changed its corporate structure from a corporation to a limited liability company, and changed its name to "Fidelity Distributors Company LLC".
Fidelity Investments Institutional Operations Company, Inc. converted from a Massachusetts corporation to a Massachusetts LLC, and changed its name to "Fidelity Investments Institutional Operations Company LLC".
2. Investments in Fidelity Central Funds.
The Fund invests in Fidelity Central Funds, which are open-end investment companies generally available only to other investment companies and accounts managed by the investment adviser and its affiliates. The Fund's Schedule of Investments lists each of the Fidelity Central Funds held as of period end, if any, as an investment of the Fund, but does not include the underlying holdings of each Fidelity Central Fund. As an Investing Fund, the Fund indirectly bears its proportionate share of the expenses of the underlying Fidelity Central Funds.
The Money Market Central Funds seek preservation of capital and current income and are managed by the investment adviser. Annualized expenses of the Money Market Central Funds as of their most recent shareholder report date ranged from less than .005% to .01%.
A complete unaudited list of holdings for each Fidelity Central Fund is available upon request or at the Securities and Exchange Commission (the SEC) website at www.sec.gov. In addition, the financial statements of the Fidelity Central Funds, which are not covered by the Fund's Report of Independent Registered Public Accounting Firm, are available on the SEC website or upon request.
3. Significant Accounting Policies.
The Fund is an investment company and applies the accounting and reporting guidance of the Financial Accounting Standards Board (FASB) Accounting Standards Codification Topic 946 Financial Services – Investments Companies. The financial statements have been prepared in conformity with accounting principles generally accepted in the United States of America (GAAP), which require management to make certain estimates and assumptions at the date of the financial statements. Actual results could differ from those estimates. Subsequent events, if any, through the date that the financial statements were issued have been evaluated in the preparation of the financial statements. The following summarizes the significant accounting policies of the Fund:
Investment Valuation. Investments are valued as of 4:00 p.m. Eastern time on the last calendar day of the period. The Board of Trustees (the Board) has delegated the day to day responsibility for the valuation of the Fund's investments to the Fair Value Committee (the Committee) established by the Fund's investment adviser. In accordance with valuation policies and procedures approved by the Board, the Fund attempts to obtain prices from one or more third party pricing vendors or brokers to value its investments. When current market prices, quotations or currency exchange rates are not readily available or reliable, investments will be fair valued in good faith by the Committee, in accordance with procedures adopted by the Board. Factors used in determining fair value vary by investment type and may include market or investment specific events, changes in interest rates and credit quality. The frequency with which these procedures are used cannot be predicted and they may be utilized to a significant extent. The Committee oversees the Fund's valuation policies and procedures and reports to the Board on the Committee's activities and fair value determinations. The Board monitors the appropriateness of the procedures used in valuing the Fund's investments and ratifies the fair value determinations of the Committee.
The Fund categorizes the inputs to valuation techniques used to value its investments into a disclosure hierarchy consisting of three levels as shown below:
- Level 1 – quoted prices in active markets for identical investments
- Level 2 – other significant observable inputs (including quoted prices for similar investments, interest rates, prepayment speeds, etc.)
- Level 3 – unobservable inputs (including the Fund's own assumptions based on the best information available)
Valuation techniques used to value the Fund's investments by major category are as follows:
Debt securities, including restricted securities, are valued based on evaluated prices received from third party pricing vendors or from brokers who make markets in such securities. Corporate bonds, bank loan obligations and preferred securities are valued by pricing vendors who utilize matrix pricing which considers yield or price of bonds of comparable quality, coupon, maturity and type or by broker-supplied prices. When independent prices are unavailable or unreliable, debt securities may be valued utilizing pricing methodologies which consider similar factors that would be used by third party pricing vendors. Debt securities are generally categorized as Level 2 in the hierarchy but may be Level 3 depending on the circumstances. The Fund invests a significant portion of its assets in below investment grade securities. The value of these securities can be more volatile due to changes in the credit quality of the issuer and is sensitive to changes in economic, market and regulatory conditions.
Equity securities, including restricted securities, for which market quotations are readily available, are valued at the last reported sale price or official closing price as reported by a third party pricing vendor on the primary market or exchange on which they are traded and are categorized as Level 1 in the hierarchy. In the event there were no sales during the day or closing prices are not available, securities are valued at the last quoted bid price or may be valued using the last available price and are generally categorized as Level 2 in the hierarchy. For equity securities, including restricted securities, where observable inputs are limited, assumptions about market activity and risk are used and these securities may be categorized as Level 3 in the hierarchy.
Investments in open-end mutual funds, including the Fidelity Central Funds, are valued at their closing net asset value (NAV) each business day and are categorized as Level 1 in the hierarchy.
Changes in valuation techniques may result in transfers in or out of an assigned level within the disclosure hierarchy. The aggregate value of investments by input level as of April 30, 2020 is included at the end of the Fund's Schedule of Investments.
Investment Transactions and Income. For financial reporting purposes, the Fund's investment holdings and NAV include trades executed through the end of the last business day of the period. The NAV per share for processing shareholder transactions is calculated as of the close of business of the New York Stock Exchange (NYSE), normally 4:00 p.m. Eastern time and includes trades executed through the end of the prior business day. Gains and losses on securities sold are determined on the basis of identified cost. Dividend income is recorded on the ex-dividend date. Income and capital gain distributions from Fidelity Central Funds, if any, are recorded on the ex-dividend date. Interest income is accrued as earned and includes coupon interest and amortization of premium and accretion of discount on debt securities as applicable. Paid in Kind (PIK) income is recorded at the fair market value of the securities received. Debt obligations may be placed on non-accrual status and related interest income may be reduced by ceasing current accruals and writing off interest receivables when the collection of all or a portion of interest has become doubtful based on consistently applied procedures. A debt obligation is removed from non-accrual status when the issuer resumes interest payments or when collectability of interest is reasonably assured.
Class Allocations and Expenses. Investment income, realized and unrealized capital gains and losses, common expenses of the Fund, and certain fund-level expense reductions, if any, are allocated daily on a pro-rata basis to each class based on the relative net assets of each class to the total net assets of the Fund. Each class differs with respect to transfer agent and distribution and service plan fees incurred. Certain expense reductions may also differ by class. For the reporting period, the allocated portion of income and expenses to each class as a percent of its average net assets may vary due to the timing of recording these transactions in relation to fluctuating net assets of the classes. Expenses directly attributable to a fund are charged to that fund. Expenses attributable to more than one fund are allocated among the respective funds on the basis of relative net assets or other appropriate methods. Expense estimates are accrued in the period to which they relate and adjustments are made when actual amounts are known.
Income Tax Information and Distributions to Shareholders. Each year, the Fund intends to qualify as a regulated investment company under Subchapter M of the Internal Revenue Code, including distributing substantially all of its taxable income and realized gains. As a result, no provision for U.S. Federal income taxes is required. As of April 30, 2020, the Fund did not have any unrecognized tax benefits in the financial statements; nor is the Fund aware of any tax positions for which it is reasonably possible that the total amounts of unrecognized tax benefits will significantly change in the next twelve months. The Fund files a U.S. federal tax return, in addition to state and local tax returns as required. The Fund's federal income tax returns are subject to examination by the Internal Revenue Service (IRS) for a period of three fiscal years after they are filed. State and local tax returns may be subject to examination for an additional fiscal year depending on the jurisdiction.
Distributions are declared and recorded daily and paid monthly from net investment income. Distributions from realized gains, if any, are declared and recorded on the ex-dividend date. Income and capital gain distributions are declared separately for each class. Income and capital gain distributions are determined in accordance with income tax regulations, which may differ from GAAP.
Capital accounts within the financial statements are adjusted for permanent book-tax differences. These adjustments have no impact on net assets or the results of operations. Capital accounts are not adjusted for temporary book-tax differences which will reverse in a subsequent period.
Book-tax differences are primarily due to market discount, defaulted bonds, capital loss carryforwards, partnerships and losses deferred due to wash sales.
As of period end, the cost and unrealized appreciation (depreciation) in securities, and derivatives if applicable, for federal income tax purposes were as follows:
| Gross unrealized appreciation | $786,119 |
| Gross unrealized depreciation | (5,322,850) |
| Net unrealized appreciation (depreciation) | $(4,536,731) |
| Tax Cost | $92,507,529 |
The tax-based components of distributable earnings as of period end were as follows:
| Undistributed ordinary income | $37,814 |
| Capital loss carryforward | $(8,401,484) |
| Net unrealized appreciation (depreciation) on securities and other investments | $(4,536,731) |
Capital loss carryforwards are only available to offset future capital gains of the Fund to the extent provided by regulations and may be limited. The capital loss carryforward information presented below, including any applicable limitation, is estimated as of fiscal period end and is subject to adjustment.
| No expiration | |
| Short-term | $(3,531,628) |
| Long-term | (4,869,856) |
| Total capital loss carryforward | $(8,401,484) |
The tax character of distributions paid was as follows:
| April 30, 2020 | April 30, 2019 | |
| Ordinary Income | $4,465,978 | $ 5,003,921 |
Restricted Securities (including Private Placements). The Fund may invest in securities that are subject to legal or contractual restrictions on resale. These securities generally may be resold in transactions exempt from registration or to the public if the securities are registered. Disposal of these securities may involve time-consuming negotiations and expense, and prompt sale at an acceptable price may be difficult. Information regarding restricted securities is included at the end of the Fund's Schedule of Investments.
Loans and Other Direct Debt Instruments. The Fund invests in direct debt instruments which are interests in amounts owed to lenders by corporate or other borrowers. These instruments may be in the form of loans, trade claims or other receivables and may include standby financing commitments such as revolving credit facilities that obligate the Fund to supply additional cash to the borrower on demand. Loans may be acquired through assignment or participation. The Fund did not have any unfunded loan commitments, which are contractual obligations for future funding, at period end.
4. Purchases and Sales of Investments.
Purchases and sales of securities, other than short-term securities, are noted in the table below.
| Purchases ($) | Sales ($) | |
| Fidelity Short Duration High Income Fund | 80,848,497 | 91,948,849 |
5. Fees and Other Transactions with Affiliates.
Management Fee. Fidelity Management & Research Company LLC (the investment adviser) and its affiliates provide the Fund with investment management related services for which the Fund pays a monthly management fee. The management fee is the sum of an individual fund fee rate that is based on an annual rate of .45% of the Fund's average net assets and an annualized group fee rate that averaged .10% during the period. The group fee rate is based upon the monthly average net assets of a group of registered investment companies with which the investment adviser has management contracts. The group fee rate decreases as assets under management increase and increases as assets under management decrease. For the reporting period, the total annual management fee rate was .55% of the Fund's average net assets.
Distribution and Service Plan Fees. In accordance with Rule 12b-1 of the 1940 Act, the Fund has adopted separate Distribution and Service Plans for each class of shares. Certain classes pay Fidelity Distributors Company LLC (FDC), an affiliate of the investment adviser, separate Distribution and Service Fees, each of which is based on an annual percentage of each class' average net assets. In addition, FDC may pay financial intermediaries for selling shares of the Fund and providing shareholder support services. For the period, the Distribution and Service Fee rates, total fees and amounts retained by FDC were as follows:
| Distribution Fee | Service Fee | Total Fees | Retained by FDC | |
| Class A | -% | .25% | $37,367 | $2,899 |
| Class M | -% | .25% | 5,852 | 61 |
| Class C | .75% | .25% | 43,926 | 5,037 |
| $87,145 | $7,997 |
Sales Load. FDC may receive a front-end sales charge of up to 4.00% for selling Class A shares and Class M shares, some of which is paid to financial intermediaries for selling shares of the Fund. Depending on the holding period, FDC may receive contingent deferred sales charges levied on Class A, Class M and Class C redemptions. The deferred sales charges are 1.00% for Class C shares, 1.00% for certain purchases of Class A shares and .25% for certain purchases of Class M shares.
For the period, sales charge amounts retained by FDC were as follows:
| Retained by FDC | |
| Class A | $1,521 |
| Class M | 227 |
| Class C(a) | 359 |
| $2,107 |
(a) When Class C shares are initially sold, FDC pays commissions from its own resources to financial intermediaries through which the sales are made.
Transfer Agent Fees. Fidelity Investments Institutional Operations Company LLC (FIIOC), an affiliate of the investment adviser, is the transfer, dividend disbursing and shareholder servicing agent for each class of the Fund. FIIOC receives account fees and asset-based fees that vary according to the account size and type of account of the shareholders of the respective classes of the Fund, except for Class Z. FIIOC receives an asset-based fee of Class Z's average net assets. FIIOC pays for typesetting, printing and mailing of shareholder reports, except proxy statements. Effective February 1, 2020, the Board approved to change the fee for Class Z from .046% to .044%.
For the period, transfer agent fees for each class were as follows:
| Amount | % of Class-Level Average Net Assets | |
| Class A | $22,518 | .15 |
| Class M | 3,756 | .16 |
| Class C | 7,857 | .18 |
| Short Duration High Income | 98,858 | .11 |
| Class I | 6,179 | .14 |
| Class Z | 927 | .05 |
| $140,095 |
Accounting Fees. Fidelity Service Company, Inc. (FSC), an affiliate of the investment adviser, maintains the Fund's accounting records. The accounting fee is based on the level of average net assets for each month. For the period, the fees were equivalent to the following annual rates:
| % of Average Net Assets | |
| Fidelity Short Duration High Income Fund | .04 |
Interfund Trades. Funds may purchase from or sell securities to other Fidelity Funds under procedures adopted by the Board. The procedures have been designed to ensure these interfund trades are executed in accordance with Rule 17a-7 of the 1940 Act. Interfund trades are included within the respective purchases and sales amounts shown in the Purchases and Sales of Investments note.
6. Committed Line of Credit.
Certain Funds participate with other funds managed by the investment adviser or an affiliate in a $4.25 billion credit facility (the "line of credit") to be utilized for temporary or emergency purposes to fund shareholder redemptions or for other short-term liquidity purposes. The participating funds have agreed to pay commitment fees on their pro-rata portion of the line of credit, which are reflected in Miscellaneous expenses on the Statement of Operations, and are as follows:
| Amount | |
| Fidelity Short Duration High Income Fund | $286 |
During the period, there were no borrowings on this line of credit.
7. Expense Reductions.
The investment adviser contractually agreed to reimburse expenses of each class to the extent annual operating expenses exceeded certain levels of class-level average net assets as noted in the table below. This reimbursement will remain in place through August 31, 2021. Some expenses, for example the compensation of the independent Trustees, and certain miscellaneous expenses such as proxy and shareholder meeting expenses, are excluded from this reimbursement.
The following classes were in reimbursement during the period:
| Expense Limitations | Reimbursement | |
| Class A | 1.05% | $14,338 |
| Class M | 1.05% | 2,538 |
| Class C | 1.80% | 5,434 |
| Short Duration High Income | .80% | 51,965 |
| Class I | .80% | 3,676 |
| Class Z | .71% | 1,517 |
| $79,468 |
In addition, during the period the investment adviser or an affiliate reimbursed and/or waived a portion of fund-level operating expenses in the amount of $405.
In addition, during the period the investment adviser or an affiliate reimbursed the Fund $501 for an operational error which is included in the accompanying Statement of Operations.
8. Distributions to Shareholders.
Distributions to shareholders of each class were as follows:
| Year ended April 30, 2020 | Year ended April 30, 2019(a) | |
| Distributions to shareholders | ||
| Class A | $556,252 | $570,580 |
| Class M | 87,233 | 92,728 |
| Class C | 131,011 | 169,779 |
| Short Duration High Income | 3,441,833 | 3,978,011 |
| Class I | 176,433 | 186,125 |
| Class Z | 73,216 | 6,698 |
| Total | $4,465,978 | $5,003,921 |
(a) Distributions for Class Z are for the period October 2, 2018 (commencement of sale of shares) to April 30, 2019.
9. Share Transactions.
Share transactions for each class were as follows and may contain automatic conversions between classes or exchanges between affiliated funds:
| Shares | Shares | Dollars | Dollars | |
| Year ended April 30, 2020 | Year ended April 30, 2019(a) | Year ended April 30, 2020 | Year ended April 30, 2019(a) | |
| Class A | ||||
| Shares sold | 738,163 | 535,255 | $6,904,779 | $4,993,042 |
| Reinvestment of distributions | 57,544 | 59,316 | 535,421 | 553,118 |
| Shares redeemed | (967,983) | (312,079) | (8,738,906) | (2,908,824) |
| Net increase (decrease) | (172,276) | 282,492 | $(1,298,706) | $2,637,336 |
| Class M | ||||
| Shares sold | 84,494 | 81,541 | $785,458 | $761,393 |
| Reinvestment of distributions | 9,140 | 9,663 | 85,002 | 90,133 |
| Shares redeemed | (124,747) | (43,489) | (1,130,115) | (404,012) |
| Net increase (decrease) | (31,113) | 47,715 | $(259,655) | $447,514 |
| Class C | ||||
| Shares sold | 262,330 | 204,330 | $2,400,007 | $1,900,782 |
| Reinvestment of distributions | 14,026 | 18,015 | 130,387 | 167,975 |
| Shares redeemed | (304,136) | (287,743) | (2,603,723) | (2,693,623) |
| Net increase (decrease) | (27,780) | (65,398) | $(73,329) | $(624,866) |
| Short Duration High Income | ||||
| Shares sold | 3,574,469 | 5,515,751 | $33,404,598 | $51,682,187 |
| Reinvestment of distributions | 295,232 | 346,618 | 2,749,018 | 3,232,670 |
| Shares redeemed | (6,048,897) | (5,379,470) | (54,825,149) | (50,139,424) |
| Net increase (decrease) | (2,179,196) | 482,899 | $(18,671,533) | $4,775,433 |
| Class I | ||||
| Shares sold | 281,610 | 153,737 | $2,620,824 | $1,428,982 |
| Reinvestment of distributions | 17,079 | 18,150 | 158,857 | 169,337 |
| Shares redeemed | (283,117) | (239,433) | (2,545,724) | (2,243,709) |
| Net increase (decrease) | 15,572 | (67,546) | $233,957 | $(645,390) |
| Class Z | ||||
| Shares sold | 325,736 | 45,679 | $3,038,787 | $424,929 |
| Reinvestment of distributions | 7,685 | 648 | 71,252 | 6,031 |
| Shares redeemed | (149,394) | (1,358) | (1,340,633) | (12,574) |
| Net increase (decrease) | 184,027 | 44,969 | $1,769,406 | $418,386 |
(a) Share transactions for Class Z are for the period October 2, 2018 (commencement of sale of shares) to April 30, 2019.
10. Other.
The Fund's organizational documents provide former and current trustees and officers with a limited indemnification against liabilities arising in connection with the performance of their duties to the Fund. In the normal course of business, the Fund may also enter into contracts that provide general indemnifications. The Fund's maximum exposure under these arrangements is unknown as this would be dependent on future claims that may be made against the Fund. The risk of material loss from such claims is considered remote.
11. Coronavirus (COVID-19) Pandemic.
An outbreak of COVID-19 first detected in China during December 2019 has since spread globally and was declared a pandemic by the World Health Organization during March 2020. Developments that disrupt global economies and financial markets, such as the COVID-19 pandemic, may magnify factors that affect the Fund's performance.
Report of Independent Registered Public Accounting Firm
To the Board of Trustees of Fidelity Summer Street Trust and Shareholders of Fidelity Short Duration High Income Fund
Opinion on the Financial Statements and Financial Highlights
We have audited the accompanying statement of assets and liabilities of Fidelity Short Duration High Income Fund (the "Fund"), a fund of Fidelity Summer Street Trust, including the schedule of investments, as of April 30, 2020, the related statement of operations for the year then ended, the statement of changes in net assets for each of the two years in the period then ended, the financial highlights for each of the five years in the period then ended, and the related notes. In our opinion, the financial statements and financial highlights present fairly, in all material respects, the financial position of the Fund as of April 30, 2020, and the results of its operations for the year then ended, the changes in its net assets for each of the two years in the period then ended, and the financial highlights for each of the five years in the period then ended in conformity with accounting principles generally accepted in the United States of America.
Basis for Opinion
These financial statements and financial highlights are the responsibility of the Fund's management. Our responsibility is to express an opinion on the Fund's financial statements and financial highlights based on our audits. We are a public accounting firm registered with the Public Company Accounting Oversight Board (United States) (PCAOB) and are required to be independent with respect to the Fund in accordance with the U.S. federal securities laws and the applicable rules and regulations of the Securities and Exchange Commission and the PCAOB.
We conducted our audits in accordance with the standards of the PCAOB. Those standards require that we plan and perform the audit to obtain reasonable assurance about whether the financial statements and financial highlights are free of material misstatement, whether due to error or fraud. The Fund is not required to have, nor were we engaged to perform, an audit of its internal control over financial reporting. As part of our audits we are required to obtain an understanding of internal control over financial reporting but not for the purpose of expressing an opinion on the effectiveness of the Fund’s internal control over financial reporting. Accordingly, we express no such opinion.
Our audits included performing procedures to assess the risks of material misstatement of the financial statements and financial highlights, whether due to error or fraud, and performing procedures that respond to those risks. Such procedures included examining, on a test basis, evidence regarding the amounts and disclosures in the financial statements and financial highlights. Our audits also included evaluating the accounting principles used and significant estimates made by management, as well as evaluating the overall presentation of the financial statements and financial highlights. Our procedures included confirmation of securities owned as of April 30, 2020, by correspondence with the custodian and brokers; when replies were not received from brokers, we performed other auditing procedures. We believe that our audits provide a reasonable basis for our opinion.
/s/ Deloitte & Touche LLP
Boston, Massachusetts
June 15, 2020
We have served as the auditor of one or more of the Fidelity investment companies since 1999.
Trustees and Officers
The Trustees, Members of the Advisory Board (if any), and officers of the trust and fund, as applicable, are listed below. The Board of Trustees governs the fund and is responsible for protecting the interests of shareholders. The Trustees are experienced executives who meet periodically throughout the year to oversee the fund's activities, review contractual arrangements with companies that provide services to the fund, oversee management of the risks associated with such activities and contractual arrangements, and review the fund's performance. Except for Bettina Doulton, each of the Trustees oversees 312 funds. Ms. Doulton oversees 210 funds.
The Trustees hold office without limit in time except that (a) any Trustee may resign; (b) any Trustee may be removed by written instrument, signed by at least two-thirds of the number of Trustees prior to such removal; (c) any Trustee who requests to be retired or who has become incapacitated by illness or injury may be retired by written instrument signed by a majority of the other Trustees; and (d) any Trustee may be removed at any special meeting of shareholders by a two-thirds vote of the outstanding voting securities of the trust. Each Trustee who is not an interested person (as defined in the 1940 Act) of the trust and the fund is referred to herein as an Independent Trustee. Each Independent Trustee shall retire not later than the last day of the calendar year in which his or her 75th birthday occurs. The Independent Trustees may waive this mandatory retirement age policy with respect to individual Trustees. Officers and Advisory Board Members hold office without limit in time, except that any officer or Advisory Board Member may resign or may be removed by a vote of a majority of the Trustees at any regular meeting or any special meeting of the Trustees. Except as indicated, each individual has held the office shown or other offices in the same company for the past five years.
The fund's Statement of Additional Information (SAI) includes more information about the Trustees. To request a free copy, call Fidelity at 1-800-544-8544 if you’re an individual investing directly with Fidelity, call 1-800-835-5092 if you’re a plan sponsor or participant with Fidelity as your recordkeeper or call 1-877-208-0098 on institutional accounts or if you’re an advisor or invest through one.
Experience, Skills, Attributes, and Qualifications of the Trustees. The Governance and Nominating Committee has adopted a statement of policy that describes the experience, qualifications, attributes, and skills that are necessary and desirable for potential Independent Trustee candidates (Statement of Policy). The Board believes that each Trustee satisfied at the time he or she was initially elected or appointed a Trustee, and continues to satisfy, the standards contemplated by the Statement of Policy. The Governance and Nominating Committee also engages professional search firms to help identify potential Independent Trustee candidates who have the experience, qualifications, attributes, and skills consistent with the Statement of Policy. From time to time, additional criteria based on the composition and skills of the current Independent Trustees, as well as experience or skills that may be appropriate in light of future changes to board composition, business conditions, and regulatory or other developments, have also been considered by the professional search firms and the Governance and Nominating Committee. In addition, the Board takes into account the Trustees' commitment and participation in Board and committee meetings, as well as their leadership of standing and ad hoc committees throughout their tenure.
In determining that a particular Trustee was and continues to be qualified to serve as a Trustee, the Board has considered a variety of criteria, none of which, in isolation, was controlling. The Board believes that, collectively, the Trustees have balanced and diverse experience, qualifications, attributes, and skills, which allow the Board to operate effectively in governing the fund and protecting the interests of shareholders. Information about the specific experience, skills, attributes, and qualifications of each Trustee, which in each case led to the Board's conclusion that the Trustee should serve (or continue to serve) as a trustee of the fund, is provided below.
Board Structure and Oversight Function. Robert A. Lawrence is an interested person and currently serves as Acting Chairman. The Trustees have determined that an interested Chairman is appropriate and benefits shareholders because an interested Chairman has a personal and professional stake in the quality and continuity of services provided to the fund. Independent Trustees exercise their informed business judgment to appoint an individual of their choosing to serve as Chairman, regardless of whether the Trustee happens to be independent or a member of management. The Independent Trustees have determined that they can act independently and effectively without having an Independent Trustee serve as Chairman and that a key structural component for assuring that they are in a position to do so is for the Independent Trustees to constitute a substantial majority for the Board. The Independent Trustees also regularly meet in executive session. Ned C. Lautenbach and David M. Thomas serve as Co-Lead Independent Trustees and as such each (i) acts as a liaison between the Independent Trustees and management with respect to matters important to the Independent Trustees and (ii) with management prepares agendas for Board meetings.
Fidelity® funds are overseen by different Boards of Trustees. The fund's Board oversees Fidelity's high income and certain equity funds, and other Boards oversee Fidelity's investment-grade bond, money market, asset allocation, and other equity funds. The asset allocation funds may invest in Fidelity® funds overseen by the fund's Board. The use of separate Boards, each with its own committee structure, allows the Trustees of each group of Fidelity® funds to focus on the unique issues of the funds they oversee, including common research, investment, and operational issues. On occasion, the separate Boards establish joint committees to address issues of overlapping consequences for the Fidelity® funds overseen by each Board.
The Trustees operate using a system of committees to facilitate the timely and efficient consideration of all matters of importance to the Trustees, the fund, and fund shareholders and to facilitate compliance with legal and regulatory requirements and oversight of the fund's activities and associated risks. The Board, acting through its committees, has charged FMR and its affiliates with (i) identifying events or circumstances the occurrence of which could have demonstrably adverse effects on the fund's business and/or reputation; (ii) implementing processes and controls to lessen the possibility that such events or circumstances occur or to mitigate the effects of such events or circumstances if they do occur; and (iii) creating and maintaining a system designed to evaluate continuously business and market conditions in order to facilitate the identification and implementation processes described in (i) and (ii) above. Because the day-to-day operations and activities of the fund are carried out by or through FMR, its affiliates, and other service providers, the fund's exposure to risks is mitigated but not eliminated by the processes overseen by the Trustees. While each of the Board's committees has responsibility for overseeing different aspects of the fund's activities, oversight is exercised primarily through the Operations, Audit, and Compliance Committees. Appropriate personnel, including but not limited to the fund's Chief Compliance Officer (CCO), FMR's internal auditor, the independent accountants, the fund's Treasurer and portfolio management personnel, make periodic reports to the Board's committees, as appropriate, including an annual review of Fidelity's risk management program for the Fidelity® funds. The responsibilities of each standing committee, including their oversight responsibilities, are described further under "Standing Committees of the Trustees."
Interested Trustees*:
Correspondence intended for a Trustee who is an interested person may be sent to Fidelity Investments, 245 Summer Street, Boston, Massachusetts 02210.
Name, Year of Birth; Principal Occupations and Other Relevant Experience+
Bettina Doulton (1964)
Year of Election or Appointment: 2020
Trustee
Ms. Doulton also serves as Trustee of other Fidelity® funds. Prior to her retirement, Ms. Doulton served in a variety of positions at Fidelity Investments, including as a managing director of research (2006-2007), portfolio manager to certain Fidelity® funds (1993-2005), equity analyst and portfolio assistant (1990-1993), and research assistant (1987-1990). Ms. Doulton currently owns and operates Phi Builders + Architects and Cellardoor Winery. Previously, Ms. Doulton served as a member of the Board of Brown Capital Management, LLC (2013-2018).
Robert A. Lawrence (1952)
Year of Election or Appointment: 2020
Trustee
Acting Chairman of the Board of Trustees
Mr. Lawrence also serves as Trustee of other funds. Previously, Mr. Lawrence served as a Member of the Advisory Board of certain funds. Prior to his retirement in 2008, Mr. Lawrence served as Vice President of certain Fidelity® funds (2006-2008), Senior Vice President, Head of High Income Division of Fidelity Management & Research Company (investment adviser firm, 2006-2008), and President of Fidelity Strategic Investments (investment adviser firm, 2002-2005).
* Determined to be an “Interested Trustee” by virtue of, among other things, his or her affiliation with the trust or various entities under common control with FMR.
+ The information includes the Trustee's principal occupation during the last five years and other information relating to the experience, attributes, and skills relevant to the Trustee's qualifications to serve as a Trustee, which led to the conclusion that the Trustee should serve as a Trustee for the fund.
Independent Trustees:
Correspondence intended for an Independent Trustee may be sent to Fidelity Investments, P.O. Box 55235, Boston, Massachusetts 02205-5235.
Name, Year of Birth; Principal Occupations and Other Relevant Experience+
Dennis J. Dirks (1948)
Year of Election or Appointment: 2005
Trustee
Mr. Dirks also serves as Trustee of other Fidelity® funds. Prior to his retirement in May 2003, Mr. Dirks served as Chief Operating Officer and as a member of the Board of The Depository Trust & Clearing Corporation (financial markets infrastructure), President, Chief Operating Officer and a member of the Board of The Depository Trust Company (DTC), President and a member of the Board of the National Securities Clearing Corporation (NSCC), Chief Executive Officer and a member of the Board of the Government Securities Clearing Corporation and Chief Executive Officer and a member of the Board of the Mortgage-Backed Securities Clearing Corporation. Mr. Dirks currently serves as a member of the Finance Committee (2016-present) and Board (2017-present) and is Treasurer (2018-present) of the Asolo Repertory Theatre.
Donald F. Donahue (1950)
Year of Election or Appointment: 2018
Trustee
Mr. Donahue also serves as Trustee of other Fidelity® funds. Mr. Donahue serves as President and Chief Executive Officer of Miranda Partners, LLC (risk consulting for the financial services industry, 2012-present). Previously, Mr. Donahue served as Chief Executive Officer (2006-2012), Chief Operating Officer (2003-2006) and Managing Director, Customer Marketing and Development (1999-2003) of The Depository Trust & Clearing Corporation (financial markets infrastructure). Mr. Donahue currently serves as a member (2007-present) and Co-Chairman (2016-present) of the Board of United Way of New York, a member of the Board of NYC Leadership Academy (2012-present) and a member of the Board of Advisors of Ripple Labs, Inc. (financial services, 2015-present). Mr. Donahue previously served as a member of the Advisory Board of certain Fidelity® funds (2015-2018).
Vicki L. Fuller (1957)
Year of Election or Appointment: 2020
Trustee
Ms. Fuller also serves as Trustee of other Fidelity® funds. Previously, Ms. Fuller served as a member of the Advisory Board of certain Fidelity® funds (2018-2020), Chief Investment Officer of the New York State Common Retirement Fund (2012-2018) and held a variety of positions at AllianceBernstein L.P. (global asset management, 1985-2012), including Managing Director (2006-2012) and Senior Vice President and Senior Portfolio Manager (2001-2006). Ms. Fuller currently serves as a member of the Board, Audit Committee and Nominating and Governance Committee of The Williams Companies, Inc. (natural gas infrastructure, 2018-present) and as a member of the Board of Treliant, LLC (consulting, 2019-present).
Patricia L. Kampling (1959)
Year of Election or Appointment: 2020
Trustee
Ms. Kampling also serves as Trustee of other Fidelity® funds. Prior to her retirement, Ms. Kampling served as Chairman of the Board and Chief Executive Officer (2012-2019), President and Chief Operating Officer (2011-2012) and Executive Vice President and Chief Financial Officer (2010-2011) of Alliant Energy Corporation. Ms. Kampling currently serves as a member of the Board, Compensation Committee and Executive Committee and as Chair of the Audit Committee of Briggs & Stratton Corporation (manufacturing, 2011-present) and as a member of the Board, Audit, Finance and Risk Committee and Safety, Environmental, Technology and Operations Committee of American Water Works Company, Inc. (utilities company, 2019-present). In addition, Ms. Kampling currently serves as a member of the Board of the Nature Conservancy, Wisconsin Chapter (2019-present). Previously, Ms. Kampling served as a Member of the Advisory Board of certain Fidelity® funds (2020), a member of the Board of Interstate Power and Light Company (2012-2019) and Wisconsin Power and Light Company (2012-2019) (each a subsidiary of Alliant Energy Corporation) and as a member of the Board and Workforce Development Committee of the Business Roundtable (2018-2019).
Alan J. Lacy (1953)
Year of Election or Appointment: 2008
Trustee
Mr. Lacy also serves as Trustee of other Fidelity® funds. Previously, Mr. Lacy served as Senior Adviser (2007-2014) of Oak Hill Capital Partners, L.P. (private equity), Chief Executive Officer (2005) and Vice Chairman (2005-2006) of Sears Holdings Corporation (retail), Chief Executive Officer and Chairman of the Board of Sears, Roebuck and Co. (retail, 2000-2005), Chairman (2014-2017) and a member of the Board (2010-2017) of Dave & Buster’s Entertainment, Inc. (restaurant and entertainment complexes) and a member of the Board of Bristol-Myers Squibb Company (global pharmaceuticals, 2008-2020). Mr. Lacy currently serves as a Trustee of the California Chapter of The Nature Conservancy (2015-present) and a member of the Board of the Center for Advanced Study in the Behavioral Sciences at Stanford University (2015-present).
Ned C. Lautenbach (1944)
Year of Election or Appointment: 2000
Trustee
Co-Lead Independent Trustee
Mr. Lautenbach also serves as Trustee of other Fidelity® funds. Mr. Lautenbach currently serves as Chair of the Board of Governors, State University System of Florida (2013-present) and is a member of the Council on Foreign Relations (1994-present). He is also a member and has in the past served as Chairman of the Board of Directors of Artis-Naples (2012-present). Previously, Mr. Lautenbach served as a member and then Lead Director of the Board of Directors of Eaton Corporation (diversified industrial, 1997-2016). He was also a Partner at Clayton, Dubilier & Rice, LLC (private equity investment, 1998-2010); as well as Director of Sony Corporation (2006-2007). In addition, Mr. Lautenbach had a 30-year career with IBM (technology company), during which time he served as Senior Vice President and as a member of the Corporate Executive Committee (1968-1998).
Joseph Mauriello (1944)
Year of Election or Appointment: 2008
Trustee
Mr. Mauriello also serves as Trustee of other Fidelity® funds. Prior to his retirement in January 2006, Mr. Mauriello served in numerous senior management positions including Deputy Chairman and Chief Operating Officer (2004-2005), and Vice Chairman of Financial Services (2002-2004) of KPMG LLP US (professional services, 1965-2005). Mr. Mauriello currently serves as a member of the Independent Directors Council Governing Council (2015-present). Previously, Mr. Mauriello served as a member of the Board of XL Group plc. (global insurance and re-insurance, 2006-2018).
Cornelia M. Small (1944)
Year of Election or Appointment: 2005
Trustee
Ms. Small also serves as Trustee of other Fidelity® funds. Previously, Ms. Small served as Chief Investment Officer, Director of Global Equity Investments and a member of Scudder, Stevens & Clark and Scudder Kemper Investments. Ms. Small previously served as a member of the Board (2009-2019) and Chair of the Investment Committee (2010-2019) of the Teagle Foundation and a member of the Investment Committee of the Berkshire Taconic Community Foundation (2008-2019).
Garnett A. Smith (1947)
Year of Election or Appointment: 2018
Trustee
Mr. Smith also serves as Trustee of other Fidelity® funds. Prior to his retirement, Mr. Smith served as Chairman and Chief Executive Officer (1990-1997) and President (1986-1990) of Inbrand Corp. (manufacturer of personal absorbent products). Prior to his employment with Inbrand Corp., he was employed by a retail fabric chain and North Carolina National Bank (now Bank of America). Mr. Smith previously served as a member of the Advisory Board of certain Fidelity® funds (2012-2013).
David M. Thomas (1949)
Year of Election or Appointment: 2008
Trustee
Co-Lead Independent Trustee
Mr. Thomas also serves as Trustee of other Fidelity® funds. Previously, Mr. Thomas served as Executive Chairman (2005-2006) and Chairman and Chief Executive Officer (2000-2005) of IMS Health, Inc. (pharmaceutical and healthcare information solutions). Mr. Thomas currently serves as Non-Executive Chairman of the Board of Fortune Brands Home and Security (home and security products, 2011-present), and a member of the Board (2004-present) and Presiding Director (2013-present) of Interpublic Group of Companies, Inc. (marketing communication).
Susan Tomasky (1953)
Year of Election or Appointment: 2020
Trustee
Ms. Tomasky also serves as Trustee of other Fidelity® funds. Prior to her retirement, Ms. Tomasky served in various executive officer positions at American Electric Power Company, Inc. (1998-2011), including most recently as President of AEP Transmission (2007-2011). Ms. Tomasky currently serves as a member of the Board and Sustainability Committee and as Chair of the Audit Committee of Marathon Petroleum Corporation (2018-present) and as a member of the Board, Corporate Governance Committee and Organization and Compensation Committee and as Chair of the Audit Committee of Public Service Enterprise Group, Inc. (utilities company, 2012-present). In addition, Ms. Tomasky currently serves as a member of the Board of the Columbus Regional Airport Authority (2007-present), as a member of the Board of the Royal Shakespeare Company – America (2009-present), as a member of the Board of the Columbus Association for the Performing Arts (2011-present) and as a member of the Board of Kenyon College (2016-present). Previously, Ms. Tomasky served as a Member of the Advisory Board of certain Fidelity® funds (2020), a member of the Board (2011-2019) and as Lead Independent Director (2015-2018) of Andeavor Corporation (previously Tesoro Corporation) (independent oil refiner and marketer) and as a member of the Board of Summit Midstream Partners LP (energy, 2012-2018).
Michael E. Wiley (1950)
Year of Election or Appointment: 2018
Trustee
Mr. Wiley also serves as Trustee of other Fidelity® funds. Previously, Mr. Wiley served as a member of the Advisory Board of certain Fidelity® funds (2018-2020), Chairman, President and CEO of Baker Hughes, Inc. (oilfield services, 2000-2004). Mr. Wiley also previously served as a member of the Board of Andeavor Corporation (independent oil refiner and marketer, 2005-2018), a member of the Board of Andeavor Logistics LP (natural resources logistics, 2015-2018) and a member of the Board of High Point Resources (exploration and production, 2005-2020).
+ The information includes the Trustee's principal occupation during the last five years and other information relating to the experience, attributes, and skills relevant to the Trustee's qualifications to serve as a Trustee, which led to the conclusion that the Trustee should serve as a Trustee for the fund.
Advisory Board Members and Officers:
Correspondence intended for a Member of the Advisory Board (if any) may be sent to Fidelity Investments, P.O. Box 55235, Boston, Massachusetts 02205-5235. Correspondence intended for an officer or Peter S. Lynch may be sent to Fidelity Investments, 245 Summer Street, Boston, Massachusetts 02210. Officers appear below in alphabetical order.
Name, Year of Birth; Principal Occupation
Peter S. Lynch (1944)
Year of Election or Appointment: 2003
Member of the Advisory Board
Mr. Lynch also serves as a Member of the Advisory Board of other Fidelity® funds. Mr. Lynch is Vice Chairman and a Director of Fidelity Management & Research Company LLC (investment adviser firm). In addition, Mr. Lynch serves as a Trustee of Boston College and as the Chairman of the Inner-City Scholarship Fund. Previously, Mr. Lynch served as Vice Chairman and a Director of FMR Co., Inc. (investment adviser firm) and on the Special Olympics International Board of Directors (1997-2006).
Elizabeth Paige Baumann (1968)
Year of Election or Appointment: 2017
Anti-Money Laundering (AML) Officer
Ms. Baumann also serves as AML Officer of other funds. She is Chief AML Officer (2012-present) and Senior Vice President (2014-present) of FMR LLC (diversified financial services company) and is an employee of Fidelity Investments. Previously, Ms. Baumann served as AML Officer of certain funds (2017-2019), as AML Officer of the funds (2012-2016), and Vice President (2007-2014) and Deputy Anti-Money Laundering Officer (2007-2012) of FMR LLC.
Craig S. Brown (1977)
Year of Election or Appointment: 2019
Assistant Treasurer
Mr. Brown also serves as Assistant Treasurer of other funds. Mr. Brown is an employee of Fidelity Investments (2013-present).
John J. Burke III (1964)
Year of Election or Appointment: 2018
Chief Financial Officer
Mr. Burke also serves as Chief Financial Officer of other funds. Mr. Burke serves as Head of Investment Operations for Fidelity Fund and Investment Operations (2018-present) and is an employee of Fidelity Investments (1998-present). Previously Mr. Burke served as head of Asset Management Investment Operations (2012-2018).
William C. Coffey (1969)
Year of Election or Appointment: 2019
Assistant Secretary
Mr. Coffey also serves as Assistant Secretary of other funds. He is Senior Vice President and Deputy General Counsel of FMR LLC (diversified financial services company, 2010-present), and is an employee of Fidelity Investments. Previously, Mr. Coffey served as Secretary and CLO of certain funds (2018-2019); CLO, Secretary, and Senior Vice President of Fidelity Management & Research Company and FMR Co., Inc. (investment adviser firms, 2018-2019); Secretary of Fidelity SelectCo, LLC and Fidelity Investments Money Management, Inc. (investment adviser firms, 2018-2019); CLO of Fidelity Management & Research (Hong Kong) Limited, FMR Investment Management (UK) Limited, and Fidelity Management & Research (Japan) Limited (investment adviser firms, 2018-2019); and Assistant Secretary of certain funds (2009-2018).
Timothy M. Cohen (1969)
Year of Election or Appointment: 2018
Vice President
Mr. Cohen also serves as Vice President of other funds. Mr. Cohen serves as Co-Head of Equity (2018-present), a Director of Fidelity Management & Research (Japan) Limited (investment adviser firm, 2016-present), and is an employee of Fidelity Investments. Previously, Mr. Cohen served as Executive Vice President of Fidelity SelectCo, LLC (2019), Head of Global Equity Research (2016-2018), Chief Investment Officer - Equity and a Director of Fidelity Management & Research (U.K.) Inc. (investment adviser firm, 2013-2015) and as a Director of Fidelity Management & Research (Hong Kong) Limited (investment adviser firm, 2017).
Jonathan Davis (1968)
Year of Election or Appointment: 2010
Assistant Treasurer
Mr. Davis also serves as Assistant Treasurer of other funds. Mr. Davis serves as Assistant Treasurer of FMR Capital, Inc. (2017-present) and is an employee of Fidelity Investments. Previously, Mr. Davis served as Vice President and Associate General Counsel of FMR LLC (diversified financial services company, 2003-2010).
Laura M. Del Prato (1964)
Year of Election or Appointment: 2018
Assistant Treasurer
Ms. Del Prato also serves as an officer of other funds. Ms. Del Prato is an employee of Fidelity Investments (2017-present). Prior to joining Fidelity Investments, Ms. Del Prato served as a Managing Director and Treasurer of the JPMorgan Mutual Funds (2014-2017). Prior to JPMorgan, Ms. Del Prato served as a partner at Cohen Fund Audit Services (accounting firm, 2012-2013) and KPMG LLP (accounting firm, 2004-2012).
Colm A. Hogan (1973)
Year of Election or Appointment: 2020
Assistant Treasurer
Mr. Hogan also serves as an officer of other funds. Mr. Hogan serves as Assistant Treasurer of FMR Capital, Inc. (2017-present) and is an employee of Fidelity Investments (2005-present). Previously, Mr. Hogan served as Deputy Treasurer of certain Fidelity® funds (2016-2020) and Assistant Treasurer of certain Fidelity® funds (2016-2018).
Pamela R. Holding (1964)
Year of Election or Appointment: 2018
Vice President
Ms. Holding also serves as Vice President of other funds. Ms. Holding serves as Co-Head of Equity (2018-present) and is an employee of Fidelity Investments (2013-present). Previously, Ms. Holding served as Executive Vice President of Fidelity SelectCo, LLC (2019) and as Chief Investment Officer of Fidelity Institutional Asset Management (2013-2018).
Cynthia Lo Bessette (1969)
Year of Election or Appointment: 2019
Secretary and Chief Legal Officer (CLO)
Ms. Lo Bessette also serves as an officer of other funds. Ms. Lo Bessette serves as CLO, Secretary, and Senior Vice President of Fidelity Management & Research Company LLC (investment adviser firm, 2019-present); and CLO of Fidelity Management & Research (Hong Kong) Limited, FMR Investment Management (UK) Limited, and Fidelity Management & Research (Japan) Limited (investment adviser firms, 2019-present). She is a Senior Vice President and Deputy General Counsel of FMR LLC (diversified financial services company, 2019-present), and is an employee of Fidelity Investments. Previously, Ms. Lo Bessette served as CLO, Secretary, and Senior Vice President of FMR Co., Inc. (investment adviser firm, 2019); Secretary of Fidelity SelectCo, LLC and Fidelity Investments Money Management, Inc. (investment adviser firms, 2019). Prior to joining Fidelity Investments, Ms. Lo Bessette was Executive Vice President, General Counsel (2016-2019) and Senior Vice President, Deputy General Counsel (2015-2016) of OppenheimerFunds (investment management company) and Deputy Chief Legal Officer (2013-2015) of Jennison Associates LLC (investment adviser firm).
Chris Maher (1972)
Year of Election or Appointment: 2020
Deputy Treasurer
Mr. Maher also serves as an officer of other funds. Mr. Maher serves as Assistant Treasurer of FMR Capital, Inc. (2017-present), and is an employee of Fidelity Investments (2008-present). Previously, Mr. Maher served as Assistant Treasurer of certain funds (2013-2020); Vice President of Asset Management Compliance (2013), Vice President of the Program Management Group of FMR (investment adviser firm, 2010-2013), and Vice President of Valuation Oversight (2008-2010).
Jason P. Pogorelec (1975)
Year of Election or Appointment: 2020
Chief Compliance Officer
Mr. Pogorelec also serves as an officer of other funds. Mr. Pogorelec serves as Vice President, Associate General Counsel (2010-present) and is an employee of Fidelity Investments (2006-present). Previously, Mr. Pogorelec served as Assistant Secretary of certain Fidelity funds (2015-2020).
Stacie M. Smith (1974)
Year of Election or Appointment: 2016
President and Treasurer
Ms. Smith also serves as an officer of other funds. Ms. Smith serves as Assistant Treasurer of FMR Capital, Inc. (2017-present), is an employee of Fidelity Investments (2009-present), and has served in other fund officer roles. Prior to joining Fidelity Investments, Ms. Smith served as Senior Audit Manager of Ernst & Young LLP (accounting firm, 1996-2009). Previously, Ms. Smith served as Assistant Treasurer (2013-2019) and Deputy Treasurer (2013-2016) of certain Fidelity® funds.
Marc L. Spector (1972)
Year of Election or Appointment: 2016
Assistant Treasurer
Mr. Spector also serves as an officer of other funds. Mr. Spector serves as Assistant Treasurer of FMR Capital, Inc. (2017-present) and is an employee of Fidelity Investments (2016-present). Prior to joining Fidelity Investments, Mr. Spector served as Director at the Siegfried Group (accounting firm, 2013-2016), and prior to Siegfried Group as audit senior manager at Deloitte & Touche LLP (accounting firm, 2005-2013).
Jim Wegmann (1979)
Year of Election or Appointment: 2019
Assistant Treasurer
Mr. Wegmann also serves as Assistant Treasurer of other funds. Mr. Wegmann is an employee of Fidelity Investments (2011-present).
Shareholder Expense Example
As a shareholder of the Fund, you incur two types of costs: (1) transaction costs, including sales charges (loads) on purchase payments or redemption proceeds, and (2) ongoing costs, including management fees, distribution and/or service (12b-1) fees and other Fund expenses. This Example is intended to help you understand your ongoing costs (in dollars) of investing in the Fund and to compare these costs with the ongoing costs of investing in other mutual funds.
The Example is based on an investment of $1,000 invested at the beginning of the period and held for the entire period (November 1, 2019 to April 30, 2020).
Actual Expenses
The first line of the accompanying table for each class of the Fund provides information about actual account values and actual expenses. You may use the information in this line, together with the amount you invested, to estimate the expenses that you paid over the period. Simply divide your account value by $1,000.00 (for example, an $8,600 account value divided by $1,000.00 = 8.6), then multiply the result by the number in the first line for a class of the Fund under the heading entitled "Expenses Paid During Period" to estimate the expenses you paid on your account during this period. In addition, the Fund, as a shareholder in the underlying Fidelity Central Funds, will indirectly bear its pro-rata share of the fees and expenses incurred by the underlying Fidelity Central Funds. These fees and expenses are not included in the Fund's annualized expense ratio used to calculate the expense estimate in the table below.
Hypothetical Example for Comparison Purposes
The second line of the accompanying table for each class of the Fund provides information about hypothetical account values and hypothetical expenses based on a Class' actual expense ratio and an assumed rate of return of 5% per year before expenses, which is not the Class' actual return. The hypothetical account values and expenses may not be used to estimate the actual ending account balance or expenses you paid for the period. You may use this information to compare the ongoing costs of investing in the Fund and other funds. To do so, compare this 5% hypothetical example with the 5% hypothetical examples that appear in the shareholder reports of the other funds. In addition, the Fund, as a shareholder in the underlying Fidelity Central Funds, will indirectly bear its pro-rata share of the fees and expenses incurred by the underlying Fidelity Central Funds. These fees and expenses are not included in the Fund's annualized expense ratio used to calculate the expense estimate in the table below.
Please note that the expenses shown in the table are meant to highlight your ongoing costs only and do not reflect any transaction costs. Therefore, the second line of the table is useful in comparing ongoing costs only, and will not help you determine the relative total costs of owning different funds. In addition, if these transactional costs were included, your costs would have been higher.
| Annualized Expense Ratio-A | Beginning Account Value November 1, 2019 | Ending Account Value April 30, 2020 | Expenses Paid During Period-B November 1, 2019 to April 30, 2020 | |
| Class A | 1.05% | |||
| Actual | $1,000.00 | $959.90 | $5.12 | |
| Hypothetical-C | $1,000.00 | $1,019.64 | $5.27 | |
| Class M | 1.05% | |||
| Actual | $1,000.00 | $958.80 | $5.11 | |
| Hypothetical-C | $1,000.00 | $1,019.64 | $5.27 | |
| Class C | 1.80% | |||
| Actual | $1,000.00 | $955.30 | $8.75 | |
| Hypothetical-C | $1,000.00 | $1,015.91 | $9.02 | |
| Short Duration High Income | .80% | |||
| Actual | $1,000.00 | $961.10 | $3.90 | |
| Hypothetical-C | $1,000.00 | $1,020.89 | $4.02 | |
| Class I | .80% | |||
| Actual | $1,000.00 | $961.10 | $3.90 | |
| Hypothetical-C | $1,000.00 | $1,020.89 | $4.02 | |
| Class Z | .71% | |||
| Actual | $1,000.00 | $960.50 | $3.46 | |
| Hypothetical-C | $1,000.00 | $1,021.33 | $3.57 |
A Annualized expense ratio reflects expenses net of applicable fee waivers.
B Expenses are equal to each Class' annualized expense ratio, multiplied by the average account value over the period, multiplied by 182/366 (to reflect the one-half year period).
C 5% return per year before expenses
Distributions (Unaudited)
A total of 0.52% of the dividends distributed during the fiscal year was derived from interest on U.S. Government securities which is generally exempt from state income tax.
The fund designates $1,098,041 of distributions paid during the period January 1, 2020 to April 30, 2020 as qualifying to be taxed as interest-related dividends for nonresident alien shareholders.
The fund will notify shareholders in January 2021 of amounts for use in preparing 2020 income tax returns.
Board Approval of Investment Advisory Contracts and Management Fees
Fidelity Short Duration High Income Fund
Each year, the Board of Trustees, including the Independent Trustees (together, the Board), votes on the renewal of the management contract with Fidelity Management & Research Company LLC (FMR) and the sub-advisory agreements (together, the Advisory Contracts) for the fund. FMR and the sub-advisers are referred to herein as the Investment Advisers. The Board, assisted by the advice of fund counsel and Independent Trustees' counsel, requests and considers a broad range of information relevant to the renewal of the Advisory Contracts throughout the year.Approval of Amended and Restated Advisory Contracts. At its November 2019 meeting, the Board unanimously determined to approve an amended and restated management contract and sub-advisory agreements (Amended and Restated Contracts) for a stub period of January 1, 2020 through January 31, 2020 in connection with a consolidation of certain of Fidelity's advisory businesses. The Board considered that, on or about January 1, 2020, FMR Co., Inc. (FMRC) and Fidelity Investments Money Management, Inc. (FIMM) expected to merge with and into FMR and, after the merger, FMR expected to redomicile as a Delaware limited liability company. The Board also approved the termination of the sub-advisory agreement with FMRC and FIMM upon the completion of the merger. The Board noted that references to FMR in the Amended and Restated Contracts would be updated to reflect FMR's new form of organization and domicile and considered that the definition of "group assets" for purposes of the fund's group fee would be modified to avoid double-counting assets once the reorganization is complete. The Board also noted Fidelity's assurance that neither the planned consolidation nor the Amended and Restated Contracts will change the investment processes, the level or nature of services provided, the resources and personnel allocated, trading and compliance operations, or any fees paid by the fund.The Board meets regularly and, at each of its meetings, covers an extensive agenda of topics and materials and considers factors that are relevant to its annual consideration of the renewal of the fund's Advisory Contracts, including the services and support provided to the fund and its shareholders. The Board has established various standing committees (Committees), each composed of and chaired by Independent Trustees with varying backgrounds, to which the Board has assigned specific subject matter responsibilities in order to enhance effective decision-making by the Board. The Board, acting directly and through its Committees, requests and receives information concerning the annual consideration of the renewal of the fund's Advisory Contracts. The Board also meets as needed to review matters specifically related to the Board's annual consideration of the renewal of the Advisory Contracts. Members of the Board may also meet with trustees of other Fidelity funds through joint ad hoc committees to discuss certain matters relevant to all of the Fidelity funds.At its January 2020 meeting, the Board unanimously determined to renew the fund's Advisory Contracts. In reaching its determination, the Board considered all factors it believed relevant, including (i) the nature, extent, and quality of the services provided to the fund and its shareholders (including the investment performance of the fund); (ii) the competitiveness of the fund's management fee and total expense ratio relative to peer funds; (iii) the total costs of the services provided by and the profits realized by Fidelity from its relationships with the fund; and (iv) the extent to which, if any, economies of scale exist and are realized as the fund grows, and whether any economies of scale are appropriately shared with fund shareholders.In considering whether to renew the Advisory Contracts for the fund, the Board reached a determination, with the assistance of fund counsel and Independent Trustees' counsel and through the exercise of its business judgment, that the renewal of the Advisory Contracts was in the best interests of the fund and its shareholders and that the compensation payable under the Advisory Contracts was fair and reasonable. The Board's decision to renew the Advisory Contracts was not based on any single factor, but rather was based on a comprehensive consideration of all the information provided to the Board at its meetings throughout the year. The Board, in reaching its determination to renew the Advisory Contracts, was aware that shareholders of the fund have a broad range of investment choices available to them, including a wide choice among funds offered by Fidelity's competitors, and that the fund's shareholders, who have the opportunity to review and weigh the disclosure provided by the fund in its prospectus and other public disclosures, have chosen to invest in this fund, which is part of the Fidelity family of funds.Nature, Extent, and Quality of Services Provided. The Board considered Fidelity's staffing as it relates to the fund, including the backgrounds of investment personnel of Fidelity, and also considered the fund's investment objective, strategies, and related investment philosophy. The Independent Trustees also had discussions with senior management of Fidelity's investment operations and investment groups. The Board considered the structure of the investment personnel compensation program and whether this structure provides appropriate incentives to act in the best interests of the fund. Additionally, the Board considered the portfolio managers' investments, if any, in the funds that they manage.Resources Dedicated to Investment Management and Support Services. The Board and the Fund Oversight and Research Committees reviewed the general qualifications and capabilities of Fidelity's investment staff, including its size, education, experience, and resources, as well as Fidelity's approach to recruiting, training, managing, and compensating investment personnel. The Board noted that Fidelity has continued to increase the resources devoted to non-U.S. offices, including expansion of Fidelity's global investment organization. The Board also noted that Fidelity's analysts have extensive resources, tools and capabilities that allow them to conduct sophisticated quantitative and fundamental analysis, as well as credit analysis of issuers, counterparties and guarantors. Further, the Board considered that Fidelity's investment professionals have sufficient access to global information and data so as to provide competitive investment results over time, and that those professionals also have access to sophisticated tools that permit them to assess portfolio construction and risk and performance attribution characteristics continuously, as well as to transmit new information and research conclusions rapidly around the world. Additionally, in its deliberations, the Board considered Fidelity's trading, risk management, compliance, and technology and operations capabilities and resources, which are integral parts of the investment management process.Shareholder and Administrative Services. The Board considered (i) the nature, extent, quality, and cost of advisory, administrative, and shareholder services performed by the Investment Advisers and their affiliates under the Advisory Contracts and under separate agreements covering transfer agency, pricing and bookkeeping, and securities lending services for the fund; (ii) the nature and extent of the supervision of third party service providers, principally custodians, subcustodians, and pricing vendors; and (iii) the resources devoted to, and the record of compliance with, the fund's compliance policies and procedures. The Board also reviewed the allocation of fund brokerage, including allocations to brokers affiliated with the Investment Advisers, the use of brokerage commissions to pay fund expenses, and the use of "soft" commission dollars to pay for research services.The Board noted that the growth of fund assets over time across the complex allows Fidelity to reinvest in the development of services designed to enhance the value and convenience of the Fidelity funds as investment vehicles. These services include 24-hour access to account information and market information over the Internet and through telephone representatives, investor education materials and asset allocation tools, and the expanded availability of Fidelity Investor Centers.The Board noted that it and the boards of certain other Fidelity funds had formed an ad hoc Committee on Transfer Agency Fees to review the variety of transfer agency fee structures throughout the industry and Fidelity's competitive positioning with respect to industry participants.Investment in a Large Fund Family. The Board considered the benefits to shareholders of investing in a Fidelity fund, including the benefits of investing in a fund that is part of a large family of funds offering a variety of investment disciplines and providing a large variety of mutual fund investor services. The Board noted that Fidelity had taken, or had made recommendations that resulted in the Fidelity funds taking, a number of actions over the previous year that benefited particular funds, including: (i) continuing to dedicate additional resources to Fidelity's investment research process, which includes meetings with management of issuers of securities in which the funds invest, and to the support of the senior management team that oversees asset management; (ii) continuing efforts to enhance Fidelity's global research capabilities; (iii) launching new funds and ETFs with innovative structures, strategies and pricing and making other enhancements to meet client needs; (iv) launching new share classes of existing funds; (v) eliminating purchase minimums and broadening eligibility requirements for certain funds and share classes; (vi) reducing management fees and total expenses for certain target date funds and index funds; (vii) lowering expense caps for certain existing funds and classes, and converting certain voluntary expense caps to contractual caps, to reduce expenses borne by shareholders; (viii) rationalizing product lines and gaining increased efficiencies from fund mergers, liquidations, and share class consolidations; (ix) continuing to develop, acquire and implement systems and technology to improve services to the funds and shareholders, strengthen information security, and increase efficiency; and (x) continuing to implement enhancements to further strengthen Fidelity's product line to increase investors' probability of success in achieving their investment goals, including retirement income goals.Investment Performance. The Board considered whether the fund has operated in accordance with its investment objective, as well as its record of compliance with its investment restrictions and its performance history. The Board noted that there were portfolio management changes for the fund in December 2018 and June 2019. The Board will continue to monitor closely the fund's performance as the new portfolio manager(s) establishes a track record.The Board took into account discussions that occur at Board meetings throughout the year with representatives of the Investment Advisers about fund investment performance. In this regard the Board noted that as part of regularly scheduled fund reviews and other reports to the Board on fund performance, the Board considers annualized return information for the fund for different time periods, measured against an appropriate securities market index (benchmark index) and a peer group of funds with similar objectives (peer group), if any. In its evaluation of fund investment performance, the Board gave particular attention to information indicating changes in performance of certain Fidelity funds for specific time periods and discussed with the Investment Advisers the reasons for any overperformance or underperformance.In addition to reviewing absolute and relative fund performance, the Independent Trustees periodically consider the appropriateness of fund performance metrics in evaluating the results achieved. In general, the Independent Trustees believe that fund performance should be evaluated based on net performance (after fees and expenses) of both the highest performing and lowest performing fund share classes, where applicable, compared to appropriate benchmark indices, over appropriate time periods that may include full market cycles, and compared to peer groups, as applicable, over the same periods, taking into account relevant factors including the following: general market conditions; issuer-specific information; and fund cash flows and other factors.The Independent Trustees recognize that shareholders evaluate performance on a net basis over their own holding periods, for which one-, three-, and five-year periods are often used as a proxy. For this reason, the performance information reviewed by the Board also included net cumulative total return information for the fund and an appropriate benchmark index for the most recent one-, three-, and five-year periods ended June 30, 2019, as shown below. A peer group is not shown below because the fund does not generally utilize a peer group for performance comparison purposes.Fidelity Short Duration High Income Fund
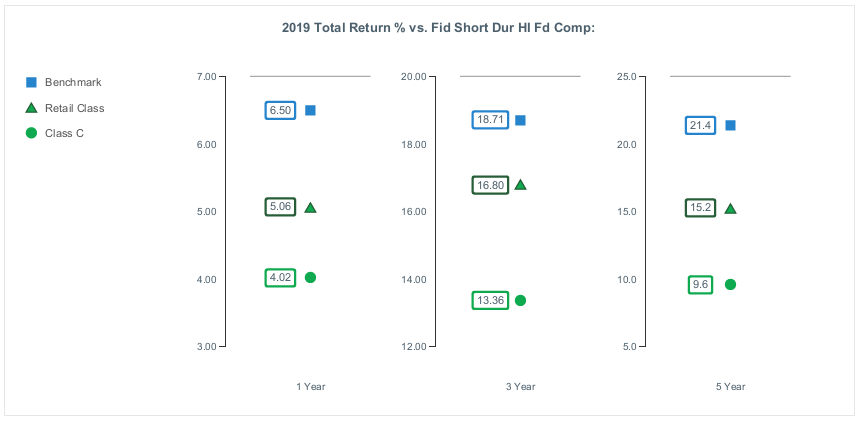
Fidelity Short Duration High Income Fund
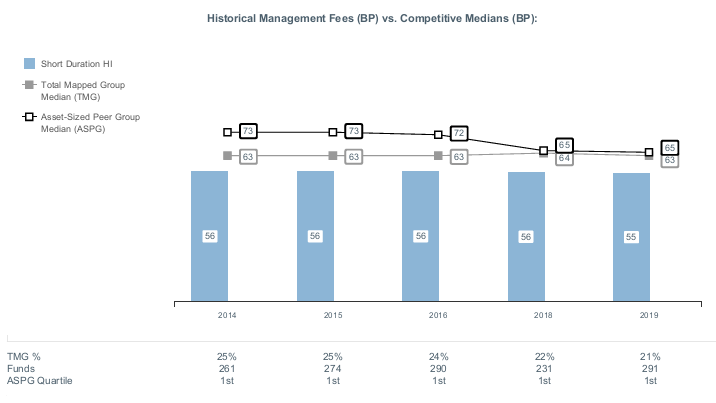
Liquidity Risk Management Program
The Securities and Exchange Commission adopted Rule 22e-4 under the Investment Company Act of 1940 (the Liquidity Rule) to promote effective liquidity risk management throughout the open-end investment company industry, thereby reducing the risk that funds will be unable to meet their redemption obligations and mitigating dilution of the interests of fund shareholders.
The Fund has adopted and implemented a liquidity risk management program pursuant to the Liquidity Rule (the Program) effective December 1, 2018. The Program is reasonably designed to assess and manage the Fund’s liquidity risk and to comply with the requirements of the Liquidity Rule. The Fund’s Board of Trustees (the Board) has designated the Fund’s investment adviser as administrator of the Program. The Fidelity advisers have established a Liquidity Risk Management Committee (the LRM Committee) to manage the Program for each of the Fidelity Funds. The LRM Committee monitors the adequacy and effectiveness of implementation of the Program and on a periodic basis assesses each Fund’s liquidity risk based on a variety of factors including (1) the Fund’s investment strategy, (2) portfolio liquidity and cash flow projections during normal and reasonably foreseeable stressed conditions, (3) shareholder redemptions, (4) borrowings and other funding sources and (5) in the case of exchange-traded funds, certain additional factors including the effect of the Fund’s prices and spreads, market participants, and basket compositions on the overall liquidity of the Fund’s portfolio, as applicable.
In accordance with the Program, each of the Fund’s portfolio investments is classified into one of four liquidity categories described below based on a determination of a reasonable expectation for how long it would take to convert the investment to cash (or sell or dispose of the investment) without significantly changing its market value.
- Highly liquid investments – cash or convertible to cash within three business days or less
- Moderately liquid investments – convertible to cash in three to seven calendar days
- Less liquid investments – can be sold or disposed of, but not settled, within seven calendar days
- Illiquid investments – cannot be sold or disposed of within seven calendar days
Liquidity classification determinations take into account a variety of factors including various market, trading and investment-specific considerations, as well as market depth, and generally utilize analysis from a third-party liquidity metrics service.
The Liquidity Rule places a 15% limit on a fund’s illiquid investments and requires funds that do not primarily hold assets that are highly liquid investments to determine and maintain a minimum percentage of the fund’s net assets to be invested in highly liquid investments (highly liquid investment minimum or HLIM). The Program includes provisions reasonably designed to comply with the 15% limit on illiquid investments and for determining, periodically reviewing and complying with the HLIM requirement as applicable.
At a recent meeting of the Fund’s Board of Trustees, the LRM Committee provided a written report to the Board pertaining to the operation, adequacy, and effectiveness of implementation of the Program for the annual period from December 1, 2018 through November 30, 2019. The report concluded that the Program has been implemented and is operating effectively and is reasonably designed to assess and manage the Fund’s liquidity risk.
![]()
SDH-ANN-0620
1.969434.106
Fidelity® Women's Leadership Fund
April 30, 2020
Includes Fidelity and Fidelity Advisor share classes
See the inside front cover for important information about access to your fund’s shareholder reports.
Beginning on January 1, 2021, as permitted by regulations adopted by the Securities and Exchange Commission, paper copies of a fund’s shareholder reports will no longer be sent by mail, unless you specifically request paper copies of the reports from the fund or from your financial intermediary, such as a financial advisor, broker-dealer or bank. Instead, the reports will be made available on a website, and you will be notified by mail each time a report is posted and provided with a website link to access the report.
If you already elected to receive shareholder reports electronically, you will not be affected by this change and you need not take any action. You may elect to receive shareholder reports and other communications from a fund electronically, by contacting your financial intermediary. For Fidelity customers, visit Fidelity's web site or call Fidelity using the contact information listed below.
You may elect to receive all future reports in paper free of charge. If you wish to continue receiving paper copies of your shareholder reports, you may contact your financial intermediary or, if you are a Fidelity customer, visit Fidelity’s website, or call Fidelity at the applicable toll-free number listed below. Your election to receive reports in paper will apply to all funds held with the fund complex/your financial intermediary.
| Account Type | Website | Phone Number |
| Brokerage, Mutual Fund, or Annuity Contracts: | fidelity.com/mailpreferences | 1-800-343-3548 |
| Employer Provided Retirement Accounts: | netbenefits.fidelity.com/preferences (choose 'no' under Required Disclosures to continue to print) | 1-800-343-0860 |
| Advisor Sold Accounts Serviced Through Your Financial Intermediary: | Contact Your Financial Intermediary | Your Financial Intermediary's phone number |
| Advisor Sold Accounts Serviced by Fidelity: | institutional.fidelity.com | 1-877-208-0098 |
Contents
Board Approval of Investment Advisory Contracts and Management Fees | |
To view a fund's proxy voting guidelines and proxy voting record for the 12-month period ended June 30, visit http://www.fidelity.com/proxyvotingresults or visit the Securities and Exchange Commission's (SEC) web site at http://www.sec.gov.
You may also call 1-800-544-8544 if you’re an individual investing directly with Fidelity, call 1-800-835-5092 if you’re a plan sponsor or participant with Fidelity as your recordkeeper or call 1-877-208-0098 on institutional accounts or if you’re an advisor or invest through one to request a free copy of the proxy voting guidelines.
Standard & Poor's, S&P and S&P 500 are registered service marks of The McGraw-Hill Companies, Inc. and have been licensed for use by Fidelity Distributors Corporation.
Other third-party marks appearing herein are the property of their respective owners.
All other marks appearing herein are registered or unregistered trademarks or service marks of FMR LLC or an affiliated company. © 2020 FMR LLC. All rights reserved.
This report and the financial statements contained herein are submitted for the general information of the shareholders of the Fund. This report is not authorized for distribution to prospective investors in the Fund unless preceded or accompanied by an effective prospectus.
A fund files its complete schedule of portfolio holdings with the SEC for the first and third quarters of each fiscal year on Form N-PORT. Forms N-PORT are available on the SEC’s web site at http://www.sec.gov. A fund's Forms N-PORT may be reviewed and copied at the SEC’s Public Reference Room in Washington, DC. Information regarding the operation of the SEC's Public Reference Room may be obtained by calling 1-800-SEC-0330.
For a complete list of a fund's portfolio holdings, view the most recent holdings listing, semiannual report, or annual report on Fidelity's web site at http://www.fidelity.com, http://www.institutional.fidelity.com, or http://www.401k.com, as applicable.
NOT FDIC INSURED •MAY LOSE VALUE •NO BANK GUARANTEE
Neither the Fund nor Fidelity Distributors Corporation is a bank.
Note to Shareholders:
Early in 2020, the outbreak and spread of a new coronavirus emerged as a public health emergency that had a major influence on financial markets, primarily based on its impact on the global economy and the outlook for corporate earnings. The virus causes a respiratory disease known as COVID-19. On March 11, the World Health Organization declared the COVID-19 outbreak a pandemic, citing sustained risk of further global spread.
In the weeks following, as the crisis worsened, we witnessed an escalating human tragedy with wide-scale social and economic consequences from coronavirus-containment measures. The outbreak of COVID-19 prompted a number of measures to limit the spread, including travel and border restrictions, quarantines, and restrictions on large gatherings. In turn, these resulted in lower consumer activity, diminished demand for a wide range of products and services, disruption in manufacturing and supply chains, and – given the wide variability in outcomes regarding the outbreak – significant market uncertainty and volatility. Amid the turmoil, the U.S. government took unprecedented action – in concert with the U.S. Federal Reserve and central banks around the world – to help support consumers, businesses, and the broader economy, and to limit disruption to the financial system.
The situation continues to unfold, and the extent and duration of its impact on financial markets and the economy remain highly uncertain. Extreme events such as the coronavirus crisis are “exogenous shocks” that can have significant adverse effects on mutual funds and their investments. Although multiple asset classes may be affected by market disruption, the duration and impact may not be the same for all types of assets.
Fidelity is committed to helping you stay informed amid news about COVID-19 and during increased market volatility, and we’re taking extra steps to be responsive to customer needs. We encourage you to visit our websites, where we offer ongoing updates, commentary, and analysis on the markets and our funds.
Performance: The Bottom Line
Average annual total return reflects the change in the value of an investment, assuming reinvestment of distributions from dividend income and capital gains (the profits earned upon the sale of securities that have grown in value, if any) and assuming a constant rate of performance each year. The hypothetical investment and the average annual total returns do not reflect the deduction of taxes that a shareholder would pay on fund distributions or the redemption of fund shares. During periods of reimbursement by Fidelity, a fund’s total return will be greater than it would be had the reimbursement not occurred. How a fund did yesterday is no guarantee of how it will do tomorrow.
Average annual total returns for Fidelity® Women's Leadership Fund will be reported once the fund is a year old.
$10,000 Over Life of Fund
Let's say hypothetically that $10,000 was invested in Fidelity® Women's Leadership Fund, a class of the fund, on May 1, 2019, when the fund started.
The chart shows how the value of your investment would have changed, and also shows how the Russell 3000® Index performed over the same period.
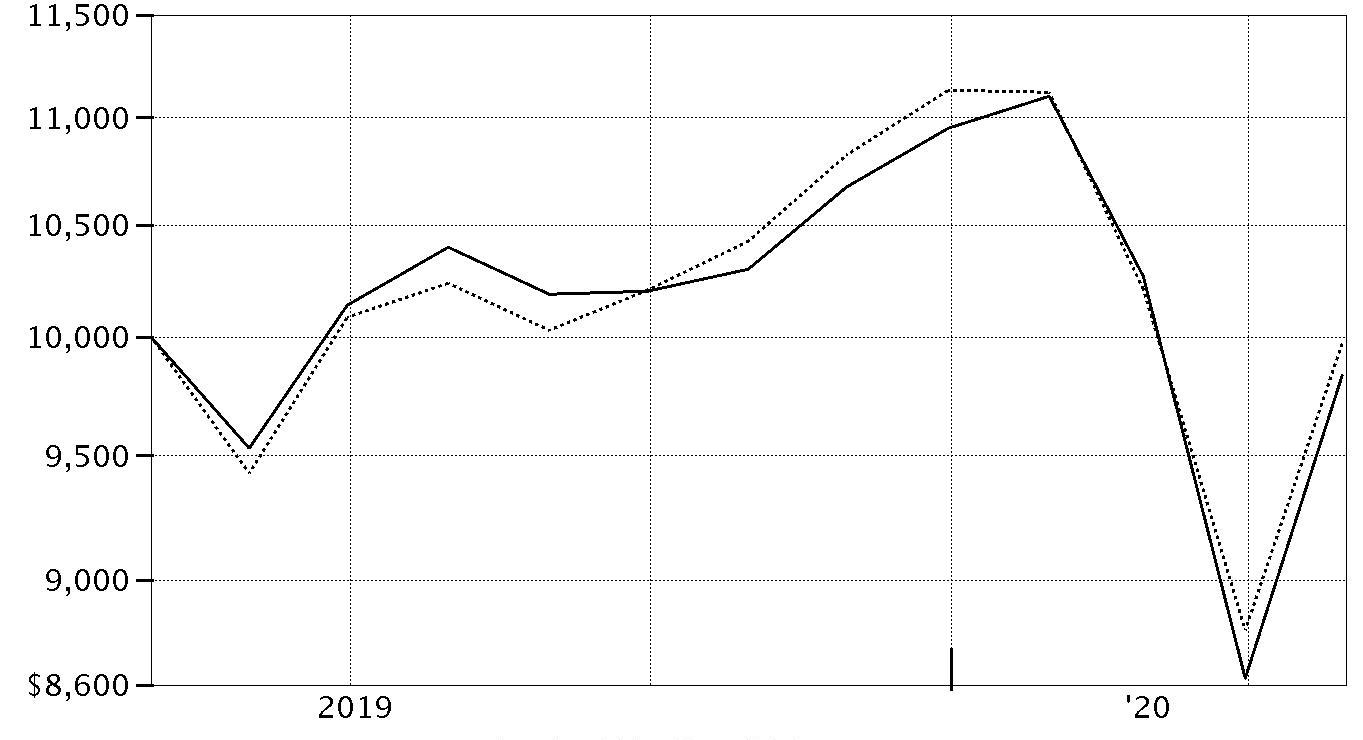
| Period Ending Values | ||
| $9,837 | Fidelity® Women's Leadership Fund | |
| $9,973 | Russell 3000® Index | |
Management's Discussion of Fund Performance
Market Recap: The U.S. equity bellwether S&P 500® index gained 0.86% for the 12 months ending April 30, 2020, as the early-2020 outbreak and spread of the coronavirus hampered global economic growth and the outlook for corporate earnings. Declared a pandemic on March 11, the crisis and containment efforts caused broad contraction in economic activity, along with extreme uncertainty, volatility and dislocation in financial markets. By mid-March, U.S. stocks entered bear-market territory less than a month after hitting an all-time high and extending the longest-running bull market in American history. Following a flattish January to open the year, stocks slid in late February (-8.23%), after a surge in COVID-19 cases outside China pushed investors to safer asset classes. The downtrend continued in March (-12.35%), capping the index’s worst quarterly result since 2008. A historically rapid and expansive U.S. monetary/fiscal-policy response helped mitigate the most acute near-term liquidity issues and provided a partial offset to the economic disruption. This was evident in April, when the index achieved its highest monthly gain (+12.82%) since 1991, boosted by improving coronavirus trends, plans for reopening the economy and progress on potential treatments. By sector, energy stocks (-38%) fell hard along with the price of crude oil. Financials (-17%) and industrials (-16%) also lagged. In contrast, information technology (+18%) led, followed by health care (+15%), a defensive sector that saw higher demand due to the virus-containment response.Comments from Portfolio Manager Nicole Connolly: From the fund's inception on May 1, 2019 through April 30, 2020, the fund's share classes (excluding sales charges, if applicable) returned roughly -2%, outpacing the -6.01% result of the MSCI U.S. Women's Leadership Index. The fund lagged the -0.27% return of the Russell 3000 Index for the same period. Looking at the fund's performance relative to the MSCI index, active management added value in 10 of 11 equity market sectors, with stock selection being the biggest driver of outperformance this period. Specifically, stock choices in the consumer discretionary, financials and health care sectors contributed most to the fund's relative outperformance. In terms of individual stocks, the fund's overweight position in software provider Microsoft (+40%) was our largest contributor. Sizable out-of-benchmark stakes in biopharmaceutical firm AstraZeneca (+44%), offshore wind energy provider Orsted (+34%) and Vertex Pharmaceuticals (+51%) also added value. Conversely, stock picks and an underweighting in the outperforming consumer staples sector held back the fund's relative result. Untimely positioning in computer networking company Arista Networks (-30%) was the fund's biggest individual relative detractor. A non-index stake in fuel card provider Wex (-38%) also hurt, as did an overweighting in private label credit card company Synchrony Financial (-41%).The views expressed above reflect those of the portfolio manager(s) only through the end of the period as stated on the cover of this report and do not necessarily represent the views of Fidelity or any other person in the Fidelity organization. Any such views are subject to change at any time based upon market or other conditions and Fidelity disclaims any responsibility to update such views. These views may not be relied on as investment advice and, because investment decisions for a Fidelity fund are based on numerous factors, may not be relied on as an indication of trading intent on behalf of any Fidelity fund.
Investment Summary (Unaudited)
Top Five Stocks as of April 30, 2020
| % of fund's net assets | |
| Microsoft Corp. | 3.7 |
| AstraZeneca PLC sponsored ADR | 2.2 |
| Accenture PLC Class A | 1.9 |
| Anthem, Inc. | 1.8 |
| Adobe, Inc. | 1.7 |
| 11.3 |
Top Five Market Sectors as of April 30, 2020
| % of fund's net assets | |
| Information Technology | 29.8 |
| Health Care | 14.5 |
| Financials | 11.9 |
| Consumer Discretionary | 11.2 |
| Industrials | 9.8 |
Asset Allocation (% of fund's net assets)
| As of April 30, 2020* | ||
| Stocks | 97.0% | |
| Short-Term Investments and Net Other Assets (Liabilities) | 3.0% | |

* Foreign investments - 17.7%
Schedule of Investments April 30, 2020
Showing Percentage of Net Assets
| Common Stocks - 97.0% | |||
| Shares | Value | ||
| COMMUNICATION SERVICES - 5.4% | |||
| Entertainment - 3.4% | |||
| Netflix, Inc. (a) | 843 | $353,934 | |
| The Walt Disney Co. | 3,652 | 394,964 | |
| Zynga, Inc. (a) | 21,580 | 162,713 | |
| 911,611 | |||
| Interactive Media & Services - 1.5% | |||
| Facebook, Inc. Class A (a) | 1,503 | 307,679 | |
| Match Group, Inc. (a) | 1,215 | 93,506 | |
| 401,185 | |||
| Media - 0.5% | |||
| The New York Times Co. Class A | 4,343 | 141,234 | |
| TOTAL COMMUNICATION SERVICES | 1,454,030 | ||
| CONSUMER DISCRETIONARY - 11.2% | |||
| Automobiles - 0.0% | |||
| General Motors Co. | 20 | 446 | |
| Diversified Consumer Services - 0.7% | |||
| Bright Horizons Family Solutions, Inc. (a) | 1,604 | 186,786 | |
| Hotels, Restaurants & Leisure - 0.9% | |||
| Starbucks Corp. | 3,173 | 243,464 | |
| Household Durables - 0.8% | |||
| Taylor Morrison Home Corp. (a) | 13,952 | 203,002 | |
| Internet & Direct Marketing Retail - 2.5% | |||
| Amazon.com, Inc. (a) | 148 | 366,152 | |
| Etsy, Inc. (a) | 2,946 | 191,107 | |
| Trainline PLC (b) | 27,354 | 130,712 | |
| 687,971 | |||
| Specialty Retail - 5.4% | |||
| Best Buy Co., Inc. | 2,903 | 222,747 | |
| Burlington Stores, Inc. (a) | 767 | 140,123 | |
| Lowe's Companies, Inc. | 2,551 | 267,217 | |
| Ross Stores, Inc. | 635 | 58,014 | |
| The Home Depot, Inc. | 1,156 | 254,123 | |
| Ulta Beauty, Inc. (a) | 989 | 215,523 | |
| Williams-Sonoma, Inc. | 4,777 | 295,410 | |
| 1,453,157 | |||
| Textiles, Apparel & Luxury Goods - 0.9% | |||
| Aritzia LP (a) | 6,952 | 82,758 | |
| LVMH Moet Hennessy Louis Vuitton SE | 421 | 162,756 | |
| Tapestry, Inc. | 47 | 699 | |
| 246,213 | |||
| TOTAL CONSUMER DISCRETIONARY | 3,021,039 | ||
| CONSUMER STAPLES - 5.0% | |||
| Food & Staples Retailing - 0.5% | |||
| Loblaw Companies Ltd. | 2,884 | 141,926 | |
| Food Products - 2.4% | |||
| Danone SA | 2,690 | 187,485 | |
| General Mills, Inc. | 3,944 | 236,206 | |
| The Hershey Co. | 1,717 | 227,382 | |
| 651,073 | |||
| Personal Products - 2.1% | |||
| Estee Lauder Companies, Inc. Class A | 1,206 | 212,738 | |
| Shiseido Co. Ltd. | 2,824 | 166,032 | |
| Unilever NV | 3,619 | 180,224 | |
| 558,994 | |||
| TOTAL CONSUMER STAPLES | 1,351,993 | ||
| ENERGY - 1.7% | |||
| Oil, Gas & Consumable Fuels - 1.7% | |||
| Chevron Corp. | 3,506 | 322,552 | |
| Equinor ASA | 10,558 | 147,832 | |
| Occidental Petroleum Corp. | 76 | 1,262 | |
| Valero Energy Corp. | 12 | 760 | |
| 472,406 | |||
| FINANCIALS - 11.9% | |||
| Banks - 3.4% | |||
| Bank of America Corp. | 12,240 | 294,372 | |
| Citigroup, Inc. | 6,263 | 304,131 | |
| First Horizon National Corp. | 16,838 | 152,889 | |
| JPMorgan Chase & Co. | 1,872 | 179,263 | |
| 930,655 | |||
| Capital Markets - 4.0% | |||
| Macquarie Group Ltd. | 2,154 | 142,687 | |
| Morgan Stanley | 3,281 | 129,370 | |
| Morningstar, Inc. | 1,842 | 287,278 | |
| MSCI, Inc. | 469 | 153,363 | |
| The NASDAQ OMX Group, Inc. | 3,392 | 372,001 | |
| 1,084,699 | |||
| Consumer Finance - 1.5% | |||
| American Express Co. | 2,116 | 193,085 | |
| Synchrony Financial | 10,882 | 215,355 | |
| 408,440 | |||
| Insurance - 3.0% | |||
| Hartford Financial Services Group, Inc. | 4,251 | 161,495 | |
| Primerica, Inc. | 1,373 | 142,668 | |
| Principal Financial Group, Inc. | 4,249 | 154,706 | |
| Progressive Corp. | 4,403 | 340,352 | |
| 799,221 | |||
| TOTAL FINANCIALS | 3,223,015 | ||
| HEALTH CARE - 14.5% | |||
| Biotechnology - 2.0% | |||
| Veracyte, Inc. (a) | 3,881 | 104,671 | |
| Vertex Pharmaceuticals, Inc. (a) | 1,201 | 301,691 | |
| Zai Lab Ltd. ADR (a) | 2,085 | 130,771 | |
| 537,133 | |||
| Health Care Equipment & Supplies - 3.1% | |||
| Hologic, Inc. (a) | 7,373 | 369,387 | |
| Insulet Corp. (a) | 476 | 95,067 | |
| Medtronic PLC | 1,330 | 129,848 | |
| Stryker Corp. | 1,263 | 235,461 | |
| 829,763 | |||
| Health Care Providers & Services - 5.1% | |||
| 1Life Healthcare, Inc. (a) | 7,564 | 186,604 | |
| AMN Healthcare Services, Inc. (a) | 3,243 | 152,356 | |
| Anthem, Inc. | 1,747 | 490,435 | |
| Cigna Corp. | 1,502 | 294,062 | |
| CVS Health Corp. | 4,030 | 248,047 | |
| Progyny, Inc. (a) | 67 | 1,570 | |
| 1,373,074 | |||
| Pharmaceuticals - 4.3% | |||
| AstraZeneca PLC sponsored ADR | 11,146 | 582,713 | |
| GlaxoSmithKline PLC | 18,290 | 381,577 | |
| Zoetis, Inc. Class A | 1,563 | 202,112 | |
| 1,166,402 | |||
| TOTAL HEALTH CARE | 3,906,372 | ||
| INDUSTRIALS - 9.8% | |||
| Aerospace & Defense - 2.1% | |||
| Lockheed Martin Corp. | 763 | 296,853 | |
| Northrop Grumman Corp. | 818 | 270,488 | |
| 567,341 | |||
| Airlines - 0.4% | |||
| Southwest Airlines Co. | 3,564 | 111,375 | |
| Commercial Services & Supplies - 2.0% | |||
| Stericycle, Inc. (a) | 2,196 | 107,165 | |
| Tomra Systems ASA | 4,777 | 158,720 | |
| Waste Connection, Inc. (United States) | 7 | 601 | |
| Waste Management, Inc. | 2,777 | 277,756 | |
| 544,242 | |||
| Electrical Equipment - 2.6% | |||
| AMETEK, Inc. | 2,588 | 217,056 | |
| nVent Electric PLC | 5,173 | 96,476 | |
| Sensata Technologies, Inc. PLC (a) | 5,504 | 200,236 | |
| Sunrun, Inc. (a) | 5,559 | 77,993 | |
| Vestas Wind Systems A/S | 1,224 | 105,109 | |
| 696,870 | |||
| Machinery - 2.2% | |||
| Federal Signal Corp. | 10,632 | 286,320 | |
| Gardner Denver Holdings, Inc. (a) | 6,105 | 177,533 | |
| Otis Worldwide Corp. (a) | 2,567 | 130,686 | |
| 594,539 | |||
| Professional Services - 0.5% | |||
| Verisk Analytics, Inc. | 928 | 141,826 | |
| TOTAL INDUSTRIALS | 2,656,193 | ||
| INFORMATION TECHNOLOGY - 29.8% | |||
| Communications Equipment - 2.5% | |||
| Arista Networks, Inc. (a) | 1,207 | 264,695 | |
| Cisco Systems, Inc. | 9,401 | 398,414 | |
| 663,109 | |||
| Electronic Equipment & Components - 1.7% | |||
| CDW Corp. | 2,266 | 251,073 | |
| Insight Enterprises, Inc. (a) | 3,785 | 205,488 | |
| 456,561 | |||
| IT Services - 10.3% | |||
| Accenture PLC Class A | 2,713 | 502,420 | |
| Amdocs Ltd. | 2,117 | 136,419 | |
| Automatic Data Processing, Inc. | 954 | 139,942 | |
| Capgemini SA | 2,799 | 262,989 | |
| Genpact Ltd. | 3,387 | 116,614 | |
| IBM Corp. | 6 | 753 | |
| Leidos Holdings, Inc. | 2,738 | 270,542 | |
| MasterCard, Inc. Class A | 1,301 | 357,736 | |
| PayPal Holdings, Inc. (a) | 2,021 | 248,583 | |
| Twilio, Inc. Class A (a) | 1,657 | 186,081 | |
| Visa, Inc. Class A | 1,444 | 258,072 | |
| WEX, Inc. (a) | 2,255 | 298,382 | |
| 2,778,533 | |||
| Semiconductors & Semiconductor Equipment - 2.1% | |||
| Advanced Micro Devices, Inc. (a) | 2,892 | 151,512 | |
| Marvell Technology Group Ltd. | 2,237 | 59,817 | |
| NVIDIA Corp. | 1,243 | 363,304 | |
| 574,633 | |||
| Software - 11.7% | |||
| Adobe, Inc. (a) | 1,333 | 471,402 | |
| HubSpot, Inc. (a) | 1,563 | 263,569 | |
| Intuit, Inc. | 1,175 | 317,027 | |
| Microsoft Corp. | 5,561 | 996,587 | |
| Pagerduty, Inc. | 10,852 | 229,086 | |
| Salesforce.com, Inc. (a) | 2,793 | 452,326 | |
| SAP SE sponsored ADR | 1,783 | 211,357 | |
| ServiceNow, Inc. (a) | 307 | 107,923 | |
| Talend SA ADR (a) | 4,779 | 124,636 | |
| 3,173,913 | |||
| Technology Hardware, Storage & Peripherals - 1.5% | |||
| Apple, Inc. | 1,345 | 395,161 | |
| TOTAL INFORMATION TECHNOLOGY | 8,041,910 | ||
| MATERIALS - 3.0% | |||
| Chemicals - 1.4% | |||
| Albemarle Corp. U.S. | 2,336 | 143,500 | |
| Ecolab, Inc. | 505 | 97,718 | |
| Valvoline, Inc. | 7,960 | 136,832 | |
| 378,050 | |||
| Metals & Mining - 1.6% | |||
| Commercial Metals Co. | 6,052 | 96,469 | |
| Newmont Corp. | 5,661 | 336,716 | |
| 433,185 | |||
| TOTAL MATERIALS | 811,235 | ||
| REAL ESTATE - 1.6% | |||
| Equity Real Estate Investment Trusts (REITs) - 1.6% | |||
| Equity Lifestyle Properties, Inc. | 4,048 | 244,135 | |
| Store Capital Corp. | 9,942 | 199,536 | |
| 443,671 | |||
| UTILITIES - 3.1% | |||
| Electric Utilities - 2.0% | |||
| Duke Energy Corp. | 1,541 | 130,461 | |
| NextEra Energy, Inc. | 761 | 175,882 | |
| ORSTED A/S (b) | 2,419 | 244,556 | |
| 550,899 | |||
| Multi-Utilities - 0.4% | |||
| CMS Energy Corp. | 1,721 | 98,252 | |
| Water Utilities - 0.7% | |||
| American Water Works Co., Inc. | 1,503 | 182,900 | |
| TOTAL UTILITIES | 832,051 | ||
| TOTAL COMMON STOCKS | |||
| (Cost $26,461,471) | 26,213,915 | ||
| Money Market Funds - 3.0% | |||
| Fidelity Cash Central Fund 0.16% (c) | |||
| (Cost $813,260) | 813,068 | 813,312 | |
| TOTAL INVESTMENT IN SECURITIES - 100.0% | |||
| (Cost $27,274,731) | 27,027,227 | ||
| NET OTHER ASSETS (LIABILITIES) - 0.0% | 2,308 | ||
| NET ASSETS - 100% | $27,029,535 |
Legend
(a) Non-income producing
(b) Security exempt from registration under Rule 144A of the Securities Act of 1933. These securities may be resold in transactions exempt from registration, normally to qualified institutional buyers. At the end of the period, the value of these securities amounted to $375,268 or 1.4% of net assets.
(c) Affiliated fund that is generally available only to investment companies and other accounts managed by Fidelity Investments. The rate quoted is the annualized seven-day yield of the fund at period end. A complete unaudited listing of the fund's holdings as of its most recent quarter end is available upon request. In addition, each Fidelity Central Fund's financial statements, which are not covered by the Fund's Report of Independent Registered Public Accounting Firm, are available on the SEC's website or upon request.
Affiliated Central Funds
Information regarding fiscal year to date income earned by the Fund from investments in Fidelity Central Funds is as follows:
| Fund | Income earned |
| Fidelity Cash Central Fund | $11,627 |
| Total | $11,627 |
Amounts in the income column in the above table include any capital gain distributions from underlying funds, which are presented in the corresponding line-item in the Statement of Operations, if applicable.
Investment Valuation
The following is a summary of the inputs used, as of April 30, 2020, involving the Fund's assets and liabilities carried at fair value. The inputs or methodology used for valuing securities may not be an indication of the risk associated with investing in those securities. For more information on valuation inputs, and their aggregation into the levels used below, please refer to the Investment Valuation section in the accompanying Notes to Financial Statements.
| Valuation Inputs at Reporting Date: | ||||
| Description | Total | Level 1 | Level 2 | Level 3 |
| Investments in Securities: | ||||
| Equities: | ||||
| Communication Services | $1,454,030 | $1,454,030 | $-- | $-- |
| Consumer Discretionary | 3,021,039 | 2,858,283 | 162,756 | -- |
| Consumer Staples | 1,351,993 | 818,252 | 533,741 | -- |
| Energy | 472,406 | 472,406 | -- | -- |
| Financials | 3,223,015 | 3,080,328 | 142,687 | -- |
| Health Care | 3,906,372 | 3,524,795 | 381,577 | -- |
| Industrials | 2,656,193 | 2,551,084 | 105,109 | -- |
| Information Technology | 8,041,910 | 8,041,910 | -- | -- |
| Materials | 811,235 | 811,235 | -- | -- |
| Real Estate | 443,671 | 443,671 | -- | -- |
| Utilities | 832,051 | 832,051 | -- | -- |
| Money Market Funds | 813,312 | 813,312 | -- | -- |
| Total Investments in Securities: | $27,027,227 | $25,701,357 | $1,325,870 | $-- |
Other Information
Distribution of investments by country or territory of incorporation, as a percentage of Total Net Assets, is as follows (Unaudited):
| United States of America | 82.3% |
| United Kingdom | 4.8% |
| Ireland | 2.8% |
| France | 2.7% |
| Denmark | 1.3% |
| Norway | 1.1% |
| Others (Individually Less Than 1%) | 5.0% |
| 100.0% |
See accompanying notes which are an integral part of the financial statements.
Financial Statements
Statement of Assets and Liabilities
| April 30, 2020 | ||
| Assets | ||
| Investment in securities, at value — See accompanying schedule: Unaffiliated issuers (cost $26,461,471) | $26,213,915 | |
| Fidelity Central Funds (cost $813,260) | 813,312 | |
| Total Investment in Securities (cost $27,274,731) | $27,027,227 | |
| Receivable for fund shares sold | 49,723 | |
| Dividends receivable | 14,243 | |
| Distributions receivable from Fidelity Central Funds | 131 | |
| Prepaid expenses | 3 | |
| Receivable from investment adviser for expense reductions | 60,808 | |
| Other receivables | 306 | |
| Total assets | 27,152,441 | |
| Liabilities | ||
| Payable for investments purchased | $38,162 | |
| Payable for fund shares redeemed | 22,252 | |
| Accrued management fee | 11,313 | |
| Distribution and service plan fees payable | 685 | |
| Audit fee payable | 38,867 | |
| Other affiliated payables | 5,920 | |
| Other payables and accrued expenses | 5,707 | |
| Total liabilities | 122,906 | |
| Net Assets | $27,029,535 | |
| Net Assets consist of: | ||
| Paid in capital | $28,679,112 | |
| Total accumulated earnings (loss) | (1,649,577) | |
| Net Assets | $27,029,535 | |
| Net Asset Value and Maximum Offering Price | ||
| Class A: | ||
| Net Asset Value and redemption price per share ($768,667 ÷ 78,440 shares)(a) | $9.80 | |
| Maximum offering price per share (100/94.25 of $9.80) | $10.40 | |
| Class M: | ||
| Net Asset Value and redemption price per share ($443,196 ÷ 45,303 shares)(a) | $9.78 | |
| Maximum offering price per share (100/96.50 of $9.78) | $10.13 | |
| Class C: | ||
| Net Asset Value and offering price per share ($468,045 ÷ 48,041 shares)(a) | $9.74 | |
| Fidelity Women's Leadership Fund: | ||
| Net Asset Value, offering price and redemption price per share ($22,271,779 ÷ 2,269,348 shares) | $9.81 | |
| Class I: | ||
| Net Asset Value, offering price and redemption price per share ($702,053 ÷ 71,541 shares) | $9.81 | |
| Class Z: | ||
| Net Asset Value, offering price and redemption price per share ($2,375,795 ÷ 241,726 shares) | $9.83 |
(a) Redemption price per share is equal to net asset value less any applicable contingent deferred sales charge.
See accompanying notes which are an integral part of the financial statements.
Statement of Operations
| For the period May 1, 2019 (commencement of operations) to April 30, 2020 | ||
| Investment Income | ||
| Dividends | $275,778 | |
| Income from Fidelity Central Funds | 11,627 | |
| Total income | 287,405 | |
| Expenses | ||
| Management fee | $95,695 | |
| Transfer agent fees | 45,271 | |
| Distribution and service plan fees | 5,550 | |
| Accounting fees and expenses | 6,972 | |
| Custodian fees and expenses | 25,584 | |
| Independent trustees' fees and expenses | 87 | |
| Registration fees | 164,792 | |
| Audit | 45,971 | |
| Legal | 9 | |
| Miscellaneous | 1,570 | |
| Total expenses before reductions | 391,501 | |
| Expense reductions | (210,656) | |
| Total expenses after reductions | 180,845 | |
| Net investment income (loss) | 106,560 | |
| Realized and Unrealized Gain (Loss) | ||
| Net realized gain (loss) on: | ||
| Investment securities: | ||
| Unaffiliated issuers | (1,440,064) | |
| Fidelity Central Funds | (82) | |
| Foreign currency transactions | 1,295 | |
| Total net realized gain (loss) | (1,438,851) | |
| Change in net unrealized appreciation (depreciation) on: | ||
| Investment securities: | ||
| Unaffiliated issuers | (247,556) | |
| Fidelity Central Funds | 52 | |
| Assets and liabilities in foreign currencies | (12) | |
| Total change in net unrealized appreciation (depreciation) | (247,516) | |
| Net gain (loss) | (1,686,367) | |
| Net increase (decrease) in net assets resulting from operations | $(1,579,807) |
See accompanying notes which are an integral part of the financial statements.
Statement of Changes in Net Assets
| For the period May 1, 2019 (commencement of operations) to April 30, 2020 | |
| Increase (Decrease) in Net Assets | |
| Operations | |
| Net investment income (loss) | $106,560 |
| Net realized gain (loss) | (1,438,851) |
| Change in net unrealized appreciation (depreciation) | (247,516) |
| Net increase (decrease) in net assets resulting from operations | (1,579,807) |
| Distributions to shareholders | (61,425) |
| Share transactions - net increase (decrease) | 28,670,767 |
| Total increase (decrease) in net assets | 27,029,535 |
| Net Assets | |
| Beginning of period | – |
| End of period | $27,029,535 |
See accompanying notes which are an integral part of the financial statements.
Financial Highlights
Fidelity Women's Leadership Fund Class A
| Years ended April 30, | 2020 A |
| Selected Per–Share Data | |
| Net asset value, beginning of period | $10.00 |
| Income from Investment Operations | |
| Net investment income (loss)B | .04 |
| Net realized and unrealized gain (loss) | (.22) |
| Total from investment operations | (.18) |
| Distributions from net investment income | (.02) |
| Total distributions | (.02) |
| Net asset value, end of period | $9.80 |
| Total ReturnC,D | (1.84)% |
| Ratios to Average Net AssetsE,F | |
| Expenses before reductions | 2.50% |
| Expenses net of fee waivers, if any | 1.25% |
| Expenses net of all reductions | 1.25% |
| Net investment income (loss) | .37% |
| Supplemental Data | |
| Net assets, end of period (000 omitted) | $769 |
| Portfolio turnover rateG | 52% |
A For the period May 1, 2019 (commencement of operations) to April 30, 2020.
B Calculated based on average shares outstanding during the period.
C Total returns would have been lower if certain expenses had not been reduced during the applicable periods shown.
D Total returns do not include the effect of the sales charges.
E Fees and expenses of any underlying Fidelity Central Funds are not included in the Fund's expense ratio. The Fund indirectly bears its proportionate share of the expenses of any underlying Fidelity Central Funds.
F Expense ratios reflect operating expenses of the class. Expenses before reductions do not reflect amounts reimbursed by the investment adviser or reductions from brokerage service arrangements or reductions from other expense offset arrangements and do not represent the amount paid by the class during periods when reimbursements or reductions occur. Expense ratios before reductions for start-up periods may not be representative of longer-term operating periods. Expenses net of fee waivers reflect expenses after reimbursement by the investment adviser but prior to reductions from brokerage service arrangements or other expense offset arrangements. Expenses net of all reductions represent the net expenses paid by the class.
G Amount does not include the portfolio activity of any underlying Fidelity Central Funds.
See accompanying notes which are an integral part of the financial statements.
Fidelity Women's Leadership Fund Class M
| Years ended April 30, | 2020 A |
| Selected Per–Share Data | |
| Net asset value, beginning of period | $10.00 |
| Income from Investment Operations | |
| Net investment income (loss)B | .01 |
| Net realized and unrealized gain (loss) | (.22) |
| Total from investment operations | (.21) |
| Distributions from net investment income | (.01) |
| Total distributions | (.01) |
| Net asset value, end of period | $9.78 |
| Total ReturnC,D | (2.12)% |
| Ratios to Average Net AssetsE,F | |
| Expenses before reductions | 2.86% |
| Expenses net of fee waivers, if any | 1.50% |
| Expenses net of all reductions | 1.50% |
| Net investment income (loss) | .12% |
| Supplemental Data | |
| Net assets, end of period (000 omitted) | $443 |
| Portfolio turnover rateG | 52% |
A For the period May 1, 2019 (commencement of operations) to April 30, 2020.
B Calculated based on average shares outstanding during the period.
C Total returns would have been lower if certain expenses had not been reduced during the applicable periods shown.
D Total returns do not include the effect of the sales charges.
E Fees and expenses of any underlying Fidelity Central Funds are not included in the Fund's expense ratio. The Fund indirectly bears its proportionate share of the expenses of any underlying Fidelity Central Funds.
F Expense ratios reflect operating expenses of the class. Expenses before reductions do not reflect amounts reimbursed by the investment adviser or reductions from brokerage service arrangements or reductions from other expense offset arrangements and do not represent the amount paid by the class during periods when reimbursements or reductions occur. Expense ratios before reductions for start-up periods may not be representative of longer-term operating periods. Expenses net of fee waivers reflect expenses after reimbursement by the investment adviser but prior to reductions from brokerage service arrangements or other expense offset arrangements. Expenses net of all reductions represent the net expenses paid by the class.
G Amount does not include the portfolio activity of any underlying Fidelity Central Funds.
See accompanying notes which are an integral part of the financial statements.
Fidelity Women's Leadership Fund Class C
| Years ended April 30, | 2020 A |
| Selected Per–Share Data | |
| Net asset value, beginning of period | $10.00 |
| Income from Investment Operations | |
| Net investment income (loss)B | (.04) |
| Net realized and unrealized gain (loss) | (.22) |
| Total from investment operations | (.26) |
| Net asset value, end of period | $9.74 |
| Total ReturnC,D | (2.60)% |
| Ratios to Average Net AssetsE,F | |
| Expenses before reductions | 3.36% |
| Expenses net of fee waivers, if any | 2.00% |
| Expenses net of all reductions | 2.00% |
| Net investment income (loss) | (.38)% |
| Supplemental Data | |
| Net assets, end of period (000 omitted) | $468 |
| Portfolio turnover rateG | 52% |
A For the period May 1, 2019 (commencement of operations) to April 30, 2020.
B Calculated based on average shares outstanding during the period.
C Total returns would have been lower if certain expenses had not been reduced during the applicable periods shown.
D Total returns do not include the effect of the contingent deferred sales charge.
E Fees and expenses of any underlying Fidelity Central Funds are not included in the Fund's expense ratio. The Fund indirectly bears its proportionate share of the expenses of any underlying Fidelity Central Funds.
F Expense ratios reflect operating expenses of the class. Expenses before reductions do not reflect amounts reimbursed by the investment adviser or reductions from brokerage service arrangements or reductions from other expense offset arrangements and do not represent the amount paid by the class during periods when reimbursements or reductions occur. Expense ratios before reductions for start-up periods may not be representative of longer-term operating periods. Expenses net of fee waivers reflect expenses after reimbursement by the investment adviser but prior to reductions from brokerage service arrangements or other expense offset arrangements. Expenses net of all reductions represent the net expenses paid by the class.
G Amount does not include the portfolio activity of any underlying Fidelity Central Funds.
See accompanying notes which are an integral part of the financial statements.
Fidelity Women's Leadership Fund
| Years ended April 30, | 2020 A |
| Selected Per–Share Data | |
| Net asset value, beginning of period | $10.00 |
| Income from Investment Operations | |
| Net investment income (loss)B | .06 |
| Net realized and unrealized gain (loss) | (.22) |
| Total from investment operations | (.16) |
| Distributions from net investment income | (.03) |
| Total distributions | (.03) |
| Net asset value, end of period | $9.81 |
| Total ReturnC | (1.63)% |
| Ratios to Average Net AssetsD,E | |
| Expenses before reductions | 2.19% |
| Expenses net of fee waivers, if any | 1.00% |
| Expenses net of all reductions | 1.00% |
| Net investment income (loss) | .62% |
| Supplemental Data | |
| Net assets, end of period (000 omitted) | $22,272 |
| Portfolio turnover rateF | 52% |
A For the period May 1, 2019 (commencement of operations) to April 30, 2020.
B Calculated based on average shares outstanding during the period.
C Total returns would have been lower if certain expenses had not been reduced during the applicable periods shown.
D Fees and expenses of any underlying Fidelity Central Funds are not included in the Fund's expense ratio. The Fund indirectly bears its proportionate share of the expenses of any underlying Fidelity Central Funds.
E Expense ratios reflect operating expenses of the class. Expenses before reductions do not reflect amounts reimbursed by the investment adviser or reductions from brokerage service arrangements or reductions from other expense offset arrangements and do not represent the amount paid by the class during periods when reimbursements or reductions occur. Expense ratios before reductions for start-up periods may not be representative of longer-term operating periods. Expenses net of fee waivers reflect expenses after reimbursement by the investment adviser but prior to reductions from brokerage service arrangements or other expense offset arrangements. Expenses net of all reductions represent the net expenses paid by the class.
F Amount does not include the portfolio activity of any underlying Fidelity Central Funds.
See accompanying notes which are an integral part of the financial statements.
Fidelity Women's Leadership Fund Class I
| Years ended April 30, | 2020 A |
| Selected Per–Share Data | |
| Net asset value, beginning of period | $10.00 |
| Income from Investment Operations | |
| Net investment income (loss)B | .06 |
| Net realized and unrealized gain (loss) | (.22) |
| Total from investment operations | (.16) |
| Distributions from net investment income | (.03) |
| Total distributions | (.03) |
| Net asset value, end of period | $9.81 |
| Total ReturnC | (1.63)% |
| Ratios to Average Net AssetsD,E | |
| Expenses before reductions | 2.22% |
| Expenses net of fee waivers, if any | 1.00% |
| Expenses net of all reductions | 1.00% |
| Net investment income (loss) | .62% |
| Supplemental Data | |
| Net assets, end of period (000 omitted) | $702 |
| Portfolio turnover rateF | 52% |
A For the period May 1, 2019 (commencement of operations) to April 30, 2020.
B Calculated based on average shares outstanding during the period.
C Total returns would have been lower if certain expenses had not been reduced during the applicable periods shown.
D Fees and expenses of any underlying Fidelity Central Funds are not included in the Fund's expense ratio. The Fund indirectly bears its proportionate share of the expenses of any underlying Fidelity Central Funds.
E Expense ratios reflect operating expenses of the class. Expenses before reductions do not reflect amounts reimbursed by the investment adviser or reductions from brokerage service arrangements or reductions from other expense offset arrangements and do not represent the amount paid by the class during periods when reimbursements or reductions occur. Expense ratios before reductions for start-up periods may not be representative of longer-term operating periods. Expenses net of fee waivers reflect expenses after reimbursement by the investment adviser but prior to reductions from brokerage service arrangements or other expense offset arrangements. Expenses net of all reductions represent the net expenses paid by the class.
F Amount does not include the portfolio activity of any underlying Fidelity Central Funds.
See accompanying notes which are an integral part of the financial statements.
Fidelity Women's Leadership Fund Class Z
| Years ended April 30, | 2020 A |
| Selected Per–Share Data | |
| Net asset value, beginning of period | $10.00 |
| Income from Investment Operations | |
| Net investment income (loss)B | .08 |
| Net realized and unrealized gain (loss) | (.22) |
| Total from investment operations | (.14) |
| Distributions from net investment income | (.03) |
| Total distributions | (.03) |
| Net asset value, end of period | $9.83 |
| Total ReturnC | (1.43)% |
| Ratios to Average Net AssetsD,E | |
| Expenses before reductions | 1.88% |
| Expenses net of fee waivers, if any | .85% |
| Expenses net of all reductions | .85% |
| Net investment income (loss) | .76% |
| Supplemental Data | |
| Net assets, end of period (000 omitted) | $2,376 |
| Portfolio turnover rateF | 52% |
A For the period May 1, 2019 (commencement of operations) to April 30, 2020.
B Calculated based on average shares outstanding during the period.
C Total returns would have been lower if certain expenses had not been reduced during the applicable periods shown.
D Fees and expenses of any underlying Fidelity Central Funds are not included in the Fund's expense ratio. The Fund indirectly bears its proportionate share of the expenses of any underlying Fidelity Central Funds.
E Expense ratios reflect operating expenses of the class. Expenses before reductions do not reflect amounts reimbursed by the investment adviser or reductions from brokerage service arrangements or reductions from other expense offset arrangements and do not represent the amount paid by the class during periods when reimbursements or reductions occur. Expense ratios before reductions for start-up periods may not be representative of longer-term operating periods. Expenses net of fee waivers reflect expenses after reimbursement by the investment adviser but prior to reductions from brokerage service arrangements or other expense offset arrangements. Expenses net of all reductions represent the net expenses paid by the class.
F Amount does not include the portfolio activity of any underlying Fidelity Central Funds.
See accompanying notes which are an integral part of the financial statements.
Notes to Financial Statements
For the period ended April 30, 2020
1. Organization.
Fidelity Women's Leadership Fund (the Fund) is a fund of Fidelity Summer Street Trust (the Trust) and is authorized to issue an unlimited number of shares. The Trust is registered under the Investment Company Act of 1940, as amended (the 1940 Act), as an open-end management investment company organized as a Massachusetts business trust. The Fund offers Class A, Class M, Class C, Fidelity Woman's Leadership Fund, Class I and Class Z shares, each of which has equal rights as to assets and voting privileges. Each class has exclusive voting rights with respect to matters that affect that class. Class C shares will automatically convert to Class A shares after a holding period of ten years from the initial date of purchase, with certain exceptions.
Effective January 1, 2020:
Investment advisers Fidelity Investments Money Management, Inc., FMR Co., Inc., and Fidelity SelectCo, LLC, merged with and into Fidelity Management & Research Company. In connection with the merger transactions, the resulting, merged investment adviser was then redomiciled from Massachusetts to Delaware, changed its corporate structure from a corporation to a limited liability company, and changed its name to "Fidelity Management & Research Company LLC".
Broker-dealer Fidelity Distributors Corporation merged with and into Fidelity Investments Institutional Services Company, Inc. ("FIISC"). FIISC was then redomiciled from Massachusetts to Delaware, changed its corporate structure from a corporation to a limited liability company, and changed its name to "Fidelity Distributors Company LLC".
Fidelity Investments Institutional Operations Company, Inc. converted from a Massachusetts corporation to a Massachusetts LLC, and changed its name to "Fidelity Investments Institutional Operations Company LLC".
2. Investments in Fidelity Central Funds.
The Fund invests in Fidelity Central Funds, which are open-end investment companies generally available only to other investment companies and accounts managed by the investment adviser and its affiliates. The Fund's Schedule of Investments lists each of the Fidelity Central Funds held as of period end, if any, as an investment of the Fund, but does not include the underlying holdings of each Fidelity Central Fund. As an Investing Fund, the Fund indirectly bears its proportionate share of the expenses of the underlying Fidelity Central Funds.
The Money Market Central Funds seek preservation of capital and current income and are managed by the investment adviser. Annualized expenses of the Money Market Central Funds as of their most recent shareholder report date ranged from less than .005% to .01%.
A complete unaudited list of holdings for each Fidelity Central Fund is available upon request or at the Securities and Exchange Commission (the SEC) website at www.sec.gov. In addition, the financial statements of the Fidelity Central Funds, which are not covered by the Fund's Report of Independent Registered Public Accounting Firm, are available on the SEC website or upon request.
3. Significant Accounting Policies.
The Fund is an investment company and applies the accounting and reporting guidance of the Financial Accounting Standards Board (FASB) Accounting Standards Codification Topic 946 Financial Services – Investments Companies. The financial statements have been prepared in conformity with accounting principles generally accepted in the United States of America (GAAP), which require management to make certain estimates and assumptions at the date of the financial statements. Actual results could differ from those estimates. Subsequent events, if any, through the date that the financial statements were issued have been evaluated in the preparation of the financial statements. The following summarizes the significant accounting policies of the Fund:
Investment Valuation. Investments are valued as of 4:00 p.m. Eastern time on the last calendar day of the period. The Board of Trustees (the Board) has delegated the day to day responsibility for the valuation of the Fund's investments to the Fair Value Committee (the Committee) established by the Fund's investment adviser. In accordance with valuation policies and procedures approved by the Board, the Fund attempts to obtain prices from one or more third party pricing vendors or brokers to value its investments. When current market prices, quotations or currency exchange rates are not readily available or reliable, investments will be fair valued in good faith by the Committee, in accordance with procedures adopted by the Board. Factors used in determining fair value vary by investment type and may include market or investment specific events. The frequency with which these procedures are used cannot be predicted and they may be utilized to a significant extent. The Committee oversees the Fund's valuation policies and procedures and reports to the Board on the Committee's activities and fair value determinations. The Board monitors the appropriateness of the procedures used in valuing the Fund's investments and ratifies the fair value determinations of the Committee.
The Fund categorizes the inputs to valuation techniques used to value its investments into a disclosure hierarchy consisting of three levels as shown below:
- Level 1 – quoted prices in active markets for identical investments
- Level 2 – other significant observable inputs (including quoted prices for similar investments, interest rates, prepayment speeds, etc.)
- Level 3 – unobservable inputs (including the Fund's own assumptions based on the best information available)
Valuation techniques used to value the Fund's investments by major category are as follows:
Equity securities, including restricted securities, for which market quotations are readily available, are valued at the last reported sale price or official closing price as reported by a third party pricing vendor on the primary market or exchange on which they are traded and are categorized as Level 1 in the hierarchy. In the event there were no sales during the day or closing prices are not available, securities are valued at the last quoted bid price or may be valued using the last available price and are generally categorized as Level 2 in the hierarchy. For foreign equity securities, when market or security specific events arise, comparisons to the valuation of American Depositary Receipts (ADRs), futures contracts, Exchange-Traded Funds (ETFs) and certain indexes as well as quoted prices for similar securities may be used and would be categorized as Level 2 in the hierarchy. For equity securities, including restricted securities, where observable inputs are limited, assumptions about market activity and risk are used and these securities may be categorized as Level 3 in the hierarchy.
Investments in open-end mutual funds, including the Fidelity Central Funds, are valued at their closing net asset value (NAV) each business day and are categorized as Level 1 in the hierarchy.
Changes in valuation techniques may result in transfers in or out of an assigned level within the disclosure hierarchy. The aggregate value of investments by input level as of April 30, 2020 is included at the end of the Fund's Schedule of Investments.
Foreign Currency. The Fund may use foreign currency contracts to facilitate transactions in foreign-denominated securities. Gains and losses from these transactions may arise from changes in the value of the foreign currency or if the counterparties do not perform under the contracts' terms.
Foreign-denominated assets, including investment securities, and liabilities are translated into U.S. dollars at the exchange rates at period end. Purchases and sales of investment securities, income and dividends received and expenses denominated in foreign currencies are translated into U.S. dollars at the exchange rate in effect on the transaction date.
The effects of exchange rate fluctuations on investments are included with the net realized and unrealized gain (loss) on investment securities. Other foreign currency transactions resulting in realized and unrealized gain (loss) are disclosed separately.
Investment Transactions and Income. For financial reporting purposes, the Fund's investment holdings and NAV include trades executed through the end of the last business day of the period. The NAV per share for processing shareholder transactions is calculated as of the close of business of the New York Stock Exchange (NYSE), normally 4:00 p.m. Eastern time and includes trades executed through the end of the prior business day. Gains and losses on securities sold are determined on the basis of identified cost. Dividend income is recorded on the ex-dividend date, except for certain dividends from foreign securities where the ex-dividend date may have passed, which are recorded as soon as the Fund is informed of the ex-dividend date. Non-cash dividends included in dividend income, if any, are recorded at the fair market value of the securities received. Income and capital gain distributions from Fidelity Central Funds, if any, are recorded on the ex-dividend date. Certain distributions received by the Fund represent a return of capital or capital gain. The Fund determines the components of these distributions subsequent to the ex-dividend date, based upon receipt of tax filings or other correspondence relating to the underlying investment. These distributions are recorded as a reduction of cost of investments and/or as a realized gain. Investment income is recorded net of foreign taxes withheld where recovery of such taxes is uncertain.
Class Allocations and Expenses. Investment income, realized and unrealized capital gains and losses, common expenses of the Fund, and certain fund-level expense reductions, if any, are allocated daily on a pro-rata basis to each class based on the relative net assets of each class to the total net assets of the Fund. Each class differs with respect to transfer agent and distribution and service plan fees incurred. Certain expense reductions may also differ by class. For the reporting period, the allocated portion of income and expenses to each class as a percent of its average net assets may vary due to the timing of recording these transactions in relation to fluctuating net assets of the classes. Expenses directly attributable to a fund are charged to that fund. Expenses attributable to more than one fund are allocated among the respective funds on the basis of relative net assets or other appropriate methods. Expense estimates are accrued in the period to which they relate and adjustments are made when actual amounts are known.
Income Tax Information and Distributions to Shareholders. Each year, the Fund intends to qualify as a regulated investment company under Subchapter M of the Internal Revenue Code, including distributing substantially all of its taxable income and realized gains. As a result, no provision for U.S. Federal income taxes is required. As of April 30, 2020, the Fund did not have any unrecognized tax benefits in the financial statements; nor is the Fund aware of any tax positions for which it is reasonably possible that the total amounts of unrecognized tax benefits will significantly change in the next twelve months. The Fund files a U.S. federal tax return, in addition to state and local tax returns as required. The Fund's federal income tax returns are subject to examination by the Internal Revenue Service (IRS) for a period of three fiscal years after they are filed. State and local tax returns may be subject to examination for an additional fiscal year depending on the jurisdiction. Foreign taxes are provided for based on the Fund's understanding of the tax rules and rates that exist in the foreign markets in which it invests.
Distributions are declared and recorded on the ex-dividend date. Income and capital gain distributions are declared separately for each class. Income and capital gain distributions are determined in accordance with income tax regulations, which may differ from GAAP. In addition, the Fund claimed a portion of the payment made to redeeming shareholders as a distribution for income tax purposes.
Capital accounts within the financial statements are adjusted for permanent book-tax differences. These adjustments have no impact on net assets or the results of operations. Capital accounts are not adjusted for temporary book-tax differences which will reverse in a subsequent period.
Book-tax differences are primarily due to foreign currency transactions, capital loss carryforwards and losses deferred due to wash sales.
As of period end, the cost and unrealized appreciation (depreciation) in securities, and derivatives if applicable, for federal income tax purposes were as follows:
| Gross unrealized appreciation | $2,177,216 |
| Gross unrealized depreciation | (2,571,100) |
| Net unrealized appreciation (depreciation) | $(393,884) |
| Tax Cost | $27,421,111 |
The tax-based components of distributable earnings as of period end were as follows:
| Undistributed ordinary income | $38,085 |
| Capital loss carryforward | $(1,293,766) |
| Net unrealized appreciation (depreciation) on securities and other investments | $(393,896) |
Capital loss carryforwards are only available to offset future capital gains of the Fund to the extent provided by regulations and may be limited. The capital loss carryforward information presented below, including any applicable limitation, is estimated as of fiscal period end and is subject to adjustment.
| No expiration | |
| Short-term | $(1,293,766) |
The tax character of distributions paid was as follows:
| April 30, 2020 | |
| Ordinary Income | $61,425 |
Restricted Securities (including Private Placements). The Fund may invest in securities that are subject to legal or contractual restrictions on resale. These securities generally may be resold in transactions exempt from registration or to the public if the securities are registered. Disposal of these securities may involve time-consuming negotiations and expense, and prompt sale at an acceptable price may be difficult. Information regarding restricted securities is included at the end of the Fund's Schedule of Investments.
4. Purchases and Sales of Investments.
Purchases and sales of securities, other than short-term securities, are noted in the table below.
| Purchases ($) | Sales ($) | |
| Fidelity Women's Leadership Fund | 37,400,413 | 9,497,902 |
5. Fees and Other Transactions with Affiliates.
Management Fee. Fidelity Management & Research Company LLC (the investment adviser) and its affiliates provide the Fund with investment management related services for which the Fund pays a monthly management fee. The management fee is the sum of an individual fund fee rate that is based on an annual rate of .30% of the Fund's average net assets and an annualized group fee rate that averaged .23% during the period. The group fee rate is based upon the monthly average net assets of a group of registered investment companies with which the investment adviser has management contracts. The group fee rate decreases as assets under management increase and increases as assets under management decrease. In addition, the management fee is subject to a performance adjustment (up to a maximum of +/- .10% of the Fund's average net assets over a 36 month performance period). The upward or downward adjustment to the management fee is based on the relative investment performance of Fidelity Women’s Leadership Fund as compared to its benchmark index, the Russell 3000 Index, over the same 36 month performance period. The Fund's performance adjustment will not take effect until May 1, 2020. Subsequent months will be added until the performance period includes 36 months. For the reporting period, the total annual management fee rate was .54% of the Fund's average net assets.
Distribution and Service Plan Fees. In accordance with Rule 12b-1 of the 1940 Act, the Fund has adopted separate Distribution and Service Plans for each class of shares. Certain classes pay Fidelity Distributors Company LLC (FDC), an affiliate of the investment adviser, separate Distribution and Service Fees, each of which is based on an annual percentage of each class' average net assets. In addition, FDC may pay financial intermediaries for selling shares of the Fund and providing shareholder support services. For the period, the Distribution and Service Fee rates, total fees and amounts retained by FDC were as follows:
| Distribution Fee | Service Fee | Total Fees | Retained by FDC | |
| Class A | -% | .25% | $1,361 | $442 |
| Class M | .25% | .25% | 1,428 | 814 |
| Class C | .75% | .25% | 2,761 | 2,318 |
| $5,550 | $3,574 |
Sales Load. FDC may receive a front-end sales charge of up to 5.75% for selling Class A shares and 3.50% for selling Class M shares, some of which is paid to financial intermediaries for selling shares of the Fund. Depending on the holding period, FDC may receive contingent deferred sales charges levied on Class A, Class M and Class C redemptions. The deferred sales charges are 1.00% for Class C shares, 1.00% for certain purchases of Class A shares and .25% for certain purchases of Class M shares.
For the period, sales charge amounts retained by FDC were as follows:
| Retained by FDC | |
| Class A | $1,684 |
| Class M | 568 |
| Class C(a) | 19 |
| $2,271 |
(a) When Class C shares are initially sold, FDC pays commissions from its own resources to financial intermediaries through which the sales are made.
Transfer Agent Fees. Fidelity Investments Institutional Operations Company LLC (FIIOC), an affiliate of the investment adviser, is the transfer, dividend disbursing and shareholder servicing agent for each class of the Fund. FIIOC receives account fees and asset-based fees that vary according to the account size and type of account of the shareholders of the respective classes of the Fund, except for Class Z. FIIOC receives an asset-based fee of Class Z's average net assets. FIIOC pays for typesetting, printing and mailing of shareholder reports, except proxy statements. Effective February 1, 2020, the Board approved to change the fee for Class Z from .046% to .044%.
For the period, transfer agent fees for each applicable class were as follows:
| Amount | % of Class-Level Average Net Assets | |
| Class A | $887 | .16 |
| Class M | 481 | .17 |
| Class C | 401 | .15 |
| Fidelity Women's Leadership Fund | 42,032 | .29 |
| Class I | 738 | .16 |
| Class Z | 732 | .04 |
| $45,271 |
Accounting Fees. Fidelity Service Company, Inc. (FSC), an affiliate of the investment adviser, maintains the Fund's accounting records. The accounting fee is based on the level of average net assets for each month. For the period, the fees were equivalent to the following annual rates:
| % of Average Net Assets | |
| Fidelity Women's Leadership Fund | .04 |
Brokerage Commissions. A portion of portfolio transactions were placed with brokerage firms which are affiliates of the investment adviser. Brokerage commissions are included in net realized gain (loss) and change in net unrealized appreciation (depreciation) in the Statement of Operations. The commissions paid to these affiliated firms were as follows:
| Amount | |
| Fidelity Women's Leadership Fund | $374 |
Interfund Trades. Funds may purchase from or sell securities to other Fidelity Funds under procedures adopted by the Board. The procedures have been designed to ensure these interfund trades are executed in accordance with Rule 17a-7 of the 1940 Act. Interfund trades are included within the respective purchases and sales amounts shown in the Purchases and Sales of Investments note.
6. Committed Line of Credit.
Certain Funds participate with other funds managed by the investment adviser or an affiliate in a $4.25 billion credit facility (the "line of credit") to be utilized for temporary or emergency purposes to fund shareholder redemptions or for other short-term liquidity purposes. The participating funds have agreed to pay commitment fees on their pro-rata portion of the line of credit, which are reflected in Miscellaneous expenses on the Statement of Operations, and are as follows:
| Amount | |
| Fidelity Women's Leadership Fund | $2 |
During the period, there were no borrowings on this line of credit.
7. Expense Reductions.
The investment adviser contractually agreed to reimburse expenses of each class to the extent annual operating expenses exceeded certain levels of class-level average net assets as noted in the table below. This reimbursement will remain in place through August 31, 2021. Some expenses, for example the compensation of the independent Trustees are excluded from this reimbursement.
The following classes were in reimbursement during the period:
| Expense Limitations | Reimbursement | |
| Class A | 1.25% | $6,745 |
| Class M | 1.50% | 3,861 |
| Class C | 2.00% | 3,739 |
| Fidelity Women's Leadership Fund | 1.00% | 172,555 |
| Class I | 1.00% | 5,775 |
| Class Z | .85% | 17,169 |
| $209,844 |
Commissions paid to certain brokers with whom the investment adviser, or its affiliates, places trades on behalf of the Fund include an amount in addition to trade execution, which may be rebated back to the Fund to offset certain expenses. This amount totaled $767 for the period.
In addition, during the period the investment adviser or an affiliate reimbursed and/or waived a portion of fund-level operating expenses in the amount of $45.
8. Distributions to Shareholders.
Distributions to shareholders of each class were as follows:
| Year ended April 30, 2020 | |
| Distributions to shareholders | |
| Class A | $1,124 |
| Class M | 307 |
| Fidelity Women's Leadership Fund | 51,980 |
| Class I | 1,486 |
| Class Z | 6,528 |
| Total | $61,425 |
9. Share Transactions.
Share transactions for each class were as follows and may contain automatic conversions between classes or exchanges between affiliated funds:
| Shares | Dollars | |
| Year ended April 30, 2020 | Year ended April 30, 2020 | |
| Class A | ||
| Shares sold | 80,039 | $809,764 |
| Reinvestment of distributions | 103 | 1,124 |
| Shares redeemed | (1,702) | (15,681) |
| Net increase (decrease) | 78,440 | $795,207 |
| Class M | ||
| Shares sold | 46,220 | $479,639 |
| Reinvestment of distributions | 28 | 307 |
| Shares redeemed | (945) | (9,259) |
| Net increase (decrease) | 45,303 | $470,687 |
| Class C | ||
| Shares sold | 48,236 | $512,663 |
| Shares redeemed | (195) | (2,000) |
| Net increase (decrease) | 48,041 | $510,663 |
| Fidelity Women's Leadership Fund | ||
| Shares sold | 2,817,326 | $28,987,122 |
| Reinvestment of distributions | 4,612 | 50,270 |
| Shares redeemed | (552,590) | (5,444,931) |
| Net increase (decrease) | 2,269,348 | $23,592,461 |
| Class I | ||
| Shares sold | 78,405 | $812,024 |
| Reinvestment of distributions | 127 | 1,383 |
| Shares redeemed | (6,991) | (68,276) |
| Net increase (decrease) | 71,541 | $745,131 |
| Class Z | ||
| Shares sold | 382,936 | $3,866,272 |
| Reinvestment of distributions | 521 | 5,680 |
| Shares redeemed | (141,731) | (1,315,334) |
| Net increase (decrease) | 241,726 | $2,556,618 |
10. Other.
The Fund's organizational documents provide former and current trustees and officers with a limited indemnification against liabilities arising in connection with the performance of their duties to the Fund. In the normal course of business, the Fund may also enter into contracts that provide general indemnifications. The Fund's maximum exposure under these arrangements is unknown as this would be dependent on future claims that may be made against the Fund. The risk of material loss from such claims is considered remote.
11. Coronavirus (COVID-19) Pandemic.
An outbreak of COVID-19 first detected in China during December 2019 has since spread globally and was declared a pandemic by the World Health Organization during March 2020. Developments that disrupt global economies and financial markets, such as the COVID-19 pandemic, may magnify factors that affect the Fund's performance.
Report of Independent Registered Public Accounting Firm
To the Board of Trustees of Fidelity Summer Street Trust and Shareholders of Fidelity Women's Leadership Fund :
Opinion on the Financial Statements and Financial Highlights
We have audited the accompanying statement of assets and liabilities of Fidelity Women’s Leadership Fund (the "Fund"), a fund of Fidelity Summer Street Trust, including the schedule of investments, as of April 30, 2020, the related statement of operations, the statement of changes in net assets and the financial highlights for the period from May 1, 2019 (commencement of operations) through April 30, 2020, and the related notes. In our opinion, the financial statements and financial highlights present fairly, in all material respects, the financial position of the Fund as of April 30, 2020, and the results of its operations, the changes in its net assets and the financial highlights for the period from May 1, 2019 (commencement of operations) through April 30, 2020 in conformity with accounting principles generally accepted in the United States of America.
Basis for Opinion
These financial statements and financial highlights are the responsibility of the Fund's management. Our responsibility is to express an opinion on the Fund's financial statements and financial highlights based on our audit. We are a public accounting firm registered with the Public Company Accounting Oversight Board (United States) (PCAOB) and are required to be independent with respect to the Fund in accordance with the U.S. federal securities laws and the applicable rules and regulations of the Securities and Exchange Commission and the PCAOB.
We conducted our audit in accordance with the standards of the PCAOB. Those standards require that we plan and perform the audit to obtain reasonable assurance about whether the financial statements and financial highlights are free of material misstatement, whether due to error or fraud. The Fund is not required to have, nor were we engaged to perform, an audit of its internal control over financial reporting. As part of our audit we are required to obtain an understanding of internal control over financial reporting but not for the purpose of expressing an opinion on the effectiveness of the Fund’s internal control over financial reporting. Accordingly, we express no such opinion.
Our audit included performing procedures to assess the risks of material misstatement of the financial statements and financial highlights, whether due to error or fraud, and performing procedures that respond to those risks. Such procedures included examining, on a test basis, evidence regarding the amounts and disclosures in the financial statements and financial highlights. Our audit also included evaluating the accounting principles used and significant estimates made by management, as well as evaluating the overall presentation of the financial statements and financial highlights. Our procedures included confirmation of securities owned as of April 30, 2020, by correspondence with the custodian and brokers; when replies were not received from brokers, we performed other auditing procedures. We believe that our audit provides a reasonable basis for our opinion.
/s/ Deloitte & Touche LLP
Boston, Massachusetts
June 15, 2020
We have served as the auditor of one or more of the Fidelity investment companies since 1999.
Trustees and Officers
The Trustees, Members of the Advisory Board (if any), and officers of the trust and fund, as applicable, are listed below. The Board of Trustees governs the fund and is responsible for protecting the interests of shareholders. The Trustees are experienced executives who meet periodically throughout the year to oversee the fund's activities, review contractual arrangements with companies that provide services to the fund, oversee management of the risks associated with such activities and contractual arrangements, and review the fund's performance. Except for Bettina Doulton, each of the Trustees oversees 312 funds. Ms. Doulton oversees 210 funds.
The Trustees hold office without limit in time except that (a) any Trustee may resign; (b) any Trustee may be removed by written instrument, signed by at least two-thirds of the number of Trustees prior to such removal; (c) any Trustee who requests to be retired or who has become incapacitated by illness or injury may be retired by written instrument signed by a majority of the other Trustees; and (d) any Trustee may be removed at any special meeting of shareholders by a two-thirds vote of the outstanding voting securities of the trust. Each Trustee who is not an interested person (as defined in the 1940 Act) of the trust and the fund is referred to herein as an Independent Trustee. Each Independent Trustee shall retire not later than the last day of the calendar year in which his or her 75th birthday occurs. The Independent Trustees may waive this mandatory retirement age policy with respect to individual Trustees. Officers and Advisory Board Members hold office without limit in time, except that any officer or Advisory Board Member may resign or may be removed by a vote of a majority of the Trustees at any regular meeting or any special meeting of the Trustees. Except as indicated, each individual has held the office shown or other offices in the same company for the past five years.
The fund's Statement of Additional Information (SAI) includes more information about the Trustees. To request a free copy, call Fidelity at 1-800-544-8544 if you’re an individual investing directly with Fidelity, call 1-800-835-5092 if you’re a plan sponsor or participant with Fidelity as your recordkeeper or call 1-877-208-0098 on institutional accounts or if you’re an advisor or invest through one.
Experience, Skills, Attributes, and Qualifications of the Trustees. The Governance and Nominating Committee has adopted a statement of policy that describes the experience, qualifications, attributes, and skills that are necessary and desirable for potential Independent Trustee candidates (Statement of Policy). The Board believes that each Trustee satisfied at the time he or she was initially elected or appointed a Trustee, and continues to satisfy, the standards contemplated by the Statement of Policy. The Governance and Nominating Committee also engages professional search firms to help identify potential Independent Trustee candidates who have the experience, qualifications, attributes, and skills consistent with the Statement of Policy. From time to time, additional criteria based on the composition and skills of the current Independent Trustees, as well as experience or skills that may be appropriate in light of future changes to board composition, business conditions, and regulatory or other developments, have also been considered by the professional search firms and the Governance and Nominating Committee. In addition, the Board takes into account the Trustees' commitment and participation in Board and committee meetings, as well as their leadership of standing and ad hoc committees throughout their tenure.
In determining that a particular Trustee was and continues to be qualified to serve as a Trustee, the Board has considered a variety of criteria, none of which, in isolation, was controlling. The Board believes that, collectively, the Trustees have balanced and diverse experience, qualifications, attributes, and skills, which allow the Board to operate effectively in governing the fund and protecting the interests of shareholders. Information about the specific experience, skills, attributes, and qualifications of each Trustee, which in each case led to the Board's conclusion that the Trustee should serve (or continue to serve) as a trustee of the fund, is provided below.
Board Structure and Oversight Function. Robert A. Lawrence is an interested person and currently serves as Acting Chairman. The Trustees have determined that an interested Chairman is appropriate and benefits shareholders because an interested Chairman has a personal and professional stake in the quality and continuity of services provided to the fund. Independent Trustees exercise their informed business judgment to appoint an individual of their choosing to serve as Chairman, regardless of whether the Trustee happens to be independent or a member of management. The Independent Trustees have determined that they can act independently and effectively without having an Independent Trustee serve as Chairman and that a key structural component for assuring that they are in a position to do so is for the Independent Trustees to constitute a substantial majority for the Board. The Independent Trustees also regularly meet in executive session. Ned C. Lautenbach and David M. Thomas serve as Co-Lead Independent Trustees and as such each (i) acts as a liaison between the Independent Trustees and management with respect to matters important to the Independent Trustees and (ii) with management prepares agendas for Board meetings.
Fidelity® funds are overseen by different Boards of Trustees. The fund's Board oversees Fidelity's high income and certain equity funds, and other Boards oversee Fidelity's investment-grade bond, money market, asset allocation, and other equity funds. The asset allocation funds may invest in Fidelity® funds overseen by the fund's Board. The use of separate Boards, each with its own committee structure, allows the Trustees of each group of Fidelity® funds to focus on the unique issues of the funds they oversee, including common research, investment, and operational issues. On occasion, the separate Boards establish joint committees to address issues of overlapping consequences for the Fidelity® funds overseen by each Board.
The Trustees operate using a system of committees to facilitate the timely and efficient consideration of all matters of importance to the Trustees, the fund, and fund shareholders and to facilitate compliance with legal and regulatory requirements and oversight of the fund's activities and associated risks. The Board, acting through its committees, has charged FMR and its affiliates with (i) identifying events or circumstances the occurrence of which could have demonstrably adverse effects on the fund's business and/or reputation; (ii) implementing processes and controls to lessen the possibility that such events or circumstances occur or to mitigate the effects of such events or circumstances if they do occur; and (iii) creating and maintaining a system designed to evaluate continuously business and market conditions in order to facilitate the identification and implementation processes described in (i) and (ii) above. Because the day-to-day operations and activities of the fund are carried out by or through FMR, its affiliates, and other service providers, the fund's exposure to risks is mitigated but not eliminated by the processes overseen by the Trustees. While each of the Board's committees has responsibility for overseeing different aspects of the fund's activities, oversight is exercised primarily through the Operations, Audit, and Compliance Committees. Appropriate personnel, including but not limited to the fund's Chief Compliance Officer (CCO), FMR's internal auditor, the independent accountants, the fund's Treasurer and portfolio management personnel, make periodic reports to the Board's committees, as appropriate, including an annual review of Fidelity's risk management program for the Fidelity® funds. The responsibilities of each standing committee, including their oversight responsibilities, are described further under "Standing Committees of the Trustees."
Interested Trustees*:
Correspondence intended for a Trustee who is an interested person may be sent to Fidelity Investments, 245 Summer Street, Boston, Massachusetts 02210.
Name, Year of Birth; Principal Occupations and Other Relevant Experience+
Bettina Doulton (1964)
Year of Election or Appointment: 2020
Trustee
Ms. Doulton also serves as Trustee of other Fidelity® funds. Prior to her retirement, Ms. Doulton served in a variety of positions at Fidelity Investments, including as a managing director of research (2006-2007), portfolio manager to certain Fidelity® funds (1993-2005), equity analyst and portfolio assistant (1990-1993), and research assistant (1987-1990). Ms. Doulton currently owns and operates Phi Builders + Architects and Cellardoor Winery. Previously, Ms. Doulton served as a member of the Board of Brown Capital Management, LLC (2013-2018).
Robert A. Lawrence (1952)
Year of Election or Appointment: 2020
Trustee
Acting Chairman of the Board of Trustees
Mr. Lawrence also serves as Trustee of other funds. Previously, Mr. Lawrence served as a Member of the Advisory Board of certain funds. Prior to his retirement in 2008, Mr. Lawrence served as Vice President of certain Fidelity® funds (2006-2008), Senior Vice President, Head of High Income Division of Fidelity Management & Research Company (investment adviser firm, 2006-2008), and President of Fidelity Strategic Investments (investment adviser firm, 2002-2005).
* Determined to be an “Interested Trustee” by virtue of, among other things, his or her affiliation with the trust or various entities under common control with FMR.
+ The information includes the Trustee's principal occupation during the last five years and other information relating to the experience, attributes, and skills relevant to the Trustee's qualifications to serve as a Trustee, which led to the conclusion that the Trustee should serve as a Trustee for the fund.
Independent Trustees:
Correspondence intended for an Independent Trustee may be sent to Fidelity Investments, P.O. Box 55235, Boston, Massachusetts 02205-5235.
Name, Year of Birth; Principal Occupations and Other Relevant Experience+
Dennis J. Dirks (1948)
Year of Election or Appointment: 2005
Trustee
Mr. Dirks also serves as Trustee of other Fidelity® funds. Prior to his retirement in May 2003, Mr. Dirks served as Chief Operating Officer and as a member of the Board of The Depository Trust & Clearing Corporation (financial markets infrastructure), President, Chief Operating Officer and a member of the Board of The Depository Trust Company (DTC), President and a member of the Board of the National Securities Clearing Corporation (NSCC), Chief Executive Officer and a member of the Board of the Government Securities Clearing Corporation and Chief Executive Officer and a member of the Board of the Mortgage-Backed Securities Clearing Corporation. Mr. Dirks currently serves as a member of the Finance Committee (2016-present) and Board (2017-present) and is Treasurer (2018-present) of the Asolo Repertory Theatre.
Donald F. Donahue (1950)
Year of Election or Appointment: 2018
Trustee
Mr. Donahue also serves as Trustee of other Fidelity® funds. Mr. Donahue serves as President and Chief Executive Officer of Miranda Partners, LLC (risk consulting for the financial services industry, 2012-present). Previously, Mr. Donahue served as Chief Executive Officer (2006-2012), Chief Operating Officer (2003-2006) and Managing Director, Customer Marketing and Development (1999-2003) of The Depository Trust & Clearing Corporation (financial markets infrastructure). Mr. Donahue currently serves as a member (2007-present) and Co-Chairman (2016-present) of the Board of United Way of New York, a member of the Board of NYC Leadership Academy (2012-present) and a member of the Board of Advisors of Ripple Labs, Inc. (financial services, 2015-present). Mr. Donahue previously served as a member of the Advisory Board of certain Fidelity® funds (2015-2018).
Vicki L. Fuller (1957)
Year of Election or Appointment: 2020
Trustee
Ms. Fuller also serves as Trustee of other Fidelity® funds. Previously, Ms. Fuller served as a member of the Advisory Board of certain Fidelity® funds (2018-2020), Chief Investment Officer of the New York State Common Retirement Fund (2012-2018) and held a variety of positions at AllianceBernstein L.P. (global asset management, 1985-2012), including Managing Director (2006-2012) and Senior Vice President and Senior Portfolio Manager (2001-2006). Ms. Fuller currently serves as a member of the Board, Audit Committee and Nominating and Governance Committee of The Williams Companies, Inc. (natural gas infrastructure, 2018-present) and as a member of the Board of Treliant, LLC (consulting, 2019-present).
Patricia L. Kampling (1959)
Year of Election or Appointment: 2020
Trustee
Ms. Kampling also serves as Trustee of other Fidelity® funds. Prior to her retirement, Ms. Kampling served as Chairman of the Board and Chief Executive Officer (2012-2019), President and Chief Operating Officer (2011-2012) and Executive Vice President and Chief Financial Officer (2010-2011) of Alliant Energy Corporation. Ms. Kampling currently serves as a member of the Board, Compensation Committee and Executive Committee and as Chair of the Audit Committee of Briggs & Stratton Corporation (manufacturing, 2011-present) and as a member of the Board, Audit, Finance and Risk Committee and Safety, Environmental, Technology and Operations Committee of American Water Works Company, Inc. (utilities company, 2019-present). In addition, Ms. Kampling currently serves as a member of the Board of the Nature Conservancy, Wisconsin Chapter (2019-present). Previously, Ms. Kampling served as a Member of the Advisory Board of certain Fidelity® funds (2020), a member of the Board of Interstate Power and Light Company (2012-2019) and Wisconsin Power and Light Company (2012-2019) (each a subsidiary of Alliant Energy Corporation) and as a member of the Board and Workforce Development Committee of the Business Roundtable (2018-2019).
Alan J. Lacy (1953)
Year of Election or Appointment: 2008
Trustee
Mr. Lacy also serves as Trustee of other Fidelity® funds. Previously, Mr. Lacy served as Senior Adviser (2007-2014) of Oak Hill Capital Partners, L.P. (private equity), Chief Executive Officer (2005) and Vice Chairman (2005-2006) of Sears Holdings Corporation (retail), Chief Executive Officer and Chairman of the Board of Sears, Roebuck and Co. (retail, 2000-2005), Chairman (2014-2017) and a member of the Board (2010-2017) of Dave & Buster’s Entertainment, Inc. (restaurant and entertainment complexes) and a member of the Board of Bristol-Myers Squibb Company (global pharmaceuticals, 2008-2020). Mr. Lacy currently serves as a Trustee of the California Chapter of The Nature Conservancy (2015-present) and a member of the Board of the Center for Advanced Study in the Behavioral Sciences at Stanford University (2015-present).
Ned C. Lautenbach (1944)
Year of Election or Appointment: 2000
Trustee
Co-Lead Independent Trustee
Mr. Lautenbach also serves as Trustee of other Fidelity® funds. Mr. Lautenbach currently serves as Chair of the Board of Governors, State University System of Florida (2013-present) and is a member of the Council on Foreign Relations (1994-present). He is also a member and has in the past served as Chairman of the Board of Directors of Artis-Naples (2012-present). Previously, Mr. Lautenbach served as a member and then Lead Director of the Board of Directors of Eaton Corporation (diversified industrial, 1997-2016). He was also a Partner at Clayton, Dubilier & Rice, LLC (private equity investment, 1998-2010); as well as Director of Sony Corporation (2006-2007). In addition, Mr. Lautenbach had a 30-year career with IBM (technology company), during which time he served as Senior Vice President and as a member of the Corporate Executive Committee (1968-1998).
Joseph Mauriello (1944)
Year of Election or Appointment: 2008
Trustee
Mr. Mauriello also serves as Trustee of other Fidelity® funds. Prior to his retirement in January 2006, Mr. Mauriello served in numerous senior management positions including Deputy Chairman and Chief Operating Officer (2004-2005), and Vice Chairman of Financial Services (2002-2004) of KPMG LLP US (professional services, 1965-2005). Mr. Mauriello currently serves as a member of the Independent Directors Council Governing Council (2015-present). Previously, Mr. Mauriello served as a member of the Board of XL Group plc. (global insurance and re-insurance, 2006-2018).
Cornelia M. Small (1944)
Year of Election or Appointment: 2005
Trustee
Ms. Small also serves as Trustee of other Fidelity® funds. Previously, Ms. Small served as Chief Investment Officer, Director of Global Equity Investments and a member of Scudder, Stevens & Clark and Scudder Kemper Investments. Ms. Small previously served as a member of the Board (2009-2019) and Chair of the Investment Committee (2010-2019) of the Teagle Foundation and a member of the Investment Committee of the Berkshire Taconic Community Foundation (2008-2019).
Garnett A. Smith (1947)
Year of Election or Appointment: 2018
Trustee
Mr. Smith also serves as Trustee of other Fidelity® funds. Prior to his retirement, Mr. Smith served as Chairman and Chief Executive Officer (1990-1997) and President (1986-1990) of Inbrand Corp. (manufacturer of personal absorbent products). Prior to his employment with Inbrand Corp., he was employed by a retail fabric chain and North Carolina National Bank (now Bank of America). Mr. Smith previously served as a member of the Advisory Board of certain Fidelity® funds (2012-2013).
David M. Thomas (1949)
Year of Election or Appointment: 2008
Trustee
Co-Lead Independent Trustee
Mr. Thomas also serves as Trustee of other Fidelity® funds. Previously, Mr. Thomas served as Executive Chairman (2005-2006) and Chairman and Chief Executive Officer (2000-2005) of IMS Health, Inc. (pharmaceutical and healthcare information solutions). Mr. Thomas currently serves as Non-Executive Chairman of the Board of Fortune Brands Home and Security (home and security products, 2011-present), and a member of the Board (2004-present) and Presiding Director (2013-present) of Interpublic Group of Companies, Inc. (marketing communication).
Susan Tomasky (1953)
Year of Election or Appointment: 2020
Trustee
Ms. Tomasky also serves as Trustee of other Fidelity® funds. Prior to her retirement, Ms. Tomasky served in various executive officer positions at American Electric Power Company, Inc. (1998-2011), including most recently as President of AEP Transmission (2007-2011). Ms. Tomasky currently serves as a member of the Board and Sustainability Committee and as Chair of the Audit Committee of Marathon Petroleum Corporation (2018-present) and as a member of the Board, Corporate Governance Committee and Organization and Compensation Committee and as Chair of the Audit Committee of Public Service Enterprise Group, Inc. (utilities company, 2012-present). In addition, Ms. Tomasky currently serves as a member of the Board of the Columbus Regional Airport Authority (2007-present), as a member of the Board of the Royal Shakespeare Company – America (2009-present), as a member of the Board of the Columbus Association for the Performing Arts (2011-present) and as a member of the Board of Kenyon College (2016-present). Previously, Ms. Tomasky served as a Member of the Advisory Board of certain Fidelity® funds (2020), a member of the Board (2011-2019) and as Lead Independent Director (2015-2018) of Andeavor Corporation (previously Tesoro Corporation) (independent oil refiner and marketer) and as a member of the Board of Summit Midstream Partners LP (energy, 2012-2018).
Michael E. Wiley (1950)
Year of Election or Appointment: 2018
Trustee
Mr. Wiley also serves as Trustee of other Fidelity® funds. Previously, Mr. Wiley served as a member of the Advisory Board of certain Fidelity® funds (2018-2020), Chairman, President and CEO of Baker Hughes, Inc. (oilfield services, 2000-2004). Mr. Wiley also previously served as a member of the Board of Andeavor Corporation (independent oil refiner and marketer, 2005-2018), a member of the Board of Andeavor Logistics LP (natural resources logistics, 2015-2018) and a member of the Board of High Point Resources (exploration and production, 2005-2020).
+ The information includes the Trustee's principal occupation during the last five years and other information relating to the experience, attributes, and skills relevant to the Trustee's qualifications to serve as a Trustee, which led to the conclusion that the Trustee should serve as a Trustee for the fund.
Advisory Board Members and Officers:
Correspondence intended for a Member of the Advisory Board (if any) may be sent to Fidelity Investments, P.O. Box 55235, Boston, Massachusetts 02205-5235. Correspondence intended for an officer or Peter S. Lynch may be sent to Fidelity Investments, 245 Summer Street, Boston, Massachusetts 02210. Officers appear below in alphabetical order.
Name, Year of Birth; Principal Occupation
Peter S. Lynch (1944)
Year of Election or Appointment: 2003
Member of the Advisory Board
Mr. Lynch also serves as a Member of the Advisory Board of other Fidelity® funds. Mr. Lynch is Vice Chairman and a Director of Fidelity Management & Research Company LLC (investment adviser firm). In addition, Mr. Lynch serves as a Trustee of Boston College and as the Chairman of the Inner-City Scholarship Fund. Previously, Mr. Lynch served as Vice Chairman and a Director of FMR Co., Inc. (investment adviser firm) and on the Special Olympics International Board of Directors (1997-2006).
Elizabeth Paige Baumann (1968)
Year of Election or Appointment: 2017
Anti-Money Laundering (AML) Officer
Ms. Baumann also serves as AML Officer of other funds. She is Chief AML Officer (2012-present) and Senior Vice President (2014-present) of FMR LLC (diversified financial services company) and is an employee of Fidelity Investments. Previously, Ms. Baumann served as AML Officer of certain funds (2017-2019), as AML Officer of the funds (2012-2016), and Vice President (2007-2014) and Deputy Anti-Money Laundering Officer (2007-2012) of FMR LLC.
Craig S. Brown (1977)
Year of Election or Appointment: 2019
Assistant Treasurer
Mr. Brown also serves as Assistant Treasurer of other funds. Mr. Brown is an employee of Fidelity Investments (2013-present).
John J. Burke III (1964)
Year of Election or Appointment: 2018
Chief Financial Officer
Mr. Burke also serves as Chief Financial Officer of other funds. Mr. Burke serves as Head of Investment Operations for Fidelity Fund and Investment Operations (2018-present) and is an employee of Fidelity Investments (1998-present). Previously Mr. Burke served as head of Asset Management Investment Operations (2012-2018).
William C. Coffey (1969)
Year of Election or Appointment: 2019
Assistant Secretary
Mr. Coffey also serves as Assistant Secretary of other funds. He is Senior Vice President and Deputy General Counsel of FMR LLC (diversified financial services company, 2010-present), and is an employee of Fidelity Investments. Previously, Mr. Coffey served as Secretary and CLO of certain funds (2018-2019); CLO, Secretary, and Senior Vice President of Fidelity Management & Research Company and FMR Co., Inc. (investment adviser firms, 2018-2019); Secretary of Fidelity SelectCo, LLC and Fidelity Investments Money Management, Inc. (investment adviser firms, 2018-2019); CLO of Fidelity Management & Research (Hong Kong) Limited, FMR Investment Management (UK) Limited, and Fidelity Management & Research (Japan) Limited (investment adviser firms, 2018-2019); and Assistant Secretary of certain funds (2009-2018).
Timothy M. Cohen (1969)
Year of Election or Appointment: 2018
Vice President
Mr. Cohen also serves as Vice President of other funds. Mr. Cohen serves as Co-Head of Equity (2018-present), a Director of Fidelity Management & Research (Japan) Limited (investment adviser firm, 2016-present), and is an employee of Fidelity Investments. Previously, Mr. Cohen served as Executive Vice President of Fidelity SelectCo, LLC (2019), Head of Global Equity Research (2016-2018), Chief Investment Officer - Equity and a Director of Fidelity Management & Research (U.K.) Inc. (investment adviser firm, 2013-2015) and as a Director of Fidelity Management & Research (Hong Kong) Limited (investment adviser firm, 2017).
Jonathan Davis (1968)
Year of Election or Appointment: 2010
Assistant Treasurer
Mr. Davis also serves as Assistant Treasurer of other funds. Mr. Davis serves as Assistant Treasurer of FMR Capital, Inc. (2017-present) and is an employee of Fidelity Investments. Previously, Mr. Davis served as Vice President and Associate General Counsel of FMR LLC (diversified financial services company, 2003-2010).
Laura M. Del Prato (1964)
Year of Election or Appointment: 2018
Assistant Treasurer
Ms. Del Prato also serves as an officer of other funds. Ms. Del Prato is an employee of Fidelity Investments (2017-present). Prior to joining Fidelity Investments, Ms. Del Prato served as a Managing Director and Treasurer of the JPMorgan Mutual Funds (2014-2017). Prior to JPMorgan, Ms. Del Prato served as a partner at Cohen Fund Audit Services (accounting firm, 2012-2013) and KPMG LLP (accounting firm, 2004-2012).
Colm A. Hogan (1973)
Year of Election or Appointment: 2020
Assistant Treasurer
Mr. Hogan also serves as an officer of other funds. Mr. Hogan serves as Assistant Treasurer of FMR Capital, Inc. (2017-present) and is an employee of Fidelity Investments (2005-present). Previously, Mr. Hogan served as Deputy Treasurer of certain Fidelity® funds (2016-2020) and Assistant Treasurer of certain Fidelity® funds (2016-2018).
Pamela R. Holding (1964)
Year of Election or Appointment: 2018
Vice President
Ms. Holding also serves as Vice President of other funds. Ms. Holding serves as Co-Head of Equity (2018-present) and is an employee of Fidelity Investments (2013-present). Previously, Ms. Holding served as Executive Vice President of Fidelity SelectCo, LLC (2019) and as Chief Investment Officer of Fidelity Institutional Asset Management (2013-2018).
Cynthia Lo Bessette (1969)
Year of Election or Appointment: 2019
Secretary and Chief Legal Officer (CLO)
Ms. Lo Bessette also serves as an officer of other funds. Ms. Lo Bessette serves as CLO, Secretary, and Senior Vice President of Fidelity Management & Research Company LLC (investment adviser firm, 2019-present); and CLO of Fidelity Management & Research (Hong Kong) Limited, FMR Investment Management (UK) Limited, and Fidelity Management & Research (Japan) Limited (investment adviser firms, 2019-present). She is a Senior Vice President and Deputy General Counsel of FMR LLC (diversified financial services company, 2019-present), and is an employee of Fidelity Investments. Previously, Ms. Lo Bessette served as CLO, Secretary, and Senior Vice President of FMR Co., Inc. (investment adviser firm, 2019); Secretary of Fidelity SelectCo, LLC and Fidelity Investments Money Management, Inc. (investment adviser firms, 2019). Prior to joining Fidelity Investments, Ms. Lo Bessette was Executive Vice President, General Counsel (2016-2019) and Senior Vice President, Deputy General Counsel (2015-2016) of OppenheimerFunds (investment management company) and Deputy Chief Legal Officer (2013-2015) of Jennison Associates LLC (investment adviser firm).
Chris Maher (1972)
Year of Election or Appointment: 2020
Deputy Treasurer
Mr. Maher also serves as an officer of other funds. Mr. Maher serves as Assistant Treasurer of FMR Capital, Inc. (2017-present), and is an employee of Fidelity Investments (2008-present). Previously, Mr. Maher served as Assistant Treasurer of certain funds (2013-2020); Vice President of Asset Management Compliance (2013), Vice President of the Program Management Group of FMR (investment adviser firm, 2010-2013), and Vice President of Valuation Oversight (2008-2010).
Jason P. Pogorelec (1975)
Year of Election or Appointment: 2020
Chief Compliance Officer
Mr. Pogorelec also serves as an officer of other funds. Mr. Pogorelec serves as Vice President, Associate General Counsel (2010-present) and is an employee of Fidelity Investments (2006-present). Previously, Mr. Pogorelec served as Assistant Secretary of certain Fidelity funds (2015-2020).
Stacie M. Smith (1974)
Year of Election or Appointment: 2016
President and Treasurer
Ms. Smith also serves as an officer of other funds. Ms. Smith serves as Assistant Treasurer of FMR Capital, Inc. (2017-present), is an employee of Fidelity Investments (2009-present), and has served in other fund officer roles. Prior to joining Fidelity Investments, Ms. Smith served as Senior Audit Manager of Ernst & Young LLP (accounting firm, 1996-2009). Previously, Ms. Smith served as Assistant Treasurer (2013-2019) and Deputy Treasurer (2013-2016) of certain Fidelity® funds.
Marc L. Spector (1972)
Year of Election or Appointment: 2016
Assistant Treasurer
Mr. Spector also serves as an officer of other funds. Mr. Spector serves as Assistant Treasurer of FMR Capital, Inc. (2017-present) and is an employee of Fidelity Investments (2016-present). Prior to joining Fidelity Investments, Mr. Spector served as Director at the Siegfried Group (accounting firm, 2013-2016), and prior to Siegfried Group as audit senior manager at Deloitte & Touche LLP (accounting firm, 2005-2013).
Jim Wegmann (1979)
Year of Election or Appointment: 2019
Assistant Treasurer
Mr. Wegmann also serves as Assistant Treasurer of other funds. Mr. Wegmann is an employee of Fidelity Investments (2011-present).
Shareholder Expense Example
As a shareholder of the Fund, you incur two types of costs: (1) transaction costs, including sales charges (loads) on purchase payments or redemption proceeds, and (2) ongoing costs, including management fees, distribution and/or service (12b-1) fees and other Fund expenses. This Example is intended to help you understand your ongoing costs (in dollars) of investing in the Fund and to compare these costs with the ongoing costs of investing in other mutual funds.
The Example is based on an investment of $1,000 invested at the beginning of the period and held for the entire period (November 1, 2019 to April 30, 2020).
Actual Expenses
The first line of the accompanying table for each class of the Fund provides information about actual account values and actual expenses. You may use the information in this line, together with the amount you invested, to estimate the expenses that you paid over the period. Simply divide your account value by $1,000.00 (for example, an $8,600 account value divided by $1,000.00 = 8.6), then multiply the result by the number in the first line for a class of the Fund under the heading entitled "Expenses Paid During Period" to estimate the expenses you paid on your account during this period. In addition, the Fund, as a shareholder in the underlying Fidelity Central Funds, will indirectly bear its pro-rata share of the fees and expenses incurred by the underlying Fidelity Central Funds. These fees and expenses are not included in the Fund's annualized expense ratio used to calculate the expense estimate in the table below.
Hypothetical Example for Comparison Purposes
The second line of the accompanying table for each class of the Fund provides information about hypothetical account values and hypothetical expenses based on a Class' actual expense ratio and an assumed rate of return of 5% per year before expenses, which is not the Class' actual return. The hypothetical account values and expenses may not be used to estimate the actual ending account balance or expenses you paid for the period. You may use this information to compare the ongoing costs of investing in the Fund and other funds. To do so, compare this 5% hypothetical example with the 5% hypothetical examples that appear in the shareholder reports of the other funds. In addition, the Fund, as a shareholder in the underlying Fidelity Central Funds, will indirectly bear its pro-rata share of the fees and expenses incurred by the underlying Fidelity Central Funds. These fees and expenses are not included in the Fund's annualized expense ratio used to calculate the expense estimate in the table below.
Please note that the expenses shown in the table are meant to highlight your ongoing costs only and do not reflect any transaction costs. Therefore, the second line of the table is useful in comparing ongoing costs only, and will not help you determine the relative total costs of owning different funds. In addition, if these transactional costs were included, your costs would have been higher.
| Annualized Expense Ratio-A | Beginning Account Value November 1, 2019 | Ending Account Value April 30, 2020 | Expenses Paid During Period-B November 1, 2019 to April 30, 2020 | |
| Class A | 1.25% | |||
| Actual | $1,000.00 | $954.90 | $6.08 | |
| Hypothetical-C | $1,000.00 | $1,018.65 | $6.27 | |
| Class M | 1.50% | |||
| Actual | $1,000.00 | $953.10 | $7.28 | |
| Hypothetical-C | $1,000.00 | $1,017.40 | $7.52 | |
| Class C | 2.00% | |||
| Actual | $1,000.00 | $951.20 | $9.70 | |
| Hypothetical-C | $1,000.00 | $1,014.92 | $10.02 | |
| Fidelity Women's Leadership Fund | 1.00% | |||
| Actual | $1,000.00 | $955.00 | $4.86 | |
| Hypothetical-C | $1,000.00 | $1,019.89 | $5.02 | |
| Class I | 1.00% | |||
| Actual | $1,000.00 | $955.00 | $4.86 | |
| Hypothetical-C | $1,000.00 | $1,019.89 | $5.02 | |
| Class Z | .85% | |||
| Actual | $1,000.00 | $956.10 | $4.13 | |
| Hypothetical-C | $1,000.00 | $1,020.64 | $4.27 |
A Annualized expense ratio reflects expenses net of applicable fee waivers.
B Expenses are equal to each Class' annualized expense ratio, multiplied by the average account value over the period, multiplied by 182/366 (to reflect the one-half year period).
C 5% return per year before expenses
Distributions (Unaudited)
Class A, Class M, Fidelity Women's Leadership Fund, Class I, and Class Z designate 100% of the dividends distributed in December, 2019 during the fiscal year as qualifying for the dividends–received deduction for corporate shareholders.
Class A, Class M, Fidelity Women's Leadership Fund, Class I, and Class Z designate 100% of each dividend distributed during the fiscal year as amounts which may be taken into account as a dividend for purposes of the maximum rate under section 1(h)(11) of the Internal Revenue Code.
The fund will notify shareholders in January 2021 of amounts for use in preparing 2020 income tax returns.
Board Approval of Investment Advisory Contracts and Management Fees
Fidelity Women's Leadership Fund
Each year, the Board of Trustees, including the Independent Trustees (together, the Board), votes on the renewal of the management contract with Fidelity Management & Research Company LLC (FMR) and the sub-advisory agreements (together, the Advisory Contracts) for the fund. FMR and the sub-advisers are referred to herein as the Investment Advisers. The Board, assisted by the advice of fund counsel and Independent Trustees' counsel, requests and considers a broad range of information relevant to the renewal of the Advisory Contracts throughout the year.Approval of Amended and Restated Advisory Contracts. At its November 2019 meeting, the Board unanimously determined to approve an amended and restated management contract and sub-advisory agreements (Amended and Restated Contracts) for a stub period of January 1, 2020 through January 31, 2020 in connection with a consolidation of certain of Fidelity's advisory businesses. The Board considered that, on or about January 1, 2020, FMR Co., Inc. (FMRC) expected to merge with and into FMR and, after the merger, FMR expected to redomicile as a Delaware limited liability company. The Board also approved the termination of the sub-advisory agreement with FMRC upon the completion of the merger. The Board noted that references to FMR in the Amended and Restated Contracts would be updated to reflect FMR's new form of organization and domicile and considered that the definition of "group assets" for purposes of the fund's group fee would be modified to avoid double-counting assets once the reorganization is complete. The Board also noted Fidelity's assurance that neither the planned consolidation nor the Amended and Restated Contracts will change the investment processes, the level or nature of services provided, the resources and personnel allocated, trading and compliance operations, or any fees paid by the fund.The Board meets regularly and, at each of its meetings, covers an extensive agenda of topics and materials and considers factors that are relevant to its annual consideration of the renewal of the fund's Advisory Contracts, including the services and support provided to the fund and its shareholders. The Board has established various standing committees (Committees), each composed of and chaired by Independent Trustees with varying backgrounds, to which the Board has assigned specific subject matter responsibilities in order to enhance effective decision-making by the Board. The Board, acting directly and through its Committees, requests and receives information concerning the annual consideration of the renewal of the fund's Advisory Contracts. The Board also meets as needed to review matters specifically related to the Board's annual consideration of the renewal of the Advisory Contracts. Members of the Board may also meet with trustees of other Fidelity funds through joint ad hoc committees to discuss certain matters relevant to all of the Fidelity funds.At its January 2020 meeting, the Board unanimously determined to renew the fund's Advisory Contracts. In reaching its determination, the Board considered all factors it believed relevant, including (i) the nature, extent, and quality of the services provided to the fund and its shareholders (including the investment performance of the fund); (ii) the competitiveness of the fund's management fee and total expense ratio relative to peer funds; (iii) the total costs of the services provided by and the profits realized by Fidelity from its relationships with the fund; and (iv) the extent to which, if any, economies of scale exist and are realized as the fund grows, and whether any economies of scale are appropriately shared with fund shareholders.In considering whether to renew the Advisory Contracts for the fund, the Board reached a determination, with the assistance of fund counsel and Independent Trustees' counsel and through the exercise of its business judgment, that the renewal of the Advisory Contracts was in the best interests of the fund and its shareholders and that the compensation payable under the Advisory Contracts was fair and reasonable. The Board's decision to renew the Advisory Contracts was not based on any single factor, but rather was based on a comprehensive consideration of all the information provided to the Board at its meetings throughout the year. The Board, in reaching its determination to renew the Advisory Contracts, was aware that shareholders of the fund have a broad range of investment choices available to them, including a wide choice among funds offered by Fidelity's competitors, and that the fund's shareholders, who have the opportunity to review and weigh the disclosure provided by the fund in its prospectus and other public disclosures, have chosen to invest in this fund, which is part of the Fidelity family of funds.Nature, Extent, and Quality of Services Provided. The Board considered Fidelity's staffing as it relates to the fund, including the backgrounds of investment personnel of Fidelity, and also considered the fund's investment objective, strategies, and related investment philosophy. The Independent Trustees also had discussions with senior management of Fidelity's investment operations and investment groups. The Board considered the structure of the investment personnel compensation program and whether this structure provides appropriate incentives to act in the best interests of the fund. Additionally, the Board considered the portfolio managers' investments, if any, in the funds that they manage.Resources Dedicated to Investment Management and Support Services. The Board and the Fund Oversight and Research Committees reviewed the general qualifications and capabilities of Fidelity's investment staff, including its size, education, experience, and resources, as well as Fidelity's approach to recruiting, training, managing, and compensating investment personnel. The Board noted that Fidelity has continued to increase the resources devoted to non-U.S. offices, including expansion of Fidelity's global investment organization. The Board also noted that Fidelity's analysts have extensive resources, tools and capabilities that allow them to conduct sophisticated quantitative and fundamental analysis, as well as credit analysis of issuers, counterparties and guarantors. Further, the Board considered that Fidelity's investment professionals have sufficient access to global information and data so as to provide competitive investment results over time, and that those professionals also have access to sophisticated tools that permit them to assess portfolio construction and risk and performance attribution characteristics continuously, as well as to transmit new information and research conclusions rapidly around the world. Additionally, in its deliberations, the Board considered Fidelity's trading, risk management, compliance, and technology and operations capabilities and resources, which are integral parts of the investment management process.Shareholder and Administrative Services. The Board considered (i) the nature, extent, quality, and cost of advisory, administrative, and shareholder services performed by the Investment Advisers and their affiliates under the Advisory Contracts and under separate agreements covering transfer agency, pricing and bookkeeping, and securities lending services for the fund; (ii) the nature and extent of the supervision of third party service providers, principally custodians, subcustodians, and pricing vendors; and (iii) the resources devoted to, and the record of compliance with, the fund's compliance policies and procedures. The Board also reviewed the allocation of fund brokerage, including allocations to brokers affiliated with the Investment Advisers, the use of brokerage commissions to pay fund expenses, and the use of "soft" commission dollars to pay for research services.The Board noted that the growth of fund assets over time across the complex allows Fidelity to reinvest in the development of services designed to enhance the value and convenience of the Fidelity funds as investment vehicles. These services include 24-hour access to account information and market information over the Internet and through telephone representatives, investor education materials and asset allocation tools, and the expanded availability of Fidelity Investor Centers.The Board noted that it and the boards of certain other Fidelity funds had formed an ad hoc Committee on Transfer Agency Fees to review the variety of transfer agency fee structures throughout the industry and Fidelity's competitive positioning with respect to industry participants.Investment in a Large Fund Family. The Board considered the benefits to shareholders of investing in a Fidelity fund, including the benefits of investing in a fund that is part of a large family of funds offering a variety of investment disciplines and providing a large variety of mutual fund investor services. The Board noted that Fidelity had taken, or had made recommendations that resulted in the Fidelity funds taking, a number of actions over the previous year that benefited particular funds, including: (i) continuing to dedicate additional resources to Fidelity's investment research process, which includes meetings with management of issuers of securities in which the funds invest, and to the support of the senior management team that oversees asset management; (ii) continuing efforts to enhance Fidelity's global research capabilities; (iii) launching new funds and ETFs with innovative structures, strategies and pricing and making other enhancements to meet client needs; (iv) launching new share classes of existing funds; (v) eliminating purchase minimums and broadening eligibility requirements for certain funds and share classes; (vi) reducing management fees and total expenses for certain target date funds and index funds; (vii) lowering expense caps for certain existing funds and classes, and converting certain voluntary expense caps to contractual caps, to reduce expenses borne by shareholders; (viii) rationalizing product lines and gaining increased efficiencies from fund mergers, liquidations, and share class consolidations; (ix) continuing to develop, acquire and implement systems and technology to improve services to the funds and shareholders, strengthen information security, and increase efficiency; and (x) continuing to implement enhancements to further strengthen Fidelity's product line to increase investors' probability of success in achieving their investment goals, including retirement income goals.Investment Performance. The Board considered whether the fund has operated in accordance with its investment objective, as well as its record of compliance with its investment restrictions. As the fund recently commenced operations, the Board did not believe that it was appropriate to assign significant weight to its limited investment performance.Based on its review, the Board concluded that the nature, extent, and quality of services provided to the fund under the Advisory Contracts should continue to benefit the shareholders of the fund.Competitiveness of Management Fee and Total Expense Ratio. The Board considered the fund's management fee and total expense ratio compared to "mapped groups" of competitive funds and classes created for the purpose of facilitating the Trustees' competitive analysis of management fees and total expenses. Fidelity creates "mapped groups" by combining similar Lipper investment objective categories that have comparable investment mandates. Combining Lipper investment objective categories aids the Board's management fee and total expense ratio comparisons by broadening the competitive group used for comparison.Management Fee. The Board considered two proprietary management fee comparisons for the period of the fund's operations ended June 30 shown in basis points (BP) in the chart below. The group of Lipper funds used by the Board for management fee comparisons is referred to below as the "Total Mapped Group." The Total Mapped Group comparison focuses on a fund's standing in terms of gross management fees before expense reimbursements or caps, and without giving effect to the fund's performance adjustment, relative to the total universe of funds with comparable investment mandates, regardless of whether their management fee structures also are comparable. Funds with comparable investment mandates offer exposure to similar types of securities. Funds with comparable management fee structures have similar management fee contractual arrangements (e.g., flat rate charged for advisory services, all-inclusive fee rate, etc.). "TMG %" represents the percentage of funds in the Total Mapped Group that had management fees that were lower than the fund's. For example, a hypothetical TMG % of 20% would mean that 80% of the funds in the Total Mapped Group had higher, and 20% had lower, management fees than the fund. The fund's actual TMG % and the number of funds in the Total Mapped Group are in the chart below. The "Asset-Sized Peer Group" (ASPG) comparison focuses on a fund's standing relative to a subset of non-Fidelity funds within the Total Mapped Group that are similar in size and management fee structure without taking into account performance adjustments, if any. For example, if a fund is in the first quartile of the ASPG, the fund's management fee ranks in the least expensive or lowest 25% of funds in the ASPG. The ASPG represents at least 15% of the funds in the Total Mapped Group with comparable asset size and management fee structures, subject to a minimum of 50 funds (or all funds in the Total Mapped Group if fewer than 50). Additional information, such as the ASPG quartile in which the fund's management fee rate ranked and the impact of the fund's performance adjustment, is also included in the chart and was considered by the Board.Fidelity Women's Leadership Fund

Liquidity Risk Management Program
The Securities and Exchange Commission adopted Rule 22e-4 under the Investment Company Act of 1940 (the Liquidity Rule) to promote effective liquidity risk management throughout the open-end investment company industry, thereby reducing the risk that funds will be unable to meet their redemption obligations and mitigating dilution of the interests of fund shareholders.
The Fund has adopted and implemented a liquidity risk management program pursuant to the Liquidity Rule (the Program) effective December 1, 2018. The Program is reasonably designed to assess and manage the Fund’s liquidity risk and to comply with the requirements of the Liquidity Rule. The Fund’s Board of Trustees (the Board) has designated the Fund’s investment adviser as administrator of the Program. The Fidelity advisers have established a Liquidity Risk Management Committee (the LRM Committee) to manage the Program for each of the Fidelity Funds. The LRM Committee monitors the adequacy and effectiveness of implementation of the Program and on a periodic basis assesses each Fund’s liquidity risk based on a variety of factors including (1) the Fund’s investment strategy, (2) portfolio liquidity and cash flow projections during normal and reasonably foreseeable stressed conditions, (3) shareholder redemptions, (4) borrowings and other funding sources and (5) in the case of exchange-traded funds, certain additional factors including the effect of the Fund’s prices and spreads, market participants, and basket compositions on the overall liquidity of the Fund’s portfolio, as applicable.
In accordance with the Program, each of the Fund’s portfolio investments is classified into one of four liquidity categories described below based on a determination of a reasonable expectation for how long it would take to convert the investment to cash (or sell or dispose of the investment) without significantly changing its market value.
- Highly liquid investments – cash or convertible to cash within three business days or less
- Moderately liquid investments – convertible to cash in three to seven calendar days
- Less liquid investments – can be sold or disposed of, but not settled, within seven calendar days
- Illiquid investments – cannot be sold or disposed of within seven calendar days
Liquidity classification determinations take into account a variety of factors including various market, trading and investment-specific considerations, as well as market depth, and generally utilize analysis from a third-party liquidity metrics service.
The Liquidity Rule places a 15% limit on a fund’s illiquid investments and requires funds that do not primarily hold assets that are highly liquid investments to determine and maintain a minimum percentage of the fund’s net assets to be invested in highly liquid investments (highly liquid investment minimum or HLIM). The Program includes provisions reasonably designed to comply with the 15% limit on illiquid investments and for determining, periodically reviewing and complying with the HLIM requirement as applicable.
At a recent meeting of the Fund’s Board of Trustees, the LRM Committee provided a written report to the Board pertaining to the operation, adequacy, and effectiveness of implementation of the Program for the annual period from December 1, 2018 through November 30, 2019. The report concluded that the Program has been implemented and is operating effectively and is reasonably designed to assess and manage the Fund’s liquidity risk.
![]()
WLF-ANN-0620
1.9893105.100
Fidelity® U.S. Low Volatility Equity Fund
April 30, 2020
See the inside front cover for important information about access to your fund’s shareholder reports.
Beginning on January 1, 2021, as permitted by regulations adopted by the Securities and Exchange Commission, paper copies of a fund’s shareholder reports will no longer be sent by mail, unless you specifically request paper copies of the reports from the fund or from your financial intermediary, such as a financial advisor, broker-dealer or bank. Instead, the reports will be made available on a website, and you will be notified by mail each time a report is posted and provided with a website link to access the report.
If you already elected to receive shareholder reports electronically, you will not be affected by this change and you need not take any action. You may elect to receive shareholder reports and other communications from a fund electronically, by contacting your financial intermediary. For Fidelity customers, visit Fidelity's web site or call Fidelity using the contact information listed below.
You may elect to receive all future reports in paper free of charge. If you wish to continue receiving paper copies of your shareholder reports, you may contact your financial intermediary or, if you are a Fidelity customer, visit Fidelity’s website, or call Fidelity at the applicable toll-free number listed below. Your election to receive reports in paper will apply to all funds held with the fund complex/your financial intermediary.
| Account Type | Website | Phone Number |
| Brokerage, Mutual Fund, or Annuity Contracts: | fidelity.com/mailpreferences | 1-800-343-3548 |
| Employer Provided Retirement Accounts: | netbenefits.fidelity.com/preferences (choose 'no' under Required Disclosures to continue to print) | 1-800-343-0860 |
| Advisor Sold Accounts Serviced Through Your Financial Intermediary: | Contact Your Financial Intermediary | Your Financial Intermediary's phone number |
| Advisor Sold Accounts Serviced by Fidelity: | institutional.fidelity.com | 1-877-208-0098 |
Contents
Board Approval of Investment Advisory Contracts and Management Fees | |
To view a fund's proxy voting guidelines and proxy voting record for the 12-month period ended June 30, visit http://www.fidelity.com/proxyvotingresults or visit the Securities and Exchange Commission's (SEC) web site at http://www.sec.gov.
You may also call 1-800-544-8544 to request a free copy of the proxy voting guidelines.
Standard & Poor's, S&P and S&P 500 are registered service marks of The McGraw-Hill Companies, Inc. and have been licensed for use by Fidelity Distributors Corporation.
Other third-party marks appearing herein are the property of their respective owners.
All other marks appearing herein are registered or unregistered trademarks or service marks of FMR LLC or an affiliated company. © 2020 FMR LLC. All rights reserved.
This report and the financial statements contained herein are submitted for the general information of the shareholders of the Fund. This report is not authorized for distribution to prospective investors in the Fund unless preceded or accompanied by an effective prospectus.
A fund files its complete schedule of portfolio holdings with the SEC for the first and third quarters of each fiscal year on Form N-PORT. Forms N-PORT are available on the SEC’s web site at http://www.sec.gov. A fund's Forms N-PORT may be reviewed and copied at the SEC’s Public Reference Room in Washington, DC. Information regarding the operation of the SEC's Public Reference Room may be obtained by calling 1-800-SEC-0330.
For a complete list of a fund's portfolio holdings, view the most recent holdings listing, semiannual report, or annual report on Fidelity's web site at http://www.fidelity.com, http://www.institutional.fidelity.com, or http://www.401k.com, as applicable.
NOT FDIC INSURED •MAY LOSE VALUE •NO BANK GUARANTEE
Neither the Fund nor Fidelity Distributors Corporation is a bank.
Note to Shareholders:
Early in 2020, the outbreak and spread of a new coronavirus emerged as a public health emergency that had a major influence on financial markets, primarily based on its impact on the global economy and the outlook for corporate earnings. The virus causes a respiratory disease known as COVID-19. On March 11, the World Health Organization declared the COVID-19 outbreak a pandemic, citing sustained risk of further global spread.
In the weeks following, as the crisis worsened, we witnessed an escalating human tragedy with wide-scale social and economic consequences from coronavirus-containment measures. The outbreak of COVID-19 prompted a number of measures to limit the spread, including travel and border restrictions, quarantines, and restrictions on large gatherings. In turn, these resulted in lower consumer activity, diminished demand for a wide range of products and services, disruption in manufacturing and supply chains, and – given the wide variability in outcomes regarding the outbreak – significant market uncertainty and volatility. Amid the turmoil, the U.S. government took unprecedented action – in concert with the U.S. Federal Reserve and central banks around the world – to help support consumers, businesses, and the broader economy, and to limit disruption to the financial system.
The situation continues to unfold, and the extent and duration of its impact on financial markets and the economy remain highly uncertain. Extreme events such as the coronavirus crisis are “exogenous shocks” that can have significant adverse effects on mutual funds and their investments. Although multiple asset classes may be affected by market disruption, the duration and impact may not be the same for all types of assets.
Fidelity is committed to helping you stay informed amid news about COVID-19 and during increased market volatility, and we’re taking extra steps to be responsive to customer needs. We encourage you to visit our websites, where we offer ongoing updates, commentary, and analysis on the markets and our funds.
Investment Summary (Unaudited)
Top Five Stocks as of April 30, 2020
| % of fund's net assets | |
| Newmont Corp. | 1.1 |
| Barrick Gold Corp. (Canada) | 1.1 |
| Royal Gold, Inc. | 1.1 |
| Regeneron Pharmaceuticals, Inc. | 1.0 |
| Microsoft Corp. | 1.0 |
| 5.3 |
Top Five Market Sectors as of April 30, 2020
| % of fund's net assets | |
| Consumer Staples | 15.7 |
| Information Technology | 14.4 |
| Utilities | 11.8 |
| Health Care | 10.9 |
| Financials | 10.8 |
Asset Allocation (% of fund's net assets)
| As of April 30, 2020 * | ||
| Stocks | 99.6% | |
| Short-Term Investments and Net Other Assets (Liabilities) | 0.4% | |

* Foreign investments - 12.2%
Schedule of Investments April 30, 2020
Showing Percentage of Net Assets
| Common Stocks - 98.8% | |||
| Shares | Value | ||
| COMMUNICATION SERVICES - 5.6% | |||
| Diversified Telecommunication Services - 1.0% | |||
| HKT Trust/HKT Ltd. unit | 767,388 | $1,238,350 | |
| Orange SA | 135,686 | 1,648,455 | |
| 2,886,805 | |||
| Entertainment - 2.3% | |||
| Activision Blizzard, Inc. | 34,475 | 2,197,092 | |
| Electronic Arts, Inc. (a) | 20,022 | 2,287,714 | |
| Take-Two Interactive Software, Inc. (a) | 18,564 | 2,247,172 | |
| 6,731,978 | |||
| Interactive Media & Services - 0.7% | |||
| Facebook, Inc. Class A (a) | 11,100 | 2,272,281 | |
| Media - 0.7% | |||
| Comcast Corp. Class A | 53,430 | 2,010,571 | |
| Wireless Telecommunication Services - 0.9% | |||
| T-Mobile U.S., Inc. (a) | 29,513 | 2,591,241 | |
| TOTAL COMMUNICATION SERVICES | 16,492,876 | ||
| CONSUMER DISCRETIONARY - 9.2% | |||
| Diversified Consumer Services - 1.7% | |||
| Grand Canyon Education, Inc. (a) | 27,181 | 2,338,110 | |
| Laureate Education, Inc. Class A (a) | 78,954 | 747,694 | |
| Service Corp. International | 53,126 | 1,951,849 | |
| 5,037,653 | |||
| Hotels, Restaurants & Leisure - 1.5% | |||
| McDonald's Corp. | 11,878 | 2,227,838 | |
| Starbucks Corp. | 27,232 | 2,089,511 | |
| 4,317,349 | |||
| Household Durables - 2.0% | |||
| D.R. Horton, Inc. | 39,774 | 1,878,128 | |
| Lennar Corp. Class A | 37,271 | 1,866,159 | |
| NVR, Inc. (a) | 676 | 2,095,600 | |
| 5,839,887 | |||
| Internet & Direct Marketing Retail - 0.8% | |||
| Amazon.com, Inc. (a) | 978 | 2,419,572 | |
| Multiline Retail - 1.8% | |||
| Dollar General Corp. | 16,268 | 2,851,780 | |
| Dollar Tree, Inc. (a) | 30,691 | 2,445,152 | |
| 5,296,932 | |||
| Specialty Retail - 1.4% | |||
| Ross Stores, Inc. | 19,908 | 1,818,795 | |
| TJX Companies, Inc. | 47,453 | 2,327,570 | |
| 4,146,365 | |||
| TOTAL CONSUMER DISCRETIONARY | 27,057,758 | ||
| CONSUMER STAPLES - 15.7% | |||
| Beverages - 2.9% | |||
| Keurig Dr. Pepper, Inc. | 75,079 | 1,986,590 | |
| Monster Beverage Corp. (a) | 37,011 | 2,287,650 | |
| PepsiCo, Inc. | 17,855 | 2,362,038 | |
| The Coca-Cola Co. | 44,515 | 2,042,793 | |
| 8,679,071 | |||
| Food & Staples Retailing - 3.0% | |||
| BJ's Wholesale Club Holdings, Inc. (a) | 85,828 | 2,258,135 | |
| Kroger Co. | 76,309 | 2,412,127 | |
| Performance Food Group Co. (a) | 23,511 | 690,048 | |
| U.S. Foods Holding Corp. (a) | 51,865 | 1,115,098 | |
| Walmart, Inc. | 19,309 | 2,347,009 | |
| 8,822,417 | |||
| Food Products - 5.8% | |||
| Conagra Brands, Inc. | 61,846 | 2,068,130 | |
| Kellogg Co. | 37,148 | 2,433,194 | |
| Lamb Weston Holdings, Inc. | 27,513 | 1,688,198 | |
| Mondelez International, Inc. | 46,327 | 2,383,061 | |
| Nestle SA (Reg. S) | 18,870 | 1,998,522 | |
| The Hershey Co. | 16,661 | 2,206,416 | |
| The J.M. Smucker Co. | 22,541 | 2,590,186 | |
| Tyson Foods, Inc. Class A | 28,311 | 1,760,661 | |
| 17,128,368 | |||
| Household Products - 2.5% | |||
| Colgate-Palmolive Co. | 35,237 | 2,476,104 | |
| Kimberly-Clark Corp. | 17,343 | 2,401,659 | |
| Procter & Gamble Co. | 19,849 | 2,339,602 | |
| 7,217,365 | |||
| Personal Products - 0.7% | |||
| Unilever NV | 39,537 | 1,968,916 | |
| Tobacco - 0.8% | |||
| Universal Corp. | 50,881 | 2,461,114 | |
| TOTAL CONSUMER STAPLES | 46,277,251 | ||
| FINANCIALS - 10.8% | |||
| Banks - 0.4% | |||
| Wells Fargo & Co. | 43,120 | 1,252,636 | |
| Capital Markets - 2.4% | |||
| Houlihan Lokey | 39,519 | 2,346,638 | |
| Intercontinental Exchange, Inc. | 25,010 | 2,237,145 | |
| The NASDAQ OMX Group, Inc. | 22,292 | 2,444,764 | |
| 7,028,547 | |||
| Diversified Financial Services - 0.7% | |||
| Berkshire Hathaway, Inc. Class B (a) | 10,650 | 1,995,384 | |
| Insurance - 7.3% | |||
| Allstate Corp. | 20,877 | 2,123,608 | |
| Assurant, Inc. | 17,111 | 1,817,873 | |
| Axis Capital Holdings Ltd. | 43,880 | 1,606,008 | |
| Brown & Brown, Inc. | 65,182 | 2,340,686 | |
| Chubb Ltd. | 17,084 | 1,845,243 | |
| Hartford Financial Services Group, Inc. | 39,727 | 1,509,229 | |
| Marsh & McLennan Companies, Inc. | 19,262 | 1,874,770 | |
| Old Republic International Corp. | 105,000 | 1,674,750 | |
| The Travelers Companies, Inc. | 17,250 | 1,745,873 | |
| Tokio Marine Holdings, Inc. | 37,196 | 1,745,078 | |
| White Mountains Insurance Group Ltd. | 2,095 | 2,038,435 | |
| Willis Group Holdings PLC | 7,293 | 1,300,269 | |
| 21,621,822 | |||
| TOTAL FINANCIALS | 31,898,389 | ||
| HEALTH CARE - 10.9% | |||
| Biotechnology - 2.5% | |||
| Amgen, Inc. | 9,692 | 2,318,520 | |
| Regeneron Pharmaceuticals, Inc. (a) | 5,510 | 2,897,599 | |
| Vertex Pharmaceuticals, Inc. (a) | 8,205 | 2,061,096 | |
| 7,277,215 | |||
| Health Care Equipment & Supplies - 2.3% | |||
| Becton, Dickinson & Co. | 8,836 | 2,231,355 | |
| Danaher Corp. | 14,774 | 2,414,958 | |
| Masimo Corp. (a) | 10,053 | 2,150,437 | |
| 6,796,750 | |||
| Health Care Providers & Services - 2.4% | |||
| Humana, Inc. | 6,562 | 2,505,503 | |
| Premier, Inc. (a) | 68,179 | 2,260,816 | |
| UnitedHealth Group, Inc. | 7,813 | 2,285,068 | |
| 7,051,387 | |||
| Pharmaceuticals - 3.7% | |||
| AstraZeneca PLC (United Kingdom) | 21,851 | 2,285,442 | |
| Bristol-Myers Squibb Co. | 40,857 | 2,484,514�� | |
| Eli Lilly & Co. | 17,040 | 2,635,066 | |
| Jazz Pharmaceuticals PLC (a) | 11,538 | 1,272,065 | |
| Roche Holding AG (participation certificate) | 6,966 | 2,412,308 | |
| 11,089,395 | |||
| TOTAL HEALTH CARE | 32,214,747 | ||
| INDUSTRIALS - 6.8% | |||
| Aerospace & Defense - 1.5% | |||
| Lockheed Martin Corp. | 6,032 | 2,346,810 | |
| Northrop Grumman Corp. | 6,564 | 2,170,518 | |
| 4,517,328 | |||
| Commercial Services & Supplies - 1.5% | |||
| Waste Connection, Inc. (United States) | 26,192 | 2,250,155 | |
| Waste Management, Inc. | 20,899 | 2,090,318 | |
| 4,340,473 | |||
| Industrial Conglomerates - 0.8% | |||
| Roper Technologies, Inc. | 6,896 | 2,351,743 | |
| Professional Services - 0.8% | |||
| Verisk Analytics, Inc. | 14,784 | 2,259,439 | |
| Road & Rail - 2.2% | |||
| Heartland Express, Inc. | 109,222 | 2,139,659 | |
| Landstar System, Inc. | 20,757 | 2,144,406 | |
| Schneider National, Inc. Class B | 103,449 | 2,266,568 | |
| 6,550,633 | |||
| TOTAL INDUSTRIALS | 20,019,616 | ||
| INFORMATION TECHNOLOGY - 14.4% | |||
| Communications Equipment - 1.8% | |||
| Cisco Systems, Inc. | 51,539 | 2,184,223 | |
| Juniper Networks, Inc. | 48,580 | 1,049,328 | |
| Motorola Solutions, Inc. | 14,129 | 2,031,891 | |
| 5,265,442 | |||
| Electronic Equipment & Components - 1.1% | |||
| Keysight Technologies, Inc. (a) | 21,920 | 2,121,198 | |
| TE Connectivity Ltd. | 16,555 | 1,216,130 | |
| 3,337,328 | |||
| IT Services - 8.2% | |||
| Accenture PLC Class A | 11,976 | 2,217,835 | |
| Akamai Technologies, Inc. (a) | 21,213 | 2,072,722 | |
| Black Knight, Inc. (a) | 36,323 | 2,563,314 | |
| Booz Allen Hamilton Holding Corp. Class A | 32,201 | 2,364,841 | |
| ExlService Holdings, Inc. (a) | 23,659 | 1,460,470 | |
| Fidelity National Information Services, Inc. | 16,434 | 2,167,480 | |
| Fiserv, Inc. (a) | 20,285 | 2,090,572 | |
| Jack Henry & Associates, Inc. | 16,012 | 2,618,763 | |
| MasterCard, Inc. Class A | 7,751 | 2,131,292 | |
| Maximus, Inc. | 30,831 | 2,075,543 | |
| Visa, Inc. Class A | 12,550 | 2,242,936 | |
| 24,005,768 | |||
| Software - 3.3% | |||
| Adobe, Inc. (a) | 6,595 | 2,332,256 | |
| Microsoft Corp. | 16,113 | 2,887,611 | |
| Oracle Corp. | 52,678 | 2,790,354 | |
| Oracle Corp. Japan | 17,611 | 1,824,855 | |
| 9,835,076 | |||
| TOTAL INFORMATION TECHNOLOGY | 42,443,614 | ||
| MATERIALS - 7.1% | |||
| Chemicals - 1.4% | |||
| Air Products & Chemicals, Inc. | 7,813 | 1,762,457 | |
| Ecolab, Inc. | 12,168 | 2,354,508 | |
| 4,116,965 | |||
| Containers & Packaging - 0.8% | |||
| Aptargroup, Inc. | 20,651 | 2,211,309 | |
| Metals & Mining - 4.9% | |||
| Agnico Eagle Mines Ltd. (Canada) | 36,483 | 2,131,659 | |
| Barrick Gold Corp. (Canada) | 123,272 | 3,173,128 | |
| Newmont Corp. | 54,415 | 3,236,603 | |
| Royal Gold, Inc. | 25,876 | 3,170,586 | |
| Wheaton Precious Metals Corp. | 71,916 | 2,732,596 | |
| 14,444,572 | |||
| TOTAL MATERIALS | 20,772,846 | ||
| REAL ESTATE - 6.5% | |||
| Equity Real Estate Investment Trusts (REITs) - 6.5% | |||
| Alexandria Real Estate Equities, Inc. | 14,443 | 2,268,851 | |
| American Tower Corp. | 11,202 | 2,666,076 | |
| CubeSmart | 77,543 | 1,954,084 | |
| Douglas Emmett, Inc. | 50,459 | 1,538,495 | |
| Equinix, Inc. | 4,073 | 2,750,090 | |
| Equity Lifestyle Properties, Inc. | 32,567 | 1,964,116 | |
| Essex Property Trust, Inc. | 7,343 | 1,792,426 | |
| Invitation Homes, Inc. | 46,840 | 1,107,766 | |
| National Retail Properties, Inc. | 42,441 | 1,385,274 | |
| UDR, Inc. | 48,722 | 1,825,613 | |
| 19,252,791 | |||
| UTILITIES - 11.8% | |||
| Electric Utilities - 6.9% | |||
| American Electric Power Co., Inc. | 25,370 | 2,108,501 | |
| Duke Energy Corp. | 26,728 | 2,262,792 | |
| Entergy Corp. | 19,406 | 1,853,467 | |
| Evergy, Inc. | 36,620 | 2,139,707 | |
| Eversource Energy | 28,810 | 2,324,967 | |
| NextEra Energy, Inc. | 9,543 | 2,205,578 | |
| Pinnacle West Capital Corp. | 26,418 | 2,033,922 | |
| Portland General Electric Co. | 30,980 | 1,449,554 | |
| PPL Corp. | 68,144 | 1,732,220 | |
| Xcel Energy, Inc. | 32,821 | 2,086,103 | |
| 20,196,811 | |||
| Gas Utilities - 2.7% | |||
| Atmos Energy Corp. | 21,370 | 2,179,099 | |
| New Jersey Resources Corp. | 51,730 | 1,747,439 | |
| ONE Gas, Inc. | 25,344 | 2,020,170 | |
| Spire, Inc. | 28,403 | 2,072,283 | |
| 8,018,991 | |||
| Multi-Utilities - 2.2% | |||
| Ameren Corp. | 31,208 | 2,270,382 | |
| CMS Energy Corp. | 38,220 | 2,181,980 | |
| Dominion Energy, Inc. | 28,086 | 2,166,273 | |
| 6,618,635 | |||
| TOTAL UTILITIES | 34,834,437 | ||
| TOTAL COMMON STOCKS | |||
| (Cost $296,126,584) | 291,264,325 | ||
| Money Market Funds - 1.0% | |||
| Fidelity Cash Central Fund 0.16% (b) | |||
| (Cost $2,861,019) | 2,860,161 | 2,861,019 | |
| Equity Funds - 0.8% | |||
| Domestic Equity Funds - 0.8% | |||
| iShares MSCI USA Minimum Volatility ETF | |||
| (Cost $2,448,073) | 41,500 | 2,451,405 | |
| TOTAL INVESTMENT IN SECURITIES - 100.6% | |||
| (Cost $301,435,676) | 296,576,749 | ||
| NET OTHER ASSETS (LIABILITIES) - (0.6)% | (1,886,668) | ||
| NET ASSETS - 100% | $294,690,081 |
Security Type Abbreviations
ETF – Exchange-Traded Fund
Legend
(a) Non-income producing
(b) Affiliated fund that is generally available only to investment companies and other accounts managed by Fidelity Investments. The rate quoted is the annualized seven-day yield of the fund at period end. A complete unaudited listing of the fund's holdings as of its most recent quarter end is available upon request. In addition, each Fidelity Central Fund's financial statements, which are not covered by the Fund's Report of Independent Registered Public Accounting Firm, are available on the SEC's website or upon request.
Affiliated Central Funds
Information regarding fiscal year to date income earned by the Fund from investments in Fidelity Central Funds is as follows:
| Fund | Income earned |
| Fidelity Cash Central Fund | $775 |
| Total | $775 |
Amounts in the income column in the above table include any capital gain distributions from underlying funds, which are presented in the corresponding line-item in the Statement of Operations, if applicable.
Investment Valuation
The following is a summary of the inputs used, as of April 30, 2020, involving the Fund's assets and liabilities carried at fair value. The inputs or methodology used for valuing securities may not be an indication of the risk associated with investing in those securities. For more information on valuation inputs, and their aggregation into the levels used below, please refer to the Investment Valuation section in the accompanying Notes to Financial Statements.
| Valuation Inputs at Reporting Date: | ||||
| Description | Total | Level 1 | Level 2 | Level 3 |
| Investments in Securities: | ||||
| Equities: | ||||
| Communication Services | $16,492,876 | $13,606,071 | $2,886,805 | $-- |
| Consumer Discretionary | 27,057,758 | 27,057,758 | -- | -- |
| Consumer Staples | 46,277,251 | 42,309,813 | 3,967,438 | -- |
| Financials | 31,898,389 | 30,153,311 | 1,745,078 | -- |
| Health Care | 32,214,747 | 27,516,997 | 4,697,750 | -- |
| Industrials | 20,019,616 | 20,019,616 | -- | -- |
| Information Technology | 42,443,614 | 42,443,614 | -- | -- |
| Materials | 20,772,846 | 20,772,846 | -- | -- |
| Real Estate | 19,252,791 | 19,252,791 | -- | -- |
| Utilities | 34,834,437 | 34,834,437 | -- | -- |
| Money Market Funds | 2,861,019 | 2,861,019 | -- | -- |
| Equity Funds | 2,451,405 | 2,451,405 | -- | -- |
| Total Investments in Securities: | $296,576,749 | $283,279,678 | $13,297,071 | $-- |
Other Information
Distribution of investments by country or territory of incorporation, as a percentage of Total Net Assets, is as follows (Unaudited):
| United States of America | 87.8% |
| Canada | 3.5% |
| Switzerland | 2.5% |
| Bermuda | 1.3% |
| Japan | 1.2% |
| Ireland | 1.2% |
| Others (Individually Less Than 1%) | 2.5% |
| 100.0% |
See accompanying notes which are an integral part of the financial statements.
Financial Statements
Statement of Assets and Liabilities
| April 30, 2020 | ||
| Assets | ||
| Investment in securities, at value — See accompanying schedule: Unaffiliated issuers (cost $298,574,657) | $293,715,730 | |
| Fidelity Central Funds (cost $2,861,019) | 2,861,019 | |
| Total Investment in Securities (cost $301,435,676) | $296,576,749 | |
| Foreign currency held at value (cost $1,028) | 1,038 | |
| Receivable for investments sold | 420,361 | |
| Receivable for fund shares sold | 4,709,121 | |
| Dividends receivable | 48,323 | |
| Distributions receivable from Fidelity Central Funds | 18 | |
| Prepaid expenses | 14,668 | |
| Receivable from investment adviser for expense reductions | 5,560 | |
| Other receivables | 95 | |
| Total assets | 301,775,933 | |
| Liabilities | ||
| Payable for investments purchased | $6,986,893 | |
| Payable for fund shares redeemed | 45,442 | |
| Accrued management fee | 10,095 | |
| Other affiliated payables | 4,982 | |
| Other payables and accrued expenses | 38,440 | |
| Total liabilities | 7,085,852 | |
| Net Assets | $294,690,081 | |
| Net Assets consist of: | ||
| Paid in capital | $298,280,618 | |
| Total accumulated earnings (loss) | (3,590,537) | |
| Net Assets | $294,690,081 | |
| Net Asset Value, offering price and redemption price per share ($294,690,081 ÷ 31,930,882 shares) | $9.23 |
See accompanying notes which are an integral part of the financial statements.
Statement of Operations
| For the period November 5, 2019 (commencement of operations) to April 30, 2020 | ||
| Investment Income | ||
| Dividends | $100,457 | |
| Income from Fidelity Central Funds | 775 | |
| Total income | 101,232 | |
| Expenses | ||
| Management fee | $22,317 | |
| Transfer agent fees | 9,416 | |
| Accounting fees and expenses | 1,628 | |
| Custodian fees and expenses | 14,642 | |
| Independent trustees' fees and expenses | 12 | |
| Registration fees | 15,717 | |
| Audit | 31,136 | |
| Miscellaneous | 989 | |
| Total expenses before reductions | 95,857 | |
| Expense reductions | (55,988) | |
| Total expenses after reductions | 39,869 | |
| Net investment income (loss) | 61,363 | |
| Realized and Unrealized Gain (Loss) | ||
| Net realized gain (loss) on: | ||
| Investment securities: | ||
| Unaffiliated issuers | (586,701) | |
| Fidelity Central Funds | 65 | |
| Foreign currency transactions | 1,152 | |
| Total net realized gain (loss) | (585,484) | |
| Change in net unrealized appreciation (depreciation) on: | ||
| Investment securities: | ||
| Unaffiliated issuers | (4,858,927) | |
| Assets and liabilities in foreign currencies | 33 | |
| Total change in net unrealized appreciation (depreciation) | (4,858,894) | |
| Net gain (loss) | (5,444,378) | |
| Net increase (decrease) in net assets resulting from operations | $(5,383,015) |
See accompanying notes which are an integral part of the financial statements.
Statement of Changes in Net Assets
| For the period November 5, 2019 (commencement of operations) to April 30, 2020 | |
| Increase (Decrease) in Net Assets | |
| Operations | |
| Net investment income (loss) | $61,363 |
| Net realized gain (loss) | (585,484) |
| Change in net unrealized appreciation (depreciation) | (4,858,894) |
| Net increase (decrease) in net assets resulting from operations | (5,383,015) |
| Distributions to shareholders | (9,940) |
| Share transactions | |
| Proceeds from sales of shares | 303,645,984 |
| Reinvestment of distributions | 9,899 |
| Cost of shares redeemed | (3,572,847) |
| Net increase (decrease) in net assets resulting from share transactions | 300,083,036 |
| Total increase (decrease) in net assets | 294,690,081 |
| Net Assets | |
| Beginning of period | – |
| End of period | $294,690,081 |
| Other Information | |
| Shares | |
| Sold | 32,321,840 |
| Issued in reinvestment of distributions | 970 |
| Redeemed | (391,928) |
| Net increase (decrease) | 31,930,882 |
See accompanying notes which are an integral part of the financial statements.
Financial Highlights
Fidelity U.S. Low Volatility Equity Fund
| Years ended April 30, | 2020 A |
| Selected Per–Share Data | |
| Net asset value, beginning of period | $10.00 |
| Income from Investment Operations | |
| Net investment income (loss)B | .05 |
| Net realized and unrealized gain (loss) | (.79) |
| Total from investment operations | (.74) |
| Distributions from net investment income | (.03) |
| Total distributions | (.03) |
| Net asset value, end of period | $9.23 |
| Total ReturnC,D | (7.44)% |
| Ratios to Average Net AssetsE,F | |
| Expenses before reductions | 2.28%G |
| Expenses net of fee waivers, if any | .95%G |
| Expenses net of all reductions | .95%G |
| Net investment income (loss) | 1.46%G |
| Supplemental Data | |
| Net assets, end of period (000 omitted) | $294,690 |
| Portfolio turnover rateH | 101%I,J |
A For the period November 5, 2019 (commencement of operations) to April 30, 2020.
B Calculated based on average shares outstanding during the period.
C Total returns for periods of less than one year are not annualized.
D Total returns would have been lower if certain expenses had not been reduced during the applicable periods shown.
E Fees and expenses of any underlying Fidelity Central Funds are not included in the Fund's expense ratio. The Fund indirectly bears its proportionate share of the expenses of any underlying Fidelity Central Funds.
F Expense ratios reflect operating expenses of the Fund. Expenses before reductions do not reflect amounts reimbursed by the investment adviser or reductions from brokerage service arrangements or reductions from other expense offset arrangements and do not represent the amount paid by the Fund during periods when reimbursements or reductions occur. Expense ratios before reductions for start-up periods may not be representative of longer term operating periods. Expenses net of fee waivers reflect expenses after reimbursement by the investment adviser but prior to reductions from brokerage service arrangements or other expense offset arrangements. Expenses net of all reductions represent the net expenses paid by the Fund.
G Annualized
H Amount does not include the portfolio activity of any underlying Fidelity Central Funds.
I Portfolio turnover rate excludes securities received or delivered in-kind.
J Amount not annualized.
See accompanying notes which are an integral part of the financial statements.
Notes to Financial Statements
For the period ended April 30, 2020
1. Organization.
Fidelity U.S. Low Volatility Equity Fund (the Fund) is a fund of Fidelity Summer Street Trust (the Trust) and is authorized to issue an unlimited number of shares. Share transactions on the Statement of Changes in Net Assets may contain exchanges between affiliated funds. The Trust is registered under the Investment Company Act of 1940, as amended (the 1940 Act), as an open-end management investment company organized as a Massachusetts business trust.
Effective January 1, 2020:
Investment advisers Fidelity Investments Money Management, Inc., FMR Co., Inc., and Fidelity SelectCo, LLC, merged with and into Fidelity Management & Research Company. In connection with the merger transactions, the resulting, merged investment adviser was then redomiciled from Massachusetts to Delaware, changed its corporate structure from a corporation to a limited liability company, and changed its name to "Fidelity Management & Research Company LLC".
Fidelity Investments Institutional Operations Company, Inc. converted from a Massachusetts corporation to a Massachusetts LLC, and changed its name to "Fidelity Investments Institutional Operations Company LLC".
2. Investments in Fidelity Central Funds.
The Fund invests in Fidelity Central Funds, which are open-end investment companies generally available only to other investment companies and accounts managed by the investment adviser and its affiliates. The Fund's Schedule of Investments lists each of the Fidelity Central Funds held as of period end, if any, as an investment of the Fund, but does not include the underlying holdings of each Fidelity Central Fund. As an Investing Fund, the Fund indirectly bears its proportionate share of the expenses of the underlying Fidelity Central Funds.
The Money Market Central Funds seek preservation of capital and current income and are managed by the investment adviser. Annualized expenses of the Money Market Central Funds as of their most recent shareholder report date ranged from less than .005% to .01%.
A complete unaudited list of holdings for each Fidelity Central Fund is available upon request or at the Securities and Exchange Commission (the SEC) website at www.sec.gov. In addition, the financial statements of the Fidelity Central Funds, which are not covered by the Fund's Report of Independent Registered Public Accounting Firm, are available on the SEC website or upon request.
3. Significant Accounting Policies.
The Fund is an investment company and applies the accounting and reporting guidance of the Financial Accounting Standards Board (FASB) Accounting Standards Codification Topic 946 Financial Services – Investments Companies. The financial statements have been prepared in conformity with accounting principles generally accepted in the United States of America (GAAP), which require management to make certain estimates and assumptions at the date of the financial statements. Actual results could differ from those estimates. Subsequent events, if any, through the date that the financial statements were issued have been evaluated in the preparation of the financial statements. The following summarizes the significant accounting policies of the Fund:
Investment Valuation. Investments are valued as of 4:00 p.m. Eastern time on the last calendar day of the period. The Board of Trustees (the Board) has delegated the day to day responsibility for the valuation of the Fund's investments to the Fair Value Committee (the Committee) established by the Fund's investment adviser. In accordance with valuation policies and procedures approved by the Board, the Fund attempts to obtain prices from one or more third party pricing vendors or brokers to value its investments. When current market prices, quotations or currency exchange rates are not readily available or reliable, investments will be fair valued in good faith by the Committee, in accordance with procedures adopted by the Board. Factors used in determining fair value vary by investment type and may include market or investment specific events. The frequency with which these procedures are used cannot be predicted and they may be utilized to a significant extent. The Committee oversees the Fund's valuation policies and procedures and reports to the Board on the Committee's activities and fair value determinations. The Board monitors the appropriateness of the procedures used in valuing the Fund's investments and ratifies the fair value determinations of the Committee.
The Fund categorizes the inputs to valuation techniques used to value its investments into a disclosure hierarchy consisting of three levels as shown below:
- Level 1 – quoted prices in active markets for identical investments
- Level 2 – other significant observable inputs (including quoted prices for similar investments, interest rates, prepayment speeds, etc.)
- Level 3 – unobservable inputs (including the Fund's own assumptions based on the best information available)
Valuation techniques used to value the Fund's investments by major category are as follows:
Equity securities, including restricted securities, for which market quotations are readily available, are valued at the last reported sale price or official closing price as reported by a third party pricing vendor on the primary market or exchange on which they are traded and are categorized as Level 1 in the hierarchy. In the event there were no sales during the day or closing prices are not available, securities are valued at the last quoted bid price or may be valued using the last available price and are generally categorized as Level 2 in the hierarchy. For foreign equity securities, when market or security specific events arise, comparisons to the valuation of American Depositary Receipts (ADRs), futures contracts, Exchange-Traded Funds (ETFs) and certain indexes as well as quoted prices for similar securities may be used and would be categorized as Level 2 in the hierarchy. For equity securities, including restricted securities, where observable inputs are limited, assumptions about market activity and risk are used and these securities may be categorized as Level 3 in the hierarchy.
ETFs are valued at their last sale price or official closing price as reported by a third party pricing vendor on the primary market or exchange on which they are traded and are categorized as Level 1 in the hierarchy. In the event there were no sales during the day but the exchange reports a closing bid level, ETFs are valued at the closing bid and would be categorized as Level 1 in the hierarchy. In the event there was no closing bid, ETFs may be valued by another method that the Board believes reflects fair value in accordance with the Board's fair value pricing policies and may be categorized as Level 2 in the hierarchy.
Investments in open-end mutual funds, including the Fidelity Central Funds, are valued at their closing net asset value (NAV) each business day and are categorized as Level 1 in the hierarchy.
Changes in valuation techniques may result in transfers in or out of an assigned level within the disclosure hierarchy. The aggregate value of investments by input level as of April 30, 2020 is included at the end of the Fund's Schedule of Investments.
Foreign Currency. The Fund may use foreign currency contracts to facilitate transactions in foreign-denominated securities. Gains and losses from these transactions may arise from changes in the value of the foreign currency or if the counterparties do not perform under the contracts' terms.
Foreign-denominated assets, including investment securities, and liabilities are translated into U.S. dollars at the exchange rates at period end. Purchases and sales of investment securities, income and dividends received and expenses denominated in foreign currencies are translated into U.S. dollars at the exchange rate in effect on the transaction date.
The effects of exchange rate fluctuations on investments are included with the net realized and unrealized gain (loss) on investment securities. Other foreign currency transactions resulting in realized and unrealized gain (loss) are disclosed separately.
Investment Transactions and Income. For financial reporting purposes, the Fund's investment holdings and NAV include trades executed through the end of the last business day of the period. The NAV per share for processing shareholder transactions is calculated as of the close of business of the New York Stock Exchange (NYSE), normally 4:00 p.m. Eastern time and includes trades executed through the end of the prior business day. Gains and losses on securities sold are determined on the basis of identified cost. Dividend income is recorded on the ex-dividend date, except for certain dividends from foreign securities where the ex-dividend date may have passed, which are recorded as soon as the Fund is informed of the ex-dividend date. Non-cash dividends included in dividend income, if any, are recorded at the fair market value of the securities received. Income and capital gain distributions from Fidelity Central Funds, if any, are recorded on the ex-dividend date. Certain distributions received by the Fund represent a return of capital or capital gain. The Fund determines the components of these distributions subsequent to the ex-dividend date, based upon receipt of tax filings or other correspondence relating to the underlying investment. These distributions are recorded as a reduction of cost of investments and/or as a realized gain. Investment income is recorded net of foreign taxes withheld where recovery of such taxes is uncertain.
Expenses. Expenses directly attributable to a fund are charged to that fund. Expenses attributable to more than one fund are allocated among the respective funds on the basis of relative net assets or other appropriate methods. Expense estimates are accrued in the period to which they relate and adjustments are made when actual amounts are known.
Income Tax Information and Distributions to Shareholders. Each year, the Fund intends to qualify as a regulated investment company under Subchapter M of the Internal Revenue Code, including distributing substantially all of its taxable income and realized gains. As a result, no provision for U.S. Federal income taxes is required. As of April 30, 2020, the Fund did not have any unrecognized tax benefits in the financial statements; nor is the Fund aware of any tax positions for which it is reasonably possible that the total amounts of unrecognized tax benefits will significantly change in the next twelve months. The Fund files a U.S. federal tax return, in addition to state and local tax returns as required. The Fund's federal income tax returns are subject to examination by the Internal Revenue Service (IRS) for a period of three fiscal years after they are filed. State and local tax returns may be subject to examination for an additional fiscal year depending on the jurisdiction. Foreign taxes are provided for based on the Fund's understanding of the tax rules and rates that exist in the foreign markets in which it invests.
Distributions are declared and recorded on the ex-dividend date. Income and capital gain distributions are determined in accordance with income tax regulations, which may differ from GAAP.
Capital accounts within the financial statements are adjusted for permanent book-tax differences. These adjustments have no impact on net assets or the results of operations. Capital accounts are not adjusted for temporary book-tax differences which will reverse in a subsequent period.
Book-tax differences are primarily due to in-kind transactions, foreign currency transactions and losses deferred due to wash sales and capital loss carryforwards.
As of period end, the cost and unrealized appreciation (depreciation) in securities, and derivatives if applicable, for federal income tax purposes were as follows:
| Gross unrealized appreciation | $3,294,248 |
| Gross unrealized depreciation | (6,413,963) |
| Net unrealized appreciation (depreciation) | $(3,119,715) |
| Tax Cost | $299,696,464 |
The tax-based components of distributable earnings as of period end were as follows:
| Undistributed ordinary income | $52,575 |
| Capital loss carryforward | $(523,430) |
| Net unrealized appreciation (depreciation) on securities and other investments | $(3,119,682) |
Capital loss carryforwards are only available to offset future capital gains of the Fund to the extent provided by regulations and may be limited. The capital loss carryforward information presented below, including any applicable limitation, is estimated as of fiscal period end and is subject to adjustment.
| No expiration | |
| Short-term | $(523,430) |
| Total capital loss carryforward | $(523,430) |
Due to large subscriptions in the period, approximately $437,552 of the Fund's realized capital losses are subject to limitation. Due to this limitation, the Fund will only be permitted to use approximately $148,547 of those capital losses per year to offset capital gains.
The tax character of distributions paid was as follows:
| April 30, 2020(a) | |
| Ordinary Income | $9,940 |
| Total | $9,940 |
(a) For the period November 5, 2019 (commencement of operations) to April 30, 2020.
4. Purchases and Sales of Investments.
Purchases and sales of securities, other than short-term securities and in-kind transactions, are noted in the table below.
| Purchases ($) | Sales ($) | |
| Fidelity U.S. Low Volatility Equity Fund | 18,744,942 | 6,677,746 |
5. Fees and Other Transactions with Affiliates.
Management Fee. Fidelity Management & Research Company LLC (the investment adviser) and its affiliates provide the Fund with investment management related services for which the Fund pays a monthly management fee. The management fee is the sum of an individual fund fee rate that is based on an annual rate of .30% of the Fund's average net assets and an annualized group fee rate that averaged .23% during the period. The group fee rate is based upon the monthly average net assets of a group of registered investment companies with which the investment adviser has management contracts. The group fee rate decreases as assets under management increase and increases as assets under management decrease. For the reporting period, the total annualized management fee rate was .53% of the Fund's average net assets.
Transfer Agent Fees. Fidelity Investments Institutional Operations Company LLC (FIIOC), an affiliate of the investment adviser, is the Fund's transfer, dividend disbursing and shareholder servicing agent. FIIOC receives account fees and asset-based fees that vary according to account size and type of account. FIIOC pays for typesetting, printing and mailing of shareholder reports, except proxy statements. For the period, the transfer agent fees were equivalent to an annualized rate of .22% of average net assets.
Accounting Fees. Fidelity Service Company, Inc. (FSC), an affiliate of the investment adviser, maintains the Fund's accounting records. The accounting fee is based on the level of average net assets for each month. For the period, the fees were equivalent to the following annualized rates:
| % of Average Net Assets | |
| Fidelity U.S. Low Volatility Equity Fund | .04 |
Brokerage Commissions. A portion of portfolio transactions were placed with brokerage firms which are affiliates of the investment adviser. Brokerage commissions are included in net realized gain (loss) and change in net unrealized appreciation (depreciation) in the Statement of Operations. The commissions paid to these affiliated firms were as follows:
| Amount | |
| Fidelity U.S. Low Volatility Equity Fund | $230 |
Interfund Trades. Funds may purchase from or sell securities to other Fidelity Funds under procedures adopted by the Board. The procedures have been designed to ensure these interfund trades are executed in accordance with Rule 17a-7 of the 1940 Act. Interfund trades are included within the respective purchases and sales amounts shown in the Purchases and Sales of Investments note.
Affiliated Exchanges In-Kind. During the period, VIP FundsManager 20% Portfolio, VIP FundsManager 50% Portfolio, VIP FundsManager 60% Portfolio, VIP FundsManager 70% Portfolio, and VIP FundsManager 85% Portfolio (the Investing Funds) completed exchange in-kind transactions with the Fund. The Investing Funds delivered investments and cash valued at $289,970,779 in exchange for 30,946,721 shares of the Fund, as presented in the accompanying table. The value of investments delivered from the Investing Funds is included in proceeds from sales of shares in the accompanying Statements of Changes in Net Assets. Details of the transactions are presented in the accompanying table:
| Fund | Value of investments and cash, delivered from Investing Fund | Exchanged number of shares |
| VIP FundsManager 20% Portfolio | $5,912,068 | 630,957 |
| VIP FundsManager 50% Portfolio | 101,614,757 | 10,844,691 |
| VIP FundsManager 60% Portfolio | 127,748,659 | 13,633,795 |
| VIP FundsManager 70% Portfolio | 38,918,062 | 4,153,475 |
| VIP FundsManager 85% Portfolio | 15,777,233 | 1,683,803 |
| Total | $289,970,779 | 30,946,721 |
6. Committed Line of Credit.
Certain Funds participate with other funds managed by the investment adviser or an affiliate in a $4.25 billion credit facility (the "line of credit") to be utilized for temporary or emergency purposes to fund shareholder redemptions or for other short-term liquidity purposes. The participating funds have agreed to pay commitment fees on their pro-rata portion of the line of credit, which are reflected in Miscellaneous expenses on the Statement of Operations, and are as follows:
| Amount | |
| Fidelity U.S. Low Volatility Equity Fund | $1 |
During the period, there were no borrowings on this line of credit.
7. Expense Reductions.
The investment adviser contractually agreed to reimburse the Fund to the extent annual operating expenses exceeded .95% of average net assets. This reimbursement will remain in place through August 31, 2021. Some expenses, for example the compensation of the independent Trustees, and certain miscellaneous expenses such as proxy and shareholder meeting expenses, are excluded from this reimbursement. During the period this reimbursement reduced the Fund's expenses by $55,803.
Commissions paid to certain brokers with whom the investment adviser, or its affiliates, places trades on behalf of the Fund include an amount in addition to trade execution, which may be rebated back to the Fund to offset certain expenses. This amount totaled $166 for the period. In addition, through arrangements with the Fund's custodian, credits realized as a result of certain uninvested cash balances were used to reduce the Fund's expenses by $12.
In addition, during the period the investment adviser or an affiliate reimbursed and/or waived a portion of operating expenses in the amount of $7.
8. Other.
The Fund's organizational documents provide former and current trustees and officers with a limited indemnification against liabilities arising in connection with the performance of their duties to the Fund. In the normal course of business, the Fund may also enter into contracts that provide general indemnifications. The Fund's maximum exposure under these arrangements is unknown as this would be dependent on future claims that may be made against the Fund. The risk of material loss from such claims is considered remote.
At the end of the period, VIP FundsManager 50% Portfolio, VIP FundsManager 60% Portfolio and VIP FundsManager 70% Portfolio, were the owners of record of approximately 34%, 43% and 13%, respectively, of the total outstanding shares of the Fund. Mutual funds managed by the investment adviser or its affiliates were the owners of record, in the aggregate, of approximately 97% of the total outstanding shares of the Fund.
9. Coronavirus (COVID-19) Pandemic.
An outbreak of COVID-19 first detected in China during December 2019 has since spread globally and was declared a pandemic by the World Health Organization during March 2020. Developments that disrupt global economies and financial markets, such as the COVID-19 pandemic, may magnify factors that affect the Fund's performance.
Report of Independent Registered Public Accounting Firm
To the Board of Trustees of Fidelity Summer Street Trust and Shareholders of Fidelity U.S. Low Volatility Equity Fund
Opinion on the Financial Statements
We have audited the accompanying statement of assets and liabilities, including the schedule of investments, of Fidelity U.S. Low Volatility Equity Fund (one of the funds constituting Fidelity Summer Street Trust, referred to hereafter as the “Fund”) as of April 30, 2020, and the related statements of operations and changes in net assets, including the related notes, and the financial highlights for the period November 5, 2019 (commencement of operations) through April 30, 2020 (collectively referred to as the “financial statements”). In our opinion, the financial statements present fairly, in all material respects, the financial position of the Fund as of April 30, 2020, and the results of its operations, changes in its net assets, and the financial highlights for the period November 5, 2019 (commencement of operations) through April 30, 2020 in conformity with accounting principles generally accepted in the United States of America.
Basis for Opinion
These financial statements are the responsibility of the Fund’s management. Our responsibility is to express an opinion on the Fund’s financial statements based on our audit. We are a public accounting firm registered with the Public Company Accounting Oversight Board (United States) (PCAOB) and are required to be independent with respect to the Fund in accordance with the U.S. federal securities laws and the applicable rules and regulations of the Securities and Exchange Commission and the PCAOB.
We conducted our audit of these financial statements in accordance with the standards of the PCAOB. Those standards require that we plan and perform the audit to obtain reasonable assurance about whether the financial statements are free of material misstatement, whether due to error or fraud.
Our audit included performing procedures to assess the risks of material misstatement of the financial statements, whether due to error or fraud, and performing procedures that respond to those risks. Such procedures included examining, on a test basis, evidence regarding the amounts and disclosures in the financial statements. Our audit also included evaluating the accounting principles used and significant estimates made by management, as well as evaluating the overall presentation of the financial statements. Our procedures included confirmation of securities owned as of April 30, 2020 by correspondence with the custodian. We believe that our audit provides a reasonable basis for our opinion.
PricewaterhouseCoopers LLP
Boston, Massachusetts
June 15, 2020
We have served as the auditor of one or more investment companies in the Fidelity group of funds since 1932.
Trustees and Officers
The Trustees, Members of the Advisory Board (if any), and officers of the trust and fund, as applicable, are listed below. The Board of Trustees governs the fund and is responsible for protecting the interests of shareholders. The Trustees are experienced executives who meet periodically throughout the year to oversee the fund's activities, review contractual arrangements with companies that provide services to the fund, oversee management of the risks associated with such activities and contractual arrangements, and review the fund's performance. Except for Bettina Doulton, each of the Trustees oversees 312 funds. Ms. Doulton oversees 210 funds.
The Trustees hold office without limit in time except that (a) any Trustee may resign; (b) any Trustee may be removed by written instrument, signed by at least two-thirds of the number of Trustees prior to such removal; (c) any Trustee who requests to be retired or who has become incapacitated by illness or injury may be retired by written instrument signed by a majority of the other Trustees; and (d) any Trustee may be removed at any special meeting of shareholders by a two-thirds vote of the outstanding voting securities of the trust. Each Trustee who is not an interested person (as defined in the 1940 Act) of the trust and the fund is referred to herein as an Independent Trustee. Each Independent Trustee shall retire not later than the last day of the calendar year in which his or her 75th birthday occurs. The Independent Trustees may waive this mandatory retirement age policy with respect to individual Trustees. Officers and Advisory Board Members hold office without limit in time, except that any officer or Advisory Board Member may resign or may be removed by a vote of a majority of the Trustees at any regular meeting or any special meeting of the Trustees. Except as indicated, each individual has held the office shown or other offices in the same company for the past five years.
The fund’s Statement of Additional Information (SAI) includes more information about the Trustees. To request a free copy, call Fidelity at 1-800-544-8544.
Experience, Skills, Attributes, and Qualifications of the Trustees. The Governance and Nominating Committee has adopted a statement of policy that describes the experience, qualifications, attributes, and skills that are necessary and desirable for potential Independent Trustee candidates (Statement of Policy). The Board believes that each Trustee satisfied at the time he or she was initially elected or appointed a Trustee, and continues to satisfy, the standards contemplated by the Statement of Policy. The Governance and Nominating Committee also engages professional search firms to help identify potential Independent Trustee candidates who have the experience, qualifications, attributes, and skills consistent with the Statement of Policy. From time to time, additional criteria based on the composition and skills of the current Independent Trustees, as well as experience or skills that may be appropriate in light of future changes to board composition, business conditions, and regulatory or other developments, have also been considered by the professional search firms and the Governance and Nominating Committee. In addition, the Board takes into account the Trustees' commitment and participation in Board and committee meetings, as well as their leadership of standing and ad hoc committees throughout their tenure.
In determining that a particular Trustee was and continues to be qualified to serve as a Trustee, the Board has considered a variety of criteria, none of which, in isolation, was controlling. The Board believes that, collectively, the Trustees have balanced and diverse experience, qualifications, attributes, and skills, which allow the Board to operate effectively in governing the fund and protecting the interests of shareholders. Information about the specific experience, skills, attributes, and qualifications of each Trustee, which in each case led to the Board's conclusion that the Trustee should serve (or continue to serve) as a trustee of the fund, is provided below.
Board Structure and Oversight Function. Robert A. Lawrence is an interested person and currently serves as Acting Chairman. The Trustees have determined that an interested Chairman is appropriate and benefits shareholders because an interested Chairman has a personal and professional stake in the quality and continuity of services provided to the fund. Independent Trustees exercise their informed business judgment to appoint an individual of their choosing to serve as Chairman, regardless of whether the Trustee happens to be independent or a member of management. The Independent Trustees have determined that they can act independently and effectively without having an Independent Trustee serve as Chairman and that a key structural component for assuring that they are in a position to do so is for the Independent Trustees to constitute a substantial majority for the Board. The Independent Trustees also regularly meet in executive session. Ned C. Lautenbach and David M. Thomas serve as Co-Lead Independent Trustees and as such each (i) acts as a liaison between the Independent Trustees and management with respect to matters important to the Independent Trustees and (ii) with management prepares agendas for Board meetings.
Fidelity® funds are overseen by different Boards of Trustees. The fund's Board oversees Fidelity's high income and certain equity funds, and other Boards oversee Fidelity's investment-grade bond, money market, asset allocation, and other equity funds. The asset allocation funds may invest in Fidelity® funds overseen by the fund's Board. The use of separate Boards, each with its own committee structure, allows the Trustees of each group of Fidelity® funds to focus on the unique issues of the funds they oversee, including common research, investment, and operational issues. On occasion, the separate Boards establish joint committees to address issues of overlapping consequences for the Fidelity® funds overseen by each Board.
The Trustees operate using a system of committees to facilitate the timely and efficient consideration of all matters of importance to the Trustees, the fund, and fund shareholders and to facilitate compliance with legal and regulatory requirements and oversight of the fund's activities and associated risks. The Board, acting through its committees, has charged FMR and its affiliates with (i) identifying events or circumstances the occurrence of which could have demonstrably adverse effects on the fund's business and/or reputation; (ii) implementing processes and controls to lessen the possibility that such events or circumstances occur or to mitigate the effects of such events or circumstances if they do occur; and (iii) creating and maintaining a system designed to evaluate continuously business and market conditions in order to facilitate the identification and implementation processes described in (i) and (ii) above. Because the day-to-day operations and activities of the fund are carried out by or through FMR, its affiliates, and other service providers, the fund's exposure to risks is mitigated but not eliminated by the processes overseen by the Trustees. While each of the Board's committees has responsibility for overseeing different aspects of the fund's activities, oversight is exercised primarily through the Operations, Audit, and Compliance Committees. Appropriate personnel, including but not limited to the fund's Chief Compliance Officer (CCO), FMR's internal auditor, the independent accountants, the fund's Treasurer and portfolio management personnel, make periodic reports to the Board's committees, as appropriate, including an annual review of Fidelity's risk management program for the Fidelity® funds. The responsibilities of each standing committee, including their oversight responsibilities, are described further under "Standing Committees of the Trustees."
Interested Trustees*:
Correspondence intended for a Trustee who is an interested person may be sent to Fidelity Investments, 245 Summer Street, Boston, Massachusetts 02210.
Name, Year of Birth; Principal Occupations and Other Relevant Experience+
Bettina Doulton (1964)
Year of Election or Appointment: 2020
Trustee
Ms. Doulton also serves as Trustee of other Fidelity® funds. Prior to her retirement, Ms. Doulton served in a variety of positions at Fidelity Investments, including as a managing director of research (2006-2007), portfolio manager to certain Fidelity® funds (1993-2005), equity analyst and portfolio assistant (1990-1993), and research assistant (1987-1990). Ms. Doulton currently owns and operates Phi Builders + Architects and Cellardoor Winery. Previously, Ms. Doulton served as a member of the Board of Brown Capital Management, LLC (2013-2018).
Robert A. Lawrence (1952)
Year of Election or Appointment: 2020
Trustee
Acting Chairman of the Board of Trustees
Mr. Lawrence also serves as Trustee of other funds. Previously, Mr. Lawrence served as a Member of the Advisory Board of certain funds. Prior to his retirement in 2008, Mr. Lawrence served as Vice President of certain Fidelity® funds (2006-2008), Senior Vice President, Head of High Income Division of Fidelity Management & Research Company (investment adviser firm, 2006-2008), and President of Fidelity Strategic Investments (investment adviser firm, 2002-2005).
* Determined to be an “Interested Trustee” by virtue of, among other things, his or her affiliation with the trust or various entities under common control with FMR.
+ The information includes the Trustee's principal occupation during the last five years and other information relating to the experience, attributes, and skills relevant to the Trustee's qualifications to serve as a Trustee, which led to the conclusion that the Trustee should serve as a Trustee for the fund.
Independent Trustees:
Correspondence intended for an Independent Trustee may be sent to Fidelity Investments, P.O. Box 55235, Boston, Massachusetts 02205-5235.
Name, Year of Birth; Principal Occupations and Other Relevant Experience+
Dennis J. Dirks (1948)
Year of Election or Appointment: 2005
Trustee
Mr. Dirks also serves as Trustee of other Fidelity® funds. Prior to his retirement in May 2003, Mr. Dirks served as Chief Operating Officer and as a member of the Board of The Depository Trust & Clearing Corporation (financial markets infrastructure), President, Chief Operating Officer and a member of the Board of The Depository Trust Company (DTC), President and a member of the Board of the National Securities Clearing Corporation (NSCC), Chief Executive Officer and a member of the Board of the Government Securities Clearing Corporation and Chief Executive Officer and a member of the Board of the Mortgage-Backed Securities Clearing Corporation. Mr. Dirks currently serves as a member of the Finance Committee (2016-present) and Board (2017-present) and is Treasurer (2018-present) of the Asolo Repertory Theatre.
Donald F. Donahue (1950)
Year of Election or Appointment: 2018
Trustee
Mr. Donahue also serves as Trustee of other Fidelity® funds. Mr. Donahue serves as President and Chief Executive Officer of Miranda Partners, LLC (risk consulting for the financial services industry, 2012-present). Previously, Mr. Donahue served as Chief Executive Officer (2006-2012), Chief Operating Officer (2003-2006) and Managing Director, Customer Marketing and Development (1999-2003) of The Depository Trust & Clearing Corporation (financial markets infrastructure). Mr. Donahue currently serves as a member (2007-present) and Co-Chairman (2016-present) of the Board of United Way of New York, a member of the Board of NYC Leadership Academy (2012-present) and a member of the Board of Advisors of Ripple Labs, Inc. (financial services, 2015-present). Mr. Donahue previously served as a member of the Advisory Board of certain Fidelity® funds (2015-2018).
Vicki L. Fuller (1957)
Year of Election or Appointment: 2020
Trustee
Ms. Fuller also serves as Trustee of other Fidelity® funds. Previously, Ms. Fuller served as a member of the Advisory Board of certain Fidelity® funds (2018-2020), Chief Investment Officer of the New York State Common Retirement Fund (2012-2018) and held a variety of positions at AllianceBernstein L.P. (global asset management, 1985-2012), including Managing Director (2006-2012) and Senior Vice President and Senior Portfolio Manager (2001-2006). Ms. Fuller currently serves as a member of the Board, Audit Committee and Nominating and Governance Committee of The Williams Companies, Inc. (natural gas infrastructure, 2018-present) and as a member of the Board of Treliant, LLC (consulting, 2019-present).
Patricia L. Kampling (1959)
Year of Election or Appointment: 2020
Trustee
Ms. Kampling also serves as Trustee of other Fidelity® funds. Prior to her retirement, Ms. Kampling served as Chairman of the Board and Chief Executive Officer (2012-2019), President and Chief Operating Officer (2011-2012) and Executive Vice President and Chief Financial Officer (2010-2011) of Alliant Energy Corporation. Ms. Kampling currently serves as a member of the Board, Compensation Committee and Executive Committee and as Chair of the Audit Committee of Briggs & Stratton Corporation (manufacturing, 2011-present) and as a member of the Board, Audit, Finance and Risk Committee and Safety, Environmental, Technology and Operations Committee of American Water Works Company, Inc. (utilities company, 2019-present). In addition, Ms. Kampling currently serves as a member of the Board of the Nature Conservancy, Wisconsin Chapter (2019-present). Previously, Ms. Kampling served as a Member of the Advisory Board of certain Fidelity® funds (2020), a member of the Board of Interstate Power and Light Company (2012-2019) and Wisconsin Power and Light Company (2012-2019) (each a subsidiary of Alliant Energy Corporation) and as a member of the Board and Workforce Development Committee of the Business Roundtable (2018-2019).
Alan J. Lacy (1953)
Year of Election or Appointment: 2008
Trustee
Mr. Lacy also serves as Trustee of other Fidelity® funds. Previously, Mr. Lacy served as Senior Adviser (2007-2014) of Oak Hill Capital Partners, L.P. (private equity), Chief Executive Officer (2005) and Vice Chairman (2005-2006) of Sears Holdings Corporation (retail), Chief Executive Officer and Chairman of the Board of Sears, Roebuck and Co. (retail, 2000-2005), Chairman (2014-2017) and a member of the Board (2010-2017) of Dave & Buster’s Entertainment, Inc. (restaurant and entertainment complexes) and a member of the Board of Bristol-Myers Squibb Company (global pharmaceuticals, 2008-2020). Mr. Lacy currently serves as a Trustee of the California Chapter of The Nature Conservancy (2015-present) and a member of the Board of the Center for Advanced Study in the Behavioral Sciences at Stanford University (2015-present).
Ned C. Lautenbach (1944)
Year of Election or Appointment: 2000
Trustee
Co-Lead Independent Trustee
Mr. Lautenbach also serves as Trustee of other Fidelity® funds. Mr. Lautenbach currently serves as Chair of the Board of Governors, State University System of Florida (2013-present) and is a member of the Council on Foreign Relations (1994-present). He is also a member and has in the past served as Chairman of the Board of Directors of Artis-Naples (2012-present). Previously, Mr. Lautenbach served as a member and then Lead Director of the Board of Directors of Eaton Corporation (diversified industrial, 1997-2016). He was also a Partner at Clayton, Dubilier & Rice, LLC (private equity investment, 1998-2010); as well as Director of Sony Corporation (2006-2007). In addition, Mr. Lautenbach had a 30-year career with IBM (technology company), during which time he served as Senior Vice President and as a member of the Corporate Executive Committee (1968-1998).
Joseph Mauriello (1944)
Year of Election or Appointment: 2008
Trustee
Mr. Mauriello also serves as Trustee of other Fidelity® funds. Prior to his retirement in January 2006, Mr. Mauriello served in numerous senior management positions including Deputy Chairman and Chief Operating Officer (2004-2005), and Vice Chairman of Financial Services (2002-2004) of KPMG LLP US (professional services, 1965-2005). Mr. Mauriello currently serves as a member of the Independent Directors Council Governing Council (2015-present). Previously, Mr. Mauriello served as a member of the Board of XL Group plc. (global insurance and re-insurance, 2006-2018).
Cornelia M. Small (1944)
Year of Election or Appointment: 2005
Trustee
Ms. Small also serves as Trustee of other Fidelity® funds. Previously, Ms. Small served as Chief Investment Officer, Director of Global Equity Investments and a member of Scudder, Stevens & Clark and Scudder Kemper Investments. Ms. Small previously served as a member of the Board (2009-2019) and Chair of the Investment Committee (2010-2019) of the Teagle Foundation and a member of the Investment Committee of the Berkshire Taconic Community Foundation (2008-2019).
Garnett A. Smith (1947)
Year of Election or Appointment: 2018
Trustee
Mr. Smith also serves as Trustee of other Fidelity® funds. Prior to his retirement, Mr. Smith served as Chairman and Chief Executive Officer (1990-1997) and President (1986-1990) of Inbrand Corp. (manufacturer of personal absorbent products). Prior to his employment with Inbrand Corp., he was employed by a retail fabric chain and North Carolina National Bank (now Bank of America). Mr. Smith previously served as a member of the Advisory Board of certain Fidelity® funds (2012-2013).
David M. Thomas (1949)
Year of Election or Appointment: 2008
Trustee
Co-Lead Independent Trustee
Mr. Thomas also serves as Trustee of other Fidelity® funds. Previously, Mr. Thomas served as Executive Chairman (2005-2006) and Chairman and Chief Executive Officer (2000-2005) of IMS Health, Inc. (pharmaceutical and healthcare information solutions). Mr. Thomas currently serves as Non-Executive Chairman of the Board of Fortune Brands Home and Security (home and security products, 2011-present), and a member of the Board (2004-present) and Presiding Director (2013-present) of Interpublic Group of Companies, Inc. (marketing communication).
Susan Tomasky (1953)
Year of Election or Appointment: 2020
Trustee
Ms. Tomasky also serves as Trustee of other Fidelity® funds. Prior to her retirement, Ms. Tomasky served in various executive officer positions at American Electric Power Company, Inc. (1998-2011), including most recently as President of AEP Transmission (2007-2011). Ms. Tomasky currently serves as a member of the Board and Sustainability Committee and as Chair of the Audit Committee of Marathon Petroleum Corporation (2018-present) and as a member of the Board, Corporate Governance Committee and Organization and Compensation Committee and as Chair of the Audit Committee of Public Service Enterprise Group, Inc. (utilities company, 2012-present). In addition, Ms. Tomasky currently serves as a member of the Board of the Columbus Regional Airport Authority (2007-present), as a member of the Board of the Royal Shakespeare Company – America (2009-present), as a member of the Board of the Columbus Association for the Performing Arts (2011-present) and as a member of the Board of Kenyon College (2016-present). Previously, Ms. Tomasky served as a Member of the Advisory Board of certain Fidelity® funds (2020), a member of the Board (2011-2019) and as Lead Independent Director (2015-2018) of Andeavor Corporation (previously Tesoro Corporation) (independent oil refiner and marketer) and as a member of the Board of Summit Midstream Partners LP (energy, 2012-2018).
Michael E. Wiley (1950)
Year of Election or Appointment: 2018
Trustee
Mr. Wiley also serves as Trustee of other Fidelity® funds. Previously, Mr. Wiley served as a member of the Advisory Board of certain Fidelity® funds (2018-2020), Chairman, President and CEO of Baker Hughes, Inc. (oilfield services, 2000-2004). Mr. Wiley also previously served as a member of the Board of Andeavor Corporation (independent oil refiner and marketer, 2005-2018), a member of the Board of Andeavor Logistics LP (natural resources logistics, 2015-2018) and a member of the Board of High Point Resources (exploration and production, 2005-2020).
+ The information includes the Trustee's principal occupation during the last five years and other information relating to the experience, attributes, and skills relevant to the Trustee's qualifications to serve as a Trustee, which led to the conclusion that the Trustee should serve as a Trustee for the fund.
Advisory Board Members and Officers:
Correspondence intended for a Member of the Advisory Board (if any) may be sent to Fidelity Investments, P.O. Box 55235, Boston, Massachusetts 02205-5235. Correspondence intended for an officer or Peter S. Lynch may be sent to Fidelity Investments, 245 Summer Street, Boston, Massachusetts 02210. Officers appear below in alphabetical order.
Name, Year of Birth; Principal Occupation
Peter S. Lynch (1944)
Year of Election or Appointment: 2003
Member of the Advisory Board
Mr. Lynch also serves as a Member of the Advisory Board of other Fidelity® funds. Mr. Lynch is Vice Chairman and a Director of Fidelity Management & Research Company LLC (investment adviser firm). In addition, Mr. Lynch serves as a Trustee of Boston College and as the Chairman of the Inner-City Scholarship Fund. Previously, Mr. Lynch served as Vice Chairman and a Director of FMR Co., Inc. (investment adviser firm) and on the Special Olympics International Board of Directors (1997-2006).
Elizabeth Paige Baumann (1968)
Year of Election or Appointment: 2017
Anti-Money Laundering (AML) Officer
Ms. Baumann also serves as AML Officer of other funds. She is Chief AML Officer (2012-present) and Senior Vice President (2014-present) of FMR LLC (diversified financial services company) and is an employee of Fidelity Investments. Previously, Ms. Baumann served as AML Officer of certain funds (2017-2019), as AML Officer of the funds (2012-2016), and Vice President (2007-2014) and Deputy Anti-Money Laundering Officer (2007-2012) of FMR LLC.
Craig S. Brown (1977)
Year of Election or Appointment: 2019
Assistant Treasurer
Mr. Brown also serves as Assistant Treasurer of other funds. Mr. Brown is an employee of Fidelity Investments (2013-present).
John J. Burke III (1964)
Year of Election or Appointment: 2018
Chief Financial Officer
Mr. Burke also serves as Chief Financial Officer of other funds. Mr. Burke serves as Head of Investment Operations for Fidelity Fund and Investment Operations (2018-present) and is an employee of Fidelity Investments (1998-present). Previously Mr. Burke served as head of Asset Management Investment Operations (2012-2018).
William C. Coffey (1969)
Year of Election or Appointment: 2019
Assistant Secretary
Mr. Coffey also serves as Assistant Secretary of other funds. He is Senior Vice President and Deputy General Counsel of FMR LLC (diversified financial services company, 2010-present), and is an employee of Fidelity Investments. Previously, Mr. Coffey served as Secretary and CLO of certain funds (2018-2019); CLO, Secretary, and Senior Vice President of Fidelity Management & Research Company and FMR Co., Inc. (investment adviser firms, 2018-2019); Secretary of Fidelity SelectCo, LLC and Fidelity Investments Money Management, Inc. (investment adviser firms, 2018-2019); CLO of Fidelity Management & Research (Hong Kong) Limited, FMR Investment Management (UK) Limited, and Fidelity Management & Research (Japan) Limited (investment adviser firms, 2018-2019); and Assistant Secretary of certain funds (2009-2018).
Timothy M. Cohen (1969)
Year of Election or Appointment: 2018
Vice President
Mr. Cohen also serves as Vice President of other funds. Mr. Cohen serves as Co-Head of Equity (2018-present), a Director of Fidelity Management & Research (Japan) Limited (investment adviser firm, 2016-present), and is an employee of Fidelity Investments. Previously, Mr. Cohen served as Executive Vice President of Fidelity SelectCo, LLC (2019), Head of Global Equity Research (2016-2018), Chief Investment Officer - Equity and a Director of Fidelity Management & Research (U.K.) Inc. (investment adviser firm, 2013-2015) and as a Director of Fidelity Management & Research (Hong Kong) Limited (investment adviser firm, 2017).
Jonathan Davis (1968)
Year of Election or Appointment: 2010
Assistant Treasurer
Mr. Davis also serves as Assistant Treasurer of other funds. Mr. Davis serves as Assistant Treasurer of FMR Capital, Inc. (2017-present) and is an employee of Fidelity Investments. Previously, Mr. Davis served as Vice President and Associate General Counsel of FMR LLC (diversified financial services company, 2003-2010).
Laura M. Del Prato (1964)
Year of Election or Appointment: 2018
Assistant Treasurer
Ms. Del Prato also serves as an officer of other funds. Ms. Del Prato is an employee of Fidelity Investments (2017-present). Prior to joining Fidelity Investments, Ms. Del Prato served as a Managing Director and Treasurer of the JPMorgan Mutual Funds (2014-2017). Prior to JPMorgan, Ms. Del Prato served as a partner at Cohen Fund Audit Services (accounting firm, 2012-2013) and KPMG LLP (accounting firm, 2004-2012).
Colm A. Hogan (1973)
Year of Election or Appointment: 2020
Assistant Treasurer
Mr. Hogan also serves as an officer of other funds. Mr. Hogan serves as Assistant Treasurer of FMR Capital, Inc. (2017-present) and is an employee of Fidelity Investments (2005-present). Previously, Mr. Hogan served as Deputy Treasurer of certain Fidelity® funds (2016-2020) and Assistant Treasurer of certain Fidelity® funds (2016-2018).
Pamela R. Holding (1964)
Year of Election or Appointment: 2018
Vice President
Ms. Holding also serves as Vice President of other funds. Ms. Holding serves as Co-Head of Equity (2018-present) and is an employee of Fidelity Investments (2013-present). Previously, Ms. Holding served as Executive Vice President of Fidelity SelectCo, LLC (2019) and as Chief Investment Officer of Fidelity Institutional Asset Management (2013-2018).
Cynthia Lo Bessette (1969)
Year of Election or Appointment: 2019
Secretary and Chief Legal Officer (CLO)
Ms. Lo Bessette also serves as an officer of other funds. Ms. Lo Bessette serves as CLO, Secretary, and Senior Vice President of Fidelity Management & Research Company LLC (investment adviser firm, 2019-present); and CLO of Fidelity Management & Research (Hong Kong) Limited, FMR Investment Management (UK) Limited, and Fidelity Management & Research (Japan) Limited (investment adviser firms, 2019-present). She is a Senior Vice President and Deputy General Counsel of FMR LLC (diversified financial services company, 2019-present), and is an employee of Fidelity Investments. Previously, Ms. Lo Bessette served as CLO, Secretary, and Senior Vice President of FMR Co., Inc. (investment adviser firm, 2019); Secretary of Fidelity SelectCo, LLC and Fidelity Investments Money Management, Inc. (investment adviser firms, 2019). Prior to joining Fidelity Investments, Ms. Lo Bessette was Executive Vice President, General Counsel (2016-2019) and Senior Vice President, Deputy General Counsel (2015-2016) of OppenheimerFunds (investment management company) and Deputy Chief Legal Officer (2013-2015) of Jennison Associates LLC (investment adviser firm).
Chris Maher (1972)
Year of Election or Appointment: 2020
Deputy Treasurer
Mr. Maher also serves as an officer of other funds. Mr. Maher serves as Assistant Treasurer of FMR Capital, Inc. (2017-present), and is an employee of Fidelity Investments (2008-present). Previously, Mr. Maher served as Assistant Treasurer of certain funds (2013-2020); Vice President of Asset Management Compliance (2013), Vice President of the Program Management Group of FMR (investment adviser firm, 2010-2013), and Vice President of Valuation Oversight (2008-2010).
Jason P. Pogorelec (1975)
Year of Election or Appointment: 2020
Chief Compliance Officer
Mr. Pogorelec also serves as an officer of other funds. Mr. Pogorelec serves as Vice President, Associate General Counsel (2010-present) and is an employee of Fidelity Investments (2006-present). Previously, Mr. Pogorelec served as Assistant Secretary of certain Fidelity funds (2015-2020).
Stacie M. Smith (1974)
Year of Election or Appointment: 2016
President and Treasurer
Ms. Smith also serves as an officer of other funds. Ms. Smith serves as Assistant Treasurer of FMR Capital, Inc. (2017-present), is an employee of Fidelity Investments (2009-present), and has served in other fund officer roles. Prior to joining Fidelity Investments, Ms. Smith served as Senior Audit Manager of Ernst & Young LLP (accounting firm, 1996-2009). Previously, Ms. Smith served as Assistant Treasurer (2013-2019) and Deputy Treasurer (2013-2016) of certain Fidelity® funds.
Marc L. Spector (1972)
Year of Election or Appointment: 2016
Assistant Treasurer
Mr. Spector also serves as an officer of other funds. Mr. Spector serves as Assistant Treasurer of FMR Capital, Inc. (2017-present) and is an employee of Fidelity Investments (2016-present). Prior to joining Fidelity Investments, Mr. Spector served as Director at the Siegfried Group (accounting firm, 2013-2016), and prior to Siegfried Group as audit senior manager at Deloitte & Touche LLP (accounting firm, 2005-2013).
Jim Wegmann (1979)
Year of Election or Appointment: 2019
Assistant Treasurer
Mr. Wegmann also serves as Assistant Treasurer of other funds. Mr. Wegmann is an employee of Fidelity Investments (2011-present).
Shareholder Expense Example
As a shareholder of the Fund, you incur two types of costs: (1) transaction costs, and (2) ongoing costs, including management fees and other Fund expenses. This Example is intended to help you understand your ongoing costs (in dollars) of investing in the Fund and to compare these costs with the ongoing costs of investing in other mutual funds.
The actual expense Example is based on an investment of $1,000 invested at the beginning of the period and held for the entire period (November 5, 2019 to April 30, 2020). The hypothetical expense Example is based on an investment of $1,000 invested for the one-half year period (November 1, 2019 to April 30, 2020).
Actual Expenses
The first line of the accompanying table provides information about actual account values and actual expenses. You may use the information in this line, together with the amount you invested, to estimate the expenses that you paid over the period. Simply divide your account value by $1,000.00 (for example, an $8,600 account value divided by $1,000.00 = 8.6), then multiply the result by the number in the first line under the heading entitled "Expenses Paid During Period" to estimate the expenses you paid on your account during this period. In addition, the Fund, as a shareholder in the underlying Fidelity Central Funds, will indirectly bear its pro-rata share of the fees and expenses incurred by the underlying Fidelity Central Funds. These fees and expenses are not included in the Fund's annualized expense ratio used to calculate the expense estimate in the table below.
Hypothetical Example for Comparison Purposes
The second line of the accompanying table provides information about hypothetical account values and hypothetical expenses based on the Fund's actual expense ratio and an assumed rate of return of 5% per year before expenses, which is not the Fund's actual return. The hypothetical account values and expenses may not be used to estimate the actual ending account balance or expenses you paid for the period. You may use this information to compare the ongoing costs of investing in the Fund and other funds. To do so, compare this 5% hypothetical example with the 5% hypothetical examples that appear in the shareholder reports of the other funds. In addition, the Fund, as a shareholder in the underlying Fidelity Central Funds, will indirectly bear its pro-rata share of the fees and expenses incurred by the underlying Fidelity Central Funds. These fees and expenses are not included in the Fund's annualized expense ratio used to calculate the expense estimate in the table below.
Please note that the expenses shown in the table are meant to highlight your ongoing costs only and do not reflect any transaction costs. Therefore, the second line of the table is useful in comparing ongoing costs only, and will not help you determine the relative total costs of owning different funds.
| Annualized Expense Ratio-A | Beginning Account Value | Ending Account Value April 30, 2020 | Expenses Paid During Period | |
| Actual | .95% | $1,000.00 | $925.60 | $4.45-B |
| Hypothetical-C | $1,000.00 | $1,020.14 | $4.77-D |
A Annualized expense ratio reflects expenses net of applicable fee waivers.
B Actual expenses are equal to the Fund's annualized expense ratio, multiplied by the average account value over the period, multiplied by 178/366 (to reflect the period November 5, 2019 to April 30, 2020).
C 5% return per year before expenses
D Hypothetical expenses are equal to the Fund's annualized expense ratio, multiplied by the average account value over the period, multiplied by 182/366 (to reflect the one-half year period).
Distributions (Unaudited)
The fund designates 67% of the dividend distributed during the fiscal year as qualifying for the dividends–received deduction for corporate shareholders.
The fund designates 80% of the dividend distributed during the fiscal year as amounts which may be taken into account as a dividend for the purposes of the maximum rate under section 1(h)(11) of the Internal Revenue Code.
The fund designates 19% of the dividend distributed during the fiscal year as a section 199A dividend.
The fund will notify shareholders in January 2021 of amounts for use in preparing 2020 income tax returns.
Board Approval of Investment Advisory Contracts and Management Fees
Fidelity U.S. Low Volatility Equity Fund
Board Approval of Investment Advisory Contracts and Management Fees
Fidelity U.S. Low Volatility Equity Fund
Each year, the Board of Trustees, including the Independent Trustees (together, the Board), votes on the renewal of the management contract with Fidelity Management & Research Company LLC (FMR) and the sub-advisory agreements (together, the Advisory Contracts) for the fund. FMR and the sub-advisers are referred to herein as the Investment Advisers. The Board, assisted by the advice of fund counsel and Independent Trustees' counsel, requests and considers a broad range of information relevant to the renewal of the Advisory Contracts throughout the year.Approval of Amended and Restated Advisory Contracts. At its November 2019 meeting, the Board unanimously determined to approve an amended and restated management contract and sub-advisory agreements (Amended and Restated Contracts) for a stub period of January 1, 2020 through January 31, 2020 in connection with a consolidation of certain of Fidelity's advisory businesses. The Board considered that, on or about January 1, 2020, FMR Co., Inc. (FMRC) expected to merge with and into FMR and, after the merger, FMR expected to redomicile as a Delaware limited liability company. The Board also approved the termination of the sub-advisory agreement with FMRC upon the completion of the merger. The Board noted that references to FMR in the Amended and Restated Contracts would be updated to reflect FMR's new form of organization and domicile and considered that the definition of "group assets" for purposes of the fund's group fee would be modified to avoid double-counting assets once the reorganization is complete. The Board also noted Fidelity's assurance that neither the planned consolidation nor the Amended and Restated Contracts will change the investment processes, the level or nature of services provided, the resources and personnel allocated, trading and compliance operations, or any fees paid by the fund.The Board meets regularly and, at each of its meetings, covers an extensive agenda of topics and materials and considers factors that are relevant to its annual consideration of the renewal of the fund's Advisory Contracts, including the services and support provided to the fund and its shareholders. The Board has established various standing committees (Committees), each composed of and chaired by Independent Trustees with varying backgrounds, to which the Board has assigned specific subject matter responsibilities in order to enhance effective decision-making by the Board. The Board, acting directly and through its Committees, requests and receives information concerning the annual consideration of the renewal of the fund's Advisory Contracts. The Board also meets as needed to review matters specifically related to the Board's annual consideration of the renewal of the Advisory Contracts. Members of the Board may also meet with trustees of other Fidelity funds through joint ad hoc committees to discuss certain matters relevant to all of the Fidelity funds.At its January 2020 meeting, the Board unanimously determined to renew the fund's Advisory Contracts. In reaching its determination, the Board considered all factors it believed relevant, including (i) the nature, extent, and quality of the services provided to the fund and its shareholders (including the investment performance of the fund); (ii) the competitiveness of the fund's management fee and total expense ratio relative to peer funds; (iii) the total costs of the services provided by and the profits realized by Fidelity from its relationships with the fund; and (iv) the extent to which, if any, economies of scale exist and are realized as the fund grows, and whether any economies of scale are appropriately shared with fund shareholders.In considering whether to renew the Advisory Contracts for the fund, the Board reached a determination, with the assistance of fund counsel and Independent Trustees' counsel and through the exercise of its business judgment, that the renewal of the Advisory Contracts was in the best interests of the fund and its shareholders and that the compensation payable under the Advisory Contracts was fair and reasonable. The Board's decision to renew the Advisory Contracts was not based on any single factor, but rather was based on a comprehensive consideration of all the information provided to the Board at its meetings throughout the year. The Board, in reaching its determination to renew the Advisory Contracts, was aware that shareholders of the fund have a broad range of investment choices available to them, including a wide choice among funds offered by Fidelity's competitors, and that the fund's shareholders, who have the opportunity to review and weigh the disclosure provided by the fund in its prospectus and other public disclosures, have chosen to invest in this fund, which is part of the Fidelity family of funds.Nature, Extent, and Quality of Services Provided. The Board considered Fidelity's staffing as it relates to the fund, including the backgrounds of investment personnel of Fidelity, and also considered the fund's investment objective, strategies, and related investment philosophy. The Independent Trustees also had discussions with senior management of Fidelity's investment operations and investment groups. The Board considered the structure of the investment personnel compensation program and whether this structure provides appropriate incentives to act in the best interests of the fund. Additionally, the Board considered the portfolio managers' investments, if any, in the funds that they manage.Resources Dedicated to Investment Management and Support Services. The Board and the Fund Oversight and Research Committees reviewed the general qualifications and capabilities of Fidelity's investment staff, including its size, education, experience, and resources, as well as Fidelity's approach to recruiting, training, managing, and compensating investment personnel. The Board noted that Fidelity has continued to increase the resources devoted to non-U.S. offices, including expansion of Fidelity's global investment organization. The Board also noted that Fidelity's analysts have extensive resources, tools and capabilities that allow them to conduct sophisticated quantitative and fundamental analysis, as well as credit analysis of issuers, counterparties and guarantors. Further, the Board considered that Fidelity's investment professionals have sufficient access to global information and data so as to provide competitive investment results over time, and that those professionals also have access to sophisticated tools that permit them to assess portfolio construction and risk and performance attribution characteristics continuously, as well as to transmit new information and research conclusions rapidly around the world. Additionally, in its deliberations, the Board considered Fidelity's trading, risk management, compliance, and technology and operations capabilities and resources, which are integral parts of the investment management process.Shareholder and Administrative Services. The Board considered (i) the nature, extent, quality, and cost of advisory, administrative, and shareholder services performed by the Investment Advisers and their affiliates under the Advisory Contracts and under separate agreements covering transfer agency, pricing and bookkeeping, and securities lending services for the fund; (ii) the nature and extent of the supervision of third party service providers, principally custodians, subcustodians, and pricing vendors; and (iii) the resources devoted to, and the record of compliance with, the fund's compliance policies and procedures. The Board also reviewed the allocation of fund brokerage, including allocations to brokers affiliated with the Investment Advisers, the use of brokerage commissions to pay fund expenses, and the use of "soft" commission dollars to pay for research services.The Board noted that the growth of fund assets over time across the complex allows Fidelity to reinvest in the development of services designed to enhance the value and convenience of the Fidelity funds as investment vehicles. These services include 24-hour access to account information and market information over the Internet and through telephone representatives, investor education materials and asset allocation tools, and the expanded availability of Fidelity Investor Centers.The Board noted that it and the boards of certain other Fidelity funds had formed an ad hoc Committee on Transfer Agency Fees to review the variety of transfer agency fee structures throughout the industry and Fidelity's competitive positioning with respect to industry participants.Investment in a Large Fund Family. The Board considered the benefits to shareholders of investing in a Fidelity fund, including the benefits of investing in a fund that is part of a large family of funds offering a variety of investment disciplines and providing a large variety of mutual fund investor services. The Board noted that Fidelity had taken, or had made recommendations that resulted in the Fidelity funds taking, a number of actions over the previous year that benefited particular funds, including: (i) continuing to dedicate additional resources to Fidelity's investment research process, which includes meetings with management of issuers of securities in which the funds invest, and to the support of the senior management team that oversees asset management; (ii) continuing efforts to enhance Fidelity's global research capabilities; (iii) launching new funds and ETFs with innovative structures, strategies and pricing and making other enhancements to meet client needs; (iv) launching new share classes of existing funds; (v) eliminating purchase minimums and broadening eligibility requirements for certain funds and share classes; (vi) reducing management fees and total expenses for certain target date funds and index funds; (vii) lowering expense caps for certain existing funds and classes, and converting certain voluntary expense caps to contractual caps, to reduce expenses borne by shareholders; (viii) rationalizing product lines and gaining increased efficiencies from fund mergers, liquidations, and share class consolidations; (ix) continuing to develop, acquire and implement systems and technology to improve services to the funds and shareholders, strengthen information security, and increase efficiency; and (x) continuing to implement enhancements to further strengthen Fidelity's product line to increase investors' probability of success in achieving their investment goals, including retirement income goals.Investment Performance. The Board considered whether the fund has operated in accordance with its investment objective, as well as its record of compliance with its investment restrictions. As the fund recently commenced operations, the Board did not believe that it was appropriate to assign significant weight to its limited investment performance.Based on its review, the Board concluded that the nature, extent, and quality of services provided to the fund under the Advisory Contracts should continue to benefit the shareholders of the fund.Competitiveness of Management Fee and Total Expense Ratio. The Board considered the fund's management fee and total expense ratio. The Board further considered that it received and reviewed information regarding the fund's management fee rate and total expense ratio compared to "mapped groups" of competitive funds and classes in connection with the approval of the management contract and sub-advisory agreements in September 2019. The Board noted that, because the fund did not commence operations until November 2019, no new competitive management fee and expense information was considered by the Board.Management Fee. The Board noted that it and the boards of other Fidelity funds formed an ad hoc Committee on Group Fee, which meets periodically, to conduct an in-depth review of the "group fee" component of the management fee of funds with such management fee structures. The Committee's focus included the mechanics of the group fee, the competitive landscape of group fee structures, Fidelity funds with no group fee component and investment products not included in group fee assets. The Board also considered that, for funds subject to the group fee, FMR agreed to voluntarily waive fees over a specified period of time in amounts designed to account for assets converted from certain funds to certain collective investment trusts.The Board also noted that, in 2013, the ad hoc Committee on Management Fees was formed to conduct an in-depth review of the management fee rates of Fidelity's active equity mutual funds. The Committee focused on the following areas: (i) standard fee structures; (ii) research consumption and trading evolution; (iii) management fee competitiveness/profitability by category; and (iv) factors that drive institutional pricing.Based on its review, the Board concluded that the fund's management fee is fair and reasonable in light of the services that the fund receives and the other factors considered.Total Expense Ratio. The Board further considered that FMR has contractually agreed to reimburse the fund to the extent that total operating expenses (excluding interest, certain taxes, certain securities lending costs, brokerage commissions, fees and expenses of the Independent Trustees, proxy and shareholder meeting expenses, extraordinary expenses, and acquired fund fees and expenses, if any), as a percentage of its average net assets, exceed 0.95% through August 31, 2021.Fees Charged to Other Fidelity Clients. The Board also considered Fidelity fee structures and other information with respect to clients of Fidelity, such as other funds advised or subadvised by Fidelity, pension plan clients, and other institutional clients with similar mandates. The Board noted that a joint ad hoc committee created by it and the boards of other Fidelity funds periodically reviews and compares Fidelity's institutional investment advisory business with its business of providing services to the Fidelity funds and also noted the most recent findings of the committee. The Board noted that the committee's review included a consideration of the differences in services provided, fees charged, and costs incurred, as well as competition in the markets serving the different categories of clients.Based on its review of total expense ratios and fees charged to other Fidelity clients, the Board concluded that the fund's total expense ratio was reasonable in light of the services that the fund and its shareholders receive and the other factors considered.Costs of the Services and Profitability. The Board considered the revenues earned and the expenses incurred by Fidelity in conducting the business of developing, marketing, distributing, managing, administering and servicing the Fidelity funds and servicing the Fidelity funds' shareholders. The Board also considered the level of Fidelity's profits in respect of all the Fidelity funds.On an annual basis, Fidelity presents to the Board information about the profitability of its relationships with the Fidelity funds. Fidelity calculates profitability information for each Fidelity fund, as well as aggregate profitability information for groups of Fidelity funds and all Fidelity funds, using a series of detailed revenue and cost allocation methodologies which originate with the books and records of Fidelity on which Fidelity's audited financial statements are based. The Audit Committee of the Board reviews any significant changes from the prior year's methodologies and the full Board approves such changes.PricewaterhouseCoopers LLP (PwC), auditor to Fidelity and certain Fidelity funds, has been engaged annually by the Board as part of the Board's assessment of Fidelity's profitability analysis. PwC's engagement includes the review and assessment of the methodologies used by Fidelity in determining the revenues and expenses attributable to Fidelity's mutual fund business, and completion of agreed-upon procedures in respect of the mathematical accuracy of the Fidelity fund profitability information and its conformity to established allocation methodologies. After considering PwC's reports issued under the engagement and information provided by Fidelity, the Board concluded that while other allocation methods may also be reasonable, Fidelity's profitability methodologies are reasonable in all material respects.The Board also reviewed Fidelity's non-fund businesses and potential indirect benefits such businesses may have received as a result of their association with Fidelity's mutual fund business (i.e., fall-out benefits) as well as cases where Fidelity's affiliates may benefit from the funds' business. The Board noted that changes to fall-out benefits year-over-year reflect business developments at Fidelity's various businesses. The Board considered that a joint ad hoc committee created by it and the boards of other Fidelity funds had recently been established, and met periodically, to evaluate potential fall-out benefits (PFOB Committee). The Board noted that the PFOB Committee, among other things: (i) discussed the legal framework surrounding potential fall-out benefits; (ii) reviewed the Board's responsibilities and approach to potential fall-out benefits; and (iii) reviewed practices employed by competitor funds regarding the review of potential fall-out benefits.The Board considered the costs of the services provided by and the profits realized by Fidelity in connection with the operation of the Fidelity funds, including the conclusions of the PFOB Committee, and was satisfied that the profitability was not excessive.Economies of Scale. The Board considered whether there have been economies of scale in respect of the management of the Fidelity funds, whether the Fidelity funds (including the fund) have appropriately benefited from any such economies of scale, and whether there is potential for realization of any further economies of scale. The Board considered the extent to which the fund will benefit from economies of scale as assets grow through increased services to the fund, through waivers or reimbursements, or through fee or expense ratio reductions. The Board also noted that a committee (the Economies of Scale Committee) created by it and the boards of other Fidelity funds periodically analyzes whether Fidelity attains economies of scale in respect of the management and servicing of the Fidelity funds, whether the Fidelity funds have appropriately benefited from such economies of scale, and whether there is potential for realization of any further economies of scale.The Board recognized that the fund's management contract incorporates a "group fee" structure, which provides for lower group fee rates as total "group assets" increase, and for higher group fee rates as total "group assets" decrease ("group assets" as defined in the management contract). FMR calculates the group fee rates based on a tiered asset "breakpoint" schedule that varies based on asset class. The Board considered that the group fee is designed to deliver the benefits of economies of scale to fund shareholders when total Fidelity fund assets increase, even if assets of any particular fund are unchanged or have declined, because some portion of Fidelity's costs are attributable to services provided to all Fidelity funds, and all funds benefit if those costs can be allocated among more assets. The Board concluded that, given the group fee structure, fund shareholders will benefit from lower management fees as "group assets" increase at the fund complex level, regardless of whether Fidelity achieves any such economies of scale.The Board concluded, taking into account the analysis of the Economies of Scale Committee, that economies of scale, if any, are being appropriately shared between fund shareholders and Fidelity.Additional Information Requested by the Board. In order to develop fully the factual basis for consideration of the Fidelity funds' advisory contracts, the Board requested and received additional information on certain topics, including: (i) fund flow and performance trends, in particular the underperformance of certain funds and strategies, and Fidelity's long-term strategies for certain funds; (ii) consideration of performance fees for additional funds; (iii) changes in Fidelity's non-fund businesses and the impact of such changes on the funds; (iv) metrics for evaluating index fund and ETF performance and information about ETF trading characteristics; (v) the methodology with respect to evaluating competitive fund data and peer group classifications and fee comparisons; (vi) the expense structures for different funds and classes; (vii) information regarding other accounts managed by Fidelity, including collective investment trusts and separately managed accounts; and (viii) Fidelity's philosophies and strategies for evaluating funds and classes with lower or declining asset levels.Based on its evaluation of all of the conclusions noted above, and after considering all factors it believed relevant, the Board concluded that the advisory fee arrangements are fair and reasonable, and that the fund's Amended and Restated Contracts should be approved and the fund's Advisory Contracts should be renewed.Liquidity Risk Management Program
The Securities and Exchange Commission adopted Rule 22e-4 under the Investment Company Act of 1940 (the Liquidity Rule) to promote effective liquidity risk management throughout the open-end investment company industry, thereby reducing the risk that funds will be unable to meet their redemption obligations and mitigating dilution of the interests of fund shareholders.
The Fund has adopted and implemented a liquidity risk management program pursuant to the Liquidity Rule (the Program) effective December 1, 2018. The Program is reasonably designed to assess and manage the Fund’s liquidity risk and to comply with the requirements of the Liquidity Rule. The Fund’s Board of Trustees (the Board) has designated the Fund’s investment adviser as administrator of the Program. The Fidelity advisers have established a Liquidity Risk Management Committee (the LRM Committee) to manage the Program for each of the Fidelity Funds. The LRM Committee monitors the adequacy and effectiveness of implementation of the Program and on a periodic basis assesses each Fund’s liquidity risk based on a variety of factors including (1) the Fund’s investment strategy, (2) portfolio liquidity and cash flow projections during normal and reasonably foreseeable stressed conditions, (3) shareholder redemptions, (4) borrowings and other funding sources and (5) in the case of exchange-traded funds, certain additional factors including the effect of the Fund’s prices and spreads, market participants, and basket compositions on the overall liquidity of the Fund’s portfolio, as applicable.
In accordance with the Program, each of the Fund’s portfolio investments is classified into one of four liquidity categories described below based on a determination of a reasonable expectation for how long it would take to convert the investment to cash (or sell or dispose of the investment) without significantly changing its market value.
- Highly liquid investments – cash or convertible to cash within three business days or less
- Moderately liquid investments – convertible to cash in three to seven calendar days
- Less liquid investments – can be sold or disposed of, but not settled, within seven calendar days
- Illiquid investments – cannot be sold or disposed of within seven calendar days
Liquidity classification determinations take into account a variety of factors including various market, trading and investment-specific considerations, as well as market depth, and generally utilize analysis from a third-party liquidity metrics service.
The Liquidity Rule places a 15% limit on a fund’s illiquid investments and requires funds that do not primarily hold assets that are highly liquid investments to determine and maintain a minimum percentage of the fund’s net assets to be invested in highly liquid investments (highly liquid investment minimum or HLIM). The Program includes provisions reasonably designed to comply with the 15% limit on illiquid investments and for determining, periodically reviewing and complying with the HLIM requirement as applicable.
At a recent meeting of the Fund’s Board of Trustees, the LRM Committee provided a written report to the Board pertaining to the operation, adequacy, and effectiveness of implementation of the Program for the annual period from December 1, 2018 through November 30, 2019. The report concluded that the Program has been implemented and is operating effectively and is reasonably designed to assess and manage the Fund’s liquidity risk.
![]()
USL-ANN-0620
1.9896228.100
Item 2.
Code of Ethics
As of the end of the period, April 30, 2020, Fidelity Summer Street Trust (the trust) has adopted a code of ethics, as defined in Item 2 of Form N-CSR, that applies to its President and Treasurer and its Chief Financial Officer. A copy of the code of ethics is filed as an exhibit to this Form N-CSR.
Item 3.
Audit Committee Financial Expert
The Board of Trustees of the trust has determined that Joseph Mauriello is an audit committee financial expert, as defined in Item 3 of Form N-CSR. Mr. Mauriello is independent for purposes of Item 3 of Form N-CSR.
Item 4.
Principal Accountant Fees and Services
Fees and Services
The following table presents fees billed by Deloitte & Touche LLP, the member firms of Deloitte Touche Tohmatsu, and their respective affiliates (collectively, “Deloitte Entities”) in each of the last two fiscal years for services rendered to Fidelity Series High Income Fund, Fidelity Short Duration High Income Fund and Fidelity Women’s Leadership Fund (the “Funds”):
Services Billed by Deloitte Entities
April 30, 2020 FeesA,B
Audit Fees | Audit-Related Fees | Tax Fees | All Other Fees | |
Fidelity Series High Income Fund | $52,400 | $100 | $8,500 | $1,200 |
Fidelity Short Duration High Income Fund | $54,900 | $100 | $8,500 | $1,200 |
Fidelity Women’s Leadership Fund | $34,200 | $- | $6,900 | $700 |
April 30, 2019 FeesA,B
Audit Fees | Audit-Related Fees | Tax Fees | All Other Fees | |
Fidelity Series High Income Fund | $55,000 | $100 | $6,300 | $1,600 |
Fidelity Short Duration High Income Fund | $58,000 | $100 | $6,300 | $1,700 |
Fidelity Women’s Leadership Fund | $- | $- | $- | $- |
A Amounts may reflect rounding.
B Fidelity Women’s Leadership Fund commenced operations on May 1, 2019.
The following table presents fees billed by PricewaterhouseCoopers LLP (“PwC”) in each of the last two fiscal years for services rendered to Fidelity Capital & Income Fund, Fidelity Focused High Income Fund, Fidelity Global High Income Fund, Fidelity High Income Fund and Fidelity U.S. Low Volatility Equity Fund (the “Funds”):
Services Billed by PwC
April 30, 2020 FeesA,B
Audit Fees | Audit-Related Fees | Tax Fees | All Other Fees | |
Fidelity Capital & Income Fund | $102,100 | $8,700 | $11,400 | $3,700 |
Fidelity Focused High Income Fund | $64,500 | $5,600 | $8,100 | $2,400 |
Fidelity Global High Income Fund | $60,200 | $5,400 | $8,700 | $2,200 |
Fidelity High Income Fund | $101,500 | $8,200 | $11,400 | $3,400 |
Fidelity U.S. Low Volatility Equity Fund | $25,400 | $1,400 | $9,000 | $500 |
April 30, 2019 FeesA,B
Audit Fees | Audit-Related Fees | Tax Fees | All Other Fees | |
Fidelity Capital & Income Fund | $111,000 | $9,400 | $4,300 | $4,500 |
Fidelity Focused High Income Fund | $71,000 | $6,100 | $3,300 | $2,900 |
Fidelity Global High Income Fund | $67,000 | $5,700 | $3,300 | $2,700 |
Fidelity High Income Fund | $105,000 | $8,400 | $3,300 | $4,000 |
Fidelity U.S. Low Volatility Equity Fund | $- | $- | $- | $- |
A Amounts may reflect rounding.
B Fidelity U.S. Low Volatility Equity Fund commenced operations on November 5, 2019.
The following table(s) present(s) fees billed by Deloitte Entities and PwC that were required to be approved by the Audit Committee for services that relate directly to the operations and financial reporting of the Fund(s) and that are rendered on behalf of Fidelity Management & Research Company LLC ("FMR") and entities controlling, controlled by, or under common control with FMR (not including any sub-adviser whose role is primarily portfolio management and is subcontracted with or overseen by another investment adviser) that provide ongoing services to the Fund(s) (“Fund Service Providers”):
Services Billed by Deloitte Entities
April 30, 2020A,B | April 30, 2019A,B | |
Audit-Related Fees | $- | $290,000 |
Tax Fees | $3,000 | $5,000 |
All Other Fees | $- | $- |
A Amounts may reflect rounding.
B May include amounts billed prior to the Fidelity Women’s Leadership Fund’s commencement of operations.
Services Billed by PwC
April 30, 2020A,B | April 30, 2019A,B | |
Audit-Related Fees | $8,596,700 | $7,890,000 |
Tax Fees | $17,700 | $20,000 |
All Other Fees | $- | $- |
A Amounts may reflect rounding.
B May include amounts billed prior to the Fidelity U.S. Low Volatility Equity Fund’s commencement of operations.
“Audit-Related Fees” represent fees billed for assurance and related services that are reasonably related to the performance of the fund audit or the review of the fund's financial statements and that are not reported under Audit Fees.
“Tax Fees” represent fees billed for tax compliance, tax advice or tax planning that relate directly to the operations and financial reporting of the fund.
“All Other Fees” represent fees billed for services provided to the fund or Fund Service Provider, a significant portion of which are assurance related, that relate directly to the
operations and financial reporting of the fund, excluding those services that are reported under Audit Fees, Audit-Related Fees or Tax Fees.
Assurance services must be performed by an independent public accountant.
* * *
The aggregate non-audit fees billed by Deloitte Entities and PwC for services rendered to the Fund(s), FMR (not including any sub-adviser whose role is primarily portfolio management and is subcontracted with or overseen by another investment adviser), and any Fund Service Provider for each of the last two fiscal years of the Fund(s) are as follows:
Billed By | April 30, 2020A,B | April 30, 2019A,B |
Deloitte Entities | $531,800 | $720,000 |
PwC | $13,539,600 | $12,440,000 |
A Amounts may reflect rounding.
B May include amounts billed prior to the Fidelity Women’s Leadership Fund and Fidelity U.S. Low Volatility Equity Funds’ commencement of operations.
The trust's Audit Committee has considered non-audit services that were not pre-approved that were provided by Deloitte Entities and PwC to Fund Service Providers to be compatible with maintaining the independence of Deloitte Entities and PwC in its(their) audit of the Fund(s), taking into account representations from Deloitte Entities and PwC, in accordance with Public Company Accounting Oversight Board rules, regarding its independence from the Fund(s) and its(their) related entities and FMR’s review of the appropriateness and permissibility under applicable law of such non-audit services prior to their provision to the Fund(s) Service Providers.
Audit Committee Pre-Approval Policies and Procedures
The trust’s Audit Committee must pre-approve all audit and non-audit services provided by a fund’s independent registered public accounting firm relating to the operations or financial reporting of the fund. Prior to the commencement of any audit or non-audit services to a fund, the Audit Committee reviews the services to determine whether they are appropriate and permissible under applicable law.
The Audit Committee has adopted policies and procedures to, among other purposes, provide a framework for the Committee’s consideration of non-audit services by the audit firms that audit the Fidelity funds. The policies and procedures require that any non-audit service provided by a fund audit firm to a Fidelity fund and any non-audit service provided by a fund auditor to a Fund Service Provider that relates directly to the operations and financial reporting of a Fidelity fund (“Covered Service”) are subject to approval by the Audit Committee before such service is provided.
All Covered Services must be approved in advance of provision of the service either: (i) by formal resolution of the Audit Committee, or (ii) by oral or written approval of the service by the Chair of the Audit Committee (or if the Chair is unavailable, such other member of the Audit Committee as may be designated by the Chair to act in the Chair’s absence). The approval contemplated by (ii) above is permitted where the Treasurer determines that action on such an engagement is necessary before the next meeting of the Audit Committee.
Non-audit services provided by a fund audit firm to a Fund Service Provider that do not relate directly to the operations and financial reporting of a Fidelity fund are reported to the Audit Committee periodically.
Non-Audit Services Approved Pursuant to Rule 2-01(c)(7)(i)(C) and (ii) of Regulation S-X (“De Minimis Exception”)
There were no non-audit services approved or required to be approved by the Audit Committee pursuant to the De Minimis Exception during the Fund’s(s’) last two fiscal years relating to services provided to (i) the Fund(s) or (ii) any Fund Service Provider that relate directly to the operations and financial reporting of the Fund(s).
Item 5.
Audit Committee of Listed Registrants
Not applicable.
Item 6.
Investments
(a)
Not applicable.
(b)
Not applicable.
Item 7.
Disclosure of Proxy Voting Policies and Procedures for Closed-End Management Investment Companies
Not applicable.
Item 8.
Portfolio Managers of Closed-End Management Investment Companies
Not applicable.
Item 9.
Purchase of Equity Securities by Closed-End Management Investment Company and Affiliated Purchasers
Not applicable.
Item 10.
Submission of Matters to a Vote of Security Holders
There were no material changes to the procedures by which shareholders may recommend nominees to the trust’s Board of Trustees.
Item 11.
Controls and Procedures
(a)(i) The President and Treasurer and the Chief Financial Officer have concluded that the trust’s disclosure controls and procedures (as defined in Rule 30a-3(c) under the Investment Company Act) provide reasonable assurances that material information relating to the trust is made known to them by the appropriate persons, based on their evaluation of these controls and procedures as of a date within 90 days of the filing date of this report.
(a)(ii) There was no change in the trust’s internal control over financial reporting (as defined in Rule 30a-3(d) under the Investment Company Act) that occurred during the period covered by this report that has materially affected, or is reasonably likely to materially affect, the trust’s internal control over financial reporting.
Item 12.
Disclosure of Securities Lending Activities for Closed-End Management
Investment Companies
Not applicable.
Item 13.
Exhibits
(a) | (1) | Code of Ethics pursuant to Item 2 of Form N-CSR is filed and attached hereto as EX-99.CODE ETH. |
(a) | (2) | |
(a) | (3) | Not applicable. |
(b) |
SIGNATURES
Pursuant to the requirements of the Securities Exchange Act of 1934 and the Investment Company Act of 1940, the registrant has duly caused this report to be signed on its behalf by the undersigned, thereunto duly authorized.
Fidelity Summer Street Trust
By: | /s/Stacie M. Smith |
Stacie M. Smith | |
President and Treasurer | |
Date: | June 19, 2020 |
Pursuant to the requirements of the Securities Exchange Act of 1934 and the Investment Company Act of 1940, this report has been signed below by the following persons on behalf of the registrant and in the capacities and on the dates indicated.
By: | /s/Stacie M. Smith |
Stacie M. Smith | |
President and Treasurer | |
Date: | June 19, 2020 |
By: | /s/John J. Burke III |
John J. Burke III | |
Chief Financial Officer | |
Date: | June 19, 2020 |